UNITED STATES
SECURITIES AND EXCHANGE COMMISSION
Washington, D.C. 20549
FORM N-CSR
CERTIFIED SHAREHOLDER REPORT
OF
REGISTERED MANAGEMENT INVESTMENT COMPANIES
Investment Company Act file number: 811-05962
| Name of Registrant: | Vanguard Variable Insurance Funds |
| Address of Registrant: | P.O. Box 2600 |
| | Valley Forge, PA 19482 |
| Name and address of agent for service: | Anne E. Robinson, Esquire |
| | P.O. Box 876 |
| | Valley Forge, PA 19482 |
Registrant’s telephone number, including area code: (610) 669-1000
Date of fiscal year end: December 31
Date of reporting period: January 1, 2020-December 31, 2020
Item 1: Reports to Shareholders
Annual Report | December 31, 2020
Vanguard Variable Insurance Funds
Contents
Your Portfolio’s Performance at a Glance
| 1 |
Advisor’s Report
| 2 |
About Your Portfolio’s Expenses
| 4 |
Performance Summary
| 5 |
Financial Statements
| 7 |
Please note: The opinions expressed in this report are just that—informed opinions. They should not be considered promises or advice. Also, please keep in mind that the information and opinions cover the period through the date on the front of this report. Of course, the risks of investing in your portfolio are spelled out in the prospectus.
Your Portfolio’s Performance at a Glance
| • | The Balanced Portfolio of Vanguard Variable Insurance Funds returned 10.68% for the 12 months ended December 31, 2020, trailing the 15.80% return of its composite benchmark. Please note that the portfolio’s returns are different from those in Vanguard Variable Annuity (and other plans that invest in the portfolio), which take into account insurance-related expenses. |
| • | The emergence of COVID-19 in early 2020 turned into a global health crisis, and aggressive attempts to contain it resulted in a sharp downturn in economic activity. Unemployment spiked, and sectors where social distancing isn’t possible were hit hard. Stocks initially plummeted as infections surged, but they finished the year significantly higher, thanks in part to rapid and robust monetary and fiscal action by policymakers and the rollout of COVID-19 vaccines as the year drew to a close. Many central banks slashed short-term interest rates and expanded or extended asset-purchase programs. |
| • | Returns were positive in eight of the stock sectors the portfolio invests in. Poor selection in consumer discretionary and an underweighting of information technology were the biggest detractors relative to the benchmark. |
| • | Over the decade ended December 31, the portfolio’s average annual return trailed that of its benchmark by about 1 percentage point. |
Market Barometer
Average Annual Total Returns
Periods Ended December 31, 2020 |
| | One Year | Three Years | Five Years |
| Stocks | | | |
| Russell 1000 Index (Large-caps) | 20.96% | 14.82% | 15.60% |
| Russell 2000 Index (Small-caps) | 19.96 | 10.25 | 13.26 |
| Russell 3000 Index (Broad U.S. market) | 20.89 | 14.49 | 15.43 |
| FTSE All-World ex US Index (International) | 11.22 | 5.18 | 9.16 |
| Bonds | | | |
| Bloomberg Barclays U.S. Aggregate Bond Index (Broad taxable market) | 7.51% | 5.34% | 4.44% |
Bloomberg Barclays Municipal Bond Index
(Broad tax-exempt market) | 5.21 | 4.64 | 3.91 |
| FTSE Three-Month U.S. Treasury Bill Index | 0.58 | 1.56 | 1.16 |
| CPI | | | |
| Consumer Price Index | 1.36% | 1.85% | 1.95% |
The Balanced Portfolio of Vanguard Variable Insurance Funds returned 10.68% for the 12 months ended December 31, 2020, trailing the 15.80% return of its blended benchmark (a mix of 65% large-capitalization stocks and 35% high-quality corporate bonds). The stock portion of the portfolio underperformed its benchmark, the Standard & Poor’s 500 Index, while the bond portion outperformed its benchmark, the Bloomberg Barclays U.S. Credit A or Better Bond Index.
The investment environment
Stock markets in the United States and abroad posted positive results for the year. The S&P 500 Index returned 18.40%, the MSCI World Index 16.50%, and the MSCI EAFE Index 7.82%.
Throughout the year, the primary factors influencing the environment for equities were effects of the COVID-19 pandemic, declining interest rates, and the U.S. presidential election.
COVID-19 spread globally in March, bringing affected countries’ economies to a near-standstill. The impact extended to businesses across almost all sectors, even those considered more stable or defensive. Stock prices fell sharply at the outset for businesses directly affected by the shutdown and those with higher leverage. As the pandemic extended into the summer, high-growth stocks drove up the market from the lows of March, with many of these businesses benefiting from consumers’ shift to digital.
In addition, interest rates generally declined during 2020. The Federal Reserve continued its supportive policy, cutting rates to near zero in March to help bolster the market. The low rates magnified exceptional fundamentals for many high-growth stocks. This resulted in strong performance from many high-growth technology companies, particularly in the mega-capitalization spectrum of the market.
The fourth quarter of 2020 was marked by two significant events: the presidential
election and the development of COVID-19 vaccines. The market reacted positively to both events and performed strongly throughout the quarter. The high-growth dominance that marked much of 2020 began to subside as positive vaccine news led to optimism for a cyclical recovery.
In the U.S., large-cap growth stocks, as measured by the Russell 1000 Growth Index (+38.49%), significantly outperformed large-cap value stocks, as measured by the Russell 1000 Value Index (+2.80%). This trend hindered the portfolio, which incorporates valuation as a component of the investment process.
The broad fixed income markets largely generated positive total returns over the year, spurred by a significant decline in U.S. Treasury yields and the compression of credit spreads after they had widened earlier in 2020. Markets were primarily influenced by the pandemic-driven growth slowdown and then by the unprecedented speed and magnitude of stimulus measures enacted by the Fed and the U.S. government.
For the year, the Bloomberg Barclays U.S. Aggregate Bond Index returned 7.51% and the higher-quality credit market performed even better, as the Bloomberg Barclays U.S. Credit A or Better Bond Index returned 9.42%. The yield of the 10-year Treasury note fell, beginning 2020 at 1.92% and ending at 0.91%.
Our shortfalls
In the stock portfolio, sector allocation and security selection detracted from relative returns. Specifically, the portfolio’s average overweight position in the financial sector significantly hurt, contributing to underperformance for the year. The portfolio’s average overweight position in energy also detracted, as did its underweight allocation to information technology.
Selection was weakest in consumer discretionary, health care, and real estate. The biggest detractors included Bank of America, BP, Prudential Financial, and
JPMorgan Chase. A lack of exposure to or underweight positions in Amazon, NVIDIA, and PayPal also hurt relative returns.
On the fixed income side, moderate out-of-benchmark allocations to consumer asset-backed securities and commercial mortgage-backed securities (MBS) were slight relative detractors, as was an underweight allocation to local agency bonds. Our duration/yield curve positioning also modestly hurt. The primary detractor was positioning in the long end of the yield curve in the second quarter as the curve steepened.
Our successes
Our stock selection in financials, energy, and utilities partly offset negative returns. Taiwan Semiconductor, BlackRock, Charles Schwab, and Deere & Co. were strong individual contributors to results, as was a lack of exposure to Wells Fargo and Boeing. An underweight allocation to Exxon Mobil also helped overall performance.
In the fixed income portfolio, spread sectors struggled at the start of 2020 before reversing course and rallying to end up tightening for the year. Selection among investment-grade corporates—particularly consumer noncyclicals, technology, communications, and transportation within the industrial sector—mainly drove outperformance of the benchmark. Selection in financials and utilities also helped. In noncorporate credit, an underweighting of local authority bonds and supranationals contributed, as did selection in sovereigns. An out-of-benchmark allocation to agency MBS pass-throughs also boosted relative returns.
Portfolio positioning
We remain balanced on the intermediate-term outlook for equity markets. On the encouraging side, the uncertainty surrounding the election is largely behind us. And with all the vaccine progress, we can begin to conceive of a post-COVID economy. However, we appreciate the logistical challenges of
vaccine production and distribution and recognize the economic uncertainty that still lies ahead.
At the portfolio level, we are excited about the prospects for many individual businesses. Large-cap financials Charles Schwab and JPMorgan Chase show strong underlying growth despite the difficult rate environment. Across sectors, businesses such as McDonald’s, HCA, Facebook, Danaher, Blackstone, and Home Depot have all navigated the difficult conditions far better than expected. Pharmaceutical giant Pfizer has been one of the leaders in developing a COVID-19 vaccine. IT companies such as Google and Microsoft continue to achieve success across a range of businesses, products, and shareholders.
Over the year, we initiated new positions in Facebook, Procter & Gamble, and medical supply company Becton Dickinson. We believe that Facebook has shown excellent business resilience and has benefited from the accelerating shift to digital. It is investing to extend its competitive advantage, and we believe it still has a long runway for growth. Procter & Gamble has an excellent management team with solid market-share dynamics across key products that have continued to execute well. Nine of its 10 product categories have grown organically despite the difficult economic environment. Becton Dickinson makes a wide range of everyday products that are essential to the delivery of health care. It has a stable demand profile, with a dominant market-share position across most categories.
Although the portfolio remains overweight in financials, we significantly reduced our positioning in the sector during the year: We eliminated several holdings because we were less confident they could create value at an attractive rate over time. The portfolio remains underweight in IT,
though we added to the sector over the year by buying competitively advantaged, growing businesses with strong management teams.
We remain committed to our investment philosophy and process of constructing a portfolio of resilient businesses at reasonable valuations run by management teams that are likely to make value-enhancing decisions over the long term. Our goal is to deliver a superior rate of economic growth (earnings plus dividends) over the long term and provide downside protection in difficult economic and market environments.
On the fixed income side, we believe that credit valuations are modestly high in the face of near-term uncertainty. We expect the Fed to hold short rates low while long rates could rise over time as economic activity rebounds after the vaccine rollout. We have positioned the portfolio’s fixed income portion with a slight duration underweight relative to the benchmark.
While fundamentals are likely to remain strained for the medium term, credit markets continue to be our main investment focus and are well-supported by global central bank policy. We are underweight in corporate credit relative to the all-credit benchmark, with a bias toward defensive sectors with lower earnings volatility while also seeking opportunities to move up in credit quality. On an industry basis, the portfolio is overweight in less-cyclical sectors such as communications and utilities while remaining cautious about more cyclical ones such as energy. We remain overweight in taxable municipals given their diversification benefit and resilient underlying credit quality coupled with relatively attractive valuations.
The fixed income portfolio maintains an out-of-benchmark allocation to U.S. governments and an out-of-benchmark
agency MBS allocation. We believe that agency MBS, beyond providing strong liquidity, are well-supported by Fed buying despite concerns about prepayment speeds. The portfolio holds MBS pass-throughs, focusing on low-coupon To-Be-Announced (TBA) securities to maintain carry and liquidity, as well as collateralized mortgage obligations and a modest allocation to delegated underwriting and servicing for their stable cash flows.
Consistent with our practices, we hold adequate liquidity in the portfolio’s fixed income portion, notably government bonds and agency MBS as our “all-weather” liquidity buffer. This buffer should provide downside protection for shareholders if the economic cycle or the equity portfolios, or both, take an unfavorable turn.
We remain disciplined in applying our investment process, which allows us to create a balanced portfolio that we believe should perform well in various environments. We remain focused on long-term, low-turnover investing— features that we believe will serve the portfolio’s shareholders well over time.
Portfolio Managers:
Daniel J. Pozen
Senior Managing Director and
Equity Portfolio Manager
Michael E. Stack, CFA,
Senior Managing Director and
Fixed Income Portfolio Manager
Loren L. Moran, CFA,
Senior Managing Director and
Fixed Income Portfolio Manager
Wellington Management Company llp
January 21, 2021
About Your Portfolio’s Expenses
As a shareholder of the portfolio, you incur ongoing costs, which include costs for portfolio management, administrative services, and shareholder reports (like this one), among others. Operating expenses, which are deducted from a portfolio's gross income, directly reduce the investment return of the portfolio.
A portfolio's expenses are expressed as a percentage of its average net assets. This figure is known as the expense ratio. The following examples are intended to help you understand the ongoing costs (in dollars) of investing in your portfolio and to compare these costs with those of other mutual funds. The examples are based on an investment of $1,000 made at the beginning of the period shown and held for the entire period.
The accompanying table illustrates your portfolio's costs in two ways:
| • | Based on actual portfolio return. This section helps you to estimate the actual expenses that you paid over the period. The ”Ending Account Value“ shown is derived from the portfolio's actual return, and the third column shows the dollar amount that would have been paid by an investor who started with $1,000 in the portfolio. You may use the information here, together with the amount you invested, to estimate the expenses that you paid over the period. |
To do so, simply divide your account value by $1,000 (for example, an $8,600 account value divided by $1,000 = 8.6), then multiply the result by the number given for your portfolio under the heading ”Expenses Paid During Period.“
| • | Based on hypothetical 5% yearly return. This section is intended to help you compare your portfolio's costs with those of other mutual funds. It assumes that the portfolio had a yearly return of 5% before expenses, but that the expense ratio is unchanged. In this case—because the return used is not the portfolio's actual return—the results do not apply to your investment. The example is useful in making comparisons because the Securities and Exchange Commission requires all mutual funds to calculate expenses based on a 5% return. You can assess your portfolio's costs by comparing this hypothetical example with the hypothetical examples that appear in shareholder reports of other funds. |
Note that the expenses shown in the table are meant to highlight and help you compare ongoing costs only and do not reflect transaction costs incurred by the portfolio for buying and selling securities. The portfolio’s expense ratio does not reflect additional fees and expenses associated with the annuity or life insurance program through which you invest.
The calculations assume no shares were bought or sold during the period. Your actual costs may have been higher or lower, depending on the amount of your investment and the timing of any purchases or redemptions.
You can find more information about the portfolio's expenses, including annual expense ratios, in the Financial Statements section of this report. For additional information on operating expenses and other shareholder costs, please refer to your portfolio's current prospectus.
| Six Months Ended December 31, 2020 | | | |
| Balanced Portfolio | Beginning
Account Value
6/30/2020 | Ending
Account Value
12/31/2020 | Expenses
Paid During
Period |
| Based on Actual Portfolio Return | $1,000.00 | $1,144.90 | $1.08 |
| Based on Hypothetical 5% Yearly Return | 1,000.00 | 1,024.13 | 1.02 |
The calculations are based on expenses incurred in the most recent six-month period. The portfolio’s annualized six-month expense ratio for that period is 0.20%. The dollar amounts shown as “Expenses Paid” are equal to the annualized expense ratio multiplied by the average account value over the period, multiplied by the number of days in the most recent six-month period, then divided by the number of days in the most recent 12-month period (184/366).
All of the returns in this report represent past performance, which is not a guarantee of future results that may be achieved by the portfolio. (Current performance may be lower or higher than the performance data cited. For performance data current to the most recent month-end, visit our website at vanguard.com/performance.) Note, too, that both investment returns and principal value can fluctuate widely, so an investor’s shares, when sold, could be worth more or less than their original cost. The returns shown do not reflect taxes that a shareholder would pay on portfolio distributions or on the sale of portfolio shares. Nor do the returns reflect fees and expenses associated with the annuity or life insurance program through which a shareholder invests. If these fees and expenses were included, the portfolio's returns would be lower.
Cumulative Performance: December 31, 2010, Through December 31, 2020
Initial Investment of $10,000
| | | | Average Annual Total Returns
Periods Ended December 31, 2020 |
| | | One
Year | Five
Years | Ten
Years | Final Value
of a $10,000
Investment |
 | Balanced Portfolio | 10.68% | 10.77% | 9.88% | $25,655 |
 | Composite Stock/Bond Index | 15.80 | 12.03 | 10.89 | 28,114 |
 | Dow Jones U.S. Total Stock Market Float Adjusted Index | 20.79 | 15.36 | 13.74 | 36,240 |
Composite Stock/Bond Index: Weighted 65% S&P 500 Index and 35% Bloomberg Barclays U.S. Credit A or Better Bond Index
See Financial Highlights for dividend and capital gains information.
| Asset-Backed/Commercial Mortgage-Backed Securities | 0.8% |
| Common Stocks | 67.3 |
| Corporate Bonds | 23.4 |
| Sovereign Bonds | 0.6 |
| Taxable Municipal Bonds | 1.9 |
| U.S. Government and Agency Obligations | 6.0 |
The table reflects the portfolio’s investments, except for short-term investments and derivatives. The agency and mortgage-backed securities may include issues from government-sponsored enterprises; such issues are generally not backed by the full faith and credit of the U.S. government.
The portfolio files its complete schedule of portfolio holdings with the Securities and Exchange Commission (SEC) for the first and third quarters of each fiscal year as an exhibit to its reports on Form N-PORT. The portfolio’s Form N-PORT reports are available on the SEC’s website at www.sec.gov.
| | | Shares | Market
Value•
($000) |
| Common Stocks (65.2%) |
| Communication Services (8.2%) |
| * | Alphabet Inc. Class A | 82,844 | 145,196 |
| * | Facebook Inc. Class A | 293,753 | 80,242 |
| | Comcast Corp. Class A | 901,613 | 47,244 |
| | | | 272,682 |
| Consumer Discretionary (6.5%) |
| | McDonald's Corp. | 344,722 | 73,970 |
| | TJX Cos. Inc. | 781,754 | 53,386 |
| | Home Depot Inc. | 172,884 | 45,922 |
| * | Alibaba Group Holding Ltd. ADR | 125,691 | 29,252 |
| | Dollar General Corp. | 53,243 | 11,197 |
| * | Airbnb Inc. Class A | 15,900 | 2,334 |
| | | | 216,061 |
| Consumer Staples (5.6%) |
| | Procter & Gamble Co. | 397,188 | 55,265 |
| | Coca-Cola Co. | 822,511 | 45,106 |
| | Nestle SA (Registered) | 331,748 | 39,216 |
| | Sysco Corp. | 518,110 | 38,475 |
| | Diageo plc | 230,934 | 9,138 |
| | | | 187,200 |
| Energy (1.3%) |
| | TOTAL SE | 1,028,578 | 44,396 |
| Financials (10.1%) |
| | JPMorgan Chase & Co. | 542,891 | 68,985 |
| | Charles Schwab Corp. | 1,194,620 | 63,363 |
| | BlackRock Inc. | 59,513 | 42,941 |
| | Bank of America Corp. | 1,356,968 | 41,130 |
| | Progressive Corp. | 394,706 | 39,028 |
| | | Shares | Market
Value•
($000) |
| | Blackstone Group Inc. Class A | 434,705 | 28,173 |
| | American Express Co. | 232,840 | 28,153 |
| | Prudential plc | 749,489 | 13,782 |
| | Morgan Stanley | 174,647 | 11,968 |
| | | | 337,523 |
| Health Care (10.0%) |
| | Pfizer Inc. | 1,242,779 | 45,747 |
| | UnitedHealth Group Inc. | 124,051 | 43,502 |
| | Becton Dickinson and Co. | 173,224 | 43,344 |
| | Novartis AG (Registered) | 396,702 | 37,353 |
| | Abbott Laboratories | 295,052 | 32,305 |
| | HCA Healthcare Inc. | 168,139 | 27,652 |
| | Anthem Inc. | 82,350 | 26,442 |
| | AstraZeneca plc ADR | 515,479 | 25,769 |
| | Humana Inc. | 54,132 | 22,209 |
| | Danaher Corp. | 76,236 | 16,935 |
| | Baxter International Inc. | 170,118 | 13,650 |
| | | | 334,908 |
| Industrials (6.3%) |
| | Union Pacific Corp. | 135,311 | 28,174 |
| | Deere & Co. | 101,067 | 27,192 |
| | Raytheon Technologies Corp. | 353,916 | 25,309 |
| | Trane Technologies plc | 165,731 | 24,057 |
| | Northrop Grumman Corp. | 73,519 | 22,403 |
| | Schneider Electric SE | 133,501 | 19,295 |
| | Fortive Corp. | 263,647 | 18,671 |
| | Lockheed Martin Corp. | 49,665 | 17,630 |
| | United Parcel Service Inc. Class B | 86,866 | 14,628 |
| | | Shares | Market
Value•
($000) |
| | Vinci SA | 125,325 | 12,484 |
| | | | 209,843 |
| Information Technology (14.6%) |
| | Microsoft Corp. | 689,992 | 153,468 |
| | Apple Inc. | 821,664 | 109,027 |
| 1 | Taiwan Semiconductor Manufacturing Co. Ltd. ADR | 486,054 | 52,999 |
| | Texas Instruments Inc. | 278,340 | 45,684 |
| | Global Payments Inc. | 190,047 | 40,940 |
| | Accenture plc Class A | 68,303 | 17,841 |
| | Lam Research Corp. | 34,130 | 16,119 |
| | KLA Corp. | 56,045 | 14,511 |
| | Cisco Systems Inc. | 291,360 | 13,038 |
| | Fidelity National Information Services Inc. | 84,617 | 11,970 |
| * | salesforce.com Inc. | 44,173 | 9,830 |
| * | Vontier Corp. | 76,448 | 2,553 |
| | | | 487,980 |
| Real Estate (0.6%) |
| | American Tower Corp. | 94,735 | 21,264 |
| Utilities (2.0%) |
| | Exelon Corp. | 822,937 | 34,744 |
| | Duke Energy Corp. | 364,316 | 33,357 |
| | | | 68,101 |
| Total Common Stocks (Cost $1,533,656) | 2,179,958 |
| | | | Coupon | Maturity
Date | Face
Amount
($000) | Market
Value•
($000) |
| U.S. Government and Agency Obligations (5.9%) |
| U.S. Government Securities (5.0%) |
| | U.S. Treasury Note/Bond | 0.125% | 10/31/22 | 20,050 | 20,050 |
| | U.S. Treasury Note/Bond | 0.125% | 11/30/22 | 2,800 | 2,800 |
| | U.S. Treasury Note/Bond | 2.500% | 3/31/23 | 7,915 | 8,333 |
| | U.S. Treasury Note/Bond | 0.125% | 5/15/23 | 3,005 | 3,004 |
| | U.S. Treasury Note/Bond | 2.625% | 6/30/23 | 6,650 | 7,059 |
| | U.S. Treasury Note/Bond | 2.875% | 10/31/23 | 5,600 | 6,029 |
| | U.S. Treasury Note/Bond | 2.625% | 12/31/23 | 6,400 | 6,868 |
| | U.S. Treasury Note/Bond | 1.750% | 6/30/24 | 12,675 | 13,352 |
| | U.S. Treasury Note/Bond | 1.500% | 10/31/24 | 4,100 | 4,297 |
| | U.S. Treasury Note/Bond | 1.125% | 2/28/25 | 6,395 | 6,620 |
| | | | Coupon | Maturity
Date | Face
Amount
($000) | Market
Value•
($000) |
| | U.S. Treasury Note/Bond | 0.250% | 5/31/25 | 13,400 | 13,373 |
| | U.S. Treasury Note/Bond | 0.250% | 7/31/25 | 5,655 | 5,637 |
| | U.S. Treasury Note/Bond | 0.250% | 8/31/25 | 4,800 | 4,783 |
| | U.S. Treasury Note/Bond | 0.250% | 10/31/25 | 19,000 | 18,917 |
| | U.S. Treasury Note/Bond | 0.625% | 5/15/30 | 5,870 | 5,737 |
| | U.S. Treasury Note/Bond | 0.875% | 11/15/30 | 8,290 | 8,258 |
| 2 | U.S. Treasury Note/Bond | 1.125% | 8/15/40 | 6,050 | 5,725 |
| | U.S. Treasury Note/Bond | 3.125% | 8/15/44 | 1,740 | 2,293 |
| | U.S. Treasury Note/Bond | 2.250% | 8/15/46 | 88 | 100 |
| | U.S. Treasury Note/Bond | 2.250% | 8/15/49 | 10 | 11 |
| | U.S. Treasury Note/Bond | 2.000% | 2/15/50 | 2,116 | 2,297 |
| | | | Coupon | Maturity
Date | Face
Amount
($000) | Market
Value•
($000) |
| | U.S. Treasury Note/Bond | 1.250% | 5/15/50 | 1,394 | 1,264 |
| | U.S. Treasury Note/Bond | 1.375% | 8/15/50 | 6,475 | 6,058 |
| | U.S. Treasury Note/Bond | 1.625% | 11/15/50 | 15,060 | 14,985 |
| | | | | | | 167,850 |
| Conventional Mortgage-Backed Securities (0.4%) |
| 3,4 | Fannie Mae Pool | 2.780% | 6/1/26 | 1,025 | 1,124 |
| 3,4 | Fannie Mae Pool | 3.070% | 2/1/25 | 500 | 543 |
| 3,4 | Freddie Mac Gold Pool | 4.000% | 9/1/41 | 3 | 3 |
| 3 | Ginnie Mae I Pool | 7.000% | 11/15/31 - 11/15/33 | 51 | 59 |
| 3 | Ginnie Mae I Pool | 8.000% | 9/15/30 | 39 | 47 |
| 3,4,5 | UMBS Pool | 1.500% | 1/16/36 | 2,200 | 2,264 |
| 3,4,5 | UMBS Pool | 2.000% | 1/16/36 | 6,800 | 7,112 |
| 3,4 | UMBS Pool | 2.500% | 4/1/37 - 4/1/38 | 1,360 | 1,433 |
| | | | | | | 12,585 |
| Nonconventional Mortgage-Backed Securities (0.5%) |
| 3,4 | Fannie Mae REMICS | 1.500% | 8/25/41 - 6/25/42 | 547 | 554 |
| 3,4 | Fannie Mae REMICS | 1.700% | 6/25/43 | 110 | 112 |
| 3 | Fannie Mae REMICS | 2.000% | 6/25/44 | 113 | 115 |
| 3,4 | Fannie Mae REMICS | 3.000% | 2/25/49 - 9/25/57 | 2,535 | 2,677 |
| 3,4 | Fannie Mae REMICS | 3.500% | 4/25/31 - 6/25/59 | 8,239 | 8,852 |
| 3,4 | Fannie Mae REMICS | 4.000% | 5/25/31 - 7/25/53 | 430 | 458 |
| 3,4 | Freddie Mac REMICS | 3.000% | 12/15/39 | 103 | 104 |
| 3,4 | Freddie Mac REMICS | 3.500% | 3/15/31 | 88 | 95 |
| 3,4 | Freddie Mac REMICS | 4.000% | 12/15/30 - 4/15/31 | 1,793 | 1,965 |
| 3 | Ginnie Mae | 1.700% | 10/20/45 | 193 | 195 |
| 3 | Ginnie Mae | 1.800% | 5/20/41 | 184 | 184 |
| | | | | | | 15,311 |
| Total U.S. Government and Agency Obligations (Cost $192,234) | 195,746 |
| Asset-Backed/Commercial Mortgage-Backed Securities (0.8%) |
| 3,6 | Aaset Trust Class A Series 2019-1 | 3.844% | 5/15/39 | 395 | 373 |
| 3,6 | American Tower Trust #1 Class 2A Series 13 | 3.070% | 3/15/48 | 1,100 | 1,120 |
| 3 | AmeriCredit Automobile Receivables Trust Class C Series 2016-3 | 2.240% | 4/8/22 | 18 | 18 |
| 3,6,7 | Angel Oak Mortgage Trust Class A1 Series 2019-5 | 2.593% | 10/25/49 | 314 | 318 |
| 3,6,7 | Angel Oak Mortgage Trust Class A1 Series 2019-6 | 2.620% | 11/25/59 | 733 | 742 |
| 3,6,7 | Angel Oak Mortgage Trust I LLC Class A1 Series 2019-2 | 3.628% | 3/25/49 | 151 | 154 |
| 3,6,7 | Angel Oak Mortgage Trust I LLC Class A1 Series 2019-4 | 2.993% | 7/26/49 | 520 | 524 |
| 3,6,7 | Atlas Senior Loan Fund X Ltd Class A Series 2018-10A, 3M USD LIBOR + 1.090% | 1.327% | 1/15/31 | 246 | 243 |
| 3,6,7 | Avery Point IV CLO Ltd. Class AR Series 2014-1A, 3M USD LIBOR + 1.100% | 1.315% | 4/25/26 | 123 | 123 |
| | | | Coupon | Maturity
Date | Face
Amount
($000) | Market
Value•
($000) |
| 3,6 | Canadian Pacer Auto Receivables Trust Class A3 Series 2018-2A | 3.270% | 12/19/22 | 86 | 87 |
| 3,6 | Castlelake Aircraft Structured Trust Class A Series 2019-1A | 3.967% | 4/15/39 | 734 | 698 |
| 3,6 | Chesapeake Funding II LLC Class A1 Series 2017-A1 | 1.990% | 5/15/29 | 9 | 9 |
| 3,6 | Chesapeake Funding II LLC Class A1 Series 2018-1A | 3.040% | 4/15/30 | 415 | 420 |
| 3,6 | Chesapeake Funding II LLC Class A1 Series 2018-3A | 3.390% | 1/15/31 | 495 | 507 |
| 3,6,7 | Cloud Pass-Through Trust Class CLOU Series 2019-1A | 3.554% | 12/5/22 | 364 | 370 |
| 3,6,7 | COLT Mortgage Loan Trust Class A1 Series 2019-2 | 3.337% | 5/25/49 | 221 | 222 |
| 3,6,7 | COLT Mortgage Loan Trust Class A1 Series 2020-1 | 2.488% | 2/25/50 | 416 | 421 |
| 3,6,7 | Columbia Cent CLO 27 Ltd. Class A1 Series 2018-27A, 3M USD LIBOR + 1.150% | 1.365% | 10/25/28 | 550 | 548 |
| 3 | COMM Mortgage Trust Class A4 Series 2012-CR2 | 3.147% | 8/15/45 | 480 | 493 |
| 3,6 | DB Master Finance LLC Class A2I Series 2019-1A | 3.787% | 5/20/49 | 449 | 460 |
| 3,6 | DB Master Finance LLC Class A2II Series 2019-1A | 4.021% | 5/20/49 | 400 | 421 |
| 3,6,7 | Deephave Residential Mortgage Trust Class A1 Series 2019-2A | 3.558% | 4/25/59 | 206 | 208 |
| 3,6 | Enterprise Fleet Financing LLC Class A2 Series 2018-1 | 2.870% | 10/20/23 | 84 | 85 |
| 3,6 | Enterprise Fleet Financing LLC Class A2 Series 2018-3 | 3.380% | 5/20/24 | 214 | 216 |
| 3,6 | Enterprise Fleet Financing LLC Class A2 Series 2019-1 | 2.980% | 10/20/24 | 395 | 400 |
| 3,6 | Enterprise Fleet Financing LLC Class A2 Series 2019-2 | 2.290% | 2/20/25 | 697 | 709 |
| 3,6 | Enterprise Fleet Financing LLC Class A2 Series 2019-3 | 2.060% | 5/20/25 | 530 | 538 |
| 3,6 | Enterprise Fleet Financing LLC Class A3 Series 2018-A3 | 3.100% | 10/20/23 | 270 | 274 |
| 3,6 | Exeter Automobile Receivables Trust Class A Series 2019-4A | 2.180% | 1/17/23 | 69 | 69 |
| | | | Coupon | Maturity
Date | Face
Amount
($000) | Market
Value•
($000) |
| 3,4,7 | Fannie Mae Connecticut Avenue Securities Class 2M2 Series 2016-C03, 1M USD LIBOR + 5.900% | 6.048% | 10/25/28 | 165 | 174 |
| 3,4 | Freddie Mac Multifamily Structured Pass Through Certificates Class A2 Series K736 | 2.282% | 7/25/26 | 885 | 954 |
| 3,4 | Freddie Mac Multifamily Structured Pass Through Certificates Class A2 Series KJ25 | 2.610% | 1/25/26 | 525 | 566 |
| 3,4 | Freddie Mac Multifamily Structured Pass Through Certificates Class A3 Series K-1512 | 3.059% | 4/25/34 | 300 | 346 |
| 3,4 | Freddie Mac Multifamily Structured Pass Through Certificates Class A3 Series K-1513 | 2.797% | 8/25/34 | 300 | 340 |
| 3,6 | Hertz Fleet Lease Funding LP Class A2 Series 2019-1 | 2.700% | 1/10/33 | 599 | 607 |
| 3,6 | Horizon Aircraft Finance II Ltd. Class A Series 2019-1 | 3.721% | 7/15/39 | 314 | 303 |
| 3,6 | Horizon Aircraft Finance III Ltd. Class A Series 2019-1 | 3.425% | 11/15/39 | 314 | 303 |
| 3,6 | MACH 1 Cayman Ltd. Class A Series 2019-1 | 3.474% | 10/15/39 | 343 | 331 |
| 3,6,7 | Madison Park Funding XII Ltd. Class AR Series 2014-12A, 3M USD LIBOR + 1.260% | 1.478% | 7/20/26 | 77 | 77 |
| 3,6,7 | Madison Park Funding XIII Ltd. Class AR2 Series 2014-13A, 3M USD LIBOR + 0.950% | 1.168% | 4/19/30 | 930 | 929 |
| 3,6 | MAPS Ltd. Class A Series 2019-1A | 4.458% | 3/15/44 | 215 | 204 |
| 3,6,7 | Master Credit Card Trust II Class A Series 2018-1A, 1M USD LIBOR + 0.490% | 0.642% | 7/21/24 | 1,000 | 996 |
| 3,6 | OneMain Direct Auto Receivables Trust Class A Series Series 2018-1A | 3.430% | 12/16/24 | 655 | 662 |
| 3,6 | OneMain Financial Issuance Trust Class A Series 2019-1A | 3.480% | 2/14/31 | 1,000 | 1,003 |
| | | | Coupon | Maturity
Date | Face
Amount
($000) | Market
Value•
($000) |
| 3,6 | OneMain Financial Issuance Trust Class A1 Series 2017-1A | 2.370% | 9/14/32 | 51 | 51 |
| 3,6 | Santander Retail Auto Lease Trust Class A2 Series 2019-A | 2.720% | 1/20/22 | 124 | 124 |
| 3,6 | Santander Retail Auto Lease Trust Class A3 Series 2019-B | 2.300% | 1/20/23 | 345 | 351 |
| 3 | Seasoned Credit Risk Transfer Trust Class MA Series 2018-4 | 3.500% | 3/25/58 | 611 | 653 |
| 3 | Seasoned Credit Risk Transfer Trust Class MA Series 2019-1 | 3.500% | 7/25/58 | 883 | 941 |
| 3 | Seasoned Credit Risk Transfer Trust Class MA Series 2019-3 | 3.500% | 10/25/58 | 1,375 | 1,483 |
| 3,6 | Securitized Term Auto Receivables Trust Class A3 Series 2018-2A | 3.325% | 8/25/22 | 247 | 248 |
| 3,6,7 | Seneca Park CLO Ltd. Class AR Series 2014-1A, 3M USD LIBOR + 1.120% | 1.338% | 7/17/26 | 10 | 10 |
| 3,6,7 | SFAVE Commercial Mortgage Securities Trust Class A2B Series 2015-5AVE | 4.144% | 1/5/43 | 700 | 657 |
| 3,6 | SoFi Consumer Loan Program Trust Class A Series 2018-4 | 3.540% | 11/26/27 | 60 | 60 |
| 3,6 | SoFi Consumer Loan Program Trust Class A Series 2019-1 | 3.240% | 2/25/28 | 144 | 145 |
| 3,6 | SoFi Consumer Loan Program Trust Class A Series 2020-1 | 2.020% | 1/25/29 | 353 | 356 |
| 3,6 | Springleaf Funding Trust Class A Series 2015-BA | 3.480% | 5/15/28 | 240 | 241 |
| 3,6 | Start III LTD Class A Series 2019-2 | 3.536% | 11/15/44 | 29 | 28 |
| 3,6 | START Ireland Class A Series 2019-1 | 4.089% | 3/15/44 | 365 | 342 |
| 3,6,7 | Symphony CLO XIV Ltd Class AR Series 2014-14A, 3M USD LIBOR + 0.950% | 1.179% | 7/14/26 | 832 | 828 |
| 3,6,7 | Thacher Park CLO Ltd Class AR Series 2014-1A, 3M USD LIBOR + 1.160% | 1.378% | 10/20/26 | 84 | 84 |
| 3,6,7 | Towd Point Mortgage Trust Class A1 Series 2016-3 | 2.250% | 4/25/56 | 21 | 21 |
| 3,6 | Vantage Data Centers Issuer LLC Class A2 Series 2019-1A | 3.188% | 7/15/44 | 266 | 279 |
| | | | Coupon | Maturity
Date | Face
Amount
($000) | Market
Value•
($000) |
| 3,6 | Vantage Data Centers LLC Class A2 Series 2020-1A | 1.645% | 9/15/45 | 855 | 852 |
| 3,6,7 | Verus Securitization Trust Class A1 Series 2019-2 Series 2019-2 | 3.211% | 5/25/59 | 256 | 258 |
| 3,6,7 | Voya CLO Ltd. Class AAR2 Series 2014-1A, 3M USD LIBOR + 0.990% | 1.208% | 4/18/31 | 511 | 508 |
| 3,6 | Westlake Automobile Receivables Trust Class A2 Series 2019-3A | 2.150% | 2/15/23 | 222 | 223 |
| Total Asset-Backed/Commercial Mortgage-Backed Securities (Cost $27,144) | 27,308 |
| Corporate Bonds (22.6%) |
| Communications (1.9%) |
| | America Movil SAB de CV | 3.125% | 7/16/22 | 1,880 | 1,955 |
| | America Movil SAB de CV | 3.625% | 4/22/29 | 780 | 883 |
| | America Movil SAB de CV | 6.125% | 3/30/40 | 390 | 576 |
| | AT&T Inc. | 2.750% | 6/1/31 | 1,305 | 1,391 |
| | AT&T Inc. | 3.650% | 6/1/51 | 162 | 169 |
| | AT&T Inc. | 3.850% | 6/1/60 | 598 | 627 |
| 6 | British Telecommunications plc | 3.250% | 11/8/29 | 905 | 995 |
| | Charter Communications Operating LLC / Charter Communications Operating Capital | 5.375% | 5/1/47 | 110 | 137 |
| | Charter Communications Operating LLC / Charter Communications Operating Capital | 5.125% | 7/1/49 | 94 | 114 |
| | Charter Communications Operating LLC / Charter Communications Operating Capital | 4.800% | 3/1/50 | 127 | 151 |
| | Charter Communications Operating LLC / Charter Communications Operating Capital | 3.700% | 4/1/51 | 530 | 550 |
| | Comcast Corp. | 3.600% | 3/1/24 | 2,900 | 3,182 |
| | Comcast Corp. | 3.375% | 2/15/25 | 70 | 77 |
| | Comcast Corp. | 4.250% | 1/15/33 | 1,032 | 1,289 |
| | Comcast Corp. | 4.200% | 8/15/34 | 730 | 915 |
| | Comcast Corp. | 5.650% | 6/15/35 | 110 | 156 |
| | Comcast Corp. | 4.400% | 8/15/35 | 877 | 1,111 |
| | Comcast Corp. | 6.500% | 11/15/35 | 115 | 177 |
| | Comcast Corp. | 6.400% | 5/15/38 | 27 | 42 |
| | Comcast Corp. | 4.600% | 10/15/38 | 1,335 | 1,750 |
| | Comcast Corp. | 4.650% | 7/15/42 | 1,290 | 1,741 |
| | Comcast Corp. | 4.500% | 1/15/43 | 500 | 658 |
| | Comcast Corp. | 4.750% | 3/1/44 | 876 | 1,200 |
| | Comcast Corp. | 4.600% | 8/15/45 | 1,198 | 1,600 |
| | Comcast Corp. | 3.969% | 11/1/47 | 252 | 314 |
| | Comcast Corp. | 4.000% | 3/1/48 | 345 | 431 |
| | Comcast Corp. | 4.700% | 10/15/48 | 1,175 | 1,633 |
| | | | Coupon | Maturity
Date | Face
Amount
($000) | Market
Value•
($000) |
| | Comcast Corp. | 3.999% | 11/1/49 | 602 | 757 |
| | Comcast Corp. | 4.049% | 11/1/52 | 1,187 | 1,516 |
| | Comcast Corp. | 4.950% | 10/15/58 | 20 | 30 |
| | Comcast Corp. | 2.650% | 8/15/62 | 615 | 615 |
| 6 | Cox Communications Inc. | 3.250% | 12/15/22 | 795 | 836 |
| 6 | Cox Communications Inc. | 2.950% | 6/30/23 | 145 | 153 |
| 6 | Cox Communications Inc. | 3.150% | 8/15/24 | 181 | 196 |
| 6 | Cox Communications Inc. | 4.800% | 2/1/35 | 1,540 | 1,939 |
| 6 | Cox Communications Inc. | 6.450% | 12/1/36 | 45 | 63 |
| 6 | Cox Communications Inc. | 4.600% | 8/15/47 | 125 | 161 |
| 6 | Deutsche Telekom International Finance BV | 3.600% | 1/19/27 | 300 | 336 |
| 6 | Deutsche Telekom International Finance BV | 4.375% | 6/21/28 | 671 | 796 |
| | NBCUniversal Media LLC | 4.450% | 1/15/43 | 309 | 403 |
| | Orange SA | 4.125% | 9/14/21 | 1,740 | 1,783 |
| | Orange SA | 9.000% | 3/1/31 | 530 | 867 |
| 6 | SK Telecom Co. Ltd. | 3.750% | 4/16/23 | 385 | 411 |
| 6 | Sky Ltd. | 3.750% | 9/16/24 | 1,435 | 1,599 |
| 3,6 | Sprint Spectrum Co LLC / Sprint Spectrum Co II LLC / Sprint Spectrum Co III LLC | 4.738% | 9/20/29 | 1,300 | 1,412 |
| | Telefonica Emisiones SA | 5.213% | 3/8/47 | 800 | 1,027 |
| | Telefonica Emisiones SA | 5.520% | 3/1/49 | 1,055 | 1,422 |
| 6 | Tencent Holdings Ltd. | 3.575% | 4/11/26 | 200 | 222 |
| 6 | Tencent Holdings Ltd. | 3.595% | 1/19/28 | 2,495 | 2,752 |
| 6 | Tencent Holdings Ltd. | 3.975% | 4/11/29 | 925 | 1,054 |
| | Time Warner Entertainment Co. LP | 8.375% | 3/15/23 | 95 | 111 |
| 6 | T-Mobile USA Inc. | 2.050% | 2/15/28 | 900 | 936 |
| 6 | T-Mobile USA Inc. | 3.875% | 4/15/30 | 710 | 822 |
| 6 | T-Mobile USA Inc. | 3.300% | 2/15/51 | 580 | 597 |
| | Verizon Communications Inc. | 4.329% | 9/21/28 | 675 | 811 |
| | Verizon Communications Inc. | 4.812% | 3/15/39 | 2,406 | 3,118 |
| | Verizon Communications Inc. | 4.750% | 11/1/41 | 290 | 382 |
| | Verizon Communications Inc. | 4.862% | 8/21/46 | 1,151 | 1,545 |
| | Verizon Communications Inc. | 5.012% | 4/15/49 | 69 | 96 |
| | Verizon Communications Inc. | 4.672% | 3/15/55 | 274 | 365 |
| 6 | Verizon Communications Inc. | 2.987% | 10/30/56 | 731 | 734 |
| | | | Coupon | Maturity
Date | Face
Amount
($000) | Market
Value•
($000) |
| | ViacomCBS Inc. | 3.700% | 6/1/28 | 440 | 502 |
| | Vodafone Group plc | 5.000% | 5/30/38 | 50 | 65 |
| | Vodafone Group plc | 5.250% | 5/30/48 | 1,260 | 1,747 |
| | Walt Disney Co. | 3.000% | 9/15/22 | 245 | 256 |
| | Walt Disney Co. | 2.000% | 9/1/29 | 2,600 | 2,713 |
| | Walt Disney Co. | 2.650% | 1/13/31 | 170 | 186 |
| | Walt Disney Co. | 3.500% | 5/13/40 | 1,490 | 1,748 |
| | Walt Disney Co. | 2.750% | 9/1/49 | 560 | 592 |
| | Walt Disney Co. | 3.600% | 1/13/51 | 805 | 977 |
| | Walt Disney Co. | 3.800% | 5/13/60 | 485 | 609 |
| | | | | | | 63,086 |
| Consumer Discretionary (1.1%) |
| | Alibaba Group Holding Ltd. | 3.600% | 11/28/24 | 1,065 | 1,171 |
| | Alibaba Group Holding Ltd. | 3.400% | 12/6/27 | 3,470 | 3,876 |
| | Amazon.com Inc. | 2.800% | 8/22/24 | 345 | 373 |
| | Amazon.com Inc. | 4.800% | 12/5/34 | 995 | 1,361 |
| | Amazon.com Inc. | 4.950% | 12/5/44 | 580 | 847 |
| | Amazon.com Inc. | 4.250% | 8/22/57 | 1,335 | 1,884 |
| | AutoZone Inc. | 3.700% | 4/15/22 | 1,371 | 1,420 |
| 6 | BMW U.S. Capital LLC | 2.000% | 4/11/21 | 585 | 587 |
| 6 | BMW U.S. Capital LLC | 2.250% | 9/15/23 | 2,500 | 2,607 |
| 6 | Daimler Finance North America LLC | 2.300% | 2/12/21 | 945 | 947 |
| 6 | Daimler Finance North America LLC | 3.250% | 8/1/24 | 160 | 173 |
| 3 | Duke University | 2.832% | 10/1/55 | 775 | 841 |
| | Emory University | 2.143% | 9/1/30 | 770 | 809 |
| 6 | ERAC USA Finance LLC | 4.500% | 8/16/21 | 325 | 333 |
| 6 | ERAC USA Finance LLC | 3.300% | 10/15/22 | 40 | 42 |
| 6 | ERAC USA Finance LLC | 7.000% | 10/15/37 | 1,150 | 1,767 |
| 6 | ERAC USA Finance LLC | 5.625% | 3/15/42 | 340 | 473 |
| | General Motors Financial Co. Inc. | 3.550% | 4/9/21 | 455 | 458 |
| | General Motors Financial Co. Inc. | 3.950% | 4/13/24 | 1,570 | 1,705 |
| | Georgetown University | 4.315% | 4/1/49 | 150 | 191 |
| | Georgetown University | 2.943% | 4/1/50 | 295 | 295 |
| | Home Depot Inc. | 3.900% | 12/6/28 | 290 | 347 |
| | Home Depot Inc. | 3.300% | 4/15/40 | 825 | 971 |
| | Home Depot Inc. | 4.400% | 3/15/45 | 780 | 1,039 |
| | Home Depot Inc. | 4.500% | 12/6/48 | 345 | 484 |
| 6,7 | Hyundai Capital America, 3M USD LIBOR + 0.940% | 1.170% | 7/8/21 | 1,400 | 1,402 |
| 3 | Johns Hopkins University | 4.083% | 7/1/53 | 200 | 265 |
| 3 | Johns Hopkins University | 2.813% | 1/1/60 | 180 | 190 |
| | Lowe's Cos. Inc. | 3.100% | 5/3/27 | 1,300 | 1,457 |
| | Lowe's Cos. Inc. | 6.500% | 3/15/29 | 334 | 452 |
| | McDonald's Corp. | 2.625% | 1/15/22 | 195 | 200 |
| | McDonald's Corp. | 3.250% | 6/10/24 | 140 | 153 |
| | McDonald's Corp. | 4.875% | 12/9/45 | 1,160 | 1,565 |
| | McDonald's Corp. | 3.625% | 9/1/49 | 470 | 548 |
| 6 | Meituan | 3.050% | 10/28/30 | 230 | 240 |
| 3 | Northeastern University | 2.894% | 10/1/50 | 225 | 237 |
| | President and Fellows of Harvard College | 2.517% | 10/15/50 | 515 | 548 |
| | Starbucks Corp. | 4.500% | 11/15/48 | 1,471 | 1,894 |
| 3 | University of Chicago | 2.761% | 4/1/45 | 165 | 169 |
| | | | Coupon | Maturity
Date | Face
Amount
($000) | Market
Value•
($000) |
| | VF Corp. | 2.800% | 4/23/27 | 595 | 650 |
| | VF Corp. | 2.950% | 4/23/30 | 1,320 | 1,452 |
| | Yale University | 2.402% | 4/15/50 | 480 | 494 |
| | | | | | | 36,917 |
| Consumer Staples (1.3%) |
| 6 | Alimentation Couche-Tard Inc. | 3.550% | 7/26/27 | 2,450 | 2,756 |
| | Altria Group Inc. | 2.850% | 8/9/22 | 455 | 473 |
| | Altria Group Inc. | 5.800% | 2/14/39 | 770 | 1,012 |
| | Altria Group Inc. | 4.500% | 5/2/43 | 245 | 281 |
| | Altria Group Inc. | 3.875% | 9/16/46 | 625 | 658 |
| | Anheuser-Busch Cos. LLC / Anheuser-Busch InBev Worldwide Inc. | 4.700% | 2/1/36 | 1,290 | 1,633 |
| | Anheuser-Busch Cos. LLC / Anheuser-Busch InBev Worldwide Inc. | 4.900% | 2/1/46 | 1,940 | 2,516 |
| | Anheuser-Busch InBev Worldwide Inc. | 3.750% | 7/15/42 | 520 | 585 |
| | Anheuser-Busch InBev Worldwide Inc. | 4.600% | 4/15/48 | 395 | 500 |
| | Archer-Daniels-Midland Co. | 4.500% | 3/15/49 | 970 | 1,383 |
| | BAT Capital Corp. | 3.557% | 8/15/27 | 1,875 | 2,088 |
| 6 | Cargill Inc. | 4.307% | 5/14/21 | 2,092 | 2,122 |
| 6 | Cargill Inc. | 6.875% | 5/1/28 | 645 | 843 |
| 6 | Cargill Inc. | 2.125% | 4/23/30 | 225 | 237 |
| 6 | Cargill Inc. | 4.760% | 11/23/45 | 635 | 856 |
| 6 | CK Hutchison International 20 Ltd. | 3.375% | 5/8/50 | 560 | 639 |
| | Colgate Palmolive Co. | 7.600% | 5/19/25 | 480 | 614 |
| | Conagra Brands Inc. | 4.600% | 11/1/25 | 220 | 259 |
| | Conagra Brands Inc. | 1.375% | 11/1/27 | 345 | 347 |
| | Conagra Brands Inc. | 5.300% | 11/1/38 | 300 | 399 |
| | Constellation Brands Inc. | 2.700% | 5/9/22 | 65 | 67 |
| | Constellation Brands Inc. | 3.750% | 5/1/50 | 105 | 123 |
| 6 | Danone SA | 2.947% | 11/2/26 | 735 | 807 |
| | Diageo Capital plc | 2.625% | 4/29/23 | 1,230 | 1,288 |
| | Diageo Capital plc | 2.375% | 10/24/29 | 580 | 623 |
| | Diageo Capital plc | 2.000% | 4/29/30 | 265 | 275 |
| | Diageo Investment Corp. | 2.875% | 5/11/22 | 525 | 543 |
| | Estee Lauder Cos. Inc. | 2.375% | 12/1/29 | 370 | 400 |
| 6 | Imperial Brands Finance plc | 3.750% | 7/21/22 | 1,680 | 1,752 |
| | Kroger Co. | 3.850% | 8/1/23 | 270 | 291 |
| | Kroger Co. | 4.000% | 2/1/24 | 540 | 592 |
| | McCormick & Co. Inc. | 2.500% | 4/15/30 | 135 | 145 |
| | Molson Coors Beverage Co. | 3.500% | 5/1/22 | 690 | 718 |
| | Molson Coors Beverage Co. | 3.000% | 7/15/26 | 1,800 | 1,974 |
| | PepsiCo Inc. | 2.375% | 10/6/26 | 1,945 | 2,115 |
| | PepsiCo Inc. | 4.000% | 3/5/42 | 845 | 1,086 |
| | PepsiCo Inc. | 3.450% | 10/6/46 | 1,215 | 1,458 |
| | Philip Morris International Inc. | 2.500% | 8/22/22 | 575 | 596 |
| | Philip Morris International Inc. | 2.625% | 3/6/23 | 1,150 | 1,209 |
| | Philip Morris International Inc. | 3.600% | 11/15/23 | 620 | 676 |
| | | | Coupon | Maturity
Date | Face
Amount
($000) | Market
Value•
($000) |
| | Philip Morris International Inc. | 3.375% | 8/11/25 | 424 | 472 |
| | Philip Morris International Inc. | 4.875% | 11/15/43 | 145 | 192 |
| 3 | Procter & Gamble Co. | 9.360% | 1/1/21 | 122 | 122 |
| 6 | Sigma Alimentos SA de CV | 4.125% | 5/2/26 | 510 | 562 |
| | Unilever Capital Corp. | 4.250% | 2/10/21 | 2,805 | 2,815 |
| | Walmart Inc. | 3.550% | 6/26/25 | 1,605 | 1,816 |
| | Walmart Inc. | 3.625% | 12/15/47 | 380 | 481 |
| | | | | | | 43,399 |
| Energy (1.2%) |
| 6 | BG Energy Capital plc | 4.000% | 10/15/21 | 555 | 570 |
| | BP Capital Markets America Inc. | 3.245% | 5/6/22 | 650 | 675 |
| | BP Capital Markets America Inc. | 1.749% | 8/10/30 | 345 | 346 |
| | BP Capital Markets plc | 3.062% | 3/17/22 | 1,100 | 1,136 |
| | BP Capital Markets plc | 2.500% | 11/6/22 | 500 | 519 |
| | BP Capital Markets plc | 3.994% | 9/26/23 | 420 | 460 |
| | BP Capital Markets plc | 3.814% | 2/10/24 | 1,700 | 1,866 |
| | BP Capital Markets plc | 3.506% | 3/17/25 | 1,280 | 1,427 |
| | Chevron Corp. | 3.191% | 6/24/23 | 525 | 557 |
| | Cimarex Energy Co. | 4.375% | 6/1/24 | 927 | 1,007 |
| | ConocoPhillips Co. | 4.950% | 3/15/26 | 115 | 138 |
| | Energy Transfer Operating LP | 5.250% | 4/15/29 | 1,375 | 1,597 |
| | Energy Transfer Operating LP | 5.300% | 4/15/47 | 155 | 171 |
| | Enterprise Products Operating LLC | 4.250% | 2/15/48 | 730 | 851 |
| | Enterprise Products Operating LLC | 3.700% | 1/31/51 | 170 | 186 |
| | Equinor ASA | 2.750% | 11/10/21 | 850 | 868 |
| | Equinor ASA | 2.450% | 1/17/23 | 382 | 399 |
| | Equinor ASA | 2.650% | 1/15/24 | 360 | 382 |
| | Equinor ASA | 3.700% | 3/1/24 | 640 | 702 |
| | Equinor ASA | 3.250% | 11/10/24 | 655 | 721 |
| | Equinor ASA | 2.875% | 4/6/25 | 140 | 152 |
| | Equinor ASA | 3.125% | 4/6/30 | 2,350 | 2,656 |
| | Equinor ASA | 2.375% | 5/22/30 | 335 | 355 |
| | Exxon Mobil Corp. | 2.726% | 3/1/23 | 320 | 335 |
| | Exxon Mobil Corp. | 3.043% | 3/1/26 | 225 | 249 |
| | Exxon Mobil Corp. | 2.275% | 8/16/26 | 1,070 | 1,152 |
| | Exxon Mobil Corp. | 2.440% | 8/16/29 | 735 | 786 |
| | Exxon Mobil Corp. | 2.610% | 10/15/30 | 1,055 | 1,151 |
| | Exxon Mobil Corp. | 4.114% | 3/1/46 | 320 | 394 |
| | Phillips 66 Partners LP | 3.750% | 3/1/28 | 1,525 | 1,646 |
| 6 | Saudi Arabian Oil Co. | 3.500% | 4/16/29 | 630 | 700 |
| 6 | Schlumberger Holdings Corp. | 3.900% | 5/17/28 | 807 | 909 |
| 6 | Schlumberger Investment SA | 2.400% | 8/1/22 | 630 | 646 |
| | Schlumberger Investment SA | 3.650% | 12/1/23 | 1,120 | 1,214 |
| | Shell International Finance BV | 4.125% | 5/11/35 | 1,130 | 1,404 |
| | Shell International Finance BV | 5.500% | 3/25/40 | 345 | 496 |
| | Shell International Finance BV | 4.375% | 5/11/45 | 2,500 | 3,289 |
| 6 | Sinopec Group Overseas Development 2015 Ltd. | 3.250% | 4/28/25 | 1,615 | 1,732 |
| | | | Coupon | Maturity
Date | Face
Amount
($000) | Market
Value•
($000) |
| 6 | Sinopec Group Overseas Development 2017 Ltd. | 3.000% | 4/12/22 | 850 | 871 |
| | Suncor Energy Inc. | 5.950% | 12/1/34 | 500 | 653 |
| | Sunoco Logistics Partners Operations LP | 5.350% | 5/15/45 | 90 | 100 |
| | Sunoco Logistics Partners Operations LP | 5.400% | 10/1/47 | 20 | 22 |
| | Total Capital International SA | 2.700% | 1/25/23 | 885 | 928 |
| | Total Capital International SA | 3.750% | 4/10/24 | 1,400 | 1,553 |
| | TransCanada PipeLines Ltd. | 4.875% | 1/15/26 | 1,255 | 1,487 |
| | TransCanada PipeLines Ltd. | 4.100% | 4/15/30 | 415 | 486 |
| | | | | | | 39,944 |
| Financials (7.8%) |
| 6 | AIA Group Ltd. | 3.600% | 4/9/29 | 1,475 | 1,670 |
| 6 | AIA Group Ltd. | 3.375% | 4/7/30 | 370 | 415 |
| | American Express Credit Corp. | 2.700% | 3/3/22 | 1,505 | 1,544 |
| | American International Group Inc. | 4.250% | 3/15/29 | 1,040 | 1,247 |
| | American International Group Inc. | 4.500% | 7/16/44 | 200 | 256 |
| | American International Group Inc. | 4.750% | 4/1/48 | 135 | 181 |
| 6 | Australia & New Zealand Banking Group Ltd. | 2.570% | 11/25/35 | 685 | 695 |
| | Banco Santander SA | 3.125% | 2/23/23 | 800 | 842 |
| | Banco Santander SA | 3.848% | 4/12/23 | 400 | 429 |
| | Banco Santander SA | 2.749% | 12/3/30 | 400 | 412 |
| | Bank of America Corp. | 3.300% | 1/11/23 | 120 | 127 |
| | Bank of America Corp. | 2.816% | 7/21/23 | 1,645 | 1,709 |
| | Bank of America Corp. | 4.000% | 1/22/25 | 875 | 979 |
| | Bank of America Corp. | 3.559% | 4/23/27 | 2,450 | 2,759 |
| | Bank of America Corp. | 3.593% | 7/21/28 | 1,025 | 1,158 |
| | Bank of America Corp. | 3.419% | 12/20/28 | 512 | 578 |
| | Bank of America Corp. | 4.271% | 7/23/29 | 4,780 | 5,686 |
| | Bank of America Corp. | 3.974% | 2/7/30 | 1,895 | 2,223 |
| | Bank of America Corp. | 3.194% | 7/23/30 | 1,055 | 1,177 |
| | Bank of America Corp. | 2.496% | 2/13/31 | 1,495 | 1,586 |
| | Bank of America Corp. | 5.875% | 2/7/42 | 260 | 395 |
| | Bank of America Corp. | 5.000% | 1/21/44 | 1,000 | 1,393 |
| | Bank of America Corp. | 4.330% | 3/15/50 | 2,235 | 2,924 |
| | Bank of Montreal | 3.100% | 4/13/21 | 1,290 | 1,300 |
| 6 | Bank of Montreal | 2.500% | 1/11/22 | 1,700 | 1,737 |
| | Bank of New York Mellon Corp. | 2.200% | 8/16/23 | 460 | 482 |
| | Bank of New York Mellon Corp. | 3.000% | 2/24/25 | 720 | 790 |
| | | | Coupon | Maturity
Date | Face
Amount
($000) | Market
Value•
($000) |
| 7 | Bank of New York Mellon Corp., 3M USD LIBOR + 1.050% | 1.264% | 10/30/23 | 1,145 | 1,157 |
| | Bank of Nova Scotia | 2.800% | 7/21/21 | 750 | 760 |
| | Bank of Nova Scotia | 2.700% | 8/3/26 | 1,825 | 2,003 |
| | Barclays plc | 3.932% | 5/7/25 | 1,565 | 1,712 |
| 7 | Barclays plc, 3M USD LIBOR + 1.380% | 1.601% | 5/16/24 | 1,005 | 1,016 |
| | Berkshire Hathaway Inc. | 3.125% | 3/15/26 | 715 | 799 |
| 6 | BNP Paribas SA | 2.950% | 5/23/22 | 200 | 207 |
| | BNP Paribas SA | 3.250% | 3/3/23 | 190 | 202 |
| 6 | BNP Paribas SA | 3.800% | 1/10/24 | 1,170 | 1,276 |
| 6 | BNP Paribas SA | 3.375% | 1/9/25 | 1,775 | 1,935 |
| 6 | BNP Paribas SA | 2.819% | 11/19/25 | 1,335 | 1,422 |
| 6 | BNP Paribas SA | 3.500% | 11/16/27 | 2,050 | 2,301 |
| 6 | BPCE SA | 5.700% | 10/22/23 | 270 | 305 |
| | BPCE SA | 4.000% | 4/15/24 | 775 | 858 |
| 6 | BPCE SA | 5.150% | 7/21/24 | 1,260 | 1,423 |
| 6 | BPCE SA | 3.500% | 10/23/27 | 1,780 | 1,992 |
| 6 | BPCE SA | 2.700% | 10/1/29 | 1,450 | 1,562 |
| 7 | Canadian Imperial Bank of Commerce, 3M USD LIBOR + 0.720% | 0.939% | 6/16/22 | 1,565 | 1,577 |
| | Capital One Financial Corp. | 4.750% | 7/15/21 | 400 | 409 |
| | Capital One Financial Corp. | 3.750% | 4/24/24 | 1,305 | 1,423 |
| | Capital One Financial Corp. | 3.200% | 2/5/25 | 760 | 828 |
| | Charles Schwab Corp. | 3.200% | 3/2/27 | 545 | 607 |
| | Chubb INA Holdings Inc. | 3.350% | 5/15/24 | 555 | 606 |
| | Chubb INA Holdings Inc. | 4.350% | 11/3/45 | 800 | 1,081 |
| | Citigroup Inc. | 4.500% | 1/14/22 | 1,975 | 2,059 |
| | Citigroup Inc. | 3.520% | 10/27/28 | 1,975 | 2,226 |
| | Citigroup Inc. | 6.625% | 6/15/32 | 2,000 | 2,833 |
| | Citigroup Inc. | 3.878% | 1/24/39 | 1,025 | 1,220 |
| | Comerica Bank | 2.500% | 7/23/24 | 790 | 841 |
| 6 | Credit Agricole SA | 3.750% | 4/24/23 | 1,160 | 1,245 |
| 6 | Credit Agricole SA | 3.250% | 10/4/24 | 2,390 | 2,603 |
| | Credit Suisse AG | 3.000% | 10/29/21 | 735 | 751 |
| | Credit Suisse AG | 3.625% | 9/9/24 | 250 | 277 |
| 6 | Credit Suisse Group AG | 3.574% | 1/9/23 | 550 | 568 |
| 6 | Credit Suisse Group AG | 4.207% | 6/12/24 | 340 | 367 |
| | Credit Suisse Group AG | 3.750% | 3/26/25 | 3,470 | 3,850 |
| 6 | Credit Suisse Group AG | 2.593% | 9/11/25 | 520 | 547 |
| 6 | Credit Suisse Group AG | 3.869% | 1/12/29 | 305 | 344 |
| 6,7 | Credit Suisse Group AG, 3M USD LIBOR + 1.240% | 1.460% | 6/12/24 | 690 | 700 |
| | Credit Suisse Group Funding Guernsey Ltd. | 3.800% | 9/15/22 | 1,335 | 1,407 |
| 6 | Danske Bank A/S | 2.000% | 9/8/21 | 1,120 | 1,133 |
| 6 | Danske Bank A/S | 5.000% | 1/12/22 | 610 | 636 |
| 6 | Danske Bank A/S | 3.875% | 9/12/23 | 1,220 | ��� 1,313 |
| 6 | Danske Bank A/S | 5.375% | 1/12/24 | 795 | 893 |
| 6 | Danske Bank A/S | 1.621% | 9/11/26 | 855 | 855 |
| | Deutsche Bank AG | 4.250% | 10/14/21 | 815 | 835 |
| 6 | DNB Boligkreditt AS | 2.500% | 3/28/22 | 1,315 | 1,349 |
| | | | Coupon | Maturity
Date | Face
Amount
($000) | Market
Value•
($000) |
| 6 | Equitable Financial Life Global Funding | 1.400% | 7/7/25 | 370 | 378 |
| 6 | Equitable Financial Life Global Funding | 1.400% | 8/27/27 | 535 | 536 |
| | Fifth Third Bancorp | 2.550% | 5/5/27 | 425 | 462 |
| | Fifth Third Bank NA | 3.850% | 3/15/26 | 830 | 939 |
| 6 | Five Corners Funding Trust | 4.419% | 11/15/23 | 210 | 233 |
| | Goldman Sachs Group Inc. | 5.250% | 7/27/21 | 865 | 889 |
| | Goldman Sachs Group Inc. | 5.750% | 1/24/22 | 360 | 380 |
| | Goldman Sachs Group Inc. | 2.876% | 10/31/22 | 1,795 | 1,829 |
| | Goldman Sachs Group Inc. | 3.625% | 1/22/23 | 1,980 | 2,110 |
| | Goldman Sachs Group Inc. | 3.272% | 9/29/25 | 1,205 | 1,316 |
| | Goldman Sachs Group Inc. | 3.500% | 11/16/26 | 2,000 | 2,243 |
| | Goldman Sachs Group Inc. | 3.850% | 1/26/27 | 740 | 844 |
| | Goldman Sachs Group Inc. | 3.691% | 6/5/28 | 810 | 933 |
| | Goldman Sachs Group Inc. | 3.814% | 4/23/29 | 3,065 | 3,532 |
| | Goldman Sachs Group Inc. | 4.223% | 5/1/29 | 2,630 | 3,108 |
| | Goldman Sachs Group Inc. | 6.750% | 10/1/37 | 835 | 1,265 |
| 6 | HSBC Bank plc | 4.750% | 1/19/21 | 1,700 | 1,703 |
| | HSBC Holdings plc | 3.600% | 5/25/23 | 1,600 | 1,720 |
| | HSBC Holdings plc | 1.589% | 5/24/27 | 805 | 816 |
| | HSBC Holdings plc | 4.041% | 3/13/28 | 890 | 1,010 |
| | HSBC Holdings plc | 4.583% | 6/19/29 | 1,675 | 1,981 |
| | HSBC Holdings plc | 2.357% | 8/18/31 | 900 | 924 |
| | HSBC Holdings plc | 6.500% | 5/2/36 | 1,000 | 1,446 |
| | HSBC Holdings plc | 6.100% | 1/14/42 | 375 | 564 |
| | HSBC Holdings plc | 5.250% | 3/14/44 | 440 | 612 |
| 7 | HSBC Holdings plc, 3M USD LIBOR + 1.000% | 1.220% | 5/18/24 | 730 | 734 |
| | HSBC USA Inc. | 3.500% | 6/23/24 | 620 | 678 |
| | Huntington Bancshares Inc. | 3.150% | 3/14/21 | 499 | 501 |
| | ING Groep NV | 3.150% | 3/29/22 | 365 | 377 |
| | ING Groep NV | 3.950% | 3/29/27 | 2,695 | 3,116 |
| | Intercontinental Exchange Inc. | 2.650% | 9/15/40 | 170 | 174 |
| | Intercontinental Exchange Inc. | 3.000% | 6/15/50 | 465 | 492 |
| | Intercontinental Exchange Inc. | 3.000% | 9/15/60 | 850 | 887 |
| 6 | JAB Holdings BV | 2.200% | 11/23/30 | 290 | 291 |
| | JPMorgan Chase & Co. | 3.375% | 5/1/23 | 875 | 934 |
| | JPMorgan Chase & Co. | 3.875% | 2/1/24 | 800 | 879 |
| | JPMorgan Chase & Co. | 3.900% | 7/15/25 | 2,270 | 2,561 |
| | JPMorgan Chase & Co. | 4.125% | 12/15/26 | 765 | 887 |
| | JPMorgan Chase & Co. | 4.250% | 10/1/27 | 2,295 | 2,706 |
| | JPMorgan Chase & Co. | 4.452% | 12/5/29 | 2,100 | 2,557 |
| | JPMorgan Chase & Co. | 3.702% | 5/6/30 | 2,525 | 2,911 |
| | JPMorgan Chase & Co. | 3.109% | 4/22/41 | 835 | 932 |
| | JPMorgan Chase & Co. | 5.400% | 1/6/42 | 750 | 1,108 |
| | | | Coupon | Maturity
Date | Face
Amount
($000) | Market
Value•
($000) |
| | JPMorgan Chase & Co. | 3.964% | 11/15/48 | 6,150 | 7,724 |
| | JPMorgan Chase & Co. | 3.109% | 4/22/51 | 845 | 935 |
| 6 | Liberty Mutual Group Inc. | 4.250% | 6/15/23 | 80 | 87 |
| 6 | Liberty Mutual Group Inc. | 4.569% | 2/1/29 | 280 | 341 |
| | Loews Corp. | 2.625% | 5/15/23 | 440 | 460 |
| 6 | Macquarie Group Ltd. | 4.150% | 3/27/24 | 1,375 | 1,474 |
| | Manufacturers & Traders Trust Co. | 2.900% | 2/6/25 | 685 | 743 |
| | Marsh & McLennan Cos. Inc. | 4.375% | 3/15/29 | 675 | 821 |
| | Marsh & McLennan Cos. Inc. | 4.900% | 3/15/49 | 305 | 440 |
| 3,6 | Massachusetts Mutual Life Insurance Co. | 7.625% | 11/15/23 | 2,000 | 2,258 |
| | MetLife Inc. | 3.600% | 4/10/24 | 580 | 639 |
| | MetLife Inc. | 4.125% | 8/13/42 | 145 | 184 |
| | MetLife Inc. | 4.875% | 11/13/43 | 530 | 749 |
| 6 | Metropolitan Life Global Funding I | 3.450% | 10/9/21 | 810 | 829 |
| 6 | Metropolitan Life Global Funding I | 2.650% | 4/8/22 | 340 | 350 |
| 6 | Metropolitan Life Global Funding I | 3.450% | 12/18/26 | 640 | 730 |
| 6 | Metropolitan Life Global Funding I | 3.000% | 9/19/27 | 1,165 | 1,294 |
| | Mitsubishi UFJ Financial Group Inc. | 2.623% | 7/18/22 | 1,940 | 2,006 |
| | Morgan Stanley | 5.750% | 1/25/21 | 1,740 | 1,744 |
| | Morgan Stanley | 2.500% | 4/21/21 | 1,175 | 1,182 |
| | Morgan Stanley | 2.625% | 11/17/21 | 800 | 816 |
| | Morgan Stanley | 2.750% | 5/19/22 | 1,710 | 1,766 |
| | Morgan Stanley | 3.700% | 10/23/24 | 750 | 835 |
| | Morgan Stanley | 2.720% | 7/22/25 | 1,750 | 1,872 |
| | Morgan Stanley | 3.125% | 7/27/26 | 1,345 | 1,498 |
| | Morgan Stanley | 6.250% | 8/9/26 | 3,000 | 3,817 |
| | Morgan Stanley | 3.625% | 1/20/27 | 1,250 | 1,432 |
| | Morgan Stanley | 3.772% | 1/24/29 | 3,910 | 4,517 |
| | Morgan Stanley | 2.699% | 1/22/31 | 1,105 | 1,202 |
| | Morgan Stanley | 4.300% | 1/27/45 | 850 | 1,131 |
| 6 | National Australia Bank Ltd. | 2.332% | 8/21/30 | 1,745 | 1,759 |
| 6 | Nationwide Building Society | 3.622% | 4/26/23 | 680 | 706 |
| 6 | Nationwide Financial Services Inc. | 3.900% | 11/30/49 | 1,430 | 1,587 |
| 6 | Nationwide Mutual Insurance Co. | 4.350% | 4/30/50 | 1,320 | 1,548 |
| 6 | NBK SPC Ltd. | 2.750% | 5/30/22 | 1,530 | 1,571 |
| 6 | New York Life Global Funding | 2.900% | 1/17/24 | 810 | 868 |
| 6 | New York Life Insurance Co. | 5.875% | 5/15/33 | 2,100 | 2,876 |
| 6 | New York Life Insurance Co. | 3.750% | 5/15/50 | 345 | 409 |
| 6 | New York Life Insurance Co. | 4.450% | 5/15/69 | 435 | 581 |
| 6 | Northwestern Mutual Life Insurance Co. | 3.850% | 9/30/47 | 656 | 779 |
| 6 | Northwestern Mutual Life Insurance Co. | 3.625% | 9/30/59 | 270 | 308 |
| | PNC Bank NA | 3.300% | 10/30/24 | 460 | 506 |
| | PNC Bank NA | 2.950% | 2/23/25 | 1,105 | 1,209 |
| | PNC Bank NA | 4.200% | 11/1/25 | 255 | 292 |
| | PNC Bank NA | 3.100% | 10/25/27 | 1,165 | 1,303 |
| | PNC Bank NA | 3.250% | 1/22/28 | 1,675 | 1,905 |
| | PNC Financial Services Group Inc. | 3.900% | 4/29/24 | 580 | 641 |
| | | | Coupon | Maturity
Date | Face
Amount
($000) | Market
Value•
($000) |
| | PNC Financial Services Group Inc. | 2.550% | 1/22/30 | 1,625 | 1,776 |
| 6 | Principal Life Global Funding II | 2.500% | 9/16/29 | 1,000 | 1,081 |
| | Prudential plc | 3.125% | 4/14/30 | 645 | 731 |
| 8 | Royal Bank of Canada | 0.000% | 1/7/21 | 833 | 654 |
| | Royal Bank of Canada | 2.750% | 2/1/22 | 1,195 | 1,226 |
| | Santander Holdings USA Inc. | 3.700% | 3/28/22 | 915 | 945 |
| | Santander Holdings USA Inc. | 3.400% | 1/18/23 | 605 | 634 |
| 6 | Societe Generale SA | 3.250% | 1/12/22 | 1,015 | 1,043 |
| 6 | Standard Chartered plc | 2.744% | 9/10/22 | 2,030 | 2,052 |
| | State Street Corp. | 2.653% | 5/15/23 | 840 | 862 |
| | Svenska Handelsbanken AB | 1.875% | 9/7/21 | 1,050 | 1,062 |
| | Synchrony Bank | 3.650% | 5/24/21 | 1,290 | 1,302 |
| 6 | Teachers Insurance & Annuity Association of America | 4.900% | 9/15/44 | 875 | 1,172 |
| 6 | Teachers Insurance & Annuity Association of America | 4.270% | 5/15/47 | 1,145 | 1,428 |
| 6 | Temasek Financial I Ltd. | 2.375% | 1/23/23 | 1,130 | 1,177 |
| 6 | Temasek Financial I Ltd. | 3.625% | 8/1/28 | 1,025 | 1,199 |
| 6 | Temasek Financial I Ltd. | 2.250% | 4/6/51 | 1,150 | 1,158 |
| 6 | Temasek Financial I Ltd. | 2.500% | 10/6/70 | 670 | 678 |
| 6 | Toronto-Dominion Bank | 2.500% | 1/18/23 | 2,100 | 2,146 |
| | Truist Bank | 2.625% | 1/15/22 | 460 | 470 |
| | Truist Bank | 3.300% | 5/15/26 | 340 | 380 |
| | Truist Financial Corp. | 3.200% | 9/3/21 | 665 | 677 |
| | Truist Financial Corp. | 2.750% | 4/1/22 | 1,700 | 1,746 |
| | Truist Financial Corp. | 3.700% | 6/5/25 | 1,385 | 1,560 |
| | Truist Financial Corp. | 1.950% | 6/5/30 | 795 | 826 |
| | U.S. Bancorp | 3.700% | 1/30/24 | 1,560 | 1,701 |
| 6 | UBS Group AG | 2.650% | 2/1/22 | 1,250 | 1,281 |
| 6 | UBS Group AG | 3.126% | 8/13/30 | 555 | 621 |
| | Wachovia Corp. | 7.500% | 4/15/35 | 1,000 | 1,471 |
| | Wells Fargo & Co. | 3.500% | 3/8/22 | 640 | 664 |
| | Wells Fargo & Co. | 3.069% | 1/24/23 | 195 | 200 |
| | Wells Fargo & Co. | 3.450% | 2/13/23 | 735 | 778 |
| | Wells Fargo & Co. | 4.480% | 1/16/24 | 1,199 | 1,328 |
| | Wells Fargo & Co. | 3.750% | 1/24/24 | 1,560 | 1,700 |
| | Wells Fargo & Co. | 3.000% | 2/19/25 | 890 | 965 |
| | Wells Fargo & Co. | 3.550% | 9/29/25 | 860 | 963 |
| | Wells Fargo & Co. | 3.000% | 4/22/26 | 1,045 | 1,150 |
| | Wells Fargo & Co. | 4.100% | 6/3/26 | 340 | 389 |
| | Wells Fargo & Co. | 3.000% | 10/23/26 | 170 | 188 |
| | Wells Fargo & Co. | 3.196% | 6/17/27 | 1,705 | 1,885 |
| | Wells Fargo & Co. | 2.879% | 10/30/30 | 435 | 472 |
| | Wells Fargo & Co. | 2.572% | 2/11/31 | 2,235 | 2,358 |
| | Wells Fargo & Co. | 5.606% | 1/15/44 | 2,276 | 3,213 |
| | Wells Fargo & Co. | 4.900% | 11/17/45 | 515 | 685 |
| | Wells Fargo & Co. | 4.750% | 12/7/46 | 2,070 | 2,708 |
| | | | | | | 260,934 |
| Health Care (2.7%) |
| | AbbVie Inc. | 3.450% | 3/15/22 | 450 | 464 |
| | AbbVie Inc. | 3.800% | 3/15/25 | 575 | 641 |
| | AbbVie Inc. | 4.050% | 11/21/39 | 590 | 705 |
| | AbbVie Inc. | 4.850% | 6/15/44 | 450 | 584 |
| | AbbVie Inc. | 4.450% | 5/14/46 | 1,010 | 1,282 |
| | Advocate Health & Hospitals Corp. | 2.211% | 6/15/30 | 360 | 372 |
| | Advocate Health & Hospitals Corp. | 3.008% | 6/15/50 | 540 | 582 |
| | | | Coupon | Maturity
Date | Face
Amount
($000) | Market
Value•
($000) |
| | Aetna Inc. | 2.800% | 6/15/23 | 680 | 716 |
| 6 | Alcon Finance Corp. | 2.750% | 9/23/26 | 200 | 218 |
| 6 | Alcon Finance Corp. | 2.600% | 5/27/30 | 200 | 213 |
| 6 | Alcon Finance Corp. | 3.800% | 9/23/49 | 800 | 938 |
| | Amgen Inc. | 2.300% | 2/25/31 | 1,575 | 1,672 |
| | Amgen Inc. | 3.150% | 2/21/40 | 1,075 | 1,170 |
| | Amgen Inc. | 5.150% | 11/15/41 | 311 | 427 |
| 6 | Amgen Inc. | 2.770% | 9/1/53 | 430 | 434 |
| | Anthem Inc. | 3.300% | 1/15/23 | 1,100 | 1,165 |
| | Anthem Inc. | 3.650% | 12/1/27 | 750 | 864 |
| | Anthem Inc. | 4.101% | 3/1/28 | 1,140 | 1,348 |
| | Anthem Inc. | 4.650% | 8/15/44 | 92 | 121 |
| | Ascension Health | 2.532% | 11/15/29 | 1,405 | 1,531 |
| 3 | Ascension Health | 4.847% | 11/15/53 | 50 | 74 |
| | AstraZeneca plc | 4.000% | 1/17/29 | 2,345 | 2,793 |
| | AstraZeneca plc | 6.450% | 9/15/37 | 615 | 942 |
| 6 | Bayer US Finance II LLC | 4.250% | 12/15/25 | 1,100 | 1,257 |
| 6 | Bayer US Finance LLC | 3.000% | 10/8/21 | 1,980 | 2,018 |
| 6 | Bayer US Finance LLC | 3.375% | 10/8/24 | 815 | 888 |
| 3 | Bon Secours Mercy Health Inc. | 3.464% | 6/1/30 | 590 | 667 |
| | Bon Secours Mercy Health Inc. | 2.095% | 6/1/31 | 330 | 338 |
| | Boston Scientific Corp. | 4.000% | 3/1/29 | 195 | 229 |
| | Bristol-Myers Squibb Co. | 2.750% | 2/15/23 | 138 | 145 |
| | Bristol-Myers Squibb Co. | 3.250% | 2/20/23 | 239 | 253 |
| | Bristol-Myers Squibb Co. | 4.000% | 8/15/23 | 45 | 49 |
| | Bristol-Myers Squibb Co. | 3.400% | 7/26/29 | 885 | 1,021 |
| | Bristol-Myers Squibb Co. | 4.125% | 6/15/39 | 505 | 639 |
| | Bristol-Myers Squibb Co. | 4.550% | 2/20/48 | 217 | 299 |
| | Bristol-Myers Squibb Co. | 4.250% | 10/26/49 | 1,473 | 1,973 |
| | Children's Hospital Corp. | 2.585% | 2/1/50 | 160 | 160 |
| | Cigna Corp. | 3.250% | 4/15/25 | 880 | 963 |
| | Cigna Corp. | 4.375% | 10/15/28 | 515 | 620 |
| | CommonSpirit Health | 2.950% | 11/1/22 | 535 | 560 |
| | CommonSpirit Health | 4.200% | 8/1/23 | 535 | 578 |
| | CommonSpirit Health | 2.760% | 10/1/24 | 860 | 924 |
| | CommonSpirit Health | 3.347% | 10/1/29 | 1,245 | 1,368 |
| | CommonSpirit Health | 2.782% | 10/1/30 | 465 | 492 |
| 3 | CommonSpirit Health | 4.350% | 11/1/42 | 536 | 625 |
| | CommonSpirit Health | 4.187% | 10/1/49 | 1,275 | 1,480 |
| | Cottage Health Obligated Group | 3.304% | 11/1/49 | 470 | 524 |
| | CVS Health Corp. | 2.750% | 12/1/22 | 965 | 1,002 |
| | CVS Health Corp. | 4.300% | 3/25/28 | 110 | 131 |
| | CVS Health Corp. | 4.875% | 7/20/35 | 315 | 409 |
| | CVS Health Corp. | 4.125% | 4/1/40 | 430 | 511 |
| | CVS Health Corp. | 5.125% | 7/20/45 | 855 | 1,146 |
| | Dignity Health | 3.812% | 11/1/24 | 560 | 609 |
| | Eli Lilly and Co. | 4.150% | 3/15/59 | 80 | 109 |
| 6 | EMD Finance LLC | 2.950% | 3/19/22 | 605 | 620 |
| | Gilead Sciences Inc. | 3.700% | 4/1/24 | 1,010 | 1,103 |
| | Gilead Sciences Inc. | 3.500% | 2/1/25 | 560 | 619 |
| | Gilead Sciences Inc. | 4.500% | 2/1/45 | 940 | 1,196 |
| | Gilead Sciences Inc. | 4.750% | 3/1/46 | 600 | 795 |
| | Gilead Sciences Inc. | 2.800% | 10/1/50 | 1,235 | 1,229 |
| | GlaxoSmithKline Capital Inc. | 2.800% | 3/18/23 | 385 | 406 |
| | | | Coupon | Maturity
Date | Face
Amount
($000) | Market
Value•
($000) |
| | GlaxoSmithKline Capital Inc. | 5.375% | 4/15/34 | 2,000 | 2,860 |
| | Kaiser Foundation Hospitals | 3.150% | 5/1/27 | 380 | 428 |
| | Kaiser Foundation Hospitals | 4.875% | 4/1/42 | 365 | 499 |
| | Medtronic Inc. | 3.500% | 3/15/25 | 396 | 444 |
| | Memorial Sloan-Kettering Cancer Center | 2.955% | 1/1/50 | 590 | 625 |
| | Memorial Sloan-Kettering Cancer Center | 4.125% | 7/1/52 | 310 | 402 |
| | Memorial Sloan-Kettering Cancer Center | 4.200% | 7/1/55 | 280 | 372 |
| | Merck & Co. Inc. | 2.750% | 2/10/25 | 1,210 | 1,314 |
| | Merck & Co. Inc. | 3.400% | 3/7/29 | 1,470 | 1,709 |
| | Merck & Co. Inc. | 4.150% | 5/18/43 | 760 | 992 |
| | Merck & Co. Inc. | 4.000% | 3/7/49 | 1,915 | 2,525 |
| | Mercy Health | 4.302% | 7/1/28 | 570 | 657 |
| | Novartis Capital Corp. | 3.400% | 5/6/24 | 415 | 455 |
| | Novartis Capital Corp. | 4.400% | 5/6/44 | 640 | 880 |
| | Partners Healthcare System Inc. | 3.192% | 7/1/49 | 935 | 1,026 |
| | Partners Healthcare System Inc. | 3.342% | 7/1/60 | 955 | 1,087 |
| | Pfizer Inc. | 3.000% | 12/15/26 | 725 | 817 |
| | Pfizer Inc. | 3.450% | 3/15/29 | 2,165 | 2,524 |
| | Pfizer Inc. | 4.100% | 9/15/38 | 1,505 | 1,917 |
| | Pfizer Inc. | 2.550% | 5/28/40 | 275 | 292 |
| | Pfizer Inc. | 2.700% | 5/28/50 | 305 | 326 |
| | Providence St. Joseph Health Obligated Group | 2.746% | 10/1/26 | 390 | 424 |
| | Providence St. Joseph Health Obligated Group | 2.532% | 10/1/29 | 985 | 1,056 |
| 3 | Providence St. Joseph Health Obligated Group | 3.930% | 10/1/48 | 325 | 389 |
| 6 | Roche Holdings Inc. | 2.375% | 1/28/27 | 1,650 | 1,791 |
| 6 | Royalty Pharma plc | 3.300% | 9/2/40 | 425 | 446 |
| 6 | Royalty Pharma plc | 3.550% | 9/2/50 | 1,405 | 1,495 |
| | Rush Obligated Group | 3.922% | 11/15/29 | 330 | 391 |
| | SSM Health Care Corp. | 3.823% | 6/1/27 | 940 | 1,063 |
| | Sutter Health | 2.294% | 8/15/30 | 560 | 583 |
| 9 | Toledo Hospital | 5.750% | 11/15/38 | 560 | 667 |
| | UnitedHealth Group Inc. | 2.875% | 3/15/22 | 27 | 28 |
| | UnitedHealth Group Inc. | 2.875% | 3/15/23 | 1,175 | 1,241 |
| | UnitedHealth Group Inc. | 3.100% | 3/15/26 | 430 | 482 |
| | UnitedHealth Group Inc. | 3.850% | 6/15/28 | 1,190 | 1,411 |
| | UnitedHealth Group Inc. | 2.000% | 5/15/30 | 275 | 291 |
| | UnitedHealth Group Inc. | 4.625% | 7/15/35 | 240 | 323 |
| | UnitedHealth Group Inc. | 2.750% | 5/15/40 | 310 | 334 |
| | UnitedHealth Group Inc. | 4.250% | 3/15/43 | 1,600 | 2,100 |
| | UnitedHealth Group Inc. | 4.750% | 7/15/45 | 592 | 830 |
| | UnitedHealth Group Inc. | 4.200% | 1/15/47 | 215 | 283 |
| | UnitedHealth Group Inc. | 4.250% | 6/15/48 | 880 | 1,173 |
| | | | Coupon | Maturity
Date | Face
Amount
($000) | Market
Value•
($000) |
| | UnitedHealth Group Inc. | 4.450% | 12/15/48 | 140 | 193 |
| | UnitedHealth Group Inc. | 3.700% | 8/15/49 | 675 | 841 |
| | UnitedHealth Group Inc. | 2.900% | 5/15/50 | 1,253 | 1,377 |
| | UnitedHealth Group Inc. | 3.875% | 8/15/59 | 115 | 148 |
| 6 | Viatris Inc. | 3.850% | 6/22/40 | 530 | 596 |
| 6 | Viatris Inc. | 4.000% | 6/22/50 | 710 | 812 |
| | | | | | | 90,130 |
| Industrials (1.0%) |
| 6 | BAE Systems Holdings Inc. | 3.850% | 12/15/25 | 1,085 | 1,226 |
| 6 | BAE Systems plc | 3.400% | 4/15/30 | 215 | 243 |
| | Boeing Co. | 2.700% | 2/1/27 | 495 | 515 |
| | Burlington Northern Santa Fe LLC | 3.000% | 3/15/23 | 565 | 593 |
| | Burlington Northern Santa Fe LLC | 3.850% | 9/1/23 | 1,630 | 1,766 |
| | Burlington Northern Santa Fe LLC | 4.550% | 9/1/44 | 250 | 337 |
| | Burlington Northern Santa Fe LLC | 4.150% | 4/1/45 | 415 | 542 |
| | Burlington Northern Santa Fe LLC | 4.050% | 6/15/48 | 60 | 79 |
| | Burlington Northern Santa Fe LLC | 3.050% | 2/15/51 | 405 | 460 |
| | Canadian National Railway Co. | 2.450% | 5/1/50 | 205 | 212 |
| | Carrier Global Corp. | 2.722% | 2/15/30 | 448 | 478 |
| | Caterpillar Inc. | 3.900% | 5/27/21 | 590 | 599 |
| | Caterpillar Inc. | 2.600% | 6/26/22 | 705 | 725 |
| | Caterpillar Inc. | 3.400% | 5/15/24 | 810 | 884 |
| 3 | Continental Airlines Class A Series 2007-1 Pass Through Trust | 5.983% | 10/19/23 | 488 | 489 |
| | CSX Corp. | 4.300% | 3/1/48 | 445 | 573 |
| | CSX Corp. | 3.350% | 9/15/49 | 235 | 267 |
| 3 | Federal Express Corp. 1998 Pass Through Trust | 6.720% | 7/15/23 | 216 | 220 |
| | FedEx Corp. | 2.700% | 4/15/23 | 255 | 267 |
| | FedEx Corp. | 4.100% | 2/1/45 | 130 | 154 |
| | FedEx Corp. | 4.550% | 4/1/46 | 178 | 225 |
| | FedEx Corp. | 4.050% | 2/15/48 | 48 | 57 |
| | Illinois Tool Works Inc. | 3.500% | 3/1/24 | 1,295 | 1,406 |
| | John Deere Capital Corp. | 3.450% | 3/13/25 | 1,200 | 1,344 |
| | Kansas City Southern | 4.950% | 8/15/45 | 480 | 613 |
| | Lockheed Martin Corp. | 2.900% | 3/1/25 | 610 | 664 |
| | Lockheed Martin Corp. | 1.850% | 6/15/30 | 60 | 63 |
| | Lockheed Martin Corp. | 4.500% | 5/15/36 | 211 | 277 |
| | Lockheed Martin Corp. | 4.700% | 5/15/46 | 376 | 529 |
| | Lockheed Martin Corp. | 2.800% | 6/15/50 | 265 | 286 |
| | Lockheed Martin Corp. | 4.090% | 9/15/52 | 144 | 190 |
| | Otis Worldwide Corp. | 2.565% | 2/15/30 | 225 | 241 |
| | Otis Worldwide Corp. | 3.112% | 2/15/40 | 510 | 556 |
| | Otis Worldwide Corp. | 3.362% | 2/15/50 | 890 | 1,018 |
| | Parker-Hannifin Corp. | 3.250% | 6/14/29 | 270 | 305 |
| | Parker-Hannifin Corp. | 4.450% | 11/21/44 | 450 | 575 |
| 6 | Penske Truck Leasing Co. LP / PTL Finance Corp. | 3.450% | 7/1/24 | 465 | 506 |
| | | | Coupon | Maturity
Date | Face
Amount
($000) | Market
Value•
($000) |
| 6 | Penske Truck Leasing Co. LP / PTL Finance Corp. | 2.700% | 11/1/24 | 385 | 411 |
| 6 | Penske Truck Leasing Co. LP / PTL Finance Corp. | 3.950% | 3/10/25 | 1,435 | 1,606 |
| 6 | Penske Truck Leasing Co. LP / PTL Finance Corp. | 4.450% | 1/29/26 | 925 | 1,070 |
| | Raytheon Technologies Corp. | 4.125% | 11/16/28 | 1,125 | 1,338 |
| | Raytheon Technologies Corp. | 6.050% | 6/1/36 | 675 | 978 |
| | Raytheon Technologies Corp. | 4.450% | 11/16/38 | 275 | 346 |
| | Raytheon Technologies Corp. | 4.500% | 6/1/42 | 407 | 532 |
| 6 | Siemens Financieringsmaatschappij NV | 2.900% | 5/27/22 | 1,050 | 1,087 |
| 6 | Siemens Financieringsmaatschappij NV | 3.125% | 3/16/24 | 1,680 | 1,813 |
| 6 | Siemens Financieringsmaatschappij NV | 4.400% | 5/27/45 | 800 | 1,073 |
| 3 | Southwest Airlines Co. Series 2007-1 Pass Through Trust | 6.150% | 2/1/24 | 157 | 161 |
| | Stanley Black & Decker Inc. | 4.850% | 11/15/48 | 685 | 954 |
| | Union Pacific Corp. | 3.700% | 3/1/29 | 505 | 586 |
| | Union Pacific Corp. | 3.250% | 2/5/50 | 200 | 226 |
| | Union Pacific Corp. | 3.799% | 10/1/51 | 666 | 811 |
| | Union Pacific Corp. | 3.839% | 3/20/60 | 285 | 351 |
| 6 | Union Pacific Corp. | 2.973% | 9/16/62 | 625 | 652 |
| | Union Pacific Corp. | 3.750% | 2/5/70 | 335 | 406 |
| 3 | United Airlines Class B Series 2018-1 Pass Through Trust | 4.600% | 9/1/27 | 177 | 172 |
| | | | | | | 34,057 |
| Materials (0.0%) |
| | International Paper Co. | 4.350% | 8/15/48 | 1,255 | 1,641 |
| Real Estate (0.4%) |
| | American Tower Corp. | 5.000% | 2/15/24 | 80 | 90 |
| | American Tower Corp. | 4.400% | 2/15/26 | 450 | 520 |
| | American Tower Corp. | 3.800% | 8/15/29 | 981 | 1,137 |
| | Boston Properties LP | 3.125% | 9/1/23 | 355 | 376 |
| | Boston Properties LP | 3.800% | 2/1/24 | 45 | 49 |
| | Crown Castle International Corp. | 3.650% | 9/1/27 | 285 | 321 |
| | Crown Castle International Corp. | 3.800% | 2/15/28 | 235 | 269 |
| | Equinix Inc. | 3.000% | 7/15/50 | 1,020 | 1,034 |
| | Healthpeak Properties Inc. | 3.000% | 1/15/30 | 930 | 1,019 |
| | Realty Income Corp. | 3.250% | 1/15/31 | 380 | 431 |
| 6 | SBA Tower Trust | 3.168% | 4/9/47 | 1,330 | 1,342 |
| 6 | SBA Tower Trust | 3.448% | 3/15/48 | 705 | 743 |
| 6 | SBA Tower Trust | 2.836% | 1/15/50 | 725 | 769 |
| 6 | SBA Tower Trust | 1.884% | 7/15/50 | 265 | 271 |
| 6 | Scentre Group Trust 1 / Scentre Group Trust 2 | 4.375% | 5/28/30 | 695 | 809 |
| | Simon Property Group LP | 3.750% | 2/1/24 | 90 | 97 |
| | Simon Property Group LP | 3.375% | 10/1/24 | 275 | 299 |
| | | | Coupon | Maturity
Date | Face
Amount
($000) | Market
Value•
($000) |
| | Simon Property Group LP | 2.450% | 9/13/29 | 1,160 | 1,217 |
| | VEREIT Operating Partnership LP | 3.400% | 1/15/28 | 210 | 232 |
| | VEREIT Operating Partnership LP | 2.200% | 6/15/28 | 735 | 752 |
| | VEREIT Operating Partnership LP | 2.850% | 12/15/32 | 405 | 423 |
| | | | | | | 12,200 |
| Technology (2.0%) |
| | Apple Inc. | 3.000% | 2/9/24 | 620 | 667 |
| | Apple Inc. | 3.450% | 5/6/24 | 1,000 | 1,101 |
| | Apple Inc. | 2.850% | 5/11/24 | 1,225 | 1,321 |
| | Apple Inc. | 2.750% | 1/13/25 | 590 | 639 |
| | Apple Inc. | 3.250% | 2/23/26 | 1,020 | 1,145 |
| | Apple Inc. | 2.450% | 8/4/26 | 1,170 | 1,275 |
| | Apple Inc. | 3.350% | 2/9/27 | 1,545 | 1,758 |
| | Apple Inc. | 3.200% | 5/11/27 | 1,065 | 1,205 |
| | Apple Inc. | 2.900% | 9/12/27 | 2,250 | 2,517 |
| | Apple Inc. | 3.850% | 5/4/43 | 430 | 546 |
| | Apple Inc. | 4.450% | 5/6/44 | 120 | 164 |
| | Apple Inc. | 3.850% | 8/4/46 | 985 | 1,267 |
| | Apple Inc. | 2.650% | 5/11/50 | 640 | 677 |
| | Apple Inc. | 2.550% | 8/20/60 | 1,425 | 1,459 |
| | Broadcom Corp. / Broadcom Cayman Finance Ltd. | 3.875% | 1/15/27 | 305 | 343 |
| | Broadcom Inc. | 4.250% | 4/15/26 | 170 | 193 |
| | Broadcom Inc. | 4.110% | 9/15/28 | 1,452 | 1,653 |
| | Broadcom Inc. | 4.150% | 11/15/30 | 130 | 150 |
| | Cisco Systems Inc. | 2.500% | 9/20/26 | 431 | 472 |
| | Global Payments Inc. | 2.900% | 5/15/30 | 535 | 580 |
| | Intel Corp. | 2.875% | 5/11/24 | 800 | 861 |
| | Intel Corp. | 4.100% | 5/19/46 | 1,360 | 1,733 |
| | International Business Machines Corp. | 3.375% | 8/1/23 | 1,750 | 1,888 |
| | International Business Machines Corp. | 3.000% | 5/15/24 | 2,500 | 2,702 |
| | International Business Machines Corp. | 3.300% | 5/15/26 | 4,500 | 5,078 |
| | International Business Machines Corp. | 3.500% | 5/15/29 | 2,975 | 3,441 |
| | International Business Machines Corp. | 5.875% | 11/29/32 | 1,010 | 1,449 |
| | International Business Machines Corp. | 2.850% | 5/15/40 | 490 | 522 |
| | International Business Machines Corp. | 2.950% | 5/15/50 | 195 | 208 |
| | Microsoft Corp. | 2.875% | 2/6/24 | 975 | 1,047 |
| | Microsoft Corp. | 2.700% | 2/12/25 | 760 | 824 |
| | Microsoft Corp. | 3.125% | 11/3/25 | 435 | 486 |
| | Microsoft Corp. | 2.400% | 8/8/26 | 1,890 | 2,058 |
| | Microsoft Corp. | 3.500% | 2/12/35 | 605 | 742 |
| | Microsoft Corp. | 3.450% | 8/8/36 | 1,725 | 2,124 |
| | Microsoft Corp. | 4.100% | 2/6/37 | 769 | 1,002 |
| | Microsoft Corp. | 3.700% | 8/8/46 | 1,615 | 2,037 |
| | Microsoft Corp. | 2.525% | 6/1/50 | 3,336 | 3,505 |
| | Oracle Corp. | 2.800% | 7/8/21 | 375 | 380 |
| | Oracle Corp. | 2.500% | 5/15/22 | 1,210 | 1,243 |
| | Oracle Corp. | 2.950% | 11/15/24 | 2,190 | 2,376 |
| | Oracle Corp. | 2.950% | 5/15/25 | 355 | 388 |
| | Oracle Corp. | 3.250% | 11/15/27 | 3,065 | 3,493 |
| | Oracle Corp. | 4.000% | 11/15/47 | 895 | 1,099 |
| | Oracle Corp. | 3.600% | 4/1/50 | 1,565 | 1,822 |
| | | | Coupon | Maturity
Date | Face
Amount
($000) | Market
Value•
($000) |
| | Oracle Corp. | 3.850% | 4/1/60 | 540 | 658 |
| 6 | QUALCOMM Inc. | 1.300% | 5/20/28 | 744 | 748 |
| | QUALCOMM Inc. | 2.150% | 5/20/30 | 1,075 | 1,136 |
| 6 | QUALCOMM Inc. | 1.650% | 5/20/32 | 1,112 | 1,110 |
| | QUALCOMM Inc. | 3.250% | 5/20/50 | 385 | 446 |
| | | | | | | 65,738 |
| Utilities (3.2%) |
| | AEP Texas Inc. | 4.150% | 5/1/49 | 145 | 180 |
| | AEP Texas Inc. | 3.450% | 1/15/50 | 380 | 430 |
| | Alabama Power Co. | 5.200% | 6/1/41 | 120 | 163 |
| | Alabama Power Co. | 4.100% | 1/15/42 | 215 | 258 |
| | Alabama Power Co. | 3.750% | 3/1/45 | 630 | 757 |
| | Alabama Power Co. | 4.300% | 7/15/48 | 775 | 1,029 |
| | Ameren Illinois Co. | 3.800% | 5/15/28 | 590 | 687 |
| | Ameren Illinois Co. | 6.125% | 12/15/28 | 1,000 | 1,267 |
| | Ameren Illinois Co. | 3.700% | 12/1/47 | 140 | 171 |
| | American Water Capital Corp. | 2.950% | 9/1/27 | 540 | 595 |
| | American Water Capital Corp. | 3.750% | 9/1/47 | 45 | 55 |
| | American Water Capital Corp. | 4.200% | 9/1/48 | 845 | 1,102 |
| | American Water Capital Corp. | 4.150% | 6/1/49 | 25 | 33 |
| | American Water Capital Corp. | 3.450% | 5/1/50 | 95 | 113 |
| | Arizona Public Service Co. | 3.350% | 5/15/50 | 410 | 480 |
| | Baltimore Gas and Electric Co. | 2.900% | 6/15/50 | 238 | 256 |
| | Berkshire Hathaway Energy Co. | 6.125% | 4/1/36 | 1,135 | 1,672 |
| | Berkshire Hathaway Energy Co. | 5.950% | 5/15/37 | 25 | 36 |
| | Berkshire Hathaway Energy Co. | 5.150% | 11/15/43 | 1,490 | ��� 2,043 |
| 6 | Berkshire Hathaway Energy Co. | 4.250% | 10/15/50 | 115 | 147 |
| 6 | Boston Gas Co. | 3.150% | 8/1/27 | 140 | 153 |
| 6 | Brooklyn Union Gas Co. | 3.407% | 3/10/26 | 95 | 106 |
| 6 | Brooklyn Union Gas Co. | 4.273% | 3/15/48 | 1,720 | 2,177 |
| | CenterPoint Energy Houston Electric LLC | 4.250% | 2/1/49 | 195 | 259 |
| | CenterPoint Energy Resources Corp. | 4.000% | 4/1/28 | 1,369 | 1,598 |
| | Cleco Corporate Holdings LLC | 3.743% | 5/1/26 | 1,850 | 2,033 |
| | Cleco Corporate Holdings LLC | 3.375% | 9/15/29 | 405 | 408 |
| | Commonwealth Edison Co. | 2.950% | 8/15/27 | 645 | 715 |
| | Commonwealth Edison Co. | 4.350% | 11/15/45 | 375 | 487 |
| | Commonwealth Edison Co. | 3.650% | 6/15/46 | 175 | 207 |
| | Commonwealth Edison Co. | 4.000% | 3/1/48 | 480 | 604 |
| | Consolidated Edison Co. of New York Inc. | 4.500% | 12/1/45 | 980 | 1,264 |
| | Consolidated Edison Co. of New York Inc. | 3.850% | 6/15/46 | 76 | 88 |
| | Consolidated Edison Co. of New York Inc. | 3.950% | 4/1/50 | 50 | 61 |
| | Consolidated Edison Co. of New York Inc. | 4.625% | 12/1/54 | 1,835 | 2,431 |
| | | | Coupon | Maturity
Date | Face
Amount
($000) | Market
Value•
($000) |
| | Consolidated Edison Co. of New York Inc. | 4.500% | 5/15/58 | 630 | 827 |
| | Delmarva Power & Light Co. | 3.500% | 11/15/23 | 305 | 330 |
| | Dominion Energy Inc. | 2.715% | 8/15/21 | 450 | 455 |
| 6 | Dominion Energy Inc. | 2.450% | 1/15/23 | 3,240 | 3,369 |
| | Dominion Energy Inc. | 5.250% | 8/1/33 | 1,000 | 1,308 |
| | Dominion Energy Inc. | 4.600% | 3/15/49 | 760 | 1,012 |
| | Dominion Energy South Carolina Inc. | 6.625% | 2/1/32 | 138 | 199 |
| | Dominion Energy South Carolina Inc. | 5.300% | 5/15/33 | 44 | 59 |
| | Dominion Energy South Carolina Inc. | 5.450% | 2/1/41 | 95 | 136 |
| | Dominion Energy South Carolina Inc. | 4.600% | 6/15/43 | 202 | 271 |
| | DTE Energy Co. | 3.800% | 3/15/27 | 250 | 287 |
| | Duke Energy Carolinas LLC | 6.100% | 6/1/37 | 391 | 574 |
| | Duke Energy Carolinas LLC | 3.700% | 12/1/47 | 470 | 567 |
| | Duke Energy Corp. | 2.650% | 9/1/26 | 315 | 342 |
| | Duke Energy Corp. | 3.400% | 6/15/29 | 350 | 396 |
| | Duke Energy Corp. | 4.800% | 12/15/45 | 1,200 | 1,581 |
| | Duke Energy Corp. | 3.750% | 9/1/46 | 265 | 308 |
| | Duke Energy Florida LLC | 6.350% | 9/15/37 | 200 | 304 |
| | Duke Energy Progress LLC | 6.300% | 4/1/38 | 365 | 558 |
| | Duke Energy Progress LLC | 4.100% | 3/15/43 | 118 | 147 |
| | Duke Energy Progress LLC | 4.200% | 8/15/45 | 2,045 | 2,581 |
| 6 | East Ohio Gas Co. | 2.000% | 6/15/30 | 325 | 337 |
| 6 | East Ohio Gas Co. | 3.000% | 6/15/50 | 475 | 513 |
| | Eastern Energy Gas Holdings LLC | 3.550% | 11/1/23 | 470 | 506 |
| | Eastern Energy Gas Holdings LLC | 3.000% | 11/15/29 | 585 | 641 |
| | Eastern Energy Gas Holdings LLC | 4.800% | 11/1/43 | 125 | 160 |
| | Eastern Energy Gas Holdings LLC | 4.600% | 12/15/44 | 1,603 | 2,024 |
| 6 | Electricite de France SA | 4.875% | 9/21/38 | 2,200 | 2,748 |
| 6 | Electricite de France SA | 4.875% | 1/22/44 | 50 | 62 |
| 6 | Electricite de France SA | 4.950% | 10/13/45 | 400 | 516 |
| | Emera U.S. Finance LP | 3.550% | 6/15/26 | 965 | 1,080 |
| | Entergy Louisiana LLC | 3.120% | 9/1/27 | 410 | 456 |
| | Evergy Inc. | 2.450% | 9/15/24 | 425 | 451 |
| | Evergy Kansas Central Inc. | 3.250% | 9/1/49 | 630 | 713 |
| | Evergy Metro Inc. | 2.250% | 6/1/30 | 205 | 217 |
| | Evergy Metro Inc. | 4.200% | 3/15/48 | 137 | 176 |
| | Eversource Energy | 2.900% | 10/1/24 | 690 | 744 |
| | Eversource Energy | 3.150% | 1/15/25 | 110 | 120 |
| | Eversource Energy | 3.300% | 1/15/28 | 400 | 446 |
| | Florida Power & Light Co. | 5.650% | 2/1/35 | 1,000 | 1,410 |
| | Florida Power & Light Co. | 4.950% | 6/1/35 | 1,000 | 1,379 |
| | Florida Power & Light Co. | 5.950% | 2/1/38 | 785 | 1,174 |
| | Florida Power & Light Co. | 5.690% | 3/1/40 | 675 | 1,000 |
| | Florida Power & Light Co. | 3.700% | 12/1/47 | 480 | 599 |
| | | | Coupon | Maturity
Date | Face
Amount
($000) | Market
Value•
($000) |
| | Fortis Inc. | 3.055% | 10/4/26 | 1,195 | 1,313 |
| | Georgia Power Co. | 5.400% | 6/1/40 | 205 | 272 |
| | Georgia Power Co. | 4.750% | 9/1/40 | 988 | 1,287 |
| | Georgia Power Co. | 4.300% | 3/15/42 | 1,076 | 1,366 |
| | Georgia Power Co. | 3.700% | 1/30/50 | 170 | 206 |
| | Indiana Michigan Power Co. | 4.250% | 8/15/48 | 415 | 525 |
| 6 | Infraestructura Energetica Nova SAB de CV | 4.875% | 1/14/48 | 455 | 507 |
| 6 | KeySpan Gas East Corp. | 2.742% | 8/15/26 | 670 | 736 |
| 6 | Massachusetts Electric Co. | 5.900% | 11/15/39 | 585 | 866 |
| 6 | Metropolitan Edison Co. | 4.300% | 1/15/29 | 249 | 282 |
| | MidAmerican Energy Co. | 4.400% | 10/15/44 | 15 | 19 |
| | MidAmerican Energy Co. | 4.250% | 5/1/46 | 45 | 58 |
| | MidAmerican Energy Co. | 4.250% | 7/15/49 | 315 | 422 |
| | MidAmerican Energy Co. | 3.150% | 4/15/50 | 1,390 | 1,594 |
| 6 | Mid-Atlantic Interstate Transmission LLC | 4.100% | 5/15/28 | 195 | 218 |
| 6 | Monongahela Power Co. | 5.400% | 12/15/43 | 135 | 183 |
| | National Rural Utilities Cooperative Finance Corp. | 2.950% | 2/7/24 | 415 | 444 |
| | National Rural Utilities Cooperative Finance Corp. | 2.850% | 1/27/25 | 1,040 | 1,130 |
| | Nevada Power Co. | 3.125% | 8/1/50 | 380 | 421 |
| | NextEra Energy Capital Holdings Inc. | 2.403% | 9/1/21 | 1,295 | 1,313 |
| | NextEra Energy Capital Holdings Inc. | 3.250% | 4/1/26 | 260 | 291 |
| | NextEra Energy Capital Holdings Inc. | 3.550% | 5/1/27 | 880 | 1,000 |
| | NextEra Energy Capital Holdings Inc. | 3.500% | 4/1/29 | 390 | 445 |
| | NextEra Energy Capital Holdings Inc. | 2.750% | 11/1/29 | 590 | 638 |
| | NextEra Energy Capital Holdings Inc. | 2.250% | 6/1/30 | 1,185 | 1,242 |
| 6 | Niagara Mohawk Power Corp. | 4.278% | 12/15/28 | 1,000 | 1,196 |
| 6 | Niagara Mohawk Power Corp. | 3.025% | 6/27/50 | 540 | 573 |
| | NiSource Inc. | 5.250% | 2/15/43 | 390 | 532 |
| | NiSource Inc. | 4.800% | 2/15/44 | 270 | 352 |
| | Northern States Power Co. | 6.250% | 6/1/36 | 2,000 | 2,997 |
| 3,6 | Oglethorpe Power Corp. | 6.191% | 1/1/31 | 1,065 | 1,320 |
| | Oglethorpe Power Corp. | 5.950% | 11/1/39 | 170 | 225 |
| | Oglethorpe Power Corp. | 4.550% | 6/1/44 | 50 | 56 |
| | Oglethorpe Power Corp. | 4.250% | 4/1/46 | 537 | 562 |
| | Oglethorpe Power Corp. | 5.050% | 10/1/48 | 80 | 102 |
| | | | Coupon | Maturity
Date | Face
Amount
($000) | Market
Value•
($000) |
| 6 | Oglethorpe Power Corp. | 3.750% | 8/1/50 | 250 | 269 |
| | Oglethorpe Power Corp. | 5.250% | 9/1/50 | 630 | 779 |
| | Oncor Electric Delivery Co. LLC | 4.550% | 12/1/41 | 75 | 100 |
| | PacifiCorp | 6.250% | 10/15/37 | 2,000 | 2,973 |
| | PacifiCorp | 4.125% | 1/15/49 | 26 | 33 |
| | PacifiCorp | 4.150% | 2/15/50 | 345 | 447 |
| | PacifiCorp | 3.300% | 3/15/51 | 169 | 195 |
| | Potomac Electric Power Co. | 3.050% | 4/1/22 | 460 | 475 |
| | Potomac Electric Power Co. | 6.500% | 11/15/37 | 750 | 1,136 |
| | San Diego Gas & Electric Co. | 6.000% | 6/1/26 | 600 | 745 |
| | San Diego Gas & Electric Co. | 3.750% | 6/1/47 | 160 | 187 |
| | San Diego Gas & Electric Co. | 4.150% | 5/15/48 | 545 | 679 |
| | Sempra Energy | 2.875% | 10/1/22 | 750 | 776 |
| | Sempra Energy | 3.250% | 6/15/27 | 1,095 | 1,223 |
| | Sempra Energy | 6.000% | 10/15/39 | 600 | 859 |
| | Sierra Pacific Power Co. | 3.375% | 8/15/23 | 850 | 908 |
| | Sierra Pacific Power Co. | 2.600% | 5/1/26 | 221 | 240 |
| | Southern California Edison Co. | 2.400% | 2/1/22 | 170 | 173 |
| | Southern California Edison Co. | 3.700% | 8/1/25 | 90 | 101 |
| | Southern California Edison Co. | 6.000% | 1/15/34 | 1,000 | 1,385 |
| | Southern California Edison Co. | 5.550% | 1/15/37 | 2,250 | 2,881 |
| | Southern California Edison Co. | 6.050% | 3/15/39 | 55 | 75 |
| | Southern California Edison Co. | 4.000% | 4/1/47 | 195 | 229 |
| | Southern California Edison Co. | 4.125% | 3/1/48 | 645 | 770 |
| | Southern California Edison Co. | 3.650% | 2/1/50 | 155 | 175 |
| | Southern California Gas Co. | 2.600% | 6/15/26 | 820 | 891 |
| | Southern Co. | 2.950% | 7/1/23 | 1,280 | 1,355 |
| | Southern Co. | 4.400% | 7/1/46 | 755 | 944 |
| | Southwest Gas Corp. | 2.200% | 6/15/30 | 230 | 242 |
| | Southwestern Electric Power Co. | 6.200% | 3/15/40 | 400 | 583 |
| | Southwestern Public Service Co. | 3.700% | 8/15/47 | 102 | 121 |
| 6 | State Grid Overseas Investment 2016 Ltd | 2.750% | 5/4/22 | 1,550 | 1,587 |
| 6 | State Grid Overseas Investment 2016 Ltd | 3.500% | 5/4/27 | 775 | 858 |
| | Union Electric Co. | 4.000% | 4/1/48 | 423 | 531 |
| | Virginia Electric and Power Co. | 2.750% | 3/15/23 | 690 | 721 |
| | Virginia Electric and Power Co. | 3.500% | 3/15/27 | 435 | 491 |
| | Wisconsin Electric Power Co. | 5.700% | 12/1/36 | 690 | 972 |
| | | | | | | 108,950 |
| Total Corporate Bonds (Cost $664,164) | 756,996 |
| Sovereign Bonds (0.6%) |
| 6 | Government of Bermuda | 2.375% | 8/20/30 | 200 | 210 |
| | | | Coupon | Maturity
Date | Face
Amount
($000) | Market
Value•
($000) |
| 6 | Government of Bermuda | 3.375% | 8/20/50 | 200 | 216 |
| | International Bank for Reconstruction & Development | 4.750% | 2/15/35 | 2,000 | 2,853 |
| 10 | Japan Treasury Discount Bill | 0.000% | 1/18/21 | 500,000 | 4,842 |
| 10 | Japan Treasury Discount Bill | 0.000% | 1/25/21 | 100,000 | 968 |
| 10 | Japan Treasury Discount Bill | 0.000% | 2/1/21 | 400,000 | 3,874 |
| 10 | Japan Treasury Discount Bill | 0.000% | 2/8/21 | 55,000 | 533 |
| 6 | Kingdom of Saudi Arabia | 2.875% | 3/4/23 | 930 | 973 |
| | Republic of Colombia | 4.000% | 2/26/24 | 970 | 1,049 |
| 6 | State of Qatar | 2.375% | 6/2/21 | 1,590 | 1,602 |
| 6 | State of Qatar | 3.875% | 4/23/23 | 1,985 | 2,132 |
| 6 | State of Qatar | 4.400% | 4/16/50 | 430 | 560 |
| Total Sovereign Bonds (Cost $18,500) | 19,812 |
| Taxable Municipal Bonds (1.8%) |
| | Atlanta Downtown Development Authority Lease (Abatement) Revenue (Atlanta Federal Center Project) | 6.875% | 2/1/21 | 65 | 65 |
| | Atlanta GA Water & Wastewater Water Revenue | 2.257% | 11/1/35 | 235 | 247 |
| | Bay Area Toll Authority Highway Revenue | 2.574% | 4/1/31 | 450 | 485 |
| | Bay Area Toll Authority Highway Revenue | 6.263% | 4/1/49 | 60 | 103 |
| | Bay Area Toll Authority Highway Revenue | 7.043% | 4/1/50 | 905 | 1,657 |
| | Broward FL Airport System Port, Airport & Marina Revenue | 3.477% | 10/1/43 | 300 | 313 |
| | California GO | 7.500% | 4/1/34 | 155 | 258 |
| | California GO | 7.350% | 11/1/39 | 1,550 | 2,575 |
| | Chicago O'Hare International Airport Port, Airport & Marina Revenue | 6.395% | 1/1/40 | 155 | 234 |
| | Chicago Transit Authority Sales & Transfer Tax Receipts Sales Tax Revenue | 6.899% | 12/1/40 | 1,780 | 2,574 |
| | Chicago Transit Authority Sales & Transfer Tax Receipts Sales Tax Revenue | 6.899% | 12/1/40 | 825 | 1,193 |
| | Chicago Transit Authority Sales Tax Receipts Fund Sales Tax Revenue | 6.200% | 12/1/40 | 550 | 766 |
| | Commonwealth of Massachusetts GO | 2.514% | 7/1/41 | 270 | 283 |
| | Dallas-Fort Worth International Airport Port, Airport & Marina Revenue | 3.089% | 11/1/40 | 220 | 231 |
| | | | Coupon | Maturity
Date | Face
Amount
($000) | Market
Value•
($000) |
| | Foothill-Eastern Transportation Corridor Agency Highway Revenue | 4.094% | 1/15/49 | 155 | 166 |
| 9 | Foothill-Eastern Transportation Corridor Agency Highway Revenue | 3.924% | 1/15/53 | 1,170 | 1,249 |
| | Georgia Municipal Electric Authority Electric Power & Light Revenue | 6.637% | 4/1/57 | 1,958 | 2,978 |
| | Georgia Municipal Electric Authority Electric Power & Light Revenue | 6.655% | 4/1/57 | 306 | 473 |
| | Grand Parkway Transportation Corp. Highway Revenue | 5.184% | 10/1/42 | 1,015 | 1,404 |
| | Grand Parkway Transportation Corp. Texas System Highway Revenue | 3.236% | 10/1/52 | 930 | 973 |
| | Great Lakes Water Authority Sewage Disposal System Sewer Revenue | 3.056% | 7/1/39 | 250 | 267 |
| | Houston TX GO | 6.290% | 3/1/32 | 390 | 495 |
| | Illinois GO | 5.100% | 6/1/33 | 810 | 872 |
| | Illinois State Toll Highway Authority Highway Revenue | 6.184% | 1/1/34 | 750 | 1,084 |
| | JobsOhio Beverage System Miscellaneous Revenue | 2.833% | 1/1/38 | 160 | 173 |
| 9 | Kansas Development Finance Authority Lease (Appropriation) Revenue | 5.501% | 5/1/34 | 2,000 | 2,612 |
| | Maryland State Transportation Authority Transit Revenue | 5.888% | 7/1/43 | 545 | 801 |
| | Massachusetts School Building Authority Sales Tax Revenue | 1.753% | 8/15/30 | 1,280 | 1,297 |
| | Massachusetts School Building Authority Sales Tax Revenue | 5.715% | 8/15/39 | 1,000 | 1,450 |
| | Massachusetts School Building Authority Sales Tax Revenue | 3.395% | 10/15/40 | 500 | 538 |
| | Massachusetts School Building Authority Sales Tax Revenue | 2.950% | 5/15/43 | 650 | 675 |
| | Metropolitan Transportation Authority Fuel Sales Tax Revenue | 6.089% | 11/15/40 | 445 | 618 |
| | Metropolitan Transportation Authority Miscellaneous Taxes Revenue | 7.336% | 11/15/39 | 325 | 520 |
| | Metropolitan Transportation Authority Transit Revenue | 6.200% | 11/15/26 | 60 | 68 |
| | | | Coupon | Maturity
Date | Face
Amount
($000) | Market
Value•
($000) |
| | Metropolitan Transportation Authority Transit Revenue | 6.814% | 11/15/40 | 885 | 1,182 |
| | Metropolitan Transportation Authority Transit Revenue | 5.175% | 11/15/49 | 910 | 1,066 |
| | Metropolitan Water Reclamation District of Greater Chicago GO | 5.720% | 12/1/38 | �� 215 | 308 |
| | Michigan Finance Authority Health, Hospital, Nursing Home Revenue | 3.084% | 12/1/34 | 295 | 326 |
| | New Jersey Turnpike Authority Highway Revenue | 7.414% | 1/1/40 | 410 | 688 |
| | New Jersey Turnpike Authority Highway Revenue | 7.102% | 1/1/41 | 255 | 416 |
| | New York State Dormitory Authority Income Tax Revenue | 3.110% | 2/15/39 | 640 | 697 |
| | New York State Dormitory Authority Income Tax Revenue | 3.190% | 2/15/43 | 355 | 387 |
| | New York State Thruway Authority Highway Revenue | 2.900% | 1/1/35 | 490 | 531 |
| | New York State Thruway Authority Highway Revenue | 3.500% | 1/1/42 | 275 | 287 |
| | New York State Urban Development Corp. Income Tax Revenue | 2.100% | 3/15/22 | 1,560 | 1,577 |
| | North Texas Tollway Authority Highway Revenue | 6.718% | 1/1/49 | 1,140 | 1,977 |
| | Oregon Department of Transportation Fuel Sales Tax Revenue | 5.834% | 11/15/34 | 655 | 950 |
| 9 | Oregon School Boards Association GO | 5.528% | 6/30/28 | 2,000 | 2,417 |
| 11 | Oregon State University College & University Revenue | 3.424% | 3/1/60 | 1,000 | 1,036 |
| | Pennsylvania State University College & University Revenue | 2.790% | 9/1/43 | 660 | 691 |
| | Pennsylvania State University College & University Revenue | 2.840% | 9/1/50 | 215 | 222 |
| 12 | Philadelphia Authority for Industrial Development Miscellaneous Revenue | 6.550% | 10/15/28 | 1,945 | 2,505 |
| | Port Authority of New York & New Jersey Port, Airport & Marina Revenue | 1.086% | 7/1/23 | 605 | 614 |
| | Port Authority of New York & New Jersey Port, Airport & Marina Revenue | 5.859% | 12/1/24 | 65 | 77 |
| | | | Coupon | Maturity
Date | Face
Amount
($000) | Market
Value•
($000) |
| | Port Authority of New York & New Jersey Port, Airport & Marina Revenue | 6.040% | 12/1/29 | 265 | 353 |
| | Port Authority of New York & New Jersey Port, Airport & Marina Revenue | 4.458% | 10/1/62 | 1,175 | 1,563 |
| | Port Authority of New York & New Jersey Port, Airport & Marina Revenue | 4.810% | 10/15/65 | 640 | 887 |
| | Riverside CA General Fund Revenue | 3.857% | 6/1/45 | 260 | 279 |
| | Riverside County CA Appropriations Revenue | 3.818% | 2/15/38 | 290 | 320 |
| | Rutgers State University of New Jersey College & University Revenue | 3.270% | 5/1/43 | 350 | 375 |
| | Sales Tax Securitization Corp. Sales Tax Revenue | 4.787% | 1/1/48 | 965 | 1,207 |
| | San Antonio TX Electric & Gas Systems Electric Power & Light Revenue | 2.905% | 2/1/48 | 255 | 269 |
| | State Board of Administration Finance Corp. Miscellaneous Revenue | 1.705% | 7/1/27 | 1,035 | 1,074 |
| | Texas Transportation Commission GO | 2.562% | 4/1/42 | 235 | 239 |
| | Texas Transportation Commission State Highway Fund Miscellaneous Revenue | 4.000% | 10/1/33 | 515 | 651 |
| | University of California College & University Revenue | 1.316% | 5/15/27 | 385 | 391 |
| | University of California College & University Revenue | 1.614% | 5/15/30 | 645 | 652 |
| | University of California College & University Revenue | 4.601% | 5/15/31 | 590 | 719 |
| | University of California College & University Revenue | 4.765% | 5/15/44 | 145 | 160 |
| | University of California College & University Revenue | 3.931% | 5/15/45 | 570 | 677 |
| | University of California Regents Medical Center Pooled Health, Hospital, Nursing Home Revenue | 6.548% | 5/15/48 | 90 | 146 |
| | University of California Regents Medical Center Pooled Health, Hospital, Nursing Home Revenue | 6.583% | 5/15/49 | 700 | 1,133 |
| | University of California Regents Medical Center Pooled Health, Hospital, Nursing Home Revenue | 3.006% | 5/15/50 | 450 | 478 |
| | | | Coupon | Maturity
Date | Face
Amount
($000) | Market
Value•
($000) |
| | University of California Regents Medical Center Pooled Health, Hospital, Nursing Home Revenue | 3.256% | 5/15/60 | 880 | 990 |
| | University of Michigan College & University Revenue | 2.437% | 4/1/40 | 380 | 397 |
| | University of Michigan College & University Revenue | 2.562% | 4/1/50 | 300 | 319 |
| | University of Virginia College & University Revenue | 2.256% | 9/1/50 | 525 | 520 |
| | Utility Debt Securitization Authority Electric Power & Light Revenue | 3.435% | 12/15/25 | 210 | 220 |
| Total Taxable Municipal Bonds (Cost $52,125) | 61,670 |
| | | | | | Shares | |
| Temporary Cash Investments (3.4%) |
| Money Market Fund (0.3%) |
| 13,14 | Vanguard Market Liquidity Fund | 0.111% | ��� | 87,141 | 8,714 |
| | | | | Maturity
Date | Face
Amount
($000) | |
| U.S. Government and Agency Obligations (0.0%) |
| | U.S. Treasury Bill | 0.115% | 4/15/21 | 1,900 | 1,899 |
| | | | Coupon | Maturity
Date | Face
Amount
($000) | Market
Value•
($000) |
| Repurchase Agreement (3.1%) |
| | RBS Securities Inc.
(Dated 12/31/20,Repurchase Value $104,901,000, collateralized by U.S.Treasury Note/Bond, 1.250%–8.000%, 11/15/21–11/15/50, with a value of $106,998,000) | 0.050% | 1/4/21 | 104,900 | 104,900 |
| Total Temporary Cash Investments (Cost $115,513) | 115,513 |
| Total Investments (100.3%) (Cost $2,603,336) | 3,357,003 |
| Other Assets and Liabilities—Net (-0.3%) | (10,699) |
| Net Assets (100%) | 3,346,304 |
| Cost is in $000. |
| • | See Note A in Notes to Financial Statements. |
| * | Non-income-producing security. |
| 1 | Includes partial security positions on loan to broker-dealers. The total value of securities on loan is $8,472,000. |
| 2 | Securities with a value of $68,000 have been segregated as initial margin for open futures contracts. |
| 3 | The average or expected maturity is shorter than the final maturity shown because of the possibility of interim principal payments and prepayments or the possibility of the issue being called. |
| 4 | The issuer was placed under federal conservatorship in September 2008; since that time, its daily operations have been managed by the Federal Housing Finance Agency and it receives capital from the U.S. Treasury, as needed to maintain a positive net worth, in exchange for senior preferred stock. |
| 5 | Includes securities purchased on a when-issued or delayed-delivery basis for which the portfolio has not taken delivery as of December 31, 2020. |
| 6 | Security exempt from registration under Rule 144A of the Securities Act of 1933. Such securities may be sold in transactions exempt from registration, normally to qualified institutional buyers. At December 31, 2020, the aggregate value was $181,573,000, representing 5.4% of net assets. |
| 7 | Variable rate security; rate shown is effective rate at period end. Certain variable rate securities are not based on a published reference rate and spread but are determined by the issuer or agent based on current market conditions. |
| 8 | Face amount denominated in Canadian dollars. |
| 9 | Scheduled principal and interest payments are guaranteed by Assured Guaranty Municipal Corp. |
| 10 | Face amount denominated in Japanese yen. |
| 11 | Scheduled principal and interest payments are guaranteed by Build America Mutual Assurance Co. |
| 12 | Scheduled principal and interest payments are guaranteed by National Public Finance Guarantee Corp. |
| 13 | Affiliated money market fund available only to Vanguard funds and certain trusts and accounts managed by Vanguard. Rate shown is the 7-day yield. |
| 14 | Collateral of $8,702,000 was received for securities on loan. |
| | 1M—1-month. |
| | 3M—3-month. |
| | ADR—American Depositary Receipt. |
| | GO—General Obligation Bond. |
| | LIBOR—London Interbank Offered Rate. |
| | REMICS—Real Estate Mortgage Investment Conduits. |
| | UMBS—Uniform Mortgage-Backed Securities. |
Derivative Financial Instruments Outstanding as of Period End
| Futures Contracts |
| | | | ($000) |
| | Expiration | Number of
Long (Short)
Contracts | Notional
Amount | Value and
Unrealized
Appreciation
(Depreciation) |
| Long Futures Contracts | | | | |
| 5-Year U.S. Treasury Note | March 2021 | 77 | 9,715 | 20 |
| Short Futures Contracts | | | | |
| 10-Year U.S. Treasury Note | March 2021 | (25) | (3,452) | (4) |
| | | | | 16 |
| Forward Currency Contracts |
| | Contract
Settlement
Date | Contract Amount (000) | Unrealized
Appreciation
($000) | Unrealized
Depreciation
($000) |
| Counterparty | | Receive | Deliver | | |
| Citibank, N.A. | 1/7/21 | USD | 651 | CAD | 833 | — | (4) |
| Goldman Sachs International | 1/19/21 | USD | 4,860 | JPY | 500,000 | 17 | — |
| Toronto-Dominion Bank | 2/1/21 | USD | 3,849 | JPY | 400,000 | — | (27) |
| Toronto-Dominion Bank | 1/25/21 | USD | 962 | JPY | 100,000 | — | (7) |
| Toronto-Dominion Bank | 2/8/21 | USD | 530 | JPY | 55,000 | — | (3) |
| | | | | | | 17 | (41) |
| CAD—Canadian dollar. |
| JPY—Japanese yen. |
| USD—U.S. dollar. |
See accompanying Notes, which are an integral part of the Financial Statements.
Statement of Assets and Liabilities
| ($000s, except shares and per-share amounts) | Amount |
| Assets | |
| Investments in Securities, at Value | |
| Unaffiliated Issuers (Cost $2,594,622) | 3,348,289 |
| Affiliated Issuers (Cost $8,714) | 8,714 |
| Total Investments in Securities | 3,357,003 |
| Investment in Vanguard | 130 |
| Foreign Currency, at Value (Cost $211) | 212 |
| Receivables for Investment Securities Sold | 8,342 |
| Receivables for Accrued Income | 8,923 |
| Receivables for Capital Shares Issued | 1,066 |
| Variation Margin Receivable—Futures Contracts | 1 |
| Unrealized Appreciation—Forward Currency Contracts | 17 |
| Total Assets | 3,375,694 |
| Liabilities | |
| Due to Custodian | 2,044 |
| Payables for Investment Securities Purchased | 13,929 |
| Collateral for Securities on Loan | 8,702 |
| Payables to Investment Advisor | 336 |
| Payables for Capital Shares Redeemed | 4,048 |
| Payables to Vanguard | 290 |
| Unrealized Depreciation—Forward Currency Contracts | 41 |
| Total Liabilities | 29,390 |
| Net Assets | 3,346,304 |
| At December 31, 2020, net assets consisted of: | |
| | |
| Paid-in Capital | 2,356,594 |
| Total Distributable Earnings (Loss) | 989,710 |
| Net Assets | 3,346,304 |
| |
| Net Assets | |
Applicable to 130,314,927 outstanding $.001 par value shares of
beneficial interest (unlimited authorization) | 3,346,304 |
| Net Asset Value Per Share | $25.68 |
See accompanying Notes, which are an integral part of the Financial Statements.
Statement of Operations
|
| | Year Ended
December 31, 2020 |
| | ($000) |
| Investment Income | |
| Income | |
| Dividends1 | 44,208 |
| Interest | 31,707 |
| Securities Lending—Net | 46 |
| Total Income | 75,961 |
| Expenses | |
| Investment Advisory Fees—Note B | |
| Basic Fee | 1,595 |
| Performance Adjustment | (276) |
| The Vanguard Group—Note C | |
| Management and Administrative | 4,622 |
| Marketing and Distribution | 248 |
| Custodian Fees | 40 |
| Auditing Fees | 33 |
| Shareholders' Reports | 30 |
| Trustees’ Fees and Expenses | 4 |
| Total Expenses | 6,296 |
| Net Investment Income | 69,665 |
| Realized Net Gain (Loss) | |
| Investment Securities Sold2 | 176,174 |
| Futures Contracts | (252) |
| Options Purchased | (75) |
| Forward Currency Contracts | (26) |
| Foreign Currencies | 40 |
| Realized Net Gain (Loss) | 175,861 |
| Change in Unrealized Appreciation (Depreciation) | |
| Investment Securities2 | 67,886 |
| Futures Contracts | 132 |
| Forward Currency Contracts | 10 |
| Foreign Currencies | 71 |
| Change in Unrealized Appreciation (Depreciation) | 68,099 |
| Net Increase (Decrease) in Net Assets Resulting from Operations | 313,625 |
| 1 | Dividends are net of foreign withholding taxes of $1,081,000. |
| 2 | Realized net gain (loss), and change in unrealized appreciation (depreciation) from an affiliated company of the portfolio were $3,000, and $—, respectively. Purchases and sales are for temporary cash investment purposes. |
Statement of Changes in Net Assets
|
| | Year Ended December 31, |
| | 2020
($000) | 2019
($000) |
| Increase (Decrease) in Net Assets | | |
| Operations | | |
| Net Investment Income | 69,665 | 80,651 |
| Realized Net Gain (Loss) | 175,861 | 103,738 |
| Change in Unrealized Appreciation (Depreciation) | 68,099 | 419,867 |
| Net Increase (Decrease) in Net Assets Resulting from Operations | 313,625 | 604,256 |
| Distributions1 | | |
| Total Distributions | (186,299) | (241,965) |
| Capital Share Transactions | | |
| Issued | 249,434 | 264,878 |
| Issued in Lieu of Cash Distributions | 186,299 | 241,965 |
| Redeemed | (483,258) | (310,250) |
| Net Increase (Decrease) from Capital Share Transactions | (47,525) | 196,593 |
| Total Increase (Decrease) | 79,801 | 558,884 |
| Net Assets | | |
| Beginning of Period | 3,266,503 | 2,707,619 |
| End of Period | 3,346,304 | 3,266,503 |
| 1 | Certain prior-period numbers have been reclassified to conform with the current-period presentation. |
See accompanying Notes, which are an integral part of the Financial Statements.
For a Share Outstanding
Throughout Each Period | Year Ended December 31, |
| 2020 | 2019 | 2018 | 2017 | 2016 |
| Net Asset Value, Beginning of Period | $24.94 | $22.20 | $24.80 | $23.03 | $22.32 |
| Investment Operations | | | | | |
| Net Investment Income | .5261 | .6231 | .6261 | .5821 | .581 |
| Net Realized and Unrealized Gain (Loss) on Investments | 1.692 | 4.105 | (1.414) | 2.648 | 1.713 |
| Total from Investment Operations | 2.218 | 4.728 | (.788) | 3.230 | 2.294 |
| Distributions | | | | | |
| Dividends from Net Investment Income | (.666) | (.660) | (.582) | (.567) | (.576) |
| Distributions from Realized Capital Gains | (.812) | (1.328) | (1.230) | (.893) | (1.008) |
| Total Distributions | (1.478) | (1.988) | (1.812) | (1.460) | (1.584) |
| Net Asset Value, End of Period | $25.68 | $24.94 | $22.20 | $24.80 | $23.03 |
| Total Return | 10.68% | 22.48% | -3.41% | 14.72% | 11.01% |
| Ratios/Supplemental Data | | | | | |
| Net Assets, End of Period (Millions) | $3,346 | $3,267 | $2,708 | $2,942 | $2,554 |
| Ratio of Total Expenses to Average Net Assets2 | 0.20% | 0.21% | 0.21% | 0.23% | 0.23% |
| Ratio of Net Investment Income to Average Net Assets | 2.24% | 2.68% | 2.67% | 2.49% | 2.66% |
| Portfolio Turnover Rate3 | 49% | 29% | 36% | 28% | 33% |
| 1 | Calculated based on average shares outstanding. |
| 2 | Includes performance-based investment advisory fee increases (decreases) of (0.01%), (0.00%), (0.00%), (0.00%), and (0.01%). |
| 3 | Includes 3%, 8%, 2%, 0%, and 0% attributable to mortgage-dollar-roll activity. |
See accompanying Notes, which are an integral part of the Financial Statements.
Notes to Financial Statements
The Balanced Portfolio, a portfolio of Vanguard Variable Insurance Funds, is registered under the Investment Company Act of 1940 as an open-end investment company. The portfolio's shares are only available for purchase by separate accounts of insurance companies as investments for variable annuity plans, variable life insurance contracts, or other variable benefit insurance contracts. Certain of the portfolio’s investments are in corporate debt instruments; the issuers' abilities to meet their obligations may be affected by economic developments in their respective industries. Market disruptions associated with the COVID-19 pandemic have had a global impact, and uncertainty exists as to the long-term implications. Such disruptions can adversely affect assets of the portfolio and thus portfolio performance.
| A. | The following significant accounting policies conform to generally accepted accounting principles for U.S. investment companies. The portfolio consistently follows such policies in preparing its financial statements. |
1. Security Valuation: Securities are valued as of the close of trading on the New York Stock Exchange (generally 4 p.m., Eastern time) on the valuation date. Equity securities are valued at the latest quoted sales prices or official closing prices taken from the primary market in which each security trades; such securities not traded on the valuation date are valued at the mean of the latest quoted bid and asked prices. Bonds and temporary cash investments are valued using the latest bid prices or using valuations based on a matrix system (which considers such factors as security prices, yields, maturities, and ratings), both as furnished by independent pricing services. Structured debt securities, including mortgages and asset-backed securities, are valued using the latest bid prices or using valuations based on a matrix system that considers such factors as issuer, tranche, nominal or option-adjusted spreads, weighted average coupon, weighted average maturity, credit enhancements, and collateral. Investments in Vanguard Market Liquidity Fund are valued at that fund's net asset value. Securities for which market quotations are not readily available, or whose values have been affected by events occurring before the portfolio’s pricing time but after the close of the securities’ primary markets, are valued at their fair values calculated according to procedures adopted by the board of trustees. These procedures include obtaining quotations from an independent pricing service, monitoring news to identify significant market- or security-specific events, and evaluating changes in the values of foreign market proxies (for example, ADRs, futures contracts, or exchange-traded funds), between the time the foreign markets close and the portfolio’s pricing time. When fair-value pricing is employed, the prices of securities used by a portfolio to calculate its net asset value may differ from quoted or published prices for the same securities.
2. Foreign Currency: Securities and other assets and liabilities denominated in foreign currencies are translated into U.S. dollars using exchange rates obtained from an independent third party as of the portfolio’s pricing time on the valuation date. Realized gains (losses) and unrealized appreciation (depreciation) on investment securities include the effects of changes in exchange rates since the securities were purchased, combined with the effects of changes in security prices. Fluctuations in the value of other assets and liabilities resulting from changes in exchange rates are recorded as unrealized foreign currency gains (losses) until the assets or liabilities are settled in cash, at which time they are recorded as realized foreign currency gains (losses).
3. Futures Contracts: The portfolio uses futures contracts to invest in fixed income asset classes with greater efficiency and lower cost than is possible through direct investment, to add value when these instruments are attractively priced, or to adjust sensitivity to changes in interest rates. The primary risks associated with the use of futures contracts are imperfect correlation between changes in market values of bonds held by the portfolio and the prices of futures contracts, and the possibility of an illiquid market. Counterparty risk involving futures is mitigated because a regulated clearinghouse is the counterparty instead of the clearing broker. To further mitigate counterparty risk, the portfolio trades futures contracts on an exchange, monitors the financial strength of its clearing brokers and clearinghouse, and has entered into clearing agreements with its clearing brokers. The clearinghouse imposes initial margin requirements to secure the portfolio’s performance and requires daily settlement of variation margin representing changes in the market value of each contract. Any securities pledged as initial margin for open contracts are noted in the Schedule of Investments.
Futures contracts are valued at their quoted daily settlement prices. The notional amounts of the contracts are not recorded in the Statement of Assets and Liabilities. Fluctuations in the value of the contracts are recorded in the Statement of Assets and Liabilities as an asset (liability) and in the Statement of Operations as unrealized appreciation (depreciation) until the contracts are closed, when they are recorded as realized gains (losses) on futures contracts.
During the year ended December 31, 2020, the portfolio’s average investments in long and short futures contracts each represented less than 1% of net assets, based on the average of the notional amounts at each quarter-end during the period.
4. Forward Currency Contracts: The portfolio enters into forward currency contracts to provide the appropriate currency exposure related to any open futures contracts or to protect the value of securities and related receivables and payables against changes in foreign exchange rates. The portfolio’s risks in using these contracts include movement in the values of the foreign currencies relative to the U.S. dollar and the ability of the counterparties to fulfill their obligations under the contracts. The portfolio mitigates its counterparty risk by entering into forward currency contracts only with a diverse group of prequalified counterparties, monitoring their financial strength, entering into master netting arrangements with its counterparties, and requiring its counterparties to transfer collateral as security for their performance. In the absence of a default, the collateral pledged or received by the portfolio cannot be repledged, resold, or rehypothecated. The master netting arrangements provide that, in the event of a counterparty’s default (including bankruptcy), the portfolio may terminate the forward currency contracts, determine the net amount owed by either party in accordance with its master netting arrangements, and sell or retain any collateral held up to the net amount owed to the portfolio under the master netting arrangements. The forward currency contracts contain provisions whereby a counterparty may terminate open contracts if the portfolio’s net assets decline below a certain level, triggering a payment by the portfolio if the portfolio is in a net liability position at the time of the termination. The payment amount would be reduced by any collateral the portfolio has pledged. Any securities pledged as collateral for open contracts are noted in the Schedule of Investments. The value of collateral received or pledged is compared daily to the value of the forward currency contracts exposure with each counterparty, and any difference, if in excess of a specified minimum transfer amount, is adjusted and settled within two business days.
Forward currency contracts are valued at their quoted daily prices obtained from an independent third party, adjusted for currency risk based on the expiration date of each contract. The notional amounts of the contracts are not recorded in the Statement of Net Assets. Fluctuations in the value of the contracts are recorded in the Statement of Net Assets as an asset (liability) and in the Statement of Operations as unrealized appreciation (depreciation) until the contracts are closed, when they are recorded as realized forward currency contract gains (losses).
During the year ended December 31, 2020, the portfolio’s average investment in forward currency contracts represented less than 1% of net assets, based on the average of the notional amounts at each quarter-end during the period.
5. Options: The portfolio invests in options contracts on futures to adjust its exposure to the underlying investments. The primary risk associated with purchasing options is that if interest rates move in such a way that the option is out-of-the-money, the position is worthless at expiration, and the portfolio loses premium paid. The primary risk associated with selling options is that if interest rates move in such a way that the option is in-the-money, the counterparty exercises the option, and the portfolio loses an amount equal to the market value of the option written less the premium received. Counterparty risk involving options on futures contracts is mitigated because a regulated clearinghouse is the counterparty instead of the clearing broker. To further mitigate counterparty risk, the portfolio trades options on futures contracts on an exchange, monitors the financial strength of its clearing brokers and clearinghouses, and has entered into clearing agreements with its clearing brokers.
Options contracts on futures are valued at their quoted daily settlement prices. The premium paid for a purchased option is recorded in the Statement of Assets and Liabilities as an asset that is subsequently adjusted daily to the current market value of the option purchased. The premium received for a written option is recorded in the Statement of Assets and Liabilities as an asset with an equal liability that is subsequently adjusted daily to the current market value of the option written. The notional amounts of option contracts are not recorded in the Statement of Assets and Liabilities. Fluctuations in the value of the options are recorded in the Statement of Operations as unrealized appreciation (depreciation) until expired, closed, or exercised, at which time realized gains (losses) are recognized.
During the year ended December 31, 2020, the portfolio’s average value of investments in options purchased and options written each represented 0% of net assets, based on the average market values at each quarter-end during the period. The portfolio had no open options contracts on futures at December 31, 2020.
6. To Be Announced (TBA) Transactions: A TBA transaction is an agreement to buy or sell mortgage-backed securities with agreed-upon characteristics (face amount, coupon, maturity) for settlement at a future date. The portfolio may be a seller of TBA transactions to reduce its exposure to the mortgage-backed securities market or in order to sell mortgage-backed securities it owns under delayed-delivery arrangements. When the portfolio is a buyer of TBA transactions, it maintains cash or short-term investments in an amount sufficient to meet the purchase price at the settlement date of the TBA transaction. The primary risk associated with TBA transactions is that a counterparty
may default on its obligations. The portfolio mitigates its counterparty risk by, among other things, performing a credit analysis of counterparties, allocating transactions among numerous counterparties, and monitoring its exposure to each counterparty. The portfolio may also enter into a Master Securities Forward Transaction Agreement (MSFTA) with certain counterparties and require them to transfer collateral as security for their performance. In the absence of a default, the collateral pledged or received by the portfolio cannot be repledged, resold, or rehypothecated. Under an MSFTA, upon a counterparty default (including bankruptcy), the portfolio may terminate any TBA transactions with that counterparty, determine the net amount owed by either party in accordance with its master netting arrangements, and sell or retain any collateral held up to the net amount owed to the portfolio under the master netting arrangements.
7. Mortgage Dollar Rolls: The portfolio enters into mortgage-dollar-roll transactions, in which the portfolio sells mortgage-backed securities to a dealer and simultaneously agrees to purchase similar securities in the future at a predetermined price. The proceeds of the securities sold in mortgage-dollar-roll transactions are typically invested in high-quality short-term fixed income securities. The portfolio forgoes principal and interest paid on the securities sold, and is compensated by interest earned on the proceeds of the sale and by a lower price on the securities to be repurchased. The portfolio has also entered into mortgage-dollar-roll transactions in which the portfolio buys mortgage-backed securities from a dealer pursuant to a TBA transaction and simultaneously agrees to sell similar securities in the future at a predetermined price. The securities bought in mortgage-dollar-roll transactions are used to cover an open TBA sell position. The portfolio continues to earn interest on mortgage-backed security pools already held and receives a lower price on the securities to be sold in the future. The portfolio accounts for mortgage-dollar-roll transactions as purchases and sales; as such, these transactions may increase the portfolio’s portfolio turnover rate. Amounts to be received or paid in connection with open mortgage dollar rolls are included in Receivables for Investment Securities Sold or Payables for Investment Securities Purchased in the Statement of Assets and Liabilities.
8. Repurchase Agreements: The portfolio enters into repurchase agreements with institutional counterparties. Securities pledged as collateral to the portfolio under repurchase agreements are held by a custodian bank until the agreements mature, and in the absence of a default, such collateral cannot be repledged, resold, or rehypothecated. Each agreement requires that the market value of the collateral be sufficient to cover payments of interest and principal. The portfolio further mitigates its counterparty risk by entering into repurchase agreements only with a diverse group of prequalified counterparties, monitoring their financial strength, and entering into master repurchase agreements with its counterparties. The master repurchase agreements provide that, in the event of a counterparty's default (including bankruptcy), the portfolio may terminate any repurchase agreements with that counterparty, determine the net amount owed, and sell or retain the collateral up to the net amount owed to the portfolio. Such action may be subject to legal proceedings, which may delay or limit the disposition of collateral.
9. Federal Income Taxes: The portfolio intends to continue to qualify as a regulated investment company and distribute all of its taxable income. The portfolio’s tax returns are open to examination by the relevant tax authorities until expiration of the applicable statute of limitations, which is generally three years after the filing of the tax return. Management has analyzed the portfolio’s tax positions taken for all open federal and state income tax years, and has concluded that no provision for income tax is required in the portfolio’s financial statements.
10. Distributions: Distributions to shareholders are recorded on the ex-dividend date. Distributions are determined on a tax basis at the fiscal year-end and may differ from net investment income and realized capital gains for financial reporting purposes.
11. Securities Lending: To earn additional income, the portfolio lends its securities to qualified institutional borrowers. Security loans are subject to termination by the portfolio at any time, and are required to be secured at all times by collateral in an amount at least equal to the market value of securities loaned. Daily market fluctuations could cause the value of loaned securities to be more or less than the value of the collateral received. When this occurs, the collateral is adjusted and settled on the next business day. The portfolio further mitigates its counterparty risk by entering into securities lending transactions only with a diverse group of prequalified counterparties, monitoring their financial strength, and entering into master securities lending agreements with its counterparties. The master securities lending agreements provide that, in the event of a counterparty’s default (including bankruptcy), the portfolio may terminate any loans with that borrower, determine the net amount owed, and sell or retain the collateral up to the net amount owed to the portfolio; however, such actions may be subject to legal proceedings. While collateral mitigates counterparty risk, in the event of a default, the portfolio may experience delays and costs in recovering the securities loaned. The portfolio invests cash collateral received in Vanguard Market Liquidity Fund, and records a liability in the Statement of Assets and Liabilities for the return of the
collateral, during the period the securities are on loan. Collateral investments in Vanguard Market Liquidity Fund are subject to market appreciation or depreciation. Securities lending income represents fees charged to borrowers plus income earned on invested cash collateral, less expenses associated with the loan. During the term of the loan, the portfolio is entitled to all distributions made on or in respect of the loaned securities.
12. Credit Facilities and Interfund Lending Program: The portfolio and certain other funds managed by The Vanguard Group ("Vanguard") participate in a $4.3 billion committed credit facility provided by a syndicate of lenders pursuant to a credit agreement and an uncommitted credit facility provided by Vanguard. Both facilities may be renewed annually. Each fund is individually liable for its borrowings, if any, under the credit facilities. Borrowings may be utilized for temporary or emergency purposes, subject to the portfolio’s regulatory and contractual borrowing restrictions. With respect to the committed credit facility, the participating funds are charged administrative fees and an annual commitment fee of 0.10% of the undrawn committed amount of the facility; these fees are allocated to the funds based on a method approved by the portfolio’s board of trustees and included in Management and Administrative expenses on the portfolio’s Statement of Operations. Any borrowings under either facility bear interest at a rate based upon the higher of the one-month London Interbank Offered Rate (or an acceptable alternate rate, if necessary), federal funds effective rate, or overnight bank funding rate plus an agreed-upon spread, except that borrowings under the uncommitted credit facility may bear interest based upon an alternate rate agreed to by the portfolio and Vanguard.
In accordance with an exemptive order (the “Order”) from the SEC, the portfolio may participate in a joint lending and borrowing program that allows registered open-end Vanguard funds to borrow money from and lend money to each other for temporary or emergency purposes (the “Interfund Lending Program”), subject to compliance with the terms and conditions of the Order, and to the extent permitted by the portfolio’s investment objective and investment policies. Interfund loans and borrowings normally extend overnight, but can have a maximum duration of seven days. Loans may be called on one business day’s notice. The interest rate to be charged is governed by the conditions of the Order and internal procedures adopted by the board of trustees. The board of trustees is responsible for overseeing the Interfund Lending Program.
For the year ended December 31, 2020, the portfolio did not utilize the credit facilities or the Interfund Lending Program.
13. Other: Dividend income is recorded on the ex-dividend date. Non-cash dividends included in dividend income, if any, are recorded at the fair value of the securities received. Interest income includes income distributions received from Vanguard Market Liquidity Fund and is accrued daily. Premiums and discounts on debt securities are amortized and accreted, respectively, to interest income over the lives of the respective securities, except for premiums on certain callable debt securities that are amortized to the earliest call date. Security transactions are accounted for on the date securities are bought or sold. Costs used to determine realized gains (losses) on the sale of investment securities are those of the specific securities sold.
| B. | Wellington Management Company llp provides investment advisory services to the portfolio for a fee calculated at an annual percentage rate of average net assets. The basic fee is subject to quarterly adjustments based on the portfolio’s performance relative to the combined index comprising the S&P 500 Index and the Bloomberg Barclays U.S. Credit A or Better Bond Index for the preceding three years. For the year ended December 31, 2020, the investment advisory fee represented an effective annual rate of 0.05% of the portfolio’s average net assets, before a decrease of $276,000 (0.01%) based on performance. |
| C. | In accordance with the terms of a Funds' Service Agreement (the “FSA”) between Vanguard and the portfolio, Vanguard furnishes to the portfolio corporate management, administrative, marketing, and distribution services at Vanguard’s cost of operations (as defined by the FSA). These costs of operations are allocated to the portfolio based on methods and guidelines approved by the board of trustees and are generally settled twice a month. |
Upon the request of Vanguard, the portfolio may invest up to 0.40% of its net assets as capital in Vanguard. At December 31, 2020, the portfolio had contributed to Vanguard capital in the amount of $130,000, representing less than 0.01% of the portfolio’s net assets and 0.05% of Vanguard’s capital received pursuant to the FSA. The portfolio’s trustees and officers are also directors and employees, respectively, of Vanguard.
| D. | Various inputs may be used to determine the value of the portfolio’s investments and derivatives. These inputs are summarized in three broad levels for financial statement purposes. The inputs or methodologies used to value securities are not necessarily an indication of the risk associated with investing in those securities. |
Level 1—Quoted prices in active markets for identical securities.
Level 2—Other significant observable inputs (including quoted prices for similar securities, interest rates, prepayment speeds, credit risk, etc.).
Level 3—Significant unobservable inputs (including the portfolio’s own assumptions used to determine the fair value of investments). Any investments and derivatives valued with significant unobservable inputs are noted on the Schedule of Investments.
The following table summarizes the market value of the portfolio’s investments and derivatives as of December 31, 2020, based on the inputs used to value them:
| | Level 1
($000) | Level 2
($000) | Level 3
($000) | Total
($000) |
| Investments | | | | |
| Assets | | | | |
| Common Stocks | 2,004,294 | 175,664 | — | 2,179,958 |
| U.S. Government and Agency Obligations | — | 195,746 | — | 195,746 |
| Asset-Backed/Commercial Mortgage-Backed Securities | — | 27,308 | — | 27,308 |
| Corporate Bonds | — | 756,996 | — | 756,996 |
| Sovereign Bonds | — | 19,812 | — | 19,812 |
| Taxable Municipal Bonds | — | 61,670 | — | 61,670 |
| Temporary Cash Investments | 8,714 | 106,799 | — | 115,513 |
| Total | 2,013,008 | 1,343,995 | — | 3,357,003 |
| Derivative Financial Instruments | | | | |
| Assets | | | | |
| Futures Contracts1 | 1 | — | — | 1 |
| Foreign Currency Contracts | — | 17 | — | 17 |
| Total | 1 | 17 | — | 18 |
| Liabilities | | | | |
| Foreign Currency Contracts | — | 41 | — | 41 |
| 1 | Represents variation margin on the last day of the reporting period. |
| E. | At December 31, 2020, the fair values of derivatives were reflected in the Statement of Assets and Liabilities as follows: |
| Statement of Assets and Liabilities Caption | Interest Rate
Contracts
($000) | Foreign Exchange
Contracts
($000) | Total
($000) |
Variation Margin Receivable—
Futures Contracts | 1 | — | 1 |
| Unrealized Appreciation—Forward Currency Contracts | — | 17 | 17 |
| Total Assets | 1 | 17 | 18 |
Unrealized Depreciation—
Forward Currency Contracts | — | 41 | 41 |
| Total Liabilities | — | 41 | 41 |
Realized net gain (loss) and the change in unrealized appreciation (depreciation) on derivatives for the year ended December 31, 2020, were:
| Realized Net Gain (Loss) on Derivatives | Interest Rate
Contracts
($000) | Foreign
Exchange
Contracts
($000) | Total
($000) |
| Futures Contracts | (252) | — | (252) |
| Options Purchased | (75) | — | (75) |
| Forward Currency Contracts | — | (26) | (26) |
| Realized Net Gain (Loss) on Derivatives | (327) | (26) | (353) |
| Change in Unrealized Appreciation (Depreciation) on Derivatives |
| Futures Contracts | 132 | — | 132 |
| Forward Currency Contracts | — | 10 | 10 |
| Change in Unrealized Appreciation (Depreciation) on Derivatives | 132 | 10 | 142 |
| F. | Permanent differences between book-basis and tax-basis components of net assets are reclassified among capital accounts in the financial statements to reflect their tax character. These reclassifications have no effect on net assets or net asset value per share. As of period end, permanent differences primarily attributable to the accounting for foreign currency transactions were reclassified between the individual components of total distributable earnings (loss). |
Temporary differences between book-basis and tax-basis components of total distributable earnings (loss) arise when certain items of income, gain, or loss are recognized in different periods for financial statement and tax purposes; these differences will reverse at some time in the future. The differences are primarily related to the deferral of losses from wash sales; the deferral of losses from straddles; and the recognition of unrealized gains or losses from certain derivative contracts. As of period end, the tax-basis components of total distributable earnings (loss) are detailed in the table as follows:
| | Amount
($000) |
| Undistributed Ordinary Income | 76,189 |
| Undistributed Long-Term Gains | 161,175 |
| Capital Loss Carryforwards | — |
| Qualified Late-Year Losses | — |
| Net Unrealized Gains (Losses) | 752,346 |
The tax character of distributions paid was as follows:
| | Year Ended December 31, |
| | 2020
Amount
($000) | 2019
Amount
($000) |
| Ordinary Income* | 87,602 | 80,367 |
| Long-Term Capital Gains | 98,697 | 161,598 |
| Total | 186,299 | 241,965 |
| * | Includes short-term capital gains, if any. |
As of December 31, 2020, gross unrealized appreciation and depreciation for investments and derivatives based on cost for U.S. federal income tax purposes were as follows:
| | Amount
($000) |
| Tax Cost | 2,604,744 |
| Gross Unrealized Appreciation | 770,373 |
| Gross Unrealized Depreciation | (18,114) |
| Net Unrealized Appreciation (Depreciation) | 752,259 |
| G. | During the year ended December 31, 2020, the portfolio purchased $1,289,941,000 of investment securities and sold $1,347,936,000 of investment securities, other than U.S. government securities and temporary cash investments. Purchases and sales of U.S. government securities were $215,044,000 and $380,846,000, respectively. |
| H. | Capital shares issued and redeemed were: |
| | Year Ended December 31, |
| | 2020 | 2019 |
| | Shares
(000) | Shares
(000) |
| Issued | 10,781 | 11,351 |
| Issued in Lieu of Cash Distributions | 9,447 | 10,988 |
| Redeemed | (20,878) | (13,353) |
| Net Increase (Decrease) in Shares Outstanding | (650) | 8,986 |
At December 31, 2020, one shareholder (an insurance company separate account whose holdings in the portfolio represent the indirect investment of Vanguard Variable Annuity contract holders) was the record or beneficial owner of 72% of the portfolio’s net assets. If this shareholder was to redeem its investment in the portfolio, the redemption might result in an increase in the portfolio’s expense ratio, cause the portfolio to incur higher transaction costs, or lead to the realization of taxable capital gains.
| I. | Management has determined that no events or transactions occurred subsequent to December 31, 2020, that would require recognition or disclosure in these financial statements. |
Report of Independent Registered Public Accounting Firm
To the Board of Trustees of Vanguard Variable Insurance Funds and Shareholders of Balanced Portfolio
Opinion on the Financial Statements
We have audited the accompanying statement of assets and liabilities, including the schedule of investments, of Balanced Portfolio (one of the portfolios constituting Vanguard Variable Insurance Funds, referred to hereafter as the "Portfolio”) as of December 31, 2020, the related statement of operations for the year ended December 31, 2020, the statement of changes in net assets for each of the two years in the period ended December 31, 2020, including the related notes, and the financial highlights for each of the five years in the period ended December 31, 2020 (collectively referred to as the “financial statements”). In our opinion, the financial statements present fairly, in all material respects, the financial position of the Portfolio as of December 31, 2020, the results of its operations for the year then ended, the changes in its net assets for each of the two years in the period ended December 31, 2020 and the financial highlights for each of the five years in the period ended December 31, 2020 in conformity with accounting principles generally accepted in the United States of America.
Basis for Opinion
These financial statements are the responsibility of the Portfolio’s management. Our responsibility is to express an opinion on the Portfolio’s financial statements based on our audits. We are a public accounting firm registered with the Public Company Accounting Oversight Board (United States) (PCAOB) and are required to be independent with respect to the Portfolio in accordance with the U.S. federal securities laws and the applicable rules and regulations of the Securities and Exchange Commission and the PCAOB.
We conducted our audits of these financial statements in accordance with the standards of the PCAOB. Those standards require that we plan and perform the audit to obtain reasonable assurance about whether the financial statements are free of material misstatement, whether due to error or fraud.
Our audits included performing procedures to assess the risks of material misstatement of the financial statements, whether due to error or fraud, and performing procedures that respond to those risks. Such procedures included examining, on a test basis, evidence regarding the amounts and disclosures in the financial statements. Our audits also included evaluating the accounting principles used and significant estimates made by management, as well as evaluating the overall presentation of the financial statements. Our procedures included confirmation of securities owned as of December 31, 2020 by correspondence with the custodian and brokers and by agreement to the underlying ownership records of the transfer agent; when replies were not received from brokers, we performed other auditing procedures. We believe that our audits provide a reasonable basis for our opinion.
/s/PricewaterhouseCoopers LLP
Philadelphia, Pennsylvania
February 18, 2021
We have served as the auditor of one or more investment companies in The Vanguard Group of Funds since 1975.
Special 2020 tax information (unaudited) for corporate shareholders only for Balanced Portfolio, a portfolio of Vanguard Variable Insurance Funds
This information for the fiscal year ended December 31, 2020, is included pursuant to provisions of the Internal Revenue Code for corporate shareholders only.
The portfolio distributed $98,697,000 as capital gain dividends (20% rate gain distributions) to shareholders during the fiscal year.
For corporate shareholders, 40.2% of investment income (dividend income plus short-term gains, if any) qualifies for the dividends-received deduction.
The percentage of the ordinary dividends reported by the fund that is treated as a Section 163(j) interest dividend and thus is eligible to be treated as interest income for purposes of Section 163(j) and the regulations thereunder is 32.4%.
BLOOMBERG is a trademark and service mark of Bloomberg Finance L.P. BARCLAYS is a trademark and service mark of Barclays Bank Plc, used under license. Bloomberg Finance L.P. and its affiliates, including Bloomberg Index Services Limited (BISL) (collectively, Bloomberg), or Bloomberg’s licensors, own all proprietary rights in the Bloomberg Barclays U.S. Credit A or Better Bond Index (the Index or Bloomberg Barclays Index).
Neither Barclays Bank Plc, Barclays Capital Inc., or any affiliate (collectively Barclays) or Bloomberg is the issuer or producer of the Balanced Portfolio and neither Bloomberg nor Barclays has any responsibilities, obligations or duties to investors in the Balanced Portfolio. The Index is licensed for use by The Vanguard Group, Inc. (Vanguard) as the sponsor of the Balanced Portfolio. Bloomberg and Barclays’ only relationship with Vanguard in respect of the Index is the licensing of the Index, which are determined, composed and calculated by BISL, or any successor thereto, without regard to the Issuer or the Balanced Portfolio or the owners of the Balanced Portfolio.
Additionally, Vanguard may for itself execute transaction(s) with Barclays in or relating to the Indices in connection with the Balanced Portfolio. Investors acquire the Balanced Portfolio from Vanguard and investors neither acquire any interest in the Indices nor enter into any relationship of any kind whatsoever with Bloomberg or Barclays upon making an investment in the Balanced Portfolio. The Balanced Portfolio is not sponsored, endorsed, sold or promoted by Bloomberg or Barclays. Neither Bloomberg nor Barclays makes any representation or warranty, express or implied regarding the advisability of investing in the Balanced Portfolio or the advisability of investing in securities generally or the ability of the Indices to track corresponding or relative market performance. Neither Bloomberg nor Barclays has passed on the legality or suitability of the Balanced Portfolio with respect to any person or entity. Neither Bloomberg nor Barclays is responsible for and has not participated in the determination of the timing of, prices at, or quantities of the Balanced Portfolio to be issued. Neither Bloomberg nor Barclays has any obligation to take the needs of the Issuer or the owners of the Balanced Portfolio or any other third party into consideration in determining, composing or calculating the Indices. Neither Bloomberg nor Barclays has any obligation or liability in connection with administration, marketing or trading of the Balanced Portfolio.
The licensing agreement between Bloomberg and Barclays is solely for the benefit of Bloomberg and Barclays and not for the benefit of the owners of the Balanced Portfolio, investors or other third parties. In addition, the licensing agreement between Vanguard and Bloomberg is solely for the benefit of Vanguard and Bloomberg and not for the benefit of the owners of the Balanced Portfolio, investors or other third parties.
NEITHER BLOOMBERG NOR BARCLAYS SHALL HAVE ANY LIABILITY TO THE ISSUER, INVESTORS OR TO OTHER THIRD PARTIES FOR THE QUALITY, ACCURACY AND/OR COMPLETENESS OF THE BLOOMBERG BARCLAYS INDICES OR ANY DATA INCLUDED THEREIN OR FOR INTERRUPTIONS IN THE DELIVERY OF THE BLOOMBERG BARCLAYS INDICES. NEITHER BLOOMBERG NOR BARCLAYS MAKES ANY WARRANTY, EXPRESS OR IMPLIED, AS TO RESULTS TO BE OBTAINED BY THE ISSUER, THE INVESTORS OR ANY OTHER PERSON OR ENTITY FROM THE USE OF THE BLOOMBERG BARCLAYS INDICES OR ANY DATA INCLUDED THEREIN. NEITHER BLOOMBERG NOR BARCLAYS MAKES ANY EXPRESS OR IMPLIED WARRANTIES, AND EACH HEREBY EXPRESSLY DISCLAIMS ALL WARRANTIES OF MERCHANTABILITY OR FITNESS FOR A PARTICULAR PURPOSE OR USE WITH RESPECT TO THE BLOOMBERG BARCLAYS INDICES OR ANY DATA INCLUDED THEREIN. BLOOMBERG RESERVES THE RIGHT TO CHANGE THE METHODS OF CALCULATION OR PUBLICATION, OR TO CEASE THE CALCULATION OR PUBLICATION OF THE BLOOMBERG BARCLAYS INDICES, AND NEITHER BLOOMBERG NOR BARCLAYS SHALL BE LIABLE FOR ANY MISCALCULATION OF OR ANY INCORRECT, DELAYED OR INTERRUPTED PUBLICATION WITH RESPECT TO ANY OF THE BLOOMBERG BARCLAYS INDICES. NEITHER BLOOMBERG NOR BARCLAYS SHALL BE LIABLE FOR ANY DAMAGES, INCLUDING, WITHOUT LIMITATION, ANY SPECIAL, INDIRECT OR CONSEQUENTIAL DAMAGES, OR ANY LOST PROFITS AND EVEN IF ADVISED OF THE POSSIBILITY OF SUCH, RESULTING FROM THE USE OF THE BLOOMBERG BARCLAYS INDICES OR ANY DATA INCLUDED THEREIN OR WITH RESPECT TO THE BALANCED PORTFOLIO.
None of the information supplied by Bloomberg or Barclays and used in this publication may be reproduced in any manner without the prior written permission of both Bloomberg and Barclays Capital, the investment banking division of Barclays Bank Plc. Barclays Bank Plc is registered in England No. 1026167. Registered office 1 Churchill Place London E14 5HP.
© 2021 Bloomberg. Used with Permission.
Source: Bloomberg Index Services Limited. Copyright 2021, Bloomberg. All rights reserved.
This page intentionally left blank.
The People Who Govern Your Fund
The trustees of your mutual fund are there to see that the fund is operated and managed in your best interests since, as a shareholder, you are a part owner of the fund. Your fund’s trustees also serve on the board of directors of The Vanguard Group, Inc., which is owned by the Vanguard funds and provides services to them.
A majority of Vanguard’s board members are independent, meaning that they have no affiliation with Vanguard or the funds they oversee, apart from the sizable personal investments they have made as private individuals. The independent board members have distinguished backgrounds in business, academia, and public service. Each of the trustees and executive officers oversees 211 Vanguard funds.
Information for each trustee and executive officer of the fund appears below. That information, as well as the Vanguard fund count, is as of the date on the cover of this fund report. The mailing address of the trustees and officers is P.O. Box 876, Valley Forge, PA 19482. More information about the trustees is in the Statement of Additional Information, which can be obtained, without charge, by contacting Vanguard at 800-662-7447, or online at vanguard.com.
Interested Trustee1
Mortimer J. Buckley
Born in 1969. Trustee since January 2018. Principal occupation(s) during the past five years and other experience: chairman of the board (2019–present) of Vanguard and of each of the investment companies served by Vanguard; chief executive officer (2018–present) of Vanguard; chief executive officer, president, and trustee (2018–present) of each of the investment companies served by Vanguard; president and director (2017–present) of Vanguard; and president (2018–present) of Vanguard Marketing Corporation. Chief investment officer (2013–2017), managing director (2002–2017), head of the Retail Investor Group (2006–2012), and chief information officer (2001–2006) of Vanguard. Chairman of the board (2011–2017) and trustee (2009–2017) of the Children’s Hospital of Philadelphia; and trustee (2018–present) and vice chair (2019–present) of The Shipley School.
Independent Trustees
Emerson U. Fullwood
Born in 1948. Trustee since January 2008. Principal occupation(s) during the past five years and other experience: executive chief staff and marketing officer for North America and corporate vice president (retired 2008) of Xerox Corporation (document management products and services). Former president of the Worldwide Channels Group, Latin America, and Worldwide Customer Service and executive chief staff officer of Developing Markets of Xerox. Executive in residence and 2009–2010 Distinguished Minett Professor at the Rochester Institute of Technology. Director of SPX FLOW, Inc. (multi-industry manufacturing). Director of the University of Rochester Medical Center, the Monroe Community College Foundation, the United Way of Rochester, North Carolina A&T University, and Roberts Wesleyan College. Trustee of the University of Rochester.
Amy Gutmann
Born in 1949. Trustee since June 2006. Principal occupation(s) during the past five years and other experience: president (2004–present) of the University of Pennsylvania. Christopher H. Browne Distinguished Professor of Political Science, School of Arts and Sciences, and professor of communication, Annenberg School for Communication, with secondary faculty appointments in the Department of Philosophy, School of Arts and Sciences, and at the Graduate School of Education, University of Pennsylvania.
F. Joseph Loughrey
Born in 1949. Trustee since October 2009. Principal occupation(s) during the past five years and other experience: president and chief operating officer (retired 2009) and vice chairman of the board (2008–2009) of Cummins Inc. (industrial machinery). Chairman of the board of Hillenbrand, Inc. (specialized consumer services) and the Lumina Foundation. Director of the V Foundation. Member of the advisory council for the College of Arts and Letters and chair of the advisory board to the Kellogg Institute for International Studies, both at the University of Notre Dame.
Mark Loughridge
Born in 1953. Trustee since March 2012. Principal occupation(s) during the past five years and other experience: senior vice president and chief financial officer (retired 2013) of IBM (information technology services). Fiduciary member of IBM’s Retirement Plan Committee (2004–2013), senior vice president and general manager (2002–2004) of IBM Global Financing, vice president and controller (1998–2002) of IBM, and a variety of other prior management roles at IBM. Member of the Council on Chicago Booth.
Scott C. Malpass
Born in 1962. Trustee since March 2012. Principal occupation(s) during the past five years and other experience: chief investment officer (retired June 2020) and vice president (retired June 2020) of the University of Notre Dame. Assistant professor of finance at the Mendoza College of Business, University of Notre Dame, and member of the Notre Dame 403(b) Investment Committee (retired June 2020). Member of the board of Catholic Investment Services, Inc. (investment advisors) and the board of superintendence of the Institute for the Works of Religion.
Deanna Mulligan
Born in 1963. Trustee since January 2018. Principal occupation(s) during the past five years and other experience: board chair (2020–present), chief executive officer (2011–2020), and president (2010–2019) of The Guardian Life Insurance Company of America. Chief operating officer (2010–2011) and executive vice president (2008–2010) of the individual life and disability division of Guardian Life. Member of the board of the American Council of Life Insurers and the board of the Economic Club of New York. Trustee of the Partnership for New York City (business leadership), Chief Executives for Corporate Purpose, NewYork-Presbyterian Hospital, Catalyst, and the
Bruce Museum (arts and science). Member of the Advisory Council for the Stanford Graduate School of Business.
André F. Perold
Born in 1952. Trustee since December 2004. Principal occupation(s) during the past five years and other experience: George Gund Professor of Finance and Banking, Emeritus at the Harvard Business School (retired 2011). Chief investment officer and co-managing partner of HighVista Strategies (private investment firm). Member of the board of advisors and member of the investment committee of the Museum of Fine Arts Boston. Member of the board (2018–present) of RIT Capital Partners (investment firm). Member of the investment committee of Partners Health Care System.
Sarah Bloom Raskin
Born in 1961. Trustee since January 2018. Principal occupation(s) during the past five years and other experience: deputy secretary (2014–2017) of the United States Department of the Treasury. Governor (2010–2014) of the Federal Reserve Board. Commissioner (2007–2010) of financial regulation for the State of Maryland. Member of the board of directors (2012–2014) of Neighborhood Reinvestment Corporation. Director (2017–present) of i(x) Investments, LLC; director (2017–present) of Reserve Trust. Rubenstein Fellow (2017–present) of Duke University; trustee (2017–present) of Amherst College, and trustee (2019–present) of the Folger Shakespeare Library.
Peter F. Volanakis
Born in 1955. Trustee since July 2009. Principal occupation(s) during the past five years and other experience: president and chief operating officer (retired 2010) of Corning Incorporated (communications equipment) and director of Corning Incorporated (2000–2010) and Dow Corning (2001–2010). Director (2012) of SPX Corporation (multi-industry manufacturing). Overseer of the Amos Tuck School of Business Administration, Dartmouth College (2001–2013). Chairman of the board of trustees of Colby-Sawyer College. Member of the board of Hypertherm Inc. (industrial cutting systems, software, and consumables).
1 Mr. Buckley is considered an “interested person,” as defined in the Investment Company Act of 1940, because he is an officer of the Vanguard funds.
Executive Officers
John Bendl
Born in 1970. Principal occupation(s) during the past five years and other experience: principal of Vanguard. Chief financial officer (2019–present) of each of the investment companies served by Vanguard. Chief accounting officer, treasurer, and controller of Vanguard (2017–present). Partner (2003–2016) at KPMG (audit, tax, and advisory services).
Christine M. Buchanan
Born in 1970. Principal occupation(s) during the past five years and other experience: principal of Vanguard. Treasurer (2017–present) of each of the investment companies served by Vanguard. Partner (2005–2017) at KPMG (audit, tax, and advisory services).
David Cermak
Born in 1960. Principal occupation(s) during the past five years and other experience: principal of Vanguard. Finance director (2019–present) of each of the investment companies served by Vanguard. Managing director and head (2017–present) of Vanguard Investments Singapore. Managing director and head (2017–2019) of Vanguard Investments Hong Kong. Representative director and head (2014–2017) of Vanguard Investments Japan.
John Galloway
Born in 1973. Principal occupation(s) during the past five years and other experience: principal of Vanguard.
Investment stewardship officer (September 2020–present) of each of the investment companies served by Vanguard. Head of Investor Advocacy (February 2020–present) and head of Marketing Strategy and Planning (2017–2020) at Vanguard. Deputy assistant to the President of the United States (2015).
Thomas J. Higgins
Born in 1957. Principal occupation(s) during the past five years and other experience: principal of Vanguard. Finance director (2019–present), chief financial officer (2008–2019), and treasurer (1998–2008) of each of the investment companies served by Vanguard.
Peter Mahoney
Born in 1974. Principal occupation(s) during the past five years and other experience: principal of Vanguard. Controller (2015–present) of each of the investment companies served by Vanguard. Head of International Fund Services (2008–2014) at Vanguard.
Anne E. Robinson
Born in 1970. Principal occupation(s) during the past five years and other experience: general counsel (2016–present) of Vanguard. Secretary (2016–present) of Vanguard and of each of the investment companies served by Vanguard. Managing director (2016–present) of Vanguard. Managing director and general counsel of Global Cards and Consumer Services (2014–2016) at Citigroup. Counsel (2003–2014) at American Express.
Michael Rollings
Born in 1963. Principal occupation(s) during the past five years and other experience: finance director (2017–present) and treasurer (2017) of each of the investment companies served by Vanguard. Managing director (2016–present) of Vanguard. Chief financial officer (2016–present) of Vanguard. Director (2016–present) of Vanguard Marketing Corporation. Executive vice president and chief financial officer (2006–2016) of MassMutual Financial Group.
John E. Schadl
Born in 1972. Principal occupation(s) during the past five years and other experience: principal of Vanguard. Chief compliance officer (2019–present) of Vanguard and of each of the investment companies served by Vanguard. Assistant vice president (2019–present) of Vanguard Marketing Corporation.
Vanguard Senior Management Team
| Joseph Brennan | James M. Norris |
| Mortimer J. Buckley | Thomas M. Rampulla |
| Gregory Davis | Karin A. Risi |
| John James | Anne E. Robinson |
| John T. Marcante | Michael Rollings |
| Chris D. McIsaac | Lauren Valente |
Connect with Vanguard®>vanguard.com
Fund Information > 800-662-7447
Annuity and Insurance Services > 800-522-5555
Institutional Investor Services > 800-523-1036
Text Telephone for People Who Are Deaf or Hard of Hearing > 800-749-7273
This material may be used in conjunction with the offering of shares of any Vanguard fund only if preceded or accompanied by the fund’s current prospectus.
You can obtain a free copy of Vanguard’s proxy voting guidelines by visiting vanguard.com/proxyreporting or by calling Vanguard at 800-662-2739. The guidelines are also available from the SEC’s website, www.sec.gov. In addition, you may obtain a free report on how your fund voted the proxies for securities it owned during the 12 months ended June 30. To get the report, visit either vanguard.com/proxyreporting or www.sec.gov.
All comparative mutual fund data are from Morningstar, Inc., unless otherwise noted.
You can review information about your fund on the SEC’s website, and you can receive copies of this information, for a fee, by sending a request via email addressed to publicinfo@sec.gov.
CFA® is a registered trademark owned by CFA Institute.
© 2021 The Vanguard Group, Inc.
All rights reserved.
Vanguard Marketing Corporation, Distributor.
Q690B 022021
Annual Report | December 31, 2020
Vanguard Variable Insurance Funds
Contents
Your Portfolio’s Performance at a Glance
| 1 |
Advisor’s Report
| 2 |
About Your Portfolio’s Expenses
| 4 |
Performance Summary
| 5 |
Financial Statements
| 7 |
Please note: The opinions expressed in this report are just that—informed opinions. They should not be considered promises or advice. Also, please keep in mind that the information and opinions cover the period through the date on the front of this report. Of course, the risks of investing in your portfolio are spelled out in the prospectus.
Your Portfolio’s Performance at a Glance
| • | For the 12 months ended December 31, 2020, the Capital Growth Portfolio returned 17.47%, trailing the 18.40% return of its benchmark, the Standard & Poor’s 500 Index. |
| • | The portfolio outperformed the benchmark in eight of 11 industry sectors. Our underweight position in energy, strong selection in consumer discretionary, and decision not to hold consumer staples, utilities, and real estate companies helped relative performance the most. However, selection in health care, industrials, and information technology detracted and more than offset the positive results in other sectors. |
| • | For the decade ended December 31, the portfolio produced an average annual return of 14.98%, outperforming its benchmark by more than a percentage point. |
| • | Please note that the portfolio’s returns are different from those in Vanguard Variable Annuity (and other plans that invest in the portfolio), which take into account insurance-related expenses. |
Market Barometer
Average Annual Total Returns
Periods Ended December 31, 2020 |
| | One Year | Three Years | Five Years |
| Stocks | | | |
| Russell 1000 Index (Large-caps) | 20.96% | 14.82% | 15.60% |
| Russell 2000 Index (Small-caps) | 19.96 | 10.25 | 13.26 |
| Russell 3000 Index (Broad U.S. market) | 20.89 | 14.49 | 15.43 |
| FTSE All-World ex US Index (International) | 11.22 | 5.18 | 9.16 |
| Bonds | | | |
| Bloomberg Barclays U.S. Aggregate Bond Index (Broad taxable market) | 7.51% | 5.34% | 4.44% |
Bloomberg Barclays Municipal Bond Index
(Broad tax-exempt market) | 5.21 | 4.64 | 3.91 |
| FTSE Three-Month U.S. Treasury Bill Index | 0.58 | 1.56 | 1.16 |
| CPI | | | |
| Consumer Price Index | 1.36% | 1.85% | 1.95% |
For the 12 months ended December 31, 2020, the Vanguard Capital Growth Portfolio returned 17.47%, trailing the 18.40% return of its benchmark, the unmanaged Standard & Poor’s 500 Index, and well below the 44.41% average gain of its variable insurance multicapitalization growth fund competitors. Relative to the benchmark, unfavorable stock selection more than offset favorable sector allocation for the portfolio.
Investment environment
The past year was one for the record books. What started uneventfully enough, back when yield curves and trade wars dominated investor concerns, morphed into unprecedented tumult as COVID-19 wreaked global havoc. The U.S. economy endured a "Great Pause” in March and April when local restrictions, designed to mitigate the pandemic’s toll, severely constrained activity and output. The subsequent economic collapse established several record-setting declines, among them the fastest bear-market descent, the most job losses, and the steepest GDP drop on record. Similar scenes, differing only in timing and magnitude, unfolded around the world, fracturing the once-integrated global economy.
The federal government, in tandem with authorities across the globe, unleashed a torrent of stimulus and support in response. This monetary and fiscal onslaught featured staggering amounts of deficit spending and open-ended assurances from the Federal Reserve to keep low interest rates low. But reopening proved fraught with difficulty. The initial economic recovery stalled somewhat at levels well below pre-pandemic highs, and the year ended with much of the world retrenching amid a fresh wave of infection.
Equity indexes bounced aggressively starting in late March, ahead of the economy’s turn. The S&P 500 Index surpassed its previous high-water mark within six months—a record-short bear-market dip—and its strength persisted into year-end, finishing nearly
70% above its late March low. But this impressive index-level performance masked substantial dispersion within, reflecting the pandemic’s uniquely disruptive influence. Many companies battled for survival, while some technology-oriented businesses, seemingly ready-made for stay-at-home isolation, thrived. For the full year, the information technology (+44%) and consumer discretionary (+33%) sectors fared best, while energy (–34%) and financials (–2%) followed crude oil prices and interest rates lower.
Outlook for U.S. equities
Our view on U.S. equities is decidedly mixed. The postrecession economy has relied heavily on artificial and unsustainable measures, including a $3 trillion federal deficit and the allure of unending stimulus ahead. And the market’s apparent strength, unusually concentrated in larger tech stocks, creates an unusually bifurcated stock landscape. That said, U.S. Treasury yields hover at historically depressed levels (with an 0.9% 10-year yield at year-end), providing some support for the S&P 500 Index’s elevated valuation (19.2x price/earnings valuation on 2022 estimated earnings).
We see more fundamental reasons for optimism in select cases. The groundbreaking Pfizer-BioNTech and Moderna vaccines highlight the potential for a robust medical solution. And more vaccine candidates and antibody therapies are on the cusp of clinical outcomes.
But even after the recent vaccine-fueled market rotation, many stocks still languish in this protracted socially distanced existence. Our original expectation of a fairly prompt snapback was misplaced, but we still expect the eventual “new normal” to more closely resemble its 2019 antecedent than the current state of apprehension and separation. This should divert even more oxygen from pandemic beneficiaries to a wide swath of struggling companies. A more fulsome recovery may also spur inflation and interest rates upward, which could finally and forcefully
shift sentiment from high-multiple growth stocks to inexpensive value stocks.
Portfolio update
The portfolio maintained large overweight positions in health care and industrial stocks, a modest overweight position in IT, and an equal-weight position in consumer discretionary. The portfolio was underweight in all other sectors.
Sector allocation was favorable, owing primarily to the portfolio’s overweighting of IT, the year’s best-performing sector, and its underweight positions in energy and financials, the year’s primary laggards. The large overweight positions in health care and industrials provided a partial offset.
Stock selection detracted from relative results, with weak selection in health care and industrials driving overall underperformance. In health care, the portfolio’s substantial large-cap biotechnology holdings (Biogen –17%, Amgen –2%) failed to keep pace with their smaller brethren, while medical device producer Boston Scientific (–21%) logged a difficult year. Among the portfolio’s sizable pharmaceutical positions, Eli Lilly (+31%) helped offset anemic performances from Novartis (+2%) and AstraZeneca (+3%).
In industrials, FedEx (+74%) had a strong turnaround year as e-commerce exploded, but this result could not offset our exposure to airlines (United –51%, American –45%, Delta –31%, and Southwest –13%) and key supplier Airbus (–25%) as travel collapsed.
Selection elsewhere was mixed, with strength in consumer discretionary and communication services roughly offsetting weakness in IT and financials. Tesla (+743%) was the standout, rocketing higher on stronger fundamentals and its seemingly limitless potential; Tesla coupled with Sony (+49%) more than offset the portfolio’s sizable underweighting of Amazon (+76%) in consumer discretionary. Baidu (+71%), a
Chinese search and internet services company, led the outperformance in communication services.
The portfolio’s IT holdings (+40%) outperformed the broader market, but lacking sufficient exposure to Apple (+82%), they lagged the benchmark’s return for the sector (+44%). Qualcomm (+77%), Adobe (+52%), and KLA (+48%) were key contributors. In financials, the portfolio’s exposure to large banks, most notably Wells Fargo (–42%), detracted from relative results.
Advisor perspectives
Perhaps the most noteworthy feature of today’s equity market is an element of inequity: the sheer relative size of so-called Big Tech. Just four technology stocks—Apple, Microsoft, Amazon, and Alphabet (Google)—constitute roughly 20% of the S&P 500. Their combined capitalization (more than $6 trillion) equates in size to the bottom two-thirds of the index, or to the Japan Exchange Group, the largest non-U.S. equity market. And their combined performance has strong-armed the S&P 500 to its record highs. History suggests that this concentrated tech frenzy warrants caution. In March 2000—a notoriously exuberant technology market—the four biggest stocks were “just” 16% of the market, and only three were tech stocks; with 2020’s hindsight, we know that story ended poorly for many.
But maybe this time is different, a prospect we wrestle with daily; after all, Microsoft has defied doubters and maintained its lofty perch in the Big Four.
In aggregate, valuations for these heavyweights are high but not irrationally so; their competitive moats seem to deepen with time, a function of their aggressive reinvestment strategy; and tech’s coronation feels less speculative or premature this time.
And yet the portfolio’s exposure to these four companies stood at just under 10%, or half that of the index’s, with Microsoft and Google constituting the bulk of our ownership. The portfolio’s underweighting of Apple and Amazon has created a massive multiyear performance headwind. We acknowledge these two errors of omission, but we remain cautious. Size invites competition, disruption, and regulation. These high-priced titans must be more than impressive to justify their valuations—they must be near-flawless in handling internal and external threats, known and unknown. Our bias is to search elsewhere.
Health care also features prominently in both the news and our portfolio. The pandemic reinforces the incalculable value embedded in existing drugs, therapies, and devices, which facilitate our ongoing fight against disease and death—and which presumably have helped push down COVID-19's infection fatality ratio.
But the pandemic also highlights how much value remains to be created with future breakthroughs, both in the COVID-19 realm and beyond. After a strong start, the health care sector underperformed for 2020, despite market-leading revenue growth (+7%) and earnings growth (+6%) in a year more commonly scarred with steep declines.
And this is not a pandemic-fueled surge; growth should persist indefinitely. Despite ongoing political concerns, we are optimistic that our companies will continue to develop life-saving innovations and be rewarded by the marketplace.
Finally, much ink has been spilled in past letters defending our outsized ownership of airline stocks. We viewed them as long-term growers, operating in a vastly improved industry structure and trading of late at less than half of the market’s valuation. Whatever the merits, our investment thesis—and performance—was dealt a dramatic blow by COVID-19, forcing a structural reset in both our holdings and our thinking. We continue to own these companies, albeit more selectively and with overall lower exposure, ahead of travel’s eventual revival.
Conclusion
We still believe that some semblance of normalcy will prevail. Several pandemic-driven structural changes will likely persist, including a more flexible workforce, the fast-forwarding of digital transitions, and the indefinite loss of certain business travel to Zoom. But if and when life normalizes, we expect the market’s future winners will be drawn primarily from its pool of COVID-19 losers. Our portfolio is positioned accordingly, focused on stocks whose long-term potential deviates meaningfully from today’s dislocated share prices.
PRIMECAP Management Company
January 21, 2021
About Your Portfolio’s Expenses
As a shareholder of the portfolio, you incur ongoing costs, which include costs for portfolio management, administrative services, and shareholder reports (like this one), among others. Operating expenses, which are deducted from a portfolio's gross income, directly reduce the investment return of the portfolio.
A portfolio's expenses are expressed as a percentage of its average net assets. This figure is known as the expense ratio. The following examples are intended to help you understand the ongoing costs (in dollars) of investing in your portfolio and to compare these costs with those of other mutual funds. The examples are based on an investment of $1,000 made at the beginning of the period shown and held for the entire period.
The accompanying table illustrates your portfolio's costs in two ways:
| • | Based on actual portfolio return. This section helps you to estimate the actual expenses that you paid over the period. The ”Ending Account Value“ shown is derived from the portfolio's actual return, and the third column shows the dollar amount that would have been paid by an investor who started with $1,000 in the portfolio. You may use the information here, together with the amount you invested, to estimate the expenses that you paid over the period. |
To do so, simply divide your account value by $1,000 (for example, an $8,600 account value divided by $1,000 = 8.6), then multiply the result by the number given for your portfolio under the heading ”Expenses Paid During Period.“
| • | Based on hypothetical 5% yearly return. This section is intended to help you compare your portfolio's costs with those of other mutual funds. It assumes that the portfolio had a yearly return of 5% before expenses, but that the expense ratio is unchanged. In this case—because the return used is not the portfolio's actual return—the results do not apply to your investment. The example is useful in making comparisons because the Securities and Exchange Commission requires all mutual funds to calculate expenses based on a 5% return. You can assess your portfolio's costs by comparing this hypothetical example with the hypothetical examples that appear in shareholder reports of other funds. |
Note that the expenses shown in the table are meant to highlight and help you compare ongoing costs only and do not reflect transaction costs incurred by the portfolio for buying and selling securities. The portfolio’s expense ratio does not reflect additional fees and expenses associated with the annuity or life insurance program through which you invest.
The calculations assume no shares were bought or sold during the period. Your actual costs may have been higher or lower, depending on the amount of your investment and the timing of any purchases or redemptions.
You can find more information about the portfolio's expenses, including annual expense ratios, in the Financial Statements section of this report. For additional information on operating expenses and other shareholder costs, please refer to your portfolio's current prospectus.
| Six Months Ended December 31, 2020 | | | |
| Capital Growth Portfolio | Beginning
Account Value
6/30/2020 | Ending
Account Value
12/31/2020 | Expenses
Paid During
Period |
| Based on Actual Portfolio Return | $1,000.00 | $1,245.11 | $1.92 |
| Based on Hypothetical 5% Yearly Return | 1,000.00 | 1,023.43 | 1.73 |
The calculations are based on expenses incurred in the most recent six-month period. The portfolio’s annualized six-month expense ratio for that period is 0.34%. The dollar amounts shown as “Expenses Paid” are equal to the annualized expense ratio multiplied by the average account value over the period, multiplied by the number of days in the most recent six-month period, then divided by the number of days in the most recent 12-month period (184/366).
All of the returns in this report represent past performance, which is not a guarantee of future results that may be achieved by the portfolio. (Current performance may be lower or higher than the performance data cited. For performance data current to the most recent month-end, visit our website at vanguard.com/performance.) Note, too, that both investment returns and principal value can fluctuate widely, so an investor’s shares, when sold, could be worth more or less than their original cost. The returns shown do not reflect taxes that a shareholder would pay on portfolio distributions or on the sale of portfolio shares. Nor do the returns reflect fees and expenses associated with the annuity or life insurance program through which a shareholder invests. If these fees and expenses were included, the portfolio's returns would be lower.
Cumulative Performance: December 31, 2010, Through December 31, 2020
Initial Investment of $10,000
| | | | Average Annual Total Returns
Periods Ended December 31, 2020 |
| | | One
Year | Five
Years | Ten
Years | Final Value
of a $10,000
Investment |
 | Capital Growth Portfolio | 17.47% | 15.96% | 14.98% | $40,375 |
 | S&P 500 Index | 18.40 | 15.22 | 13.88 | 36,700 |
See Financial Highlights for dividend and capital gains information.
| Communication Services | 7.2% |
| Consumer Discretionary | 13.9 |
| Energy | 0.8 |
| Financials | 6.4 |
| Health Care | 25.0 |
| Industrials | 15.7 |
| Information Technology | 30.1 |
| Materials | 0.9 |
The table reflects the portfolio’s investments, except for short-term investments. Sector categories are based on the Global Industry Classification Standard (“GICS”), except for the “Other” category (if applicable), which includes securities that have not been provided a GICS classification as of the effective reporting period.
Global Industry Classification Standard (“GICS”) was developed by and is the exclusive property and a service mark of MSCI Inc. (“MSCI”) and Standard and Poor’s, a division of McGraw-Hill Companies, Inc. (“S&P”), and is licensed for use by Vanguard. Neither MSCI, S&P nor any third party involved in making or compiling the GICS or any GICS classification makes any express or implied warranties or representations with respect to such standard or classification (or the results to be obtained by the use thereof), and all such parties hereby expressly disclaim all warranties of originality, accuracy, completeness, merchantability or fitness for a particular purpose with respect to any such standard or classification. Without limiting any of the foregoing, in no event shall MSCI, S&P, any of its affiliates or any third party involved in making or compiling the GICS or any GICS classification have any liability for any direct, indirect, special, punitive, consequential or any other damages (including lost profits) even if notified of the possibility of such damages.
The portfolio files its complete schedule of portfolio holdings with the Securities and Exchange Commission (SEC) for the first and third quarters of each fiscal year as an exhibit to its reports on Form N-PORT. The portfolio’s Form N-PORT reports are available on the SEC’s website at www.sec.gov.
| | | Shares | Market
Value•
($000) |
| Common Stocks (96.3%) |
| Communication Services (6.9%) |
| * | Alphabet Inc. Class A | 23,900 | 41,888 |
| * | Baidu Inc. ADR | 153,900 | 33,279 |
| * | Alphabet Inc. Class C | 15,970 | 27,978 |
| * | Walt Disney Co. | 97,000 | 17,575 |
| | Activision Blizzard Inc. | 160,300 | 14,884 |
| * | Charter Communications Inc. Class A | 7,200 | 4,763 |
| * | Facebook Inc. Class A | 16,600 | 4,534 |
| | | | 144,901 |
| Consumer Discretionary (13.4%) |
| * | Tesla Inc. | 84,500 | 59,629 |
| * | Alibaba Group Holding Ltd. ADR | 224,000 | 52,131 |
| | Sony Corp. ADR | 445,500 | 45,040 |
| | Ross Stores Inc. | 213,900 | 26,269 |
| * | Amazon.com Inc. | 7,200 | 23,450 |
| | Whirlpool Corp. | 105,100 | 18,969 |
| | TJX Cos. Inc. | 254,600 | 17,387 |
| * | Mattel Inc. | 813,800 | 14,201 |
| | L Brands Inc. | 238,300 | 8,862 |
| | Royal Caribbean Cruises Ltd. | 78,000 | 5,826 |
| | Carnival Corp. | 209,400 | 4,536 |
| | eBay Inc. | 46,800 | 2,352 |
| | Marriott International Inc. Class A | 11,100 | 1,464 |
| | | | 280,116 |
| Energy (0.8%) |
| | Pioneer Natural Resources Co. | 64,200 | 7,312 |
| | Hess Corp. | 131,200 | 6,926 |
| | EOG Resources Inc. | 43,200 | 2,154 |
| | | | 16,392 |
| Financials (6.1%) |
| | JPMorgan Chase & Co. | 261,000 | 33,165 |
| | Wells Fargo & Co. | 837,400 | 25,273 |
| | Charles Schwab Corp. | 461,000 | 24,451 |
| | Marsh & McLennan Cos. Inc. | 153,500 | 17,960 |
| | Bank of America Corp. | 549,000 | 16,640 |
| | Progressive Corp. | 44,500 | 4,400 |
| | US Bancorp | 81,300 | 3,788 |
| | Citigroup Inc. | 41,900 | 2,584 |
| | | | 128,261 |
| Health Care (24.1%) |
| | Eli Lilly and Co. | 609,471 | 102,903 |
| | Amgen Inc. | 297,771 | 68,464 |
| * | Biogen Inc. | 264,200 | 64,692 |
| | AstraZeneca plc ADR | 791,400 | 39,562 |
| | Novartis AG ADR | 375,650 | 35,473 |
| | Thermo Fisher Scientific Inc. | 76,100 | 35,446 |
| * | Boston Scientific Corp. | 847,702 | 30,475 |
| | Roche Holding AG | 69,645 | 24,257 |
| | | Shares | Market
Value•
($000) |
| | Bristol-Myers Squibb Co. | 242,600 | 15,048 |
| * | BioMarin Pharmaceutical Inc. | 170,800 | 14,977 |
| * | Elanco Animal Health Inc. | 450,316 | 13,811 |
| | Abbott Laboratories | 106,200 | 11,628 |
| * | BeiGene Ltd. ADR | 31,400 | 8,113 |
| | Medtronic plc | 63,300 | 7,415 |
| | Zimmer Biomet Holdings Inc. | 42,800 | 6,595 |
| | CVS Health Corp. | 82,600 | 5,642 |
| 1 | Siemens Healthineers AG | 96,400 | 4,961 |
| * | Alcon Inc. | 70,410 | 4,646 |
| | Agilent Technologies Inc. | 26,500 | 3,140 |
| | Merck & Co. Inc. | 36,200 | 2,961 |
| | Stryker Corp. | 11,100 | 2,720 |
| | Sanofi ADR | 36,800 | 1,788 |
| | | | 504,717 |
| Industrials (15.1%) |
| | FedEx Corp. | 266,400 | 69,163 |
| | Southwest Airlines Co. | 978,150 | 45,592 |
| | Siemens AG (Registered) | 281,827 | 40,596 |
| * | Airbus SE | 270,735 | 29,712 |
| | Caterpillar Inc. | 108,700 | 19,786 |
| * | United Airlines Holdings Inc. | 455,700 | 19,709 |
| | Union Pacific Corp. | 76,300 | 15,887 |
| | Delta Air Lines Inc. | 334,000 | 13,430 |
| 2 | American Airlines Group Inc. | 707,700 | 11,160 |
| | United Parcel Service Inc. Class B | 60,150 | 10,129 |
| | Alaska Air Group Inc. | 143,000 | 7,436 |
| * | TransDigm Group Inc. | 9,850 | 6,096 |
| | Textron Inc. | 102,000 | 4,930 |
| | Raytheon Technologies Corp. | 56,300 | 4,026 |
| | AMETEK Inc. | 27,800 | 3,362 |
| | Deere & Co. | 12,400 | 3,336 |
| | CSX Corp. | 34,200 | 3,104 |
| * | Lyft Inc. Class A | 44,200 | 2,171 |
| | Carrier Global Corp. | 56,300 | 2,124 |
| | General Dynamics Corp. | 14,200 | 2,113 |
| | Otis Worldwide Corp. | 28,150 | 1,901 |
| | | | 315,763 |
| Information Technology (29.0%) |
| * | Adobe Inc. | 180,500 | 90,272 |
| | Microsoft Corp. | 378,200 | 84,119 |
| | Texas Instruments Inc. | 453,600 | 74,449 |
| * | Micron Technology Inc. | 846,200 | 63,617 |
| | KLA Corp. | 152,200 | 39,406 |
| | Intel Corp. | 631,500 | 31,461 |
| | QUALCOMM Inc. | 181,700 | 27,680 |
| | Telefonaktiebolaget LM Ericsson ADR | 2,085,100 | 24,917 |
| | NetApp Inc. | 373,100 | 24,714 |
| | NVIDIA Corp. | 40,050 | 20,914 |
| | Intuit Inc. | 48,600 | 18,461 |
| | HP Inc. | 584,750 | 14,379 |
| | | Shares | Market
Value•
($000) |
| | Hewlett Packard Enterprise Co. | 1,140,550 | 13,515 |
| | Analog Devices Inc. | 86,800 | 12,823 |
| | Oracle Corp. | 194,500 | 12,582 |
| | Visa Inc. Class A | 46,000 | 10,062 |
| * | PayPal Holdings Inc. | 31,700 | 7,424 |
| | Cisco Systems Inc. | 155,600 | 6,963 |
| | Apple Inc. | 50,000 | 6,634 |
| | Entegris Inc. | 67,800 | 6,516 |
| | Corning Inc. | 127,350 | 4,585 |
| | Applied Materials Inc. | 42,000 | 3,625 |
| * | Autodesk Inc. | 7,800 | 2,382 |
| | Mastercard Inc. Class A | 6,200 | 2,213 |
| | Plantronics Inc. | 71,650 | 1,937 |
| * | BlackBerry Ltd. | 195,800 | 1,298 |
| | | | 606,948 |
| Materials (0.9%) |
| | Albemarle Corp. | 80,300 | 11,846 |
| | Linde plc | 8,300 | 2,187 |
| | DuPont de Nemours Inc. | 23,866 | 1,697 |
| | Dow Inc. | 23,866 | 1,325 |
| | Corteva Inc. | 23,866 | 924 |
| | | | 17,979 |
Total Common Stocks
(Cost $1,095,992) | 2,015,077 |
| Temporary Cash Investments (4.2%) |
| Money Market Fund (4.2%) |
| 3,4 | Vanguard Market Liquidity Fund, 0.111%
(Cost $88,331) | 883,314 | 88,332 |
Total Investments (100.5%)
(Cost $1,184,323) | 2,103,409 |
| Other Assets and Liabilities—Net (-0.5%) | (11,013) |
| Net Assets (100%) | 2,092,396 |
| Cost is in $000. |
| • | See Note A in Notes to Financial Statements. |
| * | Non-income-producing security. |
| 1 | Security exempt from registration under Rule 144A of the Securities Act of 1933. Such securities may be sold in transactions exempt from registration, normally to qualified institutional buyers. At December 31, 2020, the aggregate value was $4,961,000, representing 0.2% of net assets. |
| 2 | Includes partial security positions on loan to broker-dealers. The total value of securities on loan is $8,137,000. |
| 3 | Affiliated money market fund available only to Vanguard funds and certain trusts and accounts managed by Vanguard. Rate shown is the 7-day yield. |
| 4 | Collateral of $8,772,000 was received for securities on loan. |
| | ADR—American Depositary Receipt. |
See accompanying Notes, which are an integral part of the Financial Statements.
Statement of Assets and Liabilities
| ($000s, except shares and per-share amounts) | Amount |
| Assets | |
| Investments in Securities, at Value | |
| Unaffiliated Issuers (Cost $1,095,992) | 2,015,077 |
| Affiliated Issuers (Cost $88,331) | 88,332 |
| Total Investments in Securities | 2,103,409 |
| Investment in Vanguard | 79 |
| Cash | 794 |
| Receivables for Accrued Income | 1,390 |
| Receivables for Capital Shares Issued | 250 |
| Total Assets | 2,105,922 |
| Liabilities | |
| Payables for Investment Securities Purchased | 802 |
| Collateral for Securities on Loan | 8,772 |
| Payables to Investment Advisor | 737 |
| Payables for Capital Shares Redeemed | 3,000 |
| Payables to Vanguard | 215 |
| Total Liabilities | 13,526 |
| Net Assets | 2,092,396 |
| At December 31, 2020, net assets consisted of: | |
| | |
| Paid-in Capital | 999,596 |
| Total Distributable Earnings (Loss) | 1,092,800 |
| Net Assets | 2,092,396 |
| |
| Net Assets | |
Applicable to 46,282,275 outstanding $.001 par value shares of
beneficial interest (unlimited authorization) | 2,092,396 |
| Net Asset Value Per Share | $45.21 |
See accompanying Notes, which are an integral part of the Financial Statements.
Statement of Operations
|
| | Year Ended
December 31, 2020 |
| | ($000) |
| Investment Income | |
| Income | |
| Dividends1 | 24,659 |
| Non-Cash Dividends | 3,820 |
| Interest2 | 429 |
| Securities Lending—Net | 229 |
| Total Income | 29,137 |
| Expenses | |
| Investment Advisory Fees—Note B | 2,753 |
| The Vanguard Group—Note C | |
| Management and Administrative | 3,252 |
| Marketing and Distribution | 172 |
| Custodian Fees | 14 |
| Auditing Fees | 27 |
| Shareholders' Reports | 20 |
| Trustees’ Fees and Expenses | 2 |
| Total Expenses | 6,240 |
| Net Investment Income | 22,897 |
| Realized Net Gain (Loss) | |
| Investment Securities Sold2 | 153,697 |
| Foreign Currencies | (3) |
| Realized Net Gain (Loss) | 153,694 |
| Change in Unrealized Appreciation (Depreciation) | |
| Investment Securities2 | 126,379 |
| Foreign Currencies | 49 |
| Change in Unrealized Appreciation (Depreciation) | 126,428 |
| Net Increase (Decrease) in Net Assets Resulting from Operations | 303,019 |
| 1 | Dividends are net of foreign withholding taxes of $572,000. |
| 2 | Interest income, realized net gain (loss), and change in unrealized appreciation (depreciation) from an affiliated company of the portfolio were $429,000, $27,000, and $14,000, respectively. Purchases and sales are for temporary cash investment purposes. |
Statement of Changes in Net Assets
|
| | Year Ended December 31, |
| | 2020
($000) | 2019
($000) |
| Increase (Decrease) in Net Assets | | |
| Operations | | |
| Net Investment Income | 22,897 | 24,692 |
| Realized Net Gain (Loss) | 153,694 | 58,473 |
| Change in Unrealized Appreciation (Depreciation) | 126,428 | 336,520 |
| Net Increase (Decrease) in Net Assets Resulting from Operations | 303,019 | 419,685 |
| Distributions1 | | |
| Total Distributions | (83,976) | (68,316) |
| Capital Share Transactions | | |
| Issued | 222,798 | 222,383 |
| Issued in Lieu of Cash Distributions | 83,976 | 68,316 |
| Redeemed | (409,141) | (262,062) |
| Net Increase (Decrease) from Capital Share Transactions | (102,367) | 28,637 |
| Total Increase (Decrease) | 116,676 | 380,006 |
| Net Assets | | |
| Beginning of Period | 1,975,720 | 1,595,714 |
| End of Period | 2,092,396 | 1,975,720 |
| 1 | Certain prior-period numbers have been reclassified to conform with the current-period presentation. |
See accompanying Notes, which are an integral part of the Financial Statements.
For a Share Outstanding
Throughout Each Period | Year Ended December 31, |
| 2020 | 2019 | 2018 | 2017 | 2016 |
| Net Asset Value, Beginning of Period | $40.76 | $33.49 | $35.12 | $28.36 | $26.64 |
| Investment Operations | | | | | |
| Net Investment Income | .4781 | .5031 | .4291 | .3661 | .374 |
| Net Realized and Unrealized Gain (Loss) on Investments | 5.768 | 8.182 | (.754) | 7.580 | 2.362 |
| Total from Investment Operations | 6.246 | 8.685 | (.325) | 7.946 | 2.736 |
| Distributions | | | | | |
| Dividends from Net Investment Income | (.574) | (.411) | (.315) | (.371) | (.318) |
| Distributions from Realized Capital Gains | (1.222) | (1.004) | (.990) | (.815) | (.698) |
| Total Distributions | (1.796) | (1.415) | (1.305) | (1.186) | (1.016) |
| Net Asset Value, End of Period | $45.21 | $40.76 | $33.49 | $35.12 | $28.36 |
| Total Return | 17.47% | 26.50% | -1.18% | 28.83% | 10.84% |
| Ratios/Supplemental Data | | | | | |
| Net Assets, End of Period (Millions) | $2,092 | $1,976 | $1,596 | $1,416 | $964 |
| Ratio of Total Expenses to Average Net Assets | 0.34% | 0.34% | 0.34% | 0.36% | 0.36% |
| Ratio of Net Investment Income to Average Net Assets | 1.25% | 1.37% | 1.18% | 1.16% | 1.44% |
| Portfolio Turnover Rate | 6% | 5% | 6% | 7% | 5% |
| 1 | Calculated based on average shares outstanding. |
See accompanying Notes, which are an integral part of the Financial Statements.
Notes to Financial Statements
The Capital Growth Portfolio, a portfolio of Vanguard Variable Insurance Funds, is registered under the Investment Company Act of 1940 as an open-end investment company. The portfolio's shares are only available for purchase by separate accounts of insurance companies as investments for variable annuity plans, variable life insurance contracts, or other variable benefit insurance contracts. Market disruptions associated with the COVID-19 pandemic have had a global impact, and uncertainty exists as to the long-term implications. Such disruptions can adversely affect assets of the portfolio and thus portfolio performance.
| A. | The following significant accounting policies conform to generally accepted accounting principles for U.S. investment companies. The portfolio consistently follows such policies in preparing its financial statements. |
1. Security Valuation: Securities are valued as of the close of trading on the New York Stock Exchange (generally 4 p.m., Eastern time) on the valuation date. Equity securities are valued at the latest quoted sales prices or official closing prices taken from the primary market in which each security trades; such securities not traded on the valuation date are valued at the mean of the latest quoted bid and asked prices. Securities for which market quotations are not readily available, or whose values have been affected by events occurring before the portfolio’s pricing time but after the close of the securities’ primary markets, are valued at their fair values calculated according to procedures adopted by the board of trustees. These procedures include obtaining quotations from an independent pricing service, monitoring news to identify significant market- or security-specific events, and evaluating changes in the values of foreign market proxies (for example, ADRs, futures contracts, or exchange-traded funds), between the time the foreign markets close and the portfolio’s pricing time. When fair-value pricing is employed, the prices of securities used by a portfolio to calculate its net asset value may differ from quoted or published prices for the same securities.
Investments in Vanguard Market Liquidity Fund are valued at that fund's net asset value.
2. Foreign Currency: Securities and other assets and liabilities denominated in foreign currencies are translated into U.S. dollars using exchange rates obtained from an independent third party as of the portfolio’s pricing time on the valuation date. Realized gains (losses) and unrealized appreciation (depreciation) on investment securities include the effects of changes in exchange rates since the securities were purchased, combined with the effects of changes in security prices. Fluctuations in the value of other assets and liabilities resulting from changes in exchange rates are recorded as unrealized foreign currency gains (losses) until the assets or liabilities are settled in cash, at which time they are recorded as realized foreign currency gains (losses).
3. Federal Income Taxes: The portfolio intends to continue to qualify as a regulated investment company and distribute all of its taxable income. The portfolio’s tax returns are open to examination by the relevant tax authorities until expiration of the applicable statute of limitations, which is generally three years after the filing of the tax return. Management has analyzed the portfolio’s tax positions taken for all open federal and state income tax years, and has concluded that no provision for income tax is required in the portfolio’s financial statements.
4. Distributions: Distributions to shareholders are recorded on the ex-dividend date. Distributions are determined on a tax basis at the fiscal year-end and may differ from net investment income and realized capital gains for financial reporting purposes.
5. Securities Lending: To earn additional income, the portfolio lends its securities to qualified institutional borrowers. Security loans are subject to termination by the portfolio at any time, and are required to be secured at all times by collateral in an amount at least equal to the market value of securities loaned. Daily market fluctuations could cause the value of loaned securities to be more or less than the value of the collateral received. When this occurs, the collateral is adjusted and settled before the opening of the market on the next business day. The portfolio further mitigates its counterparty risk by entering into securities lending transactions only with a diverse group of prequalified counterparties, monitoring their financial strength, and entering into master securities lending agreements with its counterparties. The master securities lending agreements provide that, in the event of a counterparty’s default (including bankruptcy), the portfolio may terminate any loans with that borrower, determine the net amount owed, and sell or retain the collateral up to the net amount owed to the portfolio; however, such actions may be subject to legal proceedings. While collateral mitigates counterparty risk, in the event of a default, the portfolio may experience delays and costs in recovering the securities loaned. The portfolio invests cash collateral received in Vanguard Market Liquidity Fund, and records a liability in the Statement of Assets and Liabilities for the return of the collateral, during the period the securities are on loan. Collateral investments in Vanguard Market Liquidity Fund are subject to market appreciation or depreciation. Securities lending income represents fees charged to borrowers plus income earned on invested cash collateral, less expenses associated with the loan. During the term of the loan, the portfolio is entitled to all distributions made on or in respect of the loaned securities.
6. Credit Facilities and Interfund Lending Program: The portfolio and certain other funds managed by The Vanguard Group ("Vanguard") participate in a $4.3 billion committed credit facility provided by a syndicate of lenders pursuant to a credit agreement and an uncommitted credit facility provided by Vanguard. Both facilities may be renewed annually. Each fund is individually liable for its borrowings, if any, under the credit facilities. Borrowings may be utilized for temporary or emergency purposes, subject to the portfolio’s regulatory and contractual borrowing restrictions. With respect to the committed credit facility, the participating funds are charged administrative fees and an annual commitment fee of 0.10% of the undrawn committed amount of the facility; these fees are allocated to the funds based on a method approved by the portfolio’s board of trustees and included in Management and Administrative expenses on the portfolio’s Statement of Operations. Any borrowings under either facility bear interest at a rate based upon the higher of the one-month London Interbank Offered Rate (or an acceptable alternate rate, if necessary), federal funds effective rate, or overnight bank funding rate plus an agreed-upon spread, except that borrowings under the uncommitted credit facility may bear interest based upon an alternate rate agreed to by the portfolio and Vanguard.
In accordance with an exemptive order (the “Order”) from the SEC, the portfolio may participate in a joint lending and borrowing program that allows registered open-end Vanguard funds to borrow money from and lend money to each other for temporary or emergency purposes (the “Interfund Lending Program”), subject to compliance with the terms and conditions of the Order, and to the extent permitted by the portfolio’s investment objective and investment policies. Interfund loans and borrowings normally extend overnight, but can have a maximum duration of seven days. Loans may be called on one business day’s notice. The interest rate to be charged is governed by the conditions of the Order and internal procedures adopted by the board of trustees. The board of trustees is responsible for overseeing the Interfund Lending Program.
For the year ended December 31, 2020, the portfolio did not utilize the credit facilities or the Interfund Lending Program.
7. Other: Dividend income is recorded on the ex-dividend date. Non-cash dividends included in investment income are recorded at the fair value of the securities received. Interest income includes income distributions received from Vanguard Market Liquidity Fund and is accrued daily. Premiums and discounts on debt securities are amortized and accreted, respectively, to interest income over the lives of the respective securities, except for premiums on certain callable debt securities that are amortized to the earliest call date. Security transactions are accounted for on the date securities are bought or sold. Costs used to determine realized gains (losses) on the sale of investment securities are those of the specific securities sold.
| B. | PRIMECAP Management Company provides investment advisory services to the portfolio for a fee calculated at an annual percentage rate of average net assets. For the year ended December 31, 2020, the investment advisory fee represented an effective annual basic rate of 0.15% of the portfolio’s average net assets. |
| C. | In accordance with the terms of a Funds' Service Agreement (the “FSA”) between Vanguard and the portfolio, Vanguard furnishes to the portfolio corporate management, administrative, marketing, and distribution services at Vanguard’s cost of operations (as defined by the FSA). These costs of operations are allocated to the portfolio based on methods and guidelines approved by the board of trustees and are generally settled twice a month. |
Upon the request of Vanguard, the portfolio may invest up to 0.40% of its net assets as capital in Vanguard. At December 31, 2020, the portfolio had contributed to Vanguard capital in the amount of $79,000, representing less than 0.01% of the portfolio’s net assets and 0.03% of Vanguard’s capital received pursuant to the FSA. The portfolio’s trustees and officers are also directors and employees, respectively, of Vanguard.
| D. | Various inputs may be used to determine the value of the portfolio’s investments. These inputs are summarized in three broad levels for financial statement purposes. The inputs or methodologies used to value securities are not necessarily an indication of the risk associated with investing in those securities. |
Level 1—Quoted prices in active markets for identical securities.
Level 2—Other significant observable inputs (including quoted prices for similar securities, interest rates, prepayment speeds, credit risk, etc.).
Level 3—Significant unobservable inputs (including the portfolio’s own assumptions used to determine the fair value of investments). Any investments valued with significant unobservable inputs are noted on the Schedule of Investments.
The following table summarizes the market value of the portfolio’s investments as of December 31, 2020, based on the inputs used to value them:
| | Level 1
($000) | Level 2
($000) | Level 3
($000) | Total
($000) |
| Investments | | | | |
| Assets | | | | |
| Common Stocks | 1,915,551 | 99,526 | — | 2,015,077 |
| Temporary Cash Investments | 88,332 | — | — | 88,332 |
| Total | 2,003,883 | 99,526 | — | 2,103,409 |
| E. | Permanent differences between book-basis and tax-basis components of net assets are reclassified among capital accounts in the financial statements to reflect their tax character. These reclassifications have no effect on net assets or net asset value per share. As of period end, permanent differences primarily attributable to the accounting for foreign currency transactions were reclassified between the individual components of total distributable earnings (loss). |
Temporary differences between book-basis and tax-basis components of total distributable earnings (loss) arise when certain items of income, gain, or loss are recognized in different periods for financial statement and tax purposes; these differences will reverse at some time in the future. The differences are primarily related to the deferral of losses from wash sales. As of period end, the tax-basis components of total distributable earnings (loss) are detailed in the table as follows:
| | Amount
($000) |
| Undistributed Ordinary Income | 19,989 |
| Undistributed Long-Term Gains | 153,666 |
| Capital Loss Carryforwards | — |
| Qualified Late-Year Losses | — |
| Net Unrealized Gains (Losses) | 919,145 |
The tax character of distributions paid was as follows:
| | Year Ended December 31, |
| | 2020
Amount
($000) | 2019
Amount
($000) |
| Ordinary Income* | 26,842 | 20,887 |
| Long-Term Capital Gains | 57,134 | 47,429 |
| Total | 83,976 | 68,316 |
| * | Includes short-term capital gains, if any. |
As of December 31, 2020, gross unrealized appreciation and depreciation for investments based on cost for U.S. federal income tax purposes were as follows:
| | Amount
($000) |
| Tax Cost | 1,184,323 |
| Gross Unrealized Appreciation | 999,713 |
| Gross Unrealized Depreciation | (80,627) |
| Net Unrealized Appreciation (Depreciation) | 919,086 |
| F. | During the year ended December 31, 2020, the portfolio purchased $100,417,000 of investment securities and sold $253,620,000 of investment securities, other than temporary cash investments. |
| G. | Capital shares issued and redeemed were: |
| | Year Ended December 31, |
| | 2020 | 2019 |
| | Shares
(000) | Shares
(000) |
| Issued | 5,930 | 6,109 |
| Issued in Lieu of Cash Distributions | 2,763 | 1,900 |
| Redeemed | (10,888) | (7,186) |
| Net Increase (Decrease) in Shares Outstanding | (2,195) | 823 |
At December 31, 2020, one shareholder (an insurance company separate account whose holdings in the portfolio represent the indirect investment of Vanguard Variable Annuity contract holders) was the record or beneficial owner of 46% of the portfolio’s net assets. If this shareholder was to redeem its investment in the portfolio, the redemption might result in an increase in the portfolio’s expense ratio, cause the portfolio to incur higher transaction costs, or lead to the realization of taxable capital gains.
| H. | Management has determined that no events or transactions occurred subsequent to December 31, 2020, that would require recognition or disclosure in these financial statements. |
Report of Independent Registered Public Accounting Firm
To the Board of Trustees of Vanguard Variable Insurance Funds and Shareholders of Capital Growth Portfolio
Opinion on the Financial Statements
We have audited the accompanying statement of assets and liabilities, including the schedule of investments, of Capital Growth Portfolio (one of the portfolios constituting Vanguard Variable Insurance Funds, referred to hereafter as the "Portfolio”) as of December 31, 2020, the related statement of operations for the year ended December 31, 2020, the statement of changes in net assets for each of the two years in the period ended December 31, 2020, including the related notes, and the financial highlights for each of the five years in the period ended December 31, 2020 (collectively referred to as the “financial statements”). In our opinion, the financial statements present fairly, in all material respects, the financial position of the Portfolio as of December 31, 2020, the results of its operations for the year then ended, the changes in its net assets for each of the two years in the period ended December 31, 2020 and the financial highlights for each of the five years in the period ended December 31, 2020 in conformity with accounting principles generally accepted in the United States of America.
Basis for Opinion
These financial statements are the responsibility of the Portfolio’s management. Our responsibility is to express an opinion on the Portfolio’s financial statements based on our audits. We are a public accounting firm registered with the Public Company Accounting Oversight Board (United States) (PCAOB) and are required to be independent with respect to the Portfolio in accordance with the U.S. federal securities laws and the applicable rules and regulations of the Securities and Exchange Commission and the PCAOB.
We conducted our audits of these financial statements in accordance with the standards of the PCAOB. Those standards require that we plan and perform the audit to obtain reasonable assurance about whether the financial statements are free of material misstatement, whether due to error or fraud.
Our audits included performing procedures to assess the risks of material misstatement of the financial statements, whether due to error or fraud, and performing procedures that respond to those risks. Such procedures included examining, on a test basis, evidence regarding the amounts and disclosures in the financial statements. Our audits also included evaluating the accounting principles used and significant estimates made by management, as well as evaluating the overall presentation of the financial statements. Our procedures included confirmation of securities owned as of December 31, 2020 by correspondence with the custodian and brokers and by agreement to the underlying ownership records of the transfer agent; when replies were not received from brokers, we performed other auditing procedures. We believe that our audits provide a reasonable basis for our opinion.
/s/PricewaterhouseCoopers LLP
Philadelphia, Pennsylvania
February 18, 2021
We have served as the auditor of one or more investment companies in The Vanguard Group of Funds since 1975.
Special 2020 tax information (unaudited) for corporate shareholders only for Capital Growth Portfolio, a portfolio of Vanguard Variable Insurance Funds
This information for the fiscal year ended December 31, 2020, is included pursuant to provisions of the Internal Revenue Code for corporate shareholders only.
The portfolio distributed $57,135,000 as capital gain dividends (20% rate gain distributions) to shareholders during the fiscal year.
For corporate shareholders, 88.9% of investment income (dividend income plus short-term gains, if any) qualifies for the dividends-received deduction.
This page intentionally left blank.
The People Who Govern Your Fund
The trustees of your mutual fund are there to see that the fund is operated and managed in your best interests since, as a shareholder, you are a part owner of the fund. Your fund’s trustees also serve on the board of directors of The Vanguard Group, Inc., which is owned by the Vanguard funds and provides services to them.
A majority of Vanguard’s board members are independent, meaning that they have no affiliation with Vanguard or the funds they oversee, apart from the sizable personal investments they have made as private individuals. The independent board members have distinguished backgrounds in business, academia, and public service. Each of the trustees and executive officers oversees 211 Vanguard funds.
Information for each trustee and executive officer of the fund appears below. That information, as well as the Vanguard fund count, is as of the date on the cover of this fund report. The mailing address of the trustees and officers is P.O. Box 876, Valley Forge, PA 19482. More information about the trustees is in the Statement of Additional Information, which can be obtained, without charge, by contacting Vanguard at 800-662-7447, or online at vanguard.com.
Interested Trustee1
Mortimer J. Buckley
Born in 1969. Trustee since January 2018. Principal occupation(s) during the past five years and other experience: chairman of the board (2019–present) of Vanguard and of each of the investment companies served by Vanguard; chief executive officer (2018–present) of Vanguard; chief executive officer, president, and trustee (2018–present) of each of the investment companies served by Vanguard; president and director (2017–present) of Vanguard; and president (2018–present) of Vanguard Marketing Corporation. Chief investment officer (2013–2017), managing director (2002–2017), head of the Retail Investor Group (2006–2012), and chief information officer (2001–2006) of Vanguard. Chairman of the board (2011–2017) and trustee (2009–2017) of the Children’s Hospital of Philadelphia; and trustee (2018–present) and vice chair (2019–present) of The Shipley School.
Independent Trustees
Emerson U. Fullwood
Born in 1948. Trustee since January 2008. Principal occupation(s) during the past five years and other experience: executive chief staff and marketing officer for North America and corporate vice president (retired 2008) of Xerox Corporation (document management products and services). Former president of the Worldwide Channels Group, Latin America, and Worldwide Customer Service and executive chief staff officer of Developing Markets of Xerox. Executive in residence and 2009–2010 Distinguished Minett Professor at the Rochester Institute of Technology. Director of SPX FLOW, Inc. (multi-industry manufacturing). Director of the University of Rochester Medical Center, the Monroe Community College Foundation, the United Way of Rochester, North Carolina A&T University, and Roberts Wesleyan College. Trustee of the University of Rochester.
Amy Gutmann
Born in 1949. Trustee since June 2006. Principal occupation(s) during the past five years and other experience: president (2004–present) of the University of Pennsylvania. Christopher H. Browne Distinguished Professor of Political Science, School of Arts and Sciences, and professor of communication, Annenberg School for Communication, with secondary faculty appointments in the Department of Philosophy, School of Arts and Sciences, and at the Graduate School of Education, University of Pennsylvania.
F. Joseph Loughrey
Born in 1949. Trustee since October 2009. Principal occupation(s) during the past five years and other experience: president and chief operating officer (retired 2009) and vice chairman of the board (2008–2009) of Cummins Inc. (industrial machinery). Chairman of the board of Hillenbrand, Inc. (specialized consumer services) and the Lumina Foundation. Director of the V Foundation. Member of the advisory council for the College of Arts and Letters and chair of the advisory board to the Kellogg Institute for International Studies, both at the University of Notre Dame.
Mark Loughridge
Born in 1953. Trustee since March 2012. Principal occupation(s) during the past five years and other experience: senior vice president and chief financial officer (retired 2013) of IBM (information technology services). Fiduciary member of IBM’s Retirement Plan Committee (2004–2013), senior vice president and general manager (2002–2004) of IBM Global Financing, vice president and controller (1998–2002) of IBM, and a variety of other prior management roles at IBM. Member of the Council on Chicago Booth.
Scott C. Malpass
Born in 1962. Trustee since March 2012. Principal occupation(s) during the past five years and other experience: chief investment officer (retired June 2020) and vice president (retired June 2020) of the University of Notre Dame. Assistant professor of finance at the Mendoza College of Business, University of Notre Dame, and member of the Notre Dame 403(b) Investment Committee (retired June 2020). Member of the board of Catholic Investment Services, Inc. (investment advisors) and the board of superintendence of the Institute for the Works of Religion.
Deanna Mulligan
Born in 1963. Trustee since January 2018. Principal occupation(s) during the past five years and other experience: board chair (2020–present), chief executive officer (2011–2020), and president (2010–2019) of The Guardian Life Insurance Company of America. Chief operating officer (2010–2011) and executive vice president (2008–2010) of the individual life and disability division of Guardian Life. Member of the board of the American Council of Life Insurers and the board of the Economic Club of New York. Trustee of the Partnership for New York City (business leadership), Chief Executives for Corporate Purpose, NewYork-Presbyterian Hospital, Catalyst, and the
Bruce Museum (arts and science). Member of the Advisory Council for the Stanford Graduate School of Business.
André F. Perold
Born in 1952. Trustee since December 2004. Principal occupation(s) during the past five years and other experience: George Gund Professor of Finance and Banking, Emeritus at the Harvard Business School (retired 2011). Chief investment officer and co-managing partner of HighVista Strategies (private investment firm). Member of the board of advisors and member of the investment committee of the Museum of Fine Arts Boston. Member of the board (2018–present) of RIT Capital Partners (investment firm). Member of the investment committee of Partners Health Care System.
Sarah Bloom Raskin
Born in 1961. Trustee since January 2018. Principal occupation(s) during the past five years and other experience: deputy secretary (2014–2017) of the United States Department of the Treasury. Governor (2010–2014) of the Federal Reserve Board. Commissioner (2007–2010) of financial regulation for the State of Maryland. Member of the board of directors (2012–2014) of Neighborhood Reinvestment Corporation. Director (2017–present) of i(x) Investments, LLC; director (2017–present) of Reserve Trust. Rubenstein Fellow (2017–present) of Duke University; trustee (2017–present) of Amherst College, and trustee (2019–present) of the Folger Shakespeare Library.
Peter F. Volanakis
Born in 1955. Trustee since July 2009. Principal occupation(s) during the past five years and other experience: president and chief operating officer (retired 2010) of Corning Incorporated (communications equipment) and director of Corning Incorporated (2000–2010) and Dow Corning (2001–2010). Director (2012) of SPX Corporation (multi-industry manufacturing). Overseer of the Amos Tuck School of Business Administration, Dartmouth College (2001–2013). Chairman of the board of trustees of Colby-Sawyer College. Member of the board of Hypertherm Inc. (industrial cutting systems, software, and consumables).
1 Mr. Buckley is considered an “interested person,” as defined in the Investment Company Act of 1940, because he is an officer of the Vanguard funds.
Executive Officers
John Bendl
Born in 1970. Principal occupation(s) during the past five years and other experience: principal of Vanguard. Chief financial officer (2019–present) of each of the investment companies served by Vanguard. Chief accounting officer, treasurer, and controller of Vanguard (2017–present). Partner (2003–2016) at KPMG (audit, tax, and advisory services).
Christine M. Buchanan
Born in 1970. Principal occupation(s) during the past five years and other experience: principal of Vanguard. Treasurer (2017–present) of each of the investment companies served by Vanguard. Partner (2005–2017) at KPMG (audit, tax, and advisory services).
David Cermak
Born in 1960. Principal occupation(s) during the past five years and other experience: principal of Vanguard. Finance director (2019–present) of each of the investment companies served by Vanguard. Managing director and head (2017–present) of Vanguard Investments Singapore. Managing director and head (2017–2019) of Vanguard Investments Hong Kong. Representative director and head (2014–2017) of Vanguard Investments Japan.
John Galloway
Born in 1973. Principal occupation(s) during the past five years and other experience: principal of Vanguard.
Investment stewardship officer (September 2020–present) of each of the investment companies served by Vanguard. Head of Investor Advocacy (February 2020–present) and head of Marketing Strategy and Planning (2017–2020) at Vanguard. Deputy assistant to the President of the United States (2015).
Thomas J. Higgins
Born in 1957. Principal occupation(s) during the past five years and other experience: principal of Vanguard. Finance director (2019–present), chief financial officer (2008–2019), and treasurer (1998–2008) of each of the investment companies served by Vanguard.
Peter Mahoney
Born in 1974. Principal occupation(s) during the past five years and other experience: principal of Vanguard. Controller (2015–present) of each of the investment companies served by Vanguard. Head of International Fund Services (2008–2014) at Vanguard.
Anne E. Robinson
Born in 1970. Principal occupation(s) during the past five years and other experience: general counsel (2016–present) of Vanguard. Secretary (2016–present) of Vanguard and of each of the investment companies served by Vanguard. Managing director (2016–present) of Vanguard. Managing director and general counsel of Global Cards and Consumer Services (2014–2016) at Citigroup. Counsel (2003–2014) at American Express.
Michael Rollings
Born in 1963. Principal occupation(s) during the past five years and other experience: finance director (2017–present) and treasurer (2017) of each of the investment companies served by Vanguard. Managing director (2016–present) of Vanguard. Chief financial officer (2016–present) of Vanguard. Director (2016–present) of Vanguard Marketing Corporation. Executive vice president and chief financial officer (2006–2016) of MassMutual Financial Group.
John E. Schadl
Born in 1972. Principal occupation(s) during the past five years and other experience: principal of Vanguard. Chief compliance officer (2019–present) of Vanguard and of each of the investment companies served by Vanguard. Assistant vice president (2019–present) of Vanguard Marketing Corporation.
Vanguard Senior Management Team
| Joseph Brennan | James M. Norris |
| Mortimer J. Buckley | Thomas M. Rampulla |
| Gregory Davis | Karin A. Risi |
| John James | Anne E. Robinson |
| John T. Marcante | Michael Rollings |
| Chris D. McIsaac | Lauren Valente |
Connect with Vanguard®>vanguard.com
Fund Information > 800-662-7447
Annuity and Insurance Services > 800-522-5555
Institutional Investor Services > 800-523-1036
Text Telephone for People Who Are Deaf or Hard of Hearing > 800-749-7273
This material may be used in conjunction with the offering of shares of any Vanguard fund only if preceded or accompanied by the fund’s current prospectus.
You can obtain a free copy of Vanguard’s proxy voting guidelines by visiting vanguard.com/proxyreporting or by calling Vanguard at 800-662-2739. The guidelines are also available from the SEC’s website, www.sec.gov. In addition, you may obtain a free report on how your fund voted the proxies for securities it owned during the 12 months ended June 30. To get the report, visit either vanguard.com/proxyreporting or www.sec.gov.
All comparative mutual fund data are from Morningstar, Inc., unless otherwise noted.
You can review information about your fund on the SEC’s website, and you can receive copies of this information, for a fee, by sending a request via email addressed to publicinfo@sec.gov.
Source for Bloomberg Barclays indexes: Bloomberg Index Services Limited. Copyright 2021, Bloomberg. All rights reserved.
CFA® is a registered trademark owned by CFA Institute.
© 2021 The Vanguard Group, Inc.
All rights reserved.
Vanguard Marketing Corporation, Distributor.
Q690CG 022021

| | |
| | |
| | |
| | |
| Annual Report | December 31, 2020 | |
| | |
| | |
| Vanguard Variable Insurance Funds |
| | |
| | |
| | |
| | |
| | |
| | |
| | |
| | |
| | |
| |
| Conservative Allocation Portfolio | |
| |
| |
| | |
| | |
| | |
| | |
| | |
| | |
| | |
| | |
| | |
| | |
| | |
| | |
| | |
| | |
| | |
| | |
| | |
| | |
| | |
| | |
| | |
| | |
| | |
| | |
| | |
| | |
| | |
| | |
| | |
| | |
|
| | |
| | |
Contents
| Your Portfolio’s Performance at a Glance | 1 |
| About Your Portfolio’s Expenses | 2 |
| Performance Summary | 3 |
| Financial Statements | 5 |
Please note: The opinions expressed in this report are just that—informed opinions. They should not be considered promises or advice. Also, please keep in mind that the information and opinions cover the period through the date on the front of this report. Of course, the risks of investing in your portfolio are spelled out in the prospectus.
Conservative Allocation Portfolio
Your Portfolio’s Performance at a Glance
● For the 12 months ended December 31, 2020, the Conservative Allocation Portfolio returned 11.73%, behind the 12.87% return of its benchmark, the Conservative Allocation Composite Index. The portfolio posted a return different from that of its benchmark in part because of differences in the timing for rebalancing them to their target allocations.
● The period was marked by the global spread of COVID-19 and efforts to contain it. Responses from policymakers, the creation and initial distribution of vaccines, and the easing of some restrictions soon lifted investor sentiment, and stock markets hit highs in December. After an initial period of high volatility and low liquidity in the bond markets, yields fell and prices rose amid unprecedented actions taken by governments and central banks to blunt the economic impact of the virus.
● The portfolio targets an asset allocation of approximately 60% bonds and 40% stocks through these holdings: Vanguard Variable Insurance Funds Total Bond Market Index Portfolio and Equity Index Portfolio and Admiral Shares of Vanguard Total International Bond Index Fund, Vanguard Total International Stock Index Fund, and Vanguard Extended Market Index Fund.
● The Total Bond Market Index Portfolio returned more than 7%, and the Total International Bond Index Fund returned more than 4%. The Extended Market Index Fund returned about 32%, the Equity Index Portfolio about 18%, and the Total International Stock Fund more than 11%.
● Please note that the portfolio’s returns are different from those in Vanguard Variable Annuity (and other plans that invest in the portfolio), which take into account insurance-related expenses.
Market Barometer
| | Average Annual Total Returns
Periods Ended December 31, 2020 |
| | One Year | Three Years | Five Years |
| Stocks | | | |
| Russell 1000 Index (Large-caps) | 20.96% | 14.82% | 15.60% |
| Russell 2000 Index (Small-caps) | 19.96 | 10.25 | 13.26 |
| Russell 3000 Index (Broad U.S. market) | 20.89 | 14.49 | 15.43 |
| FTSE All-World ex US Index (International) | 11.22 | 5.18 | 9.16 |
| | | | |
| Bonds | | | |
| Bloomberg Barclays U.S. Aggregate Bond Index | | | |
| (Broad taxable market) | 7.51% | 5.34% | 4.44% |
| Bloomberg Barclays Municipal Bond Index | | | |
| (Broad tax-exempt market) | 5.21 | 4.64 | 3.91 |
| FTSE Three-Month U.S. Treasury Bill Index | 0.58 | 1.56 | 1.16 |
| | | | |
| CPI | | | |
| Consumer Price Index | 1.36% | 1.85% | 1.95% |
Conservative Allocation Portfolio
About Your Portfolio’s Expenses
As a shareholder of the portfolio, you incur ongoing costs, which include costs for portfolio management, administrative services, and shareholder reports (like this one), among others. Operating expenses, which are deducted from a portfolio’s gross income, directly reduce the investment return of the portfolio.
A typical portfolio’s expenses are expressed as a percentage of its average net assets. The Conservative Allocation Portfolio has no direct expenses, but bears its proportionate share of the expenses of the underlying funds in which it invests. These indirect expenses make up the acquired fund fees and expenses, also expressed as a percentage of average net assets. The following examples are intended to help you understand the ongoing costs (in dollars) of investing in your portfolio and to compare these costs with those of other mutual funds. The examples are based on an investment of $1,000 made at the beginning of the period shown and held for the entire period. The costs were calculated using the acquired fund fees and expenses for the Conservative Allocation Portfolio.
The accompanying table illustrates your portfolio’s costs in two ways:
● Based on actual portfolio return. This section helps you to estimate the actual expenses that you paid over the period. The “Ending Account Value” shown is derived from the portfolio’s actual return, and the third column shows the dollar amount that would have been paid by an investor who started with $1,000 in the portfolio. You may use the information here, together with the amount you invested, to estimate the expenses that you paid over the period.
To do so, simply divide your account value by $1,000 (for example, an $8,600 account value divided by $1,000 = 8.6), then multiply the result by the number given for your portfolio under the heading “Expenses Paid During Period.”
● Based on hypothetical 5% yearly return. This section is intended to help you compare your portfolio’s costs with those of other mutual funds. It assumes that the portfolio had a yearly return of 5% before expenses, but that the expense ratio is unchanged. In this case—because the return used is not the portfolio’s actual return—the results do not apply to your investment. The example is useful in making comparisons because the Securities and Exchange Commission requires all mutual funds to calculate expenses based on a 5% return. You can assess your portfolio’s costs by comparing this hypothetical example with the hypothetical examples that appear in shareholder reports of other funds.
Note that the expenses shown in the table are meant to highlight and help you compare ongoing costs only. The portfolio’s expense figure does not reflect additional fees and expenses associated with the annuity or life insurance program through which you invest.
The calculations assume no shares were bought or sold during the period. Your actual costs may have been higher or lower, depending on the amount of your investment and the timing of any purchases or redemptions.
You can find more information about the portfolio’s expenses in the Financial Statements section. For additional information on operating expenses and other shareholder costs, please refer to the prospectus.
Six Months Ended December 31, 2020
| | Beginning | Ending | Expenses |
| | Account Value | Account Value | Paid During |
| Conservative Allocation Portfolio | 6/30/2020 | 12/31/2020 | Period |
| Based on Actual Portfolio Return | $1,000.00 | $1,105.06 | $0.69 |
| Based on Hypothetical 5% Yearly Return | 1,000.00 | 1,024.48 | 0.66 |
The calculations are based on the Conservative Allocation Portfolio’s acquired fund fees and expenses for the most recent six-month period. The Conservative Allocation Portfolio’s annualized expense figure for that period is 0.13%. The dollar amounts shown as “Expenses Paid” are equal to the annualized average weighted expense ratio for the underlying funds, multiplied by the average account value over the period, multiplied by the number of days in the most recent six-month period, then divided by the number of days in the recent 12-month period (184/366).
Conservative Allocation Portfolio
Performance Summary
All of the returns in this report represent past performance, which is not a guarantee of future results that may be achieved by the portfolio. (Current performance may be lower or higher than the performance data cited. For performance data current to the most recent month-end, visit our website at vanguard.com/performance.) Note, too, that both investment returns and principal value can fluctuate widely, so an investor’s shares, when sold, could be worth more or less than their original cost. The returns shown do not reflect taxes that a shareholder would pay on portfolio distributions or on the sale of portfolio shares. Nor do the returns reflect fees and expenses associated with the annuity or life insurance program through which a shareholder invests. If these fees and expenses were included, the portfolio’s returns would be lower.
Cumulative Performance: October 19, 2011–December 31, 2020
Initial Investment of $10,000
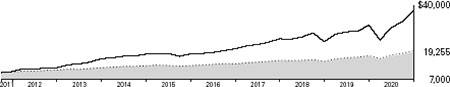
| | | | Average Annual Total Returns | |
| | | Periods Ended December 31, 2020 | |
| | | | | Since | Final Value |
| | | One | Five | Inception | of a $10,000 |
| | | Year | Years | (10/19/2011) | Investment |
 | Conservative Allocation Portfolio | 11.73% | 8.10% | 7.38% | $19,255 |
 | Conservative Allocation Composite Index | 12.87 | 8.55 | 7.70 | 19,785 |
 | Dow Jones U.S. Total Stock Market | | | | |
| | Float Adjusted Index | 20.79 | 15.36 | 15.45 | 37,512 |
Conservative Allocation Composite Index: Weighted 48% Bloomberg Barclays U.S. Aggregate Float Adjusted Index, 28% S&P Total Market Index, 12% Bloomberg Barclays Global Aggregate ex-USD Float Adjusted RIC Capped Index (USD Hedged), and 12% FTSE Global All Cap ex US Index as of June 3, 2013. Previously, the composite was weighted 60% Bloomberg Barclays U.S. Aggregate Float Adjusted Index, 28% S&P Total Market Index, and 12% MSCI ACWI ex USA IMI Index through June 2, 2013.
“Since Inception” performance is calculated from the portfolio’s inception date for both the portfolio and its comparative standard(s).
See Financial Highlights for dividend and capital gains information.
Conservative Allocation Portfolio
Underlying Vanguard Funds
As of December 31, 2020
| Vanguard Variable Insurance Funds— | |
| Total Bond Market Index Portfolio | 41.9% |
| Vanguard Variable Insurance Funds— | |
| Equity Index Portfolio | 19.8 |
| Vanguard Total International Bond | |
| Index Fund Admiral Shares | 17.9 |
| Vanguard Total International Stock | |
| Index Fund Admiral Shares | 16.1 |
| Vanguard Extended Market Index Fund | |
| Admiral Shares | 4.3 |
The table reflects the portfolio’s investments, except for short-term investments.
Conservative Allocation Portfolio
Financial Statements
Schedule of Investments
As of December 31, 2020
The portfolio files its complete schedule of portfolio holdings with the Securities and Exchange Commission (SEC) for the first and third quarters of each fiscal year as an exhibit to its reports on Form N-PORT. The portfolio’s Form N-PORT reports are available on the SEC’s website at www.sec.gov.
| | | Market |
| | | Value● |
| | Shares | ($000) |
| Investment Companies (100.0%) | | |
| U.S. Stock Funds (24.1%) | | |
| Vanguard Variable Insurance Funds—Equity Index Portfolio | 1,919,541 | 103,195 |
| Vanguard Extended Market Index Fund Admiral Shares | 179,330 | 22,371 |
| | | 125,566 |
| International Stock Fund (16.1%) | | |
| Vanguard Total International Stock Index Fund Admiral Shares | 2,578,735 | 83,706 |
| | | |
| U.S. Bond Fund (41.9%) | | |
| Vanguard Variable Insurance Funds—Total Bond Market Index Portfolio | 17,070,223 | 218,670 |
| | | |
| International Bond Fund (17.9%) | | |
| Vanguard Total International Bond Index Fund Admiral Shares | 3,984,154 | 93,189 |
| Total Investments (100.0%) (Cost $466,102) | | 521,131 |
| Other Assets and Liabilities—Net (0.0%) | | 193 |
| Net Assets (100%) | | 521,324 |
Cost is in $000.
● See Note A in Notes to Financial Statements.
See accompanying Notes, which are an integral part of the Financial Statements.
Conservative Allocation Portfolio
Statement of Assets and Liabilities
As of December 31, 2020
| ($000s, except shares and per-share amounts) | Amount |
| Assets | |
| Investments in Securities, at Value—Affiliated Funds (Cost $466,102) | 521,131 |
| Receivables for Investment Securities Sold | 398 |
| Receivables for Capital Shares Issued | 294 |
| Total Assets | 521,823 |
| Liabilities | |
| Due to Custodian | 398 |
| Payables for Capital Shares Redeemed | 101 |
| Total Liabilities | 499 |
| Net Assets | 521,324 |
| | |
| At December 31, 2020, net assets consisted of: | |
| | |
| Paid-in Capital | 440,362 |
| Total Distributable Earnings (Loss) | 80,962 |
| Net Assets | 521,324 |
| | |
| Net Assets | |
| Applicable to 18,357,722 outstanding $.001 par value shares of | |
| beneficial interest (unlimited authorization) | 521,324 |
| Net Asset Value Per Share | $28.40 |
See accompanying Notes, which are an integral part of the Financial Statements.
Conservative Allocation Portfolio
Statement of Operations
| | Year Ended |
| | December 31, 2020 |
| | ($000) |
| Investment Income | |
| Income | |
| Income Distributions Received | |
| from Affiliated Funds | 8,697 |
| Net Investment Income—Note B | 8,697 |
| Realized Net Gain (Loss) | |
| Capital Gain Distributions Received | |
| from Affiliated Funds | 2,141 |
| Affiliated Funds Sold | 16,041 |
| Realized Net Gain (Loss) | 18,182 |
| Change in Unrealized Appreciation | |
| (Depreciation) from Affiliated Funds | 26,569 |
| Net Increase (Decrease) in Net Assets | |
| Resulting from Operations | 53,448 |
Statement of Changes in Net Assets
| | Year Ended December 31, |
| | 2020 | 2019 |
| | ($000) | ($000) |
| Increase (Decrease) in Net Assets | | |
| Operations | | |
| Net Investment Income | 8,697 | 9,654 |
| Realized Net Gain (Loss) | 18,182 | 6,364 |
| Change in Unrealized Appreciation (Depreciation) | 26,569 | 36,711 |
| Net Increase (Decrease) in Net Assets Resulting from Operations | 53,448 | 52,729 |
| Distributions1 | | |
| Total Distributions | (16,480) | (15,870) |
| Capital Share Transactions | | |
| Issued | 97,832 | 94,274 |
| Issued in Lieu of Cash Distributions | 16,480 | 15,870 |
| Redeemed | (54,776) | (43,396) |
| Net Increase (Decrease) from Capital Share Transactions | 59,536 | 66,748 |
| Total Increase (Decrease) | 96,504 | 103,607 |
| Net Assets | | |
| Beginning of Period | 424,820 | 321,213 |
| End of Period | 521,324 | 424,820 |
1 Certain prior-period numbers have been reclassified to conform with the current-period presentation.
See accompanying Notes, which are an integral part of the Financial Statements.
Conservative Allocation Portfolio
Financial Highlights
| For a Share Outstanding | | | Year Ended December 31, |
| Throughout Each Period | 2020 | 2019 | 2018 | 2017 | 2016 |
| Net Asset Value, Beginning of Period | $26.53 | $24.02 | $25.84 | $24.22 | $23.72 |
Investment Operations | | | | | |
| Net Investment Income1 | .499 | .660 | .581 | .592 | .527 |
| Capital Gain Distributions Received1 | .123 | .117 | .100 | .203 | .128 |
| Net Realized and Unrealized Gain (Loss) on Investments | 2.266 | 2.921 | (1.417) | 1.769 | .728 |
| Total from Investment Operations | 2.888 | 3.698 | (.736) | 2.564 | 1.383 |
| Distributions | | | | | |
| Dividends from Net Investment Income | (.631) | (.585) | (.519) | (.500) | (.407) |
| Distributions from Realized Capital Gains | (.387) | (.603) | (.565) | (.444) | (.476) |
| Total Distributions | (1.018) | (1.188) | (1.084) | (.944) | (.883) |
| Net Asset Value, End of Period | $28.40 | $26.53 | $24.02 | $25.84 | $24.22 |
| | | | | | |
| Total Return | 11.73% | 15.83% | -2.98% | 10.89% | 6.02% |
| | | | | | |
| Ratios/Supplemental Data | | | | | |
| Net Assets, End of Period (Millions) | $521 | $425 | $321 | $306 | $233 |
| Ratio of Total Expenses to Average Net Assets | — | — | — | — | — |
| Acquired Fund Fees and Expenses | 0.13% | 0.13% | 0.13% | 0.14% | 0.16% |
| Ratio of Net Investment Income to | | | | | |
| Average Net Assets | 1.90% | 2.61% | 2.33% | 2.38% | 2.20% |
| Portfolio Turnover Rate | 27% | 10% | 18% | 19% | 14% |
1 Calculated based on average shares outstanding.
See accompanying Notes, which are an integral part of the Financial Statements.
Conservative Allocation Portfolio
Notes to Financial Statements
The Conservative Allocation Portfolio, a portfolio of Vanguard Variable Insurance Funds, is registered under the Investment Company Act of 1940 as an open-end investment company. The portfolio follows a balanced investment strategy by investing in selected Vanguard funds and portfolios to achieve its targeted allocation of assets to U.S. and international stocks, and U.S. and international bonds. Financial statements and other information about each underlying fund and portfolio are available at www.vanguard.com. The portfolio’s shares are only available for purchase by separate accounts of insurance companies as investments for variable annuity plans, variable life insurance contracts, or other variable benefit insurance contracts.
Market disruptions associated with the COVID-19 pandemic have had a global impact, and uncertainty exists as to the long-term implications. Such disruptions can adversely affect assets of the portfolio and thus portfolio performance.
A. The following significant accounting policies conform to generally accepted accounting principles for U.S. investment companies. The portfolio consistently follows such policies in preparing its financial statements.
1. Security Valuation: Investments are valued at the net asset value of each underlying Vanguard fund determined as of the close of the New York Stock Exchange (generally 4 p.m., Eastern time) on the valuation date.
2. Federal Income Taxes: The portfolio intends to continue to qualify as a regulated investment company and distribute all of its taxable income. The portfolio’s tax returns are open to examination by the relevant tax authorities until expiration of the applicable statute of limitations, which is generally three years after the filing of the tax return. Management has analyzed the portfolio’s tax positions taken for all open federal and state income tax years, and has concluded that no provision for income tax is required in the portfolio’s financial statements.
3. Distributions: Distributions to shareholders are recorded on the ex-dividend date. Distributions are determined on a tax basis at the fiscal year-end and may differ from net investment income and realized capital gains for financial reporting purposes.
4. Credit Facilities and Interfund Lending Program: The portfolio and certain other funds managed by The Vanguard Group (“Vanguard”) participate in a $4.3 billion committed credit facility provided by a syndicate of lenders pursuant to a credit agreement and an uncommitted credit facility provided by Vanguard. Both facilities may be renewed annually. Each fund is individually liable for its borrowings, if any, under the credit facilities. Borrowings may be utilized for temporary or emergency purposes, subject to the portfolio’s regulatory and contractual borrowing restrictions. With respect to the committed credit facility, the participating funds are charged administrative fees and an annual commitment fee of 0.10% of the undrawn committed amount of the facility; these fees are allocated to the funds based on a method approved by the portfolio’s board of trustees and borne by the funds in which the portfolio invests (see Note B). Any borrowings under either facility bear interest at a rate based upon the higher of the one-month London Interbank Offered Rate (or an acceptable alternate rate, if necessary), federal funds effective rate, or overnight bank funding rate plus an agreed-upon spread, except that borrowings under the uncommitted credit facility may bear interest based upon an alternative rate agreed to by the portfolio and Vanguard.
In accordance with an exemptive order (the “Order”) from the SEC, the portfolio may participate in a joint lending and borrowing program that allows registered open-end Vanguard funds to borrow money from and lend money to each other for temporary or emergency purposes (the “Interfund Lending Program”), subject to compliance with the terms and conditions of the Order, and to the extent permitted by the portfolio’s investment objective and investment policies. Interfund loans and borrowings normally extend overnight, but can have a maximum duration of seven days. Loans may be called on one business day’s notice. The interest rate to be charged is governed by the conditions of the Order and internal procedures adopted by the board of trustees. The board of trustees is responsible for overseeing the Interfund Lending Program.
For the year ended December 31, 2020, the portfolio did not utilize the credit facilities or the Interfund Lending Program.
5. Other: Income and capital gain distributions received are recorded on the ex-dividend date. Security transactions are accounted for on the date securities are bought or sold. Costs used to determine realized gains (losses) on the sale of investment securities are those of the specific securities sold.
B. In accordance with the terms of a Funds’ Service Agreement (the “FSA”) between Vanguard and the portfolio, Vanguard furnishes to the portfolio investment advisory, corporate management, administrative, marketing, and distribution services at Vanguard’s cost of operations (as defined by
Conservative Allocation Portfolio
the FSA). These costs of operations are allocated to the portfolio based on methods and guidelines approved by the board of trustees. The FSA provides that expenses otherwise allocable to Vanguard funds-of-funds may be reduced or eliminated to the extent of savings realized by the underlying Vanguard funds by virtue of being part of a fund-of-funds. Accordingly, all expenses for services provided by Vanguard to the portfolio and all other expenses incurred by the portfolio during the period ended December 31, 2020, were borne by the underlying Vanguard funds in which the portfolio invests. The portfolio’s trustees and officers are also trustees and officers, respectively, of the underlying Vanguard funds, as well as directors and employees, respectively, of Vanguard.
C. Various inputs may be used to determine the value of the portfolio’s investments. These inputs are summarized in three broad levels for financial statement purposes. The inputs or methodologies used to value securities are not necessarily an indication of the risk associated with investing in those securities.
Level 1—Quoted prices in active markets for identical securities.
Level 2—Other significant observable inputs (including quoted prices for similar securities, interest rates, prepayment speeds, credit risk, etc.).
Level 3—Significant unobservable inputs (including the portfolio’s own assumptions used to determine the fair value of investments). Any investments valued with significant unobservable inputs are noted on the Schedule of Investments.
At December 31, 2020, 100% of the market value of the portfolio’s investments was determined based on Level 1 inputs.
D. Permanent differences between book-basis and tax-basis components of net assets, if any, are reclassified among capital accounts in the financial statements to reflect their tax character. These reclassifications have no effect on net assets or net asset value per share.
Temporary differences between book-basis and tax-basis components of total distributable earnings (loss) arise when certain items of income, gain, or loss are recognized in different periods for financial statement and tax purposes; these differences will reverse at some time in the future. The differences are primarily related to the deferral of losses from wash sales. As of period end, the tax-basis components of total distributable earnings (loss) are detailed in the table as follows:
| | Amount |
| | ($000) |
| Undistributed Ordinary Income | 12,197 |
| Undistributed Long-Term Gains | 13,736 |
| Capital Loss Carryforwards | — |
| Qualified Late-Year Losses | — |
| Net Unrealized Gains (Losses) | 55,029 |
The tax character of distributions paid was as follows:
| | Year Ended December 31, |
| | 2020 | 2019 |
| | Amount | Amount |
| | ($000) | ($000) |
| Ordinary Income* | 10,780 | 7,901 |
| Long-Term Capital Gains | 5,700 | 7,969 |
| Total | 16,480 | 15,870 |
* Includes short-term capital gains, if any.
As of December 31, 2020, gross unrealized appreciation and depreciation for investments based on cost for U.S. federal income tax purposes were as follows:
| | Amount |
| | ($000) |
| Tax Cost | 466,102 |
| Gross Unrealized Appreciation | 55,054 |
| Gross Unrealized Depreciation | (25) |
| Net Unrealized Appreciation (Depreciation) | 55,029 |
Conservative Allocation Portfolio
E. Capital shares issued and redeemed were:
| | Year Ended December 31, |
| | 2020 | 2019 |
| | Shares | Shares |
| | (000) | (000) |
| Issued | 3,717 | 3,717 |
| Issued in Lieu of Cash Distributions | 708 | 651 |
| Redeemed | (2,083) | (1,725) |
| Net Increase (Decrease) in Shares Outstanding | 2,342 | 2,643 |
At December 31, 2020, one shareholder (an insurance company separate account whose holdings in the portfolio represent the indirect investment of Vanguard Variable Annuity contract holders) was the record or beneficial owner of 85% of the portfolio’s net assets. If this shareholder were to redeem its investment in the portfolio, the redemption might lead to the realization of taxable capital gains.
F. Transactions during the period in affiliated underlying Vanguard funds were as follows:
| | | | | | Current Period Transactions | |
| | Dec. 31, | | Proceeds | Realized | | | | | Dec. 31, |
| | 2019 | | from | Net | Change in | | Capital Gain | 2020 |
| | Market | Purchases | Securities | Gain | Unrealized | Distributions | Market |
| | Value | at Cost | Sold | (Loss) | App. (Dep.) | Income | Received | Value |
| | ($000) | ($000) | ($000) | ($000) | ($000) | ($000) | ($000) | ($000) |
| Vanguard Market | | | | | | | | | |
| Liquidity Fund | — | NA1 | NA1 | — | — | 1 | — | | — |
| Vanguard Extended | | | | | | | | | |
| Market Index Fund | 16,962 | 4,726 | 5,617 | 2,007 | 4,293 | 261 | — | | 22,371 |
| Vanguard Variable | | | | | | | | | |
| Insurance Funds— | | | | | | | | | |
| Equity Index Portfolio | 86,099 | 40,545 | 38,308 | 7,034 | 7,825 | 1,704 | 1,999 | | 103,195 |
| Vanguard Variable | | | | | | | | | |
| Insurance Funds— | | | | | | | | | |
| Total Bond Market | | | | | | | | | |
| Index Portfolio | 177,402 | 78,969 | 47,198 | 3,024 | 6,473 | 4,128 | — | | 218,670 |
| Vanguard Total | | | | | | | | | |
| International Bond | | | | | | | | | |
| Index Fund | 75,707 | 28,271 | 13,642 | 1,519 | 1,334 | 775 | 142 | | 93,189 |
| Vanguard Total | | | | | | | | | |
| International Stock | | | | | | | | | |
| Index Fund | 68,618 | 26,801 | 20,814 | 2,457 | 6,644 | 1,828 | — | | 83,706 |
| Total | 424,788 | 179,312 | 125,579 | 16,041 | 26,569 | 8,697 | 2,141 | | 521,131 |
1 Not applicable—purchases and sales are for temporary cash investment purposes.
G. Management has determined that no events or transactions occurred subsequent to December 31, 2020, that would require recognition or disclosure in these financial statements.
Conservative Allocation Portfolio
Report of Independent Registered Public Accounting Firm
To the Board of Trustees of Vanguard Variable Insurance Funds and Shareholders of Conservative Allocation Portfolio
Opinion on the Financial Statements
We have audited the accompanying statement of assets and liabilities, including the schedule of investments, of Conservative Allocation Portfolio (one of the portfolios constituting Vanguard Variable Insurance Funds, referred to hereafter as the “Portfolio”) as of December 31, 2020, the related statement of operations for the year ended December 31, 2020, the statement of changes in net assets for each of the two years in the period ended December 31, 2020, including the related notes, and the financial highlights for each of the five years in the period ended December 31, 2020 (collectively referred to as the “financial statements”). In our opinion, the financial statements present fairly, in all material respects, the financial position of the Portfolio as of December 31, 2020, the results of its operations for the year then ended, the changes in its net assets for each of the two years in the period ended December 31, 2020 and the financial highlights for each of the five years in the period ended December 31, 2020 in conformity with accounting principles generally accepted in the United States of America.
Basis for Opinion
These financial statements are the responsibility of the Portfolio’s management. Our responsibility is to express an opinion on the Portfolio’s financial statements based on our audits. We are a public accounting firm registered with the Public Company Accounting Oversight Board (United States) (PCAOB) and are required to be independent with respect to the Portfolio in accordance with the U.S. federal securities laws and the applicable rules and regulations of the Securities and Exchange Commission and the PCAOB.
We conducted our audits of these financial statements in accordance with the standards of the PCAOB. Those standards require that we plan and perform the audit to obtain reasonable assurance about whether the financial statements are free of material misstatement, whether due to error or fraud.
Our audits included performing procedures to assess the risks of material misstatement of the financial statements, whether due to error or fraud, and performing procedures that respond to those risks. Such procedures included examining, on a test basis, evidence regarding the amounts and disclosures in the financial statements. Our audits also included evaluating the accounting principles used and significant estimates made by management, as well as evaluating the overall presentation of the financial statements. Our procedures included confirmation of securities owned as of December 31, 2020 by correspondence with the transfer agent. We believe that our audits provide a reasonable basis for our opinion.
/s/PricewaterhouseCoopers LLP
Philadelphia, Pennsylvania
February 18, 2021
We have served as the auditor of one or more investment companies in The Vanguard Group of Funds since 1975.
Special 2020 tax information (unaudited) for corporate shareholders only for Conservative Allocation Portfolio, a portfolio of Vanguard Variable Insurance Funds
This information for the fiscal year ended December 31, 2020, is included pursuant to provisions of the Internal Revenue Code for corporate shareholders only.
The portfolio distributed $5,700,000 as capital gain dividends (20% rate gain distributions) to shareholders during the fiscal year.
For corporate shareholders, 16.1% of investment income (dividend income plus short-term gains, if any) qualifies for the dividends-received deduction.
The portfolio designates to shareholders foreign source income of $2,766,000 and foreign taxes paid of $184,000. Shareholders will receive more detailed information with their Form 1099-DIV in January 2021 to determine the calendar-year amounts to be included on their 2020 tax returns.
Conservative Allocation Portfolio
BLOOMBERG is a trademark and service mark of Bloomberg Finance L.P. BARCLAYS is a trademark and service mark of Barclays Bank Plc, used under license. Bloomberg Finance L.P. and its affiliates, including Bloomberg Index Services Limited (BISL) (collectively, Bloomberg), or Bloomberg’s licensors, own all proprietary rights in the Bloomberg Barclays U.S. Aggregate Float Adjusted Index and the Bloomberg Barclays Global Aggregate ex-USD Float Adjusted RIC Capped Index (USD Hedged) (the Indices or Bloomberg Barclays Indices).
Neither Barclays Bank Plc, Barclays Capital Inc., or any affiliate (collectively Barclays) or Bloomberg is the issuer or producer of the Conservative Allocation Portfolio and neither Bloomberg nor Barclays has any responsibilities, obligations or duties to investors in the Conservative Allocation Portfolio. The Indices are licensed for use by The Vanguard Group, Inc. (Vanguard) as the sponsor of the Conservative Allocation Portfolio. Bloomberg and Barclays’ only relationship with Vanguard in respect of the Indices is the licensing of the Indices, which are determined, composed and calculated by BISL, or any successor thereto, without regard to the Issuer or the Conservative Allocation Portfolio or the owners of the Conservative Allocation Portfolio.
Additionally, Vanguard may for itself execute transaction(s) with Barclays in or relating to the Indices in connection with the Conservative Allocation Portfolio. Investors acquire the Conservative Allocation Portfolio from Vanguard and investors neither acquire any interest in the Indices nor enter into any relationship of any kind whatsoever with Bloomberg or Barclays upon making an investment in the Conservative Allocation Portfolio. The Conservative Allocation Portfolio is not sponsored, endorsed, sold or promoted by Bloomberg or Barclays. Neither Bloomberg nor Barclays makes any representation or warranty, express or implied regarding the advisability of investing in the Conservative Allocation Portfolio or the advisability of investing in securities generally or the ability of the Indices to track corresponding or relative market performance. Neither Bloomberg nor Barclays has passed on the legality or suitability of the Conservative Allocation Portfolio with respect to any person or entity. Neither Bloomberg nor Barclays is responsible for and has not participated in the determination of the timing of, prices at, or quantities of the Conservative Allocation Portfolio to be issued. Neither Bloomberg nor Barclays has any obligation to take the needs of the Issuer or the owners of the Conservative Allocation Portfolio or any other third party into consideration in determining, composing or calculating the Indices. Neither Bloomberg nor Barclays has any obligation or liability in connection with administration, marketing or trading of the Conservative Allocation Portfolio.
The licensing agreement between Bloomberg and Barclays is solely for the benefit of Bloomberg and Barclays and not for the benefit of the owners of the Conservative Allocation Portfolio, investors or other third parties. In addition, the licensing agreement between Vanguard and Bloomberg is solely for the benefit of Vanguard and Bloomberg and not for the benefit of the owners of the Conservative Allocation Portfolio, investors or other third parties.
NEITHER BLOOMBERG NOR BARCLAYS SHALL HAVE ANY LIABILITY TO THE ISSUER, INVESTORS OR TO OTHER THIRD PARTIES FOR THE QUALITY, ACCURACY AND/OR COMPLETENESS OF THE BLOOMBERG BARCLAYS INDICES OR ANY DATA INCLUDED THEREIN OR FOR INTERRUPTIONS IN THE DELIVERY OF THE BLOOMBERG BARCLAYS INDICES. NEITHER BLOOMBERG NOR BARCLAYS MAKES ANY WARRANTY, EXPRESS OR IMPLIED, AS TO RESULTS TO BE OBTAINED BY THE ISSUER, THE INVESTORS OR ANY OTHER PERSON OR ENTITY FROM THE USE OF THE BLOOMBERG BARCLAYS INDICES OR ANY DATA INCLUDED THEREIN. NEITHER BLOOMBERG NOR BARCLAYS MAKES ANY EXPRESS OR IMPLIED WARRANTIES, AND EACH HEREBY EXPRESSLY DISCLAIMS ALL WARRANTIES OF MERCHANTABILITY OR FITNESS FOR A PARTICULAR PURPOSE OR USE WITH RESPECT TO THE BLOOMBERG BARCLAYS INDICES OR ANY DATA INCLUDED THEREIN. BLOOMBERG RESERVES THE RIGHT TO CHANGE THE METHODS OF CALCULATION OR PUBLICATION, OR TO CEASE THE CALCULATION OR PUBLICATION OF THE BLOOMBERG BARCLAYS INDICES, AND NEITHER BLOOMBERG NOR BARCLAYS SHALL BE LIABLE FOR ANY MISCALCULATION OF OR ANY INCORRECT, DELAYED OR INTERRUPTED PUBLICATION WITH RESPECT TO THE BLOOMBERG BARCLAYS INDICES. NEITHER BLOOMBERG NOR BARCLAYS SHALL BE LIABLE FOR ANY DAMAGES, INCLUDING, WITHOUT LIMITATION, ANY SPECIAL, INDIRECT OR CONSEQUENTIAL DAMAGES, OR ANY LOST PROFITS AND EVEN IF ADVISED OF THE POSSIBLITY OF SUCH, RESULTING FROM THE USE OF THE BLOOMBERG BARCLAYS INDICES OR ANY DATA INCLUDED THEREIN OR WITH RESPECT TO THE CONSERVATIVE ALLOCATION PORTFOLIO.
None of the information supplied by Bloomberg or Barclays and used in this publication may be reproduced in any manner without the prior written permission of both Bloomberg and Barclays Capital, the investment banking division of Barclays Bank Plc. Barclays Bank Plc is registered in England No. 1026167. Registered office 1 Churchill Place London E14 5HP.
© 2021 Bloomberg. Used with Permission.
Source: Bloomberg Index Services Limited. Copyright 2021, Bloomberg. All rights reserved.
This page intentionally left blank.
This page intentionally left blank.
The People Who Govern Your Fund
The trustees of your mutual fund are there to see that the fund is operated and managed in your best interests since, as a shareholder, you are a part owner of the fund. Your fund’s trustees also serve on the board of directors of The Vanguard Group, Inc., which is owned by the Vanguard funds and provides services to them.
A majority of Vanguard’s board members are independent, meaning that they have no affiliation with Vanguard or the funds they oversee, apart from the sizable personal investments they have made as private individuals. The independent board members have distinguished backgrounds in business, academia, and public service. Each of the trustees and executive officers oversees 211 Vanguard funds.
Information for each trustee and executive officer of the fund appears below. That information, as well as the Vanguard fund count, is as of the date on the cover of this fund report. The mailing address of the trustees and officers is P.O. Box 876, Valley Forge, PA 19482. More information about the trustees is in the Statement of Additional Information, which can be obtained, without charge, by contacting Vanguard at 800-662-7447, or online at vanguard.com.
Interested Trustee1
Mortimer J. Buckley
Born in 1969. Trustee since January 2018. Principal occupation(s) during the past five years and other experience: chairman of the board (2019–present) of Vanguard and of each of the investment companies served by Vanguard; chief executive officer (2018– present) of Vanguard; chief executive officer, president, and trustee (2018–present) of each of the investment companies served by Vanguard; president and director (2017–present) of Vanguard; and president (2018– present) of Vanguard Marketing Corporation. Chief investment officer (2013–2017), managing director (2002–2017), head of the Retail Investor Group (2006–2012), and chief information officer (2001–2006) of Vanguard. Chairman of the board (2011–2017) and trustee (2009–2017) of the Children’s Hospital of Philadelphia; and trustee (2018–present) and vice chair (2019–present) of The Shipley School.
Independent Trustees
Emerson U. Fullwood
Born in 1948. Trustee since January 2008. Principal occupation(s) during the past five years and other experience: executive chief staff and marketing officer for North America and corporate vice president (retired 2008) of Xerox Corporation (document management products and services). Former president of the Worldwide Channels Group, Latin America, and Worldwide Customer Service and executive chief staff officer of Developing Markets of Xerox. Executive in residence and 2009–2010 Distinguished Minett Professor at the Rochester Institute of Technology. Director of SPX FLOW, Inc. (multi-industry manufacturing). Director of the University of Rochester Medical Center, the Monroe Community College Foundation, the United Way of Rochester, North Carolina A&T University, and Roberts Wesleyan College. Trustee of the University of Rochester.
Amy Gutmann
Born in 1949. Trustee since June 2006. Principal occupation(s) during the past five years and other experience: president (2004–present) of the University of Pennsylvania. Christopher H. Browne Distinguished Professor of Political Science, School of Arts and Sciences, and professor of communication, Annenberg School for Communication, with secondary faculty appointments in the Department of Philosophy, School of Arts and Sciences, and at the Graduate School of Education, University of Pennsylvania.
F. Joseph Loughrey
Born in 1949. Trustee since October 2009. Principal occupation(s) during the past five years and other experience: president and chief operating officer (retired 2009) and vice chairman of the board (2008–2009) of Cummins Inc. (industrial machinery). Chairman of the board of Hillenbrand, Inc. (specialized consumer services) and the Lumina Foundation. Director of the V Foundation. Member of the advisory council for the College of Arts and Letters and
chair of the advisory board to the Kellogg Institute for International Studies, both at the University of Notre Dame.
Mark Loughridge
Born in 1953. Trustee since March 2012. Principal occupation(s) during the past five years and other experience: senior vice president and chief financial officer (retired 2013) of IBM (information technology services). Fiduciary member of IBM’s Retirement Plan Committee (2004–2013), senior vice president and general manager (2002–2004) of IBM Global Financing, vice president and controller (1998–2002) of IBM, and a variety of other prior management roles at IBM. Member of the Council on Chicago Booth.
Scott C. Malpass
Born in 1962. Trustee since March 2012. Principal occupation(s) during the past five years and other experience: chief investment officer (retired June 2020) and vice president (retired June 2020) of the University of Notre Dame. Assistant professor of finance at the Mendoza College of Business, University of Notre Dame, and member of the Notre Dame 403(b) Investment Committee (retired June 2020). Member of the board of Catholic Investment Services, Inc. (investment advisors) and the board of superintendence of the Institute for the Works of Religion.
Deanna Mulligan
Born in 1963. Trustee since January 2018. Principal occupation(s) during the past five years and other experience: board chair (2020–present), chief executive officer (2011–2020), and president (2010–2019) of The Guardian Life Insurance Company of America. Chief operating officer (2010–2011) and executive vice president (2008–2010) of the individual life and disability division of Guardian Life. Member of the board of the American Council of Life Insurers and the board of the Economic Club of New York. Trustee of the Partnership for New York City (business leadership), Chief Executives for Corporate Purpose, NewYork-Presbyterian Hospital, Catalyst, and the Bruce Museum (arts and science). Member of the Advisory Council for the Stanford Graduate School of Business.
André F. Perold
Born in 1952. Trustee since December 2004. Principal occupation(s) during the past five years and other experience: George Gund Professor of Finance and Banking, Emeritus at the Harvard Business School (retired 2011). Chief investment officer and co-managing partner of HighVista Strategies (private investment firm). Member of the board of advisors and member of the investment committee of the Museum of Fine Arts Boston. Member of the board (2018–present) of RIT Capital Partners (investment firm). Member of the investment committee of Partners Health Care System.
Sarah Bloom Raskin
Born in 1961. Trustee since January 2018. Principal occupation(s) during the past five years and other experience: deputy secretary (2014–2017) of the United States Department of the Treasury. Governor (2010–2014) of the Federal Reserve Board. Commissioner (2007–2010) of financial regulation for the State of Maryland. Member of the board of directors (2012–2014) of Neighborhood Reinvestment Corporation. Director (2017–present) of i(x) Investments, LLC; director (2017–present) of Reserve Trust. Rubenstein Fellow (2017–present) of Duke University; trustee (2017–present) of Amherst College, and trustee (2019–present) of the Folger Shakespeare Library.
Peter F. Volanakis
Born in 1955. Trustee since July 2009. Principal occupation(s) during the past five years and other experience: president and chief operating officer (retired 2010) of Corning Incorporated (communications equipment) and director of Corning Incorporated
1 Mr. Buckley is considered an “interested person,” as defined in the Investment Company Act of 1940, because he is an officer of the Vanguard funds.
(2000–2010) and Dow Corning (2001–2010). Director (2012) of SPX Corporation (multi-industry manufacturing). Overseer of the Amos Tuck School of Business Administration, Dartmouth College (2001–2013). Chairman of the board of trustees of Colby-Sawyer College. Member of the board of Hypertherm Inc. (industrial cutting systems, software, and consumables).
Executive Officers
John Bendl
Born in 1970. Principal occupation(s) during the past five years and other experience: principal of Vanguard. Chief financial officer (2019–present) of each of the investment companies served by Vanguard. Chief accounting officer, treasurer, and controller of Vanguard (2017–present). Partner (2003–2016) at KPMG (audit, tax, and advisory services).
Christine M. Buchanan
Born in 1970. Principal occupation(s) during the past five years and other experience: principal of Vanguard. Treasurer (2017–present) of each of the investment companies served by Vanguard. Partner (2005–2017) at KPMG (audit, tax, and advisory services).
David Cermak
Born in 1960. Principal occupation(s) during the past five years and other experience: principal of Vanguard. Finance director (2019–present) of each of the investment companies served by Vanguard. Managing director and head (2017–present) of Vanguard Investments Singapore. Managing director and head (2017–2019) of Vanguard Investments Hong Kong. Representative director and head (2014–2017) of Vanguard Investments Japan.
John Galloway
Born in 1973. Principal occupation(s) during the past five years and other experience: principal of Vanguard. Investment stewardship officer (September 2020–present) of each of the investment companies served by Vanguard. Head of Investor Advocacy (February 2020–present) and head of Marketing Strategy and Planning (2017–2020) at Vanguard. Deputy assistant to the President of the United States (2015).
Thomas J. Higgins
Born in 1957. Principal occupation(s) during the past five years and other experience: principal of Vanguard. Finance director (2019–present), chief financial officer (2008–2019), and treasurer (1998–2008) of each of the investment companies served by Vanguard.
Peter Mahoney
Born in 1974. Principal occupation(s) during the past five years and other experience: principal of Vanguard. Controller (2015–present) of each of the investment companies served by Vanguard. Head of International Fund Services (2008–2014) at Vanguard.
Anne E. Robinson
Born in 1970. Principal occupation(s) during the past five years and other experience: general counsel (2016–present) of Vanguard. Secretary (2016–present) of Vanguard and of each of the investment companies served by Vanguard. Managing director (2016–present) of Vanguard. Managing director and general counsel of Global Cards and Consumer Services (2014–2016) at Citigroup. Counsel (2003–2014) at American Express.
Michael Rollings
Born in 1963. Principal occupation(s) during the past five years and other experience: finance director (2017–present) and treasurer (2017) of each of the investment companies served by Vanguard. Managing director (2016–present) of Vanguard. Chief financial officer (2016–present) of Vanguard. Director (2016–present) of Vanguard Marketing Corporation. Executive vice president and chief financial officer (2006–2016) of MassMutual Financial Group.
John E. Schadl
Born in 1972. Principal occupation(s) during the past five years and other experience: principal of Vanguard. Chief compliance officer (2019–present) of Vanguard and of each of the investment companies served by Vanguard. Assistant vice president (2019–present)
of Vanguard Marketing Corporation.
Vanguard Senior Management Team
| Joseph Brennan | | James M. Norris |
| Mortimer J. Buckley | | Thomas M. Rampulla |
| Gregory Davis | | Karin A. Risi |
| John James | | Anne E. Robinson |
| John T. Marcante | | Michael Rollings |
| Chris D. McIsaac | | Lauren Valente |
Connect with Vanguard® > vanguard.com
Fund Information > 800-662-7447
Annuity and Insurance Services > 800-522-5555
Institutional Investor Services > 800-523-1036
Text Telephone for People
Who Are Deaf or Hard of Hearing > 800-749-7273
This material may be used in conjunction with the offering of shares of any Vanguard fund only if preceded or accompanied by the fund’s current prospectus.
You can obtain a free copy of Vanguard’s proxy voting guidelines by visiting vanguard.com/proxyreporting or by calling Vanguard at 800-662-2739. The guidelines are also available from the SEC’s website, www.sec.gov. In addition, you may obtain a free report on how your fund voted the proxies for securities it owned during the 12 months ended June 30. To get the report, visit either vanguard.com/proxyreporting or www.sec.gov.
All comparative mutual fund data are from Morningstar, Inc., unless otherwise noted.
You can review information about your portfolio on the SEC’s website, and you can receive copies of this information, for a fee, by sending a request via email addressed to publicinfo@sec.gov.
© 2021 The Vanguard Group, Inc.
All rights reserved. Vanguard Marketing Corporation, Distributor. Q690CA 022021 |
Annual Report | December 31, 2020
Vanguard Variable Insurance Funds
| Diversified Value Portfolio |
Contents
Your Portfolio’s Performance at a Glance
| 1 |
Advisors' Report
| 2 |
About Your Portfolio’s Expenses
| 4 |
Performance Summary
| 5 |
Financial Statements
| 7 |
Please note: The opinions expressed in this report are just that—informed opinions. They should not be considered promises or advice. Also, please keep in mind that the information and opinions cover the period through the date on the front of this report. Of course, the risks of investing in your portfolio are spelled out in the prospectus.
Your Portfolio’s Performance at a Glance
| • | For the 12 months ended December 31, 2020, the Diversified Value Portfolio returned 11.78%, well ahead of the 2.80% return of its benchmark, the Russell 1000 Value Index. |
| • | The emergence of COVID-19 in early 2020 turned into a global health crisis, and aggressive attempts to contain it resulted in a sharp downturn in economic activity. Unemployment spiked, and sectors where social distancing isn’t possible were hit hard. Stocks initially plummeted as infections surged, but they finished the year significantly higher. The gain was thanks in part to rapid and robust monetary and fiscal action by policymakers and the rollout of COVID-19 vaccines as the year drew to a close. |
| • | Growth stocks outperformed value stocks for the 12 months, while large-capitalization stocks led mid- and small-caps. The broad U.S. stock market, as measured by the CRSP US Total Market Index, returned 20.99%. |
| • | The advisor’s holdings in information technology contributed most to relative performance. Consumer discretionary, real estate, communication services, and financials also boosted returns. Materials, consumer staples, and industrials weighed the most on relative performance. |
| • | Please note that the portfolio’s returns are different from those in Vanguard Variable Annuity (and other plans that invest in the portfolio), which take into account insurance-related expenses. |
Market Barometer
Average Annual Total Returns
Periods Ended December 31, 2020 |
| | One Year | Three Years | Five Years |
| Stocks | | | |
| Russell 1000 Index (Large-caps) | 20.96% | 14.82% | 15.60% |
| Russell 2000 Index (Small-caps) | 19.96 | 10.25 | 13.26 |
| Russell 3000 Index (Broad U.S. market) | 20.89 | 14.49 | 15.43 |
| FTSE All-World ex US Index (International) | 11.22 | 5.18 | 9.16 |
| Bonds | | | |
| Bloomberg Barclays U.S. Aggregate Bond Index (Broad taxable market) | 7.51% | 5.34% | 4.44% |
Bloomberg Barclays Municipal Bond Index
(Broad tax-exempt market) | 5.21 | 4.64 | 3.91 |
| FTSE Three-Month U.S. Treasury Bill Index | 0.58 | 1.56 | 1.16 |
| CPI | | | |
| Consumer Price Index | 1.36% | 1.85% | 1.95% |
The Diversified Value Portfolio returned 11.78% for the 12 months ended December 31, 2020. It surpassed the 2.80% return of its benchmark, the Russell 1000 Value Index.
The portfolio is overseen by two independent advisors, a strategy that enhances its diversification by providing exposure to distinct yet complementary investment approaches. It is not uncommon for different advisors to have different views about individual securities or the broader investment environment.
The advisors, the amount and percentage of the portfolio’s assets each manages, and brief descriptions of their investment strategies are presented in the accompanying table. Each advisor has also prepared a discussion of the investment environment that existed during the period and of the effect it had on the portfolio’s positioning. These reports were prepared on January 21, 2021.
Lazard Asset Management LLC
Portfolio Managers
Andrew Lacey, Deputy Chairman
Ronald Temple, Managing Director
Our U.S. equity select strategy is based on the relationship between valuation and financial productivity. We have identified and empirically validated two sources of alpha, which we focus on exclusively:
| • | Compounders: Our analysis indicates these companies can sustain very high levels of financial productivity for longer than the market expects, and their share price does not reflect this sustainability. We typically invest 60% to 80% of our capital in Compounders. |
| • | Improvers: We believe companies can improve returns, but investors often are too optimistic about the probability of success. Our research indicates that companies that improve their returns on capital materially outperform the broad |
market. We typically invest 20% to 40% of our capital in them.
Over the past year, a small group of technology companies with strong growth characteristics led broad benchmark (S&P 500 Index) returns. Average company performance was more mixed. During this time, our strategy kept pace with the broad benchmark and outperformed value-based benchmarks substantially.
Results were largely driven by the Compounder component of our portfolio. Our focus on high financial productivity was rewarded during a period of significant uncertainty.
At year-end, the portfolio’s weight in Compounders was toward the higher end of the target range of 60% to 80% of capital. We believe this was appropriate amid continued economic uncertainty. That said, we are actively seeking Improvers.
During the 12 months, we took capital from the information technology and communication services sectors as stocks became more richly valued. We added capital to financials, where we found a combination of attractive Compounders and Improvers.
Hotchkis & Wiley Capital Management, LLC
Portfolio Managers
George H. Davis, Jr.,
Chief Executive Officer
Scott McBride, CFA,
President
In 2020, we witnessed the devastating impact of a worldwide pandemic on the global economy. While the effect was severe, investors perceived it as a transitory event and recognized the stimulative influence of massive monetary and fiscal intervention. These interventions helped propel the S&P 500 Index, which returned 18% for the year. Value investors
were largely left behind, however, as growth stocks soared 38% and value stocks returned a modest 3%.
This represented the largest gap between the Russell 1000 Growth Index and the Russell 1000 Value Index ever observed over a calendar year. If history is any guide, that set the stage for a value comeback. We had a glimpse of what the comeback might look like during the fourth quarter of 2020. Value stocks outperformed, buoyed by the economic ramifications of new COVID-19 vaccines and another round of fiscal stimulus.
In our experience, when a major asset class underperforms for as long as value has, most investors are underallocated to it. Signs of this neglect include incessant rhetoric about the asset class’s demise in the financial media, unusually wide valuation gaps, and the fatigue/frustration asset allocators experience when compelled to repeatedly explain why they have invested in such a lagging strategy.
When the economic winds shift, however, we believe the out-of-favor asset class will enjoy a substantial and sustained period of outperformance. Following the tech bubble, for example, value outperformed growth for seven consecutive years by more than 100 percentage points cumulatively. We have learned time and time again that patience is ultimately rewarded for those who stay focused on fundamentals and valuation.
While it outperformed in the most recent quarter, the strategy underperformed the Russell 1000 Value Index over the full calendar year. The value-focused approach that helped during the fourth quarter hurt over the course of the entire 12 months. Stock selection in financials and an overweighted position in energy were the largest detractors, followed by an overweighted exposure to and stock selection in health care. An overweighted position and stock selection in technology were the largest positive contributors.
Stock selection in industrials and an underweighted exposure to real estate also helped. The largest individual detractors to relative performance were Wells Fargo, AIG, NOV Inc., Murphy Oil, and Royal Dutch Shell. The largest positive contributors were Microsoft, FedEx, Oracle, Cummins, and Magna International.
At year-end, the Russell 1000 Value Index traded at a larger-than-normal discount to the Russell 1000 Growth Index, and the portfolio traded at a larger-than normal-discount to the Russell 1000 Value
Index. In fact, the portfolio’s discount neared record levels. It was trading at 8 times normal earnings, more than 10% below its long-term average.
The Russell 1000 Value Index, however, was trading at 16 times normal earnings, which is more than 20% above its long-term average. The portfolio’s fourth-quarter outperformance narrowed the gap modestly, but we anticipate considerably more reversion ahead.
Calendar year 2020 was challenging in a myriad of ways. However, we held steady to the principles of value investing. We
worked as a team to ensure existing investments remained prudent and to find new ideas in an ever-changing environment.
Our team remains entirely intact, the firm is healthy, and we are optimistic that our clients will be rewarded by our commitment and effort. It was reassuring to see our time-tested investing style come back into vogue during the most recent quarter, and we are optimistic that this reversion could be powerful and lasting. We look forward to the new year with enthusiasm.
Diversified Value Portfolio Investment Advisors
| |
| | Portfolio Assets Managed | |
| Investment Advisor | % | $ Million | Investment Strategy |
| Lazard Asset Management LLC | 57 | 542 | Employs a relative-value approach that seeks a combination of attractive valuation and high financial productivity. The process is research-driven, relying upon bottom-up stock analysis performed by the firm’s global sector analysts. |
| Hotchkis and Wiley Capital Management, LLC | 41 | 387 | Uses a disciplined investment approach, focusing on such investment parameters as a company’s tangible assets, sustainable cash flow, and potential for improving business performance. |
| Cash Investments | 2 | 22 | These short-term reserves are invested by Vanguard in equity index products to simulate investment in stocks. Each advisor also may maintain a modest cash position. |
About Your Portfolio’s Expenses
As a shareholder of the portfolio, you incur ongoing costs, which include costs for portfolio management, administrative services, and shareholder reports (like this one), among others. Operating expenses, which are deducted from a portfolio's gross income, directly reduce the investment return of the portfolio.
A portfolio's expenses are expressed as a percentage of its average net assets. This figure is known as the expense ratio. The following examples are intended to help you understand the ongoing costs (in dollars) of investing in your portfolio and to compare these costs with those of other mutual funds. The examples are based on an investment of $1,000 made at the beginning of the period shown and held for the entire period.
The accompanying table illustrates your portfolio's costs in two ways:
| • | Based on actual portfolio return. This section helps you to estimate the actual expenses that you paid over the period. The ”Ending Account Value“ shown is derived from the portfolio's actual return, and the third column shows the dollar amount that would have been paid by an investor who started with $1,000 in the portfolio. You may use the information here, together with the amount you invested, to estimate the expenses that you paid over the period. |
To do so, simply divide your account value by $1,000 (for example, an $8,600 account value divided by $1,000 = 8.6), then multiply the result by the number given for your portfolio under the heading ”Expenses Paid During Period.“
| • | Based on hypothetical 5% yearly return. This section is intended to help you compare your portfolio's costs with those of other mutual funds. It assumes that the portfolio had a yearly return of 5% before expenses, but that the expense ratio is unchanged. In this case—because the return used is not the portfolio's actual return—the results do not apply to your investment. The example is useful in making comparisons because the Securities and Exchange Commission requires all mutual funds to calculate expenses based on a 5% return. You can assess your portfolio's costs by comparing this hypothetical example with the hypothetical examples that appear in shareholder reports of other funds. |
Note that the expenses shown in the table are meant to highlight and help you compare ongoing costs only and do not reflect transaction costs incurred by the portfolio for buying and selling securities. The portfolio’s expense ratio does not reflect additional fees and expenses associated with the annuity or life insurance program through which you invest.
The calculations assume no shares were bought or sold during the period. Your actual costs may have been higher or lower, depending on the amount of your investment and the timing of any purchases or redemptions.
You can find more information about the portfolio's expenses, including annual expense ratios, in the Financial Statements section of this report. For additional information on operating expenses and other shareholder costs, please refer to your portfolio's current prospectus.
| Six Months Ended December 31, 2020 | | | |
| Diversified Value Portfolio | Beginning
Account Value
6/30/2020 | Ending
Account Value
12/31/2020 | Expenses
Paid During
Period |
| Based on Actual Portfolio Return | $1,000.00 | $1,264.03 | $1.59 |
| Based on Hypothetical 5% Yearly Return | 1,000.00 | 1,023.73 | 1.42 |
The calculations are based on expenses incurred in the most recent six-month period. The portfolio’s annualized six-month expense ratio for that period is 0.28%. The dollar amounts shown as “Expenses Paid” are equal to the annualized expense ratio multiplied by the average account value over the period, multiplied by the number of days in the most recent six-month period, then divided by the number of days in the most recent 12-month period (184/366).
Diversified Value Portfolio
All of the returns in this report represent past performance, which is not a guarantee of future results that may be achieved by the portfolio. (Current performance may be lower or higher than the performance data cited. For performance data current to the most recent month-end, visit our website at vanguard.com/performance.) Note, too, that both investment returns and principal value can fluctuate widely, so an investor’s shares, when sold, could be worth more or less than their original cost. The returns shown do not reflect taxes that a shareholder would pay on portfolio distributions or on the sale of portfolio shares. Nor do the returns reflect fees and expenses associated with the annuity or life insurance program through which a shareholder invests. If these fees and expenses were included, the portfolio's returns would be lower.
Cumulative Performance: December 31, 2010, Through December 31, 2020
Initial Investment of $10,000
| | | | Average Annual Total Returns
Periods Ended December 31, 2020 |
| | | One
Year | Five
Years | Ten
Years | Final Value
of a $10,000
Investment |
 | Diversified Value Portfolio | 11.78% | 10.30% | 10.60% | $27,395 |
 | Russell 1000 Value Index | 2.80 | 9.74 | 10.50 | 27,148 |
 | Dow Jones U.S. Total Stock Market Float Adjusted Index | 20.79 | 15.36 | 13.74 | 36,240 |
See Financial Highlights for dividend and capital gains information.
Diversified Value Portfolio
| Communication Services | 9.1% |
| Consumer Discretionary | 10.6 |
| Consumer Staples | 5.2 |
| Energy | 5.9 |
| Financials | 21.8 |
| Health Care | 14.6 |
| Industrials | 9.5 |
| Information Technology | 19.8 |
| Materials | 1.1 |
| Real Estate | 1.2 |
| Utilities | 1.2 |
The table reflects the portfolio’s investments, except for short-term investments and derivatives. Sector categories are based on the Global Industry Classification Standard (“GICS”), except for the “Other” category (if applicable), which includes securities that have not been provided a GICS classification as of the effective reporting period.
Global Industry Classification Standard (“GICS”) was developed by and is the exclusive property and a service mark of MSCI Inc. (“MSCI”) and Standard and Poor’s, a division of McGraw-Hill Companies, Inc. (“S&P”), and is licensed for use by Vanguard. Neither MSCI, S&P nor any third party involved in making or compiling the GICS or any GICS classification makes any express or implied warranties or representations with respect to such standard or classification (or the results to be obtained by the use thereof), and all such parties hereby expressly disclaim all warranties of originality, accuracy, completeness, merchantability or fitness for a particular purpose with respect to any such standard or classification. Without limiting any of the foregoing, in no event shall MSCI, S&P, any of its affiliates or any third party involved in making or compiling the GICS or any GICS classification have any liability for any direct, indirect, special, punitive, consequential or any other damages (including lost profits) even if notified of the possibility of such damages.
Diversified Value Portfolio
The portfolio files its complete schedule of portfolio holdings with the Securities and Exchange Commission (SEC) for the first and third quarters of each fiscal year as an exhibit to its reports on Form N-PORT. The portfolio’s Form N-PORT reports are available on the SEC’s website at www.sec.gov.
| | | Shares | Market
Value•
($000) |
| Common Stocks (95.9%) |
| Communication Services (8.7%) |
| * | Alphabet Inc. Class A | 22,627 | 39,657 |
| * | Walt Disney Co. | 38,382 | 6,954 |
| | News Corp. Class A | 350,244 | 6,294 |
| | Vodafone Group plc ADR | 363,849 | 5,996 |
| | Electronic Arts Inc. | 40,116 | 5,761 |
| * | Discovery Inc. Class C | 212,279 | 5,560 |
| | Comcast Corp. Class A | 104,838 | 5,493 |
| | ViacomCBS Inc. Class B | 76,923 | 2,866 |
| | Omnicom Group Inc. | 33,191 | 2,070 |
| | Interpublic Group of Cos. Inc. | 87,112 | 2,049 |
| | | | 82,700 |
| Consumer Discretionary (10.2%) |
| | McDonald's Corp. | 64,291 | 13,796 |
| | Lowe's Cos. Inc. | 74,384 | 11,939 |
| | General Motors Co. | 257,183 | 10,709 |
| | Starbucks Corp. | 85,698 | 9,168 |
| | Dollar General Corp. | 41,885 | 8,808 |
| * | Dollar Tree Inc. | 79,296 | 8,567 |
| | Magna International Inc. | 118,375 | 8,381 |
| | Home Depot Inc. | 25,570 | 6,792 |
| | Ross Stores Inc. | 46,131 | 5,665 |
| * | Booking Holdings Inc. | 1,600 | 3,564 |
| | Aptiv plc | 23,253 | 3,030 |
| | Harley-Davidson Inc. | 70,417 | 2,584 |
| | Goodyear Tire & Rubber Co. | 185,508 | 2,024 |
| * | Adient plc | 45,837 | 1,594 |
| | | | 96,621 |
| Consumer Staples (5.0%) |
| | Coca-Cola Co. | 226,726 | 12,434 |
| | Mondelez International Inc. Class A | 186,517 | 10,906 |
| | Procter & Gamble Co. | 77,611 | 10,799 |
| | PepsiCo Inc. | 36,342 | 5,389 |
| | Unilever plc ADR | 81,493 | 4,919 |
| | Sysco Corp. | 43,261 | 3,212 |
| | | | 47,659 |
| Energy (5.6%) |
| | ConocoPhillips | 247,954 | 9,916 |
| | Hess Corp. | 138,612 | 7,317 |
| | Marathon Oil Corp. | 987,887 | 6,589 |
| | Royal Dutch Shell plc Class A ADR | 148,836 | 5,230 |
| | Apache Corp. | 365,653 | 5,189 |
| | NOV Inc. | 367,215 | 5,042 |
| | Halliburton Co. | 247,779 | 4,683 |
| | Marathon Petroleum Corp. | 87,543 | 3,621 |
| | Schlumberger NV | 117,600 | 2,567 |
| | Baker Hughes Co. Class A | 110,600 | 2,306 |
| | Murphy Oil Corp. | 76,240 | 922 |
| | | | 53,382 |
| Financials (21.0%) |
| | Bank of America Corp. | 882,620 | 26,752 |
| | Intercontinental Exchange Inc. | 198,710 | 22,909 |
| | | Shares | Market
Value•
($000) |
| | Citigroup Inc. | 320,653 | 19,772 |
| | American International Group Inc. | 496,102 | 18,783 |
| | Wells Fargo & Co. | 566,633 | 17,101 |
| | American Express Co. | 95,145 | 11,504 |
| | Goldman Sachs Group Inc. | 36,290 | 9,570 |
| | JPMorgan Chase & Co. | 67,984 | 8,639 |
| | Marsh & McLennan Cos. Inc. | 67,085 | 7,849 |
| | PNC Financial Services Group Inc. | 51,771 | 7,714 |
| | Citizens Financial Group Inc. | 185,961 | 6,650 |
| | Travelers Cos. Inc. | 43,782 | 6,146 |
| | Charles Schwab Corp. | 107,640 | 5,709 |
| | Hartford Financial Services Group Inc. | 102,600 | 5,025 |
| | Equitable Holdings Inc. | 194,264 | 4,971 |
| | Commerce Bancshares Inc. | 72,436 | 4,759 |
| | Discover Financial Services | 36,677 | 3,320 |
| | Bank of New York Mellon Corp. | 73,534 | 3,121 |
| | Morgan Stanley | 43,057 | 2,951 |
| | CIT Group Inc. | 73,752 | 2,648 |
| | Fifth Third Bancorp | 64,323 | 1,773 |
| | State Street Corp. | 23,210 | 1,689 |
| | | | 199,355 |
| Health Care (14.0%) |
| | Johnson & Johnson | 153,739 | 24,195 |
| | Medtronic plc | 206,323 | 24,169 |
| | Anthem Inc. | 32,981 | 10,590 |
| | Danaher Corp. | 43,740 | 9,716 |
| | Thermo Fisher Scientific Inc. | 20,114 | 9,369 |
| | Humana Inc. | 22,429 | 9,202 |
| | Zoetis Inc. | 43,841 | 7,256 |
| | GlaxoSmithKline plc ADR | 152,016 | 5,594 |
| * | IQVIA Holdings Inc. | 29,816 | 5,342 |
| * | Laboratory Corp. of America Holdings | 23,782 | 4,841 |
| * | Boston Scientific Corp. | 118,316 | 4,253 |
| | UnitedHealth Group Inc. | 11,400 | 3,998 |
| | Sanofi ADR | 77,664 | 3,774 |
| * | Centene Corp. | 49,460 | 2,969 |
| | Bristol-Myers Squibb Co. | 40,900 | 2,537 |
| | Zimmer Biomet Holdings Inc. | 16,011 | 2,467 |
| * | Maravai LifeSciences Holdings Inc. Class A | 67,839 | 1,903 |
| * | Biogen Inc. | 5,488 | 1,344 |
| | | | 133,519 |
| Industrials (9.1%) |
| | Honeywell International Inc. | 99,181 | 21,096 |
| | General Electric Co. | 1,775,122 | 19,171 |
| | Norfolk Southern Corp. | 43,101 | 10,241 |
| * | CNH Industrial NV | 671,434 | 8,621 |
| | Cummins Inc. | 30,651 | 6,961 |
| | Waste Management Inc. | 55,067 | 6,494 |
| | FedEx Corp. | 24,773 | 6,432 |
| | Caterpillar Inc. | 22,712 | 4,134 |
| | | Shares | Market
Value•
($000) |
| | PACCAR Inc. | 17,820 | 1,538 |
| | Fluor Corp. | 85,250 | 1,361 |
| * | Embraer SA ADR | 94,911 | 646 |
| | | | 86,695 |
| Information Technology (19.0%) |
| | Microsoft Corp. | 218,453 | 48,588 |
| | Apple Inc. | 140,046 | 18,583 |
| | Visa Inc. Class A | 63,941 | 13,986 |
| | Analog Devices Inc. | 93,222 | 13,772 |
| | Texas Instruments Inc. | 73,256 | 12,023 |
| | Oracle Corp. | 126,864 | 8,207 |
| | Cisco Systems Inc. | 182,519 | 8,168 |
| | Hewlett Packard Enterprise Co. | 591,907 | 7,014 |
| | Accenture plc Class A | 24,077 | 6,289 |
| | Amphenol Corp. Class A | 45,887 | 6,001 |
| | Corning Inc. | 163,030 | 5,869 |
| | TE Connectivity Ltd. | 42,860 | 5,189 |
| | Fidelity National Information Services Inc. | 35,838 | 5,070 |
| | Telefonaktiebolaget LM Ericsson ADR | 411,915 | 4,922 |
| * | salesforce.com Inc. | 20,322 | 4,522 |
| | Applied Materials Inc. | 45,231 | 3,903 |
| * | Palo Alto Networks Inc. | 10,081 | 3,583 |
| | CDW Corp. | 22,149 | 2,919 |
| * | F5 Networks Inc. | 12,300 | 2,164 |
| | | | 180,772 |
| Materials (1.0%) |
| | Avery Dennison Corp. | 36,325 | 5,634 |
| | International Paper Co. | 86,397 | 4,296 |
| | | | 9,930 |
| Real Estate (1.2%) |
| | Prologis Inc. | 93,628 | 9,331 |
| | Host Hotels & Resorts Inc. | 124,400 | 1,820 |
| | | | 11,151 |
| Utilities (1.1%) |
| | PPL Corp. | 295,855 | 8,343 |
| | Southern Co. | 36,123 | 2,219 |
| | | | 10,562 |
Total Common Stocks
(Cost $812,849) | 912,346 |
Diversified Value Portfolio
| | | Shares | Market
Value•
($000) |
| Temporary Cash Investments (4.6%) |
| Money Market Fund (4.6%) |
| 1 | Vanguard Market Liquidity Fund, 0.111%
(Cost $43,904) | 439,037 | 43,904 |
Total Investments (100.5%)
(Cost $856,753) | 956,250 |
| Other Assets and Liabilities—Net (-0.5%) | (5,010) |
| Net Assets (100%) | 951,240 |
| Cost is in $000. |
| • | See Note A in Notes to Financial Statements. |
| * | Non-income-producing security. |
| 1 | Affiliated money market fund available only to Vanguard funds and certain trusts and accounts managed by Vanguard. Rate shown is the 7-day yield. |
| | ADR—American Depositary Receipt. |
Derivative Financial Instruments Outstanding as of Period End
| Futures Contracts |
| | | | ($000) |
| | Expiration | Number of
Long (Short)
Contracts | Notional
Amount | Value and
Unrealized
Appreciation
(Depreciation) |
| Long Futures Contracts | | | | |
| E-mini S&P 500 Index | March 2021 | 157 | 29,428 | 741 |
See accompanying Notes, which are an integral part of the Financial Statements.
Diversified Value Portfolio
Statement of Assets and Liabilities
| ($000s, except shares and per-share amounts) | Amount |
| Assets | |
| Investments in Securities, at Value | |
| Unaffiliated Issuers (Cost $812,849) | 912,346 |
| Affiliated Issuers (Cost $43,904) | 43,904 |
| Total Investments in Securities | 956,250 |
| Investment in Vanguard | 36 |
| Cash | 228 |
| Cash Collateral Pledged—Futures Contracts | 1,727 |
| Receivables for Investment Securities Sold | 87 |
| Receivables for Accrued Income | 875 |
| Receivables for Capital Shares Issued | 210 |
| Variation Margin Receivable—Futures Contracts | 193 |
| Total Assets | 959,606 |
| Liabilities | |
| Payables for Investment Securities Purchased | 1,388 |
| Payables to Investment Advisor | 259 |
| Payables for Capital Shares Redeemed | 6,636 |
| Payables to Vanguard | 83 |
| Total Liabilities | 8,366 |
| Net Assets | 951,240 |
| At December 31, 2020, net assets consisted of: | |
| | |
| Paid-in Capital | 823,931 |
| Total Distributable Earnings (Loss) | 127,309 |
| Net Assets | 951,240 |
| |
| Net Assets | |
Applicable to 69,236,136 outstanding $.001 par value shares of
beneficial interest (unlimited authorization) | 951,240 |
| Net Asset Value Per Share | $13.74 |
See accompanying Notes, which are an integral part of the Financial Statements.
Diversified Value Portfolio
Statement of Operations
|
| | Year Ended
December 31, 2020 |
| | ($000) |
| Investment Income | |
| Income | |
| Dividends1 | 16,220 |
| Interest2 | 270 |
| Securities Lending—Net | 33 |
| Total Income | 16,523 |
| Expenses | |
| Investment Advisory Fees—Note B | |
| Basic Fee | 974 |
| Performance Adjustment | — |
| The Vanguard Group—Note C | |
| Management and Administrative | 1,198 |
| Marketing and Distribution | 69 |
| Custodian Fees | 19 |
| Auditing Fees | 32 |
| Shareholders' Reports | 13 |
| Trustees’ Fees and Expenses | 1 |
| Total Expenses | 2,306 |
| Net Investment Income | 14,217 |
| Realized Net Gain (Loss) | |
| Investment Securities Sold2 | 12,146 |
| Futures Contracts | 3,935 |
| Realized Net Gain (Loss) | 16,081 |
| Change in Unrealized Appreciation (Depreciation) | |
| Investment Securities2 | 61,460 |
| Futures Contracts | 448 |
| Change in Unrealized Appreciation (Depreciation) | 61,908 |
| Net Increase (Decrease) in Net Assets Resulting from Operations | 92,206 |
| 1 | Dividends are net of foreign withholding taxes of $70,000. |
| 2 | Interest income, realized net gain (loss), and change in unrealized appreciation (depreciation) from an affiliated company of the portfolio were $269,000, $7,000, and $—, respectively. Purchases and sales are for temporary cash investment purposes. |
Statement of Changes in Net Assets
|
| | Year Ended December 31, |
| | 2020
($000) | 2019
($000) |
| Increase (Decrease) in Net Assets | | |
| Operations | | |
| Net Investment Income | 14,217 | 22,410 |
| Realized Net Gain (Loss) | 16,081 | 148,015 |
| Change in Unrealized Appreciation (Depreciation) | 61,908 | 43,477 |
| Net Increase (Decrease) in Net Assets Resulting from Operations | 92,206 | 213,902 |
| Distributions1 | | |
| Total Distributions | (170,717) | (83,175) |
| Capital Share Transactions | | |
| Issued | 95,482 | 72,081 |
| Issued in Lieu of Cash Distributions | 170,717 | 83,175 |
| Redeemed | (210,173) | (199,650) |
| Net Increase (Decrease) from Capital Share Transactions | 56,026 | (44,394) |
| Total Increase (Decrease) | (22,485) | 86,333 |
| Net Assets | | |
| Beginning of Period | 973,725 | 887,392 |
| End of Period | 951,240 | 973,725 |
| 1 | Certain prior-period numbers have been reclassified to conform with the current-period presentation. |
See accompanying Notes, which are an integral part of the Financial Statements.
Diversified Value Portfolio
For a Share Outstanding
Throughout Each Period | Year Ended December 31, |
| 2020 | 2019 | 2018 | 2017 | 2016 |
| Net Asset Value, Beginning of Period | $16.45 | $14.33 | $17.04 | $17.11 | $16.55 |
| Investment Operations | | | | | |
| Net Investment Income | .2091 | .3641 | .4121 | .4011 | .496 |
| Net Realized and Unrealized Gain (Loss) on Investments | .133 | 3.135 | (1.872) | 1.658 | 1.468 |
| Total from Investment Operations | .342 | 3.499 | (1.460) | 2.059 | 1.964 |
| Distributions | | | | | |
| Dividends from Net Investment Income | (.409) | (.462) | (.423) | (.491) | (.461) |
| Distributions from Realized Capital Gains | (2.643) | (.917) | (.827) | (1.638) | (.943) |
| Total Distributions | (3.052) | (1.379) | (1.250) | (2.129) | (1.404) |
| Net Asset Value, End of Period | $13.74 | $16.45 | $14.33 | $17.04 | $17.11 |
| Total Return | 11.78% | 25.70% | -9.12% | 13.16% | 12.96% |
| Ratios/Supplemental Data | | | | | |
| Net Assets, End of Period (Millions) | $951 | $974 | $887 | $1,137 | $1,130 |
| Ratio of Total Expenses to Average Net Assets2 | 0.28% | 0.24% | 0.25% | 0.27% | 0.27% |
| Ratio of Net Investment Income to Average Net Assets | 1.70% | 2.39% | 2.58% | 2.45% | 3.01% |
| Portfolio Turnover Rate | 34% | 117% | 18% | 18% | 34% |
| 1 | Calculated based on average shares outstanding. |
| 2 | Includes performance-based investment advisory fee increases (decreases) of 0.00%, (0.03%), (0.03%), (0.03%), and (0.03%). |
See accompanying Notes, which are an integral part of the Financial Statements.
Diversified Value Portfolio
Notes to Financial Statements
The Diversified Value Portfolio, a portfolio of Vanguard Variable Insurance Funds, is registered under the Investment Company Act of 1940 as an open-end investment company. The portfolio's shares are only available for purchase by separate accounts of insurance companies as investments for variable annuity plans, variable life insurance contracts, or other variable benefit insurance contracts. Market disruptions associated with the COVID-19 pandemic have had a global impact, and uncertainty exists as to the long-term implications. Such disruptions can adversely affect assets of the portfolio and thus portfolio performance.
| A. | The following significant accounting policies conform to generally accepted accounting principles for U.S. investment companies. The portfolio consistently follows such policies in preparing its financial statements. |
1. Security Valuation: Securities are valued as of the close of trading on the New York Stock Exchange (generally 4 p.m., Eastern time) on the valuation date. Equity securities are valued at the latest quoted sales prices or official closing prices taken from the primary market in which each security trades; such securities not traded on the valuation date are valued at the mean of the latest quoted bid and asked prices. Securities for which market quotations are not readily available, or whose values have been materially affected by events occurring before the portfolio’s pricing time but after the close of the securities’ primary markets, are valued by methods deemed by the board of trustees to represent fair value. Investments in Vanguard Market Liquidity Fund are valued at that fund's net asset value.
2. Futures Contracts: The portfolio uses index futures contracts to a limited extent, with the objective of maintaining full exposure to the stock market while maintaining liquidity. The portfolio may purchase or sell futures contracts to achieve a desired level of investment, whether to accommodate portfolio turnover or cash flows from capital share transactions. The primary risks associated with the use of futures contracts are imperfect correlation between changes in market values of stocks held by the portfolio and the prices of futures contracts, and the possibility of an illiquid market. Counterparty risk involving futures is mitigated because a regulated clearinghouse is the counterparty instead of the clearing broker. To further mitigate counterparty risk, the portfolio trades futures contracts on an exchange, monitors the financial strength of its clearing brokers and clearinghouse, and has entered into clearing agreements with its clearing brokers. The clearinghouse imposes initial margin requirements to secure the portfolio’s performance and requires daily settlement of variation margin representing changes in the market value of each contract. Any securities pledged as initial margin for open contracts are noted in the Schedule of Investments.
Futures contracts are valued at their quoted daily settlement prices. The notional amounts of the contracts are not recorded in the Statement of Assets and Liabilities. Fluctuations in the value of the contracts are recorded in the Statement of Assets and Liabilities as an asset (liability) and in the Statement of Operations as unrealized appreciation (depreciation) until the contracts are closed, when they are recorded as realized gains (losses) on futures contracts.
During the year ended December 31, 2020, the portfolio’s average investments in long and short futures contracts represented 3% and 0% of net assets, respectively, based on the average of the notional amounts at each quarter-end during the period.
3. Federal Income Taxes: The portfolio intends to continue to qualify as a regulated investment company and distribute all of its taxable income. The portfolio’s tax returns are open to examination by the relevant tax authorities until expiration of the applicable statute of limitations, which is generally three years after the filing of the tax return. Management has analyzed the portfolio’s tax positions taken for all open federal and state income tax years, and has concluded that no provision for income tax is required in the portfolio’s financial statements.
4. Distributions: Distributions to shareholders are recorded on the ex-dividend date. Distributions are determined on a tax basis at the fiscal year-end and may differ from net investment income and realized capital gains for financial reporting purposes.
5. Securities Lending: To earn additional income, the portfolio lends its securities to qualified institutional borrowers. Security loans are subject to termination by the portfolio at any time, and are required to be secured at all times by collateral in an amount at least equal to the market value of securities loaned. Daily market fluctuations could cause the value of loaned securities to be more or less than the value of the collateral received. When this occurs, the collateral is adjusted and settled on the next business day. The portfolio further mitigates its counterparty risk by entering into securities lending transactions only with a diverse group of prequalified counterparties, monitoring their financial strength, and entering into master securities lending agreements with its counterparties. The master securities lending agreements provide that, in the event of a counterparty’s default (including bankruptcy), the portfolio may terminate any loans with that
Diversified Value Portfolio
borrower, determine the net amount owed, and sell or retain the collateral up to the net amount owed to the portfolio; however, such actions may be subject to legal proceedings. While collateral mitigates counterparty risk, in the event of a default, the portfolio may experience delays and costs in recovering the securities loaned. The portfolio invests cash collateral received in Vanguard Market Liquidity Fund, and records a liability in the Statement of Assets and Liabilities for the return of the collateral, during the period the securities are on loan. Collateral investments in Vanguard Market Liquidity Fund are subject to market appreciation or depreciation. Securities lending income represents fees charged to borrowers plus income earned on invested cash collateral, less expenses associated with the loan. During the term of the loan, the portfolio is entitled to all distributions made on or in respect of the loaned securities.
6. Credit Facilities and Interfund Lending Program: The portfolio and certain other funds managed by The Vanguard Group ("Vanguard") participate in a $4.3 billion committed credit facility provided by a syndicate of lenders pursuant to a credit agreement and an uncommitted credit facility provided by Vanguard. Both facilities may be renewed annually. Each fund is individually liable for its borrowings, if any, under the credit facilities. Borrowings may be utilized for temporary or emergency purposes, subject to the portfolio’s regulatory and contractual borrowing restrictions. With respect to the committed credit facility, the participating funds are charged administrative fees and an annual commitment fee of 0.10% of the undrawn committed amount of the facility; these fees are allocated to the funds based on a method approved by the portfolio’s board of trustees and included in Management and Administrative expenses on the portfolio’s Statement of Operations. Any borrowings under either facility bear interest at a rate based upon the higher of the one-month London Interbank Offered Rate (or an acceptable alternate rate, if necessary), federal funds effective rate, or overnight bank funding rate plus an agreed-upon spread, except that borrowings under the uncommitted credit facility may bear interest based upon an alternate rate agreed to by the portfolio and Vanguard.
In accordance with an exemptive order (the “Order”) from the SEC, the portfolio may participate in a joint lending and borrowing program that allows registered open-end Vanguard funds to borrow money from and lend money to each other for temporary or emergency purposes (the “Interfund Lending Program”), subject to compliance with the terms and conditions of the Order, and to the extent permitted by the portfolio’s investment objective and investment policies. Interfund loans and borrowings normally extend overnight, but can have a maximum duration of seven days. Loans may be called on one business day’s notice. The interest rate to be charged is governed by the conditions of the Order and internal procedures adopted by the board of trustees. The board of trustees is responsible for overseeing the Interfund Lending Program.
For the year ended December 31, 2020, the portfolio did not utilize the credit facilities or the Interfund Lending Program.
7. Other: Dividend income is recorded on the ex-dividend date. Non-cash dividends included in dividend income, if any, are recorded at the fair value of the securities received. Interest income includes income distributions received from Vanguard Market Liquidity Fund and is accrued daily. Premiums and discounts on debt securities are amortized and accreted, respectively, to interest income over the lives of the respective securities, except for premiums on certain callable debt securities that are amortized to the earliest call date. Security transactions are accounted for on the date securities are bought or sold. Costs used to determine realized gains (losses) on the sale of investment securities are those of the specific securities sold.
| B. | The investment advisory firms Lazard Asset Management LLC and Hotchkis and Wiley Capital Management, LLC, each provide investment advisory services to a portion of the portfolio for a fee calculated at an annual percentage rate of average net assets managed by the advisor. In accordance with the advisory contracts entered into with Lazard Asset Management LLC and Hotchkis and Wiley Capital Management, LLC, beginning January 1, 2021, the investment advisory fees will be subject to quarterly adjustments based on performance relative to the S&P 500 Index and the Russell 1000 Value Index, respectively, since December 31, 2019. |
Vanguard manages the cash reserves of the portfolio as described below.
For the year ended December 31, 2020, the aggregate investment advisory fee paid to all advisors represented an effective annual basic rate of 0.12% of the portfolio’s average net assets.
| C. | In accordance with the terms of a Funds' Service Agreement (the “FSA”) between Vanguard and the portfolio, Vanguard furnishes to the portfolio corporate management, administrative, marketing, distribution, and cash management services at Vanguard’s cost of operations (as defined by the FSA). These costs of operations are allocated to the portfolio based on methods and guidelines approved by the board of trustees and are generally settled twice a month. |
Diversified Value Portfolio
Upon the request of Vanguard, the portfolio may invest up to 0.40% of its net assets as capital in Vanguard. At December 31, 2020, the portfolio had contributed to Vanguard capital in the amount of $36,000, representing less than 0.01% of the portfolio’s net assets and 0.01% of Vanguard’s capital received pursuant to the FSA. The portfolio’s trustees and officers are also directors and employees, respectively, of Vanguard.
| D. | Various inputs may be used to determine the value of the portfolio’s investments and derivatives. These inputs are summarized in three broad levels for financial statement purposes. The inputs or methodologies used to value securities are not necessarily an indication of the risk associated with investing in those securities. |
Level 1—Quoted prices in active markets for identical securities.
Level 2—Other significant observable inputs (including quoted prices for similar securities, interest rates, prepayment speeds, credit risk, etc.).
Level 3—Significant unobservable inputs (including the portfolio’s own assumptions used to determine the fair value of investments). Any investments and derivatives valued with significant unobservable inputs are noted on the Schedule of Investments.
At December 31, 2020, 100% of the market value of the portfolio’s investments and derivatives was determined based on Level 1 inputs.
| E. | Permanent differences between book-basis and tax-basis components of net assets, if any, are reclassified among capital accounts in the financial statements to reflect their tax character. These reclassifications have no effect on net assets or net asset value per share. |
Temporary differences between book-basis and tax-basis components of total distributable earnings (loss) arise when certain items of income, gain, or loss are recognized in different periods for financial statement and tax purposes; these differences will reverse at some time in the future. The differences are primarily related to the deferral of losses from wash sales; and the recognition of unrealized gains or losses from certain derivative contracts. As of period end, the tax-basis components of total distributable earnings (loss) are detailed in the table as follows:
| | Amount
($000) |
| Undistributed Ordinary Income | 11,377 |
| Undistributed Long-Term Gains | 16,435 |
| Capital Loss Carryforwards | — |
| Qualified Late-Year Losses | — |
| Net Unrealized Gains (Losses) | 99,497 |
The tax character of distributions paid was as follows:
| | Year Ended December 31, |
| | 2020
Amount
($000) | 2019
Amount
($000) |
| Ordinary Income* | 26,163 | 29,777 |
| Long-Term Capital Gains | 144,554 | 53,398 |
| Total | 170,717 | 83,175 |
| * | Includes short-term capital gains, if any. |
As of December 31, 2020, gross unrealized appreciation and depreciation for investments and derivatives based on cost for U.S. federal income tax purposes were as follows:
| | Amount
($000) |
| Tax Cost | 856,753 |
| Gross Unrealized Appreciation | 163,956 |
| Gross Unrealized Depreciation | (64,459) |
| Net Unrealized Appreciation (Depreciation) | 99,497 |
| F. | During the year ended December 31, 2020, the portfolio purchased $271,547,000 of investment securities and sold $370,811,000 of investment securities, other than temporary cash investments. |
Diversified Value Portfolio
| G. | Capital shares issued and redeemed were: |
| | Year Ended December 31, |
| | 2020 | 2019 |
| | Shares
(000) | Shares
(000) |
| Issued | 8,217 | 4,725 |
| Issued in Lieu of Cash Distributions | 18,926 | 5,732 |
| Redeemed | (17,100) | (13,173) |
| Net Increase (Decrease) in Shares Outstanding | 10,043 | (2,716) |
At December 31, 2020, two shareholders (insurance company separate accounts whose holdings in the portfolio represent the indirect investment of Vanguard Variable Annuity contract holders) were each a record or beneficial owner of at least 25% or more of the portfolio’s net assets, with a combined ownership of 76%. If any of these shareholders were to redeem their investment in the portfolio, the redemption might result in an increase in the portfolio’s expense ratio, cause the portfolio to incur higher transaction costs or lead to the realization of taxable gains.
| H. | Management has determined that no events or transactions occurred subsequent to December 31, 2020, that would require recognition or disclosure in these financial statements. |
Report of Independent Registered Public Accounting Firm
To the Board of Trustees of Vanguard Variable Insurance Funds and Shareholders of Diversified Value Portfolio
Opinion on the Financial Statements
We have audited the accompanying statement of assets and liabilities, including the schedule of investments, of Diversified Value Portfolio (one of the portfolios constituting Vanguard Variable Insurance Funds, referred to hereafter as the "Portfolio”) as of December 31, 2020, the related statement of operations for the year ended December 31, 2020, the statement of changes in net assets for each of the two years in the period ended December 31, 2020, including the related notes, and the financial highlights for each of the five years in the period ended December 31, 2020 (collectively referred to as the “financial statements”). In our opinion, the financial statements present fairly, in all material respects, the financial position of the Portfolio as of December 31, 2020, the results of its operations for the year then ended, the changes in its net assets for each of the two years in the period ended December 31, 2020 and the financial highlights for each of the five years in the period ended December 31, 2020 in conformity with accounting principles generally accepted in the United States of America.
Basis for Opinion
These financial statements are the responsibility of the Portfolio’s management. Our responsibility is to express an opinion on the Portfolio’s financial statements based on our audits. We are a public accounting firm registered with the Public Company Accounting Oversight Board (United States) (PCAOB) and are required to be independent with respect to the Portfolio in accordance with the U.S. federal securities laws and the applicable rules and regulations of the Securities and Exchange Commission and the PCAOB.
We conducted our audits of these financial statements in accordance with the standards of the PCAOB. Those standards require that we plan and perform the audit to obtain reasonable assurance about whether the financial statements are free of material misstatement, whether due to error or fraud.
Our audits included performing procedures to assess the risks of material misstatement of the financial statements, whether due to error or fraud, and performing procedures that respond to those risks. Such procedures included examining, on a test basis, evidence regarding the amounts and disclosures in the financial statements. Our audits also included evaluating the accounting principles used and significant estimates made by management, as well as evaluating the overall presentation of the financial statements. Our procedures included confirmation of securities owned as of December 31, 2020 by correspondence with the custodian and brokers and by agreement to the underlying ownership records of the transfer agent; when replies were not received from brokers, we performed other auditing procedures. We believe that our audits provide a reasonable basis for our opinion.
/s/PricewaterhouseCoopers LLP
Philadelphia, Pennsylvania
February 18, 2021
We have served as the auditor of one or more investment companies in The Vanguard Group of Funds since 1975.
Special 2020 tax information (unaudited) for corporate shareholders only for Diversified Value Portfolio, a portfolio of Vanguard Variable Insurance Funds
This information for the fiscal year ended December 31, 2020, is included pursuant to provisions of the Internal Revenue Code for corporate shareholders only.
The portfolio distributed $144,554,000 as capital gain dividends (20% rate gain distributions) to shareholders during the fiscal year.
For corporate shareholders, 100% of investment income (dividend income plus short-term gains, if any) qualifies for the dividends-received deduction.
This page intentionally left blank.
The People Who Govern Your Fund
The trustees of your mutual fund are there to see that the fund is operated and managed in your best interests since, as a shareholder, you are a part owner of the fund. Your fund’s trustees also serve on the board of directors of The Vanguard Group, Inc., which is owned by the Vanguard funds and provides services to them.
A majority of Vanguard’s board members are independent, meaning that they have no affiliation with Vanguard or the funds they oversee, apart from the sizable personal investments they have made as private individuals. The independent board members have distinguished backgrounds in business, academia, and public service. Each of the trustees and executive officers oversees 211 Vanguard funds.
Information for each trustee and executive officer of the fund appears below. That information, as well as the Vanguard fund count, is as of the date on the cover of this fund report. The mailing address of the trustees and officers is P.O. Box 876, Valley Forge, PA 19482. More information about the trustees is in the Statement of Additional Information, which can be obtained, without charge, by contacting Vanguard at 800-662-7447, or online at vanguard.com.
Interested Trustee1
Mortimer J. Buckley
Born in 1969. Trustee since January 2018. Principal occupation(s) during the past five years and other experience: chairman of the board (2019–present) of Vanguard and of each of the investment companies served by Vanguard; chief executive officer (2018–present) of Vanguard; chief executive officer, president, and trustee (2018–present) of each of the investment companies served by Vanguard; president and director (2017–present) of Vanguard; and president (2018–present) of Vanguard Marketing Corporation. Chief investment officer (2013–2017), managing director (2002–2017), head of the Retail Investor Group (2006–2012), and chief information officer (2001–2006) of Vanguard. Chairman of the board (2011–2017) and trustee (2009–2017) of the Children’s Hospital of Philadelphia; and trustee (2018–present) and vice chair (2019–present) of The Shipley School.
Independent Trustees
Emerson U. Fullwood
Born in 1948. Trustee since January 2008. Principal occupation(s) during the past five years and other experience: executive chief staff and marketing officer for North America and corporate vice president (retired 2008) of Xerox Corporation (document management products and services). Former president of the Worldwide Channels Group, Latin America, and Worldwide Customer Service and executive chief staff officer of Developing Markets of Xerox. Executive in residence and 2009–2010 Distinguished Minett Professor at the Rochester Institute of Technology. Director of SPX FLOW, Inc. (multi-industry manufacturing). Director of the University of Rochester Medical Center, the Monroe Community College Foundation, the United Way of Rochester, North Carolina A&T University, and Roberts Wesleyan College. Trustee of the University of Rochester.
Amy Gutmann
Born in 1949. Trustee since June 2006. Principal occupation(s) during the past five years and other experience: president (2004–present) of the University of Pennsylvania. Christopher H. Browne Distinguished Professor of Political Science, School of Arts and Sciences, and professor of communication, Annenberg School for Communication, with secondary faculty appointments in the Department of Philosophy, School of Arts and Sciences, and at the Graduate School of Education, University of Pennsylvania.
F. Joseph Loughrey
Born in 1949. Trustee since October 2009. Principal occupation(s) during the past five years and other experience: president and chief operating officer (retired 2009) and vice chairman of the board (2008–2009) of Cummins Inc. (industrial machinery). Chairman of the board of Hillenbrand, Inc. (specialized consumer services) and the Lumina Foundation. Director of the V Foundation. Member of the advisory council for the College of Arts and Letters and chair of the advisory board to the Kellogg Institute for International Studies, both at the University of Notre Dame.
Mark Loughridge
Born in 1953. Trustee since March 2012. Principal occupation(s) during the past five years and other experience: senior vice president and chief financial officer (retired 2013) of IBM (information technology services). Fiduciary member of IBM’s Retirement Plan Committee (2004–2013), senior vice president and general manager (2002–2004) of IBM Global Financing, vice president and controller (1998–2002) of IBM, and a variety of other prior management roles at IBM. Member of the Council on Chicago Booth.
Scott C. Malpass
Born in 1962. Trustee since March 2012. Principal occupation(s) during the past five years and other experience: chief investment officer (retired June 2020) and vice president (retired June 2020) of the University of Notre Dame. Assistant professor of finance at the Mendoza College of Business, University of Notre Dame, and member of the Notre Dame 403(b) Investment Committee (retired June 2020). Member of the board of Catholic Investment Services, Inc. (investment advisors) and the board of superintendence of the Institute for the Works of Religion.
Deanna Mulligan
Born in 1963. Trustee since January 2018. Principal occupation(s) during the past five years and other experience: board chair (2020–present), chief executive officer (2011–2020), and president (2010–2019) of The Guardian Life Insurance Company of America. Chief operating officer (2010–2011) and executive vice president (2008–2010) of the individual life and disability division of Guardian Life. Member of the board of the American Council of Life Insurers and the board of the Economic Club of New York. Trustee of the Partnership for New York City (business leadership), Chief Executives for Corporate Purpose, NewYork-Presbyterian Hospital, Catalyst, and the
Bruce Museum (arts and science). Member of the Advisory Council for the Stanford Graduate School of Business.
André F. Perold
Born in 1952. Trustee since December 2004. Principal occupation(s) during the past five years and other experience: George Gund Professor of Finance and Banking, Emeritus at the Harvard Business School (retired 2011). Chief investment officer and co-managing partner of HighVista Strategies (private investment firm). Member of the board of advisors and member of the investment committee of the Museum of Fine Arts Boston. Member of the board (2018–present) of RIT Capital Partners (investment firm). Member of the investment committee of Partners Health Care System.
Sarah Bloom Raskin
Born in 1961. Trustee since January 2018. Principal occupation(s) during the past five years and other experience: deputy secretary (2014–2017) of the United States Department of the Treasury. Governor (2010–2014) of the Federal Reserve Board. Commissioner (2007–2010) of financial regulation for the State of Maryland. Member of the board of directors (2012–2014) of Neighborhood Reinvestment Corporation. Director (2017–present) of i(x) Investments, LLC; director (2017–present) of Reserve Trust. Rubenstein Fellow (2017–present) of Duke University; trustee (2017–present) of Amherst College, and trustee (2019–present) of the Folger Shakespeare Library.
Peter F. Volanakis
Born in 1955. Trustee since July 2009. Principal occupation(s) during the past five years and other experience: president and chief operating officer (retired 2010) of Corning Incorporated (communications equipment) and director of Corning Incorporated (2000–2010) and Dow Corning (2001–2010). Director (2012) of SPX Corporation (multi-industry manufacturing). Overseer of the Amos Tuck School of Business Administration, Dartmouth College (2001–2013). Chairman of the board of trustees of Colby-Sawyer College. Member of the board of Hypertherm Inc. (industrial cutting systems, software, and consumables).
1 Mr. Buckley is considered an “interested person,” as defined in the Investment Company Act of 1940, because he is an officer of the Vanguard funds.
Executive Officers
John Bendl
Born in 1970. Principal occupation(s) during the past five years and other experience: principal of Vanguard. Chief financial officer (2019–present) of each of the investment companies served by Vanguard. Chief accounting officer, treasurer, and controller of Vanguard (2017–present). Partner (2003–2016) at KPMG (audit, tax, and advisory services).
Christine M. Buchanan
Born in 1970. Principal occupation(s) during the past five years and other experience: principal of Vanguard. Treasurer (2017–present) of each of the investment companies served by Vanguard. Partner (2005–2017) at KPMG (audit, tax, and advisory services).
David Cermak
Born in 1960. Principal occupation(s) during the past five years and other experience: principal of Vanguard. Finance director (2019–present) of each of the investment companies served by Vanguard. Managing director and head (2017–present) of Vanguard Investments Singapore. Managing director and head (2017–2019) of Vanguard Investments Hong Kong. Representative director and head (2014–2017) of Vanguard Investments Japan.
John Galloway
Born in 1973. Principal occupation(s) during the past five years and other experience: principal of Vanguard.
Investment stewardship officer (September 2020–present) of each of the investment companies served by Vanguard. Head of Investor Advocacy (February 2020–present) and head of Marketing Strategy and Planning (2017–2020) at Vanguard. Deputy assistant to the President of the United States (2015).
Thomas J. Higgins
Born in 1957. Principal occupation(s) during the past five years and other experience: principal of Vanguard. Finance director (2019–present), chief financial officer (2008–2019), and treasurer (1998–2008) of each of the investment companies served by Vanguard.
Peter Mahoney
Born in 1974. Principal occupation(s) during the past five years and other experience: principal of Vanguard. Controller (2015–present) of each of the investment companies served by Vanguard. Head of International Fund Services (2008–2014) at Vanguard.
Anne E. Robinson
Born in 1970. Principal occupation(s) during the past five years and other experience: general counsel (2016–present) of Vanguard. Secretary (2016–present) of Vanguard and of each of the investment companies served by Vanguard. Managing director (2016–present) of Vanguard. Managing director and general counsel of Global Cards and Consumer Services (2014–2016) at Citigroup. Counsel (2003–2014) at American Express.
Michael Rollings
Born in 1963. Principal occupation(s) during the past five years and other experience: finance director (2017–present) and treasurer (2017) of each of the investment companies served by Vanguard. Managing director (2016–present) of Vanguard. Chief financial officer (2016–present) of Vanguard. Director (2016–present) of Vanguard Marketing Corporation. Executive vice president and chief financial officer (2006–2016) of MassMutual Financial Group.
John E. Schadl
Born in 1972. Principal occupation(s) during the past five years and other experience: principal of Vanguard. Chief compliance officer (2019–present) of Vanguard and of each of the investment companies served by Vanguard. Assistant vice president (2019–present) of Vanguard Marketing Corporation.
Vanguard Senior Management Team
| Joseph Brennan | James M. Norris |
| Mortimer J. Buckley | Thomas M. Rampulla |
| Gregory Davis | Karin A. Risi |
| John James | Anne E. Robinson |
| John T. Marcante | Michael Rollings |
| Chris D. McIsaac | Lauren Valente |
Connect with Vanguard®>vanguard.com
Fund Information > 800-662-7447
Annuity and Insurance Services > 800-522-5555
Institutional Investor Services > 800-523-1036
Text Telephone for People Who Are Deaf or Hard of Hearing > 800-749-7273
This material may be used in conjunction with the offering of shares of any Vanguard fund only if preceded or accompanied by the fund’s current prospectus.
You can obtain a free copy of Vanguard’s proxy voting guidelines by visiting vanguard.com/proxyreporting or by calling Vanguard at 800-662-2739. The guidelines are also available from the SEC’s website, www.sec.gov. In addition, you may obtain a free report on how your fund voted the proxies for securities it owned during the 12 months ended June 30. To get the report, visit either vanguard.com/proxyreporting or www.sec.gov.
All comparative mutual fund data are from Morningstar, Inc., unless otherwise noted.
You can review information about your fund on the SEC’s website, and you can receive copies of this information, for a fee, by sending a request via email addressed to publicinfo@sec.gov.
Source for Bloomberg Barclays indexes: Bloomberg Index Services Limited. Copyright 2021, Bloomberg. All rights reserved.
CFA® is a registered trademark owned by CFA Institute.
© 2021 The Vanguard Group, Inc.
All rights reserved.
Vanguard Marketing Corporation, Distributor.
Q690DV 022021
Annual Report | December 31, 2020
Vanguard Variable Insurance Funds
Contents
Your Portfolio’s Performance at a Glance
| 1 |
Advisors' Report
| 2 |
About Your Portfolio’s Expenses
| 4 |
Performance Summary
| 5 |
Financial Statements
| 7 |
Please note: The opinions expressed in this report are just that—informed opinions. They should not be considered promises or advice. Also, please keep in mind that the information and opinions cover the period through the date on the front of this report. Of course, the risks of investing in your portfolio are spelled out in the prospectus.
Your Portfolio’s Performance at a Glance
| • | For the 12 months ended December 31, 2020, the Equity Income Portfolio of Vanguard Variable Insurance Funds returned 3.25%, outperforming the 1.16% return of its benchmark, the FTSE High Dividend Yield Index. |
| • | Stocks initially plummeted after the emergence of COVID-19 in early 2020 but finished the year significantly higher. That was thanks in part to rapid, robust monetary and fiscal action by policymakers and the rollout of COVID-19 vaccines at the end of the year. |
| • | Positive selection in financials, consumer discretionary, health care, and communication services boosted performance. The portfolio’s positions in consumer staples, materials, utilities, and information technology detracted. |
| • | For the decade ended December 31, 2020, the portfolio produced an average annual return of 11.62%, slightly above that of its benchmark. |
| • | Please note that the portfolio’s returns are different from those in Vanguard Variable Annuity (and other plans that invest in the portfolio), which take into account insurance-related expenses. |
Market Barometer
Average Annual Total Returns
Periods Ended December 31, 2020 |
| | One Year | Three Years | Five Years |
| Stocks | | | |
| Russell 1000 Index (Large-caps) | 20.96% | 14.82% | 15.60% |
| Russell 2000 Index (Small-caps) | 19.96 | 10.25 | 13.26 |
| Russell 3000 Index (Broad U.S. market) | 20.89 | 14.49 | 15.43 |
| FTSE All-World ex US Index (International) | 11.22 | 5.18 | 9.16 |
| Bonds | | | |
| Bloomberg Barclays U.S. Aggregate Bond Index (Broad taxable market) | 7.51% | 5.34% | 4.44% |
Bloomberg Barclays Municipal Bond Index
(Broad tax-exempt market) | 5.21 | 4.64 | 3.91 |
| FTSE Three-Month U.S. Treasury Bill Index | 0.58 | 1.56 | 1.16 |
| CPI | | | |
| Consumer Price Index | 1.36% | 1.85% | 1.95% |
The Equity Income Portfolio returned 3.25% for the 12 months ended December 31, 2020. The portfolio outperformed the 1.16% return of its benchmark, the FTSE High Dividend Yield Index.
The portfolio is managed by two independent advisors, a strategy that enhances diversification by providing exposure to distinct yet complementary investment approaches. It is not uncommon for different advisors to have different views about individual securities or the broader investment environment.
The advisors, the amount and percentage of the portfolio’s assets each manages, and brief descriptions of their investment strategies are presented in the accompanying table. Each advisor has also provided a discussion of the investment environment that existed during the 12 months and its effect on the portfolio’s positioning. These comments were prepared on January 20, 2021.
Wellington Management Company llp
Portfolio Manager:
W. Michael Reckmeyer, III, CFA,
Senior Managing Director
Investment environment
U.S. equities gained 18.40% over the 12 months ended December 31, 2020, as measured by the Standard & Poor’s 500 Index. After achieving record highs in February, U.S. stocks ended the first quarter sharply lower, as COVID-19 spread rapidly throughout the country. The pandemic caused significant market disruptions and financial damage, and heightened fears of a severe economic downturn.
However, the unprecedented scale of the fiscal and monetary stimulus implemented by Congress and the Federal Reserve was the biggest driver of the market’s rebound in the second quarter. In September, the S&P 500 Index declined for the first time in five months on concerns about a resurgence in COVID-19 in many areas of
the country, an undetermined timeline for vaccines, high unemployment, elevated debt burdens, and uncertainty about additional fiscal stimulus.
During the fourth quarter, U.S. equities rallied, bolstered by better-than-expected third-quarter earnings, economic resilience, substantial monetary support from the Fed, and optimism that vaccines would support a broad reopening of the U.S. economy in 2021. Former Vice President Joe Biden was elected president after a closely contested election, removing a key element of uncertainty for the market.
Our successes and shortfalls
Throughout 2020, our portion of the portfolio benefited from strong stock selection. Our holdings in financials, communication services, and consumer discretionary contributed most to relative performance. This was partially offset by weaker security selection in utilities, information technology, and consumer staples. Sector allocation, a result of our bottom-up selection process, also aided results, because of our overweight positions in consumer discretionary, industrials, and health care.
Top contributors to relative performance included our out-of-benchmark position in Deere and overweight to Home Depot. Not holding benchmark constituents Wells Fargo and AT&T also benefited performance. We also reduced exposure to Exxon Mobil, a large benchmark constituent, and eventually eliminated the position during the period, which aided relative performance.
Individual detractors included our out-of-benchmark position in Suncor Energy, a Canadian oil sands company, and our overweight to Bank of America. Not owning benchmark constituents Qualcomm and Broadcom also weighed on relative results because both stocks posted strong gains over the year.
At the end of 2020, we were most overweighted to the health care,
industrial, and real estate sectors and most underweighted to the materials, energy, and information technology sectors.
Our largest new positions during the year included Becton Dickinson, a medical device manufacturer; General Dynamics, a defense contractor with exposure to commercial aerospace; and Morgan Stanley, a diversified financials company with a growing wealth management segment. We also added to our positions in Johnson & Johnson and Procter & Gamble.
Some of our more notable eliminations included Intel, the manufacturer of computer processors; Chevron, a major oil company; and Koninklijke Philips, the Dutch multinational conglomerate with an increasing focus on health care. We trimmed our positions in Home Depot and Deere on the back of strong performance.
The volatility of this past year afforded us the opportunity to upgrade the quality of the portfolio, as companies with strong balance sheets and sustainable dividends sold off on short-term concerns about the COVID-19 pandemic. We remain focused on finding quality dividend-paying companies with superior total-return potential at discounted valuations.
Vanguard Quantitative Equity Group
Portfolio Managers:
James P. Stetler
Binbin Guo, Principal, Head of
Alpha Equity Investments
Investment environment
The emergence of COVID-19 in early 2020 turned into a global health crisis, and aggressive attempts to contain it resulted in a sharp downturn in economic activity. Unemployment spiked, and sectors where social distancing isn’t possible were hit hard.
Stocks initially plummeted as infections surged, but they finished the year
significantly higher, thanks in part to rapid, robust monetary and fiscal action by policymakers and the rollout of COVID-19 vaccines as the year drew to a close. The S&P 500 Index returned 18.40% for the 12 months ended December 31, 2020, while the FTSE Global All-Cap ex US Index returned 11.24%.
The broad fixed income markets generated positive returns as many central banks slashed short-term interest rates and expanded or extended asset-purchase programs.
Investment strategy
While it’s important to understand how overall performance is affected by the macroeconomic factors described above, our approach to investing focuses on specific fundamentals, not technical analysis of stock price movements.
We use a strict quantitative approach to evaluate a stock’s attractiveness based on five characteristics: high quality—healthy balance sheets and steady cash-flow generation; management decisions—sound investment policies that favor internal over external funding;
consistent earnings growth—the ability to grow earnings year after year; strong market sentiment—market confirmation of our view; and reasonable valuation—we strive to avoid overpriced stocks.
The interaction of these characteristics generates an expected return that seeks to capitalize on investor biases. We then construct our portfolio with the goal of maximizing these expected returns and minimizing exposure to risks that our research indicates do not improve returns, such as industry selection and other risks relative to our benchmark.
Portfolio update
Against this fiscal year’s backdrop, our sentiment, valuation, and management decisions models aided relative performance, while our quality and growth models detracted.
Results lagged the benchmark in eight of 11 industry sectors. Our positions in information technology, utilities, and health care helped relative performance while our positions in consumer staples, industrials, and financials detracted the most.
At the individual stock level, some of the strongest results came from overweights to information technology company Qualcomm, industrials company United Parcel Service, consumer staples company Altria Group, and energy company Schlumberger. An underweight to Occidential Petroleum also added to relative performance.
The greatest shortfalls came from overweighting consumer discretionary company Carnival, consumer staples company Coty, industrials company Copa Holdings, CVR Energy, and communication services company Meredith.
We continue to believe that constructing a portfolio focused on fundamentals will benefit investors over the long term, although we recognize that the market can reward or punish us in the near term. We believe our portfolio offers a strong mix of stocks with attractive valuations, positive sentiment, and high-quality earnings consistency.
Equity Income Portfolio Investment Advisors
| |
| | Portfolio Assets Managed | |
| Investment Advisor | % | $ Million | Investment Strategy |
| Wellington Management Company llp | 63 | 1,267 | Employs a fundamental approach to identify desirable individual stocks, seeking those that typically offer above-average dividend yields, below-average valuations, and the potential for dividend increases in the future. |
| Vanguard Quantitative Equity Group | 34 | 690 | Employs a quantitative approach that focuses on fundamental factors, using models that assess valuation, growth prospects, management decisions, market sentiment, and earnings and balance-sheet quality of companies as compared with their peers. |
| Cash Investments | 3 | 64 | These short-term reserves are invested by Vanguard in equity index products to simulate investment in stocks. Each advisor may also maintain a modest cash position. |
About Your Portfolio’s Expenses
As a shareholder of the portfolio, you incur ongoing costs, which include costs for portfolio management, administrative services, and shareholder reports (like this one), among others. Operating expenses, which are deducted from a portfolio's gross income, directly reduce the investment return of the portfolio.
A portfolio's expenses are expressed as a percentage of its average net assets. This figure is known as the expense ratio. The following examples are intended to help you understand the ongoing costs (in dollars) of investing in your portfolio and to compare these costs with those of other mutual funds. The examples are based on an investment of $1,000 made at the beginning of the period shown and held for the entire period.
The accompanying table illustrates your portfolio's costs in two ways:
| • | Based on actual portfolio return. This section helps you to estimate the actual expenses that you paid over the period. The ”Ending Account Value“ shown is derived from the portfolio's actual return, and the third column shows the dollar amount that would have been paid by an investor who started with $1,000 in the portfolio. You may use the information here, together with the amount you invested, to estimate the expenses that you paid over the period. |
To do so, simply divide your account value by $1,000 (for example, an $8,600 account value divided by $1,000 = 8.6), then multiply the result by the number given for your portfolio under the heading ”Expenses Paid During Period.“
| • | Based on hypothetical 5% yearly return. This section is intended to help you compare your portfolio's costs with those of other mutual funds. It assumes that the portfolio had a yearly return of 5% before expenses, but that the expense ratio is unchanged. In this case—because the return used is not the portfolio's actual return—the results do not apply to your investment. The example is useful in making comparisons because the Securities and Exchange Commission requires all mutual funds to calculate expenses based on a 5% return. You can assess your portfolio's costs by comparing this hypothetical example with the hypothetical examples that appear in shareholder reports of other funds. |
Note that the expenses shown in the table are meant to highlight and help you compare ongoing costs only and do not reflect transaction costs incurred by the portfolio for buying and selling securities. The portfolio’s expense ratio does not reflect additional fees and expenses associated with the annuity or life insurance program through which you invest.
The calculations assume no shares were bought or sold during the period. Your actual costs may have been higher or lower, depending on the amount of your investment and the timing of any purchases or redemptions.
You can find more information about the portfolio's expenses, including annual expense ratios, in the Financial Statements section of this report. For additional information on operating expenses and other shareholder costs, please refer to your portfolio's current prospectus.
| Six Months Ended December 31, 2020 | | | |
| Equity Income Portfolio | Beginning
Account Value
6/30/2020 | Ending
Account Value
12/31/2020 | Expenses
Paid During
Period |
| Based on Actual Portfolio Return | $1,000.00 | $1,187.34 | $1.65 |
| Based on Hypothetical 5% Yearly Return | 1,000.00 | 1,023.63 | 1.53 |
The calculations are based on expenses incurred in the most recent six-month period. The portfolio’s annualized six-month expense ratio for that period is 0.30%. The dollar amounts shown as “Expenses Paid” are equal to the annualized expense ratio multiplied by the average account value over the period, multiplied by the number of days in the most recent six-month period, then divided by the number of days in the most recent 12-month period (184/366).
All of the returns in this report represent past performance, which is not a guarantee of future results that may be achieved by the portfolio. (Current performance may be lower or higher than the performance data cited. For performance data current to the most recent month-end, visit our website at vanguard.com/performance.) Note, too, that both investment returns and principal value can fluctuate widely, so an investor’s shares, when sold, could be worth more or less than their original cost. The returns shown do not reflect taxes that a shareholder would pay on portfolio distributions or on the sale of portfolio shares. Nor do the returns reflect fees and expenses associated with the annuity or life insurance program through which a shareholder invests. If these fees and expenses were included, the portfolio's returns would be lower.
Cumulative Performance: December 31, 2010, Through December 31, 2020
Initial Investment of $10,000
| | | | Average Annual Total Returns
Periods Ended December 31, 2020 |
| | | One
Year | Five
Years | Ten
Years | Final Value
of a $10,000
Investment |
 | Equity Income Portfolio | 3.25% | 10.45% | 11.62% | $30,032 |
 | FTSE High Dividend Yield Index | 1.16 | 10.03 | 11.57 | 29,894 |
 | Dow Jones U.S. Total Stock Market Float Adjusted Index | 20.79 | 15.36 | 13.74 | 36,240 |
See Financial Highlights for dividend and capital gains information.
| Communication Services | 5.7% |
| Consumer Discretionary | 4.2 |
| Consumer Staples | 13.7 |
| Energy | 4.4 |
| Financials | 20.5 |
| Health Care | 18.3 |
| Industrials | 10.7 |
| Information Technology | 10.6 |
| Materials | 3.2 |
| Real Estate | 1.1 |
| Utilities | 7.6 |
The table reflects the portfolio’s investments, except for short-term investments and derivatives. Sector categories are based on the Global Industry Classification Standard (“GICS”), except for the “Other” category (if applicable), which includes securities that have not been provided a GICS classification as of the effective reporting period.
Global Industry Classification Standard (“GICS”) was developed by and is the exclusive property and a service mark of MSCI Inc. (“MSCI”) and Standard and Poor’s, a division of McGraw-Hill Companies, Inc. (“S&P”), and is licensed for use by Vanguard. Neither MSCI, S&P nor any third party involved in making or compiling the GICS or any GICS classification makes any express or implied warranties or representations with respect to such standard or classification (or the results to be obtained by the use thereof), and all such parties hereby expressly disclaim all warranties of originality, accuracy, completeness, merchantability or fitness for a particular purpose with respect to any such standard or classification. Without limiting any of the foregoing, in no event shall MSCI, S&P, any of its affiliates or any third party involved in making or compiling the GICS or any GICS classification have any liability for any direct, indirect, special, punitive, consequential or any other damages (including lost profits) even if notified of the possibility of such damages.
The portfolio files its complete schedule of portfolio holdings with the Securities and Exchange Commission (SEC) for the first and third quarters of each fiscal year as an exhibit to its reports on Form N-PORT. The portfolio’s Form N-PORT reports are available on the SEC’s website at www.sec.gov.
| | | Shares | Market
Value•
($000) |
| Common Stocks (96.1%) |
| Communication Services (5.5%) |
| | Comcast Corp. Class A | 947,917 | 49,671 |
| | Verizon Communications Inc. | 698,992 | 41,066 |
| | AT&T Inc. | 323,224 | 9,296 |
| | Interpublic Group of Cos. Inc. | 169,791 | 3,994 |
| | CenturyLink Inc. | 388,591 | 3,789 |
| | Omnicom Group Inc. | 47,383 | 2,955 |
| | Telephone and Data Systems Inc. | 43,747 | 812 |
| | | | 111,583 |
| Consumer Discretionary (4.1%) |
| | McDonald's Corp. | 109,253 | 23,444 |
| | TJX Cos. Inc. | 185,195 | 12,647 |
| | Lowe's Cos. Inc. | 64,775 | 10,397 |
| | VF Corp. | 112,387 | 9,599 |
| | Home Depot Inc. | 29,570 | 7,854 |
| | H&R Block Inc. | 213,609 | 3,388 |
| | Whirlpool Corp. | 18,505 | 3,340 |
| | Best Buy Co. Inc. | 33,447 | 3,338 |
| | Newell Brands Inc. | 142,830 | 3,032 |
| | Target Corp. | 14,410 | 2,544 |
| | Big Lots Inc. | 58,796 | 2,524 |
| | Polaris Inc. | 3,541 | 337 |
| | | | 82,444 |
| Consumer Staples (13.2%) |
| | Procter & Gamble Co. | 366,137 | 50,944 |
| | Philip Morris International Inc. | 443,820 | 36,744 |
| | Coca-Cola Co. | 570,716 | 31,298 |
| | PepsiCo Inc. | 177,115 | 26,266 |
| | Mondelez International Inc. Class A | 361,974 | 21,165 |
| | Archer-Daniels-Midland Co. | 320,622 | 16,162 |
| | Walmart Inc. | 103,795 | 14,962 |
| | Kellogg Co. | 192,399 | 11,973 |
| | Unilever plc ADR | 194,091 | 11,715 |
| | Altria Group Inc. | 197,830 | 8,111 |
| | Nestle SA ADR | 54,600 | 6,432 |
| | General Mills Inc. | 90,322 | 5,311 |
| | Kimberly-Clark Corp. | 35,536 | 4,791 |
| | Clorox Co. | 22,829 | 4,610 |
| | Conagra Brands Inc. | 112,924 | 4,095 |
| | Campbell Soup Co. | 75,967 | 3,673 |
| | J M Smucker Co. | 29,306 | 3,388 |
| | Nu Skin Enterprises Inc. Class A | 25,387 | 1,387 |
| | Weis Markets Inc. | 28,916 | 1,382 |
| | Hershey Co. | 4,426 | 674 |
| | Spectrum Brands Holdings Inc. | 6,049 | 478 |
| | Colgate-Palmolive Co. | 5,562 | 476 |
| | SpartanNash Co. | 16,062 | 280 |
| | | ��� | 266,317 |
| | | Shares | Market
Value•
($000) |
| Energy (4.2%) |
| | Phillips 66 | 178,551 | 12,488 |
| | TC Energy Corp. | 272,594 | 11,082 |
| | ConocoPhillips | 251,577 | 10,060 |
| | Chevron Corp. | 102,317 | 8,641 |
| | Pioneer Natural Resources Co. | 69,298 | 7,892 |
| | Exxon Mobil Corp. | 176,368 | 7,270 |
| | Kinder Morgan Inc. | 512,698 | 7,009 |
| | Halliburton Co. | 302,682 | 5,721 |
| | Williams Cos. Inc. | 199,710 | 4,004 |
| | Schlumberger NV | 179,940 | 3,928 |
| | Targa Resources Corp. | 120,007 | 3,166 |
| | Devon Energy Corp. | 141,918 | 2,244 |
| | Apache Corp. | 94,450 | 1,340 |
| | | | 84,845 |
| Financials (19.7%) |
| | JPMorgan Chase & Co. | 540,165 | 68,639 |
| | Bank of America Corp. | 1,629,582 | 49,393 |
| | BlackRock Inc. | 43,435 | 31,340 |
| | Morgan Stanley | 431,799 | 29,591 |
| | Progressive Corp. | 296,025 | 29,271 |
| | MetLife Inc. | 618,565 | 29,042 |
| | Chubb Ltd. | 175,691 | 27,042 |
| | Truist Financial Corp. | 407,580 | 19,535 |
| | PNC Financial Services Group Inc. | 100,214 | 14,932 |
| | Blackstone Group Inc. Class A | 211,384 | 13,700 |
| | Citigroup Inc. | 197,248 | 12,162 |
| | Wells Fargo & Co. | 258,572 | 7,804 |
| | Travelers Cos. Inc. | 44,257 | 6,212 |
| | Aflac Inc. | 115,263 | 5,126 |
| | Jefferies Financial Group Inc. | 175,741 | 4,323 |
| | FNB Corp. | 418,077 | 3,972 |
| | Associated Banc-Corp. | 218,522 | 3,726 |
| | Unum Group | 156,265 | 3,585 |
| | Virtu Financial Inc. Class A | 139,883 | 3,521 |
| | Navient Corp. | 356,402 | 3,500 |
| | US Bancorp | 70,939 | 3,305 |
| | First American Financial Corp. | 51,336 | 2,650 |
| | CNO Financial Group Inc. | 100,889 | 2,243 |
| | Fifth Third Bancorp | 76,129 | 2,099 |
| | T Rowe Price Group Inc. | 13,255 | 2,007 |
| | Regions Financial Corp. | 123,085 | 1,984 |
| | MGIC Investment Corp. | 133,316 | 1,673 |
| | Old National Bancorp | 96,849 | 1,604 |
| | Equitable Holdings Inc. | 55,715 | 1,426 |
| | CME Group Inc. | 7,575 | 1,379 |
| | Cullen/Frost Bankers Inc. | 14,994 | 1,308 |
| | OneMain Holdings Inc. | 24,820 | 1,195 |
| | Bank of New York Mellon Corp. | 27,973 | 1,187 |
| | Mercury General Corp. | 22,615 | 1,181 |
| | First Hawaiian Inc. | 42,235 | 996 |
| | Ally Financial Inc. | 26,535 | 946 |
| | | Shares | Market
Value•
($000) |
| | Columbia Banking System Inc. | 23,067 | 828 |
| | PacWest Bancorp | 29,898 | 759 |
| | First Financial Bancorp | 37,284 | 653 |
| | Hope Bancorp Inc. | 54,347 | 593 |
| | State Street Corp. | 7,412 | 539 |
| | Valley National Bancorp | 46,217 | 451 |
| | Westamerica BanCorp. | 6,766 | 374 |
| | M&T Bank Corp. | 2,804 | 357 |
| | Prudential Financial Inc. | 4,304 | 336 |
| | | | 398,489 |
| Health Care (17.6%) |
| | Johnson & Johnson | 551,225 | 86,752 |
| | Pfizer Inc. | 1,341,247 | 49,371 |
| | Eli Lilly and Co. | 218,329 | 36,863 |
| | Merck & Co. Inc. | 426,929 | 34,923 |
| | Medtronic plc | 245,422 | 28,749 |
| | UnitedHealth Group Inc. | 71,208 | 24,971 |
| | Becton Dickinson and Co. | 73,700 | 18,441 |
| | CVS Health Corp. | 211,972 | 14,478 |
| | Roche Holding AG | 34,603 | 12,052 |
| | Novartis AG (Registered) | 125,075 | 11,777 |
| | AstraZeneca plc ADR | 233,790 | 11,687 |
| | AbbVie Inc. | 71,121 | 7,621 |
| | Bristol-Myers Squibb Co. | 86,981 | 5,395 |
| | Amgen Inc. | 19,748 | 4,540 |
| | Cardinal Health Inc. | 78,968 | 4,229 |
| | Gilead Sciences Inc. | 70,610 | 4,114 |
| | | | 355,963 |
| Industrials (10.3%) |
| | Lockheed Martin Corp. | 89,624 | 31,815 |
| | Raytheon Technologies Corp. | 295,259 | 21,114 |
| | Eaton Corp. plc | 155,970 | 18,738 |
| | Union Pacific Corp. | 87,814 | 18,285 |
| | Caterpillar Inc. | 92,348 | 16,809 |
| | Deere & Co. | 56,333 | 15,156 |
| | General Dynamics Corp. | 99,681 | 14,834 |
| | Honeywell International Inc. | 54,526 | 11,598 |
| | 3M Co. | 53,623 | 9,373 |
| | United Parcel Service Inc. Class B | 51,912 | 8,742 |
| | Illinois Tool Works Inc. | 34,818 | 7,099 |
| | Trane Technologies plc | 48,586 | 7,053 |
| | Johnson Controls International plc | 82,000 | 3,820 |
| | Fastenal Co. | 77,933 | 3,805 |
| | Steelcase Inc. Class A | 277,151 | 3,755 |
| | MSC Industrial Direct Co. Inc. Class A | 32,455 | 2,739 |
| | Triton International Ltd. | 50,173 | 2,434 |
| | Emerson Electric Co. | 26,933 | 2,165 |
| | Cummins Inc. | 9,218 | 2,093 |
| | Hubbell Inc. Class B | 12,651 | 1,984 |
| | Watsco Inc. | 5,026 | 1,139 |
| | | Shares | Market
Value•
($000) |
| | H&E Equipment Services Inc. | 33,211 | 990 |
| | ManpowerGroup Inc. | 8,300 | 748 |
| | nVent Electric plc | 30,999 | 722 |
| | Nielsen Holdings plc | 33,063 | 690 |
| | Ryder System Inc. | 6,926 | 428 |
| | McGrath RentCorp. | 5,532 | 371 |
| | | | 208,499 |
| Information Technology (10.2%) |
| | Cisco Systems Inc. | 1,118,546 | 50,055 |
| | Corning Inc. | 575,872 | 20,731 |
| | TE Connectivity Ltd. | 159,672 | 19,332 |
| | Automatic Data Processing Inc. | 94,703 | 16,687 |
| | KLA Corp. | 61,938 | 16,036 |
| | QUALCOMM Inc. | 91,611 | 13,956 |
| | Analog Devices Inc. | 92,021 | 13,594 |
| | Intel Corp. | 265,805 | 13,242 |
| | International Business Machines Corp. | 77,744 | 9,786 |
| | Texas Instruments Inc. | 57,700 | 9,470 |
| | Broadcom Inc. | 13,889 | 6,081 |
| | HP Inc. | 239,726 | 5,895 |
| | Seagate Technology plc | 42,225 | 2,625 |
| | ManTech International Corp. Class A | 29,263 | 2,603 |
| | ADTRAN Inc. | 150,035 | 2,216 |
| | Xperi Holding Corp. | 105,726 | 2,210 |
| | Avnet Inc. | 21,152 | 743 |
| | | | 205,262 |
| Materials (3.0%) |
| | Celanese Corp. Class A | 116,129 | 15,090 |
| | PPG Industries Inc. | 101,726 | 14,671 |
| | Linde plc | 28,351 | 7,471 |
| | Dow Inc. | 109,478 | 6,076 |
| | Corteva Inc. | 120,718 | 4,674 |
| | Sensient Technologies Corp. | 52,903 | 3,903 |
| | Commercial Metals Co. | 167,999 | 3,451 |
| | International Paper Co. | 40,020 | 1,990 |
| | RPM International Inc. | 16,425 | 1,491 |
| | Cabot Corp. | 18,703 | 839 |
| | Worthington Industries Inc. | 16,273 | 835 |
| | Air Products and Chemicals Inc. | 1,505 | 411 |
| | Scotts Miracle-Gro Co. | 1,957 | 390 |
| | | | 61,292 |
| Real Estate (1.0%) |
| | Crown Castle International Corp. | 128,356 | 20,433 |
| Utilities (7.3%) |
| | Sempra Energy | 172,613 | 21,993 |
| | Dominion Energy Inc. | 272,560 | 20,496 |
| | Exelon Corp. | 460,660 | 19,449 |
| | Duke Energy Corp. | 138,600 | 12,690 |
| | | Shares | Market
Value•
($000) |
| | American Electric Power Co. Inc. | 145,053 | 12,079 |
| | Entergy Corp. | 84,903 | 8,477 |
| | Southern Co. | 120,658 | 7,412 |
| | NextEra Energy Inc. | 88,264 | 6,810 |
| | DTE Energy Co. | 49,500 | 6,010 |
| | WEC Energy Group Inc. | 52,442 | 4,826 |
| | AES Corp. | 200,396 | 4,709 |
| | UGI Corp. | 124,049 | 4,337 |
| | CenterPoint Energy Inc. | 177,747 | 3,846 |
| | Evergy Inc. | 66,009 | 3,664 |
| | Hawaiian Electric Industries Inc. | 93,346 | 3,304 |
| | Vistra Corp. | 166,829 | 3,280 |
| | Clearway Energy Inc. Class C | 53,646 | 1,713 |
| | Clearway Energy Inc. Class A | 43,041 | 1,272 |
| | Public Service Enterprise Group Inc. | 9,168 | 534 |
| | NRG Energy Inc. | 9,541 | 358 |
| | OGE Energy Corp. | 9,988 | 318 |
| | | | 147,577 |
Total Common Stocks
(Cost $1,630,000) | 1,942,704 |
| Temporary Cash Investments (3.5%) |
| Money Market Fund (2.8%) |
| 1 | Vanguard Market Liquidity Fund, 0.111%
| 574,094 | 57,409 |
| | | Face
Amount
($000) | |
| Repurchase Agreement (0.6%) |
| | BNP Paribas Securities Corp. 0.060%, 1/4/21
(Dated 12/31/20, Repurchase Value $11,300,000, collateralized by Federal Home Loan Mortgage Corp., 3.000%, 6/1/50, Federal National Mortgage Association, 3.000%, 9/1/49, Government National Mortgage Associataion, 2.250%, 7/20/41, U.S.Treasury Note/Bond, 0.375%–7.875%, 2/15/21–5/15/30 and U.S. Treasury Bill, 0.000%, 10/7/21–11/4/21, with a value of $11,526,000) | 11,300 | 11,300 |
| | | Face
Amount
($000) | Market
Value•
($000) |
| U.S. Government and Agency Obligations (0.1%) |
| 2 | U.S. Cash Management Bill, 0.083%, 3/30/21 | 200 | 200 |
| 2 | U.S. Treasury Bill, 0.097%, 1/5/21 | 770 | 770 |
| 2 | U.S. Treasury Bill, 0.096%, 1/28/21 | 1,300 | 1,300 |
| | | | 2,270 |
Total Temporary Cash Investments
(Cost $70,979) | 70,979 |
Total Investments (99.6%)
(Cost $1,700,979) | 2,013,683 |
| Other Assets and Liabilities—Net (0.4%) | 7,754 |
| Net Assets (100%) | 2,021,437 |
| Cost is in $000. |
| • | See Note A in Notes to Financial Statements. |
| 1 | Affiliated money market fund available only to Vanguard funds and certain trusts and accounts managed by Vanguard. Rate shown is the 7-day yield. |
| 2 | Securities with a value of $2,171,000 have been segregated as initial margin for open futures contracts. |
| | ADR—American Depositary Receipt. |
Derivative Financial Instruments Outstanding as of Period End
| Futures Contracts |
| | | | ($000) |
| | Expiration | Number of
Long (Short)
Contracts | Notional
Amount | Value and
Unrealized
Appreciation
(Depreciation) |
| Long Futures Contracts | | | | |
| E-mini S&P 500 Index | March 2021 | 322 | 60,356 | 1,382 |
See accompanying Notes, which are an integral part of the Financial Statements.
Statement of Assets and Liabilities
| ($000s, except shares and per-share amounts) | Amount |
| Assets | |
| Investments in Securities, at Value | |
| Unaffiliated Issuers (Cost $1,643,570) | 1,956,274 |
| Affiliated Issuers (Cost $57,409) | 57,409 |
| Total Investments in Securities | 2,013,683 |
| Investment in Vanguard | 76 |
| Cash | 7 |
| Cash Collateral Pledged—Futures Contracts | 1,518 |
| Receivables for Accrued Income | 3,243 |
| Receivables for Capital Shares Issued | 6,838 |
| Variation Margin Receivable—Futures Contracts | 409 |
| Total Assets | 2,025,774 |
| Liabilities | |
| Payables for Investment Securities Purchased | 5 |
| Payables to Investment Advisor | 350 |
| Payables for Capital Shares Redeemed | 3,732 |
| Payables to Vanguard | 250 |
| Total Liabilities | 4,337 |
| Net Assets | 2,021,437 |
| At December 31, 2020, net assets consisted of: | |
| | |
| Paid-in Capital | 1,621,874 |
| Total Distributable Earnings (Loss) | 399,563 |
| Net Assets | 2,021,437 |
| |
| Net Assets | |
Applicable to 87,632,632 outstanding $.001 par value shares of
beneficial interest (unlimited authorization) | 2,021,437 |
| Net Asset Value Per Share | $23.07 |
See accompanying Notes, which are an integral part of the Financial Statements.
Statement of Operations
|
| | Year Ended
December 31, 2020 |
| | ($000) |
| Investment Income | |
| Income | |
| Dividends1 | 54,525 |
| Interest2 | 436 |
| Securities Lending—Net | 23 |
| Total Income | 54,984 |
| Expenses | |
| Investment Advisory Fees—Note B | |
| Basic Fee | 1,621 |
| Performance Adjustment | 186 |
| The Vanguard Group—Note C | |
| Management and Administrative | 3,221 |
| Marketing and Distribution | 182 |
| Custodian Fees | 25 |
| Auditing Fees | 31 |
| Shareholders' Reports | 17 |
| Trustees’ Fees and Expenses | 2 |
| Total Expenses | 5,285 |
| Net Investment Income | 49,699 |
| Realized Net Gain (Loss) | |
| Investment Securities Sold2 | 31,053 |
| Futures Contracts | 10,726 |
| Foreign Currencies | 5 |
| Realized Net Gain (Loss) | 41,784 |
| Change in Unrealized Appreciation (Depreciation) | |
| Investment Securities2 | (18,093) |
| Futures Contracts | 369 |
| Foreign Currencies | 45 |
| Change in Unrealized Appreciation (Depreciation) | (17,679) |
| Net Increase (Decrease) in Net Assets Resulting from Operations | 73,804 |
| 1 | Dividends are net of foreign withholding taxes of $355,000. |
| 2 | Interest income, realized net gain (loss), and change in unrealized appreciation (depreciation) from an affiliated company of the portfolio were $322,000, $6,000, and $2,000, respectively. Purchases and sales are for temporary cash investment purposes. |
Statement of Changes in Net Assets
|
| | Year Ended December 31, |
| | 2020
($000) | 2019
($000) |
| Increase (Decrease) in Net Assets | | |
| Operations | | |
| Net Investment Income | 49,699 | 44,674 |
| Realized Net Gain (Loss) | 41,784 | 57,154 |
| Change in Unrealized Appreciation (Depreciation) | (17,679) | 247,398 |
| Net Increase (Decrease) in Net Assets Resulting from Operations | 73,804 | 349,226 |
| Distributions1 | | |
| Total Distributions | (106,167) | (135,143) |
| Capital Share Transactions | | |
| Issued | 395,902 | 355,641 |
| Issued in Lieu of Cash Distributions | 106,167 | 135,143 |
| Redeemed | (282,471) | (244,176) |
| Net Increase (Decrease) from Capital Share Transactions | 219,598 | 246,608 |
| Total Increase (Decrease) | 187,235 | 460,691 |
| Net Assets | | |
| Beginning of Period | 1,834,202 | 1,373,511 |
| End of Period | 2,021,437 | 1,834,202 |
| 1 | Certain prior-period numbers have been reclassified to conform with the current-period presentation. |
See accompanying Notes, which are an integral part of the Financial Statements.
For a Share Outstanding
Throughout Each Period | Year Ended December 31, |
| 2020 | 2019 | 2018 | 2017 | 2016 |
| Net Asset Value, Beginning of Period | $24.17 | $21.24 | $24.64 | $22.10 | $21.22 |
| Investment Operations | | | | | |
| Net Investment Income | .5951 | .6191 | .6201 | .5821 | .568 |
| Net Realized and Unrealized Gain (Loss) on Investments | (.305) | 4.319 | (1.977) | 3.275 | 2.361 |
| Total from Investment Operations | .290 | 4.938 | (1.357) | 3.857 | 2.929 |
| Distributions | | | | | |
| Dividends from Net Investment Income | (.618) | (.586) | (.562) | (.583) | (.583) |
| Distributions from Realized Capital Gains | (.772) | (1.422) | (1.481) | (.734) | (1.466) |
| Total Distributions | (1.390) | (2.008) | (2.043) | (1.317) | (2.049) |
| Net Asset Value, End of Period | $23.07 | $24.17 | $21.24 | $24.64 | $22.10 |
| Total Return | 3.25% | 24.43% | -5.96% | 18.25% | 15.07% |
| Ratios/Supplemental Data | | | | | |
| Net Assets, End of Period (Millions) | $2,021 | $1,834 | $1,374 | $1,372 | $1,172 |
| Ratio of Total Expenses to Average Net Assets2 | 0.30% | 0.30% | 0.29% | 0.31% | 0.30% |
| Ratio of Net Investment Income to Average Net Assets | 2.86% | 2.76% | 2.69% | 2.56% | 2.89% |
| Portfolio Turnover Rate | 40% | 33% | 36% | 38% | 32% |
| 1 | Calculated based on average shares outstanding. |
| 2 | Includes performance-based investment advisory fee increases (decreases) of 0.01%, 0.01%, (0.00%), (0.00%), and (0.01%). |
See accompanying Notes, which are an integral part of the Financial Statements.
Notes to Financial Statements
The Equity Income Portfolio, a portfolio of Vanguard Variable Insurance Funds, is registered under the Investment Company Act of 1940 as an open-end investment company. The portfolio's shares are only available for purchase by separate accounts of insurance companies as investments for variable annuity plans, variable life insurance contracts, or other variable benefit insurance contracts. Market disruptions associated with the COVID-19 pandemic have had a global impact, and uncertainty exists as to the long-term implications. Such disruptions can adversely affect assets of the portfolio and thus portfolio performance.
| A. | The following significant accounting policies conform to generally accepted accounting principles for U.S. investment companies. The portfolio consistently follows such policies in preparing its financial statements. |
1. Security Valuation: Securities are valued as of the close of trading on the New York Stock Exchange (generally 4 p.m., Eastern time) on the valuation date. Equity securities are valued at the latest quoted sales prices or official closing prices taken from the primary market in which each security trades; such securities not traded on the valuation date are valued at the mean of the latest quoted bid and asked prices. Securities for which market quotations are not readily available, or whose values have been affected by events occurring before the portfolio’s pricing time but after the close of the securities’ primary markets, are valued at their fair values calculated according to procedures adopted by the board of trustees. These procedures include obtaining quotations from an independent pricing service, monitoring news to identify significant market- or security-specific events, and evaluating changes in the values of foreign market proxies (for example, ADRs, futures contracts, or exchange-traded funds), between the time the foreign markets close and the portfolio’s pricing time. When fair-value pricing is employed, the prices of securities used by a portfolio to calculate its net asset value may differ from quoted or published prices for the same securities.
Investments in Vanguard Market Liquidity Fund are valued at that fund's net asset value. Temporary cash investments are valued using the latest bid prices or using valuations based on a matrix system (which considers such factors as security prices, yields, maturities, and ratings), both as furnished by independent pricing services.
2. Foreign Currency: Securities and other assets and liabilities denominated in foreign currencies are translated into U.S. dollars using exchange rates obtained from an independent third party as of the portfolio’s pricing time on the valuation date. Realized gains (losses) and unrealized appreciation (depreciation) on investment securities include the effects of changes in exchange rates since the securities were purchased, combined with the effects of changes in security prices. Fluctuations in the value of other assets and liabilities resulting from changes in exchange rates are recorded as unrealized foreign currency gains (losses) until the assets or liabilities are settled in cash, at which time they are recorded as realized foreign currency gains (losses).
3. Futures Contracts: The portfolio uses index futures contracts to a limited extent, with the objective of maintaining full exposure to the stock market while maintaining liquidity. The portfolio may purchase or sell futures contracts to achieve a desired level of investment, whether to accommodate portfolio turnover or cash flows from capital share transactions. The primary risks associated with the use of futures contracts are imperfect correlation between changes in market values of stocks held by the portfolio and the prices of futures contracts, and the possibility of an illiquid market. Counterparty risk involving futures is mitigated because a regulated clearinghouse is the counterparty instead of the clearing broker. To further mitigate counterparty risk, the portfolio trades futures contracts on an exchange, monitors the financial strength of its clearing brokers and clearinghouse, and has entered into clearing agreements with its clearing brokers. The clearinghouse imposes initial margin requirements to secure the portfolio’s performance and requires daily settlement of variation margin representing changes in the market value of each contract. Any securities pledged as initial margin for open contracts are noted in the Schedule of Investments.
Futures contracts are valued at their quoted daily settlement prices. The notional amounts of the contracts are not recorded in the Statement of Assets and Liabilities. Fluctuations in the value of the contracts are recorded in the Statement of Assets and Liabilities as an asset (liability) and in the Statement of Operations as unrealized appreciation (depreciation) until the contracts are closed, when they are recorded as realized gains (losses) on futures contracts.
During the year ended December 31, 2020, the portfolio’s average investments in long and short futures contracts represented 3% and 0% of net assets, respectively, based on the average of the notional amounts at each quarter-end during the period.
4. Repurchase Agreements: The portfolio enters into repurchase agreements with institutional counterparties. Securities pledged as collateral to the portfolio under repurchase agreements are held by a custodian bank until the agreements mature, and in the absence of a default, such collateral cannot be repledged, resold, or rehypothecated. Each agreement requires that the market value of
the collateral be sufficient to cover payments of interest and principal. The portfolio further mitigates its counterparty risk by entering into repurchase agreements only with a diverse group of prequalified counterparties, monitoring their financial strength, and entering into master repurchase agreements with its counterparties. The master repurchase agreements provide that, in the event of a counterparty's default (including bankruptcy), the portfolio may terminate any repurchase agreements with that counterparty, determine the net amount owed, and sell or retain the collateral up to the net amount owed to the portfolio. Such action may be subject to legal proceedings, which may delay or limit the disposition of collateral.
5. Federal Income Taxes: The portfolio intends to continue to qualify as a regulated investment company and distribute all of its taxable income. The portfolio’s tax returns are open to examination by the relevant tax authorities until expiration of the applicable statute of limitations, which is generally three years after the filing of the tax return. Management has analyzed the portfolio’s tax positions taken for all open federal and state income tax years, and has concluded that no provision for income tax is required in the portfolio’s financial statements.
6. Distributions: Distributions to shareholders are recorded on the ex-dividend date. Distributions are determined on a tax basis at the fiscal year-end and may differ from net investment income and realized capital gains for financial reporting purposes.
7. Securities Lending: To earn additional income, the portfolio lends its securities to qualified institutional borrowers. Security loans are subject to termination by the portfolio at any time, and are required to be secured at all times by collateral in an amount at least equal to the market value of securities loaned. Daily market fluctuations could cause the value of loaned securities to be more or less than the value of the collateral received. When this occurs, the collateral is adjusted and settled before the opening of the market on the next business day. The portfolio further mitigates its counterparty risk by entering into securities lending transactions only with a diverse group of prequalified counterparties, monitoring their financial strength, and entering into master securities lending agreements with its counterparties. The master securities lending agreements provide that, in the event of a counterparty’s default (including bankruptcy), the portfolio may terminate any loans with that borrower, determine the net amount owed, and sell or retain the collateral up to the net amount owed to the portfolio; however, such actions may be subject to legal proceedings. While collateral mitigates counterparty risk, in the event of a default, the portfolio may experience delays and costs in recovering the securities loaned. The portfolio invests cash collateral received in Vanguard Market Liquidity Fund, and records a liability in the Statement of Assets and Liabilities for the return of the collateral, during the period the securities are on loan. Collateral investments in Vanguard Market Liquidity Fund are subject to market appreciation or depreciation. Securities lending income represents fees charged to borrowers plus income earned on invested cash collateral, less expenses associated with the loan. During the term of the loan, the portfolio is entitled to all distributions made on or in respect of the loaned securities.
8. Credit Facilities and Interfund Lending Program: The portfolio and certain other funds managed by The Vanguard Group ("Vanguard") participate in a $4.3 billion committed credit facility provided by a syndicate of lenders pursuant to a credit agreement and an uncommitted credit facility provided by Vanguard. Both facilities may be renewed annually. Each fund is individually liable for its borrowings, if any, under the credit facilities. Borrowings may be utilized for temporary or emergency purposes, subject to the portfolio’s regulatory and contractual borrowing restrictions. With respect to the committed credit facility, the participating funds are charged administrative fees and an annual commitment fee of 0.10% of the undrawn committed amount of the facility; these fees are allocated to the funds based on a method approved by the portfolio’s board of trustees and included in Management and Administrative expenses on the portfolio’s Statement of Operations. Any borrowings under either facility bear interest at a rate based upon the higher of the one-month London Interbank Offered Rate (or an acceptable alternate rate, if necessary), federal funds effective rate, or overnight bank funding rate plus an agreed-upon spread, except that borrowings under the uncommitted credit facility may bear interest based upon an alternate rate agreed to by the portfolio and Vanguard.
In accordance with an exemptive order (the “Order”) from the SEC, the portfolio may participate in a joint lending and borrowing program that allows registered open-end Vanguard funds to borrow money from and lend money to each other for temporary or emergency purposes (the “Interfund Lending Program”), subject to compliance with the terms and conditions of the Order, and to the extent permitted by the portfolio’s investment objective and investment policies. Interfund loans and borrowings normally extend overnight, but can have a maximum duration of seven days. Loans may be called on one business day’s notice. The interest rate to be charged is governed by the conditions of the Order and internal procedures adopted by the board of trustees. The board of trustees is responsible for overseeing the Interfund Lending Program.
For the year ended December 31, 2020, the portfolio did not utilize the credit facilities or the Interfund Lending Program.
9. Other: Dividend income is recorded on the ex-dividend date. Non-cash dividends included in dividend income, if any, are recorded at the fair value of the securities received. Interest income includes income distributions received from Vanguard Market Liquidity Fund and is accrued daily. Premiums and discounts on debt securities are amortized and accreted, respectively, to interest income over the lives of the respective securities, except for premiums on certain callable debt securities that are amortized to the earliest call date. Security transactions are accounted for on the date securities are bought or sold. Costs used to determine realized gains (losses) on the sale of investment securities are those of the specific securities sold.
| B. | Wellington Management Company llp provides investment advisory services to a portion of the portfolio for a fee calculated at an annual percentage rate of average net assets managed by the advisor. The basic fee is subject to quarterly adjustments based on the portfolio’s performance relative to the FTSE High Dividend Yield Index for the preceding three years. |
Vanguard provides investment advisory services to a portion of the portfolio as described below; the portfolio paid Vanguard advisory fees of $521,000 for the year ended December 31, 2020.
For the year ended December 31, 2020, the aggregate investment advisory fee paid to all advisors represented an effective annual basic rate of 0.09% of the portfolio’s average net assets, before an increase of $186,000 (0.01%) based on performance.
| C. | In accordance with the terms of a Funds' Service Agreement (the “FSA”) between Vanguard and the portfolio, Vanguard furnishes to the portfolio investment advisory, corporate management, administrative, marketing, and distribution services at Vanguard’s cost of operations (as defined by the FSA). These costs of operations are allocated to the portfolio based on methods and guidelines approved by the board of trustees and are generally settled twice a month. |
Upon the request of Vanguard, the portfolio may invest up to 0.40% of its net assets as capital in Vanguard. At December 31, 2020, the portfolio had contributed to Vanguard capital in the amount of $76,000, representing less than 0.01% of the portfolio’s net assets and 0.03% of Vanguard’s capital received pursuant to the FSA. The portfolio’s trustees and officers are also directors and employees, respectively, of Vanguard.
| D. | Various inputs may be used to determine the value of the portfolio’s investments and derivatives. These inputs are summarized in three broad levels for financial statement purposes. The inputs or methodologies used to value securities are not necessarily an indication of the risk associated with investing in those securities. |
Level 1—Quoted prices in active markets for identical securities.
Level 2—Other significant observable inputs (including quoted prices for similar securities, interest rates, prepayment speeds, credit risk, etc.).
Level 3—Significant unobservable inputs (including the portfolio’s own assumptions used to determine the fair value of investments). Any investments and derivatives valued with significant unobservable inputs are noted on the Schedule of Investments.
The following table summarizes the market value of the portfolio’s investments and derivatives as of December 31, 2020, based on the inputs used to value them:
| | Level 1
($000) | Level 2
($000) | Level 3
($000) | Total
($000) |
| Investments | | | | |
| Assets | | | | |
| Common Stocks | 1,918,875 | 23,829 | — | 1,942,704 |
| Temporary Cash Investments | 57,409 | 13,570 | — | 70,979 |
| Total | 1,976,284 | 37,399 | — | 2,013,683 |
| Derivative Financial Instruments | | | | |
| Assets | | | | |
| Futures Contracts1 | 409 | — | — | 409 |
| 1 | Represents variation margin on the last day of the reporting period. |
| E. | Permanent differences between book-basis and tax-basis components of net assets are reclassified among capital accounts in the financial statements to reflect their tax character. These |
reclassifications have no effect on net assets or net asset value per share. As of period end, permanent differences primarily attributable to the accounting for foreign currency transactions were reclassified between the individual components of total distributable earnings (loss).
Temporary differences between book-basis and tax-basis components of total distributable earnings (loss) arise when certain items of income, gain, or loss are recognized in different periods for financial statement and tax purposes; these differences will reverse at some time in the future. The differences are primarily related to the deferral of losses from wash sales; and the recognition of unrealized gains or losses from certain derivative contracts. As of period end, the tax-basis components of total distributable earnings (loss) are detailed in the table as follows:
| | Amount
($000) |
| Undistributed Ordinary Income | 44,782 |
| Undistributed Long-Term Gains | 43,419 |
| Capital Loss Carryforwards | — |
| Qualified Late-Year Losses | — |
| Net Unrealized Gains (Losses) | 311,362 |
The tax character of distributions paid was as follows:
| | Year Ended December 31, |
| | 2020
Amount
($000) | 2019
Amount
($000) |
| Ordinary Income* | 47,225 | 43,462 |
| Long-Term Capital Gains | 58,942 | 91,681 |
| Total | 106,167 | 135,143 |
| * | Includes short-term capital gains, if any. |
As of December 31, 2020, gross unrealized appreciation and depreciation for investments and derivatives based on cost for U.S. federal income tax purposes were as follows:
| | Amount
($000) |
| Tax Cost | 1,702,374 |
| Gross Unrealized Appreciation | 376,617 |
| Gross Unrealized Depreciation | (65,308) |
| Net Unrealized Appreciation (Depreciation) | 311,309 |
| F. | During the year ended December 31, 2020, the portfolio purchased $839,034,000 of investment securities and sold $663,556,000 of investment securities, other than temporary cash investments. |
| G. | Capital shares issued and redeemed were: |
| | Year Ended December 31, |
| | 2020 | 2019 |
| | Shares
(000) | Shares
(000) |
| Issued | 19,269 | 15,838 |
| Issued in Lieu of Cash Distributions | 6,241 | 6,289 |
| Redeemed | (13,762) | (10,907) |
| Net Increase (Decrease) in Shares Outstanding | 11,748 | 11,220 |
At December 31, 2020, two shareholders (insurance company separate accounts whose holdings in the portfolio represent the indirect investment of Vanguard Variable Annuity contract holders) were each a record or beneficial owner of at least 25% or more of the portfolio’s net assets, with a combined ownership of 68%. If any of these shareholders were to redeem their investment in the portfolio, the redemption might result in an increase in the portfolio’s expense ratio, cause the portfolio to incur higher transaction costs or lead to the realization of taxable gains.
| H. | Management has determined that no events or transactions occurred subsequent to December 31, 2020, that would require recognition or disclosure in these financial statements. |
Report of Independent Registered Public Accounting Firm
To the Board of Trustees of Vanguard Variable Insurance Funds and Shareholders of Equity Income Portfolio
Opinion on the Financial Statements
We have audited the accompanying statement of assets and liabilities, including the schedule of investments, of Equity Income Portfolio (one of the portfolios constituting Vanguard Variable Insurance Funds, referred to hereafter as the "Portfolio”) as of December 31, 2020, the related statement of operations for the year ended December 31, 2020, the statement of changes in net assets for each of the two years in the period ended December 31, 2020, including the related notes, and the financial highlights for each of the five years in the period ended December 31, 2020 (collectively referred to as the “financial statements”). In our opinion, the financial statements present fairly, in all material respects, the financial position of the Portfolio as of December 31, 2020, the results of its operations for the year then ended, the changes in its net assets for each of the two years in the period ended December 31, 2020 and the financial highlights for each of the five years in the period ended December 31, 2020 in conformity with accounting principles generally accepted in the United States of America.
Basis for Opinion
These financial statements are the responsibility of the Portfolio’s management. Our responsibility is to express an opinion on the Portfolio’s financial statements based on our audits. We are a public accounting firm registered with the Public Company Accounting Oversight Board (United States) (PCAOB) and are required to be independent with respect to the Portfolio in accordance with the U.S. federal securities laws and the applicable rules and regulations of the Securities and Exchange Commission and the PCAOB.
We conducted our audits of these financial statements in accordance with the standards of the PCAOB. Those standards require that we plan and perform the audit to obtain reasonable assurance about whether the financial statements are free of material misstatement, whether due to error or fraud.
Our audits included performing procedures to assess the risks of material misstatement of the financial statements, whether due to error or fraud, and performing procedures that respond to those risks. Such procedures included examining, on a test basis, evidence regarding the amounts and disclosures in the financial statements. Our audits also included evaluating the accounting principles used and significant estimates made by management, as well as evaluating the overall presentation of the financial statements. Our procedures included confirmation of securities owned as of December 31, 2020 by correspondence with the custodian, transfer agent and brokers; when replies were not received from brokers, we performed other auditing procedures. We believe that our audits provide a reasonable basis for our opinion.
/s/PricewaterhouseCoopers LLP
Philadelphia, Pennsylvania
February 18, 2021
We have served as the auditor of one or more investment companies in The Vanguard Group of Funds since 1975.
Special 2020 tax information (unaudited) for corporate shareholders only for Equity Income Portfolio, a portfolio of Vanguard Variable Insurance Funds
This information for the fiscal year ended December 31, 2020, is included pursuant to provisions of the Internal Revenue Code for corporate shareholders only.
The portfolio distributed $58,942,000 as capital gain dividends (20% rate gain distributions) to shareholders during the fiscal year.
For corporate shareholders, 100% of investment income (dividend income plus short-term gains, if any) qualifies for the dividends-received deduction.
This page intentionally left blank.
The People Who Govern Your Fund
The trustees of your mutual fund are there to see that the fund is operated and managed in your best interests since, as a shareholder, you are a part owner of the fund. Your fund’s trustees also serve on the board of directors of The Vanguard Group, Inc., which is owned by the Vanguard funds and provides services to them.
A majority of Vanguard’s board members are independent, meaning that they have no affiliation with Vanguard or the funds they oversee, apart from the sizable personal investments they have made as private individuals. The independent board members have distinguished backgrounds in business, academia, and public service. Each of the trustees and executive officers oversees 211 Vanguard funds.
Information for each trustee and executive officer of the fund appears below. That information, as well as the Vanguard fund count, is as of the date on the cover of this fund report. The mailing address of the trustees and officers is P.O. Box 876, Valley Forge, PA 19482. More information about the trustees is in the Statement of Additional Information, which can be obtained, without charge, by contacting Vanguard at 800-662-7447, or online at vanguard.com.
Interested Trustee1
Mortimer J. Buckley
Born in 1969. Trustee since January 2018. Principal occupation(s) during the past five years and other experience: chairman of the board (2019–present) of Vanguard and of each of the investment companies served by Vanguard; chief executive officer (2018–present) of Vanguard; chief executive officer, president, and trustee (2018–present) of each of the investment companies served by Vanguard; president and director (2017–present) of Vanguard; and president (2018–present) of Vanguard Marketing Corporation. Chief investment officer (2013–2017), managing director (2002–2017), head of the Retail Investor Group (2006–2012), and chief information officer (2001–2006) of Vanguard. Chairman of the board (2011–2017) and trustee (2009–2017) of the Children’s Hospital of Philadelphia; and trustee (2018–present) and vice chair (2019–present) of The Shipley School.
Independent Trustees
Emerson U. Fullwood
Born in 1948. Trustee since January 2008. Principal occupation(s) during the past five years and other experience: executive chief staff and marketing officer for North America and corporate vice president (retired 2008) of Xerox Corporation (document management products and services). Former president of the Worldwide Channels Group, Latin America, and Worldwide Customer Service and executive chief staff officer of Developing Markets of Xerox. Executive in residence and 2009–2010 Distinguished Minett Professor at the Rochester Institute of Technology. Director of SPX FLOW, Inc. (multi-industry manufacturing). Director of the University of Rochester Medical Center, the Monroe Community College Foundation, the United Way of Rochester, North Carolina A&T University, and Roberts Wesleyan College. Trustee of the University of Rochester.
Amy Gutmann
Born in 1949. Trustee since June 2006. Principal occupation(s) during the past five years and other experience: president (2004–present) of the University of Pennsylvania. Christopher H. Browne Distinguished Professor of Political Science, School of Arts and Sciences, and professor of communication, Annenberg School for Communication, with secondary faculty appointments in the Department of Philosophy, School of Arts and Sciences, and at the Graduate School of Education, University of Pennsylvania.
F. Joseph Loughrey
Born in 1949. Trustee since October 2009. Principal occupation(s) during the past five years and other experience: president and chief operating officer (retired 2009) and vice chairman of the board (2008–2009) of Cummins Inc. (industrial machinery). Chairman of the board of Hillenbrand, Inc. (specialized consumer services) and the Lumina Foundation. Director of the V Foundation. Member of the advisory council for the College of Arts and Letters and chair of the advisory board to the Kellogg Institute for International Studies, both at the University of Notre Dame.
Mark Loughridge
Born in 1953. Trustee since March 2012. Principal occupation(s) during the past five years and other experience: senior vice president and chief financial officer (retired 2013) of IBM (information technology services). Fiduciary member of IBM’s Retirement Plan Committee (2004–2013), senior vice president and general manager (2002–2004) of IBM Global Financing, vice president and controller (1998–2002) of IBM, and a variety of other prior management roles at IBM. Member of the Council on Chicago Booth.
Scott C. Malpass
Born in 1962. Trustee since March 2012. Principal occupation(s) during the past five years and other experience: chief investment officer (retired June 2020) and vice president (retired June 2020) of the University of Notre Dame. Assistant professor of finance at the Mendoza College of Business, University of Notre Dame, and member of the Notre Dame 403(b) Investment Committee (retired June 2020). Member of the board of Catholic Investment Services, Inc. (investment advisors) and the board of superintendence of the Institute for the Works of Religion.
Deanna Mulligan
Born in 1963. Trustee since January 2018. Principal occupation(s) during the past five years and other experience: board chair (2020–present), chief executive officer (2011–2020), and president (2010–2019) of The Guardian Life Insurance Company of America. Chief operating officer (2010–2011) and executive vice president (2008–2010) of the individual life and disability division of Guardian Life. Member of the board of the American Council of Life Insurers and the board of the Economic Club of New York. Trustee of the Partnership for New York City (business leadership), Chief Executives for Corporate Purpose, NewYork-Presbyterian Hospital, Catalyst, and the
Bruce Museum (arts and science). Member of the Advisory Council for the Stanford Graduate School of Business.
André F. Perold
Born in 1952. Trustee since December 2004. Principal occupation(s) during the past five years and other experience: George Gund Professor of Finance and Banking, Emeritus at the Harvard Business School (retired 2011). Chief investment officer and co-managing partner of HighVista Strategies (private investment firm). Member of the board of advisors and member of the investment committee of the Museum of Fine Arts Boston. Member of the board (2018–present) of RIT Capital Partners (investment firm). Member of the investment committee of Partners Health Care System.
Sarah Bloom Raskin
Born in 1961. Trustee since January 2018. Principal occupation(s) during the past five years and other experience: deputy secretary (2014–2017) of the United States Department of the Treasury. Governor (2010–2014) of the Federal Reserve Board. Commissioner (2007–2010) of financial regulation for the State of Maryland. Member of the board of directors (2012–2014) of Neighborhood Reinvestment Corporation. Director (2017–present) of i(x) Investments, LLC; director (2017–present) of Reserve Trust. Rubenstein Fellow (2017–present) of Duke University; trustee (2017–present) of Amherst College, and trustee (2019–present) of the Folger Shakespeare Library.
Peter F. Volanakis
Born in 1955. Trustee since July 2009. Principal occupation(s) during the past five years and other experience: president and chief operating officer (retired 2010) of Corning Incorporated (communications equipment) and director of Corning Incorporated (2000–2010) and Dow Corning (2001–2010). Director (2012) of SPX Corporation (multi-industry manufacturing). Overseer of the Amos Tuck School of Business Administration, Dartmouth College (2001–2013). Chairman of the board of trustees of Colby-Sawyer College. Member of the board of Hypertherm Inc. (industrial cutting systems, software, and consumables).
1 Mr. Buckley is considered an “interested person,” as defined in the Investment Company Act of 1940, because he is an officer of the Vanguard funds.
Executive Officers
John Bendl
Born in 1970. Principal occupation(s) during the past five years and other experience: principal of Vanguard. Chief financial officer (2019–present) of each of the investment companies served by Vanguard. Chief accounting officer, treasurer, and controller of Vanguard (2017–present). Partner (2003–2016) at KPMG (audit, tax, and advisory services).
Christine M. Buchanan
Born in 1970. Principal occupation(s) during the past five years and other experience: principal of Vanguard. Treasurer (2017–present) of each of the investment companies served by Vanguard. Partner (2005–2017) at KPMG (audit, tax, and advisory services).
David Cermak
Born in 1960. Principal occupation(s) during the past five years and other experience: principal of Vanguard. Finance director (2019–present) of each of the investment companies served by Vanguard. Managing director and head (2017–present) of Vanguard Investments Singapore. Managing director and head (2017–2019) of Vanguard Investments Hong Kong. Representative director and head (2014–2017) of Vanguard Investments Japan.
John Galloway
Born in 1973. Principal occupation(s) during the past five years and other experience: principal of Vanguard.
Investment stewardship officer (September 2020–present) of each of the investment companies served by Vanguard. Head of Investor Advocacy (February 2020–present) and head of Marketing Strategy and Planning (2017–2020) at Vanguard. Deputy assistant to the President of the United States (2015).
Thomas J. Higgins
Born in 1957. Principal occupation(s) during the past five years and other experience: principal of Vanguard. Finance director (2019–present), chief financial officer (2008–2019), and treasurer (1998–2008) of each of the investment companies served by Vanguard.
Peter Mahoney
Born in 1974. Principal occupation(s) during the past five years and other experience: principal of Vanguard. Controller (2015–present) of each of the investment companies served by Vanguard. Head of International Fund Services (2008–2014) at Vanguard.
Anne E. Robinson
Born in 1970. Principal occupation(s) during the past five years and other experience: general counsel (2016–present) of Vanguard. Secretary (2016–present) of Vanguard and of each of the investment companies served by Vanguard. Managing director (2016–present) of Vanguard. Managing director and general counsel of Global Cards and Consumer Services (2014–2016) at Citigroup. Counsel (2003–2014) at American Express.
Michael Rollings
Born in 1963. Principal occupation(s) during the past five years and other experience: finance director (2017–present) and treasurer (2017) of each of the investment companies served by Vanguard. Managing director (2016–present) of Vanguard. Chief financial officer (2016–present) of Vanguard. Director (2016–present) of Vanguard Marketing Corporation. Executive vice president and chief financial officer (2006–2016) of MassMutual Financial Group.
John E. Schadl
Born in 1972. Principal occupation(s) during the past five years and other experience: principal of Vanguard. Chief compliance officer (2019–present) of Vanguard and of each of the investment companies served by Vanguard. Assistant vice president (2019–present) of Vanguard Marketing Corporation.
Vanguard Senior Management Team
| Joseph Brennan | James M. Norris |
| Mortimer J. Buckley | Thomas M. Rampulla |
| Gregory Davis | Karin A. Risi |
| John James | Anne E. Robinson |
| John T. Marcante | Michael Rollings |
| Chris D. McIsaac | Lauren Valente |
Connect with Vanguard® > vanguard.com
Fund Information > 800-662-7447
Annuity and Insurance Services > 800-522-5555
Institutional Investor Services > 800-523-1036
Text Telephone for People Who Are Deaf or Hard of Hearing > 800-749-7273
This material may be used in conjunction with the offering of shares of any Vanguard fund only if preceded or accompanied by the fund’s current prospectus.
You can obtain a free copy of Vanguard’s proxy voting guidelines by visiting vanguard.com/proxyreporting or by calling Vanguard at 800-662-2739. The guidelines are also available from the SEC’s website, www.sec.gov. In addition, you may obtain a free report on how your fund voted the proxies for securities it owned during the 12 months ended June 30. To get the report, visit either vanguard.com/proxyreporting or www.sec.gov.
All comparative mutual fund data are from Morningstar, Inc., unless otherwise noted.
You can review information about your fund on the SEC’s website, and you can receive copies of this information, for a fee, by sending a request via email addressed to publicinfo@sec.gov.
Source for Bloomberg Barclays indexes: Bloomberg Index Services Limited. Copyright 2021, Bloomberg. All rights reserved.
CFA® is a registered trademark owned by CFA Institute.
© 2021 The Vanguard Group, Inc.
All rights reserved.
Vanguard Marketing Corporation, Distributor.
Q690EQUC 022021
Annual Report | December 31, 2020
Vanguard Variable Insurance Funds
Contents
Your Portfolio’s Performance at a Glance
| 1 |
About Your Portfolio’s Expenses
| 2 |
Performance Summary
| 3 |
Financial Statements
| 5 |
Please note: The opinions expressed in this report are just that—informed opinions. They should not be considered promises or advice. Also, please keep in mind that the information and opinions cover the period through the date on the front of this report. Of course, the risks of investing in your fund are spelled out in the prospectus.
Your Portfolio’s Performance at a Glance
| • | For the 12 months ended December 31, 2020, the Equity Index Portfolio of Vanguard Variable Insurance Funds returned 18.20%, in line with the 18.40% return of its benchmark, the Standard & Poor’s 500 Index, after factoring in the portfolio’s expenses. |
| • | Stocks initially plummeted after the emergence of COVID-19 in early 2020 but finished the year significantly higher. That was thanks in part to rapid, robust monetary and fiscal action by policymakers and the rollout of COVID-19 vaccines at the end of the year. |
| • | The portfolio benefited most from its holdings in the information technology, consumer discretionary, and communication services sectors. |
| • | The portfolio recorded an average annual return of 13.72% for the 10 years ended December 31, 2020, in line with its benchmark average of 13.88%. |
| • | Please note that the portfolio returns in Vanguard Variable Insurance Funds are different from those in Vanguard Variable Annuity (and other plans that invest in the fund), which take into account insurance-related expenses. |
Market Barometer
| | Average Annual Total Returns
Periods Ended December 31, 2020 |
| | One Year | Three Years | Five Years |
| Stocks | | | |
| Russell 1000 Index (Large-caps) | 20.96% | 14.82% | 15.60% |
| Russell 2000 Index (Small-caps) | 19.96 | 10.25 | 13.26 |
| Russell 3000 Index (Broad U.S. market) | 20.89 | 14.49 | 15.43 |
| FTSE All-World ex US Index (International) | 11.22 | 5.18 | 9.16 |
| Bonds | | | |
| Bloomberg Barclays U.S. Aggregate Bond Index (Broad taxable market) | 7.51% | 5.34% | 4.44% |
| Bloomberg Barclays Municipal Bond Index (Broad tax-exempt market) | 5.21 | 4.64 | 3.91 |
| FTSE Three-Month U.S. Treasury Bill Index | 0.58 | 1.56 | 1.16 |
| CPI | | | |
| Consumer Price Index | 1.36% | 1.85% | 1.95% |
About Your Portfolio’s Expenses
As a shareholder of the portfolio, you incur ongoing costs, which include costs for portfolio management, administrative services, and shareholder reports (like this one), among others. Operating expenses, which are deducted from a portfolio’s gross income, directly reduce the investment return of the portfolio.
A portfolio‘s expenses are expressed as a percentage of its average net assets. This figure is known as the expense ratio. The following examples are intended to help you understand the ongoing costs (in dollars) of investing in your portfolio and to compare these costs with those of other mutual funds. The examples are based on an investment of $1,000 made at the beginning of the period shown and held for the entire period.
The accompanying table illustrates your portfolio’s costs in two ways:
| • | Based on actual portfolio return. This section helps you to estimate the actual expenses that you paid over the period. The ”Ending Account Value“ shown is derived from the portfolio’s actual return, and the third column shows the dollar amount that would have been paid by an investor who started with $1,000 in the portfolio. You may use the information here, together with the amount you invested, to estimate the expenses that you paid over the period. |
To do so, simply divide your account value by $1,000 (for example, an $8,600 account value divided by $1,000 = 8.6), then multiply the result by the number given for your portfolio under the heading ”Expenses Paid During Period.”
| • | Based on hypothetical 5% yearly return. This section is intended to help you compare your portfolio‘s costs with those of other mutual funds. It assumes that the portfolio had a yearly return of 5% before expenses, but that the expense ratio is unchanged. In this case—because the return used is not the portfolio’s actual return—the results do not apply to your investment. The example is useful in making comparisons because the Securities and Exchange Commission requires all mutual funds to calculate expenses based on a 5% return. You can assess your portfolio’s costs by comparing this hypothetical example with the hypothetical examples that appear in shareholder reports of other funds. |
Note that the expenses shown in the table are meant to highlight and help you compare ongoing costs only and do not reflect transaction costs incurred by the portfolio for buying and selling securities. The portfolio’s expense ratio does not reflect additional fees and expenses associated with the annuity or life insurance program through which you invest.
The calculations assume no shares were bought or sold during the period. Your actual costs may have been higher or lower, depending on the amount of your investment and the timing of any purchases or redemptions.
You can find more information about the portfolio’s expenses, including annual expense ratios, in the Financial Statements section of this report. For additional information on operating expenses and other shareholder costs, please refer to your portfolio’s current prospectus.
| Six Months Ended December 31, 2020 | | | |
| Equity Index Portfolio | Beginning
Account Value
6/30/2020 | Ending
Account Value
12/31/2020 | Expenses
Paid During
Period |
| Based on Actual Portfolio Return | $1,000.00 | $1,220.70 | $0.78 |
| Based on Hypothetical 5% Yearly Return | 1,000.00 | 1,024.43 | 0.71 |
The calculations are based on expenses incurred in the most recent six-month period. The portfolio's annualized six-month expense ratio for that period is 0.14%. The dollar amounts shown as ”Expenses Paid” are equal to the annualized expense ratio multiplied by the average account value over the period, multiplied by the number of days in the most recent six-month period, then divided by the number of days in the most recent 12-month period (184/366).
All of the returns in this report represent past performance, which is not a guarantee of future results that may be achieved by the portfolio. (Current performance may be lower or higher than the performance data cited. For performance data current to the most recent month-end, visit our website at vanguard.com/performance.) Note, too, that both investment returns and principal value can fluctuate widely, so an investor’s shares, when sold, could be worth more or less than their original cost. The returns shown do not reflect taxes that a shareholder would pay on portfolio distributions or on the sale of portfolio shares. Nor do the returns reflect fees and expenses associated with the annuity or life insurance program through which a shareholder invests. If these fees and expenses were included, the portfolio’s returns would be lower.
Cumulative Performance: December 31, 2010, Through December 31, 2020
Initial Investment of $10,000
| | | | Average Annual Total Returns
Periods Ended December 31, 2020 |
| | | One
Year | Five
Years | Ten
Years | Final Value
of a $10,000
Investment |
 | Equity Index Portfolio | 18.20% | 15.05% | 13.72% | $36,173 |
 | S&P 500 Index | 18.40 | 15.22 | 13.88 | 36,700 |
 | Dow Jones U.S. Total Stock Market Float Adjusted Index | 20.79 | 15.36 | 13.74 | 36,240 |
See Financial Highlights for dividend and capital gains information.
| Communication Services | 10.8% |
| Consumer Discretionary | 12.7 |
| Consumer Staples | 6.5 |
| Energy | 2.3 |
| Financials | 10.4 |
| Health Care | 13.5 |
| Industrials | 8.4 |
| Information Technology | 27.6 |
| Materials | 2.6 |
| Real Estate | 2.4 |
| Utilities | 2.8 |
The table reflects the portfolio’s investments, except for short-term investments and derivatives. Sector categories are based on the Global Industry Classification Standard (“GICS”), except for the “Other” category (if applicable), which includes securities that have not been provided a GICS classification as of the effective reporting period.
The portfolio may invest in derivatives (such as futures and swap contracts) for various reasons, including, but not limited to, attempting to remain fully invested and tracking its target index as closely as possible.
The Global Industry Classification Standard (“GICS”) was developed by and is the exclusive property and a service mark of MSCI Inc. (“MSCI”) and Standard and Poor’s, a division of McGraw-Hill Companies, Inc. (“S&P”), and is licensed for use by Vanguard. Neither MSCI, S&P nor any third party involved in making or compiling the GICS or any GICS classification makes any express or implied warranties or representations with respect to such standard or classification (or the results to be obtained by the use thereof), and all such parties hereby expressly disclaim all warranties of originality, accuracy, completeness, merchantability or fitness for a particular purpose with respect to any such standard or classification. Without limiting any of the foregoing, in no event shall MSCI, S&P, any of its affiliates or any third party involved in making or compiling the GICS or any GICS classification have any liability for any direct, indirect, special, punitive, consequential or any other damages (including lost profits) even if notified of the possibility of such damages.
The portfolio files its complete schedule of portfolio holdings with the Securities and Exchange Commission (SEC) for the first and third quarters of each fiscal year as an exhibit to its reports on Form N-PORT. The portfolio’s Form N-PORT reports are available on the SEC’s website at www.sec.gov.
| | | | | | Shares | Market
Value•
($000) |
| Common Stocks (99.2%) |
| Communication Services (10.7%) |
| * | Facebook Inc. Class A | 569,523 | 155,571 |
| * | Alphabet Inc. Class A | 71,190 | 124,770 |
| * | Alphabet Inc. Class C | 68,805 | 120,538 |
| * | Walt Disney Co. | 428,905 | 77,709 |
| | Verizon Communications Inc. | 980,245 | 57,589 |
| | Comcast Corp. Class A | 1,081,583 | 56,675 |
| * | Netflix Inc. | 104,667 | 56,597 |
| | AT&T Inc. | 1,688,130 | 48,550 |
| * | Charter Communications Inc. Class A | 34,558 | 22,862 |
| * | T-Mobile US Inc. | 138,160 | 18,631 |
| | Activision Blizzard Inc. | 183,122 | 17,003 |
| * | Twitter Inc. | 188,469 | 10,206 |
| | Electronic Arts Inc. | 68,737 | 9,871 |
| * | Take-Two Interactive Software Inc. | 27,287 | 5,670 |
| | ViacomCBS Inc. Class B | 133,671 | 4,980 |
| | Omnicom Group Inc. | 50,864 | 3,172 |
| * | Live Nation Entertainment Inc. | 33,831 | 2,486 |
| | Fox Corp. Class A | 79,734 | 2,322 |
| | CenturyLink Inc. | 233,626 | 2,278 |
| | Interpublic Group of Cos. Inc. | 92,293 | 2,171 |
| * | Discovery Inc. Class C | 73,650 | 1,929 |
| * | DISH Network Corp. Class A | 58,505 | 1,892 |
| | News Corp. Class A | 101,368 | 1,821 |
| * | Discovery Inc. Class A | 37,558 | 1,130 |
| | Fox Corp. Class B | 36,732 | 1,061 |
| | News Corp. Class B | 19,941 | 354 |
| | | | | | | 807,838 |
| Consumer Discretionary (12.6%) |
| * | Amazon.com Inc. | 101,039 | 329,077 |
| * | Tesla Inc. | 179,655 | 126,777 |
| | Home Depot Inc. | 255,064 | 67,750 |
| | NIKE Inc. Class B | 297,290 | 42,058 |
| | McDonald's Corp. | 176,542 | 37,882 |
| | Starbucks Corp. | 278,100 | 29,751 |
| | Lowe's Cos. Inc. | 173,606 | 27,866 |
| * | Booking Holdings Inc. | 9,703 | 21,611 |
| | Target Corp. | 118,630 | 20,942 |
| | TJX Cos. Inc. | 284,490 | 19,428 |
| | General Motors Co. | 298,371 | 12,424 |
| | Dollar General Corp. | 58,042 | 12,206 |
| | Ross Stores Inc. | 84,366 | 10,361 |
| * | Chipotle Mexican Grill Inc. Class A | 6,632 | 9,197 |
| | Aptiv plc | 64,004 | 8,339 |
| | Marriott International Inc. Class A | 63,039 | 8,316 |
| | Ford Motor Co. | 926,125 | 8,141 |
| | eBay Inc. | 155,226 | 7,800 |
| * | O'Reilly Automotive Inc. | 17,173 | 7,772 |
| | Yum! Brands Inc. | 71,514 | 7,764 |
| | Hilton Worldwide Holdings Inc. | 65,784 | 7,319 |
| * | AutoZone Inc. | 5,496 | 6,515 |
| | VF Corp. | 75,840 | 6,478 |
| * | Dollar Tree Inc. | 55,776 | 6,026 |
| | Best Buy Co. Inc. | 54,669 | 5,455 |
| | DR Horton Inc. | 78,659 | 5,421 |
| * | Etsy Inc. | 29,911 | 5,321 |
| | Lennar Corp. Class A | 64,457 | 4,914 |
| | Las Vegas Sands Corp. | 77,709 | 4,631 |
| | | | | | Shares | Market
Value•
($000) |
| | Expedia Group Inc. | 32,163 | 4,258 |
| | Garmin Ltd. | 35,291 | 4,223 |
| | Tractor Supply Co. | 27,563 | 3,875 |
| * | Ulta Beauty Inc. | 13,330 | 3,828 |
| | Carnival Corp. | 175,960 | 3,811 |
| | Darden Restaurants Inc. | 30,805 | 3,670 |
| * | CarMax Inc. | 38,823 | 3,667 |
| | Domino's Pizza Inc. | 9,322 | 3,575 |
| | Pool Corp. | 9,501 | 3,539 |
| | Genuine Parts Co. | 34,133 | 3,428 |
| * | NVR Inc. | 830 | 3,386 |
| | Tiffany & Co. | 25,565 | 3,361 |
| | Royal Caribbean Cruises Ltd. | 44,056 | 3,291 |
| | MGM Resorts International | 96,998 | 3,056 |
| | Hasbro Inc. | 30,152 | 2,820 |
| | PulteGroup Inc. | 63,432 | 2,735 |
| | Whirlpool Corp. | 14,798 | 2,671 |
| | Wynn Resorts Ltd. | 22,971 | 2,592 |
| | Advance Auto Parts Inc. | 16,054 | 2,529 |
| * | LKQ Corp. | 66,245 | 2,334 |
| | BorgWarner Inc. | 57,846 | 2,235 |
| | L Brands Inc. | 55,273 | 2,056 |
| | Tapestry Inc. | 65,638 | 2,040 |
| * | Mohawk Industries Inc. | 14,150 | 1,994 |
| * | Norwegian Cruise Line Holdings Ltd. | 74,681 | 1,899 |
| | Newell Brands Inc. | 89,348 | 1,897 |
| | PVH Corp. | 16,822 | 1,579 |
| | Leggett & Platt Inc. | 31,354 | 1,389 |
| | Hanesbrands Inc. | 82,421 | 1,202 |
| | Ralph Lauren Corp. Class A | 11,411 | 1,184 |
| | Gap Inc. | 48,678 | 983 |
| * | Under Armour Inc. Class A | 44,811 | 769 |
| * | Under Armour Inc. Class C | 45,820 | 682 |
| | Lennar Corp. Class B | 1,028 | 63 |
| | | | | | | 954,163 |
| Consumer Staples (6.5%) |
| | Procter & Gamble Co. | 587,340 | 81,722 |
| | Coca-Cola Co. | 916,280 | 50,249 |
| | PepsiCo Inc. | 327,377 | 48,550 |
| | Walmart Inc. | 328,391 | 47,338 |
| | Costco Wholesale Corp. | 104,525 | 39,383 |
| | Philip Morris International Inc. | 368,951 | 30,545 |
| | Mondelez International Inc. Class A | 338,770 | 19,808 |
| | Altria Group Inc. | 440,387 | 18,056 |
| | Colgate-Palmolive Co. | 203,008 | 17,359 |
| | Estee Lauder Cos. Inc. Class A | 53,660 | 14,284 |
| | Kimberly-Clark Corp. | 80,583 | 10,865 |
| | Sysco Corp. | 120,718 | 8,965 |
| | Constellation Brands Inc. Class A | 40,173 | 8,800 |
| | General Mills Inc. | 144,880 | 8,519 |
| * | Monster Beverage Corp. | 87,597 | 8,101 |
| | Walgreens Boots Alliance Inc. | 170,410 | 6,796 |
| | Archer-Daniels-Midland Co. | 131,938 | 6,651 |
| | Clorox Co. | 29,896 | 6,037 |
| | Kroger Co. | 183,683 | 5,834 |
| | McCormick & Co. Inc. (Non-Voting) | 58,999 | 5,640 |
| | Kraft Heinz Co. | 153,736 | 5,328 |
| | Hershey Co. | 34,905 | 5,317 |
| | Church & Dwight Co. Inc. | 58,954 | 5,143 |
| | | | | | Shares | Market
Value•
($000) |
| | Tyson Foods Inc. Class A | 69,589 | 4,484 |
| | Conagra Brands Inc. | 115,583 | 4,191 |
| | Kellogg Co. | 60,181 | 3,745 |
| | Brown-Forman Corp. Class B | 43,184 | 3,430 |
| | J M Smucker Co. | 26,994 | 3,121 |
| | Hormel Foods Corp. | 66,428 | 3,096 |
| | Lamb Weston Holdings Inc. | 34,625 | 2,726 |
| | Campbell Soup Co. | 47,918 | 2,317 |
| | Molson Coors Beverage Co. Class B | 44,512 | 2,011 |
| | | | | | | 488,411 |
| Energy (2.2%) |
| | Exxon Mobil Corp. | 1,001,678 | 41,289 |
| | Chevron Corp. | 456,049 | 38,513 |
| | ConocoPhillips | 253,049 | 10,119 |
| | Phillips 66 | 103,573 | 7,244 |
| | Schlumberger NV | 330,098 | 7,206 |
| | EOG Resources Inc. | 138,325 | 6,898 |
| | Marathon Petroleum Corp. | 154,318 | 6,383 |
| | Kinder Morgan Inc. | 461,690 | 6,311 |
| | Williams Cos. Inc. | 287,853 | 5,771 |
| | Valero Energy Corp. | 96,757 | 5,474 |
| | Pioneer Natural Resources Co. | 38,903 | 4,431 |
| | ONEOK Inc. | 105,148 | 4,036 |
| | Halliburton Co. | 209,182 | 3,954 |
| | Occidental Petroleum Corp. | 198,301 | 3,433 |
| | Hess Corp. | 64,667 | 3,414 |
| | Baker Hughes Co. Class A | 162,286 | 3,384 |
| | Concho Resources Inc. | 46,451 | 2,710 |
| | Diamondback Energy Inc. | 37,381 | 1,809 |
| | Cabot Oil & Gas Corp. | 94,309 | 1,535 |
| | Devon Energy Corp. | 90,528 | 1,431 |
| | Apache Corp. | 89,324 | 1,267 |
| | National Oilwell Varco Inc. | 91,910 | 1,262 |
| | Marathon Oil Corp. | 186,801 | 1,246 |
| | TechnipFMC plc | 99,536 | 936 |
| | HollyFrontier Corp. | 35,618 | 921 |
| | | | | | | 170,977 |
| Financials (10.4%) |
| * | Berkshire Hathaway Inc. Class B | 429,515 | 99,592 |
| | JPMorgan Chase & Co. | 722,129 | 91,761 |
| | Bank of America Corp. | 1,803,394 | 54,661 |
| | Citigroup Inc. | 493,235 | 30,413 |
| | Wells Fargo & Co. | 979,489 | 29,561 |
| | BlackRock Inc. | 33,598 | 24,242 |
| | Morgan Stanley | 338,557 | 23,201 |
| | Goldman Sachs Group Inc. | 81,499 | 21,492 |
| | Charles Schwab Corp. | 353,373 | 18,743 |
| | S&P Global Inc. | 56,986 | 18,733 |
| | American Express Co. | 154,511 | 18,682 |
| | Chubb Ltd. | 106,923 | 16,458 |
| | CME Group Inc. | 85,040 | 15,482 |
| | Intercontinental Exchange Inc. | 132,951 | 15,328 |
| | Truist Financial Corp. | 319,412 | 15,309 |
| | US Bancorp | 324,807 | 15,133 |
| | PNC Financial Services Group Inc. | 100,387 | 14,958 |
| | Marsh & McLennan Cos. Inc. | 120,157 | 14,058 |
| | Progressive Corp. | 138,721 | 13,717 |
| | Aon plc Class A | 54,167 | 11,444 |
| | Moody's Corp. | 38,260 | 11,105 |
| | Capital One Financial Corp. | 108,353 | 10,711 |
| | MSCI Inc. Class A | 19,645 | 8,772 |
| | MetLife Inc. | 181,293 | 8,512 |
| | Travelers Cos. Inc. | 60,035 | 8,427 |
| | Bank of New York Mellon Corp. | 193,205 | 8,200 |
| | T. Rowe Price Group Inc. | 53,666 | 8,124 |
| | Allstate Corp. | 72,074 | 7,923 |
| | American International Group Inc. | 204,222 | 7,732 |
| | Prudential Financial Inc. | 93,880 | 7,329 |
| | | | | | Shares | Market
Value•
($000) |
| * | Berkshire Hathaway Inc. Class A | 21 | 7,304 |
| | Aflac Inc. | 154,885 | 6,889 |
| | Discover Financial Services | 72,680 | 6,580 |
| | Willis Towers Watson plc | 30,568 | 6,440 |
| | State Street Corp. | 83,670 | 6,090 |
| | First Republic Bank | 41,235 | 6,059 |
| | Arthur J Gallagher & Co. | 45,616 | 5,643 |
| | Ameriprise Financial Inc. | 27,989 | 5,439 |
| | MarketAxess Holdings Inc. | 8,981 | 5,124 |
| * | SVB Financial Group | 12,295 | 4,768 |
| | Fifth Third Bancorp | 169,101 | 4,662 |
| | Northern Trust Corp. | 49,234 | 4,586 |
| | Synchrony Financial | 128,432 | 4,458 |
| | Hartford Financial Services Group Inc. | 84,775 | 4,152 |
| | M&T Bank Corp. | 30,354 | 3,864 |
| | KeyCorp | 231,034 | 3,791 |
| | Regions Financial Corp. | 227,240 | 3,663 |
| | Citizens Financial Group Inc. | 101,467 | 3,628 |
| | Nasdaq Inc. | 27,160 | 3,605 |
| | Cincinnati Financial Corp. | 35,402 | 3,093 |
| | Huntington Bancshares Inc. | 240,706 | 3,040 |
| | Principal Financial Group Inc. | 60,449 | 2,999 |
| | Raymond James Financial Inc. | 28,828 | 2,758 |
| | Loews Corp. | 55,272 | 2,488 |
| | Cboe Global Markets Inc. | 25,557 | 2,380 |
| | Everest Re Group Ltd. | 9,455 | 2,213 |
| | W R Berkley Corp. | 33,308 | 2,212 |
| | Globe Life Inc. | 22,779 | 2,163 |
| | Lincoln National Corp. | 42,980 | 2,162 |
| | Assurant Inc. | 14,033 | 1,912 |
| | Comerica Inc. | 32,912 | 1,838 |
| | Zions Bancorp NA | 38,808 | 1,686 |
| | Franklin Resources Inc. | 64,714 | 1,617 |
| | Invesco Ltd. | 89,101 | 1,553 |
| | People's United Financial Inc. | 100,530 | 1,300 |
| | Unum Group | 48,182 | 1,105 |
| | | | | | | 783,067 |
| Health Care (13.4%) |
| | Johnson & Johnson | 623,658 | 98,151 |
| | UnitedHealth Group Inc. | 224,787 | 78,828 |
| | Merck & Co. Inc. | 599,377 | 49,029 |
| | Pfizer Inc. | 1,316,842 | 48,473 |
| | Abbott Laboratories | 419,888 | 45,974 |
| | AbbVie Inc. | 418,256 | 44,816 |
| | Thermo Fisher Scientific Inc. | 93,893 | 43,733 |
| | Medtronic plc | 318,892 | 37,355 |
| | Danaher Corp. | 149,780 | 33,272 |
| | Bristol-Myers Squibb Co. | 535,378 | 33,209 |
| | Eli Lilly & Co. | 188,095 | 31,758 |
| | Amgen Inc. | 137,922 | 31,711 |
| * | Intuitive Surgical Inc. | 27,853 | 22,787 |
| | CVS Health Corp. | 310,108 | 21,180 |
| | Stryker Corp. | 77,463 | ��� 18,982 |
| | Anthem Inc. | 58,926 | 18,921 |
| | Zoetis Inc. | 112,604 | 18,636 |
| | Cigna Corp. | 85,598 | 17,820 |
| | Gilead Sciences Inc. | 296,984 | 17,302 |
| | Becton Dickinson & Co. | 68,714 | 17,194 |
| * | Vertex Pharmaceuticals Inc. | 61,614 | 14,562 |
| * | Edwards Lifesciences Corp. | 147,674 | 13,472 |
| | Humana Inc. | 31,359 | 12,866 |
| * | Illumina Inc. | 34,591 | 12,799 |
| * | Boston Scientific Corp. | 339,328 | 12,199 |
| * | Regeneron Pharmaceuticals Inc. | 24,843 | 12,002 |
| | HCA Healthcare Inc. | 62,541 | 10,285 |
| * | IDEXX Laboratories Inc. | 20,211 | 10,103 |
| | Baxter International Inc. | 121,042 | 9,712 |
| * | Align Technology Inc. | 17,005 | 9,087 |
| * | Biogen Inc. | 36,467 | 8,929 |
| | | | | | Shares | Market
Value•
($000) |
| | Agilent Technologies Inc. | 72,522 | 8,593 |
| * | DexCom Inc. | 22,762 | 8,416 |
| * | Centene Corp. | 137,425 | 8,250 |
| * | IQVIA Holdings Inc. | 45,444 | 8,142 |
| * | Alexion Pharmaceuticals Inc. | 51,873 | 8,105 |
| | Zimmer Biomet Holdings Inc. | 49,139 | 7,572 |
| | ResMed Inc. | 34,355 | 7,302 |
| | McKesson Corp. | 38,075 | 6,622 |
| * | Mettler-Toledo International Inc. | 5,643 | 6,431 |
| | Cerner Corp. | 72,732 | 5,708 |
| * | Viatris Inc. | 285,398 | 5,348 |
| | West Pharmaceutical Services Inc. | 17,544 | 4,970 |
| * | Laboratory Corp. of America Holdings | 23,044 | 4,691 |
| | Teleflex Inc. | 11,018 | 4,535 |
| * | Hologic Inc. | 60,807 | 4,429 |
| | Cooper Cos. Inc. | 11,603 | 4,216 |
| * | Catalent Inc. | 38,968 | 4,055 |
| * | Incyte Corp. | 44,045 | 3,831 |
| | STERIS plc | 20,187 | 3,826 |
| | PerkinElmer Inc. | 26,493 | 3,802 |
| | Quest Diagnostics Inc. | 31,885 | 3,800 |
| * | Varian Medical Systems Inc. | 21,613 | 3,782 |
| | Cardinal Health Inc. | 69,425 | 3,718 |
| * | Waters Corp. | 14,680 | 3,632 |
| * | ABIOMED Inc. | 10,692 | 3,466 |
| | AmerisourceBergen Corp. Class A | 34,796 | 3,402 |
| * | Bio-Rad Laboratories Inc. Class A | 5,093 | 2,969 |
| | DENTSPLY SIRONA Inc. | 51,710 | 2,708 |
| | Universal Health Services Inc. Class B | 18,390 | 2,529 |
| * | Henry Schein Inc. | 33,781 | 2,259 |
| * | DaVita Inc. | 17,489 | 2,053 |
| | Perrigo Co. plc | 32,294 | 1,444 |
| | | | | | | 1,009,753 |
| Industrials (8.3%) |
| | Honeywell International Inc. | 166,237 | 35,359 |
| | Union Pacific Corp. | 159,641 | 33,240 |
| | United Parcel Service Inc. Class B | 169,425 | 28,531 |
| | Boeing Co. | 125,722 | 26,912 |
| | Raytheon Technologies Corp. | 359,780 | 25,728 |
| | 3M Co. | 136,656 | 23,886 |
| | Caterpillar Inc. | 128,694 | 23,425 |
| | General Electric Co. | 2,075,376 | 22,414 |
| | Lockheed Martin Corp. | 58,321 | 20,703 |
| | Deere & Co. | 74,232 | 19,972 |
| | CSX Corp. | 181,188 | 16,443 |
| | FedEx Corp. | 57,228 | 14,858 |
| | Norfolk Southern Corp. | 60,176 | 14,298 |
| | Illinois Tool Works Inc. | 68,218 | 13,908 |
| | Emerson Electric Co. | 141,672 | 11,386 |
| | Eaton Corp. plc | 94,428 | 11,345 |
| | Northrop Grumman Corp. | 36,732 | 11,193 |
| | Waste Management Inc. | 92,107 | 10,862 |
| | Roper Technologies Inc. | 24,849 | 10,712 |
| | L3Harris Technologies Inc. | 49,790 | 9,411 |
| | Parker-Hannifin Corp. | 30,528 | 8,316 |
| | Trane Technologies plc | 56,914 | 8,262 |
| | General Dynamics Corp. | 55,093 | 8,199 |
| | Verisk Analytics Inc. Class A | 38,538 | 8,000 |
| | Johnson Controls International plc | 171,583 | 7,994 |
| * | TransDigm Group Inc. | 12,904 | 7,986 |
| | Cummins Inc. | 35,083 | 7,967 |
| | IHS Markit Ltd. | 88,344 | 7,936 |
| | Cintas Corp. | 20,836 | 7,365 |
| | Carrier Global Corp. | 193,129 | 7,285 |
| | PACCAR Inc. | 82,135 | 7,087 |
| | Rockwell Automation Inc. | 27,546 | 6,909 |
| | Stanley Black & Decker Inc. | 37,989 | 6,783 |
| | Fastenal Co. | 136,131 | 6,647 |
| | AMETEK Inc. | 54,554 | 6,598 |
| | | | | | Shares | Market
Value•
($000) |
| | Southwest Airlines Co. | 139,969 | 6,524 |
| | Otis Worldwide Corp. | 96,564 | 6,523 |
| * | Copart Inc. | 49,284 | 6,271 |
| | Delta Air Lines Inc. | 151,251 | 6,082 |
| | Fortive Corp. | 79,988 | 5,665 |
| | Equifax Inc. | 28,856 | 5,565 |
| | Republic Services Inc. Class A | 49,761 | 4,792 |
| | Kansas City Southern | 22,221 | 4,536 |
| | Old Dominion Freight Line Inc. | 22,839 | 4,458 |
| | WW Grainger Inc. | 10,667 | 4,356 |
| | Xylem Inc. | 42,643 | 4,341 |
| | Dover Corp. | 34,095 | 4,304 |
| * | Ingersoll Rand Inc. | 87,945 | 4,007 |
| * | United Rentals Inc. | 17,068 | 3,958 |
| | Expeditors International of Washington Inc. | 40,047 | 3,809 |
| | IDEX Corp. | 17,911 | 3,568 |
| * | Teledyne Technologies Inc. | 8,726 | 3,420 |
| | Masco Corp. | 61,908 | 3,401 |
| | Jacobs Engineering Group Inc. | 30,668 | 3,342 |
| | Westinghouse Air Brake Technologies Corp. | 42,328 | 3,098 |
| | CH Robinson Worldwide Inc. | 32,321 | 3,034 |
| * | United Airlines Holdings Inc. | 69,241 | 2,995 |
| | Fortune Brands Home & Security Inc. | 32,869 | 2,818 |
| | JB Hunt Transport Services Inc. | 19,754 | 2,699 |
| | Howmet Aerospace Inc. | 92,332 | 2,635 |
| | Textron Inc. | 54,152 | 2,617 |
| | Allegion plc | 21,775 | 2,534 |
| | Quanta Services Inc. | 32,855 | 2,366 |
| | American Airlines Group Inc. | 144,510 | 2,279 |
| | Snap-on Inc. | 12,828 | 2,195 |
| | Pentair plc | 39,359 | 2,090 |
| | Rollins Inc. | 52,342 | 2,045 |
| | Nielsen Holdings plc | 84,465 | 1,763 |
| | A O Smith Corp. | 32,041 | 1,756 |
| | Robert Half International Inc. | 26,970 | 1,685 |
| | Huntington Ingalls Industries Inc. | 9,581 | 1,633 |
| | Alaska Air Group Inc. | 29,257 | 1,521 |
| | Flowserve Corp. | 30,750 | 1,133 |
| | | | | | | 629,738 |
| Information Technology (27.4%) |
| | Apple Inc. | 3,786,235 | 502,396 |
| | Microsoft Corp. | 1,791,147 | 398,387 |
| | Visa Inc. Class A | 401,711 | 87,866 |
| | NVIDIA Corp. | 146,642 | 76,576 |
| | Mastercard Inc. Class A | 208,413 | 74,391 |
| * | PayPal Holdings Inc. | 277,583 | 65,010 |
| * | Adobe Inc. | 113,651 | 56,839 |
| | Intel Corp. | 970,812 | 48,366 |
| * | salesforce.com Inc. | 216,777 | 48,239 |
| | Cisco Systems Inc. | 1,001,111 | 44,800 |
| | Broadcom Inc. | 95,823 | 41,956 |
| | QUALCOMM Inc. | 267,925 | 40,816 |
| | Accenture plc Class A | 150,091 | 39,205 |
| | Texas Instruments Inc. | 217,416 | 35,685 |
| | Oracle Corp. | 449,396 | 29,071 |
| | International Business Machines Corp. | 211,111 | 26,575 |
| * | Advanced Micro Devices Inc. | 284,933 | 26,131 |
| * | ServiceNow Inc. | 46,224 | 25,443 |
| | Intuit Inc. | 62,253 | 23,647 |
| | Fidelity National Information Services Inc. | 147,010 | 20,796 |
| * | Micron Technology Inc. | 263,717 | 19,826 |
| | Applied Materials Inc. | 216,345 | 18,671 |
| | Automatic Data Processing Inc. | 101,600 | 17,902 |
| | Lam Research Corp. | 34,116 | 16,112 |
| * | Autodesk Inc. | 52,097 | 15,907 |
| * | Fiserv Inc. | 136,217 | 15,510 |
| | Global Payments Inc. | 70,927 | 15,279 |
| | Analog Devices Inc. | 87,531 | 12,931 |
| | Cognizant Technology Solutions Corp. Class A | 126,679 | 10,381 |
| | | | | | Shares | Market
Value•
($000) |
| | KLA Corp. | 36,699 | 9,502 |
| | TE Connectivity Ltd. | 78,383 | 9,490 |
| * | Synopsys Inc. | 36,175 | 9,378 |
| | Amphenol Corp. Class A | 70,902 | 9,272 |
| * | Cadence Design Systems Inc. | 66,110 | 9,019 |
| | Microchip Technology Inc. | 61,711 | 8,523 |
| | Xilinx Inc. | 58,096 | 8,236 |
| | HP Inc. | 325,571 | 8,006 |
| * | ANSYS Inc. | 20,361 | 7,407 |
| | Paychex Inc. | 75,853 | 7,068 |
| | Motorola Solutions Inc. | 40,199 | 6,836 |
| | Corning Inc. | 181,173 | 6,522 |
| | Skyworks Solutions Inc. | 39,395 | 6,023 |
| * | Keysight Technologies Inc. | 43,957 | 5,806 |
| | Maxim Integrated Products Inc. | 63,244 | 5,607 |
| * | FleetCor Technologies Inc. | 19,786 | 5,398 |
| * | Paycom Software Inc. | 11,590 | 5,242 |
| * | VeriSign Inc. | 23,757 | 5,141 |
| * | Zebra Technologies Corp. Class A | 12,654 | 4,863 |
| * | Fortinet Inc. | 31,879 | 4,735 |
| | Teradyne Inc. | 39,290 | 4,711 |
| * | Qorvo Inc. | 26,986 | 4,487 |
| | CDW Corp. | 33,945 | 4,474 |
| | Broadridge Financial Solutions Inc. | 27,355 | 4,191 |
| * | Tyler Technologies Inc. | 9,542 | 4,165 |
| * | Akamai Technologies Inc. | 38,516 | 4,044 |
| | Western Digital Corp. | 71,982 | 3,987 |
| | Citrix Systems Inc. | 29,131 | 3,790 |
| * | Arista Networks Inc. | 12,890 | 3,745 |
| | Hewlett Packard Enterprise Co. | 304,491 | 3,608 |
| | NetApp Inc. | 52,853 | 3,501 |
| * | Gartner Inc. | 21,125 | 3,384 |
| | Leidos Holdings Inc. | 31,652 | 3,327 |
| | Seagate Technology plc | 52,885 | 3,287 |
| | Jack Henry & Associates Inc. | 18,056 | 2,925 |
| | NortonLifeLock Inc. | 140,036 | 2,910 |
| * | F5 Networks Inc. | 14,576 | 2,565 |
| | Western Union Co. | 97,271 | 2,134 |
| * | IPG Photonics Corp. | 8,450 | 1,891 |
| | Juniper Networks Inc. | 78,030 | 1,756 |
| | DXC Technology Co. | 60,199 | 1,550 |
| | FLIR Systems Inc. | 31,031 | 1,360 |
| * | Vontier Corp. | 31,872 | 1,065 |
| | Xerox Holdings Corp. | 39,430 | 914 |
| | | | | | | 2,070,559 |
| Materials (2.6%) |
| | Linde plc | 124,340 | 32,765 |
| | Air Products and Chemicals Inc. | 52,364 | 14,307 |
| | Sherwin-Williams Co. | 19,366 | 14,232 |
| | Ecolab Inc. | 58,835 | 12,730 |
| | DuPont de Nemours Inc. | 173,848 | 12,362 |
| | Newmont Corp. | 190,338 | 11,399 |
| | Dow Inc. | 175,765 | 9,755 |
| | Freeport-McMoRan Inc. | 344,338 | 8,960 |
| | PPG Industries Inc. | 55,985 | 8,074 |
| | Ball Corp. | 77,541 | 7,225 |
| | Corteva Inc. | 176,636 | 6,839 |
| | LyondellBasell Industries NV Class A | 60,998 | 5,591 |
| | Vulcan Materials Co. | 31,451 | 4,665 |
| | International Paper Co. | 93,292 | 4,638 |
| | Amcor plc | 371,068 | 4,367 |
| | Martin Marietta Materials Inc. | 14,733 | 4,184 |
| | Nucor Corp. | 71,439 | 3,800 |
| | Albemarle Corp. | 25,188 | 3,716 |
| | Celanese Corp. Class A | 27,658 | 3,594 |
| | FMC Corp. | 30,700 | 3,528 |
| | Eastman Chemical Co. | 32,053 | 3,214 |
| | Packaging Corp. of America | 22,432 | 3,094 |
| | Avery Dennison Corp. | 19,734 | 3,061 |
| | | | | | Shares | Market
Value•
($000) |
| 1 | International Flavors & Fragrances Inc. | 25,299 | 2,754 |
| | Westrock Co. | 62,290 | 2,712 |
| | CF Industries Holdings Inc. | 50,616 | 1,959 |
| | Mosaic Co. | 81,619 | 1,878 |
| | Sealed Air Corp. | 36,703 | 1,681 |
| | | | | | | 197,084 |
| Real Estate (2.4%) |
| | American Tower Corp. | 105,243 | 23,623 |
| | Prologis Inc. | 175,141 | 17,455 |
| | Crown Castle International Corp. | 102,187 | 16,267 |
| | Equinix Inc. | 21,111 | 15,077 |
| | Digital Realty Trust Inc. | 66,394 | 9,263 |
| | Public Storage | 36,050 | 8,325 |
| | SBA Communications Corp. Class A | 26,343 | 7,432 |
| | Simon Property Group Inc. | 77,754 | 6,631 |
| | Welltower Inc. | 98,969 | 6,395 |
| | Weyerhaeuser Co. | 177,044 | 5,936 |
| | AvalonBay Communities Inc. | 33,124 | 5,314 |
| | Alexandria Real Estate Equities Inc. | 29,296 | 5,221 |
| | Realty Income Corp. | 83,218 | 5,174 |
| * | CBRE Group Inc. Class A | 79,597 | 4,992 |
| | Equity Residential | 81,285 | 4,819 |
| | Ventas Inc. | 88,624 | 4,346 |
| | Healthpeak Properties Inc. | 127,387 | 3,851 |
| | Essex Property Trust Inc. | 15,428 | 3,663 |
| | Extra Space Storage Inc. | 30,577 | 3,543 |
| | Duke Realty Corp. | 88,004 | 3,518 |
| | Mid-America Apartment Communities Inc. | 27,060 | 3,428 |
| | Boston Properties Inc. | 33,515 | 3,168 |
| | UDR Inc. | 69,679 | 2,678 |
| | Host Hotels & Resorts Inc. | 166,884 | 2,441 |
| | Iron Mountain Inc. | 68,186 | 2,010 |
| | Regency Centers Corp. | 37,340 | 1,702 |
| | Kimco Realty Corp. | 102,337 | 1,536 |
| | Federal Realty Investment Trust | 16,290 | 1,387 |
| | Vornado Realty Trust | 37,113 | 1,386 |
| | SL Green Realty Corp. | 17,173 | 1,023 |
| | | | | | | 181,604 |
| Utilities (2.7%) |
| | NextEra Energy Inc. | 464,072 | 35,803 |
| | Duke Energy Corp. | 174,326 | 15,961 |
| | Southern Co. | 250,232 | 15,372 |
| | Dominion Energy Inc. | 193,232 | 14,531 |
| | American Electric Power Co. Inc. | 117,618 | 9,794 |
| | Exelon Corp. | 231,163 | 9,760 |
| | Sempra Energy | 68,366 | 8,710 |
| | Xcel Energy Inc. | 124,541 | 8,303 |
| | Eversource Energy | 81,284 | 7,032 |
| | Public Service Enterprise Group Inc. | 119,941 | 6,992 |
| | WEC Energy Group Inc. | 74,793 | 6,883 |
| | American Water Works Co. Inc. | 42,987 | 6,597 |
| | Consolidated Edison Inc. | 81,151 | 5,865 |
| | Edison International | 89,794 | 5,641 |
| | DTE Energy Co. | 45,921 | 5,575 |
| | PPL Corp. | 182,458 | 5,145 |
| | Entergy Corp. | 47,375 | 4,730 |
| | Ameren Corp. | 58,489 | 4,566 |
| | CMS Energy Corp. | 67,747 | 4,133 |
| | FirstEnergy Corp. | 128,376 | 3,930 |
| | AES Corp. | 157,365 | 3,698 |
| | Alliant Energy Corp. | 59,089 | 3,045 |
| | Evergy Inc. | 53,667 | 2,979 |
| | Atmos Energy Corp. | 29,790 | 2,843 |
| | CenterPoint Energy Inc. | 128,908 | 2,790 |
| | NRG Energy Inc. | 57,782 | 2,170 |
| | Pinnacle West Capital Corp. | 26,641 | 2,130 |
| | | | | | Shares | Market
Value•
($000) |
| | NiSource Inc. | 90,678 | 2,080 |
| | | | | | | 207,058 |
Total Common Stocks
(Cost $4,036,605) | 7,500,252 |
| Temporary Cash Investments (0.7%) |
| Money Market Fund (0.7%) |
| 2,3 | Vanguard Market Liquidity Fund, 0.111% | 486,636 | 48,663 |
| | | | | | Face
Amount
($000) | |
| U.S. Government and Agency Obligations (0.0%) |
| 4 | United States Treasury Bill, 0.097%, 1/5/21 | 1,470 | 1,470 |
| 4 | United States Treasury Bill, 0.095%, 1/28/21 | 1,002 | 1,002 |
| | | | | | | 2,472 |
Total Temporary Cash Investments
(Cost $51,135) | 51,135 |
Total Investments (99.9%)
(Cost $4,087,740) | | 7,551,387 |
| Other Assets and Liabilities—Net (0.1%) | | 3,977 |
| Net Assets (100%) | | 7,555,364 |
| Cost is in $000. |
| • | See Note A in Notes to Financial Statements. |
| * | Non-income-producing security. |
| 1 | Includes partial security positions on loan to broker-dealers. The total value of securities on loan is $2,645,000. |
| 2 | Affiliated money market fund available only to Vanguard funds and certain trusts and accounts managed by Vanguard. Rate shown is the 7-day yield. |
| 3 | Collateral of $2,770,000 was received for securities on loan. |
| 4 | Securities with a value of $2,472,000 have been segregated as initial margin for open futures contracts. |
Derivative Financial Instruments Outstanding as of Period End
| Futures Contracts |
| | | | ($000) |
| | Expiration | Number of
Long (Short)
Contracts | Notional
Amount | Value and
Unrealized
Appreciation
(Depreciation) |
| Long Futures Contracts | | | | |
| E-mini S&P 500 Index | March 2021 | 293 | 54,920 | 1,251 |
See accompanying Notes, which are an integral part of the Financial Statements.
Statement of Assets and Liabilities
| ($000s, except shares and per-share amounts) | Amount |
| Assets | |
| Investments in Securities, at Value | |
| Unaffiliated Issuers (Cost $4,039,077) | 7,502,724 |
| Affiliated Issuers (Cost $48,663) | 48,663 |
| Total Investments in Securities | 7,551,387 |
| Investment in Vanguard | 286 |
| Cash Collateral Pledged—Futures Contracts | 677 |
| Receivables for Accrued Income | 5,572 |
| Receivables for Capital Shares Issued | 806 |
| Variation Margin Receivable—Futures Contracts | 350 |
| Total Assets | 7,559,078 |
| Liabilities | |
| Due to Custodian | 11 |
| Payables for Investment Securities Purchased | 3 |
| Collateral for Securities on Loan | 2,770 |
| Payables for Capital Shares Redeemed | 362 |
| Payables to Vanguard | 568 |
| Total Liabilities | 3,714 |
| Net Assets | 7,555,364 |
| At December 31, 2020, net assets consisted of: | |
| | |
| Paid-in Capital | 3,678,282 |
| Total Distributable Earnings (Loss) | 3,877,082 |
| Net Assets | 7,555,364 |
| | |
| Net Assets | |
Applicable to 140,527,793 outstanding $.001 par value shares of
beneficial interest (unlimited authorization) | 7,555,364 |
| Net Asset Value Per Share | $53.76 |
|
| | Year Ended
December 31, 2020 |
| | ($000) |
| Investment Income | |
| Income | |
| Dividends | 121,672 |
| Interest1 | 163 |
| Securities Lending—Net | 116 |
| Total Income | 121,951 |
| Expenses | |
| The Vanguard Group—Note B | |
| Investment Advisory Services | 978 |
| Management and Administrative | 7,409 |
| Marketing and Distribution | 576 |
| Custodian Fees | 50 |
| Auditing Fees | 72 |
| Shareholders’ Reports | 42 |
| Trustees’ Fees and Expenses | 4 |
| Total Expenses | 9,131 |
| Net Investment Income | 112,820 |
| Realized Net Gain (Loss) | |
| Investment Securities Sold1 | 302,910 |
| Futures Contracts | 8,611 |
| Realized Net Gain (Loss) | 311,521 |
| Change in Unrealized Appreciation (Depreciation) | |
| Investment Securities1 | 748,174 |
| Futures Contracts | 655 |
| Change in Unrealized Appreciation (Depreciation) | 748,829 |
| Net Increase (Decrease) in Net Assets Resulting from Operations | 1,173,170 |
| 1 | Interest income, realized net gain (loss), and change in unrealized appreciation (depreciation) from an affiliated company of the portfolio were $150,000, ($22,000), and $3,000, respectively. Purchases and sales are for temporary cash investment purposes. |
Statement of Changes in Net Assets
|
| | Year Ended December 31, |
| | 2020
($000) | 2019
($000) |
| Increase (Decrease) in Net Assets | | |
| Operations | | |
| Net Investment Income | 112,820 | 107,281 |
| Realized Net Gain (Loss) | 311,521 | 132,104 |
| Change in Unrealized Appreciation (Depreciation) | 748,829 | 1,295,996 |
| Net Increase (Decrease) in Net Assets Resulting from Operations | 1,173,170 | 1,535,381 |
| Distributions1 | | |
| Total Distributions | (242,631) | (247,426) |
| Capital Share Transactions | | |
| Issued | 996,555 | 584,985 |
| Issued in Lieu of Cash Distributions | 242,631 | 247,426 |
| Redeemed | (1,072,379) | (596,018) |
| Net Increase (Decrease) from Capital Share Transactions | 166,807 | 236,393 |
| Total Increase (Decrease) | 1,097,346 | 1,524,348 |
| Net Assets | | |
| Beginning of Period | 6,458,018 | 4,933,670 |
| End of Period | 7,555,364 | 6,458,018 |
| 1 | Certain prior-period numbers have been reclassified to conform with the current-period presentation. |
For a Share Outstanding
Throughout Each Period | Year Ended December 31, |
| 2020 | 2019 | 2018 | 2017 | 2016 |
| Net Asset Value, Beginning of Period | $47.70 | $38.03 | $41.17 | $35.63 | $33.25 |
| Investment Operations | | | | | |
| Net Investment Income | .7981 | .8051 | .8041 | .6991 | .704 |
| Net Realized and Unrealized Gain (Loss) on Investments | 7.014 | 10.791 | (2.556) | 6.734 | 3.055 |
| Total from Investment Operations | 7.812 | 11.596 | (1.752) | 7.433 | 3.759 |
| Distributions | | | | | |
| Dividends from Net Investment Income | (.806) | (.834) | (.703) | (.699) | (.759) |
| Distributions from Realized Capital Gains | (.946) | (1.092) | (.685) | (1.194) | (.620) |
| Total Distributions | (1.752) | (1.926) | (1.388) | (1.893) | (1.379) |
| Net Asset Value, End of Period | $53.76 | $47.70 | $38.03 | $41.17 | $35.63 |
| Total Return | 18.20% | 31.30% | -4.51% | 21.66% | 11.81% |
| Ratios/Supplemental Data | | | | | |
| Net Assets, End of Period (Millions) | $7,555 | $6,458 | $4,934 | $5,178 | $4,329 |
| Ratio of Total Expenses to Average Net Assets | 0.14% | 0.14% | 0.14% | 0.15% | 0.15% |
| Ratio of Net Investment Income to Average Net Assets | 1.73% | 1.87% | 1.94% | 1.85% | 2.08% |
| Portfolio Turnover Rate | 8% | 4% | 5% | 5% | 7% |
| 1 | Calculated based on average shares outstanding. |
See accompanying Notes, which are an integral part of the Financial Statements.
Notes to Financial Statements
The Equity Index Portfolio, a portfolio of Vanguard Variable Insurance Funds, is registered under the Investment Company Act of 1940 as an open-end investment company. The portfolio’s shares are only available for purchase by separate accounts of insurance companies as investments for variable annuity plans, variable life insurance contracts, or other variable benefit insurance contracts. Market disruptions associated with the COVID-19 pandemic have had a global impact, and uncertainty exists as to the long-term implications. Such disruptions can adversely affect assets of the portfolio and thus portfolio performance.
A. The following significant accounting policies conform to generally accepted accounting principles for U.S. investment companies. The portfolio consistently follows such policies in preparing its financial statements.
1. Security Valuation: Securities are valued as of the close of trading on the New York Stock Exchange (generally 4 p.m., Eastern time) on the valuation date. Equity securities are valued at the latest quoted sales prices or official closing prices taken from the primary market in which each security trades; such securities not traded on the valuation date are valued at the mean of the latest quoted bid and asked prices. Securities for which market quotations are not readily available, or whose values have been materially affected by events occurring before the portfolio's pricing time but after the close of the securities’ primary markets, are valued by methods deemed by the board of trustees to represent fair value. Investments in Vanguard Market Liquidity Fund are valued at that fund's net asset value. Temporary cash investments are valued using the latest bid prices or using valuations based on a matrix system (which considers such factors as security prices, yields, maturities, and ratings), both as furnished by independent pricing services.
2. Futures Contracts: The portfolio uses index futures contracts to a limited extent, with the objectives of maintaining full exposure to the stock market, maintaining liquidity, and minimizing transaction costs. The portfolio may purchase futures contracts to immediately invest incoming cash in the market, or sell futures in response to cash outflows, thereby simulating a fully invested position in the underlying index while maintaining a cash balance for liquidity. The primary risks associated with the use of futures contracts are imperfect correlation between changes in market values of stocks held by the portfolio and the prices of futures contracts, and the possibility of an illiquid market. Counterparty risk involving futures is mitigated because a regulated clearinghouse is the counterparty instead of the clearing broker. To further mitigate counterparty risk, the portfolio trades futures contracts on an exchange, monitors the financial strength of its clearing brokers and clearinghouse, and has entered into clearing agreements with its clearing brokers. The clearinghouse imposes initial margin requirements to secure the portfolio’s performance and requires daily settlement of variation margin representing changes in the market value of each contract. Any securities pledged as initial margin for open contracts are noted in the Schedule of Investments.
Futures contracts are valued at their quoted daily settlement prices. The notional amounts of the contracts are not recorded in the Statement of Assets and Liabilities. Fluctuations in the value of the contracts are recorded in the Statement of Assets and Liabilities as an asset (liability) and in the Statement of Operations as unrealized appreciation (depreciation) until the contracts are closed, when they are recorded as realized gains (losses) on futures contracts.
During the year ended December 31, 2020, the portfolio’s average investments in long and short futures contracts represented 1% and 0% of net assets, respectively, based on the average of the notional amounts at each quarter-end during the period.
3. Federal Income Taxes: The portfolio intends to continue to qualify as a regulated investment company and distribute all of its taxable income. The portfolio’s tax returns are open to examination by the relevant tax authorities until expiration of the applicable statute of limitations, which is generally three years after the filing of the tax return. Management has analyzed the portfolio’s tax positions taken for all open federal and state income tax years, and has concluded that no provision for income tax is required in the portfolio’s financial statements.
4. Distributions: Distributions to shareholders are recorded on the ex-dividend date. Distributions are determined on a tax basis at the fiscal year-end and may differ from net investment income and realized capital gains for financial reporting purposes.
5. Securities Lending: To earn additional income, the portfolio lends its securities to qualified institutional borrowers. Security loans are subject to termination by the portfolio at any time, and are required to be secured at all times by collateral in an amount at least equal to the market value of securities loaned. Daily market fluctuations could cause the value of loaned securities to be more or less than the value of the collateral received. When this occurs, the collateral is adjusted and settled before the opening of the market on the next business day. The portfolio further mitigates its counterparty risk by entering into securities lending transactions only with a diverse group of
prequalified counterparties, monitoring their financial strength, and entering into master securities lending agreements with its counterparties. The master securities lending agreements provide that, in the event of a counterparty’s default (including bankruptcy), the portfolio may terminate any loans with that borrower, determine the net amount owed, and sell or retain the collateral up to the net amount owed to the portfolio; however, such actions may be subject to legal proceedings. While collateral mitigates counterparty risk, in the event of a default, the portfolio may experience delays and costs in recovering the securities loaned. The portfolio invests cash collateral received in Vanguard Market Liquidity Fund, and records a liability in the Statement of Assets and Liabilities for the return of the collateral, during the period the securities are on loan. Collateral investments in Vanguard Market Liquidity Fund are subject to market appreciation or depreciation. Securities lending income represents fees charged to borrowers plus income earned on invested cash collateral, less expenses associated with the loan. During the term of the loan, the portfolio is entitled to all distributions made on or in respect of the loaned securities.
6. Credit Facilities and Interfund Lending Program: The portfolio and certain other funds managed by The Vanguard Group ("Vanguard") participate in a $4.3 billion committed credit facility provided by a syndicate of lenders pursuant to a credit agreement and an uncommitted credit facility provided by Vanguard. Both facilities may be renewed annually. Each fund is individually liable for its borrowings, if any, under the credit facilities. Borrowings may be utilized for temporary or emergency purposes, subject to the portfolio’s regulatory and contractual borrowing restrictions. With respect to the committed credit facility, the participating funds are charged administrative fees and an annual commitment fee of 0.10% of the undrawn committed amount of the facility; these fees are allocated to the funds based on a method approved by the portfolio’s board of trustees and included in Management and Administrative expenses on the portfolio’s Statement of Operations. Any borrowings under either facility bear interest at a rate based upon the higher of the one-month London Interbank Offered Rate (or an acceptable alternate rate, if necessary), federal funds effective rate, or overnight bank funding rate plus an agreed-upon spread, except that borrowings under the uncommitted credit facility may bear interest based upon an alternative rate agreed to by the portfolio and Vanguard.
In accordance with an exemptive order (the “Order”) from the SEC, the portfolio may participate in a joint lending and borrowing program that allows registered open-end Vanguard funds to borrow money from and lend money to each other for temporary or emergency purposes (the “Interfund Lending Program”), subject to compliance with the terms and conditions of the Order, and to the extent permitted by the portfolio’s investment objective and investment policies. Interfund loans and borrowings normally extend overnight, but can have a maximum duration of seven days. Loans may be called on one business day’s notice. The interest rate to be charged is governed by the conditions of the Order and internal procedures adopted by the board of trustees. The board of trustees is responsible for overseeing the Interfund Lending Program.
For the year ended December 31, 2020, the portfolio did not utilize the credit facilities or the Interfund Lending Program.
7. Other: Dividend income is recorded on the ex-dividend date. Non-cash dividends included in dividend income, if any, are recorded at the fair value of the securities received. Interest income includes income distributions received from Vanguard Market Liquidity Fund and is accrued daily. Premiums and discounts on debt securities are amortized and accreted, respectively, to interest income over the lives of the respective securities, except for premiums on certain callable debt securities that are amortized to the earliest call date. Security transactions are accounted for on the date securities are bought or sold. Costs used to determine realized gains (losses) on the sale of investment securities are those of the specific securities sold.
B. In accordance with the terms of a Funds’ Service Agreement (the “FSA”) between Vanguard and the portfolio, Vanguard furnishes to the portfolio investment advisory, corporate management, administrative, marketing, and distribution services at Vanguard’s cost of operations (as defined by the FSA). These costs of operations are allocated to the portfolio based on methods and guidelines approved by the board of trustees and are generally settled twice a month.
Upon the request of Vanguard, the portfolio may invest up to 0.40% of its net assets as capital in Vanguard. At December 31, 2020, the portfolio had contributed to Vanguard capital in the amount of $286,000, representing less than 0.01% of the portfolio’s net assets and 0.11% of Vanguard’s capital received pursuant to the FSA. The portfolio’s trustees and officers are also directors and employees, respectively, of Vanguard.
C. Various inputs may be used to determine the value of the portfolio’s investments and derivatives. These inputs are summarized in three broad levels for financial statement purposes. The inputs or methodologies used to value securities are not necessarily an indication of the risk associated with investing in those securities.
Level 1—Quoted prices in active markets for identical securities.
Level 2—Other significant observable inputs (including quoted prices for similar securities, interest rates, prepayment speeds, credit risk, etc.).
Level 3—Significant unobservable inputs (including the portfolio’s own assumptions used to determine the fair value of investments). Any investments and derivatives valued with significant unobservable inputs are noted on the Schedule of Investments.
The following table summarizes the market value of the portfolio's investments and derivatives as of December 31, 2020, based on the inputs used to value them:
| | Level 1
($000) | Level 2
($000) | Level 3
($000) | Total
($000) |
| Investments | | | | |
| Assets | | | | |
| Common Stocks | 7,500,252 | — | — | 7,500,252 |
| Temporary Cash Investments | 48,663 | 2,472 | — | 51,135 |
| Total | 7,548,915 | 2,472 | — | 7,551,387 |
| | | | |
| Derivative Financial Instruments | | | | |
| Assets | | | | |
| Futures Contracts1 | 350 | — | — | 350 |
| 1 | Represents variation margin on the last day of the reporting period. |
D. Permanent differences between book-basis and tax-basis components of net assets, if any, are reclassified among capital accounts in the financial statements to reflect their tax character. These reclassifications have no effect on net assets or net asset value per share.
Temporary differences between book-basis and tax-basis components of total distributable earnings (losses) arise when certain items of income, gain, or loss are recognized in different periods for financial statement and tax purposes; these differences will reverse at some time in the future. The differences are primarily related to the deferral of losses from wash sales; and the recognition of unrealized gains or losses from certain derivative contracts. As of period end, the tax-basis components of total distributable earnings (losses) are detailed in the table as follows:
| | Amount
($000) |
| Undistributed Ordinary Income | 103,290 |
| Undistributed Long-Term Gains | 309,745 |
| Capital Loss Carryforwards | — |
| Qualified Late-Year Losses | — |
| Net Unrealized Gains (Losses) | 3,464,047 |
The tax character of distributions paid was as follows:
| | Year Ended December 31, |
| | 2020
Amount
($000) | 2019
Amount
($000) |
| Ordinary Income* | 115,359 | 107,488 |
| Long-Term Capital Gains | 127,272 | 139,938 |
| Total | 242,631 | 247,426 |
| * | Includes short-term capital gains, if any. |
As of December 31, 2020, gross unrealized appreciation and depreciation for investments and derivatives based on cost for U.S. federal income tax purposes were as follows:
| | Amount
($000) |
| Tax Cost | 4,087,340 |
| Gross Unrealized Appreciation | 3,896,974 |
| Gross Unrealized Depreciation | (432,927) |
| Net Unrealized Appreciation (Depreciation) | 3,464,047 |
E. During the year ended December 31, 2020, the portfolio purchased $559,039,000 of investment securities and sold $528,240,000 of investment securities, other than temporary cash investments.
F. Capital shares issued and redeemed were:
| | Year Ended December 31, | |
| | 2020
Shares
(000) | | 2019
Shares
(000) | |
| | | |
| Issued | 22,103 | | 13,588 | |
| Issued in Lieu of Cash Distributions | 6,753 | | 6,019 | |
| Redeemed | (23,722) | | (13,957) | |
| Net Increase (Decrease) in Shares Outstanding | 5,134 | | 5,650 | |
At December 31, 2020, two shareholders (an insurance company separate account whose holdings in the portfolio represent the indirect investment of Vanguard Variable Annuity contract holders and Total Stock Market Index Portfolio) were each a record or beneficial owner of 25% or more of the portfolio’s net assets, with a combined ownership of 67%. If any of these shareholders were to redeem their investment in the portfolio, the redemption might result in an increase in the portfolio's expense ratio, cause the portfolio to incur higher transaction costs, or lead to the realization of taxable capital gains.
G. Management has determined that no events or transactions occurred subsequent to December 31, 2020, that would require recognition or disclosure in these financial statements.
Report of Independent Registered
Public Accounting Firm
To the Board of Trustees of Vanguard Variable Insurance Funds and Shareholders of Equity Index Portfolio
Opinion on the Financial Statements
We have audited the accompanying statement of assets and liabilities, including the schedule of investments, of Equity Index Portfolio (one of the portfolios constituting Vanguard Variable Insurance Funds, referred to hereafter as the "Portfolio”) as of December 31, 2020, the related statement of operations for the year ended December 31, 2020, the statement of changes in net assets for each of the two years in the period ended December 31, 2020, including the related notes, and the financial highlights for each of the five years in the period ended December 31, 2020 (collectively referred to as the “financial statements”). In our opinion, the financial statements present fairly, in all material respects, the financial position of the Portfolio as of December 31, 2020, the results of its operations for the year then ended, the changes in its net assets for each of the two years in the period ended December 31, 2020 and the financial highlights for each of the five years in the period ended December 31, 2020 in conformity with accounting principles generally accepted in the United States of America.
Basis for Opinion
These financial statements are the responsibility of the Portfolio’s management. Our responsibility is to express an opinion on the Portfolio’s financial statements based on our audits. We are a public accounting firm registered with the Public Company Accounting Oversight Board (United States) (PCAOB) and are required to be independent with respect to the Portfolio in accordance with the U.S. federal securities laws and the applicable rules and regulations of the Securities and Exchange Commission and the PCAOB.
We conducted our audits of these financial statements in accordance with the standards of the PCAOB. Those standards require that we plan and perform the audit to obtain reasonable assurance about whether the financial statements are free of material misstatement, whether due to error or fraud.
Our audits included performing procedures to assess the risks of material misstatement of the financial statements, whether due to error or fraud, and performing procedures that respond to those risks. Such procedures included examining, on a test basis, evidence regarding the amounts and disclosures in the financial statements. Our audits also included evaluating the accounting principles used and significant estimates made by management, as well as evaluating the overall presentation of the financial statements. Our procedures included confirmation of securities owned as of December 31, 2020 by correspondence with the custodian and brokers and by agreement to the underlying ownership records of the transfer agent; when replies were not received from brokers, we performed other auditing procedures. We believe that our audits provide a reasonable basis for our opinion.
/s/PricewaterhouseCoopers LLP
Philadelphia, Pennsylvania
February 18, 2021
We have served as the auditor of one or more investment companies in The Vanguard Group of Funds since 1975.
Special 2020 tax information (unaudited) for corporate shareholders only for Equity Index Portfolio, a portfolio of Vanguard Variable Insurance Funds
This information for the fiscal year ended December 31, 2020, is included pursuant to provisions of the Internal Revenue Code for corporate shareholders only.
The portfolio distributed $127,272,000 as capital gain dividends (20% rate gain distributions) to shareholders during the fiscal year.
For corporate shareholders, 98.5% of investment income (dividend income plus short-term gains, if any) qualifies for the dividends-received deduction.
The S&P 500 Index is a product of S&P Dow Jones Indices LLC, a division of S&P Global, or its affiliates (“SPDJI”), and has been licensed for use by Vanguard. Standard & Poor’s®, and S&P® are registered trademarks of Standard & Poor’s Financial Services LLC, a division of S&P Global (“S&P”) and Dow Jones® is a registered trademark of Dow Jones Trademark Holdings LLC (“Dow Jones”). The trademarks have been licensed to SPDJI and have been sublicensed for use for certain purposes by Vanguard. Vanguard Equity Index Portfolio is not sponsored, endorsed, sold or promoted by SPDJI, Dow Jones, S&P, any of their respective affiliates (collectively, “S&P Dow Jones Indices”). S&P Dow Jones Indices make no representation or warranty, express or implied, to the owners of the Vanguard Equity Index Portfolio or any member of the public regarding the advisability of investing in securities generally or in Vanguard Equity Index Portfolio particularly or the ability of the S&P 500 Index to track general market performance. S&P Dow Jones Indices’ only relationship to Vanguard with respect to the S&P 500 Index is the licensing of the Index and certain trademarks, service marks and/or trade names of S&P Dow Jones Indices and/or its licensors. The S&P 500 Index is determined, composed and calculated by S&P Dow Jones Indices without regard to Vanguard or the Vanguard Equity Index Portfolio. S&P Dow Jones Indices have no obligation to take the needs of Vanguard or the owners of Vanguard Equity Index Portfolio into consideration in determining, composing or calculating the S&P 500 Index. S&P Dow Jones Indices are not responsible for and have not participated in the determination of the prices, and amount of Vanguard Equity Index Portfolio or the timing of the issuance or sale of Vanguard Equity Index Portfolio or in the determination or calculation of the equation by which Vanguard Equity Index Portfolio is to be converted into cash, surrendered or redeemed, as the case may be. S&P Dow Jones Indices have no obligation or liability in connection with the administration, marketing or trading of Vanguard Equity Index Portfolio. There is no assurance that investment products based on the S&P 500 Index will accurately track index performance or provide positive investment returns. S&P Dow Jones Indices LLC is not an investment advisor. Inclusion of a security within an index is not a recommendation by S&P Dow Jones Indices to buy, sell, or hold such security, nor is it considered to be investment advice.
S&P DOW JONES INDICES DOES NOT GUARANTEE THE ADEQUACY, ACCURACY, TIMELINESS AND/OR THE COMPLETENESS OF THE S&P 500 INDEX OR ANY DATA RELATED THERETO OR ANY COMMUNICATION, INCLUDING BUT NOT LIMITED TO, ORAL OR WRITTEN COMMUNICATION (INCLUDING ELECTRONIC COMMUNICATIONS) WITH RESPECT THERETO. S&P DOW JONES INDICES SHALL NOT BE SUBJECT TO ANY DAMAGES OR LIABILITY FOR ANY ERRORS, OMISSIONS, OR DELAYS THEREIN. S&P DOW JONES INDICES MAKE NO EXPRESS OR IMPLIED WARRANTIES, AND EXPRESSLY DISCLAIMS ALL WARRANTIES, OF MERCHANTABILITY OR FITNESS FOR A PARTICULAR PURPOSE OR USE OR AS TO RESULTS TO BE OBTAINED BY VANGUARD, OWNERS OF THE VANGUARD EQUITY INDEX PORTFOLIO, OR ANY OTHER PERSON OR ENTITY FROM THE USE OF THE S&P 500 INDEX OR WITH RESPECT TO ANY DATA RELATED THERETO. WITHOUT LIMITING ANY OF THE FOREGOING, IN NO EVENT WHATSOEVER SHALL S&P DOW JONES INDICES BE LIABLE FOR ANY INDIRECT, SPECIAL, INCIDENTAL, PUNITIVE, OR CONSEQUENTIAL DAMAGES INCLUDING BUT NOT LIMITED TO, LOSS OF PROFITS, TRADING LOSSES, LOST TIME OR GOODWILL, EVEN IF THEY HAVE BEEN ADVISED OF THE POSSIBILITY OF SUCH DAMAGES, WHETHER IN CONTRACT, TORT, STRICT LIABILITY, OR OTHERWISE. THERE ARE NO THIRD PARTY BENEFICIARIES OF ANY AGREEMENTS OR ARRANGEMENTS BETWEEN S&P DOW JONES INDICES AND VANGUARD, OTHER THAN THE LICENSORS OF S&P DOW JONES INDICES.
This page intentionally left blank.
The People Who Govern Your Fund
The trustees of your mutual fund are there to see that the fund is operated and managed in your best interests since, as a shareholder, you are a part owner of the fund. Your fund’s trustees also serve on the board of directors of The Vanguard Group, Inc., which is owned by the Vanguard funds and provides services to them.
A majority of Vanguard’s board members are independent, meaning that they have no affiliation with Vanguard or the funds they oversee, apart from the sizable personal investments they have made as private individuals. The independent board members have distinguished backgrounds in business, academia, and public service. Each of the trustees and executive officers oversees 211 Vanguard funds.
Information for each trustee and executive officer of the fund appears below. That information, as well as the Vanguard fund count, is as of the date on the cover of this fund report. The mailing address of the trustees and officers is P.O. Box 876, Valley Forge, PA 19482. More information about the trustees is in the Statement of Additional Information, which can be obtained, without charge, by contacting Vanguard at 800-662-7447, or online at vanguard.com.
Interested Trustee1
Mortimer J. Buckley
Born in 1969. Trustee since January 2018. Principal occupation(s) during the past five years and other experience: chairman of the board (2019–present) of Vanguard and of each of the investment companies served by Vanguard; chief executive officer (2018–present) of Vanguard; chief executive officer, president, and trustee (2018–present) of each of the investment companies served by Vanguard; president and director (2017–present) of Vanguard; and president (2018–present) of Vanguard Marketing Corporation. Chief investment officer (2013–2017), managing director (2002–2017), head of the Retail Investor Group (2006–2012), and chief information officer (2001–2006) of Vanguard. Chairman of the board (2011–2017) and trustee (2009–2017) of the Children’s Hospital of Philadelphia; and trustee (2018–present) and vice chair (2019–present) of The Shipley School.
Independent Trustees
Emerson U. Fullwood
Born in 1948. Trustee since January 2008. Principal occupation(s) during the past five years and other experience: executive chief staff and marketing officer for North America and corporate vice president (retired 2008) of Xerox Corporation (document management products and services). Former president of the Worldwide Channels Group, Latin America, and Worldwide Customer Service and executive chief staff officer of Developing Markets of Xerox. Executive in residence and 2009–2010 Distinguished Minett Professor at the Rochester Institute of Technology. Director of SPX FLOW, Inc. (multi-industry manufacturing). Director of the University of Rochester Medical Center, the Monroe Community College Foundation, the United Way of Rochester, North Carolina A&T University, and Roberts Wesleyan College. Trustee of the University of Rochester.
Amy Gutmann
Born in 1949. Trustee since June 2006. Principal occupation(s) during the past five years and other experience: president (2004–present) of the University of Pennsylvania. Christopher H. Browne Distinguished Professor of Political Science, School of Arts and Sciences, and professor of communication, Annenberg School for Communication, with secondary faculty appointments in the Department of Philosophy, School of Arts and Sciences, and at the Graduate School of Education, University of Pennsylvania.
F. Joseph Loughrey
Born in 1949. Trustee since October 2009. Principal occupation(s) during the past five years and other experience: president and chief operating officer (retired 2009) and vice chairman of the board (2008–2009) of Cummins Inc. (industrial machinery). Chairman of the board of Hillenbrand, Inc. (specialized consumer services) and the Lumina Foundation. Director of the V Foundation. Member of the advisory council for the College of Arts and Letters and chair of the advisory board to the Kellogg Institute for International Studies, both at the University of Notre Dame.
Mark Loughridge
Born in 1953. Trustee since March 2012. Principal occupation(s) during the past five years and other experience: senior vice president and chief financial officer (retired 2013) of IBM (information technology services). Fiduciary member of IBM’s Retirement Plan Committee (2004–2013), senior vice president and general manager (2002–2004) of IBM Global Financing, vice president and controller (1998–2002) of
IBM, and a variety of other prior management roles at IBM. Member of the Council on Chicago Booth.
Scott C. Malpass
Born in 1962. Trustee since March 2012. Principal occupation(s) during the past five years and other experience: chief investment officer (retired June 2020) and vice president (retired June 2020) of the University of Notre Dame. Assistant professor of finance at the Mendoza College of Business, University of Notre Dame, and member of the Notre Dame 403(b) Investment Committee (retired June 2020). Member of the board of Catholic Investment Services, Inc. (investment advisors) and the board of superintendence of the Institute for the Works of Religion.
Deanna Mulligan
Born in 1963. Trustee since January 2018. Principal occupation(s) during the past five years and other experience: board chair (2020–present), chief executive officer (2011–2020), and president (2010–2019) of The Guardian Life Insurance Company of America. Chief operating officer (2010–2011) and executive vice president (2008–2010) of the individual life and disability division of Guardian Life. Member of the board of the American Council of Life Insurers and the board of the Economic Club of New York. Trustee of the Partnership for New York City (business leadership), Chief Executives for Corporate Purpose, NewYork-Presbyterian Hospital, Catalyst, and the Bruce Museum (arts and science). Member of the Advisory Council for the Stanford Graduate School of Business.
André F. Perold
Born in 1952. Trustee since December 2004. Principal occupation(s) during the past five years and other experience: George Gund Professor of Finance and Banking, Emeritus at the Harvard Business School (retired 2011). Chief investment officer and co-managing partner of HighVista Strategies (private investment firm). Member of the board of advisors and member of the investment committee of the Museum of Fine Arts Boston. Member of the board (2018–present) of RIT Capital Partners (investment firm). Member of the investment committee of Partners Health Care System.
Sarah Bloom Raskin
Born in 1961. Trustee since January 2018. Principal occupation(s) during the past five years and other experience: deputy secretary (2014–2017) of the United States Department of the Treasury. Governor (2010–2014) of the Federal Reserve Board. Commissioner (2007–2010) of financial regulation for the State of Maryland. Member of the board of directors (2012–2014) of Neighborhood Reinvestment Corporation. Director (2017–present) of i(x) Investments, LLC; director (2017–present) of Reserve Trust. Rubenstein Fellow (2017–present) of Duke University; trustee (2017–present) of Amherst College, and trustee (2019–present) of the Folger Shakespeare Library.
Peter F. Volanakis
Born in 1955. Trustee since July 2009. Principal occupation(s) during the past five years and other experience: president and chief operating officer (retired 2010) of Corning Incorporated (communications equipment) and director of Corning Incorporated (2000–2010) and Dow Corning (2001–2010). Director (2012) of SPX Corporation (multi-industry manufacturing). Overseer of the Amos Tuck School of Business Administration, Dartmouth College (2001–2013). Chairman of the board of trustees of Colby-Sawyer College. Member of the board of Hypertherm Inc. (industrial cutting systems, software, and consumables).
1 Mr. Buckley is considered “interested person,” as defined in the Investment Company Act of 1940, because he is an officer of the Vanguard funds.
Executive Officers
John Bendl
Born in 1970. Principal occupation(s) during the past five years and other experience: principal of Vanguard. Chief financial officer (2019–present) of each of the investment companies served by Vanguard. Chief accounting officer, treasurer, and controller of Vanguard (2017–present). Partner (2003–2016) at KPMG (audit, tax, and advisory services).
Christine M. Buchanan
Born in 1970. Principal occupation(s) during the past five years and other experience: principal of Vanguard. Treasurer (2017–present) of each of the investment companies served by Vanguard. Partner (2005–2017) at KPMG (audit, tax, and advisory services).
David Cermak
Born in 1960. Principal occupation(s) during the past five years and other experience: principal of Vanguard. Finance director (2019–present) of each of the investment companies served by Vanguard. Managing director and head (2017–present) of Vanguard Investments Singapore. Managing director and head (2017–2019) of Vanguard Investments Hong Kong. Representative director and head (2014–2017) of Vanguard Investments Japan.
John Galloway
Born in 1973. Principal occupation(s) during the past five years and other experience: principal of Vanguard. Investment stewardship officer (September 2020–present) of each of the investment companies served by Vanguard. Head of Investor Advocacy (February 2020–present) and head of Marketing Strategy and Planning (2017–2020) at Vanguard. Deputy assistant to the President of the United States (2015).
Thomas J. Higgins
Born in 1957. Principal occupation(s) during the past five years and other experience: principal of Vanguard. Finance director (2019–present), chief financial officer (2008–2019), and treasurer (1998–2008) of each of the investment companies served by Vanguard.
Peter Mahoney
Born in 1974. Principal occupation(s) during the past five years and other experience: principal of Vanguard. Controller (2015–present) of each of the investment companies served by Vanguard. Head of International Fund Services (2008–2014) at Vanguard.
Anne E. Robinson
Born in 1970. Principal occupation(s) during the past five years and other experience: general counsel (2016–present) of Vanguard. Secretary (2016–present) of Vanguard and of each of the investment companies served by Vanguard. Managing director (2016–present) of Vanguard. Managing director and general counsel of Global Cards and Consumer Services (2014–2016) at Citigroup. Counsel (2003–2014) at American Express.
Michael Rollings
Born in 1963. Principal occupation(s) during the past five years and other experience: finance director (2017–present) and treasurer (2017) of each of the investment companies served by Vanguard. Managing director (2016–present) of Vanguard. Chief financial officer (2016–present) of Vanguard. Director (2016–present) of Vanguard Marketing Corporation. Executive vice president and chief financial officer (2006–2016) of MassMutual Financial Group.
John E. Schadl
Born in 1972. Principal occupation(s) during the past five years and other experience: principal of Vanguard. Chief compliance officer (2019–present) of Vanguard and of each of the investment companies served by Vanguard. Assistant vice president (2019–present) of Vanguard Marketing Corporation.
Vanguard Senior Management Team
| Joseph Brennan | James M. Norris |
| Mortimer J. Buckley | Thomas M. Rampulla |
| Gregory Davis | Karin A. Risi |
| John James | Anne E. Robinson |
| John T. Marcante | Michael Rollings |
| Chris D. McIsaac | Lauren Valente |
Connect with Vanguard®>vanguard.com
Fund Information > 800-662-7447
Direct Investor Account Services > 800-662-2739
Institutional Investor Services > 800-523-1036
Text Telephone for People
Who Are Deaf or Hard of Hearing > 800-749-7273
This material may be used in conjunction with the offering of shares of any Vanguard fund only if preceded or accompanied by the fund’s current prospectus.
All comparative mutual fund data are from Lipper, a Thomson Reuters Company, or Morningstar, Inc., unless otherwise noted.
You can obtain a free copy of Vanguard’s proxy voting guidelines by visiting vanguard.com/proxyreporting or by calling Vanguard at 800-662-2739. The guidelines are also available from the SEC’s website, www.sec.gov. In addition, you may obtain a free report on how your fund voted the proxies for securities it owned during the 12 months ended June 30. To get the report, visit either vanguard.com/proxyreporting or www.sec.gov.
You can review information about your portfolio on the SEC’s website, and you can receive copies of this information, for a fee, by sending a request via email addressed to publicinfo@sec.gov.
Source for Bloomberg Barclays indexes: Bloomberg Index Services Limited. Copyright 2021, Bloomberg. All rights reserved.
CFA® is a registered trademark owned by CFA Institute.
© 2021 The Vanguard Group, Inc.
All rights reserved.
Vanguard Marketing Corporation, Distributor.
Q690EQUX 022021
| |
| |
| |
| |
| Annual Report | December 31, 2020 |
| |
| |
| Vanguard Variable Insurance Funds |
|
| |
| |
| |
| |
| |
| |
| |
| |
| |
| |
| |
| Global Bond Index Portfolio |
| (with underlying Total Bond Market Index Portfolio) |
|
| |
|
| |
| |
| |
| |
| |
| |
| |
| |
| |
| |
| |
| |
| |
| |
| |
| |
| |
| |
| |
| |
| |
| |
| |
| |
| |
| |
| |
| |
| |
| |
| |
| |
| |
| |
| |
| |
Contents
| Global Bond Index Portfolio | |
| (with underlying Total Bond Market Index Portfolio) | 1 |
Please note: The opinions expressed in this report are just that—informed opinions. They should not be considered promises or advice. Also, please keep in mind that the information and opinions cover the period through the date on the front of this report. Of course, the risks of investing in your portfolio are spelled out in the prospectus.
Global Bond Index Portfolio
Your Portfolio’s Performance at a Glance
• For the 12 months ended December 31, 2020, the Global Bond Index Portfolio returned 6.67%. It performed in line with the 6.85% return of its benchmark, the Global Bond Composite Index, after factoring in expenses.
• The emergence of COVID-19 in early 2020 turned into a global health crisis, and aggressive attempts to contain it resulted in a sharp downturn in economic activity. Unemployment spiked, and sectors where social distancing isn’t possible were hit hard. Policymakers were quick to provide robust fiscal and monetary stimulus to blunt the pandemic’s economic impact. Many central banks slashed short-term interest rates and expanded or extended asset-purchase programs. Bond prices rose and yields declined.
• U.S. bonds, which make up about 70% of the benchmark, returned almost 8%. Japanese bonds returned less than 1%, French bonds about 5%, and German bonds about 4%, and both U.K. and Italian bonds returned about 9%. Lower-quality bonds outperformed their higher-quality counterparts.
• Please note that the portfolio’s returns are different from those in Vanguard Variable Annuity (and other plans that invest in the portfolio), which take into account insurance-related expenses.
Market Barometer
| | | Average Annual Total Returns |
| | | Periods Ended December 31, 2020 |
| | One Year | Three Years | Five Years |
| Stocks | | | |
| Russell 1000 Index (Large-caps) | 20.96% | 14.82% | 15.60% |
| Russell 2000 Index (Small-caps) | 19.96 | 10.25 | 13.26 |
| Russell 3000 Index (Broad U.S. market) | 20.89 | 14.49 | 15.43 |
| FTSE All-World ex US Index (International) | 11.22 | 5.18 | 9.16 |
| | | | |
| Bonds | | | |
| Bloomberg Barclays U.S. Aggregate Bond Index | | | |
| (Broad taxable market) | 7.51% | 5.34% | 4.44% |
| Bloomberg Barclays Municipal Bond Index | | | |
| (Broad tax-exempt market) | 5.21 | 4.64 | 3.91 |
| FTSE Three-Month U.S. Treasury Bill Index | 0.58 | 1.56 | 1.16 |
| | | | |
| CPI | | | |
| Consumer Price Index | 1.36% | 1.85% | 1.95% |
Global Bond Index Portfolio
About Your Portfolio’s Expenses
As a shareholder of the portfolio, you incur ongoing costs, which include costs for portfolio management, administrative services, and shareholder reports (like this one), among others. Operating expenses, which are deducted from a portfolio’s gross income, directly reduce the investment return of the portfolio.
A typical portfolio’s expenses are expressed as a percentage of its average net assets. The Global Bond Index Portfolio has no direct expenses, but bears its proportionate share of the expenses of the underlying funds in which it invests. These indirect expenses make up the acquired fund fees and expenses, also expressed as a percentage of average net assets. The following examples are intended to help you understand the ongoing costs (in dollars) of investing in your portfolio and to compare these costs with those of other mutual funds. The examples are based on an investment of $1,000 made at the beginning of the period shown and held for the entire period. The costs were calculated using the acquired fund fees and expenses for the Global Bond Index Portfolio.
The accompanying table illustrates your portfolio’s costs in two ways:
• Based on actual portfolio return. This section helps you to estimate the actual expenses that you paid over the period. The “Ending Account Value” shown is derived from the portfolio’s actual return, and the third column shows the dollar amount that would have been paid by an investor who started with $1,000 in the portfolio. You may use the information here, together with the amount you invested, to estimate the expenses that you paid over the period.
To do so, simply divide your account value by $1,000 (for example, an $8,600 account value divided by $1,000 = 8.6), then multiply the result by the number given for your portfolio under the heading “Expenses Paid During Period.”
• Based on hypothetical 5% yearly return. This section is intended to help you compare your portfolio’s costs with those of other mutual funds. It assumes that the portfolio had a yearly return of 5% before expenses, but that the expense ratio is unchanged. In this case—because the return used is not the portfolio’s actual return—the results do not apply to your investment. The example is useful in making comparisons because the Securities and Exchange Commission requires all mutual funds to calculate expenses based on a 5% return. You can assess your portfolio’s costs by comparing this hypothetical example with the hypothetical examples that appear in shareholder reports of other funds.
Note that the expenses shown in the table are meant to highlight and help you compare ongoing costs only. The portfolio’s expense figure does not reflect additional fees and expenses associated with the annuity or life insurance program through which you invest.
The calculations assume no shares were bought or sold during the period. Your actual costs may have been higher or lower, depending on the amount of your investment and the timing of any purchases or redemptions.
You can find more information about the portfolio’s expenses in the Financial Statements section. For additional information on operating expenses and other shareholder costs, please refer to the prospectus.
Six Months Ended December 31, 2020
| | Beginning | Ending | Expenses |
| | Account Value | Account Value | Paid During |
| Global Bond Index Portfolio | 6/30/2020 | 12/31/2020 | Period |
| Based on Actual Portfolio Return | $1,000.00 | $1,015.41 | $0.66 |
| Based on Hypothetical 5% Yearly Return | 1,000.00 | 1,024.48 | 0.66 |
The calculations are based on expenses incurred in the most recent six-month period. The portfolio’s annualized six-month expense ratio for that period is 0.13%. The dollar amounts shown as “Expenses Paid” are equal to the annualized expense ratio multiplied by the average account value over the period, multiplied by the number of days in the most recent six-month period, then divided by the number of days in the most recent 12-month period (184/366).
Global Bond Index Portfolio
Performance Summary
All of the returns in this report represent past performance, which is not a guarantee of future results that may be achieved by the portfolio. (Current performance may be lower or higher than the performance data cited. For performance data current to the most recent month-end, visit our website at vanguard.com/performance.) Note, too, that both investment returns and principal value can fluctuate widely, so an investor’s shares, when sold, could be worth more or less than their original cost. The returns shown do not reflect taxes that a shareholder would pay on portfolio distributions or on the sale of portfolio shares. Nor do the returns reflect fees and expenses associated with the annuity or life insurance program through which a shareholder invests. If these fees and expenses were included, the portfolio’s returns would be lower.
Cumulative Performance: September 7, 2017–December 31, 2020
Initial Investment of $10,000
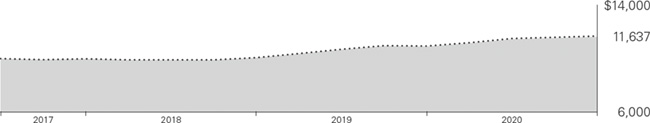
| | | Average Annual Total Returns | |
| | | Periods Ended December 31, 2020 | |
| | | | Since | Final Value | |
| | | One | Inception | of a $10,000 | |
| | | Year | (9/7/2017) | Investment | |
 | Global Bond Index Portfolio | 6.67% | 4.68% | $11,637 | |
 | Global Bond Composite Index | 6.85 | 4.83 | 11,692 | |
Global Bond Composite Index: Weighted 70% Bloomberg Barclays U.S. Aggregate Float Adjusted Index and 30% Bloomberg Barclays Global Aggregate ex-USD Float Adjusted RIC Capped Index (USD Hedged).
“Since Inception” performance is calculated from the portfolio’s inception date for both the portfolio and its comparative standard(s).
See Financial Highlights for dividend and capital gains information.
Global Bond Index Portfolio
Underlying Vanguard Funds
As of December 31, 2020
| Vanguard Variable Insurance Funds | |
| Total Bond Market Index Portfolio | 70.0% |
| Vanguard Total International Bond | |
| Index Fund Admiral Shares | 30.0 |
The table reflects the portfolio’s investments, except for short-term investments.
Global Bond Index Portfolio
Financial Statements
Schedule of Investments
As of December 31, 2020
The portfolio files its complete schedule of portfolio holdings with the Securities and Exchange Commission (SEC) for the first and third quarters of each fiscal year as an exhibit to its reports on Form N-PORT. The portfolio’s Form N-PORT reports are available on the SEC’s website at www.sec.gov.
| | | Market |
| | | Value• |
| | Shares | ($000) |
| Investment Companies (100.1%) | | |
| U.S. Bond Fund (70.1%) | | |
| Vanguard Variable Insurance Funds—Total Bond Market Index Portfolio | 23,940,955 | 306,684 |
| | | |
| International Bond Fund (30.0%) | | |
| Vanguard Total International Bond Index Fund Admiral Shares | 5,614,927 | 131,333 |
| Total Investment Companies (Cost $418,800) | | 438,017 |
| Temporary Cash Investment (0.1%) | | |
| Money Market Fund (0.1%) | | |
| 1 Vanguard Market Liquidity Fund, 0.111% (Cost $323) | 3,231 | 323 |
| Total Investments (100.2%) (Cost $419,123) | | 438,340 |
| Other Assets and Liabilities—Net (-0.2%) | | (693) |
| Net Assets (100%) | | 437,647 |
Cost is in $000.
• See Note A in Notes to Financial Statements.
1 Affiliated money market fund available only to Vanguard funds and certain trusts and accounts managed by Vanguard. Rate shown is the 7-day yield.
See accompanying Notes, which are an integral part of the Financial Statements.
Global Bond Index Portfolio
Statement of Assets and Liabilities
As of December 31, 2020
| ($000s, except shares and per-share amounts) | Amount |
| Assets | |
| Investments in Securities, at Value—Affiliated Funds (Cost $419,123) | 438,340 |
| Receivables for Capital Shares Issued | 106 |
| Total Assets | 438,446 |
| Liabilities | |
| Payables for Investment Securities Purchased | 323 |
| Payables for Capital Shares Redeemed | 476 |
| Total Liabilities | 799 |
| Net Assets | 437,647 |
| | |
| At December 31, 2020, net assets consisted of: | |
| | |
| Paid-in Capital | 405,065 |
| Total Distributable Earnings (Loss) | 32,582 |
| Net Assets | 437,647 |
| | |
| Net Assets | |
| Applicable to 19,537,245 outstanding $.001 par value shares of beneficial interest (unlimited authorization) | 437,647 |
| Net Asset Value Per Share | $22.40 |
See accompanying Notes, which are an integral part of the Financial Statements.
Global Bond Index Portfolio
Statement of Operations
| | Year Ended |
| | December 31, 2020 |
| | ($000) |
| Investment Income | |
| Income | |
| Income Distributions Received from | |
| Affiliated Funds | 8,049 |
| Net Investment Income—Note B | 8,049 |
| Realized Net Gain (Loss) | |
| Capital Gain Distributions Received | |
| from Affiliated Funds | 200 |
| Affiliated Funds Sold | 5,667 |
| Realized Net Gain (Loss) | 5,867 |
| Change in Unrealized Appreciation (Depreciation) from Affiliated Funds | 10,779 |
| Net Increase (Decrease) in Net Assets Resulting from Operations | 24,695 |
Statement of Changes in Net Assets
| | Year Ended December 31, |
| | 2020 | 2019 |
| | ($000) | ($000) |
| Increase (Decrease) in Net Assets | | |
| Operations | | |
| Net Investment Income | 8,049 | 5,652 |
| Realized Net Gain (Loss) | 5,867 | 1,481 |
| Change in Unrealized Appreciation (Depreciation) | 10,779 | 9,127 |
| Net Increase (Decrease) in Net Assets Resulting from Operations | 24,695 | 16,260 |
| Distributions1 | | |
| Total Distributions | (7,540) | (3,058) |
| Capital Share Transactions | | |
| Issued | 267,805 | 90,552 |
| Issued in Lieu of Cash Distributions | 7,540 | 3,058 |
| Redeemed | (86,908) | (37,595) |
| Net Increase (Decrease) from Capital Share Transactions | 188,437 | 56,015 |
| Total Increase (Decrease) | 205,592 | 69,217 |
| Net Assets | | |
| Beginning of Period | 232,055 | 162,838 |
| End of Period | 437,647 | 232,055 |
1 Certain prior-period numbers have been reclassified to conform with the current-period presentation.
See accompanying Notes, which are an integral part of the Financial Statements.
Global Bond Index Portfolio
Financial Highlights
| | | | | Sept. 7, | |
| | Year Ended December 31, | 20171 to | |
| | Dec. 31, | |
| For a Share Outstanding Throughout Each Period | 2020 | 2019 | 2018 | 2017 | |
| Net Asset Value, Beginning of Period | $21.41 | $20.07 | $19.97 | $20.00 | |
| Investment Operations | | | | | |
| Net Investment Income2 | .437 | .571 | .462 | .164 | |
| Capital Gain Distributions Received2 | .011 | — | .020 | — | |
| Net Realized and Unrealized Gain (Loss) on Investments | .962 | 1.100 | (.327) | (.194) | |
| Total from Investment Operations | 1.410 | 1.671 | .155 | (.030) | |
| Distributions | | | | | |
| Dividends from Net Investment Income | (.338) | (.306) | (.051) | — | |
| Distributions from Realized Capital Gains | (.082) | (.025) | (.004) | — | |
| Total Distributions | (.420) | (.331) | (.055) | — | |
| Net Asset Value, End of Period | $22.40 | $21.41 | $20.07 | $19.97 | |
| | | | | | |
| Total Return | 6.67% | 8.41% | 0.78% | -0.15% | |
| | | | | | |
| Ratios/Supplemental Data | | | | | |
| Net Assets, End of Period (Millions) | $438 | $232 | $163 | $55 | |
| Ratio of Total Expenses to Average Net Assets | — | — | — | — | |
| Acquired Fund Fees and Expenses | 0.13% | 0.13% | 0.13% | 0.14%3 | |
| Ratio of Net Investment Income to Average Net Assets | 1.98% | 2.73% | 2.34% | 2.59%3 | |
| Portfolio Turnover Rate | 16% | 12% | 10% | 8% | |
| 2 | Calculated based on average shares outstanding. |
See accompanying Notes, which are an integral part of the Financial Statements.
Global Bond Index Portfolio
Notes to Financial Statements
The Global Bond Index Portfolio, a portfolio of Vanguard Variable Insurance Funds, is registered under the Investment Company Act of 1940 as an open-end investment company. The portfolio seeks to match the return of its target index by investing in selected Vanguard funds and portfolios. The portfolio invests a substantial amount of its assets in Vanguard Variable Insurance Funds Total Bond Market Index Portfolio. The accompanying financial statements of Vanguard Variable Insurance Funds Total Bond Market Index Portfolio should be read in conjunction with the financial statements of the portfolio. Financial statements and other information about each underlying fund and portfolio are available at www.vanguard.com. The portfolio’s shares are only available for purchase by separate accounts of insurance companies as investments for variable annuity plans, variable life insurance contracts, or other variable benefit insurance contracts.
Market disruptions associated with the COVID-19 pandemic have had a global impact, and uncertainty exists as to the long-term implications. Such disruptions can adversely affect assets of the portfolio and thus portfolio performance.
A. The following significant accounting policies conform to generally accepted accounting principles for U.S. investment companies. The portfolio consistently follows such policies in preparing its financial statements.
1. Security Valuation: Investments are valued at the net asset value of each underlying Vanguard fund determined as of the close of the New York Stock Exchange (generally 4 p.m., Eastern time) on the valuation date.
2. Federal Income Taxes: The portfolio intends to continue to qualify as a regulated investment company and distribute all of its taxable income. The portfolio’s tax returns are open to examination by the relevant tax authorities until expiration of the applicable statute of limitations, which is generally three years after the filing of the tax return. Management has analyzed the portfolio’s tax positions taken for all open federal and state income tax years, and has concluded that no provision for income tax is required in the portfolio’s financial statements.
3. Distributions: Distributions to shareholders are recorded on the ex-dividend date. Distributions are determined on a tax basis at the fiscal year-end and may differ from net investment income and realized capital gains for financial reporting purposes.
4. Credit Facilities and Interfund Lending Program: The portfolio and certain other funds managed by The Vanguard Group (“Vanguard”) participate in a $4.3 billion committed credit facility provided by a syndicate of lenders pursuant to a credit agreement and an uncommitted credit facility provided by Vanguard. Both facilities may be renewed annually. Each fund is individually liable for its borrowings, if any, under the credit facilities. Borrowings may be utilized for temporary or emergency purposes, subject to the portfolio’s regulatory and contractual borrowing restrictions. With respect to the committed credit facility, the participating funds are charged administrative fees and an annual commitment fee of 0.10% of the undrawn committed amount of the facility; these fees are allocated to the funds based on a method approved by the portfolio’s board of trustees and borne by the funds in which the portfolio invests (see Note B). Any borrowings under either facility bear interest at a rate based upon the higher of the one-month London Interbank Offered Rate (or an acceptable alternate rate, if necessary), federal funds effective rate, or overnight bank funding rate plus an agreed-upon spread, except that borrowings under the uncommitted credit facility may bear interest based upon an alternative rate agreed to by the portfolio and Vanguard.
In accordance with an exemptive order (the “Order”) from the SEC, the portfolio may participate in a joint lending and borrowing program that allows registered open-end Vanguard funds to borrow money from and lend money to each other for temporary or emergency purposes (the “Interfund Lending Program”), subject to compliance with the terms and conditions of the Order, and to the extent permitted by the portfolio’s investment objective and investment policies. Interfund loans and borrowings normally extend overnight, but can have a maximum duration of seven days. Loans may be called on one business day’s notice. The interest rate to be charged is governed by the conditions of the Order and internal procedures adopted by the board of trustees. The board of trustees is responsible for overseeing the Interfund Lending Program.
For the year ended December 31, 2020, the portfolio did not utilize the credit facilities or the Interfund Lending Program.
5. Other: Income and capital gain distributions received are recorded on the ex-dividend date. Security transactions are accounted for on the date securities are bought or sold. Costs used to determine realized gains (losses) on the sale of investment securities are those of the specific securities sold.
Global Bond Index Portfolio
B. In accordance with the terms of a Funds’ Service Agreement (the “FSA”) between Vanguard and the portfolio, Vanguard furnishes to the portfolio investment advisory, corporate management, administrative, marketing, and distribution services at Vanguard’s cost of operations (as defined by the FSA). These costs of operations are allocated to the portfolio based on methods and guidelines approved by the board of trustees. The FSA provides that expenses otherwise allocable to Vanguard funds-of-funds may be reduced or eliminated to the extent of savings realized by the underlying Vanguard funds by virtue of being part of a fund-of-funds. Accordingly, all expenses for services provided by Vanguard to the portfolio and all other expenses incurred by the portfolio during the period ended December 31, 2020, were borne by the underlying Vanguard funds in which the portfolio invests. The portfolio’s trustees and officers are also trustees and officers, respectively, of the underlying Vanguard funds, as well as directors and employees, respectively, of Vanguard.
C. Various inputs may be used to determine the value of the portfolio’s investments. These inputs are summarized in three broad levels for financial statement purposes. The inputs or methodologies used to value securities are not necessarily an indication of the risk associated with investing in those securities.
Level 1—Quoted prices in active markets for identical securities.
Level 2—Other significant observable inputs (including quoted prices for similar securities, interest rates, prepayment speeds, credit risk, etc.).
Level 3—Significant unobservable inputs (including the portfolio’s own assumptions used to determine the fair value of investments). Any investments valued with significant unobservable inputs are noted on the Schedule of Investments.
At December 31, 2020, 100% of the market value of the portfolio’s investments was determined based on Level 1 inputs.
D. Permanent differences between book-basis and tax-basis components of net assets, if any, are reclassified among capital accounts in the financial statements to reflect their tax character. These reclassifications have no effect on net assets or net asset value per share.
Temporary differences between book-basis and tax-basis components of total distributable earnings (loss) arise when certain items of income, gain, or loss are recognized in different periods for financial statement and tax purposes; these differences will reverse at some time in the future. The differences are primarily related to the deferral of losses from wash sales. As of period end, the tax-basis components of total distributable earnings (loss) are detailed in the table as follows:
| | Amount |
| | ($000) |
| Undistributed Ordinary Income | 7,498 |
| Undistributed Long-Term Gains | 5,867 |
| Capital Loss Carryforwards | — |
| Qualified Late-Year Losses | — |
| Net Unrealized Gains (Losses) | 19,217 |
The tax character of distributions paid was as follows:
| | Year Ended December 31, |
| | 2020 | 2019 |
| | Amount | Amount |
| | ($000) | ($000) |
| Ordinary Income* | 6,476 | 2,939 |
| Long-Term Capital Gains | 1,064 | 119 |
| Total | 7,540 | 3,058 |
* Includes short-term capital gains, if any.
As of December 31, 2020, gross unrealized appreciation and depreciation for investments based on cost for U.S. federal income tax purposes were as follows:
| | Amount |
| | ($000) |
| Tax Cost | 419,123 |
| Gross Unrealized Appreciation | 19,239 |
| Gross Unrealized Depreciation | (22) |
| Net Unrealized Appreciation (Depreciation) | 19,217 |
Global Bond Index Portfolio
E. Capital shares issued and redeemed were:
| | Year Ended December 31, |
| | 2020 | 2019 |
| | Shares | Shares |
| | (000) | (000) |
| Issued | 12,283 | 4,355 |
| Issued in Lieu of Cash Distributions | 351 | 150 |
| Redeemed | (3,935) | (1,781) |
| Net Increase (Decrease) in Shares Outstanding | 8,699 | 2,724 |
At December 31, 2020, two shareholders (an insurance company separate account whose holdings in the portfolio represent the indirect investment of Vanguard Variable Annuity contract holders) were each the record or beneficial owner of 25% or more of the portfolio’s net assets, with a combined ownership of 71%. If any of these shareholders were to redeem their investment in the portfolio, the redemption might result in an increase in the portfolio’s expense ratio, cause the portfolio to incur higher transaction costs, or lead to the realization of taxable capital gains.
F. Transactions during the period in affiliated underlying Vanguard funds were as follows:
| | | | | | Current Period Transactions | |
| | Dec. 31, | | Proceeds | Realized | | | | Dec. 31, |
| | 2019 | | from | Net | Change in | | Capital Gain | 2020 |
| | Market | Purchases | Securities | Gain | Unrealized | | Distributions | Market |
| | Value | at Cost | Sold | (Loss) | App. (Dep.) | Income | Received | Value |
| | ($000) | ($000) | ($000) | ($000) | ($000) | ($000) | ($000) | ($000) |
| Vanguard Market Liquidity Fund | 12 | NA1 | NA1 | — | — | 2 | — | 323 |
| Vanguard Total International Bond Index Fund | 69,689 | 78,390 | 20,371 | 1,192 | 2,433 | 1,182 | 200 | 131,333 |
| Vanguard Variable Insurance Funds—Total Bond Market Index Portfolio | 162,411 | 174,948 | 43,496 | 4,475 | 8,346 | 6,865 | — | 306,684 |
| Total | 232,112 | 253,338 | 63,867 | 5,667 | 10,779 | 8,049 | 200 | 438,340 |
1 Not applicable—purchases and sales are for temporary cash investment purposes.
G. Management has determined that no events or transactions occurred subsequent to December 31, 2020, that would require recognition or disclosure in these financial statements.
Global Bond Index Portfolio
Report of Independent Registered Public Accounting Firm
To the Board of Trustees of Vanguard Variable Insurance Funds and Shareholders of Global Bond Index Portfolio
Opinion on the Financial Statements
We have audited the accompanying statement of assets and liabilities, including the schedule of investments, of Global Bond Index Portfolio (one of the portfolios constituting Vanguard Variable Insurance Funds, referred to hereafter as the “Portfolio”) as of December 31, 2020, the related statement of operations for the year ended December 31, 2020, the statement of changes in net assets for each of the two years in the period ended December 31, 2020, including the related notes, and the financial highlights for each of the three years in the period ended December 31, 2020 and for the period September 7, 2017 (inception) through December 31, 2017 (collectively referred to as the “financial statements”). In our opinion, the financial statements present fairly, in all material respects, the financial position of the Portfolio as of December 31, 2020, the results of its operations for the year then ended, the changes in its net assets for each of the two years in the period ended December 31, 2020 and the financial highlights for each of the three years in the period ended December 31, 2020 and for the period September 7, 2017 (inception) through December 31, 2017 in conformity with accounting principles generally accepted in the United States of America.
Basis for Opinion
These financial statements are the responsibility of the Portfolio’s management. Our responsibility is to express an opinion on the Portfolio’s financial statements based on our audits. We are a public accounting firm registered with the Public Company Accounting Oversight Board (United States) (PCAOB) and are required to be independent with respect to the Portfolio in accordance with the U.S. federal securities laws and the applicable rules and regulations of the Securities and Exchange Commission and the PCAOB.
We conducted our audits of these financial statements in accordance with the standards of the PCAOB. Those standards require that we plan and perform the audit to obtain reasonable assurance about whether the financial statements are free of material misstatement, whether due to error or fraud.
Our audits included performing procedures to assess the risks of material misstatement of the financial statements, whether due to error or fraud, and performing procedures that respond to those risks. Such procedures included examining, on a test basis, evidence regarding the amounts and disclosures in the financial statements. Our audits also included evaluating the accounting principles used and significant estimates made by management, as well as evaluating the overall presentation of the financial statements. Our procedures included confirmation of securities owned as of December 31, 2020 by correspondence with the transfer agent. We believe that our audits provide a reasonable basis for our opinion.
/s/PricewaterhouseCoopers LLP
Philadelphia, Pennsylvania
February 18, 2021
We have served as the auditor of one or more investment companies in The Vanguard Group of Funds since 1975.
Special 2020 tax information (unaudited) for corporate shareholders only for Global Bond Index Portfolio, a portfolio of Vanguard Variable Insurance Funds
This information for the fiscal year ended December 31, 2020, is included pursuant to provisions of the Internal Revenue Code for corporate shareholders only.
The portfolio distributed $1,064,000 as capital gain dividends (20% rate gain distributions) to shareholders during the fiscal year.
Global Bond Index Portfolio
BLOOMBERG is a trademark and service mark of Bloomberg Finance L.P. BARCLAYS is a trademark and service mark of Barclays Bank Plc, used under license. Bloomberg Finance L.P. and its affiliates, including Bloomberg Index Services Limited (BISL) (collectively, Bloomberg), or Bloomberg’s licensors, own all proprietary rights in the Bloomberg Barclays U.S. Aggregate Float Adjusted Index and the Bloomberg Barclays Global Aggregate ex-USD Float Adjusted RIC Capped Index (USD Hedged) (the Indices or Bloomberg Barclays Indices).
Neither Barclays Bank Plc, Barclays Capital Inc., or any affiliate (collectively Barclays) or Bloomberg is the issuer or producer of the Global Bond Index Portfolio and neither Bloomberg nor Barclays has any responsibilities, obligations or duties to investors in the Global Bond Index Portfolio. The Indices are licensed for use by The Vanguard Group, Inc. (Vanguard) as the sponsor of the Global Bond Index Portfolio. Bloomberg and Barclays’ only relationship with Vanguard in respect of the Indices is the licensing of the Indices, which are determined, composed and calculated by BISL, or any successor thereto, without regard to the Issuer or the Global Bond Index Portfolio or the owners of the Global Bond Index Portfolio.
Additionally, Vanguard may for itself execute transaction(s) with Barclays in or relating to the Indices in connection with the Global Bond Index Portfolio. Investors acquire the Global Bond Index Portfolio from Vanguard and investors neither acquire any interest in the Indices nor enter into any relationship of any kind whatsoever with Bloomberg or Barclays upon making an investment in the Global Bond Index Portfolio. The Global Bond Index Portfolio is not sponsored, endorsed, sold or promoted by Bloomberg or Barclays. Neither Bloomberg nor Barclays makes any representation or warranty, express or implied regarding the advisability of investing in the Global Bond Index Portfolio or the advisability of investing in securities generally or the ability of the Indices to track corresponding or relative market performance. Neither Bloomberg nor Barclays has passed on the legality or suitability of the Global Bond Index Portfolio with respect to any person or entity. Neither Bloomberg nor Barclays is responsible for and has not participated in the determination of the timing of, prices at, or quantities of the Global Bond Index Portfolio to be issued. Neither Bloomberg nor Barclays has any obligation to take the needs of the Issuer or the owners of the Global Bond Index Portfolio or any other third party into consideration in determining, composing or calculating the Indices. Neither Bloomberg nor Barclays has any obligation or liability in connection with administration, marketing or trading of the Global Bond Index Portfolio.
The licensing agreement between Bloomberg and Barclays is solely for the benefit of Bloomberg and Barclays and not for the benefit of the owners of the Global Bond Index Portfolio, investors or other third parties. In addition, the licensing agreement between Vanguard and Bloomberg is solely for the benefit of Vanguard and Bloomberg and not for the benefit of the owners of the Global Bond Index Portfolio, investors or other third parties.
NEITHER BLOOMBERG NOR BARCLAYS SHALL HAVE ANY LIABILITY TO THE ISSUER, INVESTORS OR TO OTHER THIRD PARTIES FOR THE QUALITY, ACCURACY AND/OR COMPLETENESS OF THE BLOOMBERG BARCLAYS INDICES OR ANY DATA INCLUDED THEREIN OR FOR INTERRUPTIONS IN THE DELIVERY OF THE BLOOMBERG BARCLAYS INDICES. NEITHER BLOOMBERG NOR BARCLAYS MAKES ANY WARRANTY, EXPRESS OR IMPLIED, AS TO RESULTS TO BE OBTAINED BY THE ISSUER, THE INVESTORS OR ANY OTHER PERSON OR ENTITY FROM THE USE OF THE BLOOMBERG BARCLAYS INDICES OR ANY DATA INCLUDED THEREIN. NEITHER BLOOMBERG NOR BARCLAYS MAKES ANY EXPRESS OR IMPLIED WARRANTIES, AND EACH HEREBY EXPRESSLY DISCLAIMS ALL WARRANTIES OF MERCHANTABILITY OR FITNESS FOR A PARTICULAR PURPOSE OR USE WITH RESPECT TO THE BLOOMBERG BARCLAYS INDICES OR ANY DATA INCLUDED THEREIN. BLOOMBERG RESERVES THE RIGHT TO CHANGE THE METHODS OF CALCULATION OR PUBLICATION, OR TO CEASE THE CALCULATION OR PUBLICATION OF THE BLOOMBERG BARCLAYS INDICES, AND NEITHER BLOOMBERG NOR BARCLAYS SHALL BE LIABLE FOR ANY MISCALCULATION OF OR ANY INCORRECT, DELAYED OR INTERRUPTED PUBLICATION WITH RESPECT TO THE BLOOMBERG BARCLAYS INDICES. NEITHER BLOOMBERG NOR BARCLAYS SHALL BE LIABLE FOR ANY DAMAGES, INCLUDING, WITHOUT LIMITATION, ANY SPECIAL, INDIRECT OR CONSEQUENTIAL DAMAGES, OR ANY LOST PROFITS AND EVEN IF ADVISED OF THE POSSIBLITY OF SUCH, RESULTING FROM THE USE OF THE BLOOMBERG BARCLAYS INDICES OR ANY DATA INCLUDED THEREIN OR WITH RESPECT TO THE GLOBAL BOND INDEX PORTFOLIO.
None of the information supplied by Bloomberg or Barclays and used in this publication may be reproduced in any manner without the prior written permission of both Bloomberg and Barclays Capital, the investment banking division of Barclays Bank Plc. Barclays Bank Plc is registered in England No. 1026167. Registered office 1 Churchill Place London E14 5HP.
© 2021 Bloomberg. Used with Permission.
Source: Bloomberg Index Services Limited. Copyright 2021, Bloomberg. All rights reserved
Total Bond Market Index Portfolio
Your Portfolio’s Performance at a Glance
| • | For the 12 months ended December 31, 2020, the Total Bond Market Index Portfolio returned 7.58%, in line with the 7.75% return of its benchmark index after taking into account the cost of running the portfolio. |
| • | The year was defined by the COVID-19 pandemic and efforts to contain it. Travel restrictions, supply-chain disruptions, business closures, and a spike in unemployment led swiftly to deep recessions around the world. However, many governments were quick to provide fiscal stimulus in the form of spending, loans, loan guarantees, job retention programs, and extended unemployment benefits. Central banks in developed markets responded rapidly, cutting interest rates, restarting or expanding asset purchases, and providing additional liquidity—all in an effort to blunt the economic impact of the virus. They also pledged to remain vigilant and take more actions if needed. |
| • | U.S. Treasuries, which account for about 40% of the portfolio’s assets, posted a return of 8.00%. Mortgage-backed securities returned less than that, as low mortgage rates led to plenty of supply. Corporate bonds, on the other hand, fared even better than Treasuries, returning 9.89%. With the U.S. economy looking like it might recover faster than had been expected, the spread between yields of corporates and those of Treasuries tightened. |
| • | By credit quality, lower-rated investment-grade bonds generally did better than higher-rated ones; by maturity, longer-dated bonds significantly outperformed. |
| • | Please note that the portfolio’s returns are different from those in Vanguard Variable Annuity (and other plans that invest in the portfolio), which take into account insurance-related expenses. |
Market Barometer
Average Annual Total Returns
Periods Ended December 31, 2020 |
| | One Year | Three Years | Five Years |
| Stocks | | | |
| Russell 1000 Index (Large-caps) | 20.96% | 14.82% | 15.60% |
| Russell 2000 Index (Small-caps) | 19.96 | 10.25 | 13.26 |
| Russell 3000 Index (Broad U.S. market) | 20.89 | 14.49 | 15.43 |
| FTSE All-World ex US Index (International) | 11.22 | 5.18 | 9.16 |
| Bonds | | | |
| Bloomberg Barclays U.S. Aggregate Bond Index (Broad taxable market) | 7.51% | 5.34% | 4.44% |
Bloomberg Barclays Municipal Bond Index
(Broad tax-exempt market) | 5.21 | 4.64 | 3.91 |
| FTSE Three-Month U.S. Treasury Bill Index | 0.58 | 1.56 | 1.16 |
| CPI | | | |
| Consumer Price Index | 1.36% | 1.85% | 1.95% |
Total Bond Market Index Portfolio
About Your Portfolio’s Expenses
As a shareholder of the portfolio, you incur ongoing costs, which include costs for portfolio management, administrative services, and shareholder reports (like this one), among others. Operating expenses, which are deducted from a portfolio's gross income, directly reduce the investment return of the portfolio.
A portfolio's expenses are expressed as a percentage of its average net assets. This figure is known as the expense ratio. The following examples are intended to help you understand the ongoing costs (in dollars) of investing in your portfolio and to compare these costs with those of other mutual funds. The examples are based on an investment of $1,000 made at the beginning of the period shown and held for the entire period.
The accompanying table illustrates your portfolio's costs in two ways:
| • | Based on actual portfolio return. This section helps you to estimate the actual expenses that you paid over the period. The ”Ending Account Value“ shown is derived from the portfolio's actual return, and the third column shows the dollar amount that would have been paid by an investor who started with $1,000 in the portfolio. You may use the information here, together with the amount you invested, to estimate the expenses that you paid over the period. |
To do so, simply divide your account value by $1,000 (for example, an $8,600 account value divided by $1,000 = 8.6), then multiply the result by the number given for your portfolio under the heading ”Expenses Paid During Period.“
| • | Based on hypothetical 5% yearly return. This section is intended to help you compare your portfolio's costs with those of other mutual funds. It assumes that the portfolio had a yearly return of 5% before expenses, but that the expense ratio is unchanged. In this case—because the return used is not the portfolio's actual return—the results do not apply to your investment. The example is useful in making comparisons because the Securities and Exchange Commission requires all mutual funds to calculate expenses based on a 5% return. You can assess your portfolio's costs by comparing this hypothetical example with the hypothetical examples that appear in shareholder reports of other funds. |
Note that the expenses shown in the table are meant to highlight and help you compare ongoing costs only and do not reflect transaction costs incurred by the portfolio for buying and selling securities. The portfolio’s expense ratio does not reflect additional fees and expenses associated with the annuity or life insurance program through which you invest.
The calculations assume no shares were bought or sold during the period. Your actual costs may have been higher or lower, depending on the amount of your investment and the timing of any purchases or redemptions.
You can find more information about the portfolio's expenses, including annual expense ratios, in the Financial Statements section of this report. For additional information on operating expenses and other shareholder costs, please refer to your portfolio's current prospectus.
| Six Months Ended December 31, 2020 | | | |
| Total Bond Market Index Portfolio | Beginning
Account Value
6/30/2020 | Ending
Account Value
12/31/2020 | Expenses
Paid During
Period |
| Based on Actual Portfolio Return | $1,000.00 | $1,012.65 | $0.71 |
| Based on Hypothetical 5% Yearly Return | 1,000.00 | 1,024.43 | 0.71 |
The calculations are based on expenses incurred in the most recent six-month period. The portfolio’s annualized six-month expense ratio for that period is 0.14%. The dollar amounts shown as “Expenses Paid” are equal to the annualized expense ratio multiplied by the average account value over the period, multiplied by the number of days in the most recent six-month period, then divided by the number of days in the most recent 12-month period (184/366).
Total Bond Market Index Portfolio
All of the returns in this report represent past performance, which is not a guarantee of future results that may be achieved by the portfolio. (Current performance may be lower or higher than the performance data cited. For performance data current to the most recent month-end, visit our website at vanguard.com/performance.) Note, too, that both investment returns and principal value can fluctuate widely, so an investor’s shares, when sold, could be worth more or less than their original cost. The returns shown do not reflect taxes that a shareholder would pay on portfolio distributions or on the sale of portfolio shares. Nor do the returns reflect fees and expenses associated with the annuity or life insurance program through which a shareholder invests. If these fees and expenses were included, the portfolio's returns would be lower.
Cumulative Performance: December 31, 2010, Through December 31, 2020
Initial Investment of $10,000
| | | | Average Annual Total Returns
Periods Ended December 31, 2020 |
| | | One
Year | Five
Years | Ten
Years | Final Value
of a $10,000
Investment |
 | Total Bond Market Index Portfolio | 7.58% | 4.36% | 3.71% | $14,394 |
 | Bloomberg Barclays U.S. Aggregate Float Adjusted Index | 7.75 | 4.53 | 3.89 | 14,644 |
See Financial Highlights for dividend and capital gains information.
Total Bond Market Index Portfolio
| Asset-Backed/Commercial Mortgage-Backed Securities | 2.6% |
| Corporate Bonds | 30.1 |
| Sovereign Bonds | 4.0 |
| Taxable Municipal Bonds | 0.8 |
| U.S. Government and Agency Obligations | 62.5 |
The table reflects the portfolio’s investments, except for short-term investments. The agency and mortgage-backed securities may include issues from government-sponsored enterprises; such issues are generally not backed by the full faith and credit of the U.S. government.
The portfolio may invest in derivatives (such as futures and swap contracts) for various reasons, including, but not limited to, attempting to remain fully invested and tracking its target index as closely as possible.
Total Bond Market Index Portfolio
The portfolio files its complete schedule of portfolio holdings with the Securities and Exchange Commission (SEC) for the first and third quarters of each fiscal year as an exhibit to its reports on Form N-PORT. The portfolio’s Form N-PORT reports are available on the SEC’s website at www.sec.gov.
| | | | Coupon | Maturity
Date | Face
Amount
($000) | Market
Value•
($000) |
| U.S. Government and Agency Obligations (62.0%) |
| U.S. Government Securities (39.8%) |
| | U.S. Treasury Note/Bond | 7.875% | 2/15/21 | 1,180 | 1,190 |
| | U.S. Treasury Note/Bond | 8.000% | 11/15/21 | 3,400 | 3,628 |
| | U.S. Treasury Note/Bond | 2.000% | 12/31/21 | 6,670 | 6,794 |
| | U.S. Treasury Note/Bond | 2.125% | 12/31/21 | 928 | 946 |
| | U.S. Treasury Note/Bond | 2.500% | 1/15/22 | 7,601 | 7,787 |
| | U.S. Treasury Note/Bond | 1.375% | 1/31/22 | 4,868 | 4,933 |
| | U.S. Treasury Note/Bond | 1.500% | 1/31/22 | 2,384 | 2,419 |
| | U.S. Treasury Note/Bond | 1.875% | 1/31/22 | 8,835 | 9,002 |
| | U.S. Treasury Note/Bond | 2.000% | 2/15/22 | 135 | 138 |
| | U.S. Treasury Note/Bond | 2.500% | 2/15/22 | 9,901 | 10,164 |
| | U.S. Treasury Note/Bond | 1.750% | 2/28/22 | 6,330 | 6,449 |
| | U.S. Treasury Note/Bond | 1.875% | 2/28/22 | 9,990 | 10,193 |
| | U.S. Treasury Note/Bond | 2.375% | 3/15/22 | 10,896 | 11,189 |
| | U.S. Treasury Note/Bond | 0.375% | 3/31/22 | 11,505 | 11,541 |
| | U.S. Treasury Note/Bond | 1.750% | 3/31/22 | 9,889 | 10,088 |
| | U.S. Treasury Note/Bond | 1.875% | 3/31/22 | 5,215 | 5,328 |
| | U.S. Treasury Note/Bond | 2.250% | 4/15/22 | 10,050 | 10,325 |
| | U.S. Treasury Note/Bond | 0.125% | 4/30/22 | 2,938 | 2,938 |
| | U.S. Treasury Note/Bond | 1.750% | 4/30/22 | 4,977 | 5,084 |
| | U.S. Treasury Note/Bond | 1.875% | 4/30/22 | 4,927 | 5,041 |
| | U.S. Treasury Note/Bond | 2.125% | 5/15/22 | 221 | 227 |
| | U.S. Treasury Note/Bond | 0.125% | 5/31/22 | 560 | 560 |
| | U.S. Treasury Note/Bond | 1.750% | 5/31/22 | 5,115 | 5,232 |
| | U.S. Treasury Note/Bond | 1.875% | 5/31/22 | 6,650 | 6,813 |
| | U.S. Treasury Note/Bond | 1.750% | 6/15/22 | 6,281 | 6,428 |
| | U.S. Treasury Note/Bond | 0.125% | 6/30/22 | 9,814 | 9,814 |
| | U.S. Treasury Note/Bond | 1.750% | 6/30/22 | 5,500 | 5,633 |
| | U.S. Treasury Note/Bond | 2.125% | 6/30/22 | 5,235 | 5,391 |
| | U.S. Treasury Note/Bond | 1.750% | 7/15/22 | 6,092 | 6,243 |
| | U.S. Treasury Note/Bond | 0.125% | 7/31/22 | 7,974 | 7,975 |
| | U.S. Treasury Note/Bond | 1.875% | 7/31/22 | 6,417 | 6,593 |
| | U.S. Treasury Note/Bond | 2.000% | 7/31/22 | 6,025 | 6,202 |
| | U.S. Treasury Note/Bond | 1.500% | 8/15/22 | 10,098 | 10,322 |
| | U.S. Treasury Note/Bond | 1.625% | 8/15/22 | 2,169 | 2,222 |
| | U.S. Treasury Note/Bond | 7.250% | 8/15/22 | 875 | 975 |
| | U.S. Treasury Note/Bond | 0.125% | 8/31/22 | 16,730 | 16,730 |
| | U.S. Treasury Note/Bond | 1.625% | 8/31/22 | 9,570 | 9,806 |
| | U.S. Treasury Note/Bond | 1.875% | 8/31/22 | 5,445 | 5,602 |
| | U.S. Treasury Note/Bond | 1.500% | 9/15/22 | 778 | 796 |
| | U.S. Treasury Note/Bond | 0.125% | 9/30/22 | 1,631 | 1,631 |
| | U.S. Treasury Note/Bond | 1.750% | 9/30/22 | 9,437 | 9,702 |
| | U.S. Treasury Note/Bond | 1.875% | 9/30/22 | 9,975 | 10,277 |
| | U.S. Treasury Note/Bond | 1.375% | 10/15/22 | 4,386 | 4,483 |
| | U.S. Treasury Note/Bond | 1.875% | 10/31/22 | 6,520 | 6,727 |
| | U.S. Treasury Note/Bond | 2.000% | 10/31/22 | 7,947 | 8,217 |
| | U.S. Treasury Note/Bond | 1.625% | 11/15/22 | 21,235 | 21,826 |
| | U.S. Treasury Note/Bond | 7.625% | 11/15/22 | 40 | 46 |
| | U.S. Treasury Note/Bond | 0.125% | 11/30/22 | 27,065 | 27,065 |
| | U.S. Treasury Note/Bond | 2.000% | 11/30/22 | 20,733 | 21,469 |
| | U.S. Treasury Note/Bond | 1.625% | 12/15/22 | 7,625 | 7,847 |
| | U.S. Treasury Note/Bond | 2.125% | 12/31/22 | 12,951 | 13,465 |
| | U.S. Treasury Note/Bond | 1.500% | 1/15/23 | 7,705 | 7,919 |
| | U.S. Treasury Note/Bond | 1.750% | 1/31/23 | 7,020 | 7,255 |
| | U.S. Treasury Note/Bond | 2.000% | 2/15/23 | 8,298 | 8,625 |
| | U.S. Treasury Note/Bond | 7.125% | 2/15/23 | 1,690 | 1,938 |
| | U.S. Treasury Note/Bond | 1.500% | 2/28/23 | 2,889 | 2,974 |
| | U.S. Treasury Note/Bond | 0.500% | 3/15/23 | 12,726 | 12,829 |
| | | | Coupon | Maturity
Date | Face
Amount
($000) | Market
Value•
($000) |
| | U.S. Treasury Note/Bond | 1.500% | 3/31/23 | 7,005 | 7,217 |
| | U.S. Treasury Note/Bond | 2.500% | 3/31/23 | 6,770 | 7,128 |
| | U.S. Treasury Note/Bond | 0.250% | 4/15/23 | 8,425 | 8,446 |
| | U.S. Treasury Note/Bond | 1.625% | 4/30/23 | 215 | 222 |
| | U.S. Treasury Note/Bond | 2.750% | 4/30/23 | 3,500 | 3,712 |
| | U.S. Treasury Note/Bond | 0.125% | 5/15/23 | 4,220 | 4,219 |
| | U.S. Treasury Note/Bond | 1.750% | 5/15/23 | 7,400 | 7,680 |
| | U.S. Treasury Note/Bond | 1.625% | 5/31/23 | 7,175 | 7,431 |
| | U.S. Treasury Note/Bond | 2.750% | 5/31/23 | 5,850 | 6,216 |
| | U.S. Treasury Note/Bond | 0.250% | 6/15/23 | 13,420 | 13,454 |
| | U.S. Treasury Note/Bond | 1.375% | 6/30/23 | 5,050 | 5,204 |
| | U.S. Treasury Note/Bond | 2.625% | 6/30/23 | 5,398 | 5,730 |
| | U.S. Treasury Note/Bond | 0.125% | 7/15/23 | 25,859 | 25,843 |
| | U.S. Treasury Note/Bond | 1.250% | 7/31/23 | 2,630 | 2,705 |
| | U.S. Treasury Note/Bond | 2.750% | 7/31/23 | 3,555 | 3,793 |
| | U.S. Treasury Note/Bond | 0.125% | 8/15/23 | 5,695 | 5,691 |
| | U.S. Treasury Note/Bond | 6.250% | 8/15/23 | 6,565 | 7,607 |
| | U.S. Treasury Note/Bond | 1.375% | 8/31/23 | 10,235 | 10,568 |
| | U.S. Treasury Note/Bond | 2.750% | 8/31/23 | 4,860 | 5,194 |
| | U.S. Treasury Note/Bond | 0.125% | 9/15/23 | 10,870 | 10,861 |
| | U.S. Treasury Note/Bond | 1.375% | 9/30/23 | 2,315 | 2,392 |
| | U.S. Treasury Note/Bond | 2.875% | 9/30/23 | 4,309 | 4,629 |
| | U.S. Treasury Note/Bond | 0.125% | 10/15/23 | 3,605 | 3,602 |
| | U.S. Treasury Note/Bond | 1.625% | 10/31/23 | 3,750 | 3,906 |
| | U.S. Treasury Note/Bond | 2.875% | 10/31/23 | 9,503 | 10,231 |
| | U.S. Treasury Note/Bond | 0.250% | 11/15/23 | 1,040 | 1,043 |
| | U.S. Treasury Note/Bond | 2.750% | 11/15/23 | 4,261 | 4,578 |
| | U.S. Treasury Note/Bond | 2.125% | 11/30/23 | 6,150 | 6,502 |
| | U.S. Treasury Note/Bond | 2.875% | 11/30/23 | 344 | 371 |
| | U.S. Treasury Note/Bond | 0.125% | 12/15/23 | 18,392 | 18,369 |
| | U.S. Treasury Note/Bond | 2.250% | 12/31/23 | 2,267 | 2,408 |
| | U.S. Treasury Note/Bond | 2.625% | 12/31/23 | 7,337 | 7,874 |
| | U.S. Treasury Note/Bond | 2.250% | 1/31/24 | 3,215 | 3,420 |
| | U.S. Treasury Note/Bond | 2.500% | 1/31/24 | 9,419 | 10,090 |
| | U.S. Treasury Note/Bond | 2.750% | 2/15/24 | 10,710 | 11,570 |
| | U.S. Treasury Note/Bond | 2.125% | 2/29/24 | 11,700 | 12,415 |
| | U.S. Treasury Note/Bond | 2.375% | 2/29/24 | 6,712 | 7,176 |
| | U.S. Treasury Note/Bond | 2.125% | 3/31/24 | 18,446 | 19,599 |
| | U.S. Treasury Note/Bond | 2.000% | 4/30/24 | 1,260 | 1,335 |
| | U.S. Treasury Note/Bond | 2.250% | 4/30/24 | 10,559 | 11,278 |
| | U.S. Treasury Note/Bond | 2.000% | 5/31/24 | 11,547 | 12,253 |
| | U.S. Treasury Note/Bond | 1.750% | 6/30/24 | 8,060 | 8,491 |
| | U.S. Treasury Note/Bond | 2.000% | 6/30/24 | 10,955 | 11,636 |
| | U.S. Treasury Note/Bond | 1.750% | 7/31/24 | 9,127 | 9,626 |
| | U.S. Treasury Note/Bond | 2.125% | 7/31/24 | 9,736 | 10,399 |
| | U.S. Treasury Note/Bond | 2.375% | 8/15/24 | 11,564 | 12,460 |
| | U.S. Treasury Note/Bond | 1.250% | 8/31/24 | 10,125 | 10,502 |
| | U.S. Treasury Note/Bond | 1.875% | 8/31/24 | 4,655 | 4,935 |
| | U.S. Treasury Note/Bond | 1.500% | 9/30/24 | 785 | 822 |
| | U.S. Treasury Note/Bond | 2.125% | 9/30/24 | 3,394 | 3,633 |
| | U.S. Treasury Note/Bond | 1.500% | 10/31/24 | 9,070 | 9,505 |
| | U.S. Treasury Note/Bond | 2.250% | 10/31/24 | 5,980 | 6,437 |
| | U.S. Treasury Note/Bond | 2.250% | 11/15/24 | 12,681 | 13,660 |
| | U.S. Treasury Note/Bond | 7.500% | 11/15/24 | 25 | 32 |
| | U.S. Treasury Note/Bond | 1.500% | 11/30/24 | 7,847 | 8,228 |
| | U.S. Treasury Note/Bond | 2.125% | 11/30/24 | 10,054 | 10,787 |
| | U.S. Treasury Note/Bond | 1.750% | 12/31/24 | 14,765 | 15,637 |
| | U.S. Treasury Note/Bond | 2.250% | 12/31/24 | 1,645 | 1,775 |
| | U.S. Treasury Note/Bond | 1.375% | 1/31/25 | 4,905 | 5,126 |
Total Bond Market Index Portfolio
| | | | Coupon | Maturity
Date | Face
Amount
($000) | Market
Value•
($000) |
| | U.S. Treasury Note/Bond | 2.500% | 1/31/25 | 6,340 | 6,915 |
| | U.S. Treasury Note/Bond | 2.000% | 2/15/25 | 8,625 | 9,234 |
| | U.S. Treasury Note/Bond | 1.125% | 2/28/25 | 330 | 342 |
| | U.S. Treasury Note/Bond | 2.750% | 2/28/25 | 2,513 | 2,770 |
| | U.S. Treasury Note/Bond | 0.500% | 3/31/25 | 23,074 | 23,283 |
| | U.S. Treasury Note/Bond | 2.625% | 3/31/25 | 1,961 | 2,155 |
| | U.S. Treasury Note/Bond | 0.375% | 4/30/25 | 2,194 | 2,202 |
| | U.S. Treasury Note/Bond | 2.875% | 4/30/25 | 4,060 | 4,510 |
| | U.S. Treasury Note/Bond | 2.125% | 5/15/25 | 12,735 | 13,744 |
| | U.S. Treasury Note/Bond | 0.250% | 5/31/25 | 9,593 | 9,574 |
| | U.S. Treasury Note/Bond | 2.875% | 5/31/25 | 6,350 | 7,065 |
| | U.S. Treasury Note/Bond | 0.250% | 6/30/25 | 9,264 | 9,239 |
| | U.S. Treasury Note/Bond | 2.750% | 6/30/25 | 4,880 | 5,411 |
| | U.S. Treasury Note/Bond | 0.250% | 7/31/25 | 8,797 | 8,769 |
| | U.S. Treasury Note/Bond | 2.875% | 7/31/25 | 5,105 | 5,698 |
| | U.S. Treasury Note/Bond | 2.000% | 8/15/25 | 14,580 | 15,706 |
| | U.S. Treasury Note/Bond | 6.875% | 8/15/25 | 2,085 | 2,707 |
| | U.S. Treasury Note/Bond | 0.250% | 8/31/25 | 6,080 | 6,059 |
| | U.S. Treasury Note/Bond | 2.750% | 8/31/25 | 6,385 | 7,099 |
| | U.S. Treasury Note/Bond | 0.250% | 9/30/25 | 5,675 | 5,652 |
| | U.S. Treasury Note/Bond | 0.250% | 10/31/25 | 7,765 | 7,731 |
| | U.S. Treasury Note/Bond | 3.000% | 10/31/25 | 4,015 | 4,526 |
| | U.S. Treasury Note/Bond | 2.250% | 11/15/25 | 10,421 | 11,382 |
| | U.S. Treasury Note/Bond | 0.375% | 11/30/25 | 12,230 | 12,245 |
| | U.S. Treasury Note/Bond | 2.875% | 11/30/25 | 6,285 | 7,056 |
| | U.S. Treasury Note/Bond | 0.250% | 12/31/25 | 5,550 | 5,553 |
| | U.S. Treasury Note/Bond | 2.625% | 12/31/25 | 9,165 | 10,192 |
| | U.S. Treasury Note/Bond | 1.625% | 2/15/26 | 16,476 | 17,521 |
| | U.S. Treasury Note/Bond | 2.250% | 3/31/26 | 6,250 | 6,853 |
| | U.S. Treasury Note/Bond | 2.375% | 4/30/26 | 4,780 | 5,277 |
| | U.S. Treasury Note/Bond | 1.625% | 5/15/26 | 10,789 | 11,484 |
| | U.S. Treasury Note/Bond | 2.125% | 5/31/26 | 6,595 | 7,198 |
| | U.S. Treasury Note/Bond | 1.875% | 6/30/26 | 9,335 | 10,070 |
| | U.S. Treasury Note/Bond | 1.875% | 7/31/26 | 8,066 | 8,706 |
| | U.S. Treasury Note/Bond | 1.500% | 8/15/26 | 10,068 | 10,657 |
| | U.S. Treasury Note/Bond | 6.750% | 8/15/26 | 630 | 850 |
| | U.S. Treasury Note/Bond | 1.625% | 9/30/26 | 5,215 | 5,557 |
| | U.S. Treasury Note/Bond | 1.625% | 10/31/26 | 7,825 | 8,342 |
| | U.S. Treasury Note/Bond | 2.000% | 11/15/26 | 19,605 | 21,327 |
| | U.S. Treasury Note/Bond | 6.500% | 11/15/26 | 765 | 1,031 |
| | U.S. Treasury Note/Bond | 1.625% | 11/30/26 | 7,070 | 7,539 |
| | U.S. Treasury Note/Bond | 1.750% | 12/31/26 | 9,983 | 10,724 |
| | U.S. Treasury Note/Bond | 1.500% | 1/31/27 | 1,335 | 1,414 |
| | U.S. Treasury Note/Bond | 2.250% | 2/15/27 | 6,372 | 7,041 |
| | U.S. Treasury Note/Bond | 6.625% | 2/15/27 | 65 | 89 |
| | U.S. Treasury Note/Bond | 1.125% | 2/28/27 | 16,798 | 17,412 |
| | U.S. Treasury Note/Bond | 0.625% | 3/31/27 | 15,968 | 16,058 |
| | U.S. Treasury Note/Bond | 0.500% | 4/30/27 | 910 | 907 |
| | U.S. Treasury Note/Bond | 2.375% | 5/15/27 | 8,831 | 9,847 |
| | U.S. Treasury Note/Bond | 0.500% | 5/31/27 | 10,505 | 10,464 |
| | U.S. Treasury Note/Bond | 0.500% | 6/30/27 | 12,990 | 12,929 |
| | U.S. Treasury Note/Bond | 0.375% | 7/31/27 | 12,560 | 12,389 |
| | U.S. Treasury Note/Bond | 2.250% | 8/15/27 | 8,422 | 9,333 |
| | U.S. Treasury Note/Bond | 6.375% | 8/15/27 | 185 | 255 |
| | U.S. Treasury Note/Bond | 0.500% | 8/31/27 | 10,825 | 10,752 |
| | U.S. Treasury Note/Bond | 0.375% | 9/30/27 | 7,875 | 7,751 |
| | U.S. Treasury Note/Bond | 0.500% | 10/31/27 | 12,115 | 12,013 |
| | U.S. Treasury Note/Bond | 2.250% | 11/15/27 | 11,502 | 12,767 |
| | U.S. Treasury Note/Bond | 6.125% | 11/15/27 | 1,839 | 2,521 |
| | U.S. Treasury Note/Bond | 0.625% | 11/30/27 | 17,153 | 17,142 |
| | U.S. Treasury Note/Bond | 0.625% | 12/31/27 | 7,195 | 7,184 |
| | U.S. Treasury Note/Bond | 2.750% | 2/15/28 | 7,480 | 8,573 |
| | U.S. Treasury Note/Bond | 2.875% | 5/15/28 | 12,080 | 13,992 |
| | U.S. Treasury Note/Bond | 2.875% | 8/15/28 | 13,082 | 15,189 |
| | U.S. Treasury Note/Bond | 5.500% | 8/15/28 | 2,745 | 3,720 |
| | U.S. Treasury Note/Bond | 3.125% | 11/15/28 | 11,328 | 13,406 |
| | U.S. Treasury Note/Bond | 5.250% | 11/15/28 | 1,655 | 2,228 |
| | U.S. Treasury Note/Bond | 2.375% | 5/15/29 | 11,877 | 13,414 |
| | U.S. Treasury Note/Bond | 1.625% | 8/15/29 | 11,565 | 12,367 |
| | | | Coupon | Maturity
Date | Face
Amount
($000) | Market
Value•
($000) |
| | U.S. Treasury Note/Bond | 1.750% | 11/15/29 | 8,091 | 8,741 |
| | U.S. Treasury Note/Bond | 1.500% | 2/15/30 | 2,454 | 2,595 |
| | U.S. Treasury Note/Bond | 0.625% | 5/15/30 | 14,212 | 13,890 |
| | U.S. Treasury Note/Bond | 6.250% | 5/15/30 | 2,350 | 3,499 |
| | U.S. Treasury Note/Bond | 0.625% | 8/15/30 | 18,252 | 17,790 |
| | U.S. Treasury Note/Bond | 0.875% | 11/15/30 | 17,931 | 17,861 |
| | U.S. Treasury Note/Bond | 5.375% | 2/15/31 | 6,075 | 8,713 |
| | U.S. Treasury Note/Bond | 4.500% | 2/15/36 | 3,338 | 4,894 |
| | U.S. Treasury Note/Bond | 4.750% | 2/15/37 | 1,600 | 2,436 |
| | U.S. Treasury Note/Bond | 5.000% | 5/15/37 | 1,250 | 1,957 |
| | U.S. Treasury Note/Bond | 4.375% | 2/15/38 | 1,450 | 2,153 |
| | U.S. Treasury Note/Bond | 4.500% | 5/15/38 | 1,559 | 2,351 |
| | U.S. Treasury Note/Bond | 3.500% | 2/15/39 | 1,920 | 2,604 |
| | U.S. Treasury Note/Bond | 4.250% | 5/15/39 | 2,247 | 3,330 |
| | U.S. Treasury Note/Bond | 4.500% | 8/15/39 | 2,516 | 3,844 |
| | U.S. Treasury Note/Bond | 4.375% | 11/15/39 | 2,742 | 4,141 |
| | U.S. Treasury Note/Bond | 4.625% | 2/15/40 | 3,750 | 5,837 |
| | U.S. Treasury Note/Bond | 1.125% | 5/15/40 | 11,395 | 10,809 |
| | U.S. Treasury Note/Bond | 4.375% | 5/15/40 | 2,735 | 4,146 |
| | U.S. Treasury Note/Bond | 1.125% | 8/15/40 | 15,455 | 14,624 |
| | U.S. Treasury Note/Bond | 3.875% | 8/15/40 | 3,015 | 4,316 |
| | U.S. Treasury Note/Bond | 1.375% | 11/15/40 | 9,098 | 8,991 |
| | U.S. Treasury Note/Bond | 4.250% | 11/15/40 | 3,295 | 4,945 |
| | U.S. Treasury Note/Bond | 4.750% | 2/15/41 | 3,956 | 6,315 |
| | U.S. Treasury Note/Bond | 4.375% | 5/15/41 | 925 | 1,417 |
| | U.S. Treasury Note/Bond | 3.750% | 8/15/41 | 2,825 | 4,011 |
| | U.S. Treasury Note/Bond | 3.125% | 11/15/41 | 2,701 | 3,529 |
| | U.S. Treasury Note/Bond | 3.125% | 2/15/42 | 3,631 | 4,756 |
| | U.S. Treasury Note/Bond | 3.000% | 5/15/42 | 2,720 | 3,496 |
| | U.S. Treasury Note/Bond | 2.750% | 8/15/42 | 5,595 | 6,929 |
| | U.S. Treasury Note/Bond | 2.750% | 11/15/42 | 5,746 | 7,111 |
| | U.S. Treasury Note/Bond | 3.125% | 2/15/43 | 6,850 | 8,976 |
| | U.S. Treasury Note/Bond | 3.625% | 8/15/43 | 7,405 | 10,450 |
| | U.S. Treasury Note/Bond | 3.625% | 2/15/44 | 9,051 | 12,804 |
| | U.S. Treasury Note/Bond | 3.375% | 5/15/44 | 7,699 | 10,519 |
| | U.S. Treasury Note/Bond | 3.125% | 8/15/44 | 9,331 | 12,295 |
| | U.S. Treasury Note/Bond | 3.000% | 11/15/44 | 8,262 | 10,684 |
| | U.S. Treasury Note/Bond | 2.500% | 2/15/45 | 9,820 | 11,701 |
| | U.S. Treasury Note/Bond | 3.000% | 5/15/45 | 7,577 | 9,826 |
| | U.S. Treasury Note/Bond | 2.875% | 8/15/45 | 4,491 | 5,711 |
| | U.S. Treasury Note/Bond | 3.000% | 11/15/45 | 3,084 | 4,010 |
| | U.S. Treasury Note/Bond | 2.500% | 2/15/46 | 3,475 | 4,148 |
| | U.S. Treasury Note/Bond | 2.500% | 5/15/46 | 8,981 | 10,725 |
| | U.S. Treasury Note/Bond | 2.250% | 8/15/46 | 7,656 | 8,735 |
| | U.S. Treasury Note/Bond | 2.875% | 11/15/46 | 11,825 | 15,101 |
| | U.S. Treasury Note/Bond | 3.000% | 2/15/47 | 9,000 | 11,765 |
| | U.S. Treasury Note/Bond | 3.000% | 5/15/47 | 7,293 | 9,545 |
| | U.S. Treasury Note/Bond | 2.750% | 8/15/47 | 6,713 | 8,412 |
| | U.S. Treasury Note/Bond | 2.750% | 11/15/47 | 908 | 1,139 |
| | U.S. Treasury Note/Bond | 3.000% | 2/15/48 | 8,479 | 11,123 |
| | U.S. Treasury Note/Bond | 3.125% | 5/15/48 | 8,984 | 12,053 |
| | U.S. Treasury Note/Bond | 3.000% | 8/15/48 | 9,510 | 12,502 |
| | U.S. Treasury Note/Bond | 3.375% | 11/15/48 | 4,300 | 6,037 |
| | U.S. Treasury Note/Bond | 3.000% | 2/15/49 | 11,044 | 14,557 |
| | U.S. Treasury Note/Bond | 2.250% | 8/15/49 | 5,029 | 5,752 |
| | U.S. Treasury Note/Bond | 2.375% | 11/15/49 | 1,676 | 1,967 |
| | U.S. Treasury Note/Bond | 2.000% | 2/15/50 | 9,144 | 9,929 |
| | U.S. Treasury Note/Bond | 1.250% | 5/15/50 | 19,291 | 17,488 |
| | U.S. Treasury Note/Bond | 1.375% | 8/15/50 | 23,085 | 21,599 |
| | U.S. Treasury Note/Bond | 1.625% | 11/15/50 | 13,795 | 13,726 |
| | | | | | | 1,937,111 |
| Agency Bonds and Notes (1.5%) |
| | Federal Farm Credit Banks Funding Corp. | 3.050% | 11/15/21 | 100 | 102 |
| | Federal Farm Credit Banks Funding Corp. | 1.600% | 12/28/21 | 225 | 228 |
| | Federal Farm Credit Banks Funding Corp. | 0.375% | 4/8/22 | 700 | 702 |
Total Bond Market Index Portfolio
| | | | Coupon | Maturity
Date | Face
Amount
($000) | Market
Value•
($000) |
| | Federal Farm Credit Banks Funding Corp. | 0.125% | 11/23/22 | 750 | 750 |
| | Federal Farm Credit Banks Funding Corp. | 1.770% | 6/26/23 | 150 | 156 |
| | Federal Farm Credit Banks Funding Corp. | 3.500% | 12/20/23 | 75 | 82 |
| | Federal Home Loan Banks | 3.000% | 10/12/21 | 1,500 | 1,533 |
| | Federal Home Loan Banks | 1.625% | 11/19/21 | 760 | 770 |
| | Federal Home Loan Banks | 1.875% | 11/29/21 | 500 | 508 |
| | Federal Home Loan Banks | 1.625% | 12/20/21 | 1,300 | 1,319 |
| | Federal Home Loan Banks | 0.250% | 6/3/22 | 2,000 | 2,003 |
| | Federal Home Loan Banks | 2.125% | 6/10/22 | 175 | 180 |
| | Federal Home Loan Banks | 0.125% | 8/12/22 | 1,000 | 1,000 |
| | Federal Home Loan Banks | 2.000% | 9/9/22 | 250 | 258 |
| | Federal Home Loan Banks | 0.125% | 10/21/22 | 500 | 500 |
| | Federal Home Loan Banks | 1.375% | 2/17/23 | 800 | 821 |
| | Federal Home Loan Banks | 2.125% | 3/10/23 | 970 | 1,012 |
| | Federal Home Loan Banks | 2.500% | 2/13/24 | 535 | 573 |
| | Federal Home Loan Banks | 1.500% | 8/15/24 | 330 | 345 |
| | Federal Home Loan Banks | 0.500% | 4/14/25 | 1,000 | 1,005 |
| | Federal Home Loan Banks | 0.375% | 9/4/25 | 500 | 499 |
| | Federal Home Loan Banks | 3.250% | 11/16/28 | 315 | 375 |
| | Federal Home Loan Banks | 5.500% | 7/15/36 | 1,400 | 2,162 |
| 1 | Federal Home Loan Mortgage Corp. | 2.375% | 1/13/22 | 800 | 818 |
| 1 | Federal Home Loan Mortgage Corp. | 0.250% | 6/8/22 | 600 | 601 |
| 1 | Federal Home Loan Mortgage Corp. | 0.125% | 7/25/22 | 800 | 800 |
| 1 | Federal Home Loan Mortgage Corp. | 0.375% | 4/20/23 | 200 | 201 |
| 1 | Federal Home Loan Mortgage Corp. | 0.375% | 5/5/23 | 600 | 603 |
| 1 | Federal Home Loan Mortgage Corp. | 2.750% | 6/19/23 | 500 | 532 |
| 1 | Federal Home Loan Mortgage Corp. | 0.250% | 6/26/23 | 2,000 | 2,004 |
| 1 | Federal Home Loan Mortgage Corp. | 0.250% | 8/24/23 | 1,650 | 1,653 |
| 1 | Federal Home Loan Mortgage Corp. | 0.250% | 9/8/23 | 1,800 | 1,802 |
| 1 | Federal Home Loan Mortgage Corp. | 0.250% | 12/4/23 | 1,500 | 1,502 |
| 1 | Federal Home Loan Mortgage Corp. | 1.500% | 2/12/25 | 1,200 | 1,256 |
| 1 | Federal Home Loan Mortgage Corp. | 0.375% | 7/21/25 | 1,500 | 1,498 |
| 1 | Federal Home Loan Mortgage Corp. | 0.375% | 9/23/25 | 2,000 | 1,995 |
| 1 | Federal Home Loan Mortgage Corp. | 6.750% | 9/15/29 | 127 | 189 |
| 1 | Federal Home Loan Mortgage Corp. | 6.750% | 3/15/31 | 1,525 | 2,358 |
| 1 | Federal Home Loan Mortgage Corp. | 6.250% | 7/15/32 | 502 | 777 |
| 1 | Federal National Mortgage Association | 1.375% | 10/7/21 | 1,200 | 1,212 |
| 1 | Federal National Mortgage Association | 2.000% | 1/5/22 | 500 | 509 |
| 1 | Federal National Mortgage Association | 2.625% | 1/11/22 | 216 | 221 |
| 1 | Federal National Mortgage Association | 2.250% | 4/12/22 | 476 | 489 |
| 1 | Federal National Mortgage Association | 1.375% | 9/6/22 | 350 | 357 |
| 1 | Federal National Mortgage Association | 2.000% | 10/5/22 | 850 | 878 |
| 1 | Federal National Mortgage Association | 2.375% | 1/19/23 | 2,394 | 2,503 |
| 1 | Federal National Mortgage Association | 0.250% | 5/22/23 | 1,200 | 1,203 |
| | | | Coupon | Maturity
Date | Face
Amount
($000) | Market
Value•
($000) |
| 1 | Federal National Mortgage Association | 0.250% | 7/10/23 | 2,000 | 2,004 |
| 1 | Federal National Mortgage Association | 2.875% | 9/12/23 | 400 | 429 |
| 1 | Federal National Mortgage Association | 0.250% | 11/27/23 | 1,000 | 1,001 |
| 1 | Federal National Mortgage Association | 2.500% | 2/5/24 | 975 | 1,043 |
| 1 | Federal National Mortgage Association | 1.750% | 7/2/24 | 1,028 | 1,082 |
| 1 | Federal National Mortgage Association | 2.625% | 9/6/24 | 160 | 174 |
| 1 | Federal National Mortgage Association | 1.625% | 10/15/24 | 970 | 1,020 |
| 1 | Federal National Mortgage Association | 1.625% | 1/7/25 | 1,300 | 1,367 |
| 1 | Federal National Mortgage Association | 0.625% | 4/22/25 | 1,000 | 1,011 |
| 1 | Federal National Mortgage Association | 0.500% | 6/17/25 | 1,000 | 1,004 |
| 1 | Federal National Mortgage Association | 0.375% | 8/25/25 | 2,000 | 1,996 |
| 1 | Federal National Mortgage Association | 0.500% | 11/7/25 | 2,000 | 2,005 |
| 1 | Federal National Mortgage Association | 2.125% | 4/24/26 | 575 | 625 |
| 1 | Federal National Mortgage Association | 1.875% | 9/24/26 | 500 | 539 |
| 1 | Federal National Mortgage Association | 0.750% | 10/8/27 | 1,000 | 1,000 |
| 1 | Federal National Mortgage Association | 6.250% | 5/15/29 | 175 | 250 |
| 1 | Federal National Mortgage Association | 7.125% | 1/15/30 | 925 | 1,411 |
| 1 | Federal National Mortgage Association | 7.250% | 5/15/30 | 300 | 465 |
| 1 | Federal National Mortgage Association | 0.875% | 8/5/30 | 1,000 | 983 |
| 1 | Federal National Mortgage Association | 6.625% | 11/15/30 | 300 | 455 |
| 1 | Federal National Mortgage Association | 5.625% | 7/15/37 | 275 | 437 |
| 1 | Freddie Mac | 0.125% | 10/16/23 | 1,000 | 998 |
| 1 | Freddie Mac | 0.250% | 11/6/23 | 1,000 | 1,001 |
| | Private Export Funding Corp. | 4.300% | 12/15/21 | 100 | 104 |
| | Private Export Funding Corp. | 2.800% | 5/15/22 | 125 | 129 |
| | Private Export Funding Corp. | 2.050% | 11/15/22 | 1,075 | 1,110 |
| | Private Export Funding Corp. | 3.550% | 1/15/24 | 100 | 109 |
| | Private Export Funding Corp. | 2.450% | 7/15/24 | 100 | 107 |
| | Private Export Funding Corp. | 3.250% | 6/15/25 | 50 | 56 |
| | Tennessee Valley Authority | 1.875% | 8/15/22 | 175 | 180 |
| | Tennessee Valley Authority | 2.875% | 9/15/24 | 191 | 209 |
| | Tennessee Valley Authority | 0.750% | 5/15/25 | 200 | 203 |
| | Tennessee Valley Authority | 6.750% | 11/1/25 | 134 | 173 |
| | Tennessee Valley Authority | 7.125% | 5/1/30 | 1,000 | 1,528 |
| | Tennessee Valley Authority | 4.650% | 6/15/35 | 175 | 243 |
| | Tennessee Valley Authority | 5.880% | 4/1/36 | 250 | 385 |
| | Tennessee Valley Authority | 5.500% | 6/15/38 | 100 | 153 |
Total Bond Market Index Portfolio
| | | | Coupon | Maturity
Date | Face
Amount
($000) | Market
Value•
($000) |
| | Tennessee Valley Authority | 5.250% | 9/15/39 | 412 | 621 |
| | Tennessee Valley Authority | 4.875% | 1/15/48 | 100 | 151 |
| | Tennessee Valley Authority | 5.375% | 4/1/56 | 50 | 85 |
| | Tennessee Valley Authority | 4.625% | 9/15/60 | 180 | 279 |
| | Tennessee Valley Authority | 4.250% | 9/15/65 | 200 | 295 |
| | | | | | | 71,264 |
| Conventional Mortgage-Backed Securities (20.3%) |
| 1,2 | Fannie Mae Pool | 6.500% | 9/1/32 | 16 | 17 |
| 1,2 | Freddie Mac Gold Pool | 2.000% | 8/1/28–12/1/31 | 515 | 539 |
| 1,2 | Freddie Mac Gold Pool | 2.500% | 4/1/27–2/1/43 | 9,934 | 10,409 |
| 1,2 | Freddie Mac Gold Pool | 3.000% | 10/1/26–8/1/47 | 34,660 | 36,706 |
| 1,2 | Freddie Mac Gold Pool | 3.500% | 9/1/25–11/1/48 | 41,600 | 44,600 |
| 1,2 | Freddie Mac Gold Pool | 4.000% | 6/1/24–11/1/48 | 23,168 | 25,210 |
| 1,2 | Freddie Mac Gold Pool | 4.500% | 4/1/21–10/1/48 | 11,448 | 12,622 |
| 1,2 | Freddie Mac Gold Pool | 5.000% | 1/1/22–11/1/48 | 2,924 | 3,301 |
| 1,2 | Freddie Mac Gold Pool | 5.500% | 7/1/22–6/1/41 | 2,108 | 2,421 |
| 1,2 | Freddie Mac Gold Pool | 6.000% | 9/1/21–3/1/39 | 1,557 | 1,815 |
| 1,2 | Freddie Mac Gold Pool | 6.500% | 8/1/23–4/1/39 | 474 | 547 |
| 1,2 | Freddie Mac Gold Pool | 7.000% | 4/1/23–2/1/37 | 117 | 130 |
| 1,2 | Freddie Mac Gold Pool | 7.500% | 1/1/23–4/1/28 | 8 | 11 |
| 1,2 | Freddie Mac Gold Pool | 8.000% | 1/1/22–7/1/30 | 10 | 11 |
| 1,2 | Freddie Mac Gold Pool | 8.500% | 7/1/24–11/1/30 | 9 | 10 |
| 1,2 | Freddie Mac Gold Pool | 9.000% | 5/1/27–5/1/30 | 4 | 4 |
| 2 | Ginnie Mae I Pool | 3.000% | 1/15/26–12/15/45 | 2,177 | 2,267 |
| 2 | Ginnie Mae I Pool | 3.500% | 11/15/25–9/15/49 | 2,109 | 2,238 |
| 2 | Ginnie Mae I Pool | 4.000% | 10/15/24–11/15/47 | 2,376 | 2,560 |
| 2 | Ginnie Mae I Pool | 4.500% | 10/15/24–3/15/41 | 2,310 | 2,578 |
| 2 | Ginnie Mae I Pool | 5.000% | 5/15/33–4/15/41 | 1,769 | 2,000 |
| 2 | Ginnie Mae I Pool | 5.500% | 1/15/32–12/15/40 | 1,080 | 1,238 |
| 2 | Ginnie Mae I Pool | 6.000% | 1/15/24–3/15/40 | 779 | 887 |
| 2 | Ginnie Mae I Pool | 6.500% | 11/15/23–12/15/38 | 203 | 222 |
| 2 | Ginnie Mae I Pool | 7.000% | 5/15/23–10/15/31 | 46 | 52 |
| 2 | Ginnie Mae I Pool | 7.500% | 4/15/22–1/15/31 | 16 | 21 |
| 2 | Ginnie Mae I Pool | 8.000% | 3/15/22–10/15/30 | 14 | 17 |
| 2 | Ginnie Mae I Pool | 8.500% | 6/15/24–9/15/26 | 1 | 1 |
| 2 | Ginnie Mae II Pool | 2.000% | 11/20/50 | 2,387 | 2,497 |
| 2 | Ginnie Mae II Pool | 2.500% | 6/20/27–11/20/50 | 24,859 | 26,386 |
| 2 | Ginnie Mae II Pool | 3.000% | 2/20/27–9/20/50 | 60,410 | 63,884 |
| 2 | Ginnie Mae II Pool | 3.500% | 9/20/25–8/20/50 | 57,717 | 62,081 |
| 2 | Ginnie Mae II Pool | 4.000% | 9/20/25–11/20/49 | 30,235 | 32,698 |
| 2 | Ginnie Mae II Pool | 4.500% | 2/20/39–9/20/49 | 15,925 | 17,387 |
| 2 | Ginnie Mae II Pool | 5.000% | 12/20/32–3/20/49 | 5,507 | 6,095 |
| 2 | Ginnie Mae II Pool | 5.500% | 6/20/34–9/20/41 | 843 | 977 |
| 2 | Ginnie Mae II Pool | 6.000% | 3/20/33–7/20/39 | 402 | 468 |
| 2 | Ginnie Mae II Pool | 6.500% | 12/20/35–11/20/39 | 151 | 177 |
| 2 | Ginnie Mae II Pool | 7.000% | 8/20/36–4/20/38 | 20 | 24 |
| 1,2,3 | UMBS Pool | 1.500% | 1/16/36–1/14/51 | 25,543 | 26,016 |
| 1,2,3 | UMBS Pool | 2.000% | 11/1/23–1/14/51 | 126,405 | 131,496 |
| 1,2,3 | UMBS Pool | 2.500% | 1/1/27–1/14/51 | 110,571 | 116,410 |
| 1,2,3 | UMBS Pool | 3.000% | 11/1/25–1/14/51 | 122,947 | 129,873 |
| 1,2,3 | UMBS Pool | 3.500% | 9/1/25–1/14/51 | 86,329 | 92,448 |
| 1,2,3 | UMBS Pool | 4.000% | 2/1/24–1/14/51 | 65,574 | 71,131 |
| 1,2 | UMBS Pool | 4.500% | 11/1/22–7/1/50 | 30,588 | 33,766 |
| 1,2 | UMBS Pool | 5.000% | 6/1/21–3/1/50 | 10,995 | 12,413 |
| 1,2 | UMBS Pool | 5.500% | 6/1/21–6/1/49 | 4,256 | 4,936 |
| 1,2 | UMBS Pool | 6.000% | 2/1/21–5/1/41 | 2,644 | 3,095 |
| 1,2 | UMBS Pool | 6.500% | 12/1/23–10/1/39 | 701 | 813 |
| 1,2 | UMBS Pool | 7.000% | 6/1/23–11/1/37 | 188 | 219 |
| 1,2 | UMBS Pool | 7.500% | 11/1/22–2/1/32 | 23 | 25 |
| 1,2 | UMBS Pool | 8.000% | 6/1/22–11/1/30 | 11 | 12 |
| 1,2 | UMBS Pool | 8.500% | 7/1/22–4/1/31 | 4 | 4 |
| 1,2 | UMBS Pool | 9.500% | 2/1/25 | 1 | 1 |
| | | | | | | 987,766 |
| | | | Coupon | Maturity
Date | Face
Amount
($000) | Market
Value•
($000) |
| Nonconventional Mortgage-Backed Securities (0.4%) |
| 1,2,4 | Fannie Mae Pool, 12M USD LIBOR + 1.290% | 2.799% | 12/1/41 | 19 | 20 |
| 1,2,4 | Fannie Mae Pool, 12M USD LIBOR + 1.310% | 1.889% | 9/1/37 | 40 | 42 |
| 1,2,4 | Fannie Mae Pool, 12M USD LIBOR + 1.392% | 2.033% | 10/1/37 | 16 | 17 |
| 1,2,4 | Fannie Mae Pool, 12M USD LIBOR + 1.432% | 2.066% | 7/1/36 | 4 | 4 |
| 1,2,4 | Fannie Mae Pool, 12M USD LIBOR + 1.474% | 3.338% | 3/1/43 | 49 | 50 |
| 1,2,4 | Fannie Mae Pool, 12M USD LIBOR + 1.553% | 2.190% | 9/1/43 | 6 | 6 |
| 1,2,4 | Fannie Mae Pool, 12M USD LIBOR + 1.560% | 2.279% | 7/1/43 | 97 | 100 |
| 1,2,4 | Fannie Mae Pool, 12M USD LIBOR + 1.601% | 2.610% | 6/1/43 | 26 | 26 |
| 1,2,4 | Fannie Mae Pool, 12M USD LIBOR + 1.613% | 2.903% | 8/1/39 | 20 | 20 |
| 1,2,4 | Fannie Mae Pool, 12M USD LIBOR + 1.623% | 3.623% | 2/1/36 | 4 | 4 |
| 1,2,4 | Fannie Mae Pool, 12M USD LIBOR + 1.625% | 2.337% | 8/1/35 | 40 | 43 |
| 1,2,4 | Fannie Mae Pool, 12M USD LIBOR + 1.625% | 2.424% | 10/1/37 | 9 | 9 |
| 1,2,4 | Fannie Mae Pool, 12M USD LIBOR + 1.627% | 3.627% | 3/1/38 | 4 | 5 |
| 1,2,4 | Fannie Mae Pool, 12M USD LIBOR + 1.635% | 2.135% | 11/1/36 | 4 | 4 |
| 1,2,4 | Fannie Mae Pool, 12M USD LIBOR + 1.643% | 3.381% | 1/1/37 | 6 | 6 |
| 1,2,4 | Fannie Mae Pool, 12M USD LIBOR + 1.657% | 2.443% | 10/1/42 | 16 | 16 |
| 1,2,4 | Fannie Mae Pool, 12M USD LIBOR + 1.660% | 2.207% | 9/1/40 | 4 | 5 |
| 1,2,4 | Fannie Mae Pool, 12M USD LIBOR + 1.665% | 2.540% | 6/1/36 | 1 | 1 |
| 1,2,4 | Fannie Mae Pool, 12M USD LIBOR + 1.684% | 2.104% | 12/1/33 | 5 | 5 |
| 1,2,4 | Fannie Mae Pool, 12M USD LIBOR + 1.690% | 2.212% | 10/1/39 | 9 | 9 |
| 1,2,4 | Fannie Mae Pool, 12M USD LIBOR + 1.690% | 2.326% | 9/1/42 | 36 | 37 |
| 1,2,4 | Fannie Mae Pool, 12M USD LIBOR + 1.690% | 3.149% | 5/1/40 | 10 | 11 |
| 1,2,4 | Fannie Mae Pool, 12M USD LIBOR + 1.693% | 2.364% | 11/1/39 | 9 | 9 |
| 1,2,4 | Fannie Mae Pool, 12M USD LIBOR + 1.695% | 2.445% | 7/1/39 | 4 | 4 |
| 1,2,4 | Fannie Mae Pool, 12M USD LIBOR + 1.698% | 2.453% | 8/1/40 | 10 | 11 |
| 1,2,4 | Fannie Mae Pool, 12M USD LIBOR + 1.700% | 2.452% | 1/1/42 | 21 | 22 |
| 1,2,4 | Fannie Mae Pool, 12M USD LIBOR + 1.700% | 2.678% | 7/1/37 | 8 | 8 |
| 1,2,4 | Fannie Mae Pool, 12M USD LIBOR + 1.700% | 3.128% | 12/1/40 | 11 | 12 |
| 1,2,4 | Fannie Mae Pool, 12M USD LIBOR + 1.701% | 2.245% | 10/1/42 | 16 | 17 |
| 1,2,4 | Fannie Mae Pool, 12M USD LIBOR + 1.705% | 2.108% | 11/1/39 | 4 | 4 |
| 1,2,4 | Fannie Mae Pool, 12M USD LIBOR + 1.722% | 3.567% | 5/1/42 | 22 | 23 |
| 1,2,4 | Fannie Mae Pool, 12M USD LIBOR + 1.729% | 2.229% | 9/1/34 | 4 | 4 |
| 1,2,4 | Fannie Mae Pool, 12M USD LIBOR + 1.736% | 2.537% | 9/1/43 | 32 | 33 |
| 1,2,4 | Fannie Mae Pool, 12M USD LIBOR + 1.739% | 2.614% | 6/1/41 | 3 | 3 |
| 1,2,4 | Fannie Mae Pool, 12M USD LIBOR + 1.747% | 2.604% | 7/1/41 | 26 | 28 |
| 1,2,4 | Fannie Mae Pool, 12M USD LIBOR + 1.750% | 2.445% | 10/1/40 | 6 | 6 |
Total Bond Market Index Portfolio
| | | | Coupon | Maturity
Date | Face
Amount
($000) | Market
Value•
($000) |
| 1,2,4 | Fannie Mae Pool, 12M USD LIBOR + 1.771% | 3.512% | 5/1/42 | 7 | 7 |
| 1,2,4 | Fannie Mae Pool, 12M USD LIBOR + 1.780% | 3.780% | 2/1/41 | 6 | 7 |
| 1,2,4 | Fannie Mae Pool, 12M USD LIBOR + 1.781% | 3.098% | 7/1/42 | 11 | 12 |
| 1,2,4 | Fannie Mae Pool, 12M USD LIBOR + 1.792% | 3.383% | 8/1/42 | 37 | 37 |
| 1,2,4 | Fannie Mae Pool, 12M USD LIBOR + 1.795% | 2.803% | 3/1/42 | 15 | 16 |
| 1,2,4 | Fannie Mae Pool, 12M USD LIBOR + 1.795% | 3.795% | 3/1/42 | 20 | 21 |
| 1,2,4 | Fannie Mae Pool, 12M USD LIBOR + 1.805% | 2.274% | 11/1/41 | 20 | 22 |
| 1,2,4 | Fannie Mae Pool, 12M USD LIBOR + 1.810% | 2.185% | 11/1/39 | 6 | 6 |
| 1,2,4 | Fannie Mae Pool, 12M USD LIBOR + 1.810% | 2.310% | 11/1/33–10/1/40 | 18 | 20 |
| 1,2,4 | Fannie Mae Pool, 12M USD LIBOR + 1.810% | 3.810% | 12/1/40 | 10 | 10 |
| 1,2,4 | Fannie Mae Pool, 12M USD LIBOR + 1.813% | 2.213% | 11/1/41 | 11 | 12 |
| 1,2,4 | Fannie Mae Pool, 12M USD LIBOR + 1.813% | 2.573% | 9/1/40 | 22 | 23 |
| 1,2,4 | Fannie Mae Pool, 12M USD LIBOR + 1.813% | 2.937% | 1/1/42 | 15 | 16 |
| 1,2,4 | Fannie Mae Pool, 12M USD LIBOR + 1.815% | 2.287% | 12/1/41 | 14 | 15 |
| 1,2,4 | Fannie Mae Pool, 12M USD LIBOR + 1.815% | 2.289% | 12/1/40 | 8 | 9 |
| 1,2,4 | Fannie Mae Pool, 12M USD LIBOR + 1.815% | 2.315% | 11/1/40 | 4 | 5 |
| 1,2,4 | Fannie Mae Pool, 12M USD LIBOR + 1.815% | 3.082% | 5/1/41 | 11 | 12 |
| 1,2,4 | Fannie Mae Pool, 12M USD LIBOR + 1.815% | 3.815% | 2/1/41 | 10 | 11 |
| 1,2,4 | Fannie Mae Pool, 12M USD LIBOR + 1.819% | 3.528% | 3/1/41 | 21 | 22 |
| 1,2,4 | Fannie Mae Pool, 12M USD LIBOR + 1.820% | 2.609% | 12/1/40 | 7 | 7 |
| 1,2,4 | Fannie Mae Pool, 12M USD LIBOR + 1.823% | 2.327% | 12/1/39 | 10 | 11 |
| 1,2,4 | Fannie Mae Pool, 12M USD LIBOR + 1.824% | 3.824% | 2/1/41 | 10 | 10 |
| 1,2,4 | Fannie Mae Pool, 12M USD LIBOR + 1.825% | 3.825% | 3/1/41 | 9 | 10 |
| 1,2,4 | Fannie Mae Pool, 12M USD LIBOR + 1.830% | 2.830% | 6/1/41 | 14 | 15 |
| 1,2,4 | Fannie Mae Pool, 12M USD LIBOR + 1.830% | 3.496% | 4/1/41 | 17 | 17 |
| 1,2,4 | Fannie Mae Pool, 12M USD LIBOR + 1.835% | 3.526% | 1/1/40 | 12 | 13 |
| 1,2,4 | Fannie Mae Pool, 12M USD LIBOR + 1.840% | 2.566% | 8/1/39 | 10 | 10 |
| 1,2,4 | Fannie Mae Pool, 12M USD LIBOR + 1.874% | 3.610% | 5/1/40 | 3 | 3 |
| 1,2,4 | Fannie Mae Pool, 12M USD LIBOR + 1.880% | 2.809% | 11/1/34 | 7 | 7 |
| 1,2,4 | Fannie Mae Pool, 12M USD LIBOR + 1.909% | 3.659% | 4/1/37 | 9 | 10 |
| 1,2,4 | Fannie Mae Pool, 12M USD LIBOR + 1.912% | 2.787% | 5/1/36 | 3 | 3 |
| 1,2,4 | Fannie Mae Pool, 1YR CMT + 2.155% | 3.780% | 12/1/37 | 15 | 16 |
| 1,2,4 | Fannie Mae Pool, 1YR CMT + 2.268% | 2.393% | 12/1/35 | 9 | 10 |
| 1,2,4 | Fannie Mae Pool, 1YR CMT + 2.313% | 3.623% | 1/1/35 | 13 | 14 |
| 1,2,4 | Fannie Mae Pool, 6M USD LIBOR + 1.146% | 1.396% | 4/1/37 | 10 | 11 |
| 1,2,4 | Fannie Mae Pool, 6M USD LIBOR + 1.840% | 2.715% | 8/1/37 | 10 | 11 |
| | | | Coupon | Maturity
Date | Face
Amount
($000) | Market
Value•
($000) |
| 1,2,4 | Freddie Mac Non Gold Pool, 12M USD LIBOR + 1.487% | 3.218% | 3/1/37 | 1 | 1 |
| 1,2,4 | Freddie Mac Non Gold Pool, 12M USD LIBOR + 1.588% | 2.389% | 9/1/37 | 3 | 3 |
| 1,2,4 | Freddie Mac Non Gold Pool, 12M USD LIBOR + 1.625% | 3.625% | 1/1/38 | 2 | 2 |
| 1,2,4 | Freddie Mac Non Gold Pool, 12M USD LIBOR + 1.640% | 2.135% | 12/1/36 | 8 | 9 |
| 1,2,4 | Freddie Mac Non Gold Pool, 12M USD LIBOR + 1.640% | 2.647% | 5/1/42 | 3 | 3 |
| 1,2,4 | Freddie Mac Non Gold Pool, 12M USD LIBOR + 1.660% | 2.160% | 10/1/37 | 8 | 9 |
| 1,2,4 | Freddie Mac Non Gold Pool, 12M USD LIBOR + 1.695% | 3.695% | 2/1/37 | 6 | 6 |
| 1,2,4 | Freddie Mac Non Gold Pool, 12M USD LIBOR + 1.727% | 3.727% | 1/1/35 | 2 | 2 |
| 1,2,4 | Freddie Mac Non Gold Pool, 12M USD LIBOR + 1.743% | 2.118% | 12/1/36 | 15 | 15 |
| 1,2,4 | Freddie Mac Non Gold Pool, 12M USD LIBOR + 1.745% | 3.657% | 12/1/40 | 14 | 15 |
| 1,2,4 | Freddie Mac Non Gold Pool, 12M USD LIBOR + 1.750% | 3.500% | 5/1/38 | 1 | 1 |
| 1,2,4 | Freddie Mac Non Gold Pool, 12M USD LIBOR + 1.765% | 2.219% | 12/1/36 | 4 | 4 |
| 1,2,4 | Freddie Mac Non Gold Pool, 12M USD LIBOR + 1.798% | 2.040% | 12/1/34 | 3 | 3 |
| 1,2,4 | Freddie Mac Non Gold Pool, 12M USD LIBOR + 1.830% | 2.773% | 12/1/35 | 8 | 9 |
| 1,2,4 | Freddie Mac Non Gold Pool, 12M USD LIBOR + 1.861% | 3.213% | 2/1/42 | 7 | 8 |
| 1,2,4 | Freddie Mac Non Gold Pool, 12M USD LIBOR + 1.880% | 2.772% | 6/1/40 | 6 | 6 |
| 1,2,4 | Freddie Mac Non Gold Pool, 12M USD LIBOR + 1.880% | 2.813% | 6/1/41 | 5 | 5 |
| 1,2,4 | Freddie Mac Non Gold Pool, 12M USD LIBOR + 1.880% | 2.880% | 6/1/40 | 12 | 12 |
| 1,2,4 | Freddie Mac Non Gold Pool, 12M USD LIBOR + 1.880% | 3.044% | 5/1/40 | 3 | 4 |
| 1,2,4 | Freddie Mac Non Gold Pool, 12M USD LIBOR + 1.880% | 3.630% | 5/1/40 | 2 | 2 |
| 1,2,4 | Freddie Mac Non Gold Pool, 12M USD LIBOR + 1.880% | 3.880% | 12/1/40–3/1/41 | 18 | 19 |
| 1,2,4 | Freddie Mac Non Gold Pool, 12M USD LIBOR + 1.889% | 3.790% | 2/1/42 | 8 | 8 |
| 1,2,4 | Freddie Mac Non Gold Pool, 12M USD LIBOR + 1.894% | 2.532% | 9/1/40 | 18 | 19 |
| 1,2,4 | Freddie Mac Non Gold Pool, 12M USD LIBOR + 1.900% | 2.363% | 11/1/40 | 14 | 14 |
Total Bond Market Index Portfolio
| | | | Coupon | Maturity
Date | Face
Amount
($000) | Market
Value•
($000) |
| 1,2,4 | Freddie Mac Non Gold Pool, 12M USD LIBOR + 1.900% | 2.806% | 6/1/40 | 9 | 9 |
| 1,2,4 | Freddie Mac Non Gold Pool, 12M USD LIBOR + 1.910% | 3.644% | 1/1/41 | 2 | 2 |
| 1,2,4 | Freddie Mac Non Gold Pool, 12M USD LIBOR + 1.910% | 3.910% | 2/1/41 | 12 | 12 |
| 1,2,4 | Freddie Mac Non Gold Pool, 12M USD LIBOR + 2.006% | 3.309% | 5/1/37 | 14 | 15 |
| 1,2,4 | Freddie Mac Non Gold Pool, 12M USD LIBOR + 2.085% | 4.085% | 3/1/38 | 2 | 3 |
| 1,2,4 | Freddie Mac Non Gold Pool, 1YR CMT + 2.250% | 2.378% | 11/1/34 | 18 | 19 |
| 1,2,4 | Freddie Mac Non Gold Pool, 1YR CMT + 2.250% | 2.934% | 5/1/36 | 3 | 3 |
| 1,2,4 | Freddie Mac Non Gold Pool, 1YR CMT + 2.250% | 3.757% | 2/1/36 | 6 | 6 |
| 1,2,4 | Freddie Mac Non Gold Pool, 1YR CMT + 2.410% | 3.769% | 10/1/36 | 9 | 10 |
| 1,2,4 | Freddie Mac Non Gold Pool, 6M USD LIBOR + 1.355% | 1.855% | 6/1/37 | 7 | 7 |
| 2,3 | Ginnie Mae | 2.000% | 1/21/51 | 12,607 | 13,180 |
| 2,3 | Ginnie Mae | 2.500% | 1/21/51 | 3,828 | 4,052 |
| 2,4 | Ginnie Mae II Pool, 1YR CMT + 1.500% | 1.625% | 7/20/38 | 3 | 2 |
| 2,4 | Ginnie Mae II Pool, 1YR CMT + 1.500% | 2.250% | 7/20/41–8/20/41 | 30 | 31 |
| 2,4 | Ginnie Mae II Pool, 1YR CMT + 1.500% | 2.875% | 4/20/41–6/20/43 | 78 | 81 |
| 2,4 | Ginnie Mae II Pool, 1YR CMT + 1.500% | 3.000% | 1/20/41–3/20/43 | 78 | 82 |
| 2,4 | Ginnie Mae II Pool, 1YR CMT + 1.500% | 3.125% | 10/20/38–12/20/42 | 112 | 116 |
| 2,4 | Ginnie Mae II Pool, 1YR CMT + 2.000% | 2.375% | 5/20/41 | 3 | 3 |
| 2,4 | Ginnie Mae II Pool, 1YR CMT + 2.000% | 3.375% | 5/20/41 | 5 | 6 |
| 2,4 | Ginnie Mae II Pool, 1YR CMT + 2.000% | 3.625% | 11/20/40 | 1 | 1 |
| | | | | | | 18,904 |
| Total U.S. Government and Agency Obligations (Cost $2,853,872) | 3,015,045 |
| Asset-Backed/Commercial Mortgage-Backed Securities (2.6%) |
| 2 | Ally Auto Receivables Trust Class A3 Series 2018-1 | 2.350% | 6/15/22 | 13 | 13 |
| 2 | Ally Auto Receivables Trust Class A3 Series 2018-3 | 3.000% | �� 1/17/23 | 10 | 10 |
| 2 | Ally Auto Receivables Trust Class A3 Series 2019-2 | 2.230% | 1/16/24 | 275 | 279 |
| 2 | Ally Auto Receivables Trust Class A3 Series 2019-4 | 1.840% | 6/17/24 | 230 | 233 |
| 2 | Ally Auto Receivables Trust Class A4 Series 2018-1 | 2.530% | 2/15/23 | 25 | 25 |
| 2 | Ally Auto Receivables Trust Class A4 Series 2018-3 | 3.120% | 7/17/23 | 50 | 52 |
| 2 | Ally Auto Receivables Trust Class A4 Series 2019-2 | 2.260% | 8/15/24 | 50 | 52 |
| | | | Coupon | Maturity
Date | Face
Amount
($000) | Market
Value•
($000) |
| 2 | Ally Auto Receivables Trust Class A4 Series 2019-4 | 1.920% | 1/15/25 | 25 | 26 |
| 2 | Ally Master Owner Trust Class A Series 2018-2 | 3.290% | 5/15/23 | 100 | 101 |
| 2 | Ally Master Owner Trust Class A2 Series 2018-1 | 2.700% | 1/17/23 | 425 | 425 |
| 2 | American Express Credit Account Master Trust Class A Series 2017-7 | 2.350% | 5/15/25 | 225 | 234 |
| 2 | American Express Credit Account Master Trust Class A Series 2018-2 | 3.010% | 10/15/25 | 250 | 265 |
| 2 | American Express Credit Account Master Trust Class A Series 2018-4 | 2.990% | 12/15/23 | 325 | 328 |
| 2 | American Express Credit Account Master Trust Class A Series 2018-8 | 3.180% | 4/15/24 | 100 | 102 |
| 2 | AmeriCredit Automobile Receivables Trust Class A3 Series 2018-1 | 3.070% | 12/19/22 | 22 | 22 |
| 2 | AmeriCredit Automobile Receivables Trust Class A3 Series 2019-1 | 2.970% | 11/20/23 | 67 | 68 |
| 2 | AmeriCredit Automobile Receivables Trust Class A3 Series 2020-1 | 1.110% | 8/19/24 | 500 | 505 |
| 2 | AmeriCredit Automobile Receivables Trust Class A3 Series 2020-2 | 0.660% | 12/18/24 | 25 | 25 |
| 2 | AmeriCredit Automobile Receivables Trust Class A3 Series 2020-3 | 0.530% | 6/18/25 | 25 | 25 |
| 2 | AmeriCredit Automobile Receivables Trust Class B Series 2018-1 | 3.260% | 1/18/24 | 56 | 57 |
| 2 | AmeriCredit Automobile Receivables Trust Class B Series 2020-3 | 0.760% | 12/18/25 | 25 | 25 |
| 2 | AmeriCredit Automobile Receivables Trust Class C Series 2018-1 | 3.500% | 1/18/24 | 50 | 52 |
| 2 | BA Credit Card Trust Class A1 Series 2018-A1 | 2.700% | 7/17/23 | 475 | 476 |
| 2 | BA Credit Card Trust Class A1 Series 2019-A1 | 1.740% | 1/15/25 | 150 | 154 |
| 2 | BA Credit Card Trust Class A2 Series 2018-A2 | 3.000% | 9/15/23 | 400 | 403 |
| 2 | BAMLL Commercial Mortgage Securities Trust Class A4 Series 2017-BNK3 | 3.574% | 2/15/50 | 72 | 82 |
| 2 | Banc of America Commercial Mortgage Trust Class A4 Series 2015-UBS7 | 3.705% | 9/15/48 | 75 | 84 |
| 2 | Banc of America Commercial Mortgage Trust Class AS Series 2017-BNK3 | 3.748% | 2/15/50 | 28 | 32 |
| 2 | Banc of America Commercial Mortgage Trust Class ASB Series 2015-UBS7 | 3.429% | 9/15/48 | 48 | 51 |
| 2 | BANK Class A2 Series 2018-BN14 | 4.128% | 9/15/60 | 50 | 54 |
| 2 | BANK Class A3 Series 2017-BNK9 | 3.279% | 11/15/54 | 150 | 167 |
| 2,4 | BANK Class A3 Series 2018-BN11 | 4.046% | 3/15/61 | 100 | 118 |
Total Bond Market Index Portfolio
| | | | Coupon | Maturity
Date | Face
Amount
($000) | Market
Value•
($000) |
| 2 | BANK Class A3 Series 2019-BN19 | 3.183% | 8/15/61 | 275 | 311 |
| 2 | BANK Class A3 Series 2019-BN23 | 2.920% | 12/15/52 | 180 | 200 |
| 2 | BANK Class A3 Series 2019-BN24 | 2.960% | 11/15/62 | 150 | 168 |
| 2 | BANK Class A3 Series 2019-BNK20 | 3.011% | 9/15/62 | 170 | 190 |
| 2 | BANK Class A4 Series 2017-BNK6 | 3.254% | 7/15/60 | 50 | 56 |
| 2 | BANK Class A4 Series 2017-BNK7 | 3.175% | 9/15/60 | 100 | 111 |
| 2 | BANK Class A4 Series 2017-BNK8 | 3.488% | 11/15/50 | 150 | 171 |
| 2 | BANK Class A4 Series 2017-BNK9 | 3.538% | 11/15/54 | 150 | 172 |
| 2,4 | BANK Class A4 Series 2018-BN12 | 4.255% | 5/15/61 | 125 | 149 |
| 2 | BANK Class A4 Series 2018-BN13 | 3.953% | 8/15/61 | 50 | 58 |
| 2,4 | BANK Class A4 Series 2018-BN15 | 4.407% | 11/15/61 | 110 | 133 |
| 2,4 | BANK Class A4 Series 2018-BNK14 | 4.231% | 9/15/60 | 100 | 119 |
| 2 | BANK Class A4 Series 2019-BN16 | 4.005% | 2/15/52 | 125 | 148 |
| 2 | BANK Class A4 Series 2019-BN18 | 3.584% | 5/15/62 | 375 | 434 |
| 2 | BANK Class A4 Series 2019-BN22 | 2.978% | 11/15/62 | 290 | 324 |
| 2 | BANK Class A4 Series 2019-BNK17 | 3.714% | 4/15/52 | 100 | 117 |
| 2 | BANK Class A4 Series 2020-BN26 | 2.403% | 3/15/63 | 175 | 187 |
| 2 | BANK Class A4 Series 2020-BN29 | 1.997% | 11/15/53 | 50 | 52 |
| 2 | BANK Class A4 Series 2020-BNK28 | 1.844% | 3/15/63 | 50 | 51 |
| 2 | BANK Class A4 Series 2020-BNK30 | 1.925% | 12/10/53 | 75 | 77 |
| 2 | BANK Class A5 Series 2017-BNK5 | 3.390% | 6/15/60 | 150 | 170 |
| 2 | BANK Class A5 Series 2017-BNK6 | 3.518% | 7/15/60 | 404 | 461 |
| 2 | BANK Class A5 Series 2017-BNK7 | 3.435% | 9/15/60 | 75 | 85 |
| 2 | BANK Class A5 Series 2018-BN10 | 3.688% | 2/15/61 | 250 | 288 |
| 2,4 | BANK Class A5 Series 2018-BN13 | 4.217% | 8/15/61 | 25 | 30 |
| 2 | BANK Class A5 Series 2019-BN21 | 2.851% | 10/17/52 | 375 | 415 |
| 2 | BANK Class A5 Series 2020-BN25 | 2.649% | 1/15/63 | 200 | 218 |
| 2 | BANK Class A5 Series 2020-BN27 | 2.144% | 4/15/63 | 150 | 158 |
| 2 | BANK Class AS Series 2017-BNK5 | 3.624% | 6/15/60 | 100 | 111 |
| 2 | BANK Class AS Series 2017-BNK6 | 3.741% | 7/15/60 | 404 | 453 |
| 2 | BANK Class AS Series 2017-BNK7 | 3.748% | 9/15/60 | 75 | 85 |
| 2 | BANK Class AS Series 2017-BNK8 | 3.731% | 11/15/50 | 25 | 29 |
| 2,4 | BANK Class AS Series 2018-BN10 | 3.898% | 2/15/61 | 50 | 57 |
| 2,4 | BANK Class AS Series 2018-BN12 | 4.357% | 5/15/61 | 50 | 59 |
| 2,4 | BANK Class AS Series 2018-BN14 | 4.481% | 9/15/60 | 25 | 30 |
| 2 | BANK Class AS Series 2019-BN17 | 3.976% | 4/15/52 | 25 | 29 |
| | | | Coupon | Maturity
Date | Face
Amount
($000) | Market
Value•
($000) |
| 2,4 | BANK Class AS Series 2019-BN18 | 3.826% | 5/15/62 | 50 | 58 |
| 2 | BANK Class AS Series 2019-BN21 | 3.093% | 10/17/52 | 75 | 83 |
| 2 | BANK Class AS Series 2019-BN23 | 3.203% | 12/15/52 | 75 | 84 |
| 2,4 | BANK Class AS Series 2019-BN24 | 3.283% | 11/15/62 | 75 | 84 |
| 2 | BANK Class AS Series 2020-BN25 | 2.841% | 1/15/63 | 65 | 70 |
| 2 | BANK Class AS Series 2020-BN26 | 2.687% | 3/15/63 | 55 | 59 |
| 2 | BANK Class AS Series 2020-BN27 | 2.551% | 4/15/63 | 50 | 53 |
| 2 | BANK Class ASB Series 2018-BN10 | 3.641% | 2/15/61 | 50 | 56 |
| 2,4 | BANK Class C Series 2019-BNK19 | 4.034% | 8/15/61 | 35 | 36 |
| 2 | Barclays Commercial Mortgage Trust Class A4 Series 2019-C3 | 3.583% | 5/15/52 | 700 | 814 |
| 2 | Barclays Commercial Mortgage Trust Class A4 Series 2019-C5 | 3.063% | 11/15/52 | 150 | 168 |
| 2 | Barclays Commercial Mortgage Trust Class A5 Series 2019-C4 | 2.919% | 8/15/52 | 275 | 304 |
| 2 | Barclays Commercial Mortgage Trust Class AS Series 2019-C4 | 3.171% | 8/15/52 | 25 | 28 |
| 2,4 | Barclays Commercial Mortgage Trust Class AS Series 2019-C5 | 3.366% | 11/15/52 | 100 | 112 |
| 2 | BBCMS Mortgage Trust Class A4 Series 2017-C1 | 3.674% | 2/15/50 | 325 | 372 |
| 2 | BBCMS Mortgage Trust Class A4 Series 2020-C6 | 2.639% | 2/15/53 | 100 | 110 |
| 2 | BBCMS Mortgage Trust Class A5 Series 2018-C2 | 4.314% | 12/15/51 | 125 | 150 |
| 2 | BBCMS Mortgage Trust Class A5 Series 2020-C7 | 2.037% | 4/15/53 | 50 | 52 |
| 2 | BBCMS Mortgage Trust Class A5 Series 2020-C8 | 2.040% | 10/15/53 | 125 | 130 |
| 2 | BBCMS Mortgage Trust Class AS Series 2017-C1 | 3.898% | 2/15/50 | 100 | 113 |
| 2 | BBCMS Mortgage Trust Class AS Series 2020-C6 | 2.840% | 2/15/53 | 35 | 38 |
| 2,4 | Bear Stearns Commercial Mortgage Securities Trust Class AM Series 2007-T26 | 5.432% | 1/12/45 | 27 | 27 |
| 2 | Benchmark Mortgage Trust Class A2 Series 2018-B2 | 3.662% | 2/15/51 | 125 | 131 |
| 2 | Benchmark Mortgage Trust Class A2 Series 2018-B3 | 3.848% | 4/10/51 | 100 | 106 |
| 2 | Benchmark Mortgage Trust Class A2 Series 2018-B6 | 4.203% | 10/10/51 | 50 | 54 |
Total Bond Market Index Portfolio
| | | | Coupon | Maturity
Date | Face
Amount
($000) | Market
Value•
($000) |
| 2 | Benchmark Mortgage Trust Class A3 Series 2020-IG1 | 2.687% | 9/15/43 | 125 | 137 |
| 2 | Benchmark Mortgage Trust Class A4 Series 2018-B5 | 4.208% | 7/15/51 | 75 | �� 89 |
| 2 | Benchmark Mortgage Trust Class A4 Series 2018-B6 | 4.261% | 10/10/51 | 50 | 60 |
| 2,4 | Benchmark Mortgage Trust Class A4 Series 2018-B7 | 4.510% | 5/15/53 | 175 | 213 |
| 2 | Benchmark Mortgage Trust Class A4 Series 2019-B10 | 3.717% | 3/15/62 | 80 | 93 |
| 2 | Benchmark Mortgage Trust Class A4 Series 2019-B13 | 2.952% | 8/15/57 | 280 | 311 |
| 2,4 | Benchmark Mortgage Trust Class A5 Series 2018-B1 | 3.666% | 1/15/51 | 100 | 115 |
| 2,4 | Benchmark Mortgage Trust Class A5 Series 2018-B2 | 3.882% | 2/15/51 | 325 | 378 |
| 2 | Benchmark Mortgage Trust Class A5 Series 2018-B3 | 4.025% | 4/10/51 | 225 | 264 |
| 2,4 | Benchmark Mortgage Trust Class A5 Series 2018-B4 | 4.121% | 7/15/51 | 350 | 414 |
| 2 | Benchmark Mortgage Trust Class A5 Series 2018-B8 | 4.232% | 1/15/52 | 125 | 150 |
| 2 | Benchmark Mortgage Trust Class A5 Series 2019-B11 | 3.542% | 5/15/52 | 275 | 317 |
| 2 | Benchmark Mortgage Trust Class A5 Series 2019-B14 | 3.049% | 12/15/62 | 225 | 252 |
| 2 | Benchmark Mortgage Trust Class A5 Series 2019-B15 | 2.928% | 12/15/72 | 230 | 256 |
| 2 | Benchmark Mortgage Trust Class A5 Series 2019-B9 | 4.016% | 3/15/52 | 105 | 125 |
| 2 | Benchmark Mortgage Trust Class A5 Series 2020-B16 | 2.732% | 2/15/53 | 100 | 110 |
| 2 | Benchmark Mortgage Trust Class A5 Series 2020-B17 | 2.289% | 3/15/53 | 100 | 106 |
| 2 | Benchmark Mortgage Trust Class A5 Series 2020-B19 | 1.850% | 9/15/53 | 63 | 65 |
| 2 | Benchmark Mortgage Trust Class A5 Series 2020-B20 | 2.034% | 10/15/53 | 100 | 104 |
| 2 | Benchmark Mortgage Trust Class A5 Series 2020-B21 | 1.978% | 12/17/53 | 125 | 129 |
| 2 | Benchmark Mortgage Trust Class A5 Series 2020-B22 | 1.973% | 1/15/54 | 100 | 103 |
| 2,4 | Benchmark Mortgage Trust Class AM Series 2018-B1 | 3.878% | 1/15/51 | 50 | 57 |
| 2,4 | Benchmark Mortgage Trust Class AM Series 2018-B4 | 4.311% | 7/15/51 | 75 | 87 |
| 2 | Benchmark Mortgage Trust Class AM Series 2019-B10 | 3.979% | 3/15/62 | 50 | 58 |
| | | | Coupon | Maturity
Date | Face
Amount
($000) | Market
Value•
($000) |
| 2,4 | Benchmark Mortgage Trust Class AM Series 2020-B16 | 2.944% | 2/15/53 | 25 | 27 |
| 2,4 | Benchmark Mortgage Trust Class AS Series 2018-B2 | 4.084% | 2/15/51 | 150 | 173 |
| 2 | Benchmark Mortgage Trust Class AS Series 2018-B6 | 4.441% | 10/10/51 | 25 | 30 |
| 2,4 | Benchmark Mortgage Trust Class AS Series 2018-B8 | 4.532% | 1/15/52 | 50 | 60 |
| 2 | Benchmark Mortgage Trust Class AS Series 2019-B11 | 3.784% | 5/15/52 | 75 | 86 |
| 2 | Benchmark Mortgage Trust Class AS Series 2020-B17 | 2.583% | 3/15/53 | 30 | 32 |
| 2 | Benchmark Mortgage Trust Class AS Series 2020-B19 | 2.148% | 9/15/53 | 25 | 26 |
| 2 | Benchmark Mortgage Trust Class AS Series 2020-B20 | 2.375% | 10/15/53 | 10 | 11 |
| 2,4 | Benchmark Mortgage Trust Class AS Series 2020-IG1 | 2.909% | 9/15/43 | 50 | 54 |
| 2 | BMW Vehicle Owner Trust Class A3 Series 2018-A | 2.350% | 4/25/22 | 17 | 17 |
| 2 | BMW Vehicle Owner Trust Class A3 Series 2020-A | 0.480% | 10/25/24 | 25 | 25 |
| 2 | BMW Vehicle Owner Trust Class A4 Series 2018-A | 2.510% | 6/25/24 | 50 | 51 |
| 2 | Cantor Commercial Real Estate Lending Class A4 Series 2019-CF3 | 3.006% | 1/15/53 | 135 | 151 |
| 2 | Cantor Commercial Real Estate Lending Class A5 Series 2019-CF1 | 3.786% | 5/15/52 | 125 | 147 |
| 2 | Cantor Commercial Real Estate Lending Class A5 Series 2019-CF2 | 2.874% | 11/15/52 | 140 | 155 |
| 2 | Cantor Commercial Real Estate Lending Class AS Series 2019-CF3 | 3.298% | 1/15/53 | 60 | 67 |
| 2 | Capital One Multi-Asset Execution Trust Class A1 Series 2018-A1 | 3.010% | 2/15/24 | 125 | 126 |
| 2 | Capital One Multi-Asset Execution Trust Class A1 Series 2019-A1 | 2.840% | 12/15/24 | 75 | 77 |
| 2 | Capital One Multi-Asset Execution Trust Class A6 Series 2017-A6 | 2.290% | 7/15/25 | 225 | 233 |
| 2 | Capital One Prime Auto Receivables Trust Class A3 Series 2019-1 | 2.510% | 11/15/23 | 100 | 102 |
| 2 | Capital One Prime Auto Receivables Trust Class A3 Series 2020-1 | 1.600% | 11/15/24 | 50 | 51 |
| 2 | Capital One Prime Auto Receivables Trust Class A4 Series 2019-1 | 2.560% | 10/15/24 | 35 | 36 |
| 2 | Capital One Prime Auto Receivables Trust Class A4 Series 2020-1 | 1.630% | 8/15/25 | 15 | 15 |
| 2 | CarMax Auto Owner Trust Class A3 Series 2017-4 | 2.110% | 10/17/22 | 17 | 17 |
Total Bond Market Index Portfolio
| | | | Coupon | Maturity
Date | Face
Amount
($000) | Market
Value•
($000) |
| 2 | CarMax Auto Owner Trust Class A3 Series 2018-1 | 2.480% | 11/15/22 | 27 | 28 |
| 2 | CarMax Auto Owner Trust Class A3 Series 2018-2 | 2.980% | 1/17/23 | 38 | 39 |
| 2 | Carmax Auto Owner Trust Class A3 Series 2019-4 | 2.020% | 11/15/24 | 180 | 185 |
| 2 | Carmax Auto Owner Trust Class A3 Series 2020-1 | 1.890% | 12/16/24 | 90 | 92 |
| 2 | CarMax Auto Owner Trust Class A3 Series 2020-2 | 1.700% | 11/15/24 | 25 | 25 |
| 2 | CarMax Auto Owner Trust Class A3 Series 2020-3 | 0.620% | 3/17/25 | 75 | 75 |
| 2 | CarMax Auto Owner Trust Class A3 Series 2020-4 | 0.500% | 8/15/25 | 475 | 475 |
| 2 | CarMax Auto Owner Trust Class A3 Series 2020-4 | 0.630% | 6/15/26 | 25 | 25 |
| 2 | CarMax Auto Owner Trust Class A4 Series 2017-4 | 2.330% | 5/15/23 | 50 | 51 |
| 2 | CarMax Auto Owner Trust Class A4 Series 2018-1 | 2.640% | 6/15/23 | 50 | 51 |
| 2 | CarMax Auto Owner Trust Class A4 Series 2018-2 | 3.160% | 7/17/23 | 50 | 52 |
| 2 | CarMax Auto Owner Trust Class A4 Series 2019-4 | 2.130% | 7/15/25 | 25 | 26 |
| 2 | Carmax Auto Owner Trust Class A4 Series 2020-1 | 2.030% | 6/16/25 | 15 | 16 |
| 2 | CarMax Auto Owner Trust Class A4 Series 2020-3 | 0.770% | 3/16/26 | 25 | 25 |
| 2 | CD Commercial Mortgage Trust Class AAB Series 2017-CD3 | 3.453% | 2/10/50 | 25 | 27 |
| 2 | CD Commercial Mortgage Trust Class ASB Series 2017-CD6 | 3.332% | 11/13/50 | 50 | 55 |
| 2 | CD Mortgage Trust Class A4 Series 2016-CD1 | 2.724% | 8/10/49 | 150 | 163 |
| 2,4 | CD Mortgage Trust Class A4 Series 2016-CD2 | 3.526% | 11/10/49 | 100 | 113 |
| 2 | CD Mortgage Trust Class A4 Series 2017-CD3 | 3.631% | 2/10/50 | 144 | 164 |
| 2 | CD Mortgage Trust Class A4 Series 2018-CD7 | 4.279% | 8/15/51 | 75 | 89 |
| 2 | CD Mortgage Trust Class A4 Series 2019-CD8 | 2.912% | 8/15/57 | 450 | 497 |
| 2 | CD Mortgage Trust Class A5 Series 2017-CD6 | 3.456% | 11/13/50 | 125 | 142 |
| 2,4 | CD Mortgage Trust Class AM Series 2017-CD6 | 3.709% | 11/13/50 | 75 | 84 |
| 2 | CD Mortgage Trust Class AS Series 2017-CD3 | 3.833% | 2/10/50 | 31 | 34 |
| 2 | CenterPoint Energy Transition Bond Co. IV LLC Class A3 Series 2012-1 | 3.028% | 10/15/25 | 315 | 332 |
| 2 | CFCRE Commercial Mortgage Trust Class A3 Series 2016-C3 | 3.865% | 1/10/48 | 125 | 142 |
| 2,4 | CFCRE Commercial Mortgage Trust Class A3 Series 2016-C6 | 3.217% | 11/10/49 | 250 | 275 |
| 2 | CFCRE Commercial Mortgage Trust Class A4 Series 2016-C4 | 3.283% | 5/10/58 | 150 | 164 |
| | | | Coupon | Maturity
Date | Face
Amount
($000) | Market
Value•
($000) |
| 2 | CFCRE Commercial Mortgage Trust Class A4 Series 2017-C8 | 3.572% | 6/15/50 | 50 | 57 |
| 2 | CFCRE Commercial Mortgage Trust Class AM Series 2016-C4 | 3.691% | 5/10/58 | 100 | 110 |
| 2 | CGMS Commercial Mortgage Trust Class A4 Series 2017-B1 | 3.458% | 8/15/50 | 250 | 284 |
| 2,4 | CGMS Commercial Mortgage Trust Class AS Series 2017-B1 | 3.711% | 8/15/50 | 50 | 56 |
| 2 | Chase Issuance Trust Class A1 Series 2020-A1 | 1.530% | 1/15/25 | 450 | 462 |
| 2 | Chase Issuance Trust Class A2 Series 2014-A2 | 2.770% | 3/15/23 | 225 | 226 |
| 2 | Chase Issuance Trust Class A7 Series 2012-A7 | 2.160% | 9/15/24 | 313 | 323 |
| 2 | Citibank Credit Card Issuance Trust Class A1 Series 2014-A1 | 2.880% | 1/23/23 | 100 | 100 |
| 2 | Citibank Credit Card Issuance Trust Class A1 Series 2018-A1 | 2.490% | 1/20/23 | 550 | 551 |
| 2 | Citibank Credit Card Issuance Trust Class A2 Series 2016-A2 | 2.190% | 11/20/23 | 200 | 203 |
| 2 | Citibank Credit Card Issuance Trust Class A3 Series 2018-A3 | 3.290% | 5/23/25 | 450 | 483 |
| 2 | Citibank Credit Card Issuance Trust Class A5 Series 2014-A5 | 2.680% | 6/7/23 | 200 | 202 |
| 2 | Citigroup Commercial Mortgage Trust Class A2 Series 2018-B2 | 3.788% | 3/10/51 | 50 | 53 |
| 2 | Citigroup Commercial Mortgage Trust Class A3 Series 2016-P4 | 2.646% | 7/10/49 | 150 | 160 |
| 2 | Citigroup Commercial Mortgage Trust Class A4 Series 2012-GC8 | 3.024% | 9/10/45 | 69 | 71 |
| 2 | Citigroup Commercial Mortgage Trust Class A4 Series 2013-GC11 | 3.093% | 4/10/46 | 100 | 105 |
| 2,4 | Citigroup Commercial Mortgage Trust Class A4 Series 2013-GC15 | 4.371% | 9/10/46 | 50 | 55 |
| 2 | Citigroup Commercial Mortgage Trust Class A4 Series 2014-GC19 | 4.023% | 3/10/47 | 25 | 27 |
| 2 | Citigroup Commercial Mortgage Trust Class A4 Series 2014-GC23 | 3.622% | ��� 7/10/47 | 100 | 109 |
| 2 | Citigroup Commercial Mortgage Trust Class A4 Series 2014-GC25 | 3.635% | 10/10/47 | 175 | 192 |
Total Bond Market Index Portfolio
| | | | Coupon | Maturity
Date | Face
Amount
($000) | Market
Value•
($000) |
| 2 | Citigroup Commercial Mortgage Trust Class A4 Series 2015-GC29 | 3.192% | 4/10/48 | 175 | 191 |
| 2 | Citigroup Commercial Mortgage Trust Class A4 Series 2015-GC31 | 3.762% | 6/10/48 | 100 | 112 |
| 2 | Citigroup Commercial Mortgage Trust Class A4 Series 2015-GC33 | 3.778% | 9/10/58 | 100 | 112 |
| 2 | Citigroup Commercial Mortgage Trust Class A4 Series 2016-C1 | 3.209% | 5/10/49 | 125 | 139 |
| 2 | Citigroup Commercial Mortgage Trust Class A4 Series 2016-GC37 | 3.314% | 4/10/49 | 50 | 56 |
| 2 | Citigroup Commercial Mortgage Trust Class A4 Series 2016-P4 | 2.902% | 7/10/49 | 75 | 82 |
| 2 | Citigroup Commercial Mortgage Trust Class A4 Series 2017-C4 | 3.471% | 10/12/50 | 250 | 284 |
| 2 | Citigroup Commercial Mortgage Trust Class A4 Series 2018-B2 | 4.009% | 3/10/51 | 275 | 321 |
| 2 | Citigroup Commercial Mortgage Trust Class A4 Series 2019-GC43 | 3.038% | 11/10/52 | 275 | 307 |
| 2 | Citigroup Commercial Mortgage Trust Class A5 Series 2014-GC21 | 3.855% | 5/10/47 | 50 | 55 |
| 2 | Citigroup Commercial Mortgage Trust Class A5 Series 2015-GC27 | 3.137% | 2/10/48 | 225 | 244 |
| 2 | Citigroup Commercial Mortgage Trust Class A5 Series 2016-GC36 | 3.616% | 2/10/49 | 475 | 534 |
| 2 | Citigroup Commercial Mortgage Trust Class A5 Series 2019-GC41 | 2.869% | 8/10/56 | 225 | 248 |
| 2 | Citigroup Commercial Mortgage Trust Class A5 Series 2020-GC46 | 2.717% | 2/15/53 | 110 | 120 |
| 2 | Citigroup Commercial Mortgage Trust Class AAB Series 2014-GC19 | 3.552% | 3/10/47 | 16 | 17 |
| 2 | Citigroup Commercial Mortgage Trust Class AAB Series 2016-C1 | 3.003% | 5/10/49 | 55 | 58 |
| 2,4 | Citigroup Commercial Mortgage Trust Class AS Series 2013-GC15 | 4.649% | 9/10/46 | 75 | 81 |
| 2 | Citigroup Commercial Mortgage Trust Class AS Series 2014-GC19 | 4.345% | 3/10/47 | 25 | 27 |
| | | | Coupon | Maturity
Date | Face
Amount
($000) | Market
Value•
($000) |
| 2 | Citigroup Commercial Mortgage Trust Class AS Series 2015-GC27 | 3.571% | 2/10/48 | 100 | 108 |
| 2 | Citigroup Commercial Mortgage Trust Class AS Series 2017-C4 | 3.764% | 10/12/50 | 50 | 56 |
| 2,4 | Citigroup Commercial Mortgage Trust Class AS Series 2020-GC46 | 2.918% | 2/15/53 | 45 | 49 |
| 2,4 | Citigroup Commercial Mortgage Trust Class B Series 2014-GC21 | 4.328% | 5/10/47 | 50 | 53 |
| 2,4 | Citigroup Commercial Mortgage Trust Class B Series 2015-GC29 | 3.758% | 4/10/48 | 84 | 89 |
| 2 | COMM Mortgage Trust Class A2 Series 2014-CR15 | 2.928% | 2/10/47 | 26 | 26 |
| 2 | COMM Mortgage Trust Class A2 Series 2014-UBS6 | 2.935% | 12/10/47 | 21 | 21 |
| 2 | COMM Mortgage Trust Class A2 Series 2015-CR22 | 2.856% | 3/10/48 | 14 | 14 |
| 2 | COMM Mortgage Trust Class A3 Series 2012-CR4 | 2.853% | 10/15/45 | 124 | 128 |
| 2 | COMM Mortgage Trust Class A3 Series 2013-CR11 | 3.983% | 8/10/50 | 40 | 43 |
| 2 | COMM Mortgage Trust Class A3 Series 2013-CR12 | 3.765% | 10/10/46 | 48 | 51 |
| 2 | COMM Mortgage Trust Class A3 Series 2014-CR21 | 3.528% | 12/10/47 | 160 | 172 |
| 2 | COMM Mortgage Trust Class A3 Series 2017-COR2 | 3.510% | 9/10/50 | 35 | 40 |
| 2 | COMM Mortgage Trust Class A3 Series 2018-COR3 | 4.228% | 5/10/51 | 125 | 149 |
| 2 | COMM Mortgage Trust Class A4 Series 2012-CR2 | 3.147% | 8/15/45 | 58 | 60 |
| 2,4 | COMM Mortgage Trust Class A4 Series 2013-CR10 | 4.210% | 8/10/46 | 20 | 22 |
| 2 | COMM Mortgage Trust Class A4 Series 2013-CR11 | 4.258% | 8/10/50 | 150 | 164 |
| 2 | COMM Mortgage Trust Class A4 Series 2013-CR12 | 4.046% | 10/10/46 | 50 | 54 |
| 2 | COMM Mortgage Trust Class A4 Series 2013-CR6 | 3.101% | 3/10/46 | 515 | 537 |
| 2 | COMM Mortgage Trust Class A4 Series 2013-CR7 | 3.213% | 3/10/46 | 31 | 32 |
| 2,4 | COMM Mortgage Trust Class A4 Series 2013-CR9 | 4.219% | 7/10/45 | 90 | 96 |
| 2 | COMM Mortgage Trust Class A4 Series 2013-LC6 | 2.941% | 1/10/46 | 83 | 87 |
| 2,4 | COMM Mortgage Trust Class A4 Series 2014-CR15 | 4.074% | 2/10/47 | 56 | 62 |
| 2 | COMM Mortgage Trust Class A4 Series 2014-CR20 | 3.590% | 11/10/47 | 50 | 55 |
Total Bond Market Index Portfolio
| | | | Coupon | Maturity
Date | Face
Amount
($000) | Market
Value•
($000) |
| 2 | COMM Mortgage Trust Class A4 Series 2014-LC15 | 4.006% | 4/10/47 | 150 | 164 |
| 2 | COMM Mortgage Trust Class A4 Series 2014-UBS3 | 3.819% | 6/10/47 | 100 | 110 |
| 2 | COMM Mortgage Trust Class A4 Series 2014-UBS5 | 3.838% | 9/10/47 | 125 | 138 |
| 2 | COMM Mortgage Trust Class A4 Series 2015-CCRE24 | 3.432% | 8/10/48 | 242 | 266 |
| 2 | COMM Mortgage Trust Class A4 Series 2015-CR23 | 3.497% | 5/10/48 | 100 | 111 |
| 2 | COMM Mortgage Trust Class A4 Series 2015-CR25 | 3.759% | 8/10/48 | 125 | 140 |
| 2 | COMM Mortgage Trust Class A4 Series 2015-CR26 | 3.630% | 10/10/48 | 225 | 253 |
| 2 | COMM Mortgage Trust Class A4 Series 2015-CR27 | 3.612% | 10/10/48 | 125 | 140 |
| 2 | COMM Mortgage Trust Class A4 Series 2015-LC19 | 3.183% | 2/10/48 | 125 | 136 |
| 2 | COMM Mortgage Trust Class A4 Series 2016-CR28 | 3.762% | 2/10/49 | 150 | 169 |
| 2,4 | COMM Mortgage Trust Class A5 Series 2013-CR8 | 3.612% | 6/10/46 | 71 | 75 |
| 2 | COMM Mortgage Trust Class A5 Series 2013-LC13 | 4.205% | 8/10/46 | 40 | 43 |
| 2 | COMM Mortgage Trust Class A5 Series 2014-CR17 | 3.977% | 5/10/47 | 50 | 55 |
| 2 | COMM Mortgage Trust Class A5 Series 2014-CR19 | 3.796% | 8/10/47 | 175 | 193 |
| 2 | COMM Mortgage Trust Class A5 Series 2014-LC17 | 3.917% | 10/10/47 | 50 | 55 |
| 2 | COMM Mortgage Trust Class A5 Series 2014-UBS2 | 3.961% | 3/10/47 | 54 | 59 |
| 2 | COMM Mortgage Trust Class A5 Series 2014-UBS4 | 3.694% | 8/10/47 | 125 | 137 |
| 2 | COMM Mortgage Trust Class A5 Series 2014-UBS6 | 3.644% | 12/10/47 | 225 | 248 |
| 2 | COMM Mortgage Trust Class A5 Series 2015-CR22 | 3.309% | 3/10/48 | 150 | 165 |
| 2 | COMM Mortgage Trust Class A5 Series 2015-DC1 | 3.350% | 2/10/48 | 75 | 82 |
| 2 | COMM Mortgage Trust Class A5 Series 2019-GC44 | 2.950% | 8/15/57 | 115 | 128 |
| 2 | COMM Mortgage Trust Class AM Series 2012-CR2 | 3.791% | 8/15/45 | 65 | 67 |
| 2,5 | COMM Mortgage Trust Class AM Series 2012-CR3 | 3.416% | 10/15/45 | 78 | 80 |
| 2,4 | COMM Mortgage Trust Class AM Series 2013-CR11 | 4.715% | 8/10/50 | 30 | 33 |
| | | | Coupon | Maturity
Date | Face
Amount
($000) | Market
Value•
($000) |
| 2 | COMM Mortgage Trust Class AM Series 2013-CR12 | 4.300% | 10/10/46 | 25 | 26 |
| 2 | COMM Mortgage Trust Class AM Series 2013-LC6 | 3.282% | 1/10/46 | 58 | 60 |
| 2 | COMM Mortgage Trust Class AM Series 2014-CCRE19 | 4.080% | 8/10/47 | 50 | 55 |
| 2 | COMM Mortgage Trust Class AM Series 2014-CR16 | 4.278% | 4/10/47 | 75 | 82 |
| 2 | COMM Mortgage Trust Class AM Series 2014-UBS2 | 4.199% | 3/10/47 | 15 | 16 |
| 2 | COMM Mortgage Trust Class AM Series 2014-UBS4 | 3.968% | 8/10/47 | 44 | 48 |
| 2 | COMM Mortgage Trust Class AM Series 2014-UBS6 | 4.048% | 12/10/47 | 50 | 55 |
| 2,4 | COMM Mortgage Trust Class AM Series 2015-CR22 | 3.603% | 3/10/48 | 100 | 110 |
| 2 | COMM Mortgage Trust Class AM Series 2015-CR23 | 3.801% | 5/10/48 | 50 | 55 |
| 2 | COMM Mortgage Trust Class AM Series 2015-LC19 | 3.527% | 2/10/48 | 50 | 54 |
| 2 | COMM Mortgage Trust Class ASB Series 2013-CCRE11 | 3.660% | 8/10/50 | 18 | 19 |
| 2 | COMM Mortgage Trust Class ASB Series 2013-CR12 | 3.623% | 10/10/46 | 30 | 31 |
| 2 | COMM Mortgage Trust Class ASB Series 2014-CCRE15 | 3.595% | 2/10/47 | 20 | 21 |
| 2 | COMM Mortgage Trust Class ASB Series 2014-CCRE16 | 3.653% | 4/10/47 | 35 | 36 |
| 2 | COMM Mortgage Trust Class ASB Series 2014-CCRE17 | 3.598% | 5/10/47 | 17 | 18 |
| 2 | COMM Mortgage Trust Class ASB Series 2014-CCRE18 | 3.452% | 7/15/47 | 32 | 33 |
| 2 | COMM Mortgage Trust Class ASB Series 2014-UBS2 | 3.472% | 3/10/47 | 14 | 15 |
| 2 | COMM Mortgage Trust Class ASB Series 2014-UBS6 | 3.387% | 12/10/47 | 100 | 105 |
| 2 | COMM Mortgage Trust Class ASB Series 2015-CCRE23 | 3.257% | 5/10/48 | 65 | 69 |
| 2 | COMM Mortgage Trust Class ASB Series 2015-CCRE27 | 3.404% | 10/10/48 | 121 | 129 |
| 2 | COMM Mortgage Trust Class ASB Series 2015-LC19 | 3.040% | 2/10/48 | 21 | 22 |
| 2 | COMM Mortgage Trust Class ASB Series 2016-DC2 | 3.550% | 2/10/49 | 125 | 134 |
| 2,4 | COMM Mortgage Trust Class B Series 2013-CR12 | 4.762% | 10/10/46 | 25 | 25 |
| 2,4 | COMM Mortgage Trust Class B Series 2014-CCRE15 | 4.692% | 2/10/47 | 28 | 30 |
Total Bond Market Index Portfolio
| | | | Coupon | Maturity
Date | Face
Amount
($000) | Market
Value•
($000) |
| 2 | COMM Mortgage Trust Class B Series 2014-CR17 | 4.377% | 5/10/47 | 25 | 26 |
| 2 | COMM Mortgage Trust Class B Series 2014-UBS2 | 4.701% | 3/10/47 | 10 | 11 |
| 2,4 | COMM Mortgage Trust Class C Series 2013-LC6 | 4.242% | 1/10/46 | 25 | 25 |
| 2,4 | COMM Mortgage Trust Class C Series 2014-CCRE15 | 4.742% | 2/10/47 | 50 | 53 |
| 2 | CSAIL Commercial Mortgage Trust Class A3 Series 2019-C16 | 3.329% | 6/15/52 | 275 | 313 |
| 2 | CSAIL Commercial Mortgage Trust Class A4 Series 2015-C1 | 3.505% | 4/15/50 | 100 | 110 |
| 2 | CSAIL Commercial Mortgage Trust Class A4 Series 2015-C2 | 3.504% | 6/15/57 | 150 | 166 |
| 2 | CSAIL Commercial Mortgage Trust Class A4 Series 2015-C3 | 3.718% | 8/15/48 | 100 | 111 |
| 2 | CSAIL Commercial Mortgage Trust Class A4 Series 2015-C4 | 3.808% | 11/15/48 | 200 | 226 |
| 2 | CSAIL Commercial Mortgage Trust Class A4 Series 2017-C8 | 3.392% | 6/15/50 | 150 | 168 |
| 2,4 | CSAIL Commercial Mortgage Trust Class A4 Series 2018-CX12 | 4.224% | 8/15/51 | 25 | 30 |
| 2 | CSAIL Commercial Mortgage Trust Class A4 Series 2019-C15 | 4.053% | 3/15/52 | 225 | 263 |
| 2 | CSAIL Commercial Mortgage Trust Class A5 Series 2016-C7 | 3.502% | 11/15/49 | 200 | 223 |
| 2,4 | CSAIL Commercial Mortgage Trust Class A5 Series 2017-CX10 | 3.458% | 11/15/50 | 150 | 170 |
| 2 | CSAIL Commercial Mortgage Trust Class A5 Series 2017-CX9 | 3.446% | 9/15/50 | 50 | 56 |
| 2,4 | CSAIL Commercial Mortgage Trust Class A5 Series 2018-CX11 | 4.033% | 4/15/51 | 275 | 316 |
| 2,4 | CSAIL Commercial Mortgage Trust Class AS Series 2015-C1 | 3.791% | 4/15/50 | 75 | 82 |
| 2,4 | CSAIL Commercial Mortgage Trust Class AS Series 2015-C2 | 3.849% | 6/15/57 | 75 | 80 |
| 2 | CSAIL Commercial Mortgage Trust Class ASB Series 2015-C3 | 3.448% | 8/15/48 | 78 | 82 |
| | | | Coupon | Maturity
Date | Face
Amount
($000) | Market
Value•
($000) |
| 2 | CSAIL Commercial Mortgage Trust Class ASB Series 2015-C4 | 3.617% | 11/15/48 | 48 | 51 |
| 2,4 | CSAIL Commercial Mortgage Trust Class B Series 2015-C1 | 4.044% | 4/15/50 | 50 | 53 |
| 2,4 | CSAIL Commercial Mortgage Trust Class B Series 2015-C3 | 4.126% | 8/15/48 | 50 | 46 |
| 2 | DBGS Mortgage Trust Class A4 Series 2018-C1 | 4.466% | 10/15/51 | 100 | 122 |
| 2 | DBJPM Mortgage Trust Class A4 Series 2016-C1 | 3.276% | 5/10/49 | 75 | 83 |
| 2 | DBJPM Mortgage Trust Class A5 Series 2016-C3 | 2.890% | 8/10/49 | 100 | 109 |
| 2 | DBJPM Mortgage Trust Class A5 Series 2017-C6 | 3.328% | 6/10/50 | 100 | 113 |
| 2 | DBJPM Mortgage Trust Class A5 Series 2020-C9 | 1.926% | 9/15/53 | 50 | 52 |
| 2,4 | DBJPM Mortgage Trust Class AM Series 2017-C6 | 3.561% | 6/10/50 | 50 | 55 |
| 2 | Discover Card Execution Note Trust Class A Series 2015-A3 | 1.890% | 10/15/24 | 275 | 283 |
| 2 | Discover Card Execution Note Trust Class A1 Series 2015-A1 | 3.030% | 8/15/25 | 225 | 238 |
| 2 | Discover Card Execution Note Trust Class A2 Series 2017-A2 | 2.390% | 7/15/24 | 150 | 153 |
| 2 | Drive Auto Receivables Trust Class B Series 2020-1 | 2.080% | 7/15/24 | 75 | 76 |
| 2 | Drive Auto Receivables Trust Class C Series 2018-2 | 3.630% | 8/15/24 | 3 | 3 |
| 2 | Drive Auto Receivables Trust Class C Series 2020-1 | 2.360% | 3/16/26 | 50 | 51 |
| 1,2,4 | Fannie Mae Multifamily Remic Trust Class A2 Series 2015-M12 | 2.797% | 5/25/25 | 225 | 240 |
| 1,2,4 | Fannie Mae-Aces Class 1A Series 2014-M7 | 3.234% | 6/25/24 | 232 | 248 |
| 1,2 | Fannie Mae-Aces Class A Series 2015-M2 | 2.620% | 12/25/24 | 166 | 177 |
| 1,2 | Fannie Mae-Aces Class A1 Series 2015-M8 | 2.344% | 1/25/25 | 65 | 68 |
| 1,2 | Fannie Mae-Aces Class A2 Series 2011-M4 | 3.726% | 6/25/21 | 67 | 67 |
| 1,2,4 | Fannie Mae-Aces Class A2 Series 2013-M14 | 3.329% | 10/25/23 | 245 | 260 |
| 1,2 | Fannie Mae-Aces Class A2 Series 2013-M7 | 2.280% | 12/27/22 | 52 | 53 |
| 1,2,4 | Fannie Mae-Aces Class A2 Series 2014-M1 | 3.128% | 7/25/23 | 275 | 290 |
| 1,2,4 | Fannie Mae-Aces Class A2 Series 2014-M13 | 3.021% | 8/25/24 | 185 | 200 |
| 1,2,4 | Fannie Mae-Aces Class A2 Series 2014-M2 | 3.513% | 12/25/23 | 244 | 261 |
Total Bond Market Index Portfolio
| | | | Coupon | Maturity
Date | Face
Amount
($000) | Market
Value•
($000) |
| 1,2,4 | Fannie Mae-Aces Class A2 Series 2014-M3 | 3.495% | 1/25/24 | 117 | 126 |
| 1,2,4 | Fannie Mae-Aces Class A2 Series 2014-M4 | 3.346% | 3/25/24 | 167 | 179 |
| 1,2,4 | Fannie Mae-Aces Class A2 Series 2014-M6 | 2.679% | 5/25/21 | 76 | 76 |
| 1,2,4 | Fannie Mae-Aces Class A2 Series 2014-M8 | 3.056% | 6/25/24 | 143 | 153 |
| 1,2,4 | Fannie Mae-Aces Class A2 Series 2014-M9 | 3.103% | 7/25/24 | 189 | 205 |
| 1,2 | Fannie Mae-Aces Class A2 Series 2015-M1 | 2.532% | 9/25/24 | 282 | 299 |
| 1,2,4 | Fannie Mae-Aces Class A2 Series 2015-M10 | 3.092% | 4/25/27 | 100 | 111 |
| 1,2,4 | Fannie Mae-Aces Class A2 Series 2015-M15 | 2.923% | 10/25/25 | 275 | 302 |
| 1,2 | Fannie Mae-Aces Class A2 Series 2015-M3 | 2.723% | 10/25/24 | 92 | 98 |
| 1,2 | Fannie Mae-Aces Class A2 Series 2015-M7 | 2.590% | 12/25/24 | 171 | 182 |
| 1,2,4 | Fannie Mae-Aces Class A2 Series 2015-M8 | 2.900% | 1/25/25 | 100 | 108 |
| 1,2,4 | Fannie Mae-Aces Class A2 Series 2016-M11 | 2.369% | 7/25/26 | 250 | 269 |
| 1,2,4 | Fannie Mae-Aces Class A2 Series 2016-M12 | 2.444% | 9/25/26 | 250 | 269 |
| 1,2,4 | Fannie Mae-Aces Class A2 Series 2016-M13 | 2.483% | 9/25/26 | 75 | 82 |
| 1,2 | Fannie Mae-Aces Class A2 Series 2016-M3 | 2.702% | 2/25/26 | 98 | 107 |
| 1,2 | Fannie Mae-Aces Class A2 Series 2016-M4 | 2.576% | 3/25/26 | 100 | 108 |
| 1,2 | Fannie Mae-Aces Class A2 Series 2016-M42 | 1.270% | 7/25/30 | 10 | 10 |
| 1,2 | Fannie Mae-Aces Class A2 Series 2016-M5 | 2.469% | 4/25/26 | 200 | 216 |
| 1,2 | Fannie Mae-Aces Class A2 Series 2016-M7 | 2.499% | 9/25/26 | 75 | 80 |
| 1,2 | Fannie Mae-Aces Class A2 Series 2016-M9 | 2.292% | 6/25/26 | 300 | 320 |
| 1,2,4 | Fannie Mae-Aces Class A2 Series 2017-M1 | 2.417% | 10/25/26 | 200 | 218 |
| 1,2,4 | Fannie Mae-Aces Class A2 Series 2017-M12 | 3.079% | 6/25/27 | 300 | 338 |
| 1,2,4 | Fannie Mae-Aces Class A2 Series 2017-M2 | 2.801% | 2/25/27 | 200 | 222 |
| 1,2,4 | Fannie Mae-Aces Class A2 Series 2017-M4 | 2.584% | 12/25/26 | 200 | 219 |
| | | | Coupon | Maturity
Date | Face
Amount
($000) | Market
Value•
($000) |
| 1,2,4 | Fannie Mae-Aces Class A2 Series 2017-M5 | 3.171% | 4/25/29 | 75 | 86 |
| 1,2,4 | Fannie Mae-Aces Class A2 Series 2017-M7 | 2.961% | 2/25/27 | 250 | 280 |
| 1,2,4 | Fannie Mae-Aces Class A2 Series 2017-M8 | 3.061% | 5/25/27 | 514 | 578 |
| 1,2,4 | Fannie Mae-Aces Class A2 Series 2018-M10 | 3.370% | 7/25/28 | 125 | 145 |
| 1,2 | Fannie Mae-Aces Class A2 Series 2018-M10 | 3.610% | 2/25/31 | 300 | 358 |
| 1,2,4 | Fannie Mae-Aces Class A2 Series 2018-M12 | 3.639% | 8/25/30 | 50 | 60 |
| 1,2,4 | Fannie Mae-Aces Class A2 Series 2018-M13 | 3.697% | 9/25/30 | 200 | 242 |
| 1,2,4 | Fannie Mae-Aces Class A2 Series 2018-M14 | 3.578% | 8/25/28 | 100 | 118 |
| 1,2,4 | Fannie Mae-Aces Class A2 Series 2018-M4 | 3.045% | 3/25/28 | 165 | 188 |
| 1,2,4 | Fannie Mae-Aces Class A2 Series 2018-M7 | 3.052% | 3/25/28 | 100 | 114 |
| 1,2,4 | Fannie Mae-Aces Class A2 Series 2019-M1 | 3.555% | 9/25/28 | 200 | 236 |
| 1,2 | Fannie Mae-Aces Class A2 Series 2019-M18 | 2.469% | 8/25/29 | 250 | 272 |
| 1,2,4 | Fannie Mae-Aces Class A2 Series 2019-M2 | 3.631% | 11/25/28 | 200 | 234 |
| 1,2 | Fannie Mae-Aces Class A2 Series 2019-M5 | 3.273% | 2/25/29 | 200 | 222 |
| 1,2 | Fannie Mae-Aces Class A2 Series 2019-M7 | 3.143% | 4/25/29 | 230 | 264 |
| 1,2 | Fannie Mae-Aces Class A2 Series 2019-M9 | 2.937% | 4/25/29 | 325 | 365 |
| 1,2 | Fannie Mae-Aces Class A2 Series 2020-M1 | 2.444% | 10/25/29 | 950 | 1,043 |
| 1,2 | Fannie Mae-Aces Class A2 Series 2020-M14 | 1.784% | 5/25/30 | 150 | 155 |
| 1,2 | Fannie Mae-Aces Class A2 Series 2020-M22 | 2.522% | 8/25/29 | 375 | 413 |
| 1,2,4 | Fannie Mae-Aces Class A2 Series 2020-M29 | 1.492% | 5/25/30 | 100 | 101 |
| 1,2 | Fannie Mae-Aces Class A2 Series 2020-M46 | 1.323% | 5/25/30 | 250 | 254 |
| 1,2 | Fannie Mae-Aces Class A2 Series 2020-M5 | 2.210% | 1/25/30 | 125 | 133 |
| 1,2,4 | Fannie Mae-Aces Class A2 Series 2020-M52 | 1.320% | 10/25/30 | 175 | 178 |
| 1,2 | Fannie Mae-Aces Class A3 Series 2011-M2 | 3.764% | ��� 4/25/21 | 34 | 35 |
Total Bond Market Index Portfolio
| | | | Coupon | Maturity
Date | Face
Amount
($000) | Market
Value•
($000) |
| 1,2,4 | Fannie Mae-Aces Class APT Series 2013-M12 | 2.411% | 3/25/23 | 170 | 176 |
| 1,2,4 | Fannie Mae-Aces Class APT Series 2013-M14 | 2.548% | 4/25/23 | 44 | 44 |
| 1,2,4 | Fannie Mae-Aces Class ASV2 Series 2014-M12 | 2.614% | 10/25/21 | 135 | 136 |
| 1,2,4 | Fannie Mae-Aces Class ATS2 Series 2013-M4 | 2.608% | 3/25/22 | 1 | 1 |
| 1,2,4 | Fannie Mae-Aces Class ATS2 Series 2018-M2 | 2.902% | 1/25/28 | 425 | 464 |
| 1,2,4 | Fannie Mae-Aces Class AV2 Series 2015-M4 | 2.509% | 7/25/22 | 115 | 117 |
| 1,2 | Fannie Mae-Aces Class AV2 Series 2016-M2 | 2.152% | 1/25/23 | 118 | 121 |
| 1,2 | Fannie Mae-Aces Class AV2 Series 2016-M7 | 2.157% | 10/25/23 | 47 | 48 |
| 1,2,4 | Fannie Mae-Aces Class AV2 Series 2017-M10 | 2.555% | 7/25/24 | 110 | 117 |
| 1,2,4 | Fannie Mae-Aces Class AV2 Series 2017-M15 | 3.136% | 11/25/27 | 275 | 304 |
| 2 | Fifth Third Auto Trust Class A3 Series 2019-1 | 2.640% | 12/15/23 | 125 | 127 |
| 2 | Fifth Third Auto Trust Class A4 Series 2019-1 | 2.690% | 11/16/26 | 50 | 52 |
| 2 | Ford Credit Auto Lease Trust Class A3 Series 2019-A | 2.900% | 5/15/22 | 30 | 30 |
| 2 | Ford Credit Auto Lease Trust Class A4 Series 2019-A | 2.980% | 6/15/22 | 25 | 25 |
| 2 | Ford Credit Auto Owner Trust Class A3 Series 2017-C | 2.010% | 3/15/22 | 23 | 23 |
| 2 | Ford Credit Auto Owner Trust Class A3 Series 2019-A | 2.780% | 9/15/23 | 150 | 153 |
| 2 | Ford Credit Auto Owner Trust Class A3 Series 2020-A | 1.040% | 8/15/24 | 25 | 25 |
| 2 | Ford Credit Auto Owner Trust Class A3 Series 2020-B | 0.560% | 10/15/24 | 150 | 151 |
| 2 | Ford Credit Auto Owner Trust Class A3 Series 2020-C | 0.410% | 7/15/25 | 75 | 75 |
| 2 | Ford Credit Auto Owner Trust Class A4 Series 2019-A | 2.850% | 8/15/24 | 50 | 52 |
| 2 | Ford Credit Auto Owner Trust Class A4 Series 2020-B | 0.790% | 11/15/25 | 35 | 35 |
| 2 | Ford Credit Auto Owner Trust Class A4 Series 2020-C | 0.510% | 8/15/26 | 25 | 25 |
| 2 | Ford Credit Floorplan Master Owner Trust Class A Series 2017-3 | 2.480% | 9/15/24 | 170 | 176 |
| 2 | Ford Credit Floorplan Master Owner Trust Class A Series 2018-2 | 3.170% | 3/15/25 | 200 | 212 |
| 2 | Ford Credit Floorplan Master Owner Trust Class A Series 2020-2 | 1.060% | 9/15/27 | 50 | 51 |
| | | | Coupon | Maturity
Date | Face
Amount
($000) | Market
Value•
($000) |
| 2 | Ford Credit Floorplan Master Owner Trust Class A1 Series 2018-1 | 2.950% | 5/15/23 | 225 | 227 |
| 2 | Ford Credit Floorplan Master Owner Trust Class A1 Series 2020-1 | 0.700% | 9/15/25 | 275 | 276 |
| 1,2 | Freddie Mac Multifamily Structured Pass Through Certificates Class A1 Series K030 | 2.779% | 9/25/22 | 78 | 80 |
| 1,2 | Freddie Mac Multifamily Structured Pass Through Certificates Class A1 Series K032 | 3.016% | 2/25/23 | 102 | 105 |
| 1,2 | Freddie Mac Multifamily Structured Pass Through Certificates Class A1 Series K033 | 2.871% | 2/25/23 | 130 | 134 |
| 1,2 | Freddie Mac Multifamily Structured Pass Through Certificates Class A1 Series K038 | 2.604% | 10/25/23 | 34 | 35 |
| 1,2 | Freddie Mac Multifamily Structured Pass Through Certificates Class A1 Series K039 | 2.683% | 12/25/23 | 28 | 29 |
| 1,2 | Freddie Mac Multifamily Structured Pass Through Certificates Class A1 Series K040 | 2.768% | 4/25/24 | 59 | 61 |
| 1,2 | Freddie Mac Multifamily Structured Pass Through Certificates Class A1 Series K042 | 2.267% | 6/25/24 | 28 | 29 |
| 1,2 | Freddie Mac Multifamily Structured Pass Through Certificates Class A1 Series K043 | 2.532% | 10/25/23 | 27 | 28 |
| 1,2 | Freddie Mac Multifamily Structured Pass Through Certificates Class A1 Series K045 | 2.493% | 11/25/24 | 79 | 82 |
| 1,2 | Freddie Mac Multifamily Structured Pass Through Certificates Class A1 Series K047 | 2.827% | 12/25/24 | 64 | 67 |
| 1,2 | Freddie Mac Multifamily Structured Pass Through Certificates Class A1 Series K080 | 3.736% | 4/25/28 | 95 | 107 |
| 1,2 | Freddie Mac Multifamily Structured Pass Through Certificates Class A1 Series K087 | 3.591% | 10/25/27 | 94 | 104 |
| 1,2 | Freddie Mac Multifamily Structured Pass Through Certificates Class A1 Series K121 | 0.995% | 8/25/30 | 25 | 25 |
| 1,2 | Freddie Mac Multifamily Structured Pass Through Certificates Class A1 Series K122 | 0.863% | 5/25/30 | 15 | 15 |
| 1,2 | Freddie Mac Multifamily Structured Pass Through Certificates Class A1 Series K718 | 2.375% | 9/25/21 | 30 | 30 |
| 1,2 | Freddie Mac Multifamily Structured Pass Through Certificates Class A1 Series K730 | 3.452% | 9/25/24 | 22 | 23 |
| 1,2 | Freddie Mac Multifamily Structured Pass Through Certificates Class A2 Series K014 | 3.871% | 4/25/21 | 96 | 96 |
Total Bond Market Index Portfolio
| | | | Coupon | Maturity
Date | Face
Amount
($000) | Market
Value•
($000) |
| 1,2 | Freddie Mac Multifamily Structured Pass Through Certificates Class A2 Series K017 | 2.873% | 12/25/21 | 311 | 316 |
| 1,2 | Freddie Mac Multifamily Structured Pass Through Certificates Class A2 Series K019 | 2.272% | 3/25/22 | 143 | 146 |
| 1,2 | Freddie Mac Multifamily Structured Pass Through Certificates Class A2 Series K020 | 2.373% | 5/25/22 | 350 | 358 |
| 1,2 | Freddie Mac Multifamily Structured Pass Through Certificates Class A2 Series K021 | 2.396% | 6/25/22 | 225 | 231 |
| 1,2 | Freddie Mac Multifamily Structured Pass Through Certificates Class A2 Series K026 | 2.510% | 11/25/22 | 325 | 336 |
| 1,2 | Freddie Mac Multifamily Structured Pass Through Certificates Class A2 Series K027 | 2.637% | 1/25/23 | 325 | 337 |
| 1,2 | Freddie Mac Multifamily Structured Pass Through Certificates Class A2 Series K028 | 3.111% | 2/25/23 | 475 | 500 |
| 1,2 | Freddie Mac Multifamily Structured Pass Through Certificates Class A2 Series K029 | 3.320% | 2/25/23 | 325 | 344 |
| 1,2,4 | Freddie Mac Multifamily Structured Pass Through Certificates Class A2 Series K030 | 3.250% | 4/25/23 | 325 | 344 |
| 1,2,4 | Freddie Mac Multifamily Structured Pass Through Certificates Class A2 Series K031 | 3.300% | 4/25/23 | 1,215 | 1,291 |
| 1,2,4 | Freddie Mac Multifamily Structured Pass Through Certificates Class A2 Series K032 | 3.310% | 5/25/23 | 340 | 362 |
| 1,2,4 | Freddie Mac Multifamily Structured Pass Through Certificates Class A2 Series K033 | 3.060% | 7/25/23 | 325 | 345 |
| 1,2,4 | Freddie Mac Multifamily Structured Pass Through Certificates Class A2 Series K034 | 3.531% | 7/25/23 | 288 | 309 |
| 1,2,4 | Freddie Mac Multifamily Structured Pass Through Certificates Class A2 Series K035 | 3.458% | 8/25/23 | 400 | 429 |
| 1,2,4 | Freddie Mac Multifamily Structured Pass Through Certificates Class A2 Series K036 | 3.527% | 10/25/23 | 325 | 351 |
| 1,2 | Freddie Mac Multifamily Structured Pass Through Certificates Class A2 Series K038 | 3.389% | 3/25/24 | 400 | 435 |
| 1,2 | Freddie Mac Multifamily Structured Pass Through Certificates Class A2 Series K039 | 3.303% | 7/25/24 | 225 | 246 |
| 1,2 | Freddie Mac Multifamily Structured Pass Through Certificates Class A2 Series K040 | 3.241% | 9/25/24 | 275 | 302 |
| | | | Coupon | Maturity
Date | Face
Amount
($000) | Market
Value•
($000) |
| 1,2 | Freddie Mac Multifamily Structured Pass Through Certificates Class A2 Series K041 | 3.171% | 10/25/24 | 275 | 302 |
| 1,2 | Freddie Mac Multifamily Structured Pass Through Certificates Class A2 Series K042 | 2.670% | 12/25/24 | 25 | 27 |
| 1,2 | Freddie Mac Multifamily Structured Pass Through Certificates Class A2 Series K043 | 3.062% | 12/25/24 | 150 | 164 |
| 1,2 | Freddie Mac Multifamily Structured Pass Through Certificates Class A2 Series K045 | 3.023% | 1/25/25 | 175 | 192 |
| 1,2 | Freddie Mac Multifamily Structured Pass Through Certificates Class A2 Series K046 | 3.205% | 3/25/25 | 175 | 194 |
| 1,2,4 | Freddie Mac Multifamily Structured Pass Through Certificates Class A2 Series K047 | 3.329% | 5/25/25 | 175 | 195 |
| 1,2,4 | Freddie Mac Multifamily Structured Pass Through Certificates Class A2 Series K048 | 3.284% | 6/25/25 | 225 | 250 |
| 1,2 | Freddie Mac Multifamily Structured Pass Through Certificates Class A2 Series K049 | 3.010% | 7/25/25 | 125 | 138 |
| 1,2,4 | Freddie Mac Multifamily Structured Pass Through Certificates Class A2 Series K050 | 3.334% | 8/25/25 | 200 | 224 |
| 1,2 | Freddie Mac Multifamily Structured Pass Through Certificates Class A2 Series K052 | 3.151% | 11/25/25 | 125 | 139 |
| 1,2 | Freddie Mac Multifamily Structured Pass Through Certificates Class A2 Series K053 | 2.995% | 12/25/25 | 75 | 83 |
| 1,2 | Freddie Mac Multifamily Structured Pass Through Certificates Class A2 Series K054 | 2.745% | 1/25/26 | 200 | 220 |
| 1,2 | Freddie Mac Multifamily Structured Pass Through Certificates Class A2 Series K056 | 2.525% | 5/25/26 | 150 | 164 |
| 1,2 | Freddie Mac Multifamily Structured Pass Through Certificates Class A2 Series K058 | 2.653% | 8/25/26 | 100 | 110 |
| 1,2,4 | Freddie Mac Multifamily Structured Pass Through Certificates Class A2 Series K063 | 3.430% | 1/25/27 | 475 | 545 |
| 1,2 | Freddie Mac Multifamily Structured Pass Through Certificates Class A2 Series K064 | 3.224% | 3/25/27 | 300 | 342 |
| 1,2 | Freddie Mac Multifamily Structured Pass Through Certificates Class A2 Series K065 | 3.243% | 4/25/27 | 433 | 495 |
| 1,2 | Freddie Mac Multifamily Structured Pass Through Certificates Class A2 Series K066 | 3.117% | 6/25/27 | 150 | 171 |
Total Bond Market Index Portfolio
| | | | Coupon | Maturity
Date | Face
Amount
($000) | Market
Value•
($000) |
| 1,2 | Freddie Mac Multifamily Structured Pass Through Certificates Class A2 Series K067 | 3.194% | 7/25/27 | 500 | 572 |
| 1,2 | Freddie Mac Multifamily Structured Pass Through Certificates Class A2 Series K068 | 3.244% | 8/25/27 | 125 | 144 |
| 1,2,4 | Freddie Mac Multifamily Structured Pass Through Certificates Class A2 Series K069 | 3.187% | 9/25/27 | 200 | ��� 229 |
| 1,2,4 | Freddie Mac Multifamily Structured Pass Through Certificates Class A2 Series K070 | 3.303% | 11/25/27 | 75 | 87 |
| 1,2 | Freddie Mac Multifamily Structured Pass Through Certificates Class A2 Series K071 | 3.286% | 11/25/27 | 100 | 115 |
| 1,2 | Freddie Mac Multifamily Structured Pass Through Certificates Class A2 Series K072 | 3.444% | 12/25/27 | 100 | 116 |
| 1,2 | Freddie Mac Multifamily Structured Pass Through Certificates Class A2 Series K073 | 3.350% | 1/25/28 | 125 | 145 |
| 1,2 | Freddie Mac Multifamily Structured Pass Through Certificates Class A2 Series K074 | 3.600% | 1/25/28 | 225 | 264 |
| 1,2,4 | Freddie Mac Multifamily Structured Pass Through Certificates Class A2 Series K075 | 3.650% | 2/25/28 | 150 | 177 |
| 1,2 | Freddie Mac Multifamily Structured Pass Through Certificates Class A2 Series K076 | 3.900% | 4/25/28 | 350 | 418 |
| 1,2 | Freddie Mac Multifamily Structured Pass Through Certificates Class A2 Series K078 | 3.854% | 6/25/28 | 100 | 119 |
| 1,2 | Freddie Mac Multifamily Structured Pass Through Certificates Class A2 Series K079 | 3.926% | 6/25/28 | 25 | 30 |
| 1,2,4 | Freddie Mac Multifamily Structured Pass Through Certificates Class A2 Series K080 | 3.926% | 7/25/28 | 175 | 210 |
| 1,2,4 | Freddie Mac Multifamily Structured Pass Through Certificates Class A2 Series K081 | 3.900% | 8/25/28 | 100 | 120 |
| 1,2,4 | Freddie Mac Multifamily Structured Pass Through Certificates Class A2 Series K082 | 3.920% | 9/25/28 | 75 | 90 |
| 1,2,4 | Freddie Mac Multifamily Structured Pass Through Certificates Class A2 Series K083 | 4.050% | 9/25/28 | 1,700 | 2,059 |
| 1,2,4 | Freddie Mac Multifamily Structured Pass Through Certificates Class A2 Series K084 | 3.780% | 10/25/28 | 275 | 324 |
| 1,2,4 | Freddie Mac Multifamily Structured Pass Through Certificates Class A2 Series K085 | 4.060% | 10/25/28 | 225 | 272 |
| | | | Coupon | Maturity
Date | Face
Amount
($000) | Market
Value•
($000) |
| 1,2 | Freddie Mac Multifamily Structured Pass Through Certificates Class A2 Series K087 | 3.771% | 12/25/28 | 400 | 479 |
| 1,2 | Freddie Mac Multifamily Structured Pass Through Certificates Class A2 Series K088 | 3.690% | 1/25/29 | 275 | 328 |
| 1,2 | Freddie Mac Multifamily Structured Pass Through Certificates Class A2 Series K089 | 3.563% | 1/25/29 | 25 | 30 |
| 1,2 | Freddie Mac Multifamily Structured Pass Through Certificates Class A2 Series K090 | 3.422% | 2/25/29 | 200 | 235 |
| 1,2 | Freddie Mac Multifamily Structured Pass Through Certificates Class A2 Series K091 | 3.505% | 3/25/29 | 450 | 532 |
| 1,2 | Freddie Mac Multifamily Structured Pass Through Certificates Class A2 Series K092 | 3.298% | 4/25/29 | 225 | 263 |
| 1,2 | Freddie Mac Multifamily Structured Pass Through Certificates Class A2 Series K093 | 2.982% | 5/25/29 | 400 | 457 |
| 1,2 | Freddie Mac Multifamily Structured Pass Through Certificates Class A2 Series K094 | 2.903% | 6/25/29 | 275 | 313 |
| 1,2 | Freddie Mac Multifamily Structured Pass Through Certificates Class A2 Series K095 | 2.785% | 6/25/29 | 275 | 310 |
| 1,2 | Freddie Mac Multifamily Structured Pass Through Certificates Class A2 Series K096 | 2.519% | 7/25/29 | 225 | 249 |
| 1,2 | Freddie Mac Multifamily Structured Pass Through Certificates Class A2 Series K098 | 2.425% | 8/25/29 | 450 | 496 |
| 1,2 | Freddie Mac Multifamily Structured Pass Through Certificates Class A2 Series K099 | 2.595% | 9/25/29 | 210 | 234 |
| 1,2 | Freddie Mac Multifamily Structured Pass Through Certificates Class A2 Series K101 | 2.524% | 10/25/29 | 370 | 412 |
| 1,2 | Freddie Mac Multifamily Structured Pass Through Certificates Class A2 Series K102 | 2.537% | 10/25/29 | 350 | 390 |
| 1,2 | Freddie Mac Multifamily Structured Pass Through Certificates Class A2 Series K103 | 2.651% | 11/25/29 | 300 | 337 |
| 1,2 | Freddie Mac Multifamily Structured Pass Through Certificates Class A2 Series K104 | 2.253% | 1/25/30 | 445 | 485 |
| 1,2 | Freddie Mac Multifamily Structured Pass Through Certificates Class A2 Series K105 | 1.872% | 1/25/30 | 95 | 101 |
| 1,2 | Freddie Mac Multifamily Structured Pass Through Certificates Class A2 Series K106 | 2.069% | 1/25/30 | 1,300 | 1,400 |
Total Bond Market Index Portfolio
| | | | Coupon | Maturity
Date | Face
Amount
($000) | Market
Value•
($000) |
| 1,2 | Freddie Mac Multifamily Structured Pass Through Certificates Class A2 Series K107 | 1.639% | 1/25/30 | 100 | 104 |
| 1,2 | Freddie Mac Multifamily Structured Pass Through Certificates Class A2 Series K108 | 1.517% | 3/25/30 | 150 | 155 |
| 1,2 | Freddie Mac Multifamily Structured Pass Through Certificates Class A2 Series K109 | 1.558% | 4/25/30 | 425 | 440 |
| 1,2 | Freddie Mac Multifamily Structured Pass Through Certificates Class A2 Series K110 | 1.477% | 4/25/30 | 25 | 26 |
| 1,2 | Freddie Mac Multifamily Structured Pass Through Certificates Class A2 Series K111 | 1.350% | 5/25/30 | 25 | 25 |
| 1,2 | Freddie Mac Multifamily Structured Pass Through Certificates Class A2 Series K114 | 1.366% | 6/25/30 | 125 | 127 |
| 1,2 | Freddie Mac Multifamily Structured Pass Through Certificates Class A2 Series K116 | 1.378% | 7/25/30 | 320 | 326 |
| 1,2 | Freddie Mac Multifamily Structured Pass Through Certificates Class A2 Series K117 | 1.406% | 8/25/30 | 25 | 26 |
| 1,2 | Freddie Mac Multifamily Structured Pass Through Certificates Class A2 Series K118 | 1.493% | 9/25/30 | 400 | 411 |
| 1,2 | Freddie Mac Multifamily Structured Pass Through Certificates Class A2 Series K120 | 1.500% | 10/25/30 | 300 | 308 |
| 1,2 | Freddie Mac Multifamily Structured Pass Through Certificates Class A2 Series K121 | 1.547% | 10/25/30 | 175 | 181 |
| 1,2 | Freddie Mac Multifamily Structured Pass Through Certificates Class A2 Series K122 | 1.521% | 11/25/30 | 175 | 180 |
| 1,2 | Freddie Mac Multifamily Structured Pass Through Certificates Class A2 Series K-1510 | 3.718% | 1/25/31 | 75 | 90 |
| 1,2 | Freddie Mac Multifamily Structured Pass Through Certificates Class A2 Series K-1511 | 3.470% | 3/25/31 | 100 | 116 |
| 1,2 | Freddie Mac Multifamily Structured Pass Through Certificates Class A2 Series K-1514 | 2.859% | 10/25/34 | 225 | 257 |
| 1,2 | Freddie Mac Multifamily Structured Pass Through Certificates Class A2 Series K-1515 | 1.940% | 2/25/35 | 150 | 156 |
| 1,2 | Freddie Mac Multifamily Structured Pass Through Certificates Class A2 Series K-1516 | 1.721% | 5/25/35 | 225 | 227 |
| 1,2 | Freddie Mac Multifamily Structured Pass Through Certificates Class A2 Series K-1517 | 1.716% | 7/25/35 | 25 | 25 |
| | | | Coupon | Maturity
Date | Face
Amount
($000) | Market
Value•
($000) |
| 1,2 | Freddie Mac Multifamily Structured Pass Through Certificates Class A2 Series K-1518 | 1.860% | 10/25/35 | 100 | 103 |
| 1,2 | Freddie Mac Multifamily Structured Pass Through Certificates Class A2 Series K152 | 3.080% | 1/25/31 | 100 | 115 |
| 1,2 | Freddie Mac Multifamily Structured Pass Through Certificates Class A2 Series K155 | 3.750% | 11/25/32 | 100 | 121 |
| 1,2,4 | Freddie Mac Multifamily Structured Pass Through Certificates Class A2 Series K157 | 3.990% | 5/25/33 | 75 | 92 |
| 1,2 | Freddie Mac Multifamily Structured Pass Through Certificates Class A2 Series K715 | 2.856% | 1/25/21 | 13 | 13 |
| 1,2 | Freddie Mac Multifamily Structured Pass Through Certificates Class A2 Series K716 | 3.130% | 6/25/21 | 344 | 345 |
| 1,2 | Freddie Mac Multifamily Structured Pass Through Certificates Class A2 Series K717 | 2.991% | 9/25/21 | 221 | 223 |
| 1,2 | Freddie Mac Multifamily Structured Pass Through Certificates Class A2 Series K718 | 2.791% | 1/25/22 | 225 | 229 |
| 1,2 | Freddie Mac Multifamily Structured Pass Through Certificates Class A2 Series K720 | 2.716% | 6/25/22 | 150 | 154 |
| 1,2 | Freddie Mac Multifamily Structured Pass Through Certificates Class A2 Series K723 | 2.454% | 8/25/23 | 125 | 131 |
| 1,2,4 | Freddie Mac Multifamily Structured Pass Through Certificates Class A2 Series K724 | 3.062% | 11/25/23 | 100 | 107 |
| 1,2 | Freddie Mac Multifamily Structured Pass Through Certificates Class A2 Series K726 | 2.905% | 4/25/24 | 181 | 193 |
| 1,2 | Freddie Mac Multifamily Structured Pass Through Certificates Class A2 Series K727 | 2.946% | 7/25/24 | 200 | 215 |
| 1,2,4 | Freddie Mac Multifamily Structured Pass Through Certificates Class A2 Series K728 | 3.064% | 8/25/24 | 1,550 | 1,678 |
| 1,2,4 | Freddie Mac Multifamily Structured Pass Through Certificates Class A2 Series K730 | 3.590% | 1/25/25 | 275 | 305 |
| 1,2,4 | Freddie Mac Multifamily Structured Pass Through Certificates Class A2 Series K731 | 3.600% | 2/25/25 | 225 | 247 |
| 1,2 | Freddie Mac Multifamily Structured Pass Through Certificates Class A2 Series K734 | 3.208% | 2/25/26 | 375 | 418 |
| 1,2 | Freddie Mac Multifamily Structured Pass Through Certificates Class A2 Series K735 | 2.862% | 5/25/26 | 500 | 552 |
Total Bond Market Index Portfolio
| | | | Coupon | Maturity
Date | Face
Amount
($000) | Market
Value•
($000) |
| 1,2 | Freddie Mac Multifamily Structured Pass Through Certificates Class A2 Series K737 | 2.525% | 10/25/26 | 400 | 438 |
| 1,2 | Freddie Mac Multifamily Structured Pass Through Certificates Class A2 Series K738 | 1.545% | 1/25/27 | 100 | 104 |
| 1,2 | Freddie Mac Multifamily Structured Pass Through Certificates Class A2 Series K739 | 1.336% | 9/25/27 | 25 | 26 |
| 1,2 | Freddie Mac Multifamily Structured Pass Through Certificates Class A2 Series KC02 | 3.370% | 7/25/25 | 175 | 189 |
| 1,2 | Freddie Mac Multifamily Structured Pass Through Certificates Class A2 Series KW01 | 2.853% | 1/25/26 | 200 | 218 |
| 1,2 | Freddie Mac Multifamily Structured Pass Through Certificates Class A3 Series K-1510 | 3.794% | 1/25/34 | 125 | 154 |
| 1,2 | Freddie Mac Multifamily Structured Pass Through Certificates Class A3 Series K-1511 | 3.542% | 3/25/34 | 225 | 273 |
| 1,2 | Freddie Mac Multifamily Structured Pass Through Certificates Class A3 Series K-1513 | 2.797% | 8/25/34 | 335 | 380 |
| 1,2 | Freddie Mac Multifamily Structured Pass Through Certificates Class A3 Series K154 | 3.459% | 11/25/32 | 50 | 60 |
| 1,2 | Freddie Mac Multifamily Structured Pass Through Certificates Class A3 Series K155 | 3.750% | 4/25/33 | 200 | 244 |
| 1,2,4 | Freddie Mac Multifamily Structured Pass Through Certificates Class A3 Series K157 | 3.990% | 8/25/33 | 75 | 94 |
| 2 | GM Financial Automobile Leasing Trust Class A3 Series 2019-2 | 2.670% | 3/21/22 | 52 | 53 |
| 2 | GM Financial Automobile Leasing Trust Class A3 Series 2020-1 | 1.670% | 12/20/22 | 25 | 25 |
| 2 | GM Financial Automobile Leasing Trust Class A3 Series 2020-2 | 0.800% | 7/20/23 | 25 | 25 |
| 2 | GM Financial Automobile Leasing Trust Class A3 Series 2020-3 | 0.450% | 8/21/23 | 50 | 50 |
| 2 | GM Financial Automobile Leasing Trust Class A4 Series 2019-2 | 2.720% | 3/20/23 | 50 | 51 |
| 2 | GM Financial Automobile Leasing Trust Class A4 Series 2020-1 | 1.700% | 12/20/23 | 10 | 10 |
| 2 | GM Financial Automobile Leasing Trust Class A4 Series 2020-3 | 0.510% | 10/21/24 | 25 | 25 |
| 2 | GM Financial Consumer Automobile Receivables Trust Class A3 Series 2018-2 | 2.810% | 12/16/22 | 47 | 47 |
| 2 | GM Financial Consumer Automobile Receivables Trust Class A3 Series 2020-1 | 1.840% | 9/16/24 | 90 | 92 |
| | | | Coupon | Maturity
Date | Face
Amount
($000) | Market
Value•
($000) |
| 2 | GM Financial Consumer Automobile Receivables Trust Class A3 Series 2020-3 | 0.450% | 4/16/25 | 175 | 176 |
| 2 | GM Financial Consumer Automobile Receivables Trust Class A3 Series 2020-4 | 0.380% | 8/18/25 | 115 | 115 |
| 2 | GM Financial Consumer Automobile Receivables Trust Class A4 Series 2018-2 | 3.020% | 12/18/23 | 75 | 77 |
| 2 | GM Financial Consumer Automobile Receivables Trust Class A4 Series 2020-1 | 1.900% | 3/17/25 | 30 | 31 |
| 2 | GM Financial Consumer Automobile Receivables Trust Class A4 Series 2020-3 | 0.580% | 1/16/26 | 25 | 25 |
| 2 | GS Mortgage Securities Corp II Class A5 Series 2013-GC10 | 2.943% | 2/10/46 | 92 | 95 |
| 2 | GS Mortgage Securities Corp II Class AS Series 2013-GC10 | 3.279% | 2/10/46 | 35 | 36 |
| 2 | GS Mortgage Securities Trust Class A3 Series 2012-GC6 | 3.482% | 1/10/45 | 299 | 304 |
| 2 | GS Mortgage Securities Trust Class A3 Series 2012-GCJ9 | 2.773% | 11/10/45 | 122 | 126 |
| 2 | GS Mortgage Securities Trust Class A3 Series 2017-GS6 | 3.433% | 5/10/50 | 150 | 169 |
| 2 | GS Mortgage Securities Trust Class A4 Series 2011-GC5 | 3.707% | 8/10/44 | 77 | 78 |
| 2 | GS Mortgage Securities Trust Class A4 Series 2012-GCJ7 | 3.377% | 5/10/45 | 107 | 109 |
| 2 | GS Mortgage Securities Trust Class A4 Series 2013-GC12 | 3.135% | 6/10/46 | 90 | 95 |
| 2 | GS Mortgage Securities Trust Class A4 Series 2014-GC18 | 4.074% | 1/10/47 | 200 | 217 |
| 2 | GS Mortgage Securities Trust Class A4 Series 2015-GC30 | 3.382% | 5/10/50 | 150 | 165 |
| 2 | GS Mortgage Securities Trust Class A4 Series 2015-GC32 | 3.764% | 7/10/48 | 50 | 56 |
| 2 | GS Mortgage Securities Trust Class A4 Series 2015-GC34 | 3.506% | 10/10/48 | 100 | 111 |
| 2 | GS Mortgage Securities Trust Class A4 Series 2016-GS2 | 3.050% | 5/10/49 | 75 | 82 |
| 2 | GS Mortgage Securities Trust Class A4 Series 2016-GS3 | 2.850% | 10/10/49 | 200 | 218 |
| 2,4 | GS Mortgage Securities Trust Class A4 Series 2016-GS4 | 3.442% | 11/10/49 | 75 | 84 |
| 2 | GS Mortgage Securities Trust Class A4 Series 2017-GS5 | 3.674% | 3/10/50 | 150 | 170 |
| 2 | GS Mortgage Securities Trust Class A4 Series 2017-GS7 | 3.430% | 8/10/50 | 261 | 295 |
| 2 | GS Mortgage Securities Trust Class A4 Series 2019-GC39 | 3.567% | 5/10/52 | 100 | 115 |
Total Bond Market Index Portfolio
| | | | Coupon | Maturity
Date | Face
Amount
($000) | Market
Value•
($000) |
| 2 | GS Mortgage Securities Trust Class A4 Series 2019-GC40 | 3.160% | 7/10/52 | 150 | 169 |
| 2 | GS Mortgage Securities Trust Class A4 Series 2019-GC42 | 3.001% | 9/1/52 | 275 | 307 |
| 2 | GS Mortgage Securities Trust Class A4 Series 2019-GSA1 | 3.048% | 11/10/52 | 125 | 140 |
| 2,4 | GS Mortgage Securities Trust Class A5 Series 2013-GC13 | 4.051% | 7/10/46 | 20 | 22 |
| 2 | GS Mortgage Securities Trust Class A5 Series 2013-GC14 | 4.243% | 8/10/46 | 150 | 163 |
| 2 | GS Mortgage Securities Trust Class A5 Series 2014-GC22 | 3.862% | 6/10/47 | 50 | 55 |
| 2 | GS Mortgage Securities Trust Class A5 Series 2014-GC24 | 3.931% | 9/10/47 | 125 | 138 |
| 2 | GS Mortgage Securities Trust Class A5 Series 2014-GC26 | 3.629% | 11/10/47 | 225 | 248 |
| 2 | GS Mortgage Securities Trust Class A5 Series 2015-GC28 | 3.396% | 2/10/48 | 150 | 164 |
| 2 | GS Mortgage Securities Trust Class A5 Series 2020-GC45 | 2.911% | 2/13/53 | 125 | 139 |
| 2 | GS Mortgage Securities Trust Class A5 Series 2020-GC47 | 2.377% | 5/12/53 | 75 | 80 |
| 2 | GS Mortgage Securities Trust Class A5 Series 2020-GSA2 | 2.012% | 12/12/53 | 125 | 129 |
| 2 | GS Mortgage Securities Trust Class AAB Series 2013-GC14 | 3.817% | 8/10/46 | 16 | 16 |
| 2 | GS Mortgage Securities Trust Class AAB Series 2014-GC22 | 3.467% | 6/10/47 | 33 | 34 |
| 2 | GS Mortgage Securities Trust Class AAB Series 2014-GC26 | 3.365% | 11/10/47 | 59 | 62 |
| 2 | GS Mortgage Securities Trust Class AAB Series 2015-GC32 | 3.513% | 7/10/48 | 115 | 122 |
| 2 | GS Mortgage Securities Trust Class AB Series 2015-GC34 | 3.278% | 10/10/48 | 121 | 129 |
| 2 | GS Mortgage Securities Trust Class AS Series 2013-GCJ2 | 3.375% | 6/10/46 | 39 | 41 |
| 2 | GS Mortgage Securities Trust Class AS Series 2014-GC26 | 3.964% | 11/10/47 | 50 | 55 |
| 2,4 | GS Mortgage Securities Trust Class AS Series 2016-GS4 | 3.645% | 11/10/49 | 50 | 55 |
| 2,4 | GS Mortgage Securities Trust Class AS Series 2017-GS5 | 3.826% | 3/10/50 | 50 | 56 |
| 2 | GS Mortgage Securities Trust Class AS Series 2017-GS7 | 3.663% | 8/10/50 | 70 | 79 |
| 2 | GS Mortgage Securities Trust Class AS Series 2019-GC42 | 3.212% | 9/1/52 | 50 | 56 |
| 2,4 | GS Mortgage Securities Trust Class AS Series 2020-GC45 | 3.173% | 2/13/53 | 35 | 39 |
| | | | Coupon | Maturity
Date | Face
Amount
($000) | Market
Value•
($000) |
| 2 | GS Mortgage Securities Trust Class AS Series 2020-GSA2 | 2.224% | 12/12/53 | 25 | 26 |
| 2,4 | GS Mortgage Securities Trust Class B Series 2014-GC24 | 4.511% | 9/10/47 | 25 | 24 |
| 2,4 | GS Mortgage Securities Trust Class B Series 2014-GC26 | 4.215% | 11/10/47 | 50 | 52 |
| 2,4 | GS Mortgage Securities Trust Class C Series 2017-GS6 | 4.322% | 5/10/50 | 10 | 11 |
| 2 | Honda Auto Receivables Owner Trust Class A3 Series 2017-4 | 2.050% | 11/22/21 | 3 | 3 |
| 2 | Honda Auto Receivables Owner Trust Class A3 Series 2018-1I | 2.600% | 2/15/22 | 49 | 50 |
| 2 | Honda Auto Receivables Owner Trust Class A3 Series 2018-2 | 3.010% | 5/18/22 | 28 | 28 |
| 2 | Honda Auto Receivables Owner Trust Class A3 Series 2019-2 | 2.520% | 6/21/23 | 150 | 153 |
| 2 | Honda Auto Receivables Owner Trust Class A3 Series 2020-1 | 1.610% | 4/22/24 | 110 | 112 |
| 2 | Honda Auto Receivables Owner Trust Class A3 Series 2020-3 | 0.370% | 10/18/24 | 100 | 100 |
| 2 | Honda Auto Receivables Owner Trust Class A4 Series 2018-1I | 2.780% | 5/15/24 | 75 | 76 |
| 2 | Honda Auto Receivables Owner Trust Class A4 Series 2018-2 | 3.160% | 8/19/24 | 50 | 51 |
| 2 | Honda Auto Receivables Owner Trust Class A4 Series 2019-2 | 2.540% | 3/21/25 | 30 | 31 |
| 2 | Honda Auto Receivables Owner Trust Class A4 Series 2020-1 | 1.630% | 10/21/26 | 20 | 21 |
| 2 | Honda Auto Receivables Owner Trust Class A4 Series 2020-3 | 0.460% | 4/19/27 | 25 | 25 |
| 2 | Hyundai Auto Receivables Trust Class A3 Series 2018-A | 2.790% | 7/15/22 | 18 | 18 |
| 2 | Hyundai Auto Receivables Trust Class A3 Series 2020-A | 1.410% | 11/15/24 | 10 | 10 |
| 2 | Hyundai Auto Receivables Trust Class A3 Series 2020-B | 0.480% | 12/16/24 | 50 | 50 |
| 2 | Hyundai Auto Receivables Trust Class A3 Series 2020-C | 0.380% | 5/15/25 | 50 | 50 |
| 2 | Hyundai Auto Receivables Trust Class A4 Series 2018-A | 2.940% | 6/17/24 | 75 | 77 |
| 2 | Hyundai Auto Receivables Trust Class A4 Series 2020-B | 0.620% | 12/15/25 | 25 | 25 |
| 2 | JP Morgan Chase Commercial Mortgage Securities Trust Class A3 Series 2012-C6 | 3.507% | 5/15/45 | 149 | 153 |
| 2 | JP Morgan Chase Commercial Mortgage Securities Trust Class A3 Series 2012-C8 | 2.829% | 10/15/45 | 109 | 112 |
Total Bond Market Index Portfolio
| | | | Coupon | Maturity
Date | Face
Amount
($000) | Market
Value•
($000) |
| 2 | JP Morgan Chase Commercial Mortgage Securities Trust Class A4 Series 2012-CBX | 3.483% | 6/15/45 | 163 | 166 |
| 2 | JP Morgan Chase Commercial Mortgage Securities Trust Class A4 Series 2013-C16 | 4.166% | 12/15/46 | 100 | 109 |
| 2,4 | JP Morgan Chase Commercial Mortgage Securities Trust Class A4 Series 2016-JP4 | 3.648% | 12/15/49 | 100 | 114 |
| 2 | JP Morgan Chase Commercial Mortgage Securities Trust Class A5 Series 2013-C10 | 3.143% | 12/15/47 | 51 | 54 |
| 2 | JP Morgan Chase Commercial Mortgage Securities Trust Class A5 Series 2013-LC11 | 2.960% | 4/15/46 | 208 | 218 |
| 2 | JP Morgan Chase Commercial Mortgage Securities Trust Class A5 Series 2014-C20 | 3.805% | 7/15/47 | 75 | 82 |
| 2 | JP Morgan Chase Commercial Mortgage Securities Trust Class A5 Series 2015-JP1 | 3.914% | 1/15/49 | 75 | 85 |
| 2 | JP Morgan Chase Commercial Mortgage Securities Trust Class A5 Series 2016-JP3 | 2.870% | 8/15/49 | 250 | 273 |
| 2 | JP Morgan Chase Commercial Mortgage Securities Trust Class AS Series 2013-C10 | 3.372% | 12/15/47 | 39 | 41 |
| 2,4 | JP Morgan Chase Commercial Mortgage Securities Trust Class AS Series 2016-JP4 | 3.870% | 12/15/49 | 75 | 84 |
| 2 | JP Morgan Chase Commercial Mortgage Securities Trust Class B Series 2013-LC11 | 3.499% | 4/15/46 | 50 | 49 |
| 2 | JPMBB Commercial Mortgage Securities Trust Class A2 Series 2014-C24 | 2.940% | 11/15/47 | 11 | 11 |
| 2 | JPMBB Commercial Mortgage Securities Trust Class A3 Series 2014-C19 | 3.669% | 4/15/47 | 50 | 50 |
| 2 | JPMBB Commercial Mortgage Securities Trust Class A3 Series 2015-C31 | 3.801% | 8/15/48 | 107 | 120 |
| 2,4 | JPMBB Commercial Mortgage Securities Trust Class A4 Series 2013-C14 | 4.133% | 8/15/46 | 100 | 106 |
| 2 | JPMBB Commercial Mortgage Securities Trust Class A4 Series 2014-C19 | 3.997% | 4/15/47 | 95 | 104 |
| | | | Coupon | Maturity
Date | Face
Amount
($000) | Market
Value•
($000) |
| 2 | JPMBB Commercial Mortgage Securities Trust Class A4 Series 2014-C22 | 3.801% | 9/15/47 | 175 | 192 |
| 2 | JPMBB Commercial Mortgage Securities Trust Class A4 Series 2014-C26 | 3.494% | 1/15/48 | 175 | 192 |
| 2 | JPMBB Commercial Mortgage Securities Trust Class A4 Series 2015-C27 | 3.179% | 2/15/48 | 59 | 64 |
| 2 | JPMBB Commercial Mortgage Securities Trust Class A4 Series 2015-C28 | 3.227% | 10/15/48 | 125 | 136 |
| 2 | JPMBB Commercial Mortgage Securities Trust Class A4 Series 2015-C29 | 3.611% | 5/15/48 | 100 | 111 |
| 2 | JPMBB Commercial Mortgage Securities Trust Class A4 Series 2015-C33 | 3.770% | 12/15/48 | 82 | 93 |
| 2 | JPMBB Commercial Mortgage Securities Trust Class A5 Series 2013-C12 | 3.664% | 7/15/45 | 39 | 42 |
| 2 | JPMBB Commercial Mortgage Securities Trust Class A5 Series 2013-C15 | 4.131% | 11/15/45 | 65 | 71 |
| 2 | JPMBB Commercial Mortgage Securities Trust Class A5 Series 2014-C18 | 4.079% | 2/15/47 | 127 | 139 |
| 2 | JPMBB Commercial Mortgage Securities Trust Class A5 Series 2014-C21 | 3.775% | 8/15/47 | 25 | 27 |
| 2 | JPMBB Commercial Mortgage Securities Trust Class A5 Series 2014-C23 | 3.934% | 9/15/47 | 85 | 94 |
| 2 | JPMBB Commercial Mortgage Securities Trust Class A5 Series 2014-C24 | 3.639% | 11/15/47 | 50 | 55 |
| 2 | JPMBB Commercial Mortgage Securities Trust Class A5 Series 2014-C25 | 3.672% | 11/15/47 | 200 | 220 |
| 2 | JPMBB Commercial Mortgage Securities Trust Class A5 Series 2015-C30 | 3.822% | 7/15/48 | 100 | 112 |
| 2 | JPMBB Commercial Mortgage Securities Trust Class A5 Series 2015-C32 | 3.598% | 11/15/48 | 125 | 140 |
| 2,4 | JPMBB Commercial Mortgage Securities Trust Class AS Series 2013-C12 | 4.038% | 7/15/45 | 26 | 28 |
| 2,4 | JPMBB Commercial Mortgage Securities Trust Class AS Series 2013-C14 | 4.409% | 8/15/46 | 30 | 32 |
| 2 | JPMBB Commercial Mortgage Securities Trust Class AS Series 2013-C15 | 4.420% | 11/15/45 | 35 | 38 |
Total Bond Market Index Portfolio
| | | | Coupon | Maturity
Date | Face
Amount
($000) | Market
Value•
($000) |
| 2,4 | JPMBB Commercial Mortgage Securities Trust Class AS Series 2014-C18 | 4.439% | 2/15/47 | 25 | 27 |
| 2,4 | JPMBB Commercial Mortgage Securities Trust Class AS Series 2014-C19 | 4.243% | 4/15/47 | 50 | 55 |
| 2 | JPMBB Commercial Mortgage Securities Trust Class AS Series 2014-C22 | 4.110% | 9/15/47 | 50 | 55 |
| 2,4 | JPMBB Commercial Mortgage Securities Trust Class AS Series 2014-C23 | 4.202% | 9/15/47 | 50 | 55 |
| 2,4 | JPMBB Commercial Mortgage Securities Trust Class AS Series 2014-C24 | 3.914% | 11/15/47 | 75 | 81 |
| 2 | JPMBB Commercial Mortgage Securities Trust Class AS Series 2014-C25 | 4.065% | 11/15/47 | 50 | 55 |
| 2 | JPMBB Commercial Mortgage Securities Trust Class AS Series 2014-C26 | 3.800% | 1/15/48 | 50 | 55 |
| 2 | JPMBB Commercial Mortgage Securities Trust Class AS Series 2015-C28 | 3.532% | 10/15/48 | 50 | 54 |
| 2,4 | JPMBB Commercial Mortgage Securities Trust Class AS Series 2015-C30 | 4.226% | 7/15/48 | 50 | 56 |
| 2,4 | JPMBB Commercial Mortgage Securities Trust Class ASB Series 2013-C14 | 3.761% | 8/15/46 | 22 | 23 |
| 2 | JPMBB Commercial Mortgage Securities Trust Class ASB Series 2013-C15 | 3.659% | 11/15/45 | 6 | 6 |
| 2 | JPMBB Commercial Mortgage Securities Trust Class ASB Series 2014-C21 | 3.428% | 8/15/47 | 22 | 23 |
| 2 | JPMBB Commercial Mortgage Securities Trust Class ASB Series 2015-C27 | 3.017% | 2/15/48 | 92 | 96 |
| 2 | JPMBB Commercial Mortgage Securities Trust Class ASB Series 2015-C29 | 3.304% | 5/15/48 | 50 | 53 |
| 2 | JPMBB Commercial Mortgage Securities Trust Class ASB Series 2015-C30 | 3.559% | 7/15/48 | 111 | 116 |
| 2 | JPMBB Commercial Mortgage Securities Trust Class ASB Series 2015-C31 | 3.540% | 8/15/48 | 49 | 52 |
| 2 | JPMBB Commercial Mortgage Securities Trust Class ASB Series 2015-C32 | 3.358% | 11/15/48 | 111 | 118 |
| 2 | JPMBB Commercial Mortgage Securities Trust Class ASB Series 2016-C1 | 3.316% | 3/15/49 | 73 | 78 |
| | | | Coupon | Maturity
Date | Face
Amount
($000) | Market
Value•
($000) |
| 2,4 | JPMBB Commercial Mortgage Securities Trust Class B Series 2014-C18 | 4.794% | 2/15/47 | 30 | 32 |
| 2 | JPMBB Commercial Mortgage Securities Trust Class B Series 2014-C26 | 3.951% | 1/15/48 | 50 | 53 |
| 2 | JPMCC Commercial Mortgage Securities Trust Class A2 Series 2017-JP6 | 3.050% | 7/15/50 | 31 | 32 |
| 2 | JPMCC Commercial Mortgage Securities Trust Class A4 Series 2019-COR5 | 3.386% | 6/13/52 | 200 | 228 |
| 2 | JPMCC Commercial Mortgage Securities Trust Class A5 Series 2017-JP5 | 3.723% | 3/15/50 | 400 | 458 |
| 2 | JPMCC Commercial Mortgage Securities Trust Class A5 Series 2017-JP6 | 3.490% | 7/15/50 | 100 | 113 |
| 2 | JPMCC Commercial Mortgage Securities Trust Class A5 Series 2019-COR4 | 4.029% | 3/10/52 | 300 | 356 |
| 2 | JPMCC Commercial Mortgage Securities Trust Class AS Series 2017-JP6 | 3.744% | 7/15/50 | 100 | 112 |
| 2 | JPMCC Commercial Mortgage Securities Trust Class AS Series 2019-COR5 | 3.669% | 6/13/52 | 25 | 28 |
| 2 | JPMDB Commercial Mortgage Securities Trust Class A4 Series 2016-C2 | 3.144% | 6/15/49 | 75 | 83 |
| 2 | JPMDB Commercial Mortgage Securities Trust Class A4 Series 2018-C8 | 4.211% | 6/15/51 | 225 | 267 |
| 2 | JPMDB Commercial Mortgage Securities Trust Class A4 Series 2019-COR6 | 3.057% | 11/13/52 | 175 | 196 |
| 2 | JPMDB Commercial Mortgage Securities Trust Class A5 Series 2017-C7 | 3.409% | 10/15/50 | 75 | 85 |
| 2 | JPMDB Commercial Mortgage Securities Trust Class A5 Series 2020-COR7 | 2.180% | 5/13/53 | 50 | 52 |
| 2 | JPMDB Commercial Mortgage Securities Trust Class AS Series 2016-C2 | 3.484% | 6/15/49 | 50 | 54 |
| 2,4 | JPMDB Commercial Mortgage Securities Trust Class AS Series 2017-C7 | 3.713% | 10/15/50 | 50 | 57 |
| 2 | JPMDB Commercial Mortgage Securities Trust Class AS Series 2018-C8 | 4.421% | 6/15/51 | 25 | 29 |
| 2 | Mercedes-Benz Auto Lease Trust Class A3 Series 2020-A | 1.840% | 12/15/22 | 50 | 51 |
| 2 | Mercedes-Benz Auto Lease Trust Class A4 Series 2020-A | 1.880% | 9/15/25 | 25 | 26 |
Total Bond Market Index Portfolio
| | | | Coupon | Maturity
Date | Face
Amount
($000) | Market
Value•
($000) |
| 2 | Mercedes-Benz Auto Lease Trust Class A4 Series 2020-B | 0.500% | 6/15/26 | 10 | 10 |
| 2 | Mercedes-Benz Auto Receivables Trust Class A3 Series 2020-1 | 0.550% | 2/18/25 | 50 | 50 |
| 2 | Mercedes-Benz Auto Receivables Trust Class A4 Series 2020-1 | 0.770% | 10/15/26 | 10 | 10 |
| 2 | Morgan Stanley Bank of America Merrill Lynch Trust Class A3 Series 2017-C34 | 3.276% | 11/15/52 | 125 | 137 |
| 2 | Morgan Stanley Bank of America Merrill Lynch Trust Class A4 Series 2012-C5 | 3.176% | 8/15/45 | 100 | 103 |
| 2,4 | Morgan Stanley Bank of America Merrill Lynch Trust Class A4 Series 2013-C11 | 4.152% | 8/15/46 | 40 | 43 |
| 2,4 | Morgan Stanley Bank of America Merrill Lynch Trust Class A4 Series 2013-C12 | 4.259% | 10/15/46 | 100 | 109 |
| 2 | Morgan Stanley Bank of America Merrill Lynch Trust Class A4 Series 2013-C7 | 2.918% | 2/15/46 | 68 | 71 |
| 2 | Morgan Stanley Bank of America Merrill Lynch Trust Class A4 Series 2013-C8 | 3.134% | 12/15/48 | 100 | 105 |
| 2 | Morgan Stanley Bank of America Merrill Lynch Trust Class A4 Series 2013-C9 | 3.102% | 5/15/46 | 50 | 53 |
| 2 | Morgan Stanley Bank of America Merrill Lynch Trust Class A4 Series 2014-C19 | 3.526% | 12/15/47 | 75 | 82 |
| 2 | Morgan Stanley Bank of America Merrill Lynch Trust Class A4 Series 2015-C20 | 3.249% | 2/15/48 | 200 | 217 |
| 2 | Morgan Stanley Bank of America Merrill Lynch Trust Class A4 Series 2015-C22 | 3.306% | 4/15/48 | 75 | 82 |
| 2 | Morgan Stanley Bank of America Merrill Lynch Trust Class A4 Series 2015-C23 | 3.719% | 7/15/50 | 125 | 140 |
| 2 | Morgan Stanley Bank of America Merrill Lynch Trust Class A4 Series 2015-C24 | 3.732% | 5/15/48 | 75 | 84 |
| 2 | Morgan Stanley Bank of America Merrill Lynch Trust Class A4 Series 2015-C27 | 3.753% | 12/15/47 | 75 | 84 |
| 2 | Morgan Stanley Bank of America Merrill Lynch Trust Class A4 Series 2016-C28 | 3.544% | 1/15/49 | 225 | 252 |
| 2 | Morgan Stanley Bank of America Merrill Lynch Trust Class A4 Series 2017-C34 | 3.536% | 11/15/52 | 150 | 170 |
| 2 | Morgan Stanley Bank of America Merrill Lynch Trust Class A5 Series 2014-C14 | 4.064% | 2/15/47 | 100 | 108 |
| | | | Coupon | Maturity
Date | Face
Amount
($000) | Market
Value•
($000) |
| 2 | Morgan Stanley Bank of America Merrill Lynch Trust Class A5 Series 2014-C16 | 3.892% | 6/15/47 | 100 | 109 |
| 2 | Morgan Stanley Bank of America Merrill Lynch Trust Class A5 Series 2015-C25 | 3.635% | 10/15/48 | 75 | 84 |
| 2 | Morgan Stanley Bank of America Merrill Lynch Trust Class A5 Series 2015-C26 | 3.531% | 10/15/48 | 75 | 84 |
| 2 | Morgan Stanley Bank of America Merrill Lynch Trust Class A5 Series 2016-C30 | 2.860% | 9/15/49 | 200 | 219 |
| 2 | Morgan Stanley Bank of America Merrill Lynch Trust Class A5 Series 2016-C31 | 3.102% | 11/15/49 | 250 | 276 |
| 2 | Morgan Stanley Bank of America Merrill Lynch Trust Class A5 Series 2017-C33 | 3.599% | 5/15/50 | 150 | 170 |
| 2,4 | Morgan Stanley Bank of America Merrill Lynch Trust Class AS Series 2013-C11 | 4.352% | 8/15/46 | 20 | 19 |
| 2 | Morgan Stanley Bank of America Merrill Lynch Trust Class AS Series 2013-C7 | 3.214% | 2/15/46 | 14 | 14 |
| 2 | Morgan Stanley Bank of America Merrill Lynch Trust Class AS Series 2013-C8 | 3.376% | 12/15/48 | 50 | 52 |
| 2 | Morgan Stanley Bank of America Merrill Lynch Trust Class AS Series 2013-C9 | 3.456% | 5/15/46 | 50 | 52 |
| 2 | Morgan Stanley Bank of America Merrill Lynch Trust Class AS Series 2017-C33 | 3.852% | 5/15/50 | 100 | 112 |
| 2 | Morgan Stanley Bank of America Merrill Lynch Trust Class ASB Series 2014-C16 | 3.477% | 6/15/47 | 17 | 18 |
| 2 | Morgan Stanley Bank of America Merrill Lynch Trust Class ASB Series 2014-C19 | 3.326% | 12/15/47 | 41 | 43 |
| 2 | Morgan Stanley Bank of America Merrill Lynch Trust Class ASB Series 2015-C20 | 3.069% | 2/15/48 | 42 | 44 |
| 2 | Morgan Stanley Bank of America Merrill Lynch Trust Class ASB Series 2015-C22 | 3.040% | 4/15/48 | 89 | 94 |
| 2 | Morgan Stanley Bank of America Merrill Lynch Trust Class ASB Series 2015-C23 | 3.398% | 7/15/50 | 46 | 48 |
| 2 | Morgan Stanley Bank of America Merrill Lynch Trust Class ASB Series 2015-C25 | 3.383% | 10/15/48 | 120 | 127 |
| 2 | Morgan Stanley Bank of America Merrill Lynch Trust Class ASB Series 2015-C26 | 3.323% | 10/15/48 | 72 | 77 |
Total Bond Market Index Portfolio
| | | | Coupon | Maturity
Date | Face
Amount
($000) | Market
Value•
($000) |
| 2 | Morgan Stanley Bank of America Merrill Lynch Trust Class ASB Series 2015-C27 | 3.557% | 12/15/47 | 49 | 52 |
| 2 | Morgan Stanley Bank of America Merrill Lynch Trust Class ASB Series 2016-C28 | 3.288% | 1/15/49 | 100 | 105 |
| 2,4 | Morgan Stanley Bank of America Merrill Lynch Trust Class B Series 2014-C14 | 4.860% | 2/15/47 | 100 | 107 |
| 2,4 | Morgan Stanley Bank of America Merrill Lynch Trust Class B Series 2014-C16 | 4.335% | 6/15/47 | 50 | 51 |
| 2,4 | Morgan Stanley Bank of America Merrill Lynch Trust Class B Series 2014-C18 | 4.481% | 10/15/47 | 50 | 54 |
| 2,4 | Morgan Stanley Bank of America Merrill Lynch Trust Class B Series 2015-C22 | 3.883% | 4/15/48 | 50 | 52 |
| 2 | Morgan Stanley Capital I Trust Class A3 Series 2019-L2 | 3.806% | 3/15/52 | 50 | 58 |
| 2 | Morgan Stanley Capital I Trust Class A3 Series 2020-L4 | 2.698% | 2/15/53 | 175 | 190 |
| 2 | Morgan Stanley Capital I Trust Class A4 Series 2012-C4 | 3.244% | 3/15/45 | 350 | 356 |
| 2 | Morgan Stanley Capital I Trust Class A4 Series 2015-UBS8 | 3.809% | 12/15/48 | 75 | 84 |
| 2 | Morgan Stanley Capital I Trust Class A4 Series 2016-BNK2 | 3.049% | 11/15/49 | 100 | 110 |
| 2 | Morgan Stanley Capital I Trust Class A4 Series 2016-UB11 | 2.782% | 8/15/49 | 200 | 218 |
| 2 | Morgan Stanley Capital I Trust Class A4 Series 2016-UBS12 | 3.596% | 12/15/49 | 200 | 226 |
| 2 | Morgan Stanley Capital I Trust Class A4 Series 2019-H6 | 3.417% | 6/15/52 | 250 | 283 |
| 2 | Morgan Stanley Capital I Trust Class A4 Series 2019-L2 | 4.071% | 3/15/52 | 150 | 177 |
| 2 | Morgan Stanley Capital I Trust Class A4 Series 2019-L3 | 3.127% | 11/15/52 | 200 | 223 |
| 2 | Morgan Stanley Capital I Trust Class A5 Series 2017-H1 | 3.530% | 6/15/50 | 150 | 170 |
| 2 | Morgan Stanley Capital I Trust Class AS Series 2012-C4 | 3.773% | 3/15/45 | 75 | 76 |
| 2 | Morgan Stanley Capital I Trust Class AS Series 2016-BNK2 | 3.282% | 11/15/49 | 83 | 91 |
| 2 | Morgan Stanley Capital I Trust Class AS Series 2019-H6 | 3.700% | 6/15/52 | 25 | 28 |
| 2 | Morgan Stanley Capital I Trust Class AS Series 2020-L4 | 2.880% | 2/15/53 | 25 | 27 |
| 2 | Nissan Auto Lease Trust Class A3 Series 2020-A | 1.840% | 1/17/23 | 50 | 51 |
| 2 | Nissan Auto Lease Trust Class A4 Series 2020-A | 1.880% | 4/15/25 | 25 | 26 |
| | | | Coupon | Maturity
Date | Face
Amount
($000) | Market
Value•
($000) |
| 2 | Nissan Auto Receivables Owner Trust Class A3 Series 2018-A | 2.650% | 5/16/22 | 28 | 29 |
| 2 | Nissan Auto Receivables Owner Trust Class A3 Series 2019-B | 2.500% | 11/15/23 | 125 | 127 |
| 2 | Nissan Auto Receivables Owner Trust Class A3 Series 2019-C | 1.930% | 7/15/24 | 150 | 153 |
| 2 | Nissan Auto Receivables Owner Trust Class A3 Series 2020-A | 0.550% | 7/15/24 | 50 | 50 |
| 2 | Nissan Auto Receivables Owner Trust Class A3 Series 2020-A | 1.380% | 12/16/24 | 50 | 51 |
| 2 | Nissan Auto Receivables Owner Trust Class A4 Series 2017-B | 1.950% | 10/16/23 | 99 | 99 |
| 2 | Nissan Auto Receivables Owner Trust Class A4 Series 2018-A | 2.890% | 6/17/24 | 100 | 102 |
| 2 | Nissan Auto Receivables Owner Trust Class A4 Series 2019-B | 2.540% | 12/15/25 | 30 | 31 |
| 2 | Nissan Auto Receivables Owner Trust Class A4 Series 2019-C | 1.950% | 5/15/26 | 35 | 36 |
| 2 | Santander Drive Auto Receivables Trust Class B Series 2020-2 | 0.960% | 11/15/24 | 25 | 25 |
| 2 | Santander Drive Auto Receivables Trust Class B Series 2020-3 | 0.690% | 3/17/25 | 25 | 25 |
| 2 | Santander Drive Auto Receivables Trust Class B Series 2020-4 | 0.730% | 3/17/25 | 25 | 25 |
| 2 | Santander Drive Auto Receivables Trust Class C Series 2018-2 | 3.350% | 7/17/23 | 28 | 28 |
| 2 | Santander Drive Auto Receivables Trust Class C Series 2018-3 | 3.510% | 8/15/23 | 28 | 28 |
| 2 | Santander Drive Auto Receivables Trust Class C Series 2020-2 | 1.460% | 9/15/25 | 25 | 25 |
| 2 | Santander Drive Auto Receivables Trust Class C Series 2020-3 | 1.120% | 1/15/26 | 25 | 25 |
| 2 | Santander Drive Auto Receivables Trust Class C Series 2020-4 | 1.010% | 1/15/26 | 25 | 25 |
| 2 | Synchrony Card Issuance Trust Class A Series 2018-A1 | 3.380% | 9/15/24 | 275 | 281 |
| 2 | Synchrony Credit Card Master Note Trust Class A Series 2016-2 | 2.210% | 5/15/24 | 373 | 375 |
| 2 | Synchrony Credit Card Master Note Trust Class A Series 2017-2 | 2.620% | 10/15/25 | 150 | 156 |
| 2 | Synchrony Credit Card Master Note Trust Class A Series 2018-1 | 2.970% | 3/15/24 | 275 | 276 |
| 2 | Synchrony Credit Card Master Note Trust Class A Series 2018-2 | 3.470% | 5/15/26 | 275 | 294 |
| 2 | Toyota Auto Receivables Owner Trust Class A3 Series 2017-D | 1.930% | 1/18/22 | 27 | 27 |
| 2 | Toyota Auto Receivables Owner Trust Class A3 Series 2018-A | 2.350% | 5/16/22 | 31 | 31 |
Total Bond Market Index Portfolio
| | | | Coupon | Maturity
Date | Face
Amount
($000) | Market
Value•
($000) |
| 2 | Toyota Auto Receivables Owner Trust Class A3 Series 2018-B | 2.960% | 9/15/22 | 58 | 59 |
| 2 | Toyota Auto Receivables Owner Trust Class A3 Series 2020-A | 1.660% | 5/15/24 | 135 | 138 |
| 2 | Toyota Auto Receivables Owner Trust Class A3 Series 2020-B | 1.360% | 8/15/24 | 10 | 10 |
| 2 | Toyota Auto Receivables Owner Trust Class A3 Series 2020-D | 0.350% | 1/15/25 | 75 | 75 |
| 2 | Toyota Auto Receivables Owner Trust Class A4 Series 2018-A | 2.520% | 5/15/23 | 50 | 51 |
| 2 | Toyota Auto Receivables Owner Trust Class A4 Series 2018-B | 3.110% | 11/15/23 | 25 | 26 |
| 2 | Toyota Auto Receivables Owner Trust Class A4 Series 2020-A | 1.680% | 5/15/25 | 25 | 26 |
| 2 | Toyota Auto Receivables Owner Trust Class A4 Series 2020-D | 0.470% | 1/15/26 | 25 | 25 |
| 2 | UBS Commercial Mortgage Trust Class A2 Series 2018-C13 | 4.208% | 10/15/51 | 24 | 26 |
| 2 | UBS Commercial Mortgage Trust Class A3 Series 2017-C4 | 3.301% | 10/15/50 | 100 | 110 |
| 2 | UBS Commercial Mortgage Trust Class A3 Series 2018-C8 | 3.720% | 2/15/51 | 150 | 172 |
| 2 | UBS Commercial Mortgage Trust Class A4 Series 2017-C1 | 3.460% | 6/15/50 | 100 | 112 |
| 2 | UBS Commercial Mortgage Trust Class A4 Series 2017-C2 | 3.487% | 8/15/50 | 150 | 171 |
| 2 | UBS Commercial Mortgage Trust Class A4 Series 2017-C3 | 3.426% | 8/15/50 | 175 | 198 |
| 2 | UBS Commercial Mortgage Trust Class A4 Series 2017-C4 | 3.563% | 10/15/50 | 150 | 169 |
| 2 | UBS Commercial Mortgage Trust Class A4 Series 2017-C7 | 3.679% | 12/15/50 | 150 | 173 |
| 2 | UBS Commercial Mortgage Trust Class A4 Series 2018-C13 | 4.334% | 10/15/51 | 75 | 90 |
| 2 | UBS Commercial Mortgage Trust Class A4 Series 2018-C14 | 4.448% | 12/15/51 | 225 | 271 |
| 2 | UBS Commercial Mortgage Trust Class A4 Series 2018-C15 | 4.341% | 12/15/51 | 125 | 149 |
| 2 | UBS Commercial Mortgage Trust Class A4 Series 2018-C8 | 3.983% | 2/15/51 | 275 | 322 |
| | | | Coupon | Maturity
Date | Face
Amount
($000) | Market
Value•
($000) |
| 2 | UBS Commercial Mortgage Trust Class A4 Series 2019-C16 | 3.605% | 4/15/52 | 100 | 115 |
| 2 | UBS Commercial Mortgage Trust Class A4 Series 2019-C17 | 2.921% | 10/15/52 | 125 | 137 |
| 2 | UBS Commercial Mortgage Trust Class A4 Series 2019-C18 | 3.035% | 12/15/52 | 75 | 83 |
| 2 | UBS Commercial Mortgage Trust Class A5 Series 2017-C5 | 3.474% | 11/15/50 | 100 | 113 |
| 2,4 | UBS Commercial Mortgage Trust Class A5 Series 2018-C11 | 4.241% | 6/15/51 | 125 | 147 |
| 2 | UBS Commercial Mortgage Trust Class A5 Series 2018-C12 | 4.296% | 8/15/51 | 100 | 119 |
| 2 | UBS Commercial Mortgage Trust Class AS Series 2017-C1 | 3.724% | 6/15/50 | 50 | 56 |
| 2,4 | UBS Commercial Mortgage Trust Class AS Series 2017-C2 | 3.740% | 8/15/50 | 50 | 56 |
| 2,4 | UBS Commercial Mortgage Trust Class AS Series 2017-C3 | 3.739% | 8/15/50 | 75 | 84 |
| 2,4 | UBS Commercial Mortgage Trust Class AS Series 2017-C4 | 3.836% | 10/15/50 | 62 | 70 |
| 2,4 | UBS Commercial Mortgage Trust Class AS Series 2017-C7 | 4.061% | 12/15/50 | 100 | 112 |
| 2,4 | UBS Commercial Mortgage Trust Class AS Series 2018-C8 | 4.215% | 2/15/51 | 75 | 87 |
| 2 | UBS-Barclays Commercial Mortgage Trust Class A4 Series 2013-C5 | 3.185% | 3/10/46 | 104 | 109 |
| 2 | UBS-Barclays Commercial Mortgage Trust Class A4 Series 2013-C6 | 3.244% | 4/10/46 | 165 | 173 |
| 2 | UBS-Barclays Commercial Mortgage Trust Class A4 Series 2018-C10 | 4.313% | 5/15/51 | 175 | 207 |
| 2,4 | UBS-Barclays Commercial Mortgage Trust Class A4 Series 2018-C9 | 4.117% | 3/15/51 | 275 | 322 |
| 2 | UBS-Barclays Commercial Mortgage Trust Class AS Series 2013-C6 | 3.469% | 4/10/46 | 25 | 26 |
| 2 | UBS-Barclays Commercial Mortgage Trust Class AS Series 2019-C16 | 3.887% | 4/15/52 | 25 | 29 |
Total Bond Market Index Portfolio
| | | | Coupon | Maturity
Date | Face
Amount
($000) | Market
Value•
($000) |
| 2 | Wells Fargo Commercial Mortgage Trust Class A2 Series 2015-NXS1 | 2.632% | 5/15/48 | 7 | 7 |
| 2 | Wells Fargo Commercial Mortgage Trust Class A3 Series 2012-LC5 | 2.918% | 10/15/45 | 62 | 64 |
| 2 | Wells Fargo Commercial Mortgage Trust Class A3 Series 2014-LC18 | 3.271% | 12/15/47 | 42 | 43 |
| 2 | Wells Fargo Commercial Mortgage Trust Class A3 Series 2016-BNK1 | 2.652% | 8/15/49 | 150 | 162 |
| 2 | Wells Fargo Commercial Mortgage Trust Class A3 Series 2016-C36 | 2.807% | 11/15/59 | 50 | 54 |
| 2 | Wells Fargo Commercial Mortgage Trust Class A3 Series 2017-C40 | 3.317% | 10/15/50 | 100 | 110 |
| 2 | Wells Fargo Commercial Mortgage Trust Class A4 Series 2015-C26 | 3.166% | 2/15/48 | 75 | 82 |
| 2 | Wells Fargo Commercial Mortgage Trust Class A4 Series 2015-C27 | 3.190% | 2/15/48 | 234 | 249 |
| 2 | Wells Fargo Commercial Mortgage Trust Class A4 Series 2015-C28 | 3.540% | 5/15/48 | 175 | 194 |
| 2 | Wells Fargo Commercial Mortgage Trust Class A4 Series 2015-C29 | 3.637% | 6/15/48 | 175 | 195 |
| 2 | Wells Fargo Commercial Mortgage Trust Class A4 Series 2015-LC22 | 3.839% | 9/15/58 | 75 | 85 |
| 2 | Wells Fargo Commercial Mortgage Trust Class A4 Series 2015-P2 | 3.809% | 12/15/48 | 50 | 57 |
| 2 | Wells Fargo Commercial Mortgage Trust Class A4 Series 2015-SG1 | 3.789% | 9/15/48 | 209 | 232 |
| 2 | Wells Fargo Commercial Mortgage Trust Class A4 Series 2016-C32 | 3.560% | 1/15/59 | 125 | 139 |
| 2 | Wells Fargo Commercial Mortgage Trust Class A4 Series 2016-C33 | 3.426% | 3/15/59 | 325 | 364 |
| 2 | Wells Fargo Commercial Mortgage Trust Class A4 Series 2016-C34 | 3.096% | 6/15/49 | 75 | 81 |
| 2 | Wells Fargo Commercial Mortgage Trust Class A4 Series 2016-LC24 | 2.942% | 10/15/49 | 162 | 178 |
| 2 | Wells Fargo Commercial Mortgage Trust Class A4 Series 2017-C40 | 3.581% | 10/15/50 | 150 | 171 |
| | | | Coupon | Maturity
Date | Face
Amount
($000) | Market
Value•
($000) |
| 2 | Wells Fargo Commercial Mortgage Trust Class A4 Series 2017-C41 | 3.472% | 11/15/50 | 250 | 283 |
| 2,4 | Wells Fargo Commercial Mortgage Trust Class A4 Series 2018-C43 | 4.012% | 3/15/51 | 275 | 322 |
| 2 | Wells Fargo Commercial Mortgage Trust Class A4 Series 2018-C45 | 4.184% | 6/15/51 | 200 | 236 |
| 2 | Wells Fargo Commercial Mortgage Trust Class A4 Series 2018-C46 | 4.152% | 8/15/51 | 75 | 88 |
| 2 | Wells Fargo Commercial Mortgage Trust Class A4 Series 2018-C47 | 4.442% | 9/15/61 | 150 | 180 |
| 2 | Wells Fargo Commercial Mortgage Trust Class A4 Series 2019-C51 | 3.311% | 6/15/52 | 200 | 227 |
| 2 | Wells Fargo Commercial Mortgage Trust Class A4 Series 2019-C53 | 3.040% | 10/15/52 | 200 | 224 |
| 2 | Wells Fargo Commercial Mortgage Trust Class A4 Series 2019-C54 | 3.146% | 12/15/52 | 100 | 113 |
| 2 | Wells Fargo Commercial Mortgage Trust Class A4 Series 2020-C58 | 2.092% | 7/15/53 | 50 | 52 |
| 2 | Wells Fargo Commercial Mortgage Trust Class A5 Series 2014-LC16 | 3.817% | 8/15/50 | 75 | 82 |
| 2 | Wells Fargo Commercial Mortgage Trust Class A5 Series 2014-LC18 | 3.405% | 12/15/47 | 125 | 137 |
| 2 | Wells Fargo Commercial Mortgage Trust Class A5 Series 2015-LC20 | 3.184% | 4/15/50 | 276 | 302 |
| 2 | Wells Fargo Commercial Mortgage Trust Class A5 Series 2015-NXS1 | 3.148% | 5/15/48 | 50 | 55 |
| 2 | Wells Fargo Commercial Mortgage Trust Class A5 Series 2016-C37 | 3.794% | 12/15/49 | 100 | 114 |
| 2 | Wells Fargo Commercial Mortgage Trust Class A5 Series 2017-C38 | 3.453% | 7/15/50 | 192 | 218 |
| 2 | Wells Fargo Commercial Mortgage Trust Class A5 Series 2017-C39 | 3.418% | 9/15/50 | 175 | 198 |
| 2 | Wells Fargo Commercial Mortgage Trust Class A5 Series 2018-C44 | 4.212% | 5/15/51 | 175 | 206 |
| 2 | Wells Fargo Commercial Mortgage Trust Class A5 Series 2019-C49 | 4.023% | 3/15/52 | 225 | 266 |
Total Bond Market Index Portfolio
| | | | Coupon | Maturity
Date | Face
Amount
($000) | Market
Value•
($000) |
| 2 | Wells Fargo Commercial Mortgage Trust Class A5 Series 2019-C50 | 3.729% | 5/15/52 | 125 | 145 |
| 2 | Wells Fargo Commercial Mortgage Trust Class A5 Series 2019-C52 | 2.892% | 8/15/52 | 270 | 298 |
| 2 | Wells Fargo Commercial Mortgage Trust Class A5 Series 2020-C55 | 2.725% | 2/15/53 | 165 | 181 |
| 2 | Wells Fargo Commercial Mortgage Trust Class A5 Series 2020-C56 | 2.448% | 6/15/53 | 50 | 54 |
| 2 | Wells Fargo Commercial Mortgage Trust Class AS Series 2014-LC18 | 3.808% | 12/15/47 | 75 | 83 |
| 2 | Wells Fargo Commercial Mortgage Trust Class AS Series 2015-C26 | 3.580% | 2/15/48 | 50 | 54 |
| 2,4 | Wells Fargo Commercial Mortgage Trust Class AS Series 2015-C28 | 3.872% | 5/15/48 | 31 | 34 |
| 2,4 | Wells Fargo Commercial Mortgage Trust Class AS Series 2015-LC22 | 4.207% | 9/15/58 | 75 | 84 |
| 2,4 | Wells Fargo Commercial Mortgage Trust Class AS Series 2017-C38 | 3.665% | 7/15/50 | 54 | 60 |
| 2 | Wells Fargo Commercial Mortgage Trust Class AS Series 2017-C39 | 3.702% | 9/15/50 | 100 | 112 |
| 2,4 | Wells Fargo Commercial Mortgage Trust Class AS Series 2017-C40 | 3.854% | 10/15/50 | 25 | 28 |
| 2,4 | Wells Fargo Commercial Mortgage Trust Class AS Series 2018-C43 | 4.152% | 3/15/51 | 50 | 58 |
| 2 | Wells Fargo Commercial Mortgage Trust Class AS Series 2019-C52 | 3.143% | 8/15/52 | 100 | 111 |
| 2 | Wells Fargo Commercial Mortgage Trust Class ASB Series 2015-C26 | 2.991% | 2/15/48 | 107 | 112 |
| 2 | Wells Fargo Commercial Mortgage Trust Class ASB Series 2015-C29 | 3.400% | 6/15/48 | 111 | 117 |
| 2 | Wells Fargo Commercial Mortgage Trust Class ASB Series 2015-LC20 | 2.978% | 4/15/50 | 25 | 27 |
| 2 | Wells Fargo Commercial Mortgage Trust Class ASB Series 2015-LC22 | 3.571% | 9/15/58 | 47 | 50 |
| 2 | Wells Fargo Commercial Mortgage Trust Class ASB Series 2015-NXS1 | 2.934% | 5/15/48 | 42 | 43 |
| | | | Coupon | Maturity
Date | Face
Amount
($000) | Market
Value•
($000) |
| 2 | Wells Fargo Commercial Mortgage Trust Class ASB Series 2015-P2 | 3.656% | 12/15/48 | 100 | 107 |
| 2 | Wells Fargo Commercial Mortgage Trust Class ASB Series 2016-C32 | 3.324% | 1/15/59 | 58 | 62 |
| 2 | Wells Fargo Commercial Mortgage Trust Class ASB Series 2016-LC24 | 2.825% | 10/15/49 | 100 | 105 |
| 2 | Wells Fargo Commercial Mortgage Trust Class B Series 2015-LC20 | 3.719% | 4/15/50 | 50 | 53 |
| 2 | WFRBS Commercial Mortgage Trust Class A2 Series 2012-C7 | 3.431% | 6/15/45 | 125 | 128 |
| 2 | WFRBS Commercial Mortgage Trust Class A3 Series 2012-C8 | 3.001% | 8/15/45 | 75 | 77 |
| 2 | WFRBS Commercial Mortgage Trust Class A3 Series 2012-C9 | 2.870% | 11/15/45 | 122 | 126 |
| 2 | WFRBS Commercial Mortgage Trust Class A3 Series 2014-C19 | 3.660% | 3/15/47 | 18 | 18 |
| 2 | WFRBS Commercial Mortgage Trust Class A3 Series 2014-C24 | 3.428% | 11/15/47 | 38 | 39 |
| 2 | WFRBS Commercial Mortgage Trust Class A4 Series 2012-C6 | 3.440% | 4/15/45 | 166 | 168 |
| 2 | WFRBS Commercial Mortgage Trust Class A4 Series 2013-C12 | 3.198% | 3/15/48 | 39 | 41 |
| 2 | WFRBS Commercial Mortgage Trust Class A4 Series 2013-C13 | 3.001% | 5/15/45 | 76 | 80 |
| 2,4 | WFRBS Commercial Mortgage Trust Class A4 Series 2013-C15 | 4.153% | 8/15/46 | 100 | 108 |
| 2 | WFRBS Commercial Mortgage Trust Class A4 Series 2013-C17 | 4.023% | 12/15/46 | 25 | 27 |
| 2 | WFRBS Commercial Mortgage Trust Class A5 Series 2013-C11 | 3.071% | 3/15/45 | 94 | 98 |
| 2 | WFRBS Commercial Mortgage Trust Class A5 Series 2013-C14 | 3.337% | 6/15/46 | 150 | 159 |
| 2 | WFRBS Commercial Mortgage Trust Class A5 Series 2013-C16 | 4.415% | 9/15/46 | 30 | 33 |
| 2 | WFRBS Commercial Mortgage Trust Class A5 Series 2014-C19 | 4.101% | 3/15/47 | 50 | 55 |
| 2 | WFRBS Commercial Mortgage Trust Class A5 Series 2014-C20 | 3.995% | 5/15/47 | 25 | 27 |
Total Bond Market Index Portfolio
| | | | Coupon | Maturity
Date | Face
Amount
($000) | Market
Value•
($000) |
| 2 | WFRBS Commercial Mortgage Trust Class A5 Series 2014-C21 | 3.678% | 8/15/47 | 75 | 82 |
| 2 | WFRBS Commercial Mortgage Trust Class A5 Series 2014-C22 | 3.752% | 9/15/57 | 150 | 165 |
| 2 | WFRBS Commercial Mortgage Trust Class A5 Series 2014-C23 | 3.917% | 10/15/57 | 50 | 55 |
| 2 | WFRBS Commercial Mortgage Trust Class A5 Series 2014-C24 | 3.607% | 11/15/47 | 65 | 71 |
| 2 | WFRBS Commercial Mortgage Trust Class A5 Series 2014-LC14 | 4.045% | 3/15/47 | 140 | 153 |
| 2,4 | WFRBS Commercial Mortgage Trust Class AS Series 2012-C7 | 4.090% | 6/15/45 | 100 | 101 |
| 2 | WFRBS Commercial Mortgage Trust Class AS Series 2013-C12 | 3.560% | 3/15/48 | 18 | 19 |
| 2 | WFRBS Commercial Mortgage Trust Class AS Series 2013-C13 | 3.345% | 5/15/45 | 15 | 16 |
| 2 | WFRBS Commercial Mortgage Trust Class AS Series 2013-C14 | 3.488% | 6/15/46 | 75 | 78 |
| 2,4 | WFRBS Commercial Mortgage Trust Class AS Series 2013-C15 | 4.358% | 8/15/46 | 20 | 21 |
| 2,4 | WFRBS Commercial Mortgage Trust Class AS Series 2013-C16 | 4.668% | 9/15/46 | 50 | 54 |
| 2 | WFRBS Commercial Mortgage Trust Class AS Series 2013-C17 | 4.255% | 12/15/46 | 25 | 27 |
| 2 | WFRBS Commercial Mortgage Trust Class AS Series 2014-C20 | 4.176% | 5/15/47 | 25 | 27 |
| 2,4 | WFRBS Commercial Mortgage Trust Class AS Series 2014-LC14 | 4.351% | 3/15/47 | 60 | 65 |
| 2 | WFRBS Commercial Mortgage Trust Class ASB Series 2013-C15 | 3.720% | 8/15/46 | 10 | 10 |
| 2 | WFRBS Commercial Mortgage Trust Class ASB Series 2013-C16 | 3.963% | 9/15/46 | 18 | 19 |
| 2 | WFRBS Commercial Mortgage Trust Class ASB Series 2013-C17 | 3.558% | 12/15/46 | 15 | 16 |
| 2 | WFRBS Commercial Mortgage Trust Class ASB Series 2014-C19 | 3.618% | 3/15/47 | 17 | 17 |
| | | | Coupon | Maturity
Date | Face
Amount
($000) | Market
Value•
($000) |
| 2 | WFRBS Commercial Mortgage Trust Class ASB Series 2014-C20 | 3.638% | 5/15/47 | 17 | 18 |
| 2 | WFRBS Commercial Mortgage Trust Class ASB Series 2014-C23 | 3.636% | 10/15/57 | 60 | 63 |
| 2 | WFRBS Commercial Mortgage Trust Class ASB Series 2014-LC14 | 3.522% | 3/15/47 | 38 | 39 |
| 2,4 | WFRBS Commercial Mortgage Trust Class B Series 2013-C17 | 4.788% | 12/15/46 | 25 | 27 |
| 2,4 | WFRBS Commercial Mortgage Trust Class B Series 2014-C19 | 4.723% | 3/15/47 | 25 | 27 |
| 2,4 | WFRBS Commercial Mortgage Trust Class B Series 2014-C22 | 4.371% | 9/15/57 | 25 | 27 |
| 2 | World Financial Network Credit Card Master Note Trust Class A Series 2018-A | 3.070% | 12/16/24 | 200 | 201 |
| 2 | World Omni Auto Receivables Trust Class A3 Series 2019-C | 1.960% | 12/16/24 | 125 | 127 |
| 2 | World Omni Auto Receivables Trust Class A3 Series 2020-A | 1.700% | 1/17/23 | 50 | 51 |
| 2 | World Omni Auto Receivables Trust Class A3 Series 2020-A | 1.100% | 4/15/25 | 90 | 91 |
| 2 | World Omni Auto Receivables Trust Class A3 Series 2020-B | 0.630% | 5/15/25 | 50 | 50 |
| 2 | World Omni Auto Receivables Trust Class A3 Series 2020-C | 0.480% | 11/17/25 | 50 | 50 |
| 2 | World Omni Auto Receivables Trust Class A4 Series 2020-A | 1.790% | 6/16/25 | 25 | 26 |
| 2 | World Omni Auto Receivables Trust Class A4 Series 2020-B | 0.820% | 1/15/26 | 10 | 10 |
| 2 | World Omni Auto Receivables Trust Class A4 Series 2020-C | 0.610% | 10/15/26 | 25 | 25 |
| 2 | World Omni Automobile Lease Securitization Trust Class A3 Series 2020-B | 0.450% | 2/15/24 | 100 | 100 |
| 2 | World Omni Automobile Lease Securitization Trust Class A4 Series 2020-B | 0.520% | 2/17/26 | 25 | 25 |
| 2 | World Omni Select Auto Trust Class A3 Series 2020-A | 0.550% | 7/15/25 | 25 | 25 |
| Total Asset-Backed/Commercial Mortgage-Backed Securities (Cost $120,519) | 128,762 |
| Corporate Bonds (29.8%) |
| Communications (2.7%) |
| | Activision Blizzard Inc. | 3.400% | 9/15/26 | 160 | 182 |
| | Activision Blizzard Inc. | 1.350% | 9/15/30 | 150 | 147 |
| | Activision Blizzard Inc. | 4.500% | 6/15/47 | 200 | 260 |
| | Activision Blizzard Inc. | 2.500% | 9/15/50 | 300 | 290 |
| | Alphabet Inc. | 0.450% | 8/15/25 | 500 | 500 |
| | Alphabet Inc. | 0.800% | 8/15/27 | 500 | 498 |
| | Alphabet Inc. | 1.100% | 8/15/30 | 500 | 492 |
| | Alphabet Inc. | 1.900% | 8/15/40 | 200 | 195 |
| | Alphabet Inc. | 2.050% | 8/15/50 | 500 | 477 |
Total Bond Market Index Portfolio
| | | | Coupon | Maturity
Date | Face
Amount
($000) | Market
Value•
($000) |
| | Alphabet Inc. | 2.250% | 8/15/60 | 500 | 479 |
| | America Movil SAB de CV | 3.125% | 7/16/22 | 300 | 312 |
| | America Movil SAB de CV | 3.625% | 4/22/29 | 200 | 226 |
| | America Movil SAB de CV | 2.875% | 5/7/30 | 200 | 217 |
| | America Movil SAB de CV | 6.375% | 3/1/35 | 300 | 450 |
| | America Movil SAB de CV | 6.125% | 11/15/37 | 150 | 214 |
| | America Movil SAB de CV | 6.125% | 3/30/40 | 200 | 295 |
| | America Movil SAB de CV | 4.375% | 7/16/42 | 250 | 312 |
| | America Movil SAB de CV | 4.375% | 4/22/49 | 400 | 514 |
| | AT&T Inc. | 3.000% | 6/30/22 | 767 | 793 |
| | AT&T Inc. | 4.050% | 12/15/23 | 100 | 110 |
| | AT&T Inc. | 4.450% | 4/1/24 | 250 | 279 |
| | AT&T Inc. | 3.950% | 1/15/25 | 268 | 301 |
| | AT&T Inc. | 3.400% | 5/15/25 | 940 | 1,043 |
| | AT&T Inc. | 3.600% | 7/15/25 | 275 | 309 |
| | AT&T Inc. | 4.125% | 2/17/26 | 515 | 595 |
| | AT&T Inc. | 3.800% | 2/15/27 | 700 | 804 |
| | AT&T Inc. | 2.300% | 6/1/27 | 450 | 480 |
| | AT&T Inc. | 1.650% | 2/1/28 | 500 | 509 |
| | AT&T Inc. | 4.100% | 2/15/28 | 402 | 472 |
| | AT&T Inc. | 4.350% | 3/1/29 | 650 | 773 |
| | AT&T Inc. | 4.300% | 2/15/30 | 660 | 788 |
| | AT&T Inc. | 2.750% | 6/1/31 | 450 | 480 |
| | AT&T Inc. | 2.250% | 2/1/32 | 600 | 608 |
| 5 | AT&T Inc. | 2.550% | 12/1/33 | 472 | 485 |
| | AT&T Inc. | 4.500% | 5/15/35 | 200 | 242 |
| | AT&T Inc. | 5.250% | 3/1/37 | 500 | 645 |
| | AT&T Inc. | 4.900% | 8/15/37 | 300 | 374 |
| | AT&T Inc. | 4.850% | 3/1/39 | 480 | 595 |
| | AT&T Inc. | 3.500% | 6/1/41 | 500 | 539 |
| | AT&T Inc. | 5.550% | 8/15/41 | 225 | 298 |
| | AT&T Inc. | 5.150% | 3/15/42 | 375 | 478 |
| | AT&T Inc. | 4.900% | 6/15/42 | 525 | 655 |
| | AT&T Inc. | 4.300% | 12/15/42 | 271 | 316 |
| | AT&T Inc. | 3.100% | 2/1/43 | 500 | 507 |
| | AT&T Inc. | 4.350% | 6/15/45 | 312 | 357 |
| | AT&T Inc. | 4.750% | 5/15/46 | 350 | 434 |
| | AT&T Inc. | 5.150% | 11/15/46 | 736 | 960 |
| | AT&T Inc. | 5.450% | 3/1/47 | 500 | 670 |
| | AT&T Inc. | 4.500% | 3/9/48 | 400 | 474 |
| | AT&T Inc. | 4.550% | 3/9/49 | 362 | 435 |
| | AT&T Inc. | 5.150% | 2/15/50 | 332 | 429 |
| | AT&T Inc. | 3.650% | 6/1/51 | 600 | 628 |
| 5 | AT&T Inc. | 3.500% | 9/15/53 | 1,558 | 1,562 |
| 5 | AT&T Inc. | 3.550% | 9/15/55 | 1,550 | 1,551 |
| 3,5 | AT&T Inc. | 3.800% | 12/1/57 | 1,287 | 1,343 |
| 5 | AT&T Inc. | 3.650% | 9/15/59 | 629 | 631 |
| | AT&T Inc. | 3.850% | 6/1/60 | 300 | 315 |
| | AT&T Inc. | 3.500% | 2/1/61 | 400 | 396 |
| | Baidu Inc. | 3.500% | 11/28/22 | 275 | 288 |
| | Baidu Inc. | 3.875% | 9/29/23 | 200 | 216 |
| | Baidu Inc. | 4.375% | 5/14/24 | 200 | 220 |
| | Baidu Inc. | 3.075% | 4/7/25 | 200 | 214 |
| | Baidu Inc. | 3.625% | 7/6/27 | 200 | 221 |
| | Baidu Inc. | 4.375% | 3/29/28 | 100 | 115 |
| | Baidu Inc. | 3.425% | 4/7/30 | 200 | 222 |
| | Bell Canada | 4.300% | 7/29/49 | 100 | 130 |
| | Booking Holdings Inc. | 2.750% | 3/15/23 | 100 | 105 |
| | Booking Holdings Inc. | 3.650% | 3/15/25 | 100 | 111 |
| | Booking Holdings Inc. | 4.100% | 4/13/25 | 200 | 226 |
| | Booking Holdings Inc. | 3.600% | 6/1/26 | 225 | 255 |
| | Booking Holdings Inc. | 3.550% | 3/15/28 | 100 | 114 |
| | Booking Holdings Inc. | 4.625% | 4/13/30 | 400 | 496 |
| | British Telecommunications plc | 4.500% | 12/4/23 | 200 | 221 |
| | British Telecommunications plc | 5.125% | 12/4/28 | 100 | 123 |
| | British Telecommunications plc | 9.625% | 12/15/30 | 516 | 854 |
| | | | Coupon | Maturity
Date | Face
Amount
($000) | Market
Value•
($000) |
| | Charter Communications Operating LLC / Charter Communications Operating Capital | 4.464% | 7/23/22 | 676 | 712 |
| | Charter Communications Operating LLC / Charter Communications Operating Capital | 4.500% | 2/1/24 | 175 | 194 |
| | Charter Communications Operating LLC / Charter Communications Operating Capital | 4.908% | 7/23/25 | 850 | 988 |
| | Charter Communications Operating LLC / Charter Communications Operating Capital | 3.750% | 2/15/28 | 730 | 818 |
| | Charter Communications Operating LLC / Charter Communications Operating Capital | 5.050% | 3/30/29 | 225 | 272 |
| | Charter Communications Operating LLC / Charter Communications Operating Capital | 2.800% | 4/1/31 | 330 | 348 |
| | Charter Communications Operating LLC / Charter Communications Operating Capital | 6.384% | 10/23/35 | 575 | 787 |
| | Charter Communications Operating LLC / Charter Communications Operating Capital | 5.375% | 4/1/38 | 150 | 187 |
| | Charter Communications Operating LLC / Charter Communications Operating Capital | 6.484% | 10/23/45 | 650 | 918 |
| | Charter Communications Operating LLC / Charter Communications Operating Capital | 5.375% | 5/1/47 | 450 | 560 |
| | Charter Communications Operating LLC / Charter Communications Operating Capital | 5.750% | 4/1/48 | 400 | 523 |
| | Charter Communications Operating LLC / Charter Communications Operating Capital | 5.125% | 7/1/49 | 375 | 456 |
| | Charter Communications Operating LLC / Charter Communications Operating Capital | 4.800% | 3/1/50 | 550 | 655 |
| | Charter Communications Operating LLC / Charter Communications Operating Capital | 3.700% | 4/1/51 | 400 | 415 |
| | Charter Communications Operating LLC / Charter Communications Operating Capital | 6.834% | 10/23/55 | 75 | 114 |
| | Charter Communications Operating, LLC / Charter Communications Operating Capital Corp. | 3.850% | 4/1/61 | 500 | 503 |
| | Comcast Cable Communications Holdings Inc. | 9.455% | 11/15/22 | 139 | 163 |
| | Comcast Corp. | 3.000% | 2/1/24 | 710 | 764 |
| | Comcast Corp. | 3.375% | 2/15/25 | 264 | 292 |
| | Comcast Corp. | 3.100% | 4/1/25 | 395 | 433 |
| | Comcast Corp. | 3.375% | 8/15/25 | 951 | 1,057 |
| | Comcast Corp. | 3.950% | 10/15/25 | 625 | 716 |
| | Comcast Corp. | 3.150% | 3/1/26 | 400 | 444 |
| | Comcast Corp. | 2.350% | 1/15/27 | 495 | 532 |
Total Bond Market Index Portfolio
| | | | Coupon | Maturity
Date | Face
Amount
($000) | Market
Value•
($000) |
| | Comcast Corp. | 3.300% | 4/1/27 | 150 | 170 |
| | Comcast Corp. | 3.150% | 2/15/28 | 325 | 364 |
| | Comcast Corp. | 4.150% | 10/15/28 | 950 | 1,137 |
| | Comcast Corp. | 2.650% | 2/1/30 | 300 | 327 |
| | Comcast Corp. | 3.400% | 4/1/30 | 350 | 402 |
| | Comcast Corp. | 4.250% | 10/15/30 | 350 | 428 |
| | Comcast Corp. | 1.950% | 1/15/31 | 500 | 513 |
| | Comcast Corp. | 1.500% | 2/15/31 | 500 | 496 |
| | Comcast Corp. | 4.250% | 1/15/33 | 275 | 343 |
| | Comcast Corp. | 4.200% | 8/15/34 | 175 | 219 |
| | Comcast Corp. | 5.650% | 6/15/35 | 1,065 | 1,510 |
| | Comcast Corp. | 4.400% | 8/15/35 | 150 | 190 |
| | Comcast Corp. | 3.200% | 7/15/36 | 225 | 255 |
| | Comcast Corp. | 6.450% | 3/15/37 | 175 | 267 |
| | Comcast Corp. | 6.950% | 8/15/37 | 250 | 399 |
| | Comcast Corp. | 3.900% | 3/1/38 | 175 | 213 |
| | Comcast Corp. | 6.400% | 5/15/38 | 100 | 154 |
| | Comcast Corp. | 4.600% | 10/15/38 | 550 | 721 |
| | Comcast Corp. | 3.250% | 11/1/39 | 250 | 282 |
| | Comcast Corp. | 6.400% | 3/1/40 | 150 | 234 |
| | Comcast Corp. | 3.750% | 4/1/40 | 300 | 362 |
| | Comcast Corp. | 4.650% | 7/15/42 | 370 | 499 |
| | Comcast Corp. | 4.500% | 1/15/43 | 100 | 132 |
| | Comcast Corp. | 4.600% | 8/15/45 | 250 | 334 |
| | Comcast Corp. | 3.400% | 7/15/46 | 500 | 577 |
| | Comcast Corp. | 3.969% | 11/1/47 | 1,086 | 1,354 |
| | Comcast Corp. | 4.700% | 10/15/48 | 475 | 660 |
| | Comcast Corp. | 3.999% | 11/1/49 | 268 | 337 |
| | Comcast Corp. | 3.450% | 2/1/50 | 400 | 470 |
| | Comcast Corp. | 2.800% | 1/15/51 | 500 | 521 |
| | Comcast Corp. | 2.450% | 8/15/52 | 500 | 485 |
| | Comcast Corp. | 4.950% | 10/15/58 | 475 | 719 |
| | Comcast Corp. | 2.650% | 8/15/62 | 500 | 500 |
| | Deutsche Telekom International Finance BV | 8.750% | 6/15/30 | 775 | 1,223 |
| | Discovery Communications LLC | 2.950% | 3/20/23 | 100 | 105 |
| | Discovery Communications LLC | 3.800% | 3/13/24 | 100 | 109 |
| | Discovery Communications LLC | 3.900% | 11/15/24 | 150 | 166 |
| | Discovery Communications LLC | 3.450% | 3/15/25 | 380 | 417 |
| | Discovery Communications LLC | 3.950% | 6/15/25 | 303 | 340 |
| | Discovery Communications LLC | 3.950% | 3/20/28 | 400 | 457 |
| | Discovery Communications LLC | 3.625% | 5/15/30 | 230 | 263 |
| | Discovery Communications LLC | 5.000% | 9/20/37 | 325 | 411 |
| | Discovery Communications LLC | 6.350% | 6/1/40 | 150 | 213 |
| | Discovery Communications LLC | 4.875% | 4/1/43 | 300 | 369 |
| | Discovery Communications LLC | 5.200% | 9/20/47 | 225 | 292 |
| | Discovery Communications LLC | 5.300% | 5/15/49 | 75 | 98 |
| | Discovery Communications LLC | 4.650% | 5/15/50 | 200 | 250 |
| 3,5 | Discovery Communications LLC | 4.000% | 9/15/55 | 269 | 300 |
| | Electronic Arts Inc. | 4.800% | 3/1/26 | 100 | 119 |
| 5 | Expedia Group Inc. | 3.600% | 12/15/23 | 100 | 106 |
| | Expedia Group Inc. | 4.500% | 8/15/24 | 100 | 109 |
| | Expedia Group Inc. | 5.000% | 2/15/26 | 150 | 167 |
| 5 | Expedia Group Inc. | 4.625% | 8/1/27 | 150 | 167 |
| | Expedia Group Inc. | 3.250% | 2/15/30 | 250 | 259 |
| | Fox Corp. | 3.666% | 1/25/22 | 50 | 52 |
| | | | Coupon | Maturity
Date | Face
Amount
($000) | Market
Value•
($000) |
| | Fox Corp. | 4.030% | 1/25/24 | 250 | 275 |
| | Fox Corp. | 3.050% | 4/7/25 | 100 | 109 |
| | Fox Corp. | 4.709% | 1/25/29 | 375 | 454 |
| | Fox Corp. | 3.500% | 4/8/30 | 150 | 170 |
| | Fox Corp. | 5.476% | 1/25/39 | 250 | 342 |
| | Fox Corp. | 5.576% | 1/25/49 | 425 | 617 |
| | Grupo Televisa SAB | 6.625% | 3/18/25 | 100 | 122 |
| | Grupo Televisa SAB | 4.625% | 1/30/26 | 100 | 112 |
| | Grupo Televisa SAB | 6.625% | 1/15/40 | 125 | 175 |
| | Grupo Televisa SAB | 5.000% | 5/13/45 | 425 | 514 |
| | Grupo Televisa SAB | 5.250% | 5/24/49 | 200 | 253 |
| | Interpublic Group of Cos. Inc. | 3.750% | 2/15/23 | 150 | 160 |
| | Interpublic Group of Cos. Inc. | 4.200% | 4/15/24 | 422 | 469 |
| | Interpublic Group of Cos. Inc. | 4.650% | 10/1/28 | 100 | 120 |
| | Interpublic Group of Cos. Inc. | 4.750% | 3/30/30 | 100 | 124 |
| | Interpublic Group of Cos. Inc. | 5.400% | 10/1/48 | 175 | 239 |
| | Koninklijke KPN NV | 8.375% | 10/1/30 | 125 | 177 |
| | NBCUniversal Media LLC | 6.400% | 4/30/40 | 150 | 235 |
| | NBCUniversal Media LLC | 5.950% | 4/1/41 | 225 | 343 |
| | NBCUniversal Media LLC | 4.450% | 1/15/43 | 225 | 293 |
| | Omnicom Group Inc. | 3.625% | 5/1/22 | 250 | 261 |
| | Omnicom Group Inc. | 3.650% | 11/1/24 | 150 | 165 |
| | Omnicom Group Inc. | 3.600% | 4/15/26 | 250 | 285 |
| | Omnicom Group Inc. | 2.450% | 4/30/30 | 150 | 159 |
| | Omnicom Group Inc. | 4.200% | 6/1/30 | 100 | 120 |
| | Orange SA | 9.000% | 3/1/31 | 450 | 736 |
| | Orange SA | 5.375% | 1/13/42 | 325 | 462 |
| | Orange SA | 5.500% | 2/6/44 | 200 | 291 |
| | Rogers Communications Inc. | 3.000% | 3/15/23 | 205 | 215 |
| | Rogers Communications Inc. | 4.100% | 10/1/23 | ��� 175 | 191 |
| | Rogers Communications Inc. | 3.625% | 12/15/25 | 125 | 141 |
| | Rogers Communications Inc. | 2.900% | 11/15/26 | 100 | 111 |
| | Rogers Communications Inc. | 4.500% | 3/15/43 | 265 | 336 |
| | Rogers Communications Inc. | 5.000% | 3/15/44 | 190 | 259 |
| | Rogers Communications Inc. | 4.350% | 5/1/49 | 450 | 575 |
| | Rogers Communications Inc. | 3.700% | 11/15/49 | 150 | 174 |
| | Telefonica Emisiones SA | 4.103% | 3/8/27 | 250 | 289 |
| | Telefonica Emisiones SA | 7.045% | 6/20/36 | 475 | 711 |
| | Telefonica Emisiones SA | 4.665% | 3/6/38 | 200 | 241 |
| | Telefonica Emisiones SA | 5.213% | 3/8/47 | 550 | 706 |
| | Telefonica Emisiones SA | 4.895% | 3/6/48 | 250 | 312 |
| | Telefonica Emisiones SA | 5.520% | 3/1/49 | 335 | 451 |
| | Telefonica Europe BV | 8.250% | 9/15/30 | 250 | 381 |
| | TELUS Corp. | 2.800% | 2/16/27 | 100 | 109 |
| | TELUS Corp. | 4.300% | 6/15/49 | 200 | 250 |
| | Tencent Music Entertainment Group | 2.000% | 9/3/30 | 200 | 198 |
| | Time Warner Cable LLC | 6.550% | 5/1/37 | 200 | 273 |
| | Time Warner Cable LLC | 7.300% | 7/1/38 | 50 | 74 |
| | Time Warner Cable LLC | 6.750% | 6/15/39 | 400 | 571 |
| | Time Warner Cable LLC | 5.875% | 11/15/40 | 425 | 563 |
| | Time Warner Cable LLC | 5.500% | 9/1/41 | 250 | 322 |
| | Time Warner Cable LLC | 4.500% | 9/15/42 | 250 | 291 |
| | Time Warner Entertainment Co. LP | 8.375% | 3/15/23 | 200 | 234 |
| | Time Warner Entertainment Co. LP | 8.375% | 7/15/33 | 200 | 309 |
| 5 | T-Mobile USA Inc. | 3.500% | 4/15/25 | 600 | 663 |
Total Bond Market Index Portfolio
| | | | Coupon | Maturity
Date | Face
Amount
($000) | Market
Value•
($000) |
| 5 | T-Mobile USA Inc. | 1.500% | 2/15/26 | 200 | 205 |
| 5 | T-Mobile USA Inc. | 3.750% | 4/15/27 | 800 | 910 |
| 5 | T-Mobile USA Inc. | 2.050% | 2/15/28 | 250 | 260 |
| 5 | T-Mobile USA Inc. | 3.875% | 4/15/30 | 1,520 | 1,759 |
| 5 | T-Mobile USA Inc. | 2.550% | 2/15/31 | 900 | 944 |
| 5 | T-Mobile USA Inc. | 2.250% | 11/15/31 | 500 | 513 |
| 5 | T-Mobile USA Inc. | 4.375% | 4/15/40 | 400 | 486 |
| 5 | T-Mobile USA Inc. | 4.500% | 4/15/50 | 600 | 744 |
| 5 | T-Mobile USA Inc. | 3.300% | 2/15/51 | 1,000 | 1,030 |
| | TWDC Enterprises 18 Corp. | 2.550% | 2/15/22 | 75 | 77 |
| | TWDC Enterprises 18 Corp. | 2.450% | 3/4/22 | 75 | 77 |
| | TWDC Enterprises 18 Corp. | 3.150% | 9/17/25 | 150 | 166 |
| | TWDC Enterprises 18 Corp. | 1.850% | 7/30/26 | 1,070 | 1,124 |
| | TWDC Enterprises 18 Corp. | 4.375% | 8/16/41 | 75 | 95 |
| | TWDC Enterprises 18 Corp. | 4.125% | 12/1/41 | 205 | 255 |
| | TWDC Enterprises 18 Corp. | 3.700% | 12/1/42 | 125 | 148 |
| | TWDC Enterprises 18 Corp. | 3.000% | 7/30/46 | 300 | 328 |
| | Verizon Communications Inc. | 5.150% | 9/15/23 | 830 | 934 |
| | Verizon Communications Inc. | 3.500% | 11/1/24 | 400 | 441 |
| | Verizon Communications Inc. | 3.376% | 2/15/25 | 534 | 593 |
| | Verizon Communications Inc. | 0.850% | 11/20/25 | 500 | 503 |
| | Verizon Communications Inc. | 2.625% | 8/15/26 | 475 | 520 |
| | Verizon Communications Inc. | 4.125% | 3/16/27 | 700 | 825 |
| | Verizon Communications Inc. | 3.000% | 3/22/27 | 150 | 166 |
| | Verizon Communications Inc. | 4.329% | 9/21/28 | 1,229 | 1,476 |
| | Verizon Communications Inc. | 4.016% | 12/3/29 | 927 | 1,099 |
| | Verizon Communications Inc. | 3.150% | 3/22/30 | 310 | 347 |
| 5 | Verizon Communications Inc. | 1.680% | 10/30/30 | 527 | 523 |
| | Verizon Communications Inc. | 4.500% | 8/10/33 | 575 | 725 |
| | Verizon Communications Inc. | 4.400% | 11/1/34 | 725 | 905 |
| | Verizon Communications Inc. | 4.272% | 1/15/36 | 513 | 634 |
| | Verizon Communications Inc. | 5.250% | 3/16/37 | 300 | 407 |
| | Verizon Communications Inc. | 4.812% | 3/15/39 | 350 | 454 |
| | Verizon Communications Inc. | 2.650% | 11/20/40 | 500 | 506 |
| | Verizon Communications Inc. | 4.750% | 11/1/41 | 175 | 230 |
| | Verizon Communications Inc. | 3.850% | 11/1/42 | 425 | 503 |
| | Verizon Communications Inc. | 4.125% | 8/15/46 | 250 | 305 |
| | Verizon Communications Inc. | 4.862% | 8/21/46 | 1,279 | 1,716 |
| | Verizon Communications Inc. | 4.522% | 9/15/48 | 747 | 969 |
| | Verizon Communications Inc. | 5.012% | 4/15/49 | 385 | 533 |
| | Verizon Communications Inc. | 4.000% | 3/22/50 | 250 | 302 |
| | | | Coupon | Maturity
Date | Face
Amount
($000) | Market
Value•
($000) |
| | Verizon Communications Inc. | 2.875% | 11/20/50 | 500 | 503 |
| | Verizon Communications Inc. | 4.672% | 3/15/55 | 600 | 799 |
| 5 | Verizon Communications Inc. | 2.987% | 10/30/56 | 900 | 904 |
| | Verizon Communications Inc. | 3.000% | 11/20/60 | 500 | 502 |
| | ViacomCBS Inc. | 4.250% | 9/1/23 | 225 | 245 |
| | ViacomCBS Inc. | 3.875% | 4/1/24 | 124 | 135 |
| | ViacomCBS Inc. | 3.700% | 8/15/24 | 175 | 192 |
| | ViacomCBS Inc. | 3.500% | 1/15/25 | 150 | 164 |
| | ViacomCBS Inc. | 4.750% | 5/15/25 | 300 | 348 |
| | ViacomCBS Inc. | 2.900% | 1/15/27 | 279 | 306 |
| | ViacomCBS Inc. | 3.375% | 2/15/28 | 100 | 112 |
| | ViacomCBS Inc. | 3.700% | 6/1/28 | 100 | 114 |
| | ViacomCBS Inc. | 4.950% | 1/15/31 | 250 | 314 |
| | ViacomCBS Inc. | 4.200% | 5/19/32 | 200 | 241 |
| | ViacomCBS Inc. | 5.500% | 5/15/33 | 75 | 96 |
| | ViacomCBS Inc. | 6.875% | 4/30/36 | 240 | 348 |
| | ViacomCBS Inc. | 5.900% | 10/15/40 | 225 | 298 |
| | ViacomCBS Inc. | 4.850% | 7/1/42 | 225 | 274 |
| | ViacomCBS Inc. | 4.375% | 3/15/43 | 406 | 479 |
| | ViacomCBS Inc. | 5.850% | 9/1/43 | 225 | 309 |
| | ViacomCBS Inc. | 4.900% | 8/15/44 | 100 | 123 |
| | ViacomCBS Inc. | 4.950% | 5/19/50 | 250 | 321 |
| | Vodafone Group plc | 3.750% | 1/16/24 | 650 | 710 |
| | Vodafone Group plc | 4.125% | 5/30/25 | 500 | 571 |
| | Vodafone Group plc | 4.375% | 5/30/28 | 650 | 778 |
| | Vodafone Group plc | 7.875% | 2/15/30 | 150 | 222 |
| | Vodafone Group plc | 6.250% | 11/30/32 | 100 | 138 |
| | Vodafone Group plc | 6.150% | 2/27/37 | 200 | 288 |
| | Vodafone Group plc | 5.000% | 5/30/38 | 325 | 423 |
| | Vodafone Group plc | 4.375% | 2/19/43 | 275 | 340 |
| | Vodafone Group plc | 5.250% | 5/30/48 | 700 | 971 |
| | Vodafone Group plc | 4.875% | 6/19/49 | 350 | 466 |
| | Vodafone Group plc | 4.250% | 9/17/50 | 450 | 554 |
| | Vodafone Group plc | 5.125% | 6/19/59 | 100 | 137 |
| | Walt Disney Co. | 1.650% | 9/1/22 | 100 | 102 |
| | Walt Disney Co. | 3.000% | 9/15/22 | 275 | 287 |
| | Walt Disney Co. | 1.750% | 8/30/24 | 100 | 104 |
| | Walt Disney Co. | 3.700% | 9/15/24 | 200 | 222 |
| | Walt Disney Co. | 3.350% | 3/24/25 | 345 | 382 |
| | Walt Disney Co. | 3.700% | 10/15/25 | 125 | 141 |
| | Walt Disney Co. | 1.750% | 1/13/26 | 300 | 314 |
| | Walt Disney Co. | 2.200% | 1/13/28 | 200 | 214 |
| | Walt Disney Co. | 2.000% | 9/1/29 | 400 | 417 |
| | Walt Disney Co. | 3.800% | 3/22/30 | 240 | 286 |
| | Walt Disney Co. | 2.650% | 1/13/31 | 700 | 768 |
| | Walt Disney Co. | 6.200% | 12/15/34 | 400 | 600 |
| | Walt Disney Co. | 6.400% | 12/15/35 | 365 | 566 |
| | Walt Disney Co. | 6.650% | 11/15/37 | 200 | 315 |
| | Walt Disney Co. | 4.625% | 3/23/40 | 75 | 100 |
| | Walt Disney Co. | 3.500% | 5/13/40 | 400 | 469 |
| | Walt Disney Co. | 5.400% | 10/1/43 | 100 | 146 |
| | Walt Disney Co. | 4.750% | 9/15/44 | 175 | 240 |
| | Walt Disney Co. | 2.750% | 9/1/49 | 400 | 423 |
| | Walt Disney Co. | 4.700% | 3/23/50 | 395 | 557 |
| | Walt Disney Co. | 3.600% | 1/13/51 | 600 | 728 |
| | Walt Disney Co. | 3.800% | 5/13/60 | 300 | 377 |
| | Weibo Corp. | 3.500% | 7/5/24 | 200 | 209 |
| | Weibo Corp. | 3.375% | 7/8/30 | 200 | 204 |
| | WPP Finance 2010 | 3.625% | 9/7/22 | 200 | 210 |
| | WPP Finance 2010 | 3.750% | 9/19/24 | 100 | 111 |
| | | | | | | 130,957 |
| Consumer Discretionary (1.7%) |
| | Advance Auto Parts Inc. | 3.900% | 4/15/30 | 250 | 286 |
| | Alibaba Group Holding Ltd. | 2.800% | 6/6/23 | 200 | 210 |
Total Bond Market Index Portfolio
| | | | Coupon | Maturity
Date | Face
Amount
($000) | Market
Value•
($000) |
| | Alibaba Group Holding Ltd. | 3.600% | 11/28/24 | 400 | 440 |
| | Alibaba Group Holding Ltd. | 3.400% | 12/6/27 | 400 | 447 |
| | Alibaba Group Holding Ltd. | 4.500% | 11/28/34 | 280 | 346 |
| | Alibaba Group Holding Ltd. | 4.000% | 12/6/37 | 200 | 235 |
| | Alibaba Group Holding Ltd. | 4.200% | 12/6/47 | 425 | 535 |
| | Alibaba Group Holding Ltd. | 4.400% | 12/6/57 | 100 | 133 |
| | Amazon.com Inc. | 3.300% | 12/5/21 | 200 | 204 |
| | Amazon.com Inc. | 2.500% | 11/29/22 | 150 | 156 |
| | Amazon.com Inc. | 2.400% | 2/22/23 | 450 | 470 |
| | Amazon.com Inc. | 0.400% | 6/3/23 | 200 | 201 |
| | Amazon.com Inc. | 2.800% | 8/22/24 | 250 | 270 |
| | Amazon.com Inc. | 3.800% | 12/5/24 | 120 | 135 |
| | Amazon.com Inc. | 0.800% | 6/3/25 | 285 | 289 |
| | Amazon.com Inc. | 5.200% | 12/3/25 | 225 | 273 |
| | Amazon.com Inc. | 1.200% | 6/3/27 | 285 | 291 |
| | Amazon.com Inc. | 3.150% | 8/22/27 | 725 | 824 |
| | Amazon.com Inc. | 1.500% | 6/3/30 | 505 | 513 |
| | Amazon.com Inc. | 4.800% | 12/5/34 | 225 | 308 |
| | Amazon.com Inc. | 3.875% | 8/22/37 | 600 | 745 |
| | Amazon.com Inc. | 4.950% | 12/5/44 | 350 | 511 |
| | Amazon.com Inc. | 4.050% | 8/22/47 | 600 | 791 |
| | Amazon.com Inc. | 2.500% | 6/3/50 | 590 | 610 |
| | Amazon.com Inc. | 4.250% | 8/22/57 | 500 | 706 |
| | Amazon.com Inc. | 2.700% | 6/3/60 | 400 | 427 |
| | American Honda Finance Corp. | 3.375% | 12/10/21 | 150 | 154 |
| | American Honda Finance Corp. | 2.200% | 6/27/22 | 150 | 154 |
| | American Honda Finance Corp. | 0.400% | 10/21/22 | 500 | 500 |
| | American Honda Finance Corp. | 2.600% | 11/16/22 | 40 | 42 |
| | American Honda Finance Corp. | 1.950% | 5/10/23 | 200 | 207 |
| | American Honda Finance Corp. | 0.875% | 7/7/23 | 200 | 202 |
| | American Honda Finance Corp. | 3.450% | 7/14/23 | 125 | 134 |
| | American Honda Finance Corp. | 3.625% | 10/10/23 | 100 | 109 |
| | American Honda Finance Corp. | 2.900% | 2/16/24 | 150 | 161 |
| | American Honda Finance Corp. | 2.400% | 6/27/24 | 100 | 106 |
| | American Honda Finance Corp. | 2.150% | 9/10/24 | 125 | 132 |
| | American Honda Finance Corp. | 1.200% | 7/8/25 | 200 | 204 |
| | American Honda Finance Corp. | 2.300% | 9/9/26 | 50 | 54 |
| | American Honda Finance Corp. | 2.350% | 1/8/27 | 100 | 107 |
| | American Honda Finance Corp. | 3.500% | 2/15/28 | 100 | 115 |
| 2 | American University | 3.672% | 4/1/49 | 75 | 83 |
| | Aptiv Corp. | 4.150% | 3/15/24 | 125 | 137 |
| | Aptiv plc | 4.250% | 1/15/26 | 150 | 173 |
| | Aptiv plc | 4.350% | 3/15/29 | 50 | 58 |
| | Aptiv plc | 4.400% | 10/1/46 | 50 | 54 |
| | Aptiv plc | 5.400% | 3/15/49 | 50 | 62 |
| | AutoNation Inc. | 3.500% | 11/15/24 | 205 | 221 |
| | AutoNation Inc. | 4.500% | 10/1/25 | 150 | 168 |
| | AutoNation Inc. | 3.800% | 11/15/27 | 75 | 83 |
| | AutoZone Inc. | 3.700% | 4/15/22 | 100 | 104 |
| | AutoZone Inc. | 2.875% | 1/15/23 | 75 | 78 |
| | | | Coupon | Maturity
Date | Face
Amount
($000) | Market
Value•
($000) |
| | AutoZone Inc. | 3.125% | 7/15/23 | 125 | 133 |
| | AutoZone Inc. | 3.125% | 4/18/24 | 130 | 140 |
| | AutoZone Inc. | 3.250% | 4/15/25 | 132 | 144 |
| | AutoZone Inc. | 3.625% | 4/15/25 | 153 | 171 |
| | AutoZone Inc. | 3.125% | 4/21/26 | 100 | 110 |
| | AutoZone Inc. | 3.750% | 6/1/27 | 100 | 114 |
| | AutoZone Inc. | 3.750% | 4/18/29 | 100 | 115 |
| | AutoZone Inc. | 4.000% | 4/15/30 | 250 | 294 |
| | AutoZone Inc. | 1.650% | 1/15/31 | 500 | 496 |
| | Best Buy Co. Inc. | 4.450% | 10/1/28 | 200 | 240 |
| | BorgWarner Inc. | 3.375% | 3/15/25 | 75 | 83 |
| | BorgWarner Inc. | 2.650% | 7/1/27 | 200 | 215 |
| | BorgWarner Inc. | 4.375% | 3/15/45 | 100 | 117 |
| 2 | Boston University | 4.061% | 10/1/48 | 50 | 63 |
| | California Institute of Technology | 4.321% | 8/1/45 | 70 | 95 |
| | California Institute of Technology | 4.700% | 11/1/11 | 50 | 69 |
| | California Institute of Technology | 3.650% | 9/1/19 | 100 | 113 |
| | Cleveland Clinic Foundation | 4.858% | 1/1/14 | 100 | 141 |
| | Daimler Finance North America LLC | 8.500% | 1/18/31 | 250 | 395 |
| | Darden Restaurants Inc. | 3.850% | 5/1/27 | 200 | 219 |
| | Darden Restaurants Inc. | 4.550% | 2/15/48 | 50 | 55 |
| | DR Horton Inc. | 4.375% | 9/15/22 | 100 | 105 |
| | DR Horton Inc. | 4.750% | 2/15/23 | 225 | 242 |
| | DR Horton Inc. | 5.750% | 8/15/23 | 75 | 84 |
| | DR Horton Inc. | 2.500% | 10/15/24 | 100 | 107 |
| 2 | Duke University | 2.682% | 10/1/44 | 100 | 105 |
| 2 | Duke University | 2.832% | 10/1/55 | 300 | 325 |
| | eBay Inc. | 2.600% | 7/15/22 | 300 | 308 |
| | eBay Inc. | 2.750% | 1/30/23 | 175 | 183 |
| | eBay Inc. | 3.450% | 8/1/24 | 125 | 136 |
| | eBay Inc. | 1.900% | 3/11/25 | 180 | 189 |
| | eBay Inc. | 3.600% | 6/5/27 | 300 | 341 |
| | eBay Inc. | 2.700% | 3/11/30 | 200 | 215 |
| | eBay Inc. | 4.000% | 7/15/42 | 200 | 227 |
| | Emory University | 2.143% | 9/1/30 | 150 | 158 |
| | Emory University | 2.969% | 9/1/50 | 50 | 53 |
| | Ford Foundation | 2.415% | 6/1/50 | 60 | 61 |
| | Ford Foundation | 2.815% | 6/1/70 | 150 | 160 |
| | Fortune Brands Home & Security Inc. | 4.000% | 9/21/23 | 100 | 109 |
| | Fortune Brands Home & Security Inc. | 4.000% | 6/15/25 | 233 | 264 |
| | Fortune Brands Home & Security Inc. | 3.250% | 9/15/29 | 50 | 55 |
| | General Motors Co. | 4.875% | 10/2/23 | 625 | 693 |
| | General Motors Co. | 5.400% | 10/2/23 | 250 | 281 |
| | General Motors Co. | 6.125% | 10/1/25 | 600 | 727 |
| | General Motors Co. | 6.800% | 10/1/27 | 100 | 128 |
| | General Motors Co. | 5.000% | 4/1/35 | 165 | 198 |
| | General Motors Co. | 6.600% | 4/1/36 | 250 | 341 |
| | General Motors Co. | 5.150% | 4/1/38 | 225 | 271 |
| | General Motors Co. | 6.250% | 10/2/43 | 210 | 282 |
| | General Motors Co. | 5.200% | 4/1/45 | 230 | 279 |
| | General Motors Co. | 6.750% | 4/1/46 | 130 | 186 |
| | General Motors Co. | 5.400% | 4/1/48 | 200 | 251 |
| | General Motors Co. | 5.950% | 4/1/49 | 175 | 235 |
| | General Motors Financial Co. Inc. | 3.450% | 1/14/22 | 125 | 128 |
| | General Motors Financial Co. Inc. | 3.450% | 4/10/22 | 355 | 365 |
| | General Motors Financial Co. Inc. | 3.150% | 6/30/22 | 100 | 104 |
| | General Motors Financial Co. Inc. | 3.550% | 7/8/22 | 200 | 209 |
Total Bond Market Index Portfolio
| | | | Coupon | Maturity
Date | Face
Amount
($000) | Market
Value•
($000) |
| | General Motors Financial Co. Inc. | 3.250% | 1/5/23 | 275 | 288 |
| | General Motors Financial Co. Inc. | 5.200% | 3/20/23 | 300 | 329 |
| | General Motors Financial Co. Inc. | 3.700% | 5/9/23 | 200 | 212 |
| | General Motors Financial Co. Inc. | 4.250% | 5/15/23 | 150 | 162 |
| | General Motors Financial Co. Inc. | 4.150% | 6/19/23 | 200 | 215 |
| | General Motors Financial Co. Inc. | 1.700% | 8/18/23 | 500 | 512 |
| | General Motors Financial Co. Inc. | 5.100% | 1/17/24 | 100 | 112 |
| | General Motors Financial Co. Inc. | 3.950% | 4/13/24 | 400 | 434 |
| | General Motors Financial Co. Inc. | 3.500% | 11/7/24 | 200 | 216 |
| | General Motors Financial Co. Inc. | 4.000% | 1/15/25 | 175 | 192 |
| | General Motors Financial Co. Inc. | 2.900% | 2/26/25 | 958 | 1,022 |
| | General Motors Financial Co. Inc. | 4.350% | 4/9/25 | 325 | 364 |
| | General Motors Financial Co. Inc. | 2.750% | 6/20/25 | 150 | 160 |
| | General Motors Financial Co. Inc. | 5.250% | 3/1/26 | 150 | 177 |
| | General Motors Financial Co. Inc. | 4.350% | 1/17/27 | 325 | 370 |
| | General Motors Financial Co. Inc. | 2.700% | 8/20/27 | 500 | 527 |
| | General Motors Financial Co. Inc. | 3.600% | 6/21/30 | 800 | 889 |
| | George Washington University | 4.126% | 9/15/48 | 300 | 374 |
| | Georgetown University | 4.315% | 4/1/49 | 68 | 87 |
| | Georgetown University | 2.943% | 4/1/50 | 100 | 100 |
| | Georgetown University | 5.215% | 10/1/18 | 59 | 85 |
| | Harley-Davidson Inc. | 3.500% | 7/28/25 | 100 | 109 |
| | Harley-Davidson Inc. | 4.625% | 7/28/45 | 125 | 142 |
| | Hasbro Inc. | 3.900% | 11/19/29 | 350 | 396 |
| | Hasbro Inc. | 6.350% | 3/15/40 | 125 | 161 |
| | Hasbro Inc. | 5.100% | 5/15/44 | 50 | 56 |
| | Home Depot Inc. | 3.250% | 3/1/22 | 150 | 155 |
| | Home Depot Inc. | 2.625% | 6/1/22 | 265 | 273 |
| | Home Depot Inc. | 2.700% | 4/1/23 | 25 | 26 |
| | Home Depot Inc. | 3.750% | 2/15/24 | 200 | 219 |
| | Home Depot Inc. | 3.000% | 4/1/26 | 275 | 306 |
| | Home Depot Inc. | 2.125% | 9/15/26 | 100 | 108 |
| | Home Depot Inc. | 2.500% | 4/15/27 | 395 | 432 |
| | Home Depot Inc. | 2.800% | 9/14/27 | 200 | 223 |
| | Home Depot Inc. | 3.900% | 12/6/28 | 100 | 120 |
| | Home Depot Inc. | 2.950% | 6/15/29 | 600 | 681 |
| | Home Depot Inc. | 2.700% | 4/15/30 | 445 | 496 |
| | Home Depot Inc. | 5.875% | 12/16/36 | 825 | 1,249 |
| | Home Depot Inc. | 3.300% | 4/15/40 | 295 | 347 |
| | Home Depot Inc. | 5.950% | 4/1/41 | 175 | 272 |
| | Home Depot Inc. | 4.200% | 4/1/43 | 200 | 259 |
| | Home Depot Inc. | 4.875% | 2/15/44 | 300 | 423 |
| | Home Depot Inc. | 4.400% | 3/15/45 | 100 | 133 |
| | Home Depot Inc. | 4.250% | 4/1/46 | 330 | 440 |
| | Home Depot Inc. | 3.900% | 6/15/47 | 250 | 318 |
| | Home Depot Inc. | 4.500% | 12/6/48 | 225 | 315 |
| | Home Depot Inc. | 3.125% | 12/15/49 | 525 | 602 |
| | Home Depot Inc. | 3.350% | 4/15/50 | 375 | 444 |
| | Hyatt Hotels Corp. | 3.375% | 7/15/23 | 100 | 105 |
| | Hyatt Hotels Corp. | 4.850% | 3/15/26 | 50 | 56 |
| | Hyatt Hotels Corp. | 4.375% | 9/15/28 | 75 | 82 |
| | JD.com Inc. | 3.125% | 4/29/21 | 200 | 202 |
| | JD.com Inc. | 3.375% | 1/14/30 | 200 | 217 |
| | | | Coupon | Maturity
Date | Face
Amount
($000) | Market
Value•
($000) |
| 2 | Johns Hopkins University | 4.083% | 7/1/53 | 75 | 100 |
| | Kohl's Corp. | 4.250% | 7/17/25 | 300 | 326 |
| | Kohl's Corp. | 5.550% | 7/17/45 | 100 | 107 |
| | Las Vegas Sands Corp. | 3.200% | 8/8/24 | 365 | 386 |
| | Las Vegas Sands Corp. | 2.900% | 6/25/25 | 200 | 209 |
| | Las Vegas Sands Corp. | 3.500% | 8/18/26 | 145 | 155 |
| | Las Vegas Sands Corp. | 3.900% | 8/8/29 | 65 | 70 |
| | Lear Corp. | 3.800% | 9/15/27 | 100 | 111 |
| | Lear Corp. | 4.250% | 5/15/29 | 150 | 170 |
| | Lear Corp. | 3.500% | 5/30/30 | 100 | 108 |
| | Lear Corp. | 5.250% | 5/15/49 | 125 | 152 |
| | Leggett & Platt Inc. | 3.800% | 11/15/24 | 100 | 108 |
| | Leggett & Platt Inc. | 3.500% | 11/15/27 | 125 | 136 |
| | Leggett & Platt Inc. | 4.400% | 3/15/29 | 75 | 86 |
| | Leland Stanford Junior University | 3.647% | 5/1/48 | 500 | 640 |
| | Lennar Corp. | 4.750% | 11/15/22 | 200 | 212 |
| | Lennar Corp. | 4.500% | 4/30/24 | 300 | 333 |
| | Lennar Corp. | 5.250% | 6/1/26 | 200 | 237 |
| | Lennar Corp. | 4.750% | 11/29/27 | 200 | 236 |
| | Lowe's Cos. Inc. | 3.120% | 4/15/22 | 150 | 154 |
| | Lowe's Cos. Inc. | 3.875% | 9/15/23 | 275 | 299 |
| | Lowe's Cos. Inc. | 3.125% | 9/15/24 | 100 | 109 |
| | Lowe's Cos. Inc. | 3.375% | 9/15/25 | 200 | 223 |
| | Lowe's Cos. Inc. | 2.500% | 4/15/26 | 250 | 270 |
| | Lowe's Cos. Inc. | 3.100% | 5/3/27 | 350 | 392 |
| | Lowe's Cos. Inc. | 1.300% | 4/15/28 | 260 | 262 |
| | Lowe's Cos. Inc. | 6.500% | 3/15/29 | 67 | 91 |
| | Lowe's Cos. Inc. | 3.650% | 4/5/29 | 300 | 350 |
| | Lowe's Cos. Inc. | 4.500% | 4/15/30 | 250 | 309 |
| | Lowe's Cos. Inc. | 1.700% | 10/15/30 | 300 | 302 |
| | Lowe's Cos. Inc. | 4.250% | 9/15/44 | 28 | 33 |
| | Lowe's Cos. Inc. | 3.700% | 4/15/46 | 250 | 294 |
| | Lowe's Cos. Inc. | 4.050% | 5/3/47 | 300 | 371 |
| | Lowe's Cos. Inc. | 4.550% | 4/5/49 | 375 | 498 |
| | Lowe's Cos. Inc. | 3.000% | 10/15/50 | 500 | 532 |
| | Magna International Inc. | 3.625% | 6/15/24 | 170 | 186 |
| | Magna International Inc. | 4.150% | 10/1/25 | 100 | 115 |
| | Magna International Inc. | 2.450% | 6/15/30 | 100 | 107 |
| | Marriott International Inc. | 2.125% | 10/3/22 | 200 | 203 |
| | Marriott International Inc. | 3.750% | 3/15/25 | 175 | 189 |
| | Marriott International Inc. | 3.750% | 10/1/25 | 65 | 70 |
| | Marriott International Inc. | 3.125% | 6/15/26 | 1,083 | 1,153 |
| | Marriott International Inc. | 4.000% | 4/15/28 | 50 | 55 |
| | Marriott International Inc. | 4.625% | 6/15/30 | 200 | 234 |
| | Masco Corp. | 4.375% | 4/1/26 | 100 | 117 |
| | Masco Corp. | 3.500% | 11/15/27 | 100 | 113 |
| | Masco Corp. | 7.750% | 8/1/29 | 24 | ��33 |
| | Masco Corp. | 2.000% | 10/1/30 | 500 | 508 |
| | Masco Corp. | 4.500% | 5/15/47 | 100 | 125 |
| 2 | Massachusetts Institute of Technology | 3.959% | 7/1/38 | 125 | 156 |
| | Massachusetts Institute of Technology | 2.989% | 7/1/50 | 85 | 98 |
| | Massachusetts Institute of Technology | 5.600% | 7/1/11 | 130 | 227 |
| | Massachusetts Institute of Technology | 4.678% | 7/1/14 | 275 | 412 |
| | Massachusetts Institute of Technology | 3.885% | 7/1/16 | 100 | 127 |
| | McDonald's Corp. | 2.625% | 1/15/22 | 275 | 282 |
| | McDonald's Corp. | 3.350% | 4/1/23 | 200 | 213 |
| | McDonald's Corp. | 3.300% | 7/1/25 | 497 | 553 |
| | McDonald's Corp. | 3.700% | 1/30/26 | 300 | 341 |
| | McDonald's Corp. | 3.500% | 3/1/27 | 200 | 228 |
| | McDonald's Corp. | 3.500% | 7/1/27 | 315 | 361 |
| | McDonald's Corp. | 3.800% | 4/1/28 | 350 | 409 |
| | McDonald's Corp. | 2.625% | 9/1/29 | 200 | 219 |
| | McDonald's Corp. | 2.125% | 3/1/30 | 200 | 211 |
| | McDonald's Corp. | 3.600% | 7/1/30 | 200 | 234 |
Total Bond Market Index Portfolio
| | | | Coupon | Maturity
Date | Face
Amount
($000) | Market
Value•
($000) |
| | McDonald's Corp. | 4.700% | 12/9/35 | 200 | 260 |
| | McDonald's Corp. | 6.300% | 10/15/37 | 150 | 225 |
| | McDonald's Corp. | 6.300% | 3/1/38 | 100 | 151 |
| | McDonald's Corp. | 5.700% | 2/1/39 | 100 | 143 |
| | McDonald's Corp. | 3.700% | 2/15/42 | 25 | 29 |
| | McDonald's Corp. | 3.625% | 5/1/43 | 100 | 115 |
| | McDonald's Corp. | 4.600% | 5/26/45 | 210 | 273 |
| | McDonald's Corp. | 4.875% | 12/9/45 | 300 | 405 |
| | McDonald's Corp. | 4.450% | 3/1/47 | 250 | 324 |
| | McDonald's Corp. | 4.450% | 9/1/48 | 150 | 196 |
| | McDonald's Corp. | 3.625% | 9/1/49 | 350 | 408 |
| | McDonald's Corp. | 4.200% | 4/1/50 | 200 | 257 |
| | Mohawk Industries Inc. | 3.850% | 2/1/23 | 100 | 106 |
| | Mohawk Industries Inc. | 3.625% | 5/15/30 | 125 | 140 |
| | NIKE Inc. | 2.400% | 3/27/25 | 225 | 242 |
| | NIKE Inc. | 2.375% | 11/1/26 | 200 | 218 |
| | NIKE Inc. | 2.750% | 3/27/27 | 200 | 221 |
| | NIKE Inc. | 2.850% | 3/27/30 | 200 | 226 |
| | NIKE Inc. | 3.250% | 3/27/40 | 200 | 232 |
| | NIKE Inc. | 3.625% | 5/1/43 | 125 | 152 |
| | NIKE Inc. | 3.875% | 11/1/45 | 225 | 288 |
| | NIKE Inc. | 3.375% | 11/1/46 | 100 | 118 |
| | NIKE Inc. | 3.375% | 3/27/50 | 300 | 369 |
| 2 | Northwestern University | 4.643% | 12/1/44 | 75 | 99 |
| 2 | Northwestern University | 2.640% | 12/1/50 | 50 | 51 |
| 2 | Northwestern University | 3.662% | 12/1/57 | 75 | 95 |
| | NVR Inc. | 3.950% | 9/15/22 | 100 | 105 |
| | NVR Inc. | 3.000% | 5/15/30 | 200 | 217 |
| | O'Reilly Automotive Inc. | 3.800% | 9/1/22 | 100 | 105 |
| | O'Reilly Automotive Inc. | 3.850% | 6/15/23 | 75 | 80 |
| | O'Reilly Automotive Inc. | 3.600% | 9/1/27 | 325 | 371 |
| | O'Reilly Automotive Inc. | 1.750% | 3/15/31 | 500 | 500 |
| | President and Fellows of Harvard College | 4.875% | 10/15/40 | 225 | 321 |
| | President and Fellows of Harvard College | 3.150% | 7/15/46 | 100 | 118 |
| | PulteGroup Inc. | 5.500% | 3/1/26 | 200 | 238 |
| | Pultegroup, Inc. | 6.375% | 5/15/33 | 300 | 411 |
| | Ralph Lauren Corp. | 1.700% | 6/15/22 | 100 | 102 |
| | Ralph Lauren Corp. | 3.750% | 9/15/25 | 50 | 56 |
| | Ralph Lauren Corp. | 2.950% | �� 6/15/30 | 200 | 216 |
| | Rockefeller Foundation | 2.492% | 10/1/50 | 250 | 255 |
| | Ross Stores Inc. | 4.600% | 4/15/25 | 200 | 231 |
| | Ross Stores Inc. | 1.875% | 4/15/31 | 200 | 201 |
| | Sands China Ltd. | 4.600% | 8/8/23 | 400 | 428 |
| | Sands China Ltd. | 5.125% | 8/8/25 | 400 | 449 |
| 5 | Sands China Ltd. | 3.800% | 1/8/26 | 200 | 213 |
| | Sands China Ltd. | 5.400% | 8/8/28 | 300 | 351 |
| 5 | Sands China Ltd. | 4.375% | 6/18/30 | 200 | 222 |
| | Starbucks Corp. | 1.300% | 5/7/22 | 100 | 101 |
| | Starbucks Corp. | 2.700% | 6/15/22 | 75 | 77 |
| | Starbucks Corp. | 3.100% | 3/1/23 | 375 | 396 |
| | Starbucks Corp. | 3.850% | 10/1/23 | 100 | 108 |
| | Starbucks Corp. | 2.450% | 6/15/26 | 200 | 216 |
| | Starbucks Corp. | 3.500% | 3/1/28 | 100 | 115 |
| | Starbucks Corp. | 4.000% | 11/15/28 | 200 | 237 |
| | Starbucks Corp. | 3.550% | 8/15/29 | 200 | 232 |
| | Starbucks Corp. | 2.250% | 3/12/30 | 450 | 475 |
| | Starbucks Corp. | 2.550% | 11/15/30 | 300 | 324 |
| | Starbucks Corp. | 4.300% | 6/15/45 | 50 | 61 |
| | Starbucks Corp. | 3.750% | 12/1/47 | 125 | 146 |
| | Starbucks Corp. | 4.500% | 11/15/48 | 200 | 257 |
| | Starbucks Corp. | 3.350% | 3/12/50 | 100 | 111 |
| | Starbucks Corp. | 3.500% | 11/15/50 | 300 | 344 |
| | Steelcase Inc. | 5.125% | 1/18/29 | 125 | 147 |
| | Tapestry Inc. | 3.000% | 7/15/22 | 125 | 128 |
| | Tapestry Inc. | 4.250% | 4/1/25 | 97 | 105 |
| | Tapestry Inc. | 4.125% | 7/15/27 | 100 | 108 |
| | TJX Cos. Inc. | 2.500% | 5/15/23 | 100 | 104 |
| | | | Coupon | Maturity
Date | Face
Amount
($000) | Market
Value•
($000) |
| | TJX Cos. Inc. | 3.500% | 4/15/25 | 150 | 167 |
| | TJX Cos. Inc. | 2.250% | 9/15/26 | 350 | 377 |
| | TJX Cos. Inc. | 3.750% | 4/15/27 | 450 | 520 |
| | TJX Cos. Inc. | 1.600% | 5/15/31 | 500 | 504 |
| | Toyota Motor Corp. | 2.157% | 7/2/22 | 100 | 103 |
| | Toyota Motor Corp. | 3.419% | 7/20/23 | 150 | 162 |
| | Toyota Motor Corp. | 2.358% | 7/2/24 | 100 | 106 |
| | Toyota Motor Corp. | 2.760% | 7/2/29 | 100 | 112 |
| | Toyota Motor Credit Corp. | 2.600% | 1/11/22 | 200 | 205 |
| | Toyota Motor Credit Corp. | 3.300% | 1/12/22 | 175 | 181 |
| | Toyota Motor Credit Corp. | 2.650% | 4/12/22 | 500 | 515 |
| | Toyota Motor Credit Corp. | 1.150% | 5/26/22 | 1,100 | 1,113 |
| | Toyota Motor Credit Corp. | 2.800% | 7/13/22 | 100 | 104 |
| | Toyota Motor Credit Corp. | 2.150% | 9/8/22 | 200 | 206 |
| | Toyota Motor Credit Corp. | 2.625% | 1/10/23 | 100 | 105 |
| | Toyota Motor Credit Corp. | 0.500% | 8/14/23 | 500 | 502 |
| | Toyota Motor Credit Corp. | 1.350% | 8/25/23 | 200 | 205 |
| | Toyota Motor Credit Corp. | 2.250% | 10/18/23 | 300 | 315 |
| | Toyota Motor Credit Corp. | 2.900% | 4/17/24 | 125 | 134 |
| | Toyota Motor Credit Corp. | 1.800% | 2/13/25 | 250 | 262 |
| | Toyota Motor Credit Corp. | 3.400% | 4/14/25 | 125 | 139 |
| | Toyota Motor Credit Corp. | 3.200% | 1/11/27 | 200 | 224 |
| | Toyota Motor Credit Corp. | 1.150% | 8/13/27 | 500 | 502 |
| | Toyota Motor Credit Corp. | 3.050% | 1/11/28 | 100 | 112 |
| | Toyota Motor Credit Corp. | 3.650% | 1/8/29 | 100 | 118 |
| | Toyota Motor Credit Corp. | 2.150% | 2/13/30 | 150 | 160 |
| | Toyota Motor Credit Corp. | 3.375% | 4/1/30 | 400 | 468 |
| | Tractor Supply Co. | 1.750% | 11/1/30 | 200 | 201 |
| | Trustees of Boston College | 3.129% | 7/1/52 | 100 | 109 |
| | Trustees of Princeton University | 5.700% | 3/1/39 | 200 | 303 |
| | Trustees of Princeton University | 2.516% | 7/1/50 | 150 | 159 |
| | Trustees of the University of Pennsylvania | 2.396% | 10/1/50 | 200 | 205 |
| 2 | University of Chicago | 2.547% | 4/1/50 | 500 | 500 |
| 2 | University of Chicago | 4.003% | 10/1/53 | 100 | 132 |
| 2 | University of Notre Dame du Lac | 3.438% | 2/15/45 | 100 | 122 |
| | University of Notre Dame du Lac | 3.394% | 2/15/48 | 125 | 154 |
| | University of Pennsylvania | 4.674% | 9/1/12 | 50 | 72 |
| 2 | University of Southern California | 3.028% | 10/1/39 | 100 | 109 |
| 2 | University of Southern California | 3.841% | 10/1/47 | 200 | 252 |
| | University of Southern California | 5.250% | 10/1/11 | 100 | 158 |
| | VF Corp. | 2.050% | 4/23/22 | 200 | 204 |
| | VF Corp. | 2.400% | 4/23/25 | 200 | 214 |
| | VF Corp. | 2.950% | 4/23/30 | 200 | 220 |
| | Whirlpool Corp. | 4.700% | 6/1/22 | 100 | 106 |
| | Whirlpool Corp. | 4.000% | 3/1/24 | 50 | 55 |
| | Whirlpool Corp. | 3.700% | 5/1/25 | 75 | 83 |
| | Whirlpool Corp. | 4.750% | 2/26/29 | 150 | 183 |
| | Whirlpool Corp. | 4.500% | 6/1/46 | 100 | 124 |
| | Whirlpool Corp. | 4.600% | 5/15/50 | 75 | 97 |
| 2 | William Marsh Rice University | 3.574% | 5/15/45 | 150 | 182 |
| | Yale University | 0.873% | 4/15/25 | 100 | 102 |
| | Yale University | 1.482% | 4/15/30 | 100 | 102 |
| | Yale University | 2.402% | 4/15/50 | 100 | 103 |
| | | | | | | 83,626 |
| Consumer Staples (2.1%) |
| | Ahold Finance USA LLC | 6.875% | 5/1/29 | 100 | 139 |
| | Altria Group Inc. | 3.490% | 2/14/22 | 200 | 207 |
| | Altria Group Inc. | 2.850% | 8/9/22 | 375 | 390 |
| | Altria Group Inc. | 2.950% | 5/2/23 | 400 | 421 |
| | Altria Group Inc. | 4.000% | 1/31/24 | 250 | 275 |
Total Bond Market Index Portfolio
| | | | Coupon | Maturity
Date | Face
Amount
($000) | Market
Value•
($000) |
| | Altria Group Inc. | 2.350% | 5/6/25 | 150 | 159 |
| | Altria Group Inc. | 4.400% | 2/14/26 | 275 | 319 |
| | Altria Group Inc. | 2.625% | 9/16/26 | 75 | 81 |
| | Altria Group Inc. | 4.800% | 2/14/29 | 575 | 686 |
| | Altria Group Inc. | 5.800% | 2/14/39 | 400 | 525 |
| | Altria Group Inc. | 4.250% | 8/9/42 | 275 | 307 |
| | Altria Group Inc. | 4.500% | 5/2/43 | 125 | 143 |
| | Altria Group Inc. | 5.375% | 1/31/44 | 350 | 448 |
| | Altria Group Inc. | 3.875% | 9/16/46 | 175 | 184 |
| | Altria Group Inc. | 5.950% | 2/14/49 | 500 | 699 |
| | Altria Group Inc. | 4.450% | 5/6/50 | 200 | 237 |
| | Altria Group Inc. | 6.200% | 2/14/59 | 175 | 245 |
| | Anheuser-Busch Cos LLC / Anheuser-Busch InBev Worldwide Inc. | 3.650% | 2/1/26 | 1,045 | 1,181 |
| | Anheuser-Busch Cos. LLC / Anheuser-Busch InBev Worldwide Inc. | 4.700% | 2/1/36 | 1,195 | 1,512 |
| | Anheuser-Busch Cos. LLC / Anheuser-Busch InBev Worldwide Inc. | 4.900% | 2/1/46 | 2,310 | 2,996 |
| | Anheuser-Busch InBev Finance Inc. | 4.700% | 2/1/36 | 100 | 126 |
| | Anheuser-Busch InBev Finance Inc. | 4.000% | 1/17/43 | 300 | 341 |
| | Anheuser-Busch InBev Finance Inc. | 4.625% | 2/1/44 | 200 | 247 |
| | Anheuser-Busch InBev Finance Inc. | 4.900% | 2/1/46 | 475 | 616 |
| | Anheuser-Busch InBev Worldwide Inc. | 4.150% | 1/23/25 | 882 | 1,004 |
| | Anheuser-Busch InBev Worldwide Inc. | 4.000% | 4/13/28 | 500 | 588 |
| | Anheuser-Busch InBev Worldwide Inc. | 4.750% | 1/23/29 | 925 | 1,140 |
| | Anheuser-Busch InBev Worldwide Inc. | 4.900% | 1/23/31 | 340 | 432 |
| | Anheuser-Busch InBev Worldwide Inc. | 4.375% | 4/15/38 | 275 | 337 |
| | Anheuser-Busch InBev Worldwide Inc. | 8.200% | 1/15/39 | 150 | 255 |
| | Anheuser-Busch InBev Worldwide Inc. | 5.450% | 1/23/39 | 125 | 169 |
| | Anheuser-Busch InBev Worldwide Inc. | 4.950% | 1/15/42 | 325 | 427 |
| | Anheuser-Busch InBev Worldwide Inc. | 3.750% | 7/15/42 | 325 | 366 |
| | Anheuser-Busch InBev Worldwide Inc. | 4.600% | 4/15/48 | 700 | 886 |
| | Anheuser-Busch InBev Worldwide Inc. | 4.439% | 10/6/48 | 601 | 744 |
| | Anheuser-Busch InBev Worldwide Inc. | 5.550% | 1/23/49 | 600 | 852 |
| | Anheuser-Busch InBev Worldwide Inc. | 4.500% | 6/1/50 | 400 | 503 |
| | Anheuser-Busch InBev Worldwide Inc. | 4.750% | 4/15/58 | 350 | 458 |
| | Anheuser-Busch InBev Worldwide Inc. | 5.800% | 1/23/59 | 155 | 235 |
| | Anheuser-Busch InBev Worldwide Inc. | 4.600% | 6/1/60 | 375 | 482 |
| | Archer-Daniels-Midland Co. | 2.750% | 3/27/25 | 100 | 109 |
| | Archer-Daniels-Midland Co. | 2.500% | 8/11/26 | 200 | 218 |
| | Archer-Daniels-Midland Co. | 3.250% | 3/27/30 | 200 | 230 |
| | Archer-Daniels-Midland Co. | 5.935% | 10/1/32 | 80 | 114 |
| | Archer-Daniels-Midland Co. | 5.375% | 9/15/35 | 95 | 136 |
| | Archer-Daniels-Midland Co. | 3.750% | 9/15/47 | 50 | 63 |
| | | | Coupon | Maturity
Date | Face
Amount
($000) | Market
Value•
($000) |
| | Archer-Daniels-Midland Co. | 4.500% | 3/15/49 | 125 | 178 |
| | BAT Capital Corp. | 2.764% | 8/15/22 | 325 | 336 |
| | BAT Capital Corp. | 3.222% | 8/15/24 | 650 | 704 |
| | BAT Capital Corp. | 3.215% | 9/6/26 | 200 | 220 |
| | BAT Capital Corp. | 4.700% | 4/2/27 | 100 | 118 |
| | BAT Capital Corp. | 3.557% | 8/15/27 | 675 | 752 |
| | BAT Capital Corp. | 2.259% | 3/25/28 | 500 | 518 |
| | BAT Capital Corp. | 3.462% | 9/6/29 | 125 | 137 |
| | BAT Capital Corp. | 2.726% | 3/25/31 | 500 | 518 |
| | BAT Capital Corp. | 4.390% | 8/15/37 | 525 | 588 |
| | BAT Capital Corp. | 4.540% | 8/15/47 | 575 | 637 |
| | BAT Capital Corp. | 4.758% | 9/6/49 | 250 | 286 |
| | BAT Capital Corp. | 3.984% | 9/25/50 | 500 | 520 |
| | BAT International Finance plc | 1.668% | 3/25/26 | 500 | 511 |
| | Beam Suntory Inc. | 3.250% | 5/15/22 | 50 | 52 |
| | Brown-Forman Corp. | 3.500% | 4/15/25 | 81 | 90 |
| | Brown-Forman Corp. | 4.500% | 7/15/45 | 100 | 134 |
| | Bunge Ltd. Finance Corp. | 3.000% | 9/25/22 | 250 | 260 |
| | Bunge Ltd. Finance Corp. | 4.350% | 3/15/24 | 125 | 138 |
| | Bunge Ltd. Finance Corp. | 3.750% | 9/25/27 | 200 | 228 |
| | Campbell Soup Co. | 3.650% | 3/15/23 | 65 | 69 |
| | Campbell Soup Co. | 3.950% | 3/15/25 | 200 | 225 |
| | Campbell Soup Co. | 3.300% | 3/19/25 | 125 | 137 |
| | Campbell Soup Co. | 4.150% | 3/15/28 | 175 | 205 |
| | Campbell Soup Co. | 2.375% | 4/24/30 | 150 | 157 |
| | Campbell Soup Co. | 4.800% | 3/15/48 | 135 | 180 |
| | Campbell Soup Co. | 3.125% | 4/24/50 | 100 | 106 |
| | Church & Dwight Co. Inc. | 2.450% | 8/1/22 | 25 | 26 |
| | Church & Dwight Co. Inc. | 3.150% | 8/1/27 | 100 | 111 |
| | Church & Dwight Co. Inc. | 3.950% | 8/1/47 | 75 | 94 |
| | Clorox Co. | 3.050% | 9/15/22 | 100 | 104 |
| | Clorox Co. | 3.500% | 12/15/24 | 175 | 193 |
| | Clorox Co. | 3.100% | 10/1/27 | 50 | 56 |
| | Clorox Co. | 3.900% | 5/15/28 | 50 | 59 |
| | Clorox Co. | 1.800% | 5/15/30 | 50 | 51 |
| | Coca-Cola Co. | 3.200% | 11/1/23 | 225 | 244 |
| | Coca-Cola Co. | 1.750% | 9/6/24 | 100 | 105 |
| | Coca-Cola Co. | 2.950% | 3/25/25 | 220 | 242 |
| | Coca-Cola Co. | 2.875% | 10/27/25 | 300 | 333 |
| | Coca-Cola Co. | 2.550% | 6/1/26 | 100 | 109 |
| | Coca-Cola Co. | 2.250% | 9/1/26 | 410 | 445 |
| | Coca-Cola Co. | 3.375% | 3/25/27 | 200 | 229 |
| | Coca-Cola Co. | 2.900% | 5/25/27 | 50 | 56 |
| | Coca-Cola Co. | 1.000% | 3/15/28 | 500 | 501 |
| | Coca-Cola Co. | 2.125% | 9/6/29 | 125 | 134 |
| | Coca-Cola Co. | 3.450% | 3/25/30 | 250 | 293 |
| | Coca-Cola Co. | 1.375% | 3/15/31 | 500 | 498 |
| | Coca-Cola Co. | 4.125% | 3/25/40 | 100 | 129 |
| | Coca-Cola Co. | 2.500% | 6/1/40 | 200 | 212 |
| | Coca-Cola Co. | 4.200% | 3/25/50 | 175 | 240 |
| | Coca-Cola Co. | 2.600% | 6/1/50 | 300 | 316 |
| | Coca-Cola Co. | 2.750% | 6/1/60 | 325 | 350 |
| | Coca-Cola Consolidated Inc. | 3.800% | 11/25/25 | 125 | 139 |
| | Coca-Cola Femsa SAB de CV | 2.750% | 1/22/30 | 200 | 216 |
| | Coca-Cola Femsa SAB de CV | 5.250% | 11/26/43 | 150 | 210 |
| | Colgate-Palmolive Co. | 2.250% | 11/15/22 | 75 | 78 |
| | Colgate-Palmolive Co. | 2.100% | 5/1/23 | 280 | 291 |
| | Colgate-Palmolive Co. | 3.250% | 3/15/24 | 100 | 109 |
| | Colgate-Palmolive Co. | 4.000% | 8/15/45 | 150 | 201 |
| | Colgate-Palmolive Co. | 3.700% | 8/1/47 | 100 | 130 |
| | Conagra Brands Inc. | 3.250% | 9/15/22 | 75 | 78 |
| | Conagra Brands Inc. | 3.200% | 1/25/23 | 79 | 83 |
| | Conagra Brands Inc. | 4.300% | 5/1/24 | 200 | 223 |
| | Conagra Brands Inc. | 4.600% | 11/1/25 | 150 | 177 |
| | Conagra Brands Inc. | 1.375% | 11/1/27 | 200 | 201 |
Total Bond Market Index Portfolio
| | | | Coupon | Maturity
Date | Face
Amount
($000) | Market
Value•
($000) |
| | Conagra Brands Inc. | 7.000% | 10/1/28 | 75 | 101 |
| | Conagra Brands Inc. | 4.850% | 11/1/28 | 250 | 310 |
| | Conagra Brands Inc. | 8.250% | 9/15/30 | 50 | 75 |
| | Conagra Brands Inc. | 5.300% | 11/1/38 | 200 | 266 |
| | Conagra Brands Inc. | 5.400% | 11/1/48 | 200 | 282 |
| | Constellation Brands Inc. | 2.700% | 5/9/22 | 50 | 51 |
| | Constellation Brands Inc. | 2.650% | 11/7/22 | 250 | 260 |
| | Constellation Brands Inc. | 3.200% | 2/15/23 | 250 | 264 |
| | Constellation Brands Inc. | 4.250% | 5/1/23 | 200 | 218 |
| | Constellation Brands Inc. | 4.750% | 11/15/24 | 175 | 201 |
| | Constellation Brands Inc. | 4.400% | 11/15/25 | 100 | 116 |
| | Constellation Brands Inc. | 3.700% | 12/6/26 | 100 | 114 |
| | Constellation Brands Inc. | 3.500% | 5/9/27 | 150 | 170 |
| | Constellation Brands Inc. | 3.600% | 2/15/28 | 175 | 200 |
| | Constellation Brands Inc. | 4.650% | 11/15/28 | 75 | 91 |
| | Constellation Brands Inc. | 3.150% | 8/1/29 | 225 | 250 |
| | Constellation Brands Inc. | 2.875% | 5/1/30 | 356 | 390 |
| | Constellation Brands Inc. | 4.500% | 5/9/47 | 75 | 95 |
| | Constellation Brands Inc. | 4.100% | 2/15/48 | 100 | 121 |
| | Constellation Brands Inc. | 5.250% | 11/15/48 | 225 | 316 |
| | Constellation Brands Inc. | 3.750% | 5/1/50 | 125 | 147 |
| | Costco Wholesale Corp. | 2.300% | 5/18/22 | 150 | 154 |
| | Costco Wholesale Corp. | 2.750% | 5/18/24 | 275 | 295 |
| | Costco Wholesale Corp. | 3.000% | 5/18/27 | 100 | 112 |
| | Costco Wholesale Corp. | 1.375% | 6/20/27 | 250 | 257 |
| | Costco Wholesale Corp. | 1.600% | 4/20/30 | 400 | 409 |
| | Costco Wholesale Corp. | 1.750% | 4/20/32 | 200 | 208 |
| | Delhaize America LLC | 9.000% | 4/15/31 | 100 | 160 |
| | Diageo Capital plc | 2.625% | 4/29/23 | 500 | 524 |
| | Diageo Capital plc | 2.125% | �� 10/24/24 | 200 | 211 |
| | Diageo Capital plc | 1.375% | 9/29/25 | 200 | 205 |
| | Diageo Capital plc | 2.375% | 10/24/29 | 200 | 215 |
| | Diageo Capital plc | 2.000% | 4/29/30 | 200 | 208 |
| | Diageo Capital plc | 2.125% | 4/29/32 | 200 | 211 |
| | Diageo Capital plc | 5.875% | 9/30/36 | 50 | 72 |
| | Diageo Capital plc | 3.875% | 4/29/43 | 100 | 124 |
| | Diageo Investment Corp. | 2.875% | 5/11/22 | 300 | 310 |
| | Diageo Investment Corp. | 4.250% | 5/11/42 | 150 | 191 |
| | Dollar General Corp. | 3.250% | 4/15/23 | 150 | 159 |
| | Dollar General Corp. | 4.150% | 11/1/25 | 105 | 121 |
| | Dollar General Corp. | 3.875% | 4/15/27 | 150 | 173 |
| | Dollar General Corp. | 4.125% | 5/1/28 | 150 | 177 |
| | Dollar General Corp. | 3.500% | 4/3/30 | 100 | 115 |
| | Dollar General Corp. | 4.125% | 4/3/50 | 200 | 252 |
| | Dollar Tree Inc. | 3.700% | 5/15/23 | 100 | 107 |
| | Dollar Tree Inc. | 4.000% | 5/15/25 | 200 | 226 |
| | Dollar Tree Inc. | 4.200% | 5/15/28 | 300 | 355 |
| | Estee Lauder Cos. Inc. | 3.150% | 3/15/27 | 150 | 169 |
| | Estee Lauder Cos. Inc. | 2.375% | 12/1/29 | 125 | 135 |
| | Estee Lauder Cos. Inc. | 6.000% | 5/15/37 | 75 | 111 |
| | Estee Lauder Cos. Inc. | 4.375% | 6/15/45 | 100 | 131 |
| | Estee Lauder Cos. Inc. | 4.150% | 3/15/47 | 100 | 131 |
| | Estee Lauder Cos. Inc. | 3.125% | 12/1/49 | 125 | 143 |
| | Flowers Foods Inc. | 4.375% | 4/1/22 | 50 | 52 |
| | Flowers Foods Inc. | 3.500% | 10/1/26 | 75 | 84 |
| | Fomento Economico Mexicano SAB de CV | 4.375% | 5/10/43 | 100 | 125 |
| | Fomento Economico Mexicano SAB de CV | 3.500% | 1/16/50 | 600 | 667 |
| | General Mills Inc. | 3.150% | 12/15/21 | 25 | 25 |
| | General Mills Inc. | 2.600% | 10/12/22 | 250 | 260 |
| | General Mills Inc. | 3.700% | 10/17/23 | 575 | 626 |
| | General Mills Inc. | 3.650% | 2/15/24 | 100 | 108 |
| | General Mills Inc. | 4.200% | 4/17/28 | 225 | 269 |
| | General Mills Inc. | 2.875% | 4/15/30 | 150 | 166 |
| | General Mills Inc. | 4.550% | 4/17/38 | 75 | 96 |
| | General Mills Inc. | 5.400% | 6/15/40 | 100 | 141 |
| | General Mills Inc. | 4.150% | 2/15/43 | 100 | 126 |
| | General Mills Inc. | 4.700% | 4/17/48 | 225 | 316 |
| | | | Coupon | Maturity
Date | Face
Amount
($000) | Market
Value•
($000) |
| | Hershey Co. | 2.625% | 5/1/23 | 100 | 105 |
| | Hershey Co. | 3.375% | 5/15/23 | 150 | 161 |
| | Hershey Co. | 2.050% | 11/15/24 | 55 | 58 |
| | Hershey Co. | 3.200% | 8/21/25 | 65 | 72 |
| | Hershey Co. | 2.300% | 8/15/26 | 100 | 108 |
| | Hershey Co. | 2.450% | 11/15/29 | 130 | 142 |
| | Hershey Co. | 1.700% | 6/1/30 | 30 | 31 |
| | Hershey Co. | 3.125% | 11/15/49 | 150 | 170 |
| | Hershey Co. | 2.650% | 6/1/50 | 100 | 106 |
| | Hormel Foods Corp. | 1.800% | 6/11/30 | 200 | 207 |
| | Ingredion Inc. | 3.200% | 10/1/26 | 100 | 111 |
| | Ingredion Inc. | 2.900% | 6/1/30 | 175 | 192 |
| | Ingredion Inc. | 3.900% | 6/1/50 | 100 | 119 |
| | JM Smucker Co. | 3.000% | 3/15/22 | 100 | 103 |
| | JM Smucker Co. | 3.500% | 3/15/25 | 175 | 195 |
| | JM Smucker Co. | 3.375% | 12/15/27 | 150 | 169 |
| | JM Smucker Co. | 2.375% | 3/15/30 | 100 | 106 |
| | JM Smucker Co. | 4.250% | 3/15/35 | 100 | 122 |
| | JM Smucker Co. | 4.375% | 3/15/45 | 125 | 156 |
| | JM Smucker Co. | 3.550% | 3/15/50 | 50 | 56 |
| | Kellogg Co. | 2.650% | 12/1/23 | 126 | 134 |
| | Kellogg Co. | 3.250% | 4/1/26 | 125 | 140 |
| | Kellogg Co. | 3.400% | 11/15/27 | 125 | 142 |
| | Kellogg Co. | 4.300% | 5/15/28 | 100 | 119 |
| | Kellogg Co. | 2.100% | 6/1/30 | 100 | 105 |
| | Kellogg Co. | 7.450% | 4/1/31 | 125 | 189 |
| | Kellogg Co. | 4.500% | 4/1/46 | 210 | 271 |
| | Keurig Dr Pepper Inc. | 2.700% | 11/15/22 | 50 | 52 |
| | Keurig Dr Pepper Inc. | 4.057% | 5/25/23 | 375 | 407 |
| | Keurig Dr Pepper Inc. | 3.130% | 12/15/23 | 100 | 107 |
| | Keurig Dr Pepper Inc. | 4.417% | 5/25/25 | 275 | 316 |
| | Keurig Dr Pepper Inc. | 3.400% | 11/15/25 | 100 | 112 |
| | Keurig Dr Pepper Inc. | 2.550% | 9/15/26 | 75 | 82 |
| | Keurig Dr Pepper Inc. | 3.430% | 6/15/27 | 100 | 113 |
| | Keurig Dr Pepper Inc. | 4.597% | 5/25/28 | 395 | 479 |
| | Keurig Dr Pepper Inc. | 3.200% | 5/1/30 | 150 | 170 |
| | Keurig Dr Pepper Inc. | 7.450% | 5/1/38 | 16 | 25 |
| | Keurig Dr Pepper Inc. | 4.985% | 5/25/38 | 100 | 134 |
| | Keurig Dr Pepper Inc. | 4.500% | 11/15/45 | 200 | 255 |
| | Keurig Dr Pepper Inc. | 4.420% | 12/15/46 | 125 | 157 |
| | Keurig Dr Pepper Inc. | 3.800% | 5/1/50 | 150 | 179 |
| | Kimberly-Clark Corp. | 3.050% | 8/15/25 | 50 | 56 |
| | Kimberly-Clark Corp. | 2.750% | 2/15/26 | 100 | 111 |
| | Kimberly-Clark Corp. | 1.050% | 9/15/27 | 500 | 505 |
| | Kimberly-Clark Corp. | 3.950% | 11/1/28 | 50 | 60 |
| | Kimberly-Clark Corp. | 3.200% | 4/25/29 | 150 | 173 |
| | Kimberly-Clark Corp. | 3.100% | 3/26/30 | 155 | 178 |
| | Kimberly-Clark Corp. | 6.625% | 8/1/37 | 250 | 409 |
| | Kimberly-Clark Corp. | 5.300% | 3/1/41 | 25 | 36 |
| | Kimberly-Clark Corp. | 3.200% | 7/30/46 | 175 | 207 |
| | Koninklijke Ahold Delhaize NV | 5.700% | 10/1/40 | 37 | 54 |
| | Kroger Co. | 3.400% | 4/15/22 | 75 | 77 |
| | Kroger Co. | 2.800% | 8/1/22 | 100 | 104 |
| | Kroger Co. | 4.000% | 2/1/24 | 100 | 110 |
| | Kroger Co. | 3.500% | 2/1/26 | 160 | 179 |
| | Kroger Co. | 2.650% | 10/15/26 | 140 | 153 |
| | Kroger Co. | 3.700% | 8/1/27 | 100 | 115 |
| | Kroger Co. | 7.700% | 6/1/29 | 50 | 70 |
| | Kroger Co. | 8.000% | 9/15/29 | 125 | 181 |
| | Kroger Co. | 2.200% | 5/1/30 | 100 | 105 |
| | Kroger Co. | 7.500% | 4/1/31 | 100 | 146 |
| | Kroger Co. | 5.400% | 7/15/40 | 50 | 67 |
| | Kroger Co. | 5.000% | 4/15/42 | 125 | 165 |
| | Kroger Co. | 5.150% | 8/1/43 | 100 | 136 |
| | Kroger Co. | 3.875% | 10/15/46 | 100 | 117 |
| | Kroger Co. | 4.450% | 2/1/47 | 225 | 283 |
| | Kroger Co. | 4.650% | 1/15/48 | 75 | 97 |
| | Kroger Co. | 5.400% | 1/15/49 | 25 | 36 |
Total Bond Market Index Portfolio
| | | | Coupon | Maturity
Date | Face
Amount
($000) | Market
Value•
($000) |
| | Kroger Co. | 3.950% | 1/15/50 | 175 | 210 |
| | McCormick & Co. Inc. | 3.900% | 7/15/21 | 50 | 51 |
| | McCormick & Co. Inc. | 3.150% | 8/15/24 | 150 | 163 |
| | McCormick & Co. Inc. | 3.400% | 8/15/27 | 150 | 168 |
| | McCormick & Co. Inc. | 2.500% | 4/15/30 | 250 | 268 |
| | Mead Johnson Nutrition Co. | 4.125% | 11/15/25 | 355 | 409 |
| | Mead Johnson Nutrition Co. | 5.900% | 11/1/39 | 100 | 148 |
| | Mead Johnson Nutrition Co. | 4.600% | 6/1/44 | 150 | 198 |
| | Molson Coors Beverage Co. | 3.500% | 5/1/22 | 25 | 26 |
| | Molson Coors Beverage Co. | 3.000% | 7/15/26 | 375 | 411 |
| | Molson Coors Beverage Co. | 5.000% | 5/1/42 | 200 | 250 |
| | Molson Coors Beverage Co. | 4.200% | 7/15/46 | 375 | 429 |
| 5 | Mondelez International Holdings Netherlands BV | 2.125% | 9/19/22 | 200 | 206 |
| | Mondelez International Inc. | 0.625% | 7/1/22 | 200 | 201 |
| | Mondelez International Inc. | 2.125% | 4/13/23 | 100 | 104 |
| | Mondelez International Inc. | 1.500% | 5/4/25 | 100 | 104 |
| | Mondelez International Inc. | 2.750% | 4/13/30 | 250 | 274 |
| | Mondelez International Inc. | 1.875% | 10/15/32 | 500 | 507 |
| | Mondelez International Inc. | 2.625% | 9/4/50 | 250 | 251 |
| | PepsiCo Inc. | 2.750% | 3/5/22 | 375 | 386 |
| | PepsiCo Inc. | 2.250% | 5/2/22 | 150 | 154 |
| | PepsiCo Inc. | 0.750% | 5/1/23 | 125 | 127 |
| | PepsiCo Inc. | 3.600% | 3/1/24 | 700 | 764 |
| | PepsiCo Inc. | 2.250% | 3/19/25 | 265 | 283 |
| | PepsiCo Inc. | 2.750% | 4/30/25 | 200 | 217 |
| | PepsiCo Inc. | 3.500% | 7/17/25 | 452 | 507 |
| | PepsiCo Inc. | 2.375% | 10/6/26 | 225 | 245 |
| | PepsiCo Inc. | 2.625% | 3/19/27 | 100 | 110 |
| | PepsiCo Inc. | 3.000% | 10/15/27 | 325 | 366 |
| | PepsiCo Inc. | 2.625% | 7/29/29 | 200 | 220 |
| | PepsiCo Inc. | 2.750% | 3/19/30 | 345 | 384 |
| | PepsiCo Inc. | 1.625% | 5/1/30 | 200 | 205 |
| | PepsiCo Inc. | 1.400% | 2/25/31 | 500 | 502 |
| | PepsiCo Inc. | 3.500% | 3/19/40 | 175 | 210 |
| | PepsiCo Inc. | 4.000% | 3/5/42 | 175 | 225 |
| | PepsiCo Inc. | 3.600% | 8/13/42 | 100 | 121 |
| | PepsiCo Inc. | 4.250% | 10/22/44 | 225 | 294 |
| | PepsiCo Inc. | 4.600% | 7/17/45 | 75 | 105 |
| | PepsiCo Inc. | 4.450% | 4/14/46 | 500 | 697 |
| | PepsiCo Inc. | 3.450% | 10/6/46 | 300 | 360 |
| | PepsiCo Inc. | 4.000% | 5/2/47 | 100 | 131 |
| | PepsiCo Inc. | 3.375% | 7/29/49 | 200 | 242 |
| | PepsiCo Inc. | 2.875% | 10/15/49 | 325 | 363 |
| | PepsiCo Inc. | 3.625% | 3/19/50 | 290 | 366 |
| | PepsiCo Inc. | 3.875% | 3/19/60 | 150 | 200 |
| | Philip Morris International Inc. | 2.500% | 11/2/22 | 300 | 311 |
| | Philip Morris International Inc. | 2.625% | 3/6/23 | 100 | 105 |
| | Philip Morris International Inc. | 1.125% | 5/1/23 | 125 | 127 |
| | Philip Morris International Inc. | 2.125% | 5/10/23 | 95 | 99 |
| | Philip Morris International Inc. | 3.600% | 11/15/23 | 500 | 545 |
| | | | Coupon | Maturity
Date | Face
Amount
($000) | Market
Value•
($000) |
| | Philip Morris International Inc. | 2.875% | 5/1/24 | 220 | 237 |
| | Philip Morris International Inc. | 3.250% | 11/10/24 | 250 | 275 |
| | Philip Morris International Inc. | 1.500% | 5/1/25 | 125 | 129 |
| | Philip Morris International Inc. | 3.375% | 8/11/25 | 150 | 167 |
| | Philip Morris International Inc. | 2.750% | 2/25/26 | 180 | 196 |
| | Philip Morris International Inc. | 3.125% | 3/2/28 | 100 | 112 |
| | Philip Morris International Inc. | 3.375% | 8/15/29 | 250 | 286 |
| | Philip Morris International Inc. | 2.100% | 5/1/30 | 150 | 155 |
| | Philip Morris International Inc. | 1.750% | 11/1/30 | 500 | 506 |
| | Philip Morris International Inc. | 6.375% | 5/16/38 | 200 | 302 |
| | Philip Morris International Inc. | 4.375% | 11/15/41 | 500 | 623 |
| | Philip Morris International Inc. | 4.500% | 3/20/42 | 125 | 158 |
| | Philip Morris International Inc. | 3.875% | 8/21/42 | 25 | 29 |
| | Philip Morris International Inc. | 4.875% | 11/15/43 | 155 | 205 |
| | Philip Morris International Inc. | 4.250% | �� 11/10/44 | 200 | 251 |
| 2 | Procter & Gamble Co. | 9.360% | 1/1/21 | 29 | 29 |
| | Procter & Gamble Co. | 2.300% | 2/6/22 | 425 | 434 |
| | Procter & Gamble Co. | 3.100% | 8/15/23 | 150 | 161 |
| | Procter & Gamble Co. | 0.550% | 10/29/25 | 500 | 501 |
| | Procter & Gamble Co. | 2.450% | 11/3/26 | 100 | 110 |
| | Procter & Gamble Co. | 2.800% | 3/25/27 | 500 | 556 |
| | Procter & Gamble Co. | 3.000% | 3/25/30 | 500 | 573 |
| | Procter & Gamble Co. | 1.200% | 10/29/30 | 500 | 498 |
| | Procter & Gamble Co. | 5.550% | 3/5/37 | 150 | 229 |
| | Procter & Gamble Co. | 3.550% | 3/25/40 | 188 | 234 |
| | Procter & Gamble Co. | 3.500% | 10/25/47 | 169 | 219 |
| | Procter & Gamble Co. | 3.600% | 3/25/50 | 173 | 232 |
| | Reynolds American Inc. | 4.850% | 9/15/23 | 125 | 139 |
| | Reynolds American Inc. | 4.450% | 6/12/25 | 525 | 597 |
| | Reynolds American Inc. | 5.700% | 8/15/35 | 175 | 221 |
| | Reynolds American Inc. | 7.250% | 6/15/37 | 100 | 137 |
| | Reynolds American Inc. | 6.150% | 9/15/43 | 75 | 97 |
| | Reynolds American Inc. | 5.850% | 8/15/45 | 450 | 574 |
| | Sysco Corp. | 2.600% | 6/12/22 | 125 | 129 |
| | Sysco Corp. | 3.750% | 10/1/25 | 75 | 84 |
| | Sysco Corp. | 3.300% | 7/15/26 | 250 | 277 |
| | Sysco Corp. | 3.250% | 7/15/27 | 175 | 195 |
| | Sysco Corp. | 2.400% | 2/15/30 | 100 | 104 |
| | Sysco Corp. | 5.950% | 4/1/30 | 250 | 328 |
| | Sysco Corp. | 6.600% | 4/1/40 | 175 | 255 |
| | Sysco Corp. | 4.850% | 10/1/45 | 50 | 62 |
| | Sysco Corp. | 4.500% | 4/1/46 | 200 | 242 |
| | Sysco Corp. | 4.450% | 3/15/48 | 100 | 120 |
| | Sysco Corp. | 3.300% | 2/15/50 | 105 | 110 |
| | Sysco Corp. | 6.600% | 4/1/50 | 250 | 384 |
| | Target Corp. | 2.900% | 1/15/22 | 200 | 206 |
| | Target Corp. | 3.500% | 7/1/24 | 325 | 360 |
| | Target Corp. | 2.250% | 4/15/25 | 200 | 214 |
| | Target Corp. | 2.500% | 4/15/26 | 175 | 193 |
| | Target Corp. | 3.375% | 4/15/29 | 200 | 234 |
| | Target Corp. | 2.650% | 9/15/30 | 250 | 280 |
| | Target Corp. | 6.500% | 10/15/37 | 103 | 166 |
| | Target Corp. | 7.000% | 1/15/38 | 125 | 208 |
| | Target Corp. | 3.900% | 11/15/47 | 300 | 392 |
| | Tyson Foods Inc. | 4.500% | 6/15/22 | 275 | 288 |
| | Tyson Foods Inc. | 3.900% | 9/28/23 | 100 | 109 |
Total Bond Market Index Portfolio
| | | | Coupon | Maturity
Date | Face
Amount
($000) | Market
Value•
($000) |
| | Tyson Foods Inc. | 3.950% | 8/15/24 | 925 | 1,027 |
| | Tyson Foods Inc. | 4.000% | 3/1/26 | 100 | 115 |
| | Tyson Foods Inc. | 3.550% | 6/2/27 | 275 | 313 |
| | Tyson Foods Inc. | 4.350% | 3/1/29 | 280 | 339 |
| | Tyson Foods Inc. | 4.875% | 8/15/34 | 100 | 131 |
| | Tyson Foods Inc. | 5.150% | 8/15/44 | 200 | 274 |
| | Tyson Foods Inc. | 4.550% | 6/2/47 | 150 | 197 |
| | Tyson Foods Inc. | 5.100% | 9/28/48 | 275 | 395 |
| | Unilever Capital Corp. | 3.000% | 3/7/22 | 100 | 103 |
| | Unilever Capital Corp. | 3.250% | 3/7/24 | 250 | 271 |
| | Unilever Capital Corp. | 2.600% | 5/5/24 | 450 | 480 |
| | Unilever Capital Corp. | 3.375% | 3/22/25 | 100 | 111 |
| | Unilever Capital Corp. | 3.100% | 7/30/25 | 225 | 249 |
| | Unilever Capital Corp. | 2.000% | 7/28/26 | 125 | 133 |
| | Unilever Capital Corp. | 1.375% | 9/14/30 | 300 | ���301 |
| | Unilever Capital Corp. | 5.900% | 11/15/32 | 200 | 290 |
| | Walgreen Co. | 3.100% | 9/15/22 | 250 | 261 |
| | Walgreen Co. | 4.400% | 9/15/42 | 195 | 210 |
| | Walgreens Boots Alliance Inc. | 3.800% | 11/18/24 | 375 | 413 |
| | Walgreens Boots Alliance Inc. | 3.450% | 6/1/26 | 325 | 360 |
| | Walgreens Boots Alliance Inc. | 3.200% | 4/15/30 | 150 | 163 |
| | Walgreens Boots Alliance Inc. | 4.500% | 11/18/34 | 125 | 143 |
| | Walgreens Boots Alliance Inc. | 4.800% | 11/18/44 | 275 | 311 |
| | Walgreens Boots Alliance Inc. | 4.650% | 6/1/46 | 115 | 126 |
| | Walgreens Boots Alliance Inc. | 4.100% | 4/15/50 | 150 | 159 |
| | Walmart Inc. | 2.350% | 12/15/22 | 800 | 832 |
| | Walmart Inc. | 2.550% | 4/11/23 | 150 | 157 |
| | Walmart Inc. | 3.400% | 6/26/23 | 250 | 268 |
| | Walmart Inc. | 3.300% | 4/22/24 | 250 | 272 |
| | Walmart Inc. | 2.850% | 7/8/24 | 275 | 297 |
| | Walmart Inc. | 2.650% | 12/15/24 | 200 | 216 |
| | Walmart Inc. | 3.550% | 6/26/25 | 309 | 350 |
| | Walmart Inc. | 3.050% | 7/8/26 | 250 | 281 |
| | Walmart Inc. | 5.875% | 4/5/27 | 405 | 517 |
| | Walmart Inc. | 3.700% | 6/26/28 | 450 | 529 |
| | Walmart Inc. | 3.250% | 7/8/29 | 300 | 347 |
| | Walmart Inc. | 2.375% | 9/24/29 | 175 | 191 |
| | Walmart Inc. | 7.550% | 2/15/30 | 105 | 160 |
| | Walmart Inc. | 5.250% | 9/1/35 | 385 | 559 |
| | Walmart Inc. | 6.200% | 4/15/38 | 315 | 498 |
| | Walmart Inc. | 3.950% | 6/28/38 | 275 | 349 |
| | Walmart Inc. | 5.000% | 10/25/40 | 100 | 144 |
| | Walmart Inc. | 4.000% | 4/11/43 | 274 | 350 |
| | Walmart Inc. | 4.300% | 4/22/44 | 361 | 487 |
| | Walmart Inc. | 3.625% | 12/15/47 | 265 | 336 |
| | Walmart Inc. | 4.050% | 6/29/48 | 500 | 677 |
| | Walmart Inc. | 2.950% | 9/24/49 | 400 | 459 |
| | | | | | | 103,691 |
| Energy (2.5%) |
| | Baker Hughes a GE Co. LLC / Baker Hughes Co-Obligor Inc. | 2.773% | 12/15/22 | 425 | 443 |
| | Baker Hughes a GE Co. LLC / Baker Hughes Co-Obligor Inc. | 3.337% | 12/15/27 | 200 | 224 |
| | Baker Hughes a GE Co. LLC / Baker Hughes Co-Obligor Inc. | 3.138% | 11/7/29 | 250 | 274 |
| | Baker Hughes a GE Co. LLC / Baker Hughes Co-Obligor Inc. | 4.486% | 5/1/30 | 200 | 241 |
| | Baker Hughes a GE Co. LLC / Baker Hughes Co-Obligor Inc. | 5.125% | 9/15/40 | 175 | 231 |
| | | | Coupon | Maturity
Date | Face
Amount
($000) | Market
Value•
($000) |
| | Baker Hughes a GE Co. LLC / Baker Hughes Co-Obligor Inc. | 4.080% | 12/15/47 | 275 | 312 |
| | Boardwalk Pipelines LP | 3.375% | 2/1/23 | 100 | 104 |
| | Boardwalk Pipelines LP | 4.950% | 12/15/24 | 150 | 167 |
| | Boardwalk Pipelines LP | 5.950% | 6/1/26 | 200 | 236 |
| | Boardwalk Pipelines LP | 4.450% | 7/15/27 | 100 | 112 |
| | BP Capital Markets America Inc. | 3.245% | 5/6/22 | 250 | 260 |
| | BP Capital Markets America Inc. | 2.520% | 9/19/22 | 50 | 52 |
| | BP Capital Markets America Inc. | 2.937% | 4/6/23 | 100 | 106 |
| | BP Capital Markets America Inc. | 2.750% | 5/10/23 | 300 | 316 |
| | BP Capital Markets America Inc. | 3.216% | 11/28/23 | 1,082 | 1,162 |
| | BP Capital Markets America Inc. | 3.194% | 4/6/25 | 230 | 253 |
| | BP Capital Markets America Inc. | 3.410% | 2/11/26 | 100 | 112 |
| | BP Capital Markets America Inc. | 3.119% | 5/4/26 | 550 | 608 |
| | BP Capital Markets America Inc. | 3.017% | 1/16/27 | 400 | 441 |
| | BP Capital Markets America Inc. | 3.937% | 9/21/28 | 175 | 206 |
| | BP Capital Markets America Inc. | 4.234% | 11/6/28 | 225 | 268 |
| | BP Capital Markets America Inc. | 3.633% | 4/6/30 | 350 | 407 |
| | BP Capital Markets America Inc. | 3.000% | 2/24/50 | 450 | 461 |
| | BP Capital Markets America Inc. | 2.772% | 11/10/50 | 500 | 492 |
| | BP Capital Markets America Inc. | 2.939% | 6/4/51 | 500 | 507 |
| | BP Capital Markets plc | 3.062% | 3/17/22 | 25 | 26 |
| | BP Capital Markets plc | 2.500% | 11/6/22 | 450 | 467 |
| | BP Capital Markets plc | 3.994% | 9/26/23 | 200 | 219 |
| | BP Capital Markets plc | 3.814% | 2/10/24 | 400 | 439 |
| | BP Capital Markets plc | 3.535% | 11/4/24 | 68 | 75 |
| | BP Capital Markets plc | 3.506% | 3/17/25 | 200 | 223 |
| | BP Capital Markets plc | 3.279% | 9/19/27 | 200 | 225 |
| | BP Capital Markets plc | 3.723% | 11/28/28 | 175 | 203 |
| | Burlington Resources LLC | 7.400% | 12/1/31 | 175 | 260 |
| | Burlington Resources LLC | 5.950% | 10/15/36 | 200 | 282 |
| | Canadian Natural Resources Ltd. | 2.950% | 1/15/23 | 200 | 209 |
| | Canadian Natural Resources Ltd. | 2.050% | 7/15/25 | 100 | 105 |
| | Canadian Natural Resources Ltd. | 3.850% | 6/1/27 | 750 | 841 |
| | Canadian Natural Resources Ltd. | 2.950% | 7/15/30 | 100 | 106 |
| | Canadian Natural Resources Ltd. | 7.200% | 1/15/32 | 150 | 200 |
| | Canadian Natural Resources Ltd. | 6.450% | 6/30/33 | 125 | 164 |
| | Canadian Natural Resources Ltd. | 5.850% | 2/1/35 | 100 | 126 |
| | Canadian Natural Resources Ltd. | 6.500% | 2/15/37 | 50 | 66 |
| | Canadian Natural Resources Ltd. | 6.250% | 3/15/38 | 100 | 134 |
| | Canadian Natural Resources Ltd. | 4.950% | 6/1/47 | 140 | 177 |
| | Cheniere Corpus Christi Holdings LLC | 7.000% | 6/30/24 | 200 | 233 |
| | Cheniere Corpus Christi Holdings LLC | 5.875% | 3/31/25 | 225 | 261 |
Total Bond Market Index Portfolio
| | | | Coupon | Maturity
Date | Face
Amount
($000) | Market
Value•
($000) |
| | Cheniere Corpus Christi Holdings LLC | 5.125% | 6/30/27 | 525 | 619 |
| | Cheniere Corpus Christi Holdings LLC | 3.700% | 11/15/29 | 300 | 334 |
| | Chevron Corp. | 2.355% | 12/5/22 | 1,130 | 1,169 |
| | Chevron Corp. | 1.141% | 5/11/23 | 300 | 306 |
| | Chevron Corp. | 3.191% | 6/24/23 | 225 | 239 |
| | Chevron Corp. | 1.554% | 5/11/25 | 900 | 933 |
| | Chevron Corp. | 2.236% | 5/11/30 | 500 | 534 |
| | Chevron Corp. | 2.978% | 5/11/40 | 100 | 110 |
| | Chevron USA Inc. | 0.333% | 8/12/22 | 500 | 501 |
| | Chevron USA Inc. | 1.018% | 8/12/27 | 500 | 500 |
| | Chevron USA Inc. | 2.343% | 8/12/50 | 500 | 483 |
| | Cimarex Energy Co. | 4.375% | 6/1/24 | 200 | 217 |
| | Cimarex Energy Co. | 3.900% | 5/15/27 | 350 | 383 |
| | CNOOC Finance 2013 Ltd. | 3.300% | 9/30/49 | 250 | 247 |
| | CNOOC Finance 2014 ULC | 4.250% | 4/30/24 | 300 | 325 |
| | CNOOC Finance 2015 USA LLC | 3.500% | 5/5/25 | 500 | 539 |
| | CNOOC Finance 2015 USA LLC | 4.375% | 5/2/28 | 300 | 343 |
| | CNOOC Petroleum North America ULC | 7.875% | 3/15/32 | 50 | 74 |
| | CNOOC Petroleum North America ULC | 6.400% | 5/15/37 | 450 | 627 |
| | Columbia Pipeline Group Inc. | 4.500% | 6/1/25 | 300 | 346 |
| | Columbia Pipeline Group Inc. | 5.800% | 6/1/45 | 100 | 137 |
| | Concho Resources Inc. | 3.750% | 10/1/27 | 400 | 453 |
| | Concho Resources Inc. | 4.300% | 8/15/28 | 100 | 118 |
| | Concho Resources Inc. | 2.400% | 2/15/31 | 500 | 522 |
| | Concho Resources Inc. | 4.875% | 10/1/47 | 200 | 269 |
| | ConocoPhillips | 5.900% | 10/15/32 | 450 | 613 |
| | ConocoPhillips | 5.900% | 5/15/38 | 450 | 644 |
| | ConocoPhillips | 6.500% | 2/1/39 | 200 | 306 |
| | ConocoPhillips Co. | 3.350% | 11/15/24 | 50 | 55 |
| | ConocoPhillips Co. | 6.950% | 4/15/29 | 350 | 488 |
| | ConocoPhillips Co. | 4.300% | 11/15/44 | 275 | 348 |
| | Devon Energy Corp. | 5.850% | 12/15/25 | 100 | 118 |
| | Devon Energy Corp. | 7.875% | 9/30/31 | 160 | 222 |
| | Devon Energy Corp. | 7.950% | 4/15/32 | 163 | 229 |
| | Devon Energy Corp. | 5.600% | 7/15/41 | 375 | 455 |
| | Devon Energy Corp. | 5.000% | 6/15/45 | 150 | 177 |
| | Diamondback Energy Inc. | 3.250% | 12/1/26 | 500 | 534 |
| | Diamondback Energy Inc. | 3.500% | 12/1/29 | 500 | 532 |
| | Ecopetrol SA | 5.875% | 9/18/23 | 225 | 251 |
| | Ecopetrol SA | 4.125% | 1/16/25 | 200 | 218 |
| | Ecopetrol SA | 5.375% | 6/26/26 | 750 | 862 |
| | Ecopetrol SA | 6.875% | 4/29/30 | 400 | 515 |
| | Ecopetrol SA | 7.375% | 9/18/43 | 100 | 136 |
| | Ecopetrol SA | 5.875% | 5/28/45 | 400 | 483 |
| | Enable Midstream Partners LP | 3.900% | 5/15/24 | 150 | 153 |
| | Enable Midstream Partners LP | 4.400% | 3/15/27 | 150 | 150 |
| | Enable Midstream Partners LP | 4.950% | 5/15/28 | 200 | 204 |
| | Enable Midstream Partners LP | 4.150% | 9/15/29 | 200 | 198 |
| | Enable Midstream Partners LP | 5.000% | 5/15/44 | 100 | 95 |
| | Enbridge Energy Partners LP | 5.875% | 10/15/25 | 150 | 182 |
| | Enbridge Energy Partners LP | 7.500% | 4/15/38 | 150 | 212 |
| | Enbridge Energy Partners LP | 5.500% | 9/15/40 | 75 | 94 |
| | Enbridge Energy Partners LP | 7.375% | 10/15/45 | 125 | 192 |
| | | | Coupon | Maturity
Date | Face
Amount
($000) | Market
Value•
($000) |
| | Enbridge Inc. | 2.900% | 7/15/22 | 75 | 78 |
| | Enbridge Inc. | 2.500% | 1/15/25 | 100 | 107 |
| | Enbridge Inc. | 3.700% | 7/15/27 | 150 | 170 |
| | Enbridge Inc. | 3.125% | 11/15/29 | 200 | 219 |
| | Enbridge Inc. | 4.500% | 6/10/44 | 100 | 117 |
| | Enbridge Inc. | 4.000% | 11/15/49 | 100 | 114 |
| | Energy Transfer Operating LP | 3.600% | 2/1/23 | 450 | 471 |
| | Energy Transfer Operating LP | 4.250% | 3/15/23 | 400 | 420 |
| | Energy Transfer Operating LP | 4.200% | 9/15/23 | 80 | 86 |
| | Energy Transfer Operating LP | 4.050% | 3/15/25 | 1,000 | 1,092 |
| | Energy Transfer Operating LP | 2.900% | 5/15/25 | 100 | 106 |
| | Energy Transfer Operating LP | 4.750% | 1/15/26 | 500 | 554 |
| | Energy Transfer Operating LP | 5.500% | 6/1/27 | 300 | 351 |
| | Energy Transfer Operating LP | 4.950% | 6/15/28 | 350 | 404 |
| | Energy Transfer Operating LP | 5.250% | 4/15/29 | 425 | 494 |
| | Energy Transfer Operating LP | 3.750% | 5/15/30 | 450 | 487 |
| | Energy Transfer Operating LP | 6.625% | 10/15/36 | 150 | 180 |
| | Energy Transfer Operating LP | 5.800% | 6/15/38 | 150 | 171 |
| | Energy Transfer Operating LP | 6.050% | 6/1/41 | 100 | 115 |
| | Energy Transfer Operating LP | 6.500% | 2/1/42 | 275 | 333 |
| | Energy Transfer Operating LP | 5.150% | 3/15/45 | 150 | 162 |
| | Energy Transfer Operating LP | 6.125% | 12/15/45 | 200 | 234 |
| | Energy Transfer Operating LP | 5.300% | 4/15/47 | 200 | 220 |
| | Energy Transfer Operating LP | 6.000% | 6/15/48 | 100 | 119 |
| | Energy Transfer Operating LP | 6.250% | 4/15/49 | 320 | 386 |
| | Energy Transfer Operating LP | 5.000% | 5/15/50 | 500 | 546 |
| | Energy Transfer Partners LP | 6.000% | 6/15/48 | 200 | 237 |
| | Energy Transfer Partners LP / Regency Energy Finance Corp. | 5.875% | 3/1/22 | 175 | 183 |
| | Energy Transfer Partners LP / Regency Energy Finance Corp. | 5.000% | 10/1/22 | 200 | 212 |
| | Energy Transfer Partners LP / Regency Energy Finance Corp. | 4.500% | 11/1/23 | 100 | 108 |
| | Enterprise Products Operating LLC | 3.500% | 2/1/22 | 100 | 103 |
| | Enterprise Products Operating LLC | 3.350% | 3/15/23 | 425 | 443 |
| | Enterprise Products Operating LLC | 3.900% | 2/15/24 | 175 | 192 |
| | Enterprise Products Operating LLC | 3.750% | 2/15/25 | 150 | 168 |
| | Enterprise Products Operating LLC | 3.700% | 2/15/26 | 150 | 170 |
| | Enterprise Products Operating LLC | 3.950% | 2/15/27 | 100 | 112 |
| | Enterprise Products Operating LLC | 3.125% | 7/31/29 | 550 | 609 |
| | Enterprise Products Operating LLC | 2.800% | 1/31/30 | 300 | 325 |
Total Bond Market Index Portfolio
| | | | Coupon | Maturity
Date | Face
Amount
($000) | Market
Value•
($000) |
| | Enterprise Products Operating LLC | 6.875% | 3/1/33 | 175 | 244 |
| | Enterprise Products Operating LLC | 7.550% | 4/15/38 | 150 | 228 |
| | Enterprise Products Operating LLC | 6.125% | 10/15/39 | 300 | 414 |
| | Enterprise Products Operating LLC | 5.950% | 2/1/41 | 175 | 240 |
| | Enterprise Products Operating LLC | 4.450% | 2/15/43 | 300 | 358 |
| | Enterprise Products Operating LLC | 4.850% | 3/15/44 | 520 | 640 |
| | Enterprise Products Operating LLC | 4.900% | 5/15/46 | 425 | 532 |
| | Enterprise Products Operating LLC | 4.250% | 2/15/48 | 300 | 350 |
| | Enterprise Products Operating LLC | 4.200% | 1/31/50 | 350 | 411 |
| | Enterprise Products Operating LLC | 3.700% | 1/31/51 | 300 | 329 |
| | Enterprise Products Operating LLC | 3.200% | 2/15/52 | 500 | 504 |
| | Enterprise Products Operating LLC | 3.950% | 1/31/60 | 200 | 219 |
| | Enterprise Products Operating LLC | 4.875% | 8/16/77 | 100 | 96 |
| | Enterprise Products Operating LLC | 5.250% | 8/16/77 | 100 | 101 |
| | Enterprise Products Operating LLC | 5.375% | 2/15/78 | 200 | 198 |
| | EOG Resources Inc. | 2.625% | 3/15/23 | 450 | 470 |
| | EOG Resources Inc. | 4.150% | 1/15/26 | 150 | 172 |
| | EOG Resources Inc. | 4.375% | 4/15/30 | 255 | 310 |
| | EOG Resources Inc. | 4.950% | 4/15/50 | 200 | 271 |
| | Equinor ASA | 3.150% | 1/23/22 | 150 | 153 |
| | Equinor ASA | 2.450% | 1/17/23 | 450 | 470 |
| | Equinor ASA | 2.650% | 1/15/24 | 375 | 397 |
| | Equinor ASA | 3.700% | 3/1/24 | 150 | 165 |
| | Equinor ASA | 3.250% | 11/10/24 | 150 | 165 |
| | Equinor ASA | 7.250% | 9/23/27 | 250 | 339 |
| | Equinor ASA | 3.625% | 9/10/28 | 175 | 203 |
| | Equinor ASA | 2.375% | 5/22/30 | 200 | 212 |
| | Equinor ASA | 5.100% | 8/17/40 | 125 | 176 |
| | Equinor ASA | 4.250% | 11/23/41 | 175 | 220 |
| | Equinor ASA | 3.950% | 5/15/43 | 125 | 151 |
| | Equinor ASA | 4.800% | 11/8/43 | 175 | 235 |
| | Equinor ASA | 3.250% | 11/18/49 | 225 | 250 |
| | Equinor ASA | 3.700% | 4/6/50 | 405 | 486 |
| | Exxon Mobil Corp. | 2.397% | 3/6/22 | 400 | 407 |
| | Exxon Mobil Corp. | 1.902% | 8/16/22 | 300 | 308 |
| | Exxon Mobil Corp. | 1.571% | 4/15/23 | 950 | 968 |
| | Exxon Mobil Corp. | 2.019% | 8/16/24 | 100 | 105 |
| | Exxon Mobil Corp. | 2.992% | 3/19/25 | 850 | 929 |
| | Exxon Mobil Corp. | 3.043% | 3/1/26 | 300 | 332 |
| | Exxon Mobil Corp. | 2.275% | 8/16/26 | 200 | 215 |
| | Exxon Mobil Corp. | 2.440% | 8/16/29 | 250 | 267 |
| | Exxon Mobil Corp. | 3.482% | 3/19/30 | 375 | 434 |
| | Exxon Mobil Corp. | 2.610% | 10/15/30 | 650 | 709 |
| | Exxon Mobil Corp. | 2.995% | 8/16/39 | 300 | 325 |
| | Exxon Mobil Corp. | 4.227% | 3/19/40 | 400 | 496 |
| | Exxon Mobil Corp. | 3.567% | 3/6/45 | 235 | 268 |
| | Exxon Mobil Corp. | 4.114% | 3/1/46 | 400 | 492 |
| | Exxon Mobil Corp. | 4.327% | 3/19/50 | 825 | 1,075 |
| | Exxon Mobil Corp. | 3.452% | 4/15/51 | 600 | 685 |
| | Halliburton Co. | 3.500% | 8/1/23 | 112 | 119 |
| | Halliburton Co. | 3.800% | 11/15/25 | 22 | 25 |
| | Halliburton Co. | 2.920% | 3/1/30 | 300 | 317 |
| | Halliburton Co. | 4.850% | 11/15/35 | 200 | 230 |
| | Halliburton Co. | 6.700% | 9/15/38 | 345 | 456 |
| | Halliburton Co. | 4.500% | 11/15/41 | 100 | 108 |
| | Halliburton Co. | 4.750% | 8/1/43 | 150 | 167 |
| | | | Coupon | Maturity
Date | Face
Amount
($000) | Market
Value•
($000) |
| | Halliburton Co. | 5.000% | 11/15/45 | 500 | 591 |
| | Helmerich & Payne Inc. | 4.650% | 3/15/25 | 50 | 55 |
| | Hess Corp. | 3.500% | 7/15/24 | 100 | 106 |
| | Hess Corp. | 4.300% | 4/1/27 | 250 | 277 |
| | Hess Corp. | 7.125% | 3/15/33 | 100 | 130 |
| | Hess Corp. | 6.000% | 1/15/40 | 250 | 304 |
| | Hess Corp. | 5.600% | 2/15/41 | 300 | 364 |
| | HollyFrontier Corp. | 5.875% | 4/1/26 | 200 | 218 |
| | Husky Energy Inc. | 4.000% | 4/15/24 | 150 | 160 |
| | Husky Energy Inc. | 4.400% | 4/15/29 | 250 | 276 |
| | Husky Energy Inc. | 6.800% | 9/15/37 | 50 | 63 |
| | Kinder Morgan Energy Partners LP | 3.450% | 2/15/23 | 25 | 26 |
| | Kinder Morgan Energy Partners LP | 3.500% | 9/1/23 | 250 | 267 |
| | Kinder Morgan Energy Partners LP | 4.300% | 5/1/24 | 625 | 691 |
| | Kinder Morgan Energy Partners LP | 7.300% | 8/15/33 | 275 | 381 |
| | Kinder Morgan Energy Partners LP | 5.800% | 3/15/35 | 50 | 63 |
| | Kinder Morgan Energy Partners LP | 6.500% | 2/1/37 | 250 | 324 |
| | Kinder Morgan Energy Partners LP | 6.950% | 1/15/38 | 50 | 69 |
| | Kinder Morgan Energy Partners LP | 6.500% | 9/1/39 | 200 | 262 |
| | Kinder Morgan Energy Partners LP | 6.550% | 9/15/40 | 250 | 330 |
| | Kinder Morgan Energy Partners LP | 5.625% | 9/1/41 | 50 | 61 |
| | Kinder Morgan Energy Partners LP | 5.000% | 8/15/42 | 25 | 29 |
| | Kinder Morgan Energy Partners LP | 4.700% | 11/1/42 | 475 | 542 |
| | Kinder Morgan Energy Partners LP | 5.000% | 3/1/43 | 75 | 87 |
| | Kinder Morgan Inc. | 3.150% | 1/15/23 | 200 | 210 |
| | Kinder Morgan Inc. | 4.300% | 6/1/25 | 300 | 342 |
| | Kinder Morgan Inc. | 4.300% | 3/1/28 | 500 | 586 |
| | Kinder Morgan Inc. | 7.800% | 8/1/31 | 290 | 413 |
| | Kinder Morgan Inc. | 7.750% | 1/15/32 | 265 | 382 |
| | Kinder Morgan Inc. | 5.300% | 12/1/34 | 175 | 217 |
| | Kinder Morgan Inc. | 5.550% | 6/1/45 | 200 | 256 |
| | Kinder Morgan Inc. | 5.050% | 2/15/46 | 350 | 428 |
| | Kinder Morgan Inc. | 3.250% | 8/1/50 | 400 | 401 |
| | Magellan Midstream Partners LP | 3.250% | 6/1/30 | 200 | 224 |
| | Magellan Midstream Partners LP | 5.150% | 10/15/43 | 125 | 158 |
| | Magellan Midstream Partners LP | 4.250% | 9/15/46 | 200 | 227 |
| | Magellan Midstream Partners LP | 4.200% | 10/3/47 | 150 | 171 |
| | Magellan Midstream Partners LP | 4.850% | 2/1/49 | 100 | 125 |
| | Magellan Midstream Partners LP | 3.950% | 3/1/50 | 50 | 56 |
| | Marathon Oil Corp. | 2.800% | 11/1/22 | 60 | 62 |
| | Marathon Oil Corp. | 3.850% | 6/1/25 | 100 | 107 |
| | Marathon Oil Corp. | 4.400% | 7/15/27 | 200 | 221 |
| | Marathon Oil Corp. | 6.800% | 3/15/32 | 400 | 492 |
| | Marathon Oil Corp. | 5.200% | 6/1/45 | 100 | 115 |
| | Marathon Petroleum Corp. | 4.750% | 12/15/23 | 500 | 553 |
| | Marathon Petroleum Corp. | 4.700% | 5/1/25 | 300 | 344 |
| | Marathon Petroleum Corp. | 5.125% | 12/15/26 | 200 | 238 |
| | Marathon Petroleum Corp. | 6.500% | 3/1/41 | 300 | 402 |
Total Bond Market Index Portfolio
| | | | Coupon | Maturity
Date | Face
Amount
($000) | Market
Value•
($000) |
| | Marathon Petroleum Corp. | 4.750% | 9/15/44 | 275 | 315 |
| | Marathon Petroleum Corp. | 4.500% | 4/1/48 | 100 | 112 |
| | MPLX LP | 3.500% | 12/1/22 | 25 | 26 |
| | MPLX LP | 3.375% | 3/15/23 | 100 | 106 |
| | MPLX LP | 4.500% | 7/15/23 | 200 | 218 |
| | MPLX LP | 4.875% | 12/1/24 | 513 | 587 |
| | MPLX LP | 4.875% | 6/1/25 | 283 | 327 |
| | MPLX LP | 4.125% | 3/1/27 | 300 | 345 |
| | MPLX LP | 4.250% | 12/1/27 | 400 | 466 |
| | MPLX LP | 4.000% | 3/15/28 | 400 | 456 |
| | MPLX LP | 2.650% | 8/15/30 | 500 | 522 |
| | MPLX LP | 4.500% | 4/15/38 | 300 | 339 |
| | MPLX LP | 5.200% | 3/1/47 | 250 | 303 |
| | MPLX LP | 4.700% | 4/15/48 | 275 | 327 |
| | MPLX LP | 5.500% | 2/15/49 | 455 | 590 |
| | National Oilwell Varco Inc. | 3.600% | 12/1/29 | 200 | 209 |
| | National Oilwell Varco Inc. | 3.950% | 12/1/42 | 125 | 126 |
| | Noble Energy Inc. | 3.850% | 1/15/28 | 100 | 116 |
| | Noble Energy Inc. | 3.250% | 10/15/29 | 200 | 228 |
| | Noble Energy Inc. | 6.000% | 3/1/41 | 100 | 149 |
| | Noble Energy Inc. | 5.250% | 11/15/43 | 175 | 247 |
| | Noble Energy Inc. | 5.050% | 11/15/44 | 250 | 348 |
| | Noble Energy Inc. | 4.950% | 8/15/47 | 100 | 140 |
| | Noble Energy Inc. | 4.200% | 10/15/49 | 155 | 197 |
| | ONEOK Inc. | 7.500% | 9/1/23 | 100 | 115 |
| | ONEOK Inc. | 2.750% | 9/1/24 | 100 | 105 |
| | ONEOK Inc. | 2.200% | 9/15/25 | 425 | 442 |
| | ONEOK Inc. | 4.550% | 7/15/28 | 100 | 114 |
| | ONEOK Inc. | 4.350% | 3/15/29 | 100 | 113 |
| | ONEOK Inc. | 3.400% | 9/1/29 | 245 | 260 |
| | ONEOK Inc. | 3.100% | 3/15/30 | 200 | 213 |
| | ONEOK Inc. | 4.950% | 7/13/47 | 200 | 220 |
| | ONEOK Inc. | 4.450% | 9/1/49 | 150 | 157 |
| | ONEOK Inc. | 4.500% | 3/15/50 | 300 | 318 |
| | ONEOK Partners LP | 3.375% | 10/1/22 | 400 | 416 |
| | ONEOK Partners LP | 6.650% | 10/1/36 | 300 | 376 |
| | ONEOK Partners LP | 6.850% | 10/15/37 | 300 | 385 |
| | ONEOK Partners LP | 6.125% | 2/1/41 | 150 | 179 |
| 2 | Petroleos Mexicanos | 2.378% | 4/15/25 | 22 | 23 |
| | Phillips 66 | 4.300% | 4/1/22 | 275 | 288 |
| | Phillips 66 | 3.700% | 4/6/23 | 100 | 107 |
| | Phillips 66 | 3.850% | 4/9/25 | 300 | 338 |
| | Phillips 66 | 3.900% | 3/15/28 | 300 | 344 |
| | Phillips 66 | 2.150% | 12/15/30 | 100 | 101 |
| | Phillips 66 | 4.650% | 11/15/34 | 500 | 610 |
| | Phillips 66 | 4.875% | 11/15/44 | 500 | 629 |
| | Phillips 66 Partners LP | 2.450% | 12/15/24 | 50 | 52 |
| | Phillips 66 Partners LP | 3.605% | 2/15/25 | 250 | 270 |
| | Phillips 66 Partners LP | 3.750% | 3/1/28 | 50 | 54 |
| | Phillips 66 Partners LP | 3.150% | 12/15/29 | 100 | 104 |
| | Phillips 66 Partners LP | 4.680% | 2/15/45 | 245 | 263 |
| | Pioneer Natural Resources Co. | 4.450% | 1/15/26 | 225 | 262 |
| | Pioneer Natural Resources Co. | 1.900% | 8/15/30 | 300 | 297 |
| | Plains All American Pipeline LP / PAA Finance Corp. | 3.650% | 6/1/22 | 100 | 103 |
| | Plains All American Pipeline LP / PAA Finance Corp. | 2.850% | 1/31/23 | 289 | 299 |
| | Plains All American Pipeline LP / PAA Finance Corp. | 3.600% | 11/1/24 | 600 | 639 |
| | Plains All American Pipeline LP / PAA Finance Corp. | 4.500% | 12/15/26 | 100 | 112 |
| | | | Coupon | Maturity
Date | Face
Amount
($000) | Market
Value•
($000) |
| | Plains All American Pipeline LP / PAA Finance Corp. | 3.550% | 12/15/29 | 175 | 183 |
| | Plains All American Pipeline LP / PAA Finance Corp. | 3.800% | 9/15/30 | 200 | 214 |
| | Plains All American Pipeline LP / PAA Finance Corp. | 6.650% | 1/15/37 | 100 | 121 |
| | Plains All American Pipeline LP / PAA Finance Corp. | 4.300% | 1/31/43 | 225 | 220 |
| | Plains All American Pipeline LP / PAA Finance Corp. | 4.700% | 6/15/44 | 200 | 208 |
| | Sabine Pass Liquefaction LLC | 6.250% | 3/15/22 | 325 | 342 |
| | Sabine Pass Liquefaction LLC | 5.625% | 4/15/23 | 350 | 383 |
| | Sabine Pass Liquefaction LLC | 5.750% | 5/15/24 | 600 | 684 |
| | Sabine Pass Liquefaction LLC | 5.625% | 3/1/25 | 400 | 466 |
| | Sabine Pass Liquefaction LLC | 5.875% | 6/30/26 | 450 | 544 |
| | Sabine Pass Liquefaction LLC | 5.000% | 3/15/27 | 250 | 295 |
| | Sabine Pass Liquefaction LLC | 4.200% | 3/15/28 | 300 | 344 |
| 5 | Sabine Pass Liquefaction LLC | 4.500% | 5/15/30 | 300 | 356 |
| | Schlumberger Investment SA | 3.650% | 12/1/23 | 325 | 352 |
| | Schlumberger Investment SA | 2.650% | 6/26/30 | 300 | 320 |
| | Shell International Finance BV | 3.400% | 8/12/23 | 75 | 81 |
| | Shell International Finance BV | 0.375% | 9/15/23 | 500 | 501 |
| | Shell International Finance BV | 2.000% | 11/7/24 | 200 | 210 |
| | Shell International Finance BV | 2.375% | 4/6/25 | 500 | 535 |
| | Shell International Finance BV | 3.250% | 5/11/25 | 200 | 221 |
| | Shell International Finance BV | 2.875% | 5/10/26 | 500 | 552 |
| | Shell International Finance BV | 2.500% | 9/12/26 | 900 | 987 |
| | Shell International Finance BV | 3.875% | 11/13/28 | 100 | 118 |
| | Shell International Finance BV | 2.375% | 11/7/29 | 1,050 | 1,125 |
| | Shell International Finance BV | 4.125% | 5/11/35 | 300 | 373 |
| | Shell International Finance BV | 6.375% | 12/15/38 | 475 | 734 |
| | Shell International Finance BV | 5.500% | 3/25/40 | 175 | 251 |
| | Shell International Finance BV | 4.550% | 8/12/43 | 300 | 399 |
| | Shell International Finance BV | 4.375% | 5/11/45 | 630 | 829 |
| | Shell International Finance BV | 4.000% | 5/10/46 | 700 | 877 |
| | Shell International Finance BV | 3.125% | 11/7/49 | 650 | 721 |
| | Spectra Energy Partners LP | 4.750% | 3/15/24 | 600 | 669 |
| | Spectra Energy Partners LP | 3.500% | 3/15/25 | 138 | 151 |
| | Spectra Energy Partners LP | 3.375% | 10/15/26 | 205 | 228 |
Total Bond Market Index Portfolio
| | | | Coupon | Maturity
Date | Face
Amount
($000) | Market
Value•
($000) |
| | Spectra Energy Partners LP | 5.950% | 9/25/43 | 40 | 52 |
| | Spectra Energy Partners LP | 4.500% | 3/15/45 | 325 | 383 |
| | Suncor Energy Inc. | 2.800% | 5/15/23 | 300 | 315 |
| | Suncor Energy Inc. | 3.600% | 12/1/24 | 100 | 110 |
| | Suncor Energy Inc. | 3.100% | 5/15/25 | 100 | 109 |
| | Suncor Energy Inc. | 5.950% | 12/1/34 | 125 | 163 |
| | Suncor Energy Inc. | 6.800% | 5/15/38 | 225 | 315 |
| | Suncor Energy Inc. | 6.500% | 6/15/38 | 525 | 732 |
| | Suncor Energy Inc. | 4.000% | 11/15/47 | 200 | 225 |
| | Sunoco Logistics Partners Operations LP | 3.450% | 1/15/23 | 50 | 52 |
| | Sunoco Logistics Partners Operations LP | 4.250% | 4/1/24 | 225 | 243 |
| | Sunoco Logistics Partners Operations LP | 4.000% | 10/1/27 | 150 | 164 |
| | Sunoco Logistics Partners Operations LP | 4.950% | 1/15/43 | 175 | 180 |
| | Sunoco Logistics Partners Operations LP | 5.300% | 4/1/44 | 325 | 347 |
| | Sunoco Logistics Partners Operations LP | 5.350% | 5/15/45 | 50 | 56 |
| | Sunoco Logistics Partners Operations LP | 5.400% | 10/1/47 | 275 | 303 |
| | TC PipeLines LP | 3.900% | 5/25/27 | 50 | 56 |
| | TechnipFMC plc | 3.450% | 10/1/22 | 75 | 77 |
| | Total Capital Canada Ltd. | 2.750% | 7/15/23 | 125 | 132 |
| | Total Capital International SA | 2.875% | 2/17/22 | 300 | 309 |
| | Total Capital International SA | 2.700% | 1/25/23 | 50 | �� 52 |
| | Total Capital International SA | 3.700% | 1/15/24 | 525 | 575 |
| | Total Capital International SA | 2.434% | 1/10/25 | 175 | 187 |
| | Total Capital International SA | 3.455% | 2/19/29 | 325 | 376 |
| | Total Capital International SA | 2.829% | 1/10/30 | 300 | 335 |
| | Total Capital International SA | 2.986% | 6/29/41 | 200 | 218 |
| | Total Capital International SA | 3.461% | 7/12/49 | 200 | 230 |
| | Total Capital International SA | 3.127% | 5/29/50 | 500 | 544 |
| | Total Capital International SA | 3.386% | 6/29/60 | 200 | 226 |
| | Total Capital SA | 3.883% | 10/11/28 | 100 | 118 |
| | TransCanada PipeLines Ltd. | 2.500% | 8/1/22 | 400 | 413 |
| | TransCanada PipeLines Ltd. | 4.250% | 5/15/28 | 250 | 294 |
| | TransCanada PipeLines Ltd. | 4.100% | 4/15/30 | 500 | 586 |
| | TransCanada PipeLines Ltd. | 4.625% | 3/1/34 | 536 | 646 |
| | TransCanada PipeLines Ltd. | 5.600% | 3/31/34 | 150 | 193 |
| | TransCanada PipeLines Ltd. | 5.850% | 3/15/36 | 300 | 400 |
| | TransCanada PipeLines Ltd. | 6.200% | 10/15/37 | 425 | 590 |
| | TransCanada PipeLines Ltd. | 4.750% | 5/15/38 | 350 | 435 |
| | TransCanada PipeLines Ltd. | 4.875% | 5/15/48 | 400 | 515 |
| | Transcontinental Gas Pipe Line Co. LLC | 4.000% | 3/15/28 | 100 | 115 |
| | Transcontinental Gas Pipe Line Co. LLC | 3.250% | 5/15/30 | 200 | 223 |
| | | | Coupon | Maturity
Date | Face
Amount
($000) | Market
Value•
($000) |
| | Transcontinental Gas Pipe Line Co. LLC | 4.600% | 3/15/48 | 100 | 121 |
| | Transcontinental Gas Pipe Line Co. LLC | 3.950% | 5/15/50 | 200 | 225 |
| | Valero Energy Corp. | 2.700% | 4/15/23 | 100 | 104 |
| | Valero Energy Corp. | 1.200% | 3/15/24 | 500 | 502 |
| | Valero Energy Corp. | 3.650% | 3/15/25 | 251 | 274 |
| | Valero Energy Corp. | 2.850% | 4/15/25 | 100 | 106 |
| | Valero Energy Corp. | 4.350% | 6/1/28 | 350 | 397 |
| | Valero Energy Corp. | 7.500% | 4/15/32 | 650 | 898 |
| | Valero Energy Corp. | 4.900% | 3/15/45 | 150 | 175 |
| | Valero Energy Partners LP | 4.375% | 12/15/26 | 100 | 116 |
| | Valero Energy Partners LP | 4.500% | 3/15/28 | 75 | 86 |
| | Williams Cos. Inc. | 3.600% | 3/15/22 | 475 | 490 |
| | Williams Cos. Inc. | 3.350% | 8/15/22 | 125 | 130 |
| | Williams Cos. Inc. | 3.700% | 1/15/23 | 200 | 211 |
| | Williams Cos. Inc. | 4.550% | 6/24/24 | 400 | 447 |
| | Williams Cos. Inc. | 3.900% | 1/15/25 | 681 | 753 |
| | Williams Cos. Inc. | 3.750% | 6/15/27 | 300 | 341 |
| | Williams Cos. Inc. | 3.500% | 11/15/30 | 400 | 452 |
| | Williams Cos. Inc. | 6.300% | 4/15/40 | 100 | 133 |
| | Williams Cos. Inc. | 5.800% | 11/15/43 | 100 | 127 |
| | Williams Cos. Inc. | 5.400% | 3/4/44 | 400 | 493 |
| | Williams Cos. Inc. | 5.750% | 6/24/44 | 100 | 131 |
| | Williams Cos. Inc. | 5.100% | 9/15/45 | 350 | 433 |
| | Williams Cos. Inc. | 4.850% | 3/1/48 | 150 | 183 |
| | | | | | | 122,803 |
| Financials (7.8%) |
| | ACE Capital Trust II | 9.700% | 4/1/30 | 50 | 76 |
| | Aegon NV | 5.500% | 4/11/48 | 200 | 226 |
| | AerCap Ireland Capital DAC / AerCap Global Aviation Trust | 4.450% | 12/16/21 | 70 | 72 |
| | AerCap Ireland Capital DAC / AerCap Global Aviation Trust | 3.950% | 2/1/22 | 125 | 128 |
| | AerCap Ireland Capital DAC / AerCap Global Aviation Trust | 3.500% | 5/26/22 | 100 | 103 |
| | AerCap Ireland Capital DAC / AerCap Global Aviation Trust | 4.625% | 7/1/22 | 175 | 184 |
| | AerCap Ireland Capital DAC / AerCap Global Aviation Trust | 3.300% | 1/23/23 | 125 | 130 |
| | AerCap Ireland Capital DAC / AerCap Global Aviation Trust | 4.500% | 9/15/23 | 150 | 162 |
| | AerCap Ireland Capital DAC / AerCap Global Aviation Trust | 3.500% | 1/15/25 | 186 | 197 |
| | AerCap Ireland Capital DAC / AerCap Global Aviation Trust | 6.500% | 7/15/25 | 250 | 298 |
| | AerCap Ireland Capital DAC / AerCap Global Aviation Trust | 4.450% | 10/1/25 | 125 | 139 |
| | AerCap Ireland Capital DAC / AerCap Global Aviation Trust | 3.650% | 7/21/27 | 300 | 326 |
| | AerCap Ireland Capital DAC / AerCap Global Aviation Trust | 4.625% | 10/15/27 | 500 | 569 |
| | AerCap Ireland Capital DAC / AerCap Global Aviation Trust | 3.875% | 1/23/28 | 300 | 323 |
| | Affiliated Managers Group Inc. | 4.250% | 2/15/24 | 100 | 110 |
| | Affiliated Managers Group Inc. | 3.500% | 8/1/25 | 125 | 139 |
| | Affiliated Managers Group Inc. | 3.300% | 6/15/30 | 500 | 546 |
Total Bond Market Index Portfolio
| | | | Coupon | Maturity
Date | Face
Amount
($000) | Market
Value•
($000) |
| | Aflac Inc. | 3.625% | 6/15/23 | 125 | 135 |
| | Aflac Inc. | 3.625% | 11/15/24 | 125 | 140 |
| | Aflac Inc. | 3.250% | 3/17/25 | 125 | 138 |
| | Aflac Inc. | 2.875% | 10/15/26 | 75 | 83 |
| | Aflac Inc. | 3.600% | 4/1/30 | 225 | 264 |
| | Aflac Inc. | 4.000% | 10/15/46 | 50 | 61 |
| | Aflac Inc. | 4.750% | 1/15/49 | 235 | 326 |
| | Air Lease Corp. | 3.750% | 2/1/22 | 300 | 308 |
| | Air Lease Corp. | 2.625% | 7/1/22 | 100 | 103 |
| | Air Lease Corp. | 2.250% | 1/15/23 | 100 | 102 |
| | Air Lease Corp. | 2.750% | 1/15/23 | 100 | 103 |
| | Air Lease Corp. | 3.875% | 7/3/23 | 100 | 106 |
| | Air Lease Corp. | 4.250% | 2/1/24 | 200 | 216 |
| | Air Lease Corp. | 4.250% | 9/15/24 | 75 | 82 |
| | Air Lease Corp. | 2.300% | 2/1/25 | 200 | 206 |
| | Air Lease Corp. | 3.250% | 3/1/25 | 150 | 160 |
| | Air Lease Corp. | 3.375% | 7/1/25 | 250 | 269 |
| | Air Lease Corp. | 3.625% | 4/1/27 | 75 | 80 |
| | Air Lease Corp. | 3.625% | 12/1/27 | 200 | 215 |
| | Air Lease Corp. | 4.625% | 10/1/28 | 100 | 114 |
| | Air Lease Corp. | 3.250% | 10/1/29 | 100 | 105 |
| | Air Lease Corp. | 3.000% | 2/1/30 | 225 | 232 |
| | Air Lease Corp. | 3.125% | 12/1/30 | 750 | 777 |
| | Aircastle Ltd. | 4.400% | 9/25/23 | 125 | 133 |
| | Aircastle Ltd. | 4.125% | 5/1/24 | 400 | 424 |
| | Aircastle Ltd. | 4.250% | 6/15/26 | 100 | 106 |
| | Alleghany Corp. | 3.625% | 5/15/30 | 100 | 113 |
| | Alleghany Corp. | 4.900% | 9/15/44 | 100 | 129 |
| | Allied World Assurance Co. Holdings Ltd. | 4.350% | 10/29/25 | 75 | 82 |
| | Allstate Corp. | 3.150% | 6/15/23 | 100 | 107 |
| | Allstate Corp. | 1.450% | 12/15/30 | 500 | 497 |
| | Allstate Corp. | 5.550% | 5/9/35 | 75 | 111 |
| | Allstate Corp. | 4.500% | 6/15/43 | 125 | 168 |
| | Allstate Corp. | 4.200% | 12/15/46 | 200 | 263 |
| | Allstate Corp. | 3.850% | 8/10/49 | 100 | 127 |
| | Allstate Corp. | 5.750% | 8/15/53 | 75 | 80 |
| | Allstate Corp. | 6.500% | 5/15/67 | 100 | 134 |
| | Ally Financial Inc. | 4.125% | 2/13/22 | 125 | 130 |
| | Ally Financial Inc. | 1.450% | 10/2/23 | 1,000 | 1,019 |
| | Ally Financial Inc. | 3.875% | 5/21/24 | 150 | 164 |
| | Ally Financial Inc. | 5.125% | 9/30/24 | 135 | 155 |
| | Ally Financial Inc. | 8.000% | 11/1/31 | 400 | 584 |
| | American Express Co. | 2.750% | 5/20/22 | 300 | 309 |
| | American Express Co. | 2.500% | 8/1/22 | 500 | 516 |
| | American Express Co. | 2.650% | 12/2/22 | 225 | 235 |
| | American Express Co. | 3.400% | 2/27/23 | 300 | 319 |
| | American Express Co. | 3.700% | 8/3/23 | 325 | 351 |
| | American Express Co. | 3.400% | 2/22/24 | 225 | 245 |
| | American Express Co. | 2.500% | 7/30/24 | 215 | 229 |
| | American Express Co. | 3.000% | 10/30/24 | 569 | 621 |
| | American Express Co. | 3.625% | 12/5/24 | 241 | 267 |
| | American Express Co. | 4.200% | 11/6/25 | 150 | 174 |
| | American Express Co. | 3.125% | 5/20/26 | 250 | 280 |
| | American Express Co. | 4.050% | 12/3/42 | 67 | 86 |
| | American Express Credit Corp. | 2.700% | 3/3/22 | 300 | 308 |
| | American Express Credit Corp. | 3.300% | 5/3/27 | 350 | 398 |
| | American Financial Group Inc. | 3.500% | 8/15/26 | 50 | 55 |
| | American Financial Group Inc. | 5.250% | 4/2/30 | 150 | 186 |
| | American Financial Group Inc. | 4.500% | 6/15/47 | 110 | 132 |
| | American International Group Inc. | 3.300% | 3/1/21 | 275 | 275 |
| | American International Group Inc. | 4.125% | 2/15/24 | 70 | 77 |
| | | | Coupon | Maturity
Date | Face
Amount
($000) | Market
Value•
($000) |
| | American International Group Inc. | 3.750% | 7/10/25 | 85 | 95 |
| | American International Group Inc. | 3.900% | 4/1/26 | 406 | 463 |
| | American International Group Inc. | 4.200% | 4/1/28 | 200 | 237 |
| | American International Group Inc. | 4.250% | 3/15/29 | 50 | 60 |
| | American International Group Inc. | 3.400% | 6/30/30 | 240 | 274 |
| | American International Group Inc. | 3.875% | 1/15/35 | 200 | 240 |
| | American International Group Inc. | 4.700% | 7/10/35 | 75 | 96 |
| | American International Group Inc. | 6.250% | 5/1/36 | 475 | 685 |
| | American International Group Inc. | 4.500% | 7/16/44 | 500 | 640 |
| | American International Group Inc. | 4.750% | 4/1/48 | 200 | 268 |
| | American International Group Inc. | 5.750% | 4/1/48 | 125 | 145 |
| | American International Group Inc. | 4.375% | 1/15/55 | 355 | 454 |
| | American International Group Inc. | 8.175% | 5/15/68 | 95 | 139 |
| | Ameriprise Financial Inc. | 3.000% | 3/22/22 | 50 | 52 |
| | Ameriprise Financial Inc. | 4.000% | 10/15/23 | 250 | 275 |
| | Ameriprise Financial Inc. | 3.700% | 10/15/24 | 187 | 208 |
| | Ameriprise Financial Inc. | 3.000% | 4/2/25 | 20 | 22 |
| | Ameriprise Financial Inc. | 2.875% | 9/15/26 | 100 | 111 |
| | Aon Corp. | 8.205% | 1/1/27 | 25 | 33 |
| | Aon Corp. | 4.500% | 12/15/28 | 100 | 121 |
| | Aon Corp. | 3.750% | 5/2/29 | 90 | 105 |
| | Aon Corp. | 2.800% | 5/15/30 | 405 | 442 |
| | Aon Corp. | 6.250% | 9/30/40 | 100 | 149 |
| | Aon plc | 3.500% | 6/14/24 | 250 | 272 |
| | Aon plc | 3.875% | 12/15/25 | 125 | 143 |
| | Aon plc | 4.600% | 6/14/44 | 175 | 230 |
| | Aon plc | 4.750% | 5/15/45 | 100 | 136 |
| | Arch Capital Finance LLC | 4.011% | 12/15/26 | 100 | 116 |
| | Arch Capital Finance LLC | 5.031% | 12/15/46 | 100 | 136 |
| | Arch Capital Group Ltd. | 7.350% | 5/1/34 | 50 | 76 |
| | Arch Capital Group Ltd. | 3.635% | 6/30/50 | 200 | 232 |
| | Arch Capital Group US Inc. | 5.144% | 11/1/43 | 50 | 68 |
| | Ares Capital Corp. | 3.500% | 2/10/23 | 250 | 264 |
| | Ares Capital Corp. | 4.200% | 6/10/24 | 200 | 216 |
| | Ares Capital Corp. | 4.250% | 3/1/25 | 105 | 113 |
| | Ares Capital Corp. | 3.250% | 7/15/25 | 115 | 122 |
| | Aspen Insurance Holdings Ltd. | 4.650% | 11/15/23 | 175 | 187 |
| | Associated Bank NA | 3.500% | 8/13/21 | 50 | 51 |
| | Assurant Inc. | 4.000% | 3/15/23 | 50 | 53 |
| | Assurant Inc. | 4.200% | 9/27/23 | 100 | 109 |
| | Assurant Inc. | 4.900% | 3/27/28 | 100 | 116 |
| | Assurant Inc. | 6.750% | 2/15/34 | 9 | 12 |
| | Assured Guaranty US Holdings Inc. | 5.000% | 7/1/24 | 75 | 86 |
| | Athene Holding Ltd. | 4.125% | 1/12/28 | 200 | 223 |
| | Athene Holding Ltd. | 6.150% | 4/3/30 | 110 | 137 |
| | Athene Holding Ltd. | 3.500% | 1/15/31 | 500 | 531 |
| | Australia & New Zealand Banking Group Ltd. | 2.625% | 5/19/22 | 200 | 207 |
| | Australia & New Zealand Banking Group Ltd. | 2.625% | 11/9/22 | 200 | 209 |
| | Australia & New Zealand Banking Group Ltd. | 3.700% | 11/16/25 | 250 | 286 |
| | AXA SA | 8.600% | 12/15/30 | 225 | 350 |
| | AXIS Specialty Finance LLC | 3.900% | 7/15/29 | 50 | 56 |
Total Bond Market Index Portfolio
| | | | Coupon | Maturity
Date | Face
Amount
($000) | Market
Value•
($000) |
| | AXIS Specialty Finance LLC | 4.900% | 1/15/40 | 50 | 52 |
| | AXIS Specialty Finance plc | 4.000% | 12/6/27 | 550 | 608 |
| | Banco Santander SA | 3.848% | 4/12/23 | 200 | 214 |
| | Banco Santander SA | 5.179% | 11/19/25 | 250 | 292 |
| | Banco Santander SA | 4.250% | 4/11/27 | 600 | 691 |
| | Banco Santander SA | 3.800% | 2/23/28 | 200 | 226 |
| | Banco Santander SA | 4.379% | 4/12/28 | 200 | 233 |
| | Bancolombia SA | 3.000% | 1/29/25 | 200 | 208 |
| | Bank of America Corp. | 2.503% | 10/21/22 | 1,100 | 1,119 |
| | Bank of America Corp. | 3.300% | 1/11/23 | 600 | 636 |
| | Bank of America Corp. | 3.124% | 1/20/23 | 145 | 149 |
| | Bank of America Corp. | 2.881% | 4/24/23 | 1,000 | 1,031 |
| | Bank of America Corp. | 2.816% | 7/21/23 | 1,300 | 1,351 |
| | Bank of America Corp. | 4.100% | 7/24/23 | 300 | 328 |
| | Bank of America Corp. | 3.004% | 12/20/23 | 2,846 | 2,995 |
| | Bank of America Corp. | 3.550% | 3/5/24 | 690 | 735 |
| | Bank of America Corp. | 3.864% | 7/23/24 | 125 | 136 |
| | Bank of America Corp. | 4.200% | 8/26/24 | 650 | 724 |
| | Bank of America Corp. | 0.810% | 10/24/24 | 500 | 504 |
| | Bank of America Corp. | 4.000% | 1/22/25 | 755 | 845 |
| | Bank of America Corp. | 3.950% | 4/21/25 | 500 | 563 |
| | Bank of America Corp. | 3.093% | 10/1/25 | 350 | 378 |
| | Bank of America Corp. | 2.456% | 10/22/25 | 300 | 319 |
| | Bank of America Corp. | 3.366% | 1/23/26 | 300 | 329 |
| | Bank of America Corp. | 2.015% | 2/13/26 | 1,000 | 1,046 |
| | Bank of America Corp. | 4.450% | 3/3/26 | 475 | 553 |
| | Bank of America Corp. | 3.500% | 4/19/26 | 320 | 362 |
| | Bank of America Corp. | 1.319% | 6/19/26 | 500 | 508 |
| | Bank of America Corp. | 4.250% | 10/22/26 | 725 | 842 |
| | Bank of America Corp. | 1.197% | 10/24/26 | 500 | 506 |
| | Bank of America Corp. | 3.559% | 4/23/27 | 750 | 845 |
| | Bank of America Corp. | 3.248% | 10/21/27 | 750 | 839 |
| | Bank of America Corp. | 4.183% | 11/25/27 | 560 | 648 |
| | Bank of America Corp. | 3.824% | 1/20/28 | 425 | 487 |
| | Bank of America Corp. | 3.705% | 4/24/28 | 350 | 397 |
| | Bank of America Corp. | 3.593% | 7/21/28 | 800 | 903 |
| | Bank of America Corp. | 3.419% | 12/20/28 | 1,334 | 1,505 |
| | Bank of America Corp. | 3.970% | 3/5/29 | 225 | 262 |
| | Bank of America Corp. | 4.271% | 7/23/29 | 575 | 684 |
| | Bank of America Corp. | 3.974% | 2/7/30 | 150 | 176 |
| | Bank of America Corp. | 3.194% | 7/23/30 | 1,125 | 1,255 |
| | Bank of America Corp. | 2.884% | 10/22/30 | 300 | 328 |
| | Bank of America Corp. | 2.496% | 2/13/31 | 750 | 796 |
| | Bank of America Corp. | 2.592% | 4/29/31 | 2,000 | 2,145 |
| | Bank of America Corp. | 6.110% | 1/29/37 | 335 | 487 |
| | Bank of America Corp. | 4.244% | 4/24/38 | 300 | 368 |
| | Bank of America Corp. | 7.750% | 5/14/38 | 340 | 579 |
| | Bank of America Corp. | 4.078% | 4/23/40 | 550 | 669 |
| | Bank of America Corp. | 2.676% | 6/19/41 | 1,000 | 1,041 |
| | Bank of America Corp. | 5.875% | 2/7/42 | 300 | 456 |
| | Bank of America Corp. | 5.000% | 1/21/44 | 750 | 1,045 |
| | Bank of America Corp. | 4.875% | 4/1/44 | 300 | 413 |
| | Bank of America Corp. | 4.750% | 4/21/45 | 100 | 135 |
| | Bank of America Corp. | 4.443% | 1/20/48 | 100 | 132 |
| | Bank of America Corp. | 4.330% | 3/15/50 | 250 | 327 |
| | Bank of America Corp. | 4.083% | 3/20/51 | 1,500 | 1,886 |
| | Bank of America Corp. | 2.831% | 10/24/51 | 500 | 521 |
| | Bank of America NA | 6.000% | 10/15/36 | 250 | 374 |
| | Bank of Montreal | 1.900% | 8/27/21 | 325 | 329 |
| | Bank of Montreal | 2.900% | 3/26/22 | 425 | 439 |
| | Bank of Montreal | 2.350% | 9/11/22 | 46 | 48 |
| | Bank of Montreal | 2.550% | 11/6/22 | 104 | 108 |
| | Bank of Montreal | 0.450% | 12/8/23 | 500 | 500 |
| | Bank of Montreal | 3.300% | 2/5/24 | 300 | 325 |
| | Bank of Montreal | 2.500% | 6/28/24 | 200 | 213 |
| | Bank of Montreal | 1.850% | 5/1/25 | 457 | 479 |
| | Bank of Montreal | 4.338% | 10/5/28 | 100 | 109 |
| | | | Coupon | Maturity
Date | Face
Amount
($000) | Market
Value•
($000) |
| | Bank of Montreal | 3.803% | 12/15/32 | 500 | 564 |
| | Bank of New York Mellon Corp. | 2.600% | 2/7/22 | 675 | 690 |
| | Bank of New York Mellon Corp. | 1.950% | 8/23/22 | 250 | 257 |
| | Bank of New York Mellon Corp. | 2.950% | 1/29/23 | 195 | 205 |
| | Bank of New York Mellon Corp. | 3.500% | 4/28/23 | 225 | 241 |
| | Bank of New York Mellon Corp. | 2.661% | 5/16/23 | 225 | 232 |
| | Bank of New York Mellon Corp. | 3.450% | 8/11/23 | 125 | 135 |
| | Bank of New York Mellon Corp. | 2.200% | 8/16/23 | 225 | 236 |
| | Bank of New York Mellon Corp. | 3.250% | 9/11/24 | 150 | 164 |
| | Bank of New York Mellon Corp. | 2.100% | 10/24/24 | 225 | 239 |
| | Bank of New York Mellon Corp. | 3.000% | 2/24/25 | 547 | 600 |
| | Bank of New York Mellon Corp. | 2.800% | 5/4/26 | 200 | 221 |
| | Bank of New York Mellon Corp. | 2.450% | 8/17/26 | 125 | 136 |
| | Bank of New York Mellon Corp. | 3.250% | 5/16/27 | 150 | 170 |
| | Bank of New York Mellon Corp. | 3.442% | 2/7/28 | 150 | 171 |
| | Bank of New York Mellon Corp. | 3.000% | 10/30/28 | 200 | 223 |
| | Bank of New York Mellon Corp. | 3.300% | 8/23/29 | 100 | 114 |
| | Bank of Nova Scotia | 1.875% | 4/26/21 | 175 | 176 |
| | Bank of Nova Scotia | 2.700% | 3/7/22 | 250 | 257 |
| | Bank of Nova Scotia | 2.375% | 1/18/23 | 50 | 52 |
| | Bank of Nova Scotia | 1.950% | 2/1/23 | 875 | 903 |
| | Bank of Nova Scotia | 3.400% | 2/11/24 | 200 | 217 |
| | Bank of Nova Scotia | 2.200% | 2/3/25 | 1,875 | 1,972 |
| | Bank of Nova Scotia | 4.500% | 12/16/25 | 300 | 348 |
| | Bank of Nova Scotia | 2.700% | 8/3/26 | 100 | 110 |
| | Barclays plc | 3.200% | 8/10/21 | 150 | 152 |
| | Barclays plc | 3.684% | 1/10/23 | 100 | 103 |
| | Barclays plc | 4.610% | 2/15/23 | 200 | 208 |
| | Barclays plc | 4.338% | 5/16/24 | 1,000 | 1,080 |
| | Barclays plc | 3.650% | 3/16/25 | 350 | 386 |
| | Barclays plc | 3.932% | 5/7/25 | 200 | 219 |
| | Barclays plc | 4.375% | 1/12/26 | 300 | 344 |
| | Barclays plc | 2.852% | 5/7/26 | 300 | 321 |
| | Barclays plc | 5.200% | 5/12/26 | 610 | 709 |
| | Barclays plc | 4.337% | 1/10/28 | 200 | 229 |
| | Barclays plc | 4.836% | 5/9/28 | 400 | 463 |
| | Barclays plc | 4.972% | 5/16/29 | 500 | 595 |
| | Barclays plc | 5.088% | 6/20/30 | 345 | 413 |
| | Barclays plc | 2.645% | 6/24/31 | 400 | 415 |
| | Barclays plc | 5.250% | 8/17/45 | 250 | 342 |
| | Barclays plc | 4.950% | 1/10/47 | 200 | 271 |
| | BBVA USA | 2.875% | 6/29/22 | 250 | 258 |
| | Berkshire Hathaway Finance Corp. | 3.000% | 5/15/22 | 150 | 156 |
| | Berkshire Hathaway Finance Corp. | 5.750% | 1/15/40 | 140 | 214 |
| | Berkshire Hathaway Finance Corp. | 4.400% | 5/15/42 | 195 | 258 |
| | Berkshire Hathaway Finance Corp. | 4.300% | 5/15/43 | 300 | 395 |
| | Berkshire Hathaway Finance Corp. | 4.200% | 8/15/48 | 700 | 918 |
| | Berkshire Hathaway Finance Corp. | 4.250% | 1/15/49 | 230 | 304 |
| | Berkshire Hathaway Finance Corp. | 2.850% | 10/15/50 | 675 | 723 |
Total Bond Market Index Portfolio
| | | | Coupon | Maturity
Date | Face
Amount
($000) | Market
Value•
($000) |
| | Berkshire Hathaway Inc. | 2.200% | 3/15/21 | 200 | 200 |
| | Berkshire Hathaway Inc. | 3.000% | 2/11/23 | 75 | 79 |
| | Berkshire Hathaway Inc. | 2.750% | 3/15/23 | 300 | 315 |
| | Berkshire Hathaway Inc. | 3.125% | 3/15/26 | 725 | 810 |
| | BGC Partners Inc. | 3.750% | 10/1/24 | 105 | 110 |
| | BlackRock Inc. | 3.375% | 6/1/22 | 175 | 183 |
| | BlackRock Inc. | 3.500% | 3/18/24 | 175 | 192 |
| | BlackRock Inc. | 3.200% | 3/15/27 | 100 | 113 |
| | BlackRock Inc. | 3.250% | 4/30/29 | 90 | 103 |
| | BlackRock Inc. | 2.400% | 4/30/30 | 630 | 687 |
| | BlackRock Inc. | 1.900% | 1/28/31 | 145 | 151 |
| 5 | BNP Paribas SA | 3.052% | 1/13/31 | 50 | 54 |
| | BPCE SA | 2.750% | 12/2/21 | 250 | 255 |
| 5 | BPCE SA | 3.000% | 5/22/22 | 250 | 259 |
| | BPCE SA | 4.000% | 4/15/24 | 325 | 360 |
| | BPCE SA | 3.375% | 12/2/26 | 250 | 282 |
| | Brighthouse Financial Inc. | 3.700% | 6/22/27 | 141 | 153 |
| | Brighthouse Financial Inc. | 4.700% | 6/22/47 | 223 | 233 |
| | Brookfield Asset Management Inc. | 4.000% | 1/15/25 | 157 | 174 |
| | Brookfield Finance Inc. | 4.000% | 4/1/24 | 175 | 192 |
| | Brookfield Finance Inc. | 4.250% | 6/2/26 | 50 | 58 |
| | Brookfield Finance Inc. | 3.900% | 1/25/28 | 125 | 143 |
| | Brookfield Finance Inc. | 4.850% | 3/29/29 | 150 | 183 |
| | Brookfield Finance Inc. | 4.350% | 4/15/30 | 205 | 245 |
| | Brookfield Finance Inc. | 4.700% | 9/20/47 | 185 | 234 |
| | Brookfield Finance Inc. | 3.450% | 4/15/50 | 125 | 132 |
| | Brown & Brown Inc. | 4.200% | 9/15/24 | 75 | 84 |
| | Brown & Brown Inc. | 4.500% | 3/15/29 | 75 | 89 |
| | Brown & Brown Inc. | 2.375% | 3/15/31 | 500 | 520 |
| | Canadian Imperial Bank of Commerce | 2.550% | 6/16/22 | 350 | 362 |
| | Canadian Imperial Bank of Commerce | 3.500% | 9/13/23 | 200 | 217 |
| | Canadian Imperial Bank of Commerce | 0.500% | 12/14/23 | 500 | 500 |
| | Canadian Imperial Bank of Commerce | 3.100% | 4/2/24 | 200 | 216 |
| | Canadian Imperial Bank of Commerce | 2.250% | 1/28/25 | 120 | 127 |
| | Capital One Bank USA NA | 3.375% | 2/15/23 | 235 | 248 |
| | Capital One Financial Corp. | 3.050% | 3/9/22 | 175 | 181 |
| | Capital One Financial Corp. | 3.200% | 1/30/23 | 350 | 368 |
| | Capital One Financial Corp. | 3.500% | 6/15/23 | 27 | 29 |
| | Capital One Financial Corp. | 3.900% | 1/29/24 | 250 | 273 |
| | Capital One Financial Corp. | 3.750% | 4/24/24 | 450 | 491 |
| | Capital One Financial Corp. | 3.300% | 10/30/24 | 1,013 | 1,109 |
| | Capital One Financial Corp. | 4.200% | 10/29/25 | 175 | 198 |
| | Capital One Financial Corp. | 3.750% | 7/28/26 | 500 | 564 |
| | Capital One Financial Corp. | 3.750% | 3/9/27 | 100 | 113 |
| | Capital One Financial Corp. | 3.650% | 5/11/27 | 800 | 915 |
| | Capital One Financial Corp. | 3.800% | 1/31/28 | 300 | 347 |
| | Cboe Global Markets Inc. | 3.650% | 1/12/27 | 110 | 126 |
| | Charles Schwab Corp. | 3.225% | 9/1/22 | 300 | 314 |
| | Charles Schwab Corp. | 2.650% | 1/25/23 | 100 | 105 |
| | Charles Schwab Corp. | 3.550% | 2/1/24 | 400 | 435 |
| | Charles Schwab Corp. | 3.850% | 5/21/25 | 25 | 28 |
| | Charles Schwab Corp. | 0.900% | 3/11/26 | 300 | 304 |
| | Charles Schwab Corp. | 3.200% | 3/2/27 | 250 | 278 |
| | Charles Schwab Corp. | 3.200% | 1/25/28 | 100 | 113 |
| | | | Coupon | Maturity
Date | Face
Amount
($000) | Market
Value•
($000) |
| | Charles Schwab Corp. | 4.000% | 2/1/29 | 125 | 149 |
| | Charles Schwab Corp. | 3.250% | 5/22/29 | 100 | 115 |
| | Charles Schwab Corp. | 4.625% | 3/22/30 | 50 | 63 |
| | Chubb Corp. | 6.000% | 5/11/37 | 125 | 188 |
| | Chubb Corp. | 6.500% | 5/15/38 | 95 | 151 |
| | Chubb INA Holdings Inc. | 2.875% | 11/3/22 | 475 | 495 |
| | Chubb INA Holdings Inc. | 2.700% | 3/13/23 | 125 | 131 |
| | Chubb INA Holdings Inc. | 3.350% | 5/15/24 | 100 | 109 |
| | Chubb INA Holdings Inc. | 3.150% | 3/15/25 | 250 | 276 |
| | Chubb INA Holdings Inc. | 6.700% | 5/15/36 | 200 | 311 |
| | Chubb INA Holdings Inc. | 4.150% | 3/13/43 | 100 | 129 |
| | Chubb INA Holdings Inc. | 4.350% | 11/3/45 | 350 | 473 |
| | Cincinnati Financial Corp. | 6.920% | 5/15/28 | 100 | 132 |
| | Cincinnati Financial Corp. | 6.125% | 11/1/34 | 75 | 104 |
| | Citigroup Inc. | 2.350% | 8/2/21 | 150 | 152 |
| | Citigroup Inc. | 2.900% | 12/8/21 | 200 | 204 |
| | Citigroup Inc. | 4.500% | 1/14/22 | 475 | 495 |
| | Citigroup Inc. | 2.750% | 4/25/22 | 425 | 438 |
| | Citigroup Inc. | 2.700% | 10/27/22 | 375 | 390 |
| | Citigroup Inc. | 3.375% | 3/1/23 | 150 | 159 |
| | Citigroup Inc. | 3.500% | 5/15/23 | 675 | 722 |
| | Citigroup Inc. | 2.876% | 7/24/23 | 450 | 467 |
| | Citigroup Inc. | 3.875% | 10/25/23 | 738 | 811 |
| | Citigroup Inc. | 4.000% | 8/5/24 | 125 | 139 |
| | Citigroup Inc. | 0.776% | 10/30/24 | 500 | 501 |
| | Citigroup Inc. | 3.875% | 3/26/25 | 350 | 390 |
| | Citigroup Inc. | 3.352% | 4/24/25 | 1,500 | 1,630 |
| | Citigroup Inc. | 3.300% | 4/27/25 | 125 | 138 |
| | Citigroup Inc. | 4.400% | 6/10/25 | 1,796 | 2,051 |
| | Citigroup Inc. | 5.500% | 9/13/25 | 75 | 90 |
| | Citigroup Inc. | 3.700% | 1/12/26 | 275 | 312 |
| | Citigroup Inc. | 4.600% | 3/9/26 | 275 | 322 |
| | Citigroup Inc. | 3.200% | 10/21/26 | 1,025 | 1,143 |
| | Citigroup Inc. | 4.300% | 11/20/26 | 75 | 87 |
| | Citigroup Inc. | 4.450% | 9/29/27 | 1,150 | 1,349 |
| | Citigroup Inc. | 3.887% | 1/10/28 | 475 | 542 |
| | Citigroup Inc. | 3.668% | 7/24/28 | 900 | 1,022 |
| | Citigroup Inc. | 4.125% | 7/25/28 | 100 | 116 |
| | Citigroup Inc. | 3.520% | 10/27/28 | 580 | 654 |
| | Citigroup Inc. | 3.980% | 3/20/30 | 475 | 557 |
| | Citigroup Inc. | 2.976% | 11/5/30 | 300 | 328 |
| | Citigroup Inc. | 2.666% | 1/29/31 | 500 | 533 |
| | Citigroup Inc. | 4.412% | 3/31/31 | 750 | 909 |
| | Citigroup Inc. | 2.572% | 6/3/31 | 500 | 532 |
| | Citigroup Inc. | 6.625% | 6/15/32 | 100 | 142 |
| | Citigroup Inc. | 6.125% | 8/25/36 | 75 | 105 |
| | Citigroup Inc. | 3.878% | 1/24/39 | 225 | 268 |
| | Citigroup Inc. | 8.125% | 7/15/39 | 562 | 1,003 |
| | Citigroup Inc. | 5.316% | 3/26/41 | 1,000 | 1,405 |
| | Citigroup Inc. | 5.875% | 1/30/42 | 100 | 152 |
| | Citigroup Inc. | 5.300% | 5/6/44 | 375 | 526 |
| | Citigroup Inc. | 4.650% | 7/30/45 | 200 | 268 |
| | Citigroup Inc. | 4.750% | 5/18/46 | 375 | 498 |
| | Citigroup Inc. | 4.650% | 7/23/48 | 450 | 619 |
| | Citizens Bank NA | 3.250% | 2/14/22 | 250 | 257 |
| | Citizens Bank NA | 2.650% | 5/26/22 | 125 | 129 |
| | Citizens Financial Group Inc. | 4.300% | 12/3/25 | 357 | 411 |
| | Citizens Financial Group Inc. | 2.850% | 7/27/26 | 175 | 195 |
| | Citizens Financial Group Inc. | 2.500% | 2/6/30 | 200 | 212 |
| 5 | Citizens Financial Group Inc. | 2.638% | 9/30/32 | 125 | 132 |
| | CME Group Inc. | 3.000% | 9/15/22 | 125 | 131 |
| | CME Group Inc. | 3.000% | 3/15/25 | 214 | 234 |
| | CME Group Inc. | 5.300% | 9/15/43 | 200 | 297 |
| | CNA Financial Corp. | 3.950% | 5/15/24 | 150 | 166 |
| | CNA Financial Corp. | 4.500% | 3/1/26 | 125 | 146 |
Total Bond Market Index Portfolio
| | | | Coupon | Maturity
Date | Face
Amount
($000) | Market
Value•
($000) |
| | CNA Financial Corp. | 3.450% | 8/15/27 | 100 | 113 |
| | CNA Financial Corp. | 3.900% | 5/1/29 | 100 | 118 |
| | Comerica Bank | 4.000% | 7/27/25 | 50 | 56 |
| | Comerica Inc. | 3.700% | 7/31/23 | 200 | 216 |
| 5 | Commonwealth Bank of Australia | 2.750% | 3/10/22 | 500 | 514 |
| | Cooperatieve Rabobank UA | 2.750% | 1/10/22 | 250 | 256 |
| | Cooperatieve Rabobank UA | 3.875% | 2/8/22 | 525 | 545 |
| | Cooperatieve Rabobank UA | 3.950% | 11/9/22 | 125 | 133 |
| | Cooperatieve Rabobank UA | 4.625% | 12/1/23 | 175 | 195 |
| | Cooperatieve Rabobank UA | 3.375% | 5/21/25 | 666 | 746 |
| | Cooperatieve Rabobank UA | 4.375% | 8/4/25 | 600 | 682 |
| | Cooperatieve Rabobank UA | 3.750% | 7/21/26 | 475 | 536 |
| | Cooperatieve Rabobank UA | 5.250% | 5/24/41 | 100 | 148 |
| | Cooperatieve Rabobank UA | 5.750% | 12/1/43 | 250 | 370 |
| | Cooperatieve Rabobank UA | 5.250% | 8/4/45 | 350 | 490 |
| | Credit Suisse AG | 3.000% | 10/29/21 | 600 | 613 |
| | Credit Suisse AG | 3.625% | 9/9/24 | 575 | 638 |
| 5 | Credit Suisse Group AG | 3.574% | 1/9/23 | 250 | 258 |
| | Credit Suisse Group AG | 3.800% | 6/9/23 | 825 | 887 |
| | Credit Suisse Group AG | 3.750% | 3/26/25 | 250 | 277 |
| | Credit Suisse Group AG | 4.875% | 5/15/45 | 875 | 1,222 |
| | Credit Suisse Group Funding Guernsey Ltd. | 3.800% | 9/15/22 | 750 | 791 |
| | Deutsche Bank AG | 4.250% | 10/14/21 | 600 | 615 |
| | Deutsche Bank AG | 3.300% | 11/16/22 | 500 | 522 |
| | Deutsche Bank AG | 3.950% | 2/27/23 | 300 | 318 |
| | Deutsche Bank AG | 3.700% | 5/30/24 | 548 | 588 |
| | Deutsche Bank AG | 4.100% | 1/13/26 | 100 | 111 |
| | Discover Bank | 3.200% | 8/9/21 | 100 | 101 |
| | Discover Bank | 3.350% | 2/6/23 | 150 | 158 |
| | Discover Bank | 4.200% | 8/8/23 | 300 | 328 |
| | Discover Bank | 2.450% | 9/12/24 | 150 | 158 |
| | Discover Bank | 3.450% | 7/27/26 | 100 | 112 |
| | Discover Bank | 4.650% | 9/13/28 | 250 | 299 |
| | Discover Bank | 2.700% | 2/6/30 | 100 | 106 |
| | Discover Financial Services | 3.850% | 11/21/22 | 200 | 213 |
| | Discover Financial Services | 3.950% | 11/6/24 | 450 | 498 |
| | Discover Financial Services | 3.750% | 3/4/25 | 183 | 201 |
| | Discover Financial Services | 4.500% | 1/30/26 | 200 | 231 |
| | Discover Financial Services | 4.100% | 2/9/27 | 250 | 288 |
| | E*TRADE Financial Corp. | 3.800% | 8/24/27 | 75 | 86 |
| | E*TRADE Financial Corp. | 4.500% | 6/20/28 | 65 | 78 |
| | Eaton Vance Corp. | 3.625% | 6/15/23 | 50 | 54 |
| | Eaton Vance Corp. | 3.500% | 4/6/27 | 100 | 111 |
| | Enstar Group Ltd. | 4.500% | 3/10/22 | 50 | 52 |
| | Enstar Group Ltd. | 4.950% | 6/1/29 | 395 | 451 |
| | Equitable Holdings Inc. | 3.900% | 4/20/23 | 100 | 107 |
| | Equitable Holdings Inc. | 7.000% | 4/1/28 | 75 | 97 |
| | Equitable Holdings Inc. | 4.350% | 4/20/28 | 680 | 800 |
| | Equitable Holdings Inc. | 5.000% | 4/20/48 | 350 | 461 |
| | Everest Reinsurance Holdings Inc. | 4.868% | 6/1/44 | 100 | 131 |
| | Fairfax Financial Holdings Ltd. | 4.850% | 4/17/28 | 50 | 56 |
| | | | Coupon | Maturity
Date | Face
Amount
($000) | Market
Value•
($000) |
| | Fairfax Financial Holdings Ltd. | 4.625% | 4/29/30 | 100 | 112 |
| | Fidelity National Financial Inc. | 3.400% | 6/15/30 | 100 | 110 |
| | Fidelity National Financial Inc. | 2.450% | 3/15/31 | 500 | 507 |
| | Fifth Third Bancorp | 3.500% | 3/15/22 | 125 | 129 |
| | Fifth Third Bancorp | 4.300% | 1/16/24 | 275 | 303 |
| | Fifth Third Bancorp | 3.650% | 1/25/24 | 150 | 163 |
| | Fifth Third Bancorp | 2.375% | 1/28/25 | 349 | 371 |
| | Fifth Third Bancorp | 2.550% | 5/5/27 | 100 | 109 |
| | Fifth Third Bancorp | 3.950% | 3/14/28 | 75 | 88 |
| | Fifth Third Bancorp | 8.250% | 3/1/38 | 200 | 337 |
| | Fifth Third Bank NA | 3.950% | 7/28/25 | 200 | 229 |
| | Fifth Third Bank NA | 3.850% | 3/15/26 | 200 | 226 |
| | Fifth Third Bank NA | 2.250% | 2/1/27 | 250 | 266 |
| | First American Financial Corp. | 4.600% | 11/15/24 | 100 | 111 |
| | First Republic Bank | 2.500% | 6/6/22 | 100 | 103 |
| | First Republic Bank | 1.912% | 2/12/24 | 250 | 257 |
| | First Republic Bank | 4.375% | 8/1/46 | 75 | 95 |
| | FirstMerit Bank NA | 4.270% | 11/25/26 | 150 | 172 |
| | Franklin Resources Inc. | 2.800% | 9/15/22 | 225 | 234 |
| | FS KKR Capital Corp. | 4.750% | 5/15/22 | 25 | 26 |
| | FS KKR Capital Corp. | 4.625% | 7/15/24 | 25 | 26 |
| | FS KKR Capital Corp. | 4.125% | 2/1/25 | 100 | 104 |
| | FS KKR Capital Corp. | 3.400% | 1/15/26 | 500 | 496 |
| | GATX Corp. | 3.250% | 3/30/25 | 125 | 136 |
| | GATX Corp. | 3.250% | 9/15/26 | 50 | 56 |
| | GATX Corp. | 3.850% | 3/30/27 | 175 | 197 |
| | GATX Corp. | 3.500% | 3/15/28 | 100 | 112 |
| | GATX Corp. | 4.550% | 11/7/28 | 150 | 180 |
| | GATX Corp. | 4.700% | 4/1/29 | 75 | 92 |
| | GATX Corp. | 4.500% | 3/30/45 | 50 | 58 |
| 5 | GE Capital Funding LLC | 3.450% | 5/15/25 | 445 | 491 |
| 5 | GE Capital Funding LLC | 4.050% | 5/15/27 | 400 | 453 |
| 5 | GE Capital Funding LLC | 4.400% | 5/15/30 | 710 | 835 |
| 5 | GE Capital Funding LLC | 4.550% | 5/15/32 | 200 | 240 |
| | GE Capital International Funding Co. Unlimited Co. | 3.373% | 11/15/25 | 358 | 398 |
| | GE Capital International Funding Co. Unlimited Co. | 4.418% | 11/15/35 | 2,168 | 2,579 |
| | Globe Life Inc. | 3.800% | 9/15/22 | 50 | 53 |
| | Globe Life Inc. | 4.550% | 9/15/28 | 80 | 96 |
| | Goldman Sachs Capital I | 6.345% | 2/15/34 | 225 | 315 |
| | Goldman Sachs Group Inc. | 5.750% | 1/24/22 | 675 | 713 |
| | Goldman Sachs Group Inc. | 3.000% | 4/26/22 | 545 | 550 |
| | Goldman Sachs Group Inc. | 2.876% | 10/31/22 | 555 | 565 |
| | Goldman Sachs Group Inc. | 3.625% | 1/22/23 | 400 | 426 |
| | Goldman Sachs Group Inc. | 3.200% | 2/23/23 | 450 | 475 |
| | Goldman Sachs Group Inc. | 2.908% | 6/5/23 | 350 | 362 |
| | Goldman Sachs Group Inc. | 2.905% | 7/24/23 | 500 | 519 |
| | Goldman Sachs Group Inc. | 3.625% | 2/20/24 | 300 | 326 |
| | Goldman Sachs Group Inc. | 4.000% | 3/3/24 | 475 | 522 |
| | Goldman Sachs Group Inc. | 3.850% | 7/8/24 | 586 | 641 |
| | Goldman Sachs Group Inc. | 3.500% | 1/23/25 | 1,332 | 1,468 |
| | Goldman Sachs Group Inc. | 3.500% | 4/1/25 | 50 | 56 |
Total Bond Market Index Portfolio
| | | | Coupon | Maturity
Date | Face
Amount
($000) | Market
Value•
($000) |
| | Goldman Sachs Group Inc. | 3.750% | 5/22/25 | 825 | 926 |
| | Goldman Sachs Group Inc. | 3.272% | 9/29/25 | 550 | 601 |
| | Goldman Sachs Group Inc. | 4.250% | 10/21/25 | 200 | 228 |
| | Goldman Sachs Group Inc. | 3.750% | 2/25/26 | 200 | 226 |
| | Goldman Sachs Group Inc. | 3.500% | 11/16/26 | 1,250 | 1,402 |
| | Goldman Sachs Group Inc. | 1.093% | 12/9/26 | 500 | 505 |
| | Goldman Sachs Group Inc. | 5.950% | 1/15/27 | 400 | 500 |
| | Goldman Sachs Group Inc. | 3.850% | 1/26/27 | 350 | 399 |
| | Goldman Sachs Group Inc. | 3.691% | 6/5/28 | 625 | 720 |
| | Goldman Sachs Group Inc. | 3.814% | 4/23/29 | 450 | 519 |
| | Goldman Sachs Group Inc. | 4.223% | 5/1/29 | 475 | 561 |
| | Goldman Sachs Group Inc. | 3.800% | 3/15/30 | 1,250 | 1,467 |
| | Goldman Sachs Group Inc. | 6.450% | 5/1/36 | 50 | 73 |
| | Goldman Sachs Group Inc. | 6.750% | 10/1/37 | 975 | 1,478 |
| | Goldman Sachs Group Inc. | 4.017% | 10/31/38 | 405 | 493 |
| | Goldman Sachs Group Inc. | 4.411% | 4/23/39 | 500 | 636 |
| | Goldman Sachs Group Inc. | 6.250% | 2/1/41 | 675 | 1,053 |
| | Goldman Sachs Group Inc. | 4.800% | 7/8/44 | 360 | 498 |
| | Goldman Sachs Group Inc. | 5.150% | 5/22/45 | 475 | 655 |
| | Goldman Sachs Group Inc. | 4.750% | 10/21/45 | 150 | 208 |
| | Hanover Insurance Group Inc. | 4.500% | 4/15/26 | 100 | 117 |
| | Hartford Financial Services Group Inc. | 2.800% | 8/19/29 | 350 | 381 |
| | Hartford Financial Services Group Inc. | 5.950% | 10/15/36 | 50 | 70 |
| | Hartford Financial Services Group Inc. | 6.100% | 10/1/41 | 100 | 150 |
| | Hartford Financial Services Group Inc. | 4.300% | 4/15/43 | 175 | 219 |
| | Hartford Financial Services Group Inc. | 3.600% | 8/19/49 | 125 | 147 |
| | HSBC Bank USA NA | 7.000% | 1/15/39 | 250 | 396 |
| | HSBC Holdings plc | 3.262% | 3/13/23 | 560 | 578 |
| | HSBC Holdings plc | 3.600% | 5/25/23 | 200 | 215 |
| | HSBC Holdings plc | 3.033% | 11/22/23 | 200 | 209 |
| | HSBC Holdings plc | 4.250% | 3/14/24 | 250 | 276 |
| | HSBC Holdings plc | 3.950% | 5/18/24 | 1,300 | 1,401 |
| | HSBC Holdings plc | 3.803% | 3/11/25 | 1,075 | 1,174 |
| | HSBC Holdings plc | 4.250% | 8/18/25 | 150 | 169 |
| | HSBC Holdings plc | 2.633% | 11/7/25 | 200 | 213 |
| | HSBC Holdings plc | 4.300% | 3/8/26 | 1,100 | 1,268 |
| | HSBC Holdings plc | 1.645% | 4/18/26 | 2,000 | 2,041 |
| | HSBC Holdings plc | 3.900% | 5/25/26 | 450 | 513 |
| | HSBC Holdings plc | 2.099% | 6/4/26 | 1,700 | 1,765 |
| | HSBC Holdings plc | 4.292% | 9/12/26 | 500 | 568 |
| | HSBC Holdings plc | 4.375% | 11/23/26 | 350 | 404 |
| | HSBC Holdings plc | 1.589% | 5/24/27 | 500 | 507 |
| | HSBC Holdings plc | 4.041% | 3/13/28 | 400 | 454 |
| | HSBC Holdings plc | 4.583% | 6/19/29 | 400 | 473 |
| | HSBC Holdings plc | 4.950% | 3/31/30 | 550 | 683 |
| | HSBC Holdings plc | 3.973% | 5/22/30 | 570 | 657 |
| | | | Coupon | Maturity
Date | Face
Amount
($000) | Market
Value•
($000) |
| | HSBC Holdings plc | 7.625% | 5/17/32 | 100 | 145 |
| | HSBC Holdings plc | 7.350% | 11/27/32 | 100 | 134 |
| | HSBC Holdings plc | 6.500% | 5/2/36 | 600 | 867 |
| | HSBC Holdings plc | 6.500% | 9/15/37 | 50 | 72 |
| | HSBC Holdings plc | 6.800% | 6/1/38 | 200 | 301 |
| | HSBC Holdings plc | 5.250% | 3/14/44 | 750 | 1,042 |
| | HSBC USA Inc. | 3.500% | 6/23/24 | 150 | 164 |
| | Huntington Bancshares Inc. | 2.300% | 1/14/22 | 92 | 94 |
| | Huntington Bancshares Inc. | 2.550% | 2/4/30 | 250 | 267 |
| | Huntington National Bank | 2.500% | 8/7/22 | 200 | 206 |
| | Huntington National Bank | 1.800% | 2/3/23 | 275 | 282 |
| | Huntington National Bank | 3.550% | 10/6/23 | 250 | 270 |
| | Industrial & Commercial Bank of China Ltd. | 2.957% | 11/8/22 | 250 | 259 |
| | Industrial & Commercial Bank of China Ltd. | 3.538% | 11/8/27 | 250 | 276 |
| | ING Groep NV | 3.150% | 3/29/22 | 200 | 207 |
| | ING Groep NV | 4.100% | 10/2/23 | 300 | 329 |
| | ING Groep NV | 3.550% | 4/9/24 | 200 | 218 |
| | ING Groep NV | 3.950% | 3/29/27 | 300 | 347 |
| | ING Groep NV | 4.550% | 10/2/28 | 200 | 243 |
| | ING Groep NV | 4.050% | 4/9/29 | 200 | 237 |
| | Intercontinental Exchange Inc. | 2.350% | 9/15/22 | 100 | 103 |
| | Intercontinental Exchange Inc. | 4.000% | 10/15/23 | 150 | 165 |
| | Intercontinental Exchange Inc. | 3.750% | 12/1/25 | 300 | 341 |
| | Intercontinental Exchange Inc. | 3.100% | 9/15/27 | 150 | 167 |
| | Intercontinental Exchange Inc. | 3.750% | 9/21/28 | 75 | 87 |
| | Intercontinental Exchange Inc. | 2.100% | 6/15/30 | 750 | 780 |
| | Intercontinental Exchange Inc. | 2.650% | 9/15/40 | 500 | 513 |
| | Intercontinental Exchange Inc. | 4.250% | 9/21/48 | 175 | 222 |
| | Intercontinental Exchange Inc. | 3.000% | 6/15/50 | 285 | 302 |
| | Intercontinental Exchange Inc. | 3.000% | 9/15/60 | 300 | 313 |
| | International Finance Corp. | 5.875% | 8/15/22 | 160 | 172 |
| | Invesco Finance plc | 3.125% | 11/30/22 | 175 | 184 |
| | Invesco Finance plc | 4.000% | 1/30/24 | 450 | 494 |
| | Invesco Finance plc | 3.750% | 1/15/26 | 170 | 191 |
| | Invesco Finance plc | 5.375% | 11/30/43 | 75 | 97 |
| | Janus Capital Group Inc. | 4.875% | 8/1/25 | 75 | 86 |
| | Jefferies Financial Group Inc. | 5.500% | 10/18/23 | 150 | 165 |
| | Jefferies Group LLC | 5.125% | 1/20/23 | 100 | 109 |
| | Jefferies Group LLC | 6.450% | 6/8/27 | 50 | 63 |
| | Jefferies Group LLC | 6.250% | 1/15/36 | 75 | 99 |
| | Jefferies Group LLC | 6.500% | 1/20/43 | 75 | 103 |
| | Jefferies Group LLC / Jefferies Group Capital Finance Inc. | 4.850% | 1/15/27 | 200 | 236 |
| | Jefferies Group LLC / Jefferies Group Capital Finance Inc. | 4.150% | 1/23/30 | 300 | 350 |
| | JPMorgan Chase & Co. | 3.250% | 9/23/22 | 750 | 788 |
| | JPMorgan Chase & Co. | 2.972% | 1/15/23 | 370 | 380 |
| | JPMorgan Chase & Co. | 3.200% | 1/25/23 | 750 | 794 |
| | JPMorgan Chase & Co. | 3.207% | 4/1/23 | 500 | 517 |
| | JPMorgan Chase & Co. | 2.776% | 4/25/23 | 350 | 361 |
| | JPMorgan Chase & Co. | 3.375% | 5/1/23 | 300 | 320 |
| | JPMorgan Chase & Co. | 2.700% | 5/18/23 | 250 | 263 |
| | JPMorgan Chase & Co. | 3.875% | 2/1/24 | 445 | 489 |
Total Bond Market Index Portfolio
| | | | Coupon | Maturity
Date | Face
Amount
($000) | Market
Value•
($000) |
| | JPMorgan Chase & Co. | 3.559% | 4/23/24 | 485 | 519 |
| | JPMorgan Chase & Co. | 3.625% | 5/13/24 | 526 | 581 |
| | JPMorgan Chase & Co. | 1.514% | 6/1/24 | 1,640 | 1,680 |
| | JPMorgan Chase & Co. | 3.797% | 7/23/24 | 175 | 189 |
| | JPMorgan Chase & Co. | 3.875% | 9/10/24 | 575 | 642 |
| | JPMorgan Chase & Co. | 0.653% | 9/16/24 | 1,100 | 1,102 |
| | JPMorgan Chase & Co. | 4.023% | 12/5/24 | 300 | 330 |
| | JPMorgan Chase & Co. | 3.125% | 1/23/25 | 400 | 437 |
| | JPMorgan Chase & Co. | 3.220% | 3/1/25 | 600 | 646 |
| | JPMorgan Chase & Co. | 3.900% | 7/15/25 | 362 | 408 |
| | JPMorgan Chase & Co. | 2.301% | 10/15/25 | 700 | 743 |
| | JPMorgan Chase & Co. | 3.300% | 4/1/26 | 685 | 765 |
| | JPMorgan Chase & Co. | 2.083% | 4/22/26 | 500 | 528 |
| | JPMorgan Chase & Co. | 3.200% | 6/15/26 | 300 | 336 |
| | JPMorgan Chase & Co. | 2.950% | 10/1/26 | 875 | 970 |
| | JPMorgan Chase & Co. | 4.125% | 12/15/26 | 450 | 522 |
| | JPMorgan Chase & Co. | 3.960% | 1/29/27 | 500 | 575 |
| | JPMorgan Chase & Co. | 3.625% | 12/1/27 | 1,000 | 1,126 |
| | JPMorgan Chase & Co. | 3.782% | 2/1/28 | 625 | 718 |
| | JPMorgan Chase & Co. | 3.540% | 5/1/28 | 350 | 397 |
| | JPMorgan Chase & Co. | 3.509% | 1/23/29 | 575 | 655 |
| | JPMorgan Chase & Co. | 4.005% | 4/23/29 | 300 | 350 |
| | JPMorgan Chase & Co. | 4.203% | 7/23/29 | 250 | 298 |
| | JPMorgan Chase & Co. | 4.452% | 12/5/29 | 300 | 365 |
| | JPMorgan Chase & Co. | 3.702% | 5/6/30 | 300 | 346 |
| | JPMorgan Chase & Co. | 2.739% | 10/15/30 | 1,500 | 1,626 |
| | JPMorgan Chase & Co. | 4.493% | 3/24/31 | 1,050 | 1,291 |
| | JPMorgan Chase & Co. | 2.522% | 4/22/31 | 2,000 | 2,137 |
| | JPMorgan Chase & Co. | 1.764% | 11/19/31 | 500 | 504 |
| | JPMorgan Chase & Co. | 6.400% | 5/15/38 | 450 | 697 |
| | JPMorgan Chase & Co. | 3.882% | 7/24/38 | 500 | 604 |
| | JPMorgan Chase & Co. | 5.500% | 10/15/40 | 650 | 953 |
| | JPMorgan Chase & Co. | 3.109% | 4/22/41 | 500 | 558 |
| | JPMorgan Chase & Co. | 5.600% | 7/15/41 | 275 | 414 |
| | JPMorgan Chase & Co. | 5.400% | 1/6/42 | 150 | 222 |
| | JPMorgan Chase & Co. | 5.625% | 8/16/43 | 300 | 450 |
| | JPMorgan Chase & Co. | 4.950% | 6/1/45 | 100 | 141 |
| | JPMorgan Chase & Co. | 4.260% | 2/22/48 | 375 | 487 |
| | JPMorgan Chase & Co. | 4.032% | 7/24/48 | 500 | 632 |
| | JPMorgan Chase & Co. | 3.964% | 11/15/48 | 1,000 | 1,256 |
| | JPMorgan Chase & Co. | 3.897% | 1/23/49 | 400 | 503 |
| | JPMorgan Chase & Co. | 3.109% | 4/22/51 | 500 | 553 |
| | Kemper Corp. | 4.350% | 2/15/25 | 40 | 44 |
| | KeyBank NA | 2.300% | 9/14/22 | 200 | 207 |
| | KeyBank NA | 3.375% | 3/7/23 | 250 | 266 |
| | KeyBank NA | 0.423% | 1/3/24 | 500 | 500 |
| | KeyBank NA | 3.300% | 6/1/25 | 403 | 448 |
| | KeyCorp | 5.100% | 3/24/21 | 25 | 25 |
| | KeyCorp | 4.150% | 10/29/25 | 150 | 174 |
| | KeyCorp | 4.100% | 4/30/28 | 600 | 711 |
| | KeyCorp | 2.550% | 10/1/29 | 150 | 162 |
| | Lazard Group LLC | 3.750% | 2/13/25 | 50 | 55 |
| | Lazard Group LLC | 3.625% | 3/1/27 | 100 | 109 |
| | Lazard Group LLC | 4.500% | 9/19/28 | 100 | 119 |
| | Legg Mason Inc. | 4.750% | 3/15/26 | 100 | 119 |
| | Legg Mason Inc. | 5.625% | 1/15/44 | 120 | 173 |
| | Lincoln National Corp. | 4.200% | 3/15/22 | 50 | 52 |
| | Lincoln National Corp. | 4.000% | 9/1/23 | 50 | 55 |
| | Lincoln National Corp. | 3.350% | 3/9/25 | 13 | 14 |
| | Lincoln National Corp. | 3.625% | 12/12/26 | 75 | 86 |
| | Lincoln National Corp. | 3.800% | 3/1/28 | 100 | 115 |
| | Lincoln National Corp. | 3.050% | 1/15/30 | 350 | 390 |
| | Lincoln National Corp. | 6.300% | 10/9/37 | 75 | 103 |
| | Lincoln National Corp. | 7.000% | 6/15/40 | 160 | 243 |
| | Lloyds Banking Group plc | 3.000% | 1/11/22 | 300 | 308 |
| | Lloyds Banking Group plc | 2.858% | 3/17/23 | 250 | 257 |
| | Lloyds Banking Group plc | 4.050% | 8/16/23 | 900 | 978 |
| | Lloyds Banking Group plc | 2.907% | 11/7/23 | 400 | 416 |
| | Lloyds Banking Group plc | 3.900% | 3/12/24 | 200 | 220 |
| | | | Coupon | Maturity
Date | Face
Amount
($000) | Market
Value•
($000) |
| | Lloyds Banking Group plc | 4.450% | 5/8/25 | 200 | 229 |
| | Lloyds Banking Group plc | 4.582% | 12/10/25 | 700 | 799 |
| | Lloyds Banking Group plc | 4.650% | 3/24/26 | 575 | 660 |
| | Lloyds Banking Group plc | 3.750% | 1/11/27 | 200 | 227 |
| | Lloyds Banking Group plc | 4.375% | 3/22/28 | 250 | 296 |
| | Lloyds Banking Group plc | 4.550% | 8/16/28 | 200 | 241 |
| | Lloyds Banking Group plc | 3.574% | 11/7/28 | 200 | 224 |
| | Lloyds Banking Group plc | 5.300% | 12/1/45 | 450 | 616 |
| | Lloyds Banking Group plc | 4.344% | 1/9/48 | 275 | 336 |
| | Loews Corp. | 2.625% | 5/15/23 | 75 | 78 |
| | Loews Corp. | 6.000% | 2/1/35 | 50 | 72 |
| | Loews Corp. | 4.125% | 5/15/43 | 350 | 415 |
| | M&T Bank Corp. | 3.550% | 7/26/23 | 200 | 216 |
| | Manufacturers & Traders Trust Co. | 2.900% | 2/6/25 | 160 | 174 |
| | Manulife Financial Corp. | 4.150% | 3/4/26 | 175 | 203 |
| | Manulife Financial Corp. | 4.061% | 2/24/32 | 190 | 206 |
| | Manulife Financial Corp. | 5.375% | 3/4/46 | 200 | 289 |
| | Markel Corp. | 4.900% | 7/1/22 | 125 | 133 |
| | Markel Corp. | 3.500% | 11/1/27 | 50 | 56 |
| | Markel Corp. | 3.350% | 9/17/29 | 75 | 84 |
| | Markel Corp. | 4.300% | 11/1/47 | 50 | 63 |
| | Markel Corp. | 5.000% | 5/20/49 | 150 | 206 |
| | Markel Corp. | 4.150% | 9/17/50 | 200 | 251 |
| | Marsh & McLennan Cos. Inc. | 3.300% | 3/14/23 | 75 | 79 |
| | Marsh & McLennan Cos. Inc. | 3.500% | 6/3/24 | 100 | 109 |
| | Marsh & McLennan Cos. Inc. | 3.500% | 3/10/25 | 100 | 111 |
| | Marsh & McLennan Cos. Inc. | 3.750% | 3/14/26 | 100 | 113 |
| | Marsh & McLennan Cos. Inc. | 4.375% | 3/15/29 | 325 | 395 |
| | Marsh & McLennan Cos. Inc. | 2.250% | 11/15/30 | 710 | 751 |
| | Marsh & McLennan Cos. Inc. | 4.350% | 1/30/47 | 100 | 133 |
| | Marsh & McLennan Cos. Inc. | 4.200% | 3/1/48 | 200 | 261 |
| | Marsh & McLennan Cos. Inc. | 4.900% | 3/15/49 | 450 | 649 |
| | Mercury General Corp. | 4.400% | 3/15/27 | 75 | 83 |
| | MetLife Inc. | 3.048% | 12/15/22 | 225 | 236 |
| | MetLife Inc. | 3.600% | 4/10/24 | 175 | 193 |
| | MetLife Inc. | 3.000% | 3/1/25 | 250 | 274 |
| | MetLife Inc. | 3.600% | 11/13/25 | 400 | 453 |
| | MetLife Inc. | 4.550% | 3/23/30 | 500 | 626 |
| | MetLife Inc. | 6.500% | 12/15/32 | 175 | 266 |
| | MetLife Inc. | 6.375% | 6/15/34 | 100 | 152 |
| | MetLife Inc. | 5.875% | 2/6/41 | 590 | 901 |
| | MetLife Inc. | 4.125% | 8/13/42 | 175 | 222 |
| | MetLife Inc. | 4.875% | 11/13/43 | 205 | 290 |
| | MetLife Inc. | 4.721% | 12/15/44 | 63 | 86 |
| | MetLife Inc. | 4.600% | 5/13/46 | 150 | 207 |
| | MetLife Inc. | 6.400% | 12/15/66 | 210 | 268 |
| | Mitsubishi UFJ Financial Group Inc. | 2.998% | 2/22/22 | 1,275 | 1,313 |
| | Mitsubishi UFJ Financial Group Inc. | 3.218% | 3/7/22 | 200 | 207 |
| | Mitsubishi UFJ Financial Group Inc. | 2.623% | 7/18/22 | 675 | 698 |
| | Mitsubishi UFJ Financial Group Inc. | 2.665% | 7/25/22 | 300 | 310 |
| | Mitsubishi UFJ Financial Group Inc. | 3.455% | 3/2/23 | 300 | 319 |
| | Mitsubishi UFJ Financial Group Inc. | 3.761% | ��� 7/26/23 | 740 | 802 |
| | Mitsubishi UFJ Financial Group Inc. | 2.527% | 9/13/23 | 100 | 105 |
Total Bond Market Index Portfolio
| | | | Coupon | Maturity
Date | Face
Amount
($000) | Market
Value•
($000) |
| | Mitsubishi UFJ Financial Group Inc. | 3.407% | 3/7/24 | 200 | 217 |
| | Mitsubishi UFJ Financial Group Inc. | 2.801% | 7/18/24 | 200 | 214 |
| | Mitsubishi UFJ Financial Group Inc. | 3.777% | 3/2/25 | 250 | 279 |
| | Mitsubishi UFJ Financial Group Inc. | 1.412% | 7/17/25 | 2,000 | 2,041 |
| | Mitsubishi UFJ Financial Group Inc. | 3.850% | 3/1/26 | 525 | 603 |
| | Mitsubishi UFJ Financial Group Inc. | 2.757% | 9/13/26 | 250 | 273 |
| | Mitsubishi UFJ Financial Group Inc. | 3.677% | 2/22/27 | 500 | 568 |
| | Mitsubishi UFJ Financial Group Inc. | 3.287% | 7/25/27 | 250 | 283 |
| | Mitsubishi UFJ Financial Group Inc. | 3.961% | 3/2/28 | 200 | 234 |
| | Mitsubishi UFJ Financial Group Inc. | 4.050% | 9/11/28 | 200 | 238 |
| | Mitsubishi UFJ Financial Group Inc. | 3.741% | 3/7/29 | 200 | 235 |
| | Mitsubishi UFJ Financial Group Inc. | 3.195% | 7/18/29 | 175 | 196 |
| | Mitsubishi UFJ Financial Group Inc. | 2.559% | 2/25/30 | 50 | 54 |
| | Mitsubishi UFJ Financial Group Inc. | 2.048% | 7/17/30 | 500 | 519 |
| | Mitsubishi UFJ Financial Group Inc. | 4.286% | 7/26/38 | 50 | 64 |
| | Mitsubishi UFJ Financial Group Inc. | 3.751% | 7/18/39 | 200 | 242 |
| | Mizuho Financial Group Inc. | 3.549% | 3/5/23 | 200 | 213 |
| | Mizuho Financial Group Inc. | 2.721% | 7/16/23 | 300 | 309 |
| | Mizuho Financial Group Inc. | 3.922% | 9/11/24 | 200 | 217 |
| | Mizuho Financial Group Inc. | 2.839% | 7/16/25 | 375 | 399 |
| | Mizuho Financial Group Inc. | 2.555% | 9/13/25 | 100 | 106 |
| | Mizuho Financial Group Inc. | 3.663% | 2/28/27 | 250 | 283 |
| | Mizuho Financial Group Inc. | 4.018% | 3/5/28 | 325 | 380 |
| | Mizuho Financial Group Inc. | 4.254% | 9/11/29 | 400 | 474 |
| | Mizuho Financial Group Inc. | 3.153% | 7/16/30 | 500 | 552 |
| | Mizuho Financial Group Inc. | 2.869% | 9/13/30 | 100 | 108 |
| | Morgan Stanley | 2.750% | 5/19/22 | 600 | 619 |
| | Morgan Stanley | 4.875% | 11/1/22 | 425 | 458 |
| | Morgan Stanley | 3.125% | 1/23/23 | 250 | 264 |
| | Morgan Stanley | 3.750% | 2/25/23 | 675 | 723 |
| | Morgan Stanley | 0.560% | 11/10/23 | 500 | 501 |
| | Morgan Stanley | 3.737% | 4/24/24 | 750 | 804 |
| | Morgan Stanley | 3.875% | 4/29/24 | 545 | 602 |
| | Morgan Stanley | 3.700% | 10/23/24 | 650 | 724 |
| | Morgan Stanley | 4.000% | 7/23/25 | 330 | 376 |
| | Morgan Stanley | 5.000% | 11/24/25 | 650 | 776 |
| | Morgan Stanley | 3.875% | 1/27/26 | 225 | 258 |
| | Morgan Stanley | 2.188% | 4/28/26 | 1,000 | 1,055 |
| | Morgan Stanley | 3.125% | 7/27/26 | 700 | 780 |
| | Morgan Stanley | 6.250% | 8/9/26 | 425 | 541 |
| | Morgan Stanley | 4.350% | 9/8/26 | 400 | 470 |
| | Morgan Stanley | 0.985% | 12/10/26 | 500 | 503 |
| | Morgan Stanley | 3.625% | 1/20/27 | 250 | 286 |
| | Morgan Stanley | 3.950% | 4/23/27 | 325 | 373 |
| | Morgan Stanley | 3.591% | 7/22/28 | 935 | 1,067 |
| | Morgan Stanley | 3.772% | 1/24/29 | 575 | 664 |
| | | | Coupon | Maturity
Date | Face
Amount
($000) | Market
Value•
($000) |
| | Morgan Stanley | 4.431% | 1/23/30 | 550 | 669 |
| | Morgan Stanley | 2.699% | 1/22/31 | 1,750 | 1,903 |
| | Morgan Stanley | 3.622% | 4/1/31 | 600 | 694 |
| | Morgan Stanley | 1.794% | 2/13/32 | 500 | 502 |
| | Morgan Stanley | 7.250% | 4/1/32 | 150 | 231 |
| | Morgan Stanley | 3.971% | 7/22/38 | 375 | 460 |
| | Morgan Stanley | 4.457% | 4/22/39 | 250 | 322 |
| | Morgan Stanley | 6.375% | 7/24/42 | 600 | 976 |
| | Morgan Stanley | 4.300% | 1/27/45 | 650 | 865 |
| | Morgan Stanley | 4.375% | 1/22/47 | 175 | 237 |
| | Morgan Stanley | 5.597% | 3/24/51 | 500 | 799 |
| | MUFG Americas Holdings Corp. | 3.500% | 6/18/22 | 475 | 497 |
| | MUFG Americas Holdings Corp. | 3.000% | 2/10/25 | 80 | 87 |
| | MUFG Union Bank NA | 3.150% | 4/1/22 | 1,200 | 1,239 |
| | Nasdaq Inc. | 4.250% | 6/1/24 | 125 | 138 |
| | Nasdaq Inc. | 3.850% | 6/30/26 | 100 | 115 |
| | Nasdaq Inc. | 1.650% | 1/15/31 | 500 | 495 |
| | Nasdaq Inc. | 2.500% | 12/21/40 | 200 | 197 |
| | Nasdaq Inc. | 3.250% | 4/28/50 | 35 | 38 |
| | National Australia Bank Ltd. | 3.000% | 1/20/23 | 250 | 263 |
| | National Australia Bank Ltd. | 3.625% | 6/20/23 | 250 | 270 |
| | National Australia Bank Ltd. | 3.375% | 1/14/26 | 100 | 113 |
| | National Australia Bank Ltd. | 2.500% | 7/12/26 | 200 | 218 |
| | National Bank of Canada | 2.100% | 2/1/23 | 200 | 206 |
| | Natwest Group plc | 3.498% | 5/15/23 | 500 | 519 |
| | Natwest Group plc | 3.875% | 9/12/23 | 600 | 651 |
| | Natwest Group plc | 6.000% | 12/19/23 | 100 | 114 |
| | Natwest Group plc | 5.125% | 5/28/24 | 500 | 557 |
| | Natwest Group plc | 4.519% | 6/25/24 | 300 | 327 |
| | Natwest Group plc | 4.892% | 5/18/29 | 1,000 | 1,199 |
| | Natwest Group plc | 5.076% | 1/27/30 | 200 | 245 |
| | Natwest Group plc | 4.445% | 5/8/30 | 700 | 830 |
| | Nippon Life Insurance Co. | 3.375% | 5/8/32 | 50 | 55 |
| | Nomura Holdings Inc. | 2.648% | 1/16/25 | 170 | 181 |
| | Nomura Holdings Inc. | 1.851% | 7/16/25 | 300 | 313 |
| | Nomura Holdings Inc. | 3.103% | 1/16/30 | 400 | 436 |
| | Nomura Holdings Inc. | 2.679% | 7/16/30 | 250 | 264 |
| | Northern Trust Corp. | 3.375% | 8/23/21 | 100 | 102 |
| | Northern Trust Corp. | 3.950% | 10/30/25 | 150 | 173 |
| | Northern Trust Corp. | 3.650% | 8/3/28 | 100 | 117 |
| | Oaktree Specialty Lending Corp. | 3.500% | 2/25/25 | 40 | 41 |
| | Old Republic International Corp. | 4.875% | 10/1/24 | 121 | 138 |
| | Old Republic International Corp. | 3.875% | 8/26/26 | 100 | 115 |
| | ORIX Corp. | 2.900% | 7/18/22 | 50 | 52 |
| | ORIX Corp. | 3.250% | 12/4/24 | 75 | 82 |
| | ORIX Corp. | 3.700% | 7/18/27 | 200 | 228 |
| | Owl Rock Capital Corp. | 5.250% | 4/15/24 | 25 | 27 |
| | Owl Rock Capital Corp. | 4.000% | 3/30/25 | 47 | 49 |
| | Owl Rock Capital Corp. | 3.750% | 7/22/25 | 180 | 186 |
| | PartnerRe Finance B LLC | 3.700% | 7/2/29 | 95 | 109 |
| | People's United Bank NA | 4.000% | 7/15/24 | 100 | 108 |
| | People's United Financial Inc. | 3.650% | 12/6/22 | 100 | 105 |
| | PNC Bank NA | 2.550% | 12/9/21 | 100 | 102 |
| | PNC Bank NA | 2.625% | 2/17/22 | 175 | 179 |
| | PNC Bank NA | 2.450% | 7/28/22 | 100 | 103 |
| | PNC Bank NA | 2.700% | 11/1/22 | 450 | 469 |
| | PNC Bank NA | 2.028% | 12/9/22 | 145 | 147 |
| | PNC Bank NA | 3.300% | 10/30/24 | 706 | 777 |
| | PNC Bank NA | 2.950% | 2/23/25 | 293 | 321 |
| | PNC Bank NA | 3.250% | 6/1/25 | 169 | 187 |
Total Bond Market Index Portfolio
| | | | Coupon | Maturity
Date | Face
Amount
($000) | Market
Value•
($000) |
| | PNC Bank NA | 3.100% | 10/25/27 | 250 | 280 |
| | PNC Bank NA | 3.250% | 1/22/28 | 150 | 171 |
| | PNC Bank NA | 4.050% | 7/26/28 | 250 | 296 |
| | PNC Bank NA | 2.700% | 10/22/29 | 150 | 163 |
| | PNC Financial Services Group Inc. | 3.300% | 3/8/22 | 340 | 351 |
| | PNC Financial Services Group Inc. | 3.500% | 1/23/24 | 100 | 109 |
| | PNC Financial Services Group Inc. | 3.900% | 4/29/24 | 125 | 138 |
| | PNC Financial Services Group Inc. | 3.150% | 5/19/27 | 450 | 507 |
| | PNC Financial Services Group Inc. | 3.450% | 4/23/29 | 500 | 577 |
| | PNC Financial Services Group Inc. | 2.550% | 1/22/30 | 425 | 464 |
| | Primerica Inc. | 4.750% | 7/15/22 | 125 | 133 |
| | Principal Financial Group Inc. | 3.300% | 9/15/22 | 50 | 52 |
| | Principal Financial Group Inc. | 3.125% | 5/15/23 | 100 | 106 |
| | Principal Financial Group Inc. | 3.400% | 5/15/25 | 128 | 142 |
| | Principal Financial Group Inc. | 3.100% | 11/15/26 | 100 | 111 |
| | Principal Financial Group Inc. | 4.625% | 9/15/42 | 50 | 64 |
| | Principal Financial Group Inc. | 4.350% | 5/15/43 | 50 | 63 |
| | Principal Financial Group Inc. | 4.300% | 11/15/46 | 295 | 374 |
| | Private Export Funding Corp. | 1.750% | 11/15/24 | 75 | 79 |
| | Progressive Corp. | 3.750% | 8/23/21 | 75 | 77 |
| | Progressive Corp. | 2.450% | 1/15/27 | 150 | 163 |
| | Progressive Corp. | 6.625% | 3/1/29 | 125 | 170 |
| | Progressive Corp. | 4.350% | 4/25/44 | 50 | 66 |
| | Progressive Corp. | 4.125% | 4/15/47 | 290 | 382 |
| | Progressive Corp. | 4.200% | 3/15/48 | 115 | 154 |
| | Progressive Corp. | 3.950% | 3/26/50 | 180 | 235 |
| | Prospect Capital Corp. | 5.875% | 3/15/23 | 8 | 8 |
| | Prudential Financial Inc. | 3.500% | 5/15/24 | 125 | 138 |
| | Prudential Financial Inc. | 3.878% | 3/27/28 | 250 | 296 |
| | Prudential Financial Inc. | 5.750% | 7/15/33 | 100 | 135 |
| | Prudential Financial Inc. | 5.700% | 12/14/36 | 125 | 180 |
| | Prudential Financial Inc. | 6.625% | 12/1/37 | 65 | 97 |
| | Prudential Financial Inc. | 3.000% | 3/10/40 | 50 | 54 |
| | Prudential Financial Inc. | 6.625% | 6/21/40 | 65 | 100 |
| | Prudential Financial Inc. | 5.875% | 9/15/42 | 125 | 133 |
| | Prudential Financial Inc. | 5.625% | 6/15/43 | 375 | 402 |
| | Prudential Financial Inc. | 5.100% | 8/15/43 | 50 | 62 |
| | Prudential Financial Inc. | 5.200% | 3/15/44 | 85 | 92 |
| | Prudential Financial Inc. | 4.600% | 5/15/44 | 525 | 684 |
| | Prudential Financial Inc. | 5.375% | 5/15/45 | 250 | 272 |
| | Prudential Financial Inc. | 3.905% | 12/7/47 | 182 | 219 |
| | Prudential Financial Inc. | 5.700% | 9/15/48 | 250 | 289 |
| | Prudential Financial Inc. | 3.935% | 12/7/49 | 263 | 319 |
| | Prudential Financial Inc. | 4.350% | 2/25/50 | 210 | 273 |
| | Prudential Financial Inc. | 3.700% | 10/1/50 | 200 | 210 |
| | Prudential plc | 3.125% | 4/14/30 | 200 | 227 |
| | Raymond James Financial Inc. | 3.625% | 9/15/26 | 75 | 86 |
| | Raymond James Financial Inc. | 4.650% | 4/1/30 | 55 | 67 |
| | Raymond James Financial Inc. | 4.950% | 7/15/46 | 210 | 287 |
| | Regions Bank | 6.450% | 6/26/37 | 250 | 352 |
| | Regions Financial Corp. | 3.800% | 8/14/23 | 200 | 217 |
| | Regions Financial Corp. | 2.250% | 5/18/25 | 100 | 106 |
| | Reinsurance Group of America Inc. | 4.700% | 9/15/23 | 75 | 83 |
| | | | Coupon | Maturity
Date | Face
Amount
($000) | Market
Value•
($000) |
| | Reinsurance Group of America Inc. | 3.900% | 5/15/29 | 50 | 57 |
| | RenaissanceRe Finance Inc. | 3.700% | 4/1/25 | 10 | 11 |
| | RenaissanceRe Finance Inc. | 3.450% | 7/1/27 | 75 | 82 |
| | RenaissanceRe Holdings Ltd. | 3.600% | 4/15/29 | 75 | 85 |
| | Royal Bank of Canada | 2.300% | 3/22/21 | 175 | 176 |
| | Royal Bank of Canada | 2.750% | 2/1/22 | 300 | 308 |
| | Royal Bank of Canada | 2.800% | 4/29/22 | 300 | 309 |
| | Royal Bank of Canada | 1.950% | 1/17/23 | 150 | 155 |
| | Royal Bank of Canada | 1.600% | 4/17/23 | 800 | 822 |
| | Royal Bank of Canada | 3.700% | 10/5/23 | 100 | 109 |
| | Royal Bank of Canada | 2.550% | 7/16/24 | 200 | 214 |
| | Royal Bank of Canada | 2.250% | 11/1/24 | 650 | 691 |
| | Royal Bank of Canada | 4.650% | 1/27/26 | 250 | 295 |
| | Santander Holdings USA Inc. | 3.400% | 1/18/23 | 115 | 121 |
| | Santander Holdings USA Inc. | 4.500% | 7/17/25 | 1,125 | 1,272 |
| | Santander Holdings USA Inc. | 3.244% | 10/5/26 | 900 | 979 |
| | Santander Holdings USA Inc. | 4.400% | 7/13/27 | 250 | 285 |
| | Santander UK Group Holdings plc | 2.875% | 8/5/21 | 225 | 228 |
| | Santander UK Group Holdings plc | 3.571% | 1/10/23 | 200 | 206 |
| | Santander UK Group Holdings plc | 1.532% | 8/21/26 | 600 | 603 |
| | Santander UK Group Holdings plc | 3.823% | 11/3/28 | 200 | 225 |
| | Santander UK plc | 2.100% | 1/13/23 | 325 | 335 |
| | Santander UK plc | 4.000% | 3/13/24 | 200 | 221 |
| | Santander UK plc | 2.875% | 6/18/24 | 200 | 214 |
| | Selective Insurance Group Inc. | 5.375% | 3/1/49 | 50 | 63 |
| | Sixth Street Specialty Lending Inc. | 3.875% | 11/1/24 | 50 | 52 |
| | Skandinaviska Enskilda Banken AB | 2.625% | 3/15/21 | 300 | 301 |
| | Skandinaviska Enskilda Banken AB | 2.800% | 3/11/22 | 250 | 257 |
| | Sompo International Holdings Ltd. | 4.700% | 10/15/22 | 100 | 107 |
| | State Street Corp. | 2.653% | 5/15/23 | 300 | 308 |
| | State Street Corp. | 3.100% | 5/15/23 | 400 | 425 |
| | State Street Corp. | 3.700% | 11/20/23 | 83 | 91 |
| | State Street Corp. | 3.776% | 12/3/24 | 200 | 219 |
| | State Street Corp. | 3.300% | 12/16/24 | 227 | 252 |
| | State Street Corp. | 3.550% | 8/18/25 | 464 | 524 |
| | State Street Corp. | 2.354% | 11/1/25 | 125 | 133 |
| | State Street Corp. | 2.650% | 5/19/26 | 125 | 137 |
| | State Street Corp. | 4.141% | 12/3/29 | 200 | 241 |
| | State Street Corp. | 2.400% | 1/24/30 | 150 | 163 |
| | State Street Corp. | 3.031% | 11/1/34 | 125 | 136 |
| | Stifel Financial Corp. | 4.250% | 7/18/24 | 150 | 168 |
| | Sumitomo Mitsui Banking Corp. | 3.200% | 7/18/22 | 250 | 260 |
| | Sumitomo Mitsui Banking Corp. | 3.950% | 7/19/23 | 100 | 109 |
| | Sumitomo Mitsui Banking Corp. | 3.950% | 1/10/24 | 250 | 273 |
| | Sumitomo Mitsui Banking Corp. | 3.400% | 7/11/24 | 250 | 272 |
| | Sumitomo Mitsui Financial Group Inc. | 2.442% | 10/19/21 | 475 | 482 |
| | Sumitomo Mitsui Financial Group Inc. | 2.846% | 1/11/22 | 250 | 256 |
| | Sumitomo Mitsui Financial Group Inc. | 2.784% | 7/12/22 | 200 | 207 |
Total Bond Market Index Portfolio
| | | | Coupon | Maturity
Date | Face
Amount
($000) | Market
Value•
($000) |
| | Sumitomo Mitsui Financial Group Inc. | 2.778% | 10/18/22 | 200 | 208 |
| | Sumitomo Mitsui Financial Group Inc. | 3.102% | 1/17/23 | 250 | 264 |
| | Sumitomo Mitsui Financial Group Inc. | 3.748% | 7/19/23 | 200 | 216 |
| | Sumitomo Mitsui Financial Group Inc. | 3.936% | 10/16/23 | 200 | 219 |
| | Sumitomo Mitsui Financial Group Inc. | 2.696% | 7/16/24 | 375 | 400 |
| | Sumitomo Mitsui Financial Group Inc. | 2.348% | 1/15/25 | 320 | 339 |
| | Sumitomo Mitsui Financial Group Inc. | 3.784% | 3/9/26 | 150 | 171 |
| | Sumitomo Mitsui Financial Group Inc. | 2.632% | 7/14/26 | 125 | 136 |
| | Sumitomo Mitsui Financial Group Inc. | 3.010% | 10/19/26 | 175 | 194 |
| | Sumitomo Mitsui Financial Group Inc. | 3.446% | 1/11/27 | 200 | 224 |
| | Sumitomo Mitsui Financial Group Inc. | 3.364% | 7/12/27 | 700 | 786 |
| | Sumitomo Mitsui Financial Group Inc. | 3.544% | 1/17/28 | 300 | 341 |
| | Sumitomo Mitsui Financial Group Inc. | 3.944% | 7/19/28 | 100 | 117 |
| | Sumitomo Mitsui Financial Group Inc. | 3.040% | 7/16/29 | 475 | 527 |
| | Sumitomo Mitsui Financial Group Inc. | 3.202% | 9/17/29 | 150 | 164 |
| | Sumitomo Mitsui Financial Group Inc. | 2.750% | 1/15/30 | 370 | 403 |
| | SVB Financial Group | 3.500% | 1/29/25 | 100 | 109 |
| | SVB Financial Group | 3.125% | 6/5/30 | 50 | 56 |
| | Svenska Handelsbanken AB | 2.450% | 3/30/21 | 300 | 302 |
| | Swiss Re America Holding Corp. | 7.000% | 2/15/26 | 75 | 95 |
| | Synchrony Bank | 3.000% | 6/15/22 | 100 | 103 |
| | Synchrony Financial | 2.850% | 7/25/22 | 75 | 77 |
| | Synchrony Financial | 4.250% | 8/15/24 | 250 | 274 |
| | Synchrony Financial | 4.500% | 7/23/25 | 426 | 478 |
| | Synchrony Financial | 3.700% | 8/4/26 | 125 | 138 |
| | Synchrony Financial | 3.950% | 12/1/27 | 300 | 335 |
| | Synovus Financial Corp. | 3.125% | 11/1/22 | 50 | 52 |
| | TD Ameritrade Holding Corp. | 2.950% | 4/1/22 | 125 | 128 |
| | TD Ameritrade Holding Corp. | 3.625% | 4/1/25 | 384 | 426 |
| | TD Ameritrade Holding Corp. | 3.300% | 4/1/27 | 125 | 140 |
| | TD Ameritrade Holding Corp. | 2.750% | 10/1/29 | 50 | 55 |
| 5 | Toronto-Dominion Bank | 2.250% | 3/15/21 | 250 | 251 |
| | Toronto-Dominion Bank | 2.125% | 4/7/21 | 175 | 176 |
| | Toronto-Dominion Bank | 1.900% | 12/1/22 | 225 | 232 |
| | Toronto-Dominion Bank | 0.750% | 6/12/23 | 1,500 | 1,511 |
| | Toronto-Dominion Bank | 3.250% | 3/11/24 | 400 | 434 |
| | Toronto-Dominion Bank | 2.650% | 6/12/24 | 500 | 536 |
| | Toronto-Dominion Bank | 1.150% | 6/12/25 | 200 | 204 |
| | Travelers Cos. Inc. | 6.250% | 6/15/37 | 150 | 229 |
| | Travelers Cos. Inc. | 4.600% | 8/1/43 | 100 | 136 |
| | Travelers Cos. Inc. | 4.300% | 8/25/45 | 150 | 199 |
| | Travelers Cos. Inc. | 4.000% | 5/30/47 | 125 | 162 |
| | Travelers Cos. Inc. | 4.100% | 3/4/49 | 200 | 266 |
| | Travelers Cos. Inc. | 2.550% | 4/27/50 | 500 | 522 |
| | Trinity Acquisition plc | 4.400% | 3/15/26 | 100 | 116 |
| | Truist Bank | 2.625% | 1/15/22 | 250 | 256 |
| | Truist Bank | 2.800% | 5/17/22 | 400 | 413 |
| | Truist Bank | 3.502% | 8/2/22 | 250 | 254 |
| | Truist Bank | 3.000% | 2/2/23 | 75 | 79 |
| | | | Coupon | Maturity
Date | Face
Amount
($000) | Market
Value•
($000) |
| | Truist Bank | 1.250% | 3/9/23 | 1,000 | 1,019 |
| | Truist Bank | 3.200% | 4/1/24 | 500 | 543 |
| | Truist Bank | 3.689% | 8/2/24 | 250 | 270 |
| | Truist Bank | 2.150% | 12/6/24 | 250 | 265 |
| | Truist Bank | 3.625% | 9/16/25 | 500 | 561 |
| | Truist Bank | 3.300% | 5/15/26 | 200 | 223 |
| | Truist Financial Corp. | 2.900% | 3/3/21 | 75 | 75 |
| | Truist Financial Corp. | 2.700% | 1/27/22 | 125 | 128 |
| | Truist Financial Corp. | 2.750% | 4/1/22 | 175 | 180 |
| | Truist Financial Corp. | 3.050% | 6/20/22 | 500 | 519 |
| | Truist Financial Corp. | 3.750% | 12/6/23 | 250 | 274 |
| | Truist Financial Corp. | 2.500% | 8/1/24 | 75 | 80 |
| | Truist Financial Corp. | 2.850% | 10/26/24 | 192 | 207 |
| | Truist Financial Corp. | 3.700% | 6/5/25 | 175 | 197 |
| | Truist Financial Corp. | 1.200% | 8/5/25 | 200 | 205 |
| | Truist Financial Corp. | 1.125% | 8/3/27 | 500 | 503 |
| | Truist Financial Corp. | 3.875% | 3/19/29 | 200 | 233 |
| | Truist Financial Corp. | 1.950% | 6/5/30 | 100 | 104 |
| | U.S. Bancorp | 2.625% | 1/24/22 | 200 | 205 |
| | U.S. Bancorp | 3.000% | 3/15/22 | 125 | 129 |
| | U.S. Bancorp | 2.950% | 7/15/22 | 400 | 415 |
| | U.S. Bancorp | 3.700% | 1/30/24 | 150 | 164 |
| | U.S. Bancorp | 3.375% | 2/5/24 | 500 | 543 |
| | U.S. Bancorp | 2.400% | 7/30/24 | 200 | 213 |
| | U.S. Bancorp | 3.600% | 9/11/24 | 50 | 55 |
| | U.S. Bancorp | 3.950% | 11/17/25 | 25 | 29 |
| | U.S. Bancorp | 3.100% | 4/27/26 | 300 | 334 |
| | U.S. Bancorp | 2.375% | 7/22/26 | 25 | 27 |
| | U.S. Bancorp | 3.150% | 4/27/27 | 275 | 308 |
| | U.S. Bancorp | 3.900% | 4/26/28 | 75 | 89 |
| | U.S. Bancorp | 3.000% | 7/30/29 | 240 | 267 |
| | U.S. Bank NA | 1.800% | 1/21/22 | 175 | 178 |
| | U.S. Bank NA | 2.650% | 5/23/22 | 250 | 258 |
| | U.S. Bank NA | 1.950% | 1/9/23 | 300 | 310 |
| | U.S. Bank NA | 2.850% | 1/23/23 | 250 | 262 |
| | U.S. Bank NA | 3.400% | 7/24/23 | 250 | 269 |
| | U.S. Bank NA | 2.050% | 1/21/25 | 175 | 185 |
| | U.S. Bank NA | 2.800% | 1/27/25 | 625 | 678 |
| 5 | UBS Group AG | 3.126% | 8/13/30 | 50 | 56 |
| | Unum Group | 4.000% | 3/15/24 | 125 | 136 |
| | Unum Group | 4.000% | 6/15/29 | 80 | 90 |
| | Unum Group | 5.750% | 8/15/42 | 75 | 91 |
| | Unum Group | 4.500% | 12/15/49 | 100 | 106 |
| | Voya Financial Inc. | 3.125% | 7/15/24 | 100 | 108 |
| | Voya Financial Inc. | 3.650% | 6/15/26 | 250 | 285 |
| | Voya Financial Inc. | 5.700% | 7/15/43 | 75 | 102 |
| | Voya Financial Inc. | 4.800% | 6/15/46 | 40 | 51 |
| | Voya Financial Inc. | 4.700% | 1/23/48 | 100 | 104 |
| | Wachovia Corp. | 6.605% | 10/1/25 | 265 | 325 |
| | Wells Fargo & Co. | 3.500% | 3/8/22 | 450 | 467 |
| | Wells Fargo & Co. | 2.625% | 7/22/22 | 735 | 761 |
| | Wells Fargo & Co. | 3.069% | 1/24/23 | 1,050 | 1,078 |
| | Wells Fargo & Co. | 3.450% | 2/13/23 | 350 | 371 |
| | Wells Fargo & Co. | 3.750% | 1/24/24 | 200 | 218 |
| | Wells Fargo & Co. | 1.654% | 6/2/24 | 1,500 | 1,535 |
| | Wells Fargo & Co. | 3.000% | 2/19/25 | 425 | 461 |
| | Wells Fargo & Co. | 2.406% | 10/30/25 | 600 | 633 |
| | Wells Fargo & Co. | 2.164% | 2/11/26 | 500 | 524 |
| | Wells Fargo & Co. | 3.000% | 4/22/26 | 1,275 | 1,403 |
| | Wells Fargo & Co. | 4.100% | 6/3/26 | 725 | 829 |
| | Wells Fargo & Co. | 3.000% | 10/23/26 | 675 | 748 |
| | Wells Fargo & Co. | 4.300% | 7/22/27 | 475 | 555 |
| | Wells Fargo & Co. | 3.584% | 5/22/28 | 500 | 566 |
| | Wells Fargo & Co. | 4.150% | 1/24/29 | 200 | 237 |
| | Wells Fargo & Co. | 2.879% | 10/30/30 | 1,800 | 1,953 |
| | Wells Fargo & Co. | 4.478% | 4/4/31 | 1,250 | 1,527 |
| | Wells Fargo & Co. | 5.375% | 2/7/35 | 200 | 272 |
| | Wells Fargo & Co. | 3.068% | 4/30/41 | 600 | 650 |
| | Wells Fargo & Co. | 5.375% | 11/2/43 | 1,000 | 1,387 |
Total Bond Market Index Portfolio
| | | | Coupon | Maturity
Date | Face
Amount
($000) | Market
Value•
($000) |
| | Wells Fargo & Co. | 5.606% | 1/15/44 | 600 | 847 |
| | Wells Fargo & Co. | 4.650% | 11/4/44 | 325 | 416 |
| | Wells Fargo & Co. | 3.900% | 5/1/45 | 250 | 312 |
| | Wells Fargo & Co. | 4.900% | 11/17/45 | 250 | 333 |
| | Wells Fargo & Co. | 4.400% | 6/14/46 | 300 | 374 |
| | Wells Fargo & Co. | 4.750% | 12/7/46 | 350 | 458 |
| | Wells Fargo & Co. | 5.013% | 4/4/51 | 1,750 | 2,484 |
| | Wells Fargo Bank NA | 3.550% | 8/14/23 | 750 | 810 |
| | Wells Fargo Bank NA | 5.950% | 8/26/36 | 200 | 280 |
| | Wells Fargo Bank NA | 5.850% | 2/1/37 | 300 | 422 |
| | Wells Fargo Bank NA | 6.600% | 1/15/38 | 225 | 341 |
| | Westpac Banking Corp. | 2.500% | 6/28/22 | 1,000 | 1,033 |
| | Westpac Banking Corp. | 2.750% | 1/11/23 | 200 | 210 |
| | Westpac Banking Corp. | 2.000% | 1/13/23 | 150 | 155 |
| | Westpac Banking Corp. | 3.650% | 5/15/23 | 75 | 81 |
| | Westpac Banking Corp. | 3.300% | 2/26/24 | 250 | 272 |
| | Westpac Banking Corp. | 2.350% | 2/19/25 | 200 | 214 |
| | Westpac Banking Corp. | 2.850% | 5/13/26 | 200 | 222 |
| | Westpac Banking Corp. | 2.700% | 8/19/26 | 175 | 193 |
| | Westpac Banking Corp. | 3.350% | 3/8/27 | 250 | 284 |
| | Westpac Banking Corp. | 2.650% | 1/16/30 | 150 | 168 |
| | Westpac Banking Corp. | 2.894% | 2/4/30 | 425 | 446 |
| | Westpac Banking Corp. | 4.322% | 11/23/31 | 500 | 570 |
| | Westpac Banking Corp. | 4.110% | 7/24/34 | 25 | 28 |
| | Westpac Banking Corp. | 2.668% | 11/15/35 | 315 | 324 |
| | Westpac Banking Corp. | 4.421% | 7/24/39 | 600 | 762 |
| | Westpac Banking Corp. | 2.963% | 11/16/40 | 200 | 213 |
| | Willis North America Inc. | 3.600% | 5/15/24 | 125 | 137 |
| | Willis North America Inc. | 4.500% | 9/15/28 | 100 | 120 |
| | Willis North America Inc. | 2.950% | 9/15/29 | 940 | 1,027 |
| | Willis North America Inc. | 5.050% | 9/15/48 | 50 | 70 |
| | Willis North America Inc. | 3.875% | 9/15/49 | 90 | 110 |
| | XLIT Ltd. | 4.450% | 3/31/25 | 189 | 216 |
| | XLIT Ltd. | 5.500% | 3/31/45 | 100 | 140 |
| | Zions Bancorp NA | 3.250% | 10/29/29 | 250 | 263 |
| | | | | | | 380,183 |
| Health Care (3.4%) |
| | Abbott Laboratories | 2.550% | 3/15/22 | 175 | 180 |
| | Abbott Laboratories | 3.400% | 11/30/23 | 316 | 342 |
| | Abbott Laboratories | 2.950% | 3/15/25 | 175 | 192 |
| | Abbott Laboratories | 3.875% | 9/15/25 | 75 | 86 |
| | Abbott Laboratories | 3.750% | 11/30/26 | 367 | 429 |
| | Abbott Laboratories | 1.150% | 1/30/28 | 100 | 101 |
| | Abbott Laboratories | 1.400% | 6/30/30 | 150 | 152 |
| | Abbott Laboratories | 4.750% | 11/30/36 | 375 | 516 |
| | Abbott Laboratories | 5.300% | 5/27/40 | 250 | 368 |
| | Abbott Laboratories | 4.750% | 4/15/43 | 175 | 245 |
| | Abbott Laboratories | 4.900% | 11/30/46 | 775 | 1,142 |
| | AbbVie Inc. | 3.450% | 3/15/22 | 507 | 523 |
| | AbbVie Inc. | 3.250% | 10/1/22 | 300 | 312 |
| | AbbVie Inc. | 2.900% | 11/6/22 | 800 | 836 |
| | AbbVie Inc. | 3.200% | 11/6/22 | 275 | 288 |
| | AbbVie Inc. | 2.300% | 11/21/22 | 625 | 647 |
| | AbbVie Inc. | 2.800% | 3/15/23 | 100 | 104 |
| | AbbVie Inc. | 2.850% | 5/14/23 | 200 | 210 |
| | AbbVie Inc. | 3.750% | 11/14/23 | 250 | 272 |
| | AbbVie Inc. | 3.850% | 6/15/24 | 200 | 220 |
| | AbbVie Inc. | 2.600% | 11/21/24 | 750 | 802 |
| | AbbVie Inc. | 3.800% | 3/15/25 | 590 | 658 |
| | AbbVie Inc. | 3.600% | 5/14/25 | 911 | 1,016 |
| | AbbVie Inc. | 3.200% | 5/14/26 | 350 | 388 |
| | AbbVie Inc. | 2.950% | 11/21/26 | 740 | 818 |
| | AbbVie Inc. | 4.250% | 11/14/28 | 350 | 419 |
| | AbbVie Inc. | 3.200% | 11/21/29 | 1,130 | 1,269 |
| | AbbVie Inc. | 4.550% | 3/15/35 | 350 | 442 |
| | AbbVie Inc. | 4.500% | 5/14/35 | 495 | 622 |
| | AbbVie Inc. | 4.300% | 5/14/36 | 190 | 234 |
| | AbbVie Inc. | 4.050% | 11/21/39 | 825 | 986 |
| | AbbVie Inc. | 4.625% | 10/1/42 | 190 | 242 |
| | | | Coupon | Maturity
Date | Face
Amount
($000) | Market
Value•
($000) |
| | AbbVie Inc. | 4.400% | 11/6/42 | 501 | 628 |
| | AbbVie Inc. | 4.850% | 6/15/44 | 230 | 299 |
| | AbbVie Inc. | 4.750% | 3/15/45 | 200 | 259 |
| | AbbVie Inc. | 4.700% | 5/14/45 | 602 | 784 |
| | AbbVie Inc. | 4.450% | 5/14/46 | 455 | 578 |
| | AbbVie Inc. | 4.875% | 11/14/48 | 550 | 744 |
| | AbbVie Inc. | 4.250% | 11/21/49 | 1,025 | 1,277 |
| | Adventist Health System | 2.952% | 3/1/29 | 100 | 108 |
| | Adventist Health System | 3.630% | 3/1/49 | 100 | 111 |
| | Advocate Health & Hospitals Corp. | 3.829% | 8/15/28 | 50 | 57 |
| | Advocate Health & Hospitals Corp. | 2.211% | 6/15/30 | 25 | 26 |
| | Advocate Health & Hospitals Corp. | 4.272% | 8/15/48 | 100 | 130 |
| | Advocate Health & Hospitals Corp. | 3.387% | 10/15/49 | 75 | 85 |
| | Advocate Health & Hospitals Corp. | 3.008% | 6/15/50 | 75 | 81 |
| | Aetna Inc. | 2.750% | 11/15/22 | 200 | 207 |
| | Aetna Inc. | 2.800% | 6/15/23 | 125 | 132 |
| | Aetna Inc. | 3.500% | 11/15/24 | 125 | 137 |
| | Aetna Inc. | 6.625% | 6/15/36 | 130 | 192 |
| | Aetna Inc. | 6.750% | 12/15/37 | 100 | 152 |
| | Aetna Inc. | 4.500% | 5/15/42 | 75 | 92 |
| | Aetna Inc. | 4.125% | 11/15/42 | 75 | 89 |
| | Aetna Inc. | 3.875% | 8/15/47 | 300 | 353 |
| | Agilent Technologies Inc. | 3.200% | 10/1/22 | 57 | 59 |
| | Agilent Technologies Inc. | 3.875% | 7/15/23 | 100 | 108 |
| | Agilent Technologies Inc. | 3.050% | 9/22/26 | 75 | 83 |
| | Agilent Technologies Inc. | 2.750% | 9/15/29 | 100 | 109 |
| | Agilent Technologies Inc. | 2.100% | 6/4/30 | 100 | 104 |
| | AHS Hospital Corp. | 5.024% | 7/1/45 | 75 | 104 |
| 2 | Allina Health System | 3.887% | 4/15/49 | 75 | 85 |
| | AmerisourceBergen Corp. | 3.400% | 5/15/24 | 75 | 81 |
| | AmerisourceBergen Corp. | 3.250% | 3/1/25 | 50 | 55 |
| | AmerisourceBergen Corp. | 3.450% | 12/15/27 | 275 | 314 |
| | AmerisourceBergen Corp. | 2.800% | 5/15/30 | 100 | 109 |
| | AmerisourceBergen Corp. | 4.250% | 3/1/45 | 25 | 30 |
| | AmerisourceBergen Corp. | 4.300% | 12/15/47 | 175 | 214 |
| | Amgen Inc. | 2.700% | 5/1/22 | 75 | 77 |
| | Amgen Inc. | 2.650% | 5/11/22 | 275 | 283 |
| | Amgen Inc. | 3.625% | 5/15/22 | 225 | 233 |
| | Amgen Inc. | 2.250% | 8/19/23 | 150 | 157 |
| | Amgen Inc. | 3.625% | 5/22/24 | 500 | 549 |
| | Amgen Inc. | 1.900% | 2/21/25 | 100 | 105 |
| | Amgen Inc. | 3.125% | 5/1/25 | 175 | 192 |
| | Amgen Inc. | 2.600% | 8/19/26 | 455 | 496 |
| | Amgen Inc. | 2.200% | 2/21/27 | 150 | 160 |
| | Amgen Inc. | 2.450% | 2/21/30 | 300 | 321 |
| | Amgen Inc. | 3.150% | 2/21/40 | 625 | 680 |
| | Amgen Inc. | 4.950% | 10/1/41 | 240 | 318 |
| | Amgen Inc. | 5.150% | 11/15/41 | 126 | 173 |
| | Amgen Inc. | 4.400% | 5/1/45 | 450 | 568 |
| | Amgen Inc. | 4.563% | 6/15/48 | 356 | 467 |
| | Amgen Inc. | 3.375% | 2/21/50 | 725 | 804 |
| | Amgen Inc. | 4.663% | 6/15/51 | 659 | 889 |
| 5 | Amgen Inc. | 2.770% | 9/1/53 | 172 | 174 |
| | Anthem Inc. | 3.125% | 5/15/22 | 150 | 156 |
| | Anthem Inc. | 2.950% | 12/1/22 | 150 | 157 |
| | Anthem Inc. | 3.300% | 1/15/23 | 625 | 662 |
| | Anthem Inc. | 3.500% | 8/15/24 | 475 | 521 |
| | Anthem Inc. | 3.350% | 12/1/24 | 160 | 176 |
| | Anthem Inc. | 2.375% | 1/15/25 | 100 | 107 |
| | Anthem Inc. | 3.650% | 12/1/27 | 300 | 346 |
| | Anthem Inc. | 4.101% | 3/1/28 | 400 | 473 |
| | Anthem Inc. | 2.875% | 9/15/29 | 125 | 138 |
| | Anthem Inc. | 2.250% | 5/15/30 | 105 | 111 |
| | Anthem Inc. | 5.950% | 12/15/34 | 1 | 1 |
| | Anthem Inc. | 5.850% | 1/15/36 | 75 | 104 |
Total Bond Market Index Portfolio
| | | | Coupon | Maturity
Date | Face
Amount
($000) | Market
Value•
($000) |
| | Anthem Inc. | 6.375% | 6/15/37 | 50 | 72 |
| | Anthem Inc. | 4.625% | 5/15/42 | 175 | 228 |
| | Anthem Inc. | 4.650% | 1/15/43 | 775 | 1,013 |
| | Anthem Inc. | 5.100% | 1/15/44 | 100 | 138 |
| | Anthem Inc. | 4.375% | 12/1/47 | 300 | 386 |
| | Anthem Inc. | 4.550% | 3/1/48 | 155 | 205 |
| | Anthem Inc. | 4.850% | 8/15/54 | 30 | 38 |
| | Ascension Health | 2.532% | 11/15/29 | 100 | 109 |
| | Ascension Health | 3.106% | 11/15/39 | 100 | 111 |
| | Ascension Health | 3.945% | 11/15/46 | 175 | 225 |
| 2 | Ascension Health | 4.847% | 11/15/53 | 75 | 112 |
| | AstraZeneca plc | 2.375% | 6/12/22 | 225 | 231 |
| | AstraZeneca plc | 3.500% | 8/17/23 | 225 | 242 |
| | AstraZeneca plc | 3.375% | 11/16/25 | 400 | 450 |
| | AstraZeneca plc | 0.700% | 4/8/26 | 500 | 497 |
| | AstraZeneca plc | 3.125% | 6/12/27 | 175 | 195 |
| | AstraZeneca plc | 4.000% | 1/17/29 | 200 | 238 |
| | AstraZeneca plc | 1.375% | 8/6/30 | 500 | 494 |
| | AstraZeneca plc | 6.450% | 9/15/37 | 450 | 689 |
| | AstraZeneca plc | 4.000% | 9/18/42 | 290 | 358 |
| | AstraZeneca plc | 4.375% | 11/16/45 | 200 | 263 |
| | AstraZeneca plc | 4.375% | 8/17/48 | 135 | 181 |
| | AstraZeneca plc | 2.125% | 8/6/50 | 250 | 234 |
| | Banner Health | 2.338% | 1/1/30 | 125 | 130 |
| | Banner Health | 3.181% | 1/1/50 | 75 | 80 |
| | Baptist Healthcare System Obligated Group | 3.540% | 8/15/50 | 250 | 278 |
| | Baxalta Inc. | 3.600% | 6/23/22 | 15 | 16 |
| | Baxalta Inc. | 4.000% | 6/23/25 | 97 | 109 |
| | Baxalta Inc. | 5.250% | 6/23/45 | 73 | 101 |
| 5 | Baxter International Inc. | 3.950% | 4/1/30 | 95 | 113 |
| 5 | Baxter International Inc. | 1.730% | 4/1/31 | 500 | 502 |
| | Baxter International Inc. | 3.500% | 8/15/46 | 100 | 114 |
| | Baylor Scott & White Holdings | 4.185% | 11/15/45 | 100 | 122 |
| | Becton Dickinson and Co. | 2.894% | 6/6/22 | 299 | 309 |
| | Becton Dickinson and Co. | 3.300% | 3/1/23 | 50 | 52 |
| | Becton Dickinson and Co. | 3.734% | 12/15/24 | 272 | 301 |
| | Becton Dickinson and Co. | 3.700% | 6/6/27 | 375 | 429 |
| | Becton Dickinson and Co. | 4.875% | 5/15/44 | 26 | 32 |
| | Becton Dickinson and Co. | 4.685% | 12/15/44 | 196 | 252 |
| | Becton Dickinson and Co. | 4.669% | 6/6/47 | 300 | 392 |
| | Biogen Inc. | 3.625% | 9/15/22 | 275 | 290 |
| | Biogen Inc. | 4.050% | 9/15/25 | 350 | 401 |
| | Biogen Inc. | 2.250% | 5/1/30 | 300 | 312 |
| | Biogen Inc. | 5.200% | 9/15/45 | 350 | 470 |
| | Biogen Inc. | 3.150% | 5/1/50 | 300 | 308 |
| 2 | Bon Secours Mercy Health Inc. | 3.464% | 6/1/30 | 100 | 113 |
| | Bon Secours Mercy Health Inc. | 3.205% | 6/1/50 | 250 | 266 |
| | Boston Scientific Corp. | 3.375% | 5/15/22 | 26 | 27 |
| | Boston Scientific Corp. | 3.450% | 3/1/24 | 175 | 189 |
| | Boston Scientific Corp. | 3.850% | 5/15/25 | 77 | 87 |
| | Boston Scientific Corp. | 1.900% | 6/1/25 | 550 | 575 |
| | Boston Scientific Corp. | 3.750% | 3/1/26 | 125 | 142 |
| | Boston Scientific Corp. | 4.000% | 3/1/29 | 150 | 176 |
| | Boston Scientific Corp. | 2.650% | 6/1/30 | 400 | 428 |
| | Boston Scientific Corp. | 7.000% | 11/15/35 | 100 | 146 |
| | Boston Scientific Corp. | 4.550% | 3/1/39 | 175 | 223 |
| | Boston Scientific Corp. | 7.375% | 1/15/40 | 50 | 79 |
| | Boston Scientific Corp. | 4.700% | 3/1/49 | 200 | 272 |
| | Bristol-Myers Squibb Co. | 2.600% | 5/16/22 | 300 | 309 |
| | Bristol-Myers Squibb Co. | 2.000% | 8/1/22 | 275 | 282 |
| | Bristol-Myers Squibb Co. | 3.550% | 8/15/22 | 325 | 342 |
| | Bristol-Myers Squibb Co. | 3.250% | 2/20/23 | 200 | 212 |
| | Bristol-Myers Squibb Co. | 7.150% | 6/15/23 | 200 | 233 |
| | Bristol-Myers Squibb Co. | 4.000% | 8/15/23 | 125 | 137 |
| | Bristol-Myers Squibb Co. | 0.537% | 11/13/23 | 500 | 500 |
| | | | Coupon | Maturity
Date | Face
Amount
($000) | Market
Value•
($000) |
| | Bristol-Myers Squibb Co. | 3.625% | 5/15/24 | 175 | 192 |
| | Bristol-Myers Squibb Co. | 2.900% | 7/26/24 | 675 | 730 |
| | Bristol-Myers Squibb Co. | 3.875% | 8/15/25 | 799 | 911 |
| | Bristol-Myers Squibb Co. | 0.750% | 11/13/25 | 500 | 501 |
| | Bristol-Myers Squibb Co. | 3.200% | 6/15/26 | 460 | 518 |
| | Bristol-Myers Squibb Co. | 1.125% | 11/13/27 | 500 | 501 |
| | Bristol-Myers Squibb Co. | 3.450% | 11/15/27 | 210 | 241 |
| | Bristol-Myers Squibb Co. | 3.900% | 2/20/28 | 275 | 324 |
| | Bristol-Myers Squibb Co. | 3.400% | 7/26/29 | 500 | 577 |
| | Bristol-Myers Squibb Co. | 1.450% | 11/13/30 | 500 | 497 |
| | Bristol-Myers Squibb Co. | 4.125% | 6/15/39 | 380 | 481 |
| | Bristol-Myers Squibb Co. | 5.700% | 10/15/40 | 50 | 72 |
| | Bristol-Myers Squibb Co. | 2.350% | 11/13/40 | 500 | 510 |
| | Bristol-Myers Squibb Co. | 3.250% | 8/1/42 | 100 | 115 |
| | Bristol-Myers Squibb Co. | 5.250% | 8/15/43 | 150 | 212 |
| | Bristol-Myers Squibb Co. | 4.500% | 3/1/44 | 75 | 104 |
| | Bristol-Myers Squibb Co. | 4.625% | 5/15/44 | 175 | 235 |
| | Bristol-Myers Squibb Co. | 5.000% | 8/15/45 | 475 | 685 |
| | Bristol-Myers Squibb Co. | 4.350% | 11/15/47 | 250 | 337 |
| | Bristol-Myers Squibb Co. | 4.550% | 2/20/48 | 300 | 413 |
| | Bristol-Myers Squibb Co. | 4.250% | 10/26/49 | 500 | 670 |
| | Bristol-Myers Squibb Co. | 2.550% | 11/13/50 | 500 | 513 |
| | Cardinal Health Inc. | 2.616% | 6/15/22 | 115 | 118 |
| | Cardinal Health Inc. | 3.200% | 3/15/23 | 150 | 159 |
| | Cardinal Health Inc. | 3.079% | 6/15/24 | 290 | 312 |
| | Cardinal Health Inc. | 3.750% | 9/15/25 | 100 | 113 |
| | Cardinal Health Inc. | 4.600% | 3/15/43 | 75 | 89 |
| | Cardinal Health Inc. | 4.500% | 11/15/44 | 50 | 58 |
| | Cardinal Health Inc. | 4.900% | 9/15/45 | 100 | 123 |
| | Cardinal Health Inc. | 4.368% | 6/15/47 | 125 | 147 |
| | Children's Health System of Texas | 2.511% | 8/15/50 | 100 | 97 |
| | Children's Hospital Corp. | 4.115% | 1/1/47 | 75 | 96 |
| | Children's Hospital Corp. | 2.585% | 2/1/50 | 50 | 50 |
| | Children's Hospital Medical Center | 4.268% | 5/15/44 | 50 | 63 |
| | CHRISTUS Health | 4.341% | 7/1/28 | 125 | 147 |
| | Cigna Corp. | 3.900% | 2/15/22 | 200 | 207 |
| | Cigna Corp. | 3.050% | 11/30/22 | 100 | 104 |
| | Cigna Corp. | 3.000% | 7/15/23 | 700 | 739 |
| | Cigna Corp. | 3.750% | 7/15/23 | 133 | 143 |
| | Cigna Corp. | 3.500% | 6/15/24 | 175 | 191 |
| | Cigna Corp. | 3.250% | 4/15/25 | 250 | 274 |
| | Cigna Corp. | 4.125% | 11/15/25 | 467 | 537 |
| | Cigna Corp. | 4.500% | 2/25/26 | 390 | 452 |
| | Cigna Corp. | 3.400% | 3/1/27 | 275 | 309 |
| | Cigna Corp. | 7.875% | 5/15/27 | 41 | 56 |
| | Cigna Corp. | 4.375% | 10/15/28 | 610 | 735 |
| | Cigna Corp. | 2.400% | 3/15/30 | 765 | 812 |
| | Cigna Corp. | 4.800% | 8/15/38 | 415 | 534 |
| | Cigna Corp. | 3.200% | 3/15/40 | 150 | 163 |
| | Cigna Corp. | 6.125% | 11/15/41 | 92 | 133 |
| | Cigna Corp. | 4.800% | 7/15/46 | 400 | 524 |
| | Cigna Corp. | 3.875% | 10/15/47 | 120 | 141 |
| | Cigna Corp. | 4.900% | 12/15/48 | 445 | 608 |
| | Cigna Corp. | 3.400% | 3/15/50 | 375 | 419 |
| | City of Hope | 5.623% | 11/15/43 | 75 | 107 |
| | City of Hope | 4.378% | 8/15/48 | 100 | 121 |
| | CommonSpirit Health | 2.950% | 11/1/22 | 75 | 78 |
| | CommonSpirit Health | 2.760% | 10/1/24 | 100 | 107 |
| | CommonSpirit Health | 2.782% | 10/1/30 | 500 | 529 |
| 2 | CommonSpirit Health | 4.350% | 11/1/42 | 225 | 262 |
| | CommonSpirit Health | 3.817% | 10/1/49 | 50 | 57 |
| | CommonSpirit Health | 4.187% | 10/1/49 | 200 | 232 |
| | Community Health Network Inc. | 3.099% | 5/1/50 | 250 | 252 |
| | Cottage Health Obligated Group | 3.304% | 11/1/49 | 100 | 112 |
| | CVS Health Corp. | 3.500% | 7/20/22 | 350 | 365 |
Total Bond Market Index Portfolio
| | | | Coupon | Maturity
Date | Face
Amount
($000) | Market
Value•
($000) |
| | CVS Health Corp. | 2.750% | 12/1/22 | 150 | 156 |
| | CVS Health Corp. | 4.750% | 12/1/22 | 150 | 160 |
| | CVS Health Corp. | 3.700% | 3/9/23 | 934 | 998 |
| | CVS Health Corp. | 3.375% | 8/12/24 | 275 | 300 |
| | CVS Health Corp. | 3.875% | 7/20/25 | 573 | 648 |
| | CVS Health Corp. | 2.875% | 6/1/26 | 425 | 467 |
| | CVS Health Corp. | 3.000% | 8/15/26 | 450 | 496 |
| | CVS Health Corp. | 3.625% | 4/1/27 | 100 | 114 |
| | CVS Health Corp. | 1.300% | 8/21/27 | 400 | 403 |
| | CVS Health Corp. | 4.300% | 3/25/28 | 1,742 | 2,072 |
| | CVS Health Corp. | 3.250% | 8/15/29 | 360 | 405 |
| | CVS Health Corp. | 1.750% | 8/21/30 | 225 | 225 |
| | CVS Health Corp. | 1.875% | 2/28/31 | 500 | 505 |
| | CVS Health Corp. | 4.875% | 7/20/35 | 125 | 162 |
| | CVS Health Corp. | 4.780% | 3/25/38 | 1,000 | 1,264 |
| | CVS Health Corp. | 6.125% | 9/15/39 | 75 | 108 |
| | CVS Health Corp. | 4.125% | 4/1/40 | 200 | 238 |
| | CVS Health Corp. | 2.700% | 8/21/40 | 275 | 278 |
| | CVS Health Corp. | 5.300% | 12/5/43 | 150 | 203 |
| | CVS Health Corp. | 5.125% | 7/20/45 | 775 | 1,039 |
| | CVS Health Corp. | 5.050% | 3/25/48 | 1,650 | 2,229 |
| | CVS Health Corp. | 4.250% | 4/1/50 | 300 | 374 |
| | Danaher Corp. | 3.350% | 9/15/25 | 100 | 112 |
| | Danaher Corp. | 4.375% | 9/15/45 | 75 | 98 |
| | Danaher Corp. | 2.600% | 10/1/50 | 500 | 517 |
| | Dartmouth-Hitchcock Health | 4.178% | 8/1/48 | 100 | 118 |
| | DENTSPLY SIRONA Inc. | 3.250% | 6/1/30 | 150 | 167 |
| | DH Europe Finance II Sarl | 2.050% | 11/15/22 | 250 | 258 |
| | DH Europe Finance II Sarl | 2.200% | 11/15/24 | 250 | 263 |
| | DH Europe Finance II Sarl | 2.600% | 11/15/29 | ��� 150 | 163 |
| | DH Europe Finance II Sarl | 3.250% | 11/15/39 | 175 | 199 |
| | Dignity Health | 3.125% | 11/1/22 | 50 | 52 |
| | Dignity Health | 3.812% | 11/1/24 | 100 | 109 |
| | Dignity Health | 4.500% | 11/1/42 | 100 | 112 |
| | Dignity Health | 5.267% | 11/1/64 | 50 | 67 |
| | Duke University Health System Inc. | 3.920% | 6/1/47 | 100 | 124 |
| | Edwards Lifesciences Corp. | 4.300% | 6/15/28 | 100 | 118 |
| | Eli Lilly and Co. | 2.350% | 5/15/22 | 50 | 51 |
| | Eli Lilly and Co. | 2.750% | 6/1/25 | 71 | 77 |
| | Eli Lilly and Co. | 3.375% | 3/15/29 | 225 | 261 |
| | Eli Lilly and Co. | 3.950% | 3/15/49 | 300 | 391 |
| | Eli Lilly and Co. | 2.250% | 5/15/50 | 500 | 491 |
| | Eli Lilly and Co. | 4.150% | 3/15/59 | 350 | 478 |
| | Eli Lilly and Co. | 2.500% | 9/15/60 | 250 | 253 |
| | Gilead Sciences Inc. | 3.250% | 9/1/22 | 375 | 391 |
| | Gilead Sciences Inc. | 2.500% | 9/1/23 | 300 | 316 |
| | Gilead Sciences Inc. | 3.700% | 4/1/24 | 470 | 513 |
| | Gilead Sciences Inc. | 3.650% | 3/1/26 | 575 | 652 |
| | Gilead Sciences Inc. | 2.950% | 3/1/27 | 225 | 248 |
| | Gilead Sciences Inc. | 4.600% | 9/1/35 | 275 | 355 |
| | Gilead Sciences Inc. | 4.000% | 9/1/36 | 150 | 181 |
| | Gilead Sciences Inc. | 5.650% | 12/1/41 | 175 | 252 |
| | Gilead Sciences Inc. | 4.800% | 4/1/44 | 300 | 395 |
| | Gilead Sciences Inc. | 4.500% | 2/1/45 | 325 | 413 |
| | Gilead Sciences Inc. | 4.750% | 3/1/46 | 455 | 603 |
| | Gilead Sciences Inc. | 4.150% | 3/1/47 | 475 | 583 |
| | GlaxoSmithKline Capital Inc. | 2.800% | 3/18/23 | 50 | 53 |
| | GlaxoSmithKline Capital Inc. | 3.375% | 5/15/23 | 225 | 241 |
| | GlaxoSmithKline Capital Inc. | 3.625% | 5/15/25 | 604 | 680 |
| | GlaxoSmithKline Capital Inc. | 3.875% | 5/15/28 | 375 | 446 |
| | GlaxoSmithKline Capital Inc. | 5.375% | 4/15/34 | 85 | 122 |
| | | | Coupon | Maturity
Date | Face
Amount
($000) | Market
Value•
($000) |
| | GlaxoSmithKline Capital Inc. | 6.375% | 5/15/38 | 550 | 868 |
| | GlaxoSmithKline Capital Inc. | 4.200% | 3/18/43 | 100 | 129 |
| | GlaxoSmithKline Capital plc | 2.850% | 5/8/22 | 100 | 103 |
| | GlaxoSmithKline Capital plc | 2.875% | 6/1/22 | 350 | 362 |
| | GlaxoSmithKline Capital plc | 0.534% | 10/1/23 | 500 | 502 |
| | GlaxoSmithKline Capital plc | 3.000% | 6/1/24 | 200 | 216 |
| | GlaxoSmithKline Capital plc | 3.375% | 6/1/29 | 25 | 29 |
| | Hackensack Meridian Health Inc. | 2.675% | 9/1/41 | 250 | 251 |
| | Hackensack Meridian Health Inc. | 4.211% | 7/1/48 | 125 | 158 |
| | Hackensack Meridian Health Inc. | 4.500% | 7/1/57 | 50 | 67 |
| 2 | Hartford HealthCare Corp. | 3.447% | 7/1/54 | 75 | 79 |
| | HCA Inc. | 4.750% | 5/1/23 | 250 | 272 |
| | HCA Inc. | 5.000% | 3/15/24 | 425 | 477 |
| | HCA Inc. | 5.250% | 4/15/25 | 320 | 373 |
| | HCA Inc. | 5.250% | 6/15/26 | 325 | 383 |
| | HCA Inc. | 4.500% | 2/15/27 | 125 | 145 |
| | HCA Inc. | 4.125% | 6/15/29 | 405 | 470 |
| | HCA Inc. | 5.125% | 6/15/39 | 200 | 254 |
| | HCA Inc. | 5.500% | 6/15/47 | 425 | 561 |
| | HCA Inc. | 5.250% | 6/15/49 | 300 | 393 |
| | Hospital Special Surgery | 2.667% | 10/1/50 | 10 | 10 |
| | Humana Inc. | 2.900% | 12/15/22 | 150 | 157 |
| | Humana Inc. | 3.850% | 10/1/24 | 326 | 361 |
| | Humana Inc. | 3.950% | 3/15/27 | 150 | 173 |
| | Humana Inc. | 4.875% | 4/1/30 | 135 | 169 |
| | Humana Inc. | 4.625% | 12/1/42 | 110 | 139 |
| | Humana Inc. | 4.950% | 10/1/44 | 270 | 364 |
| | Humana Inc. | 3.950% | 8/15/49 | 40 | 49 |
| | IHC Health Services Inc. | 4.131% | 5/15/48 | 100 | 130 |
| | Indiana University Health Inc. Obligated Group | 3.970% | 11/1/48 | 125 | 158 |
| | Iowa Health System | 3.665% | 2/15/50 | 125 | 143 |
| | Johns Hopkins Health System Corp. | 3.837% | 5/15/46 | 125 | 156 |
| | Johnson & Johnson | 2.250% | 3/3/22 | 325 | 332 |
| | Johnson & Johnson | 2.050% | 3/1/23 | 125 | 129 |
| | Johnson & Johnson | 3.375% | 12/5/23 | 200 | 218 |
| | Johnson & Johnson | 2.625% | 1/15/25 | 250 | 271 |
| | Johnson & Johnson | 0.550% | 9/1/25 | 500 | 503 |
| | Johnson & Johnson | 2.450% | 3/1/26 | 350 | 381 |
| | Johnson & Johnson | 2.950% | 3/3/27 | 200 | 224 |
| | Johnson & Johnson | 0.950% | 9/1/27 | 500 | 502 |
| | Johnson & Johnson | 2.900% | 1/15/28 | 100 | 113 |
| | Johnson & Johnson | 6.950% | 9/1/29 | 75 | 109 |
| | Johnson & Johnson | 1.300% | 9/1/30 | 500 | 501 |
| | Johnson & Johnson | 4.950% | 5/15/33 | 150 | 207 |
| | Johnson & Johnson | 4.375% | 12/5/33 | 175 | 231 |
| | Johnson & Johnson | 3.550% | 3/1/36 | 175 | 214 |
| | Johnson & Johnson | 3.625% | 3/3/37 | 300 | 368 |
| | Johnson & Johnson | 5.950% | 8/15/37 | 200 | 310 |
| | Johnson & Johnson | 3.400% | 1/15/38 | 200 | 239 |
| | Johnson & Johnson | 2.100% | 9/1/40 | 250 | 252 |
| | Johnson & Johnson | 4.500% | 9/1/40 | 150 | 206 |
| | Johnson & Johnson | 4.850% | 5/15/41 | 75 | 105 |
| | Johnson & Johnson | 4.500% | 12/5/43 | 200 | 278 |
| | Johnson & Johnson | 3.700% | 3/1/46 | 350 | 446 |
| | Johnson & Johnson | 3.750% | 3/3/47 | 250 | 321 |
| | Johnson & Johnson | 3.500% | 1/15/48 | 150 | 186 |
| | Johnson & Johnson | 2.250% | 9/1/50 | 500 | 503 |
Total Bond Market Index Portfolio
| | | | Coupon | Maturity
Date | Face
Amount
($000) | Market
Value•
($000) |
| | Kaiser Foundation Hospitals | 3.500% | 4/1/22 | 50 | 52 |
| | Kaiser Foundation Hospitals | 3.150% | 5/1/27 | 100 | 113 |
| | Kaiser Foundation Hospitals | 4.875% | 4/1/42 | 235 | 321 |
| | Kaiser Foundation Hospitals | 4.150% | 5/1/47 | 150 | 194 |
| | Kaiser Foundation Hospitals | 3.266% | 11/1/49 | 225 | 256 |
| | Koninklijke KPN NV | 6.875% | 3/11/38 | 100 | 156 |
| | Koninklijke Philips NV | 5.000% | 3/15/42 | 150 | 201 |
| | Laboratory Corp. of America Holdings | 3.200% | 2/1/22 | 500 | 515 |
| | Laboratory Corp. of America Holdings | 3.750% | 8/23/22 | 25 | 26 |
| | Laboratory Corp. of America Holdings | 3.250% | 9/1/24 | 150 | 163 |
| | Laboratory Corp. of America Holdings | 2.300% | 12/1/24 | 100 | 106 |
| | Laboratory Corp. of America Holdings | 3.600% | 2/1/25 | 200 | 221 |
| | Laboratory Corp. of America Holdings | 3.600% | 9/1/27 | 100 | 114 |
| | Laboratory Corp. of America Holdings | 2.950% | 12/1/29 | 125 | 138 |
| | Laboratory Corp. of America Holdings | 4.700% | 2/1/45 | 195 | 255 |
| | Mayo Clinic | 3.774% | 11/15/43 | 75 | 90 |
| | Mayo Clinic | 4.128% | 11/15/52 | 50 | 66 |
| | McKesson Corp. | 3.796% | 3/15/24 | 200 | 219 |
| | McKesson Corp. | 0.900% | 12/3/25 | 500 | 501 |
| | McKesson Corp. | 3.950% | 2/16/28 | 200 | 233 |
| 2 | MedStar Health Inc. | 3.626% | 8/15/49 | 75 | 87 |
| | Medtronic Inc. | 3.500% | 3/15/25 | 279 | 312 |
| | Medtronic Inc. | 4.375% | 3/15/35 | 411 | 553 |
| | Medtronic Inc. | 4.625% | 3/15/45 | 344 | 487 |
| | Memorial Health Services | 3.447% | 11/1/49 | 150 | 161 |
| | Memorial Sloan-Kettering Cancer Center | 2.955% | 1/1/50 | 100 | 106 |
| | Memorial Sloan-Kettering Cancer Center | 4.125% | 7/1/52 | 150 | 195 |
| | Memorial Sloan-Kettering Cancer Center | 4.200% | 7/1/55 | 25 | 33 |
| | Merck & Co. Inc. | 2.350% | 2/10/22 | 250 | 256 |
| | Merck & Co. Inc. | 2.400% | 9/15/22 | 250 | 258 |
| | Merck & Co. Inc. | 2.800% | 5/18/23 | 325 | 344 |
| | Merck & Co. Inc. | 2.900% | 3/7/24 | 25 | 27 |
| | Merck & Co. Inc. | 2.750% | 2/10/25 | 740 | 804 |
| | Merck & Co. Inc. | 0.750% | 2/24/26 | 150 | 151 |
| | Merck & Co. Inc. | 3.400% | 3/7/29 | 375 | 436 |
| | Merck & Co. Inc. | 1.450% | 6/24/30 | 210 | 212 |
| | Merck & Co. Inc. | 6.500% | 12/1/33 | 125 | 194 |
| | Merck & Co. Inc. | 3.900% | 3/7/39 | 200 | 253 |
| | Merck & Co. Inc. | 2.350% | 6/24/40 | 200 | 206 |
| | Merck & Co. Inc. | 3.600% | 9/15/42 | 100 | 123 |
| | Merck & Co. Inc. | 4.150% | 5/18/43 | 200 | 261 |
| | Merck & Co. Inc. | 3.700% | 2/10/45 | 525 | 653 |
| | Merck & Co. Inc. | 4.000% | 3/7/49 | 300 | 396 |
| | Merck & Co. Inc. | 2.450% | 6/24/50 | 300 | 309 |
| | Mercy Health | 4.302% | 7/1/28 | 25 | 29 |
| | Methodist Hospital | 2.705% | 12/1/50 | 300 | 307 |
| 2 | Montefiore Obligated Group | 5.246% | 11/1/48 | 150 | 182 |
| | Mount Sinai Hospitals Group Inc. | 3.737% | 7/1/49 | 100 | 113 |
| | Mount Sinai Hospitals Group Inc. | 3.391% | 7/1/50 | 500 | 544 |
| | MultiCare Health System | 2.803% | 8/15/50 | 250 | 258 |
| | Mylan Inc. | 4.200% | 11/29/23 | 100 | 109 |
| | Mylan Inc. | 5.400% | 11/29/43 | 100 | 132 |
| | | | Coupon | Maturity
Date | Face
Amount
($000) | Market
Value•
($000) |
| | Mylan Inc. | 5.200% | 4/15/48 | 175 | 229 |
| | New York and Presbyterian Hospital | 4.024% | 8/1/45 | 130 | 163 |
| | New York and Presbyterian Hospital | 4.063% | 8/1/56 | 75 | 98 |
| | New York and Presbyterian Hospital | 2.606% | 8/1/60 | 300 | 290 |
| | New York and Presbyterian Hospital | 3.954% | 8/1/19 | 125 | 145 |
| | Northwell Healthcare Inc. | 3.979% | 11/1/46 | 100 | 114 |
| | Northwell Healthcare Inc. | 4.260% | 11/1/47 | 200 | 240 |
| | Northwell Healthcare Inc. | 3.809% | 11/1/49 | 100 | 114 |
| | Novartis Capital Corp. | 2.400% | 5/17/22 | 400 | 411 |
| | Novartis Capital Corp. | 2.400% | 9/21/22 | 175 | 182 |
| | Novartis Capital Corp. | 3.400% | 5/6/24 | 400 | 439 |
| | Novartis Capital Corp. | 1.750% | 2/14/25 | 200 | 210 |
| | Novartis Capital Corp. | 3.000% | 11/20/25 | 350 | 387 |
| | Novartis Capital Corp. | 2.000% | 2/14/27 | 525 | 559 |
| | Novartis Capital Corp. | 3.100% | 5/17/27 | 175 | 197 |
| | Novartis Capital Corp. | 2.200% | 8/14/30 | 410 | 440 |
| | Novartis Capital Corp. | 3.700% | 9/21/42 | 100 | 123 |
| | Novartis Capital Corp. | 4.400% | 5/6/44 | 375 | 515 |
| | Novartis Capital Corp. | 4.000% | 11/20/45 | 225 | 294 |
| | Novartis Capital Corp. | 2.750% | 8/14/50 | 75 | 82 |
| | NYU Langone Hospitals | 4.784% | 7/1/44 | 100 | 127 |
| 2 | NYU Langone Hospitals | 4.368% | 7/1/47 | 110 | 133 |
| | NYU Langone Hospitals | 3.380% | 7/1/55 | 200 | 208 |
| 2 | OhioHealth Corp. | 3.042% | 11/15/50 | 100 | 109 |
| | Orlando Health Obligated Group | 4.089% | 10/1/48 | 50 | 61 |
| | Partners Healthcare System Inc. | 3.192% | 7/1/49 | 150 | 165 |
| | Partners Healthcare System Inc. | 4.117% | 7/1/55 | 50 | 64 |
| | Partners Healthcare System Inc. | 3.342% | 7/1/60 | 250 | 284 |
| | PeaceHealth Obligated Group | 4.787% | 11/15/48 | 75 | 100 |
| | PeaceHealth Obligated Group | 3.218% | 11/15/50 | 200 | 216 |
| | PerkinElmer Inc. | 3.300% | 9/15/29 | 175 | 197 |
| | Perrigo Finance Unlimited Co. | 3.900% | 12/15/24 | 200 | 220 |
| | Perrigo Finance Unlimited Co. | 4.375% | 3/15/26 | 225 | 254 |
| | Perrigo Finance Unlimited Co. | 4.900% | 12/15/44 | 80 | 89 |
| | Pfizer Inc. | 2.200% | 12/15/21 | 100 | 102 |
| | Pfizer Inc. | 2.800% | 3/11/22 | 200 | 206 |
| | Pfizer Inc. | 3.200% | 9/15/23 | 125 | 135 |
| | Pfizer Inc. | 2.950% | 3/15/24 | 150 | 162 |
| | Pfizer Inc. | 3.400% | 5/15/24 | 100 | 110 |
| | Pfizer Inc. | 0.800% | 5/28/25 | 125 | 127 |
| | Pfizer Inc. | 2.750% | 6/3/26 | 290 | 320 |
| | Pfizer Inc. | 3.000% | 12/15/26 | 300 | 338 |
| | Pfizer Inc. | 3.600% | 9/15/28 | 200 | 236 |
| | Pfizer Inc. | 3.450% | 3/15/29 | 375 | 437 |
| | Pfizer Inc. | 2.625% | 4/1/30 | 300 | 332 |
| | Pfizer Inc. | 1.700% | 5/28/30 | 225 | 232 |
| | Pfizer Inc. | 4.000% | 12/15/36 | 300 | 380 |
| | Pfizer Inc. | 4.100% | 9/15/38 | 150 | 191 |
| | Pfizer Inc. | 3.900% | 3/15/39 | 125 | 156 |
| | Pfizer Inc. | 7.200% | 3/15/39 | 425 | 729 |
| | Pfizer Inc. | 2.550% | 5/28/40 | 200 | 212 |
| | Pfizer Inc. | 4.300% | 6/15/43 | 125 | 165 |
| | Pfizer Inc. | 4.400% | 5/15/44 | 200 | 268 |
| | Pfizer Inc. | 4.125% | 12/15/46 | 250 | 329 |
| | Pfizer Inc. | 4.200% | 9/15/48 | 350 | 467 |
| | Pfizer Inc. | 4.000% | 3/15/49 | 175 | 229 |
| | Pfizer Inc. | 2.700% | 5/28/50 | 350 | 374 |
Total Bond Market Index Portfolio
| | | | Coupon | Maturity
Date | Face
Amount
($000) | Market
Value•
($000) |
| | Pharmacia LLC | 6.600% | 12/1/28 | 175 | 242 |
| | Providence St. Joseph Health Obligated Group | 2.746% | 10/1/26 | 50 | 54 |
| | Providence St. Joseph Health Obligated Group | 2.532% | 10/1/29 | 150 | 161 |
| 2 | Providence St. Joseph Health Obligated Group | 3.744% | 10/1/47 | 75 | 88 |
| 2 | Providence St. Joseph Health Obligated Group | 3.930% | 10/1/48 | 75 | 90 |
| | Quest Diagnostics Inc. | 4.250% | 4/1/24 | 100 | 110 |
| | Quest Diagnostics Inc. | 3.500% | 3/30/25 | 100 | 111 |
| | Quest Diagnostics Inc. | 3.450% | 6/1/26 | 125 | 141 |
| | Quest Diagnostics Inc. | 4.200% | 6/30/29 | 140 | 166 |
| | Quest Diagnostics Inc. | 2.950% | 6/30/30 | 160 | 176 |
| | Quest Diagnostics Inc. | 2.800% | 6/30/31 | 125 | 137 |
| | Quest Diagnostics Inc. | 5.750% | 1/30/40 | 13 | 17 |
| | Quest Diagnostics Inc. | 4.700% | 3/30/45 | 25 | 31 |
| | Regeneron Pharmaceuticals Inc. | 1.750% | 9/15/30 | 500 | 491 |
| 5 | Royalty Pharma plc | 0.750% | 9/2/23 | 500 | 502 |
| 5 | Royalty Pharma plc | 2.200% | 9/2/30 | 500 | 510 |
| 5 | Royalty Pharma plc | 3.550% | 9/2/50 | 350 | 372 |
| | Rush Obligated Group | 3.922% | 11/15/29 | 75 | 89 |
| | RWJ Barnabas Health Inc. | 3.949% | 7/1/46 | 100 | 121 |
| | RWJ Barnabas Health Inc. | 3.477% | 7/1/49 | 25 | 28 |
| | Sanofi | 3.375% | 6/19/23 | 225 | 241 |
| | Sanofi | 3.625% | 6/19/28 | 225 | 262 |
| | Shire Acquisitions Investments Ireland DAC | 2.875% | 9/23/23 | 1,425 | 1,511 |
| | Shire Acquisitions Investments Ireland DAC | 3.200% | 9/23/26 | 575 | 642 |
| | Smith & Nephew plc | 2.032% | 10/14/30 | 500 | 507 |
| | Spectrum Health System Obligated Group | 3.487% | 7/15/49 | 75 | 86 |
| | SSM Health Care Corp. | 3.688% | 6/1/23 | 150 | 160 |
| | SSM Health Care Corp. | 3.823% | 6/1/27 | 100 | 113 |
| | Stanford Health Care | 3.795% | 11/15/48 | 125 | 156 |
| | Stryker Corp. | 3.375% | 5/15/24 | 213 | 232 |
| | Stryker Corp. | 1.150% | 6/15/25 | 100 | 102 |
| | Stryker Corp. | 3.375% | 11/1/25 | 140 | 157 |
| | Stryker Corp. | 3.500% | 3/15/26 | 183 | 207 |
| | Stryker Corp. | 3.650% | 3/7/28 | 50 | 58 |
| | Stryker Corp. | 4.100% | 4/1/43 | 75 | 91 |
| | Stryker Corp. | 4.375% | 5/15/44 | 50 | 62 |
| | Stryker Corp. | 4.625% | 3/15/46 | 175 | 233 |
| | Stryker Corp. | 2.900% | 6/15/50 | 100 | 106 |
| | Sutter Health | 1.321% | 8/15/25 | 500 | 507 |
| | Sutter Health | 3.695% | 8/15/28 | 75 | 85 |
| | Sutter Health | 4.091% | 8/15/48 | 75 | 91 |
| | Takeda Pharmaceutical Co. Ltd. | 4.400% | 11/26/23 | 200 | 222 |
| | Takeda Pharmaceutical Co. Ltd. | 5.000% | 11/26/28 | 405 | 503 |
| | Takeda Pharmaceutical Co. Ltd. | 2.050% | 3/31/30 | 500 | 510 |
| | Takeda Pharmaceutical Co. Ltd. | 3.025% | 7/9/40 | 400 | 419 |
| | Takeda Pharmaceutical Co. Ltd. | 3.175% | 7/9/50 | 410 | 437 |
| | Takeda Pharmaceutical Co. Ltd. | 3.375% | 7/9/60 | 400 | 444 |
| | Texas Health Resources | 2.328% | 11/15/50 | 400 | 378 |
| | Thermo Fisher Scientific Inc. | 3.000% | 4/15/23 | 125 | 132 |
| | Thermo Fisher Scientific Inc. | 4.133% | 3/25/25 | 230 | 262 |
| | Thermo Fisher Scientific Inc. | 3.650% | 12/15/25 | 400 | 453 |
| | | | Coupon | Maturity
Date | Face
Amount
($000) | Market
Value•
($000) |
| | Thermo Fisher Scientific Inc. | 2.950% | 9/19/26 | 200 | 223 |
| | Thermo Fisher Scientific Inc. | 3.200% | 8/15/27 | 50 | 56 |
| | Thermo Fisher Scientific Inc. | 2.600% | 10/1/29 | 225 | 246 |
| | Thermo Fisher Scientific Inc. | 4.497% | 3/25/30 | 85 | 105 |
| | Thermo Fisher Scientific Inc. | 5.300% | 2/1/44 | 185 | 269 |
| | Toledo Hospital | 5.325% | 11/15/28 | 50 | 58 |
| | Toledo Hospital | 6.015% | 11/15/48 | 75 | 93 |
| | Trinity Health Corp. | 4.125% | 12/1/45 | 85 | 104 |
| | UnitedHealth Group Inc. | 2.125% | 3/15/21 | 225 | 226 |
| | UnitedHealth Group Inc. | 2.875% | 12/15/21 | 125 | 128 |
| | UnitedHealth Group Inc. | 3.350% | 7/15/22 | 180 | 189 |
| | UnitedHealth Group Inc. | 2.375% | 10/15/22 | 150 | 156 |
| | UnitedHealth Group Inc. | 2.750% | 2/15/23 | 175 | 183 |
| | UnitedHealth Group Inc. | 2.875% | 3/15/23 | 25 | 26 |
| | UnitedHealth Group Inc. | 3.500% | 6/15/23 | 100 | 107 |
| | UnitedHealth Group Inc. | 3.500% | 2/15/24 | 100 | 109 |
| | UnitedHealth Group Inc. | 2.375% | 8/15/24 | 300 | 320 |
| | UnitedHealth Group Inc. | 3.750% | 7/15/25 | 950 | 1,082 |
| | UnitedHealth Group Inc. | 3.700% | 12/15/25 | 75 | 86 |
| | UnitedHealth Group Inc. | 3.100% | 3/15/26 | 225 | 252 |
| | UnitedHealth Group Inc. | 3.450% | 1/15/27 | 175 | 200 |
| | UnitedHealth Group Inc. | 3.375% | 4/15/27 | 350 | 399 |
| | UnitedHealth Group Inc. | 2.950% | 10/15/27 | 150 | 168 |
| | UnitedHealth Group Inc. | 3.850% | 6/15/28 | 400 | 474 |
| | UnitedHealth Group Inc. | 3.875% | 12/15/28 | 150 | 179 |
| | UnitedHealth Group Inc. | 2.875% | 8/15/29 | 150 | 170 |
| | UnitedHealth Group Inc. | 2.000% | 5/15/30 | 755 | 800 |
| | UnitedHealth Group Inc. | 4.625% | 7/15/35 | 175 | 235 |
| | UnitedHealth Group Inc. | 6.500% | 6/15/37 | 50 | 79 |
| | UnitedHealth Group Inc. | 6.625% | 11/15/37 | 125 | 199 |
| | UnitedHealth Group Inc. | 6.875% | 2/15/38 | 245 | 401 |
| | UnitedHealth Group Inc. | 3.500% | 8/15/39 | ��� 240 | 283 |
| | UnitedHealth Group Inc. | 2.750% | 5/15/40 | 200 | 216 |
| | UnitedHealth Group Inc. | 5.950% | 2/15/41 | 60 | 92 |
| | UnitedHealth Group Inc. | 4.625% | 11/15/41 | 110 | 149 |
| | UnitedHealth Group Inc. | 4.375% | 3/15/42 | 50 | 65 |
| | UnitedHealth Group Inc. | 3.950% | 10/15/42 | 175 | 221 |
| | UnitedHealth Group Inc. | 4.250% | 3/15/43 | 125 | 164 |
| | UnitedHealth Group Inc. | 4.750% | 7/15/45 | 305 | 428 |
| | UnitedHealth Group Inc. | 4.200% | 1/15/47 | 210 | 277 |
| | UnitedHealth Group Inc. | 4.250% | 4/15/47 | 290 | 382 |
| | UnitedHealth Group Inc. | 4.250% | 6/15/48 | 300 | 400 |
| | UnitedHealth Group Inc. | 4.450% | 12/15/48 | 150 | 206 |
| | UnitedHealth Group Inc. | 3.700% | 8/15/49 | 310 | 386 |
| | UnitedHealth Group Inc. | 2.900% | 5/15/50 | 250 | 275 |
| | UnitedHealth Group Inc. | 3.875% | 8/15/59 | 420 | 542 |
| | UnitedHealth Group Inc. | 3.125% | 5/15/60 | 250 | 289 |
| 5 | Universal Health Services Inc. | 2.650% | 10/15/30 | 500 | 517 |
| | UPMC | 3.600% | 4/3/25 | 125 | 139 |
| | Utah Acquisition Sub Inc. | 3.950% | 6/15/26 | 375 | 429 |
| | Utah Acquisition Sub Inc. | 5.250% | 6/15/46 | 225 | 295 |
| 5 | Viatris Inc. | 1.125% | 6/22/22 | 200 | 202 |
| 5 | Viatris Inc. | 1.650% | 6/22/25 | 175 | 181 |
| 5 | Viatris Inc. | 2.300% | 6/22/27 | 175 | 186 |
| 5 | Viatris Inc. | 2.700% | 6/22/30 | 525 | 554 |
| 5 | Viatris Inc. | 3.850% | 6/22/40 | 325 | 366 |
| 5 | Viatris Inc. | 4.000% | 6/22/50 | 400 | 457 |
| 2 | Willis-Knighton Medical Center | 4.813% | 9/1/48 | 50 | 66 |
| | Wyeth LLC | 7.250% | 3/1/23 | 250 | 286 |
| | Wyeth LLC | 6.450% | 2/1/24 | 300 | 354 |
| | Wyeth LLC | 6.500% | 2/1/34 | 150 | 233 |
| | Wyeth LLC | 6.000% | 2/15/36 | 85 | 127 |
| | Wyeth LLC | 5.950% | 4/1/37 | 385 | 579 |
Total Bond Market Index Portfolio
| | | | Coupon | Maturity
Date | Face
Amount
($000) | Market
Value•
($000) |
| | Zeneca Wilmington Inc. | 7.000% | 11/15/23 | 25 | 29 |
| | Zimmer Biomet Holdings Inc. | 3.150% | 4/1/22 | 175 | 180 |
| | Zimmer Biomet Holdings Inc. | 3.700% | 3/19/23 | 50 | 53 |
| | Zimmer Biomet Holdings Inc. | 3.550% | 4/1/25 | 350 | 387 |
| | Zimmer Biomet Holdings Inc. | 5.750% | 11/30/39 | 50 | 65 |
| | Zimmer Biomet Holdings Inc. | 4.450% | 8/15/45 | 150 | 175 |
| | Zoetis Inc. | 3.250% | 2/1/23 | 350 | 368 |
| | Zoetis Inc. | 4.500% | 11/13/25 | 100 | 117 |
| | Zoetis Inc. | 3.000% | 9/12/27 | 150 | 168 |
| | Zoetis Inc. | 3.900% | 8/20/28 | 100 | 118 |
| | Zoetis Inc. | 2.000% | 5/15/30 | 150 | 155 |
| | Zoetis Inc. | 4.700% | 2/1/43 | 175 | 239 |
| | Zoetis Inc. | 3.950% | 9/12/47 | 150 | 187 |
| | Zoetis Inc. | 4.450% | 8/20/48 | 75 | 100 |
| | Zoetis Inc. | 3.000% | 5/15/50 | 125 | 137 |
| | | | | | | 166,705 |
| Industrials (2.5%) |
| | 3M Co. | 2.750% | 3/1/22 | 100 | 103 |
| | 3M Co. | 1.750% | 2/14/23 | 200 | 206 |
| | 3M Co. | 2.250% | 3/15/23 | 175 | 182 |
| | 3M Co. | 3.250% | 2/14/24 | 100 | 108 |
| | 3M Co. | 2.000% | 2/14/25 | 150 | 159 |
| | 3M Co. | 2.650% | 4/15/25 | 100 | 109 |
| | 3M Co. | 3.000% | 8/7/25 | 100 | 111 |
| | 3M Co. | 2.250% | 9/19/26 | 150 | �� 162 |
| | 3M Co. | 2.875% | 10/15/27 | 125 | 139 |
| | 3M Co. | 3.375% | 3/1/29 | 150 | 173 |
| | 3M Co. | 2.375% | 8/26/29 | 250 | 270 |
| | 3M Co. | 3.050% | 4/15/30 | 115 | 130 |
| | 3M Co. | 3.125% | 9/19/46 | 75 | 83 |
| | 3M Co. | 3.625% | 10/15/47 | 100 | 119 |
| | 3M Co. | 4.000% | 9/14/48 | 250 | 321 |
| | 3M Co. | 3.250% | 8/26/49 | 375 | 426 |
| | 3M Co. | 3.700% | 4/15/50 | 125 | 153 |
| | Allegion plc | 3.500% | 10/1/29 | 75 | 83 |
| | Allegion US Holding Co. Inc. | 3.550% | 10/1/27 | 175 | 192 |
| 2 | American Airlines Class A Series 2016-3 Pass Through Trust | 3.250% | 4/15/30 | 41 | 37 |
| 2 | American Airlines Class AA Series 2015-2 Pass Through Trust | 3.600% | 3/22/29 | 43 | 42 |
| 2 | American Airlines Class AA Series 2016-1 Pass Through Trust | 3.575% | 7/15/29 | 121 | 119 |
| 2 | American Airlines Class AA Series 2016-3 Pass Through Trust | 3.000% | 4/15/30 | 123 | 121 |
| 2 | American Airlines Class AA Series 2017-1 Pass Through Trust | 3.650% | 8/15/30 | 41 | 41 |
| 2 | American Airlines Class AA Series 2019-1 Pass Through Trust | 3.150% | 8/15/33 | 48 | 46 |
| | Amphenol Corp. | 3.200% | 4/1/24 | 50 | 54 |
| | Amphenol Corp. | 2.050% | 3/1/25 | 40 | 42 |
| | Amphenol Corp. | 4.350% | 6/1/29 | 100 | 122 |
| | Amphenol Corp. | 2.800% | 2/15/30 | 275 | 301 |
| | Block Financial LLC | 5.500% | 11/1/22 | 100 | 106 |
| | Block Financial LLC | 5.250% | 10/1/25 | 100 | 114 |
| | Block Financial LLC | 3.875% | 8/15/30 | 300 | 324 |
| | BNSF Funding Trust I | 6.613% | 12/15/55 | 65 | 75 |
| | Boeing Co. | 2.125% | 3/1/22 | 50 | 51 |
| | Boeing Co. | 2.700% | 5/1/22 | 75 | 77 |
| | Boeing Co. | 2.800% | 3/1/23 | 400 | 415 |
| | | | Coupon | Maturity
Date | Face
Amount
($000) | Market
Value•
($000) |
| | Boeing Co. | 4.508% | 5/1/23 | 625 | 675 |
| | Boeing Co. | 1.875% | 6/15/23 | 200 | 204 |
| | Boeing Co. | 1.950% | 2/1/24 | 500 | 515 |
| | Boeing Co. | 2.800% | 3/1/24 | 75 | 79 |
| | Boeing Co. | 2.850% | 10/30/24 | 100 | 105 |
| | Boeing Co. | 2.500% | 3/1/25 | 145 | 150 |
| | Boeing Co. | 4.875% | 5/1/25 | 695 | 791 |
| | Boeing Co. | 3.100% | 5/1/26 | 100 | 107 |
| | Boeing Co. | 2.250% | 6/15/26 | 50 | 51 |
| | Boeing Co. | 2.700% | 2/1/27 | 195 | 203 |
| | Boeing Co. | 2.800% | 3/1/27 | 50 | 52 |
| | Boeing Co. | 5.040% | 5/1/27 | 460 | 538 |
| | Boeing Co. | 3.250% | 3/1/28 | 100 | 106 |
| | Boeing Co. | 3.450% | 11/1/28 | 60 | 64 |
| | Boeing Co. | 3.200% | 3/1/29 | 200 | 210 |
| | Boeing Co. | 2.950% | 2/1/30 | 190 | 195 |
| | Boeing Co. | 5.150% | 5/1/30 | 945 | 1,143 |
| | Boeing Co. | 3.625% | 2/1/31 | 275 | 300 |
| | Boeing Co. | 6.125% | 2/15/33 | 75 | 97 |
| | Boeing Co. | 3.600% | 5/1/34 | 350 | 368 |
| | Boeing Co. | 3.250% | 2/1/35 | 190 | 195 |
| | Boeing Co. | 6.625% | 2/15/38 | 50 | 67 |
| | Boeing Co. | 3.550% | 3/1/38 | 50 | 51 |
| | Boeing Co. | 3.500% | 3/1/39 | 75 | 75 |
| | Boeing Co. | 6.875% | 3/15/39 | 100 | 136 |
| | Boeing Co. | 5.875% | 2/15/40 | 75 | 96 |
| | Boeing Co. | 5.705% | 5/1/40 | 740 | 959 |
| | Boeing Co. | 3.375% | 6/15/46 | 75 | 73 |
| | Boeing Co. | 3.650% | 3/1/47 | 150 | 150 |
| | Boeing Co. | 3.625% | 3/1/48 | 75 | 75 |
| | Boeing Co. | 3.850% | 11/1/48 | 60 | 62 |
| | Boeing Co. | 3.900% | 5/1/49 | 150 | 156 |
| | Boeing Co. | 3.750% | 2/1/50 | 50 | 53 |
| | Boeing Co. | 5.805% | 5/1/50 | 1,130 | 1,552 |
| | Boeing Co. | 3.825% | 3/1/59 | 200 | 202 |
| | Boeing Co. | 3.950% | 8/1/59 | 75 | 79 |
| | Boeing Co. | 5.930% | 5/1/60 | 735 | 1,041 |
| | Burlington Northern Santa Fe LLC | 3.050% | 3/15/22 | 150 | 154 |
| | Burlington Northern Santa Fe LLC | 3.050% | 9/1/22 | 150 | 156 |
| | Burlington Northern Santa Fe LLC | 3.000% | 3/15/23 | 175 | 184 |
| | Burlington Northern Santa Fe LLC | 3.850% | 9/1/23 | 75 | 81 |
| | Burlington Northern Santa Fe LLC | 3.750% | 4/1/24 | 200 | 219 |
| | Burlington Northern Santa Fe LLC | 3.400% | 9/1/24 | 150 | 164 |
| | Burlington Northern Santa Fe LLC | 3.000% | 4/1/25 | 100 | 109 |
| | Burlington Northern Santa Fe LLC | 3.650% | 9/1/25 | 75 | 85 |
| | Burlington Northern Santa Fe LLC | 3.250% | 6/15/27 | 225 | 255 |
| | Burlington Northern Santa Fe LLC | 6.200% | 8/15/36 | 125 | 189 |
| | Burlington Northern Santa Fe LLC | 5.050% | 3/1/41 | 125 | 172 |
| | Burlington Northern Santa Fe LLC | 5.400% | 6/1/41 | 250 | 361 |
| | Burlington Northern Santa Fe LLC | 4.400% | 3/15/42 | 250 | 329 |
| | Burlington Northern Santa Fe LLC | 4.375% | 9/1/42 | 200 | 265 |
| | Burlington Northern Santa Fe LLC | 4.450% | 3/15/43 | 175 | 235 |
| | Burlington Northern Santa Fe LLC | 5.150% | 9/1/43 | 125 | 179 |
| | Burlington Northern Santa Fe LLC | 4.900% | 4/1/44 | 100 | 141 |
Total Bond Market Index Portfolio
| | | | Coupon | Maturity
Date | Face
Amount
($000) | Market
Value•
($000) |
| | Burlington Northern Santa Fe LLC | 4.550% | 9/1/44 | 150 | 202 |
| | Burlington Northern Santa Fe LLC | 4.150% | 4/1/45 | 125 | 163 |
| | Burlington Northern Santa Fe LLC | 4.700% | 9/1/45 | 75 | 105 |
| | Burlington Northern Santa Fe LLC | 3.900% | 8/1/46 | 150 | 190 |
| | Burlington Northern Santa Fe LLC | 4.125% | 6/15/47 | 125 | 164 |
| | Burlington Northern Santa Fe LLC | 4.050% | 6/15/48 | 375 | 492 |
| | Burlington Northern Santa Fe LLC | 4.150% | 12/15/48 | 200 | 267 |
| | Burlington Northern Santa Fe LLC | 3.550% | 2/15/50 | 400 | 486 |
| | Burlington Northern Santa Fe LLC | 3.050% | 2/15/51 | 200 | 227 |
| | Canadian National Railway Co. | 2.850% | 12/15/21 | 75 | 76 |
| | Canadian National Railway Co. | 2.950% | 11/21/24 | 233 | 252 |
| | Canadian National Railway Co. | 6.250% | 8/1/34 | 75 | 115 |
| | Canadian National Railway Co. | 6.200% | 6/1/36 | 75 | 111 |
| | Canadian National Railway Co. | 6.375% | 11/15/37 | 100 | 155 |
| | Canadian National Railway Co. | 3.200% | 8/2/46 | 175 | 204 |
| | Canadian National Railway Co. | 3.650% | 2/3/48 | 125 | 153 |
| | Canadian National Railway Co. | 2.450% | 5/1/50 | 175 | 181 |
| | Canadian Pacific Railway Co. | 4.450% | 3/15/23 | 225 | 242 |
| | Canadian Pacific Railway Co. | 2.050% | 3/5/30 | 200 | 210 |
| | Canadian Pacific Railway Co. | 7.125% | 10/15/31 | 100 | 149 |
| | Canadian Pacific Railway Co. | 5.950% | 5/15/37 | 450 | 659 |
| | Canadian Pacific Railway Co. | 6.125% | 9/15/15 | 120 | 199 |
| | Carrier Global Corp. | 1.923% | 2/15/23 | 400 | 412 |
| | Carrier Global Corp. | 2.242% | 2/15/25 | 400 | 421 |
| | Carrier Global Corp. | 2.493% | 2/15/27 | 250 | 269 |
| | Carrier Global Corp. | 2.722% | 2/15/30 | 600 | 640 |
| | Carrier Global Corp. | 3.377% | 4/5/40 | 300 | 328 |
| | Carrier Global Corp. | 3.577% | 4/5/50 | 400 | 447 |
| | Caterpillar Financial Services Corp. | 2.950% | 2/26/22 | 200 | 206 |
| | Caterpillar Financial Services Corp. | 0.950% | 5/13/22 | 150 | 151 |
| | Caterpillar Financial Services Corp. | 2.400% | 6/6/22 | 150 | 154 |
| | Caterpillar Financial Services Corp. | 1.950% | 11/18/22 | 350 | 361 |
| | Caterpillar Financial Services Corp. | 2.550% | 11/29/22 | 200 | 209 |
| | Caterpillar Financial Services Corp. | 3.450% | 5/15/23 | 200 | 215 |
| | Caterpillar Financial Services Corp. | 0.650% | 7/7/23 | 250 | 252 |
| | Caterpillar Financial Services Corp. | 3.650% | 12/7/23 | 70 | 77 |
| | Caterpillar Financial Services Corp. | 2.850% | 5/17/24 | 125 | 135 |
| | Caterpillar Financial Services Corp. | 3.300% | 6/9/24 | 250 | 273 |
| | Caterpillar Financial Services Corp. | 2.150% | 11/8/24 | 300 | 318 |
| | | | Coupon | Maturity
Date | Face
Amount
($000) | Market
Value•
($000) |
| | Caterpillar Financial Services Corp. | 3.250% | 12/1/24 | 477 | 528 |
| | Caterpillar Financial Services Corp. | 1.450% | 5/15/25 | 100 | 104 |
| | Caterpillar Financial Services Corp. | 0.800% | 11/13/25 | 500 | 502 |
| | Caterpillar Financial Services Corp. | 2.400% | 8/9/26 | 100 | 109 |
| | Caterpillar Financial Services Corp. | 3.250% | 9/19/49 | 200 | 234 |
| | Caterpillar Inc. | 2.600% | 6/26/22 | 50 | 51 |
| | Caterpillar Inc. | 3.400% | 5/15/24 | 150 | 164 |
| | Caterpillar Inc. | 2.600% | 9/19/29 | 200 | 220 |
| | Caterpillar Inc. | 2.600% | 4/9/30 | 120 | 132 |
| | Caterpillar Inc. | 6.050% | 8/15/36 | 100 | 148 |
| | Caterpillar Inc. | 5.200% | 5/27/41 | 150 | 218 |
| | Caterpillar Inc. | 3.803% | 8/15/42 | 243 | 307 |
| | Caterpillar Inc. | 3.250% | 4/9/50 | 240 | 281 |
| | Caterpillar Inc. | 4.750% | 5/15/64 | 100 | 149 |
| | Cintas Corp. No. 2 | 2.900% | 4/1/22 | 100 | 103 |
| | Cintas Corp. No. 2 | 3.250% | 6/1/22 | 75 | 77 |
| | Cintas Corp. No. 2 | 3.700% | 4/1/27 | 175 | 201 |
| | CNH Industrial Capital LLC | 1.950% | 7/2/23 | 75 | 77 |
| | CNH Industrial Capital LLC | 4.200% | 1/15/24 | 675 | 743 |
| | CNH Industrial NV | 3.850% | 11/15/27 | 100 | 113 |
| 2 | Continental Airlines Class A Series 2007-1 Pass Through Trust | 5.983% | 10/19/23 | 39 | 39 |
| 2 | Continental Airlines Class A Series 2012-2 Pass Through Trust | 4.000% | 4/29/26 | 33 | 33 |
| | Crane Co. | 4.450% | 12/15/23 | 50 | 55 |
| | Crane Co. | 4.200% | 3/15/48 | 125 | 131 |
| | CSX Corp. | 3.400% | 8/1/24 | 62 | 68 |
| | CSX Corp. | 3.350% | 11/1/25 | 150 | 168 |
| | CSX Corp. | 3.250% | 6/1/27 | 150 | 169 |
| | CSX Corp. | 3.800% | 3/1/28 | 350 | 407 |
| | CSX Corp. | 4.250% | 3/15/29 | 200 | 241 |
| | CSX Corp. | 2.400% | 2/15/30 | 172 | 185 |
| | CSX Corp. | 6.220% | 4/30/40 | 152 | 229 |
| | CSX Corp. | 5.500% | 4/15/41 | 225 | 314 |
| | CSX Corp. | 4.750% | 5/30/42 | 210 | 275 |
| | CSX Corp. | 4.100% | 3/15/44 | 150 | 185 |
| | CSX Corp. | 4.300% | 3/1/48 | 250 | 322 |
| | CSX Corp. | 4.750% | 11/15/48 | 200 | 274 |
| | CSX Corp. | 4.500% | 3/15/49 | 225 | 301 |
| | CSX Corp. | 3.350% | 9/15/49 | 125 | 142 |
| | CSX Corp. | 3.800% | 4/15/50 | 200 | 247 |
| | CSX Corp. | 3.950% | 5/1/50 | 125 | 155 |
| | CSX Corp. | 4.500% | 8/1/54 | 25 | 34 |
| | CSX Corp. | 4.250% | 11/1/66 | 150 | 199 |
| | CSX Corp. | 4.650% | 3/1/68 | 75 | 104 |
| | Cummins Inc. | 0.750% | 9/1/25 | 400 | 402 |
| | Cummins Inc. | 1.500% | 9/1/30 | 400 | 402 |
| | Cummins Inc. | 2.600% | 9/1/50 | 200 | 204 |
| | Deere & Co. | 2.600% | �� 6/8/22 | 125 | 128 |
| | Deere & Co. | 2.750% | 4/15/25 | 100 | 109 |
| | Deere & Co. | 5.375% | 10/16/29 | 125 | 166 |
| | Deere & Co. | 3.100% | 4/15/30 | 145 | 165 |
| | Deere & Co. | 7.125% | 3/3/31 | 100 | 147 |
| | Deere & Co. | 3.900% | 6/9/42 | 250 | 318 |
| | Deere & Co. | 2.875% | 9/7/49 | 200 | 223 |
| | Deere & Co. | 3.750% | 4/15/50 | 175 | 227 |
| 2 | Delta Air Lines Class A Series 2007-1 Pass Through Trust | 6.821% | 2/10/24 | 92 | 93 |
| 2 | Delta Air Lines Class AA Series 2015-1 Pass Through Trust | 3.625% | 1/30/29 | 39 | 39 |
Total Bond Market Index Portfolio
| | | | Coupon | Maturity
Date | Face
Amount
($000) | Market
Value•
($000) |
| | Delta Air Lines Class AA Series 2019-1 Pass Through Trust | 3.204% | 10/25/25 | 75 | 77 |
| 2 | Delta Air Lines Class AA Series 2020-1 Pass Through Trust | 2.000% | 12/10/29 | 146 | 144 |
| | Dover Corp. | 3.150% | 11/15/25 | 200 | 220 |
| | Dover Corp. | 2.950% | 11/4/29 | 75 | 81 |
| | Dover Corp. | 6.600% | 3/15/38 | 75 | 107 |
| | Eaton Corp. | 2.750% | 11/2/22 | 300 | 313 |
| | Eaton Corp. | 3.103% | 9/15/27 | 125 | 140 |
| | Eaton Corp. | 4.000% | 11/2/32 | 150 | 181 |
| | Eaton Corp. | 4.150% | 11/2/42 | 150 | 188 |
| | Eaton Corp. | 3.915% | 9/15/47 | 50 | 59 |
| | Emerson Electric Co. | 2.625% | 12/1/21 | 150 | 153 |
| | Emerson Electric Co. | 3.150% | 6/1/25 | 200 | 221 |
| | Emerson Electric Co. | 1.800% | 10/15/27 | 225 | 237 |
| | Emerson Electric Co. | 1.950% | 10/15/30 | 100 | 105 |
| | Emerson Electric Co. | 2.750% | 10/15/50 | 150 | 159 |
| | FedEx Corp. | 2.625% | 8/1/22 | 100 | 104 |
| | FedEx Corp. | 3.200% | 2/1/25 | 150 | 165 |
| | FedEx Corp. | 3.800% | 5/15/25 | 500 | 565 |
| | FedEx Corp. | 3.250% | 4/1/26 | 100 | 112 |
| | FedEx Corp. | 3.300% | 3/15/27 | 100 | 112 |
| | FedEx Corp. | 3.100% | 8/5/29 | 200 | 222 |
| | FedEx Corp. | 4.250% | 5/15/30 | 100 | 121 |
| | FedEx Corp. | 3.900% | 2/1/35 | 200 | 238 |
| | FedEx Corp. | 3.875% | 8/1/42 | 125 | 146 |
| | FedEx Corp. | 4.100% | 4/15/43 | 75 | 88 |
| | FedEx Corp. | 5.100% | 1/15/44 | 250 | 334 |
| | FedEx Corp. | 4.100% | 2/1/45 | 125 | 148 |
| | FedEx Corp. | 4.750% | 11/15/45 | 250 | 323 |
| | FedEx Corp. | 4.550% | 4/1/46 | 225 | 285 |
| | FedEx Corp. | 4.400% | 1/15/47 | 125 | 155 |
| | FedEx Corp. | 4.050% | 2/15/48 | 200 | 239 |
| | FedEx Corp. | 4.950% | 10/17/48 | 250 | 340 |
| | FedEx Corp. | 5.250% | 5/15/50 | 250 | 353 |
| | FedEx Corp. | 4.500% | 2/1/65 | 60 | 69 |
| 2 | FedEx Corp. Class AA Series 2020-1 Pass Through Trust | 1.875% | 8/20/35 | 500 | 510 |
| | Flowserve Corp. | 3.500% | 9/15/22 | 250 | 259 |
| | Flowserve Corp. | 4.000% | 11/15/23 | 50 | 53 |
| | Flowserve Corp. | 3.500% | 10/1/30 | 90 | 96 |
| | Fortive Corp. | 3.150% | 6/15/26 | 150 | 167 |
| | Fortive Corp. | 4.300% | 6/15/46 | 100 | 123 |
| | General Dynamics Corp. | 3.375% | 5/15/23 | 200 | 214 |
| | General Dynamics Corp. | 1.875% | 8/15/23 | 300 | 311 |
| | General Dynamics Corp. | 2.375% | 11/15/24 | 320 | 341 |
| | General Dynamics Corp. | 3.250% | 4/1/25 | 150 | 165 |
| | General Dynamics Corp. | 3.500% | 5/15/25 | 200 | 223 |
| | General Dynamics Corp. | 3.500% | 4/1/27 | 100 | 114 |
| | General Dynamics Corp. | 2.625% | 11/15/27 | 200 | 218 |
| | General Dynamics Corp. | 3.750% | 5/15/28 | 200 | 234 |
| | General Dynamics Corp. | 3.625% | 4/1/30 | 200 | 237 |
| | General Dynamics Corp. | 4.250% | 4/1/40 | 150 | 194 |
| | General Dynamics Corp. | 3.600% | 11/15/42 | 100 | 122 |
| | General Dynamics Corp. | 4.250% | 4/1/50 | 140 | 189 |
| | General Electric Co. | 3.150% | 9/7/22 | 91 | 95 |
| | General Electric Co. | 3.100% | 1/9/23 | 574 | 603 |
| | General Electric Co. | 3.450% | 5/15/24 | 100 | 109 |
| | General Electric Co. | 3.450% | 5/1/27 | 200 | 225 |
| | General Electric Co. | 6.750% | 3/15/32 | 705 | 990 |
| | General Electric Co. | 6.150% | 8/7/37 | 161 | 220 |
| | General Electric Co. | 5.875% | 1/14/38 | 560 | 758 |
| | General Electric Co. | 6.875% | 1/10/39 | 338 | 495 |
| | General Electric Co. | 4.250% | 5/1/40 | 300 | 354 |
| | General Electric Co. | 4.125% | 10/9/42 | 153 | 178 |
| | General Electric Co. | 4.500% | 3/11/44 | 438 | 535 |
| | General Electric Co. | 4.350% | 5/1/50 | 725 | 878 |
| | | | Coupon | Maturity
Date | Face
Amount
($000) | Market
Value•
($000) |
| | Hexcel Corp. | 4.700% | 8/15/25 | 100 | 112 |
| | Hexcel Corp. | 3.950% | 2/15/27 | 75 | 81 |
| | Honeywell International Inc. | 2.150% | 8/8/22 | 100 | 103 |
| | Honeywell International Inc. | 0.483% | 8/19/22 | 500 | 501 |
| | Honeywell International Inc. | 2.300% | 8/15/24 | 425 | 453 |
| | Honeywell International Inc. | 1.350% | 6/1/25 | 275 | 285 |
| | Honeywell International Inc. | 2.500% | 11/1/26 | 50 | 55 |
| | Honeywell International Inc. | 2.700% | 8/15/29 | 100 | 112 |
| | Honeywell International Inc. | 1.950% | 6/1/30 | 1,000 | 1,055 |
| | Honeywell International Inc. | 5.700% | 3/15/37 | 200 | 285 |
| | Honeywell International Inc. | 5.375% | 3/1/41 | 150 | 216 |
| | Honeywell International Inc. | 2.800% | 6/1/50 | 225 | 246 |
| | Hubbell Inc. | 3.350% | 3/1/26 | 75 | 82 |
| | Hubbell Inc. | 3.150% | 8/15/27 | 50 | 53 |
| | Hubbell Inc. | 3.500% | 2/15/28 | 175 | 191 |
| | Huntington Ingalls Industries Inc. | 3.844% | 5/1/25 | 100 | 111 |
| | Huntington Ingalls Industries Inc. | 3.483% | 12/1/27 | 125 | 140 |
| | Huntington Ingalls Industries Inc. | 4.200% | 5/1/30 | 100 | 118 |
| | IDEX Corp. | 3.000% | 5/1/30 | 75 | 83 |
| | Illinois Tool Works Inc. | 3.500% | 3/1/24 | 200 | 217 |
| | Illinois Tool Works Inc. | 2.650% | 11/15/26 | 300 | 331 |
| | Illinois Tool Works Inc. | 4.875% | 9/15/41 | 75 | 103 |
| | Illinois Tool Works Inc. | 3.900% | 9/1/42 | 250 | 315 |
| | JB Hunt Transport Services Inc. | 3.300% | 8/15/22 | 100 | 104 |
| | JB Hunt Transport Services Inc. | 3.875% | 3/1/26 | 25 | 29 |
| 2 | JetBlue Class A Series 2020-1 Pass Through Trust | 4.000% | 5/15/34 | 150 | 161 |
| 2 | JetBlue Class AA Series 2019-1 Pass Through Trust | 2.750% | 11/15/33 | 144 | 144 |
| | John Deere Capital Corp. | 1.950% | 6/13/22 | 375 | 384 |
| | John Deere Capital Corp. | 2.150% | 9/8/22 | 400 | 413 |
| | John Deere Capital Corp. | 2.700% | 1/6/23 | 100 | 105 |
| | John Deere Capital Corp. | 2.800% | 1/27/23 | 50 | 53 |
| | John Deere Capital Corp. | 2.800% | 3/6/23 | 100 | 105 |
| | John Deere Capital Corp. | 3.450% | 6/7/23 | 200 | 215 |
| | John Deere Capital Corp. | 0.700% | 7/5/23 | 100 | 101 |
| | John Deere Capital Corp. | 3.650% | 10/12/23 | 50 | 55 |
| | John Deere Capital Corp. | 2.600% | 3/7/24 | 75 | 80 |
| | John Deere Capital Corp. | 2.650% | 6/24/24 | 75 | 81 |
| | John Deere Capital Corp. | 2.050% | 1/9/25 | 350 | 371 |
| | John Deere Capital Corp. | 3.450% | 3/13/25 | 300 | 336 |
| | John Deere Capital Corp. | 3.400% | 9/11/25 | 75 | 84 |
| | John Deere Capital Corp. | 2.650% | 6/10/26 | 100 | 110 |
| | John Deere Capital Corp. | 2.250% | 9/14/26 | 125 | 135 |
| | John Deere Capital Corp. | 2.800% | 9/8/27 | 150 | 167 |
| | John Deere Capital Corp. | 3.050% | 1/6/28 | 100 | 112 |
| | John Deere Capital Corp. | 3.450% | 3/7/29 | 50 | 58 |
| | John Deere Capital Corp. | 2.800% | 7/18/29 | 150 | 167 |
| | John Deere Capital Corp. | 2.450% | 1/9/30 | 175 | 191 |
| | Johnson Controls International plc | 3.625% | 7/2/24 | 126 | 137 |
| | Johnson Controls International plc | 3.900% | 2/14/26 | 37 | 42 |
Total Bond Market Index Portfolio
| | | | Coupon | Maturity
Date | Face
Amount
($000) | Market
Value•
($000) |
| | Johnson Controls International plc | 6.000% | 1/15/36 | 39 | 55 |
| | Johnson Controls International plc | 4.625% | 7/2/44 | 175 | 226 |
| | Johnson Controls International plc | 5.125% | 9/14/45 | 14 | 19 |
| | Johnson Controls International plc | 4.500% | 2/15/47 | 100 | 132 |
| | Johnson Controls International plc | 4.950% | 7/2/64 | 72 | 98 |
| | Kansas City Southern | 3.000% | 5/15/23 | 250 | 260 |
| | Kansas City Southern | 2.875% | 11/15/29 | 100 | 108 |
| | Kansas City Southern | 4.300% | 5/15/43 | 75 | 87 |
| | Kansas City Southern | 4.950% | 8/15/45 | 125 | 160 |
| | Kansas City Southern | 4.700% | 5/1/48 | 225 | 284 |
| | Kansas City Southern | 3.500% | 5/1/50 | 100 | 111 |
| | Kennametal Inc. | 3.875% | 2/15/22 | 50 | 51 |
| | Kennametal Inc. | 4.625% | 6/15/28 | 120 | 133 |
| | Keysight Technologies Inc. | 4.550% | 10/30/24 | 195 | 221 |
| | Keysight Technologies Inc. | 4.600% | 4/6/27 | 125 | 149 |
| | Keysight Technologies Inc. | 3.000% | 10/30/29 | 100 | 111 |
| | Kirby Corp. | 4.200% | 3/1/28 | 300 | 331 |
| | L3Harris Technologies Inc. | 3.850% | 6/15/23 | 600 | 647 |
| | L3Harris Technologies Inc. | 3.950% | 5/28/24 | 103 | 113 |
| | L3Harris Technologies Inc. | 3.832% | 4/27/25 | 200 | 224 |
| | L3Harris Technologies Inc. | 3.850% | 12/15/26 | 50 | 58 |
| | L3Harris Technologies Inc. | 4.400% | 6/15/28 | 175 | 209 |
| | L3Harris Technologies Inc. | 4.854% | 4/27/35 | 100 | 131 |
| | L3Harris Technologies Inc. | 6.150% | 12/15/40 | 100 | 149 |
| | L3Harris Technologies Inc. | 5.054% | 4/27/45 | 100 | 139 |
| | Legrand France SA | 8.500% | 2/15/25 | 68 | 89 |
| | Lennox International Inc. | 3.000% | 11/15/23 | 100 | 105 |
| | Lennox International Inc. | 1.700% | 8/1/27 | 50 | 51 |
| | Lockheed Martin Corp. | 3.100% | 1/15/23 | 100 | 105 |
| | Lockheed Martin Corp. | 3.550% | 1/15/26 | 380 | 430 |
| | Lockheed Martin Corp. | 1.850% | 6/15/30 | 179 | 187 |
| | Lockheed Martin Corp. | 3.600% | 3/1/35 | 150 | 181 |
| | Lockheed Martin Corp. | 4.500% | 5/15/36 | 100 | 131 |
| | Lockheed Martin Corp. | 6.150% | 9/1/36 | 375 | 563 |
| | Lockheed Martin Corp. | 4.070% | 12/15/42 | 270 | 348 |
| | Lockheed Martin Corp. | 3.800% | 3/1/45 | 100 | 124 |
| | Lockheed Martin Corp. | 4.700% | 5/15/46 | 275 | 387 |
| | Lockheed Martin Corp. | 2.800% | 6/15/50 | 175 | 189 |
| | Lockheed Martin Corp. | 4.090% | 9/15/52 | 331 | 436 |
| | Norfolk Southern Corp. | 3.000% | 4/1/22 | 225 | 231 |
| | Norfolk Southern Corp. | 2.903% | 2/15/23 | 48 | 50 |
| | Norfolk Southern Corp. | 3.850% | 1/15/24 | 75 | 82 |
| | Norfolk Southern Corp. | 5.590% | 5/17/25 | 50 | 60 |
| | Norfolk Southern Corp. | 3.650% | 8/1/25 | 50 | 56 |
| | Norfolk Southern Corp. | 7.800% | 5/15/27 | 60 | 82 |
| | Norfolk Southern Corp. | 3.150% | 6/1/27 | 125 | 138 |
| | Norfolk Southern Corp. | 3.800% | 8/1/28 | 113 | 132 |
| | Norfolk Southern Corp. | 2.550% | 11/1/29 | 200 | 215 |
| | Norfolk Southern Corp. | 4.837% | 10/1/41 | 113 | 153 |
| | Norfolk Southern Corp. | 4.450% | 6/15/45 | 75 | 97 |
| | Norfolk Southern Corp. | 4.650% | 1/15/46 | 75 | 100 |
| | Norfolk Southern Corp. | 4.150% | 2/28/48 | 25 | 32 |
| | Norfolk Southern Corp. | 4.100% | 5/15/49 | 73 | 92 |
| | Norfolk Southern Corp. | 3.400% | 11/1/49 | 75 | 85 |
| | Norfolk Southern Corp. | 3.050% | 5/15/50 | 350 | 384 |
| | Norfolk Southern Corp. | 4.050% | 8/15/52 | 239 | 303 |
| | Norfolk Southern Corp. | 3.155% | 5/15/55 | 438 | 470 |
| | Northrop Grumman Corp. | 2.550% | 10/15/22 | 200 | 207 |
| | Northrop Grumman Corp. | 3.250% | 8/1/23 | 150 | 161 |
| | Northrop Grumman Corp. | 2.930% | 1/15/25 | 275 | 299 |
| | Northrop Grumman Corp. | 3.200% | 2/1/27 | 150 | 167 |
| | Northrop Grumman Corp. | 3.250% | 1/15/28 | 100 | 112 |
| | Northrop Grumman Corp. | 4.400% | 5/1/30 | 290 | 359 |
| | Northrop Grumman Corp. | 5.150% | 5/1/40 | 100 | 137 |
| | Northrop Grumman Corp. | 5.050% | 11/15/40 | 150 | 205 |
| | | | Coupon | Maturity
Date | Face
Amount
($000) | Market
Value•
($000) |
| | Northrop Grumman Corp. | 4.750% | 6/1/43 | 275 | 365 |
| | Northrop Grumman Corp. | 4.030% | 10/15/47 | 380 | 476 |
| | Northrop Grumman Corp. | 5.250% | 5/1/50 | 310 | 460 |
| | Nvent Finance Sarl | 3.950% | 4/15/23 | 200 | 211 |
| | Nvent Finance Sarl | 4.550% | 4/15/28 | 100 | 109 |
| | Oshkosh Corp. | 4.600% | 5/15/28 | 185 | 218 |
| | Oshkosh Corp. | 3.100% | 3/1/30 | 60 | 65 |
| | Otis Worldwide Corp. | 2.293% | 4/5/27 | 200 | 214 |
| | Otis Worldwide Corp. | 2.565% | 2/15/30 | 400 | 429 |
| | Otis Worldwide Corp. | 3.112% | 2/15/40 | 600 | 654 |
| | Otis Worldwide Corp. | 3.362% | 2/15/50 | 150 | 172 |
| | PACCAR Financial Corp. | 2.850% | 3/1/22 | 100 | 103 |
| | PACCAR Financial Corp. | 2.650% | 5/10/22 | 100 | 103 |
| | PACCAR Financial Corp. | 2.300% | 8/10/22 | 50 | 52 |
| | PACCAR Financial Corp. | 2.000% | 9/26/22 | 50 | 52 |
| | PACCAR Financial Corp. | 3.400% | 8/9/23 | 100 | 108 |
| | PACCAR Financial Corp. | 0.350% | 8/11/23 | 500 | 500 |
| | PACCAR Financial Corp. | 2.150% | 8/15/24 | 75 | 79 |
| | PACCAR Financial Corp. | 1.800% | 2/6/25 | 60 | 63 |
| | Parker-Hannifin Corp. | 3.500% | 9/15/22 | 175 | 184 |
| | Parker-Hannifin Corp. | 2.700% | 6/14/24 | 110 | 118 |
| | Parker-Hannifin Corp. | 3.300% | 11/21/24 | 290 | 317 |
| | Parker-Hannifin Corp. | 3.250% | 3/1/27 | 125 | 139 |
| | Parker-Hannifin Corp. | 3.250% | 6/14/29 | 75 | 85 |
| | Parker-Hannifin Corp. | 6.250% | 5/15/38 | 150 | 218 |
| | Parker-Hannifin Corp. | 4.450% | 11/21/44 | 200 | 255 |
| | Parker-Hannifin Corp. | 4.100% | 3/1/47 | 75 | 93 |
| | Parker-Hannifin Corp. | 4.000% | 6/14/49 | 110 | 138 |
| | Precision Castparts Corp. | 2.500% | 1/15/23 | 200 | 208 |
| | Precision Castparts Corp. | 3.250% | 6/15/25 | 175 | 193 |
| | Precision Castparts Corp. | 3.900% | 1/15/43 | 75 | 87 |
| | Precision Castparts Corp. | 4.375% | 6/15/45 | 200 | 252 |
| | Quanta Services Inc. | 2.900% | 10/1/30 | 400 | 428 |
| | Raytheon Technologies Corp. | 2.800% | 3/15/22 | 170 | 174 |
| | Raytheon Technologies Corp. | 2.500% | 12/15/22 | 275 | 285 |
| | Raytheon Technologies Corp. | 3.650% | 8/16/23 | 16 | 17 |
| | Raytheon Technologies Corp. | 3.200% | 3/15/24 | 175 | 188 |
| | Raytheon Technologies Corp. | 3.950% | 8/16/25 | 617 | 708 |
| | Raytheon Technologies Corp. | 3.500% | 3/15/27 | 300 | 339 |
| | Raytheon Technologies Corp. | 3.125% | 5/4/27 | 225 | 251 |
| | Raytheon Technologies Corp. | 7.200% | 8/15/27 | 25 | 34 |
| | Raytheon Technologies Corp. | 6.700% | 8/1/28 | 75 | 102 |
| | Raytheon Technologies Corp. | 4.125% | 11/16/28 | 750 | 892 |
| | Raytheon Technologies Corp. | 7.500% | 9/15/29 | 125 | 181 |
| | Raytheon Technologies Corp. | 2.250% | 7/1/30 | 300 | 318 |
| | Raytheon Technologies Corp. | 5.400% | 5/1/35 | 150 | 203 |
| | Raytheon Technologies Corp. | 6.050% | 6/1/36 | 100 | 145 |
| | Raytheon Technologies Corp. | 6.125% | 7/15/38 | 100 | 148 |
| | Raytheon Technologies Corp. | 4.450% | 11/16/38 | 175 | 220 |
| | Raytheon Technologies Corp. | 5.700% | 4/15/40 | 100 | 145 |
| | Raytheon Technologies Corp. | 4.700% | 12/15/41 | 50 | 65 |
| | Raytheon Technologies Corp. | 4.500% | 6/1/42 | 675 | 882 |
Total Bond Market Index Portfolio
| | | | Coupon | Maturity
Date | Face
Amount
($000) | Market
Value•
($000) |
| | Raytheon Technologies Corp. | 4.800% | 12/15/43 | 65 | 84 |
| | Raytheon Technologies Corp. | 4.150% | 5/15/45 | 200 | 253 |
| | Raytheon Technologies Corp. | 3.750% | 11/1/46 | 200 | 235 |
| | Raytheon Technologies Corp. | 4.350% | 4/15/47 | 250 | 323 |
| | Raytheon Technologies Corp. | 4.050% | 5/4/47 | 300 | 371 |
| | Raytheon Technologies Corp. | 4.625% | 11/16/48 | 350 | 473 |
| | Raytheon Technologies Corp. | 3.125% | 7/1/50 | 370 | 407 |
| | Republic Services Inc. | 2.500% | 8/15/24 | 200 | 213 |
| | Republic Services Inc. | 0.875% | 11/15/25 | 500 | 502 |
| | Republic Services Inc. | 1.450% | 2/15/31 | 500 | 488 |
| | Republic Services Inc. | 1.750% | 2/15/32 | 175 | 175 |
| | Republic Services Inc. | 6.200% | 3/1/40 | 175 | 259 |
| | Republic Services Inc. | 5.700% | 5/15/41 | 100 | 142 |
| | Rockwell Automation Inc. | 3.500% | 3/1/29 | 100 | 116 |
| | Rockwell Automation Inc. | 4.200% | 3/1/49 | 125 | 167 |
| | Roper Technologies Inc. | 2.800% | 12/15/21 | 200 | 204 |
| | Roper Technologies Inc. | 2.350% | 9/15/24 | 125 | 133 |
| | Roper Technologies Inc. | 1.000% | 9/15/25 | 500 | 503 |
| | Roper Technologies Inc. | 3.850% | 12/15/25 | 100 | 113 |
| | Roper Technologies Inc. | 3.800% | 12/15/26 | 145 | 167 |
| | Roper Technologies Inc. | 1.400% | 9/15/27 | 500 | 503 |
| | Roper Technologies Inc. | 4.200% | 9/15/28 | 175 | 208 |
| | Roper Technologies Inc. | 2.950% | 9/15/29 | 125 | 137 |
| | Roper Technologies Inc. | 2.000% | 6/30/30 | 125 | 127 |
| | Roper Technologies Inc. | 1.750% | 2/15/31 | 500 | 497 |
| | Ryder System Inc. | 2.875% | 6/1/22 | 75 | 77 |
| | Ryder System Inc. | 3.400% | 3/1/23 | 75 | 79 |
| | Ryder System Inc. | 3.750% | 6/9/23 | 225 | 242 |
| | Ryder System Inc. | 3.650% | 3/18/24 | 150 | 164 |
| | Ryder System Inc. | 2.500% | 9/1/24 | 50 | 53 |
| | Ryder System Inc. | 4.625% | 6/1/25 | 193 | 224 |
| | Ryder System Inc. | 2.900% | 12/1/26 | 100 | 110 |
| | Snap-on Inc. | 3.250% | 3/1/27 | 50 | 56 |
| | Snap-on Inc. | 4.100% | 3/1/48 | 75 | 96 |
| | Snap-on Inc. | 3.100% | 5/1/50 | 75 | 84 |
| | Southwest Airlines Co. | 4.750% | 5/4/23 | 250 | 272 |
| | Southwest Airlines Co. | 5.250% | 5/4/25 | 600 | 694 |
| | Southwest Airlines Co. | 3.000% | 11/15/26 | 100 | 107 |
| | Southwest Airlines Co. | 5.125% | 6/15/27 | 775 | 920 |
| | Southwest Airlines Co. | 3.450% | 11/16/27 | 50 | 54 |
| | Southwest Airlines Co. | 2.625% | 2/10/30 | 100 | 102 |
| 2 | Southwest Airlines Co. Series 2007-1 Pass Through Trust | 6.150% | 2/1/24 | 14 | 14 |
| 2 | Spirit Airlines Series 2015-1A Pass Through Trust | 4.100% | 10/1/29 | 18 | 16 |
| | Stanley Black & Decker Inc. | 3.400% | 3/1/26 | 100 | 113 |
| | Stanley Black & Decker Inc. | 4.250% | 11/15/28 | 100 | 122 |
| | Stanley Black & Decker Inc. | 2.300% | 3/15/30 | 375 | 401 |
| | Stanley Black & Decker Inc. | 5.200% | 9/1/40 | 75 | 104 |
| | Stanley Black & Decker Inc. | 4.850% | 11/15/48 | 100 | 139 |
| | Stanley Black & Decker Inc. | 4.000% | 3/15/60 | 400 | 427 |
| | Textron Inc. | 3.875% | 3/1/25 | 65 | 71 |
| | Textron Inc. | 4.000% | 3/15/26 | 200 | 226 |
| | Textron Inc. | 3.650% | 3/15/27 | 250 | 277 |
| | Textron Inc. | 3.375% | 3/1/28 | 50 | 55 |
| | Textron Inc. | 3.900% | 9/17/29 | 225 | 256 |
| | | | Coupon | Maturity
Date | Face
Amount
($000) | Market
Value•
($000) |
| | Timken Co. | 3.875% | 9/1/24 | 100 | 107 |
| | Timken Co. | 4.500% | 12/15/28 | 25 | 28 |
| | Trane Technologies Global Holding Co Ltd. | 4.250% | 6/15/23 | 125 | 136 |
| | Trane Technologies Global Holding Co Ltd. | 5.750% | 6/15/43 | 125 | 180 |
| | Trane Technologies Luxembourg Finance SA | 3.550% | 11/1/24 | 375 | 414 |
| | Trane Technologies Luxembourg Finance SA | 3.500% | 3/21/26 | 75 | 85 |
| | Trane Technologies Luxembourg Finance SA | 3.800% | 3/21/29 | 225 | 263 |
| | Trane Technologies Luxembourg Finance SA | 4.500% | 3/21/49 | 75 | 98 |
| | Trimble Inc. | 4.150% | 6/15/23 | 50 | 54 |
| | Trimble Inc. | 4.750% | 12/1/24 | 93 | 106 |
| | Trimble Inc. | 4.900% | 6/15/28 | 50 | 60 |
| | Tyco Electronics Group SA | 3.500% | 2/3/22 | 100 | 103 |
| | Tyco Electronics Group SA | 3.450% | 8/1/24 | 125 | 136 |
| | Tyco Electronics Group SA | 3.125% | 8/15/27 | 200 | 222 |
| | Tyco Electronics Group SA | 7.125% | 10/1/37 | 125 | 188 |
| | Union Pacific Corp. | 2.950% | 3/1/22 | 100 | 103 |
| | Union Pacific Corp. | 4.163% | 7/15/22 | 534 | 560 |
| | Union Pacific Corp. | 2.950% | 1/15/23 | 25 | 26 |
| | Union Pacific Corp. | 3.500% | 6/8/23 | 150 | 161 |
| | Union Pacific Corp. | 3.646% | 2/15/24 | 50 | 54 |
| | Union Pacific Corp. | 3.150% | 3/1/24 | 100 | 108 |
| | Union Pacific Corp. | 3.250% | 1/15/25 | 206 | 225 |
| | Union Pacific Corp. | 3.750% | 7/15/25 | 560 | 635 |
| | Union Pacific Corp. | 3.250% | 8/15/25 | 50 | 55 |
| | Union Pacific Corp. | 2.750% | 3/1/26 | 75 | 82 |
| | Union Pacific Corp. | 2.150% | 2/5/27 | 90 | 95 |
| | Union Pacific Corp. | 3.950% | 9/10/28 | 300 | 356 |
| | Union Pacific Corp. | 3.700% | 3/1/29 | 200 | 232 |
| | Union Pacific Corp. | 2.400% | 2/5/30 | 200 | 215 |
| | Union Pacific Corp. | 3.375% | 2/1/35 | 100 | 114 |
| | Union Pacific Corp. | 3.600% | 9/15/37 | 290 | 336 |
| | Union Pacific Corp. | 4.375% | 9/10/38 | 250 | 311 |
| | Union Pacific Corp. | 4.050% | 11/15/45 | 150 | 183 |
| | Union Pacific Corp. | 3.250% | 2/5/50 | 200 | 226 |
| | Union Pacific Corp. | 3.799% | 10/1/51 | 560 | 682 |
| | Union Pacific Corp. | 3.875% | 2/1/55 | 100 | 122 |
| | Union Pacific Corp. | 3.950% | 8/15/59 | 100 | 122 |
| | Union Pacific Corp. | 3.839% | 3/20/60 | 386 | 476 |
| 5 | Union Pacific Corp. | 2.973% | 9/16/62 | 325 | 339 |
| | Union Pacific Corp. | 4.375% | 11/15/65 | 135 | 179 |
| | Union Pacific Corp. | 3.750% | 2/5/70 | 150 | 182 |
| 2 | United Airlines Class A Series 2013-1 Pass Through Trust | 4.300% | 2/15/27 | 53 | 53 |
| 2 | United Airlines Class A Series 2014-1 Pass Through Trust | 4.000% | 10/11/27 | 70 | 69 |
| | United Airlines Class A Series 2015-1 Pass Through Trust | 3.700% | 6/1/24 | 60 | 59 |
| 2 | United Airlines Class A Series 2016-1 Pass Through Trust | 3.450% | 1/7/30 | 42 | 41 |
| 2 | United Airlines Class A Series 2016-2 Pass Through Trust | 3.100% | 4/7/30 | 42 | 39 |
| 2 | United Airlines Class A Series 2020-1 Pass Through Trust | 5.875% | 4/15/29 | 590 | 637 |
| 2 | United Airlines Class AA Series 2015-1 Pass Through Trust | 3.450% | 6/1/29 | 137 | 135 |
Total Bond Market Index Portfolio
| | | | Coupon | Maturity
Date | Face
Amount
($000) | Market
Value•
($000) |
| 2 | United Airlines Class AA Series 2016-1 Pass Through Trust | 3.100% | 1/7/30 | 337 | 339 |
| 2 | United Airlines Class AA Series 2016-2 Pass Through Trust | 2.875% | 4/7/30 | 63 | 62 |
| 2 | United Airlines Class AA Series 2019-1 Pass Through Trust | 4.150% | 2/25/33 | 173 | 178 |
| 2 | United Airlines Class AA Series 2019-2 Pass Through Trust | 2.700% | 11/1/33 | 99 | 94 |
| | United Parcel Service Inc. | 2.450% | 10/1/22 | 175 | 181 |
| | United Parcel Service Inc. | 2.500% | 4/1/23 | 200 | 209 |
| | United Parcel Service Inc. | 2.800% | 11/15/24 | 186 | 201 |
| | United Parcel Service Inc. | 2.400% | 11/15/26 | 150 | 163 |
| | United Parcel Service Inc. | 3.050% | 11/15/27 | 200 | 226 |
| | United Parcel Service Inc. | 3.400% | 3/15/29 | 100 | 115 |
| | United Parcel Service Inc. | 2.500% | 9/1/29 | 100 | 109 |
| | United Parcel Service Inc. | 6.200% | 1/15/38 | 173 | 271 |
| | United Parcel Service Inc. | 5.200% | 4/1/40 | 255 | 362 |
| | United Parcel Service Inc. | 4.875% | 11/15/40 | 75 | 103 |
| | United Parcel Service Inc. | 3.625% | 10/1/42 | 100 | 120 |
| | United Parcel Service Inc. | 3.400% | 11/15/46 | 110 | 132 |
| | United Parcel Service Inc. | 4.250% | 3/15/49 | 125 | 168 |
| | United Parcel Service Inc. | 3.400% | 9/1/49 | 250 | 302 |
| | United Parcel Service Inc. | 5.300% | 4/1/50 | 400 | 598 |
| | Valmont Industries Inc. | 5.000% | 10/1/44 | 150 | 175 |
| | Valmont Industries Inc. | 5.250% | 10/1/54 | 75 | 89 |
| | Waste Connections Inc. | 4.250% | 12/1/28 | 100 | 119 |
| | Waste Connections Inc. | 3.500% | 5/1/29 | 200 | 227 |
| | Waste Connections Inc. | 2.600% | 2/1/30 | 139 | 149 |
| | Waste Connections Inc. | 3.050% | 4/1/50 | 75 | 80 |
| | Waste Management Inc. | 2.900% | 9/15/22 | 100 | 104 |
| | Waste Management Inc. | 2.400% | 5/15/23 | 225 | 235 |
| | Waste Management Inc. | 3.500% | 5/15/24 | 200 | 218 |
| | Waste Management Inc. | 3.125% | 3/1/25 | 150 | 164 |
| | Waste Management Inc. | 0.750% | 11/15/25 | 500 | 502 |
| | Waste Management Inc. | 3.150% | 11/15/27 | 125 | 141 |
| | Waste Management Inc. | 3.900% | 3/1/35 | 250 | 304 |
| | Waste Management Inc. | 4.100% | 3/1/45 | 150 | 188 |
| | Waste Management Inc. | 4.150% | 7/15/49 | 200 | 266 |
| | Westinghouse Air Brake Technologies Corp. | 4.400% | 3/15/24 | 275 | 301 |
| | Westinghouse Air Brake Technologies Corp. | 3.200% | 6/15/25 | 60 | 65 |
| | Westinghouse Air Brake Technologies Corp. | 3.450% | 11/15/26 | 150 | 165 |
| | Westinghouse Air Brake Technologies Corp. | 4.950% | 9/15/28 | 175 | 207 |
| | WW Grainger Inc. | 1.850% | 2/15/25 | 75 | 79 |
| | WW Grainger Inc. | 4.600% | 6/15/45 | 200 | 268 |
| | WW Grainger Inc. | 3.750% | 5/15/46 | 75 | 89 |
| | WW Grainger Inc. | 4.200% | 5/15/47 | 75 | 95 |
| | Xylem Inc. | 3.250% | 11/1/26 | 100 | 112 |
| | Xylem Inc. | 1.950% | 1/30/28 | 100 | 104 |
| | Xylem Inc. | 2.250% | 1/30/31 | 100 | 105 |
| | Xylem Inc. | 4.375% | 11/1/46 | 100 | 122 |
| | | | | | | 120,441 |
| Materials (0.9%) |
| | Air Products and Chemicals Inc. | 3.350% | 7/31/24 | 500 | 545 |
| | Air Products and Chemicals Inc. | 2.050% | 5/15/30 | 200 | 213 |
| | Air Products and Chemicals Inc. | 2.700% | 5/15/40 | 200 | 214 |
| | Air Products and Chemicals Inc. | 2.800% | 5/15/50 | 400 | 437 |
| | Albemarle Corp. | 4.150% | 12/1/24 | 132 | 146 |
| | Albemarle Corp. | 5.450% | 12/1/44 | 75 | 90 |
| | | | Coupon | Maturity
Date | Face
Amount
($000) | Market
Value•
($000) |
| | AngloGold Ashanti Holdings plc | 3.750% | 10/1/30 | 200 | 214 |
| | Avery Dennison Corp. | 4.875% | 12/6/28 | 75 | 92 |
| | Avery Dennison Corp. | 2.650% | 4/30/30 | 200 | 214 |
| | Barrick Gold Corp. | 6.450% | 10/15/35 | 75 | 102 |
| | Barrick North America Finance LLC | 5.700% | 5/30/41 | 450 | 639 |
| | Barrick North America Finance LLC | 5.750% | 5/1/43 | 150 | 216 |
| | Barrick PD Australia Finance Pty Ltd. | 5.950% | 10/15/39 | 50 | 72 |
| | Bemis Co. Inc. | 3.100% | 9/15/26 | 50 | 54 |
| | Bemis Co. Inc. | 2.630% | 6/19/30 | 125 | 135 |
| 5 | Berry Global Inc. | 1.570% | 1/15/26 | 200 | 201 |
| | BHP Billiton Finance USA Ltd. | 2.875% | 2/24/22 | 176 | 181 |
| | BHP Billiton Finance USA Ltd. | 3.850% | 9/30/23 | 50 | 55 |
| | BHP Billiton Finance USA Ltd. | 4.125% | 2/24/42 | 150 | 195 |
| | BHP Billiton Finance USA Ltd. | 5.000% | 9/30/43 | 575 | 841 |
| | Cabot Corp. | 4.000% | 7/1/29 | 55 | 59 |
| | Carlisle Cos. Inc. | 3.750% | 11/15/22 | 75 | 79 |
| | Carlisle Cos. Inc. | 3.500% | 12/1/24 | 50 | 55 |
| | Carlisle Cos. Inc. | 3.750% | 12/1/27 | 125 | 142 |
| | Carlisle Cos. Inc. | 2.750% | 3/1/30 | 150 | 160 |
| | Celanese US Holdings LLC | 3.500% | 5/8/24 | 100 | 108 |
| | Celulosa Arauco y Constitucion SA | 3.875% | 11/2/27 | 300 | 332 |
| | Celulosa Arauco y Constitucion SA | 5.500% | 11/2/47 | 200 | 240 |
| | CRH America Inc. | 5.750% | 1/15/21 | 75 | 75 |
| | Dow Chemical Co. | 3.500% | 10/1/24 | 182 | 199 |
| | Dow Chemical Co. | 4.550% | 11/30/25 | 150 | 175 |
| | Dow Chemical Co. | 4.800% | 11/30/28 | 225 | 276 |
| | Dow Chemical Co. | 2.100% | 11/15/30 | 500 | 510 |
| | Dow Chemical Co. | 4.250% | 10/1/34 | 150 | 180 |
| | Dow Chemical Co. | 9.400% | 5/15/39 | 350 | 623 |
| | Dow Chemical Co. | 5.250% | 11/15/41 | 100 | 131 |
| | Dow Chemical Co. | 4.625% | 10/1/44 | 200 | 250 |
| | Dow Chemical Co. | 5.550% | 11/30/48 | 100 | 143 |
| | Dow Chemical Co. | 3.600% | 11/15/50 | 500 | 558 |
| | DuPont de Nemours Inc. | 2.169% | 5/1/23 | 200 | 203 |
| | DuPont de Nemours Inc. | 4.205% | 11/15/23 | 475 | 524 |
| | DuPont de Nemours Inc. | 4.493% | 11/15/25 | 350 | 409 |
| | DuPont de Nemours Inc. | 4.725% | 11/15/28 | 425 | 520 |
| | DuPont de Nemours Inc. | 5.319% | 11/15/38 | 300 | 405 |
| | DuPont de Nemours Inc. | 5.419% | 11/15/48 | 475 | 686 |
| | Eastman Chemical Co. | 3.600% | 8/15/22 | 49 | 51 |
| | Eastman Chemical Co. | 3.800% | 3/15/25 | 285 | 316 |
| | Eastman Chemical Co. | 4.800% | 9/1/42 | 225 | 284 |
| | Eastman Chemical Co. | 4.650% | 10/15/44 | 150 | 189 |
| | Ecolab Inc. | 2.375% | 8/10/22 | 470 | 484 |
| | Ecolab Inc. | 2.700% | 11/1/26 | 200 | 222 |
| | Ecolab Inc. | 3.250% | 12/1/27 | 100 | 113 |
| | Ecolab Inc. | 4.800% | 3/24/30 | 300 | 382 |
| | Ecolab Inc. | 1.300% | 1/30/31 | 500 | 494 |
| | Ecolab Inc. | 3.950% | 12/1/47 | 100 | 127 |
| | EI du Pont de Nemours and Co. | 1.700% | 7/15/25 | 100 | 104 |
| | EI du Pont de Nemours and Co. | 2.300% | 7/15/30 | 100 | 106 |
| | Fibria Overseas Finance Ltd. | 5.250% | 5/12/24 | 200 | 220 |
| | Fibria Overseas Finance Ltd. | 4.000% | 1/14/25 | 150 | 161 |
| | FMC Corp. | 3.950% | 2/1/22 | 50 | 51 |
| | FMC Corp. | 4.100% | 2/1/24 | 250 | 272 |
| | FMC Corp. | 3.200% | 10/1/26 | 50 | 56 |
Total Bond Market Index Portfolio
| | | | Coupon | Maturity
Date | Face
Amount
($000) | Market
Value•
($000) |
| | FMC Corp. | 3.450% | 10/1/29 | 100 | 114 |
| | FMC Corp. | 4.500% | 10/1/49 | 100 | 130 |
| | Georgia-Pacific LLC | 8.000% | 1/15/24 | 250 | 306 |
| | Georgia-Pacific LLC | 7.375% | 12/1/25 | 100 | 130 |
| | Georgia-Pacific LLC | 8.875% | 5/15/31 | 250 | 404 |
| | International Flavors & Fragrances Inc. | 3.200% | 5/1/23 | 25 | 26 |
| | International Flavors & Fragrances Inc. | 4.450% | 9/26/28 | 50 | 59 |
| | International Flavors & Fragrances Inc. | 4.375% | 6/1/47 | 90 | 110 |
| | International Flavors & Fragrances Inc. | 5.000% | 9/26/48 | 100 | 134 |
| | International Paper Co. | 3.800% | 1/15/26 | 28 | 32 |
| | International Paper Co. | 5.000% | 9/15/35 | 100 | 131 |
| | International Paper Co. | 7.300% | 11/15/39 | 100 | 159 |
| | International Paper Co. | 4.800% | 6/15/44 | 200 | 266 |
| | International Paper Co. | 5.150% | 5/15/46 | 200 | 275 |
| | International Paper Co. | 4.400% | 8/15/47 | 200 | 258 |
| | International Paper Co. | 4.350% | 8/15/48 | 200 | 262 |
| | Kinross Gold Corp. | 5.950% | 3/15/24 | 75 | 86 |
| | Kinross Gold Corp. | 4.500% | 7/15/27 | 25 | 29 |
| | Linde Inc. | 2.450% | 2/15/22 | 450 | 458 |
| | Linde Inc. | 2.200% | 8/15/22 | 200 | 205 |
| | Linde Inc. | 2.650% | 2/5/25 | 147 | 159 |
| | Linde Inc. | 3.550% | 11/7/42 | 50 | 60 |
| | LYB International Finance BV | 5.250% | 7/15/43 | 200 | 259 |
| | LYB International Finance II BV | 3.500% | 3/2/27 | 200 | 223 |
| | LYB International Finance III LLC | 2.875% | 5/1/25 | 100 | 108 |
| | LYB International Finance III LLC | 1.250% | 10/1/25 | 500 | 507 |
| | LYB International Finance III LLC | 3.375% | 5/1/30 | 100 | 111 |
| | LYB International Finance III LLC | 4.200% | 10/15/49 | 135 | 157 |
| | LYB International Finance III LLC | 3.625% | 4/1/51 | 500 | 540 |
| | LyondellBasell Industries NV | 5.750% | 4/15/24 | 175 | 201 |
| | LyondellBasell Industries NV | 4.625% | 2/26/55 | 425 | 511 |
| | Martin Marietta Materials Inc. | 4.250% | 7/2/24 | 100 | 111 |
| | Martin Marietta Materials Inc. | 3.450% | 6/1/27 | 50 | 56 |
| | Martin Marietta Materials Inc. | 3.500% | 12/15/27 | 100 | 113 |
| | Martin Marietta Materials Inc. | 2.500% | 3/15/30 | 100 | 107 |
| | Martin Marietta Materials Inc. | 4.250% | 12/15/47 | 175 | 209 |
| | Mosaic Co. | 3.250% | 11/15/22 | 225 | 235 |
| | Mosaic Co. | 4.250% | 11/15/23 | 175 | 191 |
| | Mosaic Co. | 4.050% | 11/15/27 | 200 | 226 |
| | Mosaic Co. | 5.450% | 11/15/33 | 100 | 124 |
| | Mosaic Co. | 4.875% | 11/15/41 | 50 | 58 |
| | Mosaic Co. | 5.625% | 11/15/43 | 100 | 129 |
| | Newmont Corp. | 3.700% | 3/15/23 | 37 | 39 |
| | Newmont Corp. | 2.800% | 10/1/29 | 150 | 164 |
| | Newmont Corp. | 2.250% | 10/1/30 | 200 | 210 |
| | Newmont Corp. | 5.875% | 4/1/35 | 100 | 146 |
| | Newmont Corp. | 6.250% | 10/1/39 | 225 | 339 |
| | Newmont Corp. | 5.450% | 6/9/44 | 300 | 426 |
| | Nucor Corp. | 4.125% | 9/15/22 | 100 | 105 |
| | Nucor Corp. | 2.000% | 6/1/25 | 100 | 106 |
| | Nucor Corp. | 3.950% | 5/1/28 | 100 | 118 |
| | Nucor Corp. | 2.700% | 6/1/30 | 100 | 110 |
| 5 | Nucor Corp. | 2.979% | 12/15/55 | 400 | 417 |
| | | | Coupon | Maturity
Date | Face
Amount
($000) | Market
Value•
($000) |
| | Nutrien Ltd. | 3.500% | 6/1/23 | 299 | 318 |
| | Nutrien Ltd. | 3.375% | 3/15/25 | 250 | 275 |
| | Nutrien Ltd. | 3.000% | 4/1/25 | 250 | 270 |
| | Nutrien Ltd. | 4.000% | 12/15/26 | 50 | 58 |
| | Nutrien Ltd. | 2.950% | 5/13/30 | 175 | 193 |
| | Nutrien Ltd. | 4.125% | 3/15/35 | 250 | 297 |
| | Nutrien Ltd. | 5.625% | 12/1/40 | 275 | 380 |
| | Nutrien Ltd. | 6.125% | 1/15/41 | 25 | 36 |
| | Nutrien Ltd. | 4.900% | 6/1/43 | 50 | 64 |
| | Nutrien Ltd. | 5.250% | 1/15/45 | 200 | 275 |
| | Nutrien Ltd. | 5.000% | 4/1/49 | 100 | 138 |
| | Owens Corning | 3.400% | 8/15/26 | 200 | 221 |
| | Owens Corning | 3.950% | 8/15/29 | 100 | 115 |
| | Owens Corning | 3.875% | 6/1/30 | 50 | 58 |
| | Owens Corning | 4.300% | 7/15/47 | 200 | 240 |
| | Owens Corning | 4.400% | 1/30/48 | 75 | 90 |
| | Packaging Corp. of America | 4.500% | 11/1/23 | 350 | 385 |
| | Packaging Corp. of America | 3.400% | 12/15/27 | 100 | 112 |
| | Packaging Corp. of America | 3.000% | 12/15/29 | 140 | 155 |
| | Packaging Corp. of America | 4.050% | 12/15/49 | 90 | 111 |
| | PPG Industries Inc. | 2.400% | 8/15/24 | 200 | 212 |
| | PPG Industries Inc. | 2.550% | 6/15/30 | 300 | 321 |
| | Praxair Inc. | 1.100% | 8/10/30 | 500 | 494 |
| | Reliance Steel & Aluminum Co. | 4.500% | 4/15/23 | 100 | 108 |
| | Reliance Steel & Aluminum Co. | 1.300% | 8/15/25 | 300 | 305 |
| | Reliance Steel & Aluminum Co. | 2.150% | 8/15/30 | 300 | 308 |
| | Rio Tinto Alcan Inc. | 6.125% | 12/15/33 | 225 | 343 |
| | Rio Tinto Finance USA Ltd. | 3.750% | 6/15/25 | 317 | 358 |
| | Rio Tinto Finance USA Ltd. | 7.125% | 7/15/28 | 75 | 106 |
| | Rio Tinto Finance USA Ltd. | 5.200% | 11/2/40 | 125 | 182 |
| | Rio Tinto Finance USA plc | 4.750% | 3/22/42 | 150 | 211 |
| | Rio Tinto Finance USA plc | 4.125% | 8/21/42 | 250 | 323 |
| | Rohm and Haas Co. | 7.850% | 7/15/29 | 250 | 346 |
| | RPM International Inc. | 3.450% | 11/15/22 | 100 | 103 |
| | RPM International Inc. | 3.750% | 3/15/27 | 50 | 55 |
| | RPM International Inc. | 4.250% | 1/15/48 | 200 | 221 |
| | Sherwin-Williams Co. | 2.750% | 6/1/22 | 12 | 12 |
| | Sherwin-Williams Co. | 3.125% | 6/1/24 | 325 | 351 |
| | Sherwin-Williams Co. | 3.450% | 8/1/25 | 225 | 247 |
| | Sherwin-Williams Co. | 3.950% | 1/15/26 | 200 | 228 |
| | Sherwin-Williams Co. | 3.450% | 6/1/27 | 100 | 113 |
| | Sherwin-Williams Co. | 2.950% | 8/15/29 | 200 | 220 |
| | Sherwin-Williams Co. | 2.300% | 5/15/30 | 100 | 105 |
| | Sherwin-Williams Co. | 4.000% | 12/15/42 | 100 | 119 |
| | Sherwin-Williams Co. | 4.550% | 8/1/45 | 90 | 116 |
| | Sherwin-Williams Co. | 4.500% | 6/1/47 | 250 | 335 |
| | Sherwin-Williams Co. | 3.800% | 8/15/49 | 100 | 122 |
| | Sherwin-Williams Co. | 3.300% | 5/15/50 | 100 | 112 |
| | Sonoco Products Co. | 3.125% | 5/1/30 | 105 | 116 |
| | Sonoco Products Co. | 5.750% | 11/1/40 | 220 | 299 |
| | Southern Copper Corp. | 3.500% | 11/8/22 | 400 | 420 |
| | Southern Copper Corp. | 3.875% | 4/23/25 | ��� 50 | 55 |
| | Southern Copper Corp. | 7.500% | 7/27/35 | 100 | 152 |
| | Southern Copper Corp. | 6.750% | 4/16/40 | 325 | 492 |
| | Southern Copper Corp. | 5.875% | 4/23/45 | 500 | 726 |
| | Steel Dynamics Inc. | 2.800% | 12/15/24 | 50 | 54 |
| | Steel Dynamics Inc. | 2.400% | 6/15/25 | 100 | 106 |
| | Steel Dynamics Inc. | 3.450% | 4/15/30 | 125 | 140 |
| | Steel Dynamics Inc. | 3.250% | 1/15/31 | 100 | 112 |
| | Steel Dynamics Inc. | 3.250% | 10/15/50 | 300 | 313 |
Total Bond Market Index Portfolio
| | | | Coupon | Maturity
Date | Face
Amount
($000) | Market
Value•
($000) |
| | Suzano Austria GmbH | 6.000% | 1/15/29 | 400 | 482 |
| | Suzano Austria GmbH | 5.000% | 1/15/30 | 200 | 227 |
| | Suzano Austria GmbH | 3.750% | 1/15/31 | 200 | 213 |
| | Syngenta Finance NV | 3.125% | 3/28/22 | 100 | 101 |
| | Teck Resources Ltd. | 3.900% | 7/15/30 | 100 | 111 |
| | Teck Resources Ltd. | 6.125% | 10/1/35 | 150 | 193 |
| | Teck Resources Ltd. | 6.000% | 8/15/40 | 50 | 63 |
| | Teck Resources Ltd. | 6.250% | 7/15/41 | 325 | 414 |
| | Vale Overseas Ltd. | 6.250% | 8/10/26 | 300 | 372 |
| | Vale Overseas Ltd. | 3.750% | 7/8/30 | 100 | 112 |
| | Vale Overseas Ltd. | 8.250% | 1/17/34 | 50 | 77 |
| | Vale Overseas Ltd. | 6.875% | 11/21/36 | 410 | 601 |
| | Vale Overseas Ltd. | 6.875% | 11/10/39 | 450 | 668 |
| | Vale SA | 5.625% | 9/11/42 | 75 | 100 |
| | Vulcan Materials Co. | 4.500% | 4/1/25 | 200 | 228 |
| | Vulcan Materials Co. | 3.500% | 6/1/30 | 150 | 172 |
| | Vulcan Materials Co. | 4.500% | 6/15/47 | 125 | 154 |
| | Westlake Chemical Corp. | 3.600% | 8/15/26 | 300 | 337 |
| | Westlake Chemical Corp. | 3.375% | 6/15/30 | 100 | 110 |
| | Westlake Chemical Corp. | 5.000% | 8/15/46 | 200 | 259 |
| | WestRock MWV LLC | 7.950% | 2/15/31 | 250 | 354 |
| | WestRock RKT LLC | 4.900% | 3/1/22 | 100 | 105 |
| | WRKCo Inc. | 3.000% | 9/15/24 | 250 | 269 |
| | WRKCo Inc. | 4.650% | 3/15/26 | 100 | 118 |
| | WRKCo Inc. | 3.375% | 9/15/27 | 250 | 279 |
| | WRKCo Inc. | 4.900% | 3/15/29 | 200 | 247 |
| | WRKCo Inc. | 3.000% | 6/15/33 | 100 | 110 |
| | | | | | | 45,007 |
| Real Estate (1.1%) |
| | Alexandria Real Estate Equities Inc. | 4.000% | 1/15/24 | 175 | 193 |
| | Alexandria Real Estate Equities Inc. | 3.450% | 4/30/25 | 254 | 282 |
| | Alexandria Real Estate Equities Inc. | 3.800% | 4/15/26 | 50 | 58 |
| | Alexandria Real Estate Equities Inc. | 3.950% | 1/15/28 | 50 | 58 |
| | Alexandria Real Estate Equities Inc. | 4.500% | 7/30/29 | 100 | 122 |
| | Alexandria Real Estate Equities Inc. | 2.750% | 12/15/29 | 200 | 218 |
| | Alexandria Real Estate Equities Inc. | 4.700% | 7/1/30 | 125 | 155 |
| | Alexandria Real Estate Equities Inc. | 4.900% | 12/15/30 | 124 | 158 |
| | Alexandria Real Estate Equities Inc. | 3.375% | 8/15/31 | 150 | 171 |
| | Alexandria Real Estate Equities Inc. | 1.875% | 2/1/33 | 500 | 499 |
| | Alexandria Real Estate Equities Inc. | 4.850% | 4/15/49 | 50 | 70 |
| | Alexandria Real Estate Equities Inc. | 4.000% | 2/1/50 | 125 | 156 |
| | American Campus Communities Operating Partnership LP | 3.750% | 4/15/23 | 75 | 79 |
| | American Campus Communities Operating Partnership LP | 4.125% | 7/1/24 | 100 | 109 |
| | American Campus Communities Operating Partnership LP | 3.300% | 7/15/26 | 50 | 54 |
| | American Campus Communities Operating Partnership LP | 3.625% | 11/15/27 | 75 | 82 |
| | American Campus Communities Operating Partnership LP | 2.850% | 2/1/30 | 70 | 73 |
| | American Homes 4 Rent LP | 4.900% | 2/15/29 | 100 | 121 |
| | American Tower Corp. | 2.250% | 1/15/22 | 125 | 127 |
| | | | Coupon | Maturity
Date | Face
Amount
($000) | Market
Value•
($000) |
| | American Tower Corp. | 3.500% | 1/31/23 | 200 | 212 |
| | American Tower Corp. | 5.000% | 2/15/24 | 100 | 113 |
| | American Tower Corp. | 3.375% | 5/15/24 | 200 | 217 |
| | American Tower Corp. | 2.950% | 1/15/25 | 100 | 108 |
| | American Tower Corp. | 4.000% | 6/1/25 | 138 | 156 |
| | American Tower Corp. | 3.375% | 10/15/26 | 200 | 224 |
| | American Tower Corp. | 2.750% | 1/15/27 | 500 | 541 |
| | American Tower Corp. | 3.125% | 1/15/27 | 125 | 137 |
| | American Tower Corp. | 1.500% | 1/31/28 | 500 | 502 |
| | American Tower Corp. | 3.950% | 3/15/29 | 140 | 162 |
| | American Tower Corp. | 3.800% | 8/15/29 | 475 | 550 |
| | American Tower Corp. | 2.900% | 1/15/30 | 145 | 158 |
| | American Tower Corp. | 2.100% | 6/15/30 | 150 | 154 |
| | American Tower Corp. | 1.875% | 10/15/30 | 500 | 504 |
| | American Tower Corp. | 3.700% | 10/15/49 | 200 | 227 |
| | American Tower Corp. | 3.100% | 6/15/50 | 150 | 154 |
| | AvalonBay Communities Inc. | 2.850% | 3/15/23 | 25 | 26 |
| | AvalonBay Communities Inc. | 4.200% | 12/15/23 | 400 | 441 |
| | AvalonBay Communities Inc. | 3.450% | 6/1/25 | 100 | 111 |
| | AvalonBay Communities Inc. | 2.950% | 5/11/26 | 150 | 166 |
| | AvalonBay Communities Inc. | 2.900% | 10/15/26 | 50 | 55 |
| | AvalonBay Communities Inc. | 3.350% | 5/15/27 | 75 | 84 |
| | AvalonBay Communities Inc. | 3.200% | 1/15/28 | 75 | 84 |
| | AvalonBay Communities Inc. | 3.300% | 6/1/29 | 100 | 114 |
| | AvalonBay Communities Inc. | 3.900% | 10/15/46 | 50 | 61 |
| | AvalonBay Communities Inc. | 4.350% | 4/15/48 | 60 | 78 |
| | Boston Properties LP | 3.850% | 2/1/23 | 225 | 239 |
| | Boston Properties LP | 3.125% | 9/1/23 | 275 | 291 |
| | Boston Properties LP | 3.200% | 1/15/25 | 111 | 121 |
| | Boston Properties LP | 3.650% | 2/1/26 | 100 | 113 |
| | Boston Properties LP | 2.750% | 10/1/26 | 50 | 54 |
| | Boston Properties LP | 3.400% | 6/21/29 | 400 | 446 |
| | Boston Properties LP | 2.900% | 3/15/30 | 400 | 426 |
| | Brandywine Operating Partnership LP | 3.950% | 2/15/23 | 700 | 725 |
| | Brandywine Operating Partnership LP | 3.950% | 11/15/27 | 100 | 107 |
| | Brixmor Operating Partnership LP | 3.650% | 6/15/24 | 50 | 54 |
| | Brixmor Operating Partnership LP | 3.850% | 2/1/25 | 125 | 137 |
| | Brixmor Operating Partnership LP | 4.125% | 6/15/26 | 200 | 227 |
| | Brixmor Operating Partnership LP | 3.900% | 3/15/27 | 75 | 83 |
| | Brixmor Operating Partnership LP | 4.125% | 5/15/29 | 533 | 611 |
| | Brixmor Operating Partnership LP | 4.050% | 7/1/30 | 250 | 287 |
| | Camden Property Trust | 4.100% | 10/15/28 | 60 | 71 |
| | Camden Property Trust | 3.150% | 7/1/29 | 50 | 56 |
| | Camden Property Trust | 2.800% | 5/15/30 | 765 | 845 |
| | Camden Property Trust | 3.350% | 11/1/49 | 120 | 138 |
| | CBRE Services Inc. | 4.875% | 3/1/26 | 125 | 147 |
| | CC Holdings GS V LLC / Crown Castle GS III Corp. | 3.849% | 4/15/23 | 250 | 268 |
| | Columbia Property Trust Operating Partnership LP | 4.150% | 4/1/25 | 243 | 256 |
Total Bond Market Index Portfolio
| | | | Coupon | Maturity
Date | Face
Amount
($000) | Market
Value•
($000) |
| | Columbia Property Trust Operating Partnership LP | 3.650% | 8/15/26 | 25 | 26 |
| | Corporate Office Properties LP | 3.600% | 5/15/23 | 150 | 158 |
| | Crown Castle International Corp. | 5.250% | 1/15/23 | 125 | 137 |
| | Crown Castle International Corp. | 3.150% | 7/15/23 | 150 | ��� 160 |
| | Crown Castle International Corp. | 3.200% | 9/1/24 | 250 | 272 |
| | Crown Castle International Corp. | 1.350% | 7/15/25 | 100 | 102 |
| | Crown Castle International Corp. | 4.450% | 2/15/26 | 250 | 289 |
| | Crown Castle International Corp. | 3.700% | 6/15/26 | 175 | 197 |
| | Crown Castle International Corp. | 3.650% | 9/1/27 | 325 | 366 |
| | Crown Castle International Corp. | 3.800% | 2/15/28 | 425 | 487 |
| | Crown Castle International Corp. | 3.100% | 11/15/29 | 100 | 109 |
| | Crown Castle International Corp. | 3.300% | 7/1/30 | 115 | 128 |
| | Crown Castle International Corp. | 2.250% | 1/15/31 | 200 | 207 |
| | Crown Castle International Corp. | 4.750% | 5/15/47 | 95 | 121 |
| | Crown Castle International Corp. | 5.200% | 2/15/49 | 75 | 102 |
| | Crown Castle International Corp. | 4.150% | 7/1/50 | 100 | 120 |
| | Crown Castle International Corp. | 3.250% | 1/15/51 | 200 | 207 |
| | CubeSmart LP | 4.375% | 12/15/23 | 100 | 109 |
| | CubeSmart LP | 4.000% | 11/15/25 | 50 | 56 |
| | CubeSmart LP | 3.125% | 9/1/26 | 100 | 110 |
| | CubeSmart LP | 4.375% | 2/15/29 | 50 | 59 |
| | CubeSmart LP | 2.000% | 2/15/31 | 75 | 75 |
| | CyrusOne LP / CyrusOne Finance Corp. | 2.900% | 11/15/24 | 120 | 128 |
| | CyrusOne LP / CyrusOne Finance Corp. | 3.450% | 11/15/29 | 275 | 296 |
| | Digital Realty Trust LP | 4.450% | 7/15/28 | 370 | 444 |
| | Digital Realty Trust LP | 3.600% | 7/1/29 | 175 | 200 |
| | Duke Realty LP | 3.250% | 6/30/26 | 175 | 193 |
| | Duke Realty LP | 3.375% | 12/15/27 | 160 | 180 |
| | Duke Realty LP | 4.000% | 9/15/28 | 50 | 59 |
| | Duke Realty LP | 2.875% | 11/15/29 | 70 | 77 |
| | Duke Realty LP | 1.750% | 7/1/30 | 200 | 202 |
| | Equinix Inc. | 2.625% | 11/18/24 | 200 | 214 |
| | Equinix Inc. | 1.250% | 7/15/25 | 100 | 102 |
| | Equinix Inc. | 1.000% | 9/15/25 | 500 | 499 |
| | Equinix Inc. | 2.900% | 11/18/26 | 100 | 110 |
| | Equinix Inc. | 1.800% | 7/15/27 | 100 | 103 |
| | Equinix Inc. | 1.550% | 3/15/28 | 500 | 504 |
| | Equinix Inc. | 3.200% | 11/18/29 | 250 | 275 |
| | Equinix Inc. | 2.150% | 7/15/30 | 250 | 254 |
| | Equinix Inc. | 3.000% | 7/15/50 | 100 | 101 |
| | ERP Operating LP | 4.625% | 12/15/21 | 129 | 133 |
| | ERP Operating LP | 3.000% | 4/15/23 | 125 | 131 |
| | ERP Operating LP | 3.375% | 6/1/25 | 125 | 138 |
| | ERP Operating LP | 2.850% | 11/1/26 | 50 | 55 |
| | ERP Operating LP | 3.500% | 3/1/28 | 100 | 114 |
| | ERP Operating LP | 4.150% | 12/1/28 | 70 | 83 |
| | ERP Operating LP | 3.000% | 7/1/29 | 75 | 84 |
| | ERP Operating LP | 2.500% | 2/15/30 | 150 | 162 |
| | ERP Operating LP | 4.500% | 7/1/44 | 150 | 196 |
| | ERP Operating LP | 4.500% | 6/1/45 | 25 | 33 |
| | ERP Operating LP | 4.000% | 8/1/47 | 100 | 124 |
| | | | Coupon | Maturity
Date | Face
Amount
($000) | Market
Value•
($000) |
| | Essex Portfolio LP | 3.250% | 5/1/23 | 25 | 26 |
| | Essex Portfolio LP | 3.875% | 5/1/24 | 50 | 55 |
| | Essex Portfolio LP | 3.500% | 4/1/25 | 166 | 184 |
| | Essex Portfolio LP | 3.375% | 4/15/26 | 100 | 112 |
| | Essex Portfolio LP | 3.625% | 5/1/27 | 100 | 113 |
| | Essex Portfolio LP | 4.000% | 3/1/29 | 100 | 117 |
| | Essex Portfolio LP | 3.000% | 1/15/30 | 110 | 122 |
| | Essex Portfolio LP | 2.650% | 3/15/32 | 105 | 112 |
| | Essex Portfolio LP | 4.500% | 3/15/48 | 120 | 155 |
| | Federal Realty Investment Trust | 2.750% | 6/1/23 | 25 | 26 |
| | Federal Realty Investment Trust | 3.250% | 7/15/27 | 50 | 55 |
| | Federal Realty Investment Trust | 3.200% | 6/15/29 | 25 | 27 |
| | Federal Realty Investment Trust | 4.500% | 12/1/44 | 150 | 179 |
| | GLP Capital LP / GLP Financing II Inc. | 5.375% | 11/1/23 | 100 | 109 |
| | GLP Capital LP / GLP Financing II Inc. | 3.350% | 9/1/24 | 75 | 79 |
| | GLP Capital LP / GLP Financing II Inc. | 5.250% | 6/1/25 | 200 | 225 |
| | GLP Capital LP / GLP Financing II Inc. | 5.375% | 4/15/26 | 175 | 201 |
| | GLP Capital LP / GLP Financing II Inc. | 5.750% | 6/1/28 | 25 | 30 |
| | GLP Capital LP / GLP Financing II Inc. | 5.300% | 1/15/29 | 275 | 319 |
| | GLP Capital LP / GLP Financing II Inc. | 4.000% | 1/15/30 | 175 | 190 |
| | Healthcare Realty Trust Inc. | 3.625% | 1/15/28 | 100 | 113 |
| | Healthcare Trust of America Holdings LP | 3.500% | 8/1/26 | 130 | 147 |
| | Healthcare Trust of America Holdings LP | 3.750% | 7/1/27 | 100 | 113 |
| | Healthcare Trust of America Holdings LP | 3.100% | 2/15/30 | 100 | 109 |
| | Healthcare Trust of America Holdings LP | 2.000% | 3/15/31 | 500 | 499 |
| | Healthpeak Properties Inc. | 4.250% | 11/15/23 | 9 | 10 |
| | Healthpeak Properties Inc. | 4.200% | 3/1/24 | 125 | 137 |
| | Healthpeak Properties Inc. | 3.400% | 2/1/25 | 152 | 168 |
| | Healthpeak Properties Inc. | 3.250% | 7/15/26 | 25 | 28 |
| | Healthpeak Properties Inc. | 3.500% | 7/15/29 | 125 | 141 |
| | Healthpeak Properties Inc. | 3.000% | 1/15/30 | 800 | 876 |
| | Healthpeak Properties Inc. | 6.750% | 2/1/41 | 100 | 147 |
| | Highwoods Realty LP | 4.125% | 3/15/28 | 75 | 85 |
| | Highwoods Realty LP | 4.200% | 4/15/29 | 50 | 57 |
| | Highwoods Realty LP | 2.600% | 2/1/31 | 250 | 254 |
| | Host Hotels & Resorts LP | 3.750% | 10/15/23 | 261 | 275 |
| | Host Hotels & Resorts LP | 3.875% | 4/1/24 | 75 | 79 |
| | Host Hotels & Resorts LP | 3.375% | 12/15/29 | 100 | 102 |
| | Hudson Pacific Properties LP | 3.950% | 11/1/27 | 100 | 110 |
| | Hudson Pacific Properties LP | 4.650% | 4/1/29 | 25 | 29 |
| | Hudson Pacific Properties LP | 3.250% | 1/15/30 | 60 | 64 |
| | Kilroy Realty LP | 3.800% | 1/15/23 | 250 | 263 |
| | Kilroy Realty LP | 3.450% | 12/15/24 | 50 | 54 |
| | Kilroy Realty LP | 4.750% | 12/15/28 | 50 | 59 |
| | Kilroy Realty LP | 4.250% | 8/15/29 | 104 | 120 |
| | Kilroy Realty LP | 3.050% | 2/15/30 | 200 | 213 |
| | Kimco Realty Corp. | 3.400% | 11/1/22 | 150 | 157 |
| | Kimco Realty Corp. | 3.125% | 6/1/23 | 25 | 26 |
| | Kimco Realty Corp. | 3.300% | 2/1/25 | 58 | 63 |
| | Kimco Realty Corp. | 2.800% | 10/1/26 | 125 | 136 |
| | Kimco Realty Corp. | 3.800% | 4/1/27 | 75 | 85 |
| | Kimco Realty Corp. | 1.900% | 3/1/28 | 500 | 513 |
Total Bond Market Index Portfolio
| | | | Coupon | Maturity
Date | Face
Amount
($000) | Market
Value•
($000) |
| | Kimco Realty Corp. | 2.700% | 10/1/30 | 100 | 107 |
| | Kimco Realty Corp. | 4.125% | 12/1/46 | 50 | 54 |
| | Kimco Realty Corp. | 4.450% | 9/1/47 | 50 | 58 |
| | Kite Realty Group LP | 4.000% | 10/1/26 | 200 | 209 |
| | Life Storage LP | 3.500% | 7/1/26 | 125 | 141 |
| | Life Storage LP | 3.875% | 12/15/27 | 150 | 171 |
| | Life Storage LP | 4.000% | 6/15/29 | 25 | 29 |
| | Mid-America Apartments LP | 4.300% | 10/15/23 | 150 | 164 |
| | Mid-America Apartments LP | 3.750% | 6/15/24 | 50 | 54 |
| | Mid-America Apartments LP | 3.600% | 6/1/27 | 250 | 283 |
| | Mid-America Apartments LP | 2.750% | 3/15/30 | 150 | 164 |
| | Mid-America Apartments LP | 1.700% | 2/15/31 | 150 | 149 |
| �� | National Retail Properties Inc. | 3.500% | 10/15/27 | 350 | 384 |
| | National Retail Properties Inc. | 4.300% | 10/15/28 | 25 | 29 |
| | National Retail Properties Inc. | 2.500% | 4/15/30 | 75 | 77 |
| | National Retail Properties Inc. | 4.800% | 10/15/48 | 50 | 62 |
| | National Retail Properties Inc. | 3.100% | 4/15/50 | 50 | 48 |
| | Office Properties Income Trust | 4.150% | 2/1/22 | 100 | 102 |
| | Office Properties Income Trust | 4.000% | 7/15/22 | 100 | 102 |
| | Office Properties Income Trust | 4.250% | 5/15/24 | 100 | 104 |
| | Office Properties Income Trust | 4.500% | 2/1/25 | 50 | 53 |
| | Omega Healthcare Investors Inc. | 4.375% | 8/1/23 | 300 | 325 |
| | Omega Healthcare Investors Inc. | 4.950% | 4/1/24 | 100 | 109 |
| | Omega Healthcare Investors Inc. | 4.500% | 1/15/25 | 100 | 109 |
| | Omega Healthcare Investors Inc. | 5.250% | 1/15/26 | 100 | 114 |
| | Omega Healthcare Investors Inc. | 4.500% | 4/1/27 | 300 | 337 |
| | Omega Healthcare Investors Inc. | 4.750% | 1/15/28 | 70 | 80 |
| | Omega Healthcare Investors Inc. | 3.625% | 10/1/29 | 250 | 266 |
| | Omega Healthcare Investors Inc. | 3.375% | 2/1/31 | 500 | 525 |
| | Physicians Realty LP | 4.300% | 3/15/27 | 100 | 110 |
| | Physicians Realty LP | 3.950% | 1/15/28 | 100 | 108 |
| | Piedmont Operating Partnership LP | 3.400% | 6/1/23 | 75 | 78 |
| | Prologis LP | 2.125% | 4/15/27 | 105 | 113 |
| | Prologis LP | 3.875% | 9/15/28 | 100 | 119 |
| | Prologis LP | 4.375% | 2/1/29 | 200 | 244 |
| | Prologis LP | 2.250% | 4/15/30 | 155 | 166 |
| | Prologis LP | 1.250% | 10/15/30 | 500 | 494 |
| | Prologis LP | 4.375% | 9/15/48 | 75 | 103 |
| | Prologis LP | 3.000% | 4/15/50 | 140 | 154 |
| | Public Storage | 2.370% | 9/15/22 | 55 | 57 |
| | Public Storage | 3.094% | 9/15/27 | 100 | 112 |
| | Public Storage | 3.385% | 5/1/29 | 100 | 114 |
| | Rayonier Inc. | 3.750% | 4/1/22 | 50 | 51 |
| | Realty Income Corp. | 3.250% | 10/15/22 | 175 | 183 |
| | Realty Income Corp. | 4.650% | 8/1/23 | 250 | 274 |
| | Realty Income Corp. | 3.875% | 7/15/24 | 50 | 55 |
| | Realty Income Corp. | 3.875% | 4/15/25 | 225 | 253 |
| | Realty Income Corp. | 4.125% | 10/15/26 | 125 | 147 |
| | Realty Income Corp. | 3.000% | 1/15/27 | 150 | 165 |
| | | | Coupon | Maturity
Date | Face
Amount
($000) | Market
Value•
($000) |
| | Realty Income Corp. | 3.650% | 1/15/28 | 190 | 217 |
| | Realty Income Corp. | 3.250% | 6/15/29 | 150 | 168 |
| | Realty Income Corp. | 3.250% | 1/15/31 | 50 | 57 |
| | Realty Income Corp. | 1.800% | 3/15/33 | 500 | 501 |
| | Realty Income Corp. | 4.650% | 3/15/47 | 175 | 238 |
| | Regency Centers LP | 3.600% | 2/1/27 | 25 | 27 |
| | Regency Centers LP | 4.125% | 3/15/28 | 75 | 86 |
| | Regency Centers LP | 2.950% | 9/15/29 | 100 | 107 |
| | Regency Centers LP | 4.400% | 2/1/47 | 200 | 231 |
| | Regency Centers LP | 4.650% | 3/15/49 | 75 | 90 |
| | Sabra Health Care LP | 4.800% | 6/1/24 | 55 | 59 |
| | Sabra Health Care LP | 5.125% | 8/15/26 | 25 | 28 |
| | Sabra Health Care LP | 3.900% | 10/15/29 | 150 | 156 |
| | Simon Property Group LP | 2.350% | 1/30/22 | 150 | 152 |
| | Simon Property Group LP | 2.625% | 6/15/22 | 100 | 102 |
| | Simon Property Group LP | 2.750% | 2/1/23 | 25 | 26 |
| | Simon Property Group LP | 2.750% | 6/1/23 | 100 | 105 |
| | Simon Property Group LP | 3.750% | 2/1/24 | 150 | 162 |
| | Simon Property Group LP | 2.000% | 9/13/24 | 145 | 150 |
| | Simon Property Group LP | 3.500% | 9/1/25 | 300 | 332 |
| | Simon Property Group LP | 3.300% | 1/15/26 | 195 | 214 |
| | Simon Property Group LP | 3.250% | 11/30/26 | 75 | 83 |
| | Simon Property Group LP | 3.375% | 6/15/27 | 160 | 177 |
| | Simon Property Group LP | 3.375% | 12/1/27 | 100 | 112 |
| | Simon Property Group LP | 2.450% | 9/13/29 | 145 | 152 |
| | Simon Property Group LP | 2.650% | 7/15/30 | 200 | 212 |
| | Simon Property Group LP | 6.750% | 2/1/40 | 125 | 185 |
| | Simon Property Group LP | 4.750% | 3/15/42 | 100 | 122 |
| | Simon Property Group LP | 4.250% | 11/30/46 | 100 | 116 |
| | Simon Property Group LP | 3.250% | 9/13/49 | 200 | 205 |
| | Simon Property Group LP | 3.800% | 7/15/50 | 200 | 222 |
| | SITE Centers Corp. | 3.900% | 8/15/24 | 100 | 100 |
| | SITE Centers Corp. | 3.625% | 2/1/25 | 200 | 208 |
| | SITE Centers Corp. | 4.250% | 2/1/26 | 70 | 76 |
| | SITE Centers Corp. | 4.700% | 6/1/27 | 75 | 81 |
| | SL Green Operating Partnership LP | 3.250% | 10/15/22 | 100 | 103 |
| | Spirit Realty LP | 3.200% | 1/15/27 | 80 | 85 |
| | Spirit Realty LP | 4.000% | 7/15/29 | 60 | 67 |
| | Spirit Realty LP | 3.400% | 1/15/30 | 80 | 86 |
| | STORE Capital Corp. | 4.500% | 3/15/28 | 75 | 85 |
| | STORE Capital Corp. | 4.625% | 3/15/29 | 100 | 115 |
| | Tanger Properties LP | 3.125% | 9/1/26 | 175 | 180 |
| | Tanger Properties LP | 3.875% | 7/15/27 | 50 | 52 |
| | UDR Inc. | 2.950% | 9/1/26 | 150 | 165 |
| | UDR Inc. | 3.500% | 7/1/27 | 150 | 168 |
| | UDR Inc. | 3.500% | 1/15/28 | 250 | 280 |
| | UDR Inc. | 3.200% | 1/15/30 | 60 | 67 |
| | UDR Inc. | 3.000% | 8/15/31 | 65 | 72 |
| | UDR Inc. | 1.900% | 3/15/33 | 200 | 199 |
| | UDR Inc. | 3.100% | 11/1/34 | 65 | 73 |
| | Ventas Realty LP | 3.125% | 6/15/23 | 175 | 185 |
| | Ventas Realty LP | 3.500% | 4/15/24 | 75 | 82 |
| | Ventas Realty LP | 3.750% | 5/1/24 | 200 | 218 |
| | Ventas Realty LP | 2.650% | 1/15/25 | 75 | 80 |
| | Ventas Realty LP | 4.125% | 1/15/26 | 75 | 86 |
| | Ventas Realty LP | 3.250% | 10/15/26 | 75 | 83 |
| | Ventas Realty LP | 3.850% | 4/1/27 | 50 | 56 |
| | Ventas Realty LP | 4.000% | 3/1/28 | 125 | 142 |
| | Ventas Realty LP | 3.000% | 1/15/30 | 100 | 107 |
| | Ventas Realty LP | 4.750% | 11/15/30 | 580 | 708 |
| | Ventas Realty LP | 5.700% | 9/30/43 | 75 | 97 |
| | Ventas Realty LP | 4.375% | 2/1/45 | 60 | 66 |
| | Ventas Realty LP | 4.875% | 4/15/49 | 80 | 99 |
| | VEREIT Operating Partnership LP | 4.600% | 2/6/24 | 75 | 82 |
| | VEREIT Operating Partnership LP | 4.625% | 11/1/25 | 75 | 86 |
Total Bond Market Index Portfolio
| | | | Coupon | Maturity
Date | Face
Amount
($000) | Market
Value•
($000) |
| | VEREIT Operating Partnership LP | 3.950% | 8/15/27 | 450 | 508 |
| | VEREIT Operating Partnership LP | 3.100% | 12/15/29 | 150 | 162 |
| | Vornado Realty LP | 3.500% | 1/15/25 | 100 | 106 |
| | Washington REIT | 3.950% | 10/15/22 | 75 | 77 |
| | Weingarten Realty Investors | 3.375% | 10/15/22 | 50 | 52 |
| | Weingarten Realty Investors | 3.500% | 4/15/23 | 100 | 104 |
| | Welltower Inc. | 3.625% | 3/15/24 | 195 | 213 |
| | Welltower Inc. | 4.000% | 6/1/25 | 380 | 429 |
| | Welltower Inc. | 4.250% | 4/1/26 | 150 | 175 |
| | Welltower Inc. | 2.700% | 2/15/27 | 300 | 330 |
| | Welltower Inc. | 4.250% | 4/15/28 | 125 | 145 |
| | Welltower Inc. | 4.125% | 3/15/29 | 250 | 290 |
| | Welltower Inc. | 2.750% | 1/15/31 | 250 | 266 |
| | Welltower Inc. | 6.500% | 3/15/41 | 25 | 35 |
| | Welltower Inc. | 4.950% | 9/1/48 | 75 | 97 |
| | Weyerhaeuser Co. | 8.500% | 1/15/25 | 50 | 64 |
| | Weyerhaeuser Co. | 4.000% | 11/15/29 | 150 | 176 |
| | Weyerhaeuser Co. | 4.000% | 4/15/30 | 200 | 236 |
| | Weyerhaeuser Co. | 7.375% | 3/15/32 | 100 | 150 |
| | Weyerhaeuser Co. | 6.875% | 12/15/33 | 50 | 71 |
| | WP Carey Inc. | 4.600% | 4/1/24 | 125 | 139 |
| | WP Carey Inc. | 4.000% | 2/1/25 | 50 | 55 |
| | WP Carey Inc. | 4.250% | 10/1/26 | 75 | 86 |
| | WP Carey Inc. | 3.850% | 7/15/29 | 50 | 57 |
| | | | | | | 51,050 |
| Technology (2.7%) |
| | Adobe Inc. | 1.700% | 2/1/23 | 100 | 103 |
| | Adobe Inc. | 1.900% | 2/1/25 | 20 | 21 |
| | Adobe Inc. | 3.250% | 2/1/25 | 175 | 193 |
| | Adobe Inc. | 2.150% | 2/1/27 | 180 | 194 |
| | Adobe Inc. | 2.300% | 2/1/30 | 260 | 280 |
| | Altera Corp. | 4.100% | 11/15/23 | 75 | 83 |
| | Amdocs Ltd. | 2.538% | 6/15/30 | 200 | 210 |
| | Analog Devices Inc. | 2.875% | 6/1/23 | 450 | 473 |
| | Analog Devices Inc. | 3.125% | 12/5/23 | 75 | 81 |
| | Analog Devices Inc. | 2.950% | 4/1/25 | 85 | 93 |
| | Analog Devices Inc. | 3.500% | 12/5/26 | 200 | 227 |
| | Apple Inc. | 2.150% | 2/9/22 | 225 | 230 |
| | Apple Inc. | 2.500% | 2/9/22 | 300 | 307 |
| | Apple Inc. | 2.300% | 5/11/22 | 200 | 205 |
| | Apple Inc. | 2.700% | 5/13/22 | 250 | 258 |
| | Apple Inc. | 2.100% | 9/12/22 | 200 | 206 |
| | Apple Inc. | 2.850% | 2/23/23 | 342 | 359 |
| | Apple Inc. | 2.400% | 5/3/23 | 865 | 907 |
| | Apple Inc. | 0.750% | 5/11/23 | 400 | 405 |
| | Apple Inc. | 3.000% | 2/9/24 | 325 | 350 |
| | Apple Inc. | 3.450% | 5/6/24 | 75 | 83 |
| | Apple Inc. | 2.850% | 5/11/24 | 1,243 | 1,340 |
| | Apple Inc. | 1.800% | 9/11/24 | 150 | 157 |
| | Apple Inc. | 2.750% | 1/13/25 | 575 | 623 |
| | Apple Inc. | 1.125% | 5/11/25 | 900 | 924 |
| | Apple Inc. | 0.550% | 8/20/25 | 500 | 501 |
| | Apple Inc. | 3.250% | 2/23/26 | 705 | 791 |
| | Apple Inc. | 2.450% | 8/4/26 | 1,450 | 1,580 |
| | Apple Inc. | 3.200% | 5/11/27 | 775 | 877 |
| | Apple Inc. | 2.900% | 9/12/27 | 655 | 733 |
| | Apple Inc. | 2.200% | 9/11/29 | 350 | 377 |
| | Apple Inc. | 1.250% | 8/20/30 | 500 | 499 |
| | Apple Inc. | 4.500% | 2/23/36 | 225 | 302 |
| | Apple Inc. | 3.850% | 5/4/43 | 450 | 571 |
| | Apple Inc. | 4.450% | 5/6/44 | 200 | 274 |
| | Apple Inc. | 3.450% | 2/9/45 | 225 | 272 |
| | Apple Inc. | 4.375% | 5/13/45 | 500 | 684 |
| | Apple Inc. | 4.650% | 2/23/46 | 910 | 1,305 |
| | Apple Inc. | 3.850% | 8/4/46 | 375 | 482 |
| | | | Coupon | Maturity
Date | Face
Amount
($000) | Market
Value•
($000) |
| | Apple Inc. | 4.250% | 2/9/47 | 200 | 272 |
| | Apple Inc. | 3.750% | 9/12/47 | 525 | 656 |
| | Apple Inc. | 3.750% | 11/13/47 | 450 | 568 |
| | Apple Inc. | 2.650% | 5/11/50 | 515 | 545 |
| | Apple Inc. | 2.400% | 8/20/50 | 500 | 511 |
| | Apple Inc. | 2.550% | 8/20/60 | 500 | 512 |
| | Applied Materials Inc. | 3.900% | 10/1/25 | 145 | 166 |
| | Applied Materials Inc. | 3.300% | 4/1/27 | 225 | 256 |
| | Applied Materials Inc. | 1.750% | 6/1/30 | 200 | 207 |
| | Applied Materials Inc. | 5.100% | 10/1/35 | 100 | 139 |
| | Applied Materials Inc. | 5.850% | 6/15/41 | 125 | 197 |
| | Applied Materials Inc. | 4.350% | 4/1/47 | 175 | 242 |
| | Applied Materials Inc. | 2.750% | 6/1/50 | 200 | 217 |
| | Arrow Electronics Inc. | 3.500% | 4/1/22 | 75 | 77 |
| | Arrow Electronics Inc. | 4.500% | 3/1/23 | 50 | 54 |
| | Arrow Electronics Inc. | 3.250% | 9/8/24 | 171 | 184 |
| | Arrow Electronics Inc. | 4.000% | 4/1/25 | 50 | 55 |
| | Arrow Electronics Inc. | 3.875% | 1/12/28 | 100 | 113 |
| | Autodesk Inc. | 3.600% | 12/15/22 | 25 | 26 |
| | Autodesk Inc. | 4.375% | 6/15/25 | 100 | 114 |
| | Autodesk Inc. | 3.500% | 6/15/27 | 75 | 85 |
| | Autodesk Inc. | 2.850% | 1/15/30 | 75 | 83 |
| | Automatic Data Processing Inc. | 3.375% | 9/15/25 | 200 | 225 |
| | Automatic Data Processing Inc. | 1.250% | 9/1/30 | 400 | 395 |
| | Avnet Inc. | 4.875% | 12/1/22 | 170 | 181 |
| | Avnet Inc. | 4.625% | 4/15/26 | 100 | 113 |
| | Broadcom Corp. / Broadcom Cayman Finance Ltd. | 2.650% | 1/15/23 | 250 | 260 |
| | Broadcom Corp. / Broadcom Cayman Finance Ltd. | 3.625% | 1/15/24 | 450 | 486 |
| | Broadcom Corp. / Broadcom Cayman Finance Ltd. | 3.125% | 1/15/25 | 480 | 518 |
| | Broadcom Corp. / Broadcom Cayman Finance Ltd. | 3.875% | 1/15/27 | 925 | 1,040 |
| | Broadcom Corp. / Broadcom Cayman Finance Ltd. | 3.500% | 1/15/28 | 200 | 220 |
| | Broadcom Inc. | 3.125% | 10/15/22 | 250 | 261 |
| | Broadcom Inc. | 2.250% | 11/15/23 | 200 | 209 |
| | Broadcom Inc. | 3.625% | 10/15/24 | 186 | 204 |
| | Broadcom Inc. | 4.700% | 4/15/25 | 500 | 573 |
| | Broadcom Inc. | 3.150% | 11/15/25 | 450 | 491 |
| | Broadcom Inc. | 4.250% | 4/15/26 | 500 | 569 |
| | Broadcom Inc. | 3.459% | 9/15/26 | 661 | 731 |
| | Broadcom Inc. | 4.110% | 9/15/28 | 428 | 487 |
| | Broadcom Inc. | 4.750% | 4/15/29 | 545 | 651 |
| | Broadcom Inc. | 5.000% | 4/15/30 | 500 | 605 |
| | Broadcom Inc. | 4.150% | 11/15/30 | 600 | 693 |
| | Broadcom Inc. | 4.300% | 11/15/32 | 400 | 472 |
| | Broadridge Financial Solutions Inc. | 3.400% | 6/27/26 | 100 | 113 |
| | Broadridge Financial Solutions Inc. | 2.900% | 12/1/29 | 75 | 82 |
| | Cadence Design Systems Inc. | 4.375% | 10/15/24 | 100 | 112 |
| | Cisco Systems Inc. | 3.000% | 6/15/22 | 125 | 130 |
| | Cisco Systems Inc. | 2.200% | 9/20/23 | 150 | 157 |
| | Cisco Systems Inc. | 3.625% | 3/4/24 | 875 | 962 |
| | Cisco Systems Inc. | 2.950% | 2/28/26 | 100 | 111 |
| | Cisco Systems Inc. | 2.500% | 9/20/26 | 225 | 247 |
| | Cisco Systems Inc. | 5.500% | 1/15/40 | 800 | 1,198 |
| | Citrix Systems Inc. | 4.500% | 12/1/27 | 50 | 58 |
| | Citrix Systems Inc. | 3.300% | 3/1/30 | 75 | 83 |
| | Corning Inc. | 2.900% | 5/15/22 | 175 | 180 |
| | Corning Inc. | 4.700% | 3/15/37 | 275 | 330 |
Total Bond Market Index Portfolio
| | | | Coupon | Maturity
Date | Face
Amount
($000) | Market
Value•
($000) |
| | Corning Inc. | 5.750% | 8/15/40 | 195 | 261 |
| | Corning Inc. | 3.900% | 11/15/49 | 100 | 121 |
| | Corning Inc. | 4.375% | 11/15/57 | 350 | 432 |
| 5 | Dell International LLC / EMC Corp. | 5.450% | 6/15/23 | ���700 | 773 |
| 5 | Dell International LLC / EMC Corp. | 4.000% | 7/15/24 | 100 | 110 |
| 5 | Dell International LLC / EMC Corp. | 5.850% | 7/15/25 | 200 | 240 |
| 5 | Dell International LLC / EMC Corp. | 6.020% | 6/15/26 | 1,075 | 1,310 |
| 5 | Dell International LLC / EMC Corp. | 4.900% | 10/1/26 | 250 | 295 |
| 5 | Dell International LLC / EMC Corp. | 6.100% | 7/15/27 | 100 | 124 |
| 5 | Dell International LLC / EMC Corp. | 5.300% | 10/1/29 | 325 | 398 |
| 5 | Dell International LLC / EMC Corp. | 6.200% | 7/15/30 | 150 | 195 |
| 5 | Dell International LLC / EMC Corp. | 8.100% | 7/15/36 | 320 | 471 |
| 5 | Dell International LLC / EMC Corp. | 8.350% | 7/15/46 | 425 | 643 |
| | DXC Technology Co. | 4.000% | 4/15/23 | 50 | 53 |
| | DXC Technology Co. | 4.250% | 4/15/24 | 250 | 273 |
| | DXC Technology Co. | 4.125% | 4/15/25 | 100 | 110 |
| | Equifax Inc. | 3.950% | 6/15/23 | 50 | 54 |
| | Equifax Inc. | 2.600% | 12/1/24 | 75 | 80 |
| | Equifax Inc. | 2.600% | 12/15/25 | 100 | 108 |
| | Equifax Inc. | 3.100% | 5/15/30 | 120 | 133 |
| | Fidelity National Information Services Inc. | 3.500% | 4/15/23 | 143 | 152 |
| | Fidelity National Information Services Inc. | 3.875% | 6/5/24 | 150 | 165 |
| | Fidelity National Information Services Inc. | 3.000% | 8/15/26 | 414 | 461 |
| | Fidelity National Information Services Inc. | 3.750% | 5/21/29 | 200 | 234 |
| | Fiserv Inc. | 3.800% | 10/1/23 | 200 | 218 |
| | Fiserv Inc. | 2.750% | 7/1/24 | 400 | 429 |
| | Fiserv Inc. | 3.850% | 6/1/25 | 400 | 452 |
| | Fiserv Inc. | 3.200% | 7/1/26 | 200 | 224 |
| | Fiserv Inc. | 2.250% | 6/1/27 | 300 | 319 |
| | Fiserv Inc. | 4.200% | 10/1/28 | 200 | 237 |
| | Fiserv Inc. | 3.500% | 7/1/29 | 800 | 913 |
| | Fiserv Inc. | 2.650% | 6/1/30 | 200 | 216 |
| | Fiserv Inc. | 4.400% | 7/1/49 | 415 | 556 |
| | Flex Ltd. | 4.750% | 6/15/25 | 26 | 30 |
| | Flex Ltd. | 4.875% | 6/15/29 | 50 | 59 |
| | FLIR Systems Inc. | 2.500% | 8/1/30 | 100 | 105 |
| | Global Payments Inc. | 3.750% | 6/1/23 | 250 | 268 |
| | Global Payments Inc. | 4.000% | 6/1/23 | 100 | 108 |
| | Global Payments Inc. | 2.650% | 2/15/25 | 337 | 361 |
| | Global Payments Inc. | 4.800% | 4/1/26 | 150 | 178 |
| | Global Payments Inc. | 3.200% | 8/15/29 | 310 | 344 |
| | Global Payments Inc. | 2.900% | 5/15/30 | 200 | 217 |
| | Global Payments Inc. | 4.150% | 8/15/49 | 200 | 245 |
| | Hewlett Packard Enterprise Co. | 4.400% | 10/15/22 | 350 | 372 |
| | Hewlett Packard Enterprise Co. | 2.250% | 4/1/23 | 200 | 208 |
| | Hewlett Packard Enterprise Co. | 4.450% | 10/2/23 | 300 | 330 |
| | Hewlett Packard Enterprise Co. | 1.450% | 4/1/24 | 150 | 154 |
| | Hewlett Packard Enterprise Co. | 4.650% | 10/1/24 | 200 | 227 |
| | | | Coupon | Maturity
Date | Face
Amount
($000) | Market
Value•
($000) |
| | Hewlett Packard Enterprise Co. | 4.900% | 10/15/25 | 500 | 585 |
| | Hewlett Packard Enterprise Co. | 1.750% | 4/1/26 | 150 | 155 |
| | Hewlett Packard Enterprise Co. | 6.200% | 10/15/35 | 150 | 193 |
| | Hewlett Packard Enterprise Co. | 6.350% | 10/15/45 | 375 | 495 |
| | HP Inc. | 4.050% | 9/15/22 | 100 | 106 |
| | HP Inc. | 2.200% | 6/17/25 | 300 | 318 |
| | HP Inc. | 3.000% | 6/17/27 | 350 | 386 |
| | HP Inc. | 3.400% | 6/17/30 | 500 | 554 |
| | HP Inc. | 6.000% | 9/15/41 | 100 | 130 |
| | IBM Credit LLC | 2.200% | 9/8/22 | 100 | 103 |
| | IBM Credit LLC | 3.000% | 2/6/23 | 150 | 158 |
| | IHS Markit Ltd. | 3.625% | �� 5/1/24 | 100 | 109 |
| | IHS Markit Ltd. | 4.750% | 8/1/28 | 140 | 172 |
| | IHS Markit Ltd. | 4.250% | 5/1/29 | 100 | 120 |
| | Intel Corp. | 3.100% | 7/29/22 | 175 | 183 |
| | Intel Corp. | 2.700% | 12/15/22 | 404 | 423 |
| | Intel Corp. | 2.875% | 5/11/24 | 1,050 | 1,130 |
| | Intel Corp. | 3.400% | 3/25/25 | 300 | 332 |
| | Intel Corp. | 3.700% | 7/29/25 | 450 | 507 |
| | Intel Corp. | 2.600% | 5/19/26 | 210 | 229 |
| | Intel Corp. | 3.750% | 3/25/27 | 400 | 463 |
| | Intel Corp. | 2.450% | 11/15/29 | 375 | 404 |
| | Intel Corp. | 3.900% | 3/25/30 | 345 | 413 |
| | Intel Corp. | 4.000% | 12/15/32 | 150 | 185 |
| | Intel Corp. | 4.600% | 3/25/40 | 150 | 197 |
| | Intel Corp. | 4.800% | 10/1/41 | 162 | 220 |
| | Intel Corp. | 4.250% | 12/15/42 | 150 | 192 |
| | Intel Corp. | 4.100% | 5/19/46 | 250 | 319 |
| | Intel Corp. | 4.100% | 5/11/47 | 200 | 255 |
| | Intel Corp. | 3.734% | 12/8/47 | 674 | 807 |
| | Intel Corp. | 3.250% | 11/15/49 | 300 | 335 |
| | Intel Corp. | 4.750% | 3/25/50 | 400 | 558 |
| | Intel Corp. | 3.100% | 2/15/60 | 200 | 216 |
| | Intel Corp. | 4.950% | 3/25/60 | 155 | 229 |
| | International Business Machines Corp. | 2.850% | 5/13/22 | 500 | 518 |
| | International Business Machines Corp. | 1.875% | 8/1/22 | 675 | 692 |
| | International Business Machines Corp. | 2.875% | 11/9/22 | 240 | 252 |
| | International Business Machines Corp. | 3.375% | 8/1/23 | 450 | 485 |
| | International Business Machines Corp. | 3.625% | 2/12/24 | 450 | 493 |
| | International Business Machines Corp. | 3.000% | 5/15/24 | 600 | 649 |
| | International Business Machines Corp. | 7.000% | 10/30/25 | 300 | 388 |
| | International Business Machines Corp. | 3.450% | 2/19/26 | 285 | 322 |
| | International Business Machines Corp. | 3.300% | 5/15/26 | 700 | 790 |
| | International Business Machines Corp. | 1.700% | 5/15/27 | 265 | 275 |
| | International Business Machines Corp. | 6.220% | 8/1/27 | 75 | 98 |
| | International Business Machines Corp. | 6.500% | 1/15/28 | 75 | 100 |
| | International Business Machines Corp. | 3.500% | 5/15/29 | 750 | 867 |
| | International Business Machines Corp. | 1.950% | 5/15/30 | 265 | 272 |
| | International Business Machines Corp. | 4.150% | 5/15/39 | 400 | 505 |
| | International Business Machines Corp. | 5.600% | 11/30/39 | 148 | 216 |
Total Bond Market Index Portfolio
| | | | Coupon | Maturity
Date | Face
Amount
($000) | Market
Value•
($000) |
| | International Business Machines Corp. | 2.850% | 5/15/40 | 265 | 282 |
| | International Business Machines Corp. | 4.000% | 6/20/42 | 358 | 442 |
| | International Business Machines Corp. | 4.250% | 5/15/49 | 500 | 652 |
| | International Business Machines Corp. | 2.950% | 5/15/50 | 265 | 282 |
| | Intuit Inc. | 0.650% | 7/15/23 | 100 | 101 |
| | Intuit Inc. | 0.950% | 7/15/25 | 100 | 101 |
| | Intuit Inc. | 1.350% | 7/15/27 | 100 | 102 |
| | Intuit Inc. | 1.650% | 7/15/30 | 100 | 103 |
| | Jabil Inc. | 3.950% | 1/12/28 | 100 | 113 |
| | Jabil Inc. | 3.600% | 1/15/30 | 100 | 111 |
| | Jabil Inc. | 3.000% | 1/15/31 | 150 | 160 |
| | Juniper Networks Inc. | 3.750% | 8/15/29 | 500 | 572 |
| | Juniper Networks Inc. | 5.950% | 3/15/41 | 25 | 33 |
| | KLA Corp. | 4.650% | 11/1/24 | 250 | 284 |
| | KLA Corp. | 4.100% | 3/15/29 | 150 | 179 |
| | KLA Corp. | 5.000% | 3/15/49 | 75 | 104 |
| | KLA Corp. | 3.300% | 3/1/50 | 50 | 56 |
| | Lam Research Corp. | 3.800% | 3/15/25 | 145 | 162 |
| | Lam Research Corp. | 3.750% | 3/15/26 | 150 | 172 |
| | Lam Research Corp. | 4.000% | 3/15/29 | 200 | 239 |
| | Lam Research Corp. | 1.900% | 6/15/30 | 250 | 259 |
| | Lam Research Corp. | 4.875% | 3/15/49 | 125 | 181 |
| | Lam Research Corp. | 2.875% | 6/15/50 | 150 | 161 |
| | Lam Research Corp. | 3.125% | 6/15/60 | 100 | 111 |
| 5 | Leidos Inc. | 2.950% | 5/15/23 | 95 | 100 |
| 5 | Leidos Inc. | 3.625% | 5/15/25 | 100 | 112 |
| 5 | Leidos Inc. | 4.375% | 5/15/30 | 150 | 179 |
| 5 | Leidos Inc. | 2.300% | 2/15/31 | 200 | 204 |
| | Marvell Technology Group Ltd. | 4.200% | 6/22/23 | 100 | 108 |
| | Marvell Technology Group Ltd. | 4.875% | 6/22/28 | 100 | 118 |
| | Mastercard Inc. | 3.375% | 4/1/24 | 300 | 328 |
| | Mastercard Inc. | 2.000% | 3/3/25 | 400 | 424 |
| | Mastercard Inc. | 2.950% | 11/21/26 | 100 | 112 |
| | Mastercard Inc. | 3.300% | 3/26/27 | 200 | 228 |
| | Mastercard Inc. | 2.950% | 6/1/29 | 275 | 309 |
| | Mastercard Inc. | 3.350% | 3/26/30 | 300 | 349 |
| | Mastercard Inc. | 3.950% | 2/26/48 | 100 | 129 |
| | Mastercard Inc. | 3.650% | 6/1/49 | 250 | 309 |
| | Mastercard Inc. | 3.850% | 3/26/50 | 400 | 514 |
| | Maxim Integrated Products Inc. | 3.375% | 3/15/23 | 75 | 79 |
| | Maxim Integrated Products Inc. | 3.450% | 6/15/27 | 100 | 112 |
| | Microchip Technology Inc. | 4.333% | 6/1/23 | 100 | 108 |
| | Micron Technology Inc. | 4.640% | 2/6/24 | 50 | 56 |
| | Micron Technology Inc. | 4.975% | 2/6/26 | 100 | 118 |
| | Micron Technology Inc. | 4.185% | 2/15/27 | 200 | 237 |
| | Micron Technology Inc. | 5.327% | 2/6/29 | 150 | 187 |
| | Micron Technology Inc. | 4.663% | 2/15/30 | 100 | 122 |
| | Microsoft Corp. | 2.400% | 2/6/22 | 620 | 634 |
| | Microsoft Corp. | 2.375% | 2/12/22 | 450 | 460 |
| | Microsoft Corp. | 2.650% | 11/3/22 | 200 | 208 |
| | Microsoft Corp. | 2.375% | 5/1/23 | 75 | 78 |
| | Microsoft Corp. | 2.000% | 8/8/23 | 300 | 313 |
| | Microsoft Corp. | 2.875% | 2/6/24 | 500 | 537 |
| | Microsoft Corp. | 3.125% | 11/3/25 | 1,132 | 1,265 |
| | Microsoft Corp. | 2.400% | 8/8/26 | 805 | 877 |
| | Microsoft Corp. | 3.300% | 2/6/27 | 675 | 768 |
| | Microsoft Corp. | 3.500% | 2/12/35 | 325 | 399 |
| | Microsoft Corp. | 4.200% | 11/3/35 | 375 | 492 |
| | Microsoft Corp. | 3.450% | 8/8/36 | 425 | 523 |
| | Microsoft Corp. | 4.100% | 2/6/37 | 500 | 652 |
| | Microsoft Corp. | 3.500% | 11/15/42 | 330 | 403 |
| | Microsoft Corp. | 3.700% | 8/8/46 | 1,635 | 2,062 |
| | | | Coupon | Maturity
Date | Face
Amount
($000) | Market
Value•
($000) |
| | Microsoft Corp. | 4.250% | 2/6/47 | 300 | 424 |
| | Microsoft Corp. | 2.525% | 6/1/50 | 1,478 | 1,553 |
| | Microsoft Corp. | 4.000% | 2/12/55 | 525 | 720 |
| | Microsoft Corp. | 3.950% | 8/8/56 | 331 | 447 |
| | Microsoft Corp. | 2.675% | 6/1/60 | 594 | 641 |
| | Moody's Corp. | 4.500% | 9/1/22 | 100 | 106 |
| | Moody's Corp. | 4.875% | 2/15/24 | 250 | 280 |
| | Moody's Corp. | 3.250% | 1/15/28 | 200 | 225 |
| | Moody's Corp. | 4.875% | 12/17/48 | 125 | 169 |
| | Moody's Corp. | 3.250% | 5/20/50 | 100 | 109 |
| | Moody's Corp. | 2.550% | 8/18/60 | 300 | 281 |
| | Motorola Solutions Inc. | 4.000% | 9/1/24 | 240 | 268 |
| | Motorola Solutions Inc. | 4.600% | 2/23/28 | 125 | 151 |
| | Motorola Solutions Inc. | 5.500% | 9/1/44 | 75 | 95 |
| | NetApp Inc. | 3.300% | 9/29/24 | 75 | 82 |
| | NetApp Inc. | 1.875% | 6/22/25 | 150 | 157 |
| | NetApp Inc. | 2.375% | 6/22/27 | 100 | 107 |
| | NetApp Inc. | 2.700% | 6/22/30 | 200 | 215 |
| | NVIDIA Corp. | 3.200% | 9/16/26 | 200 | 226 |
| | NVIDIA Corp. | 2.850% | 4/1/30 | 300 | 336 |
| | NVIDIA Corp. | 3.500% | 4/1/40 | 200 | 240 |
| | NVIDIA Corp. | 3.500% | 4/1/50 | 605 | 730 |
| | NVIDIA Corp. | 3.700% | 4/1/60 | 113 | 143 |
| 5 | NXP BV / NXP Funding LLC | 4.875% | 3/1/24 | 200 | 225 |
| 5 | NXP BV / NXP Funding LLC | 5.350% | 3/1/26 | 100 | 121 |
| 5 | NXP BV / NXP Funding LLC | 5.550% | 12/1/28 | 175 | 223 |
| 5 | NXP BV / NXP Funding LLC / NXP USA Inc. | 4.300% | 6/18/29 | 450 | 536 |
| 5 | NXP BV / NXP Funding LLC / NXP USA Inc. | 3.400% | 5/1/30 | 200 | 226 |
| | Oracle Corp. | 2.500% | 5/15/22 | 250 | 257 |
| | Oracle Corp. | 2.400% | 9/15/23 | 750 | 788 |
| | Oracle Corp. | 3.400% | 7/8/24 | 450 | 492 |
| | Oracle Corp. | 2.950% | 11/15/24 | 425 | 461 |
| | Oracle Corp. | 2.500% | 4/1/25 | 919 | 987 |
| | Oracle Corp. | 2.650% | 7/15/26 | 2,361 | 2,581 |
| | Oracle Corp. | 2.800% | 4/1/27 | 500 | 550 |
| | Oracle Corp. | 2.950% | 4/1/30 | 750 | 836 |
| | Oracle Corp. | 4.300% | 7/8/34 | 325 | 409 |
| | Oracle Corp. | 3.900% | 5/15/35 | 150 | 183 |
| | Oracle Corp. | 3.850% | 7/15/36 | 250 | 301 |
| | Oracle Corp. | 3.800% | 11/15/37 | 525 | 628 |
| | Oracle Corp. | 6.125% | 7/8/39 | 150 | 230 |
| | Oracle Corp. | 3.600% | 4/1/40 | 605 | 708 |
| | Oracle Corp. | 5.375% | 7/15/40 | 700 | 999 |
| | Oracle Corp. | 4.500% | 7/8/44 | 250 | 325 |
| | Oracle Corp. | 4.125% | 5/15/45 | 425 | 524 |
| | Oracle Corp. | 4.000% | 7/15/46 | 575 | 703 |
| | Oracle Corp. | 4.000% | 11/15/47 | 475 | 583 |
| | Oracle Corp. | 3.600% | 4/1/50 | 1,120 | 1,304 |
| | Oracle Corp. | 4.375% | 5/15/55 | 150 | 197 |
| | Oracle Corp. | 3.850% | 4/1/60 | 700 | 853 |
| | PayPal Holdings Inc. | 2.200% | 9/26/22 | 200 | 207 |
| | PayPal Holdings Inc. | 1.350% | 6/1/23 | 200 | 205 |
| | PayPal Holdings Inc. | 2.400% | 10/1/24 | 100 | 107 |
| | PayPal Holdings Inc. | 1.650% | 6/1/25 | 200 | 209 |
| | PayPal Holdings Inc. | 2.650% | 10/1/26 | 300 | 329 |
| | PayPal Holdings Inc. | 2.850% | 10/1/29 | 400 | 444 |
| | PayPal Holdings Inc. | 2.300% | 6/1/30 | 200 | 214 |
| | PayPal Holdings Inc. | 3.250% | 6/1/50 | 310 | 355 |
| | QUALCOMM Inc. | 3.000% | 5/20/22 | 100 | 104 |
| | QUALCOMM Inc. | 2.600% | 1/30/23 | 90 | 94 |
| | QUALCOMM Inc. | 2.900% | 5/20/24 | 172 | 185 |
| | QUALCOMM Inc. | 3.450% | 5/20/25 | 200 | 223 |
| | QUALCOMM Inc. | 3.250% | 5/20/27 | 400 | 453 |
Total Bond Market Index Portfolio
| | | | Coupon | Maturity
Date | Face
Amount
($000) | Market
Value•
($000) |
| 5 | QUALCOMM Inc. | 1.300% | 5/20/28 | 378 | 380 |
| 5 | QUALCOMM Inc. | 1.650% | 5/20/32 | 414 | 413 |
| | QUALCOMM Inc. | 4.650% | 5/20/35 | 200 | 267 |
| | QUALCOMM Inc. | 4.800% | 5/20/45 | 275 | 388 |
| | QUALCOMM Inc. | 4.300% | 5/20/47 | 350 | 474 |
| | QUALCOMM Inc. | 3.250% | 5/20/50 | 200 | 232 |
| | RELX Capital Inc. | 3.500% | 3/16/23 | 125 | 133 |
| | RELX Capital Inc. | 4.000% | 3/18/29 | 100 | 118 |
| | RELX Capital Inc. | 3.000% | 5/22/30 | 150 | 167 |
| | S&P Global Inc. | 4.000% | 6/15/25 | 149 | 169 |
| | S&P Global Inc. | 2.500% | 12/1/29 | 125 | 136 |
| | S&P Global Inc. | 1.250% | 8/15/30 | 400 | 396 |
| | S&P Global Inc. | 3.250% | 12/1/49 | 150 | 175 |
| | S&P Global Inc. | 2.300% | 8/15/60 | 100 | 94 |
| | salesforce.com Inc. | 3.250% | 4/11/23 | 200 | 213 |
| | salesforce.com Inc. | 3.700% | 4/11/28 | 325 | 382 |
| | ServiceNow Inc. | 1.400% | 9/1/30 | 500 | 487 |
| | Texas Instruments Inc. | 1.850% | 5/15/22 | 100 | 102 |
| | Texas Instruments Inc. | 2.625% | 5/15/24 | 25 | 27 |
| | Texas Instruments Inc. | 1.375% | 3/12/25 | 200 | 207 |
| | Texas Instruments Inc. | 2.900% | 11/3/27 | 94 | 105 |
| | Texas Instruments Inc. | 2.250% | 9/4/29 | 100 | 107 |
| | Texas Instruments Inc. | 1.750% | 5/4/30 | 210 | 216 |
| | Texas Instruments Inc. | 3.875% | 3/15/39 | 142 | 177 |
| | Texas Instruments Inc. | 4.150% | 5/15/48 | 400 | 532 |
| | Thomson Reuters Corp. | 5.500% | 8/15/35 | 75 | 100 |
| | Thomson Reuters Corp. | 5.850% | 4/15/40 | 100 | 138 |
| | Thomson Reuters Corp. | 5.650% | 11/23/43 | 100 | 135 |
| | Verisk Analytics Inc. | 4.125% | 9/12/22 | 275 | 290 |
| | Verisk Analytics Inc. | 4.000% | 6/15/25 | 150 | 170 |
| | Verisk Analytics Inc. | 4.125% | 3/15/29 | 400 | 478 |
| | Verisk Analytics Inc. | 5.500% | 6/15/45 | 50 | 71 |
| | Verisk Analytics Inc. | 3.625% | 5/15/50 | 100 | 116 |
| | Visa Inc. | 2.150% | 9/15/22 | 100 | 103 |
| | Visa Inc. | 2.800% | 12/14/22 | 550 | 575 |
| | Visa Inc. | 3.150% | 12/14/25 | 925 | 1,037 |
| | Visa Inc. | 1.900% | 4/15/27 | 200 | 212 |
| | Visa Inc. | 0.750% | 8/15/27 | 500 | 498 |
| | Visa Inc. | 2.750% | 9/15/27 | 150 | 167 |
| | Visa Inc. | 1.100% | 2/15/31 | 400 | 392 |
| | Visa Inc. | 4.150% | 12/14/35 | 325 | 421 |
| | Visa Inc. | 2.700% | 4/15/40 | 200 | 218 |
| | Visa Inc. | 4.300% | 12/14/45 | 725 | 990 |
| | Visa Inc. | 3.650% | 9/15/47 | 100 | 125 |
| | Visa Inc. | 2.000% | 8/15/50 | 500 | 472 |
| | VMware Inc. | 2.950% | 8/21/22 | 300 | 311 |
| | VMware Inc. | 4.500% | 5/15/25 | 200 | 228 |
| | VMware Inc. | 4.650% | 5/15/27 | 100 | 117 |
| | VMware Inc. | 3.900% | 8/21/27 | 300 | 338 |
| | VMware Inc. | 4.700% | 5/15/30 | 900 | 1,082 |
| | Western Union Co. | 3.600% | 3/15/22 | 100 | 103 |
| | Western Union Co. | 2.850% | 1/10/25 | 108 | 116 |
| | Western Union Co. | 6.200% | 11/17/36 | 100 | 126 |
| | Western Union Co. | 6.200% | 6/21/40 | 35 | 43 |
| | Xilinx Inc. | 2.950% | 6/1/24 | 150 | 161 |
| | Xilinx Inc. | 2.375% | 6/1/30 | 200 | 209 |
| | | | | | | 129,933 |
| Utilities (2.4%) |
| | AEP Texas Inc. | 2.400% | 10/1/22 | 75 | 77 |
| | AEP Texas Inc. | 3.950% | 6/1/28 | 100 | 117 |
| | AEP Texas Inc. | 2.100% | 7/1/30 | 200 | 209 |
| | AEP Texas Inc. | 3.800% | 10/1/47 | 50 | 59 |
| | AEP Texas Inc. | 3.450% | 1/15/50 | 50 | 57 |
| | AEP Transmission Co. LLC | 4.000% | 12/1/46 | 75 | 94 |
| | AEP Transmission Co. LLC | 3.750% | 12/1/47 | 100 | 121 |
| | AEP Transmission Co. LLC | 3.800% | 6/15/49 | 70 | 85 |
| | AEP Transmission Co. LLC | 3.150% | 9/15/49 | 70 | 77 |
| 5 | AES Corp. | 1.375% | 1/15/26 | 300 | 302 |
| 5 | AES Corp. | 2.450% | 1/15/31 | 300 | 304 |
| | | | Coupon | Maturity
Date | Face
Amount
($000) | Market
Value•
($000) |
| | Alabama Power Co. | 1.450% | 9/15/30 | 500 | 503 |
| | Alabama Power Co. | 6.125% | 5/15/38 | 50 | 75 |
| | Alabama Power Co. | 3.850% | 12/1/42 | 25 | 31 |
| | Alabama Power Co. | 4.150% | 8/15/44 | 75 | 95 |
| | Alabama Power Co. | 3.750% | 3/1/45 | 150 | 180 |
| | Alabama Power Co. | 4.300% | 1/2/46 | 250 | 329 |
| | Alabama Power Co. | 3.700% | 12/1/47 | 100 | 122 |
| | Alabama Power Co. | 4.300% | 7/15/48 | 100 | 133 |
| | Alabama Power Co. | 3.450% | 10/1/49 | 550 | 649 |
| | Ameren Corp. | 2.500% | 9/15/24 | 100 | 106 |
| | Ameren Corp. | 3.650% | 2/15/26 | 80 | 90 |
| | Ameren Corp. | 3.500% | 1/15/31 | 100 | 115 |
| | Ameren Illinois Co. | 2.700% | 9/1/22 | 250 | 258 |
| | Ameren Illinois Co. | 3.800% | 5/15/28 | 75 | 87 |
| | Ameren Illinois Co. | 3.700% | 12/1/47 | 150 | 183 |
| | Ameren Illinois Co. | 3.250% | 3/15/50 | 60 | 69 |
| | American Electric Power Co. Inc. | 3.650% | 12/1/21 | 100 | 103 |
| | American Electric Power Co. Inc. | 2.950% | 12/15/22 | 25 | 26 |
| | American Electric Power Co. Inc. | 3.200% | 11/13/27 | 75 | 84 |
| | American Electric Power Co. Inc. | 4.300% | 12/1/28 | 150 | 178 |
| | American Water Capital Corp. | 3.400% | 3/1/25 | 125 | 138 |
| | American Water Capital Corp. | 2.950% | 9/1/27 | 325 | 358 |
| | American Water Capital Corp. | 3.450% | 6/1/29 | 125 | 143 |
| | American Water Capital Corp. | 2.800% | 5/1/30 | 100 | 110 |
| | American Water Capital Corp. | 6.593% | 10/15/37 | 150 | 232 |
| | American Water Capital Corp. | 4.300% | 9/1/45 | 100 | 129 |
| | American Water Capital Corp. | 3.750% | 9/1/47 | 200 | 244 |
| | American Water Capital Corp. | 4.200% | 9/1/48 | 100 | 130 |
| | American Water Capital Corp. | 4.150% | 6/1/49 | 125 | 164 |
| | American Water Capital Corp. | 3.450% | 5/1/50 | 100 | 119 |
| | Appalachian Power Co. | 3.300% | 6/1/27 | 500 | 558 |
| | Appalachian Power Co. | 4.500% | 3/1/49 | 425 | 561 |
| | Appalachian Power Co. | 3.700% | 5/1/50 | 100 | 120 |
| | Arizona Public Service Co. | 3.150% | 5/15/25 | 100 | 110 |
| | Arizona Public Service Co. | 2.950% | 9/15/27 | 50 | 55 |
| | Arizona Public Service Co. | 4.500% | 4/1/42 | 25 | 32 |
| | Arizona Public Service Co. | 4.350% | 11/15/45 | 125 | 160 |
| | Arizona Public Service Co. | 3.750% | 5/15/46 | 125 | 153 |
| | Arizona Public Service Co. | 4.250% | 3/1/49 | 100 | 130 |
| | Arizona Public Service Co. | 3.500% | 12/1/49 | 60 | 70 |
| | Atmos Energy Corp. | 3.000% | 6/15/27 | 100 | 111 |
| | Atmos Energy Corp. | 2.625% | 9/15/29 | 50 | 55 |
| | Atmos Energy Corp. | 5.500% | 6/15/41 | 200 | 287 |
| | Atmos Energy Corp. | 4.150% | 1/15/43 | 100 | 125 |
| | Atmos Energy Corp. | 4.125% | 10/15/44 | 50 | 63 |
| | Atmos Energy Corp. | 3.375% | 9/15/49 | 400 | 464 |
| | Avangrid Inc. | 3.150% | 12/1/24 | 230 | 251 |
| | Avangrid Inc. | 3.800% | 6/1/29 | 195 | 224 |
| | Avista Corp. | 4.350% | 6/1/48 | 75 | 95 |
| | Baltimore Gas and Electric Co. | 2.400% | 8/15/26 | 50 | 54 |
| | Baltimore Gas and Electric Co. | 3.500% | 8/15/46 | 100 | 115 |
| | Baltimore Gas and Electric Co. | 3.750% | 8/15/47 | 250 | 306 |
| | Baltimore Gas and Electric Co. | 4.250% | 9/15/48 | 50 | 65 |
Total Bond Market Index Portfolio
| | | | Coupon | Maturity
Date | Face
Amount
($000) | Market
Value•
($000) |
| | Baltimore Gas and Electric Co. | 3.200% | 9/15/49 | 80 | 89 |
| | Baltimore Gas and Electric Co. | 2.900% | 6/15/50 | 100 | 108 |
| | Berkshire Hathaway Energy Co. | 2.800% | 1/15/23 | 125 | 131 |
| | Berkshire Hathaway Energy Co. | 3.750% | 11/15/23 | 100 | 108 |
| | Berkshire Hathaway Energy Co. | 3.500% | 2/1/25 | 100 | 110 |
| | Berkshire Hathaway Energy Co. | 3.250% | 4/15/28 | 125 | 142 |
| 5 | Berkshire Hathaway Energy Co. | 3.700% | 7/15/30 | 700 | 826 |
| | Berkshire Hathaway Energy Co. | 6.125% | 4/1/36 | 100 | 147 |
| | Berkshire Hathaway Energy Co. | 5.950% | 5/15/37 | 225 | 325 |
| | Berkshire Hathaway Energy Co. | 5.150% | 11/15/43 | 150 | 206 |
| | Berkshire Hathaway Energy Co. | 4.500% | 2/1/45 | 150 | 189 |
| | Berkshire Hathaway Energy Co. | 3.800% | 7/15/48 | 50 | 60 |
| | Berkshire Hathaway Energy Co. | 4.450% | 1/15/49 | 200 | 266 |
| 5 | Berkshire Hathaway Energy Co. | 4.250% | 10/15/50 | 200 | 256 |
| | Black Hills Corp. | 4.250% | 11/30/23 | 100 | 110 |
| | Black Hills Corp. | 3.950% | 1/15/26 | 75 | 84 |
| | Black Hills Corp. | 3.150% | 1/15/27 | 75 | 81 |
| | Black Hills Corp. | 3.050% | 10/15/29 | 70 | 76 |
| | Black Hills Corp. | 4.350% | 5/1/33 | 75 | 91 |
| | Black Hills Corp. | 4.200% | 9/15/46 | 50 | 61 |
| | Black Hills Corp. | 3.875% | 10/15/49 | 70 | 82 |
| | CenterPoint Energy Houston Electric LLC | 2.400% | 9/1/26 | 300 | 324 |
| | CenterPoint Energy Houston Electric LLC | 6.950% | 3/15/33 | 50 | 74 |
| | CenterPoint Energy Houston Electric LLC | 3.950% | 3/1/48 | 75 | 96 |
| | CenterPoint Energy Houston Electric LLC | 4.250% | 2/1/49 | 150 | 199 |
| | CenterPoint Energy Houston Electric LLC | 2.900% | 7/1/50 | 100 | 109 |
| | CenterPoint Energy Inc. | 2.500% | 9/1/22 | 100 | 103 |
| | CenterPoint Energy Inc. | 3.850% | 2/1/24 | 325 | 355 |
| | CenterPoint Energy Inc. | 2.500% | 9/1/24 | 100 | 106 |
| | CenterPoint Energy Inc. | 4.250% | 11/1/28 | 75 | 89 |
| | CenterPoint Energy Inc. | 2.950% | 3/1/30 | 80 | 87 |
| | CenterPoint Energy Inc. | 3.700% | 9/1/49 | 50 | 58 |
| | CenterPoint Energy Resources Corp. | 3.550% | 4/1/23 | 50 | 53 |
| | CenterPoint Energy Resources Corp. | 4.000% | 4/1/28 | 100 | 117 |
| | CenterPoint Energy Resources Corp. | 5.850% | 1/15/41 | 250 | 348 |
| | CenterPoint Energy Resources Corp. | 4.100% | 9/1/47 | 50 | 61 |
| | Cleco Corporate Holdings LLC | 3.743% | 5/1/26 | 100 | 110 |
| | Cleco Corporate Holdings LLC | 4.973% | 5/1/46 | 125 | 146 |
| | Cleveland Electric Illuminating Co. | 5.500% | 8/15/24 | 225 | 259 |
| | Cleveland Electric Illuminating Co. | 5.950% | 12/15/36 | 75 | 91 |
| | CMS Energy Corp. | 3.000% | 5/15/26 | 75 | 83 |
| | CMS Energy Corp. | 3.450% | 8/15/27 | 50 | 56 |
| | CMS Energy Corp. | 4.875% | 3/1/44 | 75 | 99 |
| | CMS Energy Corp. | 4.750% | 6/1/50 | 100 | 113 |
| | | | Coupon | Maturity
Date | Face
Amount
($000) | Market
Value•
($000) |
| | Commonwealth Edison Co. | 2.950% | 8/15/27 | 75 | 83 |
| | Commonwealth Edison Co. | 2.200% | 3/1/30 | 50 | 54 |
| | Commonwealth Edison Co. | 5.900% | 3/15/36 | 150 | 216 |
| | Commonwealth Edison Co. | 6.450% | 1/15/38 | 175 | 268 |
| | Commonwealth Edison Co. | 4.600% | 8/15/43 | 75 | 99 |
| | Commonwealth Edison Co. | 4.700% | 1/15/44 | 175 | 234 |
| | Commonwealth Edison Co. | 3.700% | 3/1/45 | 75 | 88 |
| | Commonwealth Edison Co. | 3.650% | 6/15/46 | 175 | 207 |
| | Commonwealth Edison Co. | 3.750% | 8/15/47 | 100 | 120 |
| | Commonwealth Edison Co. | 4.000% | 3/1/48 | 150 | 189 |
| | Commonwealth Edison Co. | 4.000% | 3/1/49 | 125 | 159 |
| | Commonwealth Edison Co. | 3.000% | 3/1/50 | 200 | 218 |
| | Connecticut Light and Power Co. | 2.500% | 1/15/23 | 125 | 130 |
| | Connecticut Light and Power Co. | 0.750% | 12/1/25 | 500 | 502 |
| | Connecticut Light and Power Co. | 3.200% | 3/15/27 | 50 | 56 |
| | Connecticut Light and Power Co. | 4.300% | 4/15/44 | 150 | 195 |
| | Connecticut Light and Power Co. | 4.000% | 4/1/48 | 160 | 207 |
| | Consolidated Edison Co. of New York Inc. | 3.350% | 4/1/30 | 600 | 687 |
| | Consolidated Edison Co. of New York Inc. | 5.300% | 3/1/35 | 200 | 263 |
| | Consolidated Edison Co. of New York Inc. | 5.850% | 3/15/36 | 275 | 381 |
| | Consolidated Edison Co. of New York Inc. | 6.200% | 6/15/36 | 75 | 107 |
| | Consolidated Edison Co. of New York Inc. | 3.950% | 3/1/43 | 125 | 147 |
| | Consolidated Edison Co. of New York Inc. | 4.450% | 3/15/44 | 200 | 250 |
| | Consolidated Edison Co. of New York Inc. | 4.500% | 12/1/45 | 375 | 484 |
| | Consolidated Edison Co. of New York Inc. | 3.850% | 6/15/46 | 145 | 168 |
| | Consolidated Edison Co. of New York Inc. | 3.875% | 6/15/47 | 75 | 88 |
| | Consolidated Edison Co. of New York Inc. | 4.125% | 5/15/49 | 400 | 493 |
| | Consolidated Edison Co. of New York Inc. | 3.950% | 4/1/50 | 250 | 305 |
| | Consolidated Edison Co. of New York Inc. | 4.000% | 11/15/57 | 75 | 92 |
| | Consolidated Edison Co. of New York Inc. | 4.500% | 5/15/58 | 120 | 157 |
| | Consolidated Edison Co. of New York Inc. | 3.000% | 12/1/60 | 500 | 509 |
| | Consumers Energy Co. | 3.375% | 8/15/23 | 275 | 295 |
| | Consumers Energy Co. | 3.800% | 11/15/28 | 75 | 88 |
| | Consumers Energy Co. | 3.950% | 5/15/43 | 75 | 94 |
| | Consumers Energy Co. | 3.250% | 8/15/46 | 50 | 57 |
| | Consumers Energy Co. | 3.950% | 7/15/47 | 50 | 64 |
| | Consumers Energy Co. | 4.050% | 5/15/48 | 125 | 164 |
| | Consumers Energy Co. | 4.350% | 4/15/49 | 80 | 110 |
| | Consumers Energy Co. | 3.100% | 8/15/50 | 80 | 92 |
| | Consumers Energy Co. | 3.500% | 8/1/51 | 400 | 493 |
| | Consumers Energy Co. | 2.500% | 5/1/60 | 100 | 100 |
Total Bond Market Index Portfolio
| | | | Coupon | Maturity
Date | Face
Amount
($000) | Market
Value•
($000) |
| | Delmarva Power & Light Co. | 3.500% | 11/15/23 | 25 | 27 |
| | Delmarva Power & Light Co. | 4.150% | 5/15/45 | 100 | 124 |
| | Dominion Energy Inc. | 3.071% | 8/15/24 | 75 | 81 |
| | Dominion Energy Inc. | 3.900% | 10/1/25 | 125 | 143 |
| | Dominion Energy Inc. | 2.850% | 8/15/26 | 125 | 138 |
| | Dominion Energy Inc. | 4.250% | 6/1/28 | 125 | 149 |
| | Dominion Energy Inc. | 3.375% | 4/1/30 | 125 | 142 |
| | Dominion Energy Inc. | 6.300% | 3/15/33 | 75 | 106 |
| | Dominion Energy Inc. | 5.950% | 6/15/35 | 225 | 314 |
| | Dominion Energy Inc. | 4.900% | 8/1/41 | 280 | 365 |
| | Dominion Energy Inc. | 4.050% | 9/15/42 | 300 | 359 |
| | Dominion Energy Inc. | 4.600% | 3/15/49 | 200 | 266 |
| | Dominion Energy Inc. | 5.750% | 10/1/54 | 100 | 111 |
| | Dominion Energy South Carolina Inc. | 6.625% | 2/1/32 | 50 | 72 |
| | Dominion Energy South Carolina Inc. | 6.050% | 1/15/38 | 125 | 185 |
| | Dominion Energy South Carolina Inc. | 5.450% | 2/1/41 | 75 | 107 |
| | Dominion Energy South Carolina Inc. | 4.600% | 6/15/43 | 75 | 100 |
| | DTE Electric Co. | 3.650% | 3/15/24 | 250 | 272 |
| | DTE Electric Co. | 3.375% | 3/1/25 | 150 | 166 |
| | DTE Electric Co. | 2.250% | 3/1/30 | 200 | 214 |
| | DTE Electric Co. | 2.625% | 3/1/31 | 100 | 110 |
| | DTE Electric Co. | 4.000% | 4/1/43 | 225 | 279 |
| | DTE Electric Co. | 3.700% | 6/1/46 | 50 | 61 |
| | DTE Electric Co. | 3.750% | 8/15/47 | 100 | 124 |
| | DTE Electric Co. | 3.950% | 3/1/49 | 128 | 166 |
| | DTE Electric Co. | 2.950% | 3/1/50 | 150 | 168 |
| | DTE Energy Co. | 2.600% | 6/15/22 | 50 | 52 |
| | DTE Energy Co. | 2.250% | 11/1/22 | 400 | 413 |
| | DTE Energy Co. | 3.700% | 8/1/23 | 125 | 135 |
| | DTE Energy Co. | 2.529% | 10/1/24 | 100 | 107 |
| | DTE Energy Co. | 1.050% | 6/1/25 | 500 | 505 |
| | DTE Energy Co. | 2.850% | 10/1/26 | 300 | 329 |
| | DTE Energy Co. | 3.800% | 3/15/27 | 175 | 201 |
| | DTE Energy Co. | 3.400% | 6/15/29 | 100 | 113 |
| | DTE Energy Co. | 2.950% | 3/1/30 | 60 | 66 |
| | DTE Energy Co. | 6.375% | 4/15/33 | 75 | 107 |
| | Duke Energy Carolinas LLC | 2.500% | 3/15/23 | 100 | 104 |
| | Duke Energy Carolinas LLC | 3.050% | 3/15/23 | 100 | 106 |
| | Duke Energy Carolinas LLC | 2.950% | 12/1/26 | 100 | 112 |
| | Duke Energy Carolinas LLC | 3.950% | 11/15/28 | 125 | 148 |
| | Duke Energy Carolinas LLC | 6.000% | 12/1/28 | 125 | 162 |
| | Duke Energy Carolinas LLC | 2.450% | 8/15/29 | 200 | 215 |
| | Duke Energy Carolinas LLC | 2.450% | 2/1/30 | 100 | 108 |
| | Duke Energy Carolinas LLC | 6.100% | 6/1/37 | 100 | 147 |
| | Duke Energy Carolinas LLC | 6.000% | 1/15/38 | 25 | 37 |
| | Duke Energy Carolinas LLC | 6.050% | 4/15/38 | 25 | 38 |
| | Duke Energy Carolinas LLC | 5.300% | 2/15/40 | 150 | 213 |
| | Duke Energy Carolinas LLC | 4.000% | 9/30/42 | 175 | 216 |
| | Duke Energy Carolinas LLC | 3.875% | 3/15/46 | 100 | 123 |
| | Duke Energy Carolinas LLC | 3.700% | 12/1/47 | 100 | 121 |
| | | | Coupon | Maturity
Date | Face
Amount
($000) | Market
Value•
($000) |
| | Duke Energy Carolinas LLC | 3.950% | 3/15/48 | 300 | 373 |
| | Duke Energy Carolinas LLC | 3.200% | 8/15/49 | 400 | 455 |
| | Duke Energy Corp. | 2.400% | 8/15/22 | 200 | 206 |
| | Duke Energy Corp. | 3.050% | 8/15/22 | 275 | 285 |
| | Duke Energy Corp. | 3.750% | 4/15/24 | 325 | 358 |
| | Duke Energy Corp. | 2.650% | 9/1/26 | 80 | 87 |
| | Duke Energy Corp. | 3.150% | 8/15/27 | 300 | 334 |
| | Duke Energy Corp. | 2.450% | 6/1/30 | 100 | 106 |
| | Duke Energy Corp. | 4.800% | 12/15/45 | 125 | 165 |
| | Duke Energy Corp. | 3.750% | 9/1/46 | 405 | 471 |
| | Duke Energy Corp. | 4.200% | 6/15/49 | 400 | 508 |
| | Duke Energy Florida LLC | 3.800% | 7/15/28 | 100 | 117 |
| | Duke Energy Florida LLC | 2.500% | 12/1/29 | 425 | 462 |
| | Duke Energy Florida LLC | 1.750% | 6/15/30 | 100 | 102 |
| | Duke Energy Florida LLC | 6.350% | 9/15/37 | 225 | 342 |
| | Duke Energy Florida LLC | 6.400% | 6/15/38 | 200 | 309 |
| | Duke Energy Florida LLC | 3.850% | 11/15/42 | 200 | 237 |
| | Duke Energy Florida LLC | 3.400% | 10/1/46 | 100 | 114 |
| | Duke Energy Florida LLC | 4.200% | 7/15/48 | 200 | 259 |
| 2 | Duke Energy Florida Project Finance LLC | 1.731% | 9/1/24 | 36 | 36 |
| 2 | Duke Energy Florida Project Finance LLC | 2.538% | 9/1/31 | 100 | 108 |
| | Duke Energy Indiana LLC | 6.350% | 8/15/38 | 740 | 1,133 |
| | Duke Energy Indiana LLC | 3.750% | 5/15/46 | 225 | 269 |
| | Duke Energy Ohio Inc. | 2.125% | 6/1/30 | 100 | 105 |
| | Duke Energy Ohio Inc. | 3.700% | 6/15/46 | 25 | 29 |
| | Duke Energy Progress LLC | 2.800% | 5/15/22 | 100 | 103 |
| | Duke Energy Progress LLC | 3.375% | 9/1/23 | 25 | 27 |
| | Duke Energy Progress LLC | 3.700% | 9/1/28 | 175 | 203 |
| | Duke Energy Progress LLC | 3.450% | 3/15/29 | 125 | 143 |
| | Duke Energy Progress LLC | 4.375% | 3/30/44 | 300 | 385 |
| | Duke Energy Progress LLC | 4.150% | 12/1/44 | 100 | 127 |
| | Duke Energy Progress LLC | 3.700% | 10/15/46 | 50 | 60 |
| | Duke Energy Progress LLC | 3.600% | 9/15/47 | 100 | 120 |
| | Eastern Energy Gas Holdings LLC | 2.500% | 11/15/24 | 100 | 107 |
| | Eastern Energy Gas Holdings LLC | 3.600% | 12/15/24 | 200 | 221 |
| | Eastern Energy Gas Holdings LLC | 3.000% | 11/15/29 | 100 | 110 |
| | Eastern Energy Gas Holdings LLC | 4.600% | 12/15/44 | 200 | 253 |
| | Edison International | 2.400% | 9/15/22 | 125 | 128 |
| | Edison International | 3.125% | 11/15/22 | 80 | 83 |
| | Edison International | 2.950% | 3/15/23 | 200 | 208 |
| | Edison International | 5.750% | 6/15/27 | 25 | 30 |
| | El Paso Electric Co. | 6.000% | 5/15/35 | 50 | 69 |
| | El Paso Electric Co. | 5.000% | 12/1/44 | 75 | 88 |
| | Emera U.S. Finance LP | 3.550% | 6/15/26 | 150 | 168 |
| | Emera U.S. Finance LP | 4.750% | 6/15/46 | 245 | 311 |
| | Enel Chile SA | 4.875% | 6/12/28 | 125 | 148 |
| | Entergy Arkansas LLC | 3.500% | 4/1/26 | 50 | 56 |
| | Entergy Arkansas LLC | 2.650% | 6/15/51 | 500 | 512 |
| | Entergy Corp. | 4.000% | 7/15/22 | 150 | 157 |
| | Entergy Corp. | 2.950% | 9/1/26 | 200 | 220 |
| | Entergy Corp. | 2.800% | 6/15/30 | 100 | 108 |
| | Entergy Corp. | 3.750% | 6/15/50 | 300 | 347 |
| | Entergy Gulf States Louisiana LLC | 5.590% | 10/1/24 | 223 | 263 |
| | Entergy Louisiana LLC | 5.400% | 11/1/24 | 382 | 448 |
Total Bond Market Index Portfolio
| | | | Coupon | Maturity
Date | Face
Amount
($000) | Market
Value•
($000) |
| | Entergy Louisiana LLC | 2.400% | 10/1/26 | 75 | 81 |
| | Entergy Louisiana LLC | 3.120% | 9/1/27 | 100 | 111 |
| | Entergy Louisiana LLC | 3.050% | 6/1/31 | 100 | 113 |
| | Entergy Louisiana LLC | 4.000% | 3/15/33 | 150 | 186 |
| | Entergy Louisiana LLC | 4.950% | 1/15/45 | 150 | 165 |
| | Entergy Louisiana LLC | 4.200% | 9/1/48 | 200 | 261 |
| | Entergy Louisiana LLC | 4.200% | 4/1/50 | 100 | 130 |
| | Entergy Louisiana LLC | 2.900% | 3/15/51 | 100 | 106 |
| | Entergy Mississippi LLC | 2.850% | 6/1/28 | 125 | 137 |
| | Entergy Texas Inc. | 1.750% | 3/15/31 | 500 | 500 |
| | Essential Utilities Inc. | 3.566% | 5/1/29 | 75 | 85 |
| | Essential Utilities Inc. | 2.704% | 4/15/30 | 100 | 108 |
| | Essential Utilities Inc. | 4.276% | 5/1/49 | 85 | 107 |
| | Essential Utilities Inc. | 3.351% | 4/15/50 | 200 | 223 |
| | Evergy Inc. | 2.450% | 9/15/24 | 50 | 53 |
| | Evergy Inc. | 2.900% | 9/15/29 | 150 | 163 |
| | Evergy Kansas Central Inc. | 2.550% | 7/1/26 | 150 | 163 |
| | Evergy Kansas Central Inc. | 3.100% | 4/1/27 | 100 | 110 |
| | Evergy Kansas Central Inc. | 4.125% | 3/1/42 | 200 | 245 |
| | Evergy Kansas Central Inc. | 4.100% | 4/1/43 | 100 | 124 |
| | Evergy Kansas Central Inc. | 4.250% | 12/1/45 | 25 | 33 |
| | Evergy Metro Inc. | 3.150% | 3/15/23 | 75 | 79 |
| | Evergy Metro Inc. | 2.250% | 6/1/30 | 100 | 106 |
| | Evergy Metro Inc. | 5.300% | 10/1/41 | 100 | 137 |
| | Evergy Metro Inc. | 4.200% | 6/15/47 | 100 | 128 |
| | Eversource Energy | 2.750% | 3/15/22 | 75 | 77 |
| | Eversource Energy | 3.800% | 12/1/23 | 75 | 82 |
| | Eversource Energy | 2.900% | 10/1/24 | 50 | 54 |
| | Eversource Energy | 3.150% | 1/15/25 | 168 | 183 |
| | Eversource Energy | 3.300% | 1/15/28 | 100 | 112 |
| | Eversource Energy | 4.250% | 4/1/29 | 200 | 239 |
| | Eversource Energy | 3.450% | 1/15/50 | 400 | 457 |
| | Exelon Corp. | 3.497% | 6/1/22 | 200 | 208 |
| | Exelon Corp. | 3.950% | 6/15/25 | 200 | 226 |
| | Exelon Corp. | 3.400% | 4/15/26 | 200 | 225 |
| | Exelon Corp. | 4.050% | 4/15/30 | 250 | 295 |
| | Exelon Corp. | 4.950% | 6/15/35 | 225 | 283 |
| | Exelon Corp. | 5.625% | 6/15/35 | 20 | 27 |
| | Exelon Corp. | 5.100% | 6/15/45 | 145 | 197 |
| | Exelon Corp. | 4.450% | 4/15/46 | 175 | 223 |
| | Exelon Generation Co. LLC | 6.250% | 10/1/39 | 360 | 433 |
| | Exelon Generation Co. LLC | 5.750% | 10/1/41 | 75 | 85 |
| | Exelon Generation Co. LLC | 5.600% | 6/15/42 | 155 | 176 |
| | Florida Power & Light Co. | 3.250% | 6/1/24 | 25 | 27 |
| | Florida Power & Light Co. | 2.850% | 4/1/25 | 300 | 327 |
| | Florida Power & Light Co. | 5.625% | 4/1/34 | 25 | 36 |
| | Florida Power & Light Co. | 5.960% | 4/1/39 | 375 | 569 |
| | Florida Power & Light Co. | 4.125% | 2/1/42 | 170 | 216 |
| | Florida Power & Light Co. | 4.050% | 6/1/42 | 125 | 159 |
| | Florida Power & Light Co. | 3.800% | 12/15/42 | 75 | 93 |
| | Florida Power & Light Co. | 3.700% | 12/1/47 | 150 | 187 |
| | Florida Power & Light Co. | 3.950% | 3/1/48 | 325 | 421 |
| | Florida Power & Light Co. | 4.125% | 6/1/48 | 100 | 131 |
| | Florida Power & Light Co. | 3.990% | 3/1/49 | 100 | 131 |
| | Florida Power & Light Co. | 3.150% | 10/1/49 | 555 | 637 |
| | Fortis Inc. | 3.055% | 10/4/26 | 295 | 324 |
| | Georgia Power Co. | 2.100% | 7/30/23 | 75 | 78 |
| | Georgia Power Co. | 2.200% | 9/15/24 | 225 | 237 |
| | Georgia Power Co. | 3.250% | 4/1/26 | 100 | 111 |
| | Georgia Power Co. | 4.750% | 9/1/40 | 175 | 228 |
| | Georgia Power Co. | 4.300% | 3/15/43 | 100 | 127 |
| | Gulf Power Co. | 3.300% | 5/30/27 | 50 | 56 |
| | | | Coupon | Maturity
Date | Face
Amount
($000) | Market
Value•
($000) |
| | Iberdrola International BV | 6.750% | 7/15/36 | 75 | 115 |
| | Indiana Michigan Power Co. | 3.850% | 5/15/28 | 250 | 290 |
| | Indiana Michigan Power Co. | 3.750% | 7/1/47 | 150 | 175 |
| | Indiana Michigan Power Co. | 4.250% | 8/15/48 | 100 | 127 |
| | Interstate Power and Light Co. | 3.250% | 12/1/24 | 202 | 221 |
| | Interstate Power and Light Co. | 4.100% | 9/26/28 | 125 | 149 |
| | Interstate Power and Light Co. | 3.600% | 4/1/29 | 60 | 69 |
| | Interstate Power and Light Co. | 2.300% | 6/1/30 | 100 | 105 |
| | Interstate Power and Light Co. | 6.250% | 7/15/39 | 50 | 73 |
| | Interstate Power and Light Co. | 3.700% | 9/15/46 | 75 | 86 |
| | ITC Holdings Corp. | 2.700% | 11/15/22 | 100 | 104 |
| | ITC Holdings Corp. | 3.650% | 6/15/24 | 75 | 82 |
| | ITC Holdings Corp. | 3.350% | 11/15/27 | 100 | 113 |
| | ITC Holdings Corp. | 5.300% | 7/1/43 | 200 | 266 |
| 2 | John Sevier Combined Cycle Generation LLC | 4.626% | 1/15/42 | 65 | 82 |
| | Kentucky Utilities Co. | 5.125% | 11/1/40 | 125 | 173 |
| | Kentucky Utilities Co. | 4.375% | 10/1/45 | 100 | 130 |
| | Kentucky Utilities Co. | 3.300% | 6/1/50 | 200 | 227 |
| | Louisville Gas and Electric Co. | 3.300% | 10/1/25 | 75 | 83 |
| | Louisville Gas and Electric Co. | 4.250% | 4/1/49 | 170 | 220 |
| | MidAmerican Energy Co. | 3.500% | 10/15/24 | 179 | 197 |
| | MidAmerican Energy Co. | 3.100% | 5/1/27 | 150 | 168 |
| | MidAmerican Energy Co. | 3.650% | 4/15/29 | 200 | 237 |
| | MidAmerican Energy Co. | 6.750% | 12/30/31 | 125 | 187 |
| | MidAmerican Energy Co. | 5.750% | 11/1/35 | 125 | 182 |
| | MidAmerican Energy Co. | 4.800% | 9/15/43 | 100 | 136 |
| | MidAmerican Energy Co. | 3.950% | 8/1/47 | 100 | 125 |
| | MidAmerican Energy Co. | 4.250% | 7/15/49 | 200 | 268 |
| | Mississippi Power Co. | 4.250% | 3/15/42 | 100 | 122 |
| | National Fuel Gas Co. | 3.750% | 3/1/23 | 275 | 288 |
| | National Fuel Gas Co. | 5.500% | 1/15/26 | 50 | 58 |
| | National Fuel Gas Co. | 4.750% | 9/1/28 | 50 | 54 |
| | National Grid USA | 5.803% | 4/1/35 | 50 | 67 |
| | National Rural Utilities Cooperative Finance Corp. | 1.750% | 1/21/22 | 50 | 51 |
| | National Rural Utilities Cooperative Finance Corp. | 2.700% | 2/15/23 | 300 | 314 |
| | National Rural Utilities Cooperative Finance Corp. | 2.950% | 2/7/24 | 775 | 829 |
| | National Rural Utilities Cooperative Finance Corp. | 3.400% | 2/7/28 | 150 | 172 |
| | National Rural Utilities Cooperative Finance Corp. | 3.900% | 11/1/28 | 100 | 117 |
| | National Rural Utilities Cooperative Finance Corp. | 3.700% | 3/15/29 | 100 | 117 |
| | National Rural Utilities Cooperative Finance Corp. | 2.400% | 3/15/30 | 100 | 108 |
| | National Rural Utilities Cooperative Finance Corp. | 4.023% | 11/1/32 | 204 | 252 |
| | National Rural Utilities Cooperative Finance Corp. | 4.750% | 4/30/43 | 25 | 26 |
Total Bond Market Index Portfolio
| | | | Coupon | Maturity
Date | Face
Amount
($000) | Market
Value•
($000) |
| | National Rural Utilities Cooperative Finance Corp. | 5.250% | 4/20/46 | 75 | 83 |
| | National Rural Utilities Cooperative Finance Corp. | 4.400% | 11/1/48 | 400 | 533 |
| | National Rural Utilities Cooperative Finance Corp. | 4.300% | 3/15/49 | 100 | 131 |
| | Nevada Power Co. | 3.700% | 5/1/29 | 200 | 233 |
| | Nevada Power Co. | 2.400% | 5/1/30 | 75 | 80 |
| | Nevada Power Co. | 6.750% | 7/1/37 | 75 | 113 |
| | Nevada Power Co. | 3.125% | 8/1/50 | 150 | 166 |
| | NextEra Energy Capital Holdings Inc. | 2.900% | 4/1/22 | 350 | 361 |
| | NextEra Energy Capital Holdings Inc. | 2.800% | 1/15/23 | 105 | 110 |
| | NextEra Energy Capital Holdings Inc. | 3.150% | 4/1/24 | 100 | 108 |
| | NextEra Energy Capital Holdings Inc. | 2.750% | 5/1/25 | 700 | 757 |
| | NextEra Energy Capital Holdings Inc. | 3.250% | 4/1/26 | 50 | 56 |
| | NextEra Energy Capital Holdings Inc. | 3.550% | 5/1/27 | 250 | 284 |
| | NextEra Energy Capital Holdings Inc. | 3.500% | 4/1/29 | 100 | 114 |
| | NextEra Energy Capital Holdings Inc. | 2.750% | 11/1/29 | 100 | 108 |
| | NextEra Energy Capital Holdings Inc. | 2.250% | 6/1/30 | 500 | 524 |
| | NextEra Energy Capital Holdings Inc. | 4.800% | 12/1/77 | 125 | 136 |
| | NextEra Energy Capital Holdings Inc. | 5.650% | 5/1/79 | 100 | 118 |
| | NiSource Inc. | 0.950% | 8/15/25 | 500 | 503 |
| | NiSource Inc. | 3.490% | 5/15/27 | 250 | 283 |
| | NiSource Inc. | 2.950% | 9/1/29 | 200 | 218 |
| | NiSource Inc. | 3.600% | 5/1/30 | 200 | 230 |
| | NiSource Inc. | 1.700% | 2/15/31 | 500 | 497 |
| | NiSource Inc. | 5.950% | 6/15/41 | 77 | 110 |
| | NiSource Inc. | 4.800% | 2/15/44 | 125 | 163 |
| | NiSource Inc. | 5.650% | 2/1/45 | 100 | 144 |
| | NiSource Inc. | 4.375% | 5/15/47 | 250 | 317 |
| | NiSource Inc. | 3.950% | 3/30/48 | 200 | 245 |
| | Northern States Power Co. | 6.250% | 6/1/36 | 75 | 112 |
| | Northern States Power Co. | 6.200% | 7/1/37 | 50 | 76 |
| | Northern States Power Co. | 5.350% | 11/1/39 | 175 | 253 |
| | Northern States Power Co. | 3.400% | 8/15/42 | 105 | 121 |
| | Northern States Power Co. | 4.000% | 8/15/45 | 50 | 65 |
| | Northern States Power Co. | 2.900% | 3/1/50 | 250 | 282 |
| | Northern States Power Co. | 2.600% | 6/1/51 | 100 | 105 |
| | NSTAR Electric Co. | 2.375% | 10/15/22 | 125 | 129 |
| | NSTAR Electric Co. | 3.200% | 5/15/27 | 125 | 141 |
| | NSTAR Electric Co. | 3.250% | 5/15/29 | 50 | 57 |
| | NSTAR Electric Co. | 5.500% | 3/15/40 | 75 | 107 |
| | Oglethorpe Power Corp. | 5.950% | 11/1/39 | 50 | 66 |
| | Oglethorpe Power Corp. | 5.375% | 11/1/40 | 175 | 216 |
| | Ohio Edison Co. | 6.875% | 7/15/36 | 100 | 136 |
| | Ohio Power Co. | 4.150% | 4/1/48 | 100 | 128 |
| | Ohio Power Co. | 4.000% | 6/1/49 | 240 | 301 |
| | Oklahoma Gas and Electric Co. | 3.800% | 8/15/28 | 75 | 87 |
| | Oklahoma Gas and Electric Co. | 3.250% | 4/1/30 | 100 | 113 |
| | | | Coupon | Maturity
Date | Face
Amount
($000) | Market
Value•
($000) |
| | Oklahoma Gas and Electric Co. | 4.150% | 4/1/47 | 50 | 62 |
| | Oklahoma Gas and Electric Co. | 3.850% | 8/15/47 | 75 | 88 |
| | Oncor Electric Delivery Co. LLC | 4.100% | 6/1/22 | 175 | 182 |
| | Oncor Electric Delivery Co. LLC | 2.750% | 6/1/24 | 100 | 107 |
| | Oncor Electric Delivery Co. LLC | 2.950% | 4/1/25 | 75 | 82 |
| | Oncor Electric Delivery Co. LLC | 3.700% | 11/15/28 | 50 | 58 |
| | Oncor Electric Delivery Co. LLC | 7.250% | 1/15/33 | 50 | 77 |
| | Oncor Electric Delivery Co. LLC | 7.500% | 9/1/38 | 125 | 207 |
| | Oncor Electric Delivery Co. LLC | 5.250% | 9/30/40 | 125 | 178 |
| | Oncor Electric Delivery Co. LLC | 4.550% | 12/1/41 | 75 | 100 |
| | Oncor Electric Delivery Co. LLC | 5.300% | 6/1/42 | 37 | 53 |
| | Oncor Electric Delivery Co. LLC | 3.750% | 4/1/45 | 100 | 122 |
| | Oncor Electric Delivery Co. LLC | 3.800% | 9/30/47 | 50 | 61 |
| | Oncor Electric Delivery Co. LLC | 3.800% | 6/1/49 | 200 | 248 |
| | Oncor Electric Delivery Co. LLC | 3.100% | 9/15/49 | 400 | 459 |
| 5 | Oncor Electric Delivery Co. LLC | 5.350% | 10/1/52 | 63 | 96 |
| | ONE Gas Inc. | 2.000% | 5/15/30 | 100 | 104 |
| | ONE Gas Inc. | 4.658% | 2/1/44 | 125 | 164 |
| | ONE Gas Inc. | 4.500% | 11/1/48 | 75 | 101 |
| | Pacific Gas and Electric Co. | 1.750% | 6/16/22 | 500 | 501 |
| | Pacific Gas and Electric Co. | 3.850% | 11/15/23 | 250 | 266 |
| | Pacific Gas and Electric Co. | 3.450% | 7/1/25 | 200 | 215 |
| | Pacific Gas and Electric Co. | 3.150% | 1/1/26 | 300 | 320 |
| | Pacific Gas and Electric Co. | 3.300% | 12/1/27 | 800 | 853 |
| | Pacific Gas and Electric Co. | 3.750% | 7/1/28 | 300 | 327 |
| | Pacific Gas and Electric Co. | 4.550% | 7/1/30 | 1,100 | 1,251 |
| | Pacific Gas and Electric Co. | 4.500% | 7/1/40 | 500 | 557 |
| | Pacific Gas and Electric Co. | 4.750% | 2/15/44 | 500 | 561 |
| | Pacific Gas and Electric Co. | 4.300% | 3/15/45 | 200 | 213 |
| | Pacific Gas and Electric Co. | 4.950% | 7/1/50 | 800 | 953 |
| | Pacific Gas and Electric Co. | 3.500% | 8/1/50 | 500 | 496 |
| | PacifiCorp | 2.950% | 2/1/22 | 100 | 102 |
| | PacifiCorp | 3.600% | 4/1/24 | 125 | 136 |
| | PacifiCorp | 3.500% | 6/15/29 | 100 | 115 |
| | PacifiCorp | 2.700% | 9/15/30 | 50 | 55 |
| | PacifiCorp | 7.700% | 11/15/31 | 450 | 694 |
| | PacifiCorp | 5.250% | 6/15/35 | 640 | 887 |
| | PacifiCorp | 6.100% | 8/1/36 | 100 | 144 |
| | PacifiCorp | 6.250% | 10/15/37 | 125 | 186 |
| | PacifiCorp | 6.350% | 7/15/38 | 75 | 113 |
| | PacifiCorp | 4.100% | 2/1/42 | 200 | 244 |
| | PacifiCorp | 4.125% | 1/15/49 | 100 | 127 |
| | PacifiCorp | 4.150% | 2/15/50 | 200 | 259 |
| | PacifiCorp | 3.300% | 3/15/51 | 100 | 115 |
Total Bond Market Index Portfolio
| | | | Coupon | Maturity
Date | Face
Amount
($000) | Market
Value•
($000) |
| | PECO Energy Co. | 2.375% | 9/15/22 | 300 | 308 |
| | PECO Energy Co. | 3.900% | 3/1/48 | 75 | 95 |
| | PECO Energy Co. | 2.800% | 6/15/50 | 200 | 210 |
| | Piedmont Natural Gas Co. Inc. | 3.500% | 6/1/29 | 110 | 126 |
| | Piedmont Natural Gas Co. Inc. | 4.650% | 8/1/43 | 50 | 64 |
| | Piedmont Natural Gas Co. Inc. | 3.640% | 11/1/46 | 75 | 86 |
| | Piedmont Natural Gas Co. Inc. | 3.350% | 6/1/50 | 100 | 112 |
| | Pinnacle West Capital Corp. | 1.300% | 6/15/25 | 200 | 203 |
| | Potomac Electric Power Co. | 6.500% | 11/15/37 | 250 | 379 |
| | Potomac Electric Power Co. | 4.150% | 3/15/43 | 150 | 188 |
| | PPL Capital Funding Inc. | 4.200% | 6/15/22 | 25 | 26 |
| | PPL Capital Funding Inc. | 3.500% | 12/1/22 | 115 | 121 |
| | PPL Capital Funding Inc. | 3.400% | 6/1/23 | 100 | 106 |
| | PPL Capital Funding Inc. | 3.950% | 3/15/24 | 50 | 55 |
| | PPL Capital Funding Inc. | 3.100% | 5/15/26 | 100 | 110 |
| | PPL Capital Funding Inc. | 4.700% | 6/1/43 | 75 | 93 |
| | PPL Capital Funding Inc. | 5.000% | 3/15/44 | 200 | 257 |
| | PPL Capital Funding Inc. | 4.000% | 9/15/47 | 75 | 88 |
| | PPL Electric Utilities Corp. | 6.250% | 5/15/39 | 100 | 150 |
| | PPL Electric Utilities Corp. | 4.125% | 6/15/44 | 50 | 62 |
| | PPL Electric Utilities Corp. | 4.150% | 10/1/45 | 155 | 193 |
| | PPL Electric Utilities Corp. | 3.950% | 6/1/47 | 75 | 93 |
| | Progress Energy Inc. | 3.150% | 4/1/22 | 40 | 41 |
| | Progress Energy Inc. | 7.000% | 10/30/31 | 119 | 168 |
| | Progress Energy Inc. | 6.000% | 12/1/39 | 125 | 176 |
| | PSEG Power LLC | 3.850% | 6/1/23 | 125 | 134 |
| | PSEG Power LLC | 8.625% | 4/15/31 | 96 | 145 |
| | Public Service Co. of Colorado | 3.700% | 6/15/28 | 75 | 87 |
| | Public Service Co. of Colorado | 1.900% | 1/15/31 | 100 | 104 |
| | Public Service Co. of Colorado | 3.600% | 9/15/42 | 175 | 210 |
| | Public Service Co. of Colorado | 4.100% | 6/15/48 | 75 | 97 |
| | Public Service Co. of Colorado | 2.700% | 1/15/51 | 100 | 107 |
| | Public Service Co. of New Hampshire | 3.500% | 11/1/23 | 50 | 54 |
| | Public Service Co. of New Hampshire | 3.600% | 7/1/49 | 75 | 90 |
| | Public Service Electric and Gas Co. | 3.000% | 5/15/25 | 80 | 87 |
| | Public Service Electric and Gas Co. | 2.250% | 9/15/26 | 250 | 270 |
| | Public Service Electric and Gas Co. | 3.000% | 5/15/27 | 75 | 83 |
| | Public Service Electric and Gas Co. | 3.200% | 5/15/29 | 70 | 80 |
| | Public Service Electric and Gas Co. | 2.450% | 1/15/30 | 50 | 54 |
| | Public Service Electric and Gas Co. | 3.800% | 3/1/46 | 250 | 305 |
| | Public Service Electric and Gas Co. | 3.850% | 5/1/49 | 200 | 254 |
| | Public Service Electric and Gas Co. | 3.150% | 1/1/50 | 200 | 229 |
| | Public Service Electric and Gas Co. | 2.050% | 8/1/50 | 500 | 467 |
| | Public Service Enterprise Group Inc. | 2.650% | 11/15/22 | 100 | 104 |
| | Public Service Enterprise Group Inc. | 1.600% | 8/15/30 | 500 | 492 |
| | Puget Energy Inc. | 5.625% | 7/15/22 | 200 | 212 |
| | Puget Energy Inc. | 3.650% | 5/15/25 | 400 | 436 |
| | | | Coupon | Maturity
Date | Face
Amount
($000) | Market
Value•
($000) |
| | Puget Energy Inc. | 4.100% | 6/15/30 | 100 | 113 |
| | Puget Sound Energy Inc. | 6.274% | 3/15/37 | 125 | 180 |
| | Puget Sound Energy Inc. | 5.757% | 10/1/39 | 125 | 178 |
| | Puget Sound Energy Inc. | 4.300% | 5/20/45 | 100 | 126 |
| | Puget Sound Energy Inc. | 4.223% | 6/15/48 | 125 | 160 |
| | Puget Sound Energy Inc. | 3.250% | 9/15/49 | 90 | 99 |
| | San Diego Gas & Electric Co. | 2.500% | 5/15/26 | ��� 250 | 271 |
| | San Diego Gas & Electric Co. | 1.700% | 10/1/30 | 500 | 503 |
| | San Diego Gas & Electric Co. | 4.500% | 8/15/40 | 100 | 127 |
| | San Diego Gas & Electric Co. | 3.750% | 6/1/47 | 75 | 88 |
| | San Diego Gas & Electric Co. | 4.150% | 5/15/48 | 75 | 94 |
| | San Diego Gas & Electric Co. | 3.320% | 4/15/50 | 100 | 113 |
| | Sempra Energy | 2.875% | 10/1/22 | 100 | 103 |
| | Sempra Energy | 2.900% | 2/1/23 | 100 | 105 |
| | Sempra Energy | 4.050% | 12/1/23 | 100 | 109 |
| | Sempra Energy | 3.750% | 11/15/25 | 424 | 479 |
| | Sempra Energy | 3.250% | 6/15/27 | 150 | 168 |
| | Sempra Energy | 3.400% | 2/1/28 | 200 | 228 |
| | Sempra Energy | 3.800% | 2/1/38 | 200 | 230 |
| | Sempra Energy | 6.000% | 10/15/39 | 150 | 215 |
| | Sempra Energy | 4.000% | 2/1/48 | 175 | 207 |
| | Sierra Pacific Power Co. | 2.600% | 5/1/26 | 100 | 108 |
| 2 | Southern California Edison Co. | 1.845% | 2/1/22 | 22 | 21 |
| | Southern California Edison Co. | 2.400% | 2/1/22 | 75 | 76 |
| | Southern California Edison Co. | 3.400% | 6/1/23 | 75 | 79 |
| | Southern California Edison Co. | 3.500% | 10/1/23 | 175 | 188 |
| | Southern California Edison Co. | 3.700% | 8/1/25 | 150 | 169 |
| | Southern California Edison Co. | 3.650% | 3/1/28 | 100 | 112 |
| | Southern California Edison Co. | 4.200% | 3/1/29 | 75 | 87 |
| | Southern California Edison Co. | 6.650% | 4/1/29 | 75 | 94 |
| | Southern California Edison Co. | 2.850% | 8/1/29 | 275 | 299 |
| | Southern California Edison Co. | 2.250% | 6/1/30 | 300 | 311 |
| | Southern California Edison Co. | 5.750% | 4/1/35 | 75 | 102 |
| | Southern California Edison Co. | 5.350% | 7/15/35 | 200 | 270 |
| | Southern California Edison Co. | 5.625% | 2/1/36 | 125 | 160 |
| | Southern California Edison Co. | 5.500% | 3/15/40 | 100 | 133 |
| | Southern California Edison Co. | 4.500% | 9/1/40 | 275 | 331 |
| | Southern California Edison Co. | 4.050% | 3/15/42 | 208 | 237 |
| | Southern California Edison Co. | 3.900% | 3/15/43 | 100 | 113 |
| | Southern California Edison Co. | 4.000% | 4/1/47 | 335 | 393 |
| | Southern California Edison Co. | 4.125% | 3/1/48 | 350 | 418 |
| | Southern California Edison Co. | 4.875% | 3/1/49 | 100 | 132 |
| | Southern California Edison Co. | 3.650% | 2/1/50 | 500 | 566 |
| | Southern California Gas Co. | 2.600% | 6/15/26 | 200 | 217 |
Total Bond Market Index Portfolio
| | | | Coupon | Maturity
Date | Face
Amount
($000) | Market
Value•
($000) |
| | Southern California Gas Co. | 2.550% | 2/1/30 | 150 | 162 |
| | Southern California Gas Co. | 3.750% | 9/15/42 | 75 | 89 |
| | Southern California Gas Co. | 4.125% | 6/1/48 | 75 | 96 |
| | Southern California Gas Co. | 3.950% | 2/15/50 | 70 | 87 |
| | Southern Co. | 3.250% | 7/1/26 | 350 | 391 |
| | Southern Co. | 4.250% | 7/1/36 | 200 | 246 |
| | Southern Co. | 4.400% | 7/1/46 | 360 | 450 |
| | Southern Co. | 4.000% | 1/15/51 | 300 | 316 |
| | Southern Co. Gas Capital Corp. | 3.250% | 6/15/26 | 75 | 84 |
| | Southern Co. Gas Capital Corp. | 1.750% | 1/15/31 | 500 | 503 |
| | Southern Co. Gas Capital Corp. | 5.875% | 3/15/41 | 75 | 109 |
| | Southern Co. Gas Capital Corp. | 4.400% | 6/1/43 | 50 | 62 |
| | Southern Co. Gas Capital Corp. | 3.950% | 10/1/46 | 100 | 117 |
| | Southern Co. Gas Capital Corp. | 4.400% | 5/30/47 | 100 | 126 |
| | Southern Power Co. | 2.500% | 12/15/21 | 350 | 357 |
| | Southern Power Co. | 4.150% | 12/1/25 | 100 | 115 |
| | Southern Power Co. | 5.150% | 9/15/41 | 100 | 123 |
| | Southern Power Co. | 5.250% | 7/15/43 | 50 | 61 |
| | Southern Power Co. | 4.950% | 12/15/46 | 75 | 90 |
| | Southwest Gas Corp. | 3.700% | 4/1/28 | 50 | 57 |
| | Southwest Gas Corp. | 3.800% | 9/29/46 | 75 | 86 |
| | Southwest Gas Corp. | 4.150% | 6/1/49 | 25 | 30 |
| | Southwestern Electric Power Co. | 2.750% | 10/1/26 | 100 | 108 |
| | Southwestern Electric Power Co. | 4.100% | 9/15/28 | 100 | 117 |
| | Southwestern Electric Power Co. | 6.200% | 3/15/40 | 75 | 109 |
| | Southwestern Electric Power Co. | 3.900% | 4/1/45 | 200 | 232 |
| | Southwestern Electric Power Co. | 3.850% | 2/1/48 | 325 | 380 |
| | Southwestern Public Service Co. | 3.300% | 6/15/24 | 165 | 178 |
| | Southwestern Public Service Co. | 4.500% | 8/15/41 | 100 | 129 |
| | Southwestern Public Service Co. | 3.400% | 8/15/46 | 275 | 310 |
| | Southwestern Public Service Co. | 3.700% | 8/15/47 | 75 | 89 |
| | Southwestern Public Service Co. | 4.400% | 11/15/48 | 275 | 356 |
| | Southwestern Public Service Co. | 3.750% | 6/15/49 | 75 | 91 |
| | Southwestern Public Service Co. | 3.150% | 5/1/50 | 100 | 112 |
| | Tampa Electric Co. | 4.100% | 6/15/42 | 50 | 61 |
| | Tampa Electric Co. | 4.350% | 5/15/44 | 50 | 63 |
| | Tampa Electric Co. | 4.300% | 6/15/48 | 75 | 97 |
| | Tampa Electric Co. | 4.450% | 6/15/49 | 125 | 163 |
| | Tampa Electric Co. | 3.625% | 6/15/50 | 50 | 60 |
| | Toledo Edison Co. | 6.150% | 5/15/37 | 75 | 102 |
| | Tucson Electric Power Co. | 3.050% | 3/15/25 | 50 | 54 |
| | Union Electric Co. | 3.500% | 4/15/24 | 250 | 271 |
| | Union Electric Co. | 2.950% | 3/15/30 | 500 | 560 |
| | Union Electric Co. | 8.450% | 3/15/39 | 150 | 257 |
| | Union Electric Co. | 3.650% | 4/15/45 | 125 | 148 |
| | Union Electric Co. | 4.000% | 4/1/48 | 275 | 345 |
| | Union Electric Co. | 3.250% | 10/1/49 | 100 | 113 |
| | Veolia Environnement SA | 6.750% | 6/1/38 | 39 | 55 |
| | Virginia Electric and Power Co. | 3.450% | 2/15/24 | 50 | 54 |
| | | | Coupon | Maturity
Date | Face
Amount
($000) | Market
Value•
($000) |
| | Virginia Electric and Power Co. | 2.950% | 11/15/26 | 75 | 83 |
| | Virginia Electric and Power Co. | 3.500% | 3/15/27 | 250 | 282 |
| | Virginia Electric and Power Co. | 3.800% | 4/1/28 | 150 | 175 |
| | Virginia Electric and Power Co. | 2.875% | 7/15/29 | 275 | 307 |
| | Virginia Electric and Power Co. | 6.000% | 1/15/36 | 125 | 181 |
| | Virginia Electric and Power Co. | 6.000% | 5/15/37 | 150 | 219 |
| | Virginia Electric and Power Co. | 6.350% | 11/30/37 | 50 | 75 |
| | Virginia Electric and Power Co. | 4.000% | 1/15/43 | 400 | 499 |
| | Virginia Electric and Power Co. | 4.450% | 2/15/44 | 475 | 618 |
| | Virginia Electric and Power Co. | 4.200% | 5/15/45 | 75 | 96 |
| | Virginia Electric and Power Co. | 4.000% | 11/15/46 | 100 | 128 |
| | Virginia Electric and Power Co. | 3.800% | 9/15/47 | 100 | 124 |
| | Virginia Electric and Power Co. | 4.600% | 12/1/48 | 175 | 242 |
| | Virginia Electric and Power Co. | 3.300% | 12/1/49 | 210 | 244 |
| | Washington Gas Light Co. | 3.796% | 9/15/46 | 100 | 119 |
| | Washington Gas Light Co. | 3.650% | 9/15/49 | 30 | 36 |
| | WEC Energy Group Inc. | 0.550% | 9/15/23 | 500 | 502 |
| | WEC Energy Group Inc. | 3.550% | 6/15/25 | 168 | 187 |
| | WEC Energy Group Inc. | 1.375% | 10/15/27 | 500 | 508 |
| | Wisconsin Electric Power Co. | 2.050% | 12/15/24 | 100 | 106 |
| | Wisconsin Electric Power Co. | 4.300% | 10/15/48 | 100 | 134 |
| | Wisconsin Power and Light Co. | 6.375% | 8/15/37 | 100 | 147 |
| | Wisconsin Power and Light Co. | 3.650% | 4/1/50 | 50 | 59 |
| | Xcel Energy Inc. | 3.300% | 6/1/25 | 325 | 353 |
| | Xcel Energy Inc. | 3.350% | 12/1/26 | 75 | 84 |
| | Xcel Energy Inc. | 4.000% | 6/15/28 | 75 | 89 |
| | Xcel Energy Inc. | 2.600% | 12/1/29 | 200 | 217 |
| | Xcel Energy Inc. | 3.400% | 6/1/30 | 250 | 287 |
| | Xcel Energy Inc. | 3.500% | 12/1/49 | 100 | 116 |
| | | | | | | 117,112 |
| Total Corporate Bonds (Cost $1,291,562) | 1,451,508 |
| Sovereign Bonds (3.9%) |
| | African Development Bank | 0.500% | 4/22/22 | 500 | 502 |
| | African Development Bank | 1.625% | 9/16/22 | 400 | 410 |
| | African Development Bank | 2.125% | 11/16/22 | 700 | 725 |
| | African Development Bank | 3.000% | 9/20/23 | 275 | 295 |
| | Asian Development Bank | 2.000% | 2/16/22 | 980 | 1,000 |
| | Asian Development Bank | 1.875% | 2/18/22 | 600 | 611 |
| | Asian Development Bank | 0.625% | 4/7/22 | 1,100 | 1,106 |
| | Asian Development Bank | 1.875% | 7/19/22 | 600 | 616 |
| | Asian Development Bank | 1.750% | 9/13/22 | 1,100 | 1,129 |
| | Asian Development Bank | 1.625% | 1/24/23 | 200 | 206 |
| | Asian Development Bank | 2.750% | 3/17/23 | 1,000 | 1,056 |
| | Asian Development Bank | 0.250% | 7/14/23 | 1,300 | 1,301 |
| | Asian Development Bank | 0.250% | 10/6/23 | 600 | 600 |
| | Asian Development Bank | 2.625% | 1/30/24 | 1,000 | 1,072 |
| | Asian Development Bank | 1.500% | 10/18/24 | 500 | 522 |
| | Asian Development Bank | 2.000% | 1/22/25 | 300 | 320 |
Total Bond Market Index Portfolio
| | | | Coupon | Maturity
Date | Face
Amount
($000) | Market
Value•
($000) |
| | Asian Development Bank | 0.625% | 4/29/25 | 700 | 706 |
| | Asian Development Bank | 0.375% | 9/3/25 | 1,000 | 997 |
| | Asian Development Bank | 2.000% | 4/24/26 | 100 | 108 |
| | Asian Development Bank | 2.625% | 1/12/27 | 200 | 223 |
| | Asian Development Bank | 2.375% | 8/10/27 | 275 | 304 |
| | Asian Development Bank | 6.220% | 8/15/27 | 100 | 132 |
| | Asian Development Bank | 2.500% | 11/2/27 | 673 | 750 |
| | Asian Development Bank | 5.820% | 6/16/28 | 148 | 199 |
| | Asian Development Bank | 3.125% | 9/26/28 | 130 | 152 |
| | Asian Development Bank | 1.750% | 9/19/29 | 200 | 213 |
| | Asian Development Bank | 1.875% | 1/24/30 | 200 | 215 |
| | Asian Development Bank | 0.750% | 10/8/30 | 500 | 487 |
| | Asian Infrastructure Investment Bank | 0.250% | 9/29/23 | 500 | 500 |
| | Asian Infrastructure Investment Bank | 2.250% | 5/16/24 | 500 | 532 |
| | Asian Infrastructure Investment Bank | 0.500% | 5/28/25 | 400 | 400 |
| | Canada | 2.625% | 1/25/22 | 250 | 256 |
| | Canada | 2.000% | 11/15/22 | 570 | 589 |
| | Canada | 1.625% | 1/22/25 | 550 | 575 |
| | Corp. Andina de Fomento | 3.250% | 2/11/22 | 45 | 46 |
| | Corp. Andina de Fomento | 2.750% | 1/6/23 | 125 | 130 |
| | Corp. Andina de Fomento | 2.375% | 5/12/23 | 100 | 103 |
| | Corp. Andina de Fomento | 3.750% | 11/23/23 | 925 | 999 |
| | Council of Europe Development Bank | 1.750% | 9/26/22 | 150 | 154 |
| | Council of Europe Development Bank | 2.625% | 2/13/23 | 425 | 447 |
| | Council of Europe Development Bank | 0.250% | 6/10/23 | 100 | 100 |
| | Council of Europe Development Bank | 0.250% | 10/20/23 | 500 | 500 |
| | Council of Europe Development Bank | 1.375% | 2/27/25 | 200 | 208 |
| | European Bank for Reconstruction & Development | 1.875% | 2/23/22 | 200 | 204 |
| | European Bank for Reconstruction & Development | 2.750% | 3/7/23 | 925 | 976 |
| | European Bank for Reconstruction & Development | 0.250% | 7/10/23 | 200 | 200 |
| | European Bank for Reconstruction & Development | 1.625% | 9/27/24 | 270 | 283 |
| | European Bank for Reconstruction & Development | 1.500% | 2/13/25 | �� 100 | 105 |
| | European Bank for Reconstruction & Development | 0.500% | 5/19/25 | 100 | 100 |
| | European Bank for Reconstruction & Development | 0.500% | 11/25/25 | 500 | 501 |
| | European Investment Bank | 2.875% | 12/15/21 | 1,150 | 1,180 |
| | European Investment Bank | 2.250% | 3/15/22 | 500 | 512 |
| | European Investment Bank | 2.625% | 5/20/22 | 200 | 207 |
| | European Investment Bank | 2.375% | 6/15/22 | 1,725 | 1,780 |
| | European Investment Bank | 1.375% | 9/6/22 | 720 | 734 |
| | European Investment Bank | 2.500% | 3/15/23 | 600 | 630 |
| | European Investment Bank | 1.375% | 5/15/23 | 600 | 617 |
| | European Investment Bank | 2.875% | 8/15/23 | 800 | 856 |
| | | | Coupon | Maturity
Date | Face
Amount
($000) | Market
Value•
($000) |
| | European Investment Bank | 0.250% | 9/15/23 | 1,750 | 1,752 |
| | European Investment Bank | 3.125% | 12/14/23 | 500 | 542 |
| | European Investment Bank | 3.250% | 1/29/24 | 810 | 884 |
| | European Investment Bank | 2.625% | 3/15/24 | 530 | 570 |
| | European Investment Bank | 2.250% | 6/24/24 | 550 | 587 |
| | European Investment Bank | 2.500% | 10/15/24 | 276 | 299 |
| | European Investment Bank | 1.875% | 2/10/25 | 1,050 | 1,115 |
| | European Investment Bank | 1.625% | 3/14/25 | 100 | 105 |
| | European Investment Bank | 0.625% | 7/25/25 | 1,600 | 1,616 |
| | European Investment Bank | 0.375% | 12/15/25 | 2,000 | 1,993 |
| | European Investment Bank | 2.375% | 5/24/27 | 225 | 249 |
| | European Investment Bank | 0.625% | 10/21/27 | 500 | 497 |
| | European Investment Bank | 1.625% | 10/9/29 | 125 | 132 |
| | European Investment Bank | 0.875% | 5/17/30 | 200 | 198 |
| | European Investment Bank | 0.750% | 9/23/30 | 500 | 489 |
| | European Investment Bank | 4.875% | 2/15/36 | 325 | 479 |
| 6 | Export Development Canada | 1.750% | 7/18/22 | 580 | 593 |
| 6 | Export Development Canada | 2.500% | 1/24/23 | 40 | 42 |
| 6 | Export Development Canada | 1.375% | 2/24/23 | 1,000 | 1,020 |
| 6 | Export Development Canada | 2.625% | 2/21/24 | 250 | 268 |
| | Export-Import Bank of Korea | 5.000% | 4/11/22 | 275 | 291 |
| | Export-Import Bank of Korea | 3.000% | 11/1/22 | 400 | 419 |
| | Export-Import Bank of Korea | 3.625% | 11/27/23 | 200 | 218 |
| | Export-Import Bank of Korea | 4.000% | 1/14/24 | 650 | 714 |
| | Export-Import Bank of Korea | 2.625% | 5/26/26 | 200 | 219 |
| | Export-Import Bank of Korea | 1.250% | 9/21/30 | 500 | 490 |
| | FMS Wertmanagement | 2.000% | 8/1/22 | 470 | 483 |
| | FMS Wertmanagement | 2.750% | 3/6/23 | 300 | 316 |
| | Hydro-Quebec | 8.400% | 1/15/22 | 375 | 405 |
| | Hydro-Quebec | 8.050% | 7/7/24 | 325 | 407 |
| | Inter-American Development Bank | 2.125% | 1/18/22 | 700 | 714 |
| | Inter-American Development Bank | 1.750% | 4/14/22 | 800 | 816 |
| | Inter-American Development Bank | 3.000% | 9/26/22 | 500 | 524 |
| | Inter-American Development Bank | 2.500% | 1/18/23 | 1,025 | 1,073 |
| | Inter-American Development Bank | 0.500% | 5/24/23 | 400 | 403 |
| | Inter-American Development Bank | 3.000% | 10/4/23 | 625 | 672 |
| | Inter-American Development Bank | 0.250% | 11/15/23 | 1,000 | 1,001 |
| | Inter-American Development Bank | 2.625% | 1/16/24 | 150 | 161 |
Total Bond Market Index Portfolio
| | | | Coupon | Maturity
Date | Face
Amount
($000) | Market
Value•
($000) |
| | Inter-American Development Bank | 3.000% | 2/21/24 | 900 | 976 |
| | Inter-American Development Bank | 2.125% | 1/15/25 | 1,100 | 1,177 |
| | Inter-American Development Bank | 1.750% | 3/14/25 | 200 | 211 |
| | Inter-American Development Bank | 0.875% | 4/3/25 | 500 | 510 |
| | Inter-American Development Bank | 7.000% | 6/15/25 | 134 | 171 |
| | Inter-American Development Bank | 0.625% | 7/15/25 | 1,300 | 1,312 |
| | Inter-American Development Bank | 2.000% | 6/2/26 | 750 | 807 |
| | Inter-American Development Bank | 2.000% | 7/23/26 | 100 | 108 |
| | Inter-American Development Bank | 2.375% | 7/7/27 | 450 | 496 |
| | Inter-American Development Bank | 0.625% | 9/16/27 | 800 | 793 |
| | Inter-American Development Bank | 3.125% | 9/18/28 | 875 | 1,025 |
| | Inter-American Development Bank | 3.875% | 10/28/41 | 200 | 276 |
| | Inter-American Development Bank | 3.200% | 8/7/42 | 100 | 126 |
| | International Bank for Reconstruction & Development | 2.125% | 12/13/21 | 255 | 260 |
| | International Bank for Reconstruction & Development | 2.000% | 1/26/22 | 145 | 148 |
| | International Bank for Reconstruction & Development | 1.625% | 2/10/22 | 1,325 | 1,346 |
| | International Bank for Reconstruction & Development | 2.125% | 7/1/22 | 1,775 | 1,826 |
| | International Bank for Reconstruction & Development | 1.875% | 6/19/23 | 1,100 | 1,145 |
| | International Bank for Reconstruction & Development | 3.000% | 9/27/23 | 1,125 | 1,210 |
| | International Bank for Reconstruction & Development | 0.250% | 11/24/23 | 700 | 700 |
| | International Bank for Reconstruction & Development | 2.500% | 3/19/24 | 1,100 | 1,178 |
| | International Bank for Reconstruction & Development | 1.500% | 8/28/24 | 695 | 725 |
| | International Bank for Reconstruction & Development | 2.500% | 11/25/24 | 750 | 813 |
| | International Bank for Reconstruction & Development | 1.625% | 1/15/25 | 200 | 210 |
| | International Bank for Reconstruction & Development | 0.625% | 4/22/25 | 1,500 | 1,514 |
| | International Bank for Reconstruction & Development | 0.375% | 7/28/25 | 1,500 | 1,497 |
| | International Bank for Reconstruction & Development | 2.500% | 7/29/25 | 1,150 | 1,258 |
| | International Bank for Reconstruction & Development | 0.500% | 10/28/25 | 2,000 | 2,005 |
| | International Bank for Reconstruction & Development | 3.125% | 11/20/25 | 470 | 530 |
| | | | Coupon | Maturity
Date | Face
Amount
($000) | Market
Value•
($000) |
| | International Bank for Reconstruction & Development | 2.500% | 11/22/27 | 350 | 391 |
| | International Bank for Reconstruction & Development | 0.750% | 11/24/27 | 900 | 901 |
| | International Bank for Reconstruction & Development | 1.750% | 10/23/29 | 200 | 213 |
| | International Bank for Reconstruction & Development | 0.875% | 5/14/30 | 400 | 396 |
| | International Bank for Reconstruction & Development | 0.750% | 8/26/30 | 800 | 780 |
| | International Bank for Reconstruction & Development | 4.750% | 2/15/35 | 250 | 357 |
| | International Finance Corp. | 2.000% | 10/24/22 | 200 | 207 |
| | International Finance Corp. | 2.875% | 7/31/23 | 575 | 614 |
| | International Finance Corp. | 1.375% | 10/16/24 | 200 | 208 |
| | International Finance Corp. | 0.375% | 7/16/25 | 400 | 399 |
| | International Finance Corp. | 2.125% | 4/7/26 | 600 | 651 |
| 7 | Iraq Government Aid Bond | 2.149% | 1/18/22 | 100 | 102 |
| 7 | Israel Government Aid Bond | 5.500% | 12/4/23 | 50 | 58 |
| 7 | Israel Government Aid Bond | 5.500% | 4/26/24 | 475 | 555 |
| 8 | Japan Bank for International Cooperation | 3.125% | 7/20/21 | 275 | 279 |
| 8 | Japan Bank for International Cooperation | 2.500% | 6/1/22 | 450 | 464 |
| 8 | Japan Bank for International Cooperation | 2.375% | 7/21/22 | 250 | 258 |
| 8 | Japan Bank for International Cooperation | 2.375% | 11/16/22 | 540 | 561 |
| 8 | Japan Bank for International Cooperation | 1.750% | 1/23/23 | 500 | 514 |
| 8 | Japan Bank for International Cooperation | 0.625% | 5/22/23 | 200 | 201 |
| 8 | Japan Bank for International Cooperation | 3.250% | 7/20/23 | 300 | 322 |
| 8 | Japan Bank for International Cooperation | 3.375% | 7/31/23 | 100 | 108 |
| 8 | Japan Bank for International Cooperation | 0.375% | 9/15/23 | 600 | 600 |
| 8 | Japan Bank for International Cooperation | 3.375% | 10/31/23 | 400 | 433 |
| 8 | Japan Bank for International Cooperation | 3.000% | 5/29/24 | 500 | 543 |
| 8 | Japan Bank for International Cooperation | 1.750% | 10/17/24 | 200 | 209 |
| 8 | Japan Bank for International Cooperation | 2.125% | 2/10/25 | 330 | 350 |
Total Bond Market Index Portfolio
| | | | Coupon | Maturity
Date | Face
Amount
($000) | Market
Value•
($000) |
| 8 | Japan Bank for International Cooperation | 0.625% | 7/15/25 | 400 | 400 |
| 8 | Japan Bank for International Cooperation | 2.375% | 4/20/26 | 200 | 217 |
| 8 | Japan Bank for International Cooperation | 2.250% | 11/4/26 | 200 | 217 |
| 8 | Japan Bank for International Cooperation | 2.875% | 7/21/27 | 200 | 224 |
| 8 | Japan Bank for International Cooperation | 2.750% | 11/16/27 | 800 | 898 |
| 8 | Japan Bank for International Cooperation | 3.250% | 7/20/28 | 300 | 349 |
| 8 | Japan Bank for International Cooperation | 3.500% | 10/31/28 | 350 | 415 |
| 8 | Japan International Cooperation Agency | 2.750% | 4/27/27 | 300 | 333 |
| 7 | Kingdom of Jordan AID | 2.578% | 6/30/22 | 200 | 206 |
| 7 | Kingdom of Jordan AID | 3.000% | 6/30/25 | 200 | 217 |
| | Korea Development Bank | 3.000% | 9/14/22 | 400 | 416 |
| | Korea Development Bank | 3.375% | 3/12/23 | 700 | 745 |
| | Korea Development Bank | 3.750% | 1/22/24 | 500 | 546 |
| | Korea Development Bank | 2.125% | 10/1/24 | 200 | 211 |
| 9 | Kreditanstalt fuer Wiederaufbau | 3.125% | 12/15/21 | 1,115 | 1,145 |
| 9 | Kreditanstalt fuer Wiederaufbau | 2.500% | 2/15/22 | 1,000 | 1,025 |
| 9 | Kreditanstalt fuer Wiederaufbau | 2.125% | 3/7/22 | 1,000 | 1,023 |
| 9 | Kreditanstalt fuer Wiederaufbau | 2.125% | 6/15/22 | 750 | 771 |
| 9 | Kreditanstalt fuer Wiederaufbau | 1.750% | 8/22/22 | 1,600 | 1,641 |
| 9 | Kreditanstalt fuer Wiederaufbau | 2.000% | 10/4/22 | 950 | 980 |
| 9 | Kreditanstalt fuer Wiederaufbau | 2.375% | 12/29/22 | 950 | 991 |
| 9 | Kreditanstalt fuer Wiederaufbau | 2.125% | 1/17/23 | 1,025 | 1,065 |
| 9 | Kreditanstalt fuer Wiederaufbau | 1.625% | 2/15/23 | 1,200 | 1,235 |
| 9 | Kreditanstalt fuer Wiederaufbau | 0.250% | 10/19/23 | 800 | 799 |
| 9 | Kreditanstalt fuer Wiederaufbau | 2.625% | 2/28/24 | 400 | 430 |
| 9 | Kreditanstalt fuer Wiederaufbau | 1.375% | 8/5/24 | 900 | 929 |
| 9 | Kreditanstalt fuer Wiederaufbau | 2.500% | 11/20/24 | 1,800 | 1,951 |
| 9 | Kreditanstalt fuer Wiederaufbau | 2.000% | 5/2/25 | 150 | 160 |
| 9 | Kreditanstalt fuer Wiederaufbau | 0.375% | 7/18/25 | 1,500 | 1,497 |
| 9 | Kreditanstalt fuer Wiederaufbau | 2.875% | 4/3/28 | 500 | 575 |
| 9 | Kreditanstalt fuer Wiederaufbau | 1.750% | 9/14/29 | 175 | 186 |
| 9 | Kreditanstalt fuer Wiederaufbau | 0.000% | 4/18/36 | 400 | 320 |
| 9 | Kreditanstalt fuer Wiederaufbau | 0.000% | 6/29/37 | 200 | 157 |
| 9 | Landwirtschaftliche Rentenbank | 3.125% | 11/14/23 | 100 | 108 |
| 9 | Landwirtschaftliche Rentenbank | 2.000% | 1/13/25 | 850 | 904 |
| 9 | Landwirtschaftliche Rentenbank | 0.500% | 5/27/25 | 400 | 401 |
| | | | Coupon | Maturity
Date | Face
Amount
($000) | Market
Value•
($000) |
| 9 | Landwirtschaftliche Rentenbank | 2.375% | 6/10/25 | 475 | 515 |
| 9 | Landwirtschaftliche Rentenbank | 1.750% | 7/27/26 | 275 | 292 |
| 9 | Landwirtschaftliche Rentenbank | 2.500% | 11/15/27 | 250 | 279 |
| 9 | Landwirtschaftliche Rentenbank | 0.875% | 9/3/30 | 500 | 492 |
| | Nordic Investment Bank | 2.125% | 2/1/22 | 200 | 204 |
| | Nordic Investment Bank | 1.375% | 10/17/22 | 200 | 204 |
| | Nordic Investment Bank | 0.375% | 5/19/23 | 200 | 200 |
| | Nordic Investment Bank | 2.875% | 7/19/23 | 200 | 213 |
| | Nordic Investment Bank | 2.250% | 5/21/24 | 200 | 211 |
| | Nordic Investment Bank | 0.375% | 9/11/25 | 600 | 598 |
| 10 | Oesterreichische Kontrollbank AG | 2.625% | 1/31/22 | 100 | 103 |
| 10 | Oesterreichische Kontrollbank AG | 1.625% | 9/17/22 | 400 | 409 |
| 10 | Oesterreichische Kontrollbank AG | 2.875% | 3/13/23 | 500 | 528 |
| 10 | Oesterreichische Kontrollbank AG | 3.125% | 11/7/23 | 200 | 216 |
| 10 | Oesterreichische Kontrollbank AG | 1.500% | 2/12/25 | 100 | 104 |
| 10 | Oesterreichische Kontrollbank AG | 0.375% | 9/17/25 | 500 | 497 |
| | Province of Alberta | 2.200% | 7/26/22 | 400 | 412 |
| | Province of Alberta | 3.350% | 11/1/23 | 375 | 406 |
| | Province of Alberta | 2.950% | 1/23/24 | 300 | 323 |
| | Province of Alberta | 1.875% | 11/13/24 | 450 | 473 |
| | Province of Alberta | 1.000% | 5/20/25 | 485 | 491 |
| | Province of Alberta | 3.300% | 3/15/28 | 250 | 288 |
| | Province of Alberta | 1.300% | 7/22/30 | 500 | 487 |
| | Province of British Columbia | 2.000% | 10/23/22 | 200 | 206 |
| | Province of British Columbia | 1.750% | 9/27/24 | 225 | 233 |
| | Province of British Columbia | 2.250% | 6/2/26 | 300 | 326 |
| | Province of Manitoba | 2.125% | 5/4/22 | 60 | 62 |
| | Province of Manitoba | 2.100% | 9/6/22 | 150 | 154 |
| | Province of Manitoba | 2.600% | 4/16/24 | 150 | 161 |
| | Province of Manitoba | 2.125% | 6/22/26 | 90 | 97 |
| | Province of New Brunswick | 2.500% | 12/12/22 | 95 | 99 |
| | Province of New Brunswick | 3.625% | 2/24/28 | 105 | 122 |
| | Province of Ontario | 2.400% | 2/8/22 | 525 | 537 |
| | Province of Ontario | 2.550% | 4/25/22 | 350 | 361 |
| | Province of Ontario | 2.250% | 5/18/22 | 500 | 514 |
| | Province of Ontario | 2.450% | 6/29/22 | 150 | 155 |
| | Province of Ontario | 2.200% | 10/3/22 | 400 | 413 |
| | Province of Ontario | 3.400% | 10/17/23 | 760 | 824 |
| | Province of Ontario | 3.050% | 1/29/24 | 250 | 270 |
| | Province of Ontario | 3.200% | 5/16/24 | 150 | 164 |
| | Province of Ontario | 2.500% | 4/27/26 | 250 | 273 |
| | Province of Ontario | 2.300% | 6/15/26 | 900 | 976 |
| | Province of Ontario | 2.000% | 10/2/29 | 585 | 616 |
| | Province of Ontario | 1.125% | 10/7/30 | 500 | 494 |
| | Province of Quebec | 2.375% | 1/31/22 | 390 | 399 |
| | Province of Quebec | 2.625% | 2/13/23 | 425 | 446 |
| | Province of Quebec | 1.500% | 2/11/25 | 441 | 455 |
| | Province of Quebec | 0.600% | 7/23/25 | 500 | 498 |
| | Province of Quebec | 2.500% | 4/20/26 | 200 | 219 |
| | Province of Quebec | 2.750% | 4/12/27 | 850 | 947 |
| | Province of Quebec | 7.500% | 9/15/29 | 475 | 711 |
| | Province of Quebec | 1.350% | 5/28/30 | 400 | 403 |
| | Province of Saskatchewan | 8.500% | 7/15/22 | 58 | 65 |
| | Republic of Chile | 2.250% | 10/30/22 | 175 | 181 |
| | Republic of Chile | 3.125% | 1/21/26 | 485 | 538 |
| | Republic of Chile | 3.240% | 2/6/28 | 460 | 521 |
Total Bond Market Index Portfolio
| | | | Coupon | Maturity
Date | Face
Amount
($000) | Market
Value•
($000) |
| | Republic of Chile | 2.450% | 1/31/31 | 200 | 214 |
| | Republic of Chile | 2.550% | 1/27/32 | 200 | 215 |
| | Republic of Chile | 3.500% | 1/25/50 | 675 | 772 |
| | Republic of Colombia | 4.000% | 2/26/24 | 400 | 432 |
| | Republic of Colombia | 8.125% | 5/21/24 | 100 | 123 |
| | Republic of Colombia | 4.500% | 1/28/26 | 322 | 365 |
| | Republic of Colombia | 3.875% | 4/25/27 | 765 | 851 |
| | Republic of Colombia | 4.500% | 3/15/29 | 450 | 521 |
| | Republic of Colombia | 3.000% | 1/30/30 | 200 | 210 |
| | Republic of Colombia | 3.125% | 4/15/31 | 200 | 212 |
| | Republic of Colombia | 10.375% | 1/28/33 | 200 | 323 |
| | Republic of Colombia | 7.375% | 9/18/37 | 300 | 439 |
| | Republic of Colombia | 6.125% | 1/18/41 | 125 | 167 |
| | Republic of Colombia | 5.625% | 2/26/44 | 475 | 615 |
| | Republic of Colombia | 5.000% | 6/15/45 | 1,165 | 1,425 |
| | Republic of Colombia | 5.200% | 5/15/49 | 600 | 759 |
| | Republic of Colombia | 4.125% | 5/15/51 | 400 | 444 |
| | Republic of Hungary | 6.375% | 3/29/21 | 422 | 428 |
| | Republic of Hungary | 5.375% | 2/21/23 | 400 | 438 |
| | Republic of Hungary | 5.750% | 11/22/23 | 400 | 456 |
| | Republic of Hungary | 5.375% | 3/25/24 | 350 | 398 |
| | Republic of Hungary | 7.625% | 3/29/41 | 290 | 514 |
| | Republic of Indonesia | 2.950% | 1/11/23 | 425 | 443 |
| | Republic of Indonesia | 4.100% | 4/24/28 | 200 | 232 |
| | Republic of Indonesia | 4.750% | 2/11/29 | 425 | 515 |
| | Republic of Indonesia | 3.400% | 9/18/29 | 200 | 224 |
| | Republic of Indonesia | 2.850% | 2/14/30 | 200 | 215 |
| | Republic of Indonesia | 3.850% | 10/15/30 | 200 | 233 |
| 5 | Republic of Indonesia | 4.750% | 7/18/47 | 200 | 250 |
| | Republic of Indonesia | 4.350% | 1/11/48 | 200 | 238 |
| | Republic of Indonesia | 4.350% | 1/11/48 | 525 | 625 |
| | Republic of Indonesia | 3.700% | 10/30/49 | 200 | 219 |
| | Republic of Indonesia | 4.200% | 10/15/50 | 430 | 513 |
| | Republic of Indonesia | 4.450% | 4/15/70 | 200 | 245 |
| | Republic of Italy | 6.875% | 9/27/23 | 590 | 684 |
| | Republic of Italy | 2.375% | 10/17/24 | 475 | 499 |
| | Republic of Italy | 1.250% | 2/17/26 | 500 | 498 |
| | Republic of Italy | 2.875% | 10/17/29 | 400 | 420 |
| | Republic of Italy | 5.375% | 6/15/33 | 475 | 609 |
| | Republic of Italy | 4.000% | 10/17/49 | 500 | 550 |
| | Republic of Korea | 3.875% | 9/11/23 | 200 | 218 |
| | Republic of Korea | 5.625% | 11/3/25 | 100 | 123 |
| | Republic of Korea | 2.750% | 1/19/27 | 1,000 | 1,091 |
| | Republic of Korea | 3.875% | 9/20/48 | 125 | 166 |
| | Republic of Panama | 4.000% | 9/22/24 | 200 | 221 |
| | Republic of Panama | 3.750% | 3/16/25 | 207 | 229 |
| | Republic of Panama | 7.125% | 1/29/26 | 168 | 214 |
| | Republic of Panama | 8.875% | 9/30/27 | 238 | 341 |
| | Republic of Panama | 3.875% | 3/17/28 | 460 | 529 |
| | Republic of Panama | 9.375% | 4/1/29 | 300 | 466 |
| | Republic of Panama | 2.252% | 9/29/32 | 500 | 517 |
| 2 | Republic of Panama | 6.700% | 1/26/36 | 292 | 433 |
| 2 | Republic of Panama | 4.500% | 4/16/50 | 610 | 784 |
| 2 | Republic of Panama | 4.300% | 4/29/53 | 400 | 506 |
| 2 | Republic of Panama | 4.500% | 4/1/56 | 700 | 903 |
| 2 | Republic of Panama | 3.870% | 7/23/60 | 200 | 236 |
| | Republic of Peru | 7.350% | 7/21/25 | 225 | 288 |
| | Republic of Peru | 2.392% | 1/23/26 | 200 | 213 |
| | Republic of Peru | 2.783% | 1/23/31 | 400 | 440 |
| | Republic of Peru | 8.750% | 11/21/33 | 645 | 1,102 |
| 2 | Republic of Peru | 6.550% | 3/14/37 | 325 | 493 |
| | Republic of Peru | 5.625% | 11/18/50 | 475 | 746 |
| | Republic of Peru | 3.230% | 7/28/21 | 500 | 499 |
| | Republic of Philippines | 9.500% | 10/21/24 | 350 | 466 |
| | Republic of Philippines | 10.625% | 3/16/25 | 100 | 142 |
| | Republic of Philippines | 5.500% | 3/30/26 | 225 | 280 |
| | Republic of Philippines | 3.000% | 2/1/28 | 400 | 443 |
| | Republic of Philippines | 3.750% | 1/14/29 | 400 | 467 |
| | Republic of Philippines | 9.500% | 2/2/30 | 300 | 495 |
| | | | Coupon | Maturity
Date | Face
Amount
($000) | Market
Value•
($000) |
| | Republic of Philippines | 2.457% | 5/5/30 | 200 | 216 |
| | Republic of Philippines | 7.750% | 1/14/31 | 400 | 618 |
| | Republic of Philippines | 6.375% | 1/15/32 | 200 | 286 |
| | Republic of Philippines | 6.375% | 10/23/34 | 550 | 809 |
| | Republic of Philippines | 3.950% | 1/20/40 | 700 | 837 |
| | Republic of Philippines | 3.700% | 3/1/41 | 400 | 464 |
| | Republic of Philippines | 3.700% | 2/2/42 | 350 | 407 |
| | Republic of Philippines | 2.950% | 5/5/45 | 500 | 531 |
| | Republic of Poland | 5.125% | 4/21/21 | 245 | 248 |
| | Republic of Poland | 5.000% | 3/23/22 | 775 | 818 |
| | Republic of Poland | 3.000% | 3/17/23 | 325 | 342 |
| | Republic of Poland | 3.250% | 4/6/26 | 500 | 563 |
| 2 | Republic of Uruguay | 8.000% | 11/18/22 | 83 | 91 |
| 2 | Republic of Uruguay | 4.500% | 8/14/24 | 303 | 335 |
| 2 | Republic of Uruguay | 4.375% | 10/27/27 | 150 | 177 |
| 2 | Republic of Uruguay | 4.375% | 1/23/31 | 308 | 378 |
| 2 | Republic of Uruguay | 7.625% | 3/21/36 | 195 | 316 |
| 2 | Republic of Uruguay | 4.125% | 11/20/45 | 300 | 373 |
| 2 | Republic of Uruguay | 5.100% | 6/18/50 | 765 | 1,070 |
| 2 | Republic of Uruguay | 4.975% | 4/20/55 | 500 | 694 |
| | State of Israel | 3.150% | 6/30/23 | 400 | 427 |
| | State of Israel | 2.875% | 3/16/26 | 200 | 220 |
| | State of Israel | 3.250% | 1/17/28 | 300 | 343 |
| | State of Israel | 2.500% | 1/15/30 | 200 | 217 |
| | State of Israel | 2.750% | 7/3/30 | 600 | 661 |
| | State of Israel | 4.500% | 1/30/43 | 200 | 264 |
| | State of Israel | 4.125% | 1/17/48 | 250 | 322 |
| | State of Israel | 3.375% | 1/15/50 | 475 | 525 |
| | State of Israel | 3.875% | 7/3/50 | 400 | 481 |
| | State of Israel | 4.500% | 4/3/20 | 200 | 265 |
| | Svensk Exportkredit AB | 2.000% | 8/30/22 | 190 | 195 |
| | Svensk Exportkredit AB | 1.625% | 11/14/22 | 200 | 205 |
| | Svensk Exportkredit AB | 2.875% | 3/14/23 | 195 | 206 |
| | Svensk Exportkredit AB | 0.375% | 7/30/24 | 500 | 500 |
| | Svensk Exportkredit AB | 0.625% | 5/14/25 | 500 | 502 |
| | Svensk Exportkredit AB | 0.500% | 8/26/25 | 800 | 797 |
| 7 | Ukraine Government AID Bonds | 1.471% | 9/29/21 | 175 | 176 |
| | United Mexican States | 3.600% | 1/30/25 | 510 | 567 |
| | United Mexican States | 3.900% | 4/27/25 | 400 | 449 |
| | United Mexican States | 4.125% | 1/21/26 | 445 | 511 |
| | United Mexican States | 4.150% | 3/28/27 | 800 | 923 |
| | United Mexican States | 3.750% | 1/11/28 | 675 | 760 |
| | United Mexican States | 4.500% | 4/22/29 | 950 | 1,114 |
| | United Mexican States | 3.250% | 4/16/30 | 700 | 758 |
| | United Mexican States | 8.300% | 8/15/31 | 220 | 335 |
| | United Mexican States | 4.750% | 4/27/32 | 600 | 723 |
| | United Mexican States | 7.500% | 4/8/33 | 100 | 145 |
| | United Mexican States | 6.050% | 1/11/40 | 883 | 1,185 |
| | United Mexican States | 4.750% | 3/8/44 | 765 | 910 |
| | United Mexican States | 5.550% | 1/21/45 | 510 | 669 |
| | United Mexican States | 4.600% | 1/23/46 | 600 | 700 |
| | United Mexican States | 4.350% | 1/15/47 | 760 | 867 |
| | United Mexican States | 4.600% | 2/10/48 | 455 | 534 |
| | United Mexican States | 4.500% | 1/31/50 | 600 | 704 |
| | United Mexican States | 5.000% | 4/27/51 | 800 | 998 |
| | United Mexican States | 3.771% | 5/24/61 | 400 | 417 |
| | United Mexican States | 5.750% | 10/12/10 | 342 | 454 |
| Total Sovereign Bonds (Cost $179,204) | 192,422 |
| Taxable Municipal Bonds (0.8%) |
| | Alabama Economic Settlement Authority Miscellaneous Revenue | 3.163% | 9/15/25 | 65 | 69 |
| | American Municipal Power Inc. Electric Power & Light Revenue | 5.939% | 2/15/47 | 150 | 223 |
| | American Municipal Power Inc. Electric Power & Light Revenue | 6.270% | 2/15/50 | 50 | 71 |
Total Bond Market Index Portfolio
| | | | Coupon | Maturity
Date | Face
Amount
($000) | Market
Value•
($000) |
| | American Municipal Power Inc. Electric Power & Light Revenue | 7.499% | 2/15/50 | 50 | 83 |
| | American Municipal Power Inc. Electric Power & Light Revenue (Combination Hydroelectric Projects) | 8.084% | 2/15/50 | 125 | 235 |
| | Bay Area Toll Authority Highway Revenue | 2.574% | 4/1/31 | 75 | 81 |
| | Bay Area Toll Authority Highway Revenue | 6.918% | 4/1/40 | 100 | 156 |
| | Bay Area Toll Authority Highway Revenue | 6.263% | 4/1/49 | 250 | 431 |
| | Bay Area Toll Authority Highway Revenue | 7.043% | 4/1/50 | 100 | 183 |
| | Bay Area Toll Authority Highway Revenue | 6.907% | 10/1/50 | 200 | 369 |
| | California Department of Water Resources Power Supply Electric Power & Light Revenue, ETM | 2.000% | 5/1/22 | 150 | 153 |
| | California GO | 5.700% | 11/1/21 | 250 | 261 |
| | California GO | 3.375% | 4/1/25 | 100 | 112 |
| | California GO | 2.650% | 4/1/26 | 75 | 83 |
| | California GO | 3.500% | 4/1/28 | 150 | 175 |
| | California GO | 2.500% | 10/1/29 | 70 | 77 |
| | California GO | 4.500% | 4/1/33 | 190 | 230 |
| | California GO | 7.500% | 4/1/34 | 350 | 583 |
| | California GO | 4.600% | 4/1/38 | 300 | 361 |
| | California GO | 7.550% | 4/1/39 | 630 | 1,106 |
| | California GO | 7.300% | 10/1/39 | 75 | 124 |
| | California GO | 7.350% | 11/1/39 | 1,425 | 2,367 |
| | California GO | 7.625% | 3/1/40 | 205 | 356 |
| | California GO | 7.600% | 11/1/40 | 200 | 362 |
| | California State University College & University Revenue | 3.899% | 11/1/47 | 50 | 61 |
| | California State University College & University Revenue | 2.975% | 11/1/51 | 140 | 150 |
| | Central Puget Sound Regional Transit Authority Sales Tax Revenue | 5.491% | 11/1/39 | 50 | 73 |
| | Chicago IL GO | 7.045% | 1/1/29 | 45 | 49 |
| | Chicago O'Hare International Airport Port, Airport & Marina Revenue | 6.395% | 1/1/40 | 125 | 188 |
| | Chicago O'Hare International Airport Port, Airport & Marina Revenue | 4.472% | 1/1/49 | 75 | 93 |
| | Chicago Transit Authority Sales & Transfer Tax Receipts Sales Tax Revenue | 6.899% | 12/1/40 | 125 | 181 |
| | Clark County Department of Aviation Port, Airport & Marina Revenue | 6.820% | 7/1/45 | 100 | 166 |
| | Commonwealth Financing Authority Appropriations Revenue | 3.807% | 6/1/41 | 105 | 124 |
| | Commonwealth Financing Authority Appropriations Revenue (Plancon Program) | 3.864% | 6/1/38 | 100 | 117 |
| | Commonwealth of Massachusetts GO | 4.200% | 12/1/21 | 65 | 67 |
| | Commonwealth of Massachusetts GO | 5.456% | 12/1/39 | 150 | 221 |
| | | | Coupon | Maturity
Date | Face
Amount
($000) | Market
Value•
($000) |
| | Commonwealth of Massachusetts GO | 2.514% | 7/1/41 | 450 | 471 |
| | Commonwealth of Massachusetts GO | 2.813% | 9/1/43 | 225 | 248 |
| | Commonwealth of Massachusetts GO | 2.900% | 9/1/49 | 100 | 108 |
| | Commonwealth of Massachusetts Transportation Fund Fuel Sales Tax Revenue | 5.731% | 6/1/40 | 50 | 72 |
| | Connecticut GO | 5.090% | 10/1/30 | 175 | 213 |
| | Connecticut GO | 5.850% | 3/15/32 | 200 | 280 |
| | Cook County IL GO | 6.229% | 11/15/34 | 50 | 70 |
| | Dallas Area Rapid Transit Sales Tax Revenue | 5.999% | 12/1/44 | 100 | 153 |
| | Dallas Area Rapid Transit Sales Tax Revenue | 5.022% | 12/1/48 | 50 | 71 |
| | Dallas Convention Center Hotel Development Corp. Hotel Occupancy Tax Revenue | 7.088% | 1/1/42 | 75 | 104 |
| | Dallas Independent School District GO | 6.450% | 2/15/35 | 100 | 101 |
| | Dallas-Fort Worth International Airport Port, Airport & Marina Revenue | 2.994% | 11/1/38 | 485 | 519 |
| | Dallas-Fort Worth International Airport Port, Airport & Marina Revenue | 3.144% | 11/1/45 | 75 | 80 |
| | District of Columbia Income Tax Revenue | 5.591% | 12/1/34 | 50 | 68 |
| | District of Columbia Water & Sewer Authority Water Revenue | 4.814% | 10/1/14 | 150 | 223 |
| | East Bay Municipal Utility District Water System Water Revenue | 5.874% | 6/1/40 | 85 | 128 |
| | Foothill-Eastern Transportation Corridor Agency Highway Revenue | 4.094% | 1/15/49 | 140 | 150 |
| | Georgia Municipal Electric Authority Electric Power & Light Revenue | 6.637% | 4/1/57 | 245 | 373 |
| | Georgia Municipal Electric Authority Electric Power & Light Revenue | 6.655% | 4/1/57 | 147 | 227 |
| | Georgia Municipal Electric Authority Electric Power & Light Revenue | 7.055% | 4/1/57 | 74 | 107 |
| | Grand Parkway Transportation Corp. Texas System Highway Revenue | 3.236% | 10/1/52 | 395 | 413 |
| | Great Lakes Water Authority Sewage Disposal System Sewer Revenue | 3.056% | 7/1/39 | 100 | 107 |
| | Houston TX GO | 6.290% | 3/1/32 | 130 | 165 |
| | Illinois GO | 4.950% | 6/1/23 | 213 | 218 |
| | Illinois GO | 5.100% | 6/1/33 | 1,105 | 1,189 |
| | Illinois State Toll Highway Authority Highway Revenue | 6.184% | 1/1/34 | 50 | 72 |
| | JobsOhio Beverage System Miscellaneous Revenue | 3.985% | 1/1/29 | 150 | 173 |
| | JobsOhio Beverage System Miscellaneous Revenue | 4.532% | 1/1/35 | 100 | 128 |
Total Bond Market Index Portfolio
| | | | Coupon | Maturity
Date | Face
Amount
($000) | Market
Value•
($000) |
| | JobsOhio Beverage System Miscellaneous Revenue | 2.833% | 1/1/38 | 75 | 81 |
| | Los Angeles CA Unified School District GO | 5.755% | 7/1/29 | 200 | 258 |
| | Los Angeles CA Unified School District GO | 5.750% | 7/1/34 | 125 | 176 |
| | Los Angeles CA Unified School District GO | 6.758% | 7/1/34 | 200 | 301 |
| | Los Angeles Community College District GO | 1.606% | 8/1/28 | 100 | 104 |
| | Los Angeles Community College District GO | 1.806% | 8/1/30 | 150 | 155 |
| | Los Angeles Community College District GO | 2.106% | 8/1/32 | 100 | 104 |
| | Los Angeles County Metropolitan Transportation Authority Sales Tax Revenue | 5.735% | 6/1/39 | 75 | 103 |
| | Los Angeles County Public Works Financing Authority Lease (Abatement) Revenue | 7.618% | 8/1/40 | 50 | 85 |
| | Los Angeles Department of Water & Power System Electric Power & Light Revenue | 6.574% | 7/1/45 | 100 | 175 |
| | Los Angeles Department of Water & Power System Water Revenue | 6.603% | 7/1/50 | 100 | 186 |
| | Maryland Health & Higher Educational Facilities Authority Health, Hospital, Nursing Home Revenue | 3.197% | 7/1/50 | 500 | 518 |
| | Maryland State Transportation Authority Transit Revenue | 5.888% | 7/1/43 | 50 | 74 |
| | Massachusetts School Building Authority Sales Tax Revenue | 5.715% | 8/15/39 | 100 | 145 |
| | Massachusetts School Building Authority Sales Tax Revenue | 3.395% | 10/15/40 | 50 | 54 |
| | Massachusetts School Building Authority Sales Tax Revenue | 2.950% | 5/15/43 | 100 | 104 |
| | Metropolitan Government of Nashville & Davidson County TN Hotel Occupancy Tax Revenue | 6.731% | 7/1/43 | 50 | 76 |
| | Metropolitan Transportation Authority Miscellaneous Taxes Revenue | 7.336% | 11/15/39 | 400 | 640 |
| | Metropolitan Transportation Authority Transit Revenue | 5.871% | 11/15/39 | 50 | 61 |
| | Metropolitan Transportation Authority Transit Revenue | 5.175% | 11/15/49 | 175 | 205 |
| | Metropolitan Washington Airports Authority Dulles Toll Road Highway Revenue | 7.462% | 10/1/46 | 85 | 151 |
| | Metropolitan Water Reclamation District of Greater Chicago GO | 5.720% | 12/1/38 | 100 | 143 |
| | Miami-Dade County FL Aviation Port, Airport & Marina Revenue | 4.280% | 10/1/41 | 125 | 138 |
| | Miami-Dade County FL Water & Sewer Water Revenue | 3.490% | 10/1/42 | 75 | 81 |
| | | | Coupon | Maturity
Date | Face
Amount
($000) | Market
Value•
($000) |
| | Michigan Finance Authority Health, Hospital, Nursing Home Revenue | 3.084% | 12/1/34 | 75 | 83 |
| | Michigan Finance Authority Health, Hospital, Nursing Home Revenue | 3.384% | 12/1/40 | 200 | 225 |
| | Michigan State University College & University Revenue | 4.496% | 8/15/48 | 50 | 57 |
| | Mississippi GO | 5.245% | 11/1/34 | 50 | 66 |
| | Missouri Health & Educational Facilities Authority College & University Revenue | 3.229% | 5/15/50 | 100 | 117 |
| | Missouri Health & Educational Facilities Authority College & University Revenue | 3.652% | 8/15/57 | 100 | 126 |
| 11 | New Jersey Economic Development Authority Appropriations Revenue | 7.425% | 2/15/29 | 225 | 290 |
| | New Jersey Transportation Trust Fund Authority Appropriations Revenue | 4.081% | 6/15/39 | 75 | 79 |
| | New Jersey Transportation Trust Fund Authority Appropriations Revenue | 6.561% | 12/15/40 | 400 | 552 |
| | New Jersey Transportation Trust Fund Authority Appropriations Revenue | 4.131% | 6/15/42 | 100 | 104 |
| | New Jersey Turnpike Authority Highway Revenue | 7.414% | 1/1/40 | 100 | 168 |
| | New Jersey Turnpike Authority Highway Revenue | 7.102% | 1/1/41 | 400 | 653 |
| | New York City Transitional Finance Authority Future Tax Secured Income Tax Revenue | 5.767% | 8/1/36 | 150 | 196 |
| | New York City Transitional Finance Authority Future Tax Secured Income Tax Revenue | 5.572% | 11/1/38 | 75 | 102 |
| | New York City Transitional Finance Authority Future Tax Secured Sales Tax Revenue | 5.508% | 8/1/37 | 100 | 137 |
| | New York City Water & Sewer System Water Revenue | 5.750% | 6/15/41 | 50 | 77 |
| | New York City Water & Sewer System Water Revenue | 5.952% | 6/15/42 | 50 | 79 |
| | New York City Water & Sewer System Water Revenue | 6.011% | 6/15/42 | 50 | 79 |
| | New York City Water & Sewer System Water Revenue | 5.440% | 6/15/43 | 100 | 152 |
| | New York City Water & Sewer System Water Revenue | 5.882% | 6/15/44 | 175 | 284 |
| | New York NY GO | 5.517% | 10/1/37 | 50 | 71 |
| | New York NY GO | 6.271% | 12/1/37 | 100 | 151 |
| | New York State Dormitory Authority College & University Revenue | 3.142% | 7/1/43 | 260 | 274 |
Total Bond Market Index Portfolio
| | | | Coupon | Maturity
Date | Face
Amount
($000) | Market
Value•
($000) |
| | New York State Dormitory Authority Income Tax Revenue | 3.110% | 2/15/39 | 50 | 54 |
| | New York State Dormitory Authority Income Tax Revenue | 5.628% | 3/15/39 | 100 | 134 |
| | New York State Dormitory Authority Income Tax Revenue | 3.190% | 2/15/43 | 50 | 55 |
| | New York State Thruway Authority Highway Revenue | 2.900% | 1/1/35 | 75 | 81 |
| | New York State Thruway Authority Highway Revenue | 3.500% | 1/1/42 | 50 | 52 |
| | New York State Urban Development Corp. Income Tax Revenue | 3.900% | 3/15/33 | 100 | 115 |
| | New York State Urban Development Corp. Income Tax Revenue | 5.770% | 3/15/39 | 150 | 193 |
| | North Texas Tollway Authority Highway Revenue | 6.718% | 1/1/49 | 150 | 260 |
| | Ohio State University College & University Revenue | 4.910% | 6/1/40 | 100 | 138 |
| | Ohio State University College & University Revenue | 4.800% | 6/1/11 | 100 | 145 |
| | Ohio State University General Receipts College & University Revenue | 3.798% | 12/1/46 | 100 | 122 |
| | Ohio Turnpike & Infrastructure Commission Highway Revenue | 3.216% | 2/15/48 | 75 | 76 |
| | Ohio Water Development Authority Water Pollution Control Loan Fund Water Revenue | 4.879% | 12/1/34 | 75 | 92 |
| | Oregon Department of Transportation Fuel Sales Tax Revenue | 5.834% | 11/15/34 | 150 | 218 |
| | Oregon GO | 5.762% | 6/1/23 | 107 | 116 |
| | Oregon GO | 5.892% | 6/1/27 | 75 | 94 |
| 12 | Oregon School Boards Association GO | 5.528% | 6/30/28 | 50 | 60 |
| 13 | Oregon State University College & University Revenue | 3.424% | 3/1/60 | 150 | 155 |
| | Pennsylvania State University College & University Revenue | 2.790% | 9/1/43 | 200 | 209 |
| | Pennsylvania State University College & University Revenue | 2.840% | 9/1/50 | 100 | 103 |
| | Pennsylvania Turnpike Commission Highway Revenue | 5.511% | 12/1/45 | 75 | 114 |
| | Permanent University Fund - Texas A&M University System College & University Revenue | 3.100% | 7/1/49 | 75 | 80 |
| | Permanent University Fund - University of Texas System College & University Revenue | 3.376% | 7/1/47 | 50 | 60 |
| | Port Authority of New York & New Jersey Port, Airport & Marina Revenue | 6.040% | 12/1/29 | 75 | 100 |
| | | | Coupon | Maturity
Date | Face
Amount
($000) | Market
Value•
($000) |
| | Port Authority of New York & New Jersey Port, Airport & Marina Revenue | 4.960% | 8/1/46 | 250 | 342 |
| | Port Authority of New York & New Jersey Port, Airport & Marina Revenue | 5.310% | 8/1/46 | 100 | 112 |
| | Port Authority of New York & New Jersey Port, Airport & Marina Revenue | 4.031% | 9/1/48 | 30 | 37 |
| | Port Authority of New York & New Jersey Port, Airport & Marina Revenue | 4.926% | 10/1/51 | 100 | 139 |
| | Port Authority of New York & New Jersey Port, Airport & Marina Revenue | 4.458% | 10/1/62 | 550 | 732 |
| | Port Authority of New York & New Jersey Port, Airport & Marina Revenue | 4.810% | 10/15/65 | 100 | 139 |
| | Port Authority of New York & New Jersey Port, Airport & Marina Revenue | 3.287% | 8/1/69 | 100 | 107 |
| | Port of Morrow OR Nuclear Revenue | 2.543% | 9/1/40 | 100 | 104 |
| | Regional Transportation District Sales Tax Revenue | 5.844% | 11/1/50 | 100 | 166 |
| | Riverside County CA Appropriations Revenue | 3.818% | 2/15/38 | 50 | 55 |
| | Rutgers State University of New Jersey College & University Revenue | 5.665% | 5/1/40 | 50 | 69 |
| | Rutgers State University of New Jersey College & University Revenue | 3.270% | 5/1/43 | 25 | 27 |
| | Rutgers State University of New Jersey College & University Revenue | 3.915% | 5/1/19 | 75 | 85 |
| | Sales Tax Securitization Corp. Sales Tax Revenue | 3.587% | 1/1/43 | 75 | 79 |
| | Sales Tax Securitization Corp. Sales Tax Revenue | 3.820% | 1/1/48 | 50 | 55 |
| | Sales Tax Securitization Corp. Sales Tax Revenue | 4.787% | 1/1/48 | 100 | 125 |
| | Salt River Project Agricultural Improvement & Power District Electric Power & Light Revenue | 4.839% | 1/1/41 | 150 | 209 |
| | San Antonio TX Electric & Gas Systems Electric Power & Light Revenue | 5.985% | 2/1/39 | 125 | 189 |
| | San Antonio TX Electric & Gas Systems Electric Power & Light Revenue | 5.808% | 2/1/41 | 125 | 189 |
| | San Antonio TX Electric & Gas Systems Electric Power & Light Revenue | 2.905% | 2/1/48 | 100 | 105 |
| | San Diego County Water Authority Water Revenue | 6.138% | 5/1/49 | 100 | 156 |
| | San Francisco CA Public Utilities Commission Water Revenue | 6.950% | 11/1/50 | 100 | 172 |
Total Bond Market Index Portfolio
| | | | Coupon | Maturity
Date | Face
Amount
($000) | Market
Value•
($000) |
| | San Jose Redevelopment Agency Successor Agency Tax Allocation Revenue | 3.375% | 8/1/34 | 100 | 107 |
| | Santa Clara Valley Transportation Authority Sales Tax Revenue | 5.876% | 4/1/32 | 200 | 256 |
| | South Carolina Public Service Authority Electric Power & Light Revenue | 6.454% | 1/1/50 | 100 | 166 |
| | South Carolina Public Service Authority Nuclear Revenue | 2.388% | 12/1/23 | 50 | 52 |
| | State Board of Administration Finance Corp. Miscellaneous Revenue | 2.638% | 7/1/21 | 150 | 152 |
| | State Board of Administration Finance Corp. Miscellaneous Revenue | 1.258% | 7/1/25 | 325 | 332 |
| | State Board of Administration Finance Corp. Miscellaneous Revenue | 1.705% | 7/1/27 | 250 | 260 |
| | State Board of Administration Finance Corp. Miscellaneous Revenue | 2.154% | 7/1/30 | 250 | 263 |
| | State Public School Building Authority Miscellaneous Revenue | 5.000% | 9/15/27 | 50 | 61 |
| | Texas GO | 5.517% | 4/1/39 | 180 | 268 |
| | Texas GO | 4.681% | 4/1/40 | 50 | 68 |
| | Texas GO | 3.211% | 4/1/44 | 225 | 246 |
| | Texas Private Activity Bond Surface Transportation Corp. Highway Revenue | 3.922% | 12/31/49 | 175 | 200 |
| | Texas Transportation Commission GO | 2.562% | 4/1/42 | 100 | 102 |
| | Texas Transportation Commission GO | 2.472% | 10/1/44 | 500 | 503 |
| | Texas Transportation Commission State Highway Fund Fuel Sales Tax Revenue | 5.178% | 4/1/30 | 175 | 226 |
| | Texas Transportation Commission State Highway Fund Miscellaneous Revenue | 4.000% | 10/1/33 | 100 | 126 |
| | University of California College & University Revenue | 0.883% | 5/15/25 | 100 | 101 |
| | University of California College & University Revenue | 3.063% | 7/1/25 | 100 | 110 |
| | University of California College & University Revenue | 1.316% | 5/15/27 | 100 | 102 |
| | University of California College & University Revenue | 1.614% | 5/15/30 | 125 | 126 |
| | University of California College & University Revenue | 5.946% | 5/15/45 | 175 | 254 |
| | University of California College & University Revenue | 4.858% | 5/15/12 | 225 | 323 |
| | University of California College & University Revenue | 4.767% | 5/15/15 | 100 | 140 |
| | | | Coupon | Maturity
Date | Face
Amount
($000) | Market
Value•
($000) |
| | University of California Regents Medical Center Pooled Health, Hospital, Nursing Home Revenue | 6.548% | 5/15/48 | 350 | 568 |
| | University of California Regents Medical Center Pooled Health, Hospital, Nursing Home Revenue | 6.583% | 5/15/49 | 50 | 81 |
| | University of California Regents Medical Center Pooled Health, Hospital, Nursing Home Revenue | 3.006% | 5/15/50 | 130 | 138 |
| | University of California Regents Medical Center Pooled Health, Hospital, Nursing Home Revenue | 3.706% | 5/15/20 | 60 | 64 |
| | University of Michigan College & University Revenue | 2.437% | 4/1/40 | 100 | 104 |
| | University of Michigan College & University Revenue | 2.562% | 4/1/50 | 100 | 106 |
| | University of Nebraska Facilities Corp. College & University Revenue | 3.037% | 10/1/49 | 65 | 71 |
| | University of Pittsburgh-of the Commonwealth System of Higher Education College & University Revenue | 3.555% | 9/15/19 | 250 | 283 |
| | University of Texas System College & University Revenue | 2.439% | 8/15/49 | 50 | 51 |
| | University of Texas System Regents College & University Revenue | 4.794% | 8/15/46 | 100 | 137 |
| | University of Texas System Regents College & University Revenue | 3.354% | 8/15/47 | 50 | 60 |
| | University of Virginia College & University Revenue | 2.256% | 9/1/50 | 335 | 332 |
| | University of Virginia College & University Revenue | 4.179% | 9/1/17 | 50 | 67 |
| | Utah GO | 4.554% | 7/1/24 | 40 | 43 |
| | Utah GO | 3.539% | 7/1/25 | 50 | 54 |
| | Washington GO | 5.140% | 8/1/40 | 150 | 211 |
| 12 | Wisconsin Appropriations Revenue | 5.700% | 5/1/26 | 60 | 71 |
| | Wisconsin Appropriations Revenue | 3.154% | 5/1/27 | 100 | 113 |
| | Wisconsin Appropriations Revenue | 3.954% | 5/1/36 | 250 | 280 |
| Total Taxable Municipal Bonds (Cost $31,173) | 37,809 |
Total Bond Market Index Portfolio
| | | | Coupon | | Shares | Market
Value•
($000) |
| Temporary Cash Investments (3.4%) |
| Money Market Fund (3.4%) |
| 14 | Vanguard Market Liquidity Fund
(Cost $164,294) | 0.111% | | 1,642,950 | 164,295 |
| Total Investments (102.5%) (Cost $4,640,624) | 4,989,841 |
| Other Assets and Liabilities—Net (-2.5%) | (123,294) |
| Net Assets (100%) | 4,866,547 |
| Cost is in $000. |
| • | See Note A in Notes to Financial Statements. |
| 1 | The issuer was placed under federal conservatorship in September 2008; since that time, its daily operations have been managed by the Federal Housing Finance Agency and it receives capital from the U.S. Treasury, as needed to maintain a positive net worth, in exchange for senior preferred stock. |
| 2 | The average or expected maturity is shorter than the final maturity shown because of the possibility of interim principal payments and prepayments or the possibility of the issue being called. |
| 3 | Includes securities purchased on a when-issued or delayed-delivery basis for which the portfolio has not taken delivery as of December 31, 2020. |
| 4 | Variable rate security; rate shown is effective rate at period end. Certain variable rate securities are not based on a published reference rate and spread but are determined by the issuer or agent based on current market conditions. |
| 5 | Security exempt from registration under Rule 144A of the Securities Act of 1933. Such securities may be sold in transactions exempt from registration, normally to qualified institutional buyers. At December 31, 2020, the aggregate value was $34,611,000, representing 0.7% of net assets. |
| 6 | Guaranteed by the Government of Canada. |
| 7 | U.S. government-guaranteed. |
| 8 | Guaranteed by the Government of Japan. |
| 9 | Guaranteed by the Federal Republic of Germany. |
| 10 | Guaranteed by the Republic of Austria. |
| 11 | Scheduled principal and interest payments are guaranteed by National Public Finance Guarantee Corp. |
| 12 | Scheduled principal and interest payments are guaranteed by Assured Guaranty Municipal Corp. |
| 13 | Scheduled principal and interest payments are guaranteed by Build America Mutual Assurance Co. |
| 14 | Affiliated money market fund available only to Vanguard funds and certain trusts and accounts managed by Vanguard. Rate shown is the 7-day yield. |
| | 12M—12-month. |
| | 1YR—1-year. |
| | 6M—6-month. |
| | CMT—Constant Maturing Treasury Rate. |
| | ETM—Escrowed to Maturity. |
| | GO—General Obligation Bond. |
| | LIBOR—London Interbank Offered Rate. |
| | REIT—Real Estate Investment Trust. |
| | UMBS—Uniform Mortgage-Backed Securities. |
See accompanying Notes, which are an integral part of the Financial Statements.
Total Bond Market Index Portfolio
Statement of Assets and Liabilities
| ($000s, except shares and per-share amounts) | Amount |
| Assets | |
| Investments in Securities, at Value | |
| Unaffiliated Issuers (Cost $4,476,330) | 4,825,546 |
| Affiliated Issuers (Cost $164,294) | 164,295 |
| Total Investments in Securities | 4,989,841 |
| Investment in Vanguard | 190 |
| Receivables for Investment Securities Sold | 13,739 |
| Receivables for Accrued Income | 24,411 |
| Receivables for Capital Shares Issued | 1,881 |
| Total Assets | 5,030,062 |
| Liabilities | |
| Due to Custodian | 838 |
| Payables for Investment Securities Purchased | 161,062 |
| Payables for Capital Shares Redeemed | 1,245 |
| Payables to Vanguard | 370 |
| Total Liabilities | 163,515 |
| Net Assets | 4,866,547 |
| At December 31, 2020, net assets consisted of: | |
| | |
| Paid-in Capital | 4,388,468 |
| Total Distributable Earnings (Loss) | 478,079 |
| Net Assets | 4,866,547 |
| |
| Net Assets | |
Applicable to 379,823,332 outstanding $.001 par value shares of
beneficial interest (unlimited authorization) | 4,866,547 |
| Net Asset Value Per Share | $12.81 |
See accompanying Notes, which are an integral part of the Financial Statements.
Total Bond Market Index Portfolio
Statement of Operations
|
| | Year Ended
December 31, 2020 |
| | ($000) |
| Investment Income | |
| Income | |
| Interest1 | 107,710 |
| Total Income | 107,710 |
| Expenses | |
| The Vanguard Group—Note B | |
| Investment Advisory Services | 111 |
| Management and Administrative | 5,639 |
| Marketing and Distribution | 501 |
| Custodian Fees | 50 |
| Auditing Fees | 82 |
| Shareholders' Reports | 61 |
| Trustees’ Fees and Expenses | 3 |
| Total Expenses | 6,447 |
| Net Investment Income | 101,263 |
| Realized Net Gain (Loss) | |
| Investment Securities Sold1 | 37,717 |
| Futures Contracts | 87 |
| Realized Net Gain (Loss) | 37,804 |
| Change in Unrealized Appreciation (Depreciation) of Investment Securities1 | 187,699 |
| Net Increase (Decrease) in Net Assets Resulting from Operations | 326,766 |
| 1 | Interest income, realized net gain (loss), and change in unrealized appreciation (depreciation) from an affiliated company of the portfolio were $536,000, $36,000, and ($7,000), respectively. Purchases and sales are for temporary cash investment purposes. |
Statement of Changes in Net Assets
|
| | Year Ended December 31, |
| | 2020
($000) | 2019
($000) |
| Increase (Decrease) in Net Assets | | |
| Operations | | |
| Net Investment Income | 101,263 | 107,635 |
| Realized Net Gain (Loss) | 37,804 | 8,028 |
| Change in Unrealized Appreciation (Depreciation) | 187,699 | 204,615 |
| Net Increase (Decrease) in Net Assets Resulting from Operations | 326,766 | 320,278 |
| Distributions1 | | |
| Total Distributions | (107,753) | (97,897) |
| Capital Share Transactions | | |
| Issued | 1,363,956 | 1,031,614 |
| Issued in Lieu of Cash Distributions | 107,753 | 97,897 |
| Redeemed | (1,124,178) | (586,442) |
| Net Increase (Decrease) from Capital Share Transactions | 347,531 | 543,069 |
| Total Increase (Decrease) | 566,544 | 765,450 |
| Net Assets | | |
| Beginning of Period | 4,300,003 | 3,534,553 |
| End of Period | 4,866,547 | 4,300,003 |
| 1 | Certain prior-period numbers have been reclassified to conform with the current-period presentation. |
See accompanying Notes, which are an integral part of the Financial Statements.
Total Bond Market Index Portfolio
For a Share Outstanding
Throughout Each Period | Year Ended December 31, |
| 2020 | 2019 | 2018 | 2017 | 2016 |
| Net Asset Value, Beginning of Period | $12.21 | $11.54 | $11.86 | $11.77 | $11.79 |
| Investment Operations | | | | | |
| Net Investment Income | .2771 | .3241 | .3131 | .2921 | .283 |
| Net Realized and Unrealized Gain (Loss) on Investments | .635 | .657 | (.343) | .119 | .007 |
| Total from Investment Operations | .912 | .981 | (.030) | .411 | .290 |
| Distributions | | | | | |
| Dividends from Net Investment Income | (.312) | (.311) | (.267) | (.283) | (.277) |
| Distributions from Realized Capital Gains | — | — | (.023) | (.038) | (.033) |
| Total Distributions | (.312) | (.311) | (.290) | (.321) | (.310) |
| Net Asset Value, End of Period | $12.81 | $12.21 | $11.54 | $11.86 | $11.77 |
| Total Return | 7.58% | 8.67% | -0.21% | 3.57% | 2.47% |
| Ratios/Supplemental Data | | | | | |
| Net Assets, End of Period (Millions) | $4,867 | $4,300 | $3,535 | $3,498 | $2,985 |
| Ratio of Total Expenses to Average Net Assets | 0.14% | 0.14% | 0.14% | 0.15% | 0.15% |
| Ratio of Net Investment Income to Average Net Assets | 2.20% | 2.72% | 2.74% | 2.48% | 2.41% |
| Portfolio Turnover Rate2 | 94% | 80% | 89% | 91% | 104% |
| 1 | Calculated based on average shares outstanding. |
| 2 | Includes 28%, 19%, 26%, 24%, and 33% attributable to mortgage-dollar-roll activity. |
See accompanying Notes, which are an integral part of the Financial Statements.
Total Bond Market Index Portfolio
Notes to Financial Statements
The Total Bond Market Index Portfolio, a portfolio of Vanguard Variable Insurance Funds, is registered under the Investment Company Act of 1940 as an open-end investment company. The portfolio's shares are only available for purchase by separate accounts of insurance companies as investments for variable annuity plans, variable life insurance contracts, or other variable benefit insurance contracts.
Certain of the portfolio’s investments are in corporate debt instruments; the issuers' abilities to meet their obligations may be affected by economic developments in their respective industries. Market disruptions associated with the COVID-19 pandemic have had a global impact, and uncertainty exists as to the long-term implications. Such disruptions can adversely affect assets of the portfolio and thus portfolio performance.
| A. | The following significant accounting policies conform to generally accepted accounting principles for U.S. investment companies. The portfolio consistently follows such policies in preparing its financial statements. |
1. Security Valuation: Securities are valued as of the close of trading on the New York Stock Exchange (generally 4 p.m., Eastern time) on the valuation date. Bonds and temporary cash investments are valued using the latest bid prices or using valuations based on a matrix system (which considers such factors as security prices, yields, maturities, and ratings), both as furnished by independent pricing services. Structured debt securities, including mortgages and asset-backed securities, are valued using the latest bid prices or using valuations based on a matrix system that considers such factors as issuer, tranche, nominal or option-adjusted spreads, weighted average coupon, weighted average maturity, credit enhancements, and collateral. Investments in Vanguard Market Liquidity Fund are valued at that fund's net asset value. Securities for which market quotations are not readily available, or whose values have been affected by events occurring before the portfolio’s pricing time but after the close of the securities’ primary markets, are valued by methods deemed by the board of trustees to represent fair value.
2. Futures Contracts: The portfolio uses futures contracts to invest in fixed income asset classes with greater efficiency and lower cost than is possible through direct investment, to add value when these instruments are attractively priced, or to adjust sensitivity to changes in interest rates. The primary risks associated with the use of futures contracts are imperfect correlation between changes in market values of bonds held by the portfolio and the prices of futures contracts, and the possibility of an illiquid market. Counterparty risk involving futures is mitigated because a regulated clearinghouse is the counterparty instead of the clearing broker. To further mitigate counterparty risk, the portfolio trades futures contracts on an exchange, monitors the financial strength of its clearing brokers and clearinghouse, and has entered into clearing agreements with its clearing brokers. The clearinghouse imposes initial margin requirements to secure the portfolio’s performance and requires daily settlement of variation margin representing changes in the market value of each contract. Any securities pledged as initial margin for open contracts are noted in the Schedule of Investments.
Futures contracts are valued at their quoted daily settlement prices. The notional amounts of the contracts are not recorded in the Statement of Assets and Liabilities. Fluctuations in the value of the contracts are recorded in the Statement of Assets and Liabilities as an asset (liability) and in the Statement of Operations as unrealized appreciation (depreciation) until the contracts are closed, when they are recorded as realized gains (losses) on futures contracts.
During the year ended December 31, 2020, the portfolio’s average investments in long and short futures contracts represented less than 1% and 0% of net assets, respectively, based on the average of the notional amounts at each quarter-end during the period. The portfolio had no open futures contracts at December 31, 2020.
3. To Be Announced (TBA) Transactions: A TBA transaction is an agreement to buy or sell mortgage-backed securities with agreed-upon characteristics (face amount, coupon, maturity) for settlement at a future date. The portfolio may be a seller of TBA transactions to reduce its exposure to the mortgage-backed securities market or in order to sell mortgage-backed securities it owns under delayed-delivery arrangements. When the portfolio is a buyer of TBA transactions, it maintains cash or short-term investments in an amount sufficient to meet the purchase price at the settlement date of the TBA transaction. The primary risk associated with TBA transactions is that a counterparty may default on its obligations. The portfolio mitigates its counterparty risk by, among other things, performing a credit analysis of counterparties, allocating transactions among numerous counterparties, and monitoring its exposure to each counterparty. The portfolio may also enter into a Master Securities Forward Transaction Agreement (MSFTA) with certain counterparties and require them to transfer collateral as security for their performance. In the absence of a default, the collateral pledged or received by the portfolio cannot be repledged, resold, or rehypothecated. Under an MSFTA, upon a counterparty default (including bankruptcy), the portfolio may terminate any TBA
Total Bond Market Index Portfolio
transactions with that counterparty, determine the net amount owed by either party in accordance with its master netting arrangements, and sell or retain any collateral held up to the net amount owed to the portfolio under the master netting arrangements.
4. Mortgage Dollar Rolls: The portfolio enters into mortgage-dollar-roll transactions, in which the portfolio sells mortgage-backed securities to a dealer and simultaneously agrees to purchase similar securities in the future at a predetermined price. The proceeds of the securities sold in mortgage-dollar-roll transactions are typically invested in high-quality short-term fixed income securities. The portfolio forgoes principal and interest paid on the securities sold, and is compensated by interest earned on the proceeds of the sale and by a lower price on the securities to be repurchased. The portfolio accounts for mortgage-dollar-roll transactions as purchases and sales; as such, these transactions may increase the portfolio’s portfolio turnover rate. Amounts to be received or paid in connection with open mortgage dollar rolls are included in Receivables for Investment Securities Sold or Payables for Investment Securities Purchased in the Statement of Assets and Liabilities.
5. Federal Income Taxes: The portfolio intends to continue to qualify as a regulated investment company and distribute all of its taxable income. The portfolio’s tax returns are open to examination by the relevant tax authorities until expiration of the applicable statute of limitations, which is generally three years after the filing of the tax return. Management has analyzed the portfolio’s tax positions taken for all open federal and state income tax years, and has concluded that no provision for income tax is required in the portfolio’s financial statements.
6. Distributions: Distributions to shareholders are recorded on the ex-dividend date. Distributions are determined on a tax basis at the fiscal year-end and may differ from net investment income and realized capital gains for financial reporting purposes.
7. Credit Facilities and Interfund Lending Program: The portfolio and certain other funds managed by The Vanguard Group ("Vanguard") participate in a $4.3 billion committed credit facility provided by a syndicate of lenders pursuant to a credit agreement and an uncommitted credit facility provided by Vanguard. Both facilities may be renewed annually. Each fund is individually liable for its borrowings, if any, under the credit facilities. Borrowings may be utilized for temporary or emergency purposes, subject to the portfolio’s regulatory and contractual borrowing restrictions. With respect to the committed credit facility, the participating funds are charged administrative fees and an annual commitment fee of 0.10% of the undrawn committed amount of the facility; these fees are allocated to the funds based on a method approved by the portfolio’s board of trustees and included in Management and Administrative expenses on the portfolio’s Statement of Operations. Any borrowings under either facility bear interest at a rate based upon the higher of the one-month London Interbank Offered Rate (or an acceptable alternate rate, if necessary), federal funds effective rate, or overnight bank funding rate plus an agreed-upon spread, except that borrowings under the uncommitted credit facility may bear interest based upon an alternate rate agreed to by the portfolio and Vanguard.
In accordance with an exemptive order (the “Order”) from the SEC, the portfolio may participate in a joint lending and borrowing program that allows registered open-end Vanguard funds to borrow money from and lend money to each other for temporary or emergency purposes (the “Interfund Lending Program”), subject to compliance with the terms and conditions of the Order, and to the extent permitted by the portfolio’s investment objective and investment policies. Interfund loans and borrowings normally extend overnight, but can have a maximum duration of seven days. Loans may be called on one business day’s notice. The interest rate to be charged is governed by the conditions of the Order and internal procedures adopted by the board of trustees. The board of trustees is responsible for overseeing the Interfund Lending Program.
For the year ended December 31, 2020, the portfolio did not utilize the credit facilities or the Interfund Lending Program.
8. Other: Interest income includes income distributions received from Vanguard Market Liquidity Fund and is accrued daily. Premiums and discounts on debt securities are amortized and accreted, respectively, to interest income over the lives of the respective securities, except for premiums on certain callable debt securities that are amortized to the earliest call date. Security transactions are accounted for on the date securities are bought or sold. Costs used to determine realized gains (losses) on the sale of investment securities are those of the specific securities sold.
| B. | In accordance with the terms of a Funds' Service Agreement (the “FSA”) between Vanguard and the portfolio, Vanguard furnishes to the portfolio investment advisory, corporate management, |
Total Bond Market Index Portfolio
administrative, marketing, and distribution services at Vanguard’s cost of operations (as defined by the FSA). These costs of operations are allocated to the portfolio based on methods and guidelines approved by the board of trustees and are generally settled twice a month.
Upon the request of Vanguard, the portfolio may invest up to 0.40% of its net assets as capital in Vanguard. At December 31, 2020, the portfolio had contributed to Vanguard capital in the amount of $190,000, representing less than 0.01% of the portfolio’s net assets and 0.08% of Vanguard’s capital received pursuant to the FSA. The portfolio’s trustees and officers are also directors and employees, respectively, of Vanguard.
| C. | Various inputs may be used to determine the value of the portfolio’s investments. These inputs are summarized in three broad levels for financial statement purposes. The inputs or methodologies used to value securities are not necessarily an indication of the risk associated with investing in those securities. |
Level 1—Quoted prices in active markets for identical securities.
Level 2—Other significant observable inputs (including quoted prices for similar securities, interest rates, prepayment speeds, credit risk, etc.).
Level 3—Significant unobservable inputs (including the portfolio’s own assumptions used to determine the fair value of investments). Any investments valued with significant unobservable inputs are noted on the Schedule of Investments.
The following table summarizes the market value of the portfolio’s investments as of December 31, 2020, based on the inputs used to value them:
| | Level 1
($000) | Level 2
($000) | Level 3
($000) | Total
($000) |
| Investments | | | | |
| Assets | | | | |
| U.S. Government and Agency Obligations | — | 3,015,045 | — | 3,015,045 |
| Asset-Backed/Commercial Mortgage-Backed Securities | — | 128,762 | — | 128,762 |
| Corporate Bonds | — | 1,451,508 | — | 1,451,508 |
| Sovereign Bonds | — | 192,422 | — | 192,422 |
| Taxable Municipal Bonds | — | 37,809 | — | 37,809 |
| Temporary Cash Investments | 164,295 | — | — | 164,295 |
| Total | 164,295 | 4,825,546 | — | 4,989,841 |
| D. | Permanent differences between book-basis and tax-basis components of net assets, if any, are reclassified among capital accounts in the financial statements to reflect their tax character. These reclassifications have no effect on net assets or net asset value per share. |
Temporary differences between book-basis and tax-basis components of total distributable earnings (loss) arise when certain items of income, gain, or loss are recognized in different periods for financial statement and tax purposes; these differences will reverse at some time in the future. The differences are primarily related to the deferral of losses from wash sales; the deferral of losses from straddles; and the treatment of deflation and amortization adjustments from certain fixed income securities. As of period end, the tax-basis components of total distributable earnings (loss) are detailed in the table as follows:
| | Amount
($000) |
| Undistributed Ordinary Income | 108,979 |
| Undistributed Long-Term Gains | 25,808 |
| Capital Loss Carryforwards | — |
| Qualified Late-Year Losses | — |
| Net Unrealized Gains (Losses) | 343,292 |
Total Bond Market Index Portfolio
The tax character of distributions paid was as follows:
| | Year Ended December 31, |
| | 2020
Amount
($000) | 2019
Amount
($000) |
| Ordinary Income* | 107,753 | 97,897 |
| Long-Term Capital Gains | — | — |
| Total | 107,753 | 97,897 |
| * | Includes short-term capital gains, if any. |
As of December 31, 2020, gross unrealized appreciation and depreciation for investments based on cost for U.S. federal income tax purposes were as follows:
| | Amount
($000) |
| Tax Cost | 4,646,548 |
| Gross Unrealized Appreciation | 355,468 |
| Gross Unrealized Depreciation | (12,176) |
| Net Unrealized Appreciation (Depreciation) | 343,292 |
| E. | During the year ended December 31, 2020, the portfolio purchased $390,798,000 of investment securities and sold $120,913,000 of investment securities, other than U.S. government securities and temporary cash investments. Purchases and sales of U.S. government securities were $4,290,299,000 and $4,200,132,000, respectively. |
| F. | Capital shares issued and redeemed were: |
| | Year Ended December 31, |
| | 2020 | 2019 |
| | Shares
(000) | Shares
(000) |
| Issued | 108,475 | 86,771 |
| Issued in Lieu of Cash Distributions | 8,789 | 8,535 |
| Redeemed | (89,637) | (49,300) |
| Net Increase (Decrease) in Shares Outstanding | 27,627 | 46,006 |
At December 31, 2020, one shareholder (an insurance company separate account whose holdings in the portfolio represent the indirect investment of Vanguard Variable Annuity contract holders) was the record or beneficial owner of 35% of the portfolio’s net assets. If this shareholder was to redeem its investment in the portfolio, the redemption might result in an increase in the portfolio’s expense ratio, cause the portfolio to incur higher transaction costs, or lead to the realization of taxable capital gains.
| G. | Management has determined that no events or transactions occurred subsequent to December 31, 2020, that would require recognition or disclosure in these financial statements. |
Total Bond Market Index Portfolio
Report of Independent Registered Public Accounting Firm
To the Board of Trustees of Vanguard Variable Insurance Funds and Shareholders of Total Bond Market Index Portfolio
Opinion on the Financial Statements
We have audited the accompanying statement of assets and liabilities, including the schedule of investments, of Total Bond Market Index Portfolio (one of the portfolios constituting Vanguard Variable Insurance Funds, referred to hereafter as the "Portfolio”) as of December 31, 2020, the related statement of operations for the year ended December 31, 2020, the statement of changes in net assets for each of the two years in the period ended December 31, 2020, including the related notes, and the financial highlights for each of the five years in the period ended December 31, 2020 (collectively referred to as the “financial statements”). In our opinion, the financial statements present fairly, in all material respects, the financial position of the Portfolio as of December 31, 2020, the results of its operations for the year then ended, the changes in its net assets for each of the two years in the period ended December 31, 2020 and the financial highlights for each of the five years in the period ended December 31, 2020 in conformity with accounting principles generally accepted in the United States of America.
Basis for Opinion
These financial statements are the responsibility of the Portfolio’s management. Our responsibility is to express an opinion on the Portfolio’s financial statements based on our audits. We are a public accounting firm registered with the Public Company Accounting Oversight Board (United States) (PCAOB) and are required to be independent with respect to the Portfolio in accordance with the U.S. federal securities laws and the applicable rules and regulations of the Securities and Exchange Commission and the PCAOB.
We conducted our audits of these financial statements in accordance with the standards of the PCAOB. Those standards require that we plan and perform the audit to obtain reasonable assurance about whether the financial statements are free of material misstatement, whether due to error or fraud.
Our audits included performing procedures to assess the risks of material misstatement of the financial statements, whether due to error or fraud, and performing procedures that respond to those risks. Such procedures included examining, on a test basis, evidence regarding the amounts and disclosures in the financial statements. Our audits also included evaluating the accounting principles used and significant estimates made by management, as well as evaluating the overall presentation of the financial statements. Our procedures included confirmation of securities owned as of December 31, 2020 by correspondence with the custodian, transfer agent and brokers; when replies were not received from brokers, we performed other auditing procedures. We believe that our audits provide a reasonable basis for our opinion.
/s/PricewaterhouseCoopers LLP
Philadelphia, Pennsylvania
February 18, 2021
We have served as the auditor of one or more investment companies in The Vanguard Group of Funds since 1975.
Total Bond Market Index Portfolio
Special 2020 tax information (unaudited) for corporate shareholders only for Total Bond Market Index Portfolio, a portfolio of Vanguard Variable Insurance Funds
This information for the fiscal year ended December 31, 2020, is included pursuant to provisions of the Internal Revenue Code for corporate shareholders only.
The percentage of the ordinary dividends reported by the fund that is treated as a Section 163(j) interest dividend and thus is eligible to be treated as interest income for purposes of Section 163(j) and the regulations thereunder is 93.0%.
Total Bond Market Index Portfolio
BLOOMBERG is a trademark and service mark of Bloomberg Finance L.P. BARCLAYS is a trademark and service mark of Barclays Bank Plc, used under license. Bloomberg Finance L.P. and its affiliates, including Bloomberg Index Services Limited (BISL) (collectively, Bloomberg), or Bloomberg’s licensors, own all proprietary rights in the Bloomberg Barclays U.S. Aggregate Float Adjusted Index (the Index or Bloomberg Barclays Index).
Neither Barclays Bank Plc, Barclays Capital Inc., or any affiliate (collectively Barclays) or Bloomberg is the issuer or producer of the Total Bond Market Index Portfolio and neither Bloomberg nor Barclays has any responsibilities, obligations or duties to investors in the Total Bond Market Index Portfolio. The Index is licensed for use by The Vanguard Group, Inc. (Vanguard) as the sponsor of the Total Bond Market Index Portfolio. Bloomberg and Barclays’ only relationship with Vanguard in respect of the Index is the licensing of the Index, which are determined, composed and calculated by BISL, or any successor thereto, without regard to the Issuer or the Total Bond Market Index Portfolio or the owners of the Total Bond Market Index Portfolio.
Additionally, Vanguard may for itself execute transaction(s) with Barclays in or relating to the Indices in connection with the Municipal Bond Funds. Investors acquire the Total Bond Market Index Portfolio from Vanguard and investors neither acquire any interest in the Indices nor enter into any relationship of any kind whatsoever with Bloomberg or Barclays upon making an investment in the Total Bond Market Index Portfolio. The Total Bond Market Index Portfolio is not sponsored, endorsed, sold or promoted by Bloomberg or Barclays. Neither Bloomberg nor Barclays makes any representation or warranty, express or implied regarding the advisability of investing in the Total Bond Market Index Portfolio or the advisability of investing in securities generally or the ability of the Indices to track corresponding or relative market performance. Neither Bloomberg nor Barclays has passed on the legality or suitability of the Total Bond Market Index Portfolio with respect to any person or entity. Neither Bloomberg nor Barclays is responsible for and has not participated in the determination of the timing of, prices at, or quantities of the Total Bond Market Index Portfolio to be issued. Neither Bloomberg nor Barclays has any obligation to take the needs of the Issuer or the owners of the Total Bond Market Index Portfolio or any other third party into consideration in determining, composing or calculating the Indices. Neither Bloomberg nor Barclays has any obligation or liability in connection with administration, marketing or trading of the Total Bond Market Index Portfolio.
The licensing agreement between Bloomberg and Barclays is solely for the benefit of Bloomberg and Barclays and not for the benefit of the owners of the Total Bond Market Index Portfolio, investors or other third parties. In addition, the licensing agreement between Vanguard and Bloomberg is solely for the benefit of Vanguard and Bloomberg and not for the benefit of the owners of the Total Bond Market Index Portfolio, investors or other third parties.
NEITHER BLOOMBERG NOR BARCLAYS SHALL HAVE ANY LIABILITY TO THE ISSUER, INVESTORS OR TO OTHER THIRD PARTIES FOR THE QUALITY, ACCURACY AND/OR COMPLETENESS OF THE BLOOMBERG BARCLAYS INDICES OR ANY DATA INCLUDED THEREIN OR FOR INTERRUPTIONS IN THE DELIVERY OF THE BLOOMBERG BARCLAYS INDICES. NEITHER BLOOMBERG NOR BARCLAYS MAKES ANY WARRANTY, EXPRESS OR IMPLIED, AS TO RESULTS TO BE OBTAINED BY THE ISSUER, THE INVESTORS OR ANY OTHER PERSON OR ENTITY FROM THE USE OF THE BLOOMBERG BARCLAYS INDICES OR ANY DATA INCLUDED THEREIN. NEITHER BLOOMBERG NOR BARCLAYS MAKES ANY EXPRESS OR IMPLIED WARRANTIES, AND EACH HEREBY EXPRESSLY DISCLAIMS ALL WARRANTIES OF MERCHANTABILITY OR FITNESS FOR A PARTICULAR PURPOSE OR USE WITH RESPECT TO THE BLOOMBERG BARCLAYS INDICES OR ANY DATA INCLUDED THEREIN. BLOOMBERG RESERVES THE RIGHT TO CHANGE THE METHODS OF CALCULATION OR PUBLICATION, OR TO CEASE THE CALCULATION OR PUBLICATION OF THE BLOOMBERG BARCLAYS INDICES, AND NEITHER BLOOMBERG NOR BARCLAYS SHALL BE LIABLE FOR ANY MISCALCULATION OF OR ANY INCORRECT, DELAYED OR INTERRUPTED PUBLICATION WITH RESPECT TO ANY OF THE BLOOMBERG BARCLAYS INDICES. NEITHER BLOOMBERG NOR BARCLAYS SHALL BE LIABLE FOR ANY DAMAGES, INCLUDING, WITHOUT LIMITATION, ANY SPECIAL, INDIRECT OR CONSEQUENTIAL DAMAGES, OR ANY LOST PROFITS AND EVEN IF ADVISED OF THE POSSIBILITY OF SUCH, RESULTING FROM THE USE OF THE BLOOMBERG BARCLAYS INDICES OR ANY DATA INCLUDED THEREIN OR WITH RESPECT TO THE TOTAL BOND MARKET INDEX PORTFOLIO.
None of the information supplied by Bloomberg or Barclays and used in this publication may be reproduced in any manner without the prior written permission of both Bloomberg and Barclays Capital, the investment banking division of Barclays Bank Plc. Barclays Bank Plc is registered in England No. 1026167. Registered office 1 Churchill Place London E14 5HP.
© 2021 Bloomberg. Used with Permission.
Source: Bloomberg Index Services Limited. Copyright 2021, Bloomberg. All rights reserved.
The People Who Govern Your Fund
The trustees of your mutual fund are there to see that the fund is operated and managed in your best interests since, as a shareholder, you are a part owner of the fund. Your fund’s trustees also serve on the board of directors of The Vanguard Group, Inc., which is owned by the Vanguard funds and provides services to them.
A majority of Vanguard’s board members are independent, meaning that they have no affiliation with Vanguard or the funds they oversee, apart from the sizable personal investments they have made as private individuals. The independent board members have distinguished backgrounds in business, academia, and public service. Each of the trustees and executive officers oversees 211 Vanguard funds.
Information for each trustee and executive officer of the fund appears below. That information, as well as the Vanguard fund count, is as of the date on the cover of this fund report. The mailing address of the trustees and officers is P.O. Box 876, Valley Forge, PA 19482. More information about the trustees is in the Statement of Additional Information, which can be obtained, without charge, by contacting Vanguard at 800-662-7447, or online at vanguard.com.
Interested Trustee1
Mortimer J. Buckley
Born in 1969. Trustee since January 2018. Principal occupation(s) during the past five years and other experience: chairman of the board (2019–present) of Vanguard and of each of the investment companies served by Vanguard; chief executive officer (2018– present) of Vanguard; chief executive officer, president, and trustee (2018–present) of each of the investment companies served by Vanguard; president and director (2017–present) of Vanguard; and president (2018– present) of Vanguard Marketing Corporation. Chief investment officer (2013–2017), managing director (2002–2017), head of the Retail Investor Group (2006–2012), and chief information officer (2001–2006) of Vanguard. Chairman of the board (2011–2017) and trustee (2009–2017) of the Children’s Hospital of Philadelphia; and trustee (2018–present) and vice chair (2019–present) of The Shipley School.
Independent Trustees
Emerson U. Fullwood
Born in 1948. Trustee since January 2008. Principal occupation(s) during the past five years and other experience: executive chief staff and marketing officer for North America and corporate vice president (retired 2008) of Xerox Corporation (document management products and services). Former president of the Worldwide Channels Group, Latin America, and Worldwide Customer Service and executive chief staff officer of Developing Markets of Xerox. Executive in residence and 2009–2010 Distinguished Minett Professor at the Rochester Institute of Technology. Director of SPX FLOW, Inc. (multi-industry manufacturing). Director of the University of Rochester Medical Center, the Monroe Community College Foundation, the United Way of Rochester, North Carolina A&T University, and Roberts Wesleyan College. Trustee of the University of Rochester.
Amy Gutmann
Born in 1949. Trustee since June 2006. Principal occupation(s) during the past five years and other experience: president (2004–present) of the University of Pennsylvania. Christopher H. Browne Distinguished Professor of Political Science, School of Arts and Sciences, and professor of communication, Annenberg School for Communication, with secondary faculty appointments in the Department of Philosophy, School of Arts and Sciences, and at the Graduate School of Education, University of Pennsylvania.
F. Joseph Loughrey
Born in 1949. Trustee since October 2009. Principal occupation(s) during the past five years and other experience: president and chief operating officer (retired 2009) and vice chairman of the board (2008–2009) of Cummins Inc. (industrial machinery). Chairman of the board of Hillenbrand, Inc. (specialized consumer services) and the Lumina Foundation. Director of the V Foundation. Member of the advisory council for the College of Arts and Letters and chair of the advisory board to the Kellogg Institute for International Studies, both at the University of Notre Dame.
Mark Loughridge
Born in 1953. Trustee since March 2012. Principal occupation(s) during the past five years and other experience: senior vice president and chief financial officer (retired 2013) of IBM (information technology services). Fiduciary member of IBM’s Retirement Plan Committee (2004–2013), senior vice president and general manager (2002–2004) of IBM Global Financing, vice president and controller (1998–2002) of IBM, and a variety of other prior management roles at IBM. Member of the Council on Chicago Booth.
Scott C. Malpass
Born in 1962. Trustee since March 2012. Principal occupation(s) during the past five years and other experience: chief investment officer (retired June 2020) and vice president (retired June 2020) of the University of Notre Dame. Assistant professor of finance at the Mendoza College of Business, University of Notre Dame, and member of the Notre Dame 403(b) Investment Committee (retired June 2020). Member of the board of Catholic Investment Services, Inc. (investment advisors) and the board of superintendence of the Institute for the Works of Religion.
Deanna Mulligan
Born in 1963. Trustee since January 2018. Principal occupation(s) during the past five years and other experience: board chair (2020–present), chief executive officer (2011–2020), and president (2010–2019) of The Guardian Life Insurance Company of America. Chief operating officer (2010–2011) and executive vice president (2008–2010) of the individual life and disability division of Guardian Life. Member of the board of the American Council of Life Insurers and the board of the Economic Club of New York. Trustee of the Partnership for New York City (business leadership), Chief Executives for Corporate Purpose, NewYork-Presbyterian Hospital, Catalyst, and the Bruce Museum (arts and science). Member of the Advisory Council for the Stanford Graduate School of Business.
André F. Perold
Born in 1952. Trustee since December 2004. Principal occupation(s) during the past five years and other experience: George Gund Professor of Finance and Banking, Emeritus at the Harvard Business School (retired 2011). Chief investment officer and co-managing partner of HighVista Strategies (private investment firm). Member of the board of advisors and member of the investment committee of the Museum of Fine Arts Boston. Member of the board (2018–present) of RIT Capital Partners (investment firm). Member of the investment committee of Partners Health Care System.
Sarah Bloom Raskin
Born in 1961. Trustee since January 2018. Principal occupation(s) during the past five years and other experience: deputy secretary (2014–2017) of the United States Department of the Treasury. Governor (2010–2014) of the Federal Reserve Board. Commissioner (2007–2010) of financial regulation for the State of Maryland. Member of the board of directors (2012–2014) of Neighborhood Reinvestment Corporation. Director (2017–present) of i(x) Investments, LLC; director (2017–present) of Reserve Trust. Rubenstein Fellow (2017–present) of Duke University; trustee (2017–present) of Amherst College, and trustee (2019–present) of the Folger Shakespeare Library.
Peter F. Volanakis
Born in 1955. Trustee since July 2009. Principal occupation(s) during the past five years and other experience: president and chief operating officer (retired 2010) of Corning Incorporated (communications equipment) and director of Corning Incorporated
1 Mr. Buckley is considered an “interested person,” as defined in the Investment Company Act of 1940, because he is an officer of the Vanguard funds.
(2000–2010) and Dow Corning (2001–2010). Director (2012) of SPX Corporation (multi-industry manufacturing). Overseer of the Amos Tuck School of Business Administration, Dartmouth College (2001–2013). Chairman of the board of trustees of Colby-Sawyer College. Member of the board of Hypertherm Inc. (industrial cutting systems, software, and consumables).
Executive Officers
John Bendl
Born in 1970. Principal occupation(s) during the past five years and other experience: principal of Vanguard. Chief financial officer (2019–present) of each of the investment companies served by Vanguard. Chief accounting officer, treasurer, and controller of Vanguard (2017–present). Partner (2003–2016) at KPMG (audit, tax, and advisory services).
Christine M. Buchanan
Born in 1970. Principal occupation(s) during the past five years and other experience: principal of Vanguard. Treasurer (2017–present) of each of the investment companies served by Vanguard. Partner (2005–2017) at KPMG (audit, tax, and advisory services).
David Cermak
Born in 1960. Principal occupation(s) during the past five years and other experience: principal of Vanguard. Finance director (2019–present) of each of the investment companies served by Vanguard. Managing director and head (2017–present) of Vanguard Investments Singapore. Managing director and head (2017–2019) of Vanguard Investments Hong Kong. Representative director and head (2014–2017) of Vanguard Investments Japan.
John Galloway
Born in 1973. Principal occupation(s) during the past five years and other experience: principal of Vanguard. Investment stewardship officer (September 2020–present) of each of the investment companies served by Vanguard. Head of Investor Advocacy (February 2020–present) and head of Marketing Strategy and Planning (2017–2020) at Vanguard. Deputy assistant to the President of the United States (2015).
Thomas J. Higgins
Born in 1957. Principal occupation(s) during the past five years and other experience: principal of Vanguard. Finance director (2019–present), chief financial officer (2008–2019), and treasurer (1998–2008) of each of the investment companies served by Vanguard.
Peter Mahoney
Born in 1974. Principal occupation(s) during the past five years and other experience: principal of Vanguard. Controller (2015–present) of each of the investment companies served by Vanguard. Head of International Fund Services (2008–2014) at Vanguard.
Anne E. Robinson
Born in 1970. Principal occupation(s) during the past five years and other experience: general counsel (2016–present) of Vanguard. Secretary (2016–present) of Vanguard and of each of the investment companies served by Vanguard. Managing director (2016–present) of Vanguard. Managing director and general counsel of Global Cards and Consumer Services (2014–2016) at Citigroup. Counsel (2003–2014) at American Express.
Michael Rollings
Born in 1963. Principal occupation(s) during the past five years and other experience: finance director (2017–present) and treasurer (2017) of each of the investment companies served by Vanguard. Managing director (2016–present) of Vanguard. Chief financial officer (2016–present) of Vanguard. Director (2016–present) of Vanguard Marketing Corporation. Executive vice president and chief financial officer (2006–2016) of MassMutual Financial Group.
John E. Schadl
Born in 1972. Principal occupation(s) during the past five years and other experience: principal of Vanguard. Chief compliance officer (2019–present) of Vanguard and of each of the investment companies served by Vanguard. Assistant vice president (2019–present) of Vanguard Marketing Corporation.
Vanguard Senior Management Team
| Joseph Brennan | James M. Norris |
| Mortimer J. Buckley | Thomas M. Rampulla |
| Gregory Davis | Karin A. Risi |
| John James | Anne E. Robinson |
| John T. Marcante | Michael Rollings |
| Chris D. McIsaac | Lauren Valente |
Connect with Vanguard® > vanguard.com
Fund Information > 800-662-7447
Annuity and Insurance Services > 800-522-5555
Institutional Investor Services > 800-523-1036
Text Telephone for People
Who Are Deaf or Hard of Hearing > 800-749-7273
This material may be used in conjunction with the offering of shares of any Vanguard fund only if preceded or accompanied by the fund’s current prospectus.
You can obtain a free copy of Vanguard’s proxy voting guidelines by visiting vanguard.com/proxyreporting or by calling Vanguard at 800-662-2739. The guidelines are also available from the SEC’s website, www.sec.gov. In addition, you may obtain a free report on how your fund voted the proxies for securities it owned during the 12 months ended June 30. To get the report, visit either vanguard.com/proxyreporting or www.sec.gov.
All comparative mutual fund data are from Morningstar, Inc., unless otherwise noted.
You can review information about your portfolio on the SEC’s website, and you can receive copies of this information, for a fee, by sending a request via email addressed to publicinfo@sec.gov.
© 2021 The Vanguard Group, Inc.
All rights reserved. Vanguard Marketing Corporation, Distributor. Q690GBI 022021 |
Annual Report | December 31, 2020
Vanguard Variable Insurance Funds
Contents
Your Portfolio’s Performance at a Glance
| 1 |
Advisors' Report
| 2 |
About Your Portfolio’s Expenses
| 4 |
Performance Summary
| 5 |
Financial Statements
| 7 |
Please note: The opinions expressed in this report are just that—informed opinions. They should not be considered promises or advice. Also, please keep in mind that the information and opinions cover the period through the date on the front of this report. Of course, the risks of investing in your portfolio are spelled out in the prospectus.
Your Portfolio’s Performance at a Glance
| • | For the 12 months ended December 31, 2020, the Growth Portfolio returned 43.09%, topping the 38.49% return of its benchmark, the Russell 1000 Growth Index. Please note that the portfolio’s returns are different from those in Vanguard Variable Annuity Fund (and other plans that invest in the portfolio), which take into account insurance-related expenses. |
| • | The emergence of COVID-19 in early 2020 turned into a global health crisis, and aggressive containment efforts resulted in a sharp economic downturn. Unemployment spiked, and sectors where social distancing isn’t possible were hit hard. Although stocks initially plummeted, they finished the year significantly higher, thanks in part to policymakers’ rapid and robust monetary and fiscal action. The development and rollout of vaccines also helped the market rally. |
| • | Stock selection, especially within information technology, industrials, and communication services, drove the outperformance. An underweight allocation to the lagging health care sector, and selection within it, also helped relative returns. An underweight to, and selection within, consumer discretionary held back results. |
| • | For the decade ended December 31, 2020, the portfolio’s average annual return of 17.11% was about the same as that of its benchmark. |
| • | In January 2021, shareholders approved a Vanguard proxy proposal to reclassify the portfolio’s diversification status to “non-diversified” as defined under the Investment Company Act of 1940. This change gives the portfolio managers increased investment flexibility and raises the potential for better investment performance. However, it also presents a heightened degree of investment risk, as non-diversified funds can make more concentrated investments. |
Market Barometer
Average Annual Total Returns
Periods Ended December 31, 2020 |
| | One Year | Three Years | Five Years |
| Stocks | | | |
| Russell 1000 Index (Large-caps) | 20.96% | 14.82% | 15.60% |
| Russell 2000 Index (Small-caps) | 19.96 | 10.25 | 13.26 |
| Russell 3000 Index (Broad U.S. market) | 20.89 | 14.49 | 15.43 |
| FTSE All-World ex US Index (International) | 11.22 | 5.18 | 9.16 |
| Bonds | | | |
| Bloomberg Barclays U.S. Aggregate Bond Index (Broad taxable market) | 7.51% | 5.34% | 4.44% |
Bloomberg Barclays Municipal Bond Index
(Broad tax-exempt market) | 5.21 | 4.64 | 3.91 |
| FTSE Three-Month U.S. Treasury Bill Index | 0.58 | 1.56 | 1.16 |
| CPI | | | |
| Consumer Price Index | 1.36% | 1.85% | 1.95% |
The Growth Portfolio returned 43.09% for the 12 months ended December 31, 2020. It outpaced the 38.49% return of its benchmark, the Russell 1000 Growth Index.
The portfolio is overseen by two independent advisors, a strategy that enhances its diversification by providing exposure to distinct yet complementary investment approaches. It is not uncommon for different advisors to have different views about individual securities or the broader investment environment.
The advisors, the amount and percentage of the portfolio’s assets each manages, and brief descriptions of their investment strategies are presented in the accompanying table. Each advisor has also prepared a discussion of the investment environment that existed during the period and of the effect it had on the portfolio’s positioning. These reports were prepared on January 21, 2021.
Jackson Square Partners, LLC
Portfolio Managers:
Jeffrey S. Van Harte, CFA
Chairman and Chief Investment Officer
Christopher M. Ericksen, CFA
Daniel J. Prislin, CFA
William (Billy) G. Montana
For the 12 months ended December 31, 2020, the performance of assets we managed was largely driven by our stock exposure. On a sector level, information technology was the largest contributor and financials was the largest detractor.
Twilio, a cloud communications platform, contributed most to relative performance. Instant digital communication with customers and employees across any medium in any geography is a hugely complex problem that businesses increasingly need to solve. We believe Twilio—which is the leading
communications-as-a-service platform and several times larger than its biggest competitor—will be the primary beneficiary of that trend. In this addressable market, which is tens of billions of dollars and essentially untapped, we expect Twilio’s market share to expand meaningfully, driving consistently high revenue growth for many years.
Constellation Brands, a producer and marketer of beer, wine, and spirits, detracted. Investors became concerned about the extent of the company’s leverage and about the several unexpected anti-business initiatives from the Mexican government that hurt Constellation. We sold our position in favor of more attractive opportunities.
Earnings growth for the average company will naturally remain under scrutiny, given the impacts of COVID-19. However, companies’ fundamentals vary, and these variations can make a significant difference. Many firms have shown resilience in difficult circumstances—some even demonstrating strength and growth as beneficiaries of the pandemic.
At Jackson Square, our portfolio turnover has increased in recent quarters, as we have focused on taking advantage of market volatility to purchase some securities at the largest discounts to intrinsic business value seen since the end of the Global Financial Crisis. We also pruned from our portfolio companies that were struggling with fundamentals or carrying more leverage than we deemed prudent during these challenging times. We will continue to remain vigilant in watching for market volatility that may give us more opportunities to enhance and refine the portfolio.
With the transfer of power to President Biden complete, investor concerns will shift to assessing the impact of potential policy changes combined with a global economy that is positioned to grow once the effects of the pandemic begin to abate
later in the year. Regardless of policy outcomes or where oscillating investor sentiment stands in any given period, we remain consistent in our long-term investment philosophy: We want to own strong secular-growth companies with solid business models and competitive positions that can grow market share and deliver shareholder value in a variety of market environments.
Wellington Management Company llp
Portfolio Manager:
Andrew J. Shilling, CFA
Senior Managing Director
Our portion of the portfolio seeks to outperform growth indexes and, over the longer term, the broader market. We employ proprietary fundamental research and a rigorous valuation discipline to invest in large-capitalization companies with attractive growth characteristics. Our investment approach is based on identifying companies that possess a clear competitive advantage that will enable them to sustain above-average growth.
U.S. equities, as measured by the Standard & Poor’s 500 Index, returned 18.40% for the period. Growth stocks outperformed value stocks and large-cap companies slightly outpaced their smaller-cap peers.
Our holdings within industrials, health care, financials, and information technology contributed to relative performance; our consumer discretionary stocks detracted from it. Sector allocation, a result of our bottom-up stock selection process, also helped, with an overweight to information technology and an underweight to health care the main contributors here.
Top contributors included DocuSign, an electronic signature solutions company leading the increasing digitization of agreement workflows. The rapid shift to a work-from-home environment amid the
pandemic created strong demand for initial deals at big companies, opening the door to future cross-selling opportunities in more complex offerings. We meaningfully trimmed our position on strength over the course of the year. Given the large, underpenetrated addressable market that DocuSign is growing into, however, we maintain a modestly overweight position in the company.
Square, a digital payments platform, was another standout. After initially declining sharply in March on concerns about reduced levels of in-person transactions, it quickly rebounded as investors realized that electronic payments would dramatically increase because of the pandemic. In fact, the company’s Cash App—similar to PayPal’s Venmo app—is seeing increased adoption as people shift from using physical cash to making digital payments.
Online payments company PayPal was another top contributor. It benefited from significant growth in payment volume and active users, and from the continued
success of its Venmo app.
On the other side of the ledger, our lack of exposure to Tesla held back results. Other notable detractors included an overweight to FleetCor Technologies and an underweight to Apple.
Tesla, the leader in electric vehicles, returned more than 740% for the year. The company executed better than expected amid a number of operational challenges; it also benefited from delays in their competitors’ electric vehicle programs. Although we are disappointed to have missed this sizeable outperformance, we also believe that sentiment has run well ahead of fundamentals; therefore, we continue to avoid the stock.
FleetCor Technologies is an electronic payments company focused on truck-fleet fuel cards, with a growing non-fuel related services segment. Given the core focus on fuel cards for trucking fleets, the onset of the pandemic represented a notable headwind to the business as trucking volumes saw a sharp decline. We used this short-term weakness to add to our
position. In our view, the company has a number of secular drivers to help reaccelerate the business.
Lastly, our underweight to Apple held back performance. Although Apple has continued to defy high expectations with a strong iPhone cycle around the 5G rollout and growth in its services segment, we have been finding more compelling risk/reward opportunities elsewhere.
Stepping back, our holdings consist of high-quality, growing companies protected by sustainable barriers to entry and benefiting from long-term secular trends. We continue to believe that powerful structural changes in our economy are moving hundreds of billions of dollars into new business areas such as electronic payments, e-commerce, digital media, life sciences, and cloud computing. By identifying competitively advantaged companies at the forefront of these trends and applying our rigorous valuation discipline, we believe our holdings should outperform over the long term.
Growth Portfolio Investment Advisors
| |
| | Portfolio Assets Managed | |
| Investment Advisor | % | $ Million | Investment Strategy |
| Jackson Square Partners, LLC | 50 | 626 | Uses a bottom-up approach, seeking companies that have large end-market potential, dominant business models, and strong free-cash-flow generation that is attractively priced compared with the intrinsic value of the securities. |
| Wellington Management Company llp | 48 | 594 | Employs proprietary fundamental research and a rigorous valuation discipline in an effort to invest in high-quality, large-capitalization, sustainable-growth companies. The firm's philosophy is based on the belief that stock prices often overreact to short-term trends and that bottom-up, intensive research focused on longer-term fundamentals can be used to identify stocks that will outperform the market over time. |
| Cash Investments | 2 | 27 | These short-term reserves are invested by Vanguard in equity index products to simulate investment in stocks. Each advisor also may maintain a modest cash position. |
About Your Portfolio’s Expenses
As a shareholder of the portfolio, you incur ongoing costs, which include costs for portfolio management, administrative services, and shareholder reports (like this one), among others. Operating expenses, which are deducted from a portfolio's gross income, directly reduce the investment return of the portfolio.
A portfolio's expenses are expressed as a percentage of its average net assets. This figure is known as the expense ratio. The following examples are intended to help you understand the ongoing costs (in dollars) of investing in your portfolio and to compare these costs with those of other mutual funds. The examples are based on an investment of $1,000 made at the beginning of the period shown and held for the entire period.
The accompanying table illustrates your portfolio's costs in two ways:
| • | Based on actual portfolio return. This section helps you to estimate the actual expenses that you paid over the period. The ”Ending Account Value“ shown is derived from the portfolio's actual return, and the third column shows the dollar amount that would have been paid by an investor who started with $1,000 in the portfolio. You may use the information here, together with the amount you invested, to estimate the expenses that you paid over the period. |
To do so, simply divide your account value by $1,000 (for example, an $8,600 account value divided by $1,000 = 8.6), then multiply the result by the number given for your portfolio under the heading ”Expenses Paid During Period.“
| • | Based on hypothetical 5% yearly return. This section is intended to help you compare your portfolio's costs with those of other mutual funds. It assumes that the portfolio had a yearly return of 5% before expenses, but that the expense ratio is unchanged. In this case—because the return used is not the portfolio's actual return—the results do not apply to your investment. The example is useful in making comparisons because the Securities and Exchange Commission requires all mutual funds to calculate expenses based on a 5% return. You can assess your portfolio's costs by comparing this hypothetical example with the hypothetical examples that appear in shareholder reports of other funds. |
Note that the expenses shown in the table are meant to highlight and help you compare ongoing costs only and do not reflect transaction costs incurred by the portfolio for buying and selling securities. The portfolio’s expense ratio does not reflect additional fees and expenses associated with the annuity or life insurance program through which you invest.
The calculations assume no shares were bought or sold during the period. Your actual costs may have been higher or lower, depending on the amount of your investment and the timing of any purchases or redemptions.
You can find more information about the portfolio's expenses, including annual expense ratios, in the Financial Statements section of this report. For additional information on operating expenses and other shareholder costs, please refer to your portfolio's current prospectus.
| Six Months Ended December 31, 2020 | | | |
| Growth Portfolio | Beginning
Account Value
6/30/2020 | Ending
Account Value
12/31/2020 | Expenses
Paid During
Period |
| Based on Actual Portfolio Return | $1,000.00 | $1,257.08 | $2.27 |
| Based on Hypothetical 5% Yearly Return | 1,000.00 | 1,023.13 | 2.03 |
The calculations are based on expenses incurred in the most recent six-month period. The portfolio’s annualized six-month expense ratio for that period is 0.40%. The dollar amounts shown as “Expenses Paid” are equal to the annualized expense ratio multiplied by the average account value over the period, multiplied by the number of days in the most recent six-month period, then divided by the number of days in the most recent 12-month period (184/366).
All of the returns in this report represent past performance, which is not a guarantee of future results that may be achieved by the portfolio. (Current performance may be lower or higher than the performance data cited. For performance data current to the most recent month-end, visit our website at vanguard.com/performance.) Note, too, that both investment returns and principal value can fluctuate widely, so an investor’s shares, when sold, could be worth more or less than their original cost. The returns shown do not reflect taxes that a shareholder would pay on portfolio distributions or on the sale of portfolio shares. Nor do the returns reflect fees and expenses associated with the annuity or life insurance program through which a shareholder invests. If these fees and expenses were included, the portfolio's returns would be lower.
Cumulative Performance: December 31, 2010, Through December 31, 2020
Initial Investment of $10,000
| | | | Average Annual Total Returns
Periods Ended December 31, 2020 |
| | | One
Year | Five
Years | Ten
Years | Final Value
of a $10,000
Investment |
 | Growth Portfolio | 43.09% | 19.96% | 17.11% | $48,502 |
 | Russell 1000 Growth Index | 38.49 | 21.00 | 17.21 | 48,930 |
 | Dow Jones U.S. Total Stock Market Float Adjusted Index | 20.79 | 15.36 | 13.74 | 36,240 |
See Financial Highlights for dividend and capital gains information.
| Communication Services | 12.5% |
| Consumer Discretionary | 13.9 |
| Consumer Staples | 1.5 |
| Financials | 4.0 |
| Health Care | 9.8 |
| Industrials | 8.2 |
| Information Technology | 48.6 |
| Materials | 1.3 |
| Real Estate | 0.2 |
| Other | 0.0 |
The table reflects the portfolio’s investments, except for short-term investments and derivatives. Sector categories are based on the Global Industry Classification Standard (“GICS”), except for the “Other” category (if applicable), which includes securities that have not been provided a GICS classification as of the effective reporting period.
Global Industry Classification Standard (“GICS”) was developed by and is the exclusive property and a service mark of MSCI Inc. (“MSCI”) and Standard and Poor’s, a division of McGraw-Hill Companies, Inc. (“S&P”), and is licensed for use by Vanguard. Neither MSCI, S&P nor any third party involved in making or compiling the GICS or any GICS classification makes any express or implied warranties or representations with respect to such standard or classification (or the results to be obtained by the use thereof), and all such parties hereby expressly disclaim all warranties of originality, accuracy, completeness, merchantability or fitness for a particular purpose with respect to any such standard or classification. Without limiting any of the foregoing, in no event shall MSCI, S&P, any of its affiliates or any third party involved in making or compiling the GICS or any GICS classification have any liability for any direct, indirect, special, punitive, consequential or any other damages (including lost profits) even if notified of the possibility of such damages.
The portfolio files its complete schedule of portfolio holdings with the Securities and Exchange Commission (SEC) for the first and third quarters of each fiscal year as an exhibit to its reports on Form N-PORT. The portfolio’s Form N-PORT reports are available on the SEC’s website at www.sec.gov.
| | | Shares | Market
Value•
($000) |
| Common Stocks (97.5%) |
| Communication Services (12.1%) |
| * | Match Group Inc. | 185,120 | 27,988 |
| * | Alphabet Inc. Class C | 15,565 | 27,268 |
| * | Charter Communications Inc. Class A | 41,160 | 27,229 |
| * | Facebook Inc. Class A | 71,078 | 19,416 |
| * | Alphabet Inc. Class A | 10,575 | 18,534 |
| * | Netflix Inc. | 33,699 | 18,222 |
| * | Walt Disney Co. | 28,120 | 5,095 |
| * | ZoomInfo Technologies Inc. Class A | 103,701 | 5,002 |
| * | Twitter Inc. | 48,846 | 2,645 |
| | | | 151,399 |
| Consumer Discretionary (13.6%) |
| * | Amazon.com Inc. | 25,588 | 83,338 |
| | NIKE Inc. Class B | 158,319 | 22,397 |
| | Starbucks Corp. | 147,756 | 15,807 |
| * | Airbnb Inc. Class A | 58,302 | 8,559 |
| | TJX Cos. Inc. | 119,848 | 8,184 |
| * | DraftKings Inc. Class A | 114,968 | 5,353 |
| * | Burlington Stores Inc. | 19,982 | 5,226 |
| * | Alibaba Group Holding Ltd. ADR | 17,357 | 4,040 |
| * | Lululemon Athletica Inc. | 11,150 | 3,881 |
| | Home Depot Inc. | 12,109 | 3,216 |
| * | Booking Holdings Inc. | 1,416 | 3,154 |
| * | O'Reilly Automotive Inc. | 6,896 | 3,121 |
| *,1 | Airbnb Inc. Class B | 19,944 | 2,635 |
| | | | 168,911 |
| Consumer Staples (1.5%) |
| | Constellation Brands Inc. Class A | 51,187 | 11,213 |
| * | Monster Beverage Corp. | 73,932 | 6,837 |
| | | | 18,050 |
| Financials (3.9%) |
| | KKR & Co. Inc. | 411,289 | 16,653 |
| | American Express Co. | 65,064 | 7,867 |
| | Progressive Corp. | 62,319 | 6,162 |
| | Marsh & McLennan Cos. Inc. | 35,065 | 4,103 |
| | MarketAxess Holdings Inc. | 6,970 | 3,977 |
| * | Markel Corp. | 3,402 | 3,515 |
| | Blackstone Group Inc. Class A | 53,268 | 3,452 |
| | S&P Global Inc. | 10,388 | 3,415 |
| | | | 49,144 |
| Health Care (9.6%) |
| * | Edwards Lifesciences Corp. | 281,784 | 25,707 |
| * | Illumina Inc. | 63,193 | 23,381 |
| | | Shares | Market
Value•
($000) |
| * | Intuitive Surgical Inc. | 24,652 | 20,168 |
| * | Veeva Systems Inc. Class A | 51,443 | 14,005 |
| | UnitedHealth Group Inc. | 26,623 | 9,336 |
| * | ABIOMED Inc. | 25,260 | 8,189 |
| * | Boston Scientific Corp. | 184,488 | 6,632 |
| * | Seagen Inc. | 20,826 | 3,648 |
| * | Mettler-Toledo International Inc. | 2,698 | 3,075 |
| * | Penumbra Inc. | 15,301 | 2,678 |
| | Danaher Corp. | 7,322 | 1,627 |
| * | Biogen Inc. | 5,064 | 1,240 |
| | | | 119,686 |
| Industrials (8.0%) |
| * | Uber Technologies Inc. | 806,650 | 41,139 |
| | Waste Management Inc. | 154,829 | 18,259 |
| | TransUnion | 89,918 | 8,922 |
| * | Copart Inc. | 57,250 | 7,285 |
| | IHS Markit Ltd. | 61,943 | 5,564 |
| | Canadian National Railway Co. | 43,103 | 4,735 |
| | Northrop Grumman Corp. | 14,985 | 4,566 |
| * | Airbus SE ADR | 102,113 | 2,790 |
| | JB Hunt Transport Services Inc. | 18,160 | 2,481 |
| | Equifax Inc. | 12,102 | 2,334 |
| | IDEX Corp. | 6,994 | 1,393 |
| | | | 99,468 |
| Information Technology (47.4%) |
| | Microsoft Corp. | 412,057 | 91,650 |
| | Apple Inc. | 362,622 | 48,116 |
| | Visa Inc. Class A | 207,420 | 45,369 |
| * | PayPal Holdings Inc. | 189,432 | 44,365 |
| | Mastercard Inc. Class A | 122,861 | 43,854 |
| * | ServiceNow Inc. | 64,220 | 35,349 |
| * | Twilio Inc. Class A | 93,494 | 31,648 |
| * | Autodesk Inc. | 90,462 | 27,622 |
| * | Adobe Inc. | 53,380 | 26,696 |
| * | Paycom Software Inc. | 51,328 | 23,213 |
| * | Coupa Software Inc. | 52,348 | 17,741 |
| * | Wix.com Ltd. | 56,410 | 14,100 |
| * | Advanced Micro Devices Inc. | 143,166 | 13,130 |
| * | salesforce.com Inc. | 56,050 | 12,473 |
| * | Datadog Inc. Class A | 121,386 | 11,949 |
| * | Square Inc. Class A | 49,791 | 10,836 |
| * | FleetCor Technologies Inc. | 38,294 | 10,448 |
| | SS&C Technologies Holdings Inc. | 132,421 | 9,634 |
| | Microchip Technology Inc. | 67,705 | 9,351 |
| | Global Payments Inc. | 39,969 | 8,610 |
| | | Shares | Market
Value•
($000) |
| * | Workday Inc. Class A | 35,233 | 8,442 |
| | Fidelity National Information Services Inc. | 57,648 | 8,155 |
| | NVIDIA Corp. | 15,053 | 7,861 |
| | CDW Corp. | 47,099 | 6,207 |
| | Intuit Inc. | 14,460 | 5,493 |
| * | Splunk Inc. | 31,766 | 5,397 |
| * | Tyler Technologies Inc. | 10,170 | 4,439 |
| * | Shopify Inc. Class A | 2,697 | 3,053 |
| * | DocuSign Inc. Class A | 11,287 | 2,509 |
| | Monolithic Power Systems Inc. | 5,104 | 1,869 |
| * | Ceridian HCM Holding Inc. | 16,463 | 1,754 |
| | | | 591,333 |
| Materials (1.2%) |
| | Ball Corp. | 165,398 | 15,412 |
| Other (0.0%) |
| *,1,2 | The We Company Class A PP | 1,460 | 5 |
| Real Estate (0.2%) |
| | Equinix Inc. | 3,877 | 2,769 |
Total Common Stocks
(Cost $724,823) | 1,216,177 |
| Preferred Stocks (0.1%) |
| *,1,2,3 | The We Company Pfd. D1 PP | 19,954 | 126 |
| *,1,2,3 | The We Company Pfd. D2 PP | 15,678 | 99 |
| Total Preferred Stocks (Cost $593) | 225 |
| Temporary Cash Investments (2.5%) |
| Money Market Fund (2.3%) |
| 4 | Vanguard Market Liquidity Fund, 0.111%
| 287,490 | 28,749 |
| | | Face
Amount
($000) | Market
Value•
($000) |
| Repurchase Agreement (0.2%) |
| | Bank of America Securities LLC 0.080%, 1/4/21
(Dated 12/31/20, Repurchase Value $2,800,000, collateralized by Government National Mortgage Association, 2.984%, 9/20/70, with a value of $2,856,000) | 2,800 | 2,800 |
Total Temporary Cash Investments
(Cost $31,549) | 31,549 |
Total Investments (100.1%)
(Cost $756,965) | 1,247,951 |
| Other Assets and Liabilities—Net (-0.1%) | (738) |
| Net Assets (100%) | 1,247,213 |
| Cost is in $000. |
| • | See Note A in Notes to Financial Statements. |
| * | Non-income-producing security. |
| 1 | Restricted securities totaling $2,865,000, representing 0.2% of net assets. See Restricted Securities table for additional information. |
| 2 | Security value determined using significant unobservable inputs. |
| 3 | Perpetual security with no stated maturity date. |
| 4 | Affiliated money market fund available only to Vanguard funds and certain trusts and accounts managed by Vanguard. Rate shown is the 7-day yield. |
| | ADR—American Depositary Receipt. |
| | PP—Private Placement. |
Restricted Securities as of Period End
|
| Security Name | Acquisition
Date | Acquisition
Cost
($000) |
| The We Company Pfd. D1 PP | December 2014 | 332 |
| The We Company Pfd. D2 PP | December 2014 | 261 |
| The We Company Class A PP | December 2014 | 24 |
| Airbnb Inc. Class B | June 2015 | 928 |
Derivative Financial Instruments Outstanding as of Period End
| Futures Contracts |
| | | | ($000) |
| | Expiration | Number of
Long (Short)
Contracts | Notional
Amount | Value and
Unrealized
Appreciation
(Depreciation) |
| Long Futures Contracts | | | | |
| E-mini S&P 500 Index | March 2021 | 158 | 29,616 | 675 |
See accompanying Notes, which are an integral part of the Financial Statements.
Statement of Assets and Liabilities
| ($000s, except shares and per-share amounts) | Amount |
| Assets | |
| Investments in Securities, at Value | |
| Unaffiliated Issuers (Cost $728,216) | 1,219,202 |
| Affiliated Issuers (Cost $28,749) | 28,749 |
| Total Investments in Securities | 1,247,951 |
| Investment in Vanguard | 46 |
| Cash | 40 |
| Cash Collateral Pledged—Futures Contracts | 1,746 |
| Foreign Currency, at Value (Cost $16) | 16 |
| Receivables for Accrued Income | 49 |
| Receivables for Capital Shares Issued | 103 |
| Variation Margin Receivable—Futures Contracts | 194 |
| Total Assets | 1,250,145 |
| Liabilities | |
| Payables for Investment Securities Purchased | 3 |
| Payables to Investment Advisor | 472 |
| Payables for Capital Shares Redeemed | 2,289 |
| Payables to Vanguard | 168 |
| Total Liabilities | 2,932 |
| Net Assets | 1,247,213 |
| At December 31, 2020, net assets consisted of: | |
| | |
| Paid-in Capital | 640,346 |
| Total Distributable Earnings (Loss) | 606,867 |
| Net Assets | 1,247,213 |
| |
| Net Assets | |
Applicable to 34,700,458 outstanding $.001 par value shares of
beneficial interest (unlimited authorization) | 1,247,213 |
| Net Asset Value Per Share | $35.94 |
See accompanying Notes, which are an integral part of the Financial Statements.
Statement of Operations
|
| | Year Ended
December 31, 2020 |
| | ($000) |
| Investment Income | |
| Income | |
| Dividends1 | 4,816 |
| Interest2 | 225 |
| Securities Lending—Net | 3 |
| Total Income | 5,044 |
| Expenses | |
| Investment Advisory Fees—Note B | |
| Basic Fee | 1,424 |
| Performance Adjustment | 124 |
| The Vanguard Group—Note C | |
| Management and Administrative | 2,291 |
| Marketing and Distribution | 76 |
| Custodian Fees | 11 |
| Auditing Fees | 30 |
| Shareholders' Reports and Proxy | 37 |
| Trustees’ Fees and Expenses | 1 |
| Total Expenses | 3,994 |
| Expenses Paid Indirectly | (34) |
| Net Expenses | 3,960 |
| Net Investment Income | 1,084 |
| Realized Net Gain (Loss) | |
| Investment Securities Sold2 | 109,834 |
| Futures Contracts | 5,507 |
| Realized Net Gain (Loss) | 115,341 |
| Change in Unrealized Appreciation (Depreciation) | |
| Investment Securities2 | 252,929 |
| Futures Contracts | 393 |
| Change in Unrealized Appreciation (Depreciation) | 253,322 |
| Net Increase (Decrease) in Net Assets Resulting from Operations | 369,747 |
| 1 | Dividends are net of foreign withholding taxes of $10,000. |
| 2 | Interest income, realized net gain (loss), and change in unrealized appreciation (depreciation) from an affiliated company of the portfolio were $209,000, $2,000, and $3,000, respectively. Purchases and sales are for temporary cash investment purposes. |
Statement of Changes in Net Assets
|
| | Year Ended December 31, |
| | 2020
($000) | 2019
($000) |
| Increase (Decrease) in Net Assets | | |
| Operations | | |
| Net Investment Income | 1,084 | 3,114 |
| Realized Net Gain (Loss) | 115,341 | 42,823 |
| Change in Unrealized Appreciation (Depreciation) | 253,322 | 154,081 |
| Net Increase (Decrease) in Net Assets Resulting from Operations | 369,747 | 200,018 |
| Distributions1 | | |
| Total Distributions | (47,001) | (80,637) |
| Capital Share Transactions | | |
| Issued | 253,376 | 90,716 |
| Issued in Lieu of Cash Distributions | 47,001 | 80,637 |
| Redeemed | (167,365) | (97,322) |
| Net Increase (Decrease) from Capital Share Transactions | 133,012 | 74,031 |
| Total Increase (Decrease) | 455,758 | 193,412 |
| Net Assets | | |
| Beginning of Period | 791,455 | 598,043 |
| End of Period | 1,247,213 | 791,455 |
| 1 | Certain prior-period numbers have been reclassified to conform with the current-period presentation. |
See accompanying Notes, which are an integral part of the Financial Statements.
For a Share Outstanding
Throughout Each Period | Year Ended December 31, |
| 2020 | 2019 | 2018 | 2017 | 2016 |
| Net Asset Value, Beginning of Period | $26.95 | $22.82 | $23.99 | $19.70 | $22.58 |
| Investment Operations | | | | | |
| Net Investment Income | .0331 | .1081 | .1131 | .0941 | .115 |
| Net Realized and Unrealized Gain (Loss) on Investments | 10.536 | 7.119 | .038 | 5.685 | (.465) |
| Total from Investment Operations | 10.569 | 7.227 | .151 | 5.779 | (.350) |
| Distributions | | | | | |
| Dividends from Net Investment Income | (.104) | (.108) | (.080) | (.116) | (.126) |
| Distributions from Realized Capital Gains | (1.475) | (2.989) | (1.241) | (1.373) | (2.404) |
| Total Distributions | (1.579) | (3.097) | (1.321) | (1.489) | (2.530) |
| Net Asset Value, End of Period | $35.94 | $26.95 | $22.82 | $23.99 | $19.70 |
| Total Return | 43.09% | 33.82% | 0.20% | 30.92% | -1.08% |
| Ratios/Supplemental Data | | | | | |
| Net Assets, End of Period (Millions) | $1,247 | $791 | $598 | $558 | $415 |
| Ratio of Total Expenses to Average Net Assets2 | 0.41%3 | 0.40% | 0.39% | 0.40% | 0.42% |
| Ratio of Net Investment Income to Average Net Assets | 0.11% | 0.43% | 0.45% | 0.43% | 0.53% |
| Portfolio Turnover Rate | 41% | 32% | 47% | 28% | 28% |
| 1 | Calculated based on average shares outstanding. |
| 2 | Includes performance-based investment advisory fee increases (decreases) of 0.01%, 0.01%, 0.00%, (0.01%), and 0.00%. |
| 3 | The ratio of expenses to average net assets for the period net of reduction from broker commission abatement arrangements was 0.40%. |
See accompanying Notes, which are an integral part of the Financial Statements.
Notes to Financial Statements
The Growth Portfolio, a portfolio of Vanguard Variable Insurance Funds, is registered under the Investment Company Act of 1940 as an open-end investment company. The portfolio's shares are only available for purchase by separate accounts of insurance companies as investments for variable annuity plans, variable life insurance contracts, or other variable benefit insurance contracts. Market disruptions associated with the COVID-19 pandemic have had a global impact, and uncertainty exists as to the long-term implications. Such disruptions can adversely affect assets of the portfolio and thus portfolio performance.
| A. | The following significant accounting policies conform to generally accepted accounting principles for U.S. investment companies. The portfolio consistently follows such policies in preparing its financial statements. |
1. Security Valuation: Securities are valued as of the close of trading on the New York Stock Exchange (generally 4 p.m., Eastern time) on the valuation date. Equity securities are valued at the latest quoted sales prices or official closing prices taken from the primary market in which each security trades; such securities not traded on the valuation date are valued at the mean of the latest quoted bid and asked prices. Securities for which market quotations are not readily available, or whose values have been affected by events occurring before the portfolio’s pricing time but after the close of the securities’ primary markets, are valued at their fair values calculated according to procedures adopted by the board of trustees. These procedures include obtaining quotations from an independent pricing service, monitoring news to identify significant market- or security-specific events, and evaluating changes in the values of foreign market proxies (for example, ADRs, futures contracts, or exchange-traded funds), between the time the foreign markets close and the portfolio’s pricing time. When fair-value pricing is employed, the prices of securities used by a portfolio to calculate its net asset value may differ from quoted or published prices for the same securities.
Investments in Vanguard Market Liquidity Fund are valued at that fund's net asset value. Temporary cash investments are valued using the latest bid prices or using valuations based on a matrix system (which considers such factors as security prices, yields, maturities, and ratings), both as furnished by independent pricing services.
2. Foreign Currency: Securities and other assets and liabilities denominated in foreign currencies are translated into U.S. dollars using exchange rates obtained from an independent third party as of the portfolio’s pricing time on the valuation date. Realized gains (losses) and unrealized appreciation (depreciation) on investment securities include the effects of changes in exchange rates since the securities were purchased, combined with the effects of changes in security prices. Fluctuations in the value of other assets and liabilities resulting from changes in exchange rates are recorded as unrealized foreign currency gains (losses) until the assets or liabilities are settled in cash, at which time they are recorded as realized foreign currency gains (losses).
3. Futures Contracts: The portfolio uses index futures contracts to a limited extent, with the objective of maintaining full exposure to the stock market while maintaining liquidity. The portfolio may purchase or sell futures contracts to achieve a desired level of investment, whether to accommodate portfolio turnover or cash flows from capital share transactions. The primary risks associated with the use of futures contracts are imperfect correlation between changes in market values of stocks held by the portfolio and the prices of futures contracts, and the possibility of an illiquid market. Counterparty risk involving futures is mitigated because a regulated clearinghouse is the counterparty instead of the clearing broker. To further mitigate counterparty risk, the portfolio trades futures contracts on an exchange, monitors the financial strength of its clearing brokers and clearinghouse, and has entered into clearing agreements with its clearing brokers. The clearinghouse imposes initial margin requirements to secure the portfolio’s performance and requires daily settlement of variation margin representing changes in the market value of each contract. Any securities pledged as initial margin for open contracts are noted in the Schedule of Investments.
Futures contracts are valued at their quoted daily settlement prices. The notional amounts of the contracts are not recorded in the Statement of Assets and Liabilities. Fluctuations in the value of the contracts are recorded in the Statement of Assets and Liabilities as an asset (liability) and in the Statement of Operations as unrealized appreciation (depreciation) until the contracts are closed, when they are recorded as realized gains (losses) on futures contracts.
During the year ended December 31, 2020, the portfolio’s average investments in long and short futures contracts represented 2% and 0% of net assets, respectively, based on the average of the notional amounts at each quarter-end during the period.
4. Repurchase Agreements: The portfolio enters into repurchase agreements with institutional counterparties. Securities pledged as collateral to the portfolio under repurchase agreements are held by a custodian bank until the agreements mature, and in the absence of a default, such collateral cannot be repledged, resold, or rehypothecated. Each agreement requires that the market value of
the collateral be sufficient to cover payments of interest and principal. The portfolio further mitigates its counterparty risk by entering into repurchase agreements only with a diverse group of prequalified counterparties, monitoring their financial strength, and entering into master repurchase agreements with its counterparties. The master repurchase agreements provide that, in the event of a counterparty's default (including bankruptcy), the portfolio may terminate any repurchase agreements with that counterparty, determine the net amount owed, and sell or retain the collateral up to the net amount owed to the portfolio. Such action may be subject to legal proceedings, which may delay or limit the disposition of collateral.
5. Federal Income Taxes: The portfolio intends to continue to qualify as a regulated investment company and distribute all of its taxable income. The portfolio’s tax returns are open to examination by the relevant tax authorities until expiration of the applicable statute of limitations, which is generally three years after the filing of the tax return. Management has analyzed the portfolio’s tax positions taken for all open federal and state income tax years, and has concluded that no provision for income tax is required in the portfolio’s financial statements.
6. Distributions: Distributions to shareholders are recorded on the ex-dividend date. Distributions are determined on a tax basis at the fiscal year-end and may differ from net investment income and realized capital gains for financial reporting purposes.
7. Securities Lending: To earn additional income, the portfolio lends its securities to qualified institutional borrowers. Security loans are subject to termination by the portfolio at any time, and are required to be secured at all times by collateral in an amount at least equal to the market value of securities loaned. Daily market fluctuations could cause the value of loaned securities to be more or less than the value of the collateral received. When this occurs, the collateral is adjusted and settled on the next business day. The portfolio further mitigates its counterparty risk by entering into securities lending transactions only with a diverse group of prequalified counterparties, monitoring their financial strength, and entering into master securities lending agreements with its counterparties. The master securities lending agreements provide that, in the event of a counterparty’s default (including bankruptcy), the portfolio may terminate any loans with that borrower, determine the net amount owed, and sell or retain the collateral up to the net amount owed to the portfolio; however, such actions may be subject to legal proceedings. While collateral mitigates counterparty risk, in the event of a default, the portfolio may experience delays and costs in recovering the securities loaned. The portfolio invests cash collateral received in Vanguard Market Liquidity Fund, and records a liability in the Statement of Assets and Liabilities for the return of the collateral, during the period the securities are on loan. Collateral investments in Vanguard Market Liquidity Fund are subject to market appreciation or depreciation. Securities lending income represents fees charged to borrowers plus income earned on invested cash collateral, less expenses associated with the loan. During the term of the loan, the portfolio is entitled to all distributions made on or in respect of the loaned securities.
8. Credit Facilities and Interfund Lending Program: The portfolio and certain other funds managed by The Vanguard Group ("Vanguard") participate in a $4.3 billion committed credit facility provided by a syndicate of lenders pursuant to a credit agreement and an uncommitted credit facility provided by Vanguard. Both facilities may be renewed annually. Each fund is individually liable for its borrowings, if any, under the credit facilities. Borrowings may be utilized for temporary or emergency purposes, subject to the portfolio’s regulatory and contractual borrowing restrictions. With respect to the committed credit facility, the participating funds are charged administrative fees and an annual commitment fee of 0.10% of the undrawn committed amount of the facility; these fees are allocated to the funds based on a method approved by the portfolio’s board of trustees and included in Management and Administrative expenses on the portfolio’s Statement of Operations. Any borrowings under either facility bear interest at a rate based upon the higher of the one-month London Interbank Offered Rate (or an acceptable alternate rate, if necessary), federal funds effective rate, or overnight bank funding rate plus an agreed-upon spread, except that borrowings under the uncommitted credit facility may bear interest based upon an alternate rate agreed to by the portfolio and Vanguard.
In accordance with an exemptive order (the “Order”) from the SEC, the portfolio may participate in a joint lending and borrowing program that allows registered open-end Vanguard funds to borrow money from and lend money to each other for temporary or emergency purposes (the “Interfund Lending Program”), subject to compliance with the terms and conditions of the Order, and to the extent permitted by the portfolio’s investment objective and investment policies. Interfund loans and borrowings normally extend overnight, but can have a maximum duration of seven days. Loans may be called on one business day’s notice. The interest rate to be charged is governed by the conditions of the Order and internal procedures adopted by the board of trustees. The board of trustees is responsible for overseeing the Interfund Lending Program.
For the year ended December 31, 2020, the portfolio did not utilize the credit facilities or the Interfund Lending Program.
9. Other: Dividend income is recorded on the ex-dividend date. Non-cash dividends included in dividend income, if any, are recorded at the fair value of the securities received. Interest income includes income distributions received from Vanguard Market Liquidity Fund and is accrued daily. Premiums and discounts on debt securities are amortized and accreted, respectively, to interest income over the lives of the respective securities, except for premiums on certain callable debt securities that are amortized to the earliest call date. Security transactions are accounted for on the date securities are bought or sold. Costs used to determine realized gains (losses) on the sale of investment securities are those of the specific securities sold.
| B. | The investment advisory firms Jackson Square Partners, LLC, and Wellington Management Company llp, each provide investment advisory services to a portion of the portfolio for a fee calculated at an annual percentage rate of average net assets managed by the advisor. The basic fees of Jackson Square Partners, LLC and Wellington Management Company llp, are subject to quarterly adjustments based on performance relative to the Russell 1000 Growth Index for the preceding three years. |
In February 2021, the board of trustees approved a restructuring of the portfolio's investment advisory team, removing Jackson Square Partners, LLC, as an investment advisor to the portfolio.
Vanguard manages the cash reserves of the portfolio as described below.
For the year ended December 31, 2020, the aggregate investment advisory fee paid to all advisors represented an effective annual rate of 0.15% of the portfolio’s average net assets, before an increase of $124,000 (0.01%) based on performance.
| C. | In accordance with the terms of a Funds' Service Agreement (the “FSA”) between Vanguard and the portfolio, Vanguard furnishes to the portfolio corporate management, administrative, marketing, distribution, and cash management services at Vanguard’s cost of operations (as defined by the FSA). These costs of operations are allocated to the portfolio based on methods and guidelines approved by the board of trustees and are generally settled twice a month. |
Upon the request of Vanguard, the portfolio may invest up to 0.40% of its net assets as capital in Vanguard. At December 31, 2020, the portfolio had contributed to Vanguard capital in the amount of $46,000, representing less than 0.01% of the portfolio’s net assets and 0.02% of Vanguard’s capital received pursuant to the FSA. The portfolio’s trustees and officers are also directors and employees, respectively, of Vanguard.
| D. | The portfolio has asked its investment advisors to direct certain security trades, subject to obtaining the best price and execution, to brokers who have agreed to rebate to the portfolio part of the commissions generated. Such rebates are used solely to reduce the portfolio’s management and administrative expenses. The portfolio’s custodian bank has also agreed to reduce its fees when the portfolio maintains cash on deposit in the non-interest-bearing custody account. For the year ended December 31, 2020, these arrangements reduced the portfolio’s management and administrative expenses by $34,000 and custodian fees by less than $1,000. The total expense reduction represented an effective annual rate of less than 0.01% of the portfolio’s average net assets. |
| E. | Various inputs may be used to determine the value of the portfolio’s investments and derivatives. These inputs are summarized in three broad levels for financial statement purposes. The inputs or methodologies used to value securities are not necessarily an indication of the risk associated with investing in those securities. |
Level 1—Quoted prices in active markets for identical securities.
Level 2—Other significant observable inputs (including quoted prices for similar securities, interest rates, prepayment speeds, credit risk, etc.).
Level 3—Significant unobservable inputs (including the portfolio’s own assumptions used to determine the fair value of investments). Any investments and derivatives valued with significant unobservable inputs are noted on the Schedule of Investments.
The following table summarizes the market value of the portfolio’s investments and derivatives as of December 31, 2020, based on the inputs used to value them:
| | Level 1
($000) | Level 2
($000) | Level 3
($000) | Total
($000) |
| Investments | | | | |
| Assets | | | | |
| Common Stocks | 1,213,537 | 2,635 | 5 | 1,216,177 |
| Preferred Stocks | — | — | 225 | 225 |
| Temporary Cash Investments | 28,749 | 2,800 | — | 31,549 |
| Total | 1,242,286 | 5,435 | 230 | 1,247,951 |
| Derivative Financial Instruments | | | | |
| Assets | | | | |
| Futures Contracts1 | 194 | — | — | 194 |
| 1 | Represents variation margin on the last day of the reporting period. |
| F. | Permanent differences between book-basis and tax-basis components of net assets are reclassified among capital accounts in the financial statements to reflect their tax character. These reclassifications have no effect on net assets or net asset value per share. As of period end, permanent differences primarily attributable to the accounting for foreign currency transactions were reclassified between the individual components of total distributable earnings (loss). |
Temporary differences between book-basis and tax-basis components of total distributable earnings (loss) arise when certain items of income, gain, or loss are recognized in different periods for financial statement and tax purposes; these differences will reverse at some time in the future. The differences are primarily related to the deferral of losses from wash sales; and the recognition of unrealized gains or losses from certain derivative contracts. As of period end, the tax-basis components of total distributable earnings (loss) are detailed in the table as follows:
| | Amount
($000) |
| Undistributed Ordinary Income | 14,546 |
| Undistributed Long-Term Gains | 101,987 |
| Capital Loss Carryforwards | — |
| Qualified Late-Year Losses | — |
| Net Unrealized Gains (Losses) | 490,334 |
The tax character of distributions paid was as follows:
| | Year Ended December 31, |
| | 2020
Amount
($000) | 2019
Amount
($000) |
| Ordinary Income* | 4,091 | 2,812 |
| Long-Term Capital Gains | 42,910 | 77,825 |
| Total | 47,001 | 80,637 |
| * | Includes short-term capital gains, if any. |
As of December 31, 2020, gross unrealized appreciation and depreciation for investments and derivatives based on cost for U.S. federal income tax purposes were as follows:
| | Amount
($000) |
| Tax Cost | 757,617 |
| Gross Unrealized Appreciation | 494,951 |
| Gross Unrealized Depreciation | (4,617) |
| Net Unrealized Appreciation (Depreciation) | 490,334 |
| G. | During the year ended December 31, 2020, the portfolio purchased $480,707,000 of investment securities and sold $382,467,000 of investment securities, other than temporary cash investments. |
| H. | Capital shares issued and redeemed were: |
| | Year Ended December 31, |
| | 2020 | 2019 |
| | Shares
(000) | Shares
(000) |
| Issued | 8,998 | 3,626 |
| Issued in Lieu of Cash Distributions | 2,174 | 3,465 |
| Redeemed | (5,844) | (3,929) |
| Net Increase (Decrease) in Shares Outstanding | 5,328 | 3,162 |
At December 31, 2020, one shareholder (an insurance company separate account whose holdings in the portfolio represent the indirect investment of Vanguard Variable Annuity contract holders) was the record or beneficial owner of 72% of the portfolio’s net assets. If this shareholder was to redeem its investment in the portfolio, the redemption might result in an increase in the portfolio’s expense ratio, cause the portfolio to incur higher transaction costs, or lead to the realization of taxable capital gains.
| I. | Management has determined that no other events or transactions occurred subsequent to December 31, 2020, that would require recognition or disclosure in these financial statements. |
Report of Independent Registered Public Accounting Firm
To the Board of Trustees of Vanguard Variable Insurance Funds and Shareholders of Growth Portfolio
Opinion on the Financial Statements
We have audited the accompanying statement of assets and liabilities, including the schedule of investments, of Growth Portfolio (one of the portfolios constituting Vanguard Variable Insurance Funds, referred to hereafter as the "Portfolio”) as of December 31, 2020, the related statement of operations for the year ended December 31, 2020, the statement of changes in net assets for each of the two years in the period ended December 31, 2020, including the related notes, and the financial highlights for each of the five years in the period ended December 31, 2020 (collectively referred to as the “financial statements”). In our opinion, the financial statements present fairly, in all material respects, the financial position of the Portfolio as of December 31, 2020, the results of its operations for the year then ended, the changes in its net assets for each of the two years in the period ended December 31, 2020 and the financial highlights for each of the five years in the period ended December 31, 2020 in conformity with accounting principles generally accepted in the United States of America.
Basis for Opinion
These financial statements are the responsibility of the Portfolio’s management. Our responsibility is to express an opinion on the Portfolio’s financial statements based on our audits. We are a public accounting firm registered with the Public Company Accounting Oversight Board (United States) (PCAOB) and are required to be independent with respect to the Portfolio in accordance with the U.S. federal securities laws and the applicable rules and regulations of the Securities and Exchange Commission and the PCAOB.
We conducted our audits of these financial statements in accordance with the standards of the PCAOB. Those standards require that we plan and perform the audit to obtain reasonable assurance about whether the financial statements are free of material misstatement, whether due to error or fraud.
Our audits included performing procedures to assess the risks of material misstatement of the financial statements, whether due to error or fraud, and performing procedures that respond to those risks. Such procedures included examining, on a test basis, evidence regarding the amounts and disclosures in the financial statements. Our audits also included evaluating the accounting principles used and significant estimates made by management, as well as evaluating the overall presentation of the financial statements. Our procedures included confirmation of securities owned as of December 31, 2020 by correspondence with the custodians, transfer agent and brokers; when replies were not received from brokers, we performed other auditing procedures. We believe that our audits provide a reasonable basis for our opinion.
/s/PricewaterhouseCoopers LLP
Philadelphia, Pennsylvania
February 18, 2021
We have served as the auditor of one or more investment companies in The Vanguard Group of Funds since 1975.
Special 2020 tax information (unaudited) for corporate shareholders only for Growth Portfolio, a portfolio of Vanguard Variable Insurance Funds
This information for the fiscal year ended December 31, 2020, is included pursuant to provisions of the Internal Revenue Code for corporate shareholders only.
The portfolio distributed $42,909,000 as capital gain dividends (20% rate gain distributions) to shareholders during the fiscal year.
For corporate shareholders, 31.0% of investment income (dividend income plus short-term gains, if any) qualifies for the dividends-received deduction.
This page intentionally left blank.
The People Who Govern Your Fund
The trustees of your mutual fund are there to see that the fund is operated and managed in your best interests since, as a shareholder, you are a part owner of the fund. Your fund’s trustees also serve on the board of directors of The Vanguard Group, Inc., which is owned by the Vanguard funds and provides services to them.
A majority of Vanguard’s board members are independent, meaning that they have no affiliation with Vanguard or the funds they oversee, apart from the sizable personal investments they have made as private individuals. The independent board members have distinguished backgrounds in business, academia, and public service. Each of the trustees and executive officers oversees 211 Vanguard funds.
Information for each trustee and executive officer of the fund appears below. That information, as well as the Vanguard fund count, is as of the date on the cover of this fund report. The mailing address of the trustees and officers is P.O. Box 876, Valley Forge, PA 19482. More information about the trustees is in the Statement of Additional Information, which can be obtained, without charge, by contacting Vanguard at 800-662-7447, or online at vanguard.com.
Interested Trustee1
Mortimer J. Buckley
Born in 1969. Trustee since January 2018. Principal occupation(s) during the past five years and other experience: chairman of the board (2019–present) of Vanguard and of each of the investment companies served by Vanguard; chief executive officer (2018–present) of Vanguard; chief executive officer, president, and trustee (2018–present) of each of the investment companies served by Vanguard; president and director (2017–present) of Vanguard; and president (2018–present) of Vanguard Marketing Corporation. Chief investment officer (2013–2017), managing director (2002–2017), head of the Retail Investor Group (2006–2012), and chief information officer (2001–2006) of Vanguard. Chairman of the board (2011–2017) and trustee (2009–2017) of the Children’s Hospital of Philadelphia; and trustee (2018–present) and vice chair (2019–present) of The Shipley School.
Independent Trustees
Emerson U. Fullwood
Born in 1948. Trustee since January 2008. Principal occupation(s) during the past five years and other experience: executive chief staff and marketing officer for North America and corporate vice president (retired 2008) of Xerox Corporation (document management products and services). Former president of the Worldwide Channels Group, Latin America, and Worldwide Customer Service and executive chief staff officer of Developing Markets of Xerox. Executive in residence and 2009–2010 Distinguished Minett Professor at the Rochester Institute of Technology. Director of SPX FLOW, Inc. (multi-industry manufacturing). Director of the University of Rochester Medical Center, the Monroe Community College Foundation, the United Way of Rochester, North Carolina A&T University, and Roberts Wesleyan College. Trustee of the University of Rochester.
Amy Gutmann
Born in 1949. Trustee since June 2006. Principal occupation(s) during the past five years and other experience: president (2004–present) of the University of Pennsylvania. Christopher H. Browne Distinguished Professor of Political Science, School of Arts and Sciences, and professor of communication, Annenberg School for Communication, with secondary faculty appointments in the Department of Philosophy, School of Arts and Sciences, and at the Graduate School of Education, University of Pennsylvania.
F. Joseph Loughrey
Born in 1949. Trustee since October 2009. Principal occupation(s) during the past five years and other experience: president and chief operating officer (retired 2009) and vice chairman of the board (2008–2009) of Cummins Inc. (industrial machinery). Chairman of the board of Hillenbrand, Inc. (specialized consumer services) and the Lumina Foundation. Director of the V Foundation. Member of the advisory council for the College of Arts and Letters and chair of the advisory board to the Kellogg Institute for International Studies, both at the University of Notre Dame.
Mark Loughridge
Born in 1953. Trustee since March 2012. Principal occupation(s) during the past five years and other experience: senior vice president and chief financial officer (retired 2013) of IBM (information technology services). Fiduciary member of IBM’s Retirement Plan Committee (2004–2013), senior vice president and general manager (2002–2004) of IBM Global Financing, vice president and controller (1998–2002) of IBM, and a variety of other prior management roles at IBM. Member of the Council on Chicago Booth.
Scott C. Malpass
Born in 1962. Trustee since March 2012. Principal occupation(s) during the past five years and other experience: chief investment officer (retired June 2020) and vice president (retired June 2020) of the University of Notre Dame. Assistant professor of finance at the Mendoza College of Business, University of Notre Dame, and member of the Notre Dame 403(b) Investment Committee (retired June 2020). Member of the board of Catholic Investment Services, Inc. (investment advisors) and the board of superintendence of the Institute for the Works of Religion.
Deanna Mulligan
Born in 1963. Trustee since January 2018. Principal occupation(s) during the past five years and other experience: board chair (2020–present), chief executive officer (2011–2020), and president (2010–2019) of The Guardian Life Insurance Company of America. Chief operating officer (2010–2011) and executive vice president (2008–2010) of the individual life and disability division of Guardian Life. Member of the board of the American Council of Life Insurers and the board of the Economic Club of New York. Trustee of the Partnership for New York City (business leadership), Chief Executives for Corporate Purpose, NewYork-Presbyterian Hospital, Catalyst, and the
Bruce Museum (arts and science). Member of the Advisory Council for the Stanford Graduate School of Business.
André F. Perold
Born in 1952. Trustee since December 2004. Principal occupation(s) during the past five years and other experience: George Gund Professor of Finance and Banking, Emeritus at the Harvard Business School (retired 2011). Chief investment officer and co-managing partner of HighVista Strategies (private investment firm). Member of the board of advisors and member of the investment committee of the Museum of Fine Arts Boston. Member of the board (2018–present) of RIT Capital Partners (investment firm). Member of the investment committee of Partners Health Care System.
Sarah Bloom Raskin
Born in 1961. Trustee since January 2018. Principal occupation(s) during the past five years and other experience: deputy secretary (2014–2017) of the United States Department of the Treasury. Governor (2010–2014) of the Federal Reserve Board. Commissioner (2007–2010) of financial regulation for the State of Maryland. Member of the board of directors (2012–2014) of Neighborhood Reinvestment Corporation. Director (2017–present) of i(x) Investments, LLC; director (2017–present) of Reserve Trust. Rubenstein Fellow (2017–present) of Duke University; trustee (2017–present) of Amherst College, and trustee (2019–present) of the Folger Shakespeare Library.
Peter F. Volanakis
Born in 1955. Trustee since July 2009. Principal occupation(s) during the past five years and other experience: president and chief operating officer (retired 2010) of Corning Incorporated (communications equipment) and director of Corning Incorporated (2000–2010) and Dow Corning (2001–2010). Director (2012) of SPX Corporation (multi-industry manufacturing). Overseer of the Amos Tuck School of Business Administration, Dartmouth College (2001–2013). Chairman of the board of trustees of Colby-Sawyer College. Member of the board of Hypertherm Inc. (industrial cutting systems, software, and consumables).
1 Mr. Buckley is considered an “interested person,” as defined in the Investment Company Act of 1940, because he is an officer of the Vanguard funds.
Executive Officers
John Bendl
Born in 1970. Principal occupation(s) during the past five years and other experience: principal of Vanguard. Chief financial officer (2019–present) of each of the investment companies served by Vanguard. Chief accounting officer, treasurer, and controller of Vanguard (2017–present). Partner (2003–2016) at KPMG (audit, tax, and advisory services).
Christine M. Buchanan
Born in 1970. Principal occupation(s) during the past five years and other experience: principal of Vanguard. Treasurer (2017–present) of each of the investment companies served by Vanguard. Partner (2005–2017) at KPMG (audit, tax, and advisory services).
David Cermak
Born in 1960. Principal occupation(s) during the past five years and other experience: principal of Vanguard. Finance director (2019–present) of each of the investment companies served by Vanguard. Managing director and head (2017–present) of Vanguard Investments Singapore. Managing director and head (2017–2019) of Vanguard Investments Hong Kong. Representative director and head (2014–2017) of Vanguard Investments Japan.
John Galloway
Born in 1973. Principal occupation(s) during the past five years and other experience: principal of Vanguard.
Investment stewardship officer (September 2020–present) of each of the investment companies served by Vanguard. Head of Investor Advocacy (February 2020–present) and head of Marketing Strategy and Planning (2017–2020) at Vanguard. Deputy assistant to the President of the United States (2015).
Thomas J. Higgins
Born in 1957. Principal occupation(s) during the past five years and other experience: principal of Vanguard. Finance director (2019–present), chief financial officer (2008–2019), and treasurer (1998–2008) of each of the investment companies served by Vanguard.
Peter Mahoney
Born in 1974. Principal occupation(s) during the past five years and other experience: principal of Vanguard. Controller (2015–present) of each of the investment companies served by Vanguard. Head of International Fund Services (2008–2014) at Vanguard.
Anne E. Robinson
Born in 1970. Principal occupation(s) during the past five years and other experience: general counsel (2016–present) of Vanguard. Secretary (2016–present) of Vanguard and of each of the investment companies served by Vanguard. Managing director (2016–present) of Vanguard. Managing director and general counsel of Global Cards and Consumer Services (2014–2016) at Citigroup. Counsel (2003–2014) at American Express.
Michael Rollings
Born in 1963. Principal occupation(s) during the past five years and other experience: finance director (2017–present) and treasurer (2017) of each of the investment companies served by Vanguard. Managing director (2016–present) of Vanguard. Chief financial officer (2016–present) of Vanguard. Director (2016–present) of Vanguard Marketing Corporation. Executive vice president and chief financial officer (2006–2016) of MassMutual Financial Group.
John E. Schadl
Born in 1972. Principal occupation(s) during the past five years and other experience: principal of Vanguard. Chief compliance officer (2019–present) of Vanguard and of each of the investment companies served by Vanguard. Assistant vice president (2019–present) of Vanguard Marketing Corporation.
Vanguard Senior Management Team
| Joseph Brennan | James M. Norris |
| Mortimer J. Buckley | Thomas M. Rampulla |
| Gregory Davis | Karin A. Risi |
| John James | Anne E. Robinson |
| John T. Marcante | Michael Rollings |
| Chris D. McIsaac | Lauren Valente |
Connect with Vanguard®>vanguard.com
Fund Information > 800-662-7447
Annuity and Insurance Services > 800-522-5555
Institutional Investor Services > 800-523-1036
Text Telephone for People Who Are Deaf or Hard of Hearing > 800-749-7273
This material may be used in conjunction with the offering of shares of any Vanguard fund only if preceded or accompanied by the fund’s current prospectus.
You can obtain a free copy of Vanguard’s proxy voting guidelines by visiting vanguard.com/proxyreporting or by calling Vanguard at 800-662-2739. The guidelines are also available from the SEC’s website, www.sec.gov. In addition, you may obtain a free report on how your fund voted the proxies for securities it owned during the 12 months ended June 30. To get the report, visit either vanguard.com/proxyreporting or www.sec.gov.
All comparative mutual fund data are from Morningstar, Inc., unless otherwise noted.
You can review information about your fund on the SEC’s website, and you can receive copies of this information, for a fee, by sending a request via email addressed to publicinfo@sec.gov.
Source for Bloomberg Barclays indexes: Bloomberg Index Services Limited. Copyright 2021, Bloomberg. All rights reserved.
CFA® is a registered trademark owned by CFA Institute.
© 2021 The Vanguard Group, Inc.
All rights reserved.
Vanguard Marketing Corporation, Distributor.
Q690G 022021
Annual Report | December 31, 2020
Vanguard Variable Insurance Funds
| High Yield Bond Portfolio |
Contents
Your Portfolio’s Performance at a Glance
| 1 |
Advisor’s Report
| 2 |
About Your Portfolio’s Expenses
| 3 |
Performance Summary
| 4 |
Financial Statements
| 6 |
Please note: The opinions expressed in this report are just that—informed opinions. They should not be considered promises or advice. Also, please keep in mind that the information and opinions cover the period through the date on the front of this report. Of course, the risks of investing in your portfolio are spelled out in the prospectus.
Your Portfolio’s Performance at a Glance
| • | For the 12 months ended December 31, 2020, the High Yield Bond Portfolio returned 5.67%, lagging the 7.53% return of its benchmark, the High-Yield Corporate Composite Index. |
| • | The year was defined by the COVID-19 pandemic and efforts to contain it. Travel restrictions, supply-chain disruptions, business closures, and a spike in unemployment led swiftly to deep recessions around the world. In response, many governments were quick to provide fiscal stimulus in the form of spending, loans, loan guarantees, job retention programs, and extended unemployment benefits. Central banks in developed markets rapidly cut interest rates, restarted or expanded asset purchases, and provided additional liquidity. They also pledged to remain vigilant and take more actions if needed. |
| • | U.S. Treasuries returned 8.00%, as represented by the Bloomberg Barclays U.S. Treasury Index. Mortgage-backed securities returned less, but corporate bonds fared better, returning 9.89%, as represented by the Bloomberg Barclays U.S. Corporate Bond Index. Lower-rated investment-grade bonds bested higher-rated ones, and longer-dated bonds significantly outperformed shorter-dated ones. The spread between corporate yields and Treasury yields tightened. |
| • | Within the high-yield market, however, the spread widened. Higher-quality bonds generally outperformed those of lower quality. Among corporates, high-yield bonds issued by utilities bested those issued by financial and industrial companies. |
| • | For the 10 years ended December 31, 2020, the portfolio posted an average annual return of 6.38%. Its benchmark index recorded an average annual return of 6.57%. |
| • | Please note that the portfolio’s returns are different from those in Vanguard Variable Annuity (and other plans that invest in the portfolio), which take into account insurance-related expenses. |
Market Barometer
Average Annual Total Returns
Periods Ended December 31, 2020 |
| | One Year | Three Years | Five Years |
| Stocks | | | |
| Russell 1000 Index (Large-caps) | 20.96% | 14.82% | 15.60% |
| Russell 2000 Index (Small-caps) | 19.96 | 10.25 | 13.26 |
| Russell 3000 Index (Broad U.S. market) | 20.89 | 14.49 | 15.43 |
| FTSE All-World ex US Index (International) | 11.22 | 5.18 | 9.16 |
| Bonds | | | |
| Bloomberg Barclays U.S. Aggregate Bond Index (Broad taxable market) | 7.51% | 5.34% | 4.44% |
Bloomberg Barclays Municipal Bond Index
(Broad tax-exempt market) | 5.21 | 4.64 | 3.91 |
| FTSE Three-Month U.S. Treasury Bill Index | 0.58 | 1.56 | 1.16 |
| CPI | | | |
| Consumer Price Index | 1.36% | 1.85% | 1.95% |
The investment environment
For the 12 months ended December 31, 2020, the High Yield Bond Portfolio returned 5.67%, compared with the benchmark return of 7.53%. Please note that the portfolio’s returns are different from those in Vanguard Variable Annuity (and other plans that invest in the portfolio), which take into account insurance-related expenses.
The benefits of coupon income and decreasing interest rates offset the impact of wider credit spreads. Sovereign yields declined to record lows in several developed markets, a result of global recession fears caused by the COVID-19 pandemic.
High-yield bond spreads widened sharply in March over expectations that the decline in economic activity and supply-chain disruptions would cause credit fundamentals to deteriorate. The spreads subsequently tightened, however, reducing most of that widening by the end of the year.
Global central banks and governments deployed extraordinary monetary and fiscal stimulus during the year to support businesses and consumers. The Federal Reserve cut short-term interest rates to a range of 0%–0.25% and increased the size and scope of its asset purchase program. The European Central Bank launched its own massive asset purchase program, which included nonfinancial commercial paper for the first time, and eased collateral rules.
The 10-year U.S. Treasury yield fell to 0.91% at the end of December 2020 from 1.92% at the end of December 2019. Because bond yields and prices move in opposite directions, bond prices rose. The spread of the high-yield market widened to 360 basis points over Treasuries as of December 31, 2020, from 336 basis points at the end of 2019. The average price of high-yield bonds increased $4, to $105.
There was notable dispersion in performance by credit quality over the year as the high-yield market generally rewarded higher-quality credits, given their greater sensitivity to changes in interest rates. The highest-rated BB bonds led, returning 10.17%, according to Bloomberg Barclays High Yield Index data, while CCC-rated bonds lagged, with a 2.27% return. B-rated bonds returned 4.59%.
Our medium- to long-term macroeconomic outlook is optimistic. We expect fiscal and monetary stimulus, as well as vaccine distribution, to support the economic recovery. While we anticipate a strong rebound in the second half of 2021, we expect a difficult short-term environment because of spiking COVID-19 cases across the U.S. and disappointing initial vaccine distribution.
Although still above average, the high-yield default rate has fallen materially on the back of massive monetary and fiscal stimulus, along with wide-open capital markets. We expect defaults will continue to trend lower during 2021. Much of the “COVID discount” from last year has been narrowed, but pockets of opportunity remain. In sectors directly affected by COVID-19, security selection is key.
We expect some business models to fail because of permanent secular and/or behavioral changes, while others can adjust if capital markets give them adequate time and liquidity. We believe demand is likely to stay strong for the foreseeable future, as global interest rates stay low and aging demographic cohorts continue to seek higher yields.
Our near-term view of the high-yield market remains cautious. We believe that maintaining a slightly defensive risk posture, with an intense focus on security selection, is warranted amid spiking COVID-19 numbers, the U.S. political transition, the waning effects of government stimulus, and the fact that credit spreads tightened from last year.
Our longer-term outlook is more positive, however. We see plenty of reasons to be optimistic as we look nine to 12 months out from now. While bouts of volatility may persist, we continue to take a long-term, issuer-specific approach to finding opportunities in this market.
The portfolio’s shortfalls
Positioning and security section in the energy and financial institutions sectors detracted from relative returns. Credit selection in the food and beverage segment also hurt relative performance.
The portfolio’s successes
The portfolio benefited from positioning and positive credit selection in the transportation sector, as well as credit selection in the pharmaceuticals sector. An underweight to government securities also helped relative performance.
The portfolio’s positioning
The portfolio remains consistent in its investment objective and strategy and maintains meaningful exposure to relatively higher-quality names in the high-yield market. We believe these companies have more stable credit profiles and greater predictability of cash flows than those at the lower end of the quality spectrum.
We lean toward higher-quality credits in an effort to minimize defaults and provide stable income. We continue to diversify the portfolio’s holdings by issuer and industry. We also continue to deemphasize non-cash-paying securities, preferred stocks, and equity-linked securities, such as convertibles, because of their potential for volatility.
Michael L. Hong, CFA,
Senior Managing Director and Fixed
Income Portfolio Manager
Wellington Management Company llp
January 21, 2021
About Your Portfolio’s Expenses
As a shareholder of the portfolio, you incur ongoing costs, which include costs for portfolio management, administrative services, and shareholder reports (like this one), among others. Operating expenses, which are deducted from a portfolio's gross income, directly reduce the investment return of the portfolio.
A portfolio's expenses are expressed as a percentage of its average net assets. This figure is known as the expense ratio. The following examples are intended to help you understand the ongoing costs (in dollars) of investing in your portfolio and to compare these costs with those of other mutual funds. The examples are based on an investment of $1,000 made at the beginning of the period shown and held for the entire period.
The accompanying table illustrates your portfolio's costs in two ways:
| • | Based on actual portfolio return. This section helps you to estimate the actual expenses that you paid over the period. The ”Ending Account Value“ shown is derived from the portfolio's actual return, and the third column shows the dollar amount that would have been paid by an investor who started with $1,000 in the portfolio. You may use the information here, together with the amount you invested, to estimate the expenses that you paid over the period. |
To do so, simply divide your account value by $1,000 (for example, an $8,600 account value divided by $1,000 = 8.6), then multiply the result by the number given for your portfolio under the heading ”Expenses Paid During Period.“
| • | Based on hypothetical 5% yearly return. This section is intended to help you compare your portfolio's costs with those of other mutual funds. It assumes that the portfolio had a yearly return of 5% before expenses, but that the expense ratio is unchanged. In this case—because the return used is not the portfolio's actual return—the results do not apply to your investment. The example is useful in making comparisons because the Securities and Exchange Commission requires all mutual funds to calculate expenses based on a 5% return. You can assess your portfolio's costs by comparing this hypothetical example with the hypothetical examples that appear in shareholder reports of other funds. |
Note that the expenses shown in the table are meant to highlight and help you compare ongoing costs only and do not reflect transaction costs incurred by the portfolio for buying and selling securities. The portfolio’s expense ratio does not reflect additional fees and expenses associated with the annuity or life insurance program through which you invest.
The calculations assume no shares were bought or sold during the period. Your actual costs may have been higher or lower, depending on the amount of your investment and the timing of any purchases or redemptions.
You can find more information about the portfolio's expenses, including annual expense ratios, in the Financial Statements section of this report. For additional information on operating expenses and other shareholder costs, please refer to your portfolio's current prospectus.
| Six Months Ended December 31, 2020 | | | |
| High Yield Bond Portfolio | Beginning
Account Value
6/30/2020 | Ending
Account Value
12/31/2020 | Expenses
Paid During
Period |
| Based on Actual Portfolio Return | $1,000.00 | $1,091.40 | $1.37 |
| Based on Hypothetical 5% Yearly Return | 1,000.00 | 1,023.83 | 1.32 |
The calculations are based on expenses incurred in the most recent six-month period. The portfolio’s annualized six-month expense ratio for that period is 0.26%. The dollar amounts shown as “Expenses Paid” are equal to the annualized expense ratio multiplied by the average account value over the period, multiplied by the number of days in the most recent six-month period, then divided by the number of days in the most recent 12-month period (184/366).
High Yield Bond Portfolio
All of the returns in this report represent past performance, which is not a guarantee of future results that may be achieved by the portfolio. (Current performance may be lower or higher than the performance data cited. For performance data current to the most recent month-end, visit our website at vanguard.com/performance.) Note, too, that both investment returns and principal value can fluctuate widely, so an investor’s shares, when sold, could be worth more or less than their original cost. The returns shown do not reflect taxes that a shareholder would pay on portfolio distributions or on the sale of portfolio shares. Nor do the returns reflect fees and expenses associated with the annuity or life insurance program through which a shareholder invests. If these fees and expenses were included, the portfolio's returns would be lower.
Cumulative Performance: December 31, 2010, Through December 31, 2020
Initial Investment of $10,000
| | | | Average Annual Total Returns
Periods Ended December 31, 2020 |
| | | One
Year | Five
Years | Ten
Years | Final Value
of a $10,000
Investment |
 | High Yield Bond Portfolio | 5.67% | 7.22% | 6.38% | $18,566 |
 | High-Yield Corporate Composite Index | 7.53 | 7.93 | 6.57 | 18,899 |
 | Bloomberg Barclays U.S. Corporate High Yield Bond Index | 7.11 | 8.59 | 6.80 | 19,304 |
High-Yield Corporate Composite Index: Weighted 95% Bloomberg Barclays U.S. High-Yield Ba/B 2% Issuer Capped Index and 5% Bloomberg Barclays U.S. 1-5 Year Treasury Bond Index.
See Financial Highlights for dividend and capital gains information.
High Yield Bond Portfolio
| Communications | 20.4% |
| Consumer Discretionary | 14.0 |
| Consumer Staples | 4.5 |
| Energy | 8.7 |
| Financials | 8.5 |
| Health Care | 10.7 |
| Industrials | 7.3 |
| Materials | 11.5 |
| Real Estate | 0.9 |
| Technology | 11.8 |
| Utilities | 1.5 |
| Other | 0.2 |
The table reflects the portfolio’s investments, except for short-term investments and derivatives.
High Yield Bond Portfolio
The portfolio files its complete schedule of portfolio holdings with the Securities and Exchange Commission (SEC) for the first and third quarters of each fiscal year as an exhibit to its reports on Form N-PORT. The portfolio’s Form N-PORT reports are available on the SEC’s website at www.sec.gov.
| | | | Coupon | Maturity
Date | Face
Amount
($000) | Market
Value•
($000) |
| Corporate Bonds (94.8%) |
| Communications (19.3%) |
| 1,2 | Altice Financing SA | 2.250% | 1/15/25 | 490 | 578 |
| 2 | Altice Financing SA | 3.000% | 1/15/28 | 1,250 | 1,470 |
| 1,2 | Altice Financing SA | 3.000% | 1/15/28 | 1,260 | 1,482 |
| 1 | Altice Financing SA | 5.000% | 1/15/28 | 1,720 | 1,754 |
| 1,2 | Altice France SA | 2.125% | 2/15/25 | 585 | 689 |
| 1 | Altice France SA | 7.375% | 5/1/26 | 4,025 | 4,236 |
| 1 | Altice France SA | 5.500% | 1/15/28 | 1,700 | 1,768 |
| | Belo Corp. | 7.750% | 6/1/27 | 920 | 1,068 |
| | Belo Corp. | 7.250% | 9/15/27 | 667 | 765 |
| 1 | CCO Holdings LLC / CCO Holdings Capital Corp. | 5.750% | 2/15/26 | 775 | 801 |
| 1 | CCO Holdings LLC / CCO Holdings Capital Corp. | 5.500% | 5/1/26 | 1,630 | 1,691 |
| 1 | CCO Holdings LLC / CCO Holdings Capital Corp. | 5.875% | 5/1/27 | 445 | 463 |
| 1 | CCO Holdings LLC / CCO Holdings Capital Corp. | 5.000% | 2/1/28 | 320 | 338 |
| 1 | CCO Holdings LLC / CCO Holdings Capital Corp. | 4.500% | 8/15/30 | 2,530 | 2,694 |
| 1 | CCO Holdings LLC / CCO Holdings Capital Corp. | 4.250% | 2/1/31 | 2,055 | 2,165 |
| 1 | CCO Holdings LLC / CCO Holdings Capital Corp. | 4.500% | 5/1/32 | 3,161 | 3,374 |
| | CenturyLink Inc. | 6.750% | 12/1/23 | 755 | 837 |
| | CenturyLink Inc. | 7.500% | 4/1/24 | 557 | 624 |
| | Charter Communications Operating LLC / Charter Communications Operating Capital | 6.484% | 10/23/45 | 891 | 1,259 |
| | Charter Communications Operating LLC / Charter Communications Operating Capital | 5.375% | 5/1/47 | 500 | 623 |
| | Charter Communications Operating LLC / Charter Communications Operating Capital | 5.125% | 7/1/49 | 600 | 730 |
| 1 | CSC Holdings LLC | 5.500% | 5/15/26 | 3,890 | 4,036 |
| 1 | CSC Holdings LLC | 5.500% | 4/15/27 | 2,610 | 2,767 |
| 1 | CSC Holdings LLC | 6.500% | 2/1/29 | 1,025 | 1,154 |
| 1 | CSC Holdings LLC | 4.125% | 12/1/30 | 6,305 | 6,573 |
| 1 | CSC Holdings LLC | 3.375% | 2/15/31 | 1,935 | 1,908 |
| | DISH DBS Corp. | 6.750% | 6/1/21 | 1,935 | 1,969 |
| | DISH DBS Corp. | 5.875% | 7/15/22 | 3,746 | 3,910 |
| | DISH DBS Corp. | 5.000% | 3/15/23 | 1,384 | 1,431 |
| | DISH DBS Corp. | 5.875% | 11/15/24 | 2,405 | 2,516 |
| | DISH DBS Corp. | 7.750% | 7/1/26 | 3,685 | 4,118 |
| | DISH DBS Corp. | 7.375% | 7/1/28 | 4,005 | 4,265 |
| | Embarq Corp. | 7.995% | 6/1/36 | 720 | 884 |
| 1 | Frontier Communications Corp. | 5.875% | 10/15/27 | 810 | 876 |
| 1 | Frontier Communications Corp. | 5.000% | 5/1/28 | 2,645 | 2,757 |
| 1 | Frontier Communications Corp. | 6.750% | 5/1/29 | 1,680 | 1,798 |
| 1 | Gray Television Inc. | 5.875% | 7/15/26 | 2,280 | 2,383 |
| 1 | Gray Television Inc. | 7.000% | 5/15/27 | 715 | 783 |
| 1 | Gray Television Inc. | 4.750% | 10/15/30 | 970 | 987 |
| | Lamar Media Corp. | 3.750% | 2/15/28 | 1,770 | 1,819 |
| | | | Coupon | Maturity
Date | Face
Amount
($000) | Market
Value•
($000) |
| | Lamar Media Corp. | 4.000% | 2/15/30 | 1,920 | 1,992 |
| 1,2 | Lorca Telecom Bondco SA | 4.000% | 9/18/27 | 760 | 975 |
| 1 | Netflix Inc. | 3.625% | 6/15/25 | 335 | 356 |
| | Netflix Inc. | 4.375% | 11/15/26 | 3,405 | 3,762 |
| | Netflix Inc. | 5.875% | 11/15/28 | 140 | 167 |
| 1 | Outfront Media Capital LLC / Outfront Media Capital Corp. | 5.000% | 8/15/27 | 439 | 451 |
| 1 | Outfront Media Capital LLC / Outfront Media Capital Corp. | 4.625% | 3/15/30 | 1,882 | 1,917 |
| | Quebecor Media Inc. | 5.750% | 1/15/23 | 2,810 | 3,031 |
| 1 | Scripps Escrow II Inc. | 3.875% | 1/15/29 | 1,835 | 1,913 |
| 1 | Scripps Escrow II Inc. | 5.375% | 1/15/31 | 250 | 262 |
| 1 | Sirius XM Radio Inc. | 4.625% | 7/15/24 | 1,640 | 1,697 |
| 1 | Sirius XM Radio Inc. | 5.375% | 7/15/26 | 300 | 313 |
| 1 | Sirius XM Radio Inc. | 4.125% | 7/1/30 | 3,845 | 4,085 |
| | Sprint Capital Corp. | 6.875% | 11/15/28 | 915 | 1,207 |
| | Sprint Capital Corp. | 8.750% | 3/15/32 | 720 | 1,136 |
| | Sprint Corp. | 7.875% | 9/15/23 | 6,974 | 8,072 |
| | Sprint Corp. | 7.125% | 6/15/24 | 2,101 | 2,453 |
| | Sprint Corp. | 7.625% | 2/15/25 | 1,595 | 1,906 |
| | Telecom Italia Capital SA | 6.375% | 11/15/33 | 381 | 467 |
| | Telecom Italia Capital SA | 6.000% | 9/30/34 | 1,085 | 1,316 |
| | Telecom Italia Capital SA | 7.721% | 6/4/38 | 1,280 | 1,773 |
| 1 | Telecom Italia SPA | 5.303% | 5/30/24 | 445 | 484 |
| 1 | Telenet Finance Luxembourg Notes Sarl | 5.500% | 3/1/28 | 4,000 | 4,248 |
| | Time Warner Cable LLC | 5.875% | 11/15/40 | 60 | 79 |
| | Time Warner Cable LLC | 5.500% | 9/1/41 | 1,223 | 1,574 |
| | T-Mobile USA Inc. | 6.500% | 1/15/26 | 690 | 712 |
| | T-Mobile USA Inc. | 4.500% | 2/1/26 | 260 | 266 |
| | T-Mobile USA Inc. | 5.375% | 4/15/27 | 3,510 | 3,760 |
| 1 | UPC Holding BV | 5.500% | 1/15/28 | 2,100 | 2,208 |
| | ViacomCBS Inc. | 5.875% | 2/28/57 | 2,560 | 2,650 |
| | ViacomCBS Inc. | 6.250% | 2/28/57 | 944 | 1,058 |
| | Videotron Ltd. | 5.000% | 7/15/22 | 2,972 | 3,121 |
| 1 | Videotron Ltd. | 5.375% | 6/15/24 | 260 | 286 |
| 1 | Videotron Ltd. | 5.125% | 4/15/27 | 1,750 | 1,855 |
| 1 | Virgin Media Secured Finance plc | 5.500% | 8/15/26 | 940 | 978 |
| 1 | Virgin Media Secured Finance plc | 5.500% | 5/15/29 | 1,510 | 1,631 |
| 1 | Virgin Media Secured Finance plc | 4.500% | 8/15/30 | 1,190 | 1,244 |
| 1,3 | Virgin Media Vendor Financing Notes III DAC | 4.875% | 7/15/28 | 1,090 | 1,522 |
| 1 | Virgin Media Vendor Financing Notes IV DAC | 5.000% | 7/15/28 | 1,075 | 1,113 |
| 1 | Vmed O2 UK Financing I plc | 4.250% | 1/31/31 | 3,140 | 3,203 |
| 1 | VTR Comunicaciones SPA | 5.125% | 1/15/28 | 630 | 673 |
| 1 | VTR Finance NV | 6.375% | 7/15/28 | 255 | 278 |
| 1 | WMG Acquisition Corp. | 5.500% | 4/15/26 | 2,651 | 2,747 |
| 1,2 | WMG Acquisition Corp. | 3.625% | 10/15/26 | 220 | 278 |
| 1,2 | WMG Acquisition Corp. | 2.750% | 7/15/28 | 520 | 653 |
| 1 | WMG Acquisition Corp. | 3.875% | 7/15/30 | 1,915 | 2,030 |
| 1 | WMG Acquisition Corp. | 3.000% | 2/15/31 | 2,540 | 2,489 |
| 1 | Ziggo BV | 5.500% | 1/15/27 | 1,695 | 1,778 |
| 1 | Ziggo BV | 4.875% | 1/15/30 | 2,299 | 2,414 |
| | | | | | | 160,926 |
High Yield Bond Portfolio
| | | | Coupon | Maturity
Date | Face
Amount
($000) | Market
Value•
($000) |
| Consumer Discretionary (13.3%) |
| 1 | 1011778 BC ULC / New Red Finance Inc. | 4.250% | 5/15/24 | 2,059 | 2,100 |
| 1 | 1011778 BC ULC / New Red Finance Inc. | 3.875% | 1/15/28 | 1,185 | 1,206 |
| 1 | 1011778 BC ULC / New Red Finance Inc. | 4.375% | 1/15/28 | 1,500 | 1,547 |
| 1 | 1011778 BC ULC / New Red Finance Inc. | 3.500% | 2/15/29 | 1,370 | 1,370 |
| 1 | 1011778 BC ULC / New Red Finance Inc. | 4.000% | 10/15/30 | 3,325 | 3,350 |
| 1 | Adient Global Holdings Ltd. | 4.875% | 8/15/26 | 1,090 | 1,115 |
| 1 | Adient US LLC | 7.000% | 5/15/26 | 540 | 585 |
| 1 | American Builders & Contractors Supply Co. Inc. | 5.875% | 5/15/26 | 820 | 852 |
| 1 | American Builders & Contractors Supply Co. Inc. | 4.000% | 1/15/28 | 2,226 | 2,312 |
| | Asbury Automotive Group Inc. | 4.500% | 3/1/28 | 505 | 526 |
| | Asbury Automotive Group Inc. | 4.750% | 3/1/30 | 489 | 521 |
| 4,5 | Bass Pro Group LLC Bank Loan, 3M USD LIBOR + 5.000% | 5.750% | 1/29/21 | 1,872 | 1,875 |
| | Boyd Gaming Corp. | 6.000% | 8/15/26 | 100 | 104 |
| | Boyd Gaming Corp. | 4.750% | 12/1/27 | 3,725 | 3,869 |
| 1 | Caesars Entertainment Inc. | 6.250% | 7/1/25 | 1,810 | 1,928 |
| 1 | Caesars Entertainment Inc. | 8.125% | 7/1/27 | 1,810 | 2,002 |
| 1 | Caesars Resort Collection LLC / CRC Finco Inc. | 5.750% | 7/1/25 | 610 | 644 |
| 1 | Caesars Resort Collection LLC / CRC Finco Inc. | 5.250% | 10/15/25 | 4,754 | 4,802 |
| | Cedar Fair LP | 5.250% | 7/15/29 | 1,645 | 1,690 |
| | Cedar Fair LP / Canada's Wonderland Co. / Magnum Management Corp. | 5.375% | 6/1/24 | 535 | 539 |
| | Cedar Fair LP / Canada's Wonderland Co. / Magnum Management Corp. / Millennium Op | 5.375% | 4/15/27 | 775 | 794 |
| 1,2 | Cirsa Finance International Sarl | 6.250% | 12/20/23 | 1,460 | 1,776 |
| 1 | Cirsa Finance International Sarl | 7.875% | 12/20/23 | 1,523 | 1,538 |
| 1 | Clarios Global LP / Clarios US Finance Co. | 6.250% | 5/15/26 | 358 | 384 |
| 1 | Clarios Global LP / Clarios US Finance Co. | 8.500% | 5/15/27 | 804 | 872 |
| 4,5 | Clarios Global LP Bank Loan, 3M USD LIBOR + 3.500% | 3.647% | 1/29/21 | 1,052 | 1,047 |
| | Ford Motor Credit Co. LLC | 3.336% | 3/18/21 | 907 | 908 |
| | Ford Motor Credit Co. LLC | 3.470% | 4/5/21 | 400 | 400 |
| | Ford Motor Credit Co. LLC | 5.875% | 8/2/21 | 1,332 | 1,360 |
| | Ford Motor Credit Co. LLC | 3.813% | 10/12/21 | 580 | 587 |
| | Ford Motor Credit Co. LLC | 3.219% | 1/9/22 | 210 | 212 |
| | Ford Motor Credit Co. LLC | 3.339% | 3/28/22 | 200 | 202 |
| | Ford Motor Credit Co. LLC | 2.979% | 8/3/22 | 250 | 254 |
| | Ford Motor Credit Co. LLC | 4.250% | 9/20/22 | 420 | 433 |
| | Ford Motor Credit Co. LLC | 3.350% | 11/1/22 | 200 | 203 |
| | Ford Motor Credit Co. LLC | 3.087% | 1/9/23 | 325 | 328 |
| 5 | Ford Motor Credit Co. LLC, 3M USD LIBOR + 1.080% | 1.296% | 8/3/22 | 200 | 195 |
| 5 | Ford Motor Credit Co. LLC, 3M USD LIBOR + 1.235% | 1.456% | 2/15/23 | 255 | 245 |
| 1 | Group 1 Automotive Inc. | 4.000% | 8/15/28 | 125 | 128 |
| | | | Coupon | Maturity
Date | Face
Amount
($000) | Market
Value•
($000) |
| 1 | Hanesbrands Inc. | 4.625% | 5/15/24 | 730 | 766 |
| 1 | Hanesbrands Inc. | 5.375% | 5/15/25 | 615 | 652 |
| 1 | Hanesbrands Inc. | 4.875% | 5/15/26 | 2,974 | 3,227 |
| 4,5,6 | IRB Holding Corp. | 1.000% | 12/15/27 | 2,800 | 2,796 |
| 1 | Jacobs Entertainment Inc. | 7.875% | 2/1/24 | 600 | 616 |
| 1 | JELD-WEN Inc. | 4.625% | 12/15/25 | 345 | 353 |
| 1 | JELD-WEN Inc. | 4.875% | 12/15/27 | 395 | 421 |
| 1 | KAR Auction Services Inc. | 5.125% | 6/1/25 | 1,819 | 1,867 |
| | KB Home | 7.000% | 12/15/21 | 215 | 223 |
| | KB Home | 7.500% | 9/15/22 | 215 | 235 |
| | KB Home | 7.625% | 5/15/23 | 1,300 | 1,433 |
| | KB Home | 4.800% | 11/15/29 | 370 | 407 |
| 1 | KFC Holding Co./Pizza Hut Holdings LLC/Taco Bell of America LLC | 5.250% | 6/1/26 | 872 | 905 |
| 1 | KFC Holding Co./Pizza Hut Holdings LLC/Taco Bell of America LLC | 4.750% | 6/1/27 | 1,010 | 1,066 |
| 1 | L Brands Inc. | 6.875% | 7/1/25 | 765 | 830 |
| 1 | L Brands Inc. | 6.625% | 10/1/30 | 2,130 | 2,354 |
| | Lennar Corp. | 4.125% | 1/15/22 | 685 | 703 |
| | Lennar Corp. | 4.500% | 4/30/24 | 1,965 | 2,179 |
| | Lennar Corp. | 5.875% | 11/15/24 | 490 | 568 |
| | Lennar Corp. | 5.250% | 6/1/26 | 270 | 320 |
| | Lennar Corp. | 5.000% | 6/15/27 | 1,245 | 1,472 |
| | Lennar Corp. | 4.750% | 11/29/27 | 1,085 | 1,282 |
| 1 | Lithia Motors Inc. | 5.250% | 8/1/25 | 171 | 178 |
| 1 | Lithia Motors Inc. | 4.625% | 12/15/27 | 1,945 | 2,057 |
| 1 | Lithia Motors Inc. | 4.375% | 1/15/31 | 870 | 931 |
| | Macy's Retail Holdings LLC | 2.875% | 2/15/23 | 41 | 39 |
| | Macy's Retail Holdings LLC | 3.625% | 6/1/24 | 254 | 244 |
| | Macy's Retail Holdings LLC | 4.500% | 12/15/34 | 150 | 115 |
| | Macy's Retail Holdings LLC | 5.125% | 1/15/42 | 132 | 101 |
| | Macy's Retail Holdings LLC | 4.300% | 2/15/43 | 585 | 422 |
| 1 | Mattel Inc. | 6.750% | 12/31/25 | 835 | 878 |
| 1 | Mattel Inc. | 5.875% | 12/15/27 | 1,910 | 2,120 |
| | MGM Resorts International | 6.000% | 3/15/23 | 680 | 724 |
| | MGM Resorts International | 5.750% | 6/15/25 | 985 | 1,086 |
| 1 | Michaels Stores Inc. | 4.750% | 10/1/27 | 1,790 | 1,839 |
| 1 | PetSmart Inc. | 5.875% | 6/1/25 | 1,930 | 1,978 |
| | PulteGroup Inc. | 5.500% | 3/1/26 | 2,015 | 2,395 |
| | PulteGroup Inc. | 5.000% | 1/15/27 | 130 | 153 |
| | PVH Corp. | 4.625% | 7/10/25 | 1,135 | 1,274 |
| 1 | Scientific Games International Inc. | 7.000% | 5/15/28 | 525 | 563 |
| | Service Corp. International | 8.000% | 11/15/21 | 1,225 | 1,292 |
| | Service Corp. International | 4.625% | 12/15/27 | 505 | 538 |
| | Service Corp. International | 5.125% | 6/1/29 | 2,105 | 2,331 |
| | Service Corp. International | 3.375% | 8/15/30 | 650 | 673 |
| 1 | Speedway Motorsports LLC / Speedway Funding II Inc. | 4.875% | 11/1/27 | 600 | 596 |
| 1 | Taylor Morrison Communities Inc. | 5.875% | 6/15/27 | 750 | 848 |
| 1 | Taylor Morrison Communities Inc. | 5.125% | 8/1/30 | 1,075 | 1,204 |
| | Toll Brothers Finance Corp. | 4.875% | 11/15/25 | 295 | 332 |
| | Toll Brothers Finance Corp. | 4.875% | 3/15/27 | 1,955 | 2,234 |
| | Toll Brothers Finance Corp. | 3.800% | 11/1/29 | 3,661 | 3,975 |
| | Under Armour Inc. | 3.250% | 6/15/26 | 2,310 | 2,310 |
| 1 | William Carter Co. | 5.500% | 5/15/25 | 280 | 298 |
| 1 | William Carter Co. | 5.625% | 3/15/27 | 404 | 425 |
| 1 | WW International Inc. | 8.625% | 12/1/25 | 735 | 762 |
| 1 | Wynn Las Vegas LLC / Wynn Las Vegas Capital Corp. | 5.500% | 3/1/25 | 1,530 | 1,597 |
| 1 | Yum! Brands Inc. | 7.750% | 4/1/25 | 1,150 | 1,274 |
| 1 | Yum! Brands Inc. | 4.750% | 1/15/30 | 910 | 998 |
| | Yum! Brands Inc. | 3.625% | 3/15/31 | 2,295 | 2,318 |
| | | | | | | 110,580 |
High Yield Bond Portfolio
| | | | Coupon | Maturity
Date | Face
Amount
($000) | Market
Value•
($000) |
| Consumer Staples (4.3%) |
| | B&G Foods Inc. | 5.250% | 9/15/27 | 4,020 | 4,266 |
| 1,2 | Darling Global Finance Co. | 3.625% | 5/15/26 | 395 | 492 |
| 1 | Darling Ingredients Inc. | 5.250% | 4/15/27 | 795 | 843 |
| 1 | Energizer Holdings Inc. | 4.750% | 6/15/28 | 3,420 | 3,591 |
| 1 | Energizer Holdings Inc. | 4.375% | 3/31/29 | 580 | 600 |
| 4,5 | Froneri International Ltd. Bank Loan, 1M USD LIBOR + 2.250% | 2.397% | 1/29/21 | 901 | 891 |
| 4,5 | Froneri International Ltd. Bank Loan, 1M USD LIBOR + 5.750% | 5.897% | 1/29/21 | 296 | 298 |
| | Kraft Heinz Foods Co. | 4.625% | 1/30/29 | 120 | 137 |
| 1 | Kraft Heinz Foods Co. | 3.750% | 4/1/30 | 1,045 | 1,115 |
| 1 | Kraft Heinz Foods Co. | 4.250% | 3/1/31 | 1,200 | 1,336 |
| | Kraft Heinz Foods Co. | 5.200% | 7/15/45 | 3,010 | 3,584 |
| 1 | Kraft Heinz Foods Co. | 4.875% | 10/1/49 | 1,070 | 1,245 |
| 1 | Lamb Weston Holdings Inc. | 4.875% | 11/1/26 | 256 | 266 |
| 1 | Lamb Weston Holdings Inc. | 4.875% | 5/15/28 | 175 | 195 |
| 1 | Performance Food Group Inc. | 6.875% | 5/1/25 | 200 | 214 |
| 1 | Performance Food Group Inc. | 5.500% | 10/15/27 | 2,685 | 2,833 |
| 1 | Post Holdings Inc. | 5.000% | 8/15/26 | 3,800 | 3,923 |
| 1 | Post Holdings Inc. | 5.750% | 3/1/27 | 970 | 1,028 |
| 1 | Post Holdings Inc. | 5.625% | 1/15/28 | 2,170 | 2,314 |
| 1 | Post Holdings Inc. | 4.625% | 4/15/30 | 3,364 | 3,532 |
| 4,5 | Revlon Consumer Products Corp. Bank Loan, 1M USD LIBOR + 3.500% | 4.250% | 2/26/21 | 756 | 278 |
| | TreeHouse Foods Inc. | 4.000% | 9/1/28 | 2,070 | 2,132 |
| 1 | United Natural Foods Inc. | 6.750% | 10/15/28 | 445 | 464 |
| | | | | | | 35,577 |
| Energy (8.3%) |
| | Apache Corp. | 4.875% | 11/15/27 | 1,560 | 1,657 |
| | Apache Corp. | 5.100% | 9/1/40 | 1,065 | 1,118 |
| | Apache Corp. | 5.250% | 2/1/42 | 471 | 507 |
| | Apache Corp. | 4.750% | 4/15/43 | 1,393 | 1,438 |
| | Apache Corp. | 4.250% | 1/15/44 | 678 | 664 |
| | Apache Corp. | 5.350% | 7/1/49 | 1,372 | 1,372 |
| 1 | Blue Racer Midstream LLC / Blue Racer Finance Corp. | 7.625% | 12/15/25 | 435 | 463 |
| 1 | Blue Racer Midstream LLC / Blue Racer Finance Corp. | 6.625% | 7/15/26 | 775 | 779 |
| 1 | Buckeye Partners LP | 4.125% | 3/1/25 | 1,285 | 1,304 |
| 1 | Buckeye Partners LP | 4.500% | 3/1/28 | 1,954 | 2,010 |
| | Cheniere Corpus Christi Holdings LLC | 5.125% | 6/30/27 | 1,233 | 1,455 |
| | Cheniere Energy Partners LP | 4.500% | 10/1/29 | 1,566 | 1,652 |
| | Continental Resources Inc. | 4.375% | 1/15/28 | 1,553 | 1,586 |
| 1 | Continental Resources Inc. | 5.750% | 1/15/31 | 1,470 | 1,632 |
| | Continental Resources Inc. | 4.900% | 6/1/44 | 2,355 | 2,320 |
| 1 | DCP Midstream Operating LP | 4.750% | 9/30/21 | 672 | 682 |
| | DCP Midstream Operating LP | 4.950% | 4/1/22 | 1,436 | 1,475 |
| | DCP Midstream Operating LP | 3.875% | 3/15/23 | 801 | 825 |
| | EnLink Midstream Partners LP | 5.050% | 4/1/45 | 906 | 718 |
| | EQM Midstream Partners LP | 4.750% | 7/15/23 | 1,125 | 1,176 |
| | EQM Midstream Partners LP | 4.000% | 8/1/24 | 420 | 430 |
| 1 | EQM Midstream Partners LP | 6.000% | 7/1/25 | 1,580 | 1,724 |
| 1 | EQM Midstream Partners LP | 6.500% | 7/1/27 | 1,710 | 1,924 |
| | | | Coupon | Maturity
Date | Face
Amount
($000) | Market
Value•
($000) |
| | EQM Midstream Partners LP | 5.500% | 7/15/28 | 466 | 508 |
| | EQT Corp. | 3.000% | 10/1/22 | 385 | 389 |
| | EQT Corp. | 7.875% | 2/1/25 | 145 | 165 |
| | EQT Corp. | 3.900% | 10/1/27 | 125 | 124 |
| | EQT Corp. | 8.750% | 2/1/30 | 699 | 856 |
| | Matador Resources Co. | 5.875% | 9/15/26 | 2,487 | 2,425 |
| 4,5 | NorthRiver Midstream Finance LP Bank Loan, 3M USD LIBOR + 3.250% | 3.475% | 1/4/21 | 728 | 716 |
| | Ovintiv Inc. | 7.200% | 11/1/31 | 140 | 164 |
| | Ovintiv Inc. | 7.375% | 11/1/31 | 1,344 | 1,593 |
| | Ovintiv Inc. | 6.500% | 8/15/34 | 797 | 917 |
| | Ovintiv Inc. | 6.500% | 2/1/38 | 715 | 795 |
| 1 | Parsley Energy LLC / Parsley Finance Corp. | 5.375% | 1/15/25 | 1,344 | 1,376 |
| 1 | Parsley Energy LLC / Parsley Finance Corp. | 5.250% | 8/15/25 | 190 | 198 |
| 1 | Parsley Energy LLC / Parsley Finance Corp. | 4.125% | 2/15/28 | 420 | 445 |
| | QEP Resources Inc. | 5.375% | 10/1/22 | 1,270 | 1,314 |
| 1 | Rockies Express Pipeline LLC | 7.500% | 7/15/38 | 1,134 | 1,259 |
| 1 | Rockies Express Pipeline LLC | 6.875% | 4/15/40 | 420 | 458 |
| | SM Energy Co. | 6.125% | 11/15/22 | 935 | 902 |
| | SM Energy Co. | 5.000% | 1/15/24 | 1,994 | 1,705 |
| | Sunoco LP / Sunoco Finance Corp. | 5.500% | 2/15/26 | 1,589 | 1,629 |
| | Sunoco LP / Sunoco Finance Corp. | 6.000% | 4/15/27 | 2,265 | 2,398 |
| | Sunoco LP / Sunoco Finance Corp. | 5.875% | 3/15/28 | 1,655 | 1,781 |
| 1 | Sunoco LP / Sunoco Finance Corp. | 4.500% | 5/15/29 | 770 | 800 |
| 1 | Tallgrass Energy Partners LP / Tallgrass Energy Finance Corp. | 5.500% | 9/15/24 | 1,152 | 1,172 |
| 1 | Tallgrass Energy Partners LP / Tallgrass Energy Finance Corp. | 5.500% | 1/15/28 | 1,845 | 1,884 |
| | Targa Resources Partners LP / Targa Resources Partners Finance Corp. | 4.250% | 11/15/23 | 407 | 409 |
| | Targa Resources Partners LP / Targa Resources Partners Finance Corp. | 5.375% | 2/1/27 | 160 | 168 |
| | Targa Resources Partners LP / Targa Resources Partners Finance Corp. | 6.875% | 1/15/29 | 1,200 | 1,344 |
| 1 | Targa Resources Partners LP / Targa Resources Partners Finance Corp. | 4.875% | 2/1/31 | 1,600 | 1,736 |
| 1,7 | Transocean Guardian Ltd. | 5.875% | 1/15/24 | 1,379 | 1,165 |
| 1 | Transocean Inc. | 7.250% | 11/1/25 | 300 | 150 |
| 1 | Transocean Inc. | 8.000% | 2/1/27 | 205 | 96 |
| 1,7 | Transocean Phoenix 2 Ltd. | 7.750% | 10/15/24 | 612 | 597 |
| 1,7 | Transocean Pontus Ltd. | 6.125% | 8/1/25 | 1,120 | 1,053 |
| 1,7 | Transocean Proteus Ltd. | 6.250% | 12/1/24 | 717 | 672 |
| 1 | Vine Oil & Gas LP / Vine Oil & Gas Finance Corp. | 8.750% | 4/15/23 | 1,915 | 1,537 |
| | Western Midstream Operating LP | 3.950% | 6/1/25 | 430 | 439 |
| | Western Midstream Operating LP | 4.650% | 7/1/26 | 570 | 596 |
| | Western Midstream Operating LP | 4.750% | 8/15/28 | 120 | 125 |
High Yield Bond Portfolio
| | | | Coupon | Maturity
Date | Face
Amount
($000) | Market
Value•
($000) |
| | Western Midstream Operating LP | 5.450% | 4/1/44 | 595 | 601 |
| | Western Midstream Operating LP | 5.300% | 3/1/48 | 1,492 | 1,473 |
| | Western Midstream Operating LP | 6.250% | 2/1/50 | 1,804 | 1,975 |
| | | | | | | 69,020 |
| Financials (8.1%) |
| 1 | AerCap Global Aviation Trust | 6.500% | 6/15/45 | 3,950 | 4,050 |
| | AerCap Ireland Capital DAC / AerCap Global Aviation Trust | 4.500% | 9/15/23 | 1,045 | 1,128 |
| | Aircastle Ltd. | 5.000% | 4/1/23 | 465 | 498 |
| | Aircastle Ltd. | 4.125% | 5/1/24 | 2,110 | 2,239 |
| 4,5 | Asurion LLC Bank Loan, 1M USD LIBOR + 3.000% | 3.147% | 1/29/21 | 3,032 | 3,007 |
| 1 | Avolon Holdings Funding Ltd. | 5.250% | 5/15/24 | 1,630 | 1,771 |
| | BNP Paribas SA | 6.750% | 12/29/49 | 2,205 | 2,306 |
| | Credit Suisse Group AG | 6.250% | 12/29/49 | 5,580 | 6,096 |
| 1 | DAE Funding LLC | 5.250% | 11/15/21 | 705 | 724 |
| 1 | DAE Funding LLC | 4.500% | 8/1/22 | 1,264 | 1,277 |
| 1 | DAE Funding LLC | 5.000% | 8/1/24 | 1,020 | 1,058 |
| | Fly Leasing Ltd. | 5.250% | 10/15/24 | 800 | 762 |
| 1 | Freedom Mortgage Corp. | 8.125% | 11/15/24 | 296 | 309 |
| 1 | Freedom Mortgage Corp. | 8.250% | 4/15/25 | 1,596 | 1,670 |
| 1 | Freedom Mortgage Corp. | 7.625% | 5/1/26 | 88 | 92 |
| | Genworth Holdings Inc. | 7.200% | 2/15/21 | 830 | 831 |
| | Genworth Holdings Inc. | 7.625% | 9/24/21 | 760 | 769 |
| | Genworth Holdings Inc. | 4.900% | 8/15/23 | 1,475 | 1,405 |
| | Genworth Holdings Inc. | 4.800% | 2/15/24 | 475 | 444 |
| 1 | Genworth Mortgage Holdings Inc. | 6.500% | 8/15/25 | 2,120 | 2,290 |
| | ING Groep NV | 6.875% | 12/29/49 | 2,805 | 2,928 |
| 1 | Intesa Sanpaolo SPA | 5.017% | 6/26/24 | 900 | 981 |
| 1 | Intesa Sanpaolo SPA | 5.710% | 1/15/26 | 3,880 | 4,433 |
| | MGIC Investment Corp. | 5.750% | 8/15/23 | 685 | 736 |
| | MGIC Investment Corp. | 5.250% | 8/15/28 | 885 | 947 |
| 1 | Nationstar Mortgage Holdings Inc. | 5.125% | 12/15/30 | 1,726 | 1,804 |
| | Navient Corp. | 7.250% | 1/25/22 | 740 | 774 |
| | Navient Corp. | 6.500% | 6/15/22 | 3,890 | 4,099 |
| | Navient Corp. | 5.500% | 1/25/23 | 2,135 | 2,242 |
| | Navient Corp. | 7.250% | 9/25/23 | 310 | 340 |
| | OneMain Finance Corp. | 7.750% | 10/1/21 | 795 | 837 |
| | OneMain Finance Corp. | 8.250% | 10/1/23 | 380 | 434 |
| | OneMain Finance Corp. | 6.125% | 3/15/24 | 755 | 827 |
| | OneMain Finance Corp. | 7.125% | 3/15/26 | 2,536 | 2,973 |
| | OneMain Finance Corp. | 4.000% | 9/15/30 | 1,205 | 1,246 |
| 1 | Park Aerospace Holdings Ltd. | 5.500% | 2/15/24 | 600 | 656 |
| 1 | PennyMac Financial Services Inc. | 5.375% | 10/15/25 | 1,050 | 1,108 |
| | Radian Group Inc. | 4.500% | 10/1/24 | 2,485 | 2,600 |
| | Radian Group Inc. | 6.625% | 3/15/25 | 300 | 339 |
| | Radian Group Inc. | 4.875% | 3/15/27 | 300 | 327 |
| | UBS Group AG | 6.875% | 12/29/49 | 3,700 | 3,734 |
| | | | | | | 67,091 |
| Health Care (10.2%) |
| 1 | Acadia Healthcare Co. Inc. | 5.500% | 7/1/28 | 480 | 514 |
| 1 | Acadia Healthcare Co. Inc. | 5.000% | 4/15/29 | 350 | 372 |
| 1,2 | Avantor Funding Inc. | 2.625% | 11/1/25 | 2,316 | 2,892 |
| 1 | Avantor Funding Inc. | 4.625% | 7/15/28 | 3,035 | 3,209 |
| 1 | Bausch Health Cos. Inc. | 6.125% | 4/15/25 | 5,700 | 5,864 |
| 1 | Bausch Health Cos. Inc. | 5.500% | 11/1/25 | 2,140 | 2,204 |
| 1 | Bausch Health Cos. Inc. | 9.000% | 12/15/25 | 815 | 902 |
| 1 | Bausch Health Cos. Inc. | 9.250% | 4/1/26 | 520 | 579 |
| 1 | Bausch Health Cos. Inc. | 8.500% | 1/31/27 | 1,150 | 1,279 |
| 1 | Bausch Health Cos. Inc. | 7.000% | 1/15/28 | 540 | 593 |
| | | | Coupon | Maturity
Date | Face
Amount
($000) | Market
Value•
($000) |
| 1 | Bausch Health Cos. Inc. | 5.000% | 1/30/28 | 1,295 | 1,331 |
| 1 | Bausch Health Cos. Inc. | 7.250% | 5/30/29 | 60 | 67 |
| 1 | Bausch Health Cos. Inc. | 5.250% | 1/30/30 | 2,120 | 2,215 |
| 1 | Catalent Pharma Solutions Inc. | 5.000% | 7/15/27 | 630 | 664 |
| 1,2 | Catalent Pharma Solutions Inc. | 2.375% | 3/1/28 | 1,310 | 1,604 |
| 2 | Catalent Pharma Solutions Inc. | 2.375% | 3/1/28 | 750 | 918 |
| | Centene Corp. | 4.250% | 12/15/27 | 2,080 | 2,205 |
| | Centene Corp. | 4.625% | 12/15/29 | 1,105 | 1,227 |
| | Centene Corp. | 3.375% | 2/15/30 | 2,660 | 2,796 |
| | Centene Corp. | 3.000% | 10/15/30 | 790 | 835 |
| 1 | Charles River Laboratories International Inc. | 5.500% | 4/1/26 | 705 | 735 |
| 1 | Charles River Laboratories International Inc. | 4.250% | 5/1/28 | 1,300 | 1,367 |
| 1 | CHS/Community Health Systems Inc. | 5.625% | 3/15/27 | 1,315 | 1,419 |
| 1 | CHS/Community Health Systems Inc. | 6.000% | 1/15/29 | 770 | 832 |
| 1 | Emergent BioSolutions Inc. | 3.875% | 8/15/28 | 145 | 149 |
| 1 | Endo Dac / Endo Finance LLC / Endo Finco Inc. | 9.500% | 7/31/27 | 1,741 | 1,937 |
| 1 | Endo Dac / Endo Finance LLC / Endo Finco Inc. | 6.000% | 6/30/28 | 2,418 | 2,007 |
| 1,2 | Grifols SA | 1.625% | 2/15/25 | 810 | 990 |
| 1,2 | Grifols SA | 2.250% | 11/15/27 | 1,325 | 1,639 |
| | HCA Inc. | 5.875% | 5/1/23 | 738 | 808 |
| | HCA Inc. | 7.690% | 6/15/25 | 130 | 156 |
| | HCA Inc. | 5.875% | 2/15/26 | 2,895 | 3,333 |
| | HCA Inc. | 5.625% | 9/1/28 | 390 | 461 |
| | HCA Inc. | 5.875% | 2/1/29 | 450 | 542 |
| | HCA Inc. | 3.500% | 9/1/30 | 8,950 | 9,431 |
| 1 | Hill-Rom Holdings Inc. | 4.375% | 9/15/27 | 310 | 327 |
| 1 | Hologic Inc. | 3.250% | 2/15/29 | 1,665 | 1,696 |
| 1 | IQVIA Inc. | 5.000% | 10/15/26 | 1,450 | 1,519 |
| 1 | IQVIA Inc. | 5.000% | 5/15/27 | 4,093 | 4,339 |
| 1,2 | IQVIA Inc. | 2.250% | 1/15/28 | 1,200 | 1,478 |
| 1,2 | IQVIA Inc. | 2.875% | 6/15/28 | 1,405 | 1,770 |
| 1 | Jaguar Holding Co. II/Pharmaceutical Product Development LP | 4.625% | 6/15/25 | 395 | 414 |
| 1 | Jaguar Holding Co. II/Pharmaceutical Product Development LP | 5.000% | 6/15/28 | 435 | 466 |
| 1 | Par Pharmaceutical Inc. | 7.500% | 4/1/27 | 767 | 828 |
| 1 | Teleflex Inc. | 4.250% | 6/1/28 | 1,991 | 2,115 |
| | Tenet Healthcare Corp. | 4.625% | 7/15/24 | 279 | 286 |
| 1 | Tenet Healthcare Corp. | 4.625% | 9/1/24 | 315 | 321 |
| 1 | Tenet Healthcare Corp. | 7.500% | 4/1/25 | 305 | 334 |
| 1 | Tenet Healthcare Corp. | 4.875% | 1/1/26 | 270 | 281 |
| 1 | Tenet Healthcare Corp. | 4.625% | 6/15/28 | 870 | 916 |
| | Teva Pharmaceutical Finance Co. LLC | 6.150% | 2/1/36 | 1,485 | 1,578 |
| | Teva Pharmaceutical Finance Netherlands III BV | 3.150% | 10/1/26 | 2,890 | 2,778 |
| | Teva Pharmaceutical Finance Netherlands III BV | 6.750% | 3/1/28 | 3,385 | 3,817 |
| | Teva Pharmaceutical Finance Netherlands III BV | 4.100% | 10/1/46 | 555 | 494 |
| 1 | West Street Merger Sub Inc. | 6.375% | 9/1/25 | 820 | 838 |
| | | | | | | 84,671 |
High Yield Bond Portfolio
| | | | Coupon | Maturity
Date | Face
Amount
($000) | Market
Value•
($000) |
| Industrials (6.9%) |
| 1 | Aramark Services Inc. | 5.000% | 4/1/25 | 1,935 | 1,983 |
| | Aramark Services Inc. | 4.750% | 6/1/26 | 646 | 665 |
| 1 | Aramark Services Inc. | 5.000% | 2/1/28 | 980 | 1,033 |
| 1 | Ashtead Capital Inc. | 4.125% | 8/15/25 | 1,325 | 1,361 |
| 1 | Ashtead Capital Inc. | 4.375% | 8/15/27 | 1,545 | 1,634 |
| 1 | Bombardier Inc. | 8.750% | 12/1/21 | 290 | 300 |
| 1 | Bombardier Inc. | 5.750% | 3/15/22 | 425 | 434 |
| 1 | Bombardier Inc. | 6.125% | 1/15/23 | 1,648 | 1,615 |
| 1 | Bombardier Inc. | 7.500% | 12/1/24 | 230 | 219 |
| 1 | Bombardier Inc. | 7.500% | 3/15/25 | 702 | 655 |
| 1 | Bombardier Inc. | 7.875% | 4/15/27 | 1,135 | 1,041 |
| 1 | Brand Industrial Services Inc. | 8.500% | 7/15/25 | 3,262 | 3,311 |
| 1 | BWX Technologies Inc. | 4.125% | 6/30/28 | 1,008 | 1,050 |
| 1 | Clean Harbors Inc. | 4.875% | 7/15/27 | 1,238 | 1,303 |
| 1 | Clean Harbors Inc. | 5.125% | 7/15/29 | 768 | 840 |
| 1 | Core & Main LP | 6.125% | 8/15/25 | 160 | 164 |
| 4,5 | Core & Main LP Bank Loan, 3M USD LIBOR + 2.750% | 3.750% | 3/1/21 | 262 | 260 |
| 1 | Herc Holdings Inc. | 5.500% | 7/15/27 | 5,966 | 6,339 |
| 1,2 | Loxam SAS | 4.250% | 4/15/24 | 190 | 236 |
| 2 | Loxam SAS | 2.875% | 4/15/26 | 655 | 787 |
| 2 | Loxam SAS | 3.750% | 7/15/26 | 750 | 930 |
| 1,2 | Q-Park Holding I BV | 1.500% | 3/1/25 | 805 | 947 |
| 1,2 | Q-Park Holding I BV | 2.000% | 3/1/27 | 1,025 | 1,205 |
| 1 | Sensata Technologies BV | 4.875% | 10/15/23 | 300 | 323 |
| 1 | Sensata Technologies BV | 5.625% | 11/1/24 | 575 | 642 |
| 1 | Sensata Technologies BV | 5.000% | 10/1/25 | 1,625 | 1,800 |
| 1 | Sensata Technologies Inc. | 4.375% | 2/15/30 | 500 | 539 |
| 1 | Sensata Technologies Inc. | 3.750% | 2/15/31 | 1,977 | 2,041 |
| 1 | Signature Aviation US Holdings Inc. | 4.000% | 3/1/28 | 2,256 | 2,262 |
| 1 | Spirit AeroSystems Inc. | 5.500% | 1/15/25 | 344 | 362 |
| 1 | Stericycle Inc. | 3.875% | 1/15/29 | 255 | 262 |
| 1 | Terex Corp. | 5.625% | 2/1/25 | 246 | 253 |
| | TransDigm Inc. | 6.500% | 7/15/24 | 3,090 | 3,140 |
| | TransDigm Inc. | 6.500% | 5/15/25 | 2,565 | 2,639 |
| | United Rentals North America Inc. | 5.875% | 9/15/26 | 1,955 | 2,063 |
| | United Rentals North America Inc. | 5.500% | 5/15/27 | 2,125 | 2,276 |
| | United Rentals North America Inc. | 3.875% | 11/15/27 | 880 | 922 |
| | United Rentals North America Inc. | 4.875% | 1/15/28 | 1,620 | 1,725 |
| | United Rentals North America Inc. | 5.250% | 1/15/30 | 740 | 821 |
| | United Rentals North America Inc. | 4.000% | 7/15/30 | 3,430 | 3,619 |
| | United Rentals North America Inc. | 3.875% | 2/15/31 | 1,406 | 1,476 |
| 1,2 | Vertical Holdco GmbH | 6.625% | 7/15/28 | 200 | 262 |
| 1,2 | Vertical Midco GmbH | 4.375% | 7/15/27 | 275 | 354 |
| 1 | Vertical U.S. Newco Inc. | 5.250% | 7/15/27 | 1,160 | 1,222 |
| | | | | | | 57,315 |
| Materials (10.9%) |
| 1 | ARD Finance SA | 6.500% | 6/30/27 | 955 | 1,012 |
| 1 | Ardagh Packaging Finance plc / Ardagh Holdings USA Inc. | 4.125% | 8/15/26 | 1,490 | 1,557 |
| 1,3 | Ardagh Packaging Finance plc / Ardagh Holdings USA Inc. | 4.750% | 7/15/27 | 160 | 227 |
| 1 | Ardagh Packaging Finance plc / Ardagh Holdings USA Inc. | 5.250% | 8/15/27 | 700 | 730 |
| 1 | Ardagh Packaging Finance plc / Ardagh Holdings USA Inc. | 5.250% | 8/15/27 | 3,655 | 3,829 |
| | | | Coupon | Maturity
Date | Face
Amount
($000) | Market
Value•
($000) |
| | Ball Corp. | 4.875% | 3/15/26 | 1,100 | 1,240 |
| 2 | Ball Corp. | 1.500% | 3/15/27 | 2,105 | 2,641 |
| 1 | Berry Global Inc. | 4.500% | 2/15/26 | 1,655 | 1,692 |
| 1 | Berry Global Inc. | 4.875% | 7/15/26 | 2,120 | 2,274 |
| 1 | Berry Global Inc. | 5.625% | 7/15/27 | 215 | 231 |
| 1 | Cemex SAB de CV | 7.750% | 4/16/26 | 735 | 775 |
| | Cemex SAB de CV | 7.375% | 6/5/27 | 565 | 642 |
| | Cemex SAB de CV | 5.450% | 11/19/29 | 590 | 648 |
| 1,2 | CeramTec BondCo GmbH | 5.250% | 12/15/25 | 425 | 530 |
| | CF Industries Inc. | 4.950% | 6/1/43 | 311 | 381 |
| | CF Industries Inc. | 5.375% | 3/15/44 | 596 | 749 |
| | Chemours Co. | 7.000% | 5/15/25 | 3,115 | 3,228 |
| | Chemours Co. | 5.375% | 5/15/27 | 930 | 986 |
| | Commercial Metals Co. | 5.750% | 4/15/26 | 1,414 | 1,464 |
| | Commercial Metals Co. | 5.375% | 7/15/27 | 595 | 627 |
| 1 | Constellium SE | 6.625% | 3/1/25 | 2,185 | 2,234 |
| 1 | Constellium SE | 5.875% | 2/15/26 | 1,025 | 1,051 |
| 1 | Constellium SE | 5.625% | 6/15/28 | 500 | 538 |
| | Crown Americas LLC / Crown Americas Capital Corp. IV | 4.500% | 1/15/23 | 300 | 317 |
| | Crown Americas LLC / Crown Americas Capital Corp. V | 4.250% | 9/30/26 | 169 | 185 |
| | Crown Americas LLC / Crown Americas Capital Corp. VI | 4.750% | 2/1/26 | 2,715 | 2,817 |
| 1,2 | Crown European Holdings SA | 2.875% | 2/1/26 | 1,555 | 2,035 |
| 1,2 | Diamond BC BV | 5.625% | 8/15/25 | 3,035 | 3,740 |
| 1 | Flex Acquisition Co. Inc. | 6.875% | 1/15/25 | 4,000 | 4,055 |
| 1 | Flex Acquisition Co. Inc. | 7.875% | 7/15/26 | 215 | 226 |
| | Graphic Packaging International LLC | 4.125% | 8/15/24 | 1,045 | 1,116 |
| 1 | Graphic Packaging International LLC | 4.750% | 7/15/27 | 205 | 226 |
| 1 | Graphic Packaging International LLC | 3.500% | 3/15/28 | 2,765 | 2,855 |
| 1 | Graphic Packaging International LLC | 3.500% | 3/1/29 | 505 | 516 |
| 1 | Novelis Corp. | 5.875% | 9/30/26 | 2,206 | 2,305 |
| 1 | Novelis Corp. | 4.750% | 1/30/30 | 1,889 | 2,019 |
| 1 | OCI NV | 5.250% | 11/1/24 | 3,623 | 3,763 |
| 1 | OCI NV | 4.625% | 10/15/25 | 655 | 681 |
| 1 | OI European Group BV | 4.000% | 3/15/23 | 675 | 689 |
| | Olin Corp. | 5.125% | 9/15/27 | 1,775 | 1,850 |
| | Olin Corp. | 5.625% | 8/1/29 | 1,665 | 1,804 |
| | Olin Corp. | 5.000% | 2/1/30 | 1,097 | 1,168 |
| 1 | Owens-Brockway Glass Container Inc. | 5.875% | 8/15/23 | 2,140 | 2,292 |
| 1 | Owens-Brockway Glass Container Inc. | 5.375% | 1/15/25 | 640 | 688 |
| 1 | Owens-Brockway Glass Container Inc. | 6.375% | 8/15/25 | 1,245 | 1,379 |
| 1 | Owens-Brockway Glass Container Inc. | 6.625% | 5/13/27 | 1,180 | 1,277 |
| 1 | Reynolds Group Issuer Inc. / Reynolds Group Issuer LLC / Reynolds Group Issuer Lu | 5.125% | 7/15/23 | 84 | 85 |
| 1 | Sealed Air Corp. | 4.000% | 12/1/27 | 624 | 665 |
| 1,2 | SIG Combibloc PurchaseCo Sarl | 1.875% | 6/18/23 | 600 | 757 |
| 1,2 | SIG Combibloc PurchaseCo Sarl | 2.125% | 6/18/25 | 545 | 699 |
| | Silgan Holdings Inc. | 4.750% | 3/15/25 | 84 | 85 |
| | Silgan Holdings Inc. | 4.125% | 2/1/28 | 2,545 | 2,640 |
| 2 | Silgan Holdings Inc. | 2.250% | 6/1/28 | 1,320 | 1,636 |
| 1 | Standard Industries Inc. | 5.000% | 2/15/27 | 700 | 733 |
| 1 | Standard Industries Inc. | 4.750% | 1/15/28 | 1,025 | 1,081 |
| 1 | Standard Industries Inc. | 4.375% | 7/15/30 | 3,600 | 3,852 |
High Yield Bond Portfolio
| | | | Coupon | Maturity
Date | Face
Amount
($000) | Market
Value•
($000) |
| 1 | Standard Industries Inc. | 3.375% | 1/15/31 | 3,730 | 3,767 |
| 4,5 | Starfruit Finco B.V. Bank Loan, 1M USD LIBOR + 3.000% | 3.153% | 1/19/21 | 632 | 624 |
| 2 | Trivium Packaging Finance BV | 3.750% | 8/15/26 | 1,000 | 1,247 |
| 1,2 | Trivium Packaging Finance BV | 3.750% | 8/15/26 | 180 | 224 |
| 1 | Trivium Packaging Finance BV | 5.500% | 8/15/26 | 745 | 787 |
| 1 | Tronox Finance plc | 5.750% | 10/1/25 | 675 | 700 |
| 1 | Tronox Inc. | 6.500% | 4/15/26 | 2,956 | 3,063 |
| 1,6 | Valvoline Inc. | 3.625% | 6/15/31 | 880 | 904 |
| | | | | | | 90,838 |
| Real Estate (0.9%) |
| | GLP Capital LP / GLP Financing II Inc. | 5.375% | 11/1/23 | 1,005 | 1,098 |
| 1 | Iron Mountain Inc. | 4.875% | 9/15/27 | 595 | 622 |
| 1 | Iron Mountain Inc. | 4.875% | 9/15/29 | 2,177 | 2,291 |
| | MGM Growth Properties Operating Partnership LP / MGP Finance Co-Issuer Inc. | 5.625% | 5/1/24 | 150 | 162 |
| 1 | VICI Properties LP / VICI Note Co. Inc. | 4.250% | 12/1/26 | 1,635 | 1,696 |
| 1 | VICI Properties LP / VICI Note Co. Inc. | 3.750% | 2/15/27 | 458 | 468 |
| 1 | VICI Properties LP / VICI Note Co. Inc. | 4.625% | 12/1/29 | 820 | 878 |
| | | | | | | 7,215 |
| Technology (11.2%) |
| 1 | Black Knight InfoServ LLC | 3.625% | 9/1/28 | 1,847 | 1,884 |
| 1 | BY Crown Parent LLC / BY Bond Finance Inc. | 4.250% | 1/31/26 | 1,185 | 1,215 |
| 1 | Cardtronics Inc. / Cardtronics USA Inc. | 5.500% | 5/1/25 | 450 | 466 |
| | CDK Global Inc. | 5.875% | 6/15/26 | 915 | 956 |
| | CDK Global Inc. | 4.875% | 6/1/27 | 785 | 828 |
| 1 | CDK Global Inc. | 5.250% | 5/15/29 | 2,220 | 2,445 |
| | CDW LLC / CDW Finance Corp. | 5.500% | 12/1/24 | 112 | 124 |
| | CDW LLC / CDW Finance Corp. | 4.125% | 5/1/25 | 1,340 | 1,399 |
| | CDW LLC / CDW Finance Corp. | 4.250% | 4/1/28 | 3,590 | 3,787 |
| | CDW LLC / CDW Finance Corp. | 3.250% | 2/15/29 | 2,792 | 2,834 |
| 1 | Change Healthcare Holdings LLC / Change Healthcare Finance Inc. | 5.750% | 3/1/25 | 3,170 | 3,226 |
| 1 | Dun & Bradstreet Corp. | 6.875% | 8/15/26 | 453 | 487 |
| 4,5 | Dun & Bradstreet Corp. Bank Loan, 1M USD LIBOR + 3.750% | 3.898% | 1/27/21 | 3,335 | 3,332 |
| 1 | Entegris Inc. | 4.625% | 2/10/26 | 150 | 155 |
| 1 | Entegris Inc. | 4.375% | 4/15/28 | 1,905 | 2,029 |
| 1 | Gartner Inc. | 3.750% | 10/1/30 | 1,310 | 1,380 |
| 1 | Microchip Technology Inc. | 4.250% | 9/1/25 | 4,025 | 4,256 |
| 1 | MSCI Inc. | 4.750% | 8/1/26 | 210 | 219 |
| 1 | MSCI Inc. | 5.375% | 5/15/27 | 690 | 737 |
| 1 | MSCI Inc. | 4.000% | 11/15/29 | 2,670 | 2,844 |
| 1 | MSCI Inc. | 3.625% | 9/1/30 | 445 | 465 |
| 1 | MSCI Inc. | 3.875% | 2/15/31 | 1,190 | 1,254 |
| | Nokia of America Corp. | 6.500% | 1/15/28 | 1,355 | 1,477 |
| | Nokia of America Corp. | 6.450% | 3/15/29 | 2,612 | 2,847 |
| | Nokia Oyj | 4.375% | 6/12/27 | 2,425 | 2,655 |
| | Nokia Oyj | 6.625% | 5/15/39 | 3,855 | 4,934 |
| | NortonLifeLock Inc. | 3.950% | 6/15/22 | 345 | 353 |
| 1 | NortonLifeLock Inc. | 5.000% | 4/15/25 | 4,250 | 4,324 |
| 1 | Open Text Corp. | 5.875% | 6/1/26 | 2,180 | 2,267 |
| 1 | Open Text Corp. | 3.875% | 2/15/28 | 3,303 | 3,386 |
| | | | Coupon | Maturity
Date | Face
Amount
($000) | Market
Value•
($000) |
| 1 | Open Text Holdings Inc | 4.125% | 2/15/30 | 3,080 | 3,280 |
| 1 | Presidio Holdings Inc. | 4.875% | 2/1/27 | 1,941 | 2,048 |
| 1 | Presidio Holdings Inc. | 8.250% | 2/1/28 | 1,130 | 1,247 |
| 1 | PTC Inc. | 3.625% | 2/15/25 | 335 | 345 |
| 1 | PTC Inc. | 4.000% | 2/15/28 | 1,705 | 1,784 |
| | Qorvo Inc. | 4.375% | 10/15/29 | 3,160 | 3,476 |
| 1 | Qorvo Inc. | 3.375% | 4/1/31 | 1,770 | 1,823 |
| 1 | Sensata Technologies UK Financing Co. plc | 6.250% | 2/15/26 | 1,520 | 1,575 |
| 4,5 | SS&C Technologies Holdings Europe S.A.R.L. Bank Loan, 1M USD LIBOR + 1.750% | 1.897% | 1/29/21 | 516 | 509 |
| 1 | SS&C Technologies Inc. | 5.500% | 9/30/27 | 4,075 | 4,355 |
| 4,5 | SS&C Technologies Inc. Bank Loan, 1M USD LIBOR + 1.750% | 1.897% | 1/29/21 | 666 | 658 |
| 4,5 | SS&C Technologies Inc. Bank Loan, 1M USD LIBOR + 1.750% | 1.897% | 1/29/21 | 669 | 662 |
| | Western Digital Corp. | 4.750% | 2/15/26 | 3,879 | 4,301 |
| | Xerox Corp. | 4.375% | 3/15/23 | 698 | 734 |
| | Xerox Corp. | 4.800% | 3/1/35 | 542 | 546 |
| | Xerox Corp. | 6.750% | 12/15/39 | 1,995 | 2,135 |
| 1 | Xerox Holdings Corp. | 5.000% | 8/15/25 | 155 | 164 |
| 1 | Xerox Holdings Corp. | 5.500% | 8/15/28 | 4,435 | 4,701 |
| | | | | | | 92,908 |
| Utilities (1.4%) |
| | AmeriGas Partners LP / AmeriGas Finance Corp. | 5.625% | 5/20/24 | 1,395 | 1,521 |
| | AmeriGas Partners LP / AmeriGas Finance Corp. | 5.500% | 5/20/25 | 620 | 685 |
| | AmeriGas Partners LP / AmeriGas Finance Corp. | 5.875% | 8/20/26 | 1,765 | 1,994 |
| | AmeriGas Partners LP / AmeriGas Finance Corp. | 5.750% | 5/20/27 | 1,745 | 1,985 |
| 1 | Clearway Energy Operating LLC | 4.750% | 3/15/28 | 571 | 612 |
| 1 | NextEra Energy Operating Partners LP | 4.250% | 7/15/24 | 683 | 727 |
| 1 | NextEra Energy Operating Partners LP | 4.250% | 9/15/24 | 103 | 111 |
| 1 | NextEra Energy Operating Partners LP | 3.875% | 10/15/26 | 3,035 | 3,251 |
| 1 | NextEra Energy Operating Partners LP | 4.500% | 9/15/27 | 700 | 781 |
| | | | | | | 11,667 |
| Total Corporate Bonds (Cost $743,033) | 787,808 |
| | | | | | Shares | |
| Common Stocks (0.1%) |
| Energy (0.1%) |
| * | Whiting Petroleum Corp. | 51,071 | 1,277 |
| Other (0.0%) |
| *,8 | Homer City Holdings LLC | 62,633 | — |
| Total Common Stocks (Cost $4,596) | 1,277 |
High Yield Bond Portfolio
| | | | Coupon | Maturity
Date | Face
Amount
($000) | Market
Value•
($000) |
| Temporary Cash Investments (3.9%) |
| Repurchase Agreement (3.9%) |
| | Bank of America Securities LLC
(Dated 12/31/20, Repurchase Value $32,400,000, collateralized by Government National Mortgage Associataion, 2.515%–3.087%, 6/20/69–10/20/70, with a value of $33,048,000) (Cost $32,400) | 0.080% | 1/4/21 | 32,400 | 32,400 |
| Total Investments (98.8%) (Cost $780,029) | 821,485 |
| Other Assets and Liabilities—Net (1.2%) | 9,722 |
| Net Assets (100%) | 831,207 |
| Cost is in $000. |
| • | See Note A in Notes to Financial Statements. |
| * | Non-income-producing security. |
| 1 | Security exempt from registration under Rule 144A of the Securities Act of 1933. Such securities may be sold in transactions exempt from registration, normally to qualified institutional buyers. At December 31, 2020, the aggregate value was $441,119,000, representing 53.1% of net assets. |
| 2 | Face amount denominated in euro. |
| 3 | Face amount denominated in British pounds. |
| 4 | Security is a senior, secured, high-yield floating-rate loan. These loans are debt obligations issued by public and private companies and are comparable to high-yield bonds from a ratings and leverage perspective. At December 31, 2020 the aggregate value of these securities was $16,953,000, representing 2.0% of net assets. |
| 5 | Variable rate security; rate shown is effective rate at period end. Certain variable rate securities are not based on a published reference rate and spread but are determined by the issuer or agent based on current market conditions. |
| 6 | Includes securities purchased on a when-issued or delayed-delivery basis for which the portfolio has not taken delivery as of December 31, 2020. |
| 7 | The average or expected maturity is shorter than the final maturity shown because of the possibility of interim principal payments and prepayments or the possibility of the issue being called. |
| 8 | Security value determined using significant unobservable inputs. |
| | 1M—1-month. |
| | 3M—3-month. |
| | LIBOR—London Interbank Offered Rate. |
High Yield Bond Portfolio
Derivative Financial Instruments Outstanding as of Period End
| Forward Currency Contracts |
| | Contract
Settlement
Date | Contract Amount (000) | Unrealized
Appreciation
($000) | Unrealized
Depreciation
($000) |
| Counterparty | | Receive | Deliver | | |
| Toronto-Dominion Bank | 1/29/21 | USD | 36,982 | EUR | 30,434 | — | (224) |
| Barclays Bank plc | 1/29/21 | USD | 1,043 | EUR | 855 | — | (2) |
| Barclays Bank plc | 1/29/21 | USD | 1,533 | GBP | 1,133 | — | (16) |
| | | | | | | — | (242) |
| EUR—euro. |
| GBP—British pound. |
| USD—U.S. dollar. |
See accompanying Notes, which are an integral part of the Financial Statements.
High Yield Bond Portfolio
Statement of Assets and Liabilities
| ($000s, except shares and per-share amounts) | Amount |
| Assets | |
| Investments in Securities, at Value—Unaffiliated Issuers (Cost $780,029) | 821,485 |
| Investment in Vanguard | 32 |
| Cash | 1,447 |
| Cash Collateral Pledged—Forward Currency Contracts | 1,200 |
| Foreign Currency, at Value (Cost $2) | 2 |
| Receivables for Investment Securities Sold | 702 |
| Receivables for Accrued Income | 10,801 |
| Receivables for Capital Shares Issued | 210 |
| Total Assets | 835,879 |
| Liabilities | |
| Payables for Investment Securities Purchased | 3,730 |
| Payables to Investment Advisor | 126 |
| Payables for Capital Shares Redeemed | 484 |
| Payables to Vanguard | 90 |
| Unrealized Depreciation—Forward Currency Contracts | 242 |
| Total Liabilities | 4,672 |
| Net Assets | 831,207 |
| At December 31, 2020, net assets consisted of: | |
| | |
| Paid-in Capital | 778,311 |
| Total Distributable Earnings (Loss) | 52,896 |
| Net Assets | 831,207 |
| |
| Net Assets | |
Applicable to 102,407,736 outstanding $.001 par value shares of
beneficial interest (unlimited authorization) | 831,207 |
| Net Asset Value Per Share | $8.12 |
See accompanying Notes, which are an integral part of the Financial Statements.
High Yield Bond Portfolio
Statement of Operations
|
| | Year Ended
December 31, 2020 |
| | ($000) |
| Investment Income | |
| Income | |
| Interest | 37,519 |
| Total Income | 37,519 |
| Expenses | |
| Investment Advisory Fees—Note B | 466 |
| The Vanguard Group—Note C | |
| Management and Administrative | 1,408 |
| Marketing and Distribution | 79 |
| Custodian Fees | 20 |
| Auditing Fees | 31 |
| Shareholders' Reports | 15 |
| Trustees’ Fees and Expenses | 1 |
| Total Expenses | 2,020 |
| Net Investment Income | 35,499 |
| Realized Net Gain (Loss) | |
| Investment Securities Sold | (8,053) |
| Swap Contracts | (3,313) |
| Forward Currency Contracts | (2,735) |
| Foreign Currencies | 51 |
| Realized Net Gain (Loss) | (14,050) |
| Change in Unrealized Appreciation (Depreciation) | |
| Investment Securities | 22,034 |
| Swap Contracts | (211) |
| Forward Currency Contracts | (115) |
| Foreign Currencies | 7 |
| Change in Unrealized Appreciation (Depreciation) | 21,715 |
| Net Increase (Decrease) in Net Assets Resulting from Operations | 43,164 |
Statement of Changes in Net Assets
|
| | Year Ended December 31, |
| | 2020
($000) | 2019
($000) |
| Increase (Decrease) in Net Assets | | |
| Operations | | |
| Net Investment Income | 35,499 | 38,680 |
| Realized Net Gain (Loss) | (14,050) | (474) |
| Change in Unrealized Appreciation (Depreciation) | 21,715 | 69,137 |
| Net Increase (Decrease) in Net Assets Resulting from Operations | 43,164 | 107,343 |
| Distributions1 | | |
| Total Distributions | (39,449) | (42,939) |
| Capital Share Transactions | | |
| Issued | 259,625 | 152,281 |
| Issued in Lieu of Cash Distributions | 39,449 | 42,939 |
| Redeemed | (254,487) | (180,636) |
| Net Increase (Decrease) from Capital Share Transactions | 44,587 | 14,584 |
| Total Increase (Decrease) | 48,302 | 78,988 |
| Net Assets | | |
| Beginning of Period | 782,905 | 703,917 |
| End of Period | 831,207 | 782,905 |
| 1 | Certain prior-period numbers have been reclassified to conform with the current-period presentation. |
See accompanying Notes, which are an integral part of the Financial Statements.
High Yield Bond Portfolio
For a Share Outstanding
Throughout Each Period | Year Ended December 31, |
| 2020 | 2019 | 2018 | 2017 | 2016 |
| Net Asset Value, Beginning of Period | $8.19 | $7.53 | $8.13 | $7.99 | $7.59 |
| Investment Operations | | | | | |
| Net Investment Income | .3531 | .4101 | .4201 | .4191 | .397 |
| Net Realized and Unrealized Gain (Loss) on Investments | .021 | .731 | (.636) | .119 | .426 |
| Total from Investment Operations | .374 | 1.141 | (.216) | .538 | .823 |
| Distributions | | | | | |
| Dividends from Net Investment Income | (.444) | (.481) | (.384) | (.398) | (.423) |
| Distributions from Realized Capital Gains | — | — | — | — | — |
| Total Distributions | (.444) | (.481) | (.384) | (.398) | (.423) |
| Net Asset Value, End of Period | $8.12 | $8.19 | $7.53 | $8.13 | $7.99 |
| Total Return | 5.67% | 15.67% | -2.73% | 7.00% | 11.35% |
| Ratios/Supplemental Data | | | | | |
| Net Assets, End of Period (Millions) | $831 | $783 | $704 | $752 | $622 |
| Ratio of Total Expenses to Average Net Assets | 0.26% | 0.26% | 0.26% | 0.28% | 0.28% |
| Ratio of Net Investment Income to Average Net Assets | 4.57% | 5.21% | 5.39% | 5.22% | 5.44% |
| Portfolio Turnover Rate | 41% | 27% | 23% | 28% | 27% |
| 1 | Calculated based on average shares outstanding. |
See accompanying Notes, which are an integral part of the Financial Statements.
High Yield Bond Portfolio
Notes to Financial Statements
The High Yield Bond Portfolio, a portfolio of Vanguard Variable Insurance Funds, is registered under the Investment Company Act of 1940 as an open-end investment company. The portfolio's shares are only available for purchase by separate accounts of insurance companies as investments for variable annuity plans, variable life insurance contracts, or other variable benefit insurance contracts. Certain of the portfolio’s investments are in corporate debt instruments; the issuers' abilities to meet their obligations may be affected by economic developments in their respective industries. Market disruptions associated with the COVID-19 pandemic have had a global impact, and uncertainty exists as to the long-term implications. Such disruptions can adversely affect assets of the portfolio and thus portfolio performance.
| A. | The following significant accounting policies conform to generally accepted accounting principles for U.S. investment companies. The portfolio consistently follows such policies in preparing its financial statements. |
1. Security Valuation: Securities are valued as of the close of trading on the New York Stock Exchange (generally 4 p.m., Eastern time) on the valuation date. Bonds and temporary cash investments are valued using the latest bid prices or using valuations based on a matrix system (which considers such factors as security prices, yields, maturities, and ratings), both as furnished by independent pricing services. Equity securities are valued at the latest quoted sales prices or official closing prices taken from the primary market in which each security trades; such securities not traded on the valuation date are valued at the mean of the latest quoted bid and asked prices. Securities for which market quotations are not readily available, or whose values have been materially affected by events occurring before the portfolio’s pricing time but after the close of the securities’ primary markets, are valued by methods deemed by the board of trustees to represent fair value.
2. Foreign Currency: Securities and other assets and liabilities denominated in foreign currencies are translated into U.S. dollars using exchange rates obtained from an independent third party as of the portfolio’s pricing time on the valuation date. Realized gains (losses) and unrealized appreciation (depreciation) on investment securities include the effects of changes in exchange rates since the securities were purchased, combined with the effects of changes in security prices. Fluctuations in the value of other assets and liabilities resulting from changes in exchange rates are recorded as unrealized foreign currency gains (losses) until the assets or liabilities are settled in cash, at which time they are recorded as realized foreign currency gains (losses).
3. Forward Currency Contracts: The portfolio enters into forward currency contracts to protect the value of securities and related receivables and payables against changes in future foreign exchange rates. The portfolio’s risks in using these contracts include movement in the values of the foreign currencies relative to the U.S. dollar and the ability of the counterparties to fulfill their obligations under the contracts. The portfolio mitigates its counterparty risk by entering into forward currency contracts only with a diverse group of prequalified counterparties, monitoring their financial strength, entering into master netting arrangements with its counterparties, and requiring its counterparties to transfer collateral as security for their performance. In the absence of a default, the collateral pledged or received by the portfolio cannot be repledged, resold, or rehypothecated. The master netting arrangements provide that, in the event of a counterparty’s default (including bankruptcy), the portfolio may terminate the forward currency contracts, determine the net amount owed by either party in accordance with its master netting arrangements, and sell or retain any collateral held up to the net amount owed to the portfolio under the master netting arrangements. The forward currency contracts contain provisions whereby a counterparty may terminate open contracts if the portfolio’s net assets decline below a certain level, triggering a payment by the portfolio if the portfolio is in a net liability position at the time of the termination. The payment amount would be reduced by any collateral the portfolio has pledged. Any securities pledged as collateral for open contracts are noted in the Schedule of Investments. The value of collateral received or pledged is compared daily to the value of the forward currency contracts exposure with each counterparty, and any difference, if in excess of a specified minimum transfer amount, is adjusted and settled within two business days.
Forward currency contracts are valued at their quoted daily prices obtained from an independent third party, adjusted for currency risk based on the expiration date of each contract. The notional amounts of the contracts are not recorded in the Statement of Assets and Liabilities. Fluctuations in the value of the contracts are recorded in the Statement of Assets and Liabilities as an asset (liability) and in the Statement of Operations as unrealized appreciation (depreciation) until the contracts are closed, when they are recorded as realized gains (losses) on forward currency contracts.
During the year ended December 31, 2020, the portfolio’s average investment in forward currency contracts represented 4% of net assets, based on the average of the notional amounts at each quarter-end during the period.
High Yield Bond Portfolio
4. Swap Contracts: The portfolio invests in credit default swaps to adjust the overall credit risk of the portfolio or to actively overweight or underweight credit risk to a specific issuer or group of issuers. The portfolio may sell credit protection through credit default swaps to simulate investments in long positions that are either unavailable or considered to be less attractively priced in the bond market. The portfolio may purchase credit protection through credit default swaps to reduce credit exposure to a given issuer or issuers. Under the terms of the swaps, an up-front payment may be exchanged between the seller and buyer. In addition, the seller of the credit protection receives a periodic payment of premium from the buyer that is a fixed percentage applied to a notional amount. If, for example, the reference entity is subject to a credit event (such as bankruptcy, failure to pay, or obligation acceleration) during the term of the swap, the seller agrees to either physically settle or cash settle the swap contract. If the swap is physically settled, the seller agrees to pay the buyer an amount equal to the notional amount and take delivery of a debt instrument of the reference issuer with a par amount equal to such notional amount. If the swap is cash settled, the seller agrees to pay the buyer the difference between the notional amount and the final price for the relevant debt instrument, as determined either in a market auction or pursuant to a pre-agreed-upon valuation procedure.
The notional amounts of swap contracts are not recorded in the Statement of Assets and Liabilities. Swaps are valued daily based on market quotations received from independent pricing services or recognized dealers and the change in value is recorded in the Statement of Assets and Liabilities as an asset (liability) and in the Statement of Operations as unrealized appreciation (depreciation) until the seller of credit protection is required to take delivery (or, in a cash settled swap, pay the settlement amount determined) upon occurrence of a credit event, periodic payments are made, or the swap terminates, at which time realized gain (loss) is recorded. The net premium to be received or paid by the portfolio under swap contracts is accrued daily and recorded as realized gain (loss) over the life of the contract.
The primary risk associated with selling credit protection is that, upon the occurrence of a defined credit event, the market value of the debt instrument received by the portfolio (or, in a cash settled swap, the debt instruments used to determine the settlement payment by the portfolio) will be significantly less than the amount paid by the portfolio and, in a physically settled swap, the portfolio may receive an illiquid debt instrument. A risk associated with all types of swaps is the possibility that a counterparty may default on its obligation to pay net amounts due to the portfolio. The portfolio’s maximum amount subject to counterparty risk is the unrealized appreciation on the swap contract. The portfolio mitigates its counterparty risk by entering into swaps only with a diverse group of prequalified counterparties, monitoring their financial strength, entering into master netting arrangements with its counterparties, and requiring its counterparties to transfer collateral as security for their performance. In the absence of a default, the collateral pledged or received by the portfolio cannot be repledged, resold, or rehypothecated. In the event of a counterparty’s default (including bankruptcy), the portfolio may terminate any swap contracts with that counterparty, determine the net amount owed by either party in accordance with its master netting arrangements, and sell or retain any collateral held up to the net amount owed to the portfolio under the master netting arrangements. The swap contracts contain provisions whereby a counterparty may terminate open contracts if the portfolio net assets decline below a certain level, triggering a payment by the portfolio if the portfolio is in a net liability position at the time of the termination. The payment amount would be reduced by any collateral the portfolio has pledged. Any securities pledged as collateral for open contracts are noted in the Schedule of Investments. The value of collateral received or pledged is compared daily to the value of the swap contracts exposure with each counterparty, and any difference, if in excess of a specified minimum transfer amount, is adjusted and settled within two business days.
The portfolio enters into centrally cleared credit default swaps to achieve the same objectives specified with respect to the equivalent over-the-counter swaps but with less counterparty risk because a regulated clearinghouse is the counterparty instead of the clearing broker or executing broker. The clearinghouse imposes initial margin requirements to secure the portfolio’s performance, and requires daily settlement of variation margin representing changes in the market value of each contract. To further mitigate counterparty risk, the portfolio trades with a diverse group of prequalified executing brokers; monitors the financial strength of its clearing brokers, executing brokers, and clearinghouse; and has entered into agreements with its clearing brokers and executing brokers.
During the year ended December 31, 2020, the portfolio’s average amounts of investments in credit protection sold and credit protection purchased represented less than 1% and 0% of net assets, respectively, based on the average of the notional amounts at each quarter-end during the period.
The portfolio has no open swap contracts at December 31, 2020.
High Yield Bond Portfolio
5. Repurchase Agreements: The portfolio enters into repurchase agreements with institutional counterparties. Securities pledged as collateral to the portfolio under repurchase agreements are held by a custodian bank until the agreements mature, and in the absence of a default, such collateral cannot be repledged, resold, or rehypothecated. Each agreement requires that the market value of the collateral be sufficient to cover payments of interest and principal. The portfolio further mitigates its counterparty risk by entering into repurchase agreements only with a diverse group of prequalified counterparties, monitoring their financial strength, and entering into master repurchase agreements with its counterparties. The master repurchase agreements provide that, in the event of a counterparty's default (including bankruptcy), the portfolio may terminate any repurchase agreements with that counterparty, determine the net amount owed, and sell or retain the collateral up to the net amount owed to the portfolio. Such action may be subject to legal proceedings, which may delay or limit the disposition of collateral.
6. Federal Income Taxes: The portfolio intends to continue to qualify as a regulated investment company and distribute all of its taxable income. The portfolio’s tax returns are open to examination by the relevant tax authorities until expiration of the applicable statute of limitations, which is generally three years after the filing of the tax return. Management has analyzed the portfolio’s tax positions taken for all open federal and state income tax years, and has concluded that no provision for income tax is required in the portfolio’s financial statements.
7. Distributions: Distributions to shareholders are recorded on the ex-dividend date. Distributions are determined on a tax basis at the fiscal year-end and may differ from net investment income and realized capital gains for financial reporting purposes.
8. Credit Facilities and Interfund Lending Program: The portfolio and certain other funds managed by The Vanguard Group ("Vanguard") participate in a $4.3 billion committed credit facility provided by a syndicate of lenders pursuant to a credit agreement and an uncommitted credit facility provided by Vanguard. Both facilities may be renewed annually. Each fund is individually liable for its borrowings, if any, under the credit facilities. Borrowings may be utilized for temporary or emergency purposes, subject to the portfolio’s regulatory and contractual borrowing restrictions. With respect to the committed credit facility, the participating funds are charged administrative fees and an annual commitment fee of 0.10% of the undrawn committed amount of the facility; these fees are allocated to the funds based on a method approved by the portfolio’s board of trustees and included in Management and Administrative expenses on the portfolio’s Statement of Operations. Any borrowings under either facility bear interest at a rate based upon the higher of the one-month London Interbank Offered Rate (or an acceptable alternate rate, if necessary), federal funds effective rate, or overnight bank funding rate plus an agreed-upon spread, except that borrowings under the uncommitted credit facility may bear interest based upon an alternate rate agreed to by the portfolio and Vanguard.
In accordance with an exemptive order (the “Order”) from the SEC, the portfolio may participate in a joint lending and borrowing program that allows registered open-end Vanguard funds to borrow money from and lend money to each other for temporary or emergency purposes (the “Interfund Lending Program”), subject to compliance with the terms and conditions of the Order, and to the extent permitted by the portfolio’s investment objective and investment policies. Interfund loans and borrowings normally extend overnight, but can have a maximum duration of seven days. Loans may be called on one business day’s notice. The interest rate to be charged is governed by the conditions of the Order and internal procedures adopted by the board of trustees. The board of trustees is responsible for overseeing the Interfund Lending Program.
For the year ended December 31, 2020, the portfolio did not utilize the credit facilities or the Interfund Lending Program.
9. Other: Interest income is accrued daily. Premiums and discounts on debt securities are amortized and accreted, respectively, to interest income over the lives of the respective securities, except for premiums on certain callable debt securities that are amortized to the earliest call date. Security transactions are accounted for on the date securities are bought or sold. Costs used to determine realized gains (losses) on the sale of investment securities are those of the specific securities sold.
| B. | Wellington Management Company llp provides investment advisory services to the portfolio for a fee calculated at an annual percentage rate of average net assets. For the year ended December 31, 2020, the investment advisory fee represented an effective annual basic rate of 0.06% of the portfolio’s average net assets. |
| C. | In accordance with the terms of a Funds' Service Agreement (the “FSA”) between Vanguard and the portfolio, Vanguard furnishes to the portfolio corporate management, administrative, marketing, |
High Yield Bond Portfolio
and distribution services at Vanguard’s cost of operations (as defined by the FSA). These costs of operations are allocated to the portfolio based on methods and guidelines approved by the board of trustees and are generally settled twice a month.
Upon the request of Vanguard, the portfolio may invest up to 0.40% of its net assets as capital in Vanguard. At December 31, 2020, the portfolio had contributed to Vanguard capital in the amount of $32,000, representing less than 0.01% of the portfolio’s net assets and 0.01% of Vanguard’s capital received pursuant to the FSA. The portfolio’s trustees and officers are also directors and employees, respectively, of Vanguard.
| D. | Various inputs may be used to determine the value of the portfolio’s investments and derivatives. These inputs are summarized in three broad levels for financial statement purposes. The inputs or methodologies used to value securities are not necessarily an indication of the risk associated with investing in those securities. |
Level 1—Quoted prices in active markets for identical securities.
Level 2—Other significant observable inputs (including quoted prices for similar securities, interest rates, prepayment speeds, credit risk, etc.).
Level 3—Significant unobservable inputs (including the portfolio’s own assumptions used to determine the fair value of investments). Any investments and derivatives valued with significant unobservable inputs are noted on the Schedule of Investments.
The following table summarizes the market value of the portfolio’s investments and derivatives as of December 31, 2020, based on the inputs used to value them:
| | Level 1
($000) | Level 2
($000) | Level 3
($000) | Total
($000) |
| Investments | | | | |
| Assets | | | | |
| Corporate Bonds | — | 787,808 | — | 787,808 |
| Common Stocks | 1,277 | — | — | 1,277 |
| Temporary Cash Investments | — | 32,400 | — | 32,400 |
| Total | 1,277 | 820,208 | — | 821,485 |
| Derivative Financial Instruments | | | | |
| Liabilities | | | | |
| Forward Currency Contracts | — | 242 | — | 242 |
| E. | At December 31, 2020, the fair values of derivatives were reflected in the Statement of Assets and Liabilities as follows: |
| Statement of Assets and Liabilities Caption | Foreign
Exchange
Contracts
($000) |
| Liabilities | |
Unrealized Depreciation—
Forward Currency Contracts | 242 |
Realized net gain (loss) and the change in unrealized appreciation (depreciation) on derivatives for the year ended December 31, 2020, were:
| Realized Net Gain (Loss) on Derivatives | Foreign
Exchange
Contracts
($000) | Credit
Contracts
($000) | Total
($000) |
| Swap Contracts | — | (3,313) | (3,313) |
| Forward Currency Contracts | (2,735) | — | (2,735) |
| Realized Net Gain (Loss) on Derivatives | (2,735) | (3,313) | (6,048) |
| Change in Unrealized Appreciation (Depreciation) on Derivatives |
| Swap Contracts | — | (211) | (211) |
| Forward Currency Contracts | (115) | — | (115) |
| Change in Unrealized Appreciation (Depreciation) on Derivatives | (115) | (211) | (326) |
| F. | Permanent differences between book-basis and tax-basis components of net assets are reclassified among capital accounts in the financial statements to reflect their tax character. These |
High Yield Bond Portfolio
reclassifications have no effect on net assets or net asset value per share. As of period end, permanent differences primarily attributable to the accounting for foreign currency transactions and swap agreements were reclassified between the individual components of total distributable earnings (loss).
Temporary differences between book-basis and tax-basis components of total distributable earnings (loss) arise when certain items of income, gain, or loss are recognized in different periods for financial statement and tax purposes; these differences will reverse at some time in the future. The differences are primarily related to the deferral of losses from wash sales; the recognition of unrealized gains or losses from certain derivative contracts; the recognition of gain or loss foreign currency hedges; and the treatment of amortization adjustments from certain fixed income securities. As of period end, the tax-basis components of total distributable earnings (loss) are detailed in the table as follows:
| | Amount
($000) |
| Undistributed Ordinary Income | 33,269 |
| Undistributed Long-Term Gains | — |
| Capital Loss Carryforwards | (19,119) |
| Qualified Late-Year Losses | — |
| Net Unrealized Gains (Losses) | 38,746 |
The tax character of distributions paid was as follows:
| | Year Ended December 31, |
| | 2020
Amount
($000) | 2019
Amount
($000) |
| Ordinary Income* | 39,449 | 42,939 |
| Long-Term Capital Gains | — | — |
| Total | 39,449 | 42,939 |
| * | Includes short-term capital gains, if any. |
As of December 31, 2020, gross unrealized appreciation and depreciation for investments and derivatives based on cost for U.S. federal income tax purposes were as follows:
| | Amount
($000) |
| Tax Cost | 783,233 |
| Gross Unrealized Appreciation | 43,973 |
| Gross Unrealized Depreciation | (5,721) |
| Net Unrealized Appreciation (Depreciation) | 38,252 |
| G. | During the year ended December 31, 2020, the portfolio purchased $346,462,000 of investment securities and sold $294,270,000 of investment securities, other than temporary cash investments. |
| H. | Capital shares issued and redeemed were: |
| | Year Ended December 31, |
| | 2020 | 2019 |
| | Shares
(000) | Shares
(000) |
| Issued | 34,269 | 19,313 |
| Issued in Lieu of Cash Distributions | 5,853 | 5,672 |
| Redeemed | (33,293) | (22,931) |
| Net Increase (Decrease) in Shares Outstanding | 6,829 | 2,054 |
At December 31, 2020, one shareholder (an insurance company separate account whose holdings in the portfolio represent the indirect investment of Vanguard Variable Annuity contract holders) was the record or beneficial owner of 42% of the portfolio’s net assets. If this shareholder was to redeem its investment in the portfolio, the redemption might result in an increase in the portfolio’s expense ratio, cause the portfolio to incur higher transaction costs, or lead to the realization of taxable capital gains.
High Yield Bond Portfolio
| I. | Management has determined that no events or transactions occurred subsequent to December 31, 2020, that would require recognition or disclosure in these financial statements. |
Report of Independent Registered Public Accounting Firm
To the Board of Trustees of Vanguard Variable Insurance Funds and Shareholders of High Yield Bond Portfolio
Opinion on the Financial Statements
We have audited the accompanying statement of assets and liabilities, including the schedule of investments, of High Yield Bond Portfolio (one of the portfolios constituting Vanguard Variable Insurance Funds, referred to hereafter as the "Portfolio”) as of December 31, 2020, the related statement of operations for the year ended December 31, 2020, the statement of changes in net assets for each of the two years in the period ended December 31, 2020, including the related notes, and the financial highlights for each of the five years in the period ended December 31, 2020 (collectively referred to as the “financial statements”). In our opinion, the financial statements present fairly, in all material respects, the financial position of the Portfolio as of December 31, 2020, the results of its operations for the year then ended, the changes in its net assets for each of the two years in the period ended December 31, 2020 and the financial highlights for each of the five years in the period ended December 31, 2020 in conformity with accounting principles generally accepted in the United States of America.
Basis for Opinion
These financial statements are the responsibility of the Portfolio’s management. Our responsibility is to express an opinion on the Portfolio’s financial statements based on our audits. We are a public accounting firm registered with the Public Company Accounting Oversight Board (United States) (PCAOB) and are required to be independent with respect to the Portfolio in accordance with the U.S. federal securities laws and the applicable rules and regulations of the Securities and Exchange Commission and the PCAOB.
We conducted our audits of these financial statements in accordance with the standards of the PCAOB. Those standards require that we plan and perform the audit to obtain reasonable assurance about whether the financial statements are free of material misstatement, whether due to error or fraud.
Our audits included performing procedures to assess the risks of material misstatement of the financial statements, whether due to error or fraud, and performing procedures that respond to those risks. Such procedures included examining, on a test basis, evidence regarding the amounts and disclosures in the financial statements. Our audits also included evaluating the accounting principles used and significant estimates made by management, as well as evaluating the overall presentation of the financial statements. Our procedures included confirmation of securities owned as of December 31, 2020 by correspondence with the custodian and brokers; when replies were not received from brokers, we performed other auditing procedures. We believe that our audits provide a reasonable basis for our opinion.
/s/PricewaterhouseCoopers LLP
Philadelphia, Pennsylvania
February 18, 2021
We have served as the auditor of one or more investment companies in The Vanguard Group of Funds since 1975.
Special 2020 tax information (unaudited) for corporate shareholders only for High Yield Bond Portfolio, a portfolio of Vanguard Variable Insurance Funds
This information for the fiscal year ended December 31, 2020, is included pursuant to provisions of the Internal Revenue Code for corporate shareholders only.
The percentage of the ordinary dividends reported by the fund that is treated as a Section 163(j) interest dividend and thus is eligible to be treated as interest income for purposes of Section 163(j) and the regulations thereunder is 88.8%.
BLOOMBERG is a trademark and service mark of Bloomberg Finance L.P. BARCLAYS is a trademark and service mark of Barclays Bank Plc, used under license. Bloomberg Finance L.P. and its affiliates, including Bloomberg Index Services Limited (BISL) (collectively, Bloomberg), or Bloomberg’s licensors, own all proprietary rights in the Bloomberg Barclays U.S. High-Yield Ba/B 2% Issuer Capped Index and the Bloomberg Barclays U.S. 1–5 Year Treasury Bond Index (the Index or Bloomberg Barclays Index).
Neither Barclays Bank Plc, Barclays Capital Inc., or any affiliate (collectively Barclays) or Bloomberg is the issuer or producer of the High Yield Bond Portfolio and neither Bloomberg nor Barclays has any responsibilities, obligations or duties to investors in the High Yield Bond Portfolio. The Index is licensed for use by The Vanguard Group, Inc. (Vanguard) as the sponsor of the High Yield Bond Portfolio. Bloomberg and Barclays’ only relationship with Vanguard in respect of the Index is the licensing of the Index, which are determined, composed and calculated by BISL, or any successor thereto, without regard to the Issuer or the High Yield Bond Portfolio or the owners of the High Yield Bond Portfolio.
Additionally, Vanguard may for itself execute transaction(s) with Barclays in or relating to the Indices in connection with the Municipal Bond Funds. Investors acquire the High Yield Bond Portfolio from Vanguard and investors neither acquire any interest in the Indices nor enter into any relationship of any kind whatsoever with Bloomberg or Barclays upon making an investment in the High Yield Bond Portfolio. The High Yield Bond Portfolio is not sponsored, endorsed, sold or promoted by Bloomberg or Barclays. Neither Bloomberg nor Barclays makes any representation or warranty, express or implied regarding the advisability of investing in the High Yield Bond Portfolio or the advisability of investing in securities generally or the ability of the Indices to track corresponding or relative market performance. Neither Bloomberg nor Barclays has passed on the legality or suitability of the High Yield Bond Portfolio with respect to any person or entity. Neither Bloomberg nor Barclays is responsible for and has not participated in the determination of the timing of, prices at, or quantities of the High Yield Bond Portfolio to be issued. Neither Bloomberg nor Barclays has any obligation to take the needs of the Issuer or the owners of the High Yield Bond Portfolio or any other third party into consideration in determining, composing or calculating the Indices. Neither Bloomberg nor Barclays has any obligation or liability in connection with administration, marketing or trading of the High Yield Bond Portfolio.
The licensing agreement between Bloomberg and Barclays is solely for the benefit of Bloomberg and Barclays and not for the benefit of the owners of the High Yield Bond Portfolio, investors or other third parties. In addition, the licensing agreement between Vanguard and Bloomberg is solely for the benefit of Vanguard and Bloomberg and not for the benefit of the owners of the High Yield Bond Portfolio, investors or other third parties.
NEITHER BLOOMBERG NOR BARCLAYS SHALL HAVE ANY LIABILITY TO THE ISSUER, INVESTORS OR TO OTHER THIRD PARTIES FOR THE QUALITY, ACCURACY AND/OR COMPLETENESS OF THE BLOOMBERG BARCLAYS INDICES OR ANY DATA INCLUDED THEREIN OR FOR INTERRUPTIONS IN THE DELIVERY OF THE BLOOMBERG BARCLAYS INDICES. NEITHER BLOOMBERG NOR BARCLAYS MAKES ANY WARRANTY, EXPRESS OR IMPLIED, AS TO RESULTS TO BE OBTAINED BY THE ISSUER, THE INVESTORS OR ANY OTHER PERSON OR ENTITY FROM THE USE OF THE BLOOMBERG BARCLAYS INDICES OR ANY DATA INCLUDED THEREIN. NEITHER BLOOMBERG NOR BARCLAYS MAKES ANY EXPRESS OR IMPLIED WARRANTIES, AND EACH HEREBY EXPRESSLY DISCLAIMS ALL WARRANTIES OF MERCHANTABILITY OR FITNESS FOR A PARTICULAR PURPOSE OR USE WITH RESPECT TO THE BLOOMBERG BARCLAYS INDICES OR ANY DATA INCLUDED THEREIN. BLOOMBERG RESERVES THE RIGHT TO CHANGE THE METHODS OF CALCULATION OR PUBLICATION, OR TO CEASE THE CALCULATION OR PUBLICATION OF THE BLOOMBERG BARCLAYS INDICES, AND NEITHER BLOOMBERG NOR BARCLAYS SHALL BE LIABLE FOR ANY MISCALCULATION OF OR ANY INCORRECT, DELAYED OR INTERRUPTED PUBLICATION WITH RESPECT TO ANY OF THE BLOOMBERG BARCLAYS INDICES. NEITHER BLOOMBERG NOR BARCLAYS SHALL BE LIABLE FOR ANY DAMAGES, INCLUDING, WITHOUT LIMITATION, ANY SPECIAL, INDIRECT OR CONSEQUENTIAL DAMAGES, OR ANY LOST PROFITS AND EVEN IF ADVISED OF THE POSSIBILITY OF SUCH, RESULTING FROM THE USE OF THE BLOOMBERG BARCLAYS INDICES OR ANY DATA INCLUDED THEREIN OR WITH RESPECT TO THE HIGH YIELD BOND PORTFOLIO.
None of the information supplied by Bloomberg or Barclays and used in this publication may be reproduced in any manner without the prior written permission of both Bloomberg and Barclays Capital, the investment banking division of Barclays Bank Plc. Barclays Bank Plc is registered in England No. 1026167. Registered office 1 Churchill Place London E14 5HP.
© 2021 Bloomberg. Used with Permission.
Source: Bloomberg Index Services Limited. Copyright 2021, Bloomberg. All rights reserved.
This page intentionally left blank.
The People Who Govern Your Fund
The trustees of your mutual fund are there to see that the fund is operated and managed in your best interests since, as a shareholder, you are a part owner of the fund. Your fund’s trustees also serve on the board of directors of The Vanguard Group, Inc., which is owned by the Vanguard funds and provides services to them.
A majority of Vanguard’s board members are independent, meaning that they have no affiliation with Vanguard or the funds they oversee, apart from the sizable personal investments they have made as private individuals. The independent board members have distinguished backgrounds in business, academia, and public service. Each of the trustees and executive officers oversees 211 Vanguard funds.
Information for each trustee and executive officer of the fund appears below. That information, as well as the Vanguard fund count, is as of the date on the cover of this fund report. The mailing address of the trustees and officers is P.O. Box 876, Valley Forge, PA 19482. More information about the trustees is in the Statement of Additional Information, which can be obtained, without charge, by contacting Vanguard at 800-662-7447, or online at vanguard.com.
Interested Trustee1
Mortimer J. Buckley
Born in 1969. Trustee since January 2018. Principal occupation(s) during the past five years and other experience: chairman of the board (2019–present) of Vanguard and of each of the investment companies served by Vanguard; chief executive officer (2018–present) of Vanguard; chief executive officer, president, and trustee (2018–present) of each of the investment companies served by Vanguard; president and director (2017–present) of Vanguard; and president (2018–present) of Vanguard Marketing Corporation. Chief investment officer (2013–2017), managing director (2002–2017), head of the Retail Investor Group (2006–2012), and chief information officer (2001–2006) of Vanguard. Chairman of the board (2011–2017) and trustee (2009–2017) of the Children’s Hospital of Philadelphia; and trustee (2018–present) and vice chair (2019–present) of The Shipley School.
Independent Trustees
Emerson U. Fullwood
Born in 1948. Trustee since January 2008. Principal occupation(s) during the past five years and other experience: executive chief staff and marketing officer for North America and corporate vice president (retired 2008) of Xerox Corporation (document management products and services). Former president of the Worldwide Channels Group, Latin America, and Worldwide Customer Service and executive chief staff officer of Developing Markets of Xerox. Executive in residence and 2009–2010 Distinguished Minett Professor at the Rochester Institute of Technology. Director of SPX FLOW, Inc. (multi-industry manufacturing). Director of the University of Rochester Medical Center, the Monroe Community College Foundation, the United Way of Rochester, North Carolina A&T University, and Roberts Wesleyan College. Trustee of the University of Rochester.
Amy Gutmann
Born in 1949. Trustee since June 2006. Principal occupation(s) during the past five years and other experience: president (2004–present) of the University of Pennsylvania. Christopher H. Browne Distinguished Professor of Political Science, School of Arts and Sciences, and professor of communication, Annenberg School for Communication, with secondary faculty appointments in the Department of Philosophy, School of Arts and Sciences, and at the Graduate School of Education, University of Pennsylvania.
F. Joseph Loughrey
Born in 1949. Trustee since October 2009. Principal occupation(s) during the past five years and other experience: president and chief operating officer (retired 2009) and vice chairman of the board (2008–2009) of Cummins Inc. (industrial machinery). Chairman of the board of Hillenbrand, Inc. (specialized consumer services) and the Lumina Foundation. Director of the V Foundation. Member of the advisory council for the College of Arts and Letters and chair of the advisory board to the Kellogg Institute for International Studies, both at the University of Notre Dame.
Mark Loughridge
Born in 1953. Trustee since March 2012. Principal occupation(s) during the past five years and other experience: senior vice president and chief financial officer (retired 2013) of IBM (information technology services). Fiduciary member of IBM’s Retirement Plan Committee (2004–2013), senior vice president and general manager (2002–2004) of IBM Global Financing, vice president and controller (1998–2002) of IBM, and a variety of other prior management roles at IBM. Member of the Council on Chicago Booth.
Scott C. Malpass
Born in 1962. Trustee since March 2012. Principal occupation(s) during the past five years and other experience: chief investment officer (retired June 2020) and vice president (retired June 2020) of the University of Notre Dame. Assistant professor of finance at the Mendoza College of Business, University of Notre Dame, and member of the Notre Dame 403(b) Investment Committee (retired June 2020). Member of the board of Catholic Investment Services, Inc. (investment advisors) and the board of superintendence of the Institute for the Works of Religion.
Deanna Mulligan
Born in 1963. Trustee since January 2018. Principal occupation(s) during the past five years and other experience: board chair (2020–present), chief executive officer (2011–2020), and president (2010–2019) of The Guardian Life Insurance Company of America. Chief operating officer (2010–2011) and executive vice president (2008–2010) of the individual life and disability division of Guardian Life. Member of the board of the American Council of Life Insurers and the board of the Economic Club of New York. Trustee of the Partnership for New York City (business leadership), Chief Executives for Corporate Purpose, NewYork-Presbyterian Hospital, Catalyst, and the
Bruce Museum (arts and science). Member of the Advisory Council for the Stanford Graduate School of Business.
André F. Perold
Born in 1952. Trustee since December 2004. Principal occupation(s) during the past five years and other experience: George Gund Professor of Finance and Banking, Emeritus at the Harvard Business School (retired 2011). Chief investment officer and co-managing partner of HighVista Strategies (private investment firm). Member of the board of advisors and member of the investment committee of the Museum of Fine Arts Boston. Member of the board (2018–present) of RIT Capital Partners (investment firm). Member of the investment committee of Partners Health Care System.
Sarah Bloom Raskin
Born in 1961. Trustee since January 2018. Principal occupation(s) during the past five years and other experience: deputy secretary (2014–2017) of the United States Department of the Treasury. Governor (2010–2014) of the Federal Reserve Board. Commissioner (2007–2010) of financial regulation for the State of Maryland. Member of the board of directors (2012–2014) of Neighborhood Reinvestment Corporation. Director (2017–present) of i(x) Investments, LLC; director (2017–present) of Reserve Trust. Rubenstein Fellow (2017–present) of Duke University; trustee (2017–present) of Amherst College, and trustee (2019–present) of the Folger Shakespeare Library.
Peter F. Volanakis
Born in 1955. Trustee since July 2009. Principal occupation(s) during the past five years and other experience: president and chief operating officer (retired 2010) of Corning Incorporated (communications equipment) and director of Corning Incorporated (2000–2010) and Dow Corning (2001–2010). Director (2012) of SPX Corporation (multi-industry manufacturing). Overseer of the Amos Tuck School of Business Administration, Dartmouth College (2001–2013). Chairman of the board of trustees of Colby-Sawyer College. Member of the board of Hypertherm Inc. (industrial cutting systems, software, and consumables).
1 Mr. Buckley is considered an “interested person,” as defined in the Investment Company Act of 1940, because he is an officer of the Vanguard funds.
Executive Officers
John Bendl
Born in 1970. Principal occupation(s) during the past five years and other experience: principal of Vanguard. Chief financial officer (2019–present) of each of the investment companies served by Vanguard. Chief accounting officer, treasurer, and controller of Vanguard (2017–present). Partner (2003–2016) at KPMG (audit, tax, and advisory services).
Christine M. Buchanan
Born in 1970. Principal occupation(s) during the past five years and other experience: principal of Vanguard. Treasurer (2017–present) of each of the investment companies served by Vanguard. Partner (2005–2017) at KPMG (audit, tax, and advisory services).
David Cermak
Born in 1960. Principal occupation(s) during the past five years and other experience: principal of Vanguard. Finance director (2019–present) of each of the investment companies served by Vanguard. Managing director and head (2017–present) of Vanguard Investments Singapore. Managing director and head (2017–2019) of Vanguard Investments Hong Kong. Representative director and head (2014–2017) of Vanguard Investments Japan.
John Galloway
Born in 1973. Principal occupation(s) during the past five years and other experience: principal of Vanguard.
Investment stewardship officer (September 2020–present) of each of the investment companies served by Vanguard. Head of Investor Advocacy (February 2020–present) and head of Marketing Strategy and Planning (2017–2020) at Vanguard. Deputy assistant to the President of the United States (2015).
Thomas J. Higgins
Born in 1957. Principal occupation(s) during the past five years and other experience: principal of Vanguard. Finance director (2019–present), chief financial officer (2008–2019), and treasurer (1998–2008) of each of the investment companies served by Vanguard.
Peter Mahoney
Born in 1974. Principal occupation(s) during the past five years and other experience: principal of Vanguard. Controller (2015–present) of each of the investment companies served by Vanguard. Head of International Fund Services (2008–2014) at Vanguard.
Anne E. Robinson
Born in 1970. Principal occupation(s) during the past five years and other experience: general counsel (2016–present) of Vanguard. Secretary (2016–present) of Vanguard and of each of the investment companies served by Vanguard. Managing director (2016–present) of Vanguard. Managing director and general counsel of Global Cards and Consumer Services (2014–2016) at Citigroup. Counsel (2003–2014) at American Express.
Michael Rollings
Born in 1963. Principal occupation(s) during the past five years and other experience: finance director (2017–present) and treasurer (2017) of each of the investment companies served by Vanguard. Managing director (2016–present) of Vanguard. Chief financial officer (2016–present) of Vanguard. Director (2016–present) of Vanguard Marketing Corporation. Executive vice president and chief financial officer (2006–2016) of MassMutual Financial Group.
John E. Schadl
Born in 1972. Principal occupation(s) during the past five years and other experience: principal of Vanguard. Chief compliance officer (2019–present) of Vanguard and of each of the investment companies served by Vanguard. Assistant vice president (2019–present) of Vanguard Marketing Corporation.
Vanguard Senior Management Team
| Joseph Brennan | James M. Norris |
| Mortimer J. Buckley | Thomas M. Rampulla |
| Gregory Davis | Karin A. Risi |
| John James | Anne E. Robinson |
| John T. Marcante | Michael Rollings |
| Chris D. McIsaac | Lauren Valente |
Connect with Vanguard®>vanguard.com
Fund Information > 800-662-7447
Annuity and Insurance Services > 800-522-5555
Institutional Investor Services > 800-523-1036
Text Telephone for People Who Are Deaf or Hard of Hearing > 800-749-7273
This material may be used in conjunction with the offering of shares of any Vanguard fund only if preceded or accompanied by the fund’s current prospectus.
You can obtain a free copy of Vanguard’s proxy voting guidelines by visiting vanguard.com/proxyreporting or by calling Vanguard at 800-662-2739. The guidelines are also available from the SEC’s website, www.sec.gov. In addition, you may obtain a free report on how your fund voted the proxies for securities it owned during the 12 months ended June 30. To get the report, visit either vanguard.com/proxyreporting or www.sec.gov.
All comparative mutual fund data are from Morningstar, Inc., unless otherwise noted.
You can review information about your fund on the SEC’s website, and you can receive copies of this information, for a fee, by sending a request via email addressed to publicinfo@sec.gov.
© 2021 The Vanguard Group, Inc.
All rights reserved.
Vanguard Marketing Corporation, Distributor.
Q690HY 022021
Annual Report | December 31, 2020
Vanguard Variable Insurance Funds
Contents
Your Portfolio’s Performance at a Glance
| 1 |
Advisors' Report
| 2 |
About Your Portfolio’s Expenses
| 4 |
Performance Summary
| 5 |
Financial Statements
| 7 |
Please note: The opinions expressed in this report are just that—informed opinions. They should not be considered promises or advice. Also, please keep in mind that the information and opinions cover the period through the date on the front of this report. Of course, the risks of investing in your portfolio are spelled out in the prospectus.
Your Portfolio’s Performance at a Glance
| • | The International Portfolio of Vanguard Variable Insurance Funds returned 57.58% for the 12 months ended December 31, 2020, far outdistancing the 10.65% return of its benchmark, the MSCI All Country World Index ex USA. Please note that the portfolio’s returns are different from those in Vanguard Variable Annuity (and other plans that invest in the portfolio), which take into account insurance-related expenses. |
| • | The emergence of COVID-19 in early 2020 turned into a global health crisis, and aggressive attempts to contain it resulted in a sharp downturn in economic activity. Unemployment spiked, and sectors where social distancing isn’t possible were hit hard. Stocks initially plummeted as infections surged, but they finished the year significantly higher. The gain was thanks in part to rapid and robust monetary and fiscal action by policymakers and the rollout of COVID-19 vaccines as the year drew to a close. Many central banks slashed short-term interest rates and expanded or extended asset-purchase programs. |
| • | Returns were positive in nine of the ten sectors the portfolio invests in, most notably in consumer discretionary, the portfolio’s largest sector. Materials holdings were the biggest net detractors. |
| • | Over the decade ended December 31, 2020, the portfolio’s average annualized return outperformed that of its spliced benchmark. |
Market Barometer
Average Annual Total Returns
Periods Ended December 31, 2020 |
| | One Year | Three Years | Five Years |
| Stocks | | | |
| Russell 1000 Index (Large-caps) | 20.96% | 14.82% | 15.60% |
| Russell 2000 Index (Small-caps) | 19.96 | 10.25 | 13.26 |
| Russell 3000 Index (Broad U.S. market) | 20.89 | 14.49 | 15.43 |
| FTSE All-World ex US Index (International) | 11.22 | 5.18 | 9.16 |
| Bonds | | | |
| Bloomberg Barclays U.S. Aggregate Bond Index (Broad taxable market) | 7.51% | 5.34% | 4.44% |
Bloomberg Barclays Municipal Bond Index
(Broad tax-exempt market) | 5.21 | 4.64 | 3.91 |
| FTSE Three-Month U.S. Treasury Bill Index | 0.58 | 1.56 | 1.16 |
| CPI | | | |
| Consumer Price Index | 1.36% | 1.85% | 1.95% |
The International Portfolio of Vanguard Variable Insurance Funds returned 57.58% for the 12 months ended December 31, 2020. It far outdistanced the 10.65% return of its benchmark, the MSCI All Country World Index ex USA.
The portfolio is overseen by two independent advisors, a strategy that enhances its diversification by providing exposure to distinct yet complementary investment approaches. It is not uncommon for different advisors to have different views about individual securities or the broader investment environment.
The advisors, the amount and percentage of the portfolio’s assets each manages, and brief descriptions of their investment strategies are presented in the accompanying table. Each advisor has also prepared a discussion of the investment environment that existed during the period and of the effect it had on the portfolio’s positioning. These reports were prepared on January 21, 2021.
Baillie Gifford Overseas Ltd.
Portfolio Managers:
James K. Anderson, Partner
Head of Global Equities
Thomas Coutts, Partner
Head of International Growth
Lawrence Burns, Partner
Investment Manager
Conviction and long-termism are two of the tenets essential to good returns. They should also ensure capital is allocated to companies that have the vision to tackle some of the biggest problems in our world and support them on the inevitable bumpy market ride to success.
The events that unfolded in 2020 could never have been imagined or modeled. While COVID-19 has brought great sadness and economic loss, this extreme-tail event has accelerated change
in the corporate world. It has also brought into sharp relief the sectors that have been resistant to change. Our long-term approach and desire to own outliers has helped the portfolio invest in some developing future trends already. Despite strong share price performance from many companies within the portfolio, the long-term prospects continue to look exciting.
Your portfolio has continually evolved, and you should expect that to continue. The holdings today are almost unrecognizable from ten years ago, and we have been investing increasingly in disruptive growth companies. We are now seeing an acceleration in many trends ranging from online food delivery to electric vehicles and e-commerce.
Strong contributors to recent performance included Chinese super app Meituan Dianping which, among other segments, has the lion’s share of the food delivery market in China. In a country with densely populated cities and efficient delivery mechanisms, the company has grown considerably since we first held it as an unlisted security in 2015. To get some sense of the scale of the opportunity, U.S. company Grubhub delivers 650,000 meals per day while Meituan averages nearly 25 million.
Another standout performer was Latin America’s leading e-commerce and payments company MercadoLibre. At the end of September, the group reached more than 76 million unique active users. Its digital payments were also accelerated by the pandemic, as indicated by the 92% rise in total payment volumes on the Mercado Pago platform. Recent estimates show digital engagement in Latin America has grown from 5% pre-pandemic to almost 10% today.
Tesla continues to execute well and deliver excellent returns, as does Chinese electric vehicle maker NIO. Although NIO
is nascent and still proving its business model, its year-on-year vehicle sales doubled despite the pandemic.
There weren’t many detractors, but the pandemic weighed heavily on aerospace engine producer Rolls-Royce as the outlook for global travel remained bleak.
As the pace of change creates new opportunities for business models, so it enriches our opportunity set. Areas of the economy previously resistant to change including health care, education, and financial services are now opening, and new approaches are being adopted more rapidly. We reduced our holdings in Amazon following recent outperformance in order to invest in potentially larger and newer opportunities.
Among several new purchases and sales, we have pivoted away from core banking holdings BBVA and Svenska Handelsbanken and instead taken positions in Australian payments business Afterpay and the Dutch payment services company Adyen. We reduced our holdings in SoftBank to reflect concerns with corporate culture, specifically financial complexity, limited transparency, and shorter time horizons.
In the health care sector, we sold Swedish radiotherapy equipment maker Elekta as our conviction in the upside weakened. We added Belgian antibody-based drugs company argenx and added to our existing private holding in CureVac as it became a listed entity. Finally, we added biotechnology company Moderna because of its leading position in the field of mRNA therapeutics. The foundational nature of its technology platform means that the recent success of Moderna’s COVID vaccine should translate to a high likelihood of success in other disease areas.
Schroder Investment Management North America Inc.
Portfolio Managers:
Simon Webber, CFA
James R. Gautrey, CFA
International equities made strong progress in 2020 despite a sharp sell-off at the start of the year as the economic impact of the COVID-19 pandemic became apparent. The recovery began in March, and news in November that a number of vaccines had proved effective against the virus led global stocks to rally on investor optimism that a return to normality could be on the horizon. Good stock selection supported performance through the year, with particularly strong contributions in industrials and information technology.
Danish wind turbine supplier Vestas was a top performer as the shift to renewable energy continued to accelerate. With onshore wind projects now offering some of the most cost-competitive power generation of any type, we expect the order book will remain strong. Vestas is also achieving solid growth from its service business, which enjoys attractive margins and provides good, stable revenues.
U.K. hotel operator Whitbread was a weaker performer as the pandemic hit the hospitality sector hard. Periods of stress for any industry are an opportunity for the strong to get stronger, and that is exactly
what Whitbread has done. Having strengthened its balance sheet and continued to invest in its properties, Whitbread is already taking market share and will be in a good position to recover profitability as the economy normalizes.
Measures to control the pandemic are embedding behavioral changes in work, social, and leisure activities, many of which are likely to end up being permanent. We feel that judging where things will revert to normal and where tipping points of no return have been reached is going to be one of the biggest sources of alpha generation in the months ahead. While we think considerable demand is building for personal travel and in-person social contact, we are convinced that in areas such as the shift to online goods and services, flexible home working, and digital enablement of businesses, the growth outlook has been sustainably strengthened.
However, many of our long-standing core holdings in e-commerce, gaming, consumer, and internet sectors have performed exceptionally well this year as they were well-prepared to capitalize on the shift in consumer behavior. Despite very strong long-term growth outlooks, toward the end of the 2020 we found that expectations for many of these growth companies were becoming extended.
In contrast, for the first time in many years we have been finding more compelling growth gaps (future growth that the market is missing) in traditional industries. We have initiated a new position in Equinor, a Norwegian oil and gas company that is very well-positioned to transition its business toward sustainable energy sources through the development of offshore wind resources in the North Sea.
We also added to several of our positions in European banks, where we believe the market is overestimating the credit losses from the pandemic and will be surprised at how quickly bank earnings bounce back in 2021.
It is very encouraging to us that, despite the distractions of a pandemic, government commitments to deal with climate change have been strengthening rapidly, with China, Japan, South Korea, and the European Union all pledging to reach net zero emission economies. In a few decades’ time the energy, industrial, and transportation infrastructures of the world will look completely different, heralding a massive shift in investment from fossil fuels toward renewable energy, electric vehicles, and other low-emission technologies. We have attempted to position the portfolio well for this shift by investing in enablers of the clean energy transition in many different industries.
International Portfolio Investment Advisors
| |
| | Portfolio Assets Managed | |
| Investment Advisor | % | $ Million | Investment Strategy |
| Baillie Gifford Overseas Ltd. | 66 | 3,864 | Uses a bottom-up, stock-driven approach to select stocks that it believes have above-average growth rates and trade at reasonable prices. |
| Schroder Investment Management North America Inc. | 31 | 1,855 | Uses fundamental research to identify high-quality companies in developed and emerging markets that it believes have above-average growth potential. |
| Cash Investments | 3 | 178 | These short-term reserves are invested by Vanguard in equity index products to simulate investment in stocks. Each advisor also may maintain a modest cash position. |
About Your Portfolio’s Expenses
As a shareholder of the portfolio, you incur ongoing costs, which include costs for portfolio management, administrative services, and shareholder reports (like this one), among others. Operating expenses, which are deducted from a portfolio's gross income, directly reduce the investment return of the portfolio.
A portfolio's expenses are expressed as a percentage of its average net assets. This figure is known as the expense ratio. The following examples are intended to help you understand the ongoing costs (in dollars) of investing in your portfolio and to compare these costs with those of other mutual funds. The examples are based on an investment of $1,000 made at the beginning of the period shown and held for the entire period.
The accompanying table illustrates your portfolio's costs in two ways:
| • | Based on actual portfolio return. This section helps you to estimate the actual expenses that you paid over the period. The ”Ending Account Value“ shown is derived from the portfolio's actual return, and the third column shows the dollar amount that would have been paid by an investor who started with $1,000 in the portfolio. You may use the information here, together with the amount you invested, to estimate the expenses that you paid over the period. |
To do so, simply divide your account value by $1,000 (for example, an $8,600 account value divided by $1,000 = 8.6), then multiply the result by the number given for your portfolio under the heading ”Expenses Paid During Period.“
| • | Based on hypothetical 5% yearly return. This section is intended to help you compare your portfolio's costs with those of other mutual funds. It assumes that the portfolio had a yearly return of 5% before expenses, but that the expense ratio is unchanged. In this case—because the return used is not the portfolio's actual return—the results do not apply to your investment. The example is useful in making comparisons because the Securities and Exchange Commission requires all mutual funds to calculate expenses based on a 5% return. You can assess your portfolio's costs by comparing this hypothetical example with the hypothetical examples that appear in shareholder reports of other funds. |
Note that the expenses shown in the table are meant to highlight and help you compare ongoing costs only and do not reflect transaction costs incurred by the portfolio for buying and selling securities. The portfolio’s expense ratio does not reflect additional fees and expenses associated with the annuity or life insurance program through which you invest.
The calculations assume no shares were bought or sold during the period. Your actual costs may have been higher or lower, depending on the amount of your investment and the timing of any purchases or redemptions.
You can find more information about the portfolio's expenses, including annual expense ratios, in the Financial Statements section of this report. For additional information on operating expenses and other shareholder costs, please refer to your portfolio's current prospectus.
| Six Months Ended December 31, 2020 | | | |
| International Portfolio | Beginning
Account Value
6/30/2020 | Ending
Account Value
12/31/2020 | Expenses
Paid During
Period |
| Based on Actual Portfolio Return | $1,000.00 | $1,417.83 | $2.31 |
| Based on Hypothetical 5% Yearly Return | 1,000.00 | 1,023.23 | 1.93 |
The calculations are based on expenses incurred in the most recent six-month period. The portfolio’s annualized six-month expense ratio for that period is 0.38%. The dollar amounts shown as “Expenses Paid” are equal to the annualized expense ratio multiplied by the average account value over the period, multiplied by the number of days in the most recent six-month period, then divided by the number of days in the most recent 12-month period (184/366).
All of the returns in this report represent past performance, which is not a guarantee of future results that may be achieved by the portfolio. (Current performance may be lower or higher than the performance data cited. For performance data current to the most recent month-end, visit our website at vanguard.com/performance.) Note, too, that both investment returns and principal value can fluctuate widely, so an investor’s shares, when sold, could be worth more or less than their original cost. The returns shown do not reflect taxes that a shareholder would pay on portfolio distributions or on the sale of portfolio shares. Nor do the returns reflect fees and expenses associated with the annuity or life insurance program through which a shareholder invests. If these fees and expenses were included, the portfolio's returns would be lower.
Cumulative Performance: December 31, 2010, Through December 31, 2020
Initial Investment of $10,000
| | | | Average Annual Total Returns
Periods Ended December 31, 2020 |
| | | One
Year | Five
Years | Ten
Years | Final Value
of a $10,000
Investment |
 | International Portfolio | 57.58% | 21.30% | 12.10% | $31,347 |
 | MSCI All Country World Index ex USA | 10.65 | 8.93 | 4.92 | 16,163 |
See Financial Highlights for dividend and capital gains information.
| Communication Services | 7.9% |
| Consumer Discretionary | 38.8 |
| Consumer Staples | 4.5 |
| Energy | 1.3 |
| Financials | 8.6 |
| Health Care | 13.2 |
| Industrials | 9.4 |
| Information Technology | 13.0 |
| Materials | 1.8 |
| Utilities | 0.9 |
| Other | 0.6 |
The table reflects the portfolio’s investments, except for short-term investments and derivatives. Sector categories are based on the Global Industry Classification Standard (“GICS”), except for the “Other” category (if applicable), which includes securities that have not been provided a GICS classification as of the effective reporting period.
Global Industry Classification Standard (“GICS”) was developed by and is the exclusive property and a service mark of MSCI Inc. (“MSCI”) and Standard and Poor’s, a division of McGraw-Hill Companies, Inc. (“S&P”), and is licensed for use by Vanguard. Neither MSCI, S&P nor any third party involved in making or compiling the GICS or any GICS classification makes any express or implied warranties or representations with respect to such standard or classification (or the results to be obtained by the use thereof), and all such parties hereby expressly disclaim all warranties of originality, accuracy, completeness, merchantability or fitness for a particular purpose with respect to any such standard or classification. Without limiting any of the foregoing, in no event shall MSCI, S&P, any of its affiliates or any third party involved in making or compiling the GICS or any GICS classification have any liability for any direct, indirect, special, punitive, consequential or any other damages (including lost profits) even if notified of the possibility of such damages.
The portfolio files its complete schedule of portfolio holdings with the Securities and Exchange Commission (SEC) for the first and third quarters of each fiscal year as an exhibit to its reports on Form N-PORT. The portfolio’s Form N-PORT reports are available on the SEC’s website at www.sec.gov.
| | | Shares | Market
Value•
($000) |
| Common Stocks (95.9%) |
| Australia (0.6%) |
| * | Afterpay Ltd. | 346,322 | 31,483 |
| * | Xero Ltd. | 30,912 | 3,508 |
| | | | 34,991 |
| Austria (0.3%) |
| * | Erste Group Bank AG | 644,402 | 19,630 |
| Belgium (1.1%) |
| | Umicore SA | 1,018,473 | 48,953 |
| | UCB SA | 161,482 | 16,681 |
| | | | 65,634 |
| Brazil (0.4%) |
| | B3 SA - Brasil Bolsa Balcao | 954,319 | 11,426 |
| | Raia Drogasil SA | 1,946,480 | 9,357 |
| | | | 20,783 |
| Canada (0.8%) |
| | Toronto-Dominion Bank | 491,934 | 27,794 |
| | Canadian National Railway Co. | 192,015 | 21,110 |
| | | | 48,904 |
| China (16.4%) |
| | Tencent Holdings Ltd. | 3,645,000 | 262,272 |
| * | Alibaba Group Holding Ltd. | 6,002,288 | 174,574 |
| * | Meituan Class B | 4,063,583 | 152,967 |
| * | NIO Inc. ADR | 2,614,545 | 127,433 |
| * | TAL Education Group ADR | 1,220,913 | 87,307 |
| * | Alibaba Group Holding Ltd. ADR | 243,197 | 56,599 |
| | Ping An Insurance Group Co. of China Ltd. Class H | 3,101,000 | 37,738 |
| * | Baidu Inc. ADR | 170,578 | 36,886 |
| | China Mengniu Dairy Co. Ltd. | 4,108,000 | 24,768 |
| | Kingdee International Software Group Co. Ltd. | 1,780,000 | 7,267 |
| | | | 967,811 |
| Denmark (3.8%) |
| * | Genmab A/S | 215,206 | 87,265 |
| | Ambu A/S Class B | 1,162,938 | 49,959 |
| | Vestas Wind Systems A/S | 195,373 | 46,153 |
| | Chr Hansen Holding A/S | 149,481 | 15,444 |
| | Pandora A/S | 114,036 | 12,763 |
| | Novozymes A/S Class B | 198,539 | 11,309 |
| | | | 222,893 |
| France (6.1%) |
| | Kering SA | 230,889 | 167,564 |
| | L'Oreal SA | 221,688 | 84,586 |
| | | Shares | Market
Value•
($000) |
| | Schneider Electric SE | 460,064 | 66,492 |
| | Alstom SA | 417,529 | 23,782 |
| | Legrand SA | 103,536 | 9,262 |
| | Peugeot SA | 317,699 | 8,700 |
| | | | 360,386 |
| Germany (8.5%) |
| *,1 | Zalando SE | 862,076 | 95,890 |
| *,1 | Delivery Hero SE | 602,672 | 94,251 |
| * | HelloFresh SE | 875,923 | 67,754 |
| | Infineon Technologies AG | 1,122,824 | 42,879 |
| | Bayerische Motoren Werke AG | 410,021 | 36,187 |
| | adidas AG | 73,299 | 26,666 |
| * | Jumia Technologies AG ADR | 644,932 | 26,023 |
| | SAP SE | 149,307 | 19,338 |
| | GEA Group AG | 455,746 | 16,301 |
| | BASF SE | 191,386 | 15,128 |
| *,2 | CureVac GmbH | 193,229 | 14,099 |
| | Knorr-Bremse AG | 99,922 | 13,650 |
| | Allianz SE (Registered) | 55,423 | 13,616 |
| * | CureVac NV | 95,557 | 7,747 |
| * | MorphoSys AG | 60,083 | 7,025 |
| * | Home24 SE | 211,488 | 5,780 |
| | | | 502,334 |
| Hong Kong (2.3%) |
| | AIA Group Ltd. | 7,618,000 | 92,834 |
| | Hong Kong Exchanges & Clearing Ltd. | 743,840 | 40,801 |
| | | | 133,635 |
| India (1.3%) |
| | Housing Development Finance Corp. Ltd. | 1,000,325 | 35,047 |
| * | HDFC Bank Ltd. | 1,534,578 | 30,226 |
| | Larsen & Toubro Ltd. | 494,566 | 8,736 |
| *,2,3 | ANI Technologies Private Ltd. PP | 19,170 | 2,831 |
| | | | 76,840 |
| Indonesia (0.3%) |
| | Bank Central Asia Tbk PT | 6,577,100 | 15,854 |
| Israel (0.3%) |
| * | Wix.com Ltd. | 78,300 | 19,572 |
| Italy (1.9%) |
| | Ferrari NV | 393,814 | 91,342 |
| | Intesa Sanpaolo SPA | 8,807,485 | 20,818 |
| | | | 112,160 |
| Japan (9.7%) |
| | M3 Inc. | 2,203,200 | 208,130 |
| | Nidec Corp. | 1,003,700 | 126,976 |
| | SMC Corp. | 103,500 | 63,211 |
| | Sony Corp. | 376,700 | 37,959 |
| | | Shares | Market
Value•
($000) |
| | Takeda Pharmaceutical Co. Ltd. | 709,900 | 25,691 |
| | Recruit Holdings Co. Ltd. | 573,800 | 24,101 |
| | Murata Manufacturing Co. Ltd. | 215,500 | 19,509 |
| | Sekisui Chemical Co. Ltd. | 772,400 | 14,646 |
| | Toyota Motor Corp. | 161,100 | 12,432 |
| | SoftBank Group Corp. | 154,900 | 12,026 |
| | Pigeon Corp. | 270,900 | 11,181 |
| | SBI Holdings Inc. | 395,800 | 9,416 |
| | Suzuki Motor Corp. | 125,200 | 5,804 |
| | | | 571,082 |
| Netherlands (9.3%) |
| | ASML Holding NV | 634,754 | 307,333 |
| *,1 | Adyen NV | 51,119 | 118,777 |
| * | Argenx SE | 101,792 | 29,996 |
| | Royal Dutch Shell plc Class A | 1,503,182 | 26,461 |
| | Koninklijke Philips NV | 455,844 | 24,555 |
| | EXOR NV | 279,803 | 22,728 |
| | Royal Dutch Shell plc Class A | 948,309 | 16,887 |
| | | | 546,737 |
| Norway (0.8%) |
| | Equinor ASA | 1,633,865 | 27,574 |
| | DNB ASA | 1,046,192 | 20,501 |
| | | | 48,075 |
| South Korea (1.3%) |
| | Samsung Electronics Co. Ltd. | 714,518 | 53,357 |
| | Samsung SDI Co. Ltd. | 40,702 | 23,589 |
| | | | 76,946 |
| Spain (2.0%) |
| | Industria de Diseno Textil SA | 1,765,626 | 56,041 |
| | Iberdrola SA | 2,265,257 | 32,552 |
| | Banco Bilbao Vizcaya Argentaria SA | 5,508,103 | 27,302 |
| | | | 115,895 |
| Sweden (2.1%) |
| | Atlas Copco AB Class A | 1,083,355 | 55,680 |
| | Kinnevik AB Class B | 820,157 | 41,202 |
| | Assa Abloy AB Class B | 645,915 | 15,962 |
| | Svenska Handelsbanken AB Class A | 922,215 | 9,296 |
| | | | 122,140 |
| Switzerland (4.4%) |
| | Roche Holding AG | 167,690 | 58,406 |
| | Nestle SA (Registered) | 481,486 | 56,917 |
| | Novartis AG (Registered) | 250,022 | 23,541 |
| | | Shares | Market
Value•
($000) |
| | Temenos AG (Registered) | 158,609 | 22,099 |
| | Lonza Group AG (Registered) | 32,189 | 20,735 |
| | Cie Financiere Richemont SA (Registered) | 228,682 | 20,660 |
| * | Alcon Inc. | 275,998 | 18,325 |
| | Chocoladefabriken Lindt & Spruengli AG Ptg. Ctf. | 1,837 | 17,906 |
| | Sika AG (Registered) | 44,289 | 12,073 |
| | Straumann Holding AG (Registered) | 9,685 | 11,345 |
| | | | 262,007 |
| Taiwan (1.4%) |
| | Taiwan Semiconductor Manufacturing Co. Ltd. | 3,723,000 | 70,430 |
| * | Sea Ltd. ADR | 66,924 | 13,321 |
| | | | 83,751 |
| United Kingdom (4.6%) |
| * | Ocado Group plc | 2,211,977 | 69,169 |
| | Diageo plc | 916,146 | 36,251 |
| | Rolls-Royce Holdings plc | 17,278,472 | 26,150 |
| * | Fiat Chrysler Automobiles NV | 1,225,518 | 22,140 |
| | Whitbread plc | 444,246 | 18,817 |
| | Burberry Group plc | 733,087 | 17,902 |
| | National Grid plc | 1,419,928 | 16,780 |
| | Bunzl plc | 455,286 | 15,201 |
| | Next plc | 154,603 | 14,908 |
| | Reckitt Benckiser Group plc | 159,354 | 14,223 |
| | Barclays plc | 5,568,822 | 11,171 |
| | Glaxo Smith Kline plc | 572,594 | 10,477 |
| | | | 273,189 |
| United States (16.2%) |
| * | Tesla Inc. | 445,097 | 314,092 |
| * | MercadoLibre Inc. | 158,215 | 265,045 |
| * | Spotify Technology SA | 401,389 | 126,301 |
| * | Illumina Inc. | 333,129 | 123,258 |
| * | Amazon.com Inc. | 24,133 | 78,599 |
| * | Moderna Inc. | 265,704 | 27,758 |
| * | Booking Holdings Inc. | 8,714 | 19,408 |
| | | | 954,461 |
Total Common Stocks
(Cost $2,792,437) | 5,655,710 |
| | | Shares | Market
Value•
($000) |
| Preferred Stock (0.3%) |
| *,2,3,4 | You & Mr. Jones PP (Cost $5,200) | 5,200,000 | 16,692 |
| Temporary Cash Investments (3.5%) |
| Money Market Fund (3.4%) |
| 5 | Vanguard Market Liquidity Fund 0.111% | 2,041,331 | 204,133 |
| | | Face
Amount
($000) | |
| U.S. Government and Agency Obligations (0.1%) |
| 6 | U.S. Treasury Bill,
0.116%, 2/16/21 | 5,642 | 5,641 |
Total Temporary Cash Investments
(Cost $209,774) | 209,774 |
Total Investments (99.7%)
(Cost $3,007,411) | 5,882,176 |
| Other Assets and Liabilities—Net (0.3%) | 15,079 |
| Net Assets (100%) | 5,897,255 |
| Cost is in $000. |
| • | See Note A in Notes to Financial Statements. |
| * | Non-income-producing security. |
| 1 | Security exempt from registration under Rule 144A of the Securities Act of 1933. Such securities may be sold in transactions exempt from registration, normally to qualified institutional buyers. At December 31, 2020, the aggregate value was $308,918,000, representing 5.2% of net assets. |
| 2 | Restricted securities totaling $33,622,000, representing 0.6% of net assets. See Restricted Securities table for additional information. |
| 3 | Security value determined using significant unobservable inputs. |
| 4 | Perpetual security with no stated maturity date. |
| 5 | Affiliated money market fund available only to Vanguard funds and certain trusts and accounts managed by Vanguard. Rate shown is the 7-day yield. |
| 6 | Securities with a value of $5,641,000 have been segregated as initial margin for open futures contracts. |
| ADR—American Depositary Receipt. |
| PP—Private Placement. |
| Ptg. Ctf.—Participating Certificates. |
Restricted Securities as of Period End
|
| Security Name | Acquisition
Date | Acquisition
Cost
($000) |
| You & Mr. Jones PP | September 2015 | 5,200 |
| CureVac GmbH | October 2015 | 3,559 |
| ANI Technologies Private Ltd. PP | December 2015 | 5,969 |
Derivative Financial Instruments Outstanding as of Period End
| Futures Contracts |
| | | | ($000) |
| | Expiration | Number of
Long (Short)
Contracts | Notional
Amount | Value and
Unrealized
Appreciation
(Depreciation) |
| Long Futures Contracts | | | | |
| MSCI EAFE Index | March 2021 | 1,137 | 121,136 | 1,543 |
| MSCI Emerging Markets Index | March 2021 | 913 | 58,806 | 1,567 |
| | | | | 3,110 |
See accompanying Notes, which are an integral part of the Financial Statements.
Statement of Assets and Liabilities
| ($000s, except shares and per-share amounts) | Amount |
| Assets | |
| Investments in Securities, at Value | |
| Unaffiliated Issuers (Cost $2,803,278) | 5,678,043 |
| Affiliated Issuers (Cost $204,133) | 204,133 |
| Total Investments in Securities | 5,882,176 |
| Investment in Vanguard | 218 |
| Cash Collateral Pledged—Futures Contracts | 7,788 |
| Foreign Currency, at Value (Cost $2,721) | 2,732 |
| Receivables for Investment Securities Sold | 13,889 |
| Receivables for Accrued Income | 4,309 |
| Receivables for Capital Shares Issued | 2,792 |
| Other Assets | 48 |
| Total Assets | 5,913,952 |
| Liabilities | |
| Due to Custodian | 7,635 |
| Payables for Investment Securities Purchased | 1,562 |
| Payables to Investment Advisor | 2,501 |
| Payables for Capital Shares Redeemed | 2,449 |
| Payables to Vanguard | 602 |
| Variation Margin Payable—Futures Contracts | 1,074 |
| Deferred Foreign Capital Gain Taxes | 874 |
| Total Liabilities | 16,697 |
| Net Assets | 5,897,255 |
| At December 31, 2020, net assets consisted of: | |
| | |
| Paid-in Capital | 2,600,461 |
| Total Distributable Earnings (Loss) | 3,296,794 |
| Net Assets | 5,897,255 |
| |
| Net Assets | |
Applicable to 135,348,986 outstanding $.001 par value shares of
beneficial interest (unlimited authorization) | 5,897,255 |
| Net Asset Value Per Share | $43.57 |
See accompanying Notes, which are an integral part of the Financial Statements.
Statement of Operations
|
| | Year Ended
December 31, 2020 |
| | ($000) |
| Investment Income | |
| Income | |
| Dividends—Unaffiliated Issuers1 | 36,233 |
| Dividends—Affiliated Issuers | — |
| Interest—Unaffiliated Issuers | 47 |
| Interest—Affiliated Issuers | 595 |
| Securities Lending—Net | 1,147 |
| Total Income | 38,022 |
| Expenses | |
| Investment Advisory Fees—Note B | |
| Basic Fee | 6,656 |
| Performance Adjustment | 1,691 |
| The Vanguard Group—Note C | |
| Management and Administrative | 7,626 |
| Marketing and Distribution | 380 |
| Custodian Fees | 174 |
| Auditing Fees | 39 |
| Shareholders' Reports | 25 |
| Trustees’ Fees and Expenses | 5 |
| Total Expenses | 16,596 |
| Net Investment Income | 21,426 |
| Realized Net Gain (Loss) | |
| Investment Securities Sold—Unaffiliated Issuers | 408,702 |
| Investment Securities Sold—Affiliated Issuers | 838 |
| Futures Contracts | 114 |
| Forward Currency Contracts | (3,016) |
| Foreign Currencies | (47) |
| Realized Net Gain (Loss) | 406,591 |
| Change in Unrealized Appreciation (Depreciation) | |
| Investment Securities—Unaffiliated Issuers2 | 1,698,354 |
| Investment Securities—Affiliated Issuers | (735) |
| Futures Contracts | 3,365 |
| Forward Currency Contracts | (592) |
| Foreign Currencies | 113 |
| Change in Unrealized Appreciation (Depreciation) | 1,700,505 |
| Net Increase (Decrease) in Net Assets Resulting from Operations | 2,128,522 |
| 1 | Dividends are net of foreign withholding taxes of $3,302,000. |
| 2 | The change in unrealized appreciation (depreciation) is net of the change in deferred foreign capital gains taxes of ($686,000). |
Statement of Changes in Net Assets
|
| | Year Ended December 31, |
| | 2020
($000) | 2019
($000) |
| Increase (Decrease) in Net Assets | | |
| Operations | | |
| Net Investment Income | 21,426 | 50,520 |
| Realized Net Gain (Loss) | 406,591 | 94,562 |
| Change in Unrealized Appreciation (Depreciation) | 1,700,505 | 807,454 |
| Net Increase (Decrease) in Net Assets Resulting from Operations | 2,128,522 | 952,536 |
| Distributions1 | | |
| Total Distributions | (147,347) | (159,172) |
| Capital Share Transactions | | |
| Issued | 673,953 | 469,443 |
| Issued in Lieu of Cash Distributions | 147,347 | 159,172 |
| Redeemed | (928,547) | (507,332) |
| Net Increase (Decrease) from Capital Share Transactions | (107,247) | 121,283 |
| Total Increase (Decrease) | 1,873,928 | 914,647 |
| Net Assets | | |
| Beginning of Period | 4,023,327 | 3,108,680 |
| End of Period | 5,897,255 | 4,023,327 |
| 1 | Certain prior-period numbers have been reclassified to conform with the current-period presentation. |
See accompanying Notes, which are an integral part of the Financial Statements.
For a Share Outstanding
Throughout Each Period | Year Ended December 31, |
| 2020 | 2019 | 2018 | 2017 | 2016 |
| Net Asset Value, Beginning of Period | $29.00 | $23.14 | $27.34 | $19.54 | $19.80 |
| Investment Operations | | | | | |
| Net Investment Income1 | .158 | .371 | .367 | .224 | .271 |
| Net Realized and Unrealized Gain (Loss) on Investments | 15.535 | 6.692 | (3.644) | 7.992 | .075 |
| Total from Investment Operations | 15.693 | 7.063 | (3.277) | 8.216 | .346 |
| Distributions | | | | | |
| Dividends from Net Investment Income | (.397) | (.378) | (.212) | (.258) | (.280) |
| Distributions from Realized Capital Gains | (.726) | (.825) | (.711) | (.158) | (.326) |
| Total Distributions | (1.123) | (1.203) | (.923) | (.416) | (.606) |
| Net Asset Value, End of Period | $43.57 | $29.00 | $23.14 | $27.34 | $19.54 |
| Total Return | 57.58% | 31.22% | -12.61% | 42.60% | 1.93% |
| Ratios/Supplemental Data | | | | | |
| Net Assets, End of Period (Millions) | $5,897 | $4,023 | $3,109 | $3,198 | $2,131 |
| Ratio of Total Expenses to Average Net Assets2 | 0.38% | 0.38% | 0.37% | 0.39% | 0.39% |
| Ratio of Net Investment Income to Average Net Assets | 0.49% | 1.43% | 1.36% | 0.93% | 1.40% |
| Portfolio Turnover Rate | 22% | 14% | 16% | 16% | 29% |
| 1 | Calculated based on average shares outstanding. |
| 2 | Includes performance-based investment advisory fee increases (decreases) of 0.04%, 0.04%, 0.03%, 0.03%, and 0.03%. |
See accompanying Notes, which are an integral part of the Financial Statements.
Notes to Financial Statements
The International Portfolio, a portfolio of Vanguard Variable Insurance Funds, is registered under the Investment Company Act of 1940 as an open-end investment company. The portfolio's shares are only available for purchase by separate accounts of insurance companies as investments for variable annuity plans, variable life insurance contracts, or other variable benefit insurance contracts.The portfolio invests in securities of foreign issuers, which may subject to investment risks not normally associated with investing in securities of U.S. corporations. Market disruptions associated with the COVID-19 pandemic have had a global impact, and uncertainty exists as to the long-term implications. Such disruptions can adversely affect assets of the portfolio and thus portfolio performance.
| A. | The following significant accounting policies conform to generally accepted accounting principles for U.S. investment companies. The portfolio consistently follows such policies in preparing its financial statements. |
1. Security Valuation: Securities are valued as of the close of trading on the New York Stock Exchange (generally 4 p.m., Eastern time) on the valuation date. Equity securities are valued at the latest quoted sales prices or official closing prices taken from the primary market in which each security trades; such securities not traded on the valuation date are valued at the mean of the latest quoted bid and asked prices. Securities for which market quotations are not readily available, or whose values have been affected by events occurring before the portfolio’s pricing time but after the close of the securities’ primary markets, are valued at their fair values calculated according to procedures adopted by the board of trustees. These procedures include obtaining quotations from an independent pricing service, monitoring news to identify significant market- or security-specific events, and evaluating changes in the values of foreign market proxies (for example, ADRs, futures contracts, or exchange-traded funds), between the time the foreign markets close and the portfolio’s pricing time. When fair-value pricing is employed, the prices of securities used by a portfolio to calculate its net asset value may differ from quoted or published prices for the same securities.
Investments in Vanguard Market Liquidity Fund are valued at that fund's net asset value. Temporary cash investments are valued using the latest bid prices or using valuations based on a matrix system (which considers such factors as security prices, yields, maturities, and ratings), both as furnished by independent pricing services.
2. Foreign Currency: Securities and other assets and liabilities denominated in foreign currencies are translated into U.S. dollars using exchange rates obtained from an independent third party as of the portfolio’s pricing time on the valuation date. Realized gains (losses) and unrealized appreciation (depreciation) on investment securities include the effects of changes in exchange rates since the securities were purchased, combined with the effects of changes in security prices. Fluctuations in the value of other assets and liabilities resulting from changes in exchange rates are recorded as unrealized foreign currency gains (losses) until the assets or liabilities are settled in cash, at which time they are recorded as realized foreign currency gains (losses).
3. Futures Contracts: The portfolio uses index futures contracts to a limited extent, with the objective of maintaining full exposure to the stock market while maintaining liquidity. The portfolio may purchase or sell futures contracts to achieve a desired level of investment, whether to accommodate portfolio turnover or cash flows from capital share transactions. The primary risks associated with the use of futures contracts are imperfect correlation between changes in market values of stocks held by the portfolio and the prices of futures contracts, and the possibility of an illiquid market. Counterparty risk involving futures is mitigated because a regulated clearinghouse is the counterparty instead of the clearing broker. To further mitigate counterparty risk, the portfolio trades futures contracts on an exchange, monitors the financial strength of its clearing brokers and clearinghouse, and has entered into clearing agreements with its clearing brokers. The clearinghouse imposes initial margin requirements to secure the portfolio’s performance and requires daily settlement of variation margin representing changes in the market value of each contract. Any securities pledged as initial margin for open contracts are noted in the Schedule of Investments.
Futures contracts are valued at their quoted daily settlement prices. The notional amounts of the contracts are not recorded in the Statement of Assets and Liabilities. Fluctuations in the value of the contracts are recorded in the Statement of Assets and Liabilities as an asset (liability) and in the Statement of Operations as unrealized appreciation (depreciation) until the contracts are closed, when they are recorded as realized gains (losses) on futures contracts.
During the year ended December 31, 2020, the portfolio’s average investments in long and short futures contracts represented 3% and 0% of net assets, respectively, based on the average of the notional amounts at each quarter-end during the period.
4. Forward Currency Contracts: The portfolio enters into forward currency contracts to protect the value of securities and related receivables and payables against changes in future foreign exchange rates. The portfolio’s risks in using these contracts include movement in the values of the foreign currencies relative to the U.S. dollar and the ability of the counterparties to fulfill their obligations under the contracts. The portfolio mitigates its counterparty risk by entering into forward currency contracts only with a diverse group of prequalified counterparties, monitoring their financial strength, entering into master netting arrangements with its counterparties, and requiring its counterparties to transfer collateral as security for their performance. In the absence of a default, the collateral pledged or received by the portfolio cannot be repledged, resold, or rehypothecated. The master netting arrangements provide that, in the event of a counterparty’s default (including bankruptcy), the portfolio may terminate the forward currency contracts, determine the net amount owed by either party in accordance with its master netting arrangements, and sell or retain any collateral held up to the net amount owed to the portfolio under the master netting arrangements. The forward currency contracts contain provisions whereby a counterparty may terminate open contracts if the portfolio’s net assets decline below a certain level, triggering a payment by the portfolio if the portfolio is in a net liability position at the time of the termination. The payment amount would be reduced by any collateral the portfolio has pledged. Any securities pledged as collateral for open contracts are noted in the Schedule of Investments. The value of collateral received or pledged is compared daily to the value of the forward currency contracts exposure with each counterparty, and any difference, if in excess of a specified minimum transfer amount, is adjusted and settled within two business days.
Forward currency contracts are valued at their quoted daily prices obtained from an independent third party, adjusted for currency risk based on the expiration date of each contract. The notional amounts of the contracts are not recorded in the Statement of Assets and Liabilities. Fluctuations in the value of the contracts are recorded in the Statement of Assets and Liabilities as an asset (liability) and in the Statement of Operations as unrealized appreciation (depreciation) until the contracts are closed, when they are recorded as realized gains (losses) on forward currency contracts.
During the year ended December 31, 2020, the portfolio’s average investment in forward currency contracts represented 4% of net assets, based on the average of the notional amounts at each quarter-end during the period. The portfolio had no open forward currency contracts at December 31, 2020.
5. Federal Income Taxes: The portfolio intends to continue to qualify as a regulated investment company and distribute all of its taxable income. The portfolio’s tax returns are open to examination by the relevant tax authorities until expiration of the applicable statute of limitations, which is generally three years after the filing of the tax return. Management has analyzed the portfolio’s tax positions taken for all open federal and state income tax years, and has concluded that no provision for income tax is required in the portfolio’s financial statements.
6. Distributions: Distributions to shareholders are recorded on the ex-dividend date. Distributions are determined on a tax basis at the fiscal year-end and may differ from net investment income and realized capital gains for financial reporting purposes.
7. Securities Lending: To earn additional income, the portfolio lends its securities to qualified institutional borrowers. Security loans are subject to termination by the portfolio at any time, and are required to be secured at all times by collateral in an amount at least equal to the market value of securities loaned. Daily market fluctuations could cause the value of loaned securities to be more or less than the value of the collateral received. When this occurs, the collateral is adjusted and settled before the opening of the market on the next business day. The portfolio further mitigates its counterparty risk by entering into securities lending transactions only with a diverse group of prequalified counterparties, monitoring their financial strength, and entering into master securities lending agreements with its counterparties. The master securities lending agreements provide that, in the event of a counterparty’s default (including bankruptcy), the portfolio may terminate any loans with that borrower, determine the net amount owed, and sell or retain the collateral up to the net amount owed to the portfolio; however, such actions may be subject to legal proceedings. While collateral mitigates counterparty risk, in the event of a default, the portfolio may experience delays and costs in recovering the securities loaned. The portfolio invests cash collateral received in Vanguard Market Liquidity Fund, and records a liability in the Statement of Assets and Liabilities for the return of the collateral, during the period the securities are on loan. Collateral investments in Vanguard Market Liquidity Fund are subject to market appreciation or depreciation. Securities lending income represents fees charged to borrowers plus income earned on invested cash collateral, less expenses associated with the loan. During the term of the loan, the portfolio is entitled to all distributions made on or in respect of the loaned securities.
8. Credit Facilities and Interfund Lending Program: The portfolio and certain other funds managed by The Vanguard Group ("Vanguard") participate in a $4.3 billion committed credit facility provided by a syndicate of lenders pursuant to a credit agreement and an uncommitted credit facility provided by Vanguard. Both facilities may be renewed annually. Each fund is individually liable for its borrowings, if any, under the credit facilities. Borrowings may be utilized for temporary or emergency purposes, subject to the portfolio’s regulatory and contractual borrowing restrictions. With respect to the committed credit facility, the participating funds are charged administrative fees and an annual commitment fee of 0.10% of the undrawn committed amount of the facility; these fees are allocated to the funds based on a method approved by the portfolio’s board of trustees and included in Management and Administrative expenses on the portfolio’s Statement of Operations. Any borrowings under either facility bear interest at a rate based upon the higher of the one-month London Interbank Offered Rate (or an acceptable alternate rate, if necessary), federal funds effective rate, or overnight bank funding rate plus an agreed-upon spread, except that borrowings under the uncommitted credit facility may bear interest based upon an alternate rate agreed to by the portfolio and Vanguard.
In accordance with an exemptive order (the “Order”) from the SEC, the portfolio may participate in a joint lending and borrowing program that allows registered open-end Vanguard funds to borrow money from and lend money to each other for temporary or emergency purposes (the “Interfund Lending Program”), subject to compliance with the terms and conditions of the Order, and to the extent permitted by the portfolio’s investment objective and investment policies. Interfund loans and borrowings normally extend overnight, but can have a maximum duration of seven days. Loans may be called on one business day’s notice. The interest rate to be charged is governed by the conditions of the Order and internal procedures adopted by the board of trustees. The board of trustees is responsible for overseeing the Interfund Lending Program.
For the year ended December 31, 2020, the portfolio did not utilize the credit facilities or the Interfund Lending Program.
9. Other: Dividend income is recorded on the ex-dividend date. Non-cash dividends included in dividend income, if any, are recorded at the fair value of the securities received. Interest income includes income distributions received from Vanguard Market Liquidity Fund and is accrued daily. Premiums and discounts on debt securities are amortized and accreted, respectively, to interest income over the lives of the respective securities, except for premiums on certain callable debt securities that are amortized to the earliest call date. Security transactions are accounted for on the date securities are bought or sold. Costs used to determine realized gains (losses) on the sale of investment securities are those of the specific securities sold.
Taxes on foreign dividends and capital gains have been provided for in accordance with the portfolio’s understanding of the applicable countries’ tax rules and rates. Foreign capital gains tax, if any, is accrued daily based upon net unrealized gains.The portfolio has filed tax reclaims for previously withheld taxes on dividends earned in certain European Union countries. These filings are subject to various administrative and judicial proceedings within these countries. Such tax reclaims received during the year, if any, are included in dividend income. No other amounts for additional tax reclaims are reflected in the financial statements due to the uncertainty as to the ultimate resolution of proceedings, the likelihood of receipt of these reclaims, and the potential timing of payment.
| B. | The investment advisory firms Baillie Gifford Overseas Ltd. and Schroder Investment Management North America Inc. each provide investment advisory services to a portion of the portfolio for a fee calculated at an annual percentage rate of average net assets managed by the advisor. The basic fee of Baillie Gifford Overseas Ltd. and Schroder Investment Management North America Inc. is subject to quarterly adjustments based on performance relative to the MSCI All Country World Index ex USA for the preceding three years. |
Vanguard manages the cash reserves of the portfolio as described below.
For the year ended December 31, 2020, the aggregate investment advisory fee paid to all advisors represented an effective annual basic rate of 0.15% of the portfolio’s average net assets, before an increase of $1,691,000 (0.04%) based on performance.
| C. | In accordance with the terms of a Funds' Service Agreement (the “FSA”) between Vanguard and the portfolio, Vanguard furnishes to the portfolio corporate management, administrative, marketing, distribution, and cash management services at Vanguard’s cost of operations (as defined by the FSA). These costs of operations are allocated to the portfolio based on methods and guidelines approved by the board of trustees and are generally settled twice a month. |
Upon the request of Vanguard, the portfolio may invest up to 0.40% of its net assets as capital in Vanguard. At December 31, 2020, the portfolio had contributed to Vanguard capital in the amount of
$218,000, representing less than 0.01% of the portfolio’s net assets and 0.09% of Vanguard’s capital received pursuant to the FSA. The portfolio’s trustees and officers are also directors and employees, respectively, of Vanguard.
| D. | Various inputs may be used to determine the value of the portfolio’s investments and derivatives. These inputs are summarized in three broad levels for financial statement purposes. The inputs or methodologies used to value securities are not necessarily an indication of the risk associated with investing in those securities. |
Level 1—Quoted prices in active markets for identical securities.
Level 2—Other significant observable inputs (including quoted prices for similar securities, interest rates, prepayment speeds, credit risk, etc.).
Level 3—Significant unobservable inputs (including the portfolio’s own assumptions used to determine the fair value of investments). Any investments and derivatives valued with significant unobservable inputs are noted on the Schedule of Investments.
The following table summarizes the market value of the portfolio’s investments and derivatives as of December 31, 2020, based on the inputs used to value them:
| | Level 1
($000) | Level 2
($000) | Level 3
($000) | Total
($000) |
| Investments | | | | |
| Assets | | | | |
| Common Stocks—North and South America | 1,003,365 | 20,783 | — | 1,024,148 |
| Common Stocks—Other | 374,888 | 4,253,843 | 2,831 | 4,631,562 |
| Preferred Stock | — | — | 16,692 | 16,692 |
| Temporary Cash Investments | 204,133 | 5,641 | �� | 209,774 |
| Total | 1,582,386 | 4,280,267 | 19,523 | 5,882,176 |
| Derivative Financial Instruments | | | | |
| Liabilities | | | | |
| Futures Contracts1 | 1,074 | — | — | 1,074 |
| 1 | Represents variation margin on the last day of the reporting period. |
| E. | At December 31, 2020, the fair values of derivatives were reflected in the Statement of Assets and Liabilities as follows: |
| Statement of Assets and Liabilities Caption | Equity
Contracts
($000) | Foreign
Exchange
Contracts
($000) | Total
($000) |
| Variation Margin Payable—Futures Contracts | 1,073 | — | 1,073 |
| Total Liabilities | 1,073 | — | 1,073 |
Realized net gain (loss) and the change in unrealized appreciation (depreciation) on derivatives for the year ended December 31, 2020, were:
| Realized Net Gain (Loss) on Derivatives | Equity
Contracts
($000) | Foreign
Exchange
Contracts
($000) | Total
($000) |
| Futures Contracts | 114 | — | 114 |
| Forward Currency Contracts | — | (3,016) | (3,016) |
| Realized Net Gain (Loss) on Derivatives | 114 | (3,016) | (2,902) |
| Change in Unrealized Appreciation (Depreciation) on Derivatives |
| Futures Contracts | 3,365 | — | 3,365 |
| Forward Currency Contracts | — | (592) | (592) |
| Change in Unrealized Appreciation (Depreciation) on Derivatives | 3,365 | (592) | 2,773 |
| F. | Permanent differences between book-basis and tax-basis components of net assets are reclassified among capital accounts in the financial statements to reflect their tax character. These reclassifications have no effect on net assets or net asset value per share. As of period end, permanent differences primarily attributable to the accounting for foreign currency transactions, passive foreign investment companies, and tax expense on capital gains were reclassified between the individual components of total distributable earnings (loss). |
Temporary differences between book-basis and tax-basis components of total distributable earnings (loss) arise when certain items of income, gain, or loss are recognized in different periods for financial statement and tax purposes; these differences will reverse at some time in the future. The differences are primarily related to the deferral of losses from wash sales; the recognition of unrealized gains or losses from certain derivative contracts; and the recognition of unrealized gains from passive foreign investment companies. As of period end, the tax-basis components of total distributable earnings (loss) are detailed in the table as follows:
| | Amount
($000) |
| Undistributed Ordinary Income | 14,771 |
| Undistributed Long-Term Gains | 408,341 |
| Capital Loss Carryforwards | — |
| Qualified Late-Year Losses | — |
| Net Unrealized Gains (Losses) | 2,873,682 |
The tax character of distributions paid was as follows:
| | Year Ended December 31, |
| | 2020
Amount
($000) | 2019
Amount
($000) |
| Ordinary Income* | 63,225 | 51,642 |
| Long-Term Capital Gains | 84,122 | 107,530 |
| Total | 147,347 | 159,172 |
| * | Includes short-term capital gains, if any. |
As of December 31, 2020, gross unrealized appreciation and depreciation for investments and derivatives based on cost for U.S. federal income tax purposes were as follows:
| | Amount
($000) |
| Tax Cost | 3,007,931 |
| Gross Unrealized Appreciation | 2,979,391 |
| Gross Unrealized Depreciation | (105,146) |
| Net Unrealized Appreciation (Depreciation) | 2,874,245 |
| G. | During the year ended December 31, 2020, the portfolio purchased $912,987,000 of investment securities and sold $1,193,529,000 of investment securities, other than temporary cash investments. |
| H. | Capital share transactions for each class of shares were: |
| | Year Ended December 31, |
| | 2020 | 2019 |
| | Shares
(000) | Shares
(000) |
| Issued | 20,275 | 17,755 |
| Issued in Lieu of Cash Distributions | 6,412 | 6,218 |
| Redeemed | (30,059) | (19,574) |
| Net Increase (Decrease) in Shares Outstanding | (3,372) | 4,399 |
At December 31, 2020, one shareholder (an insurance company separate account whose holdings in the portfolio represent the indirect investment of Vanguard Variable Annuity contract holders) was the record or beneficial owner of 28% of the portfolio’s net assets. If this shareholder was to redeem its investment in the portfolio, the redemption might result in an increase in the portfolio’s expense ratio, cause the portfolio to incur higher transaction costs, or lead to the realization of taxable capital gains.
| I. | Transactions during the period in investments where the issuer is another member of The Vanguard Group were as follows: |
| | | Current Period Transactions | |
| | Dec. 31,
2019
Market
Value
($000) | Purchases
at Cost
($000) | Proceeds
from
Securities
Sold
($000) | Realized
Net
Gain
(Loss)
($000) | Change in
Unrealized
App. (Dep.)
($000) | Income
($000) | Capital Gain
Distributions
Received
($000) | Dec. 31,
2020
Market
Value
($000) |
| Vanguard FTSE All-World ex-US ETF Shares | 4,020 | — | 4,042 | 763 | (741) | — | — | — |
| Vanguard Market Liquidity Fund | 186,137 | NA1 | NA1 | 75 | 6 | 595 | — | 204,133 |
| Total | 190,157 | | | 838 | (735) | 595 | — | 204,133 |
| 1 | Not applicable—purchases and sales are for temporary cash investment purposes. |
| J. | Management has determined that no events or transactions occurred subsequent to December 31, 2020, that would require recognition or disclosure in these financial statements. |
Report of Independent Registered Public Accounting Firm
To the Board of Trustees of Vanguard Variable Insurance Funds and Shareholders of International Portfolio
Opinion on the Financial Statements
We have audited the accompanying statement of assets and liabilities, including the schedule of investments, of International Portfolio (one of the portfolios constituting Vanguard Variable Insurance Funds, referred to hereafter as the "Portfolio”) as of December 31, 2020, the related statement of operations for the year ended December 31, 2020, the statement of changes in net assets for each of the two years in the period ended December 31, 2020, including the related notes, and the financial highlights for each of the five years in the period ended December 31, 2020 (collectively referred to as the “financial statements”). In our opinion, the financial statements present fairly, in all material respects, the financial position of the Portfolio as of December 31, 2020, the results of its operations for the year then ended, the changes in its net assets for each of the two years in the period ended December 31, 2020 and the financial highlights for each of the five years in the period ended December 31, 2020 in conformity with accounting principles generally accepted in the United States of America.
Basis for Opinion
These financial statements are the responsibility of the Portfolio’s management. Our responsibility is to express an opinion on the Portfolio’s financial statements based on our audits. We are a public accounting firm registered with the Public Company Accounting Oversight Board (United States) (PCAOB) and are required to be independent with respect to the Portfolio in accordance with the U.S. federal securities laws and the applicable rules and regulations of the Securities and Exchange Commission and the PCAOB.
We conducted our audits of these financial statements in accordance with the standards of the PCAOB. Those standards require that we plan and perform the audit to obtain reasonable assurance about whether the financial statements are free of material misstatement, whether due to error or fraud.
Our audits included performing procedures to assess the risks of material misstatement of the financial statements, whether due to error or fraud, and performing procedures that respond to those risks. Such procedures included examining, on a test basis, evidence regarding the amounts and disclosures in the financial statements. Our audits also included evaluating the accounting principles used and significant estimates made by management, as well as evaluating the overall presentation of the financial statements. Our procedures included confirmation of securities owned as of December 31, 2020 by correspondence with the custodians, transfer agent and brokers; when replies were not received from brokers, we performed other auditing procedures. We believe that our audits provide a reasonable basis for our opinion.
/s/PricewaterhouseCoopers LLP
Philadelphia, Pennsylvania
February 18, 2021
We have served as the auditor of one or more investment companies in The Vanguard Group of Funds since 1975.
Special 2020 tax information (unaudited) for corporate shareholders only for International Portfolio, a portfolio of Vanguard Variable Insurance Funds
This information for the fiscal year ended December 31, 2020, is included pursuant to provisions of the Internal Revenue Code for corporate shareholders only.
The portfolio distributed $84,122,000 as capital gain dividends (20% rate gain distributions) to shareholders during the fiscal year.
The portfolio designates to shareholders foreign source income of $39,390,000 and foreign taxes paid of $2,501,000. Shareholders will receive more detailed information with their Form 1099-DIV in January 2021 to determine the calendar-year amounts to be included on their 2020 tax returns.
This page intentionally left blank.
The People Who Govern Your Fund
The trustees of your mutual fund are there to see that the fund is operated and managed in your best interests since, as a shareholder, you are a part owner of the fund. Your fund’s trustees also serve on the board of directors of The Vanguard Group, Inc., which is owned by the Vanguard funds and provides services to them.
A majority of Vanguard’s board members are independent, meaning that they have no affiliation with Vanguard or the funds they oversee, apart from the sizable personal investments they have made as private individuals. The independent board members have distinguished backgrounds in business, academia, and public service. Each of the trustees and executive officers oversees 211 Vanguard funds.
Information for each trustee and executive officer of the fund appears below. That information, as well as the Vanguard fund count, is as of the date on the cover of this fund report. The mailing address of the trustees and officers is P.O. Box 876, Valley Forge, PA 19482. More information about the trustees is in the Statement of Additional Information, which can be obtained, without charge, by contacting Vanguard at 800-662-7447, or online at vanguard.com.
Interested Trustee1
Mortimer J. Buckley
Born in 1969. Trustee since January 2018. Principal occupation(s) during the past five years and other experience: chairman of the board (2019–present) of Vanguard and of each of the investment companies served by Vanguard; chief executive officer (2018–present) of Vanguard; chief executive officer, president, and trustee (2018–present) of each of the investment companies served by Vanguard; president and director (2017–present) of Vanguard; and president (2018–present) of Vanguard Marketing Corporation. Chief investment officer (2013–2017), managing director (2002–2017), head of the Retail Investor Group (2006–2012), and chief information officer (2001–2006) of Vanguard. Chairman of the board (2011–2017) and trustee (2009–2017) of the Children’s Hospital of Philadelphia; and trustee (2018–present) and vice chair (2019–present) of The Shipley School.
Independent Trustees
Emerson U. Fullwood
Born in 1948. Trustee since January 2008. Principal occupation(s) during the past five years and other experience: executive chief staff and marketing officer for North America and corporate vice president (retired 2008) of Xerox Corporation (document management products and services). Former president of the Worldwide Channels Group, Latin America, and Worldwide Customer Service and executive chief staff officer of Developing Markets of Xerox. Executive in residence and 2009–2010 Distinguished Minett Professor at the Rochester Institute of Technology. Director of SPX FLOW, Inc. (multi-industry manufacturing). Director of the University of Rochester Medical Center, the Monroe Community College Foundation, the United Way of Rochester, North Carolina A&T University, and Roberts Wesleyan College. Trustee of the University of Rochester.
Amy Gutmann
Born in 1949. Trustee since June 2006. Principal occupation(s) during the past five years and other experience: president (2004–present) of the University of Pennsylvania. Christopher H. Browne Distinguished Professor of Political Science, School of Arts and Sciences, and professor of communication, Annenberg School for Communication, with secondary faculty appointments in the Department of Philosophy, School of Arts and Sciences, and at the Graduate School of Education, University of Pennsylvania.
F. Joseph Loughrey
Born in 1949. Trustee since October 2009. Principal occupation(s) during the past five years and other experience: president and chief operating officer (retired 2009) and vice chairman of the board (2008–2009) of Cummins Inc. (industrial machinery). Chairman of the board of Hillenbrand, Inc. (specialized consumer services) and the Lumina Foundation. Director of the V Foundation. Member of the advisory council for the College of Arts and Letters and chair of the advisory board to the Kellogg Institute for International Studies, both at the University of Notre Dame.
Mark Loughridge
Born in 1953. Trustee since March 2012. Principal occupation(s) during the past five years and other experience: senior vice president and chief financial officer (retired 2013) of IBM (information technology services). Fiduciary member of IBM’s Retirement Plan Committee (2004–2013), senior vice president and general manager (2002–2004) of IBM Global Financing, vice president and controller (1998–2002) of IBM, and a variety of other prior management roles at IBM. Member of the Council on Chicago Booth.
Scott C. Malpass
Born in 1962. Trustee since March 2012. Principal occupation(s) during the past five years and other experience: chief investment officer (retired June 2020) and vice president (retired June 2020) of the University of Notre Dame. Assistant professor of finance at the Mendoza College of Business, University of Notre Dame, and member of the Notre Dame 403(b) Investment Committee (retired June 2020). Member of the board of Catholic Investment Services, Inc. (investment advisors) and the board of superintendence of the Institute for the Works of Religion.
Deanna Mulligan
Born in 1963. Trustee since January 2018. Principal occupation(s) during the past five years and other experience: board chair (2020–present), chief executive officer (2011–2020), and president (2010–2019) of The Guardian Life Insurance Company of America. Chief operating officer (2010–2011) and executive vice president (2008–2010) of the individual life and disability division of Guardian Life. Member of the board of the American Council of Life Insurers and the board of the Economic Club of New York. Trustee of the Partnership for New York City (business leadership), Chief Executives for Corporate Purpose, NewYork-Presbyterian Hospital, Catalyst, and the
Bruce Museum (arts and science). Member of the Advisory Council for the Stanford Graduate School of Business.
André F. Perold
Born in 1952. Trustee since December 2004. Principal occupation(s) during the past five years and other experience: George Gund Professor of Finance and Banking, Emeritus at the Harvard Business School (retired 2011). Chief investment officer and co-managing partner of HighVista Strategies (private investment firm). Member of the board of advisors and member of the investment committee of the Museum of Fine Arts Boston. Member of the board (2018–present) of RIT Capital Partners (investment firm). Member of the investment committee of Partners Health Care System.
Sarah Bloom Raskin
Born in 1961. Trustee since January 2018. Principal occupation(s) during the past five years and other experience: deputy secretary (2014–2017) of the United States Department of the Treasury. Governor (2010–2014) of the Federal Reserve Board. Commissioner (2007–2010) of financial regulation for the State of Maryland. Member of the board of directors (2012–2014) of Neighborhood Reinvestment Corporation. Director (2017–present) of i(x) Investments, LLC; director (2017–present) of Reserve Trust. Rubenstein Fellow (2017–present) of Duke University; trustee (2017–present) of Amherst College, and trustee (2019–present) of the Folger Shakespeare Library.
Peter F. Volanakis
Born in 1955. Trustee since July 2009. Principal occupation(s) during the past five years and other experience: president and chief operating officer (retired 2010) of Corning Incorporated (communications equipment) and director of Corning Incorporated (2000–2010) and Dow Corning (2001–2010). Director (2012) of SPX Corporation (multi-industry manufacturing). Overseer of the Amos Tuck School of Business Administration, Dartmouth College (2001–2013). Chairman of the board of trustees of Colby-Sawyer College. Member of the board of Hypertherm Inc. (industrial cutting systems, software, and consumables).
1 Mr. Buckley is considered an “interested person,” as defined in the Investment Company Act of 1940, because he is an officer of the Vanguard funds.
Executive Officers
John Bendl
Born in 1970. Principal occupation(s) during the past five years and other experience: principal of Vanguard. Chief financial officer (2019–present) of each of the investment companies served by Vanguard. Chief accounting officer, treasurer, and controller of Vanguard (2017–present). Partner (2003–2016) at KPMG (audit, tax, and advisory services).
Christine M. Buchanan
Born in 1970. Principal occupation(s) during the past five years and other experience: principal of Vanguard. Treasurer (2017–present) of each of the investment companies served by Vanguard. Partner (2005–2017) at KPMG (audit, tax, and advisory services).
David Cermak
Born in 1960. Principal occupation(s) during the past five years and other experience: principal of Vanguard. Finance director (2019–present) of each of the investment companies served by Vanguard. Managing director and head (2017–present) of Vanguard Investments Singapore. Managing director and head (2017–2019) of Vanguard Investments Hong Kong. Representative director and head (2014–2017) of Vanguard Investments Japan.
John Galloway
Born in 1973. Principal occupation(s) during the past five years and other experience: principal of Vanguard.
Investment stewardship officer (September 2020–present) of each of the investment companies served by Vanguard. Head of Investor Advocacy (February 2020–present) and head of Marketing Strategy and Planning (2017–2020) at Vanguard. Deputy assistant to the President of the United States (2015).
Thomas J. Higgins
Born in 1957. Principal occupation(s) during the past five years and other experience: principal of Vanguard. Finance director (2019–present), chief financial officer (2008–2019), and treasurer (1998–2008) of each of the investment companies served by Vanguard.
Peter Mahoney
Born in 1974. Principal occupation(s) during the past five years and other experience: principal of Vanguard. Controller (2015–present) of each of the investment companies served by Vanguard. Head of International Fund Services (2008–2014) at Vanguard.
Anne E. Robinson
Born in 1970. Principal occupation(s) during the past five years and other experience: general counsel (2016–present) of Vanguard. Secretary (2016–present) of Vanguard and of each of the investment companies served by Vanguard. Managing director (2016–present) of Vanguard. Managing director and general counsel of Global Cards and Consumer Services (2014–2016) at Citigroup. Counsel (2003–2014) at American Express.
Michael Rollings
Born in 1963. Principal occupation(s) during the past five years and other experience: finance director (2017–present) and treasurer (2017) of each of the investment companies served by Vanguard. Managing director (2016–present) of Vanguard. Chief financial officer (2016–present) of Vanguard. Director (2016–present) of Vanguard Marketing Corporation. Executive vice president and chief financial officer (2006–2016) of MassMutual Financial Group.
John E. Schadl
Born in 1972. Principal occupation(s) during the past five years and other experience: principal of Vanguard. Chief compliance officer (2019–present) of Vanguard and of each of the investment companies served by Vanguard. Assistant vice president (2019–present) of Vanguard Marketing Corporation.
Vanguard Senior Management Team
| Joseph Brennan | James M. Norris |
| Mortimer J. Buckley | Thomas M. Rampulla |
| Gregory Davis | Karin A. Risi |
| John James | Anne E. Robinson |
| John T. Marcante | Michael Rollings |
| Chris D. McIsaac | Lauren Valente |
Connect with Vanguard®>vanguard.com
Fund Information > 800-662-7447
Annuity and Insurance Services > 800-522-5555
Institutional Investor Services > 800-523-1036
Text Telephone for People Who Are Deaf or Hard of Hearing > 800-749-7273
This material may be used in conjunction with the offering of shares of any Vanguard fund only if preceded or accompanied by the fund’s current prospectus.
You can obtain a free copy of Vanguard’s proxy voting guidelines by visiting vanguard.com/proxyreporting or by calling Vanguard at 800-662-2739. The guidelines are also available from the SEC’s website, www.sec.gov. In addition, you may obtain a free report on how your fund voted the proxies for securities it owned during the 12 months ended June 30. To get the report, visit either vanguard.com/proxyreporting or www.sec.gov.
All comparative mutual fund data are from Morningstar, Inc., unless otherwise noted.
You can review information about your fund on the SEC’s website, and you can receive copies of this information, for a fee, by sending a request via email addressed to publicinfo@sec.gov.
Source for Bloomberg Barclays indexes: Bloomberg Index Services Limited. Copyright 2021, Bloomberg. All rights reserved.
CFA® is a registered trademark owned by CFA Institute.
© 2021 The Vanguard Group, Inc.
All rights reserved.
Vanguard Marketing Corporation, Distributor.
Q690I 022021
Annual Report | December 31, 2020
Vanguard Variable Insurance Funds
Contents
Your Portfolio’s Performance at a Glance
| 1 |
About Your Portfolio’s Expenses
| 2 |
Performance Summary
| 3 |
Financial Statements
| 5 |
Please note: The opinions expressed in this report are just that—informed opinions. They should not be considered promises or advice. Also, please keep in mind that the information and opinions cover the period through the date on the front of this report. Of course, the risks of investing in your fund are spelled out in the prospectus.
Your Portfolio’s Performance at a Glance
| • | For the 12 months ended December 31, 2020, the Mid-Cap Index Portfolio returned 18.07%, in line with its benchmark index after factoring in the portfolio’s expenses. |
| • | The emergence of COVID-19 in early 2020 turned into a global health crisis, and aggressive attempts to contain it resulted in a sharp downturn in economic activity. Unemployment spiked, and sectors where social distancing isn't possible were hit hard. Stocks initially plummeted as infections surged, but they finished the year significantly higher, thanks in part to rapid and robust monetary and fiscal action by policymakers and the rollout of COVID-19 vaccines in mid-December. |
| • | Nine of the portfolio’s 11 sectors finished the year with positive returns. Technology stocks contributed the most to the portfolio’s results. Health care and industrials were also among the top performers. Energy stocks hurt the most as the pandemic severely reduced global demand for oil. |
| • | Over the 10 years ended December 31, the portfolio recorded an average annual return of 12.26%, in line with its benchmark average. |
| • | Please note that the portfolio’s returns are different from those in Vanguard Variable Annuity (and other plans that invest in the portfolio), which take into account insurance-related expenses. |
Market Barometer
| | Average Annual Total Returns
Periods Ended December 31, 2020 |
| | One Year | Three Years | Five Years |
| Stocks | | | |
| Russell 1000 Index (Large-caps) | 20.96% | 14.82% | 15.60% |
| Russell 2000 Index (Small-caps) | 19.96 | 10.25 | 13.26 |
| Russell 3000 Index (Broad U.S. market) | 20.89 | 14.49 | 15.43 |
| FTSE All-World ex US Index (International) | 11.22 | 5.18 | 9.16 |
| Bonds | | | |
| Bloomberg Barclays U.S. Aggregate Bond Index (Broad taxable market) | 7.51% | 5.34% | 4.44% |
| Bloomberg Barclays Municipal Bond Index (Broad tax-exempt market) | 5.21 | 4.64 | 3.91 |
| FTSE Three-Month U.S. Treasury Bill Index | 0.58 | 1.56 | 1.16 |
| CPI | | | |
| Consumer Price Index | 1.36% | 1.85% | 1.95% |
About Your Portfolio’s Expenses
As a shareholder of the portfolio, you incur ongoing costs, which include costs for portfolio management, administrative services, and shareholder reports (like this one), among others. Operating expenses, which are deducted from a portfolio’s gross income, directly reduce the investment return of the portfolio.
A portfolio‘s expenses are expressed as a percentage of its average net assets. This figure is known as the expense ratio. The following examples are intended to help you understand the ongoing costs (in dollars) of investing in your portfolio and to compare these costs with those of other mutual funds. The examples are based on an investment of $1,000 made at the beginning of the period shown and held for the entire period.
The accompanying table illustrates your portfolio’s costs in two ways:
| • | Based on actual portfolio return. This section helps you to estimate the actual expenses that you paid over the period. The ”Ending Account Value“ shown is derived from the portfolio’s actual return, and the third column shows the dollar amount that would have been paid by an investor who started with $1,000 in the portfolio. You may use the information here, together with the amount you invested, to estimate the expenses that you paid over the period. |
To do so, simply divide your account value by $1,000 (for example, an $8,600 account value divided by $1,000 = 8.6), then multiply the result by the number given for your portfolio under the heading ”Expenses Paid During Period.”
| • | Based on hypothetical 5% yearly return. This section is intended to help you compare your portfolio‘s costs with those of other mutual funds. It assumes that the portfolio had a yearly return of 5% before expenses, but that the expense ratio is unchanged. In this case—because the return used is not the portfolio’s actual return—the results do not apply to your investment. The example is useful in making comparisons because the Securities and Exchange Commission requires all mutual funds to calculate expenses based on a 5% return. You can assess your portfolio’s costs by comparing this hypothetical example with the hypothetical examples that appear in shareholder reports of other funds. |
Note that the expenses shown in the table are meant to highlight and help you compare ongoing costs only and do not reflect transaction costs incurred by the portfolio for buying and selling securities. The portfolio’s expense ratio does not reflect additional fees and expenses associated with the annuity or life insurance program through which you invest.
The calculations assume no shares were bought or sold during the period. Your actual costs may have been higher or lower, depending on the amount of your investment and the timing of any purchases or redemptions.
You can find more information about the portfolio’s expenses, including annual expense ratios, in the Financial Statements section of this report. For additional information on operating expenses and other shareholder costs, please refer to your portfolio’s current prospectus.
| Six Months Ended December 31, 2020 | | | |
| Mid-Cap Index Portfolio | Beginning
Account Value
6/30/2020 | Ending
Account Value
12/31/2020 | Expenses
Paid During
Period |
| Based on Actual Portfolio Return | $1,000.00 | $1,273.90 | $0.97 |
| Based on Hypothetical 5% Yearly Return | 1,000.00 | 1,024.28 | 0.87 |
The calculations are based on expenses incurred in the most recent six-month period. The portfolio's annualized six-month expense ratio for that period is 0.17%. The dollar amounts shown as ”Expenses Paid” are equal to the annualized expense ratio multiplied by the average account value over the period, multiplied by the number of days in the most recent six-month period, then divided by the number of days in the most recent 12-month period (184/366).
All of the returns in this report represent past performance, which is not a guarantee of future results that may be achieved by the portfolio. (Current performance may be lower or higher than the performance data cited. For performance data current to the most recent month-end, visit our website at vanguard.com/performance.) Note, too, that both investment returns and principal value can fluctuate widely, so an investor’s shares, when sold, could be worth more or less than their original cost. The returns shown do not reflect taxes that a shareholder would pay on portfolio distributions or on the sale of portfolio shares. Nor do the returns reflect fees and expenses associated with the annuity or life insurance program through which a shareholder invests. If these fees and expenses were included, the portfolio’s returns would be lower.
Cumulative Performance: December 31, 2010, Through December 31, 2020
Initial Investment of $10,000
| | | | Average Annual Total Returns
Periods Ended December 31, 2020 |
| | | One
Year | Five
Years | Ten
Years | Final Value
of a $10,000
Investment |
 | Mid-Cap Index Portfolio | 18.07% | 13.14% | 12.26% | $31,774 |
 | Spliced Mid-Cap Index | 18.24 | 13.30 | 12.44 | 32,295 |
 | Dow Jones U.S. Total Stock Market Float Adjusted Index | 20.79 | 15.36 | 13.74 | 36,240 |
Spliced Mid-Cap Index: MSCI US Mid Cap 450 Index through January 30, 2013; CRSP US Mid Cap Index thereafter.
See Financial Highlights for dividend and capital gains information.
| Basic Materials | 3.9% |
| Consumer Discretionary | 15.2 |
| Consumer Staples | 4.3 |
| Energy | 3.1 |
| Financials | 11.4 |
| Health Care | 11.5 |
| Industrials | 13.1 |
| Real Estate | 8.6 |
| Technology | 20.4 |
| Telecommunications | 2.2 |
| Utilities | 6.3 |
The table reflects the portfolio's investments, except for short-term investments and derivatives. Sector categories are based on the Industry Classification Benchmark (“ICB”), except for the “Other” category (if applicable), which includes securities that have not been provided an ICB classification as of the effective reporting period.
The portfolio may invest in derivatives (such as futures and swap contracts) for various reasons, including, but not limited to, attempting to remain fully invested and tracking its target index as closely as possible.
The Industry Classification Benchmark (“ICB”) is owned by FTSE. FTSE does not accept any liability to any person for any loss or damage arising out of any error or omission in the ICB.
The portfolio files its complete schedule of portfolio holdings with the Securities and Exchange Commission (SEC) for the first and third quarters of each fiscal year as an exhibit to its reports on Form N-PORT. The portfolio’s Form N-PORT reports are available on the SEC’s website at www.sec.gov.
| | | | | | Shares | Market
Value•
($000) |
| Common Stocks (99.9%) |
| Basic Materials (3.9%) |
| | Freeport-McMoRan Inc. | 553,319 | 14,397 |
| | Fastenal Co. | 218,602 | 10,674 |
| | Newmont Corp. | 152,964 | 9,161 |
| | International Paper Co. | 149,652 | 7,441 |
| | Nucor Corp. | 115,053 | 6,120 |
| | Albemarle Corp. | 40,546 | 5,981 |
| | Celanese Corp. Class A | 44,467 | 5,778 |
| | FMC Corp. | 49,406 | 5,678 |
| | Eastman Chemical Co. | 51,525 | 5,167 |
| | Avery Dennison Corp. | 31,790 | 4,931 |
| 1 | International Flavors & Fragrances Inc. | 40,755 | 4,436 |
| | LyondellBasell Industries NV Class A | 47,697 | 4,372 |
| | CF Industries Holdings Inc. | 40,794 | 1,579 |
| | Westlake Chemical Corp. | 6,147 | 502 |
| | | | | | | 86,217 |
| Consumer Discretionary (15.2%) |
| * | Chipotle Mexican Grill Inc. Class A | 10,648 | 14,766 |
| * | Peloton Interactive Inc. Class A | 92,400 | 14,019 |
| | Aptiv plc | 102,751 | 13,387 |
| * | Trade Desk Inc. Class A | 16,000 | 12,816 |
| * | Copart Inc. | 80,930 | 10,298 |
| | Delta Air Lines Inc. | 242,700 | 9,759 |
| * | Dollar Tree Inc. | 89,544 | 9,674 |
| * | Take-Two Interactive Software Inc. | 43,797 | 9,101 |
| | DR Horton Inc. | 131,839 | 9,086 |
| | Best Buy Co. Inc. | 88,730 | 8,854 |
| | Lennar Corp. Class A | 103,892 | 7,920 |
| * | Lululemon Athletica Inc. | 22,572 | 7,856 |
| | ViacomCBS Inc. Class B | 205,541 | 7,658 |
| | Garmin Ltd. | 58,246 | 6,970 |
| | Expedia Group Inc. | 51,749 | 6,852 |
| * | Carvana Co. Class A | 26,862 | 6,435 |
| | Tractor Supply Co. | 44,313 | 6,229 |
| | Tiffany & Co. | 46,188 | 6,071 |
| * | Wayfair Inc. Class A | 26,313 | 5,942 |
| * | CarMax Inc. | 62,477 | 5,902 |
| | Darden Restaurants Inc. | 49,494 | 5,896 |
| | Hilton Worldwide Holdings Inc. | 52,900 | 5,886 |
| * | Ulta Beauty Inc. | 20,410 | 5,861 |
| | Domino's Pizza Inc. | 14,991 | 5,748 |
| | Genuine Parts Co. | 54,983 | 5,522 |
| * | NVR Inc. | 1,343 | 5,479 |
| | Royal Caribbean Cruises Ltd. | 72,643 | 5,426 |
| * | AutoZone Inc. | 4,442 | 5,266 |
| | Southwest Airlines Co. | 112,400 | 5,239 |
| | Omnicom Group Inc. | 81,844 | 5,105 |
| | MGM Resorts International | 159,596 | 5,029 |
| * | DraftKings Inc. Class A | 104,466 | 4,864 |
| * | United Airlines Holdings Inc. | 112,404 | 4,861 |
| | Hasbro Inc. | 49,588 | 4,638 |
| * | Lyft Inc. Class A | 93,898 | 4,613 |
| | Carnival Corp. | 211,616 | 4,584 |
| | Fortune Brands Home & Security Inc. | 52,876 | 4,533 |
| | Whirlpool Corp. | 23,816 | 4,299 |
| * | Etsy Inc. | 24,000 | 4,270 |
| | PulteGroup Inc. | 97,228 | 4,192 |
| | Wynn Resorts Ltd. | 37,050 | 4,180 |
| | | | | | Shares | Market
Value•
($000) |
| | Advance Auto Parts Inc. | 25,886 | 4,076 |
| * | Live Nation Entertainment Inc. | 53,719 | 3,947 |
| | Fox Corp. Class A | 128,400 | 3,739 |
| | BorgWarner Inc. | 93,040 | 3,595 |
| * | LKQ Corp. | 98,438 | 3,469 |
| | News Corp. Class A | 190,821 | 3,429 |
| * | Burlington Stores Inc. | 12,660 | 3,311 |
| | Rollins Inc. | 84,417 | 3,298 |
| * | Discovery Inc. Class C | 117,612 | 3,080 |
| * | Liberty Media Corp.-Liberty SiriusXM Class C | 62,436 | 2,717 |
| * | Chewy Inc. Class A | 27,220 | 2,447 |
| | Vail Resorts Inc. | 7,652 | 2,135 |
| | Aramark | 48,349 | 1,860 |
| | Lear Corp. | 11,429 | 1,818 |
| | Interpublic Group of Cos. Inc. | 74,501 | 1,752 |
| * | Discovery Inc. Class A | 57,604 | 1,733 |
| | Fox Corp. Class B | 58,768 | 1,697 |
| | American Airlines Group Inc. | 105,551 | 1,665 |
| * | Mohawk Industries Inc. | 10,819 | 1,525 |
| | Sirius XM Holdings Inc. | 202,800 | 1,292 |
| * | Liberty Media Corp.-Liberty SiriusXM Class A | 29,545 | 1,276 |
| | Warner Music Group Corp. Class A | 30,367 | 1,154 |
| | Lennar Corp. Class B | 6,899 | 422 |
| | ViacomCBS Inc. Class A | 2,790 | 105 |
| | News Corp. Class B | 3,475 | 62 |
| | | | | | | 340,690 |
| Consumer Staples (4.3%) |
| | Corteva Inc. | 284,869 | 11,030 |
| | Clorox Co. | 48,011 | 9,694 |
| | McCormick & Co. Inc. (Non-Voting) | 94,726 | 9,056 |
| | Church & Dwight Co. Inc. | 94,530 | 8,246 |
| | Tyson Foods Inc. Class A | 112,015 | 7,218 |
| | Conagra Brands Inc. | 176,614 | 6,404 |
| | Kellogg Co. | 98,120 | 6,106 |
| | Archer-Daniels-Midland Co. | 105,900 | 5,338 |
| | McKesson Corp. | 30,600 | 5,322 |
| | AmerisourceBergen Corp. Class A | 54,424 | 5,320 |
| | Hormel Foods Corp. | 102,687 | 4,786 |
| | J M Smucker Co. | 41,280 | 4,772 |
| | Kroger Co. | 140,004 | 4,447 |
| | Lamb Weston Holdings Inc. | 55,713 | 4,387 |
| | Campbell Soup Co. | 74,758 | 3,615 |
| | Molson Coors Beverage Co. Class B | 34,408 | 1,555 |
| | | | | | | 97,296 |
| Energy (3.1%) |
| | Valero Energy Corp. | 155,200 | 8,780 |
| | Pioneer Natural Resources Co. | 62,595 | 7,129 |
| | ONEOK Inc. | 169,182 | 6,493 |
| | Occidental Petroleum Corp. | 354,400 | 6,135 |
| | Halliburton Co. | 319,555 | 6,039 |
| | Phillips 66 | 83,100 | 5,812 |
| | Hess Corp. | 105,136 | 5,550 |
| * | Cheniere Energy Inc. | 86,420 | 5,188 |
| | Baker Hughes Co. Class A | 248,312 | 5,177 |
| | Marathon Petroleum Corp. | 123,979 | 5,128 |
| | Williams Cos. Inc. | 230,864 | 4,629 |
| | Concho Resources Inc. | 74,753 | 4,362 |
| | | | | | | 70,422 |
| | | | | | Shares | Market
Value•
($000) |
| Financials (11.4%) |
| | MSCI Inc. Class A | 29,960 | 13,378 |
| | IHS Markit Ltd. | 136,493 | 12,261 |
| | Discover Financial Services | 116,732 | 10,568 |
| | Willis Towers Watson plc | 49,067 | 10,337 |
| | First Republic Bank | 66,230 | 9,731 |
| | State Street Corp. | 127,586 | 9,286 |
| | Arthur J Gallagher & Co. | 73,200 | 9,056 |
| | Ameriprise Financial Inc. | 44,892 | 8,724 |
| | KKR & Co. Inc. | 205,872 | 8,336 |
| | MarketAxess Holdings Inc. | 13,726 | 7,831 |
| * | SVB Financial Group | 19,701 | 7,641 |
| | Fifth Third Bancorp | 271,066 | 7,473 |
| | Nasdaq Inc. | 56,226 | 7,463 |
| | Northern Trust Corp. | 75,330 | 7,016 |
| | Broadridge Financial Solutions Inc. | 43,992 | 6,740 |
| | Hartford Financial Services Group Inc. | 136,312 | 6,677 |
| | American International Group Inc. | 163,900 | 6,205 |
| | KeyCorp | 372,336 | 6,110 |
| | M&T Bank Corp. | 46,486 | 5,918 |
| | Regions Financial Corp. | 365,293 | 5,888 |
| | Citizens Financial Group Inc. | 162,450 | 5,809 |
| * | Markel Corp. | 5,244 | 5,419 |
| * | Arch Capital Group Ltd. | 146,848 | 5,297 |
| | Principal Financial Group Inc. | 104,664 | 5,192 |
| | Cincinnati Financial Corp. | 58,204 | 5,085 |
| | Ally Financial Inc. | 142,308 | 5,075 |
| | Huntington Bancshares Inc. | 387,133 | 4,889 |
| | FactSet Research Systems Inc. | 14,457 | 4,807 |
| | Raymond James Financial Inc. | 46,958 | 4,492 |
| | Annaly Capital Management Inc. | 531,190 | 4,489 |
| | Fidelity National Financial Inc. | 106,144 | 4,149 |
| | Loews Corp. | 88,933 | 4,004 |
| | Equitable Holdings Inc. | 152,413 | 3,900 |
| | Cboe Global Markets Inc. | 41,170 | 3,834 |
| | Everest Re Group Ltd. | 15,224 | 3,564 |
| | Globe Life Inc. | 35,907 | 3,410 |
| | W R Berkley Corp. | 50,856 | 3,378 |
| | Franklin Resources Inc. | 115,047 | 2,875 |
| | Interactive Brokers Group Inc. Class A | 29,450 | 1,794 |
| | Lincoln National Corp. | 35,036 | 1,763 |
| | AGNC Investment Corp. | 104,101 | 1,624 |
| | Alleghany Corp. | 2,597 | 1,568 |
| | SEI Investments Co. | 24,833 | 1,427 |
| | | | | | | 254,483 |
| Health Care (11.5%) |
| * | IDEXX Laboratories Inc. | 32,471 | 16,231 |
| * | Align Technology Inc. | 27,014 | 14,436 |
| * | Veeva Systems Inc. Class A | 51,638 | 14,058 |
| * | DexCom Inc. | 36,593 | 13,529 |
| * | Centene Corp. | 220,660 | 13,246 |
| * | IQVIA Holdings Inc. | 72,973 | 13,075 |
| | ResMed Inc. | 55,184 | 11,730 |
| * | Teladoc Health Inc. | 49,700 | 9,938 |
| | Cerner Corp. | 116,648 | 9,155 |
| * | Seagen Inc. | 51,544 | 9,027 |
| * | Viatris Inc. | 463,157 | 8,680 |
| * | Exact Sciences Corp. | 60,548 | 8,022 |
| | West Pharmaceutical Services Inc. | 26,700 | 7,564 |
| * | Laboratory Corp. of America Holdings | 37,067 | 7,545 |
| | Cooper Cos. Inc. | 20,307 | 7,378 |
| | Teleflex Inc. | 17,718 | 7,292 |
| * | Hologic Inc. | 97,789 | 7,122 |
| * | Moderna Inc. | 60,252 | 6,295 |
| * | Alexion Pharmaceuticals Inc. | 39,591 | 6,186 |
| * | Incyte Corp. | 70,881 | 6,165 |
| | Quest Diagnostics Inc. | 51,292 | 6,112 |
| * | Varian Medical Systems Inc. | 34,814 | 6,093 |
| * | BioMarin Pharmaceutical Inc. | 69,114 | 6,061 |
| | | | | | Shares | Market
Value•
($000) |
| | Cardinal Health Inc. | 111,723 | 5,984 |
| * | Alnylam Pharmaceuticals Inc. | 44,233 | 5,749 |
| * | ABIOMED Inc. | 17,195 | 5,575 |
| * | Elanco Animal Health Inc. | 179,640 | 5,510 |
| | DENTSPLY SIRONA Inc. | 83,073 | 4,350 |
| | Universal Health Services Inc. Class B | 28,163 | 3,872 |
| * | Henry Schein Inc. | 54,390 | 3,636 |
| * | DaVita Inc. | 27,728 | 3,255 |
| * | Insulet Corp. | 12,600 | 3,221 |
| * | PPD Inc. | 46,677 | 1,597 |
| * | GoodRx Holdings Inc. Class A | 15,975 | 644 |
| | | | | | | 258,333 |
| Industrials (13.1%) |
| | Verisk Analytics Inc. Class A | 61,921 | 12,854 |
| | Carrier Global Corp. | 330,005 | 12,448 |
| * | TransDigm Group Inc. | 19,692 | 12,186 |
| | Cintas Corp. | 33,881 | 11,976 |
| | Ball Corp. | 124,542 | 11,605 |
| | AMETEK Inc. | 87,622 | 10,597 |
| * | Mettler-Toledo International Inc. | 9,056 | 10,321 |
| * | Keysight Technologies Inc. | 70,520 | 9,315 |
| | Equifax Inc. | 46,321 | 8,933 |
| * | FleetCor Technologies Inc. | 31,757 | 8,664 |
| | Fortive Corp. | 122,011 | 8,641 |
| | Old Dominion Freight Line Inc. | 40,205 | 7,847 |
| | Vulcan Materials Co. | 50,412 | 7,477 |
| | Synchrony Financial | 211,000 | 7,324 |
| | Kansas City Southern | 35,600 | 7,267 |
| | TransUnion | 72,403 | 7,184 |
| | WW Grainger Inc. | 17,363 | 7,090 |
| | Xylem Inc. | 68,568 | 6,980 |
| | Dover Corp. | 54,843 | 6,924 |
| | Martin Marietta Materials Inc. | 23,716 | 6,735 |
| * | Ingersoll Rand Inc. | 143,112 | 6,520 |
| * | United Rentals Inc. | 27,478 | 6,372 |
| * | Trimble Inc. | 95,204 | 6,357 |
| | Expeditors International of Washington Inc. | 64,518 | 6,136 |
| * | Waters Corp. | 23,628 | 5,846 |
| | Otis Worldwide Corp. | 82,396 | 5,566 |
| | Rockwell Automation Inc. | 22,118 | 5,547 |
| | Masco Corp. | 99,528 | 5,467 |
| | Jacobs Engineering Group Inc. | 49,380 | 5,380 |
| * | Crown Holdings Inc. | 51,263 | 5,137 |
| | Westinghouse Air Brake Technologies Corp. | 68,855 | 5,040 |
| | Packaging Corp. of America | 36,108 | 4,980 |
| | CH Robinson Worldwide Inc. | 51,790 | 4,861 |
| | JB Hunt Transport Services Inc. | 32,169 | 4,396 |
| | Westrock Co. | 100,003 | 4,353 |
| | Textron Inc. | 87,118 | 4,210 |
| * | Zebra Technologies Corp. Class A | 10,200 | 3,920 |
| | Snap-on Inc. | 20,657 | 3,535 |
| | Western Union Co. | 156,426 | 3,432 |
| | HEICO Corp. Class A | 28,499 | 3,336 |
| | Cognex Corp. | 31,541 | 2,532 |
| | Jack Henry & Associates Inc. | 14,560 | 2,359 |
| | HEICO Corp. | 15,769 | 2,088 |
| * | XPO Logistics Inc. | 17,401 | 2,074 |
| | Hubbell Inc. Class B | 10,332 | 1,620 |
| *,1 | Nikola Corp. | 33,000 | 504 |
| | | | | | | 293,936 |
| Real Estate (8.6%) |
| | Digital Realty Trust Inc. | 106,675 | 14,882 |
| * | CoStar Group Inc. | 15,006 | 13,870 |
| | SBA Communications Corp. Class A | 42,305 | 11,936 |
| | Welltower Inc. | 158,814 | 10,263 |
| | Weyerhaeuser Co. | 284,321 | 9,533 |
| | Alexandria Real Estate Equities Inc. | 51,383 | 9,158 |
| | AvalonBay Communities Inc. | 53,159 | 8,528 |
| | | | | | Shares | Market
Value•
($000) |
| | Equity Residential | 141,836 | 8,408 |
| | Realty Income Corp. | 133,569 | 8,304 |
| * | CBRE Group Inc. Class A | 121,419 | 7,615 |
| * | Zillow Group Inc. Class C | 57,100 | 7,412 |
| | Ventas Inc. | 142,500 | 6,988 |
| | Invitation Homes Inc. | 213,174 | 6,331 |
| | Sun Communities Inc. | 40,988 | 6,228 |
| | Healthpeak Properties Inc. | 204,809 | 6,191 |
| | Essex Property Trust Inc. | 24,828 | 5,895 |
| | Extra Space Storage Inc. | 49,192 | 5,699 |
| | Duke Realty Corp. | 141,699 | 5,664 |
| | Mid-America Apartment Communities Inc. | 43,538 | 5,516 |
| | Simon Property Group Inc. | 61,933 | 5,282 |
| | Boston Properties Inc. | 53,374 | 5,045 |
| | WP Carey Inc. | 66,727 | 4,710 |
| | UDR Inc. | 112,050 | 4,306 |
| | Camden Property Trust | 37,030 | 3,700 |
| | Iron Mountain Inc. | 109,663 | 3,233 |
| * | Zillow Group Inc. Class A | 15,900 | 2,161 |
| | Host Hotels & Resorts Inc. | 134,658 | 1,970 |
| | VEREIT Inc. | 41,494 | 1,568 |
| | Regency Centers Corp. | 32,399 | 1,477 |
| | | | | | | 191,873 |
| Technology (20.3%) |
| * | Twitter Inc. | 302,677 | 16,390 |
| | KLA Corp. | 58,819 | 15,229 |
| * | Synopsys Inc. | 57,761 | 14,974 |
| | Amphenol Corp. Class A | 113,926 | 14,898 |
| * | DocuSign Inc. Class A | 67,000 | 14,894 |
| * | Match Group Inc. | 96,204 | 14,545 |
| * | Cadence Design Systems Inc. | 106,245 | 14,495 |
| * | Crowdstrike Holdings Inc. Class A | 66,700 | 14,128 |
| | Microchip Technology Inc. | 99,089 | 13,685 |
| | Xilinx Inc. | 93,315 | 13,229 |
| * | Pinterest Inc. Class A | 194,504 | 12,818 |
| * | Palo Alto Networks Inc. | 34,466 | 12,249 |
| | Marvell Technology Group Ltd. | 255,138 | 12,129 |
| * | ANSYS Inc. | 32,685 | 11,891 |
| * | Okta Inc. | 45,677 | 11,614 |
| * | RingCentral Inc. Class A | 30,190 | 11,441 |
| * | Snap Inc. Class A | 211,464 | 10,588 |
| | Corning Inc. | 290,745 | 10,467 |
| * | Splunk Inc. | 61,087 | 10,378 |
| | Skyworks Solutions Inc. | 63,229 | 9,666 |
| * | Twilio Inc. Class A | 26,688 | 9,034 |
| | Maxim Integrated Products Inc. | 101,789 | 9,024 |
| * | Coupa Software Inc. | 26,200 | 8,879 |
| * | Paycom Software Inc. | 18,925 | 8,559 |
| * | VeriSign Inc. | 36,931 | 7,992 |
| * | Fortinet Inc. | 52,470 | 7,793 |
| * | Slack Technologies Inc. Class A | 174,703 | 7,379 |
| * | EPAM Systems Inc. | 20,300 | 7,274 |
| * | Qorvo Inc. | 43,378 | 7,212 |
| | CDW Corp. | 54,462 | 7,178 |
| * | Tyler Technologies Inc. | 15,400 | 6,722 |
| * | Datadog Inc. Class A | 67,300 | 6,625 |
| * | Akamai Technologies Inc. | 61,952 | 6,504 |
| | Citrix Systems Inc. | 46,853 | 6,096 |
| | Western Digital Corp. | 110,028 | 6,094 |
| | SS&C Technologies Holdings Inc. | 82,761 | 6,021 |
| * | Arista Networks Inc. | 20,190 | 5,867 |
| | Hewlett Packard Enterprise Co. | 490,268 | 5,810 |
| * | Zscaler Inc. | 28,100 | 5,612 |
| | NetApp Inc. | 84,480 | 5,596 |
| * | IAC/InterActiveCorp | 28,770 | 5,448 |
| * | GoDaddy Inc. Class A | 63,897 | 5,300 |
| | Seagate Technology plc | 83,090 | 5,165 |
| * | Gartner Inc. | 32,237 | 5,164 |
| * | Black Knight Inc. | 56,685 | 5,008 |
| | | | | | Shares | Market
Value•
($000) |
| | NortonLifeLock Inc. | 213,563 | 4,438 |
| | Teradyne Inc. | 31,600 | 3,789 |
| * | HubSpot Inc. | 8,300 | 3,290 |
| * | IPG Photonics Corp. | 13,191 | 2,952 |
| * | Cloudflare Inc. Class A | 37,900 | 2,880 |
| | Leidos Holdings Inc. | 27,100 | 2,849 |
| * | Dropbox Inc. Class A | 114,586 | 2,543 |
| * | F5 Networks Inc. | 11,731 | 2,064 |
| *,1 | Palantir Technologies Inc. Class A | 84,248 | 1,984 |
| * | ZoomInfo Technologies Inc. Class A | 29,608 | 1,428 |
| * | Unity Software Inc. | 298 | 46 |
| | | | | | | 455,327 |
| Telecommunications (2.2%) |
| * | Roku Inc. | 41,496 | 13,778 |
| | Motorola Solutions Inc. | 64,531 | 10,974 |
| * | Liberty Broadband Corp. Class C | 61,239 | 9,698 |
| | CenturyLink Inc. | 417,987 | �� 4,075 |
| *,1 | Altice USA Inc. Class A | 101,177 | 3,832 |
| * | DISH Network Corp. Class A | 92,931 | 3,005 |
| * | Liberty Broadband Corp. Class A | 9,486 | 1,495 |
| | Juniper Networks Inc. | 62,939 | 1,417 |
| | | | | | | 48,274 |
| Utilities (6.3%) |
| | Eversource Energy | 130,484 | 11,288 |
| | WEC Energy Group Inc. | 120,163 | 11,059 |
| | American Water Works Co. Inc. | 69,062 | 10,599 |
| | Waste Connections Inc. | 100,087 | 10,266 |
| | Edison International | 144,141 | 9,055 |
| | DTE Energy Co. | 73,096 | 8,875 |
| | PPL Corp. | 292,967 | 8,262 |
| | Entergy Corp. | 76,256 | 7,613 |
| | Ameren Corp. | 93,906 | 7,330 |
| * | PG&E Corp. | 566,467 | 7,058 |
| | CMS Energy Corp. | 109,099 | 6,656 |
| | FirstEnergy Corp. | 206,478 | 6,320 |
| | AES Corp. | 252,923 | 5,945 |
| | Alliant Energy Corp. | 95,198 | 4,906 |
| | Evergy Inc. | 86,265 | 4,789 |
| | Consolidated Edison Inc. | 65,100 | 4,705 |
| | CenterPoint Energy Inc. | 207,395 | 4,488 |
| | Vistra Corp. | 186,326 | 3,663 |
| | NiSource Inc. | 145,793 | 3,344 |
| | NRG Energy Inc. | 46,371 | 1,741 |
| | Pinnacle West Capital Corp. | 21,494 | 1,718 |
| | Avangrid Inc. | 23,545 | 1,070 |
| | | | | | | 140,750 |
Total Common Stocks
(Cost $1,616,411) | 2,237,601 |
| Temporary Cash Investments (0.6%) |
| Money Market Fund (0.6%) |
| 2,3 | Vanguard Market Liquidity Fund, 0.111% | 143,362 | 14,337 |
| | | | | | Face
Amount
($000) | Market
Value•
($000) |
| U.S. Government and Agency Obligations (0.0%) |
| 4 | United States Treasury Bill, 0.097%, 1/28/21 | 108 | 108 |
Total Temporary Cash Investments
(Cost $14,447) | 14,445 |
Total Investments (100.5%)
(Cost $1,630,858) | | 2,252,046 |
| Other Assets and Liabilities—Net (-0.5%) | | (11,022) |
| Net Assets (100%) | | 2,241,024 |
| Cost is in $000. |
| • | See Note A in Notes to Financial Statements. |
| * | Non-income-producing security. |
| 1 | Includes partial security positions on loan to broker-dealers. The total value of securities on loan is $9,813,000. |
| 2 | Affiliated money market fund available only to Vanguard funds and certain trusts and accounts managed by Vanguard. Rate shown is the 7-day yield. |
| 3 | Collateral of $10,392,000 was received for securities on loan. |
| 4 | Securities with a value of $108,000 have been segregated as initial margin for open futures contracts. |
Derivative Financial Instruments Outstanding as of Period End
| Futures Contracts |
| | | | ($000) |
| | Expiration | Number of
Long (Short)
Contracts | Notional
Amount | Value and
Unrealized
Appreciation
(Depreciation) |
| Long Futures Contracts | | | | |
| E-mini S&P 500 Index | March 2021 | 12 | 2,249 | 34 |
| E-mini S&P Mid-Cap 400 Index | March 2021 | 17 | 3,916 | 95 |
| | | | | 129 |
See accompanying Notes, which are an integral part of the Financial Statements.
Statement of Assets and Liabilities
| ($000s, except shares and per-share amounts) | Amount |
| Assets | |
| Investments in Securities, at Value | |
| Unaffiliated Issuers (Cost $1,616,519) | 2,237,709 |
| Affiliated Issuers (Cost $14,339) | 14,337 |
| Total Investments in Securities | 2,252,046 |
| Investment in Vanguard | 85 |
| Cash Collateral Pledged—Futures Contracts | 259 |
| Receivables for Investment Securities Sold | 3,581 |
| Receivables for Accrued Income | 2,616 |
| Receivables for Capital Shares Issued | 531 |
| Variation Margin Receivable—Futures Contracts | 22 |
| Total Assets | 2,259,140 |
| Liabilities | |
| Due to Custodian | 3,138 |
| Payables for Investment Securities Purchased | 1,285 |
| Collateral for Securities on Loan | 10,392 |
| Payables for Capital Shares Redeemed | 3,094 |
| Payables to Vanguard | 207 |
| Total Liabilities | 18,116 |
| Net Assets | 2,241,024 |
| At December 31, 2020, net assets consisted of: | |
| | |
| Paid-in Capital | 1,430,122 |
| Total Distributable Earnings (Loss) | 810,902 |
| Net Assets | 2,241,024 |
| | |
| Net Assets | |
Applicable to 86,965,574 outstanding $.001 par value shares of
beneficial interest (unlimited authorization) | 2,241,024 |
| Net Asset Value Per Share | $25.77 |
|
| | Year Ended
December 31, 2020 |
| | ($000) |
| Investment Income | |
| Income | |
| Dividends | 32,311 |
| Interest1 | 29 |
| Securities Lending—Net | 258 |
| Total Income | 32,598 |
| Expenses | |
| The Vanguard Group—Note B | |
| Investment Advisory Services | 291 |
| Management and Administrative | 2,721 |
| Marketing and Distribution | 184 |
| Custodian Fees | 50 |
| Auditing Fees | 32 |
| Shareholders’ Reports | 29 |
| Trustees’ Fees and Expenses | 1 |
| Total Expenses | 3,308 |
| Net Investment Income | 29,290 |
| Realized Net Gain (Loss) | |
| Investment Securities Sold1 | 163,174 |
| Futures Contracts | 511 |
| Realized Net Gain (Loss) | 163,685 |
| Change in Unrealized Appreciation (Depreciation) | |
| Investment Securities1 | 140,792 |
| Futures Contracts | 20 |
| Change in Unrealized Appreciation (Depreciation) | 140,812 |
| Net Increase (Decrease) in Net Assets Resulting from Operations | 333,787 |
| 1 | Interest income, realized net gain (loss), and change in unrealized appreciation (depreciation) from an affiliated company of the portfolio were $27,000, $7,000, and ($1,000), respectively. Purchases and sales are for temporary cash investment purposes. |
Statement of Changes in Net Assets
|
| | Year Ended December 31, |
| | 2020
($000) | 2019
($000) |
| Increase (Decrease) in Net Assets | | |
| Operations | | |
| Net Investment Income | 29,290 | 29,001 |
| Realized Net Gain (Loss) | 163,685 | 112,918 |
| Change in Unrealized Appreciation (Depreciation) | 140,812 | 360,047 |
| Net Increase (Decrease) in Net Assets Resulting from Operations | 333,787 | 501,966 |
| Distributions1 | | |
| Total Distributions | (142,409) | (172,303) |
| Capital Share Transactions | | |
| Issued | 302,317 | 300,982 |
| Issued in Lieu of Cash Distributions | 142,409 | 172,303 |
| Redeemed | (549,858) | (269,427) |
| Net Increase (Decrease) from Capital Share Transactions | (105,132) | 203,858 |
| Total Increase (Decrease) | 86,246 | 533,521 |
| Net Assets | | |
| Beginning of Period | 2,154,778 | 1,621,257 |
| End of Period | 2,241,024 | 2,154,778 |
| 1 | Certain prior-period numbers have been reclassified to conform with the current-period presentation. |
For a Share Outstanding
Throughout Each Period | Year Ended December 31, |
| 2020 | 2019 | 2018 | 2017 | 2016 |
| Net Asset Value, Beginning of Period | $24.03 | $20.23 | $23.72 | $21.11 | $20.76 |
| Investment Operations | | | | | |
| Net Investment Income | .3251,2 | .3341 | .3431 | .2921 | .280 |
| Net Realized and Unrealized Gain (Loss) on Investments | 3.047 | 5.621 | (2.386) | 3.575 | 1.814 |
| Total from Investment Operations | 3.372 | 5.955 | (2.043) | 3.867 | 2.094 |
| Distributions | | | | | |
| Dividends from Net Investment Income | (.344) | (.350) | (.286) | (.270) | (.292) |
| Distributions from Realized Capital Gains | (1.288) | (1.805) | (1.161) | (.987) | (1.452) |
| Total Distributions | (1.632) | (2.155) | (1.447) | (1.257) | (1.744) |
| Net Asset Value, End of Period | $25.77 | $24.03 | $20.23 | $23.72 | $21.11 |
| Total Return | 18.07% | 30.87% | -9.33% | 19.08% | 11.11% |
| Ratios/Supplemental Data | | | | | |
| Net Assets, End of Period (Millions) | $2,241 | $2,155 | $1,621 | $1,804 | $1,495 |
| Ratio of Total Expenses to Average Net Assets | 0.17% | 0.17% | 0.17% | 0.19% | 0.19% |
| Ratio of Net Investment Income to Average Net Assets | 1.50%2 | 1.49% | 1.49% | 1.32% | 1.40% |
| Portfolio Turnover Rate | 28% | 21% | 21% | 18% | 21% |
| 1 | Calculated based on average shares outstanding. |
| 2 | Net investment income per share and the ratio of net investment income to average net assets include $0.036 and 0.17%, respectively, resulting from a special dividend from NortonLifeLock Inc. in February 2020. |
See accompanying Notes, which are an integral part of the Financial Statements.
Notes to Financial Statements
The Mid-Cap Index Portfolio, a portfolio of Vanguard Variable Insurance Funds, is registered under the Investment Company Act of 1940 as an open-end investment company. The portfolio’s shares are only available for purchase by separate accounts of insurance companies as investments for variable annuity plans, variable life insurance contracts, or other variable benefit insurance contracts. Market disruptions associated with the COVID-19 pandemic have had a global impact, and uncertainty exists as to the long-term implications. Such disruptions can adversely affect assets of the portfolio and thus portfolio performance.
A. The following significant accounting policies conform to generally accepted accounting principles for U.S. investment companies. The portfolio consistently follows such policies in preparing its financial statements.
1. Security Valuation: Securities are valued as of the close of trading on the New York Stock Exchange (generally 4 p.m., Eastern time) on the valuation date. Equity securities are valued at the latest quoted sales prices or official closing prices taken from the primary market in which each security trades; such securities not traded on the valuation date are valued at the mean of the latest quoted bid and asked prices. Securities for which market quotations are not readily available, or whose values have been materially affected by events occurring before the portfolio's pricing time but after the close of the securities’ primary markets, are valued by methods deemed by the board of trustees to represent fair value. Investments in Vanguard Market Liquidity Fund are valued at that fund's net asset value. Temporary cash investments are valued using the latest bid prices or using valuations based on a matrix system (which considers such factors as security prices, yields, maturities, and ratings), both as furnished by independent pricing services.
2. Futures Contracts: The portfolio uses index futures contracts to a limited extent, with the objectives of maintaining full exposure to the stock market, maintaining liquidity, and minimizing transaction costs. The portfolio may purchase futures contracts to immediately invest incoming cash in the market, or sell futures in response to cash outflows, thereby simulating a fully invested position in the underlying index while maintaining a cash balance for liquidity. The primary risks associated with the use of futures contracts are imperfect correlation between changes in market values of stocks held by the portfolio and the prices of futures contracts, and the possibility of an illiquid market. Counterparty risk involving futures is mitigated because a regulated clearinghouse is the counterparty instead of the clearing broker. To further mitigate counterparty risk, the portfolio trades futures contracts on an exchange, monitors the financial strength of its clearing brokers and clearinghouse, and has entered into clearing agreements with its clearing brokers. The clearinghouse imposes initial margin requirements to secure the portfolio’s performance and requires daily settlement of variation margin representing changes in the market value of each contract. Any securities pledged as initial margin for open contracts are noted in the Schedule of Investments.
Futures contracts are valued at their quoted daily settlement prices. The notional amounts of the contracts are not recorded in the Statement of Assets and Liabilities. Fluctuations in the value of the contracts are recorded in the Statement of Assets and Liabilities as an asset (liability) and in the Statement of Operations as unrealized appreciation (depreciation) until the contracts are closed, when they are recorded as realized gains (losses) on futures contracts.
During the year ended December 31, 2020, the portfolio’s average investments in long and short futures contracts represented less than 1% and 0% of net assets, respectively, based on the average of the notional amounts at each quarter-end during the period.
3. Federal Income Taxes: The portfolio intends to continue to qualify as a regulated investment company and distribute all of its taxable income. The portfolio’s tax returns are open to examination by the relevant tax authorities until expiration of the applicable statute of limitations, which is generally three years after the filing of the tax return. Management has analyzed the portfolio’s tax positions taken for all open federal and state income tax years, and has concluded that no provision for income tax is required in the portfolio’s financial statements.
4. Distributions: Distributions to shareholders are recorded on the ex-dividend date. Distributions are determined on a tax basis at the fiscal year-end and may differ from net investment income and realized capital gains for financial reporting purposes.
5. Securities Lending: To earn additional income, the portfolio lends its securities to qualified institutional borrowers. Security loans are subject to termination by the portfolio at any time, and are required to be secured at all times by collateral in an amount at least equal to the market value of securities loaned. Daily market fluctuations could cause the value of loaned securities to be more or less than the value of the collateral received. When this occurs, the collateral is adjusted and settled before the opening of the market on the next business day. The portfolio further mitigates its counterparty risk by entering into securities lending transactions only with a diverse group of
prequalified counterparties, monitoring their financial strength, and entering into master securities lending agreements with its counterparties. The master securities lending agreements provide that, in the event of a counterparty’s default (including bankruptcy), the portfolio may terminate any loans with that borrower, determine the net amount owed, and sell or retain the collateral up to the net amount owed to the portfolio; however, such actions may be subject to legal proceedings. While collateral mitigates counterparty risk, in the event of a default, the portfolio may experience delays and costs in recovering the securities loaned. The portfolio invests cash collateral received in Vanguard Market Liquidity Fund, and records a liability in the Statement of Assets and Liabilities for the return of the collateral, during the period the securities are on loan. Collateral investments in Vanguard Market Liquidity Fund are subject to market appreciation or depreciation. Securities lending income represents fees charged to borrowers plus income earned on invested cash collateral, less expenses associated with the loan. During the term of the loan, the portfolio is entitled to all distributions made on or in respect of the loaned securities.
6. Credit Facilities and Interfund Lending Program: The portfolio and certain other funds managed by The Vanguard Group ("Vanguard") participate in a $4.3 billion committed credit facility provided by a syndicate of lenders pursuant to a credit agreement and an uncommitted credit facility provided by Vanguard. Both facilities may be renewed annually. Each fund is individually liable for its borrowings, if any, under the credit facilities. Borrowings may be utilized for temporary or emergency purposes, subject to the portfolio’s regulatory and contractual borrowing restrictions. With respect to the committed credit facility, the participating funds are charged administrative fees and an annual commitment fee of 0.10% of the undrawn committed amount of the facility; these fees are allocated to the funds based on a method approved by the portfolio’s board of trustees and included in Management and Administrative expenses on the portfolio’s Statement of Operations. Any borrowings under either facility bear interest at a rate based upon the higher of the one-month London Interbank Offered Rate (or an acceptable alternate rate, if necessary), federal funds effective rate, or overnight bank funding rate plus an agreed-upon spread, except that borrowings under the uncommitted credit facility may bear interest based upon an alternative rate agreed to by the portfolio and Vanguard.
In accordance with an exemptive order (the “Order”) from the SEC, the portfolio may participate in a joint lending and borrowing program that allows registered open-end Vanguard funds to borrow money from and lend money to each other for temporary or emergency purposes (the “Interfund Lending Program”), subject to compliance with the terms and conditions of the Order, and to the extent permitted by the portfolio’s investment objective and investment policies. Interfund loans and borrowings normally extend overnight, but can have a maximum duration of seven days. Loans may be called on one business day’s notice. The interest rate to be charged is governed by the conditions of the Order and internal procedures adopted by the board of trustees. The board of trustees is responsible for overseeing the Interfund Lending Program.
For the year ended December 31, 2020, the portfolio did not utilize the credit facilities or the Interfund Lending Program.
7. Other: Dividend income is recorded on the ex-dividend date. Non-cash dividends included in dividend income, if any, are recorded at the fair value of the securities received. Interest income includes income distributions received from Vanguard Market Liquidity Fund and is accrued daily. Premiums and discounts on debt securities are amortized and accreted, respectively, to interest income over the lives of the respective securities, except for premiums on certain callable debt securities that are amortized to the earliest call date. Security transactions are accounted for on the date securities are bought or sold. Costs used to determine realized gains (losses) on the sale of investment securities are those of the specific securities sold.
B. In accordance with the terms of a Funds’ Service Agreement (the “FSA”) between Vanguard and the portfolio, Vanguard furnishes to the portfolio investment advisory, corporate management, administrative, marketing, and distribution services at Vanguard’s cost of operations (as defined by the FSA). These costs of operations are allocated to the portfolio based on methods and guidelines approved by the board of trustees and are generally settled twice a month.
Upon the request of Vanguard, the portfolio may invest up to 0.40% of its net assets as capital in Vanguard. At December 31, 2020, the portfolio had contributed to Vanguard capital in the amount of $85,000, representing less than 0.01% of the portfolio’s net assets and 0.03% of Vanguard’s capital received pursuant to the FSA. The portfolio’s trustees and officers are also directors and employees, respectively, of Vanguard.
C. Various inputs may be used to determine the value of the portfolio’s investments and derivatives. These inputs are summarized in three broad levels for financial statement purposes. The inputs or methodologies used to value securities are not necessarily an indication of the risk associated with investing in those securities.
Level 1—Quoted prices in active markets for identical securities.
Level 2—Other significant observable inputs (including quoted prices for similar securities, interest rates, prepayment speeds, credit risk, etc.).
Level 3—Significant unobservable inputs (including the portfolio’s own assumptions used to determine the fair value of investments). Any investments and derivatives valued with significant unobservable inputs are noted on the Schedule of Investments.
The following table summarizes the market value of the portfolio's investments and derivatives as of December 31, 2020, based on the inputs used to value them:
| | Level 1
($000) | Level 2
($000) | Level 3
($000) | Total
($000) |
| Investments | | | | |
| Assets | | | | |
| Common Stocks | 2,237,601 | — | — | 2,237,601 |
| Temporary Cash Investments | 14,337 | 108 | — | 14,445 |
| Total | 2,251,938 | 108 | — | 2,252,046 |
| | | | |
| Derivative Financial Instruments | | | | |
| Assets | | | | |
| Futures Contracts1 | 22 | — | — | 22 |
| 1 | Represents variation margin on the last day of the reporting period. |
D. Permanent differences between book-basis and tax-basis components of net assets, if any, are reclassified among capital accounts in the financial statements to reflect their tax character. These reclassifications have no effect on net assets or net asset value per share.
Temporary differences between book-basis and tax-basis components of total distributable earnings (losses) arise when certain items of income, gain, or loss are recognized in different periods for financial statement and tax purposes; these differences will reverse at some time in the future. The differences are primarily related to the deferral of losses from wash sales and the recognition of unrealized gains or losses from certain derivative contracts. As of period end, the tax-basis components of total distributable earnings (losses) are detailed in the table as follows:
| | Amount
($000) |
| Undistributed Ordinary Income | 45,598 |
| Undistributed Long-Term Gains | 144,283 |
| Capital Loss Carryforwards | — |
| Qualified Late-Year Losses | — |
| Net Unrealized Gains (Losses) | 621,021 |
The tax character of distributions paid was as follows:
| | Year Ended December 31, |
| | 2020
Amount
($000) | 2019
Amount
($000) |
| Ordinary Income* | 31,056 | 32,008 |
| Long-Term Capital Gains | 111,353 | 140,295 |
| Total | 142,409 | 172,303 |
| * | Includes short-term capital gains, if any. |
As of December 31, 2020, gross unrealized appreciation and depreciation for investments and derivatives based on cost for U.S. federal income tax purposes were as follows:
| | Amount
($000) |
| Tax Cost | 1,631,025 |
| Gross Unrealized Appreciation | 689,240 |
| Gross Unrealized Depreciation | (68,219) |
| Net Unrealized Appreciation (Depreciation) | 621,021 |
E. During the year ended December 31, 2020, the portfolio purchased $536,088,000 of investment securities and sold $746,889,000 of investment securities, other than temporary cash investments.
The portfolio purchased securities from and sold securities to other Vanguard funds or accounts managed by Vanguard or its affiliates, in accordance with procedures adopted by the board of trustees in compliance with Rule 17a-7 of the Investment Company Act of 1940. For the year ended December 31, 2020, such purchases and sales were $35,782,000 and $192,588,000, respectively; these amounts, other than temporary cash investments, are included in the purchases and sales of investment securities noted above.
F. Capital shares issued and redeemed were:
| | Year Ended December 31, | |
| | 2020
Shares
(000) | | 2019
Shares
(000) | |
| | | |
| Issued | 14,451 | | 13,473 | |
| Issued in Lieu of Cash Distributions | 8,812 | | 8,135 | |
| Redeemed | (25,982) | | (12,082) | |
| Net Increase (Decrease) in Shares Outstanding | (2,719) | | 9,526 | |
At December 31, 2020, one shareholder (an insurance company separate account whose holdings in the portfolio represent the indirect investment of Vanguard Variable Annuity contract holders) was the record or beneficial owner of 40% of the portfolio’s net assets. If this shareholder were to redeem its investment in the portfolio, the redemption might result in an increase in the portfolio's expense ratio, cause the portfolio to incur higher transaction costs, or lead to the realization of taxable gains.
G. Management has determined that no events or transactions occurred subsequent to December 31, 2020, that would require recognition or disclosure in these financial statements.
Report of Independent Registered
Public Accounting Firm
To the Board of Trustees of Vanguard Variable Insurance Funds and Shareholders of Mid-Cap Index Portfolio
Opinion on the Financial Statements
We have audited the accompanying statement of assets and liabilities, including the schedule of investments, of Mid-Cap Index Portfolio (one of the portfolios constituting Vanguard Variable Insurance Funds, referred to hereafter as the "Portfolio”) as of December 31, 2020, the related statement of operations for the year ended December 31, 2020, the statement of changes in net assets for each of the two years in the period ended December 31, 2020, including the related notes, and the financial highlights for each of the five years in the period ended December 31, 2020 (collectively referred to as the “financial statements”). In our opinion, the financial statements present fairly, in all material respects, the financial position of the Portfolio as of December 31, 2020, the results of its operations for the year then ended, the changes in its net assets for each of the two years in the period ended December 31, 2020 and the financial highlights for each of the five years in the period ended December 31, 2020 in conformity with accounting principles generally accepted in the United States of America.
Basis for Opinion
These financial statements are the responsibility of the Portfolio’s management. Our responsibility is to express an opinion on the Portfolio’s financial statements based on our audits. We are a public accounting firm registered with the Public Company Accounting Oversight Board (United States) (PCAOB) and are required to be independent with respect to the Portfolio in accordance with the U.S. federal securities laws and the applicable rules and regulations of the Securities and Exchange Commission and the PCAOB.
We conducted our audits of these financial statements in accordance with the standards of the PCAOB. Those standards require that we plan and perform the audit to obtain reasonable assurance about whether the financial statements are free of material misstatement, whether due to error or fraud.
Our audits included performing procedures to assess the risks of material misstatement of the financial statements, whether due to error or fraud, and performing procedures that respond to those risks. Such procedures included examining, on a test basis, evidence regarding the amounts and disclosures in the financial statements. Our audits also included evaluating the accounting principles used and significant estimates made by management, as well as evaluating the overall presentation of the financial statements. Our procedures included confirmation of securities owned as of December 31, 2020 by correspondence with the custodian and brokers and by agreement to the underlying ownership records of the transfer agent; when replies were not received from brokers, we performed other auditing procedures. We believe that our audits provide a reasonable basis for our opinion.
/s/PricewaterhouseCoopers LLP
Philadelphia, Pennsylvania
February 18, 2021
We have served as the auditor of one or more investment companies in The Vanguard Group of Funds since 1975.
Special 2020 tax information (unaudited) for corporate shareholders only for Mid-Cap Index Portfolio, a portfolio of Vanguard Variable Insurance Funds
This information for the fiscal year ended December 31, 2020, is included pursuant to provisions of the Internal Revenue Code for corporate shareholders only.
The portfolio distributed $111,353,000 as capital gain dividends (20% rate gain distributions) to shareholders during the fiscal year.
For corporate shareholders, 54.7% of investment income (dividend income plus short-term gains, if any) qualifies for the dividends-received deduction.
The CRSP US Mid Cap Index (the “Index”) is a product of the Center for Research in Security Prices, LLC (“CRSP”), an affiliate of the University of Chicago (“University”), and has been licensed for use by Vanguard. CRSP® is a trademark of CRSP; and has been licensed by CRSP for use for certain purposes by Vanguard. The Vanguard Mid-Cap Index Portfolio is not sponsored, endorsed, sold or promoted by CRSP or University. Neither CRSP nor University makes any representation or warranty, express or implied, to the owners of the Vanguard Mid-Cap Index Portfolio or any member of the public regarding the advisability of investing in securities generally or in Vanguard Mid-Cap Index Portfolio particularly or the ability of the Index to track general market performance. The Index is determined, composed and calculated without regard to Vanguard or the Vanguard Mid-Cap Index Portfolio. Neither CRSP nor the University has any obligation to take the needs of Vanguard or the owners of Vanguard Mid-Cap Index Portfolio into consideration in determining, composing or calculating the Index. Neither CRSP nor the University is responsible for and has not participated in the determination of the prices and amount of Vanguard Mid-Cap Index Portfolio or the timing of the issuance or sale of Vanguard Mid-Cap Index Portfolio or in the determination or calculation of the equation by which Vanguard Mid-Cap Index Portfolio is to be converted into cash, surrendered or redeemed, as the case may be. Neither CRSP nor the University has any obligation or liability in connection with the administration, marketing or trading of Vanguard Mid-Cap Index Portfolio. There is no assurance that investment products based on the Index will accurately track index performance or provide positive investment returns. Neither CRSP nor the University is an investment advisor. Inclusion of a security within an index is not a recommendation by CRSP or the University to buy, sell, or hold such security, nor is it considered to be investment advice.
NEITHER CRSP NOR THE UNIVERSITY GUARANTEE THE ADEQUACY, ACCURACY, TIMELINESS AND/OR THE COMPLETENESS OF THE INDEX OR ANY DATA RELATED THERETO OR ANY COMMUNICATION, INCLUDING BUT NOT LIMITED TO, ORAL OR WRITTEN COMMUNICATION (INCLUDING ELECTRONIC COMMUNICATIONS) WITH RESPECT THERETO. NEITHER CRSP NOR THE UNIVERSITY SHALL BE SUBJECT TO ANY DAMAGES OR LIABILITY FOR ANY ERRORS, OMISSIONS, OR DELAYS THEREIN. NEITHER CRSP NOR THE UNIVERSITY MAKES ANY EXPRESS OR IMPLIED WARRANTIES, AND CRSP AND THE UNIVERSITY EXPRESSLY DISCLAIM ALL WARRANTIES, OF MERCHANTABILITY OR FITNESS FOR A PARTICULAR PURPOSE OR USE OR AS TO RESULTS TO BE OBTAINED BY VANGUARD, OWNERS OF THE VANGUARD MID-CAP INDEX PORTFOLIO, OR ANY OTHER PERSON OR ENTITY FROM THE USE OF THE INDEX OR WITH RESPECT TO ANY DATA RELATED THERETO. WITHOUT LIMITING ANY OF THE FOREGOING, IN NO EVENT WHATSOEVER SHALL CRSP OR THE UNIVERSITY BE LIABLE FOR ANY INDIRECT, SPECIAL, INCIDENTAL, PUNITIVE, OR CONSEQUENTIAL DAMAGES INCLUDING BUT NOT LIMITED TO, LOSS OF PROFITS, TRADING LOSSES, LOST TIME OR GOODWILL, EVEN IF IT HAS BEEN ADVISED OF THE POSSIBILITY OF SUCH DAMAGES, WHETHER IN CONTRACT, TORT, STRICT LIABILITY, OR OTHERWISE. THERE ARE NO THIRD-PARTY BENEFICIARIES OF ANY AGREEMENTS OR ARRANGEMENTS BETWEEN CRSP AND VANGUARD, OTHER THAN THE LICENSORS, IF ANY, OF CRSP.
This page intentionally left blank.
The People Who Govern Your Fund
The trustees of your mutual fund are there to see that the fund is operated and managed in your best interests since, as a shareholder, you are a part owner of the fund. Your fund’s trustees also serve on the board of directors of The Vanguard Group, Inc., which is owned by the Vanguard funds and provides services to them.
A majority of Vanguard’s board members are independent, meaning that they have no affiliation with Vanguard or the funds they oversee, apart from the sizable personal investments they have made as private individuals. The independent board members have distinguished backgrounds in business, academia, and public service. Each of the trustees and executive officers oversees 211 Vanguard funds.
Information for each trustee and executive officer of the fund appears below. That information, as well as the Vanguard fund count, is as of the date on the cover of this fund report. The mailing address of the trustees and officers is P.O. Box 876, Valley Forge, PA 19482. More information about the trustees is in the Statement of Additional Information, which can be obtained, without charge, by contacting Vanguard at 800-662-7447, or online at vanguard.com.
Interested Trustee1
Mortimer J. Buckley
Born in 1969. Trustee since January 2018. Principal occupation(s) during the past five years and other experience: chairman of the board (2019–present) of Vanguard and of each of the investment companies served by Vanguard; chief executive officer (2018–present) of Vanguard; chief executive officer, president, and trustee (2018–present) of each of the investment companies served by Vanguard; president and director (2017–present) of Vanguard; and president (2018–present) of Vanguard Marketing Corporation. Chief investment officer (2013–2017), managing director (2002–2017), head of the Retail Investor Group (2006–2012), and chief information officer (2001–2006) of Vanguard. Chairman of the board (2011–2017) and trustee (2009–2017) of the Children’s Hospital of Philadelphia; and trustee (2018–present) and vice chair (2019–present) of The Shipley School.
Independent Trustees
Emerson U. Fullwood
Born in 1948. Trustee since January 2008. Principal occupation(s) during the past five years and other experience: executive chief staff and marketing officer for North America and corporate vice president (retired 2008) of Xerox Corporation (document management products and services). Former president of the Worldwide Channels Group, Latin America, and Worldwide Customer Service and executive chief staff officer of Developing Markets of Xerox. Executive in residence and 2009–2010 Distinguished Minett Professor at the Rochester Institute of Technology. Director of SPX FLOW, Inc. (multi-industry manufacturing). Director of the University of Rochester Medical Center, the Monroe Community College Foundation, the United Way of Rochester, North Carolina A&T University, and Roberts Wesleyan College. Trustee of the University of Rochester.
Amy Gutmann
Born in 1949. Trustee since June 2006. Principal occupation(s) during the past five years and other experience: president (2004–present) of the University of Pennsylvania. Christopher H. Browne Distinguished Professor of Political Science, School of Arts and Sciences, and professor of communication, Annenberg School for Communication, with secondary faculty appointments in the Department of Philosophy, School of Arts and Sciences, and at the Graduate School of Education, University of Pennsylvania.
F. Joseph Loughrey
Born in 1949. Trustee since October 2009. Principal occupation(s) during the past five years and other experience: president and chief operating officer (retired 2009) and vice chairman of the board (2008–2009) of Cummins Inc. (industrial machinery). Chairman of the board of Hillenbrand, Inc. (specialized consumer services) and the Lumina Foundation. Director of the V Foundation. Member of the advisory council for the College of Arts and Letters and chair of the advisory board to the Kellogg Institute for International Studies, both at the University of Notre Dame.
Mark Loughridge
Born in 1953. Trustee since March 2012. Principal occupation(s) during the past five years and other experience: senior vice president and chief financial officer (retired 2013) of IBM (information technology services). Fiduciary member of IBM’s Retirement Plan Committee (2004–2013), senior vice president and general manager (2002–2004) of IBM Global Financing, vice president and controller (1998–2002) of
IBM, and a variety of other prior management roles at IBM. Member of the Council on Chicago Booth.
Scott C. Malpass
Born in 1962. Trustee since March 2012. Principal occupation(s) during the past five years and other experience: chief investment officer (retired June 2020) and vice president (retired June 2020) of the University of Notre Dame. Assistant professor of finance at the Mendoza College of Business, University of Notre Dame, and member of the Notre Dame 403(b) Investment Committee (retired June 2020). Member of the board of Catholic Investment Services, Inc. (investment advisors) and the board of superintendence of the Institute for the Works of Religion.
Deanna Mulligan
Born in 1963. Trustee since January 2018. Principal occupation(s) during the past five years and other experience: board chair (2020–present), chief executive officer (2011–2020), and president (2010–2019) of The Guardian Life Insurance Company of America. Chief operating officer (2010–2011) and executive vice president (2008–2010) of the individual life and disability division of Guardian Life. Member of the board of the American Council of Life Insurers and the board of the Economic Club of New York. Trustee of the Partnership for New York City (business leadership), Chief Executives for Corporate Purpose, NewYork-Presbyterian Hospital, Catalyst, and the Bruce Museum (arts and science). Member of the Advisory Council for the Stanford Graduate School of Business.
André F. Perold
Born in 1952. Trustee since December 2004. Principal occupation(s) during the past five years and other experience: George Gund Professor of Finance and Banking, Emeritus at the Harvard Business School (retired 2011). Chief investment officer and co-managing partner of HighVista Strategies (private investment firm). Member of the board of advisors and member of the investment committee of the Museum of Fine Arts Boston. Member of the board (2018–present) of RIT Capital Partners (investment firm). Member of the investment committee of Partners Health Care System.
Sarah Bloom Raskin
Born in 1961. Trustee since January 2018. Principal occupation(s) during the past five years and other experience: deputy secretary (2014–2017) of the United States Department of the Treasury. Governor (2010–2014) of the Federal Reserve Board. Commissioner (2007–2010) of financial regulation for the State of Maryland. Member of the board of directors (2012–2014) of Neighborhood Reinvestment Corporation. Director (2017–present) of i(x) Investments, LLC; director (2017–present) of Reserve Trust. Rubenstein Fellow (2017–present) of Duke University; trustee (2017–present) of Amherst College, and trustee (2019–present) of the Folger Shakespeare Library.
Peter F. Volanakis
Born in 1955. Trustee since July 2009. Principal occupation(s) during the past five years and other experience: president and chief operating officer (retired 2010) of Corning Incorporated (communications equipment) and director of Corning Incorporated (2000–2010) and Dow Corning (2001–2010). Director (2012) of SPX Corporation (multi-industry manufacturing). Overseer of the Amos Tuck School of Business Administration, Dartmouth College (2001–2013). Chairman of the board of trustees of Colby-Sawyer College. Member of the board of Hypertherm Inc. (industrial cutting systems, software, and consumables).
1 Mr. Buckley is considered “interested person,” as defined in the Investment Company Act of 1940, because he is an officer of the Vanguard funds.
Executive Officers
John Bendl
Born in 1970. Principal occupation(s) during the past five years and other experience: principal of Vanguard. Chief financial officer (2019–present) of each of the investment companies served by Vanguard. Chief accounting officer, treasurer, and controller of Vanguard (2017–present). Partner (2003–2016) at KPMG (audit, tax, and advisory services).
Christine M. Buchanan
Born in 1970. Principal occupation(s) during the past five years and other experience: principal of Vanguard. Treasurer (2017–present) of each of the investment companies served by Vanguard. Partner (2005–2017) at KPMG (audit, tax, and advisory services).
David Cermak
Born in 1960. Principal occupation(s) during the past five years and other experience: principal of Vanguard. Finance director (2019–present) of each of the investment companies served by Vanguard. Managing director and head (2017–present) of Vanguard Investments Singapore. Managing director and head (2017–2019) of Vanguard Investments Hong Kong. Representative director and head (2014–2017) of Vanguard Investments Japan.
John Galloway
Born in 1973. Principal occupation(s) during the past five years and other experience: principal of Vanguard. Investment stewardship officer (September 2020–present) of each of the investment companies served by Vanguard. Head of Investor Advocacy (February 2020–present) and head of Marketing Strategy and Planning (2017–2020) at Vanguard. Deputy assistant to the President of the United States (2015).
Thomas J. Higgins
Born in 1957. Principal occupation(s) during the past five years and other experience: principal of Vanguard. Finance director (2019–present), chief financial officer (2008–2019), and treasurer (1998–2008) of each of the investment companies served by Vanguard.
Peter Mahoney
Born in 1974. Principal occupation(s) during the past five years and other experience: principal of Vanguard. Controller (2015–present) of each of the investment companies served by Vanguard. Head of International Fund Services (2008–2014) at Vanguard.
Anne E. Robinson
Born in 1970. Principal occupation(s) during the past five years and other experience: general counsel (2016–present) of Vanguard. Secretary (2016–present) of Vanguard and of each of the investment companies served by Vanguard. Managing director (2016–present) of Vanguard. Managing director and general counsel of Global Cards and Consumer Services (2014–2016) at Citigroup. Counsel (2003–2014) at American Express.
Michael Rollings
Born in 1963. Principal occupation(s) during the past five years and other experience: finance director (2017–present) and treasurer (2017) of each of the investment companies served by Vanguard. Managing director (2016–present) of Vanguard. Chief financial officer (2016–present) of Vanguard. Director (2016–present) of Vanguard Marketing Corporation. Executive vice president and chief financial officer (2006–2016) of MassMutual Financial Group.
John E. Schadl
Born in 1972. Principal occupation(s) during the past five years and other experience: principal of Vanguard. Chief compliance officer (2019–present) of Vanguard and of each of the investment companies served by Vanguard. Assistant vice president (2019–present) of Vanguard Marketing Corporation.
Vanguard Senior Management Team
| Joseph Brennan | James M. Norris |
| Mortimer J. Buckley | Thomas M. Rampulla |
| Gregory Davis | Karin A. Risi |
| John James | Anne E. Robinson |
| John T. Marcante | Michael Rollings |
| Chris D. McIsaac | Lauren Valente |
Connect with Vanguard®>vanguard.com
Fund Information > 800-662-7447
Direct Investor Account Services > 800-662-2739
Institutional Investor Services > 800-523-1036
Text Telephone for People
Who Are Deaf or Hard of Hearing > 800-749-7273
This material may be used in conjunction with the offering of shares of any Vanguard fund only if preceded or accompanied by the fund’s current prospectus.
All comparative mutual fund data are from Lipper, a Thomson Reuters Company, or Morningstar, Inc., unless otherwise noted.
You can obtain a free copy of Vanguard’s proxy voting guidelines by visiting vanguard.com/proxyreporting or by calling Vanguard at 800-662-2739. The guidelines are also available from the SEC’s website, www.sec.gov. In addition, you may obtain a free report on how your fund voted the proxies for securities it owned during the 12 months ended June 30. To get the report, visit either vanguard.com/proxyreporting or www.sec.gov.
You can review information about your portfolio on the SEC’s website, and you can receive copies of this information, for a fee, by sending a request via email addressed to publicinfo@sec.gov.
Source for Bloomberg Barclays indexes: Bloomberg Index Services Limited. Copyright 2021, Bloomberg. All rights reserved.
CFA® is a registered trademark owned by CFA Institute.
© 2021 The Vanguard Group, Inc.
All rights reserved.
Vanguard Marketing Corporation, Distributor.
Q690MC 022021
| | |
| | |
| | |
| | |
| Annual Report | December 31, 2020 | |
| | |
| | |
| Vanguard Variable Insurance Funds |
| | |
| | |
| | |
| | |
| | |
| | |
| | |
| | |
| | |
| |
| Moderate Allocation Portfolio | |
| |
| |
| | |
| | |
| | |
| | |
| | |
| | |
| | |
| | |
| | |
| | |
| | |
| | |
| | |
| | |
| | |
| | |
| | |
| | |
| | |
| | |
| | |
| | |
| | |
| | |
| | |
| | |
| | |
| | |
| | |
| | |
|
| | |
| | |
Contents
| Your Portfolio’s Performance at a Glance | 1 |
| About Your Portfolio’s Expenses | 2 |
| Performance Summary | 3 |
| Financial Statements | 5 |
Please note: The opinions expressed in this report are just that—informed opinions. They should not be considered promises or advice. Also, please keep in mind that the information and opinions cover the period through the date on the front of this report. Of course, the risks of investing in your portfolio are spelled out in the prospectus.
Moderate Allocation Portfolio
Your Portfolio’s Performance at a Glance
• For the 12 months ended December 31, 2020, the Moderate Allocation Portfolio returned 13.77%, behind the 15.20% return of its benchmark, the Moderate Allocation Composite Index. The portfolio posted a return different from that of its benchmark in part because of differences in the timing for rebalancing them to their target allocations.
• The period was marked by the global spread of COVID-19 and efforts to contain it. Responses from policymakers, the creation and initial distribution of vaccines, and the easing of some restrictions soon lifted investor sentiment, and stock markets hit highs in December. After an initial period of high volatility and low liquidity in the bond markets, yields fell and prices rose amid unprecedented actions taken by governments and central banks to blunt the economic impact of the virus.
• The portfolio targets an asset allocation of approximately 60% stocks and 40% bonds through these holdings: Vanguard Variable Insurance Funds Total Bond Market Index Portfolio and Equity Index Portfolio and Admiral Shares of Vanguard Total International Bond Index Fund, Vanguard Total International Stock Index Fund, and Vanguard Extended Market Index Fund.
• The Extended Market Index Fund returned about 32%, the Equity Index Portfolio about 18%, and the Total International Stock Index Fund more than 11%. The Total Bond Market Index Portfolio returned more than 7%, and the Total International Bond Index Fund returned more than 4%.
• Please note that the portfolio’s returns are different from those in Vanguard Variable Annuity (and other plans that invest in the portfolio), which take into account insurance-related expenses.
Market Barometer
| | Average Annual Total Returns Periods Ended December 31, 2020 |
| | One Year | Three Years | Five Years |
| Stocks | | | |
| Russell 1000 Index (Large-caps) | 20.96% | 14.82% | 15.60% |
| Russell 2000 Index (Small-caps) | 19.96 | 10.25 | 13.26 |
| Russell 3000 Index (Broad U.S. market) | 20.89 | 14.49 | 15.43 |
| FTSE All-World ex US Index (International) | 11.22 | 5.18 | 9.16 |
| | | | |
| Bonds | | | |
| Bloomberg Barclays U.S. Aggregate Bond Index | | | |
| (Broad taxable market) | 7.51% | 5.34% | 4.44% |
| Bloomberg Barclays Municipal Bond Index | | | |
| (Broad tax-exempt market) | 5.21 | 4.64 | 3.91 |
| FTSE Three-Month U.S. Treasury Bill Index | 0.58 | 1.56 | 1.16 |
| | | | |
| CPI | | | |
| Consumer Price Index | 1.36% | 1.85% | 1.95% |
Moderate Allocation Portfolio
About Your Portfolio’s Expenses
As a shareholder of the portfolio, you incur ongoing costs, which include costs for portfolio management, administrative services, and shareholder reports (like this one), among others. Operating expenses, which are deducted from a portfolio’s gross income, directly reduce the investment return of the portfolio.
A typical portfolio’s expenses are expressed as a percentage of its average net assets. The Moderate Allocation Portfolio has no direct expenses, but bears its proportionate share of the expenses of the underlying funds in which it invests. These indirect expenses make up the acquired fund fees and expenses, also expressed as a percentage of average net assets. The following examples are intended to help you understand the ongoing costs (in dollars) of investing in your portfolio and to compare these costs with those of other mutual funds. The examples are based on an investment of $1,000 made at the beginning of the period shown and held for the entire period. The costs were calculated using the acquired fund fees and expenses for the Moderate Allocation Portfolio.
The accompanying table illustrates your portfolio’s costs in two ways:
• Based on actual portfolio return. This section helps you to estimate the actual expenses that you paid over the period. The “Ending Account Value” shown is derived from the portfolio’s actual return, and the third column shows the dollar amount that would have been paid by an investor who started with $1,000 in the portfolio. You may use the information here, together with the amount you invested, to estimate the expenses that you paid over the period.
To do so, simply divide your account value by $1,000 (for example, an $8,600 account value divided by $1,000 = 8.6), then multiply the result by the number given for your portfolio under the heading “Expenses Paid During Period.”
• Based on hypothetical 5% yearly return. This section is intended to help you compare your portfolio’s costs with those of other mutual funds. It assumes that the portfolio had a yearly return of 5% before expenses, but that the expense ratio is unchanged. In this case—because the return used is not the portfolio’s actual return—the results do not apply to your investment. The example is useful in making comparisons because the Securities and Exchange Commission requires all mutual funds to calculate expenses based on a 5% return. You can assess your portfolio’s costs by comparing this hypothetical example with the hypothetical examples that appear in shareholder reports of other funds.
Note that the expenses shown in the table are meant to highlight and help you compare ongoing costs only. The portfolio’s expense figure does not reflect additional fees and expenses associated with the annuity or life insurance program through which you invest.
The calculations assume no shares were bought or sold during the period. Your actual costs may have been higher or lower, depending on the amount of your investment and the timing of any purchases or redemptions.
You can find more information about the portfolio’s expenses in the Financial Statements section. For additional information on operating expenses and other shareholder costs, please refer to the prospectus.
Six Months Ended December 31, 2020
| | Beginning | Ending | Expenses |
| | Account Value | Account Value | Paid During |
| Moderate Allocation Portfolio | 6/30/2020 | 12/31/2020 | Period |
| Based on Actual Portfolio Return | $1,000.00 | $1,151.53 | $0.65 |
| Based on Hypothetical 5% Yearly Return | 1,000.00 | 1,024.53 | 0.61 |
The calculations are based on the Moderate Allocation Portfolio’s acquired fund fees and expenses for the most recent six-month period. The Moderate Allocation Portfolio’s annualized expense figure for that period is 0.12%. The dollar amounts shown as “Expenses Paid” are equal to the annualized average weighted expense ratio for the underlying funds, multiplied by the average account value over the period, multiplied by the number of days in the most recent six-month period, then divided by the number of days in the recent 12-month period (184/366).
Moderate Allocation Portfolio
Performance Summary
All of the returns in this report represent past performance, which is not a guarantee of future results that may be achieved by the portfolio. (Current performance may be lower or higher than the performance data cited. For performance data current to the most recent month-end, visit our website at vanguard.com/performance.) Note, too, that both investment returns and principal value can fluctuate widely, so an investor’s shares, when sold, could be worth more or less than their original cost. The returns shown do not reflect taxes that a shareholder would pay on portfolio distributions or on the sale of portfolio shares. Nor do the returns reflect fees and expenses associated with the annuity or life insurance program through which a shareholder invests. If these fees and expenses were included, the portfolio’s returns would be lower.
Cumulative Performance: October 19, 2011–December 31, 2020
Initial Investment of $10,000

| | | | Average Annual Total Returns | | |
| | | Periods Ended December 31, 2020 | | |
| | | | | Since | Final Value | |
| | | One | Five | Inception | of a $10,000 | |
| | | Year | Years | (10/19/2011) | Investment | |
 | Moderate Allocation Portfolio | 13.77% | 9.80% | 9.19% | $22,453 | |
| | |
 | Moderate Allocation Composite Index | 15.20 | 10.39 | 9.60 | 23,232 | |
 | Dow Jones U.S. Total Stock Market | | | | | |
| | | | | | |
| | Float Adjusted Index | 20.79 | 15.36 | 15.45 | 37,512 | |
Moderate Allocation Composite Index: Weighted 42% S&P Total Market Index, 32% Bloomberg Barclays U.S. Aggregate Float Adjusted Index, 18% FTSE Global All Cap ex US Index, and 8% Bloomberg Barclays Global Aggregate ex-USD Float Adjusted RIC Capped Index (USD Hedged) as of June 3, 2013. Previously, the composite was weighted 42% S&P Total Market Index, 40% Bloomberg Barclays U.S. Aggregate Float Adjusted Index, and 18% MSCI ACWI ex USA IMI Index.
“Since Inception” performance is calculated from the portfolio’s inception date for both the portfolio and its comparative standard(s).
See Financial Highlights for dividend and capital gains information.
Moderate Allocation Portfolio
Underlying Vanguard Funds
As of December 31, 2020
| Vanguard Variable Insurance Funds—Equity Index Portfolio | 29.4% |
| Vanguard Variable Insurance Funds—Total Bond Market Index Portfolio | 27.8 |
| Vanguard Total International Stock Index Fund Admiral Shares | 24.2 |
| Vanguard Total International Bond Index Fund Admiral Shares | 12.0 |
| Vanguard Extended Market Index Fund Admiral Shares | 6.6 |
The table reflects the portfolio’s investments, except for short-term investments.
Moderate Allocation Portfolio
Financial Statements
Schedule of Investments
As of December 31, 2020
The portfolio files its complete schedule of portfolio holdings with the Securities and Exchange Commission (SEC) for the first and third quarters of each fiscal year as an exhibit to its reports on Form N-PORT. The portfolio’s Form N-PORT reports are available on the SEC’s website at www.sec.gov.
| | | Market |
| | | Value• |
| | Shares | ($000) |
| Investment Companies (100.0%) | | |
| U.S. Stock Funds (36.0%) | | |
| Vanguard Variable Insurance Funds—Equity Index Portfolio | 3,722,316 | 200,112 |
| Vanguard Extended Market Index Fund Admiral Shares | 361,471 | 45,093 |
| | | 245,205 |
| | | |
| International Stock Fund (24.2%) | | |
| Vanguard Total International Stock Index Fund Admiral Shares | 5,067,260 | 164,483 |
| | | |
| U.S. Bond Fund (27.8%) | | |
| Vanguard Variable Insurance Funds—Total Bond Market Index Portfolio | 14,756,633 | 189,033 |
| | | |
| International Bond Fund (12.0%) | | |
| Vanguard Total International Bond Index Fund Admiral Shares | 3,485,631 | 81,529 |
| Total Investments (100.0%) (Cost $580,977) | | 680,250 |
| Other Assets and Liabilities—Net (0.0%) | | (285) |
| Net Assets (100%) | | 679,965 |
Cost is in $000.
• See Note A in Notes to Financial Statements.
See accompanying Notes, which are an integral part of the Financial Statements.
Moderate Allocation Portfolio
Statement of Assets and Liabilities
As of December 31, 2020
| ($000s, except shares and per-share amounts) | Amount |
| Assets | |
| Investments in Securities, at Value—Affiliated Funds (Cost $580,977) | 680,250 |
| Receivables for Investment Securities Sold | 2 |
| Receivables for Capital Shares Issued | 6 |
| Total Assets | 680,258 |
| Liabilities | |
| Due to Custodian | 2 |
| Payables for Capital Shares Redeemed | 291 |
| Total Liabilities | 293 |
| Net Assets | 679,965 |
| | |
| At December 31, 2020, net assets consisted of: | |
| | |
| Paid-in Capital | 546,529 |
| Total Distributable Earnings (Loss) | 133,436 |
| Net Assets | 679,965 |
| | |
| Net Assets | |
| Applicable to 20,954,007 outstanding $.001 par value shares of beneficial interest (unlimited authorization) | 679,965 |
| Net Asset Value Per Share | $32.45 |
See accompanying Notes, which are an integral part of the Financial Statements.
Moderate Allocation Portfolio
Statement of Operations
| | Year Ended |
| | December 31, 2020 |
| | ($000) |
| Investment Income | |
| Income | |
| Income Distributions Received from Affiliated Funds | 10,787 |
| Net Investment Income—Note B | 10,787 |
| Realized Net Gain (Loss) | |
| Capital Gain Distributions Received from Affiliated Funds | 3,585 |
| Affiliated Funds Sold | 20,948 |
| Realized Net Gain (Loss) | 24,533 |
| Change in Unrealized Appreciation (Depreciation) from Affiliated Funds | 46,407 |
| Net Increase (Decrease) in Net Assets Resulting from Operations | 81,727 |
Statement of Changes in Net Assets
| | Year Ended December 31, |
| | 2020 | 2019 |
| | ($000) | ($000) |
| Increase (Decrease) in Net Assets | | |
| Operations | | |
| Net Investment Income | 10,787 | 11,835 |
| Realized Net Gain (Loss) | 24,533 | 11,716 |
| Change in Unrealized Appreciation (Depreciation) | 46,407 | 57,473 |
| Net Increase (Decrease) in Net Assets Resulting from Operations | 81,727 | 81,024 |
| Distributions1 | | |
| Total Distributions | (24,041) | (20,535) |
| Capital Share Transactions | | |
| Issued | 133,393 | 96,476 |
| Issued in Lieu of Cash Distributions | 24,041 | 20,535 |
| Redeemed | (66,835) | (45,572) |
| Net Increase (Decrease) from Capital Share Transactions | 90,599 | 71,439 |
| Total Increase (Decrease) | 148,285 | 131,928 |
| Net Assets | | |
| Beginning of Period | 531,680 | 399,752 |
| End of Period | 679,965 | 531,680 |
1 Certain prior-period numbers have been reclassified to conform with the current-period presentation.
See accompanying Notes, which are an integral part of the Financial Statements.
Moderate Allocation Portfolio
Financial Highlights
| For a Share Outstanding | | | Year Ended December 31, |
| Throughout Each Period | 2020 | 2019 | 2018 | 2017 | 2016 |
| Net Asset Value, Beginning of Period | $30.12 | $26.46 | $29.35 | $26.67 | $25.80 |
| Investment Operations | | | | | |
| Net Investment Income1 | .552 | .720 | .634 | .657 | .581 |
| Capital Gain Distributions Received | .184 | .199 | .148 | .309 | .182 |
| Net Realized and Unrealized Gain (Loss) on Investments | 2.976 | 4.106 | (2.142) | 2.863 | 1.112 |
| Total from Investment Operations | 3.712 | 5.025 | (1.360) | 3.829 | 1.875 |
| Distributions | | | | | |
| Dividends from Net Investment Income | (.720) | (.657) | (.577) | (.545) | (.439) |
| Distributions from Realized Capital Gains | (.662) | (.708) | (.953) | (.604) | (.566) |
| Total Distributions | (1.382) | (1.365) | (1.530) | (1.149) | (1.005) |
| Net Asset Value, End of Period | $32.45 | $30.12 | $26.46 | $29.35 | $26.67 |
| | | | | | |
| Total Return | 13.77% | 19.53% | -4.94% | 14.80% | 7.55% |
| | | | | | |
| Ratios/Supplemental Data | | | | | |
| Net Assets, End of Period (Millions) | $680 | $532 | $400 | $394 | $294 |
| Ratio of Total Expenses to Average Net Assets | — | — | — | — | — |
| Acquired Fund Fees and Expenses | 0.12% | 0.12% | 0.12% | 0.14% | 0.16% |
| Ratio of Net Investment Income to Average Net Assets | 1.89% | 2.54% | 2.25% | 2.36% | 2.25% |
| Portfolio Turnover Rate | 26% | 13% | 20% | 21% | 14% |
1 Calculated based on average shares outstanding.
See accompanying Notes, which are an integral part of the Financial Statements.
Moderate Allocation Portfolio
Notes to Financial Statements
The Moderate Allocation Portfolio, a portfolio of Vanguard Variable Insurance Funds, is registered under the Investment Company Act of 1940 as an open-end investment company. The portfolio follows a balanced investment strategy by investing in selected Vanguard funds and portfolios to achieve its targeted allocation of assets to U.S. and international stocks, and U.S. and international bonds. Financial statements and other information about each underlying fund and portfolio are available at www.vanguard.com. The portfolio’s shares are only available for purchase by separate accounts of insurance companies as investments for variable annuity plans, variable life insurance contracts, or other variable benefit insurance contracts.
Market disruptions associated with the COVID-19 pandemic have had a global impact, and uncertainty exists as to the long-term implications. Such disruptions can adversely affect assets of the portfolio and thus portfolio performance.
A. The following significant accounting policies conform to generally accepted accounting principles for U.S. investment companies. The portfolio consistently follows such policies in preparing its financial statements.
1. Security Valuation: Investments are valued at the net asset value of each underlying Vanguard fund determined as of the close of the New York Stock Exchange (generally 4 p.m., Eastern time) on the valuation date.
2. Federal Income Taxes: The portfolio intends to continue to qualify as a regulated investment company and distribute all of its taxable income. The portfolio’s tax returns are open to examination by the relevant tax authorities until expiration of the applicable statute of limitations, which is generally three years after the filing of the tax return. Management has analyzed the portfolio’s tax positions taken for all open federal and state income tax years, and has concluded that no provision for income tax is required in the portfolio’s financial statements.
3. Distributions: Distributions to shareholders are recorded on the ex-dividend date. Distributions are determined on a tax basis at the fiscal year-end and may differ from net investment income and realized capital gains for financial reporting purposes.
4. Credit Facilities and Interfund Lending Program: The portfolio and certain other funds managed by The Vanguard Group (“Vanguard”) participate in a $4.3 billion committed credit facility provided by a syndicate of lenders pursuant to a credit agreement and an uncommitted credit facility provided by Vanguard. Both facilities may be renewed annually. Each fund is individually liable for its borrowings, if any, under the credit facilities. Borrowings may be utilized for temporary or emergency purposes, subject to the portfolio’s regulatory and contractual borrowing restrictions. With respect to the committed credit facility, the participating funds are charged administrative fees and an annual commitment fee of 0.10% of the undrawn committed amount of the facility; these fees are allocated to the funds based on a method approved by the portfolio’s board of trustees and borne by the funds in which the portfolio invests (see Note B). Any borrowings under either facility bear interest at a rate based upon the higher of the one-month London Interbank Offered Rate (or an acceptable alternate rate, if necessary), federal funds effective rate, or overnight bank funding rate plus an agreed-upon spread, except that borrowings under the uncommitted credit facility may bear interest based upon an alternative rate agreed to by the portfolio and Vanguard.
In accordance with an exemptive order (the “Order”) from the SEC, the portfolio may participate in a joint lending and borrowing program that allows registered open-end Vanguard funds to borrow money from and lend money to each other for temporary or emergency purposes (the “Interfund Lending Program”), subject to compliance with the terms and conditions of the Order, and to the extent permitted by the portfolio’s investment objective and investment policies. Interfund loans and borrowings normally extend overnight, but can have a maximum duration of seven days. Loans may be called on one business day’s notice. The interest rate to be charged is governed by the conditions of the Order and internal procedures adopted by the board of trustees. The board of trustees is responsible for overseeing the Interfund Lending Program.
For the year ended December 31, 2020, the portfolio did not utilize the credit facilities or the Interfund Lending Program.
5. Other: Income and capital gain distributions received are recorded on the ex-dividend date. Security transactions are accounted for on the date securities are bought or sold. Costs used to determine realized gains (losses) on the sale of investment securities are those of the specific securities sold.
B. In accordance with the terms of a Funds’ Service Agreement (the “FSA”) between Vanguard and the portfolio, Vanguard furnishes to the portfolio investment advisory, corporate management, administrative, marketing, and distribution services at Vanguard’s cost of operations (as defined by the FSA). These costs of operations are allocated to the portfolio based on methods and guidelines
Moderate Allocation Portfolio
approved by the board of trustees. The FSA provides that expenses otherwise allocable to Vanguard funds-of-funds may be reduced or eliminated to the extent of savings realized by the underlying Vanguard funds by virtue of being part of a fund-of-funds. Accordingly, all expenses for services provided by Vanguard to the portfolio and all other expenses incurred by the portfolio during the period ended December 31, 2020, were borne by the underlying Vanguard funds in which the portfolio invests. The portfolio’s trustees and officers are also trustees and officers, respectively, of the underlying Vanguard funds, as well as directors and employees, respectively, of Vanguard.
C. Various inputs may be used to determine the value of the portfolio’s investments. These inputs are summarized in three broad levels for financial statement purposes. The inputs or methodologies used to value securities are not necessarily an indication of the risk associated with investing in those securities.
Level 1—Quoted prices in active markets for identical securities.
Level 2—Other significant observable inputs (including quoted prices for similar securities, interest rates, prepayment speeds, credit risk, etc.).
Level 3—Significant unobservable inputs (including the portfolio’s own assumptions used to determine the fair value of investments). Any investments valued with significant unobservable inputs are noted on the Schedule of Investments.
At December 31, 2020, 100% of the market value of the portfolio’s investments was determined based on Level 1 inputs.
D. Permanent differences between book-basis and tax-basis components of net assets, if any, are reclassified among capital accounts in the financial statements to reflect their tax character. These reclassifications have no effect on net assets or net asset value per share.
Temporary differences between book-basis and tax-basis components of total distributable earnings (loss) arise when certain items of income, gain, or loss are recognized in different periods for financial statement and tax purposes; these differences will reverse at some time in the future. The differences are primarily related to the deferral of losses from wash sales. As of period end, the tax-basis components of total distributable earnings (loss) are detailed in the table as follows:
| | Amount |
| | ($000) |
| Undistributed Ordinary Income | 13,000 |
| Undistributed Long-Term Gains | 21,163 |
| Capital Loss Carryforwards | — |
| Qualified Late-Year Losses | — |
| Net Unrealized Gains (Losses) | 99,273 |
The tax character of distributions paid was as follows:
| | Year Ended December 31, |
| | 2020 | 2019 |
| | Amount | Amount |
| | ($000) | ($000) |
| Ordinary Income* | 13,036 | 9,885 |
| Long-Term Capital Gains | 11,005 | 10,650 |
| Total | 24,041 | 20,535 |
* Includes short-term capital gains, if any.
As of December 31, 2020, gross unrealized appreciation and depreciation for investments based on cost for U.S. federal income tax purposes were as follows:
| | Amount |
| | ($000) |
| Tax Cost | 580,977 |
| Gross Unrealized Appreciation | 99,289 |
| Gross Unrealized Depreciation | (16) |
| Net Unrealized Appreciation (Depreciation) | 99,273 |
Moderate Allocation Portfolio
E. Capital shares issued and redeemed were:
| | Year Ended December 31, |
| | 2020 | 2019 |
| | Shares | Shares |
| | (000) | (000) |
| Issued | 4,652 | 3,403 |
| Issued in Lieu of Cash Distributions | 974 | 754 |
| Redeemed | (2,325) | (1,613) |
| Net Increase (Decrease) in Shares Outstanding | 3,301 | 2,544 |
At December 31, 2020, one shareholder (an insurance company separate account whose holdings in the portfolio represent the indirect investment of Vanguard Variable Annuity contract holders) was the record or beneficial owner of 78% of the portfolio’s net assets. If this shareholder were to redeem its investment in the portfolio, the redemption might lead to the realization of taxable capital gains.
F. Transactions during the period in affiliated underlying Vanguard funds were as follows:
| | | | | | Current Period Transactions | |
| | Dec. 31, | | Proceeds | Realized | | | | Dec. 31, |
| | 2019 | | from | Net | Change in | | Capital Gain | 2020 |
| | Market | Purchases | Securities | Gain | Unrealized | | Distributions | Market |
| | Value | at Cost | Sold | (Loss) | App. (Dep.) | Income | Received | Value |
| | ($000) | ($000) | ($000) | ($000) | ($000) | ($000) | ($000) | ($000) |
| Vanguard Market Liquidity Fund | — | NA1 | NA1 | — | — | — | — | — |
| Vanguard Extended Market Index Fund | 31,519 | 7,755 | 5,707 | 1,937 | 9,589 | 495 | — | 45,093 |
| Vanguard Total International Bond Index Fund | 63,242 | 32,296 | 16,482 | 1,355 | 1,118 | 648 | 123 | 81,529 |
| Vanguard Total International Stock Index Fund | 128,492 | 43,203 | 24,623 | 2,841 | 14,570 | 3,505 | — | 164,483 |
| Vanguard Variable Insurance Funds—Equity Index Portfolio | 160,856 | 58,418 | 47,105 | 11,651 | 16,292 | 2,951 | 3,462 | 200,112 |
| Vanguard Variable Insurance Funds—Total Bond Market Index Portfolio | 147,506 | 86,999 | 53,474 | 3,164 | 4,838 | 3,188 | — | 189,033 |
| Total | 531,615 | 228,671 | 147,391 | 20,948 | 46,407 | 10,787 | 3,585 | 680,250 |
1 Not applicable—purchases and sales are for temporary cash investment purposes.
G. Management has determined that no events or transactions occurred subsequent to December 31, 2020, that would require recognition or disclosure in these financial statements.
Moderate Allocation Portfolio
Report of Independent Registered Public Accounting Firm
To the Board of Trustees of Vanguard Variable Insurance Funds and Shareholders of Moderate Allocation Portfolio
Opinion on the Financial Statements
We have audited the accompanying statement of assets and liabilities, including the schedule of investments, of Moderate Allocation Portfolio (one of the portfolios constituting Vanguard Variable Insurance Funds, referred to hereafter as the “Portfolio”) as of December 31, 2020, the related statement of operations for the year ended December 31, 2020, the statement of changes in net assets for each of the two years in the period ended December 31, 2020, including the related notes, and the financial highlights for each of the five years in the period ended December 31, 2020 (collectively referred to as the “financial statements”). In our opinion, the financial statements present fairly, in all material respects, the financial position of the Portfolio as of December 31, 2020, the results of its operations for the year then ended, the changes in its net assets for each of the two years in the period ended December 31, 2020 and the financial highlights for each of the five years in the period ended December 31, 2020 in conformity with accounting principles generally accepted in the United States of America.
Basis for Opinion
These financial statements are the responsibility of the Portfolio’s management. Our responsibility is to express an opinion on the Portfolio’s financial statements based on our audits. We are a public accounting firm registered with the Public Company Accounting Oversight Board (United States) (PCAOB) and are required to be independent with respect to the Portfolio in accordance with the U.S. federal securities laws and the applicable rules and regulations of the Securities and Exchange Commission and the PCAOB.
We conducted our audits of these financial statements in accordance with the standards of the PCAOB. Those standards require that we plan and perform the audit to obtain reasonable assurance about whether the financial statements are free of material misstatement, whether due to error or fraud.
Our audits included performing procedures to assess the risks of material misstatement of the financial statements, whether due to error or fraud, and performing procedures that respond to those risks. Such procedures included examining, on a test basis, evidence regarding the amounts and disclosures in the financial statements. Our audits also included evaluating the accounting principles used and significant estimates made by management, as well as evaluating the overall presentation of the financial statements. Our procedures included confirmation of securities owned as of December 31, 2020 by correspondence with the transfer agent. We believe that our audits provide a reasonable basis for our opinion.
/s/PricewaterhouseCoopers LLP
Philadelphia, Pennsylvania
February 18, 2021
We have served as the auditor of one or more investment companies in The Vanguard Group of Funds since 1975.
Special 2020 tax information (unaudited) for corporate shareholders only for Moderate Allocation Portfolio, a portfolio of Vanguard Variable Insurance Funds
This information for the fiscal year ended December 31, 2020, is included pursuant to provisions of the Internal Revenue Code for corporate shareholders only.
The portfolio distributed $11,005,000 as capital gain dividends (20% rate gain distributions) to shareholders during the fiscal year.
For corporate shareholders, 21.6% of investment income (dividend income plus short-term gains, if any) qualifies for the dividends-received deduction.
The portfolio designates to shareholders foreign source income of $4,473,000 and foreign taxes paid of $339,000. Shareholders will receive more detailed information with their Form 1099-DIV in January 2021 to determine the calendar-year amounts to be included on their 2020 tax returns.
Moderate Allocation Portfolio
BLOOMBERG is a trademark and service mark of Bloomberg Finance L.P. BARCLAYS is a trademark and service mark of Barclays Bank Plc, used under license. Bloomberg Finance L.P. and its affiliates, including Bloomberg Index Services Limited (BISL) (collectively, Bloomberg), or Bloomberg’s licensors, own all proprietary rights in the Bloomberg Barclays U.S. Aggregate Float Adjusted Index and the Bloomberg Barclays Global Aggregate ex-USD Float Adjusted RIC Capped Index (USD Hedged) (the Indices or Bloomberg Barclays Indices).
Neither Barclays Bank Plc, Barclays Capital Inc., or any affiliate (collectively Barclays) or Bloomberg is the issuer or producer of the Moderate Allocation Portfolio and neither Bloomberg nor Barclays has any responsibilities, obligations or duties to investors in the Moderate Allocation Portfolio. The Indices are licensed for use by The Vanguard Group, Inc. (Vanguard) as the sponsor of the Moderate Allocation Portfolio. Bloomberg and Barclays’ only relationship with Vanguard in respect of the Indices is the licensing of the Indices, which are determined, composed and calculated by BISL, or any successor thereto, without regard to the Issuer or the Moderate Allocation Portfolio or the owners of the Moderate Allocation Portfolio.
Additionally, Vanguard may for itself execute transaction(s) with Barclays in or relating to the Indices in connection with the Moderate Allocation Portfolio. Investors acquire the Moderate Allocation Portfolio from Vanguard and investors neither acquire any interest in the Indices nor enter into any relationship of any kind whatsoever with Bloomberg or Barclays upon making an investment in the Moderate Allocation Portfolio. The Moderate Allocation Portfolio is not sponsored, endorsed, sold or promoted by Bloomberg or Barclays. Neither Bloomberg nor Barclays makes any representation or warranty, express or implied regarding the advisability of investing in the Moderate Allocation Portfolio or the advisability of investing in securities generally or the ability of the Indices to track corresponding or relative market performance. Neither Bloomberg nor Barclays has passed on the legality or suitability of the Moderate Allocation Portfolio with respect to any person or entity. Neither Bloomberg nor Barclays is responsible for and has not participated in the determination of the timing of, prices at, or quantities of the Moderate Allocation Portfolio to be issued. Neither Bloomberg nor Barclays has any obligation to take the needs of the Issuer or the owners of the Moderate Allocation Portfolio or any other third party into consideration in determining, composing or calculating the Indices. Neither Bloomberg nor Barclays has any obligation or liability in connection with administration, marketing or trading of the Moderate Allocation Portfolio.
The licensing agreement between Bloomberg and Barclays is solely for the benefit of Bloomberg and Barclays and not for the benefit of the owners of the Moderate Allocation Portfolio, investors or other third parties. In addition, the licensing agreement between Vanguard and Bloomberg is solely for the benefit of Vanguard and Bloomberg and not for the benefit of the owners of the Moderate Allocation Portfolio, investors or other third parties.
NEITHER BLOOMBERG NOR BARCLAYS SHALL HAVE ANY LIABILITY TO THE ISSUER, INVESTORS OR TO OTHER THIRD PARTIES FOR THE QUALITY, ACCURACY AND/OR COMPLETENESS OF THE BLOOMBERG BARCLAYS INDICES OR ANY DATA INCLUDED THEREIN OR FOR INTERRUPTIONS IN THE DELIVERY OF THE BLOOMBERG BARCLAYS INDICES. NEITHER BLOOMBERG NOR BARCLAYS MAKES ANY WARRANTY, EXPRESS OR IMPLIED, AS TO RESULTS TO BE OBTAINED BY THE ISSUER, THE INVESTORS OR ANY OTHER PERSON OR ENTITY FROM THE USE OF THE BLOOMBERG BARCLAYS INDICES OR ANY DATA INCLUDED THEREIN. NEITHER BLOOMBERG NOR BARCLAYS MAKES ANY EXPRESS OR IMPLIED WARRANTIES, AND EACH HEREBY EXPRESSLY DISCLAIMS ALL WARRANTIES OF MERCHANTABILITY OR FITNESS FOR A PARTICULAR PURPOSE OR USE WITH RESPECT TO THE BLOOMBERG BARCLAYS INDICES OR ANY DATA INCLUDED THEREIN. BLOOMBERG RESERVES THE RIGHT TO CHANGE THE METHODS OF CALCULATION OR PUBLICATION, OR TO CEASE THE CALCULATION OR PUBLICATION OF THE BLOOMBERG BARCLAYS INDICES, AND NEITHER BLOOMBERG NOR BARCLAYS SHALL BE LIABLE FOR ANY MISCALCULATION OF OR ANY INCORRECT, DELAYED OR INTERRUPTED PUBLICATION WITH RESPECT TO THE BLOOMBERG BARCLAYS INDICES. NEITHER BLOOMBERG NOR BARCLAYS SHALL BE LIABLE FOR ANY DAMAGES, INCLUDING, WITHOUT LIMITATION, ANY SPECIAL, INDIRECT OR CONSEQUENTIAL DAMAGES, OR ANY LOST PROFITS AND EVEN IF ADVISED OF THE POSSIBLITY OF SUCH, RESULTING FROM THE USE OF THE BLOOMBERG BARCLAYS INDICES OR ANY DATA INCLUDED THEREIN OR WITH RESPECT TO THE MODERATE ALLOCATION PORTFOLIO.
None of the information supplied by Bloomberg or Barclays and used in this publication may be reproduced in any manner without the prior written permission of both Bloomberg and Barclays Capital, the investment banking division of Barclays Bank Plc. Barclays Bank Plc is registered in England No. 1026167. Registered office 1 Churchill Place London E14 5HP.
© 2021 Bloomberg. Used with Permission.
Source: Bloomberg Index Services Limited. Copyright 2021, Bloomberg. All rights reserved.
This page intentionally left blank.
This page intentionally left blank.
The People Who Govern Your Fund
The trustees of your mutual fund are there to see that the fund is operated and managed in your best interests since, as a shareholder, you are a part owner of the fund. Your fund’s trustees also serve on the board of directors of The Vanguard Group, Inc., which is owned by the Vanguard funds and provides services to them.
A majority of Vanguard’s board members are independent, meaning that they have no affiliation with Vanguard or the funds they oversee, apart from the sizable personal investments they have made as private individuals. The independent board members have distinguished backgrounds in business, academia, and public service. Each of the trustees and executive officers oversees 211 Vanguard funds.
Information for each trustee and executive officer of the fund appears below. That information, as well as the Vanguard fund count, is as of the date on the cover of this fund report. The mailing address of the trustees and officers is P.O. Box 876, Valley Forge, PA 19482. More information about the trustees is in the Statement of Additional Information, which can be obtained, without charge, by contacting Vanguard at 800-662-7447, or online at vanguard.com.
Interested Trustee1
Mortimer J. Buckley
Born in 1969. Trustee since January 2018. Principal occupation(s) during the past five years and other experience: chairman of the board (2019–present) of Vanguard and of each of the investment companies served by Vanguard; chief executive officer (2018– present) of Vanguard; chief executive officer, president, and trustee (2018–present) of each of the investment companies served by Vanguard; president and director (2017–present) of Vanguard; and president (2018– present) of Vanguard Marketing Corporation. Chief investment officer (2013–2017), managing director (2002–2017), head of the Retail Investor Group (2006–2012), and chief information officer (2001–2006) of Vanguard. Chairman of the board (2011–2017) and trustee (2009–2017) of the Children’s Hospital of Philadelphia; and trustee (2018–present) and vice chair (2019–present) of The Shipley School.
Independent Trustees
Emerson U. Fullwood
Born in 1948. Trustee since January 2008. Principal occupation(s) during the past five years and other experience: executive chief staff and marketing officer for North America and corporate vice president (retired 2008) of Xerox Corporation (document management products and services). Former president of the Worldwide Channels Group, Latin America, and Worldwide Customer Service and executive chief staff officer of Developing Markets of Xerox. Executive in residence and 2009–2010 Distinguished Minett Professor at the Rochester Institute of Technology. Director of SPX FLOW, Inc. (multi-industry manufacturing). Director of the University of Rochester Medical Center, the Monroe Community College Foundation, the United Way of Rochester, North Carolina A&T University, and Roberts Wesleyan College. Trustee of the University of Rochester.
Amy Gutmann
Born in 1949. Trustee since June 2006. Principal occupation(s) during the past five years and other experience: president (2004–present) of the University of Pennsylvania. Christopher H. Browne Distinguished Professor of Political Science, School of Arts and Sciences, and professor of communication, Annenberg School for Communication, with secondary faculty appointments in the Department of Philosophy, School of Arts and Sciences, and at the Graduate School of Education, University of Pennsylvania.
F. Joseph Loughrey
Born in 1949. Trustee since October 2009. Principal occupation(s) during the past five years and other experience: president and chief operating officer (retired 2009) and vice chairman of the board (2008–2009) of Cummins Inc. (industrial machinery). Chairman of the board of Hillenbrand, Inc. (specialized consumer services) and the Lumina Foundation. Director of the V Foundation. Member of the advisory council for the College of Arts and Letters and chair of the advisory board to the Kellogg Institute for International Studies, both at the University of Notre Dame.
Mark Loughridge
Born in 1953. Trustee since March 2012. Principal occupation(s) during the past five years and other experience: senior vice president and chief financial officer (retired 2013) of IBM (information technology services). Fiduciary member of IBM’s Retirement Plan Committee (2004–2013), senior vice president and general manager (2002–2004) of IBM Global Financing, vice president and controller (1998–2002) of IBM, and a variety of other prior management roles at IBM. Member of the Council on Chicago Booth.
Scott C. Malpass
Born in 1962. Trustee since March 2012. Principal occupation(s) during the past five years and other experience: chief investment officer (retired June 2020) and vice president (retired June 2020) of the University of Notre Dame. Assistant professor of finance at the Mendoza College of Business, University of Notre Dame, and member of the Notre Dame 403(b) Investment Committee (retired June 2020). Member of the board of Catholic Investment Services, Inc. (investment advisors) and the board of superintendence of the Institute for the Works of Religion.
Deanna Mulligan
Born in 1963. Trustee since January 2018. Principal occupation(s) during the past five years and other experience: board chair (2020–present), chief executive officer (2011–2020), and president (2010–2019) of The Guardian Life Insurance Company of America. Chief operating officer (2010–2011) and executive vice president (2008–2010) of the individual life and disability division of Guardian Life. Member of the board of the American Council of Life Insurers and the board of the Economic Club of New York. Trustee of the Partnership for New York City (business leadership), Chief Executives for Corporate Purpose, NewYork-Presbyterian Hospital, Catalyst, and the Bruce Museum (arts and science). Member of the Advisory Council for the Stanford Graduate School of Business.
André F. Perold
Born in 1952. Trustee since December 2004. Principal occupation(s) during the past five years and other experience: George Gund Professor of Finance and Banking, Emeritus at the Harvard Business School (retired 2011). Chief investment officer and co-managing partner of HighVista Strategies (private investment firm). Member of the board of advisors and member of the investment committee of the Museum of Fine Arts Boston. Member of the board (2018–present) of RIT Capital Partners (investment firm). Member of the investment committee of Partners Health Care System.
Sarah Bloom Raskin
Born in 1961. Trustee since January 2018. Principal occupation(s) during the past five years and other experience: deputy secretary (2014–2017) of the United States Department of the Treasury. Governor (2010–2014) of the Federal Reserve Board. Commissioner (2007–2010) of financial regulation for the State of Maryland. Member of the board of directors (2012–2014) of Neighborhood Reinvestment Corporation. Director (2017–present) of i(x) Investments, LLC; director (2017–present) of Reserve Trust. Rubenstein Fellow (2017–present) of Duke University; trustee (2017–present) of Amherst College, and trustee (2019–present) of the Folger Shakespeare Library.
Peter F. Volanakis
Born in 1955. Trustee since July 2009. Principal occupation(s) during the past five years and other experience: president and chief operating officer (retired 2010) of Corning Incorporated (communications equipment) and director of Corning Incorporated
1 Mr. Buckley is considered an “interested person,” as defined in the Investment Company Act of 1940, because he is an officer of the Vanguard funds.
(2000–2010) and Dow Corning (2001–2010). Director (2012) of SPX Corporation (multi-industry manufacturing). Overseer of the Amos Tuck School of Business Administration, Dartmouth College (2001–2013). Chairman of the board of trustees of Colby-Sawyer College. Member of the board of Hypertherm Inc. (industrial cutting systems, software, and consumables).
Executive Officers
John Bendl
Born in 1970. Principal occupation(s) during the past five years and other experience: principal of Vanguard. Chief financial officer (2019–present) of each of the investment companies served by Vanguard. Chief accounting officer, treasurer, and controller of Vanguard (2017–present). Partner (2003–2016) at KPMG (audit, tax, and advisory services).
Christine M. Buchanan
Born in 1970. Principal occupation(s) during the past five years and other experience: principal of Vanguard. Treasurer (2017–present) of each of the investment companies served by Vanguard. Partner (2005–2017) at KPMG (audit, tax, and advisory services).
David Cermak
Born in 1960. Principal occupation(s) during the past five years and other experience: principal of Vanguard. Finance director (2019–present) of each of the investment companies served by Vanguard. Managing director and head (2017–present) of Vanguard Investments Singapore. Managing director and head (2017–2019) of Vanguard Investments Hong Kong. Representative director and head (2014–2017) of Vanguard Investments Japan.
John Galloway
Born in 1973. Principal occupation(s) during the past five years and other experience: principal of Vanguard. Investment stewardship officer (September 2020–present) of each of the investment companies served by Vanguard. Head of Investor Advocacy (February 2020–present) and head of Marketing Strategy and Planning (2017–2020) at Vanguard. Deputy assistant to the President of the United States (2015).
Thomas J. Higgins
Born in 1957. Principal occupation(s) during the past five years and other experience: principal of Vanguard. Finance director (2019–present), chief financial officer (2008–2019), and treasurer (1998–2008) of each of the investment companies served by Vanguard.
Peter Mahoney
Born in 1974. Principal occupation(s) during the past five years and other experience: principal of Vanguard. Controller (2015–present) of each of the investment companies served by Vanguard. Head of International Fund Services (2008–2014) at Vanguard.
Anne E. Robinson
Born in 1970. Principal occupation(s) during the past five years and other experience: general counsel (2016–present) of Vanguard. Secretary (2016–present) of Vanguard and of each of the investment companies served by Vanguard. Managing director (2016–present) of Vanguard. Managing director and general counsel of Global Cards and Consumer Services (2014–2016) at Citigroup. Counsel (2003–2014) at American Express.
Michael Rollings
Born in 1963. Principal occupation(s) during the past five years and other experience: finance director (2017–present) and treasurer (2017) of each of the investment companies served by Vanguard. Managing director (2016–present) of Vanguard. Chief financial officer (2016–present) of Vanguard. Director (2016–present) of Vanguard Marketing Corporation. Executive vice president and chief financial officer (2006–2016) of MassMutual Financial Group.
John E. Schadl
Born in 1972. Principal occupation(s) during the past five years and other experience: principal of Vanguard. Chief compliance officer (2019–present) of Vanguard and of each of the investment companies served by Vanguard. Assistant vice president (2019–present) of Vanguard Marketing Corporation.
Vanguard Senior Management Team
| Joseph Brennan | James M. Norris |
| Mortimer J. Buckley | Thomas M. Rampulla |
| Gregory Davis | Karin A. Risi |
| John James | Anne E. Robinson |
| John T. Marcante | Michael Rollings |
| Chris D. McIsaac | Lauren Valente |
Connect with Vanguard® > vanguard.com
Fund Information > 800-662-7447
Annuity and Insurance Services > 800-522-5555
Institutional Investor Services > 800-523-1036
Text Telephone for People
Who Are Deaf or Hard of Hearing > 800-749-7273
This material may be used in conjunction with the offering of shares of any Vanguard fund only if preceded or accompanied by the fund’s current prospectus.
You can obtain a free copy of Vanguard’s proxy voting guidelines by visiting vanguard.com/proxyreporting or by calling Vanguard at 800-662-2739. The guidelines are also available from the SEC’s website, www.sec.gov. In addition, you may obtain a free report on how your fund voted the proxies for securities it owned during the 12 months ended June 30. To get the report, visit either vanguard.com/proxyreporting or www.sec.gov.
All comparative mutual fund data are from Morningstar, Inc., unless otherwise noted.
You can review information about your portfolio on the SEC’s website, and you can receive copies of this information, for a fee, by sending a request via email addressed to publicinfo@sec.gov.
| | © 2021 The Vanguard Group, Inc. |
| | All rights reserved. |
| | Vanguard Marketing Corporation, Distributor. |
| |
| | Q690MA 022021 |
Annual Report | December 31, 2020
Vanguard Variable Insurance Funds
Contents
About Your Portfolio’s Expenses
| 1 |
Financial Statements
| 3 |
Please note: The opinions expressed in this report are just that—informed opinions. They should not be considered promises or advice. Also, please keep in mind that the information and opinions cover the period through the date on the front of this report. Of course, the risks of investing in your portfolio are spelled out in the prospectus.
About Your Portfolio’s Expenses
As a shareholder of the portfolio, you incur ongoing costs, which include costs for portfolio management, administrative services, and shareholder reports (like this one), among others. Operating expenses, which are deducted from a portfolio's gross income, directly reduce the investment return of the portfolio.
A portfolio's expenses are expressed as a percentage of its average net assets. This figure is known as the expense ratio. The following examples are intended to help you understand the ongoing costs (in dollars) of investing in your portfolio and to compare these costs with those of other mutual funds. The examples are based on an investment of $1,000 made at the beginning of the period shown and held for the entire period.
The accompanying table illustrates your portfolio's costs in two ways:
| • | Based on actual portfolio return. This section helps you to estimate the actual expenses that you paid over the period. The ”Ending Account Value“ shown is derived from the portfolio's actual return, and the third column shows the dollar amount that would have been paid by an investor who started with $1,000 in the portfolio. You may use the information here, together with the amount you invested, to estimate the expenses that you paid over the period. |
To do so, simply divide your account value by $1,000 (for example, an $8,600 account value divided by $1,000 = 8.6), then multiply the result by the number given for your portfolio under the heading ”Expenses Paid During Period.“
| • | Based on hypothetical 5% yearly return. This section is intended to help you compare your portfolio's costs with those of other mutual funds. It assumes that the portfolio had a yearly return of 5% before expenses, but that the expense ratio is unchanged. In this case—because the return used is not the portfolio's actual return—the results do not apply to your investment. The example is useful in making comparisons because the Securities and Exchange Commission requires all mutual funds to calculate expenses based on a 5% return. You can assess your portfolio's costs by comparing this hypothetical example with the hypothetical examples that appear in shareholder reports of other funds. |
Note that the expenses shown in the table are meant to highlight and help you compare ongoing costs only and do not reflect transaction costs incurred by the portfolio for buying and selling securities. The portfolio’s expense ratio does not reflect additional fees and expenses associated with the annuity or life insurance program through which you invest.
The calculations assume no shares were bought or sold during the period. Your actual costs may have been higher or lower, depending on the amount of your investment and the timing of any purchases or redemptions.
You can find more information about the portfolio's expenses, including annual expense ratios, in the Financial Statements section of this report. For additional information on operating expenses and other shareholder costs, please refer to your portfolio's current prospectus.
| Six Months Ended December 31, 2020 | | | |
| Money Market Portfolio | Beginning
Account Value
6/30/2020 | Ending
Account Value
12/31/2020 | Expenses
Paid During
Period |
| Based on Actual Portfolio Return | $1,000.00 | $1,000.24 | $0.70 |
| Based on Hypothetical 5% Yearly Return | 1,000.00 | 1,024.43 | 0.71 |
The calculations are based on expenses incurred in the most recent six-month period. The portfolio’s annualized six-month expense ratio for that period is 0.14%. The dollar amounts shown as “Expenses Paid” are equal to the annualized expense ratio multiplied by the average account value over the period, multiplied by the number of days in the most recent six-month period, then divided by the number of days in the most recent 12-month period (184/366).
Portfolio Allocation (% of investments)
| U.S. Government and Agency Obligations | 98.1% |
| Certificates of Deposit | 0.3 |
| Commercial Paper | 1.6 |
| Tax-Exempt Municipal Bonds | 0.0 |
The portfolio publishes its holdings on a monthly basis on Vanguard’s website and files them with the Securities and Exchange Commission (SEC) on Form N-MFP. The portfolio’s Form N-MFP filings may be viewed via a link on the “Portfolio Holdings” page at www.vanguard.com or on the SEC’s website at www.sec.gov.
| | | Yield1 | Maturity
Date | Face
Amount
($000) | Market
Value•
($000) |
| U.S. Government and Agency Obligations (100.4%) |
| 2 | Fannie Mae Discount Notes | 0.112%–0.122% | 1/20/21 | 7,117 | 7,117 |
| 2 | Fannie Mae Discount Notes | 0.101%–0.112% | 1/27/21 | 14,967 | 14,966 |
| 2 | Fannie Mae Discount Notes | 0.101%–0.122% | 2/3/21 | 14,800 | 14,798 |
| 2 | Fannie Mae Discount Notes | 0.101% | 2/17/21 | 13,594 | 13,592 |
| 2 | Fannie Mae Discount Notes | 0.097% | 3/10/21 | 8,000 | 7,998 |
| 3 | Federal Farm Credit Banks Funding Corp., SOFR + 0.060% | 0.150% | 1/1/21 | 1,000 | 1,000 |
| 3 | Federal Farm Credit Banks Funding Corp., SOFR + 0.080% | 0.170% | 1/1/21 | 1,000 | 1,000 |
| 3 | Federal Farm Credit Banks Funding Corp., SOFR + 0.080% | 0.170% | 1/1/21 | 1,000 | 1,000 |
| 3 | Federal Farm Credit Banks Funding Corp., SOFR + 0.145% | 0.235% | 1/1/21 | 1,000 | 1,001 |
| 3 | Federal Farm Credit Banks Funding Corp., SOFR + 0.190% | 0.280% | 1/1/21 | 6,000 | 6,009 |
| 3 | Federal Farm Credit Banks Funding Corp., SOFR + 0.220% | 0.260% | 1/1/21 | 1,000 | 1,002 |
| 3 | Federal Farm Credit Banks Funding Corp., U.S. Treasury 3M Bill Money Market Yield + 0.065% | 0.160% | 1/5/21 | 2,000 | 2,000 |
| 3 | Federal Farm Credit Banks Funding Corp., U.S. Treasury 3M Bill Money Market Yield + 0.070% | 0.165% | 1/5/21 | 2,000 | 2,000 |
| 3 | Federal Farm Credit Banks Funding Corp., U.S. Treasury 3M Bill Money Market Yield + 0.070% | 0.165% | 1/5/21 | 1,000 | 1,000 |
| | Federal Farm Credit Discount Notes | 0.142% | 2/18/21 | 3,500 | 3,499 |
| | Federal Farm Credit Discount Notes | 0.101% | 4/12/21 | 5,000 | 4,999 |
| | Federal Farm Credit Discount Notes | 0.112% | 5/24/21 | 8,500 | 8,496 |
| | Federal Farm Credit Discount Notes | 0.122% | 6/1/21 | 520 | 520 |
| | Federal Home Loan Bank Discount Notes | 0.122% | 1/11/21 | 6,000 | 6,000 |
| | Federal Home Loan Bank Discount Notes | 0.101%–0.122% | 1/20/21 | 4,646 | 4,646 |
| | Federal Home Loan Bank Discount Notes | 0.127% | 1/27/21 | 2,850 | 2,850 |
| | Federal Home Loan Bank Discount Notes | 0.112% | 1/29/21 | 7,606 | 7,605 |
| | Federal Home Loan Bank Discount Notes | 0.083% | 2/3/21 | 15,000 | 14,999 |
| | Federal Home Loan Bank Discount Notes | 0.122%–0.152% | 2/5/21 | 11,643 | 11,641 |
| | Federal Home Loan Bank Discount Notes | 0.092%–0.096% | 2/10/21 | 21,596 | 21,594 |
| | | Yield1 | Maturity
Date | Face
Amount
($000) | Market
Value•
($000) |
| | Federal Home Loan Bank Discount Notes | 0.096% | 2/17/21 | 2,000 | 2,000 |
| | Federal Home Loan Bank Discount Notes | 0.101% | 2/19/21 | 9,200 | 9,199 |
| | Federal Home Loan Bank Discount Notes | 0.097%–0.132% | 2/24/21 | 21,350 | 21,347 |
| | Federal Home Loan Bank Discount Notes | 0.111% | 3/3/21 | 2,000 | 2,000 |
| | Federal Home Loan Bank Discount Notes | 0.097%–0.152% | 3/5/21 | 11,000 | 10,997 |
| | Federal Home Loan Bank Discount Notes | 0.084%–0.094% | 3/10/21 | 9,280 | 9,278 |
| | Federal Home Loan Bank Discount Notes | 0.132% | 3/19/21 | 500 | 500 |
| | Federal Home Loan Bank Discount Notes | 0.142% | 3/24/21 | 4,155 | 4,154 |
| | Federal Home Loan Bank Discount Notes | 0.152% | 3/31/21 | 5,000 | 4,998 |
| | Federal Home Loan Bank Discount Notes | 0.122% | 4/7/21 | 744 | 744 |
| | Federal Home Loan Bank Discount Notes | 0.112% | 4/21/21 | 5,000 | 4,998 |
| | Federal Home Loan Bank Discount Notes | 0.111%–0.122% | 4/30/21 | 13,625 | 13,620 |
| | Federal Home Loan Bank Discount Notes | 0.112% | 5/21/21 | 10,000 | 9,996 |
| | Federal Home Loan Bank Discount Notes | 0.122% | 5/26/21 | 9,050 | 9,046 |
| | Federal Home Loan Bank Discount Notes | 0.101% | 6/2/21 | 597 | 597 |
| | Federal Home Loan Bank Discount Notes | 0.095%–0.122% | 6/4/21 | 31,535 | 31,521 |
| | Federal Home Loan Bank Discount Notes | 0.095%–0.101% | 6/11/21 | 9,300 | 9,296 |
| | Federal Home Loan Bank Discount Notes | 0.118% | 6/14/21 | 1,000 | 999 |
| | Federal Home Loan Banks | 0.100% | 2/1/21 | 4,000 | 4,000 |
| | Federal Home Loan Banks | 0.100% | 2/8/21 | 1,000 | 1,000 |
| | Federal Home Loan Banks | 1.375% | 2/18/21 | 3,970 | 3,977 |
| 3 | Federal Home Loan Banks, SOFR + 0.020% | 0.110% | 1/4/21 | 9,000 | 9,000 |
| 3 | Federal Home Loan Banks, SOFR + 0.035% | 0.125% | 1/4/21 | 1,000 | 1,000 |
| 3 | Federal Home Loan Banks, SOFR + 0.035% | 0.125% | 1/4/21 | 1,000 | 1,000 |
| 3 | Federal Home Loan Banks, SOFR + 0.045% | 0.135% | 1/4/21 | 1,000 | 1,000 |
| 3 | Federal Home Loan Banks, SOFR + 0.050% | 0.140% | 1/4/21 | 14,000 | 13,999 |
| 3 | Federal Home Loan Banks, SOFR + 0.050% | 0.140% | 1/4/21 | 10,500 | 10,500 |
| 3 | Federal Home Loan Banks, SOFR + 0.050% | 0.140% | 1/4/21 | 6,000 | 6,000 |
| 3 | Federal Home Loan Banks, SOFR + 0.050% | 0.140% | 1/4/21 | 750 | 750 |
| 3 | Federal Home Loan Banks, SOFR + 0.055% | 0.145% | 1/4/21 | 5,000 | 5,001 |
| 3 | Federal Home Loan Banks, SOFR + 0.055% | 0.145% | 1/4/21 | 3,000 | 3,000 |
| 3 | Federal Home Loan Banks, SOFR + 0.055% | 0.145% | 1/4/21 | 2,000 | 2,000 |
| | | Yield1 | Maturity
Date | Face
Amount
($000) | Market
Value•
($000) |
| 3 | Federal Home Loan Banks, SOFR + 0.060% | 0.150% | 1/4/21 | 6,000 | 6,000 |
| 3 | Federal Home Loan Banks, SOFR + 0.065% | 0.155% | 1/4/21 | 9,000 | 8,999 |
| 3 | Federal Home Loan Banks, SOFR + 0.070% | 0.160% | 1/4/21 | 6,000 | 6,000 |
| 3 | Federal Home Loan Banks, SOFR + 0.070% | 0.160% | 1/4/21 | 1,000 | 1,000 |
| 3 | Federal Home Loan Banks, SOFR + 0.075% | 0.165% | 1/4/21 | 7,200 | 7,198 |
| 3 | Federal Home Loan Banks, SOFR + 0.075% | 0.165% | 1/4/21 | 1,000 | 1,000 |
| 3 | Federal Home Loan Banks, SOFR + 0.080% | 0.170% | 1/4/21 | 5,000 | 5,000 |
| 3 | Federal Home Loan Banks, SOFR + 0.080% | 0.170% | 1/4/21 | 1,000 | 1,000 |
| 3 | Federal Home Loan Banks, SOFR + 0.085% | 0.175% | 1/4/21 | 1,000 | 1,000 |
| 3 | Federal Home Loan Banks, SOFR + 0.090% | 0.180% | 1/4/21 | 750 | 750 |
| 3 | Federal Home Loan Banks, SOFR + 0.095% | 0.185% | 1/4/21 | 1,000 | 1,000 |
| 3 | Federal Home Loan Banks, SOFR + 0.100% | 0.190% | 1/4/21 | 13,000 | 13,000 |
| 3 | Federal Home Loan Banks, SOFR + 0.100% | 0.190% | 1/4/21 | 7,000 | 7,000 |
| 3 | Federal Home Loan Banks, SOFR + 0.115% | 0.205% | 1/1/21 | 4,000 | 4,000 |
| 3 | Federal Home Loan Banks, SOFR + 0.130% | 0.220% | 1/4/21 | 7,000 | 7,000 |
| 3 | Federal Home Loan Banks, SOFR + 0.130% | 0.220% | 1/4/21 | 1,100 | 1,100 |
| 3 | Federal Home Loan Banks, SOFR + 0.135% | 0.225% | 1/4/21 | 1,900 | 1,900 |
| 3 | Federal Home Loan Banks, SOFR + 0.135% | 0.225% | 1/4/21 | 1,000 | 1,000 |
| 3 | Federal Home Loan Banks, SOFR + 0.140% | 0.230% | 1/4/21 | 3,000 | 3,000 |
| 3 | Federal Home Loan Banks, SOFR + 0.160% | 0.250% | 1/4/21 | 5,245 | 5,246 |
| 2,3 | Federal Home Loan Mortgage Corp., SOFR + 0.095% | 0.185% | 1/1/21 | 2,000 | 2,000 |
| 2,3 | Federal Home Loan Mortgage Corp., SOFR + 0.120% | 0.210% | 1/1/21 | 8,000 | 8,000 |
| 2,3 | Federal Home Loan Mortgage Corp., SOFR + 0.140% | 0.230% | 1/1/21 | 5,000 | 4,999 |
| 2,3 | Federal Home Loan Mortgage Corp., SOFR + 0.145% | 0.235% | 1/1/21 | 6,000 | 6,000 |
| 2,3 | Federal Home Loan Mortgage Corp., SOFR + 0.150% | 0.240% | 1/1/21 | 17,000 | 16,999 |
| 2,3 | Federal Home Loan Mortgage Corp., SOFR + 0.160% | 0.250% | 1/1/21 | 5,000 | 5,006 |
| 2,3 | Federal Home Loan Mortgage Corp., SOFR + 0.180% | 0.270% | 1/1/21 | 3,000 | 3,000 |
| 2,3 | Federal Home Loan Mortgage Corp., SOFR + 0.190% | 0.280% | 1/1/21 | 15,000 | 15,000 |
| 2,3 | Federal Home Loan Mortgage Corp., SOFR + 0.190% | 0.280% | 1/1/21 | 1,000 | 1,000 |
| 2,3 | Federal Home Loan Mortgage Corp., SOFR + 0.200% | 0.290% | 1/1/21 | 1,000 | 1,000 |
| 2 | Federal National Mortgage Association | 1.375% | 2/26/21 | 1,000 | 1,002 |
| 2 | Federal National Mortgage Association | 2.500% | 4/13/21 | 1,755 | 1,767 |
| | | Yield1 | Maturity
Date | Face
Amount
($000) | Market
Value•
($000) |
| 2,3 | Federal National Mortgage Association, SOFR + 0.075% | 0.165% | 1/1/21 | 3,000 | 2,999 |
| 2,3 | Federal National Mortgage Association, SOFR + 0.100% | 0.190% | 1/1/21 | 2,500 | 2,499 |
| 2,3 | Federal National Mortgage Association, SOFR + 0.120% | 0.210% | 1/1/21 | 1,200 | 1,201 |
| 2,3 | Federal National Mortgage Association, SOFR + 0.130% | 0.220% | 1/1/21 | 11,000 | 11,000 |
| 2,3 | Federal National Mortgage Association, SOFR + 0.140% | 0.230% | 1/1/21 | 2,000 | 2,000 |
| 2,3 | Federal National Mortgage Association, SOFR + 0.150% | 0.240% | 1/1/21 | 1,000 | 1,000 |
| 2,3 | Federal National Mortgage Association, SOFR + 0.180% | 0.270% | 1/1/21 | 5,000 | 5,000 |
| 2,3 | Federal National Mortgage Association, SOFR + 0.190% | 0.280% | 1/1/21 | 4,300 | 4,302 |
| 2,3 | Federal National Mortgage Association, SOFR + 0.300% | 0.390% | 1/1/21 | 9,000 | 9,023 |
| 2,3 | Federal National Mortgage Association, SOFR + 0.360% | 0.450% | 1/1/21 | 2,750 | 2,759 |
| | U.S. Cash Management Bill | 0.086%–0.103% | 3/9/21 | 26,503 | 26,498 |
| | U.S. Cash Management Bill | 0.082% | 3/30/21 | 10,000 | 9,998 |
| | U.S. Cash Management Bill | 0.082% | 4/6/21 | 20,000 | 19,995 |
| | U.S. Cash Management Bill | 0.103% | 4/13/21 | 25,000 | 24,993 |
| | U.S. Cash Management Bill | 0.088% | 5/11/21 | 10,000 | 9,997 |
| | U.S. Treasury Bill | 0.096% | 1/5/21 | 19,272 | 19,272 |
| | U.S. Treasury Bill | 0.093%–0.165% | 1/7/21 | 34,040 | 34,039 |
| | U.S. Treasury Bill | 0.108% | 1/12/21 | 15,000 | 14,999 |
| | U.S. Treasury Bill | 0.104%–0.145% | 1/14/21 | 35,000 | 34,998 |
| | U.S. Treasury Bill | 0.117% | 1/19/21 | 15,000 | 14,999 |
| | U.S. Treasury Bill | 0.095%–0.135% | 1/21/21 | 77,111 | 77,106 |
| | U.S. Treasury Bill | 0.112% | 1/26/21 | 10,000 | 9,999 |
| | U.S. Treasury Bill | 0.098% | 1/28/21 | 12,151 | 12,150 |
| | U.S. Treasury Bill | 0.107% | 2/2/21 | 15,000 | 14,999 |
| | U.S. Treasury Bill | 0.105% | 2/4/21 | 12,359 | 12,358 |
| | U.S. Treasury Bill | 0.082%–0.120% | 2/11/21 | 37,000 | 36,995 |
| | U.S. Treasury Bill | 0.091% | 2/16/21 | 30,000 | 29,996 |
| | U.S. Treasury Bill | 0.120% | 2/25/21 | 30,000 | 29,994 |
| | U.S. Treasury Bill | 0.079%–0.101% | 3/2/21 | 28,115 | 28,111 |
| | U.S. Treasury Bill | 0.120% | 3/18/21 | 25,000 | 24,994 |
| | U.S. Treasury Bill | 0.093%–0.105% | 4/1/21 | 24,246 | 24,240 |
| | U.S. Treasury Bill | 0.110% | 4/8/21 | 20,000 | 19,994 |
| | U.S. Treasury Bill | 0.115% | 4/15/21 | 20,000 | 19,993 |
| | U.S. Treasury Bill | 0.115% | 4/22/21 | 25,000 | 24,991 |
| | U.S. Treasury Bill | 0.110% | 4/29/21 | 15,000 | 14,995 |
| | U.S. Treasury Bill | 0.110% | 5/6/21 | 10,000 | 9,996 |
| | U.S. Treasury Bill | 0.110% | 5/13/21 | 25,000 | 24,990 |
| | U.S. Treasury Bill | 0.100% | 5/20/21 | 15,000 | 14,994 |
| | U.S. Treasury Bill | 0.089% | 5/27/21 | 951 | 951 |
| | U.S. Treasury Bill | 0.090% | 6/3/21 | 10,000 | 9,996 |
| | U.S. Treasury Bill | 0.090% | 6/10/21 | 20,000 | 19,992 |
| | U.S. Treasury Bill | 0.085% | 6/17/21 | 15,000 | 14,994 |
| | U.S. Treasury Bill | 0.090% | 6/24/21 | 9,920 | 9,916 |
| | U.S. Treasury Bill | 0.100% | 7/1/21 | 30,000 | 29,985 |
| 3 | U.S. Treasury Floating Rate Note, U.S. Treasury 3M Bill Money Market Yield + 0.055% | 0.150% | 1/5/21 | 10,000 | 9,999 |
| | U.S. Treasury Note/Bond | 2.000% | 1/15/21 | 8,726 | 8,732 |
| | U.S. Treasury Note/Bond | 2.375% | 4/15/21 | 2,433 | 2,449 |
| Total U.S. Government and Agency Obligations (Cost $1,306,295) | 1,306,295 |
| | | Yield1 | Maturity
Date | Face
Amount
($000) | Market
Value•
($000) |
| Certificates of Deposit (0.3%) |
| | Landesbank Baden-Wuerttemberg | 0.270% | 1/11/21 | 4,000 | 4,000 |
| Total Certificates of Deposit (Cost $4,000) | 4,000 |
| Commercial Paper (1.6%) |
| | JP Morgan Securities LLC | 0.130% | 1/5/21 | 3,000 | 3,000 |
| | Landesbank Baden-Wuerttemberg | 0.080% | 1/5/21 | 15,000 | 14,999 |
| | Landesbank Baden-Wuerttemberg | 0.110% | 1/11/21 | 1,500 | 1,500 |
| | Landesbank Hessen-Thueringen Girozentrale | 0.120% | 1/6/21 | 2,000 | 2,000 |
| Total Commercial Paper (Cost $21,499) | 21,499 |
| Tax-Exempt Municipal Bonds (0.0%) |
| 4 | Chicago Midway International Airport Port, Airport & Marina Revenue VRDO | 0.120% | 1/7/21 | 210 | 210 |
| Total Tax-Exempt Municipal Bonds (Cost $210) | 210 |
| Total Investments (102.3%) (Cost $1,332,004) | 1,332,004 |
| Other Assets and Liabilities—Net (-2.3%) | (30,578) |
| Net Assets (100%) | 1,301,426 |
| Cost is in $000. |
| • | See Note A in Notes to Financial Statements. |
| 1 | Represents annualized yield at date of purchase for discount securities, and coupon for coupon-bearing securities. |
| 2 | The issuer was placed under federal conservatorship in September 2008; since that time, its daily operations have been managed by the Federal Housing Finance Agency and it receives capital from the U.S. Treasury, as needed to maintain a positive net worth, in exchange for senior preferred stock. |
| 3 | Variable rate security; rate shown is effective rate at period end. Certain variable rate securities are not based on a published reference rate and spread but are determined by the issuer or agent based on current market conditions. |
| 4 | Scheduled principal and interest payments are guaranteed by bank letter of credit. |
| | 3M—3-month. |
| | SOFR—Secured Overnight Financing Rate. |
| | VRDO—Variable Rate Demand Obligation. |
See accompanying Notes, which are an integral part of the Financial Statements.
Statement of Assets and Liabilities
| ($000s, except shares and per-share amounts) | Amount |
| Assets | |
| Investments in Securities, at Value—Unaffiliated Issuers (Cost $1,332,004) | 1,332,004 |
| Investment in Vanguard | 52 |
| Receivables for Investment Securities Sold | 5 |
| Receivables for Accrued Income | 206 |
| Receivables for Capital Shares Issued | 968 |
| Total Assets | 1,333,235 |
| Liabilities | |
| Payables for Investment Securities Purchased | 31,595 |
| Payables for Capital Shares Redeemed | 118 |
| Payables to Vanguard | 96 |
| Total Liabilities | 31,809 |
| Net Assets | 1,301,426 |
| At December 31, 2020, net assets consisted of: | |
| | |
| Paid-in Capital | 1,301,351 |
| Total Distributable Earnings (Loss) | 75 |
| Net Assets | 1,301,426 |
| |
| Net Assets | |
Applicable to 1,300,951,171 outstanding $.001 par value shares of
beneficial interest (unlimited authorization) | 1,301,426 |
| Net Asset Value Per Share | $1.00 |
See accompanying Notes, which are an integral part of the Financial Statements.
Statement of Operations
|
| | Year Ended
December 31, 2020 |
| | ($000) |
| Investment Income | |
| Income | |
| Interest | 8,720 |
| Total Income | 8,720 |
| Expenses | |
| The Vanguard Group—Note B | |
| Investment Advisory Services | 33 |
| Management and Administrative | 1,803 |
| Marketing and Distribution | 137 |
| Custodian Fees | 13 |
| Auditing Fees | 31 |
| Shareholders' Reports | 36 |
| Trustees’ Fees and Expenses | 1 |
| Total Expenses | 2,054 |
| Expense Reduction—Note B | (69) |
| Net Expenses | 1,985 |
| Net Investment Income | 6,735 |
| Realized Net Gain (Loss) on Investment Securities Sold | 97 |
| Net Increase (Decrease) in Net Assets Resulting from Operations | 6,832 |
Statement of Changes in Net Assets
|
| | Year Ended December 31, |
| | 2020
($000) | 2019
($000) |
| Increase (Decrease) in Net Assets | | |
| Operations | | |
| Net Investment Income | 6,735 | 27,317 |
| Realized Net Gain (Loss) | 97 | 3 |
| Net Increase (Decrease) in Net Assets Resulting from Operations | 6,832 | 27,320 |
| Distributions1 | | |
| Total Distributions | (6,741) | (27,441) |
| Capital Share Transactions (at $1.00 per share) | | |
| Issued | 531,624 | 374,573 |
| Issued in Lieu of Cash Distributions | 6,676 | 27,441 |
| Redeemed | (480,411) | (376,165) |
| Net Increase (Decrease) from Capital Share Transactions | 57,889 | 25,849 |
| Total Increase (Decrease) | 57,980 | 25,728 |
| Net Assets | | |
| Beginning of Period | 1,243,446 | 1,217,718 |
| End of Period | 1,301,426 | 1,243,446 |
| 1 | Certain prior-period numbers have been reclassified to conform with the current-period presentation. |
See accompanying Notes, which are an integral part of the Financial Statements.
For a Share Outstanding
Throughout Each Period | Year Ended December 31, |
| 2020 | 2019 | 2018 | 2017 | 2016 |
| Net Asset Value, Beginning of Period | $1.00 | $1.00 | $1.00 | $1.00 | $1.00 |
| Investment Operations | | | | | |
| Net Investment Income | .0051 | .0221 | .0201 | .0101 | .005 |
| Net Realized and Unrealized Gain (Loss) on Investments | — | — | — | — | — |
| Total from Investment Operations | .005 | .022 | .020 | .010 | .005 |
| Distributions | | | | | |
| Dividends from Net Investment Income | (.005) | (.022) | (.020) | (.010) | (.005) |
| Distributions from Realized Capital Gains | — | — | — | — | — |
| Total Distributions | (.005) | (.022) | (.020) | (.010) | (.005) |
| Net Asset Value, End of Period | $1.00 | $1.00 | $1.00 | $1.00 | $1.00 |
| Total Return | 0.52% | 2.26% | 1.97% | 1.01% | 0.48% |
| Ratios/Supplemental Data | | | | | |
| Net Assets, End of Period (Millions) | $1,301 | $1,243 | $1,218 | $961 | $965 |
| Ratio of Expenses to Average Net Assets2 | 0.15% | 0.15% | 0.15% | 0.16% | 0.16% |
| Ratio of Net Investment Income to Average Net Assets | 0.49% | 2.23% | 1.97% | 1.00% | 0.46% |
| 1 | Calculated based on average shares outstanding. |
| 2 | Vanguard and the board of trustees have agreed to temporarily limit certain net operating expenses in excess of the portfolio’s daily yield in order to maintain a zero or positive yield for the portfolio. Vanguard and the board of trustees may terminate the temporary expense limitation at any time. The portfolio is not obligated to repay this amount to Vanguard. The ratio of total expenses to average net assets before an expense reduction was 0.15% for 2020 and 0.16% for 2016. For the years ended December 31, 2019, 2018 and 2017, there were no expense reductions. |
See accompanying Notes, which are an integral part of the Financial Statements.
Notes to Financial Statements
The Money Market Portfolio, a portfolio of Vanguard Variable Insurance Funds, is registered under the Investment Company Act of 1940 as an open-end investment company. The portfolio's shares are only available for purchase by separate accounts of insurance companies as investments for variable annuity plans, variable life insurance contracts, or other variable benefit insurance contracts.
In December 2020, the Money Market Portfolio announced changes to the portfolio's investment strategy and the portfolio's designation to a “government” money market fund. The changes became effective in January 2021.
The portfolio invests in short-term debt instruments of companies primarily operating in specific industries, particularly financial services; the issuers' abilities to meet their obligations may be affected by economic developments in such industries. Market disruptions associated with the COVID-19 pandemic have had a global impact, and uncertainty exists as to the long-term implications. Such disruptions can adversely affect assets of the portfolio and thus portfolio performance.
| A. | The following significant accounting policies conform to generally accepted accounting principles for U.S. investment companies. The portfolio consistently follows such policies in preparing its financial statements. |
1. Security Valuation: Securities are valued as of the close of trading on the New York Stock Exchange (generally 4 p.m., Eastern time) on the valuation date. Securities are valued at amortized cost, which approximates market value.
2. Federal Income Taxes: The portfolio intends to continue to qualify as a regulated investment company and distribute all of its taxable income. The portfolio’s tax returns are open to examination by the relevant tax authorities until expiration of the applicable statute of limitations, which is generally three years after the filing of the tax return. Management has analyzed the portfolio’s tax positions taken for all open federal and state income tax years, and has concluded that no provision for income tax is required in the portfolio’s financial statements.
3. Distributions: Distributions from net investment income are declared daily and paid on the first business day of the following month. Annual distributions from realized capital gains, if any, are recorded on the ex-dividend date. Distributions are determined on a tax basis at the fiscal year-end and may differ from net investment income and realized capital gains for financial reporting purposes.
4. Credit Facilities and Interfund Lending Program: The portfolio and certain other funds managed by The Vanguard Group ("Vanguard") participate in a $4.3 billion committed credit facility provided by a syndicate of lenders pursuant to a credit agreement and an uncommitted credit facility provided by Vanguard. Both facilities may be renewed annually. Each fund is individually liable for its borrowings, if any, under the credit facilities. Borrowings may be utilized for temporary or emergency purposes, subject to the portfolio’s regulatory and contractual borrowing restrictions. With respect to the committed credit facility, the participating funds are charged administrative fees and an annual commitment fee of 0.10% of the undrawn committed amount of the facility; these fees are allocated to the funds based on a method approved by the portfolio’s board of trustees and included in Management and Administrative expenses on the portfolio’s Statement of Operations. Any borrowings under either facility bear interest at a rate based upon the higher of the one-month London Interbank Offered Rate (or an acceptable alternate rate, if necessary), federal funds effective rate, or overnight bank funding rate plus an agreed-upon spread, except that borrowings under the uncommitted credit facility may bear interest based upon an alternate rate agreed to by the portfolio and Vanguard.
In accordance with an exemptive order (the “Order”) from the SEC, the portfolio may participate in a joint lending and borrowing program that allows registered open-end Vanguard funds to borrow money from and lend money to each other for temporary or emergency purposes (the “Interfund Lending Program”), subject to compliance with the terms and conditions of the Order, and to the extent permitted by the portfolio’s investment objective and investment policies. Interfund loans and borrowings normally extend overnight, but can have a maximum duration of seven days. Loans may be called on one business day’s notice. The interest rate to be charged is governed by the conditions of the Order and internal procedures adopted by the board of trustees. The board of trustees is responsible for overseeing the Interfund Lending Program.
For the year ended December 31, 2020, the portfolio did not utilize the credit facilities or the Interfund Lending Program.
5. Other: Interest income is accrued daily. Premiums and discounts on debt securities are amortized and accreted, respectively, to interest income over the lives of the respective securities, except for premiums on certain callable debt securities that are amortized to the earliest call date. Security transactions are accounted for on the date securities are bought or sold. Costs used to determine realized gains (losses) on the sale of investment securities are those of the specific securities sold.
| B. | In accordance with the terms of a Funds' Service Agreement (the “FSA”) between Vanguard and the portfolio, Vanguard furnishes to the portfolio investment advisory, corporate management, administrative, marketing, and distribution services at Vanguard’s cost of operations (as defined by the FSA). These costs of operations are allocated to the portfolio based on methods and guidelines approved by the board of trustees and are generally settled twice a month. |
Upon the request of Vanguard, the portfolio may invest up to 0.40% of its net assets as capital in Vanguard. At December 31, 2020, the portfolio had contributed to Vanguard capital in the amount of $52,000, representing less than 0.01% of the portfolio’s net assets and 0.02% of Vanguard’s capital received pursuant to the FSA. The portfolio’s trustees and officers are also directors and employees, respectively, of Vanguard.
Vanguard and the board of trustees have agreed to temporarily limit certain net operating expenses in excess of the portfolio’s daily yield in order to maintain a zero or positive yield for the portfolio. Vanguard and the board of trustees may terminate the temporary expense limitation at any time. For the year ended December 31, 2020, Vanguard's expenses were reduced by $69,000 (an effective annual rate of less than 0.01% of the portfolio’s average net assets); the portfolio is not obligated to repay this amount to Vanguard.
| C. | Various inputs may be used to determine the value of the portfolio’s investments. These inputs are summarized in three broad levels for financial statement purposes. The inputs or methodologies used to value securities are not necessarily an indication of the risk associated with investing in those securities. |
Level 1—Quoted prices in active markets for identical securities.
Level 2—Other significant observable inputs (including quoted prices for similar securities, interest rates, prepayment speeds, credit risk, etc.).
Level 3—Significant unobservable inputs (including the portfolio’s own assumptions used to determine the fair value of investments). Any investments valued with significant unobservable inputs are noted on the Schedule of Investments.
At December 31, 2020, 100% of the market value of the portfolio’s investments was determined using amortized cost, in accordance with rules under the Investment Company Act of 1940. Amortized cost approximates the current fair value of a security, but since the value is not obtained from a quoted price in an active market, securities valued at amortized cost are considered to be valued using Level 2 inputs.
| D. | Permanent differences between book-basis and tax-basis components of net assets, if any, are reclassified among capital accounts in the financial statements to reflect their tax character. These reclassifications have no effect on net assets or net asset value per share. |
Temporary differences between book-basis and tax-basis components of total distributable earnings (loss) arise when certain items of income, gain, or loss are recognized in different periods for financial statement and tax purposes; these differences will reverse at some time in the future. As of period end, the tax-basis components of total distributable earnings (loss) are detailed in the table as follows:
| | Amount
($000) |
| Undistributed Ordinary Income | 75 |
| Undistributed Long-Term Gains | — |
| Capital Loss Carryforwards | — |
| Qualified Late-Year Losses | — |
| Net Unrealized Gains (Losses) | — |
The tax character of distributions paid was as follows:
| | Year Ended December 31, |
| | 2020
Amount
($000) | 2019
Amount
($000) |
| Ordinary Income* | 6,741 | 27,441 |
| Long-Term Capital Gains | — | — |
| Total | 6,741 | 27,441 |
| * | Includes short-term capital gains, if any. |
As of December 31, 2020, gross unrealized appreciation and depreciation for investments based on cost for U.S. federal income tax purposes were as follows:
| | Amount
($000) |
| Tax Cost | 1,332,004 |
| Gross Unrealized Appreciation | — |
| Gross Unrealized Depreciation | — |
| Net Unrealized Appreciation (Depreciation) | — |
| E. | At December 31, 2020, one shareholder (an insurance company separate account whose holdings in the portfolio represent the indirect investment of Vanguard Variable Annuity contract holders), was the record or beneficial owner of 89% of the portfolio’s net assets. If this shareholder was to redeem its investment in the portfolio, the redemption might result in an increase in the portfolio’s expense ratio, cause the portfolio to incur higher transaction costs, or lead to the realization of taxable capital gains. |
| F. | Management has determined that no other events or transactions occurred subsequent to December 31, 2020, that would require recognition or disclosure in these financial statements. |
Report of Independent Registered Public Accounting Firm
To the Board of Trustees of Vanguard Variable Insurance Funds and Shareholders of Money Market Portfolio
Opinion on the Financial Statements
We have audited the accompanying statement of assets and liabilities, including the schedule of investments, of Money Market Portfolio (one of the portfolios constituting Vanguard Variable Insurance Funds, referred to hereafter as the "Portfolio”) as of December 31, 2020, the related statement of operations for the year ended December 31, 2020, the statement of changes in net assets for each of the two years in the period ended December 31, 2020, including the related notes, and the financial highlights for each of the five years in the period ended December 31, 2020 (collectively referred to as the “financial statements”). In our opinion, the financial statements present fairly, in all material respects, the financial position of the Portfolio as of December 31, 2020, the results of its operations for the year then ended, the changes in its net assets for each of the two years in the period ended December 31, 2020 and the financial highlights for each of the five years in the period ended December 31, 2020 in conformity with accounting principles generally accepted in the United States of America.
Basis for Opinion
These financial statements are the responsibility of the Portfolio’s management. Our responsibility is to express an opinion on the Portfolio’s financial statements based on our audits. We are a public accounting firm registered with the Public Company Accounting Oversight Board (United States) (PCAOB) and are required to be independent with respect to the Portfolio in accordance with the U.S. federal securities laws and the applicable rules and regulations of the Securities and Exchange Commission and the PCAOB.
We conducted our audits of these financial statements in accordance with the standards of the PCAOB. Those standards require that we plan and perform the audit to obtain reasonable assurance about whether the financial statements are free of material misstatement, whether due to error or fraud.
Our audits included performing procedures to assess the risks of material misstatement of the financial statements, whether due to error or fraud, and performing procedures that respond to those risks. Such procedures included examining, on a test basis, evidence regarding the amounts and disclosures in the financial statements. Our audits also included evaluating the accounting principles used and significant estimates made by management, as well as evaluating the overall presentation of the financial statements. Our procedures included confirmation of securities owned as of December 31, 2020 by correspondence with the custodian and brokers; when replies were not received from brokers, we performed other auditing procedures. We believe that our audits provide a reasonable basis for our opinion.
/s/PricewaterhouseCoopers LLP
Philadelphia, Pennsylvania
February 18, 2021
We have served as the auditor of one or more investment companies in The Vanguard Group of Funds since 1975.
Special 2020 tax information (unaudited) for corporate shareholders only for Money Market Portfolio, a portfolio of Vanguard Variable Insurance Funds
This information for the fiscal year ended December 31, 2020, is included pursuant to provisions of the Internal Revenue Code for corporate shareholders only.
The percentage of the ordinary dividends reported by the fund that is treated as a Section 163(j) interest dividend and thus is eligible to be treated as interest income for purposes of Section 163(j) and the regulations thereunder is 100%.
This page intentionally left blank.
The People Who Govern Your Fund
The trustees of your mutual fund are there to see that the fund is operated and managed in your best interests since, as a shareholder, you are a part owner of the fund. Your fund’s trustees also serve on the board of directors of The Vanguard Group, Inc., which is owned by the Vanguard funds and provides services to them.
A majority of Vanguard’s board members are independent, meaning that they have no affiliation with Vanguard or the funds they oversee, apart from the sizable personal investments they have made as private individuals. The independent board members have distinguished backgrounds in business, academia, and public service. Each of the trustees and executive officers oversees 211 Vanguard funds.
Information for each trustee and executive officer of the fund appears below. That information, as well as the Vanguard fund count, is as of the date on the cover of this fund report. The mailing address of the trustees and officers is P.O. Box 876, Valley Forge, PA 19482. More information about the trustees is in the Statement of Additional Information, which can be obtained, without charge, by contacting Vanguard at 800-662-7447, or online at vanguard.com.
Interested Trustee1
Mortimer J. Buckley
Born in 1969. Trustee since January 2018. Principal occupation(s) during the past five years and other experience: chairman of the board (2019–present) of Vanguard and of each of the investment companies served by Vanguard; chief executive officer (2018–present) of Vanguard; chief executive officer, president, and trustee (2018–present) of each of the investment companies served by Vanguard; president and director (2017–present) of Vanguard; and president (2018–present) of Vanguard Marketing Corporation. Chief investment officer (2013–2017), managing director (2002–2017), head of the Retail Investor Group (2006–2012), and chief information officer (2001–2006) of Vanguard. Chairman of the board (2011–2017) and trustee (2009–2017) of the Children’s Hospital of Philadelphia; and trustee (2018–present) and vice chair (2019–present) of The Shipley School.
Independent Trustees
Emerson U. Fullwood
Born in 1948. Trustee since January 2008. Principal occupation(s) during the past five years and other experience: executive chief staff and marketing officer for North America and corporate vice president (retired 2008) of Xerox Corporation (document management products and services). Former president of the Worldwide Channels Group, Latin America, and Worldwide Customer Service and executive chief staff officer of Developing Markets of Xerox. Executive in residence and 2009–2010 Distinguished Minett Professor at the Rochester Institute of Technology. Director of SPX FLOW, Inc. (multi-industry manufacturing). Director of the University of Rochester Medical Center, the Monroe Community College Foundation, the United Way of Rochester, North Carolina A&T University, and Roberts Wesleyan College. Trustee of the University of Rochester.
Amy Gutmann
Born in 1949. Trustee since June 2006. Principal occupation(s) during the past five years and other experience: president (2004–present) of the University of Pennsylvania. Christopher H. Browne Distinguished Professor of Political Science, School of Arts and Sciences, and professor of communication, Annenberg School for Communication, with secondary faculty appointments in the Department of Philosophy, School of Arts and Sciences, and at the Graduate School of Education, University of Pennsylvania.
F. Joseph Loughrey
Born in 1949. Trustee since October 2009. Principal occupation(s) during the past five years and other experience: president and chief operating officer (retired 2009) and vice chairman of the board (2008–2009) of Cummins Inc. (industrial machinery). Chairman of the board of Hillenbrand, Inc. (specialized consumer services) and the Lumina Foundation. Director of the V Foundation. Member of the advisory council for the College of Arts and Letters and chair of the advisory board to the Kellogg Institute for International Studies, both at the University of Notre Dame.
Mark Loughridge
Born in 1953. Trustee since March 2012. Principal occupation(s) during the past five years and other experience: senior vice president and chief financial officer (retired 2013) of IBM (information technology services). Fiduciary member of IBM’s Retirement Plan Committee (2004–2013), senior vice president and general manager (2002–2004) of IBM Global Financing, vice president and controller (1998–2002) of IBM, and a variety of other prior management roles at IBM. Member of the Council on Chicago Booth.
Scott C. Malpass
Born in 1962. Trustee since March 2012. Principal occupation(s) during the past five years and other experience: chief investment officer (retired June 2020) and vice president (retired June 2020) of the University of Notre Dame. Assistant professor of finance at the Mendoza College of Business, University of Notre Dame, and member of the Notre Dame 403(b) Investment Committee (retired June 2020). Member of the board of Catholic Investment Services, Inc. (investment advisors) and the board of superintendence of the Institute for the Works of Religion.
Deanna Mulligan
Born in 1963. Trustee since January 2018. Principal occupation(s) during the past five years and other experience: board chair (2020–present), chief executive officer (2011–2020), and president (2010–2019) of The Guardian Life Insurance Company of America. Chief operating officer (2010–2011) and executive vice president (2008–2010) of the individual life and disability division of Guardian Life. Member of the board of the American Council of Life Insurers and the board of the Economic Club of New York. Trustee of the Partnership for New York City (business leadership), Chief Executives for Corporate Purpose, NewYork-Presbyterian Hospital, Catalyst, and the
Bruce Museum (arts and science). Member of the Advisory Council for the Stanford Graduate School of Business.
André F. Perold
Born in 1952. Trustee since December 2004. Principal occupation(s) during the past five years and other experience: George Gund Professor of Finance and Banking, Emeritus at the Harvard Business School (retired 2011). Chief investment officer and co-managing partner of HighVista Strategies (private investment firm). Member of the board of advisors and member of the investment committee of the Museum of Fine Arts Boston. Member of the board (2018–present) of RIT Capital Partners (investment firm). Member of the investment committee of Partners Health Care System.
Sarah Bloom Raskin
Born in 1961. Trustee since January 2018. Principal occupation(s) during the past five years and other experience: deputy secretary (2014–2017) of the United States Department of the Treasury. Governor (2010–2014) of the Federal Reserve Board. Commissioner (2007–2010) of financial regulation for the State of Maryland. Member of the board of directors (2012–2014) of Neighborhood Reinvestment Corporation. Director (2017–present) of i(x) Investments, LLC; director (2017–present) of Reserve Trust. Rubenstein Fellow (2017–present) of Duke University; trustee (2017–present) of Amherst College, and trustee (2019–present) of the Folger Shakespeare Library.
Peter F. Volanakis
Born in 1955. Trustee since July 2009. Principal occupation(s) during the past five years and other experience: president and chief operating officer (retired 2010) of Corning Incorporated (communications equipment) and director of Corning Incorporated (2000–2010) and Dow Corning (2001–2010). Director (2012) of SPX Corporation (multi-industry manufacturing). Overseer of the Amos Tuck School of Business Administration, Dartmouth College (2001–2013). Chairman of the board of trustees of Colby-Sawyer College. Member of the board of Hypertherm Inc. (industrial cutting systems, software, and consumables).
1 Mr. Buckley is considered an “interested person,” as defined in the Investment Company Act of 1940, because he is an officer of the Vanguard funds.
Executive Officers
John Bendl
Born in 1970. Principal occupation(s) during the past five years and other experience: principal of Vanguard. Chief financial officer (2019–present) of each of the investment companies served by Vanguard. Chief accounting officer, treasurer, and controller of Vanguard (2017–present). Partner (2003–2016) at KPMG (audit, tax, and advisory services).
Christine M. Buchanan
Born in 1970. Principal occupation(s) during the past five years and other experience: principal of Vanguard. Treasurer (2017–present) of each of the investment companies served by Vanguard. Partner (2005–2017) at KPMG (audit, tax, and advisory services).
David Cermak
Born in 1960. Principal occupation(s) during the past five years and other experience: principal of Vanguard. Finance director (2019–present) of each of the investment companies served by Vanguard. Managing director and head (2017–present) of Vanguard Investments Singapore. Managing director and head (2017–2019) of Vanguard Investments Hong Kong. Representative director and head (2014–2017) of Vanguard Investments Japan.
John Galloway
Born in 1973. Principal occupation(s) during the past five years and other experience: principal of Vanguard.
Investment stewardship officer (September 2020–present) of each of the investment companies served by Vanguard. Head of Investor Advocacy (February 2020–present) and head of Marketing Strategy and Planning (2017–2020) at Vanguard. Deputy assistant to the President of the United States (2015).
Thomas J. Higgins
Born in 1957. Principal occupation(s) during the past five years and other experience: principal of Vanguard. Finance director (2019–present), chief financial officer (2008–2019), and treasurer (1998–2008) of each of the investment companies served by Vanguard.
Peter Mahoney
Born in 1974. Principal occupation(s) during the past five years and other experience: principal of Vanguard. Controller (2015–present) of each of the investment companies served by Vanguard. Head of International Fund Services (2008–2014) at Vanguard.
Anne E. Robinson
Born in 1970. Principal occupation(s) during the past five years and other experience: general counsel (2016–present) of Vanguard. Secretary (2016–present) of Vanguard and of each of the investment companies served by Vanguard. Managing director (2016–present) of Vanguard. Managing director and general counsel of Global Cards and Consumer Services (2014–2016) at Citigroup. Counsel (2003–2014) at American Express.
Michael Rollings
Born in 1963. Principal occupation(s) during the past five years and other experience: finance director (2017–present) and treasurer (2017) of each of the investment companies served by Vanguard. Managing director (2016–present) of Vanguard. Chief financial officer (2016–present) of Vanguard. Director (2016–present) of Vanguard Marketing Corporation. Executive vice president and chief financial officer (2006–2016) of MassMutual Financial Group.
John E. Schadl
Born in 1972. Principal occupation(s) during the past five years and other experience: principal of Vanguard. Chief compliance officer (2019–present) of Vanguard and of each of the investment companies served by Vanguard. Assistant vice president (2019–present) of Vanguard Marketing Corporation.
Vanguard Senior Management Team
| Joseph Brennan | James M. Norris |
| Mortimer J. Buckley | Thomas M. Rampulla |
| Gregory Davis | Karin A. Risi |
| John James | Anne E. Robinson |
| John T. Marcante | Michael Rollings |
| Chris D. McIsaac | Lauren Valente |
Connect with Vanguard®>vanguard.com
Fund Information > 800-662-7447
Annuity and Insurance Services > 800-522-5555
Institutional Investor Services > 800-523-1036
Text Telephone for People Who Are Deaf or Hard of Hearing > 800-749-7273
This material may be used in conjunction with the offering of shares of any Vanguard fund only if preceded or accompanied by the fund’s current prospectus.
You can obtain a free copy of Vanguard’s proxy voting guidelines by visiting vanguard.com/proxyreporting or by calling Vanguard at 800-662-2739. The guidelines are also available from the SEC’s website, www.sec.gov. In addition, you may obtain a free report on how your fund voted the proxies for securities it owned during the 12 months ended June 30. To get the report, visit either vanguard.com/proxyreporting or www.sec.gov.
All comparative mutual fund data are from Morningstar, Inc., unless otherwise noted.
You can review information about your fund on the SEC’s website, and you can receive copies of this information, for a fee, by sending a request via email addressed to publicinfo@sec.gov.
Source for Bloomberg Barclays indexes: Bloomberg Index Services Limited. Copyright 2021, Bloomberg. All rights reserved.
© 2021 The Vanguard Group, Inc.
All rights reserved.
Vanguard Marketing Corporation, Distributor.
Q690MM 022021
Annual Report | December 31, 2020
Vanguard Variable Insurance Funds
Real Estate Index Portfolio
Contents
Your Portfolio’s Performance at a Glance
| 1 |
About Your Portfolio’s Expenses
| 2 |
Performance Summary
| 3 |
Financial Statements
| 5 |
Please note: The opinions expressed in this report are just that—informed opinions. They should not be considered promises or advice. Also, please keep in mind that the information and opinions cover the period through the date on the front of this report. Of course, the risks of investing in your fund are spelled out in the prospectus.
Your Portfolio’s Performance at a Glance
| • | For the 12 months ended December 31, 2020, the Real Estate Index Portfolio returned –4.85%, in line with its target benchmark after factoring in the portfolio’s expenses. |
| • | The emergence of COVID-19 in early 2020 turned into a global health crisis, and aggressive attempts to contain it resulted in a sharp downturn in economic activity. Unemployment spiked, and sectors where social distancing isn't possible were hit hard. Stocks initially plummeted as infections surged, but they finished the year significantly higher. The gain was thanks in part to rapid and robust monetary and fiscal action by policymakers and the rollout of COVID-19 vaccines as the year drew to a close. |
| • | While the broad U.S. stock market returned about 21%, REITs were among the worst-performing sectors as the pandemic weighed heavily on commercial real estate. Seven of the REIT market’s 12 subsectors posted negative returns. Retail REITs and hotel and resort REITs, which depend on physical movement by consumers, were among the subsectors affected most by the pandemic. Office REITs also performed poorly in the remote work environment. |
| • | There were bright spots, however. Industrial REITs, which include warehouse and distribution sites, performed well as stay-at-home consumers shopped more online. REITs that invest in data centers also benefited from increased demand for facilities that house servers and computer equipment. |
| • | Please note that the portfolio’s returns are different from those in Vanguard Variable Annuity (and other plans that invest in the portfolio), which take into account insurance-related expenses. |
| • | In January 2021, shareholders approved a Vanguard proxy proposal to reclassify the portfolio’s diversification status to “non-diversified” as defined under the Investment Company Act of 1940. While this change provides the portfolio managers with increased investment flexibility and potential for better investment performance, it presents a heightened degree of investment risk due to a non-diversified portfolio’s ability to make more concentrated investments. |
Market Barometer
| | Average Annual Total Returns
Periods Ended December 31, 2020 |
| | One Year | Three Years | Five Years |
| Stocks | | | |
| Russell 1000 Index (Large-caps) | 20.96% | 14.82% | 15.60% |
| Russell 2000 Index (Small-caps) | 19.96 | 10.25 | 13.26 |
| Russell 3000 Index (Broad U.S. market) | 20.89 | 14.49 | 15.43 |
| FTSE All-World ex US Index (International) | 11.22 | 5.18 | 9.16 |
| Bonds | | | |
| Bloomberg Barclays U.S. Aggregate Bond Index (Broad taxable market) | 7.51% | 5.34% | 4.44% |
| Bloomberg Barclays Municipal Bond Index (Broad tax-exempt market) | 5.21 | 4.64 | 3.91 |
| FTSE Three-Month U.S. Treasury Bill Index | 0.58 | 1.56 | 1.16 |
| CPI | | | |
| Consumer Price Index | 1.36% | 1.85% | 1.95% |
About Your Portfolio’s Expenses
As a shareholder of the portfolio, you incur ongoing costs, which include costs for portfolio management, administrative services, and shareholder reports (like this one), among others. Operating expenses, which are deducted from a portfolio’s gross income, directly reduce the investment return of the portfolio.
A portfolio‘s expenses are expressed as a percentage of its average net assets. This figure is known as the expense ratio. The following examples are intended to help you understand the ongoing costs (in dollars) of investing in your portfolio and to compare these costs with those of other mutual funds. The examples are based on an investment of $1,000 made at the beginning of the period shown and held for the entire period.
The accompanying table illustrates your portfolio’s costs in two ways:
| • | Based on actual portfolio return. This section helps you to estimate the actual expenses that you paid over the period. The ”Ending Account Value“ shown is derived from the portfolio’s actual return, and the third column shows the dollar amount that would have been paid by an investor who started with $1,000 in the portfolio. You may use the information here, together with the amount you invested, to estimate the expenses that you paid over the period. |
To do so, simply divide your account value by $1,000 (for example, an $8,600 account value divided by $1,000 = 8.6), then multiply the result by the number given for your portfolio under the heading ”Expenses Paid During Period.”
| • | Based on hypothetical 5% yearly return. This section is intended to help you compare your portfolio‘s costs with those of other mutual funds. It assumes that the portfolio had a yearly return of 5% before expenses, but that the expense ratio is unchanged. In this case—because the return used is not the portfolio’s actual return—the results do not apply to your investment. The example is useful in making comparisons because the Securities and Exchange Commission requires all mutual funds to calculate expenses based on a 5% return. You can assess your portfolio’s costs by comparing this hypothetical example with the hypothetical examples that appear in shareholder reports of other funds. |
Note that the expenses shown in the table are meant to highlight and help you compare ongoing costs only and do not reflect transaction costs incurred by the portfolio for buying and selling securities. The portfolio’s expense ratio does not reflect additional fees and expenses associated with the annuity or life insurance program through which you invest.
The calculations assume no shares were bought or sold during the period. Your actual costs may have been higher or lower, depending on the amount of your investment and the timing of any purchases or redemptions.
You can find more information about the portfolio’s expenses, including annual expense ratios, in the Financial Statements section of this report. For additional information on operating expenses and other shareholder costs, please refer to your portfolio’s current prospectus.
| Six Months Ended December 31, 2020 | | | |
| Real Estate Index Portfolio | Beginning
Account Value
6/30/2020 | Ending
Account Value
12/31/2020 | Expenses
Paid During
Period |
| Based on Actual Portfolio Return | $1,000.00 | $1,105.90 | $1.38 |
| Based on Hypothetical 5% Yearly Return | 1,000.00 | 1,023.83 | 1.32 |
The calculations are based on expenses incurred in the most recent six-month period. The portfolio's annualized six-month expense ratio for that period is 0.26%. The dollar amounts shown as ”Expenses Paid” are equal to the annualized expense ratio multiplied by the average account value over the period, multiplied by the number of days in the most recent six-month period, then divided by the number of days in the most recent 12-month period (184/366).
Real Estate Index Portfolio
All of the returns in this report represent past performance, which is not a guarantee of future results that may be achieved by the portfolio. (Current performance may be lower or higher than the performance data cited. For performance data current to the most recent month-end, visit our website at vanguard.com/performance.) Note, too, that both investment returns and principal value can fluctuate widely, so an investor’s shares, when sold, could be worth more or less than their original cost. The returns shown do not reflect taxes that a shareholder would pay on portfolio distributions or on the sale of portfolio shares. Nor do the returns reflect fees and expenses associated with the annuity or life insurance program through which a shareholder invests. If these fees and expenses were included, the portfolio’s returns would be lower.
Cumulative Performance: December 31, 2010, Through December 31, 2020
Initial Investment of $10,000
| | | | Average Annual Total Returns
Periods Ended December 31, 2020 |
| | | One
Year | Five
Years | Ten
Years | Final Value
of a $10,000
Investment |
 | Real Estate Index Portfolio | -4.85% | 5.66% | 8.60% | $22,830 |
 | Real Estate Spliced Index | -4.55 | 5.90 | 8.85 | 23,351 |
 | Dow Jones U.S. Total Stock Market Float Adjusted Index | 20.79 | 15.36 | 13.74 | 36,240 |
Real Estate Spliced Index: MSCI US REIT Index adjusted to include a 2% cash position (Lipper Money Market Average) through April 30, 2009; the MSCI US REIT Index through January 18, 2018; and the MSCI US Investable Market Real Estate 25/50 Index thereafter.
See Financial Highlights for dividend and capital gains information.
Real Estate Index Portfolio
| Diversified Real Estate Activities | 0.2% |
| Diversified REITs | 3.9 |
| Health Care REITs | 9.2 |
| Hotel & Resort REITs | 3.3 |
| Industrial REITs | 11.1 |
| Office REITs | 7.9 |
| Real Estate Development | 0.3 |
| Real Estate Operating Companies | 0.2 |
| Real Estate Services | 3.6 |
| Residential REITs | 13.9 |
| Retail REITs | 9.1 |
| Specialized REITs | 37.3 |
The table reflects the portfolio’s investments, except for short-term investments and derivatives. Sector categories are based on the Global Industry Classification Standard (“GICS”), except for the “Other” category (if applicable), which includes securities that have not been provided a GICS classification as of the effective reporting period.
The portfolio may invest in derivatives (such as futures and swap contracts) for various reasons, including, but not limited to, attempting to remain fully invested and tracking its target index as closely as possible.
The Global Industry Classification Standard (“GICS”) was developed by and is the exclusive property and a service mark of MSCI Inc. (“MSCI”) and Standard and Poor’s, a division of McGraw-Hill Companies, Inc. (“S&P”), and is licensed for use by Vanguard. Neither MSCI, S&P nor any third party involved in making or compiling the GICS or any GICS classification makes any express or implied warranties or representations with respect to such standard or classification (or the results to be obtained by the use thereof), and all such parties hereby expressly disclaim all warranties of originality, accuracy, completeness, merchantability or fitness for a particular purpose with respect to any such standard or classification. Without limiting any of the foregoing, in no event shall MSCI, S&P, any of its affiliates or any third party involved in making or compiling the GICS or any GICS classification have any liability for any direct, indirect, special, punitive, consequential or any other damages (including lost profits) even if notified of the possibility of such damages.
Real Estate Index Portfolio
The portfolio files its complete schedule of portfolio holdings with the Securities and Exchange Commission (SEC) for the first and third quarters of each fiscal year as an exhibit to its reports on Form N-PORT. The portfolio’s Form N-PORT reports are available on the SEC’s website at www.sec.gov.
| | | | | | Shares | Market
Value•
($000) |
| Equity Real Estate Investment Trusts (REITs) (91.4%) |
| Diversified REITs (3.7%) |
| | WP Carey Inc. | 151,224 | 10,674 |
| | STORE Capital Corp. | 209,373 | 7,115 |
| | VEREIT Inc. | 187,205 | 7,075 |
| | PS Business Parks Inc. | 17,859 | 2,373 |
| | Colony Capital Inc. | 418,735 | 2,014 |
| | Essential Properties Realty Trust Inc. | 81,093 | 1,719 |
| | Washington REIT | 72,026 | 1,558 |
| | Global Net Lease Inc. | 78,663 | 1,348 |
| | American Assets Trust Inc. | 44,782 | 1,293 |
| | Empire State Realty Trust Inc. Class A | 127,877 | 1,192 |
| | Alexander & Baldwin Inc. | 60,425 | 1,037 |
| | iStar Inc. | 66,123 | 982 |
| | Armada Hoffler Properties Inc. | 49,399 | 554 |
| | Gladstone Commercial Corp. | 29,132 | 524 |
| | One Liberty Properties Inc. | 14,316 | 287 |
| | | | | | | 39,745 |
| Health Care REITs (8.8%) |
| | Welltower Inc. | 362,615 | 23,432 |
| | Ventas Inc. | 324,244 | 15,901 |
| | Healthpeak Properties Inc. | 467,255 | 14,125 |
| | Medical Properties Trust Inc. | 459,308 | 10,008 |
| | Omega Healthcare Investors Inc. | 197,364 | 7,168 |
| | Healthcare Trust of America Inc. Class A | 189,745 | 5,226 |
| | Healthcare Realty Trust Inc. | 118,344 | 3,503 |
| | Physicians Realty Trust | 181,298 | 3,227 |
| | Sabra Health Care REIT Inc. | 178,227 | 3,096 |
| | National Health Investors Inc. | 38,680 | 2,676 |
| | CareTrust REIT Inc. | 83,385 | 1,849 |
| | LTC Properties Inc. | 34,352 | 1,337 |
| | Community Healthcare Trust Inc. | 18,619 | 877 |
| | Diversified Healthcare Trust | 204,018 | 841 |
| | Universal Health Realty Income Trust | 11,219 | 721 |
| | Global Medical REIT Inc. | 38,125 | 498 |
| | New Senior Investment Group Inc. | 72,012 | 373 |
| | | | | | | 94,858 |
| Hotel & Resort REITs (3.2%) |
| | Host Hotels & Resorts Inc. | 613,182 | 8,971 |
| | MGM Growth Properties LLC Class A | 114,603 | 3,587 |
| | Park Hotels & Resorts Inc. | 203,995 | 3,499 |
| | Ryman Hospitality Properties Inc. | 45,525 | 3,085 |
| | Apple Hospitality REIT Inc. | 183,688 | 2,371 |
| | Pebblebrook Hotel Trust | 113,456 | 2,133 |
| | Sunstone Hotel Investors Inc. | 187,428 | 2,124 |
| | RLJ Lodging Trust | 143,599 | 2,032 |
| | Service Properties Trust | 143,637 | 1,650 |
| | Xenia Hotels & Resorts Inc. | 99,503 | 1,512 |
| * | DiamondRock Hospitality Co. | 174,480 | 1,439 |
| | Summit Hotel Properties Inc. | 90,623 | 817 |
| | Chatham Lodging Trust | 40,286 | 435 |
| | CorePoint Lodging Inc. | 35,596 | 245 |
| | Hersha Hospitality Trust Class A | 30,064 | 237 |
| | | | | | | 34,137 |
| Industrial REITs (10.6%) |
| | Prologis Inc. | 641,750 | 63,957 |
| | Duke Realty Corp. | 322,121 | 12,875 |
| | Americold Realty Trust | 176,986 | 6,607 |
| | | | | | Shares | Market
Value•
($000) |
| | Rexford Industrial Realty Inc. | 107,351 | 5,272 |
| | EastGroup Properties Inc. | 34,147 | 4,714 |
| | First Industrial Realty Trust Inc. | 110,508 | 4,656 |
| | STAG Industrial Inc. | 129,814 | 4,066 |
| | Terreno Realty Corp. | 59,456 | 3,479 |
| | Innovative Industrial Properties Inc. | 18,896 | 3,461 |
| | Lexington Realty Trust | 240,024 | 2,549 |
| | Monmouth Real Estate Investment Corp. | 80,160 | 1,388 |
| | Industrial Logistics Properties Trust | 57,075 | 1,329 |
| | | | | | | 114,353 |
| Office REITs (7.5%) |
| | Alexandria Real Estate Equities Inc. | 109,567 | 19,527 |
| | Boston Properties Inc. | 128,374 | 12,135 |
| | Vornado Realty Trust | 141,040 | 5,267 |
| | Kilroy Realty Corp. | 89,932 | 5,162 |
| | Douglas Emmett Inc. | 152,549 | 4,451 |
| | Cousins Properties Inc. | 129,232 | 4,329 |
| | SL Green Realty Corp. | 63,869 | 3,805 |
| | Highwoods Properties Inc. | 90,365 | 3,581 |
| | JBG SMITH Properties | 104,835 | 3,278 |
| | Hudson Pacific Properties Inc. | 133,531 | 3,208 |
| | Equity Commonwealth | 105,407 | �� 2,876 |
| | Corporate Office Properties Trust | 97,167 | 2,534 |
| | Piedmont Office Realty Trust Inc. Class A | 109,622 | 1,779 |
| | Brandywine Realty Trust | 148,368 | 1,767 |
| | Easterly Government Properties Inc. | 69,452 | 1,573 |
| | Columbia Property Trust Inc. | 98,705 | 1,416 |
| | Paramount Group Inc. | 155,537 | 1,406 |
| | Mack-Cali Realty Corp. | 78,198 | 974 |
| | Office Properties Income Trust | 42,525 | 966 |
| | Franklin Street Properties Corp. | 91,659 | 401 |
| | City Office REIT Inc. | 37,237 | 364 |
| | | | | | | 80,799 |
| Residential REITs (13.2%) |
| | AvalonBay Communities Inc. | 122,312 | 19,623 |
| | Equity Residential | 323,514 | 19,178 |
| | Invitation Homes Inc. | 487,209 | 14,470 |
| | Essex Property Trust Inc. | 56,594 | 13,437 |
| | Sun Communities Inc. | 85,422 | 12,980 |
| | Mid-America Apartment Communities Inc. | 99,434 | 12,597 |
| | UDR Inc. | 256,550 | 9,859 |
| | Equity LifeStyle Properties Inc. | 150,350 | 9,526 |
| | Camden Property Trust | 84,702 | 8,464 |
| | American Homes 4 Rent Class A | 245,145 | 7,354 |
| | American Campus Communities Inc. | 119,574 | 5,114 |
| * | Apartment Income REIT Corp. | 129,021 | 4,956 |
| | Independence Realty Trust Inc. | 82,831 | 1,112 |
| | Centerspace | 10,999 | 777 |
| | Front Yard Residential Corp. | 47,848 | 775 |
| | NexPoint Residential Trust Inc. | 16,671 | 705 |
| | Apartment Investment & Management Co. Class A | 128,363 | 678 |
| | UMH Properties Inc. | 31,687 | 469 |
| | Preferred Apartment Communities Inc. Class A | 43,270 | 320 |
| | | | | | | 142,394 |
| Retail REITs (8.7%) |
| | Simon Property Group Inc. | 282,547 | 24,096 |
| | Realty Income Corp. | 299,844 | 18,641 |
| | Regency Centers Corp. | 147,105 | 6,706 |
| | National Retail Properties Inc. | 150,488 | 6,158 |
Real Estate Index Portfolio
| | | | | | Shares | Market
Value•
($000) |
| | Kimco Realty Corp. | 375,149 | 5,631 |
| | Federal Realty Investment Trust | 62,321 | 5,305 |
| | Brixmor Property Group Inc. | 258,013 | 4,270 |
| | Spirit Realty Capital Inc. | 89,215 | 3,584 |
| | Agree Realty Corp. | 46,701 | 3,110 |
| | Weingarten Realty Investors | 105,400 | 2,284 |
| | Retail Properties of America Inc. Class A | 186,590 | 1,597 |
| | Retail Opportunity Investments Corp. | 103,024 | 1,379 |
| | SITE Centers Corp. | 134,718 | 1,363 |
| | Urban Edge Properties | 100,582 | 1,301 |
| | Kite Realty Group Trust | 72,546 | 1,085 |
| | Acadia Realty Trust | 74,262 | 1,054 |
| 1 | Macerich Co. | 98,465 | 1,051 |
| | Getty Realty Corp. | 30,601 | 843 |
| 1 | Tanger Factory Outlet Centers Inc. | 80,149 | 798 |
| | American Finance Trust Inc. | 93,084 | 692 |
| | RPT Realty | 69,087 | 598 |
| | Alexander's Inc. | 1,971 | 547 |
| *,1 | Seritage Growth Properties Class A | 31,477 | 462 |
| | Saul Centers Inc. | 12,088 | 383 |
| | Urstadt Biddle Properties Inc. Class A | 25,881 | 366 |
| | Whitestone REIT | 32,442 | 259 |
| | Retail Value Inc. | 14,508 | 216 |
| 1 | Washington Prime Group Inc. | 17,526 | 114 |
| *,2 | Spirit MTA REIT | 42,040 | 11 |
| | | | | | | 93,904 |
| Specialized REITs (35.7%) |
| | American Tower Corp. | 385,298 | 86,484 |
| | Crown Castle International Corp. | 374,629 | 59,637 |
| | Equinix Inc. | 46,918 | 33,508 |
| | Digital Realty Trust Inc. | 233,664 | 32,598 |
| | Public Storage | 136,641 | 31,555 |
| | SBA Communications Corp. Class A | 97,230 | 27,431 |
| | Weyerhaeuser Co. | 648,423 | 21,742 |
| | Extra Space Storage Inc. | 112,192 | 12,999 |
| | VICI Properties Inc. | 463,247 | 11,813 |
| | Gaming & Leisure Properties Inc. | 184,379 | 7,818 |
| | CyrusOne Inc. | 101,538 | 7,427 |
| | Iron Mountain Inc. | 250,489 | 7,384 |
| | Lamar Advertising Co. Class A | 75,139 | 6,253 |
| | CubeSmart | 167,984 | 5,646 |
| | Life Storage Inc. | 40,736 | 4,863 |
| | CoreSite Realty Corp. | 36,957 | 4,630 |
| | Rayonier Inc. | 119,056 | 3,498 |
| | QTS Realty Trust Inc. Class A | 53,139 | 3,288 |
| | PotlatchDeltic Corp. | 58,347 | 2,919 |
| | Outfront Media Inc. | 125,116 | 2,447 |
| | National Storage Affiliates Trust | 59,689 | 2,151 |
| | EPR Properties | 64,726 | 2,104 |
| | Uniti Group Inc. | 160,374 | 1,881 |
| | Four Corners Property Trust Inc. | 61,309 | 1,825 |
| | GEO Group Inc. | 106,837 | 947 |
| | Safehold Inc. | 10,956 | 794 |
| | CatchMark Timber Trust Inc. Class A | 41,580 | 389 |
| | CoreCivic Inc. | 14,850 | 97 |
| | | | | | | 384,128 |
| Total Equity Real Estate Investment Trusts (REITs) (Cost $1,018,011) | 984,318 |
| Real Estate Management & Development (4.1%) |
| Diversified Real Estate Activities (0.2%) |
| | St. Joe Co. | 28,421 | 1,207 |
| | | | | | Shares | Market
Value•
($000) |
| | RMR Group Inc. Class A | 13,107 | 506 |
| * | Tejon Ranch Co. | 18,898 | 273 |
| * | Five Point Holdings LLC Class A | 44,312 | 242 |
| | | | | | | 2,228 |
| Real Estate Development (0.3%) |
| * | Howard Hughes Corp. | 35,973 | 2,839 |
| * | Forestar Group Inc. | 14,519 | 293 |
| | | | | | | 3,132 |
| Real Estate Operating Companies (0.2%) |
| | Kennedy-Wilson Holdings Inc. | 112,344 | 2,010 |
| * | FRP Holdings Inc. | 4,715 | 214 |
| | | | | | | 2,224 |
| Real Estate Services (3.4%) |
| * | CBRE Group Inc. Class A | 291,419 | 18,278 |
| * | Jones Lang LaSalle Inc. | 44,912 | 6,664 |
| * | Redfin Corp. | 81,948 | 5,624 |
| * | eXp World Holdings Inc. | 23,820 | 1,503 |
| * | Cushman & Wakefield plc | 96,522 | 1,431 |
| * | Realogy Holdings Corp. | 99,434 | 1,305 |
| | Newmark Group Inc. Class A | 132,089 | 963 |
| * | Marcus & Millichap Inc. | 20,227 | 753 |
| | RE/MAX Holdings Inc. Class A | 15,546 | 565 |
| * | Altisource Portfolio Solutions SA | 4,880 | 63 |
| | | | | | | 37,149 |
| Total Real Estate Management & Development (Cost $39,346) | 44,733 |
| Temporary Cash Investments (2.4%) |
| Money Market Fund (2.4%) |
| 3,4 | Vanguard Market Liquidity Fund, 0.111% | 253,909 | 25,391 |
| | | | | | Face
Amount
($000) | |
| U.S. Government and Agency Obligations (0.0%) |
| 5 | United States Treasury Bill, 0.095%, 1/28/21 | 189 | 189 |
Total Temporary Cash Investments
(Cost $25,582) | 25,580 |
Total Investments (97.9%)
(Cost $1,082,939) | | 1,054,631 |
| Other Assets and Liabilities—Net (2.1%) | | 22,476 |
| Net Assets (100%) | | 1,077,107 |
| Cost is in $000. |
| • | See Note A in Notes to Financial Statements. |
| * | Non-income-producing security. |
| 1 | Includes partial security positions on loan to broker-dealers. The total value of securities on loan is $1,819,000. |
| 2 | Security value determined using significant unobservable inputs. |
| 3 | Affiliated money market fund available only to Vanguard funds and certain trusts and accounts managed by Vanguard. Rate shown is the 7-day yield. |
| 4 | Collateral of $1,930,000 was received for securities on loan. |
| 5 | Securities with a value of $82,000 have been segregated as initial margin for open futures contracts. |
| | REIT—Real Estate Investment Trust. |
Real Estate Index Portfolio
Derivative Financial Instruments Outstanding as of Period End
| Futures Contracts |
| | | | ($000) |
| | Expiration | Number of
Long (Short)
Contracts | Notional
Amount | Value and
Unrealized
Appreciation
(Depreciation) |
| Long Futures Contracts | | | | |
| Dow Jones U.S. Real Estate Index | March 2021 | 33 | 1,105 | 29 |
| Over-the-Counter Total Return Swaps |
| Reference Entity | Termination
Date | Counterparty | Notional
Amount
($000) | Floating
Interest
Rate
Received
(Paid)1
(%) | Value and
Unrealized
Appreciation
($000) | Value and
Unrealized
(Depreciation)
($000) |
| Equinix Inc. | 2/2/21 | GSI | 20,869 | (0.153) | 552 | — |
| 1 | Based on 1M USD London Interbank Offered Rate (LIBOR) as of the most recent payment date. Floating interest payment received/paid monthly. |
| | 1M—1-month |
| | GSI—Goldman Sachs International. |
At December 31, 2020, the counterparties had deposited in segregated accounts securities with a value of $546,000 in connection with open over-the-counter swap contracts.
See accompanying Notes, which are an integral part of the Financial Statements.
Real Estate Index Portfolio
Statement of Assets and Liabilities
| ($000s, except shares and per-share amounts) | Amount |
| Assets | |
| Investments in Securities, at Value | |
| Unaffiliated Issuers (Cost $1,057,546) | 1,029,240 |
| Affiliated Issuers (Cost $25,393) | 25,391 |
| Total Investments in Securities | 1,054,631 |
| Investment in Vanguard | 40 |
| Receivables for Investment Securities Sold | 702 |
| Receivables for Accrued Income | 4,329 |
| Receivables for Capital Shares Issued | 25,683 |
| Variation Margin Receivable—Futures Contracts | 11 |
| Unrealized Appreciation—Over-the-Counter Swap Contracts | 552 |
| Total Assets | 1,085,948 |
| Liabilities | |
| Payables for Investment Securities Purchased | 6,389 |
| Collateral for Securities on Loan | 1,930 |
| Payables for Capital Shares Redeemed | 375 |
| Payables to Vanguard | 147 |
| Total Liabilities | 8,841 |
| Net Assets | 1,077,107 |
| At December 31, 2020, net assets consisted of: | |
| | |
| Paid-in Capital | 1,046,650 |
| Total Distributable Earnings (Loss) | 30,457 |
| Net Assets | 1,077,107 |
| | |
| Net Assets | |
Applicable to 86,649,376 outstanding $.001 par value shares of
beneficial interest (unlimited authorization) | 1,077,107 |
| Net Asset Value Per Share | $12.43 |
Real Estate Index Portfolio
|
| | Year Ended
December 31, 2020 |
| | ($000) |
| Investment Income | |
| Income | |
| Dividends | 25,097 |
| Interest1 | 46 |
| Securities Lending—Net | 136 |
| Total Income | 25,279 |
| Expenses | |
| The Vanguard Group—Note B | |
| Investment Advisory Services | 155 |
| Management and Administrative | 2,364 |
| Marketing and Distribution | 96 |
| Custodian Fees | 12 |
| Auditing Fees | 34 |
| Shareholders’ Reports and Proxy Fees | 19 |
| Trustees’ Fees and Expenses | 1 |
| Total Expenses | 2,681 |
| Net Investment Income | 22,598 |
| Realized Net Gain (Loss) | |
| Capital Gain Distributions Received | 9,165 |
| Investment Securities Sold1 | 23,994 |
| Futures Contracts | (391) |
| Swap Contracts | 3,743 |
| Realized Net Gain (Loss) | 36,511 |
| Change in Unrealized Appreciation (Depreciation) | |
| Investment Securities1 | (133,339) |
| Futures Contracts | (56) |
| Swap Contracts | 552 |
| Change in Unrealized Appreciation (Depreciation) | (132,843) |
| Net Increase (Decrease) in Net Assets Resulting from Operations | (73,734) |
| 1 | Interest income, realized net gain (loss), and change in unrealized appreciation (depreciation) from an affiliated company of the portfolio were $45,000, $14,000, and ($2,000), respectively. Purchases and sales are for temporary cash investment purposes. |
Real Estate Index Portfolio
Statement of Changes in Net Assets
|
| | Year Ended December 31, |
| | 2020
($000) | 2019
($000) |
| Increase (Decrease) in Net Assets | | |
| Operations | | |
| Net Investment Income | 22,598 | 29,148 |
| Realized Net Gain (Loss) | 36,511 | 17,588 |
| Change in Unrealized Appreciation (Depreciation) | (132,843) | 230,170 |
| Net Increase (Decrease) in Net Assets Resulting from Operations | (73,734) | 276,906 |
| Distributions1 | | |
| Total Distributions | (44,948) | (85,887) |
| Capital Share Transactions | | |
| Issued | 151,575 | 159,509 |
| Issued in Lieu of Cash Distributions | 44,948 | 85,887 |
| Redeemed | (243,185) | (159,033) |
| Net Increase (Decrease) from Capital Share Transactions | (46,662) | 86,363 |
| Total Increase (Decrease) | (165,344) | 277,382 |
| Net Assets | | |
| Beginning of Period | 1,242,451 | 965,069 |
| End of Period | 1,077,107 | 1,242,451 |
| 1 | Certain prior-period numbers have been reclassified to conform with the current-period presentation. |
Real Estate Index Portfolio
For a Share Outstanding
Throughout Each Period | Year Ended December 31, |
| 2020 | 2019 | 2018 | 2017 | 2016 |
| Net Asset Value, Beginning of Period | $13.74 | $11.57 | $13.14 | $13.48 | $13.77 |
| Investment Operations | | | | | |
| Net Investment Income | .2591 | .3291 | .3671 | .3751 | .346 |
| Net Realized and Unrealized Gain (Loss) on Investments | (1.054) | 2.874 | (1.084) | .220 | .734 |
| Total from Investment Operations | (.795) | 3.203 | (.717) | .595 | 1.080 |
| Distributions | | | | | |
| Dividends from Net Investment Income | (.316) | (.368) | (.383) | (.336) | (.375) |
| Distributions from Realized Capital Gains | (.199) | (.665) | (.470) | (.599) | (.995) |
| Total Distributions | (.515) | (1.033) | (.853) | (.935) | (1.370) |
| Net Asset Value, End of Period | $12.43 | $13.74 | $11.57 | $13.14 | $13.48 |
| Total Return | -4.85% | 28.81% | -5.35% | 4.78% | 8.36% |
| Ratios/Supplemental Data | | | | | |
| Net Assets, End of Period (Millions) | $1,077 | $1,242 | $965 | $1,077 | $1,093 |
| Ratio of Total Expenses to Average Net Assets | 0.26% | 0.26% | 0.26% | 0.27% | 0.27% |
| Ratio of Net Investment Income to Average Net Assets | 2.19% | 2.52% | 3.04% | 2.87% | 2.55% |
| Portfolio Turnover Rate | 10% | 7% | 35% | 10% | 14% |
| 1 | Calculated based on average shares outstanding. |
See accompanying Notes, which are an integral part of the Financial Statements.
Real Estate Index Portfolio
Notes to Financial Statements
The Real Estate Index Portfolio, a portfolio of Vanguard Variable Insurance Funds, is registered under the Investment Company Act of 1940 as an open-end investment company. The portfolio’s shares are only available for purchase by separate accounts of insurance companies as investments for variable annuity plans, variable life insurance contracts, or other variable benefit insurance contracts. Market disruptions associated with the COVID-19 pandemic have had a global impact, and uncertainty exists as to the long-term implications. Such disruptions can adversely affect assets of the portfolio and thus portfolio performance.
A. The following significant accounting policies conform to generally accepted accounting principles for U.S. investment companies. The portfolio consistently follows such policies in preparing its financial statements.
1. Security Valuation: Securities are valued as of the close of trading on the New York Stock Exchange (generally 4 p.m., Eastern time) on the valuation date. Equity securities are valued at the latest quoted sales prices or official closing prices taken from the primary market in which each security trades; such securities not traded on the valuation date are valued at the mean of the latest quoted bid and asked prices. Securities for which market quotations are not readily available, or whose values have been materially affected by events occurring before the portfolio's pricing time but after the close of the securities’ primary markets, are valued by methods deemed by the board of trustees to represent fair value. Investments in Vanguard Market Liquidity Fund are valued at that fund's net asset value. Temporary cash investments are valued using the latest bid prices or using valuations based on a matrix system (which considers such factors as security prices, yields, maturities, and ratings), both as furnished by independent pricing services.
2. Futures Contracts: The portfolio uses index futures contracts to a limited extent, with the objectives of maintaining full exposure to the stock market, maintaining liquidity, and minimizing transaction costs. The portfolio may purchase futures contracts to immediately invest incoming cash in the market, or sell futures in response to cash outflows, thereby simulating a fully invested position in the underlying index while maintaining a cash balance for liquidity. The primary risks associated with the use of futures contracts are imperfect correlation between changes in market values of stocks held by the portfolio and the prices of futures contracts, and the possibility of an illiquid market. Counterparty risk involving futures is mitigated because a regulated clearinghouse is the counterparty instead of the clearing broker. To further mitigate counterparty risk, the portfolio trades futures contracts on an exchange, monitors the financial strength of its clearing brokers and clearinghouse, and has entered into clearing agreements with its clearing brokers. The clearinghouse imposes initial margin requirements to secure the portfolio’s performance and requires daily settlement of variation margin representing changes in the market value of each contract. Any securities pledged as initial margin for open contracts are noted in the Schedule of Investments.
Futures contracts are valued at their quoted daily settlement prices. The notional amounts of the contracts are not recorded in the Statement of Assets and Liabilities. Fluctuations in the value of the contracts are recorded in the Statement of Assets and Liabilities as an asset (liability) and in the Statement of Operations as unrealized appreciation (depreciation) until the contracts are closed, when they are recorded as realized gains (losses) on futures contracts.
During the year ended December 31, 2020, the portfolio’s average investments in long and short futures contracts represented less than 1% and 0% of net assets, respectively, based on the average of the notional amounts at each quarter-end during the period.
3. Swap Contracts: The portfolio has entered into equity swap contracts to earn the total return on selected reference stocks in the portfolio’s target index. Under the terms of the swaps, the portfolio receives the total return on the referenced stock (i.e., receiving the increase or paying the decrease in value of the selected reference stock and receiving the equivalent of any dividends in respect of the selected referenced stock) over a specified period of time, applied to a notional amount that represents the value of a designated number of shares of the selected reference stock at the beginning of the equity swap contract. The portfolio also pays a floating rate that is based on short-term interest rates, applied to the notional amount. At the same time, the portfolio generally invests an amount approximating the notional amount of the swap in high-quality temporary cash investments.
A risk associated with all types of swaps is the possibility that a counterparty may default on its obligation to pay net amounts due to the portfolio. The portfolio’s maximum amount subject to counterparty risk is the unrealized appreciation on the swap contract. The portfolio mitigates its counterparty risk by entering into swaps only with a diverse group of prequalified counterparties, monitoring their financial strength, entering into master netting arrangements with its counterparties, and requiring its counterparties to transfer collateral as security for their performance. In the absence of a default, the collateral pledged or received by the portfolio cannot be repledged, resold, or
Real Estate Index Portfolio
rehypothecated. In the event of a counterparty’s default (including bankruptcy), the portfolio may terminate any swap contracts with that counterparty, determine the net amount owed by either party in accordance with its master netting arrangements, and sell or retain any collateral held up to the net amount owed to the portfolio under the master netting arrangements. The swap contracts contain provisions whereby a counterparty may terminate open contracts if the portfolio's net assets decline below a certain level, triggering a payment by the portfolio if the portfolio is in a net liability position at the time of the termination. The payment amount would be reduced by any collateral the portfolio has pledged. Any securities pledged as collateral for open contracts are noted in the Schedule of Investments. The value of collateral received or pledged is compared daily to the value of the swap contracts exposure with each counterparty, and any difference, if in excess of a specified minimum transfer amount, is adjusted and settled within two business days.
The notional amounts of swap contracts are not recorded in the Statement of Assets and Liabilities. Swaps are valued daily based on market quotations received from independent pricing services or recognized dealers and the change in value is recorded in the Statement of Assets and Liabilities as an asset (liability) and in the Statement of Operations as unrealized appreciation (depreciation) until periodic payments are made or the termination of the swap, at which time realized gain (loss) is recorded.
During the year ended December 31, 2020, the portfolio’s average amounts of investments in total return swaps represented 2% of net assets, based on the average of notional amounts at each quarter-end during the period.
4. Distributions: Distributions to shareholders are recorded on the ex-dividend date. Distributions are determined on a tax basis at the fiscal year-end and may differ from net investment income and realized capital gains for financial reporting purposes.
5. Securities Lending: To earn additional income, the portfolio lends its securities to qualified institutional borrowers. Security loans are subject to termination by the portfolio at any time, and are required to be secured at all times by collateral in an amount at least equal to the market value of securities loaned. Daily market fluctuations could cause the value of loaned securities to be more or less than the value of the collateral received. When this occurs, the collateral is adjusted and settled before the opening of the market on the next business day. The portfolio further mitigates its counterparty risk by entering into securities lending transactions only with a diverse group of prequalified counterparties, monitoring their financial strength, and entering into master securities lending agreements with its counterparties. The master securities lending agreements provide that, in the event of a counterparty’s default (including bankruptcy), the portfolio may terminate any loans with that borrower, determine the net amount owed, and sell or retain the collateral up to the net amount owed to the portfolio; however, such actions may be subject to legal proceedings. While collateral mitigates counterparty risk, in the event of a default, the portfolio may experience delays and costs in recovering the securities loaned. The portfolio invests cash collateral received in Vanguard Market Liquidity Fund, and records a liability in the Statement of Assets and Liabilities for the return of the collateral, during the period the securities are on loan. Collateral investments in Vanguard Market Liquidity Fund are subject to market appreciation or depreciation. Securities lending income represents fees charged to borrowers plus income earned on invested cash collateral, less expenses associated with the loan. During the term of the loan, the portfolio is entitled to all distributions made on or in respect of the loaned securities.
6. Credit Facilities and Interfund Lending Program: The portfolio and certain other funds managed by The Vanguard Group ("Vanguard") participate in a $4.3 billion committed credit facility provided by a syndicate of lenders pursuant to a credit agreement and an uncommitted credit facility provided by Vanguard. Both facilities may be renewed annually. Each fund is individually liable for its borrowings, if any, under the credit facilities. Borrowings may be utilized for temporary or emergency purposes, subject to the portfolio’s regulatory and contractual borrowing restrictions. With respect to the committed credit facility, the participating funds are charged administrative fees and an annual commitment fee of 0.10% of the undrawn committed amount of the facility; these fees are allocated to the funds based on a method approved by the portfolio’s board of trustees and included in Management and Administrative expenses on the portfolio’s Statement of Operations. Any borrowings under either facility bear interest at a rate based upon the higher of the one-month London Interbank Offered Rate (or an acceptable alternate rate, if necessary), federal funds effective rate, or overnight bank funding rate plus an agreed-upon spread, except that borrowings under the uncommitted credit facility may bear interest based upon an alternative rate agreed to by the portfolio and Vanguard.
In accordance with an exemptive order (the “Order”) from the SEC, the portfolio may participate in a joint lending and borrowing program that allows registered open-end Vanguard funds to borrow money from and lend money to each other for temporary or emergency purposes (the “Interfund
Real Estate Index Portfolio
Lending Program”), subject to compliance with the terms and conditions of the Order, and to the extent permitted by the portfolio’s investment objective and investment policies. Interfund loans and borrowings normally extend overnight, but can have a maximum duration of seven days. Loans may be called on one business day’s notice. The interest rate to be charged is governed by the conditions of the Order and internal procedures adopted by the board of trustees. The board of trustees is responsible for overseeing the Interfund Lending Program.
For the year ended December 31, 2020, the portfolio did not utilize the credit facilities or the Interfund Lending Program.
7. Other: Distributions received from investment securities are recorded on the ex-dividend date. Each investment security reports annually the tax character of its distributions. Dividend income, capital gain distributions received, and unrealized appreciation (depreciation) reflect the amounts of taxable income, capital gain, and return of capital reported by the investment securities, and management’s estimates of such amounts for investment security distributions for which actual information has not been reported. Interest income includes income distributions received from Vanguard Market Liquidity Fund and is accrued daily. Premiums and discounts on debt securities are amortized and accreted, respectively, to interest income over the lives of the respective securities, except for premiums on certain callable debt securities that are amortized to the earliest call date.
Security transactions are accounted for on the date securities are bought or sold. Costs used to determine realized gains (losses) on the sale of investment securities are those of the specific securities sold.
B. In accordance with the terms of a Funds’ Service Agreement (the “FSA”) between Vanguard and the portfolio, Vanguard furnishes to the portfolio investment advisory, corporate management, administrative, marketing, and distribution services at Vanguard’s cost of operations (as defined by the FSA). These costs of operations are allocated to the portfolio based on methods and guidelines approved by the board of trustees and are generally settled twice a month.
Upon the request of Vanguard, the portfolio may invest up to 0.40% of its net assets as capital in Vanguard. At December 31, 2020, the portfolio had contributed to Vanguard capital in the amount of $40,000, representing less than 0.01% of the portfolio’s net assets and 0.02% of Vanguard’s capital received pursuant to the FSA. The portfolio’s trustees and officers are also directors and employees, respectively, of Vanguard.
C. Various inputs may be used to determine the value of the portfolio’s investments and derivatives. These inputs are summarized in three broad levels for financial statement purposes. The inputs or methodologies used to value securities are not necessarily an indication of the risk associated with investing in those securities.
Level 1—Quoted prices in active markets for identical securities.
Level 2—Other significant observable inputs (including quoted prices for similar securities, interest rates, prepayment speeds, credit risk, etc.).
Level 3—Significant unobservable inputs (including the portfolio’s own assumptions used to determine the fair value of investments). Any investments and derivatives valued with significant unobservable inputs are noted on the Schedule of Investments.
The following table summarizes the market value of the portfolio's investments and derivatives as of December 31, 2020, based on the inputs used to value them:
| | Level 1
($000) | Level 2
($000) | Level 3
($000) | Total
($000) |
| Investments | | | | |
| Assets | | | | |
| Common Stocks | 1,029,040 | — | 11 | 1,029,051 |
| Temporary Cash Investments | 25,391 | 189 | — | 25,580 |
| Total | 1,054,431 | 189 | 11 | 1,054,631 |
| | | | |
| Derivative Financial Instruments | | | | |
| Assets | | | | |
| Futures Contracts1 | 12 | — | — | 12 |
| Swap Contracts | — | 552 | — | 552 |
| Total | 12 | 552 | — | 564 |
| 1 | Represents variation margin on the last day of the reporting period. |
Real Estate Index Portfolio
D. Permanent differences between book-basis and tax-basis components of net assets, if any, are reclassified among capital accounts in the financial statements to reflect their tax character. These reclassifications have no effect on net assets or net asset value per share.
Temporary differences between book-basis and tax-basis components of total distributable earnings (losses) arise when certain items of income, gain, or loss are recognized in different periods for financial statement and tax purposes; these differences will reverse at some time in the future. The differences are primarily related to the deferral of losses from wash sales; and the recognition of unrealized gains or losses from certain derivative contracts. As of period end, the tax-basis components of total distributable earnings (losses) are detailed in the table as follows:
| | Amount
($000) |
| Undistributed Ordinary Income | 24,144 |
| Undistributed Long-Term Gains | 33,530 |
| Capital Loss Carryforwards | — |
| Qualified Late-Year Losses | — |
| Net Unrealized Gains (Losses) | (29,128) |
The tax character of distributions paid was as follows:
| | Year Ended December 31, |
| | 2020
Amount
($000) | 2019
Amount
($000) |
| Ordinary Income | 28,768 | 37,050 |
| Long-Term Capital Gains | 16,180 | 48,837 |
| Total | 44,948 | 85,887 |
As of December 31, 2020, gross unrealized appreciation and depreciation for investments and derivatives based on cost for U.S. federal income tax purposes were as follows:
| | Amount
($000) |
| Tax Cost | 1,083,759 |
| Gross Unrealized Appreciation | 177,843 |
| Gross Unrealized Depreciation | (206,971) |
| Net Unrealized Appreciation (Depreciation) | (29,128) |
E. During the year ended December 31, 2020, the portfolio purchased $102,182,000 of investment securities and sold $197,857,000 of investment securities, other than temporary cash investments.
F. Capital shares issued and redeemed were:
| | Year Ended December 31, | |
| | 2020
Shares
(000) | | 2019
Shares
(000) | |
| | | |
| Issued | 12,842 | | 12,229 | |
| Issued in Lieu of Cash Distributions | 4,527 | | 7,040 | |
| Redeemed | (21,151) | | (12,225) | |
| Net Increase (Decrease) in Shares Outstanding | (3,782) | | 7,044 | |
At December 31, 2020, one shareholder (an insurance company separate account whose holdings in the portfolio represent the indirect investment of Vanguard Variable Annuity contract holders) was the record or beneficial owner of 42% of the portfolio’s net assets. If this shareholder were to redeem its investment in the portfolio, the redemption might result in an increase in the portfolio's expense ratio, cause the portfolio to incur higher transaction costs, or lead to the realization of taxable gains.
G. Management has determined that no events or transactions occurred subsequent to December 31, 2020, that would require recognition or disclosure in these financial statements.
Report of Independent Registered
Public Accounting Firm
To the Board of Trustees of Vanguard Variable Insurance Funds and Shareholders of Real Estate Index Portfolio
Opinion on the Financial Statements
We have audited the accompanying statement of assets and liabilities, including the schedule of investments, of Real Estate Index Portfolio (one of the portfolios constituting Vanguard Variable Insurance Funds, referred to hereafter as the "Portfolio”) as of December 31, 2020, the related statement of operations for the year ended December 31, 2020, the statement of changes in net assets for each of the two years in the period ended December 31, 2020, including the related notes, and the financial highlights for each of the five years in the period ended December 31, 2020 (collectively referred to as the “financial statements”). In our opinion, the financial statements present fairly, in all material respects, the financial position of the Portfolio as of December 31, 2020, the results of its operations for the year then ended, the changes in its net assets for each of the two years in the period ended December 31, 2020 and the financial highlights for each of the five years in the period ended December 31, 2020 in conformity with accounting principles generally accepted in the United States of America.
Basis for Opinion
These financial statements are the responsibility of the Portfolio’s management. Our responsibility is to express an opinion on the Portfolio’s financial statements based on our audits. We are a public accounting firm registered with the Public Company Accounting Oversight Board (United States) (PCAOB) and are required to be independent with respect to the Portfolio in accordance with the U.S. federal securities laws and the applicable rules and regulations of the Securities and Exchange Commission and the PCAOB.
We conducted our audits of these financial statements in accordance with the standards of the PCAOB. Those standards require that we plan and perform the audit to obtain reasonable assurance about whether the financial statements are free of material misstatement, whether due to error or fraud.
Our audits included performing procedures to assess the risks of material misstatement of the financial statements, whether due to error or fraud, and performing procedures that respond to those risks. Such procedures included examining, on a test basis, evidence regarding the amounts and disclosures in the financial statements. Our audits also included evaluating the accounting principles used and significant estimates made by management, as well as evaluating the overall presentation of the financial statements. Our procedures included confirmation of securities owned as of December 31, 2020 by correspondence with the custodian and brokers and by agreement to the underlying ownership records of the transfer agent; when replies were not received from brokers, we performed other auditing procedures. We believe that our audits provide a reasonable basis for our opinion.
/s/PricewaterhouseCoopers LLP
Philadelphia, Pennsylvania
February 18, 2021
We have served as the auditor of one or more investment companies in The Vanguard Group of Funds since 1975.
Special 2020 tax information (unaudited) for corporate shareholders only for Real Estate Index Portfolio, a portfolio of Vanguard Variable Insurance Funds
This information for the fiscal year ended December 31, 2020, is included pursuant to provisions of the Internal Revenue Code for corporate shareholders only.
The portfolio distributed $16,180,000 as capital gain dividends (from net long-term capital gains) to shareholders during the fiscal year. The portfolio designates $13,883,000 of its capital gain dividends as 20% rate gain distributions and $2,297,000 as unrecaptured section 1250 gain distributions (25% rate gain).
THESE FUNDS ARE NOT SPONSORED, ENDORSED, SOLD OR PROMOTED BY MSCI INC. (“MSCI”), ANY OF ITS AFFILIATES, ANY OF ITS DIRECT OR INDIRECT INFORMATION PROVIDERS OR ANY OTHER THIRD PARTY INVOLVED IN, OR RELATED TO, COMPILING, COMPUTING OR CREATING ANY MSCI INDEX (COLLECTIVELY, THE “MSCI PARTIES”). THE MSCI INDEXES ARE THE EXCLUSIVE PROPERTY OF MSCI. MSCI AND THE MSCI INDEX NAMES ARE SERVICE MARK(S) OF MSCI OR ITS AFFILIATES AND HAVE BEEN LICENSED FOR USE FOR CERTAIN PURPOSES BY VANGUARD. NONE OF THE MSCI PARTIES MAKES ANY REPRESENTATION OR WARRANTY, EXPRESS OR IMPLIED, TO THE OWNERS OF THESE FUNDS OR ANY MEMBER OF THE PUBLIC REGARDING THE ADVISABILITY OF INVESTING IN FUNDS GENERALLY OR IN THESE FUNDS PARTICULARLY OR THE ABILITY OF ANY MSCI INDEX TO TRACK CORRESPONDING STOCK MARKET PERFORMANCE. MSCI OR ITS AFFILIATES ARE THE LICENSORS OF CERTAIN TRADEMARKS, SERVICE MARKS AND TRADE NAMES AND OF THE MSCI INDEXES WHICH ARE DETERMINED, COMPOSED AND CALCULATED BY MSCI WITHOUT REGARD TO THESE FUNDS OR THE ISSUER OR OWNER OF THESE FUNDS. NONE OF THE MSCI PARTIES HAS ANY OBLIGATION TO TAKE THE NEEDS OF THE ISSUERS OR OWNERS OF THESE FUNDS INTO CONSIDERATION IN DETERMINING, COMPOSING OR CALCULATING THE MSCI INDEXES. NONE OF THE MSCI PARTIES IS RESPONSIBLE FOR OR HAS PARTICIPATED IN THE DETERMINATION OF THE TIMING OF, PRICES AT, OR QUANTITIES OF THESE FUNDS TO BE ISSUED OR IN THE DETERMINATION OR CALCULATION OF THE CONSIDERATION INTO WHICH THESE FUNDS ARE REDEEMABLE. NONE OF THE MSCI PARTIES HAS ANY OBLIGATION OR LIABILITY TO THE OWNERS OF THESE FUNDS IN CONNECTION WITH THE ADMINISTRATION, MARKETING OR OFFERING OF THESE FUNDS.
ALTHOUGH MSCI SHALL OBTAIN INFORMATION FOR INCLUSION IN OR FOR USE IN THE CALCULATION OF THE MSCI INDEXES FROM SOURCES WHICH MSCI CONSIDERS RELIABLE, NONE OF THE MSCI PARTIES WARRANTS OR GUARANTEES THE ORIGINALITY, ACCURACY AND/OR THE COMPLETENESS OF ANY MSCI INDEX OR ANY DATA INCLUDED THEREIN. NONE OF THE MSCI PARTIES MAKES ANY WARRANTY, EXPRESS OR IMPLIED, AS TO RESULTS TO BE OBTAINED BY LICENSEE, LICENSEE’S CUSTOMERS OR COUNTERPARTIES, ISSUERS OF THE FUNDS, OWNERS OF THE FUNDS, OR ANY OTHER PERSON OR ENTITY, FROM THE USE OF ANY MSCI INDEX OR ANY DATA INCLUDED THEREIN IN CONNECTION WITH THE RIGHTS LICENSED HEREUNDER OR FOR ANY OTHER USE. NONE OF THE MSCI PARTIES SHALL HAVE ANY LIABILITY FOR ANY ERRORS, OMISSIONS OR INTERRUPTIONS OF OR IN CONNECTION WITH ANY MSCI INDEX OR ANY DATA INCLUDED THEREIN. FURTHER, NONE OF THE MSCI PARTIES MAKES ANY EXPRESS OR IMPLIED WARRANTIES OF ANY KIND, AND THE MSCI PARTIES HEREBY EXPRESSLY DISCLAIM ALL WARRANTIES OF MERCHANTABILITY OR FITNESS FOR A PARTICULAR PURPOSE, WITH RESPECT TO ANY MSCI INDEX AND ANY DATA INCLUDED THEREIN. WITHOUT LIMITING ANY OF THE FOREGOING, IN NO EVENT SHALL ANY OF THE MSCI PARTIES HAVE ANY LIABILITY FOR ANY DIRECT, INDIRECT, SPECIAL, PUNITIVE, CONSEQUENTIAL OR ANY OTHER DAMAGES (INCLUDING WITHOUT LIMITATION LOST PROFITS) EVEN IF NOTIFIED OF THE POSSIBILITY OF SUCH DAMAGES.
This page intentionally left blank.
The People Who Govern Your Fund
The trustees of your mutual fund are there to see that the fund is operated and managed in your best interests since, as a shareholder, you are a part owner of the fund. Your fund’s trustees also serve on the board of directors of The Vanguard Group, Inc., which is owned by the Vanguard funds and provides services to them.
A majority of Vanguard’s board members are independent, meaning that they have no affiliation with Vanguard or the funds they oversee, apart from the sizable personal investments they have made as private individuals. The independent board members have distinguished backgrounds in business, academia, and public service. Each of the trustees and executive officers oversees 211 Vanguard funds.
Information for each trustee and executive officer of the fund appears below. That information, as well as the Vanguard fund count, is as of the date on the cover of this fund report. The mailing address of the trustees and officers is P.O. Box 876, Valley Forge, PA 19482. More information about the trustees is in the Statement of Additional Information, which can be obtained, without charge, by contacting Vanguard at 800-662-7447, or online at vanguard.com.
Interested Trustee1
Mortimer J. Buckley
Born in 1969. Trustee since January 2018. Principal occupation(s) during the past five years and other experience: chairman of the board (2019–present) of Vanguard and of each of the investment companies served by Vanguard; chief executive officer (2018–present) of Vanguard; chief executive officer, president, and trustee (2018–present) of each of the investment companies served by Vanguard; president and director (2017–present) of Vanguard; and president (2018–present) of Vanguard Marketing Corporation. Chief investment officer (2013–2017), managing director (2002–2017), head of the Retail Investor Group (2006–2012), and chief information officer (2001–2006) of Vanguard. Chairman of the board (2011–2017) and trustee (2009–2017) of the Children’s Hospital of Philadelphia; and trustee (2018–present) and vice chair (2019–present) of The Shipley School.
Independent Trustees
Emerson U. Fullwood
Born in 1948. Trustee since January 2008. Principal occupation(s) during the past five years and other experience: executive chief staff and marketing officer for North America and corporate vice president (retired 2008) of Xerox Corporation (document management products and services). Former president of the Worldwide Channels Group, Latin America, and Worldwide Customer Service and executive chief staff officer of Developing Markets of Xerox. Executive in residence and 2009–2010 Distinguished Minett Professor at the Rochester Institute of Technology. Director of SPX FLOW, Inc. (multi-industry manufacturing). Director of the University of Rochester Medical Center, the Monroe Community College Foundation, the United Way of Rochester, North Carolina A&T University, and Roberts Wesleyan College. Trustee of the University of Rochester.
Amy Gutmann
Born in 1949. Trustee since June 2006. Principal occupation(s) during the past five years and other experience: president (2004–present) of the University of Pennsylvania. Christopher H. Browne Distinguished Professor of Political Science, School of Arts and Sciences, and professor of communication, Annenberg School for Communication, with secondary faculty appointments in the Department of Philosophy, School of Arts and Sciences, and at the Graduate School of Education, University of Pennsylvania.
F. Joseph Loughrey
Born in 1949. Trustee since October 2009. Principal occupation(s) during the past five years and other experience: president and chief operating officer (retired 2009) and vice chairman of the board (2008–2009) of Cummins Inc. (industrial machinery). Chairman of the board of Hillenbrand, Inc. (specialized consumer services) and the Lumina Foundation. Director of the V Foundation. Member of the advisory council for the College of Arts and Letters and chair of the advisory board to the Kellogg Institute for International Studies, both at the University of Notre Dame.
Mark Loughridge
Born in 1953. Trustee since March 2012. Principal occupation(s) during the past five years and other experience: senior vice president and chief financial officer (retired 2013) of IBM (information technology services). Fiduciary member of IBM’s Retirement Plan Committee (2004–2013), senior vice president and general manager (2002–2004) of IBM Global Financing, vice president and controller (1998–2002) of
IBM, and a variety of other prior management roles at IBM. Member of the Council on Chicago Booth.
Scott C. Malpass
Born in 1962. Trustee since March 2012. Principal occupation(s) during the past five years and other experience: chief investment officer (retired June 2020) and vice president (retired June 2020) of the University of Notre Dame. Assistant professor of finance at the Mendoza College of Business, University of Notre Dame, and member of the Notre Dame 403(b) Investment Committee (retired June 2020). Member of the board of Catholic Investment Services, Inc. (investment advisors) and the board of superintendence of the Institute for the Works of Religion.
Deanna Mulligan
Born in 1963. Trustee since January 2018. Principal occupation(s) during the past five years and other experience: board chair (2020–present), chief executive officer (2011–2020), and president (2010–2019) of The Guardian Life Insurance Company of America. Chief operating officer (2010–2011) and executive vice president (2008–2010) of the individual life and disability division of Guardian Life. Member of the board of the American Council of Life Insurers and the board of the Economic Club of New York. Trustee of the Partnership for New York City (business leadership), Chief Executives for Corporate Purpose, NewYork-Presbyterian Hospital, Catalyst, and the Bruce Museum (arts and science). Member of the Advisory Council for the Stanford Graduate School of Business.
André F. Perold
Born in 1952. Trustee since December 2004. Principal occupation(s) during the past five years and other experience: George Gund Professor of Finance and Banking, Emeritus at the Harvard Business School (retired 2011). Chief investment officer and co-managing partner of HighVista Strategies (private investment firm). Member of the board of advisors and member of the investment committee of the Museum of Fine Arts Boston. Member of the board (2018–present) of RIT Capital Partners (investment firm). Member of the investment committee of Partners Health Care System.
Sarah Bloom Raskin
Born in 1961. Trustee since January 2018. Principal occupation(s) during the past five years and other experience: deputy secretary (2014–2017) of the United States Department of the Treasury. Governor (2010–2014) of the Federal Reserve Board. Commissioner (2007–2010) of financial regulation for the State of Maryland. Member of the board of directors (2012–2014) of Neighborhood Reinvestment Corporation. Director (2017–present) of i(x) Investments, LLC; director (2017–present) of Reserve Trust. Rubenstein Fellow (2017–present) of Duke University; trustee (2017–present) of Amherst College, and trustee (2019–present) of the Folger Shakespeare Library.
Peter F. Volanakis
Born in 1955. Trustee since July 2009. Principal occupation(s) during the past five years and other experience: president and chief operating officer (retired 2010) of Corning Incorporated (communications equipment) and director of Corning Incorporated (2000–2010) and Dow Corning (2001–2010). Director (2012) of SPX Corporation (multi-industry manufacturing). Overseer of the Amos Tuck School of Business Administration, Dartmouth College (2001–2013). Chairman of the board of trustees of Colby-Sawyer College. Member of the board of Hypertherm Inc. (industrial cutting systems, software, and consumables).
1 Mr. Buckley is considered “interested person,” as defined in the Investment Company Act of 1940, because he is an officer of the Vanguard funds.
Executive Officers
John Bendl
Born in 1970. Principal occupation(s) during the past five years and other experience: principal of Vanguard. Chief financial officer (2019–present) of each of the investment companies served by Vanguard. Chief accounting officer, treasurer, and controller of Vanguard (2017–present). Partner (2003–2016) at KPMG (audit, tax, and advisory services).
Christine M. Buchanan
Born in 1970. Principal occupation(s) during the past five years and other experience: principal of Vanguard. Treasurer (2017–present) of each of the investment companies served by Vanguard. Partner (2005–2017) at KPMG (audit, tax, and advisory services).
David Cermak
Born in 1960. Principal occupation(s) during the past five years and other experience: principal of Vanguard. Finance director (2019–present) of each of the investment companies served by Vanguard. Managing director and head (2017–present) of Vanguard Investments Singapore. Managing director and head (2017–2019) of Vanguard Investments Hong Kong. Representative director and head (2014–2017) of Vanguard Investments Japan.
John Galloway
Born in 1973. Principal occupation(s) during the past five years and other experience: principal of Vanguard. Investment stewardship officer (September 2020–present) of each of the investment companies served by Vanguard. Head of Investor Advocacy (February 2020–present) and head of Marketing Strategy and Planning (2017–2020) at Vanguard. Deputy assistant to the President of the United States (2015).
Thomas J. Higgins
Born in 1957. Principal occupation(s) during the past five years and other experience: principal of Vanguard. Finance director (2019–present), chief financial officer (2008–2019), and treasurer (1998–2008) of each of the investment companies served by Vanguard.
Peter Mahoney
Born in 1974. Principal occupation(s) during the past five years and other experience: principal of Vanguard. Controller (2015–present) of each of the investment companies served by Vanguard. Head of International Fund Services (2008–2014) at Vanguard.
Anne E. Robinson
Born in 1970. Principal occupation(s) during the past five years and other experience: general counsel (2016–present) of Vanguard. Secretary (2016–present) of Vanguard and of each of the investment companies served by Vanguard. Managing director (2016–present) of Vanguard. Managing director and general counsel of Global Cards and Consumer Services (2014–2016) at Citigroup. Counsel (2003–2014) at American Express.
Michael Rollings
Born in 1963. Principal occupation(s) during the past five years and other experience: finance director (2017–present) and treasurer (2017) of each of the investment companies served by Vanguard. Managing director (2016–present) of Vanguard. Chief financial officer (2016–present) of Vanguard. Director (2016–present) of Vanguard Marketing Corporation. Executive vice president and chief financial officer (2006–2016) of MassMutual Financial Group.
John E. Schadl
Born in 1972. Principal occupation(s) during the past five years and other experience: principal of Vanguard. Chief compliance officer (2019–present) of Vanguard and of each of the investment companies served by Vanguard. Assistant vice president (2019–present) of Vanguard Marketing Corporation.
Vanguard Senior Management Team
| Joseph Brennan | James M. Norris |
| Mortimer J. Buckley | Thomas M. Rampulla |
| Gregory Davis | Karin A. Risi |
| John James | Anne E. Robinson |
| John T. Marcante | Michael Rollings |
| Chris D. McIsaac | Lauren Valente |
Connect with Vanguard®>vanguard.com
Fund Information > 800-662-7447
Direct Investor Account Services > 800-662-2739
Institutional Investor Services > 800-523-1036
Text Telephone for People
Who Are Deaf or Hard of Hearing > 800-749-7273
This material may be used in conjunction with the offering of shares of any Vanguard fund only if preceded or accompanied by the fund’s current prospectus.
All comparative mutual fund data are from Lipper, a Thomson Reuters Company, or Morningstar, Inc., unless otherwise noted.
You can obtain a free copy of Vanguard’s proxy voting guidelines by visiting vanguard.com/proxyreporting or by calling Vanguard at 800-662-2739. The guidelines are also available from the SEC’s website, www.sec.gov. In addition, you may obtain a free report on how your fund voted the proxies for securities it owned during the 12 months ended June 30. To get the report, visit either vanguard.com/proxyreporting or www.sec.gov.
You can review information about your portfolio on the SEC’s website, and you can receive copies of this information, for a fee, by sending a request via email addressed to publicinfo@sec.gov.
Source for Bloomberg Barclays indexes: Bloomberg Index Services Limited. Copyright 2021, Bloomberg. All rights reserved.
CFA® is a registered trademark owned by CFA Institute.
© 2021 The Vanguard Group, Inc.
All rights reserved.
Vanguard Marketing Corporation, Distributor.
Q690REIT 022021
Annual Report | December 31, 2020
Vanguard Variable Insurance Funds
| Short-Term Investment-Grade Portfolio |
Contents
Your Portfolio’s Performance at a Glance
| 1 |
Advisor’s Report
| 2 |
About Your Portfolio’s Expenses
| 3 |
Performance Summary
| 4 |
Financial Statements
| 6 |
Please note: The opinions expressed in this report are just that—informed opinions. They should not be considered promises or advice. Also, please keep in mind that the information and opinions cover the period through the date on the front of this report. Of course, the risks of investing in your portfolio are spelled out in the prospectus.
Your Portfolio’s Performance at a Glance
| • | For the 12 months ended December 31, 2020, the Short-Term Investment-Grade Portfolio returned 5.49%, outpacing the 5.19% return of its benchmark index, the Bloomberg Barclays U.S. 1–5 Year Credit Bond Index. |
| • | The spread of COVID-19 in early 2020 turned into a global health crisis. Aggressive attempts to contain the virus resulted in a sharp downturn in economic activity and a sharp increase in unemployment rates. While volatility in the bond markets initially spiked and liquidity eroded as the pandemic spread, central banks slashed interest rates and enacted stimulus programs to blunt the impact on the economy. |
| • | With yields falling and prices rising, the broad U.S. bond market returned almost 8% for the year. Corporate bonds fared even better, returning close to 10%, with longer-dated bonds performing best. |
| • | The portfolio’s fairly conservative stance going into 2020, because of stretched valuations, meant that its advisor could dial up the fund’s exposure to credit as valuations turned more attractive in the wake of the pandemic. That shift from defense to offense helped the fund outperform. Security selection also contributed. |
| • | Please note that the portfolio’s returns are different from those in Vanguard Variable Annuity (and other plans that invest in the portfolio), which take into account insurance-related expenses. |
Market Barometer
Average Annual Total Returns
Periods Ended December 31, 2020 |
| | One Year | Three Years | Five Years |
| Stocks | | | |
| Russell 1000 Index (Large-caps) | 20.96% | 14.82% | 15.60% |
| Russell 2000 Index (Small-caps) | 19.96 | 10.25 | 13.26 |
| Russell 3000 Index (Broad U.S. market) | 20.89 | 14.49 | 15.43 |
| FTSE All-World ex US Index (International) | 11.22 | 5.18 | 9.16 |
| Bonds | | | |
| Bloomberg Barclays U.S. Aggregate Bond Index (Broad taxable market) | 7.51% | 5.34% | 4.44% |
Bloomberg Barclays Municipal Bond Index
(Broad tax-exempt market) | 5.21 | 4.64 | 3.91 |
| FTSE Three-Month U.S. Treasury Bill Index | 0.58 | 1.56 | 1.16 |
| CPI | | | |
| Consumer Price Index | 1.36% | 1.85% | 1.95% |
With bond yields falling in 2020, prices rose, contributing to strong returns for the 12 months ended December 31. The Short-Term Investment-Grade Portfolio returned 5.49%, outpacing the 5.19% return of its benchmark index, the Bloomberg Barclays U.S. 1–5 Year Credit Bond Index.
Please note that the portfolio’s returns are different from those in Vanguard Variable Annuity (and other plans that invest in the portfolio), which take into account insurance-related expenses.
With yields falling, the portfolio’s 30-day SEC yield stood at 0.83% as of December 31, down from 2.21% a year earlier. The 30-day SEC yield is a proxy for a portfolio’s potential annualized rate of income.
A rough ride for financial markets
The 12 months were defined by the outbreak of the novel coronavirus in early 2020 and the aggressive efforts to contain it that upended economies and financial markets worldwide. As the pandemic spread, crude oil prices sank, lockdowns multiplied, nonessential businesses were shuttered, and unemployment soared.
At the height of investor panic in March, there was a spike in volatility and an erosion in liquidity in the bond market. With investors trying to sell their most liquid assets, even some high-quality issuers saw their yield spreads versus risk-free assets widen dramatically.
Governments around the world were quick to take action, however, committing trillions of dollars in spending, loans, and loan guarantees to blunt the pandemic’s impact on economic activity and jobs. Many central banks, including the Federal Reserve, slashed short-term interest rates and ramped up bond purchases to keep longer-term rates low and provide liquidity. The Fed also signaled it would be more tolerant of inflation, leading the market to expect short-term rates to remain low into 2023.
Yields of U.S. Treasuries fell
and corporate spreads recovered
Fed action pushed shorter-term U.S. Treasury yields to near zero. The yield of the 2-year Treasury note fell 145 basis points over the fiscal year to 0.12%. (A basis point is one-hundredth of a percentage point.) On fallout from the pandemic, longer-term yields fell as well. The yield of the bellwether 10-year Treasury note ended 101 basis points lower, at 0.91%.
Corporate fundamentals proved more resilient than expected, and corporate defaults rose less than had been feared in the spring of 2020. That support, along with a drop in interest rates, central bank bond buying, and steady global demand for yield, helped credit spread levels tighten significantly compared with where they were in March and April.
Conservative positioning, security
selection aided performance
Investors who rode out the market turmoil in 2020 were rewarded with solid returns. Our disciplined approach to risk paid off in this challenging environment. Going into 2020, we were fairly conservatively positioned given that valuations seemed stretched and considering the current stage of the economic cycle. We obviously didn’t see the coronavirus pandemic coming, but our conservative positioning did allow us to take additional credit risk via investment-grade corporates in March and April at very attractive valuations after the virus spread. That wasn’t the case for some asset managers who were carrying more risk ahead of the pandemic, chasing a few extra basis points of potential return despite valuations being elevated.
Security selection also was positive. We focused our selection on high-quality credits that we felt from a business standpoint would continue to flourish and that had the best opportunity to recover
quickly compared with sectors and names that were more directly impacted by the virus.
In this falling rate environment, the portfolio’s shorter duration compared with that of its benchmark dampened performance.
Expect more bumps in the road
on the recovery from COVID-19
Risks remain that increases in COVID-19 infections could lead to renewed lockdowns that would further hurt economic growth and that the distribution of vaccines may take longer than hoped for. These risks are somewhat mitigated, however, because governments are now better prepared to deal with outbreaks. Moreover, the Fed has signaled it will remain vigilant and provide more support to the market if needed.
Although more fiscal stimulus is expected, the road to economic recovery is likely to be bumpy and long. That may well translate into periods of turbulence market in the year ahead, which is why a focus on diversification, deep research, and discipline will be key to potential investment success.
Whatever the markets may bring, our experienced team of portfolio managers, traders, and credit analysts will continue to seek attractive investment opportunities that will add to the portfolio’s performance.
Portfolio Managers:
Daniel Shaykevich, Principal
Samuel C. Martinez, CFA
Arvind Narayanan, CFA
Vanguard Fixed Income Group
January 20, 2021
About Your Portfolio’s Expenses
As a shareholder of the portfolio, you incur ongoing costs, which include costs for portfolio management, administrative services, and shareholder reports (like this one), among others. Operating expenses, which are deducted from a portfolio's gross income, directly reduce the investment return of the portfolio.
A portfolio's expenses are expressed as a percentage of its average net assets. This figure is known as the expense ratio. The following examples are intended to help you understand the ongoing costs (in dollars) of investing in your portfolio and to compare these costs with those of other mutual funds. The examples are based on an investment of $1,000 made at the beginning of the period shown and held for the entire period.
The accompanying table illustrates your portfolio's costs in two ways:
| • | Based on actual portfolio return. This section helps you to estimate the actual expenses that you paid over the period. The ”Ending Account Value“ shown is derived from the portfolio's actual return, and the third column shows the dollar amount that would have been paid by an investor who started with $1,000 in the portfolio. You may use the information here, together with the amount you invested, to estimate the expenses that you paid over the period. |
To do so, simply divide your account value by $1,000 (for example, an $8,600 account value divided by $1,000 = 8.6), then multiply the result by the number given for your portfolio under the heading ”Expenses Paid During Period.“
| • | Based on hypothetical 5% yearly return. This section is intended to help you compare your portfolio's costs with those of other mutual funds. It assumes that the portfolio had a yearly return of 5% before expenses, but that the expense ratio is unchanged. In this case—because the return used is not the portfolio's actual return—the results do not apply to your investment. The example is useful in making comparisons because the Securities and Exchange Commission requires all mutual funds to calculate expenses based on a 5% return. You can assess your portfolio's costs by comparing this hypothetical example with the hypothetical examples that appear in shareholder reports of other funds. |
Note that the expenses shown in the table are meant to highlight and help you compare ongoing costs only and do not reflect transaction costs incurred by the portfolio for buying and selling securities. The portfolio’s expense ratio does not reflect additional fees and expenses associated with the annuity or life insurance program through which you invest.
The calculations assume no shares were bought or sold during the period. Your actual costs may have been higher or lower, depending on the amount of your investment and the timing of any purchases or redemptions.
You can find more information about the portfolio's expenses, including annual expense ratios, in the Financial Statements section of this report. For additional information on operating expenses and other shareholder costs, please refer to your portfolio's current prospectus.
| Six Months Ended December 31, 2020 | | | |
| Short-Term Investment-Grade Portfolio | Beginning
Account Value
6/30/2020 | Ending
Account Value
12/31/2020 | Expenses
Paid During
Period |
| Based on Actual Portfolio Return | $1,000.00 | $1,019.25 | $0.71 |
| Based on Hypothetical 5% Yearly Return | 1,000.00 | 1,024.43 | 0.71 |
The calculations are based on expenses incurred in the most recent six-month period. The portfolio’s annualized six-month expense ratio for that period is 0.14%. The dollar amounts shown as “Expenses Paid” are equal to the annualized expense ratio multiplied by the average account value over the period, multiplied by the number of days in the most recent six-month period, then divided by the number of days in the most recent 12-month period (184/366).
Short-Term Investment-Grade Portfolio
All of the returns in this report represent past performance, which is not a guarantee of future results that may be achieved by the portfolio. (Current performance may be lower or higher than the performance data cited. For performance data current to the most recent month-end, visit our website at vanguard.com/performance.) Note, too, that both investment returns and principal value can fluctuate widely, so an investor’s shares, when sold, could be worth more or less than their original cost. The returns shown do not reflect taxes that a shareholder would pay on portfolio distributions or on the sale of portfolio shares. Nor do the returns reflect fees and expenses associated with the annuity or life insurance program through which a shareholder invests. If these fees and expenses were included, the portfolio's returns would be lower.
Cumulative Performance: December 31, 2010, Through December 31, 2020
Initial Investment of $10,000
| | | | Average Annual Total Returns
Periods Ended December 31, 2020 |
| | | One
Year | Five
Years | Ten
Years | Final Value
of a $10,000
Investment |
 | Short-Term Investment-Grade Portfolio | 5.49% | 3.39% | 2.73% | $13,089 |
 | Bloomberg Barclays U.S. 1-5 Year Credit Bond Index | 5.19 | 3.54 | 3.04 | 13,493 |
 | Bloomberg Barclays U.S. Aggregate Bond Index | 7.51 | 4.44 | 3.84 | 14,576 |
See Financial Highlights for dividend and capital gains information.
Short-Term Investment-Grade Portfolio
| Asset-Backed/Commercial Mortgage-Backed Securities | 12.0% |
| Common Stocks | 0.1 |
| Corporate Bonds | 74.4 |
| Sovereign Bonds | 4.0 |
| Taxable Municipal Bonds | 0.1 |
| U.S. Government and Agency Obligations | 9.4 |
The table reflects the portfolio’s investments, except for short-term investments and derivatives. The agency and mortgage-backed securities may include issues from government-sponsored enterprises; such issues are generally not backed by the full faith and credit of the U.S. government.
Short-Term Investment-Grade Portfolio
The portfolio files its complete schedule of portfolio holdings with the Securities and Exchange Commission (SEC) for the first and third quarters of each fiscal year as an exhibit to its reports on Form N-PORT. The portfolio’s Form N-PORT reports are available on the SEC’s website at www.sec.gov.
| | | | Coupon | Maturity
Date | Face
Amount
($000) | Market
Value•
($000) |
| U.S. Government and Agency Obligations (9.1%) |
| U.S. Government Securities (6.0%) |
| | U.S. Treasury Note/Bond | 0.125% | 6/30/22 | 10,000 | 10,000 |
| | U.S. Treasury Note/Bond | 0.125% | 9/30/22 | 25,000 | 25,000 |
| | U.S. Treasury Note/Bond | 1.375% | 2/15/23 | 10,000 | 10,262 |
| | U.S. Treasury Note/Bond | 0.250% | 6/15/23 | 25,000 | 25,062 |
| 1 | U.S. Treasury Note/Bond | 0.250% | 11/15/23 | 29,000 | 29,082 |
| 1 | U.S. Treasury Note/Bond | 0.500% | 3/31/25 | 8,000 | 8,073 |
| 2 | U.S. Treasury Note/Bond | 1.125% | 2/28/27 | 5,000 | 5,183 |
| | U.S. Treasury Note/Bond | 0.625% | 3/31/27 | 8,000 | 8,045 |
| 3 | U.S. Treasury Note/Bond | 1.500% | 2/15/30 | 12,000 | 12,690 |
| 1,2 | U.S. Treasury Note/Bond | 2.375% | 11/15/49 | 500 | 587 |
| | | | | | | 133,984 |
| Conventional Mortgage-Backed Securities (2.6%) |
| 4,5,6 | UMBS Pool | 1.500% | 2/12/51 | 3,000 | 3,027 |
| 4,5,6 | UMBS Pool | 2.000% | 2/12/51 | 52,500 | 54,469 |
| | | | | | | 57,496 |
| Nonconventional Mortgage-Backed Securities (0.5%) |
| 4,5,7 | Fannie Mae Pool, 12M USD LIBOR + 1.690% | 3.690% | 2/1/37 | 8 | 8 |
| 4,5,7 | Fannie Mae Pool, 12M USD LIBOR + 1.750% | 2.305% | 9/1/32 | 4 | 5 |
| 4,5,7 | Fannie Mae Pool, 12M USD LIBOR + 1.760% | 2.821% | 8/1/37 | 6 | 7 |
| 4,5,7 | Fannie Mae Pool, 12M USD LIBOR + 1.785% | 2.410% | 8/1/33 | 21 | 23 |
| 4,5,7 | Fannie Mae Pool, 12M USD LIBOR + 1.785% | 2.535% | 8/1/33 | 12 | 12 |
| 4,5,7 | Fannie Mae Pool, 12M USD LIBOR + 1.800% | 2.707% | 7/1/33 | 60 | 62 |
| 4,5,7 | Fannie Mae Pool, 12M USD LIBOR + 1.960% | 2.710% | 5/1/33 | 2 | 2 |
| 4,5,7 | Fannie Mae Pool, 1YR CMT + 2.000% | 2.795% | 12/1/32 | 4 | 4 |
| 4,5,7 | Fannie Mae Pool, 1YR CMT + 2.125% | 2.705% | 6/1/33 | 19 | 20 |
| 4,5,7 | Fannie Mae Pool, 1YR CMT + 2.185% | 2.560% | 7/1/32 | 1 | 1 |
| 4,5,7 | Fannie Mae Pool, 1YR CMT + 2.210% | 3.320% | 5/1/33 | 25 | 26 |
| 4,5 | Fannie Mae REMICS | 1.750% | 11/25/32 | 580 | 591 |
| 4,5 | Fannie Mae REMICS | 2.100% | 4/25/43 | 285 | 290 |
| 4,5 | Fannie Mae REMICS | 2.250% | 7/25/43–6/25/44 | 377 | 388 |
| 4,5 | Fannie Mae REMICS | 2.500% | 6/25/40–1/25/50 | 915 | 949 |
| 4,5 | Fannie Mae REMICS | 3.000% | 9/25/49 | 521 | 549 |
| 4,5 | Fannie Mae REMICS | 3.500% | 12/25/45 | 465 | 511 |
| 4,5,7 | Freddie Mac Non Gold Pool, 12M USD LIBOR + 1.750% | 2.536% | 8/1/37 | 24 | 25 |
| 4,5,7 | Freddie Mac Non Gold Pool, 12M USD LIBOR + 1.893% | 2.393% | 9/1/32 | 15 | 15 |
| 4,5,7 | Freddie Mac Non Gold Pool, 12M USD LIBOR + 1.961% | 2.461% | 10/1/32 | 4 | 5 |
| 4,5,7 | Freddie Mac Non Gold Pool, 12M USD LIBOR + 1.961% | 2.586% | 8/1/33 | 10 | 11 |
| 4,5,7 | Freddie Mac Non Gold Pool, 12M USD LIBOR + 1.961% | 3.961% | 2/1/33 | 2 | 2 |
| | | | Coupon | Maturity
Date | Face
Amount
($000) | Market
Value•
($000) |
| 4,5,7 | Freddie Mac Non Gold Pool, 1YR CMT + 2.254% | 2.379% | 9/1/32 | 1 | 1 |
| 4,5 | Freddie Mac REMICS | 2.000% | 7/15/42 | 486 | 499 |
| 4,5 | Freddie Mac REMICS | 2.250% | 4/15/43–6/15/44 | 776 | 798 |
| 4,5 | Freddie Mac REMICS | 2.500% | 10/25/48–12/25/49 | 1,364 | 1,430 |
| 4,5 | Freddie Mac REMICS | 2.750% | 10/25/49 | 215 | 227 |
| 4,5 | Freddie Mac REMICS | 3.000% | 10/15/45–7/25/49 | 1,694 | 1,781 |
| 4,5 | Freddie Mac REMICS | 3.500% | 5/15/40–12/25/49 | 559 | 590 |
| 4,5 | Freddie Mac REMICS | 6.500% | 5/15/24 | 319 | 332 |
| 4 | Ginnie Mae | 2.500% | 9/20/49 | 452 | 471 |
| 4 | Ginnie Mae | 2.750% | 9/20/45–5/20/46 | 1,706 | 1,735 |
| 4 | Ginnie Mae | 3.000% | 3/20/41–12/20/47 | 323 | 334 |
| | | | | | | 11,704 |
| Total U.S. Government and Agency Obligations (Cost $202,567) | 203,184 |
| Asset-Backed/Commercial Mortgage-Backed Securities (11.7%) |
| 4 | Ally Auto Receivables Trust Class A4 Series 2019-1 | 3.020% | 4/15/24 | 240 | 250 |
| 4 | Ally Auto Receivables Trust Class A4 Series 2019-4 | 1.920% | 1/15/25 | 250 | 257 |
| 4,8 | American Homes 4 Rent Trust Class A Series 2014-SFR2 | 3.786% | 10/17/36 | 268 | 286 |
| 4,8 | American Homes 4 Rent Trust Class A Series 2014-SFR3 | 3.678% | 12/17/36 | 392 | 416 |
| 4,8 | American Homes 4 Rent Trust Class A Series 2015-SFR1 | 3.467% | 4/17/52 | 341 | 360 |
| 4,8 | American Homes 4 Rent Trust Class A Series 2015-SFR2 | 3.732% | 10/17/52 | 164 | 176 |
| 4,8 | American Homes 4 Rent Trust Class B Series 2014-SFR2 | 4.290% | 10/17/36 | 80 | 86 |
| 4,8 | American Homes 4 Rent Trust Class B Series 2015-SFR2 | 4.295% | 10/17/52 | 100 | 109 |
| 4 | AmeriCredit Automobile Receivables Trust Class B Series 2020-2 | 0.970% | 2/18/26 | 180 | 182 |
| 4 | AmeriCredit Automobile Receivables Trust Class C Series 2020-2 | 1.480% | 2/18/26 | 250 | 253 |
| 4 | AmeriCredit Automobile Receivables Trust Class D Series 2016-3 | 2.710% | 9/8/22 | 240 | 241 |
| 4 | Americredit Automobile Receivables Trust Class D Series 2018-2 | 4.010% | 7/18/24 | 700 | 741 |
| 4 | Americredit Automobile Receivables Trust Class D Series 2019-1 | 3.620% | 3/18/25 | 560 | 595 |
| 4 | AmeriCredit Automobile Receivables Trust Class D Series 2020-2 | 2.130% | 3/18/26 | 270 | 276 |
| 4 | AmeriCredit Automobile Receivables Trust Class D Series 2020-3 | 1.490% | 9/18/26 | 170 | 170 |
| 4,8 | AOA Mortgage Trust Class A Series 2015-1177 | 2.957% | 12/13/29 | 280 | 282 |
Short-Term Investment-Grade Portfolio
| | | | Coupon | Maturity
Date | Face
Amount
($000) | Market
Value•
($000) |
| 4,8 | Applebee's Funding LLC / IHOP Funding LLC Class A2I Series 2019-1A | 4.194% | 6/7/49 | 150 | 148 |
| 4,8 | ARL Second LLC Class A1 Series 2014-1A | 2.920% | 6/15/44 | 207 | 205 |
| 4,7,8 | Aventura Mall Trust Class A Series 2018-AVM | 4.112% | 7/5/40 | 240 | 261 |
| 4,8 | Avis Budget Rental Car Funding AESOP LLC Class A Series 2016-1A | 2.990% | 6/20/22 | 100 | 101 |
| 4,8 | Avis Budget Rental Car Funding AESOP LLC Class A Series 2017-1A | 3.070% | 9/20/23 | 180 | 186 |
| 4,8 | Avis Budget Rental Car Funding AESOP LLC Class A Series 2019-1A | 3.450% | 3/20/23 | 590 | 605 |
| 4,8 | BAMLL Commercial Mortgage Securities Trust Class A Series 2012-PARK | 2.959% | 12/10/30 | 125 | 130 |
| 4 | BAMLL Commercial Mortgage Securities Trust Class A4 Series 2017-BNK3 | 3.574% | 2/15/50 | 110 | 125 |
| 4,8 | BAMLL Commercial Mortgage Securities Trust Class AMP Series 2019-BPR | 3.287% | 11/5/32 | 410 | 408 |
| 4 | Banc of America Commercial Mortgage Trust Class A3 Series 2015-UBS7 | 3.441% | 9/15/48 | 294 | 319 |
| 4,7 | Banc of America Commercial Mortgage Trust Class C Series 2015-UBS7 | 4.359% | 9/15/48 | 40 | 35 |
| 4,7 | Banc of America Funding Trust Class 2A2 Series 2006-H | 3.137% | 9/20/46 | 128 | 100 |
| 4 | BANK Class A4 Series 2017-BNK4 | 3.625% | 5/15/50 | 150 | 171 |
| 4 | BANK Class A4 Series 2017-BNK7 | 3.175% | 9/15/60 | 30 | 33 |
| 4 | BANK Class A4 Series 2017-BNK8 | 3.488% | 11/15/50 | 360 | 411 |
| 4,7 | BANK Class A4 Series 2018-BN12 | 4.255% | 5/15/61 | 70 | 83 |
| 4 | BANK Class A5 Series 2017-BNK7 | 3.435% | 9/15/60 | 270 | 307 |
| 4 | BANK Class AS Series 2017-BNK6 | 3.741% | 7/15/60 | 80 | 90 |
| 4 | BANK Class ASB Series 2018-BN14 | 4.185% | 9/15/60 | 485 | 562 |
| 4 | BANK Class ASB Series 2019-BN17 | 3.623% | 4/15/52 | 164 | 188 |
| 4,7 | Bear Stearns ARM Trust Class 1A1 Series 2007-3 | 3.800% | 5/25/47 | 159 | 136 |
| 4,7 | Bear Stearns ARM Trust Class 2A1 Series 2006-4 | 2.950% | 10/25/36 | 179 | 168 |
| 4 | Benchmark Mortgage Trust Class A4 Series 2018-B6 | 4.261% | 10/10/51 | 820 | 983 |
| 4 | Benchmark Mortgage Trust Class A5 Series 2020-B16 | 2.732% | 2/15/53 | 430 | 471 |
| | | | Coupon | Maturity
Date | Face
Amount
($000) | Market
Value•
($000) |
| 4,7 | Benchmark Mortgage Trust Class AM Series 2018-B1 | 3.878% | 1/15/51 | 160 | 182 |
| 4 | Benchmark Mortgage Trust Class ASB Series 2019-B10 | 3.615% | 3/15/62 | 177 | 202 |
| 4,7 | Brazos Higher Education Authority Inc Class A16 Series 2005-3, 3M USD LIBOR + 0.200% | 0.451% | 6/25/26 | 109 | 109 |
| 4,7 | Brazos Higher Education Authority Inc. Class A2 Series 2011-1, 3M USD LIBOR + 0.800% | 1.007% | 2/25/30 | 254 | 255 |
| 4,8 | BX Trust Class A Series 2019-OC11 | 3.202% | 12/9/41 | 500 | 548 |
| 4,8 | Canadian Pacer Auto Receivables Trust Class A3 Series 2018-2A | 3.270% | 12/19/22 | 111 | 111 |
| 4,8 | Canadian Pacer Auto Receivables Trust Class A3 Series 2020-1A | 1.830% | 7/19/24 | 930 | 945 |
| 4,8 | Canadian Pacer Auto Receivables Trust Class A4 Series 2018-1A | 3.220% | 9/19/22 | 220 | 222 |
| 4,8 | Canadian Pacer Auto Receivables Trust Class A4 Series 2018-2A | 3.440% | 8/21/23 | 80 | 82 |
| 4,8 | Canadian Pacer Auto Receivables Trust Class A4 Series 2019-1A | 2.960% | 6/19/24 | 140 | 145 |
| 4,8 | Canadian Pacer Auto Receivables Trust Class A4 Series 2020-1A | 1.890% | 3/19/25 | 200 | 203 |
| 4 | Capital One Prime Auto Receivables Trust Class A3 Series 2019-1 | 2.510% | 11/15/23 | 1,170 | 1,190 |
| 4 | Capital One Prime Auto Receivables Trust Class A3 Series 2019-2 | 1.920% | 5/15/24 | 1,530 | 1,558 |
| 4 | Capital One Prime Auto Receivables Trust Class A3 Series 2020-1 | 1.600% | 11/15/24 | 4,390 | 4,474 |
| 4 | Capital One Prime Auto Receivables Trust Class A4 Series 2019-1 | 2.560% | 10/15/24 | 390 | 406 |
| 4 | Capital One Prime Auto Receivables Trust Class A4 Series 2020-1 | 1.630% | 8/15/25 | 790 | 814 |
| 4 | Carmax Auto Owner Trust Class A3 Series 2019-3 | 2.180% | 8/15/24 | 1,500 | 1,536 |
| 4 | Carmax Auto Owner Trust Class A3 Series 2019-4 | 2.020% | 11/15/24 | 1,650 | 1,695 |
| 4 | CarMax Auto Owner Trust Class A4 Series 2018-3 | 3.270% | 3/15/24 | 430 | 449 |
| 4 | CarMax Auto Owner Trust Class A4 Series 2018-4 | 3.480% | 2/15/24 | 240 | 253 |
Short-Term Investment-Grade Portfolio
| | | | Coupon | Maturity
Date | Face
Amount
($000) | Market
Value•
($000) |
| 4 | CarMax Auto Owner Trust Class A4 Series 2019-3 | 2.300% | 4/15/25 | 270 | 282 |
| 4 | CarMax Auto Owner Trust Class A4 Series 2019-4 | 2.130% | 7/15/25 | 440 | 460 |
| 4 | Carmax Auto Owner Trust Class A4 Series 2020-1 | 2.030% | 6/16/25 | 380 | 395 |
| 4 | CarMax Auto Owner Trust Class B Series 2017-4 | 2.460% | 8/15/23 | 130 | 133 |
| 4 | CarMax Auto Owner Trust Class B Series 2018-1 | 2.830% | 9/15/23 | 500 | 515 |
| 4 | CarMax Auto Owner Trust Class B Series 2018-2 | 3.370% | 10/16/23 | 140 | 146 |
| 4 | CarMax Auto Owner Trust Class B Series 2018-4 | 3.670% | 5/15/24 | 210 | 222 |
| 4 | CarMax Auto Owner Trust Class B Series 2019-3 | 2.500% | 4/15/25 | 350 | 367 |
| 4 | CarMax Auto Owner Trust Class B Series 2020-3 | 1.090% | 3/16/26 | 260 | 264 |
| 4 | CarMax Auto Owner Trust Class C Series 2017-4 | 2.700% | 10/16/23 | 130 | 132 |
| 4 | CarMax Auto Owner Trust Class C Series 2018-1 | 2.950% | 11/15/23 | 220 | 227 |
| 4 | CarMax Auto Owner Trust Class C Series 2018-2 | 3.570% | 12/15/23 | 200 | 208 |
| 4 | CarMax Auto Owner Trust Class C Series 2018-4 | 3.850% | 7/15/24 | 140 | 148 |
| 4 | CarMax Auto Owner Trust Class C Series 2019-4 | 2.600% | 9/15/25 | 140 | 146 |
| 4 | CarMax Auto Owner Trust Class C Series 2020-3 | 1.690% | 4/15/26 | 160 | 163 |
| 4 | CarMax Auto Owner Trust Class C Series 2020-4 | 1.300% | 8/17/26 | 210 | 211 |
| 4 | CarMax Auto Owner Trust Class D Series 2018-2 | 3.990% | 4/15/25 | 210 | 218 |
| 4 | CarMax Auto Owner Trust Class D Series 2018-4 | 4.150% | 4/15/25 | 200 | 211 |
| 4 | CD Mortgage Trust Class A4 Series 2016-CD1 | 2.724% | 8/10/49 | 95 | 103 |
| 4 | CD Mortgage Trust Class A4 Series 2017-CD3 | 3.631% | 2/10/50 | 110 | 125 |
| 4,7 | CD Mortgage Trust Class A4 Series 2017-CD4 | 3.514% | 5/10/50 | 180 | 204 |
| 4 | CD Mortgage Trust Class A5 Series 2017-CD6 | 3.456% | 11/13/50 | 165 | 188 |
| 4,7 | CD Mortgage Trust Class C Series 2016-CD1 | 3.631% | 8/10/49 | 40 | 39 |
| 4 | CFCRE Commercial Mortgage Trust Class A4 Series 2016-C4 | 3.283% | 5/10/58 | 502 | 550 |
| | | | Coupon | Maturity
Date | Face
Amount
($000) | Market
Value•
($000) |
| 4,7,8 | CFCRE Commercial Mortgage Trust Class AJ Series 2011-C2 | 5.739% | 12/15/47 | 390 | 399 |
| 4,8 | Chesapeake Funding II LLC Class A1 Series 2018-1A | 3.040% | 4/15/30 | 294 | 298 |
| 4,8 | Chesapeake Funding II LLC Class A1 Series 2018-1A | 2.940% | 4/15/31 | 761 | 773 |
| 4,7 | CHL Mortgage Pass-Through Trust Class 1A1 Series 2006-HYB1 | 2.919% | 3/20/36 | 106 | 89 |
| 4,7 | CHL Mortgage Pass-Through Trust Class 3A1 Series 2007-HYB2 | 3.081% | 2/25/47 | 120 | 94 |
| 4 | Citigroup Commercial Mortgage Trust Class A3 Series 2014-GC23 | 3.356% | 7/10/47 | 313 | 337 |
| 4 | Citigroup Commercial Mortgage Trust Class A3 Series 2014-GC25 | 3.372% | 10/10/47 | 1,400 | 1,518 |
| 4 | Citigroup Commercial Mortgage Trust Class A3 Series 2017-P8 | 3.203% | 9/15/50 | 60 | 66 |
| 4 | Citigroup Commercial Mortgage Trust Class A4 Series 2013-GC11 | 3.093% | 4/10/46 | 156 | 164 |
| 4,7 | Citigroup Commercial Mortgage Trust Class A4 Series 2013-GC15 | 4.371% | 9/10/46 | 90 | 98 |
| 4 | Citigroup Commercial Mortgage Trust Class A4 Series 2014-GC19 | 4.023% | 3/10/47 | 550 | 601 |
| 4 | Citigroup Commercial Mortgage Trust Class A4 Series 2014-GC21 | 3.575% | 5/10/47 | 85 | 89 |
| 4 | Citigroup Commercial Mortgage Trust Class A4 Series 2014-GC23 | 3.622% | 7/10/47 | 570 | 624 |
| 4 | Citigroup Commercial Mortgage Trust Class A4 Series 2014-GC25 | 3.635% | 10/10/47 | 1,251 | 1,372 |
| 4 | Citigroup Commercial Mortgage Trust Class A4 Series 2015-GC31 | 3.762% | 6/10/48 | 435 | 487 |
| 4 | Citigroup Commercial Mortgage Trust Class A4 Series 2017-C4 | 3.471% | 10/12/50 | 185 | 211 |
| 4 | Citigroup Commercial Mortgage Trust Class A4 Series 2017-P8 | 3.465% | 9/15/50 | 220 | 250 |
| 4,7 | Citigroup Commercial Mortgage Trust Class A4 Series 2018-C5 | 4.228% | 6/10/51 | 10 | 12 |
| 4 | Citigroup Commercial Mortgage Trust Class A5 Series 2014-GC21 | 3.855% | 5/10/47 | 1,208 | 1,321 |
Short-Term Investment-Grade Portfolio
| | | | Coupon | Maturity
Date | Face
Amount
($000) | Market
Value•
($000) |
| 4 | Citigroup Commercial Mortgage Trust Class A5 Series 2015-GC27 | 3.137% | 2/10/48 | 770 | 835 |
| 4,8 | Citigroup Commercial Mortgage Trust Class AS Series 2012-GC8 | 3.683% | 9/10/45 | 52 | 54 |
| 4 | Citigroup Commercial Mortgage Trust Class AS Series 2014-GC23 | 3.863% | 7/10/47 | 310 | 338 |
| 4,7 | Citigroup Commercial Mortgage Trust Class B Series 2014-GC23 | 4.175% | 7/10/47 | 130 | 141 |
| 4 | Citigroup Commercial Mortgage Trust Class B Series 2017-P8 | 4.192% | 9/15/50 | 240 | 267 |
| 4,7 | Citigroup Commercial Mortgage Trust Class C Series 2014-GC23 | 4.431% | 7/10/47 | 153 | 161 |
| 4,7 | Citigroup Commercial Mortgage Trust Class C Series 2015-GC33 | 4.571% | 9/10/58 | 100 | 99 |
| 4,7 | Citigroup Commercial Mortgage Trust Class C Series 2017-P8 | 4.267% | 9/15/50 | 240 | 248 |
| 4,7 | Citigroup Mortgage Loan Trust Class 2A1A Series 2007-AR8 | 3.358% | 7/25/37 | 71 | 67 |
| 4,7,8 | COMM 2013-CCRE9 Mortgage Trust Class AM Series 2013-CR9 | 4.243% | 7/10/45 | 250 | 265 |
| 4,7,8 | COMM Mortgage Trust Class A Series 2014-277P | 3.611% | 8/10/49 | 980 | 1,058 |
| 4,7,8 | COMM Mortgage Trust Class A2 Series 2013-SFS | 2.987% | 4/12/35 | 280 | 280 |
| 4 | COMM Mortgage Trust Class A2 Series 2014-CR15 | 2.928% | 2/10/47 | 89 | 89 |
| 4 | COMM Mortgage Trust Class A3 Series 2012-CR4 | 2.853% | 10/15/45 | 262 | 270 |
| 4 | COMM Mortgage Trust Class A3 Series 2013-CR11 | 3.983% | 8/10/50 | 270 | 291 |
| 4 | COMM Mortgage Trust Class A3 Series 2013-CR12 | 3.765% | 10/10/46 | 171 | 182 |
| 4 | COMM Mortgage Trust Class A3 Series 2014-CR14 | 3.955% | 2/10/47 | 50 | 54 |
| 4 | COMM Mortgage Trust Class A3 Series 2014-CR20 | 3.326% | 11/10/47 | 640 | 688 |
| 4 | COMM Mortgage Trust Class A4 Series 2012-CR2 | 3.147% | 8/15/45 | 75 | 77 |
| 4 | COMM Mortgage Trust Class A4 Series 2012-CR5 | 2.771% | 12/10/45 | 70 | 72 |
| 4 | COMM Mortgage Trust Class A4 Series 2013-CR11 | 4.258% | 8/10/50 | 1,047 | 1,144 |
| 4 | COMM Mortgage Trust Class A4 Series 2013-CR12 | 4.046% | 10/10/46 | 1,006 | 1,094 |
| | | | Coupon | Maturity
Date | Face
Amount
($000) | Market
Value•
($000) |
| 4,7 | COMM Mortgage Trust Class A4 Series 2013-CR13 | 4.194% | 11/10/46 | 576 | 631 |
| 4 | COMM Mortgage Trust Class A4 Series 2013-CR8 | 3.334% | 6/10/46 | 38 | 40 |
| 4,7 | COMM Mortgage Trust Class A4 Series 2013-CR9 | 4.219% | 7/10/45 | 330 | 352 |
| 4 | COMM Mortgage Trust Class A4 Series 2013-LC6 | 2.941% | 1/10/46 | 80 | 83 |
| 4,7 | COMM Mortgage Trust Class A4 Series 2014-CR14 | 4.236% | 2/10/47 | 470 | 517 |
| 4,7 | COMM Mortgage Trust Class A4 Series 2014-CR15 | 4.074% | 2/10/47 | 500 | 549 |
| 4 | COMM Mortgage Trust Class A4 Series 2014-CR17 | 3.700% | 5/10/47 | 39 | 42 |
| 4 | COMM Mortgage Trust Class A4 Series 2014-CR18 | 3.550% | 7/15/47 | 213 | 229 |
| 4 | COMM Mortgage Trust Class A4 Series 2015-CR25 | 3.759% | 8/10/48 | 131 | 146 |
| 4 | COMM Mortgage Trust Class A4 Series 2015-CR26 | 3.630% | 10/10/48 | 753 | 846 |
| 4 | COMM Mortgage Trust Class A4 Series 2015-CR27 | 3.612% | 10/10/48 | 405 | 452 |
| 4 | COMM Mortgage Trust Class A4 Series 2015-LC19 | 3.183% | 2/10/48 | 245 | 266 |
| 4,7 | COMM Mortgage Trust Class A5 Series 2013-CR8 | 3.612% | 6/10/46 | 1,205 | 1,273 |
| 4 | COMM Mortgage Trust Class A5 Series 2013-LC13 | 4.205% | 8/10/46 | 315 | 340 |
| 4 | COMM Mortgage Trust Class A5 Series 2014-CR17 | 3.977% | 5/10/47 | 1,141 | 1,260 |
| 4 | COMM Mortgage Trust Class A5 Series 2014-CR18 | 3.828% | 7/15/47 | 781 | 861 |
| 4 | COMM Mortgage Trust Class A5 Series 2014-LC17 | 3.917% | 10/10/47 | 479 | 529 |
| 4 | COMM Mortgage Trust Class A5 Series 2015-CR22 | 3.309% | 3/10/48 | 825 | 909 |
| 4 | COMM Mortgage Trust Class A5 Series 2015-CR24 | 3.696% | 8/10/48 | 252 | 283 |
| 4 | COMM Mortgage Trust Class AM Series 2012-CR2 | 3.791% | 8/15/45 | 100 | 103 |
| 4,8 | COMM Mortgage Trust Class AM Series 2012-CR3 | 3.416% | 10/15/45 | 260 | 267 |
| 4 | COMM Mortgage Trust Class AM Series 2012-CR4 | 3.251% | 10/15/45 | 40 | 41 |
| 4,8 | COMM Mortgage Trust Class AM Series 2013-CR6 | 3.147% | 3/10/46 | 250 | 260 |
| 4,7,8 | COMM Mortgage Trust Class AM Series 2013-LC13 | 4.557% | 8/10/46 | 435 | 474 |
Short-Term Investment-Grade Portfolio
| | | | Coupon | Maturity
Date | Face
Amount
($000) | Market
Value•
($000) |
| 4,7 | COMM Mortgage Trust Class AM Series 2014-CR15 | 4.426% | 2/10/47 | 250 | 274 |
| 4 | COMM Mortgage Trust Class AM Series 2014-CR17 | 4.174% | 5/10/47 | 650 | 709 |
| 4,8 | COMM Mortgage Trust Class B Series 2013-CR6 | 3.397% | 3/10/46 | 70 | 71 |
| 4,7,8 | COMM Mortgage Trust Class C Series 2013-CR9 | 4.243% | 7/10/45 | 280 | 266 |
| 4,7 | COMM Mortgage Trust Class C Series 2014-CR17 | 4.783% | 5/10/47 | 200 | 198 |
| 4,7 | COMM Mortgage Trust Class C Series 2015-CR27 | 4.454% | 10/10/48 | 825 | 907 |
| 4,5,7,8 | Connecticut Avenue Securities Trust Class 2M1 Series 2020-R07, 1M USD LIBOR + 0.750% | 0.898% | 1/25/40 | 1,475 | 1,476 |
| 4 | CSAIL Commercial Mortgage Trust Class A4 Series 2015-C2 | 3.504% | 6/15/57 | 140 | 155 |
| 4 | CSAIL Commercial Mortgage Trust Class A4 Series 2015-C4 | 3.808% | 11/15/48 | 981 | 1,107 |
| 4 | CSAIL Commercial Mortgage Trust Class A5 Series 2016-C7 | 3.502% | 11/15/49 | 1,483 | 1,654 |
| 4,7 | CSAIL Commercial Mortgage Trust Class C Series 2015-C3 | 4.376% | 8/15/48 | 240 | 209 |
| 4,7 | CSAIL Commercial Mortgage Trust Class C Series 2016-C5 | 4.630% | 11/15/48 | 220 | 214 |
| 4 | DBGS Mortgage Trust Class A4 Series 2018-C1 | 4.466% | 10/15/51 | 1,010 | 1,229 |
| 4 | DBJPM Mortgage Trust Class A5 Series 2017-C6 | 3.328% | 6/10/50 | 130 | 146 |
| 4,8 | DLL LLC Class A3 Series 2019-MA2 | 2.340% | 9/20/23 | 490 | 498 |
| 4,8 | DLL LLC Class A4 Series 2018-ST2 | 3.590% | 6/20/24 | 300 | 306 |
| 4,8 | DLL LLC Class A4 Series 2019-DA1 | 2.920% | 4/20/27 | 460 | 480 |
| 4,8 | DLL LLC Class A4 Series 2019-MT3 | 2.150% | 9/21/26 | 200 | 206 |
| 4 | Drive Auto Receivables Trust Class B Series 2020-2 | 1.420% | 3/17/25 | 230 | 233 |
| 4 | Drive Auto Receivables Trust Class C Series 2018-3 | 3.720% | 9/16/24 | 243 | 244 |
| 4 | Drive Auto Receivables Trust Class C Series 2018-5 | 3.990% | 1/15/25 | 770 | 784 |
| 4 | Drive Auto Receivables Trust Class C Series 2020-2 | 2.280% | 8/17/26 | 190 | 196 |
| 4,8 | Drive Auto Receivables Trust Class D Series 2016-CA | 4.180% | 3/15/24 | 261 | 264 |
| 4 | Drive Auto Receivables Trust Class D Series 2017-1 | 3.840% | 3/15/23 | 23 | 23 |
| | | | Coupon | Maturity
Date | Face
Amount
($000) | Market
Value•
($000) |
| 4 | Drive Auto Receivables Trust Class D Series 2018-3 | 4.300% | 9/16/24 | 530 | 549 |
| 4 | Drive Auto Receivables Trust Class D Series 2018-5 | 4.300% | 4/15/26 | 660 | 695 |
| 4 | Drive Auto Receivables Trust Class D Series 2019-2 | 3.690% | 8/17/26 | 500 | 526 |
| 4 | Drive Auto Receivables Trust Class D Series 2019-4 | 2.700% | 2/16/27 | 180 | 186 |
| 4 | Drive Auto Receivables Trust Class D Series 2020-1 | 2.700% | 5/17/27 | 180 | 187 |
| 4 | Drive Auto Receivables Trust Class D Series 2020-2 | 3.050% | 5/15/28 | 200 | 211 |
| 4,7,8 | Edsouth Indenture No. 9 LLC Class A Series 2015-1, 1M USD LIBOR + 0.800% | 0.948% | 10/25/56 | 285 | 284 |
| 4,7,8 | EDvestinU Private Education Loan Issue No. 1 LLC Class A Series 2019-A | 3.580% | 11/25/38 | 195 | 206 |
| 4,8 | ELFI Graduate Loan Program LLC Class A2 Series 2018-A | 3.430% | 8/25/42 | 310 | 321 |
| 4,8 | Enterprise Fleet Financing LLC Class A2 Series 2019-1 | 2.980% | 10/20/24 | 159 | 161 |
| 4,8 | Enterprise Fleet Financing LLC Class A2 Series 2020-1 | 1.780% | 12/22/25 | 1,695 | 1,721 |
| 4,8 | Fair Square Issuance Trust Class A Series 2020-AA | 2.900% | 9/20/24 | 440 | 445 |
| 4,7 | First Horizon Mortgage Class 1A1 Series 2006-AR3 Pass-Through Trust | 2.506% | 11/25/36 | 64 | 51 |
| 4,7 | First Horizon Mortgage Class 1A1 Series 2006-AR4 Pass-Through Trust | 3.118% | 1/25/37 | 117 | 86 |
| 4,8 | FirstKey Homes Trust Class A Series FKH 2020-SFR2 | 1.266% | 10/19/37 | 400 | 402 |
| 4 | Ford Credit Auto Lease Trust Class B Series 2020-B | 1.000% | 11/15/23 | 490 | 493 |
| 4 | Ford Credit Auto Lease Trust Class C Series 2020-B | 1.700% | 2/15/25 | 340 | 345 |
| 4,8 | Ford Credit Auto Owner Trust Class A Series 2017-2 | 2.360% | 3/15/29 | 430 | 445 |
| 4,8 | Ford Credit Auto Owner Trust Class A Series 2018-1 | 3.190% | 7/15/31 | 2,230 | 2,449 |
| 4,8 | Ford Credit Auto Owner Trust Class A Series 2018-2 | 3.470% | 1/15/30 | 650 | 699 |
| 4,8 | Ford Credit Auto Owner Trust Class A Series 2020-1 | 2.040% | 8/15/31 | 640 | 674 |
| 4,8 | Ford Credit Auto Owner Trust Class A Series 2020-2 | 1.060% | 4/15/33 | 1,510 | 1,521 |
| 4 | Ford Credit Auto Owner Trust Class A4 Series 2019-A | 2.850% | 8/15/24 | 900 | 940 |
Short-Term Investment-Grade Portfolio
| | | | Coupon | Maturity
Date | Face
Amount
($000) | Market
Value•
($000) |
| 4,8 | Ford Credit Auto Owner Trust Class B Series 2017-2 | 2.600% | 3/15/29 | 180 | 185 |
| 4,8 | Ford Credit Auto Owner Trust Class B Series 2018-1 | 3.340% | 7/15/31 | 810 | 881 |
| 4,8 | Ford Credit Auto Owner Trust Class B Series 2018-2 | 3.610% | 1/15/30 | 530 | 566 |
| 4,8 | Ford Credit Auto Owner Trust Class B Series 2020-1 | 2.290% | 8/15/31 | 630 | 658 |
| 4,8 | Ford Credit Auto Owner Trust Class B Series 2020-2 | 1.490% | 4/15/33 | 550 | 553 |
| 4 | Ford Credit Auto Owner Trust Class B Series 2020-B | 1.190% | 1/15/26 | 500 | 508 |
| 4,8 | Ford Credit Auto Owner Trust Class C Series 2017-2 | 2.750% | 3/15/29 | 370 | 380 |
| 4,8 | Ford Credit Auto Owner Trust Class C Series 2018-2 | 3.760% | 1/15/30 | 240 | 255 |
| 4 | Ford Credit Auto Owner Trust Class C Series 2019-A | 3.250% | 9/15/25 | 370 | 390 |
| 4,8 | Ford Credit Auto Owner Trust Class C Series 2020-1 | 2.540% | 8/15/31 | 770 | 804 |
| 4,8 | Ford Credit Auto Owner Trust Class C Series 2020-2 | 1.740% | 4/15/33 | 440 | 443 |
| 4 | Ford Credit Auto Owner Trust Class C Series 2020-B | 2.040% | 12/15/26 | 300 | 311 |
| 4 | Ford Credit Auto Owner Trust Class C Series 2020-C | 1.040% | 5/15/28 | 170 | 170 |
| 4 | Ford Credit Floorplan Master Owner Trust A Class A Series 2019-4 | 2.440% | 9/15/26 | 1,200 | 1,280 |
| 4 | Ford Credit Floorplan Master Owner Trust A Class A1 Series 2019-3 | 2.230% | 9/15/24 | 520 | 536 |
| 4 | Ford Credit Floorplan Master Owner Trust A Class B Series 2019-1 | 3.250% | 4/15/26 | 260 | 280 |
| 4 | Ford Credit Floorplan Master Owner Trust A Class B Series 2019-3 | 2.420% | 9/15/24 | 120 | 124 |
| 4 | Ford Credit Floorplan Master Owner Trust A Class B Series 2020-1 | 0.980% | 9/15/25 | 340 | 342 |
| 4 | Ford Credit Floorplan Master Owner Trust A Class C Series 2020-1 | 1.420% | 9/15/25 | 360 | 364 |
| 4 | Ford Credit Floorplan Master Owner Trust A Class D Series 2020-1 | 2.120% | 9/15/25 | 510 | 511 |
| 4,5,7,8 | Freddie Mac STACR REMIC Trust Class M1 Series 2020-DNA2, 1M USD LIBOR + 0.750% | 0.898% | 2/25/50 | 1,324 | 1,325 |
| 4,5,7,8 | Freddie Mac STACR REMIC Trust Class M1 Series 2020-HQA1, 1M USD LIBOR + 0.750% | 0.898% | 1/25/50 | 139 | 140 |
| | | | Coupon | Maturity
Date | Face
Amount
($000) | Market
Value•
($000) |
| 4,5,7,8 | Freddie Mac STARC REMIC Trust Class M1 Series 2020-DNA1, 1M USD LIBOR + 0.700% | 0.848% | 1/25/50 | 257 | 257 |
| 4,8 | Global SC Finance VII Srl Class A Series 2020-2A | 2.260% | 11/19/40 | 560 | 565 |
| 4 | GM Financial Automobile Leasing Trust Class B Series 2020-1 | 1.840% | 12/20/23 | 460 | 468 |
| 4 | GM Financial Automobile Leasing Trust Class B Series 2020-2 | 1.560% | 7/22/24 | 180 | 183 |
| 4 | GM Financial Automobile Leasing Trust Class B Series 2020-3 | 0.760% | 10/21/24 | 200 | 201 |
| 4 | GM Financial Automobile Leasing Trust Class C Series 2020-1 | 2.040% | 12/20/23 | 300 | 305 |
| 4 | GM Financial Automobile Leasing Trust Class C Series 2020-2 | 2.560% | 7/22/24 | 150 | 155 |
| 4 | GM Financial Automobile Leasing Trust Class C Series 2020-3 | 1.110% | 10/21/24 | 380 | 380 |
| 4 | GM Financial Automobile Leasing Trust Class D Series 2020-1 | 2.280% | 6/20/24 | 210 | 214 |
| 4 | GM Financial Automobile Leasing Trust Class D Series 2020-2 | 3.210% | 12/20/24 | 210 | 219 |
| 4 | GM Financial Automobile Leasing Trust Class D Series 2020-3 | 1.710% | 2/20/25 | 340 | 342 |
| 4 | GM Financial Consumer Automobile Receivables Trust Class A4 Series 2018-4 | 3.320% | 6/17/24 | 250 | 262 |
| 4 | GM Financial Consumer Automobile Receivables Trust Class A4 Series 2019-4 | 1.760% | 1/16/25 | 170 | 175 |
| 4,8 | GM Financial Consumer Automobile Receivables Trust Class B Series 2017-3A | 2.330% | 3/16/23 | 70 | 71 |
| 4 | GM Financial Consumer Automobile Receivables Trust Class B Series 2020-3 | 0.810% | 1/16/26 | 200 | 201 |
| 4 | GM Financial Consumer Automobile Receivables Trust Class B Series 2020-4 | 0.730% | 3/16/26 | 240 | 241 |
| 4 | GM Financial Consumer Automobile Receivables Trust Class C Series 2020-3 | 1.370% | 1/16/26 | 100 | 101 |
| 4 | GM Financial Consumer Automobile Receivables Trust Class C Series 2020-4 | 1.050% | 5/18/26 | 90 | 90 |
Short-Term Investment-Grade Portfolio
| | | | Coupon | Maturity
Date | Face
Amount
($000) | Market
Value•
($000) |
| 4 | GM Financial Consumer Automobile Receivables Trust Class D Series 2020-3 | 1.910% | 9/16/27 | 100 | 100 |
| 4,7 | GMACM Mortgage Loan Trust Class 3A1 Series 2005-AR6 | 3.069% | 11/19/35 | 19 | 17 |
| 4,8 | GMF Floorplan Owner Revolving Trust Class A Series 2019-1 | 2.700% | 4/15/24 | 410 | 422 |
| 4,8 | GMF Floorplan Owner Revolving Trust Class A Series 2020-2 | 0.690% | 10/15/25 | 1,920 | 1,927 |
| 4,8 | GMF Floorplan Owner Revolving Trust Class B Series 2020-1 | 1.030% | 8/15/25 | 140 | 141 |
| 4,8 | GMF Floorplan Owner Revolving Trust Class B Series 2020-2 | 0.960% | 10/15/25 | 280 | 281 |
| 4,8 | GMF Floorplan Owner Revolving Trust Class C Series 2020-1 | 1.480% | 8/15/25 | 110 | 111 |
| 4,8 | GMF Floorplan Owner Revolving Trust Class C Series 2020-2 | 1.310% | 10/15/25 | 200 | 202 |
| 4,8 | Golden Credit Card Trust Class A Series 2018-4A | 3.440% | 8/15/25 | 770 | 827 |
| 4,7,8 | Gosforth Funding plc, Class A1 Series 2018-1A, 3M USD LIBOR + 0.450% | 0.657% | 8/25/60 | 208 | 208 |
| 4,8 | GreatAmerica Leasing Receivables Funding LLC Class A4 Series 2019-1 | 3.210% | 2/18/25 | 210 | 220 |
| 4,8 | GS Mortgage Securities Corp II Class A Series 2012-BWTR | 2.954% | 11/5/34 | 860 | 866 |
| 4,7 | GS Mortgage Securities Corp. II Class A5 Series 2018-GS10 | 4.155% | 7/10/51 | 130 | 154 |
| 4,8 | GS Mortgage Securities Corp. Trust Class A Series 2012-ALOHA | 3.551% | 4/10/34 | 790 | 797 |
| 4 | GS Mortgage Securities Trust Class A3 Series 2017-GS6 | 3.433% | 5/10/50 | 220 | 248 |
| 4 | GS Mortgage Securities Trust Class A4 Series 2013-GC12 | 3.135% | 6/10/46 | 306 | 322 |
| 4 | GS Mortgage Securities Trust Class A4 Series 2013-GCJ14 | 3.955% | 8/10/46 | 705 | 737 |
| 4 | GS Mortgage Securities Trust Class A4 Series 2014-GC26 | 3.364% | 11/10/47 | 500 | 538 |
| 4 | GS Mortgage Securities Trust Class A4 Series 2015-GC28 | 3.136% | 2/10/48 | 939 | 1,006 |
| 4 | GS Mortgage Securities Trust Class A4 Series 2015-GC30 | 3.382% | 5/10/50 | 300 | 330 |
| 4 | GS Mortgage Securities Trust Class A4 Series 2015-GC32 | 3.764% | 7/10/48 | 99 | 111 |
| 4 | GS Mortgage Securities Trust Class A4 Series 2015-GC34 | 3.506% | 10/10/48 | 588 | 655 |
| 4 | GS Mortgage Securities Trust Class A4 Series 2016-GS3 | 2.850% | 10/10/49 | 530 | 579 |
| 4,7 | GS Mortgage Securities Trust Class A4 Series 2018-GS9 | 3.992% | 3/10/51 | 10 | 12 |
| | | | Coupon | Maturity
Date | Face
Amount
($000) | Market
Value•
($000) |
| 4 | GS Mortgage Securities Trust Class A4 Series 2019-GC38 | 3.968% | 2/10/52 | 200 | 235 |
| 4 | GS Mortgage Securities Trust Class A4 Series 2019-GC40 | 3.160% | 7/10/52 | 110 | 124 |
| 4 | GS Mortgage Securities Trust Class A4 Series 2019-GC42 | 3.001% | 9/1/52 | 200 | 223 |
| 4,7 | GS Mortgage Securities Trust Class A5 Series 2013-GC13 | 4.051% | 7/10/46 | 543 | 587 |
| 4 | GS Mortgage Securities Trust Class A5 Series 2013-GC14 | 4.243% | 8/10/46 | 1,015 | 1,100 |
| 4 | GS Mortgage Securities Trust Class A5 Series 2014-GC20 | 3.998% | 4/10/47 | 1,000 | 1,089 |
| 4 | GS Mortgage Securities Trust Class A5 Series 2014-GC24 | 3.931% | 9/10/47 | 807 | 888 |
| 4 | GS Mortgage Securities Trust Class A5 Series 2014-GC26 | 3.629% | 11/10/47 | 330 | 363 |
| 4 | GS Mortgage Securities Trust Class A5 Series 2015-GC28 | 3.396% | 2/10/48 | 677 | 740 |
| 4,8 | GS Mortgage Securities Trust Class AS Series 2012-GC6 | 4.948% | 1/10/45 | 25 | 26 |
| 4 | GS Mortgage Securities Trust Class AS Series 2014-GC20 | 4.258% | 4/10/47 | 20 | 22 |
| 4,7 | GS Mortgage Securities Trust Class AS Series 2014-GC24 | 4.162% | 9/10/47 | 380 | 417 |
| 4,7 | GS Mortgage Securities Trust Class B Series 2013-GCJ12 | 3.777% | 6/10/46 | 200 | 208 |
| 4,7 | GS Mortgage Securities Trust Class B Series 2014-GC24 | 4.511% | 9/10/47 | 270 | 258 |
| 4,7,8 | GS Mortgage Securities Trust Class C Series 2011-GC3 | 5.545% | 3/10/44 | 70 | 70 |
| 4,7 | GS Mortgage Securities Trust Class C Series 2012-GCJ7 | 5.628% | 5/10/45 | 210 | 205 |
| 4,7,8 | GS Mortgage Securities Trust Class C Series 2013-GC13 | 4.084% | 7/10/46 | 140 | 137 |
| 4,7 | GS Mortgage Securities Trust Class C Series 2014-GC24 | 4.532% | 9/10/47 | 410 | 339 |
| 4,7 | GS Mortgage Securities Trust Class C Series 2015-GC34 | 4.648% | 10/10/48 | 310 | 284 |
| 4,8 | Hardee's Funding LLC Class A23 Series 2018-1A | 5.710% | 6/20/48 | 538 | 582 |
| 4,8 | Harley Marine Financing LLC Class A2 Series 2018-1A | 5.682% | 5/15/43 | 449 | 401 |
| 4 | Harley-Davidson Motorcycle Trust Class A3 Series 2019-A | 2.340% | 2/15/24 | 1,230 | 1,245 |
| 4 | Harley-Davidson Motorcycle Trust Class A3 Series 2020-A | 1.870% | 10/15/24 | 760 | 774 |
Short-Term Investment-Grade Portfolio
| | | | Coupon | Maturity
Date | Face
Amount
($000) | Market
Value•
($000) |
| 4 | Harley-Davidson Motorcycle Trust Class A4 Series 2019-A | 2.390% | 11/15/26 | 270 | 279 |
| 4 | Harley-Davidson Motorcycle Trust Class A4 Series 2019-A | 1.930% | 4/15/27 | 240 | 248 |
| 4,8 | Hertz Fleet Lease Funding LP Class A2 Series 2018-1 | 3.230% | 5/10/32 | 417 | 419 |
| 4,8 | Hertz Vehicle Financing II LP Class A Series 2015-3A | 2.670% | 9/25/21 | 43 | 43 |
| 4,8 | Hertz Vehicle Financing II LP Class A Series 2016-2A | 2.950% | 3/25/22 | 84 | 84 |
| 4,8 | Hilton USA Trust Class A Series 2016-HHV | 3.719% | 11/5/38 | 80 | 87 |
| 4,7,8 | Holmes Master Issuer plc Class A2 Series 2018-2A, 3M USD LIBOR + 0.420% | 0.657% | 10/15/54 | 226 | 226 |
| 4 | Honda Auto Receivables Owner Trust Class A4 Series 2018-3 | 3.070% | 11/21/24 | 210 | 215 |
| 4 | Honda Auto Receivables Owner Trust Class A4 Series 2018-4 | 3.300% | 7/15/25 | 200 | 208 |
| 4 | Honda Auto Receivables Owner Trust Class A4 Series 2019-1 | 2.900% | 6/18/24 | 230 | 239 |
| 4 | Honda Auto Receivables Owner Trust Class A4 Series 2019-3 | 1.850% | 8/15/25 | 500 | 515 |
| 4 | Honda Auto Receivables Owner Trust Class A4 Series 2020-1 | 1.630% | 10/21/26 | 720 | 742 |
| 4,8 | Houston Galleria Mall Trust Class A1A2 Series 2015-HGLR | 3.087% | 3/5/37 | 3,030 | 3,110 |
| 4,8 | HPEFS Equipment Trust Class A3 Series 2019-1A | 2.210% | 9/20/29 | 100 | 101 |
| 4,8 | HPEFS Equipment Trust Class A3 Series 2020-1A | 1.760% | 2/20/30 | 600 | 609 |
| 4,8 | HPEFS Equipment Trust Class B Series 2019-1A | 2.320% | 9/20/29 | 180 | 183 |
| 4,8 | HPEFS Equipment Trust Class B Series 2020-1A | 1.890% | 2/20/30 | 300 | 305 |
| 4,8 | HPEFS Equipment Trust Class C Series 2019-1A | 2.490% | 9/20/29 | 100 | 102 |
| 4,8 | HPEFS Equipment Trust Class D Series 2019-1A | 2.720% | 9/20/29 | 100 | 102 |
| 4,8 | Hudson Yards Mortgage Trust Class A Series 2019-30HY | 3.228% | 7/10/39 | 330 | 371 |
| 4,8 | Hudsons Bay Simon JV Trust Class A7 Series 2015-HB7 | 3.914% | 8/5/34 | 500 | 437 |
| 4,8 | Hyundai Auto Lease Securitization Trust Class B Series 2020-B | 0.810% | 10/15/24 | 190 | 190 |
| 4 | Hyundai Auto Receivables Trust Class A3 Series 2019-B | 1.940% | 2/15/24 | 1,460 | 1,487 |
| | | | Coupon | Maturity
Date | Face
Amount
($000) | Market
Value•
($000) |
| 4 | Hyundai Auto Receivables Trust Class A4 Series 2019-B | 2.000% | 4/15/25 | 410 | 425 |
| 4 | Hyundai Auto Receivables Trust Class B Series 2019-A | 2.940% | 5/15/25 | 190 | 200 |
| 4 | Hyundai Auto Receivables Trust Class B Series 2019-B | 2.210% | 4/15/25 | 120 | 125 |
| 4 | Hyundai Auto Receivables Trust Class B Series 2020-B | 0.940% | 12/15/25 | 130 | 131 |
| 4 | Hyundai Auto Receivables Trust Class B Series 2020-C | 0.810% | 11/16/26 | 280 | 280 |
| 4 | Hyundai Auto Receivables Trust Class C Series 2020-B | 1.600% | 12/15/26 | 160 | 163 |
| 4 | Hyundai Auto Receivables Trust Class C Series 2020-C | 1.080% | 12/15/27 | 250 | 250 |
| 4,8 | Hyundai Floorplan Master Owner Trust Class A Series 2019-1 | 2.680% | 4/15/24 | 510 | 525 |
| 4,7,8 | Invitation Homes Trust Class A Series 2017-SFR2, 1M USD LIBOR + 0.850% | 1.003% | 12/17/36 | 657 | 654 |
| 4,7,8 | Invitation Homes Trust Class A Series 2018-SFR1, 1M USD LIBOR + 0.700% | 0.853% | 3/17/37 | 653 | 644 |
| 4,7,8 | Invitation Homes Trust Class B Series 2017-SFR2, 1M USD LIBOR + 1.150% | 1.303% | 12/17/36 | 250 | 249 |
| 4,7,8 | Invitation Homes Trust Class B Series 2018-SFR1, 1M USD LIBOR + 0.950% | 1.103% | 3/17/37 | 260 | 258 |
| 4,7,8 | Irvine Core Office Trust Class A2 Series 2013-IRV | 3.173% | 5/15/48 | 358 | 376 |
| 4,8 | Jackson Park Trust Class A Series 2019-LIC | 2.766% | 10/14/39 | 530 | 566 |
| 4,8 | JP Morgan Chase Commercial Mortgage Securities Trust Class A Series 2012-HSBC | 3.093% | 7/5/32 | 138 | 141 |
| 4,8 | JP Morgan Chase Commercial Mortgage Securities Trust Class A3 Series 2010-C2 | 4.070% | 11/15/43 | 30 | 30 |
| 4 | JP Morgan Chase Commercial Mortgage Securities Trust Class A3 Series 2012-C6 | 3.507% | 5/15/45 | 277 | 286 |
| 4 | JP Morgan Chase Commercial Mortgage Securities Trust Class A3 Series 2012-C8 | 2.829% | 10/15/45 | 319 | 329 |
| 4 | JP Morgan Chase Commercial Mortgage Securities Trust Class A3 Series 2013-C16 | 3.881% | 12/15/46 | 60 | 64 |
Short-Term Investment-Grade Portfolio
| | | | Coupon | Maturity
Date | Face
Amount
($000) | Market
Value•
($000) |
| 4,8 | JP Morgan Chase Commercial Mortgage Securities Trust Class A4 Series 2011-C3 | 4.717% | 2/15/46 | 274 | 274 |
| 4,7 | JP Morgan Chase Commercial Mortgage Securities Trust Class A4 Series 2013-C13 | 3.994% | 1/15/46 | 323 | 347 |
| 4 | JP Morgan Chase Commercial Mortgage Securities Trust Class A4 Series 2013-C16 | 4.166% | 12/15/46 | 410 | 448 |
| 4 | JP Morgan Chase Commercial Mortgage Securities Trust Class A5 Series 2012-LC9 | 2.840% | 12/15/47 | 755 | 779 |
| 4 | JP Morgan Chase Commercial Mortgage Securities Trust Class A5 Series 2013-LC11 | 2.960% | 4/15/46 | 402 | 421 |
| 4 | JP Morgan Chase Commercial Mortgage Securities Trust Class A5 Series 2016-JP3 | 2.870% | 8/15/49 | 1,164 | 1,272 |
| 4,7,8 | JP Morgan Chase Commercial Mortgage Securities Trust Class AS Series 2011-C5 | 5.424% | 8/15/46 | 100 | 102 |
| 4,8 | JP Morgan Chase Commercial Mortgage Securities Trust Class AS Series 2012-C8 | 3.424% | 10/15/45 | 100 | 104 |
| 4 | JP Morgan Chase Commercial Mortgage Securities Trust Class AS Series 2012-CBX | 4.271% | 6/15/45 | 650 | 676 |
| 4 | JP Morgan Chase Commercial Mortgage Securities Trust Class AS Series 2013-C16 | 4.517% | 12/15/46 | 400 | 429 |
| 4,7 | JP Morgan Chase Commercial Mortgage Securities Trust Class B Series 2013-C16 | 4.962% | 12/15/46 | 550 | 584 |
| 4,7,8 | JP Morgan Chase Commercial Mortgage Securities Trust Class C Series 2010-C2 | 5.655% | 11/15/43 | 150 | 149 |
| 4,7 | JP Morgan Chase Commercial Mortgage Securities Trust Class C Series 2013-C13 | 4.078% | 1/15/46 | 170 | 174 |
| 4,7 | JP Morgan Chase Commercial Mortgage Securities Trust Class C Series 2013-C16 | 5.027% | 12/15/46 | 270 | 280 |
| 4,7,8 | JP Morgan Chase Commercial Mortgage Securities Trust Class D Series 2010-C2 | 5.655% | 11/15/43 | 170 | 107 |
| | | | Coupon | Maturity
Date | Face
Amount
($000) | Market
Value•
($000) |
| 4,7,8 | JP Morgan Commercial Mortgage-Backed Securities Trust Class A4B Series 2011-RR1 | 4.717% | 3/16/46 | 70 | 70 |
| 4 | JPMBB Commercial Mortgage Securities Trust Class A3 Series 2014-C26 | 3.231% | 1/15/48 | 553 | 593 |
| 4 | JPMBB Commercial Mortgage Securities Trust Class A3 Series 2015-C31 | 3.801% | 8/15/48 | 590 | 663 |
| 4,7 | JPMBB Commercial Mortgage Securities Trust Class A4 Series 2013-C14 | 4.133% | 8/15/46 | 300 | 319 |
| 4 | JPMBB Commercial Mortgage Securities Trust Class A4 Series 2013-C17 | 4.199% | 1/15/47 | 497 | 544 |
| 4 | JPMBB Commercial Mortgage Securities Trust Class A4 Series 2014-C19 | 3.997% | 4/15/47 | 70 | 77 |
| 4 | JPMBB Commercial Mortgage Securities Trust Class A4 Series 2014-C26 | 3.494% | 1/15/48 | 1,030 | 1,130 |
| 4 | JPMBB Commercial Mortgage Securities Trust Class A4 Series 2015-C27 | 3.179% | 2/15/48 | 354 | 385 |
| 4 | JPMBB Commercial Mortgage Securities Trust Class A4 Series 2015-C30 | 3.551% | 7/15/48 | 580 | 635 |
| 4 | JPMBB Commercial Mortgage Securities Trust Class A4 Series 2015-C33 | 3.770% | 12/15/48 | 513 | 579 |
| 4 | JPMBB Commercial Mortgage Securities Trust Class A5 Series 2013-C12 | 3.664% | 7/15/45 | 439 | 467 |
| 4 | JPMBB Commercial Mortgage Securities Trust Class A5 Series 2013-C15 | 4.131% | 11/15/45 | 800 | 870 |
| 4 | JPMBB Commercial Mortgage Securities Trust Class A5 Series 2014-C18 | 4.079% | 2/15/47 | 750 | 824 |
| 4 | JPMBB Commercial Mortgage Securities Trust Class A5 Series 2014-C24 | 3.639% | 11/15/47 | 1,204 | 1,323 |
| 4 | JPMBB Commercial Mortgage Securities Trust Class A5 Series 2015-C32 | 3.598% | 11/15/48 | 270 | 301 |
| 4,7 | JPMBB Commercial Mortgage Securities Trust Class AS Series 2013-C12 | 4.038% | 7/15/45 | 180 | 190 |
| 4,7 | JPMBB Commercial Mortgage Securities Trust Class AS Series 2014-C18 | 4.439% | 2/15/47 | 300 | 322 |
| 4,7 | JPMBB Commercial Mortgage Securities Trust Class AS Series 2015-C30 | 4.226% | 7/15/48 | 385 | 429 |
Short-Term Investment-Grade Portfolio
| | | | Coupon | Maturity
Date | Face
Amount
($000) | Market
Value•
($000) |
| 4,7 | JPMBB Commercial Mortgage Securities Trust Class B Series 2014-C18 | 4.794% | 2/15/47 | 300 | 318 |
| 4,7 | JPMBB Commercial Mortgage Securities Trust Class C Series 2014-C18 | 4.794% | 2/15/47 | 150 | 152 |
| 4 | JPMCC Commercial Mortgage Securities Trust Class A4 Series 2017-JP6 | 3.224% | 7/15/50 | 250 | 279 |
| 4 | JPMCC Commercial Mortgage Securities Trust Class A5 Series 2017-JP5 | 3.723% | 3/15/50 | 200 | 229 |
| 4 | JPMCC Commercial Mortgage Securities Trust Class A5 Series 2017-JP6 | 3.490% | 7/15/50 | 280 | 318 |
| 4 | JPMCC Commercial Mortgage Securities Trust Class A5 Series 2017-JP7 | 3.454% | 9/15/50 | 350 | 397 |
| 4 | JPMDB Commercial Mortgage Securities Trust Class A3 Series 2016-C4 | 3.141% | 12/15/49 | 220 | 244 |
| 4 | JPMDB Commercial Mortgage Securities Trust Class A4 Series 2018-C8 | 4.211% | 6/15/51 | 10 | 12 |
| 4 | JPMDB Commercial Mortgage Securities Trust Class A5 Series 2017-C7 | 3.409% | 10/15/50 | 160 | 181 |
| 4,7 | Lanark Master Issuer plc Class 1A Series 2018-2A, 3M USD LIBOR + 0.420% | 0.676% | 12/22/69 | 193 | 193 |
| 4,7,8 | Lanark Master Issuer plc Class 1A Series 2020-1A | 2.277% | 12/22/69 | 280 | 287 |
| 4,8 | Laurel Road Prime Student Loan Trust Class A2B Series 2017-C | 2.810% | 11/25/42 | 283 | 289 |
| 4,8 | Laurel Road Prime Student Loan Trust Class A2FX Series 2018-B | 3.540% | 5/26/43 | 431 | 443 |
| 4,8 | LCCM Mortgage Trust Class A Series 2014-909 | 3.388% | 5/15/31 | 450 | 450 |
| 4,7 | MASTR Adjustable Rate Mortgages Trust Class 5A1 Series 2004-3 | 2.437% | 4/25/34 | 5 | 4 |
| 4 | Mercedes-Benz Auto Receivables Trust Class A4 Series 2019-1 | 2.040% | 1/15/26 | 590 | 615 |
| 4,8 | Mercedes-Benz Master Owner Trust Class A Series 2019-BA | 2.610% | 5/15/24 | 1,370 | 1,412 |
| 4,7 | Merrill Lynch Mortgage Investors Trust MLMI Class 2A Series 2003-A4 | 3.321% | 7/25/33 | 6 | 6 |
| 4,7 | Merrill Lynch Mortgage Investors Trust MLMI Class 2A2 Series 2003-A2, 6M USD LIBOR + 1.500% | 1.757% | 2/25/33 | 12 | 11 |
| | | | Coupon | Maturity
Date | Face
Amount
($000) | Market
Value•
($000) |
| 4,8 | MMAF Equipment Finance LLC Class A4 Series 2018-A | 3.390% | 1/10/25 | 200 | 208 |
| 4,8 | MMAF Equipment Finance LLC Class A5 Series 2015-AA | 2.490% | 2/19/36 | 286 | 290 |
| 4,8 | MMAF Equipment Finance LLC Class A5 Series 2018-A | 3.610% | 3/10/42 | 110 | 119 |
| 4,8 | MMAF Equipment Finance LLC Class A5 Series 2019-A | 3.080% | 11/12/41 | 220 | 238 |
| 4 | Morgan Stanley Bank of America Merrill Lynch Trust Class A3 Series 2013-C11 | 3.960% | 8/15/46 | 259 | 273 |
| 4 | Morgan Stanley Bank of America Merrill Lynch Trust Class A3 Series 2014-C15 | 3.773% | 4/15/47 | 668 | 721 |
| 4 | Morgan Stanley Bank of America Merrill Lynch Trust Class A3 Series 2015-C23 | 3.451% | 7/15/50 | 233 | 255 |
| 4 | Morgan Stanley Bank of America Merrill Lynch Trust Class A3 Series 2015-C24 | 3.479% | 5/15/48 | 420 | 457 |
| 4 | Morgan Stanley Bank of America Merrill Lynch Trust Class A4 Series 2012-C5 | 3.176% | 8/15/45 | 506 | 522 |
| 4 | Morgan Stanley Bank of America Merrill Lynch Trust Class A4 Series 2012-C6 | 2.858% | 11/15/45 | 114 | 117 |
| 4,7 | Morgan Stanley Bank of America Merrill Lynch Trust Class A4 Series 2013-C10 | 4.082% | 7/15/46 | 683 | 731 |
| 4,7 | Morgan Stanley Bank of America Merrill Lynch Trust Class A4 Series 2013-C11 | 4.152% | 8/15/46 | 580 | 626 |
| 4,7 | Morgan Stanley Bank of America Merrill Lynch Trust Class A4 Series 2013-C12 | 4.259% | 10/15/46 | 80 | 87 |
| 4 | Morgan Stanley Bank of America Merrill Lynch Trust Class A4 Series 2013-C13 | 4.039% | 11/15/46 | 200 | 218 |
| 4 | Morgan Stanley Bank of America Merrill Lynch Trust Class A4 Series 2013-C7 | 2.918% | 2/15/46 | 130 | 135 |
| 4 | Morgan Stanley Bank of America Merrill Lynch Trust Class A4 Series 2013-C9 | 3.102% | 5/15/46 | 595 | 626 |
| 4 | Morgan Stanley Bank of America Merrill Lynch Trust Class A4 Series 2014-C15 | 4.051% | 4/15/47 | 315 | 345 |
| 4 | Morgan Stanley Bank of America Merrill Lynch Trust Class A4 Series 2014-C18 | 3.923% | 10/15/47 | 490 | 542 |
| 4 | Morgan Stanley Bank of America Merrill Lynch Trust Class A4 Series 2014-C19 | 3.526% | 12/15/47 | 440 | 482 |
Short-Term Investment-Grade Portfolio
| | | | Coupon | Maturity
Date | Face
Amount
($000) | Market
Value•
($000) |
| 4 | Morgan Stanley Bank of America Merrill Lynch Trust Class A4 Series 2015-C20 | 3.249% | 2/15/48 | 780 | 845 |
| 4 | Morgan Stanley Bank of America Merrill Lynch Trust Class A4 Series 2015-C23 | 3.719% | 7/15/50 | 822 | 918 |
| 4 | Morgan Stanley Bank of America Merrill Lynch Trust Class A4 Series 2016-C29 | 3.325% | 5/15/49 | 2,279 | 2,522 |
| 4 | Morgan Stanley Bank of America Merrill Lynch Trust Class A4 Series 2016-C32 | 3.720% | 12/15/49 | 2,904 | 3,322 |
| 4 | Morgan Stanley Bank of America Merrill Lynch Trust Class A4 Series 2017-C34 | 3.536% | 11/15/52 | 490 | 557 |
| 4 | Morgan Stanley Bank of America Merrill Lynch Trust Class A5 Series 2014-C14 | 4.064% | 2/15/47 | 450 | 487 |
| 4 | Morgan Stanley Bank of America Merrill Lynch Trust Class A5 Series 2014-C16 | 3.892% | 6/15/47 | 504 | 550 |
| 4 | Morgan Stanley Bank of America Merrill Lynch Trust Class A5 Series 2014-C17 | 3.741% | 8/15/47 | 320 | 351 |
| 4 | Morgan Stanley Bank of America Merrill Lynch Trust Class A5 Series 2015-C25 | 3.635% | 10/15/48 | 1,455 | 1,634 |
| 4 | Morgan Stanley Bank of America Merrill Lynch Trust Class AS Series 2012-C5 | 3.792% | 8/15/45 | 50 | 52 |
| 4 | Morgan Stanley Bank of America Merrill Lynch Trust Class AS Series 2013-C7 | 3.214% | 2/15/46 | 60 | 62 |
| 4,7 | Morgan Stanley Bank of America Merrill Lynch Trust Class AS Series 2014-C14 | 4.384% | 2/15/47 | 450 | 488 |
| 4 | Morgan Stanley Bank of America Merrill Lynch Trust Class AS Series 2014-C16 | 4.094% | 6/15/47 | 230 | 251 |
| 4 | Morgan Stanley Bank of America Merrill Lynch Trust Class AS Series 2014-C17 | 4.011% | 8/15/47 | 160 | 173 |
| 4,7 | Morgan Stanley Bank of America Merrill Lynch Trust Class B Series 2014-C16 | 4.335% | 6/15/47 | 660 | 678 |
| 4,7 | Morgan Stanley Bank of America Merrill Lynch Trust Class C Series 2013-C10 | 4.082% | 7/15/46 | 70 | 51 |
| 4,7 | Morgan Stanley Bank of America Merrill Lynch Trust Class C Series 2014-C15 | 4.906% | 4/15/47 | 50 | 52 |
| 4,7 | Morgan Stanley Bank of America Merrill Lynch Trust Class C Series 2014-C16 | 4.768% | 6/15/47 | 300 | 254 |
| | | | Coupon | Maturity
Date | Face
Amount
($000) | Market
Value•
($000) |
| 4,7 | Morgan Stanley Bank of America Merrill Lynch Trust Class C Series 2016-C29 | 4.746% | 5/15/49 | 40 | 39 |
| 4 | Morgan Stanley Capital I Class A4 Series 2017-HR2 | 3.587% | 12/15/50 | 195 | 221 |
| 4 | Morgan Stanley Capital I Class ASB Series 2017-HR2 | 3.509% | 12/15/50 | 140 | 156 |
| 4,8 | Morgan Stanley Capital I Trust Class A Series 2014-150E | 3.912% | 9/9/32 | 675 | 727 |
| 4,8 | Morgan Stanley Capital I Trust Class A Series 2014-CPT | 3.350% | 7/13/29 | 600 | 609 |
| 4,8 | Morgan Stanley Capital I Trust Class A Series 2015-420 | 3.727% | 10/12/50 | 676 | 727 |
| 4,8 | Morgan Stanley Capital I Trust Class A2 Series 2012-STAR | 3.201% | 8/5/34 | 411 | 417 |
| 4 | Morgan Stanley Capital I Trust Class A4 Series 2012-C4 | 3.244% | 3/15/45 | 380 | 386 |
| 4 | Morgan Stanley Capital I Trust Class A4 Series 2015-UBS8 | 3.809% | 12/15/48 | 916 | 1,031 |
| 4 | Morgan Stanley Capital I Trust Class A4 Series 2016-BNK2 | 3.049% | 11/15/49 | 400 | 441 |
| 4 | Morgan Stanley Capital I Trust Class A4 Series 2016-UB11 | 2.782% | 8/15/49 | 654 | 711 |
| 4 | Morgan Stanley Capital I Trust Class A4 Series 2016-UBS9 | 3.594% | 3/15/49 | 963 | 1,068 |
| 4 | Morgan Stanley Capital I Trust Class AS Series 2012-C4 | 3.773% | 3/15/45 | 60 | 61 |
| 4,7 | Morgan Stanley Capital I Trust Class C Series 2015-UBS8 | 4.583% | 12/15/48 | 150 | 140 |
| 4,7 | Morgan Stanley Mortgage Loan Trust Class 5A1 Series 2006-8AR | 2.201% | 6/25/36 | 56 | 52 |
| 4,8 | MSBAM Commercial Mortgage Securities Trust Class A2 Series 2012-CKSV | 3.277% | 10/15/30 | 785 | 751 |
| 4,8 | Navient Private Education Loan Trust Class A2A Series 2017-A | 2.880% | 12/16/58 | 300 | 308 |
| 4,8 | Navient Private Education Loan Trust Class A2A Series 2018-BA | 3.610% | 12/15/59 | 467 | 489 |
| 4,8 | Navient Private Education Refi Loan Trust Class A2 Series 2018-CA | 3.520% | 6/16/42 | 1,143 | 1,164 |
| 4,8 | Navient Private Education Refi Loan Trust Class A2A Series 2018-DA | 4.000% | 12/15/59 | 1,267 | 1,345 |
| 4,7,8 | Navient Student Loan Trust Class A2 Series 2016-2A, 1M USD LIBOR + 1.050% | 1.198% | 6/25/65 | 22 | 22 |
| 4,7,8 | Navient Student Loan Trust Class A2 Series 2016-3A, 1M USD LIBOR + 0.850% | 0.998% | 6/25/65 | 2 | 2 |
Short-Term Investment-Grade Portfolio
| | | | Coupon | Maturity
Date | Face
Amount
($000) | Market
Value•
($000) |
| 4,7,8 | Navient Student Loan Trust Class A2 Series 2016-6A, 1M USD LIBOR + 0.750% | 0.898% | 3/25/66 | 507 | 508 |
| 4,8 | Navient Student Loan Trust Class A2 Series 2018-EA | 3.390% | 12/15/59 | 560 | 587 |
| 4,8 | Navient Student Loan Trust Class A2 Series 2018-EA | 4.000% | 12/15/59 | 2,078 | 2,135 |
| 4 | Nissan Auto Receivables Owner Trust Class A4 Series 2018-B | 3.160% | 12/16/24 | 340 | 354 |
| 4 | Nissan Auto Receivables Owner Trust Class A4 Series 2019-A | 3.000% | 9/15/25 | 280 | 294 |
| 4 | Nissan Auto Receivables Owner Trust Class A4 Series 2019-B | 2.540% | 12/15/25 | 610 | 639 |
| 4,8 | One Bryant Park Trust Class A Series 2019-OBP | 2.516% | 9/15/54 | 530 | 563 |
| 4,8 | Palisades Center Trust Class A Series 2016-PLSD | 2.713% | 4/13/33 | 200 | 167 |
| 4,7,8 | Pepper Residential Securities Trust Class A1U Series 21A, 1M USD LIBOR + 0.880% | 1.033% | 1/16/60 | 289 | 288 |
| 4,7,8 | Pepper Residential Securities Trust No. 22 Class A1U Series 22A, 1M USD LIBOR + 1.000% | 1.102% | 6/20/60 | 143 | 142 |
| 4,7,8 | Pepper Residential Securities Trust No. 23 Class A1U Series 23A, 1M USD LIBOR + 0.950% | 1.108% | 8/18/60 | 116 | 116 |
| 4,8 | PFS Financing Corp Class A Series 2020-E | 1.000% | 10/15/25 | 290 | 292 |
| 4,8 | PFS Financing Corp. Class A Series 2020-A | 1.270% | 6/15/25 | 520 | 527 |
| 4,7,8 | PHEAA Student Loan Trust Class A Series 2016-2A, 1M USD LIBOR + 0.950% | 1.098% | 11/25/65 | 468 | 467 |
| 4,8 | Progress Residential Trust Class A Series 2018-SFR1 | 3.255% | 3/17/35 | 559 | 560 |
| 4,8 | Progress Residential Trust Class A Series 2018-SFR3 | 3.880% | 10/17/35 | 998 | 1,017 |
| 4,8 | Progress Residential Trust Class A Series 2020-SFR2 | 2.078% | 6/17/37 | 120 | 123 |
| 4,8 | Progress Residential Trust Class B Series 2018-SFR1 | 3.484% | 3/17/35 | 100 | 100 |
| 4,7,8 | RESIMAC Bastille Trust Class A1 Series 2018-1NCA, 1M USD LIBOR + 0.850% | 1.003% | 12/5/59 | 355 | 353 |
| 4,7,8 | RESIMAC MBS Trust Class A1A Series 2018-2A | 0.999% | 4/10/50 | 61 | 61 |
| 4,7,8 | RESIMAC Premier Class A1 Series 2018-1A, 1M USD LIBOR + 0.800% | 0.949% | 11/10/49 | 305 | 304 |
| 4,7 | RFMSI Series Trust Class 2A1 Series 2006-SA3 | 4.535% | 9/25/36 | 57 | 45 |
| | | | Coupon | Maturity
Date | Face
Amount
($000) | Market
Value•
($000) |
| 4,7 | RFMSI Trust Class 2A1 Series 2006-SA2 | 4.735% | 8/25/36 | 177 | 151 |
| 4 | Santander Drive Auto Receivables Trust Class B Series 2020-2 | 0.960% | 11/15/24 | 320 | 322 |
| 4 | Santander Drive Auto Receivables Trust Class C Series 2017-3 | 2.760% | 12/15/22 | 17 | 17 |
| 4 | Santander Drive Auto Receivables Trust Class C Series 2020-2 | 1.460% | 9/15/25 | 630 | 636 |
| 4 | Santander Drive Auto Receivables Trust Class C Series 2020-3 | 1.120% | 1/15/26 | 830 | 834 |
| 4 | Santander Drive Auto Receivables Trust Class D Series 2018-1 | 3.320% | 3/15/24 | 520 | 532 |
| 4 | Santander Drive Auto Receivables Trust Class D Series 2018-3 | 4.070% | 8/15/24 | 1,390 | 1,438 |
| 4 | Santander Drive Auto Receivables Trust Class D Series 2018-4 | 3.980% | 12/15/25 | 780 | 814 |
| 4 | Santander Drive Auto Receivables Trust Class D Series 2018-5 | 4.190% | 12/16/24 | 1,250 | 1,297 |
| 4 | Santander Drive Auto Receivables Trust Class D Series 2020-2 | 2.220% | 9/15/26 | 880 | 898 |
| 4 | Santander Drive Auto Receivables Trust Class D Series 2020-3 | 1.640% | 11/16/26 | 930 | 944 |
| 4 | Santander Drive Auto Receivables Trust Class D Series 2020-4 | 1.480% | 1/15/27 | 430 | 434 |
| 4,8 | Santander Retail Auto Lease Trust Class A3 Series 2020-A | 1.740% | 7/20/23 | 1,370 | 1,400 |
| 4,8 | Santander Retail Auto Lease Trust Class A4 Series 2020-A | 1.760% | 3/20/24 | 340 | 349 |
| 4,8 | Santander Retail Auto Lease Trust Class C Series 2020-B | 1.180% | 12/20/24 | 310 | 312 |
| 4,8 | Santander Retail Auto Lease Trust Class D Series 2020-A | 2.520% | 11/20/24 | 470 | 481 |
| 4,8 | Santander Retail Auto Lease Trust Class D Series 2020-B | 1.980% | 10/20/25 | 600 | 601 |
| 4,8 | Securitized Term Auto Receivables Trust Class A4 Series 2018-1A | 3.298% | 11/25/22 | 160 | 163 |
| 4,8 | Securitized Term Auto Receivables Trust Class A4 Series 2018-2A | 3.544% | 6/26/23 | 230 | 235 |
| 4,8 | SLM Private Education Loan Trust Class B Series 2014-A | 3.500% | 11/15/44 | 100 | 102 |
| 4,8 | SMB Private Education Loan Trust Class A2A Series 2016-A | 2.700% | 5/15/31 | 160 | 164 |
| 4,8 | SMB Private Education Loan Trust Class A2A Series 2017-B | 2.820% | 10/15/35 | 334 | 346 |
| 4,8 | SMB Private Education Loan Trust Class A2A Series 2018-A | 3.500% | 2/15/36 | 1,305 | 1,380 |
| 4,8 | SMB Private Education Loan Trust Class A2A Series 2018-B | 3.600% | 1/15/37 | 639 | 672 |
Short-Term Investment-Grade Portfolio
| | | | Coupon | Maturity
Date | Face
Amount
($000) | Market
Value•
($000) |
| 4,8 | SMB Private Education Loan Trust Class A2A Series 2018-C | 3.630% | 11/15/35 | 874 | 936 |
| 4,7,8 | SMB Private Education Loan Trust Class A2B Series 2016-B, 1M USD LIBOR + 1.450% | 1.609% | 2/17/32 | 149 | 151 |
| 4,7,8 | SMB Private Education Loan Trust Class A2B Series 2016-C, 1M USD LIBOR + 1.100% | 1.259% | 9/15/34 | 163 | 164 |
| 4,7,8 | SMB Private Education Loan Trust Class A2B Series 2017-A, 1M USD LIBOR + 0.900% | 1.059% | 9/15/34 | 185 | 186 |
| 4,7,8 | SoFi Professional Loan Program LLC Class A1 Series 2016-D, 1M USD LIBOR + 0.950% | 1.098% | 1/25/39 | 24 | 24 |
| 4,7,8 | SoFi Professional Loan Program LLC Class A1 Series 2017-C, 1M USD LIBOR + 0.600% | 0.748% | 7/25/40 | 14 | 14 |
| 4,8 | SoFi Professional Loan Program LLC Class A2B Series 2016-C | 2.360% | 12/27/32 | 71 | 72 |
| 4,8 | SoFi Professional Loan Program LLC Class A2B Series 2016-D | 2.340% | 4/25/33 | 82 | 83 |
| 4,8 | SoFi Professional Loan Program LLC Class A2B Series 2017-A | 2.400% | 3/26/40 | 22 | 22 |
| 4,8 | SoFi Professional Loan Program LLC Class A2B Series 2017-E | 2.720% | 11/26/40 | 296 | 302 |
| 4,8 | SoFi Professional Loan Program LLC Class A2B Series 2018-A | 2.950% | 2/25/42 | 343 | 351 |
| 4,8 | SoFi Professional Loan Program LLC Class A2BSeries 2016-B | 2.740% | 10/25/32 | 62 | 62 |
| 4,8 | SoFi Professional Loan Program LLC Class A2FX Series 2016-D | 3.340% | 8/25/47 | 684 | 704 |
| 4,8 | SoFi Professional Loan Program LLC Class A2FX Series 2017-B | 2.740% | 5/25/40 | 150 | 152 |
| 4,8 | SoFi Professional Loan Program LLC Class A2FX Series 2017-D | 2.650% | 9/25/40 | 204 | 209 |
| 4,8 | SoFi Professional Loan Program LLC Class A2FX Series 2017-F | 2.840% | 1/25/41 | 221 | 226 |
| 4,8 | SoFi Professional Loan Program LLC Class A2FX Series 2018-C | 3.590% | 1/25/48 | 1,300 | 1,346 |
| 4,8 | SoFi Professional Loan Program LLC Class A2FX Series 2018-D | 3.600% | 2/25/48 | 1,110 | 1,148 |
| | | | Coupon | Maturity
Date | Face
Amount
($000) | Market
Value•
($000) |
| 4,8 | SoFi Professional Loan Program LLC Class A2FX Series 2019-B | 3.090% | 8/17/48 | 520 | 537 |
| 4,8 | SoFi Professional Loan Program Trust Class A1FX Series 2020-A | 2.060% | 5/15/46 | 895 | 899 |
| 4 | Synchrony Card Funding LLC Class A Series 2019-A2 | 2.340% | 6/15/25 | 880 | 906 |
| 4 | Synchrony Credit Card Master Note Trust Class B Series 2017-2 | 2.820% | 10/15/25 | 290 | 301 |
| 4 | Synchrony Credit Card Master Note Trust Class C Series 2016-2C | 2.950% | 5/15/24 | 280 | 282 |
| 4 | Synchrony Credit Card Master Note Trust Class C Series 2017-2 | 3.010% | 10/15/25 | 380 | 394 |
| 4,8 | Taco Bell Funding LLC Class A23 Series 2019-1A | 4.970% | 5/25/46 | 87 | 93 |
| 4,8 | Taco Bell Funding LLC Class A2II Series 2016-1A | 4.377% | 5/25/46 | 203 | 204 |
| 4,8 | Tesla Auto Lease Trust Class A4 Series 2019-A | 2.200% | 11/21/22 | 400 | 411 |
| 4,8 | Tesla Auto Lease Trust Class A4 Series 2020-A | 0.780% | 12/20/23 | 130 | 131 |
| 4,8 | Tesla Auto Lease Trust Class C Series 2018-B | 4.360% | 10/20/21 | 330 | 336 |
| 4,8 | Tesla Auto Lease Trust Class C Series 2020-A | 1.680% | 2/20/24 | 100 | 101 |
| 4,8 | Textainer Marine Containers VII Ltd Class A Series 2019-1A | 3.960% | 4/20/44 | 321 | 324 |
| 4,8 | Tidewater Auto Receivables Trust Class C Series 2018-AA | 3.840% | 11/15/24 | 199 | 201 |
| 4,8 | Tidewater Auto Receivables Trust Class D Series 2018-AA | 4.300% | 11/15/24 | 120 | 123 |
| 4,8 | TMSQ Mortgage Trust Class A Series 2014-1500 | 3.680% | 10/10/36 | 640 | 688 |
| 4,8 | Toyota Auto Loan Extended Note Trust Class A Series 2019-1A | 2.560% | 11/25/31 | 100 | 107 |
| 4,8 | Toyota Auto Loan Extended Note Trust Class A Series 2020-1A | 1.350% | 5/25/33 | 590 | 608 |
| 4 | Toyota Auto Receivables Owner Trust Class A4 Series 2019-A | 3.000% | 5/15/24 | 190 | 199 |
| 4 | Toyota Auto Receivables Owner Trust Class A4 Series 2019-D | 1.990% | 2/18/25 | 300 | 312 |
| 4 | Toyota Auto Receivables Owner Trust Class A4 Series 2020-A | 1.680% | 5/15/25 | 900 | 931 |
| 4,8 | Trafigura Securitisation Finance plc Class A2 Series 2018-1A | 3.730% | 3/15/22 | 1,500 | 1,531 |
| 4,8 | Trinity Rail Leasing LLC Class A2 Series 2018-1A | 4.620% | 6/17/48 | 740 | 770 |
Short-Term Investment-Grade Portfolio
| | | | Coupon | Maturity
Date | Face
Amount
($000) | Market
Value•
($000) |
| 4,8 | TRIP Rail Master Funding LLC Class A1 Series 2017-1A | 2.709% | 8/15/47 | 24 | 24 |
| 4 | UBS Commercial Mortgage Trust Class A4 Series 2017-C7 | 3.679% | 12/15/50 | 150 | 173 |
| 4 | UBS Commercial Mortgage Trust Class AS Series 2012-C1 | 4.171% | 5/10/45 | 30 | 31 |
| 4 | UBS Commercial Mortgage Trust Class ASB Series 2019-C16 | 3.460% | 4/15/52 | 167 | 189 |
| 4,8 | UBS-BAMLL Trust Class A Series 2012-WRM | 3.663% | 6/10/30 | 606 | 610 |
| 4 | UBS-Barclays Commercial Mortgage Trust Class A4 Series 2013-C6 | 3.244% | 4/10/46 | 150 | 157 |
| 4 | UBS-Barclays Commercial Mortgage Trust Class A5 Series 2012-C4 | 2.850% | 12/10/45 | 223 | 231 |
| 4 | UBS-Barclays Commercial Mortgage Trust Class AS Series 2013-C6 | 3.469% | 4/10/46 | 50 | 52 |
| 4 | Verizon Owner Trust Class B Series 2020-A | 1.980% | 7/22/24 | 500 | 516 |
| 4 | Verizon Owner Trust Class B Series 2020-B | 0.680% | 2/20/25 | 1,300 | 1,307 |
| 4 | Verizon Owner Trust Class C Series 2020-B | 0.830% | 2/20/25 | 430 | 432 |
| 4,8 | VNDO Mortgage Trust Class A Series 2012-6AVE | 2.996% | 11/15/30 | 297 | 306 |
| 4 | Volkswagen Auto Loan Enhanced Trust Class A4 Series 2018-1 | 3.150% | 7/22/24 | 220 | 227 |
| 4 | Volkswagen Auto Loan Enhanced Trust Class A4 Series 2018-2 | 3.330% | 2/20/25 | 220 | 228 |
| 4,7 | WaMu Mortgage Pass-Through Certificates Class 1A7 Series 2003-AR9 Trust | 2.782% | 9/25/33 | 7 | 7 |
| 4,7 | WaMu Mortgage Pass-Through Certificates Class A Series 2002-AR18 Trust | 2.564% | 1/25/33 | 5 | 5 |
| 4,7 | WaMu Mortgage Pass-Through Certificates Class A7 Series 2003-AR7 Trust | 2.713% | 8/25/33 | 5 | 5 |
| 4 | Wells Fargo Commercial Mortgage Trust Class A3 Series 2012-LC5 | 2.918% | 10/15/45 | 622 | 642 |
| 4 | Wells Fargo Commercial Mortgage Trust Class A3 Series 2015-C30 | 3.411% | 9/15/58 | 453 | 500 |
| 4 | Wells Fargo Commercial Mortgage Trust Class A3 Series 2016-BNK1 | 2.652% | 8/15/49 | 320 | 346 |
| | | | Coupon | Maturity
Date | Face
Amount
($000) | Market
Value•
($000) |
| 4,7 | Wells Fargo Commercial Mortgage Trust Class A4 Series 2013-LC12 | 4.218% | 7/15/46 | 777 | 835 |
| 4 | Wells Fargo Commercial Mortgage Trust Class A4 Series 2015-C27 | 3.190% | 2/15/48 | 638 | 678 |
| 4 | Wells Fargo Commercial Mortgage Trust Class A4 Series 2015-C29 | 3.637% | 6/15/48 | 585 | 653 |
| 4 | Wells Fargo Commercial Mortgage Trust Class A4 Series 2015-C30 | 3.664% | 9/15/58 | 420 | 471 |
| 4 | Wells Fargo Commercial Mortgage Trust Class A4 Series 2015-LC22 | 3.839% | 9/15/58 | 899 | 1,013 |
| 4 | Wells Fargo Commercial Mortgage Trust Class A4 Series 2016-C32 | 3.560% | 1/15/59 | 1,344 | 1,498 |
| 4 | Wells Fargo Commercial Mortgage Trust Class A4 Series 2016-C37 | 3.525% | 12/15/49 | 260 | 290 |
| 4 | Wells Fargo Commercial Mortgage Trust Class A4 Series 2017-C39 | 3.157% | 9/15/50 | 120 | 133 |
| 4 | Wells Fargo Commercial Mortgage Trust Class A4 Series 2017-C40 | 3.581% | 10/15/50 | 250 | 285 |
| 4 | Wells Fargo Commercial Mortgage Trust Class A4 Series 2017-RC1 | 3.631% | 1/15/60 | 194 | 222 |
| 4 | Wells Fargo Commercial Mortgage Trust Class A4 Series 2018-C46 | 4.152% | 8/15/51 | 290 | 342 |
| 4 | Wells Fargo Commercial Mortgage Trust Class A4 Series 2019-C54 | 3.146% | 12/15/52 | 160 | 180 |
| 4 | Wells Fargo Commercial Mortgage Trust Class A5 Series 2014-LC16 | 3.817% | 8/15/50 | 1,120 | 1,219 |
| 4 | Wells Fargo Commercial Mortgage Trust Class A5 Series 2014-LC18 | 3.405% | 12/15/47 | 870 | 955 |
| 4 | Wells Fargo Commercial Mortgage Trust Class AS Series 2012-LC5 | 3.539% | 10/15/45 | 40 | 41 |
| 4,7 | Wells Fargo Commercial Mortgage Trust Class AS Series 2013-LC12 | 4.275% | 7/15/46 | 110 | 117 |
| 4 | Wells Fargo Commercial Mortgage Trust Class AS Series 2014-LC16 | 4.020% | 8/15/50 | 200 | 212 |
| 4,7 | Wells Fargo Commercial Mortgage Trust Class AS Series 2015-C30 | 4.067% | 9/15/58 | 350 | 388 |
Short-Term Investment-Grade Portfolio
| | | | Coupon | Maturity
Date | Face
Amount
($000) | Market
Value•
($000) |
| 4,7 | Wells Fargo Commercial Mortgage Trust Class AS Series 2015-LC22 | 4.207% | 9/15/58 | 275 | 307 |
| 4 | Wells Fargo Commercial Mortgage Trust Class ASB Series 2019-C49 | 3.933% | 3/15/52 | 210 | 243 |
| 4 | Wells Fargo Commercial Mortgage Trust Class B Series 2014-LC16 | 4.322% | 8/15/50 | 350 | 351 |
| 4 | Wells Fargo Commercial Mortgage Trust Class C Series 2014-LC16 | 4.458% | 8/15/50 | 220 | 204 |
| 4,7 | Wells Fargo Commercial Mortgage Trust Class C Series 2015-C29 | 4.213% | 6/15/48 | 270 | 265 |
| 4,7 | Wells Fargo Commercial Mortgage Trust Class C Series 2015-C30 | 4.498% | 9/15/58 | 270 | 268 |
| 4,7 | Wells Fargo Commercial Mortgage Trust Class C Series 2015-LC22 | 4.537% | 9/15/58 | 315 | 312 |
| 4,7 | Wells Fargo Commercial Mortgage Trust Class C Series 2018-C43 | 4.514% | 3/15/51 | 80 | 82 |
| 4,7 | Wells Fargo Mortgage Backed Securities Trust Class 2A1 Series 2006-AR14 | 2.771% | 10/25/36 | 91 | 84 |
| 4,8 | Wendy's Funding LLC Class A21 Series 2018-1A | 3.573% | 3/15/48 | 155 | 160 |
| 4,7,8 | WFLD Mortgage Trust Class A Series 2014-MONT | 3.755% | 8/10/31 | 875 | 891 |
| 4 | WFRBS Commercial Mortgage Trust Class A2 Series 2012-C7 | 3.431% | 6/15/45 | 274 | 281 |
| 4 | WFRBS Commercial Mortgage Trust Class A3 Series 2012-C10 | 2.875% | 12/15/45 | 265 | 274 |
| 4 | WFRBS Commercial Mortgage Trust Class A3 Series 2012-C8 | 3.001% | 8/15/45 | 102 | 105 |
| 4 | WFRBS Commercial Mortgage Trust Class A3 Series 2012-C9 | 2.870% | 11/15/45 | 512 | 529 |
| 4,8 | WFRBS Commercial Mortgage Trust Class A4 Series 2011-C3 | 4.375% | 3/15/44 | 209 | 210 |
| 4,7 | WFRBS Commercial Mortgage Trust Class A4 Series 2013-C15 | 4.153% | 8/15/46 | 355 | 383 |
| 4 | WFRBS Commercial Mortgage Trust Class A4 Series 2013-C17 | 4.023% | 12/15/46 | 230 | 250 |
| 4 | WFRBS Commercial Mortgage Trust Class A4 Series 2014-C19 | 3.829% | 3/15/47 | 480 | 515 |
| | | | Coupon | Maturity
Date | Face
Amount
($000) | Market
Value•
($000) |
| 4 | WFRBS Commercial Mortgage Trust Class A4 Series 2014-C21 | 3.410% | 8/15/47 | 31 | 33 |
| 4 | WFRBS Commercial Mortgage Trust Class A4 Series 2014-C23 | 3.650% | 10/15/57 | 492 | 540 |
| 4 | WFRBS Commercial Mortgage Trust Class A4 Series 2014-LC14 | 3.766% | 3/15/47 | 58 | 62 |
| 4 | WFRBS Commercial Mortgage Trust Class A5 Series 2013-C16 | 4.415% | 9/15/46 | 350 | 382 |
| 4,7 | WFRBS Commercial Mortgage Trust Class A5 Series 2013-C18 | 4.162% | 12/15/46 | 665 | 729 |
| 4 | WFRBS Commercial Mortgage Trust Class A5 Series 2014-C19 | 4.101% | 3/15/47 | 530 | 584 |
| 4 | WFRBS Commercial Mortgage Trust Class A5 Series 2014-C20 | 3.995% | 5/15/47 | 565 | 620 |
| 4 | WFRBS Commercial Mortgage Trust Class A5 Series 2014-C21 | 3.678% | 8/15/47 | 989 | 1,082 |
| 4 | WFRBS Commercial Mortgage Trust Class A5 Series 2014-C23 | 3.917% | 10/15/57 | 340 | 376 |
| 4 | WFRBS Commercial Mortgage Trust Class A5 Series 2014-C24 | 3.607% | 11/15/47 | 342 | 375 |
| 4 | WFRBS Commercial Mortgage Trust Class A5 Series 2014-LC14 | 4.045% | 3/15/47 | 903 | 987 |
| 4,7 | WFRBS Commercial Mortgage Trust Class AS Series 2012-C7 | 4.090% | 6/15/45 | 135 | 136 |
| 4 | WFRBS Commercial Mortgage Trust Class AS Series 2012-C9 | 3.388% | 11/15/45 | 70 | 73 |
| 4 | WFRBS Commercial Mortgage Trust Class AS Series 2013-C13 | 3.345% | 5/15/45 | 50 | 53 |
| 4 | WFRBS Commercial Mortgage Trust Class AS Series 2014-C21 | 3.891% | 8/15/47 | 170 | 183 |
| 4,7 | WFRBS Commercial Mortgage Trust Class B Series 2013-C18 | 4.862% | 12/15/46 | 140 | 150 |
| 4 | WFRBS Commercial Mortgage Trust Class B Series 2014-C20 | 4.378% | 5/15/47 | 280 | 270 |
| 4,7 | WFRBS Commercial Mortgage Trust Class C Series 2014-C20 | 4.513% | 5/15/47 | 90 | 82 |
Short-Term Investment-Grade Portfolio
| | | | Coupon | Maturity
Date | Face
Amount
($000) | Market
Value•
($000) |
| 4 | World Omni Auto Receivables Trust Class A4 Series 2018-D | 3.440% | 12/16/24 | 130 | 137 |
| 4 | World Omni Auto Receivables Trust Class A4 Series 2019-A | 3.220% | 6/16/25 | 230 | 243 |
| 4 | World Omni Auto Receivables Trust Class B Series 2018-A | 2.890% | 4/15/25 | 220 | 226 |
| 4 | World Omni Auto Receivables Trust Class B Series 2019-B | 2.860% | 6/16/25 | 170 | 178 |
| 4 | World Omni Auto Receivables Trust Class B Series 2020-B | 1.220% | 3/16/26 | 150 | 152 |
| 4 | World Omni Auto Receivables Trust Class B Series 2020-C | 0.870% | 10/15/26 | 300 | 300 |
| 4 | World Omni Auto Receivables Trust Class C Series 2020-C | 1.390% | 5/17/27 | 100 | 101 |
| 4 | World Omni Automobile Lease Securitization Trust Class B Series 2019-A | 3.240% | 7/15/24 | 210 | 215 |
| Total Asset-Backed/Commercial Mortgage-Backed Securities (Cost $249,284) | 260,301 |
| Corporate Bonds (72.3%) |
| Communications (4.3%) |
| 8 | Arches Buyer Inc. | 4.250% | 6/1/28 | 15 | 15 |
| 8 | Arches Buyer Inc. | 6.125% | 12/1/28 | 10 | 10 |
| 9 | AT&T Inc. | 2.650% | 12/17/21 | 450 | 561 |
| | AT&T Inc. | 3.000% | 6/30/22 | 991 | 1,025 |
| | AT&T Inc. | 2.625% | 12/1/22 | 200 | 207 |
| 9 | AT&T Inc. | 1.950% | 9/15/23 | 495 | 636 |
| | AT&T Inc. | 4.050% | 12/15/23 | 130 | 144 |
| | AT&T Inc. | 4.450% | 4/1/24 | 90 | 100 |
| | AT&T Inc. | 3.950% | 1/15/25 | 250 | 281 |
| | AT&T Inc. | 3.400% | 5/15/25 | 825 | 916 |
| | AT&T Inc. | 3.600% | 7/15/25 | 55 | 62 |
| 8 | CCO Holdings LLC / CCO Holdings Capital Corp. | 4.500% | 8/15/30 | 95 | 101 |
| | Charter Communications Operating LLC / Charter Communications Operating Capital | 4.464% | 7/23/22 | 7,989 | 8,414 |
| | Charter Communications Operating LLC / Charter Communications Operating Capital | 4.500% | 2/1/24 | 1,896 | 2,101 |
| | Charter Communications Operating LLC / Charter Communications Operating Capital | 4.908% | 7/23/25 | 3,610 | 4,195 |
| | Comcast Corp. | 3.600% | 3/1/24 | 30 | 33 |
| | Comcast Corp. | 3.700% | 4/15/24 | 2,722 | 2,991 |
| | Comcast Corp. | 3.375% | 2/15/25 | 800 | 884 |
| | Comcast Corp. | 3.375% | 8/15/25 | 1,780 | 1,978 |
| | Comcast Corp. | 3.950% | 10/15/25 | 330 | 378 |
| 8 | Cox Communications Inc. | 3.150% | 8/15/24 | 725 | 786 |
| | CSC Holdings LLC | 6.750% | 11/15/21 | 150 | 156 |
| 8 | CSC Holdings LLC | 5.375% | 2/1/28 | 150 | 160 |
| | | | Coupon | Maturity
Date | Face
Amount
($000) | Market
Value•
($000) |
| 8 | CSC Holdings LLC | 7.500% | 4/1/28 | 30 | 34 |
| 8 | CSC Holdings LLC | 5.750% | 1/15/30 | 60 | 66 |
| 8 | CSC Holdings LLC | 4.625% | 12/1/30 | 149 | 155 |
| 8 | Deutsche Telekom International Finance BV | 2.485% | 9/19/23 | 450 | 469 |
| | Discovery Communications LLC | 2.950% | 3/20/23 | 1,970 | 2,073 |
| | Discovery Communications LLC | 3.800% | 3/13/24 | 845 | 922 |
| | Discovery Communications LLC | 3.900% | 11/15/24 | 897 | 995 |
| | Discovery Communications LLC | 3.950% | 6/15/25 | 105 | 118 |
| 8 | Expedia Group Inc. | 3.600% | 12/15/23 | 160 | 170 |
| 8 | Expedia Group Inc. | 6.250% | 5/1/25 | 20 | 23 |
| 8 | Expedia Group Inc. | 4.625% | 8/1/27 | 105 | 117 |
| | Fox Corp. | 3.666% | 1/25/22 | 1,763 | 1,825 |
| | Fox Corp. | 4.030% | 1/25/24 | 1,275 | 1,401 |
| | Fox Corp. | 3.050% | 4/7/25 | 2,013 | 2,204 |
| 8 | Frontier Communications Corp. | 5.875% | 10/15/27 | 35 | 38 |
| 8 | Frontier Communications Corp. | 5.000% | 5/1/28 | 175 | 182 |
| 8 | Frontier Communications Corp. | 6.750% | 5/1/29 | 60 | 64 |
| | Interpublic Group of Cos. Inc. | 3.750% | 10/1/21 | 1,810 | 1,854 |
| | Interpublic Group of Cos. Inc. | 4.200% | 4/15/24 | 200 | 222 |
| | Lamar Media Corp. | 5.750% | 2/1/26 | 30 | 31 |
| | Lamar Media Corp. | 3.750% | 2/15/28 | 40 | 41 |
| | Lamar Media Corp. | 4.875% | 1/15/29 | 20 | 21 |
| | Lamar Media Corp. | 4.000% | 2/15/30 | 72 | 75 |
| 8 | Level 3 Financing Inc. | 4.625% | 9/15/27 | 80 | 83 |
| 8 | Level 3 Financing Inc. | 4.250% | 7/1/28 | 95 | 97 |
| 8 | Level 3 Financing Inc. | 3.625% | 1/15/29 | 80 | 80 |
| | Level 3 Financing, Inc. | 5.250% | 3/15/26 | 50 | 52 |
| 8 | Netflix Inc. | 3.625% | 6/15/25 | 420 | 447 |
| | Netflix Inc. | 5.875% | 11/15/28 | 10 | 12 |
| 8 | Nexstar Broadcasting Inc. | 5.625% | 7/15/27 | 120 | 129 |
| 8 | Nexstar Broadcasting Inc. | 4.750% | 11/1/28 | 100 | 104 |
| | Omnicom Group Inc. | 3.625% | 5/1/22 | 3,435 | 3,581 |
| 8 | QualityTech LP / QTS Finance Corp. | 3.875% | 10/1/28 | 65 | 66 |
| | Qwest Corp. | 6.750% | 12/1/21 | 1,100 | 1,152 |
| | Rogers Communications Inc. | 3.000% | 3/15/23 | 70 | 73 |
| 8 | Scripps Escrow II Inc. | 3.875% | 1/15/29 | 35 | 36 |
| 8 | Sirius XM Radio Inc. | 4.625% | 7/15/24 | 240 | 248 |
| 8 | Sirius XM Radio Inc. | 5.000% | 8/1/27 | 20 | 21 |
| 8 | Sky Ltd. | 3.125% | 11/26/22 | 1,560 | 1,640 |
| 8 | Sky Ltd. | 3.750% | 9/16/24 | 1,580 | 1,761 |
| | Sprint Corp. | 7.125% | 6/15/24 | 364 | 425 |
| | Sprint Corp. | 7.625% | 3/1/26 | 110 | 136 |
| 8 | Tegna Inc. | 4.750% | 3/15/26 | 130 | 138 |
| | Telefonica Emisiones SA | 5.462% | 2/16/21 | 406 | 409 |
| | Time Warner Entertainment Co. LP | 8.375% | 3/15/23 | 270 | 316 |
| | T-Mobile USA Inc. | 6.000% | 3/1/23 | 640 | 642 |
| 8 | T-Mobile USA Inc. | 3.500% | 4/15/25 | 8,395 | 9,278 |
| | T-Mobile USA Inc. | 4.500% | 2/1/26 | 290 | 296 |
| 6,8 | Townsquare Media Inc. | 6.875% | 2/1/26 | 34 | 36 |
| | TWDC Enterprises 18 Corp. | 2.550% | 2/15/22 | 60 | 61 |
Short-Term Investment-Grade Portfolio
| | | | Coupon | Maturity
Date | Face
Amount
($000) | Market
Value•
($000) |
| | TWDC Enterprises 18 Corp. | 2.350% | 12/1/22 | 400 | 416 |
| 8 | Twitter Inc. | 3.875% | 12/15/27 | 60 | 64 |
| 10 | Verizon Communications Inc. | 3.500% | 2/17/23 | 170 | 139 |
| | Verizon Communications Inc. | 5.150% | 9/15/23 | 2,350 | 2,645 |
| | Verizon Communications Inc. | 4.150% | 3/15/24 | 300 | 332 |
| | Verizon Communications Inc. | 3.500% | 11/1/24 | 700 | 772 |
| | Verizon Communications Inc. | 3.376% | 2/15/25 | 1,365 | 1,515 |
| | Verizon Communications Inc. | 0.850% | 11/20/25 | 3,740 | 3,764 |
| 8 | Verizon Communications Inc. | 1.680% | 10/30/30 | 41 | 41 |
| 7,10 | Verizon Communications Inc., 3M Australian Bank Bill Rate + 1.220% | 1.239% | 2/17/23 | 1,030 | 803 |
| | ViacomCBS Inc. | 3.375% | 3/1/22 | 400 | 410 |
| | ViacomCBS Inc. | 2.500% | 2/15/23 | 488 | 504 |
| | ViacomCBS Inc. | 2.900% | 6/1/23 | 876 | 917 |
| | ViacomCBS Inc. | 4.250% | 9/1/23 | 4,612 | 5,013 |
| | ViacomCBS Inc. | 3.875% | 4/1/24 | 35 | 38 |
| | ViacomCBS Inc. | 3.500% | 1/15/25 | 300 | 329 |
| | ViacomCBS Inc. | 4.750% | 5/15/25 | 3,443 | 3,996 |
| 8 | Virgin Media Finance plc | 5.000% | 7/15/30 | 65 | 67 |
| 8 | Virgin Media Vendor Financing Notes IV DAC | 5.000% | 7/15/28 | 115 | 119 |
| 9 | Vivendi SA | 0.000% | 6/13/22 | 400 | 490 |
| 8 | Vmed O2 UK Financing I plc | 4.250% | 1/31/31 | 90 | 92 |
| 7,10 | Vodafone Group plc | 1.070% | 12/13/22 | 140 | 108 |
| | Vodafone Group plc | 2.950% | 2/19/23 | 715 | 752 |
| | Vodafone Group plc | 3.750% | 1/16/24 | 3,950 | 4,315 |
| | Vodafone Group plc | 4.125% | 5/30/25 | 390 | 445 |
| | Walt Disney Co. | 1.750% | 8/30/24 | 3,610 | 3,758 |
| | Walt Disney Co. | 3.700% | 9/15/24 | 110 | 122 |
| | Walt Disney Co. | 3.350% | 3/24/25 | 2,080 | 2,304 |
| 8 | WMG Acquisition Corp. | 3.000% | 2/15/31 | 70 | 69 |
| | WPP Finance 2010 | 3.625% | 9/7/22 | 30 | 32 |
| 8 | Zayo Group Holdings Inc. | 4.000% | 3/1/27 | 155 | 156 |
| 8 | Zayo Group Holdings Inc. | 6.125% | 3/1/28 | 50 | 53 |
| | | | | | | 95,133 |
| Consumer Discretionary (5.2%) |
| 8 | 1011778 BC ULC / New Red Finance Inc. | 4.375% | 1/15/28 | 65 | 67 |
| 8 | 1011778 BC ULC / New Red Finance Inc. | 3.500% | 2/15/29 | 30 | 30 |
| | Amazon.com Inc. | 2.800% | 8/22/24 | 383 | 414 |
| | Amazon.com Inc. | 5.200% | 12/3/25 | 2,870 | 3,488 |
| 8 | American Builders & Contractors Supply Co. Inc. | 4.000% | 1/15/28 | 30 | 31 |
| | American Honda Finance Corp. | 3.375% | 12/10/21 | 2,900 | 2,983 |
| 9 | American Honda Finance Corp. | 1.600% | 4/20/22 | 700 | 875 |
| 9 | American Honda Finance Corp. | 0.350% | 8/26/22 | 2,395 | 2,952 |
| | American Honda Finance Corp. | 2.600% | 11/16/22 | 80 | 83 |
| | American Honda Finance Corp. | 2.050% | 1/10/23 | 100 | 103 |
| | American Honda Finance Corp. | 1.950% | 5/10/23 | 2,000 | 2,073 |
| | | | Coupon | Maturity
Date | Face
Amount
($000) | Market
Value•
($000) |
| | American Honda Finance Corp. | 0.875% | 7/7/23 | 3,000 | 3,036 |
| | American Honda Finance Corp. | 0.650% | 9/8/23 | 372 | 374 |
| | American Honda Finance Corp. | 3.625% | 10/10/23 | 3,000 | 3,260 |
| | American Honda Finance Corp. | 2.400% | 6/27/24 | 1,500 | 1,594 |
| | American Honda Finance Corp. | 2.150% | 9/10/24 | 1,000 | 1,057 |
| | American Honda Finance Corp. | 1.200% | ��� 7/8/25 | 618 | 632 |
| | Asbury Automotive Group Inc. | 4.500% | 3/1/28 | 72 | 75 |
| | Asbury Automotive Group Inc. | 4.750% | 3/1/30 | 20 | 21 |
| | AutoZone Inc. | 2.875% | 1/15/23 | 115 | 120 |
| | AutoZone Inc. | 3.625% | 4/15/25 | 3,050 | 3,415 |
| | BorgWarner Inc. | 3.375% | 3/15/25 | 200 | 220 |
| 8 | Burlington Coat Factory Warehouse Corp. | 6.250% | 4/15/25 | 45 | 48 |
| 8 | Caesars Entertainment Inc. | 6.250% | 7/1/25 | 80 | 85 |
| 8 | Caesars Resort Collection LLC / CRC Finco Inc. | 5.750% | 7/1/25 | 20 | 21 |
| 8 | Carnival Corp. | 11.500% | 4/1/23 | 84 | 97 |
| 8 | Churchill Downs Inc. | 5.500% | 4/1/27 | 115 | 122 |
| 8 | Churchill Downs Inc. | 4.750% | 1/15/28 | 90 | 95 |
| 8 | Clarios Global LP | 6.750% | 5/15/25 | 40 | 43 |
| 8 | Clarios Global LP / Clarios US Finance Co. | 6.250% | 5/15/26 | 50 | 54 |
| 8 | Cornerstone Building Brands Inc. | 6.125% | 1/15/29 | 35 | 37 |
| 8 | Daimler Finance North America LLC | 2.700% | 6/14/24 | 821 | 875 |
| 8 | ERAC USA Finance LLC | 2.600% | 12/1/21 | 300 | 305 |
| 8 | ERAC USA Finance LLC | 3.300% | 10/15/22 | 1,000 | 1,050 |
| 8 | ERAC USA Finance LLC | 2.700% | 11/1/23 | 700 | 738 |
| 8 | ERAC USA Finance LLC | 3.850% | 11/15/24 | 260 | 288 |
| 8 | ERAC USA Finance LLC | 3.300% | 12/1/26 | 100 | 111 |
| | Ford Motor Co. | 8.500% | 4/21/23 | 116 | 131 |
| | Ford Motor Credit Co. LLC | 3.339% | 3/28/22 | 200 | 202 |
| | Ford Motor Credit Co. LLC | 3.087% | 1/9/23 | 170 | 172 |
| | Ford Motor Credit Co. LLC | 5.125% | 6/16/25 | 80 | 87 |
| | Ford Motor Credit Co. LLC | 4.134% | 8/4/25 | 40 | 42 |
| | Ford Motor Credit Co. LLC | 3.375% | 11/13/25 | 505 | 517 |
| | Ford Motor Credit Co. LLC | 4.125% | 8/17/27 | 205 | 215 |
| | Ford Motor Credit Co. LLC | 3.815% | 11/2/27 | 60 | 62 |
| | General Motors Co. | 4.875% | 10/2/23 | 1,840 | 2,041 |
| | General Motors Co. | 5.400% | 10/2/23 | 2,060 | 2,313 |
| | General Motors Co. | 6.125% | 10/1/25 | 2,300 | 2,786 |
| | General Motors Financial Co. Inc. | 4.200% | 3/1/21 | 1,095 | 1,098 |
| | General Motors Financial Co. Inc. | 4.375% | 9/25/21 | 3,660 | 3,759 |
| | General Motors Financial Co. Inc. | 4.200% | 11/6/21 | 1,200 | 1,234 |
| | General Motors Financial Co. Inc. | 3.450% | 4/10/22 | 350 | 360 |
| | General Motors Financial Co. Inc. | 3.150% | 6/30/22 | 100 | 103 |
| | General Motors Financial Co. Inc. | 3.250% | 1/5/23 | 490 | 513 |
Short-Term Investment-Grade Portfolio
| | | | Coupon | Maturity
Date | Face
Amount
($000) | Market
Value•
($000) |
| | General Motors Financial Co. Inc. | 5.200% | 3/20/23 | 3,587 | 3,933 |
| | General Motors Financial Co. Inc. | 4.250% | 5/15/23 | 200 | 216 |
| | General Motors Financial Co. Inc. | 4.150% | 6/19/23 | 100 | 108 |
| | General Motors Financial Co. Inc. | 5.100% | 1/17/24 | 2,750 | 3,070 |
| | General Motors Financial Co. Inc. | 3.950% | 4/13/24 | 650 | 706 |
| | General Motors Financial Co. Inc. | 3.500% | 11/7/24 | 1,300 | 1,403 |
| | General Motors Financial Co. Inc. | 2.900% | 2/26/25 | 680 | 725 |
| | General Motors Financial Co. Inc. | 4.350% | 4/9/25 | 1,250 | 1,400 |
| | General Motors Financial Co. Inc. | 2.750% | 6/20/25 | 553 | 590 |
| | General Motors Financial Co. Inc. | 4.300% | 7/13/25 | 990 | 1,109 |
| | Goodyear Tire & Rubber Co. | 9.500% | 5/31/25 | 85 | 96 |
| | Goodyear Tire & Rubber Co. | 4.875% | 3/15/27 | 118 | 121 |
| 8 | Harley-Davidson Financial Services Inc. | 2.850% | 1/15/21 | 155 | 155 |
| 8 | Harley-Davidson Financial Services Inc. | 2.550% | 6/9/22 | 955 | 974 |
| 8 | Harley-Davidson Financial Services Inc. | 3.350% | 6/8/25 | 500 | 538 |
| 8 | Hilton Domestic Operating Co. Inc. | 5.375% | 5/1/25 | 120 | 128 |
| | Hilton Domestic Operating Co. Inc. | 5.125% | 5/1/26 | 90 | 93 |
| 8 | Hilton Domestic Operating Co. Inc. | 5.750% | 5/1/28 | 30 | 33 |
| 8 | Hilton Domestic Operating Co. Inc. | 3.750% | 5/1/29 | 165 | 172 |
| 8 | International Game Technology plc | 6.250% | 1/15/27 | 15 | 17 |
| 8 | International Game Technology plc | 5.250% | 1/15/29 | 60 | 65 |
| 8 | Ken Garff Automotive LLC | 4.875% | 9/15/28 | 100 | 104 |
| 8 | L Brands Inc. | 6.875% | 7/1/25 | 25 | 27 |
| | Lennar Corp. | 5.375% | 10/1/22 | 80 | 86 |
| | Lennar Corp. | 4.875% | 12/15/23 | 500 | 553 |
| | Lennar Corp. | 4.750% | 5/30/25 | 600 | 685 |
| | Lennar Corp. | 5.250% | 6/1/26 | 20 | 24 |
| 8 | Lithia Motors Inc. | 5.250% | 8/1/25 | 115 | 119 |
| 8 | Live Nation Entertainment Inc. | 6.500% | 5/15/27 | 215 | 240 |
| 8 | Live Nation Entertainment Inc. | 4.750% | 10/15/27 | 40 | 41 |
| 6,8 | Live Nation Entertainment Inc. | 3.750% | 1/15/28 | 80 | 81 |
| | Lowe's Cos. Inc. | 3.125% | 9/15/24 | 100 | 108 |
| | Marriott International Inc. | 5.750% | 5/1/25 | 85 | 99 |
| | Marriott International Inc. | 4.625% | 6/15/30 | 120 | 141 |
| | McDonald's Corp. | 3.350% | 4/1/23 | 1,132 | 1,204 |
| | McDonald's Corp. | 3.375% | 5/26/25 | 700 | 777 |
| | McDonald's Corp. | 3.300% | 7/1/25 | 3,030 | 3,370 |
| | McDonald's Corp. | 1.450% | 9/1/25 | 700 | 724 |
| 8 | Michaels Stores Inc. | 4.750% | 10/1/27 | 35 | 36 |
| 8 | Nissan Motor Acceptance Corp. | 1.900% | 9/14/21 | 355 | 357 |
| 8 | Nissan Motor Acceptance Corp. | 3.650% | 9/21/21 | 405 | 412 |
| 8 | Nissan Motor Co. Ltd. | 3.043% | 9/15/23 | 3,815 | 3,990 |
| 8 | Nissan Motor Co. Ltd. | 3.522% | 9/17/25 | 1,500 | 1,606 |
| | | | Coupon | Maturity
Date | Face
Amount
($000) | Market
Value•
($000) |
| | Penske Automotive Group Inc. | 3.500% | 9/1/25 | 100 | 100 |
| | PulteGroup Inc. | 5.500% | 3/1/26 | 80 | 95 |
| | PulteGroup Inc. | 5.000% | 1/15/27 | 40 | 47 |
| | Ralph Lauren Corp. | 1.700% | 6/15/22 | 200 | 204 |
| | Ross Stores Inc. | 0.875% | 4/15/26 | 2,000 | 1,999 |
| 8 | Royal Caribbean Cruises Ltd. | 10.875% | 6/1/23 | 20 | 23 |
| 8 | Royal Caribbean Cruises Ltd. | 9.125% | 6/15/23 | 20 | 22 |
| 8 | Royal Caribbean Cruises Ltd. | 11.500% | 6/1/25 | 40 | 47 |
| | TJX Cos. Inc. | 3.500% | 4/15/25 | 1,500 | 1,674 |
| 9 | Toyota Finance Australia Ltd. | 1.584% | 4/21/22 | 990 | 1,239 |
| | Toyota Motor Credit Corp. | 2.700% | 1/11/23 | 100 | 105 |
| | Toyota Motor Credit Corp. | 2.900% | 3/30/23 | 3,000 | 3,170 |
| | Toyota Motor Credit Corp. | 0.500% | 8/14/23 | 1,100 | 1,105 |
| | Toyota Motor Credit Corp. | 1.350% | 8/25/23 | 3,000 | 3,076 |
| | Toyota Motor Credit Corp. | 3.450% | 9/20/23 | 2,745 | 2,970 |
| | Toyota Motor Credit Corp. | 2.900% | 4/17/24 | 70 | 75 |
| | Toyota Motor Credit Corp. | 3.000% | 4/1/25 | 1,950 | 2,143 |
| | Toyota Motor Credit Corp. | 0.800% | 10/16/25 | 2,500 | 2,511 |
| 9 | Toyota Motor Finance Netherlands BV | 0.625% | 9/26/23 | 410 | 513 |
| | TRI Pointe Group Inc. | 5.700% | 6/15/28 | 195 | 220 |
| 8 | Vail Resorts Inc. | 6.250% | 5/15/25 | 210 | 224 |
| 9 | Volkswagen Bank GmbH | 0.750% | 6/15/23 | 490 | 608 |
| 9 | Volkswagen Financial Services AG | 2.500% | 4/6/23 | 495 | 637 |
| 9 | Volkswagen Financial Services AG | 0.875% | 4/12/23 | 500 | 622 |
| 10 | Volkswagen Financial Services Australia Pty Ltd. | 3.100% | 4/17/23 | 250 | 201 |
| 8 | Volkswagen Group of America Finance LLC | 2.500% | 9/24/21 | 1,200 | 1,218 |
| 8 | Volkswagen Group of America Finance LLC | 4.000% | 11/12/21 | 1,785 | 1,839 |
| 8 | Volkswagen Group of America Finance LLC | 2.900% | 5/13/22 | 1,600 | 1,650 |
| 8 | Volkswagen Group of America Finance LLC | 2.700% | 9/26/22 | 1,200 | 1,244 |
| 8 | Volkswagen Group of America Finance LLC | 0.750% | 11/23/22 | 2,000 | 2,005 |
| 8 | Volkswagen Group of America Finance LLC | 3.125% | 5/12/23 | 1,000 | 1,056 |
| 8 | Volkswagen Group of America Finance LLC | 4.250% | 11/13/23 | 599 | 659 |
| 8 | Volkswagen Group of America Finance LLC | 0.875% | 11/22/23 | 3,000 | 3,015 |
| 8 | Volkswagen Group of America Finance LLC | 3.350% | 5/13/25 | 500 | 549 |
| 8 | Volkswagen Group of America Finance LLC | 1.250% | 11/24/25 | 1,750 | 1,762 |
| 8 | White Cap Buyer LLC | 6.875% | 10/15/28 | 35 | 37 |
| 8 | William Carter Co. | 5.500% | 5/15/25 | 129 | 137 |
| 8 | Williams Scotsman International Inc. | 4.625% | 8/15/28 | 86 | 89 |
| 8 | Wyndham Hotels & Resorts Inc. | 4.375% | 8/15/28 | 35 | 36 |
| | | | | | | 115,869 |
Short-Term Investment-Grade Portfolio
| | | | Coupon | Maturity
Date | Face
Amount
($000) | Market
Value•
($000) |
| Consumer Staples (4.6%) |
| 8 | Alimentation Couche-Tard Inc. | 2.700% | 7/26/22 | 3,675 | 3,799 |
| | Altria Group Inc. | 3.490% | 2/14/22 | 5,840 | 6,040 |
| | Altria Group Inc. | 2.850% | 8/9/22 | 740 | 769 |
| 9 | Altria Group Inc. | 1.000% | 2/15/23 | 985 | 1,227 |
| | Altria Group Inc. | 4.000% | 1/31/24 | 2,000 | 2,197 |
| | Altria Group Inc. | 3.800% | 2/14/24 | 200 | 218 |
| | Altria Group Inc. | 2.350% | 5/6/25 | 3,209 | 3,402 |
| | Anheuser-Busch InBev Worldwide Inc. | 4.150% | 1/23/25 | 6,250 | 7,112 |
| | BAT Capital Corp. | 3.222% | 8/15/24 | 3,150 | 3,414 |
| | BAT Capital Corp. | 3.215% | 9/6/26 | 156 | 172 |
| | BAT Capital Corp. | 4.700% | 4/2/27 | 600 | 706 |
| 9 | BAT International Finance plc | 4.875% | 2/24/21 | 360 | 443 |
| 11 | BAT International Finance plc | 1.750% | 7/5/21 | 420 | 577 |
| 8 | BAT International Finance plc | 3.950% | 6/15/25 | 2,180 | 2,447 |
| | BAT International Finance plc | 1.668% | 3/25/26 | 1,250 | 1,278 |
| | Bunge Ltd. Finance Corp Co. | 1.630% | 8/17/25 | 220 | 227 |
| | Campbell Soup Co. | 3.650% | 3/15/23 | 372 | 397 |
| 9 | CK Hutchison Finance 16 Ltd. | 1.250% | 4/6/23 | 450 | 564 |
| | Conagra Brands Inc. | 4.300% | 5/1/24 | 498 | 556 |
| | Constellation Brands Inc. | 2.650% | 11/7/22 | 687 | 714 |
| | Constellation Brands Inc. | 3.200% | 2/15/23 | 390 | 412 |
| | Constellation Brands Inc. | 4.250% | 5/1/23 | 2,700 | 2,940 |
| | Constellation Brands Inc. | 4.750% | 11/15/24 | 963 | 1,105 |
| | Constellation Brands Inc. | 4.400% | 11/15/25 | 500 | 580 |
| 9 | Diageo Finance plc | 0.250% | 10/22/21 | 855 | 1,048 |
| | Dollar General Corp. | 3.250% | 4/15/23 | 3,000 | 3,175 |
| | Estee Lauder Cos. Inc. | 2.000% | 12/1/24 | 140 | 148 |
| | General Mills Inc. | 3.200% | 4/16/21 | 715 | 721 |
| | General Mills Inc. | 2.600% | 10/12/22 | 850 | 883 |
| | General Mills Inc. | 3.700% | 10/17/23 | 681 | 741 |
| | Grupo Bimbo SAB de CV | 4.500% | 1/25/22 | 400 | 416 |
| 8 | Grupo Bimbo SAB de CV | 4.500% | 1/25/22 | 300 | 312 |
| | Hershey Co. | 0.900% | 6/1/25 | 100 | 101 |
| | JM Smucker Co. | 3.500% | 3/15/25 | 1,401 | 1,559 |
| | Kellogg Co. | 2.650% | 12/1/23 | 905 | 966 |
| | Keurig Dr Pepper Inc. | 3.551% | 5/25/21 | 429 | 435 |
| | Keurig Dr Pepper Inc. | 4.057% | 5/25/23 | 3,407 | 3,700 |
| | Keurig Dr Pepper Inc. | 3.130% | 12/15/23 | 680 | 730 |
| | Keurig Dr Pepper Inc. | 4.417% | 5/25/25 | 1,900 | 2,185 |
| | Kimberly-Clark Corp. | 3.050% | 8/15/25 | 200 | 222 |
| 8 | Kraft Heinz Foods Co. | 3.875% | 5/15/27 | 160 | 173 |
| | Kroger Co. | 3.400% | 4/15/22 | 1,925 | 1,986 |
| | Kroger Co. | 2.800% | 8/1/22 | 1,142 | 1,183 |
| | Kroger Co. | 3.850% | 8/1/23 | 600 | 647 |
| | Kroger Co. | 4.000% | 2/1/24 | 1,302 | 1,428 |
| 8 | Kronos Acquisition Holdings Inc. / KIK Custom Products Inc. | 5.000% | 12/31/26 | 10 | 10 |
| 8 | Lamb Weston Holdings Inc. | 4.625% | 11/1/24 | 222 | 231 |
| 8 | Lamb Weston Holdings Inc. | 4.875% | 11/1/26 | 70 | 73 |
| 8 | Lamb Weston Holdings Inc. | 4.875% | 5/15/28 | 75 | 83 |
| | McCormick & Co. Inc. | 2.700% | 8/15/22 | 972 | 1,003 |
| | | | Coupon | Maturity
Date | Face
Amount
($000) | Market
Value•
($000) |
| | McCormick & Co. Inc. | 3.150% | 8/15/24 | 100 | 108 |
| 8 | Mondelez International Holdings Netherlands BV | 2.125% | 9/19/22 | 200 | 206 |
| 8 | Mondelez International Holdings Netherlands BV | 2.250% | 9/19/24 | 900 | 949 |
| | Mondelez International Inc. | 0.625% | 7/1/22 | 1,000 | 1,005 |
| | Mondelez International Inc. | 2.125% | 4/13/23 | 2,073 | 2,154 |
| | Mondelez International Inc. | 1.500% | 5/4/25 | 2,083 | 2,156 |
| 8 | Nestle Holdings Inc. | 3.500% | 9/24/25 | 1,055 | 1,184 |
| 9 | PepsiCo Inc. | 0.250% | 5/6/24 | 515 | 638 |
| | PepsiCo Inc. | 2.250% | 3/19/25 | 15 | 16 |
| 8 | Performance Food Group Inc. | 5.500% | 6/1/24 | 273 | 275 |
| 8 | Performance Food Group Inc. | 6.875% | 5/1/25 | 35 | 37 |
| 8 | Performance Food Group Inc. | 5.500% | 10/15/27 | 140 | 148 |
| 8 | Pernod Ricard SA | 4.250% | 7/15/22 | 285 | 301 |
| | Philip Morris International Inc. | 2.500% | 8/22/22 | 270 | 280 |
| | Philip Morris International Inc. | 2.500% | 11/2/22 | 250 | 259 |
| | Philip Morris International Inc. | 2.625% | 3/6/23 | 225 | 237 |
| | Philip Morris International Inc. | 1.125% | 5/1/23 | 1,800 | 1,835 |
| | Philip Morris International Inc. | 2.125% | 5/10/23 | 400 | 415 |
| | Philip Morris International Inc. | 2.875% | 5/1/24 | 1,000 | 1,078 |
| | Philip Morris International Inc. | 1.500% | 5/1/25 | 3,900 | 4,034 |
| | Philip Morris International Inc. | 0.875% | 5/1/26 | 1,000 | 1,004 |
| 8 | Post Holdings Inc. | 5.750% | 3/1/27 | 20 | 21 |
| 8 | Post Holdings Inc. | 4.625% | 4/15/30 | 87 | 91 |
| 8 | Reckitt Benckiser Treasury Services plc | 2.375% | 6/24/22 | 4,140 | 4,259 |
| 8 | Reckitt Benckiser Treasury Services plc | 2.750% | 6/26/24 | 5,450 | 5,801 |
| | Reynolds American Inc. | 4.850% | 9/15/23 | 100 | 112 |
| | Reynolds American Inc. | 4.450% | 6/12/25 | 3,012 | 3,425 |
| | Sysco Corp. | 5.650% | 4/1/25 | 500 | 595 |
| | Tyson Foods Inc. | 4.500% | 6/15/22 | 300 | 314 |
| | Tyson Foods Inc. | 3.900% | 9/28/23 | 1,000 | 1,091 |
| | Tyson Foods Inc. | 3.950% | 8/15/24 | 932 | 1,035 |
| | Unilever Capital Corp. | 2.600% | 5/5/24 | 1,400 | 1,494 |
| 8 | United Natural Foods Inc. | 6.750% | 10/15/28 | 60 | 63 |
| | Walmart Inc. | 3.300% | 4/22/24 | 330 | 359 |
| | Walmart Inc. | 2.850% | 7/8/24 | 360 | 389 |
| | | | | | | 102,823 |
| Energy (7.7%) |
| | Baker Hughes a GE Co. LLC / Baker Hughes Co-Obligor Inc. | 2.773% | 12/15/22 | 1,023 | 1,066 |
| | BP Capital Markets America Inc. | 2.520% | 9/19/22 | 1,665 | 1,723 |
| | BP Capital Markets America Inc. | 2.937% | 4/6/23 | 1,105 | 1,167 |
| | BP Capital Markets America Inc. | 2.750% | 5/10/23 | 1,920 | 2,024 |
| | BP Capital Markets America Inc. | 3.216% | 11/28/23 | 2,230 | 2,394 |
| | BP Capital Markets America Inc. | 3.790% | 2/6/24 | 1,820 | 1,991 |
Short-Term Investment-Grade Portfolio
| | | | Coupon | Maturity
Date | Face
Amount
($000) | Market
Value•
($000) |
| | BP Capital Markets America Inc. | 3.224% | 4/14/24 | 1,540 | 1,663 |
| | BP Capital Markets America Inc. | 3.194% | 4/6/25 | 1,385 | 1,523 |
| | BP Capital Markets plc | 2.500% | 11/6/22 | 695 | 722 |
| | BP Capital Markets plc | 3.814% | 2/10/24 | 1,100 | 1,207 |
| | BP Capital Markets plc | 3.535% | 11/4/24 | 1,061 | 1,177 |
| | BP Capital Markets plc | 3.506% | 3/17/25 | 355 | 396 |
| | Buckeye Partners LP | 4.150% | 7/1/23 | 95 | 98 |
| | Canadian Natural Resources Ltd. | 2.950% | 1/15/23 | 1,635 | 1,709 |
| | Canadian Natural Resources Ltd. | 3.800% | 4/15/24 | 135 | 145 |
| | Canadian Natural Resources Ltd. | 3.900% | 2/1/25 | 430 | 470 |
| | Canadian Natural Resources Ltd. | 2.050% | 7/15/25 | 620 | 650 |
| | Cenovus Energy Inc. | 3.000% | 8/15/22 | 150 | 152 |
| | Cenovus Energy Inc. | 5.375% | 7/15/25 | 190 | 214 |
| | Cheniere Corpus Christi Holdings LLC | 7.000% | 6/30/24 | 3,370 | 3,925 |
| | Cheniere Corpus Christi Holdings LLC | 5.875% | 3/31/25 | 2,025 | 2,352 |
| 8 | Cheniere Energy Inc. | 4.625% | 10/15/28 | 125 | 132 |
| | Chevron Corp. | 1.554% | 5/11/25 | 2,814 | 2,916 |
| | Chevron USA Inc. | 0.687% | 8/12/25 | 1,400 | 1,404 |
| | Cimarex Energy Co. | 4.375% | 6/1/24 | 195 | 212 |
| | CNOOC Finance 2012 Ltd. | 3.875% | 5/2/22 | 1,622 | 1,680 |
| | CNOOC Finance 2014 ULC | 4.250% | 4/30/24 | 710 | 770 |
| | CNOOC Finance 2015 USA LLC | 3.500% | 5/5/25 | 837 | 902 |
| | CNPC General Capital Ltd. | 3.950% | 4/19/22 | 200 | 207 |
| | ConocoPhillips Co. | 2.400% | 12/15/22 | 665 | 687 |
| | ConocoPhillips Co. | 4.950% | 3/15/26 | 1,265 | 1,519 |
| | DCP Midstream Operating LP | 5.625% | 7/15/27 | 58 | 64 |
| | Diamondback Energy Inc. | 2.875% | 12/1/24 | 1,415 | 1,487 |
| | Diamondback Energy Inc. | 4.750% | 5/31/25 | 200 | 225 |
| | Ecopetrol SA | 5.875% | 9/18/23 | 828 | 925 |
| | Ecopetrol SA | 5.375% | 6/26/26 | 840 | 966 |
| | Empresa Nacional del Petroleo | 4.375% | 10/30/24 | 400 | 440 |
| | Empresa Nacional del Petroleo | 3.750% | 8/5/26 | 255 | 279 |
| | Empresa Nacional del Petroleo | 5.250% | 11/6/29 | 400 | 473 |
| | Enbridge Energy Partners LP | 5.875% | 10/15/25 | 320 | 388 |
| | Enbridge Inc. | 2.900% | 7/15/22 | 430 | 445 |
| | Enbridge Inc. | 4.000% | 10/1/23 | 1,015 | 1,104 |
| | Enbridge Inc. | 3.500% | 6/10/24 | 160 | 174 |
| | Enbridge Inc. | 2.500% | 1/15/25 | 1,010 | 1,079 |
| 8 | Endeavor Energy Resources LP / EER Finance Inc. | 6.625% | 7/15/25 | 39 | 42 |
| | Energy Transfer Operating LP | 4.650% | 6/1/21 | 995 | 997 |
| | Energy Transfer Operating LP | 5.200% | 2/1/22 | 1,452 | 1,505 |
| | Energy Transfer Operating LP | 3.600% | 2/1/23 | 575 | 602 |
| | Energy Transfer Operating LP | 4.250% | 3/15/23 | 1,189 | 1,247 |
| | Energy Transfer Operating LP | 4.200% | 9/15/23 | 1,542 | 1,661 |
| | Energy Transfer Operating LP | 5.875% | 1/15/24 | 1,060 | 1,189 |
| | | | Coupon | Maturity
Date | Face
Amount
($000) | Market
Value•
($000) |
| | Energy Transfer Operating LP | 4.900% | 2/1/24 | 1,310 | 1,434 |
| | Energy Transfer Operating LP | 4.500% | 4/15/24 | 1,105 | 1,185 |
| | Energy Transfer Partners | 0.789% | 1/28/21 | 1,000 | 999 |
| | Energy Transfer Partners LP / Regency Energy Finance Corp. | 5.875% | 3/1/22 | 2,350 | 2,457 |
| | Energy Transfer Partners LP / Regency Energy Finance Corp. | 5.000% | 10/1/22 | 2,535 | 2,687 |
| | Energy Transfer Partners LP / Regency Energy Finance Corp. | 4.500% | 11/1/23 | 2,630 | 2,844 |
| 8 | Eni SPA | 4.000% | 9/12/23 | 1,845 | 2,009 |
| 8 | EnLink Midstream LLC | 5.625% | 1/15/28 | 30 | 31 |
| | Enterprise Products Operating LLC | 3.500% | 2/1/22 | 1,820 | 1,881 |
| | Enterprise Products Operating LLC | 3.900% | 2/15/24 | 875 | 958 |
| | EOG Resources Inc. | 2.625% | 3/15/23 | 562 | 586 |
| | EOG Resources Inc. | 3.150% | 4/1/25 | 995 | 1,088 |
| 8 | EQM Midstream Partners LP | 6.000% | 7/1/25 | 95 | 104 |
| | EQT Corp. | 3.000% | 10/1/22 | 18 | 18 |
| | EQT Corp. | 5.000% | 1/15/29 | 125 | 132 |
| 9 | Exxon Mobil Corp. | 0.142% | 6/26/24 | 985 | 1,214 |
| | Exxon Mobil Corp. | 2.019% | 8/16/24 | 3,095 | 3,254 |
| | Exxon Mobil Corp. | 2.992% | 3/19/25 | 875 | 957 |
| | Gazprom PJSC Via Gaz Capital SA | 6.510% | 3/7/22 | 270 | 286 |
| 9 | Gazprom PJSC Via Gaz Capital SA | 3.125% | 11/17/23 | 100 | 130 |
| 9 | Gazprom PJSC Via Gaz Capital SA | 2.949% | 1/24/24 | 570 | 733 |
| 9 | Gazprom PJSC Via Gaz Capital SA | 2.250% | 11/22/24 | 100 | 127 |
| | Harvest Operations Corp. | 3.000% | 9/21/22 | 200 | 209 |
| | Husky Energy Inc. | 3.950% | 4/15/22 | 40 | 41 |
| 8 | KazMunayGas National Co. JSC | 6.375% | 10/24/48 | 400 | 573 |
| | Kinder Morgan Energy Partners LP | 5.800% | 3/1/21 | 145 | 146 |
| | Kinder Morgan Energy Partners LP | 5.000% | 10/1/21 | 360 | 368 |
| | Kinder Morgan Energy Partners LP | 4.150% | 3/1/22 | 115 | 120 |
| | Kinder Morgan Energy Partners LP | 3.950% | 9/1/22 | 2,300 | 2,410 |
| | Kinder Morgan Energy Partners LP | 3.450% | 2/15/23 | 1,005 | 1,058 |
| | Kinder Morgan Energy Partners LP | 3.500% | 9/1/23 | 390 | 417 |
| | Kinder Morgan Energy Partners LP | 4.150% | 2/1/24 | 370 | 405 |
| | Kinder Morgan Energy Partners LP | 4.300% | 5/1/24 | 505 | 559 |
| | Kinder Morgan Energy Partners LP | 4.250% | 9/1/24 | 155 | 173 |
| 8 | Kinder Morgan Inc. | 5.000% | 2/15/21 | 870 | 872 |
| | Kinder Morgan Inc. | 3.150% | 1/15/23 | 2,725 | 2,861 |
| 8 | Kinder Morgan Inc. | 5.625% | 11/15/23 | 1,310 | 1,477 |
| | Kinder Morgan Inc. | 4.300% | 6/1/25 | 540 | 615 |
| | Marathon Oil Corp. | 2.800% | 11/1/22 | 852 | 875 |
| | Marathon Petroleum Corp. | 5.125% | 3/1/21 | 900 | 907 |
| | Marathon Petroleum Corp. | 4.500% | 5/1/23 | 2,710 | 2,937 |
| | Marathon Petroleum Corp. | 4.750% | 12/15/23 | 1,545 | 1,709 |
Short-Term Investment-Grade Portfolio
| | | | Coupon | Maturity
Date | Face
Amount
($000) | Market
Value•
($000) |
| | Marathon Petroleum Corp. | 3.625% | 9/15/24 | 1,045 | 1,138 |
| | Marathon Petroleum Corp. | 4.700% | 5/1/25 | 2,577 | 2,951 |
| 8 | MEG Energy Corp. | 6.500% | 1/15/25 | 114 | 117 |
| 8 | Midwest Connector Capital Co. LLC | 3.625% | 4/1/22 | 2,055 | 2,092 |
| 8 | Midwest Connector Capital Co. LLC | 3.900% | 4/1/24 | 653 | 669 |
| | MPLX LP | 3.500% | 12/1/22 | 1,103 | 1,158 |
| | MPLX LP | 3.375% | 3/15/23 | 475 | 504 |
| | MPLX LP | 4.500% | 7/15/23 | 70 | 76 |
| | MPLX LP | 4.875% | 12/1/24 | 920 | 1,052 |
| | MPLX LP | 1.750% | 3/1/26 | 1,505 | 1,554 |
| | Noble Energy Inc. | 3.900% | 11/15/24 | 550 | 613 |
| | Nustar Logistics LP | 5.750% | 10/1/25 | 140 | 149 |
| | Occidental Petroleum Corp. | 3.500% | 6/15/25 | 110 | 106 |
| | Occidental Petroleum Corp. | 5.500% | 12/1/25 | 90 | 93 |
| | Occidental Petroleum Corp. | 3.400% | 4/15/26 | 35 | 33 |
| | Occidental Petroleum Corp. | 3.200% | 8/15/26 | 155 | 145 |
| | Occidental Petroleum Corp. | 6.625% | 9/1/30 | 42 | 45 |
| | ONEOK Inc. | 2.750% | 9/1/24 | 1,385 | 1,461 |
| | ONEOK Inc. | 2.200% | 9/15/25 | 260 | 270 |
| | ONEOK Partners LP | 3.375% | 10/1/22 | 145 | 151 |
| | ONEOK Partners LP | 5.000% | 9/15/23 | 630 | 689 |
| | ONEOK Partners LP | 4.900% | 3/15/25 | 320 | 362 |
| | Ovintiv Exploration Inc. | 5.750% | 1/30/22 | 975 | 1,009 |
| | Ovintiv Exploration Inc. | 5.625% | 7/1/24 | 200 | 215 |
| | Ovintiv Inc. | 3.900% | 11/15/21 | 140 | 141 |
| 8 | Parsley Energy LLC / Parsley Finance Corp. | 5.375% | 1/15/25 | 50 | 51 |
| 8 | Parsley Energy LLC / Parsley Finance Corp. | 5.250% | 8/15/25 | 30 | 31 |
| | Pertamina Persero PT | 4.875% | 5/3/22 | 1,129 | 1,186 |
| | Pertamina Persero PT | 4.300% | 5/20/23 | 200 | 215 |
| | Petroleos Mexicanos | 4.625% | 9/21/23 | 1 | 1 |
| | Petronas Capital Ltd. | 3.125% | 3/18/22 | 380 | 392 |
| | Petronas Capital Ltd. | 7.875% | 5/22/22 | 315 | 347 |
| 8 | Petronas Capital Ltd. | 3.500% | 4/21/30 | 268 | 308 |
| | Phillips 66 | 3.700% | 4/6/23 | 985 | 1,055 |
| | Phillips 66 | 0.900% | 2/15/24 | 815 | 818 |
| | Phillips 66 | 3.850% | 4/9/25 | 475 | 535 |
| | Plains All American Pipeline LP / PAA Finance Corp. | 3.650% | 6/1/22 | 885 | 912 |
| | Plains All American Pipeline LP / PAA Finance Corp. | 3.850% | 10/15/23 | 585 | 626 |
| | Plains All American Pipeline LP / PAA Finance Corp. | 3.600% | 11/1/24 | 350 | 373 |
| | Plains All American Pipeline LP / PAA Finance Corp. | 4.650% | 10/15/25 | 355 | 397 |
| 8 | Rattler Midstream LP | 5.625% | 7/15/25 | 35 | 37 |
| | Sabine Pass Liquefaction LLC | 6.250% | 3/15/22 | 1,490 | 1,568 |
| | Sabine Pass Liquefaction LLC | 5.625% | 4/15/23 | 4,007 | 4,388 |
| | Sabine Pass Liquefaction LLC | 5.750% | 5/15/24 | 1,885 | 2,149 |
| | Sabine Pass Liquefaction LLC | 5.625% | 3/1/25 | 1,665 | 1,938 |
| 8 | Saudi Arabian Oil Co. | 1.625% | 11/24/25 | 215 | 220 |
| | Schlumberger Finance Canada Ltd. | 1.400% | 9/17/25 | 330 | 338 |
| | | | Coupon | Maturity
Date | Face
Amount
($000) | Market
Value•
($000) |
| | Shell International Finance BV | 2.250% | 1/6/23 | 472 | 490 |
| | Shell International Finance BV | 3.400% | 8/12/23 | 70 | 75 |
| | Shell International Finance BV | 0.375% | 9/15/23 | 610 | 611 |
| | Shell International Finance BV | 2.000% | 11/7/24 | 3,745 | 3,929 |
| | Shell International Finance BV | 2.375% | 4/6/25 | 1,145 | 1,225 |
| | Shell International Finance BV | 3.250% | 5/11/25 | 1,210 | 1,340 |
| | Sinopec Group Overseas Development 2012 Ltd. | 3.900% | 5/17/22 | 277 | 288 |
| 8 | Sinopec Group Overseas Development 2013 Ltd. | 4.375% | 10/17/23 | 800 | 872 |
| | Sinopec Group Overseas Development 2013 Ltd. | 4.375% | 10/17/23 | 1,140 | 1,242 |
| | Sinopec Group Overseas Development 2017 Ltd. | 2.500% | 9/13/22 | 1,332 | 1,364 |
| | Southern Natural Gas Co LLC / Southern Natural Issuing Corp. | 4.400% | 6/15/21 | 155 | 156 |
| | Spectra Energy Partners LP | 3.500% | 3/15/25 | 365 | 401 |
| | State Oil Co. of the Azerbaijan Republic | 4.750% | 3/13/23 | 225 | 240 |
| | Suncor Energy Inc. | 2.800% | 5/15/23 | 1,510 | 1,588 |
| | Suncor Energy Inc. | 3.600% | 12/1/24 | 315 | 347 |
| | Sunoco Logistics Partners Operations LP | 4.400% | 4/1/21 | 1,570 | 1,580 |
| | Sunoco Logistics Partners Operations LP | 3.450% | 1/15/23 | 485 | 506 |
| | Sunoco Logistics Partners Operations LP | 4.250% | 4/1/24 | 1,305 | 1,409 |
| 8 | Tallgrass Energy Partners LP / Tallgrass Energy Finance Corp. | 7.500% | 10/1/25 | 10 | 11 |
| | Targa Resources Partners LP / Targa Resources Partners Finance Corp. | 6.500% | 7/15/27 | 50 | 54 |
| | Total Capital Canada Ltd. | 2.750% | 7/15/23 | 998 | 1,056 |
| | Total Capital International SA | 2.700% | 1/25/23 | 255 | 267 |
| | Total Capital International SA | 3.700% | 1/15/24 | 700 | 767 |
| | Total Capital International SA | 2.434% | 1/10/25 | 2,945 | 3,139 |
| | TransCanada PipeLines Ltd. | 2.500% | 8/1/22 | 1,970 | 2,034 |
| | TransCanada PipeLines Ltd. | 3.750% | 10/16/23 | 880 | 951 |
| | Valero Energy Corp. | 2.700% | 4/15/23 | 825 | 860 |
| | Valero Energy Corp. | 1.200% | 3/15/24 | 1,305 | 1,310 |
| | Valero Energy Corp. | 2.850% | 4/15/25 | 430 | 457 |
| | Western Midstream Operating LP | 5.050% | 2/1/30 | 180 | 200 |
| | Williams Cos. Inc. | 7.875% | 9/1/21 | 120 | 126 |
| | Williams Cos. Inc. | 4.000% | 11/15/21 | 395 | 404 |
| | Williams Cos. Inc. | 3.600% | 3/15/22 | 2,645 | 2,729 |
| | Williams Cos. Inc. | 3.350% | 8/15/22 | 270 | 280 |
Short-Term Investment-Grade Portfolio
| | | | Coupon | Maturity
Date | Face
Amount
($000) | Market
Value•
($000) |
| | Williams Cos. Inc. | 3.700% | 1/15/23 | 845 | 892 |
| | Williams Cos. Inc. | 4.500% | 11/15/23 | 2,567 | 2,824 |
| | Williams Cos. Inc. | 4.550% | 6/24/24 | 3,770 | 4,213 |
| | Williams Cos. Inc. | 3.900% | 1/15/25 | 285 | 315 |
| | Williams Cos. Inc. | 4.000% | 9/15/25 | 345 | 389 |
| | WPX Energy Inc. | 5.750% | 6/1/26 | 30 | 32 |
| | WPX Energy Inc. | 5.250% | 10/15/27 | 100 | 106 |
| | WPX Energy Inc. | 5.875% | 6/15/28 | 40 | 43 |
| | WPX Energy Inc. | 4.500% | 1/15/30 | 175 | 186 |
| | | | | | | 172,321 |
| Financials (25.9%) |
| 9 | ABN AMRO Bank NV | 6.375% | 4/27/21 | 450 | 560 |
| | AerCap Ireland Capital DAC / AerCap Global Aviation Trust | 3.300% | 1/23/23 | 300 | 312 |
| | AerCap Ireland Capital DAC / AerCap Global Aviation Trust | 4.125% | 7/3/23 | 315 | 337 |
| | AerCap Ireland Capital DAC / AerCap Global Aviation Trust | 4.500% | 9/15/23 | 420 | 453 |
| | AerCap Ireland Capital DAC / AerCap Global Aviation Trust | 4.875% | 1/16/24 | 525 | 573 |
| | AerCap Ireland Capital DAC / AerCap Global Aviation Trust | 3.150% | 2/15/24 | 830 | 869 |
| | AerCap Ireland Capital DAC / AerCap Global Aviation Trust | 2.875% | 8/14/24 | 325 | 336 |
| | AerCap Ireland Capital DAC / AerCap Global Aviation Trust | 3.500% | 1/15/25 | 960 | 1,019 |
| | AerCap Ireland Capital DAC / AerCap Global Aviation Trust | 6.500% | 7/15/25 | 510 | 608 |
| | AerCap Ireland Capital DAC / AerCap Global Aviation Trust | 4.450% | 10/1/25 | 300 | 334 |
| | AerCap Ireland Capital DAC / AerCap Global Aviation Trust | 4.450% | 4/3/26 | 150 | 168 |
| | Aflac Inc. | 3.625% | 11/15/24 | 445 | 498 |
| 8 | AIG Global Funding | 2.700% | 12/15/21 | 315 | 322 |
| | Air Lease Corp. | 2.250% | 1/15/23 | 672 | 689 |
| | Air Lease Corp. | 2.750% | 1/15/23 | 245 | 253 |
| | Air Lease Corp. | 3.875% | 7/3/23 | 365 | 389 |
| | Air Lease Corp. | 4.250% | 2/1/24 | 580 | 628 |
| | Air Lease Corp. | 2.300% | 2/1/25 | 1,000 | 1,030 |
| | Air Lease Corp. | 3.250% | 3/1/25 | 90 | 96 |
| | Air Lease Corp. | 3.375% | 7/1/25 | 415 | 446 |
| | Air Lease Corp. | 2.875% | 1/15/26 | 2,240 | 2,365 |
| | Aircastle Ltd. | 4.125% | 5/1/24 | 210 | 223 |
| 8 | Alliant Holdings Intermediate LLC / Alliant Holdings Co-Issuer | 4.250% | 10/15/27 | 40 | 41 |
| 8 | Alliant Holdings Intermediate LLC / Alliant Holdings Co-Issuer | 6.750% | 10/15/27 | 10 | 11 |
| | Allstate Corp. | 0.750% | 12/15/25 | 410 | 412 |
| | Ally Financial Inc. | 4.125% | 2/13/22 | 385 | 400 |
| | Ally Financial Inc. | 4.625% | 5/19/22 | 270 | 284 |
| | Ally Financial Inc. | 1.450% | 10/2/23 | 2,345 | 2,389 |
| | Ally Financial Inc. | 3.875% | 5/21/24 | 330 | 361 |
| | Ally Financial Inc. | 5.125% | 9/30/24 | 55 | 63 |
| | Ally Financial Inc. | 5.750% | 11/20/25 | 150 | 174 |
| | American Express Co. | 3.700% | 11/5/21 | 370 | 379 |
| | American Express Co. | 2.750% | 5/20/22 | 478 | 493 |
| | American Express Co. | 2.500% | 8/1/22 | 300 | 310 |
| | | | Coupon | Maturity
Date | Face
Amount
($000) | Market
Value•
($000) |
| | American Express Co. | 3.700% | 8/3/23 | 5,492 | 5,938 |
| | American Express Co. | 3.400% | 2/22/24 | 1,445 | 1,573 |
| | American Express Co. | 2.500% | 7/30/24 | 3,314 | 3,538 |
| | American Express Co. | 3.000% | 10/30/24 | 1,140 | 1,244 |
| | American International Group Inc. | 4.875% | 6/1/22 | 400 | 424 |
| | American International Group Inc. | 2.500% | 6/30/25 | 2,004 | 2,154 |
| | American International Group Inc. | 3.750% | 7/10/25 | 710 | 798 |
| | Ameriprise Financial Inc. | 3.000% | 3/22/22 | 700 | 723 |
| | Ameriprise Financial Inc. | 4.000% | 10/15/23 | 100 | 110 |
| | Ameriprise Financial Inc. | 3.700% | 10/15/24 | 900 | 1,001 |
| | Ameriprise Financial Inc. | 3.000% | 4/2/25 | 740 | 806 |
| | Aon plc | 4.000% | 11/27/23 | 260 | 284 |
| 8 | Apollo Management Holdings LP | 4.000% | 5/30/24 | 165 | 183 |
| | Assurant Inc. | 4.200% | 9/27/23 | 300 | 328 |
| 9 | Athene Global Funding | 1.875% | 6/23/23 | 815 | 1,040 |
| 8 | Athene Global Funding | 1.200% | 10/13/23 | 1,210 | 1,217 |
| 9 | Australia & New Zealand Banking Group Ltd. | 0.625% | 2/21/23 | 410 | 510 |
| 8 | Australia & New Zealand Banking Group Ltd. | 2.950% | 7/22/30 | 450 | 476 |
| 7,10 | Australia & New Zealand Banking Group Ltd., 3M Australian Bank Bill Rate + 2.700% | 2.719% | 5/17/26 | 250 | 194 |
| 8 | Avolon Holdings Funding Ltd. | 4.250% | 4/15/26 | 475 | 511 |
| | Banco Santander SA | 3.125% | 2/23/23 | 200 | 210 |
| | Banco Santander SA | 2.706% | 6/27/24 | 2,600 | 2,772 |
| | Banco Santander SA | 2.746% | 5/28/25 | 1,240 | 1,324 |
| 7,10 | Banco Santander SA, 3M Australian Bank Bill Rate + 1.650% | 1.730% | 1/19/23 | 600 | 464 |
| | Bank of America Corp. | 2.738% | 1/23/22 | 500 | 500 |
| | Bank of America Corp. | 3.499% | 5/17/22 | 810 | 819 |
| | Bank of America Corp. | 3.124% | 1/20/23 | 1,035 | 1,063 |
| | Bank of America Corp. | 2.816% | 7/21/23 | 500 | 519 |
| 9 | Bank of America Corp. | 0.750% | 7/26/23 | 2,255 | 2,817 |
| | Bank of America Corp. | 3.004% | 12/20/23 | 1,698 | 1,787 |
| | Bank of America Corp. | 4.125% | 1/22/24 | 1,732 | 1,922 |
| | Bank of America Corp. | 3.550% | 3/5/24 | 4,503 | 4,796 |
| | Bank of America Corp. | 4.000% | 4/1/24 | 300 | 332 |
| | Bank of America Corp. | 3.864% | 7/23/24 | 1,200 | 1,302 |
| | Bank of America Corp. | 4.200% | 8/26/24 | 520 | 579 |
| | Bank of America Corp. | 0.810% | 10/24/24 | 2,030 | 2,047 |
| | Bank of America Corp. | 4.000% | 1/22/25 | 2,220 | 2,483 |
| | Bank of America Corp. | 3.458% | 3/15/25 | 300 | 325 |
| | Bank of America Corp. | 3.950% | 4/21/25 | 1,365 | 1,537 |
| | Bank of America Corp. | 3.875% | 8/1/25 | 150 | 171 |
| | Bank of America Corp. | 0.981% | 9/25/25 | 1,700 | 1,716 |
| | Bank of America Corp. | 3.093% | 10/1/25 | 2,071 | 2,238 |
| | Bank of America Corp. | 2.456% | 10/22/25 | 750 | 799 |
| | Bank of America Corp. | 3.366% | 1/23/26 | 857 | 940 |
| | Bank of America Corp. | 2.015% | 2/13/26 | 650 | 680 |
| | Bank of America Corp. | 1.319% | 6/19/26 | 1,565 | 1,590 |
| | Bank of America Corp. | 1.197% | 10/24/26 | 1,000 | 1,011 |
| | Bank of Montreal | 3.300% | 2/5/24 | 4,815 | 5,211 |
| | Bank of Montreal | 4.338% | 10/5/28 | 1,565 | 1,714 |
| | Bank of New York Mellon Corp. | 1.850% | 1/27/23 | 450 | 463 |
| | Bank of New York Mellon Corp. | 2.950% | 1/29/23 | 400 | 420 |
| | Bank of New York Mellon Corp. | 2.661% | 5/16/23 | 150 | 155 |
| | Bank of New York Mellon Corp. | 3.450% | 8/11/23 | 1,338 | 1,444 |
| | Bank of New York Mellon Corp. | 3.650% | 2/4/24 | 440 | 482 |
Short-Term Investment-Grade Portfolio
| | | | Coupon | Maturity
Date | Face
Amount
($000) | Market
Value•
($000) |
| | Bank of New York Mellon Corp. | 3.400% | 5/15/24 | 670 | 732 |
| | Bank of New York Mellon Corp. | 3.250% | 9/11/24 | 372 | 408 |
| | Bank of New York Mellon Corp. | 2.100% | 10/24/24 | 600 | 639 |
| | Bank of New York Mellon Corp. | 3.000% | 2/24/25 | 639 | 701 |
| | Bank of New York Mellon Corp. | 1.600% | 4/24/25 | 1,233 | 1,286 |
| | Bank of Nova Scotia | 1.950% | 2/1/23 | 2,940 | 3,034 |
| | Bank of Nova Scotia | 2.200% | 2/3/25 | 1,600 | 1,683 |
| | Bank of Nova Scotia | 1.300% | 6/11/25 | 870 | 891 |
| | Bank of Nova Scotia | 4.500% | 12/16/25 | 570 | 662 |
| 11 | Banque Federative du Credit Mutuel SA | 1.375% | 12/20/21 | 500 | 692 |
| 8 | Banque Federative du Credit Mutuel SA | 2.125% | 11/21/22 | 1,250 | 1,287 |
| 8 | Banque Federative du Credit Mutuel SA | 3.750% | 7/20/23 | 1,780 | 1,922 |
| 8 | Banque Federative du Credit Mutuel SA | 0.650% | 2/27/24 | 1,280 | 1,280 |
| 8 | Banque Federative du Credit Mutuel SA | 2.375% | 11/21/24 | 800 | 847 |
| 11 | Barclays Bank plc | 10.000% | 5/21/21 | 1,417 | 2,000 |
| | Barclays plc | 3.684% | 1/10/23 | 200 | 206 |
| | Barclays plc | 4.610% | 2/15/23 | 200 | 208 |
| | Barclays plc | 4.375% | 9/11/24 | 1,530 | 1,693 |
| | Barclays plc | 1.007% | 12/10/24 | 1,780 | 1,789 |
| | Barclays plc | 3.650% | 3/16/25 | 600 | 662 |
| | Barclays plc | 3.932% | 5/7/25 | 1,965 | 2,150 |
| | Barclays plc | 2.852% | 5/7/26 | 1,500 | 1,605 |
| 9 | Berkshire Hathaway Inc. | 0.625% | 1/17/23 | 990 | 1,231 |
| 9 | Blackstone Property Partners Europe Holdings Sarl | 1.400% | 7/6/22 | 775 | 962 |
| 9 | Blackstone Property Partners Europe Holdings Sarl | 0.500% | 9/12/23 | 820 | 1,011 |
| 8 | BNP Paribas SA | 2.819% | 11/19/25 | 1,160 | 1,235 |
| 8 | BNP Paribas SA | 2.219% | 6/9/26 | 540 | 564 |
| 8 | BOC Aviation Ltd. | 2.375% | 9/15/21 | 790 | 795 |
| | BPCE SA | 2.750% | 12/2/21 | 295 | 301 |
| 8 | BPCE SA | 2.375% | 1/14/25 | 750 | 788 |
| 7,10 | BPCE SA, 3M Australian Bank Bill Rate + 1.110% | 1.160% | 4/26/23 | 660 | 516 |
| | Brown & Brown Inc. | 4.200% | 9/15/24 | 1,120 | 1,251 |
| | Canadian Imperial Bank of Commerce | 2.606% | 7/22/23 | 1,180 | 1,220 |
| | Canadian Imperial Bank of Commerce | 3.500% | 9/13/23 | 480 | 520 |
| | Canadian Imperial Bank of Commerce | 3.100% | 4/2/24 | 980 | 1,060 |
| | Canadian Imperial Bank of Commerce | 0.950% | 10/23/25 | 570 | 574 |
| | Capital One Bank USA NA | 2.014% | 1/27/23 | 2,100 | 2,137 |
| | Capital One Bank USA NA | 3.375% | 2/15/23 | 1,125 | 1,189 |
| | Capital One Bank USA NA | 2.280% | 1/28/26 | 520 | 542 |
| | Capital One Financial Corp. | 3.050% | 3/9/22 | 1,140 | 1,177 |
| | Capital One Financial Corp. | 2.600% | 5/11/23 | 135 | 141 |
| | Capital One Financial Corp. | 3.500% | 6/15/23 | 40 | 43 |
| | Capital One Financial Corp. | 3.750% | 4/24/24 | 500 | 545 |
| | Capital One Financial Corp. | 3.300% | 10/30/24 | 500 | 547 |
| | | | Coupon | Maturity
Date | Face
Amount
($000) | Market
Value•
($000) |
| | Capital One NA | 2.250% | 9/13/21 | 450 | 455 |
| | Capital One NA | 2.150% | 9/6/22 | 300 | 308 |
| | Charles Schwab Corp. | 3.550% | 2/1/24 | 200 | 218 |
| | Charles Schwab Corp. | 4.200% | 3/24/25 | 413 | 474 |
| | Charles Schwab Corp. | 3.850% | 5/21/25 | 1,120 | 1,274 |
| | Charles Schwab Corp. | 0.900% | 3/11/26 | 960 | 972 |
| | Chubb INA Holdings Inc. | 2.700% | 3/13/23 | 795 | 836 |
| | Chubb INA Holdings Inc. | 3.350% | 5/15/24 | 3,172 | 3,461 |
| | Chubb INA Holdings Inc. | 3.150% | 3/15/25 | 748 | 826 |
| | Citibank NA | 2.844% | 5/20/22 | 500 | 505 |
| | Citibank NA | 3.650% | 1/23/24 | 500 | 546 |
| 7,10 | Citibank NA, 3M Australian Bank Bill Rate + 0.750% | 0.770% | 5/20/22 | 500 | 388 |
| | Citigroup Inc. | 4.500% | 1/14/22 | 340 | 354 |
| 9 | Citigroup Inc. | 0.500% | 1/29/22 | 295 | 364 |
| | Citigroup Inc. | 2.750% | 4/25/22 | 1,185 | 1,221 |
| | Citigroup Inc. | 2.312% | 11/4/22 | 1,949 | 1,979 |
| | Citigroup Inc. | 3.142% | 1/24/23 | 975 | 1,002 |
| | Citigroup Inc. | 3.500% | 5/15/23 | 500 | 535 |
| | Citigroup Inc. | 2.876% | 7/24/23 | 1,440 | 1,496 |
| | Citigroup Inc. | 1.678% | 5/15/24 | 1,345 | 1,386 |
| | Citigroup Inc. | 4.044% | 6/1/24 | 2,250 | 2,435 |
| | Citigroup Inc. | 3.750% | 6/16/24 | 200 | 221 |
| | Citigroup Inc. | 0.776% | 10/30/24 | 880 | 883 |
| | Citigroup Inc. | 3.875% | 3/26/25 | 795 | 885 |
| | Citigroup Inc. | 3.352% | 4/24/25 | 1,990 | 2,163 |
| | Citigroup Inc. | 3.300% | 4/27/25 | 395 | 437 |
| | Citigroup Inc. | 4.400% | 6/10/25 | 612 | 699 |
| | Citigroup Inc. | 5.500% | 9/13/25 | 60 | 72 |
| | Citigroup Inc. | 4.600% | 3/9/26 | 800 | 936 |
| | Citigroup Inc. | 3.106% | 4/8/26 | 1,535 | 1,678 |
| | Citigroup Inc. | 3.200% | 10/21/26 | 230 | 256 |
| 7,10 | Citigroup Inc., 3M Australian Bank Bill Rate + 1.550% | 1.579% | 5/4/21 | 1,137 | 880 |
| 7,10 | Citigroup Inc., 3M Australian Bank Bill Rate + 1.720% | 1.776% | 10/27/23 | 200 | 158 |
| | Citizens Bank NA | 3.250% | 2/14/22 | 1,125 | 1,157 |
| 7,10 | Commonwealth Bank of Australia, 3M Australian Bank Bill Rate + 2.650% | 2.670% | 6/3/26 | 100 | 78 |
| | Cooperatieve Rabobank UA | 3.950% | 11/9/22 | 250 | 265 |
| | Cooperatieve Rabobank UA | 2.750% | 1/10/23 | 1,260 | 1,321 |
| 8 | Cooperatieve Rabobank UA | 3.875% | 9/26/23 | 1,245 | 1,357 |
| | Cooperatieve Rabobank UA | 4.625% | 12/1/23 | 2,084 | 2,319 |
| 9 | Cooperatieve Rabobank UA | 0.625% | 2/27/24 | 500 | 625 |
| 8 | Cooperatieve Rabobank UA | 2.625% | 7/22/24 | 1,015 | 1,079 |
| | Cooperatieve Rabobank UA | 4.375% | 8/4/25 | 500 | 569 |
| | Credit Suisse AG | 2.100% | 11/12/21 | 350 | 355 |
| | Credit Suisse AG | 1.000% | 5/5/23 | 500 | 508 |
| | Credit Suisse AG | 3.625% | 9/9/24 | 2,190 | 2,428 |
| | Credit Suisse AG | 2.950% | 4/9/25 | 250 | 273 |
| 8 | Credit Suisse Group AG | 3.574% | 1/9/23 | 1,105 | 1,140 |
| | Credit Suisse Group AG | 3.800% | 6/9/23 | 830 | 893 |
| 8 | Credit Suisse Group AG | 4.207% | 6/12/24 | 2,370 | 2,557 |
| | Credit Suisse Group AG | 3.750% | 3/26/25 | 665 | 738 |
| 8 | Credit Suisse Group AG | 2.193% | 6/5/26 | 420 | 438 |
| 7,10 | Credit Suisse Group AG, 3M Australian Bank Bill Rate + 1.250% | 1.268% | 3/8/24 | 310 | 239 |
Short-Term Investment-Grade Portfolio
| | | | Coupon | Maturity
Date | Face
Amount
($000) | Market
Value•
($000) |
| 9 | Credit Suisse Group Funding Guernsey Ltd. | 1.250% | 4/14/22 | 1,245 | 1,549 |
| 8 | Danske Bank A/S | 2.000% | 9/8/21 | 800 | 809 |
| 9 | Danske Bank A/S | 1.375% | 5/24/22 | 295 | 368 |
| 8 | Danske Bank A/S | 3.001% | 9/20/22 | 1,000 | 1,015 |
| 8 | Danske Bank A/S | 3.875% | 9/12/23 | 1,000 | 1,076 |
| 8 | Danske Bank A/S | 1.171% | 12/8/23 | 1,530 | 1,530 |
| | Deutsche Bank AG | 2.222% | 9/18/24 | 935 | 960 |
| | Deutsche Bank AG | 2.129% | 11/24/26 | 1,075 | 1,095 |
| | Development Bank of Kazakhstan JSC | 4.125% | 12/10/22 | 1,160 | 1,215 |
| 8,12 | Dexia Credit Local SA | 2.500% | 1/25/21 | 2,450 | 2,453 |
| 8,12 | Dexia Credit Local SA | 1.875% | 9/15/21 | 235 | 238 |
| 8,12 | Dexia Credit Local SA | 2.375% | 9/20/22 | 250 | 258 |
| | Discover Bank | 4.200% | 8/8/23 | 350 | 383 |
| | Discover Bank | 2.450% | 9/12/24 | 1,050 | 1,107 |
| | Discover Bank | 4.682% | 8/9/28 | 550 | 580 |
| | Discover Financial Services | 3.950% | 11/6/24 | 165 | 182 |
| 8 | DNB Bank ASA | 2.150% | 12/2/22 | 200 | 207 |
| 8 | DNB Bank ASA | 1.127% | 9/16/26 | 720 | 725 |
| | Equitable Holdings Inc. | 3.900% | 4/20/23 | 1,110 | 1,193 |
| 9 | FCA Bank SPA | 1.250% | 6/21/22 | 670 | 833 |
| 9 | FCA Bank SPA | 0.625% | 11/24/22 | 300 | 370 |
| | Fidelity National Financial Inc. | 5.500% | �� 9/1/22 | 80 | 86 |
| | Fifth Third Bancorp | 3.650% | 1/25/24 | 900 | 978 |
| | Fifth Third Bank NA | 1.800% | 1/30/23 | 800 | 823 |
| | First Republic Bank | 2.500% | 6/6/22 | 2,265 | 2,329 |
| | First Republic Bank | 1.912% | 2/12/24 | 1,760 | 1,812 |
| 8 | Five Corners Funding Trust | 4.419% | 11/15/23 | 3,113 | 3,451 |
| | Franklin Resources Inc. | 2.800% | 9/15/22 | 870 | 906 |
| | FS KKR Capital Corp. | 3.400% | 1/15/26 | 690 | 684 |
| | GATX Corp. | 3.250% | 3/30/25 | 60 | 65 |
| 8 | GE Capital Funding LLC | 3.450% | 5/15/25 | 405 | 447 |
| | Goldman Sachs Group Inc. | 2.875% | 2/25/21 | 1,128 | 1,131 |
| | Goldman Sachs Group Inc. | 5.750% | 1/24/22 | 763 | 806 |
| | Goldman Sachs Group Inc. | 3.000% | 4/26/22 | 1,557 | 1,570 |
| 9 | Goldman Sachs Group Inc. | 1.375% | 7/26/22 | 295 | 369 |
| | Goldman Sachs Group Inc. | 2.876% | 10/31/22 | 1,967 | 2,004 |
| | Goldman Sachs Group Inc. | 2.908% | 6/5/23 | 807 | 836 |
| | Goldman Sachs Group Inc. | 2.905% | 7/24/23 | 1,143 | 1,185 |
| | Goldman Sachs Group Inc. | 0.627% | 11/17/23 | 740 | 742 |
| | Goldman Sachs Group Inc. | 3.625% | 2/20/24 | 1,820 | 1,978 |
| | Goldman Sachs Group Inc. | 4.000% | 3/3/24 | 690 | 758 |
| | Goldman Sachs Group Inc. | 3.850% | 7/8/24 | 1,575 | 1,724 |
| | Goldman Sachs Group Inc. | 3.500% | 1/23/25 | 1,145 | 1,262 |
| | Goldman Sachs Group Inc. | 3.500% | 4/1/25 | 2,560 | 2,847 |
| | Goldman Sachs Group Inc. | 3.750% | 5/22/25 | 700 | 786 |
| | Goldman Sachs Group Inc. | 3.272% | 9/29/25 | 3,207 | 3,503 |
| | Goldman Sachs Group Inc. | 4.250% | 10/21/25 | 610 | 695 |
| | Goldman Sachs Group Inc. | 3.500% | 11/16/26 | 845 | 948 |
| | | | Coupon | Maturity
Date | Face
Amount
($000) | Market
Value•
($000) |
| | Goldman Sachs Group Inc. | 1.093% | 12/9/26 | 1,370 | 1,383 |
| 7,10 | Goldman Sachs Group Inc., 3M Australian Bank Bill Rate + 1.200% | 1.220% | 5/16/23 | 630 | 491 |
| 7,10 | Goldman Sachs Group Inc., 3M Australian Bank Bill Rate + 1.370% | 1.388% | 9/8/21 | 520 | 404 |
| 8 | Great-West Lifeco US Finance 2020 LP | 0.904% | 8/12/25 | 460 | 461 |
| | HSBC Holdings plc | 3.262% | 3/13/23 | 2,870 | 2,962 |
| | HSBC Holdings plc | 3.600% | 5/25/23 | 2,220 | 2,387 |
| | HSBC Holdings plc | 3.033% | 11/22/23 | 2,991 | 3,132 |
| 13 | HSBC Holdings plc | 3.196% | 12/5/23 | 1,600 | 1,342 |
| | HSBC Holdings plc | 4.250% | 3/14/24 | 1,025 | 1,131 |
| | HSBC Holdings plc | 3.950% | 5/18/24 | 1,775 | 1,913 |
| | HSBC Holdings plc | 3.803% | 3/11/25 | 2,120 | 2,314 |
| | HSBC Holdings plc | 4.250% | 8/18/25 | 900 | 1,014 |
| | HSBC Holdings plc | 2.633% | 11/7/25 | 2,084 | 2,215 |
| | HSBC Holdings plc | 1.645% | 4/18/26 | 1,425 | 1,454 |
| | HSBC Holdings plc | 2.099% | 6/4/26 | 2,000 | 2,076 |
| | HSBC Holdings plc | 4.292% | 9/12/26 | 1,120 | 1,271 |
| 7,10 | HSBC Holdings plc, 3M Australian Bank Bill Rate + 1.100% | 1.120% | 2/16/24 | 200 | 153 |
| | Huntington Bancshares Inc. | 4.350% | 2/4/23 | 200 | 213 |
| | Huntington National Bank | 2.500% | 8/7/22 | 1,747 | 1,803 |
| | Huntington National Bank | 3.550% | 10/6/23 | 2,065 | 2,233 |
| | ING Groep NV | 3.550% | 4/9/24 | 200 | 218 |
| | Intercontinental Exchange Inc. | 0.700% | 6/15/23 | 860 | 866 |
| | Intercontinental Exchange Inc. | 4.000% | 10/15/23 | 630 | 691 |
| 8 | Intesa Sanpaolo SPA | 3.250% | 9/23/24 | 1,690 | 1,801 |
| | Invesco Finance plc | 3.125% | 11/30/22 | 970 | 1,019 |
| | Invesco Finance plc | 4.000% | 1/30/24 | 1,370 | 1,505 |
| | Jefferies Group LLC | 5.125% | 1/20/23 | 820 | 894 |
| 9 | JPMorgan Chase & Co. | 2.750% | 8/24/22 | 1,510 | 1,936 |
| | JPMorgan Chase & Co. | 2.972% | 1/15/23 | 1,916 | 1,969 |
| | JPMorgan Chase & Co. | 3.207% | 4/1/23 | 1,836 | 1,899 |
| | JPMorgan Chase & Co. | 2.776% | 4/25/23 | 1,779 | 1,837 |
| | JPMorgan Chase & Co. | 2.700% | 5/18/23 | 457 | 480 |
| | JPMorgan Chase & Co. | 3.559% | 4/23/24 | 1,215 | 1,301 |
| | JPMorgan Chase & Co. | 3.625% | 5/13/24 | 735 | 812 |
| | JPMorgan Chase & Co. | 1.514% | 6/1/24 | 950 | 973 |
| | JPMorgan Chase & Co. | 3.797% | 7/23/24 | 480 | 519 |
| | JPMorgan Chase & Co. | 3.875% | 9/10/24 | 100 | 112 |
| | JPMorgan Chase & Co. | 0.653% | 9/16/24 | 735 | 736 |
| | JPMorgan Chase & Co. | 4.023% | 12/5/24 | 2,457 | 2,699 |
| | JPMorgan Chase & Co. | 3.125% | 1/23/25 | 670 | 733 |
| | JPMorgan Chase & Co. | 3.220% | 3/1/25 | 4,532 | 4,882 |
| | JPMorgan Chase & Co. | 2.301% | 10/15/25 | 3,435 | 3,644 |
| | JPMorgan Chase & Co. | 2.005% | 3/13/26 | 1,190 | 1,247 |
| | JPMorgan Chase & Co. | 2.083% | 4/22/26 | 2,165 | 2,287 |
| | JPMorgan Chase & Co. | 1.045% | 11/19/26 | 1,640 | 1,658 |
| | KeyBank NA | 0.423% | 1/3/24 | 1,070 | 1,070 |
| 8 | Ladder Capital Finance Holdings LLLP / Ladder Capital Finance Corp. | 4.250% | 2/1/27 | 45 | 44 |
| 9 | LeasePlan Corp. NV | 1.000% | 2/25/22 | 335 | 415 |
| 9 | Leeds Building Society | 2.625% | 4/1/21 | 400 | 492 |
| 14,15 | Lehman Brothers E-Capital Trust I | 3.589% | 8/19/65 | 210 | — |
| | Lincoln National Corp. | 4.000% | 9/1/23 | 453 | 494 |
Short-Term Investment-Grade Portfolio
| | | | Coupon | Maturity
Date | Face
Amount
($000) | Market
Value•
($000) |
| 9 | Lloyds Banking Group plc | 0.750% | 11/9/21 | 450 | 554 |
| | Lloyds Banking Group plc | 2.858% | 3/17/23 | 2,065 | 2,121 |
| | Lloyds Banking Group plc | 1.326% | 6/15/23 | 2,040 | 2,050 |
| | Lloyds Banking Group plc | 4.050% | 8/16/23 | 1,450 | 1,576 |
| | Lloyds Banking Group plc | 2.907% | 11/7/23 | 4,000 | 4,160 |
| | Lloyds Banking Group plc | 3.900% | 3/12/24 | 500 | 549 |
| | Lloyds Banking Group plc | 4.500% | 11/4/24 | 300 | 335 |
| | Lloyds Banking Group plc | 4.450% | 5/8/25 | 765 | 874 |
| | Lloyds Banking Group plc | 3.870% | 7/9/25 | 871 | 957 |
| 10 | Macquarie Bank Ltd. | 1.750% | 6/21/22 | 90 | 71 |
| 7,10 | Macquarie Bank Ltd., 3M Australian Bank Bill Rate + 0.750% | 0.764% | 6/21/22 | 1,860 | 1,444 |
| 10 | Macquarie Group Ltd. | 3.250% | 12/15/22 | 400 | 315 |
| 8 | Macquarie Group Ltd. | 3.189% | 11/28/23 | 275 | 287 |
| | Macquarie Group Ltd. | 3.189% | 11/28/23 | 960 | 1,003 |
| 7,10 | Macquarie Group Ltd., 3M Australian Bank Bill Rate + 1.150% | 1.168% | 12/15/22 | 1,150 | 889 |
| 7 | Manufacturers & Traders Trust Co., 3M USD LIBOR + 0.640% | 0.865% | 12/1/21 | 245 | 245 |
| | Marsh & McLennan Cos. Inc. | 3.300% | 3/14/23 | 172 | 182 |
| | Marsh & McLennan Cos. Inc. | 4.050% | 10/15/23 | 387 | 423 |
| | Marsh & McLennan Cos. Inc. | 3.500% | 6/3/24 | 250 | 272 |
| 8 | MassMutual Global Funding II | 2.750% | 6/22/24 | 2,200 | 2,364 |
| | MetLife Inc. | 3.600% | 4/10/24 | 205 | 226 |
| 8 | Metropolitan Life Global Funding I | 1.950% | 1/13/23 | 280 | 288 |
| 8 | Metropolitan Life Global Funding I | 0.900% | 6/8/23 | 840 | 851 |
| 8 | Metropolitan Life Global Funding I | 3.600% | 1/11/24 | 405 | 443 |
| 9 | Metropolitan Life Global Funding I | 0.375% | 4/9/24 | 495 | 615 |
| | Mitsubishi UFJ Financial Group Inc. | 3.218% | 3/7/22 | 1,905 | 1,968 |
| | Mitsubishi UFJ Financial Group Inc. | 2.623% | 7/18/22 | 1,210 | 1,251 |
| | Mitsubishi UFJ Financial Group Inc. | 2.665% | 7/25/22 | 1,293 | 1,338 |
| | Mitsubishi UFJ Financial Group Inc. | 3.761% | 7/26/23 | 3,270 | 3,544 |
| | Mitsubishi UFJ Financial Group Inc. | 2.527% | 9/13/23 | 200 | 211 |
| | Mitsubishi UFJ Financial Group Inc. | 3.407% | 3/7/24 | 1,575 | 1,705 |
| | Mitsubishi UFJ Financial Group Inc. | 2.801% | 7/18/24 | 660 | 707 |
| | Mitsubishi UFJ Financial Group Inc. | 0.848% | 9/15/24 | 2,150 | 2,158 |
| | Mitsubishi UFJ Financial Group Inc. | 2.193% | 2/25/25 | 2,350 | 2,482 |
| | Mitsubishi UFJ Financial Group Inc. | 3.777% | 3/2/25 | 900 | 1,004 |
| | Mitsubishi UFJ Financial Group Inc. | 1.412% | 7/17/25 | 1,035 | 1,056 |
| 8 | Mizuho Bank Ltd. | 2.950% | 10/17/22 | 480 | 502 |
| 8 | Mizuho Bank Ltd. | 3.750% | 4/16/24 | 240 | 264 |
| 8 | Mizuho Bank Ltd. | 3.600% | 9/25/24 | 400 | 441 |
| | | | Coupon | Maturity
Date | Face
Amount
($000) | Market
Value•
($000) |
| | Mizuho Financial Group Inc. | 2.273% | 9/13/21 | 460 | 466 |
| | Mizuho Financial Group Inc. | 2.953% | 2/28/22 | 915 | 942 |
| | Mizuho Financial Group Inc. | 2.721% | 7/16/23 | 1,800 | 1,857 |
| | Mizuho Financial Group Inc. | 1.241% | 7/10/24 | 1,410 | 1,424 |
| | Mizuho Financial Group Inc. | 2.226% | 5/25/26 | 600 | 629 |
| | Morgan Stanley | 5.500% | 7/28/21 | 800 | 823 |
| | Morgan Stanley | 2.625% | 11/17/21 | 1,060 | 1,081 |
| | Morgan Stanley | 2.750% | 5/19/22 | 2,995 | 3,092 |
| | Morgan Stanley | 4.875% | 11/1/22 | 740 | 797 |
| 9 | Morgan Stanley | 1.000% | 12/2/22 | 800 | 999 |
| | Morgan Stanley | 3.125% | 1/23/23 | 5,540 | 5,847 |
| | Morgan Stanley | 3.750% | 2/25/23 | 1,395 | 1,494 |
| | Morgan Stanley | 4.100% | 5/22/23 | 800 | 867 |
| | Morgan Stanley | 0.560% | 11/10/23 | 1,470 | 1,472 |
| | Morgan Stanley | 3.737% | 4/24/24 | 657 | 704 |
| | Morgan Stanley | 3.700% | 10/23/24 | 1,115 | 1,241 |
| | Morgan Stanley | 2.720% | 7/22/25 | 3,658 | 3,913 |
| | Morgan Stanley | 4.000% | 7/23/25 | 450 | 513 |
| | Morgan Stanley | 0.864% | 10/21/25 | 390 | 393 |
| | Morgan Stanley | 5.000% | 11/24/25 | 195 | 233 |
| | Morgan Stanley | 2.188% | 4/28/26 | 1,847 | 1,949 |
| | Morgan Stanley | 0.985% | 12/10/26 | 650 | 654 |
| | MUFG Americas Holdings Corp. | 3.500% | 6/18/22 | 266 | 278 |
| | MUFG Union Bank NA | 3.150% | 4/1/22 | 3,350 | 3,459 |
| | MUFG Union Bank NA | 2.100% | 12/9/22 | 1,000 | 1,032 |
| | Nasdaq Inc. | 0.445% | 12/21/22 | 320 | 320 |
| 9 | National Australia Bank Ltd. | 0.250% | 5/20/24 | 410 | 509 |
| 8 | National Bank of Canada | 2.150% | 10/7/22 | 500 | 515 |
| | National Bank of Canada | 2.100% | 2/1/23 | 1,330 | 1,368 |
| | National Bank of Canada | 0.550% | 11/15/24 | 1,140 | 1,144 |
| 8 | National Secs Clearing | 0.400% | 12/7/23 | 440 | 441 |
| 8 | National Secs Clearing | 0.750% | 12/7/25 | 500 | 501 |
| 8 | Nationwide Building Society | 2.000% | 1/27/23 | 1,575 | 1,628 |
| 8 | Nationwide Building Society | 3.766% | 3/8/24 | 200 | 213 |
| 8 | Nationwide Building Society | 4.363% | 8/1/24 | 950 | 1,033 |
| 8 | Nationwide Building Society | 1.000% | 8/28/25 | 800 | 803 |
| | Natwest Group plc | 6.125% | 12/15/22 | 267 | 293 |
| | Natwest Group plc | 3.498% | 5/15/23 | 740 | 769 |
| | Natwest Group plc | 6.100% | 6/10/23 | 605 | 676 |
| | Natwest Group plc | 3.875% | 9/12/23 | 510 | 553 |
| | Natwest Group plc | 6.000% | 12/19/23 | 530 | 605 |
| | Natwest Group plc | 2.359% | 5/22/24 | 320 | 331 |
| | Natwest Group plc | 5.125% | 5/28/24 | 397 | 442 |
| | Natwest Group plc | 4.519% | 6/25/24 | 905 | 986 |
| | Natwest Group plc | 4.269% | 3/22/25 | 2,263 | 2,482 |
| | Natwest Group plc | 3.754% | 11/1/29 | 1,180 | 1,252 |
| 8 | New York Life Global Funding | 1.100% | 5/5/23 | 330 | 335 |
| | Nomura Holdings Inc. | 2.648% | 1/16/25 | 1,000 | 1,065 |
| | Nomura Holdings Inc. | 1.851% | 7/16/25 | 2,125 | 2,215 |
| 8 | Nordea Bank Abp | 1.000% | 6/9/23 | 600 | 607 |
| 8 | Nordea Bank Abp | 0.750% | 8/28/25 | 1,200 | 1,202 |
| 8 | Nuveen Finance LLC | 4.125% | 11/1/24 | 488 | 549 |
| 9 | Nykredit Realkredit AS | 0.250% | 1/20/23 | 1,000 | 1,229 |
| | ORIX Corp. | 4.050% | 1/16/24 | 150 | 164 |
| | Owl Rock Capital Corp. | 3.750% | 7/22/25 | 330 | 342 |
| | Owl Rock Capital Corp. | 4.250% | 1/15/26 | 60 | 63 |
| | Owl Rock Capital Corp. | 3.400% | 7/15/26 | 770 | 780 |
| | PNC Bank NA | 2.700% | 11/1/22 | 330 | 344 |
Short-Term Investment-Grade Portfolio
| | | | Coupon | Maturity
Date | Face
Amount
($000) | Market
Value•
($000) |
| | PNC Bank NA | 2.028% | 12/9/22 | 940 | 955 |
| | PNC Bank NA | 1.743% | 2/24/23 | 400 | 406 |
| | PNC Bank NA | 3.800% | 7/25/23 | 750 | 810 |
| | PNC Bank NA | 3.300% | 10/30/24 | 2,424 | 2,667 |
| | PNC Bank NA | 2.950% | 2/23/25 | 690 | 755 |
| | PNC Bank NA | 3.250% | 6/1/25 | 1,860 | 2,062 |
| | PNC Financial Services Group Inc. | 2.854% | 11/9/22 | 523 | 547 |
| | PNC Financial Services Group Inc. | 3.900% | 4/29/24 | 248 | 274 |
| | Prudential Financial Inc. | 4.500% | 11/16/21 | 250 | 259 |
| | Prudential Financial Inc. | 5.200% | 3/15/44 | 85 | 92 |
| 8 | Reliance Standard Life Global Funding II | 2.150% | 1/21/23 | 400 | 410 |
| 8 | Reliance Standard Life Global Funding II | 3.850% | 9/19/23 | 1,120 | 1,206 |
| | Royal Bank of Canada | 1.600% | 4/17/23 | 1,000 | 1,027 |
| | Royal Bank of Canada | 3.700% | 10/5/23 | 1,915 | 2,087 |
| | Royal Bank of Canada | 0.500% | 10/26/23 | 1,320 | 1,325 |
| | Royal Bank of Canada | 2.550% | 7/16/24 | 5,047 | 5,398 |
| | Royal Bank of Canada | 2.250% | 11/1/24 | 5,165 | 5,493 |
| | Royal Bank of Canada | 1.150% | 6/10/25 | 550 | 560 |
| | Santander Holdings USA Inc. | 3.700% | 3/28/22 | 874 | 902 |
| | Santander Holdings USA Inc. | 3.400% | 1/18/23 | 1,480 | 1,551 |
| | Santander Holdings USA Inc. | 3.500% | 6/7/24 | 2,410 | 2,604 |
| | Santander Holdings USA Inc. | 3.450% | 6/2/25 | 415 | 451 |
| | Santander Holdings USA Inc. | 4.500% | 7/17/25 | 60 | 68 |
| | Santander UK Group Holdings plc | 3.571% | 1/10/23 | 620 | 639 |
| | Santander UK Group Holdings plc | 3.373% | 1/5/24 | 2,017 | 2,115 |
| | Santander UK Group Holdings plc | 4.796% | 11/15/24 | 820 | 909 |
| | Santander UK Group Holdings plc | 1.532% | 8/21/26 | 675 | 679 |
| | Santander UK plc | 3.750% | 11/15/21 | 1,250 | 1,286 |
| | Santander UK plc | 2.100% | 1/13/23 | 1,200 | 1,238 |
| | Santander UK plc | 4.000% | 3/13/24 | 1,730 | 1,908 |
| | Santander UK plc | 2.875% | 6/18/24 | 655 | 700 |
| 8 | Skandinaviska Enskilda Banken AB | 0.550% | 9/1/23 | 2,390 | 2,393 |
| 8 | Skandinaviska Enskilda Banken AB | 0.850% | 9/2/25 | 200 | 200 |
| 9 | Skandinaviska Enskilda Banken AB | 2.500% | 5/28/26 | 570 | 703 |
| 8 | SMBC Aviation Capital Finance DAC | 2.650% | 7/15/21 | 445 | 447 |
| 8 | Standard Chartered plc | 1.319% | 10/14/23 | 630 | 634 |
| | State Street Corp. | 2.825% | 3/30/23 | 405 | 417 |
| | State Street Corp. | 3.100% | 5/15/23 | 400 | 425 |
| | State Street Corp. | 3.776% | 12/3/24 | 580 | 635 |
| | State Street Corp. | 3.550% | 8/18/25 | 866 | 977 |
| | State Street Corp. | 2.354% | 11/1/25 | 1,330 | 1,412 |
| | State Street Corp. | 2.901% | 3/30/26 | 270 | 293 |
| | Stifel Financial Corp. | 4.250% | 7/18/24 | 485 | 542 |
| | Sumitomo Mitsui Financial Group Inc. | 2.442% | 10/19/21 | 1,014 | 1,029 |
| | Sumitomo Mitsui Financial Group Inc. | 2.784% | 7/12/22 | 3,002 | 3,109 |
| | Sumitomo Mitsui Financial Group Inc. | 2.778% | 10/18/22 | 1,380 | 1,434 |
| | Sumitomo Mitsui Financial Group Inc. | 3.102% | 1/17/23 | 2,205 | 2,326 |
| | Sumitomo Mitsui Financial Group Inc. | 3.748% | 7/19/23 | 2,320 | 2,511 |
| | Sumitomo Mitsui Financial Group Inc. | 3.936% | 10/16/23 | 150 | 164 |
| | | | Coupon | Maturity
Date | Face
Amount
($000) | Market
Value•
($000) |
| | Sumitomo Mitsui Financial Group Inc. | 2.696% | 7/16/24 | 5,410 | 5,766 |
| | Sumitomo Mitsui Financial Group Inc. | 2.448% | 9/27/24 | 200 | 212 |
| | Sumitomo Mitsui Financial Group Inc. | 2.348% | 1/15/25 | 800 | 848 |
| | Sumitomo Mitsui Financial Group Inc. | 1.474% | 7/8/25 | 1,380 | 1,411 |
| 7,10 | Sumitomo Mitsui Financial Group Inc., 3M Australian Bank Bill Rate + 1.200% | 1.219% | 3/7/23 | 263 | 205 |
| 7,10 | Sumitomo Mitsui Financial Group Inc., 3M Australian Bank Bill Rate + 1.250% | 1.330% | 10/16/24 | 785 | 612 |
| 7,10 | Sumitomo Mitsui Financial Group Inc., 3M Australian Bank Bill Rate + 1.270% | 1.290% | 3/29/22 | 1,227 | 953 |
| 8 | Svenska Handelsbanken AB | 0.625% | 6/30/23 | 1,270 | 1,273 |
| 10 | Svenska Handelsbanken AB | 3.250% | 9/27/23 | 390 | 323 |
| | Svenska Handelsbanken AB | 3.900% | 11/20/23 | 581 | 635 |
| 9 | Svenska Handelsbanken AB | 0.125% | 6/18/24 | 410 | 507 |
| 11 | Swedbank AB | 1.250% | 12/29/21 | 590 | 816 |
| 11 | Swedbank AB | 1.625% | 12/28/22 | 1,120 | 1,575 |
| 8 | Swedbank AB | 0.600% | 9/25/23 | 1,070 | 1,074 |
| | Synchrony Bank | 3.000% | 6/15/22 | 400 | 413 |
| | Synchrony Financial | 2.850% | 7/25/22 | 780 | 805 |
| | Synchrony Financial | 4.375% | 3/19/24 | 490 | 538 |
| | Synchrony Financial | 4.250% | 8/15/24 | 900 | 985 |
| | Synchrony Financial | 4.500% | 7/23/25 | 465 | 522 |
| | TD Ameritrade Holding Corp. | 3.625% | 4/1/25 | 100 | 111 |
| | Toronto-Dominion Bank | 0.750% | 6/12/23 | 3,050 | 3,073 |
| | Toronto-Dominion Bank | 3.500% | 7/19/23 | 2,935 | 3,169 |
| 9 | Toronto-Dominion Bank | 0.625% | 7/20/23 | 410 | 512 |
| | Toronto-Dominion Bank | 0.450% | 9/11/23 | 2,990 | 2,993 |
| | Toronto-Dominion Bank | 2.650% | 6/12/24 | 865 | 927 |
| | Toronto-Dominion Bank | 1.150% | 6/12/25 | 1,050 | 1,069 |
| | Toronto-Dominion Bank | 0.750% | 9/11/25 | 1,945 | 1,946 |
| 7,10 | Toronto-Dominion Bank, 3M Australian Bank Bill Rate + 1.000% | 1.080% | 7/10/24 | 1,110 | 867 |
| | Truist Bank | 1.250% | 3/9/23 | 250 | 255 |
| | Truist Bank | 3.200% | 4/1/24 | 4,811 | 5,220 |
| | Truist Bank | 3.689% | 8/2/24 | 1,150 | 1,244 |
| | Truist Bank | 2.150% | 12/6/24 | 2,780 | 2,943 |
| | Truist Bank | 1.500% | 3/10/25 | 580 | 599 |
| | Truist Financial Corp. | 2.700% | 1/27/22 | 650 | 665 |
| | Truist Financial Corp. | 3.950% | 3/22/22 | 100 | 104 |
| | Truist Financial Corp. | 3.050% | 6/20/22 | 681 | 706 |
| | Truist Financial Corp. | 2.200% | 3/16/23 | 1,090 | 1,132 |
| | Truist Financial Corp. | 3.750% | 12/6/23 | 355 | 389 |
| | Truist Financial Corp. | 2.500% | 8/1/24 | 1,975 | 2,103 |
| | Truist Financial Corp. | 2.850% | 10/26/24 | 45 | 48 |
| | Truist Financial Corp. | 1.200% | 8/5/25 | 735 | 754 |
| | U.S. Bancorp | 3.700% | 1/30/24 | 1,449 | 1,580 |
| | U.S. Bancorp | 3.375% | 2/5/24 | 1,966 | 2,134 |
| | U.S. Bancorp | 2.400% | 7/30/24 | 2,167 | 2,306 |
| | U.S. Bancorp | 3.600% | 9/11/24 | 490 | 539 |
| | U.S. Bancorp | 1.450% | 5/12/25 | 1,200 | 1,243 |
| | U.S. Bank NA | 2.050% | 1/21/25 | 1,250 | 1,319 |
| 8 | UBS Group AG | 2.650% | 2/1/22 | 1,722 | 1,765 |
| 8 | UBS Group AG | 3.491% | 5/23/23 | 210 | 219 |
| 8 | UBS Group AG | 2.859% | 8/15/23 | 1,872 | 1,941 |
| 8 | UBS Group AG | 1.008% | 7/30/24 | 1,285 | 1,296 |
Short-Term Investment-Grade Portfolio
| | | | Coupon | Maturity
Date | Face
Amount
($000) | Market
Value•
($000) |
| 9 | Unione di Banche Italiane SPA | 1.000% | 7/22/22 | 295 | 366 |
| 14,15 | Washington Mutual Bank / Debt not acquired by JPMorgan | 6.875% | 6/15/11 | 517 | — |
| | Wells Fargo & Co. | 4.600% | 4/1/21 | 673 | 679 |
| | Wells Fargo & Co. | 2.100% | 7/26/21 | 1,000 | 1,010 |
| 11 | Wells Fargo & Co. | 2.125% | 4/22/22 | 705 | 985 |
| | Wells Fargo & Co. | 2.625% | 7/22/22 | 3,110 | 3,219 |
| | Wells Fargo & Co. | 3.069% | 1/24/23 | 1,410 | 1,448 |
| | Wells Fargo & Co. | 3.450% | 2/13/23 | 1,500 | 1,588 |
| | Wells Fargo & Co. | 3.750% | 1/24/24 | 2,775 | 3,024 |
| 9 | Wells Fargo & Co. | 0.500% | 4/26/24 | 515 | 638 |
| | Wells Fargo & Co. | 1.654% | 6/2/24 | 1,680 | 1,720 |
| | Wells Fargo & Co. | 3.300% | 9/9/24 | 534 | 585 |
| | Wells Fargo & Co. | 3.000% | 2/19/25 | 540 | 586 |
| | Wells Fargo & Co. | 2.406% | 10/30/25 | 3,310 | 3,495 |
| | Wells Fargo & Co. | 2.164% | 2/11/26 | 1,790 | 1,878 |
| | Wells Fargo & Co. | 2.188% | 4/30/26 | 2,625 | 2,764 |
| 7,10 | Wells Fargo & Co., 3M Australian Bank Bill Rate + 1.100% | 1.156% | 4/27/22 | 657 | 510 |
| 7,10 | Wells Fargo & Co., 3M Australian Bank Bill Rate + 1.320% | 1.376% | 7/27/21 | 1,635 | 1,267 |
| | Wells Fargo Bank NA | 2.082% | 9/9/22 | 3,750 | 3,787 |
| 11 | Wells Fargo Bank NA | 5.250% | 8/1/23 | 1,000 | 1,522 |
| | Wells Fargo Bank NA | 3.550% | 8/14/23 | 5,684 | 6,139 |
| | Westpac Banking Corp. | 2.750% | 1/11/23 | 800 | 838 |
| | Westpac Banking Corp. | 2.000% | 1/13/23 | 210 | 217 |
| 9 | Westpac Banking Corp. | 0.750% | 10/17/23 | 410 | 515 |
| | Westpac Banking Corp. | 3.300% | 2/26/24 | 3,100 | 3,368 |
| | Westpac Banking Corp. | 2.894% | 2/4/30 | 655 | 687 |
| 7,10 | Westpac Banking Corp., 3M Australian Bank Bill Rate + 1.800% | 1.811% | 6/22/28 | 1,800 | 1,402 |
| 7,10 | Westpac Banking Corp., 3M Australian Bank Bill Rate + 3.100% | 3.120% | 3/10/26 | 1,200 | 929 |
| | Willis North America Inc. | 3.600% | 5/15/24 | 1,845 | 2,016 |
| | | | | | | 579,836 |
| Health Care (8.3%) |
| | AbbVie Inc. | 3.375% | 11/14/21 | 1,778 | 1,825 |
| | AbbVie Inc. | 2.150% | 11/19/21 | 8,500 | 8,630 |
| | AbbVie Inc. | 5.000% | 12/15/21 | 860 | 887 |
| | AbbVie Inc. | 3.450% | 3/15/22 | 2,345 | 2,418 |
| | AbbVie Inc. | 3.250% | 10/1/22 | 416 | 433 |
| | AbbVie Inc. | 2.900% | 11/6/22 | 3,380 | 3,534 |
| | AbbVie Inc. | 3.200% | 11/6/22 | 2,058 | 2,156 |
| | AbbVie Inc. | 2.300% | 11/21/22 | 6,500 | 6,728 |
| | AbbVie Inc. | 2.800% | 3/15/23 | 200 | 209 |
| | AbbVie Inc. | 2.850% | 5/14/23 | 100 | 105 |
| 9 | AbbVie Inc. | 1.250% | 6/1/24 | 495 | 629 |
| | AbbVie Inc. | 3.850% | 6/15/24 | 1,914 | 2,101 |
| | AbbVie Inc. | 2.600% | 11/21/24 | 9,275 | 9,914 |
| | AbbVie Inc. | 3.800% | 3/15/25 | 432 | 482 |
| | AbbVie Inc. | 3.600% | 5/14/25 | 270 | 301 |
| | Aetna Inc. | 2.750% | 11/15/22 | 375 | 389 |
| | Aetna Inc. | 2.800% | 6/15/23 | 731 | 769 |
| | Aetna Inc. | 3.500% | 11/15/24 | 330 | 363 |
| | Amgen Inc. | 2.700% | 5/1/22 | 565 | 581 |
| | Amgen Inc. | 2.650% | 5/11/22 | 510 | 525 |
| | Amgen Inc. | 3.625% | 5/15/22 | 74 | 77 |
| | Amgen Inc. | 1.900% | 2/21/25 | 500 | 526 |
| | Amgen Inc. | 3.125% | 5/1/25 | 100 | 110 |
| | Anthem Inc. | 2.375% | 1/15/25 | 240 | 256 |
| | AstraZeneca plc | 2.375% | 6/12/22 | 90 | 92 |
| | AstraZeneca plc | 3.500% | 8/17/23 | 290 | 312 |
| | AstraZeneca plc | 3.375% | 11/16/25 | 1,500 | 1,686 |
| 8 | Bausch Health Cos. Inc. | 7.000% | 3/15/24 | 250 | 257 |
| | | | Coupon | Maturity
Date | Face
Amount
($000) | Market
Value•
($000) |
| 8 | Bausch Health Cos. Inc. | 6.125% | 4/15/25 | 300 | 309 |
| 8 | Bausch Health Cos. Inc. | 5.500% | 11/1/25 | 60 | 62 |
| 8 | Bausch Health Cos. Inc. | 5.750% | 8/15/27 | 70 | 75 |
| 8 | Bausch Health Cos. Inc. | 7.000% | 1/15/28 | 30 | 33 |
| | Baxalta Inc. | 3.600% | 6/23/22 | 100 | 104 |
| 8 | Bayer US Finance II LLC | 3.875% | 12/15/23 | 2,087 | 2,271 |
| 8 | Bayer US Finance II LLC | 4.250% | 12/15/25 | 2,205 | 2,519 |
| | Becton Dickinson and Co. | 3.125% | 11/8/21 | 900 | 920 |
| | Becton Dickinson and Co. | 2.894% | 6/6/22 | 342 | 353 |
| | Becton Dickinson and Co. | 3.363% | 6/6/24 | 1,110 | 1,203 |
| 9 | Becton Dickinson Euro Finance Sarl | 0.174% | 6/4/21 | 2,085 | 2,549 |
| | Biogen Inc. | 3.625% | 9/15/22 | 1,275 | 1,345 |
| | Boston Scientific Corp. | 3.450% | 3/1/24 | 1,835 | 1,986 |
| | Boston Scientific Corp. | 1.900% | 6/1/25 | 1,910 | 1,998 |
| | Boston Scientific Corp. | 3.750% | 3/1/26 | 77 | 87 |
| | Bristol-Myers Squibb Co. | 2.750% | 2/15/23 | 1,305 | 1,367 |
| | Bristol-Myers Squibb Co. | 3.250% | 2/20/23 | 575 | 609 |
| | Bristol-Myers Squibb Co. | 0.537% | 11/13/23 | 1,500 | 1,501 |
| | Bristol-Myers Squibb Co. | 3.625% | 5/15/24 | 700 | 767 |
| | Bristol-Myers Squibb Co. | 2.900% | 7/26/24 | 6,955 | 7,518 |
| | Bristol-Myers Squibb Co. | 3.875% | 8/15/25 | 500 | 570 |
| | Bristol-Myers Squibb Co. | 0.750% | 11/13/25 | 1,500 | 1,502 |
| | Cardinal Health Inc. | 3.079% | 6/15/24 | 495 | 532 |
| | Centene Corp. | 4.750% | 1/15/25 | 100 | 103 |
| 8 | Centene Corp. | 5.375% | 6/1/26 | 60 | 63 |
| | Cigna Corp. | 3.050% | 11/30/22 | 1,350 | 1,408 |
| | Cigna Corp. | 3.000% | 7/15/23 | 1,795 | 1,894 |
| | Cigna Corp. | 3.750% | 7/15/23 | 2,052 | 2,213 |
| | Cigna Corp. | 3.500% | 6/15/24 | 2,333 | 2,542 |
| | Cigna Corp. | 3.250% | 4/15/25 | 1,000 | 1,094 |
| | Cigna Corp. | 4.125% | 11/15/25 | 2,246 | 2,582 |
| | CommonSpirit Health | 4.200% | 8/1/23 | 100 | 108 |
| | CommonSpirit Health | 2.760% | 10/1/24 | 985 | 1,058 |
| | CommonSpirit Health | 1.547% | 10/1/25 | 500 | 513 |
| | Coventry Health Care Inc. | 5.450% | 6/15/21 | 300 | 303 |
| | CVS Health Corp. | 3.500% | 7/20/22 | 1,000 | 1,044 |
| | CVS Health Corp. | 2.750% | 12/1/22 | 1,200 | 1,246 |
| | CVS Health Corp. | 3.700% | 3/9/23 | 3,585 | 3,831 |
| | CVS Health Corp. | 2.625% | 8/15/24 | 2,900 | 3,103 |
| | CVS Health Corp. | 4.100% | 3/25/25 | 1,728 | 1,959 |
| 9 | Danaher Corp. | 1.700% | 3/30/24 | 490 | 633 |
| 8 | DaVita Inc. | 4.625% | 6/1/30 | 245 | 260 |
| 8 | DaVita Inc. | 3.750% | 2/15/31 | 95 | 96 |
| | DH Europe Finance II Sarl | 2.050% | 11/15/22 | 2,730 | 2,815 |
| | DH Europe Finance II Sarl | 2.200% | 11/15/24 | 4,400 | 4,631 |
| | Encompass Health Corp. | 4.500% | 2/1/28 | 60 | 63 |
| | Gilead Sciences Inc. | 3.250% | 9/1/22 | 858 | 896 |
| | Gilead Sciences Inc. | 2.500% | 9/1/23 | 1,125 | 1,184 |
| | Gilead Sciences Inc. | 0.750% | 9/29/23 | 2,800 | 2,807 |
| | Gilead Sciences Inc. | 3.700% | 4/1/24 | 3,022 | 3,301 |
| | Gilead Sciences Inc. | 3.500% | 2/1/25 | 2,442 | 2,698 |
| | Gilead Sciences Inc. | 3.650% | 3/1/26 | 720 | 817 |
| | GlaxoSmithKline Capital Inc. | 3.375% | 5/15/23 | 770 | 825 |
| 9 | GlaxoSmithKline Capital plc | 0.125% | 5/12/23 | 410 | 504 |
Short-Term Investment-Grade Portfolio
| | | | Coupon | Maturity
Date | Face
Amount
($000) | Market
Value•
($000) |
| | GlaxoSmithKline Capital plc | 0.534% | 10/1/23 | 525 | 527 |
| | GlaxoSmithKline Capital plc | 3.000% | 6/1/24 | 4,091 | 4,418 |
| | HCA Inc. | 4.750% | 5/1/23 | 1,000 | 1,089 |
| | HCA Inc. | 5.000% | 3/15/24 | 2,729 | 3,063 |
| | HCA Inc. | 5.375% | 2/1/25 | 155 | 174 |
| | HCA Inc. | 5.250% | 4/15/25 | 200 | 233 |
| | HCA Inc. | 5.375% | 9/1/26 | 40 | 46 |
| | HCA Inc. | 3.500% | 9/1/30 | 40 | 42 |
| 8 | Hill-Rom Holdings Inc. | 4.375% | 9/15/27 | 135 | 142 |
| | Laboratory Corp. of America Holdings | 3.750% | 8/23/22 | 1,760 | 1,841 |
| | Laboratory Corp. of America Holdings | 3.250% | 9/1/24 | 200 | 218 |
| | Laboratory Corp. of America Holdings | 3.600% | 2/1/25 | 300 | 331 |
| | McKesson Corp. | 2.700% | 12/15/22 | 1,900 | 1,973 |
| | McKesson Corp. | 2.850% | 3/15/23 | 650 | 679 |
| | McKesson Corp. | 3.796% | 3/15/24 | 2,300 | 2,521 |
| | McKesson Corp. | 0.900% | 12/3/25 | 500 | 501 |
| 9 | Medtronic Global Holdings SCA | 0.000% | 3/15/23 | 2,155 | 2,644 |
| | Medtronic Inc. | 3.500% | 3/15/25 | 922 | 1,033 |
| | Merck & Co. Inc. | 2.900% | 3/7/24 | 80 | 86 |
| | Merck & Co. Inc. | 2.750% | 2/10/25 | 410 | 445 |
| 8 | Mylan Inc. | 3.125% | 1/15/23 | 865 | 908 |
| | Pfizer Inc. | 0.800% | 5/28/25 | 1,290 | 1,308 |
| 8 | Royalty Pharma plc | 0.750% | 9/2/23 | 1,000 | 1,004 |
| 8 | Royalty Pharma plc | 1.200% | 9/2/25 | 1,500 | 1,520 |
| | Shire Acquisitions Investments Ireland DAC | 2.400% | 9/23/21 | 2,197 | 2,226 |
| | Shire Acquisitions Investments Ireland DAC | 2.875% | 9/23/23 | 2,300 | 2,439 |
| | SSM Health Care Corp. | 3.688% | 6/1/23 | 1,565 | 1,673 |
| | Stryker Corp. | 3.375% | 5/15/24 | 250 | 272 |
| | Stryker Corp. | 1.150% | 6/15/25 | 1,500 | 1,530 |
| | Takeda Pharmaceutical Co. Ltd. | 4.000% | 11/26/21 | 4,965 | 5,114 |
| 8 | Takeda Pharmaceutical Co. Ltd. | 2.450% | 1/18/22 | 850 | 867 |
| 9 | Takeda Pharmaceutical Co. Ltd. | 1.125% | 11/21/22 | 490 | 612 |
| | Takeda Pharmaceutical Co. Ltd. | 4.400% | 11/26/23 | 1,957 | 2,169 |
| 8 | Tenet Healthcare Corp. | 4.625% | 9/1/24 | 50 | 51 |
| 8 | Tenet Healthcare Corp. | 7.500% | 4/1/25 | 20 | 22 |
| 8 | Tenet Healthcare Corp. | 4.875% | 1/1/26 | 195 | 203 |
| | Thermo Fisher Scientific Inc. | 3.000% | 4/15/23 | 470 | 496 |
| | Thermo Fisher Scientific Inc. | 4.133% | 3/25/25 | 1,200 | 1,365 |
| | UnitedHealth Group Inc. | 2.375% | 10/15/22 | 1,550 | 1,608 |
| | UnitedHealth Group Inc. | 2.750% | 2/15/23 | 210 | 220 |
| | UnitedHealth Group Inc. | 2.875% | 3/15/23 | 1,315 | 1,389 |
| | UnitedHealth Group Inc. | 3.500% | 2/15/24 | 743 | 812 |
| | UnitedHealth Group Inc. | 2.375% | 8/15/24 | 1,435 | 1,530 |
| | UnitedHealth Group Inc. | 3.750% | 7/15/25 | 280 | 319 |
| | UnitedHealth Group Inc. | 1.250% | 1/15/26 | 340 | 349 |
| 9 | Upjohn Finance BV | 0.816% | 6/23/22 | 990 | 1,225 |
| | Utah Acquisition Sub Inc. | 3.150% | 6/15/21 | 1,500 | 1,515 |
| 9 | Utah Acquisition Sub Inc. | 2.250% | 11/22/24 | 710 | 934 |
| 8 | Viatris Inc. | 1.125% | 6/22/22 | 2,200 | 2,222 |
| 8 | Viatris Inc. | 1.650% | 6/22/25 | 3,054 | 3,159 |
| | Zimmer Biomet Holdings Inc. | 3.150% | 4/1/22 | 655 | 674 |
| | | | Coupon | Maturity
Date | Face
Amount
($000) | Market
Value•
($000) |
| | Zimmer Biomet Holdings Inc. | 3.550% | 4/1/25 | 320 | 354 |
| | Zoetis Inc. | 3.250% | 2/1/23 | 419 | 441 |
| | | | | | | 185,605 |
| Industrials (4.8%) |
| | 3M Co. | 2.650% | 4/15/25 | 745 | 809 |
| 8 | Air Canada | 7.750% | 4/15/21 | 1,392 | 1,401 |
| 4,8 | Air Canada Class B Series 2013-1B Pass Through Trust | 5.375% | 11/15/22 | 508 | 501 |
| 8 | Airbus Finance BV | 2.700% | 4/17/23 | 225 | 236 |
| 8 | Allison Transmission Inc. | 4.750% | 10/1/27 | 120 | 126 |
| 8 | Allison Transmission Inc. | 3.750% | 1/30/31 | 115 | 117 |
| 8 | Aramark Services Inc. | 6.375% | 5/1/25 | 170 | 182 |
| | Aramark Services Inc. | 4.750% | 6/1/26 | 50 | 51 |
| 8 | Aramark Services Inc. | 5.000% | 2/1/28 | 30 | 32 |
| 10 | Aurizon Network Pty Ltd. | 4.000% | 6/21/24 | 240 | 202 |
| 10 | Australia Pacific Airports Melbourne Pty Ltd. | 4.000% | 9/15/22 | 430 | 344 |
| | Block Financial LLC | 5.250% | 10/1/25 | 173 | 198 |
| | Boeing Co. | 2.700% | 5/1/22 | 460 | 471 |
| | Boeing Co. | 4.508% | 5/1/23 | 5,777 | 6,236 |
| | Boeing Co. | 1.875% | 6/15/23 | 775 | 790 |
| | Boeing Co. | 2.800% | 3/1/24 | 875 | 920 |
| | Boeing Co. | 2.850% | 10/30/24 | 245 | 258 |
| | Boeing Co. | 4.875% | 5/1/25 | 3,505 | 3,991 |
| | Boeing Co. | 2.600% | 10/30/25 | 348 | 364 |
| | Burlington Northern Santa Fe LLC | 3.750% | 4/1/24 | 365 | 400 |
| | Burlington Northern Santa Fe LLC | 3.400% | 9/1/24 | 230 | 252 |
| | Burlington Northern Santa Fe LLC | 3.000% | 4/1/25 | 55 | 60 |
| | Canadian Pacific Railway Co. | 2.900% | 2/1/25 | 330 | 356 |
| 8 | Cargo Aircraft Management Inc. | 4.750% | 2/1/28 | 85 | 87 |
| | Carrier Global Corp. | 1.923% | 2/15/23 | 675 | 695 |
| | Carrier Global Corp. | 2.242% | 2/15/25 | 3,269 | 3,443 |
| | Caterpillar Financial Services Corp. | 2.400% | 6/6/22 | 470 | 484 |
| | Caterpillar Financial Services Corp. | 1.950% | 11/18/22 | 360 | 371 |
| | Caterpillar Financial Services Corp. | 2.550% | 11/29/22 | 530 | 553 |
| | Caterpillar Financial Services Corp. | 2.625% | 3/1/23 | 420 | 440 |
| | Caterpillar Financial Services Corp. | 3.450% | 5/15/23 | 30 | 32 |
| | Caterpillar Financial Services Corp. | 0.450% | 9/14/23 | 1,885 | 1,891 |
| | Caterpillar Financial Services Corp. | 3.750% | 11/24/23 | 730 | 799 |
| | Caterpillar Financial Services Corp. | 2.850% | 5/17/24 | 400 | 431 |
| | Caterpillar Financial Services Corp. | 3.300% | 6/9/24 | 550 | 601 |
| | Caterpillar Financial Services Corp. | 2.150% | 11/8/24 | 400 | 424 |
| | Caterpillar Financial Services Corp. | 0.800% | 11/13/25 | 1,000 | 1,004 |
| | Caterpillar Inc. | 3.400% | 5/15/24 | 400 | 437 |
| 8 | Clark Equipment Co. | 5.875% | 6/1/25 | 60 | 63 |
| 8 | Clean Harbors Inc. | 4.875% | 7/15/27 | 230 | 242 |
| 8 | Clean Harbors Inc. | 5.125% | 7/15/29 | 30 | 33 |
| | CNH Industrial Capital LLC | 4.875% | 4/1/21 | 95 | 96 |
| | CNH Industrial Capital LLC | 3.875% | 10/15/21 | 230 | 235 |
Short-Term Investment-Grade Portfolio
| | | | Coupon | Maturity
Date | Face
Amount
($000) | Market
Value•
($000) |
| | CNH Industrial Capital LLC | 4.375% | 4/5/22 | 750 | 784 |
| | CNH Industrial Capital LLC | 1.950% | 7/2/23 | 790 | 814 |
| | CNH Industrial NV | 4.500% | 8/15/23 | 1,620 | 1,770 |
| 4 | Continental Airlines Class A Series 2010-1 Pass Through Trust | 4.750% | 7/12/22 | 59 | 59 |
| 4 | Continental Airlines Series 2005-ERJ1 Pass Through Trust | 9.798% | 10/1/22 | 13 | 13 |
| | CSX Corp. | 3.400% | 8/1/24 | 1,565 | 1,709 |
| | CSX Corp. | 3.350% | 11/1/25 | 140 | 157 |
| 4 | CSX Transportation Inc. | 6.251% | 1/15/23 | 80 | 88 |
| | Cummins Inc. | 0.750% | 9/1/25 | 420 | 423 |
| | Deere & Co. | 2.750% | 4/15/25 | 710 | 771 |
| 4 | Delta Air Lines Class A Series 2007-1 Pass Through Trust | 6.821% | 2/10/24 | 123 | 125 |
| 4 | Delta Air Lines Class B Series 2007-1 Pass Through Trust | 8.021% | 2/10/24 | 111 | 111 |
| | Delta Air Lines Inc. | 2.900% | 10/28/24 | 70 | 69 |
| 8 | Delta Air Lines Inc. | 7.000% | 5/1/25 | 425 | 491 |
| | Delta Air Lines Inc. | 7.375% | 1/15/26 | 85 | 97 |
| 4,8 | Delta Air Lines Inc. / SkyMiles IP Ltd. | 4.500% | 10/20/25 | 2,060 | 2,199 |
| | Dover Corp. | 3.150% | 11/15/25 | 210 | 231 |
| | Embraer Netherlands Finance BV | 5.050% | 6/15/25 | 119 | 126 |
| | Embraer Overseas Ltd. | 5.696% | 9/16/23 | 37 | 39 |
| | Embraer SA | 5.150% | 6/15/22 | 610 | 627 |
| | FedEx Corp. | 3.400% | 1/14/22 | 645 | 665 |
| | FedEx Corp. | 3.800% | 5/15/25 | 2,805 | 3,168 |
| | General Dynamics Corp. | 1.875% | 8/15/23 | 160 | 166 |
| | General Dynamics Corp. | 2.375% | 11/15/24 | 30 | 32 |
| | General Dynamics Corp. | 3.250% | 4/1/25 | 1,710 | 1,885 |
| | General Dynamics Corp. | 3.500% | 5/15/25 | 1,070 | 1,194 |
| 8 | H&E Equipment Services Inc. | 3.875% | 12/15/28 | 205 | 206 |
| 8 | Heathrow Funding Ltd. | 4.875% | 7/15/23 | 1,275 | 1,300 |
| | Hillenbrand Inc. | 5.750% | 6/15/25 | 55 | 60 |
| 9 | Honeywell International Inc. | 0.000% | 3/10/24 | 200 | 245 |
| | Honeywell International Inc. | 1.350% | 6/1/25 | 950 | 984 |
| | Howmet Aerospace Inc. | 6.875% | 5/1/25 | 50 | 59 |
| | Huntington Ingalls Industries Inc. | 3.844% | 5/1/25 | 945 | 1,051 |
| | Illinois Tool Works Inc. | 3.375% | 9/15/21 | 80 | 81 |
| | John Deere Capital Corp. | 3.450% | 6/7/23 | 15 | 16 |
| | John Deere Capital Corp. | 2.650% | 6/24/24 | 80 | 86 |
| 9 | John Deere Cash Management SA | 1.375% | 4/2/24 | 495 | 636 |
| | Johnson Controls International plc | 3.750% | 12/1/21 | 25 | 26 |
| | Johnson Controls International plc | 3.625% | 7/2/24 | 303 | 329 |
| | L3Harris Technologies Inc. | 3.850% | 6/15/23 | 3,571 | 3,849 |
| | L3Harris Technologies Inc. | 3.950% | 5/28/24 | 672 | 736 |
| | L3Harris Technologies Inc. | 3.832% | 4/27/25 | 155 | 174 |
| | Lennox International Inc. | 1.350% | 8/1/25 | 230 | 235 |
| | Lockheed Martin Corp. | 2.900% | 3/1/25 | 120 | 131 |
| 8 | Meritor Inc. | 4.500% | 12/15/28 | 15 | 15 |
| | | | Coupon | Maturity
Date | Face
Amount
($000) | Market
Value•
($000) |
| 8 | Mileage Plus Holdings LLC / Mileage Plus Intellectual Property Assets Ltd. | 6.500% | 6/20/27 | 437 | 471 |
| 8 | Mueller Water Products Inc. | 5.500% | 6/15/26 | 50 | 52 |
| 7,10 | New Terminal Financing Co Pty Ltd., 3M Australian Bank Bill Rate + 1.450% | 1.530% | 7/12/24 | 250 | 188 |
| | Norfolk Southern Corp. | 3.650% | 8/1/25 | 270 | 302 |
| | Norfolk Southern Corp. | 2.900% | 6/15/26 | 340 | 375 |
| | Northrop Grumman Corp. | 3.500% | 3/15/21 | 105 | 106 |
| | Northrop Grumman Corp. | 2.550% | 10/15/22 | 2,288 | 2,374 |
| | Northrop Grumman Corp. | 2.930% | 1/15/25 | 2,192 | 2,384 |
| | Otis Worldwide Corp. | 2.056% | 4/5/25 | 2,560 | 2,699 |
| | Parker-Hannifin Corp. | 3.500% | 9/15/22 | 200 | 210 |
| | Parker-Hannifin Corp. | 3.300% | 11/21/24 | 250 | 273 |
| 8 | Penske Truck Leasing Co. LP / PTL Finance Corp. | 3.300% | 4/1/21 | 1,070 | 1,075 |
| 8 | Penske Truck Leasing Co. LP / PTL Finance Corp. | 4.250% | 1/17/23 | 120 | 129 |
| 8 | Penske Truck Leasing Co. LP / PTL Finance Corp. | 2.700% | 3/14/23 | 340 | 355 |
| 8 | Penske Truck Leasing Co. LP / PTL Finance Corp. | 4.125% | 8/1/23 | 140 | 152 |
| 8 | Penske Truck Leasing Co. LP / PTL Finance Corp. | 1.200% | 11/15/25 | 1,150 | 1,158 |
| | Precision Castparts Corp. | 2.500% | 1/15/23 | 430 | 447 |
| 10 | Qantas Airways Ltd. | 7.500% | 6/11/21 | 1,300 | 1,027 |
| 10 | Qantas Airways Ltd. | 7.750% | 5/19/22 | 1,280 | 1,064 |
| | Raytheon Technologies Corp. | 2.800% | 3/15/22 | 2,485 | 2,550 |
| | Raytheon Technologies Corp. | 2.500% | 12/15/22 | 1,297 | 1,343 |
| | Raytheon Technologies Corp. | 3.650% | 8/16/23 | 308 | 332 |
| | Raytheon Technologies Corp. | 3.200% | 3/15/24 | 4,495 | 4,841 |
| | Raytheon Technologies Corp. | 3.950% | 8/16/25 | 2,120 | 2,432 |
| | Republic Services Inc. | 2.500% | 8/15/24 | 40 | 43 |
| | Republic Services Inc. | 3.200% | 3/15/25 | 385 | 422 |
| | Republic Services Inc. | 0.875% | 11/15/25 | 500 | 502 |
| 8 | Rolls-Royce plc | 3.625% | 10/14/25 | 245 | 246 |
| 8 | Rolls-Royce plc | 5.750% | 10/15/27 | 115 | 127 |
| | Ryder System Inc. | 2.875% | 6/1/22 | 1,350 | 1,394 |
| | Ryder System Inc. | 2.500% | 9/1/22 | 300 | 310 |
| | Ryder System Inc. | 3.650% | 3/18/24 | 2,105 | 2,299 |
| 9 | Siemens Financieringsmaatschappij NV | 0.125% | 6/5/22 | 500 | 614 |
| | Southwest Airlines Co. | 2.750% | 11/16/22 | 1,000 | 1,033 |
| | Southwest Airlines Co. | 4.750% | 5/4/23 | 800 | 869 |
| | Southwest Airlines Co. | 5.250% | 5/4/25 | 345 | 399 |
| 9 | Thales SA | 0.000% | 5/31/22 | 600 | 735 |
| | TransDigm Inc. | 6.500% | 5/15/25 | 40 | 41 |
| 8 | TransDigm Inc. | 8.000% | 12/15/25 | 45 | 50 |
| 8 | TransDigm Inc. | 6.250% | 3/15/26 | 120 | 128 |
| | TransDigm Inc. | 5.500% | 11/15/27 | 150 | 157 |
| | Tyco Electronics Group SA | 4.875% | 1/15/21 | 380 | 380 |
Short-Term Investment-Grade Portfolio
| | | | Coupon | Maturity
Date | Face
Amount
($000) | Market
Value•
($000) |
| | Tyco Electronics Group SA | 3.500% | 2/3/22 | 1,565 | 1,605 |
| | Tyco Electronics Group SA | 3.450% | 8/1/24 | 725 | 786 |
| 4 | UAL Series 2007-1 Pass Through Trust | 6.636% | 1/2/24 | 427 | 430 |
| | Union Pacific Corp. | 3.200% | 6/8/21 | 135 | 137 |
| | Union Pacific Corp. | 2.950% | 3/1/22 | 1,299 | 1,339 |
| | Union Pacific Corp. | 2.950% | 1/15/23 | 797 | 833 |
| | Union Pacific Corp. | 3.500% | 6/8/23 | 1,475 | 1,579 |
| | Union Pacific Corp. | 3.646% | 2/15/24 | 400 | 435 |
| | Union Pacific Corp. | 3.150% | 3/1/24 | 1,440 | 1,561 |
| | Union Pacific Corp. | 3.250% | 1/15/25 | 50 | 55 |
| | Union Pacific Corp. | 3.250% | 8/15/25 | 230 | 254 |
| | Union Pacific Corp. | 2.750% | 3/1/26 | 300 | 327 |
| 9 | United Parcel Service Inc. | 0.375% | 11/15/23 | 410 | 509 |
| | United Parcel Service Inc. | 2.200% | 9/1/24 | 340 | 361 |
| | United Rentals North America Inc. | 3.875% | 11/15/27 | 207 | 217 |
| 4 | US Airways Series 2001-1C Pass Through Trust | 7.346% | 9/20/23 | 113 | 102 |
| | Waste Management Inc. | 2.400% | 5/15/23 | 110 | 115 |
| | Waste Management Inc. | 0.750% | 11/15/25 | 700 | 702 |
| 8 | WESCO Distribution Inc. | 7.250% | 6/15/28 | 155 | 176 |
| 10 | WSO Finance Pty Ltd. | 3.500% | 7/14/23 | 310 | 252 |
| | | | | | | 106,553 |
| Materials (1.7%) |
| 8 | Air Liquide Finance SA | 2.250% | 9/27/23 | 1,435 | 1,502 |
| | Air Products and Chemicals Inc. | 2.750% | 2/3/23 | 2 | 2 |
| 8 | Arconic Corp. | 6.000% | 5/15/25 | 35 | 37 |
| 8 | Ardagh Packaging Finance plc / Ardagh Holdings USA Inc. | 5.250% | 4/30/25 | 75 | 79 |
| 8 | Ardagh Packaging Finance plc / Ardagh Holdings USA Inc. | 5.250% | 8/15/27 | 150 | 157 |
| 8 | Axalta Coating Systems LLC / Axalta Coating Systems Dutch Holding B BV | 4.750% | 6/15/27 | 80 | 85 |
| | Ball Corp. | 5.000% | 3/15/22 | 30 | 31 |
| | Ball Corp. | 4.000% | 11/15/23 | 215 | 229 |
| | Ball Corp. | 4.875% | 3/15/26 | 120 | 135 |
| 8 | Berry Global Inc. | 1.570% | 1/15/26 | 470 | 474 |
| 8 | Berry Global Inc. | 4.875% | 7/15/26 | 195 | 209 |
| 8 | Berry Global Inc. | 5.625% | 7/15/27 | 95 | 102 |
| | BHP Billiton Finance USA Ltd. | 2.875% | 2/24/22 | 210 | 216 |
| | BHP Billiton Finance USA Ltd. | 3.850% | 9/30/23 | 520 | 568 |
| 8 | Big River Steel LLC / BRS Finance Corp. | 6.625% | 1/31/29 | 60 | 65 |
| 8 | CANPACK SA / Eastern PA Land Investment Holding LLC | 3.125% | 11/1/25 | 60 | 61 |
| 8 | Chevron Phillips Chemical Co. LLC / Chevron Phillips Chemical Co. LP | 3.300% | 5/1/23 | 1,710 | 1,804 |
| | Dow Chemical Co. | 3.500% | 10/1/24 | 545 | 595 |
| | Dow Chemical Co. | 4.550% | 11/30/25 | 320 | 374 |
| | DuPont de Nemours Inc. | 4.205% | 11/15/23 | 3,106 | 3,428 |
| | DuPont de Nemours Inc. | 4.493% | 11/15/25 | 1,305 | 1,523 |
| | Eastman Chemical Co. | 3.600% | 8/15/22 | 575 | 600 |
| | EI du Pont de Nemours and Co. | 1.700% | 7/15/25 | 315 | 328 |
| | | | Coupon | Maturity
Date | Face
Amount
($000) | Market
Value•
($000) |
| 8 | Element Solutions Inc. Co. | 3.875% | 9/1/28 | 120 | 123 |
| | FMC Corp. | 3.950% | 2/1/22 | 610 | 626 |
| 8 | FMG Resources August 2006 Pty Ltd. | 4.500% | 9/15/27 | 35 | 39 |
| | Freeport-McMoRan Inc. | 4.375% | 8/1/28 | 200 | 212 |
| 8 | Georgia-Pacific LLC | 0.625% | 5/15/24 | 4,895 | 4,912 |
| 8 | Georgia-Pacific LLC | 1.750% | 9/30/25 | 2,860 | 2,989 |
| 8 | Georgia-Pacific LLC | 0.950% | 5/15/26 | 1,220 | 1,226 |
| 8 | Graham Packaging Co. Inc. | 7.125% | 8/15/28 | 60 | 66 |
| 8 | Graphic Packaging International LLC | 3.500% | 3/15/28 | 40 | 41 |
| 8 | Graphic Packaging International LLC | 3.500% | 3/1/29 | 63 | 64 |
| 8 | Hudbay Minerals Inc. | 6.125% | 4/1/29 | 61 | 66 |
| 8 | Indonesia Asahan Aluminium Persero PT | 5.230% | 11/15/21 | 740 | 767 |
| 8 | Indonesia Asahan Aluminium Persero PT | 4.750% | 5/15/25 | 788 | 872 |
| 8 | Ingevity Corp. | 3.875% | 11/1/28 | 70 | 70 |
| 8 | Kraton Polymers LLC / Kraton Polymers Capital Corp. | 4.250% | 12/15/25 | 70 | 71 |
| | LYB International Finance BV | 4.000% | 7/15/23 | 1,205 | 1,307 |
| | LYB International Finance III LLC | 2.875% | 5/1/25 | 600 | 649 |
| | LYB International Finance III LLC | 1.250% | 10/1/25 | 540 | 547 |
| | LyondellBasell Industries NV | 5.750% | 4/15/24 | 2,255 | 2,590 |
| | Mosaic Co. | 4.250% | 11/15/23 | 345 | 377 |
| | Newmont Corp. | 3.625% | 6/9/21 | 30 | 30 |
| | Newmont Corp. | 3.500% | 3/15/22 | 2 | 2 |
| | Newmont Corp. | 3.700% | 3/15/23 | 1,098 | 1,149 |
| 8 | Novelis Corp. | 4.750% | 1/30/30 | 55 | 59 |
| | Nucor Corp. | 2.000% | 6/1/25 | 460 | 485 |
| | Nutrien Ltd. | 3.150% | 10/1/22 | 514 | 535 |
| | Nutrien Ltd. | 1.900% | 5/13/23 | 941 | 972 |
| | Nutrien Ltd. | 3.500% | 6/1/23 | 276 | 294 |
| | Nutrien Ltd. | 3.625% | 3/15/24 | 151 | 164 |
| | Nutrien Ltd. | 3.375% | 3/15/25 | 205 | 225 |
| 8 | Nutrition & Biosciences Inc. | 0.697% | 9/15/22 | 570 | 572 |
| 8 | OCI NV | 5.250% | 11/1/24 | 50 | 52 |
| 8 | OCI NV | 4.625% | 10/15/25 | 60 | 62 |
| | Packaging Corp. of America | 3.650% | 9/15/24 | 11 | 12 |
| 8 | Reynolds Group Issuer Inc. / Reynolds Group Issuer LLC / Reynolds Group Issuer Lu | 4.000% | 10/15/27 | 235 | 240 |
| | Rio Tinto Finance USA Ltd. | 3.750% | 6/15/25 | 155 | 175 |
| | Sherwin-Williams Co. | 4.200% | 1/15/22 | 2 | 2 |
| | Sherwin-Williams Co. | 3.125% | 6/1/24 | 2 | 2 |
| | Silgan Holdings Inc. | 4.125% | 2/1/28 | 100 | 104 |
| | Steel Dynamics Inc. | 2.800% | 12/15/24 | 445 | 477 |
| | Steel Dynamics Inc. | 2.400% | 6/15/25 | 530 | 562 |
| 8 | Trivium Packaging Finance BV | 5.500% | 8/15/26 | 10 | 11 |
| 8 | Trivium Packaging Finance BV | 8.500% | 8/15/27 | 110 | 121 |
| | WestRock RKT LLC | 4.900% | 3/1/22 | 200 | 210 |
| | WestRock RKT LLC | 4.000% | ��3/1/23 | 1,010 | 1,074 |
| 8 | WR Grace & Co-Conn | 4.875% | 6/15/27 | 60 | 63 |
| | WRKCo Inc. | 3.000% | 9/15/24 | 960 | 1,032 |
| | WRKCo Inc. | 3.750% | 3/15/25 | 270 | 301 |
| | | | | | | 39,205 |
Short-Term Investment-Grade Portfolio
| | | | Coupon | Maturity
Date | Face
Amount
($000) | Market
Value•
($000) |
| Real Estate (2.5%) |
| 10 | Ale Direct Property Trust | 4.000% | 8/20/22 | 370 | 293 |
| | Alexandria Real Estate Equities Inc. | 4.000% | 1/15/24 | 1,955 | 2,151 |
| | Alexandria Real Estate Equities Inc. | 3.450% | 4/30/25 | 1,120 | 1,243 |
| | American Tower Corp. | 3.000% | 6/15/23 | 1,824 | 1,933 |
| | American Tower Corp. | 0.600% | 1/15/24 | 1,630 | 1,630 |
| | American Tower Corp. | 3.375% | 5/15/24 | 930 | 1,010 |
| | American Tower Corp. | 2.950% | 1/15/25 | 140 | 152 |
| | American Tower Corp. | 2.400% | 3/15/25 | 1,118 | 1,189 |
| | American Tower Corp. | 4.000% | 6/1/25 | 460 | 519 |
| 9 | Aroundtown SA | 0.375% | 9/23/22 | 1,800 | 2,211 |
| | AvalonBay Communities Inc. | 2.850% | 3/15/23 | 400 | 418 |
| | Brandywine Operating Partnership LP | 4.100% | 10/1/24 | 185 | 196 |
| | Brixmor Operating Partnership LP | 3.650% | 6/15/24 | 915 | 991 |
| | Brixmor Operating Partnership LP | 3.850% | 2/1/25 | 146 | 160 |
| | Camden Property Trust | 2.950% | 12/15/22 | 1,150 | 1,199 |
| | Camden Property Trust | 4.875% | 6/15/23 | 410 | 447 |
| | Camden Property Trust | 4.250% | 1/15/24 | 1,518 | 1,659 |
| | Camden Property Trust | 3.500% | 9/15/24 | 180 | 195 |
| | CC Holdings GS V LLC / Crown Castle GS III Corp. | 3.849% | 4/15/23 | 762 | 818 |
| | Corporate Office Properties LP | 3.600% | 5/15/23 | 455 | 480 |
| | Corporate Office Properties LP | 5.000% | 7/1/25 | 80 | 92 |
| | Corporate Office Properties LP | 2.250% | 3/15/26 | 865 | 899 |
| | Crown Castle International Corp. | 5.250% | 1/15/23 | 3,814 | 4,171 |
| | Crown Castle International Corp. | 3.150% | 7/15/23 | 1,202 | 1,279 |
| | Crown Castle International Corp. | 3.200% | 9/1/24 | 1,930 | 2,097 |
| | Crown Castle International Corp. | 1.350% | 7/15/25 | 860 | 875 |
| | Crown Castle International Corp. | 3.700% | 6/15/26 | 340 | 383 |
| | CubeSmart LP | 4.000% | 11/15/25 | 240 | 271 |
| | Digital Realty Trust LP | 2.750% | 2/1/23 | 110 | 115 |
| | Digital Realty Trust LP | 4.750% | 10/1/25 | 90 | 105 |
| | Duke Realty LP | 3.250% | 6/30/26 | 430 | 474 |
| | ERP Operating LP | 3.000% | 4/15/23 | 10 | 11 |
| | Essex Portfolio LP | 3.375% | 1/15/23 | 140 | 147 |
| | Federal Realty Investment Trust | 2.750% | 6/1/23 | 260 | 271 |
| | Federal Realty Investment Trust | 3.950% | 1/15/24 | 84 | 91 |
| | Healthpeak Properties Inc. | 4.250% | 11/15/23 | 850 | 932 |
| | Healthpeak Properties Inc. | 4.200% | 3/1/24 | 465 | 510 |
| | Healthpeak Properties Inc. | 3.875% | 8/15/24 | 202 | 223 |
| | Healthpeak Properties Inc. | 3.400% | 2/1/25 | 280 | 309 |
| | Highwoods Realty LP | 3.200% | 6/15/21 | 277 | 279 |
| | Highwoods Realty LP | 3.625% | 1/15/23 | 170 | 177 |
| | Kilroy Realty LP | 3.450% | 12/15/24 | 169 | 183 |
| | Kimco Realty Corp. | 3.125% | 6/1/23 | 657 | 693 |
| | Kimco Realty Corp. | 2.700% | 3/1/24 | 125 | 132 |
| | Kimco Realty Corp. | 3.300% | 2/1/25 | 1,040 | 1,136 |
| | MGM Growth Properties Operating Partnership LP / MGP Finance Co-Issuer Inc. | 5.625% | 5/1/24 | 386 | 418 |
| | | | Coupon | Maturity
Date | Face
Amount
($000) | Market
Value•
($000) |
| 8 | MGM Growth Properties Operating Partnership LP / MGP Finance Co-Issuer Inc. | 4.625% | 6/15/25 | 161 | 171 |
| | MGM Growth Properties Operating Partnership LP / MGP Finance Co-Issuer Inc. | 4.500% | 9/1/26 | 33 | 36 |
| | Mid-America Apartments LP | 4.300% | 10/15/23 | 135 | 147 |
| | Mid-America Apartments LP | 3.750% | 6/15/24 | 160 | 174 |
| | National Retail Properties Inc. | 3.300% | 4/15/23 | 140 | 148 |
| | National Retail Properties Inc. | 3.900% | 6/15/24 | 390 | 427 |
| | National Retail Properties Inc. | 4.000% | 11/15/25 | 310 | 349 |
| | Omega Healthcare Investors Inc. | 4.950% | 4/1/24 | 527 | 574 |
| | Omega Healthcare Investors Inc. | 4.500% | 1/15/25 | 320 | 350 |
| 8 | Ontario Teachers' Cadillac Fairview Properties Trust | 3.125% | 3/20/22 | 1,326 | 1,366 |
| 8 | Ontario Teachers' Cadillac Fairview Properties Trust | 3.875% | 3/20/27 | 200 | 221 |
| | Realty Income Corp. | 3.250% | 10/15/22 | 2,410 | 2,514 |
| | Realty Income Corp. | 3.875% | 7/15/24 | 165 | 182 |
| | Realty Income Corp. | 3.875% | 4/15/25 | 485 | 546 |
| | Realty Income Corp. | 0.750% | 3/15/26 | 330 | 329 |
| | Regency Centers LP | 3.750% | 6/15/24 | 40 | 43 |
| | Sabra Health Care LP | 4.800% | 6/1/24 | 1,620 | 1,725 |
| | Simon Property Group LP | 2.500% | 7/15/21 | 700 | 704 |
| | Simon Property Group LP | 2.350% | 1/30/22 | 1,295 | 1,314 |
| | Simon Property Group LP | 2.625% | 6/15/22 | 130 | 133 |
| | Simon Property Group LP | 2.750% | 2/1/23 | 200 | 209 |
| | Simon Property Group LP | 3.750% | 2/1/24 | 1,060 | 1,148 |
| | Simon Property Group LP | 2.000% | 9/13/24 | 2,446 | 2,532 |
| | Simon Property Group LP | 3.375% | 10/1/24 | 90 | 98 |
| | Simon Property Group LP | 3.500% | 9/1/25 | 335 | 371 |
| | Ventas Realty LP | 3.125% | 6/15/23 | 281 | 296 |
| | Ventas Realty LP | 3.750% | 5/1/24 | 55 | 60 |
| | Ventas Realty LP | 2.650% | 1/15/25 | 140 | 150 |
| | Ventas Realty LP | 3.500% | 2/1/25 | 80 | 88 |
| | VEREIT Operating Partnership LP | 4.600% | 2/6/24 | 50 | 55 |
| | VEREIT Operating Partnership LP | 4.625% | 11/1/25 | 75 | 86 |
| | Weingarten Realty Investors | 3.500% | 4/15/23 | 150 | 155 |
| | Welltower Inc. | 3.750% | 3/15/23 | 729 | 774 |
| | Welltower Inc. | 3.950% | 9/1/23 | 1,095 | 1,190 |
| | Welltower Inc. | 3.625% | 3/15/24 | 565 | 616 |
| | Welltower Inc. | 4.000% | 6/1/25 | 1,520 | 1,718 |
| | | | | | | 56,166 |
| Technology (3.4%) |
| | Analog Devices Inc. | 2.950% | 4/1/25 | 400 | 436 |
| | Apple Inc. | 3.000% | 2/9/24 | 1,329 | 1,430 |
| | Apple Inc. | 3.450% | 5/6/24 | 1,570 | 1,728 |
| | Apple Inc. | 2.850% | 5/11/24 | 3,066 | 3,305 |
| | Apple Inc. | 2.750% | 1/13/25 | 1,300 | 1,408 |
Short-Term Investment-Grade Portfolio
| | | | Coupon | Maturity
Date | Face
Amount
($000) | Market
Value•
($000) |
| | Broadcom Corp. / Broadcom Cayman Finance Ltd. | 3.625% | 1/15/24 | 570 | 616 |
| | Broadcom Inc. | 2.250% | 11/15/23 | 1,235 | 1,288 |
| | Broadcom Inc. | 3.625% | 10/15/24 | 3,761 | 4,129 |
| | Broadcom Inc. | 4.700% | 4/15/25 | 800 | 916 |
| | Broadcom Inc. | 3.150% | 11/15/25 | 360 | 393 |
| | Broadcom Inc. | 4.250% | 4/15/26 | 1,160 | 1,320 |
| | CDW LLC / CDW Finance Corp. | 4.125% | 5/1/25 | 100 | 104 |
| | CDW LLC / CDW Finance Corp. | 4.250% | 4/1/28 | 45 | 48 |
| | CDW LLC / CDW Finance Corp. | 3.250% | 2/15/29 | 70 | 71 |
| 8 | CommScope Inc. | 5.500% | 3/1/24 | 160 | 165 |
| 8 | CommScope Inc. | 6.000% | 3/1/26 | 75 | 79 |
| 8 | CommScope Inc. | 8.250% | 3/1/27 | 20 | 21 |
| 8 | CommScope Inc. | 7.125% | 7/1/28 | 58 | 62 |
| 8 | Dell International LLC / EMC Corp. | 5.450% | 6/15/23 | 1,285 | 1,419 |
| 8 | Dell International LLC / EMC Corp. | 4.000% | 7/15/24 | 845 | 929 |
| 8 | Dell International LLC / EMC Corp. | 5.850% | 7/15/25 | 2,060 | 2,475 |
| | DXC Technology Co. | 4.000% | 4/15/23 | 1,100 | 1,172 |
| | Equifax Inc. | 2.600% | 12/1/24 | 601 | 643 |
| 9 | Fidelity National Information Services Inc. | 0.125% | 5/21/21 | 600 | 734 |
| 9 | Fidelity National Information Services Inc. | 0.125% | 12/3/22 | 1,000 | 1,228 |
| | Fidelity National Information Services Inc. | 3.500% | 4/15/23 | 800 | 850 |
| | Fiserv Inc. | 3.800% | 10/1/23 | 585 | 637 |
| | Fiserv Inc. | 2.750% | 7/1/24 | 5,290 | 5,675 |
| 8 | Gartner Inc. | 3.750% | 10/1/30 | 35 | 37 |
| | Global Payments Inc. | 3.800% | 4/1/21 | 1,500 | 1,508 |
| | Hewlett Packard Enterprise Co. | 4.400% | 10/15/22 | 1,150 | 1,221 |
| | Hewlett Packard Enterprise Co. | 4.900% | 10/15/25 | 650 | 761 |
| | Intel Corp. | 3.700% | 7/29/25 | 300 | 338 |
| 9 | International Business Machines Corp. | 0.375% | 1/31/23 | 600 | 742 |
| | International Business Machines Corp. | 3.375% | 8/1/23 | 195 | 210 |
| | International Business Machines Corp. | 3.625% | 2/12/24 | 1,800 | 1,971 |
| | International Business Machines Corp. | 3.000% | 5/15/24 | 2,345 | 2,535 |
| | International Business Machines Corp. | 3.300% | 5/15/26 | 330 | 372 |
| | Intuit Inc. | 0.650% | 7/15/23 | 300 | 302 |
| | Juniper Networks Inc. | 1.200% | 12/10/25 | 1,490 | 1,508 |
| | Marvell Technology Group Ltd. | 4.200% | 6/22/23 | 750 | 812 |
| | Micron Technology Inc. | 2.497% | 4/24/23 | 260 | 271 |
| | Micron Technology Inc. | 4.640% | 2/6/24 | 770 | 856 |
| | Microsoft Corp. | 3.125% | 11/3/25 | 287 | 321 |
| 8 | Nielsen Finance LLC / Nielsen Finance Co. | 5.625% | 10/1/28 | 90 | 97 |
| 8 | NXP BV / NXP Funding LLC | 3.875% | 9/1/22 | 3,657 | 3,854 |
| 8 | NXP BV / NXP Funding LLC | 4.625% | 6/1/23 | 700 | 767 |
| 8 | NXP BV / NXP Funding LLC | 4.875% | 3/1/24 | 2,360 | 2,658 |
| | Oracle Corp. | 2.625% | 2/15/23 | 1,939 | 2,030 |
| | Oracle Corp. | 3.625% | 7/15/23 | 200 | 216 |
| | Oracle Corp. | 2.400% | 9/15/23 | 3,777 | 3,968 |
| | | | Coupon | Maturity
Date | Face
Amount
($000) | Market
Value•
($000) |
| | Oracle Corp. | 3.400% | 7/8/24 | 745 | 814 |
| | Oracle Corp. | 2.950% | 11/15/24 | 800 | 868 |
| | Oracle Corp. | 2.500% | 4/1/25 | 2,190 | 2,352 |
| | PayPal Holdings Inc. | 2.200% | 9/26/22 | 3,552 | 3,669 |
| | Qorvo Inc. | 4.375% | 10/15/29 | 35 | 39 |
| 8 | Qorvo Inc. | 3.375% | 4/1/31 | 55 | 57 |
| 8 | Sabre GLBL Inc. | 9.250% | 4/15/25 | 45 | 54 |
| 8 | Sabre GLBL Inc. | 7.375% | 9/1/25 | 103 | 112 |
| 8 | Seagate HDD Cayman | 3.125% | 7/15/29 | 215 | 214 |
| 8 | SS&C Technologies Inc. | 5.500% | 9/30/27 | 60 | 64 |
| | Verisk Analytics Inc. | 5.800% | 5/1/21 | 315 | 320 |
| | Verisk Analytics Inc. | 4.125% | 9/12/22 | 1,200 | 1,265 |
| | Verisk Analytics Inc. | 4.000% | 6/15/25 | 10 | 11 |
| | Visa Inc. | 3.150% | 12/14/25 | 1,500 | 1,681 |
| | VMware Inc. | 2.950% | 8/21/22 | 1,853 | 1,922 |
| | VMware Inc. | 4.500% | 5/15/25 | 1,700 | 1,940 |
| | Western Digital Corp. | 4.750% | 2/15/26 | 260 | 288 |
| | | | | | | 76,306 |
| Utilities (3.9%) |
| | AEP Texas Inc. | 2.400% | 10/1/22 | 700 | 723 |
| | Ameren Corp. | 2.500% | 9/15/24 | 1,060 | 1,126 |
| | American Electric Power Co. Inc. | 1.000% | 11/1/25 | 325 | 329 |
| 7,10 | Australian Gas Networks Ltd., 3M Australian Bank Bill Rate + 0.400% | 0.410% | 7/1/24 | 500 | 375 |
| | Baltimore Gas and Electric Co. | 2.800% | 8/15/22 | 100 | 103 |
| | Baltimore Gas and Electric Co. | 3.350% | 7/1/23 | 190 | 203 |
| | Berkshire Hathaway Energy Co. | 3.750% | 11/15/23 | 2,365 | 2,566 |
| 8 | Calpine Corp. | 4.500% | 2/15/28 | 245 | 255 |
| | CenterPoint Energy Inc. | 3.600% | 11/1/21 | 1,115 | 1,144 |
| | CenterPoint Energy Inc. | 2.500% | 9/1/22 | 1,470 | 1,519 |
| | CenterPoint Energy Inc. | 3.850% | 2/1/24 | 65 | 71 |
| | Comision Federal de Electricidad | 4.875% | 5/26/21 | 400 | 406 |
| | Connecticut Light and Power Co. | 2.500% | 1/15/23 | 820 | 852 |
| | Consolidated Edison Inc. | 0.650% | 12/1/23 | 1,340 | 1,342 |
| | Dominion Energy Inc. | 2.750% | 9/15/22 | 1,245 | 1,285 |
| 8 | Dominion Energy Inc. | 2.450% | 1/15/23 | 100 | 104 |
| | Dominion Energy Inc. | 3.300% | 3/15/25 | 900 | 990 |
| 7 | Dominion Energy Inc., 3M USD LIBOR + 0.530% | 0.747% | 9/15/23 | 1,100 | 1,103 |
| | DTE Electric Co. | 2.650% | 6/15/22 | 30 | 31 |
| | DTE Electric Co. | 3.375% | 3/1/25 | 10 | 11 |
| | DTE Energy Co. | 2.600% | 6/15/22 | 1,170 | 1,206 |
| | DTE Energy Co. | 3.300% | 6/15/22 | 1,000 | 1,036 |
| | DTE Energy Co. | 2.250% | 11/1/22 | 2,495 | 2,578 |
| | DTE Energy Co. | 3.700% | 8/1/23 | 1,995 | 2,155 |
| | DTE Energy Co. | 3.850% | 12/1/23 | 330 | 359 |
| | DTE Energy Co. | 1.050% | 6/1/25 | 660 | 667 |
| | Duke Energy Corp. | 3.227% | 3/11/22 | 8,375 | 8,652 |
| | Duke Energy Corp. | 3.950% | 10/15/23 | 1,794 | 1,948 |
| | Duke Energy Corp. | 3.750% | 4/15/24 | 700 | 770 |
| | Duke Energy Corp. | 0.900% | 9/15/25 | 990 | 988 |
| | Duke Energy Ohio Inc. | 3.800% | 9/1/23 | 380 | 410 |
| | Duke Energy Progress LLC | 3.250% | 8/15/25 | 300 | 334 |
| 9 | E.ON International Finance BV | 6.500% | 8/10/21 | 400 | 508 |
| 11 | E.ON International Finance BV | 5.500% | 7/6/22 | 800 | 1,178 |
| 11 | E.ON International Finance BV | 5.625% | 12/6/23 | 100 | 157 |
| 9 | E.ON SE | 0.000% | 10/24/22 | 410 | 503 |
Short-Term Investment-Grade Portfolio
| | | | Coupon | Maturity
Date | Face
Amount
($000) | Market
Value•
($000) |
| 8 | East Ohio Gas Co. | 1.300% | 6/15/25 | 210 | 214 |
| | Eastern Energy Gas Holdings LLC | 3.550% | 11/1/23 | 300 | 323 |
| | Eastern Energy Gas Holdings LLC | 2.500% | 11/15/24 | 170 | 182 |
| | Eastern Energy Gas Holdings LLC | 3.600% | 12/15/24 | 665 | 736 |
| 8 | EDP Finance BV | 5.250% | 1/14/21 | 2,070 | 2,072 |
| 8 | Electricite de France SA | 4.500% | 9/21/28 | 200 | 238 |
| 8 | Enel Finance International NV | 2.875% | 5/25/22 | 200 | 207 |
| 8 | Engie SA | 2.875% | 10/10/22 | 175 | 182 |
| | Entergy Arkansas LLC | 3.050% | 6/1/23 | 220 | 232 |
| | Entergy Arkansas LLC | 3.700% | 6/1/24 | 320 | 351 |
| | Entergy Corp. | 4.000% | 7/15/22 | 1,260 | 1,319 |
| | Entergy Corp. | 0.900% | 9/15/25 | 1,675 | 1,674 |
| | Entergy Louisiana LLC | 4.800% | 5/1/21 | 335 | 336 |
| | Entergy Louisiana LLC | 3.300% | 12/1/22 | 50 | 52 |
| | Entergy Louisiana LLC | 4.050% | 9/1/23 | 360 | 391 |
| | Entergy Louisiana LLC | 0.620% | 11/17/23 | 1,075 | 1,078 |
| | Evergy Inc. | 2.450% | 9/15/24 | 1,500 | 1,590 |
| | Eversource Energy | 0.800% | 8/15/25 | 405 | 404 |
| | Exelon Corp. | 2.450% | 4/15/21 | 215 | 216 |
| | Exelon Corp. | 3.950% | 6/15/25 | 500 | 566 |
| | Exelon Generation Co. LLC | 3.400% | 3/15/22 | 222 | 229 |
| | Florida Power & Light Co. | 2.850% | 4/1/25 | 540 | 588 |
| | Georgia Power Co. | 2.200% | 9/15/24 | 820 | 863 |
| | ITC Holdings Corp. | 2.700% | 11/15/22 | 750 | 781 |
| | Korea Midland Power Co. Ltd | 2.375% | 7/22/22 | 304 | 313 |
| | Korea Midland Power Co. Ltd. | 2.500% | 7/21/21 | 200 | 202 |
| | Korea Midland Power Co. Ltd. | 3.375% | 1/22/22 | 937 | 964 |
| | LG&E and KU Energy LLC | 4.375% | 10/1/21 | 280 | 285 |
| | MidAmerican Energy Co. | 3.700% | 9/15/23 | 130 | 140 |
| | MidAmerican Energy Co. | 3.500% | 10/15/24 | 1,000 | 1,101 |
| | National Rural Utilities Cooperative Finance Corp. | 2.700% | 2/15/23 | 300 | 313 |
| | National Rural Utilities Cooperative Finance Corp. | 3.400% | 11/15/23 | 195 | 210 |
| | National Rural Utilities Cooperative Finance Corp. | 2.950% | 2/7/24 | 25 | 27 |
| | NextEra Energy Capital Holdings Inc. | 2.900% | 4/1/22 | 1,445 | 1,489 |
| | NextEra Energy Capital Holdings Inc. | 2.800% | 1/15/23 | 180 | 188 |
| | NextEra Energy Capital Holdings Inc. | 3.150% | 4/1/24 | 1,200 | 1,292 |
| | NextEra Energy Capital Holdings Inc. | 2.750% | 5/1/25 | 1,240 | 1,341 |
| 8 | NRG Energy Inc. | 2.000% | 12/2/25 | 820 | 847 |
| | NRG Energy Inc. | 7.250% | 5/15/26 | 448 | 475 |
| 8 | NRG Energy Inc. | 3.375% | 2/15/29 | 130 | 133 |
| | NSTAR Electric Co. | 3.500% | 9/15/21 | 310 | 314 |
| | NSTAR Electric Co. | 2.375% | 10/15/22 | 535 | 551 |
| | Oncor Electric Delivery Co. LLC | 4.100% | 6/1/22 | 235 | 245 |
| | Oncor Electric Delivery Co. LLC | 2.750% | 6/1/24 | 1,425 | 1,521 |
| | Oncor Electric Delivery Co. LLC | 2.950% | 4/1/25 | 390 | 427 |
| | Pacific Gas and Electric Co. | 3.500% | 6/15/25 | 335 | 359 |
| | | | Coupon | Maturity
Date | Face
Amount
($000) | Market
Value•
($000) |
| | Pacific Gas and Electric Co. | 3.450% | 7/1/25 | 335 | 360 |
| | PacifiCorp | 3.600% | 4/1/24 | 525 | 571 |
| 8 | Pattern Energy Operations LP / Pattern Energy Operations Inc. | 4.500% | 8/15/28 | 70 | 74 |
| | PECO Energy Co. | 3.150% | 10/15/25 | 115 | 128 |
| | Perusahaan Perseroan Persero PT Perusahaan Listrik Negara | 5.500% | 11/22/21 | 912 | 950 |
| | PG&E Corp. | 5.000% | 7/1/28 | 125 | 133 |
| | Potomac Electric Power Co. | 3.600% | 3/15/24 | 340 | 369 |
| | PPL Capital Funding Inc. | 4.200% | 6/15/22 | 50 | 52 |
| | PPL Capital Funding Inc. | 3.500% | 12/1/22 | 225 | 236 |
| | Progress Energy Inc. | 3.150% | 4/1/22 | 520 | 534 |
| | Public Service Electric and Gas Co. | 3.250% | 9/1/23 | 110 | 118 |
| | Public Service Electric and Gas Co. | 3.000% | 5/15/25 | 275 | 301 |
| | Public Service Enterprise Group Inc. | 2.650% | 11/15/22 | 45 | 47 |
| | Public Service Enterprise Group Inc. | 2.875% | 6/15/24 | 2,040 | 2,186 |
| | Public Service Enterprise Group Inc. | 0.800% | 8/15/25 | 1,685 | 1,679 |
| | Puget Energy Inc. | 6.000% | 9/1/21 | 100 | 103 |
| | Puget Energy Inc. | 5.625% | 7/15/22 | 1,175 | 1,247 |
| | Sempra Energy | 2.900% | 2/1/23 | 415 | 435 |
| | Southern Co. Gas Capital Corp. | 2.450% | 10/1/23 | 155 | 163 |
| | Southwestern Electric Power Co. | 3.550% | 2/15/22 | 490 | 503 |
| | Southwestern Public Service Co. | 3.300% | 6/15/24 | 1,340 | 1,443 |
| | State Grid Overseas Investment 2014 Ltd. | 4.125% | 5/7/24 | 250 | 275 |
| | State Grid Overseas Investment 2016 Ltd. | 2.750% | 5/4/22 | 692 | 709 |
| | State Grid Overseas Investment 2016 Ltd. | 3.750% | 5/2/23 | 310 | 330 |
| | Tampa Electric Co. | 5.400% | 5/15/21 | 370 | 377 |
| 10 | United Energy Distribution Pty Ltd. | 3.850% | 10/23/24 | 800 | 686 |
| 7,10 | Victoria Power Networks Finance Pty Ltd., 3M Australian Bank Bill Rate + 0.280% | 0.365% | 1/15/22 | 1,810 | 1,384 |
| | Virginia Electric and Power Co. | 3.450% | 9/1/22 | 715 | 744 |
| | Virginia Electric and Power Co. | 2.750% | 3/15/23 | 145 | 151 |
| | Virginia Electric and Power Co. | 3.450% | 2/15/24 | 575 | 619 |
| | Virginia Electric and Power Co. | 3.100% | 5/15/25 | 300 | 328 |
| 8 | Vistra Operations Co. LLC | 5.500% | 9/1/26 | 195 | 203 |
| 8 | Vistra Operations Co. LLC | 5.625% | 2/15/27 | 485 | 516 |
| 8 | Vistra Operations Co. LLC | 5.000% | 7/31/27 | 125 | 133 |
| | WEC Energy Group Inc. | 0.550% | 9/15/23 | 1,835 | 1,844 |
| | Xcel Energy Inc. | 0.500% | 10/15/23 | 700 | 702 |
| | | | | | | 86,181 |
| Total Corporate Bonds (Cost $1,561,628) | 1,615,998 |
| Sovereign Bonds (3.9%) |
| 8 | Arab Petroleum Investments Corp. | 4.125% | 9/18/23 | 442 | 481 |
Short-Term Investment-Grade Portfolio
| | | | Coupon | Maturity
Date | Face
Amount
($000) | Market
Value•
($000) |
| 8 | Banque Ouest Africaine de Developpement | 5.500% | 5/6/21 | 200 | 203 |
| 8 | Banque Ouest Africaine de Developpement | 5.000% | 7/27/27 | 430 | 477 |
| 8 | CDP Financial Inc. | 3.150% | 7/24/24 | 670 | 733 |
| | Corp. Andina de Fomento | 4.375% | 6/15/22 | 678 | 712 |
| | Corp. Andina de Fomento | 2.375% | 5/12/23 | 950 | 981 |
| | Corp. Andina de Fomento | 1.625% | 9/23/25 | 1,665 | 1,686 |
| 8 | Corp. Financiera de Desarrollo SA | 4.750% | 2/8/22 | 150 | 156 |
| 8 | Corp. Financiera de Desarrollo SA | 2.400% | 9/28/27 | 250 | 254 |
| | Dominican Republic | 6.600% | 1/28/24 | 185 | 210 |
| | Dominican Republic | 5.500% | 1/27/25 | 135 | 152 |
| 8 | Dominican Republic | 4.875% | 9/23/32 | 667 | 743 |
| | Emirate of Abu Dhabi | 0.750% | 9/2/23 | 200 | 200 |
| | Emirate of Abu Dhabi | 2.125% | 9/30/24 | 815 | 856 |
| 8 | Emirate of Abu Dhabi | 2.125% | 9/30/24 | 4,825 | 5,067 |
| 8 | Emirate of Abu Dhabi | 2.500% | 4/16/25 | 1,124 | 1,200 |
| | Federative Republic of Brazil | 2.875% | 6/6/25 | 440 | 459 |
| | Federative Republic of Brazil | 3.875% | 6/12/30 | 563 | 593 |
| | Fondo MIVIVIENDA SA | 3.500% | 1/31/23 | 1,105 | 1,157 |
| 8 | Government of Bermuda | 4.138% | 1/3/23 | 200 | 213 |
| 16 | Japan Finance Organization for Municipalities | 4.000% | 1/13/21 | 250 | 250 |
| | Kingdom of Morocco | 4.250% | 12/11/22 | 1,009 | 1,060 |
| 8,9 | Kingdom of Morocco | 1.375% | 3/30/26 | 1,500 | 1,847 |
| 9 | Kingdom of Morocco | 1.375% | 3/30/26 | 200 | 246 |
| | Kingdom of Saudi Arabia | 2.375% | 10/26/21 | 1,660 | 1,685 |
| | Korea Development Bank | 3.250% | 2/19/24 | 295 | 318 |
| | Korea Hydro & Nuclear Power Co. Ltd. | 3.000% | 9/19/22 | 200 | 208 |
| 8 | Korea National Oil Corp. | 2.875% | 3/27/22 | 400 | 412 |
| | KSA Sukuk Ltd. | 2.894% | 4/20/22 | 1,869 | 1,924 |
| | KSA Sukuk Ltd. | 3.628% | 4/20/27 | 1,549 | 1,737 |
| | Kuwait | 2.750% | 3/20/22 | 2,278 | 2,341 |
| 9,17 | MFB Magyar Fejlesztesi Bank Zrt | 1.375% | 6/24/25 | 541 | 684 |
| | Perusahaan Penerbit SBSN Indonesia III | 3.400% | 3/29/21 | 225 | 227 |
| | Perusahaan Penerbit SBSN Indonesia III | 3.400% | 3/29/22 | 661 | 683 |
| | Perusahaan Penerbit SBSN Indonesia III | 3.300% | 11/21/22 | 200 | 210 |
| | Perusahaan Penerbit SBSN Indonesia III | 3.900% | 8/20/24 | 200 | 220 |
| | Province of Nova Scotia | 8.250% | 7/30/22 | 315 | 353 |
| | Province of Quebec | 2.750% | 8/25/21 | 715 | 724 |
| | Republic of Azerbaijan | 4.750% | 3/18/24 | 400 | 438 |
| 9 | Republic of Chile | 1.625% | 1/30/25 | 663 | 864 |
| | Republic of Colombia | 4.375% | 7/12/21 | 2,140 | 2,183 |
| | Republic of Colombia | 2.625% | 3/15/23 | 1,400 | 1,446 |
| | Republic of Colombia | 4.000% | 2/26/24 | 5,600 | 6,054 |
| | Republic of Colombia | 4.500% | 1/28/26 | 825 | 934 |
| | Republic of Croatia | 6.375% | 3/24/21 | 1,215 | 1,229 |
| | Republic of Croatia | 5.500% | 4/4/23 | 1,000 | 1,099 |
| | Republic of Guatemala | 5.750% | 6/6/22 | 300 | 318 |
| | Republic of Hungary | 6.375% | 3/29/21 | 2,324 | 2,356 |
| | Republic of Hungary | 5.375% | 2/21/23 | 2,636 | 2,886 |
| | Republic of Hungary | 5.750% | 11/22/23 | �� 1,741 | 1,985 |
| 9 | Republic of Hungary | 1.125% | 4/28/26 | 1,000 | 1,284 |
| 8 | Republic of Indonesia | 3.700% | 1/8/22 | 400 | 412 |
| | Republic of Indonesia | 3.750% | 4/25/22 | 1,412 | 1,469 |
| 8 | Republic of Lithuania | 6.125% | 3/9/21 | 195 | 197 |
| | | | Coupon | Maturity
Date | Face
Amount
($000) | Market
Value•
($000) |
| | Republic of Lithuania | 6.125% | 3/9/21 | 1,375 | 1,386 |
| | Republic of Lithuania | 6.625% | 2/1/22 | 880 | 939 |
| | Republic of Panama | 4.000% | 9/22/24 | 1,745 | 1,930 |
| | Republic of Panama | 3.750% | 3/16/25 | 1,465 | 1,621 |
| | Republic of Panama | 7.125% | 1/29/26 | 780 | 995 |
| | Republic of Paraguay | 4.625% | 1/25/23 | 1,374 | 1,477 |
| | Republic of Peru | 7.350% | 7/21/25 | 1,160 | 1,485 |
| 9 | Republic of Philippines | 0.000% | 2/3/23 | 1,199 | 1,460 |
| | Republic of Poland | 5.125% | 4/21/21 | 815 | 825 |
| | Republic of Serbia | 7.250% | 9/28/21 | 1,252 | 1,312 |
| | Republic of Slovenia | 5.500% | 10/26/22 | 280 | 306 |
| 8 | Republic of Slovenia | 5.250% | 2/18/24 | 300 | 344 |
| | Republic of South Africa | 5.875% | 9/16/25 | 1,095 | 1,252 |
| | Republic of South Africa | 4.875% | 4/14/26 | 270 | 295 |
| | Republic of South Africa | 4.850% | 9/27/27 | 400 | 433 |
| | Republic of Trinidad and Tobago | 4.375% | 1/16/24 | 806 | 859 |
| 4 | Republic of Uruguay | 4.500% | 8/14/24 | 190 | 210 |
| | Romania | 4.375% | 8/22/23 | 370 | 403 |
| | Romania | 4.875% | 1/22/24 | 224 | 250 |
| 9 | Romania | 2.750% | 2/26/26 | 2,581 | 3,481 |
| 9 | Romania | 2.000% | 12/8/26 | 1,074 | 1,402 |
| | Russian Federation | 4.750% | 5/27/26 | 1,000 | 1,154 |
| | Sharjah Sukuk Program Ltd. | 3.854% | 4/3/26 | 1,020 | 1,106 |
| | Sharjah Sukuk Program Ltd. | 2.942% | 6/10/27 | 267 | 276 |
| | State of Israel | 3.150% | 6/30/23 | 525 | 560 |
| | State of Israel | 2.750% | 7/3/30 | 134 | 148 |
| | State of Qatar | 4.500% | 1/20/22 | 445 | 463 |
| | State of Qatar | 3.375% | 3/14/24 | 200 | 216 |
| | State of Qatar | 3.400% | 4/16/25 | 1,815 | 2,002 |
| | United Mexican States | 4.150% | 3/28/27 | 1,495 | 1,725 |
| | United Mexican States | 3.750% | 1/11/28 | 200 | 225 |
| | United Mexican States | 4.500% | 4/22/29 | 470 | 551 |
| Total Sovereign Bonds (Cost $84,372) | 87,907 |
| Taxable Municipal Bonds (0.1%) |
| 18 | New Jersey Economic Development Authority Appropriations Revenue | 7.425% | 2/15/29 | 770 | 992 |
| 7 | New Mexico Educational Assistance Foundation Student Loan Revenue, 1M USD LIBOR + 0.700% | 0.849% | 1/2/25 | 119 | 119 |
| | New York Transportation Development Corp. Miscellaneous Revenue | 4.248% | 9/1/35 | 190 | 211 |
| Total Taxable Municipal Bonds (Cost $1,275) | 1,322 |
| | | | | | Shares | |
| Common Stocks (0.1%) |
| Exchange-Traded Fund (0.1%) |
| 19 | Vanguard Short-Term Corporate Bond ETF
(Cost $2,608) | 32,236 | 2,683 |
| | | | | | | |
| Temporary Cash Investments (5.5%) |
| Money Market Fund (5.5%) |
| 20 | Vanguard Market Liquidity Fund
(Cost $121,884) | 0.111% | | 1,218,844 | 121,885 |
Short-Term Investment-Grade Portfolio
| | | Counterparty | Expiration
Date | Exercise
Rate | Notional
Amount on
Underlying
Swap
($000) | Market
Value•
($000) |
| Options Purchased (0.0%) |
| Over-the-Counter Swaptions (0.0%) |
| Put Swaptions |
| | 5-Year CDX-NA-HY-S35-V1, Credit Protection Sold, Receives 5.000% Quarterly | JPMC | 1/20/21 | 1.050% | 2,475 | 2 |
| | 5-Year CDX-NA-IG-S35-V1, Credit Protection Sold, Receives 1.000% Quarterly | JPMC | 2/17/21 | 0.600% | 5,315 | 6 |
| Total Options Purchased (Cost $34) | 8 |
| Total Investments (102.7%) (Cost $2,223,652) | 2,293,288 |
| Other Assets and Liabilities—Net (-2.7%) | (59,418) |
| Net Assets (100%) | 2,233,870 |
| Cost is in $000. |
| • | See Note A in Notes to Financial Statements. |
| 1 | Securities with a value of $2,621,000 has been segregated as collateral for open forward currency contracts and over-the-counter swap contracts. |
| 2 | Securities with a value of $1,541,000 have been segregated as initial margin for open centrally cleared swap contracts. |
| 3 | Securities with a value of $748,000 have been segregated as initial margin for open futures contracts. |
| 4 | The average or expected maturity is shorter than the final maturity shown because of the possibility of interim principal payments and prepayments or the possibility of the issue being called. |
| 5 | The issuer was placed under federal conservatorship in September 2008; since that time, its daily operations have been managed by the Federal Housing Finance Agency and it receives capital from the U.S. Treasury, as needed to maintain a positive net worth, in exchange for senior preferred stock. |
| 6 | Includes securities purchased on a when-issued or delayed-delivery basis for which the portfolio has not taken delivery as of December 31, 2020. |
| 7 | Variable rate security; rate shown is effective rate at period end. Certain variable rate securities are not based on a published reference rate and spread but are determined by the issuer or agent based on current market conditions. |
| 8 | Security exempt from registration under Rule 144A of the Securities Act of 1933. Such securities may be sold in transactions exempt from registration, normally to qualified institutional buyers. At December 31, 2020, the aggregate value was $300,199,000, representing 13.4% of net assets. |
| 9 | Face amount denominated in euro. |
| 10 | Face amount denominated in Australian dollars. |
| 11 | Face amount denominated in British pounds. |
| 12 | Guaranteed by multiple countries. |
| 13 | Face amount denominated in Canadian dollars. |
| 14 | Non-income-producing security--security in default. |
| 15 | Security value determined using significant unobservable inputs. |
| 16 | Guaranteed by the Government of Japan. |
| 17 | Guaranteed by the Republic of Hungary. |
| 18 | Scheduled principal and interest payments are guaranteed by National Public Finance Guarantee Corp. |
| 19 | Considered an affiliated company of the portfolio as the issuer is another member of The Vanguard Group. |
| 20 | Affiliated money market fund available only to Vanguard funds and certain trusts and accounts managed by Vanguard. Rate shown is the 7-day yield. |
| | 12M—12-month. |
| | 1M—1-month. |
| | 1YR—1-year. |
| | 3M—3-month. |
| | 6M—6-month. |
| | CMT—Constant Maturing Treasury Rate. |
| | JPMC—JP Morgan Chase Bank N.A. |
| | LIBOR—London Interbank Offered Rate. |
| | REMICS—Real Estate Mortgage Investment Conduits. |
| | UMBS—Uniform Mortgage-Backed Securities. |
Short-Term Investment-Grade Portfolio
Derivative Financial Instruments Outstanding as of Period End
| | Counterparty | Expiration
Date | Exercise
Rate | Notional
Amount on
Underlying
Swap
($000) | Market
Value
($000) |
| Over-the-Counter Swaptions |
| Call Swaptions | | | | | |
| 5-Year CDX-NA-IG-S35-V1, Credit Protection Sold, Receives 1.000% Quarterly | JPMC | 2/17/21 | 0.525% | 5,315 | (12) |
| |
| Put Swaptions | | | | | |
| 5-Year CDX-NA-IG-S35-V1, Credit Protection Purchased, Pays 1.000% Quarterly | JPMC | 1/20/21 | 0.650% | 11,138 | (3) |
| 5-Year CDX-NA-IG-S35-V1, Credit Protection Purchased, Pays 1.000% Quarterly | JPMC | 2/17/21 | 0.525% | 5,315 | (10) |
| | | | | | (13) |
| Total Options Written (Premiums Received $47) | | | | (25) |
| JPMC—JP Morgan Chase Bank N.A. |
| Futures Contracts |
| | | | ($000) |
| | Expiration | Number of
Long (Short)
Contracts | Notional
Amount | Value and
Unrealized
Appreciation
(Depreciation) |
| Long Futures Contracts | | | | |
| 10-Year U.S. Treasury Note | March 2021 | 18 | 2,485 | 5 |
| 2-Year U.S. Treasury Note | March 2021 | 543 | 119,990 | 91 |
| 5-Year U.S. Treasury Note | March 2021 | 322 | 40,625 | 3 |
| Long U.S. Treasury Bond | March 2021 | 2 | 346 | 1 |
| | | | | 100 |
| |
| Short Futures Contracts | | | | |
| AUD 10-Year Treasury Bond | March 2021 | (8) | (908) | (2) |
| AUD 3-Year Treasury Bond | March 2021 | (31) | (2,807) | (2) |
| Euro-Bobl | March 2021 | (97) | (16,019) | (17) |
| Euro-Bund | March 2021 | (6) | (1,302) | (6) |
| Euro-Schatz | March 2021 | (214) | (29,352) | 17 |
| Five-Year Government of Canada Bond | March 2021 | (9) | (903) | (2) |
| Long Gilt | March 2021 | (9) | (1,668) | (19) |
| Ultra 10-Year U.S. Treasury Note | March 2021 | (191) | (29,865) | 20 |
| Ultra Long U.S. Treasury Bond | March 2021 | (5) | (1,068) | 12 |
| | | | | 1 |
| | | | | 101 |
| Forward Currency Contracts |
| | Contract
Settlement
Date | Contract Amount (000) | Unrealized
Appreciation
($000) | Unrealized
Depreciation
($000) |
| Counterparty | | Receive | Deliver | | |
| Royal Bank of Canada | 1/8/21 | EUR | 200 | USD | 245 | — | (1) |
| Bank of Montreal | 1/8/21 | EUR | 149 | USD | 179 | 4 | — |
| Barclays Bank plc | 1/8/21 | EUR | 107 | USD | 130 | 1 | — |
| Citibank, N.A. | 1/8/21 | USD | 19,470 | AUD | 26,697 | — | (1,115) |
| Morgan Stanley Capital Services Inc. | 1/8/21 | USD | 1,301 | CAD | 1,694 | — | (30) |
| Toronto-Dominion Bank | 1/8/21 | USD | — | CAD | — | — | — |
| BNP Paribas | 1/8/21 | USD | 26,336 | EUR | 22,119 | — | (692) |
Short-Term Investment-Grade Portfolio
| Forward Currency Contracts (continued) |
| | Contract
Settlement
Date | Contract Amount (000) | Unrealized
Appreciation
($000) | Unrealized
Depreciation
($000) |
| Counterparty | | Receive | Deliver | | |
| Deutsche Bank AG | 1/8/21 | USD | 13,776 | EUR | 11,556 | — | (345) |
| Toronto-Dominion Bank | 1/8/21 | USD | 13,949 | EUR | 11,470 | — | (67) |
| Deutsche Bank AG | 1/8/21 | USD | 12,933 | EUR | 10,552 | 40 | — |
| BNP Paribas | 1/8/21 | USD | 9,370 | GBP | 7,023 | — | (236) |
| UBS AG (London) | 1/8/21 | USD | 5 | JPY | 471 | — | — |
| | | | | | | 45 | (2,486) |
| AUD—Australian dollar. |
| CAD—Canadian dollar. |
| EUR—euro. |
| GBP—British pound. |
| JPY—Japanese yen. |
| USD—U.S. dollar. |
| Centrally Cleared Credit Default Swaps |
| Reference Entity | Termination
Date | Notional Amount
(000) | Periodic
Premium
Received
(Paid)1
(%) | Value
($000) | Unrealized
Appreciation
(Depreciation)
($000) |
| Credit Protection Sold | | | | | |
| CDX-NA-IG-S35-V1 | 12/23/25 | USD 40,930 | 1.000 | 1,010 | 46 |
| |
| Credit Protection Purchased | | | | | |
| CDX-NA-HY-S35-V1 | 12/23/25 | USD 885 | (5.000) | (84) | (11) |
| | | | | 926 | 35 |
| 1 Periodic premium received/paid quarterly. |
| USD—U.S. dollar. |
| Over-the-Counter Credit Default Swaps |
Reference
Entity | Termination
Date | Counterparty | Notional
Amount
($000) | Periodic
Premium
Received
(Paid)1
(%) | Value
($000) | Remaining
Up-Front
Premium
Paid
(Received)
($000) | Unrealized
Appreciation
($000) | Unrealized
Depreciation
($000) |
| Credit Protection Sold/Moody's Rating |
| Berkshire Hathaway Inc./Aa2 | 12/21/22 | BARC | 415 | 1.000 | 7 | 3 | 4 | — |
| Berkshire Hathaway Inc./Aa2 | 6/21/22 | BARC | 835 | 1.000 | 11 | 4 | 7 | — |
| Boeing Co./Baa2 | 6/21/24 | GSI | 635 | 1.000 | (2) | 11 | — | (13) |
| Metlife Inc./A3 | 12/21/21 | BARC | 160 | 1.000 | 1 | — | 1 | — |
| People’s Republic of China/A1 | 6/21/24 | GSI | 295 | 1.000 | 9 | 5 | 4 | — |
| People’s Republic of China/A1 | 6/21/22 | BNPSW | 665 | 1.000 | 10 | 2 | 8 | — |
| Republic of Indonesia/Baa2 | 12/23/25 | BARC | 710 | 1.000 | 11 | — | 11 | — |
| Republic of Indonesia/Baa2 | 12/23/25 | BARC | 492 | 1.000 | 8 | 2 | 6 | — |
| Republic of Indonesia/Baa2 | 12/23/25 | BARC | 300 | 1.000 | 4 | — | 4 | — |
| Republic of Indonesia/Baa2 | 12/23/25 | BNPSW | 720 | 1.000 | 12 | (1) | 13 | — |
| Republic of Indonesia/Baa2 | 12/23/25 | GSI | 487 | 1.000 | 8 | — | 8 | — |
| Verizon Communications Inc./Baa1 | 12/21/22 | GSI | 835 | 1.000 | 13 | 6 | 7 | — |
| | | | | | 92 | 32 | 73 | (13) |
| |
Short-Term Investment-Grade Portfolio
| Over-the-Counter Credit Default Swaps (continued) |
Reference
Entity | Termination
Date | Counterparty | Notional
Amount
($000) | Periodic
Premium
Received
(Paid)1
(%) | Value
($000) | Remaining
Up-Front
Premium
Paid
(Received)
($000) | Unrealized
Appreciation
($000) | Unrealized
Depreciation
($000) |
| Credit Protection Purchased |
| Bank of China Ltd. | 6/21/23 | BNPSW | 515 | (1.000) | (11) | (4) | — | (7) |
| Bank of China Ltd. | 6/21/22 | BNPSW | 665 | (1.000) | (9) | — | — | (9) |
| Bank of China Ltd. | 12/21/21 | BNPSW | 300 | (1.000) | (3) | — | — | (3) |
| Boeing Co. | 12/21/24 | JPMC | 310 | (1.000) | 2 | 21 | — | (19) |
| Commerzbank AG | 6/22/21 | BOANA | 590 | (1.000) | (2) | 1 | — | (3) |
| CVS Health Corp. | 12/21/21 | BARC | 465 | (1.000) | (4) | (3) | — | (1) |
| CVS Health Corp. | 12/21/21 | BARC | 160 | (1.000) | (1) | (1) | — | — |
| CVS Health Corp. | 12/21/21 | JPMC | 700 | (1.000) | (6) | (4) | — | (2) |
| Deutsche Bank AG | 12/21/22 | JPMC | 500 | (1.000) | (7) | (1) | — | (6) |
| Federative Republic of Brazil | 12/23/25 | GSCM | 275 | (1.000) | 6 | 36 | — | (30) |
| Federative Republic of Brazil | 12/23/25 | MSCS | 341 | (1.000) | 7 | 18 | — | (11) |
| Lincoln National Corp. | 12/21/21 | BARC | 160 | (1.000) | (1) | — | — | (1) |
| Lincoln National Corp. | 6/22/21 | BARC | 80 | (1.000) | (1) | — | — | (1) |
| Lincoln National Corp. | 6/22/21 | BARC | 80 | (1.000) | (1) | — | — | (1) |
| McDonald’s Corp. | 6/21/22 | GSI | 675 | (1.000) | (9) | (6) | — | (3) |
| Raytheon Co. | 12/21/21 | GSI | 585 | (1.000) | (6) | (4) | — | (2) |
| Raytheon Co. | 12/21/21 | GSI | 580 | (1.000) | (5) | (4) | — | (1) |
| Republic of Colombia | 12/23/25 | BOANA | 360 | 1.000 | (3) | (3) | — | — |
| Republic of Colombia | 12/23/25 | GSI | 720 | (1.000) | (4) | 11 | — | (15) |
| Republic of South Africa | 12/23/25 | GSI | 673 | (1.000) | 33 | 60 | — | (27) |
| Republic of South Africa | 12/23/25 | MSCS | 955 | (1.000) | 47 | 85 | — | (38) |
| Societe Generale SA | 12/21/21 | JPMC | 235 | (1.000) | (2) | — | — | (2) |
| Standard Chartered plc | 12/21/21 | JPMC | 395 | (1.000) | (4) | — | — | (4) |
| State of Qatar | 6/21/22 | CITNA | 50 | (1.000) | (1) | — | — | (1) |
| United Mexican States | 12/23/25 | MSCS | 180 | 1.000 | (1) | (1) | — | — |
| United Mexican States | 6/21/25 | BARC | 400 | (1.000) | (6) | 6 | — | (12) |
| | | | | | 8 | 207 | — | (199) |
| | | | | | 100 | 239 | 73 | (212) |
The notional amount represents the maximum potential amount the fund could be required to pay as a seller of credit protection if the reference entity was subject to a credit event.
| 1 | Periodic premium received/paid quarterly. |
| BARC—Barclays Bank plc. |
| BNPSW—BNP Paribas. |
| BOANA—Bank of America, N.A. |
| CITNA—Citibank NA. |
| GSCM—Goldman Sachs Bank USA. |
| GSI—Goldman Sachs International. |
| JPMC—JP Morgan Chase Bank N.A. |
| MSCS—Morgan Stanley Capital Services LLC. |
Short-Term Investment-Grade Portfolio
| Centrally Cleared Interest Rate Swaps |
Termination
Date | Future
Effective
Date1 | Notional
Amount
($000) | Fixed
Interest
Rate
Received
(Paid)2
(%) | Floating
Interest
Rate
Received
(Paid)3
(%) | Value
($000) | Unrealized
Appreciation
(Depreciation)
($000) |
| 3/17/23 | 3/17/21 | 7,154 | (0.000) | 0.000 | 9 | (3) |
| 3/18/24 | 3/17/21 | 7,346 | (0.000) | 0.000 | 23 | (5) |
| 3/17/25 | 3/17/21 | 3,738 | (0.000) | 0.000 | 27 | (4) |
| 3/17/26 | 3/17/21 | 2,267 | (0.250) | 0.000 | 3 | (3) |
| 3/17/28 | 3/17/21 | 4,101 | (0.250) | 0.000 | 66 | (6) |
| | | | | | 128 | (21) |
| 1 | Forward interest rate swap. In a forward interest rate swap, the portfolio and the counterparty agree to make periodic net payments beginning on a specified future effective date. |
| 2 | Fixed interest payment received/paid annually. |
| 3 | Based on Secured Overnight Financing Rate (SOFR) as of the most recent payment date. Floating interest payment received/paid semiannually. |
See accompanying Notes, which are an integral part of the Financial Statements.
Short-Term Investment-Grade Portfolio
Statement of Assets and Liabilities
| ($000s, except shares and per-share amounts) | Amount |
| Assets | |
| Investments in Securities, at Value | |
| Unaffiliated Issuers (Cost $2,099,160) | 2,168,720 |
| Affiliated Issuers (Cost $124,492) | 124,568 |
| Total Investments in Securities | 2,293,288 |
| Investment in Vanguard | 91 |
| Foreign Currency, at Value (Cost $430) | 445 |
| Receivables for Investment Securities Sold | 112,894 |
| Receivables for Accrued Income | 14,140 |
| Receivables for Capital Shares Issued | 1,191 |
| Swaps Premiums Paid | 271 |
| Variation Margin Receivable—Centrally Cleared Swap Contracts | 22 |
| Unrealized Appreciation—Forward Currency Contracts | 45 |
| Unrealized Appreciation—Over-the-Counter Swap Contracts | 73 |
| Total Assets | 2,422,460 |
| Liabilities | |
| Due to Custodian | 480 |
| Payables for Investment Securities Purchased | 169,857 |
| Payables for Capital Shares Redeemed | 15,286 |
| Payables to Vanguard | 174 |
| Options Written, at Value (Premiums Received $47) | 25 |
| Swap Premiums Received | 32 |
| Variation Margin Payable—Futures Contracts | 28 |
| Variation Margin Payable—Centrally Cleared Swap Contracts | 10 |
| Unrealized Depreciation—Forward Currency Contracts | 2,486 |
| Unrealized Depreciation—Over-the-Counter Swap Contracts | 212 |
| Total Liabilities | 188,590 |
| Net Assets | 2,233,870 |
| At December 31, 2020, net assets consisted of: | |
| | |
| Paid-in Capital | 2,114,794 |
| Total Distributable Earnings (Loss) | 119,076 |
| Net Assets | 2,233,870 |
| |
| Net Assets | |
Applicable to 200,953,114 outstanding $.001 par value shares of
beneficial interest (unlimited authorization) | 2,233,870 |
| Net Asset Value Per Share | $11.12 |
See accompanying Notes, which are an integral part of the Financial Statements.
Short-Term Investment-Grade Portfolio
Statement of Operations
|
| | Year Ended
December 31, 2020 |
| | ($000) |
| Investment Income | |
| Income | |
| Dividends—Affiliated Issuers | 43 |
| Interest—Unaffiliated Issuers | 48,627 |
| Interest—Affiliated Issuers | 372 |
| Total Income | 49,042 |
| Expenses | |
| The Vanguard Group—Note B | |
| Investment Advisory Services | 204 |
| Management and Administrative | 2,411 |
| Marketing and Distribution | 223 |
| Custodian Fees | 67 |
| Auditing Fees | 36 |
| Shareholders' Reports | 11 |
| Trustees’ Fees and Expenses | 1 |
| Total Expenses | 2,953 |
| Net Investment Income | 46,089 |
| Realized Net Gain (Loss) | |
| Investment Securities Sold—Unaffiliated Issuers | 24,371 |
| Investment Securities Sold—Affiliated Issuers | (104) |
| Futures Contracts | (124) |
| Options Purchased | (75) |
| Options Written | 447 |
| Swap Contracts | 1,421 |
| Forward Currency Contracts | (2,167) |
| Foreign Currencies | (1,148) |
| Realized Net Gain (Loss) | 22,621 |
| Change in Unrealized Appreciation (Depreciation) | |
| Investment Securities—Unaffiliated Issuers | 40,220 |
| Investment Securities—Affiliated Issuers | 76 |
| Futures Contracts | (6) |
| Options Purchased | 45 |
| Options Written | 21 |
| Swap Contracts | 4 |
| Forward Currency Contracts | (2,057) |
| Foreign Currencies | 22 |
| Change in Unrealized Appreciation (Depreciation) | 38,325 |
| Net Increase (Decrease) in Net Assets Resulting from Operations | 107,035 |
Statement of Changes in Net Assets
|
| | Year Ended December 31, |
| | 2020
($000) | 2019
($000) |
| Increase (Decrease) in Net Assets | | |
| Operations | | |
| Net Investment Income | 46,089 | 51,367 |
| Realized Net Gain (Loss) | 22,621 | 2,825 |
| Change in Unrealized Appreciation (Depreciation) | 38,325 | 45,833 |
| Net Increase (Decrease) in Net Assets Resulting from Operations | 107,035 | 100,025 |
| Distributions1 | | |
| Total Distributions | (51,983) | (46,758) |
| Capital Share Transactions | | |
| Issued | 835,630 | 444,226 |
| Issued in Lieu of Cash Distributions | 51,983 | 46,758 |
| Redeemed | (615,413) | (320,964) |
| Net Increase (Decrease) from Capital Share Transactions | 272,200 | 170,020 |
| Total Increase (Decrease) | 327,252 | 223,287 |
| Net Assets | | |
| Beginning of Period | 1,906,618 | 1,683,331 |
| End of Period | 2,233,870 | 1,906,618 |
| 1 | Certain prior-period numbers have been reclassified to conform with the current-period presentation. |
See accompanying Notes, which are an integral part of the Financial Statements.
Short-Term Investment-Grade Portfolio
For a Share Outstanding
Throughout Each Period | Year Ended December 31, |
| 2020 | 2019 | 2018 | 2017 | 2016 |
| Net Asset Value, Beginning of Period | $10.84 | $10.54 | $10.63 | $10.63 | $10.55 |
| Investment Operations | | | | | |
| Net Investment Income | .2381 | .3021 | .2841 | .2241 | .215 |
| Net Realized and Unrealized Gain (Loss) on Investments | .336 | .287 | (.187) | .005 | .068 |
| Total from Investment Operations | .574 | .589 | .097 | .229 | .283 |
| Distributions | | | | | |
| Dividends from Net Investment Income | (.294) | (.289) | (.187) | (.211) | (.203) |
| Distributions from Realized Capital Gains | — | — | — | (.018) | — |
| Total Distributions | (.294) | (.289) | (.187) | (.229) | (.203) |
| Net Asset Value, End of Period | $11.12 | $10.84 | $10.54 | $10.63 | $10.63 |
| Total Return | 5.49% | 5.69% | 0.94% | 2.19% | 2.72% |
| Ratios/Supplemental Data | | | | | |
| Net Assets, End of Period (Millions) | $2,234 | $1,907 | $1,683 | $1,604 | $1,372 |
| Ratio of Total Expenses to Average Net Assets | 0.14% | 0.14% | 0.14% | 0.16% | 0.16% |
| Ratio of Net Investment Income to Average Net Assets | 2.18% | 2.83% | 2.72% | 2.11% | 2.05% |
| Portfolio Turnover Rate | 89%2 | 67%2 | 78% | 83% | 65% |
| 1 | Calculated based on average shares outstanding. |
| 2 | Includes 7% and 1% attributable to mortgage-dollar-roll activity. |
See accompanying Notes, which are an integral part of the Financial Statements.
Short-Term Investment-Grade Portfolio
Notes to Financial Statements
The Short-Term Investment-Grade Portfolio, a portfolio of Vanguard Variable Insurance Funds, is registered under the Investment Company Act of 1940 as an open-end investment company. The portfolio’s shares are only available for purchase by separate accounts of insurance companies as investments for variable annuity plans, variable life insurance contracts, or other variable benefit insurance contracts. Certain of the portfolio’s investments are in corporate debt instruments; the issuers’ abilities to meet their obligations may be affected by economic developments in their respective industries. Market disruptions associated with the COVID-19 pandemic have had a global impact, and uncertainty exists as to the long-term implications. Such disruptions can adversely affect assets of the portfolio and thus portfolio performance.
| A. | The following significant accounting policies conform to generally accepted accounting principles for U.S. investment companies. The portfolio consistently follows such policies in preparing its financial statements. |
1. Security Valuation: Securities are valued as of the close of trading on the New York Stock Exchange (generally 4 p.m., Eastern time) on the valuation date. Bonds and temporary cash investments are valued using the latest bid prices or using valuations based on a matrix system (which considers such factors as security prices, yields, maturities, and ratings), both as furnished by independent pricing services. Structured debt securities, including mortgages and asset-backed securities, are valued using the latest bid prices or using valuations based on a matrix system that considers such factors as issuer, tranche, nominal or option-adjusted spreads, weighted average coupon, weighted average maturity, credit enhancements, and collateral. Equity securities are valued at the latest quoted sales prices or official closing prices taken from the primary market in which each security trades; such securities not traded on the valuation date are valued at the mean of the latest quoted bid and asked prices. Investments in Vanguard Market Liquidity Fund are valued at that fund's net asset value.
Securities for which market quotations are not readily available, or whose values have been affected by events occurring before the portfolio’s pricing time but after the close of the securities’ primary markets, are valued at their fair values calculated according to procedures adopted by the board of trustees. These procedures include obtaining quotations from an independent pricing service, monitoring news to identify significant market- or security-specific events, and evaluating changes in the values of foreign market proxies (for example, ADRs, futures contracts, or exchange-traded funds), between the time the foreign markets close and the portfolio’s pricing time. When fair-value pricing is employed, the prices of securities used by a portfolio to calculate its net asset value may differ from quoted or published prices for the same securities.
2. Foreign Currency: Securities and other assets and liabilities denominated in foreign currencies are translated into U.S. dollars using exchange rates obtained from an independent third party as of the portfolio’s pricing time on the valuation date. Realized gains (losses) and unrealized appreciation (depreciation) on investment securities include the effects of changes in exchange rates since the securities were purchased, combined with the effects of changes in security prices. Fluctuations in the value of other assets and liabilities resulting from changes in exchange rates are recorded as unrealized foreign currency gains (losses) until the assets or liabilities are settled in cash, at which time they are recorded as realized foreign currency gains (losses).
3. Futures Contracts: The portfolio uses futures contracts to invest in fixed income asset classes with greater efficiency and lower cost than is possible through direct investment, to add value when these instruments are attractively priced, or to adjust sensitivity to changes in interest rates. The primary risks associated with the use of futures contracts are imperfect correlation between changes in market values of bonds held by the portfolio and the prices of futures contracts, and the possibility of an illiquid market. Counterparty risk involving futures is mitigated because a regulated clearinghouse is the counterparty instead of the clearing broker. To further mitigate counterparty risk, the portfolio trades futures contracts on an exchange, monitors the financial strength of its clearing brokers and clearinghouse, and has entered into clearing agreements with its clearing brokers. The clearinghouse imposes initial margin requirements to secure the portfolio’s performance and requires daily settlement of variation margin representing changes in the market value of each contract. Any securities pledged as initial margin for open contracts are noted in the Schedule of Investments.
Futures contracts are valued at their quoted daily settlement prices. The notional amounts of the contracts are not recorded in the Statement of Assets and Liabilities. Fluctuations in the value of the contracts are recorded in the Statement of Assets and Liabilities as an asset (liability) and in the Statement of Operations as unrealized appreciation (depreciation) until the contracts are closed, when they are recorded as realized gains (losses) on futures contracts.
During the year ended December 31, 2020, the portfolio’s average investments in long and short futures contracts each represented 3% of net assets, based on the average of the notional amounts at each quarter-end during the period.
Short-Term Investment-Grade Portfolio
4. Forward Currency Contracts: The portfolio enters into forward currency contracts to protect the value of securities and related receivables and payables against changes in future foreign exchange rates. The portfolio’s risks in using these contracts include movement in the values of the foreign currencies relative to the U.S. dollar and the ability of the counterparties to fulfill their obligations under the contracts. The portfolio mitigates its counterparty risk by entering into forward currency contracts only with a diverse group of prequalified counterparties, monitoring their financial strength, entering into master netting arrangements with its counterparties, and requiring its counterparties to transfer collateral as security for their performance. In the absence of a default, the collateral pledged or received by the portfolio cannot be repledged, resold, or rehypothecated. The master netting arrangements provide that, in the event of a counterparty’s default (including bankruptcy), the portfolio may terminate the forward currency contracts, determine the net amount owed by either party in accordance with its master netting arrangements, and sell or retain any collateral held up to the net amount owed to the portfolio under the master netting arrangements. The forward currency contracts contain provisions whereby a counterparty may terminate open contracts if the portfolio’s net assets decline below a certain level, triggering a payment by the portfolio if the portfolio is in a net liability position at the time of the termination. The payment amount would be reduced by any collateral the portfolio has pledged. Any securities pledged as collateral for open contracts are noted in the Schedule of Investments. The value of collateral received or pledged is compared daily to the value of the forward currency contracts exposure with each counterparty, and any difference, if in excess of a specified minimum transfer amount, is adjusted and settled within two business days.
Forward currency contracts are valued at their quoted daily prices obtained from an independent third party, adjusted for currency risk based on the expiration date of each contract. The notional amounts of the contracts are not recorded in the Statement of Assets and Liabilities. Fluctuations in the value of the contracts are recorded in the Statement of Assets and Liabilities as an asset (liability) and in the Statement of Operations as unrealized appreciation (depreciation) until the contracts are closed, when they are recorded as realized gains (losses) on forward currency contracts.
During the year ended December 31, 2020, the portfolio’s average investment in forward currency contracts represented 4% of net assets, based on the average of the notional amounts at each quarter-end during the period.
5. Options: The portfolio invests in options contracts on futures to adjust its exposure to the underlying investments. The primary risk associated with purchasing options is that if interest rates move in such a way that the option is out-of-the-money, the position is worthless at expiration, and the portfolio loses premium paid. The primary risk associated with selling options is that if interest rates move in such a way that the option is in-the-money, the counterparty exercises the option, and the portfolio loses an amount equal to the market value of the option written less the premium received. Counterparty risk involving options on futures contracts is mitigated because a regulated clearinghouse is the counterparty instead of the clearing broker. To further mitigate counterparty risk, the portfolio trades options on futures contracts on an exchange, monitors the financial strength of its clearing brokers and clearinghouses, and has entered into clearing agreements with its clearing brokers.
Options contracts on futures are valued at their quoted daily settlement prices. The premium paid for a purchased option is recorded in the Statement of Assets and Liabilities as an asset that is subsequently adjusted daily to the current market value of the option purchased. The premium received for a written option is recorded in the Statement of Assets and Liabilities as an asset with an equal liability that is subsequently adjusted daily to the current market value of the option written. The notional amounts of option contracts are not recorded in the Statement of Assets and Liabilities. Fluctuations in the value of the options are recorded in the Statement of Operations as unrealized appreciation (depreciation) until expired, closed, or exercised, at which time realized gains (losses) are recognized.
During the year ended December 31, 2020, the portfolio’s average value of investments in options purchased and options written each represented less than 1% of net assets, based on the average market values at each quarter-end during the period.
6. Swaptions: The portfolio invests in options on swaps, which are transacted over-the-counter (OTC) and not on an exchange. The portfolio enters into swaptions to adjust the portfolio’s sensitivity to interest rates or to adjust its exposure to the underlying investments. The portfolio may purchase a swaption from a counterparty whereby the portfolio has the right to enter into a swap in which the portfolio will pay a fixed rate and receive a floating rate, each applied to a notional amount. The portfolio may also sell a swaption to a counterparty whereby the portfolio grants the counterparty the right to enter into a swap in which the portfolio will pay a floating rate and receive a fixed rate, each applied to a notional amount. Swaptions also include options that allow an existing swap to be terminated or extended by one of the counterparties. Unlike exchange-traded options, which are
Short-Term Investment-Grade Portfolio
standardized with respect to the underlying instrument, expiration date, contract size, and strike price, the terms of OTC options generally are established through negotiation with the other party to the option contract. Although this type of arrangement allows the purchaser or writer greater flexibility to tailor an option to its needs, OTC options generally involve greater credit risk than exchange-traded options. Credit risk involves the possibility that a counterparty may default on its obligation to pay net amounts due to the portfolio. The portfolio mitigates its counterparty risk by entering into swaptions with a diverse group of prequalified counterparties and monitoring their financial strength.
The primary risk associated with purchasing swaptions is that interest rates or the value of the underlying investments move in such a way that the swaption is out-of-the money, the position is worthless at expiration, and the portfolio loses the premium paid. The primary risk associated with selling swaptions is that interest rates or the value of the underlying investments move in such a way that the swaption is in-the-money, the counterparty exercises the swaption, and the resulting interest rate swap results in a negative cash flow to the portfolio in an amount greater than the premium received. A risk associated with all types of swaptions is the possibility that a counterparty may default on its obligations under the swaption contract.
Swaptions are valued based on market quotations received from independent pricing services or recognized dealers. The premium paid for a purchased swaption is recorded in the Statement of Assets and Liabilities as an asset and is subsequently adjusted daily based on the current market value of the swaption. The premium received for a written swaption is recorded in the Statement of Assets and Liabilities as an asset with an equal liability and is subsequently adjusted daily based on the current market value of the swaption. The notional amounts of option contracts are not recorded in the Statement of Assets and Liabilities. Fluctuations in the value of swaptions are recorded in the Statement of Operations as unrealized appreciation (depreciation) until expired, closed, or exercised, at which time realized gains(losses) are recognized.
During the year ended December 31, 2020, the portfolio’s average value of investments in swaptions purchased and swaptions written each represented less than 1% of net assets, based on the average market values at each quarter-end during the period.
7. Swap Contracts: The portfolio invests in credit default swaps to adjust the overall credit risk of the portfolio or to actively overweight or underweight credit risk to a specific issuer or group of issuers. The portfolio may sell credit protection through credit default swaps to simulate investments in long positions that are either unavailable or considered to be less attractively priced in the bond market. The portfolio may purchase credit protection through credit default swaps to reduce credit exposure to a given issuer or issuers. Under the terms of the swaps, an up-front payment may be exchanged between the seller and buyer. In addition, the seller of the credit protection receives a periodic payment of premium from the buyer that is a fixed percentage applied to a notional amount. If, for example, the reference entity is subject to a credit event (such as bankruptcy, failure to pay, or obligation acceleration) during the term of the swap, the seller agrees to either physically settle or cash settle the swap contract. If the swap is physically settled, the seller agrees to pay the buyer an amount equal to the notional amount and take delivery of a debt instrument of the reference issuer with a par amount equal to such notional amount. If the swap is cash settled, the seller agrees to pay the buyer the difference between the notional amount and the final price for the relevant debt instrument, as determined either in a market auction or pursuant to a pre-agreed-upon valuation procedure.
The portfolio enters into interest rate swap transactions to adjust the portfolio’s sensitivity to changes in interest rates and maintain the ability to generate income at prevailing market rates. Under the terms of the swaps, one party pays the other an amount that is a fixed percentage rate applied to a notional amount. In return, the counterparty agrees to pay a floating rate, which is reset periodically based on short-term interest rates, applied to the same notional amount.
The notional amounts of swap contracts are not recorded in the Statement of Assets and Liabilities. Swaps are valued daily based on market quotations received from independent pricing services or recognized dealers and the change in value is recorded in the Statement of Assets and Liabilities as an asset (liability) and in the Statement of Operations as unrealized appreciation (depreciation) until the seller of credit protection is required to take delivery (or, in a cash settled swap, pay the settlement amount determined) upon occurrence of a credit event, periodic payments are made, or the swap terminates, at which time realized gain (loss) is recorded. The net premium to be received or paid by the portfolio under swap contracts is accrued daily and recorded as realized gain (loss) over the life of the contract.
The primary risk associated with selling credit protection is that, upon the occurrence of a defined credit event, the market value of the debt instrument received by the portfolio (or, in a cash settled
Short-Term Investment-Grade Portfolio
swap, the debt instruments used to determine the settlement payment by the portfolio) will be significantly less than the amount paid by the portfolio and, in a physically settled swap, the portfolio may receive an illiquid debt instrument. A risk associated with all types of swaps is the possibility that a counterparty may default on its obligation to pay net amounts due to the portfolio. The portfolio’s maximum amount subject to counterparty risk is the unrealized appreciation on the swap contract. The portfolio mitigates its counterparty risk by entering into swaps only with a diverse group of prequalified counterparties, monitoring their financial strength, entering into master netting arrangements with its counterparties, and requiring its counterparties to transfer collateral as security for their performance. In the absence of a default, the collateral pledged or received by the portfolio cannot be repledged, resold, or rehypothecated. In the event of a counterparty’s default (including bankruptcy), the portfolio may terminate any swap contracts with that counterparty, determine the net amount owed by either party in accordance with its master netting arrangements, and sell or retain any collateral held up to the net amount owed to the portfolio under the master netting arrangements. The swap contracts contain provisions whereby a counterparty may terminate open contracts if the portfolio net assets decline below a certain level, triggering a payment by the portfolio if the portfolio is in a net liability position at the time of the termination. The payment amount would be reduced by any collateral the portfolio has pledged. Any securities pledged as collateral for open contracts are noted in the Schedule of Investments. The value of collateral received or pledged is compared daily to the value of the swap contracts exposure with each counterparty, and any difference, if in excess of a specified minimum transfer amount, is adjusted and settled within two business days.
The portfolio enters into centrally cleared interest rate and credit default swaps to achieve the same objectives specified with respect to the equivalent over-the-counter swaps but with less counterparty risk because a regulated clearinghouse is the counterparty instead of the clearing broker or executing broker. The clearinghouse imposes initial margin requirements to secure the portfolio’s performance, and requires daily settlement of variation margin representing changes in the market value of each contract. To further mitigate counterparty risk, the portfolio trades with a diverse group of prequalified executing brokers; monitors the financial strength of its clearing brokers, executing brokers, and clearinghouse; and has entered into agreements with its clearing brokers and executing brokers.
During the year ended December 31, 2020, the portfolio’s average amounts of investments in credit protection sold and credit protection purchased represented 3% and 1% of net assets, respectively, based on the average of the notional amounts at each quarter-end during the period. The average amount of investments in interest rate swaps represented 2% of net assets, based on the average of notional amounts at each quarter-end during the period.
8. To Be Announced (TBA) Transactions: A TBA transaction is an agreement to buy or sell mortgage-backed securities with agreed-upon characteristics (face amount, coupon, maturity) for settlement at a future date. The portfolio may be a seller of TBA transactions to reduce its exposure to the mortgage-backed securities market or in order to sell mortgage-backed securities it owns under delayed-delivery arrangements. When the portfolio is a buyer of TBA transactions, it maintains cash or short-term investments in an amount sufficient to meet the purchase price at the settlement date of the TBA transaction. The primary risk associated with TBA transactions is that a counterparty may default on its obligations. The portfolio mitigates its counterparty risk by, among other things, performing a credit analysis of counterparties, allocating transactions among numerous counterparties, and monitoring its exposure to each counterparty. The portfolio may also enter into a Master Securities Forward Transaction Agreement (MSFTA) with certain counterparties and require them to transfer collateral as security for their performance. In the absence of a default, the collateral pledged or received by the portfolio cannot be repledged, resold, or rehypothecated. Under an MSFTA, upon a counterparty default (including bankruptcy), the portfolio may terminate any TBA transactions with that counterparty, determine the net amount owed by either party in accordance with its master netting arrangements, and sell or retain any collateral held up to the net amount owed to the portfolio under the master netting arrangements.
9. Mortgage Dollar Rolls: The portfolio enters into mortgage-dollar-roll transactions, in which the portfolio sells mortgage-backed securities to a dealer and simultaneously agrees to purchase similar securities in the future at a predetermined price. The proceeds of the securities sold in mortgage-dollar-roll transactions are typically invested in high-quality short-term fixed income securities. The portfolio forgoes principal and interest paid on the securities sold, and is compensated by interest earned on the proceeds of the sale and by a lower price on the securities to be repurchased. The portfolio has also entered into mortgage-dollar-roll transactions in which the portfolio buys mortgage-backed securities from a dealer pursuant to a TBA transaction and simultaneously agrees to sell similar securities in the future at a predetermined price. The securities bought in mortgage-dollar-roll transactions are used to cover an open TBA sell position. The portfolio continues to earn interest on mortgage-backed security pools already held and receives a lower price on the securities to be sold in the future. The portfolio accounts for mortgage-dollar-roll transactions
Short-Term Investment-Grade Portfolio
as purchases and sales; as such, these transactions may increase the portfolio’s portfolio turnover rate. Amounts to be received or paid in connection with open mortgage dollar rolls are included in Receivables for Investment Securities Sold or Payables for Investment Securities Purchased in the Statement of Assets and Liabilities.
10. Federal Income Taxes: The portfolio intends to continue to qualify as a regulated investment company and distribute all of its taxable income. The portfolio’s tax returns are open to examination by the relevant tax authorities until expiration of the applicable statute of limitations, which is generally three years after the filing of the tax return. Management has analyzed the portfolio’s tax positions taken for all open federal and state income tax years, and has concluded that no provision for income tax is required in the portfolio’s financial statements.
11. Distributions: Distributions to shareholders are recorded on the ex-dividend date. Distributions are determined on a tax basis at the fiscal year-end and may differ from net investment income and realized capital gains for financial reporting purposes.
12. Credit Facilities and Interfund Lending Program: The portfolio and certain other funds managed by The Vanguard Group ("Vanguard") participate in a $4.3 billion committed credit facility provided by a syndicate of lenders pursuant to a credit agreement and an uncommitted credit facility provided by Vanguard. Both facilities may be renewed annually. Each fund is individually liable for its borrowings, if any, under the credit facilities. Borrowings may be utilized for temporary or emergency purposes, subject to the portfolio’s regulatory and contractual borrowing restrictions. With respect to the committed credit facility, the participating funds are charged administrative fees and an annual commitment fee of 0.10% of the undrawn committed amount of the facility; these fees are allocated to the funds based on a method approved by the portfolio’s board of trustees and included in Management and Administrative expenses on the portfolio’s Statement of Operations. Any borrowings under either facility bear interest at a rate based upon the higher of the one-month London Interbank Offered Rate (or an acceptable alternate rate, if necessary), federal funds effective rate, or overnight bank funding rate plus an agreed-upon spread, except that borrowings under the uncommitted credit facility may bear interest based upon an alternate rate agreed to by the portfolio and Vanguard.
In accordance with an exemptive order (the “Order”) from the SEC, the portfolio may participate in a joint lending and borrowing program that allows registered open-end Vanguard funds to borrow money from and lend money to each other for temporary or emergency purposes (the “Interfund Lending Program”), subject to compliance with the terms and conditions of the Order, and to the extent permitted by the portfolio’s investment objective and investment policies. Interfund loans and borrowings normally extend overnight, but can have a maximum duration of seven days. Loans may be called on one business day’s notice. The interest rate to be charged is governed by the conditions of the Order and internal procedures adopted by the board of trustees. The board of trustees is responsible for overseeing the Interfund Lending Program.
For the year ended December 31, 2020, the portfolio did not utilize the credit facilities or the Interfund Lending Program.
13. Other: Interest income includes income distributions received from Vanguard Market Liquidity Fund and is accrued daily. Premiums and discounts on debt securities are amortized and accreted, respectively, to interest income over the lives of the respective securities, except for premiums on certain callable debt securities that are amortized to the earliest call date. Security transactions are accounted for on the date securities are bought or sold. Costs used to determine realized gains (losses) on the sale of investment securities are those of the specific securities sold.
| B. | In accordance with the terms of a Funds' Service Agreement (the “FSA”) between Vanguard and the portfolio, Vanguard furnishes to the portfolio investment advisory, corporate management, administrative, marketing, and distribution services at Vanguard’s cost of operations (as defined by the FSA). These costs of operations are allocated to the portfolio based on methods and guidelines approved by the board of trustees and are generally settled twice a month. |
Upon the request of Vanguard, the portfolio may invest up to 0.40% of its net assets as capital in Vanguard. At December 31, 2020, the portfolio had contributed to Vanguard capital in the amount of $91,000, representing less than 0.01% of the portfolio’s net assets and 0.04% of Vanguard’s capital received pursuant to the FSA. The portfolio’s trustees and officers are also directors and employees, respectively, of Vanguard.
| C. | Various inputs may be used to determine the value of the portfolio’s investments and derivatives. These inputs are summarized in three broad levels for financial statement purposes. The inputs or methodologies used to value securities are not necessarily an indication of the risk associated with investing in those securities. |
Short-Term Investment-Grade Portfolio
Level 1—Quoted prices in active markets for identical securities.
Level 2—Other significant observable inputs (including quoted prices for similar securities, interest rates, prepayment speeds, credit risk, etc.).
Level 3—Significant unobservable inputs (including the portfolio’s own assumptions used to determine the fair value of investments). Any investments and derivatives valued with significant unobservable inputs are noted on the Schedule of Investments.
The following table summarizes the market value of the portfolio’s investments and derivatives as of December 31, 2020, based on the inputs used to value them:
| | Level 1
($000) | Level 2
($000) | Level 3
($000) | Total
($000) |
| Investments | | | | |
| Assets | | | | |
| U.S. Government and Agency Obligations | — | 203,184 | — | 203,184 |
| Asset-Backed/Commercial Mortgage-Backed Securities | — | 260,301 | — | 260,301 |
| Corporate Bonds | — | 1,615,998 | — | 1,615,998 |
| Sovereign Bonds | — | 87,907 | — | 87,907 |
| Taxable Municipal Bonds | — | 1,322 | — | 1,322 |
| Common Stocks | 2,683 | — | — | 2,683 |
| Temporary Cash Investments | 121,885 | — | — | 121,885 |
| Options Purchased | — | 8 | — | 8 |
| Total | 124,568 | 2,168,720 | — | 2,293,288 |
| Derivative Financial Instruments | | | | |
| Assets | | | | |
| Forward Currency Contracts | — | 45 | — | 45 |
| Swap Contracts | 221 | 73 | — | 95 |
| Total | 22 | 118 | — | 140 |
| Liabilities | | | | |
| Options Written | — | 25 | — | 25 |
| Futures Contracts1 | 28 | — | — | 28 |
| Forward Currency Contracts | — | 2,486 | — | 2,486 |
| Swap Contracts | 101 | 212 | — | 222 |
| Total | 38 | 2,723 | — | 2,761 |
| 1 | Represents variation margin on the last day of the reporting period. |
| D. | At December 31, 2020, the fair values of derivatives were reflected in the Statement of Assets and Liabilities as follows: |
| Statement of Assets and Liabilities Caption | Interest Rate
Contracts
($000) | Foreign Exchange
Contracts
($000) | Credit
Contracts
($000) | Total
($000) |
| Investments in Secuties, at Value—Unaffiliated Issuers (Options Purchased) | — | — | 8 | 8 |
| Swap Premiums Paid | — | — | 271 | 271 |
| Variation Margin Receivable—Centrally Cleared Swap Contracts | — | — | 22 | 22 |
Unrealized Appreciation—
Over-the-Counter Swap Contracts | — | — | 73 | 73 |
| Unrealized Appreciation—Forward Currency Contracts | — | 45 | — | 45 |
| Total Assets | — | 45 | 374 | 419 |
| Options Written, at value | — | — | 25 | 25 |
| Swap Premiums Received | — | — | 32 | 32 |
| Variation Margin Payable—Futures Contracts | 28 | — | — | 28 |
| Variation Margin Payable—Centrally Cleared Swap Contracts | 10 | — | — | 10 |
Unrealized Depreciation—
Over-the-Counter Swap Contracts | — | — | 212 | 212 |
Short-Term Investment-Grade Portfolio
| Statement of Assets and Liabilities Caption | Interest Rate
Contracts
($000) | Foreign Exchange
Contracts
($000) | Credit
Contracts
($000) | Total
($000) |
Unrealized Depreciation—
Forward Currency Contracts | — | 2,486 | — | 2,486 |
| Total Liabilities | 38 | 2,486 | 269 | 2,793 |
Realized net gain (loss) and the change in unrealized appreciation (depreciation) on derivatives for the year ended December 31, 2020, were:
| Realized Net Gain (Loss) on Derivatives | Interest Rate
Contracts
($000) | Foreign
Exchange
Contracts
($000) | Credit
Contracts
($000) | Total
($000) |
| Futures Contracts | (124) | — | — | (124) |
| Options Purchased | (23) | — | (52) | (75) |
| Options Written | 313 | — | 134 | 447 |
| Swap Contracts | (1,798) | — | 3,219 | 1,421 |
| Forward Currency Contracts | — | (2,167) | — | (2,167) |
| Realized Net Gain (Loss) on Derivatives | (1,632) | (2,167) | 3,301 | (498) |
| Change in Unrealized Appreciation (Depreciation) on Derivatives |
| Futures Contracts | (6) | — | — | (6) |
| Options Purchased | 53 | — | (8) | 45 |
| Options Written | (8) | — | 29 | 21 |
| Swap Contracts | (142) | — | 146 | 4 |
| Forward Currency Contracts | — | (2,057) | — | (2,057) |
| Change in Unrealized Appreciation (Depreciation) on Derivatives | (103) | (2,057) | 167 | (1,993) |
| E. | Permanent differences between book-basis and tax-basis components of net assets are reclassified among capital accounts in the financial statements to reflect their tax character. These reclassifications have no effect on net assets or net asset value per share. As of period end, permanent differences primarily attributable to the accounting for foreign currency transactions and swap agreements were reclassified between the individual components of total distributable earnings (loss). |
Temporary differences between book-basis and tax-basis components of total distributable earnings (loss) arise when certain items of income, gain, or loss are recognized in different periods for financial statement and tax purposes; these differences will reverse at some time in the future. The differences are primarily related to the deferral of losses from wash sales; the deferral of losses from straddles; the recognition of unrealized gains or losses from certain derivative contracts; the recognition of gain or loss from foreign currency hedges; and the treatment of amortization adjustments from certain fixed income securities. As of period end, the tax-basis components of total distributable earnings (loss) are detailed in the table as follows:
| | Amount
($000) |
| Undistributed Ordinary Income | 51,527 |
| Undistributed Long-Term Gains | 5,128 |
| Capital Loss Carryforwards | — |
| Qualified Late-Year Losses | — |
| Net Unrealized Gains (Losses) | 62,421 |
The tax character of distributions paid was as follows:
| | Year Ended December 31, |
| | 2020
Amount
($000) | 2019
Amount
($000) |
| Ordinary Income* | 51,983 | 46,758 |
| Long-Term Capital Gains | — | — |
| Total | 51,983 | 46,758 |
| * | Includes short-term capital gains, if any. |
Short-Term Investment-Grade Portfolio
As of December 31, 2020, gross unrealized appreciation and depreciation for investments and derivatives based on cost for U.S. federal income tax purposes were as follows:
| | Amount
($000) |
| Tax Cost | 2,230,969 |
| Gross Unrealized Appreciation | 64,732 |
| Gross Unrealized Depreciation | (2,324) |
| Net Unrealized Appreciation (Depreciation) | 62,408 |
| F. | During the year ended December 31, 2020, the portfolio purchased $1,343,100,000 of investment securities and sold $1,125,529,000 of investment securities, other than U.S. government securities and temporary cash investments. Purchases and sales of U.S. government securities were $788,787,000 and $651,834,000, respectively. |
The portfolio purchased securities from and sold securities to other Vanguard funds or accounts managed by Vanguard or its affiliates, in accordance with procedures adopted by the board of trustees in compliance with Rule 17a-7 of the Investment Company Act of 1940. For the year ended ended December 31, 2020, such purchases and sales were $244,124,000 and $214,652,000, respectively; these amounts, other than temporary cash investments, are included in the purchases and sales of investment securities noted above.
| G. | Capital share transactions for each class of shares were: |
| | Year Ended December 31, |
| | 2020 | 2019 |
| | Shares
(000) | Shares
(000) |
| Issued | 76,734 | 41,665 |
| Issued in Lieu of Cash Distributions | 5,027 | 4,483 |
| Redeemed | (56,633) | (30,064) |
| Net Increase (Decrease) in Shares Outstanding | 25,128 | 16,084 |
At December 31, 2020, one shareholder (an insurance company separate account whose holdings in the portfolio represent the indirect investment of Vanguard Variable Annuity contract holders) was the record or beneficial owner of 48% of the portfolio’s net assets. If this shareholder was to redeem its investment in the portfolio, the redemption might result in an increase in the portfolio’s expense ratio, cause the portfolio to incur higher transaction costs, or lead to the realization of taxable capital gains.
| H. | Transactions during the period in investments where the issuer is another member of The Vanguard Group were as follows: |
| | | Current Period Transactions | |
| | Dec. 31,
2019
Market
Value
($000) | Purchases
at Cost
($000) | Proceeds
from
Securities
Sold
($000) | Realized
Net
Gain
(Loss)
($000) | Change in
Unrealized
App. (Dep.)
($000) | Income
($000) | Capital Gain
Distributions
Received
($000) | Dec. 31,
2020
Market
Value
($000) |
| Vanguard Market Liquidity Fund | 33,582 | NA1 | NA1 | (104) | 1 | 372 | — | 121,885 |
| Vanguard Short-Term Corporate Bond ETF | — | 2,608 | — | — | 75 | 43 | — | 2,683 |
| Total | 33,582 | | | (104) | 76 | 415 | — | 124,568 |
| 1 | Not applicable—purchases and sales are for temporary cash investment purposes. |
| I. | Management has determined that no events or transactions occurred subsequent to December 31, 2020, that would require recognition or disclosure in these financial statements. |
Report of Independent Registered Public Accounting Firm
To the Board of Trustees of Vanguard Variable Insurance Funds and Shareholders of Short-Term Investment-Grade Portfolio
Opinion on the Financial Statements
We have audited the accompanying statement of assets and liabilities, including the schedule of investments, of Short-Term Investment-Grade Portfolio (one of the portfolios constituting Vanguard Variable Insurance Funds, referred to hereafter as the "Portfolio”) as of December 31, 2020, the related statement of operations for the year ended December 31, 2020, the statement of changes in net assets for each of the two years in the period ended December 31, 2020, including the related notes, and the financial highlights for each of the five years in the period ended December 31, 2020 (collectively referred to as the “financial statements”). In our opinion, the financial statements present fairly, in all material respects, the financial position of the Portfolio as of December 31, 2020, the results of its operations for the year then ended, the changes in its net assets for each of the two years in the period ended December 31, 2020 and the financial highlights for each of the five years in the period ended December 31, 2020 in conformity with accounting principles generally accepted in the United States of America.
Basis for Opinion
These financial statements are the responsibility of the Portfolio’s management. Our responsibility is to express an opinion on the Portfolio’s financial statements based on our audits. We are a public accounting firm registered with the Public Company Accounting Oversight Board (United States) (PCAOB) and are required to be independent with respect to the Portfolio in accordance with the U.S. federal securities laws and the applicable rules and regulations of the Securities and Exchange Commission and the PCAOB.
We conducted our audits of these financial statements in accordance with the standards of the PCAOB. Those standards require that we plan and perform the audit to obtain reasonable assurance about whether the financial statements are free of material misstatement, whether due to error or fraud.
Our audits included performing procedures to assess the risks of material misstatement of the financial statements, whether due to error or fraud, and performing procedures that respond to those risks. Such procedures included examining, on a test basis, evidence regarding the amounts and disclosures in the financial statements. Our audits also included evaluating the accounting principles used and significant estimates made by management, as well as evaluating the overall presentation of the financial statements. Our procedures included confirmation of securities owned as of December 31, 2020 by correspondence with the custodian, transfer agent and brokers; when replies were not received from brokers, we performed other auditing procedures. We believe that our audits provide a reasonable basis for our opinion.
/s/PricewaterhouseCoopers LLP
Philadelphia, Pennsylvania
February 18, 2021
We have served as the auditor of one or more investment companies in The Vanguard Group of Funds since 1975.
Special 2020 tax information (unaudited) for corporate shareholders only for Short-Term Investment-Grade Portfolio, a portfolio of Vanguard Variable Insurance Funds
This information for the fiscal year ended December 31, 2020, is included pursuant to provisions of the Internal Revenue Code for corporate shareholders only.
The percentage of the ordinary dividends reported by the fund that is treated as a Section 163(j) interest dividend and thus is eligible to be treated as interest income for purposes of Section 163(j) and the regulations thereunder is 87.9%.
Change to Vanguard Variable Insurance Funds Short-Term Investment-Grade Portfolio
In May 2020, the Board of Trustees of Vanguard Variable Insurance Funds approved the removal of Vanguard Short-Term Investment-Grade Portfolio’s (the “Portfolio”) limitation on investing no more than 30% of its assets in medium-quality fixed income securities. Medium-quality fixed income securities are considered investment-grade securities, and are those rated the equivalent of Baa1, Baa2, or Baa3 by Moody‘s Investors Service, Inc. or another independent rating agency; or, if unrated, are determined to be of comparable quality by the Portfolio’s advisor.
All references to the Portfolio’s limitation on investing no more than 30% of its assets in medium-quality fixed income securities are deleted. The Portfolio’s expense ratio, investment objective, and advisor remain unchanged.
BLOOMBERG is a trademark and service mark of Bloomberg Finance L.P. BARCLAYS is a trademark and service mark of Barclays Bank Plc, used under license. Bloomberg Finance L.P. and its affiliates, including Bloomberg Index Services Limited (BISL) (collectively, Bloomberg), or Bloomberg’s licensors, own all proprietary rights in the Bloomberg Barclays U.S. 1–5 Year Credit Bond Index (the Index or Bloomberg Barclays Index).
Neither Barclays Bank Plc, Barclays Capital Inc., or any affiliate (collectively Barclays) or Bloomberg is the issuer or producer of the Short-Term Investment-Grade Portfolio and neither Bloomberg nor Barclays has any responsibilities, obligations or duties to investors in the Short-Term Investment-Grade Portfolio. The Index is licensed for use by The Vanguard Group, Inc. (Vanguard) as the sponsor of the Short-Term Investment-Grade Portfolio. Bloomberg and Barclays’ only relationship with Vanguard in respect of the Index is the licensing of the Index, which are determined, composed and calculated by BISL, or any successor thereto, without regard to the Issuer or the Short-Term Investment-Grade Portfolio or the owners of the Short-Term Investment-Grade Portfolio.
Additionally, Vanguard may for itself execute transaction(s) with Barclays in or relating to the Indices in connection with the Municipal Bond Funds. Investors acquire the Short-Term Investment-Grade Portfolio from Vanguard and investors neither acquire any interest in the Indices nor enter into any relationship of any kind whatsoever with Bloomberg or Barclays upon making an investment in the Short-Term Investment-Grade Portfolio. The Short-Term Investment-Grade Portfolio is not sponsored, endorsed, sold or promoted by Bloomberg or Barclays. Neither Bloomberg nor Barclays makes any representation or warranty, express or implied regarding the advisability of investing in the Short-Term Investment-Grade Portfolio or the advisability of investing in securities generally or the ability of the Indices to track corresponding or relative market performance. Neither Bloomberg nor Barclays has passed on the legality or suitability of the Short-Term Investment-Grade Portfolio with respect to any person or entity. Neither Bloomberg nor Barclays is responsible for and has not participated in the determination of the timing of, prices at, or quantities of the Short-Term Investment-Grade Portfolio to be issued. Neither Bloomberg nor Barclays has any obligation to take the needs of the Issuer or the owners of the Short-Term Investment-Grade Portfolio or any other third party into consideration in determining, composing or calculating the Indices. Neither Bloomberg nor Barclays has any obligation or liability in connection with administration, marketing or trading of the Short-Term Investment-Grade Portfolio.
The licensing agreement between Bloomberg and Barclays is solely for the benefit of Bloomberg and Barclays and not for the benefit of the owners of the Short-Term Investment-Grade Portfolio, investors or other third parties. In addition, the licensing agreement between Vanguard and Bloomberg is solely for the benefit of Vanguard and Bloomberg and not for the benefit of the owners of the Short-Term Investment-Grade Portfolio, investors or other third parties.
NEITHER BLOOMBERG NOR BARCLAYS SHALL HAVE ANY LIABILITY TO THE ISSUER, INVESTORS OR TO OTHER THIRD PARTIES FOR THE QUALITY, ACCURACY AND/OR COMPLETENESS OF THE BLOOMBERG BARCLAYS INDICES OR ANY DATA INCLUDED THEREIN OR FOR INTERRUPTIONS IN THE DELIVERY OF THE BLOOMBERG BARCLAYS INDICES. NEITHER BLOOMBERG NOR BARCLAYS MAKES ANY WARRANTY, EXPRESS OR IMPLIED, AS TO RESULTS TO BE OBTAINED BY THE ISSUER, THE INVESTORS OR ANY OTHER PERSON OR ENTITY FROM THE USE OF THE BLOOMBERG BARCLAYS INDICES OR ANY DATA INCLUDED THEREIN. NEITHER BLOOMBERG NOR BARCLAYS MAKES ANY EXPRESS OR IMPLIED WARRANTIES, AND EACH HEREBY EXPRESSLY DISCLAIMS ALL WARRANTIES OF MERCHANTABILITY OR FITNESS FOR A PARTICULAR PURPOSE OR USE WITH RESPECT TO THE BLOOMBERG BARCLAYS INDICES OR ANY DATA INCLUDED THEREIN. BLOOMBERG RESERVES THE RIGHT TO CHANGE THE METHODS OF CALCULATION OR PUBLICATION, OR TO CEASE THE CALCULATION OR PUBLICATION OF THE BLOOMBERG BARCLAYS INDICES, AND NEITHER BLOOMBERG NOR BARCLAYS SHALL BE LIABLE FOR ANY MISCALCULATION OF OR ANY INCORRECT, DELAYED OR INTERRUPTED PUBLICATION WITH RESPECT TO ANY OF THE BLOOMBERG BARCLAYS INDICES. NEITHER BLOOMBERG NOR BARCLAYS SHALL BE LIABLE FOR ANY DAMAGES, INCLUDING, WITHOUT LIMITATION, ANY SPECIAL, INDIRECT OR CONSEQUENTIAL DAMAGES, OR ANY LOST PROFITS AND EVEN IF ADVISED OF THE POSSIBILITY OF SUCH, RESULTING FROM THE USE OF THE BLOOMBERG BARCLAYS INDICES OR ANY DATA INCLUDED THEREIN OR WITH RESPECT TO THE SHORT-TERM INVESTMENT-GRADE PORTFOLIO.
None of the information supplied by Bloomberg or Barclays and used in this publication may be reproduced in any manner without the prior written permission of both Bloomberg and Barclays Capital, the investment banking division of Barclays Bank Plc. Barclays Bank Plc is registered in England No. 1026167. Registered office 1 Churchill Place London E14 5HP.
© 2021 Bloomberg. Used with Permission.
Source: Bloomberg Index Services Limited. Copyright 2021, Bloomberg. All rights reserved.
This page intentionally left blank.
The People Who Govern Your Fund
The trustees of your mutual fund are there to see that the fund is operated and managed in your best interests since, as a shareholder, you are a part owner of the fund. Your fund’s trustees also serve on the board of directors of The Vanguard Group, Inc., which is owned by the Vanguard funds and provides services to them.
A majority of Vanguard’s board members are independent, meaning that they have no affiliation with Vanguard or the funds they oversee, apart from the sizable personal investments they have made as private individuals. The independent board members have distinguished backgrounds in business, academia, and public service. Each of the trustees and executive officers oversees 211 Vanguard funds.
Information for each trustee and executive officer of the fund appears below. That information, as well as the Vanguard fund count, is as of the date on the cover of this fund report. The mailing address of the trustees and officers is P.O. Box 876, Valley Forge, PA 19482. More information about the trustees is in the Statement of Additional Information, which can be obtained, without charge, by contacting Vanguard at 800-662-7447, or online at vanguard.com.
Interested Trustee1
Mortimer J. Buckley
Born in 1969. Trustee since January 2018. Principal occupation(s) during the past five years and other experience: chairman of the board (2019–present) of Vanguard and of each of the investment companies served by Vanguard; chief executive officer (2018–present) of Vanguard; chief executive officer, president, and trustee (2018–present) of each of the investment companies served by Vanguard; president and director (2017–present) of Vanguard; and president (2018–present) of Vanguard Marketing Corporation. Chief investment officer (2013–2017), managing director (2002–2017), head of the Retail Investor Group (2006–2012), and chief information officer (2001–2006) of Vanguard. Chairman of the board (2011–2017) and trustee (2009–2017) of the Children’s Hospital of Philadelphia; and trustee (2018–present) and vice chair (2019–present) of The Shipley School.
Independent Trustees
Emerson U. Fullwood
Born in 1948. Trustee since January 2008. Principal occupation(s) during the past five years and other experience: executive chief staff and marketing officer for North America and corporate vice president (retired 2008) of Xerox Corporation (document management products and services). Former president of the Worldwide Channels Group, Latin America, and Worldwide Customer Service and executive chief staff officer of Developing Markets of Xerox. Executive in residence and 2009–2010 Distinguished Minett Professor at the Rochester Institute of Technology. Director of SPX FLOW, Inc. (multi-industry manufacturing). Director of the University of Rochester Medical Center, the Monroe Community College Foundation, the United Way of Rochester, North Carolina A&T University, and Roberts Wesleyan College. Trustee of the University of Rochester.
Amy Gutmann
Born in 1949. Trustee since June 2006. Principal occupation(s) during the past five years and other experience: president (2004–present) of the University of Pennsylvania. Christopher H. Browne Distinguished Professor of Political Science, School of Arts and Sciences, and professor of communication, Annenberg School for Communication, with secondary faculty appointments in the Department of Philosophy, School of Arts and Sciences, and at the Graduate School of Education, University of Pennsylvania.
F. Joseph Loughrey
Born in 1949. Trustee since October 2009. Principal occupation(s) during the past five years and other experience: president and chief operating officer (retired 2009) and vice chairman of the board (2008–2009) of Cummins Inc. (industrial machinery). Chairman of the board of Hillenbrand, Inc. (specialized consumer services) and the Lumina Foundation. Director of the V Foundation. Member of the advisory council for the College of Arts and Letters and chair of the advisory board to the Kellogg Institute for International Studies, both at the University of Notre Dame.
Mark Loughridge
Born in 1953. Trustee since March 2012. Principal occupation(s) during the past five years and other experience: senior vice president and chief financial officer (retired 2013) of IBM (information technology services). Fiduciary member of IBM’s Retirement Plan Committee (2004–2013), senior vice president and general manager (2002–2004) of IBM Global Financing, vice president and controller (1998–2002) of IBM, and a variety of other prior management roles at IBM. Member of the Council on Chicago Booth.
Scott C. Malpass
Born in 1962. Trustee since March 2012. Principal occupation(s) during the past five years and other experience: chief investment officer (retired June 2020) and vice president (retired June 2020) of the University of Notre Dame. Assistant professor of finance at the Mendoza College of Business, University of Notre Dame, and member of the Notre Dame 403(b) Investment Committee (retired June 2020). Member of the board of Catholic Investment Services, Inc. (investment advisors) and the board of superintendence of the Institute for the Works of Religion.
Deanna Mulligan
Born in 1963. Trustee since January 2018. Principal occupation(s) during the past five years and other experience: board chair (2020–present), chief executive officer (2011–2020), and president (2010–2019) of The Guardian Life Insurance Company of America. Chief operating officer (2010–2011) and executive vice president (2008–2010) of the individual life and disability division of Guardian Life. Member of the board of the American Council of Life Insurers and the board of the Economic Club of New York. Trustee of the Partnership for New York City (business leadership), Chief Executives for Corporate Purpose, NewYork-Presbyterian Hospital, Catalyst, and the
Bruce Museum (arts and science). Member of the Advisory Council for the Stanford Graduate School of Business.
André F. Perold
Born in 1952. Trustee since December 2004. Principal occupation(s) during the past five years and other experience: George Gund Professor of Finance and Banking, Emeritus at the Harvard Business School (retired 2011). Chief investment officer and co-managing partner of HighVista Strategies (private investment firm). Member of the board of advisors and member of the investment committee of the Museum of Fine Arts Boston. Member of the board (2018–present) of RIT Capital Partners (investment firm). Member of the investment committee of Partners Health Care System.
Sarah Bloom Raskin
Born in 1961. Trustee since January 2018. Principal occupation(s) during the past five years and other experience: deputy secretary (2014–2017) of the United States Department of the Treasury. Governor (2010–2014) of the Federal Reserve Board. Commissioner (2007–2010) of financial regulation for the State of Maryland. Member of the board of directors (2012–2014) of Neighborhood Reinvestment Corporation. Director (2017–present) of i(x) Investments, LLC; director (2017–present) of Reserve Trust. Rubenstein Fellow (2017–present) of Duke University; trustee (2017–present) of Amherst College, and trustee (2019–present) of the Folger Shakespeare Library.
Peter F. Volanakis
Born in 1955. Trustee since July 2009. Principal occupation(s) during the past five years and other experience: president and chief operating officer (retired 2010) of Corning Incorporated (communications equipment) and director of Corning Incorporated (2000–2010) and Dow Corning (2001–2010). Director (2012) of SPX Corporation (multi-industry manufacturing). Overseer of the Amos Tuck School of Business Administration, Dartmouth College (2001–2013). Chairman of the board of trustees of Colby-Sawyer College. Member of the board of Hypertherm Inc. (industrial cutting systems, software, and consumables).
1 Mr. Buckley is considered an “interested person,” as defined in the Investment Company Act of 1940, because he is an officer of the Vanguard funds.
Executive Officers
John Bendl
Born in 1970. Principal occupation(s) during the past five years and other experience: principal of Vanguard. Chief financial officer (2019–present) of each of the investment companies served by Vanguard. Chief accounting officer, treasurer, and controller of Vanguard (2017–present). Partner (2003–2016) at KPMG (audit, tax, and advisory services).
Christine M. Buchanan
Born in 1970. Principal occupation(s) during the past five years and other experience: principal of Vanguard. Treasurer (2017–present) of each of the investment companies served by Vanguard. Partner (2005–2017) at KPMG (audit, tax, and advisory services).
David Cermak
Born in 1960. Principal occupation(s) during the past five years and other experience: principal of Vanguard. Finance director (2019–present) of each of the investment companies served by Vanguard. Managing director and head (2017–present) of Vanguard Investments Singapore. Managing director and head (2017–2019) of Vanguard Investments Hong Kong. Representative director and head (2014–2017) of Vanguard Investments Japan.
John Galloway
Born in 1973. Principal occupation(s) during the past five years and other experience: principal of Vanguard.
Investment stewardship officer (September 2020–present) of each of the investment companies served by Vanguard. Head of Investor Advocacy (February 2020–present) and head of Marketing Strategy and Planning (2017–2020) at Vanguard. Deputy assistant to the President of the United States (2015).
Thomas J. Higgins
Born in 1957. Principal occupation(s) during the past five years and other experience: principal of Vanguard. Finance director (2019–present), chief financial officer (2008–2019), and treasurer (1998–2008) of each of the investment companies served by Vanguard.
Peter Mahoney
Born in 1974. Principal occupation(s) during the past five years and other experience: principal of Vanguard. Controller (2015–present) of each of the investment companies served by Vanguard. Head of International Fund Services (2008–2014) at Vanguard.
Anne E. Robinson
Born in 1970. Principal occupation(s) during the past five years and other experience: general counsel (2016–present) of Vanguard. Secretary (2016–present) of Vanguard and of each of the investment companies served by Vanguard. Managing director (2016–present) of Vanguard. Managing director and general counsel of Global Cards and Consumer Services (2014–2016) at Citigroup. Counsel (2003–2014) at American Express.
Michael Rollings
Born in 1963. Principal occupation(s) during the past five years and other experience: finance director (2017–present) and treasurer (2017) of each of the investment companies served by Vanguard. Managing director (2016–present) of Vanguard. Chief financial officer (2016–present) of Vanguard. Director (2016–present) of Vanguard Marketing Corporation. Executive vice president and chief financial officer (2006–2016) of MassMutual Financial Group.
John E. Schadl
Born in 1972. Principal occupation(s) during the past five years and other experience: principal of Vanguard. Chief compliance officer (2019–present) of Vanguard and of each of the investment companies served by Vanguard. Assistant vice president (2019–present) of Vanguard Marketing Corporation.
Vanguard Senior Management Team
| Joseph Brennan | James M. Norris |
| Mortimer J. Buckley | Thomas M. Rampulla |
| Gregory Davis | Karin A. Risi |
| John James | Anne E. Robinson |
| John T. Marcante | Michael Rollings |
| Chris D. McIsaac | Lauren Valente |
Connect with Vanguard®>vanguard.com
Fund Information > 800-662-7447
Annuity and Insurance Services > 800-522-5555
Institutional Investor Services > 800-523-1036
Text Telephone for People Who Are Deaf or Hard of Hearing > 800-749-7273
This material may be used in conjunction with the offering of shares of any Vanguard fund only if preceded or accompanied by the fund’s current prospectus.
You can obtain a free copy of Vanguard’s proxy voting guidelines by visiting vanguard.com/proxyreporting or by calling Vanguard at 800-662-2739. The guidelines are also available from the SEC’s website, www.sec.gov. In addition, you may obtain a free report on how your fund voted the proxies for securities it owned during the 12 months ended June 30. To get the report, visit either vanguard.com/proxyreporting or www.sec.gov.
All comparative mutual fund data are from Morningstar, Inc., unless otherwise noted.
You can review information about your fund on the SEC’s website, and you can receive copies of this information, for a fee, by sending a request via email addressed to publicinfo@sec.gov.
Source for Bloomberg Barclays indexes: Bloomberg Index Services Limited. Copyright 2021, Bloomberg. All rights reserved.
© 2021 The Vanguard Group, Inc.
All rights reserved.
Vanguard Marketing Corporation, Distributor.
Q690ST 022021
Annual Report | December 31, 2020
Vanguard Variable Insurance Funds
| Small Company Growth Portfolio |
Contents
Your Portfolio’s Performance at a Glance
| 1 |
Advisors' Report
| 2 |
About Your Portfolio’s Expenses
| 4 |
Performance Summary
| 5 |
Financial Statements
| 7 |
Please note: The opinions expressed in this report are just that—informed opinions. They should not be considered promises or advice. Also, please keep in mind that the information and opinions cover the period through the date on the front of this report. Of course, the risks of investing in your portfolio are spelled out in the prospectus.
Your Portfolio’s Performance at a Glance
| • | For the 12 months ended December 31, 2020, the Small Company Growth Portfolio of Vanguard Variable Insurance Fund returned 23.18%. It lagged the 40.47% return of its benchmark, the Russell 2500 Growth Index. |
| • | Stocks finished the year significantly higher, thanks in part to rapid and robust monetary and fiscal action by policymakers and the rollout of COVID-19 vaccines at the end of the year. |
| • | Selection in information technology, consumer discretionary, health care, and industrials weighed on results the most. Our selection in communication services as well as our underweight positions in materials and real estate contributed most to relative performance. |
| • | For the decade ended December 31, the fund produced an average annual return of 13.53%, below that of its benchmark. |
| • | Please note that the portfolio returns in Vanguard Variable Insurance Fund are different from those in Vanguard Variable Annuity (and other plans that invest in the fund), which take into account insurance-related expenses. |
Market Barometer
Average Annual Total Returns
Periods Ended December 31, 2020 |
| | One Year | Three Years | Five Years |
| Stocks | | | |
| Russell 1000 Index (Large-caps) | 20.96% | 14.82% | 15.60% |
| Russell 2000 Index (Small-caps) | 19.96 | 10.25 | 13.26 |
| Russell 3000 Index (Broad U.S. market) | 20.89 | 14.49 | 15.43 |
| FTSE All-World ex US Index (International) | 11.22 | 5.18 | 9.16 |
| Bonds | | | |
| Bloomberg Barclays U.S. Aggregate Bond Index (Broad taxable market) | 7.51% | 5.34% | 4.44% |
Bloomberg Barclays Municipal Bond Index
(Broad tax-exempt market) | 5.21 | 4.64 | 3.91 |
| FTSE Three-Month U.S. Treasury Bill Index | 0.58 | 1.56 | 1.16 |
| CPI | | | |
| Consumer Price Index | 1.36% | 1.85% | 1.95% |
The Small Company Growth Portfolio returned 23.18% for the 12 months ended December 31, 2020. It lagged the 40.47% return of its benchmark, the Russell 2500 Growth Index.
The portfolio is managed by two independent advisors, a strategy that enhances diversification by providing exposure to distinct yet complementary investment approaches. It is not uncommon for different advisors to have different views about individual securities or the broader investment environment.
The advisors, the amount and percentage of the portfolio’s assets each manages, and brief descriptions of their investment strategies are presented in the accompanying table. Each advisor has also prepared a discussion of the investment environment that existed during the 12 months and its effect on the portfolio’s positioning. These comments were prepared on January 20, 2021.
Vanguard Quantitative Equity Group
Portfolio Managers:
James P. Stetler
Binbin Guo, Principal, Head of
Alpha Equity Investments
The investment environment
The emergence of COVID-19 in early 2020 turned into a global health crisis, and aggressive attempts to contain it resulted in a sharp downturn in economic activity. Unemployment spiked, and sectors where social distancing isn’t possible were hit hard.
Stocks initially plummeted as infections surged, but they finished the year significantly higher, thanks in part to rapid and robust monetary and fiscal action by policymakers and the rollout of COVID-19 vaccines as the year drew to a close. The Standard & Poor’s 500 Index returned 18.40% for the 12 months ended December 31, 2020, while the FTSE Global All-Cap ex US Index returned 11.24%.
The broad fixed income markets generated positive returns as many central banks slashed short-term interest rates and expanded or extended asset-purchase programs.
Investment objective and strategy
Although our portion of the portfolio’s overall performance was affected by the macroeconomic factors we’ve described, our approach to investing focuses on specific stock fundamentals that we believe are more likely to produce outperformance over the long run. Those fundamentals include: high quality, management decisions, consistent earnings growth, strong market sentiment, and reasonable valuation.
Using these five themes, we generate a composite stock ranking, seeking to capitalize on investor biases. We then monitor our portfolio based on those rankings and adjust when appropriate to maximize expected return while minimizing exposure to risks that our research indicates do not improve returns (such as industry selection and other risks relative to our benchmark).
Our successes and shortfalls
Over the 12 months, our quality, growth, and management decisions models detracted from performance. Our sentiment model produced gains, and our valuation model was roughly neutral. Results lagged the benchmark in nine of 11 industry sectors, with communication services and materials producing positive results. Health care, industrials, and information technology detracted most from relative performance.
At the individual stock level, underweight allocations to Dexcom in health care and DocuSign in information technology were among the biggest detractors, as were overweights to Esperion Therapeutics in health care and Spirit AeroSystems and Huntington Ingalls in industrials. The strongest results came from overweighting communication services
companies TechTarget, Zynga, and Match Group. Our positions in materials companies Scotts Miracle-Gro and W.R. Grace also aided results.
We continue to believe that a portfolio focused on fundamentals will benefit investors over the long term, although we recognize that the market can reward or punish us in the near term. We believe our portfolio offers a strong mix of stocks with attractive valuations and high-quality, consistent earnings characteristics.
ArrowMark Partners
Portfolio Managers:
Chad Meade, Partner
Brian Schaub, CFA, Partner
Investment environment
Through the first couple of weeks of 2020, equities extended their long bull run as the outlook for the global economy continued to brighten. This exuberance ended abruptly in late February, as the novel coronavirus that originated in China began to spread globally, requiring quarantines that shut down entire economies.
In response to stay-at-home orders, businesses shuttered their doors, ultimately resulting in more than 40 million Americans filing for unemployment. In the U.S., Congress passed a $2.2 trillion relief package in March, while the Federal Reserve responded with unprecedented monetary stimulus. Equity markets rose significantly through the end of the year as election uncertainty cleared, COVID-19 vaccines from Moderna and Pfizer-BioNTech began to be administered, and Congress passed a second relief package aimed at small businesses and individuals.
Investment objective
Our investment process prioritizes the management of risk over the opportunity for return. Our goal is to build an
all-weather portfolio that can perform in a variety of market conditions. We look to build a portfolio that can mitigate capital losses on the downside and, secondarily, provide 100% upside participation during market recoveries.
Portfolio results
During the 12 months, our investment process was challenged because of investors’ significant appetite for risk, likely driven by record-low 10-year U.S. Treasury yields. Companies suffering losses were significant outperformers as a whole, and the most expensive companies saw their price-to-sale multiples continue to expand through the year. Our valuation discipline led us to slower-growing but highly profitable companies that were out of favor.
Health care holdings delivered the largest positive contribution to returns during the fiscal year. Within the biotechnology industry, Immunomedics appreciated significantly. The company develops targeted treatments for cancer through its
antibody drug conjugate platform. The Food and Drug Administration approved the drug in April and it became commercially available in May, with sales quickly gaining momentum. Not surprisingly, the value of Immunomedics’ drug platform attracted acquisition interest and, in September, the company accepted Gilead Sciences’ buyout offer of $21 billion, which was more than double Immunomedics’ market capitalization at the time.
The largest individual contributor to performance during the 12 months was communication services company Pinterest, a social media platform where users create, manage, and share theme-based image collections. The company generates revenue through a targeted advertising model. The stock rallied after management reported extremely strong revenue growth as advertisers attempted to capitalize on stay-at-home mandates.
Information technology and industrials detracted from relative returns. In
information technology, both our underweight to this top-performing sector and several individual holdings adversely impacted performance. One of those was Belden, a diversified supplier of specialty network solutions to the enterprise and industrial markets. The company has repositioned the product portfolio to focus on higher-growth end markets such as industrial automation, smart buildings, cybersecurity, broadband, and 5G.
In industrials, Kirby, the largest U.S. supplier of inland marine transportation, hurt relative performance. After rallying during the second quarter on high utilization of its barges, the stock pulled back in the third quarter, as weak demand for refined oil resulting from pandemic-related travel restrictions led to decreased barge usage.
As always, we will continue to look for opportunities that can perform in a variety of market conditions and mitigate capital losses.
Small Company Growth Portfolio Investment Advisors
| |
| | Portfolio Assets Managed | |
| Investment Advisor | % | $ Million | Investment Strategy |
| Vanguard Quantitative Equity Group | 50 | 1,061 | Employs a quantitative approach that focuses on fundamental factors, using models that assess valuation, growth prospects, management decisions, market sentiment, and earnings and balance-sheet quality of companies as compared with their peers. |
| ArrowMark Partners | 48 | 1,037 | The firm uses in-depth fundamental research to uncover companies that, in its opinion, can control their own economic destiny. It starts by identifying businesses with strong competitive advantages in industries with high barriers to entry, then narrows the focus to companies with large potential markets and high-quality business models focused on the future. Finally, considerations are made for potential downside risk, resulting in a diversified portfolio of between 75 and 100 stocks. |
| Cash Investments | 2 | 32 | These short-term reserves are invested by Vanguard in equity index products to simulate investment in stocks. Each advisor also may maintain a modest cash position. |
About Your Portfolio’s Expenses
As a shareholder of the portfolio, you incur ongoing costs, which include costs for portfolio management, administrative services, and shareholder reports (like this one), among others. Operating expenses, which are deducted from a portfolio's gross income, directly reduce the investment return of the portfolio.
A portfolio's expenses are expressed as a percentage of its average net assets. This figure is known as the expense ratio. The following examples are intended to help you understand the ongoing costs (in dollars) of investing in your portfolio and to compare these costs with those of other mutual funds. The examples are based on an investment of $1,000 made at the beginning of the period shown and held for the entire period.
The accompanying table illustrates your portfolio's costs in two ways:
| • | Based on actual portfolio return. This section helps you to estimate the actual expenses that you paid over the period. The ”Ending Account Value“ shown is derived from the portfolio's actual return, and the third column shows the dollar amount that would have been paid by an investor who started with $1,000 in the portfolio. You may use the information here, together with the amount you invested, to estimate the expenses that you paid over the period. |
To do so, simply divide your account value by $1,000 (for example, an $8,600 account value divided by $1,000 = 8.6), then multiply the result by the number given for your portfolio under the heading ”Expenses Paid During Period.“
| • | Based on hypothetical 5% yearly return. This section is intended to help you compare your portfolio's costs with those of other mutual funds. It assumes that the portfolio had a yearly return of 5% before expenses, but that the expense ratio is unchanged. In this case—because the return used is not the portfolio's actual return—the results do not apply to your investment. The example is useful in making comparisons because the Securities and Exchange Commission requires all mutual funds to calculate expenses based on a 5% return. You can assess your portfolio's costs by comparing this hypothetical example with the hypothetical examples that appear in shareholder reports of other funds. |
Note that the expenses shown in the table are meant to highlight and help you compare ongoing costs only and do not reflect transaction costs incurred by the portfolio for buying and selling securities. The portfolio’s expense ratio does not reflect additional fees and expenses associated with the annuity or life insurance program through which you invest.
The calculations assume no shares were bought or sold during the period. Your actual costs may have been higher or lower, depending on the amount of your investment and the timing of any purchases or redemptions.
You can find more information about the portfolio's expenses, including annual expense ratios, in the Financial Statements section of this report. For additional information on operating expenses and other shareholder costs, please refer to your portfolio's current prospectus.
| Six Months Ended December 31, 2020 | | | |
| Small Company Growth Portfolio | Beginning
Account Value
6/30/2020 | Ending
Account Value
12/31/2020 | Expenses
Paid During
Period |
| Based on Actual Portfolio Return | $1,000.00 | $1,336.06 | $1.76 |
| Based on Hypothetical 5% Yearly Return | 1,000.00 | 1,023.63 | 1.53 |
The calculations are based on expenses incurred in the most recent six-month period. The portfolio’s annualized six-month expense ratio for that period is 0.30%. The dollar amounts shown as “Expenses Paid” are equal to the annualized expense ratio multiplied by the average account value over the period, multiplied by the number of days in the most recent six-month period, then divided by the number of days in the most recent 12-month period (184/366).
Small Company Growth Portfolio
All of the returns in this report represent past performance, which is not a guarantee of future results that may be achieved by the portfolio. (Current performance may be lower or higher than the performance data cited. For performance data current to the most recent month-end, visit our website at vanguard.com/performance.) Note, too, that both investment returns and principal value can fluctuate widely, so an investor’s shares, when sold, could be worth more or less than their original cost. The returns shown do not reflect taxes that a shareholder would pay on portfolio distributions or on the sale of portfolio shares. Nor do the returns reflect fees and expenses associated with the annuity or life insurance program through which a shareholder invests. If these fees and expenses were included, the portfolio's returns would be lower.
Cumulative Performance: December 31, 2010, Through December 31, 2020
Initial Investment of $10,000
| | | | Average Annual Total Returns
Periods Ended December 31, 2020 |
| | | One
Year | Five
Years | Ten
Years | Final Value
of a $10,000
Investment |
 | Small Company Growth Portfolio | 23.18% | 15.74% | 13.53% | $35,557 |
 | Russell 2500 Growth Index | 40.47 | 18.68 | 15.00 | 40,450 |
 | Dow Jones U.S. Total Stock Market Float Adjusted Index | 20.79 | 15.36 | 13.74 | 36,240 |
See Financial Highlights for dividend and capital gains information.
Small Company Growth Portfolio
| Communication Services | 1.6% |
| Consumer Discretionary | 12.9 |
| Consumer Staples | 1.5 |
| Energy | 0.1 |
| Financials | 3.4 |
| Health Care | 29.3 |
| Industrials | 18.7 |
| Information Technology | 28.1 |
| Materials | 1.8 |
| Real Estate | 1.3 |
| Utilities | 0.5 |
| Other | 0.8 |
The table reflects the portfolio’s investments, except for short-term investments and derivatives. Sector categories are based on the Global Industry Classification Standard (“GICS”), except for the “Other” category (if applicable), which includes securities that have not been provided a GICS classification as of the effective reporting period.
Global Industry Classification Standard (“GICS”) was developed by and is the exclusive property and a service mark of MSCI Inc. (“MSCI”) and Standard and Poor’s, a division of McGraw-Hill Companies, Inc. (“S&P”), and is licensed for use by Vanguard. Neither MSCI, S&P nor any third party involved in making or compiling the GICS or any GICS classification makes any express or implied warranties or representations with respect to such standard or classification (or the results to be obtained by the use thereof), and all such parties hereby expressly disclaim all warranties of originality, accuracy, completeness, merchantability or fitness for a particular purpose with respect to any such standard or classification. Without limiting any of the foregoing, in no event shall MSCI, S&P, any of its affiliates or any third party involved in making or compiling the GICS or any GICS classification have any liability for any direct, indirect, special, punitive, consequential or any other damages (including lost profits) even if notified of the possibility of such damages.
Small Company Growth Portfolio
The portfolio files its complete schedule of portfolio holdings with the Securities and Exchange Commission (SEC) for the first and third quarters of each fiscal year as an exhibit to its reports on Form N-PORT. The portfolio’s Form N-PORT reports are available on the SEC’s website at www.sec.gov.
| | | Shares | Market
Value•
($000) |
| Common Stocks (97.1%) |
| Communication Services (1.5%) |
| * | TechTarget Inc. | 116,776 | 6,903 |
| * | Cargurus Inc. | 208,737 | 6,623 |
| * | Match Group Inc. | 33,339 | 5,041 |
| * | Zynga Inc. Class A | 452,005 | 4,461 |
| * | Bandwidth Inc. Class A | 20,316 | 3,122 |
| * | Boingo Wireless Inc. | 151,378 | 1,926 |
| * | Zillow Group Inc. Class A | 12,340 | 1,677 |
| * | Cardlytics Inc. | 5,901 | 842 |
| * | Vonage Holdings Corp. | 51,490 | 663 |
| * | EverQuote Inc. Class A | 16,287 | 608 |
| * | Glu Mobile Inc. | 61,049 | 550 |
| * | LiveXLive Media Inc. | 63,390 | 208 |
| | | | 32,624 |
| Consumer Discretionary (12.5%) |
| * | Skechers USA Inc. Class A | 751,793 | 27,019 |
| * | Sally Beauty Holdings Inc. | 1,803,132 | 23,513 |
| | Hanesbrands Inc. | 1,553,713 | 22,653 |
| * | frontdoor Inc. | 441,305 | 22,158 |
| | Shutterstock Inc. | 230,467 | 16,525 |
| * | Etsy Inc. | 83,735 | 14,897 |
| * | Vroom Inc. | 311,211 | 12,750 |
| | Polaris Inc. | 98,629 | 9,397 |
| | Carter's Inc. | 80,296 | 7,553 |
| | Wingstop Inc. | 52,419 | 6,948 |
| * | Grand Canyon Education Inc. | 65,024 | 6,054 |
| | Papa John's International Inc. | 67,883 | 5,760 |
| * | Fox Factory Holding Corp. | 53,361 | 5,641 |
| * | RH | 12,101 | 5,415 |
| * | Planet Fitness Inc. Class A | 64,786 | 5,029 |
| * | TopBuild Corp. | 26,734 | 4,921 |
| | PulteGroup Inc. | 112,013 | 4,830 |
| * | NVR Inc. | 1,060 | 4,325 |
| | Murphy USA Inc. | 32,105 | 4,202 |
| * | Chegg Inc. | 40,388 | 3,648 |
| * | Penn National Gaming Inc. | 37,121 | 3,206 |
| * | Gentherm Inc. | 47,948 | 3,127 |
| | Rent-A-Center Inc. | 75,170 | 2,878 |
| * | Caesars Entertainment Inc. | 38,690 | 2,874 |
| * | Stamps.com Inc. | 12,907 | 2,532 |
| * | Dorman Products Inc. | 28,492 | 2,474 |
| * | Perdoceo Education Corp. | 177,951 | 2,248 |
| | Service Corp. International | 41,022 | 2,014 |
| | H&R Block Inc. | 126,100 | 2,000 |
| * | iRobot Corp. | 22,983 | 1,845 |
| * | Skyline Champion Corp. | 51,116 | 1,582 |
| | Domino's Pizza Inc. | 3,725 | 1,428 |
| | | Shares | Market
Value•
($000) |
| * | Lumber Liquidators Holdings Inc. | 45,473 | 1,398 |
| * | Sleep Number Corp. | 16,630 | 1,361 |
| * | El Pollo Loco Holdings Inc. | 75,000 | 1,358 |
| | Camping World Holdings Inc. Class A | 51,592 | 1,344 |
| | Big Lots Inc. | 30,510 | 1,310 |
| | PetMed Express Inc. | 39,401 | 1,263 |
| * | YETI Holdings Inc. | 16,710 | 1,144 |
| | Strategic Education Inc. | 11,564 | 1,102 |
| | Pool Corp. | 2,840 | 1,058 |
| | Ruth's Hospitality Group Inc. | 55,279 | 980 |
| * | Asbury Automotive Group Inc. | 6,297 | 918 |
| * | Deckers Outdoor Corp. | 3,078 | 883 |
| * | Visteon Corp. | 6,967 | 875 |
| * | Leslie's Inc. | 28,637 | 795 |
| * | Overstock.com Inc. | 16,022 | 769 |
| * | Master Craft Boat Holdings Inc. | 30,495 | 758 |
| * | Tempur Sealy International Inc. | 27,446 | 741 |
| * | Scientific Games Corp. Class A | 17,608 | 731 |
| | Standard Motor Products Inc. | 17,683 | 715 |
| * | Malibu Boats Inc. Class A | 10,059 | 628 |
| * | CarParts.com Inc. | 49,817 | 617 |
| | Brinker International Inc. | 10,196 | 577 |
| * | Sonos Inc. | 21,019 | 492 |
| * | Waitr Holdings Inc. | 176,543 | 491 |
| | Core-Mark Holding Co. Inc. | 16,239 | 477 |
| | Red Rock Resorts Inc. Class A | 16,478 | 413 |
| * | Lovesac Co. | 9,044 | 390 |
| * | 1-800-Flowers.com Inc. Class A | 13,510 | 351 |
| | Churchill Downs Inc. | 1,562 | 304 |
| | Wendy's Co. | 9,981 | 219 |
| * | Golden Entertainment Inc. | 10,809 | 215 |
| * | Accel Entertainment Inc. Class A | 21,068 | 213 |
| * | Noodles & Co. Class A | 24,231 | 191 |
| * | GAN Ltd. | 8,886 | 180 |
| | Winnebago Industries Inc. | 2,524 | 151 |
| * | Aaron's Co. Inc. | 2,593 | 49 |
| | | | 266,907 |
| Consumer Staples (1.4%) |
| | Coca-Cola Consolidated Inc. | 22,006 | 5,860 |
| | John B Sanfilippo & Son Inc. | 57,411 | 4,527 |
| | | Shares | Market
Value•
($000) |
| * | BJ's Wholesale Club Holdings Inc. | 88,331 | 3,293 |
| * | Boston Beer Co. Inc. Class A | 3,061 | 3,043 |
| * | Herbalife Nutrition Ltd. | 59,351 | 2,852 |
| 1 | B&G Foods Inc. | 67,999 | 1,886 |
| | Casey's General Stores Inc. | 10,345 | 1,848 |
| * | USANA Health Sciences Inc. | 13,428 | 1,035 |
| * | Beyond Meat Inc. | 6,779 | 847 |
| | Reynolds Consumer Products Inc. | 26,976 | 810 |
| 1 | National Beverage Corp. | 9,190 | 780 |
| | Vector Group Ltd. | 58,270 | 679 |
| * | TreeHouse Foods Inc. | 15,580 | 662 |
| * | Central Garden & Pet Co. Class A | 17,496 | 636 |
| * | Celsius Holdings Inc. | 12,017 | 605 |
| * | elf Beauty Inc. | 16,158 | 407 |
| * | Mission Produce Inc. | 15,217 | 229 |
| | | | 29,999 |
| Energy (0.1%) |
| * | Dorian LPG Ltd. | 80,634 | 983 |
| * | Magnolia Oil & Gas Corp. Class A | 107,338 | 758 |
| | | | 1,741 |
| Financials (3.3%) |
| | LPL Financial Holdings Inc. | 176,743 | 18,420 |
| | WisdomTree Investments Inc. | 1,889,436 | 10,109 |
| | Primerica Inc. | 54,134 | 7,250 |
| | Bank OZK | 215,182 | 6,729 |
| | Virtus Investment Partners Inc. | 19,798 | 4,296 |
| | First Financial Bankshares Inc. | 81,925 | 2,964 |
| | Artisan Partners Asset Management Inc. Class A | 54,639 | 2,751 |
| | Virtu Financial Inc. Class A | 107,046 | 2,694 |
| | Brightsphere Investment Group Inc. | 111,149 | 2,143 |
| | Cowen Inc. Class A | 75,274 | 1,956 |
| | Kinsale Capital Group Inc. | 8,697 | 1,741 |
| * | Palomar Holdings Inc. | 15,862 | 1,409 |
| | Erie Indemnity Co. Class A | 5,068 | 1,245 |
| | Ares Management Corp. Class A | 22,261 | 1,047 |
| | FactSet Research Systems Inc. | 2,882 | 958 |
| * | Trupanion Inc. | 6,890 | 825 |
| | Universal Insurance Holdings Inc. | 51,576 | 779 |
| * | eHealth Inc. | 8,275 | 584 |
Small Company Growth Portfolio
| | | Shares | Market
Value•
($000) |
| | Prosperity Bancshares Inc. | 6,690 | 464 |
| | Westamerica BanCorp. | 8,123 | 449 |
| | PROG Holdings Inc. | 5,187 | 279 |
| * | Assetmark Financial Holdings Inc. | 8,500 | 206 |
| | PennyMac Financial Services Inc. | 1,800 | 118 |
| | | | 69,416 |
| Health Care (28.5%) |
| * | BioTelemetry Inc. | 357,635 | 25,778 |
| | STERIS plc | 127,354 | 24,139 |
| * | Merit Medical Systems Inc. | 411,573 | 22,846 |
| * | Syneos Health Inc. | 303,466 | 20,675 |
| * | Quidel Corp. | 114,156 | 20,508 |
| * | Hologic Inc. | 209,522 | 15,259 |
| * | HealthEquity Inc. | 206,687 | 14,408 |
| | Cooper Cos. Inc. | 34,075 | 12,380 |
| * | Kodiak Sciences Inc. | 83,313 | 12,240 |
| * | Axogen Inc. | 628,653 | 11,253 |
| * | AMN Healthcare Services Inc. | 159,716 | 10,901 |
| * | Sarepta Therapeutics Inc. | 63,035 | 10,747 |
| * | Novocure Ltd. | 60,047 | 10,391 |
| * | MEDNAX Inc. | 422,616 | 10,371 |
| * | Omnicell Inc. | 82,348 | 9,883 |
| * | Heron Therapeutics Inc. | 461,129 | 9,760 |
| * | PRA Health Sciences Inc. | 74,473 | 9,342 |
| | Chemed Corp. | 17,257 | 9,191 |
| * | Deciphera Pharmaceuticals Inc. | 160,468 | 9,158 |
| * | Nevro Corp. | 48,704 | 8,431 |
| * | Exact Sciences Corp. | 60,516 | 8,018 |
| * | Neurocrine Biosciences Inc. | 82,677 | 7,925 |
| * | Sotera Health Co. | 284,731 | 7,813 |
| * | Medpace Holdings Inc. | 56,052 | 7,802 |
| * | Revance Therapeutics Inc. | 272,767 | 7,730 |
| * | ABIOMED Inc. | 23,034 | 7,468 |
| * | Halozyme Therapeutics Inc. | 168,090 | 7,179 |
| * | Natera Inc. | 71,731 | 7,139 |
| | Bruker Corp. | 130,591 | 7,069 |
| * | Travere Thrapeutics Inc. | 253,910 | 6,920 |
| * | Avantor Inc. | 243,244 | 6,847 |
| * | Agios Pharmaceuticals Inc. | 153,325 | 6,644 |
| *,1 | Ontrak Inc. | 98,213 | 6,069 |
| * | Pacific Biosciences of California Inc. | 230,897 | 5,989 |
| * | Acceleron Pharma Inc. | 46,754 | 5,982 |
| * | Charles River Laboratories International Inc. | 23,000 | 5,747 |
| * | Integra LifeSciences Holdings Corp. | 84,091 | 5,459 |
| * | Ultragenyx Pharmaceutical Inc. | 37,629 | 5,209 |
| * | Allakos Inc. | 36,597 | 5,124 |
| * | Tenet Healthcare Corp. | 123,605 | 4,936 |
| * | LHC Group Inc. | 22,753 | 4,854 |
| * | Horizon Therapeutics plc | 65,347 | 4,780 |
| * | Haemonetics Corp. | 40,220 | 4,776 |
| * | Masimo Corp. | 17,719 | 4,755 |
| * | SpringWorks Therapeutics Inc. | 65,351 | 4,739 |
| * | Viking Therapeutics Inc. | 831,286 | 4,680 |
| | | Shares | Market
Value•
($000) |
| * | Ironwood Pharmaceuticals Inc. Class A | 401,537 | 4,574 |
| * | CorVel Corp. | 43,087 | 4,567 |
| * | Corcept Therapeutics Inc. | 173,808 | 4,547 |
| | Luminex Corp. | 191,054 | 4,417 |
| * | Molina Healthcare Inc. | 19,674 | 4,184 |
| * | Veeva Systems Inc. Class A | 15,203 | 4,139 |
| * | Intellia Therapeutics Inc. | 75,432 | 4,104 |
| * | Emergent BioSolutions Inc. | 45,464 | 4,074 |
| * | IQVIA Holdings Inc. | 22,260 | 3,988 |
| * | Arvinas Inc. | 45,579 | 3,871 |
| * | iRhythm Technologies Inc. | 15,746 | 3,735 |
| | Encompass Health Corp. | 44,180 | 3,653 |
| | PerkinElmer Inc. | 24,180 | 3,470 |
| | Hill-Rom Holdings Inc. | 34,040 | 3,335 |
| * | Ionis Pharmaceuticals Inc. | 54,830 | 3,100 |
| * | Alkermes plc | 145,887 | 2,910 |
| * | Guardant Health Inc. | 22,363 | 2,882 |
| * | Schrodinger Inc. | 35,662 | 2,824 |
| * | Turning Point Therapeutics Inc. | 22,776 | 2,775 |
| | Ensign Group Inc. | 36,765 | 2,681 |
| * | Enanta Pharmaceuticals Inc. | 60,163 | 2,533 |
| * | Denali Therapeutics Inc. | 29,483 | 2,470 |
| * | GenMark Diagnostics Inc. | 169,085 | 2,469 |
| * | Inovalon Holdings Inc. Class A | 134,526 | 2,444 |
| * | MacroGenics Inc. | 103,882 | 2,375 |
| *,1 | Esperion Therapeutics Inc. | 89,561 | 2,329 |
| | West Pharmaceutical Services Inc. | 7,986 | 2,263 |
| * | CareDx Inc. | 29,608 | 2,145 |
| * | Providence Service Corp. | 14,993 | 2,078 |
| * | AdaptHealth Corp. Class A | 51,552 | 1,936 |
| * | Immunovant Inc. | 41,535 | 1,919 |
| * | Bioxcel Therapeutics Inc. | 41,222 | 1,904 |
| * | Neogen Corp. | 21,882 | 1,735 |
| * | Tivity Health Inc. | 86,067 | 1,686 |
| * | Surmodics Inc. | 37,910 | 1,650 |
| * | Meridian Bioscience Inc. | 86,721 | 1,621 |
| * | Iovance Biotherapeutics Inc. | 34,690 | 1,610 |
| *,1 | Precigen Inc. | 153,813 | 1,569 |
| * | Voyager Therapeutics Inc. | 219,290 | 1,568 |
| * | Puma Biotechnology Inc. | 152,472 | 1,564 |
| * | Novavax Inc. | 13,660 | 1,523 |
| * | Bluebird Bio Inc. | 34,848 | 1,508 |
| * | Omeros Corp. | 100,883 | 1,441 |
| * | ImmunoGen Inc. | 220,353 | 1,421 |
| * | Surgery Partners Inc. | 44,523 | 1,292 |
| | Bio-Techne Corp. | 3,922 | 1,245 |
| * | Pennant Group Inc. | 21,188 | 1,230 |
| *,1 | Ligand Pharmaceuticals Inc. | 12,046 | 1,198 |
| * | ACADIA Pharmaceuticals Inc. | 22,302 | 1,192 |
| | | Shares | Market
Value•
($000) |
| * | Pulmonx Corp. | 17,225 | 1,189 |
| * | MannKind Corp. | 377,275 | 1,181 |
| * | Mirati Therapeutics Inc. | 5,353 | 1,176 |
| * | Select Medical Holdings Corp. | 42,511 | 1,176 |
| * | CytoSorbents Corp. | 141,955 | 1,131 |
| * | Constellation Pharmaceuticals Inc. | 39,163 | 1,128 |
| * | 10X Genomics Inc. Class A | 7,736 | 1,095 |
| * | Karuna Therapeutics Inc. | 10,573 | 1,074 |
| * | OraSure Technologies Inc. | 100,409 | 1,063 |
| * | Kiniksa Pharmaceuticals Ltd. Class A | 59,019 | 1,043 |
| * | Minerva Neurosciences Inc. | 425,897 | 997 |
| * | Precision BioSciences Inc. | 118,241 | 986 |
| *,1 | Inovio Pharmaceuticals Inc. | 110,779 | 980 |
| * | Molecular Templates Inc. | 104,194 | 978 |
| | US Physical Therapy Inc. | 8,049 | 968 |
| * | PPD Inc. | 26,564 | 909 |
| * | Inspire Medical Systems Inc. | 4,487 | 844 |
| * | Black Diamond Therapeutics Inc. | 26,251 | 841 |
| * | Radius Health Inc. | 46,807 | 836 |
| * | AtriCure Inc. | 14,028 | 781 |
| * | ChemoCentryx Inc. | 12,427 | 769 |
| * | Cytokinetics Inc. | 36,672 | 762 |
| * | Accolade Inc. | 17,438 | 759 |
| * | Selecta Biosciences Inc. | 250,077 | 758 |
| * | Codexis Inc. | 34,145 | 745 |
| * | Fortress Biotech Inc. | 233,336 | 740 |
| *,1 | VBI Vaccines Inc. | 266,222 | 732 |
| * | Vanda Pharmaceuticals Inc. | 51,973 | 683 |
| * | Zogenix Inc. | 32,345 | 647 |
| * | SIGA Technologies Inc. | 88,618 | 644 |
| * | Calithera Biosciences Inc. | 129,548 | 636 |
| * | Myriad Genetics Inc. | 30,657 | 606 |
| * | Agenus Inc. | 186,382 | 593 |
| * | Invitae Corp. | 14,148 | 592 |
| * | Protagonist Therapeutics Inc. | 28,372 | 572 |
| * | Silk Road Medical Inc. | 9,084 | 572 |
| * | Seres Therapeutics Inc. | 22,049 | 540 |
| * | Fulgent Genetics Inc. | 9,920 | 517 |
| * | Pieris Pharmaceuticals Inc. | 190,939 | 477 |
| * | Apellis Pharmaceuticals Inc. | 8,275 | 473 |
| * | Syros Pharmaceuticals Inc. | 41,972 | 455 |
| * | Prestige Consumer Healthcare Inc. | 12,346 | 431 |
| * | ICU Medical Inc. | 1,975 | 424 |
| * | Pliant Therapeutics Inc. | 17,905 | 407 |
| | Phibro Animal Health Corp. Class A | 19,844 | 385 |
| * | Vir Biotechnology Inc. | 14,286 | 383 |
| * | Sientra Inc. | 97,196 | 378 |
| * | Karyopharm Therapeutics Inc. | 23,988 | 371 |
| *,1 | Marinus Pharmaceuticals Inc. | 28,667 | 350 |
| * | Passage Bio Inc. | 12,516 | 320 |
Small Company Growth Portfolio
| | | Shares | Market
Value•
($000) |
| * | CytomX Therapeutics Inc. | 48,143 | 315 |
| * | Cue Biopharma Inc. | 23,438 | 293 |
| * | Fate Therapeutics Inc. | 3,048 | 277 |
| * | Jounce Therapeutics Inc. | 37,884 | 265 |
| * | BioSig Technologies Inc. | 64,280 | 251 |
| * | Paratek Pharmaceuticals Inc. | 39,185 | 245 |
| *,1 | Co-Diagnostics Inc. | 25,352 | 236 |
| * | Mersana Therapeutics Inc. | 8,743 | 233 |
| * | Twist Bioscience Corp. | 1,561 | 221 |
| * | Durect Corp. | 103,948 | 215 |
| * | Replimune Group Inc. | 5,357 | 204 |
| * | Ideaya Biosciences Inc. | 12,528 | 175 |
| * | CryoPort Inc. | 3,775 | 166 |
| * | Acutus Medical Inc. | 5,006 | 144 |
| * | Recro Pharma Inc. | 49,143 | 140 |
| * | Electromed Inc. | 11,616 | 114 |
| *,1 | Cassava Sciences Inc. | 16,164 | 110 |
| * | Ovid therapeutics Inc. | 45,031 | 104 |
| * | Bellerophon Therapeutics Inc. | 14,592 | 97 |
| * | Accelerate Diagnostics Inc. | 12,377 | 94 |
| * | Akebia Therapeutics Inc. | 31,453 | 88 |
| * | Arcturus Therapeutics Holdings Inc. | 1,827 | 79 |
| * | Assembly Biosciences Inc. | 11,583 | 70 |
| *,1 | Vaxart Inc. | 11,546 | 66 |
| | | | 606,361 |
| Industrials (18.1%) |
| * | Generac Holdings Inc. | 128,906 | 29,314 |
| | Ritchie Bros Auctioneers Inc. | 413,669 | 28,771 |
| * | TriNet Group Inc. | 334,518 | 26,962 |
| * | Sensata Technologies Holding plc | 496,380 | 26,179 |
| | ABM Industries Inc. | 532,023 | 20,132 |
| | Matson Inc. | 309,552 | 17,635 |
| * | Clean Harbors Inc. | 221,374 | 16,847 |
| * | Kirby Corp. | 267,280 | 13,853 |
| * | Middleby Corp. | 101,979 | 13,147 |
| | Tennant Co. | 186,643 | 13,097 |
| | Forward Air Corp. | 167,935 | 12,904 |
| | CH Robinson Worldwide Inc. | 134,622 | 12,637 |
| | John Bean Technologies Corp. | 99,489 | 11,329 |
| * | Cimpress plc | 115,351 | 10,121 |
| | Woodward Inc. | 70,716 | 8,594 |
| * | Builders FirstSource Inc. | 194,826 | 7,951 |
| | Landstar System Inc. | 53,034 | 7,142 |
| * | GMS Inc. | 199,252 | 6,073 |
| | Allegion plc | 52,145 | 6,069 |
| | Kennametal Inc. | 154,973 | 5,616 |
| * | Atkore International Group Inc. | 132,208 | 5,435 |
| | Heartland Express Inc. | 271,352 | 4,911 |
| | BWX Technologies Inc. | 80,415 | 4,847 |
| | Kforce Inc. | 105,735 | 4,450 |
| * | Great Lakes Dredge & Dock Corp. | 297,029 | 3,912 |
| | UFP Industries Inc. | 67,783 | 3,765 |
| | Boise Cascade Co. | 78,016 | 3,729 |
| * | Plug Power Inc. | 99,194 | 3,364 |
| | Franklin Electric Co. Inc. | 46,327 | 3,206 |
| | EMCOR Group Inc. | 34,897 | 3,192 |
| | | Shares | Market
Value•
($000) |
| * | Sunrun Inc. | 41,706 | 2,894 |
| | Mueller Industries Inc. | 81,751 | 2,870 |
| | Graco Inc. | 37,767 | 2,732 |
| | Fortune Brands Home & Security Inc. | 29,090 | 2,494 |
| | Allison Transmission Holdings Inc. | 50,755 | 2,189 |
| | Tetra Tech Inc. | 18,840 | 2,181 |
| * | Upwork Inc. | 61,774 | 2,132 |
| | Hubbell Inc. Class B | 13,282 | 2,082 |
| | Exponent Inc. | 23,008 | 2,071 |
| * | SiteOne Landscape Supply Inc. | 12,268 | 1,946 |
| | Robert Half International Inc. | 30,177 | 1,885 |
| | Enerpac Tool Group Corp. Class A | 81,985 | 1,854 |
| | AAON Inc. | 27,309 | 1,820 |
| | Applied Industrial Technologies Inc. | 21,901 | 1,708 |
| | McGrath RentCorp. | 24,904 | 1,671 |
| * | Masonite International Corp. | 13,981 | 1,375 |
| | Steelcase Inc. Class A | 90,963 | 1,233 |
| * | Array Technologies Inc. | 26,012 | 1,122 |
| * | Vicor Corp. | 11,696 | 1,079 |
| * | Ameresco Inc. Class A | 19,088 | 997 |
| *,1 | Alpha Pro Tech Ltd. | 79,499 | 886 |
| | Shyft Group Inc. | 30,625 | 869 |
| | Douglas Dynamics Inc. | 19,189 | 821 |
| | CAI International Inc. | 26,233 | 820 |
| * | MasTec Inc. | 10,462 | 713 |
| | Werner Enterprises Inc. | 17,924 | 703 |
| * | Atlas Air Worldwide Holdings Inc. | 12,687 | 692 |
| * | Trex Co. Inc. | 8,061 | 675 |
| | Systemax Inc. | 18,547 | 666 |
| * | American Woodmark Corp. | 6,947 | 652 |
| * | Gibraltar Industries Inc. | 8,562 | 616 |
| | Lindsay Corp. | 4,548 | 584 |
| | MSA Safety Inc. | 3,904 | 583 |
| * | SPX Corp. | 9,778 | 533 |
| * | Daseke Inc. | 78,250 | 455 |
| | National Presto Industries Inc. | 4,939 | 437 |
| | Primoris Services Corp. | 14,604 | 403 |
| * | Echo Global Logistics Inc. | 11,174 | 300 |
| | CoreLogic Inc. | 3,473 | 269 |
| | Nordson Corp. | 1,333 | 268 |
| * | Bloom Energy Corp. Class A | 9,021 | 259 |
| | Acuity Brands Inc. | 1,907 | 231 |
| * | Mastech Digital Inc. | 13,130 | 209 |
| | Helios Technologies Inc. | 3,755 | 200 |
| | | | 386,363 |
| Information Technology (27.3%) |
| * | J2 Global Inc. | 325,263 | 31,775 |
| * | ON Semiconductor Corp. | 874,099 | 28,609 |
| * | 2U Inc. | 514,196 | 20,573 |
| * | Proofpoint Inc. | 144,172 | 19,667 |
| * | Pluralsight Inc. Class A | 831,202 | 17,422 |
| * | Euronet Worldwide Inc. | 119,349 | 17,296 |
| | Belden Inc. | 344,872 | 14,450 |
| * | Trimble Inc. | 213,961 | 14,286 |
| * | Zendesk Inc. | 96,001 | 13,740 |
| * | SolarWinds Corp. | 913,939 | 13,663 |
| * | Gartner Inc. | 82,613 | 13,234 |
| | | Shares | Market
Value•
($000) |
| * | Enphase Energy Inc. | 74,612 | 13,092 |
| * | Nuance Communications Inc. | 290,871 | 12,825 |
| * | Fair Isaac Corp. | 24,715 | 12,630 |
| * | 8x8 Inc. | 312,644 | 10,777 |
| | Teradyne Inc. | 87,605 | 10,503 |
| | Booz Allen Hamilton Holding Corp. Class A | 120,381 | 10,495 |
| * | Five9 Inc. | 57,534 | 10,034 |
| * | New Relic Inc. | 143,844 | 9,407 |
| * | Workiva Inc. Class A | 94,833 | 8,689 |
| * | FireEye Inc. | 365,971 | 8,439 |
| * | Manhattan Associates Inc. | 79,412 | 8,353 |
| * | SolarEdge Technologies Inc. | 25,489 | 8,134 |
| * | Anaplan Inc. | 104,528 | 7,510 |
| * | Domo Inc. Class B | 106,171 | 6,771 |
| * | ChannelAdvisor Corp. | 422,395 | 6,750 |
| | Jabil Inc. | 155,570 | 6,616 |
| * | Cadence Design Systems Inc. | 47,961 | 6,543 |
| * | Fortinet Inc. | 42,286 | 6,281 |
| * | Synaptics Inc. | 64,628 | 6,230 |
| * | Atlassian Corp. plc Class A | 26,255 | 6,140 |
| | SS&C Technologies Holdings Inc. | 84,322 | 6,134 |
| * | Zebra Technologies Corp. Class A | 15,393 | 5,916 |
| * | Box Inc. Class A | 325,569 | 5,877 |
| * | EPAM Systems Inc. | 16,031 | 5,745 |
| | MAXIMUS Inc. | 75,947 | 5,559 |
| * | Teradata Corp. | 237,913 | 5,346 |
| | CDW Corp. | 40,450 | 5,331 |
| * | HubSpot Inc. | 13,247 | 5,252 |
| | TTEC Holdings Inc. | 70,278 | 5,125 |
| * | MongoDB Inc. | 13,820 | 4,962 |
| * | Avalara Inc. | 29,446 | 4,855 |
| * | Verint Systems Inc. | 72,039 | 4,840 |
| * | Silicon Laboratories Inc. | 35,769 | 4,555 |
| * | Wix.com Ltd. | 17,499 | 4,374 |
| * | Fastly Inc. Class A | 49,833 | 4,354 |
| *,1 | SunPower Corp. | 168,340 | 4,316 |
| * | SPS Commerce Inc. | 38,739 | 4,207 |
| * | FormFactor Inc. | 95,684 | 4,116 |
| * | Digital Turbine Inc. | 70,496 | 3,987 |
| *,1 | Sumo Logic Inc. | 128,908 | 3,684 |
| * | Diodes Inc. | 51,848 | 3,655 |
| * | Cornerstone OnDemand Inc. | 81,666 | 3,597 |
| * | Bill.Com Holdings Inc. | 25,423 | 3,470 |
| * | Cirrus Logic Inc. | 41,396 | 3,403 |
| * | StoneCo. Ltd. Class A | 38,300 | 3,214 |
| * | MACOM Technology Solutions Holdings Inc. Class H | 56,893 | 3,131 |
| * | eGain Corp. | 257,311 | 3,039 |
| | CDK Global Inc. | 57,106 | 2,960 |
| | Brooks Automation Inc. | 43,246 | 2,934 |
| | Monolithic Power Systems Inc. | 7,854 | 2,876 |
| * | Model N Inc. | 79,699 | 2,844 |
| * | Calix Inc. | 95,453 | 2,841 |
| * | Zscaler Inc. | 13,314 | 2,659 |
| * | Elastic NV | 17,234 | 2,518 |
| * | Alteryx Inc. Class A | 19,590 | 2,386 |
| * | Avaya Holdings Corp. | 122,331 | 2,343 |
| * | Alarm.com Holdings Inc. | 22,584 | 2,336 |
Small Company Growth Portfolio
| | | Shares | Market
Value•
($000) |
| * | Ceridian HCM Holding Inc. | 21,728 | 2,315 |
| | Perspecta Inc. | 95,647 | 2,303 |
| * | Unisys Corp. | 112,046 | 2,205 |
| * | NeoPhotonics Corp. | 228,967 | 2,081 |
| | Amkor Technology Inc. | 132,601 | 2,000 |
| | CSG Systems International Inc. | 40,732 | 1,836 |
| * | Avid Technology Inc. | 114,851 | 1,823 |
| * | A10 Networks Inc. | 182,417 | 1,799 |
| * | Agilysys Inc. | 45,798 | 1,758 |
| * | Cloudflare Inc. Class A | 21,983 | 1,670 |
| * | Itron Inc. | 17,324 | 1,661 |
| * | Veritone Inc. | 55,491 | 1,579 |
| * | International Money Express Inc. | 100,184 | 1,555 |
| * | Lattice Semiconductor Corp. | 32,839 | 1,505 |
| * | Sitime Corp. | 13,021 | 1,457 |
| | Plantronics Inc. | 53,541 | 1,447 |
| * | Extreme Networks Inc. | 205,165 | 1,414 |
| * | Paylocity Holding Corp. | 6,516 | 1,342 |
| * | Comm Scope Holding Co. Inc. | 96,312 | 1,291 |
| * | Brightcove Inc. | 65,784 | 1,210 |
| * | Everbridge Inc. | 7,635 | 1,138 |
| * | Sailpoint Technologies Holdings Inc. | 19,882 | 1,059 |
| * | Nutanix Inc. Class A | 31,660 | 1,009 |
| * | Perficient Inc. | 20,799 | 991 |
| * | Lumentum Holdings Inc. | 10,174 | 964 |
| * | PagerDuty Inc. | 21,346 | 890 |
| * | Sprout Social Inc. Class A | 19,429 | 882 |
| | QAD Inc. Class A | 13,129 | 829 |
| * | Benefitfocus Inc. | 54,762 | 793 |
| * | Axcelis Technologies Inc. | 26,834 | 781 |
| * | Ultra Clean Holdings Inc. | 23,466 | 731 |
| * | NCR Corp. | 17,474 | 657 |
| * | Infinera Corp. | 58,792 | 616 |
| | NIC Inc. | 22,686 | 586 |
| * | BigCommerce Holdings Inc. Series 1 | 9,129 | 586 |
| * | ePlus Inc. | 6,264 | 551 |
| * | Black Knight Inc. | 5,842 | 516 |
| * | MicroStrategy Inc. Class A | 1,325 | 515 |
| * | PFSweb Inc. | 73,268 | 493 |
| * | Mitek Systems Inc. | 24,289 | 432 |
| * | CEVA Inc. | 9,344 | 425 |
| * | Sanmina Corp. | 11,637 | 371 |
| | Progress Software Corp. | 8,065 | 364 |
| | Xperi Holding Corp. | 14,060 | 294 |
| | VirnetX Holding Corp. | 52,697 | 266 |
| | Badger Meter Inc. | 2,776 | 261 |
| | | Shares | Market
Value•
($000) |
| * | DSP Group Inc. | 15,480 | 257 |
| * | PDF Solutions Inc. | 10,930 | 236 |
| * | LivePerson Inc. | 3,783 | 235 |
| * | GTT Communications Inc. | 44,847 | 160 |
| | | | 581,814 |
| Materials (1.8%) |
| | Scotts Miracle-Gro Co. | 41,025 | 8,170 |
| | Graphic Packaging Holding Co. | 411,204 | 6,966 |
| | Element Solutions Inc. | 293,005 | 5,195 |
| | Myers Industries Inc. | 196,293 | 4,079 |
| | RPM International Inc. | 33,479 | 3,039 |
| | Louisiana-Pacific Corp. | 74,996 | 2,788 |
| | Royal Gold Inc. | 23,274 | 2,475 |
| | Sealed Air Corp. | 43,728 | 2,002 |
| | Avery Dennison Corp. | 8,259 | 1,281 |
| | Sensient Technologies Corp. | 11,241 | 829 |
| | O-I Glass Inc. | 31,064 | 370 |
| * | Forterra Inc. | 20,496 | 353 |
| * | Koppers Holdings Inc. | 9,186 | 286 |
| | | | 37,833 |
| Other (0.8%) |
| * | Jaws Acquisition Corp. Class A | 1,267,735 | 17,000 |
| *,2 | Nupathe Inc. CVR | 345,900 | — |
| | | | 17,000 |
| Real Estate (1.3%) |
| * | Redfin Corp. | 144,577 | 9,922 |
| | Uniti Group Inc. | 345,578 | 4,054 |
| | Iron Mountain Inc. | 126,082 | 3,717 |
| | PS Business Parks Inc. | 23,204 | 3,083 |
| 1 | GEO Group Inc. | 238,664 | 2,115 |
| | Innovative Industrial Properties Inc. | 6,755 | 1,237 |
| | National Health Investors Inc. | 14,841 | 1,027 |
| | Equity LifeStyle Properties Inc. | 9,715 | 616 |
| | CatchMark Timber Trust Inc. Class A | 49,044 | 459 |
| | Universal Health Realty Income Trust | 5,167 | 332 |
| | CareTrust REIT Inc. | 14,665 | 325 |
| | Alexander's Inc. | 1,022 | 283 |
| | American Finance Trust Inc. | 37,389 | 278 |
| | LTC Properties Inc. | 6,483 | 252 |
| | | | 27,700 |
| Utilities (0.5%) |
| | American States Water Co. | 53,685 | 4,268 |
| | Ormat Technologies Inc. | 25,647 | 2,315 |
| | | Shares | Market
Value•
($000) |
| | Brookfield Infrastructure Corp. Class A | 16,841 | 1,218 |
| | Clearway Energy Inc. Class A | 37,555 | 1,110 |
| | California Water Service Group | 8,882 | 480 |
| | | | 9,391 |
Total Common Stocks
(Cost $1,648,083) | 2,067,149 |
| Temporary Cash Investments (5.3%) |
| Money Market Fund (5.2%) |
| 3,4 | Vanguard Market Liquidity Fund, 0.111%
| 1,105,505 | 110,550 |
| | | Face
Amount
($000) | |
| U.S. Government and Agency Obligations (0.1%) |
| 5 | U.S. Cash Management Bill, 0.083%, 3/30/21 | 300 | 300 |
| 5 | U.S. Treasury Bill, 0.096%, 1/28/21 | 1,148 | 1,148 |
| 5 | U.S. Treasury Bill, 0.116%, 2/16/21 | 1,465 | 1,465 |
| | | | 2,913 |
Total Temporary Cash Investments
(Cost $113,467) | 113,463 |
Total Investments (102.4%)
(Cost $1,761,550) | 2,180,612 |
| Other Assets and Liabilities—Net (-2.4%) | (50,629) |
| Net Assets (100%) | 2,129,983 |
| Cost is in $000. |
| • | See Note A in Notes to Financial Statements. |
| * | Non-income-producing security. |
| 1 | Includes partial security positions on loan to broker-dealers. The total value of securities on loan is $22,884,000. |
| 2 | Security value determined using significant unobservable inputs. |
| 3 | Affiliated money market fund available only to Vanguard funds and certain trusts and accounts managed by Vanguard. Rate shown is the 7-day yield. |
| 4 | Collateral of $25,057,000 was received for securities on loan. |
| 5 | Securities with a value of $2,695,000 have been segregated as initial margin for open futures contracts. |
| | CVR—Contingent Value Rights. |
| | REIT—Real Estate Investment Trust. |
Derivative Financial Instruments Outstanding as of Period End
| Futures Contracts |
| | | | ($000) |
| | Expiration | Number of
Long (Short)
Contracts | Notional
Amount | Value and
Unrealized
Appreciation
(Depreciation) |
| Long Futures Contracts | | | | |
| E-mini Russell 2000 Index | March 2021 | 618 | 61,021 | 1,922 |
See accompanying Notes, which are an integral part of the Financial Statements.
Small Company Growth Portfolio
Statement of Assets and Liabilities
| ($000s, except shares and per-share amounts) | Amount |
| Assets | |
| Investments in Securities, at Value | |
| Unaffiliated Issuers (Cost $1,650,996) | 2,070,062 |
| Affiliated Issuers (Cost $110,554) | 110,550 |
| Total Investments in Securities | 2,180,612 |
| Investment in Vanguard | 79 |
| Cash | 1,076 |
| Cash Collateral Pledged—Futures Contracts | 150 |
| Receivables for Investment Securities Sold | 1,063 |
| Receivables for Accrued Income | 545 |
| Receivables for Capital Shares Issued | 415 |
| Total Assets | 2,183,940 |
| Liabilities | |
| Payables for Investment Securities Purchased | 1,080 |
| Collateral for Securities on Loan | 25,057 |
| Payables to Investment Advisor | 383 |
| Payables for Capital Shares Redeemed | 27,112 |
| Payables to Vanguard | 258 |
| Variation Margin Payable—Futures Contracts | 67 |
| Total Liabilities | 53,957 |
| Net Assets | 2,129,983 |
| At December 31, 2020, net assets consisted of: | |
| | |
| Paid-in Capital | 1,595,403 |
| Total Distributable Earnings (Loss) | 534,580 |
| Net Assets | 2,129,983 |
| |
| Net Assets | |
Applicable to 86,965,207 outstanding $.001 par value shares of
beneficial interest (unlimited authorization) | 2,129,983 |
| Net Asset Value Per Share | $24.49 |
See accompanying Notes, which are an integral part of the Financial Statements.
Small Company Growth Portfolio
Statement of Operations
|
| | Year Ended
December 31, 2020 |
| | ($000) |
| Investment Income | |
| Income | |
| Dividends | 12,660 |
| Interest1 | 430 |
| Securities Lending—Net | 1,831 |
| Total Income | 14,921 |
| Expenses | |
| Investment Advisory Fees—Note B | |
| Basic Fee | 2,509 |
| Performance Adjustment | (344) |
| The Vanguard Group—Note C | |
| Management and Administrative | 3,010 |
| Marketing and Distribution | 182 |
| Custodian Fees | 25 |
| Auditing Fees | 30 |
| Shareholders' Reports | 35 |
| Trustees’ Fees and Expenses | 2 |
| Total Expenses | 5,449 |
| Net Investment Income | 9,472 |
| Realized Net Gain (Loss) | |
| Investment Securities Sold1 | 100,373 |
| Futures Contracts | 8,838 |
| Realized Net Gain (Loss) | 109,211 |
| Change in Unrealized Appreciation (Depreciation) | |
| Investment Securities1 | 268,991 |
| Futures Contracts | 1,245 |
| Change in Unrealized Appreciation (Depreciation) | 270,236 |
| Net Increase (Decrease) in Net Assets Resulting from Operations | 388,919 |
| 1 | Interest income, realized net gain (loss), and change in unrealized appreciation (depreciation) from an affiliated company of the portfolio were $409,000, $38,000, and $4,000, respectively. Purchases and sales are for temporary cash investment purposes. |
Statement of Changes in Net Assets
|
| | Year Ended December 31, |
| | 2020
($000) | 2019
($000) |
| Increase (Decrease) in Net Assets | | |
| Operations | | |
| Net Investment Income | 9,472 | 12,062 |
| Realized Net Gain (Loss) | 109,211 | 174,524 |
| Change in Unrealized Appreciation (Depreciation) | 270,236 | 302,576 |
| Net Increase (Decrease) in Net Assets Resulting from Operations | 388,919 | 489,162 |
| Distributions1 | | |
| Total Distributions | (190,506) | (234,887) |
| Capital Share Transactions | | |
| Issued | 190,807 | 241,143 |
| Issued in Lieu of Cash Distributions | 190,506 | 234,887 |
| Redeemed | (560,869) | (446,197) |
| Net Increase (Decrease) from Capital Share Transactions | (179,556) | 29,833 |
| Total Increase (Decrease) | 18,857 | 284,108 |
| Net Assets | | |
| Beginning of Period | 2,111,126 | 1,827,018 |
| End of Period | 2,129,983 | 2,111,126 |
| 1 | Certain prior-period numbers have been reclassified to conform with the current-period presentation. |
See accompanying Notes, which are an integral part of the Financial Statements.
Small Company Growth Portfolio
For a Share Outstanding
Throughout Each Period | Year Ended December 31, |
| 2020 | 2019 | 2018 | 2017 | 2016 |
| Net Asset Value, Beginning of Period | $23.08 | $20.30 | $24.62 | $21.50 | $20.79 |
| Investment Operations | | | | | |
| Net Investment Income | .1021 | .1281 | .1231 | .1091 | .116 |
| Net Realized and Unrealized Gain (Loss) on Investments | 3.521 | 5.323 | (1.563) | 4.652 | 2.547 |
| Total from Investment Operations | 3.623 | 5.451 | (1.440) | 4.761 | 2.663 |
| Distributions | | | | | |
| Dividends from Net Investment Income | (.143) | (.118) | (.103) | (.111) | (.074) |
| Distributions from Realized Capital Gains | (2.070) | (2.553) | (2.777) | (1.530) | (1.879) |
| Total Distributions | (2.213) | (2.671) | (2.880) | (1.641) | (1.953) |
| Net Asset Value, End of Period | $24.49 | $23.08 | $20.30 | $24.62 | $21.50 |
| Total Return | 23.18% | 28.05% | -7.22% | 23.46% | 14.94% |
| Ratios/Supplemental Data | | | | | |
| Net Assets, End of Period (Millions) | $2,130 | $2,111 | $1,827 | $1,750 | $1,397 |
| Ratio of Total Expenses to Average Net Assets2 | 0.30% | 0.32% | 0.32% | 0.34% | 0.36% |
| Ratio of Net Investment Income to Average Net Assets | 0.52% | 0.59% | 0.52% | 0.48% | 0.58% |
| Portfolio Turnover Rate | 53% | 58% | 66% | 93% | 91% |
| 1 | Calculated based on average shares outstanding. |
| 2 | Includes performance-based investment advisory fee increases (decreases) of (0.02%), 0.01%, 0.01%, 0.00%, and 0.00%. |
See accompanying Notes, which are an integral part of the Financial Statements.
Small Company Growth Portfolio
Notes to Financial Statements
The Small Company Growth Portfolio, a portfolio of Vanguard Variable Insurance Funds, is registered under the Investment Company Act of 1940 as an open-end investment company. The portfolio's shares are only available for purchase by separate accounts of insurance companies as investments for variable annuity plans, variable life insurance contracts, or other variable benefit insurance contracts. Market disruptions associated with the COVID-19 pandemic have had a global impact, and uncertainty exists as to the long-term implications. Such disruptions can adversely affect assets of the portfolio and thus portfolio performance.
| A. | The following significant accounting policies conform to generally accepted accounting principles for U.S. investment companies. The portfolio consistently follows such policies in preparing its financial statements. |
1. Security Valuation: Securities are valued as of the close of trading on the New York Stock Exchange (generally 4 p.m., Eastern time) on the valuation date. Equity securities are valued at the latest quoted sales prices or official closing prices taken from the primary market in which each security trades; such securities not traded on the valuation date are valued at the mean of the latest quoted bid and asked prices. Securities for which market quotations are not readily available, or whose values have been affected by events occurring before the portfolio’s pricing time but after the close of the securities’ primary markets, are valued at their fair values calculated according to procedures adopted by the board of trustees. These procedures include obtaining quotations from an independent pricing service, monitoring news to identify significant market- or security-specific events, and evaluating changes in the values of foreign market proxies (for example, ADRs, futures contracts, or exchange-traded funds), between the time the foreign markets close and the portfolio’s pricing time. When fair-value pricing is employed, the prices of securities used by a portfolio to calculate its net asset value may differ from quoted or published prices for the same securities.
Investments in Vanguard Market Liquidity Fund are valued at that fund's net asset value. Temporary cash investments are valued using the latest bid prices or using valuations based on a matrix system (which considers such factors as security prices, yields, maturities, and ratings), both as furnished by independent pricing services.
2. Futures Contracts: The portfolio uses index futures contracts to a limited extent, with the objective of maintaining full exposure to the stock market while maintaining liquidity. The portfolio may purchase or sell futures contracts to achieve a desired level of investment, whether to accommodate portfolio turnover or cash flows from capital share transactions. The primary risks associated with the use of futures contracts are imperfect correlation between changes in market values of stocks held by the portfolio and the prices of futures contracts, and the possibility of an illiquid market. Counterparty risk involving futures is mitigated because a regulated clearinghouse is the counterparty instead of the clearing broker. To further mitigate counterparty risk, the portfolio trades futures contracts on an exchange, monitors the financial strength of its clearing brokers and clearinghouse, and has entered into clearing agreements with its clearing brokers. The clearinghouse imposes initial margin requirements to secure the portfolio’s performance and requires daily settlement of variation margin representing changes in the market value of each contract. Any securities pledged as initial margin for open contracts are noted in the Schedule of Investments.
Futures contracts are valued at their quoted daily settlement prices. The notional amounts of the contracts are not recorded in the Statement of Assets and Liabilities. Fluctuations in the value of the contracts are recorded in the Statement of Assets and Liabilities as an asset (liability) and in the Statement of Operations as unrealized appreciation (depreciation) until the contracts are closed, when they are recorded as realized gains (losses) on futures contracts.
During the year ended December 31, 2020, the portfolio’s average investments in long and short futures contracts represented 3% and 0% of net assets, respectively, based on the average of the notional amounts at each quarter-end during the period.
3. Federal Income Taxes: The portfolio intends to continue to qualify as a regulated investment company and distribute all of its taxable income. The portfolio’s tax returns are open to examination by the relevant tax authorities until expiration of the applicable statute of limitations, which is generally three years after the filing of the tax return. Management has analyzed the portfolio’s tax positions taken for all open federal and state income tax years, and has concluded that no provision for income tax is required in the portfolio’s financial statements.
4. Distributions: Distributions to shareholders are recorded on the ex-dividend date. Distributions are determined on a tax basis at the fiscal year-end and may differ from net investment income and realized capital gains for financial reporting purposes.
Small Company Growth Portfolio
5. Securities Lending: To earn additional income, the portfolio lends its securities to qualified institutional borrowers. Security loans are subject to termination by the portfolio at any time, and are required to be secured at all times by collateral in an amount at least equal to the market value of securities loaned. Daily market fluctuations could cause the value of loaned securities to be more or less than the value of the collateral received. When this occurs, the collateral is adjusted and settled on the next business day. The portfolio further mitigates its counterparty risk by entering into securities lending transactions only with a diverse group of prequalified counterparties, monitoring their financial strength, and entering into master securities lending agreements with its counterparties. The master securities lending agreements provide that, in the event of a counterparty’s default (including bankruptcy), the portfolio may terminate any loans with that borrower, determine the net amount owed, and sell or retain the collateral up to the net amount owed to the portfolio; however, such actions may be subject to legal proceedings. While collateral mitigates counterparty risk, in the event of a default, the portfolio may experience delays and costs in recovering the securities loaned. The portfolio invests cash collateral received in Vanguard Market Liquidity Fund, and records a liability in the Statement of Assets and Liabilities for the return of the collateral, during the period the securities are on loan. Collateral investments in Vanguard Market Liquidity Fund are subject to market appreciation or depreciation. Securities lending income represents fees charged to borrowers plus income earned on invested cash collateral, less expenses associated with the loan. During the term of the loan, the portfolio is entitled to all distributions made on or in respect of the loaned securities.
6. Credit Facilities and Interfund Lending Program: The portfolio and certain other funds managed by The Vanguard Group ("Vanguard") participate in a $4.3 billion committed credit facility provided by a syndicate of lenders pursuant to a credit agreement and an uncommitted credit facility provided by Vanguard. Both facilities may be renewed annually. Each fund is individually liable for its borrowings, if any, under the credit facilities. Borrowings may be utilized for temporary or emergency purposes, subject to the portfolio’s regulatory and contractual borrowing restrictions. With respect to the committed credit facility, the participating funds are charged administrative fees and an annual commitment fee of 0.10% of the undrawn committed amount of the facility; these fees are allocated to the funds based on a method approved by the portfolio’s board of trustees and included in Management and Administrative expenses on the portfolio’s Statement of Operations. Any borrowings under either facility bear interest at a rate based upon the higher of the one-month London Interbank Offered Rate (or an acceptable alternate rate, if necessary), federal funds effective rate, or overnight bank funding rate plus an agreed-upon spread, except that borrowings under the uncommitted credit facility may bear interest based upon an alternate rate agreed to by the portfolio and Vanguard.
In accordance with an exemptive order (the “Order”) from the SEC, the portfolio may participate in a joint lending and borrowing program that allows registered open-end Vanguard funds to borrow money from and lend money to each other for temporary or emergency purposes (the “Interfund Lending Program”), subject to compliance with the terms and conditions of the Order, and to the extent permitted by the portfolio’s investment objective and investment policies. Interfund loans and borrowings normally extend overnight, but can have a maximum duration of seven days. Loans may be called on one business day’s notice. The interest rate to be charged is governed by the conditions of the Order and internal procedures adopted by the board of trustees. The board of trustees is responsible for overseeing the Interfund Lending Program.
For the year ended December 31, 2020, the portfolio did not utilize the credit facilities or the Interfund Lending Program.
7. Other: Dividend income is recorded on the ex-dividend date. Non-cash dividends included in dividend income, if any, are recorded at the fair value of the securities received. Interest income includes income distributions received from Vanguard Market Liquidity Fund and is accrued daily. Premiums and discounts on debt securities are amortized and accreted, respectively, to interest income over the lives of the respective securities, except for premiums on certain callable debt securities that are amortized to the earliest call date. Security transactions are accounted for on the date securities are bought or sold. Costs used to determine realized gains (losses) on the sale of investment securities are those of the specific securities sold.
| B. | The investment advisory firm ArrowMark Colorado Holdings, LLC, provides investment advisory services to a portion of the portfolio for a fee calculated at an annual percentage rate of average net assets managed by the advisor. The basic fee of ArrowMark Colorado Holdings, LLC, is subject to quarterly adjustments based on performance relative to the Russell 2500 Growth Index since March 31, 2016. |
Vanguard provides investment advisory services to a portion of the portfolio as described below; the portfolio paid Vanguard advisory fees of $737,000 for the year ended December 31, 2020.
Small Company Growth Portfolio
For the year ended December 31, 2020, the aggregate investment advisory fee paid to all advisors represented an effective annual basic rate of 0.14% of the portfolio’s average net assets, before a decrease of of $344,000 (0.02%) based on performance.
| C. | In accordance with the terms of a Funds' Service Agreement (the “FSA”) between Vanguard and the portfolio, Vanguard furnishes to the portfolio investment advisory, corporate management, administrative, marketing, and distribution services at Vanguard’s cost of operations (as defined by the FSA). These costs of operations are allocated to the portfolio based on methods and guidelines approved by the board of trustees and are generally settled twice a month. |
Upon the request of Vanguard, the portfolio may invest up to 0.40% of its net assets as capital in Vanguard. At December 31, 2020, the portfolio had contributed to Vanguard capital in the amount of $79,000, representing less than 0.01% of the portfolio’s net assets and 0.03% of Vanguard’s capital received pursuant to the FSA. The portfolio’s trustees and officers are also directors and employees, respectively, of Vanguard.
| D. | Various inputs may be used to determine the value of the portfolio’s investments and derivatives. These inputs are summarized in three broad levels for financial statement purposes. The inputs or methodologies used to value securities are not necessarily an indication of the risk associated with investing in those securities. |
Level 1—Quoted prices in active markets for identical securities.
Level 2—Other significant observable inputs (including quoted prices for similar securities, interest rates, prepayment speeds, credit risk, etc.).
Level 3—Significant unobservable inputs (including the portfolio’s own assumptions used to determine the fair value of investments). Any investments and derivatives valued with significant unobservable inputs are noted on the Schedule of Investments.
The following table summarizes the market value of the portfolio’s investments and derivatives as of December 31, 2020, based on the inputs used to value them:
| | Level 1
($000) | Level 2
($000) | Level 3
($000) | Total
($000) |
| Investments | | | | |
| Assets | | | | |
| Common Stocks | 2,067,149 | — | — | 2,067,149 |
| Temporary Cash Investments | 110,550 | 2,913 | — | 113,463 |
| Total | 2,177,699 | 2,913 | — | 2,180,612 |
| Derivative Financial Instruments | | | | |
| Liabilities | | | | |
| Futures Contracts1 | 67 | — | — | 67 |
| 1 | Represents variation margin on the last day of the reporting period. |
| E. | Permanent differences between book-basis and tax-basis components of net assets, if any, are reclassified among capital accounts in the financial statements to reflect their tax character. These reclassifications have no effect on net assets or net asset value per share. |
Temporary differences between book-basis and tax-basis components of total distributable earnings (loss) arise when certain items of income, gain, or loss are recognized in different periods for financial statement and tax purposes; these differences will reverse at some time in the future. The differences are primarily related to the deferral of losses from wash sales; the recognition of unrealized gains or losses from certain derivative contracts; and the recognition of unrealized gains from passive foreign investment companies. As of period end, the tax-basis components of total distributable earnings (loss) are detailed in the table as follows:
| | Amount
($000) |
| Undistributed Ordinary Income | 75,183 |
| Undistributed Long-Term Gains | 40,416 |
| Capital Loss Carryforwards | — |
| Qualified Late-Year Losses | — |
| Net Unrealized Gains (Losses) | 418,981 |
Small Company Growth Portfolio
The tax character of distributions paid was as follows:
| | Year Ended December 31, |
| | 2020
Amount
($000) | 2019
Amount
($000) |
| Ordinary Income* | 15,395 | 53,162 |
| Long-Term Capital Gains | 175,111 | 181,725 |
| Total | 190,506 | 234,887 |
| * | Includes short-term capital gains, if any. |
As of December 31, 2020, gross unrealized appreciation and depreciation for investments and derivatives based on cost for U.S. federal income tax purposes were as follows:
| | Amount
($000) |
| Tax Cost | 1,761,631 |
| Gross Unrealized Appreciation | 548,114 |
| Gross Unrealized Depreciation | (129,133) |
| Net Unrealized Appreciation (Depreciation) | 418,981 |
| F. | During the year ended December 31, 2020, the portfolio purchased $939,094,000 of investment securities and sold $1,274,935,000 of investment securities, other than temporary cash investments. |
| G. | Capital shares issued and redeemed were: |
| | Year Ended December 31, |
| | 2020 | 2019 |
| | Shares
(000) | Shares
(000) |
| Issued | 10,624 | 11,011 |
| Issued in Lieu of Cash Distributions | 13,855 | 11,101 |
| Redeemed | (28,989) | (20,656) |
| Net Increase (Decrease) in Shares Outstanding | (4,510) | 1,456 |
At December 31, 2020, one shareholder (an insurance company separate account whose holdings in the portfolio represent the indirect investment of Vanguard Variable Annuity contract holders) was the record or beneficial owner of 46% of the portfolio’s net assets. If this shareholder was to redeem its investment in the portfolio, the redemption might result in an increase in the portfolio’s expense ratio, cause the portfolio to incur higher transaction costs, or lead to the realization of taxable capital gains.
| H. | Management has determined that no events or transactions occurred subsequent to December 31, 2020, that would require recognition or disclosure in these financial statements. |
Report of Independent Registered Public Accounting Firm
To the Board of Trustees of Vanguard Variable Insurance Funds and Shareholders of Small Company Growth Portfolio
Opinion on the Financial Statements
We have audited the accompanying statement of assets and liabilities, including the schedule of investments, of Small Company Growth Portfolio (one of the portfolios constituting Vanguard Variable Insurance Funds, referred to hereafter as the "Portfolio”) as of December 31, 2020, the related statement of operations for the year ended December 31, 2020, the statement of changes in net assets for each of the two years in the period ended December 31, 2020, including the related notes, and the financial highlights for each of the five years in the period ended December 31, 2020 (collectively referred to as the “financial statements”). In our opinion, the financial statements present fairly, in all material respects, the financial position of the Portfolio as of December 31, 2020, the results of its operations for the year then ended, the changes in its net assets for each of the two years in the period ended December 31, 2020 and the financial highlights for each of the five years in the period ended December 31, 2020 in conformity with accounting principles generally accepted in the United States of America.
Basis for Opinion
These financial statements are the responsibility of the Portfolio’s management. Our responsibility is to express an opinion on the Portfolio’s financial statements based on our audits. We are a public accounting firm registered with the Public Company Accounting Oversight Board (United States) (PCAOB) and are required to be independent with respect to the Portfolio in accordance with the U.S. federal securities laws and the applicable rules and regulations of the Securities and Exchange Commission and the PCAOB.
We conducted our audits of these financial statements in accordance with the standards of the PCAOB. Those standards require that we plan and perform the audit to obtain reasonable assurance about whether the financial statements are free of material misstatement, whether due to error or fraud.
Our audits included performing procedures to assess the risks of material misstatement of the financial statements, whether due to error or fraud, and performing procedures that respond to those risks. Such procedures included examining, on a test basis, evidence regarding the amounts and disclosures in the financial statements. Our audits also included evaluating the accounting principles used and significant estimates made by management, as well as evaluating the overall presentation of the financial statements. Our procedures included confirmation of securities owned as of December 31, 2020 by correspondence with the custodian and brokers and by agreement to the underlying ownership records of the transfer agent; when replies were not received from brokers, we performed other auditing procedures. We believe that our audits provide a reasonable basis for our opinion.
/s/PricewaterhouseCoopers LLP
Philadelphia, Pennsylvania
February 18, 2021
We have served as the auditor of one or more investment companies in The Vanguard Group of Funds since 1975.
Special 2020 tax information (unaudited) for corporate shareholders only for Small Company Growth Portfolio, a portfolio of Vanguard Variable Insurance Funds
The portfolio distributed $175,111,000 as capital gain dividends (20% rate gain distributions) to shareholders during the fiscal year.
For corporate shareholders, 13.8% of investment income (dividend income plus short-term gains, if any) qualifies for the dividends-received deduction.
This page intentionally left blank.
The People Who Govern Your Fund
The trustees of your mutual fund are there to see that the fund is operated and managed in your best interests since, as a shareholder, you are a part owner of the fund. Your fund’s trustees also serve on the board of directors of The Vanguard Group, Inc., which is owned by the Vanguard funds and provides services to them.
A majority of Vanguard’s board members are independent, meaning that they have no affiliation with Vanguard or the funds they oversee, apart from the sizable personal investments they have made as private individuals. The independent board members have distinguished backgrounds in business, academia, and public service. Each of the trustees and executive officers oversees 211 Vanguard funds.
Information for each trustee and executive officer of the fund appears below. That information, as well as the Vanguard fund count, is as of the date on the cover of this fund report. The mailing address of the trustees and officers is P.O. Box 876, Valley Forge, PA 19482. More information about the trustees is in the Statement of Additional Information, which can be obtained, without charge, by contacting Vanguard at 800-662-7447, or online at vanguard.com.
Interested Trustee1
Mortimer J. Buckley
Born in 1969. Trustee since January 2018. Principal occupation(s) during the past five years and other experience: chairman of the board (2019–present) of Vanguard and of each of the investment companies served by Vanguard; chief executive officer (2018–present) of Vanguard; chief executive officer, president, and trustee (2018–present) of each of the investment companies served by Vanguard; president and director (2017–present) of Vanguard; and president (2018–present) of Vanguard Marketing Corporation. Chief investment officer (2013–2017), managing director (2002–2017), head of the Retail Investor Group (2006–2012), and chief information officer (2001–2006) of Vanguard. Chairman of the board (2011–2017) and trustee (2009–2017) of the Children’s Hospital of Philadelphia; and trustee (2018–present) and vice chair (2019–present) of The Shipley School.
Independent Trustees
Emerson U. Fullwood
Born in 1948. Trustee since January 2008. Principal occupation(s) during the past five years and other experience: executive chief staff and marketing officer for North America and corporate vice president (retired 2008) of Xerox Corporation (document management products and services). Former president of the Worldwide Channels Group, Latin America, and Worldwide Customer Service and executive chief staff officer of Developing Markets of Xerox. Executive in residence and 2009–2010 Distinguished Minett Professor at the Rochester Institute of Technology. Director of SPX FLOW, Inc. (multi-industry manufacturing). Director of the University of Rochester Medical Center, the Monroe Community College Foundation, the United Way of Rochester, North Carolina A&T University, and Roberts Wesleyan College. Trustee of the University of Rochester.
Amy Gutmann
Born in 1949. Trustee since June 2006. Principal occupation(s) during the past five years and other experience: president (2004–present) of the University of Pennsylvania. Christopher H. Browne Distinguished Professor of Political Science, School of Arts and Sciences, and professor of communication, Annenberg School for Communication, with secondary faculty appointments in the Department of Philosophy, School of Arts and Sciences, and at the Graduate School of Education, University of Pennsylvania.
F. Joseph Loughrey
Born in 1949. Trustee since October 2009. Principal occupation(s) during the past five years and other experience: president and chief operating officer (retired 2009) and vice chairman of the board (2008–2009) of Cummins Inc. (industrial machinery). Chairman of the board of Hillenbrand, Inc. (specialized consumer services) and the Lumina Foundation. Director of the V Foundation. Member of the advisory council for the College of Arts and Letters and chair of the advisory board to the Kellogg Institute for International Studies, both at the University of Notre Dame.
Mark Loughridge
Born in 1953. Trustee since March 2012. Principal occupation(s) during the past five years and other experience: senior vice president and chief financial officer (retired 2013) of IBM (information technology services). Fiduciary member of IBM’s Retirement Plan Committee (2004–2013), senior vice president and general manager (2002–2004) of IBM Global Financing, vice president and controller (1998–2002) of IBM, and a variety of other prior management roles at IBM. Member of the Council on Chicago Booth.
Scott C. Malpass
Born in 1962. Trustee since March 2012. Principal occupation(s) during the past five years and other experience: chief investment officer (retired June 2020) and vice president (retired June 2020) of the University of Notre Dame. Assistant professor of finance at the Mendoza College of Business, University of Notre Dame, and member of the Notre Dame 403(b) Investment Committee (retired June 2020). Member of the board of Catholic Investment Services, Inc. (investment advisors) and the board of superintendence of the Institute for the Works of Religion.
Deanna Mulligan
Born in 1963. Trustee since January 2018. Principal occupation(s) during the past five years and other experience: board chair (2020–present), chief executive officer (2011–2020), and president (2010–2019) of The Guardian Life Insurance Company of America. Chief operating officer (2010–2011) and executive vice president (2008–2010) of the individual life and disability division of Guardian Life. Member of the board of the American Council of Life Insurers and the board of the Economic Club of New York. Trustee of the Partnership for New York City (business leadership), Chief Executives for Corporate Purpose, NewYork-Presbyterian Hospital, Catalyst, and the
Bruce Museum (arts and science). Member of the Advisory Council for the Stanford Graduate School of Business.
André F. Perold
Born in 1952. Trustee since December 2004. Principal occupation(s) during the past five years and other experience: George Gund Professor of Finance and Banking, Emeritus at the Harvard Business School (retired 2011). Chief investment officer and co-managing partner of HighVista Strategies (private investment firm). Member of the board of advisors and member of the investment committee of the Museum of Fine Arts Boston. Member of the board (2018–present) of RIT Capital Partners (investment firm). Member of the investment committee of Partners Health Care System.
Sarah Bloom Raskin
Born in 1961. Trustee since January 2018. Principal occupation(s) during the past five years and other experience: deputy secretary (2014–2017) of the United States Department of the Treasury. Governor (2010–2014) of the Federal Reserve Board. Commissioner (2007–2010) of financial regulation for the State of Maryland. Member of the board of directors (2012–2014) of Neighborhood Reinvestment Corporation. Director (2017–present) of i(x) Investments, LLC; director (2017–present) of Reserve Trust. Rubenstein Fellow (2017–present) of Duke University; trustee (2017–present) of Amherst College, and trustee (2019–present) of the Folger Shakespeare Library.
Peter F. Volanakis
Born in 1955. Trustee since July 2009. Principal occupation(s) during the past five years and other experience: president and chief operating officer (retired 2010) of Corning Incorporated (communications equipment) and director of Corning Incorporated (2000–2010) and Dow Corning (2001–2010). Director (2012) of SPX Corporation (multi-industry manufacturing). Overseer of the Amos Tuck School of Business Administration, Dartmouth College (2001–2013). Chairman of the board of trustees of Colby-Sawyer College. Member of the board of Hypertherm Inc. (industrial cutting systems, software, and consumables).
1 Mr. Buckley is considered an “interested person,” as defined in the Investment Company Act of 1940, because he is an officer of the Vanguard funds.
Executive Officers
John Bendl
Born in 1970. Principal occupation(s) during the past five years and other experience: principal of Vanguard. Chief financial officer (2019–present) of each of the investment companies served by Vanguard. Chief accounting officer, treasurer, and controller of Vanguard (2017–present). Partner (2003–2016) at KPMG (audit, tax, and advisory services).
Christine M. Buchanan
Born in 1970. Principal occupation(s) during the past five years and other experience: principal of Vanguard. Treasurer (2017–present) of each of the investment companies served by Vanguard. Partner (2005–2017) at KPMG (audit, tax, and advisory services).
David Cermak
Born in 1960. Principal occupation(s) during the past five years and other experience: principal of Vanguard. Finance director (2019–present) of each of the investment companies served by Vanguard. Managing director and head (2017–present) of Vanguard Investments Singapore. Managing director and head (2017–2019) of Vanguard Investments Hong Kong. Representative director and head (2014–2017) of Vanguard Investments Japan.
John Galloway
Born in 1973. Principal occupation(s) during the past five years and other experience: principal of Vanguard.
Investment stewardship officer (September 2020–present) of each of the investment companies served by Vanguard. Head of Investor Advocacy (February 2020–present) and head of Marketing Strategy and Planning (2017–2020) at Vanguard. Deputy assistant to the President of the United States (2015).
Thomas J. Higgins
Born in 1957. Principal occupation(s) during the past five years and other experience: principal of Vanguard. Finance director (2019–present), chief financial officer (2008–2019), and treasurer (1998–2008) of each of the investment companies served by Vanguard.
Peter Mahoney
Born in 1974. Principal occupation(s) during the past five years and other experience: principal of Vanguard. Controller (2015–present) of each of the investment companies served by Vanguard. Head of International Fund Services (2008–2014) at Vanguard.
Anne E. Robinson
Born in 1970. Principal occupation(s) during the past five years and other experience: general counsel (2016–present) of Vanguard. Secretary (2016–present) of Vanguard and of each of the investment companies served by Vanguard. Managing director (2016–present) of Vanguard. Managing director and general counsel of Global Cards and Consumer Services (2014–2016) at Citigroup. Counsel (2003–2014) at American Express.
Michael Rollings
Born in 1963. Principal occupation(s) during the past five years and other experience: finance director (2017–present) and treasurer (2017) of each of the investment companies served by Vanguard. Managing director (2016–present) of Vanguard. Chief financial officer (2016–present) of Vanguard. Director (2016–present) of Vanguard Marketing Corporation. Executive vice president and chief financial officer (2006–2016) of MassMutual Financial Group.
John E. Schadl
Born in 1972. Principal occupation(s) during the past five years and other experience: principal of Vanguard. Chief compliance officer (2019–present) of Vanguard and of each of the investment companies served by Vanguard. Assistant vice president (2019–present) of Vanguard Marketing Corporation.
Vanguard Senior Management Team
| Joseph Brennan | James M. Norris |
| Mortimer J. Buckley | Thomas M. Rampulla |
| Gregory Davis | Karin A. Risi |
| John James | Anne E. Robinson |
| John T. Marcante | Michael Rollings |
| Chris D. McIsaac | Lauren Valente |
Connect with Vanguard® > vanguard.com
Fund Information > 800-662-7447
Annuity and Insurance Services > 800-522-5555
Institutional Investor Services > 800-523-1036
Text Telephone for People Who Are Deaf or Hard of Hearing > 800-749-7273
This material may be used in conjunction with the offering of shares of any Vanguard fund only if preceded or accompanied by the fund’s current prospectus.
You can obtain a free copy of Vanguard’s proxy voting guidelines by visiting vanguard.com/proxyreporting or by calling Vanguard at 800-662-2739. The guidelines are also available from the SEC’s website, www.sec.gov. In addition, you may obtain a free report on how your fund voted the proxies for securities it owned during the 12 months ended June 30. To get the report, visit either vanguard.com/proxyreporting or www.sec.gov.
All comparative mutual fund data are from Morningstar, Inc., unless otherwise noted.
You can review information about your fund on the SEC’s website, and you can receive copies of this information, for a fee, by sending a request via email addressed to publicinfo@sec.gov.
Source for Bloomberg Barclays indexes: Bloomberg Index Services Limited. Copyright 2021, Bloomberg. All rights reserved.
CFA® is a registered trademark owned by CFA Institute.
© 2021 The Vanguard Group, Inc.
All rights reserved.
Vanguard Marketing Corporation, Distributor.
Q690SCG 022021
Annual Report | December 31, 2020
Vanguard Variable Insurance Funds
| Total Bond Market Index Portfolio |
Contents
Your Portfolio’s Performance at a Glance
| 1 |
About Your Portfolio’s Expenses
| 2 |
Performance Summary
| 3 |
Financial Statements
| 5 |
Please note: The opinions expressed in this report are just that—informed opinions. They should not be considered promises or advice. Also, please keep in mind that the information and opinions cover the period through the date on the front of this report. Of course, the risks of investing in your portfolio are spelled out in the prospectus.
Your Portfolio’s Performance at a Glance
| • | For the 12 months ended December 31, 2020, the Total Bond Market Index Portfolio returned 7.58%, in line with the 7.75% return of its benchmark index after taking into account the cost of running the portfolio. |
| • | The year was defined by the COVID-19 pandemic and efforts to contain it. Travel restrictions, supply-chain disruptions, business closures, and a spike in unemployment led swiftly to deep recessions around the world. However, many governments were quick to provide fiscal stimulus in the form of spending, loans, loan guarantees, job retention programs, and extended unemployment benefits. Central banks in developed markets responded rapidly, cutting interest rates, restarting or expanding asset purchases, and providing additional liquidity—all in an effort to blunt the economic impact of the virus. They also pledged to remain vigilant and take more actions if needed. |
| • | U.S. Treasuries, which account for about 40% of the portfolio’s assets, posted a return of 8.00%. Mortgage-backed securities returned less than that, as low mortgage rates led to plenty of supply. Corporate bonds, on the other hand, fared even better than Treasuries, returning 9.89%. With the U.S. economy looking like it might recover faster than had been expected, the spread between yields of corporates and those of Treasuries tightened. |
| • | By credit quality, lower-rated investment-grade bonds generally did better than higher-rated ones; by maturity, longer-dated bonds significantly outperformed. |
| • | Please note that the portfolio’s returns are different from those in Vanguard Variable Annuity (and other plans that invest in the portfolio), which take into account insurance-related expenses. |
Market Barometer
Average Annual Total Returns
Periods Ended December 31, 2020 |
| | One Year | Three Years | Five Years |
| Stocks | | | |
| Russell 1000 Index (Large-caps) | 20.96% | 14.82% | 15.60% |
| Russell 2000 Index (Small-caps) | 19.96 | 10.25 | 13.26 |
| Russell 3000 Index (Broad U.S. market) | 20.89 | 14.49 | 15.43 |
| FTSE All-World ex US Index (International) | 11.22 | 5.18 | 9.16 |
| Bonds | | | |
| Bloomberg Barclays U.S. Aggregate Bond Index (Broad taxable market) | 7.51% | 5.34% | 4.44% |
Bloomberg Barclays Municipal Bond Index
(Broad tax-exempt market) | 5.21 | 4.64 | 3.91 |
| FTSE Three-Month U.S. Treasury Bill Index | 0.58 | 1.56 | 1.16 |
| CPI | | | |
| Consumer Price Index | 1.36% | 1.85% | 1.95% |
About Your Portfolio’s Expenses
As a shareholder of the portfolio, you incur ongoing costs, which include costs for portfolio management, administrative services, and shareholder reports (like this one), among others. Operating expenses, which are deducted from a portfolio's gross income, directly reduce the investment return of the portfolio.
A portfolio's expenses are expressed as a percentage of its average net assets. This figure is known as the expense ratio. The following examples are intended to help you understand the ongoing costs (in dollars) of investing in your portfolio and to compare these costs with those of other mutual funds. The examples are based on an investment of $1,000 made at the beginning of the period shown and held for the entire period.
The accompanying table illustrates your portfolio's costs in two ways:
| • | Based on actual portfolio return. This section helps you to estimate the actual expenses that you paid over the period. The ”Ending Account Value“ shown is derived from the portfolio's actual return, and the third column shows the dollar amount that would have been paid by an investor who started with $1,000 in the portfolio. You may use the information here, together with the amount you invested, to estimate the expenses that you paid over the period. |
To do so, simply divide your account value by $1,000 (for example, an $8,600 account value divided by $1,000 = 8.6), then multiply the result by the number given for your portfolio under the heading ”Expenses Paid During Period.“
| • | Based on hypothetical 5% yearly return. This section is intended to help you compare your portfolio's costs with those of other mutual funds. It assumes that the portfolio had a yearly return of 5% before expenses, but that the expense ratio is unchanged. In this case—because the return used is not the portfolio's actual return—the results do not apply to your investment. The example is useful in making comparisons because the Securities and Exchange Commission requires all mutual funds to calculate expenses based on a 5% return. You can assess your portfolio's costs by comparing this hypothetical example with the hypothetical examples that appear in shareholder reports of other funds. |
Note that the expenses shown in the table are meant to highlight and help you compare ongoing costs only and do not reflect transaction costs incurred by the portfolio for buying and selling securities. The portfolio’s expense ratio does not reflect additional fees and expenses associated with the annuity or life insurance program through which you invest.
The calculations assume no shares were bought or sold during the period. Your actual costs may have been higher or lower, depending on the amount of your investment and the timing of any purchases or redemptions.
You can find more information about the portfolio's expenses, including annual expense ratios, in the Financial Statements section of this report. For additional information on operating expenses and other shareholder costs, please refer to your portfolio's current prospectus.
| Six Months Ended December 31, 2020 | | | |
| Total Bond Market Index Portfolio | Beginning
Account Value
6/30/2020 | Ending
Account Value
12/31/2020 | Expenses
Paid During
Period |
| Based on Actual Portfolio Return | $1,000.00 | $1,012.65 | $0.71 |
| Based on Hypothetical 5% Yearly Return | 1,000.00 | 1,024.43 | 0.71 |
The calculations are based on expenses incurred in the most recent six-month period. The portfolio’s annualized six-month expense ratio for that period is 0.14%. The dollar amounts shown as “Expenses Paid” are equal to the annualized expense ratio multiplied by the average account value over the period, multiplied by the number of days in the most recent six-month period, then divided by the number of days in the most recent 12-month period (184/366).
Total Bond Market Index Portfolio
All of the returns in this report represent past performance, which is not a guarantee of future results that may be achieved by the portfolio. (Current performance may be lower or higher than the performance data cited. For performance data current to the most recent month-end, visit our website at vanguard.com/performance.) Note, too, that both investment returns and principal value can fluctuate widely, so an investor’s shares, when sold, could be worth more or less than their original cost. The returns shown do not reflect taxes that a shareholder would pay on portfolio distributions or on the sale of portfolio shares. Nor do the returns reflect fees and expenses associated with the annuity or life insurance program through which a shareholder invests. If these fees and expenses were included, the portfolio's returns would be lower.
Cumulative Performance: December 31, 2010, Through December 31, 2020
Initial Investment of $10,000
| | | | Average Annual Total Returns
Periods Ended December 31, 2020 |
| | | One
Year | Five
Years | Ten
Years | Final Value
of a $10,000
Investment |
| Total Bond Market Index Portfolio | 7.58% | 4.36% | 3.71% | $14,394 |
| Bloomberg Barclays U.S. Aggregate Float Adjusted Index | 7.75 | 4.53 | 3.89 | 14,644 |
See Financial Highlights for dividend and capital gains information.
Total Bond Market Index Portfolio
| Asset-Backed/Commercial Mortgage-Backed Securities | 2.6% |
| Corporate Bonds | 30.1 |
| Sovereign Bonds | 4.0 |
| Taxable Municipal Bonds | 0.8 |
| U.S. Government and Agency Obligations | 62.5 |
The table reflects the portfolio’s investments, except for short-term investments. The agency and mortgage-backed securities may include issues from government-sponsored enterprises; such issues are generally not backed by the full faith and credit of the U.S. government.
The portfolio may invest in derivatives (such as futures and swap contracts) for various reasons, including, but not limited to, attempting to remain fully invested and tracking its target index as closely as possible.
Total Bond Market Index Portfolio
The portfolio files its complete schedule of portfolio holdings with the Securities and Exchange Commission (SEC) for the first and third quarters of each fiscal year as an exhibit to its reports on Form N-PORT. The portfolio’s Form N-PORT reports are available on the SEC’s website at www.sec.gov.
| | | | Coupon | Maturity
Date | Face
Amount
($000) | Market
Value•
($000) |
| U.S. Government and Agency Obligations (62.0%) |
| U.S. Government Securities (39.8%) |
| | U.S. Treasury Note/Bond | 7.875% | 2/15/21 | 1,180 | 1,190 |
| | U.S. Treasury Note/Bond | 8.000% | 11/15/21 | 3,400 | 3,628 |
| | U.S. Treasury Note/Bond | 2.000% | 12/31/21 | 6,670 | 6,794 |
| | U.S. Treasury Note/Bond | 2.125% | 12/31/21 | 928 | 946 |
| | U.S. Treasury Note/Bond | 2.500% | 1/15/22 | 7,601 | 7,787 |
| | U.S. Treasury Note/Bond | 1.375% | 1/31/22 | 4,868 | 4,933 |
| | U.S. Treasury Note/Bond | 1.500% | 1/31/22 | 2,384 | 2,419 |
| | U.S. Treasury Note/Bond | 1.875% | 1/31/22 | 8,835 | 9,002 |
| | U.S. Treasury Note/Bond | 2.000% | 2/15/22 | 135 | 138 |
| | U.S. Treasury Note/Bond | 2.500% | 2/15/22 | 9,901 | 10,164 |
| | U.S. Treasury Note/Bond | 1.750% | 2/28/22 | 6,330 | 6,449 |
| | U.S. Treasury Note/Bond | 1.875% | 2/28/22 | 9,990 | 10,193 |
| | U.S. Treasury Note/Bond | 2.375% | 3/15/22 | 10,896 | 11,189 |
| | U.S. Treasury Note/Bond | 0.375% | 3/31/22 | 11,505 | 11,541 |
| | U.S. Treasury Note/Bond | 1.750% | 3/31/22 | 9,889 | 10,088 |
| | U.S. Treasury Note/Bond | 1.875% | 3/31/22 | 5,215 | 5,328 |
| | U.S. Treasury Note/Bond | 2.250% | 4/15/22 | 10,050 | 10,325 |
| | U.S. Treasury Note/Bond | 0.125% | 4/30/22 | 2,938 | 2,938 |
| | U.S. Treasury Note/Bond | 1.750% | 4/30/22 | 4,977 | 5,084 |
| | U.S. Treasury Note/Bond | 1.875% | 4/30/22 | 4,927 | 5,041 |
| | U.S. Treasury Note/Bond | 2.125% | 5/15/22 | 221 | 227 |
| | U.S. Treasury Note/Bond | 0.125% | 5/31/22 | 560 | 560 |
| | U.S. Treasury Note/Bond | 1.750% | 5/31/22 | 5,115 | 5,232 |
| | U.S. Treasury Note/Bond | 1.875% | 5/31/22 | 6,650 | 6,813 |
| | U.S. Treasury Note/Bond | 1.750% | 6/15/22 | 6,281 | 6,428 |
| | U.S. Treasury Note/Bond | 0.125% | 6/30/22 | 9,814 | 9,814 |
| | U.S. Treasury Note/Bond | 1.750% | 6/30/22 | 5,500 | 5,633 |
| | U.S. Treasury Note/Bond | 2.125% | 6/30/22 | 5,235 | 5,391 |
| | U.S. Treasury Note/Bond | 1.750% | 7/15/22 | 6,092 | 6,243 |
| | U.S. Treasury Note/Bond | 0.125% | 7/31/22 | 7,974 | 7,975 |
| | U.S. Treasury Note/Bond | 1.875% | 7/31/22 | 6,417 | 6,593 |
| | U.S. Treasury Note/Bond | 2.000% | 7/31/22 | 6,025 | 6,202 |
| | U.S. Treasury Note/Bond | 1.500% | 8/15/22 | 10,098 | 10,322 |
| | U.S. Treasury Note/Bond | 1.625% | 8/15/22 | 2,169 | 2,222 |
| | U.S. Treasury Note/Bond | 7.250% | 8/15/22 | 875 | 975 |
| | U.S. Treasury Note/Bond | 0.125% | 8/31/22 | 16,730 | 16,730 |
| | U.S. Treasury Note/Bond | 1.625% | 8/31/22 | 9,570 | 9,806 |
| | U.S. Treasury Note/Bond | 1.875% | 8/31/22 | 5,445 | 5,602 |
| | U.S. Treasury Note/Bond | 1.500% | 9/15/22 | 778 | 796 |
| | U.S. Treasury Note/Bond | 0.125% | 9/30/22 | 1,631 | 1,631 |
| | U.S. Treasury Note/Bond | 1.750% | 9/30/22 | 9,437 | 9,702 |
| | U.S. Treasury Note/Bond | 1.875% | 9/30/22 | 9,975 | 10,277 |
| | U.S. Treasury Note/Bond | 1.375% | 10/15/22 | 4,386 | 4,483 |
| | U.S. Treasury Note/Bond | 1.875% | 10/31/22 | 6,520 | 6,727 |
| | U.S. Treasury Note/Bond | 2.000% | 10/31/22 | 7,947 | 8,217 |
| | U.S. Treasury Note/Bond | 1.625% | 11/15/22 | 21,235 | 21,826 |
| | U.S. Treasury Note/Bond | 7.625% | 11/15/22 | 40 | 46 |
| | U.S. Treasury Note/Bond | 0.125% | 11/30/22 | 27,065 | 27,065 |
| | U.S. Treasury Note/Bond | 2.000% | 11/30/22 | 20,733 | 21,469 |
| | U.S. Treasury Note/Bond | 1.625% | 12/15/22 | 7,625 | 7,847 |
| | U.S. Treasury Note/Bond | 2.125% | 12/31/22 | 12,951 | 13,465 |
| | U.S. Treasury Note/Bond | 1.500% | 1/15/23 | 7,705 | 7,919 |
| | U.S. Treasury Note/Bond | 1.750% | 1/31/23 | 7,020 | 7,255 |
| | U.S. Treasury Note/Bond | 2.000% | 2/15/23 | 8,298 | 8,625 |
| | U.S. Treasury Note/Bond | 7.125% | 2/15/23 | 1,690 | 1,938 |
| | U.S. Treasury Note/Bond | 1.500% | 2/28/23 | 2,889 | 2,974 |
| | U.S. Treasury Note/Bond | 0.500% | 3/15/23 | 12,726 | 12,829 |
| | | | Coupon | Maturity
Date | Face
Amount
($000) | Market
Value•
($000) |
| | U.S. Treasury Note/Bond | 1.500% | 3/31/23 | 7,005 | 7,217 |
| | U.S. Treasury Note/Bond | 2.500% | 3/31/23 | 6,770 | 7,128 |
| | U.S. Treasury Note/Bond | 0.250% | 4/15/23 | 8,425 | 8,446 |
| | U.S. Treasury Note/Bond | 1.625% | 4/30/23 | 215 | 222 |
| | U.S. Treasury Note/Bond | 2.750% | 4/30/23 | 3,500 | 3,712 |
| | U.S. Treasury Note/Bond | 0.125% | 5/15/23 | 4,220 | 4,219 |
| | U.S. Treasury Note/Bond | 1.750% | 5/15/23 | 7,400 | 7,680 |
| | U.S. Treasury Note/Bond | 1.625% | 5/31/23 | 7,175 | 7,431 |
| | U.S. Treasury Note/Bond | 2.750% | 5/31/23 | 5,850 | 6,216 |
| | U.S. Treasury Note/Bond | 0.250% | 6/15/23 | 13,420 | 13,454 |
| | U.S. Treasury Note/Bond | 1.375% | 6/30/23 | 5,050 | 5,204 |
| | U.S. Treasury Note/Bond | 2.625% | 6/30/23 | 5,398 | 5,730 |
| | U.S. Treasury Note/Bond | 0.125% | 7/15/23 | 25,859 | 25,843 |
| | U.S. Treasury Note/Bond | 1.250% | 7/31/23 | 2,630 | 2,705 |
| | U.S. Treasury Note/Bond | 2.750% | 7/31/23 | 3,555 | 3,793 |
| | U.S. Treasury Note/Bond | 0.125% | 8/15/23 | 5,695 | 5,691 |
| | U.S. Treasury Note/Bond | 6.250% | 8/15/23 | 6,565 | 7,607 |
| | U.S. Treasury Note/Bond | 1.375% | 8/31/23 | 10,235 | 10,568 |
| | U.S. Treasury Note/Bond | 2.750% | 8/31/23 | 4,860 | 5,194 |
| | U.S. Treasury Note/Bond | 0.125% | 9/15/23 | 10,870 | 10,861 |
| | U.S. Treasury Note/Bond | 1.375% | 9/30/23 | 2,315 | 2,392 |
| | U.S. Treasury Note/Bond | 2.875% | 9/30/23 | 4,309 | 4,629 |
| | U.S. Treasury Note/Bond | 0.125% | 10/15/23 | 3,605 | 3,602 |
| | U.S. Treasury Note/Bond | 1.625% | 10/31/23 | 3,750 | 3,906 |
| | U.S. Treasury Note/Bond | 2.875% | 10/31/23 | 9,503 | 10,231 |
| | U.S. Treasury Note/Bond | 0.250% | 11/15/23 | 1,040 | 1,043 |
| | U.S. Treasury Note/Bond | 2.750% | 11/15/23 | 4,261 | 4,578 |
| | U.S. Treasury Note/Bond | 2.125% | 11/30/23 | 6,150 | 6,502 |
| | U.S. Treasury Note/Bond | 2.875% | 11/30/23 | 344 | 371 |
| | U.S. Treasury Note/Bond | 0.125% | 12/15/23 | 18,392 | 18,369 |
| | U.S. Treasury Note/Bond | 2.250% | 12/31/23 | 2,267 | 2,408 |
| | U.S. Treasury Note/Bond | 2.625% | 12/31/23 | 7,337 | 7,874 |
| | U.S. Treasury Note/Bond | 2.250% | 1/31/24 | 3,215 | 3,420 |
| | U.S. Treasury Note/Bond | 2.500% | 1/31/24 | 9,419 | 10,090 |
| | U.S. Treasury Note/Bond | 2.750% | 2/15/24 | 10,710 | 11,570 |
| | U.S. Treasury Note/Bond | 2.125% | 2/29/24 | 11,700 | 12,415 |
| | U.S. Treasury Note/Bond | 2.375% | 2/29/24 | 6,712 | 7,176 |
| | U.S. Treasury Note/Bond | 2.125% | 3/31/24 | 18,446 | 19,599 |
| | U.S. Treasury Note/Bond | 2.000% | 4/30/24 | 1,260 | 1,335 |
| | U.S. Treasury Note/Bond | 2.250% | 4/30/24 | 10,559 | 11,278 |
| | U.S. Treasury Note/Bond | 2.000% | 5/31/24 | 11,547 | 12,253 |
| | U.S. Treasury Note/Bond | 1.750% | 6/30/24 | 8,060 | 8,491 |
| | U.S. Treasury Note/Bond | 2.000% | 6/30/24 | 10,955 | 11,636 |
| | U.S. Treasury Note/Bond | 1.750% | 7/31/24 | 9,127 | 9,626 |
| | U.S. Treasury Note/Bond | 2.125% | 7/31/24 | 9,736 | 10,399 |
| | U.S. Treasury Note/Bond | 2.375% | 8/15/24 | 11,564 | 12,460 |
| | U.S. Treasury Note/Bond | 1.250% | 8/31/24 | 10,125 | 10,502 |
| | U.S. Treasury Note/Bond | 1.875% | 8/31/24 | 4,655 | 4,935 |
| | U.S. Treasury Note/Bond | 1.500% | 9/30/24 | 785 | 822 |
| | U.S. Treasury Note/Bond | 2.125% | 9/30/24 | 3,394 | 3,633 |
| | U.S. Treasury Note/Bond | 1.500% | 10/31/24 | 9,070 | 9,505 |
| | U.S. Treasury Note/Bond | 2.250% | 10/31/24 | 5,980 | 6,437 |
| | U.S. Treasury Note/Bond | 2.250% | 11/15/24 | 12,681 | 13,660 |
| | U.S. Treasury Note/Bond | 7.500% | 11/15/24 | 25 | 32 |
| | U.S. Treasury Note/Bond | 1.500% | 11/30/24 | 7,847 | 8,228 |
| | U.S. Treasury Note/Bond | 2.125% | 11/30/24 | 10,054 | 10,787 |
| | U.S. Treasury Note/Bond | 1.750% | 12/31/24 | 14,765 | 15,637 |
| | U.S. Treasury Note/Bond | 2.250% | 12/31/24 | 1,645 | 1,775 |
| | U.S. Treasury Note/Bond | 1.375% | 1/31/25 | 4,905 | 5,126 |
Total Bond Market Index Portfolio
| | | | Coupon | Maturity
Date | Face
Amount
($000) | Market
Value•
($000) |
| | U.S. Treasury Note/Bond | 2.500% | 1/31/25 | 6,340 | 6,915 |
| | U.S. Treasury Note/Bond | 2.000% | 2/15/25 | 8,625 | 9,234 |
| | U.S. Treasury Note/Bond | 1.125% | 2/28/25 | 330 | 342 |
| | U.S. Treasury Note/Bond | 2.750% | 2/28/25 | 2,513 | 2,770 |
| | U.S. Treasury Note/Bond | 0.500% | 3/31/25 | 23,074 | 23,283 |
| | U.S. Treasury Note/Bond | 2.625% | 3/31/25 | 1,961 | 2,155 |
| | U.S. Treasury Note/Bond | 0.375% | 4/30/25 | 2,194 | 2,202 |
| | U.S. Treasury Note/Bond | 2.875% | 4/30/25 | 4,060 | 4,510 |
| | U.S. Treasury Note/Bond | 2.125% | 5/15/25 | 12,735 | 13,744 |
| | U.S. Treasury Note/Bond | 0.250% | 5/31/25 | 9,593 | 9,574 |
| | U.S. Treasury Note/Bond | 2.875% | 5/31/25 | 6,350 | 7,065 |
| | U.S. Treasury Note/Bond | 0.250% | 6/30/25 | 9,264 | 9,239 |
| | U.S. Treasury Note/Bond | 2.750% | 6/30/25 | 4,880 | 5,411 |
| | U.S. Treasury Note/Bond | 0.250% | 7/31/25 | 8,797 | 8,769 |
| | U.S. Treasury Note/Bond | 2.875% | 7/31/25 | 5,105 | 5,698 |
| | U.S. Treasury Note/Bond | 2.000% | 8/15/25 | 14,580 | 15,706 |
| | U.S. Treasury Note/Bond | 6.875% | 8/15/25 | 2,085 | 2,707 |
| | U.S. Treasury Note/Bond | 0.250% | 8/31/25 | 6,080 | 6,059 |
| | U.S. Treasury Note/Bond | 2.750% | 8/31/25 | 6,385 | 7,099 |
| | U.S. Treasury Note/Bond | 0.250% | 9/30/25 | 5,675 | 5,652 |
| | U.S. Treasury Note/Bond | 0.250% | 10/31/25 | 7,765 | 7,731 |
| | U.S. Treasury Note/Bond | 3.000% | 10/31/25 | 4,015 | 4,526 |
| | U.S. Treasury Note/Bond | 2.250% | 11/15/25 | 10,421 | 11,382 |
| | U.S. Treasury Note/Bond | 0.375% | 11/30/25 | 12,230 | 12,245 |
| | U.S. Treasury Note/Bond | 2.875% | 11/30/25 | 6,285 | 7,056 |
| | U.S. Treasury Note/Bond | 0.250% | 12/31/25 | 5,550 | 5,553 |
| | U.S. Treasury Note/Bond | 2.625% | 12/31/25 | 9,165 | 10,192 |
| | U.S. Treasury Note/Bond | 1.625% | 2/15/26 | 16,476 | 17,521 |
| | U.S. Treasury Note/Bond | 2.250% | 3/31/26 | 6,250 | 6,853 |
| | U.S. Treasury Note/Bond | 2.375% | 4/30/26 | 4,780 | 5,277 |
| | U.S. Treasury Note/Bond | 1.625% | 5/15/26 | 10,789 | 11,484 |
| | U.S. Treasury Note/Bond | 2.125% | 5/31/26 | 6,595 | 7,198 |
| | U.S. Treasury Note/Bond | 1.875% | 6/30/26 | 9,335 | 10,070 |
| | U.S. Treasury Note/Bond | 1.875% | 7/31/26 | 8,066 | 8,706 |
| | U.S. Treasury Note/Bond | 1.500% | 8/15/26 | 10,068 | 10,657 |
| | U.S. Treasury Note/Bond | 6.750% | 8/15/26 | 630 | 850 |
| | U.S. Treasury Note/Bond | 1.625% | 9/30/26 | 5,215 | 5,557 |
| | U.S. Treasury Note/Bond | 1.625% | 10/31/26 | 7,825 | 8,342 |
| | U.S. Treasury Note/Bond | 2.000% | 11/15/26 | 19,605 | 21,327 |
| | U.S. Treasury Note/Bond | 6.500% | 11/15/26 | 765 | 1,031 |
| | U.S. Treasury Note/Bond | 1.625% | 11/30/26 | 7,070 | 7,539 |
| | U.S. Treasury Note/Bond | 1.750% | 12/31/26 | 9,983 | 10,724 |
| | U.S. Treasury Note/Bond | 1.500% | 1/31/27 | 1,335 | 1,414 |
| | U.S. Treasury Note/Bond | 2.250% | 2/15/27 | 6,372 | 7,041 |
| | U.S. Treasury Note/Bond | 6.625% | 2/15/27 | 65 | 89 |
| | U.S. Treasury Note/Bond | 1.125% | 2/28/27 | 16,798 | 17,412 |
| | U.S. Treasury Note/Bond | 0.625% | 3/31/27 | 15,968 | 16,058 |
| | U.S. Treasury Note/Bond | 0.500% | 4/30/27 | 910 | 907 |
| | U.S. Treasury Note/Bond | 2.375% | 5/15/27 | 8,831 | 9,847 |
| | U.S. Treasury Note/Bond | 0.500% | 5/31/27 | 10,505 | 10,464 |
| | U.S. Treasury Note/Bond | 0.500% | 6/30/27 | 12,990 | 12,929 |
| | U.S. Treasury Note/Bond | 0.375% | 7/31/27 | 12,560 | 12,389 |
| | U.S. Treasury Note/Bond | 2.250% | 8/15/27 | 8,422 | 9,333 |
| | U.S. Treasury Note/Bond | 6.375% | 8/15/27 | 185 | 255 |
| | U.S. Treasury Note/Bond | 0.500% | 8/31/27 | 10,825 | 10,752 |
| | U.S. Treasury Note/Bond | 0.375% | 9/30/27 | 7,875 | 7,751 |
| | U.S. Treasury Note/Bond | 0.500% | 10/31/27 | 12,115 | 12,013 |
| | U.S. Treasury Note/Bond | 2.250% | 11/15/27 | 11,502 | 12,767 |
| | U.S. Treasury Note/Bond | 6.125% | 11/15/27 | 1,839 | 2,521 |
| | U.S. Treasury Note/Bond | 0.625% | 11/30/27 | 17,153 | 17,142 |
| | U.S. Treasury Note/Bond | 0.625% | 12/31/27 | 7,195 | 7,184 |
| | U.S. Treasury Note/Bond | 2.750% | 2/15/28 | 7,480 | 8,573 |
| | U.S. Treasury Note/Bond | 2.875% | 5/15/28 | 12,080 | 13,992 |
| | U.S. Treasury Note/Bond | 2.875% | 8/15/28 | 13,082 | 15,189 |
| | U.S. Treasury Note/Bond | 5.500% | 8/15/28 | 2,745 | 3,720 |
| | U.S. Treasury Note/Bond | 3.125% | 11/15/28 | 11,328 | 13,406 |
| | U.S. Treasury Note/Bond | 5.250% | 11/15/28 | 1,655 | 2,228 |
| | U.S. Treasury Note/Bond | 2.375% | 5/15/29 | 11,877 | 13,414 |
| | U.S. Treasury Note/Bond | 1.625% | 8/15/29 | 11,565 | 12,367 |
| | | | Coupon | Maturity
Date | Face
Amount
($000) | Market
Value•
($000) |
| | U.S. Treasury Note/Bond | 1.750% | 11/15/29 | 8,091 | 8,741 |
| | U.S. Treasury Note/Bond | 1.500% | 2/15/30 | 2,454 | 2,595 |
| | U.S. Treasury Note/Bond | 0.625% | 5/15/30 | 14,212 | 13,890 |
| | U.S. Treasury Note/Bond | 6.250% | 5/15/30 | 2,350 | 3,499 |
| | U.S. Treasury Note/Bond | 0.625% | 8/15/30 | 18,252 | 17,790 |
| | U.S. Treasury Note/Bond | 0.875% | 11/15/30 | 17,931 | 17,861 |
| | U.S. Treasury Note/Bond | 5.375% | 2/15/31 | 6,075 | 8,713 |
| | U.S. Treasury Note/Bond | 4.500% | 2/15/36 | 3,338 | 4,894 |
| | U.S. Treasury Note/Bond | 4.750% | 2/15/37 | 1,600 | 2,436 |
| | U.S. Treasury Note/Bond | 5.000% | 5/15/37 | 1,250 | 1,957 |
| | U.S. Treasury Note/Bond | 4.375% | 2/15/38 | 1,450 | 2,153 |
| | U.S. Treasury Note/Bond | 4.500% | 5/15/38 | 1,559 | 2,351 |
| | U.S. Treasury Note/Bond | 3.500% | 2/15/39 | 1,920 | 2,604 |
| | U.S. Treasury Note/Bond | 4.250% | 5/15/39 | 2,247 | 3,330 |
| | U.S. Treasury Note/Bond | 4.500% | 8/15/39 | 2,516 | 3,844 |
| | U.S. Treasury Note/Bond | 4.375% | 11/15/39 | 2,742 | 4,141 |
| | U.S. Treasury Note/Bond | 4.625% | 2/15/40 | 3,750 | 5,837 |
| | U.S. Treasury Note/Bond | 1.125% | 5/15/40 | 11,395 | 10,809 |
| | U.S. Treasury Note/Bond | 4.375% | 5/15/40 | 2,735 | 4,146 |
| | U.S. Treasury Note/Bond | 1.125% | 8/15/40 | 15,455 | 14,624 |
| | U.S. Treasury Note/Bond | 3.875% | 8/15/40 | 3,015 | 4,316 |
| | U.S. Treasury Note/Bond | 1.375% | 11/15/40 | 9,098 | 8,991 |
| | U.S. Treasury Note/Bond | 4.250% | 11/15/40 | 3,295 | 4,945 |
| | U.S. Treasury Note/Bond | 4.750% | 2/15/41 | 3,956 | 6,315 |
| | U.S. Treasury Note/Bond | 4.375% | 5/15/41 | 925 | 1,417 |
| | U.S. Treasury Note/Bond | 3.750% | 8/15/41 | 2,825 | 4,011 |
| | U.S. Treasury Note/Bond | 3.125% | 11/15/41 | 2,701 | 3,529 |
| | U.S. Treasury Note/Bond | 3.125% | 2/15/42 | 3,631 | 4,756 |
| | U.S. Treasury Note/Bond | 3.000% | 5/15/42 | 2,720 | 3,496 |
| | U.S. Treasury Note/Bond | 2.750% | 8/15/42 | 5,595 | 6,929 |
| | U.S. Treasury Note/Bond | 2.750% | 11/15/42 | 5,746 | 7,111 |
| | U.S. Treasury Note/Bond | 3.125% | 2/15/43 | 6,850 | 8,976 |
| | U.S. Treasury Note/Bond | 3.625% | 8/15/43 | 7,405 | 10,450 |
| | U.S. Treasury Note/Bond | 3.625% | 2/15/44 | 9,051 | 12,804 |
| | U.S. Treasury Note/Bond | 3.375% | 5/15/44 | 7,699 | 10,519 |
| | U.S. Treasury Note/Bond | 3.125% | 8/15/44 | 9,331 | 12,295 |
| | U.S. Treasury Note/Bond | 3.000% | 11/15/44 | 8,262 | 10,684 |
| | U.S. Treasury Note/Bond | 2.500% | 2/15/45 | 9,820 | 11,701 |
| | U.S. Treasury Note/Bond | 3.000% | 5/15/45 | 7,577 | 9,826 |
| | U.S. Treasury Note/Bond | 2.875% | 8/15/45 | 4,491 | 5,711 |
| | U.S. Treasury Note/Bond | 3.000% | 11/15/45 | 3,084 | 4,010 |
| | U.S. Treasury Note/Bond | 2.500% | 2/15/46 | 3,475 | 4,148 |
| | U.S. Treasury Note/Bond | 2.500% | 5/15/46 | 8,981 | 10,725 |
| | U.S. Treasury Note/Bond | 2.250% | 8/15/46 | 7,656 | 8,735 |
| | U.S. Treasury Note/Bond | 2.875% | 11/15/46 | 11,825 | 15,101 |
| | U.S. Treasury Note/Bond | 3.000% | 2/15/47 | 9,000 | 11,765 |
| | U.S. Treasury Note/Bond | 3.000% | 5/15/47 | 7,293 | 9,545 |
| | U.S. Treasury Note/Bond | 2.750% | 8/15/47 | 6,713 | 8,412 |
| | U.S. Treasury Note/Bond | 2.750% | 11/15/47 | 908 | 1,139 |
| | U.S. Treasury Note/Bond | 3.000% | 2/15/48 | 8,479 | 11,123 |
| | U.S. Treasury Note/Bond | 3.125% | 5/15/48 | 8,984 | 12,053 |
| | U.S. Treasury Note/Bond | 3.000% | 8/15/48 | 9,510 | 12,502 |
| | U.S. Treasury Note/Bond | 3.375% | 11/15/48 | 4,300 | 6,037 |
| | U.S. Treasury Note/Bond | 3.000% | 2/15/49 | 11,044 | 14,557 |
| | U.S. Treasury Note/Bond | 2.250% | 8/15/49 | 5,029 | 5,752 |
| | U.S. Treasury Note/Bond | 2.375% | 11/15/49 | 1,676 | 1,967 |
| | U.S. Treasury Note/Bond | 2.000% | 2/15/50 | 9,144 | 9,929 |
| | U.S. Treasury Note/Bond | 1.250% | 5/15/50 | 19,291 | 17,488 |
| | U.S. Treasury Note/Bond | 1.375% | 8/15/50 | 23,085 | 21,599 |
| | U.S. Treasury Note/Bond | 1.625% | 11/15/50 | 13,795 | 13,726 |
| | | | | | | 1,937,111 |
| Agency Bonds and Notes (1.5%) |
| | Federal Farm Credit Banks Funding Corp. | 3.050% | 11/15/21 | 100 | 102 |
| | Federal Farm Credit Banks Funding Corp. | 1.600% | 12/28/21 | 225 | 228 |
| | Federal Farm Credit Banks Funding Corp. | 0.375% | 4/8/22 | 700 | 702 |
Total Bond Market Index Portfolio
| | | | Coupon | Maturity
Date | Face
Amount
($000) | Market
Value•
($000) |
| | Federal Farm Credit Banks Funding Corp. | 0.125% | 11/23/22 | 750 | 750 |
| | Federal Farm Credit Banks Funding Corp. | 1.770% | 6/26/23 | 150 | 156 |
| | Federal Farm Credit Banks Funding Corp. | 3.500% | 12/20/23 | 75 | 82 |
| | Federal Home Loan Banks | 3.000% | 10/12/21 | 1,500 | 1,533 |
| | Federal Home Loan Banks | 1.625% | 11/19/21 | 760 | 770 |
| | Federal Home Loan Banks | 1.875% | 11/29/21 | 500 | 508 |
| | Federal Home Loan Banks | 1.625% | 12/20/21 | 1,300 | 1,319 |
| | Federal Home Loan Banks | 0.250% | 6/3/22 | 2,000 | 2,003 |
| | Federal Home Loan Banks | 2.125% | 6/10/22 | 175 | 180 |
| | Federal Home Loan Banks | 0.125% | 8/12/22 | 1,000 | 1,000 |
| | Federal Home Loan Banks | 2.000% | 9/9/22 | 250 | 258 |
| | Federal Home Loan Banks | 0.125% | 10/21/22 | 500 | 500 |
| | Federal Home Loan Banks | 1.375% | 2/17/23 | 800 | 821 |
| | Federal Home Loan Banks | 2.125% | 3/10/23 | 970 | 1,012 |
| | Federal Home Loan Banks | 2.500% | 2/13/24 | 535 | 573 |
| | Federal Home Loan Banks | 1.500% | 8/15/24 | 330 | 345 |
| | Federal Home Loan Banks | 0.500% | 4/14/25 | 1,000 | 1,005 |
| | Federal Home Loan Banks | 0.375% | 9/4/25 | 500 | 499 |
| | Federal Home Loan Banks | 3.250% | 11/16/28 | 315 | 375 |
| | Federal Home Loan Banks | 5.500% | 7/15/36 | 1,400 | 2,162 |
| 1 | Federal Home Loan Mortgage Corp. | 2.375% | 1/13/22 | 800 | 818 |
| 1 | Federal Home Loan Mortgage Corp. | 0.250% | 6/8/22 | 600 | 601 |
| 1 | Federal Home Loan Mortgage Corp. | 0.125% | 7/25/22 | 800 | 800 |
| 1 | Federal Home Loan Mortgage Corp. | 0.375% | 4/20/23 | 200 | 201 |
| 1 | Federal Home Loan Mortgage Corp. | 0.375% | 5/5/23 | 600 | 603 |
| 1 | Federal Home Loan Mortgage Corp. | 2.750% | 6/19/23 | 500 | 532 |
| 1 | Federal Home Loan Mortgage Corp. | 0.250% | 6/26/23 | 2,000 | 2,004 |
| 1 | Federal Home Loan Mortgage Corp. | 0.250% | 8/24/23 | 1,650 | 1,653 |
| 1 | Federal Home Loan Mortgage Corp. | 0.250% | 9/8/23 | 1,800 | 1,802 |
| 1 | Federal Home Loan Mortgage Corp. | 0.250% | 12/4/23 | 1,500 | 1,502 |
| 1 | Federal Home Loan Mortgage Corp. | 1.500% | 2/12/25 | 1,200 | 1,256 |
| 1 | Federal Home Loan Mortgage Corp. | 0.375% | 7/21/25 | 1,500 | 1,498 |
| 1 | Federal Home Loan Mortgage Corp. | 0.375% | 9/23/25 | 2,000 | 1,995 |
| 1 | Federal Home Loan Mortgage Corp. | 6.750% | 9/15/29 | 127 | 189 |
| 1 | Federal Home Loan Mortgage Corp. | 6.750% | 3/15/31 | 1,525 | 2,358 |
| 1 | Federal Home Loan Mortgage Corp. | 6.250% | 7/15/32 | 502 | 777 |
| 1 | Federal National Mortgage Association | 1.375% | 10/7/21 | 1,200 | 1,212 |
| 1 | Federal National Mortgage Association | 2.000% | 1/5/22 | 500 | 509 |
| 1 | Federal National Mortgage Association | 2.625% | 1/11/22 | 216 | 221 |
| 1 | Federal National Mortgage Association | 2.250% | 4/12/22 | 476 | 489 |
| 1 | Federal National Mortgage Association | 1.375% | 9/6/22 | 350 | 357 |
| 1 | Federal National Mortgage Association | 2.000% | 10/5/22 | 850 | 878 |
| 1 | Federal National Mortgage Association | 2.375% | 1/19/23 | 2,394 | 2,503 |
| 1 | Federal National Mortgage Association | 0.250% | 5/22/23 | 1,200 | 1,203 |
| | | | Coupon | Maturity
Date | Face
Amount
($000) | Market
Value•
($000) |
| 1 | Federal National Mortgage Association | 0.250% | 7/10/23 | 2,000 | 2,004 |
| 1 | Federal National Mortgage Association | 2.875% | 9/12/23 | 400 | 429 |
| 1 | Federal National Mortgage Association | 0.250% | 11/27/23 | 1,000 | 1,001 |
| 1 | Federal National Mortgage Association | 2.500% | 2/5/24 | 975 | 1,043 |
| 1 | Federal National Mortgage Association | 1.750% | 7/2/24 | 1,028 | 1,082 |
| 1 | Federal National Mortgage Association | 2.625% | 9/6/24 | 160 | 174 |
| 1 | Federal National Mortgage Association | 1.625% | 10/15/24 | 970 | 1,020 |
| 1 | Federal National Mortgage Association | 1.625% | 1/7/25 | 1,300 | 1,367 |
| 1 | Federal National Mortgage Association | 0.625% | 4/22/25 | 1,000 | 1,011 |
| 1 | Federal National Mortgage Association | 0.500% | 6/17/25 | 1,000 | 1,004 |
| 1 | Federal National Mortgage Association | 0.375% | 8/25/25 | 2,000 | 1,996 |
| 1 | Federal National Mortgage Association | 0.500% | 11/7/25 | 2,000 | 2,005 |
| 1 | Federal National Mortgage Association | 2.125% | 4/24/26 | 575 | 625 |
| 1 | Federal National Mortgage Association | 1.875% | 9/24/26 | 500 | 539 |
| 1 | Federal National Mortgage Association | 0.750% | 10/8/27 | 1,000 | 1,000 |
| 1 | Federal National Mortgage Association | 6.250% | 5/15/29 | 175 | 250 |
| 1 | Federal National Mortgage Association | 7.125% | 1/15/30 | 925 | 1,411 |
| 1 | Federal National Mortgage Association | 7.250% | 5/15/30 | 300 | 465 |
| 1 | Federal National Mortgage Association | 0.875% | 8/5/30 | 1,000 | 983 |
| 1 | Federal National Mortgage Association | 6.625% | 11/15/30 | 300 | 455 |
| 1 | Federal National Mortgage Association | 5.625% | 7/15/37 | 275 | 437 |
| 1 | Freddie Mac | 0.125% | 10/16/23 | 1,000 | 998 |
| 1 | Freddie Mac | 0.250% | 11/6/23 | 1,000 | 1,001 |
| | Private Export Funding Corp. | 4.300% | 12/15/21 | 100 | 104 |
| | Private Export Funding Corp. | 2.800% | 5/15/22 | 125 | 129 |
| | Private Export Funding Corp. | 2.050% | 11/15/22 | 1,075 | 1,110 |
| | Private Export Funding Corp. | 3.550% | 1/15/24 | 100 | 109 |
| | Private Export Funding Corp. | 2.450% | 7/15/24 | 100 | 107 |
| | Private Export Funding Corp. | 3.250% | 6/15/25 | 50 | 56 |
| | Tennessee Valley Authority | 1.875% | 8/15/22 | 175 | 180 |
| | Tennessee Valley Authority | 2.875% | 9/15/24 | 191 | 209 |
| | Tennessee Valley Authority | 0.750% | 5/15/25 | 200 | 203 |
| | Tennessee Valley Authority | 6.750% | 11/1/25 | 134 | 173 |
| | Tennessee Valley Authority | 7.125% | 5/1/30 | 1,000 | 1,528 |
| | Tennessee Valley Authority | 4.650% | 6/15/35 | 175 | 243 |
| | Tennessee Valley Authority | 5.880% | 4/1/36 | 250 | 385 |
| | Tennessee Valley Authority | 5.500% | 6/15/38 | 100 | 153 |
Total Bond Market Index Portfolio
| | | | Coupon | Maturity
Date | Face
Amount
($000) | Market
Value•
($000) |
| | Tennessee Valley Authority | 5.250% | 9/15/39 | 412 | 621 |
| | Tennessee Valley Authority | 4.875% | 1/15/48 | 100 | 151 |
| | Tennessee Valley Authority | 5.375% | 4/1/56 | 50 | 85 |
| | Tennessee Valley Authority | 4.625% | 9/15/60 | 180 | 279 |
| | Tennessee Valley Authority | 4.250% | 9/15/65 | 200 | 295 |
| | | | | | | 71,264 |
| Conventional Mortgage-Backed Securities (20.3%) |
| 1,2 | Fannie Mae Pool | 6.500% | 9/1/32 | 16 | 17 |
| 1,2 | Freddie Mac Gold Pool | 2.000% | 8/1/28–12/1/31 | 515 | 539 |
| 1,2 | Freddie Mac Gold Pool | 2.500% | 4/1/27–2/1/43 | 9,934 | 10,409 |
| 1,2 | Freddie Mac Gold Pool | 3.000% | 10/1/26–8/1/47 | 34,660 | 36,706 |
| 1,2 | Freddie Mac Gold Pool | 3.500% | 9/1/25–11/1/48 | 41,600 | 44,600 |
| 1,2 | Freddie Mac Gold Pool | 4.000% | 6/1/24–11/1/48 | 23,168 | 25,210 |
| 1,2 | Freddie Mac Gold Pool | 4.500% | 4/1/21–10/1/48 | 11,448 | 12,622 |
| 1,2 | Freddie Mac Gold Pool | 5.000% | 1/1/22–11/1/48 | 2,924 | 3,301 |
| 1,2 | Freddie Mac Gold Pool | 5.500% | 7/1/22–6/1/41 | 2,108 | 2,421 |
| 1,2 | Freddie Mac Gold Pool | 6.000% | 9/1/21–3/1/39 | 1,557 | 1,815 |
| 1,2 | Freddie Mac Gold Pool | 6.500% | 8/1/23–4/1/39 | 474 | 547 |
| 1,2 | Freddie Mac Gold Pool | 7.000% | 4/1/23–2/1/37 | 117 | 130 |
| 1,2 | Freddie Mac Gold Pool | 7.500% | 1/1/23–4/1/28 | 8 | 11 |
| 1,2 | Freddie Mac Gold Pool | 8.000% | 1/1/22–7/1/30 | 10 | 11 |
| 1,2 | Freddie Mac Gold Pool | 8.500% | 7/1/24–11/1/30 | 9 | 10 |
| 1,2 | Freddie Mac Gold Pool | 9.000% | 5/1/27–5/1/30 | 4 | 4 |
| 2 | Ginnie Mae I Pool | 3.000% | 1/15/26–12/15/45 | 2,177 | 2,267 |
| 2 | Ginnie Mae I Pool | 3.500% | 11/15/25–9/15/49 | 2,109 | 2,238 |
| 2 | Ginnie Mae I Pool | 4.000% | 10/15/24–11/15/47 | 2,376 | 2,560 |
| 2 | Ginnie Mae I Pool | 4.500% | 10/15/24–3/15/41 | 2,310 | 2,578 |
| 2 | Ginnie Mae I Pool | 5.000% | 5/15/33–4/15/41 | 1,769 | 2,000 |
| 2 | Ginnie Mae I Pool | 5.500% | 1/15/32–12/15/40 | 1,080 | 1,238 |
| 2 | Ginnie Mae I Pool | 6.000% | 1/15/24–3/15/40 | 779 | 887 |
| 2 | Ginnie Mae I Pool | 6.500% | 11/15/23–12/15/38 | 203 | 222 |
| 2 | Ginnie Mae I Pool | 7.000% | 5/15/23–10/15/31 | 46 | 52 |
| 2 | Ginnie Mae I Pool | 7.500% | 4/15/22–1/15/31 | 16 | 21 |
| 2 | Ginnie Mae I Pool | 8.000% | 3/15/22–10/15/30 | 14 | 17 |
| 2 | Ginnie Mae I Pool | 8.500% | 6/15/24–9/15/26 | 1 | 1 |
| 2 | Ginnie Mae II Pool | 2.000% | 11/20/50 | 2,387 | 2,497 |
| 2 | Ginnie Mae II Pool | 2.500% | 6/20/27–11/20/50 | 24,859 | 26,386 |
| 2 | Ginnie Mae II Pool | 3.000% | 2/20/27–9/20/50 | 60,410 | 63,884 |
| 2 | Ginnie Mae II Pool | 3.500% | 9/20/25–8/20/50 | 57,717 | 62,081 |
| 2 | Ginnie Mae II Pool | 4.000% | 9/20/25–11/20/49 | 30,235 | 32,698 |
| 2 | Ginnie Mae II Pool | 4.500% | 2/20/39–9/20/49 | 15,925 | 17,387 |
| 2 | Ginnie Mae II Pool | 5.000% | 12/20/32–3/20/49 | 5,507 | 6,095 |
| 2 | Ginnie Mae II Pool | 5.500% | 6/20/34–9/20/41 | 843 | 977 |
| 2 | Ginnie Mae II Pool | 6.000% | 3/20/33–7/20/39 | 402 | 468 |
| 2 | Ginnie Mae II Pool | 6.500% | 12/20/35–11/20/39 | 151 | 177 |
| 2 | Ginnie Mae II Pool | 7.000% | 8/20/36–4/20/38 | 20 | 24 |
| 1,2,3 | UMBS Pool | 1.500% | 1/16/36–1/14/51 | 25,543 | 26,016 |
| 1,2,3 | UMBS Pool | 2.000% | 11/1/23–1/14/51 | 126,405 | 131,496 |
| 1,2,3 | UMBS Pool | 2.500% | 1/1/27–1/14/51 | 110,571 | 116,410 |
| 1,2,3 | UMBS Pool | 3.000% | 11/1/25–1/14/51 | 122,947 | 129,873 |
| 1,2,3 | UMBS Pool | 3.500% | 9/1/25–1/14/51 | 86,329 | 92,448 |
| 1,2,3 | UMBS Pool | 4.000% | 2/1/24–1/14/51 | 65,574 | 71,131 |
| 1,2 | UMBS Pool | 4.500% | 11/1/22–7/1/50 | 30,588 | 33,766 |
| 1,2 | UMBS Pool | 5.000% | 6/1/21–3/1/50 | 10,995 | 12,413 |
| 1,2 | UMBS Pool | 5.500% | 6/1/21–6/1/49 | 4,256 | 4,936 |
| 1,2 | UMBS Pool | 6.000% | 2/1/21–5/1/41 | 2,644 | 3,095 |
| 1,2 | UMBS Pool | 6.500% | 12/1/23–10/1/39 | 701 | 813 |
| 1,2 | UMBS Pool | 7.000% | 6/1/23–11/1/37 | 188 | 219 |
| 1,2 | UMBS Pool | 7.500% | 11/1/22–2/1/32 | 23 | 25 |
| 1,2 | UMBS Pool | 8.000% | 6/1/22–11/1/30 | 11 | 12 |
| 1,2 | UMBS Pool | 8.500% | 7/1/22–4/1/31 | 4 | 4 |
| 1,2 | UMBS Pool | 9.500% | 2/1/25 | 1 | 1 |
| | | | | | | 987,766 |
| | | | Coupon | Maturity
Date | Face
Amount
($000) | Market
Value•
($000) |
| Nonconventional Mortgage-Backed Securities (0.4%) |
| 1,2,4 | Fannie Mae Pool, 12M USD LIBOR + 1.290% | 2.799% | 12/1/41 | 19 | 20 |
| 1,2,4 | Fannie Mae Pool, 12M USD LIBOR + 1.310% | 1.889% | 9/1/37 | 40 | 42 |
| 1,2,4 | Fannie Mae Pool, 12M USD LIBOR + 1.392% | 2.033% | 10/1/37 | 16 | 17 |
| 1,2,4 | Fannie Mae Pool, 12M USD LIBOR + 1.432% | 2.066% | 7/1/36 | 4 | 4 |
| 1,2,4 | Fannie Mae Pool, 12M USD LIBOR + 1.474% | 3.338% | 3/1/43 | 49 | 50 |
| 1,2,4 | Fannie Mae Pool, 12M USD LIBOR + 1.553% | 2.190% | 9/1/43 | 6 | 6 |
| 1,2,4 | Fannie Mae Pool, 12M USD LIBOR + 1.560% | 2.279% | 7/1/43 | 97 | 100 |
| 1,2,4 | Fannie Mae Pool, 12M USD LIBOR + 1.601% | 2.610% | 6/1/43 | 26 | 26 |
| 1,2,4 | Fannie Mae Pool, 12M USD LIBOR + 1.613% | 2.903% | 8/1/39 | 20 | 20 |
| 1,2,4 | Fannie Mae Pool, 12M USD LIBOR + 1.623% | 3.623% | 2/1/36 | 4 | 4 |
| 1,2,4 | Fannie Mae Pool, 12M USD LIBOR + 1.625% | 2.337% | 8/1/35 | 40 | 43 |
| 1,2,4 | Fannie Mae Pool, 12M USD LIBOR + 1.625% | 2.424% | 10/1/37 | 9 | 9 |
| 1,2,4 | Fannie Mae Pool, 12M USD LIBOR + 1.627% | 3.627% | 3/1/38 | 4 | 5 |
| 1,2,4 | Fannie Mae Pool, 12M USD LIBOR + 1.635% | 2.135% | 11/1/36 | 4 | 4 |
| 1,2,4 | Fannie Mae Pool, 12M USD LIBOR + 1.643% | 3.381% | 1/1/37 | 6 | 6 |
| 1,2,4 | Fannie Mae Pool, 12M USD LIBOR + 1.657% | 2.443% | 10/1/42 | 16 | 16 |
| 1,2,4 | Fannie Mae Pool, 12M USD LIBOR + 1.660% | 2.207% | 9/1/40 | 4 | 5 |
| 1,2,4 | Fannie Mae Pool, 12M USD LIBOR + 1.665% | 2.540% | 6/1/36 | 1 | 1 |
| 1,2,4 | Fannie Mae Pool, 12M USD LIBOR + 1.684% | 2.104% | 12/1/33 | 5 | 5 |
| 1,2,4 | Fannie Mae Pool, 12M USD LIBOR + 1.690% | 2.212% | 10/1/39 | 9 | 9 |
| 1,2,4 | Fannie Mae Pool, 12M USD LIBOR + 1.690% | 2.326% | 9/1/42 | 36 | 37 |
| 1,2,4 | Fannie Mae Pool, 12M USD LIBOR + 1.690% | 3.149% | 5/1/40 | 10 | 11 |
| 1,2,4 | Fannie Mae Pool, 12M USD LIBOR + 1.693% | 2.364% | 11/1/39 | 9 | 9 |
| 1,2,4 | Fannie Mae Pool, 12M USD LIBOR + 1.695% | 2.445% | 7/1/39 | 4 | 4 |
| 1,2,4 | Fannie Mae Pool, 12M USD LIBOR + 1.698% | 2.453% | 8/1/40 | 10 | 11 |
| 1,2,4 | Fannie Mae Pool, 12M USD LIBOR + 1.700% | 2.452% | 1/1/42 | 21 | 22 |
| 1,2,4 | Fannie Mae Pool, 12M USD LIBOR + 1.700% | 2.678% | 7/1/37 | 8 | 8 |
| 1,2,4 | Fannie Mae Pool, 12M USD LIBOR + 1.700% | 3.128% | 12/1/40 | 11 | 12 |
| 1,2,4 | Fannie Mae Pool, 12M USD LIBOR + 1.701% | 2.245% | 10/1/42 | 16 | 17 |
| 1,2,4 | Fannie Mae Pool, 12M USD LIBOR + 1.705% | 2.108% | 11/1/39 | 4 | 4 |
| 1,2,4 | Fannie Mae Pool, 12M USD LIBOR + 1.722% | 3.567% | 5/1/42 | 22 | 23 |
| 1,2,4 | Fannie Mae Pool, 12M USD LIBOR + 1.729% | 2.229% | 9/1/34 | 4 | 4 |
| 1,2,4 | Fannie Mae Pool, 12M USD LIBOR + 1.736% | 2.537% | 9/1/43 | 32 | 33 |
| 1,2,4 | Fannie Mae Pool, 12M USD LIBOR + 1.739% | 2.614% | 6/1/41 | 3 | 3 |
| 1,2,4 | Fannie Mae Pool, 12M USD LIBOR + 1.747% | 2.604% | 7/1/41 | 26 | 28 |
| 1,2,4 | Fannie Mae Pool, 12M USD LIBOR + 1.750% | 2.445% | 10/1/40 | 6 | 6 |
Total Bond Market Index Portfolio
| | | | Coupon | Maturity
Date | Face
Amount
($000) | Market
Value•
($000) |
| 1,2,4 | Fannie Mae Pool, 12M USD LIBOR + 1.771% | 3.512% | 5/1/42 | 7 | 7 |
| 1,2,4 | Fannie Mae Pool, 12M USD LIBOR + 1.780% | 3.780% | 2/1/41 | 6 | 7 |
| 1,2,4 | Fannie Mae Pool, 12M USD LIBOR + 1.781% | 3.098% | 7/1/42 | 11 | 12 |
| 1,2,4 | Fannie Mae Pool, 12M USD LIBOR + 1.792% | 3.383% | 8/1/42 | 37 | 37 |
| 1,2,4 | Fannie Mae Pool, 12M USD LIBOR + 1.795% | 2.803% | 3/1/42 | 15 | 16 |
| 1,2,4 | Fannie Mae Pool, 12M USD LIBOR + 1.795% | 3.795% | 3/1/42 | 20 | 21 |
| 1,2,4 | Fannie Mae Pool, 12M USD LIBOR + 1.805% | 2.274% | 11/1/41 | 20 | 22 |
| 1,2,4 | Fannie Mae Pool, 12M USD LIBOR + 1.810% | 2.185% | 11/1/39 | 6 | 6 |
| 1,2,4 | Fannie Mae Pool, 12M USD LIBOR + 1.810% | 2.310% | 11/1/33–10/1/40 | 18 | 20 |
| 1,2,4 | Fannie Mae Pool, 12M USD LIBOR + 1.810% | 3.810% | 12/1/40 | 10 | 10 |
| 1,2,4 | Fannie Mae Pool, 12M USD LIBOR + 1.813% | 2.213% | 11/1/41 | 11 | 12 |
| 1,2,4 | Fannie Mae Pool, 12M USD LIBOR + 1.813% | 2.573% | 9/1/40 | 22 | 23 |
| 1,2,4 | Fannie Mae Pool, 12M USD LIBOR + 1.813% | 2.937% | 1/1/42 | 15 | 16 |
| 1,2,4 | Fannie Mae Pool, 12M USD LIBOR + 1.815% | 2.287% | 12/1/41 | 14 | 15 |
| 1,2,4 | Fannie Mae Pool, 12M USD LIBOR + 1.815% | 2.289% | 12/1/40 | 8 | 9 |
| 1,2,4 | Fannie Mae Pool, 12M USD LIBOR + 1.815% | 2.315% | 11/1/40 | 4 | 5 |
| 1,2,4 | Fannie Mae Pool, 12M USD LIBOR + 1.815% | 3.082% | 5/1/41 | 11 | 12 |
| 1,2,4 | Fannie Mae Pool, 12M USD LIBOR + 1.815% | 3.815% | 2/1/41 | 10 | 11 |
| 1,2,4 | Fannie Mae Pool, 12M USD LIBOR + 1.819% | 3.528% | 3/1/41 | 21 | 22 |
| 1,2,4 | Fannie Mae Pool, 12M USD LIBOR + 1.820% | 2.609% | 12/1/40 | 7 | 7 |
| 1,2,4 | Fannie Mae Pool, 12M USD LIBOR + 1.823% | 2.327% | 12/1/39 | 10 | 11 |
| 1,2,4 | Fannie Mae Pool, 12M USD LIBOR + 1.824% | 3.824% | 2/1/41 | 10 | 10 |
| 1,2,4 | Fannie Mae Pool, 12M USD LIBOR + 1.825% | 3.825% | 3/1/41 | 9 | 10 |
| 1,2,4 | Fannie Mae Pool, 12M USD LIBOR + 1.830% | 2.830% | 6/1/41 | 14 | 15 |
| 1,2,4 | Fannie Mae Pool, 12M USD LIBOR + 1.830% | 3.496% | 4/1/41 | 17 | 17 |
| 1,2,4 | Fannie Mae Pool, 12M USD LIBOR + 1.835% | 3.526% | 1/1/40 | 12 | 13 |
| 1,2,4 | Fannie Mae Pool, 12M USD LIBOR + 1.840% | 2.566% | 8/1/39 | 10 | 10 |
| 1,2,4 | Fannie Mae Pool, 12M USD LIBOR + 1.874% | 3.610% | 5/1/40 | 3 | 3 |
| 1,2,4 | Fannie Mae Pool, 12M USD LIBOR + 1.880% | 2.809% | 11/1/34 | 7 | 7 |
| 1,2,4 | Fannie Mae Pool, 12M USD LIBOR + 1.909% | 3.659% | 4/1/37 | 9 | 10 |
| 1,2,4 | Fannie Mae Pool, 12M USD LIBOR + 1.912% | 2.787% | 5/1/36 | 3 | 3 |
| 1,2,4 | Fannie Mae Pool, 1YR CMT + 2.155% | 3.780% | 12/1/37 | 15 | 16 |
| 1,2,4 | Fannie Mae Pool, 1YR CMT + 2.268% | 2.393% | 12/1/35 | 9 | 10 |
| 1,2,4 | Fannie Mae Pool, 1YR CMT + 2.313% | 3.623% | 1/1/35 | 13 | 14 |
| 1,2,4 | Fannie Mae Pool, 6M USD LIBOR + 1.146% | 1.396% | 4/1/37 | 10 | 11 |
| 1,2,4 | Fannie Mae Pool, 6M USD LIBOR + 1.840% | 2.715% | 8/1/37 | 10 | 11 |
| | | | Coupon | Maturity
Date | Face
Amount
($000) | Market
Value•
($000) |
| 1,2,4 | Freddie Mac Non Gold Pool, 12M USD LIBOR + 1.487% | 3.218% | 3/1/37 | 1 | 1 |
| 1,2,4 | Freddie Mac Non Gold Pool, 12M USD LIBOR + 1.588% | 2.389% | 9/1/37 | 3 | 3 |
| 1,2,4 | Freddie Mac Non Gold Pool, 12M USD LIBOR + 1.625% | 3.625% | 1/1/38 | 2 | 2 |
| 1,2,4 | Freddie Mac Non Gold Pool, 12M USD LIBOR + 1.640% | 2.135% | 12/1/36 | 8 | 9 |
| 1,2,4 | Freddie Mac Non Gold Pool, 12M USD LIBOR + 1.640% | 2.647% | 5/1/42 | 3 | 3 |
| 1,2,4 | Freddie Mac Non Gold Pool, 12M USD LIBOR + 1.660% | 2.160% | 10/1/37 | 8 | 9 |
| 1,2,4 | Freddie Mac Non Gold Pool, 12M USD LIBOR + 1.695% | 3.695% | 2/1/37 | 6 | 6 |
| 1,2,4 | Freddie Mac Non Gold Pool, 12M USD LIBOR + 1.727% | 3.727% | 1/1/35 | 2 | 2 |
| 1,2,4 | Freddie Mac Non Gold Pool, 12M USD LIBOR + 1.743% | 2.118% | 12/1/36 | 15 | 15 |
| 1,2,4 | Freddie Mac Non Gold Pool, 12M USD LIBOR + 1.745% | 3.657% | 12/1/40 | 14 | 15 |
| 1,2,4 | Freddie Mac Non Gold Pool, 12M USD LIBOR + 1.750% | 3.500% | 5/1/38 | 1 | 1 |
| 1,2,4 | Freddie Mac Non Gold Pool, 12M USD LIBOR + 1.765% | 2.219% | 12/1/36 | 4 | 4 |
| 1,2,4 | Freddie Mac Non Gold Pool, 12M USD LIBOR + 1.798% | 2.040% | 12/1/34 | 3 | 3 |
| 1,2,4 | Freddie Mac Non Gold Pool, 12M USD LIBOR + 1.830% | 2.773% | 12/1/35 | 8 | 9 |
| 1,2,4 | Freddie Mac Non Gold Pool, 12M USD LIBOR + 1.861% | 3.213% | 2/1/42 | 7 | 8 |
| 1,2,4 | Freddie Mac Non Gold Pool, 12M USD LIBOR + 1.880% | 2.772% | 6/1/40 | 6 | 6 |
| 1,2,4 | Freddie Mac Non Gold Pool, 12M USD LIBOR + 1.880% | 2.813% | 6/1/41 | 5 | 5 |
| 1,2,4 | Freddie Mac Non Gold Pool, 12M USD LIBOR + 1.880% | 2.880% | 6/1/40 | 12 | 12 |
| 1,2,4 | Freddie Mac Non Gold Pool, 12M USD LIBOR + 1.880% | 3.044% | 5/1/40 | 3 | 4 |
| 1,2,4 | Freddie Mac Non Gold Pool, 12M USD LIBOR + 1.880% | 3.630% | 5/1/40 | 2 | 2 |
| 1,2,4 | Freddie Mac Non Gold Pool, 12M USD LIBOR + 1.880% | 3.880% | 12/1/40–3/1/41 | 18 | 19 |
| 1,2,4 | Freddie Mac Non Gold Pool, 12M USD LIBOR + 1.889% | 3.790% | 2/1/42 | 8 | 8 |
| 1,2,4 | Freddie Mac Non Gold Pool, 12M USD LIBOR + 1.894% | 2.532% | 9/1/40 | 18 | 19 |
| 1,2,4 | Freddie Mac Non Gold Pool, 12M USD LIBOR + 1.900% | 2.363% | 11/1/40 | 14 | 14 |
Total Bond Market Index Portfolio
| | | | Coupon | Maturity
Date | Face
Amount
($000) | Market
Value•
($000) |
| 1,2,4 | Freddie Mac Non Gold Pool, 12M USD LIBOR + 1.900% | 2.806% | 6/1/40 | 9 | 9 |
| 1,2,4 | Freddie Mac Non Gold Pool, 12M USD LIBOR + 1.910% | 3.644% | 1/1/41 | 2 | 2 |
| 1,2,4 | Freddie Mac Non Gold Pool, 12M USD LIBOR + 1.910% | 3.910% | 2/1/41 | 12 | 12 |
| 1,2,4 | Freddie Mac Non Gold Pool, 12M USD LIBOR + 2.006% | 3.309% | 5/1/37 | 14 | 15 |
| 1,2,4 | Freddie Mac Non Gold Pool, 12M USD LIBOR + 2.085% | 4.085% | 3/1/38 | 2 | 3 |
| 1,2,4 | Freddie Mac Non Gold Pool, 1YR CMT + 2.250% | 2.378% | 11/1/34 | 18 | 19 |
| 1,2,4 | Freddie Mac Non Gold Pool, 1YR CMT + 2.250% | 2.934% | 5/1/36 | 3 | 3 |
| 1,2,4 | Freddie Mac Non Gold Pool, 1YR CMT + 2.250% | 3.757% | 2/1/36 | 6 | 6 |
| 1,2,4 | Freddie Mac Non Gold Pool, 1YR CMT + 2.410% | 3.769% | 10/1/36 | 9 | 10 |
| 1,2,4 | Freddie Mac Non Gold Pool, 6M USD LIBOR + 1.355% | 1.855% | 6/1/37 | 7 | 7 |
| 2,3 | Ginnie Mae | 2.000% | 1/21/51 | 12,607 | 13,180 |
| 2,3 | Ginnie Mae | 2.500% | 1/21/51 | 3,828 | 4,052 |
| 2,4 | Ginnie Mae II Pool, 1YR CMT + 1.500% | 1.625% | 7/20/38 | 3 | 2 |
| 2,4 | Ginnie Mae II Pool, 1YR CMT + 1.500% | 2.250% | 7/20/41–8/20/41 | 30 | 31 |
| 2,4 | Ginnie Mae II Pool, 1YR CMT + 1.500% | 2.875% | 4/20/41–6/20/43 | 78 | 81 |
| 2,4 | Ginnie Mae II Pool, 1YR CMT + 1.500% | 3.000% | 1/20/41–3/20/43 | 78 | 82 |
| 2,4 | Ginnie Mae II Pool, 1YR CMT + 1.500% | 3.125% | 10/20/38–12/20/42 | 112 | 116 |
| 2,4 | Ginnie Mae II Pool, 1YR CMT + 2.000% | 2.375% | 5/20/41 | 3 | 3 |
| 2,4 | Ginnie Mae II Pool, 1YR CMT + 2.000% | 3.375% | 5/20/41 | 5 | 6 |
| 2,4 | Ginnie Mae II Pool, 1YR CMT + 2.000% | 3.625% | 11/20/40 | 1 | 1 |
| | | | | | | 18,904 |
| Total U.S. Government and Agency Obligations (Cost $2,853,872) | 3,015,045 |
| Asset-Backed/Commercial Mortgage-Backed Securities (2.6%) |
| 2 | Ally Auto Receivables Trust Class A3 Series 2018-1 | 2.350% | 6/15/22 | 13 | 13 |
| 2 | Ally Auto Receivables Trust Class A3 Series 2018-3 | 3.000% | 1/17/23 | 10 | 10 |
| 2 | Ally Auto Receivables Trust Class A3 Series 2019-2 | 2.230% | 1/16/24 | 275 | 279 |
| 2 | Ally Auto Receivables Trust Class A3 Series 2019-4 | 1.840% | 6/17/24 | 230 | 233 |
| 2 | Ally Auto Receivables Trust Class A4 Series 2018-1 | 2.530% | 2/15/23 | 25 | 25 |
| 2 | Ally Auto Receivables Trust Class A4 Series 2018-3 | 3.120% | 7/17/23 | 50 | 52 |
| 2 | Ally Auto Receivables Trust Class A4 Series 2019-2 | 2.260% | 8/15/24 | 50 | 52 |
| | | | Coupon | Maturity
Date | Face
Amount
($000) | Market
Value•
($000) |
| 2 | Ally Auto Receivables Trust Class A4 Series 2019-4 | 1.920% | 1/15/25 | 25 | 26 |
| 2 | Ally Master Owner Trust Class A Series 2018-2 | 3.290% | 5/15/23 | 100 | 101 |
| 2 | Ally Master Owner Trust Class A2 Series 2018-1 | 2.700% | 1/17/23 | 425 | 425 |
| 2 | American Express Credit Account Master Trust Class A Series 2017-7 | 2.350% | 5/15/25 | 225 | 234 |
| 2 | American Express Credit Account Master Trust Class A Series 2018-2 | 3.010% | 10/15/25 | 250 | 265 |
| 2 | American Express Credit Account Master Trust Class A Series 2018-4 | 2.990% | 12/15/23 | 325 | 328 |
| 2 | American Express Credit Account Master Trust Class A Series 2018-8 | 3.180% | 4/15/24 | 100 | 102 |
| 2 | AmeriCredit Automobile Receivables Trust Class A3 Series 2018-1 | 3.070% | 12/19/22 | 22 | 22 |
| 2 | AmeriCredit Automobile Receivables Trust Class A3 Series 2019-1 | 2.970% | 11/20/23 | 67 | 68 |
| 2 | AmeriCredit Automobile Receivables Trust Class A3 Series 2020-1 | 1.110% | 8/19/24 | 500 | 505 |
| 2 | AmeriCredit Automobile Receivables Trust Class A3 Series 2020-2 | 0.660% | 12/18/24 | 25 | 25 |
| 2 | AmeriCredit Automobile Receivables Trust Class A3 Series 2020-3 | 0.530% | 6/18/25 | 25 | 25 |
| 2 | AmeriCredit Automobile Receivables Trust Class B Series 2018-1 | 3.260% | 1/18/24 | 56 | 57 |
| 2 | AmeriCredit Automobile Receivables Trust Class B Series 2020-3 | 0.760% | 12/18/25 | 25 | 25 |
| 2 | AmeriCredit Automobile Receivables Trust Class C Series 2018-1 | 3.500% | 1/18/24 | 50 | 52 |
| 2 | BA Credit Card Trust Class A1 Series 2018-A1 | 2.700% | 7/17/23 | 475 | 476 |
| 2 | BA Credit Card Trust Class A1 Series 2019-A1 | 1.740% | 1/15/25 | 150 | 154 |
| 2 | BA Credit Card Trust Class A2 Series 2018-A2 | 3.000% | 9/15/23 | 400 | 403 |
| 2 | BAMLL Commercial Mortgage Securities Trust Class A4 Series 2017-BNK3 | 3.574% | 2/15/50 | 72 | 82 |
| 2 | Banc of America Commercial Mortgage Trust Class A4 Series 2015-UBS7 | 3.705% | 9/15/48 | 75 | 84 |
| 2 | Banc of America Commercial Mortgage Trust Class AS Series 2017-BNK3 | 3.748% | 2/15/50 | 28 | 32 |
| 2 | Banc of America Commercial Mortgage Trust Class ASB Series 2015-UBS7 | 3.429% | 9/15/48 | 48 | 51 |
| 2 | BANK Class A2 Series 2018-BN14 | 4.128% | 9/15/60 | 50 | 54 |
| 2 | BANK Class A3 Series 2017-BNK9 | 3.279% | 11/15/54 | 150 | 167 |
| 2,4 | BANK Class A3 Series 2018-BN11 | 4.046% | 3/15/61 | 100 | 118 |
Total Bond Market Index Portfolio
| | | | Coupon | Maturity
Date | Face
Amount
($000) | Market
Value•
($000) |
| 2 | BANK Class A3 Series 2019-BN19 | 3.183% | 8/15/61 | 275 | 311 |
| 2 | BANK Class A3 Series 2019-BN23 | 2.920% | 12/15/52 | 180 | 200 |
| 2 | BANK Class A3 Series 2019-BN24 | 2.960% | 11/15/62 | 150 | 168 |
| 2 | BANK Class A3 Series 2019-BNK20 | 3.011% | 9/15/62 | 170 | 190 |
| 2 | BANK Class A4 Series 2017-BNK6 | 3.254% | 7/15/60 | 50 | 56 |
| 2 | BANK Class A4 Series 2017-BNK7 | 3.175% | 9/15/60 | 100 | 111 |
| 2 | BANK Class A4 Series 2017-BNK8 | 3.488% | 11/15/50 | 150 | 171 |
| 2 | BANK Class A4 Series 2017-BNK9 | 3.538% | 11/15/54 | 150 | 172 |
| 2,4 | BANK Class A4 Series 2018-BN12 | 4.255% | 5/15/61 | 125 | 149 |
| 2 | BANK Class A4 Series 2018-BN13 | 3.953% | 8/15/61 | 50 | 58 |
| 2,4 | BANK Class A4 Series 2018-BN15 | 4.407% | 11/15/61 | 110 | 133 |
| 2,4 | BANK Class A4 Series 2018-BNK14 | 4.231% | 9/15/60 | 100 | 119 |
| 2 | BANK Class A4 Series 2019-BN16 | 4.005% | 2/15/52 | 125 | 148 |
| 2 | BANK Class A4 Series 2019-BN18 | 3.584% | 5/15/62 | 375 | 434 |
| 2 | BANK Class A4 Series 2019-BN22 | 2.978% | 11/15/62 | 290 | 324 |
| 2 | BANK Class A4 Series 2019-BNK17 | 3.714% | 4/15/52 | 100 | 117 |
| 2 | BANK Class A4 Series 2020-BN26 | 2.403% | 3/15/63 | 175 | 187 |
| 2 | BANK Class A4 Series 2020-BN29 | 1.997% | 11/15/53 | 50 | 52 |
| 2 | BANK Class A4 Series 2020-BNK28 | 1.844% | 3/15/63 | 50 | 51 |
| 2 | BANK Class A4 Series 2020-BNK30 | 1.925% | 12/10/53 | 75 | 77 |
| 2 | BANK Class A5 Series 2017-BNK5 | 3.390% | 6/15/60 | 150 | 170 |
| 2 | BANK Class A5 Series 2017-BNK6 | 3.518% | 7/15/60 | 404 | 461 |
| 2 | BANK Class A5 Series 2017-BNK7 | 3.435% | 9/15/60 | 75 | 85 |
| 2 | BANK Class A5 Series 2018-BN10 | 3.688% | 2/15/61 | 250 | 288 |
| 2,4 | BANK Class A5 Series 2018-BN13 | 4.217% | 8/15/61 | 25 | 30 |
| 2 | BANK Class A5 Series 2019-BN21 | 2.851% | 10/17/52 | 375 | 415 |
| 2 | BANK Class A5 Series 2020-BN25 | 2.649% | 1/15/63 | 200 | 218 |
| 2 | BANK Class A5 Series 2020-BN27 | 2.144% | 4/15/63 | 150 | 158 |
| 2 | BANK Class AS Series 2017-BNK5 | 3.624% | 6/15/60 | 100 | 111 |
| 2 | BANK Class AS Series 2017-BNK6 | 3.741% | 7/15/60 | 404 | 453 |
| 2 | BANK Class AS Series 2017-BNK7 | 3.748% | 9/15/60 | 75 | 85 |
| 2 | BANK Class AS Series 2017-BNK8 | 3.731% | 11/15/50 | 25 | 29 |
| 2,4 | BANK Class AS Series 2018-BN10 | 3.898% | 2/15/61 | 50 | 57 |
| 2,4 | BANK Class AS Series 2018-BN12 | 4.357% | 5/15/61 | 50 | 59 |
| 2,4 | BANK Class AS Series 2018-BN14 | 4.481% | 9/15/60 | 25 | 30 |
| 2 | BANK Class AS Series 2019-BN17 | 3.976% | 4/15/52 | 25 | 29 |
| | | | Coupon | Maturity
Date | Face
Amount
($000) | Market
Value•
($000) |
| 2,4 | BANK Class AS Series 2019-BN18 | 3.826% | 5/15/62 | 50 | 58 |
| 2 | BANK Class AS Series 2019-BN21 | 3.093% | 10/17/52 | 75 | 83 |
| 2 | BANK Class AS Series 2019-BN23 | 3.203% | 12/15/52 | 75 | 84 |
| 2,4 | BANK Class AS Series 2019-BN24 | 3.283% | 11/15/62 | 75 | 84 |
| 2 | BANK Class AS Series 2020-BN25 | 2.841% | 1/15/63 | 65 | 70 |
| 2 | BANK Class AS Series 2020-BN26 | 2.687% | 3/15/63 | 55 | 59 |
| 2 | BANK Class AS Series 2020-BN27 | 2.551% | 4/15/63 | 50 | 53 |
| 2 | BANK Class ASB Series 2018-BN10 | 3.641% | 2/15/61 | 50 | 56 |
| 2,4 | BANK Class C Series 2019-BNK19 | 4.034% | 8/15/61 | 35 | 36 |
| 2 | Barclays Commercial Mortgage Trust Class A4 Series 2019-C3 | 3.583% | 5/15/52 | 700 | 814 |
| 2 | Barclays Commercial Mortgage Trust Class A4 Series 2019-C5 | 3.063% | 11/15/52 | 150 | 168 |
| 2 | Barclays Commercial Mortgage Trust Class A5 Series 2019-C4 | 2.919% | 8/15/52 | 275 | 304 |
| 2 | Barclays Commercial Mortgage Trust Class AS Series 2019-C4 | 3.171% | 8/15/52 | 25 | 28 |
| 2,4 | Barclays Commercial Mortgage Trust Class AS Series 2019-C5 | 3.366% | 11/15/52 | 100 | 112 |
| 2 | BBCMS Mortgage Trust Class A4 Series 2017-C1 | 3.674% | 2/15/50 | 325 | 372 |
| 2 | BBCMS Mortgage Trust Class A4 Series 2020-C6 | 2.639% | 2/15/53 | 100 | 110 |
| 2 | BBCMS Mortgage Trust Class A5 Series 2018-C2 | 4.314% | 12/15/51 | 125 | 150 |
| 2 | BBCMS Mortgage Trust Class A5 Series 2020-C7 | 2.037% | 4/15/53 | 50 | 52 |
| 2 | BBCMS Mortgage Trust Class A5 Series 2020-C8 | 2.040% | 10/15/53 | 125 | 130 |
| 2 | BBCMS Mortgage Trust Class AS Series 2017-C1 | 3.898% | 2/15/50 | 100 | 113 |
| 2 | BBCMS Mortgage Trust Class AS Series 2020-C6 | 2.840% | 2/15/53 | 35 | 38 |
| 2,4 | Bear Stearns Commercial Mortgage Securities Trust Class AM Series 2007-T26 | 5.432% | 1/12/45 | 27 | 27 |
| 2 | Benchmark Mortgage Trust Class A2 Series 2018-B2 | 3.662% | 2/15/51 | 125 | 131 |
| 2 | Benchmark Mortgage Trust Class A2 Series 2018-B3 | 3.848% | 4/10/51 | 100 | 106 |
| 2 | Benchmark Mortgage Trust Class A2 Series 2018-B6 | 4.203% | 10/10/51 | 50 | 54 |
Total Bond Market Index Portfolio
| | | | Coupon | Maturity
Date | Face
Amount
($000) | Market
Value•
($000) |
| 2 | Benchmark Mortgage Trust Class A3 Series 2020-IG1 | 2.687% | 9/15/43 | 125 | 137 |
| 2 | Benchmark Mortgage Trust Class A4 Series 2018-B5 | 4.208% | 7/15/51 | 75 | 89 |
| 2 | Benchmark Mortgage Trust Class A4 Series 2018-B6 | 4.261% | 10/10/51 | 50 | 60 |
| 2,4 | Benchmark Mortgage Trust Class A4 Series 2018-B7 | 4.510% | 5/15/53 | 175 | 213 |
| 2 | Benchmark Mortgage Trust Class A4 Series 2019-B10 | 3.717% | 3/15/62 | 80 | 93 |
| 2 | Benchmark Mortgage Trust Class A4 Series 2019-B13 | 2.952% | 8/15/57 | 280 | 311 |
| 2,4 | Benchmark Mortgage Trust Class A5 Series 2018-B1 | 3.666% | 1/15/51 | 100 | 115 |
| 2,4 | Benchmark Mortgage Trust Class A5 Series 2018-B2 | 3.882% | 2/15/51 | 325 | 378 |
| 2 | Benchmark Mortgage Trust Class A5 Series 2018-B3 | 4.025% | 4/10/51 | 225 | 264 |
| 2,4 | Benchmark Mortgage Trust Class A5 Series 2018-B4 | 4.121% | 7/15/51 | 350 | 414 |
| 2 | Benchmark Mortgage Trust Class A5 Series 2018-B8 | 4.232% | 1/15/52 | 125 | 150 |
| 2 | Benchmark Mortgage Trust Class A5 Series 2019-B11 | 3.542% | 5/15/52 | 275 | 317 |
| 2 | Benchmark Mortgage Trust Class A5 Series 2019-B14 | 3.049% | 12/15/62 | 225 | 252 |
| 2 | Benchmark Mortgage Trust Class A5 Series 2019-B15 | 2.928% | 12/15/72 | 230 | 256 |
| 2 | Benchmark Mortgage Trust Class A5 Series 2019-B9 | 4.016% | 3/15/52 | 105 | 125 |
| 2 | Benchmark Mortgage Trust Class A5 Series 2020-B16 | 2.732% | 2/15/53 | 100 | 110 |
| 2 | Benchmark Mortgage Trust Class A5 Series 2020-B17 | 2.289% | 3/15/53 | 100 | 106 |
| 2 | Benchmark Mortgage Trust Class A5 Series 2020-B19 | 1.850% | 9/15/53 | 63 | 65 |
| 2 | Benchmark Mortgage Trust Class A5 Series 2020-B20 | 2.034% | 10/15/53 | 100 | 104 |
| 2 | Benchmark Mortgage Trust Class A5 Series 2020-B21 | 1.978% | 12/17/53 | 125 | 129 |
| 2 | Benchmark Mortgage Trust Class A5 Series 2020-B22 | 1.973% | 1/15/54 | 100 | 103 |
| 2,4 | Benchmark Mortgage Trust Class AM Series 2018-B1 | 3.878% | 1/15/51 | 50 | 57 |
| 2,4 | Benchmark Mortgage Trust Class AM Series 2018-B4 | 4.311% | 7/15/51 | 75 | 87 |
| 2 | Benchmark Mortgage Trust Class AM Series 2019-B10 | 3.979% | 3/15/62 | 50 | 58 |
| | | | Coupon | Maturity
Date | Face
Amount
($000) | Market
Value•
($000) |
| 2,4 | Benchmark Mortgage Trust Class AM Series 2020-B16 | 2.944% | 2/15/53 | 25 | 27 |
| 2,4 | Benchmark Mortgage Trust Class AS Series 2018-B2 | 4.084% | 2/15/51 | 150 | 173 |
| 2 | Benchmark Mortgage Trust Class AS Series 2018-B6 | 4.441% | 10/10/51 | 25 | 30 |
| 2,4 | Benchmark Mortgage Trust Class AS Series 2018-B8 | 4.532% | 1/15/52 | 50 | 60 |
| 2 | Benchmark Mortgage Trust Class AS Series 2019-B11 | 3.784% | 5/15/52 | 75 | 86 |
| 2 | Benchmark Mortgage Trust Class AS Series 2020-B17 | 2.583% | 3/15/53 | 30 | 32 |
| 2 | Benchmark Mortgage Trust Class AS Series 2020-B19 | 2.148% | 9/15/53 | 25 | 26 |
| 2 | Benchmark Mortgage Trust Class AS Series 2020-B20 | 2.375% | 10/15/53 | 10 | 11 |
| 2,4 | Benchmark Mortgage Trust Class AS Series 2020-IG1 | 2.909% | 9/15/43 | 50 | 54 |
| 2 | BMW Vehicle Owner Trust Class A3 Series 2018-A | 2.350% | 4/25/22 | 17 | 17 |
| 2 | BMW Vehicle Owner Trust Class A3 Series 2020-A | 0.480% | 10/25/24 | 25 | 25 |
| 2 | BMW Vehicle Owner Trust Class A4 Series 2018-A | 2.510% | 6/25/24 | 50 | 51 |
| 2 | Cantor Commercial Real Estate Lending Class A4 Series 2019-CF3 | 3.006% | 1/15/53 | 135 | 151 |
| 2 | Cantor Commercial Real Estate Lending Class A5 Series 2019-CF1 | 3.786% | 5/15/52 | 125 | 147 |
| 2 | Cantor Commercial Real Estate Lending Class A5 Series 2019-CF2 | 2.874% | 11/15/52 | 140 | 155 |
| 2 | Cantor Commercial Real Estate Lending Class AS Series 2019-CF3 | 3.298% | 1/15/53 | 60 | 67 |
| 2 | Capital One Multi-Asset Execution Trust Class A1 Series 2018-A1 | 3.010% | 2/15/24 | 125 | 126 |
| 2 | Capital One Multi-Asset Execution Trust Class A1 Series 2019-A1 | 2.840% | 12/15/24 | 75 | 77 |
| 2 | Capital One Multi-Asset Execution Trust Class A6 Series 2017-A6 | 2.290% | 7/15/25 | 225 | 233 |
| 2 | Capital One Prime Auto Receivables Trust Class A3 Series 2019-1 | 2.510% | 11/15/23 | 100 | 102 |
| 2 | Capital One Prime Auto Receivables Trust Class A3 Series 2020-1 | 1.600% | 11/15/24 | 50 | 51 |
| 2 | Capital One Prime Auto Receivables Trust Class A4 Series 2019-1 | 2.560% | 10/15/24 | 35 | 36 |
| 2 | Capital One Prime Auto Receivables Trust Class A4 Series 2020-1 | 1.630% | 8/15/25 | 15 | 15 |
| 2 | CarMax Auto Owner Trust Class A3 Series 2017-4 | 2.110% | 10/17/22 | 17 | 17 |
Total Bond Market Index Portfolio
| | | | Coupon | Maturity
Date | Face
Amount
($000) | Market
Value•
($000) |
| 2 | CarMax Auto Owner Trust Class A3 Series 2018-1 | 2.480% | 11/15/22 | 27 | 28 |
| 2 | CarMax Auto Owner Trust Class A3 Series 2018-2 | 2.980% | 1/17/23 | 38 | 39 |
| 2 | Carmax Auto Owner Trust Class A3 Series 2019-4 | 2.020% | 11/15/24 | 180 | 185 |
| 2 | Carmax Auto Owner Trust Class A3 Series 2020-1 | 1.890% | 12/16/24 | 90 | 92 |
| 2 | CarMax Auto Owner Trust Class A3 Series 2020-2 | 1.700% | 11/15/24 | 25 | 25 |
| 2 | CarMax Auto Owner Trust Class A3 Series 2020-3 | 0.620% | 3/17/25 | 75 | 75 |
| 2 | CarMax Auto Owner Trust Class A3 Series 2020-4 | 0.500% | 8/15/25 | 475 | 475 |
| 2 | CarMax Auto Owner Trust Class A3 Series 2020-4 | 0.630% | 6/15/26 | 25 | 25 |
| 2 | CarMax Auto Owner Trust Class A4 Series 2017-4 | 2.330% | 5/15/23 | 50 | 51 |
| 2 | CarMax Auto Owner Trust Class A4 Series 2018-1 | 2.640% | 6/15/23 | 50 | 51 |
| 2 | CarMax Auto Owner Trust Class A4 Series 2018-2 | 3.160% | 7/17/23 | 50 | 52 |
| 2 | CarMax Auto Owner Trust Class A4 Series 2019-4 | 2.130% | 7/15/25 | 25 | 26 |
| 2 | Carmax Auto Owner Trust Class A4 Series 2020-1 | 2.030% | 6/16/25 | 15 | 16 |
| 2 | CarMax Auto Owner Trust Class A4 Series 2020-3 | 0.770% | 3/16/26 | 25 | 25 |
| 2 | CD Commercial Mortgage Trust Class AAB Series 2017-CD3 | 3.453% | 2/10/50 | 25 | 27 |
| 2 | CD Commercial Mortgage Trust Class ASB Series 2017-CD6 | 3.332% | 11/13/50 | 50 | 55 |
| 2 | CD Mortgage Trust Class A4 Series 2016-CD1 | 2.724% | 8/10/49 | 150 | 163 |
| 2,4 | CD Mortgage Trust Class A4 Series 2016-CD2 | 3.526% | 11/10/49 | 100 | 113 |
| 2 | CD Mortgage Trust Class A4 Series 2017-CD3 | 3.631% | 2/10/50 | 144 | 164 |
| 2 | CD Mortgage Trust Class A4 Series 2018-CD7 | 4.279% | 8/15/51 | 75 | 89 |
| 2 | CD Mortgage Trust Class A4 Series 2019-CD8 | 2.912% | 8/15/57 | 450 | 497 |
| 2 | CD Mortgage Trust Class A5 Series 2017-CD6 | 3.456% | 11/13/50 | 125 | 142 |
| 2,4 | CD Mortgage Trust Class AM Series 2017-CD6 | 3.709% | 11/13/50 | 75 | 84 |
| 2 | CD Mortgage Trust Class AS Series 2017-CD3 | 3.833% | 2/10/50 | 31 | 34 |
| 2 | CenterPoint Energy Transition Bond Co. IV LLC Class A3 Series 2012-1 | 3.028% | 10/15/25 | 315 | 332 |
| 2 | CFCRE Commercial Mortgage Trust Class A3 Series 2016-C3 | 3.865% | 1/10/48 | 125 | 142 |
| 2,4 | CFCRE Commercial Mortgage Trust Class A3 Series 2016-C6 | 3.217% | 11/10/49 | 250 | 275 |
| 2 | CFCRE Commercial Mortgage Trust Class A4 Series 2016-C4 | 3.283% | 5/10/58 | 150 | 164 |
| | | | Coupon | Maturity
Date | Face
Amount
($000) | Market
Value•
($000) |
| 2 | CFCRE Commercial Mortgage Trust Class A4 Series 2017-C8 | 3.572% | 6/15/50 | 50 | 57 |
| 2 | CFCRE Commercial Mortgage Trust Class AM Series 2016-C4 | 3.691% | 5/10/58 | 100 | 110 |
| 2 | CGMS Commercial Mortgage Trust Class A4 Series 2017-B1 | 3.458% | 8/15/50 | 250 | 284 |
| 2,4 | CGMS Commercial Mortgage Trust Class AS Series 2017-B1 | 3.711% | 8/15/50 | 50 | 56 |
| 2 | Chase Issuance Trust Class A1 Series 2020-A1 | 1.530% | 1/15/25 | 450 | 462 |
| 2 | Chase Issuance Trust Class A2 Series 2014-A2 | 2.770% | 3/15/23 | 225 | 226 |
| 2 | Chase Issuance Trust Class A7 Series 2012-A7 | 2.160% | 9/15/24 | 313 | 323 |
| 2 | Citibank Credit Card Issuance Trust Class A1 Series 2014-A1 | 2.880% | 1/23/23 | 100 | 100 |
| 2 | Citibank Credit Card Issuance Trust Class A1 Series 2018-A1 | 2.490% | 1/20/23 | 550 | 551 |
| 2 | Citibank Credit Card Issuance Trust Class A2 Series 2016-A2 | 2.190% | 11/20/23 | 200 | 203 |
| 2 | Citibank Credit Card Issuance Trust Class A3 Series 2018-A3 | 3.290% | 5/23/25 | 450 | 483 |
| 2 | Citibank Credit Card Issuance Trust Class A5 Series 2014-A5 | 2.680% | 6/7/23 | 200 | 202 |
| 2 | Citigroup Commercial Mortgage Trust Class A2 Series 2018-B2 | 3.788% | 3/10/51 | 50 | 53 |
| 2 | Citigroup Commercial Mortgage Trust Class A3 Series 2016-P4 | 2.646% | 7/10/49 | 150 | 160 |
| 2 | Citigroup Commercial Mortgage Trust Class A4 Series 2012-GC8 | 3.024% | 9/10/45 | 69 | 71 |
| 2 | Citigroup Commercial Mortgage Trust Class A4 Series 2013-GC11 | 3.093% | 4/10/46 | 100 | 105 |
| 2,4 | Citigroup Commercial Mortgage Trust Class A4 Series 2013-GC15 | 4.371% | 9/10/46 | 50 | 55 |
| 2 | Citigroup Commercial Mortgage Trust Class A4 Series 2014-GC19 | 4.023% | 3/10/47 | 25 | 27 |
| 2 | Citigroup Commercial Mortgage Trust Class A4 Series 2014-GC23 | 3.622% | 7/10/47 | 100 | 109 |
| 2 | Citigroup Commercial Mortgage Trust Class A4 Series 2014-GC25 | 3.635% | 10/10/47 | 175 | 192 |
Total Bond Market Index Portfolio
| | | | Coupon | Maturity
Date | Face
Amount
($000) | Market
Value•
($000) |
| 2 | Citigroup Commercial Mortgage Trust Class A4 Series 2015-GC29 | 3.192% | 4/10/48 | 175 | 191 |
| 2 | Citigroup Commercial Mortgage Trust Class A4 Series 2015-GC31 | 3.762% | 6/10/48 | 100 | 112 |
| 2 | Citigroup Commercial Mortgage Trust Class A4 Series 2015-GC33 | 3.778% | 9/10/58 | 100 | 112 |
| 2 | Citigroup Commercial Mortgage Trust Class A4 Series 2016-C1 | 3.209% | 5/10/49 | 125 | 139 |
| 2 | Citigroup Commercial Mortgage Trust Class A4 Series 2016-GC37 | 3.314% | 4/10/49 | 50 | 56 |
| 2 | Citigroup Commercial Mortgage Trust Class A4 Series 2016-P4 | 2.902% | 7/10/49 | 75 | 82 |
| 2 | Citigroup Commercial Mortgage Trust Class A4 Series 2017-C4 | 3.471% | 10/12/50 | 250 | 284 |
| 2 | Citigroup Commercial Mortgage Trust Class A4 Series 2018-B2 | 4.009% | 3/10/51 | 275 | 321 |
| 2 | Citigroup Commercial Mortgage Trust Class A4 Series 2019-GC43 | 3.038% | 11/10/52 | 275 | 307 |
| 2 | Citigroup Commercial Mortgage Trust Class A5 Series 2014-GC21 | 3.855% | 5/10/47 | 50 | 55 |
| 2 | Citigroup Commercial Mortgage Trust Class A5 Series 2015-GC27 | 3.137% | 2/10/48 | 225 | 244 |
| 2 | Citigroup Commercial Mortgage Trust Class A5 Series 2016-GC36 | 3.616% | 2/10/49 | 475 | 534 |
| 2 | Citigroup Commercial Mortgage Trust Class A5 Series 2019-GC41 | 2.869% | 8/10/56 | 225 | 248 |
| 2 | Citigroup Commercial Mortgage Trust Class A5 Series 2020-GC46 | 2.717% | 2/15/53 | 110 | 120 |
| 2 | Citigroup Commercial Mortgage Trust Class AAB Series 2014-GC19 | 3.552% | 3/10/47 | 16 | 17 |
| 2 | Citigroup Commercial Mortgage Trust Class AAB Series 2016-C1 | 3.003% | 5/10/49 | 55 | 58 |
| 2,4 | Citigroup Commercial Mortgage Trust Class AS Series 2013-GC15 | 4.649% | 9/10/46 | 75 | 81 |
| 2 | Citigroup Commercial Mortgage Trust Class AS Series 2014-GC19 | 4.345% | 3/10/47 | 25 | 27 |
| | | | Coupon | Maturity
Date | Face
Amount
($000) | Market
Value•
($000) |
| 2 | Citigroup Commercial Mortgage Trust Class AS Series 2015-GC27 | 3.571% | 2/10/48 | 100 | 108 |
| 2 | Citigroup Commercial Mortgage Trust Class AS Series 2017-C4 | 3.764% | 10/12/50 | 50 | 56 |
| 2,4 | Citigroup Commercial Mortgage Trust Class AS Series 2020-GC46 | 2.918% | 2/15/53 | 45 | 49 |
| 2,4 | Citigroup Commercial Mortgage Trust Class B Series 2014-GC21 | 4.328% | 5/10/47 | 50 | 53 |
| 2,4 | Citigroup Commercial Mortgage Trust Class B Series 2015-GC29 | 3.758% | 4/10/48 | 84 | 89 |
| 2 | COMM Mortgage Trust Class A2 Series 2014-CR15 | 2.928% | 2/10/47 | 26 | 26 |
| 2 | COMM Mortgage Trust Class A2 Series 2014-UBS6 | 2.935% | 12/10/47 | 21 | 21 |
| 2 | COMM Mortgage Trust Class A2 Series 2015-CR22 | 2.856% | 3/10/48 | 14 | 14 |
| 2 | COMM Mortgage Trust Class A3 Series 2012-CR4 | 2.853% | 10/15/45 | 124 | 128 |
| 2 | COMM Mortgage Trust Class A3 Series 2013-CR11 | 3.983% | 8/10/50 | 40 | 43 |
| 2 | COMM Mortgage Trust Class A3 Series 2013-CR12 | 3.765% | 10/10/46 | 48 | 51 |
| 2 | COMM Mortgage Trust Class A3 Series 2014-CR21 | 3.528% | 12/10/47 | 160 | 172 |
| 2 | COMM Mortgage Trust Class A3 Series 2017-COR2 | 3.510% | 9/10/50 | 35 | 40 |
| 2 | COMM Mortgage Trust Class A3 Series 2018-COR3 | 4.228% | 5/10/51 | 125 | 149 |
| 2 | COMM Mortgage Trust Class A4 Series 2012-CR2 | 3.147% | 8/15/45 | 58 | 60 |
| 2,4 | COMM Mortgage Trust Class A4 Series 2013-CR10 | 4.210% | 8/10/46 | 20 | 22 |
| 2 | COMM Mortgage Trust Class A4 Series 2013-CR11 | 4.258% | 8/10/50 | 150 | 164 |
| 2 | COMM Mortgage Trust Class A4 Series 2013-CR12 | 4.046% | 10/10/46 | 50 | 54 |
| 2 | COMM Mortgage Trust Class A4 Series 2013-CR6 | 3.101% | 3/10/46 | 515 | 537 |
| 2 | COMM Mortgage Trust Class A4 Series 2013-CR7 | 3.213% | 3/10/46 | 31 | 32 |
| 2,4 | COMM Mortgage Trust Class A4 Series 2013-CR9 | 4.219% | 7/10/45 | 90 | 96 |
| 2 | COMM Mortgage Trust Class A4 Series 2013-LC6 | 2.941% | 1/10/46 | 83 | 87 |
| 2,4 | COMM Mortgage Trust Class A4 Series 2014-CR15 | 4.074% | 2/10/47 | 56 | 62 |
| 2 | COMM Mortgage Trust Class A4 Series 2014-CR20 | 3.590% | 11/10/47 | 50 | 55 |
Total Bond Market Index Portfolio
| | | | Coupon | Maturity
Date | Face
Amount
($000) | Market
Value•
($000) |
| 2 | COMM Mortgage Trust Class A4 Series 2014-LC15 | 4.006% | 4/10/47 | 150 | 164 |
| 2 | COMM Mortgage Trust Class A4 Series 2014-UBS3 | 3.819% | 6/10/47 | 100 | 110 |
| 2 | COMM Mortgage Trust Class A4 Series 2014-UBS5 | 3.838% | 9/10/47 | 125 | 138 |
| 2 | COMM Mortgage Trust Class A4 Series 2015-CCRE24 | 3.432% | 8/10/48 | 242 | 266 |
| 2 | COMM Mortgage Trust Class A4 Series 2015-CR23 | 3.497% | 5/10/48 | 100 | 111 |
| 2 | COMM Mortgage Trust Class A4 Series 2015-CR25 | 3.759% | 8/10/48 | 125 | 140 |
| 2 | COMM Mortgage Trust Class A4 Series 2015-CR26 | 3.630% | 10/10/48 | 225 | 253 |
| 2 | COMM Mortgage Trust Class A4 Series 2015-CR27 | 3.612% | 10/10/48 | 125 | 140 |
| 2 | COMM Mortgage Trust Class A4 Series 2015-LC19 | 3.183% | 2/10/48 | 125 | 136 |
| 2 | COMM Mortgage Trust Class A4 Series 2016-CR28 | 3.762% | 2/10/49 | 150 | 169 |
| 2,4 | COMM Mortgage Trust Class A5 Series 2013-CR8 | 3.612% | 6/10/46 | 71 | 75 |
| 2 | COMM Mortgage Trust Class A5 Series 2013-LC13 | 4.205% | 8/10/46 | 40 | 43 |
| 2 | COMM Mortgage Trust Class A5 Series 2014-CR17 | 3.977% | 5/10/47 | 50 | 55 |
| 2 | COMM Mortgage Trust Class A5 Series 2014-CR19 | 3.796% | 8/10/47 | 175 | 193 |
| 2 | COMM Mortgage Trust Class A5 Series 2014-LC17 | 3.917% | 10/10/47 | 50 | 55 |
| 2 | COMM Mortgage Trust Class A5 Series 2014-UBS2 | 3.961% | 3/10/47 | 54 | 59 |
| 2 | COMM Mortgage Trust Class A5 Series 2014-UBS4 | 3.694% | 8/10/47 | 125 | 137 |
| 2 | COMM Mortgage Trust Class A5 Series 2014-UBS6 | 3.644% | 12/10/47 | 225 | 248 |
| 2 | COMM Mortgage Trust Class A5 Series 2015-CR22 | 3.309% | 3/10/48 | 150 | 165 |
| 2 | COMM Mortgage Trust Class A5 Series 2015-DC1 | 3.350% | 2/10/48 | 75 | 82 |
| 2 | COMM Mortgage Trust Class A5 Series 2019-GC44 | 2.950% | 8/15/57 | 115 | 128 |
| 2 | COMM Mortgage Trust Class AM Series 2012-CR2 | 3.791% | 8/15/45 | 65 | 67 |
| 2,5 | COMM Mortgage Trust Class AM Series 2012-CR3 | 3.416% | 10/15/45 | 78 | 80 |
| 2,4 | COMM Mortgage Trust Class AM Series 2013-CR11 | 4.715% | 8/10/50 | 30 | 33 |
| | | | Coupon | Maturity
Date | Face
Amount
($000) | Market
Value•
($000) |
| 2 | COMM Mortgage Trust Class AM Series 2013-CR12 | 4.300% | 10/10/46 | 25 | 26 |
| 2 | COMM Mortgage Trust Class AM Series 2013-LC6 | 3.282% | 1/10/46 | 58 | 60 |
| 2 | COMM Mortgage Trust Class AM Series 2014-CCRE19 | 4.080% | 8/10/47 | 50 | 55 |
| 2 | COMM Mortgage Trust Class AM Series 2014-CR16 | 4.278% | 4/10/47 | 75 | 82 |
| 2 | COMM Mortgage Trust Class AM Series 2014-UBS2 | 4.199% | 3/10/47 | 15 | 16 |
| 2 | COMM Mortgage Trust Class AM Series 2014-UBS4 | 3.968% | 8/10/47 | 44 | 48 |
| 2 | COMM Mortgage Trust Class AM Series 2014-UBS6 | 4.048% | 12/10/47 | 50 | 55 |
| 2,4 | COMM Mortgage Trust Class AM Series 2015-CR22 | 3.603% | 3/10/48 | 100 | 110 |
| 2 | COMM Mortgage Trust Class AM Series 2015-CR23 | 3.801% | 5/10/48 | 50 | 55 |
| 2 | COMM Mortgage Trust Class AM Series 2015-LC19 | 3.527% | 2/10/48 | 50 | 54 |
| 2 | COMM Mortgage Trust Class ASB Series 2013-CCRE11 | 3.660% | 8/10/50 | 18 | 19 |
| 2 | COMM Mortgage Trust Class ASB Series 2013-CR12 | 3.623% | 10/10/46 | 30 | 31 |
| 2 | COMM Mortgage Trust Class ASB Series 2014-CCRE15 | 3.595% | 2/10/47 | 20 | 21 |
| 2 | COMM Mortgage Trust Class ASB Series 2014-CCRE16 | 3.653% | 4/10/47 | 35 | 36 |
| 2 | COMM Mortgage Trust Class ASB Series 2014-CCRE17 | 3.598% | 5/10/47 | 17 | 18 |
| 2 | COMM Mortgage Trust Class ASB Series 2014-CCRE18 | 3.452% | 7/15/47 | 32 | 33 |
| 2 | COMM Mortgage Trust Class ASB Series 2014-UBS2 | 3.472% | 3/10/47 | 14 | 15 |
| 2 | COMM Mortgage Trust Class ASB Series 2014-UBS6 | 3.387% | 12/10/47 | 100 | 105 |
| 2 | COMM Mortgage Trust Class ASB Series 2015-CCRE23 | 3.257% | 5/10/48 | 65 | 69 |
| 2 | COMM Mortgage Trust Class ASB Series 2015-CCRE27 | 3.404% | 10/10/48 | 121 | 129 |
| 2 | COMM Mortgage Trust Class ASB Series 2015-LC19 | 3.040% | 2/10/48 | 21 | 22 |
| 2 | COMM Mortgage Trust Class ASB Series 2016-DC2 | 3.550% | 2/10/49 | 125 | 134 |
| 2,4 | COMM Mortgage Trust Class B Series 2013-CR12 | 4.762% | 10/10/46 | 25 | 25 |
| 2,4 | COMM Mortgage Trust Class B Series 2014-CCRE15 | 4.692% | 2/10/47 | 28 | 30 |
Total Bond Market Index Portfolio
| | | | Coupon | Maturity
Date | Face
Amount
($000) | Market
Value•
($000) |
| 2 | COMM Mortgage Trust Class B Series 2014-CR17 | 4.377% | 5/10/47 | 25 | 26 |
| 2 | COMM Mortgage Trust Class B Series 2014-UBS2 | 4.701% | 3/10/47 | 10 | 11 |
| 2,4 | COMM Mortgage Trust Class C Series 2013-LC6 | 4.242% | 1/10/46 | 25 | 25 |
| 2,4 | COMM Mortgage Trust Class C Series 2014-CCRE15 | 4.742% | 2/10/47 | 50 | 53 |
| 2 | CSAIL Commercial Mortgage Trust Class A3 Series 2019-C16 | 3.329% | 6/15/52 | 275 | 313 |
| 2 | CSAIL Commercial Mortgage Trust Class A4 Series 2015-C1 | 3.505% | 4/15/50 | 100 | 110 |
| 2 | CSAIL Commercial Mortgage Trust Class A4 Series 2015-C2 | 3.504% | 6/15/57 | 150 | 166 |
| 2 | CSAIL Commercial Mortgage Trust Class A4 Series 2015-C3 | 3.718% | 8/15/48 | 100 | 111 |
| 2 | CSAIL Commercial Mortgage Trust Class A4 Series 2015-C4 | 3.808% | 11/15/48 | 200 | 226 |
| 2 | CSAIL Commercial Mortgage Trust Class A4 Series 2017-C8 | 3.392% | 6/15/50 | 150 | 168 |
| 2,4 | CSAIL Commercial Mortgage Trust Class A4 Series 2018-CX12 | 4.224% | 8/15/51 | 25 | 30 |
| 2 | CSAIL Commercial Mortgage Trust Class A4 Series 2019-C15 | 4.053% | 3/15/52 | 225 | 263 |
| 2 | CSAIL Commercial Mortgage Trust Class A5 Series 2016-C7 | 3.502% | 11/15/49 | 200 | 223 |
| 2,4 | CSAIL Commercial Mortgage Trust Class A5 Series 2017-CX10 | 3.458% | 11/15/50 | 150 | 170 |
| 2 | CSAIL Commercial Mortgage Trust Class A5 Series 2017-CX9 | 3.446% | 9/15/50 | 50 | 56 |
| 2,4 | CSAIL Commercial Mortgage Trust Class A5 Series 2018-CX11 | 4.033% | 4/15/51 | 275 | 316 |
| 2,4 | CSAIL Commercial Mortgage Trust Class AS Series 2015-C1 | 3.791% | 4/15/50 | 75 | 82 |
| 2,4 | CSAIL Commercial Mortgage Trust Class AS Series 2015-C2 | 3.849% | 6/15/57 | 75 | 80 |
| 2 | CSAIL Commercial Mortgage Trust Class ASB Series 2015-C3 | 3.448% | 8/15/48 | 78 | 82 |
| | | | Coupon | Maturity
Date | Face
Amount
($000) | Market
Value•
($000) |
| 2 | CSAIL Commercial Mortgage Trust Class ASB Series 2015-C4 | 3.617% | 11/15/48 | 48 | 51 |
| 2,4 | CSAIL Commercial Mortgage Trust Class B Series 2015-C1 | 4.044% | 4/15/50 | 50 | 53 |
| 2,4 | CSAIL Commercial Mortgage Trust Class B Series 2015-C3 | 4.126% | 8/15/48 | 50 | 46 |
| 2 | DBGS Mortgage Trust Class A4 Series 2018-C1 | 4.466% | 10/15/51 | 100 | 122 |
| 2 | DBJPM Mortgage Trust Class A4 Series 2016-C1 | 3.276% | 5/10/49 | 75 | 83 |
| 2 | DBJPM Mortgage Trust Class A5 Series 2016-C3 | 2.890% | 8/10/49 | 100 | 109 |
| 2 | DBJPM Mortgage Trust Class A5 Series 2017-C6 | 3.328% | 6/10/50 | 100 | 113 |
| 2 | DBJPM Mortgage Trust Class A5 Series 2020-C9 | 1.926% | 9/15/53 | 50 | 52 |
| 2,4 | DBJPM Mortgage Trust Class AM Series 2017-C6 | 3.561% | 6/10/50 | 50 | 55 |
| 2 | Discover Card Execution Note Trust Class A Series 2015-A3 | 1.890% | 10/15/24 | 275 | 283 |
| 2 | Discover Card Execution Note Trust Class A1 Series 2015-A1 | 3.030% | 8/15/25 | 225 | 238 |
| 2 | Discover Card Execution Note Trust Class A2 Series 2017-A2 | 2.390% | 7/15/24 | 150 | 153 |
| 2 | Drive Auto Receivables Trust Class B Series 2020-1 | 2.080% | 7/15/24 | 75 | 76 |
| 2 | Drive Auto Receivables Trust Class C Series 2018-2 | 3.630% | 8/15/24 | 3 | 3 |
| 2 | Drive Auto Receivables Trust Class C Series 2020-1 | 2.360% | 3/16/26 | 50 | 51 |
| 1,2,4 | Fannie Mae Multifamily Remic Trust Class A2 Series 2015-M12 | 2.797% | 5/25/25 | 225 | 240 |
| 1,2,4 | Fannie Mae-Aces Class 1A Series 2014-M7 | 3.234% | 6/25/24 | 232 | 248 |
| 1,2 | Fannie Mae-Aces Class A Series 2015-M2 | 2.620% | 12/25/24 | 166 | 177 |
| 1,2 | Fannie Mae-Aces Class A1 Series 2015-M8 | 2.344% | 1/25/25 | 65 | 68 |
| 1,2 | Fannie Mae-Aces Class A2 Series 2011-M4 | 3.726% | 6/25/21 | 67 | 67 |
| 1,2,4 | Fannie Mae-Aces Class A2 Series 2013-M14 | 3.329% | 10/25/23 | 245 | 260 |
| 1,2 | Fannie Mae-Aces Class A2 Series 2013-M7 | 2.280% | 12/27/22 | 52 | 53 |
| 1,2,4 | Fannie Mae-Aces Class A2 Series 2014-M1 | 3.128% | 7/25/23 | 275 | 290 |
| 1,2,4 | Fannie Mae-Aces Class A2 Series 2014-M13 | 3.021% | 8/25/24 | 185 | 200 |
| 1,2,4 | Fannie Mae-Aces Class A2 Series 2014-M2 | 3.513% | 12/25/23 | 244 | 261 |
Total Bond Market Index Portfolio
| | | | Coupon | Maturity
Date | Face
Amount
($000) | Market
Value•
($000) |
| 1,2,4 | Fannie Mae-Aces Class A2 Series 2014-M3 | 3.495% | 1/25/24 | 117 | 126 |
| 1,2,4 | Fannie Mae-Aces Class A2 Series 2014-M4 | 3.346% | 3/25/24 | 167 | 179 |
| 1,2,4 | Fannie Mae-Aces Class A2 Series 2014-M6 | 2.679% | 5/25/21 | 76 | 76 |
| 1,2,4 | Fannie Mae-Aces Class A2 Series 2014-M8 | 3.056% | 6/25/24 | 143 | 153 |
| 1,2,4 | Fannie Mae-Aces Class A2 Series 2014-M9 | 3.103% | 7/25/24 | 189 | 205 |
| 1,2 | Fannie Mae-Aces Class A2 Series 2015-M1 | 2.532% | 9/25/24 | 282 | 299 |
| 1,2,4 | Fannie Mae-Aces Class A2 Series 2015-M10 | 3.092% | 4/25/27 | 100 | 111 |
| 1,2,4 | Fannie Mae-Aces Class A2 Series 2015-M15 | 2.923% | 10/25/25 | 275 | 302 |
| 1,2 | Fannie Mae-Aces Class A2 Series 2015-M3 | 2.723% | 10/25/24 | 92 | 98 |
| 1,2 | Fannie Mae-Aces Class A2 Series 2015-M7 | 2.590% | 12/25/24 | 171 | 182 |
| 1,2,4 | Fannie Mae-Aces Class A2 Series 2015-M8 | 2.900% | 1/25/25 | 100 | 108 |
| 1,2,4 | Fannie Mae-Aces Class A2 Series 2016-M11 | 2.369% | 7/25/26 | 250 | 269 |
| 1,2,4 | Fannie Mae-Aces Class A2 Series 2016-M12 | 2.444% | 9/25/26 | 250 | 269 |
| 1,2,4 | Fannie Mae-Aces Class A2 Series 2016-M13 | 2.483% | 9/25/26 | 75 | 82 |
| 1,2 | Fannie Mae-Aces Class A2 Series 2016-M3 | 2.702% | 2/25/26 | 98 | 107 |
| 1,2 | Fannie Mae-Aces Class A2 Series 2016-M4 | 2.576% | 3/25/26 | 100 | 108 |
| 1,2 | Fannie Mae-Aces Class A2 Series 2016-M42 | 1.270% | 7/25/30 | 10 | 10 |
| 1,2 | Fannie Mae-Aces Class A2 Series 2016-M5 | 2.469% | 4/25/26 | 200 | 216 |
| 1,2 | Fannie Mae-Aces Class A2 Series 2016-M7 | 2.499% | 9/25/26 | 75 | 80 |
| 1,2 | Fannie Mae-Aces Class A2 Series 2016-M9 | 2.292% | 6/25/26 | 300 | 320 |
| 1,2,4 | Fannie Mae-Aces Class A2 Series 2017-M1 | 2.417% | 10/25/26 | 200 | 218 |
| 1,2,4 | Fannie Mae-Aces Class A2 Series 2017-M12 | 3.079% | 6/25/27 | 300 | 338 |
| 1,2,4 | Fannie Mae-Aces Class A2 Series 2017-M2 | 2.801% | 2/25/27 | 200 | 222 |
| 1,2,4 | Fannie Mae-Aces Class A2 Series 2017-M4 | 2.584% | 12/25/26 | 200 | 219 |
| | | | Coupon | Maturity
Date | Face
Amount
($000) | Market
Value•
($000) |
| 1,2,4 | Fannie Mae-Aces Class A2 Series 2017-M5 | 3.171% | 4/25/29 | 75 | 86 |
| 1,2,4 | Fannie Mae-Aces Class A2 Series 2017-M7 | 2.961% | 2/25/27 | 250 | 280 |
| 1,2,4 | Fannie Mae-Aces Class A2 Series 2017-M8 | 3.061% | 5/25/27 | 514 | 578 |
| 1,2,4 | Fannie Mae-Aces Class A2 Series 2018-M10 | 3.370% | 7/25/28 | 125 | 145 |
| 1,2 | Fannie Mae-Aces Class A2 Series 2018-M10 | 3.610% | 2/25/31 | 300 | 358 |
| 1,2,4 | Fannie Mae-Aces Class A2 Series 2018-M12 | 3.639% | 8/25/30 | 50 | 60 |
| 1,2,4 | Fannie Mae-Aces Class A2 Series 2018-M13 | 3.697% | 9/25/30 | 200 | 242 |
| 1,2,4 | Fannie Mae-Aces Class A2 Series 2018-M14 | 3.578% | 8/25/28 | 100 | 118 |
| 1,2,4 | Fannie Mae-Aces Class A2 Series 2018-M4 | 3.045% | 3/25/28 | 165 | 188 |
| 1,2,4 | Fannie Mae-Aces Class A2 Series 2018-M7 | 3.052% | 3/25/28 | 100 | 114 |
| 1,2,4 | Fannie Mae-Aces Class A2 Series 2019-M1 | 3.555% | 9/25/28 | 200 | 236 |
| 1,2 | Fannie Mae-Aces Class A2 Series 2019-M18 | 2.469% | 8/25/29 | 250 | 272 |
| 1,2,4 | Fannie Mae-Aces Class A2 Series 2019-M2 | 3.631% | 11/25/28 | 200 | 234 |
| 1,2 | Fannie Mae-Aces Class A2 Series 2019-M5 | 3.273% | 2/25/29 | 200 | 222 |
| 1,2 | Fannie Mae-Aces Class A2 Series 2019-M7 | 3.143% | 4/25/29 | 230 | 264 |
| 1,2 | Fannie Mae-Aces Class A2 Series 2019-M9 | 2.937% | 4/25/29 | 325 | 365 |
| 1,2 | Fannie Mae-Aces Class A2 Series 2020-M1 | 2.444% | 10/25/29 | 950 | 1,043 |
| 1,2 | Fannie Mae-Aces Class A2 Series 2020-M14 | 1.784% | 5/25/30 | 150 | 155 |
| 1,2 | Fannie Mae-Aces Class A2 Series 2020-M22 | 2.522% | 8/25/29 | 375 | 413 |
| 1,2,4 | Fannie Mae-Aces Class A2 Series 2020-M29 | 1.492% | 5/25/30 | 100 | 101 |
| 1,2 | Fannie Mae-Aces Class A2 Series 2020-M46 | 1.323% | 5/25/30 | 250 | 254 |
| 1,2 | Fannie Mae-Aces Class A2 Series 2020-M5 | 2.210% | 1/25/30 | 125 | 133 |
| 1,2,4 | Fannie Mae-Aces Class A2 Series 2020-M52 | 1.320% | 10/25/30 | 175 | 178 |
| 1,2 | Fannie Mae-Aces Class A3 Series 2011-M2 | 3.764% | 4/25/21 | 34 | 35 |
Total Bond Market Index Portfolio
| | | | Coupon | Maturity
Date | Face
Amount
($000) | Market
Value•
($000) |
| 1,2,4 | Fannie Mae-Aces Class APT Series 2013-M12 | 2.411% | 3/25/23 | 170 | 176 |
| 1,2,4 | Fannie Mae-Aces Class APT Series 2013-M14 | 2.548% | 4/25/23 | 44 | 44 |
| 1,2,4 | Fannie Mae-Aces Class ASV2 Series 2014-M12 | 2.614% | 10/25/21 | 135 | 136 |
| 1,2,4 | Fannie Mae-Aces Class ATS2 Series 2013-M4 | 2.608% | 3/25/22 | 1 | 1 |
| 1,2,4 | Fannie Mae-Aces Class ATS2 Series 2018-M2 | 2.902% | 1/25/28 | 425 | 464 |
| 1,2,4 | Fannie Mae-Aces Class AV2 Series 2015-M4 | 2.509% | 7/25/22 | 115 | 117 |
| 1,2 | Fannie Mae-Aces Class AV2 Series 2016-M2 | 2.152% | 1/25/23 | 118 | 121 |
| 1,2 | Fannie Mae-Aces Class AV2 Series 2016-M7 | 2.157% | 10/25/23 | 47 | 48 |
| 1,2,4 | Fannie Mae-Aces Class AV2 Series 2017-M10 | 2.555% | 7/25/24 | 110 | 117 |
| 1,2,4 | Fannie Mae-Aces Class AV2 Series 2017-M15 | 3.136% | 11/25/27 | 275 | 304 |
| 2 | Fifth Third Auto Trust Class A3 Series 2019-1 | 2.640% | 12/15/23 | 125 | 127 |
| 2 | Fifth Third Auto Trust Class A4 Series 2019-1 | 2.690% | 11/16/26 | 50 | 52 |
| 2 | Ford Credit Auto Lease Trust Class A3 Series 2019-A | 2.900% | 5/15/22 | 30 | 30 |
| 2 | Ford Credit Auto Lease Trust Class A4 Series 2019-A | 2.980% | 6/15/22 | 25 | 25 |
| 2 | Ford Credit Auto Owner Trust Class A3 Series 2017-C | 2.010% | 3/15/22 | 23 | 23 |
| 2 | Ford Credit Auto Owner Trust Class A3 Series 2019-A | 2.780% | 9/15/23 | 150 | 153 |
| 2 | Ford Credit Auto Owner Trust Class A3 Series 2020-A | 1.040% | 8/15/24 | 25 | 25 |
| 2 | Ford Credit Auto Owner Trust Class A3 Series 2020-B | 0.560% | 10/15/24 | 150 | 151 |
| 2 | Ford Credit Auto Owner Trust Class A3 Series 2020-C | 0.410% | 7/15/25 | 75 | 75 |
| 2 | Ford Credit Auto Owner Trust Class A4 Series 2019-A | 2.850% | 8/15/24 | 50 | 52 |
| 2 | Ford Credit Auto Owner Trust Class A4 Series 2020-B | 0.790% | 11/15/25 | 35 | 35 |
| 2 | Ford Credit Auto Owner Trust Class A4 Series 2020-C | 0.510% | 8/15/26 | 25 | 25 |
| 2 | Ford Credit Floorplan Master Owner Trust Class A Series 2017-3 | 2.480% | 9/15/24 | 170 | 176 |
| 2 | Ford Credit Floorplan Master Owner Trust Class A Series 2018-2 | 3.170% | 3/15/25 | 200 | 212 |
| 2 | Ford Credit Floorplan Master Owner Trust Class A Series 2020-2 | 1.060% | 9/15/27 | 50 | 51 |
| | | | Coupon | Maturity
Date | Face
Amount
($000) | Market
Value•
($000) |
| 2 | Ford Credit Floorplan Master Owner Trust Class A1 Series 2018-1 | 2.950% | 5/15/23 | 225 | 227 |
| 2 | Ford Credit Floorplan Master Owner Trust Class A1 Series 2020-1 | 0.700% | 9/15/25 | 275 | 276 |
| 1,2 | Freddie Mac Multifamily Structured Pass Through Certificates Class A1 Series K030 | 2.779% | 9/25/22 | 78 | 80 |
| 1,2 | Freddie Mac Multifamily Structured Pass Through Certificates Class A1 Series K032 | 3.016% | 2/25/23 | 102 | 105 |
| 1,2 | Freddie Mac Multifamily Structured Pass Through Certificates Class A1 Series K033 | 2.871% | 2/25/23 | 130 | 134 |
| 1,2 | Freddie Mac Multifamily Structured Pass Through Certificates Class A1 Series K038 | 2.604% | 10/25/23 | 34 | 35 |
| 1,2 | Freddie Mac Multifamily Structured Pass Through Certificates Class A1 Series K039 | 2.683% | 12/25/23 | 28 | 29 |
| 1,2 | Freddie Mac Multifamily Structured Pass Through Certificates Class A1 Series K040 | 2.768% | 4/25/24 | 59 | 61 |
| 1,2 | Freddie Mac Multifamily Structured Pass Through Certificates Class A1 Series K042 | 2.267% | 6/25/24 | 28 | 29 |
| 1,2 | Freddie Mac Multifamily Structured Pass Through Certificates Class A1 Series K043 | 2.532% | 10/25/23 | 27 | 28 |
| 1,2 | Freddie Mac Multifamily Structured Pass Through Certificates Class A1 Series K045 | 2.493% | 11/25/24 | 79 | 82 |
| 1,2 | Freddie Mac Multifamily Structured Pass Through Certificates Class A1 Series K047 | 2.827% | 12/25/24 | 64 | 67 |
| 1,2 | Freddie Mac Multifamily Structured Pass Through Certificates Class A1 Series K080 | 3.736% | 4/25/28 | 95 | 107 |
| 1,2 | Freddie Mac Multifamily Structured Pass Through Certificates Class A1 Series K087 | 3.591% | 10/25/27 | 94 | 104 |
| 1,2 | Freddie Mac Multifamily Structured Pass Through Certificates Class A1 Series K121 | 0.995% | 8/25/30 | 25 | 25 |
| 1,2 | Freddie Mac Multifamily Structured Pass Through Certificates Class A1 Series K122 | 0.863% | 5/25/30 | 15 | 15 |
| 1,2 | Freddie Mac Multifamily Structured Pass Through Certificates Class A1 Series K718 | 2.375% | 9/25/21 | 30 | 30 |
| 1,2 | Freddie Mac Multifamily Structured Pass Through Certificates Class A1 Series K730 | 3.452% | 9/25/24 | 22 | 23 |
| 1,2 | Freddie Mac Multifamily Structured Pass Through Certificates Class A2 Series K014 | 3.871% | 4/25/21 | 96 | 96 |
Total Bond Market Index Portfolio
| | | | Coupon | Maturity
Date | Face
Amount
($000) | Market
Value•
($000) |
| 1,2 | Freddie Mac Multifamily Structured Pass Through Certificates Class A2 Series K017 | 2.873% | 12/25/21 | 311 | 316 |
| 1,2 | Freddie Mac Multifamily Structured Pass Through Certificates Class A2 Series K019 | 2.272% | 3/25/22 | 143 | 146 |
| 1,2 | Freddie Mac Multifamily Structured Pass Through Certificates Class A2 Series K020 | 2.373% | 5/25/22 | 350 | 358 |
| 1,2 | Freddie Mac Multifamily Structured Pass Through Certificates Class A2 Series K021 | 2.396% | 6/25/22 | 225 | 231 |
| 1,2 | Freddie Mac Multifamily Structured Pass Through Certificates Class A2 Series K026 | 2.510% | 11/25/22 | 325 | 336 |
| 1,2 | Freddie Mac Multifamily Structured Pass Through Certificates Class A2 Series K027 | 2.637% | 1/25/23 | 325 | 337 |
| 1,2 | Freddie Mac Multifamily Structured Pass Through Certificates Class A2 Series K028 | 3.111% | 2/25/23 | 475 | 500 |
| 1,2 | Freddie Mac Multifamily Structured Pass Through Certificates Class A2 Series K029 | 3.320% | 2/25/23 | 325 | 344 |
| 1,2,4 | Freddie Mac Multifamily Structured Pass Through Certificates Class A2 Series K030 | 3.250% | 4/25/23 | 325 | 344 |
| 1,2,4 | Freddie Mac Multifamily Structured Pass Through Certificates Class A2 Series K031 | 3.300% | 4/25/23 | 1,215 | 1,291 |
| 1,2,4 | Freddie Mac Multifamily Structured Pass Through Certificates Class A2 Series K032 | 3.310% | 5/25/23 | 340 | 362 |
| 1,2,4 | Freddie Mac Multifamily Structured Pass Through Certificates Class A2 Series K033 | 3.060% | 7/25/23 | 325 | 345 |
| 1,2,4 | Freddie Mac Multifamily Structured Pass Through Certificates Class A2 Series K034 | 3.531% | 7/25/23 | 288 | 309 |
| 1,2,4 | Freddie Mac Multifamily Structured Pass Through Certificates Class A2 Series K035 | 3.458% | 8/25/23 | 400 | 429 |
| 1,2,4 | Freddie Mac Multifamily Structured Pass Through Certificates Class A2 Series K036 | 3.527% | 10/25/23 | 325 | 351 |
| 1,2 | Freddie Mac Multifamily Structured Pass Through Certificates Class A2 Series K038 | 3.389% | 3/25/24 | 400 | 435 |
| 1,2 | Freddie Mac Multifamily Structured Pass Through Certificates Class A2 Series K039 | 3.303% | 7/25/24 | 225 | 246 |
| 1,2 | Freddie Mac Multifamily Structured Pass Through Certificates Class A2 Series K040 | 3.241% | 9/25/24 | 275 | 302 |
| | | | Coupon | Maturity
Date | Face
Amount
($000) | Market
Value•
($000) |
| 1,2 | Freddie Mac Multifamily Structured Pass Through Certificates Class A2 Series K041 | 3.171% | 10/25/24 | 275 | 302 |
| 1,2 | Freddie Mac Multifamily Structured Pass Through Certificates Class A2 Series K042 | 2.670% | 12/25/24 | 25 | 27 |
| 1,2 | Freddie Mac Multifamily Structured Pass Through Certificates Class A2 Series K043 | 3.062% | 12/25/24 | 150 | 164 |
| 1,2 | Freddie Mac Multifamily Structured Pass Through Certificates Class A2 Series K045 | 3.023% | 1/25/25 | 175 | 192 |
| 1,2 | Freddie Mac Multifamily Structured Pass Through Certificates Class A2 Series K046 | 3.205% | 3/25/25 | 175 | 194 |
| 1,2,4 | Freddie Mac Multifamily Structured Pass Through Certificates Class A2 Series K047 | 3.329% | 5/25/25 | 175 | 195 |
| 1,2,4 | Freddie Mac Multifamily Structured Pass Through Certificates Class A2 Series K048 | 3.284% | 6/25/25 | 225 | 250 |
| 1,2 | Freddie Mac Multifamily Structured Pass Through Certificates Class A2 Series K049 | 3.010% | 7/25/25 | 125 | 138 |
| 1,2,4 | Freddie Mac Multifamily Structured Pass Through Certificates Class A2 Series K050 | 3.334% | 8/25/25 | 200 | 224 |
| 1,2 | Freddie Mac Multifamily Structured Pass Through Certificates Class A2 Series K052 | 3.151% | 11/25/25 | 125 | 139 |
| 1,2 | Freddie Mac Multifamily Structured Pass Through Certificates Class A2 Series K053 | 2.995% | 12/25/25 | 75 | 83 |
| 1,2 | Freddie Mac Multifamily Structured Pass Through Certificates Class A2 Series K054 | 2.745% | 1/25/26 | 200 | 220 |
| 1,2 | Freddie Mac Multifamily Structured Pass Through Certificates Class A2 Series K056 | 2.525% | 5/25/26 | 150 | 164 |
| 1,2 | Freddie Mac Multifamily Structured Pass Through Certificates Class A2 Series K058 | 2.653% | 8/25/26 | 100 | 110 |
| 1,2,4 | Freddie Mac Multifamily Structured Pass Through Certificates Class A2 Series K063 | 3.430% | 1/25/27 | 475 | 545 |
| 1,2 | Freddie Mac Multifamily Structured Pass Through Certificates Class A2 Series K064 | 3.224% | 3/25/27 | 300 | 342 |
| 1,2 | Freddie Mac Multifamily Structured Pass Through Certificates Class A2 Series K065 | 3.243% | 4/25/27 | 433 | 495 |
| 1,2 | Freddie Mac Multifamily Structured Pass Through Certificates Class A2 Series K066 | 3.117% | 6/25/27 | 150 | 171 |
Total Bond Market Index Portfolio
| | | | Coupon | Maturity
Date | Face
Amount
($000) | Market
Value•
($000) |
| 1,2 | Freddie Mac Multifamily Structured Pass Through Certificates Class A2 Series K067 | 3.194% | 7/25/27 | 500 | 572 |
| 1,2 | Freddie Mac Multifamily Structured Pass Through Certificates Class A2 Series K068 | 3.244% | 8/25/27 | 125 | 144 |
| 1,2,4 | Freddie Mac Multifamily Structured Pass Through Certificates Class A2 Series K069 | 3.187% | 9/25/27 | 200 | 229 |
| 1,2,4 | Freddie Mac Multifamily Structured Pass Through Certificates Class A2 Series K070 | 3.303% | 11/25/27 | 75 | 87 |
| 1,2 | Freddie Mac Multifamily Structured Pass Through Certificates Class A2 Series K071 | 3.286% | 11/25/27 | 100 | 115 |
| 1,2 | Freddie Mac Multifamily Structured Pass Through Certificates Class A2 Series K072 | 3.444% | 12/25/27 | 100 | 116 |
| 1,2 | Freddie Mac Multifamily Structured Pass Through Certificates Class A2 Series K073 | 3.350% | 1/25/28 | 125 | 145 |
| 1,2 | Freddie Mac Multifamily Structured Pass Through Certificates Class A2 Series K074 | 3.600% | 1/25/28 | 225 | 264 |
| 1,2,4 | Freddie Mac Multifamily Structured Pass Through Certificates Class A2 Series K075 | 3.650% | 2/25/28 | 150 | 177 |
| 1,2 | Freddie Mac Multifamily Structured Pass Through Certificates Class A2 Series K076 | 3.900% | 4/25/28 | 350 | 418 |
| 1,2 | Freddie Mac Multifamily Structured Pass Through Certificates Class A2 Series K078 | 3.854% | 6/25/28 | 100 | 119 |
| 1,2 | Freddie Mac Multifamily Structured Pass Through Certificates Class A2 Series K079 | 3.926% | 6/25/28 | 25 | 30 |
| 1,2,4 | Freddie Mac Multifamily Structured Pass Through Certificates Class A2 Series K080 | 3.926% | 7/25/28 | 175 | 210 |
| 1,2,4 | Freddie Mac Multifamily Structured Pass Through Certificates Class A2 Series K081 | 3.900% | 8/25/28 | 100 | 120 |
| 1,2,4 | Freddie Mac Multifamily Structured Pass Through Certificates Class A2 Series K082 | 3.920% | 9/25/28 | 75 | 90 |
| 1,2,4 | Freddie Mac Multifamily Structured Pass Through Certificates Class A2 Series K083 | 4.050% | 9/25/28 | 1,700 | 2,059 |
| 1,2,4 | Freddie Mac Multifamily Structured Pass Through Certificates Class A2 Series K084 | 3.780% | 10/25/28 | 275 | 324 |
| 1,2,4 | Freddie Mac Multifamily Structured Pass Through Certificates Class A2 Series K085 | 4.060% | 10/25/28 | 225 | 272 |
| | | | Coupon | Maturity
Date | Face
Amount
($000) | Market
Value•
($000) |
| 1,2 | Freddie Mac Multifamily Structured Pass Through Certificates Class A2 Series K087 | 3.771% | 12/25/28 | 400 | 479 |
| 1,2 | Freddie Mac Multifamily Structured Pass Through Certificates Class A2 Series K088 | 3.690% | 1/25/29 | 275 | 328 |
| 1,2 | Freddie Mac Multifamily Structured Pass Through Certificates Class A2 Series K089 | 3.563% | 1/25/29 | 25 | 30 |
| 1,2 | Freddie Mac Multifamily Structured Pass Through Certificates Class A2 Series K090 | 3.422% | 2/25/29 | 200 | 235 |
| 1,2 | Freddie Mac Multifamily Structured Pass Through Certificates Class A2 Series K091 | 3.505% | 3/25/29 | 450 | 532 |
| 1,2 | Freddie Mac Multifamily Structured Pass Through Certificates Class A2 Series K092 | 3.298% | 4/25/29 | 225 | 263 |
| 1,2 | Freddie Mac Multifamily Structured Pass Through Certificates Class A2 Series K093 | 2.982% | 5/25/29 | 400 | 457 |
| 1,2 | Freddie Mac Multifamily Structured Pass Through Certificates Class A2 Series K094 | 2.903% | 6/25/29 | 275 | 313 |
| 1,2 | Freddie Mac Multifamily Structured Pass Through Certificates Class A2 Series K095 | 2.785% | 6/25/29 | 275 | 310 |
| 1,2 | Freddie Mac Multifamily Structured Pass Through Certificates Class A2 Series K096 | 2.519% | 7/25/29 | 225 | 249 |
| 1,2 | Freddie Mac Multifamily Structured Pass Through Certificates Class A2 Series K098 | 2.425% | 8/25/29 | 450 | 496 |
| 1,2 | Freddie Mac Multifamily Structured Pass Through Certificates Class A2 Series K099 | 2.595% | 9/25/29 | 210 | 234 |
| 1,2 | Freddie Mac Multifamily Structured Pass Through Certificates Class A2 Series K101 | 2.524% | 10/25/29 | 370 | 412 |
| 1,2 | Freddie Mac Multifamily Structured Pass Through Certificates Class A2 Series K102 | 2.537% | 10/25/29 | 350 | 390 |
| 1,2 | Freddie Mac Multifamily Structured Pass Through Certificates Class A2 Series K103 | 2.651% | 11/25/29 | 300 | 337 |
| 1,2 | Freddie Mac Multifamily Structured Pass Through Certificates Class A2 Series K104 | 2.253% | 1/25/30 | 445 | 485 |
| 1,2 | Freddie Mac Multifamily Structured Pass Through Certificates Class A2 Series K105 | 1.872% | 1/25/30 | 95 | 101 |
| 1,2 | Freddie Mac Multifamily Structured Pass Through Certificates Class A2 Series K106 | 2.069% | 1/25/30 | 1,300 | 1,400 |
Total Bond Market Index Portfolio
| | | | Coupon | Maturity
Date | Face
Amount
($000) | Market
Value•
($000) |
| 1,2 | Freddie Mac Multifamily Structured Pass Through Certificates Class A2 Series K107 | 1.639% | 1/25/30 | 100 | 104 |
| 1,2 | Freddie Mac Multifamily Structured Pass Through Certificates Class A2 Series K108 | 1.517% | 3/25/30 | 150 | 155 |
| 1,2 | Freddie Mac Multifamily Structured Pass Through Certificates Class A2 Series K109 | 1.558% | 4/25/30 | 425 | 440 |
| 1,2 | Freddie Mac Multifamily Structured Pass Through Certificates Class A2 Series K110 | 1.477% | 4/25/30 | 25 | 26 |
| 1,2 | Freddie Mac Multifamily Structured Pass Through Certificates Class A2 Series K111 | 1.350% | 5/25/30 | 25 | 25 |
| 1,2 | Freddie Mac Multifamily Structured Pass Through Certificates Class A2 Series K114 | 1.366% | 6/25/30 | 125 | 127 |
| 1,2 | Freddie Mac Multifamily Structured Pass Through Certificates Class A2 Series K116 | 1.378% | 7/25/30 | 320 | 326 |
| 1,2 | Freddie Mac Multifamily Structured Pass Through Certificates Class A2 Series K117 | 1.406% | 8/25/30 | 25 | 26 |
| 1,2 | Freddie Mac Multifamily Structured Pass Through Certificates Class A2 Series K118 | 1.493% | 9/25/30 | 400 | 411 |
| 1,2 | Freddie Mac Multifamily Structured Pass Through Certificates Class A2 Series K120 | 1.500% | 10/25/30 | 300 | 308 |
| 1,2 | Freddie Mac Multifamily Structured Pass Through Certificates Class A2 Series K121 | 1.547% | 10/25/30 | 175 | 181 |
| 1,2 | Freddie Mac Multifamily Structured Pass Through Certificates Class A2 Series K122 | 1.521% | 11/25/30 | 175 | 180 |
| 1,2 | Freddie Mac Multifamily Structured Pass Through Certificates Class A2 Series K-1510 | 3.718% | 1/25/31 | 75 | 90 |
| 1,2 | Freddie Mac Multifamily Structured Pass Through Certificates Class A2 Series K-1511 | 3.470% | 3/25/31 | 100 | 116 |
| 1,2 | Freddie Mac Multifamily Structured Pass Through Certificates Class A2 Series K-1514 | 2.859% | 10/25/34 | 225 | 257 |
| 1,2 | Freddie Mac Multifamily Structured Pass Through Certificates Class A2 Series K-1515 | 1.940% | 2/25/35 | 150 | 156 |
| 1,2 | Freddie Mac Multifamily Structured Pass Through Certificates Class A2 Series K-1516 | 1.721% | 5/25/35 | 225 | 227 |
| 1,2 | Freddie Mac Multifamily Structured Pass Through Certificates Class A2 Series K-1517 | 1.716% | 7/25/35 | 25 | 25 |
| | | | Coupon | Maturity
Date | Face
Amount
($000) | Market
Value•
($000) |
| 1,2 | Freddie Mac Multifamily Structured Pass Through Certificates Class A2 Series K-1518 | 1.860% | 10/25/35 | 100 | 103 |
| 1,2 | Freddie Mac Multifamily Structured Pass Through Certificates Class A2 Series K152 | 3.080% | 1/25/31 | 100 | 115 |
| 1,2 | Freddie Mac Multifamily Structured Pass Through Certificates Class A2 Series K155 | 3.750% | 11/25/32 | 100 | 121 |
| 1,2,4 | Freddie Mac Multifamily Structured Pass Through Certificates Class A2 Series K157 | 3.990% | 5/25/33 | 75 | 92 |
| 1,2 | Freddie Mac Multifamily Structured Pass Through Certificates Class A2 Series K715 | 2.856% | 1/25/21 | 13 | 13 |
| 1,2 | Freddie Mac Multifamily Structured Pass Through Certificates Class A2 Series K716 | 3.130% | 6/25/21 | 344 | 345 |
| 1,2 | Freddie Mac Multifamily Structured Pass Through Certificates Class A2 Series K717 | 2.991% | 9/25/21 | 221 | 223 |
| 1,2 | Freddie Mac Multifamily Structured Pass Through Certificates Class A2 Series K718 | 2.791% | 1/25/22 | 225 | 229 |
| 1,2 | Freddie Mac Multifamily Structured Pass Through Certificates Class A2 Series K720 | 2.716% | 6/25/22 | 150 | 154 |
| 1,2 | Freddie Mac Multifamily Structured Pass Through Certificates Class A2 Series K723 | 2.454% | 8/25/23 | 125 | 131 |
| 1,2,4 | Freddie Mac Multifamily Structured Pass Through Certificates Class A2 Series K724 | 3.062% | 11/25/23 | 100 | 107 |
| 1,2 | Freddie Mac Multifamily Structured Pass Through Certificates Class A2 Series K726 | 2.905% | 4/25/24 | 181 | 193 |
| 1,2 | Freddie Mac Multifamily Structured Pass Through Certificates Class A2 Series K727 | 2.946% | 7/25/24 | 200 | 215 |
| 1,2,4 | Freddie Mac Multifamily Structured Pass Through Certificates Class A2 Series K728 | 3.064% | 8/25/24 | 1,550 | 1,678 |
| 1,2,4 | Freddie Mac Multifamily Structured Pass Through Certificates Class A2 Series K730 | 3.590% | 1/25/25 | 275 | 305 |
| 1,2,4 | Freddie Mac Multifamily Structured Pass Through Certificates Class A2 Series K731 | 3.600% | 2/25/25 | 225 | 247 |
| 1,2 | Freddie Mac Multifamily Structured Pass Through Certificates Class A2 Series K734 | 3.208% | 2/25/26 | 375 | 418 |
| 1,2 | Freddie Mac Multifamily Structured Pass Through Certificates Class A2 Series K735 | 2.862% | 5/25/26 | 500 | 552 |
Total Bond Market Index Portfolio
| | | | Coupon | Maturity
Date | Face
Amount
($000) | Market
Value•
($000) |
| 1,2 | Freddie Mac Multifamily Structured Pass Through Certificates Class A2 Series K737 | 2.525% | 10/25/26 | 400 | 438 |
| 1,2 | Freddie Mac Multifamily Structured Pass Through Certificates Class A2 Series K738 | 1.545% | 1/25/27 | 100 | 104 |
| 1,2 | Freddie Mac Multifamily Structured Pass Through Certificates Class A2 Series K739 | 1.336% | 9/25/27 | 25 | 26 |
| 1,2 | Freddie Mac Multifamily Structured Pass Through Certificates Class A2 Series KC02 | 3.370% | 7/25/25 | 175 | 189 |
| 1,2 | Freddie Mac Multifamily Structured Pass Through Certificates Class A2 Series KW01 | 2.853% | 1/25/26 | 200 | 218 |
| 1,2 | Freddie Mac Multifamily Structured Pass Through Certificates Class A3 Series K-1510 | 3.794% | 1/25/34 | 125 | 154 |
| 1,2 | Freddie Mac Multifamily Structured Pass Through Certificates Class A3 Series K-1511 | 3.542% | 3/25/34 | 225 | 273 |
| 1,2 | Freddie Mac Multifamily Structured Pass Through Certificates Class A3 Series K-1513 | 2.797% | 8/25/34 | 335 | 380 |
| 1,2 | Freddie Mac Multifamily Structured Pass Through Certificates Class A3 Series K154 | 3.459% | 11/25/32 | 50 | 60 |
| 1,2 | Freddie Mac Multifamily Structured Pass Through Certificates Class A3 Series K155 | 3.750% | 4/25/33 | 200 | 244 |
| 1,2,4 | Freddie Mac Multifamily Structured Pass Through Certificates Class A3 Series K157 | 3.990% | 8/25/33 | 75 | 94 |
| 2 | GM Financial Automobile Leasing Trust Class A3 Series 2019-2 | 2.670% | 3/21/22 | 52 | 53 |
| 2 | GM Financial Automobile Leasing Trust Class A3 Series 2020-1 | 1.670% | 12/20/22 | 25 | 25 |
| 2 | GM Financial Automobile Leasing Trust Class A3 Series 2020-2 | 0.800% | 7/20/23 | 25 | 25 |
| 2 | GM Financial Automobile Leasing Trust Class A3 Series 2020-3 | 0.450% | 8/21/23 | 50 | 50 |
| 2 | GM Financial Automobile Leasing Trust Class A4 Series 2019-2 | 2.720% | 3/20/23 | 50 | 51 |
| 2 | GM Financial Automobile Leasing Trust Class A4 Series 2020-1 | 1.700% | 12/20/23 | 10 | 10 |
| 2 | GM Financial Automobile Leasing Trust Class A4 Series 2020-3 | 0.510% | 10/21/24 | 25 | 25 |
| 2 | GM Financial Consumer Automobile Receivables Trust Class A3 Series 2018-2 | 2.810% | 12/16/22 | 47 | 47 |
| 2 | GM Financial Consumer Automobile Receivables Trust Class A3 Series 2020-1 | 1.840% | 9/16/24 | 90 | 92 |
| | | | Coupon | Maturity
Date | Face
Amount
($000) | Market
Value•
($000) |
| 2 | GM Financial Consumer Automobile Receivables Trust Class A3 Series 2020-3 | 0.450% | 4/16/25 | 175 | 176 |
| 2 | GM Financial Consumer Automobile Receivables Trust Class A3 Series 2020-4 | 0.380% | 8/18/25 | 115 | 115 |
| 2 | GM Financial Consumer Automobile Receivables Trust Class A4 Series 2018-2 | 3.020% | 12/18/23 | 75 | 77 |
| 2 | GM Financial Consumer Automobile Receivables Trust Class A4 Series 2020-1 | 1.900% | 3/17/25 | 30 | 31 |
| 2 | GM Financial Consumer Automobile Receivables Trust Class A4 Series 2020-3 | 0.580% | 1/16/26 | 25 | 25 |
| 2 | GS Mortgage Securities Corp II Class A5 Series 2013-GC10 | 2.943% | 2/10/46 | 92 | 95 |
| 2 | GS Mortgage Securities Corp II Class AS Series 2013-GC10 | 3.279% | 2/10/46 | 35 | 36 |
| 2 | GS Mortgage Securities Trust Class A3 Series 2012-GC6 | 3.482% | 1/10/45 | 299 | 304 |
| 2 | GS Mortgage Securities Trust Class A3 Series 2012-GCJ9 | 2.773% | 11/10/45 | 122 | 126 |
| 2 | GS Mortgage Securities Trust Class A3 Series 2017-GS6 | 3.433% | 5/10/50 | 150 | 169 |
| 2 | GS Mortgage Securities Trust Class A4 Series 2011-GC5 | 3.707% | 8/10/44 | 77 | 78 |
| 2 | GS Mortgage Securities Trust Class A4 Series 2012-GCJ7 | 3.377% | 5/10/45 | 107 | 109 |
| 2 | GS Mortgage Securities Trust Class A4 Series 2013-GC12 | 3.135% | 6/10/46 | 90 | 95 |
| 2 | GS Mortgage Securities Trust Class A4 Series 2014-GC18 | 4.074% | 1/10/47 | 200 | 217 |
| 2 | GS Mortgage Securities Trust Class A4 Series 2015-GC30 | 3.382% | 5/10/50 | 150 | 165 |
| 2 | GS Mortgage Securities Trust Class A4 Series 2015-GC32 | 3.764% | 7/10/48 | 50 | 56 |
| 2 | GS Mortgage Securities Trust Class A4 Series 2015-GC34 | 3.506% | 10/10/48 | 100 | 111 |
| 2 | GS Mortgage Securities Trust Class A4 Series 2016-GS2 | 3.050% | 5/10/49 | 75 | 82 |
| 2 | GS Mortgage Securities Trust Class A4 Series 2016-GS3 | 2.850% | 10/10/49 | 200 | 218 |
| 2,4 | GS Mortgage Securities Trust Class A4 Series 2016-GS4 | 3.442% | 11/10/49 | 75 | 84 |
| 2 | GS Mortgage Securities Trust Class A4 Series 2017-GS5 | 3.674% | 3/10/50 | 150 | 170 |
| 2 | GS Mortgage Securities Trust Class A4 Series 2017-GS7 | 3.430% | 8/10/50 | 261 | 295 |
| 2 | GS Mortgage Securities Trust Class A4 Series 2019-GC39 | 3.567% | 5/10/52 | 100 | 115 |
Total Bond Market Index Portfolio
| | | | Coupon | Maturity
Date | Face
Amount
($000) | Market
Value•
($000) |
| 2 | GS Mortgage Securities Trust Class A4 Series 2019-GC40 | 3.160% | 7/10/52 | 150 | 169 |
| 2 | GS Mortgage Securities Trust Class A4 Series 2019-GC42 | 3.001% | 9/1/52 | 275 | 307 |
| 2 | GS Mortgage Securities Trust Class A4 Series 2019-GSA1 | 3.048% | 11/10/52 | 125 | 140 |
| 2,4 | GS Mortgage Securities Trust Class A5 Series 2013-GC13 | 4.051% | 7/10/46 | 20 | 22 |
| 2 | GS Mortgage Securities Trust Class A5 Series 2013-GC14 | 4.243% | 8/10/46 | 150 | 163 |
| 2 | GS Mortgage Securities Trust Class A5 Series 2014-GC22 | 3.862% | 6/10/47 | 50 | 55 |
| 2 | GS Mortgage Securities Trust Class A5 Series 2014-GC24 | 3.931% | 9/10/47 | 125 | 138 |
| 2 | GS Mortgage Securities Trust Class A5 Series 2014-GC26 | 3.629% | 11/10/47 | 225 | 248 |
| 2 | GS Mortgage Securities Trust Class A5 Series 2015-GC28 | 3.396% | 2/10/48 | 150 | 164 |
| 2 | GS Mortgage Securities Trust Class A5 Series 2020-GC45 | 2.911% | 2/13/53 | 125 | 139 |
| 2 | GS Mortgage Securities Trust Class A5 Series 2020-GC47 | 2.377% | 5/12/53 | 75 | 80 |
| 2 | GS Mortgage Securities Trust Class A5 Series 2020-GSA2 | 2.012% | 12/12/53 | 125 | 129 |
| 2 | GS Mortgage Securities Trust Class AAB Series 2013-GC14 | 3.817% | 8/10/46 | 16 | 16 |
| 2 | GS Mortgage Securities Trust Class AAB Series 2014-GC22 | 3.467% | 6/10/47 | 33 | 34 |
| 2 | GS Mortgage Securities Trust Class AAB Series 2014-GC26 | 3.365% | 11/10/47 | 59 | 62 |
| 2 | GS Mortgage Securities Trust Class AAB Series 2015-GC32 | 3.513% | 7/10/48 | 115 | 122 |
| 2 | GS Mortgage Securities Trust Class AB Series 2015-GC34 | 3.278% | 10/10/48 | 121 | 129 |
| 2 | GS Mortgage Securities Trust Class AS Series 2013-GCJ2 | 3.375% | 6/10/46 | 39 | 41 |
| 2 | GS Mortgage Securities Trust Class AS Series 2014-GC26 | 3.964% | 11/10/47 | 50 | 55 |
| 2,4 | GS Mortgage Securities Trust Class AS Series 2016-GS4 | 3.645% | 11/10/49 | 50 | 55 |
| 2,4 | GS Mortgage Securities Trust Class AS Series 2017-GS5 | 3.826% | 3/10/50 | 50 | 56 |
| 2 | GS Mortgage Securities Trust Class AS Series 2017-GS7 | 3.663% | 8/10/50 | 70 | 79 |
| 2 | GS Mortgage Securities Trust Class AS Series 2019-GC42 | 3.212% | 9/1/52 | 50 | 56 |
| 2,4 | GS Mortgage Securities Trust Class AS Series 2020-GC45 | 3.173% | 2/13/53 | 35 | 39 |
| | | | Coupon | Maturity
Date | Face
Amount
($000) | Market
Value•
($000) |
| 2 | GS Mortgage Securities Trust Class AS Series 2020-GSA2 | 2.224% | 12/12/53 | 25 | 26 |
| 2,4 | GS Mortgage Securities Trust Class B Series 2014-GC24 | 4.511% | 9/10/47 | 25 | 24 |
| 2,4 | GS Mortgage Securities Trust Class B Series 2014-GC26 | 4.215% | 11/10/47 | 50 | 52 |
| 2,4 | GS Mortgage Securities Trust Class C Series 2017-GS6 | 4.322% | 5/10/50 | 10 | 11 |
| 2 | Honda Auto Receivables Owner Trust Class A3 Series 2017-4 | 2.050% | 11/22/21 | 3 | 3 |
| 2 | Honda Auto Receivables Owner Trust Class A3 Series 2018-1I | 2.600% | 2/15/22 | 49 | 50 |
| 2 | Honda Auto Receivables Owner Trust Class A3 Series 2018-2 | 3.010% | 5/18/22 | 28 | 28 |
| 2 | Honda Auto Receivables Owner Trust Class A3 Series 2019-2 | 2.520% | 6/21/23 | 150 | 153 |
| 2 | Honda Auto Receivables Owner Trust Class A3 Series 2020-1 | 1.610% | 4/22/24 | 110 | 112 |
| 2 | Honda Auto Receivables Owner Trust Class A3 Series 2020-3 | 0.370% | 10/18/24 | 100 | 100 |
| 2 | Honda Auto Receivables Owner Trust Class A4 Series 2018-1I | 2.780% | 5/15/24 | 75 | 76 |
| 2 | Honda Auto Receivables Owner Trust Class A4 Series 2018-2 | 3.160% | 8/19/24 | 50 | 51 |
| 2 | Honda Auto Receivables Owner Trust Class A4 Series 2019-2 | 2.540% | 3/21/25 | 30 | 31 |
| 2 | Honda Auto Receivables Owner Trust Class A4 Series 2020-1 | 1.630% | 10/21/26 | 20 | 21 |
| 2 | Honda Auto Receivables Owner Trust Class A4 Series 2020-3 | 0.460% | 4/19/27 | 25 | 25 |
| 2 | Hyundai Auto Receivables Trust Class A3 Series 2018-A | 2.790% | 7/15/22 | 18 | 18 |
| 2 | Hyundai Auto Receivables Trust Class A3 Series 2020-A | 1.410% | 11/15/24 | 10 | 10 |
| 2 | Hyundai Auto Receivables Trust Class A3 Series 2020-B | 0.480% | 12/16/24 | 50 | 50 |
| 2 | Hyundai Auto Receivables Trust Class A3 Series 2020-C | 0.380% | 5/15/25 | 50 | 50 |
| 2 | Hyundai Auto Receivables Trust Class A4 Series 2018-A | 2.940% | 6/17/24 | 75 | 77 |
| 2 | Hyundai Auto Receivables Trust Class A4 Series 2020-B | 0.620% | 12/15/25 | 25 | 25 |
| 2 | JP Morgan Chase Commercial Mortgage Securities Trust Class A3 Series 2012-C6 | 3.507% | 5/15/45 | 149 | 153 |
| 2 | JP Morgan Chase Commercial Mortgage Securities Trust Class A3 Series 2012-C8 | 2.829% | 10/15/45 | 109 | 112 |
Total Bond Market Index Portfolio
| | | | Coupon | Maturity
Date | Face
Amount
($000) | Market
Value•
($000) |
| 2 | JP Morgan Chase Commercial Mortgage Securities Trust Class A4 Series 2012-CBX | 3.483% | 6/15/45 | 163 | 166 |
| 2 | JP Morgan Chase Commercial Mortgage Securities Trust Class A4 Series 2013-C16 | 4.166% | 12/15/46 | 100 | 109 |
| 2,4 | JP Morgan Chase Commercial Mortgage Securities Trust Class A4 Series 2016-JP4 | 3.648% | 12/15/49 | 100 | 114 |
| 2 | JP Morgan Chase Commercial Mortgage Securities Trust Class A5 Series 2013-C10 | 3.143% | 12/15/47 | 51 | 54 |
| 2 | JP Morgan Chase Commercial Mortgage Securities Trust Class A5 Series 2013-LC11 | 2.960% | 4/15/46 | 208 | 218 |
| 2 | JP Morgan Chase Commercial Mortgage Securities Trust Class A5 Series 2014-C20 | 3.805% | 7/15/47 | 75 | 82 |
| 2 | JP Morgan Chase Commercial Mortgage Securities Trust Class A5 Series 2015-JP1 | 3.914% | 1/15/49 | 75 | 85 |
| 2 | JP Morgan Chase Commercial Mortgage Securities Trust Class A5 Series 2016-JP3 | 2.870% | 8/15/49 | 250 | 273 |
| 2 | JP Morgan Chase Commercial Mortgage Securities Trust Class AS Series 2013-C10 | 3.372% | 12/15/47 | 39 | 41 |
| 2,4 | JP Morgan Chase Commercial Mortgage Securities Trust Class AS Series 2016-JP4 | 3.870% | 12/15/49 | 75 | 84 |
| 2 | JP Morgan Chase Commercial Mortgage Securities Trust Class B Series 2013-LC11 | 3.499% | 4/15/46 | 50 | 49 |
| 2 | JPMBB Commercial Mortgage Securities Trust Class A2 Series 2014-C24 | 2.940% | 11/15/47 | 11 | 11 |
| 2 | JPMBB Commercial Mortgage Securities Trust Class A3 Series 2014-C19 | 3.669% | 4/15/47 | 50 | 50 |
| 2 | JPMBB Commercial Mortgage Securities Trust Class A3 Series 2015-C31 | 3.801% | 8/15/48 | 107 | 120 |
| 2,4 | JPMBB Commercial Mortgage Securities Trust Class A4 Series 2013-C14 | 4.133% | 8/15/46 | 100 | 106 |
| 2 | JPMBB Commercial Mortgage Securities Trust Class A4 Series 2014-C19 | 3.997% | 4/15/47 | 95 | 104 |
| | | | Coupon | Maturity
Date | Face
Amount
($000) | Market
Value•
($000) |
| 2 | JPMBB Commercial Mortgage Securities Trust Class A4 Series 2014-C22 | 3.801% | 9/15/47 | 175 | 192 |
| 2 | JPMBB Commercial Mortgage Securities Trust Class A4 Series 2014-C26 | 3.494% | 1/15/48 | 175 | 192 |
| 2 | JPMBB Commercial Mortgage Securities Trust Class A4 Series 2015-C27 | 3.179% | 2/15/48 | 59 | 64 |
| 2 | JPMBB Commercial Mortgage Securities Trust Class A4 Series 2015-C28 | 3.227% | 10/15/48 | 125 | 136 |
| 2 | JPMBB Commercial Mortgage Securities Trust Class A4 Series 2015-C29 | 3.611% | ��� 5/15/48 | 100 | 111 |
| 2 | JPMBB Commercial Mortgage Securities Trust Class A4 Series 2015-C33 | 3.770% | 12/15/48 | 82 | 93 |
| 2 | JPMBB Commercial Mortgage Securities Trust Class A5 Series 2013-C12 | 3.664% | 7/15/45 | 39 | 42 |
| 2 | JPMBB Commercial Mortgage Securities Trust Class A5 Series 2013-C15 | 4.131% | 11/15/45 | 65 | 71 |
| 2 | JPMBB Commercial Mortgage Securities Trust Class A5 Series 2014-C18 | 4.079% | 2/15/47 | 127 | 139 |
| 2 | JPMBB Commercial Mortgage Securities Trust Class A5 Series 2014-C21 | 3.775% | 8/15/47 | 25 | 27 |
| 2 | JPMBB Commercial Mortgage Securities Trust Class A5 Series 2014-C23 | 3.934% | 9/15/47 | 85 | 94 |
| 2 | JPMBB Commercial Mortgage Securities Trust Class A5 Series 2014-C24 | 3.639% | 11/15/47 | 50 | 55 |
| 2 | JPMBB Commercial Mortgage Securities Trust Class A5 Series 2014-C25 | 3.672% | 11/15/47 | 200 | 220 |
| 2 | JPMBB Commercial Mortgage Securities Trust Class A5 Series 2015-C30 | 3.822% | 7/15/48 | 100 | 112 |
| 2 | JPMBB Commercial Mortgage Securities Trust Class A5 Series 2015-C32 | 3.598% | 11/15/48 | 125 | 140 |
| 2,4 | JPMBB Commercial Mortgage Securities Trust Class AS Series 2013-C12 | 4.038% | 7/15/45 | 26 | 28 |
| 2,4 | JPMBB Commercial Mortgage Securities Trust Class AS Series 2013-C14 | 4.409% | 8/15/46 | 30 | 32 |
| 2 | JPMBB Commercial Mortgage Securities Trust Class AS Series 2013-C15 | 4.420% | 11/15/45 | 35 | 38 |
Total Bond Market Index Portfolio
| | | | Coupon | Maturity
Date | Face
Amount
($000) | Market
Value•
($000) |
| 2,4 | JPMBB Commercial Mortgage Securities Trust Class AS Series 2014-C18 | 4.439% | 2/15/47 | 25 | 27 |
| 2,4 | JPMBB Commercial Mortgage Securities Trust Class AS Series 2014-C19 | 4.243% | 4/15/47 | 50 | 55 |
| 2 | JPMBB Commercial Mortgage Securities Trust Class AS Series 2014-C22 | 4.110% | 9/15/47 | 50 | 55 |
| 2,4 | JPMBB Commercial Mortgage Securities Trust Class AS Series 2014-C23 | 4.202% | 9/15/47 | 50 | 55 |
| 2,4 | JPMBB Commercial Mortgage Securities Trust Class AS Series 2014-C24 | 3.914% | 11/15/47 | 75 | 81 |
| 2 | JPMBB Commercial Mortgage Securities Trust Class AS Series 2014-C25 | 4.065% | 11/15/47 | 50 | 55 |
| 2 | JPMBB Commercial Mortgage Securities Trust Class AS Series 2014-C26 | 3.800% | 1/15/48 | 50 | 55 |
| 2 | JPMBB Commercial Mortgage Securities Trust Class AS Series 2015-C28 | 3.532% | 10/15/48 | 50 | 54 |
| 2,4 | JPMBB Commercial Mortgage Securities Trust Class AS Series 2015-C30 | 4.226% | 7/15/48 | 50 | 56 |
| 2,4 | JPMBB Commercial Mortgage Securities Trust Class ASB Series 2013-C14 | 3.761% | 8/15/46 | 22 | 23 |
| 2 | JPMBB Commercial Mortgage Securities Trust Class ASB Series 2013-C15 | 3.659% | 11/15/45 | 6 | 6 |
| 2 | JPMBB Commercial Mortgage Securities Trust Class ASB Series 2014-C21 | 3.428% | 8/15/47 | 22 | 23 |
| 2 | JPMBB Commercial Mortgage Securities Trust Class ASB Series 2015-C27 | 3.017% | 2/15/48 | 92 | 96 |
| 2 | JPMBB Commercial Mortgage Securities Trust Class ASB Series 2015-C29 | 3.304% | 5/15/48 | 50 | 53 |
| 2 | JPMBB Commercial Mortgage Securities Trust Class ASB Series 2015-C30 | 3.559% | 7/15/48 | 111 | 116 |
| 2 | JPMBB Commercial Mortgage Securities Trust Class ASB Series 2015-C31 | 3.540% | 8/15/48 | 49 | 52 |
| 2 | JPMBB Commercial Mortgage Securities Trust Class ASB Series 2015-C32 | 3.358% | 11/15/48 | 111 | 118 |
| 2 | JPMBB Commercial Mortgage Securities Trust Class ASB Series 2016-C1 | 3.316% | 3/15/49 | 73 | 78 |
| | | | Coupon | Maturity
Date | Face
Amount
($000) | Market
Value•
($000) |
| 2,4 | JPMBB Commercial Mortgage Securities Trust Class B Series 2014-C18 | 4.794% | 2/15/47 | 30 | 32 |
| 2 | JPMBB Commercial Mortgage Securities Trust Class B Series 2014-C26 | 3.951% | 1/15/48 | 50 | 53 |
| 2 | JPMCC Commercial Mortgage Securities Trust Class A2 Series 2017-JP6 | 3.050% | 7/15/50 | 31 | 32 |
| 2 | JPMCC Commercial Mortgage Securities Trust Class A4 Series 2019-COR5 | 3.386% | 6/13/52 | 200 | 228 |
| 2 | JPMCC Commercial Mortgage Securities Trust Class A5 Series 2017-JP5 | 3.723% | 3/15/50 | 400 | 458 |
| 2 | JPMCC Commercial Mortgage Securities Trust Class A5 Series 2017-JP6 | 3.490% | 7/15/50 | 100 | 113 |
| 2 | JPMCC Commercial Mortgage Securities Trust Class A5 Series 2019-COR4 | 4.029% | 3/10/52 | 300 | 356 |
| 2 | JPMCC Commercial Mortgage Securities Trust Class AS Series 2017-JP6 | 3.744% | 7/15/50 | 100 | 112 |
| 2 | JPMCC Commercial Mortgage Securities Trust Class AS Series 2019-COR5 | 3.669% | 6/13/52 | 25 | 28 |
| 2 | JPMDB Commercial Mortgage Securities Trust Class A4 Series 2016-C2 | 3.144% | 6/15/49 | 75 | 83 |
| 2 | JPMDB Commercial Mortgage Securities Trust Class A4 Series 2018-C8 | 4.211% | 6/15/51 | 225 | 267 |
| 2 | JPMDB Commercial Mortgage Securities Trust Class A4 Series 2019-COR6 | 3.057% | 11/13/52 | 175 | 196 |
| 2 | JPMDB Commercial Mortgage Securities Trust Class A5 Series 2017-C7 | 3.409% | 10/15/50 | 75 | 85 |
| 2 | JPMDB Commercial Mortgage Securities Trust Class A5 Series 2020-COR7 | 2.180% | 5/13/53 | 50 | 52 |
| 2 | JPMDB Commercial Mortgage Securities Trust Class AS Series 2016-C2 | 3.484% | 6/15/49 | 50 | 54 |
| 2,4 | JPMDB Commercial Mortgage Securities Trust Class AS Series 2017-C7 | 3.713% | 10/15/50 | 50 | 57 |
| 2 | JPMDB Commercial Mortgage Securities Trust Class AS Series 2018-C8 | 4.421% | 6/15/51 | 25 | 29 |
| 2 | Mercedes-Benz Auto Lease Trust Class A3 Series 2020-A | 1.840% | 12/15/22 | 50 | 51 |
| 2 | Mercedes-Benz Auto Lease Trust Class A4 Series 2020-A | 1.880% | 9/15/25 | 25 | 26 |
Total Bond Market Index Portfolio
| | | | Coupon | Maturity
Date | Face
Amount
($000) | Market
Value•
($000) |
| 2 | Mercedes-Benz Auto Lease Trust Class A4 Series 2020-B | 0.500% | 6/15/26 | 10 | 10 |
| 2 | Mercedes-Benz Auto Receivables Trust Class A3 Series 2020-1 | 0.550% | 2/18/25 | 50 | 50 |
| 2 | Mercedes-Benz Auto Receivables Trust Class A4 Series 2020-1 | 0.770% | 10/15/26 | 10 | 10 |
| 2 | Morgan Stanley Bank of America Merrill Lynch Trust Class A3 Series 2017-C34 | 3.276% | 11/15/52 | 125 | 137 |
| 2 | Morgan Stanley Bank of America Merrill Lynch Trust Class A4 Series 2012-C5 | 3.176% | 8/15/45 | 100 | 103 |
| 2,4 | Morgan Stanley Bank of America Merrill Lynch Trust Class A4 Series 2013-C11 | 4.152% | 8/15/46 | 40 | 43 |
| 2,4 | Morgan Stanley Bank of America Merrill Lynch Trust Class A4 Series 2013-C12 | 4.259% | 10/15/46 | 100 | 109 |
| 2 | Morgan Stanley Bank of America Merrill Lynch Trust Class A4 Series 2013-C7 | 2.918% | 2/15/46 | 68 | 71 |
| 2 | Morgan Stanley Bank of America Merrill Lynch Trust Class A4 Series 2013-C8 | 3.134% | 12/15/48 | 100 | 105 |
| 2 | Morgan Stanley Bank of America Merrill Lynch Trust Class A4 Series 2013-C9 | 3.102% | 5/15/46 | 50 | 53 |
| 2 | Morgan Stanley Bank of America Merrill Lynch Trust Class A4 Series 2014-C19 | 3.526% | 12/15/47 | 75 | 82 |
| 2 | Morgan Stanley Bank of America Merrill Lynch Trust Class A4 Series 2015-C20 | 3.249% | 2/15/48 | 200 | 217 |
| 2 | Morgan Stanley Bank of America Merrill Lynch Trust Class A4 Series 2015-C22 | 3.306% | 4/15/48 | 75 | 82 |
| 2 | Morgan Stanley Bank of America Merrill Lynch Trust Class A4 Series 2015-C23 | 3.719% | 7/15/50 | 125 | 140 |
| 2 | Morgan Stanley Bank of America Merrill Lynch Trust Class A4 Series 2015-C24 | 3.732% | 5/15/48 | 75 | 84 |
| 2 | Morgan Stanley Bank of America Merrill Lynch Trust Class A4 Series 2015-C27 | 3.753% | 12/15/47 | 75 | 84 |
| 2 | Morgan Stanley Bank of America Merrill Lynch Trust Class A4 Series 2016-C28 | 3.544% | 1/15/49 | 225 | 252 |
| 2 | Morgan Stanley Bank of America Merrill Lynch Trust Class A4 Series 2017-C34 | 3.536% | 11/15/52 | 150 | 170 |
| 2 | Morgan Stanley Bank of America Merrill Lynch Trust Class A5 Series 2014-C14 | 4.064% | 2/15/47 | 100 | 108 |
| | | | Coupon | Maturity
Date | Face
Amount
($000) | Market
Value•
($000) |
| 2 | Morgan Stanley Bank of America Merrill Lynch Trust Class A5 Series 2014-C16 | 3.892% | 6/15/47 | 100 | 109 |
| 2 | Morgan Stanley Bank of America Merrill Lynch Trust Class A5 Series 2015-C25 | 3.635% | 10/15/48 | 75 | 84 |
| 2 | Morgan Stanley Bank of America Merrill Lynch Trust Class A5 Series 2015-C26 | 3.531% | 10/15/48 | 75 | 84 |
| 2 | Morgan Stanley Bank of America Merrill Lynch Trust Class A5 Series 2016-C30 | 2.860% | 9/15/49 | 200 | 219 |
| 2 | Morgan Stanley Bank of America Merrill Lynch Trust Class A5 Series 2016-C31 | 3.102% | 11/15/49 | 250 | 276 |
| 2 | Morgan Stanley Bank of America Merrill Lynch Trust Class A5 Series 2017-C33 | 3.599% | 5/15/50 | 150 | 170 |
| 2,4 | Morgan Stanley Bank of America Merrill Lynch Trust Class AS Series 2013-C11 | 4.352% | 8/15/46 | 20 | 19 |
| 2 | Morgan Stanley Bank of America Merrill Lynch Trust Class AS Series 2013-C7 | 3.214% | 2/15/46 | 14 | 14 |
| 2 | Morgan Stanley Bank of America Merrill Lynch Trust Class AS Series 2013-C8 | 3.376% | 12/15/48 | 50 | 52 |
| 2 | Morgan Stanley Bank of America Merrill Lynch Trust Class AS Series 2013-C9 | 3.456% | 5/15/46 | 50 | 52 |
| 2 | Morgan Stanley Bank of America Merrill Lynch Trust Class AS Series 2017-C33 | 3.852% | 5/15/50 | 100 | 112 |
| 2 | Morgan Stanley Bank of America Merrill Lynch Trust Class ASB Series 2014-C16 | 3.477% | 6/15/47 | 17 | 18 |
| 2 | Morgan Stanley Bank of America Merrill Lynch Trust Class ASB Series 2014-C19 | 3.326% | 12/15/47 | 41 | 43 |
| 2 | Morgan Stanley Bank of America Merrill Lynch Trust Class ASB Series 2015-C20 | 3.069% | 2/15/48 | 42 | 44 |
| 2 | Morgan Stanley Bank of America Merrill Lynch Trust Class ASB Series 2015-C22 | 3.040% | 4/15/48 | 89 | 94 |
| 2 | Morgan Stanley Bank of America Merrill Lynch Trust Class ASB Series 2015-C23 | 3.398% | 7/15/50 | 46 | 48 |
| 2 | Morgan Stanley Bank of America Merrill Lynch Trust Class ASB Series 2015-C25 | 3.383% | 10/15/48 | 120 | 127 |
| 2 | Morgan Stanley Bank of America Merrill Lynch Trust Class ASB Series 2015-C26 | 3.323% | 10/15/48 | 72 | 77 |
Total Bond Market Index Portfolio
| | | | Coupon | Maturity
Date | Face
Amount
($000) | Market
Value•
($000) |
| 2 | Morgan Stanley Bank of America Merrill Lynch Trust Class ASB Series 2015-C27 | 3.557% | 12/15/47 | 49 | 52 |
| 2 | Morgan Stanley Bank of America Merrill Lynch Trust Class ASB Series 2016-C28 | 3.288% | 1/15/49 | 100 | 105 |
| 2,4 | Morgan Stanley Bank of America Merrill Lynch Trust Class B Series 2014-C14 | 4.860% | 2/15/47 | 100 | 107 |
| 2,4 | Morgan Stanley Bank of America Merrill Lynch Trust Class B Series 2014-C16 | 4.335% | 6/15/47 | 50 | 51 |
| 2,4 | Morgan Stanley Bank of America Merrill Lynch Trust Class B Series 2014-C18 | 4.481% | 10/15/47 | 50 | 54 |
| 2,4 | Morgan Stanley Bank of America Merrill Lynch Trust Class B Series 2015-C22 | 3.883% | 4/15/48 | 50 | 52 |
| 2 | Morgan Stanley Capital I Trust Class A3 Series 2019-L2 | 3.806% | 3/15/52 | 50 | 58 |
| 2 | Morgan Stanley Capital I Trust Class A3 Series 2020-L4 | 2.698% | 2/15/53 | 175 | 190 |
| 2 | Morgan Stanley Capital I Trust Class A4 Series 2012-C4 | 3.244% | 3/15/45 | 350 | 356 |
| 2 | Morgan Stanley Capital I Trust Class A4 Series 2015-UBS8 | 3.809% | 12/15/48 | 75 | 84 |
| 2 | Morgan Stanley Capital I Trust Class A4 Series 2016-BNK2 | 3.049% | 11/15/49 | 100 | 110 |
| 2 | Morgan Stanley Capital I Trust Class A4 Series 2016-UB11 | 2.782% | 8/15/49 | 200 | 218 |
| 2 | Morgan Stanley Capital I Trust Class A4 Series 2016-UBS12 | 3.596% | 12/15/49 | 200 | 226 |
| 2 | Morgan Stanley Capital I Trust Class A4 Series 2019-H6 | 3.417% | 6/15/52 | 250 | 283 |
| 2 | Morgan Stanley Capital I Trust Class A4 Series 2019-L2 | 4.071% | 3/15/52 | 150 | 177 |
| 2 | Morgan Stanley Capital I Trust Class A4 Series 2019-L3 | 3.127% | 11/15/52 | 200 | 223 |
| 2 | Morgan Stanley Capital I Trust Class A5 Series 2017-H1 | 3.530% | 6/15/50 | 150 | 170 |
| 2 | Morgan Stanley Capital I Trust Class AS Series 2012-C4 | 3.773% | 3/15/45 | 75 | 76 |
| 2 | Morgan Stanley Capital I Trust Class AS Series 2016-BNK2 | 3.282% | 11/15/49 | 83 | 91 |
| 2 | Morgan Stanley Capital I Trust Class AS Series 2019-H6 | 3.700% | 6/15/52 | 25 | 28 |
| 2 | Morgan Stanley Capital I Trust Class AS Series 2020-L4 | 2.880% | 2/15/53 | 25 | 27 |
| 2 | Nissan Auto Lease Trust Class A3 Series 2020-A | 1.840% | 1/17/23 | 50 | 51 |
| 2 | Nissan Auto Lease Trust Class A4 Series 2020-A | 1.880% | 4/15/25 | 25 | 26 |
| | | | Coupon | Maturity
Date | Face
Amount
($000) | Market
Value•
($000) |
| 2 | Nissan Auto Receivables Owner Trust Class A3 Series 2018-A | 2.650% | 5/16/22 | 28 | 29 |
| 2 | Nissan Auto Receivables Owner Trust Class A3 Series 2019-B | 2.500% | 11/15/23 | 125 | 127 |
| 2 | Nissan Auto Receivables Owner Trust Class A3 Series 2019-C | 1.930% | 7/15/24 | 150 | 153 |
| 2 | Nissan Auto Receivables Owner Trust Class A3 Series 2020-A | 0.550% | 7/15/24 | 50 | 50 |
| 2 | Nissan Auto Receivables Owner Trust Class A3 Series 2020-A | 1.380% | 12/16/24 | 50 | 51 |
| 2 | Nissan Auto Receivables Owner Trust Class A4 Series 2017-B | 1.950% | 10/16/23 | 99 | 99 |
| 2 | Nissan Auto Receivables Owner Trust Class A4 Series 2018-A | 2.890% | 6/17/24 | 100 | 102 |
| 2 | Nissan Auto Receivables Owner Trust Class A4 Series 2019-B | 2.540% | 12/15/25 | 30 | 31 |
| 2 | Nissan Auto Receivables Owner Trust Class A4 Series 2019-C | 1.950% | 5/15/26 | 35 | 36 |
| 2 | Santander Drive Auto Receivables Trust Class B Series 2020-2 | 0.960% | 11/15/24 | 25 | 25 |
| 2 | Santander Drive Auto Receivables Trust Class B Series 2020-3 | 0.690% | 3/17/25 | 25 | 25 |
| 2 | Santander Drive Auto Receivables Trust Class B Series 2020-4 | 0.730% | 3/17/25 | 25 | 25 |
| 2 | Santander Drive Auto Receivables Trust Class C Series 2018-2 | 3.350% | 7/17/23 | 28 | 28 |
| 2 | Santander Drive Auto Receivables Trust Class C Series 2018-3 | 3.510% | 8/15/23 | 28 | 28 |
| 2 | Santander Drive Auto Receivables Trust Class C Series 2020-2 | 1.460% | 9/15/25 | 25 | 25 |
| 2 | Santander Drive Auto Receivables Trust Class C Series 2020-3 | 1.120% | 1/15/26 | 25 | 25 |
| 2 | Santander Drive Auto Receivables Trust Class C Series 2020-4 | 1.010% | 1/15/26 | 25 | 25 |
| 2 | Synchrony Card Issuance Trust Class A Series 2018-A1 | 3.380% | 9/15/24 | 275 | 281 |
| 2 | Synchrony Credit Card Master Note Trust Class A Series 2016-2 | 2.210% | 5/15/24 | 373 | 375 |
| 2 | Synchrony Credit Card Master Note Trust Class A Series 2017-2 | 2.620% | 10/15/25 | 150 | 156 |
| 2 | Synchrony Credit Card Master Note Trust Class A Series 2018-1 | 2.970% | 3/15/24 | 275 | 276 |
| 2 | Synchrony Credit Card Master Note Trust Class A Series 2018-2 | 3.470% | 5/15/26 | 275 | 294 |
| 2 | Toyota Auto Receivables Owner Trust Class A3 Series 2017-D | 1.930% | 1/18/22 | 27 | 27 |
| 2 | Toyota Auto Receivables Owner Trust Class A3 Series 2018-A | 2.350% | 5/16/22 | 31 | 31 |
Total Bond Market Index Portfolio
| | | | Coupon | Maturity
Date | Face
Amount
($000) | Market
Value•
($000) |
| 2 | Toyota Auto Receivables Owner Trust Class A3 Series 2018-B | 2.960% | 9/15/22 | 58 | 59 |
| 2 | Toyota Auto Receivables Owner Trust Class A3 Series 2020-A | 1.660% | 5/15/24 | 135 | 138 |
| 2 | Toyota Auto Receivables Owner Trust Class A3 Series 2020-B | 1.360% | 8/15/24 | 10 | 10 |
| 2 | Toyota Auto Receivables Owner Trust Class A3 Series 2020-D | 0.350% | 1/15/25 | 75 | 75 |
| 2 | Toyota Auto Receivables Owner Trust Class A4 Series 2018-A | 2.520% | 5/15/23 | 50 | 51 |
| 2 | Toyota Auto Receivables Owner Trust Class A4 Series 2018-B | 3.110% | 11/15/23 | 25 | 26 |
| 2 | Toyota Auto Receivables Owner Trust Class A4 Series 2020-A | 1.680% | 5/15/25 | 25 | 26 |
| 2 | Toyota Auto Receivables Owner Trust Class A4 Series 2020-D | 0.470% | 1/15/26 | 25 | 25 |
| 2 | UBS Commercial Mortgage Trust Class A2 Series 2018-C13 | 4.208% | 10/15/51 | 24 | 26 |
| 2 | UBS Commercial Mortgage Trust Class A3 Series 2017-C4 | 3.301% | 10/15/50 | 100 | 110 |
| 2 | UBS Commercial Mortgage Trust Class A3 Series 2018-C8 | 3.720% | 2/15/51 | 150 | 172 |
| 2 | UBS Commercial Mortgage Trust Class A4 Series 2017-C1 | 3.460% | 6/15/50 | 100 | 112 |
| 2 | UBS Commercial Mortgage Trust Class A4 Series 2017-C2 | 3.487% | 8/15/50 | 150 | 171 |
| 2 | UBS Commercial Mortgage Trust Class A4 Series 2017-C3 | 3.426% | 8/15/50 | 175 | 198 |
| 2 | UBS Commercial Mortgage Trust Class A4 Series 2017-C4 | 3.563% | 10/15/50 | 150 | 169 |
| 2 | UBS Commercial Mortgage Trust Class A4 Series 2017-C7 | 3.679% | 12/15/50 | 150 | 173 |
| 2 | UBS Commercial Mortgage Trust Class A4 Series 2018-C13 | 4.334% | 10/15/51 | 75 | 90 |
| 2 | UBS Commercial Mortgage Trust Class A4 Series 2018-C14 | 4.448% | 12/15/51 | 225 | 271 |
| 2 | UBS Commercial Mortgage Trust Class A4 Series 2018-C15 | 4.341% | 12/15/51 | 125 | 149 |
| 2 | UBS Commercial Mortgage Trust Class A4 Series 2018-C8 | 3.983% | 2/15/51 | 275 | 322 |
| | | | Coupon | Maturity
Date | Face
Amount
($000) | Market
Value•
($000) |
| 2 | UBS Commercial Mortgage Trust Class A4 Series 2019-C16 | 3.605% | 4/15/52 | 100 | 115 |
| 2 | UBS Commercial Mortgage Trust Class A4 Series 2019-C17 | 2.921% | 10/15/52 | 125 | 137 |
| 2 | UBS Commercial Mortgage Trust Class A4 Series 2019-C18 | 3.035% | 12/15/52 | 75 | 83 |
| 2 | UBS Commercial Mortgage Trust Class A5 Series 2017-C5 | 3.474% | 11/15/50 | 100 | 113 |
| 2,4 | UBS Commercial Mortgage Trust Class A5 Series 2018-C11 | 4.241% | 6/15/51 | 125 | 147 |
| 2 | UBS Commercial Mortgage Trust Class A5 Series 2018-C12 | 4.296% | 8/15/51 | 100 | 119 |
| 2 | UBS Commercial Mortgage Trust Class AS Series 2017-C1 | 3.724% | 6/15/50 | 50 | 56 |
| 2,4 | UBS Commercial Mortgage Trust Class AS Series 2017-C2 | 3.740% | 8/15/50 | 50 | 56 |
| 2,4 | UBS Commercial Mortgage Trust Class AS Series 2017-C3 | 3.739% | 8/15/50 | 75 | 84 |
| 2,4 | UBS Commercial Mortgage Trust Class AS Series 2017-C4 | 3.836% | 10/15/50 | 62 | 70 |
| 2,4 | UBS Commercial Mortgage Trust Class AS Series 2017-C7 | 4.061% | 12/15/50 | 100 | 112 |
| 2,4 | UBS Commercial Mortgage Trust Class AS Series 2018-C8 | 4.215% | 2/15/51 | 75 | 87 |
| 2 | UBS-Barclays Commercial Mortgage Trust Class A4 Series 2013-C5 | 3.185% | 3/10/46 | 104 | 109 |
| 2 | UBS-Barclays Commercial Mortgage Trust Class A4 Series 2013-C6 | 3.244% | 4/10/46 | 165 | 173 |
| 2 | UBS-Barclays Commercial Mortgage Trust Class A4 Series 2018-C10 | 4.313% | 5/15/51 | 175 | 207 |
| 2,4 | UBS-Barclays Commercial Mortgage Trust Class A4 Series 2018-C9 | 4.117% | 3/15/51 | 275 | 322 |
| 2 | UBS-Barclays Commercial Mortgage Trust Class AS Series 2013-C6 | 3.469% | 4/10/46 | 25 | 26 |
| 2 | UBS-Barclays Commercial Mortgage Trust Class AS Series 2019-C16 | 3.887% | 4/15/52 | 25 | 29 |
Total Bond Market Index Portfolio
| | | | Coupon | Maturity
Date | Face
Amount
($000) | Market
Value•
($000) |
| 2 | Wells Fargo Commercial Mortgage Trust Class A2 Series 2015-NXS1 | 2.632% | 5/15/48 | 7 | 7 |
| 2 | Wells Fargo Commercial Mortgage Trust Class A3 Series 2012-LC5 | 2.918% | 10/15/45 | 62 | 64 |
| 2 | Wells Fargo Commercial Mortgage Trust Class A3 Series 2014-LC18 | 3.271% | 12/15/47 | 42 | 43 |
| 2 | Wells Fargo Commercial Mortgage Trust Class A3 Series 2016-BNK1 | 2.652% | 8/15/49 | 150 | 162 |
| 2 | Wells Fargo Commercial Mortgage Trust Class A3 Series 2016-C36 | 2.807% | 11/15/59 | 50 | 54 |
| 2 | Wells Fargo Commercial Mortgage Trust Class A3 Series 2017-C40 | 3.317% | 10/15/50 | 100 | 110 |
| 2 | Wells Fargo Commercial Mortgage Trust Class A4 Series 2015-C26 | 3.166% | 2/15/48 | 75 | 82 |
| 2 | Wells Fargo Commercial Mortgage Trust Class A4 Series 2015-C27 | 3.190% | 2/15/48 | 234 | 249 |
| 2 | Wells Fargo Commercial Mortgage Trust Class A4 Series 2015-C28 | 3.540% | 5/15/48 | 175 | 194 |
| 2 | Wells Fargo Commercial Mortgage Trust Class A4 Series 2015-C29 | 3.637% | 6/15/48 | 175 | 195 |
| 2 | Wells Fargo Commercial Mortgage Trust Class A4 Series 2015-LC22 | 3.839% | 9/15/58 | 75 | 85 |
| 2 | Wells Fargo Commercial Mortgage Trust Class A4 Series 2015-P2 | 3.809% | 12/15/48 | 50 | 57 |
| 2 | Wells Fargo Commercial Mortgage Trust Class A4 Series 2015-SG1 | 3.789% | 9/15/48 | 209 | 232 |
| 2 | Wells Fargo Commercial Mortgage Trust Class A4 Series 2016-C32 | 3.560% | 1/15/59 | 125 | 139 |
| 2 | Wells Fargo Commercial Mortgage Trust Class A4 Series 2016-C33 | 3.426% | 3/15/59 | 325 | 364 |
| 2 | Wells Fargo Commercial Mortgage Trust Class A4 Series 2016-C34 | 3.096% | 6/15/49 | 75 | 81 |
| 2 | Wells Fargo Commercial Mortgage Trust Class A4 Series 2016-LC24 | 2.942% | 10/15/49 | 162 | 178 |
| 2 | Wells Fargo Commercial Mortgage Trust Class A4 Series 2017-C40 | 3.581% | 10/15/50 | 150 | 171 |
| | | | Coupon | Maturity
Date | Face
Amount
($000) | Market
Value•
($000) |
| 2 | Wells Fargo Commercial Mortgage Trust Class A4 Series 2017-C41 | 3.472% | 11/15/50 | 250 | 283 |
| 2,4 | Wells Fargo Commercial Mortgage Trust Class A4 Series 2018-C43 | 4.012% | 3/15/51 | 275 | 322 |
| 2 | Wells Fargo Commercial Mortgage Trust Class A4 Series 2018-C45 | 4.184% | 6/15/51 | 200 | 236 |
| 2 | Wells Fargo Commercial Mortgage Trust Class A4 Series 2018-C46 | 4.152% | 8/15/51 | 75 | 88 |
| 2 | Wells Fargo Commercial Mortgage Trust Class A4 Series 2018-C47 | 4.442% | 9/15/61 | 150 | 180 |
| 2 | Wells Fargo Commercial Mortgage Trust Class A4 Series 2019-C51 | 3.311% | 6/15/52 | 200 | 227 |
| 2 | Wells Fargo Commercial Mortgage Trust Class A4 Series 2019-C53 | 3.040% | 10/15/52 | 200 | 224 |
| 2 | Wells Fargo Commercial Mortgage Trust Class A4 Series 2019-C54 | 3.146% | 12/15/52 | 100 | 113 |
| 2 | Wells Fargo Commercial Mortgage Trust Class A4 Series 2020-C58 | 2.092% | 7/15/53 | 50 | 52 |
| 2 | Wells Fargo Commercial Mortgage Trust Class A5 Series 2014-LC16 | 3.817% | 8/15/50 | 75 | 82 |
| 2 | Wells Fargo Commercial Mortgage Trust Class A5 Series 2014-LC18 | 3.405% | 12/15/47 | 125 | 137 |
| 2 | Wells Fargo Commercial Mortgage Trust Class A5 Series 2015-LC20 | 3.184% | 4/15/50 | 276 | 302 |
| 2 | Wells Fargo Commercial Mortgage Trust Class A5 Series 2015-NXS1 | 3.148% | 5/15/48 | 50 | 55 |
| 2 | Wells Fargo Commercial Mortgage Trust Class A5 Series 2016-C37 | 3.794% | 12/15/49 | 100 | 114 |
| 2 | Wells Fargo Commercial Mortgage Trust Class A5 Series 2017-C38 | 3.453% | 7/15/50 | 192 | 218 |
| 2 | Wells Fargo Commercial Mortgage Trust Class A5 Series 2017-C39 | 3.418% | 9/15/50 | 175 | 198 |
| 2 | Wells Fargo Commercial Mortgage Trust Class A5 Series 2018-C44 | 4.212% | 5/15/51 | 175 | 206 |
| 2 | Wells Fargo Commercial Mortgage Trust Class A5 Series 2019-C49 | 4.023% | 3/15/52 | 225 | 266 |
Total Bond Market Index Portfolio
| | | | Coupon | Maturity
Date | Face
Amount
($000) | Market
Value•
($000) |
| 2 | Wells Fargo Commercial Mortgage Trust Class A5 Series 2019-C50 | 3.729% | 5/15/52 | 125 | 145 |
| 2 | Wells Fargo Commercial Mortgage Trust Class A5 Series 2019-C52 | 2.892% | 8/15/52 | 270 | 298 |
| 2 | Wells Fargo Commercial Mortgage Trust Class A5 Series 2020-C55 | 2.725% | 2/15/53 | 165 | 181 |
| 2 | Wells Fargo Commercial Mortgage Trust Class A5 Series 2020-C56 | 2.448% | 6/15/53 | 50 | 54 |
| 2 | Wells Fargo Commercial Mortgage Trust Class AS Series 2014-LC18 | 3.808% | 12/15/47 | 75 | 83 |
| 2 | Wells Fargo Commercial Mortgage Trust Class AS Series 2015-C26 | 3.580% | 2/15/48 | 50 | 54 |
| 2,4 | Wells Fargo Commercial Mortgage Trust Class AS Series 2015-C28 | 3.872% | 5/15/48 | 31 | 34 |
| 2,4 | Wells Fargo Commercial Mortgage Trust Class AS Series 2015-LC22 | 4.207% | 9/15/58 | 75 | 84 |
| 2,4 | Wells Fargo Commercial Mortgage Trust Class AS Series 2017-C38 | 3.665% | 7/15/50 | 54 | 60 |
| 2 | Wells Fargo Commercial Mortgage Trust Class AS Series 2017-C39 | 3.702% | 9/15/50 | 100 | 112 |
| 2,4 | Wells Fargo Commercial Mortgage Trust Class AS Series 2017-C40 | 3.854% | 10/15/50 | 25 | 28 |
| 2,4 | Wells Fargo Commercial Mortgage Trust Class AS Series 2018-C43 | 4.152% | 3/15/51 | 50 | 58 |
| 2 | Wells Fargo Commercial Mortgage Trust Class AS Series 2019-C52 | 3.143% | 8/15/52 | 100 | 111 |
| 2 | Wells Fargo Commercial Mortgage Trust Class ASB Series 2015-C26 | 2.991% | 2/15/48 | 107 | 112 |
| 2 | Wells Fargo Commercial Mortgage Trust Class ASB Series 2015-C29 | 3.400% | 6/15/48 | 111 | 117 |
| 2 | Wells Fargo Commercial Mortgage Trust Class ASB Series 2015-LC20 | 2.978% | 4/15/50 | 25 | 27 |
| 2 | Wells Fargo Commercial Mortgage Trust Class ASB Series 2015-LC22 | 3.571% | 9/15/58 | 47 | 50 |
| 2 | Wells Fargo Commercial Mortgage Trust Class ASB Series 2015-NXS1 | 2.934% | 5/15/48 | 42 | 43 |
| | | | Coupon | Maturity
Date | Face
Amount
($000) | Market
Value•
($000) |
| 2 | Wells Fargo Commercial Mortgage Trust Class ASB Series 2015-P2 | 3.656% | 12/15/48 | 100 | 107 |
| 2 | Wells Fargo Commercial Mortgage Trust Class ASB Series 2016-C32 | 3.324% | 1/15/59 | 58 | 62 |
| 2 | Wells Fargo Commercial Mortgage Trust Class ASB Series 2016-LC24 | 2.825% | 10/15/49 | 100 | 105 |
| 2 | Wells Fargo Commercial Mortgage Trust Class B Series 2015-LC20 | 3.719% | 4/15/50 | 50 | 53 |
| 2 | WFRBS Commercial Mortgage Trust Class A2 Series 2012-C7 | 3.431% | 6/15/45 | 125 | 128 |
| 2 | WFRBS Commercial Mortgage Trust Class A3 Series 2012-C8 | 3.001% | 8/15/45 | 75 | 77 |
| 2 | WFRBS Commercial Mortgage Trust Class A3 Series 2012-C9 | 2.870% | 11/15/45 | 122 | 126 |
| 2 | WFRBS Commercial Mortgage Trust Class A3 Series 2014-C19 | 3.660% | 3/15/47 | 18 | 18 |
| 2 | WFRBS Commercial Mortgage Trust Class A3 Series 2014-C24 | 3.428% | 11/15/47 | 38 | 39 |
| 2 | WFRBS Commercial Mortgage Trust Class A4 Series 2012-C6 | 3.440% | 4/15/45 | 166 | 168 |
| 2 | WFRBS Commercial Mortgage Trust Class A4 Series 2013-C12 | 3.198% | 3/15/48 | 39 | 41 |
| 2 | WFRBS Commercial Mortgage Trust Class A4 Series 2013-C13 | 3.001% | 5/15/45 | 76 | 80 |
| 2,4 | WFRBS Commercial Mortgage Trust Class A4 Series 2013-C15 | 4.153% | 8/15/46 | 100 | 108 |
| 2 | WFRBS Commercial Mortgage Trust Class A4 Series 2013-C17 | 4.023% | 12/15/46 | 25 | 27 |
| 2 | WFRBS Commercial Mortgage Trust Class A5 Series 2013-C11 | 3.071% | 3/15/45 | 94 | 98 |
| 2 | WFRBS Commercial Mortgage Trust Class A5 Series 2013-C14 | 3.337% | 6/15/46 | 150 | 159 |
| 2 | WFRBS Commercial Mortgage Trust Class A5 Series 2013-C16 | 4.415% | 9/15/46 | 30 | 33 |
| 2 | WFRBS Commercial Mortgage Trust Class A5 Series 2014-C19 | 4.101% | 3/15/47 | 50 | 55 |
| 2 | WFRBS Commercial Mortgage Trust Class A5 Series 2014-C20 | 3.995% | 5/15/47 | 25 | 27 |
Total Bond Market Index Portfolio
| | | | Coupon | Maturity
Date | Face
Amount
($000) | Market
Value•
($000) |
| 2 | WFRBS Commercial Mortgage Trust Class A5 Series 2014-C21 | 3.678% | 8/15/47 | 75 | 82 |
| 2 | WFRBS Commercial Mortgage Trust Class A5 Series 2014-C22 | 3.752% | 9/15/57 | 150 | 165 |
| 2 | WFRBS Commercial Mortgage Trust Class A5 Series 2014-C23 | 3.917% | 10/15/57 | 50 | 55 |
| 2 | WFRBS Commercial Mortgage Trust Class A5 Series 2014-C24 | 3.607% | 11/15/47 | 65 | 71 |
| 2 | WFRBS Commercial Mortgage Trust Class A5 Series 2014-LC14 | 4.045% | 3/15/47 | 140 | 153 |
| 2,4 | WFRBS Commercial Mortgage Trust Class AS Series 2012-C7 | 4.090% | 6/15/45 | 100 | 101 |
| 2 | WFRBS Commercial Mortgage Trust Class AS Series 2013-C12 | 3.560% | 3/15/48 | 18 | 19 |
| 2 | WFRBS Commercial Mortgage Trust Class AS Series 2013-C13 | 3.345% | 5/15/45 | 15 | 16 |
| 2 | WFRBS Commercial Mortgage Trust Class AS Series 2013-C14 | 3.488% | 6/15/46 | 75 | 78 |
| 2,4 | WFRBS Commercial Mortgage Trust Class AS Series 2013-C15 | 4.358% | 8/15/46 | 20 | 21 |
| 2,4 | WFRBS Commercial Mortgage Trust Class AS Series 2013-C16 | 4.668% | 9/15/46 | 50 | 54 |
| 2 | WFRBS Commercial Mortgage Trust Class AS Series 2013-C17 | 4.255% | 12/15/46 | 25 | 27 |
| 2 | WFRBS Commercial Mortgage Trust Class AS Series 2014-C20 | 4.176% | 5/15/47 | 25 | 27 |
| 2,4 | WFRBS Commercial Mortgage Trust Class AS Series 2014-LC14 | 4.351% | 3/15/47 | 60 | 65 |
| 2 | WFRBS Commercial Mortgage Trust Class ASB Series 2013-C15 | 3.720% | 8/15/46 | 10 | 10 |
| 2 | WFRBS Commercial Mortgage Trust Class ASB Series 2013-C16 | 3.963% | 9/15/46 | 18 | 19 |
| 2 | WFRBS Commercial Mortgage Trust Class ASB Series 2013-C17 | 3.558% | 12/15/46 | 15 | 16 |
| 2 | WFRBS Commercial Mortgage Trust Class ASB Series 2014-C19 | 3.618% | 3/15/47 | 17 | 17 |
| | | | Coupon | Maturity
Date | Face
Amount
($000) | Market
Value•
($000) |
| 2 | WFRBS Commercial Mortgage Trust Class ASB Series 2014-C20 | 3.638% | 5/15/47 | 17 | 18 |
| 2 | WFRBS Commercial Mortgage Trust Class ASB Series 2014-C23 | 3.636% | 10/15/57 | 60 | 63 |
| 2 | WFRBS Commercial Mortgage Trust Class ASB Series 2014-LC14 | 3.522% | 3/15/47 | 38 | 39 |
| 2,4 | WFRBS Commercial Mortgage Trust Class B Series 2013-C17 | 4.788% | 12/15/46 | 25 | 27 |
| 2,4 | WFRBS Commercial Mortgage Trust Class B Series 2014-C19 | 4.723% | 3/15/47 | 25 | 27 |
| 2,4 | WFRBS Commercial Mortgage Trust Class B Series 2014-C22 | 4.371% | 9/15/57 | 25 | 27 |
| 2 | World Financial Network Credit Card Master Note Trust Class A Series 2018-A | 3.070% | 12/16/24 | 200 | 201 |
| 2 | World Omni Auto Receivables Trust Class A3 Series 2019-C | 1.960% | 12/16/24 | 125 | 127 |
| 2 | World Omni Auto Receivables Trust Class A3 Series 2020-A | 1.700% | 1/17/23 | 50 | 51 |
| 2 | World Omni Auto Receivables Trust Class A3 Series 2020-A | 1.100% | 4/15/25 | 90 | 91 |
| 2 | World Omni Auto Receivables Trust Class A3 Series 2020-B | 0.630% | 5/15/25 | 50 | 50 |
| 2 | World Omni Auto Receivables Trust Class A3 Series 2020-C | 0.480% | 11/17/25 | 50 | 50 |
| 2 | World Omni Auto Receivables Trust Class A4 Series 2020-A | 1.790% | 6/16/25 | 25 | 26 |
| 2 | World Omni Auto Receivables Trust Class A4 Series 2020-B | 0.820% | 1/15/26 | 10 | 10 |
| 2 | World Omni Auto Receivables Trust Class A4 Series 2020-C | 0.610% | 10/15/26 | 25 | 25 |
| 2 | World Omni Automobile Lease Securitization Trust Class A3 Series 2020-B | 0.450% | 2/15/24 | 100 | 100 |
| 2 | World Omni Automobile Lease Securitization Trust Class A4 Series 2020-B | 0.520% | 2/17/26 | 25 | 25 |
| 2 | World Omni Select Auto Trust Class A3 Series 2020-A | 0.550% | 7/15/25 | 25 | 25 |
| Total Asset-Backed/Commercial Mortgage-Backed Securities (Cost $120,519) | 128,762 |
| Corporate Bonds (29.8%) |
| Communications (2.7%) |
| | Activision Blizzard Inc. | 3.400% | 9/15/26 | 160 | 182 |
| | Activision Blizzard Inc. | 1.350% | 9/15/30 | 150 | 147 |
| | Activision Blizzard Inc. | 4.500% | 6/15/47 | 200 | 260 |
| | Activision Blizzard Inc. | 2.500% | 9/15/50 | 300 | 290 |
| | Alphabet Inc. | 0.450% | 8/15/25 | 500 | 500 |
| | Alphabet Inc. | 0.800% | 8/15/27 | 500 | 498 |
| | Alphabet Inc. | 1.100% | 8/15/30 | 500 | 492 |
| | Alphabet Inc. | 1.900% | 8/15/40 | 200 | 195 |
| | Alphabet Inc. | 2.050% | 8/15/50 | 500 | 477 |
Total Bond Market Index Portfolio
| | | | Coupon | Maturity
Date | Face
Amount
($000) | Market
Value•
($000) |
| | Alphabet Inc. | 2.250% | 8/15/60 | 500 | 479 |
| | America Movil SAB de CV | 3.125% | 7/16/22 | 300 | 312 |
| | America Movil SAB de CV | 3.625% | 4/22/29 | 200 | 226 |
| | America Movil SAB de CV | 2.875% | 5/7/30 | 200 | 217 |
| | America Movil SAB de CV | 6.375% | 3/1/35 | 300 | 450 |
| | America Movil SAB de CV | 6.125% | 11/15/37 | 150 | 214 |
| | America Movil SAB de CV | 6.125% | 3/30/40 | 200 | 295 |
| | America Movil SAB de CV | 4.375% | 7/16/42 | 250 | 312 |
| | America Movil SAB de CV | 4.375% | 4/22/49 | 400 | 514 |
| | AT&T Inc. | 3.000% | 6/30/22 | 767 | 793 |
| | AT&T Inc. | 4.050% | 12/15/23 | 100 | 110 |
| | AT&T Inc. | 4.450% | 4/1/24 | 250 | 279 |
| | AT&T Inc. | 3.950% | 1/15/25 | 268 | 301 |
| | AT&T Inc. | 3.400% | 5/15/25 | 940 | 1,043 |
| | AT&T Inc. | 3.600% | 7/15/25 | 275 | 309 |
| | AT&T Inc. | 4.125% | 2/17/26 | 515 | 595 |
| | AT&T Inc. | 3.800% | 2/15/27 | 700 | 804 |
| | AT&T Inc. | 2.300% | 6/1/27 | 450 | 480 |
| | AT&T Inc. | 1.650% | 2/1/28 | 500 | 509 |
| | AT&T Inc. | 4.100% | 2/15/28 | 402 | 472 |
| | AT&T Inc. | 4.350% | 3/1/29 | 650 | 773 |
| | AT&T Inc. | 4.300% | 2/15/30 | 660 | 788 |
| | AT&T Inc. | 2.750% | 6/1/31 | 450 | 480 |
| | AT&T Inc. | 2.250% | 2/1/32 | 600 | 608 |
| 5 | AT&T Inc. | 2.550% | 12/1/33 | 472 | 485 |
| | AT&T Inc. | 4.500% | 5/15/35 | 200 | 242 |
| | AT&T Inc. | 5.250% | 3/1/37 | 500 | 645 |
| | AT&T Inc. | 4.900% | 8/15/37 | 300 | 374 |
| | AT&T Inc. | 4.850% | 3/1/39 | 480 | 595 |
| | AT&T Inc. | 3.500% | 6/1/41 | 500 | 539 |
| | AT&T Inc. | 5.550% | 8/15/41 | 225 | 298 |
| | AT&T Inc. | 5.150% | 3/15/42 | 375 | 478 |
| | AT&T Inc. | 4.900% | 6/15/42 | 525 | 655 |
| | AT&T Inc. | 4.300% | 12/15/42 | 271 | 316 |
| | AT&T Inc. | 3.100% | 2/1/43 | 500 | 507 |
| | AT&T Inc. | 4.350% | 6/15/45 | 312 | 357 |
| | AT&T Inc. | 4.750% | 5/15/46 | 350 | 434 |
| | AT&T Inc. | 5.150% | 11/15/46 | 736 | 960 |
| | AT&T Inc. | 5.450% | 3/1/47 | 500 | 670 |
| | AT&T Inc. | 4.500% | 3/9/48 | 400 | 474 |
| | AT&T Inc. | 4.550% | 3/9/49 | 362 | 435 |
| | AT&T Inc. | 5.150% | 2/15/50 | 332 | 429 |
| | AT&T Inc. | 3.650% | 6/1/51 | 600 | 628 |
| 5 | AT&T Inc. | 3.500% | 9/15/53 | 1,558 | 1,562 |
| 5 | AT&T Inc. | 3.550% | 9/15/55 | 1,550 | 1,551 |
| 3,5 | AT&T Inc. | 3.800% | 12/1/57 | 1,287 | 1,343 |
| 5 | AT&T Inc. | 3.650% | 9/15/59 | 629 | 631 |
| | AT&T Inc. | 3.850% | 6/1/60 | 300 | 315 |
| | AT&T Inc. | 3.500% | 2/1/61 | 400 | 396 |
| | Baidu Inc. | 3.500% | 11/28/22 | 275 | 288 |
| | Baidu Inc. | 3.875% | 9/29/23 | 200 | 216 |
| | Baidu Inc. | 4.375% | 5/14/24 | 200 | 220 |
| | Baidu Inc. | 3.075% | 4/7/25 | 200 | 214 |
| | Baidu Inc. | 3.625% | 7/6/27 | 200 | 221 |
| | Baidu Inc. | 4.375% | 3/29/28 | 100 | 115 |
| | Baidu Inc. | 3.425% | 4/7/30 | 200 | 222 |
| | Bell Canada | 4.300% | 7/29/49 | 100 | 130 |
| | Booking Holdings Inc. | 2.750% | 3/15/23 | 100 | 105 |
| | Booking Holdings Inc. | 3.650% | 3/15/25 | 100 | 111 |
| | Booking Holdings Inc. | 4.100% | 4/13/25 | 200 | 226 |
| | Booking Holdings Inc. | 3.600% | 6/1/26 | 225 | 255 |
| | Booking Holdings Inc. | 3.550% | 3/15/28 | 100 | 114 |
| | Booking Holdings Inc. | 4.625% | 4/13/30 | 400 | 496 |
| | British Telecommunications plc | 4.500% | 12/4/23 | 200 | 221 |
| | British Telecommunications plc | 5.125% | 12/4/28 | 100 | 123 |
| | British Telecommunications plc | 9.625% | 12/15/30 | 516 | 854 |
| | | | Coupon | Maturity
Date | Face
Amount
($000) | Market
Value•
($000) |
| | Charter Communications Operating LLC / Charter Communications Operating Capital | 4.464% | 7/23/22 | 676 | 712 |
| | Charter Communications Operating LLC / Charter Communications Operating Capital | 4.500% | 2/1/24 | 175 | 194 |
| | Charter Communications Operating LLC / Charter Communications Operating Capital | 4.908% | 7/23/25 | 850 | 988 |
| | Charter Communications Operating LLC / Charter Communications Operating Capital | 3.750% | 2/15/28 | 730 | 818 |
| | Charter Communications Operating LLC / Charter Communications Operating Capital | 5.050% | 3/30/29 | 225 | 272 |
| | Charter Communications Operating LLC / Charter Communications Operating Capital | 2.800% | 4/1/31 | 330 | 348 |
| | Charter Communications Operating LLC / Charter Communications Operating Capital | 6.384% | 10/23/35 | 575 | 787 |
| | Charter Communications Operating LLC / Charter Communications Operating Capital | 5.375% | 4/1/38 | 150 | 187 |
| | Charter Communications Operating LLC / Charter Communications Operating Capital | 6.484% | 10/23/45 | 650 | 918 |
| | Charter Communications Operating LLC / Charter Communications Operating Capital | 5.375% | 5/1/47 | 450 | 560 |
| | Charter Communications Operating LLC / Charter Communications Operating Capital | 5.750% | 4/1/48 | 400 | 523 |
| | Charter Communications Operating LLC / Charter Communications Operating Capital | 5.125% | 7/1/49 | 375 | 456 |
| | Charter Communications Operating LLC / Charter Communications Operating Capital | 4.800% | 3/1/50 | 550 | 655 |
| | Charter Communications Operating LLC / Charter Communications Operating Capital | 3.700% | 4/1/51 | 400 | 415 |
| | Charter Communications Operating LLC / Charter Communications Operating Capital | 6.834% | 10/23/55 | 75 | 114 |
| | Charter Communications Operating, LLC / Charter Communications Operating Capital Corp. | 3.850% | 4/1/61 | 500 | 503 |
| | Comcast Cable Communications Holdings Inc. | 9.455% | 11/15/22 | 139 | 163 |
| | Comcast Corp. | 3.000% | 2/1/24 | 710 | 764 |
| | Comcast Corp. | 3.375% | 2/15/25 | 264 | 292 |
| | Comcast Corp. | 3.100% | 4/1/25 | 395 | 433 |
| | Comcast Corp. | 3.375% | 8/15/25 | 951 | 1,057 |
| | Comcast Corp. | 3.950% | 10/15/25 | 625 | 716 |
| | Comcast Corp. | 3.150% | 3/1/26 | 400 | 444 |
| | Comcast Corp. | 2.350% | 1/15/27 | 495 | 532 |
Total Bond Market Index Portfolio
| | | | Coupon | Maturity
Date | Face
Amount
($000) | Market
Value•
($000) |
| | Comcast Corp. | 3.300% | 4/1/27 | 150 | 170 |
| | Comcast Corp. | 3.150% | 2/15/28 | 325 | 364 |
| | Comcast Corp. | 4.150% | 10/15/28 | 950 | 1,137 |
| | Comcast Corp. | 2.650% | 2/1/30 | 300 | 327 |
| | Comcast Corp. | 3.400% | 4/1/30 | 350 | 402 |
| | Comcast Corp. | 4.250% | 10/15/30 | 350 | 428 |
| | Comcast Corp. | 1.950% | 1/15/31 | 500 | 513 |
| | Comcast Corp. | 1.500% | 2/15/31 | 500 | 496 |
| | Comcast Corp. | 4.250% | 1/15/33 | 275 | 343 |
| | Comcast Corp. | 4.200% | 8/15/34 | 175 | 219 |
| | Comcast Corp. | 5.650% | 6/15/35 | 1,065 | 1,510 |
| | Comcast Corp. | 4.400% | 8/15/35 | 150 | 190 |
| | Comcast Corp. | 3.200% | 7/15/36 | 225 | 255 |
| | Comcast Corp. | 6.450% | 3/15/37 | 175 | 267 |
| | Comcast Corp. | 6.950% | 8/15/37 | 250 | 399 |
| | Comcast Corp. | 3.900% | 3/1/38 | 175 | 213 |
| | Comcast Corp. | 6.400% | 5/15/38 | 100 | 154 |
| | Comcast Corp. | 4.600% | 10/15/38 | 550 | 721 |
| | Comcast Corp. | 3.250% | 11/1/39 | 250 | 282 |
| | Comcast Corp. | 6.400% | 3/1/40 | 150 | 234 |
| | Comcast Corp. | 3.750% | 4/1/40 | 300 | 362 |
| | Comcast Corp. | 4.650% | 7/15/42 | 370 | 499 |
| | Comcast Corp. | 4.500% | 1/15/43 | 100 | 132 |
| | Comcast Corp. | 4.600% | 8/15/45 | 250 | 334 |
| | Comcast Corp. | 3.400% | 7/15/46 | 500 | 577 |
| | Comcast Corp. | 3.969% | 11/1/47 | 1,086 | 1,354 |
| | Comcast Corp. | 4.700% | 10/15/48 | 475 | 660 |
| | Comcast Corp. | 3.999% | 11/1/49 | 268 | 337 |
| | Comcast Corp. | 3.450% | 2/1/50 | 400 | 470 |
| | Comcast Corp. | 2.800% | 1/15/51 | 500 | 521 |
| | Comcast Corp. | 2.450% | 8/15/52 | 500 | 485 |
| | Comcast Corp. | 4.950% | 10/15/58 | 475 | 719 |
| | Comcast Corp. | 2.650% | 8/15/62 | 500 | 500 |
| | Deutsche Telekom International Finance BV | 8.750% | 6/15/30 | 775 | 1,223 |
| | Discovery Communications LLC | 2.950% | 3/20/23 | 100 | 105 |
| | Discovery Communications LLC | 3.800% | 3/13/24 | 100 | 109 |
| | Discovery Communications LLC | 3.900% | 11/15/24 | 150 | 166 |
| | Discovery Communications LLC | 3.450% | 3/15/25 | 380 | 417 |
| | Discovery Communications LLC | 3.950% | 6/15/25 | 303 | 340 |
| | Discovery Communications LLC | 3.950% | 3/20/28 | 400 | 457 |
| | Discovery Communications LLC | 3.625% | 5/15/30 | 230 | 263 |
| | Discovery Communications LLC | 5.000% | 9/20/37 | 325 | 411 |
| | Discovery Communications LLC | 6.350% | 6/1/40 | 150 | 213 |
| | Discovery Communications LLC | 4.875% | 4/1/43 | 300 | 369 |
| | Discovery Communications LLC | 5.200% | 9/20/47 | 225 | 292 |
| | Discovery Communications LLC | 5.300% | 5/15/49 | 75 | 98 |
| | Discovery Communications LLC | 4.650% | 5/15/50 | 200 | 250 |
| 3,5 | Discovery Communications LLC | 4.000% | 9/15/55 | 269 | 300 |
| | Electronic Arts Inc. | 4.800% | 3/1/26 | 100 | 119 |
| 5 | Expedia Group Inc. | 3.600% | 12/15/23 | 100 | 106 |
| | Expedia Group Inc. | 4.500% | 8/15/24 | 100 | 109 |
| | Expedia Group Inc. | 5.000% | 2/15/26 | 150 | 167 |
| 5 | Expedia Group Inc. | 4.625% | 8/1/27 | 150 | 167 |
| | Expedia Group Inc. | 3.250% | 2/15/30 | 250 | 259 |
| | Fox Corp. | 3.666% | 1/25/22 | 50 | 52 |
| | | | Coupon | Maturity
Date | Face
Amount
($000) | Market
Value•
($000) |
| | Fox Corp. | 4.030% | 1/25/24 | 250 | 275 |
| | Fox Corp. | 3.050% | 4/7/25 | 100 | 109 |
| | Fox Corp. | 4.709% | 1/25/29 | 375 | 454 |
| | Fox Corp. | 3.500% | 4/8/30 | 150 | 170 |
| | Fox Corp. | 5.476% | 1/25/39 | 250 | 342 |
| | Fox Corp. | 5.576% | 1/25/49 | 425 | 617 |
| | Grupo Televisa SAB | 6.625% | 3/18/25 | 100 | 122 |
| | Grupo Televisa SAB | 4.625% | 1/30/26 | 100 | 112 |
| | Grupo Televisa SAB | 6.625% | 1/15/40 | 125 | 175 |
| | Grupo Televisa SAB | 5.000% | 5/13/45 | 425 | 514 |
| | Grupo Televisa SAB | 5.250% | 5/24/49 | 200 | 253 |
| | Interpublic Group of Cos. Inc. | 3.750% | 2/15/23 | 150 | 160 |
| | Interpublic Group of Cos. Inc. | 4.200% | 4/15/24 | 422 | 469 |
| | Interpublic Group of Cos. Inc. | 4.650% | 10/1/28 | 100 | 120 |
| | Interpublic Group of Cos. Inc. | 4.750% | 3/30/30 | 100 | 124 |
| | Interpublic Group of Cos. Inc. | 5.400% | 10/1/48 | 175 | 239 |
| | Koninklijke KPN NV | 8.375% | 10/1/30 | 125 | 177 |
| | NBCUniversal Media LLC | 6.400% | 4/30/40 | 150 | 235 |
| | NBCUniversal Media LLC | 5.950% | 4/1/41 | 225 | 343 |
| | NBCUniversal Media LLC | 4.450% | 1/15/43 | 225 | 293 |
| | Omnicom Group Inc. | 3.625% | 5/1/22 | 250 | 261 |
| | Omnicom Group Inc. | 3.650% | 11/1/24 | 150 | 165 |
| | Omnicom Group Inc. | 3.600% | 4/15/26 | 250 | 285 |
| | Omnicom Group Inc. | 2.450% | 4/30/30 | 150 | 159 |
| | Omnicom Group Inc. | 4.200% | 6/1/30 | 100 | 120 |
| | Orange SA | 9.000% | 3/1/31 | 450 | 736 |
| | Orange SA | 5.375% | 1/13/42 | 325 | 462 |
| | Orange SA | 5.500% | 2/6/44 | 200 | 291 |
| | Rogers Communications Inc. | 3.000% | 3/15/23 | 205 | 215 |
| | Rogers Communications Inc. | 4.100% | 10/1/23 | 175 | 191 |
| | Rogers Communications Inc. | 3.625% | 12/15/25 | 125 | 141 |
| | Rogers Communications Inc. | 2.900% | 11/15/26 | 100 | 111 |
| | Rogers Communications Inc. | 4.500% | 3/15/43 | 265 | 336 |
| | Rogers Communications Inc. | 5.000% | 3/15/44 | 190 | 259 |
| | Rogers Communications Inc. | 4.350% | 5/1/49 | 450 | 575 |
| | Rogers Communications Inc. | 3.700% | 11/15/49 | 150 | 174 |
| | Telefonica Emisiones SA | 4.103% | 3/8/27 | 250 | 289 |
| | Telefonica Emisiones SA | 7.045% | 6/20/36 | 475 | 711 |
| | Telefonica Emisiones SA | 4.665% | 3/6/38 | 200 | 241 |
| | Telefonica Emisiones SA | 5.213% | 3/8/47 | 550 | 706 |
| | Telefonica Emisiones SA | 4.895% | 3/6/48 | 250 | 312 |
| | Telefonica Emisiones SA | 5.520% | 3/1/49 | 335 | 451 |
| | Telefonica Europe BV | 8.250% | 9/15/30 | 250 | 381 |
| | TELUS Corp. | 2.800% | 2/16/27 | 100 | 109 |
| | TELUS Corp. | 4.300% | 6/15/49 | 200 | 250 |
| | Tencent Music Entertainment Group | 2.000% | 9/3/30 | 200 | 198 |
| | Time Warner Cable LLC | 6.550% | 5/1/37 | 200 | 273 |
| | Time Warner Cable LLC | 7.300% | 7/1/38 | 50 | 74 |
| | Time Warner Cable LLC | 6.750% | 6/15/39 | 400 | 571 |
| | Time Warner Cable LLC | 5.875% | 11/15/40 | 425 | 563 |
| | Time Warner Cable LLC | 5.500% | 9/1/41 | 250 | 322 |
| | Time Warner Cable LLC | 4.500% | 9/15/42 | 250 | 291 |
| | Time Warner Entertainment Co. LP | 8.375% | 3/15/23 | 200 | 234 |
| | Time Warner Entertainment Co. LP | 8.375% | 7/15/33 | 200 | 309 |
| 5 | T-Mobile USA Inc. | 3.500% | 4/15/25 | 600 | 663 |
Total Bond Market Index Portfolio
| | | | Coupon | Maturity
Date | Face
Amount
($000) | Market
Value•
($000) |
| 5 | T-Mobile USA Inc. | 1.500% | 2/15/26 | 200 | 205 |
| 5 | T-Mobile USA Inc. | 3.750% | 4/15/27 | 800 | 910 |
| 5 | T-Mobile USA Inc. | 2.050% | 2/15/28 | 250 | 260 |
| 5 | T-Mobile USA Inc. | 3.875% | 4/15/30 | 1,520 | 1,759 |
| 5 | T-Mobile USA Inc. | 2.550% | 2/15/31 | 900 | 944 |
| 5 | T-Mobile USA Inc. | 2.250% | 11/15/31 | 500 | 513 |
| 5 | T-Mobile USA Inc. | 4.375% | 4/15/40 | 400 | 486 |
| 5 | T-Mobile USA Inc. | 4.500% | 4/15/50 | 600 | 744 |
| 5 | T-Mobile USA Inc. | 3.300% | 2/15/51 | 1,000 | 1,030 |
| | TWDC Enterprises 18 Corp. | 2.550% | 2/15/22 | 75 | 77 |
| | TWDC Enterprises 18 Corp. | 2.450% | 3/4/22 | 75 | 77 |
| | TWDC Enterprises 18 Corp. | 3.150% | 9/17/25 | 150 | 166 |
| | TWDC Enterprises 18 Corp. | 1.850% | 7/30/26 | 1,070 | 1,124 |
| | TWDC Enterprises 18 Corp. | 4.375% | 8/16/41 | 75 | 95 |
| | TWDC Enterprises 18 Corp. | 4.125% | 12/1/41 | 205 | 255 |
| | TWDC Enterprises 18 Corp. | 3.700% | 12/1/42 | 125 | 148 |
| | TWDC Enterprises 18 Corp. | 3.000% | 7/30/46 | 300 | 328 |
| | Verizon Communications Inc. | 5.150% | 9/15/23 | 830 | 934 |
| | Verizon Communications Inc. | 3.500% | 11/1/24 | 400 | 441 |
| | Verizon Communications Inc. | 3.376% | 2/15/25 | 534 | 593 |
| | Verizon Communications Inc. | 0.850% | 11/20/25 | 500 | 503 |
| | Verizon Communications Inc. | 2.625% | 8/15/26 | 475 | 520 |
| | Verizon Communications Inc. | 4.125% | 3/16/27 | 700 | 825 |
| | Verizon Communications Inc. | 3.000% | 3/22/27 | 150 | 166 |
| | Verizon Communications Inc. | 4.329% | 9/21/28 | 1,229 | 1,476 |
| | Verizon Communications Inc. | 4.016% | 12/3/29 | 927 | 1,099 |
| | Verizon Communications Inc. | 3.150% | 3/22/30 | 310 | 347 |
| 5 | Verizon Communications Inc. | 1.680% | 10/30/30 | 527 | 523 |
| | Verizon Communications Inc. | 4.500% | 8/10/33 | 575 | 725 |
| | Verizon Communications Inc. | 4.400% | 11/1/34 | 725 | 905 |
| | Verizon Communications Inc. | 4.272% | 1/15/36 | 513 | 634 |
| | Verizon Communications Inc. | 5.250% | 3/16/37 | 300 | 407 |
| | Verizon Communications Inc. | 4.812% | 3/15/39 | 350 | 454 |
| | Verizon Communications Inc. | 2.650% | 11/20/40 | 500 | 506 |
| | Verizon Communications Inc. | 4.750% | 11/1/41 | 175 | 230 |
| | Verizon Communications Inc. | 3.850% | 11/1/42 | 425 | 503 |
| | Verizon Communications Inc. | 4.125% | 8/15/46 | 250 | 305 |
| | Verizon Communications Inc. | 4.862% | 8/21/46 | 1,279 | 1,716 |
| | Verizon Communications Inc. | 4.522% | 9/15/48 | 747 | 969 |
| | Verizon Communications Inc. | 5.012% | 4/15/49 | 385 | 533 |
| | Verizon Communications Inc. | 4.000% | 3/22/50 | 250 | 302 |
| | | | Coupon | Maturity
Date | Face
Amount
($000) | Market
Value•
($000) |
| | Verizon Communications Inc. | 2.875% | 11/20/50 | 500 | 503 |
| | Verizon Communications Inc. | 4.672% | 3/15/55 | 600 | 799 |
| 5 | Verizon Communications Inc. | 2.987% | 10/30/56 | 900 | 904 |
| | Verizon Communications Inc. | 3.000% | 11/20/60 | 500 | 502 |
| | ViacomCBS Inc. | 4.250% | 9/1/23 | 225 | 245 |
| | ViacomCBS Inc. | 3.875% | 4/1/24 | 124 | 135 |
| | ViacomCBS Inc. | 3.700% | 8/15/24 | 175 | 192 |
| | ViacomCBS Inc. | 3.500% | 1/15/25 | 150 | 164 |
| | ViacomCBS Inc. | 4.750% | 5/15/25 | 300 | 348 |
| | ViacomCBS Inc. | 2.900% | 1/15/27 | 279 | 306 |
| | ViacomCBS Inc. | 3.375% | 2/15/28 | 100 | 112 |
| | ViacomCBS Inc. | 3.700% | 6/1/28 | 100 | 114 |
| | ViacomCBS Inc. | 4.950% | 1/15/31 | 250 | 314 |
| | ViacomCBS Inc. | 4.200% | 5/19/32 | 200 | 241 |
| | ViacomCBS Inc. | 5.500% | 5/15/33 | 75 | 96 |
| | ViacomCBS Inc. | 6.875% | 4/30/36 | 240 | 348 |
| | ViacomCBS Inc. | 5.900% | 10/15/40 | 225 | 298 |
| | ViacomCBS Inc. | 4.850% | 7/1/42 | 225 | 274 |
| | ViacomCBS Inc. | 4.375% | 3/15/43 | 406 | 479 |
| | ViacomCBS Inc. | 5.850% | 9/1/43 | 225 | 309 |
| | ViacomCBS Inc. | 4.900% | 8/15/44 | 100 | 123 |
| | ViacomCBS Inc. | 4.950% | 5/19/50 | 250 | 321 |
| | Vodafone Group plc | 3.750% | 1/16/24 | 650 | 710 |
| | Vodafone Group plc | 4.125% | 5/30/25 | 500 | 571 |
| | Vodafone Group plc | 4.375% | 5/30/28 | 650 | 778 |
| | Vodafone Group plc | 7.875% | 2/15/30 | 150 | 222 |
| | Vodafone Group plc | 6.250% | 11/30/32 | 100 | 138 |
| | Vodafone Group plc | 6.150% | 2/27/37 | 200 | 288 |
| | Vodafone Group plc | 5.000% | 5/30/38 | 325 | 423 |
| | Vodafone Group plc | 4.375% | 2/19/43 | 275 | 340 |
| | Vodafone Group plc | 5.250% | 5/30/48 | 700 | 971 |
| | Vodafone Group plc | 4.875% | 6/19/49 | 350 | 466 |
| | Vodafone Group plc | 4.250% | 9/17/50 | 450 | 554 |
| | Vodafone Group plc | 5.125% | 6/19/59 | 100 | 137 |
| | Walt Disney Co. | 1.650% | 9/1/22 | 100 | 102 |
| | Walt Disney Co. | 3.000% | 9/15/22 | 275 | 287 |
| | Walt Disney Co. | 1.750% | 8/30/24 | 100 | 104 |
| | Walt Disney Co. | 3.700% | 9/15/24 | 200 | 222 |
| | Walt Disney Co. | 3.350% | 3/24/25 | 345 | 382 |
| | Walt Disney Co. | 3.700% | 10/15/25 | 125 | 141 |
| | Walt Disney Co. | 1.750% | 1/13/26 | 300 | 314 |
| | Walt Disney Co. | 2.200% | 1/13/28 | 200 | 214 |
| | Walt Disney Co. | 2.000% | 9/1/29 | 400 | 417 |
| | Walt Disney Co. | 3.800% | 3/22/30 | 240 | 286 |
| | Walt Disney Co. | 2.650% | 1/13/31 | 700 | 768 |
| | Walt Disney Co. | 6.200% | 12/15/34 | 400 | 600 |
| | Walt Disney Co. | 6.400% | 12/15/35 | 365 | 566 |
| | Walt Disney Co. | 6.650% | 11/15/37 | 200 | 315 |
| | Walt Disney Co. | 4.625% | 3/23/40 | 75 | 100 |
| | Walt Disney Co. | 3.500% | 5/13/40 | 400 | 469 |
| | Walt Disney Co. | 5.400% | 10/1/43 | 100 | 146 |
| | Walt Disney Co. | 4.750% | 9/15/44 | 175 | 240 |
| | Walt Disney Co. | 2.750% | 9/1/49 | 400 | 423 |
| | Walt Disney Co. | 4.700% | 3/23/50 | 395 | 557 |
| | Walt Disney Co. | 3.600% | 1/13/51 | 600 | 728 |
| | Walt Disney Co. | 3.800% | 5/13/60 | 300 | 377 |
| | Weibo Corp. | 3.500% | 7/5/24 | 200 | 209 |
| | Weibo Corp. | 3.375% | 7/8/30 | 200 | 204 |
| | WPP Finance 2010 | 3.625% | 9/7/22 | 200 | 210 |
| | WPP Finance 2010 | 3.750% | 9/19/24 | 100 | 111 |
| | | | | | | 130,957 |
| Consumer Discretionary (1.7%) |
| | Advance Auto Parts Inc. | 3.900% | 4/15/30 | 250 | 286 |
| | Alibaba Group Holding Ltd. | 2.800% | 6/6/23 | 200 | 210 |
Total Bond Market Index Portfolio
| | | | Coupon | Maturity
Date | Face
Amount
($000) | Market
Value•
($000) |
| | Alibaba Group Holding Ltd. | 3.600% | 11/28/24 | 400 | 440 |
| | Alibaba Group Holding Ltd. | 3.400% | 12/6/27 | 400 | 447 |
| | Alibaba Group Holding Ltd. | 4.500% | 11/28/34 | 280 | 346 |
| | Alibaba Group Holding Ltd. | 4.000% | 12/6/37 | 200 | 235 |
| | Alibaba Group Holding Ltd. | 4.200% | 12/6/47 | 425 | 535 |
| | Alibaba Group Holding Ltd. | 4.400% | 12/6/57 | 100 | 133 |
| | Amazon.com Inc. | 3.300% | 12/5/21 | 200 | 204 |
| | Amazon.com Inc. | 2.500% | 11/29/22 | 150 | 156 |
| | Amazon.com Inc. | 2.400% | 2/22/23 | 450 | 470 |
| | Amazon.com Inc. | 0.400% | 6/3/23 | 200 | 201 |
| | Amazon.com Inc. | 2.800% | 8/22/24 | 250 | 270 |
| | Amazon.com Inc. | 3.800% | 12/5/24 | 120 | 135 |
| | Amazon.com Inc. | 0.800% | 6/3/25 | 285 | 289 |
| | Amazon.com Inc. | 5.200% | 12/3/25 | 225 | 273 |
| | Amazon.com Inc. | 1.200% | 6/3/27 | 285 | 291 |
| | Amazon.com Inc. | 3.150% | 8/22/27 | 725 | 824 |
| | Amazon.com Inc. | 1.500% | 6/3/30 | 505 | 513 |
| | Amazon.com Inc. | 4.800% | 12/5/34 | 225 | 308 |
| | Amazon.com Inc. | 3.875% | 8/22/37 | 600 | 745 |
| | Amazon.com Inc. | 4.950% | 12/5/44 | 350 | 511 |
| | Amazon.com Inc. | 4.050% | 8/22/47 | 600 | 791 |
| | Amazon.com Inc. | 2.500% | 6/3/50 | 590 | 610 |
| | Amazon.com Inc. | 4.250% | 8/22/57 | 500 | 706 |
| | Amazon.com Inc. | 2.700% | 6/3/60 | 400 | 427 |
| | American Honda Finance Corp. | 3.375% | 12/10/21 | 150 | 154 |
| | American Honda Finance Corp. | 2.200% | 6/27/22 | 150 | 154 |
| | American Honda Finance Corp. | 0.400% | 10/21/22 | 500 | 500 |
| | American Honda Finance Corp. | 2.600% | 11/16/22 | 40 | 42 |
| | American Honda Finance Corp. | 1.950% | 5/10/23 | 200 | 207 |
| | American Honda Finance Corp. | 0.875% | 7/7/23 | 200 | 202 |
| | American Honda Finance Corp. | 3.450% | 7/14/23 | 125 | 134 |
| | American Honda Finance Corp. | 3.625% | 10/10/23 | 100 | 109 |
| | American Honda Finance Corp. | 2.900% | 2/16/24 | 150 | 161 |
| | American Honda Finance Corp. | 2.400% | 6/27/24 | 100 | 106 |
| | American Honda Finance Corp. | 2.150% | 9/10/24 | 125 | 132 |
| | American Honda Finance Corp. | 1.200% | 7/8/25 | 200 | 204 |
| | American Honda Finance Corp. | 2.300% | 9/9/26 | 50 | 54 |
| | American Honda Finance Corp. | 2.350% | 1/8/27 | 100 | 107 |
| | American Honda Finance Corp. | 3.500% | 2/15/28 | 100 | 115 |
| 2 | American University | 3.672% | 4/1/49 | 75 | 83 |
| | Aptiv Corp. | 4.150% | 3/15/24 | 125 | 137 |
| | Aptiv plc | 4.250% | 1/15/26 | 150 | 173 |
| | Aptiv plc | 4.350% | 3/15/29 | 50 | 58 |
| | Aptiv plc | 4.400% | 10/1/46 | 50 | 54 |
| | Aptiv plc | 5.400% | 3/15/49 | 50 | 62 |
| | AutoNation Inc. | 3.500% | 11/15/24 | 205 | 221 |
| | AutoNation Inc. | 4.500% | 10/1/25 | 150 | 168 |
| | AutoNation Inc. | 3.800% | 11/15/27 | 75 | 83 |
| | AutoZone Inc. | 3.700% | 4/15/22 | 100 | 104 |
| | AutoZone Inc. | 2.875% | 1/15/23 | 75 | 78 |
| | | | Coupon | Maturity
Date | Face
Amount
($000) | Market
Value•
($000) |
| | AutoZone Inc. | 3.125% | 7/15/23 | 125 | 133 |
| | AutoZone Inc. | 3.125% | 4/18/24 | 130 | 140 |
| | AutoZone Inc. | 3.250% | 4/15/25 | 132 | 144 |
| | AutoZone Inc. | 3.625% | 4/15/25 | 153 | 171 |
| | AutoZone Inc. | 3.125% | 4/21/26 | 100 | 110 |
| | AutoZone Inc. | 3.750% | 6/1/27 | 100 | 114 |
| | AutoZone Inc. | 3.750% | 4/18/29 | 100 | 115 |
| | AutoZone Inc. | 4.000% | 4/15/30 | 250 | 294 |
| | AutoZone Inc. | 1.650% | 1/15/31 | 500 | 496 |
| | Best Buy Co. Inc. | 4.450% | 10/1/28 | 200 | 240 |
| | BorgWarner Inc. | 3.375% | 3/15/25 | 75 | 83 |
| | BorgWarner Inc. | 2.650% | 7/1/27 | 200 | 215 |
| | BorgWarner Inc. | 4.375% | 3/15/45 | 100 | 117 |
| 2 | Boston University | 4.061% | 10/1/48 | 50 | 63 |
| | California Institute of Technology | 4.321% | 8/1/45 | 70 | 95 |
| | California Institute of Technology | 4.700% | 11/1/11 | 50 | 69 |
| | California Institute of Technology | 3.650% | 9/1/19 | 100 | 113 |
| | Cleveland Clinic Foundation | 4.858% | 1/1/14 | 100 | 141 |
| | Daimler Finance North America LLC | 8.500% | 1/18/31 | 250 | 395 |
| | Darden Restaurants Inc. | 3.850% | 5/1/27 | 200 | 219 |
| | Darden Restaurants Inc. | 4.550% | 2/15/48 | 50 | 55 |
| | DR Horton Inc. | 4.375% | 9/15/22 | 100 | 105 |
| | DR Horton Inc. | 4.750% | 2/15/23 | 225 | 242 |
| | DR Horton Inc. | 5.750% | 8/15/23 | 75 | 84 |
| | DR Horton Inc. | 2.500% | 10/15/24 | 100 | 107 |
| 2 | Duke University | 2.682% | 10/1/44 | 100 | 105 |
| 2 | Duke University | 2.832% | 10/1/55 | 300 | 325 |
| | eBay Inc. | 2.600% | 7/15/22 | 300 | 308 |
| | eBay Inc. | 2.750% | 1/30/23 | 175 | 183 |
| | eBay Inc. | 3.450% | 8/1/24 | 125 | 136 |
| | eBay Inc. | 1.900% | 3/11/25 | 180 | 189 |
| | eBay Inc. | 3.600% | 6/5/27 | 300 | 341 |
| | eBay Inc. | 2.700% | 3/11/30 | 200 | 215 |
| | eBay Inc. | 4.000% | 7/15/42 | 200 | 227 |
| | Emory University | 2.143% | 9/1/30 | 150 | 158 |
| | Emory University | 2.969% | 9/1/50 | 50 | 53 |
| | Ford Foundation | 2.415% | 6/1/50 | 60 | 61 |
| | Ford Foundation | 2.815% | 6/1/70 | 150 | 160 |
| | Fortune Brands Home & Security Inc. | 4.000% | 9/21/23 | 100 | 109 |
| | Fortune Brands Home & Security Inc. | 4.000% | 6/15/25 | 233 | 264 |
| | Fortune Brands Home & Security Inc. | 3.250% | 9/15/29 | 50 | 55 |
| | General Motors Co. | 4.875% | 10/2/23 | 625 | 693 |
| | General Motors Co. | 5.400% | 10/2/23 | 250 | 281 |
| | General Motors Co. | 6.125% | 10/1/25 | 600 | 727 |
| | General Motors Co. | 6.800% | 10/1/27 | 100 | 128 |
| | General Motors Co. | 5.000% | 4/1/35 | 165 | 198 |
| | General Motors Co. | 6.600% | 4/1/36 | 250 | 341 |
| | General Motors Co. | 5.150% | 4/1/38 | 225 | 271 |
| | General Motors Co. | 6.250% | 10/2/43 | 210 | 282 |
| | General Motors Co. | 5.200% | 4/1/45 | 230 | 279 |
| | General Motors Co. | 6.750% | 4/1/46 | 130 | 186 |
| | General Motors Co. | 5.400% | 4/1/48 | 200 | 251 |
| | General Motors Co. | 5.950% | 4/1/49 | 175 | 235 |
| | General Motors Financial Co. Inc. | 3.450% | 1/14/22 | 125 | 128 |
| | General Motors Financial Co. Inc. | 3.450% | 4/10/22 | 355 | 365 |
| | General Motors Financial Co. Inc. | 3.150% | 6/30/22 | 100 | 104 |
| | General Motors Financial Co. Inc. | 3.550% | 7/8/22 | 200 | 209 |
Total Bond Market Index Portfolio
| | | | Coupon | Maturity
Date | Face
Amount
($000) | Market
Value•
($000) |
| | General Motors Financial Co. Inc. | 3.250% | 1/5/23 | 275 | 288 |
| | General Motors Financial Co. Inc. | 5.200% | 3/20/23 | 300 | 329 |
| | General Motors Financial Co. Inc. | 3.700% | 5/9/23 | 200 | 212 |
| | General Motors Financial Co. Inc. | 4.250% | 5/15/23 | 150 | 162 |
| | General Motors Financial Co. Inc. | 4.150% | 6/19/23 | 200 | 215 |
| | General Motors Financial Co. Inc. | 1.700% | 8/18/23 | 500 | 512 |
| | General Motors Financial Co. Inc. | 5.100% | 1/17/24 | 100 | 112 |
| | General Motors Financial Co. Inc. | 3.950% | 4/13/24 | 400 | 434 |
| | General Motors Financial Co. Inc. | 3.500% | 11/7/24 | 200 | 216 |
| | General Motors Financial Co. Inc. | 4.000% | 1/15/25 | 175 | 192 |
| | General Motors Financial Co. Inc. | 2.900% | 2/26/25 | 958 | 1,022 |
| | General Motors Financial Co. Inc. | 4.350% | 4/9/25 | 325 | 364 |
| | General Motors Financial Co. Inc. | 2.750% | 6/20/25 | 150 | 160 |
| | General Motors Financial Co. Inc. | 5.250% | 3/1/26 | 150 | 177 |
| | General Motors Financial Co. Inc. | 4.350% | 1/17/27 | 325 | 370 |
| | General Motors Financial Co. Inc. | 2.700% | 8/20/27 | 500 | 527 |
| | General Motors Financial Co. Inc. | 3.600% | 6/21/30 | 800 | 889 |
| | George Washington University | 4.126% | 9/15/48 | 300 | 374 |
| | Georgetown University | 4.315% | 4/1/49 | 68 | 87 |
| | Georgetown University | 2.943% | 4/1/50 | 100 | 100 |
| | Georgetown University | 5.215% | 10/1/18 | 59 | 85 |
| | Harley-Davidson Inc. | 3.500% | 7/28/25 | 100 | 109 |
| | Harley-Davidson Inc. | 4.625% | 7/28/45 | 125 | 142 |
| | Hasbro Inc. | 3.900% | 11/19/29 | 350 | 396 |
| | Hasbro Inc. | 6.350% | 3/15/40 | 125 | 161 |
| | Hasbro Inc. | 5.100% | 5/15/44 | 50 | 56 |
| | Home Depot Inc. | 3.250% | 3/1/22 | 150 | 155 |
| | Home Depot Inc. | 2.625% | 6/1/22 | 265 | 273 |
| | Home Depot Inc. | 2.700% | 4/1/23 | 25 | 26 |
| | Home Depot Inc. | 3.750% | 2/15/24 | 200 | 219 |
| | Home Depot Inc. | 3.000% | 4/1/26 | 275 | 306 |
| | Home Depot Inc. | 2.125% | 9/15/26 | 100 | 108 |
| | Home Depot Inc. | 2.500% | 4/15/27 | 395 | 432 |
| | Home Depot Inc. | 2.800% | 9/14/27 | 200 | 223 |
| | Home Depot Inc. | 3.900% | 12/6/28 | 100 | 120 |
| | Home Depot Inc. | 2.950% | 6/15/29 | 600 | 681 |
| | Home Depot Inc. | 2.700% | 4/15/30 | 445 | 496 |
| | Home Depot Inc. | 5.875% | 12/16/36 | 825 | 1,249 |
| | Home Depot Inc. | 3.300% | 4/15/40 | 295 | 347 |
| | Home Depot Inc. | 5.950% | 4/1/41 | 175 | 272 |
| | Home Depot Inc. | 4.200% | 4/1/43 | 200 | 259 |
| | Home Depot Inc. | 4.875% | 2/15/44 | 300 | 423 |
| | Home Depot Inc. | 4.400% | 3/15/45 | 100 | 133 |
| | Home Depot Inc. | 4.250% | 4/1/46 | 330 | 440 |
| | Home Depot Inc. | 3.900% | 6/15/47 | 250 | 318 |
| | Home Depot Inc. | 4.500% | 12/6/48 | 225 | 315 |
| | Home Depot Inc. | 3.125% | 12/15/49 | 525 | 602 |
| | Home Depot Inc. | 3.350% | 4/15/50 | 375 | 444 |
| | Hyatt Hotels Corp. | 3.375% | 7/15/23 | 100 | 105 |
| | Hyatt Hotels Corp. | 4.850% | 3/15/26 | 50 | 56 |
| | Hyatt Hotels Corp. | 4.375% | 9/15/28 | 75 | 82 |
| | JD.com Inc. | 3.125% | 4/29/21 | 200 | 202 |
| | JD.com Inc. | 3.375% | 1/14/30 | 200 | 217 |
| | | | Coupon | Maturity
Date | Face
Amount
($000) | Market
Value•
($000) |
| 2 | Johns Hopkins University | 4.083% | 7/1/53 | 75 | 100 |
| | Kohl's Corp. | 4.250% | 7/17/25 | 300 | 326 |
| | Kohl's Corp. | 5.550% | 7/17/45 | 100 | 107 |
| | Las Vegas Sands Corp. | 3.200% | 8/8/24 | 365 | 386 |
| | Las Vegas Sands Corp. | 2.900% | 6/25/25 | 200 | 209 |
| | Las Vegas Sands Corp. | 3.500% | 8/18/26 | 145 | 155 |
| | Las Vegas Sands Corp. | 3.900% | 8/8/29 | 65 | 70 |
| | Lear Corp. | 3.800% | 9/15/27 | 100 | 111 |
| | Lear Corp. | 4.250% | 5/15/29 | 150 | 170 |
| | Lear Corp. | 3.500% | 5/30/30 | 100 | 108 |
| | Lear Corp. | 5.250% | 5/15/49 | 125 | 152 |
| | Leggett & Platt Inc. | 3.800% | 11/15/24 | 100 | 108 |
| | Leggett & Platt Inc. | 3.500% | 11/15/27 | 125 | 136 |
| | Leggett & Platt Inc. | 4.400% | 3/15/29 | 75 | 86 |
| | Leland Stanford Junior University | 3.647% | 5/1/48 | 500 | 640 |
| | Lennar Corp. | 4.750% | 11/15/22 | 200 | 212 |
| | Lennar Corp. | 4.500% | 4/30/24 | 300 | 333 |
| | Lennar Corp. | 5.250% | 6/1/26 | 200 | 237 |
| | Lennar Corp. | 4.750% | 11/29/27 | 200 | 236 |
| | Lowe's Cos. Inc. | 3.120% | 4/15/22 | 150 | 154 |
| | Lowe's Cos. Inc. | 3.875% | 9/15/23 | 275 | 299 |
| | Lowe's Cos. Inc. | 3.125% | 9/15/24 | 100 | 109 |
| | Lowe's Cos. Inc. | 3.375% | 9/15/25 | 200 | 223 |
| | Lowe's Cos. Inc. | 2.500% | 4/15/26 | 250 | 270 |
| | Lowe's Cos. Inc. | 3.100% | 5/3/27 | 350 | 392 |
| | Lowe's Cos. Inc. | 1.300% | 4/15/28 | 260 | 262 |
| | Lowe's Cos. Inc. | 6.500% | 3/15/29 | 67 | 91 |
| | Lowe's Cos. Inc. | 3.650% | 4/5/29 | 300 | 350 |
| | Lowe's Cos. Inc. | 4.500% | 4/15/30 | 250 | 309 |
| | Lowe's Cos. Inc. | 1.700% | 10/15/30 | 300 | 302 |
| | Lowe's Cos. Inc. | 4.250% | 9/15/44 | 28 | 33 |
| | Lowe's Cos. Inc. | 3.700% | 4/15/46 | 250 | 294 |
| | Lowe's Cos. Inc. | 4.050% | 5/3/47 | 300 | 371 |
| | Lowe's Cos. Inc. | 4.550% | 4/5/49 | 375 | 498 |
| | Lowe's Cos. Inc. | 3.000% | 10/15/50 | 500 | 532 |
| | Magna International Inc. | 3.625% | 6/15/24 | 170 | 186 |
| | Magna International Inc. | 4.150% | 10/1/25 | 100 | 115 |
| | Magna International Inc. | 2.450% | 6/15/30 | 100 | 107 |
| | Marriott International Inc. | 2.125% | 10/3/22 | 200 | 203 |
| | Marriott International Inc. | 3.750% | 3/15/25 | 175 | 189 |
| | Marriott International Inc. | 3.750% | 10/1/25 | 65 | 70 |
| | Marriott International Inc. | 3.125% | 6/15/26 | 1,083 | 1,153 |
| | Marriott International Inc. | 4.000% | 4/15/28 | 50 | 55 |
| | Marriott International Inc. | 4.625% | 6/15/30 | 200 | 234 |
| | Masco Corp. | 4.375% | 4/1/26 | 100 | 117 |
| | Masco Corp. | 3.500% | 11/15/27 | 100 | 113 |
| | Masco Corp. | 7.750% | 8/1/29 | 24 | 33 |
| | Masco Corp. | 2.000% | 10/1/30 | 500 | 508 |
| | Masco Corp. | 4.500% | 5/15/47 | 100 | 125 |
| 2 | Massachusetts Institute of Technology | 3.959% | 7/1/38 | 125 | 156 |
| | Massachusetts Institute of Technology | 2.989% | 7/1/50 | 85 | 98 |
| | Massachusetts Institute of Technology | 5.600% | 7/1/11 | 130 | 227 |
| | Massachusetts Institute of Technology | 4.678% | 7/1/14 | 275 | 412 |
| | Massachusetts Institute of Technology | 3.885% | 7/1/16 | 100 | 127 |
| | McDonald's Corp. | 2.625% | 1/15/22 | 275 | 282 |
| | McDonald's Corp. | 3.350% | 4/1/23 | 200 | 213 |
| | McDonald's Corp. | 3.300% | 7/1/25 | 497 | 553 |
| | McDonald's Corp. | 3.700% | 1/30/26 | 300 | 341 |
| | McDonald's Corp. | 3.500% | 3/1/27 | 200 | 228 |
| | McDonald's Corp. | 3.500% | 7/1/27 | 315 | 361 |
| | McDonald's Corp. | 3.800% | 4/1/28 | 350 | 409 |
| | McDonald's Corp. | 2.625% | 9/1/29 | 200 | 219 |
| | McDonald's Corp. | 2.125% | 3/1/30 | 200 | 211 |
| | McDonald's Corp. | 3.600% | 7/1/30 | 200 | 234 |
Total Bond Market Index Portfolio
| | | | Coupon | Maturity
Date | Face
Amount
($000) | Market
Value•
($000) |
| | McDonald's Corp. | 4.700% | 12/9/35 | 200 | 260 |
| | McDonald's Corp. | 6.300% | 10/15/37 | 150 | 225 |
| | McDonald's Corp. | 6.300% | 3/1/38 | 100 | 151 |
| | McDonald's Corp. | 5.700% | 2/1/39 | 100 | 143 |
| | McDonald's Corp. | 3.700% | 2/15/42 | 25 | 29 |
| | McDonald's Corp. | 3.625% | 5/1/43 | 100 | 115 |
| | McDonald's Corp. | 4.600% | 5/26/45 | 210 | 273 |
| | McDonald's Corp. | 4.875% | 12/9/45 | 300 | 405 |
| | McDonald's Corp. | 4.450% | 3/1/47 | 250 | 324 |
| | McDonald's Corp. | 4.450% | 9/1/48 | 150 | 196 |
| | McDonald's Corp. | 3.625% | 9/1/49 | 350 | 408 |
| | McDonald's Corp. | 4.200% | 4/1/50 | 200 | 257 |
| | Mohawk Industries Inc. | 3.850% | 2/1/23 | 100 | 106 |
| | Mohawk Industries Inc. | 3.625% | 5/15/30 | 125 | 140 |
| | NIKE Inc. | 2.400% | 3/27/25 | 225 | 242 |
| | NIKE Inc. | 2.375% | 11/1/26 | 200 | 218 |
| | NIKE Inc. | 2.750% | 3/27/27 | 200 | 221 |
| | NIKE Inc. | 2.850% | 3/27/30 | 200 | 226 |
| | NIKE Inc. | 3.250% | 3/27/40 | 200 | 232 |
| | NIKE Inc. | 3.625% | 5/1/43 | 125 | 152 |
| | NIKE Inc. | 3.875% | 11/1/45 | 225 | 288 |
| | NIKE Inc. | 3.375% | 11/1/46 | 100 | 118 |
| | NIKE Inc. | 3.375% | 3/27/50 | 300 | 369 |
| 2 | Northwestern University | 4.643% | 12/1/44 | 75 | 99 |
| 2 | Northwestern University | 2.640% | 12/1/50 | 50 | 51 |
| 2 | Northwestern University | 3.662% | 12/1/57 | 75 | 95 |
| | NVR Inc. | 3.950% | 9/15/22 | 100 | 105 |
| | NVR Inc. | 3.000% | 5/15/30 | 200 | 217 |
| | O'Reilly Automotive Inc. | 3.800% | 9/1/22 | 100 | 105 |
| | O'Reilly Automotive Inc. | 3.850% | 6/15/23 | 75 | 80 |
| | O'Reilly Automotive Inc. | 3.600% | 9/1/27 | 325 | 371 |
| | O'Reilly Automotive Inc. | 1.750% | 3/15/31 | 500 | 500 |
| | President and Fellows of Harvard College | 4.875% | 10/15/40 | 225 | 321 |
| | President and Fellows of Harvard College | 3.150% | 7/15/46 | 100 | 118 |
| | PulteGroup Inc. | 5.500% | 3/1/26 | 200 | 238 |
| | Pultegroup, Inc. | 6.375% | 5/15/33 | 300 | 411 |
| | Ralph Lauren Corp. | 1.700% | 6/15/22 | 100 | 102 |
| | Ralph Lauren Corp. | 3.750% | 9/15/25 | 50 | 56 |
| | Ralph Lauren Corp. | 2.950% | 6/15/30 | 200 | 216 |
| | Rockefeller Foundation | 2.492% | 10/1/50 | 250 | 255 |
| | Ross Stores Inc. | 4.600% | 4/15/25 | 200 | 231 |
| | Ross Stores Inc. | 1.875% | 4/15/31 | 200 | 201 |
| | Sands China Ltd. | 4.600% | 8/8/23 | 400 | 428 |
| | Sands China Ltd. | 5.125% | 8/8/25 | 400 | 449 |
| 5 | Sands China Ltd. | 3.800% | 1/8/26 | 200 | 213 |
| | Sands China Ltd. | 5.400% | 8/8/28 | 300 | 351 |
| 5 | Sands China Ltd. | 4.375% | 6/18/30 | 200 | 222 |
| | Starbucks Corp. | 1.300% | 5/7/22 | 100 | 101 |
| | Starbucks Corp. | 2.700% | 6/15/22 | 75 | 77 |
| | Starbucks Corp. | 3.100% | 3/1/23 | 375 | 396 |
| | Starbucks Corp. | 3.850% | 10/1/23 | 100 | 108 |
| | Starbucks Corp. | 2.450% | 6/15/26 | 200 | 216 |
| | Starbucks Corp. | 3.500% | 3/1/28 | 100 | 115 |
| | Starbucks Corp. | 4.000% | 11/15/28 | 200 | 237 |
| | Starbucks Corp. | 3.550% | 8/15/29 | 200 | 232 |
| | Starbucks Corp. | 2.250% | 3/12/30 | 450 | 475 |
| | Starbucks Corp. | 2.550% | 11/15/30 | 300 | 324 |
| | Starbucks Corp. | 4.300% | 6/15/45 | 50 | 61 |
| | Starbucks Corp. | 3.750% | 12/1/47 | 125 | 146 |
| | Starbucks Corp. | 4.500% | 11/15/48 | 200 | 257 |
| | Starbucks Corp. | 3.350% | 3/12/50 | 100 | 111 |
| | Starbucks Corp. | 3.500% | 11/15/50 | 300 | 344 |
| | Steelcase Inc. | 5.125% | 1/18/29 | 125 | 147 |
| | Tapestry Inc. | 3.000% | 7/15/22 | 125 | 128 |
| | Tapestry Inc. | 4.250% | 4/1/25 | 97 | 105 |
| | Tapestry Inc. | 4.125% | 7/15/27 | 100 | 108 |
| | TJX Cos. Inc. | 2.500% | 5/15/23 | 100 | 104 |
| | | | Coupon | Maturity
Date | Face
Amount
($000) | Market
Value•
($000) |
| | TJX Cos. Inc. | 3.500% | 4/15/25 | 150 | 167 |
| | TJX Cos. Inc. | 2.250% | 9/15/26 | 350 | 377 |
| | TJX Cos. Inc. | 3.750% | 4/15/27 | 450 | 520 |
| | TJX Cos. Inc. | 1.600% | 5/15/31 | 500 | 504 |
| | Toyota Motor Corp. | 2.157% | 7/2/22 | 100 | 103 |
| | Toyota Motor Corp. | 3.419% | 7/20/23 | 150 | 162 |
| | Toyota Motor Corp. | 2.358% | 7/2/24 | 100 | 106 |
| | Toyota Motor Corp. | 2.760% | 7/2/29 | 100 | 112 |
| | Toyota Motor Credit Corp. | 2.600% | 1/11/22 | 200 | 205 |
| | Toyota Motor Credit Corp. | 3.300% | 1/12/22 | 175 | 181 |
| | Toyota Motor Credit Corp. | 2.650% | 4/12/22 | 500 | 515 |
| | Toyota Motor Credit Corp. | 1.150% | 5/26/22 | 1,100 | 1,113 |
| | Toyota Motor Credit Corp. | 2.800% | 7/13/22 | 100 | 104 |
| | Toyota Motor Credit Corp. | 2.150% | 9/8/22 | 200 | 206 |
| | Toyota Motor Credit Corp. | 2.625% | 1/10/23 | 100 | 105 |
| | Toyota Motor Credit Corp. | 0.500% | 8/14/23 | 500 | 502 |
| | Toyota Motor Credit Corp. | 1.350% | 8/25/23 | 200 | 205 |
| | Toyota Motor Credit Corp. | 2.250% | 10/18/23 | 300 | 315 |
| | Toyota Motor Credit Corp. | 2.900% | 4/17/24 | 125 | 134 |
| | Toyota Motor Credit Corp. | 1.800% | 2/13/25 | 250 | 262 |
| | Toyota Motor Credit Corp. | 3.400% | 4/14/25 | 125 | 139 |
| | Toyota Motor Credit Corp. | 3.200% | 1/11/27 | 200 | 224 |
| | Toyota Motor Credit Corp. | 1.150% | 8/13/27 | 500 | 502 |
| | Toyota Motor Credit Corp. | 3.050% | 1/11/28 | 100 | 112 |
| | Toyota Motor Credit Corp. | 3.650% | 1/8/29 | 100 | 118 |
| | Toyota Motor Credit Corp. | 2.150% | 2/13/30 | 150 | 160 |
| | Toyota Motor Credit Corp. | 3.375% | 4/1/30 | 400 | 468 |
| | Tractor Supply Co. | 1.750% | 11/1/30 | 200 | 201 |
| | Trustees of Boston College | 3.129% | 7/1/52 | 100 | 109 |
| | Trustees of Princeton University | 5.700% | 3/1/39 | 200 | 303 |
| | Trustees of Princeton University | 2.516% | 7/1/50 | 150 | 159 |
| | Trustees of the University of Pennsylvania | 2.396% | 10/1/50 | 200 | 205 |
| 2 | University of Chicago | 2.547% | 4/1/50 | 500 | 500 |
| 2 | University of Chicago | 4.003% | 10/1/53 | 100 | 132 |
| 2 | University of Notre Dame du Lac | 3.438% | 2/15/45 | 100 | 122 |
| | University of Notre Dame du Lac | 3.394% | 2/15/48 | 125 | 154 |
| | University of Pennsylvania | 4.674% | 9/1/12 | 50 | 72 |
| 2 | University of Southern California | 3.028% | 10/1/39 | 100 | 109 |
| 2 | University of Southern California | 3.841% | 10/1/47 | 200 | 252 |
| | University of Southern California | 5.250% | 10/1/11 | 100 | 158 |
| | VF Corp. | 2.050% | 4/23/22 | 200 | 204 |
| | VF Corp. | 2.400% | 4/23/25 | 200 | 214 |
| | VF Corp. | 2.950% | 4/23/30 | 200 | 220 |
| | Whirlpool Corp. | 4.700% | 6/1/22 | 100 | 106 |
| | Whirlpool Corp. | 4.000% | 3/1/24 | 50 | 55 |
| | Whirlpool Corp. | 3.700% | 5/1/25 | 75 | 83 |
| | Whirlpool Corp. | 4.750% | 2/26/29 | 150 | 183 |
| | Whirlpool Corp. | 4.500% | 6/1/46 | 100 | 124 |
| | Whirlpool Corp. | 4.600% | 5/15/50 | 75 | 97 |
| 2 | William Marsh Rice University | 3.574% | 5/15/45 | 150 | 182 |
| | Yale University | 0.873% | 4/15/25 | 100 | 102 |
| | Yale University | 1.482% | 4/15/30 | 100 | 102 |
| | Yale University | 2.402% | 4/15/50 | 100 | 103 |
| | | | | | | 83,626 |
| Consumer Staples (2.1%) |
| | Ahold Finance USA LLC | 6.875% | 5/1/29 | 100 | 139 |
| | Altria Group Inc. | 3.490% | 2/14/22 | 200 | 207 |
| | Altria Group Inc. | 2.850% | 8/9/22 | 375 | 390 |
| | Altria Group Inc. | 2.950% | 5/2/23 | 400 | 421 |
| | Altria Group Inc. | 4.000% | 1/31/24 | 250 | 275 |
Total Bond Market Index Portfolio
| | | | Coupon | Maturity
Date | Face
Amount
($000) | Market
Value•
($000) |
| | Altria Group Inc. | 2.350% | 5/6/25 | 150 | 159 |
| | Altria Group Inc. | 4.400% | 2/14/26 | 275 | 319 |
| | Altria Group Inc. | 2.625% | 9/16/26 | 75 | 81 |
| | Altria Group Inc. | 4.800% | 2/14/29 | 575 | 686 |
| | Altria Group Inc. | 5.800% | 2/14/39 | 400 | 525 |
| | Altria Group Inc. | 4.250% | 8/9/42 | 275 | 307 |
| | Altria Group Inc. | 4.500% | 5/2/43 | 125 | 143 |
| | Altria Group Inc. | 5.375% | 1/31/44 | 350 | 448 |
| | Altria Group Inc. | 3.875% | 9/16/46 | 175 | 184 |
| | Altria Group Inc. | 5.950% | 2/14/49 | 500 | 699 |
| | Altria Group Inc. | 4.450% | 5/6/50 | 200 | 237 |
| | Altria Group Inc. | 6.200% | 2/14/59 | 175 | 245 |
| | Anheuser-Busch Cos LLC / Anheuser-Busch InBev Worldwide Inc. | 3.650% | 2/1/26 | 1,045 | 1,181 |
| | Anheuser-Busch Cos. LLC / Anheuser-Busch InBev Worldwide Inc. | 4.700% | 2/1/36 | 1,195 | 1,512 |
| | Anheuser-Busch Cos. LLC / Anheuser-Busch InBev Worldwide Inc. | 4.900% | 2/1/46 | 2,310 | 2,996 |
| | Anheuser-Busch InBev Finance Inc. | 4.700% | 2/1/36 | 100 | 126 |
| | Anheuser-Busch InBev Finance Inc. | 4.000% | 1/17/43 | 300 | 341 |
| | Anheuser-Busch InBev Finance Inc. | 4.625% | 2/1/44 | 200 | 247 |
| | Anheuser-Busch InBev Finance Inc. | 4.900% | 2/1/46 | 475 | 616 |
| | Anheuser-Busch InBev Worldwide Inc. | 4.150% | 1/23/25 | 882 | 1,004 |
| | Anheuser-Busch InBev Worldwide Inc. | 4.000% | 4/13/28 | 500 | 588 |
| | Anheuser-Busch InBev Worldwide Inc. | 4.750% | 1/23/29 | 925 | 1,140 |
| | Anheuser-Busch InBev Worldwide Inc. | 4.900% | 1/23/31 | 340 | 432 |
| | Anheuser-Busch InBev Worldwide Inc. | 4.375% | 4/15/38 | 275 | 337 |
| | Anheuser-Busch InBev Worldwide Inc. | 8.200% | 1/15/39 | 150 | 255 |
| | Anheuser-Busch InBev Worldwide Inc. | 5.450% | 1/23/39 | 125 | 169 |
| | Anheuser-Busch InBev Worldwide Inc. | 4.950% | 1/15/42 | 325 | 427 |
| | Anheuser-Busch InBev Worldwide Inc. | 3.750% | 7/15/42 | 325 | 366 |
| | Anheuser-Busch InBev Worldwide Inc. | 4.600% | 4/15/48 | 700 | 886 |
| | Anheuser-Busch InBev Worldwide Inc. | 4.439% | 10/6/48 | 601 | 744 |
| | Anheuser-Busch InBev Worldwide Inc. | 5.550% | 1/23/49 | 600 | 852 |
| | Anheuser-Busch InBev Worldwide Inc. | 4.500% | 6/1/50 | 400 | 503 |
| | Anheuser-Busch InBev Worldwide Inc. | 4.750% | 4/15/58 | 350 | 458 |
| | Anheuser-Busch InBev Worldwide Inc. | 5.800% | 1/23/59 | 155 | 235 |
| | Anheuser-Busch InBev Worldwide Inc. | 4.600% | 6/1/60 | 375 | 482 |
| | Archer-Daniels-Midland Co. | 2.750% | 3/27/25 | 100 | 109 |
| | Archer-Daniels-Midland Co. | 2.500% | 8/11/26 | 200 | 218 |
| | Archer-Daniels-Midland Co. | 3.250% | 3/27/30 | 200 | 230 |
| | Archer-Daniels-Midland Co. | 5.935% | 10/1/32 | 80 | 114 |
| | Archer-Daniels-Midland Co. | 5.375% | 9/15/35 | 95 | 136 |
| | Archer-Daniels-Midland Co. | 3.750% | 9/15/47 | 50 | 63 |
| | | | Coupon | Maturity
Date | Face
Amount
($000) | Market
Value•
($000) |
| | Archer-Daniels-Midland Co. | 4.500% | 3/15/49 | 125 | 178 |
| | BAT Capital Corp. | 2.764% | 8/15/22 | 325 | 336 |
| | BAT Capital Corp. | 3.222% | 8/15/24 | 650 | 704 |
| | BAT Capital Corp. | 3.215% | 9/6/26 | 200 | 220 |
| | BAT Capital Corp. | 4.700% | 4/2/27 | 100 | 118 |
| | BAT Capital Corp. | 3.557% | 8/15/27 | 675 | 752 |
| | BAT Capital Corp. | 2.259% | 3/25/28 | 500 | 518 |
| | BAT Capital Corp. | 3.462% | 9/6/29 | 125 | 137 |
| | BAT Capital Corp. | 2.726% | 3/25/31 | 500 | 518 |
| | BAT Capital Corp. | 4.390% | 8/15/37 | 525 | 588 |
| | BAT Capital Corp. | 4.540% | 8/15/47 | 575 | 637 |
| | BAT Capital Corp. | 4.758% | 9/6/49 | 250 | 286 |
| | BAT Capital Corp. | 3.984% | 9/25/50 | 500 | 520 |
| | BAT International Finance plc | 1.668% | 3/25/26 | 500 | 511 |
| | Beam Suntory Inc. | 3.250% | 5/15/22 | 50 | 52 |
| | Brown-Forman Corp. | 3.500% | 4/15/25 | 81 | 90 |
| | Brown-Forman Corp. | 4.500% | 7/15/45 | 100 | 134 |
| | Bunge Ltd. Finance Corp. | 3.000% | 9/25/22 | 250 | 260 |
| | Bunge Ltd. Finance Corp. | 4.350% | 3/15/24 | 125 | 138 |
| | Bunge Ltd. Finance Corp. | 3.750% | 9/25/27 | 200 | 228 |
| | Campbell Soup Co. | 3.650% | 3/15/23 | 65 | 69 |
| | Campbell Soup Co. | 3.950% | 3/15/25 | 200 | 225 |
| | Campbell Soup Co. | 3.300% | 3/19/25 | 125 | 137 |
| | Campbell Soup Co. | 4.150% | 3/15/28 | 175 | 205 |
| | Campbell Soup Co. | 2.375% | 4/24/30 | 150 | 157 |
| | Campbell Soup Co. | 4.800% | 3/15/48 | 135 | 180 |
| | Campbell Soup Co. | 3.125% | 4/24/50 | 100 | 106 |
| | Church & Dwight Co. Inc. | 2.450% | 8/1/22 | 25 | 26 |
| | Church & Dwight Co. Inc. | 3.150% | 8/1/27 | 100 | 111 |
| | Church & Dwight Co. Inc. | 3.950% | 8/1/47 | 75 | 94 |
| | Clorox Co. | 3.050% | 9/15/22 | 100 | 104 |
| | Clorox Co. | 3.500% | 12/15/24 | 175 | 193 |
| | Clorox Co. | 3.100% | 10/1/27 | 50 | 56 |
| | Clorox Co. | 3.900% | 5/15/28 | 50 | 59 |
| | Clorox Co. | 1.800% | 5/15/30 | 50 | 51 |
| | Coca-Cola Co. | 3.200% | 11/1/23 | 225 | 244 |
| | Coca-Cola Co. | 1.750% | 9/6/24 | 100 | 105 |
| | Coca-Cola Co. | 2.950% | 3/25/25 | 220 | 242 |
| | Coca-Cola Co. | 2.875% | 10/27/25 | 300 | 333 |
| | Coca-Cola Co. | 2.550% | 6/1/26 | 100 | 109 |
| | Coca-Cola Co. | 2.250% | 9/1/26 | 410 | 445 |
| | Coca-Cola Co. | 3.375% | 3/25/27 | 200 | 229 |
| | Coca-Cola Co. | 2.900% | 5/25/27 | 50 | 56 |
| | Coca-Cola Co. | 1.000% | 3/15/28 | 500 | 501 |
| | Coca-Cola Co. | 2.125% | 9/6/29 | 125 | 134 |
| | Coca-Cola Co. | 3.450% | 3/25/30 | 250 | 293 |
| | Coca-Cola Co. | 1.375% | 3/15/31 | 500 | 498 |
| | Coca-Cola Co. | 4.125% | 3/25/40 | 100 | 129 |
| | Coca-Cola Co. | 2.500% | 6/1/40 | 200 | 212 |
| | Coca-Cola Co. | 4.200% | 3/25/50 | 175 | 240 |
| | Coca-Cola Co. | 2.600% | 6/1/50 | 300 | 316 |
| | Coca-Cola Co. | 2.750% | 6/1/60 | 325 | 350 |
| | Coca-Cola Consolidated Inc. | 3.800% | 11/25/25 | 125 | 139 |
| | Coca-Cola Femsa SAB de CV | 2.750% | 1/22/30 | 200 | 216 |
| | Coca-Cola Femsa SAB de CV | 5.250% | 11/26/43 | 150 | 210 |
| | Colgate-Palmolive Co. | 2.250% | 11/15/22 | 75 | 78 |
| | Colgate-Palmolive Co. | 2.100% | 5/1/23 | 280 | 291 |
| | Colgate-Palmolive Co. | 3.250% | 3/15/24 | 100 | 109 |
| | Colgate-Palmolive Co. | 4.000% | 8/15/45 | 150 | 201 |
| | Colgate-Palmolive Co. | 3.700% | 8/1/47 | 100 | 130 |
| | Conagra Brands Inc. | 3.250% | 9/15/22 | 75 | 78 |
| | Conagra Brands Inc. | 3.200% | 1/25/23 | 79 | 83 |
| | Conagra Brands Inc. | 4.300% | 5/1/24 | 200 | 223 |
| | Conagra Brands Inc. | 4.600% | 11/1/25 | 150 | 177 |
| | Conagra Brands Inc. | 1.375% | 11/1/27 | 200 | 201 |
Total Bond Market Index Portfolio
| | | | Coupon | Maturity
Date | Face
Amount
($000) | Market
Value•
($000) |
| | Conagra Brands Inc. | 7.000% | 10/1/28 | 75 | 101 |
| | Conagra Brands Inc. | 4.850% | 11/1/28 | 250 | 310 |
| | Conagra Brands Inc. | 8.250% | 9/15/30 | 50 | 75 |
| | Conagra Brands Inc. | 5.300% | 11/1/38 | 200 | 266 |
| | Conagra Brands Inc. | 5.400% | 11/1/48 | 200 | 282 |
| | Constellation Brands Inc. | 2.700% | 5/9/22 | 50 | 51 |
| | Constellation Brands Inc. | 2.650% | 11/7/22 | 250 | 260 |
| | Constellation Brands Inc. | 3.200% | 2/15/23 | 250 | 264 |
| | Constellation Brands Inc. | 4.250% | 5/1/23 | 200 | 218 |
| | Constellation Brands Inc. | 4.750% | 11/15/24 | 175 | 201 |
| | Constellation Brands Inc. | 4.400% | 11/15/25 | 100 | 116 |
| | Constellation Brands Inc. | 3.700% | 12/6/26 | 100 | 114 |
| | Constellation Brands Inc. | 3.500% | 5/9/27 | 150 | 170 |
| | Constellation Brands Inc. | 3.600% | 2/15/28 | 175 | 200 |
| | Constellation Brands Inc. | 4.650% | 11/15/28 | 75 | 91 |
| | Constellation Brands Inc. | 3.150% | 8/1/29 | 225 | 250 |
| | Constellation Brands Inc. | 2.875% | 5/1/30 | 356 | 390 |
| | Constellation Brands Inc. | 4.500% | 5/9/47 | 75 | 95 |
| | Constellation Brands Inc. | 4.100% | 2/15/48 | 100 | 121 |
| | Constellation Brands Inc. | 5.250% | 11/15/48 | 225 | 316 |
| | Constellation Brands Inc. | 3.750% | 5/1/50 | 125 | 147 |
| | Costco Wholesale Corp. | 2.300% | 5/18/22 | 150 | 154 |
| | Costco Wholesale Corp. | 2.750% | 5/18/24 | 275 | 295 |
| | Costco Wholesale Corp. | 3.000% | 5/18/27 | 100 | 112 |
| | Costco Wholesale Corp. | 1.375% | 6/20/27 | 250 | 257 |
| | Costco Wholesale Corp. | 1.600% | 4/20/30 | 400 | 409 |
| | Costco Wholesale Corp. | 1.750% | 4/20/32 | 200 | 208 |
| | Delhaize America LLC | 9.000% | 4/15/31 | 100 | 160 |
| | Diageo Capital plc | 2.625% | 4/29/23 | 500 | 524 |
| | Diageo Capital plc | 2.125% | 10/24/24 | 200 | 211 |
| | Diageo Capital plc | 1.375% | 9/29/25 | 200 | 205 |
| | Diageo Capital plc | 2.375% | 10/24/29 | 200 | 215 |
| | Diageo Capital plc | 2.000% | 4/29/30 | 200 | 208 |
| | Diageo Capital plc | 2.125% | 4/29/32 | 200 | 211 |
| | Diageo Capital plc | 5.875% | 9/30/36 | 50 | 72 |
| | Diageo Capital plc | 3.875% | 4/29/43 | 100 | 124 |
| | Diageo Investment Corp. | 2.875% | 5/11/22 | 300 | 310 |
| | Diageo Investment Corp. | 4.250% | 5/11/42 | 150 | 191 |
| | Dollar General Corp. | 3.250% | 4/15/23 | 150 | 159 |
| | Dollar General Corp. | 4.150% | 11/1/25 | 105 | 121 |
| | Dollar General Corp. | 3.875% | 4/15/27 | 150 | 173 |
| | Dollar General Corp. | 4.125% | 5/1/28 | 150 | 177 |
| | Dollar General Corp. | 3.500% | 4/3/30 | 100 | 115 |
| | Dollar General Corp. | 4.125% | 4/3/50 | 200 | 252 |
| | Dollar Tree Inc. | 3.700% | 5/15/23 | 100 | 107 |
| | Dollar Tree Inc. | 4.000% | 5/15/25 | 200 | 226 |
| | Dollar Tree Inc. | 4.200% | 5/15/28 | 300 | 355 |
| | Estee Lauder Cos. Inc. | 3.150% | 3/15/27 | 150 | 169 |
| | Estee Lauder Cos. Inc. | 2.375% | 12/1/29 | 125 | 135 |
| | Estee Lauder Cos. Inc. | 6.000% | 5/15/37 | 75 | 111 |
| | Estee Lauder Cos. Inc. | 4.375% | 6/15/45 | 100 | 131 |
| | Estee Lauder Cos. Inc. | 4.150% | 3/15/47 | 100 | 131 |
| | Estee Lauder Cos. Inc. | 3.125% | 12/1/49 | 125 | 143 |
| | Flowers Foods Inc. | 4.375% | 4/1/22 | 50 | 52 |
| | Flowers Foods Inc. | 3.500% | 10/1/26 | 75 | 84 |
| | Fomento Economico Mexicano SAB de CV | 4.375% | 5/10/43 | 100 | 125 |
| | Fomento Economico Mexicano SAB de CV | 3.500% | 1/16/50 | 600 | 667 |
| | General Mills Inc. | 3.150% | 12/15/21 | 25 | 25 |
| | General Mills Inc. | 2.600% | 10/12/22 | 250 | 260 |
| | General Mills Inc. | 3.700% | 10/17/23 | 575 | 626 |
| | General Mills Inc. | 3.650% | 2/15/24 | 100 | 108 |
| | General Mills Inc. | 4.200% | 4/17/28 | 225 | 269 |
| | General Mills Inc. | 2.875% | 4/15/30 | 150 | 166 |
| | General Mills Inc. | 4.550% | 4/17/38 | 75 | 96 |
| | General Mills Inc. | 5.400% | 6/15/40 | 100 | 141 |
| | General Mills Inc. | 4.150% | 2/15/43 | 100 | 126 |
| | General Mills Inc. | 4.700% | 4/17/48 | 225 | 316 |
| | | | Coupon | Maturity
Date | Face
Amount
($000) | Market
Value•
($000) |
| | Hershey Co. | 2.625% | 5/1/23 | 100 | 105 |
| | Hershey Co. | 3.375% | 5/15/23 | 150 | 161 |
| | Hershey Co. | 2.050% | 11/15/24 | 55 | 58 |
| | Hershey Co. | 3.200% | 8/21/25 | 65 | 72 |
| | Hershey Co. | 2.300% | 8/15/26 | 100 | 108 |
| | Hershey Co. | 2.450% | 11/15/29 | 130 | 142 |
| | Hershey Co. | 1.700% | 6/1/30 | 30 | 31 |
| | Hershey Co. | 3.125% | 11/15/49 | 150 | 170 |
| | Hershey Co. | 2.650% | 6/1/50 | 100 | 106 |
| | Hormel Foods Corp. | 1.800% | 6/11/30 | 200 | 207 |
| | Ingredion Inc. | 3.200% | 10/1/26 | 100 | 111 |
| | Ingredion Inc. | 2.900% | 6/1/30 | 175 | 192 |
| | Ingredion Inc. | 3.900% | 6/1/50 | 100 | 119 |
| | JM Smucker Co. | 3.000% | 3/15/22 | 100 | 103 |
| | JM Smucker Co. | 3.500% | 3/15/25 | 175 | 195 |
| | JM Smucker Co. | 3.375% | 12/15/27 | 150 | 169 |
| | JM Smucker Co. | 2.375% | 3/15/30 | 100 | 106 |
| | JM Smucker Co. | 4.250% | 3/15/35 | 100 | 122 |
| | JM Smucker Co. | 4.375% | 3/15/45 | 125 | 156 |
| | JM Smucker Co. | 3.550% | 3/15/50 | 50 | 56 |
| | Kellogg Co. | 2.650% | 12/1/23 | 126 | 134 |
| | Kellogg Co. | 3.250% | 4/1/26 | 125 | 140 |
| | Kellogg Co. | 3.400% | 11/15/27 | 125 | 142 |
| | Kellogg Co. | 4.300% | 5/15/28 | 100 | 119 |
| | Kellogg Co. | 2.100% | 6/1/30 | 100 | 105 |
| | Kellogg Co. | 7.450% | 4/1/31 | 125 | 189 |
| | Kellogg Co. | 4.500% | 4/1/46 | 210 | 271 |
| | Keurig Dr Pepper Inc. | 2.700% | 11/15/22 | 50 | 52 |
| | Keurig Dr Pepper Inc. | 4.057% | 5/25/23 | 375 | 407 |
| | Keurig Dr Pepper Inc. | 3.130% | 12/15/23 | 100 | 107 |
| | Keurig Dr Pepper Inc. | 4.417% | 5/25/25 | 275 | 316 |
| | Keurig Dr Pepper Inc. | 3.400% | 11/15/25 | 100 | 112 |
| | Keurig Dr Pepper Inc. | 2.550% | 9/15/26 | 75 | 82 |
| | Keurig Dr Pepper Inc. | 3.430% | 6/15/27 | 100 | 113 |
| | Keurig Dr Pepper Inc. | 4.597% | 5/25/28 | 395 | 479 |
| | Keurig Dr Pepper Inc. | 3.200% | 5/1/30 | 150 | 170 |
| | Keurig Dr Pepper Inc. | 7.450% | 5/1/38 | 16 | 25 |
| | Keurig Dr Pepper Inc. | 4.985% | 5/25/38 | 100 | 134 |
| | Keurig Dr Pepper Inc. | 4.500% | 11/15/45 | 200 | 255 |
| | Keurig Dr Pepper Inc. | 4.420% | 12/15/46 | 125 | 157 |
| | Keurig Dr Pepper Inc. | 3.800% | 5/1/50 | 150 | 179 |
| | Kimberly-Clark Corp. | 3.050% | 8/15/25 | 50 | 56 |
| | Kimberly-Clark Corp. | 2.750% | 2/15/26 | 100 | 111 |
| | Kimberly-Clark Corp. | 1.050% | 9/15/27 | 500 | 505 |
| | Kimberly-Clark Corp. | 3.950% | 11/1/28 | 50 | 60 |
| | Kimberly-Clark Corp. | 3.200% | 4/25/29 | 150 | 173 |
| | Kimberly-Clark Corp. | 3.100% | 3/26/30 | 155 | 178 |
| | Kimberly-Clark Corp. | 6.625% | 8/1/37 | 250 | 409 |
| | Kimberly-Clark Corp. | 5.300% | 3/1/41 | 25 | 36 |
| | Kimberly-Clark Corp. | 3.200% | 7/30/46 | 175 | 207 |
| | Koninklijke Ahold Delhaize NV | 5.700% | 10/1/40 | 37 | 54 |
| | Kroger Co. | 3.400% | 4/15/22 | 75 | 77 |
| | Kroger Co. | 2.800% | 8/1/22 | 100 | 104 |
| | Kroger Co. | 4.000% | 2/1/24 | 100 | 110 |
| | Kroger Co. | 3.500% | 2/1/26 | 160 | 179 |
| | Kroger Co. | 2.650% | 10/15/26 | 140 | 153 |
| | Kroger Co. | 3.700% | 8/1/27 | 100 | 115 |
| | Kroger Co. | 7.700% | 6/1/29 | 50 | 70 |
| | Kroger Co. | 8.000% | 9/15/29 | 125 | 181 |
| | Kroger Co. | 2.200% | 5/1/30 | 100 | 105 |
| | Kroger Co. | 7.500% | 4/1/31 | 100 | 146 |
| | Kroger Co. | 5.400% | 7/15/40 | 50 | 67 |
| | Kroger Co. | 5.000% | 4/15/42 | 125 | 165 |
| | Kroger Co. | 5.150% | 8/1/43 | 100 | 136 |
| | Kroger Co. | 3.875% | 10/15/46 | 100 | 117 |
| | Kroger Co. | 4.450% | 2/1/47 | 225 | 283 |
| | Kroger Co. | 4.650% | 1/15/48 | 75 | 97 |
| | Kroger Co. | 5.400% | 1/15/49 | 25 | 36 |
Total Bond Market Index Portfolio
| | | | Coupon | Maturity
Date | Face
Amount
($000) | Market
Value•
($000) |
| | Kroger Co. | 3.950% | 1/15/50 | 175 | 210 |
| | McCormick & Co. Inc. | 3.900% | 7/15/21 | 50 | 51 |
| | McCormick & Co. Inc. | 3.150% | 8/15/24 | 150 | 163 |
| | McCormick & Co. Inc. | 3.400% | 8/15/27 | 150 | 168 |
| | McCormick & Co. Inc. | 2.500% | 4/15/30 | 250 | 268 |
| | Mead Johnson Nutrition Co. | 4.125% | 11/15/25 | 355 | 409 |
| | Mead Johnson Nutrition Co. | 5.900% | 11/1/39 | 100 | 148 |
| | Mead Johnson Nutrition Co. | 4.600% | 6/1/44 | 150 | 198 |
| | Molson Coors Beverage Co. | 3.500% | 5/1/22 | 25 | 26 |
| | Molson Coors Beverage Co. | 3.000% | 7/15/26 | 375 | 411 |
| | Molson Coors Beverage Co. | 5.000% | 5/1/42 | 200 | 250 |
| | Molson Coors Beverage Co. | 4.200% | 7/15/46 | 375 | 429 |
| 5 | Mondelez International Holdings Netherlands BV | 2.125% | 9/19/22 | 200 | 206 |
| | Mondelez International Inc. | 0.625% | 7/1/22 | 200 | 201 |
| | Mondelez International Inc. | 2.125% | 4/13/23 | 100 | 104 |
| | Mondelez International Inc. | 1.500% | 5/4/25 | 100 | 104 |
| | Mondelez International Inc. | 2.750% | 4/13/30 | 250 | 274 |
| | Mondelez International Inc. | 1.875% | 10/15/32 | 500 | 507 |
| | Mondelez International Inc. | 2.625% | 9/4/50 | 250 | 251 |
| | PepsiCo Inc. | 2.750% | 3/5/22 | 375 | 386 |
| | PepsiCo Inc. | 2.250% | 5/2/22 | 150 | 154 |
| | PepsiCo Inc. | 0.750% | 5/1/23 | 125 | 127 |
| | PepsiCo Inc. | 3.600% | 3/1/24 | 700 | 764 |
| | PepsiCo Inc. | 2.250% | 3/19/25 | 265 | 283 |
| | PepsiCo Inc. | 2.750% | 4/30/25 | 200 | 217 |
| | PepsiCo Inc. | 3.500% | 7/17/25 | 452 | 507 |
| | PepsiCo Inc. | 2.375% | 10/6/26 | 225 | 245 |
| | PepsiCo Inc. | 2.625% | 3/19/27 | 100 | 110 |
| | PepsiCo Inc. | 3.000% | 10/15/27 | 325 | 366 |
| | PepsiCo Inc. | 2.625% | 7/29/29 | 200 | 220 |
| | PepsiCo Inc. | 2.750% | 3/19/30 | 345 | 384 |
| | PepsiCo Inc. | 1.625% | 5/1/30 | 200 | 205 |
| | PepsiCo Inc. | 1.400% | 2/25/31 | 500 | 502 |
| | PepsiCo Inc. | 3.500% | 3/19/40 | 175 | 210 |
| | PepsiCo Inc. | 4.000% | 3/5/42 | 175 | 225 |
| | PepsiCo Inc. | 3.600% | 8/13/42 | 100 | 121 |
| | PepsiCo Inc. | 4.250% | 10/22/44 | 225 | 294 |
| | PepsiCo Inc. | 4.600% | 7/17/45 | 75 | 105 |
| | PepsiCo Inc. | 4.450% | 4/14/46 | 500 | 697 |
| | PepsiCo Inc. | 3.450% | 10/6/46 | 300 | 360 |
| | PepsiCo Inc. | 4.000% | 5/2/47 | 100 | 131 |
| | PepsiCo Inc. | 3.375% | 7/29/49 | 200 | 242 |
| | PepsiCo Inc. | 2.875% | 10/15/49 | 325 | 363 |
| | PepsiCo Inc. | 3.625% | 3/19/50 | 290 | 366 |
| | PepsiCo Inc. | 3.875% | 3/19/60 | 150 | 200 |
| | Philip Morris International Inc. | 2.500% | 11/2/22 | 300 | 311 |
| | Philip Morris International Inc. | 2.625% | 3/6/23 | 100 | 105 |
| | Philip Morris International Inc. | 1.125% | 5/1/23 | 125 | 127 |
| | Philip Morris International Inc. | 2.125% | 5/10/23 | 95 | 99 |
| | Philip Morris International Inc. | 3.600% | 11/15/23 | 500 | 545 |
| | | | Coupon | Maturity
Date | Face
Amount
($000) | Market
Value•
($000) |
| | Philip Morris International Inc. | 2.875% | 5/1/24 | 220 | 237 |
| | Philip Morris International Inc. | 3.250% | 11/10/24 | 250 | 275 |
| | Philip Morris International Inc. | 1.500% | 5/1/25 | 125 | 129 |
| | Philip Morris International Inc. | 3.375% | 8/11/25 | 150 | 167 |
| | Philip Morris International Inc. | 2.750% | 2/25/26 | 180 | 196 |
| | Philip Morris International Inc. | 3.125% | 3/2/28 | 100 | 112 |
| | Philip Morris International Inc. | 3.375% | 8/15/29 | 250 | 286 |
| | Philip Morris International Inc. | 2.100% | 5/1/30 | 150 | 155 |
| | Philip Morris International Inc. | 1.750% | 11/1/30 | 500 | 506 |
| | Philip Morris International Inc. | 6.375% | 5/16/38 | 200 | 302 |
| | Philip Morris International Inc. | 4.375% | 11/15/41 | 500 | 623 |
| | Philip Morris International Inc. | 4.500% | 3/20/42 | 125 | 158 |
| | Philip Morris International Inc. | 3.875% | 8/21/42 | 25 | 29 |
| | Philip Morris International Inc. | 4.875% | 11/15/43 | 155 | 205 |
| | Philip Morris International Inc. | 4.250% | 11/10/44 | 200 | 251 |
| 2 | Procter & Gamble Co. | 9.360% | 1/1/21 | 29 | 29 |
| | Procter & Gamble Co. | 2.300% | 2/6/22 | 425 | 434 |
| | Procter & Gamble Co. | 3.100% | 8/15/23 | 150 | 161 |
| | Procter & Gamble Co. | 0.550% | 10/29/25 | 500 | 501 |
| | Procter & Gamble Co. | 2.450% | 11/3/26 | 100 | 110 |
| | Procter & Gamble Co. | 2.800% | 3/25/27 | 500 | 556 |
| | Procter & Gamble Co. | 3.000% | 3/25/30 | 500 | 573 |
| | Procter & Gamble Co. | 1.200% | 10/29/30 | 500 | 498 |
| | Procter & Gamble Co. | 5.550% | 3/5/37 | 150 | 229 |
| | Procter & Gamble Co. | 3.550% | 3/25/40 | 188 | 234 |
| | Procter & Gamble Co. | 3.500% | 10/25/47 | 169 | 219 |
| | Procter & Gamble Co. | 3.600% | 3/25/50 | 173 | 232 |
| | Reynolds American Inc. | 4.850% | 9/15/23 | 125 | 139 |
| | Reynolds American Inc. | 4.450% | 6/12/25 | 525 | 597 |
| | Reynolds American Inc. | 5.700% | 8/15/35 | 175 | 221 |
| | Reynolds American Inc. | 7.250% | 6/15/37 | 100 | 137 |
| | Reynolds American Inc. | 6.150% | 9/15/43 | 75 | 97 |
| | Reynolds American Inc. | 5.850% | 8/15/45 | 450 | 574 |
| | Sysco Corp. | 2.600% | 6/12/22 | 125 | 129 |
| | Sysco Corp. | 3.750% | 10/1/25 | 75 | 84 |
| | Sysco Corp. | 3.300% | 7/15/26 | 250 | 277 |
| | Sysco Corp. | 3.250% | 7/15/27 | 175 | 195 |
| | Sysco Corp. | 2.400% | 2/15/30 | 100 | 104 |
| | Sysco Corp. | 5.950% | 4/1/30 | 250 | 328 |
| | Sysco Corp. | 6.600% | 4/1/40 | 175 | 255 |
| | Sysco Corp. | 4.850% | 10/1/45 | 50 | 62 |
| | Sysco Corp. | 4.500% | 4/1/46 | 200 | 242 |
| | Sysco Corp. | 4.450% | 3/15/48 | 100 | 120 |
| | Sysco Corp. | 3.300% | 2/15/50 | 105 | 110 |
| | Sysco Corp. | 6.600% | 4/1/50 | 250 | 384 |
| | Target Corp. | 2.900% | 1/15/22 | 200 | 206 |
| | Target Corp. | 3.500% | 7/1/24 | 325 | 360 |
| | Target Corp. | 2.250% | 4/15/25 | 200 | 214 |
| | Target Corp. | 2.500% | 4/15/26 | 175 | 193 |
| | Target Corp. | 3.375% | 4/15/29 | 200 | 234 |
| | Target Corp. | 2.650% | 9/15/30 | 250 | 280 |
| | Target Corp. | 6.500% | 10/15/37 | 103 | 166 |
| | Target Corp. | 7.000% | 1/15/38 | 125 | 208 |
| | Target Corp. | 3.900% | 11/15/47 | 300 | 392 |
| | Tyson Foods Inc. | 4.500% | 6/15/22 | 275 | 288 |
| | Tyson Foods Inc. | 3.900% | 9/28/23 | 100 | 109 |
Total Bond Market Index Portfolio
| | | | Coupon | Maturity
Date | Face
Amount
($000) | Market
Value•
($000) |
| | Tyson Foods Inc. | 3.950% | 8/15/24 | 925 | 1,027 |
| | Tyson Foods Inc. | 4.000% | 3/1/26 | 100 | 115 |
| | Tyson Foods Inc. | 3.550% | 6/2/27 | 275 | 313 |
| | Tyson Foods Inc. | 4.350% | 3/1/29 | 280 | 339 |
| | Tyson Foods Inc. | 4.875% | 8/15/34 | 100 | 131 |
| | Tyson Foods Inc. | 5.150% | 8/15/44 | 200 | 274 |
| | Tyson Foods Inc. | 4.550% | 6/2/47 | 150 | 197 |
| | Tyson Foods Inc. | 5.100% | 9/28/48 | 275 | 395 |
| | Unilever Capital Corp. | 3.000% | 3/7/22 | 100 | 103 |
| | Unilever Capital Corp. | 3.250% | 3/7/24 | 250 | 271 |
| | Unilever Capital Corp. | 2.600% | 5/5/24 | 450 | 480 |
| | Unilever Capital Corp. | 3.375% | 3/22/25 | 100 | 111 |
| | Unilever Capital Corp. | 3.100% | 7/30/25 | 225 | 249 |
| | Unilever Capital Corp. | 2.000% | 7/28/26 | 125 | 133 |
| | Unilever Capital Corp. | 1.375% | 9/14/30 | 300 | 301 |
| | Unilever Capital Corp. | 5.900% | 11/15/32 | 200 | 290 |
| | Walgreen Co. | 3.100% | 9/15/22 | 250 | 261 |
| | Walgreen Co. | 4.400% | 9/15/42 | 195 | 210 |
| | Walgreens Boots Alliance Inc. | 3.800% | 11/18/24 | 375 | 413 |
| | Walgreens Boots Alliance Inc. | 3.450% | 6/1/26 | 325 | 360 |
| | Walgreens Boots Alliance Inc. | 3.200% | 4/15/30 | 150 | 163 |
| | Walgreens Boots Alliance Inc. | 4.500% | 11/18/34 | 125 | 143 |
| | Walgreens Boots Alliance Inc. | 4.800% | 11/18/44 | 275 | 311 |
| | Walgreens Boots Alliance Inc. | 4.650% | 6/1/46 | 115 | 126 |
| | Walgreens Boots Alliance Inc. | 4.100% | 4/15/50 | 150 | 159 |
| | Walmart Inc. | 2.350% | 12/15/22 | 800 | 832 |
| | Walmart Inc. | 2.550% | 4/11/23 | 150 | 157 |
| | Walmart Inc. | 3.400% | 6/26/23 | 250 | 268 |
| | Walmart Inc. | 3.300% | 4/22/24 | 250 | 272 |
| | Walmart Inc. | 2.850% | 7/8/24 | 275 | 297 |
| | Walmart Inc. | 2.650% | 12/15/24 | 200 | 216 |
| | Walmart Inc. | 3.550% | 6/26/25 | 309 | 350 |
| | Walmart Inc. | 3.050% | 7/8/26 | 250 | 281 |
| | Walmart Inc. | 5.875% | 4/5/27 | 405 | 517 |
| | Walmart Inc. | 3.700% | 6/26/28 | 450 | 529 |
| | Walmart Inc. | 3.250% | 7/8/29 | 300 | 347 |
| | Walmart Inc. | 2.375% | 9/24/29 | 175 | 191 |
| | Walmart Inc. | 7.550% | 2/15/30 | 105 | 160 |
| | Walmart Inc. | 5.250% | 9/1/35 | 385 | 559 |
| | Walmart Inc. | 6.200% | 4/15/38 | 315 | 498 |
| | Walmart Inc. | 3.950% | 6/28/38 | 275 | 349 |
| | Walmart Inc. | 5.000% | 10/25/40 | 100 | 144 |
| | Walmart Inc. | 4.000% | 4/11/43 | 274 | 350 |
| | Walmart Inc. | 4.300% | 4/22/44 | 361 | 487 |
| | Walmart Inc. | 3.625% | 12/15/47 | 265 | 336 |
| | Walmart Inc. | 4.050% | 6/29/48 | 500 | 677 |
| | Walmart Inc. | 2.950% | 9/24/49 | 400 | 459 |
| | | | | | | 103,691 |
| Energy (2.5%) |
| | Baker Hughes a GE Co. LLC / Baker Hughes Co-Obligor Inc. | 2.773% | 12/15/22 | 425 | 443 |
| | Baker Hughes a GE Co. LLC / Baker Hughes Co-Obligor Inc. | 3.337% | 12/15/27 | 200 | 224 |
| | Baker Hughes a GE Co. LLC / Baker Hughes Co-Obligor Inc. | 3.138% | 11/7/29 | 250 | 274 |
| | Baker Hughes a GE Co. LLC / Baker Hughes Co-Obligor Inc. | 4.486% | 5/1/30 | 200 | 241 |
| | Baker Hughes a GE Co. LLC / Baker Hughes Co-Obligor Inc. | 5.125% | 9/15/40 | 175 | 231 |
| | | | Coupon | Maturity
Date | Face
Amount
($000) | Market
Value•
($000) |
| | Baker Hughes a GE Co. LLC / Baker Hughes Co-Obligor Inc. | 4.080% | 12/15/47 | 275 | 312 |
| | Boardwalk Pipelines LP | 3.375% | 2/1/23 | 100 | 104 |
| | Boardwalk Pipelines LP | 4.950% | 12/15/24 | 150 | 167 |
| | Boardwalk Pipelines LP | 5.950% | 6/1/26 | 200 | 236 |
| | Boardwalk Pipelines LP | 4.450% | 7/15/27 | 100 | 112 |
| | BP Capital Markets America Inc. | 3.245% | 5/6/22 | 250 | 260 |
| | BP Capital Markets America Inc. | 2.520% | 9/19/22 | 50 | 52 |
| | BP Capital Markets America Inc. | 2.937% | 4/6/23 | 100 | 106 |
| | BP Capital Markets America Inc. | 2.750% | 5/10/23 | 300 | 316 |
| | BP Capital Markets America Inc. | 3.216% | 11/28/23 | 1,082 | 1,162 |
| | BP Capital Markets America Inc. | 3.194% | 4/6/25 | 230 | 253 |
| | BP Capital Markets America Inc. | 3.410% | 2/11/26 | 100 | 112 |
| | BP Capital Markets America Inc. | 3.119% | 5/4/26 | 550 | 608 |
| | BP Capital Markets America Inc. | 3.017% | 1/16/27 | 400 | 441 |
| | BP Capital Markets America Inc. | 3.937% | 9/21/28 | 175 | 206 |
| | BP Capital Markets America Inc. | 4.234% | 11/6/28 | 225 | 268 |
| | BP Capital Markets America Inc. | 3.633% | 4/6/30 | 350 | 407 |
| | BP Capital Markets America Inc. | 3.000% | 2/24/50 | 450 | 461 |
| | BP Capital Markets America Inc. | 2.772% | 11/10/50 | 500 | 492 |
| | BP Capital Markets America Inc. | 2.939% | 6/4/51 | 500 | 507 |
| | BP Capital Markets plc | 3.062% | 3/17/22 | 25 | 26 |
| | BP Capital Markets plc | 2.500% | 11/6/22 | 450 | 467 |
| | BP Capital Markets plc | 3.994% | 9/26/23 | 200 | 219 |
| | BP Capital Markets plc | 3.814% | 2/10/24 | 400 | 439 |
| | BP Capital Markets plc | 3.535% | 11/4/24 | 68 | 75 |
| | BP Capital Markets plc | 3.506% | 3/17/25 | 200 | 223 |
| | BP Capital Markets plc | 3.279% | 9/19/27 | 200 | 225 |
| | BP Capital Markets plc | 3.723% | 11/28/28 | 175 | 203 |
| | Burlington Resources LLC | 7.400% | 12/1/31 | 175 | 260 |
| | Burlington Resources LLC | 5.950% | 10/15/36 | 200 | 282 |
| | Canadian Natural Resources Ltd. | 2.950% | 1/15/23 | 200 | 209 |
| | Canadian Natural Resources Ltd. | 2.050% | 7/15/25 | 100 | 105 |
| | Canadian Natural Resources Ltd. | 3.850% | 6/1/27 | 750 | 841 |
| | Canadian Natural Resources Ltd. | 2.950% | 7/15/30 | 100 | 106 |
| | Canadian Natural Resources Ltd. | 7.200% | 1/15/32 | 150 | 200 |
| | Canadian Natural Resources Ltd. | 6.450% | 6/30/33 | 125 | 164 |
| | Canadian Natural Resources Ltd. | 5.850% | 2/1/35 | 100 | 126 |
| | Canadian Natural Resources Ltd. | 6.500% | 2/15/37 | 50 | 66 |
| | Canadian Natural Resources Ltd. | 6.250% | 3/15/38 | 100 | 134 |
| | Canadian Natural Resources Ltd. | 4.950% | 6/1/47 | 140 | 177 |
| | Cheniere Corpus Christi Holdings LLC | 7.000% | 6/30/24 | 200 | 233 |
| | Cheniere Corpus Christi Holdings LLC | 5.875% | 3/31/25 | 225 | 261 |
Total Bond Market Index Portfolio
| | | | Coupon | Maturity
Date | Face
Amount
($000) | Market
Value•
($000) |
| | Cheniere Corpus Christi Holdings LLC | 5.125% | 6/30/27 | 525 | 619 |
| | Cheniere Corpus Christi Holdings LLC | 3.700% | 11/15/29 | 300 | 334 |
| | Chevron Corp. | 2.355% | 12/5/22 | 1,130 | 1,169 |
| | Chevron Corp. | 1.141% | 5/11/23 | 300 | 306 |
| | Chevron Corp. | 3.191% | 6/24/23 | 225 | 239 |
| | Chevron Corp. | 1.554% | 5/11/25 | 900 | 933 |
| | Chevron Corp. | 2.236% | 5/11/30 | 500 | 534 |
| | Chevron Corp. | 2.978% | 5/11/40 | 100 | 110 |
| | Chevron USA Inc. | 0.333% | 8/12/22 | 500 | 501 |
| | Chevron USA Inc. | 1.018% | 8/12/27 | 500 | 500 |
| | Chevron USA Inc. | 2.343% | 8/12/50 | 500 | 483 |
| | Cimarex Energy Co. | 4.375% | 6/1/24 | 200 | 217 |
| | Cimarex Energy Co. | 3.900% | 5/15/27 | 350 | 383 |
| | CNOOC Finance 2013 Ltd. | 3.300% | 9/30/49 | 250 | 247 |
| | CNOOC Finance 2014 ULC | 4.250% | 4/30/24 | 300 | 325 |
| | CNOOC Finance 2015 USA LLC | 3.500% | 5/5/25 | 500 | 539 |
| | CNOOC Finance 2015 USA LLC | 4.375% | 5/2/28 | 300 | 343 |
| | CNOOC Petroleum North America ULC | 7.875% | 3/15/32 | 50 | 74 |
| | CNOOC Petroleum North America ULC | 6.400% | 5/15/37 | 450 | 627 |
| | Columbia Pipeline Group Inc. | 4.500% | 6/1/25 | 300 | 346 |
| | Columbia Pipeline Group Inc. | 5.800% | 6/1/45 | 100 | 137 |
| | Concho Resources Inc. | 3.750% | 10/1/27 | 400 | 453 |
| | Concho Resources Inc. | 4.300% | 8/15/28 | 100 | 118 |
| | Concho Resources Inc. | 2.400% | 2/15/31 | 500 | 522 |
| | Concho Resources Inc. | 4.875% | 10/1/47 | 200 | 269 |
| | ConocoPhillips | 5.900% | 10/15/32 | 450 | 613 |
| | ConocoPhillips | 5.900% | 5/15/38 | 450 | 644 |
| | ConocoPhillips | 6.500% | 2/1/39 | 200 | 306 |
| | ConocoPhillips Co. | 3.350% | 11/15/24 | 50 | 55 |
| | ConocoPhillips Co. | 6.950% | 4/15/29 | 350 | 488 |
| | ConocoPhillips Co. | 4.300% | 11/15/44 | 275 | 348 |
| | Devon Energy Corp. | 5.850% | 12/15/25 | 100 | 118 |
| | Devon Energy Corp. | 7.875% | 9/30/31 | 160 | 222 |
| | Devon Energy Corp. | 7.950% | 4/15/32 | 163 | 229 |
| | Devon Energy Corp. | 5.600% | 7/15/41 | 375 | 455 |
| | Devon Energy Corp. | 5.000% | 6/15/45 | 150 | 177 |
| | Diamondback Energy Inc. | 3.250% | 12/1/26 | 500 | 534 |
| | Diamondback Energy Inc. | 3.500% | 12/1/29 | 500 | 532 |
| | Ecopetrol SA | 5.875% | 9/18/23 | 225 | 251 |
| | Ecopetrol SA | 4.125% | 1/16/25 | 200 | 218 |
| | Ecopetrol SA | 5.375% | 6/26/26 | 750 | 862 |
| | Ecopetrol SA | 6.875% | 4/29/30 | 400 | 515 |
| | Ecopetrol SA | 7.375% | ��� 9/18/43 | 100 | 136 |
| | Ecopetrol SA | 5.875% | 5/28/45 | 400 | 483 |
| | Enable Midstream Partners LP | 3.900% | 5/15/24 | 150 | 153 |
| | Enable Midstream Partners LP | 4.400% | 3/15/27 | 150 | 150 |
| | Enable Midstream Partners LP | 4.950% | 5/15/28 | 200 | 204 |
| | Enable Midstream Partners LP | 4.150% | 9/15/29 | 200 | 198 |
| | Enable Midstream Partners LP | 5.000% | 5/15/44 | 100 | 95 |
| | Enbridge Energy Partners LP | 5.875% | 10/15/25 | 150 | 182 |
| | Enbridge Energy Partners LP | 7.500% | 4/15/38 | 150 | 212 |
| | Enbridge Energy Partners LP | 5.500% | 9/15/40 | 75 | 94 |
| | Enbridge Energy Partners LP | 7.375% | 10/15/45 | 125 | 192 |
| | | | Coupon | Maturity
Date | Face
Amount
($000) | Market
Value•
($000) |
| | Enbridge Inc. | 2.900% | 7/15/22 | 75 | 78 |
| | Enbridge Inc. | 2.500% | 1/15/25 | 100 | 107 |
| | Enbridge Inc. | 3.700% | 7/15/27 | 150 | 170 |
| | Enbridge Inc. | 3.125% | 11/15/29 | 200 | 219 |
| | Enbridge Inc. | 4.500% | 6/10/44 | 100 | 117 |
| | Enbridge Inc. | 4.000% | 11/15/49 | 100 | 114 |
| | Energy Transfer Operating LP | 3.600% | 2/1/23 | 450 | 471 |
| | Energy Transfer Operating LP | 4.250% | 3/15/23 | 400 | 420 |
| | Energy Transfer Operating LP | 4.200% | 9/15/23 | 80 | 86 |
| | Energy Transfer Operating LP | 4.050% | 3/15/25 | 1,000 | 1,092 |
| | Energy Transfer Operating LP | 2.900% | 5/15/25 | 100 | 106 |
| | Energy Transfer Operating LP | 4.750% | 1/15/26 | 500 | 554 |
| | Energy Transfer Operating LP | 5.500% | 6/1/27 | 300 | 351 |
| | Energy Transfer Operating LP | 4.950% | 6/15/28 | 350 | 404 |
| | Energy Transfer Operating LP | 5.250% | 4/15/29 | 425 | 494 |
| | Energy Transfer Operating LP | 3.750% | 5/15/30 | 450 | 487 |
| | Energy Transfer Operating LP | 6.625% | 10/15/36 | 150 | 180 |
| | Energy Transfer Operating LP | 5.800% | 6/15/38 | 150 | 171 |
| | Energy Transfer Operating LP | 6.050% | 6/1/41 | 100 | 115 |
| | Energy Transfer Operating LP | 6.500% | 2/1/42 | 275 | 333 |
| | Energy Transfer Operating LP | 5.150% | 3/15/45 | 150 | 162 |
| | Energy Transfer Operating LP | 6.125% | 12/15/45 | 200 | 234 |
| | Energy Transfer Operating LP | 5.300% | 4/15/47 | 200 | 220 |
| | Energy Transfer Operating LP | 6.000% | 6/15/48 | 100 | 119 |
| | Energy Transfer Operating LP | 6.250% | 4/15/49 | 320 | 386 |
| | Energy Transfer Operating LP | 5.000% | 5/15/50 | 500 | 546 |
| | Energy Transfer Partners LP | 6.000% | 6/15/48 | 200 | 237 |
| | Energy Transfer Partners LP / Regency Energy Finance Corp. | 5.875% | 3/1/22 | 175 | 183 |
| | Energy Transfer Partners LP / Regency Energy Finance Corp. | 5.000% | 10/1/22 | 200 | 212 |
| | Energy Transfer Partners LP / Regency Energy Finance Corp. | 4.500% | 11/1/23 | 100 | 108 |
| | Enterprise Products Operating LLC | 3.500% | 2/1/22 | 100 | 103 |
| | Enterprise Products Operating LLC | 3.350% | 3/15/23 | 425 | 443 |
| | Enterprise Products Operating LLC | 3.900% | 2/15/24 | 175 | 192 |
| | Enterprise Products Operating LLC | 3.750% | 2/15/25 | 150 | 168 |
| | Enterprise Products Operating LLC | 3.700% | 2/15/26 | 150 | 170 |
| | Enterprise Products Operating LLC | 3.950% | 2/15/27 | 100 | 112 |
| | Enterprise Products Operating LLC | 3.125% | 7/31/29 | 550 | 609 |
| | Enterprise Products Operating LLC | 2.800% | 1/31/30 | 300 | 325 |
Total Bond Market Index Portfolio
| | | | Coupon | Maturity
Date | Face
Amount
($000) | Market
Value•
($000) |
| | Enterprise Products Operating LLC | 6.875% | 3/1/33 | 175 | 244 |
| | Enterprise Products Operating LLC | 7.550% | 4/15/38 | 150 | 228 |
| | Enterprise Products Operating LLC | 6.125% | 10/15/39 | 300 | 414 |
| | Enterprise Products Operating LLC | 5.950% | 2/1/41 | 175 | 240 |
| | Enterprise Products Operating LLC | 4.450% | 2/15/43 | 300 | 358 |
| | Enterprise Products Operating LLC | 4.850% | 3/15/44 | 520 | 640 |
| | Enterprise Products Operating LLC | 4.900% | 5/15/46 | 425 | 532 |
| | Enterprise Products Operating LLC | 4.250% | 2/15/48 | 300 | 350 |
| | Enterprise Products Operating LLC | 4.200% | 1/31/50 | 350 | 411 |
| | Enterprise Products Operating LLC | 3.700% | 1/31/51 | 300 | 329 |
| | Enterprise Products Operating LLC | 3.200% | 2/15/52 | 500 | 504 |
| | Enterprise Products Operating LLC | 3.950% | 1/31/60 | 200 | 219 |
| | Enterprise Products Operating LLC | 4.875% | 8/16/77 | 100 | 96 |
| | Enterprise Products Operating LLC | 5.250% | 8/16/77 | 100 | 101 |
| | Enterprise Products Operating LLC | 5.375% | 2/15/78 | 200 | 198 |
| | EOG Resources Inc. | 2.625% | 3/15/23 | 450 | 470 |
| | EOG Resources Inc. | 4.150% | 1/15/26 | 150 | 172 |
| | EOG Resources Inc. | 4.375% | 4/15/30 | 255 | 310 |
| | EOG Resources Inc. | 4.950% | 4/15/50 | 200 | 271 |
| | Equinor ASA | 3.150% | 1/23/22 | 150 | 153 |
| | Equinor ASA | 2.450% | 1/17/23 | 450 | 470 |
| | Equinor ASA | 2.650% | 1/15/24 | 375 | 397 |
| | Equinor ASA | 3.700% | 3/1/24 | 150 | 165 |
| | Equinor ASA | 3.250% | 11/10/24 | 150 | 165 |
| | Equinor ASA | 7.250% | 9/23/27 | 250 | 339 |
| | Equinor ASA | 3.625% | 9/10/28 | 175 | 203 |
| | Equinor ASA | 2.375% | 5/22/30 | 200 | 212 |
| | Equinor ASA | 5.100% | 8/17/40 | 125 | 176 |
| | Equinor ASA | 4.250% | 11/23/41 | 175 | 220 |
| | Equinor ASA | 3.950% | 5/15/43 | 125 | 151 |
| | Equinor ASA | 4.800% | 11/8/43 | 175 | 235 |
| | Equinor ASA | 3.250% | 11/18/49 | 225 | 250 |
| | Equinor ASA | 3.700% | 4/6/50 | 405 | 486 |
| | Exxon Mobil Corp. | 2.397% | 3/6/22 | 400 | 407 |
| | Exxon Mobil Corp. | 1.902% | 8/16/22 | 300 | 308 |
| | Exxon Mobil Corp. | 1.571% | 4/15/23 | 950 | 968 |
| | Exxon Mobil Corp. | 2.019% | 8/16/24 | 100 | 105 |
| | Exxon Mobil Corp. | 2.992% | 3/19/25 | 850 | 929 |
| | Exxon Mobil Corp. | 3.043% | 3/1/26 | 300 | 332 |
| | Exxon Mobil Corp. | 2.275% | 8/16/26 | 200 | 215 |
| | Exxon Mobil Corp. | 2.440% | 8/16/29 | 250 | 267 |
| | Exxon Mobil Corp. | 3.482% | 3/19/30 | 375 | 434 |
| | Exxon Mobil Corp. | 2.610% | 10/15/30 | 650 | 709 |
| | Exxon Mobil Corp. | 2.995% | 8/16/39 | 300 | 325 |
| | Exxon Mobil Corp. | 4.227% | 3/19/40 | 400 | 496 |
| | Exxon Mobil Corp. | 3.567% | 3/6/45 | 235 | 268 |
| | Exxon Mobil Corp. | 4.114% | 3/1/46 | 400 | 492 |
| | Exxon Mobil Corp. | 4.327% | 3/19/50 | 825 | 1,075 |
| | Exxon Mobil Corp. | 3.452% | 4/15/51 | 600 | 685 |
| | Halliburton Co. | 3.500% | 8/1/23 | 112 | 119 |
| | Halliburton Co. | 3.800% | 11/15/25 | 22 | 25 |
| | Halliburton Co. | 2.920% | 3/1/30 | 300 | 317 |
| | Halliburton Co. | 4.850% | 11/15/35 | 200 | 230 |
| | Halliburton Co. | 6.700% | 9/15/38 | 345 | 456 |
| | Halliburton Co. | 4.500% | 11/15/41 | 100 | 108 |
| | Halliburton Co. | 4.750% | 8/1/43 | 150 | 167 |
| | | | Coupon | Maturity
Date | Face
Amount
($000) | Market
Value•
($000) |
| | Halliburton Co. | 5.000% | 11/15/45 | 500 | 591 |
| | Helmerich & Payne Inc. | 4.650% | 3/15/25 | 50 | 55 |
| | Hess Corp. | 3.500% | 7/15/24 | 100 | 106 |
| | Hess Corp. | 4.300% | 4/1/27 | 250 | 277 |
| | Hess Corp. | 7.125% | 3/15/33 | 100 | 130 |
| | Hess Corp. | 6.000% | 1/15/40 | 250 | 304 |
| | Hess Corp. | 5.600% | 2/15/41 | 300 | 364 |
| | HollyFrontier Corp. | 5.875% | 4/1/26 | 200 | 218 |
| | Husky Energy Inc. | 4.000% | 4/15/24 | 150 | 160 |
| | Husky Energy Inc. | 4.400% | 4/15/29 | 250 | 276 |
| | Husky Energy Inc. | 6.800% | 9/15/37 | 50 | 63 |
| | Kinder Morgan Energy Partners LP | 3.450% | 2/15/23 | 25 | 26 |
| | Kinder Morgan Energy Partners LP | 3.500% | 9/1/23 | 250 | 267 |
| | Kinder Morgan Energy Partners LP | 4.300% | 5/1/24 | 625 | 691 |
| | Kinder Morgan Energy Partners LP | 7.300% | 8/15/33 | 275 | 381 |
| | Kinder Morgan Energy Partners LP | 5.800% | 3/15/35 | 50 | 63 |
| | Kinder Morgan Energy Partners LP | 6.500% | 2/1/37 | 250 | 324 |
| | Kinder Morgan Energy Partners LP | 6.950% | 1/15/38 | 50 | 69 |
| | Kinder Morgan Energy Partners LP | 6.500% | 9/1/39 | 200 | 262 |
| | Kinder Morgan Energy Partners LP | 6.550% | 9/15/40 | 250 | 330 |
| | Kinder Morgan Energy Partners LP | 5.625% | 9/1/41 | 50 | 61 |
| | Kinder Morgan Energy Partners LP | 5.000% | 8/15/42 | 25 | 29 |
| | Kinder Morgan Energy Partners LP | 4.700% | 11/1/42 | 475 | 542 |
| | Kinder Morgan Energy Partners LP | 5.000% | 3/1/43 | 75 | 87 |
| | Kinder Morgan Inc. | 3.150% | 1/15/23 | 200 | 210 |
| | Kinder Morgan Inc. | 4.300% | 6/1/25 | 300 | 342 |
| | Kinder Morgan Inc. | 4.300% | 3/1/28 | 500 | 586 |
| | Kinder Morgan Inc. | 7.800% | 8/1/31 | 290 | 413 |
| | Kinder Morgan Inc. | 7.750% | 1/15/32 | 265 | 382 |
| | Kinder Morgan Inc. | 5.300% | 12/1/34 | 175 | 217 |
| | Kinder Morgan Inc. | 5.550% | 6/1/45 | 200 | 256 |
| | Kinder Morgan Inc. | 5.050% | 2/15/46 | 350 | 428 |
| | Kinder Morgan Inc. | 3.250% | 8/1/50 | 400 | 401 |
| | Magellan Midstream Partners LP | 3.250% | 6/1/30 | 200 | 224 |
| | Magellan Midstream Partners LP | 5.150% | 10/15/43 | 125 | 158 |
| | Magellan Midstream Partners LP | 4.250% | 9/15/46 | 200 | 227 |
| | Magellan Midstream Partners LP | 4.200% | 10/3/47 | 150 | 171 |
| | Magellan Midstream Partners LP | 4.850% | 2/1/49 | 100 | 125 |
| | Magellan Midstream Partners LP | 3.950% | 3/1/50 | 50 | 56 |
| | Marathon Oil Corp. | 2.800% | 11/1/22 | 60 | 62 |
| | Marathon Oil Corp. | 3.850% | 6/1/25 | 100 | 107 |
| | Marathon Oil Corp. | 4.400% | 7/15/27 | 200 | 221 |
| | Marathon Oil Corp. | 6.800% | 3/15/32 | 400 | 492 |
| | Marathon Oil Corp. | 5.200% | 6/1/45 | 100 | 115 |
| | Marathon Petroleum Corp. | 4.750% | 12/15/23 | 500 | 553 |
| | Marathon Petroleum Corp. | 4.700% | 5/1/25 | 300 | 344 |
| | Marathon Petroleum Corp. | 5.125% | 12/15/26 | 200 | 238 |
| | Marathon Petroleum Corp. | 6.500% | 3/1/41 | 300 | 402 |
Total Bond Market Index Portfolio
| | | | Coupon | Maturity
Date | Face
Amount
($000) | Market
Value•
($000) |
| | Marathon Petroleum Corp. | 4.750% | 9/15/44 | 275 | 315 |
| | Marathon Petroleum Corp. | 4.500% | 4/1/48 | 100 | 112 |
| | MPLX LP | 3.500% | 12/1/22 | 25 | 26 |
| | MPLX LP | 3.375% | 3/15/23 | 100 | 106 |
| | MPLX LP | 4.500% | 7/15/23 | 200 | 218 |
| | MPLX LP | 4.875% | 12/1/24 | 513 | 587 |
| | MPLX LP | 4.875% | 6/1/25 | 283 | 327 |
| | MPLX LP | 4.125% | 3/1/27 | 300 | 345 |
| | MPLX LP | 4.250% | 12/1/27 | 400 | 466 |
| | MPLX LP | 4.000% | 3/15/28 | 400 | 456 |
| | MPLX LP | 2.650% | 8/15/30 | 500 | 522 |
| | MPLX LP | 4.500% | 4/15/38 | 300 | 339 |
| | MPLX LP | 5.200% | 3/1/47 | 250 | 303 |
| | MPLX LP | 4.700% | 4/15/48 | 275 | 327 |
| | MPLX LP | 5.500% | 2/15/49 | 455 | 590 |
| | National Oilwell Varco Inc. | 3.600% | 12/1/29 | 200 | 209 |
| | National Oilwell Varco Inc. | 3.950% | 12/1/42 | 125 | 126 |
| | Noble Energy Inc. | 3.850% | 1/15/28 | 100 | 116 |
| | Noble Energy Inc. | 3.250% | 10/15/29 | 200 | 228 |
| | Noble Energy Inc. | 6.000% | 3/1/41 | 100 | 149 |
| | Noble Energy Inc. | 5.250% | 11/15/43 | 175 | 247 |
| | Noble Energy Inc. | 5.050% | 11/15/44 | 250 | 348 |
| | Noble Energy Inc. | 4.950% | 8/15/47 | 100 | 140 |
| | Noble Energy Inc. | 4.200% | 10/15/49 | 155 | 197 |
| | ONEOK Inc. | 7.500% | 9/1/23 | 100 | 115 |
| | ONEOK Inc. | 2.750% | 9/1/24 | 100 | 105 |
| | ONEOK Inc. | 2.200% | 9/15/25 | 425 | 442 |
| | ONEOK Inc. | 4.550% | 7/15/28 | 100 | 114 |
| | ONEOK Inc. | 4.350% | 3/15/29 | 100 | 113 |
| | ONEOK Inc. | 3.400% | 9/1/29 | 245 | 260 |
| | ONEOK Inc. | 3.100% | 3/15/30 | 200 | 213 |
| | ONEOK Inc. | 4.950% | 7/13/47 | 200 | 220 |
| | ONEOK Inc. | 4.450% | 9/1/49 | 150 | 157 |
| | ONEOK Inc. | 4.500% | 3/15/50 | 300 | 318 |
| | ONEOK Partners LP | 3.375% | 10/1/22 | 400 | 416 |
| | ONEOK Partners LP | 6.650% | 10/1/36 | 300 | 376 |
| | ONEOK Partners LP | 6.850% | 10/15/37 | 300 | 385 |
| | ONEOK Partners LP | 6.125% | 2/1/41 | 150 | 179 |
| 2 | Petroleos Mexicanos | 2.378% | 4/15/25 | 22 | 23 |
| | Phillips 66 | 4.300% | 4/1/22 | 275 | 288 |
| | Phillips 66 | 3.700% | 4/6/23 | 100 | 107 |
| | Phillips 66 | 3.850% | 4/9/25 | 300 | 338 |
| | Phillips 66 | 3.900% | 3/15/28 | 300 | 344 |
| | Phillips 66 | 2.150% | 12/15/30 | 100 | 101 |
| | Phillips 66 | 4.650% | 11/15/34 | 500 | 610 |
| | Phillips 66 | 4.875% | 11/15/44 | 500 | 629 |
| | Phillips 66 Partners LP | 2.450% | 12/15/24 | 50 | 52 |
| | Phillips 66 Partners LP | 3.605% | 2/15/25 | 250 | 270 |
| | Phillips 66 Partners LP | 3.750% | 3/1/28 | 50 | 54 |
| | Phillips 66 Partners LP | 3.150% | 12/15/29 | 100 | 104 |
| | Phillips 66 Partners LP | 4.680% | 2/15/45 | 245 | 263 |
| | Pioneer Natural Resources Co. | 4.450% | 1/15/26 | 225 | 262 |
| | Pioneer Natural Resources Co. | 1.900% | 8/15/30 | 300 | 297 |
| | Plains All American Pipeline LP / PAA Finance Corp. | 3.650% | 6/1/22 | 100 | 103 |
| | Plains All American Pipeline LP / PAA Finance Corp. | 2.850% | 1/31/23 | 289 | 299 |
| | Plains All American Pipeline LP / PAA Finance Corp. | 3.600% | 11/1/24 | 600 | 639 |
| | Plains All American Pipeline LP / PAA Finance Corp. | 4.500% | 12/15/26 | 100 | 112 |
| | | | Coupon | Maturity
Date | Face
Amount
($000) | Market
Value•
($000) |
| | Plains All American Pipeline LP / PAA Finance Corp. | 3.550% | 12/15/29 | 175 | 183 |
| | Plains All American Pipeline LP / PAA Finance Corp. | 3.800% | 9/15/30 | 200 | 214 |
| | Plains All American Pipeline LP / PAA Finance Corp. | 6.650% | 1/15/37 | 100 | 121 |
| | Plains All American Pipeline LP / PAA Finance Corp. | 4.300% | 1/31/43 | 225 | 220 |
| | Plains All American Pipeline LP / PAA Finance Corp. | 4.700% | 6/15/44 | 200 | 208 |
| | Sabine Pass Liquefaction LLC | 6.250% | 3/15/22 | 325 | 342 |
| | Sabine Pass Liquefaction LLC | 5.625% | 4/15/23 | 350 | 383 |
| | Sabine Pass Liquefaction LLC | 5.750% | 5/15/24 | 600 | 684 |
| | Sabine Pass Liquefaction LLC | 5.625% | 3/1/25 | 400 | 466 |
| | Sabine Pass Liquefaction LLC | 5.875% | 6/30/26 | 450 | 544 |
| | Sabine Pass Liquefaction LLC | 5.000% | 3/15/27 | 250 | 295 |
| | Sabine Pass Liquefaction LLC | 4.200% | 3/15/28 | 300 | 344 |
| 5 | Sabine Pass Liquefaction LLC | 4.500% | 5/15/30 | 300 | 356 |
| | Schlumberger Investment SA | 3.650% | 12/1/23 | 325 | 352 |
| | Schlumberger Investment SA | 2.650% | 6/26/30 | 300 | 320 |
| | Shell International Finance BV | 3.400% | 8/12/23 | 75 | 81 |
| | Shell International Finance BV | 0.375% | 9/15/23 | 500 | 501 |
| | Shell International Finance BV | 2.000% | 11/7/24 | 200 | 210 |
| | Shell International Finance BV | 2.375% | 4/6/25 | 500 | 535 |
| | Shell International Finance BV | 3.250% | 5/11/25 | 200 | 221 |
| | Shell International Finance BV | 2.875% | 5/10/26 | 500 | 552 |
| | Shell International Finance BV | 2.500% | 9/12/26 | 900 | 987 |
| | Shell International Finance BV | 3.875% | 11/13/28 | 100 | 118 |
| | Shell International Finance BV | 2.375% | 11/7/29 | 1,050 | 1,125 |
| | Shell International Finance BV | 4.125% | 5/11/35 | 300 | 373 |
| | Shell International Finance BV | 6.375% | 12/15/38 | 475 | 734 |
| | Shell International Finance BV | 5.500% | 3/25/40 | 175 | 251 |
| | Shell International Finance BV | 4.550% | 8/12/43 | 300 | 399 |
| | Shell International Finance BV | 4.375% | 5/11/45 | 630 | 829 |
| | Shell International Finance BV | 4.000% | 5/10/46 | 700 | 877 |
| | Shell International Finance BV | 3.125% | 11/7/49 | 650 | 721 |
| | Spectra Energy Partners LP | 4.750% | 3/15/24 | 600 | 669 |
| | Spectra Energy Partners LP | 3.500% | 3/15/25 | 138 | 151 |
| | Spectra Energy Partners LP | 3.375% | 10/15/26 | 205 | 228 |
Total Bond Market Index Portfolio
| | | | Coupon | Maturity
Date | Face
Amount
($000) | Market
Value•
($000) |
| | Spectra Energy Partners LP | 5.950% | 9/25/43 | 40 | 52 |
| | Spectra Energy Partners LP | 4.500% | 3/15/45 | 325 | 383 |
| | Suncor Energy Inc. | 2.800% | 5/15/23 | 300 | 315 |
| | Suncor Energy Inc. | 3.600% | 12/1/24 | 100 | 110 |
| | Suncor Energy Inc. | 3.100% | 5/15/25 | 100 | 109 |
| | Suncor Energy Inc. | 5.950% | 12/1/34 | 125 | 163 |
| | Suncor Energy Inc. | 6.800% | 5/15/38 | 225 | 315 |
| | Suncor Energy Inc. | 6.500% | 6/15/38 | 525 | 732 |
| | Suncor Energy Inc. | 4.000% | 11/15/47 | 200 | 225 |
| | Sunoco Logistics Partners Operations LP | 3.450% | 1/15/23 | 50 | 52 |
| | Sunoco Logistics Partners Operations LP | 4.250% | 4/1/24 | 225 | 243 |
| | Sunoco Logistics Partners Operations LP | 4.000% | 10/1/27 | 150 | 164 |
| | Sunoco Logistics Partners Operations LP | 4.950% | 1/15/43 | 175 | 180 |
| | Sunoco Logistics Partners Operations LP | 5.300% | 4/1/44 | 325 | 347 |
| | Sunoco Logistics Partners Operations LP | 5.350% | 5/15/45 | 50 | 56 |
| | Sunoco Logistics Partners Operations LP | 5.400% | 10/1/47 | 275 | 303 |
| | TC PipeLines LP | 3.900% | 5/25/27 | 50 | 56 |
| | TechnipFMC plc | 3.450% | 10/1/22 | 75 | 77 |
| | Total Capital Canada Ltd. | 2.750% | 7/15/23 | 125 | 132 |
| | Total Capital International SA | 2.875% | 2/17/22 | 300 | 309 |
| | Total Capital International SA | 2.700% | 1/25/23 | 50 | 52 |
| | Total Capital International SA | 3.700% | 1/15/24 | 525 | 575 |
| | Total Capital International SA | 2.434% | 1/10/25 | 175 | 187 |
| | Total Capital International SA | 3.455% | 2/19/29 | 325 | 376 |
| | Total Capital International SA | 2.829% | 1/10/30 | 300 | 335 |
| | Total Capital International SA | 2.986% | 6/29/41 | 200 | 218 |
| | Total Capital International SA | 3.461% | 7/12/49 | 200 | 230 |
| | Total Capital International SA | 3.127% | 5/29/50 | 500 | 544 |
| | Total Capital International SA | 3.386% | 6/29/60 | 200 | 226 |
| | Total Capital SA | 3.883% | 10/11/28 | 100 | 118 |
| | TransCanada PipeLines Ltd. | 2.500% | 8/1/22 | 400 | 413 |
| | TransCanada PipeLines Ltd. | 4.250% | 5/15/28 | 250 | 294 |
| | TransCanada PipeLines Ltd. | 4.100% | �� 4/15/30 | 500 | 586 |
| | TransCanada PipeLines Ltd. | 4.625% | 3/1/34 | 536 | 646 |
| | TransCanada PipeLines Ltd. | 5.600% | 3/31/34 | 150 | 193 |
| | TransCanada PipeLines Ltd. | 5.850% | 3/15/36 | 300 | 400 |
| | TransCanada PipeLines Ltd. | 6.200% | 10/15/37 | 425 | 590 |
| | TransCanada PipeLines Ltd. | 4.750% | 5/15/38 | 350 | 435 |
| | TransCanada PipeLines Ltd. | 4.875% | 5/15/48 | 400 | 515 |
| | Transcontinental Gas Pipe Line Co. LLC | 4.000% | 3/15/28 | 100 | 115 |
| | Transcontinental Gas Pipe Line Co. LLC | 3.250% | 5/15/30 | 200 | 223 |
| | | | Coupon | Maturity
Date | Face
Amount
($000) | Market
Value•
($000) |
| | Transcontinental Gas Pipe Line Co. LLC | 4.600% | 3/15/48 | 100 | 121 |
| | Transcontinental Gas Pipe Line Co. LLC | 3.950% | 5/15/50 | 200 | 225 |
| | Valero Energy Corp. | 2.700% | 4/15/23 | 100 | 104 |
| | Valero Energy Corp. | 1.200% | 3/15/24 | 500 | 502 |
| | Valero Energy Corp. | 3.650% | 3/15/25 | 251 | 274 |
| | Valero Energy Corp. | 2.850% | 4/15/25 | 100 | 106 |
| | Valero Energy Corp. | 4.350% | 6/1/28 | 350 | 397 |
| | Valero Energy Corp. | 7.500% | 4/15/32 | 650 | 898 |
| | Valero Energy Corp. | 4.900% | 3/15/45 | 150 | 175 |
| | Valero Energy Partners LP | 4.375% | 12/15/26 | 100 | 116 |
| | Valero Energy Partners LP | 4.500% | 3/15/28 | 75 | 86 |
| | Williams Cos. Inc. | 3.600% | 3/15/22 | 475 | 490 |
| | Williams Cos. Inc. | 3.350% | 8/15/22 | 125 | 130 |
| | Williams Cos. Inc. | 3.700% | 1/15/23 | 200 | 211 |
| | Williams Cos. Inc. | 4.550% | 6/24/24 | 400 | 447 |
| | Williams Cos. Inc. | 3.900% | 1/15/25 | 681 | 753 |
| | Williams Cos. Inc. | 3.750% | 6/15/27 | 300 | 341 |
| | Williams Cos. Inc. | 3.500% | 11/15/30 | 400 | 452 |
| | Williams Cos. Inc. | 6.300% | 4/15/40 | 100 | 133 |
| | Williams Cos. Inc. | 5.800% | 11/15/43 | 100 | 127 |
| | Williams Cos. Inc. | 5.400% | 3/4/44 | 400 | 493 |
| | Williams Cos. Inc. | 5.750% | 6/24/44 | 100 | 131 |
| | Williams Cos. Inc. | 5.100% | 9/15/45 | 350 | 433 |
| | Williams Cos. Inc. | 4.850% | 3/1/48 | 150 | 183 |
| | | | | | | 122,803 |
| Financials (7.8%) |
| | ACE Capital Trust II | 9.700% | 4/1/30 | 50 | 76 |
| | Aegon NV | 5.500% | 4/11/48 | 200 | 226 |
| | AerCap Ireland Capital DAC / AerCap Global Aviation Trust | 4.450% | 12/16/21 | 70 | 72 |
| | AerCap Ireland Capital DAC / AerCap Global Aviation Trust | 3.950% | 2/1/22 | 125 | 128 |
| | AerCap Ireland Capital DAC / AerCap Global Aviation Trust | 3.500% | 5/26/22 | 100 | 103 |
| | AerCap Ireland Capital DAC / AerCap Global Aviation Trust | 4.625% | 7/1/22 | 175 | 184 |
| | AerCap Ireland Capital DAC / AerCap Global Aviation Trust | 3.300% | 1/23/23 | 125 | 130 |
| | AerCap Ireland Capital DAC / AerCap Global Aviation Trust | 4.500% | 9/15/23 | 150 | 162 |
| | AerCap Ireland Capital DAC / AerCap Global Aviation Trust | 3.500% | 1/15/25 | 186 | 197 |
| | AerCap Ireland Capital DAC / AerCap Global Aviation Trust | 6.500% | 7/15/25 | 250 | 298 |
| | AerCap Ireland Capital DAC / AerCap Global Aviation Trust | 4.450% | 10/1/25 | 125 | 139 |
| | AerCap Ireland Capital DAC / AerCap Global Aviation Trust | 3.650% | 7/21/27 | 300 | 326 |
| | AerCap Ireland Capital DAC / AerCap Global Aviation Trust | 4.625% | 10/15/27 | 500 | 569 |
| | AerCap Ireland Capital DAC / AerCap Global Aviation Trust | 3.875% | 1/23/28 | 300 | 323 |
| | Affiliated Managers Group Inc. | 4.250% | 2/15/24 | 100 | 110 |
| | Affiliated Managers Group Inc. | 3.500% | 8/1/25 | 125 | 139 |
| | Affiliated Managers Group Inc. | 3.300% | 6/15/30 | 500 | 546 |
Total Bond Market Index Portfolio
| | | | Coupon | Maturity
Date | Face
Amount
($000) | Market
Value•
($000) |
| | Aflac Inc. | 3.625% | 6/15/23 | 125 | 135 |
| | Aflac Inc. | 3.625% | 11/15/24 | 125 | 140 |
| | Aflac Inc. | 3.250% | 3/17/25 | 125 | 138 |
| | Aflac Inc. | 2.875% | 10/15/26 | 75 | 83 |
| | Aflac Inc. | 3.600% | 4/1/30 | 225 | 264 |
| | Aflac Inc. | 4.000% | 10/15/46 | 50 | 61 |
| | Aflac Inc. | 4.750% | 1/15/49 | 235 | 326 |
| | Air Lease Corp. | 3.750% | 2/1/22 | 300 | 308 |
| | Air Lease Corp. | 2.625% | 7/1/22 | 100 | 103 |
| | Air Lease Corp. | 2.250% | 1/15/23 | 100 | 102 |
| | Air Lease Corp. | 2.750% | 1/15/23 | 100 | 103 |
| | Air Lease Corp. | 3.875% | 7/3/23 | 100 | 106 |
| | Air Lease Corp. | 4.250% | 2/1/24 | 200 | 216 |
| | Air Lease Corp. | 4.250% | 9/15/24 | 75 | 82 |
| | Air Lease Corp. | 2.300% | 2/1/25 | 200 | 206 |
| | Air Lease Corp. | 3.250% | 3/1/25 | 150 | 160 |
| | Air Lease Corp. | 3.375% | 7/1/25 | 250 | 269 |
| | Air Lease Corp. | 3.625% | 4/1/27 | 75 | 80 |
| | Air Lease Corp. | 3.625% | 12/1/27 | 200 | 215 |
| | Air Lease Corp. | 4.625% | 10/1/28 | 100 | 114 |
| | Air Lease Corp. | 3.250% | 10/1/29 | 100 | 105 |
| | Air Lease Corp. | 3.000% | 2/1/30 | 225 | 232 |
| | Air Lease Corp. | 3.125% | 12/1/30 | 750 | 777 |
| | Aircastle Ltd. | 4.400% | 9/25/23 | 125 | 133 |
| | Aircastle Ltd. | 4.125% | 5/1/24 | 400 | 424 |
| | Aircastle Ltd. | 4.250% | 6/15/26 | 100 | 106 |
| | Alleghany Corp. | 3.625% | 5/15/30 | 100 | 113 |
| | Alleghany Corp. | 4.900% | 9/15/44 | 100 | 129 |
| | Allied World Assurance Co. Holdings Ltd. | 4.350% | 10/29/25 | 75 | 82 |
| | Allstate Corp. | 3.150% | 6/15/23 | 100 | 107 |
| | Allstate Corp. | 1.450% | 12/15/30 | 500 | 497 |
| | Allstate Corp. | 5.550% | 5/9/35 | 75 | 111 |
| | Allstate Corp. | 4.500% | 6/15/43 | 125 | 168 |
| | Allstate Corp. | 4.200% | 12/15/46 | 200 | 263 |
| | Allstate Corp. | 3.850% | 8/10/49 | 100 | 127 |
| | Allstate Corp. | 5.750% | 8/15/53 | 75 | 80 |
| | Allstate Corp. | 6.500% | 5/15/67 | 100 | 134 |
| | Ally Financial Inc. | 4.125% | 2/13/22 | 125 | 130 |
| | Ally Financial Inc. | 1.450% | 10/2/23 | 1,000 | 1,019 |
| | Ally Financial Inc. | 3.875% | 5/21/24 | 150 | 164 |
| | Ally Financial Inc. | 5.125% | 9/30/24 | 135 | 155 |
| | Ally Financial Inc. | 8.000% | 11/1/31 | 400 | 584 |
| | American Express Co. | 2.750% | 5/20/22 | 300 | 309 |
| | American Express Co. | 2.500% | 8/1/22 | 500 | 516 |
| | American Express Co. | 2.650% | 12/2/22 | 225 | 235 |
| | American Express Co. | 3.400% | 2/27/23 | 300 | 319 |
| | American Express Co. | 3.700% | 8/3/23 | 325 | 351 |
| | American Express Co. | 3.400% | 2/22/24 | 225 | 245 |
| | American Express Co. | 2.500% | 7/30/24 | 215 | 229 |
| | American Express Co. | 3.000% | 10/30/24 | 569 | 621 |
| | American Express Co. | 3.625% | 12/5/24 | 241 | 267 |
| | American Express Co. | 4.200% | 11/6/25 | 150 | 174 |
| | American Express Co. | 3.125% | 5/20/26 | 250 | 280 |
| | American Express Co. | 4.050% | 12/3/42 | 67 | 86 |
| | American Express Credit Corp. | 2.700% | 3/3/22 | 300 | 308 |
| | American Express Credit Corp. | 3.300% | 5/3/27 | 350 | 398 |
| | American Financial Group Inc. | 3.500% | 8/15/26 | 50 | 55 |
| | American Financial Group Inc. | 5.250% | 4/2/30 | 150 | 186 |
| | American Financial Group Inc. | 4.500% | 6/15/47 | 110 | 132 |
| | American International Group Inc. | 3.300% | 3/1/21 | 275 | 275 |
| | American International Group Inc. | 4.125% | 2/15/24 | 70 | 77 |
| | | | Coupon | Maturity
Date | Face
Amount
($000) | Market
Value•
($000) |
| | American International Group Inc. | 3.750% | 7/10/25 | 85 | 95 |
| | American International Group Inc. | 3.900% | 4/1/26 | 406 | 463 |
| | American International Group Inc. | 4.200% | 4/1/28 | 200 | 237 |
| | American International Group Inc. | 4.250% | 3/15/29 | 50 | 60 |
| | American International Group Inc. | 3.400% | 6/30/30 | 240 | 274 |
| | American International Group Inc. | 3.875% | 1/15/35 | 200 | 240 |
| | American International Group Inc. | 4.700% | 7/10/35 | 75 | 96 |
| | American International Group Inc. | 6.250% | 5/1/36 | 475 | 685 |
| | American International Group Inc. | 4.500% | 7/16/44 | 500 | 640 |
| | American International Group Inc. | 4.750% | 4/1/48 | 200 | 268 |
| | American International Group Inc. | 5.750% | 4/1/48 | 125 | 145 |
| | American International Group Inc. | 4.375% | 1/15/55 | 355 | 454 |
| | American International Group Inc. | 8.175% | 5/15/68 | 95 | 139 |
| | Ameriprise Financial Inc. | 3.000% | 3/22/22 | 50 | 52 |
| | Ameriprise Financial Inc. | 4.000% | 10/15/23 | 250 | 275 |
| | Ameriprise Financial Inc. | 3.700% | 10/15/24 | 187 | 208 |
| | Ameriprise Financial Inc. | 3.000% | 4/2/25 | 20 | 22 |
| | Ameriprise Financial Inc. | 2.875% | 9/15/26 | 100 | 111 |
| | Aon Corp. | 8.205% | 1/1/27 | 25 | 33 |
| | Aon Corp. | 4.500% | 12/15/28 | 100 | 121 |
| | Aon Corp. | 3.750% | 5/2/29 | 90 | 105 |
| | Aon Corp. | 2.800% | 5/15/30 | 405 | 442 |
| | Aon Corp. | 6.250% | 9/30/40 | 100 | 149 |
| | Aon plc | 3.500% | 6/14/24 | 250 | 272 |
| | Aon plc | 3.875% | 12/15/25 | 125 | 143 |
| | Aon plc | 4.600% | 6/14/44 | 175 | 230 |
| | Aon plc | 4.750% | 5/15/45 | 100 | 136 |
| | Arch Capital Finance LLC | 4.011% | 12/15/26 | 100 | 116 |
| | Arch Capital Finance LLC | 5.031% | 12/15/46 | 100 | 136 |
| | Arch Capital Group Ltd. | 7.350% | 5/1/34 | 50 | 76 |
| | Arch Capital Group Ltd. | 3.635% | 6/30/50 | 200 | 232 |
| | Arch Capital Group US Inc. | 5.144% | 11/1/43 | 50 | 68 |
| | Ares Capital Corp. | 3.500% | 2/10/23 | 250 | 264 |
| | Ares Capital Corp. | 4.200% | 6/10/24 | 200 | 216 |
| | Ares Capital Corp. | 4.250% | 3/1/25 | 105 | 113 |
| | Ares Capital Corp. | 3.250% | 7/15/25 | 115 | 122 |
| | Aspen Insurance Holdings Ltd. | 4.650% | 11/15/23 | 175 | 187 |
| | Associated Bank NA | 3.500% | 8/13/21 | 50 | 51 |
| | Assurant Inc. | 4.000% | 3/15/23 | 50 | 53 |
| | Assurant Inc. | 4.200% | 9/27/23 | 100 | 109 |
| | Assurant Inc. | 4.900% | 3/27/28 | 100 | 116 |
| | Assurant Inc. | 6.750% | 2/15/34 | 9 | 12 |
| | Assured Guaranty US Holdings Inc. | 5.000% | 7/1/24 | 75 | 86 |
| | Athene Holding Ltd. | 4.125% | 1/12/28 | 200 | 223 |
| | Athene Holding Ltd. | 6.150% | 4/3/30 | 110 | 137 |
| | Athene Holding Ltd. | 3.500% | 1/15/31 | 500 | 531 |
| | Australia & New Zealand Banking Group Ltd. | 2.625% | 5/19/22 | 200 | 207 |
| | Australia & New Zealand Banking Group Ltd. | 2.625% | 11/9/22 | 200 | 209 |
| | Australia & New Zealand Banking Group Ltd. | 3.700% | 11/16/25 | 250 | 286 |
| | AXA SA | 8.600% | 12/15/30 | 225 | 350 |
| | AXIS Specialty Finance LLC | 3.900% | 7/15/29 | 50 | 56 |
Total Bond Market Index Portfolio
| | | | Coupon | Maturity
Date | Face
Amount
($000) | Market
Value•
($000) |
| | AXIS Specialty Finance LLC | 4.900% | 1/15/40 | 50 | 52 |
| | AXIS Specialty Finance plc | 4.000% | 12/6/27 | 550 | 608 |
| | Banco Santander SA | 3.848% | 4/12/23 | 200 | 214 |
| | Banco Santander SA | 5.179% | 11/19/25 | 250 | 292 |
| | Banco Santander SA | 4.250% | 4/11/27 | 600 | 691 |
| | Banco Santander SA | 3.800% | 2/23/28 | 200 | 226 |
| | Banco Santander SA | 4.379% | 4/12/28 | 200 | 233 |
| | Bancolombia SA | 3.000% | 1/29/25 | 200 | 208 |
| | Bank of America Corp. | 2.503% | 10/21/22 | 1,100 | 1,119 |
| | Bank of America Corp. | 3.300% | 1/11/23 | 600 | 636 |
| | Bank of America Corp. | 3.124% | 1/20/23 | 145 | 149 |
| | Bank of America Corp. | 2.881% | 4/24/23 | 1,000 | 1,031 |
| | Bank of America Corp. | 2.816% | 7/21/23 | 1,300 | 1,351 |
| | Bank of America Corp. | 4.100% | 7/24/23 | 300 | 328 |
| | Bank of America Corp. | 3.004% | 12/20/23 | 2,846 | 2,995 |
| | Bank of America Corp. | 3.550% | 3/5/24 | 690 | 735 |
| | Bank of America Corp. | 3.864% | 7/23/24 | 125 | 136 |
| | Bank of America Corp. | 4.200% | 8/26/24 | 650 | 724 |
| | Bank of America Corp. | 0.810% | 10/24/24 | 500 | 504 |
| | Bank of America Corp. | 4.000% | 1/22/25 | 755 | 845 |
| | Bank of America Corp. | 3.950% | 4/21/25 | 500 | 563 |
| | Bank of America Corp. | 3.093% | 10/1/25 | 350 | 378 |
| | Bank of America Corp. | 2.456% | 10/22/25 | 300 | 319 |
| | Bank of America Corp. | 3.366% | 1/23/26 | 300 | 329 |
| | Bank of America Corp. | 2.015% | 2/13/26 | 1,000 | 1,046 |
| | Bank of America Corp. | 4.450% | 3/3/26 | 475 | 553 |
| | Bank of America Corp. | 3.500% | 4/19/26 | 320 | 362 |
| | Bank of America Corp. | 1.319% | 6/19/26 | 500 | 508 |
| | Bank of America Corp. | 4.250% | 10/22/26 | 725 | 842 |
| | Bank of America Corp. | 1.197% | 10/24/26 | 500 | 506 |
| | Bank of America Corp. | 3.559% | 4/23/27 | 750 | 845 |
| | Bank of America Corp. | 3.248% | 10/21/27 | 750 | 839 |
| | Bank of America Corp. | 4.183% | 11/25/27 | 560 | 648 |
| | Bank of America Corp. | 3.824% | 1/20/28 | 425 | 487 |
| | Bank of America Corp. | 3.705% | 4/24/28 | 350 | 397 |
| | Bank of America Corp. | 3.593% | 7/21/28 | 800 | 903 |
| | Bank of America Corp. | 3.419% | 12/20/28 | 1,334 | 1,505 |
| | Bank of America Corp. | 3.970% | 3/5/29 | 225 | 262 |
| | Bank of America Corp. | 4.271% | 7/23/29 | 575 | 684 |
| | Bank of America Corp. | 3.974% | 2/7/30 | 150 | 176 |
| | Bank of America Corp. | 3.194% | 7/23/30 | 1,125 | 1,255 |
| | Bank of America Corp. | 2.884% | 10/22/30 | 300 | 328 |
| | Bank of America Corp. | 2.496% | 2/13/31 | 750 | 796 |
| | Bank of America Corp. | 2.592% | 4/29/31 | 2,000 | 2,145 |
| | Bank of America Corp. | 6.110% | 1/29/37 | 335 | 487 |
| | Bank of America Corp. | 4.244% | 4/24/38 | 300 | 368 |
| | Bank of America Corp. | 7.750% | 5/14/38 | 340 | 579 |
| | Bank of America Corp. | 4.078% | 4/23/40 | 550 | 669 |
| | Bank of America Corp. | 2.676% | 6/19/41 | 1,000 | 1,041 |
| | Bank of America Corp. | 5.875% | 2/7/42 | 300 | 456 |
| | Bank of America Corp. | 5.000% | 1/21/44 | 750 | 1,045 |
| | Bank of America Corp. | 4.875% | 4/1/44 | 300 | 413 |
| | Bank of America Corp. | 4.750% | 4/21/45 | 100 | 135 |
| | Bank of America Corp. | 4.443% | 1/20/48 | 100 | 132 |
| | Bank of America Corp. | 4.330% | 3/15/50 | 250 | 327 |
| | Bank of America Corp. | 4.083% | 3/20/51 | 1,500 | 1,886 |
| | Bank of America Corp. | 2.831% | 10/24/51 | 500 | 521 |
| | Bank of America NA | 6.000% | 10/15/36 | 250 | 374 |
| | Bank of Montreal | 1.900% | 8/27/21 | 325 | 329 |
| | Bank of Montreal | 2.900% | 3/26/22 | 425 | 439 |
| | Bank of Montreal | 2.350% | 9/11/22 | 46 | 48 |
| | Bank of Montreal | 2.550% | 11/6/22 | 104 | 108 |
| | Bank of Montreal | 0.450% | 12/8/23 | 500 | 500 |
| | Bank of Montreal | 3.300% | 2/5/24 | 300 | 325 |
| | Bank of Montreal | 2.500% | 6/28/24 | 200 | 213 |
| | Bank of Montreal | 1.850% | 5/1/25 | 457 | 479 |
| | Bank of Montreal | 4.338% | 10/5/28 | 100 | 109 |
| | | | Coupon | Maturity
Date | Face
Amount
($000) | Market
Value•
($000) |
| | Bank of Montreal | 3.803% | 12/15/32 | 500 | 564 |
| | Bank of New York Mellon Corp. | 2.600% | 2/7/22 | 675 | 690 |
| | Bank of New York Mellon Corp. | 1.950% | 8/23/22 | 250 | 257 |
| | Bank of New York Mellon Corp. | 2.950% | 1/29/23 | 195 | 205 |
| | Bank of New York Mellon Corp. | 3.500% | 4/28/23 | 225 | 241 |
| | Bank of New York Mellon Corp. | 2.661% | 5/16/23 | 225 | 232 |
| | Bank of New York Mellon Corp. | 3.450% | 8/11/23 | 125 | 135 |
| | Bank of New York Mellon Corp. | 2.200% | 8/16/23 | 225 | 236 |
| | Bank of New York Mellon Corp. | 3.250% | 9/11/24 | 150 | 164 |
| | Bank of New York Mellon Corp. | 2.100% | 10/24/24 | 225 | 239 |
| | Bank of New York Mellon Corp. | 3.000% | 2/24/25 | 547 | 600 |
| | Bank of New York Mellon Corp. | 2.800% | 5/4/26 | 200 | 221 |
| | Bank of New York Mellon Corp. | 2.450% | 8/17/26 | 125 | 136 |
| | Bank of New York Mellon Corp. | 3.250% | 5/16/27 | 150 | 170 |
| | Bank of New York Mellon Corp. | 3.442% | 2/7/28 | 150 | 171 |
| | Bank of New York Mellon Corp. | 3.000% | 10/30/28 | 200 | 223 |
| | Bank of New York Mellon Corp. | 3.300% | 8/23/29 | 100 | 114 |
| | Bank of Nova Scotia | 1.875% | 4/26/21 | 175 | 176 |
| | Bank of Nova Scotia | 2.700% | 3/7/22 | 250 | 257 |
| | Bank of Nova Scotia | 2.375% | 1/18/23 | 50 | 52 |
| | Bank of Nova Scotia | 1.950% | 2/1/23 | 875 | 903 |
| | Bank of Nova Scotia | 3.400% | 2/11/24 | 200 | 217 |
| | Bank of Nova Scotia | 2.200% | 2/3/25 | 1,875 | 1,972 |
| | Bank of Nova Scotia | 4.500% | 12/16/25 | 300 | 348 |
| | Bank of Nova Scotia | 2.700% | 8/3/26 | 100 | 110 |
| | Barclays plc | 3.200% | 8/10/21 | 150 | 152 |
| | Barclays plc | 3.684% | 1/10/23 | 100 | 103 |
| | Barclays plc | 4.610% | 2/15/23 | 200 | 208 |
| | Barclays plc | 4.338% | 5/16/24 | 1,000 | 1,080 |
| | Barclays plc | 3.650% | 3/16/25 | 350 | 386 |
| | Barclays plc | 3.932% | 5/7/25 | 200 | 219 |
| | Barclays plc | 4.375% | 1/12/26 | 300 | 344 |
| | Barclays plc | 2.852% | 5/7/26 | 300 | 321 |
| | Barclays plc | 5.200% | 5/12/26 | 610 | 709 |
| | Barclays plc | 4.337% | 1/10/28 | 200 | 229 |
| | Barclays plc | 4.836% | 5/9/28 | 400 | 463 |
| | Barclays plc | 4.972% | 5/16/29 | 500 | 595 |
| | Barclays plc | 5.088% | 6/20/30 | 345 | 413 |
| | Barclays plc | 2.645% | 6/24/31 | 400 | 415 |
| | Barclays plc | 5.250% | 8/17/45 | 250 | 342 |
| | Barclays plc | 4.950% | 1/10/47 | 200 | 271 |
| | BBVA USA | 2.875% | 6/29/22 | 250 | 258 |
| | Berkshire Hathaway Finance Corp. | 3.000% | 5/15/22 | 150 | 156 |
| | Berkshire Hathaway Finance Corp. | 5.750% | 1/15/40 | 140 | 214 |
| | Berkshire Hathaway Finance Corp. | 4.400% | 5/15/42 | 195 | 258 |
| | Berkshire Hathaway Finance Corp. | 4.300% | 5/15/43 | 300 | 395 |
| | Berkshire Hathaway Finance Corp. | 4.200% | 8/15/48 | 700 | 918 |
| | Berkshire Hathaway Finance Corp. | 4.250% | 1/15/49 | 230 | 304 |
| | Berkshire Hathaway Finance Corp. | 2.850% | 10/15/50 | 675 | 723 |
Total Bond Market Index Portfolio
| | | | Coupon | Maturity
Date | Face
Amount
($000) | Market
Value•
($000) |
| | Berkshire Hathaway Inc. | 2.200% | 3/15/21 | 200 | 200 |
| | Berkshire Hathaway Inc. | 3.000% | 2/11/23 | 75 | 79 |
| | Berkshire Hathaway Inc. | 2.750% | 3/15/23 | 300 | 315 |
| | Berkshire Hathaway Inc. | 3.125% | 3/15/26 | 725 | 810 |
| | BGC Partners Inc. | 3.750% | 10/1/24 | 105 | 110 |
| | BlackRock Inc. | 3.375% | 6/1/22 | 175 | 183 |
| | BlackRock Inc. | 3.500% | 3/18/24 | 175 | 192 |
| | BlackRock Inc. | 3.200% | 3/15/27 | 100 | 113 |
| | BlackRock Inc. | 3.250% | 4/30/29 | 90 | 103 |
| | BlackRock Inc. | 2.400% | 4/30/30 | 630 | 687 |
| | BlackRock Inc. | 1.900% | 1/28/31 | 145 | 151 |
| 5 | BNP Paribas SA | 3.052% | 1/13/31 | 50 | 54 |
| | BPCE SA | 2.750% | 12/2/21 | 250 | 255 |
| 5 | BPCE SA | 3.000% | 5/22/22 | 250 | 259 |
| | BPCE SA | 4.000% | 4/15/24 | 325 | 360 |
| | BPCE SA | 3.375% | 12/2/26 | 250 | 282 |
| | Brighthouse Financial Inc. | 3.700% | 6/22/27 | 141 | 153 |
| | Brighthouse Financial Inc. | 4.700% | 6/22/47 | 223 | 233 |
| | Brookfield Asset Management Inc. | 4.000% | 1/15/25 | 157 | 174 |
| | Brookfield Finance Inc. | 4.000% | 4/1/24 | 175 | 192 |
| | Brookfield Finance Inc. | 4.250% | 6/2/26 | 50 | 58 |
| | Brookfield Finance Inc. | 3.900% | 1/25/28 | 125 | 143 |
| | Brookfield Finance Inc. | 4.850% | 3/29/29 | 150 | 183 |
| | Brookfield Finance Inc. | 4.350% | 4/15/30 | 205 | 245 |
| | Brookfield Finance Inc. | 4.700% | 9/20/47 | 185 | 234 |
| | Brookfield Finance Inc. | 3.450% | 4/15/50 | 125 | 132 |
| | Brown & Brown Inc. | 4.200% | 9/15/24 | 75 | 84 |
| | Brown & Brown Inc. | 4.500% | 3/15/29 | 75 | 89 |
| | Brown & Brown Inc. | 2.375% | 3/15/31 | 500 | 520 |
| | Canadian Imperial Bank of Commerce | 2.550% | 6/16/22 | 350 | 362 |
| | Canadian Imperial Bank of Commerce | 3.500% | 9/13/23 | 200 | 217 |
| | Canadian Imperial Bank of Commerce | 0.500% | 12/14/23 | 500 | 500 |
| | Canadian Imperial Bank of Commerce | 3.100% | 4/2/24 | 200 | 216 |
| | Canadian Imperial Bank of Commerce | 2.250% | 1/28/25 | 120 | 127 |
| | Capital One Bank USA NA | 3.375% | 2/15/23 | 235 | 248 |
| | Capital One Financial Corp. | 3.050% | 3/9/22 | 175 | 181 |
| | Capital One Financial Corp. | 3.200% | 1/30/23 | 350 | 368 |
| | Capital One Financial Corp. | 3.500% | 6/15/23 | 27 | 29 |
| | Capital One Financial Corp. | 3.900% | 1/29/24 | 250 | 273 |
| | Capital One Financial Corp. | 3.750% | 4/24/24 | 450 | 491 |
| | Capital One Financial Corp. | 3.300% | 10/30/24 | 1,013 | 1,109 |
| | Capital One Financial Corp. | 4.200% | 10/29/25 | 175 | 198 |
| | Capital One Financial Corp. | 3.750% | 7/28/26 | 500 | 564 |
| | Capital One Financial Corp. | 3.750% | 3/9/27 | 100 | 113 |
| | Capital One Financial Corp. | 3.650% | 5/11/27 | 800 | 915 |
| | Capital One Financial Corp. | 3.800% | 1/31/28 | 300 | 347 |
| | Cboe Global Markets Inc. | 3.650% | 1/12/27 | 110 | 126 |
| | Charles Schwab Corp. | 3.225% | 9/1/22 | 300 | 314 |
| | Charles Schwab Corp. | 2.650% | 1/25/23 | 100 | 105 |
| | Charles Schwab Corp. | 3.550% | 2/1/24 | 400 | 435 |
| | Charles Schwab Corp. | 3.850% | 5/21/25 | 25 | 28 |
| | Charles Schwab Corp. | 0.900% | 3/11/26 | 300 | 304 |
| | Charles Schwab Corp. | 3.200% | 3/2/27 | 250 | 278 |
| | Charles Schwab Corp. | 3.200% | 1/25/28 | 100 | 113 |
| | | | Coupon | Maturity
Date | Face
Amount
($000) | Market
Value•
($000) |
| | Charles Schwab Corp. | 4.000% | 2/1/29 | 125 | 149 |
| | Charles Schwab Corp. | 3.250% | 5/22/29 | 100 | 115 |
| | Charles Schwab Corp. | 4.625% | 3/22/30 | 50 | 63 |
| | Chubb Corp. | 6.000% | 5/11/37 | 125 | 188 |
| | Chubb Corp. | 6.500% | 5/15/38 | 95 | 151 |
| | Chubb INA Holdings Inc. | 2.875% | 11/3/22 | 475 | 495 |
| | Chubb INA Holdings Inc. | 2.700% | 3/13/23 | 125 | 131 |
| | Chubb INA Holdings Inc. | 3.350% | 5/15/24 | 100 | 109 |
| | Chubb INA Holdings Inc. | 3.150% | 3/15/25 | 250 | 276 |
| | Chubb INA Holdings Inc. | 6.700% | 5/15/36 | 200 | 311 |
| | Chubb INA Holdings Inc. | 4.150% | 3/13/43 | 100 | 129 |
| | Chubb INA Holdings Inc. | 4.350% | 11/3/45 | 350 | 473 |
| | Cincinnati Financial Corp. | 6.920% | 5/15/28 | 100 | 132 |
| | Cincinnati Financial Corp. | 6.125% | 11/1/34 | 75 | 104 |
| | Citigroup Inc. | 2.350% | 8/2/21 | 150 | 152 |
| | Citigroup Inc. | 2.900% | 12/8/21 | 200 | 204 |
| | Citigroup Inc. | 4.500% | 1/14/22 | 475 | 495 |
| | Citigroup Inc. | 2.750% | 4/25/22 | 425 | 438 |
| | Citigroup Inc. | 2.700% | 10/27/22 | 375 | 390 |
| | Citigroup Inc. | 3.375% | 3/1/23 | 150 | 159 |
| | Citigroup Inc. | 3.500% | 5/15/23 | 675 | 722 |
| | Citigroup Inc. | 2.876% | 7/24/23 | 450 | 467 |
| | Citigroup Inc. | 3.875% | 10/25/23 | 738 | 811 |
| | Citigroup Inc. | 4.000% | 8/5/24 | 125 | 139 |
| | Citigroup Inc. | 0.776% | 10/30/24 | 500 | 501 |
| | Citigroup Inc. | 3.875% | 3/26/25 | 350 | 390 |
| | Citigroup Inc. | 3.352% | 4/24/25 | 1,500 | 1,630 |
| | Citigroup Inc. | 3.300% | 4/27/25 | 125 | 138 |
| | Citigroup Inc. | 4.400% | 6/10/25 | 1,796 | 2,051 |
| | Citigroup Inc. | 5.500% | 9/13/25 | 75 | 90 |
| | Citigroup Inc. | 3.700% | 1/12/26 | 275 | 312 |
| | Citigroup Inc. | 4.600% | 3/9/26 | 275 | 322 |
| | Citigroup Inc. | 3.200% | 10/21/26 | 1,025 | 1,143 |
| | Citigroup Inc. | 4.300% | 11/20/26 | 75 | 87 |
| | Citigroup Inc. | 4.450% | 9/29/27 | 1,150 | 1,349 |
| | Citigroup Inc. | 3.887% | 1/10/28 | 475 | 542 |
| | Citigroup Inc. | 3.668% | 7/24/28 | 900 | 1,022 |
| | Citigroup Inc. | 4.125% | 7/25/28 | 100 | 116 |
| | Citigroup Inc. | 3.520% | 10/27/28 | 580 | 654 |
| | Citigroup Inc. | 3.980% | 3/20/30 | 475 | 557 |
| | Citigroup Inc. | 2.976% | 11/5/30 | 300 | 328 |
| | Citigroup Inc. | 2.666% | 1/29/31 | 500 | 533 |
| | Citigroup Inc. | 4.412% | 3/31/31 | 750 | 909 |
| | Citigroup Inc. | 2.572% | 6/3/31 | 500 | 532 |
| | Citigroup Inc. | 6.625% | 6/15/32 | 100 | 142 |
| | Citigroup Inc. | 6.125% | 8/25/36 | 75 | 105 |
| | Citigroup Inc. | 3.878% | 1/24/39 | 225 | 268 |
| | Citigroup Inc. | 8.125% | 7/15/39 | 562 | 1,003 |
| | Citigroup Inc. | 5.316% | 3/26/41 | 1,000 | 1,405 |
| | Citigroup Inc. | 5.875% | 1/30/42 | 100 | 152 |
| | Citigroup Inc. | 5.300% | 5/6/44 | 375 | 526 |
| | Citigroup Inc. | 4.650% | 7/30/45 | 200 | 268 |
| | Citigroup Inc. | 4.750% | 5/18/46 | 375 | 498 |
| | Citigroup Inc. | 4.650% | 7/23/48 | 450 | 619 |
| | Citizens Bank NA | 3.250% | 2/14/22 | 250 | 257 |
| | Citizens Bank NA | 2.650% | 5/26/22 | 125 | 129 |
| | Citizens Financial Group Inc. | 4.300% | 12/3/25 | 357 | 411 |
| | Citizens Financial Group Inc. | 2.850% | 7/27/26 | 175 | 195 |
| | Citizens Financial Group Inc. | 2.500% | 2/6/30 | 200 | 212 |
| 5 | Citizens Financial Group Inc. | 2.638% | 9/30/32 | 125 | 132 |
| | CME Group Inc. | 3.000% | 9/15/22 | 125 | 131 |
| | CME Group Inc. | 3.000% | 3/15/25 | 214 | 234 |
| | CME Group Inc. | 5.300% | 9/15/43 | 200 | 297 |
| | CNA Financial Corp. | 3.950% | 5/15/24 | 150 | 166 |
| | CNA Financial Corp. | 4.500% | 3/1/26 | 125 | 146 |
Total Bond Market Index Portfolio
| | | | Coupon | Maturity
Date | Face
Amount
($000) | Market
Value•
($000) |
| | CNA Financial Corp. | 3.450% | 8/15/27 | 100 | 113 |
| | CNA Financial Corp. | 3.900% | 5/1/29 | 100 | 118 |
| | Comerica Bank | 4.000% | 7/27/25 | 50 | 56 |
| | Comerica Inc. | 3.700% | 7/31/23 | 200 | 216 |
| 5 | Commonwealth Bank of Australia | 2.750% | 3/10/22 | 500 | 514 |
| | Cooperatieve Rabobank UA | 2.750% | 1/10/22 | 250 | 256 |
| | Cooperatieve Rabobank UA | 3.875% | 2/8/22 | 525 | 545 |
| | Cooperatieve Rabobank UA | 3.950% | 11/9/22 | 125 | 133 |
| | Cooperatieve Rabobank UA | 4.625% | 12/1/23 | 175 | 195 |
| | Cooperatieve Rabobank UA | 3.375% | 5/21/25 | 666 | 746 |
| | Cooperatieve Rabobank UA | 4.375% | 8/4/25 | 600 | 682 |
| | Cooperatieve Rabobank UA | 3.750% | 7/21/26 | 475 | 536 |
| | Cooperatieve Rabobank UA | 5.250% | 5/24/41 | 100 | 148 |
| | Cooperatieve Rabobank UA | 5.750% | 12/1/43 | 250 | 370 |
| | Cooperatieve Rabobank UA | 5.250% | 8/4/45 | 350 | 490 |
| | Credit Suisse AG | 3.000% | 10/29/21 | 600 | 613 |
| | Credit Suisse AG | 3.625% | 9/9/24 | 575 | 638 |
| 5 | Credit Suisse Group AG | 3.574% | 1/9/23 | 250 | 258 |
| | Credit Suisse Group AG | 3.800% | 6/9/23 | 825 | 887 |
| | Credit Suisse Group AG | 3.750% | 3/26/25 | 250 | 277 |
| | Credit Suisse Group AG | 4.875% | 5/15/45 | 875 | 1,222 |
| | Credit Suisse Group Funding Guernsey Ltd. | 3.800% | 9/15/22 | 750 | 791 |
| | Deutsche Bank AG | 4.250% | 10/14/21 | 600 | 615 |
| | Deutsche Bank AG | 3.300% | 11/16/22 | 500 | 522 |
| | Deutsche Bank AG | 3.950% | 2/27/23 | 300 | 318 |
| | Deutsche Bank AG | 3.700% | 5/30/24 | 548 | 588 |
| | Deutsche Bank AG | 4.100% | 1/13/26 | 100 | 111 |
| | Discover Bank | 3.200% | 8/9/21 | 100 | 101 |
| | Discover Bank | 3.350% | 2/6/23 | 150 | 158 |
| | Discover Bank | 4.200% | 8/8/23 | 300 | 328 |
| | Discover Bank | 2.450% | 9/12/24 | 150 | 158 |
| | Discover Bank | 3.450% | 7/27/26 | 100 | 112 |
| | Discover Bank | 4.650% | 9/13/28 | 250 | 299 |
| | Discover Bank | 2.700% | 2/6/30 | 100 | 106 |
| | Discover Financial Services | 3.850% | 11/21/22 | 200 | 213 |
| | Discover Financial Services | 3.950% | 11/6/24 | 450 | 498 |
| | Discover Financial Services | 3.750% | 3/4/25 | 183 | 201 |
| | Discover Financial Services | 4.500% | 1/30/26 | 200 | 231 |
| | Discover Financial Services | 4.100% | 2/9/27 | 250 | 288 |
| | E*TRADE Financial Corp. | 3.800% | 8/24/27 | 75 | 86 |
| | E*TRADE Financial Corp. | 4.500% | 6/20/28 | 65 | 78 |
| | Eaton Vance Corp. | 3.625% | 6/15/23 | 50 | 54 |
| | Eaton Vance Corp. | 3.500% | 4/6/27 | 100 | 111 |
| | Enstar Group Ltd. | 4.500% | 3/10/22 | 50 | 52 |
| | Enstar Group Ltd. | 4.950% | 6/1/29 | 395 | 451 |
| | Equitable Holdings Inc. | 3.900% | 4/20/23 | 100 | 107 |
| | Equitable Holdings Inc. | 7.000% | 4/1/28 | 75 | 97 |
| | Equitable Holdings Inc. | 4.350% | 4/20/28 | 680 | 800 |
| | Equitable Holdings Inc. | 5.000% | 4/20/48 | 350 | 461 |
| | Everest Reinsurance Holdings Inc. | 4.868% | 6/1/44 | 100 | 131 |
| | Fairfax Financial Holdings Ltd. | 4.850% | 4/17/28 | 50 | 56 |
| | | | Coupon | Maturity
Date | Face
Amount
($000) | Market
Value•
($000) |
| | Fairfax Financial Holdings Ltd. | 4.625% | 4/29/30 | 100 | 112 |
| | Fidelity National Financial Inc. | 3.400% | 6/15/30 | 100 | 110 |
| | Fidelity National Financial Inc. | 2.450% | 3/15/31 | 500 | 507 |
| | Fifth Third Bancorp | 3.500% | 3/15/22 | 125 | 129 |
| | Fifth Third Bancorp | 4.300% | 1/16/24 | 275 | 303 |
| | Fifth Third Bancorp | 3.650% | 1/25/24 | 150 | 163 |
| | Fifth Third Bancorp | 2.375% | 1/28/25 | 349 | 371 |
| | Fifth Third Bancorp | 2.550% | 5/5/27 | 100 | 109 |
| | Fifth Third Bancorp | 3.950% | 3/14/28 | 75 | 88 |
| | Fifth Third Bancorp | 8.250% | 3/1/38 | 200 | 337 |
| | Fifth Third Bank NA | 3.950% | 7/28/25 | 200 | 229 |
| | Fifth Third Bank NA | 3.850% | 3/15/26 | 200 | 226 |
| | Fifth Third Bank NA | 2.250% | 2/1/27 | 250 | 266 |
| | First American Financial Corp. | 4.600% | 11/15/24 | 100 | 111 |
| | First Republic Bank | 2.500% | 6/6/22 | 100 | 103 |
| | First Republic Bank | 1.912% | 2/12/24 | 250 | 257 |
| | First Republic Bank | 4.375% | 8/1/46 | 75 | 95 |
| | FirstMerit Bank NA | 4.270% | 11/25/26 | 150 | 172 |
| | Franklin Resources Inc. | 2.800% | 9/15/22 | 225 | 234 |
| | FS KKR Capital Corp. | 4.750% | 5/15/22 | 25 | 26 |
| | FS KKR Capital Corp. | 4.625% | 7/15/24 | 25 | 26 |
| | FS KKR Capital Corp. | 4.125% | 2/1/25 | 100 | 104 |
| | FS KKR Capital Corp. | 3.400% | 1/15/26 | 500 | 496 |
| | GATX Corp. | 3.250% | 3/30/25 | 125 | 136 |
| | GATX Corp. | 3.250% | 9/15/26 | 50 | 56 |
| | GATX Corp. | 3.850% | 3/30/27 | 175 | 197 |
| | GATX Corp. | 3.500% | 3/15/28 | 100 | 112 |
| | GATX Corp. | 4.550% | 11/7/28 | 150 | 180 |
| | GATX Corp. | 4.700% | 4/1/29 | 75 | 92 |
| | GATX Corp. | 4.500% | 3/30/45 | 50 | 58 |
| 5 | GE Capital Funding LLC | 3.450% | 5/15/25 | 445 | 491 |
| 5 | GE Capital Funding LLC | 4.050% | 5/15/27 | 400 | 453 |
| 5 | GE Capital Funding LLC | 4.400% | 5/15/30 | 710 | 835 |
| 5 | GE Capital Funding LLC | 4.550% | 5/15/32 | 200 | 240 |
| | GE Capital International Funding Co. Unlimited Co. | 3.373% | 11/15/25 | 358 | 398 |
| | GE Capital International Funding Co. Unlimited Co. | 4.418% | 11/15/35 | 2,168 | 2,579 |
| | Globe Life Inc. | 3.800% | 9/15/22 | 50 | 53 |
| | Globe Life Inc. | 4.550% | 9/15/28 | 80 | 96 |
| | Goldman Sachs Capital I | 6.345% | 2/15/34 | 225 | 315 |
| | Goldman Sachs Group Inc. | 5.750% | 1/24/22 | 675 | 713 |
| | Goldman Sachs Group Inc. | 3.000% | 4/26/22 | 545 | 550 |
| | Goldman Sachs Group Inc. | 2.876% | 10/31/22 | 555 | 565 |
| | Goldman Sachs Group Inc. | 3.625% | 1/22/23 | 400 | 426 |
| | Goldman Sachs Group Inc. | 3.200% | 2/23/23 | 450 | 475 |
| | Goldman Sachs Group Inc. | 2.908% | 6/5/23 | 350 | 362 |
| | Goldman Sachs Group Inc. | 2.905% | 7/24/23 | 500 | 519 |
| | Goldman Sachs Group Inc. | 3.625% | 2/20/24 | 300 | 326 |
| | Goldman Sachs Group Inc. | 4.000% | 3/3/24 | 475 | 522 |
| | Goldman Sachs Group Inc. | 3.850% | 7/8/24 | 586 | 641 |
| | Goldman Sachs Group Inc. | 3.500% | 1/23/25 | 1,332 | 1,468 |
| | Goldman Sachs Group Inc. | 3.500% | 4/1/25 | 50 | 56 |
Total Bond Market Index Portfolio
| | | | Coupon | Maturity
Date | Face
Amount
($000) | Market
Value•
($000) |
| | Goldman Sachs Group Inc. | 3.750% | 5/22/25 | 825 | 926 |
| | Goldman Sachs Group Inc. | 3.272% | 9/29/25 | 550 | 601 |
| | Goldman Sachs Group Inc. | 4.250% | 10/21/25 | 200 | 228 |
| | Goldman Sachs Group Inc. | 3.750% | 2/25/26 | 200 | 226 |
| | Goldman Sachs Group Inc. | 3.500% | 11/16/26 | 1,250 | 1,402 |
| | Goldman Sachs Group Inc. | 1.093% | 12/9/26 | 500 | 505 |
| | Goldman Sachs Group Inc. | 5.950% | 1/15/27 | 400 | 500 |
| | Goldman Sachs Group Inc. | 3.850% | 1/26/27 | 350 | 399 |
| | Goldman Sachs Group Inc. | 3.691% | 6/5/28 | 625 | 720 |
| | Goldman Sachs Group Inc. | 3.814% | 4/23/29 | 450 | 519 |
| | Goldman Sachs Group Inc. | 4.223% | 5/1/29 | 475 | 561 |
| | Goldman Sachs Group Inc. | 3.800% | 3/15/30 | 1,250 | 1,467 |
| | Goldman Sachs Group Inc. | 6.450% | 5/1/36 | 50 | 73 |
| | Goldman Sachs Group Inc. | 6.750% | 10/1/37 | 975 | 1,478 |
| | Goldman Sachs Group Inc. | 4.017% | 10/31/38 | 405 | 493 |
| | Goldman Sachs Group Inc. | 4.411% | 4/23/39 | 500 | 636 |
| | Goldman Sachs Group Inc. | 6.250% | 2/1/41 | 675 | 1,053 |
| | Goldman Sachs Group Inc. | 4.800% | 7/8/44 | 360 | 498 |
| | Goldman Sachs Group Inc. | 5.150% | 5/22/45 | 475 | 655 |
| | Goldman Sachs Group Inc. | 4.750% | 10/21/45 | 150 | 208 |
| | Hanover Insurance Group Inc. | 4.500% | 4/15/26 | 100 | 117 |
| | Hartford Financial Services Group Inc. | 2.800% | 8/19/29 | 350 | 381 |
| | Hartford Financial Services Group Inc. | 5.950% | 10/15/36 | 50 | 70 |
| | Hartford Financial Services Group Inc. | 6.100% | 10/1/41 | 100 | 150 |
| | Hartford Financial Services Group Inc. | 4.300% | 4/15/43 | 175 | 219 |
| | Hartford Financial Services Group Inc. | 3.600% | 8/19/49 | 125 | 147 |
| | HSBC Bank USA NA | 7.000% | 1/15/39 | 250 | 396 |
| | HSBC Holdings plc | 3.262% | 3/13/23 | 560 | 578 |
| | HSBC Holdings plc | 3.600% | 5/25/23 | 200 | 215 |
| | HSBC Holdings plc | 3.033% | 11/22/23 | 200 | 209 |
| | HSBC Holdings plc | 4.250% | 3/14/24 | 250 | 276 |
| | HSBC Holdings plc | 3.950% | 5/18/24 | 1,300 | 1,401 |
| | HSBC Holdings plc | 3.803% | 3/11/25 | 1,075 | 1,174 |
| | HSBC Holdings plc | 4.250% | 8/18/25 | 150 | 169 |
| | HSBC Holdings plc | 2.633% | 11/7/25 | 200 | 213 |
| | HSBC Holdings plc | 4.300% | 3/8/26 | 1,100 | 1,268 |
| | HSBC Holdings plc | 1.645% | 4/18/26 | 2,000 | 2,041 |
| | HSBC Holdings plc | 3.900% | 5/25/26 | 450 | 513 |
| | HSBC Holdings plc | 2.099% | 6/4/26 | 1,700 | 1,765 |
| | HSBC Holdings plc | 4.292% | 9/12/26 | 500 | 568 |
| | HSBC Holdings plc | 4.375% | 11/23/26 | 350 | 404 |
| | HSBC Holdings plc | 1.589% | 5/24/27 | 500 | 507 |
| | HSBC Holdings plc | 4.041% | 3/13/28 | 400 | 454 |
| | HSBC Holdings plc | 4.583% | 6/19/29 | 400 | 473 |
| | HSBC Holdings plc | 4.950% | 3/31/30 | 550 | 683 |
| | HSBC Holdings plc | 3.973% | 5/22/30 | 570 | 657 |
| | | | Coupon | Maturity
Date | Face
Amount
($000) | Market
Value•
($000) |
| | HSBC Holdings plc | 7.625% | 5/17/32 | 100 | 145 |
| | HSBC Holdings plc | 7.350% | 11/27/32 | 100 | 134 |
| | HSBC Holdings plc | 6.500% | 5/2/36 | 600 | 867 |
| | HSBC Holdings plc | 6.500% | 9/15/37 | 50 | 72 |
| | HSBC Holdings plc | 6.800% | 6/1/38 | 200 | 301 |
| | HSBC Holdings plc | 5.250% | 3/14/44 | 750 | 1,042 |
| | HSBC USA Inc. | 3.500% | 6/23/24 | 150 | 164 |
| | Huntington Bancshares Inc. | 2.300% | 1/14/22 | 92 | 94 |
| | Huntington Bancshares Inc. | 2.550% | 2/4/30 | 250 | 267 |
| | Huntington National Bank | 2.500% | 8/7/22 | 200 | 206 |
| | Huntington National Bank | 1.800% | 2/3/23 | 275 | 282 |
| | Huntington National Bank | 3.550% | 10/6/23 | 250 | 270 |
| | Industrial & Commercial Bank of China Ltd. | 2.957% | 11/8/22 | 250 | 259 |
| | Industrial & Commercial Bank of China Ltd. | 3.538% | 11/8/27 | 250 | 276 |
| | ING Groep NV | 3.150% | 3/29/22 | 200 | 207 |
| | ING Groep NV | 4.100% | 10/2/23 | 300 | 329 |
| | ING Groep NV | 3.550% | 4/9/24 | 200 | 218 |
| | ING Groep NV | 3.950% | 3/29/27 | 300 | 347 |
| | ING Groep NV | 4.550% | 10/2/28 | 200 | 243 |
| | ING Groep NV | 4.050% | 4/9/29 | 200 | 237 |
| | Intercontinental Exchange Inc. | 2.350% | 9/15/22 | 100 | 103 |
| | Intercontinental Exchange Inc. | 4.000% | 10/15/23 | 150 | 165 |
| | Intercontinental Exchange Inc. | 3.750% | 12/1/25 | 300 | 341 |
| | Intercontinental Exchange Inc. | 3.100% | 9/15/27 | 150 | 167 |
| | Intercontinental Exchange Inc. | 3.750% | 9/21/28 | 75 | 87 |
| | Intercontinental Exchange Inc. | 2.100% | 6/15/30 | 750 | 780 |
| | Intercontinental Exchange Inc. | 2.650% | 9/15/40 | 500 | 513 |
| | Intercontinental Exchange Inc. | 4.250% | 9/21/48 | 175 | 222 |
| | Intercontinental Exchange Inc. | 3.000% | 6/15/50 | 285 | 302 |
| | Intercontinental Exchange Inc. | 3.000% | 9/15/60 | 300 | 313 |
| | International Finance Corp. | 5.875% | 8/15/22 | 160 | 172 |
| | Invesco Finance plc | 3.125% | 11/30/22 | 175 | 184 |
| | Invesco Finance plc | 4.000% | 1/30/24 | 450 | 494 |
| | Invesco Finance plc | 3.750% | 1/15/26 | 170 | 191 |
| | Invesco Finance plc | 5.375% | 11/30/43 | 75 | 97 |
| | Janus Capital Group Inc. | 4.875% | 8/1/25 | 75 | 86 |
| | Jefferies Financial Group Inc. | 5.500% | 10/18/23 | 150 | 165 |
| | Jefferies Group LLC | 5.125% | 1/20/23 | 100 | 109 |
| | Jefferies Group LLC | 6.450% | 6/8/27 | 50 | 63 |
| | Jefferies Group LLC | 6.250% | 1/15/36 | 75 | 99 |
| | Jefferies Group LLC | 6.500% | 1/20/43 | 75 | 103 |
| | Jefferies Group LLC / Jefferies Group Capital Finance Inc. | 4.850% | 1/15/27 | 200 | 236 |
| | Jefferies Group LLC / Jefferies Group Capital Finance Inc. | 4.150% | 1/23/30 | 300 | 350 |
| | JPMorgan Chase & Co. | 3.250% | 9/23/22 | 750 | 788 |
| | JPMorgan Chase & Co. | 2.972% | 1/15/23 | 370 | 380 |
| | JPMorgan Chase & Co. | 3.200% | 1/25/23 | 750 | 794 |
| | JPMorgan Chase & Co. | 3.207% | 4/1/23 | 500 | 517 |
| | JPMorgan Chase & Co. | 2.776% | 4/25/23 | 350 | 361 |
| | JPMorgan Chase & Co. | 3.375% | 5/1/23 | 300 | 320 |
| | JPMorgan Chase & Co. | 2.700% | 5/18/23 | 250 | 263 |
| | JPMorgan Chase & Co. | 3.875% | 2/1/24 | 445 | 489 |
Total Bond Market Index Portfolio
| | | | Coupon | Maturity
Date | Face
Amount
($000) | Market
Value•
($000) |
| | JPMorgan Chase & Co. | 3.559% | 4/23/24 | 485 | 519 |
| | JPMorgan Chase & Co. | 3.625% | 5/13/24 | 526 | 581 |
| | JPMorgan Chase & Co. | 1.514% | 6/1/24 | 1,640 | 1,680 |
| | JPMorgan Chase & Co. | 3.797% | 7/23/24 | 175 | 189 |
| | JPMorgan Chase & Co. | 3.875% | 9/10/24 | 575 | 642 |
| | JPMorgan Chase & Co. | 0.653% | 9/16/24 | 1,100 | 1,102 |
| | JPMorgan Chase & Co. | 4.023% | 12/5/24 | 300 | 330 |
| | JPMorgan Chase & Co. | 3.125% | 1/23/25 | 400 | 437 |
| | JPMorgan Chase & Co. | 3.220% | 3/1/25 | 600 | 646 |
| | JPMorgan Chase & Co. | 3.900% | 7/15/25 | 362 | 408 |
| | JPMorgan Chase & Co. | 2.301% | 10/15/25 | 700 | 743 |
| | JPMorgan Chase & Co. | 3.300% | 4/1/26 | 685 | 765 |
| | JPMorgan Chase & Co. | 2.083% | 4/22/26 | 500 | 528 |
| | JPMorgan Chase & Co. | 3.200% | 6/15/26 | 300 | 336 |
| | JPMorgan Chase & Co. | 2.950% | 10/1/26 | 875 | 970 |
| | JPMorgan Chase & Co. | 4.125% | 12/15/26 | 450 | 522 |
| | JPMorgan Chase & Co. | 3.960% | 1/29/27 | 500 | 575 |
| | JPMorgan Chase & Co. | 3.625% | 12/1/27 | 1,000 | 1,126 |
| | JPMorgan Chase & Co. | 3.782% | 2/1/28 | 625 | 718 |
| | JPMorgan Chase & Co. | 3.540% | 5/1/28 | 350 | 397 |
| | JPMorgan Chase & Co. | 3.509% | 1/23/29 | 575 | 655 |
| | JPMorgan Chase & Co. | 4.005% | 4/23/29 | 300 | 350 |
| | JPMorgan Chase & Co. | 4.203% | 7/23/29 | 250 | 298 |
| | JPMorgan Chase & Co. | 4.452% | 12/5/29 | 300 | 365 |
| | JPMorgan Chase & Co. | 3.702% | 5/6/30 | 300 | 346 |
| | JPMorgan Chase & Co. | 2.739% | 10/15/30 | 1,500 | 1,626 |
| | JPMorgan Chase & Co. | 4.493% | 3/24/31 | 1,050 | 1,291 |
| | JPMorgan Chase & Co. | 2.522% | 4/22/31 | 2,000 | 2,137 |
| | JPMorgan Chase & Co. | 1.764% | 11/19/31 | 500 | 504 |
| | JPMorgan Chase & Co. | 6.400% | 5/15/38 | 450 | 697 |
| | JPMorgan Chase & Co. | 3.882% | 7/24/38 | 500 | 604 |
| | JPMorgan Chase & Co. | 5.500% | 10/15/40 | 650 | 953 |
| | JPMorgan Chase & Co. | 3.109% | 4/22/41 | 500 | 558 |
| | JPMorgan Chase & Co. | 5.600% | 7/15/41 | 275 | 414 |
| | JPMorgan Chase & Co. | 5.400% | 1/6/42 | 150 | 222 |
| | JPMorgan Chase & Co. | 5.625% | 8/16/43 | 300 | 450 |
| | JPMorgan Chase & Co. | 4.950% | 6/1/45 | 100 | 141 |
| | JPMorgan Chase & Co. | 4.260% | 2/22/48 | 375 | 487 |
| | JPMorgan Chase & Co. | 4.032% | 7/24/48 | 500 | 632 |
| | JPMorgan Chase & Co. | 3.964% | 11/15/48 | 1,000 | 1,256 |
| | JPMorgan Chase & Co. | 3.897% | 1/23/49 | 400 | 503 |
| | JPMorgan Chase & Co. | 3.109% | 4/22/51 | 500 | 553 |
| | Kemper Corp. | 4.350% | 2/15/25 | 40 | 44 |
| | KeyBank NA | 2.300% | 9/14/22 | 200 | 207 |
| | KeyBank NA | 3.375% | 3/7/23 | 250 | 266 |
| | KeyBank NA | 0.423% | 1/3/24 | 500 | 500 |
| | KeyBank NA | 3.300% | 6/1/25 | 403 | 448 |
| | KeyCorp | 5.100% | 3/24/21 | 25 | 25 |
| | KeyCorp | 4.150% | 10/29/25 | 150 | 174 |
| | KeyCorp | 4.100% | 4/30/28 | 600 | 711 |
| | KeyCorp | 2.550% | 10/1/29 | 150 | 162 |
| | Lazard Group LLC | 3.750% | 2/13/25 | 50 | 55 |
| | Lazard Group LLC | 3.625% | 3/1/27 | 100 | 109 |
| | Lazard Group LLC | 4.500% | 9/19/28 | 100 | 119 |
| | Legg Mason Inc. | 4.750% | 3/15/26 | 100 | 119 |
| | Legg Mason Inc. | 5.625% | 1/15/44 | 120 | 173 |
| | Lincoln National Corp. | 4.200% | 3/15/22 | 50 | 52 |
| | Lincoln National Corp. | 4.000% | 9/1/23 | 50 | 55 |
| | Lincoln National Corp. | 3.350% | 3/9/25 | 13 | 14 |
| | Lincoln National Corp. | 3.625% | 12/12/26 | 75 | 86 |
| | Lincoln National Corp. | 3.800% | 3/1/28 | 100 | 115 |
| | Lincoln National Corp. | 3.050% | 1/15/30 | 350 | 390 |
| | Lincoln National Corp. | 6.300% | 10/9/37 | 75 | 103 |
| | Lincoln National Corp. | 7.000% | 6/15/40 | 160 | 243 |
| | Lloyds Banking Group plc | 3.000% | 1/11/22 | 300 | 308 |
| | Lloyds Banking Group plc | 2.858% | 3/17/23 | 250 | 257 |
| | Lloyds Banking Group plc | 4.050% | 8/16/23 | 900 | 978 |
| | Lloyds Banking Group plc | 2.907% | 11/7/23 | 400 | 416 |
| | Lloyds Banking Group plc | 3.900% | 3/12/24 | 200 | 220 |
| | | | Coupon | Maturity
Date | Face
Amount
($000) | Market
Value•
($000) |
| | Lloyds Banking Group plc | 4.450% | 5/8/25 | 200 | 229 |
| | Lloyds Banking Group plc | 4.582% | 12/10/25 | 700 | 799 |
| | Lloyds Banking Group plc | 4.650% | 3/24/26 | 575 | 660 |
| | Lloyds Banking Group plc | 3.750% | 1/11/27 | 200 | 227 |
| | Lloyds Banking Group plc | 4.375% | 3/22/28 | 250 | 296 |
| | Lloyds Banking Group plc | 4.550% | 8/16/28 | 200 | 241 |
| | Lloyds Banking Group plc | 3.574% | 11/7/28 | 200 | 224 |
| | Lloyds Banking Group plc | 5.300% | 12/1/45 | 450 | 616 |
| | Lloyds Banking Group plc | 4.344% | 1/9/48 | 275 | 336 |
| | Loews Corp. | 2.625% | 5/15/23 | 75 | 78 |
| | Loews Corp. | 6.000% | 2/1/35 | 50 | 72 |
| | Loews Corp. | 4.125% | 5/15/43 | 350 | 415 |
| | M&T Bank Corp. | 3.550% | 7/26/23 | 200 | 216 |
| | Manufacturers & Traders Trust Co. | 2.900% | 2/6/25 | 160 | 174 |
| | Manulife Financial Corp. | 4.150% | 3/4/26 | 175 | 203 |
| | Manulife Financial Corp. | 4.061% | 2/24/32 | 190 | 206 |
| | Manulife Financial Corp. | 5.375% | 3/4/46 | 200 | 289 |
| | Markel Corp. | 4.900% | 7/1/22 | 125 | 133 |
| | Markel Corp. | 3.500% | 11/1/27 | 50 | 56 |
| | Markel Corp. | 3.350% | 9/17/29 | 75 | 84 |
| | Markel Corp. | 4.300% | 11/1/47 | 50 | 63 |
| | Markel Corp. | 5.000% | 5/20/49 | 150 | 206 |
| | Markel Corp. | 4.150% | 9/17/50 | 200 | 251 |
| | Marsh & McLennan Cos. Inc. | 3.300% | 3/14/23 | 75 | 79 |
| | Marsh & McLennan Cos. Inc. | 3.500% | 6/3/24 | 100 | 109 |
| | Marsh & McLennan Cos. Inc. | 3.500% | 3/10/25 | 100 | 111 |
| | Marsh & McLennan Cos. Inc. | 3.750% | 3/14/26 | 100 | 113 |
| | Marsh & McLennan Cos. Inc. | 4.375% | 3/15/29 | 325 | 395 |
| | Marsh & McLennan Cos. Inc. | 2.250% | 11/15/30 | 710 | 751 |
| | Marsh & McLennan Cos. Inc. | 4.350% | 1/30/47 | 100 | 133 |
| | Marsh & McLennan Cos. Inc. | 4.200% | 3/1/48 | 200 | 261 |
| | Marsh & McLennan Cos. Inc. | 4.900% | 3/15/49 | 450 | 649 |
| | Mercury General Corp. | 4.400% | 3/15/27 | 75 | 83 |
| | MetLife Inc. | 3.048% | 12/15/22 | 225 | 236 |
| | MetLife Inc. | 3.600% | 4/10/24 | 175 | 193 |
| | MetLife Inc. | 3.000% | 3/1/25 | 250 | 274 |
| | MetLife Inc. | 3.600% | 11/13/25 | 400 | 453 |
| | MetLife Inc. | 4.550% | 3/23/30 | 500 | 626 |
| | MetLife Inc. | 6.500% | 12/15/32 | 175 | 266 |
| | MetLife Inc. | 6.375% | 6/15/34 | 100 | 152 |
| | MetLife Inc. | 5.875% | 2/6/41 | 590 | 901 |
| | MetLife Inc. | 4.125% | 8/13/42 | 175 | 222 |
| | MetLife Inc. | 4.875% | 11/13/43 | 205 | 290 |
| | MetLife Inc. | 4.721% | 12/15/44 | 63 | 86 |
| | MetLife Inc. | 4.600% | 5/13/46 | 150 | 207 |
| | MetLife Inc. | 6.400% | 12/15/66 | 210 | 268 |
| | Mitsubishi UFJ Financial Group Inc. | 2.998% | 2/22/22 | 1,275 | 1,313 |
| | Mitsubishi UFJ Financial Group Inc. | 3.218% | 3/7/22 | 200 | 207 |
| | Mitsubishi UFJ Financial Group Inc. | 2.623% | 7/18/22 | 675 | 698 |
| | Mitsubishi UFJ Financial Group Inc. | 2.665% | 7/25/22 | 300 | 310 |
| | Mitsubishi UFJ Financial Group Inc. | 3.455% | 3/2/23 | 300 | 319 |
| | Mitsubishi UFJ Financial Group Inc. | 3.761% | 7/26/23 | 740 | 802 |
| | Mitsubishi UFJ Financial Group Inc. | 2.527% | 9/13/23 | 100 | 105 |
Total Bond Market Index Portfolio
| | | | Coupon | Maturity
Date | Face
Amount
($000) | Market
Value•
($000) |
| | Mitsubishi UFJ Financial Group Inc. | 3.407% | 3/7/24 | 200 | 217 |
| | Mitsubishi UFJ Financial Group Inc. | 2.801% | 7/18/24 | 200 | 214 |
| | Mitsubishi UFJ Financial Group Inc. | 3.777% | 3/2/25 | 250 | 279 |
| | Mitsubishi UFJ Financial Group Inc. | 1.412% | 7/17/25 | 2,000 | 2,041 |
| | Mitsubishi UFJ Financial Group Inc. | 3.850% | 3/1/26 | 525 | 603 |
| | Mitsubishi UFJ Financial Group Inc. | 2.757% | 9/13/26 | 250 | 273 |
| | Mitsubishi UFJ Financial Group Inc. | 3.677% | 2/22/27 | 500 | 568 |
| | Mitsubishi UFJ Financial Group Inc. | 3.287% | ���7/25/27 | 250 | 283 |
| | Mitsubishi UFJ Financial Group Inc. | 3.961% | 3/2/28 | 200 | 234 |
| | Mitsubishi UFJ Financial Group Inc. | 4.050% | 9/11/28 | 200 | 238 |
| | Mitsubishi UFJ Financial Group Inc. | 3.741% | 3/7/29 | 200 | 235 |
| | Mitsubishi UFJ Financial Group Inc. | 3.195% | 7/18/29 | 175 | 196 |
| | Mitsubishi UFJ Financial Group Inc. | 2.559% | 2/25/30 | 50 | 54 |
| | Mitsubishi UFJ Financial Group Inc. | 2.048% | 7/17/30 | 500 | 519 |
| | Mitsubishi UFJ Financial Group Inc. | 4.286% | 7/26/38 | 50 | 64 |
| | Mitsubishi UFJ Financial Group Inc. | 3.751% | 7/18/39 | 200 | 242 |
| | Mizuho Financial Group Inc. | 3.549% | 3/5/23 | 200 | 213 |
| | Mizuho Financial Group Inc. | 2.721% | 7/16/23 | 300 | 309 |
| | Mizuho Financial Group Inc. | 3.922% | 9/11/24 | 200 | 217 |
| | Mizuho Financial Group Inc. | 2.839% | 7/16/25 | 375 | 399 |
| | Mizuho Financial Group Inc. | 2.555% | 9/13/25 | 100 | 106 |
| | Mizuho Financial Group Inc. | 3.663% | 2/28/27 | 250 | 283 |
| | Mizuho Financial Group Inc. | 4.018% | 3/5/28 | 325 | 380 |
| | Mizuho Financial Group Inc. | 4.254% | 9/11/29 | 400 | 474 |
| | Mizuho Financial Group Inc. | 3.153% | 7/16/30 | 500 | 552 |
| | Mizuho Financial Group Inc. | 2.869% | 9/13/30 | 100 | 108 |
| | Morgan Stanley | 2.750% | 5/19/22 | 600 | 619 |
| | Morgan Stanley | 4.875% | 11/1/22 | 425 | 458 |
| | Morgan Stanley | 3.125% | 1/23/23 | 250 | 264 |
| | Morgan Stanley | 3.750% | 2/25/23 | 675 | 723 |
| | Morgan Stanley | 0.560% | 11/10/23 | 500 | 501 |
| | Morgan Stanley | 3.737% | 4/24/24 | 750 | 804 |
| | Morgan Stanley | 3.875% | 4/29/24 | 545 | 602 |
| | Morgan Stanley | 3.700% | 10/23/24 | 650 | 724 |
| | Morgan Stanley | 4.000% | 7/23/25 | 330 | 376 |
| | Morgan Stanley | 5.000% | 11/24/25 | 650 | 776 |
| | Morgan Stanley | 3.875% | 1/27/26 | 225 | 258 |
| | Morgan Stanley | 2.188% | 4/28/26 | 1,000 | 1,055 |
| | Morgan Stanley | 3.125% | 7/27/26 | 700 | 780 |
| | Morgan Stanley | 6.250% | 8/9/26 | 425 | 541 |
| | Morgan Stanley | 4.350% | 9/8/26 | 400 | 470 |
| | Morgan Stanley | 0.985% | 12/10/26 | 500 | 503 |
| | Morgan Stanley | 3.625% | 1/20/27 | 250 | 286 |
| | Morgan Stanley | 3.950% | 4/23/27 | 325 | 373 |
| | Morgan Stanley | 3.591% | 7/22/28 | 935 | 1,067 |
| | Morgan Stanley | 3.772% | 1/24/29 | 575 | 664 |
| | | | Coupon | Maturity
Date | Face
Amount
($000) | Market
Value•
($000) |
| | Morgan Stanley | 4.431% | 1/23/30 | 550 | 669 |
| | Morgan Stanley | 2.699% | 1/22/31 | 1,750 | 1,903 |
| | Morgan Stanley | 3.622% | 4/1/31 | 600 | 694 |
| | Morgan Stanley | 1.794% | 2/13/32 | 500 | 502 |
| | Morgan Stanley | 7.250% | 4/1/32 | 150 | 231 |
| | Morgan Stanley | 3.971% | 7/22/38 | 375 | 460 |
| | Morgan Stanley | 4.457% | 4/22/39 | 250 | 322 |
| | Morgan Stanley | 6.375% | 7/24/42 | 600 | 976 |
| | Morgan Stanley | 4.300% | 1/27/45 | 650 | 865 |
| | Morgan Stanley | 4.375% | 1/22/47 | 175 | 237 |
| | Morgan Stanley | 5.597% | 3/24/51 | 500 | 799 |
| | MUFG Americas Holdings Corp. | 3.500% | 6/18/22 | 475 | 497 |
| | MUFG Americas Holdings Corp. | 3.000% | 2/10/25 | 80 | 87 |
| | MUFG Union Bank NA | 3.150% | 4/1/22 | 1,200 | 1,239 |
| | Nasdaq Inc. | 4.250% | 6/1/24 | 125 | 138 |
| | Nasdaq Inc. | 3.850% | 6/30/26 | 100 | 115 |
| | Nasdaq Inc. | 1.650% | 1/15/31 | 500 | 495 |
| | Nasdaq Inc. | 2.500% | 12/21/40 | 200 | 197 |
| | Nasdaq Inc. | 3.250% | 4/28/50 | 35 | 38 |
| | National Australia Bank Ltd. | 3.000% | 1/20/23 | 250 | 263 |
| | National Australia Bank Ltd. | 3.625% | 6/20/23 | 250 | 270 |
| | National Australia Bank Ltd. | 3.375% | 1/14/26 | 100 | 113 |
| | National Australia Bank Ltd. | 2.500% | 7/12/26 | 200 | 218 |
| | National Bank of Canada | 2.100% | 2/1/23 | 200 | 206 |
| | Natwest Group plc | 3.498% | 5/15/23 | 500 | 519 |
| | Natwest Group plc | 3.875% | 9/12/23 | 600 | 651 |
| | Natwest Group plc | 6.000% | 12/19/23 | 100 | 114 |
| | Natwest Group plc | 5.125% | 5/28/24 | 500 | 557 |
| | Natwest Group plc | 4.519% | 6/25/24 | 300 | 327 |
| | Natwest Group plc | 4.892% | 5/18/29 | 1,000 | 1,199 |
| | Natwest Group plc | 5.076% | 1/27/30 | 200 | 245 |
| | Natwest Group plc | 4.445% | 5/8/30 | 700 | 830 |
| | Nippon Life Insurance Co. | 3.375% | 5/8/32 | 50 | 55 |
| | Nomura Holdings Inc. | 2.648% | 1/16/25 | 170 | 181 |
| | Nomura Holdings Inc. | 1.851% | 7/16/25 | 300 | 313 |
| | Nomura Holdings Inc. | 3.103% | 1/16/30 | 400 | 436 |
| | Nomura Holdings Inc. | 2.679% | 7/16/30 | 250 | 264 |
| | Northern Trust Corp. | 3.375% | 8/23/21 | 100 | 102 |
| | Northern Trust Corp. | 3.950% | 10/30/25 | 150 | 173 |
| | Northern Trust Corp. | 3.650% | 8/3/28 | 100 | 117 |
| | Oaktree Specialty Lending Corp. | 3.500% | 2/25/25 | 40 | 41 |
| | Old Republic International Corp. | 4.875% | 10/1/24 | 121 | 138 |
| | Old Republic International Corp. | 3.875% | 8/26/26 | 100 | 115 |
| | ORIX Corp. | 2.900% | 7/18/22 | 50 | 52 |
| | ORIX Corp. | 3.250% | 12/4/24 | 75 | 82 |
| | ORIX Corp. | 3.700% | 7/18/27 | 200 | 228 |
| | Owl Rock Capital Corp. | 5.250% | 4/15/24 | 25 | 27 |
| | Owl Rock Capital Corp. | 4.000% | 3/30/25 | 47 | 49 |
| | Owl Rock Capital Corp. | 3.750% | 7/22/25 | 180 | 186 |
| | PartnerRe Finance B LLC | 3.700% | 7/2/29 | 95 | 109 |
| | People's United Bank NA | 4.000% | 7/15/24 | 100 | 108 |
| | People's United Financial Inc. | 3.650% | 12/6/22 | 100 | 105 |
| | PNC Bank NA | 2.550% | 12/9/21 | 100 | 102 |
| | PNC Bank NA | 2.625% | 2/17/22 | 175 | 179 |
| | PNC Bank NA | 2.450% | 7/28/22 | 100 | 103 |
| | PNC Bank NA | 2.700% | 11/1/22 | 450 | 469 |
| | PNC Bank NA | 2.028% | 12/9/22 | 145 | 147 |
| | PNC Bank NA | 3.300% | 10/30/24 | 706 | 777 |
| | PNC Bank NA | 2.950% | 2/23/25 | 293 | 321 |
| | PNC Bank NA | 3.250% | 6/1/25 | 169 | 187 |
Total Bond Market Index Portfolio
| | | | Coupon | Maturity
Date | Face
Amount
($000) | Market
Value•
($000) |
| | PNC Bank NA | 3.100% | 10/25/27 | 250 | 280 |
| | PNC Bank NA | 3.250% | 1/22/28 | 150 | 171 |
| | PNC Bank NA | 4.050% | 7/26/28 | 250 | 296 |
| | PNC Bank NA | 2.700% | 10/22/29 | 150 | 163 |
| | PNC Financial Services Group Inc. | 3.300% | 3/8/22 | 340 | 351 |
| | PNC Financial Services Group Inc. | 3.500% | 1/23/24 | 100 | 109 |
| | PNC Financial Services Group Inc. | 3.900% | 4/29/24 | 125 | 138 |
| | PNC Financial Services Group Inc. | 3.150% | 5/19/27 | 450 | 507 |
| | PNC Financial Services Group Inc. | 3.450% | 4/23/29 | 500 | 577 |
| | PNC Financial Services Group Inc. | 2.550% | 1/22/30 | 425 | 464 |
| | Primerica Inc. | 4.750% | 7/15/22 | 125 | 133 |
| | Principal Financial Group Inc. | 3.300% | 9/15/22 | 50 | 52 |
| | Principal Financial Group Inc. | 3.125% | 5/15/23 | 100 | 106 |
| | Principal Financial Group Inc. | 3.400% | 5/15/25 | 128 | 142 |
| | Principal Financial Group Inc. | 3.100% | 11/15/26 | 100 | 111 |
| | Principal Financial Group Inc. | 4.625% | 9/15/42 | 50 | 64 |
| | Principal Financial Group Inc. | 4.350% | 5/15/43 | 50 | 63 |
| | Principal Financial Group Inc. | 4.300% | 11/15/46 | 295 | 374 |
| | Private Export Funding Corp. | 1.750% | 11/15/24 | 75 | 79 |
| | Progressive Corp. | 3.750% | 8/23/21 | 75 | 77 |
| | Progressive Corp. | 2.450% | 1/15/27 | 150 | 163 |
| | Progressive Corp. | 6.625% | 3/1/29 | 125 | 170 |
| | Progressive Corp. | 4.350% | 4/25/44 | 50 | 66 |
| | Progressive Corp. | 4.125% | 4/15/47 | 290 | 382 |
| | Progressive Corp. | 4.200% | 3/15/48 | 115 | 154 |
| | Progressive Corp. | 3.950% | 3/26/50 | 180 | 235 |
| | Prospect Capital Corp. | 5.875% | 3/15/23 | 8 | 8 |
| | Prudential Financial Inc. | 3.500% | 5/15/24 | 125 | 138 |
| | Prudential Financial Inc. | 3.878% | 3/27/28 | 250 | 296 |
| | Prudential Financial Inc. | 5.750% | 7/15/33 | 100 | 135 |
| | Prudential Financial Inc. | 5.700% | 12/14/36 | 125 | 180 |
| | Prudential Financial Inc. | 6.625% | 12/1/37 | 65 | 97 |
| | Prudential Financial Inc. | 3.000% | 3/10/40 | 50 | 54 |
| | Prudential Financial Inc. | 6.625% | 6/21/40 | 65 | 100 |
| | Prudential Financial Inc. | 5.875% | 9/15/42 | 125 | 133 |
| | Prudential Financial Inc. | 5.625% | 6/15/43 | 375 | 402 |
| | Prudential Financial Inc. | 5.100% | 8/15/43 | 50 | 62 |
| | Prudential Financial Inc. | 5.200% | 3/15/44 | 85 | 92 |
| | Prudential Financial Inc. | 4.600% | 5/15/44 | 525 | 684 |
| | Prudential Financial Inc. | 5.375% | 5/15/45 | 250 | 272 |
| | Prudential Financial Inc. | 3.905% | 12/7/47 | 182 | 219 |
| | Prudential Financial Inc. | 5.700% | 9/15/48 | 250 | 289 |
| | Prudential Financial Inc. | 3.935% | 12/7/49 | 263 | 319 |
| | Prudential Financial Inc. | 4.350% | 2/25/50 | 210 | 273 |
| | Prudential Financial Inc. | 3.700% | 10/1/50 | 200 | 210 |
| | Prudential plc | 3.125% | 4/14/30 | 200 | 227 |
| | Raymond James Financial Inc. | 3.625% | 9/15/26 | 75 | 86 |
| | Raymond James Financial Inc. | 4.650% | 4/1/30 | 55 | 67 |
| | Raymond James Financial Inc. | 4.950% | 7/15/46 | 210 | 287 |
| | Regions Bank | 6.450% | 6/26/37 | 250 | 352 |
| | Regions Financial Corp. | 3.800% | 8/14/23 | 200 | 217 |
| | Regions Financial Corp. | 2.250% | 5/18/25 | 100 | 106 |
| | Reinsurance Group of America Inc. | 4.700% | 9/15/23 | 75 | 83 |
| | | | Coupon | Maturity
Date | Face
Amount
($000) | Market
Value•
($000) |
| | Reinsurance Group of America Inc. | 3.900% | 5/15/29 | 50 | 57 |
| | RenaissanceRe Finance Inc. | 3.700% | 4/1/25 | 10 | 11 |
| | RenaissanceRe Finance Inc. | 3.450% | 7/1/27 | 75 | 82 |
| | RenaissanceRe Holdings Ltd. | 3.600% | 4/15/29 | 75 | 85 |
| | Royal Bank of Canada | 2.300% | 3/22/21 | 175 | 176 |
| | Royal Bank of Canada | 2.750% | 2/1/22 | 300 | 308 |
| | Royal Bank of Canada | 2.800% | 4/29/22 | 300 | 309 |
| | Royal Bank of Canada | 1.950% | 1/17/23 | 150 | 155 |
| | Royal Bank of Canada | 1.600% | 4/17/23 | 800 | 822 |
| | Royal Bank of Canada | 3.700% | 10/5/23 | 100 | 109 |
| | Royal Bank of Canada | 2.550% | 7/16/24 | 200 | 214 |
| | Royal Bank of Canada | 2.250% | 11/1/24 | 650 | 691 |
| | Royal Bank of Canada | 4.650% | 1/27/26 | 250 | 295 |
| | Santander Holdings USA Inc. | 3.400% | 1/18/23 | 115 | 121 |
| | Santander Holdings USA Inc. | 4.500% | 7/17/25 | 1,125 | 1,272 |
| | Santander Holdings USA Inc. | 3.244% | 10/5/26 | 900 | 979 |
| | Santander Holdings USA Inc. | 4.400% | 7/13/27 | 250 | 285 |
| | Santander UK Group Holdings plc | 2.875% | 8/5/21 | 225 | 228 |
| | Santander UK Group Holdings plc | 3.571% | 1/10/23 | 200 | 206 |
| | Santander UK Group Holdings plc | 1.532% | 8/21/26 | 600 | 603 |
| | Santander UK Group Holdings plc | 3.823% | 11/3/28 | 200 | 225 |
| | Santander UK plc | 2.100% | 1/13/23 | 325 | 335 |
| | Santander UK plc | 4.000% | 3/13/24 | 200 | 221 |
| | Santander UK plc | 2.875% | 6/18/24 | 200 | 214 |
| | Selective Insurance Group Inc. | 5.375% | 3/1/49 | 50 | 63 |
| | Sixth Street Specialty Lending Inc. | 3.875% | 11/1/24 | 50 | 52 |
| | Skandinaviska Enskilda Banken AB | 2.625% | 3/15/21 | 300 | 301 |
| | Skandinaviska Enskilda Banken AB | 2.800% | 3/11/22 | 250 | 257 |
| | Sompo International Holdings Ltd. | 4.700% | 10/15/22 | 100 | 107 |
| | State Street Corp. | 2.653% | 5/15/23 | 300 | 308 |
| | State Street Corp. | 3.100% | 5/15/23 | 400 | 425 |
| | State Street Corp. | 3.700% | 11/20/23 | 83 | 91 |
| | State Street Corp. | 3.776% | 12/3/24 | 200 | 219 |
| | State Street Corp. | 3.300% | 12/16/24 | 227 | 252 |
| | State Street Corp. | 3.550% | 8/18/25 | 464 | 524 |
| | State Street Corp. | 2.354% | 11/1/25 | 125 | 133 |
| | State Street Corp. | 2.650% | 5/19/26 | 125 | 137 |
| | State Street Corp. | 4.141% | 12/3/29 | 200 | 241 |
| | State Street Corp. | 2.400% | 1/24/30 | 150 | 163 |
| | State Street Corp. | 3.031% | 11/1/34 | 125 | 136 |
| | Stifel Financial Corp. | 4.250% | 7/18/24 | 150 | 168 |
| | Sumitomo Mitsui Banking Corp. | 3.200% | 7/18/22 | 250 | 260 |
| | Sumitomo Mitsui Banking Corp. | 3.950% | 7/19/23 | 100 | 109 |
| | Sumitomo Mitsui Banking Corp. | 3.950% | 1/10/24 | 250 | 273 |
| | Sumitomo Mitsui Banking Corp. | 3.400% | 7/11/24 | 250 | 272 |
| | Sumitomo Mitsui Financial Group Inc. | 2.442% | 10/19/21 | 475 | 482 |
| | Sumitomo Mitsui Financial Group Inc. | 2.846% | 1/11/22 | 250 | 256 |
| | Sumitomo Mitsui Financial Group Inc. | 2.784% | 7/12/22 | 200 | 207 |
Total Bond Market Index Portfolio
| | | | Coupon | Maturity
Date | Face
Amount
($000) | Market
Value•
($000) |
| | Sumitomo Mitsui Financial Group Inc. | 2.778% | 10/18/22 | 200 | 208 |
| | Sumitomo Mitsui Financial Group Inc. | 3.102% | 1/17/23 | 250 | 264 |
| | Sumitomo Mitsui Financial Group Inc. | 3.748% | 7/19/23 | 200 | 216 |
| | Sumitomo Mitsui Financial Group Inc. | 3.936% | 10/16/23 | 200 | 219 |
| | Sumitomo Mitsui Financial Group Inc. | 2.696% | 7/16/24 | 375 | 400 |
| | Sumitomo Mitsui Financial Group Inc. | 2.348% | 1/15/25 | 320 | 339 |
| | Sumitomo Mitsui Financial Group Inc. | 3.784% | 3/9/26 | 150 | 171 |
| | Sumitomo Mitsui Financial Group Inc. | 2.632% | 7/14/26 | 125 | 136 |
| | Sumitomo Mitsui Financial Group Inc. | 3.010% | 10/19/26 | 175 | 194 |
| | Sumitomo Mitsui Financial Group Inc. | 3.446% | 1/11/27 | 200 | 224 |
| | Sumitomo Mitsui Financial Group Inc. | 3.364% | 7/12/27 | 700 | 786 |
| | Sumitomo Mitsui Financial Group Inc. | 3.544% | 1/17/28 | 300 | 341 |
| | Sumitomo Mitsui Financial Group Inc. | 3.944% | 7/19/28 | 100 | 117 |
| | Sumitomo Mitsui Financial Group Inc. | 3.040% | 7/16/29 | 475 | 527 |
| | Sumitomo Mitsui Financial Group Inc. | 3.202% | 9/17/29 | 150 | 164 |
| | Sumitomo Mitsui Financial Group Inc. | 2.750% | 1/15/30 | 370 | 403 |
| | SVB Financial Group | 3.500% | 1/29/25 | 100 | 109 |
| | SVB Financial Group | 3.125% | 6/5/30 | 50 | 56 |
| | Svenska Handelsbanken AB | 2.450% | 3/30/21 | 300 | 302 |
| | Swiss Re America Holding Corp. | 7.000% | 2/15/26 | 75 | 95 |
| | Synchrony Bank | 3.000% | 6/15/22 | 100 | 103 |
| | Synchrony Financial | 2.850% | 7/25/22 | 75 | 77 |
| | Synchrony Financial | 4.250% | 8/15/24 | 250 | 274 |
| | Synchrony Financial | 4.500% | 7/23/25 | 426 | 478 |
| | Synchrony Financial | 3.700% | 8/4/26 | 125 | 138 |
| | Synchrony Financial | 3.950% | 12/1/27 | 300 | 335 |
| | Synovus Financial Corp. | 3.125% | 11/1/22 | 50 | 52 |
| | TD Ameritrade Holding Corp. | 2.950% | 4/1/22 | 125 | 128 |
| | TD Ameritrade Holding Corp. | 3.625% | 4/1/25 | 384 | 426 |
| | TD Ameritrade Holding Corp. | 3.300% | 4/1/27 | 125 | 140 |
| | TD Ameritrade Holding Corp. | 2.750% | 10/1/29 | 50 | 55 |
| 5 | Toronto-Dominion Bank | 2.250% | 3/15/21 | 250 | 251 |
| | Toronto-Dominion Bank | 2.125% | 4/7/21 | 175 | 176 |
| | Toronto-Dominion Bank | 1.900% | 12/1/22 | 225 | 232 |
| | Toronto-Dominion Bank | 0.750% | 6/12/23 | 1,500 | 1,511 |
| | Toronto-Dominion Bank | 3.250% | 3/11/24 | 400 | 434 |
| | Toronto-Dominion Bank | 2.650% | 6/12/24 | 500 | 536 |
| | Toronto-Dominion Bank | 1.150% | 6/12/25 | 200 | 204 |
| | Travelers Cos. Inc. | 6.250% | 6/15/37 | 150 | 229 |
| | Travelers Cos. Inc. | 4.600% | 8/1/43 | 100 | 136 |
| | Travelers Cos. Inc. | 4.300% | 8/25/45 | 150 | 199 |
| | Travelers Cos. Inc. | 4.000% | 5/30/47 | 125 | 162 |
| | Travelers Cos. Inc. | 4.100% | 3/4/49 | 200 | 266 |
| | Travelers Cos. Inc. | 2.550% | 4/27/50 | 500 | 522 |
| | Trinity Acquisition plc | 4.400% | 3/15/26 | 100 | 116 |
| | Truist Bank | 2.625% | 1/15/22 | 250 | 256 |
| | Truist Bank | 2.800% | 5/17/22 | 400 | 413 |
| | Truist Bank | 3.502% | 8/2/22 | 250 | 254 |
| | Truist Bank | 3.000% | 2/2/23 | 75 | 79 |
| | | | Coupon | Maturity
Date | Face
Amount
($000) | Market
Value•
($000) |
| | Truist Bank | 1.250% | 3/9/23 | 1,000 | 1,019 |
| | Truist Bank | 3.200% | 4/1/24 | 500 | 543 |
| | Truist Bank | 3.689% | 8/2/24 | 250 | 270 |
| | Truist Bank | 2.150% | 12/6/24 | 250 | 265 |
| | Truist Bank | 3.625% | 9/16/25 | 500 | 561 |
| | Truist Bank | 3.300% | 5/15/26 | 200 | 223 |
| | Truist Financial Corp. | 2.900% | 3/3/21 | 75 | 75 |
| | Truist Financial Corp. | 2.700% | 1/27/22 | 125 | 128 |
| | Truist Financial Corp. | 2.750% | 4/1/22 | 175 | 180 |
| | Truist Financial Corp. | 3.050% | 6/20/22 | 500 | 519 |
| | Truist Financial Corp. | 3.750% | 12/6/23 | 250 | 274 |
| | Truist Financial Corp. | 2.500% | 8/1/24 | 75 | 80 |
| | Truist Financial Corp. | 2.850% | 10/26/24 | 192 | 207 |
| | Truist Financial Corp. | 3.700% | 6/5/25 | 175 | 197 |
| | Truist Financial Corp. | 1.200% | 8/5/25 | 200 | 205 |
| | Truist Financial Corp. | 1.125% | 8/3/27 | 500 | 503 |
| | Truist Financial Corp. | 3.875% | 3/19/29 | 200 | 233 |
| | Truist Financial Corp. | 1.950% | 6/5/30 | 100 | 104 |
| | U.S. Bancorp | 2.625% | 1/24/22 | 200 | 205 |
| | U.S. Bancorp | 3.000% | 3/15/22 | 125 | 129 |
| | U.S. Bancorp | 2.950% | 7/15/22 | 400 | 415 |
| | U.S. Bancorp | 3.700% | 1/30/24 | 150 | 164 |
| | U.S. Bancorp | 3.375% | 2/5/24 | 500 | 543 |
| | U.S. Bancorp | 2.400% | 7/30/24 | 200 | 213 |
| | U.S. Bancorp | 3.600% | 9/11/24 | 50 | 55 |
| | U.S. Bancorp | 3.950% | 11/17/25 | 25 | 29 |
| | U.S. Bancorp | 3.100% | 4/27/26 | 300 | 334 |
| | U.S. Bancorp | 2.375% | 7/22/26 | 25 | 27 |
| | U.S. Bancorp | 3.150% | 4/27/27 | 275 | 308 |
| | U.S. Bancorp | 3.900% | 4/26/28 | 75 | 89 |
| | U.S. Bancorp | 3.000% | 7/30/29 | 240 | 267 |
| | U.S. Bank NA | 1.800% | 1/21/22 | 175 | ��� 178 |
| | U.S. Bank NA | 2.650% | 5/23/22 | 250 | 258 |
| | U.S. Bank NA | 1.950% | 1/9/23 | 300 | 310 |
| | U.S. Bank NA | 2.850% | 1/23/23 | 250 | 262 |
| | U.S. Bank NA | 3.400% | 7/24/23 | 250 | 269 |
| | U.S. Bank NA | 2.050% | 1/21/25 | 175 | 185 |
| | U.S. Bank NA | 2.800% | 1/27/25 | 625 | 678 |
| 5 | UBS Group AG | 3.126% | 8/13/30 | 50 | 56 |
| | Unum Group | 4.000% | 3/15/24 | 125 | 136 |
| | Unum Group | 4.000% | 6/15/29 | 80 | 90 |
| | Unum Group | 5.750% | 8/15/42 | 75 | 91 |
| | Unum Group | 4.500% | 12/15/49 | 100 | 106 |
| | Voya Financial Inc. | 3.125% | 7/15/24 | 100 | 108 |
| | Voya Financial Inc. | 3.650% | 6/15/26 | 250 | 285 |
| | Voya Financial Inc. | 5.700% | 7/15/43 | 75 | 102 |
| | Voya Financial Inc. | 4.800% | 6/15/46 | 40 | 51 |
| | Voya Financial Inc. | 4.700% | 1/23/48 | 100 | 104 |
| | Wachovia Corp. | 6.605% | 10/1/25 | 265 | 325 |
| | Wells Fargo & Co. | 3.500% | 3/8/22 | 450 | 467 |
| | Wells Fargo & Co. | 2.625% | 7/22/22 | 735 | 761 |
| | Wells Fargo & Co. | 3.069% | 1/24/23 | 1,050 | 1,078 |
| | Wells Fargo & Co. | 3.450% | 2/13/23 | 350 | 371 |
| | Wells Fargo & Co. | 3.750% | 1/24/24 | 200 | 218 |
| | Wells Fargo & Co. | 1.654% | 6/2/24 | 1,500 | 1,535 |
| | Wells Fargo & Co. | 3.000% | 2/19/25 | 425 | 461 |
| | Wells Fargo & Co. | 2.406% | 10/30/25 | 600 | 633 |
| | Wells Fargo & Co. | 2.164% | 2/11/26 | 500 | 524 |
| | Wells Fargo & Co. | 3.000% | 4/22/26 | 1,275 | 1,403 |
| | Wells Fargo & Co. | 4.100% | 6/3/26 | 725 | 829 |
| | Wells Fargo & Co. | 3.000% | 10/23/26 | 675 | 748 |
| | Wells Fargo & Co. | 4.300% | 7/22/27 | 475 | 555 |
| | Wells Fargo & Co. | 3.584% | 5/22/28 | 500 | 566 |
| | Wells Fargo & Co. | 4.150% | 1/24/29 | 200 | 237 |
| | Wells Fargo & Co. | 2.879% | 10/30/30 | 1,800 | 1,953 |
| | Wells Fargo & Co. | 4.478% | 4/4/31 | 1,250 | 1,527 |
| | Wells Fargo & Co. | 5.375% | 2/7/35 | 200 | 272 |
| | Wells Fargo & Co. | 3.068% | 4/30/41 | 600 | 650 |
| | Wells Fargo & Co. | 5.375% | 11/2/43 | 1,000 | 1,387 |
Total Bond Market Index Portfolio
| | | | Coupon | Maturity
Date | Face
Amount
($000) | Market
Value•
($000) |
| | Wells Fargo & Co. | 5.606% | 1/15/44 | 600 | 847 |
| | Wells Fargo & Co. | 4.650% | 11/4/44 | 325 | 416 |
| | Wells Fargo & Co. | 3.900% | 5/1/45 | 250 | 312 |
| | Wells Fargo & Co. | 4.900% | 11/17/45 | 250 | 333 |
| | Wells Fargo & Co. | 4.400% | 6/14/46 | 300 | 374 |
| | Wells Fargo & Co. | 4.750% | 12/7/46 | 350 | 458 |
| | Wells Fargo & Co. | 5.013% | 4/4/51 | 1,750 | 2,484 |
| | Wells Fargo Bank NA | 3.550% | 8/14/23 | 750 | 810 |
| | Wells Fargo Bank NA | 5.950% | 8/26/36 | 200 | 280 |
| | Wells Fargo Bank NA | 5.850% | 2/1/37 | 300 | 422 |
| | Wells Fargo Bank NA | 6.600% | 1/15/38 | 225 | 341 |
| | Westpac Banking Corp. | 2.500% | 6/28/22 | 1,000 | 1,033 |
| | Westpac Banking Corp. | 2.750% | 1/11/23 | 200 | 210 |
| | Westpac Banking Corp. | 2.000% | 1/13/23 | 150 | 155 |
| | Westpac Banking Corp. | 3.650% | 5/15/23 | 75 | 81 |
| | Westpac Banking Corp. | 3.300% | 2/26/24 | 250 | 272 |
| | Westpac Banking Corp. | 2.350% | 2/19/25 | 200 | 214 |
| | Westpac Banking Corp. | 2.850% | 5/13/26 | 200 | 222 |
| | Westpac Banking Corp. | 2.700% | 8/19/26 | 175 | 193 |
| | Westpac Banking Corp. | 3.350% | 3/8/27 | 250 | 284 |
| | Westpac Banking Corp. | 2.650% | 1/16/30 | 150 | 168 |
| | Westpac Banking Corp. | 2.894% | 2/4/30 | 425 | 446 |
| | Westpac Banking Corp. | 4.322% | 11/23/31 | 500 | 570 |
| | Westpac Banking Corp. | 4.110% | 7/24/34 | 25 | 28 |
| | Westpac Banking Corp. | 2.668% | 11/15/35 | 315 | 324 |
| | Westpac Banking Corp. | 4.421% | 7/24/39 | 600 | 762 |
| | Westpac Banking Corp. | 2.963% | 11/16/40 | 200 | 213 |
| | Willis North America Inc. | 3.600% | 5/15/24 | 125 | 137 |
| | Willis North America Inc. | 4.500% | 9/15/28 | 100 | 120 |
| | Willis North America Inc. | 2.950% | 9/15/29 | 940 | 1,027 |
| | Willis North America Inc. | 5.050% | 9/15/48 | 50 | 70 |
| | Willis North America Inc. | 3.875% | 9/15/49 | 90 | 110 |
| | XLIT Ltd. | 4.450% | 3/31/25 | 189 | 216 |
| | XLIT Ltd. | 5.500% | 3/31/45 | 100 | 140 |
| | Zions Bancorp NA | 3.250% | 10/29/29 | 250 | 263 |
| | | | | | | 380,183 |
| Health Care (3.4%) |
| | Abbott Laboratories | 2.550% | 3/15/22 | 175 | 180 |
| | Abbott Laboratories | 3.400% | 11/30/23 | 316 | 342 |
| | Abbott Laboratories | 2.950% | 3/15/25 | 175 | 192 |
| | Abbott Laboratories | 3.875% | 9/15/25 | 75 | 86 |
| | Abbott Laboratories | 3.750% | 11/30/26 | 367 | 429 |
| | Abbott Laboratories | 1.150% | 1/30/28 | 100 | 101 |
| | Abbott Laboratories | 1.400% | 6/30/30 | 150 | 152 |
| | Abbott Laboratories | 4.750% | 11/30/36 | 375 | 516 |
| | Abbott Laboratories | 5.300% | 5/27/40 | 250 | 368 |
| | Abbott Laboratories | 4.750% | 4/15/43 | 175 | 245 |
| | Abbott Laboratories | 4.900% | 11/30/46 | 775 | 1,142 |
| | AbbVie Inc. | 3.450% | 3/15/22 | 507 | 523 |
| | AbbVie Inc. | 3.250% | 10/1/22 | 300 | 312 |
| | AbbVie Inc. | 2.900% | 11/6/22 | 800 | 836 |
| | AbbVie Inc. | 3.200% | 11/6/22 | 275 | 288 |
| | AbbVie Inc. | 2.300% | 11/21/22 | 625 | 647 |
| | AbbVie Inc. | 2.800% | 3/15/23 | 100 | 104 |
| | AbbVie Inc. | 2.850% | 5/14/23 | 200 | 210 |
| | AbbVie Inc. | 3.750% | 11/14/23 | 250 | 272 |
| | AbbVie Inc. | 3.850% | 6/15/24 | 200 | 220 |
| | AbbVie Inc. | 2.600% | 11/21/24 | 750 | 802 |
| | AbbVie Inc. | 3.800% | 3/15/25 | 590 | 658 |
| | AbbVie Inc. | 3.600% | 5/14/25 | 911 | 1,016 |
| | AbbVie Inc. | 3.200% | 5/14/26 | 350 | 388 |
| | AbbVie Inc. | 2.950% | 11/21/26 | 740 | 818 |
| | AbbVie Inc. | 4.250% | 11/14/28 | 350 | 419 |
| | AbbVie Inc. | 3.200% | 11/21/29 | 1,130 | 1,269 |
| | AbbVie Inc. | 4.550% | 3/15/35 | 350 | 442 |
| | AbbVie Inc. | 4.500% | 5/14/35 | 495 | 622 |
| | AbbVie Inc. | 4.300% | 5/14/36 | 190 | 234 |
| | AbbVie Inc. | 4.050% | 11/21/39 | 825 | 986 |
| | AbbVie Inc. | 4.625% | 10/1/42 | 190 | 242 |
| | | | Coupon | Maturity
Date | Face
Amount
($000) | Market
Value•
($000) |
| | AbbVie Inc. | 4.400% | 11/6/42 | 501 | 628 |
| | AbbVie Inc. | 4.850% | 6/15/44 | 230 | 299 |
| | AbbVie Inc. | 4.750% | 3/15/45 | 200 | 259 |
| | AbbVie Inc. | 4.700% | 5/14/45 | 602 | 784 |
| | AbbVie Inc. | 4.450% | 5/14/46 | 455 | 578 |
| | AbbVie Inc. | 4.875% | 11/14/48 | 550 | 744 |
| | AbbVie Inc. | 4.250% | 11/21/49 | 1,025 | 1,277 |
| | Adventist Health System | 2.952% | 3/1/29 | 100 | 108 |
| | Adventist Health System | 3.630% | 3/1/49 | 100 | 111 |
| | Advocate Health & Hospitals Corp. | 3.829% | 8/15/28 | 50 | 57 |
| | Advocate Health & Hospitals Corp. | 2.211% | 6/15/30 | 25 | 26 |
| | Advocate Health & Hospitals Corp. | 4.272% | 8/15/48 | 100 | 130 |
| | Advocate Health & Hospitals Corp. | 3.387% | 10/15/49 | 75 | 85 |
| | Advocate Health & Hospitals Corp. | 3.008% | 6/15/50 | 75 | 81 |
| | Aetna Inc. | 2.750% | 11/15/22 | 200 | 207 |
| | Aetna Inc. | 2.800% | 6/15/23 | 125 | 132 |
| | Aetna Inc. | 3.500% | 11/15/24 | 125 | 137 |
| | Aetna Inc. | 6.625% | 6/15/36 | 130 | 192 |
| | Aetna Inc. | 6.750% | 12/15/37 | 100 | 152 |
| | Aetna Inc. | 4.500% | 5/15/42 | 75 | 92 |
| | Aetna Inc. | 4.125% | 11/15/42 | 75 | 89 |
| | Aetna Inc. | 3.875% | 8/15/47 | 300 | 353 |
| | Agilent Technologies Inc. | 3.200% | 10/1/22 | 57 | 59 |
| | Agilent Technologies Inc. | 3.875% | 7/15/23 | 100 | 108 |
| | Agilent Technologies Inc. | 3.050% | 9/22/26 | 75 | 83 |
| | Agilent Technologies Inc. | 2.750% | 9/15/29 | 100 | 109 |
| | Agilent Technologies Inc. | 2.100% | 6/4/30 | 100 | 104 |
| | AHS Hospital Corp. | 5.024% | 7/1/45 | 75 | 104 |
| 2 | Allina Health System | 3.887% | 4/15/49 | 75 | 85 |
| | AmerisourceBergen Corp. | 3.400% | 5/15/24 | 75 | 81 |
| | AmerisourceBergen Corp. | 3.250% | 3/1/25 | 50 | 55 |
| | AmerisourceBergen Corp. | 3.450% | 12/15/27 | 275 | 314 |
| | AmerisourceBergen Corp. | 2.800% | 5/15/30 | 100 | 109 |
| | AmerisourceBergen Corp. | 4.250% | 3/1/45 | 25 | 30 |
| | AmerisourceBergen Corp. | 4.300% | 12/15/47 | 175 | 214 |
| | Amgen Inc. | 2.700% | 5/1/22 | 75 | 77 |
| | Amgen Inc. | 2.650% | 5/11/22 | 275 | 283 |
| | Amgen Inc. | 3.625% | 5/15/22 | 225 | 233 |
| | Amgen Inc. | 2.250% | 8/19/23 | 150 | 157 |
| | Amgen Inc. | 3.625% | 5/22/24 | 500 | 549 |
| | Amgen Inc. | 1.900% | 2/21/25 | 100 | 105 |
| | Amgen Inc. | 3.125% | 5/1/25 | 175 | 192 |
| | Amgen Inc. | 2.600% | 8/19/26 | 455 | 496 |
| | Amgen Inc. | 2.200% | 2/21/27 | 150 | 160 |
| | Amgen Inc. | 2.450% | 2/21/30 | 300 | 321 |
| | Amgen Inc. | 3.150% | 2/21/40 | 625 | 680 |
| | Amgen Inc. | 4.950% | 10/1/41 | 240 | 318 |
| | Amgen Inc. | 5.150% | 11/15/41 | 126 | 173 |
| | Amgen Inc. | 4.400% | 5/1/45 | 450 | 568 |
| | Amgen Inc. | 4.563% | 6/15/48 | 356 | 467 |
| | Amgen Inc. | 3.375% | 2/21/50 | 725 | 804 |
| | Amgen Inc. | 4.663% | 6/15/51 | 659 | 889 |
| 5 | Amgen Inc. | 2.770% | 9/1/53 | 172 | 174 |
| | Anthem Inc. | 3.125% | 5/15/22 | 150 | 156 |
| | Anthem Inc. | 2.950% | 12/1/22 | 150 | 157 |
| | Anthem Inc. | 3.300% | 1/15/23 | 625 | 662 |
| | Anthem Inc. | 3.500% | 8/15/24 | 475 | 521 |
| | Anthem Inc. | 3.350% | 12/1/24 | 160 | 176 |
| | Anthem Inc. | 2.375% | 1/15/25 | 100 | 107 |
| | Anthem Inc. | 3.650% | 12/1/27 | 300 | 346 |
| | Anthem Inc. | 4.101% | 3/1/28 | 400 | 473 |
| | Anthem Inc. | 2.875% | 9/15/29 | 125 | 138 |
| | Anthem Inc. | 2.250% | 5/15/30 | 105 | 111 |
| | Anthem Inc. | 5.950% | 12/15/34 | 1 | 1 |
| | Anthem Inc. | 5.850% | 1/15/36 | 75 | 104 |
Total Bond Market Index Portfolio
| | | | Coupon | Maturity
Date | Face
Amount
($000) | Market
Value•
($000) |
| | Anthem Inc. | 6.375% | 6/15/37 | 50 | 72 |
| | Anthem Inc. | 4.625% | 5/15/42 | 175 | 228 |
| | Anthem Inc. | 4.650% | 1/15/43 | 775 | 1,013 |
| | Anthem Inc. | 5.100% | 1/15/44 | 100 | 138 |
| | Anthem Inc. | 4.375% | 12/1/47 | 300 | 386 |
| | Anthem Inc. | 4.550% | 3/1/48 | 155 | 205 |
| | Anthem Inc. | 4.850% | 8/15/54 | 30 | 38 |
| | Ascension Health | 2.532% | 11/15/29 | 100 | 109 |
| | Ascension Health | 3.106% | 11/15/39 | 100 | 111 |
| | Ascension Health | 3.945% | 11/15/46 | 175 | 225 |
| 2 | Ascension Health | 4.847% | 11/15/53 | 75 | 112 |
| | AstraZeneca plc | 2.375% | 6/12/22 | 225 | 231 |
| | AstraZeneca plc | 3.500% | 8/17/23 | 225 | 242 |
| | AstraZeneca plc | 3.375% | 11/16/25 | 400 | 450 |
| | AstraZeneca plc | 0.700% | 4/8/26 | 500 | 497 |
| | AstraZeneca plc | 3.125% | 6/12/27 | 175 | 195 |
| | AstraZeneca plc | 4.000% | 1/17/29 | 200 | 238 |
| | AstraZeneca plc | 1.375% | 8/6/30 | 500 | 494 |
| | AstraZeneca plc | 6.450% | 9/15/37 | 450 | 689 |
| | AstraZeneca plc | 4.000% | 9/18/42 | 290 | 358 |
| | AstraZeneca plc | 4.375% | 11/16/45 | 200 | 263 |
| | AstraZeneca plc | 4.375% | 8/17/48 | 135 | 181 |
| | AstraZeneca plc | 2.125% | 8/6/50 | 250 | 234 |
| | Banner Health | 2.338% | 1/1/30 | 125 | 130 |
| | Banner Health | 3.181% | 1/1/50 | 75 | 80 |
| | Baptist Healthcare System Obligated Group | 3.540% | 8/15/50 | 250 | 278 |
| | Baxalta Inc. | 3.600% | 6/23/22 | 15 | 16 |
| | Baxalta Inc. | 4.000% | 6/23/25 | 97 | 109 |
| | Baxalta Inc. | 5.250% | 6/23/45 | 73 | 101 |
| 5 | Baxter International Inc. | 3.950% | 4/1/30 | 95 | 113 |
| 5 | Baxter International Inc. | 1.730% | 4/1/31 | 500 | 502 |
| | Baxter International Inc. | 3.500% | 8/15/46 | 100 | 114 |
| | Baylor Scott & White Holdings | 4.185% | 11/15/45 | 100 | 122 |
| | Becton Dickinson and Co. | 2.894% | 6/6/22 | 299 | 309 |
| | Becton Dickinson and Co. | 3.300% | 3/1/23 | 50 | 52 |
| | Becton Dickinson and Co. | 3.734% | 12/15/24 | 272 | 301 |
| | Becton Dickinson and Co. | 3.700% | 6/6/27 | 375 | 429 |
| | Becton Dickinson and Co. | 4.875% | 5/15/44 | 26 | 32 |
| | Becton Dickinson and Co. | 4.685% | 12/15/44 | 196 | 252 |
| | Becton Dickinson and Co. | 4.669% | 6/6/47 | 300 | 392 |
| | Biogen Inc. | 3.625% | 9/15/22 | 275 | 290 |
| | Biogen Inc. | 4.050% | 9/15/25 | 350 | 401 |
| | Biogen Inc. | 2.250% | 5/1/30 | 300 | 312 |
| | Biogen Inc. | 5.200% | 9/15/45 | 350 | 470 |
| | Biogen Inc. | 3.150% | 5/1/50 | 300 | 308 |
| 2 | Bon Secours Mercy Health Inc. | 3.464% | 6/1/30 | 100 | 113 |
| | Bon Secours Mercy Health Inc. | 3.205% | 6/1/50 | 250 | 266 |
| | Boston Scientific Corp. | 3.375% | 5/15/22 | 26 | 27 |
| | Boston Scientific Corp. | 3.450% | 3/1/24 | 175 | 189 |
| | Boston Scientific Corp. | 3.850% | 5/15/25 | 77 | 87 |
| | Boston Scientific Corp. | 1.900% | 6/1/25 | 550 | 575 |
| | Boston Scientific Corp. | 3.750% | 3/1/26 | 125 | 142 |
| | Boston Scientific Corp. | 4.000% | 3/1/29 | 150 | 176 |
| | Boston Scientific Corp. | 2.650% | 6/1/30 | 400 | 428 |
| | Boston Scientific Corp. | 7.000% | 11/15/35 | 100 | 146 |
| | Boston Scientific Corp. | 4.550% | 3/1/39 | 175 | 223 |
| | Boston Scientific Corp. | 7.375% | 1/15/40 | 50 | 79 |
| | Boston Scientific Corp. | 4.700% | 3/1/49 | 200 | 272 |
| | Bristol-Myers Squibb Co. | 2.600% | 5/16/22 | 300 | 309 |
| | Bristol-Myers Squibb Co. | 2.000% | 8/1/22 | 275 | 282 |
| | Bristol-Myers Squibb Co. | 3.550% | 8/15/22 | 325 | 342 |
| | Bristol-Myers Squibb Co. | 3.250% | 2/20/23 | 200 | 212 |
| | Bristol-Myers Squibb Co. | 7.150% | 6/15/23 | 200 | 233 |
| | Bristol-Myers Squibb Co. | 4.000% | 8/15/23 | 125 | 137 |
| | Bristol-Myers Squibb Co. | 0.537% | 11/13/23 | 500 | 500 |
| | | | Coupon | Maturity
Date | Face
Amount
($000) | Market
Value•
($000) |
| | Bristol-Myers Squibb Co. | 3.625% | 5/15/24 | 175 | 192 |
| | Bristol-Myers Squibb Co. | 2.900% | 7/26/24 | 675 | 730 |
| | Bristol-Myers Squibb Co. | 3.875% | 8/15/25 | 799 | 911 |
| | Bristol-Myers Squibb Co. | 0.750% | 11/13/25 | 500 | 501 |
| | Bristol-Myers Squibb Co. | 3.200% | 6/15/26 | 460 | 518 |
| | Bristol-Myers Squibb Co. | 1.125% | 11/13/27 | 500 | 501 |
| | Bristol-Myers Squibb Co. | 3.450% | 11/15/27 | 210 | 241 |
| | Bristol-Myers Squibb Co. | 3.900% | 2/20/28 | 275 | 324 |
| | Bristol-Myers Squibb Co. | 3.400% | 7/26/29 | 500 | 577 |
| | Bristol-Myers Squibb Co. | 1.450% | 11/13/30 | 500 | 497 |
| | Bristol-Myers Squibb Co. | 4.125% | 6/15/39 | 380 | 481 |
| | Bristol-Myers Squibb Co. | 5.700% | 10/15/40 | 50 | 72 |
| | Bristol-Myers Squibb Co. | 2.350% | 11/13/40 | 500 | 510 |
| | Bristol-Myers Squibb Co. | 3.250% | 8/1/42 | 100 | 115 |
| | Bristol-Myers Squibb Co. | 5.250% | 8/15/43 | 150 | 212 |
| | Bristol-Myers Squibb Co. | 4.500% | 3/1/44 | 75 | 104 |
| | Bristol-Myers Squibb Co. | 4.625% | 5/15/44 | 175 | 235 |
| | Bristol-Myers Squibb Co. | 5.000% | 8/15/45 | 475 | 685 |
| | Bristol-Myers Squibb Co. | 4.350% | 11/15/47 | 250 | 337 |
| | Bristol-Myers Squibb Co. | 4.550% | 2/20/48 | 300 | 413 |
| | Bristol-Myers Squibb Co. | 4.250% | 10/26/49 | 500 | 670 |
| | Bristol-Myers Squibb Co. | 2.550% | 11/13/50 | 500 | 513 |
| | Cardinal Health Inc. | 2.616% | 6/15/22 | 115 | 118 |
| | Cardinal Health Inc. | 3.200% | 3/15/23 | 150 | 159 |
| | Cardinal Health Inc. | 3.079% | 6/15/24 | 290 | 312 |
| | Cardinal Health Inc. | 3.750% | 9/15/25 | 100 | 113 |
| | Cardinal Health Inc. | 4.600% | 3/15/43 | 75 | 89 |
| | Cardinal Health Inc. | 4.500% | 11/15/44 | 50 | 58 |
| | Cardinal Health Inc. | 4.900% | 9/15/45 | 100 | 123 |
| | Cardinal Health Inc. | 4.368% | 6/15/47 | 125 | 147 |
| | Children's Health System of Texas | 2.511% | 8/15/50 | 100 | 97 |
| | Children's Hospital Corp. | 4.115% | 1/1/47 | 75 | 96 |
| | Children's Hospital Corp. | 2.585% | 2/1/50 | 50 | 50 |
| | Children's Hospital Medical Center | 4.268% | 5/15/44 | 50 | 63 |
| | CHRISTUS Health | 4.341% | 7/1/28 | 125 | 147 |
| | Cigna Corp. | 3.900% | 2/15/22 | 200 | 207 |
| | Cigna Corp. | 3.050% | 11/30/22 | 100 | 104 |
| | Cigna Corp. | 3.000% | 7/15/23 | 700 | 739 |
| | Cigna Corp. | 3.750% | 7/15/23 | 133 | 143 |
| | Cigna Corp. | 3.500% | 6/15/24 | 175 | 191 |
| | Cigna Corp. | 3.250% | 4/15/25 | 250 | 274 |
| | Cigna Corp. | 4.125% | 11/15/25 | 467 | 537 |
| | Cigna Corp. | 4.500% | 2/25/26 | 390 | 452 |
| | Cigna Corp. | 3.400% | 3/1/27 | 275 | 309 |
| | Cigna Corp. | 7.875% | 5/15/27 | 41 | 56 |
| | Cigna Corp. | 4.375% | 10/15/28 | 610 | 735 |
| | Cigna Corp. | 2.400% | 3/15/30 | 765 | 812 |
| | Cigna Corp. | 4.800% | 8/15/38 | 415 | 534 |
| | Cigna Corp. | 3.200% | 3/15/40 | 150 | 163 |
| | Cigna Corp. | 6.125% | 11/15/41 | 92 | 133 |
| | Cigna Corp. | 4.800% | 7/15/46 | 400 | 524 |
| | Cigna Corp. | 3.875% | 10/15/47 | 120 | 141 |
| | Cigna Corp. | 4.900% | 12/15/48 | 445 | 608 |
| | Cigna Corp. | 3.400% | 3/15/50 | 375 | 419 |
| | City of Hope | 5.623% | 11/15/43 | 75 | 107 |
| | City of Hope | 4.378% | 8/15/48 | 100 | 121 |
| | CommonSpirit Health | 2.950% | 11/1/22 | 75 | 78 |
| | CommonSpirit Health | 2.760% | 10/1/24 | 100 | 107 |
| | CommonSpirit Health | 2.782% | 10/1/30 | 500 | 529 |
| 2 | CommonSpirit Health | 4.350% | 11/1/42 | 225 | 262 |
| | CommonSpirit Health | 3.817% | 10/1/49 | 50 | 57 |
| | CommonSpirit Health | 4.187% | 10/1/49 | 200 | 232 |
| | Community Health Network Inc. | 3.099% | 5/1/50 | 250 | 252 |
| | Cottage Health Obligated Group | 3.304% | 11/1/49 | 100 | 112 |
| | CVS Health Corp. | 3.500% | 7/20/22 | 350 | 365 |
Total Bond Market Index Portfolio
| | | | Coupon | Maturity
Date | Face
Amount
($000) | Market
Value•
($000) |
| | CVS Health Corp. | 2.750% | 12/1/22 | 150 | 156 |
| | CVS Health Corp. | 4.750% | 12/1/22 | 150 | 160 |
| | CVS Health Corp. | 3.700% | 3/9/23 | 934 | 998 |
| | CVS Health Corp. | 3.375% | 8/12/24 | 275 | 300 |
| | CVS Health Corp. | 3.875% | 7/20/25 | 573 | 648 |
| | CVS Health Corp. | 2.875% | 6/1/26 | 425 | 467 |
| | CVS Health Corp. | 3.000% | 8/15/26 | 450 | 496 |
| | CVS Health Corp. | 3.625% | 4/1/27 | 100 | 114 |
| | CVS Health Corp. | 1.300% | 8/21/27 | 400 | 403 |
| | CVS Health Corp. | 4.300% | 3/25/28 | 1,742 | 2,072 |
| | CVS Health Corp. | 3.250% | 8/15/29 | 360 | 405 |
| | CVS Health Corp. | 1.750% | 8/21/30 | 225 | 225 |
| | CVS Health Corp. | 1.875% | 2/28/31 | 500 | 505 |
| | CVS Health Corp. | 4.875% | 7/20/35 | 125 | 162 |
| | CVS Health Corp. | 4.780% | 3/25/38 | 1,000 | 1,264 |
| | CVS Health Corp. | 6.125% | 9/15/39 | 75 | 108 |
| | CVS Health Corp. | 4.125% | 4/1/40 | 200 | 238 |
| | CVS Health Corp. | 2.700% | 8/21/40 | 275 | 278 |
| | CVS Health Corp. | 5.300% | 12/5/43 | 150 | 203 |
| | CVS Health Corp. | 5.125% | 7/20/45 | 775 | 1,039 |
| | CVS Health Corp. | 5.050% | 3/25/48 | 1,650 | 2,229 |
| | CVS Health Corp. | 4.250% | 4/1/50 | 300 | 374 |
| | Danaher Corp. | 3.350% | 9/15/25 | 100 | 112 |
| | Danaher Corp. | 4.375% | 9/15/45 | 75 | 98 |
| | Danaher Corp. | 2.600% | 10/1/50 | 500 | 517 |
| | Dartmouth-Hitchcock Health | 4.178% | 8/1/48 | 100 | 118 |
| | DENTSPLY SIRONA Inc. | 3.250% | 6/1/30 | 150 | 167 |
| | DH Europe Finance II Sarl | 2.050% | 11/15/22 | 250 | 258 |
| | DH Europe Finance II Sarl | 2.200% | 11/15/24 | 250 | 263 |
| | DH Europe Finance II Sarl | 2.600% | 11/15/29 | 150 | 163 |
| | DH Europe Finance II Sarl | 3.250% | 11/15/39 | 175 | 199 |
| | Dignity Health | 3.125% | 11/1/22 | 50 | 52 |
| | Dignity Health | 3.812% | 11/1/24 | 100 | 109 |
| | Dignity Health | 4.500% | 11/1/42 | 100 | 112 |
| | Dignity Health | 5.267% | 11/1/64 | 50 | 67 |
| | Duke University Health System Inc. | 3.920% | 6/1/47 | 100 | 124 |
| | Edwards Lifesciences Corp. | 4.300% | 6/15/28 | 100 | 118 |
| | Eli Lilly and Co. | 2.350% | 5/15/22 | 50 | 51 |
| | Eli Lilly and Co. | 2.750% | 6/1/25 | 71 | 77 |
| | Eli Lilly and Co. | 3.375% | 3/15/29 | 225 | 261 |
| | Eli Lilly and Co. | 3.950% | 3/15/49 | 300 | 391 |
| | Eli Lilly and Co. | 2.250% | 5/15/50 | 500 | 491 |
| | Eli Lilly and Co. | 4.150% | 3/15/59 | 350 | 478 |
| | Eli Lilly and Co. | 2.500% | 9/15/60 | 250 | 253 |
| | Gilead Sciences Inc. | 3.250% | 9/1/22 | 375 | 391 |
| | Gilead Sciences Inc. | 2.500% | 9/1/23 | 300 | 316 |
| | Gilead Sciences Inc. | 3.700% | 4/1/24 | 470 | 513 |
| | Gilead Sciences Inc. | 3.650% | 3/1/26 | 575 | 652 |
| | Gilead Sciences Inc. | 2.950% | 3/1/27 | 225 | 248 |
| | Gilead Sciences Inc. | 4.600% | 9/1/35 | 275 | 355 |
| | Gilead Sciences Inc. | 4.000% | 9/1/36 | 150 | 181 |
| | Gilead Sciences Inc. | 5.650% | 12/1/41 | 175 | 252 |
| | Gilead Sciences Inc. | 4.800% | 4/1/44 | 300 | 395 |
| | Gilead Sciences Inc. | 4.500% | 2/1/45 | 325 | 413 |
| | Gilead Sciences Inc. | 4.750% | 3/1/46 | 455 | 603 |
| | Gilead Sciences Inc. | 4.150% | 3/1/47 | 475 | 583 |
| | GlaxoSmithKline Capital Inc. | 2.800% | 3/18/23 | 50 | 53 |
| | GlaxoSmithKline Capital Inc. | 3.375% | 5/15/23 | 225 | 241 |
| | GlaxoSmithKline Capital Inc. | 3.625% | 5/15/25 | 604 | 680 |
| | GlaxoSmithKline Capital Inc. | 3.875% | 5/15/28 | 375 | 446 |
| | GlaxoSmithKline Capital Inc. | 5.375% | 4/15/34 | 85 | 122 |
| | | | Coupon | Maturity
Date | Face
Amount
($000) | Market
Value•
($000) |
| | GlaxoSmithKline Capital Inc. | 6.375% | 5/15/38 | 550 | 868 |
| | GlaxoSmithKline Capital Inc. | 4.200% | 3/18/43 | 100 | 129 |
| | GlaxoSmithKline Capital plc | 2.850% | 5/8/22 | 100 | 103 |
| | GlaxoSmithKline Capital plc | 2.875% | 6/1/22 | 350 | 362 |
| | GlaxoSmithKline Capital plc | 0.534% | 10/1/23 | 500 | 502 |
| | GlaxoSmithKline Capital plc | 3.000% | 6/1/24 | 200 | 216 |
| | GlaxoSmithKline Capital plc | 3.375% | 6/1/29 | 25 | 29 |
| | Hackensack Meridian Health Inc. | 2.675% | 9/1/41 | 250 | 251 |
| | Hackensack Meridian Health Inc. | 4.211% | 7/1/48 | 125 | 158 |
| | Hackensack Meridian Health Inc. | 4.500% | 7/1/57 | 50 | 67 |
| 2 | Hartford HealthCare Corp. | 3.447% | 7/1/54 | 75 | 79 |
| | HCA Inc. | 4.750% | 5/1/23 | 250 | 272 |
| | HCA Inc. | 5.000% | 3/15/24 | 425 | 477 |
| | HCA Inc. | 5.250% | 4/15/25 | 320 | 373 |
| | HCA Inc. | 5.250% | 6/15/26 | 325 | 383 |
| | HCA Inc. | 4.500% | 2/15/27 | 125 | 145 |
| | HCA Inc. | 4.125% | 6/15/29 | 405 | 470 |
| | HCA Inc. | 5.125% | 6/15/39 | 200 | 254 |
| | HCA Inc. | 5.500% | 6/15/47 | 425 | 561 |
| | HCA Inc. | 5.250% | 6/15/49 | 300 | 393 |
| | Hospital Special Surgery | 2.667% | 10/1/50 | 10 | 10 |
| | Humana Inc. | 2.900% | 12/15/22 | 150 | 157 |
| | Humana Inc. | 3.850% | 10/1/24 | 326 | 361 |
| | Humana Inc. | 3.950% | 3/15/27 | 150 | 173 |
| | Humana Inc. | 4.875% | 4/1/30 | 135 | 169 |
| | Humana Inc. | 4.625% | 12/1/42 | 110 | 139 |
| | Humana Inc. | 4.950% | 10/1/44 | 270 | 364 |
| | Humana Inc. | 3.950% | 8/15/49 | 40 | 49 |
| | IHC Health Services Inc. | 4.131% | 5/15/48 | 100 | 130 |
| | Indiana University Health Inc. Obligated Group | 3.970% | 11/1/48 | 125 | 158 |
| | Iowa Health System | 3.665% | 2/15/50 | 125 | 143 |
| | Johns Hopkins Health System Corp. | 3.837% | 5/15/46 | 125 | 156 |
| | Johnson & Johnson | 2.250% | 3/3/22 | 325 | 332 |
| | Johnson & Johnson | 2.050% | 3/1/23 | 125 | 129 |
| | Johnson & Johnson | 3.375% | 12/5/23 | 200 | 218 |
| | Johnson & Johnson | 2.625% | 1/15/25 | 250 | 271 |
| | Johnson & Johnson | 0.550% | 9/1/25 | 500 | 503 |
| | Johnson & Johnson | 2.450% | 3/1/26 | 350 | 381 |
| | Johnson & Johnson | 2.950% | 3/3/27 | 200 | 224 |
| | Johnson & Johnson | 0.950% | 9/1/27 | 500 | 502 |
| | Johnson & Johnson | 2.900% | 1/15/28 | 100 | 113 |
| | Johnson & Johnson | 6.950% | 9/1/29 | 75 | 109 |
| | Johnson & Johnson | 1.300% | 9/1/30 | 500 | 501 |
| | Johnson & Johnson | 4.950% | 5/15/33 | 150 | 207 |
| | Johnson & Johnson | 4.375% | 12/5/33 | 175 | 231 |
| | Johnson & Johnson | 3.550% | 3/1/36 | 175 | 214 |
| | Johnson & Johnson | 3.625% | 3/3/37 | 300 | 368 |
| | Johnson & Johnson | 5.950% | 8/15/37 | 200 | 310 |
| | Johnson & Johnson | 3.400% | 1/15/38 | 200 | 239 |
| | Johnson & Johnson | 2.100% | 9/1/40 | 250 | 252 |
| | Johnson & Johnson | 4.500% | 9/1/40 | 150 | 206 |
| | Johnson & Johnson | 4.850% | 5/15/41 | 75 | 105 |
| | Johnson & Johnson | 4.500% | 12/5/43 | 200 | 278 |
| | Johnson & Johnson | 3.700% | 3/1/46 | 350 | 446 |
| | Johnson & Johnson | 3.750% | 3/3/47 | 250 | 321 |
| | Johnson & Johnson | 3.500% | 1/15/48 | 150 | 186 |
| | Johnson & Johnson | 2.250% | 9/1/50 | 500 | 503 |
Total Bond Market Index Portfolio
| | | | Coupon | Maturity
Date | Face
Amount
($000) | Market
Value•
($000) |
| | Kaiser Foundation Hospitals | 3.500% | 4/1/22 | 50 | 52 |
| | Kaiser Foundation Hospitals | 3.150% | 5/1/27 | 100 | 113 |
| | Kaiser Foundation Hospitals | 4.875% | 4/1/42 | 235 | 321 |
| | Kaiser Foundation Hospitals | 4.150% | 5/1/47 | 150 | 194 |
| | Kaiser Foundation Hospitals | 3.266% | 11/1/49 | 225 | 256 |
| | Koninklijke KPN NV | 6.875% | 3/11/38 | 100 | 156 |
| | Koninklijke Philips NV | 5.000% | 3/15/42 | 150 | 201 |
| | Laboratory Corp. of America Holdings | 3.200% | 2/1/22 | 500 | 515 |
| | Laboratory Corp. of America Holdings | 3.750% | 8/23/22 | 25 | 26 |
| | Laboratory Corp. of America Holdings | 3.250% | 9/1/24 | 150 | 163 |
| | Laboratory Corp. of America Holdings | 2.300% | 12/1/24 | 100 | 106 |
| | Laboratory Corp. of America Holdings | 3.600% | 2/1/25 | 200 | 221 |
| | Laboratory Corp. of America Holdings | 3.600% | 9/1/27 | 100 | 114 |
| | Laboratory Corp. of America Holdings | 2.950% | 12/1/29 | 125 | 138 |
| | Laboratory Corp. of America Holdings | 4.700% | 2/1/45 | 195 | 255 |
| | Mayo Clinic | 3.774% | 11/15/43 | 75 | 90 |
| | Mayo Clinic | 4.128% | 11/15/52 | 50 | 66 |
| | McKesson Corp. | 3.796% | 3/15/24 | 200 | 219 |
| | McKesson Corp. | 0.900% | 12/3/25 | 500 | 501 |
| | McKesson Corp. | 3.950% | 2/16/28 | 200 | 233 |
| 2 | MedStar Health Inc. | 3.626% | 8/15/49 | 75 | 87 |
| | Medtronic Inc. | 3.500% | 3/15/25 | 279 | 312 |
| | Medtronic Inc. | 4.375% | 3/15/35 | 411 | 553 |
| | Medtronic Inc. | 4.625% | 3/15/45 | 344 | 487 |
| | Memorial Health Services | 3.447% | 11/1/49 | 150 | 161 |
| | Memorial Sloan-Kettering Cancer Center | 2.955% | 1/1/50 | 100 | 106 |
| | Memorial Sloan-Kettering Cancer Center | 4.125% | 7/1/52 | 150 | 195 |
| | Memorial Sloan-Kettering Cancer Center | 4.200% | 7/1/55 | 25 | 33 |
| | Merck & Co. Inc. | 2.350% | 2/10/22 | 250 | 256 |
| | Merck & Co. Inc. | 2.400% | 9/15/22 | 250 | 258 |
| | Merck & Co. Inc. | 2.800% | 5/18/23 | 325 | 344 |
| | Merck & Co. Inc. | 2.900% | 3/7/24 | 25 | 27 |
| | Merck & Co. Inc. | 2.750% | 2/10/25 | 740 | 804 |
| | Merck & Co. Inc. | 0.750% | 2/24/26 | 150 | 151 |
| | Merck & Co. Inc. | 3.400% | 3/7/29 | 375 | 436 |
| | Merck & Co. Inc. | 1.450% | ���6/24/30 | 210 | 212 |
| | Merck & Co. Inc. | 6.500% | 12/1/33 | 125 | 194 |
| | Merck & Co. Inc. | 3.900% | 3/7/39 | 200 | 253 |
| | Merck & Co. Inc. | 2.350% | 6/24/40 | 200 | 206 |
| | Merck & Co. Inc. | 3.600% | 9/15/42 | 100 | 123 |
| | Merck & Co. Inc. | 4.150% | 5/18/43 | 200 | 261 |
| | Merck & Co. Inc. | 3.700% | 2/10/45 | 525 | 653 |
| | Merck & Co. Inc. | 4.000% | 3/7/49 | 300 | 396 |
| | Merck & Co. Inc. | 2.450% | 6/24/50 | 300 | 309 |
| | Mercy Health | 4.302% | 7/1/28 | 25 | 29 |
| | Methodist Hospital | 2.705% | 12/1/50 | 300 | 307 |
| 2 | Montefiore Obligated Group | 5.246% | 11/1/48 | 150 | 182 |
| | Mount Sinai Hospitals Group Inc. | 3.737% | 7/1/49 | 100 | 113 |
| | Mount Sinai Hospitals Group Inc. | 3.391% | 7/1/50 | 500 | 544 |
| | MultiCare Health System | 2.803% | 8/15/50 | 250 | 258 |
| | Mylan Inc. | 4.200% | 11/29/23 | 100 | 109 |
| | Mylan Inc. | 5.400% | 11/29/43 | 100 | 132 |
| | | | Coupon | Maturity
Date | Face
Amount
($000) | Market
Value•
($000) |
| | Mylan Inc. | 5.200% | 4/15/48 | 175 | 229 |
| | New York and Presbyterian Hospital | 4.024% | 8/1/45 | 130 | 163 |
| | New York and Presbyterian Hospital | 4.063% | 8/1/56 | 75 | 98 |
| | New York and Presbyterian Hospital | 2.606% | 8/1/60 | 300 | 290 |
| | New York and Presbyterian Hospital | 3.954% | 8/1/19 | 125 | 145 |
| | Northwell Healthcare Inc. | 3.979% | 11/1/46 | 100 | 114 |
| | Northwell Healthcare Inc. | 4.260% | 11/1/47 | 200 | 240 |
| | Northwell Healthcare Inc. | 3.809% | 11/1/49 | 100 | 114 |
| | Novartis Capital Corp. | 2.400% | 5/17/22 | 400 | 411 |
| | Novartis Capital Corp. | 2.400% | 9/21/22 | 175 | 182 |
| | Novartis Capital Corp. | 3.400% | 5/6/24 | 400 | 439 |
| | Novartis Capital Corp. | 1.750% | 2/14/25 | 200 | 210 |
| | Novartis Capital Corp. | 3.000% | 11/20/25 | 350 | 387 |
| | Novartis Capital Corp. | 2.000% | 2/14/27 | 525 | 559 |
| | Novartis Capital Corp. | 3.100% | 5/17/27 | 175 | 197 |
| | Novartis Capital Corp. | 2.200% | 8/14/30 | 410 | 440 |
| | Novartis Capital Corp. | 3.700% | 9/21/42 | 100 | 123 |
| | Novartis Capital Corp. | 4.400% | 5/6/44 | 375 | 515 |
| | Novartis Capital Corp. | 4.000% | 11/20/45 | 225 | 294 |
| | Novartis Capital Corp. | 2.750% | 8/14/50 | 75 | 82 |
| | NYU Langone Hospitals | 4.784% | 7/1/44 | 100 | 127 |
| 2 | NYU Langone Hospitals | 4.368% | 7/1/47 | 110 | 133 |
| | NYU Langone Hospitals | 3.380% | 7/1/55 | 200 | 208 |
| 2 | OhioHealth Corp. | 3.042% | 11/15/50 | 100 | 109 |
| | Orlando Health Obligated Group | 4.089% | 10/1/48 | 50 | 61 |
| | Partners Healthcare System Inc. | 3.192% | 7/1/49 | 150 | 165 |
| | Partners Healthcare System Inc. | 4.117% | 7/1/55 | 50 | 64 |
| | Partners Healthcare System Inc. | 3.342% | 7/1/60 | 250 | 284 |
| | PeaceHealth Obligated Group | 4.787% | 11/15/48 | 75 | 100 |
| | PeaceHealth Obligated Group | 3.218% | 11/15/50 | 200 | 216 |
| | PerkinElmer Inc. | 3.300% | 9/15/29 | 175 | 197 |
| | Perrigo Finance Unlimited Co. | 3.900% | 12/15/24 | 200 | 220 |
| | Perrigo Finance Unlimited Co. | 4.375% | 3/15/26 | 225 | 254 |
| | Perrigo Finance Unlimited Co. | 4.900% | 12/15/44 | 80 | 89 |
| | Pfizer Inc. | 2.200% | 12/15/21 | 100 | 102 |
| | Pfizer Inc. | 2.800% | 3/11/22 | 200 | 206 |
| | Pfizer Inc. | 3.200% | 9/15/23 | 125 | 135 |
| | Pfizer Inc. | 2.950% | 3/15/24 | 150 | 162 |
| | Pfizer Inc. | 3.400% | 5/15/24 | 100 | 110 |
| | Pfizer Inc. | 0.800% | 5/28/25 | 125 | ��� 127 |
| | Pfizer Inc. | 2.750% | 6/3/26 | 290 | 320 |
| | Pfizer Inc. | 3.000% | 12/15/26 | 300 | 338 |
| | Pfizer Inc. | 3.600% | 9/15/28 | 200 | 236 |
| | Pfizer Inc. | 3.450% | 3/15/29 | 375 | 437 |
| | Pfizer Inc. | 2.625% | 4/1/30 | 300 | 332 |
| | Pfizer Inc. | 1.700% | 5/28/30 | 225 | 232 |
| | Pfizer Inc. | 4.000% | 12/15/36 | 300 | 380 |
| | Pfizer Inc. | 4.100% | 9/15/38 | 150 | 191 |
| | Pfizer Inc. | 3.900% | 3/15/39 | 125 | 156 |
| | Pfizer Inc. | 7.200% | 3/15/39 | 425 | 729 |
| | Pfizer Inc. | 2.550% | 5/28/40 | 200 | 212 |
| | Pfizer Inc. | 4.300% | 6/15/43 | 125 | 165 |
| | Pfizer Inc. | 4.400% | 5/15/44 | 200 | 268 |
| | Pfizer Inc. | 4.125% | 12/15/46 | 250 | 329 |
| | Pfizer Inc. | 4.200% | 9/15/48 | 350 | 467 |
| | Pfizer Inc. | 4.000% | 3/15/49 | 175 | 229 |
| | Pfizer Inc. | 2.700% | 5/28/50 | 350 | 374 |
Total Bond Market Index Portfolio
| | | | Coupon | Maturity
Date | Face
Amount
($000) | Market
Value•
($000) |
| | Pharmacia LLC | 6.600% | 12/1/28 | 175 | 242 |
| | Providence St. Joseph Health Obligated Group | 2.746% | 10/1/26 | 50 | 54 |
| | Providence St. Joseph Health Obligated Group | 2.532% | 10/1/29 | 150 | 161 |
| 2 | Providence St. Joseph Health Obligated Group | 3.744% | 10/1/47 | 75 | 88 |
| 2 | Providence St. Joseph Health Obligated Group | 3.930% | 10/1/48 | 75 | 90 |
| | Quest Diagnostics Inc. | 4.250% | 4/1/24 | 100 | 110 |
| | Quest Diagnostics Inc. | 3.500% | 3/30/25 | 100 | 111 |
| | Quest Diagnostics Inc. | 3.450% | 6/1/26 | 125 | 141 |
| | Quest Diagnostics Inc. | 4.200% | 6/30/29 | 140 | 166 |
| | Quest Diagnostics Inc. | 2.950% | 6/30/30 | 160 | 176 |
| | Quest Diagnostics Inc. | 2.800% | 6/30/31 | 125 | 137 |
| | Quest Diagnostics Inc. | 5.750% | 1/30/40 | 13 | 17 |
| | Quest Diagnostics Inc. | 4.700% | 3/30/45 | 25 | 31 |
| | Regeneron Pharmaceuticals Inc. | 1.750% | 9/15/30 | 500 | 491 |
| 5 | Royalty Pharma plc | 0.750% | 9/2/23 | 500 | 502 |
| 5 | Royalty Pharma plc | 2.200% | 9/2/30 | 500 | 510 |
| 5 | Royalty Pharma plc | 3.550% | 9/2/50 | 350 | 372 |
| | Rush Obligated Group | 3.922% | 11/15/29 | 75 | 89 |
| | RWJ Barnabas Health Inc. | 3.949% | 7/1/46 | 100 | 121 |
| | RWJ Barnabas Health Inc. | 3.477% | 7/1/49 | 25 | 28 |
| | Sanofi | 3.375% | 6/19/23 | 225 | 241 |
| | Sanofi | 3.625% | 6/19/28 | 225 | 262 |
| | Shire Acquisitions Investments Ireland DAC | 2.875% | 9/23/23 | 1,425 | 1,511 |
| | Shire Acquisitions Investments Ireland DAC | 3.200% | 9/23/26 | 575 | 642 |
| | Smith & Nephew plc | 2.032% | 10/14/30 | 500 | 507 |
| | Spectrum Health System Obligated Group | 3.487% | 7/15/49 | 75 | 86 |
| | SSM Health Care Corp. | 3.688% | 6/1/23 | 150 | 160 |
| | SSM Health Care Corp. | 3.823% | 6/1/27 | 100 | 113 |
| | Stanford Health Care | 3.795% | 11/15/48 | 125 | 156 |
| | Stryker Corp. | 3.375% | 5/15/24 | 213 | 232 |
| | Stryker Corp. | 1.150% | 6/15/25 | 100 | 102 |
| | Stryker Corp. | 3.375% | 11/1/25 | 140 | 157 |
| | Stryker Corp. | 3.500% | 3/15/26 | 183 | 207 |
| | Stryker Corp. | 3.650% | 3/7/28 | 50 | 58 |
| | Stryker Corp. | 4.100% | 4/1/43 | 75 | 91 |
| | Stryker Corp. | 4.375% | 5/15/44 | 50 | 62 |
| | Stryker Corp. | 4.625% | 3/15/46 | 175 | 233 |
| | Stryker Corp. | 2.900% | 6/15/50 | 100 | 106 |
| | Sutter Health | 1.321% | 8/15/25 | 500 | 507 |
| | Sutter Health | 3.695% | 8/15/28 | 75 | 85 |
| | Sutter Health | 4.091% | 8/15/48 | 75 | 91 |
| | Takeda Pharmaceutical Co. Ltd. | 4.400% | 11/26/23 | 200 | 222 |
| | Takeda Pharmaceutical Co. Ltd. | 5.000% | 11/26/28 | 405 | 503 |
| | Takeda Pharmaceutical Co. Ltd. | 2.050% | 3/31/30 | 500 | 510 |
| | Takeda Pharmaceutical Co. Ltd. | 3.025% | 7/9/40 | 400 | 419 |
| | Takeda Pharmaceutical Co. Ltd. | 3.175% | 7/9/50 | 410 | 437 |
| | Takeda Pharmaceutical Co. Ltd. | 3.375% | 7/9/60 | 400 | 444 |
| | Texas Health Resources | 2.328% | 11/15/50 | 400 | 378 |
| | Thermo Fisher Scientific Inc. | 3.000% | 4/15/23 | 125 | 132 |
| | Thermo Fisher Scientific Inc. | 4.133% | 3/25/25 | 230 | 262 |
| | Thermo Fisher Scientific Inc. | 3.650% | 12/15/25 | 400 | 453 |
| | | | Coupon | Maturity
Date | Face
Amount
($000) | Market
Value•
($000) |
| | Thermo Fisher Scientific Inc. | 2.950% | 9/19/26 | 200 | 223 |
| | Thermo Fisher Scientific Inc. | 3.200% | 8/15/27 | 50 | 56 |
| | Thermo Fisher Scientific Inc. | 2.600% | 10/1/29 | 225 | 246 |
| | Thermo Fisher Scientific Inc. | 4.497% | 3/25/30 | 85 | 105 |
| | Thermo Fisher Scientific Inc. | 5.300% | 2/1/44 | 185 | 269 |
| | Toledo Hospital | 5.325% | 11/15/28 | 50 | 58 |
| | Toledo Hospital | 6.015% | 11/15/48 | 75 | 93 |
| | Trinity Health Corp. | 4.125% | 12/1/45 | 85 | 104 |
| | UnitedHealth Group Inc. | 2.125% | 3/15/21 | 225 | 226 |
| | UnitedHealth Group Inc. | 2.875% | 12/15/21 | 125 | 128 |
| | UnitedHealth Group Inc. | 3.350% | 7/15/22 | 180 | 189 |
| | UnitedHealth Group Inc. | 2.375% | 10/15/22 | 150 | 156 |
| | UnitedHealth Group Inc. | 2.750% | 2/15/23 | 175 | 183 |
| | UnitedHealth Group Inc. | 2.875% | 3/15/23 | 25 | 26 |
| | UnitedHealth Group Inc. | 3.500% | 6/15/23 | 100 | 107 |
| | UnitedHealth Group Inc. | 3.500% | 2/15/24 | 100 | 109 |
| | UnitedHealth Group Inc. | 2.375% | 8/15/24 | 300 | 320 |
| | UnitedHealth Group Inc. | 3.750% | 7/15/25 | 950 | 1,082 |
| | UnitedHealth Group Inc. | 3.700% | 12/15/25 | 75 | 86 |
| | UnitedHealth Group Inc. | 3.100% | 3/15/26 | 225 | 252 |
| | UnitedHealth Group Inc. | 3.450% | 1/15/27 | 175 | 200 |
| | UnitedHealth Group Inc. | 3.375% | 4/15/27 | 350 | 399 |
| | UnitedHealth Group Inc. | 2.950% | 10/15/27 | 150 | 168 |
| | UnitedHealth Group Inc. | 3.850% | 6/15/28 | 400 | 474 |
| | UnitedHealth Group Inc. | 3.875% | 12/15/28 | 150 | 179 |
| | UnitedHealth Group Inc. | 2.875% | 8/15/29 | 150 | 170 |
| | UnitedHealth Group Inc. | 2.000% | 5/15/30 | 755 | 800 |
| | UnitedHealth Group Inc. | 4.625% | 7/15/35 | 175 | 235 |
| | UnitedHealth Group Inc. | 6.500% | 6/15/37 | 50 | 79 |
| | UnitedHealth Group Inc. | 6.625% | 11/15/37 | 125 | 199 |
| | UnitedHealth Group Inc. | 6.875% | 2/15/38 | 245 | 401 |
| | UnitedHealth Group Inc. | 3.500% | 8/15/39 | 240 | 283 |
| | UnitedHealth Group Inc. | 2.750% | 5/15/40 | 200 | 216 |
| | UnitedHealth Group Inc. | 5.950% | 2/15/41 | 60 | 92 |
| | UnitedHealth Group Inc. | 4.625% | 11/15/41 | 110 | 149 |
| | UnitedHealth Group Inc. | 4.375% | 3/15/42 | 50 | 65 |
| | UnitedHealth Group Inc. | 3.950% | 10/15/42 | 175 | 221 |
| | UnitedHealth Group Inc. | 4.250% | 3/15/43 | 125 | 164 |
| | UnitedHealth Group Inc. | 4.750% | 7/15/45 | 305 | 428 |
| | UnitedHealth Group Inc. | 4.200% | 1/15/47 | 210 | 277 |
| | UnitedHealth Group Inc. | 4.250% | 4/15/47 | 290 | 382 |
| | UnitedHealth Group Inc. | 4.250% | 6/15/48 | 300 | 400 |
| | UnitedHealth Group Inc. | 4.450% | 12/15/48 | 150 | 206 |
| | UnitedHealth Group Inc. | 3.700% | 8/15/49 | 310 | 386 |
| | UnitedHealth Group Inc. | 2.900% | 5/15/50 | 250 | 275 |
| | UnitedHealth Group Inc. | 3.875% | 8/15/59 | 420 | 542 |
| | UnitedHealth Group Inc. | 3.125% | 5/15/60 | 250 | 289 |
| 5 | Universal Health Services Inc. | 2.650% | 10/15/30 | 500 | 517 |
| | UPMC | 3.600% | 4/3/25 | 125 | 139 |
| | Utah Acquisition Sub Inc. | 3.950% | 6/15/26 | 375 | 429 |
| | Utah Acquisition Sub Inc. | 5.250% | 6/15/46 | 225 | 295 |
| 5 | Viatris Inc. | 1.125% | 6/22/22 | 200 | 202 |
| 5 | Viatris Inc. | 1.650% | 6/22/25 | 175 | 181 |
| 5 | Viatris Inc. | 2.300% | 6/22/27 | 175 | 186 |
| 5 | Viatris Inc. | 2.700% | 6/22/30 | 525 | 554 |
| 5 | Viatris Inc. | 3.850% | 6/22/40 | 325 | 366 |
| 5 | Viatris Inc. | 4.000% | 6/22/50 | 400 | 457 |
| 2 | Willis-Knighton Medical Center | 4.813% | 9/1/48 | 50 | 66 |
| | Wyeth LLC | 7.250% | 3/1/23 | 250 | 286 |
| | Wyeth LLC | 6.450% | 2/1/24 | 300 | 354 |
| | Wyeth LLC | 6.500% | 2/1/34 | 150 | 233 |
| | Wyeth LLC | 6.000% | 2/15/36 | 85 | 127 |
| | Wyeth LLC | 5.950% | 4/1/37 | 385 | 579 |
Total Bond Market Index Portfolio
| | | | Coupon | Maturity
Date | Face
Amount
($000) | Market
Value•
($000) |
| | Zeneca Wilmington Inc. | 7.000% | 11/15/23 | 25 | 29 |
| | Zimmer Biomet Holdings Inc. | 3.150% | 4/1/22 | 175 | 180 |
| | Zimmer Biomet Holdings Inc. | 3.700% | 3/19/23 | 50 | 53 |
| | Zimmer Biomet Holdings Inc. | 3.550% | 4/1/25 | 350 | 387 |
| | Zimmer Biomet Holdings Inc. | 5.750% | 11/30/39 | 50 | 65 |
| | Zimmer Biomet Holdings Inc. | 4.450% | 8/15/45 | 150 | 175 |
| | Zoetis Inc. | 3.250% | 2/1/23 | 350 | 368 |
| | Zoetis Inc. | 4.500% | 11/13/25 | 100 | 117 |
| | Zoetis Inc. | 3.000% | 9/12/27 | 150 | 168 |
| | Zoetis Inc. | 3.900% | 8/20/28 | 100 | 118 |
| | Zoetis Inc. | 2.000% | 5/15/30 | 150 | 155 |
| | Zoetis Inc. | 4.700% | 2/1/43 | 175 | 239 |
| | Zoetis Inc. | 3.950% | 9/12/47 | 150 | 187 |
| | Zoetis Inc. | 4.450% | 8/20/48 | 75 | 100 |
| | Zoetis Inc. | 3.000% | 5/15/50 | 125 | 137 |
| | | | | | | 166,705 |
| Industrials (2.5%) |
| | 3M Co. | 2.750% | 3/1/22 | 100 | 103 |
| | 3M Co. | 1.750% | 2/14/23 | 200 | 206 |
| | 3M Co. | 2.250% | 3/15/23 | 175 | 182 |
| | 3M Co. | 3.250% | 2/14/24 | 100 | 108 |
| | 3M Co. | 2.000% | 2/14/25 | 150 | 159 |
| | 3M Co. | 2.650% | 4/15/25 | 100 | 109 |
| | 3M Co. | 3.000% | 8/7/25 | 100 | 111 |
| | 3M Co. | 2.250% | 9/19/26 | 150 | 162 |
| | 3M Co. | 2.875% | 10/15/27 | 125 | 139 |
| | 3M Co. | 3.375% | 3/1/29 | 150 | 173 |
| | 3M Co. | 2.375% | 8/26/29 | 250 | 270 |
| | 3M Co. | 3.050% | 4/15/30 | 115 | 130 |
| | 3M Co. | 3.125% | 9/19/46 | 75 | 83 |
| | 3M Co. | 3.625% | 10/15/47 | 100 | 119 |
| | 3M Co. | 4.000% | 9/14/48 | 250 | 321 |
| | 3M Co. | 3.250% | 8/26/49 | 375 | 426 |
| | 3M Co. | 3.700% | 4/15/50 | 125 | 153 |
| | Allegion plc | 3.500% | 10/1/29 | 75 | 83 |
| | Allegion US Holding Co. Inc. | 3.550% | 10/1/27 | 175 | 192 |
| 2 | American Airlines Class A Series 2016-3 Pass Through Trust | 3.250% | 4/15/30 | 41 | 37 |
| 2 | American Airlines Class AA Series 2015-2 Pass Through Trust | 3.600% | 3/22/29 | 43 | 42 |
| 2 | American Airlines Class AA Series 2016-1 Pass Through Trust | 3.575% | 7/15/29 | 121 | 119 |
| 2 | American Airlines Class AA Series 2016-3 Pass Through Trust | 3.000% | 4/15/30 | 123 | 121 |
| 2 | American Airlines Class AA Series 2017-1 Pass Through Trust | 3.650% | 8/15/30 | 41 | 41 |
| 2 | American Airlines Class AA Series 2019-1 Pass Through Trust | 3.150% | 8/15/33 | 48 | 46 |
| | Amphenol Corp. | 3.200% | 4/1/24 | 50 | 54 |
| | Amphenol Corp. | 2.050% | 3/1/25 | 40 | 42 |
| | Amphenol Corp. | 4.350% | 6/1/29 | 100 | 122 |
| | Amphenol Corp. | 2.800% | 2/15/30 | 275 | 301 |
| | Block Financial LLC | 5.500% | 11/1/22 | 100 | 106 |
| | Block Financial LLC | 5.250% | 10/1/25 | 100 | 114 |
| | Block Financial LLC | 3.875% | 8/15/30 | 300 | 324 |
| | BNSF Funding Trust I | 6.613% | 12/15/55 | 65 | 75 |
| | Boeing Co. | 2.125% | 3/1/22 | 50 | 51 |
| | Boeing Co. | 2.700% | 5/1/22 | 75 | 77 |
| | Boeing Co. | 2.800% | 3/1/23 | 400 | 415 |
| | | | Coupon | Maturity
Date | Face
Amount
($000) | Market
Value•
($000) |
| | Boeing Co. | 4.508% | 5/1/23 | 625 | 675 |
| | Boeing Co. | 1.875% | 6/15/23 | 200 | 204 |
| | Boeing Co. | 1.950% | 2/1/24 | 500 | 515 |
| | Boeing Co. | 2.800% | 3/1/24 | 75 | 79 |
| | Boeing Co. | 2.850% | 10/30/24 | 100 | 105 |
| | Boeing Co. | 2.500% | 3/1/25 | 145 | 150 |
| | Boeing Co. | 4.875% | 5/1/25 | 695 | 791 |
| | Boeing Co. | 3.100% | 5/1/26 | 100 | 107 |
| | Boeing Co. | 2.250% | 6/15/26 | 50 | 51 |
| | Boeing Co. | 2.700% | 2/1/27 | 195 | 203 |
| | Boeing Co. | 2.800% | 3/1/27 | 50 | 52 |
| | Boeing Co. | 5.040% | 5/1/27 | 460 | 538 |
| | Boeing Co. | 3.250% | 3/1/28 | 100 | 106 |
| | Boeing Co. | 3.450% | 11/1/28 | 60 | 64 |
| | Boeing Co. | 3.200% | 3/1/29 | 200 | 210 |
| | Boeing Co. | 2.950% | 2/1/30 | 190 | 195 |
| | Boeing Co. | 5.150% | 5/1/30 | 945 | 1,143 |
| | Boeing Co. | 3.625% | 2/1/31 | 275 | 300 |
| | Boeing Co. | 6.125% | 2/15/33 | 75 | 97 |
| | Boeing Co. | 3.600% | 5/1/34 | 350 | 368 |
| | Boeing Co. | 3.250% | 2/1/35 | 190 | 195 |
| | Boeing Co. | 6.625% | 2/15/38 | 50 | 67 |
| | Boeing Co. | 3.550% | 3/1/38 | 50 | 51 |
| | Boeing Co. | 3.500% | 3/1/39 | 75 | 75 |
| | Boeing Co. | 6.875% | 3/15/39 | 100 | 136 |
| | Boeing Co. | 5.875% | 2/15/40 | 75 | 96 |
| | Boeing Co. | 5.705% | 5/1/40 | 740 | 959 |
| | Boeing Co. | 3.375% | 6/15/46 | 75 | 73 |
| | Boeing Co. | 3.650% | 3/1/47 | 150 | 150 |
| | Boeing Co. | 3.625% | 3/1/48 | 75 | 75 |
| | Boeing Co. | 3.850% | 11/1/48 | 60 | 62 |
| | Boeing Co. | 3.900% | 5/1/49 | 150 | 156 |
| | Boeing Co. | 3.750% | 2/1/50 | 50 | 53 |
| | Boeing Co. | 5.805% | 5/1/50 | 1,130 | 1,552 |
| | Boeing Co. | 3.825% | 3/1/59 | 200 | 202 |
| | Boeing Co. | 3.950% | 8/1/59 | 75 | 79 |
| | Boeing Co. | 5.930% | 5/1/60 | 735 | 1,041 |
| | Burlington Northern Santa Fe LLC | 3.050% | 3/15/22 | 150 | 154 |
| | Burlington Northern Santa Fe LLC | 3.050% | 9/1/22 | 150 | 156 |
| | Burlington Northern Santa Fe LLC | 3.000% | 3/15/23 | 175 | 184 |
| | Burlington Northern Santa Fe LLC | 3.850% | 9/1/23 | 75 | 81 |
| | Burlington Northern Santa Fe LLC | 3.750% | 4/1/24 | 200 | 219 |
| | Burlington Northern Santa Fe LLC | 3.400% | 9/1/24 | 150 | 164 |
| | Burlington Northern Santa Fe LLC | 3.000% | 4/1/25 | 100 | 109 |
| | Burlington Northern Santa Fe LLC | 3.650% | 9/1/25 | 75 | 85 |
| | Burlington Northern Santa Fe LLC | 3.250% | 6/15/27 | 225 | 255 |
| | Burlington Northern Santa Fe LLC | 6.200% | 8/15/36 | 125 | 189 |
| | Burlington Northern Santa Fe LLC | 5.050% | 3/1/41 | 125 | 172 |
| | Burlington Northern Santa Fe LLC | 5.400% | 6/1/41 | 250 | 361 |
| | Burlington Northern Santa Fe LLC | 4.400% | 3/15/42 | 250 | 329 |
| | Burlington Northern Santa Fe LLC | 4.375% | 9/1/42 | 200 | 265 |
| | Burlington Northern Santa Fe LLC | 4.450% | 3/15/43 | 175 | 235 |
| | Burlington Northern Santa Fe LLC | 5.150% | 9/1/43 | 125 | 179 |
| | Burlington Northern Santa Fe LLC | 4.900% | 4/1/44 | 100 | 141 |
Total Bond Market Index Portfolio
| | | | Coupon | Maturity
Date | Face
Amount
($000) | Market
Value•
($000) |
| | Burlington Northern Santa Fe LLC | 4.550% | 9/1/44 | 150 | 202 |
| | Burlington Northern Santa Fe LLC | 4.150% | 4/1/45 | 125 | 163 |
| | Burlington Northern Santa Fe LLC | 4.700% | 9/1/45 | 75 | 105 |
| | Burlington Northern Santa Fe LLC | 3.900% | 8/1/46 | 150 | 190 |
| | Burlington Northern Santa Fe LLC | 4.125% | 6/15/47 | 125 | 164 |
| | Burlington Northern Santa Fe LLC | 4.050% | 6/15/48 | 375 | 492 |
| | Burlington Northern Santa Fe LLC | 4.150% | 12/15/48 | 200 | 267 |
| | Burlington Northern Santa Fe LLC | 3.550% | 2/15/50 | 400 | 486 |
| | Burlington Northern Santa Fe LLC | 3.050% | 2/15/51 | 200 | 227 |
| | Canadian National Railway Co. | 2.850% | 12/15/21 | 75 | 76 |
| | Canadian National Railway Co. | 2.950% | 11/21/24 | 233 | 252 |
| | Canadian National Railway Co. | 6.250% | 8/1/34 | 75 | 115 |
| | Canadian National Railway Co. | 6.200% | 6/1/36 | 75 | 111 |
| | Canadian National Railway Co. | 6.375% | 11/15/37 | 100 | 155 |
| | Canadian National Railway Co. | 3.200% | 8/2/46 | 175 | 204 |
| | Canadian National Railway Co. | 3.650% | 2/3/48 | 125 | 153 |
| | Canadian National Railway Co. | 2.450% | 5/1/50 | 175 | 181 |
| | Canadian Pacific Railway Co. | 4.450% | 3/15/23 | 225 | 242 |
| | Canadian Pacific Railway Co. | 2.050% | 3/5/30 | 200 | 210 |
| | Canadian Pacific Railway Co. | 7.125% | 10/15/31 | 100 | 149 |
| | Canadian Pacific Railway Co. | 5.950% | 5/15/37 | 450 | 659 |
| | Canadian Pacific Railway Co. | 6.125% | 9/15/15 | 120 | 199 |
| | Carrier Global Corp. | 1.923% | 2/15/23 | 400 | 412 |
| | Carrier Global Corp. | 2.242% | 2/15/25 | 400 | 421 |
| | Carrier Global Corp. | 2.493% | 2/15/27 | 250 | 269 |
| | Carrier Global Corp. | 2.722% | 2/15/30 | 600 | 640 |
| | Carrier Global Corp. | 3.377% | 4/5/40 | 300 | 328 |
| | Carrier Global Corp. | 3.577% | 4/5/50 | 400 | 447 |
| | Caterpillar Financial Services Corp. | 2.950% | 2/26/22 | 200 | 206 |
| | Caterpillar Financial Services Corp. | 0.950% | 5/13/22 | 150 | 151 |
| | Caterpillar Financial Services Corp. | 2.400% | 6/6/22 | 150 | 154 |
| | Caterpillar Financial Services Corp. | 1.950% | 11/18/22 | 350 | 361 |
| | Caterpillar Financial Services Corp. | 2.550% | 11/29/22 | 200 | 209 |
| | Caterpillar Financial Services Corp. | 3.450% | 5/15/23 | 200 | 215 |
| | Caterpillar Financial Services Corp. | 0.650% | 7/7/23 | 250 | 252 |
| | Caterpillar Financial Services Corp. | 3.650% | 12/7/23 | 70 | 77 |
| | Caterpillar Financial Services Corp. | 2.850% | 5/17/24 | 125 | 135 |
| | Caterpillar Financial Services Corp. | 3.300% | 6/9/24 | 250 | 273 |
| | Caterpillar Financial Services Corp. | 2.150% | 11/8/24 | 300 | 318 |
| | | | Coupon | Maturity
Date | Face
Amount
($000) | Market
Value•
($000) |
| | Caterpillar Financial Services Corp. | 3.250% | 12/1/24 | 477 | 528 |
| | Caterpillar Financial Services Corp. | 1.450% | 5/15/25 | 100 | 104 |
| | Caterpillar Financial Services Corp. | 0.800% | 11/13/25 | 500 | 502 |
| | Caterpillar Financial Services Corp. | 2.400% | 8/9/26 | 100 | 109 |
| | Caterpillar Financial Services Corp. | 3.250% | 9/19/49 | 200 | 234 |
| | Caterpillar Inc. | 2.600% | 6/26/22 | 50 | 51 |
| | Caterpillar Inc. | 3.400% | 5/15/24 | 150 | 164 |
| | Caterpillar Inc. | 2.600% | 9/19/29 | 200 | 220 |
| | Caterpillar Inc. | 2.600% | 4/9/30 | 120 | 132 |
| | Caterpillar Inc. | 6.050% | 8/15/36 | 100 | 148 |
| | Caterpillar Inc. | 5.200% | 5/27/41 | 150 | 218 |
| | Caterpillar Inc. | 3.803% | 8/15/42 | 243 | 307 |
| | Caterpillar Inc. | 3.250% | 4/9/50 | 240 | 281 |
| | Caterpillar Inc. | 4.750% | 5/15/64 | 100 | 149 |
| | Cintas Corp. No. 2 | 2.900% | 4/1/22 | 100 | 103 |
| | Cintas Corp. No. 2 | 3.250% | 6/1/22 | 75 | 77 |
| | Cintas Corp. No. 2 | 3.700% | 4/1/27 | 175 | 201 |
| | CNH Industrial Capital LLC | 1.950% | 7/2/23 | 75 | 77 |
| | CNH Industrial Capital LLC | 4.200% | 1/15/24 | 675 | 743 |
| | CNH Industrial NV | 3.850% | 11/15/27 | 100 | 113 |
| 2 | Continental Airlines Class A Series 2007-1 Pass Through Trust | 5.983% | 10/19/23 | 39 | 39 |
| 2 | Continental Airlines Class A Series 2012-2 Pass Through Trust | 4.000% | 4/29/26 | 33 | 33 |
| | Crane Co. | 4.450% | 12/15/23 | 50 | 55 |
| | Crane Co. | 4.200% | 3/15/48 | 125 | 131 |
| | CSX Corp. | 3.400% | 8/1/24 | 62 | 68 |
| | CSX Corp. | 3.350% | 11/1/25 | 150 | 168 |
| | CSX Corp. | 3.250% | 6/1/27 | 150 | 169 |
| | CSX Corp. | 3.800% | 3/1/28 | 350 | 407 |
| | CSX Corp. | 4.250% | 3/15/29 | 200 | 241 |
| | CSX Corp. | 2.400% | 2/15/30 | 172 | 185 |
| | CSX Corp. | 6.220% | 4/30/40 | 152 | 229 |
| | CSX Corp. | 5.500% | 4/15/41 | 225 | 314 |
| | CSX Corp. | 4.750% | 5/30/42 | 210 | 275 |
| | CSX Corp. | 4.100% | 3/15/44 | 150 | 185 |
| | CSX Corp. | 4.300% | 3/1/48 | 250 | 322 |
| | CSX Corp. | 4.750% | 11/15/48 | 200 | 274 |
| | CSX Corp. | 4.500% | 3/15/49 | 225 | 301 |
| | CSX Corp. | 3.350% | 9/15/49 | 125 | 142 |
| | CSX Corp. | 3.800% | 4/15/50 | 200 | 247 |
| | CSX Corp. | 3.950% | 5/1/50 | 125 | 155 |
| | CSX Corp. | 4.500% | 8/1/54 | 25 | 34 |
| | CSX Corp. | 4.250% | 11/1/66 | 150 | 199 |
| | CSX Corp. | 4.650% | 3/1/68 | 75 | 104 |
| | Cummins Inc. | 0.750% | 9/1/25 | 400 | 402 |
| | Cummins Inc. | 1.500% | 9/1/30 | 400 | 402 |
| | Cummins Inc. | 2.600% | 9/1/50 | 200 | 204 |
| | Deere & Co. | 2.600% | 6/8/22 | 125 | 128 |
| | Deere & Co. | 2.750% | 4/15/25 | 100 | 109 |
| | Deere & Co. | 5.375% | 10/16/29 | 125 | 166 |
| | Deere & Co. | 3.100% | 4/15/30 | 145 | 165 |
| | Deere & Co. | 7.125% | 3/3/31 | 100 | 147 |
| | Deere & Co. | 3.900% | 6/9/42 | 250 | 318 |
| | Deere & Co. | 2.875% | 9/7/49 | 200 | 223 |
| | Deere & Co. | 3.750% | 4/15/50 | 175 | 227 |
| 2 | Delta Air Lines Class A Series 2007-1 Pass Through Trust | 6.821% | 2/10/24 | 92 | 93 |
| 2 | Delta Air Lines Class AA Series 2015-1 Pass Through Trust | 3.625% | 1/30/29 | 39 | 39 |
Total Bond Market Index Portfolio
| | | | Coupon | Maturity
Date | Face
Amount
($000) | Market
Value•
($000) |
| | Delta Air Lines Class AA Series 2019-1 Pass Through Trust | 3.204% | 10/25/25 | 75 | 77 |
| 2 | Delta Air Lines Class AA Series 2020-1 Pass Through Trust | 2.000% | 12/10/29 | 146 | 144 |
| | Dover Corp. | 3.150% | 11/15/25 | 200 | 220 |
| | Dover Corp. | 2.950% | 11/4/29 | 75 | 81 |
| | Dover Corp. | 6.600% | 3/15/38 | 75 | 107 |
| | Eaton Corp. | 2.750% | 11/2/22 | 300 | 313 |
| | Eaton Corp. | 3.103% | 9/15/27 | 125 | 140 |
| | Eaton Corp. | 4.000% | 11/2/32 | 150 | 181 |
| | Eaton Corp. | 4.150% | 11/2/42 | 150 | 188 |
| | Eaton Corp. | 3.915% | 9/15/47 | 50 | 59 |
| | Emerson Electric Co. | 2.625% | 12/1/21 | 150 | 153 |
| | Emerson Electric Co. | 3.150% | 6/1/25 | 200 | 221 |
| | Emerson Electric Co. | 1.800% | 10/15/27 | 225 | 237 |
| | Emerson Electric Co. | 1.950% | 10/15/30 | 100 | 105 |
| | Emerson Electric Co. | 2.750% | 10/15/50 | 150 | 159 |
| | FedEx Corp. | 2.625% | 8/1/22 | 100 | 104 |
| | FedEx Corp. | 3.200% | 2/1/25 | 150 | 165 |
| | FedEx Corp. | 3.800% | 5/15/25 | 500 | 565 |
| | FedEx Corp. | 3.250% | 4/1/26 | 100 | 112 |
| | FedEx Corp. | 3.300% | 3/15/27 | 100 | 112 |
| | FedEx Corp. | 3.100% | 8/5/29 | 200 | 222 |
| | FedEx Corp. | 4.250% | 5/15/30 | 100 | 121 |
| | FedEx Corp. | 3.900% | 2/1/35 | 200 | 238 |
| | FedEx Corp. | 3.875% | 8/1/42 | 125 | 146 |
| | FedEx Corp. | 4.100% | 4/15/43 | 75 | 88 |
| | FedEx Corp. | 5.100% | 1/15/44 | 250 | 334 |
| | FedEx Corp. | 4.100% | 2/1/45 | 125 | 148 |
| | FedEx Corp. | 4.750% | 11/15/45 | 250 | 323 |
| | FedEx Corp. | 4.550% | 4/1/46 | 225 | 285 |
| | FedEx Corp. | 4.400% | 1/15/47 | 125 | 155 |
| | FedEx Corp. | 4.050% | 2/15/48 | 200 | 239 |
| | FedEx Corp. | 4.950% | 10/17/48 | 250 | 340 |
| | FedEx Corp. | 5.250% | 5/15/50 | 250 | 353 |
| | FedEx Corp. | 4.500% | 2/1/65 | 60 | 69 |
| 2 | FedEx Corp. Class AA Series 2020-1 Pass Through Trust | 1.875% | 8/20/35 | 500 | 510 |
| | Flowserve Corp. | 3.500% | 9/15/22 | 250 | 259 |
| | Flowserve Corp. | 4.000% | 11/15/23 | 50 | 53 |
| | Flowserve Corp. | 3.500% | 10/1/30 | 90 | 96 |
| | Fortive Corp. | 3.150% | 6/15/26 | 150 | 167 |
| | Fortive Corp. | 4.300% | 6/15/46 | 100 | 123 |
| | General Dynamics Corp. | 3.375% | 5/15/23 | 200 | 214 |
| | General Dynamics Corp. | 1.875% | 8/15/23 | 300 | 311 |
| | General Dynamics Corp. | 2.375% | 11/15/24 | 320 | 341 |
| | General Dynamics Corp. | 3.250% | 4/1/25 | 150 | 165 |
| | General Dynamics Corp. | 3.500% | 5/15/25 | 200 | 223 |
| | General Dynamics Corp. | 3.500% | 4/1/27 | 100 | 114 |
| | General Dynamics Corp. | 2.625% | 11/15/27 | 200 | 218 |
| | General Dynamics Corp. | 3.750% | 5/15/28 | 200 | 234 |
| | General Dynamics Corp. | 3.625% | 4/1/30 | 200 | 237 |
| | General Dynamics Corp. | 4.250% | 4/1/40 | 150 | 194 |
| | General Dynamics Corp. | 3.600% | 11/15/42 | 100 | 122 |
| | General Dynamics Corp. | 4.250% | 4/1/50 | 140 | 189 |
| | General Electric Co. | 3.150% | 9/7/22 | 91 | 95 |
| | General Electric Co. | 3.100% | 1/9/23 | 574 | 603 |
| | General Electric Co. | 3.450% | 5/15/24 | 100 | 109 |
| | General Electric Co. | 3.450% | 5/1/27 | 200 | 225 |
| | General Electric Co. | 6.750% | 3/15/32 | 705 | 990 |
| | General Electric Co. | 6.150% | 8/7/37 | 161 | 220 |
| | General Electric Co. | 5.875% | 1/14/38 | 560 | 758 |
| | General Electric Co. | 6.875% | 1/10/39 | 338 | 495 |
| | General Electric Co. | 4.250% | 5/1/40 | 300 | 354 |
| | General Electric Co. | 4.125% | 10/9/42 | 153 | 178 |
| | General Electric Co. | 4.500% | 3/11/44 | 438 | 535 |
| | General Electric Co. | 4.350% | 5/1/50 | 725 | 878 |
| | | | Coupon | Maturity
Date | Face
Amount
($000) | Market
Value•
($000) |
| | Hexcel Corp. | 4.700% | 8/15/25 | 100 | 112 |
| | Hexcel Corp. | 3.950% | 2/15/27 | 75 | 81 |
| | Honeywell International Inc. | 2.150% | 8/8/22 | 100 | 103 |
| | Honeywell International Inc. | 0.483% | 8/19/22 | 500 | 501 |
| | Honeywell International Inc. | 2.300% | 8/15/24 | 425 | 453 |
| | Honeywell International Inc. | 1.350% | 6/1/25 | 275 | 285 |
| | Honeywell International Inc. | 2.500% | 11/1/26 | 50 | 55 |
| | Honeywell International Inc. | 2.700% | 8/15/29 | 100 | 112 |
| | Honeywell International Inc. | 1.950% | 6/1/30 | 1,000 | 1,055 |
| | Honeywell International Inc. | 5.700% | 3/15/37 | 200 | 285 |
| | Honeywell International Inc. | 5.375% | 3/1/41 | 150 | 216 |
| | Honeywell International Inc. | 2.800% | 6/1/50 | 225 | 246 |
| | Hubbell Inc. | 3.350% | 3/1/26 | 75 | 82 |
| | Hubbell Inc. | 3.150% | 8/15/27 | 50 | 53 |
| | Hubbell Inc. | 3.500% | 2/15/28 | 175 | 191 |
| | Huntington Ingalls Industries Inc. | 3.844% | 5/1/25 | 100 | 111 |
| | Huntington Ingalls Industries Inc. | 3.483% | 12/1/27 | 125 | 140 |
| | Huntington Ingalls Industries Inc. | 4.200% | 5/1/30 | 100 | 118 |
| | IDEX Corp. | 3.000% | 5/1/30 | 75 | 83 |
| | Illinois Tool Works Inc. | 3.500% | 3/1/24 | 200 | 217 |
| | Illinois Tool Works Inc. | 2.650% | 11/15/26 | 300 | 331 |
| | Illinois Tool Works Inc. | 4.875% | 9/15/41 | 75 | 103 |
| | Illinois Tool Works Inc. | 3.900% | 9/1/42 | 250 | 315 |
| | JB Hunt Transport Services Inc. | 3.300% | 8/15/22 | 100 | 104 |
| | JB Hunt Transport Services Inc. | 3.875% | 3/1/26 | 25 | 29 |
| 2 | JetBlue Class A Series 2020-1 Pass Through Trust | 4.000% | 5/15/34 | 150 | 161 |
| 2 | JetBlue Class AA Series 2019-1 Pass Through Trust | 2.750% | 11/15/33 | 144 | 144 |
| | John Deere Capital Corp. | 1.950% | 6/13/22 | 375 | 384 |
| | John Deere Capital Corp. | 2.150% | 9/8/22 | 400 | 413 |
| | John Deere Capital Corp. | 2.700% | 1/6/23 | 100 | 105 |
| | John Deere Capital Corp. | 2.800% | 1/27/23 | 50 | 53 |
| | John Deere Capital Corp. | 2.800% | 3/6/23 | 100 | 105 |
| | John Deere Capital Corp. | 3.450% | 6/7/23 | 200 | 215 |
| | John Deere Capital Corp. | 0.700% | 7/5/23 | 100 | 101 |
| | John Deere Capital Corp. | 3.650% | 10/12/23 | 50 | 55 |
| | John Deere Capital Corp. | 2.600% | 3/7/24 | 75 | 80 |
| | John Deere Capital Corp. | 2.650% | 6/24/24 | 75 | 81 |
| | John Deere Capital Corp. | 2.050% | 1/9/25 | 350 | 371 |
| | John Deere Capital Corp. | 3.450% | 3/13/25 | 300 | 336 |
| | John Deere Capital Corp. | 3.400% | 9/11/25 | 75 | 84 |
| | John Deere Capital Corp. | 2.650% | 6/10/26 | 100 | 110 |
| | John Deere Capital Corp. | 2.250% | 9/14/26 | 125 | 135 |
| | John Deere Capital Corp. | 2.800% | 9/8/27 | 150 | 167 |
| | John Deere Capital Corp. | 3.050% | 1/6/28 | 100 | 112 |
| | John Deere Capital Corp. | 3.450% | 3/7/29 | 50 | 58 |
| | John Deere Capital Corp. | 2.800% | 7/18/29 | 150 | 167 |
| | John Deere Capital Corp. | 2.450% | 1/9/30 | 175 | 191 |
| | Johnson Controls International plc | 3.625% | 7/2/24 | 126 | 137 |
| | Johnson Controls International plc | 3.900% | 2/14/26 | 37 | 42 |
Total Bond Market Index Portfolio
| | | | Coupon | Maturity
Date | Face
Amount
($000) | Market
Value•
($000) |
| | Johnson Controls International plc | 6.000% | 1/15/36 | 39 | 55 |
| | Johnson Controls International plc | 4.625% | 7/2/44 | 175 | 226 |
| | Johnson Controls International plc | 5.125% | 9/14/45 | 14 | 19 |
| | Johnson Controls International plc | 4.500% | 2/15/47 | 100 | 132 |
| | Johnson Controls International plc | 4.950% | 7/2/64 | 72 | 98 |
| | Kansas City Southern | 3.000% | 5/15/23 | 250 | 260 |
| | Kansas City Southern | 2.875% | 11/15/29 | 100 | 108 |
| | Kansas City Southern | 4.300% | 5/15/43 | 75 | 87 |
| | Kansas City Southern | 4.950% | 8/15/45 | 125 | 160 |
| | Kansas City Southern | 4.700% | 5/1/48 | 225 | 284 |
| | Kansas City Southern | 3.500% | 5/1/50 | 100 | 111 |
| | Kennametal Inc. | 3.875% | 2/15/22 | 50 | 51 |
| | Kennametal Inc. | 4.625% | 6/15/28 | 120 | 133 |
| | Keysight Technologies Inc. | 4.550% | 10/30/24 | 195 | 221 |
| | Keysight Technologies Inc. | 4.600% | 4/6/27 | 125 | 149 |
| | Keysight Technologies Inc. | 3.000% | 10/30/29 | 100 | 111 |
| | Kirby Corp. | 4.200% | 3/1/28 | 300 | 331 |
| | L3Harris Technologies Inc. | 3.850% | 6/15/23 | 600 | 647 |
| | L3Harris Technologies Inc. | 3.950% | 5/28/24 | 103 | 113 |
| | L3Harris Technologies Inc. | 3.832% | 4/27/25 | 200 | 224 |
| | L3Harris Technologies Inc. | 3.850% | 12/15/26 | 50 | 58 |
| | L3Harris Technologies Inc. | 4.400% | 6/15/28 | 175 | 209 |
| | L3Harris Technologies Inc. | 4.854% | 4/27/35 | 100 | 131 |
| | L3Harris Technologies Inc. | 6.150% | 12/15/40 | 100 | 149 |
| | L3Harris Technologies Inc. | 5.054% | 4/27/45 | 100 | 139 |
| | Legrand France SA | 8.500% | 2/15/25 | 68 | 89 |
| | Lennox International Inc. | 3.000% | 11/15/23 | 100 | 105 |
| | Lennox International Inc. | 1.700% | 8/1/27 | 50 | 51 |
| | Lockheed Martin Corp. | 3.100% | 1/15/23 | 100 | 105 |
| | Lockheed Martin Corp. | 3.550% | 1/15/26 | 380 | 430 |
| | Lockheed Martin Corp. | 1.850% | 6/15/30 | 179 | 187 |
| | Lockheed Martin Corp. | 3.600% | 3/1/35 | 150 | 181 |
| | Lockheed Martin Corp. | 4.500% | 5/15/36 | 100 | 131 |
| | Lockheed Martin Corp. | 6.150% | 9/1/36 | 375 | 563 |
| | Lockheed Martin Corp. | 4.070% | 12/15/42 | 270 | 348 |
| | Lockheed Martin Corp. | 3.800% | 3/1/45 | 100 | 124 |
| | Lockheed Martin Corp. | 4.700% | 5/15/46 | 275 | 387 |
| | Lockheed Martin Corp. | 2.800% | 6/15/50 | 175 | 189 |
| | Lockheed Martin Corp. | 4.090% | 9/15/52 | 331 | 436 |
| | Norfolk Southern Corp. | 3.000% | 4/1/22 | 225 | 231 |
| | Norfolk Southern Corp. | 2.903% | 2/15/23 | 48 | 50 |
| | Norfolk Southern Corp. | 3.850% | 1/15/24 | 75 | 82 |
| | Norfolk Southern Corp. | 5.590% | 5/17/25 | 50 | 60 |
| | Norfolk Southern Corp. | 3.650% | 8/1/25 | 50 | 56 |
| | Norfolk Southern Corp. | 7.800% | 5/15/27 | 60 | 82 |
| | Norfolk Southern Corp. | 3.150% | 6/1/27 | 125 | 138 |
| | Norfolk Southern Corp. | 3.800% | 8/1/28 | 113 | 132 |
| | Norfolk Southern Corp. | 2.550% | 11/1/29 | 200 | 215 |
| | Norfolk Southern Corp. | 4.837% | 10/1/41 | 113 | 153 |
| | Norfolk Southern Corp. | 4.450% | 6/15/45 | 75 | 97 |
| | Norfolk Southern Corp. | 4.650% | 1/15/46 | 75 | 100 |
| | Norfolk Southern Corp. | 4.150% | 2/28/48 | 25 | 32 |
| | Norfolk Southern Corp. | 4.100% | 5/15/49 | 73 | 92 |
| | Norfolk Southern Corp. | 3.400% | 11/1/49 | 75 | 85 |
| | Norfolk Southern Corp. | 3.050% | 5/15/50 | 350 | 384 |
| | Norfolk Southern Corp. | 4.050% | 8/15/52 | 239 | 303 |
| | Norfolk Southern Corp. | 3.155% | 5/15/55 | 438 | 470 |
| | Northrop Grumman Corp. | 2.550% | 10/15/22 | 200 | 207 |
| | Northrop Grumman Corp. | 3.250% | 8/1/23 | 150 | 161 |
| | Northrop Grumman Corp. | 2.930% | 1/15/25 | 275 | 299 |
| | Northrop Grumman Corp. | 3.200% | 2/1/27 | 150 | 167 |
| | Northrop Grumman Corp. | 3.250% | 1/15/28 | 100 | 112 |
| | Northrop Grumman Corp. | 4.400% | 5/1/30 | 290 | 359 |
| | Northrop Grumman Corp. | 5.150% | 5/1/40 | 100 | 137 |
| | Northrop Grumman Corp. | 5.050% | 11/15/40 | 150 | 205 |
| | | | Coupon | Maturity
Date | Face
Amount
($000) | Market
Value•
($000) |
| | Northrop Grumman Corp. | 4.750% | 6/1/43 | 275 | 365 |
| | Northrop Grumman Corp. | 4.030% | 10/15/47 | 380 | 476 |
| | Northrop Grumman Corp. | 5.250% | 5/1/50 | 310 | 460 |
| | Nvent Finance Sarl | 3.950% | 4/15/23 | 200 | 211 |
| | Nvent Finance Sarl | 4.550% | 4/15/28 | 100 | 109 |
| | Oshkosh Corp. | 4.600% | 5/15/28 | 185 | 218 |
| | Oshkosh Corp. | 3.100% | 3/1/30 | 60 | 65 |
| | Otis Worldwide Corp. | 2.293% | 4/5/27 | 200 | 214 |
| | Otis Worldwide Corp. | 2.565% | 2/15/30 | 400 | 429 |
| | Otis Worldwide Corp. | 3.112% | 2/15/40 | 600 | 654 |
| | Otis Worldwide Corp. | 3.362% | 2/15/50 | 150 | 172 |
| | PACCAR Financial Corp. | 2.850% | 3/1/22 | 100 | 103 |
| | PACCAR Financial Corp. | 2.650% | 5/10/22 | 100 | 103 |
| | PACCAR Financial Corp. | 2.300% | 8/10/22 | 50 | 52 |
| | PACCAR Financial Corp. | 2.000% | 9/26/22 | 50 | 52 |
| | PACCAR Financial Corp. | 3.400% | 8/9/23 | 100 | 108 |
| | PACCAR Financial Corp. | 0.350% | 8/11/23 | 500 | 500 |
| | PACCAR Financial Corp. | 2.150% | 8/15/24 | 75 | 79 |
| | PACCAR Financial Corp. | 1.800% | 2/6/25 | 60 | 63 |
| | Parker-Hannifin Corp. | 3.500% | 9/15/22 | 175 | 184 |
| | Parker-Hannifin Corp. | 2.700% | 6/14/24 | 110 | 118 |
| | Parker-Hannifin Corp. | 3.300% | 11/21/24 | 290 | 317 |
| | Parker-Hannifin Corp. | 3.250% | 3/1/27 | 125 | 139 |
| | Parker-Hannifin Corp. | 3.250% | 6/14/29 | 75 | 85 |
| | Parker-Hannifin Corp. | 6.250% | 5/15/38 | 150 | 218 |
| | Parker-Hannifin Corp. | 4.450% | 11/21/44 | 200 | 255 |
| | Parker-Hannifin Corp. | 4.100% | 3/1/47 | 75 | 93 |
| | Parker-Hannifin Corp. | 4.000% | 6/14/49 | 110 | 138 |
| | Precision Castparts Corp. | 2.500% | 1/15/23 | 200 | 208 |
| | Precision Castparts Corp. | 3.250% | 6/15/25 | 175 | 193 |
| | Precision Castparts Corp. | 3.900% | 1/15/43 | 75 | 87 |
| | Precision Castparts Corp. | 4.375% | 6/15/45 | 200 | 252 |
| | Quanta Services Inc. | 2.900% | 10/1/30 | 400 | 428 |
| | Raytheon Technologies Corp. | 2.800% | 3/15/22 | 170 | 174 |
| | Raytheon Technologies Corp. | 2.500% | 12/15/22 | 275 | 285 |
| | Raytheon Technologies Corp. | 3.650% | 8/16/23 | 16 | 17 |
| | Raytheon Technologies Corp. | 3.200% | 3/15/24 | 175 | 188 |
| | Raytheon Technologies Corp. | 3.950% | 8/16/25 | 617 | 708 |
| | Raytheon Technologies Corp. | 3.500% | 3/15/27 | 300 | 339 |
| | Raytheon Technologies Corp. | 3.125% | 5/4/27 | 225 | 251 |
| | Raytheon Technologies Corp. | 7.200% | 8/15/27 | 25 | 34 |
| | Raytheon Technologies Corp. | 6.700% | 8/1/28 | 75 | 102 |
| | Raytheon Technologies Corp. | 4.125% | 11/16/28 | 750 | 892 |
| | Raytheon Technologies Corp. | 7.500% | 9/15/29 | 125 | 181 |
| | Raytheon Technologies Corp. | 2.250% | 7/1/30 | 300 | 318 |
| | Raytheon Technologies Corp. | 5.400% | 5/1/35 | 150 | 203 |
| | Raytheon Technologies Corp. | 6.050% | 6/1/36 | 100 | 145 |
| | Raytheon Technologies Corp. | 6.125% | 7/15/38 | 100 | 148 |
| | Raytheon Technologies Corp. | 4.450% | 11/16/38 | 175 | 220 |
| | Raytheon Technologies Corp. | 5.700% | 4/15/40 | 100 | 145 |
| | Raytheon Technologies Corp. | 4.700% | 12/15/41 | 50 | 65 |
| | Raytheon Technologies Corp. | 4.500% | 6/1/42 | 675 | 882 |
Total Bond Market Index Portfolio
| | | | Coupon | Maturity
Date | Face
Amount
($000) | Market
Value•
($000) |
| | Raytheon Technologies Corp. | 4.800% | 12/15/43 | 65 | 84 |
| | Raytheon Technologies Corp. | 4.150% | 5/15/45 | 200 | 253 |
| | Raytheon Technologies Corp. | 3.750% | 11/1/46 | 200 | 235 |
| | Raytheon Technologies Corp. | 4.350% | 4/15/47 | 250 | 323 |
| | Raytheon Technologies Corp. | 4.050% | 5/4/47 | 300 | 371 |
| | Raytheon Technologies Corp. | 4.625% | 11/16/48 | 350 | 473 |
| | Raytheon Technologies Corp. | 3.125% | 7/1/50 | 370 | 407 |
| | Republic Services Inc. | 2.500% | 8/15/24 | 200 | 213 |
| | Republic Services Inc. | 0.875% | 11/15/25 | 500 | 502 |
| | Republic Services Inc. | 1.450% | 2/15/31 | 500 | 488 |
| | Republic Services Inc. | 1.750% | 2/15/32 | 175 | 175 |
| | Republic Services Inc. | 6.200% | 3/1/40 | 175 | 259 |
| | Republic Services Inc. | 5.700% | 5/15/41 | 100 | 142 |
| | Rockwell Automation Inc. | 3.500% | 3/1/29 | 100 | 116 |
| | Rockwell Automation Inc. | 4.200% | 3/1/49 | 125 | 167 |
| | Roper Technologies Inc. | 2.800% | 12/15/21 | 200 | 204 |
| | Roper Technologies Inc. | 2.350% | 9/15/24 | 125 | 133 |
| | Roper Technologies Inc. | 1.000% | 9/15/25 | 500 | 503 |
| | Roper Technologies Inc. | 3.850% | 12/15/25 | 100 | 113 |
| | Roper Technologies Inc. | 3.800% | 12/15/26 | 145 | 167 |
| | Roper Technologies Inc. | 1.400% | 9/15/27 | 500 | 503 |
| | Roper Technologies Inc. | 4.200% | 9/15/28 | 175 | 208 |
| | Roper Technologies Inc. | 2.950% | 9/15/29 | 125 | 137 |
| | Roper Technologies Inc. | 2.000% | 6/30/30 | 125 | 127 |
| | Roper Technologies Inc. | 1.750% | 2/15/31 | 500 | 497 |
| | Ryder System Inc. | 2.875% | 6/1/22 | 75 | 77 |
| | Ryder System Inc. | 3.400% | 3/1/23 | 75 | 79 |
| | Ryder System Inc. | 3.750% | 6/9/23 | 225 | 242 |
| | Ryder System Inc. | 3.650% | 3/18/24 | 150 | 164 |
| | Ryder System Inc. | 2.500% | 9/1/24 | 50 | 53 |
| | Ryder System Inc. | 4.625% | 6/1/25 | 193 | 224 |
| | Ryder System Inc. | 2.900% | 12/1/26 | 100 | 110 |
| | Snap-on Inc. | 3.250% | 3/1/27 | 50 | 56 |
| | Snap-on Inc. | 4.100% | 3/1/48 | 75 | 96 |
| | Snap-on Inc. | 3.100% | 5/1/50 | 75 | 84 |
| | Southwest Airlines Co. | 4.750% | 5/4/23 | 250 | 272 |
| | Southwest Airlines Co. | 5.250% | 5/4/25 | 600 | 694 |
| | Southwest Airlines Co. | 3.000% | 11/15/26 | 100 | 107 |
| | Southwest Airlines Co. | 5.125% | 6/15/27 | 775 | 920 |
| | Southwest Airlines Co. | 3.450% | 11/16/27 | 50 | 54 |
| | Southwest Airlines Co. | 2.625% | 2/10/30 | 100 | 102 |
| 2 | Southwest Airlines Co. Series 2007-1 Pass Through Trust | 6.150% | 2/1/24 | 14 | 14 |
| 2 | Spirit Airlines Series 2015-1A Pass Through Trust | 4.100% | 10/1/29 | 18 | 16 |
| | Stanley Black & Decker Inc. | 3.400% | 3/1/26 | 100 | 113 |
| | Stanley Black & Decker Inc. | 4.250% | 11/15/28 | 100 | 122 |
| | Stanley Black & Decker Inc. | 2.300% | 3/15/30 | 375 | 401 |
| | Stanley Black & Decker Inc. | 5.200% | 9/1/40 | 75 | 104 |
| | Stanley Black & Decker Inc. | 4.850% | 11/15/48 | 100 | 139 |
| | Stanley Black & Decker Inc. | 4.000% | 3/15/60 | 400 | 427 |
| | Textron Inc. | 3.875% | 3/1/25 | 65 | 71 |
| | Textron Inc. | 4.000% | 3/15/26 | 200 | 226 |
| | Textron Inc. | 3.650% | 3/15/27 | 250 | 277 |
| | Textron Inc. | 3.375% | 3/1/28 | 50 | 55 |
| | Textron Inc. | 3.900% | 9/17/29 | 225 | 256 |
| | | | Coupon | Maturity
Date | Face
Amount
($000) | Market
Value•
($000) |
| | Timken Co. | 3.875% | 9/1/24 | 100 | 107 |
| | Timken Co. | 4.500% | 12/15/28 | 25 | 28 |
| | Trane Technologies Global Holding Co Ltd. | 4.250% | 6/15/23 | 125 | 136 |
| | Trane Technologies Global Holding Co Ltd. | 5.750% | 6/15/43 | 125 | 180 |
| | Trane Technologies Luxembourg Finance SA | 3.550% | 11/1/24 | 375 | 414 |
| | Trane Technologies Luxembourg Finance SA | 3.500% | 3/21/26 | 75 | 85 |
| | Trane Technologies Luxembourg Finance SA | 3.800% | 3/21/29 | 225 | 263 |
| | Trane Technologies Luxembourg Finance SA | 4.500% | 3/21/49 | 75 | 98 |
| | Trimble Inc. | 4.150% | 6/15/23 | 50 | 54 |
| | Trimble Inc. | 4.750% | 12/1/24 | 93 | 106 |
| | Trimble Inc. | 4.900% | 6/15/28 | 50 | 60 |
| | Tyco Electronics Group SA | 3.500% | 2/3/22 | 100 | 103 |
| | Tyco Electronics Group SA | 3.450% | 8/1/24 | 125 | 136 |
| | Tyco Electronics Group SA | 3.125% | 8/15/27 | 200 | 222 |
| | Tyco Electronics Group SA | 7.125% | 10/1/37 | 125 | 188 |
| | Union Pacific Corp. | 2.950% | 3/1/22 | 100 | 103 |
| | Union Pacific Corp. | 4.163% | 7/15/22 | 534 | 560 |
| | Union Pacific Corp. | 2.950% | 1/15/23 | 25 | 26 |
| | Union Pacific Corp. | 3.500% | 6/8/23 | 150 | 161 |
| | Union Pacific Corp. | 3.646% | 2/15/24 | 50 | 54 |
| | Union Pacific Corp. | 3.150% | 3/1/24 | 100 | 108 |
| | Union Pacific Corp. | 3.250% | 1/15/25 | 206 | 225 |
| | Union Pacific Corp. | 3.750% | 7/15/25 | 560 | 635 |
| | Union Pacific Corp. | 3.250% | 8/15/25 | 50 | 55 |
| | Union Pacific Corp. | 2.750% | 3/1/26 | 75 | 82 |
| | Union Pacific Corp. | 2.150% | 2/5/27 | 90 | 95 |
| | Union Pacific Corp. | 3.950% | 9/10/28 | 300 | 356 |
| | Union Pacific Corp. | 3.700% | 3/1/29 | 200 | 232 |
| | Union Pacific Corp. | 2.400% | 2/5/30 | 200 | 215 |
| | Union Pacific Corp. | 3.375% | 2/1/35 | 100 | 114 |
| | Union Pacific Corp. | 3.600% | 9/15/37 | 290 | 336 |
| | Union Pacific Corp. | 4.375% | 9/10/38 | 250 | 311 |
| | Union Pacific Corp. | 4.050% | 11/15/45 | 150 | 183 |
| | Union Pacific Corp. | 3.250% | 2/5/50 | 200 | 226 |
| | Union Pacific Corp. | 3.799% | 10/1/51 | 560 | 682 |
| | Union Pacific Corp. | 3.875% | 2/1/55 | 100 | 122 |
| | Union Pacific Corp. | 3.950% | 8/15/59 | 100 | 122 |
| | Union Pacific Corp. | 3.839% | 3/20/60 | 386 | 476 |
| 5 | Union Pacific Corp. | 2.973% | 9/16/62 | 325 | 339 |
| | Union Pacific Corp. | 4.375% | 11/15/65 | 135 | 179 |
| | Union Pacific Corp. | 3.750% | 2/5/70 | 150 | 182 |
| 2 | United Airlines Class A Series 2013-1 Pass Through Trust | 4.300% | 2/15/27 | 53 | 53 |
| 2 | United Airlines Class A Series 2014-1 Pass Through Trust | 4.000% | 10/11/27 | 70 | 69 |
| | United Airlines Class A Series 2015-1 Pass Through Trust | 3.700% | 6/1/24 | 60 | 59 |
| 2 | United Airlines Class A Series 2016-1 Pass Through Trust | 3.450% | 1/7/30 | 42 | 41 |
| 2 | United Airlines Class A Series 2016-2 Pass Through Trust | 3.100% | 4/7/30 | 42 | 39 |
| 2 | United Airlines Class A Series 2020-1 Pass Through Trust | 5.875% | 4/15/29 | 590 | 637 |
| 2 | United Airlines Class AA Series 2015-1 Pass Through Trust | 3.450% | 6/1/29 | 137 | 135 |
Total Bond Market Index Portfolio
| | | | Coupon | Maturity
Date | Face
Amount
($000) | Market
Value•
($000) |
| 2 | United Airlines Class AA Series 2016-1 Pass Through Trust | 3.100% | 1/7/30 | 337 | 339 |
| 2 | United Airlines Class AA Series 2016-2 Pass Through Trust | 2.875% | 4/7/30 | 63 | 62 |
| 2 | United Airlines Class AA Series 2019-1 Pass Through Trust | 4.150% | 2/25/33 | 173 | 178 |
| 2 | United Airlines Class AA Series 2019-2 Pass Through Trust | 2.700% | 11/1/33 | 99 | 94 |
| | United Parcel Service Inc. | 2.450% | 10/1/22 | 175 | 181 |
| | United Parcel Service Inc. | 2.500% | 4/1/23 | 200 | 209 |
| | United Parcel Service Inc. | 2.800% | 11/15/24 | 186 | 201 |
| | United Parcel Service Inc. | 2.400% | 11/15/26 | 150 | 163 |
| | United Parcel Service Inc. | 3.050% | 11/15/27 | 200 | 226 |
| | United Parcel Service Inc. | 3.400% | 3/15/29 | 100 | 115 |
| | United Parcel Service Inc. | 2.500% | 9/1/29 | 100 | 109 |
| | United Parcel Service Inc. | 6.200% | 1/15/38 | 173 | 271 |
| | United Parcel Service Inc. | 5.200% | 4/1/40 | 255 | 362 |
| | United Parcel Service Inc. | 4.875% | 11/15/40 | 75 | 103 |
| | United Parcel Service Inc. | 3.625% | 10/1/42 | 100 | 120 |
| | United Parcel Service Inc. | 3.400% | 11/15/46 | 110 | 132 |
| | United Parcel Service Inc. | 4.250% | 3/15/49 | 125 | 168 |
| | United Parcel Service Inc. | 3.400% | 9/1/49 | 250 | 302 |
| | United Parcel Service Inc. | 5.300% | 4/1/50 | 400 | 598 |
| | Valmont Industries Inc. | 5.000% | 10/1/44 | 150 | 175 |
| | Valmont Industries Inc. | 5.250% | 10/1/54 | 75 | 89 |
| | Waste Connections Inc. | 4.250% | 12/1/28 | 100 | 119 |
| | Waste Connections Inc. | 3.500% | 5/1/29 | 200 | 227 |
| | Waste Connections Inc. | 2.600% | 2/1/30 | 139 | 149 |
| | Waste Connections Inc. | 3.050% | 4/1/50 | 75 | 80 |
| | Waste Management Inc. | 2.900% | 9/15/22 | 100 | 104 |
| | Waste Management Inc. | 2.400% | 5/15/23 | 225 | 235 |
| | Waste Management Inc. | 3.500% | 5/15/24 | 200 | 218 |
| | Waste Management Inc. | 3.125% | 3/1/25 | 150 | 164 |
| | Waste Management Inc. | 0.750% | 11/15/25 | 500 | 502 |
| | Waste Management Inc. | 3.150% | 11/15/27 | 125 | 141 |
| | Waste Management Inc. | 3.900% | 3/1/35 | 250 | 304 |
| | Waste Management Inc. | 4.100% | 3/1/45 | 150 | 188 |
| | Waste Management Inc. | 4.150% | 7/15/49 | 200 | 266 |
| | Westinghouse Air Brake Technologies Corp. | 4.400% | 3/15/24 | 275 | 301 |
| | Westinghouse Air Brake Technologies Corp. | 3.200% | 6/15/25 | 60 | 65 |
| | Westinghouse Air Brake Technologies Corp. | 3.450% | 11/15/26 | 150 | 165 |
| | Westinghouse Air Brake Technologies Corp. | 4.950% | 9/15/28 | 175 | 207 |
| | WW Grainger Inc. | 1.850% | 2/15/25 | 75 | 79 |
| | WW Grainger Inc. | 4.600% | 6/15/45 | 200 | 268 |
| | WW Grainger Inc. | 3.750% | 5/15/46 | 75 | 89 |
| | WW Grainger Inc. | 4.200% | 5/15/47 | 75 | 95 |
| | Xylem Inc. | 3.250% | 11/1/26 | 100 | 112 |
| | Xylem Inc. | 1.950% | 1/30/28 | 100 | 104 |
| | Xylem Inc. | 2.250% | 1/30/31 | 100 | 105 |
| | Xylem Inc. | 4.375% | 11/1/46 | 100 | 122 |
| | | | | | | 120,441 |
| Materials (0.9%) |
| | Air Products and Chemicals Inc. | 3.350% | 7/31/24 | 500 | 545 |
| | Air Products and Chemicals Inc. | 2.050% | 5/15/30 | 200 | 213 |
| | Air Products and Chemicals Inc. | 2.700% | 5/15/40 | 200 | 214 |
| | Air Products and Chemicals Inc. | 2.800% | 5/15/50 | 400 | 437 |
| | Albemarle Corp. | 4.150% | 12/1/24 | 132 | 146 |
| | Albemarle Corp. | 5.450% | 12/1/44 | 75 | 90 |
| | | | Coupon | Maturity
Date | Face
Amount
($000) | Market
Value•
($000) |
| | AngloGold Ashanti Holdings plc | 3.750% | 10/1/30 | 200 | 214 |
| | Avery Dennison Corp. | 4.875% | 12/6/28 | 75 | 92 |
| | Avery Dennison Corp. | 2.650% | 4/30/30 | 200 | 214 |
| | Barrick Gold Corp. | 6.450% | 10/15/35 | 75 | 102 |
| | Barrick North America Finance LLC | 5.700% | 5/30/41 | 450 | 639 |
| | Barrick North America Finance LLC | 5.750% | 5/1/43 | 150 | 216 |
| | Barrick PD Australia Finance Pty Ltd. | 5.950% | 10/15/39 | 50 | 72 |
| | Bemis Co. Inc. | 3.100% | 9/15/26 | 50 | 54 |
| | Bemis Co. Inc. | 2.630% | 6/19/30 | 125 | 135 |
| 5 | Berry Global Inc. | 1.570% | 1/15/26 | 200 | 201 |
| | BHP Billiton Finance USA Ltd. | 2.875% | 2/24/22 | 176 | 181 |
| | BHP Billiton Finance USA Ltd. | 3.850% | 9/30/23 | 50 | 55 |
| | BHP Billiton Finance USA Ltd. | 4.125% | 2/24/42 | 150 | 195 |
| | BHP Billiton Finance USA Ltd. | 5.000% | 9/30/43 | 575 | 841 |
| | Cabot Corp. | 4.000% | 7/1/29 | 55 | 59 |
| | Carlisle Cos. Inc. | 3.750% | 11/15/22 | 75 | 79 |
| | Carlisle Cos. Inc. | 3.500% | 12/1/24 | 50 | 55 |
| | Carlisle Cos. Inc. | 3.750% | 12/1/27 | 125 | 142 |
| | Carlisle Cos. Inc. | 2.750% | 3/1/30 | 150 | 160 |
| | Celanese US Holdings LLC | 3.500% | 5/8/24 | 100 | 108 |
| | Celulosa Arauco y Constitucion SA | 3.875% | 11/2/27 | 300 | 332 |
| | Celulosa Arauco y Constitucion SA | 5.500% | 11/2/47 | 200 | 240 |
| | CRH America Inc. | 5.750% | 1/15/21 | 75 | 75 |
| | Dow Chemical Co. | 3.500% | 10/1/24 | 182 | 199 |
| | Dow Chemical Co. | 4.550% | 11/30/25 | 150 | 175 |
| | Dow Chemical Co. | 4.800% | 11/30/28 | 225 | 276 |
| | Dow Chemical Co. | 2.100% | 11/15/30 | 500 | 510 |
| | Dow Chemical Co. | 4.250% | 10/1/34 | 150 | 180 |
| | Dow Chemical Co. | 9.400% | 5/15/39 | 350 | 623 |
| | Dow Chemical Co. | 5.250% | 11/15/41 | 100 | 131 |
| | Dow Chemical Co. | 4.625% | 10/1/44 | 200 | 250 |
| | Dow Chemical Co. | 5.550% | 11/30/48 | 100 | 143 |
| | Dow Chemical Co. | 3.600% | 11/15/50 | 500 | 558 |
| | DuPont de Nemours Inc. | 2.169% | 5/1/23 | 200 | 203 |
| | DuPont de Nemours Inc. | 4.205% | 11/15/23 | 475 | 524 |
| | DuPont de Nemours Inc. | 4.493% | 11/15/25 | 350 | 409 |
| | DuPont de Nemours Inc. | 4.725% | 11/15/28 | 425 | 520 |
| | DuPont de Nemours Inc. | 5.319% | 11/15/38 | 300 | 405 |
| | DuPont de Nemours Inc. | 5.419% | 11/15/48 | 475 | 686 |
| | Eastman Chemical Co. | 3.600% | 8/15/22 | 49 | 51 |
| | Eastman Chemical Co. | 3.800% | 3/15/25 | 285 | 316 |
| | Eastman Chemical Co. | 4.800% | 9/1/42 | 225 | 284 |
| | Eastman Chemical Co. | 4.650% | 10/15/44 | 150 | 189 |
| | Ecolab Inc. | 2.375% | 8/10/22 | 470 | 484 |
| | Ecolab Inc. | 2.700% | 11/1/26 | 200 | 222 |
| | Ecolab Inc. | 3.250% | 12/1/27 | 100 | 113 |
| | Ecolab Inc. | 4.800% | 3/24/30 | 300 | 382 |
| | Ecolab Inc. | 1.300% | 1/30/31 | 500 | 494 |
| | Ecolab Inc. | 3.950% | 12/1/47 | 100 | 127 |
| | EI du Pont de Nemours and Co. | 1.700% | 7/15/25 | 100 | 104 |
| | EI du Pont de Nemours and Co. | 2.300% | 7/15/30 | 100 | 106 |
| | Fibria Overseas Finance Ltd. | 5.250% | 5/12/24 | 200 | 220 |
| | Fibria Overseas Finance Ltd. | 4.000% | 1/14/25 | 150 | 161 |
| | FMC Corp. | 3.950% | 2/1/22 | 50 | 51 |
| | FMC Corp. | 4.100% | 2/1/24 | 250 | 272 |
| | FMC Corp. | 3.200% | 10/1/26 | 50 | 56 |
Total Bond Market Index Portfolio
| | | | Coupon | Maturity
Date | Face
Amount
($000) | Market
Value•
($000) |
| | FMC Corp. | 3.450% | 10/1/29 | 100 | 114 |
| | FMC Corp. | 4.500% | 10/1/49 | 100 | 130 |
| | Georgia-Pacific LLC | 8.000% | 1/15/24 | 250 | 306 |
| | Georgia-Pacific LLC | 7.375% | 12/1/25 | 100 | 130 |
| | Georgia-Pacific LLC | 8.875% | 5/15/31 | 250 | 404 |
| | International Flavors & Fragrances Inc. | 3.200% | 5/1/23 | 25 | 26 |
| | International Flavors & Fragrances Inc. | 4.450% | 9/26/28 | 50 | 59 |
| | International Flavors & Fragrances Inc. | 4.375% | 6/1/47 | 90 | 110 |
| | International Flavors & Fragrances Inc. | 5.000% | 9/26/48 | 100 | 134 |
| | International Paper Co. | 3.800% | 1/15/26 | 28 | 32 |
| | International Paper Co. | 5.000% | 9/15/35 | 100 | 131 |
| | International Paper Co. | 7.300% | 11/15/39 | 100 | 159 |
| | International Paper Co. | 4.800% | 6/15/44 | 200 | 266 |
| | International Paper Co. | 5.150% | 5/15/46 | 200 | 275 |
| | International Paper Co. | 4.400% | 8/15/47 | 200 | 258 |
| | International Paper Co. | 4.350% | 8/15/48 | 200 | 262 |
| | Kinross Gold Corp. | 5.950% | 3/15/24 | 75 | 86 |
| | Kinross Gold Corp. | 4.500% | 7/15/27 | 25 | 29 |
| | Linde Inc. | 2.450% | 2/15/22 | 450 | 458 |
| | Linde Inc. | 2.200% | 8/15/22 | 200 | 205 |
| | Linde Inc. | 2.650% | 2/5/25 | 147 | 159 |
| | Linde Inc. | 3.550% | 11/7/42 | 50 | 60 |
| | LYB International Finance BV | 5.250% | 7/15/43 | 200 | 259 |
| | LYB International Finance II BV | 3.500% | 3/2/27 | 200 | 223 |
| | LYB International Finance III LLC | 2.875% | 5/1/25 | 100 | 108 |
| | LYB International Finance III LLC | 1.250% | 10/1/25 | 500 | 507 |
| | LYB International Finance III LLC | 3.375% | 5/1/30 | 100 | 111 |
| | LYB International Finance III LLC | 4.200% | 10/15/49 | 135 | 157 |
| | LYB International Finance III LLC | 3.625% | 4/1/51 | 500 | 540 |
| | LyondellBasell Industries NV | 5.750% | 4/15/24 | 175 | 201 |
| | LyondellBasell Industries NV | 4.625% | 2/26/55 | 425 | 511 |
| | Martin Marietta Materials Inc. | 4.250% | 7/2/24 | 100 | 111 |
| | Martin Marietta Materials Inc. | 3.450% | 6/1/27 | 50 | 56 |
| | Martin Marietta Materials Inc. | 3.500% | 12/15/27 | 100 | 113 |
| | Martin Marietta Materials Inc. | 2.500% | 3/15/30 | 100 | 107 |
| | Martin Marietta Materials Inc. | 4.250% | 12/15/47 | 175 | 209 |
| | Mosaic Co. | 3.250% | 11/15/22 | 225 | 235 |
| | Mosaic Co. | 4.250% | 11/15/23 | 175 | 191 |
| | Mosaic Co. | 4.050% | 11/15/27 | 200 | 226 |
| | Mosaic Co. | 5.450% | 11/15/33 | 100 | 124 |
| | Mosaic Co. | 4.875% | 11/15/41 | 50 | 58 |
| | Mosaic Co. | 5.625% | 11/15/43 | 100 | 129 |
| | Newmont Corp. | 3.700% | 3/15/23 | 37 | 39 |
| | Newmont Corp. | 2.800% | 10/1/29 | 150 | 164 |
| | Newmont Corp. | 2.250% | 10/1/30 | 200 | 210 |
| | Newmont Corp. | 5.875% | 4/1/35 | 100 | 146 |
| | Newmont Corp. | 6.250% | 10/1/39 | 225 | 339 |
| | Newmont Corp. | 5.450% | 6/9/44 | 300 | 426 |
| | Nucor Corp. | 4.125% | 9/15/22 | 100 | 105 |
| | Nucor Corp. | 2.000% | 6/1/25 | 100 | 106 |
| | Nucor Corp. | 3.950% | 5/1/28 | 100 | 118 |
| | Nucor Corp. | 2.700% | 6/1/30 | 100 | 110 |
| 5 | Nucor Corp. | 2.979% | 12/15/55 | 400 | 417 |
| | | | Coupon | Maturity
Date | Face
Amount
($000) | Market
Value•
($000) |
| | Nutrien Ltd. | 3.500% | 6/1/23 | 299 | 318 |
| | Nutrien Ltd. | 3.375% | 3/15/25 | 250 | 275 |
| | Nutrien Ltd. | 3.000% | 4/1/25 | 250 | 270 |
| | Nutrien Ltd. | 4.000% | 12/15/26 | 50 | 58 |
| | Nutrien Ltd. | 2.950% | 5/13/30 | 175 | 193 |
| | Nutrien Ltd. | 4.125% | 3/15/35 | 250 | 297 |
| | Nutrien Ltd. | 5.625% | 12/1/40 | 275 | 380 |
| | Nutrien Ltd. | 6.125% | 1/15/41 | 25 | 36 |
| | Nutrien Ltd. | 4.900% | 6/1/43 | 50 | 64 |
| | Nutrien Ltd. | 5.250% | 1/15/45 | 200 | 275 |
| | Nutrien Ltd. | 5.000% | 4/1/49 | 100 | 138 |
| | Owens Corning | 3.400% | 8/15/26 | 200 | 221 |
| | Owens Corning | 3.950% | 8/15/29 | 100 | 115 |
| | Owens Corning | 3.875% | 6/1/30 | 50 | 58 |
| | Owens Corning | 4.300% | 7/15/47 | 200 | 240 |
| | Owens Corning | 4.400% | 1/30/48 | 75 | 90 |
| | Packaging Corp. of America | 4.500% | 11/1/23 | 350 | 385 |
| | Packaging Corp. of America | 3.400% | 12/15/27 | 100 | 112 |
| | Packaging Corp. of America | 3.000% | 12/15/29 | 140 | 155 |
| | Packaging Corp. of America | 4.050% | 12/15/49 | 90 | 111 |
| | PPG Industries Inc. | 2.400% | 8/15/24 | 200 | 212 |
| | PPG Industries Inc. | 2.550% | 6/15/30 | 300 | 321 |
| | Praxair Inc. | 1.100% | 8/10/30 | 500 | 494 |
| | Reliance Steel & Aluminum Co. | 4.500% | 4/15/23 | 100 | 108 |
| | Reliance Steel & Aluminum Co. | 1.300% | 8/15/25 | 300 | 305 |
| | Reliance Steel & Aluminum Co. | 2.150% | 8/15/30 | 300 | 308 |
| | Rio Tinto Alcan Inc. | 6.125% | 12/15/33 | 225 | 343 |
| | Rio Tinto Finance USA Ltd. | 3.750% | 6/15/25 | 317 | 358 |
| | Rio Tinto Finance USA Ltd. | 7.125% | 7/15/28 | 75 | 106 |
| | Rio Tinto Finance USA Ltd. | 5.200% | 11/2/40 | 125 | 182 |
| | Rio Tinto Finance USA plc | 4.750% | 3/22/42 | 150 | 211 |
| | Rio Tinto Finance USA plc | 4.125% | 8/21/42 | 250 | 323 |
| | Rohm and Haas Co. | 7.850% | 7/15/29 | 250 | 346 |
| | RPM International Inc. | 3.450% | 11/15/22 | 100 | 103 |
| | RPM International Inc. | 3.750% | 3/15/27 | 50 | 55 |
| | RPM International Inc. | 4.250% | 1/15/48 | 200 | 221 |
| | Sherwin-Williams Co. | 2.750% | 6/1/22 | 12 | 12 |
| | Sherwin-Williams Co. | 3.125% | 6/1/24 | 325 | 351 |
| | Sherwin-Williams Co. | 3.450% | 8/1/25 | 225 | 247 |
| | Sherwin-Williams Co. | 3.950% | 1/15/26 | 200 | 228 |
| | Sherwin-Williams Co. | 3.450% | 6/1/27 | 100 | 113 |
| | Sherwin-Williams Co. | 2.950% | 8/15/29 | 200 | 220 |
| | Sherwin-Williams Co. | 2.300% | 5/15/30 | 100 | 105 |
| | Sherwin-Williams Co. | 4.000% | 12/15/42 | 100 | 119 |
| | Sherwin-Williams Co. | 4.550% | 8/1/45 | 90 | 116 |
| | Sherwin-Williams Co. | 4.500% | 6/1/47 | 250 | 335 |
| | Sherwin-Williams Co. | 3.800% | 8/15/49 | 100 | 122 |
| | Sherwin-Williams Co. | 3.300% | 5/15/50 | 100 | 112 |
| | Sonoco Products Co. | 3.125% | 5/1/30 | 105 | 116 |
| | Sonoco Products Co. | 5.750% | 11/1/40 | 220 | 299 |
| | Southern Copper Corp. | 3.500% | 11/8/22 | 400 | 420 |
| | Southern Copper Corp. | 3.875% | 4/23/25 | 50 | 55 |
| | Southern Copper Corp. | 7.500% | 7/27/35 | 100 | 152 |
| | Southern Copper Corp. | 6.750% | 4/16/40 | 325 | 492 |
| | Southern Copper Corp. | 5.875% | 4/23/45 | 500 | 726 |
| | Steel Dynamics Inc. | 2.800% | 12/15/24 | 50 | 54 |
| | Steel Dynamics Inc. | 2.400% | 6/15/25 | 100 | 106 |
| | Steel Dynamics Inc. | 3.450% | 4/15/30 | 125 | 140 |
| | Steel Dynamics Inc. | 3.250% | 1/15/31 | 100 | 112 |
| | Steel Dynamics Inc. | 3.250% | 10/15/50 | 300 | 313 |
Total Bond Market Index Portfolio
| | | | Coupon | Maturity
Date | Face
Amount
($000) | Market
Value•
($000) |
| | Suzano Austria GmbH | 6.000% | 1/15/29 | 400 | 482 |
| | Suzano Austria GmbH | 5.000% | 1/15/30 | 200 | 227 |
| | Suzano Austria GmbH | 3.750% | 1/15/31 | 200 | 213 |
| | Syngenta Finance NV | 3.125% | 3/28/22 | 100 | 101 |
| | Teck Resources Ltd. | 3.900% | 7/15/30 | 100 | 111 |
| | Teck Resources Ltd. | 6.125% | 10/1/35 | 150 | 193 |
| | Teck Resources Ltd. | 6.000% | 8/15/40 | 50 | 63 |
| | Teck Resources Ltd. | 6.250% | 7/15/41 | 325 | 414 |
| | Vale Overseas Ltd. | 6.250% | 8/10/26 | 300 | 372 |
| | Vale Overseas Ltd. | 3.750% | 7/8/30 | 100 | 112 |
| | Vale Overseas Ltd. | 8.250% | 1/17/34 | 50 | 77 |
| | Vale Overseas Ltd. | 6.875% | 11/21/36 | 410 | 601 |
| | Vale Overseas Ltd. | 6.875% | 11/10/39 | 450 | 668 |
| | Vale SA | 5.625% | 9/11/42 | 75 | 100 |
| | Vulcan Materials Co. | 4.500% | 4/1/25 | 200 | 228 |
| | Vulcan Materials Co. | 3.500% | 6/1/30 | 150 | 172 |
| | Vulcan Materials Co. | 4.500% | 6/15/47 | 125 | 154 |
| | Westlake Chemical Corp. | 3.600% | 8/15/26 | 300 | 337 |
| | Westlake Chemical Corp. | 3.375% | 6/15/30 | 100 | 110 |
| | Westlake Chemical Corp. | 5.000% | 8/15/46 | 200 | 259 |
| | WestRock MWV LLC | 7.950% | 2/15/31 | 250 | 354 |
| | WestRock RKT LLC | 4.900% | 3/1/22 | 100 | 105 |
| | WRKCo Inc. | 3.000% | 9/15/24 | 250 | 269 |
| | WRKCo Inc. | 4.650% | 3/15/26 | 100 | 118 |
| | WRKCo Inc. | 3.375% | 9/15/27 | 250 | 279 |
| | WRKCo Inc. | 4.900% | 3/15/29 | 200 | 247 |
| | WRKCo Inc. | 3.000% | 6/15/33 | 100 | 110 |
| | | | | | | 45,007 |
| Real Estate (1.1%) |
| | Alexandria Real Estate Equities Inc. | 4.000% | 1/15/24 | 175 | 193 |
| | Alexandria Real Estate Equities Inc. | 3.450% | 4/30/25 | 254 | 282 |
| | Alexandria Real Estate Equities Inc. | 3.800% | 4/15/26 | 50 | 58 |
| | Alexandria Real Estate Equities Inc. | 3.950% | 1/15/28 | 50 | 58 |
| | Alexandria Real Estate Equities Inc. | 4.500% | 7/30/29 | 100 | 122 |
| | Alexandria Real Estate Equities Inc. | 2.750% | 12/15/29 | 200 | 218 |
| | Alexandria Real Estate Equities Inc. | 4.700% | 7/1/30 | 125 | 155 |
| | Alexandria Real Estate Equities Inc. | 4.900% | 12/15/30 | 124 | 158 |
| | Alexandria Real Estate Equities Inc. | 3.375% | 8/15/31 | 150 | 171 |
| | Alexandria Real Estate Equities Inc. | 1.875% | 2/1/33 | 500 | 499 |
| | Alexandria Real Estate Equities Inc. | 4.850% | 4/15/49 | 50 | 70 |
| | Alexandria Real Estate Equities Inc. | 4.000% | 2/1/50 | 125 | 156 |
| | American Campus Communities Operating Partnership LP | 3.750% | 4/15/23 | 75 | 79 |
| | American Campus Communities Operating Partnership LP | 4.125% | 7/1/24 | 100 | 109 |
| | American Campus Communities Operating Partnership LP | 3.300% | 7/15/26 | 50 | 54 |
| | American Campus Communities Operating Partnership LP | 3.625% | 11/15/27 | 75 | 82 |
| | American Campus Communities Operating Partnership LP | 2.850% | 2/1/30 | 70 | 73 |
| | American Homes 4 Rent LP | 4.900% | 2/15/29 | 100 | 121 |
| | American Tower Corp. | 2.250% | 1/15/22 | 125 | 127 |
| | | | Coupon | Maturity
Date | Face
Amount
($000) | Market
Value•
($000) |
| | American Tower Corp. | 3.500% | 1/31/23 | 200 | 212 |
| | American Tower Corp. | 5.000% | 2/15/24 | 100 | 113 |
| | American Tower Corp. | 3.375% | 5/15/24 | 200 | 217 |
| | American Tower Corp. | 2.950% | 1/15/25 | 100 | 108 |
| | American Tower Corp. | 4.000% | 6/1/25 | 138 | 156 |
| | American Tower Corp. | 3.375% | 10/15/26 | 200 | 224 |
| | American Tower Corp. | 2.750% | 1/15/27 | 500 | 541 |
| | American Tower Corp. | 3.125% | 1/15/27 | 125 | 137 |
| | American Tower Corp. | 1.500% | 1/31/28 | 500 | 502 |
| | American Tower Corp. | 3.950% | 3/15/29 | 140 | 162 |
| | American Tower Corp. | 3.800% | 8/15/29 | 475 | 550 |
| | American Tower Corp. | 2.900% | 1/15/30 | 145 | 158 |
| | American Tower Corp. | 2.100% | 6/15/30 | 150 | 154 |
| | American Tower Corp. | 1.875% | 10/15/30 | 500 | 504 |
| | American Tower Corp. | 3.700% | 10/15/49 | 200 | 227 |
| | American Tower Corp. | 3.100% | 6/15/50 | 150 | 154 |
| | AvalonBay Communities Inc. | 2.850% | 3/15/23 | 25 | 26 |
| | AvalonBay Communities Inc. | 4.200% | 12/15/23 | 400 | 441 |
| | AvalonBay Communities Inc. | 3.450% | 6/1/25 | 100 | 111 |
| | AvalonBay Communities Inc. | 2.950% | 5/11/26 | 150 | 166 |
| | AvalonBay Communities Inc. | 2.900% | 10/15/26 | 50 | 55 |
| | AvalonBay Communities Inc. | 3.350% | 5/15/27 | 75 | 84 |
| | AvalonBay Communities Inc. | 3.200% | 1/15/28 | 75 | 84 |
| | AvalonBay Communities Inc. | 3.300% | 6/1/29 | 100 | 114 |
| | AvalonBay Communities Inc. | 3.900% | 10/15/46 | 50 | 61 |
| | AvalonBay Communities Inc. | 4.350% | 4/15/48 | 60 | 78 |
| | Boston Properties LP | 3.850% | 2/1/23 | 225 | 239 |
| | Boston Properties LP | 3.125% | 9/1/23 | 275 | 291 |
| | Boston Properties LP | 3.200% | 1/15/25 | 111 | 121 |
| | Boston Properties LP | 3.650% | 2/1/26 | 100 | 113 |
| | Boston Properties LP | 2.750% | 10/1/26 | 50 | 54 |
| | Boston Properties LP | 3.400% | 6/21/29 | 400 | 446 |
| | Boston Properties LP | 2.900% | 3/15/30 | 400 | 426 |
| | Brandywine Operating Partnership LP | 3.950% | 2/15/23 | 700 | 725 |
| | Brandywine Operating Partnership LP | 3.950% | 11/15/27 | 100 | 107 |
| | Brixmor Operating Partnership LP | 3.650% | 6/15/24 | 50 | 54 |
| | Brixmor Operating Partnership LP | 3.850% | 2/1/25 | 125 | 137 |
| | Brixmor Operating Partnership LP | 4.125% | 6/15/26 | 200 | 227 |
| | Brixmor Operating Partnership LP | 3.900% | 3/15/27 | 75 | 83 |
| | Brixmor Operating Partnership LP | 4.125% | 5/15/29 | 533 | 611 |
| | Brixmor Operating Partnership LP | 4.050% | 7/1/30 | 250 | 287 |
| | Camden Property Trust | 4.100% | 10/15/28 | 60 | 71 |
| | Camden Property Trust | 3.150% | 7/1/29 | 50 | 56 |
| | Camden Property Trust | 2.800% | 5/15/30 | 765 | 845 |
| | Camden Property Trust | 3.350% | 11/1/49 | 120 | 138 |
| | CBRE Services Inc. | 4.875% | 3/1/26 | 125 | 147 |
| | CC Holdings GS V LLC / Crown Castle GS III Corp. | 3.849% | 4/15/23 | 250 | 268 |
| | Columbia Property Trust Operating Partnership LP | 4.150% | 4/1/25 | 243 | 256 |
Total Bond Market Index Portfolio
| | | | Coupon | Maturity
Date | Face
Amount
($000) | Market
Value•
($000) |
| | Columbia Property Trust Operating Partnership LP | 3.650% | 8/15/26 | 25 | 26 |
| | Corporate Office Properties LP | 3.600% | 5/15/23 | 150 | 158 |
| | Crown Castle International Corp. | 5.250% | 1/15/23 | 125 | 137 |
| | Crown Castle International Corp. | 3.150% | 7/15/23 | 150 | 160 |
| | Crown Castle International Corp. | 3.200% | 9/1/24 | 250 | 272 |
| | Crown Castle International Corp. | 1.350% | 7/15/25 | 100 | 102 |
| | Crown Castle International Corp. | 4.450% | 2/15/26 | 250 | 289 |
| | Crown Castle International Corp. | 3.700% | 6/15/26 | 175 | 197 |
| | Crown Castle International Corp. | 3.650% | 9/1/27 | 325 | 366 |
| | Crown Castle International Corp. | 3.800% | 2/15/28 | 425 | 487 |
| | Crown Castle International Corp. | 3.100% | 11/15/29 | 100 | 109 |
| | Crown Castle International Corp. | 3.300% | 7/1/30 | 115 | 128 |
| | Crown Castle International Corp. | 2.250% | 1/15/31 | 200 | 207 |
| | Crown Castle International Corp. | 4.750% | 5/15/47 | 95 | 121 |
| | Crown Castle International Corp. | 5.200% | 2/15/49 | 75 | 102 |
| | Crown Castle International Corp. | 4.150% | ��� 7/1/50 | 100 | 120 |
| | Crown Castle International Corp. | 3.250% | 1/15/51 | 200 | 207 |
| | CubeSmart LP | 4.375% | 12/15/23 | 100 | 109 |
| | CubeSmart LP | 4.000% | 11/15/25 | 50 | 56 |
| | CubeSmart LP | 3.125% | 9/1/26 | 100 | 110 |
| | CubeSmart LP | 4.375% | 2/15/29 | 50 | 59 |
| | CubeSmart LP | 2.000% | 2/15/31 | 75 | 75 |
| | CyrusOne LP / CyrusOne Finance Corp. | 2.900% | 11/15/24 | 120 | 128 |
| | CyrusOne LP / CyrusOne Finance Corp. | 3.450% | 11/15/29 | 275 | 296 |
| | Digital Realty Trust LP | 4.450% | 7/15/28 | 370 | 444 |
| | Digital Realty Trust LP | 3.600% | 7/1/29 | 175 | 200 |
| | Duke Realty LP | 3.250% | 6/30/26 | 175 | 193 |
| | Duke Realty LP | 3.375% | 12/15/27 | 160 | 180 |
| | Duke Realty LP | 4.000% | 9/15/28 | 50 | 59 |
| | Duke Realty LP | 2.875% | 11/15/29 | 70 | 77 |
| | Duke Realty LP | 1.750% | 7/1/30 | 200 | 202 |
| | Equinix Inc. | 2.625% | 11/18/24 | 200 | 214 |
| | Equinix Inc. | 1.250% | 7/15/25 | 100 | 102 |
| | Equinix Inc. | 1.000% | 9/15/25 | 500 | 499 |
| | Equinix Inc. | 2.900% | 11/18/26 | 100 | 110 |
| | Equinix Inc. | 1.800% | 7/15/27 | 100 | 103 |
| | Equinix Inc. | 1.550% | 3/15/28 | 500 | 504 |
| | Equinix Inc. | 3.200% | 11/18/29 | 250 | 275 |
| | Equinix Inc. | 2.150% | 7/15/30 | 250 | 254 |
| | Equinix Inc. | 3.000% | 7/15/50 | 100 | 101 |
| | ERP Operating LP | 4.625% | 12/15/21 | 129 | 133 |
| | ERP Operating LP | 3.000% | 4/15/23 | 125 | 131 |
| | ERP Operating LP | 3.375% | 6/1/25 | 125 | 138 |
| | ERP Operating LP | 2.850% | 11/1/26 | 50 | 55 |
| | ERP Operating LP | 3.500% | 3/1/28 | 100 | 114 |
| | ERP Operating LP | 4.150% | 12/1/28 | 70 | 83 |
| | ERP Operating LP | 3.000% | 7/1/29 | 75 | 84 |
| | ERP Operating LP | 2.500% | 2/15/30 | 150 | 162 |
| | ERP Operating LP | 4.500% | 7/1/44 | 150 | 196 |
| | ERP Operating LP | 4.500% | 6/1/45 | 25 | 33 |
| | ERP Operating LP | 4.000% | 8/1/47 | 100 | 124 |
| | | | Coupon | Maturity
Date | Face
Amount
($000) | Market
Value•
($000) |
| | Essex Portfolio LP | 3.250% | 5/1/23 | 25 | 26 |
| | Essex Portfolio LP | 3.875% | 5/1/24 | 50 | 55 |
| | Essex Portfolio LP | 3.500% | 4/1/25 | 166 | 184 |
| | Essex Portfolio LP | 3.375% | 4/15/26 | 100 | 112 |
| | Essex Portfolio LP | 3.625% | 5/1/27 | 100 | 113 |
| | Essex Portfolio LP | 4.000% | 3/1/29 | 100 | 117 |
| | Essex Portfolio LP | 3.000% | 1/15/30 | 110 | 122 |
| | Essex Portfolio LP | 2.650% | 3/15/32 | 105 | 112 |
| | Essex Portfolio LP | 4.500% | 3/15/48 | 120 | 155 |
| | Federal Realty Investment Trust | 2.750% | 6/1/23 | 25 | 26 |
| | Federal Realty Investment Trust | 3.250% | 7/15/27 | 50 | 55 |
| | Federal Realty Investment Trust | 3.200% | 6/15/29 | 25 | 27 |
| | Federal Realty Investment Trust | 4.500% | 12/1/44 | 150 | 179 |
| | GLP Capital LP / GLP Financing II Inc. | 5.375% | 11/1/23 | 100 | 109 |
| | GLP Capital LP / GLP Financing II Inc. | 3.350% | 9/1/24 | 75 | 79 |
| | GLP Capital LP / GLP Financing II Inc. | 5.250% | 6/1/25 | 200 | 225 |
| | GLP Capital LP / GLP Financing II Inc. | 5.375% | 4/15/26 | 175 | 201 |
| | GLP Capital LP / GLP Financing II Inc. | 5.750% | 6/1/28 | 25 | 30 |
| | GLP Capital LP / GLP Financing II Inc. | 5.300% | 1/15/29 | 275 | 319 |
| | GLP Capital LP / GLP Financing II Inc. | 4.000% | 1/15/30 | 175 | 190 |
| | Healthcare Realty Trust Inc. | 3.625% | 1/15/28 | 100 | 113 |
| | Healthcare Trust of America Holdings LP | 3.500% | 8/1/26 | 130 | 147 |
| | Healthcare Trust of America Holdings LP | 3.750% | 7/1/27 | 100 | 113 |
| | Healthcare Trust of America Holdings LP | 3.100% | 2/15/30 | 100 | 109 |
| | Healthcare Trust of America Holdings LP | 2.000% | 3/15/31 | 500 | 499 |
| | Healthpeak Properties Inc. | 4.250% | 11/15/23 | 9 | 10 |
| | Healthpeak Properties Inc. | 4.200% | 3/1/24 | 125 | 137 |
| | Healthpeak Properties Inc. | 3.400% | 2/1/25 | 152 | 168 |
| | Healthpeak Properties Inc. | 3.250% | 7/15/26 | 25 | 28 |
| | Healthpeak Properties Inc. | 3.500% | 7/15/29 | 125 | 141 |
| | Healthpeak Properties Inc. | 3.000% | 1/15/30 | 800 | 876 |
| | Healthpeak Properties Inc. | 6.750% | 2/1/41 | 100 | 147 |
| | Highwoods Realty LP | 4.125% | 3/15/28 | 75 | 85 |
| | Highwoods Realty LP | 4.200% | 4/15/29 | 50 | 57 |
| | Highwoods Realty LP | 2.600% | 2/1/31 | 250 | 254 |
| | Host Hotels & Resorts LP | 3.750% | 10/15/23 | 261 | 275 |
| | Host Hotels & Resorts LP | 3.875% | 4/1/24 | 75 | 79 |
| | Host Hotels & Resorts LP | 3.375% | 12/15/29 | 100 | 102 |
| | Hudson Pacific Properties LP | 3.950% | 11/1/27 | 100 | 110 |
| | Hudson Pacific Properties LP | 4.650% | 4/1/29 | 25 | 29 |
| | Hudson Pacific Properties LP | 3.250% | 1/15/30 | 60 | 64 |
| | Kilroy Realty LP | 3.800% | 1/15/23 | 250 | 263 |
| | Kilroy Realty LP | 3.450% | 12/15/24 | 50 | 54 |
| | Kilroy Realty LP | 4.750% | 12/15/28 | 50 | 59 |
| | Kilroy Realty LP | 4.250% | 8/15/29 | 104 | 120 |
| | Kilroy Realty LP | 3.050% | 2/15/30 | 200 | 213 |
| | Kimco Realty Corp. | 3.400% | 11/1/22 | 150 | 157 |
| | Kimco Realty Corp. | 3.125% | 6/1/23 | 25 | 26 |
| | Kimco Realty Corp. | 3.300% | 2/1/25 | 58 | 63 |
| | Kimco Realty Corp. | 2.800% | 10/1/26 | 125 | 136 |
| | Kimco Realty Corp. | 3.800% | 4/1/27 | 75 | 85 |
| | Kimco Realty Corp. | 1.900% | 3/1/28 | 500 | 513 |
Total Bond Market Index Portfolio
| | | | Coupon | Maturity
Date | Face
Amount
($000) | Market
Value•
($000) |
| | Kimco Realty Corp. | 2.700% | 10/1/30 | 100 | 107 |
| | Kimco Realty Corp. | 4.125% | 12/1/46 | 50 | 54 |
| | Kimco Realty Corp. | 4.450% | 9/1/47 | 50 | 58 |
| | Kite Realty Group LP | 4.000% | 10/1/26 | 200 | 209 |
| | Life Storage LP | 3.500% | 7/1/26 | 125 | 141 |
| | Life Storage LP | 3.875% | 12/15/27 | 150 | 171 |
| | Life Storage LP | 4.000% | 6/15/29 | 25 | 29 |
| | Mid-America Apartments LP | 4.300% | 10/15/23 | 150 | 164 |
| | Mid-America Apartments LP | 3.750% | 6/15/24 | 50 | 54 |
| | Mid-America Apartments LP | 3.600% | 6/1/27 | 250 | 283 |
| | Mid-America Apartments LP | 2.750% | 3/15/30 | 150 | 164 |
| | Mid-America Apartments LP | 1.700% | 2/15/31 | 150 | 149 |
| | National Retail Properties Inc. | 3.500% | 10/15/27 | 350 | 384 |
| | National Retail Properties Inc. | 4.300% | 10/15/28 | 25 | 29 |
| | National Retail Properties Inc. | 2.500% | 4/15/30 | 75 | 77 |
| | National Retail Properties Inc. | 4.800% | 10/15/48 | 50 | 62 |
| | National Retail Properties Inc. | 3.100% | 4/15/50 | 50 | 48 |
| | Office Properties Income Trust | 4.150% | 2/1/22 | 100 | 102 |
| | Office Properties Income Trust | 4.000% | 7/15/22 | 100 | 102 |
| | Office Properties Income Trust | 4.250% | 5/15/24 | 100 | 104 |
| | Office Properties Income Trust | 4.500% | 2/1/25 | 50 | 53 |
| | Omega Healthcare Investors Inc. | 4.375% | 8/1/23 | 300 | 325 |
| | Omega Healthcare Investors Inc. | 4.950% | 4/1/24 | 100 | 109 |
| | Omega Healthcare Investors Inc. | 4.500% | 1/15/25 | 100 | 109 |
| | Omega Healthcare Investors Inc. | 5.250% | 1/15/26 | 100 | 114 |
| | Omega Healthcare Investors Inc. | 4.500% | 4/1/27 | 300 | 337 |
| | Omega Healthcare Investors Inc. | 4.750% | 1/15/28 | 70 | 80 |
| | Omega Healthcare Investors Inc. | 3.625% | 10/1/29 | 250 | 266 |
| | Omega Healthcare Investors Inc. | 3.375% | 2/1/31 | 500 | 525 |
| | Physicians Realty LP | 4.300% | 3/15/27 | 100 | 110 |
| | Physicians Realty LP | 3.950% | 1/15/28 | 100 | 108 |
| | Piedmont Operating Partnership LP | 3.400% | 6/1/23 | 75 | 78 |
| | Prologis LP | 2.125% | 4/15/27 | 105 | 113 |
| | Prologis LP | 3.875% | 9/15/28 | 100 | 119 |
| | Prologis LP | 4.375% | 2/1/29 | 200 | 244 |
| | Prologis LP | 2.250% | 4/15/30 | 155 | 166 |
| | Prologis LP | 1.250% | 10/15/30 | 500 | 494 |
| | Prologis LP | 4.375% | 9/15/48 | 75 | 103 |
| | Prologis LP | 3.000% | 4/15/50 | 140 | 154 |
| | Public Storage | 2.370% | 9/15/22 | 55 | 57 |
| | Public Storage | 3.094% | 9/15/27 | 100 | 112 |
| | Public Storage | 3.385% | 5/1/29 | 100 | 114 |
| | Rayonier Inc. | 3.750% | 4/1/22 | 50 | 51 |
| | Realty Income Corp. | 3.250% | 10/15/22 | 175 | 183 |
| | Realty Income Corp. | 4.650% | 8/1/23 | 250 | 274 |
| | Realty Income Corp. | 3.875% | 7/15/24 | 50 | 55 |
| | Realty Income Corp. | 3.875% | 4/15/25 | 225 | 253 |
| | Realty Income Corp. | 4.125% | 10/15/26 | 125 | 147 |
| | Realty Income Corp. | 3.000% | 1/15/27 | 150 | 165 |
| | | | Coupon | Maturity
Date | Face
Amount
($000) | Market
Value•
($000) |
| | Realty Income Corp. | 3.650% | 1/15/28 | 190 | 217 |
| | Realty Income Corp. | 3.250% | 6/15/29 | 150 | 168 |
| | Realty Income Corp. | 3.250% | 1/15/31 | 50 | 57 |
| | Realty Income Corp. | 1.800% | 3/15/33 | 500 | 501 |
| | Realty Income Corp. | 4.650% | 3/15/47 | 175 | 238 |
| | Regency Centers LP | 3.600% | 2/1/27 | 25 | 27 |
| | Regency Centers LP | 4.125% | 3/15/28 | 75 | 86 |
| | Regency Centers LP | 2.950% | 9/15/29 | 100 | 107 |
| | Regency Centers LP | 4.400% | 2/1/47 | 200 | 231 |
| | Regency Centers LP | 4.650% | 3/15/49 | 75 | 90 |
| | Sabra Health Care LP | 4.800% | 6/1/24 | 55 | 59 |
| | Sabra Health Care LP | 5.125% | 8/15/26 | 25 | 28 |
| | Sabra Health Care LP | 3.900% | 10/15/29 | 150 | 156 |
| | Simon Property Group LP | 2.350% | 1/30/22 | 150 | 152 |
| | Simon Property Group LP | 2.625% | 6/15/22 | 100 | 102 |
| | Simon Property Group LP | 2.750% | 2/1/23 | 25 | 26 |
| | Simon Property Group LP | 2.750% | 6/1/23 | 100 | 105 |
| | Simon Property Group LP | 3.750% | 2/1/24 | 150 | 162 |
| | Simon Property Group LP | 2.000% | 9/13/24 | 145 | 150 |
| | Simon Property Group LP | 3.500% | 9/1/25 | 300 | 332 |
| | Simon Property Group LP | 3.300% | 1/15/26 | 195 | 214 |
| | Simon Property Group LP | 3.250% | 11/30/26 | 75 | 83 |
| | Simon Property Group LP | 3.375% | 6/15/27 | 160 | 177 |
| | Simon Property Group LP | 3.375% | 12/1/27 | 100 | 112 |
| | Simon Property Group LP | 2.450% | 9/13/29 | 145 | 152 |
| | Simon Property Group LP | 2.650% | 7/15/30 | 200 | 212 |
| | Simon Property Group LP | 6.750% | 2/1/40 | 125 | 185 |
| | Simon Property Group LP | 4.750% | 3/15/42 | 100 | 122 |
| | Simon Property Group LP | 4.250% | 11/30/46 | 100 | 116 |
| | Simon Property Group LP | 3.250% | 9/13/49 | 200 | 205 |
| | Simon Property Group LP | 3.800% | 7/15/50 | 200 | 222 |
| | SITE Centers Corp. | ���3.900% | 8/15/24 | 100 | 100 |
| | SITE Centers Corp. | 3.625% | 2/1/25 | 200 | 208 |
| | SITE Centers Corp. | 4.250% | 2/1/26 | 70 | 76 |
| | SITE Centers Corp. | 4.700% | 6/1/27 | 75 | 81 |
| | SL Green Operating Partnership LP | 3.250% | 10/15/22 | 100 | 103 |
| | Spirit Realty LP | 3.200% | 1/15/27 | 80 | 85 |
| | Spirit Realty LP | 4.000% | 7/15/29 | 60 | 67 |
| | Spirit Realty LP | 3.400% | 1/15/30 | 80 | 86 |
| | STORE Capital Corp. | 4.500% | 3/15/28 | 75 | 85 |
| | STORE Capital Corp. | 4.625% | 3/15/29 | 100 | 115 |
| | Tanger Properties LP | 3.125% | 9/1/26 | 175 | 180 |
| | Tanger Properties LP | 3.875% | 7/15/27 | 50 | 52 |
| | UDR Inc. | 2.950% | 9/1/26 | 150 | 165 |
| | UDR Inc. | 3.500% | 7/1/27 | 150 | 168 |
| | UDR Inc. | 3.500% | 1/15/28 | 250 | 280 |
| | UDR Inc. | 3.200% | 1/15/30 | 60 | 67 |
| | UDR Inc. | 3.000% | 8/15/31 | 65 | 72 |
| | UDR Inc. | 1.900% | 3/15/33 | 200 | 199 |
| | UDR Inc. | 3.100% | 11/1/34 | 65 | 73 |
| | Ventas Realty LP | 3.125% | 6/15/23 | 175 | 185 |
| | Ventas Realty LP | 3.500% | 4/15/24 | 75 | 82 |
| | Ventas Realty LP | 3.750% | 5/1/24 | 200 | 218 |
| | Ventas Realty LP | 2.650% | 1/15/25 | 75 | 80 |
| | Ventas Realty LP | 4.125% | 1/15/26 | 75 | 86 |
| | Ventas Realty LP | 3.250% | 10/15/26 | 75 | 83 |
| | Ventas Realty LP | 3.850% | 4/1/27 | 50 | 56 |
| | Ventas Realty LP | 4.000% | 3/1/28 | 125 | 142 |
| | Ventas Realty LP | 3.000% | 1/15/30 | 100 | 107 |
| | Ventas Realty LP | 4.750% | 11/15/30 | 580 | 708 |
| | Ventas Realty LP | 5.700% | 9/30/43 | 75 | 97 |
| | Ventas Realty LP | 4.375% | 2/1/45 | 60 | 66 |
| | Ventas Realty LP | 4.875% | 4/15/49 | 80 | 99 |
| | VEREIT Operating Partnership LP | 4.600% | 2/6/24 | 75 | 82 |
| | VEREIT Operating Partnership LP | 4.625% | 11/1/25 | 75 | 86 |
Total Bond Market Index Portfolio
| | | | Coupon | Maturity
Date | Face
Amount
($000) | Market
Value•
($000) |
| | VEREIT Operating Partnership LP | 3.950% | 8/15/27 | 450 | 508 |
| | VEREIT Operating Partnership LP | 3.100% | 12/15/29 | 150 | 162 |
| | Vornado Realty LP | 3.500% | 1/15/25 | 100 | 106 |
| | Washington REIT | 3.950% | 10/15/22 | 75 | 77 |
| | Weingarten Realty Investors | 3.375% | 10/15/22 | 50 | 52 |
| | Weingarten Realty Investors | 3.500% | 4/15/23 | 100 | 104 |
| | Welltower Inc. | 3.625% | 3/15/24 | 195 | 213 |
| | Welltower Inc. | 4.000% | 6/1/25 | 380 | 429 |
| | Welltower Inc. | 4.250% | 4/1/26 | 150 | 175 |
| | Welltower Inc. | 2.700% | 2/15/27 | 300 | 330 |
| | Welltower Inc. | 4.250% | 4/15/28 | 125 | 145 |
| | Welltower Inc. | 4.125% | 3/15/29 | 250 | 290 |
| | Welltower Inc. | 2.750% | 1/15/31 | 250 | 266 |
| | Welltower Inc. | 6.500% | 3/15/41 | 25 | 35 |
| | Welltower Inc. | 4.950% | 9/1/48 | 75 | 97 |
| | Weyerhaeuser Co. | 8.500% | 1/15/25 | 50 | 64 |
| | Weyerhaeuser Co. | 4.000% | 11/15/29 | 150 | 176 |
| | Weyerhaeuser Co. | 4.000% | 4/15/30 | 200 | 236 |
| | Weyerhaeuser Co. | 7.375% | 3/15/32 | 100 | 150 |
| | Weyerhaeuser Co. | 6.875% | 12/15/33 | 50 | 71 |
| | WP Carey Inc. | 4.600% | 4/1/24 | 125 | 139 |
| | WP Carey Inc. | 4.000% | 2/1/25 | 50 | 55 |
| | WP Carey Inc. | 4.250% | 10/1/26 | 75 | 86 |
| | WP Carey Inc. | 3.850% | 7/15/29 | 50 | 57 |
| | | | | | | 51,050 |
| Technology (2.7%) |
| | Adobe Inc. | 1.700% | 2/1/23 | 100 | 103 |
| | Adobe Inc. | 1.900% | 2/1/25 | 20 | 21 |
| | Adobe Inc. | 3.250% | 2/1/25 | 175 | 193 |
| | Adobe Inc. | 2.150% | 2/1/27 | 180 | 194 |
| | Adobe Inc. | 2.300% | 2/1/30 | 260 | 280 |
| | Altera Corp. | 4.100% | 11/15/23 | 75 | 83 |
| | Amdocs Ltd. | 2.538% | 6/15/30 | 200 | 210 |
| | Analog Devices Inc. | 2.875% | 6/1/23 | 450 | 473 |
| | Analog Devices Inc. | 3.125% | 12/5/23 | 75 | 81 |
| | Analog Devices Inc. | 2.950% | 4/1/25 | 85 | 93 |
| | Analog Devices Inc. | 3.500% | 12/5/26 | 200 | 227 |
| | Apple Inc. | 2.150% | 2/9/22 | 225 | 230 |
| | Apple Inc. | 2.500% | 2/9/22 | 300 | 307 |
| | Apple Inc. | 2.300% | 5/11/22 | 200 | 205 |
| | Apple Inc. | 2.700% | 5/13/22 | 250 | 258 |
| | Apple Inc. | 2.100% | 9/12/22 | 200 | 206 |
| | Apple Inc. | 2.850% | 2/23/23 | 342 | 359 |
| | Apple Inc. | 2.400% | 5/3/23 | 865 | 907 |
| | Apple Inc. | 0.750% | 5/11/23 | 400 | 405 |
| | Apple Inc. | 3.000% | 2/9/24 | 325 | 350 |
| | Apple Inc. | 3.450% | 5/6/24 | 75 | 83 |
| | Apple Inc. | 2.850% | 5/11/24 | 1,243 | 1,340 |
| | Apple Inc. | 1.800% | 9/11/24 | 150 | 157 |
| | Apple Inc. | 2.750% | 1/13/25 | 575 | 623 |
| | Apple Inc. | 1.125% | 5/11/25 | 900 | 924 |
| | Apple Inc. | 0.550% | 8/20/25 | 500 | 501 |
| | Apple Inc. | 3.250% | 2/23/26 | 705 | 791 |
| | Apple Inc. | 2.450% | 8/4/26 | 1,450 | 1,580 |
| | Apple Inc. | 3.200% | 5/11/27 | 775 | 877 |
| | Apple Inc. | 2.900% | 9/12/27 | 655 | 733 |
| | Apple Inc. | 2.200% | 9/11/29 | 350 | 377 |
| | Apple Inc. | 1.250% | 8/20/30 | 500 | 499 |
| | Apple Inc. | 4.500% | 2/23/36 | 225 | 302 |
| | Apple Inc. | 3.850% | 5/4/43 | 450 | 571 |
| | Apple Inc. | 4.450% | 5/6/44 | 200 | 274 |
| | Apple Inc. | 3.450% | 2/9/45 | 225 | 272 |
| | Apple Inc. | 4.375% | 5/13/45 | 500 | 684 |
| | Apple Inc. | 4.650% | 2/23/46 | 910 | 1,305 |
| | Apple Inc. | 3.850% | 8/4/46 | 375 | 482 |
| | | | Coupon | Maturity
Date | Face
Amount
($000) | Market
Value•
($000) |
| | Apple Inc. | 4.250% | 2/9/47 | 200 | 272 |
| | Apple Inc. | 3.750% | 9/12/47 | 525 | 656 |
| | Apple Inc. | 3.750% | 11/13/47 | 450 | 568 |
| | Apple Inc. | 2.650% | 5/11/50 | 515 | 545 |
| | Apple Inc. | 2.400% | 8/20/50 | 500 | 511 |
| | Apple Inc. | 2.550% | 8/20/60 | 500 | 512 |
| | Applied Materials Inc. | 3.900% | 10/1/25 | 145 | 166 |
| | Applied Materials Inc. | 3.300% | 4/1/27 | 225 | 256 |
| | Applied Materials Inc. | 1.750% | 6/1/30 | 200 | 207 |
| | Applied Materials Inc. | 5.100% | 10/1/35 | 100 | 139 |
| | Applied Materials Inc. | 5.850% | 6/15/41 | 125 | 197 |
| | Applied Materials Inc. | 4.350% | 4/1/47 | 175 | 242 |
| | Applied Materials Inc. | 2.750% | 6/1/50 | 200 | 217 |
| | Arrow Electronics Inc. | 3.500% | 4/1/22 | 75 | 77 |
| | Arrow Electronics Inc. | 4.500% | 3/1/23 | 50 | 54 |
| | Arrow Electronics Inc. | 3.250% | 9/8/24 | 171 | 184 |
| | Arrow Electronics Inc. | 4.000% | 4/1/25 | 50 | 55 |
| | Arrow Electronics Inc. | 3.875% | 1/12/28 | 100 | 113 |
| | Autodesk Inc. | 3.600% | 12/15/22 | 25 | 26 |
| | Autodesk Inc. | 4.375% | 6/15/25 | 100 | 114 |
| | Autodesk Inc. | 3.500% | 6/15/27 | 75 | 85 |
| | Autodesk Inc. | 2.850% | 1/15/30 | 75 | 83 |
| | Automatic Data Processing Inc. | 3.375% | 9/15/25 | 200 | 225 |
| | Automatic Data Processing Inc. | 1.250% | 9/1/30 | 400 | 395 |
| | Avnet Inc. | 4.875% | 12/1/22 | 170 | 181 |
| | Avnet Inc. | 4.625% | 4/15/26 | 100 | 113 |
| | Broadcom Corp. / Broadcom Cayman Finance Ltd. | 2.650% | 1/15/23 | 250 | 260 |
| | Broadcom Corp. / Broadcom Cayman Finance Ltd. | 3.625% | 1/15/24 | 450 | 486 |
| | Broadcom Corp. / Broadcom Cayman Finance Ltd. | 3.125% | 1/15/25 | 480 | 518 |
| | Broadcom Corp. / Broadcom Cayman Finance Ltd. | 3.875% | 1/15/27 | 925 | 1,040 |
| | Broadcom Corp. / Broadcom Cayman Finance Ltd. | 3.500% | 1/15/28 | 200 | 220 |
| | Broadcom Inc. | 3.125% | 10/15/22 | 250 | 261 |
| | Broadcom Inc. | 2.250% | 11/15/23 | 200 | 209 |
| | Broadcom Inc. | 3.625% | 10/15/24 | 186 | 204 |
| | Broadcom Inc. | 4.700% | 4/15/25 | 500 | 573 |
| | Broadcom Inc. | 3.150% | 11/15/25 | 450 | 491 |
| | Broadcom Inc. | 4.250% | 4/15/26 | 500 | 569 |
| | Broadcom Inc. | 3.459% | 9/15/26 | 661 | 731 |
| | Broadcom Inc. | 4.110% | 9/15/28 | 428 | 487 |
| | Broadcom Inc. | 4.750% | 4/15/29 | 545 | 651 |
| | Broadcom Inc. | 5.000% | 4/15/30 | 500 | 605 |
| | Broadcom Inc. | 4.150% | 11/15/30 | 600 | 693 |
| | Broadcom Inc. | 4.300% | 11/15/32 | 400 | 472 |
| | Broadridge Financial Solutions Inc. | 3.400% | 6/27/26 | 100 | 113 |
| | Broadridge Financial Solutions Inc. | 2.900% | 12/1/29 | 75 | 82 |
| | Cadence Design Systems Inc. | 4.375% | 10/15/24 | 100 | 112 |
| | Cisco Systems Inc. | 3.000% | 6/15/22 | 125 | 130 |
| | Cisco Systems Inc. | 2.200% | 9/20/23 | 150 | 157 |
| | Cisco Systems Inc. | 3.625% | 3/4/24 | 875 | 962 |
| | Cisco Systems Inc. | 2.950% | 2/28/26 | 100 | 111 |
| | Cisco Systems Inc. | 2.500% | 9/20/26 | 225 | 247 |
| | Cisco Systems Inc. | 5.500% | 1/15/40 | 800 | 1,198 |
| | Citrix Systems Inc. | 4.500% | 12/1/27 | 50 | 58 |
| | Citrix Systems Inc. | 3.300% | 3/1/30 | 75 | 83 |
| | Corning Inc. | 2.900% | 5/15/22 | 175 | 180 |
| | Corning Inc. | 4.700% | 3/15/37 | 275 | 330 |
Total Bond Market Index Portfolio
| | | | Coupon | Maturity
Date | Face
Amount
($000) | Market
Value•
($000) |
| | Corning Inc. | 5.750% | 8/15/40 | 195 | 261 |
| | Corning Inc. | 3.900% | 11/15/49 | 100 | 121 |
| | Corning Inc. | 4.375% | 11/15/57 | 350 | 432 |
| 5 | Dell International LLC / EMC Corp. | 5.450% | 6/15/23 | 700 | 773 |
| 5 | Dell International LLC / EMC Corp. | 4.000% | 7/15/24 | 100 | 110 |
| 5 | Dell International LLC / EMC Corp. | 5.850% | 7/15/25 | 200 | 240 |
| 5 | Dell International LLC / EMC Corp. | 6.020% | 6/15/26 | 1,075 | 1,310 |
| 5 | Dell International LLC / EMC Corp. | 4.900% | 10/1/26 | 250 | 295 |
| 5 | Dell International LLC / EMC Corp. | 6.100% | 7/15/27 | 100 | 124 |
| 5 | Dell International LLC / EMC Corp. | 5.300% | 10/1/29 | 325 | 398 |
| 5 | Dell International LLC / EMC Corp. | 6.200% | 7/15/30 | 150 | 195 |
| 5 | Dell International LLC / EMC Corp. | 8.100% | 7/15/36 | 320 | 471 |
| 5 | Dell International LLC / EMC Corp. | 8.350% | 7/15/46 | 425 | 643 |
| | DXC Technology Co. | 4.000% | 4/15/23 | 50 | 53 |
| | DXC Technology Co. | 4.250% | �� 4/15/24 | 250 | 273 |
| | DXC Technology Co. | 4.125% | 4/15/25 | 100 | 110 |
| | Equifax Inc. | 3.950% | 6/15/23 | 50 | 54 |
| | Equifax Inc. | 2.600% | 12/1/24 | 75 | 80 |
| | Equifax Inc. | 2.600% | 12/15/25 | 100 | 108 |
| | Equifax Inc. | 3.100% | 5/15/30 | 120 | 133 |
| | Fidelity National Information Services Inc. | 3.500% | 4/15/23 | 143 | 152 |
| | Fidelity National Information Services Inc. | 3.875% | 6/5/24 | 150 | 165 |
| | Fidelity National Information Services Inc. | 3.000% | 8/15/26 | 414 | 461 |
| | Fidelity National Information Services Inc. | 3.750% | 5/21/29 | 200 | 234 |
| | Fiserv Inc. | 3.800% | 10/1/23 | 200 | 218 |
| | Fiserv Inc. | 2.750% | 7/1/24 | 400 | 429 |
| | Fiserv Inc. | 3.850% | 6/1/25 | 400 | 452 |
| | Fiserv Inc. | 3.200% | 7/1/26 | 200 | 224 |
| | Fiserv Inc. | 2.250% | 6/1/27 | 300 | 319 |
| | Fiserv Inc. | 4.200% | 10/1/28 | 200 | 237 |
| | Fiserv Inc. | 3.500% | 7/1/29 | 800 | 913 |
| | Fiserv Inc. | 2.650% | 6/1/30 | 200 | 216 |
| | Fiserv Inc. | 4.400% | 7/1/49 | 415 | 556 |
| | Flex Ltd. | 4.750% | 6/15/25 | 26 | 30 |
| | Flex Ltd. | 4.875% | 6/15/29 | 50 | 59 |
| | FLIR Systems Inc. | 2.500% | 8/1/30 | 100 | 105 |
| | Global Payments Inc. | 3.750% | 6/1/23 | 250 | 268 |
| | Global Payments Inc. | 4.000% | 6/1/23 | 100 | 108 |
| | Global Payments Inc. | 2.650% | 2/15/25 | 337 | 361 |
| | Global Payments Inc. | 4.800% | 4/1/26 | 150 | 178 |
| | Global Payments Inc. | 3.200% | 8/15/29 | 310 | 344 |
| | Global Payments Inc. | 2.900% | 5/15/30 | 200 | 217 |
| | Global Payments Inc. | 4.150% | 8/15/49 | 200 | 245 |
| | Hewlett Packard Enterprise Co. | 4.400% | 10/15/22 | 350 | 372 |
| | Hewlett Packard Enterprise Co. | 2.250% | 4/1/23 | 200 | 208 |
| | Hewlett Packard Enterprise Co. | 4.450% | 10/2/23 | 300 | 330 |
| | Hewlett Packard Enterprise Co. | 1.450% | 4/1/24 | 150 | 154 |
| | Hewlett Packard Enterprise Co. | 4.650% | 10/1/24 | 200 | 227 |
| | | | Coupon | Maturity
Date | Face
Amount
($000) | Market
Value•
($000) |
| | Hewlett Packard Enterprise Co. | 4.900% | 10/15/25 | 500 | 585 |
| | Hewlett Packard Enterprise Co. | 1.750% | 4/1/26 | 150 | 155 |
| | Hewlett Packard Enterprise Co. | 6.200% | 10/15/35 | 150 | 193 |
| | Hewlett Packard Enterprise Co. | 6.350% | 10/15/45 | 375 | 495 |
| | HP Inc. | 4.050% | 9/15/22 | 100 | 106 |
| | HP Inc. | 2.200% | 6/17/25 | 300 | 318 |
| | HP Inc. | 3.000% | 6/17/27 | 350 | 386 |
| | HP Inc. | 3.400% | 6/17/30 | 500 | 554 |
| | HP Inc. | 6.000% | 9/15/41 | 100 | 130 |
| | IBM Credit LLC | 2.200% | 9/8/22 | 100 | 103 |
| | IBM Credit LLC | 3.000% | 2/6/23 | 150 | 158 |
| | IHS Markit Ltd. | 3.625% | 5/1/24 | 100 | 109 |
| | IHS Markit Ltd. | 4.750% | 8/1/28 | 140 | 172 |
| | IHS Markit Ltd. | 4.250% | 5/1/29 | 100 | 120 |
| | Intel Corp. | 3.100% | 7/29/22 | 175 | 183 |
| | Intel Corp. | 2.700% | 12/15/22 | 404 | 423 |
| | Intel Corp. | 2.875% | 5/11/24 | 1,050 | 1,130 |
| | Intel Corp. | 3.400% | 3/25/25 | 300 | 332 |
| | Intel Corp. | 3.700% | 7/29/25 | 450 | 507 |
| | Intel Corp. | 2.600% | 5/19/26 | 210 | 229 |
| | Intel Corp. | 3.750% | 3/25/27 | 400 | 463 |
| | Intel Corp. | 2.450% | 11/15/29 | 375 | 404 |
| | Intel Corp. | 3.900% | 3/25/30 | 345 | 413 |
| | Intel Corp. | 4.000% | 12/15/32 | 150 | 185 |
| | Intel Corp. | 4.600% | 3/25/40 | 150 | 197 |
| | Intel Corp. | 4.800% | 10/1/41 | 162 | 220 |
| | Intel Corp. | 4.250% | 12/15/42 | 150 | 192 |
| | Intel Corp. | 4.100% | 5/19/46 | 250 | 319 |
| | Intel Corp. | 4.100% | 5/11/47 | 200 | 255 |
| | Intel Corp. | 3.734% | 12/8/47 | 674 | 807 |
| | Intel Corp. | 3.250% | 11/15/49 | 300 | 335 |
| | Intel Corp. | 4.750% | 3/25/50 | 400 | 558 |
| | Intel Corp. | 3.100% | 2/15/60 | 200 | 216 |
| | Intel Corp. | 4.950% | 3/25/60 | 155 | 229 |
| | International Business Machines Corp. | 2.850% | 5/13/22 | 500 | 518 |
| | International Business Machines Corp. | 1.875% | 8/1/22 | 675 | 692 |
| | International Business Machines Corp. | 2.875% | 11/9/22 | 240 | 252 |
| | International Business Machines Corp. | 3.375% | 8/1/23 | 450 | 485 |
| | International Business Machines Corp. | 3.625% | 2/12/24 | 450 | 493 |
| | International Business Machines Corp. | 3.000% | 5/15/24 | 600 | 649 |
| | International Business Machines Corp. | 7.000% | 10/30/25 | 300 | 388 |
| | International Business Machines Corp. | 3.450% | 2/19/26 | 285 | 322 |
| | International Business Machines Corp. | 3.300% | 5/15/26 | 700 | 790 |
| | International Business Machines Corp. | 1.700% | 5/15/27 | 265 | 275 |
| | International Business Machines Corp. | 6.220% | 8/1/27 | 75 | 98 |
| | International Business Machines Corp. | 6.500% | 1/15/28 | 75 | 100 |
| | International Business Machines Corp. | 3.500% | 5/15/29 | 750 | 867 |
| | International Business Machines Corp. | 1.950% | 5/15/30 | 265 | 272 |
| | International Business Machines Corp. | 4.150% | 5/15/39 | 400 | 505 |
| | International Business Machines Corp. | 5.600% | 11/30/39 | 148 | 216 |
Total Bond Market Index Portfolio
| | | | Coupon | Maturity
Date | Face
Amount
($000) | Market
Value•
($000) |
| | International Business Machines Corp. | 2.850% | 5/15/40 | 265 | 282 |
| | International Business Machines Corp. | 4.000% | 6/20/42 | 358 | 442 |
| | International Business Machines Corp. | 4.250% | 5/15/49 | 500 | 652 |
| | International Business Machines Corp. | 2.950% | 5/15/50 | 265 | 282 |
| | Intuit Inc. | 0.650% | 7/15/23 | 100 | 101 |
| | Intuit Inc. | 0.950% | 7/15/25 | 100 | 101 |
| | Intuit Inc. | 1.350% | 7/15/27 | 100 | 102 |
| | Intuit Inc. | 1.650% | 7/15/30 | 100 | 103 |
| | Jabil Inc. | 3.950% | 1/12/28 | 100 | 113 |
| | Jabil Inc. | 3.600% | 1/15/30 | 100 | 111 |
| | Jabil Inc. | 3.000% | 1/15/31 | 150 | 160 |
| | Juniper Networks Inc. | 3.750% | 8/15/29 | 500 | 572 |
| | Juniper Networks Inc. | 5.950% | 3/15/41 | 25 | 33 |
| | KLA Corp. | 4.650% | 11/1/24 | 250 | 284 |
| | KLA Corp. | 4.100% | 3/15/29 | 150 | 179 |
| | KLA Corp. | 5.000% | 3/15/49 | 75 | 104 |
| | KLA Corp. | 3.300% | 3/1/50 | 50 | 56 |
| | Lam Research Corp. | 3.800% | 3/15/25 | 145 | 162 |
| | Lam Research Corp. | 3.750% | 3/15/26 | 150 | 172 |
| | Lam Research Corp. | 4.000% | 3/15/29 | 200 | 239 |
| | Lam Research Corp. | 1.900% | 6/15/30 | 250 | 259 |
| | Lam Research Corp. | 4.875% | 3/15/49 | 125 | 181 |
| | Lam Research Corp. | 2.875% | 6/15/50 | 150 | 161 |
| | Lam Research Corp. | 3.125% | 6/15/60 | 100 | 111 |
| 5 | Leidos Inc. | 2.950% | 5/15/23 | 95 | 100 |
| 5 | Leidos Inc. | 3.625% | 5/15/25 | 100 | 112 |
| 5 | Leidos Inc. | 4.375% | 5/15/30 | 150 | 179 |
| 5 | Leidos Inc. | 2.300% | 2/15/31 | 200 | 204 |
| | Marvell Technology Group Ltd. | 4.200% | 6/22/23 | 100 | 108 |
| | Marvell Technology Group Ltd. | 4.875% | 6/22/28 | 100 | 118 |
| | Mastercard Inc. | 3.375% | 4/1/24 | 300 | 328 |
| | Mastercard Inc. | 2.000% | 3/3/25 | 400 | 424 |
| | Mastercard Inc. | 2.950% | 11/21/26 | 100 | 112 |
| | Mastercard Inc. | 3.300% | 3/26/27 | 200 | 228 |
| | Mastercard Inc. | 2.950% | 6/1/29 | 275 | 309 |
| | Mastercard Inc. | 3.350% | 3/26/30 | 300 | 349 |
| | Mastercard Inc. | 3.950% | 2/26/48 | 100 | 129 |
| | Mastercard Inc. | 3.650% | 6/1/49 | 250 | 309 |
| | Mastercard Inc. | 3.850% | 3/26/50 | 400 | 514 |
| | Maxim Integrated Products Inc. | 3.375% | 3/15/23 | 75 | 79 |
| | Maxim Integrated Products Inc. | 3.450% | 6/15/27 | 100 | 112 |
| | Microchip Technology Inc. | 4.333% | 6/1/23 | 100 | 108 |
| | Micron Technology Inc. | 4.640% | 2/6/24 | 50 | 56 |
| | Micron Technology Inc. | 4.975% | 2/6/26 | 100 | 118 |
| | Micron Technology Inc. | 4.185% | 2/15/27 | 200 | 237 |
| | Micron Technology Inc. | 5.327% | 2/6/29 | 150 | 187 |
| | Micron Technology Inc. | 4.663% | 2/15/30 | 100 | 122 |
| | Microsoft Corp. | 2.400% | 2/6/22 | 620 | 634 |
| | Microsoft Corp. | 2.375% | 2/12/22 | 450 | 460 |
| | Microsoft Corp. | 2.650% | 11/3/22 | 200 | 208 |
| | Microsoft Corp. | 2.375% | 5/1/23 | 75 | 78 |
| | Microsoft Corp. | 2.000% | 8/8/23 | 300 | 313 |
| | Microsoft Corp. | 2.875% | 2/6/24 | 500 | 537 |
| | Microsoft Corp. | 3.125% | 11/3/25 | 1,132 | 1,265 |
| | Microsoft Corp. | 2.400% | 8/8/26 | 805 | 877 |
| | Microsoft Corp. | 3.300% | 2/6/27 | 675 | 768 |
| | Microsoft Corp. | 3.500% | 2/12/35 | 325 | 399 |
| | Microsoft Corp. | 4.200% | 11/3/35 | 375 | 492 |
| | Microsoft Corp. | 3.450% | 8/8/36 | 425 | 523 |
| | Microsoft Corp. | 4.100% | 2/6/37 | 500 | 652 |
| | Microsoft Corp. | 3.500% | 11/15/42 | 330 | 403 |
| | Microsoft Corp. | 3.700% | 8/8/46 | 1,635 | 2,062 |
| | | | Coupon | Maturity
Date | Face
Amount
($000) | Market
Value•
($000) |
| | Microsoft Corp. | 4.250% | 2/6/47 | 300 | 424 |
| | Microsoft Corp. | 2.525% | 6/1/50 | 1,478 | 1,553 |
| | Microsoft Corp. | 4.000% | 2/12/55 | 525 | 720 |
| | Microsoft Corp. | 3.950% | 8/8/56 | 331 | 447 |
| | Microsoft Corp. | 2.675% | 6/1/60 | 594 | 641 |
| | Moody's Corp. | 4.500% | 9/1/22 | 100 | 106 |
| | Moody's Corp. | 4.875% | 2/15/24 | 250 | 280 |
| | Moody's Corp. | 3.250% | 1/15/28 | 200 | 225 |
| | Moody's Corp. | 4.875% | 12/17/48 | 125 | 169 |
| | Moody's Corp. | 3.250% | 5/20/50 | 100 | 109 |
| | Moody's Corp. | 2.550% | 8/18/60 | 300 | 281 |
| | Motorola Solutions Inc. | 4.000% | 9/1/24 | 240 | 268 |
| | Motorola Solutions Inc. | 4.600% | 2/23/28 | 125 | 151 |
| | Motorola Solutions Inc. | 5.500% | 9/1/44 | 75 | 95 |
| | NetApp Inc. | 3.300% | 9/29/24 | 75 | 82 |
| | NetApp Inc. | 1.875% | 6/22/25 | 150 | 157 |
| | NetApp Inc. | 2.375% | 6/22/27 | 100 | 107 |
| | NetApp Inc. | 2.700% | 6/22/30 | 200 | 215 |
| | NVIDIA Corp. | 3.200% | 9/16/26 | 200 | 226 |
| | NVIDIA Corp. | 2.850% | 4/1/30 | 300 | 336 |
| | NVIDIA Corp. | 3.500% | 4/1/40 | 200 | 240 |
| | NVIDIA Corp. | 3.500% | 4/1/50 | 605 | 730 |
| | NVIDIA Corp. | 3.700% | 4/1/60 | 113 | 143 |
| 5 | NXP BV / NXP Funding LLC | 4.875% | 3/1/24 | 200 | 225 |
| 5 | NXP BV / NXP Funding LLC | 5.350% | 3/1/26 | 100 | 121 |
| 5 | NXP BV / NXP Funding LLC | 5.550% | 12/1/28 | 175 | 223 |
| 5 | NXP BV / NXP Funding LLC / NXP USA Inc. | 4.300% | 6/18/29 | 450 | 536 |
| 5 | NXP BV / NXP Funding LLC / NXP USA Inc. | 3.400% | 5/1/30 | 200 | 226 |
| | Oracle Corp. | 2.500% | 5/15/22 | 250 | 257 |
| | Oracle Corp. | 2.400% | 9/15/23 | 750 | 788 |
| | Oracle Corp. | 3.400% | 7/8/24 | 450 | 492 |
| | Oracle Corp. | 2.950% | 11/15/24 | 425 | 461 |
| | Oracle Corp. | 2.500% | 4/1/25 | 919 | 987 |
| | Oracle Corp. | 2.650% | 7/15/26 | 2,361 | 2,581 |
| | Oracle Corp. | 2.800% | 4/1/27 | 500 | 550 |
| | Oracle Corp. | 2.950% | 4/1/30 | 750 | 836 |
| | Oracle Corp. | 4.300% | 7/8/34 | 325 | 409 |
| | Oracle Corp. | 3.900% | 5/15/35 | 150 | 183 |
| | Oracle Corp. | 3.850% | 7/15/36 | 250 | 301 |
| | Oracle Corp. | 3.800% | 11/15/37 | 525 | 628 |
| | Oracle Corp. | 6.125% | 7/8/39 | 150 | 230 |
| | Oracle Corp. | 3.600% | 4/1/40 | 605 | 708 |
| | Oracle Corp. | 5.375% | 7/15/40 | 700 | 999 |
| | Oracle Corp. | 4.500% | 7/8/44 | 250 | 325 |
| | Oracle Corp. | 4.125% | 5/15/45 | 425 | 524 |
| | Oracle Corp. | 4.000% | 7/15/46 | 575 | 703 |
| | Oracle Corp. | 4.000% | 11/15/47 | 475 | 583 |
| | Oracle Corp. | 3.600% | 4/1/50 | 1,120 | 1,304 |
| | Oracle Corp. | 4.375% | 5/15/55 | 150 | 197 |
| | Oracle Corp. | 3.850% | 4/1/60 | 700 | 853 |
| | PayPal Holdings Inc. | 2.200% | 9/26/22 | 200 | 207 |
| | PayPal Holdings Inc. | 1.350% | 6/1/23 | 200 | 205 |
| | PayPal Holdings Inc. | 2.400% | 10/1/24 | 100 | 107 |
| | PayPal Holdings Inc. | 1.650% | 6/1/25 | 200 | 209 |
| | PayPal Holdings Inc. | 2.650% | 10/1/26 | 300 | 329 |
| | PayPal Holdings Inc. | 2.850% | 10/1/29 | 400 | 444 |
| | PayPal Holdings Inc. | 2.300% | 6/1/30 | 200 | 214 |
| | PayPal Holdings Inc. | 3.250% | 6/1/50 | 310 | 355 |
| | QUALCOMM Inc. | 3.000% | 5/20/22 | 100 | 104 |
| | QUALCOMM Inc. | 2.600% | 1/30/23 | 90 | 94 |
| | QUALCOMM Inc. | 2.900% | 5/20/24 | 172 | 185 |
| | QUALCOMM Inc. | 3.450% | 5/20/25 | 200 | 223 |
| | QUALCOMM Inc. | 3.250% | 5/20/27 | 400 | 453 |
Total Bond Market Index Portfolio
| | | | Coupon | Maturity
Date | Face
Amount
($000) | Market
Value•
($000) |
| 5 | QUALCOMM Inc. | 1.300% | 5/20/28 | 378 | 380 |
| 5 | QUALCOMM Inc. | 1.650% | 5/20/32 | 414 | 413 |
| | QUALCOMM Inc. | 4.650% | 5/20/35 | 200 | 267 |
| | QUALCOMM Inc. | 4.800% | 5/20/45 | 275 | 388 |
| | QUALCOMM Inc. | 4.300% | 5/20/47 | 350 | 474 |
| | QUALCOMM Inc. | 3.250% | 5/20/50 | 200 | 232 |
| | RELX Capital Inc. | 3.500% | 3/16/23 | 125 | 133 |
| | RELX Capital Inc. | 4.000% | 3/18/29 | 100 | 118 |
| | RELX Capital Inc. | 3.000% | 5/22/30 | 150 | 167 |
| | S&P Global Inc. | 4.000% | 6/15/25 | 149 | 169 |
| | S&P Global Inc. | 2.500% | 12/1/29 | 125 | 136 |
| | S&P Global Inc. | 1.250% | 8/15/30 | 400 | 396 |
| | S&P Global Inc. | 3.250% | 12/1/49 | 150 | 175 |
| | S&P Global Inc. | 2.300% | 8/15/60 | 100 | 94 |
| | salesforce.com Inc. | 3.250% | 4/11/23 | 200 | 213 |
| | salesforce.com Inc. | 3.700% | 4/11/28 | 325 | 382 |
| | ServiceNow Inc. | 1.400% | 9/1/30 | 500 | 487 |
| | Texas Instruments Inc. | 1.850% | 5/15/22 | 100 | 102 |
| | Texas Instruments Inc. | 2.625% | 5/15/24 | 25 | 27 |
| | Texas Instruments Inc. | 1.375% | 3/12/25 | 200 | 207 |
| | Texas Instruments Inc. | 2.900% | 11/3/27 | 94 | 105 |
| | Texas Instruments Inc. | 2.250% | 9/4/29 | 100 | 107 |
| | Texas Instruments Inc. | 1.750% | 5/4/30 | 210 | 216 |
| | Texas Instruments Inc. | 3.875% | 3/15/39 | 142 | 177 |
| | Texas Instruments Inc. | 4.150% | 5/15/48 | 400 | 532 |
| | Thomson Reuters Corp. | 5.500% | 8/15/35 | 75 | 100 |
| | Thomson Reuters Corp. | 5.850% | 4/15/40 | 100 | 138 |
| | Thomson Reuters Corp. | 5.650% | 11/23/43 | 100 | 135 |
| | Verisk Analytics Inc. | 4.125% | 9/12/22 | 275 | 290 |
| | Verisk Analytics Inc. | 4.000% | 6/15/25 | 150 | 170 |
| | Verisk Analytics Inc. | 4.125% | 3/15/29 | 400 | 478 |
| | Verisk Analytics Inc. | 5.500% | 6/15/45 | 50 | 71 |
| | Verisk Analytics Inc. | 3.625% | 5/15/50 | 100 | 116 |
| | Visa Inc. | 2.150% | 9/15/22 | 100 | 103 |
| | Visa Inc. | 2.800% | 12/14/22 | 550 | 575 |
| | Visa Inc. | 3.150% | 12/14/25 | 925 | 1,037 |
| | Visa Inc. | 1.900% | 4/15/27 | 200 | 212 |
| | Visa Inc. | 0.750% | 8/15/27 | 500 | 498 |
| | Visa Inc. | 2.750% | 9/15/27 | 150 | 167 |
| | Visa Inc. | 1.100% | 2/15/31 | 400 | 392 |
| | Visa Inc. | 4.150% | 12/14/35 | 325 | 421 |
| | Visa Inc. | 2.700% | 4/15/40 | 200 | 218 |
| | Visa Inc. | 4.300% | 12/14/45 | 725 | 990 |
| | Visa Inc. | 3.650% | 9/15/47 | 100 | 125 |
| | Visa Inc. | 2.000% | 8/15/50 | 500 | 472 |
| | VMware Inc. | 2.950% | 8/21/22 | 300 | 311 |
| | VMware Inc. | 4.500% | 5/15/25 | 200 | 228 |
| | VMware Inc. | 4.650% | 5/15/27 | 100 | 117 |
| | VMware Inc. | 3.900% | 8/21/27 | 300 | 338 |
| | VMware Inc. | 4.700% | 5/15/30 | 900 | 1,082 |
| | Western Union Co. | 3.600% | 3/15/22 | 100 | 103 |
| | Western Union Co. | 2.850% | 1/10/25 | 108 | 116 |
| | Western Union Co. | 6.200% | 11/17/36 | 100 | 126 |
| | Western Union Co. | 6.200% | 6/21/40 | 35 | 43 |
| | Xilinx Inc. | 2.950% | 6/1/24 | 150 | 161 |
| | Xilinx Inc. | 2.375% | 6/1/30 | 200 | 209 |
| | | | | | | 129,933 |
| Utilities (2.4%) |
| | AEP Texas Inc. | 2.400% | 10/1/22 | 75 | 77 |
| | AEP Texas Inc. | 3.950% | 6/1/28 | 100 | 117 |
| | AEP Texas Inc. | 2.100% | 7/1/30 | 200 | 209 |
| | AEP Texas Inc. | 3.800% | 10/1/47 | 50 | 59 |
| | AEP Texas Inc. | 3.450% | 1/15/50 | 50 | 57 |
| | AEP Transmission Co. LLC | 4.000% | 12/1/46 | 75 | 94 |
| | AEP Transmission Co. LLC | 3.750% | 12/1/47 | 100 | 121 |
| | AEP Transmission Co. LLC | 3.800% | 6/15/49 | 70 | 85 |
| | AEP Transmission Co. LLC | 3.150% | 9/15/49 | 70 | 77 |
| 5 | AES Corp. | 1.375% | 1/15/26 | 300 | 302 |
| 5 | AES Corp. | 2.450% | 1/15/31 | 300 | 304 |
| | | | Coupon | Maturity
Date | Face
Amount
($000) | Market
Value•
($000) |
| | Alabama Power Co. | 1.450% | 9/15/30 | 500 | 503 |
| | Alabama Power Co. | 6.125% | 5/15/38 | 50 | 75 |
| | Alabama Power Co. | 3.850% | 12/1/42 | 25 | 31 |
| | Alabama Power Co. | 4.150% | 8/15/44 | 75 | 95 |
| | Alabama Power Co. | 3.750% | 3/1/45 | 150 | 180 |
| | Alabama Power Co. | 4.300% | 1/2/46 | 250 | 329 |
| | Alabama Power Co. | 3.700% | 12/1/47 | 100 | 122 |
| | Alabama Power Co. | 4.300% | 7/15/48 | 100 | 133 |
| | Alabama Power Co. | 3.450% | 10/1/49 | 550 | 649 |
| | Ameren Corp. | 2.500% | 9/15/24 | 100 | 106 |
| | Ameren Corp. | 3.650% | 2/15/26 | 80 | 90 |
| | Ameren Corp. | 3.500% | 1/15/31 | 100 | 115 |
| | Ameren Illinois Co. | 2.700% | 9/1/22 | 250 | 258 |
| | Ameren Illinois Co. | 3.800% | 5/15/28 | 75 | 87 |
| | Ameren Illinois Co. | 3.700% | 12/1/47 | 150 | 183 |
| | Ameren Illinois Co. | 3.250% | 3/15/50 | 60 | 69 |
| | American Electric Power Co. Inc. | 3.650% | 12/1/21 | 100 | 103 |
| | American Electric Power Co. Inc. | 2.950% | 12/15/22 | 25 | 26 |
| | American Electric Power Co. Inc. | 3.200% | 11/13/27 | 75 | 84 |
| | American Electric Power Co. Inc. | 4.300% | 12/1/28 | 150 | 178 |
| | American Water Capital Corp. | 3.400% | 3/1/25 | 125 | 138 |
| | American Water Capital Corp. | 2.950% | 9/1/27 | 325 | 358 |
| | American Water Capital Corp. | 3.450% | 6/1/29 | 125 | 143 |
| | American Water Capital Corp. | 2.800% | 5/1/30 | 100 | 110 |
| | American Water Capital Corp. | 6.593% | 10/15/37 | 150 | 232 |
| | American Water Capital Corp. | 4.300% | 9/1/45 | 100 | 129 |
| | American Water Capital Corp. | 3.750% | 9/1/47 | 200 | 244 |
| | American Water Capital Corp. | 4.200% | 9/1/48 | 100 | 130 |
| | American Water Capital Corp. | 4.150% | 6/1/49 | 125 | 164 |
| | American Water Capital Corp. | 3.450% | 5/1/50 | 100 | 119 |
| | Appalachian Power Co. | 3.300% | 6/1/27 | 500 | 558 |
| | Appalachian Power Co. | 4.500% | 3/1/49 | 425 | 561 |
| | Appalachian Power Co. | 3.700% | 5/1/50 | 100 | 120 |
| | Arizona Public Service Co. | 3.150% | 5/15/25 | 100 | 110 |
| | Arizona Public Service Co. | 2.950% | 9/15/27 | 50 | 55 |
| | Arizona Public Service Co. | 4.500% | 4/1/42 | 25 | 32 |
| | Arizona Public Service Co. | 4.350% | 11/15/45 | 125 | 160 |
| | Arizona Public Service Co. | 3.750% | 5/15/46 | 125 | 153 |
| | Arizona Public Service Co. | 4.250% | 3/1/49 | 100 | 130 |
| | Arizona Public Service Co. | 3.500% | 12/1/49 | 60 | 70 |
| | Atmos Energy Corp. | 3.000% | 6/15/27 | 100 | 111 |
| | Atmos Energy Corp. | 2.625% | 9/15/29 | 50 | 55 |
| | Atmos Energy Corp. | 5.500% | 6/15/41 | 200 | 287 |
| | Atmos Energy Corp. | 4.150% | 1/15/43 | 100 | 125 |
| | Atmos Energy Corp. | 4.125% | 10/15/44 | 50 | 63 |
| | Atmos Energy Corp. | 3.375% | 9/15/49 | 400 | 464 |
| | Avangrid Inc. | 3.150% | 12/1/24 | 230 | 251 |
| | Avangrid Inc. | 3.800% | 6/1/29 | 195 | 224 |
| | Avista Corp. | 4.350% | 6/1/48 | 75 | 95 |
| | Baltimore Gas and Electric Co. | 2.400% | 8/15/26 | 50 | 54 |
| | Baltimore Gas and Electric Co. | 3.500% | 8/15/46 | 100 | 115 |
| | Baltimore Gas and Electric Co. | 3.750% | 8/15/47 | 250 | 306 |
| | Baltimore Gas and Electric Co. | 4.250% | 9/15/48 | 50 | 65 |
Total Bond Market Index Portfolio
| | | | Coupon | Maturity
Date | Face
Amount
($000) | Market
Value•
($000) |
| | Baltimore Gas and Electric Co. | 3.200% | 9/15/49 | 80 | 89 |
| | Baltimore Gas and Electric Co. | 2.900% | 6/15/50 | 100 | 108 |
| | Berkshire Hathaway Energy Co. | 2.800% | 1/15/23 | 125 | 131 |
| | Berkshire Hathaway Energy Co. | 3.750% | 11/15/23 | 100 | 108 |
| | Berkshire Hathaway Energy Co. | 3.500% | 2/1/25 | 100 | 110 |
| | Berkshire Hathaway Energy Co. | 3.250% | 4/15/28 | 125 | 142 |
| 5 | Berkshire Hathaway Energy Co. | 3.700% | 7/15/30 | 700 | 826 |
| | Berkshire Hathaway Energy Co. | 6.125% | 4/1/36 | 100 | 147 |
| | Berkshire Hathaway Energy Co. | 5.950% | 5/15/37 | 225 | 325 |
| | Berkshire Hathaway Energy Co. | 5.150% | 11/15/43 | 150 | 206 |
| | Berkshire Hathaway Energy Co. | 4.500% | 2/1/45 | 150 | 189 |
| | Berkshire Hathaway Energy Co. | 3.800% | 7/15/48 | 50 | 60 |
| | Berkshire Hathaway Energy Co. | 4.450% | 1/15/49 | 200 | 266 |
| 5 | Berkshire Hathaway Energy Co. | 4.250% | 10/15/50 | 200 | 256 |
| | Black Hills Corp. | 4.250% | 11/30/23 | 100 | 110 |
| | Black Hills Corp. | 3.950% | 1/15/26 | 75 | 84 |
| | Black Hills Corp. | 3.150% | 1/15/27 | 75 | 81 |
| | Black Hills Corp. | 3.050% | 10/15/29 | 70 | 76 |
| | Black Hills Corp. | 4.350% | 5/1/33 | 75 | 91 |
| | Black Hills Corp. | 4.200% | 9/15/46 | 50 | 61 |
| | Black Hills Corp. | 3.875% | 10/15/49 | 70 | 82 |
| | CenterPoint Energy Houston Electric LLC | 2.400% | 9/1/26 | 300 | 324 |
| | CenterPoint Energy Houston Electric LLC | 6.950% | 3/15/33 | 50 | 74 |
| | CenterPoint Energy Houston Electric LLC | 3.950% | 3/1/48 | 75 | 96 |
| | CenterPoint Energy Houston Electric LLC | 4.250% | 2/1/49 | 150 | 199 |
| | CenterPoint Energy Houston Electric LLC | 2.900% | 7/1/50 | 100 | 109 |
| | CenterPoint Energy Inc. | 2.500% | 9/1/22 | 100 | 103 |
| | CenterPoint Energy Inc. | 3.850% | 2/1/24 | 325 | 355 |
| | CenterPoint Energy Inc. | 2.500% | 9/1/24 | 100 | 106 |
| | CenterPoint Energy Inc. | 4.250% | 11/1/28 | 75 | 89 |
| | CenterPoint Energy Inc. | 2.950% | 3/1/30 | 80 | 87 |
| | CenterPoint Energy Inc. | 3.700% | 9/1/49 | 50 | 58 |
| | CenterPoint Energy Resources Corp. | 3.550% | 4/1/23 | 50 | 53 |
| | CenterPoint Energy Resources Corp. | 4.000% | 4/1/28 | 100 | 117 |
| | CenterPoint Energy Resources Corp. | 5.850% | 1/15/41 | 250 | 348 |
| | CenterPoint Energy Resources Corp. | 4.100% | 9/1/47 | 50 | 61 |
| | Cleco Corporate Holdings LLC | 3.743% | 5/1/26 | 100 | 110 |
| | Cleco Corporate Holdings LLC | 4.973% | 5/1/46 | 125 | 146 |
| | Cleveland Electric Illuminating Co. | 5.500% | 8/15/24 | 225 | 259 |
| | Cleveland Electric Illuminating Co. | 5.950% | 12/15/36 | 75 | 91 |
| | CMS Energy Corp. | 3.000% | 5/15/26 | 75 | 83 |
| | CMS Energy Corp. | 3.450% | 8/15/27 | 50 | 56 |
| | CMS Energy Corp. | 4.875% | 3/1/44 | 75 | 99 |
| | CMS Energy Corp. | 4.750% | 6/1/50 | 100 | 113 |
| | | | Coupon | Maturity
Date | Face
Amount
($000) | Market
Value•
($000) |
| | Commonwealth Edison Co. | 2.950% | 8/15/27 | 75 | 83 |
| | Commonwealth Edison Co. | 2.200% | 3/1/30 | 50 | 54 |
| | Commonwealth Edison Co. | 5.900% | 3/15/36 | 150 | 216 |
| | Commonwealth Edison Co. | 6.450% | 1/15/38 | 175 | 268 |
| | Commonwealth Edison Co. | 4.600% | 8/15/43 | 75 | 99 |
| | Commonwealth Edison Co. | 4.700% | 1/15/44 | 175 | 234 |
| | Commonwealth Edison Co. | 3.700% | 3/1/45 | 75 | 88 |
| | Commonwealth Edison Co. | 3.650% | 6/15/46 | 175 | 207 |
| | Commonwealth Edison Co. | 3.750% | 8/15/47 | 100 | 120 |
| | Commonwealth Edison Co. | 4.000% | 3/1/48 | 150 | 189 |
| | Commonwealth Edison Co. | 4.000% | 3/1/49 | 125 | 159 |
| | Commonwealth Edison Co. | 3.000% | 3/1/50 | 200 | 218 |
| | Connecticut Light and Power Co. | 2.500% | 1/15/23 | 125 | 130 |
| | Connecticut Light and Power Co. | 0.750% | 12/1/25 | 500 | 502 |
| | Connecticut Light and Power Co. | 3.200% | 3/15/27 | 50 | 56 |
| | Connecticut Light and Power Co. | 4.300% | 4/15/44 | 150 | 195 |
| | Connecticut Light and Power Co. | 4.000% | 4/1/48 | 160 | 207 |
| | Consolidated Edison Co. of New York Inc. | 3.350% | 4/1/30 | 600 | 687 |
| | Consolidated Edison Co. of New York Inc. | 5.300% | 3/1/35 | 200 | 263 |
| | Consolidated Edison Co. of New York Inc. | 5.850% | 3/15/36 | 275 | 381 |
| | Consolidated Edison Co. of New York Inc. | 6.200% | 6/15/36 | 75 | 107 |
| | Consolidated Edison Co. of New York Inc. | 3.950% | 3/1/43 | 125 | 147 |
| | Consolidated Edison Co. of New York Inc. | 4.450% | 3/15/44 | 200 | 250 |
| | Consolidated Edison Co. of New York Inc. | 4.500% | 12/1/45 | 375 | 484 |
| | Consolidated Edison Co. of New York Inc. | 3.850% | 6/15/46 | 145 | 168 |
| | Consolidated Edison Co. of New York Inc. | 3.875% | 6/15/47 | 75 | 88 |
| | Consolidated Edison Co. of New York Inc. | 4.125% | 5/15/49 | 400 | 493 |
| | Consolidated Edison Co. of New York Inc. | 3.950% | 4/1/50 | 250 | 305 |
| | Consolidated Edison Co. of New York Inc. | 4.000% | 11/15/57 | 75 | 92 |
| | Consolidated Edison Co. of New York Inc. | 4.500% | 5/15/58 | 120 | 157 |
| | Consolidated Edison Co. of New York Inc. | 3.000% | 12/1/60 | 500 | 509 |
| | Consumers Energy Co. | 3.375% | 8/15/23 | 275 | 295 |
| | Consumers Energy Co. | 3.800% | 11/15/28 | 75 | 88 |
| | Consumers Energy Co. | 3.950% | 5/15/43 | 75 | 94 |
| | Consumers Energy Co. | 3.250% | 8/15/46 | 50 | 57 |
| | Consumers Energy Co. | 3.950% | 7/15/47 | 50 | 64 |
| | Consumers Energy Co. | 4.050% | 5/15/48 | 125 | 164 |
| | Consumers Energy Co. | 4.350% | 4/15/49 | 80 | 110 |
| | Consumers Energy Co. | 3.100% | 8/15/50 | 80 | 92 |
| | Consumers Energy Co. | 3.500% | 8/1/51 | 400 | 493 |
| | Consumers Energy Co. | 2.500% | 5/1/60 | 100 | 100 |
Total Bond Market Index Portfolio
| | | | Coupon | Maturity
Date | Face
Amount
($000) | Market
Value•
($000) |
| | Delmarva Power & Light Co. | 3.500% | 11/15/23 | 25 | 27 |
| | Delmarva Power & Light Co. | 4.150% | 5/15/45 | 100 | 124 |
| | Dominion Energy Inc. | 3.071% | 8/15/24 | 75 | 81 |
| | Dominion Energy Inc. | 3.900% | 10/1/25 | 125 | 143 |
| | Dominion Energy Inc. | 2.850% | 8/15/26 | 125 | 138 |
| | Dominion Energy Inc. | 4.250% | 6/1/28 | 125 | 149 |
| | Dominion Energy Inc. | 3.375% | 4/1/30 | 125 | 142 |
| | Dominion Energy Inc. | 6.300% | 3/15/33 | 75 | 106 |
| | Dominion Energy Inc. | 5.950% | 6/15/35 | 225 | 314 |
| | Dominion Energy Inc. | 4.900% | 8/1/41 | 280 | 365 |
| | Dominion Energy Inc. | 4.050% | 9/15/42 | 300 | 359 |
| | Dominion Energy Inc. | 4.600% | 3/15/49 | 200 | 266 |
| | Dominion Energy Inc. | 5.750% | 10/1/54 | 100 | 111 |
| | Dominion Energy South Carolina Inc. | 6.625% | 2/1/32 | 50 | 72 |
| | Dominion Energy South Carolina Inc. | 6.050% | 1/15/38 | 125 | 185 |
| | Dominion Energy South Carolina Inc. | 5.450% | 2/1/41 | 75 | 107 |
| | Dominion Energy South Carolina Inc. | 4.600% | 6/15/43 | 75 | 100 |
| | DTE Electric Co. | 3.650% | 3/15/24 | 250 | 272 |
| | DTE Electric Co. | 3.375% | 3/1/25 | 150 | 166 |
| | DTE Electric Co. | 2.250% | 3/1/30 | 200 | 214 |
| | DTE Electric Co. | 2.625% | 3/1/31 | 100 | 110 |
| | DTE Electric Co. | 4.000% | 4/1/43 | 225 | 279 |
| | DTE Electric Co. | 3.700% | 6/1/46 | 50 | 61 |
| | DTE Electric Co. | 3.750% | 8/15/47 | 100 | 124 |
| | DTE Electric Co. | 3.950% | 3/1/49 | 128 | 166 |
| | DTE Electric Co. | 2.950% | 3/1/50 | 150 | 168 |
| | DTE Energy Co. | 2.600% | 6/15/22 | 50 | 52 |
| | DTE Energy Co. | 2.250% | 11/1/22 | 400 | 413 |
| | DTE Energy Co. | 3.700% | 8/1/23 | 125 | 135 |
| | DTE Energy Co. | 2.529% | 10/1/24 | 100 | 107 |
| | DTE Energy Co. | 1.050% | 6/1/25 | 500 | 505 |
| | DTE Energy Co. | 2.850% | 10/1/26 | 300 | 329 |
| | DTE Energy Co. | 3.800% | 3/15/27 | 175 | 201 |
| | DTE Energy Co. | 3.400% | 6/15/29 | 100 | 113 |
| | DTE Energy Co. | 2.950% | 3/1/30 | 60 | 66 |
| | DTE Energy Co. | 6.375% | 4/15/33 | 75 | 107 |
| | Duke Energy Carolinas LLC | 2.500% | 3/15/23 | 100 | 104 |
| | Duke Energy Carolinas LLC | 3.050% | 3/15/23 | 100 | 106 |
| | Duke Energy Carolinas LLC | 2.950% | 12/1/26 | 100 | 112 |
| | Duke Energy Carolinas LLC | 3.950% | 11/15/28 | 125 | 148 |
| | Duke Energy Carolinas LLC | 6.000% | 12/1/28 | 125 | 162 |
| | Duke Energy Carolinas LLC | 2.450% | 8/15/29 | 200 | 215 |
| | Duke Energy Carolinas LLC | 2.450% | 2/1/30 | 100 | 108 |
| | Duke Energy Carolinas LLC | 6.100% | 6/1/37 | 100 | 147 |
| | Duke Energy Carolinas LLC | 6.000% | 1/15/38 | 25 | 37 |
| | Duke Energy Carolinas LLC | 6.050% | 4/15/38 | 25 | 38 |
| | Duke Energy Carolinas LLC | 5.300% | 2/15/40 | 150 | 213 |
| | Duke Energy Carolinas LLC | 4.000% | 9/30/42 | 175 | 216 |
| | Duke Energy Carolinas LLC | 3.875% | 3/15/46 | 100 | 123 |
| | Duke Energy Carolinas LLC | 3.700% | 12/1/47 | 100 | 121 |
| | | | Coupon | Maturity
Date | Face
Amount
($000) | Market
Value•
($000) |
| | Duke Energy Carolinas LLC | 3.950% | 3/15/48 | 300 | 373 |
| | Duke Energy Carolinas LLC | 3.200% | 8/15/49 | 400 | 455 |
| | Duke Energy Corp. | 2.400% | 8/15/22 | 200 | 206 |
| | Duke Energy Corp. | 3.050% | 8/15/22 | 275 | 285 |
| | Duke Energy Corp. | 3.750% | 4/15/24 | 325 | 358 |
| | Duke Energy Corp. | 2.650% | 9/1/26 | 80 | 87 |
| | Duke Energy Corp. | 3.150% | 8/15/27 | 300 | 334 |
| | Duke Energy Corp. | 2.450% | 6/1/30 | 100 | 106 |
| | Duke Energy Corp. | 4.800% | 12/15/45 | 125 | 165 |
| | Duke Energy Corp. | 3.750% | 9/1/46 | 405 | 471 |
| | Duke Energy Corp. | 4.200% | 6/15/49 | 400 | 508 |
| | Duke Energy Florida LLC | 3.800% | 7/15/28 | 100 | 117 |
| | Duke Energy Florida LLC | 2.500% | 12/1/29 | 425 | 462 |
| | Duke Energy Florida LLC | 1.750% | 6/15/30 | 100 | 102 |
| | Duke Energy Florida LLC | 6.350% | 9/15/37 | 225 | 342 |
| | Duke Energy Florida LLC | 6.400% | 6/15/38 | 200 | 309 |
| | Duke Energy Florida LLC | 3.850% | 11/15/42 | 200 | 237 |
| | Duke Energy Florida LLC | 3.400% | 10/1/46 | 100 | 114 |
| | Duke Energy Florida LLC | 4.200% | 7/15/48 | 200 | 259 |
| 2 | Duke Energy Florida Project Finance LLC | 1.731% | 9/1/24 | 36 | 36 |
| 2 | Duke Energy Florida Project Finance LLC | 2.538% | 9/1/31 | 100 | 108 |
| | Duke Energy Indiana LLC | 6.350% | 8/15/38 | 740 | 1,133 |
| | Duke Energy Indiana LLC | 3.750% | 5/15/46 | 225 | 269 |
| | Duke Energy Ohio Inc. | 2.125% | 6/1/30 | 100 | 105 |
| | Duke Energy Ohio Inc. | 3.700% | 6/15/46 | 25 | 29 |
| | Duke Energy Progress LLC | 2.800% | 5/15/22 | 100 | 103 |
| | Duke Energy Progress LLC | 3.375% | 9/1/23 | 25 | 27 |
| | Duke Energy Progress LLC | 3.700% | 9/1/28 | 175 | 203 |
| | Duke Energy Progress LLC | 3.450% | 3/15/29 | 125 | 143 |
| | Duke Energy Progress LLC | 4.375% | 3/30/44 | 300 | 385 |
| | Duke Energy Progress LLC | 4.150% | 12/1/44 | 100 | 127 |
| | Duke Energy Progress LLC | 3.700% | 10/15/46 | 50 | 60 |
| | Duke Energy Progress LLC | 3.600% | 9/15/47 | 100 | 120 |
| | Eastern Energy Gas Holdings LLC | 2.500% | 11/15/24 | 100 | 107 |
| | Eastern Energy Gas Holdings LLC | 3.600% | 12/15/24 | 200 | 221 |
| | Eastern Energy Gas Holdings LLC | 3.000% | 11/15/29 | 100 | 110 |
| | Eastern Energy Gas Holdings LLC | 4.600% | 12/15/44 | 200 | 253 |
| | Edison International | 2.400% | 9/15/22 | 125 | 128 |
| | Edison International | 3.125% | 11/15/22 | 80 | 83 |
| | Edison International | 2.950% | 3/15/23 | 200 | 208 |
| | Edison International | 5.750% | 6/15/27 | 25 | 30 |
| | El Paso Electric Co. | 6.000% | 5/15/35 | 50 | 69 |
| | El Paso Electric Co. | 5.000% | 12/1/44 | 75 | 88 |
| | Emera U.S. Finance LP | 3.550% | 6/15/26 | 150 | 168 |
| | Emera U.S. Finance LP | 4.750% | 6/15/46 | 245 | 311 |
| | Enel Chile SA | 4.875% | 6/12/28 | 125 | 148 |
| | Entergy Arkansas LLC | 3.500% | 4/1/26 | 50 | 56 |
| | Entergy Arkansas LLC | 2.650% | 6/15/51 | 500 | 512 |
| | Entergy Corp. | 4.000% | 7/15/22 | 150 | 157 |
| | Entergy Corp. | 2.950% | 9/1/26 | 200 | 220 |
| | Entergy Corp. | 2.800% | 6/15/30 | 100 | 108 |
| | Entergy Corp. | 3.750% | 6/15/50 | 300 | 347 |
| | Entergy Gulf States Louisiana LLC | 5.590% | 10/1/24 | 223 | 263 |
| | Entergy Louisiana LLC | 5.400% | 11/1/24 | 382 | 448 |
Total Bond Market Index Portfolio
| | | | Coupon | Maturity
Date | Face
Amount
($000) | Market
Value•
($000) |
| | Entergy Louisiana LLC | 2.400% | 10/1/26 | 75 | 81 |
| | Entergy Louisiana LLC | 3.120% | 9/1/27 | 100 | 111 |
| | Entergy Louisiana LLC | 3.050% | 6/1/31 | 100 | 113 |
| | Entergy Louisiana LLC | 4.000% | 3/15/33 | 150 | 186 |
| | Entergy Louisiana LLC | 4.950% | 1/15/45 | 150 | 165 |
| | Entergy Louisiana LLC | 4.200% | 9/1/48 | 200 | 261 |
| | Entergy Louisiana LLC | 4.200% | 4/1/50 | 100 | 130 |
| | Entergy Louisiana LLC | 2.900% | 3/15/51 | 100 | 106 |
| | Entergy Mississippi LLC | 2.850% | 6/1/28 | 125 | 137 |
| | Entergy Texas Inc. | 1.750% | 3/15/31 | 500 | 500 |
| | Essential Utilities Inc. | 3.566% | 5/1/29 | 75 | 85 |
| | Essential Utilities Inc. | 2.704% | 4/15/30 | 100 | 108 |
| | Essential Utilities Inc. | 4.276% | 5/1/49 | 85 | 107 |
| | Essential Utilities Inc. | 3.351% | 4/15/50 | 200 | 223 |
| | Evergy Inc. | 2.450% | 9/15/24 | 50 | 53 |
| | Evergy Inc. | 2.900% | 9/15/29 | 150 | 163 |
| | Evergy Kansas Central Inc. | 2.550% | 7/1/26 | 150 | 163 |
| | Evergy Kansas Central Inc. | 3.100% | 4/1/27 | 100 | 110 |
| | Evergy Kansas Central Inc. | 4.125% | 3/1/42 | 200 | 245 |
| | Evergy Kansas Central Inc. | 4.100% | 4/1/43 | 100 | 124 |
| | Evergy Kansas Central Inc. | 4.250% | 12/1/45 | 25 | 33 |
| | Evergy Metro Inc. | 3.150% | 3/15/23 | 75 | 79 |
| | Evergy Metro Inc. | 2.250% | 6/1/30 | 100 | 106 |
| | Evergy Metro Inc. | 5.300% | 10/1/41 | 100 | 137 |
| | Evergy Metro Inc. | 4.200% | 6/15/47 | 100 | 128 |
| | Eversource Energy | 2.750% | 3/15/22 | 75 | 77 |
| | Eversource Energy | 3.800% | 12/1/23 | 75 | 82 |
| | Eversource Energy | 2.900% | 10/1/24 | 50 | 54 |
| | Eversource Energy | 3.150% | 1/15/25 | 168 | 183 |
| | Eversource Energy | 3.300% | 1/15/28 | 100 | 112 |
| | Eversource Energy | 4.250% | 4/1/29 | 200 | 239 |
| | Eversource Energy | 3.450% | 1/15/50 | 400 | 457 |
| | Exelon Corp. | 3.497% | 6/1/22 | 200 | 208 |
| | Exelon Corp. | 3.950% | 6/15/25 | 200 | 226 |
| | Exelon Corp. | 3.400% | 4/15/26 | 200 | 225 |
| | Exelon Corp. | 4.050% | 4/15/30 | 250 | 295 |
| | Exelon Corp. | 4.950% | 6/15/35 | 225 | 283 |
| | Exelon Corp. | 5.625% | 6/15/35 | 20 | 27 |
| | Exelon Corp. | 5.100% | 6/15/45 | 145 | 197 |
| | Exelon Corp. | 4.450% | 4/15/46 | 175 | 223 |
| | Exelon Generation Co. LLC | 6.250% | 10/1/39 | 360 | 433 |
| | Exelon Generation Co. LLC | 5.750% | 10/1/41 | 75 | 85 |
| | Exelon Generation Co. LLC | 5.600% | 6/15/42 | 155 | 176 |
| | Florida Power & Light Co. | 3.250% | 6/1/24 | 25 | 27 |
| | Florida Power & Light Co. | 2.850% | 4/1/25 | 300 | 327 |
| | Florida Power & Light Co. | 5.625% | 4/1/34 | 25 | 36 |
| | Florida Power & Light Co. | 5.960% | 4/1/39 | 375 | 569 |
| | Florida Power & Light Co. | 4.125% | 2/1/42 | 170 | 216 |
| | Florida Power & Light Co. | 4.050% | 6/1/42 | 125 | 159 |
| | Florida Power & Light Co. | 3.800% | 12/15/42 | 75 | 93 |
| | Florida Power & Light Co. | 3.700% | 12/1/47 | 150 | 187 |
| | Florida Power & Light Co. | 3.950% | 3/1/48 | 325 | 421 |
| | Florida Power & Light Co. | 4.125% | 6/1/48 | 100 | 131 |
| | Florida Power & Light Co. | 3.990% | 3/1/49 | 100 | 131 |
| | Florida Power & Light Co. | 3.150% | 10/1/49 | 555 | 637 |
| | Fortis Inc. | 3.055% | 10/4/26 | 295 | 324 |
| | Georgia Power Co. | 2.100% | 7/30/23 | 75 | 78 |
| | Georgia Power Co. | 2.200% | 9/15/24 | 225 | 237 |
| | Georgia Power Co. | 3.250% | 4/1/26 | 100 | 111 |
| | Georgia Power Co. | 4.750% | 9/1/40 | 175 | 228 |
| | Georgia Power Co. | 4.300% | 3/15/43 | 100 | 127 |
| | Gulf Power Co. | 3.300% | 5/30/27 | 50 | 56 |
| | | | Coupon | Maturity
Date | Face
Amount
($000) | Market
Value•
($000) |
| | Iberdrola International BV | 6.750% | 7/15/36 | 75 | 115 |
| | Indiana Michigan Power Co. | 3.850% | 5/15/28 | 250 | 290 |
| | Indiana Michigan Power Co. | 3.750% | 7/1/47 | 150 | 175 |
| | Indiana Michigan Power Co. | 4.250% | 8/15/48 | 100 | 127 |
| | Interstate Power and Light Co. | 3.250% | 12/1/24 | 202 | 221 |
| | Interstate Power and Light Co. | 4.100% | 9/26/28 | 125 | 149 |
| | Interstate Power and Light Co. | 3.600% | 4/1/29 | 60 | 69 |
| | Interstate Power and Light Co. | 2.300% | 6/1/30 | 100 | 105 |
| | Interstate Power and Light Co. | 6.250% | 7/15/39 | 50 | 73 |
| | Interstate Power and Light Co. | 3.700% | 9/15/46 | 75 | 86 |
| | ITC Holdings Corp. | 2.700% | 11/15/22 | 100 | 104 |
| | ITC Holdings Corp. | 3.650% | 6/15/24 | 75 | 82 |
| | ITC Holdings Corp. | 3.350% | 11/15/27 | 100 | 113 |
| | ITC Holdings Corp. | 5.300% | 7/1/43 | 200 | 266 |
| 2 | John Sevier Combined Cycle Generation LLC | 4.626% | 1/15/42 | 65 | 82 |
| | Kentucky Utilities Co. | 5.125% | 11/1/40 | 125 | 173 |
| | Kentucky Utilities Co. | 4.375% | 10/1/45 | 100 | 130 |
| | Kentucky Utilities Co. | 3.300% | 6/1/50 | 200 | 227 |
| | Louisville Gas and Electric Co. | 3.300% | 10/1/25 | 75 | 83 |
| | Louisville Gas and Electric Co. | 4.250% | 4/1/49 | 170 | 220 |
| | MidAmerican Energy Co. | 3.500% | 10/15/24 | 179 | 197 |
| | MidAmerican Energy Co. | 3.100% | 5/1/27 | 150 | 168 |
| | MidAmerican Energy Co. | 3.650% | 4/15/29 | 200 | 237 |
| | MidAmerican Energy Co. | 6.750% | 12/30/31 | 125 | 187 |
| | MidAmerican Energy Co. | 5.750% | 11/1/35 | 125 | 182 |
| | MidAmerican Energy Co. | 4.800% | 9/15/43 | 100 | 136 |
| | MidAmerican Energy Co. | 3.950% | 8/1/47 | 100 | 125 |
| | MidAmerican Energy Co. | 4.250% | 7/15/49 | 200 | 268 |
| | Mississippi Power Co. | 4.250% | 3/15/42 | 100 | 122 |
| | National Fuel Gas Co. | 3.750% | 3/1/23 | 275 | 288 |
| | National Fuel Gas Co. | 5.500% | 1/15/26 | 50 | 58 |
| | National Fuel Gas Co. | 4.750% | 9/1/28 | 50 | 54 |
| | National Grid USA | 5.803% | 4/1/35 | 50 | 67 |
| | National Rural Utilities Cooperative Finance Corp. | 1.750% | 1/21/22 | 50 | 51 |
| | National Rural Utilities Cooperative Finance Corp. | 2.700% | 2/15/23 | 300 | 314 |
| | National Rural Utilities Cooperative Finance Corp. | 2.950% | 2/7/24 | 775 | 829 |
| | National Rural Utilities Cooperative Finance Corp. | 3.400% | 2/7/28 | 150 | 172 |
| | National Rural Utilities Cooperative Finance Corp. | 3.900% | 11/1/28 | 100 | 117 |
| | National Rural Utilities Cooperative Finance Corp. | 3.700% | 3/15/29 | 100 | 117 |
| | National Rural Utilities Cooperative Finance Corp. | 2.400% | 3/15/30 | 100 | 108 |
| | National Rural Utilities Cooperative Finance Corp. | 4.023% | 11/1/32 | 204 | 252 |
| | National Rural Utilities Cooperative Finance Corp. | 4.750% | 4/30/43 | 25 | 26 |
Total Bond Market Index Portfolio
| | | | Coupon | Maturity
Date | Face
Amount
($000) | Market
Value•
($000) |
| | National Rural Utilities Cooperative Finance Corp. | 5.250% | 4/20/46 | 75 | 83 |
| | National Rural Utilities Cooperative Finance Corp. | 4.400% | 11/1/48 | 400 | 533 |
| | National Rural Utilities Cooperative Finance Corp. | 4.300% | 3/15/49 | 100 | 131 |
| | Nevada Power Co. | 3.700% | 5/1/29 | 200 | 233 |
| | Nevada Power Co. | 2.400% | 5/1/30 | 75 | 80 |
| | Nevada Power Co. | 6.750% | 7/1/37 | 75 | 113 |
| | Nevada Power Co. | 3.125% | 8/1/50 | 150 | 166 |
| | NextEra Energy Capital Holdings Inc. | 2.900% | 4/1/22 | 350 | 361 |
| | NextEra Energy Capital Holdings Inc. | 2.800% | 1/15/23 | 105 | 110 |
| | NextEra Energy Capital Holdings Inc. | 3.150% | 4/1/24 | 100 | 108 |
| | NextEra Energy Capital Holdings Inc. | 2.750% | 5/1/25 | 700 | 757 |
| | NextEra Energy Capital Holdings Inc. | 3.250% | 4/1/26 | 50 | 56 |
| | NextEra Energy Capital Holdings Inc. | 3.550% | 5/1/27 | 250 | 284 |
| | NextEra Energy Capital Holdings Inc. | 3.500% | 4/1/29 | 100 | 114 |
| | NextEra Energy Capital Holdings Inc. | 2.750% | 11/1/29 | 100 | 108 |
| | NextEra Energy Capital Holdings Inc. | 2.250% | 6/1/30 | 500 | 524 |
| | NextEra Energy Capital Holdings Inc. | 4.800% | 12/1/77 | 125 | 136 |
| | NextEra Energy Capital Holdings Inc. | 5.650% | 5/1/79 | 100 | 118 |
| | NiSource Inc. | 0.950% | 8/15/25 | 500 | 503 |
| | NiSource Inc. | 3.490% | 5/15/27 | 250 | 283 |
| | NiSource Inc. | 2.950% | 9/1/29 | 200 | 218 |
| | NiSource Inc. | 3.600% | 5/1/30 | 200 | 230 |
| | NiSource Inc. | 1.700% | 2/15/31 | 500 | 497 |
| | NiSource Inc. | 5.950% | 6/15/41 | 77 | 110 |
| | NiSource Inc. | 4.800% | 2/15/44 | 125 | 163 |
| | NiSource Inc. | 5.650% | 2/1/45 | 100 | 144 |
| | NiSource Inc. | 4.375% | 5/15/47 | 250 | 317 |
| | NiSource Inc. | 3.950% | 3/30/48 | 200 | 245 |
| | Northern States Power Co. | 6.250% | 6/1/36 | 75 | 112 |
| | Northern States Power Co. | 6.200% | 7/1/37 | 50 | 76 |
| | Northern States Power Co. | 5.350% | 11/1/39 | 175 | 253 |
| | Northern States Power Co. | 3.400% | 8/15/42 | 105 | 121 |
| | Northern States Power Co. | 4.000% | 8/15/45 | 50 | 65 |
| | Northern States Power Co. | 2.900% | 3/1/50 | 250 | 282 |
| | Northern States Power Co. | 2.600% | 6/1/51 | 100 | 105 |
| | NSTAR Electric Co. | 2.375% | 10/15/22 | 125 | 129 |
| | NSTAR Electric Co. | 3.200% | 5/15/27 | 125 | 141 |
| | NSTAR Electric Co. | 3.250% | 5/15/29 | 50 | 57 |
| | NSTAR Electric Co. | 5.500% | 3/15/40 | 75 | 107 |
| | Oglethorpe Power Corp. | 5.950% | 11/1/39 | 50 | 66 |
| | Oglethorpe Power Corp. | 5.375% | 11/1/40 | 175 | 216 |
| | Ohio Edison Co. | 6.875% | 7/15/36 | 100 | 136 |
| | Ohio Power Co. | 4.150% | 4/1/48 | 100 | 128 |
| | Ohio Power Co. | 4.000% | 6/1/49 | 240 | 301 |
| | Oklahoma Gas and Electric Co. | 3.800% | 8/15/28 | 75 | 87 |
| | Oklahoma Gas and Electric Co. | 3.250% | 4/1/30 | 100 | 113 |
| | | | Coupon | Maturity
Date | Face
Amount
($000) | Market
Value•
($000) |
| | Oklahoma Gas and Electric Co. | 4.150% | 4/1/47 | 50 | 62 |
| | Oklahoma Gas and Electric Co. | 3.850% | 8/15/47 | 75 | 88 |
| | Oncor Electric Delivery Co. LLC | 4.100% | 6/1/22 | 175 | 182 |
| | Oncor Electric Delivery Co. LLC | 2.750% | 6/1/24 | 100 | 107 |
| | Oncor Electric Delivery Co. LLC | 2.950% | 4/1/25 | 75 | 82 |
| | Oncor Electric Delivery Co. LLC | 3.700% | 11/15/28 | 50 | 58 |
| | Oncor Electric Delivery Co. LLC | 7.250% | 1/15/33 | 50 | 77 |
| | Oncor Electric Delivery Co. LLC | 7.500% | 9/1/38 | 125 | 207 |
| | Oncor Electric Delivery Co. LLC | 5.250% | 9/30/40 | 125 | 178 |
| | Oncor Electric Delivery Co. LLC | 4.550% | 12/1/41 | 75 | 100 |
| | Oncor Electric Delivery Co. LLC | 5.300% | 6/1/42 | 37 | 53 |
| | Oncor Electric Delivery Co. LLC | 3.750% | 4/1/45 | 100 | 122 |
| | Oncor Electric Delivery Co. LLC | 3.800% | 9/30/47 | 50 | 61 |
| | Oncor Electric Delivery Co. LLC | 3.800% | 6/1/49 | 200 | 248 |
| | Oncor Electric Delivery Co. LLC | 3.100% | 9/15/49 | 400 | 459 |
| 5 | Oncor Electric Delivery Co. LLC | 5.350% | 10/1/52 | 63 | 96 |
| | ONE Gas Inc. | 2.000% | 5/15/30 | 100 | 104 |
| | ONE Gas Inc. | 4.658% | 2/1/44 | 125 | 164 |
| | ONE Gas Inc. | 4.500% | 11/1/48 | 75 | 101 |
| | Pacific Gas and Electric Co. | 1.750% | 6/16/22 | 500 | 501 |
| | Pacific Gas and Electric Co. | 3.850% | 11/15/23 | 250 | 266 |
| | Pacific Gas and Electric Co. | 3.450% | 7/1/25 | 200 | 215 |
| | Pacific Gas and Electric Co. | 3.150% | 1/1/26 | 300 | 320 |
| | Pacific Gas and Electric Co. | 3.300% | 12/1/27 | 800 | 853 |
| | Pacific Gas and Electric Co. | 3.750% | 7/1/28 | 300 | 327 |
| | Pacific Gas and Electric Co. | 4.550% | 7/1/30 | 1,100 | 1,251 |
| | Pacific Gas and Electric Co. | 4.500% | 7/1/40 | 500 | 557 |
| | Pacific Gas and Electric Co. | 4.750% | 2/15/44 | 500 | 561 |
| | Pacific Gas and Electric Co. | 4.300% | 3/15/45 | 200 | 213 |
| | Pacific Gas and Electric Co. | 4.950% | 7/1/50 | 800 | 953 |
| | Pacific Gas and Electric Co. | 3.500% | 8/1/50 | 500 | 496 |
| | PacifiCorp | 2.950% | 2/1/22 | 100 | 102 |
| | PacifiCorp | 3.600% | 4/1/24 | 125 | 136 |
| | PacifiCorp | 3.500% | 6/15/29 | 100 | 115 |
| | PacifiCorp | 2.700% | 9/15/30 | 50 | 55 |
| | PacifiCorp | 7.700% | 11/15/31 | 450 | 694 |
| | PacifiCorp | 5.250% | 6/15/35 | 640 | 887 |
| | PacifiCorp | 6.100% | 8/1/36 | 100 | 144 |
| | PacifiCorp | 6.250% | 10/15/37 | 125 | 186 |
| | PacifiCorp | 6.350% | 7/15/38 | 75 | 113 |
| | PacifiCorp | 4.100% | 2/1/42 | 200 | 244 |
| | PacifiCorp | 4.125% | 1/15/49 | 100 | 127 |
| | PacifiCorp | 4.150% | 2/15/50 | 200 | 259 |
| | PacifiCorp | 3.300% | 3/15/51 | 100 | 115 |
Total Bond Market Index Portfolio
| | | | Coupon | Maturity
Date | Face
Amount
($000) | Market
Value•
($000) |
| | PECO Energy Co. | 2.375% | 9/15/22 | 300 | 308 |
| | PECO Energy Co. | 3.900% | 3/1/48 | 75 | 95 |
| | PECO Energy Co. | 2.800% | 6/15/50 | 200 | 210 |
| | Piedmont Natural Gas Co. Inc. | 3.500% | 6/1/29 | 110 | 126 |
| | Piedmont Natural Gas Co. Inc. | 4.650% | 8/1/43 | 50 | 64 |
| | Piedmont Natural Gas Co. Inc. | 3.640% | 11/1/46 | 75 | 86 |
| | Piedmont Natural Gas Co. Inc. | 3.350% | 6/1/50 | 100 | 112 |
| | Pinnacle West Capital Corp. | 1.300% | 6/15/25 | 200 | 203 |
| | Potomac Electric Power Co. | 6.500% | 11/15/37 | 250 | 379 |
| | Potomac Electric Power Co. | 4.150% | 3/15/43 | 150 | 188 |
| | PPL Capital Funding Inc. | 4.200% | 6/15/22 | 25 | 26 |
| | PPL Capital Funding Inc. | 3.500% | 12/1/22 | 115 | 121 |
| | PPL Capital Funding Inc. | 3.400% | 6/1/23 | 100 | 106 |
| | PPL Capital Funding Inc. | 3.950% | 3/15/24 | 50 | 55 |
| | PPL Capital Funding Inc. | 3.100% | 5/15/26 | 100 | 110 |
| | PPL Capital Funding Inc. | 4.700% | 6/1/43 | 75 | 93 |
| | PPL Capital Funding Inc. | 5.000% | 3/15/44 | 200 | 257 |
| | PPL Capital Funding Inc. | 4.000% | 9/15/47 | 75 | 88 |
| | PPL Electric Utilities Corp. | 6.250% | 5/15/39 | 100 | 150 |
| | PPL Electric Utilities Corp. | 4.125% | 6/15/44 | 50 | 62 |
| | PPL Electric Utilities Corp. | 4.150% | 10/1/45 | 155 | 193 |
| | PPL Electric Utilities Corp. | 3.950% | 6/1/47 | 75 | 93 |
| | Progress Energy Inc. | 3.150% | 4/1/22 | 40 | 41 |
| | Progress Energy Inc. | 7.000% | 10/30/31 | 119 | 168 |
| | Progress Energy Inc. | 6.000% | 12/1/39 | 125 | 176 |
| | PSEG Power LLC | 3.850% | 6/1/23 | 125 | 134 |
| | PSEG Power LLC | 8.625% | 4/15/31 | 96 | 145 |
| | Public Service Co. of Colorado | 3.700% | 6/15/28 | 75 | 87 |
| | Public Service Co. of Colorado | 1.900% | 1/15/31 | 100 | 104 |
| | Public Service Co. of Colorado | 3.600% | 9/15/42 | 175 | 210 |
| | Public Service Co. of Colorado | 4.100% | 6/15/48 | 75 | 97 |
| | Public Service Co. of Colorado | 2.700% | 1/15/51 | 100 | 107 |
| | Public Service Co. of New Hampshire | 3.500% | 11/1/23 | 50 | 54 |
| | Public Service Co. of New Hampshire | 3.600% | 7/1/49 | 75 | 90 |
| | Public Service Electric and Gas Co. | 3.000% | 5/15/25 | 80 | 87 |
| | Public Service Electric and Gas Co. | 2.250% | 9/15/26 | 250 | 270 |
| | Public Service Electric and Gas Co. | 3.000% | 5/15/27 | 75 | 83 |
| | Public Service Electric and Gas Co. | 3.200% | 5/15/29 | 70 | 80 |
| | Public Service Electric and Gas Co. | 2.450% | 1/15/30 | 50 | 54 |
| | Public Service Electric and Gas Co. | 3.800% | 3/1/46 | 250 | 305 |
| | Public Service Electric and Gas Co. | 3.850% | 5/1/49 | 200 | 254 |
| | Public Service Electric and Gas Co. | 3.150% | 1/1/50 | 200 | 229 |
| | Public Service Electric and Gas Co. | 2.050% | 8/1/50 | 500 | 467 |
| | Public Service Enterprise Group Inc. | 2.650% | 11/15/22 | 100 | 104 |
| | Public Service Enterprise Group Inc. | 1.600% | 8/15/30 | 500 | 492 |
| | Puget Energy Inc. | 5.625% | 7/15/22 | 200 | 212 |
| | Puget Energy Inc. | 3.650% | 5/15/25 | 400 | 436 |
| | | | Coupon | Maturity
Date | Face
Amount
($000) | Market
Value•
($000) |
| | Puget Energy Inc. | 4.100% | 6/15/30 | 100 | 113 |
| | Puget Sound Energy Inc. | 6.274% | 3/15/37 | 125 | 180 |
| | Puget Sound Energy Inc. | 5.757% | 10/1/39 | 125 | 178 |
| | Puget Sound Energy Inc. | 4.300% | 5/20/45 | 100 | 126 |
| | Puget Sound Energy Inc. | 4.223% | 6/15/48 | 125 | 160 |
| | Puget Sound Energy Inc. | 3.250% | 9/15/49 | 90 | 99 |
| | San Diego Gas & Electric Co. | 2.500% | 5/15/26 | 250 | 271 |
| | San Diego Gas & Electric Co. | 1.700% | 10/1/30 | 500 | 503 |
| | San Diego Gas & Electric Co. | 4.500% | 8/15/40 | 100 | 127 |
| | San Diego Gas & Electric Co. | 3.750% | 6/1/47 | 75 | 88 |
| | San Diego Gas & Electric Co. | 4.150% | 5/15/48 | 75 | 94 |
| | San Diego Gas & Electric Co. | 3.320% | 4/15/50 | 100 | 113 |
| | Sempra Energy | 2.875% | 10/1/22 | 100 | 103 |
| | Sempra Energy | 2.900% | 2/1/23 | 100 | 105 |
| | Sempra Energy | 4.050% | 12/1/23 | 100 | 109 |
| | Sempra Energy | 3.750% | 11/15/25 | 424 | 479 |
| | Sempra Energy | 3.250% | 6/15/27 | 150 | 168 |
| | Sempra Energy | 3.400% | 2/1/28 | 200 | 228 |
| | Sempra Energy | 3.800% | 2/1/38 | 200 | 230 |
| | Sempra Energy | 6.000% | 10/15/39 | 150 | 215 |
| | Sempra Energy | 4.000% | 2/1/48 | 175 | 207 |
| | Sierra Pacific Power Co. | 2.600% | 5/1/26 | 100 | 108 |
| 2 | Southern California Edison Co. | 1.845% | 2/1/22 | 22 | 21 |
| | Southern California Edison Co. | 2.400% | 2/1/22 | 75 | 76 |
| | Southern California Edison Co. | 3.400% | 6/1/23 | 75 | 79 |
| | Southern California Edison Co. | 3.500% | 10/1/23 | 175 | 188 |
| | Southern California Edison Co. | 3.700% | 8/1/25 | 150 | 169 |
| | Southern California Edison Co. | 3.650% | 3/1/28 | 100 | 112 |
| | Southern California Edison Co. | 4.200% | 3/1/29 | 75 | 87 |
| | Southern California Edison Co. | 6.650% | 4/1/29 | 75 | 94 |
| | Southern California Edison Co. | 2.850% | 8/1/29 | 275 | 299 |
| | Southern California Edison Co. | 2.250% | 6/1/30 | 300 | 311 |
| | Southern California Edison Co. | 5.750% | 4/1/35 | 75 | 102 |
| | Southern California Edison Co. | 5.350% | 7/15/35 | 200 | 270 |
| | Southern California Edison Co. | 5.625% | 2/1/36 | 125 | 160 |
| | Southern California Edison Co. | 5.500% | 3/15/40 | 100 | 133 |
| | Southern California Edison Co. | 4.500% | 9/1/40 | 275 | 331 |
| | Southern California Edison Co. | 4.050% | 3/15/42 | 208 | 237 |
| | Southern California Edison Co. | 3.900% | 3/15/43 | 100 | 113 |
| | Southern California Edison Co. | 4.000% | 4/1/47 | 335 | 393 |
| | Southern California Edison Co. | 4.125% | 3/1/48 | 350 | 418 |
| | Southern California Edison Co. | 4.875% | 3/1/49 | 100 | 132 |
| | Southern California Edison Co. | 3.650% | 2/1/50 | 500 | 566 |
| | Southern California Gas Co. | 2.600% | 6/15/26 | 200 | 217 |
Total Bond Market Index Portfolio
| | | | Coupon | Maturity
Date | Face
Amount
($000) | Market
Value•
($000) |
| | Southern California Gas Co. | 2.550% | 2/1/30 | 150 | 162 |
| | Southern California Gas Co. | 3.750% | 9/15/42 | 75 | 89 |
| | Southern California Gas Co. | 4.125% | 6/1/48 | 75 | 96 |
| | Southern California Gas Co. | 3.950% | 2/15/50 | 70 | 87 |
| | Southern Co. | 3.250% | 7/1/26 | 350 | 391 |
| | Southern Co. | 4.250% | 7/1/36 | 200 | 246 |
| | Southern Co. | 4.400% | 7/1/46 | 360 | 450 |
| | Southern Co. | 4.000% | 1/15/51 | 300 | 316 |
| | Southern Co. Gas Capital Corp. | 3.250% | 6/15/26 | 75 | 84 |
| | Southern Co. Gas Capital Corp. | 1.750% | 1/15/31 | 500 | 503 |
| | Southern Co. Gas Capital Corp. | 5.875% | 3/15/41 | 75 | 109 |
| | Southern Co. Gas Capital Corp. | 4.400% | 6/1/43 | 50 | 62 |
| | Southern Co. Gas Capital Corp. | 3.950% | 10/1/46 | 100 | 117 |
| | Southern Co. Gas Capital Corp. | 4.400% | 5/30/47 | 100 | 126 |
| | Southern Power Co. | 2.500% | 12/15/21 | 350 | 357 |
| | Southern Power Co. | 4.150% | 12/1/25 | 100 | 115 |
| | Southern Power Co. | 5.150% | 9/15/41 | 100 | 123 |
| | Southern Power Co. | 5.250% | 7/15/43 | 50 | 61 |
| | Southern Power Co. | 4.950% | 12/15/46 | 75 | 90 |
| | Southwest Gas Corp. | 3.700% | 4/1/28 | 50 | 57 |
| | Southwest Gas Corp. | 3.800% | 9/29/46 | 75 | 86 |
| | Southwest Gas Corp. | 4.150% | 6/1/49 | 25 | 30 |
| | Southwestern Electric Power Co. | 2.750% | 10/1/26 | 100 | 108 |
| | Southwestern Electric Power Co. | 4.100% | 9/15/28 | 100 | 117 |
| | Southwestern Electric Power Co. | 6.200% | 3/15/40 | 75 | 109 |
| | Southwestern Electric Power Co. | 3.900% | 4/1/45 | 200 | 232 |
| | Southwestern Electric Power Co. | 3.850% | 2/1/48 | 325 | 380 |
| | Southwestern Public Service Co. | 3.300% | 6/15/24 | 165 | 178 |
| | Southwestern Public Service Co. | 4.500% | 8/15/41 | 100 | 129 |
| | Southwestern Public Service Co. | 3.400% | 8/15/46 | 275 | 310 |
| | Southwestern Public Service Co. | 3.700% | 8/15/47 | 75 | 89 |
| | Southwestern Public Service Co. | 4.400% | 11/15/48 | 275 | 356 |
| | Southwestern Public Service Co. | 3.750% | 6/15/49 | 75 | 91 |
| | Southwestern Public Service Co. | 3.150% | 5/1/50 | 100 | 112 |
| | Tampa Electric Co. | 4.100% | 6/15/42 | 50 | 61 |
| | Tampa Electric Co. | 4.350% | 5/15/44 | 50 | 63 |
| | Tampa Electric Co. | 4.300% | 6/15/48 | 75 | 97 |
| | Tampa Electric Co. | 4.450% | 6/15/49 | 125 | 163 |
| | Tampa Electric Co. | 3.625% | 6/15/50 | 50 | 60 |
| | Toledo Edison Co. | 6.150% | 5/15/37 | 75 | 102 |
| | Tucson Electric Power Co. | 3.050% | 3/15/25 | 50 | 54 |
| | Union Electric Co. | 3.500% | 4/15/24 | 250 | 271 |
| | Union Electric Co. | 2.950% | 3/15/30 | 500 | 560 |
| | Union Electric Co. | 8.450% | 3/15/39 | 150 | 257 |
| | Union Electric Co. | 3.650% | 4/15/45 | 125 | 148 |
| | Union Electric Co. | 4.000% | 4/1/48 | 275 | 345 |
| | Union Electric Co. | 3.250% | 10/1/49 | 100 | 113 |
| | Veolia Environnement SA | 6.750% | 6/1/38 | 39 | 55 |
| | Virginia Electric and Power Co. | 3.450% | 2/15/24 | 50 | 54 |
| | | | Coupon | Maturity
Date | Face
Amount
($000) | Market
Value•
($000) |
| | Virginia Electric and Power Co. | 2.950% | 11/15/26 | 75 | 83 |
| | Virginia Electric and Power Co. | 3.500% | 3/15/27 | 250 | 282 |
| | Virginia Electric and Power Co. | 3.800% | 4/1/28 | 150 | 175 |
| | Virginia Electric and Power Co. | 2.875% | 7/15/29 | 275 | 307 |
| | Virginia Electric and Power Co. | 6.000% | 1/15/36 | 125 | 181 |
| | Virginia Electric and Power Co. | 6.000% | 5/15/37 | 150 | 219 |
| | Virginia Electric and Power Co. | 6.350% | 11/30/37 | 50 | 75 |
| | Virginia Electric and Power Co. | 4.000% | 1/15/43 | 400 | 499 |
| | Virginia Electric and Power Co. | 4.450% | 2/15/44 | 475 | 618 |
| | Virginia Electric and Power Co. | 4.200% | 5/15/45 | 75 | 96 |
| | Virginia Electric and Power Co. | 4.000% | 11/15/46 | 100 | 128 |
| | Virginia Electric and Power Co. | 3.800% | 9/15/47 | 100 | 124 |
| | Virginia Electric and Power Co. | 4.600% | 12/1/48 | 175 | 242 |
| | Virginia Electric and Power Co. | 3.300% | 12/1/49 | 210 | 244 |
| | Washington Gas Light Co. | 3.796% | 9/15/46 | 100 | 119 |
| | Washington Gas Light Co. | 3.650% | 9/15/49 | 30 | 36 |
| | WEC Energy Group Inc. | 0.550% | 9/15/23 | 500 | 502 |
| | WEC Energy Group Inc. | 3.550% | 6/15/25 | 168 | 187 |
| | WEC Energy Group Inc. | 1.375% | 10/15/27 | 500 | 508 |
| | Wisconsin Electric Power Co. | 2.050% | 12/15/24 | 100 | 106 |
| | Wisconsin Electric Power Co. | 4.300% | 10/15/48 | 100 | 134 |
| | Wisconsin Power and Light Co. | 6.375% | 8/15/37 | 100 | 147 |
| | Wisconsin Power and Light Co. | 3.650% | 4/1/50 | 50 | 59 |
| | Xcel Energy Inc. | 3.300% | 6/1/25 | 325 | 353 |
| | Xcel Energy Inc. | 3.350% | 12/1/26 | 75 | 84 |
| | Xcel Energy Inc. | 4.000% | 6/15/28 | 75 | 89 |
| | Xcel Energy Inc. | 2.600% | 12/1/29 | 200 | 217 |
| | Xcel Energy Inc. | 3.400% | 6/1/30 | 250 | 287 |
| | Xcel Energy Inc. | 3.500% | 12/1/49 | 100 | 116 |
| | | | | | | 117,112 |
| Total Corporate Bonds (Cost $1,291,562) | 1,451,508 |
| Sovereign Bonds (3.9%) |
| | African Development Bank | 0.500% | 4/22/22 | 500 | 502 |
| | African Development Bank | 1.625% | 9/16/22 | 400 | 410 |
| | African Development Bank | 2.125% | 11/16/22 | 700 | 725 |
| | African Development Bank | 3.000% | 9/20/23 | 275 | 295 |
| | Asian Development Bank | 2.000% | �� 2/16/22 | 980 | 1,000 |
| | Asian Development Bank | 1.875% | 2/18/22 | 600 | 611 |
| | Asian Development Bank | 0.625% | 4/7/22 | 1,100 | 1,106 |
| | Asian Development Bank | 1.875% | 7/19/22 | 600 | 616 |
| | Asian Development Bank | 1.750% | 9/13/22 | 1,100 | 1,129 |
| | Asian Development Bank | 1.625% | 1/24/23 | 200 | 206 |
| | Asian Development Bank | 2.750% | 3/17/23 | 1,000 | 1,056 |
| | Asian Development Bank | 0.250% | 7/14/23 | 1,300 | 1,301 |
| | Asian Development Bank | 0.250% | 10/6/23 | 600 | 600 |
| | Asian Development Bank | 2.625% | 1/30/24 | 1,000 | 1,072 |
| | Asian Development Bank | 1.500% | 10/18/24 | 500 | 522 |
| | Asian Development Bank | 2.000% | 1/22/25 | 300 | 320 |
Total Bond Market Index Portfolio
| | | | Coupon | Maturity
Date | Face
Amount
($000) | Market
Value•
($000) |
| | Asian Development Bank | 0.625% | 4/29/25 | 700 | 706 |
| | Asian Development Bank | 0.375% | 9/3/25 | 1,000 | 997 |
| | Asian Development Bank | 2.000% | 4/24/26 | 100 | 108 |
| | Asian Development Bank | 2.625% | 1/12/27 | 200 | 223 |
| | Asian Development Bank | 2.375% | 8/10/27 | 275 | 304 |
| | Asian Development Bank | 6.220% | 8/15/27 | 100 | 132 |
| | Asian Development Bank | 2.500% | 11/2/27 | 673 | 750 |
| | Asian Development Bank | 5.820% | 6/16/28 | 148 | 199 |
| | Asian Development Bank | 3.125% | 9/26/28 | 130 | 152 |
| | Asian Development Bank | 1.750% | 9/19/29 | 200 | 213 |
| | Asian Development Bank | 1.875% | 1/24/30 | 200 | 215 |
| | Asian Development Bank | 0.750% | 10/8/30 | 500 | 487 |
| | Asian Infrastructure Investment Bank | 0.250% | 9/29/23 | 500 | 500 |
| | Asian Infrastructure Investment Bank | 2.250% | 5/16/24 | 500 | 532 |
| | Asian Infrastructure Investment Bank | 0.500% | 5/28/25 | 400 | 400 |
| | Canada | 2.625% | 1/25/22 | 250 | 256 |
| | Canada | 2.000% | 11/15/22 | 570 | 589 |
| | Canada | 1.625% | 1/22/25 | 550 | 575 |
| | Corp. Andina de Fomento | 3.250% | 2/11/22 | 45 | 46 |
| | Corp. Andina de Fomento | 2.750% | 1/6/23 | 125 | 130 |
| | Corp. Andina de Fomento | 2.375% | 5/12/23 | 100 | 103 |
| | Corp. Andina de Fomento | 3.750% | 11/23/23 | 925 | 999 |
| | Council of Europe Development Bank | 1.750% | 9/26/22 | 150 | 154 |
| | Council of Europe Development Bank | 2.625% | 2/13/23 | 425 | 447 |
| | Council of Europe Development Bank | 0.250% | 6/10/23 | 100 | 100 |
| | Council of Europe Development Bank | 0.250% | 10/20/23 | 500 | 500 |
| | Council of Europe Development Bank | 1.375% | 2/27/25 | 200 | 208 |
| | European Bank for Reconstruction & Development | 1.875% | 2/23/22 | 200 | 204 |
| | European Bank for Reconstruction & Development | 2.750% | 3/7/23 | 925 | 976 |
| | European Bank for Reconstruction & Development | 0.250% | 7/10/23 | 200 | 200 |
| | European Bank for Reconstruction & Development | 1.625% | 9/27/24 | 270 | 283 |
| | European Bank for Reconstruction & Development | 1.500% | 2/13/25 | 100 | 105 |
| | European Bank for Reconstruction & Development | 0.500% | 5/19/25 | 100 | 100 |
| | European Bank for Reconstruction & Development | 0.500% | 11/25/25 | 500 | 501 |
| | European Investment Bank | 2.875% | 12/15/21 | 1,150 | 1,180 |
| | European Investment Bank | 2.250% | 3/15/22 | 500 | 512 |
| | European Investment Bank | 2.625% | 5/20/22 | 200 | 207 |
| | European Investment Bank | 2.375% | 6/15/22 | 1,725 | 1,780 |
| | European Investment Bank | 1.375% | 9/6/22 | 720 | 734 |
| | European Investment Bank | 2.500% | 3/15/23 | 600 | 630 |
| | European Investment Bank | 1.375% | 5/15/23 | 600 | 617 |
| | European Investment Bank | 2.875% | 8/15/23 | 800 | 856 |
| | | | Coupon | Maturity
Date | Face
Amount
($000) | Market
Value•
($000) |
| | European Investment Bank | 0.250% | 9/15/23 | 1,750 | 1,752 |
| | European Investment Bank | 3.125% | 12/14/23 | 500 | 542 |
| | European Investment Bank | 3.250% | 1/29/24 | 810 | 884 |
| | European Investment Bank | 2.625% | 3/15/24 | 530 | 570 |
| | European Investment Bank | 2.250% | 6/24/24 | 550 | 587 |
| | European Investment Bank | 2.500% | 10/15/24 | 276 | 299 |
| | European Investment Bank | 1.875% | 2/10/25 | 1,050 | 1,115 |
| | European Investment Bank | 1.625% | 3/14/25 | 100 | 105 |
| | European Investment Bank | 0.625% | 7/25/25 | 1,600 | 1,616 |
| | European Investment Bank | 0.375% | 12/15/25 | 2,000 | 1,993 |
| | European Investment Bank | 2.375% | 5/24/27 | 225 | 249 |
| | European Investment Bank | 0.625% | 10/21/27 | 500 | 497 |
| | European Investment Bank | 1.625% | 10/9/29 | 125 | 132 |
| | European Investment Bank | 0.875% | 5/17/30 | 200 | 198 |
| | European Investment Bank | 0.750% | 9/23/30 | 500 | 489 |
| | European Investment Bank | 4.875% | 2/15/36 | 325 | 479 |
| 6 | Export Development Canada | 1.750% | 7/18/22 | 580 | 593 |
| 6 | Export Development Canada | 2.500% | 1/24/23 | 40 | 42 |
| 6 | Export Development Canada | 1.375% | 2/24/23 | 1,000 | 1,020 |
| 6 | Export Development Canada | 2.625% | 2/21/24 | 250 | 268 |
| | Export-Import Bank of Korea | 5.000% | 4/11/22 | 275 | 291 |
| | Export-Import Bank of Korea | 3.000% | 11/1/22 | 400 | 419 |
| | Export-Import Bank of Korea | 3.625% | 11/27/23 | 200 | 218 |
| | Export-Import Bank of Korea | 4.000% | 1/14/24 | 650 | 714 |
| | Export-Import Bank of Korea | 2.625% | 5/26/26 | 200 | 219 |
| | Export-Import Bank of Korea | 1.250% | 9/21/30 | 500 | 490 |
| | FMS Wertmanagement | 2.000% | 8/1/22 | 470 | 483 |
| | FMS Wertmanagement | 2.750% | 3/6/23 | 300 | 316 |
| | Hydro-Quebec | 8.400% | 1/15/22 | 375 | 405 |
| | Hydro-Quebec | 8.050% | 7/7/24 | 325 | 407 |
| | Inter-American Development Bank | 2.125% | 1/18/22 | 700 | 714 |
| | Inter-American Development Bank | 1.750% | 4/14/22 | 800 | 816 |
| | Inter-American Development Bank | 3.000% | 9/26/22 | 500 | 524 |
| | Inter-American Development Bank | 2.500% | 1/18/23 | 1,025 | 1,073 |
| | Inter-American Development Bank | 0.500% | 5/24/23 | 400 | 403 |
| | Inter-American Development Bank | 3.000% | 10/4/23 | 625 | 672 |
| | Inter-American Development Bank | 0.250% | 11/15/23 | 1,000 | 1,001 |
| | Inter-American Development Bank | 2.625% | 1/16/24 | 150 | 161 |
Total Bond Market Index Portfolio
| | | | Coupon | Maturity
Date | Face
Amount
($000) | Market
Value•
($000) |
| | Inter-American Development Bank | 3.000% | 2/21/24 | 900 | 976 |
| | Inter-American Development Bank | 2.125% | 1/15/25 | 1,100 | 1,177 |
| | Inter-American Development Bank | 1.750% | 3/14/25 | 200 | 211 |
| | Inter-American Development Bank | 0.875% | 4/3/25 | 500 | 510 |
| | Inter-American Development Bank | 7.000% | 6/15/25 | 134 | 171 |
| | Inter-American Development Bank | 0.625% | 7/15/25 | 1,300 | 1,312 |
| | Inter-American Development Bank | 2.000% | 6/2/26 | 750 | 807 |
| | Inter-American Development Bank | 2.000% | 7/23/26 | 100 | 108 |
| | Inter-American Development Bank | 2.375% | 7/7/27 | 450 | 496 |
| | Inter-American Development Bank | 0.625% | 9/16/27 | 800 | 793 |
| | Inter-American Development Bank | 3.125% | 9/18/28 | 875 | 1,025 |
| | Inter-American Development Bank | 3.875% | 10/28/41 | 200 | 276 |
| | Inter-American Development Bank | 3.200% | 8/7/42 | 100 | 126 |
| | International Bank for Reconstruction & Development | 2.125% | 12/13/21 | 255 | 260 |
| | International Bank for Reconstruction & Development | 2.000% | 1/26/22 | 145 | 148 |
| | International Bank for Reconstruction & Development | 1.625% | 2/10/22 | 1,325 | 1,346 |
| | International Bank for Reconstruction & Development | 2.125% | 7/1/22 | 1,775 | 1,826 |
| | International Bank for Reconstruction & Development | 1.875% | 6/19/23 | 1,100 | 1,145 |
| | International Bank for Reconstruction & Development | 3.000% | 9/27/23 | 1,125 | 1,210 |
| | International Bank for Reconstruction & Development | 0.250% | 11/24/23 | 700 | 700 |
| | International Bank for Reconstruction & Development | 2.500% | 3/19/24 | 1,100 | 1,178 |
| | International Bank for Reconstruction & Development | 1.500% | 8/28/24 | 695 | 725 |
| | International Bank for Reconstruction & Development | 2.500% | 11/25/24 | 750 | 813 |
| | International Bank for Reconstruction & Development | 1.625% | 1/15/25 | 200 | 210 |
| | International Bank for Reconstruction & Development | 0.625% | 4/22/25 | 1,500 | 1,514 |
| | International Bank for Reconstruction & Development | 0.375% | 7/28/25 | 1,500 | 1,497 |
| | International Bank for Reconstruction & Development | 2.500% | 7/29/25 | 1,150 | 1,258 |
| | International Bank for Reconstruction & Development | 0.500% | 10/28/25 | 2,000 | 2,005 |
| | International Bank for Reconstruction & Development | 3.125% | 11/20/25 | 470 | 530 |
| | | | Coupon | Maturity
Date | Face
Amount
($000) | Market
Value•
($000) |
| | International Bank for Reconstruction & Development | 2.500% | 11/22/27 | 350 | 391 |
| | International Bank for Reconstruction & Development | 0.750% | 11/24/27 | 900 | 901 |
| | International Bank for Reconstruction & Development | 1.750% | 10/23/29 | 200 | 213 |
| | International Bank for Reconstruction & Development | 0.875% | 5/14/30 | 400 | 396 |
| | International Bank for Reconstruction & Development | 0.750% | 8/26/30 | 800 | 780 |
| | International Bank for Reconstruction & Development | 4.750% | 2/15/35 | 250 | 357 |
| | International Finance Corp. | 2.000% | 10/24/22 | 200 | 207 |
| | International Finance Corp. | 2.875% | 7/31/23 | 575 | 614 |
| | International Finance Corp. | 1.375% | 10/16/24 | 200 | 208 |
| | International Finance Corp. | 0.375% | 7/16/25 | 400 | 399 |
| | International Finance Corp. | 2.125% | 4/7/26 | 600 | 651 |
| 7 | Iraq Government Aid Bond | 2.149% | 1/18/22 | 100 | 102 |
| 7 | Israel Government Aid Bond | 5.500% | 12/4/23 | 50 | 58 |
| 7 | Israel Government Aid Bond | 5.500% | 4/26/24 | 475 | 555 |
| 8 | Japan Bank for International Cooperation | 3.125% | 7/20/21 | 275 | 279 |
| 8 | Japan Bank for International Cooperation | 2.500% | 6/1/22 | 450 | 464 |
| 8 | Japan Bank for International Cooperation | 2.375% | 7/21/22 | 250 | 258 |
| 8 | Japan Bank for International Cooperation | 2.375% | 11/16/22 | 540 | 561 |
| 8 | Japan Bank for International Cooperation | 1.750% | 1/23/23 | 500 | 514 |
| 8 | Japan Bank for International Cooperation | 0.625% | 5/22/23 | 200 | 201 |
| 8 | Japan Bank for International Cooperation | 3.250% | 7/20/23 | 300 | 322 |
| 8 | Japan Bank for International Cooperation | 3.375% | 7/31/23 | 100 | 108 |
| 8 | Japan Bank for International Cooperation | 0.375% | 9/15/23 | 600 | 600 |
| 8 | Japan Bank for International Cooperation | 3.375% | 10/31/23 | 400 | 433 |
| 8 | Japan Bank for International Cooperation | 3.000% | 5/29/24 | 500 | 543 |
| 8 | Japan Bank for International Cooperation | 1.750% | 10/17/24 | 200 | 209 |
| 8 | Japan Bank for International Cooperation | 2.125% | 2/10/25 | 330 | 350 |
Total Bond Market Index Portfolio
| | | | Coupon | Maturity
Date | Face
Amount
($000) | Market
Value•
($000) |
| 8 | Japan Bank for International Cooperation | 0.625% | 7/15/25 | 400 | 400 |
| 8 | Japan Bank for International Cooperation | 2.375% | 4/20/26 | 200 | 217 |
| 8 | Japan Bank for International Cooperation | 2.250% | 11/4/26 | 200 | 217 |
| 8 | Japan Bank for International Cooperation | 2.875% | 7/21/27 | 200 | 224 |
| 8 | Japan Bank for International Cooperation | 2.750% | 11/16/27 | 800 | 898 |
| 8 | Japan Bank for International Cooperation | 3.250% | 7/20/28 | 300 | 349 |
| 8 | Japan Bank for International Cooperation | 3.500% | 10/31/28 | 350 | 415 |
| 8 | Japan International Cooperation Agency | 2.750% | 4/27/27 | 300 | 333 |
| 7 | Kingdom of Jordan AID | 2.578% | 6/30/22 | 200 | 206 |
| 7 | Kingdom of Jordan AID | 3.000% | 6/30/25 | 200 | 217 |
| | Korea Development Bank | 3.000% | 9/14/22 | 400 | 416 |
| | Korea Development Bank | 3.375% | 3/12/23 | 700 | �� 745 |
| | Korea Development Bank | 3.750% | 1/22/24 | 500 | 546 |
| | Korea Development Bank | 2.125% | 10/1/24 | 200 | 211 |
| 9 | Kreditanstalt fuer Wiederaufbau | 3.125% | 12/15/21 | 1,115 | 1,145 |
| 9 | Kreditanstalt fuer Wiederaufbau | 2.500% | 2/15/22 | 1,000 | 1,025 |
| 9 | Kreditanstalt fuer Wiederaufbau | 2.125% | 3/7/22 | 1,000 | 1,023 |
| 9 | Kreditanstalt fuer Wiederaufbau | 2.125% | 6/15/22 | 750 | 771 |
| 9 | Kreditanstalt fuer Wiederaufbau | 1.750% | 8/22/22 | 1,600 | 1,641 |
| 9 | Kreditanstalt fuer Wiederaufbau | 2.000% | 10/4/22 | 950 | 980 |
| 9 | Kreditanstalt fuer Wiederaufbau | 2.375% | 12/29/22 | 950 | 991 |
| 9 | Kreditanstalt fuer Wiederaufbau | 2.125% | 1/17/23 | 1,025 | 1,065 |
| 9 | Kreditanstalt fuer Wiederaufbau | 1.625% | 2/15/23 | 1,200 | 1,235 |
| 9 | Kreditanstalt fuer Wiederaufbau | 0.250% | 10/19/23 | 800 | 799 |
| 9 | Kreditanstalt fuer Wiederaufbau | 2.625% | 2/28/24 | 400 | 430 |
| 9 | Kreditanstalt fuer Wiederaufbau | 1.375% | 8/5/24 | 900 | 929 |
| 9 | Kreditanstalt fuer Wiederaufbau | 2.500% | 11/20/24 | 1,800 | 1,951 |
| 9 | Kreditanstalt fuer Wiederaufbau | 2.000% | 5/2/25 | 150 | 160 |
| 9 | Kreditanstalt fuer Wiederaufbau | 0.375% | 7/18/25 | 1,500 | 1,497 |
| 9 | Kreditanstalt fuer Wiederaufbau | 2.875% | 4/3/28 | 500 | 575 |
| 9 | Kreditanstalt fuer Wiederaufbau | 1.750% | 9/14/29 | 175 | 186 |
| 9 | Kreditanstalt fuer Wiederaufbau | 0.000% | 4/18/36 | 400 | 320 |
| 9 | Kreditanstalt fuer Wiederaufbau | 0.000% | 6/29/37 | 200 | 157 |
| 9 | Landwirtschaftliche Rentenbank | 3.125% | 11/14/23 | 100 | 108 |
| 9 | Landwirtschaftliche Rentenbank | 2.000% | 1/13/25 | 850 | 904 |
| 9 | Landwirtschaftliche Rentenbank | 0.500% | 5/27/25 | 400 | 401 |
| | | | Coupon | Maturity
Date | Face
Amount
($000) | Market
Value•
($000) |
| 9 | Landwirtschaftliche Rentenbank | 2.375% | 6/10/25 | 475 | 515 |
| 9 | Landwirtschaftliche Rentenbank | 1.750% | 7/27/26 | 275 | 292 |
| 9 | Landwirtschaftliche Rentenbank | 2.500% | 11/15/27 | 250 | 279 |
| 9 | Landwirtschaftliche Rentenbank | 0.875% | 9/3/30 | 500 | 492 |
| | Nordic Investment Bank | 2.125% | 2/1/22 | 200 | 204 |
| | Nordic Investment Bank | 1.375% | 10/17/22 | 200 | 204 |
| | Nordic Investment Bank | 0.375% | 5/19/23 | 200 | 200 |
| | Nordic Investment Bank | 2.875% | 7/19/23 | 200 | 213 |
| | Nordic Investment Bank | 2.250% | 5/21/24 | 200 | 211 |
| | Nordic Investment Bank | 0.375% | 9/11/25 | 600 | 598 |
| 10 | Oesterreichische Kontrollbank AG | 2.625% | 1/31/22 | 100 | 103 |
| 10 | Oesterreichische Kontrollbank AG | 1.625% | 9/17/22 | 400 | 409 |
| 10 | Oesterreichische Kontrollbank AG | 2.875% | 3/13/23 | 500 | 528 |
| 10 | Oesterreichische Kontrollbank AG | 3.125% | 11/7/23 | 200 | 216 |
| 10 | Oesterreichische Kontrollbank AG | 1.500% | 2/12/25 | 100 | 104 |
| 10 | Oesterreichische Kontrollbank AG | 0.375% | 9/17/25 | 500 | 497 |
| | Province of Alberta | 2.200% | 7/26/22 | 400 | 412 |
| | Province of Alberta | 3.350% | 11/1/23 | 375 | 406 |
| | Province of Alberta | 2.950% | 1/23/24 | 300 | 323 |
| | Province of Alberta | 1.875% | 11/13/24 | 450 | 473 |
| | Province of Alberta | 1.000% | 5/20/25 | 485 | 491 |
| | Province of Alberta | 3.300% | 3/15/28 | 250 | 288 |
| | Province of Alberta | 1.300% | 7/22/30 | 500 | 487 |
| | Province of British Columbia | 2.000% | 10/23/22 | 200 | 206 |
| | Province of British Columbia | 1.750% | 9/27/24 | 225 | 233 |
| | Province of British Columbia | 2.250% | 6/2/26 | 300 | 326 |
| | Province of Manitoba | 2.125% | 5/4/22 | 60 | 62 |
| | Province of Manitoba | 2.100% | 9/6/22 | 150 | 154 |
| | Province of Manitoba | 2.600% | 4/16/24 | 150 | 161 |
| | Province of Manitoba | 2.125% | 6/22/26 | 90 | 97 |
| | Province of New Brunswick | 2.500% | 12/12/22 | 95 | 99 |
| | Province of New Brunswick | 3.625% | 2/24/28 | 105 | 122 |
| | Province of Ontario | 2.400% | 2/8/22 | 525 | 537 |
| | Province of Ontario | 2.550% | 4/25/22 | 350 | 361 |
| | Province of Ontario | 2.250% | 5/18/22 | 500 | 514 |
| | Province of Ontario | 2.450% | 6/29/22 | 150 | 155 |
| | Province of Ontario | 2.200% | 10/3/22 | 400 | 413 |
| | Province of Ontario | 3.400% | 10/17/23 | 760 | 824 |
| | Province of Ontario | 3.050% | 1/29/24 | 250 | 270 |
| | Province of Ontario | 3.200% | 5/16/24 | 150 | 164 |
| | Province of Ontario | 2.500% | 4/27/26 | 250 | 273 |
| | Province of Ontario | 2.300% | 6/15/26 | 900 | 976 |
| | Province of Ontario | 2.000% | 10/2/29 | 585 | 616 |
| | Province of Ontario | 1.125% | 10/7/30 | 500 | 494 |
| | Province of Quebec | 2.375% | 1/31/22 | 390 | 399 |
| | Province of Quebec | 2.625% | 2/13/23 | 425 | 446 |
| | Province of Quebec | 1.500% | 2/11/25 | 441 | 455 |
| | Province of Quebec | 0.600% | 7/23/25 | 500 | 498 |
| | Province of Quebec | 2.500% | 4/20/26 | 200 | 219 |
| | Province of Quebec | 2.750% | 4/12/27 | 850 | 947 |
| | Province of Quebec | 7.500% | 9/15/29 | 475 | 711 |
| | Province of Quebec | 1.350% | 5/28/30 | 400 | 403 |
| | Province of Saskatchewan | 8.500% | 7/15/22 | 58 | 65 |
| | Republic of Chile | 2.250% | 10/30/22 | 175 | 181 |
| | Republic of Chile | 3.125% | 1/21/26 | 485 | 538 |
| | Republic of Chile | 3.240% | 2/6/28 | 460 | 521 |
Total Bond Market Index Portfolio
| | | | Coupon | Maturity
Date | Face
Amount
($000) | Market
Value•
($000) |
| | Republic of Chile | 2.450% | 1/31/31 | 200 | 214 |
| | Republic of Chile | 2.550% | 1/27/32 | 200 | 215 |
| | Republic of Chile | 3.500% | 1/25/50 | 675 | 772 |
| | Republic of Colombia | 4.000% | 2/26/24 | 400 | 432 |
| | Republic of Colombia | 8.125% | 5/21/24 | 100 | 123 |
| | Republic of Colombia | 4.500% | 1/28/26 | 322 | 365 |
| | Republic of Colombia | 3.875% | 4/25/27 | 765 | 851 |
| | Republic of Colombia | 4.500% | 3/15/29 | 450 | 521 |
| | Republic of Colombia | 3.000% | 1/30/30 | 200 | 210 |
| | Republic of Colombia | 3.125% | 4/15/31 | 200 | 212 |
| | Republic of Colombia | 10.375% | 1/28/33 | 200 | 323 |
| | Republic of Colombia | 7.375% | 9/18/37 | 300 | 439 |
| | Republic of Colombia | 6.125% | 1/18/41 | 125 | 167 |
| | Republic of Colombia | 5.625% | 2/26/44 | 475 | 615 |
| | Republic of Colombia | 5.000% | 6/15/45 | 1,165 | 1,425 |
| | Republic of Colombia | 5.200% | 5/15/49 | 600 | 759 |
| | Republic of Colombia | 4.125% | 5/15/51 | 400 | 444 |
| | Republic of Hungary | 6.375% | 3/29/21 | 422 | 428 |
| | Republic of Hungary | 5.375% | 2/21/23 | 400 | 438 |
| | Republic of Hungary | 5.750% | 11/22/23 | 400 | 456 |
| | Republic of Hungary | 5.375% | 3/25/24 | 350 | 398 |
| | Republic of Hungary | 7.625% | 3/29/41 | 290 | 514 |
| | Republic of Indonesia | 2.950% | 1/11/23 | 425 | 443 |
| | Republic of Indonesia | 4.100% | 4/24/28 | 200 | 232 |
| | Republic of Indonesia | 4.750% | 2/11/29 | 425 | 515 |
| | Republic of Indonesia | 3.400% | 9/18/29 | 200 | 224 |
| | Republic of Indonesia | 2.850% | 2/14/30 | 200 | 215 |
| | Republic of Indonesia | 3.850% | 10/15/30 | 200 | 233 |
| 5 | Republic of Indonesia | 4.750% | 7/18/47 | 200 | 250 |
| | Republic of Indonesia | 4.350% | 1/11/48 | 200 | 238 |
| | Republic of Indonesia | 4.350% | 1/11/48 | 525 | 625 |
| | Republic of Indonesia | 3.700% | 10/30/49 | 200 | 219 |
| | Republic of Indonesia | 4.200% | 10/15/50 | 430 | 513 |
| | Republic of Indonesia | 4.450% | 4/15/70 | 200 | 245 |
| | Republic of Italy | 6.875% | 9/27/23 | 590 | 684 |
| | Republic of Italy | 2.375% | 10/17/24 | 475 | 499 |
| | Republic of Italy | 1.250% | 2/17/26 | 500 | 498 |
| | Republic of Italy | 2.875% | 10/17/29 | 400 | 420 |
| | Republic of Italy | 5.375% | 6/15/33 | 475 | 609 |
| | Republic of Italy | 4.000% | 10/17/49 | 500 | 550 |
| | Republic of Korea | 3.875% | 9/11/23 | 200 | 218 |
| | Republic of Korea | 5.625% | 11/3/25 | 100 | 123 |
| | Republic of Korea | 2.750% | 1/19/27 | 1,000 | 1,091 |
| | Republic of Korea | 3.875% | 9/20/48 | 125 | 166 |
| | Republic of Panama | 4.000% | 9/22/24 | 200 | 221 |
| | Republic of Panama | 3.750% | 3/16/25 | 207 | 229 |
| | Republic of Panama | 7.125% | 1/29/26 | 168 | 214 |
| | Republic of Panama | 8.875% | 9/30/27 | 238 | 341 |
| | Republic of Panama | 3.875% | 3/17/28 | 460 | 529 |
| | Republic of Panama | 9.375% | 4/1/29 | 300 | 466 |
| | Republic of Panama | 2.252% | 9/29/32 | 500 | 517 |
| 2 | Republic of Panama | 6.700% | 1/26/36 | 292 | 433 |
| 2 | Republic of Panama | 4.500% | 4/16/50 | 610 | 784 |
| 2 | Republic of Panama | 4.300% | 4/29/53 | 400 | 506 |
| 2 | Republic of Panama | 4.500% | 4/1/56 | 700 | 903 |
| 2 | Republic of Panama | 3.870% | 7/23/60 | 200 | 236 |
| | Republic of Peru | 7.350% | 7/21/25 | 225 | 288 |
| | Republic of Peru | 2.392% | 1/23/26 | 200 | 213 |
| | Republic of Peru | 2.783% | 1/23/31 | 400 | 440 |
| | Republic of Peru | 8.750% | 11/21/33 | 645 | 1,102 |
| 2 | Republic of Peru | 6.550% | 3/14/37 | 325 | 493 |
| | Republic of Peru | 5.625% | 11/18/50 | 475 | 746 |
| | Republic of Peru | 3.230% | 7/28/21 | 500 | 499 |
| | Republic of Philippines | 9.500% | 10/21/24 | 350 | 466 |
| | Republic of Philippines | 10.625% | 3/16/25 | 100 | 142 |
| | Republic of Philippines | 5.500% | 3/30/26 | 225 | 280 |
| | Republic of Philippines | 3.000% | 2/1/28 | 400 | 443 |
| | Republic of Philippines | 3.750% | 1/14/29 | 400 | 467 |
| | Republic of Philippines | 9.500% | 2/2/30 | 300 | 495 |
| | | | Coupon | Maturity
Date | Face
Amount
($000) | Market
Value•
($000) |
| | Republic of Philippines | 2.457% | 5/5/30 | 200 | 216 |
| | Republic of Philippines | 7.750% | 1/14/31 | 400 | 618 |
| | Republic of Philippines | 6.375% | 1/15/32 | 200 | 286 |
| | Republic of Philippines | 6.375% | 10/23/34 | 550 | 809 |
| | Republic of Philippines | 3.950% | 1/20/40 | 700 | 837 |
| | Republic of Philippines | 3.700% | 3/1/41 | 400 | 464 |
| | Republic of Philippines | 3.700% | 2/2/42 | 350 | 407 |
| | Republic of Philippines | 2.950% | 5/5/45 | 500 | 531 |
| | Republic of Poland | 5.125% | 4/21/21 | 245 | 248 |
| | Republic of Poland | 5.000% | 3/23/22 | 775 | 818 |
| | Republic of Poland | 3.000% | 3/17/23 | 325 | 342 |
| | Republic of Poland | 3.250% | 4/6/26 | 500 | 563 |
| 2 | Republic of Uruguay | 8.000% | 11/18/22 | 83 | 91 |
| 2 | Republic of Uruguay | 4.500% | 8/14/24 | ��� 303 | 335 |
| 2 | Republic of Uruguay | 4.375% | 10/27/27 | 150 | 177 |
| 2 | Republic of Uruguay | 4.375% | 1/23/31 | 308 | 378 |
| 2 | Republic of Uruguay | 7.625% | 3/21/36 | 195 | 316 |
| 2 | Republic of Uruguay | 4.125% | 11/20/45 | 300 | 373 |
| 2 | Republic of Uruguay | 5.100% | 6/18/50 | 765 | 1,070 |
| 2 | Republic of Uruguay | 4.975% | 4/20/55 | 500 | 694 |
| | State of Israel | 3.150% | 6/30/23 | 400 | 427 |
| | State of Israel | 2.875% | 3/16/26 | 200 | 220 |
| | State of Israel | 3.250% | 1/17/28 | 300 | 343 |
| | State of Israel | 2.500% | 1/15/30 | 200 | 217 |
| | State of Israel | 2.750% | 7/3/30 | 600 | 661 |
| | State of Israel | 4.500% | 1/30/43 | 200 | 264 |
| | State of Israel | 4.125% | 1/17/48 | 250 | 322 |
| | State of Israel | 3.375% | 1/15/50 | 475 | 525 |
| | State of Israel | 3.875% | 7/3/50 | 400 | 481 |
| | State of Israel | 4.500% | 4/3/20 | 200 | 265 |
| | Svensk Exportkredit AB | 2.000% | 8/30/22 | 190 | 195 |
| | Svensk Exportkredit AB | 1.625% | 11/14/22 | 200 | 205 |
| | Svensk Exportkredit AB | 2.875% | 3/14/23 | 195 | 206 |
| | Svensk Exportkredit AB | 0.375% | 7/30/24 | 500 | 500 |
| | Svensk Exportkredit AB | 0.625% | 5/14/25 | 500 | 502 |
| | Svensk Exportkredit AB | 0.500% | 8/26/25 | 800 | 797 |
| 7 | Ukraine Government AID Bonds | 1.471% | 9/29/21 | 175 | 176 |
| | United Mexican States | 3.600% | 1/30/25 | 510 | 567 |
| | United Mexican States | 3.900% | 4/27/25 | 400 | 449 |
| | United Mexican States | 4.125% | 1/21/26 | 445 | 511 |
| | United Mexican States | 4.150% | 3/28/27 | 800 | 923 |
| | United Mexican States | 3.750% | 1/11/28 | 675 | 760 |
| | United Mexican States | 4.500% | 4/22/29 | 950 | 1,114 |
| | United Mexican States | 3.250% | 4/16/30 | 700 | 758 |
| | United Mexican States | 8.300% | 8/15/31 | 220 | 335 |
| | United Mexican States | 4.750% | 4/27/32 | 600 | 723 |
| | United Mexican States | 7.500% | 4/8/33 | 100 | 145 |
| | United Mexican States | 6.050% | 1/11/40 | 883 | 1,185 |
| | United Mexican States | 4.750% | 3/8/44 | 765 | 910 |
| | United Mexican States | 5.550% | 1/21/45 | 510 | 669 |
| | United Mexican States | 4.600% | 1/23/46 | 600 | 700 |
| | United Mexican States | 4.350% | 1/15/47 | 760 | 867 |
| | United Mexican States | 4.600% | 2/10/48 | 455 | 534 |
| | United Mexican States | 4.500% | 1/31/50 | 600 | 704 |
| | United Mexican States | 5.000% | 4/27/51 | 800 | 998 |
| | United Mexican States | 3.771% | 5/24/61 | 400 | 417 |
| | United Mexican States | 5.750% | 10/12/10 | 342 | 454 |
| Total Sovereign Bonds (Cost $179,204) | 192,422 |
| Taxable Municipal Bonds (0.8%) |
| | Alabama Economic Settlement Authority Miscellaneous Revenue | 3.163% | 9/15/25 | 65 | 69 |
| | American Municipal Power Inc. Electric Power & Light Revenue | 5.939% | 2/15/47 | 150 | 223 |
| | American Municipal Power Inc. Electric Power & Light Revenue | 6.270% | 2/15/50 | 50 | 71 |
Total Bond Market Index Portfolio
| | | | Coupon | Maturity
Date | Face
Amount
($000) | Market
Value•
($000) |
| | American Municipal Power Inc. Electric Power & Light Revenue | 7.499% | 2/15/50 | 50 | 83 |
| | American Municipal Power Inc. Electric Power & Light Revenue (Combination Hydroelectric Projects) | 8.084% | 2/15/50 | 125 | 235 |
| | Bay Area Toll Authority Highway Revenue | 2.574% | 4/1/31 | 75 | 81 |
| | Bay Area Toll Authority Highway Revenue | 6.918% | 4/1/40 | 100 | 156 |
| | Bay Area Toll Authority Highway Revenue | 6.263% | 4/1/49 | 250 | 431 |
| | Bay Area Toll Authority Highway Revenue | 7.043% | 4/1/50 | 100 | 183 |
| | Bay Area Toll Authority Highway Revenue | 6.907% | 10/1/50 | 200 | 369 |
| | California Department of Water Resources Power Supply Electric Power & Light Revenue, ETM | 2.000% | 5/1/22 | 150 | 153 |
| | California GO | 5.700% | 11/1/21 | 250 | 261 |
| | California GO | 3.375% | 4/1/25 | 100 | 112 |
| | California GO | 2.650% | 4/1/26 | 75 | 83 |
| | California GO | 3.500% | 4/1/28 | 150 | 175 |
| | California GO | 2.500% | 10/1/29 | 70 | 77 |
| | California GO | 4.500% | 4/1/33 | 190 | 230 |
| | California GO | 7.500% | 4/1/34 | 350 | 583 |
| | California GO | 4.600% | 4/1/38 | 300 | 361 |
| | California GO | 7.550% | 4/1/39 | 630 | 1,106 |
| | California GO | 7.300% | 10/1/39 | 75 | 124 |
| | California GO | 7.350% | 11/1/39 | 1,425 | 2,367 |
| | California GO | 7.625% | 3/1/40 | 205 | 356 |
| | California GO | 7.600% | 11/1/40 | 200 | 362 |
| | California State University College & University Revenue | 3.899% | 11/1/47 | 50 | 61 |
| | California State University College & University Revenue | 2.975% | 11/1/51 | 140 | 150 |
| | Central Puget Sound Regional Transit Authority Sales Tax Revenue | 5.491% | 11/1/39 | 50 | 73 |
| | Chicago IL GO | 7.045% | 1/1/29 | 45 | 49 |
| | Chicago O'Hare International Airport Port, Airport & Marina Revenue | 6.395% | 1/1/40 | 125 | 188 |
| | Chicago O'Hare International Airport Port, Airport & Marina Revenue | 4.472% | 1/1/49 | 75 | 93 |
| | Chicago Transit Authority Sales & Transfer Tax Receipts Sales Tax Revenue | 6.899% | 12/1/40 | 125 | 181 |
| | Clark County Department of Aviation Port, Airport & Marina Revenue | 6.820% | 7/1/45 | 100 | 166 |
| | Commonwealth Financing Authority Appropriations Revenue | 3.807% | 6/1/41 | 105 | 124 |
| | Commonwealth Financing Authority Appropriations Revenue (Plancon Program) | 3.864% | 6/1/38 | 100 | 117 |
| | Commonwealth of Massachusetts GO | 4.200% | 12/1/21 | 65 | 67 |
| | Commonwealth of Massachusetts GO | 5.456% | 12/1/39 | 150 | 221 |
| | | | Coupon | Maturity
Date | Face
Amount
($000) | Market
Value•
($000) |
| | Commonwealth of Massachusetts GO | 2.514% | 7/1/41 | 450 | 471 |
| | Commonwealth of Massachusetts GO | 2.813% | 9/1/43 | 225 | 248 |
| | Commonwealth of Massachusetts GO | 2.900% | 9/1/49 | 100 | 108 |
| | Commonwealth of Massachusetts Transportation Fund Fuel Sales Tax Revenue | 5.731% | 6/1/40 | 50 | 72 |
| | Connecticut GO | 5.090% | 10/1/30 | 175 | 213 |
| | Connecticut GO | 5.850% | 3/15/32 | 200 | 280 |
| | Cook County IL GO | 6.229% | 11/15/34 | 50 | 70 |
| | Dallas Area Rapid Transit Sales Tax Revenue | 5.999% | 12/1/44 | 100 | 153 |
| | Dallas Area Rapid Transit Sales Tax Revenue | 5.022% | 12/1/48 | 50 | 71 |
| | Dallas Convention Center Hotel Development Corp. Hotel Occupancy Tax Revenue | 7.088% | 1/1/42 | 75 | 104 |
| | Dallas Independent School District GO | 6.450% | 2/15/35 | 100 | 101 |
| | Dallas-Fort Worth International Airport Port, Airport & Marina Revenue | 2.994% | 11/1/38 | 485 | 519 |
| | Dallas-Fort Worth International Airport Port, Airport & Marina Revenue | 3.144% | 11/1/45 | 75 | 80 |
| | District of Columbia Income Tax Revenue | 5.591% | 12/1/34 | 50 | 68 |
| | District of Columbia Water & Sewer Authority Water Revenue | 4.814% | 10/1/14 | 150 | 223 |
| | East Bay Municipal Utility District Water System Water Revenue | 5.874% | 6/1/40 | 85 | 128 |
| | Foothill-Eastern Transportation Corridor Agency Highway Revenue | 4.094% | 1/15/49 | 140 | 150 |
| | Georgia Municipal Electric Authority Electric Power & Light Revenue | 6.637% | 4/1/57 | 245 | 373 |
| | Georgia Municipal Electric Authority Electric Power & Light Revenue | 6.655% | 4/1/57 | 147 | 227 |
| | Georgia Municipal Electric Authority Electric Power & Light Revenue | 7.055% | 4/1/57 | 74 | 107 |
| | Grand Parkway Transportation Corp. Texas System Highway Revenue | 3.236% | 10/1/52 | 395 | 413 |
| | Great Lakes Water Authority Sewage Disposal System Sewer Revenue | 3.056% | 7/1/39 | 100 | 107 |
| | Houston TX GO | 6.290% | 3/1/32 | 130 | 165 |
| | Illinois GO | 4.950% | 6/1/23 | 213 | 218 |
| | Illinois GO | 5.100% | 6/1/33 | 1,105 | 1,189 |
| | Illinois State Toll Highway Authority Highway Revenue | 6.184% | 1/1/34 | 50 | 72 |
| | JobsOhio Beverage System Miscellaneous Revenue | 3.985% | 1/1/29 | 150 | 173 |
| | JobsOhio Beverage System Miscellaneous Revenue | 4.532% | 1/1/35 | 100 | 128 |
Total Bond Market Index Portfolio
| | | | Coupon | Maturity
Date | Face
Amount
($000) | Market
Value•
($000) |
| | JobsOhio Beverage System Miscellaneous Revenue | 2.833% | 1/1/38 | 75 | 81 |
| | Los Angeles CA Unified School District GO | 5.755% | 7/1/29 | 200 | 258 |
| | Los Angeles CA Unified School District GO | 5.750% | 7/1/34 | 125 | 176 |
| | Los Angeles CA Unified School District GO | 6.758% | 7/1/34 | 200 | 301 |
| | Los Angeles Community College District GO | 1.606% | 8/1/28 | 100 | 104 |
| | Los Angeles Community College District GO | 1.806% | 8/1/30 | 150 | 155 |
| | Los Angeles Community College District GO | 2.106% | 8/1/32 | 100 | 104 |
| | Los Angeles County Metropolitan Transportation Authority Sales Tax Revenue | 5.735% | 6/1/39 | 75 | 103 |
| | Los Angeles County Public Works Financing Authority Lease (Abatement) Revenue | 7.618% | 8/1/40 | 50 | 85 |
| | Los Angeles Department of Water & Power System Electric Power & Light Revenue | 6.574% | 7/1/45 | 100 | 175 |
| | Los Angeles Department of Water & Power System Water Revenue | 6.603% | 7/1/50 | 100 | 186 |
| | Maryland Health & Higher Educational Facilities Authority Health, Hospital, Nursing Home Revenue | 3.197% | 7/1/50 | 500 | 518 |
| | Maryland State Transportation Authority Transit Revenue | 5.888% | 7/1/43 | 50 | 74 |
| | Massachusetts School Building Authority Sales Tax Revenue | 5.715% | 8/15/39 | 100 | 145 |
| | Massachusetts School Building Authority Sales Tax Revenue | 3.395% | 10/15/40 | 50 | 54 |
| | Massachusetts School Building Authority Sales Tax Revenue | 2.950% | 5/15/43 | 100 | 104 |
| | Metropolitan Government of Nashville & Davidson County TN Hotel Occupancy Tax Revenue | 6.731% | 7/1/43 | 50 | 76 |
| | Metropolitan Transportation Authority Miscellaneous Taxes Revenue | 7.336% | 11/15/39 | 400 | 640 |
| | Metropolitan Transportation Authority Transit Revenue | 5.871% | 11/15/39 | 50 | 61 |
| | Metropolitan Transportation Authority Transit Revenue | 5.175% | 11/15/49 | 175 | 205 |
| | Metropolitan Washington Airports Authority Dulles Toll Road Highway Revenue | 7.462% | 10/1/46 | 85 | 151 |
| | Metropolitan Water Reclamation District of Greater Chicago GO | 5.720% | 12/1/38 | 100 | 143 |
| | Miami-Dade County FL Aviation Port, Airport & Marina Revenue | 4.280% | 10/1/41 | 125 | 138 |
| | Miami-Dade County FL Water & Sewer Water Revenue | 3.490% | 10/1/42 | 75 | 81 |
| | | | Coupon | Maturity
Date | Face
Amount
($000) | Market
Value•
($000) |
| | Michigan Finance Authority Health, Hospital, Nursing Home Revenue | 3.084% | 12/1/34 | 75 | 83 |
| | Michigan Finance Authority Health, Hospital, Nursing Home Revenue | 3.384% | 12/1/40 | 200 | 225 |
| | Michigan State University College & University Revenue | 4.496% | 8/15/48 | 50 | 57 |
| | Mississippi GO | 5.245% | 11/1/34 | 50 | 66 |
| | Missouri Health & Educational Facilities Authority College & University Revenue | 3.229% | 5/15/50 | 100 | 117 |
| | Missouri Health & Educational Facilities Authority College & University Revenue | 3.652% | 8/15/57 | 100 | 126 |
| 11 | New Jersey Economic Development Authority Appropriations Revenue | 7.425% | 2/15/29 | 225 | 290 |
| | New Jersey Transportation Trust Fund Authority Appropriations Revenue | 4.081% | 6/15/39 | 75 | 79 |
| | New Jersey Transportation Trust Fund Authority Appropriations Revenue | 6.561% | 12/15/40 | 400 | 552 |
| | New Jersey Transportation Trust Fund Authority Appropriations Revenue | 4.131% | 6/15/42 | 100 | 104 |
| | New Jersey Turnpike Authority Highway Revenue | 7.414% | 1/1/40 | 100 | 168 |
| | New Jersey Turnpike Authority Highway Revenue | 7.102% | 1/1/41 | 400 | 653 |
| | New York City Transitional Finance Authority Future Tax Secured Income Tax Revenue | 5.767% | 8/1/36 | 150 | 196 |
| | New York City Transitional Finance Authority Future Tax Secured Income Tax Revenue | 5.572% | 11/1/38 | 75 | 102 |
| | New York City Transitional Finance Authority Future Tax Secured Sales Tax Revenue | 5.508% | 8/1/37 | 100 | 137 |
| | New York City Water & Sewer System Water Revenue | 5.750% | 6/15/41 | 50 | 77 |
| | New York City Water & Sewer System Water Revenue | 5.952% | 6/15/42 | 50 | 79 |
| | New York City Water & Sewer System Water Revenue | 6.011% | 6/15/42 | 50 | 79 |
| | New York City Water & Sewer System Water Revenue | 5.440% | 6/15/43 | 100 | 152 |
| | New York City Water & Sewer System Water Revenue | 5.882% | 6/15/44 | 175 | 284 |
| | New York NY GO | 5.517% | 10/1/37 | 50 | 71 |
| | New York NY GO | 6.271% | 12/1/37 | 100 | 151 |
| | New York State Dormitory Authority College & University Revenue | 3.142% | 7/1/43 | 260 | 274 |
Total Bond Market Index Portfolio
| | | | Coupon | Maturity
Date | Face
Amount
($000) | Market
Value•
($000) |
| | New York State Dormitory Authority Income Tax Revenue | 3.110% | 2/15/39 | 50 | 54 |
| | New York State Dormitory Authority Income Tax Revenue | 5.628% | 3/15/39 | 100 | 134 |
| | New York State Dormitory Authority Income Tax Revenue | 3.190% | 2/15/43 | 50 | 55 |
| | New York State Thruway Authority Highway Revenue | 2.900% | 1/1/35 | 75 | 81 |
| | New York State Thruway Authority Highway Revenue | 3.500% | 1/1/42 | 50 | 52 |
| | New York State Urban Development Corp. Income Tax Revenue | 3.900% | 3/15/33 | 100 | 115 |
| | New York State Urban Development Corp. Income Tax Revenue | 5.770% | 3/15/39 | 150 | 193 |
| | North Texas Tollway Authority Highway Revenue | 6.718% | 1/1/49 | 150 | 260 |
| | Ohio State University College & University Revenue | 4.910% | 6/1/40 | 100 | 138 |
| | Ohio State University College & University Revenue | 4.800% | 6/1/11 | 100 | 145 |
| | Ohio State University General Receipts College & University Revenue | 3.798% | 12/1/46 | 100 | 122 |
| | Ohio Turnpike & Infrastructure Commission Highway Revenue | 3.216% | 2/15/48 | 75 | 76 |
| | Ohio Water Development Authority Water Pollution Control Loan Fund Water Revenue | 4.879% | 12/1/34 | 75 | 92 |
| | Oregon Department of Transportation Fuel Sales Tax Revenue | 5.834% | 11/15/34 | 150 | 218 |
| | Oregon GO | 5.762% | 6/1/23 | 107 | 116 |
| | Oregon GO | 5.892% | 6/1/27 | 75 | 94 |
| 12 | Oregon School Boards Association GO | 5.528% | 6/30/28 | 50 | 60 |
| 13 | Oregon State University College & University Revenue | 3.424% | 3/1/60 | 150 | 155 |
| | Pennsylvania State University College & University Revenue | 2.790% | 9/1/43 | 200 | 209 |
| | Pennsylvania State University College & University Revenue | 2.840% | 9/1/50 | 100 | 103 |
| | Pennsylvania Turnpike Commission Highway Revenue | 5.511% | 12/1/45 | 75 | 114 |
| | Permanent University Fund - Texas A&M University System College & University Revenue | 3.100% | 7/1/49 | 75 | 80 |
| | Permanent University Fund - University of Texas System College & University Revenue | 3.376% | 7/1/47 | 50 | 60 |
| | Port Authority of New York & New Jersey Port, Airport & Marina Revenue | 6.040% | 12/1/29 | 75 | 100 |
| | | | Coupon | Maturity
Date | Face
Amount
($000) | Market
Value•
($000) |
| | Port Authority of New York & New Jersey Port, Airport & Marina Revenue | 4.960% | 8/1/46 | 250 | 342 |
| | Port Authority of New York & New Jersey Port, Airport & Marina Revenue | 5.310% | 8/1/46 | 100 | 112 |
| | Port Authority of New York & New Jersey Port, Airport & Marina Revenue | 4.031% | 9/1/48 | 30 | 37 |
| | Port Authority of New York & New Jersey Port, Airport & Marina Revenue | 4.926% | 10/1/51 | 100 | 139 |
| | Port Authority of New York & New Jersey Port, Airport & Marina Revenue | 4.458% | 10/1/62 | 550 | 732 |
| | Port Authority of New York & New Jersey Port, Airport & Marina Revenue | 4.810% | 10/15/65 | 100 | 139 |
| | Port Authority of New York & New Jersey Port, Airport & Marina Revenue | 3.287% | 8/1/69 | 100 | 107 |
| | Port of Morrow OR Nuclear Revenue | 2.543% | 9/1/40 | 100 | 104 |
| | Regional Transportation District Sales Tax Revenue | 5.844% | 11/1/50 | 100 | 166 |
| | Riverside County CA Appropriations Revenue | 3.818% | 2/15/38 | 50 | 55 |
| | Rutgers State University of New Jersey College & University Revenue | 5.665% | 5/1/40 | 50 | 69 |
| | Rutgers State University of New Jersey College & University Revenue | 3.270% | 5/1/43 | 25 | 27 |
| | Rutgers State University of New Jersey College & University Revenue | 3.915% | 5/1/19 | 75 | 85 |
| | Sales Tax Securitization Corp. Sales Tax Revenue | 3.587% | 1/1/43 | 75 | 79 |
| | Sales Tax Securitization Corp. Sales Tax Revenue | 3.820% | 1/1/48 | 50 | 55 |
| | Sales Tax Securitization Corp. Sales Tax Revenue | 4.787% | 1/1/48 | 100 | 125 |
| | Salt River Project Agricultural Improvement & Power District Electric Power & Light Revenue | 4.839% | 1/1/41 | 150 | 209 |
| | San Antonio TX Electric & Gas Systems Electric Power & Light Revenue | 5.985% | 2/1/39 | 125 | 189 |
| | San Antonio TX Electric & Gas Systems Electric Power & Light Revenue | 5.808% | 2/1/41 | 125 | 189 |
| | San Antonio TX Electric & Gas Systems Electric Power & Light Revenue | 2.905% | 2/1/48 | 100 | 105 |
| | San Diego County Water Authority Water Revenue | 6.138% | 5/1/49 | 100 | 156 |
| | San Francisco CA Public Utilities Commission Water Revenue | 6.950% | 11/1/50 | 100 | 172 |
Total Bond Market Index Portfolio
| | | | Coupon | Maturity
Date | Face
Amount
($000) | Market
Value•
($000) |
| | San Jose Redevelopment Agency Successor Agency Tax Allocation Revenue | 3.375% | 8/1/34 | 100 | 107 |
| | Santa Clara Valley Transportation Authority Sales Tax Revenue | 5.876% | 4/1/32 | 200 | 256 |
| | South Carolina Public Service Authority Electric Power & Light Revenue | 6.454% | 1/1/50 | 100 | 166 |
| | South Carolina Public Service Authority Nuclear Revenue | 2.388% | 12/1/23 | 50 | 52 |
| | State Board of Administration Finance Corp. Miscellaneous Revenue | 2.638% | 7/1/21 | 150 | 152 |
| | State Board of Administration Finance Corp. Miscellaneous Revenue | 1.258% | 7/1/25 | 325 | 332 |
| | State Board of Administration Finance Corp. Miscellaneous Revenue | 1.705% | 7/1/27 | 250 | 260 |
| | State Board of Administration Finance Corp. Miscellaneous Revenue | 2.154% | 7/1/30 | 250 | 263 |
| | State Public School Building Authority Miscellaneous Revenue | 5.000% | 9/15/27 | 50 | 61 |
| | Texas GO | 5.517% | 4/1/39 | 180 | 268 |
| | Texas GO | 4.681% | 4/1/40 | 50 | 68 |
| | Texas GO | 3.211% | 4/1/44 | 225 | 246 |
| | Texas Private Activity Bond Surface Transportation Corp. Highway Revenue | 3.922% | 12/31/49 | 175 | 200 |
| | Texas Transportation Commission GO | 2.562% | 4/1/42 | 100 | 102 |
| | Texas Transportation Commission GO | 2.472% | 10/1/44 | 500 | 503 |
| | Texas Transportation Commission State Highway Fund Fuel Sales Tax Revenue | 5.178% | 4/1/30 | 175 | 226 |
| | Texas Transportation Commission State Highway Fund Miscellaneous Revenue | 4.000% | 10/1/33 | 100 | 126 |
| | University of California College & University Revenue | 0.883% | 5/15/25 | 100 | 101 |
| | University of California College & University Revenue | 3.063% | 7/1/25 | 100 | 110 |
| | University of California College & University Revenue | 1.316% | 5/15/27 | 100 | 102 |
| | University of California College & University Revenue | 1.614% | 5/15/30 | 125 | 126 |
| | University of California College & University Revenue | 5.946% | 5/15/45 | 175 | 254 |
| | University of California College & University Revenue | 4.858% | 5/15/12 | 225 | 323 |
| | University of California College & University Revenue | 4.767% | 5/15/15 | 100 | 140 |
| | | | Coupon | Maturity
Date | Face
Amount
($000) | Market
Value•
($000) |
| | University of California Regents Medical Center Pooled Health, Hospital, Nursing Home Revenue | 6.548% | 5/15/48 | 350 | 568 |
| | University of California Regents Medical Center Pooled Health, Hospital, Nursing Home Revenue | 6.583% | 5/15/49 | 50 | 81 |
| | University of California Regents Medical Center Pooled Health, Hospital, Nursing Home Revenue | 3.006% | 5/15/50 | 130 | 138 |
| | University of California Regents Medical Center Pooled Health, Hospital, Nursing Home Revenue | 3.706% | 5/15/20 | 60 | 64 |
| | University of Michigan College & University Revenue | 2.437% | 4/1/40 | 100 | 104 |
| | University of Michigan College & University Revenue | 2.562% | 4/1/50 | 100 | 106 |
| | University of Nebraska Facilities Corp. College & University Revenue | 3.037% | 10/1/49 | 65 | 71 |
| | University of Pittsburgh-of the Commonwealth System of Higher Education College & University Revenue | 3.555% | 9/15/19 | 250 | 283 |
| | University of Texas System College & University Revenue | 2.439% | 8/15/49 | 50 | 51 |
| | University of Texas System Regents College & University Revenue | 4.794% | 8/15/46 | 100 | 137 |
| | University of Texas System Regents College & University Revenue | 3.354% | 8/15/47 | 50 | 60 |
| | University of Virginia College & University Revenue | 2.256% | 9/1/50 | 335 | 332 |
| | University of Virginia College & University Revenue | 4.179% | 9/1/17 | 50 | 67 |
| | Utah GO | 4.554% | 7/1/24 | 40 | 43 |
| | Utah GO | 3.539% | 7/1/25 | 50 | 54 |
| | Washington GO | 5.140% | 8/1/40 | 150 | 211 |
| 12 | Wisconsin Appropriations Revenue | 5.700% | 5/1/26 | 60 | 71 |
| | Wisconsin Appropriations Revenue | 3.154% | 5/1/27 | 100 | 113 |
| | Wisconsin Appropriations Revenue | 3.954% | 5/1/36 | 250 | 280 |
| Total Taxable Municipal Bonds (Cost $31,173) | 37,809 |
Total Bond Market Index Portfolio
| | | | Coupon | | Shares | Market
Value•
($000) |
| Temporary Cash Investments (3.4%) |
| Money Market Fund (3.4%) |
| 14 | Vanguard Market Liquidity Fund
(Cost $164,294) | 0.111% | | 1,642,950 | 164,295 |
| Total Investments (102.5%) (Cost $4,640,624) | 4,989,841 |
| Other Assets and Liabilities—Net (-2.5%) | (123,294) |
| Net Assets (100%) | 4,866,547 |
| Cost is in $000. |
| • | See Note A in Notes to Financial Statements. |
| 1 | The issuer was placed under federal conservatorship in September 2008; since that time, its daily operations have been managed by the Federal Housing Finance Agency and it receives capital from the U.S. Treasury, as needed to maintain a positive net worth, in exchange for senior preferred stock. |
| 2 | The average or expected maturity is shorter than the final maturity shown because of the possibility of interim principal payments and prepayments or the possibility of the issue being called. |
| 3 | Includes securities purchased on a when-issued or delayed-delivery basis for which the portfolio has not taken delivery as of December 31, 2020. |
| 4 | Variable rate security; rate shown is effective rate at period end. Certain variable rate securities are not based on a published reference rate and spread but are determined by the issuer or agent based on current market conditions. |
| 5 | Security exempt from registration under Rule 144A of the Securities Act of 1933. Such securities may be sold in transactions exempt from registration, normally to qualified institutional buyers. At December 31, 2020, the aggregate value was $34,611,000, representing 0.7% of net assets. |
| 6 | Guaranteed by the Government of Canada. |
| 7 | U.S. government-guaranteed. |
| 8 | Guaranteed by the Government of Japan. |
| 9 | Guaranteed by the Federal Republic of Germany. |
| 10 | Guaranteed by the Republic of Austria. |
| 11 | Scheduled principal and interest payments are guaranteed by National Public Finance Guarantee Corp. |
| 12 | Scheduled principal and interest payments are guaranteed by Assured Guaranty Municipal Corp. |
| 13 | Scheduled principal and interest payments are guaranteed by Build America Mutual Assurance Co. |
| 14 | Affiliated money market fund available only to Vanguard funds and certain trusts and accounts managed by Vanguard. Rate shown is the 7-day yield. |
| | 12M—12-month. |
| | 1YR—1-year. |
| | 6M—6-month. |
| | CMT—Constant Maturing Treasury Rate. |
| | ETM—Escrowed to Maturity. |
| | GO—General Obligation Bond. |
| | LIBOR—London Interbank Offered Rate. |
| | REIT—Real Estate Investment Trust. |
| | UMBS—Uniform Mortgage-Backed Securities. |
See accompanying Notes, which are an integral part of the Financial Statements.
Total Bond Market Index Portfolio
Statement of Assets and Liabilities
| ($000s, except shares and per-share amounts) | Amount |
| Assets | |
| Investments in Securities, at Value | |
| Unaffiliated Issuers (Cost $4,476,330) | 4,825,546 |
| Affiliated Issuers (Cost $164,294) | 164,295 |
| Total Investments in Securities | 4,989,841 |
| Investment in Vanguard | 190 |
| Receivables for Investment Securities Sold | 13,739 |
| Receivables for Accrued Income | 24,411 |
| Receivables for Capital Shares Issued | 1,881 |
| Total Assets | 5,030,062 |
| Liabilities | |
| Due to Custodian | 838 |
| Payables for Investment Securities Purchased | 161,062 |
| Payables for Capital Shares Redeemed | 1,245 |
| Payables to Vanguard | 370 |
| Total Liabilities | 163,515 |
| Net Assets | 4,866,547 |
| At December 31, 2020, net assets consisted of: | |
| | |
| Paid-in Capital | 4,388,468 |
| Total Distributable Earnings (Loss) | 478,079 |
| Net Assets | 4,866,547 |
| |
| Net Assets | |
Applicable to 379,823,332 outstanding $.001 par value shares of
beneficial interest (unlimited authorization) | 4,866,547 |
| Net Asset Value Per Share | $12.81 |
See accompanying Notes, which are an integral part of the Financial Statements.
Total Bond Market Index Portfolio
Statement of Operations
|
| | Year Ended
December 31, 2020 |
| | ($000) |
| Investment Income | |
| Income | |
| Interest1 | 107,710 |
| Total Income | 107,710 |
| Expenses | |
| The Vanguard Group—Note B | |
| Investment Advisory Services | 111 |
| Management and Administrative | 5,639 |
| Marketing and Distribution | 501 |
| Custodian Fees | 50 |
| Auditing Fees | 82 |
| Shareholders' Reports | 61 |
| Trustees’ Fees and Expenses | 3 |
| Total Expenses | 6,447 |
| Net Investment Income | 101,263 |
| Realized Net Gain (Loss) | |
| Investment Securities Sold1 | 37,717 |
| Futures Contracts | 87 |
| Realized Net Gain (Loss) | 37,804 |
| Change in Unrealized Appreciation (Depreciation) of Investment Securities1 | 187,699 |
| Net Increase (Decrease) in Net Assets Resulting from Operations | 326,766 |
| 1 | Interest income, realized net gain (loss), and change in unrealized appreciation (depreciation) from an affiliated company of the portfolio were $536,000, $36,000, and ($7,000), respectively. Purchases and sales are for temporary cash investment purposes. |
Statement of Changes in Net Assets
|
| | Year Ended December 31, |
| | 2020
($000) | 2019
($000) |
| Increase (Decrease) in Net Assets | | |
| Operations | | |
| Net Investment Income | 101,263 | 107,635 |
| Realized Net Gain (Loss) | 37,804 | 8,028 |
| Change in Unrealized Appreciation (Depreciation) | 187,699 | 204,615 |
| Net Increase (Decrease) in Net Assets Resulting from Operations | 326,766 | 320,278 |
| Distributions1 | | |
| Total Distributions | (107,753) | (97,897) |
| Capital Share Transactions | | |
| Issued | 1,363,956 | 1,031,614 |
| Issued in Lieu of Cash Distributions | 107,753 | 97,897 |
| Redeemed | (1,124,178) | (586,442) |
| Net Increase (Decrease) from Capital Share Transactions | 347,531 | 543,069 |
| Total Increase (Decrease) | 566,544 | 765,450 |
| Net Assets | | |
| Beginning of Period | 4,300,003 | 3,534,553 |
| End of Period | 4,866,547 | 4,300,003 |
| 1 | Certain prior-period numbers have been reclassified to conform with the current-period presentation. |
See accompanying Notes, which are an integral part of the Financial Statements.
Total Bond Market Index Portfolio
For a Share Outstanding
Throughout Each Period | Year Ended December 31, |
| 2020 | 2019 | 2018 | 2017 | 2016 |
| Net Asset Value, Beginning of Period | $12.21 | $11.54 | $11.86 | $11.77 | $11.79 |
| Investment Operations | | | | | |
| Net Investment Income | .2771 | .3241 | .3131 | .2921 | .283 |
| Net Realized and Unrealized Gain (Loss) on Investments | .635 | .657 | (.343) | .119 | .007 |
| Total from Investment Operations | .912 | .981 | (.030) | .411 | .290 |
| Distributions | | | | | |
| Dividends from Net Investment Income | (.312) | (.311) | (.267) | (.283) | (.277) |
| Distributions from Realized Capital Gains | — | — | (.023) | (.038) | (.033) |
| Total Distributions | (.312) | (.311) | (.290) | (.321) | (.310) |
| Net Asset Value, End of Period | $12.81 | $12.21 | $11.54 | $11.86 | $11.77 |
| Total Return | 7.58% | 8.67% | -0.21% | 3.57% | 2.47% |
| Ratios/Supplemental Data | | | | | |
| Net Assets, End of Period (Millions) | $4,867 | $4,300 | $3,535 | $3,498 | $2,985 |
| Ratio of Total Expenses to Average Net Assets | 0.14% | 0.14% | 0.14% | 0.15% | 0.15% |
| Ratio of Net Investment Income to Average Net Assets | 2.20% | 2.72% | 2.74% | 2.48% | 2.41% |
| Portfolio Turnover Rate2 | 94% | 80% | 89% | 91% | 104% |
| 1 | Calculated based on average shares outstanding. |
| 2 | Includes 28%, 19%, 26%, 24%, and 33% attributable to mortgage-dollar-roll activity. |
See accompanying Notes, which are an integral part of the Financial Statements.
Total Bond Market Index Portfolio
Notes to Financial Statements
The Total Bond Market Index Portfolio, a portfolio of Vanguard Variable Insurance Funds, is registered under the Investment Company Act of 1940 as an open-end investment company. The portfolio's shares are only available for purchase by separate accounts of insurance companies as investments for variable annuity plans, variable life insurance contracts, or other variable benefit insurance contracts.
Certain of the portfolio’s investments are in corporate debt instruments; the issuers' abilities to meet their obligations may be affected by economic developments in their respective industries. Market disruptions associated with the COVID-19 pandemic have had a global impact, and uncertainty exists as to the long-term implications. Such disruptions can adversely affect assets of the portfolio and thus portfolio performance.
| A. | The following significant accounting policies conform to generally accepted accounting principles for U.S. investment companies. The portfolio consistently follows such policies in preparing its financial statements. |
1. Security Valuation: Securities are valued as of the close of trading on the New York Stock Exchange (generally 4 p.m., Eastern time) on the valuation date. Bonds and temporary cash investments are valued using the latest bid prices or using valuations based on a matrix system (which considers such factors as security prices, yields, maturities, and ratings), both as furnished by independent pricing services. Structured debt securities, including mortgages and asset-backed securities, are valued using the latest bid prices or using valuations based on a matrix system that considers such factors as issuer, tranche, nominal or option-adjusted spreads, weighted average coupon, weighted average maturity, credit enhancements, and collateral. Investments in Vanguard Market Liquidity Fund are valued at that fund's net asset value. Securities for which market quotations are not readily available, or whose values have been affected by events occurring before the portfolio’s pricing time but after the close of the securities’ primary markets, are valued by methods deemed by the board of trustees to represent fair value.
2. Futures Contracts: The portfolio uses futures contracts to invest in fixed income asset classes with greater efficiency and lower cost than is possible through direct investment, to add value when these instruments are attractively priced, or to adjust sensitivity to changes in interest rates. The primary risks associated with the use of futures contracts are imperfect correlation between changes in market values of bonds held by the portfolio and the prices of futures contracts, and the possibility of an illiquid market. Counterparty risk involving futures is mitigated because a regulated clearinghouse is the counterparty instead of the clearing broker. To further mitigate counterparty risk, the portfolio trades futures contracts on an exchange, monitors the financial strength of its clearing brokers and clearinghouse, and has entered into clearing agreements with its clearing brokers. The clearinghouse imposes initial margin requirements to secure the portfolio’s performance and requires daily settlement of variation margin representing changes in the market value of each contract. Any securities pledged as initial margin for open contracts are noted in the Schedule of Investments.
Futures contracts are valued at their quoted daily settlement prices. The notional amounts of the contracts are not recorded in the Statement of Assets and Liabilities. Fluctuations in the value of the contracts are recorded in the Statement of Assets and Liabilities as an asset (liability) and in the Statement of Operations as unrealized appreciation (depreciation) until the contracts are closed, when they are recorded as realized gains (losses) on futures contracts.
During the year ended December 31, 2020, the portfolio’s average investments in long and short futures contracts represented less than 1% and 0% of net assets, respectively, based on the average of the notional amounts at each quarter-end during the period. The portfolio had no open futures contracts at December 31, 2020.
3. To Be Announced (TBA) Transactions: A TBA transaction is an agreement to buy or sell mortgage-backed securities with agreed-upon characteristics (face amount, coupon, maturity) for settlement at a future date. The portfolio may be a seller of TBA transactions to reduce its exposure to the mortgage-backed securities market or in order to sell mortgage-backed securities it owns under delayed-delivery arrangements. When the portfolio is a buyer of TBA transactions, it maintains cash or short-term investments in an amount sufficient to meet the purchase price at the settlement date of the TBA transaction. The primary risk associated with TBA transactions is that a counterparty may default on its obligations. The portfolio mitigates its counterparty risk by, among other things, performing a credit analysis of counterparties, allocating transactions among numerous counterparties, and monitoring its exposure to each counterparty. The portfolio may also enter into a Master Securities Forward Transaction Agreement (MSFTA) with certain counterparties and require them to transfer collateral as security for their performance. In the absence of a default, the collateral pledged or received by the portfolio cannot be repledged, resold, or rehypothecated. Under an MSFTA, upon a counterparty default (including bankruptcy), the portfolio may terminate any TBA
Total Bond Market Index Portfolio
transactions with that counterparty, determine the net amount owed by either party in accordance with its master netting arrangements, and sell or retain any collateral held up to the net amount owed to the portfolio under the master netting arrangements.
4. Mortgage Dollar Rolls: The portfolio enters into mortgage-dollar-roll transactions, in which the portfolio sells mortgage-backed securities to a dealer and simultaneously agrees to purchase similar securities in the future at a predetermined price. The proceeds of the securities sold in mortgage-dollar-roll transactions are typically invested in high-quality short-term fixed income securities. The portfolio forgoes principal and interest paid on the securities sold, and is compensated by interest earned on the proceeds of the sale and by a lower price on the securities to be repurchased. The portfolio accounts for mortgage-dollar-roll transactions as purchases and sales; as such, these transactions may increase the portfolio’s portfolio turnover rate. Amounts to be received or paid in connection with open mortgage dollar rolls are included in Receivables for Investment Securities Sold or Payables for Investment Securities Purchased in the Statement of Assets and Liabilities.
5. Federal Income Taxes: The portfolio intends to continue to qualify as a regulated investment company and distribute all of its taxable income. The portfolio’s tax returns are open to examination by the relevant tax authorities until expiration of the applicable statute of limitations, which is generally three years after the filing of the tax return. Management has analyzed the portfolio’s tax positions taken for all open federal and state income tax years, and has concluded that no provision for income tax is required in the portfolio’s financial statements.
6. Distributions: Distributions to shareholders are recorded on the ex-dividend date. Distributions are determined on a tax basis at the fiscal year-end and may differ from net investment income and realized capital gains for financial reporting purposes.
7. Credit Facilities and Interfund Lending Program: The portfolio and certain other funds managed by The Vanguard Group ("Vanguard") participate in a $4.3 billion committed credit facility provided by a syndicate of lenders pursuant to a credit agreement and an uncommitted credit facility provided by Vanguard. Both facilities may be renewed annually. Each fund is individually liable for its borrowings, if any, under the credit facilities. Borrowings may be utilized for temporary or emergency purposes, subject to the portfolio’s regulatory and contractual borrowing restrictions. With respect to the committed credit facility, the participating funds are charged administrative fees and an annual commitment fee of 0.10% of the undrawn committed amount of the facility; these fees are allocated to the funds based on a method approved by the portfolio’s board of trustees and included in Management and Administrative expenses on the portfolio’s Statement of Operations. Any borrowings under either facility bear interest at a rate based upon the higher of the one-month London Interbank Offered Rate (or an acceptable alternate rate, if necessary), federal funds effective rate, or overnight bank funding rate plus an agreed-upon spread, except that borrowings under the uncommitted credit facility may bear interest based upon an alternate rate agreed to by the portfolio and Vanguard.
In accordance with an exemptive order (the “Order”) from the SEC, the portfolio may participate in a joint lending and borrowing program that allows registered open-end Vanguard funds to borrow money from and lend money to each other for temporary or emergency purposes (the “Interfund Lending Program”), subject to compliance with the terms and conditions of the Order, and to the extent permitted by the portfolio’s investment objective and investment policies. Interfund loans and borrowings normally extend overnight, but can have a maximum duration of seven days. Loans may be called on one business day’s notice. The interest rate to be charged is governed by the conditions of the Order and internal procedures adopted by the board of trustees. The board of trustees is responsible for overseeing the Interfund Lending Program.
For the year ended December 31, 2020, the portfolio did not utilize the credit facilities or the Interfund Lending Program.
8. Other: Interest income includes income distributions received from Vanguard Market Liquidity Fund and is accrued daily. Premiums and discounts on debt securities are amortized and accreted, respectively, to interest income over the lives of the respective securities, except for premiums on certain callable debt securities that are amortized to the earliest call date. Security transactions are accounted for on the date securities are bought or sold. Costs used to determine realized gains (losses) on the sale of investment securities are those of the specific securities sold.
| B. | In accordance with the terms of a Funds' Service Agreement (the “FSA”) between Vanguard and the portfolio, Vanguard furnishes to the portfolio investment advisory, corporate management, |
Total Bond Market Index Portfolio
administrative, marketing, and distribution services at Vanguard’s cost of operations (as defined by the FSA). These costs of operations are allocated to the portfolio based on methods and guidelines approved by the board of trustees and are generally settled twice a month.
Upon the request of Vanguard, the portfolio may invest up to 0.40% of its net assets as capital in Vanguard. At December 31, 2020, the portfolio had contributed to Vanguard capital in the amount of $190,000, representing less than 0.01% of the portfolio’s net assets and 0.08% of Vanguard’s capital received pursuant to the FSA. The portfolio’s trustees and officers are also directors and employees, respectively, of Vanguard.
| C. | Various inputs may be used to determine the value of the portfolio’s investments. These inputs are summarized in three broad levels for financial statement purposes. The inputs or methodologies used to value securities are not necessarily an indication of the risk associated with investing in those securities. |
Level 1—Quoted prices in active markets for identical securities.
Level 2—Other significant observable inputs (including quoted prices for similar securities, interest rates, prepayment speeds, credit risk, etc.).
Level 3—Significant unobservable inputs (including the portfolio’s own assumptions used to determine the fair value of investments). Any investments valued with significant unobservable inputs are noted on the Schedule of Investments.
The following table summarizes the market value of the portfolio’s investments as of December 31, 2020, based on the inputs used to value them:
| | Level 1
($000) | Level 2
($000) | Level 3
($000) | Total
($000) |
| Investments | | | | |
| Assets | | | | |
| U.S. Government and Agency Obligations | — | 3,015,045 | — | 3,015,045 |
| Asset-Backed/Commercial Mortgage-Backed Securities | — | 128,762 | — | 128,762 |
| Corporate Bonds | — | 1,451,508 | — | 1,451,508 |
| Sovereign Bonds | — | 192,422 | — | 192,422 |
| Taxable Municipal Bonds | — | 37,809 | — | 37,809 |
| Temporary Cash Investments | 164,295 | — | — | 164,295 |
| Total | 164,295 | 4,825,546 | — | 4,989,841 |
| D. | Permanent differences between book-basis and tax-basis components of net assets, if any, are reclassified among capital accounts in the financial statements to reflect their tax character. These reclassifications have no effect on net assets or net asset value per share. |
Temporary differences between book-basis and tax-basis components of total distributable earnings (loss) arise when certain items of income, gain, or loss are recognized in different periods for financial statement and tax purposes; these differences will reverse at some time in the future. The differences are primarily related to the deferral of losses from wash sales; the deferral of losses from straddles; and the treatment of deflation and amortization adjustments from certain fixed income securities. As of period end, the tax-basis components of total distributable earnings (loss) are detailed in the table as follows:
| | Amount
($000) |
| Undistributed Ordinary Income | 108,979 |
| Undistributed Long-Term Gains | 25,808 |
| Capital Loss Carryforwards | — |
| Qualified Late-Year Losses | — |
| Net Unrealized Gains (Losses) | 343,292 |
Total Bond Market Index Portfolio
The tax character of distributions paid was as follows:
| | Year Ended December 31, |
| | 2020
Amount
($000) | 2019
Amount
($000) |
| Ordinary Income* | 107,753 | 97,897 |
| Long-Term Capital Gains | — | — |
| Total | 107,753 | 97,897 |
| * | Includes short-term capital gains, if any. |
As of December 31, 2020, gross unrealized appreciation and depreciation for investments based on cost for U.S. federal income tax purposes were as follows:
| | Amount
($000) |
| Tax Cost | 4,646,548 |
| Gross Unrealized Appreciation | 355,468 |
| Gross Unrealized Depreciation | (12,176) |
| Net Unrealized Appreciation (Depreciation) | 343,292 |
| E. | During the year ended December 31, 2020, the portfolio purchased $390,798,000 of investment securities and sold $120,913,000 of investment securities, other than U.S. government securities and temporary cash investments. Purchases and sales of U.S. government securities were $4,290,299,000 and $4,200,132,000, respectively. |
| F. | Capital shares issued and redeemed were: |
| | Year Ended December 31, |
| | 2020 | 2019 |
| | Shares
(000) | Shares
(000) |
| Issued | 108,475 | 86,771 |
| Issued in Lieu of Cash Distributions | 8,789 | 8,535 |
| Redeemed | (89,637) | (49,300) |
| Net Increase (Decrease) in Shares Outstanding | 27,627 | 46,006 |
At December 31, 2020, one shareholder (an insurance company separate account whose holdings in the portfolio represent the indirect investment of Vanguard Variable Annuity contract holders) was the record or beneficial owner of 35% of the portfolio’s net assets. If this shareholder was to redeem its investment in the portfolio, the redemption might result in an increase in the portfolio’s expense ratio, cause the portfolio to incur higher transaction costs, or lead to the realization of taxable capital gains.
| G. | Management has determined that no events or transactions occurred subsequent to December 31, 2020, that would require recognition or disclosure in these financial statements. |
Report of Independent Registered Public Accounting Firm
To the Board of Trustees of Vanguard Variable Insurance Funds and Shareholders of Total Bond Market Index Portfolio
Opinion on the Financial Statements
We have audited the accompanying statement of assets and liabilities, including the schedule of investments, of Total Bond Market Index Portfolio (one of the portfolios constituting Vanguard Variable Insurance Funds, referred to hereafter as the "Portfolio”) as of December 31, 2020, the related statement of operations for the year ended December 31, 2020, the statement of changes in net assets for each of the two years in the period ended December 31, 2020, including the related notes, and the financial highlights for each of the five years in the period ended December 31, 2020 (collectively referred to as the “financial statements”). In our opinion, the financial statements present fairly, in all material respects, the financial position of the Portfolio as of December 31, 2020, the results of its operations for the year then ended, the changes in its net assets for each of the two years in the period ended December 31, 2020 and the financial highlights for each of the five years in the period ended December 31, 2020 in conformity with accounting principles generally accepted in the United States of America.
Basis for Opinion
These financial statements are the responsibility of the Portfolio’s management. Our responsibility is to express an opinion on the Portfolio’s financial statements based on our audits. We are a public accounting firm registered with the Public Company Accounting Oversight Board (United States) (PCAOB) and are required to be independent with respect to the Portfolio in accordance with the U.S. federal securities laws and the applicable rules and regulations of the Securities and Exchange Commission and the PCAOB.
We conducted our audits of these financial statements in accordance with the standards of the PCAOB. Those standards require that we plan and perform the audit to obtain reasonable assurance about whether the financial statements are free of material misstatement, whether due to error or fraud.
Our audits included performing procedures to assess the risks of material misstatement of the financial statements, whether due to error or fraud, and performing procedures that respond to those risks. Such procedures included examining, on a test basis, evidence regarding the amounts and disclosures in the financial statements. Our audits also included evaluating the accounting principles used and significant estimates made by management, as well as evaluating the overall presentation of the financial statements. Our procedures included confirmation of securities owned as of December 31, 2020 by correspondence with the custodian, transfer agent and brokers; when replies were not received from brokers, we performed other auditing procedures. We believe that our audits provide a reasonable basis for our opinion.
/s/PricewaterhouseCoopers LLP
Philadelphia, Pennsylvania
February 18, 2021
We have served as the auditor of one or more investment companies in The Vanguard Group of Funds since 1975.
Special 2020 tax information (unaudited) for corporate shareholders only for Total Bond Market Index Portfolio, a portfolio of Vanguard Variable Insurance Funds
This information for the fiscal year ended December 31, 2020, is included pursuant to provisions of the Internal Revenue Code for corporate shareholders only.
The percentage of the ordinary dividends reported by the fund that is treated as a Section 163(j) interest dividend and thus is eligible to be treated as interest income for purposes of Section 163(j) and the regulations thereunder is 93.0%.
BLOOMBERG is a trademark and service mark of Bloomberg Finance L.P. BARCLAYS is a trademark and service mark of Barclays Bank Plc, used under license. Bloomberg Finance L.P. and its affiliates, including Bloomberg Index Services Limited (BISL) (collectively, Bloomberg), or Bloomberg’s licensors, own all proprietary rights in the Bloomberg Barclays U.S. Aggregate Float Adjusted Index (the Index or Bloomberg Barclays Index).
Neither Barclays Bank Plc, Barclays Capital Inc., or any affiliate (collectively Barclays) or Bloomberg is the issuer or producer of the Total Bond Market Index Portfolio and neither Bloomberg nor Barclays has any responsibilities, obligations or duties to investors in the Total Bond Market Index Portfolio. The Index is licensed for use by The Vanguard Group, Inc. (Vanguard) as the sponsor of the Total Bond Market Index Portfolio. Bloomberg and Barclays’ only relationship with Vanguard in respect of the Index is the licensing of the Index, which are determined, composed and calculated by BISL, or any successor thereto, without regard to the Issuer or the Total Bond Market Index Portfolio or the owners of the Total Bond Market Index Portfolio.
Additionally, Vanguard may for itself execute transaction(s) with Barclays in or relating to the Indices in connection with the Municipal Bond Funds. Investors acquire the Total Bond Market Index Portfolio from Vanguard and investors neither acquire any interest in the Indices nor enter into any relationship of any kind whatsoever with Bloomberg or Barclays upon making an investment in the Total Bond Market Index Portfolio. The Total Bond Market Index Portfolio is not sponsored, endorsed, sold or promoted by Bloomberg or Barclays. Neither Bloomberg nor Barclays makes any representation or warranty, express or implied regarding the advisability of investing in the Total Bond Market Index Portfolio or the advisability of investing in securities generally or the ability of the Indices to track corresponding or relative market performance. Neither Bloomberg nor Barclays has passed on the legality or suitability of the Total Bond Market Index Portfolio with respect to any person or entity. Neither Bloomberg nor Barclays is responsible for and has not participated in the determination of the timing of, prices at, or quantities of the Total Bond Market Index Portfolio to be issued. Neither Bloomberg nor Barclays has any obligation to take the needs of the Issuer or the owners of the Total Bond Market Index Portfolio or any other third party into consideration in determining, composing or calculating the Indices. Neither Bloomberg nor Barclays has any obligation or liability in connection with administration, marketing or trading of the Total Bond Market Index Portfolio.
The licensing agreement between Bloomberg and Barclays is solely for the benefit of Bloomberg and Barclays and not for the benefit of the owners of the Total Bond Market Index Portfolio, investors or other third parties. In addition, the licensing agreement between Vanguard and Bloomberg is solely for the benefit of Vanguard and Bloomberg and not for the benefit of the owners of the Total Bond Market Index Portfolio, investors or other third parties.
NEITHER BLOOMBERG NOR BARCLAYS SHALL HAVE ANY LIABILITY TO THE ISSUER, INVESTORS OR TO OTHER THIRD PARTIES FOR THE QUALITY, ACCURACY AND/OR COMPLETENESS OF THE BLOOMBERG BARCLAYS INDICES OR ANY DATA INCLUDED THEREIN OR FOR INTERRUPTIONS IN THE DELIVERY OF THE BLOOMBERG BARCLAYS INDICES. NEITHER BLOOMBERG NOR BARCLAYS MAKES ANY WARRANTY, EXPRESS OR IMPLIED, AS TO RESULTS TO BE OBTAINED BY THE ISSUER, THE INVESTORS OR ANY OTHER PERSON OR ENTITY FROM THE USE OF THE BLOOMBERG BARCLAYS INDICES OR ANY DATA INCLUDED THEREIN. NEITHER BLOOMBERG NOR BARCLAYS MAKES ANY EXPRESS OR IMPLIED WARRANTIES, AND EACH HEREBY EXPRESSLY DISCLAIMS ALL WARRANTIES OF MERCHANTABILITY OR FITNESS FOR A PARTICULAR PURPOSE OR USE WITH RESPECT TO THE BLOOMBERG BARCLAYS INDICES OR ANY DATA INCLUDED THEREIN. BLOOMBERG RESERVES THE RIGHT TO CHANGE THE METHODS OF CALCULATION OR PUBLICATION, OR TO CEASE THE CALCULATION OR PUBLICATION OF THE BLOOMBERG BARCLAYS INDICES, AND NEITHER BLOOMBERG NOR BARCLAYS SHALL BE LIABLE FOR ANY MISCALCULATION OF OR ANY INCORRECT, DELAYED OR INTERRUPTED PUBLICATION WITH RESPECT TO ANY OF THE BLOOMBERG BARCLAYS INDICES. NEITHER BLOOMBERG NOR BARCLAYS SHALL BE LIABLE FOR ANY DAMAGES, INCLUDING, WITHOUT LIMITATION, ANY SPECIAL, INDIRECT OR CONSEQUENTIAL DAMAGES, OR ANY LOST PROFITS AND EVEN IF ADVISED OF THE POSSIBILITY OF SUCH, RESULTING FROM THE USE OF THE BLOOMBERG BARCLAYS INDICES OR ANY DATA INCLUDED THEREIN OR WITH RESPECT TO THE TOTAL BOND MARKET INDEX PORTFOLIO.
None of the information supplied by Bloomberg or Barclays and used in this publication may be reproduced in any manner without the prior written permission of both Bloomberg and Barclays Capital, the investment banking division of Barclays Bank Plc. Barclays Bank Plc is registered in England No. 1026167. Registered office 1 Churchill Place London E14 5HP.
© 2021 Bloomberg. Used with Permission.
Source: Bloomberg Index Services Limited. Copyright 2021, Bloomberg. All rights reserved.
This page intentionally left blank.
The People Who Govern Your Fund
The trustees of your mutual fund are there to see that the fund is operated and managed in your best interests since, as a shareholder, you are a part owner of the fund. Your fund’s trustees also serve on the board of directors of The Vanguard Group, Inc., which is owned by the Vanguard funds and provides services to them.
A majority of Vanguard’s board members are independent, meaning that they have no affiliation with Vanguard or the funds they oversee, apart from the sizable personal investments they have made as private individuals. The independent board members have distinguished backgrounds in business, academia, and public service. Each of the trustees and executive officers oversees 211 Vanguard funds.
Information for each trustee and executive officer of the fund appears below. That information, as well as the Vanguard fund count, is as of the date on the cover of this fund report. The mailing address of the trustees and officers is P.O. Box 876, Valley Forge, PA 19482. More information about the trustees is in the Statement of Additional Information, which can be obtained, without charge, by contacting Vanguard at 800-662-7447, or online at vanguard.com.
Interested Trustee1
Mortimer J. Buckley
Born in 1969. Trustee since January 2018. Principal occupation(s) during the past five years and other experience: chairman of the board (2019–present) of Vanguard and of each of the investment companies served by Vanguard; chief executive officer (2018–present) of Vanguard; chief executive officer, president, and trustee (2018–present) of each of the investment companies served by Vanguard; president and director (2017–present) of Vanguard; and president (2018–present) of Vanguard Marketing Corporation. Chief investment officer (2013–2017), managing director (2002–2017), head of the Retail Investor Group (2006–2012), and chief information officer (2001–2006) of Vanguard. Chairman of the board (2011–2017) and trustee (2009–2017) of the Children’s Hospital of Philadelphia; and trustee (2018–present) and vice chair (2019–present) of The Shipley School.
Independent Trustees
Emerson U. Fullwood
Born in 1948. Trustee since January 2008. Principal occupation(s) during the past five years and other experience: executive chief staff and marketing officer for North America and corporate vice president (retired 2008) of Xerox Corporation (document management products and services). Former president of the Worldwide Channels Group, Latin America, and Worldwide Customer Service and executive chief staff officer of Developing Markets of Xerox. Executive in residence and 2009–2010 Distinguished Minett Professor at the Rochester Institute of Technology. Director of SPX FLOW, Inc. (multi-industry manufacturing). Director of the University of Rochester Medical Center, the Monroe Community College Foundation, the United Way of Rochester, North Carolina A&T University, and Roberts Wesleyan College. Trustee of the University of Rochester.
Amy Gutmann
Born in 1949. Trustee since June 2006. Principal occupation(s) during the past five years and other experience: president (2004–present) of the University of Pennsylvania. Christopher H. Browne Distinguished Professor of Political Science, School of Arts and Sciences, and professor of communication, Annenberg School for Communication, with secondary faculty appointments in the Department of Philosophy, School of Arts and Sciences, and at the Graduate School of Education, University of Pennsylvania.
F. Joseph Loughrey
Born in 1949. Trustee since October 2009. Principal occupation(s) during the past five years and other experience: president and chief operating officer (retired 2009) and vice chairman of the board (2008–2009) of Cummins Inc. (industrial machinery). Chairman of the board of Hillenbrand, Inc. (specialized consumer services) and the Lumina Foundation. Director of the V Foundation. Member of the advisory council for the College of Arts and Letters and chair of the advisory board to the Kellogg Institute for International Studies, both at the University of Notre Dame.
Mark Loughridge
Born in 1953. Trustee since March 2012. Principal occupation(s) during the past five years and other experience: senior vice president and chief financial officer (retired 2013) of IBM (information technology services). Fiduciary member of IBM’s Retirement Plan Committee (2004–2013), senior vice president and general manager (2002–2004) of IBM Global Financing, vice president and controller (1998–2002) of IBM, and a variety of other prior management roles at IBM. Member of the Council on Chicago Booth.
Scott C. Malpass
Born in 1962. Trustee since March 2012. Principal occupation(s) during the past five years and other experience: chief investment officer (retired June 2020) and vice president (retired June 2020) of the University of Notre Dame. Assistant professor of finance at the Mendoza College of Business, University of Notre Dame, and member of the Notre Dame 403(b) Investment Committee (retired June 2020). Member of the board of Catholic Investment Services, Inc. (investment advisors) and the board of superintendence of the Institute for the Works of Religion.
Deanna Mulligan
Born in 1963. Trustee since January 2018. Principal occupation(s) during the past five years and other experience: board chair (2020–present), chief executive officer (2011–2020), and president (2010–2019) of The Guardian Life Insurance Company of America. Chief operating officer (2010–2011) and executive vice president (2008–2010) of the individual life and disability division of Guardian Life. Member of the board of the American Council of Life Insurers and the board of the Economic Club of New York. Trustee of the Partnership for New York City (business leadership), Chief Executives for Corporate Purpose, NewYork-Presbyterian Hospital, Catalyst, and the
Bruce Museum (arts and science). Member of the Advisory Council for the Stanford Graduate School of Business.
André F. Perold
Born in 1952. Trustee since December 2004. Principal occupation(s) during the past five years and other experience: George Gund Professor of Finance and Banking, Emeritus at the Harvard Business School (retired 2011). Chief investment officer and co-managing partner of HighVista Strategies (private investment firm). Member of the board of advisors and member of the investment committee of the Museum of Fine Arts Boston. Member of the board (2018–present) of RIT Capital Partners (investment firm). Member of the investment committee of Partners Health Care System.
Sarah Bloom Raskin
Born in 1961. Trustee since January 2018. Principal occupation(s) during the past five years and other experience: deputy secretary (2014–2017) of the United States Department of the Treasury. Governor (2010–2014) of the Federal Reserve Board. Commissioner (2007–2010) of financial regulation for the State of Maryland. Member of the board of directors (2012–2014) of Neighborhood Reinvestment Corporation. Director (2017–present) of i(x) Investments, LLC; director (2017–present) of Reserve Trust. Rubenstein Fellow (2017–present) of Duke University; trustee (2017–present) of Amherst College, and trustee (2019–present) of the Folger Shakespeare Library.
Peter F. Volanakis
Born in 1955. Trustee since July 2009. Principal occupation(s) during the past five years and other experience: president and chief operating officer (retired 2010) of Corning Incorporated (communications equipment) and director of Corning Incorporated (2000–2010) and Dow Corning (2001–2010). Director (2012) of SPX Corporation (multi-industry manufacturing). Overseer of the Amos Tuck School of Business Administration, Dartmouth College (2001–2013). Chairman of the board of trustees of Colby-Sawyer College. Member of the board of Hypertherm Inc. (industrial cutting systems, software, and consumables).
1 Mr. Buckley is considered an “interested person,” as defined in the Investment Company Act of 1940, because he is an officer of the Vanguard funds.
Executive Officers
John Bendl
Born in 1970. Principal occupation(s) during the past five years and other experience: principal of Vanguard. Chief financial officer (2019–present) of each of the investment companies served by Vanguard. Chief accounting officer, treasurer, and controller of Vanguard (2017–present). Partner (2003–2016) at KPMG (audit, tax, and advisory services).
Christine M. Buchanan
Born in 1970. Principal occupation(s) during the past five years and other experience: principal of Vanguard. Treasurer (2017–present) of each of the investment companies served by Vanguard. Partner (2005–2017) at KPMG (audit, tax, and advisory services).
David Cermak
Born in 1960. Principal occupation(s) during the past five years and other experience: principal of Vanguard. Finance director (2019–present) of each of the investment companies served by Vanguard. Managing director and head (2017–present) of Vanguard Investments Singapore. Managing director and head (2017–2019) of Vanguard Investments Hong Kong. Representative director and head (2014–2017) of Vanguard Investments Japan.
John Galloway
Born in 1973. Principal occupation(s) during the past five years and other experience: principal of Vanguard.
Investment stewardship officer (September 2020–present) of each of the investment companies served by Vanguard. Head of Investor Advocacy (February 2020–present) and head of Marketing Strategy and Planning (2017–2020) at Vanguard. Deputy assistant to the President of the United States (2015).
Thomas J. Higgins
Born in 1957. Principal occupation(s) during the past five years and other experience: principal of Vanguard. Finance director (2019–present), chief financial officer (2008–2019), and treasurer (1998–2008) of each of the investment companies served by Vanguard.
Peter Mahoney
Born in 1974. Principal occupation(s) during the past five years and other experience: principal of Vanguard. Controller (2015–present) of each of the investment companies served by Vanguard. Head of International Fund Services (2008–2014) at Vanguard.
Anne E. Robinson
Born in 1970. Principal occupation(s) during the past five years and other experience: general counsel (2016–present) of Vanguard. Secretary (2016–present) of Vanguard and of each of the investment companies served by Vanguard. Managing director (2016–present) of Vanguard. Managing director and general counsel of Global Cards and Consumer Services (2014–2016) at Citigroup. Counsel (2003–2014) at American Express.
Michael Rollings
Born in 1963. Principal occupation(s) during the past five years and other experience: finance director (2017–present) and treasurer (2017) of each of the investment companies served by Vanguard. Managing director (2016–present) of Vanguard. Chief financial officer (2016–present) of Vanguard. Director (2016–present) of Vanguard Marketing Corporation. Executive vice president and chief financial officer (2006–2016) of MassMutual Financial Group.
John E. Schadl
Born in 1972. Principal occupation(s) during the past five years and other experience: principal of Vanguard. Chief compliance officer (2019–present) of Vanguard and of each of the investment companies served by Vanguard. Assistant vice president (2019–present) of Vanguard Marketing Corporation.
Vanguard Senior Management Team
| Joseph Brennan | James M. Norris |
| Mortimer J. Buckley | Thomas M. Rampulla |
| Gregory Davis | Karin A. Risi |
| John James | Anne E. Robinson |
| John T. Marcante | Michael Rollings |
| Chris D. McIsaac | Lauren Valente |
Connect with Vanguard®>vanguard.com
Fund Information > 800-662-7447
Annuity and Insurance Services > 800-522-5555
Institutional Investor Services > 800-523-1036
Text Telephone for People Who Are Deaf or Hard of Hearing > 800-749-7273
This material may be used in conjunction with the offering of shares of any Vanguard fund only if preceded or accompanied by the fund’s current prospectus.
You can obtain a free copy of Vanguard’s proxy voting guidelines by visiting vanguard.com/proxyreporting or by calling Vanguard at 800-662-2739. The guidelines are also available from the SEC’s website, www.sec.gov. In addition, you may obtain a free report on how your fund voted the proxies for securities it owned during the 12 months ended June 30. To get the report, visit either vanguard.com/proxyreporting or www.sec.gov.
All comparative mutual fund data are from Morningstar, Inc., unless otherwise noted.
You can review information about your fund on the SEC’s website, and you can receive copies of this information, for a fee, by sending a request via email addressed to publicinfo@sec.gov.
© 2021 The Vanguard Group, Inc.
All rights reserved.
Vanguard Marketing Corporation, Distributor.
Q690TBM 022021
| | |
| | |
| | |
| | |
| Annual Report | December 31, 2020 | |
| | |
| Vanguard Variable Insurance Funds |
| | |
| | |
| | |
| | |
| | |
| | |
| | |
| | |
| | |
Total International Stock Market Index Portfolio | |
| |
| |
| |
| | |
| | |
| | |
| | |
| | |
| | |
| | |
| | |
| | |
| | |
| | |
| | |
| | |
| | |
| | |
| | |
| | |
| | |
| | |
| | |
| | |
| | |
| | |
| | |
| | |
| | |
| | |
| | |
| | |
| | |
|
| | |
| | |
Contents
| Your Portfolio’s Performance at a Glance | 1 |
| About Your Portfolio’s Expenses | 2 |
| Performance Summary | 3 |
| Financial Statements | 5 |
Please note: The opinions expressed in this report are just that—informed opinions. They should not be considered promises or advice. Also, please keep in mind that the information and opinions cover the period through the date on the front of this report. Of course, the risks of investing in your portfolio are spelled out in the prospectus.
Total International Stock Market Index Portfolio
Your Portfolio’s Performance at a Glance
● The Total International Stock Market Index Portfolio of Vanguard Variable Insurance Funds returned 11.18% for the 12 months ended December 31, 2020, closely tracking the performance of its benchmark, the FTSE Global All Cap ex US Index, which returned 11.24%. Please note that the portfolio’s returns are different from those in Vanguard Variable Annuity (and other plans that invest in the portfolio), which take into account insurance-related expenses.
● The emergence of COVID-19 in early 2020 turned into a global health crisis, and aggressive attempts to contain it resulted in a sharp downturn in economic activity. Unemployment spiked, and sectors where social distancing isn’t possible were hit hard. Stocks initially plummeted as infections surged, but they finished the year significantly higher, thanks in part to rapid and robust monetary and fiscal action by policymakers and the rollout of COVID-19 vaccines as the year drew to a close.
● As a fund of funds, the Total International Stock Market Index Portfolio seeks to capture the returns of its target benchmark by investing in underlying funds that offer broad coverage of emerging markets and developed markets outside the U.S. The portfolio provides diversified exposure to multiple regions, markets, and industry sectors and includes stocks from across the market-capitalization spectrum.
● All of the portfolio’s underlying funds posted positive gains for the year, led by Vanguard Pacific Stock Index Fund and Vanguard Emerging Markets Stock Index Fund.
Market Barometer
| | Average Annual Total Returns
Periods Ended December 31, 2020 |
| | One Year | Three Years | Five Years |
| Stocks | | | |
| Russell 1000 Index (Large-caps) | 20.96% | 14.82% | 15.60% |
| Russell 2000 Index (Small-caps) | 19.96 | 10.25 | 13.26 |
| Russell 3000 Index (Broad U.S. market) | 20.89 | 14.49 | 15.43 |
| FTSE All-World ex US Index (International) | 11.22 | 5.18 | 9.16 |
| | | | |
| Bonds | | | |
| Bloomberg Barclays U.S. Aggregate Bond Index | | | |
| (Broad taxable market) | 7.51% | 5.34% | 4.44% |
| Bloomberg Barclays Municipal Bond Index | | | |
| (Broad tax-exempt market) | 5.21 | 4.64 | 3.91 |
| FTSE Three-Month U.S. Treasury Bill Index | 0.58 | 1.56 | 1.16 |
| | | | |
| CPI | | | |
| Consumer Price Index | 1.36% | 1.85% | 1.95% |
Total International Stock Market Index Portfolio
About Your Portfolio’s Expenses
As a shareholder of the portfolio, you incur ongoing costs, which include costs for portfolio management, administrative services, and shareholder reports (like this one), among others. Operating expenses, which are deducted from a portfolio’s gross income, directly reduce the investment return of the portfolio.
A typical portfolio’s expenses are expressed as a percentage of its average net assets. The Total International Stock Market Index Portfolio has no direct expenses, but bears its proportionate share of the expenses of the underlying funds in which it invests. These indirect expenses make up the acquired fund fees and expenses, also expressed as a percentage of average net assets. The following examples are intended to help you understand the ongoing costs (in dollars) of investing in your portfolio and to compare these costs with those of other mutual funds. The examples are based on an investment of $1,000 made at the beginning of the period shown and held for the entire period. The costs were calculated using the acquired fund fees and expenses for the Total International Stock Market Index Portfolio.
The accompanying table illustrates your portfolio’s costs in two ways:
● Based on actual portfolio return. This section helps you to estimate the actual expenses that you paid over the period. The “Ending Account Value” shown is derived from the portfolio’s actual return, and the third column shows the dollar amount that would have been paid by an investor who started with $1,000 in the portfolio. You may use the information here, together with the amount you invested, to estimate the expenses that you paid over the period.
To do so, simply divide your account value by $1,000 (for example, an $8,600 account value divided by $1,000 = 8.6), then multiply the result by the number given for your portfolio under the heading “Expenses Paid During Period.”
● Based on hypothetical 5% yearly return. This section is intended to help you compare your portfolio’s costs with those of other mutual funds. It assumes that the portfolio had a yearly return of 5% before expenses, but that the expense ratio is unchanged. In this case—because the return used is not the portfolio’s actual return—the results do not apply to your investment. The example is useful in making comparisons because the Securities and Exchange Commission requires all mutual funds to calculate expenses based on a 5% return. You can assess your portfolio’s costs by comparing this hypothetical example with the hypothetical examples that appear in shareholder reports of other funds.
Note that the expenses shown in the table are meant to highlight and help you compare ongoing costs only. The portfolio’s expense figure does not reflect additional fees and expenses associated with the annuity or life insurance program through which you invest.
The calculations assume no shares were bought or sold during the period. Your actual costs may have been higher or lower, depending on the amount of your investment and the timing of any purchases or redemptions.
You can find more information about the portfolio’s expenses in the Financial Statements section. For additional information on operating expenses and other shareholder costs, please refer to the prospectus.
Six Months Ended December 31, 2020
| | Beginning | Ending | Expenses |
| | Account Value | Account Value | Paid During |
| Total International Stock Market Index Portfolio | 6/30/2020 | 12/31/2020 | Period |
| Based on Actual Portfolio Return | $1,000.00 | $1,244.85 | $0.56 |
| Based on Hypothetical 5% Yearly Return | 1,000.00 | 1,074.63 | 0.52 |
The calculations are based on the Total International Stock Market Index Portfolio’s acquired fund fees and expenses for the most recent six-month period. The Total International Stock Market Index Portfolio’s annualized expense figure for that period is 0.10%. The dollar amounts shown as “Expenses Paid” are equal to the annualized average weighted expense ratio for the underlying funds, multiplied by the average account value over the period, multiplied by the number of days in the most recent six-month period, then divided by the number of days in the recent 12-month period (184/366).
Total International Stock Market Index Portfolio
Performance Summary
All of the returns in this report represent past performance, which is not a guarantee of future results that may be achieved by the portfolio. (Current performance may be lower or higher than the performance data cited. For performance data current to the most recent month-end, visit our website at vanguard.com/performance.) Note, too, that both investment returns and principal value can fluctuate widely, so an investor’s shares, when sold, could be worth more or less than their original cost. The returns shown do not reflect taxes that a shareholder would pay on portfolio distributions or on the sale of portfolio shares. Nor do the returns reflect fees and expenses associated with the annuity or life insurance program through which a shareholder invests. If these fees and expenses were included, the portfolio’s returns would be lower.
Cumulative Performance: September 7, 2017–December 31, 2020
Initial Investment of $10,000

| | | Average Annual Total Returns | |
| | | Periods Ended December 31, 2020 | |
| | | | Since | Final Value |
| | | One | Inception | of a $10,000 |
| | | Year | (9/7/2017) | Investment |
 | Total International Stock Market Index Portfolio | 11.18% | 6.19% | $12,202 |
 | FTSE Global All Cap ex US Index | 11.24 | 6.45 | 12,303 |
“Since Inception” performance is calculated from the portfolio’s inception date for both the portfolio and its comparative standard(s).
See Financial Highlights for dividend and capital gains information.
Total International Stock Market Index Portfolio
Underlying Vanguard Funds
As of December 31, 2020
| Vanguard FTSE All-World ex-US Index Fund | |
| Admiral Shares | 28.0% |
| Vanguard Developed Markets Index Fund | |
| Admiral Shares | 27.9 |
| Vanguard Emerging Markets Stock Index Fund | |
| Admiral Shares | 18.0 |
| Vanguard European Stock Index Fund | |
| Admiral Shares | 12.2 |
| Vanguard Pacific Stock Index Fund | |
| Admiral Shares | 9.1 |
| Vanguard FTSE All-World ex-US Small-Cap | |
| Index Fund Admiral Shares | 3.1 |
| Vanguard FTSE Canada All Cap Index ETF | 1.7 |
The table reflects the portfolio’s investments, except for short-term investments.
Total International Stock Market Index Portfolio
Financial Statements
Schedule of Investments
As of December 31, 2020
The portfolio files its complete schedule of portfolio holdings with the Securities and Exchange Commission (SEC) for the first and third quarters of each fiscal year as an exhibit to its reports on Form N-PORT. The portfolio’s Form N-PORT reports are available on the SEC’s website at www.sec.gov.
| | | Market |
| | | Value● |
| | Shares | ($000) |
| Investment Companies (100.0%) | | |
| International Stock Funds (100.0%) | | |
| Vanguard FTSE All-World ex-US Index Fund Admiral Shares | 6,928,329 | 251,845 |
| Vanguard Developed Markets Index Fund Admiral Shares | 16,462,462 | 250,723 |
| Vanguard Emerging Markets Stock Index Fund Admiral Shares | 3,889,244 | 162,104 |
| Vanguard European Stock Index Fund Admiral Shares | 1,444,441 | 109,604 |
| Vanguard Pacific Stock Index Fund Admiral Shares | 831,963 | 81,799 |
| Vanguard FTSE All-World ex-US Small-Cap Index Fund Admiral Shares | 925,199 | 27,885 |
| Vanguard FTSE Canada All Cap Index ETF | 547,842 | 15,059 |
| Total Investment Companies (Cost $791,203) | | 899,019 |
| Temporary Cash Investment (0.1%) | | |
| Money Market Fund (0.1%) | | |
| 1 Vanguard Market Liquidity Fund, 0.111% (Cost $374) | 3,733 | 374 |
| Total Investments (100.1%) (Cost $791,577) | | 899,393 |
| Other Assets and Liabilities—Net (-0.1%) | | (516) |
| Net Assets (100%) | | 898,877 |
Cost is in $000.
● See Note A in Notes to Financial Statements.
1 Affiliated money market fund available only to Vanguard funds and certain trusts and accounts managed by Vanguard. Rate shown is the 7-day yield.
See accompanying Notes, which are an integral part of the Financial Statements.
Total International Stock Market Index Portfolio
Statement of Assets and Liabilities
As of December 31, 2020
| ($000s, except shares and per-share amounts) | Amount |
| Assets | |
| Investments in Securities, at Value—Affiliated Funds (Cost $791,577) | 899,393 |
| Receivables for Investment Securities Sold | 127 |
| Receivables for Accrued Income | 86 |
| Receivables for Capital Shares Issued | 160 |
| Total Assets | 899,766 |
| Liabilities | |
| Payables for Capital Shares Redeemed | 889 |
| Total Liabilities | 889 |
| Net Assets | 898,877 |
| At December 31, 2020, net assets consisted of: | |
| | |
| Paid-in Capital | 767,387 |
| Total Distributable Earnings (Loss) | 131,490 |
| Net Assets | 898,877 |
| | |
| Net Assets | |
Applicable to 39,112,099 outstanding $.001 par value shares of
beneficial interest (unlimited authorization) | 898,877 |
| Net Asset Value Per Share | $22.98 |
See accompanying Notes, which are an integral part of the Financial Statements.
Total International Stock Market Index Portfolio
Statement of Operations
| | Year Ended |
| | December 31, 2020 |
| | ($000) |
| Investment Income | |
| Income | |
| Income Distributions Received from Affiliated Funds1 | 16,188 |
| Net Investment Income—Note B | 16,188 |
| Realized Net Gain (Loss) | |
| Capital Gain Distributions Received | |
| from Affiliated Funds | — |
| Affiliated Funds Sold | 8,702 |
| Foreign Currencies | 7 |
| Realized Net Gain (Loss) | 8,709 |
Change in Unrealized Appreciation
(Depreciation) from Affiliated Funds | 100,451 |
| Net Increase (Decrease) in Net Assets | |
| Resulting from Operations | 125,348 |
1 Dividends are net of foreign withholding taxes of $58,000.
Statement of Changes in Net Assets
| | Year Ended December 31, |
| | 2020 | 2019 |
| | ($000) | ($000) |
| Increase (Decrease) in Net Assets | | |
| Operations | | |
| Net Investment Income | 16,188 | 10,299 |
| Realized Net Gain (Loss) | 8,709 | 3,231 |
| Change in Unrealized Appreciation (Depreciation) | 100,451 | 40,254 |
| Net Increase (Decrease) in Net Assets Resulting from Operations | 125,348 | 53,784 |
| Distributions1 | | |
| Total Distributions | (14,480) | (5,019) |
| Capital Share Transactions | | |
| Issued | 549,846 | 207,150 |
| Issued in Lieu of Cash Distributions | 14,480 | 5,019 |
| Redeemed | (178,307) | (59,021) |
| Net Increase (Decrease) from Capital Share Transactions | 386,019 | 153,148 |
| Total Increase (Decrease) | 496,887 | 201,913 |
| Net Assets | | |
| Beginning of Period | 401,990 | 200,077 |
| End of Period | 898,877 | 401,990 |
1 Certain prior-period numbers have been reclassified to conform with the current-period presentation.
See accompanying Notes, which are an integral part of the Financial Statements.
Total International Stock Market Index Portfolio
Financial Highlights
| | | | | Sept. 7, |
| | Year Ended December 31, | 20171 to |
| | Dec. 31, |
| For a Share Outstanding Throughout Each Period | 2020 | 2019 | 2018 | 2017 |
| Net Asset Value, Beginning of Period | $21.38 | $17.94 | $21.15 | $20.00 |
| Investment Operations | | | | |
| Net Investment Income2 | .487 | .691 | .646 | .341 |
| Capital Gain Distributions Received2 | — | — | — | — |
| Net Realized and Unrealized Gain (Loss) on Investments | 1.645 | 3.134 | (3.716) | .809 |
| Total from Investment Operations | 2.132 | 3.825 | (3.070) | 1.150 |
| Distributions | | | | |
| Dividends from Net Investment Income | (.415) | (.383) | (.127) | — |
| Distributions from Realized Capital Gains | (.117) | (.002) | (.013) | — |
| Total Distributions | (.532) | (.385) | (.140) | — |
| Net Asset Value, End of Period | $22.98 | $21.38 | $17.94 | $21.15 |
| | | | | |
| Total Return | 11.18% | 21.55% | -14.62% | 5.75% |
| | | | | |
| Ratios/Supplemental Data | | | | |
| Net Assets, End of Period (Millions) | $899 | $402 | $200 | $71 |
| Ratio of Total Expenses to Average Net Assets | — | — | — | — |
| Acquired Fund Fees and Expenses | 0.10% | 0.11% | 0.11% | 0.11%3 |
| Ratio of Net Investment Income to Average Net Assets | 2.50% | 3.50% | 3.23% | 5.20%3 |
| Portfolio Turnover Rate | 22% | 15% | 6% | 5% |
| 2 | Calculated based on average shares outstanding. |
See accompanying Notes, which are an integral part of the Financial Statements.
Total International Stock Market Index Portfolio
Notes to Financial Statements
The Total International Stock Market Index Portfolio, a portfolio of Vanguard Variable Insurance Funds, is registered under the Investment Company Act of 1940 as an open-end investment company. The portfolio seeks to match the return of its target index by investing in selected Vanguard funds and portfolios. Financial statements and other information about each underlying fund and portfolio are available at www.vanguard.com. The portfolio’s shares are only available for purchase by separate accounts of insurance companies as investments for variable annuity plans, variable life insurance contracts, or other variable benefit insurance contracts.
Market disruptions associated with the COVID-19 pandemic have had a global impact, and uncertainty exists as to the long-term implications. Such disruptions can adversely affect assets of the portfolio and thus portfolio performance.
A. The following significant accounting policies conform to generally accepted accounting principles for U.S. investment companies. The portfolio consistently follows such policies in preparing its financial statements.
1. Security Valuation: Investments are valued at the net asset value of each underlying Vanguard fund determined as of the close of the New York Stock Exchange (generally 4 p.m., Eastern time) on the valuation date. Investments in Vanguard Market Liquidity Fund are valued at that fund’s net asset value. Underlying ETFs are valued at the latest quoted sales prices or official closing prices taken from their primary market or, if not traded on the valuation date, at the mean of the latest quoted bid and asked prices.
2. Foreign Currency: Securities and other assets and liabilities denominated in foreign currencies are translated into U.S. dollars using exchange rates obtained from an independent third party as of the portfolio’s pricing time on the valuation date. Realized gains (losses) and unrealized appreciation (depreciation) on investment securities include the effects of changes in exchange rates since the securities were purchased, combined with the effects of changes in security prices. Fluctuations in the value of other assets and liabilities resulting from changes in exchange rates are recorded as unrealized foreign currency gains (losses) until the assets or liabilities are settled in cash, at which time they are recorded as realized foreign currency gains (losses).
3. Federal Income Taxes: The portfolio intends to continue to qualify as a regulated investment company and distribute all of its taxable income. The portfolio’s tax returns are open to examination by the relevant tax authorities until expiration of the applicable statute of limitations, which is generally three years after the filing of the tax return. Management has analyzed the portfolio’s tax positions taken for all open federal and state income tax years, and has concluded that no provision for income tax is required in the portfolio’s financial statements.
4. Distributions: Distributions to shareholders are recorded on the ex-dividend date. Distributions are determined on a tax basis at the fiscal year-end and may differ from net investment income and realized capital gains for financial reporting purposes.
5. Credit Facilities and Interfund Lending Program: The portfolio and certain other funds managed by The Vanguard Group (“Vanguard”) participate in a $4.3 billion committed credit facility provided by a syndicate of lenders pursuant to a credit agreement and an uncommitted credit facility provided by Vanguard. Both facilities may be renewed annually. Each fund is individually liable for its borrowings, if any, under the credit facilities. Borrowings may be utilized for temporary or emergency purposes, subject to the portfolio’s regulatory and contractual borrowing restrictions. With respect to the committed credit facility, the participating funds are charged administrative fees and an annual commitment fee of 0.10% of the undrawn committed amount of the facility; these fees are allocated to the funds based on a method approved by the portfolio’s board of trustees and borne by the funds in which the portfolio invests (see Note B). Any borrowings under either facility bear interest at a rate based upon the higher of the one-month London Interbank Offered Rate (or an acceptable alternate rate, if necessary), federal funds effective rate, or overnight bank funding rate plus an agreed-upon spread, except that borrowings under the uncommitted credit facility may bear interest based upon an alternative rate agreed to by the portfolio and Vanguard.
In accordance with an exemptive order (the “Order”) from the SEC, the portfolio may participate in a joint lending and borrowing program that allows registered open-end Vanguard funds to borrow money from and lend money to each other for temporary or emergency purposes (the “Interfund Lending Program”), subject to compliance with the terms and conditions of the Order, and to the extent permitted by the portfolio’s investment objective and investment policies. Interfund loans and borrowings normally extend overnight, but can have a maximum duration of seven days. Loans may
Total International Stock Market Index Portfolio
be called on one business day’s notice. The interest rate to be charged is governed by the conditions of the Order and internal procedures adopted by the board of trustees. The board of trustees is responsible for overseeing the Interfund Lending Program.
For the year ended December 31, 2020, the portfolio did not utilize the credit facilities or the Interfund Lending Program.
6. Other: Income and capital gain distributions received are recorded on the ex-dividend date. Security transactions are accounted for on the date securities are bought or sold. Costs used to determine realized gains (losses) on the sale of investment securities are those of the specific securities sold. Interest income includes income distributions received from Vanguard Market Liquidity Fund and is accrued daily.
B. In accordance with the terms of a Funds’ Service Agreement (the “FSA”) between Vanguard and the portfolio, Vanguard furnishes to the portfolio investment advisory, corporate management, administrative, marketing, and distribution services at Vanguard’s cost of operations (as defined by the FSA). These costs of operations are allocated to the portfolio based on methods and guidelines approved by the board of trustees. The FSA provides that expenses otherwise allocable to Vanguard funds-of-funds may be reduced or eliminated to the extent of savings realized by the underlying Vanguard funds by virtue of being part of a fund-of-funds. Accordingly, all expenses for services provided by Vanguard to the portfolio and all other expenses incurred by the portfolio during the period ended December 31, 2020, were borne by the underlying Vanguard funds in which the portfolio invests. The portfolio’s trustees and officers are also trustees and officers, respectively, of the underlying Vanguard funds, as well as directors and employees, respectively, of Vanguard.
C. Various inputs may be used to determine the value of the portfolio’s investments. These inputs are summarized in three broad levels for financial statement purposes. The inputs or methodologies used to value securities are not necessarily an indication of the risk associated with investing in those securities.
Level 1—Quoted prices in active markets for identical securities.
Level 2—Other significant observable inputs (including quoted prices for similar securities, interest rates, prepayment speeds, credit risk, etc.).
Level 3—Significant unobservable inputs (including the portfolio’s own assumptions used to determine the fair value of investments). Any investments valued with significant unobservable inputs are noted on the Schedule of Investments.
At December 31, 2020, 100% of the market value of the portfolio’s investments was determined based on Level 1 inputs.
D. Permanent differences between book-basis and tax-basis components of net assets are reclassified among capital accounts in the financial statements to reflect their tax character. These reclassifications have no effect on net assets or net asset value per share. As of period end, permanent differences primarily attributable to the accounting for foreign currency transactions were reclassified between the individual components of total distributable earnings (loss).
Temporary differences between book-basis and tax-basis components of total distributable earnings (loss) arise when certain items of income, gain, or loss are recognized in different periods for financial statement and tax purposes; these differences will reverse at some time in the future. The differences are primarily related to the deferral of losses from wash sales and the recognition of unrealized gains from passive foreign investment companies. As of period end, the tax-basis components of total distributable earnings (loss) are detailed in the table as follows:
| | Amount |
| | ($000) |
| Undistributed Ordinary Income | 25,837 |
| Undistributed Long-Term Gains | 256 |
| Capital Loss Carryforwards | — |
| Qualified Late-Year Losses | — |
| Net Unrealized Gains (Losses) | 105,397 |
Total International Stock Market Index Portfolio
The tax character of distributions paid was as follows:
| | Year Ended December 31, |
| | 2020 | 2019 |
| | Amount | Amount |
| | ($000) | ($000) |
| Ordinary Income* | 14,336 | 5,019 |
| Long-Term Capital Gains | 144 | — |
| Total | 14,480 | 5,019 |
* Includes short-term capital gains, if any.
As of December 31, 2020, gross unrealized appreciation and depreciation for investments based on cost for U.S. federal income tax purposes were as follows:
| | Amount |
| | ($000) |
| Tax Cost | 793,996 |
| Gross Unrealized Appreciation | 105,501 |
| Gross Unrealized Depreciation | (104) |
| Net Unrealized Appreciation (Depreciation) | 105,397 |
E. Capital shares issued and redeemed were:
| | Year Ended December 31, |
| | 2020 | 2019 |
| | Shares | Shares |
| | (000) | (000) |
| Issued | 28,239 | 10,380 |
| Issued in Lieu of Cash Distributions | 936 | 260 |
| Redeemed | (8,867) | (2,988) |
| Net Increase (Decrease) in Shares Outstanding | 20,308 | 7,652 |
At December 31, 2020, one shareholder (an insurance company separate account whose holdings in the portfolio represent the indirect investment of Vanguard Variable Annuity contract holders) was the record or beneficial owner of 25% of the portfolio’s net assets. If this shareholder were to redeem its investment in the portfolio, the redemption might lead to the realization of taxable capital gains.
Total International Stock Market Index Portfolio
F. Transactions during the period in affiliated underlying Vanguard funds were as follows:
| | | | | | Current Period Transactions | |
| | Dec. 31, | | Proceeds | Realized | | | | Dec. 31, |
| | 2019 | | from | Net | Change in | | Capital Gain | 2020 |
| | Market | Purchases | Securities | Gain | Unrealized | Distributions | Market |
| | Value | at Cost | Sold | (Loss) | App. (Dep.) | Income | Received | Value |
| | ($000) | ($000) | ($000) | ($000) | ($000) | ($000) | ($000) | ($000) |
| Vanguard Market | | | | | | | | |
| Liquidity Fund | 179 | NA1 | NA1 | (2) | — | 3 | — | 374 |
| Vanguard Developed | | | | | | | | |
| Markets Index Fund | 111,110 | 138,469 | 28,527 | 3,293 | 26,378 | 4,621 | — | 250,723 |
| Vanguard Emerging | | | | | | | | |
| Markets Stock | | | | | | | | |
| Index Fund | 57,119 | 105,083 | 27,036 | 3,546 | 23,392 | 2,701 | — | 162,104 |
| Vanguard European | | | | | | | | |
| Stock Index Fund | 52,231 | 70,288 | 23,672 | 3,697 | 7,060 | 2,095 | — | 109,604 |
| Vanguard FTSE | | | | | | | | |
| Canada All Cap | | | | | | | | |
| Index ETF | 4,942 | 7,875 | — | — | 2,242 | 332 | — | 15,059 |
| Vanguard FTSE | | | | | | | | |
| All-World ex-US | | | | | | | | |
| Index Fund | 111,024 | 133,895 | 23,960 | 2,060 | 28,826 | 4,525 | — | 251,845 |
| Vanguard FTSE | | | | | | | | |
| All-World ex-US | | | | | | | | |
| Small-Cap Index | | | | | | | | |
| Fund | 27,739 | 25,967 | 22,652 | (5,187) | 2,018 | 495 | — | 27,885 |
| Vanguard Pacific | | | | | | | | |
| Stock Index Fund | 37,595 | 45,574 | 13,200 | 1,295 | 10,535 | 1,416 | — | 81,799 |
| Total | 401,939 | 527,151 | 139,047 | 8,702 | 100,451 | 16,188 | — | 899,393 |
1 Not applicable—purchases and sales are for temporary cash investment purposes.
G. Management has determined that no events or transactions occurred subsequent to December 31, 2020, that would require recognition or disclosure in these financial statements.
Total International Stock Market Index Portfolio
Report of Independent Registered Public Accounting Firm
To the Board of Trustees of Vanguard Variable Insurance Funds and Shareholders of Total International Stock Market Index Portfolio
Opinion on the Financial Statements
We have audited the accompanying statement of assets and liabilities, including the schedule of investments, of Total International Stock Market Index Portfolio (one of the portfolios constituting Vanguard Variable Insurance Funds, referred to hereafter as the “Portfolio”) as of December 31, 2020, the related statement of operations for the year ended December 31, 2020, the statement of changes in net assets for each of the two years in the period ended December 31, 2020, including the related notes, and the financial highlights for each of the three years in the period ended December 31, 2020 and for the period September 7, 2017 (inception) through December 31, 2017 (collectively referred to as the “financial statements”). In our opinion, the financial statements present fairly, in all material respects, the financial position of the Portfolio as of December 31, 2020, the results of its operations for the year then ended, the changes in its net assets for each of the two years in the period ended December 31, 2020 and the financial highlights for each of the three years in the period ended December 31, 2020 and for the period September 7, 2017 (inception) through December 31, 2017 in conformity with accounting principles generally accepted in the United States of America.
Basis for Opinion
These financial statements are the responsibility of the Portfolio’s management. Our responsibility is to express an opinion on the Portfolio’s financial statements based on our audits. We are a public accounting firm registered with the Public Company Accounting Oversight Board (United States) (PCAOB) and are required to be independent with respect to the Portfolio in accordance with the U.S. federal securities laws and the applicable rules and regulations of the Securities and Exchange Commission and the PCAOB.
We conducted our audits of these financial statements in accordance with the standards of the PCAOB. Those standards require that we plan and perform the audit to obtain reasonable assurance about whether the financial statements are free of material misstatement, whether due to error or fraud.
Our audits included performing procedures to assess the risks of material misstatement of the financial statements, whether due to error or fraud, and performing procedures that respond to those risks. Such procedures included examining, on a test basis, evidence regarding the amounts and disclosures in the financial statements. Our audits also included evaluating the accounting principles used and significant estimates made by management, as well as evaluating the overall presentation of the financial statements. Our procedures included confirmation of securities owned as of December 31, 2020 by correspondence with the custodian and transfer agent. We believe that our audits provide a reasonable basis for our opinion.
/s/PricewaterhouseCoopers LLP
Philadelphia, Pennsylvania
February 18, 2021
We have served as the auditor of one or more investment companies in The Vanguard Group of Funds since 1975.
Special 2020 tax information (unaudited) for corporate shareholders only for Total International Stock Market Index Portfolio, a portfolio of Vanguard Variable Insurance Funds
This information for the fiscal year ended December 31, 2020, is included pursuant to provisions of the Internal Revenue Code for corporate shareholders only.
The portfolio distributed $144,000 as capital gain dividends (20% rate gain distributions) to shareholders during the fiscal year.
The portfolio designates to shareholders foreign source income of $17,623,000 and foreign taxes paid of $1,531,000. Shareholders will receive more detailed information with their Form 1099-DIV in January 2021 to determine the calendar-year amounts to be included on their 2020 tax returns.
Total International Stock Market Index Portfolio
London Stock Exchange Group companies include FTSE International Limited (“FTSE”), Frank Russell Company (“Russell”), MTS Next Limited (“MTS”), and FTSE TMX Global Debt Capital Markets Inc. (“FTSE TMX”). All rights reserved. “FTSE®”, “Russell®”, “MTS®”, “FTSE TMX®” and “FTSE Russell” and other service marks and trademarks related to the FTSE or Russell indexes are trademarks of the London Stock Exchange Group companies and are used by FTSE, MTS, FTSE TMX and Russell under license. All information is provided for information purposes only. Every effort is made to ensure that all information given in this publication is accurate, but no responsibility or liability can be accepted by the London Stock Exchange Group companies nor its licensors for any errors or for any loss from use of this publication. Neither the London Stock Exchange Group companies nor any of their licensors make any claim, prediction, warranty or representation whatsoever, expressly or impliedly, either as to the results to be obtained from the use of the Indices or the fitness or suitability of the Indices for any particular purpose to which they might be put. The London Stock Exchange Group companies do not provide investment advice and nothing in this document should be taken as constituting financial or investment advice. The London Stock Exchange Group companies make no representation regarding the advisability of investing in any asset. A decision to invest in any such asset should not be made in reliance on any information herein. Indexes cannot be invested in directly. Inclusion of an asset in an index is not a recommendation to buy, sell or hold that asset. The general information contained in this publication should not be acted upon without obtaining specific legal, tax, and investment advice from a licensed professional. No part of this information may be reproduced, stored in a retrieval system or transmitted in any form or by any means, electronic, mechanical, photocopying, recording or otherwise, without prior written permission of the London Stock Exchange Group companies. Distribution of the London Stock Exchange Group companies’ index values and the use of their indexes to create financial products require a license with FTSE, FTSE TMX, MTS and/or Russell and/or its licensors.
This page intentionally left blank.
The People Who Govern Your Fund
The trustees of your mutual fund are there to see that the fund is operated and managed in your best interests since, as a shareholder, you are a part owner of the fund. Your fund’s trustees also serve on the board of directors of The Vanguard Group, Inc., which is owned by the Vanguard funds and provides services to them.
A majority of Vanguard’s board members are independent, meaning that they have no affiliation with Vanguard or the funds they oversee, apart from the sizable personal investments they have made as private individuals. The independent board members have distinguished backgrounds in business, academia, and public service. Each of the trustees and executive officers oversees 211 Vanguard funds.
Information for each trustee and executive officer of the fund appears below. That information, as well as the Vanguard fund count, is as of the date on the cover of this fund report. The mailing address of the trustees and officers is P.O. Box 876, Valley Forge, PA 19482. More information about the trustees is in the Statement of Additional Information, which can be obtained, without charge, by contacting Vanguard at 800-662-7447, or online at vanguard.com.
Interested Trustee1
Mortimer J. Buckley
Born in 1969. Trustee since January 2018. Principal occupation(s) during the past five years and other experience: chairman of the board (2019–present) of Vanguard and of each of the investment companies served by Vanguard; chief executive officer (2018– present) of Vanguard; chief executive officer, president, and trustee (2018–present) of each of the investment companies served by Vanguard; president and director (2017–present) of Vanguard; and president (2018– present) of Vanguard Marketing Corporation. Chief investment officer (2013–2017), managing director (2002–2017), head of the Retail Investor Group (2006–2012), and chief information officer (2001–2006) of Vanguard. Chairman of the board (2011–2017) and trustee (2009–2017) of the Children’s Hospital of Philadelphia; and trustee (2018–present) and vice chair (2019–present) of The Shipley School.
Independent Trustees
Emerson U. Fullwood
Born in 1948. Trustee since January 2008. Principal occupation(s) during the past five years and other experience: executive chief staff and marketing officer for North America and corporate vice president (retired 2008) of Xerox Corporation (document management products and services). Former president of the Worldwide Channels Group, Latin America, and Worldwide Customer Service and executive chief staff officer of Developing Markets of Xerox. Executive in residence and 2009–2010 Distinguished Minett Professor at the Rochester Institute of Technology. Director of SPX FLOW, Inc. (multi-industry manufacturing). Director of the University of Rochester Medical Center, the Monroe Community College Foundation, the United Way of Rochester, North Carolina A&T University, and Roberts Wesleyan College. Trustee of the University of Rochester.
Amy Gutmann
Born in 1949. Trustee since June 2006. Principal occupation(s) during the past five years and other experience: president (2004–present) of the University of Pennsylvania. Christopher H. Browne Distinguished Professor of Political Science, School of Arts and Sciences, and professor of communication, Annenberg School for Communication, with secondary faculty appointments in the Department of Philosophy, School of Arts and Sciences, and at the Graduate School of Education, University of Pennsylvania.
F. Joseph Loughrey
Born in 1949. Trustee since October 2009. Principal occupation(s) during the past five years and other experience: president and chief operating officer (retired 2009) and vice chairman of the board (2008–2009) of Cummins Inc. (industrial machinery). Chairman of the board of Hillenbrand, Inc. (specialized consumer services) and the Lumina Foundation. Director of the V Foundation. Member of the advisory council for the College of Arts and Letters and chair of the advisory board to the Kellogg Institute for International Studies, both at the University of Notre Dame.
Mark Loughridge
Born in 1953. Trustee since March 2012. Principal occupation(s) during the past five years and other experience: senior vice president and chief financial officer (retired 2013) of IBM (information technology services). Fiduciary member of IBM’s Retirement Plan Committee (2004–2013), senior vice president and general manager (2002–2004) of IBM Global Financing, vice president and controller (1998–2002) of IBM, and a variety of other prior management roles at IBM. Member of the Council on Chicago Booth.
Scott C. Malpass
Born in 1962. Trustee since March 2012. Principal occupation(s) during the past five years and other experience: chief investment officer (retired June 2020) and vice president (retired June 2020) of the University of Notre Dame. Assistant professor of finance at the Mendoza College of Business, University of Notre Dame, and member of the Notre Dame 403(b) Investment Committee (retired June 2020). Member of the board of Catholic Investment Services, Inc. (investment advisors) and the board of superintendence of the Institute for the Works of Religion.
Deanna Mulligan
Born in 1963. Trustee since January 2018. Principal occupation(s) during the past five years and other experience: board chair (2020–present), chief executive��officer (2011–2020), and president (2010–2019) of The Guardian Life Insurance Company of America. Chief operating officer (2010–2011) and executive vice president (2008–2010) of the individual life and disability division of Guardian Life. Member of the board of the American Council of Life Insurers and the board of the Economic Club of New York. Trustee of the Partnership for New York City (business leadership), Chief Executives for Corporate Purpose, NewYork-Presbyterian Hospital, Catalyst, and the Bruce Museum (arts and science). Member of the Advisory Council for the Stanford Graduate School of Business.
André F. Perold
Born in 1952. Trustee since December 2004. Principal occupation(s) during the past five years and other experience: George Gund Professor of Finance and Banking, Emeritus at the Harvard Business School (retired 2011). Chief investment officer and co-managing partner of HighVista Strategies (private investment firm). Member of the board of advisors and member of the investment committee of the Museum of Fine Arts Boston. Member of the board (2018–present) of RIT Capital Partners (investment firm). Member of the investment committee of Partners Health Care System.
Sarah Bloom Raskin
Born in 1961. Trustee since January 2018. Principal occupation(s) during the past five years and other experience: deputy secretary (2014–2017) of the United States Department of the Treasury. Governor (2010–2014) of the Federal Reserve Board. Commissioner (2007–2010) of financial regulation for the State of Maryland. Member of the board of directors (2012–2014) of Neighborhood Reinvestment Corporation. Director (2017–present) of i(x) Investments, LLC; director (2017–present) of Reserve Trust. Rubenstein Fellow (2017–present) of Duke University; trustee (2017–present) of Amherst College, and trustee (2019–present) of the Folger Shakespeare Library.
Peter F. Volanakis
Born in 1955. Trustee since July 2009. Principal occupation(s) during the past five years and other experience: president and chief operating officer (retired 2010) of Corning Incorporated (communications equipment) and director of Corning Incorporated
1 Mr. Buckley is considered an “interested person,” as defined in the Investment Company Act of 1940, because he is an officer of the Vanguard funds.
(2000–2010) and Dow Corning (2001–2010). Director (2012) of SPX Corporation (multi-industry manufacturing). Overseer of the Amos Tuck School of Business Administration, Dartmouth College (2001–2013). Chairman of the board of trustees of Colby-Sawyer College. Member of the board of Hypertherm Inc. (industrial cutting systems, software, and consumables).
Executive Officers
John Bendl
Born in 1970. Principal occupation(s) during the past five years and other experience: principal of Vanguard. Chief financial officer (2019–present) of each of the investment companies served by Vanguard. Chief accounting officer, treasurer, and controller of Vanguard (2017–present). Partner (2003–2016) at KPMG (audit, tax, and advisory services).
Christine M. Buchanan
Born in 1970. Principal occupation(s) during the past five years and other experience: principal of Vanguard. Treasurer (2017–present) of each of the investment companies served by Vanguard. Partner (2005–2017) at KPMG (audit, tax, and advisory services).
David Cermak
Born in 1960. Principal occupation(s) during the past five years and other experience: principal of Vanguard. Finance director (2019–present) of each of the investment companies served by Vanguard. Managing director and head (2017–present) of Vanguard Investments Singapore. Managing director and head (2017–2019) of Vanguard Investments Hong Kong. Representative director and head (2014–2017) of Vanguard Investments Japan.
John Galloway
Born in 1973. Principal occupation(s) during the past five years and other experience: principal of Vanguard. Investment stewardship officer (September 2020–present) of each of the investment companies served by Vanguard. Head of Investor Advocacy (February 2020–present) and head of Marketing Strategy and Planning (2017–2020) at Vanguard. Deputy assistant to the President of the United States (2015).
Thomas J. Higgins
Born in 1957. Principal occupation(s) during the past five years and other experience: principal of Vanguard. Finance director (2019–present), chief financial officer (2008–2019), and treasurer (1998–2008) of each of the investment companies served by Vanguard.
Peter Mahoney
Born in 1974. Principal occupation(s) during the past five years and other experience: principal of Vanguard. Controller (2015–present) of each of the investment companies served by Vanguard. Head of International Fund Services (2008–2014) at Vanguard.
Anne E. Robinson
Born in 1970. Principal occupation(s) during the past five years and other experience: general counsel (2016–present) of Vanguard. Secretary (2016–present) of Vanguard and of each of the investment companies served by Vanguard. Managing director (2016–present) of Vanguard. Managing director and general counsel of Global Cards and Consumer Services (2014–2016) at Citigroup. Counsel (2003–2014) at American Express.
Michael Rollings
Born in 1963. Principal occupation(s) during the past five years and other experience: finance director (2017–present) and treasurer (2017) of each of the investment companies served by Vanguard. Managing director (2016–present) of Vanguard. Chief financial officer (2016–present) of Vanguard. Director (2016–present) of Vanguard Marketing Corporation. Executive vice president and chief financial officer (2006–2016) of MassMutual Financial Group.
John E. Schadl
Born in 1972. Principal occupation(s) during the past five years and other experience: principal of Vanguard. Chief compliance officer (2019–present) of Vanguard and of each of the investment companies served by Vanguard. Assistant vice president (2019–present) of Vanguard Marketing Corporation.
Vanguard Senior Management Team
| Joseph Brennan | James M. Norris |
| Mortimer J. Buckley | Thomas M. Rampulla |
| Gregory Davis | Karin A. Risi |
| John James | Anne E. Robinson |
| John T. Marcante | Michael Rollings |
| Chris D. McIsaac | Lauren Valente |
Connect with Vanguard® > vanguard.com
Fund Information > 800-662-7447
Annuity and Insurance Services > 800-522-5555
Institutional Investor Services > 800-523-1036
Text Telephone for People
Who Are Deaf or Hard of Hearing > 800-749-7273
This material may be used in conjunction with the offering of shares of any Vanguard fund only if preceded or accompanied by the fund’s current prospectus.
You can obtain a free copy of Vanguard’s proxy voting guidelines by visiting vanguard.com/proxyreporting or by calling Vanguard at 800-662-2739. The guidelines are also available from the SEC’s website, www.sec.gov. In addition, you may obtain a free report on how your fund voted the proxies for securities it owned during the 12 months ended June 30. To get the report, visit either vanguard.com/proxyreporting or www.sec.gov.
All comparative mutual fund data are from Morningstar, Inc., unless otherwise noted.
You can review information about your portfolio on the SEC’s website, and you can receive copies of this information, for a fee, by sending a request via email addressed to publicinfo@sec.gov.
Source for Bloomberg Barclays indexes: Bloomberg Index Services Limited. Copyright 2021, Bloomberg. All rights reserved.
| | © 2021 The Vanguard Group, Inc. |
| | All rights reserved. |
| | Vanguard Marketing Corporation, Distributor. |
| | |
| | Q690TISM 022021 |
| |
| |
| |
| |
| Annual Report | December 31, 2020 |
| |
| |
| Vanguard Variable Insurance Funds |
|
| |
| |
| |
| |
| |
| |
| |
| |
| |
| |
| |
| Total Stock Market Index Portfolio |
| (with underlying Equity Index Portfolio) |
|
| |
|
| |
| |
| |
| |
| |
| |
| |
| |
| |
| |
| |
| |
| |
| |
| |
| |
| |
| |
| |
| |
| |
| |
| |
| |
| |
| |
| |
| |
| |
| |
| |
| |
| |
| |
| |
| |
Contents
| Total Stock Market Index Portfolio | |
| (with underlying Equity Index Portfolio) | 1 |
Please note: The opinions expressed in this report are just that—informed opinions. They should not be considered promises or advice. Also, please keep in mind that the information and opinions cover the period through the date on the front of this report. Of course, the risks of investing in your portfolio are spelled out in the prospectus.
Total Stock Market Index Portfolio
Your Portfolio’s Performance at a Glance
● For the 12 months ended December 31, 2020, the Total Stock Market Index Portfolio of Vanguard Variable Insurance Funds returned 20.55%, in line with the 20.79% return of its benchmark index after factoring in the portfolio’s expenses.
● The portfolio, which invests in the VVIF Equity Index Portfolio and Vanguard Extended Market Index Fund, provides exposure to every segment, size, and style of the U.S. equity market.
● Stocks plummeted after COVID-19 emerged in early 2020 but ended significantly higher, thanks in part to monetary and fiscal action by policymakers and the rollout of COVID-19 vaccines at the end of the year. Large-capitalization stocks outpaced mid- and small-caps, and growth stocks beat their value counterparts.
● For the decade ended December 31, 2020, the portfolio recorded an average annual return of 13.60%, in line with its benchmark average of 13.73%.
● Please note that the portfolio’s returns are different from those in Vanguard Variable Annuity (and other plans that invest in the portfolio), which take into account insurance-related expenses.
Market Barometer
| | Average Annual Total Returns |
| | Periods Ended December 31, 2020 |
| | One Year | Three Years | Five Years |
| Stocks | | | |
| Russell 1000 Index (Large-caps) | 20.96% | 14.82% | 15.60% |
| Russell 2000 Index (Small-caps) | 19.96 | 10.25 | 13.26 |
| Russell 3000 Index (Broad U.S. market) | 20.89 | 14.49 | 15.43 |
| FTSE All-World ex US Index (International) | 11.22 | 5.18 | 9.16 |
| | | | |
| Bonds | | | |
| Bloomberg Barclays U.S. Aggregate Bond Index | | | |
| (Broad taxable market) | 7.51% | 5.34% | 4.44% |
| Bloomberg Barclays Municipal Bond Index | | | |
| (Broad tax-exempt market) | 5.21 | 4.64 | 3.91 |
| FTSE Three-Month U.S. Treasury Bill Index | 0.58 | 1.56 | 1.16 |
| | | | |
| CPI | | | |
| Consumer Price Index | 1.36% | 1.85% | 1.95% |
Total Stock Market Index Portfolio
About Your Portfolio’s Expenses
As a shareholder of the portfolio, you incur ongoing costs, which include costs for portfolio management, administrative services, and shareholder reports (like this one), among others. Operating expenses, which are deducted from a portfolio’s gross income, directly reduce the investment return of the portfolio.
A typical portfolio’s expenses are expressed as a percentage of its average net assets. The Total Stock Market Index Portfolio has no direct expenses, but bears its proportionate share of the expenses of the underlying funds in which it invests. These indirect expenses make up the acquired fund fees and expenses, also expressed as a percentage of average net assets. The following examples are intended to help you understand the ongoing costs (in dollars) of investing in your portfolio and to compare these costs with those of other mutual funds. The examples are based on an investment of $1,000 made at the beginning of the period shown and held for the entire period. The costs were calculated using the acquired fund fees and expenses for the Total Stock Market Index Portfolio.
The accompanying table illustrates your portfolio’s costs in two ways:
● Based on actual portfolio return. This section helps you to estimate the actual expenses that you paid over the period. The “Ending Account Value” shown is derived from the portfolio’s actual return, and the third column shows the dollar amount that would have been paid by an investor who started with $1,000 in the portfolio. You may use the information here, together with the amount you invested, to estimate the expenses that you paid over the period.
To do so, simply divide your account value by $1,000 (for example, an $8,600 account value divided by $1,000 = 8.6), then multiply the result by the number given for your portfolio under the heading “Expenses Paid During Period.”
● Based on hypothetical 5% yearly return. This section is intended to help you compare your portfolio’s costs with those of other mutual funds. It assumes that the portfolio had a yearly return of 5% before expenses, but that the expense ratio is unchanged. In this case—because the return used is not the portfolio’s actual return—the results do not apply to your investment. The example is useful in making comparisons because the Securities and Exchange Commission requires all mutual funds to calculate expenses based on a 5% return. You can assess your portfolio’s costs by comparing this hypothetical example with the hypothetical examples that appear in shareholder reports of other funds.
Note that the expenses shown in the table are meant to highlight and help you compare ongoing costs only. The portfolio’s expense figure does not reflect additional fees and expenses associated with the annuity or life insurance program through which you invest.
The calculations assume no shares were bought or sold during the period. Your actual costs may have been higher or lower, depending on the amount of your investment and the timing of any purchases or redemptions.
You can find more information about the portfolio’s expenses in the Financial Statements section. For additional information on operating expenses and other shareholder costs, please refer to the prospectus.
Six Months Ended December 31, 2020
| | Beginning | Ending | Expenses |
| | Account Value | Account Value | Paid During |
| Total Stock Market Index Portfolio | 6/30/2020 | 12/31/2020 | Period |
| Based on Actual Portfolio Return | $1,000.00 | $1,250.90 | $0.74 |
| Based on Hypothetical 5% Yearly Return | 1,000.00 | 1,024.48 | 0.66 |
The calculations are based on the Total Stock Market Index Portfolio’s acquired fund fees and expenses for the most recent six-month period. The Total Stock Market Index Portfolio’s annualized expense figure for that period is 0.13%. The dollar amounts shown as “Expenses Paid” are equal to the annualized expense ratio multiplied by the average account value over the period, multiplied by the number of days in the most recent six-month period, then divided by the number of days in the most recent 12-month period (184/366).
Total Stock Market Index Portfolio
Performance Summary
All of the returns in this report represent past performance, which is not a guarantee of future results that may be achieved by the portfolio. (Current performance may be lower or higher than the performance data cited. For performance data current to the most recent month-end, visit our website at vanguard.com/performance.) Note, too, that both investment returns and principal value can fluctuate widely, so an investor’s shares, when sold, could be worth more or less than their original cost. The returns shown do not reflect taxes that a shareholder would pay on portfolio distributions or on the sale of portfolio shares. Nor do the returns reflect fees and expenses associated with the annuity or life insurance program through which a shareholder invests. If these fees and expenses were included, the portfolio’s returns would be lower.
Cumulative Performance: December 31, 2010–December 31, 2020
Initial Investment of $10,000
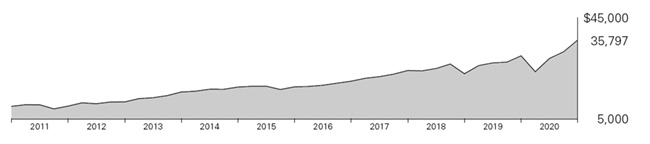
| | | Average Annual Total Returns
Periods Ended December 31, 2020 | Final Value |
| | | of a $10,000 |
| | | One Year | Five Years | Ten Years | Investment |
 | Total Stock Market Index Portfolio | 20.55% | 15.23% | 13.60% | $35,797 |
 | S&P Total Market Index | 20.79 | 15.37 | 13.73 | 36,200 |
See Financial Highlights for dividend and capital gains information.
Total Stock Market Index Portfolio
Underlying Vanguard Funds
As of December 31, 2020
| Vanguard Variable Insurance Funds Equity Index Portfolio | 81.8% |
| Vanguard Extended Market Index Fund Admiral Shares | 18.2 |
The table reflects the portfolio’s investments, except for short-term investments.
Total Stock Market Index Portfolio
Financial Statements
Schedule of Investments
As of December 31, 2020
The portfolio files its complete schedule of portfolio holdings with the Securities and Exchange Commission (SEC) for the first and third quarters of each fiscal year as an exhibit to its reports on Form N-PORT. The portfolio’s Form N-PORT reports are available on the SEC’s website at www.sec.gov.
| | | Market |
| | | Value• |
| | Shares | ($000) |
| Investment Companies (100.0%) | | |
| U.S. Stock Funds (100.0%) | | |
| Vanguard Variable Insurance Funds—Equity Index Portfolio | 52,657,784 | 2,830,882 |
| Vanguard Extended Market Index Fund Admiral Shares | 5,063,726 | 631,700 |
| Total Investment Companies (Cost $2,323,940) | | 3,462,582 |
| Temporary Cash Investment (0.0%) | | |
| Money Market Fund (0.0%) | | |
| 1 Vanguard Market Liquidity Fund, 0.111% (Cost $270) | 2,698 | 270 |
| Total Investments (100.0%) (Cost $2,324,210) | | 3,462,852 |
| Other Assets and Liabilities—Net (0.0%) | | (511) |
| Net Assets (100%) | | 3,462,341 |
Cost is in $000.
• See Note A in Notes to Financial Statements.
1 Affiliated money market fund available only to Vanguard funds and certain trusts and accounts managed by Vanguard. Rate shown is the 7-day yield.
See accompanying Notes, which are an integral part of the Financial Statements.
Total Stock Market Index Portfolio
Statement of Assets and Liabilities
As of December 31, 2020
| ($000s, except shares and per-share amounts) | Amount |
| Assets | |
| Investments in Securities, at Value—Affiliated Funds (Cost $2,324,210) | 3,462,852 |
| Receivables for Capital Shares Issued | 1,437 |
| Total Assets | 3,464,289 |
| Liabilities | |
| Payables for Investment Securities Purchased | 270 |
| Payables for Capital Shares Redeemed | 1,678 |
| Total Liabilities | 1,948 |
| Net Assets | 3,462,341 |
| At December 31, 2020, net assets consisted of: | |
| | |
| Paid-in Capital | 2,081,296 |
| Total Distributable Earnings (Loss) | 1,381,045 |
| Net Assets | 3,462,341 |
| | |
| Net Assets | |
| Applicable to 71,299,459 outstanding $.001 par value shares of beneficial interest (unlimited authorization) | 3,462,341 |
| Net Asset Value Per Share | $48.56 |
See accompanying Notes, which are an integral part of the Financial Statements.
Total Stock Market Index Portfolio
Statement of Operations
| | | Year Ended |
| | December 31, 2020 |
| | | ($000) |
| Investment Income | |
| Income | |
| Income Distributions Received | |
| from Affiliated Funds | 48,195 |
| Net Investment Income—Note B | 48,195 |
| Realized Net Gain (Loss) | |
| Capital Gain Distributions Received | |
| from Affiliated Funds | 48,616 |
| Affiliated Funds Sold | 149,759 |
| Realized Net Gain (Loss) | 198,375 |
| Change in Unrealized Appreciation (Depreciation) from Affiliated Funds | 347,064 |
| Net Increase (Decrease) in Net Assets Resulting from Operations | 593,634 |
Statement of Changes in Net Assets
| | Year Ended December 31, |
| | 2020 | 2019 |
| | ($000) | ($000) |
| Increase (Decrease) in Net Assets | | |
| Operations | | |
| Net Investment Income | 48,195 | 43,273 |
| Realized Net Gain (Loss) | 198,375 | 89,139 |
| Change in Unrealized Appreciation (Depreciation) | 347,064 | 502,495 |
| Net Increase (Decrease) in Net Assets Resulting from Operations | 593,634 | 634,907 |
| Distributions1 | | |
| Total Distributions | (134,229) | (103,354) |
| Capital Share Transactions | | |
| Issued | 628,862 | 322,975 |
| Issued in Lieu of Cash Distributions | 134,229 | 103,354 |
| Redeemed | (516,850) | (248,175) |
| Net Increase (Decrease) from Capital Share Transactions | 246,241 | 178,154 |
| Total Increase (Decrease) | 705,646 | 709,707 |
| Net Assets | | |
| Beginning of Period | 2,756,695 | 2,046,988 |
| End of Period | 3,462,341 | 2,756,695 |
1 Certain prior-period numbers have been reclassified to conform with the current-period presentation.
See accompanying Notes, which are an integral part of the Financial Statements.
Total Stock Market Index Portfolio
Financial Highlights
| For a Share Outstanding | | | Year Ended December 31, |
| Throughout Each Period | 2020 | 2019 | 2018 | 2017 | 2016 |
| Net Asset Value, Beginning of Period | $42.81 | $34.26 | $38.26 | $34.10 | $32.06 |
| Investment Operations | | | | | |
| Net Investment Income | .6781 | .6941 | .6031 | .6041 | .710 |
| Capital Gain Distributions Received | .6841 | .7891 | .4941 | .8901 | .478 |
| Net Realized and Unrealized Gain (Loss) on Investments | 6.354 | 8.792 | (2.964) | 5.270 | 2.598 |
| Total from Investment Operations | 7.716 | 10.275 | (1.867) | 6.764 | 3.786 |
| Distributions | | | | | |
| Dividends from Net Investment Income | (.671) | (.618) | (.600) | (.699) | (.484) |
| Distributions from Realized Capital Gains | (1.295) | (1.107) | (1.533) | (1.905) | (1.262) |
| Total Distributions | (1.966) | (1.725) | (2.133) | (2.604) | (1.746) |
| Net Asset Value, End of Period | $48.56 | $42.81 | $34.26 | $38.26 | $34.10 |
| | | | | | |
| Total Return | 20.55% | 30.75% | -5.34% | 20.97% | 12.56% |
| | | | | | |
| Ratios/Supplemental Data | | | | | |
| Net Assets, End of Period (Millions) | $3,462 | $2,757 | $2,047 | $2,104 | $1,735 |
| Ratio of Total Expenses to Average Net Assets | — | — | — | — | — |
| Acquired Fund Fees and Expenses | 0.13% | 0.13% | 0.13% | 0.15% | 0.16% |
| Ratio of Net Investment Income to Average Net Assets | 1.66% | 1.79% | 1.59% | 1.71% | 2.10% |
| Portfolio Turnover Rate | 13% | 4% | 5% | 6% | 9% |
1 Calculated based on average shares outstanding.
See accompanying Notes, which are an integral part of the Financial Statements.
Total Stock Market Index Portfolio
Notes to Financial Statements
The Total Stock Market Index Portfolio, a portfolio of Vanguard Variable Insurance Funds, is registered under the Investment Company Act of 1940 as an open-end investment company. The portfolio seeks to match the return of its target index by investing in selected Vanguard funds and portfolios. The portfolio invests a substantial amount of its assets in VVIF Equity Index Portfolio. The accompanying financial statements of VVIF Equity Index Portfolio should be read in conjunction with the financial statements of the portfolio. Financial statements and other information about each underlying fund and portfolio are available at www.vanguard.com. The portfolio’s shares are only available for purchase by separate accounts of insurance companies as investments for variable annuity plans, variable life insurance contracts, or other variable benefit insurance contracts.
Market disruptions associated with the COVID-19 pandemic have had a global impact, and uncertainty exists as to the long-term implications. Such disruptions can adversely affect assets of the portfolio and thus portfolio performance.
A. The following significant accounting policies conform to generally accepted accounting principles for U.S. investment companies. The portfolio consistently follows such policies in preparing its financial statements.
1. Security Valuation: Investments are valued at the net asset value of each underlying Vanguard fund determined as of the close of the New York Stock Exchange (generally 4 p.m., Eastern time) on the valuation date.
2. Federal Income Taxes: The portfolio intends to continue to qualify as a regulated investment company and distribute all of its income. The portfolio’s tax returns are open to examination by the relevant tax authorities until expiration of the applicable statute of limitations, which is generally three years after the filing of the tax return. Management has analyzed the portfolio’s tax positions taken for all open federal and state income tax years, and has concluded that no provision for income tax is required in the portfolio’s financial statements.
3. Distributions: Distributions to shareholders are recorded on the ex-dividend date. Distributions are determined on a tax basis at the fiscal year-end and may differ from net investment income and realized capital gains for financial reporting purposes.
4. Credit Facilities and Interfund Lending Program: The portfolio and certain other funds managed by The Vanguard Group (“Vanguard”) participate in a $4.3 billion committed credit facility provided by a syndicate of lenders pursuant to a credit agreement and an uncommitted credit facility provided by Vanguard. Both facilities may be renewed annually. Each fund is individually liable for its borrowings, if any, under the credit facilities. Borrowings may be utilized for temporary or emergency purposes, subject to the portfolio’s regulatory and contractual borrowing restrictions. With respect to the committed credit facility, the participating funds are charged administrative fees and an annual commitment fee of 0.10% of the undrawn committed amount of the facility; these fees are allocated to the funds based on a method approved by the portfolio’s board of trustees and borne by the funds in which the portfolio invests (see Note B). Any borrowings under either facility bear interest at a rate based upon the higher of the one-month London Interbank Offered Rate (or an acceptable alternate rate, if necessary), federal funds effective rate, or overnight bank funding rate plus an agreed-upon spread, except that borrowings under the uncommitted credit facility may bear interest based upon an alternative rate agreed to by the portfolio and Vanguard.
In accordance with an exemptive order (the “Order”) from the SEC, the portfolio may participate in a joint lending and borrowing program that allows registered open-end Vanguard funds to borrow money from and lend money to each other for temporary or emergency purposes (the “Interfund Lending Program”), subject to compliance with the terms and conditions of the Order, and to the extent permitted by the portfolio’s investment objective and investment policies. Interfund loans and borrowings normally extend overnight, but can have a maximum duration of seven days. Loans may be called on one business day’s notice. The interest rate to be charged is governed by the conditions of the Order and internal procedures adopted by the board of trustees. The board of trustees is responsible for overseeing the Interfund Lending Program.
For the year ended December 31, 2020, the portfolio did not utilize the credit facilities or the Interfund Lending Program.
5. Other: Income and capital gain distributions received are recorded on the ex-dividend date. Security transactions are accounted for on the date securities are bought or sold. Costs used to determine realized gains (losses) on the sale of investment securities are those of the specific securities sold.
B. In accordance with the terms of a Funds’ Service Agreement (the “FSA”) between Vanguard and the portfolio, Vanguard furnishes to the portfolio investment advisory, corporate management, administrative, marketing, and distribution services at Vanguard’s cost of operations (as defined by the FSA). These costs of operations are allocated to the portfolio based on methods and guidelines
Total Stock Market Index Portfolio
approved by the board of trustees. The FSA provides that expenses otherwise allocable to Vanguard funds-of-funds may be reduced or eliminated to the extent of savings realized by the underlying Vanguard funds by virtue of being part of a fund-of-funds. Accordingly, all expenses for services provided by Vanguard to the portfolio and all other expenses incurred by the portfolio during the period ended December 31, 2020, were borne by the underlying Vanguard funds in which the portfolio invests. The portfolio’s trustees and officers are also trustees and officers, respectively, of the underlying Vanguard funds, as well as directors and employees, respectively, of Vanguard.
C. Various inputs may be used to determine the value of the portfolio’s investments. These inputs are summarized in three broad levels for financial statement purposes. The inputs or methodologies used to value securities are not necessarily an indication of the risk associated with investing in those securities.
Level 1—Quoted prices in active markets for identical securities.
Level 2—Other significant observable inputs (including quoted prices for similar securities, interest rates, prepayment speeds, credit risk, etc.).
Level 3—Significant unobservable inputs (including the portfolio’s own assumptions used to determine the fair value of investments). Any investments valued with significant unobservable inputs are noted on the Schedule of Investments.
At December 31, 2020, 100% of the market value of the portfolio’s investments was determined based on Level 1 inputs.
D. Permanent differences between book-basis and tax-basis components of net assets, if any, are reclassified among capital accounts in the financial statements to reflect their tax character. These reclassifications have no effect on net assets or net asset value per share.
Temporary differences between book-basis and tax-basis components of total distributable earnings (loss) arise when certain items of income, gain, or loss are recognized in different periods for financial statement and tax purposes; these differences will reverse at some time in the future. The differences are primarily related to the deferral of losses from wash sales. As of period end, the tax-basis components of total distributable earnings (loss) are detailed in the table as follows:
| | Amount |
| | ($000) |
| Undistributed Ordinary Income | 45,489 |
| Undistributed Long-Term Gains | 196,914 |
| Capital Loss Carryforwards | — |
| Qualified Late-Year Losses | — |
| Net Unrealized Gains (Losses) | 1,138,642 |
The tax character of distributions paid was as follows:
| | Year Ended December 31, |
| | 2020 | 2019 |
| | Amount | Amount |
| | ($000) | ($000) |
| Ordinary Income* | 45,824 | 37,038 |
| Long-Term Capital Gains | 88,405 | 66,316 |
| Total | 134,229 | 103,354 |
* Includes short-term capital gains, if any.
As of December 31, 2020, gross unrealized appreciation and depreciation for investments based on cost for U.S. federal income tax purposes were as follows:
| | Amount |
| | ($000) |
| Tax Cost | 2,324,210 |
| Gross Unrealized Appreciation | 1,138,705 |
| Gross Unrealized Depreciation | (63) |
| Net Unrealized Appreciation (Depreciation) | 1,138,642 |
Total Stock Market Index Portfolio
E. Capital shares issued and redeemed were:
| | Year Ended December 31, |
| | 2020 | 2019 |
| | Shares | Shares |
| | (000) | (000) |
| Issued | 15,326 | 8,273 |
| Issued in Lieu of Cash Distributions | 4,288 | 2,779 |
| Redeemed | (12,710) | (6,412) |
| Net Increase (Decrease) in Shares Outstanding | 6,904 | 4,640 |
At December 31, 2020, one shareholder (an insurance company separate account whose holdings in the portfolio represent the indirect investment of Vanguard Variable Annuity contract holders) was the record or beneficial owner of 48% of the portfolio’s net assets. If this shareholder were to redeem its investment in the portfolio, the redemption might lead to the realization of taxable capital gains.
F. Transactions during the period in affiliated underlying Vanguard funds were as follows:
| | | | | | Current Period Transactions | |
| | Dec. 31, | | Proceeds | Realized | | | | Dec. 31, |
| | 2019 | | from | Net | Change in | Capital Gain | 2020 |
| | Market | Purchases | Securities | Gain | Unrealized | Distributions | Market |
| | Value | at Cost | Sold | (Loss) | App. (Dep.) | Income | Received | Value |
| | ($000) | ($000) | ($000) | ($000) | ($000) | ($000) | ($000) | ($000) |
| Vanguard Extended Market Index Fund | 449,314 | 125,936 | 94,609 | 31,942 | 119,117 | 6,750 | — | 631,700 |
| Vanguard Market Liquidity Fund | 13 | NA1 | NA1 | (1) | — | 3 | — | 270 |
| Vanguard Variable Insurance Funds—Equity Index Portfolio | 2,307,447 | 457,620 | 279,950 | 117,818 | 227,947 | 41,442 | 48,616 | 2,830,882 |
| Total | 2,756,774 | 583,556 | 374,559 | 149,759 | 347,064 | 48,195 | 48,616 | 3,462,852 |
1 Not applicable—purchases and sales are for temporary cash investment purposes.
G. Management has determined that no events or transactions occurred subsequent to December 31, 2020, that would require recognition or disclosure in these financial statements.
Total Stock Market Index Portfolio
Report of Independent Registered Public Accounting Firm
To the Board of Trustees of Vanguard Variable Insurance Funds and Shareholders of Total Stock Market Index Portfolio
Opinion on the Financial Statements
We have audited the accompanying statement of assets and liabilities, including the schedule of investments, of Total Stock Market Index Portfolio (one of the portfolios constituting Vanguard Variable Insurance Funds, referred to hereafter as the “Portfolio”) as of December 31, 2020, the related statement of operations for the year ended December 31, 2020, the statement of changes in net assets for each of the two years in the period ended December 31, 2020, including the related notes, and the financial highlights for each of the five years in the period ended December 31, 2020 (collectively referred to as the “financial statements”). In our opinion, the financial statements present fairly, in all material respects, the financial position of the Portfolio as of December 31, 2020, the results of its operations for the year then ended, the changes in its net assets for each of the two years in the period ended December 31, 2020 and the financial highlights for each of the five years in the period ended December 31, 2020 in conformity with accounting principles generally accepted in the United States of America.
Basis for Opinion
These financial statements are the responsibility of the Portfolio’s management. Our responsibility is to express an opinion on the Portfolio’s financial statements based on our audits. We are a public accounting firm registered with the Public Company Accounting Oversight Board (United States) (PCAOB) and are required to be independent with respect to the Portfolio in accordance with the U.S. federal securities laws and the applicable rules and regulations of the Securities and Exchange Commission and the PCAOB.
We conducted our audits of these financial statements in accordance with the standards of the PCAOB. Those standards require that we plan and perform the audit to obtain reasonable assurance about whether the financial statements are free of material misstatement, whether due to error or fraud.
Our audits included performing procedures to assess the risks of material misstatement of the financial statements, whether due to error or fraud, and performing procedures that respond to those risks. Such procedures included examining, on a test basis, evidence regarding the amounts and disclosures in the financial statements. Our audits also included evaluating the accounting principles used and significant estimates made by management, as well as evaluating the overall presentation of the financial statements. Our procedures included confirmation of securities owned as of December 31, 2020 by correspondence with the transfer agent. We believe that our audits provide a reasonable basis for our opinion.
/s/PricewaterhouseCoopers LLP
Philadelphia, Pennsylvania
February 18, 2021
We have served as the auditor of one or more investment companies in The Vanguard Group of Funds since 1975.
Special 2020 tax information (unaudited) for corporate shareholders only for Vanguard Total Stock Market Index Portfolio, a portfolio of Vanguard Variable Insurance Funds
This information for the fiscal year ended December 31, 2020, is included pursuant to provisions of the Internal Revenue Code for corporate shareholders only.
The portfolio distributed $88,405,000 as capital gain dividends (20% rate gain distributions) to shareholders during the fiscal year.
For corporate shareholders, 89.4% of investment income (dividend income plus short-term gains, if any) qualifies for the dividends-received deduction.
Total Stock Market Index Portfolio
The “S&P Total Market Index” (the “Index”) is a product of S&P Dow Jones Indices LLC (“SPDJI”), and has been licensed for use by Vanguard. Standard & Poor’s® and S&P® are registered trademarks of Standard & Poor’s Financial Services LLC (“S&P”); Dow Jones® is a registered trademark of Dow Jones Trademark Holdings LLC (“Dow Jones”); S&P® and S&P 500® are trademarks of S&P; and these trademarks have been licensed for use by SPDJI and sublicensed for certain purposes by Vanguard. The Total Stock Market Index Portfolio is not sponsored, endorsed, sold or promoted by SPDJI, Dow Jones, S&P, or any of their respective affiliates (collectively, “S&P Dow Jones Indices”). S&P Dow Jones Indices makes no representation or warranty, express or implied, to the owners of the Total Stock Market Index Portfolio or any member of the public regarding the advisability of investing in securities generally or in the Total Stock Market Index Portfolio particularly or the ability of the S&P Total Market Index to track general market performance. S&P Dow Jones Indices’ only relationship to Vanguard with respect to the S&P Total Market Index is the licensing of the Index and certain trademarks, service marks and/or trade names of S&P Dow Jones Indices and/or its licensors. The S&P Total Market Index is determined, composed and calculated by S&P Dow Jones Indices without regard to Vanguard or the Total Stock Market Index Portfolio. S&P Dow Jones Indices has no obligation to take the needs of Vanguard or the owners of the Total Stock Market Index Portfolio into consideration in determining, composing or calculating the S&P Total Market Index. S&P Dow Jones Indices is not responsible for and has not participated in the determination of the prices, and amount of the Total Stock Market Index Portfolio or the timing of the issuance or sale of the Total Stock Market Index Portfolio or in the determination or calculation of the equation by which the Total Stock Market Index Portfolio is to be converted into cash, surrendered or redeemed, as the case may be. S&P Dow Jones Indices has no obligation or liability in connection with the administration, marketing or trading of the Total Stock Market Index Portfolio. There is no assurance that investment products based on the S&P Total Market Index will accurately track index performance or provide positive investment returns. S&P Dow Jones Indices LLC is not an investment advisor. Inclusion of a security within an index is not a recommendation by S&P Dow Jones Indices to buy, sell, or hold such security, nor is it considered to be investment advice.
S&P DOW JONES INDICES DOES NOT GUARANTEE THE ADEQUACY, ACCURACY, TIMELINESS AND/OR THE COMPLETENESS OF THE S&P TOTAL MARKET INDEX OR ANY DATA RELATED THERETO OR ANY COMMUNICATION, INCLUDING BUT NOT LIMITED TO, ORAL OR WRITTEN COMMUNICATION (INCLUDING ELECTRONIC COMMUNICATIONS) WITH RESPECT THERETO. S&P DOW JONES INDICES SHALL NOT BE SUBJECT TO ANY DAMAGES OR LIABILITY FOR ANY ERRORS, OMISSIONS, OR DELAYS THEREIN. S&P DOW JONES INDICES MAKES NO EXPRESS OR IMPLIED WARRANTIES, AND EXPRESSLY DISCLAIMS ALL WARRANTIES, OF MERCHANTABILITY OR FITNESS FOR A PARTICULAR PURPOSE OR USE OR AS TO RESULTS TO BE OBTAINED BY VANGUARD, OWNERS OF THE TOTAL STOCK MARKET INDEX PORTFOLIO, OR ANY OTHER PERSON OR ENTITY FROM THE USE OF THE S&P TOTAL MARKET INDEX OR WITH RESPECT TO ANY DATA RELATED THERETO. WITHOUT LIMITING ANY OF THE FOREGOING, IN NO EVENT WHATSOEVER SHALL S&P DOW JONES INDICES BE LIABLE FOR ANY INDIRECT, SPECIAL, INCIDENTAL, PUNITIVE, OR CONSEQUENTIAL DAMAGES INCLUDING BUT NOT LIMITED TO, LOSS OF PROFITS, TRADING LOSSES, LOST TIME OR GOODWILL, EVEN IF THEY HAVE BEEN ADVISED OF THE POSSIBILITY OF SUCH DAMAGES, WHETHER IN CONTRACT, TORT, STRICT LIABILITY, OR OTHERWISE. THERE ARE NO THIRD PARTY BENEFICIARIES OF ANY AGREEMENTS OR ARRANGEMENTS BETWEEN S&P DOW JONES INDICES AND VANGUARD, OTHER THAN THE LICENSORS OF S&P DOW JONES INDICES.
Your Portfolio’s Performance at a Glance
| • | For the 12 months ended December 31, 2020, the Equity Index Portfolio of Vanguard Variable Insurance Funds returned 18.20%, in line with the 18.40% return of its benchmark, the Standard & Poor’s 500 Index, after factoring in the portfolio’s expenses. |
| • | Stocks initially plummeted after the emergence of COVID-19 in early 2020 but finished the year significantly higher. That was thanks in part to rapid, robust monetary and fiscal action by policymakers and the rollout of COVID-19 vaccines at the end of the year. |
| • | The portfolio benefited most from its holdings in the information technology, consumer discretionary, and communication services sectors. |
| • | The portfolio recorded an average annual return of 13.72% for the 10 years ended December 31, 2020, in line with its benchmark average of 13.88%. |
| • | Please note that the portfolio returns in Vanguard Variable Insurance Funds are different from those in Vanguard Variable Annuity (and other plans that invest in the fund), which take into account insurance-related expenses. |
Market Barometer
| | Average Annual Total Returns
Periods Ended December 31, 2020 |
| | One Year | Three Years | Five Years |
| Stocks | | | |
| Russell 1000 Index (Large-caps) | 20.96% | 14.82% | 15.60% |
| Russell 2000 Index (Small-caps) | 19.96 | 10.25 | 13.26 |
| Russell 3000 Index (Broad U.S. market) | 20.89 | 14.49 | 15.43 |
| FTSE All-World ex US Index (International) | 11.22 | 5.18 | 9.16 |
| Bonds | | | |
| Bloomberg Barclays U.S. Aggregate Bond Index (Broad taxable market) | 7.51% | 5.34% | 4.44% |
| Bloomberg Barclays Municipal Bond Index (Broad tax-exempt market) | 5.21 | 4.64 | 3.91 |
| FTSE Three-Month U.S. Treasury Bill Index | 0.58 | 1.56 | 1.16 |
| CPI | | | |
| Consumer Price Index | 1.36% | 1.85% | 1.95% |
About Your Portfolio’s Expenses
As a shareholder of the portfolio, you incur ongoing costs, which include costs for portfolio management, administrative services, and shareholder reports (like this one), among others. Operating expenses, which are deducted from a portfolio’s gross income, directly reduce the investment return of the portfolio.
A portfolio‘s expenses are expressed as a percentage of its average net assets. This figure is known as the expense ratio. The following examples are intended to help you understand the ongoing costs (in dollars) of investing in your portfolio and to compare these costs with those of other mutual funds. The examples are based on an investment of $1,000 made at the beginning of the period shown and held for the entire period.
The accompanying table illustrates your portfolio’s costs in two ways:
| • | Based on actual portfolio return. This section helps you to estimate the actual expenses that you paid over the period. The ”Ending Account Value“ shown is derived from the portfolio’s actual return, and the third column shows the dollar amount that would have been paid by an investor who started with $1,000 in the portfolio. You may use the information here, together with the amount you invested, to estimate the expenses that you paid over the period. |
To do so, simply divide your account value by $1,000 (for example, an $8,600 account value divided by $1,000 = 8.6), then multiply the result by the number given for your portfolio under the heading ”Expenses Paid During Period.”
| • | Based on hypothetical 5% yearly return. This section is intended to help you compare your portfolio‘s costs with those of other mutual funds. It assumes that the portfolio had a yearly return of 5% before expenses, but that the expense ratio is unchanged. In this case—because the return used is not the portfolio’s actual return—the results do not apply to your investment. The example is useful in making comparisons because the Securities and Exchange Commission requires all mutual funds to calculate expenses based on a 5% return. You can assess your portfolio’s costs by comparing this hypothetical example with the hypothetical examples that appear in shareholder reports of other funds. |
Note that the expenses shown in the table are meant to highlight and help you compare ongoing costs only and do not reflect transaction costs incurred by the portfolio for buying and selling securities. The portfolio’s expense ratio does not reflect additional fees and expenses associated with the annuity or life insurance program through which you invest.
The calculations assume no shares were bought or sold during the period. Your actual costs may have been higher or lower, depending on the amount of your investment and the timing of any purchases or redemptions.
You can find more information about the portfolio’s expenses, including annual expense ratios, in the Financial Statements section of this report. For additional information on operating expenses and other shareholder costs, please refer to your portfolio’s current prospectus.
| Six Months Ended December 31, 2020 | | | |
| Equity Index Portfolio | Beginning
Account Value
6/30/2020 | Ending
Account Value
12/31/2020 | Expenses
Paid During
Period |
| Based on Actual Portfolio Return | $1,000.00 | $1,220.70 | $0.78 |
| Based on Hypothetical 5% Yearly Return | 1,000.00 | 1,024.43 | 0.71 |
The calculations are based on expenses incurred in the most recent six-month period. The portfolio's annualized six-month expense ratio for that period is 0.14%. The dollar amounts shown as ”Expenses Paid” are equal to the annualized expense ratio multiplied by the average account value over the period, multiplied by the number of days in the most recent six-month period, then divided by the number of days in the most recent 12-month period (184/366).
All of the returns in this report represent past performance, which is not a guarantee of future results that may be achieved by the portfolio. (Current performance may be lower or higher than the performance data cited. For performance data current to the most recent month-end, visit our website at vanguard.com/performance.) Note, too, that both investment returns and principal value can fluctuate widely, so an investor’s shares, when sold, could be worth more or less than their original cost. The returns shown do not reflect taxes that a shareholder would pay on portfolio distributions or on the sale of portfolio shares. Nor do the returns reflect fees and expenses associated with the annuity or life insurance program through which a shareholder invests. If these fees and expenses were included, the portfolio’s returns would be lower.
Cumulative Performance: December 31, 2010, Through December 31, 2020
Initial Investment of $10,000
| | | | Average Annual Total Returns
Periods Ended December 31, 2020 |
| | | One
Year | Five
Years | Ten
Years | Final Value
of a $10,000
Investment |
| Equity Index Portfolio | 18.20% | 15.05% | 13.72% | $36,173 |
| S&P 500 Index | 18.40 | 15.22 | 13.88 | 36,700 |
| Dow Jones U.S. Total Stock Market Float Adjusted Index | 20.79 | 15.36 | 13.74 | 36,240 |
See Financial Highlights for dividend and capital gains information.
| Communication Services | 10.8% |
| Consumer Discretionary | 12.7 |
| Consumer Staples | 6.5 |
| Energy | 2.3 |
| Financials | 10.4 |
| Health Care | 13.5 |
| Industrials | 8.4 |
| Information Technology | 27.6 |
| Materials | 2.6 |
| Real Estate | 2.4 |
| Utilities | 2.8 |
The table reflects the portfolio’s investments, except for short-term investments and derivatives. Sector categories are based on the Global Industry Classification Standard (“GICS”), except for the “Other” category (if applicable), which includes securities that have not been provided a GICS classification as of the effective reporting period.
The portfolio may invest in derivatives (such as futures and swap contracts) for various reasons, including, but not limited to, attempting to remain fully invested and tracking its target index as closely as possible.
The Global Industry Classification Standard (“GICS”) was developed by and is the exclusive property and a service mark of MSCI Inc. (“MSCI”) and Standard and Poor’s, a division of McGraw-Hill Companies, Inc. (“S&P”), and is licensed for use by Vanguard. Neither MSCI, S&P nor any third party involved in making or compiling the GICS or any GICS classification makes any express or implied warranties or representations with respect to such standard or classification (or the results to be obtained by the use thereof), and all such parties hereby expressly disclaim all warranties of originality, accuracy, completeness, merchantability or fitness for a particular purpose with respect to any such standard or classification. Without limiting any of the foregoing, in no event shall MSCI, S&P, any of its affiliates or any third party involved in making or compiling the GICS or any GICS classification have any liability for any direct, indirect, special, punitive, consequential or any other damages (including lost profits) even if notified of the possibility of such damages.
The portfolio files its complete schedule of portfolio holdings with the Securities and Exchange Commission (SEC) for the first and third quarters of each fiscal year as an exhibit to its reports on Form N-PORT. The portfolio’s Form N-PORT reports are available on the SEC’s website at www.sec.gov.
| | | | | | Shares | Market
Value•
($000) |
| Common Stocks (99.2%) |
| Communication Services (10.7%) |
| * | Facebook Inc. Class A | 569,523 | 155,571 |
| * | Alphabet Inc. Class A | 71,190 | 124,770 |
| * | Alphabet Inc. Class C | 68,805 | 120,538 |
| * | Walt Disney Co. | 428,905 | 77,709 |
| | Verizon Communications Inc. | 980,245 | 57,589 |
| | Comcast Corp. Class A | 1,081,583 | 56,675 |
| * | Netflix Inc. | 104,667 | 56,597 |
| | AT&T Inc. | 1,688,130 | 48,550 |
| * | Charter Communications Inc. Class A | 34,558 | 22,862 |
| * | T-Mobile US Inc. | 138,160 | 18,631 |
| | Activision Blizzard Inc. | 183,122 | 17,003 |
| * | Twitter Inc. | 188,469 | 10,206 |
| | Electronic Arts Inc. | 68,737 | 9,871 |
| * | Take-Two Interactive Software Inc. | 27,287 | 5,670 |
| | ViacomCBS Inc. Class B | 133,671 | 4,980 |
| | Omnicom Group Inc. | 50,864 | 3,172 |
| * | Live Nation Entertainment Inc. | 33,831 | 2,486 |
| | Fox Corp. Class A | 79,734 | 2,322 |
| | CenturyLink Inc. | 233,626 | 2,278 |
| | Interpublic Group of Cos. Inc. | 92,293 | 2,171 |
| * | Discovery Inc. Class C | 73,650 | 1,929 |
| * | DISH Network Corp. Class A | 58,505 | 1,892 |
| | News Corp. Class A | 101,368 | 1,821 |
| * | Discovery Inc. Class A | 37,558 | 1,130 |
| | Fox Corp. Class B | 36,732 | 1,061 |
| | News Corp. Class B | 19,941 | 354 |
| | | | | | | 807,838 |
| Consumer Discretionary (12.6%) |
| * | Amazon.com Inc. | 101,039 | 329,077 |
| * | Tesla Inc. | 179,655 | 126,777 |
| | Home Depot Inc. | 255,064 | 67,750 |
| | NIKE Inc. Class B | 297,290 | 42,058 |
| | McDonald's Corp. | 176,542 | 37,882 |
| | Starbucks Corp. | 278,100 | 29,751 |
| | Lowe's Cos. Inc. | 173,606 | 27,866 |
| * | Booking Holdings Inc. | 9,703 | 21,611 |
| | Target Corp. | 118,630 | 20,942 |
| | TJX Cos. Inc. | 284,490 | 19,428 |
| | General Motors Co. | 298,371 | 12,424 |
| | Dollar General Corp. | 58,042 | 12,206 |
| | Ross Stores Inc. | 84,366 | 10,361 |
| * | Chipotle Mexican Grill Inc. Class A | 6,632 | 9,197 |
| | Aptiv plc | 64,004 | 8,339 |
| | Marriott International Inc. Class A | 63,039 | 8,316 |
| | Ford Motor Co. | 926,125 | 8,141 |
| | eBay Inc. | 155,226 | 7,800 |
| * | O'Reilly Automotive Inc. | 17,173 | 7,772 |
| | Yum! Brands Inc. | 71,514 | 7,764 |
| | Hilton Worldwide Holdings Inc. | 65,784 | 7,319 |
| * | AutoZone Inc. | 5,496 | 6,515 |
| | VF Corp. | 75,840 | 6,478 |
| * | Dollar Tree Inc. | 55,776 | 6,026 |
| | Best Buy Co. Inc. | 54,669 | 5,455 |
| | DR Horton Inc. | 78,659 | 5,421 |
| * | Etsy Inc. | 29,911 | 5,321 |
| | Lennar Corp. Class A | 64,457 | 4,914 |
| | Las Vegas Sands Corp. | 77,709 | 4,631 |
| | | | | | Shares | Market
Value•
($000) |
| | Expedia Group Inc. | 32,163 | 4,258 |
| | Garmin Ltd. | 35,291 | 4,223 |
| | Tractor Supply Co. | 27,563 | 3,875 |
| * | Ulta Beauty Inc. | 13,330 | 3,828 |
| | Carnival Corp. | 175,960 | 3,811 |
| | Darden Restaurants Inc. | 30,805 | 3,670 |
| * | CarMax Inc. | 38,823 | 3,667 |
| | Domino's Pizza Inc. | 9,322 | 3,575 |
| | Pool Corp. | 9,501 | 3,539 |
| | Genuine Parts Co. | 34,133 | 3,428 |
| * | NVR Inc. | 830 | 3,386 |
| | Tiffany & Co. | 25,565 | 3,361 |
| | Royal Caribbean Cruises Ltd. | 44,056 | 3,291 |
| | MGM Resorts International | 96,998 | 3,056 |
| | Hasbro Inc. | 30,152 | 2,820 |
| | PulteGroup Inc. | 63,432 | 2,735 |
| | Whirlpool Corp. | 14,798 | 2,671 |
| | Wynn Resorts Ltd. | 22,971 | 2,592 |
| | Advance Auto Parts Inc. | 16,054 | 2,529 |
| * | LKQ Corp. | 66,245 | 2,334 |
| | BorgWarner Inc. | 57,846 | 2,235 |
| | L Brands Inc. | 55,273 | 2,056 |
| | Tapestry Inc. | 65,638 | 2,040 |
| * | Mohawk Industries Inc. | 14,150 | 1,994 |
| * | Norwegian Cruise Line Holdings Ltd. | 74,681 | 1,899 |
| | Newell Brands Inc. | 89,348 | 1,897 |
| | PVH Corp. | 16,822 | 1,579 |
| | Leggett & Platt Inc. | 31,354 | 1,389 |
| | Hanesbrands Inc. | 82,421 | 1,202 |
| | Ralph Lauren Corp. Class A | 11,411 | 1,184 |
| | Gap Inc. | 48,678 | 983 |
| * | Under Armour Inc. Class A | 44,811 | 769 |
| * | Under Armour Inc. Class C | 45,820 | 682 |
| | Lennar Corp. Class B | 1,028 | 63 |
| | | | | | | 954,163 |
| Consumer Staples (6.5%) |
| | Procter & Gamble Co. | 587,340 | 81,722 |
| | Coca-Cola Co. | 916,280 | 50,249 |
| | PepsiCo Inc. | 327,377 | 48,550 |
| | Walmart Inc. | 328,391 | 47,338 |
| | Costco Wholesale Corp. | 104,525 | 39,383 |
| | Philip Morris International Inc. | 368,951 | 30,545 |
| | Mondelez International Inc. Class A | 338,770 | 19,808 |
| | Altria Group Inc. | 440,387 | 18,056 |
| | Colgate-Palmolive Co. | 203,008 | 17,359 |
| | Estee Lauder Cos. Inc. Class A | 53,660 | 14,284 |
| | Kimberly-Clark Corp. | 80,583 | 10,865 |
| | Sysco Corp. | 120,718 | 8,965 |
| | Constellation Brands Inc. Class A | 40,173 | 8,800 |
| | General Mills Inc. | 144,880 | 8,519 |
| * | Monster Beverage Corp. | 87,597 | 8,101 |
| | Walgreens Boots Alliance Inc. | 170,410 | 6,796 |
| | Archer-Daniels-Midland Co. | 131,938 | 6,651 |
| | Clorox Co. | 29,896 | 6,037 |
| | Kroger Co. | 183,683 | 5,834 |
| | McCormick & Co. Inc. (Non-Voting) | 58,999 | 5,640 |
| | Kraft Heinz Co. | 153,736 | 5,328 |
| | Hershey Co. | 34,905 | 5,317 |
| | Church & Dwight Co. Inc. | 58,954 | 5,143 |
| | | | | | Shares | Market
Value•
($000) |
| | Tyson Foods Inc. Class A | 69,589 | 4,484 |
| | Conagra Brands Inc. | 115,583 | 4,191 |
| | Kellogg Co. | 60,181 | 3,745 |
| | Brown-Forman Corp. Class B | 43,184 | 3,430 |
| | J M Smucker Co. | 26,994 | 3,121 |
| | Hormel Foods Corp. | 66,428 | 3,096 |
| | Lamb Weston Holdings Inc. | 34,625 | 2,726 |
| | Campbell Soup Co. | 47,918 | 2,317 |
| | Molson Coors Beverage Co. Class B | 44,512 | 2,011 |
| | | | | | | 488,411 |
| Energy (2.2%) |
| | Exxon Mobil Corp. | 1,001,678 | 41,289 |
| | Chevron Corp. | 456,049 | 38,513 |
| | ConocoPhillips | 253,049 | 10,119 |
| | Phillips 66 | 103,573 | 7,244 |
| | Schlumberger NV | 330,098 | 7,206 |
| | EOG Resources Inc. | 138,325 | 6,898 |
| | Marathon Petroleum Corp. | 154,318 | 6,383 |
| | Kinder Morgan Inc. | 461,690 | 6,311 |
| | Williams Cos. Inc. | 287,853 | 5,771 |
| | Valero Energy Corp. | 96,757 | 5,474 |
| | Pioneer Natural Resources Co. | 38,903 | 4,431 |
| | ONEOK Inc. | 105,148 | 4,036 |
| | Halliburton Co. | 209,182 | 3,954 |
| | Occidental Petroleum Corp. | 198,301 | 3,433 |
| | Hess Corp. | 64,667 | 3,414 |
| | Baker Hughes Co. Class A | 162,286 | 3,384 |
| | Concho Resources Inc. | 46,451 | 2,710 |
| | Diamondback Energy Inc. | 37,381 | 1,809 |
| | Cabot Oil & Gas Corp. | 94,309 | 1,535 |
| | Devon Energy Corp. | 90,528 | 1,431 |
| | Apache Corp. | 89,324 | 1,267 |
| | National Oilwell Varco Inc. | 91,910 | 1,262 |
| | Marathon Oil Corp. | 186,801 | 1,246 |
| | TechnipFMC plc | 99,536 | 936 |
| | HollyFrontier Corp. | 35,618 | 921 |
| | | | | | | 170,977 |
| Financials (10.4%) |
| * | Berkshire Hathaway Inc. Class B | 429,515 | 99,592 |
| | JPMorgan Chase & Co. | 722,129 | 91,761 |
| | Bank of America Corp. | 1,803,394 | 54,661 |
| | Citigroup Inc. | 493,235 | 30,413 |
| | Wells Fargo & Co. | 979,489 | 29,561 |
| | BlackRock Inc. | 33,598 | 24,242 |
| | Morgan Stanley | 338,557 | 23,201 |
| | Goldman Sachs Group Inc. | 81,499 | 21,492 |
| | Charles Schwab Corp. | 353,373 | 18,743 |
| | S&P Global Inc. | 56,986 | 18,733 |
| | American Express Co. | 154,511 | 18,682 |
| | Chubb Ltd. | 106,923 | 16,458 |
| | CME Group Inc. | 85,040 | 15,482 |
| | Intercontinental Exchange Inc. | 132,951 | 15,328 |
| | Truist Financial Corp. | 319,412 | 15,309 |
| | US Bancorp | 324,807 | 15,133 |
| | PNC Financial Services Group Inc. | 100,387 | 14,958 |
| | Marsh & McLennan Cos. Inc. | 120,157 | 14,058 |
| | Progressive Corp. | 138,721 | 13,717 |
| | Aon plc Class A | 54,167 | 11,444 |
| | Moody's Corp. | 38,260 | 11,105 |
| | Capital One Financial Corp. | 108,353 | 10,711 |
| | MSCI Inc. Class A | 19,645 | 8,772 |
| | MetLife Inc. | 181,293 | 8,512 |
| | Travelers Cos. Inc. | 60,035 | 8,427 |
| | Bank of New York Mellon Corp. | 193,205 | 8,200 |
| | T. Rowe Price Group Inc. | 53,666 | 8,124 |
| | Allstate Corp. | 72,074 | 7,923 |
| | American International Group Inc. | 204,222 | 7,732 |
| | Prudential Financial Inc. | 93,880 | 7,329 |
| | | | | | Shares | Market
Value•
($000) |
| * | Berkshire Hathaway Inc. Class A | 21 | 7,304 |
| | Aflac Inc. | 154,885 | 6,889 |
| | Discover Financial Services | 72,680 | 6,580 |
| | Willis Towers Watson plc | 30,568 | 6,440 |
| | State Street Corp. | 83,670 | 6,090 |
| | First Republic Bank | 41,235 | 6,059 |
| | Arthur J Gallagher & Co. | 45,616 | 5,643 |
| | Ameriprise Financial Inc. | 27,989 | 5,439 |
| | MarketAxess Holdings Inc. | 8,981 | 5,124 |
| * | SVB Financial Group | 12,295 | 4,768 |
| | Fifth Third Bancorp | 169,101 | 4,662 |
| | Northern Trust Corp. | 49,234 | 4,586 |
| | Synchrony Financial | 128,432 | 4,458 |
| | Hartford Financial Services Group Inc. | 84,775 | 4,152 |
| | M&T Bank Corp. | 30,354 | 3,864 |
| | KeyCorp | 231,034 | 3,791 |
| | Regions Financial Corp. | 227,240 | 3,663 |
| | Citizens Financial Group Inc. | 101,467 | 3,628 |
| | Nasdaq Inc. | 27,160 | 3,605 |
| | Cincinnati Financial Corp. | 35,402 | 3,093 |
| | Huntington Bancshares Inc. | 240,706 | 3,040 |
| | Principal Financial Group Inc. | 60,449 | 2,999 |
| | Raymond James Financial Inc. | 28,828 | 2,758 |
| | Loews Corp. | 55,272 | 2,488 |
| | Cboe Global Markets Inc. | 25,557 | 2,380 |
| | Everest Re Group Ltd. | 9,455 | 2,213 |
| | W R Berkley Corp. | 33,308 | 2,212 |
| | Globe Life Inc. | 22,779 | 2,163 |
| | Lincoln National Corp. | 42,980 | 2,162 |
| | Assurant Inc. | 14,033 | 1,912 |
| | Comerica Inc. | 32,912 | 1,838 |
| | Zions Bancorp NA | 38,808 | 1,686 |
| | Franklin Resources Inc. | 64,714 | 1,617 |
| | Invesco Ltd. | 89,101 | 1,553 |
| | People's United Financial Inc. | 100,530 | 1,300 |
| | Unum Group | 48,182 | 1,105 |
| | | | | | | 783,067 |
| Health Care (13.4%) |
| | Johnson & Johnson | 623,658 | 98,151 |
| | UnitedHealth Group Inc. | 224,787 | 78,828 |
| | Merck & Co. Inc. | 599,377 | 49,029 |
| | Pfizer Inc. | 1,316,842 | 48,473 |
| | Abbott Laboratories | 419,888 | 45,974 |
| | AbbVie Inc. | 418,256 | 44,816 |
| | Thermo Fisher Scientific Inc. | 93,893 | 43,733 |
| | Medtronic plc | 318,892 | 37,355 |
| | Danaher Corp. | 149,780 | 33,272 |
| | Bristol-Myers Squibb Co. | 535,378 | 33,209 |
| | Eli Lilly & Co. | 188,095 | 31,758 |
| | Amgen Inc. | 137,922 | 31,711 |
| * | Intuitive Surgical Inc. | 27,853 | 22,787 |
| | CVS Health Corp. | 310,108 | 21,180 |
| | Stryker Corp. | 77,463 | 18,982 |
| | Anthem Inc. | 58,926 | 18,921 |
| | Zoetis Inc. | 112,604 | 18,636 |
| | Cigna Corp. | 85,598 | 17,820 |
| | Gilead Sciences Inc. | 296,984 | 17,302 |
| | Becton Dickinson & Co. | 68,714 | 17,194 |
| * | Vertex Pharmaceuticals Inc. | 61,614 | 14,562 |
| * | Edwards Lifesciences Corp. | 147,674 | 13,472 |
| | Humana Inc. | 31,359 | 12,866 |
| * | Illumina Inc. | 34,591 | 12,799 |
| * | Boston Scientific Corp. | 339,328 | 12,199 |
| * | Regeneron Pharmaceuticals Inc. | 24,843 | 12,002 |
| | HCA Healthcare Inc. | 62,541 | 10,285 |
| * | IDEXX Laboratories Inc. | 20,211 | 10,103 |
| | Baxter International Inc. | 121,042 | 9,712 |
| * | Align Technology Inc. | 17,005 | 9,087 |
| * | Biogen Inc. | 36,467 | 8,929 |
| | | | | | Shares | Market
Value•
($000) |
| | Agilent Technologies Inc. | 72,522 | 8,593 |
| * | DexCom Inc. | 22,762 | 8,416 |
| * | Centene Corp. | 137,425 | 8,250 |
| * | IQVIA Holdings Inc. | 45,444 | 8,142 |
| * | Alexion Pharmaceuticals Inc. | 51,873 | 8,105 |
| | Zimmer Biomet Holdings Inc. | 49,139 | 7,572 |
| | ResMed Inc. | 34,355 | 7,302 |
| | McKesson Corp. | 38,075 | 6,622 |
| * | Mettler-Toledo International Inc. | 5,643 | 6,431 |
| | Cerner Corp. | 72,732 | 5,708 |
| * | Viatris Inc. | 285,398 | 5,348 |
| | West Pharmaceutical Services Inc. | 17,544 | 4,970 |
| * | Laboratory Corp. of America Holdings | 23,044 | 4,691 |
| | Teleflex Inc. | 11,018 | 4,535 |
| * | Hologic Inc. | 60,807 | 4,429 |
| | Cooper Cos. Inc. | 11,603 | 4,216 |
| * | Catalent Inc. | 38,968 | 4,055 |
| * | Incyte Corp. | 44,045 | 3,831 |
| | STERIS plc | 20,187 | 3,826 |
| | PerkinElmer Inc. | 26,493 | 3,802 |
| | Quest Diagnostics Inc. | 31,885 | 3,800 |
| * | Varian Medical Systems Inc. | 21,613 | 3,782 |
| | Cardinal Health Inc. | 69,425 | 3,718 |
| * | Waters Corp. | 14,680 | 3,632 |
| * | ABIOMED Inc. | 10,692 | 3,466 |
| | AmerisourceBergen Corp. Class A | 34,796 | 3,402 |
| * | Bio-Rad Laboratories Inc. Class A | 5,093 | 2,969 |
| | DENTSPLY SIRONA Inc. | 51,710 | 2,708 |
| | Universal Health Services Inc. Class B | 18,390 | 2,529 |
| * | Henry Schein Inc. | 33,781 | 2,259 |
| * | DaVita Inc. | 17,489 | 2,053 |
| | Perrigo Co. plc | 32,294 | 1,444 |
| | | | | | | 1,009,753 |
| Industrials (8.3%) |
| | Honeywell International Inc. | 166,237 | 35,359 |
| | Union Pacific Corp. | 159,641 | 33,240 |
| | United Parcel Service Inc. Class B | 169,425 | 28,531 |
| | Boeing Co. | 125,722 | 26,912 |
| | Raytheon Technologies Corp. | 359,780 | 25,728 |
| | 3M Co. | 136,656 | 23,886 |
| | Caterpillar Inc. | 128,694 | 23,425 |
| | General Electric Co. | 2,075,376 | 22,414 |
| | Lockheed Martin Corp. | 58,321 | 20,703 |
| | Deere & Co. | 74,232 | 19,972 |
| | CSX Corp. | 181,188 | 16,443 |
| | FedEx Corp. | 57,228 | 14,858 |
| | Norfolk Southern Corp. | 60,176 | 14,298 |
| | Illinois Tool Works Inc. | 68,218 | 13,908 |
| | Emerson Electric Co. | 141,672 | 11,386 |
| | Eaton Corp. plc | 94,428 | 11,345 |
| | Northrop Grumman Corp. | 36,732 | 11,193 |
| | Waste Management Inc. | 92,107 | 10,862 |
| | Roper Technologies Inc. | 24,849 | 10,712 |
| | L3Harris Technologies Inc. | 49,790 | 9,411 |
| | Parker-Hannifin Corp. | 30,528 | 8,316 |
| | Trane Technologies plc | 56,914 | 8,262 |
| | General Dynamics Corp. | 55,093 | 8,199 |
| | Verisk Analytics Inc. Class A | 38,538 | 8,000 |
| | Johnson Controls International plc | 171,583 | 7,994 |
| * | TransDigm Group Inc. | 12,904 | 7,986 |
| | Cummins Inc. | 35,083 | 7,967 |
| | IHS Markit Ltd. | 88,344 | 7,936 |
| | Cintas Corp. | 20,836 | 7,365 |
| | Carrier Global Corp. | 193,129 | 7,285 |
| | PACCAR Inc. | 82,135 | 7,087 |
| | Rockwell Automation Inc. | 27,546 | 6,909 |
| | Stanley Black & Decker Inc. | 37,989 | 6,783 |
| | Fastenal Co. | 136,131 | 6,647 |
| | AMETEK Inc. | 54,554 | 6,598 |
| | | | | | Shares | Market
Value•
($000) |
| | Southwest Airlines Co. | 139,969 | 6,524 |
| | Otis Worldwide Corp. | 96,564 | 6,523 |
| * | Copart Inc. | 49,284 | 6,271 |
| | Delta Air Lines Inc. | 151,251 | 6,082 |
| | Fortive Corp. | 79,988 | 5,665 |
| | Equifax Inc. | 28,856 | 5,565 |
| | Republic Services Inc. Class A | 49,761 | 4,792 |
| | Kansas City Southern | 22,221 | 4,536 |
| | Old Dominion Freight Line Inc. | 22,839 | 4,458 |
| | WW Grainger Inc. | 10,667 | 4,356 |
| | Xylem Inc. | 42,643 | 4,341 |
| | Dover Corp. | 34,095 | 4,304 |
| * | Ingersoll Rand Inc. | 87,945 | 4,007 |
| * | United Rentals Inc. | 17,068 | 3,958 |
| | Expeditors International of Washington Inc. | 40,047 | 3,809 |
| | IDEX Corp. | 17,911 | 3,568 |
| * | Teledyne Technologies Inc. | 8,726 | 3,420 |
| | Masco Corp. | 61,908 | 3,401 |
| | Jacobs Engineering Group Inc. | 30,668 | 3,342 |
| | Westinghouse Air Brake Technologies Corp. | 42,328 | 3,098 |
| | CH Robinson Worldwide Inc. | 32,321 | 3,034 |
| * | United Airlines Holdings Inc. | 69,241 | 2,995 |
| | Fortune Brands Home & Security Inc. | 32,869 | 2,818 |
| | JB Hunt Transport Services Inc. | 19,754 | 2,699 |
| | Howmet Aerospace Inc. | 92,332 | 2,635 |
| | Textron Inc. | 54,152 | 2,617 |
| | Allegion plc | 21,775 | 2,534 |
| | Quanta Services Inc. | 32,855 | 2,366 |
| | American Airlines Group Inc. | 144,510 | 2,279 |
| | Snap-on Inc. | 12,828 | 2,195 |
| | Pentair plc | 39,359 | 2,090 |
| | Rollins Inc. | 52,342 | 2,045 |
| | Nielsen Holdings plc | 84,465 | 1,763 |
| | A O Smith Corp. | 32,041 | 1,756 |
| | Robert Half International Inc. | 26,970 | 1,685 |
| | Huntington Ingalls Industries Inc. | 9,581 | 1,633 |
| | Alaska Air Group Inc. | 29,257 | 1,521 |
| | Flowserve Corp. | 30,750 | 1,133 |
| | | | | | | 629,738 |
| Information Technology (27.4%) |
| | Apple Inc. | 3,786,235 | 502,396 |
| | Microsoft Corp. | 1,791,147 | 398,387 |
| | Visa Inc. Class A | 401,711 | 87,866 |
| | NVIDIA Corp. | 146,642 | 76,576 |
| | Mastercard Inc. Class A | 208,413 | 74,391 |
| * | PayPal Holdings Inc. | 277,583 | 65,010 |
| * | Adobe Inc. | 113,651 | 56,839 |
| | Intel Corp. | 970,812 | 48,366 |
| * | salesforce.com Inc. | 216,777 | 48,239 |
| | Cisco Systems Inc. | 1,001,111 | 44,800 |
| | Broadcom Inc. | 95,823 | 41,956 |
| | QUALCOMM Inc. | 267,925 | 40,816 |
| | Accenture plc Class A | 150,091 | 39,205 |
| | Texas Instruments Inc. | 217,416 | 35,685 |
| | Oracle Corp. | 449,396 | 29,071 |
| | International Business Machines Corp. | 211,111 | 26,575 |
| * | Advanced Micro Devices Inc. | 284,933 | 26,131 |
| * | ServiceNow Inc. | 46,224 | 25,443 |
| | Intuit Inc. | 62,253 | 23,647 |
| | Fidelity National Information Services Inc. | 147,010 | 20,796 |
| * | Micron Technology Inc. | 263,717 | 19,826 |
| | Applied Materials Inc. | 216,345 | 18,671 |
| | Automatic Data Processing Inc. | 101,600 | 17,902 |
| | Lam Research Corp. | 34,116 | 16,112 |
| * | Autodesk Inc. | 52,097 | 15,907 |
| * | Fiserv Inc. | 136,217 | 15,510 |
| | Global Payments Inc. | 70,927 | 15,279 |
| | Analog Devices Inc. | 87,531 | 12,931 |
| | Cognizant Technology Solutions Corp. Class A | 126,679 | 10,381 |
| | | | | | Shares | Market
Value•
($000) |
| | KLA Corp. | 36,699 | 9,502 |
| | TE Connectivity Ltd. | 78,383 | 9,490 |
| * | Synopsys Inc. | 36,175 | 9,378 |
| | Amphenol Corp. Class A | 70,902 | 9,272 |
| * | Cadence Design Systems Inc. | 66,110 | 9,019 |
| | Microchip Technology Inc. | 61,711 | 8,523 |
| | Xilinx Inc. | 58,096 | 8,236 |
| | HP Inc. | 325,571 | 8,006 |
| * | ANSYS Inc. | 20,361 | 7,407 |
| | Paychex Inc. | 75,853 | 7,068 |
| | Motorola Solutions Inc. | 40,199 | 6,836 |
| | Corning Inc. | 181,173 | 6,522 |
| | Skyworks Solutions Inc. | 39,395 | 6,023 |
| * | Keysight Technologies Inc. | 43,957 | 5,806 |
| | Maxim Integrated Products Inc. | 63,244 | 5,607 |
| * | FleetCor Technologies Inc. | 19,786 | 5,398 |
| * | Paycom Software Inc. | 11,590 | 5,242 |
| * | VeriSign Inc. | 23,757 | 5,141 |
| * | Zebra Technologies Corp. Class A | 12,654 | 4,863 |
| * | Fortinet Inc. | 31,879 | 4,735 |
| | Teradyne Inc. | 39,290 | 4,711 |
| * | Qorvo Inc. | 26,986 | 4,487 |
| | CDW Corp. | 33,945 | 4,474 |
| | Broadridge Financial Solutions Inc. | 27,355 | 4,191 |
| * | Tyler Technologies Inc. | 9,542 | 4,165 |
| * | Akamai Technologies Inc. | 38,516 | 4,044 |
| | Western Digital Corp. | 71,982 | 3,987 |
| | Citrix Systems Inc. | 29,131 | 3,790 |
| * | Arista Networks Inc. | 12,890 | 3,745 |
| | Hewlett Packard Enterprise Co. | 304,491 | 3,608 |
| | NetApp Inc. | 52,853 | 3,501 |
| * | Gartner Inc. | 21,125 | 3,384 |
| | Leidos Holdings Inc. | 31,652 | 3,327 |
| | Seagate Technology plc | 52,885 | 3,287 |
| | Jack Henry & Associates Inc. | 18,056 | 2,925 |
| | NortonLifeLock Inc. | 140,036 | 2,910 |
| * | F5 Networks Inc. | 14,576 | 2,565 |
| | Western Union Co. | 97,271 | 2,134 |
| * | IPG Photonics Corp. | 8,450 | 1,891 |
| | Juniper Networks Inc. | 78,030 | 1,756 |
| | DXC Technology Co. | 60,199 | 1,550 |
| | FLIR Systems Inc. | 31,031 | 1,360 |
| * | Vontier Corp. | 31,872 | 1,065 |
| | Xerox Holdings Corp. | 39,430 | 914 |
| | | | | | | 2,070,559 |
| Materials (2.6%) |
| | Linde plc | 124,340 | 32,765 |
| | Air Products and Chemicals Inc. | 52,364 | 14,307 |
| | Sherwin-Williams Co. | 19,366 | 14,232 |
| | Ecolab Inc. | 58,835 | 12,730 |
| | DuPont de Nemours Inc. | 173,848 | 12,362 |
| | Newmont Corp. | 190,338 | 11,399 |
| | Dow Inc. | 175,765 | 9,755 |
| | Freeport-McMoRan Inc. | 344,338 | 8,960 |
| | PPG Industries Inc. | 55,985 | 8,074 |
| | Ball Corp. | 77,541 | 7,225 |
| | Corteva Inc. | 176,636 | 6,839 |
| | LyondellBasell Industries NV Class A | 60,998 | 5,591 |
| | Vulcan Materials Co. | 31,451 | 4,665 |
| | International Paper Co. | 93,292 | 4,638 |
| | Amcor plc | 371,068 | 4,367 |
| | Martin Marietta Materials Inc. | 14,733 | 4,184 |
| | Nucor Corp. | 71,439 | 3,800 |
| | Albemarle Corp. | 25,188 | 3,716 |
| | Celanese Corp. Class A | 27,658 | 3,594 |
| | FMC Corp. | 30,700 | 3,528 |
| | Eastman Chemical Co. | 32,053 | 3,214 |
| | Packaging Corp. of America | 22,432 | 3,094 |
| | Avery Dennison Corp. | 19,734 | 3,061 |
| | | | | | Shares | Market
Value•
($000) |
| 1 | International Flavors & Fragrances Inc. | 25,299 | 2,754 |
| | Westrock Co. | 62,290 | 2,712 |
| | CF Industries Holdings Inc. | 50,616 | 1,959 |
| | Mosaic Co. | 81,619 | 1,878 |
| | Sealed Air Corp. | 36,703 | 1,681 |
| | | | | | | 197,084 |
| Real Estate (2.4%) |
| | American Tower Corp. | 105,243 | 23,623 |
| | Prologis Inc. | 175,141 | 17,455 |
| | Crown Castle International Corp. | 102,187 | 16,267 |
| | Equinix Inc. | 21,111 | 15,077 |
| | Digital Realty Trust Inc. | 66,394 | 9,263 |
| | Public Storage | 36,050 | 8,325 |
| | SBA Communications Corp. Class A | 26,343 | 7,432 |
| | Simon Property Group Inc. | 77,754 | 6,631 |
| | Welltower Inc. | 98,969 | 6,395 |
| | Weyerhaeuser Co. | 177,044 | 5,936 |
| | AvalonBay Communities Inc. | 33,124 | 5,314 |
| | Alexandria Real Estate Equities Inc. | 29,296 | 5,221 |
| | Realty Income Corp. | 83,218 | 5,174 |
| * | CBRE Group Inc. Class A | 79,597 | 4,992 |
| | Equity Residential | 81,285 | 4,819 |
| | Ventas Inc. | 88,624 | 4,346 |
| | Healthpeak Properties Inc. | 127,387 | 3,851 |
| | Essex Property Trust Inc. | 15,428 | 3,663 |
| | Extra Space Storage Inc. | 30,577 | 3,543 |
| | Duke Realty Corp. | 88,004 | 3,518 |
| | Mid-America Apartment Communities Inc. | 27,060 | 3,428 |
| | Boston Properties Inc. | 33,515 | 3,168 |
| | UDR Inc. | 69,679 | 2,678 |
| | Host Hotels & Resorts Inc. | 166,884 | 2,441 |
| | Iron Mountain Inc. | 68,186 | 2,010 |
| | Regency Centers Corp. | 37,340 | 1,702 |
| | Kimco Realty Corp. | 102,337 | 1,536 |
| | Federal Realty Investment Trust | 16,290 | 1,387 |
| | Vornado Realty Trust | 37,113 | 1,386 |
| | SL Green Realty Corp. | 17,173 | 1,023 |
| | | | | | | 181,604 |
| Utilities (2.7%) |
| | NextEra Energy Inc. | 464,072 | 35,803 |
| | Duke Energy Corp. | 174,326 | 15,961 |
| | Southern Co. | 250,232 | 15,372 |
| | Dominion Energy Inc. | 193,232 | 14,531 |
| | American Electric Power Co. Inc. | 117,618 | 9,794 |
| | Exelon Corp. | 231,163 | 9,760 |
| | Sempra Energy | 68,366 | 8,710 |
| | Xcel Energy Inc. | 124,541 | 8,303 |
| | Eversource Energy | 81,284 | 7,032 |
| | Public Service Enterprise Group Inc. | 119,941 | 6,992 |
| | WEC Energy Group Inc. | 74,793 | 6,883 |
| | American Water Works Co. Inc. | 42,987 | 6,597 |
| | Consolidated Edison Inc. | 81,151 | 5,865 |
| | Edison International | 89,794 | 5,641 |
| | DTE Energy Co. | 45,921 | 5,575 |
| | PPL Corp. | 182,458 | 5,145 |
| | Entergy Corp. | 47,375 | 4,730 |
| | Ameren Corp. | 58,489 | 4,566 |
| | CMS Energy Corp. | 67,747 | 4,133 |
| | FirstEnergy Corp. | 128,376 | 3,930 |
| | AES Corp. | 157,365 | 3,698 |
| | Alliant Energy Corp. | 59,089 | 3,045 |
| | Evergy Inc. | 53,667 | 2,979 |
| | Atmos Energy Corp. | 29,790 | 2,843 |
| | CenterPoint Energy Inc. | 128,908 | 2,790 |
| | NRG Energy Inc. | 57,782 | 2,170 |
| | Pinnacle West Capital Corp. | 26,641 | 2,130 |
| | | | | | Shares | Market
Value•
($000) |
| | NiSource Inc. | 90,678 | 2,080 |
| | | | | | | 207,058 |
Total Common Stocks
(Cost $4,036,605) | 7,500,252 |
| Temporary Cash Investments (0.7%) |
| Money Market Fund (0.7%) |
| 2,3 | Vanguard Market Liquidity Fund, 0.111% | 486,636 | 48,663 |
| | | | | | Face
Amount
($000) | |
| U.S. Government and Agency Obligations (0.0%) |
| 4 | United States Treasury Bill, 0.097%, 1/5/21 | 1,470 | 1,470 |
| 4 | United States Treasury Bill, 0.095%, 1/28/21 | 1,002 | 1,002 |
| | | | | | | 2,472 |
Total Temporary Cash Investments
(Cost $51,135) | 51,135 |
Total Investments (99.9%)
(Cost $4,087,740) | | 7,551,387 |
| Other Assets and Liabilities—Net (0.1%) | | 3,977 |
| Net Assets (100%) | | 7,555,364 |
| Cost is in $000. |
| • | See Note A in Notes to Financial Statements. |
| * | Non-income-producing security. |
| 1 | Includes partial security positions on loan to broker-dealers. The total value of securities on loan is $2,645,000. |
| 2 | Affiliated money market fund available only to Vanguard funds and certain trusts and accounts managed by Vanguard. Rate shown is the 7-day yield. |
| 3 | Collateral of $2,770,000 was received for securities on loan. |
| 4 | Securities with a value of $2,472,000 have been segregated as initial margin for open futures contracts. |
Derivative Financial Instruments Outstanding as of Period End
| Futures Contracts |
| | | | ($000) |
| | Expiration | Number of
Long (Short)
Contracts | Notional
Amount | Value and
Unrealized
Appreciation
(Depreciation) |
| Long Futures Contracts | | | | |
| E-mini S&P 500 Index | March 2021 | 293 | 54,920 | 1,251 |
See accompanying Notes, which are an integral part of the Financial Statements.
Statement of Assets and Liabilities
| ($000s, except shares and per-share amounts) | Amount |
| Assets | |
| Investments in Securities, at Value | |
| Unaffiliated Issuers (Cost $4,039,077) | 7,502,724 |
| Affiliated Issuers (Cost $48,663) | 48,663 |
| Total Investments in Securities | 7,551,387 |
| Investment in Vanguard | 286 |
| Cash Collateral Pledged—Futures Contracts | 677 |
| Receivables for Accrued Income | 5,572 |
| Receivables for Capital Shares Issued | 806 |
| Variation Margin Receivable—Futures Contracts | 350 |
| Total Assets | 7,559,078 |
| Liabilities | |
| Due to Custodian | 11 |
| Payables for Investment Securities Purchased | 3 |
| Collateral for Securities on Loan | 2,770 |
| Payables for Capital Shares Redeemed | 362 |
| Payables to Vanguard | 568 |
| Total Liabilities | 3,714 |
| Net Assets | 7,555,364 |
| At December 31, 2020, net assets consisted of: | |
| | |
| Paid-in Capital | 3,678,282 |
| Total Distributable Earnings (Loss) | 3,877,082 |
| Net Assets | 7,555,364 |
| | |
| Net Assets | |
Applicable to 140,527,793 outstanding $.001 par value shares of
beneficial interest (unlimited authorization) | 7,555,364 |
| Net Asset Value Per Share | $53.76 |
|
| | Year Ended
December 31, 2020 |
| | ($000) |
| Investment Income | |
| Income | |
| Dividends | 121,672 |
| Interest1 | 163 |
| Securities Lending—Net | 116 |
| Total Income | 121,951 |
| Expenses | |
| The Vanguard Group—Note B | |
| Investment Advisory Services | 978 |
| Management and Administrative | 7,409 |
| Marketing and Distribution | 576 |
| Custodian Fees | 50 |
| Auditing Fees | 72 |
| Shareholders’ Reports | 42 |
| Trustees’ Fees and Expenses | 4 |
| Total Expenses | 9,131 |
| Net Investment Income | 112,820 |
| Realized Net Gain (Loss) | |
| Investment Securities Sold1 | 302,910 |
| Futures Contracts | 8,611 |
| Realized Net Gain (Loss) | 311,521 |
| Change in Unrealized Appreciation (Depreciation) | |
| Investment Securities1 | 748,174 |
| Futures Contracts | 655 |
| Change in Unrealized Appreciation (Depreciation) | 748,829 |
| Net Increase (Decrease) in Net Assets Resulting from Operations | 1,173,170 |
| 1 | Interest income, realized net gain (loss), and change in unrealized appreciation (depreciation) from an affiliated company of the portfolio were $150,000, ($22,000), and $3,000, respectively. Purchases and sales are for temporary cash investment purposes. |
Statement of Changes in Net Assets
|
| | Year Ended December 31, |
| | 2020
($000) | 2019
($000) |
| Increase (Decrease) in Net Assets | | |
| Operations | | |
| Net Investment Income | 112,820 | 107,281 |
| Realized Net Gain (Loss) | 311,521 | 132,104 |
| Change in Unrealized Appreciation (Depreciation) | 748,829 | 1,295,996 |
| Net Increase (Decrease) in Net Assets Resulting from Operations | 1,173,170 | 1,535,381 |
| Distributions1 | | |
| Total Distributions | (242,631) | (247,426) |
| Capital Share Transactions | | |
| Issued | 996,555 | 584,985 |
| Issued in Lieu of Cash Distributions | 242,631 | 247,426 |
| Redeemed | (1,072,379) | (596,018) |
| Net Increase (Decrease) from Capital Share Transactions | 166,807 | 236,393 |
| Total Increase (Decrease) | 1,097,346 | 1,524,348 |
| Net Assets | | |
| Beginning of Period | 6,458,018 | 4,933,670 |
| End of Period | 7,555,364 | 6,458,018 |
| 1 | Certain prior-period numbers have been reclassified to conform with the current-period presentation. |
For a Share Outstanding
Throughout Each Period | Year Ended December 31, |
| 2020 | 2019 | 2018 | 2017 | 2016 |
| Net Asset Value, Beginning of Period | $47.70 | $38.03 | $41.17 | $35.63 | $33.25 |
| Investment Operations | | | | | |
| Net Investment Income | .7981 | .8051 | .8041 | .6991 | .704 |
| Net Realized and Unrealized Gain (Loss) on Investments | 7.014 | 10.791 | (2.556) | 6.734 | 3.055 |
| Total from Investment Operations | 7.812 | 11.596 | (1.752) | 7.433 | 3.759 |
| Distributions | | | | | |
| Dividends from Net Investment Income | (.806) | (.834) | (.703) | (.699) | (.759) |
| Distributions from Realized Capital Gains | (.946) | (1.092) | (.685) | (1.194) | (.620) |
| Total Distributions | (1.752) | (1.926) | (1.388) | (1.893) | (1.379) |
| Net Asset Value, End of Period | $53.76 | $47.70 | $38.03 | $41.17 | $35.63 |
| Total Return | 18.20% | 31.30% | -4.51% | 21.66% | 11.81% |
| Ratios/Supplemental Data | | | | | |
| Net Assets, End of Period (Millions) | $7,555 | $6,458 | $4,934 | $5,178 | $4,329 |
| Ratio of Total Expenses to Average Net Assets | 0.14% | 0.14% | 0.14% | 0.15% | 0.15% |
| Ratio of Net Investment Income to Average Net Assets | 1.73% | 1.87% | 1.94% | 1.85% | 2.08% |
| Portfolio Turnover Rate | 8% | 4% | 5% | 5% | 7% |
| 1 | Calculated based on average shares outstanding. |
See accompanying Notes, which are an integral part of the Financial Statements.
Notes to Financial Statements
The Equity Index Portfolio, a portfolio of Vanguard Variable Insurance Funds, is registered under the Investment Company Act of 1940 as an open-end investment company. The portfolio’s shares are only available for purchase by separate accounts of insurance companies as investments for variable annuity plans, variable life insurance contracts, or other variable benefit insurance contracts. Market disruptions associated with the COVID-19 pandemic have had a global impact, and uncertainty exists as to the long-term implications. Such disruptions can adversely affect assets of the portfolio and thus portfolio performance.
A. The following significant accounting policies conform to generally accepted accounting principles for U.S. investment companies. The portfolio consistently follows such policies in preparing its financial statements.
1. Security Valuation: Securities are valued as of the close of trading on the New York Stock Exchange (generally 4 p.m., Eastern time) on the valuation date. Equity securities are valued at the latest quoted sales prices or official closing prices taken from the primary market in which each security trades; such securities not traded on the valuation date are valued at the mean of the latest quoted bid and asked prices. Securities for which market quotations are not readily available, or whose values have been materially affected by events occurring before the portfolio's pricing time but after the close of the securities’ primary markets, are valued by methods deemed by the board of trustees to represent fair value. Investments in Vanguard Market Liquidity Fund are valued at that fund's net asset value. Temporary cash investments are valued using the latest bid prices or using valuations based on a matrix system (which considers such factors as security prices, yields, maturities, and ratings), both as furnished by independent pricing services.
2. Futures Contracts: The portfolio uses index futures contracts to a limited extent, with the objectives of maintaining full exposure to the stock market, maintaining liquidity, and minimizing transaction costs. The portfolio may purchase futures contracts to immediately invest incoming cash in the market, or sell futures in response to cash outflows, thereby simulating a fully invested position in the underlying index while maintaining a cash balance for liquidity. The primary risks associated with the use of futures contracts are imperfect correlation between changes in market values of stocks held by the portfolio and the prices of futures contracts, and the possibility of an illiquid market. Counterparty risk involving futures is mitigated because a regulated clearinghouse is the counterparty instead of the clearing broker. To further mitigate counterparty risk, the portfolio trades futures contracts on an exchange, monitors the financial strength of its clearing brokers and clearinghouse, and has entered into clearing agreements with its clearing brokers. The clearinghouse imposes initial margin requirements to secure the portfolio’s performance and requires daily settlement of variation margin representing changes in the market value of each contract. Any securities pledged as initial margin for open contracts are noted in the Schedule of Investments.
Futures contracts are valued at their quoted daily settlement prices. The notional amounts of the contracts are not recorded in the Statement of Assets and Liabilities. Fluctuations in the value of the contracts are recorded in the Statement of Assets and Liabilities as an asset (liability) and in the Statement of Operations as unrealized appreciation (depreciation) until the contracts are closed, when they are recorded as realized gains (losses) on futures contracts.
During the year ended December 31, 2020, the portfolio’s average investments in long and short futures contracts represented 1% and 0% of net assets, respectively, based on the average of the notional amounts at each quarter-end during the period.
3. Federal Income Taxes: The portfolio intends to continue to qualify as a regulated investment company and distribute all of its taxable income. The portfolio’s tax returns are open to examination by the relevant tax authorities until expiration of the applicable statute of limitations, which is generally three years after the filing of the tax return. Management has analyzed the portfolio’s tax positions taken for all open federal and state income tax years, and has concluded that no provision for income tax is required in the portfolio’s financial statements.
4. Distributions: Distributions to shareholders are recorded on the ex-dividend date. Distributions are determined on a tax basis at the fiscal year-end and may differ from net investment income and realized capital gains for financial reporting purposes.
5. Securities Lending: To earn additional income, the portfolio lends its securities to qualified institutional borrowers. Security loans are subject to termination by the portfolio at any time, and are required to be secured at all times by collateral in an amount at least equal to the market value of securities loaned. Daily market fluctuations could cause the value of loaned securities to be more or less than the value of the collateral received. When this occurs, the collateral is adjusted and settled before the opening of the market on the next business day. The portfolio further mitigates its counterparty risk by entering into securities lending transactions only with a diverse group of
prequalified counterparties, monitoring their financial strength, and entering into master securities lending agreements with its counterparties. The master securities lending agreements provide that, in the event of a counterparty’s default (including bankruptcy), the portfolio may terminate any loans with that borrower, determine the net amount owed, and sell or retain the collateral up to the net amount owed to the portfolio; however, such actions may be subject to legal proceedings. While collateral mitigates counterparty risk, in the event of a default, the portfolio may experience delays and costs in recovering the securities loaned. The portfolio invests cash collateral received in Vanguard Market Liquidity Fund, and records a liability in the Statement of Assets and Liabilities for the return of the collateral, during the period the securities are on loan. Collateral investments in Vanguard Market Liquidity Fund are subject to market appreciation or depreciation. Securities lending income represents fees charged to borrowers plus income earned on invested cash collateral, less expenses associated with the loan. During the term of the loan, the portfolio is entitled to all distributions made on or in respect of the loaned securities.
6. Credit Facilities and Interfund Lending Program: The portfolio and certain other funds managed by The Vanguard Group ("Vanguard") participate in a $4.3 billion committed credit facility provided by a syndicate of lenders pursuant to a credit agreement and an uncommitted credit facility provided by Vanguard. Both facilities may be renewed annually. Each fund is individually liable for its borrowings, if any, under the credit facilities. Borrowings may be utilized for temporary or emergency purposes, subject to the portfolio’s regulatory and contractual borrowing restrictions. With respect to the committed credit facility, the participating funds are charged administrative fees and an annual commitment fee of 0.10% of the undrawn committed amount of the facility; these fees are allocated to the funds based on a method approved by the portfolio’s board of trustees and included in Management and Administrative expenses on the portfolio’s Statement of Operations. Any borrowings under either facility bear interest at a rate based upon the higher of the one-month London Interbank Offered Rate (or an acceptable alternate rate, if necessary), federal funds effective rate, or overnight bank funding rate plus an agreed-upon spread, except that borrowings under the uncommitted credit facility may bear interest based upon an alternative rate agreed to by the portfolio and Vanguard.
In accordance with an exemptive order (the “Order”) from the SEC, the portfolio may participate in a joint lending and borrowing program that allows registered open-end Vanguard funds to borrow money from and lend money to each other for temporary or emergency purposes (the “Interfund Lending Program”), subject to compliance with the terms and conditions of the Order, and to the extent permitted by the portfolio’s investment objective and investment policies. Interfund loans and borrowings normally extend overnight, but can have a maximum duration of seven days. Loans may be called on one business day’s notice. The interest rate to be charged is governed by the conditions of the Order and internal procedures adopted by the board of trustees. The board of trustees is responsible for overseeing the Interfund Lending Program.
For the year ended December 31, 2020, the portfolio did not utilize the credit facilities or the Interfund Lending Program.
7. Other: Dividend income is recorded on the ex-dividend date. Non-cash dividends included in dividend income, if any, are recorded at the fair value of the securities received. Interest income includes income distributions received from Vanguard Market Liquidity Fund and is accrued daily. Premiums and discounts on debt securities are amortized and accreted, respectively, to interest income over the lives of the respective securities, except for premiums on certain callable debt securities that are amortized to the earliest call date. Security transactions are accounted for on the date securities are bought or sold. Costs used to determine realized gains (losses) on the sale of investment securities are those of the specific securities sold.
B. In accordance with the terms of a Funds’ Service Agreement (the “FSA”) between Vanguard and the portfolio, Vanguard furnishes to the portfolio investment advisory, corporate management, administrative, marketing, and distribution services at Vanguard’s cost of operations (as defined by the FSA). These costs of operations are allocated to the portfolio based on methods and guidelines approved by the board of trustees and are generally settled twice a month.
Upon the request of Vanguard, the portfolio may invest up to 0.40% of its net assets as capital in Vanguard. At December 31, 2020, the portfolio had contributed to Vanguard capital in the amount of $286,000, representing less than 0.01% of the portfolio’s net assets and 0.11% of Vanguard’s capital received pursuant to the FSA. The portfolio’s trustees and officers are also directors and employees, respectively, of Vanguard.
C. Various inputs may be used to determine the value of the portfolio’s investments and derivatives. These inputs are summarized in three broad levels for financial statement purposes. The inputs or methodologies used to value securities are not necessarily an indication of the risk associated with investing in those securities.
Level 1—Quoted prices in active markets for identical securities.
Level 2—Other significant observable inputs (including quoted prices for similar securities, interest rates, prepayment speeds, credit risk, etc.).
Level 3—Significant unobservable inputs (including the portfolio’s own assumptions used to determine the fair value of investments). Any investments and derivatives valued with significant unobservable inputs are noted on the Schedule of Investments.
The following table summarizes the market value of the portfolio's investments and derivatives as of December 31, 2020, based on the inputs used to value them:
| | Level 1
($000) | Level 2
($000) | Level 3
($000) | Total
($000) |
| Investments | | | | |
| Assets | | | | |
| Common Stocks | 7,500,252 | — | — | 7,500,252 |
| Temporary Cash Investments | 48,663 | 2,472 | — | 51,135 |
| Total | 7,548,915 | 2,472 | — | 7,551,387 |
| | | | |
| Derivative Financial Instruments | | | | |
| Assets | | | | |
| Futures Contracts1 | 350 | — | — | 350 |
| 1 | Represents variation margin on the last day of the reporting period. |
D. Permanent differences between book-basis and tax-basis components of net assets, if any, are reclassified among capital accounts in the financial statements to reflect their tax character. These reclassifications have no effect on net assets or net asset value per share.
Temporary differences between book-basis and tax-basis components of total distributable earnings (losses) arise when certain items of income, gain, or loss are recognized in different periods for financial statement and tax purposes; these differences will reverse at some time in the future. The differences are primarily related to the deferral of losses from wash sales; and the recognition of unrealized gains or losses from certain derivative contracts. As of period end, the tax-basis components of total distributable earnings (losses) are detailed in the table as follows:
| | Amount
($000) |
| Undistributed Ordinary Income | 103,290 |
| Undistributed Long-Term Gains | 309,745 |
| Capital Loss Carryforwards | — |
| Qualified Late-Year Losses | — |
| Net Unrealized Gains (Losses) | 3,464,047 |
The tax character of distributions paid was as follows:
| | Year Ended December 31, |
| | 2020
Amount
($000) | 2019
Amount
($000) |
| Ordinary Income* | 115,359 | 107,488 |
| Long-Term Capital Gains | 127,272 | 139,938 |
| Total | 242,631 | 247,426 |
| * | Includes short-term capital gains, if any. |
As of December 31, 2020, gross unrealized appreciation and depreciation for investments and derivatives based on cost for U.S. federal income tax purposes were as follows:
| | Amount
($000) |
| Tax Cost | 4,087,340 |
| Gross Unrealized Appreciation | 3,896,974 |
| Gross Unrealized Depreciation | (432,927) |
| Net Unrealized Appreciation (Depreciation) | 3,464,047 |
E. During the year ended December 31, 2020, the portfolio purchased $559,039,000 of investment securities and sold $528,240,000 of investment securities, other than temporary cash investments.
F. Capital shares issued and redeemed were:
| | Year Ended December 31, | |
| | 2020
Shares
(000) | | 2019
Shares
(000) | |
| | | |
| Issued | 22,103 | | 13,588 | |
| Issued in Lieu of Cash Distributions | 6,753 | | 6,019 | |
| Redeemed | (23,722) | | (13,957) | |
| Net Increase (Decrease) in Shares Outstanding | 5,134 | | 5,650 | |
At December 31, 2020, two shareholders (an insurance company separate account whose holdings in the portfolio represent the indirect investment of Vanguard Variable Annuity contract holders and Total Stock Market Index Portfolio) were each a record or beneficial owner of 25% or more of the portfolio’s net assets, with a combined ownership of 67%. If any of these shareholders were to redeem their investment in the portfolio, the redemption might result in an increase in the portfolio's expense ratio, cause the portfolio to incur higher transaction costs, or lead to the realization of taxable capital gains.
G. Management has determined that no events or transactions occurred subsequent to December 31, 2020, that would require recognition or disclosure in these financial statements.
Report of Independent Registered
Public Accounting Firm
To the Board of Trustees of Vanguard Variable Insurance Funds and Shareholders of Equity Index Portfolio
Opinion on the Financial Statements
We have audited the accompanying statement of assets and liabilities, including the schedule of investments, of Equity Index Portfolio (one of the portfolios constituting Vanguard Variable Insurance Funds, referred to hereafter as the "Portfolio”) as of December 31, 2020, the related statement of operations for the year ended December 31, 2020, the statement of changes in net assets for each of the two years in the period ended December 31, 2020, including the related notes, and the financial highlights for each of the five years in the period ended December 31, 2020 (collectively referred to as the “financial statements”). In our opinion, the financial statements present fairly, in all material respects, the financial position of the Portfolio as of December 31, 2020, the results of its operations for the year then ended, the changes in its net assets for each of the two years in the period ended December 31, 2020 and the financial highlights for each of the five years in the period ended December 31, 2020 in conformity with accounting principles generally accepted in the United States of America.
Basis for Opinion
These financial statements are the responsibility of the Portfolio’s management. Our responsibility is to express an opinion on the Portfolio’s financial statements based on our audits. We are a public accounting firm registered with the Public Company Accounting Oversight Board (United States) (PCAOB) and are required to be independent with respect to the Portfolio in accordance with the U.S. federal securities laws and the applicable rules and regulations of the Securities and Exchange Commission and the PCAOB.
We conducted our audits of these financial statements in accordance with the standards of the PCAOB. Those standards require that we plan and perform the audit to obtain reasonable assurance about whether the financial statements are free of material misstatement, whether due to error or fraud.
Our audits included performing procedures to assess the risks of material misstatement of the financial statements, whether due to error or fraud, and performing procedures that respond to those risks. Such procedures included examining, on a test basis, evidence regarding the amounts and disclosures in the financial statements. Our audits also included evaluating the accounting principles used and significant estimates made by management, as well as evaluating the overall presentation of the financial statements. Our procedures included confirmation of securities owned as of December 31, 2020 by correspondence with the custodian and brokers and by agreement to the underlying ownership records of the transfer agent; when replies were not received from brokers, we performed other auditing procedures. We believe that our audits provide a reasonable basis for our opinion.
/s/PricewaterhouseCoopers LLP
Philadelphia, Pennsylvania
February 18, 2021
We have served as the auditor of one or more investment companies in The Vanguard Group of Funds since 1975.
Special 2020 tax information (unaudited) for corporate shareholders only for Equity Index Portfolio, a portfolio of Vanguard Variable Insurance Funds
This information for the fiscal year ended December 31, 2020, is included pursuant to provisions of the Internal Revenue Code for corporate shareholders only.
The portfolio distributed $127,272,000 as capital gain dividends (20% rate gain distributions) to shareholders during the fiscal year.
For corporate shareholders, 98.5% of investment income (dividend income plus short-term gains, if any) qualifies for the dividends-received deduction.
The S&P 500 Index is a product of S&P Dow Jones Indices LLC, a division of S&P Global, or its affiliates (“SPDJI”), and has been licensed for use by Vanguard. Standard & Poor’s®, and S&P® are registered trademarks of Standard & Poor’s Financial Services LLC, a division of S&P Global (“S&P”) and Dow Jones® is a registered trademark of Dow Jones Trademark Holdings LLC (“Dow Jones”). The trademarks have been licensed to SPDJI and have been sublicensed for use for certain purposes by Vanguard. Vanguard Equity Index Portfolio is not sponsored, endorsed, sold or promoted by SPDJI, Dow Jones, S&P, any of their respective affiliates (collectively, “S&P Dow Jones Indices”). S&P Dow Jones Indices make no representation or warranty, express or implied, to the owners of the Vanguard Equity Index Portfolio or any member of the public regarding the advisability of investing in securities generally or in Vanguard Equity Index Portfolio particularly or the ability of the S&P 500 Index to track general market performance. S&P Dow Jones Indices’ only relationship to Vanguard with respect to the S&P 500 Index is the licensing of the Index and certain trademarks, service marks and/or trade names of S&P Dow Jones Indices and/or its licensors. The S&P 500 Index is determined, composed and calculated by S&P Dow Jones Indices without regard to Vanguard or the Vanguard Equity Index Portfolio. S&P Dow Jones Indices have no obligation to take the needs of Vanguard or the owners of Vanguard Equity Index Portfolio into consideration in determining, composing or calculating the S&P 500 Index. S&P Dow Jones Indices are not responsible for and have not participated in the determination of the prices, and amount of Vanguard Equity Index Portfolio or the timing of the issuance or sale of Vanguard Equity Index Portfolio or in the determination or calculation of the equation by which Vanguard Equity Index Portfolio is to be converted into cash, surrendered or redeemed, as the case may be. S&P Dow Jones Indices have no obligation or liability in connection with the administration, marketing or trading of Vanguard Equity Index Portfolio. There is no assurance that investment products based on the S&P 500 Index will accurately track index performance or provide positive investment returns. S&P Dow Jones Indices LLC is not an investment advisor. Inclusion of a security within an index is not a recommendation by S&P Dow Jones Indices to buy, sell, or hold such security, nor is it considered to be investment advice.
S&P DOW JONES INDICES DOES NOT GUARANTEE THE ADEQUACY, ACCURACY, TIMELINESS AND/OR THE COMPLETENESS OF THE S&P 500 INDEX OR ANY DATA RELATED THERETO OR ANY COMMUNICATION, INCLUDING BUT NOT LIMITED TO, ORAL OR WRITTEN COMMUNICATION (INCLUDING ELECTRONIC COMMUNICATIONS) WITH RESPECT THERETO. S&P DOW JONES INDICES SHALL NOT BE SUBJECT TO ANY DAMAGES OR LIABILITY FOR ANY ERRORS, OMISSIONS, OR DELAYS THEREIN. S&P DOW JONES INDICES MAKE NO EXPRESS OR IMPLIED WARRANTIES, AND EXPRESSLY DISCLAIMS ALL WARRANTIES, OF MERCHANTABILITY OR FITNESS FOR A PARTICULAR PURPOSE OR USE OR AS TO RESULTS TO BE OBTAINED BY VANGUARD, OWNERS OF THE VANGUARD EQUITY INDEX PORTFOLIO, OR ANY OTHER PERSON OR ENTITY FROM THE USE OF THE S&P 500 INDEX OR WITH RESPECT TO ANY DATA RELATED THERETO. WITHOUT LIMITING ANY OF THE FOREGOING, IN NO EVENT WHATSOEVER SHALL S&P DOW JONES INDICES BE LIABLE FOR ANY INDIRECT, SPECIAL, INCIDENTAL, PUNITIVE, OR CONSEQUENTIAL DAMAGES INCLUDING BUT NOT LIMITED TO, LOSS OF PROFITS, TRADING LOSSES, LOST TIME OR GOODWILL, EVEN IF THEY HAVE BEEN ADVISED OF THE POSSIBILITY OF SUCH DAMAGES, WHETHER IN CONTRACT, TORT, STRICT LIABILITY, OR OTHERWISE. THERE ARE NO THIRD PARTY BENEFICIARIES OF ANY AGREEMENTS OR ARRANGEMENTS BETWEEN S&P DOW JONES INDICES AND VANGUARD, OTHER THAN THE LICENSORS OF S&P DOW JONES INDICES.
This page intentionally left blank.
The People Who Govern Your Fund
The trustees of your mutual fund are there to see that the fund is operated and managed in your best interests since, as a shareholder, you are a part owner of the fund. Your fund’s trustees also serve on the board of directors of The Vanguard Group, Inc., which is owned by the Vanguard funds and provides services to them.
A majority of Vanguard’s board members are independent, meaning that they have no affiliation with Vanguard or the funds they oversee, apart from the sizable personal investments they have made as private individuals. The independent board members have distinguished backgrounds in business, academia, and public service. Each of the trustees and executive officers oversees 211 Vanguard funds.
Information for each trustee and executive officer of the fund appears below. That information, as well as the Vanguard fund count, is as of the date on the cover of this fund report. The mailing address of the trustees and officers is P.O. Box 876, Valley Forge, PA 19482. More information about the trustees is in the Statement of Additional Information, which can be obtained, without charge, by contacting Vanguard at 800-662-7447, or online at vanguard.com.
Interested Trustee1
Mortimer J. Buckley
Born in 1969. Trustee since January 2018. Principal occupation(s) during the past five years and other experience: chairman of the board (2019–present) of Vanguard and of each of the investment companies served by Vanguard; chief executive officer (2018– present) of Vanguard; chief executive officer, president, and trustee (2018–present) of each of the investment companies served by Vanguard; president and director (2017–present) of Vanguard; and president (2018– present) of Vanguard Marketing Corporation. Chief investment officer (2013–2017), managing director (2002–2017), head of the Retail Investor Group (2006–2012), and chief information officer (2001–2006) of Vanguard. Chairman of the board (2011–2017) and trustee (2009–2017) of the Children’s Hospital of Philadelphia; and trustee (2018–present) and vice chair (2019–present) of The Shipley School.
Independent Trustees
Emerson U. Fullwood
Born in 1948. Trustee since January 2008. Principal occupation(s) during the past five years and other experience: executive chief staff and marketing officer for North America and corporate vice president (retired 2008) of Xerox Corporation (document management products and services). Former president of the Worldwide Channels Group, Latin America, and Worldwide Customer Service and executive chief staff officer of Developing Markets of Xerox. Executive in residence and 2009–2010 Distinguished Minett Professor at the Rochester Institute of Technology. Director of SPX FLOW, Inc. (multi-industry manufacturing). Director of the University of Rochester Medical Center, the Monroe Community College Foundation, the United Way of Rochester, North Carolina A&T University, and Roberts Wesleyan College. Trustee of the University of Rochester.
Amy Gutmann
Born in 1949. Trustee since June 2006. Principal occupation(s) during the past five years and other experience: president (2004–present) of the University of Pennsylvania. Christopher H. Browne Distinguished Professor of Political Science, School of Arts and Sciences, and professor of communication, Annenberg School for Communication, with secondary faculty appointments in the Department of Philosophy, School of Arts and Sciences, and at the Graduate School of Education, University of Pennsylvania.
F. Joseph Loughrey
Born in 1949. Trustee since October 2009. Principal occupation(s) during the past five years and other experience: president and chief operating officer (retired 2009) and vice chairman of the board (2008–2009) of Cummins Inc. (industrial machinery). Chairman of the board of Hillenbrand, Inc. (specialized consumer services) and the Lumina Foundation. Director of the V Foundation. Member of the advisory council for the College of Arts and Letters and chair of the advisory board to the Kellogg Institute for International Studies, both at the University of Notre Dame.
Mark Loughridge
Born in 1953. Trustee since March 2012. Principal occupation(s) during the past five years and other experience: senior vice president and chief financial officer (retired 2013) of IBM (information technology services). Fiduciary member of IBM’s Retirement Plan Committee (2004–2013), senior vice president and general manager (2002–2004) of IBM Global Financing, vice president and controller (1998–2002) of IBM, and a variety of other prior management roles at IBM. Member of the Council on Chicago Booth.
Scott C. Malpass
Born in 1962. Trustee since March 2012. Principal occupation(s) during the past five years and other experience: chief investment officer (retired June 2020) and vice president (retired June 2020) of the University of Notre Dame. Assistant professor of finance at the Mendoza College of Business, University of Notre Dame, and member of the Notre Dame 403(b) Investment Committee (retired June 2020). Member of the board of Catholic Investment Services, Inc. (investment advisors) and the board of superintendence of the Institute for the Works of Religion.
Deanna Mulligan
Born in 1963. Trustee since January 2018. Principal occupation(s) during the past five years and other experience: board chair (2020–present), chief executive officer (2011–2020), and president (2010–2019) of The Guardian Life Insurance Company of America. Chief operating officer (2010–2011) and executive vice president (2008–2010) of the individual life and disability division of Guardian Life. Member of the board of the American Council of Life Insurers and the board of the Economic Club of New York. Trustee of the Partnership for New York City (business leadership), Chief Executives for Corporate Purpose, NewYork-Presbyterian Hospital, Catalyst, and the Bruce Museum (arts and science). Member of the Advisory Council for the Stanford Graduate School of Business.
André F. Perold
Born in 1952. Trustee since December 2004. Principal occupation(s) during the past five years and other experience: George Gund Professor of Finance and Banking, Emeritus at the Harvard Business School (retired 2011). Chief investment officer and co-managing partner of HighVista Strategies (private investment firm). Member of the board of advisors and member of the investment committee of the Museum of Fine Arts Boston. Member of the board (2018–present) of RIT Capital Partners (investment firm). Member of the investment committee of Partners Health Care System.
Sarah Bloom Raskin
Born in 1961. Trustee since January 2018. Principal occupation(s) during the past five years and other experience: deputy secretary (2014–2017) of the United States Department of the Treasury. Governor (2010–2014) of the Federal Reserve Board. Commissioner (2007–2010) of financial regulation for the State of Maryland. Member of the board of directors (2012–2014) of Neighborhood Reinvestment Corporation. Director (2017–present) of i(x) Investments, LLC; director (2017–present) of Reserve Trust. Rubenstein Fellow (2017–present) of Duke University; trustee (2017–present) of Amherst College, and trustee (2019–present) of the Folger Shakespeare Library.
Peter F. Volanakis
Born in 1955. Trustee since July 2009. Principal occupation(s) during the past five years and other experience: president and chief operating officer (retired 2010) of Corning Incorporated (communications equipment) and director of Corning Incorporated
1 Mr. Buckley is considered an “interested person,” as defined in the Investment Company Act of 1940, because he is an officer of the Vanguard funds.
(2000–2010) and Dow Corning (2001–2010). Director (2012) of SPX Corporation (multi-industry manufacturing). Overseer of the Amos Tuck School of Business Administration, Dartmouth College (2001–2013). Chairman of the board of trustees of Colby-Sawyer College. Member of the board of Hypertherm Inc. (industrial cutting systems, software, and consumables).
Executive Officers
John Bendl
Born in 1970. Principal occupation(s) during the past five years and other experience: principal of Vanguard. Chief financial officer (2019–present) of each of the investment companies served by Vanguard. Chief accounting officer, treasurer, and controller of Vanguard (2017–present). Partner (2003–2016) at KPMG (audit, tax, and advisory services).
Christine M. Buchanan
Born in 1970. Principal occupation(s) during the past five years and other experience: principal of Vanguard. Treasurer (2017–present) of each of the investment companies served by Vanguard. Partner (2005–2017) at KPMG (audit, tax, and advisory services).
David Cermak
Born in 1960. Principal occupation(s) during the past five years and other experience: principal of Vanguard. Finance director (2019–present) of each of the investment companies served by Vanguard. Managing director and head (2017–present) of Vanguard Investments Singapore. Managing director and head (2017–2019) of Vanguard Investments Hong Kong. Representative director and head (2014–2017) of Vanguard Investments Japan.
John Galloway
Born in 1973. Principal occupation(s) during the past five years and other experience: principal of Vanguard. Investment stewardship officer (September 2020–present) of each of the investment companies served by Vanguard. Head of Investor Advocacy (February 2020–present) and head of Marketing Strategy and Planning (2017–2020) at Vanguard. Deputy assistant to the President of the United States (2015).
Thomas J. Higgins
Born in 1957. Principal occupation(s) during the past five years and other experience: principal of Vanguard. Finance director (2019–present), chief financial officer (2008–2019), and treasurer (1998–2008) of each of the investment companies served by Vanguard.
Peter Mahoney
Born in 1974. Principal occupation(s) during the past five years and other experience: principal of Vanguard. Controller (2015–present) of each of the investment companies served by Vanguard. Head of International Fund Services (2008–2014) at Vanguard.
Anne E. Robinson
Born in 1970. Principal occupation(s) during the past five years and other experience: general counsel (2016–present) of Vanguard. Secretary (2016–present) of Vanguard and of each of the investment companies served by Vanguard. Managing director (2016–present) of Vanguard. Managing director and general counsel of Global Cards and Consumer Services (2014–2016) at Citigroup. Counsel (2003–2014) at American Express.
Michael Rollings
Born in 1963. Principal occupation(s) during the past five years and other experience: finance director (2017–present) and treasurer (2017) of each of the investment companies served by Vanguard. Managing director (2016–present) of Vanguard. Chief financial officer (2016–present) of Vanguard. Director (2016–present) of Vanguard Marketing Corporation. Executive vice president and chief financial officer (2006–2016) of MassMutual Financial Group.
John E. Schadl
Born in 1972. Principal occupation(s) during the past five years and other experience: principal of Vanguard. Chief compliance officer (2019–present) of Vanguard and of each of the investment companies served by Vanguard. Assistant vice president (2019–present) of Vanguard Marketing Corporation.
Vanguard Senior Management Team
| Joseph Brennan | James M. Norris |
| Mortimer J. Buckley | Thomas M. Rampulla |
| Gregory Davis | Karin A. Risi |
| John James | Anne E. Robinson |
| John T. Marcante | Michael Rollings |
| Chris D. McIsaac | Lauren Valente |
Connect with Vanguard® > vanguard.com
Fund Information > 800-662-7447
Annuity and Insurance Services > 800-522-5555
Institutional Investor Services > 800-523-1036
Text Telephone for People
Who Are Deaf or Hard of Hearing > 800-749-7273
This material may be used in conjunction with the offering of shares of any Vanguard fund only if preceded or accompanied by the fund’s current prospectus.
You can obtain a free copy of Vanguard’s proxy voting guidelines by visiting vanguard.com/proxyreporting or by calling Vanguard at 800-662-2739. The guidelines are also available from the SEC’s website, www.sec.gov. In addition, you may obtain a free report on how your fund voted the proxies for securities it owned during the 12 months ended June 30. To get the report, visit either vanguard.com/proxyreporting or www.sec.gov.
All comparative mutual fund data are from Morningstar, Inc., unless otherwise noted.
You can review information about your portfolio on the SEC’s website, and you can receive copies of this information, for a fee, by sending a request via email addressed to publicinfo@sec.gov.
Source for Bloomberg Barclays indexes: Bloomberg Index Services Limited. Copyright 2021, Bloomberg. All rights reserved.
CFA® is a trademark owned by CFA Institute.
© 2021 The Vanguard Group, Inc.
All rights reserved. Vanguard Marketing Corporation, Distributor. Q690TSMI 022021 |
Item 2: Code of Ethics. The Registrant has adopted a code of ethics that applies to the Registrant’s principal executive officer, principal financial officer, principal accounting officer or controller or persons performing similar functions. The Code of Ethics was amended during the reporting period covered by this report to make certain technical, non-material changes.
Item 3: Audit Committee Financial Expert. All members of the Audit Committee have been determined by the Registrant’s Board of Trustees to be Audit Committee Financial Experts and to be independent: F. Joseph Loughrey, Mark Loughridge, Sarah Bloom Raskin, and Peter F. Volanakis.
Item 4: Principal Accountant Fees and Services.
(a) Audit Fees.
Audit Fees of the Registrant.
Fiscal Year Ended December 31, 2020: $540,000
Fiscal Year Ended December 31, 2019: $569,000
Aggregate Audit Fees of Registered Investment Companies in the Vanguard Group.
Fiscal Year Ended December 31, 2020: $10,761,407
Fiscal Year Ended December 31, 2019: $9,568,215
Includes fees billed in connection with audits of the Registrant, other registered investment companies in the Vanguard complex, The Vanguard Group, Inc., and Vanguard Marketing Corporation.
(b) Audit-Related Fees.
Fiscal Year Ended December 31, 2020: $2,915,863
Fiscal Year Ended December 31, 2019: $3,012,031
Includes fees billed in connection with assurance and related services provided to the Registrant, other registered investment companies in the Vanguard complex, The Vanguard Group, Inc., and Vanguard Marketing Corporation.
(c) Tax Fees.
Fiscal Year Ended December 31, 2020: $247,168
Fiscal Year Ended December 31, 2019: $357,238
Includes fees billed in connection with tax compliance, planning, and advice services provided to the Registrant, other registered investment companies in the Vanguard complex, The Vanguard Group, Inc., and Vanguard Marketing Corporation.
(d) All Other Fees.
Fiscal Year Ended December 31, 2020: $115,000
Fiscal Year Ended December 31, 2019: $0
Includes fees billed for services related to tax reported information provided to the Registrant, other registered investment companies in the Vanguard complex, The Vanguard Group, Inc., and Vanguard Marketing Corporation.
(e) (1) Pre-Approval Policies. The policy of the Registrant’s Audit Committee is to consider, and, if appropriate, approve before the principal accountant is engaged for such services, all specific audit and non-audit services provided to: the Registrant, other registered investment companies in the Vanguard complex, The Vanguard Group, Inc., and entities controlled by The Vanguard Group, Inc. that provide ongoing services to the Registrant. In making a determination, the Audit Committee considers whether the services are consistent with maintaining the principal accountant’s independence.
In the event of a contingency situation in which the principal accountant is needed to provide services in between scheduled Audit Committee meetings, the Chairman of the Audit Committee would be called on to consider and, if appropriate, pre-approve audit or permitted non-audit services in an amount sufficient to complete services through the next Audit Committee meeting, and to determine if such services would be consistent with maintaining the accountant’s independence. At the next scheduled Audit Committee meeting, services and fees would be presented to the Audit Committee for formal consideration, and, if appropriate, approval by the entire Audit Committee. The Audit Committee would again consider whether such services and fees are consistent with maintaining the principal accountant’s independence.
The Registrant’s Audit Committee is informed at least annually of all audit and non-audit services provided by the principal accountant to the Vanguard complex, whether such services are provided to: the Registrant, other registered investment companies in the Vanguard complex, The Vanguard Group, Inc., or other entities controlled by The Vanguard Group, Inc. that provide ongoing services to the Registrant.
(2) No percentage of the principal accountant’s fees or services were approved pursuant to the waiver provision of paragraph (c)(7)(i)(C) of Rule 2-01 of Regulation S-X.
(f) For the most recent fiscal year, over 50% of the hours worked under the principal accountant’s engagement were not performed by persons other than full-time, permanent employees of the principal accountant.
(g) Aggregate Non-Audit Fees.
Fiscal Year Ended December 31, 2020: $362,168
Fiscal Year Ended December 31, 2019: $357,238
Includes fees billed for non-audit services provided to the Registrant, other registered investment companies in the Vanguard complex, The Vanguard Group, Inc., and Vanguard Marketing Corporation.
(h) For the most recent fiscal year, the Audit Committee has determined that the provision of all non-audit services was consistent with maintaining the principal accountant’s independence.
Item 5: Audit Committee of Listed Registrants.
The Registrant is a listed issuer as defined in rule 10A-3 under the Securities Exchange Act of 1934 (“Exchange Act”). The Registrant has a separately-designated standing audit committee established in accordance with Section 3(a)(58)(A) of the Exchange Act. The Registrant’s audit committee members are: F. Joseph Loughrey, Mark Loughridge, Sarah Bloom Raskin, and Peter F. Volanakis.
Item 6: Investments.
Not Applicable
Item 7: Disclosure of Proxy Voting Policies and Procedures for Closed-End Management Investment Companies.
Not applicable.
Item 8: Portfolio Managers of Closed-End Management Investment Companies.
Not applicable.
Item 9: Purchase of Equity Securities by Closed-End Management Investment Company and Affiliated Purchasers.
Not applicable.
Item 10: Submission of Matters to a Vote of Security Holders.
Not applicable.
Item 11: Controls and Procedures.
(a) Disclosure Controls and Procedures. The Principal Executive and Financial Officers concluded that the Registrant’s Disclosure Controls and Procedures are effective based on their evaluation of the Disclosure Controls and Procedures as of a date within 90 days of the filing date of this report.
(b) Internal Control Over Financial Reporting. In 2020, a third-party service provider began performing certain administrative and accounting services for VVIF Equity Index Portfolio, VVIF Mid-Cap Index Portfolio, VVIF Real Estate Index Portfolio, VVIF Capital Growth Portfolio, VVIF Diversified Value Portfolio, VVIF Equity Income Portfolio, VVIF Growth Portfolio, VVIF Small Company Growth Portfolio, VVIF International Portfolio, VVIF Balanced Portfolio, VVIF Total Bond Market Index Portfolio, VVIF High Yield Bond Portfolio, VVIF Money Market Portfolio, and VVIF Short-Term Investment-Grade Portfolio. There were no other significant changes in the Registrant’s Internal Control Over Financial Reporting or in other factors that could significantly affect this control subsequent to the date of the evaluation, including any corrective actions with regard to significant deficiencies and material weaknesses.
Item 12: Disclosure of Securities Lending Activities for Closed-End Management Investment Companies.
Not applicable.
Item 13: Exhibits.
Pursuant to the requirements of the Securities Exchange Act of 1934 and the Investment Company Act of 1940, the registrant has duly caused this report to be signed on its behalf by the undersigned, thereunto duly authorized.
VANGUARD VARIABLE INSURANCE FUNDS
BY: /s/ MORTIMER J. BUCKLEY*
___________________________
MORTIMER J. BUCKLEY
CHIEF EXECUTIVE OFFICER
Date: February 19, 2021
Pursuant to the requirements of the Securities Exchange Act of 1934 and the Investment Company Act of 1940, this report has been signed below by the following persons on behalf of the registrant and in the capacities and on the dates indicated.
VANGUARD VARIABLE INSURANCE FUNDS
BY: /s/ MORTIMER J. BUCKLEY*
___________________________
MORTIMER J. BUCKLEY
CHIEF EXECUTIVE OFFICER
Date: February 19, 2021
VANGUARD VARIABLE INSURANCE FUNDS
BY: /s/ JOHN BENDL*
___________________________
JOHN BENDL
CHIEF FINANCIAL OFFICER
Date: February 19, 2021
* By: /s/ Anne E. Robinson
Anne E. Robinson, pursuant to a Power of Attorney filed on December 18, 2020 (see File Number 33-64845), Incorporated by Reference