South Hertfordshire United Kingdom Fund Inactive
Filed: 1 Feb 11, 12:00am
Exhibit (c)(2)
| Project Apple Tree Presentation of Results November 23, 2010 |
| Virgin Media Limited Building 280, NTL House Bartley Wood Business Park Hook Hampshire 23 November, 2010 Dear Sir s: Virgin Media Limited (“Virgin Media”) and ntl Fawnspring Limited (“ntl Fawnspring”), collectively the “Client”, have engaged Duff & Phelps Ltd (“Duff & Phelps”) to provide an independent appraisal (our “Opinion”) of the Fair Market Value of the 66.7% interest of South Hertfordshire UK Fund Limited (the “Partnership”) in ntl (South Hertfordshire) Limited (“ntl (South Hertfordshire)” or the “Company”). This report presents our analysis and conclusions. Sincerely, Duff & Phelps Ltd. By: Mathias Schumacher Managing Director 40 Bank Street ? Canary Wharf ? London E14 5NR ? Phone:+44 20-7715-6711 ? Fax: + 44 20-7715-6710 |
| Contents Duff & Phelps Section Title Executive Summary Valuation Analyses Conclusions Appendix Company Background Exhibits Page 4 10 27 31 35 3 1. 2. 3. A. B. |
| Executive Summary 1. |
| Duff & Phelps has been engaged to provide an opinion (the “Opinion” or the “Appraisal”) of the fair market value (“Fair Market Value”) of a 66.7% equity share in ntl (South Hertfordshire) Limited (the “Company”) as of 30 September 2010 (the “Valuation Date”). We understand that Virgin Media Ltd (“Virgin Media”) and ntl Fawnspring Limited (“ntl Fawnspring” or the “General Partner”), collectively You or the “Client”, require an independent valuation of the 66.7% interest of South Hertfordshire UK Fund Limited (the “Partnership”) in ntl (South Hertfordshire) Limited (“Partnership Assets”) in connection with a potential acquisition of the 66.7% interest in the Company by an affiliate of the General Partner. We understand that the Opinion is required under t he terms of the partnership agreement (the “Partnership Agreement”) which enables an affiliate of the General Partner to acquire the Partnership Assets for a price that is to be determined by the average of three separate independent appraisals of the Fair Market Value. The Opinion will be used to satisfy this requirement to perform independent appraisals of the Fair Market Value of the Company for the purpose of determining a potential acquisition price. We understand that, should You proceed with the acquisition, the results of the Opinion would be disclosed to the Limited Partners in a proxy statement to be filed with the SEC. We acknowledge the need to obtain approval of the Limited Partners through this means and, subject to review and approval of our outside legal counsel, we are willing for the Partnership to include the relevant disclosures in the proxy statement. Definition of Fair Market Value We define Fair Market Value as the price at which property, a business or an asset would change hands between a willing buyer and a willing seller, neither being under any compulsion to buy or to sell, and both having reasonable knowledge of relevant facts. In estimating Fair Market Value, we will assume the Company’s existing business to be ongoing. Executive Summary Purpose of the Engagement Duff & Phelps 5 |
| South Hertfordshire UK Fund Limited owns a 66.67% share in the Company, with the remainder being held by ntl B Limited, a subsidiary of Virgin Media. The General Partner, ntl Fawnspring Limited, and Virgin Media are wholly owned subsidiaries of Virgin Media Inc. (“Virgin Media Group”). The structure is presented below: The Partnership is governed by the Partnership Agreement and the term of the Partnership is due to expire in 2016. Prior to this date, the General Partner or an affiliate may acquire the assets of the Partnership. In order to affect this acquisition, we understand that three independent valuation appraisals are required and the purchase consideration will be based on the average of these three appraisals. Executive Summary The Partnership Agreement Duff & Phelps Virgin Media Inc “Virgin Media Group” ntl Fawnspring Limite d “General Partner” ntl (South Hertfordshire) Ltd “Company” ntl B Limited Virgin Media Limited “Virgin Media” c. 5,000 US based Limited Partners “Limited Partners” South Hertfordshire UK Fund Ltd “Partnership” 66.7% 33.3% 6 |
| In connection with this presentation, Duff & Phelps has made such reviews, analyses and inquiries as were deemed necessary and appropriate under the circumstances. Duff & Phelps also took into account its assessment of general economic, market and financial conditions, as well as its experience in securities and business valuation, in general, and with respect to similar transactions, in particular. Duff & Phelps’ procedures, investigations, and financial analysis with respect to the preparation of its analysis included, but were not limited to, the items summarised below: Held discussions with management of Virgin Media (“Management”) regarding the operations, financial conditions, future prospects and projected operations and performance of the Company; Reviewed the South Hertfordshire United Kingdom Fund Ltd Form 10-K for the fiscal year ended December 31, 2009, and the South Hertfordshire United Kingdom Fund Ltd Form 10-Q for the fiscal quarters ending March 31, 2010, June 30, 2010 and September 30, 2010; Reviewed ntl (South Hertfordshire) Limited financial statements for the years ended December 31, 2009, 2008 and 2007; Reviewed certain historic financial statements and other financial and operating data concerning the Company; Developed certain financial forecasts for the Company in conjunction with Management; Reviewed the Partnership Agreement dated December 31, 1991; Held discussion with Management regarding the transfer pricing arrangements between the Company and Virgin Media and the appropriateness of this arrangement; Reviewed publicly available analyst research reports; Reviewed conditions in, and the economic outlook for, the cable television and telephone market; Compared the financial performance of the Company with that of certain other publicly traded companies that we deemed relevant; Considere d the prices implied by comparable market transactions; and Conducted such other analyses and considered such other factors as we deemed appropriate. Executive Summary Summary of Due Diligence Duff & Phelps 7 |
| In performing its analyses Duff & Phelps, with your consent: Relied upon the accuracy, completeness, and fair presentation of all information, data, advice, opinions and representations obtained from public sources or provided to it from private sources, including Virgin Media management, and did not independently verify such information; Assumed that any information provided and discussions held related to estimates, evaluations, forecasts and projections furnished to Duff & Phelps were reasonable and based upon the best currently available information and good faith judgment of the person furnishing the same; Assumed that the final versions of all documents reviewed by Duff & Phelps in draft form conform in all material respects to the drafts reviewed; Assumed that there has been no material change in the assets, financial condition, business, or pr ospects of the Company since the date of the most recent financial statements and other information made available to Duff & Phelps; Assumed that information supplied to Duff & Phelps to be substantially accurate; and Relied upon the fact that the Client has been advised by counsel as to all legal matters with respect to the Acquisition. Duff & Phelps has made numerous assumptions with respect to industry performance, general business, market and economic conditions and other matters, many of which are beyond the control of any party involved. Duff & Phelps did not make any independent evaluation, appraisal or physical inspection of the Company’s solvency or of any specific assets or liabilities (contingent or otherwise). This presentation should not be construed as a fairness opinion, credit rating, solvency opinion, an analysis of the Company’s credit worthiness, as tax advice or as accounting advice. Duff & Phelps has not made, and assumes no respons ibility to make, any representation, or render any opinion, as to any legal matter. Executive Summary Assumptions, Qualifications and Limiting Conditions Duff & Phelps 8 |
| Based on the analyses and Assumptions, Qualifications, and Limiting Conditions presented herein, we conclude the Fair Market Value of the Partnerships 66.7% interest in the Company to be approximately £15.8m. Executive Summary Valuation Conclusion Duff & Phelps 9 Business Enterprise Value (100%) 36,000 Plus: Value of Tax Position 6,800 Business Enterprise Value including Tax Position 42,800 Less: Net Debt (19,158) Equity Value (100%) 23,642 Interest Acquired 66.7% Equity Value (66.7%) 15,769 FMV the Partnerships 66.7% equity interest in the Company (rounded) £ 15,800 |
| Valuation Analyses 2. |
| The table below shows historical key financials for the Company and Virgin Media Inc. Valuation Analyses Historical Key Financials Duff & Phelps Revenue: Revenue growth for ntl (South Hertfordshire) Limited has historically been below that of Virgin Media Inc. This is due to customer and product mix. EBITDA: EBITDA margins are comparable between ntl (South Hertfordshire) Limited and Virgin Media and have been reasonably consistent over the last 3 years. Operating Profit: At an operating profit level ntl (South Hertfordshire) Limited has reported significantly stronger results than Virgin Media over the last 3 years. This is due to higher depreciation charges (resulting from a higher proportion of fixed assets being held at the Group level), amortisation of intangibles and some goodwill impairment charges. Capex: A full allocation of capital expenditure is not made to ntl (South Hertfordshire) Limited and therefore the reported capex is significantly below that of Virgin Media. We have made an adjustment to reflect a more consistent capital expenditure profile on a standalone basis in our valuation analysis. Net Debt: A net debt figure of £19,158,375 was taken from the Q3 financials for the Partnership and it was confirmed with Management that this was the appropriate figure. Key financial metrics for the selected comparable companies are presented on slide 21. 11 ntl (South Hertfordshire) Limited Virgin Media Inc. (£ million's) 2007 2008 2009 (£ million's) 2007 2008 2009 Revenue 19.66 18.31 18.09 Revenue 3,839 3,777 3,804 % growth -6.6% -6.9% -1.2% % growth 6.6% -1.6% 0.7% EBITDA 7.27 6.48 6.86 EBITDA 1,298 1,316 1,375 % revenue 37.0% 35.4% 37.9% % revenue 33.8% 34.8% 36.1% Operating Profit 5.67 4.76 5.63 Operating Profit 75 128 201 % revenue 28.8% 26.0% 31.1% % revenue 1.9% 3.4% 5.3% Capex 0.73 0.44 0.88 Capex 534 47 8 569 % revenue 3.7% 2.4% 4.8% % revenue 13.9% 12.7% 15.0% |
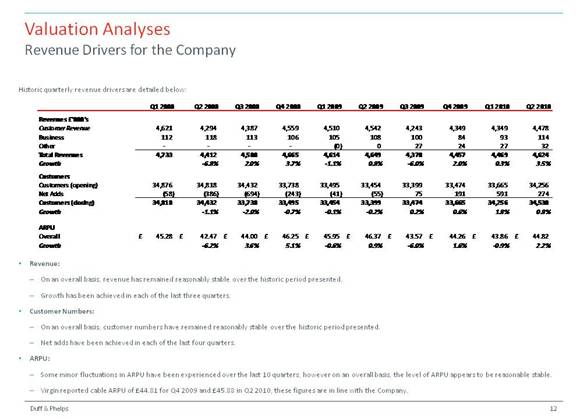
| Duff & Phelps Historic quarterly revenue drivers are detailed below: Revenue: On an overall basis, revenue has remained reasonably stable over the historic period presented. Growth has been achieved in each of the last three quarters. Customer Numbers: On an overall basis, customer numbers have remained reasonably stable over the historic period presented. Net adds have been achieved in each of the last four quarters. ARPU: Some minor fluctuations in ARPU have been experienced over the last 10 quarters, however on an overall basis, the level of ARPU appears to be reasonable stable. Virgin reported cable ARPU of £44.81 for Q4 2009 and £45.88 in Q2 2010, these figures are in line with the Company. Valuation Analyses Revenue Drivers for the Company 12 Q1 2008 Q2 2008 Q3 2008 Q4 2008 Q1 2009 Q2 2009 Q3 2009 Q4 2009 Q1 2010 Q2 2010 Revenues £'000's Customer Revenue 4,621 4,294 4,387 4,559 4,510 4,542 4,243 4,349 4,349 4,478 Business 112 118 113 106 105 108 100 84 93 114 Other - - - - (0) 0 27 24 27 32 Total Revenues 4,733 4,412 4,500 4,665 4,614 4,649 4,370 4,457 4,469 4,624 Growth -6.8% 2.0% 3.7% -1.1% 0.8% -6.0% 2.0% 0.3% 3.5% Customers Customers (opening) 34,876 34,818 34,432 33,738 33,495 33,454 33,399 33,474 33,665 34,256 Net Adds (58) (386) (694) (243) (41) (55) 75 191 591 274 Customers (closing) 34,818 34,432 33,738 33,495 33,454 33,399 33,474 33,665 34,256 34,530 Growth -1.1% -2.0% -0.7% -0.1% -0.2% 0.2% 0.6% 1.8% 0.8% ARPU Overall 45.28 £ 42.47 £ 44.00 £ 46.25 £ 45.95 £ 46.37 £ 43.57 £ 44.26 £ 43.86 £ 44.82 £ Growth -6.2% 3.6% 5.1% -0.6% 0.9% -6.0% 1.6% -0.9% 2.2% |
| Duff & Phelps Valuation Analyses Valuation Methodologies Methodologies: In performing our valuation of the Partnership Assets we have utilised the following methodologies: Income Approach; and Market Approach: Comparable publicly traded companies. Buy/ sell transactions within the industry sector. The following sections describe our application of these methodologies in more detail. Concluded Value: In order to arrive at a concluded value for the Partnerships 66.7% equity interested in the Company, we have taken the following steps: Firstly we calculate the Business Enterprise Value (“BEV”) on a 100% basis, excluding the beneficial tax position of the Company. Then we separately value the net operating losses and capital allowances available to be offset against the taxable profits and add this to the taxable BEV. To arrive at an equity value, on a 100% basis, we deduct net debt. Finally, we have been instructed to value the 66.7% interest in the Company currently owned by the Partnership and therefore we take 66.7% of the equity value. We conclude on the Fair Market Value of the Partnership’s 66.7% equity interest in the Company. 13 |
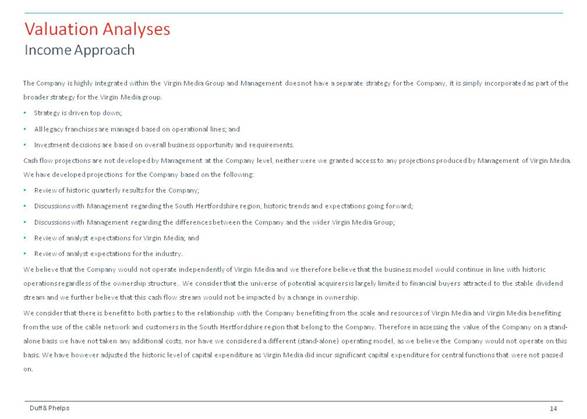
| The Company is highly integrated within the Virgin Media Group and Management does not have a separate strategy for the Company, it is simply incorporated as part of the broader strategy for the Virgin Media group. Strategy is driven top down; All legacy franchises are managed based on operational lines; and Investment decisions are based on overall business opportunity and requirements. Cash flow projections are not developed by Management at the Company level, neither were we granted access to any projections produced by Management of Virgin Media. We have developed projections for the Company based on the following: Review of historic quarterly results for the Company; Discussions with Management regarding the South Hertfordshire region, historic trends and expectations going forward; Discussions with Management regarding the differences between the Compan y and the wider Virgin Media Group; Review of analyst expectations for Virgin Media; and Review of analyst expectations for the industry. We believe that the Company would not operate independently of Virgin Media and we therefore believe that the business model would continue in line with historic operations regardless of the ownership structure. We consider that the universe of potential acquirers is largely limited to financial buyers attracted to the stable dividend stream and we further believe that this cash flow stream would not be impacted by a change in ownership. We consider that there is benefit to both parties to the relationship with the Company benefiting from the scale and resources of Virgin Media and Virgin Media benefiting from the use of the cable network and customers in the South Hertfordshire region that belong to the Company. Therefore in assessing the value of the Company on a stand-alone basis we have not taken any additional costs, nor have we considered a different (stand-alone) operating model, as we believe the Company would not operate on this basis. We have however adjusted the historic level of capital expenditure as Virgin Media did incur significant capital expenditure for central functions that were not passed on. Valuation Analyses Income Approach Duff & Phelps 14 |
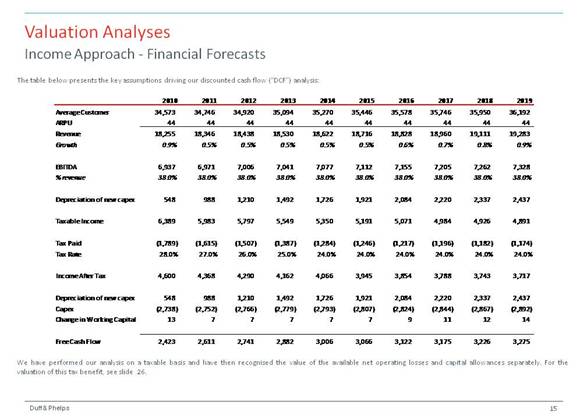
| Duff & Phelps The table below presents the key assumptions driving our discounted cash flow (“DCF”) analysis: Valuation Analyses Income Approach - Financial Forecasts We have performed our analysis on a taxable basis and have then recognised the value of the available net operating losses and capital allowances separately. For the valuation of this tax benefit, see slide 26. 15 2010 2011 2012 2013 2014 2015 2016 2017 2018 2019 Average Customer 34,573 34,746 34,920 35,094 35,270 35,446 35,578 35,746 35,950 36,192 ARPU 44 44 44 44 44 44 44 44 44 44 Revenue 18,255 18,346 18,438 18,530 18,622 18,716 18,828 18,960 19,111 19,283 Growth 0.9% 0.5% 0.5% 0.5% 0.5% 0.5% 0.6% 0.7% 0.8% 0.9% EBITDA 6,937 6,971 7,006 7,041 7,077 7,112 7,155 7,205 7,262 7,328 % revenue 38.0% 38.0% 38.0% 38.0% 38.0% 38.0% 38.0% 38.0% 38.0% 38.0% Depreciation of new capex 548 988 1, 210 1,492 1,726 1,921 2,084 2,220 2,337 2,437 Taxable Income 6,389 5,983 5,797 5,549 5,350 5,191 5,071 4,984 4,926 4,891 Tax Paid (1,789) (1,615) (1,507) (1,387) (1,284) (1,246) (1,217) (1,196) (1,182) (1,174) Tax Rate 28.0% 27.0% 26.0% 25.0% 24.0% 24.0% 24.0% 24.0% 24.0% 24.0% Income After Tax 4,600 4,368 4,290 4,162 4,066 3,945 3,854 3,788 3,743 3,717 Depreciation of new capex 548 988 1,210 1,492 1,726 1,921 2,084 2,220 2,337 2,437 Capex (2,738) (2,752) (2,766) (2,779) (2,793) (2,807) (2,824) (2,844) (2,867) (2,892) Change in Working Capital 13 7 7 7 7 7 9 11 12 14 Free Cash Flow 2,423 2,611 2,741 2,882 3,006 3,066 3,122 3,175 3,226 3,275 |
| Duff & Phelps Revenue: Revenue was developed by projecting the average annual number of subscribers multiplied by the APRU. Customer Numbers: The customer base has remained reasonable stable over the 10 quarters of detailed financial information provided. Over the last three quarters, net additions have been achieved and growth in the first half of 2010 is above previous quarters. We have assumed that growth through the remainder of 2010 is approximately in line with the first half of the year, resulting in growth in customer numbers of approximately 1% over 2009. Beyond 2010, we have assumed a minor annual increase in customer numbers of 0.5%. We consider that growth in excess of these amounts is limited due to the high penetration of the South Hertfordshire market that has already been achieved. ARPU: ARPU has remained reasonably stable over the 10 quarters of historic data provided. Based on discussions with Management, we do not consider there to be the potential for significant uplift in ARPU due to the stage of development of the market and the level of competition. However we also consider that the market is mature and the level of ARPU has been maintained, partly through conversion of customers onto triple play packages, over the last 10 quarters. In addition, we performed a review of analysts expectations for ARPU development within Virgin Media and consider that the growth potential within the Company to be below that of Virgin Media due to the higher proportion of ntl (South Hertfordshire) Limited customers already on the higher valued triple play contracts and differences in service offerings with growth within Virgin Media expected to come partly from business and mobile customers. Analysts forecast growth in ARPU for Virgin Media but at a rate of less than 5%. We have therefore maintained ARPU at a level in line with that achieved historically and have then assumed that the Company will be able to start passing on inflation and achieve a small uplift in ARPU in the outer years. EBITDA Margin: The historic EBITDA margin achieved by the Company is in line with the margins achieved by competitors, including Virgin Media, and has been reasonably stable over the last 3 years. We consider that the historic margin achieved by the Company is representative of a reasonable margin as we consider the cost allocation to be fair. A review of analysts forecasts for Virgin Media indicates the expectation of some minor margin improvements, however we understand through discussions with Management that the potential to achieve growth and margin improvement in South Hertfordshire is more limited due to the maturity of the region and the services offered. We have assumed that the margin achieved in 2009 represents a sustainable margin for the business going forward. 16 Valuation Analyses Income Approach - Financial F orecasts (continued) |
| Depreciation on New Capex: We have assumed that capital allowances are received on new capital expenditure at an annual rate of 20% in 2010 and 2011, reducing to 18% from 2012. This is applied on a reducing balance basis. The tax benefit of historic depreciation is captured separately in the valuation of the capital allowances. Tax Position We have performed our discounted cash flow analysis on the basis that the Company is subject to tax at statutory UK tax rates. We have tax on taxable income at a rate of 28% in 2010 reducing by 1% each year to 24% in 2014 in line with UK corporate tax rates. We recognise the value of the significant net operating losses and capital allowances that are available to the Company to be offset against future profit and have valued these separately. Cash Flow Adjustments Capital Expenditure: Capex as a percent of revenue has been as sumed to be 15%, based on discussions with Management. This is higher than historic levels, as seen in the financial statements of the Company, because the Company, operating as an integrated part of Virgin Media, has not been allocated a significant portion of necessary capex. On a more standalone basis the required level of capex would therefore be higher. We have reviewed historic capital expenditure for Virgin Media and the comparable company group and consider 15% to be a reasonable ongoing level. This has also been discussed with Management. Working Capital: It was noted through discussions with management that working capital requirements for the Company are low and, also given the low levels of growth forecast for the Company, investment in working capital is minimal. We have assessed the working capital levels of the selected comparable companies and have has been used the last twelve months median working capital level as representative for this business. Duff & Phelps 17 Valuation Analyses Income Approach - Financial Forecasts (continued) |
| Discount Rate We have calculated the appropriate discount rate based on a weighted average cost of capital calculation. We have applied a discount rate of 9.9%. Terminal Value The terminal value calculation has been based on a Gordon Growth Model using a long term growth rate of 1% and a discount rate of 9.9%. We consider that the Company is mature and covers limited geographical area and therefore has limited growth potential going forward and this has been reflected in our selected growth rate. We do however expect the Company to be able to achieve minimal growth, of approximately 1%, through inflationary price uplift. We have also considered the reasonableness of our calculated terminal value based on the implied exit multiples. Conclusion before Tax Position Based on a discounted cash flow analysis, we have concluded on a range for the Fair Market Value for the Business Enterprise Value of the Company, before the value of the tax position, to be approximately £31.1m to £37.0m. Our range is based on a 1% discount rate range around the selected discount rate. Duff & Phelps 18 Valuation Analyses Income Approach - Conclusion |
| We reviewed the current trading multiples of publicly traded companies that Duff & Phelps determined to be comparable to the Company. We analysed various financial metrics for each of the publicly traded companies including historical and projected revenue and EBITDA and then analysed the peer group’s trading multiples of business enterprise value to their respective financial metrics. BEV is calculated as the sum of the equity market value (diluted shares outstanding multiplied by the current stock price) and net indebtedness. The following comparable companies were selected: Virgin Media, Inc. Provides entertainment and communication services in the UK. Operates in the cable broadband internet, television, fixed line and mobile telephone services. Also provides a portfolio of voice, data and internet solutions to commercial customers. Telenet Group Hol ding NV Provides media and communications services in Belgium. The company offers broadband internet through a fiber coaxial network, cable television, fixed line and mobile telephony services. Also provides voice, data and internet products and services for its business clientele. Liberty Global, Inc. Provides video, voice and broadband internet services in Europe, Japan and Chile. The company, through its cable systems, offers broadband internet, television and telephony services. It also provides video services through satellite. Mobile telephony services are offered using third party networks. Cablevision Systems Corporation Operates as a telecommunications, media and entertainment company in New York, USA. Through its subsidiaries, the company offers cable television, high speed internet access and telephone services. The media segment includes television and newspaper content. Cogeco Cable, Inc. Provides telecommunications services to residential and commercial customers in Ca nada and Portugal. The company offers television services, broadband, and telephone services. Duff & Phelps 19 Valuation Analyses Market Approach - Selected Public Company Analysis |
| Comcast Corporation Together with its subsidiaries, the company provides entertainment, information and communication products and services in the US. The cable segment offers television, broadband internet and telephone services as well as regional sports and news networks. The programming segment consists of a number of television channels. The company also owns two professional sports teams. Mediacom Communications Corporation Provides entertainment, information and telecommunication services in the US. The company offers television, high speed internet, and telephone services. Time Warner Cable Inc. Provides video, data and voice services over its broadband cable systems in the US. In addition, it offers a range of video programming tiers and music services. ZON Multimedia – Serviços de Telecomunicacoes e Multimedia, SGPS, S.A. Provides cable and sa tellite television, broadband internet, fixed line and mobile telephony services in Portugal. The company also engages in cinema exhibition. British Sky Broadcasting Group plc Provides satellite television services in the UK and Ireland. The company also owns, operates and distributes and retails its television channels. Additionally, it provides broadband and fixed line telephony services. TalkTalk Telecom Group plc Provides telecommunication services in the UK. It offers fixed line and mobile telephony services as well as broadband services. BT Group plc Provides communication services in the UK. The company offers television broadband and fixed line and mobile telephony services, as well as networked IT services. The company also offers broadband, voice, and data connectivity services, interconnect to bespoke and managed network outsourcing and value added solutions to the communications providers in the UK. KCOM Group plc Provides integrated IT and communications services to b usinesses in the UK. The company also offers internet and telecommunications services to consumers. Kabel Deutschland Holding AG Provides telecommunications services in Germany. The company offers cable television, broadband internet, fixed line and mobile telephony services. Duff & Phelps 20 Valuation Analyses Market Approach - Selected Public Company Analysis |
| Duff & Phelps Valuation Analyses Market Approach - Selected Public Company Financials Key metrics for the selected public companies set are presented below: 21 Enterprise Value (£'000) Revenue Growth EBITDA Margin Capex ( % revenue ) Comparable Company Market Cap + Net Debt 2009 2010 2011 2009 2010 2011 2009 2010 Virgin Media, Inc. 10,573 0.7% 1.5% 4.0% 36.1% 38.1% 39.3% 15.0% 16.4% Telenet Holding NV 4,820 17.5% 8.7% 6.1% 50.0% 50.5% 50.3% 19.5% N/A Liberty Global Inc. 26,368 5.5% -20.1% 5.5% 42.9% 44.4% 45.1% 20.2% 20.6% Cablevision Systems Corporation 19,330 7.5% -7.1% 5.5% 32.4% 36.1% 36.7% 10.4% 10.3% Cogeco Cable Inc. 2,755 9.9% 5.3% 6.0% 41.0% 39.6% 39.3% 22.1% 26.3% Comcast Corporation 77,953 3.9% 5.0% 5.2% 38.4% 38.6% 38.7% 14.3% 12.8% Mediacom Communications Corp. 3,766 4.2% 3.0% 2.3% 36.6% 37.0% 36.9% 16.2% 16.0% Time Warner Cable Inc. 39,926 3.9% 5.3% 3.7% 36.1% 36.6% 36.7% 18.1% 15.6% ZON Multimedia 1,678 6.0% 6.1% 4.3% 34.5% 33.5% 34.2% 26.6% 26.1% British Sky Broadcasting Group plc 13,715 10.5% 7.9% 6.9% 19.9% 21.6% 22.8% 4.3% 5.5% TalkTalk Telecom Group PLC 1,702 N/M N/M 2.0% N/M 15.1% 16.0% N/M 5.7% BT Group plc 21,111 -1.7% -2.8% -1.8% 19.6% 28.2% 28.5% 12.0% 12.7% KCOM Group PLC. 399 -12.3% -1.8% 0.3% 14.7% 16.9% 17.6% 3.6% 4.7% Kabel Deutschland Holding AG 5,476 N/M 7.8% 7.2% 44.6% 44.8% 45.9% 18.0% 21.9% Low 399 -12.3% -20.1% -1.8% 14.7% 15.1% 16.0% 3.6% 4.7% Average 16,398 4.6% 1.5% 4.1% 34.4% 34.4% 34.9% 15.4% 15.0% Median 8,024 4.9% 5.0% 4.7% 36.1% 36.8% 36.8% 16.2% 15.6% High 77,953 17.5% 8.7% 7.2% 50.0% 50.5% 50.3% 26.6% 26.3% ntl (south Hertfordshire) Limited -1.2% 0.9% 0.5% 37.9% 38.0% 38.0% 4.8% 15.0% |
| The table below shows certain selected valuation multiples for each company: Duff & Phelps BSkyB has been excluded from this analysis due to the current take-over speculation. 22 Valuation Analyses Market Approach - Selected Public Company Valuation Multiples Revenue Multiple EBITDA Multiple Comparable Company 2009 2010 2011 2009 2010 2011 Virgin Media, Inc. 2.4 x 2.7 x 2.6 x 6.7 x 7.2 x 6.7 x Telenet Holding NV 3.7 x 3.7 x 3.5 x 7.3 x 7.3 x 6.9 x Liberty Global Inc. 2.6 x 3.0 x 2.8 x 6.1 x 6.7 x 6.3 x Cablevision Systems Corporation 2.6 x 2.7 x 2.5 x 8.0 x 7.4 x 6.9 x Cogeco Cable Inc. 2.1 x 2.1 x 2.0 x 5.2 x 5.3 x 5.1 x Comcast Corporation 2.2 x 2.1 x 2.0 x 5.6 x 5.4 x 5.1 x Mediacom Communications Corp. 2.5 x 2.5 x 2.4 x 6.9 x 6.8 x 6.6 x Time Warner Cable Inc. 2.0 x 2.1 x 2.0 x 5.7 x 5.8 x 5.6 x ZON Multimedia 2.6 x 1.9 x 1.8 x 7.4 x 5.7 x 5.4 x TalkTalk Telecom Group PLC N/M 1.0 x 0.9 x N/M 6.3 x 5.9 x BT Group plc 1.0 x 1.0 x 1.1 x 5.3 x 3.7 x 3.7 x KCOM Group PLC. 0.9 x 1.0 x 1.0 x 5.9 x 5.6 x 5.4 x Kabel Deutschland Holding AG N/M 3.5 x 3.2 x N/M 7.7 x 7.0 x Low 0.9 x 1.0 x 0.9 x 5.2 x 3.7 x 3.7 x Average 2.2 x 2.2 x 2.2 x 6.4 x 6.2 x 5.9 x Median 2.4 x 2.1 x 2.0 x 6.1 x 6.3 x 5.9 x High 3.7 x 3.7 x 3.5 x 8.0 x 7.7 x 7.0 x |
| M&A Transaction Analysis We selected transactions involving target companies that Duff & Phelps determined to be comparable to the Company. Duff & Phelps then calculated the implied enterprise value for each transaction to the target’s respective EBITDA and revenue. Duff & Phelps selected 8 comparable transactions. None of the companies or transactions utilised for comparative purposes in the analyses presented herein are identical to the Company. Accordingly, a complete valuation analysis cannot be limited to a quantitative review of the selected companies and involves considerations and judgments concerning differences in financial and operating characteristics of such companies, as well as other factors that could affect their value relative to that of the Company. Transactions We have used the following transactions as part of our analysi s: UPC Germany GmbH entered into a share purchase agreement to acquire Unitymedia GmbH from Unity Media S.C.A. for €3.5 billion on January 28, 2010. Knology, Inc. signed a definitive agreement to acquire the assets of Private Cable Co., LLC for $7.5 million in cash on November 17, 2009. Talktalk Telecom Limited entered into an agreement to acquire Tiscali UK Limited from Tiscali Holdings UK Ltd. and other shareholders for £236 million in cash on July 3, 2009. Orion Cable GmbH made a voluntary offer to acquire the remaining 74.7% stake in PrimaCom AG for approximately £153 million on October 29, 2007. BT Group plc made a recommended cash offer to acquire PlusNet Plc in a transaction valued at £62.4 million on January 24, 2007. Rogers Communications Inc. entered into an agreement to acquire an additional 6.57% of Cogeco Cable Inc. for approximately $116 million in cash on December 31, 2009. LGI Ventures Investments acquired an 18.38% stake in Telenet Holding NV on June 20, 2007 for €466.69 million. Rogers Communications Inc. entered into an agreement to acquire an additional 9.7% stake in Cogeco Inc. for $46.4 million on December 31, 2009. Duff & Phelps 23 Valuation Analyses Market Approach - Selected M&A Transaction Analysis |
| M&A Transaction Analysis: Duff & Phelps 24 Valuation Analyses Market Approach - Selected M&A Transaction Analysis (continued) Buyer Target Transaction Value (millions) Transaction Currency Percent Acquired Closing Date EV/ Revenue EV/ EBITDA UPC Germany GmbH Unitymedia GmbH 3,500.0 EUR 100% 1/28/2010 2.9 x 7.8 x Knology, Inc. Private Cable Co., LLC 7.5 USD 100% 11/17/2009 1.5 x 5.0 x Talktalk Telecom Limited Tiscali UK Limited 236.0 GBP 100% 7/3/2009 0.4 x 3.5 x Orion Cable GmbH PrimaCom AG 153.0 GBP 74.70% 10/29/2007 4.6 x 10.5 x BT Group plc PlusNet plc 62.4 GBP 100% 1/24/2007 1.5 x 7.5 x Rogers Communications Inc. Cogeco Cable Inc. 116.1 USD 6.57% 12/31/2009 2.3 x 5.6 x LGI Ventures B.V. Telenet Holding NV 466.7 EUR 18.38% 6/20/2007 4.6 x 10.4 x Rogers Communications Inc. Cogeco Inc. 46.4 USD 9.70% 12/31/2009 1.8 x 4.2 x Low 0.4 x 3.5 x Average 2.4 x 6.8 x Median 2.0 x 6.5 x High 4.6 x 10.5 x |
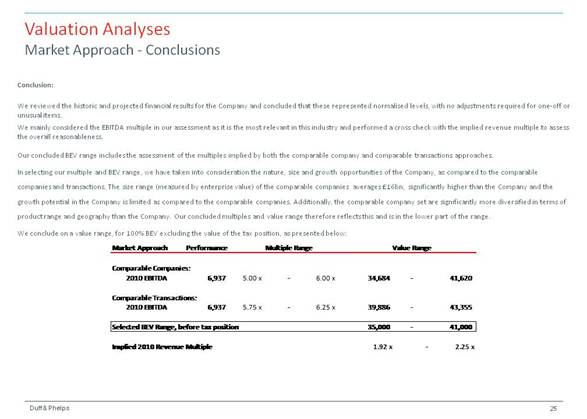
| Conclusion: We reviewed the historic and projected financial results for the Company and concluded that these represented normalised levels, with no adjustments required for one-off or unusual items. We mainly considered the EBITDA multiple in our assessment as it is the most relevant in this industry and performed a cross check with the implied revenue multiple to assess the overall reasonableness. Our concluded BEV range includes the assessment of the multiples implied by both the comparable company and comparable transactions approaches. In selecting our multiple and BEV range, we have taken into consideration the nature, size and growth opportunities of the Company, as compared to the comparable companies and transactions. The size range (measured by enterprise value) of the comparable companies averages £16bn, significantly higher than the Company and t he growth potential in the Company is limited as compared to the comparable companies. Additionally, the comparable company set are significantly more diversified in terms of product range and geography than the Company. Our concluded multiples and value range therefore reflects this and is in the lower part of the range. We conclude on a value range, for 100% BEV excluding the value of the tax position, as presented below: Duff & Phelps 25 Valuation Analyses Market Approach - Conclusions Market Approach Performance Comparable Companies: 2010 EBITDA 6,937 5.00 x - 6.00 x 34,684 - 41,620 Comparable Transactions: 2010 EBITDA 6,937 5.75 x - 6.25 x 39,886 - 43,355 Selected BEV Range, before tax position 35,000 - 41,000 Implied 2010 Revenue Multiple 1.92 x - 2.25 x Value Range Multiple Range |
| We have performed our discounted cash flow analysis using the assumption that the Company will pay taxes on its taxable income. However, based on discussions with Management, we understand that the Company has significant net operating losses and capital allowances that can be utilised going forward. Our assumptions regarding the tax position and our assessment of the value of this to the Company is detailed below: Management provided us with the tax base of the Company, at 31 December 2009, including net operating losses (“NOL’s”) of approx. £700k and available capital allowances of approx. £51.4m. Management have determined that the relevant tax legislation enables a company which has excess capital allowances over the balance sheet value of assets to use this excess against the company’s own profits. For the purpose of our val uation we have been instructed to assume that the NOL’s and Capital allowances are available to offset against the Company’s own profit stream. We determined the usage of these available losses to be offset against the forecast taxable profit level through out the projection period and estimate that the losses/ capital allowances are fully utilised by 2020. We have calculated the tax saving using projected UK corporate tax rates. We have then discounted this tax saved to present value using a discount rate of 14.7%. This discount rate is based on the cost of equity for the Company. Conclusion of Value of Tax Position We have concluded on a value of £6.8m. See Exhibit 2.2. Duff & Phelps 26 Valuation Analyses Value of Tax Position |
| Conclusions 3. |
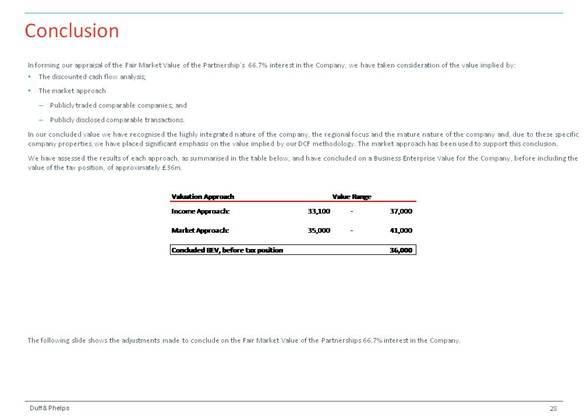
| Conclusion Duff & Phelps In forming our appraisal of the Fair Market Value of the Partnership’s 66.7% interest in the Company, we have taken consideration of the value implied by: The discounted cash flow analysis; The market approach Publicly traded comparable companies; and Publicly disclosed comparable transactions. In our concluded value we have recognised the highly integrated nature of the company, the regional focus and the mature nature of the company and, due to these specific company properties, we have placed significant emphasis on the value implied by our DCF methodology. The market approach has been used to support this conclusion. We have assessed the results of each approach, as summarised in the table below, and have concluded on a Business Enterprise Value for the Company, before including the value of the tax position, of approximately £36m. The following slide shows the adjustments made to conclude on the Fair Market Value of the Partnerships 66.7% interest in the Company. 28 Valuation Approach Income Approach: 33,100 - 37,000 Market Approach: 35,000 - 41,000 Concluded BEV, before tax position 36,000 Value Range |
| Conclusion Duff & Phelps In order to conclude on a Fair Market Value for a 66.7% equity interest (in thousands) in the Company we make the adjustments as follows: We conclude a Fair Market Value of approximately £15,800,000 for the Partnership’s 66.7% equity interest in ntl (South Hertfordshire) Limited. 29 Business Enterprise Value (100%) 36,000 Plus: Value of Tax Position 6,800 Business Enterprise Value including Tax Position 42,800 Less: Net Debt (19,158) Equity Value (100%) 23,642 Interest Acquired 66.7% Equity Value (66.7%) 15,769 FMV the Partnerships 66.7% equity interest in the Company (rounded) £ 15,800 |
| Appendix |
| Company Background A. |
| Duff & Phelps Company Background Virgin Media Virgin Media, through its fiber-optic cable network, provides entertainment and communications services in the United Kingdom. The company was formed following the merger between ntl:Telewest and Virgin Mobile UK in 2006. Virgin Media offers cable television, broadband internet, fixed line telephony and mobile telephony services to consumers and in addition provides a portfolio of voice, data and internet solutions to its business clientele. The company provides services to approximately 4.8 million residential customers, with around 60% of customers on triple-play. As of December 31, 2009, the consumer segment approximately has the following customer mix: Broadband: 3.8 million; Television: 3.7 million; Fixed line telephony: 4.1 million; and Mobile telephony: 3.2 million. The business segment provides services to approximately 65,000 UK businesses and 250 local councils. A partnership agreement was formed in 1991 between ntl Fawnspring Limited, a wholly owned subsidiary of Virgin Media, and South Hertfordshire United Kingdom Ltd to engage in the development, construction, management and operation of broadband communications networks for telephone, cable television, and Internet services in South Hertfordshire. Virgin Media indirectly owns 33.3% of the Company and 66.7% is owned by South Hertfordshire United Kingdom Ltd, however, the partnership is fully integrated with Virgin Media and is reliant on its services. 32 |
| ntl (South Hertfordshire) Limited provides cable television, fixed line telephony, broadband internet and other telecommunication services. The Company is the holder of a franchise to own and operate a cable television/telephone system in the South Hertfordshire franchise area. The Company operates within the very specific geographical region of South Hertfordshire, a suburb north of London. South Hertfordshire is a largely residential area, being a key commuter area into London. In 2009, just 2% of revenue was generated from business customers. At the end of 2009 the customer mix was as follows: TV subscribers: 26,911 customers (approx. 80% of total customer base) Fixed line telephony: 29,646 customers (approx. 80% of total customer base) Broadband: 27,511 customers (approx. 82% of total customer base) The total area covered contains approximately 96,000 h omes (and 7,000 businesses) and the Company delivers services to approximately 33,500 of these representing a market share of over 30%. This is slightly higher than the market share/ customer penetration of the Virgin Media group as a whole. The number of customers on triple play packages within the region has increase from 50% at the start of 2008 to 65% by the end of Q2 2010. This represents a higher conversion rate to triple play than the wider Virgin Media Group and a higher proportion of the Company’s customer base is on these higher value packages. Company Background ntl (South Hertfordshire) Ltd Duff & Phelps 33 |
| Duff & Phelps The Company’s operations are highly integrated with Virgin Media, being reliant on the well-known Virgin Media brand to reach customers and totally dependent on Virgin Media for its technology infrastructure, telecommunications, cable television content, marketing and billing services, customer and technical support, financing and back office services. The combined costs of managing the Virgin Media Group are allocated to each entity within the Group on a proportional basis and the Company takes an allocation of the costs which are applicable to them, the Company takes an allocation of all costs except for approx. 5% of Virgin Media’s total costs which are assessed to be unrelated to the running of the Company. We have not performed a full review of the mechanics of this allocation, however we understand that a detailed transfer pricin g study was performed in establishing this agreement. We have assessed the resulting margins earned and, on this basis, consider it to represent a fair allocation. In addition, management/ consulting fees are charged to the Company as a percentage of revenue by the General Partner, at 5% of gross revenue. Thus the combined cost base of the allocation from Virgin Media and the management/ consulting fee paid to the General Partner results in a margin being earned by the Company in line with that earned by Virgin Media. An exception to this is the allocation of capital expenditure. The Virgin Media Group spends a set amount of capex each year which is split between set top boxes, technical infrastructure, enhancing capacity and new projections/ proposition. The Company benefits from the cost sharing approach on this capex as only directly attributable cost, for example capex related to set top boxes, is recharged back. Additional capex relating to group wide investment is held at gr oup level, for example network backbone upgrades which have helped deliver higher broadband speeds, are not charged back despite some benefit of this flowing through to the Company. For this reason we have made an adjustment in our valuation to better reflect a ‘fair’ allocation of these costs and this results in a higher capex charge in our forecast periods that the actual figure reported historically. Certain Virgin Media business lines are not part of the Company: Mobile: Mobile revenues contributed approx. 15% of Virgin Media Group’s revenues in 2009. The Company delivers revenues only generated from the cable network and so does not earn this revenue stream. Content: Revenue generated from the sale of content is not earned at the Company’s level but is delivered by another group company, Future Entertainment SARL. Business: A smaller portion of revenue is generated from business customers within the South Hertfordshire franchise than the wider Virgin Media G roup. Company Background Integration within Virgin Media 34 |
| Exhibits B. |
Virgin Media, Inc.
Valuation of ntl (South Hertfordshire) Limited
Index
As of September 30, 2010
£’s thousands
Exhibits |
| |
|
|
|
| Summary of Values | 1.0 |
| Discounted Cash Flow Analysis | 2.1 |
| Value of Tax Position | 2.2 |
| Market Approach Summary | 3.0 |
| Comparable Company Multiples | 3.1 |
| Transaction Multiples | 3.2 |
|
|
|
Supporting Exhibits |
| |
| Revenue Support Schedule | 1.0 |
Virgin Media, Inc. |
| Exhibit 1.0 |
Valuation of ntl (South Hertfordshire) Limited
Summary of Values
As of September 30, 2010
£’s thousands
Valuation Approach |
| Value Range |
| ||
|
|
|
|
|
|
Income Approach (1): |
| 33,100 | - | 37,000 |
|
|
|
|
|
|
|
Market Approach (2): |
| 35,000 | - | 41,000 |
|
|
|
|
|
|
|
Concluded Business Enterprise Value, before value of Tax Position (100% basis) (3) |
|
|
| 36,000 |
|
|
|
|
|
|
|
Plus: Value of Tax Position (4) |
|
|
| 6,800 |
|
|
|
|
|
|
|
Less: Net debt (5) |
|
|
| (19,158 | ) |
|
|
|
|
|
|
Equity Value (100% basis) |
|
|
| 23,642 |
|
|
|
|
|
|
|
Interest to be Valued |
|
|
| 66.7 | % |
|
|
|
|
|
|
Equity Value (66.7% basis) |
|
|
| 15,769 |
|
|
|
|
|
|
|
FMV of the Partnerships 66.7% equity interest in ntl (South Hertfordshire) Ltd |
|
|
| 15,769 |
|
|
|
|
|
|
|
FMV of the Partnerships 66.7% equity interest in ntl (South Hertfordshire) Ltd (rounded) |
|
|
| 15,800 |
|
Notes: | |
(1) | Please refer to Exhibit 2.1 for further details. |
(2) | Please refer to Exhibit 3.0 for further details. |
(3) | Our concluded value reflects the lower end of the range of values due to the integrated nature of the Company, its relative size and growth potential. |
(4) | Please refer to Exhibit 2.2 for further details. |
(5) | Net debt figure taken from Q3 financials and confirmed by Management. |
Virgin Media, Inc. |
| Exhibit 2.1 |
Valuation of ntl (South Hertfordshire) Limited
Discounted Cash Flow Analysis
As of September 30, 2010
£’s thousands
|
|
|
| Historic |
|
|
|
|
| Projected Year Ending December, 31 |
|
|
| |||||||||||||||||||||
|
| Notes |
| 2008 |
| 2009 |
| H1 2010 A |
| H2 2010 E |
| 2010 |
| 2011 |
| 2012 |
| 2013 |
| 2014 |
| 2015 |
| 2016 |
| 2017 |
| 2018 |
| 2019 |
| Residual |
| |
|
|
|
|
|
|
|
|
|
|
|
|
|
|
|
|
|
|
|
|
|
|
|
|
|
|
|
|
|
|
|
|
|
| |
Revenue |
| (1) |
| 18,309 |
| 18,092 |
| 9,093 |
| 9,162 |
| 18,255 |
| 18,346 |
| 18,438 |
| 18,530 |
| 18,622 |
| 18,716 |
| 18,828 |
| 18,960 |
| 19,111 |
| 19,283 |
| 19,476 |
| |
% growth |
|
|
| -6.9 | % | -1.2 | % |
|
|
|
| 0.90 | % | 0.50 | % | 0.50 | % | 0.50 | % | 0.50 | % | 0.50 | % | 0.60 | % | 0.70 | % | 0.80 | % | 0.90 | % | 1.00 | % | |
|
|
|
|
|
|
|
|
|
|
|
|
|
|
|
|
|
|
|
|
|
|
|
|
|
|
|
|
|
|
|
|
|
| |
EBITDA |
| (2) |
| 6,483 |
| 6,856 |
|
|
|
|
| 6,937 |
| 6,971 |
| 7,006 |
| 7,041 |
| 7,077 |
| 7,112 |
| 7,155 |
| 7,205 |
| 7,262 |
| 7,328 |
| 7,401 |
| |
% of revenue |
|
|
| 35.4 | % | 37.9 | % |
|
|
|
| 38.0 | % | 38.0 | % | 38.0 | % | 38.0 | % | 38.0 | % | 38.0 | % | 38.0 | % | 38.0 | % | 38.0 | % | 38.0 | % | 38.0 | % | |
|
|
|
|
|
|
|
|
|
|
|
|
|
|
|
|
|
|
|
|
|
|
|
|
|
|
|
|
|
|
|
|
|
| |
Depreciation of new capex |
| (3) |
| 1,720 |
| 1,225 |
|
|
|
|
| 548 |
| 988 |
| 1,210 |
| 1,492 |
| 1,726 |
| 1,921 |
| 2,084 |
| 2,220 |
| 2,337 |
| 2,437 |
| 2,921 |
| |
% of revenue |
|
|
| 9.4 | % | 6.8 | % |
|
|
|
| 3.0 | % | 5.4 | % | 6.6 | % | 8.1 | % | 9.3 | % | 10.3 | % | 11.1 | % | 11.7 | % | 12.2 | % | 12.6 | % | 15.0 | % | |
|
|
|
|
|
|
|
|
|
|
|
|
|
|
|
|
|
|
|
|
|
|
|
|
|
|
|
|
|
|
|
|
|
| |
Taxable Income |
| (3) |
| 4,763 |
| 5,631 |
|
|
|
|
| 6,389 |
| 5,983 |
| 5,797 |
| 5,549 |
| 5,350 |
| 5,191 |
| 5,071 |
| 4,984 |
| 4,926 |
| 4,891 |
| 4,480 |
| |
% of revenue |
|
|
| 26.0 | % | 31.1 | % |
|
|
|
| 35.0 | % | 32.6 | % | 31.4 | % | 29.9 | % | 28.7 | % | 27.7 | % | 26.9 | % | 26.3 | % | 25.8 | % | 25.4 | % | 23.0 | % | |
|
|
|
|
|
|
|
|
|
|
|
|
|
|
|
|
|
|
|
|
|
|
|
|
|
|
|
|
|
|
|
|
|
| |
Tax Rate |
| (4) |
|
|
|
|
|
|
|
|
| 28.0 | % | 27.0 | % | 26.0 | % | 25.0 | % | 24.0 | % | 24.0 | % | 24.0 | % | 24.0 | % | 24.0 | % | 24.0 | % | 24.0 | % | |
Corporate Taxes |
|
|
|
|
|
|
|
|
|
|
| (1,789 | ) | (1,615 | ) | (1,507 | ) | (1,387 | ) | (1,284 | ) | (1,246 | ) | (1,217 | ) | (1,196 | ) | (1,182 | ) | (1,174 | ) | (1,075 | ) | |
Income After Tax |
|
|
|
|
|
|
|
|
|
|
| 4,600 |
| 4,368 |
| 4,290 |
| 4,162 |
| 4,066 |
| 3,945 |
| 3,854 |
| 3,788 |
| 3,743 |
| 3,717 |
| 3,404 |
| |
|
|
|
|
|
|
|
|
|
|
|
|
|
|
|
|
|
|
|
|
|
|
|
|
|
|
|
|
|
|
|
|
|
| |
Cash Flow Adjustments |
|
|
|
|
|
|
|
|
|
|
|
|
|
|
|
|
|
|
|
|
|
|
|
|
|
|
|
|
|
|
|
|
| |
Plus: Depreciation of new capex |
| (3) |
|
|
|
|
|
|
|
|
| 548 |
| 988 |
| 1,210 |
| 1,492 |
| 1,726 |
| 1,921 |
| 2,084 |
| 2,220 |
| 2,337 |
| 2,437 |
| 2,921 |
| |
Less: Capital Expenditure |
| (5) |
|
|
|
|
|
|
|
|
| (2,738 | ) | (2,752 | ) | (2,766 | ) | (2,779 | ) | (2,793 | ) | (2,807 | ) | (2,824 | ) | (2,844 | ) | (2,867 | ) | (2,892 | ) | (2,921 | ) | |
Less: Change in Working Capital |
| (6) |
|
|
|
|
|
|
|
|
| 13 |
| 7 |
| 7 |
| 7 |
| 7 |
| 7 |
| 9 |
| 11 |
| 12 |
| 14 |
| 15 |
| |
Total Cash Flow Adjustments |
|
|
|
|
|
|
|
|
|
|
| (2,178 | ) | (1,756 | ) | (1,549 | ) | (1,280 | ) | (1,060 | ) | (879 | ) | (732 | ) | (613 | ) | (518 | ) | (442 | ) | 15 |
| |
|
|
|
|
|
|
|
|
|
|
|
|
|
|
|
|
|
|
|
|
|
|
|
|
|
|
|
|
|
|
|
|
|
| |
Free Cash Flow |
|
|
|
|
|
|
|
|
|
|
| 2,423 |
| 2,611 |
| 2,741 |
| 2,882 |
| 3,006 |
| 3,066 |
| 3,122 |
| 3,175 |
| 3,226 |
| 3,275 |
| 3,420 |
| |
|
|
|
|
|
|
|
|
|
|
|
|
|
|
|
|
|
|
|
|
|
|
|
|
|
|
|
|
|
|
|
|
|
| |
Partial Period |
|
|
|
|
|
|
|
|
|
|
| 0.252 |
| 1.000 |
| 1.000 |
| 1.000 |
| 1.000 |
| 1.000 |
| 1.000 |
| 1.000 |
| 1.000 |
| 1.000 |
|
|
| |
Mid-Period |
|
|
|
|
|
|
|
|
|
|
| 0.126 |
| 0.752 |
| 1.752 |
| 2.752 |
| 3.752 |
| 4.752 |
| 5.752 |
| 6.752 |
| 7.752 |
| 8.752 |
|
|
| |
Discount Rate |
| (7) |
|
|
|
|
|
|
|
|
| 9.9 | % | 9.9 | % | 9.9 | % | 9.9 | % | 9.9 | % | 9.9 | % | 9.9 | % | 9.9 | % | 9.9 | % | 9.9 | % |
|
| |
Present Value Factor |
|
|
|
|
|
|
|
|
|
|
| 0.988 |
| 0.931 |
| 0.848 |
| 0.771 |
| 0.702 |
| 0.639 |
| 0.581 |
| 0.529 |
| 0.481 |
| 0.438 |
|
|
| |
Present Value of Cash Flows |
|
|
|
|
|
|
|
|
|
|
| 603 |
| 2,432 |
| 2,323 |
| 2,223 |
| 2,110 |
| 1,958 |
| 1,814 |
| 1,679 |
| 1,552 |
| 1,434 |
|
|
| |
|
|
|
|
|
|
|
|
|
|
|
|
|
|
|
|
|
|
|
|
|
|
|
|
|
|
|
|
|
|
|
|
|
| |
Residual Year Cash Flow |
|
|
|
|
|
|
|
|
|
|
| 3,420 |
|
|
|
|
|
|
|
|
|
|
|
|
|
|
|
|
|
|
|
|
| |
Discount Rate (k) |
|
|
|
|
|
|
|
|
|
|
| 9.9 | % |
|
|
|
|
|
|
|
|
|
|
|
|
|
|
|
|
|
|
|
| |
Long-term growth rate (g) |
| (8) |
|
|
|
|
|
|
|
|
| 1.0 | % |
|
|
|
|
|
|
|
|
|
|
|
|
|
|
|
|
|
|
|
| |
Capitalisation Rate (k-g) |
|
|
|
|
|
|
|
|
|
|
| 8.9 | % |
|
|
|
|
|
|
|
|
|
|
|
|
|
|
|
|
|
|
|
| |
|
|
|
|
|
|
|
|
|
|
|
|
|
|
|
|
|
|
|
|
|
|
|
|
|
|
|
|
|
|
|
|
|
| |
Terminal Value |
|
|
|
|
|
|
|
|
|
|
| 38,425 |
|
|
|
|
|
|
|
|
|
|
|
|
|
|
|
|
|
|
|
|
| |
PV Factor |
|
|
|
|
|
|
|
|
|
|
| 0.438 |
|
|
|
|
|
|
|
|
|
|
|
|
|
|
|
|
|
|
|
|
| |
PV of Terminal Value |
|
|
|
|
|
|
|
|
|
|
| 16,819 |
|
|
|
|
|
|
|
|
|
|
|
|
|
|
|
|
|
|
|
|
| |
|
|
|
|
|
|
|
|
|
|
|
|
|
|
|
|
|
|
|
|
|
|
|
|
|
|
|
|
|
|
|
|
|
| |
Sum of PV of Cash Flows |
|
|
|
|
|
|
|
|
|
|
| 18,127 |
|
|
|
|
|
|
|
|
|
|
|
|
|
|
|
|
|
|
|
|
| |
|
|
|
|
|
|
|
|
|
|
|
|
|
|
|
|
|
|
|
|
|
|
|
|
|
|
|
|
|
|
|
|
|
| |
Total Business Enterprise Value - Excluding NOL/ Capital Allowances |
|
|
|
|
|
|
|
|
|
|
| £ | 34,945 |
|
|
|
|
|
|
|
|
|
|
|
|
|
|
|
|
|
|
|
|
|
|
|
|
|
|
|
|
|
|
|
|
|
|
|
|
|
|
|
|
|
|
|
|
|
|
|
|
|
|
|
|
|
|
| |
Concluded Business Enterprise Value Range - Excluding NOL/ Capital Allowances (rounded) (9) |
|
|
|
|
|
|
| 33,100 |
| — |
| £ | 37,000 |
|
|
|
|
|
|
|
|
|
|
|
|
|
|
|
|
|
|
|
|
|
Notes: | |
(1) | Historic revenue and revenue drivers provided by Management. The 2010 figures presented include 6 months of actual results. Projections developed based on discussions with Management and review of analyst forecasts for Virgin Media and the industry. |
(2) | EBITDA margins are assumed to be consistent with historic levels. A small improvement reflects expectations for the market as a whole. |
(3) | Taxable depreciation is calculated based on annual forecast Capex, using a reducing balance methodolgy, and a rate of 20% in 2010 and 2011, dropping to 18% from 2012. The historic tax base is considered separately. In the terminal year, depreciation is assumed to be equal to capex. |
(4) | Projected UK corporate tax rates. |
(5) | Capital Expenditure assumed to be 15.0% of total revenue, based on discussions with Management regarding the long term requirements of the business. |
(6) | Required Working Capital assumed to be -8.0% of total revenue, based on comparable company analysis. |
(7) | Discount rate calculated based on a WACC calculation. |
(8) | Long term growth rate of 1% applied. |
(9) | Range based on a discount rate range of 1% around the selected discount rate. |
Virgin Media, Inc. | Exhibit 2.2 |
Valuation of ntl (South Hertfordshire) Limited |
|
Value of Tax Position |
|
As of September 30, 2010 |
|
£’s thousands |
|
|
|
|
|
|
| Projected Year Ending December, 31 |
| ||||||||||||||||||||
|
| Notes |
|
|
| 2010 |
| 2011 |
| 2012 |
| 2013 |
| 2014 |
| 2015 |
| 2016 |
| 2017 |
| 2018 |
| 2019 |
| 2020 |
|
|
|
|
|
|
|
|
|
|
|
|
|
|
|
|
|
|
|
|
|
|
|
|
|
|
|
|
|
Taxable Income |
| (1) |
|
|
| 6,389 |
| 5,873 |
| 5,355 |
| 4,834 |
| 4,311 |
| 4,332 |
| 4,361 |
| 4,395 |
| 4,435 |
| 4,481 |
| 4,480 |
|
|
|
|
|
|
|
|
|
|
|
|
|
|
|
|
|
|
|
|
|
|
|
|
|
|
|
|
|
Available Tax Shield: |
|
|
|
|
|
|
|
|
|
|
|
|
|
|
|
|
|
|
|
|
|
|
|
|
|
|
|
Opening balance |
| (2) |
|
|
| 52,134 |
| 45,745 |
| 39,872 |
| 34,516 |
| 29,682 |
| 25,371 |
| 21,039 |
| 16,678 |
| 12,283 |
| 7,848 |
| 3,368 |
|
Taxable Income |
|
|
|
|
| 6,389 |
| 5,873 |
| 5,355 |
| 4,834 |
| 4,311 |
| 4,332 |
| 4,361 |
| 4,395 |
| 4,435 |
| 4,481 |
| 3,368 |
|
Closing balance |
|
|
|
|
| 45,745 |
| 39,872 |
| 34,516 |
| 29,682 |
| 25,371 |
| 21,039 |
| 16,678 |
| 12,283 |
| 7,848 |
| 3,368 |
| 0 |
|
|
|
|
|
|
|
|
|
|
|
|
|
|
|
|
|
|
|
|
|
|
|
|
|
|
|
|
|
UK Corporate Tax Rate |
| (3) |
|
|
| 28 | % | 27 | % | 26 | % | 25 | % | 24 | % | 24 | % | 24 | % | 24 | % | 24 | % | 24 | % | 24 | % |
|
|
|
|
|
|
|
|
|
|
|
|
|
|
|
|
|
|
|
|
|
|
|
|
|
|
|
|
Tax Saved |
|
|
|
|
| 1,789 |
| 1,586 |
| 1,392 |
| 1,209 |
| 1,035 |
| 1,040 |
| 1,047 |
| 1,055 |
| 1,064 |
| 1,075 |
| 808 |
|
|
|
|
|
|
|
|
|
|
|
|
|
|
|
|
|
|
|
|
|
|
|
|
|
|
|
|
|
Partial Period |
|
|
|
|
| 0.252 |
| 1.000 |
| 1.000 |
| 1.000 |
| 1.000 |
| 1.000 |
| 1.000 |
| 1.000 |
| 1.000 |
| 1.000 |
| 1.000 |
|
Mid Period |
|
|
|
|
| 0.126 |
| 0.752 |
| 1.752 |
| 2.752 |
| 3.752 |
| 4.752 |
| 5.752 |
| 6.752 |
| 7.752 |
| 8.752 |
| 9.752 |
|
Discount Rate |
| (4) |
| 14.7 | % | 0.983 |
| 0.902 |
| 0.787 |
| 0.686 |
| 0.598 |
| 0.521 |
| 0.455 |
| 0.396 |
| 0.346 |
| 0.301 |
| 0.263 |
|
|
|
|
|
|
|
|
|
|
|
|
|
|
|
|
|
|
|
|
|
|
|
|
|
|
|
|
|
Present Value of Cash Flows |
|
|
|
|
| 443 |
| 1,431 |
| 1,095 |
| 829 |
| 619 |
| 542 |
| 476 |
| 418 |
| 368 |
| 324 |
| 212 |
|
|
|
|
|
|
|
|
|
|
|
|
|
|
|
|
|
|
|
|
|
|
|
|
|
|
|
|
|
Sum of PV of Cash Flows |
|
|
|
|
| 6,758 |
|
|
|
|
|
|
|
|
|
|
|
|
|
|
|
|
|
|
|
|
|
|
|
|
|
|
|
|
|
|
|
|
|
|
|
|
|
|
|
|
|
|
|
|
|
|
|
|
|
FMV of Tax Position (rounded) |
|
|
|
|
| 6,800 |
|
|
|
|
|
|
|
|
|
|
|
|
|
|
|
|
|
|
|
|
|
Notes:
(1) See Exhibit 2.1
(2) Provided by Management as per 31 December 2009.
(3) UK Corporate tax rates.
(4) A discount rate in line with the required return on equity capital has been applied.
Virgin Media, Inc. | Exhibit 3.0 |
Valuation of ntl (South Hertfordshire) Limited |
|
Market Approach Summary |
|
As of September 30, 2010 |
|
£’s thousands |
|
|
|
|
| Selected Multiple |
|
|
|
|
| ||||
|
| Metric |
| Low |
| High |
| BEV Value Range |
| ||||
|
|
|
|
|
|
|
|
|
|
|
| ||
Comparable Companies (1): |
|
|
|
|
|
|
|
|
|
|
| ||
|
|
|
|
|
|
|
|
|
|
|
| ||
2010 EBITDA (2) |
| 6,937 |
| 5.00 x | - |
| 6.00 x |
| 34,684 | - |
| 41,620 |
|
|
|
|
|
|
|
|
|
|
|
|
| ||
Comparable Transactions (3): |
|
|
|
|
|
|
|
|
|
|
| ||
|
|
|
|
|
|
|
|
|
|
|
| ||
2010 EBITDA (2) |
| 6,937 |
| 5.75 x | - |
| 6.25 x |
| 39,886 | - |
| 43,355 |
|
|
|
|
|
|
|
|
|
|
|
|
| ||
Selected BEV Range, before value of tax position (100% basis) |
|
|
|
|
|
|
| 35,000 |
| 41,000 |
| ||
|
|
|
|
|
|
|
|
|
|
|
| ||
Implied 2010 Revenue Multiple (2) |
|
|
|
|
|
|
| 1.92 x |
| 2.25 x |
| ||
Notes:
(1) Refer to Exhibit 3.1 for further details.
(2) Projected financial figures includes actual results to June 30, 2010. Second half year based on discussions with Management.
(3) Refer to Exhibit 3.2 for further details.
Virgin Media, Inc. | Exhibit 3.1 |
Valuation of ntl (South Hertfordshire) Limited |
|
Comparable Company Multiples |
|
As of September 30, 2010 |
|
£’s thousands |
|
|
| MARKET DATA AT 30-September-10 |
| REVENUE MULTIPLES |
| EBITDA MULTIPLES |
| ||||||||||||||||||||||
Company Name |
| Market |
| Net Debt |
| Minority |
| Enterprise |
| 2008 |
| 2009 |
| LTM |
| 2010 |
| 2011 |
| 2008 |
| 2009 |
| LTM |
| 2010 |
| 2011 |
|
|
|
|
|
|
|
|
|
|
|
|
|
|
|
|
|
|
|
|
|
|
|
|
|
|
|
|
|
|
|
Comparable Company Multiples |
|
|
|
|
|
|
|
|
|
|
|
|
|
|
|
|
|
|
|
|
|
|
|
|
|
|
|
|
|
Virgin Media, Inc. |
| 4,857 |
| 5,716 |
| — |
| 10,573 |
| 1.8 x |
| 2.4 x |
| 2.7 x |
| 2.7 x |
| 2.6 x |
| 5.2 x |
| 6.7 x |
| 7.2 x |
| 7.2 x |
| 6.7 x |
|
Telenet Holding NV |
| 2,756 |
| 2,065 |
| — |
| 4,820 |
| 3.1 x |
| 3.7 x |
| 3.8 x |
| 3.7 x |
| 3.5 x |
| 6.5 x |
| 7.3 x |
| 7.9 x |
| 7.3 x |
| 6.9 x |
|
Liberty Global Inc. |
| 7,508 |
| 18,512 |
| 348 |
| 26,368 |
| 2.4 x |
| 2.6 x |
| 2.2 x |
| 3.0 x |
| 2.8 x |
| 5.8 x |
| 6.1 x |
| 5.1 x |
| 6.7 x |
| 6.3 x |
|
Cablevision Systems Corporation |
| 7,983 |
| 11,331 |
| 16 |
| 19,330 |
| 2.3 x |
| 2.6 x |
| 2.4 x |
| 2.7 x |
| 2.5 x |
| 7.4 x |
| 8.0 x |
| 7.3 x |
| 7.4 x |
| 6.9 x |
|
Cogeco Cable Inc. |
| 1,771 |
| 983 |
| — |
| 2,755 |
| 2.3 x |
| 2.1 x |
| 2.2 x |
| 2.1 x |
| 2.0 x |
| 5.7 x |
| 5.2 x |
| 5.4 x |
| 5.3 x |
| 5.1 x |
|
Comcast Corporation |
| 50,743 |
| 26,978 |
| 232 |
| 77,953 |
| 2.3 x |
| 2.2 x |
| 2.1 x |
| 2.1 x |
| 2.0 x |
| 6.0 x |
| 5.6 x |
| 5.6 x |
| 5.4 x |
| 5.1 x |
|
Mediacom Communications Corp. |
| 452 |
| 3,314 |
| — |
| 3,766 |
| 2.6 x |
| 2.5 x |
| 2.5 x |
| 2.5 x |
| 2.4 x |
| 7.3 x |
| 6.9 x |
| 7.0 x |
| 6.8 x |
| 6.6 x |
|
Time Warner Cable Inc. |
| 19,189 |
| 20,733 |
| 4 |
| 39,926 |
| 2.0 x |
| 2.0 x |
| 2.2 x |
| 2.1 x |
| 2.0 x |
| 5.7 x |
| 5.7 x |
| 6.0 x |
| 5.8 x |
| 5.6 x |
|
ZON Multimedia Servicos de Telecomunicacoes e Multimedia SGPS SA |
| 896 |
| 772 |
| 9 |
| 1,678 |
| 2.1 x |
| 2.6 x |
| 2.0 x |
| 1.9 x |
| 1.8 x |
| 6.8 x |
| 7.4 x |
| 5.9 x |
| 5.7 x |
| 5.4 x |
|
British Sky Broadcasting Group plc (2) |
| 12,306 |
| 1,409 |
| — |
| 13,715 |
| 2.0 x |
| 2.1 x |
| 2.3 x |
| 2.3 x |
| 2.1 x |
| 9.3 x |
| 10.4 x |
| 11.2 x |
| 10.4 x |
| 9.2 x |
|
TalkTalk Telecom Group PLC |
| 1,341 |
| 361 |
| — |
| 1,702 |
| N/M |
| N/M |
| 1.2 x |
| 1.0 x |
| 0.9 x |
| N/M |
| N/M |
| 8.2 x |
| 6.3 x |
| 5.9 x |
|
BT Group plc |
| 10,863 |
| 10,229 |
| 19 |
| 21,111 |
| 1.0 x |
| 1.0 x |
| 1.0 x |
| 1.0 x |
| 1.1 x |
| 4.4 x |
| 5.3 x |
| 4.3 x |
| 3.7 x |
| 3.7 x |
|
KCOM Group PLC. |
| 275 |
| 124 |
| — |
| 399 |
| 0.5 x |
| 0.9 x |
| 1.0 x |
| 1.0 x |
| 1.0 x |
| 4.2 x |
| 5.9 x |
| 6.2 x |
| 5.6 x |
| 5.4 x |
|
Kabel Deutschland Holding AG |
| 2,628 |
| 2,839 |
| 9 |
| 5,476 |
| N/M |
| N/M |
| 3.6 x |
| 3.5 x |
| 3.2 x |
| N/M |
| N/M |
| 8.4 x |
| 7.7 x |
| 7.0 x |
|
|
|
|
|
|
|
|
|
|
|
|
|
|
|
|
|
|
|
|
|
|
|
|
|
|
|
|
|
|
|
Min. Selected Comps |
|
|
|
|
|
|
|
|
| 0.5 x |
| 0.9 x |
| 1.0 x |
| 1.0 x |
| 0.9 x |
| 4.2 x |
| 5.2 x |
| 4.3 x |
| 3.7 x |
| 3.7 x |
|
Mean Selected Comps |
|
|
|
|
|
|
|
|
| 2.1 x |
| 2.2 x |
| 2.2 x |
| 2.2 x |
| 2.2 x |
| 5.9 x |
| 6.4 x |
| 6.5 x |
| 6.2 x |
| 5.9 x |
|
Median Selected Comps |
|
|
|
|
|
|
|
|
| 2.3 x |
| 2.4 x |
| 2.2 x |
| 2.1 x |
| 2.0 x |
| 5.8 x |
| 6.1 x |
| 6.2 x |
| 6.3 x |
| 5.9 x |
|
Max. Selected Comps |
|
|
|
|
|
|
|
|
| 3.1 x |
| 3.7 x |
| 3.8 x |
| 3.7 x |
| 3.5 x |
| 7.4 x |
| 8.0 x |
| 8.4 x |
| 7.7 x |
| 7.0 x |
|
|
| MARKET DATA AT 30-September-10 |
| REVENUE GROWTH |
| EBITDA MARGIN |
| ||||||||||||||||||||
Company Name |
| Market |
| Net Debt |
| Minority |
| Enterprise |
| 2007 to |
| 2008 to |
| 2009 to |
| 2010 to |
| 2008 |
| 2009 |
| LTM |
| 2010 |
| 2011 |
|
|
|
|
|
|
|
|
|
|
|
|
|
|
|
|
|
|
|
|
|
|
|
|
|
|
|
|
|
Comparable Company Multiples |
|
|
|
|
|
|
|
|
|
|
|
|
|
|
|
|
|
|
|
|
|
|
|
|
|
|
|
Virgin Media, Inc. |
| 4,857 |
| 5,716 |
| — |
| 10,573 |
| -1.6 | % | 0.7 | % | 1.5 | % | 4.0 | % | 34.8 | % | 36.1 | % | 37.8 | % | 38.1 | % | 39.3 | % |
Telenet Holding NV |
| 2,756 |
| 2,065 |
| — |
| 4,820 |
| 9.3 | % | 17.5 | % | 8.7 | % | 6.1 | % | 48.2 | % | 50.0 | % | 48.3 | % | 50.5 | % | 50.3 | % |
Liberty Global Inc. |
| 7,508 |
| 18,512 |
| 348 |
| 26,368 |
| 17.3 | % | 5.5 | % | -20.1 | % | 5.5 | % | 41.5 | % | 42.9 | % | 43.1 | % | 44.4 | % | 45.1 | % |
Cablevision Systems Corporation |
| 7,983 |
| 11,331 |
| 16 |
| 19,330 |
| 11.5 | % | 7.5 | % | -7.1 | % | 5.5 | % | 30.9 | % | 32.4 | % | 33.1 | % | 36.1 | % | 36.7 | % |
Cogeco Cable Inc. |
| 1,771 |
| 983 |
| — |
| 2,755 |
| 16.1 | % | 9.9 | % | 5.3 | % | 6.0 | % | 39.6 | % | 41.0 | % | 40.1 | % | 39.6 | % | 39.3 | % |
Comcast Corporation |
| 50,743 |
| 26,978 |
| 232 |
| 77,953 |
| 10.8 | % | 3.9 | % | 5.0 | % | 5.2 | % | 38.4 | % | 38.4 | % | 38.3 | % | 38.6 | % | 38.7 | % |
Mediacom Communications Corp. |
| 452 |
| 3,314 |
| — |
| 3,766 |
| 8.4 | % | 4.2 | % | 3.0 | % | 2.3 | % | 36.1 | % | 36.6 | % | 36.5 | % | 37.0 | % | 36.9 | % |
Time Warner Cable Inc. |
| 19,189 |
| 20,733 |
| 4 |
| 39,926 |
| 7.8 | % | 3.9 | % | 5.3 | % | 3.7 | % | 36.1 | % | 36.1 | % | 36.4 | % | 36.6 | % | 36.7 | % |
ZON Multimedia Servicos de Telecomunicacoes e Multimedia SGPS SA |
| 896 |
| 772 |
| 9 |
| 1,678 |
| 8.5 | % | 6.0 | % | 6.1 | % | 4.3 | % | 31.2 | % | 34.5 | % | 33.2 | % | 33.5 | % | 34.2 | % |
British Sky Broadcasting Group plc (2) |
| 12,306 |
| 1,409 |
| — |
| 13,715 |
| 6.4 | % | 10.5 | % | 7.9 | % | 6.9 | % | 21.3 | % | 19.9 | % | 20.7 | % | 21.6 | % | 22.8 | % |
TalkTalk Telecom Group PLC |
| 1,341 |
| 361 |
| — |
| 1,702 |
| N/M |
| N/M |
| N/M |
| 2.0 | % | N/M |
| N/M |
| 14.0 | % | 15.1 | % | 16.0 | % |
BT Group plc |
| 10,863 |
| 10,229 |
| 19 |
| 21,111 |
| 3.7 | % | -1.7 | % | -2.8 | % | -1.8 | % | 23.5 | % | 19.6 | % | 24.0 | % | 28.2 | % | 28.5 | % |
KCOM Group PLC. |
| 275 |
| 124 |
| — |
| 399 |
| -4.7 | % | -12.3 | % | -1.8 | % | 0.3 | % | 12.1 | % | 14.7 | % | 15.6 | % | 16.9 | % | 17.6 | % |
Kabel Deutschland Holding AG |
| 2,628 |
| 2,839 |
| 9 |
| 5,476 |
| N/M |
| N/M |
| 7.8 | % | 7.2 | % | N/M |
| 44.6 | % | 43.0 | % | 44.8 | % | 45.9 | % |
|
|
|
|
|
|
|
|
|
|
|
|
|
|
|
|
|
|
|
|
|
|
|
|
|
|
|
|
Min. Selected Comps |
|
|
|
|
|
|
|
|
| -4.7 | % | -12.3 | % | -20.1 | % | -1.8 | % | 12.1 | % | 14.7 | % | 14.0 | % | 15.1 | % | 16.0 | % |
Mean Selected Comps |
|
|
|
|
|
|
|
|
| 7.8 | % | 4.6 | % | 1.5 | % | 4.1 | % | 32.8 | % | 34.4 | % | 33.1 | % | 34.4 | % | 34.9 | % |
Median Selected Comps |
|
|
|
|
|
|
|
|
| 8.4 | % | 4.9 | % | 5.0 | % | 4.7 | % | 35.5 | % | 36.1 | % | 36.4 | % | 36.8 | % | 36.8 | % |
Max. Selected Comps |
|
|
|
|
|
|
|
|
| 17.3 | % | 17.5 | % | 8.7 | % | 7.2 | % | 48.2 | % | 50.0 | % | 48.3 | % | 50.5 | % | 50.3 | % |
|
| Working Capital |
| Capital Expenditure |
| Depreciation |
| ||||||||||||
Company Name |
| 2008 |
| 2009 |
| LTM |
| 2009 |
| LTM |
| 2010 |
| 2009 |
| LTM |
| 2010 |
|
|
|
|
|
|
|
|
|
|
|
|
|
|
|
|
|
|
|
|
|
Comparable Company Multiples |
|
|
|
|
|
|
|
|
|
|
|
|
|
|
|
|
|
|
|
Virgin Media, Inc. |
| (460 | ) | (348 | ) | (386 | ) | 569 |
| 604 |
| 634 |
| 931 |
| 954 |
| 1,471 |
|
Telenet Holding NV |
| (302 | ) | (231 | ) | (206 | ) | 234 |
| 193 |
| N/A |
| 238 |
| 243 |
| 657 |
|
Liberty Global Inc. |
| (1,008 | ) | 742 |
| 779 |
| 2,235 |
| 2,239 |
| 1,824 |
| 2,602 |
| 2,792 |
| 3,930 |
|
Cablevision Systems Corporation |
| (440 | ) | (15 | ) | 4 |
| 810 |
| 811 |
| 741 |
| 961 |
| 875 |
| 2,606 |
|
Cogeco Cable Inc. |
| (335 | ) | (193 | ) | (173 | ) | 273 |
| 293 |
| 343 |
| 243 |
| 248 |
| 515 |
|
Comcast Corporation |
| (5,223 | ) | (4,026 | ) | (2,099 | ) | 5,117 |
| 4,899 |
| 4,821 |
| 5,483 |
| 5,487 |
| 14,486 |
|
Mediacom Communications Corp. |
| (274 | ) | (214 | ) | (73 | ) | 237 |
| 250 |
| 240 |
| 232 |
| 235 |
| 556 |
|
Time Warner Cable Inc. |
| 3,786 |
| (856 | ) | (1,109 | ) | 3,231 |
| 3,174 |
| 2,932 |
| 2,836 |
| 2,936 |
| 6,880 |
|
ZON Multimedia Servicos de Telecomunicacoes e Multimedia SGPS SA |
| (302 | ) | (108 | ) | 11 |
| 219 |
| 223 |
| 228 |
| 180 |
| 197 |
| 293 |
|
British Sky Broadcasting Group plc (2) |
| (305 | ) | (217 | ) | 287 |
| 244 |
| 261 |
| 336 |
| 160 |
| 328 |
| 1,315 |
|
TalkTalk Telecom Group PLC |
| N/M |
| N/M |
| (247 | ) | N/M |
| 44 |
| 102 |
| N/M |
| 43 |
| 270 |
|
BT Group plc |
| (3,155 | ) | (3,648 | ) | (3,517 | ) | 2,525 |
| 2,438 |
| 2,598 |
| 2,401 |
| 2,295 |
| 5,746 |
|
KCOM Group PLC. |
| (29 | ) | (50 | ) | (50 | ) | 15 |
| 15 |
| 20 |
| 20 |
| 20 |
| 71 |
|
Kabel Deutschland Holding AG |
| N/M |
| (298 | ) | (190 | ) | 264 |
| 237 |
| 346 |
| 261 |
| 273 |
| 708 |
|
|
|
|
|
|
|
|
|
|
|
|
|
|
|
|
|
|
|
|
|
Min. Selected Comps |
| (5,223 | ) | (4,026 | ) | (3,517 | ) | 15 |
| 15 |
| 20 |
| 20 |
| 20 |
| 71 |
|
Mean Selected Comps |
| (671 | ) | (728 | ) | (498 | ) | 1,229 |
| 1,120 |
| 1,166 |
| 1,273 |
| 1,209 |
| 2,822 |
|
Median Selected Comps |
| (320 | ) | (217 | ) | (182 | ) | 273 |
| 277 |
| 346 |
| 261 |
| 301 |
| 1,012 |
|
Max. Selected Comps |
| 3,786 |
| 742 |
| 779 |
| 5,117 |
| 4,899 |
| 4,821 |
| 5,483 |
| 5,487 |
| 14,486 |
|
|
| Working Capital (% of Revenue) |
| Capex (% of Revenue) |
| Depreciation (% of Capex) |
| ||||||||||||
Company Name |
| 2008 |
| 2009 |
| LTM |
| 2009 |
| LTM |
| 2010 |
| 2009 |
| LTM |
| 2010 |
|
|
|
|
|
|
|
|
|
|
|
|
|
|
|
|
|
|
|
|
|
Comparable Company Multiples |
|
|
|
|
|
|
|
|
|
|
|
|
|
|
|
|
|
|
|
Virgin Media, Inc. |
| -12.2 | % | -9.2 | % | -9.9 | % | 15.0 | % | 15.5 | % | 16.4 | % | 163.5 | % | 157.8 | % | 232.1 | % |
Telenet Holding NV |
| -29.7 | % | -19.3 | % | -16.4 | % | 19.5 | % | 15.4 | % | N/A |
| 101.9 | % | 125.6 | % | N/A |
|
Liberty Global Inc. |
| -9.6 | % | 6.7 | % | 6.5 | % | 20.2 | % | 18.8 | % | 20.6 | % | 116.4 | % | 124.7 | % | 215.4 | % |
Cablevision Systems Corporation |
| -6.1 | % | -0.2 | % | 0.0 | % | 10.4 | % | 10.2 | % | 10.3 | % | 118.6 | % | 107.9 | % | 351.8 | % |
Cogeco Cable Inc. |
| -29.8 | % | -15.7 | % | -13.7 | % | 22.1 | % | 23.1 | % | 26.3 | % | 88.9 | % | 84.6 | % | 150.2 | % |
Comcast Corporation |
| -15.2 | % | -11.3 | % | -5.7 | % | 14.3 | % | 13.4 | % | 12.8 | % | 107.2 | % | 112.0 | % | 300.5 | % |
Mediacom Communications Corp. |
| -19.5 | % | -14.6 | % | -4.9 | % | 16.2 | % | 16.8 | % | 16.0 | % | 98.1 | % | 94.3 | % | 231.7 | % |
Time Warner Cable Inc. |
| 22.0 | % | -4.8 | % | -6.0 | % | 18.1 | % | 17.3 | % | 15.6 | % | 87.8 | % | 92.5 | % | 234.7 | % |
ZON Multimedia Servicos de Telecomunicacoes e Multimedia SGPS SA |
| -38.9 | % | -13.1 | % | 1.3 | % | 26.6 | % | 26.1 | % | 26.1 | % | 82.4 | % | 88.7 | % | 128.4 | % |
British Sky Broadcasting Group plc (2) |
| -6.0 | % | -3.9 | % | 4.9 | % | 4.3 | % | 4.4 | % | 5.5 | % | 65.6 | % | 125.7 | % | 391.3 | % |
TalkTalk Telecom Group PLC |
| N/M |
| N/M |
| -16.7 | % | N/M |
| 3.0 | % | 5.7 | % | N/M |
| 97.7 | % | 264.3 | % |
BT Group plc |
| -14.8 | % | -17.4 | % | -17.0 | % | 12.0 | % | 11.8 | % | 12.7 | % | 95.1 | % | 94.1 | % | 221.2 | % |
KCOM Group PLC. |
| -5.9 | % | -11.8 | % | -12.2 | % | 3.6 | % | 3.5 | % | 4.7 | % | 132.1 | % | 137.8 | % | 361.9 | % |
Kabel Deutschland Holding AG |
| N/M |
| -20.4 | % | -12.5 | % | 18.0 | % | 15.6 | % | 21.9 | % | 98.6 | % | 115.1 | % | 204.9 | % |
|
|
|
|
|
|
|
|
|
|
|
|
|
|
|
|
|
|
|
|
Min. Selected Comps |
| -38.9 | % | -20.4 | % | -17.0 | % | 3.6 | % | 3.0 | % | 4.7 | % | 65.6 | % | 84.6 | % | 128.4 | % |
Mean Selected Comps |
| -13.8 | % | -10.4 | % | -7.3 | % | 15.4 | % | 13.9 | % | 15.0 | % | 104.3 | % | 111.3 | % | 253.0 | % |
Median Selected Comps |
| -13.5 | % | -11.8 | % | -8.0 | % | 16.2 | % | 15.4 | % | 15.6 | % | 98.6 | % | 110.0 | % | 232.1 | % |
Max. Selected Comps |
| 22.0 | % | 6.7 | % | 6.5 | % | 26.6 | % | 26.1 | % | 26.3 | % | 163.5 | % | 157.8 | % | 391.3 | % |
Notes:
(1) | Data taken from Standard & Poor’s Capital IQ database. |
(2) | Multiples of British Sky Broadcasting not reflective of true multiples as the stock price is inflated due to interest from News Corp. Figures not used in deriving multiples for Revenue and EBITDA. |
Virgin Media, Inc. | Exhibit 3.2 |
Valuation of ntl (South Hertfordshire) Limited |
|
Transaction Multiples |
|
As of September 30, 2010 |
|
Local currency millions |
|
Transaction Information (1) |
| Transaction Multiples |
| ||||||||||||||||||||
Transaction ID |
| Buyer |
| Target |
| Transaction |
| Transaction |
| Percent |
| Premium paid |
| Announced |
| Closing |
| Implied |
| EV/ |
| EV/ |
|
|
|
|
|
|
|
|
|
|
|
|
|
|
|
|
|
|
|
|
|
|
|
|
|
IQTR79350592 |
| UPC Germany GmbH |
| Unitymedia GmbH |
| 3,500.0 |
| EUR |
| 100 | % | N/M |
| 11/13/2009 |
| 1/28/2010 |
| 3,500.0 |
| 2.9 x |
| 7.8 x |
|
|
|
|
|
|
|
|
|
|
|
|
|
|
|
|
|
|
|
|
|
|
|
|
|
IQTR79226169 |
| Knology, Inc. |
| Private Cable Co., LLC |
| 7.5 |
| USD |
| 100 | % | N/M |
| 11/5/2009 |
| 11/17/2009 |
| 7.5 |
| 1.5 x |
| 5.0 x |
|
|
|
|
|
|
|
|
|
|
|
|
|
|
|
|
|
|
|
|
|
|
|
|
|
IQTR58917967 |
| Talktalk Telecom Limited (nka:TalkTalk Telecom Group PLC) |
| Tiscali UK Limited |
| 236.0 |
| GBP |
| 100 | % | N/M |
| 5/8/2009 |
| 7/3/2009 |
| 236.0 |
| 0.4 x |
| 3.5 x |
|
|
|
|
|
|
|
|
|
|
|
|
|
|
|
|
|
|
|
|
|
|
|
|
|
IQTR35509672 |
| Orion Cable GmbH |
| PrimaCom AG |
| 153.0 |
| GBP |
| 74.70 | % | 6.38 | % | 7/7/2007 |
| 10/29/2007 |
| 170.0 |
| 4.6 x |
| 10.5 x |
|
|
|
|
|
|
|
|
|
|
|
|
|
|
|
|
|
|
|
|
|
|
|
|
|
IQTR30220241 |
| BT Group plc |
| PlusNet plc |
| 62.4 |
| GBP |
| 100 | % | 7.68 | % | 11/16/2006 |
| 1/24/2007 |
| 62.4 |
| 1.5 x |
| 7.5 x |
|
|
|
|
|
|
|
|
|
|
|
|
|
|
|
|
|
|
|
|
|
|
|
|
|
IQTR81932386 |
| Rogers Communications Inc. |
| Cogeco Cable Inc. |
| 116.1 |
| USD |
| 6.57 | % | 13.34 | % | 11/26/2009 |
| 12/31/2009 |
| 2,782.8 |
| 2.3 x |
| 5.6 x |
|
|
|
|
|
|
|
|
|
|
|
|
|
|
|
|
|
|
|
|
|
|
|
|
|
IQTR35126980 |
| LGI Ventures B.V. |
| Telenet Holding NV |
| 466.7 |
| EUR |
| 18.38 | % | 6.38 | % | 6/20/2007 |
| 6/20/2007 |
| 3,855.7 |
| 4.6 x |
| 10.4 x |
|
|
|
|
|
|
|
|
|
|
|
|
|
|
|
|
|
|
|
|
|
|
|
|
|
IQTR81932476 |
| Rogers Communications Inc. |
| Cogeco Inc. |
| 46.4 |
| USD |
| 9.70 | % | 11.31 | % | 11/26/2009 |
| 12/31/2009 |
| 2,202.8 |
| 1.8 x |
| 4.2 x |
|
|
|
|
|
|
|
|
|
|
|
|
|
|
|
|
|
|
|
|
|
|
|
|
|
Low |
|
|
|
|
|
|
|
|
|
|
| 4.58 | % |
|
|
|
|
|
| 0.4 x |
| 3.5 x |
|
Mean |
|
|
|
|
|
|
|
|
|
|
| 8.20 | % |
|
|
|
|
|
| 2.4 x |
| 6.8 x |
|
Median |
|
|
|
|
|
|
|
|
|
|
| 7.68 | % |
|
|
|
|
|
| 2.0 x |
| 6.5 x |
|
High |
|
|
|
|
|
|
|
|
|
|
| 13.34 | % |
|
|
|
|
|
| 4.6 x |
| 10.5 x |
|
N/M: Not Meaningful. Multiple negative, abnormal or not disclosed
Notes:
(1) Data taken from Standard & Poor’s Capital IQ database.
(2) Premium over average share price in the 30 days prior to announcement.
Virgin Media, Inc. | Supporting Exhibit 1.0 |
Valuation of ntl (South Hertfordshire) Limited |
|
Revenue Support Schedule |
|
As of September 30, 2010 |
|
£’s thousands |
|
|
|
|
| Historic |
| Projected Year Ending December, 31 |
| ||||||||||||||||||||||||
|
| Notes |
| 2008 |
| 2009 |
| H1 2010 A |
| H2 2010 E |
| 2010 |
| 2011 |
| 2012 |
| 2013 |
| 2014 |
| 2015 |
| 2016 |
| 2017 |
| 2018 |
| 2019 |
|
|
|
|
|
|
|
|
|
|
|
|
|
|
|
|
|
|
|
|
|
|
|
|
|
|
|
|
|
|
|
|
|
Average Number of Subscribers |
| (1) |
| 34,293 |
| 33,477 |
| 34,177 |
| 34,703 |
| 34,573 |
| 34,746 |
| 34,920 |
| 35,094 |
| 35,270 |
| 35,446 |
| 35,578 |
| 35,746 |
| 35,950 |
| 36,192 |
|
ARPU (monthly) |
| (2) |
| 44.49 |
| 45.04 |
| 44.34 |
| 44.00 |
| 44.00 |
| 44.00 |
| 44.00 |
| 44.00 |
| 44.00 |
| 44.00 |
| 44.10 |
| 44.20 |
| 44.30 |
| 44.40 |
|
Revenue |
| (3) |
| 18,309 |
| 18,092 |
| 9,093 |
| 9,162 |
| 18,255 |
| 18,346 |
| 18,438 |
| 18,530 |
| 18,622 |
| 18,716 |
| 18,828 |
| 18,960 |
| 19,111 |
| 19,283 |
|
% growth |
|
|
| -6.86 | % | -1.19 | % | N/A |
| N/A |
| 0.90 | % | 0.50 | % | 0.50 | % | 0.50 | % | 0.50 | % | 0.50 | % | 0.60 | % | 0.70 | % | 0.80 | % | 0.90 | % |
Notes:
(1) Historic subscriber numbers provided by Management. Projections based on discussions with Management, historic trends and the maturity of the Company.
(2) Monthly Average Revenue Per User (“ARPU”) assumed to be constant throughout the projection period. This is based on discussions with Management, review of analyst expectations for the industry and Virgin Media. A small increase in ARPU in the outer years reflects the company being able to pass on price inflation.
(3) Revenue for 2010 includes actual revenue from the first 2 quarters. The growth seen between 2009 and 2010, following negative growth, reflects a strong first quarter. Revenue assumed to grow at 0.5% from 2011 to 2015 and increasing to 1% in the terminal year.