UNITED STATES
SECURITIES AND EXCHANGE COMMISSION
Washington, D.C. 20549
FORM N-CSR
Certified Shareholder Report of
Registered Management Investment Companies
Investment Company Act File Number: 811-05888
SMALLCAP World Fund, Inc.
(Exact Name of Registrant as Specified in Charter)
6455 Irvine Center Drive
Irvine, California 92618
(Address of Principal Executive Offices)
Registrant's telephone number, including area code: (949) 975-5000
Date of fiscal year end: September 30
Date of reporting period: September 30, 2022
Hong T. Le
SMALLCAP World Fund, Inc.
6455 Irvine Center Drive
Los Angeles, California 90071
(Name and Address of Agent for Service)
ITEM 1 – Reports to Stockholders
| SMALLCAP World Fund® |  |
| |
Annual report
for the year ended
September 30, 2022 |

We believe small
companies around
the world can provide
opportunities for
investors
SMALLCAP World Fund seeks to provide you with long-term growth of capital.
This fund is one of more than 40 offered by Capital Group, home of American Funds, one of the nation’s largest mutual fund families. For over 90 years, Capital Group has invested with a long-term focus based on thorough research and attention to risk.
Fund results shown in this report, unless otherwise indicated, are for Class F-2 shares. Class A share results are shown at net asset value unless otherwise indicated. If a sales charge (maximum 5.75%) had been deducted from Class A shares, the results would have been lower. Results are for past periods and are not predictive of results for future periods. Current and future results may be lower or higher than those shown. Prices and returns will vary, so investors may lose money. Investing for short periods makes losses more likely. For current information and month-end results, visit capitalgroup.com.
Refer to page 4 for Class F-2 and Class A share results with relevant sales charges deducted and fund expenses. For other share class results, visit capitalgroup.com and americanfundsretirement.com.
Investment results assume all distributions are reinvested and reflect applicable fees and expenses. When applicable, results reflect fee waivers and/or expense reimbursements, without which they would have been lower. Visit capitalgroup.com for more information.
Investing outside the United States may be subject to risks, such as currency fluctuations and political instability. These risks may be heightened in connection with investments in developing countries. Investing in small-capitalization stocks can involve greater risk than is customarily associated with investing in stocks of larger, more established companies. Refer to the fund prospectus and the Risk Factors section of this report for more information on these and other risks associated with investing in the fund.
Investments are not FDIC-insured, nor are they deposits of or guaranteed by a bank or any other entity, so they may lose value.
Contents
| 1 | Letter to investors |
| | |
| 4 | The value of a long-term perspective |
| | |
| 6 | Investment portfolio |
| | |
| 28 | Financial statements |
| | |
| 54 | Board of directors and other officers |
Fellow investors:
Calendar year 2022 presented us with one of the most complex and uncertain market environments in our recent history. SMALLCAP World Fund saw a negative return of 35.23% (F-2 shares) for the fund’s 12-month fiscal year ended September 30, 2022. This compares with a 24.80% decline for the fund’s primary benchmark index, the MSCI All Country World Small Cap Index, an unmanaged measure of small capitalization companies from around the world.
Record-high inflation, rising interest rates and currency fluctuations, all coming on the heels of unprecedented fiscal stimulus over the course of the COVID-19 pandemic, are just a few of the investment headwinds to emerge over the last 12 months.
As fellow shareholders, we are as disappointed in the fund’s results as you surely are. It is worth noting that despite the results this year, SMALLCAP World Fund has outpaced its benchmark index over an extended time horizon — including the five-year, ten-year and lifetime results. We are confident in the opportunities SMALLCAP World Fund provides to its investors — based on the work of our global research team of 18 portfolio managers and over 120 research analysts that are out meeting with companies every day to identify the market disruptors, technology innovators and industry standard-setters that may provide growth of capital over the next decade for our shareholders.
The year in review
First and foremost, we want our investors to know that many of the investment professionals working on behalf of this fund have weathered similar difficulties before. Given our extensive tenure and experience, this is not our first downturn.
Results at a glance
For periods ended September 30, 2022, with all distributions reinvested
| | | Cumulative
total returns | | Average annual total returns |
| | | 1 year | | 5 years | | 10 years | | Lifetime1 |
| | | | | | | | | | | | | |
| SMALLCAP World Fund (Class F-2 shares2) | | | –35.23 | % | | | 4.31 | % | | | 8.34 | % | | | 9.16 | % |
| SMALLCAP World Fund (Class A shares) | | | –35.39 | | | | 4.05 | | | | 8.05 | | | | 8.89 | |
| MSCI All Country World Small Cap Index3 | | | –24.80 | | | | 2.32 | | | | 7.02 | | | | 7.42 | |
| 1 | Lifetime returns are as of April 30, 1990, the inception date of Class A shares. | |
| 2 | Class F-2 shares were first offered on August 1, 2008. Class F-2 share results prior to the date of first sale are hypothetical based on the results of the original share class of the fund without a sales charge, adjusted for typical estimated expenses. Visit capitalgroup.com for more information on specific expense adjustments and the actual dates of first sale. |
| 3 | The MSCI All Country World Small Cap Index is unmanaged and, therefore, has no expenses. Investors cannot invest directly in an index. Results reflect dividends net of withholding taxes. Because the index was not in existence when the fund’s Class A shares were first sold, cumulative returns through May 31, 1994, reflect the returns of the S&P Developed <$1.2 Billion Index. MSCI source: MSCI. S&P source: S&P Dow Jones Indices LLC. The MSCI All Country World Small Cap Index captures small cap representation across 23 Developed Markets and 24 Emerging Markets countries. With 6,348 constituents, the index covers about 14% of the free float-adjusted market capitalization in each country. |
Our foundation is built on years of expertise, and we are confident that we are in a better position today in terms of our in-depth research capabilities than we have ever been before.
A perfect storm of elements came together this year to create an incredibly complex market backdrop. We are in the midst of battling stubbornly persistent inflation, strong currency headwinds and increasingly hawkish central banks. Rising interest rates have negatively impacted elevated equity valuations and price-to-earnings (P/E) growth multiples across the board. Record-high energy bills, and the inflationary pressures that inevitably follow, have left consumers with less disposable income and corporations with lower earnings. Outside of the U.S., our holdings have been exposed to significant currency headwinds in the face of the strong U.S. dollar.
In Europe, the Russia-Ukraine war has created a severe energy crisis forcing countries to find new sources of natural gas and renewable energy at higher prices for the consumer. Meanwhile, in China, GDP growth has decelerated materially owing to a slowdown in the property sector and the ongoing COVID-19 lockdowns. In the United States, the Fed has taken one of the most aggressive stances relative to its global central bank peers on tackling high inflation, by taking rates from near zero in the beginning of this year to over 3% as of end of September.
Among sector highlights, communication services and health care were two of the worst performing sectors over the last 12 months. Energy has been one of 2022’s few bright spots owing to the current state of geopolitical affairs and a short and steep cost curve for producers.
How the fund responded
After years of strong growth, some of the fund’s most durable holdings saw declines this year. Among our top 20 holdings, 60% had negative returns over the fiscal year period, with an average return of –8.94%. Despite market fluctuations this year, the holdings in the portfolio reflect our belief, backed by our fundamental research efforts, in the long-term potential of these companies.
Among the top contributors during the reporting period were Indian manufacturing firm Tube Investments of India (up 79.16%) and building and service provider Comfort Systems USA (up 36.47%). Among the largest detractors were database developer MongoDB (down 57.89%) and Japan-based business management and IT consulting firm BayCurrent Consulting (down 48.85%). The fund also had some exposure to Russian securities earlier in the year and those were subsequently written down.
Exposure to different sectors and industries comes from our views on the attractiveness of individual securities, rather than a top-down view. The fund saw stronger results from energy, while all other sectors were down.
Our holdings span 40 countries, as we identify compelling and differentiated opportunities across the globe. Roughly 70% of the fund’s holdings were in developed markets, with nearly 16% in emerging markets, and U.S. companies comprising just over 43% of the portfolio.
The fund closed the fiscal year with 12.5% of its assets held in cash and other short-term securities. The portfolio managers increased the fund’s liquidity to position it to capitalize on investment opportunities as they arise, and to help mitigate the effects of market volatility.
The road ahead
The early months of the COVID-19 pandemic prevented us from visiting companies and meeting with management teams. This is the foundation of our primary research process, but with the economy slowly reopening, we have been able to restart in-person engagements. We know from experience that continued in-person collaboration and first-hand research will arm our investment professionals with the best insights necessary to make the best possible investment decisions.
We agree with the Fed’s focus on breaking inflation and — although it has, and will be, a painful remedy — the first dose of medicine is showing early response signs in the deceleration of the employment market. There are differing views among our investment professionals on the potential severity and duration of the market downturn ahead. It remains to be seen how long and difficult the road ahead will be over the short-to-medium-term, but we would remind our fellow investors that, historically, bear markets and recessions have preceded strong bull markets and economic recovery.
Despite an extremely challenging geopolitical environment, we see potential for the next 12–36 months to provide a more supportive backdrop for equities globally. We are continuing to find compelling investment opportunities both within and outside of the U.S.
Regardless of the market backdrop, good companies and agile management teams with strong product and service offerings should be able to successfully navigate this environment. Against these challenging conditions and this year’s disappointing results, we see a small-cap market with dynamic companies that may be the standard bearers of innovation for years to come.
Our job is to make sure we are investing in the companies with the best prospects for future growth for our shareholders. We believe that prudent stock selection and Capital Group’s commitment to deep, fundamental research will support superior long-term outcomes for our clients. As always, we thank you for the trust you have placed in us, and your continued support of SMALLCAP World Fund. We look forward to reporting to you again in six months.
Cordially,

Julian N. Abdey
Co-President

Jonathan Knowles
Co-President

Gregory W. Wendt
Co-President
November 8, 2022
For current information about the fund, visit capitalgroup.com.
The value of a long-term perspective
Fund results shown are for Class F-2 shares and Class A shares. Class A share results reflect deduction of the maximum sales charge of 5.75% on the $10,000 investment¹; thus, the net amount invested was $9,425. Results are for past periods and are not predictive of results for future periods. Current and future results may be lower or higher than those shown. Prices and returns will vary, so investors may lose money. For current information and month-end results, visit capitalgroup.com.
Class F-2 shares were first offered on August 1, 2008. Class F-2 share results prior to the date of first sale are hypothetical based on the results of the original share class of the fund without a sales charge, adjusted for typical estimated expenses. Visit capitalgroup.com for more information on specific expense adjustments and the actual dates of first sale.
The results shown are before taxes on fund distributions and sale of fund shares.
| 1 | As outlined in the prospectus, the sales charge is reduced for accounts (and aggregated investments) of $25,000 or more and is eliminated for purchases of $1 million or more. There is no sales charge on dividends or capital gain distributions that are reinvested in additional shares. |
| 2 | Includes reinvested dividends and reinvested capital gain distributions. |
| 3 | The MSCI All Country World Small Cap Index is unmanaged and, therefore, has no expenses. Investors cannot invest directly in an index. Results reflect dividends net of withholding taxes. Because the index was not in existence when the fund’s Class A shares were first sold, cumulative returns through May 31, 1994, reflect the returns of the S&P Developed <$1.2 Billion Index. MSCI source: MSCI. S&P source: S&P Dow Jones Indices LLC. |
| 4 | For the period April 30, 1990, commencement of operations, through September 30, 1990. |
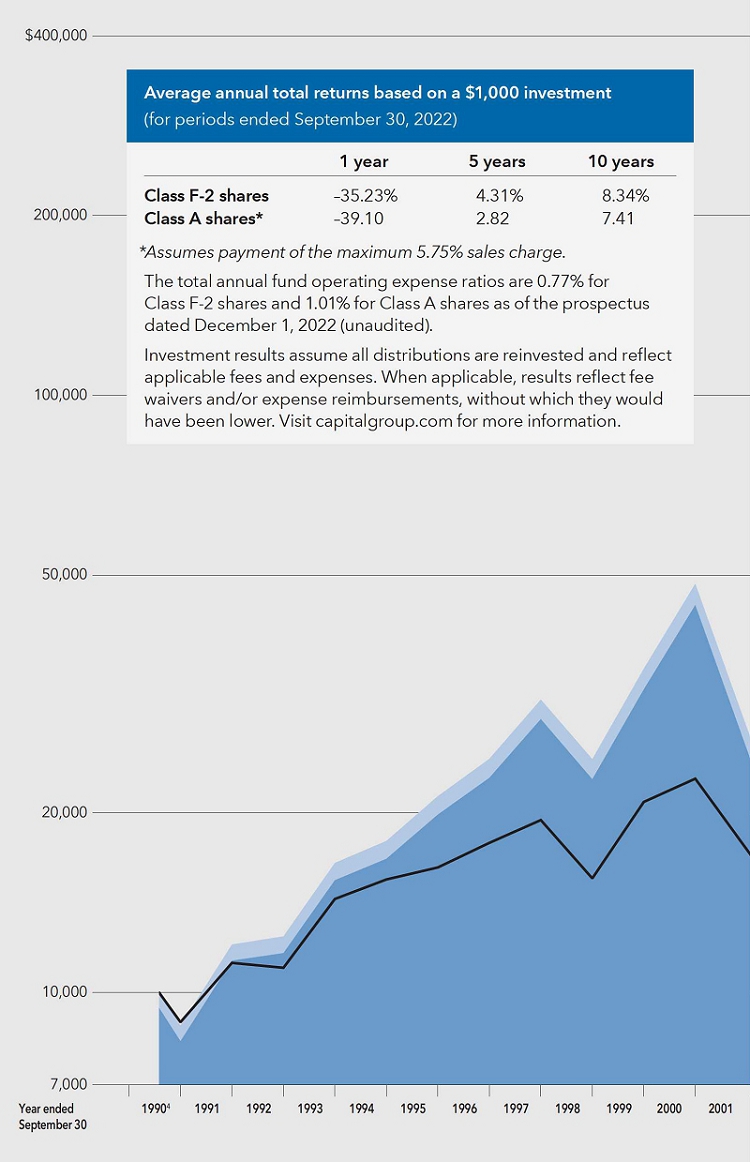
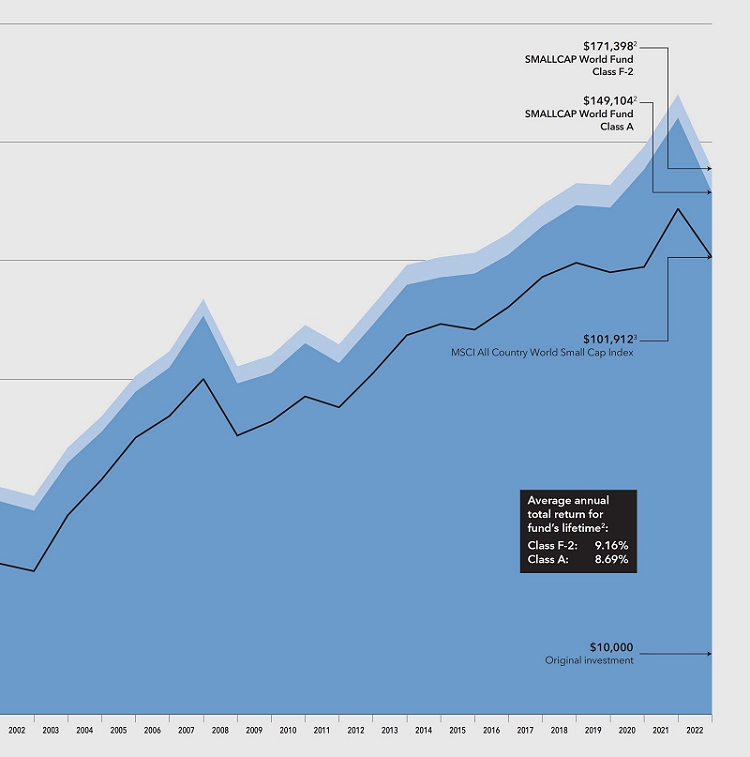
How a hypothetical $10,000 investment has grown
This chart shows how a hypothetical $10,000 investment in SMALLCAP World Fund’s Class F-2 and Class A shares grew from April 30, 1990 — the fund’s inception — through September 30, 2022, the end of the fund’s latest fiscal year. In the case of F-2 shares, the $10,000 would have grown to $171,398 with all distributions reinvested. In the case of A shares, the $10,000 would have grown to $149,104 with all distributions reinvested, even after deducting the maximum 5.75% sales charge.
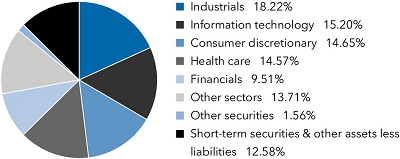
Investment portfolio September 30, 2022
| Sector diversification | Percent of net assets |
| Country diversification by domicile | | Percent of
net assets |
| United States | | | 43.89 | % |
| India | | | 6.75 | |
| Eurozone* | | | 6.22 | |
| Japan | | | 5.90 | |
| United Kingdom | | | 4.76 | |
| Sweden | | | 3.49 | |
| China | | | 2.66 | |
| Canada | | | 2.56 | |
| Switzerland | | | 1.98 | |
| Other countries | | | 9.21 | |
| Short-term securities & other assets less liabilities | | | 12.58 | |
| * | Countries using the euro as a common currency; those represented in the fund’s portfolio are Austria, Belgium, Finland, France, Germany, Greece, Ireland, Italy, the Netherlands, Slovenia and Spain. |
| Common stocks 85.86% | | Shares | | | Value
(000) | |
| Industrials 18.22% | | | | | | | | |
| Saia, Inc.1,2 | | | 1,965,521 | | | $ | 373,449 | |
| IMCD NV | | | 2,701,267 | | | | 320,583 | |
| BayCurrent Consulting, Inc.1 | | | 1,154,900 | | | | 296,667 | |
| Chart Industries, Inc.2 | | | 1,433,298 | | | | 264,228 | |
| NIBE Industrier AB, Class B | | | 29,398,225 | | | | 261,024 | |
| Comfort Systems USA, Inc.1 | | | 2,556,739 | | | | 248,847 | |
| Diploma PLC1 | | | 9,671,977 | | | | 247,981 | |
| Armstrong World Industries, Inc.1 | | | 2,888,335 | | | | 228,843 | |
| Arcosa, Inc.1 | | | 3,862,940 | | | | 220,883 | |
| Japan Airport Terminal Co., Ltd.1,2 | | | 4,936,060 | | | | 204,235 | |
| Vicor Corp.2 | | | 3,211,006 | | | | 189,899 | |
| Visional, Inc.1,2 | | | 3,025,930 | | | | 184,944 | |
| Interpump Group SpA | | | 5,272,523 | | | | 170,547 | |
| Willscot Mobile Mini Holdings Corp., Class A2 | | | 3,981,988 | | | | 160,594 | |
| Stericycle, Inc.2 | | | 3,782,687 | | | | 159,289 | |
| BELIMO Holding AG | | | 423,990 | | | | 155,274 | |
| Harmonic Drive Systems, Inc.1,3 | | | 4,928,150 | | | | 153,146 | |
| Regal Rexnord Corp. | | | 1,087,715 | | | | 152,672 | |
| ATS Automation Tooling System, Inc.1,2 | | | 5,680,718 | | | | 149,940 | |
| Cleanaway Waste Management, Ltd. | | | 75,279,081 | | | | 130,696 | |
| Wizz Air Holdings PLC1,2 | | | 7,073,107 | | | | 124,398 | |
| EnPro Industries, Inc.1 | | | 1,455,603 | | | | 123,697 | |
| International Container Terminal Services, Inc. | | | 44,009,076 | | | | 117,664 | |
| Carel Industries SpA1 | | | 6,013,018 | | | | 112,363 | |
| VAT Group AG | | | 553,276 | | | | 111,699 | |
| Alfen NV1,2 | | | 1,189,401 | | | | 109,251 | |
| TFI International, Inc. (CAD denominated) | | | 1,130,000 | | | | 102,263 | |
| TFI International, Inc. | | | 68,200 | | | | 6,171 | |
| Boyd Group Services, Inc.3 | | | 836,324 | | | | 105,316 | |
| TransDigm Group, Inc. | | | 190,000 | | | | 99,716 | |
| Trelleborg AB, Class B | | | 5,257,264 | | | | 98,049 | |
| Spirax-Sarco Engineering PLC | | | 848,200 | | | | 97,433 | |
| Kadant, Inc. | | | 575,118 | | | | 95,935 | |
| The AZEK Co., Inc., Class A2 | | | 5,687,886 | | | | 94,533 | |
| Japan Elevator Service Holdings Co., Ltd.1 | | | 7,100,154 | | | | 91,582 | |
| TechnoPro Holdings, Inc. | | | 4,047,000 | | | | 85,076 | |
| dip Corp.1 | | | 3,341,000 | | | | 85,046 | |
| Rumo SA | | | 24,541,535 | | | | 84,075 | |
| Graco, Inc. | | | 1,374,000 | | | | 82,371 | |
| Johns Lyng Group, Ltd.1 | | | 20,594,836 | | | | 81,872 | |
| Zurn Elkay Water Solutions Corp. | | | 3,296,375 | | | | 80,761 | |
| ESCO Technologies, Inc. | | | 1,095,937 | | | | 80,486 | |
| ManpowerGroup, Inc. | | | 1,235,101 | | | | 79,899 | |
| Common stocks (continued) | | Shares | | | Value
(000) | |
| Industrials (continued) | | | | | | | | |
| KEI Industries, Ltd.1 | | | 4,526,134 | | | $ | 79,713 | |
| Watsco, Inc. | | | 300,000 | | | | 77,238 | |
| Masco Corp. | | | 1,625,000 | | | | 75,871 | |
| Matson, Inc. | | | 1,231,059 | | | | 75,735 | |
| Instalco AB1 | | | 17,900,905 | | | | 71,184 | |
| AirTAC International Group | | | 3,072,590 | | | | 70,291 | |
| Pegasus Hava Tasimaciligi AS1,2 | | | 5,314,662 | | | | 68,307 | |
| Havells India, Ltd. | | | 4,117,388 | | | | 68,098 | |
| Driven Brands Holdings, Inc.2 | | | 2,412,400 | | | | 67,499 | |
| First Advantage Corp.2 | | | 5,176,895 | | | | 66,420 | |
| SHO-BOND Holdings Co., Ltd. | | | 1,466,700 | | | | 63,084 | |
| Marlowe PLC1,2,3 | | | 6,904,878 | | | | 61,893 | |
| Haitian International Holdings, Ltd. | | | 32,480,200 | | | | 61,121 | |
| Lifco AB, Class B | | | 4,195,000 | | | | 57,910 | |
| Atlas Corp.3 | | | 4,159,499 | | | | 57,817 | |
| Zhejiang Weixing New Building Materials Co., Ltd., Class A | | | 19,398,983 | | | | 56,317 | |
| CSW Industrials, Inc. | | | 458,419 | | | | 54,919 | |
| Simpson Manufacturing Co., Inc. | | | 699,036 | | | | 54,804 | |
| Quess Corp., Ltd. | | | 6,907,615 | | | | 54,700 | |
| Montrose Environmental Group, Inc.1,2 | | | 1,623,909 | | | | 54,645 | |
| CG Power and Industrial Solutions, Ltd.2 | | | 18,869,753 | | | | 54,422 | |
| Trinity Industries, Inc. | | | 2,513,238 | | | | 53,658 | |
| MonotaRO Co., Ltd. | | | 3,455,300 | | | | 52,228 | |
| Aalberts NV, non-registered shares | | | 1,596,599 | | | | 52,170 | |
| Woodward, Inc. | | | 649,000 | | | | 52,089 | |
| DO & CO AG, non-registered shares1,2,3 | | | 779,520 | | | | 51,410 | |
| Waste Connections, Inc. | | | 380,000 | | | | 51,349 | |
| APM Human Services International, Ltd.3 | | | 23,661,959 | | | | 51,233 | |
| Volution Group PLC1 | | | 15,684,638 | | | | 50,954 | |
| GVS SpA2 | | | 8,720,038 | | | | 50,920 | |
| Cargotec OYJ, Class B, non-registered shares | | | 1,682,220 | | | | 50,642 | |
| FTI Consulting, Inc.2 | | | 294,377 | | | | 48,781 | |
| Munters Group AB | | | 7,015,000 | | | | 48,737 | |
| Resideo Technologies, Inc.2 | | | 2,527,864 | | | | 48,181 | |
| Textron, Inc. | | | 780,000 | | | | 45,443 | |
| Builders FirstSource, Inc.2 | | | 760,228 | | | | 44,793 | |
| Copa Holdings, SA, Class A2 | | | 665,000 | | | | 44,562 | |
| Guangzhou Baiyun International Airport Co., Ltd., Class A2 | | | 21,926,503 | | | | 44,062 | |
| DL E&C Co., Ltd. | | | 1,793,720 | | | | 42,523 | |
| Interface, Inc.1 | | | 4,721,060 | | | | 42,442 | |
| Midac Holdings Co., Ltd.1,3 | | | 1,844,500 | | | | 42,395 | |
| Addtech AB, Class B | | | 3,165,903 | | | | 41,298 | |
| Engcon AB, Class B2 | | | 6,668,176 | | | | 40,789 | |
| Advanced Drainage Systems, Inc. | | | 323,056 | | | | 40,178 | |
| IDEX Corp. | | | 200,000 | | | | 39,970 | |
| JGC Holdings Corp. | | | 3,124,000 | | | | 39,151 | |
| Antares Vision SpA1,2,3 | | | 5,278,008 | | | | 37,577 | |
| Generac Holdings, Inc.2 | | | 207,989 | | | | 37,051 | |
| Sulzer AG | | | 641,945 | | | | 36,682 | |
| Centre Testing International Group Co., Ltd. | | | 12,715,436 | | | | 36,472 | |
| Cathay Pacific Airways, Ltd.2,3 | | | 33,879,000 | | | | 35,508 | |
| LIXIL Corp.3 | | | 2,434,500 | | | | 35,277 | |
| Montana Aerospace AG1,2 | | | 3,338,132 | | | | 34,688 | |
| Voltronic Power Technology Corp. | | | 784,000 | | | | 34,325 | |
| Atkore, Inc.2 | | | 436,200 | | | | 33,941 | |
| Marel hf. | | | 10,903,000 | | | | 33,810 | |
| Kingspan Group PLC | | | 724,000 | | | | 32,348 | |
| Hefei Meyer Optoelectronic Technology, Inc., Class A | | | 9,654,084 | | | | 31,120 | |
| Melrose Industries PLC | | | 27,747,591 | | | | 30,981 | |
| BWX Technologies, Inc. | | | 611,300 | | | | 30,791 | |
| Fasadgruppen Group AB1 | | | 3,875,833 | | | | 29,797 | |
| SIS, Ltd.2 | | | 5,440,291 | | | | 27,635 | |
| International Consolidated Airlines Group SA (CDI)2,3 | | | 26,494,000 | | | | 27,611 | |
| Sinoseal Holding Co., Ltd., Class A | | | 5,298,624 | | | | 26,609 | |
| Controladora Vuela Compañía de Aviación, SAB de CV, Class A, ordinary participation certificates (ADR)2 | | | 2,557,800 | | | | 17,879 | |
| Controladora Vuela Compañía de Aviación, SAB de CV, Class A, ordinary participation certificates2,3 | | | 11,941,586 | | | | 8,438 | |
| Kajaria Ceramics, Ltd. | | | 1,764,211 | | | | 25,947 | |
| Common stocks (continued) | | Shares | | | Value
(000) | |
| Industrials (continued) | | | | | | | | |
| Adecco Group AG | | | 936,900 | | | $ | 25,727 | |
| SK, Inc. | | | 192,683 | | | | 25,670 | |
| Upwork, Inc.2 | | | 1,790,057 | | | | 24,381 | |
| Lyft, Inc.2 | | | 1,795,000 | | | | 23,640 | |
| Sun Country Airlines Holdings, Inc.2 | | | 1,711,612 | | | | 23,295 | |
| Azelis Group NV | | | 995,108 | | | | 22,128 | |
| InPost SA2 | | | 3,711,638 | | | | 21,675 | |
| Polycab India, Ltd. | | | 607,909 | | | | 18,965 | |
| Jamna Auto Industries, Ltd. | | | 12,837,657 | | | | 17,919 | |
| Einride AB1,2,4,5 | | | 391,089 | | | | 17,834 | |
| Indutrade AB | | | 1,080,000 | | | | 17,417 | |
| Hensoldt AG | | | 808,623 | | | | 16,241 | |
| Ventia Services Group Pty, Ltd. | | | 9,155,653 | | | | 15,111 | |
| Coor Service Management Holding AB | | | 2,177,000 | | | | 14,778 | |
| Storskogen Group AB, Class B | | | 17,764,071 | | | | 14,238 | |
| RS Group PLC | | | 1,312,000 | | | | 14,001 | |
| INVISIO Communications AB | | | 950,000 | | | | 11,658 | |
| Crane Holdings, Co. | | | 130,938 | | | | 11,462 | |
| UFP Industries, Inc. | | | 154,191 | | | | 11,126 | |
| ITM Power PLC2,3 | | | 9,693,939 | | | | 11,062 | |
| XP Power, Ltd. | | | 583,458 | | | | 10,936 | |
| Heliogen, Inc.2 | | | 5,800,000 | | | | 10,788 | |
| Daiseki Co., Ltd. | | | 352,600 | | | | 10,758 | |
| Grafton Group PLC | | | 1,437,900 | | | | 10,752 | |
| Oshkosh Corp. | | | 150,000 | | | | 10,544 | |
| Intrum AB | | | 800,000 | | | | 10,046 | |
| Green Landscaping Group AB2 | | | 1,977,759 | | | | 10,001 | |
| Nolato AB, Class B | | | 2,186,962 | | | | 9,999 | |
| ICF International, Inc. | | | 91,666 | | | | 9,993 | |
| Troax Group AB | | | 708,000 | | | | 9,960 | |
| Grupa Pracuj SA | | | 1,300,000 | | | | 9,917 | |
| easyJet PLC2 | | | 3,000,000 | | | | 9,858 | |
| IMI PLC | | | 750,055 | | | | 9,306 | |
| Fluidra, SA, non-registered shares | | | 616,300 | | | | 9,188 | |
| Chemring Group PLC | | | 2,607,000 | | | | 8,158 | |
| Pyrum Innovations AG2 | | | 128,340 | | | | 7,378 | |
| Univar Solutions, Inc.2 | | | 315,595 | | | | 7,177 | |
| Norva24 Group AB2 | | | 1,650,000 | | | | 4,708 | |
| L&T Technology Services, Ltd. | | | 104,056 | | | | 4,517 | |
| TuSimple Holdings, Inc., Class A2,3 | | | 580,000 | | | | 4,408 | |
| Ceres Power Holdings PLC2,3 | | | 831,946 | | | | 3,387 | |
| HeadHunter Group PLC (ADR)4 | | | 521,600 | | | | — | 6 |
| | | | | | | | 10,129,937 | |
| | | | | | | | | |
| Information technology 15.20% | | | | | | | | |
| Wolfspeed, Inc.2 | | | 4,082,600 | | | | 421,978 | |
| MongoDB, Inc., Class A2 | | | 1,258,182 | | | | 249,825 | |
| eMemory Technology, Inc.1 | | | 6,440,334 | | | | 227,400 | |
| Smartsheet, Inc., Class A2 | | | 6,354,321 | | | | 218,334 | |
| ALTEN SA, non-registered shares1 | | | 1,742,848 | | | | 190,817 | |
| Alteryx, Inc., Class A2 | | | 3,407,576 | | | | 190,279 | |
| Kulicke and Soffa Industries, Inc.1 | | | 4,782,013 | | | | 184,251 | |
| Global Unichip Corp.1 | | | 10,059,000 | | | | 183,868 | |
| Fabrinet, non-registered shares1,2 | | | 1,919,265 | | | | 183,194 | |
| Confluent, Inc., Class A2 | | | 6,652,721 | | | | 158,135 | |
| Globant SA2 | | | 784,865 | | | | 146,833 | |
| Teradata Corp.2 | | | 4,257,782 | | | | 132,247 | |
| Keywords Studios PLC1 | | | 5,115,655 | | | | 130,461 | |
| MKS Instruments, Inc. | | | 1,455,636 | | | | 120,294 | |
| Novanta, Inc.2 | | | 1,015,687 | | | | 117,464 | |
| Dexerials Corp.1,3 | | | 5,161,500 | | | | 116,270 | |
| RingCentral, Inc., Class A2 | | | 2,869,200 | | | | 114,653 | |
| Extreme Networks, Inc.1,2 | | | 8,646,932 | | | | 113,015 | |
| Nordic Semiconductor ASA2 | | | 8,580,615 | | | | 112,390 | |
| VisEra Technologies Co., Ltd.5 | | | 11,090,000 | | | | 80,413 | |
| VisEra Technologies Co., Ltd. | | | 3,774,800 | | | | 28,811 | |
| Network International Holdings PLC1,2 | | | 32,104,275 | | | | 108,706 | |
| Alarm.com Holdings, Inc.2 | | | 1,661,500 | | | | 107,765 | |
| Common stocks (continued) | | Shares | | | Value
(000) | |
| Information technology (continued) | | | | | | | | |
| CDW Corp. | | | 650,000 | | | $ | 101,452 | |
| Clear Secure, Inc., Class A2,3 | | | 4,428,299 | | | | 101,231 | |
| Pegasystems, Inc. | | | 3,110,030 | | | | 99,956 | |
| Net One Systems Co., Ltd.1 | | | 5,162,673 | | | | 99,485 | |
| DoubleVerify Holdings, Inc.2 | | | 3,442,000 | | | | 94,139 | |
| SHIFT, Inc.2 | | | 722,200 | | | | 93,351 | |
| Endava PLC, Class A (ADR)2 | | | 1,136,921 | | | | 91,670 | |
| Credo Technology Group Holding, Ltd.1,2,3 | | | 8,194,682 | | | | 90,141 | |
| Paycom Software, Inc.2 | | | 270,525 | | | | 89,271 | |
| Viavi Solutions, Inc.2 | | | 6,830,000 | | | | 89,131 | |
| Softcat PLC | | | 6,734,335 | | | | 87,893 | |
| Tanla Platforms, Ltd.1 | | | 9,190,777 | | | | 87,331 | |
| PagSeguro Digital, Ltd., Class A2 | | | 6,492,200 | | | | 85,892 | |
| Euronet Worldwide, Inc.2 | | | 1,129,232 | | | | 85,551 | |
| SUMCO Corp. | | | 7,295,374 | | | | 84,768 | |
| SINBON Electronics Co., Ltd. | | | 9,727,000 | | | | 80,772 | |
| Money Forward, Inc.1,2 | | | 3,664,187 | | | | 75,953 | |
| CCC Intelligent Solutions Holdings, Inc.2,3 | | | 8,042,622 | | | | 73,188 | |
| Bytes Technology Group PLC1 | | | 15,122,601 | | | | 70,523 | |
| LEM Holding SA | | | 46,070 | | | | 70,375 | |
| EVERTEC, Inc. | | | 2,164,230 | | | | 67,849 | |
| Gitlab, Inc., Class A2,3 | | | 1,295,152 | | | | 66,338 | |
| Vitec Software Group AB, Class B | | | 2,228,800 | | | | 65,945 | |
| PAR Technology Corp.1,2,3 | | | 2,140,057 | | | | 63,196 | |
| Silergy Corp. | | | 4,645,824 | | | | 60,899 | |
| Topicus.com, Inc., subordinate voting shares2 | | | 1,265,553 | | | | 60,852 | |
| Ceridian HCM Holding, Inc.2 | | | 1,078,060 | | | | 60,242 | |
| Coforge, Ltd. | | | 1,469,344 | | | | 59,900 | |
| MACOM Technology Solutions Holdings, Inc.2 | | | 1,140,000 | | | | 59,041 | |
| Aixtron SE | | | 2,434,518 | | | | 58,869 | |
| Kainos Group PLC | | | 4,103,704 | | | | 58,701 | |
| Hamamatsu Photonics KK | | | 1,289,450 | | | | 55,363 | |
| Netcompany Group AS, non-registered shares2 | | | 1,577,091 | | | | 52,578 | |
| Mastek, Ltd.1 | | | 2,403,500 | | | | 50,944 | |
| Crayon Group Holding ASA1,2,3 | | | 6,588,516 | | | | 50,857 | |
| Cvent Holding Corp.2 | | | 9,655,200 | | | | 50,690 | |
| Qorvo, Inc.2 | | | 638,300 | | | | 50,687 | |
| Kingdee International Software Group Co., Ltd.2 | | | 38,667,093 | | | | 49,994 | |
| EPAM Systems, Inc.2 | | | 134,600 | | | | 48,751 | |
| Concentrix Corp. | | | 428,914 | | | | 47,880 | |
| Marqeta, Inc., Class A2 | | | 6,719,114 | | | | 47,840 | |
| Dock, Ltd.2,4,5 | | | 4,318,937 | | | | 47,206 | |
| Silicon Laboratories, Inc.2 | | | 369,000 | | | | 45,549 | |
| NCR Corp.2 | | | 2,353,790 | | | | 44,746 | |
| Megaport, Ltd.1,2,3 | | | 9,161,000 | | | | 44,425 | |
| Zuken, Inc.1 | | | 1,823,800 | | | | 44,123 | |
| Vanguard International Semiconductor Corp. | | | 21,389,394 | | | | 43,240 | |
| Nagarro SE2,3 | | | 483,317 | | | | 42,897 | |
| Computer Age Management Services, Ltd. | | | 1,387,558 | | | | 42,724 | |
| Aspen Technology, Inc.2 | | | 175,140 | | | | 41,718 | |
| Flex, Ltd.2 | | | 2,291,735 | | | | 38,180 | |
| Nuvei Corp., subordinate voting shares2 | | | 1,400,000 | | | | 37,834 | |
| ironSource, Ltd., Class A2,3 | | | 10,533,854 | | | | 36,236 | |
| Maruwa Co., Ltd. | | | 341,300 | | | | 36,196 | |
| BlackLine, Inc.2 | | | 595,000 | | | | 35,640 | |
| HashiCorp, Inc., Class A2,3 | | | 1,091,870 | | | | 35,147 | |
| INFICON Holding AG | | | 52,362 | | | | 34,853 | |
| Thoughtworks Holding, Inc.2 | | | 3,260,506 | | | | 34,203 | |
| Accton Technology Corp. | | | 4,009,000 | | | | 33,994 | |
| Perficient, Inc.2 | | | 517,165 | | | | 33,626 | |
| Bechtle AG, non-registered shares | | | 919,758 | | | | 33,465 | |
| SimCorp AS | | | 594,367 | | | | 33,274 | |
| Cognex Corp. | | | 800,000 | | | | 33,160 | |
| Bentley Systems, Inc., Class B3 | | | 1,071,370 | | | | 32,773 | |
| SentinelOne, Inc., Class A2 | | | 1,239,464 | | | | 31,681 | |
| BE Semiconductor Industries NV | | | 741,300 | | | | 31,550 | |
| Reply SpA | | | 299,378 | | | | 31,231 | |
| Unimicron Technology Corp. | | | 8,238,000 | | | | 30,590 | |
| Dye & Durham, Ltd.3 | | | 2,470,647 | | | | 30,442 | |
| Common stocks (continued) | | Shares | | | Value
(000) | |
| Information technology (continued) | | | | | | | | |
| Alkami Technology, Inc.2,3 | | | 1,950,806 | | | $ | 29,360 | |
| Trimble, Inc.2 | | | 530,000 | | | | 28,763 | |
| Disco Corp.3 | | | 131,500 | | | | 28,656 | |
| OVH Groupe SAS2,3 | | | 2,894,931 | | | | 28,615 | |
| Okta, Inc., Class A2 | | | 500,000 | | | | 28,435 | |
| Paymentus Holdings, Inc., Class A2,3 | | | 2,854,826 | | | | 27,749 | |
| Halma PLC | | | 1,200,000 | | | | 27,020 | |
| Boku, Inc.1,2,5 | | | 20,461,639 | | | | 25,379 | |
| Pushpay Holdings, Ltd.2 | | | 41,008,017 | | | | 25,133 | |
| Sinch AB2,3 | | | 17,697,918 | | | | 23,205 | |
| ePlus, inc.2 | | | 556,200 | | | | 23,105 | |
| ams OSRAM AG, non-registered shares2 | | | 3,494,900 | | | | 21,751 | |
| Technoprobe SpA2 | | | 2,980,236 | | | | 20,738 | |
| AvidXchange Holdings, Inc.2 | | | 2,445,867 | | | | 20,594 | |
| Kingboard Holdings, Ltd. | | | 7,191,000 | | | | 20,205 | |
| Truecaller AB, Class B2,3 | | | 5,941,170 | | | | 19,782 | |
| Kingboard Laminates Holdings, Ltd. | | | 22,027,500 | | | | 19,693 | |
| Alchip Technologies, Ltd. | | | 717,000 | | | | 19,313 | |
| Nayax, Ltd.2 | | | 802,200 | | | | 18,934 | |
| SmartCraft ASA, Class A1,2 | | | 13,349,780 | | | | 18,628 | |
| Semtech Corp.2 | | | 585,000 | | | | 17,205 | |
| GFT Technologies SE | | | 570,924 | | | | 17,205 | |
| LiveRamp Holdings, Inc.2 | | | 932,711 | | | | 16,938 | |
| TDCX, Inc., Class A1,2 | | | 1,781,024 | | | | 16,688 | |
| JustSystems Corp. | | | 706,700 | | | | 16,106 | |
| Nemetschek SE | | | 291,067 | | | | 14,016 | |
| Insight Enterprises, Inc.2 | | | 168,500 | | | | 13,886 | |
| LandMark Optoelectronics Corp. | | | 2,985,000 | | | | 13,276 | |
| Tripod Technology Corp. | | | 4,134,000 | | | | 12,106 | |
| 91APP, Inc. | | | 4,728,158 | | | | 11,906 | |
| eCloudvalley Digital Technology Co., Ltd. | | | 3,003,174 | | | | 11,790 | |
| Linklogis, Inc., Class B2,3 | | | 28,318,000 | | | | 11,719 | |
| Venustech Group, Inc., Class A | | | 4,107,547 | | | | 11,697 | |
| Alphawave IP Group PLC2,3 | | | 7,257,773 | | | | 11,015 | |
| MaxLinear, Inc.2 | | | 328,275 | | | | 10,708 | |
| ON Semiconductor Corp.2 | | | 167,850 | | | | 10,462 | |
| AppFolio, Inc., Class A2 | | | 98,300 | | | | 10,294 | |
| Atea ASA | | | 1,132,000 | | | | 10,017 | |
| Zebra Technologies Corp., Class A2 | | | 36,300 | | | | 9,511 | |
| GB Group PLC | | | 1,330,200 | | | | 8,978 | |
| Softline Holding PLC (GDR)1,2,4,7 | | | 10,650,000 | | | | 8,810 | |
| Softline Holding PLC (GDR)1,2,4 | | | 9,996 | | | | 8 | |
| Lime Technologies AB | | | 435,850 | | | | 8,586 | |
| LivePerson, Inc.2 | | | 850,104 | | | | 8,008 | |
| Cherry AG1,2,3 | | | 1,398,734 | | | | 7,364 | |
| Oxford Instruments PLC | | | 340,300 | | | | 6,783 | |
| Entegris, Inc. | | | 79,014 | | | | 6,560 | |
| Procore Technologies, Inc.2 | | | 125,600 | | | | 6,215 | |
| MotorK, Ltd.1,2 | | | 2,300,000 | | | | 5,468 | |
| Avaya Holdings Corp.2,3 | | | 3,363,700 | | | | 5,348 | |
| CI&T, Inc., Class A2,3 | | | 541,127 | | | | 5,081 | |
| CEVA, Inc.2 | | | 175,000 | | | | 4,590 | |
| Copperleaf Technologies, Inc.2,3 | | | 966,713 | | | | 4,395 | |
| Yotpo, Ltd.2,4,5 | | | 2,620,102 | | | | 4,297 | |
| AAC Technologies Holdings, Inc.2,3 | | | 2,629,000 | | | | 4,057 | |
| JFrog, Ltd.2 | | | 178,400 | | | | 3,944 | |
| Patreon, Inc., Class B2,4,5 | | | 189,951 | | | | 3,921 | |
| Foursquare Labs, Inc., Series A2,4,5 | | | 1,970,385 | | | | 3,231 | |
| WeCommerce Holdings, Ltd., Class A1,2,3 | | | 2,113,430 | | | | 3,060 | |
| SiteMinder, Ltd.2 | | | 750,663 | | | | 1,471 | |
| | | | | | | | 8,449,373 | |
| | | | | | | | | |
| Consumer discretionary 14.65% | | | | | | | | |
| Tube Investments of India, Ltd.1 | | | 12,231,762 | | | | 410,555 | |
| Evolution AB | | | 5,074,230 | | | | 399,608 | |
| TopBuild Corp.1,2 | | | 2,120,114 | | | | 349,352 | |
| Dollarama, Inc. | | | 5,010,000 | | | | 287,612 | |
| Floor & Decor Holdings, Inc., Class A2 | | | 4,046,400 | | | | 284,300 | |
| Common stocks (continued) | | Shares | | | Value
(000) | |
| Consumer discretionary (continued) | | | | | | | | |
| IDP Education, Ltd. | | | 11,978,890 | | | $ | 200,438 | |
| Wyndham Hotels & Resorts, Inc. | | | 3,226,678 | | | | 197,957 | |
| YETI Holdings, Inc.1,2 | | | 6,894,065 | | | | 196,619 | |
| Thor Industries, Inc. | | | 2,213,628 | | | | 154,910 | |
| Helen of Troy, Ltd.1,2 | | | 1,441,721 | | | | 139,040 | |
| DraftKings, Inc., Class A2,3 | | | 8,877,732 | | | | 134,409 | |
| Kindred Group PLC (SDR)1 | | | 15,987,668 | | | | 119,302 | |
| MakeMyTrip, Ltd., non-registered shares1,2 | | | 3,876,781 | | | | 119,017 | |
| Five Below, Inc.2 | | | 804,402 | | | | 110,742 | |
| Inchcape PLC | | | 14,693,764 | | | | 110,576 | |
| WH Smith PLC1,2 | | | 8,150,907 | | | | 108,181 | |
| Entain PLC | | | 8,978,173 | | | | 107,816 | |
| Light & Wonder, Inc.2 | | | 2,481,004 | | | | 106,385 | |
| Leslie’s, Inc.2,3 | | | 6,992,578 | | | | 102,861 | |
| Jiumaojiu International Holdings, Ltd.3 | | | 62,092,000 | | | | 101,336 | |
| Pool Corp. | | | 317,700 | | | | 101,095 | |
| NEXTAGE Co., Ltd.1 | | | 4,623,400 | | | | 100,390 | |
| Pets at Home Group PLC1 | | | 33,138,500 | | | | 96,500 | |
| Xometry, Inc., Class A2,3 | | | 1,695,180 | | | | 96,269 | |
| Bajaj Electricals, Ltd.1 | | | 6,515,607 | | | | 96,037 | |
| Polaris, Inc. | | | 985,000 | | | | 94,215 | |
| Jack in the Box, Inc.1 | | | 1,256,700 | | | | 93,084 | |
| Mattel, Inc.2 | | | 4,700,000 | | | | 89,018 | |
| Toll Brothers, Inc. | | | 2,104,633 | | | | 88,395 | |
| Asbury Automotive Group, Inc.2 | | | 575,004 | | | | 86,883 | |
| Adient PLC2 | | | 3,061,255 | | | | 84,950 | |
| Moncler SpA | | | 2,015,000 | | | | 82,735 | |
| Lennar Corp., Class A | | | 1,058,458 | | | | 78,908 | |
| Lennar Corp., Class B | | | 21,169 | | | | 1,260 | |
| Everi Holdings, Inc.1,2 | | | 4,920,396 | | | | 79,809 | |
| Melco Resorts & Entertainment, Ltd. (ADR)2 | | | 11,707,307 | | | | 77,619 | |
| KB Home | | | 2,957,918 | | | | 76,669 | |
| Auction Technology Group PLC1,2 | | | 9,570,000 | | | | 76,577 | |
| Kontoor Brands, Inc. | | | 2,208,000 | | | | 74,211 | |
| Watches of Switzerland Group PLC2 | | | 9,622,820 | | | | 71,302 | |
| Salvatore Ferragamo SpA3 | | | 4,954,090 | | | | 69,412 | |
| Domino’s Pizza Enterprises, Ltd. | | | 2,110,841 | | | | 69,107 | |
| Norwegian Cruise Line Holdings, Ltd.2,3 | | | 5,839,904 | | | | 66,341 | |
| Golden Entertainment, Inc.1,2 | | | 1,896,757 | | | | 66,178 | |
| DESCENTE, Ltd. | | | 2,865,900 | | | | 65,159 | |
| Momo.com, Inc. | | | 3,839,758 | | | | 64,730 | |
| Jumbo SA | | | 4,771,161 | | | | 63,611 | |
| Bright Horizons Family Solutions, Inc.2 | | | 1,058,300 | | | | 61,011 | |
| Domino’s Pizza Group PLC1 | | | 24,475,815 | | | | 60,604 | |
| Williams-Sonoma, Inc. | | | 500,000 | | | | 58,925 | |
| Games Workshop Group PLC | | | 917,600 | | | | 58,873 | |
| Basic-Fit NV2,3 | | | 1,895,318 | | | | 56,716 | |
| M.D.C. Holdings, Inc. | | | 2,001,000 | | | | 54,867 | |
| Domino’s Pizza, Inc. | | | 176,500 | | | | 54,750 | |
| Haichang Ocean Park Holdings, Ltd.2,3 | | | 52,649,000 | | | | 51,549 | |
| Skechers USA, Inc., Class A2 | | | 1,600,000 | | | | 50,752 | |
| Fox Factory Holding Corp.2 | | | 605,690 | | | | 47,898 | |
| Wayfair, Inc., Class A2,3 | | | 1,467,200 | | | | 47,757 | |
| LGI Homes, Inc.2 | | | 571,556 | | | | 46,508 | |
| Musti Group OYJ1 | | | 2,682,737 | | | | 46,469 | |
| Snow Peak, Inc.1,3 | | | 3,050,800 | | | | 46,400 | |
| Shoei Co., Ltd. | | | 1,224,100 | | | | 44,358 | |
| Six Flags Entertainment Corp.2 | | | 2,425,351 | | | | 42,929 | |
| Levi Strauss & Co., Class A | | | 2,950,000 | | | | 42,687 | |
| Compagnie Plastic Omnium SA | | | 3,192,845 | | | | 41,634 | |
| Malibu Boats, Inc., Class A2 | | | 851,000 | | | | 40,840 | |
| Century Communities, Inc. | | | 911,000 | | | | 38,973 | |
| Bafang Electric (Suzhou) Co., Ltd., Class A | | | 2,347,840 | | | | 38,752 | |
| Nien Made Enterprise Co., Ltd. | | | 4,920,000 | | | | 38,734 | |
| Darden Restaurants, Inc. | | | 303,300 | | | | 38,313 | |
| International Game Technology PLC | | | 2,421,600 | | | | 38,261 | |
| Arco Platform, Ltd., Class A2,3 | | | 3,480,934 | | | | 37,559 | |
| Trainline PLC2 | | | 10,584,000 | | | | 36,873 | |
| Etsy, Inc.2 | | | 366,850 | | | | 36,733 | |
| Common stocks (continued) | | Shares | | | Value
(000) | |
| Consumer discretionary (continued) | | | | | | | | |
| Cavco Industries, Inc.2 | | | 170,870 | | | $ | 35,158 | |
| Chervon Holdings, Ltd.3 | | | 9,167,900 | | | | 34,605 | |
| Victoria PLC1,2,3 | | | 6,757,962 | | | | 33,462 | |
| D.R. Horton, Inc. | | | 490,000 | | | | 33,002 | |
| Hilton Grand Vacations, Inc.2 | | | 951,800 | | | | 31,305 | |
| Americanas SA, ordinary nominative shares | | | 9,677,258 | | | | 30,461 | |
| Macy’s, Inc. | | | 1,900,000 | | | | 29,773 | |
| Tongcheng Travel Holdings, Ltd.2 | | | 15,035,800 | | | | 29,368 | |
| Flutter Entertainment PLC2 | | | 259,095 | | | | 28,305 | |
| AcadeMedia AB1 | | | 6,523,595 | | | | 28,256 | |
| On Holding AG, Class A2,3 | | | 1,742,200 | | | | 27,962 | |
| Cairn Homes PLC | | | 31,452,000 | | | | 25,259 | |
| RH2 | | | 100,000 | | | | 24,607 | |
| Graham Holdings Co., Class B | | | 45,000 | | | | 24,209 | |
| Boot Barn Holdings, Inc.2 | | | 397,000 | | | | 23,209 | |
| Persimmon PLC | | | 1,650,880 | | | | 22,728 | |
| Mazda Motor Corp. | | | 3,264,000 | | | | 21,606 | |
| B&M European Value Retail SA | | | 6,257,481 | | | | 21,248 | |
| Gentherm, Inc.2 | | | 400,500 | | | | 19,917 | |
| ABC-Mart, Inc. | | | 456,100 | | | | 19,658 | |
| XPEL, Inc.2,3 | | | 304,820 | | | | 19,643 | |
| Puuilo OYJ3 | | | 4,124,072 | | | | 19,338 | |
| China MeiDong Auto Holdings, Ltd. | | | 11,564,000 | | | | 18,297 | |
| JOANN, Inc.1,3 | | | 2,729,250 | | | | 18,068 | |
| Westlife Development, Ltd.2 | | | 1,928,968 | | | | 17,027 | |
| Lojas Quero-Quero SA1 | | | 14,974,560 | | | | 16,156 | |
| Roland Corp.3 | | | 530,600 | | | | 16,137 | |
| Beazer Homes USA, Inc.1,2 | | | 1,659,813 | | | | 16,050 | |
| Alpen Co., Ltd. | | | 1,130,000 | | | | 16,025 | |
| Mips AB | | | 543,100 | | | | 16,020 | |
| Installed Building Products, Inc. | | | 189,361 | | | | 15,336 | |
| Vail Resorts, Inc. | | | 71,000 | | | | 15,310 | |
| OneWater Marine, Inc., Class A2 | | | 504,604 | | | | 15,194 | |
| Melco International Development, Ltd.2 | | | 19,643,000 | | | | 15,125 | |
| Playtech PLC2 | | | 3,083,800 | | | | 14,961 | |
| Traeger, Inc.2 | | | 5,224,267 | | | | 14,732 | |
| Caesars Entertainment, Inc.2 | | | 400,000 | | | | 12,904 | |
| Nordstrom, Inc.3 | | | 760,000 | | | | 12,715 | |
| Porch Group, Inc.1,2,3 | | | 5,520,000 | | | | 12,420 | |
| Central Automotive Products, Ltd. | | | 787,200 | | | | 11,963 | |
| Coursera, Inc.2 | | | 1,055,400 | | | | 11,377 | |
| ThredUp Inc., Class A2,3 | | | 6,154,000 | | | | 11,323 | |
| StockX, Inc.2,4,5 | | | 161,790 | | | | 11,238 | |
| Aramark | | | 356,556 | | | | 11,125 | |
| Food & Life Companies, Ltd.3 | | | 716,300 | | | | 10,932 | |
| DPC Dash, Ltd.2,4,5 | | | 2,158,273 | | | | 10,835 | |
| Dreamfolks Services, Ltd.2 | | | 1,296,626 | | | | 5,686 | |
| Dreamfolks Services, Ltd.2,5 | | | 1,104,299 | | | | 4,704 | |
| ASOS PLC2,3 | | | 1,607,415 | | | | 10,057 | |
| Elior Group SA2,3 | | | 5,263,313 | | | | 9,491 | |
| Relaxo Footwears, Ltd. | | | 713,900 | | | | 8,780 | |
| Zhongsheng Group Holdings, Ltd. | | | 2,121,500 | | | | 8,342 | |
| Chegg, Inc.2 | | | 365,500 | | | | 7,701 | |
| Grove Collaborative Holdings, Inc., Class A2,5 | | | 3,070,667 | | | | 6,328 | |
| Grove Collaborative Holdings, Inc., Class A2 | | | 519,604 | | | | 1,164 | |
| Steven Madden, Ltd. | | | 277,000 | | | | 7,388 | |
| Bike24 Holding AG1,2,3 | | | 2,987,174 | | | | 7,135 | |
| Victoria’s Secret & Co.2 | | | 210,400 | | | | 6,127 | |
| Goodyear Tire & Rubber Co.2 | | | 558,712 | | | | 5,637 | |
| Brilliant Earth Group, Inc., Class A2 | | | 866,800 | | | | 4,967 | |
| BARK, Inc.2,3 | | | 2,500,000 | | | | 4,550 | |
| Synsam AB | | | 952,992 | | | | 4,464 | |
| Royal Caribbean Cruises, Ltd.2 | | | 78,017 | | | | 2,957 | |
| Westwing Group SE, non-registered shares2,3 | | | 344,652 | | | | 1,883 | |
| Leifheit AG, non-registered shares3 | | | 129,643 | | | | 1,688 | |
| BNN Technology PLC1,2,4 | | | 19,007,000 | | | | — | 6 |
| Ozon Holdings PLC (ADR)2,4 | | | 2,346,600 | | | | — | 6 |
| | | | | | | | 8,144,603 | |
| Common stocks (continued) | | Shares | | | Value
(000) | |
| Health care 14.57% | | | | | | | | |
| Molina Healthcare, Inc.2 | | | 2,407,600 | | | $ | 794,123 | |
| Insulet Corp.2 | | | 2,399,642 | | | | 550,478 | |
| Max Healthcare Institute, Ltd.1,2 | | | 67,134,781 | | | | 335,885 | |
| Agilon Health, Inc.2 | | | 13,114,300 | | | | 307,137 | |
| Haemonetics Corp.1,2 | | | 4,093,820 | | | | 303,065 | |
| NovoCure, Ltd.2 | | | 3,621,597 | | | | 275,169 | |
| Centene Corp.2 | | | 2,925,674 | | | | 227,647 | |
| DexCom, Inc.2 | | | 2,210,000 | | | | 177,993 | |
| Biohaven Pharmaceutical Holding Co., Ltd.2 | | | 1,140,376 | | | | 172,391 | |
| Revance Therapeutics, Inc.1,2 | | | 6,313,932 | | | | 170,476 | |
| Legend Biotech Corp. (ADR)2 | | | 4,033,599 | | | | 164,571 | |
| Shockwave Medical, Inc.2 | | | 585,000 | | | | 162,671 | |
| Oak Street Health, Inc.2 | | | 6,084,207 | | | | 149,185 | |
| Penumbra, Inc.2 | | | 780,244 | | | | 147,934 | |
| Xenon Pharmaceuticals, Inc.1,2 | | | 3,917,482 | | | | 141,421 | |
| iRhythm Technologies, Inc.2 | | | 1,025,100 | | | | 128,425 | |
| Silk Road Medical, Inc.1,2 | | | 2,791,630 | | | | 125,623 | |
| CONMED Corp.1 | | | 1,538,492 | | | | 123,341 | |
| Amplifon SpA | | | 4,668,700 | | | | 122,263 | |
| Hapvida Participações e Investimentos SA2 | | | 82,535,599 | | | | 115,824 | |
| Laurus Labs, Ltd. | | | 18,452,700 | | | | 115,790 | |
| Amvis Holdings, Inc.1 | | | 6,950,300 | | | | 115,541 | |
| Bachem Holding AG3 | | | 1,802,075 | | | | 112,102 | |
| Integra LifeSciences Holdings Corp.2 | | | 2,551,447 | | | | 108,079 | |
| Karuna Therapeutics, Inc.2 | | | 466,922 | | | | 105,025 | |
| Tandem Diabetes Care, Inc.2 | | | 2,140,500 | | | | 102,423 | |
| Globus Medical, Inc., Class A2 | | | 1,531,378 | | | | 91,224 | |
| Addus HomeCare Corp.1,2 | | | 938,900 | | | | 89,421 | |
| Inari Medical, Inc.2 | | | 1,190,498 | | | | 86,478 | |
| Fate Therapeutics, Inc.2 | | | 3,674,900 | | | | 82,355 | |
| Genus PLC | | | 2,245,985 | | | | 64,841 | |
| Pacific Biosciences of California, Inc.2,3 | | | 10,225,968 | | | | 59,362 | |
| Allogene Therapeutics, Inc.2,3 | | | 5,310,109 | | | | 57,349 | |
| Ascendis Pharma A/S (ADR)2,3 | | | 541,287 | | | | 55,893 | |
| Hypera SA, ordinary nominative shares | | | 6,689,914 | | | | 54,878 | |
| CanSino Biologics, Inc., Class H3 | | | 9,717,400 | | | | 54,588 | |
| AbCellera Biologics, Inc.2,3 | | | 5,480,000 | | | | 54,197 | |
| EBOS Group, Ltd. | | | 2,556,246 | | | | 53,617 | |
| Asahi Intecc Co., Ltd. | | | 3,346,600 | | | | 52,951 | |
| Shandong Pharmaceutical Glass Co., Ltd., Class A | | | 12,973,422 | | | | 52,841 | |
| ICON PLC2 | | | 281,109 | | | | 51,662 | |
| Encompass Health Corp. | | | 1,114,331 | | | | 50,401 | |
| Ocumension Therapeutics1,2,3 | | | 37,692,000 | | | | 48,977 | |
| CRISPR Therapeutics AG2 | | | 746,299 | | | | 48,771 | |
| Poly Medicure, Ltd. | | | 4,511,022 | | | | 47,782 | |
| Virbac SA | | | 178,400 | | | | 46,351 | |
| Ultragenyx Pharmaceutical, Inc.2 | | | 1,106,215 | | | | 45,808 | |
| Surgical Science Sweden AB1,2,3 | | | 3,271,137 | | | | 43,622 | |
| New Horizon Health, Ltd.1,2,3 | | | 22,889,335 | | | | 42,209 | |
| Alignment Healthcare, Inc.2 | | | 3,500,000 | | | | 41,440 | |
| CompuGroup Medical SE & Co. KGaA | | | 1,187,660 | | | | 41,158 | |
| Nakanishi, Inc. | | | 2,255,800 | | | | 40,959 | |
| Netcare, Ltd. | | | 54,252,695 | | | | 40,809 | |
| Medmix AG1 | | | 2,314,251 | | | | 40,482 | |
| Glaukos Corp.2 | | | 750,322 | | | | 39,947 | |
| IVERIC bio, Inc.2 | | | 2,164,099 | | | | 38,824 | |
| Carl Zeiss Meditec AG, non-registered shares | | | 368,406 | | | | 38,796 | |
| Indivior PLC2 | | | 11,805,600 | | | | 37,350 | |
| Ambu AS, Class B, non-registered shares3 | | | 3,992,766 | | | | 34,503 | |
| FIGS, Inc., Class A2 | | | 4,166,847 | | | | 34,376 | |
| Seer, Inc., Class A2 | | | 4,414,668 | | | | 34,170 | |
| NuVasive, Inc.2 | | | 766,000 | | | | 33,558 | |
| Revenio Group OYJ, non-registered shares | | | 792,790 | | | | 29,454 | |
| Exact Sciences Corp.2 | | | 890,000 | | | | 28,916 | |
| KRKA, dd, Novo mesto | | | 335,262 | | | | 28,243 | |
| Angelalign Technology, Inc.3 | | | 2,908,600 | | | | 27,599 | |
| Alnylam Pharmaceuticals, Inc.2 | | | 137,700 | | | | 27,562 | |
| SKAN Group AG3 | | | 462,566 | | | | 27,217 | |
| Incyte Corp.2 | | | 396,000 | | | | 26,389 | |
| Common stocks (continued) | | Shares | | | Value
(000) | |
| Health care (continued) | | | | | | | | |
| Fisher & Paykel Healthcare Corp., Ltd. | | | 2,510,000 | | | $ | 25,881 | |
| Zealand Pharma A/S2 | | | 1,142,366 | | | | 25,757 | |
| Idorsia, Ltd.2,3 | | | 1,959,816 | | | | 25,182 | |
| Pharmaron Beijing Co., Ltd., Class H | | | 5,167,550 | | | | 25,060 | |
| Twist Bioscience Corp.2 | | | 704,000 | | | | 24,809 | |
| Sosei Group Corp.2,3 | | | 1,861,300 | | | | 23,349 | |
| Guardant Health, Inc.2 | | | 420,239 | | | | 22,621 | |
| 10x Genomics, Inc., Class A2 | | | 793,300 | | | | 22,593 | |
| Innovent Biologics, Inc.2 | | | 6,938,500 | | | | 21,611 | |
| Amedisys, Inc.2 | | | 210,699 | | | | 20,394 | |
| Olink Holding AB (ADR)2,3 | | | 1,586,593 | | | | 19,261 | |
| Gland Pharma, Ltd.2 | | | 750,000 | | | | 19,235 | |
| Zai Lab, Ltd. (ADR)2 | | | 551,078 | | | | 18,847 | |
| CM Hospitalar SA | | | 5,671,671 | | | | 18,652 | |
| Chemed Corp. | | | 42,000 | | | | 18,336 | |
| Medacta Group SA | | | 216,959 | | | | 18,264 | |
| Fleury SA, ordinary nominative shares | | | 5,540,900 | | | | 18,160 | |
| Galapagos NV2 | | | 424,039 | | | | 18,145 | |
| CellaVision AB, non-registered shares | | | 789,300 | | | | 18,051 | |
| Ami Organics, Ltd. | | | 1,596,540 | | | | 17,857 | |
| BONESUPPORT Holding AB2 | | | 2,647,760 | | | | 17,459 | |
| Hutchmed China, Ltd. (ADR)2 | | | 1,350,035 | | | | 11,961 | |
| Hutchmed China, Ltd.2,3 | | | 2,554,000 | | | | 4,216 | |
| Natera, Inc.2 | | | 363,000 | | | | 15,907 | |
| Zentalis Pharmaceuticals, Inc.2 | | | 683,000 | | | | 14,794 | |
| PolyPeptide Group AG | | | 487,635 | | | | 14,141 | |
| Hangzhou Tigermed Consulting Co., Ltd., Class A | | | 1,090,535 | | | | 14,003 | |
| Piramal Pharma, Ltd.2,4 | | | 5,340,000 | | | | 13,575 | |
| Editas Medicine, Inc.2 | | | 1,100,000 | | | | 13,464 | |
| Sysmex Corp. | | | 220,300 | | | | 11,857 | |
| Nevro Corp.2 | | | 253,000 | | | | 11,790 | |
| Vaxcyte, Inc.2 | | | 475,303 | | | | 11,407 | |
| Dechra Pharmaceuticals PLC | | | 384,608 | | | | 11,146 | |
| Brii Biosciences, Ltd.2,3 | | | 16,214,542 | | | | 10,872 | |
| SUNWELS Co., Ltd.3 | | | 233,000 | | | | 9,944 | |
| Nordhealth AS, Class A1,2 | | | 5,120,000 | | | | 9,375 | |
| Arjo AB, Class B | | | 2,572,435 | | | | 9,368 | |
| Precision BioSciences, Inc.1,2 | | | 6,715,043 | | | | 8,730 | |
| NextGen Healthcare, Inc.2 | | | 406,300 | | | | 7,192 | |
| Creo Medical Group PLC1,2 | | | 11,533,623 | | | | 6,962 | |
| Classys, Inc. | | | 740,401 | | | | 6,913 | |
| Vitrolife AB | | | 467,551 | | | | 6,603 | |
| PetIQ, Inc., Class A2 | | | 880,561 | | | | 6,076 | |
| Diagnósticos da América SA | | | 1,728,463 | | | | 6,043 | |
| ChemoMetec A/S | | | 70,910 | | | | 5,353 | |
| KRY International AB, Series A2,4,5 | | | 19,744 | | | | 4,886 | |
| HBM Holdings, Ltd.2,3 | | | 15,992,000 | | | | 3,810 | |
| OdontoPrev SA, ordinary nominative shares | | | 2,134,000 | | | | 3,481 | |
| Cellectis SA, non-registered shares2,3 | | | 760,997 | | | | 1,769 | |
| Cellectis SA (ADR)2,3 | | | 698,804 | | | | 1,600 | |
| IO Biotech, Inc.2,3 | | | 1,235,000 | | | | 3,347 | |
| Jeisys Medical, Inc.2 | | | 605,326 | | | | 2,730 | |
| Implantica AG, Class A (SDR)2 | | | 700,000 | | | | 2,597 | |
| Sana Biotechnology, Inc.2,3 | | | 432,071 | | | | 2,592 | |
| Denali Therapeutics, Inc.2 | | | 84,264 | | | | 2,586 | |
| Intervacc AB2 | | | 850,000 | | | | 2,554 | |
| Applied Molecular Transport, Inc.2,3 | | | 1,861,107 | | | | 1,811 | |
| Autolus Therapeutics PLC (ADR)2,3 | | | 625,000 | | | | 1,338 | |
| Schrodinger, Inc.2 | | | 31,250 | | | | 781 | |
| Acutus Medical, Inc.2 | | | 797,523 | | | | 702 | |
| | | | | | | | 8,099,712 | |
| | | | | | | | | |
| Financials 9.51% | | | | | | | | |
| Ares Management Corp., Class A | | | 5,174,776 | | | | 320,577 | |
| AU Small Finance Bank, Ltd. | | | 30,476,509 | | | | 229,425 | |
| SVB Financial Group2 | | | 606,500 | | | | 203,651 | |
| Essent Group, Ltd.1 | | | 5,654,659 | | | | 197,178 | |
| Trupanion, Inc.1,2,3 | | | 3,213,692 | | | | 190,990 | |
| Common stocks (continued) | | Shares | | | Value
(000) | |
| Financials (continued) | | | | | | | | |
| Aavas Financiers, Ltd.1,2 | | | 6,038,330 | | | $ | 165,167 | |
| Cholamandalam Investment and Finance Co., Ltd. | | | 17,195,186 | | | | 153,424 | |
| RenaissanceRe Holdings, Ltd. | | | 952,200 | | | | 133,679 | |
| Independent Bank Group, Inc.1 | | | 2,166,153 | | | | 132,980 | |
| Seacoast Banking Corporation of Florida1 | | | 4,156,901 | | | | 125,663 | |
| First Republic Bank | | | 945,825 | | | | 123,477 | |
| Eurobank Ergasias Services and Holdings SA2 | | | 148,563,100 | | | | 122,901 | |
| Janus Henderson Group PLC | | | 5,650,041 | | | | 114,752 | |
| Steadfast Group, Ltd. | | | 35,229,793 | | | | 103,813 | |
| IIFL Finance, Ltd.1 | | | 23,246,993 | | | | 99,987 | |
| IIFL Wealth Management, Ltd. | | | 4,379,654 | | | | 98,842 | |
| Patria Investments, Ltd., Class A1 | | | 6,913,834 | | | | 90,226 | |
| East West Bancorp, Inc. | | | 1,308,975 | | | | 87,885 | |
| SouthState Corp. | | | 1,097,165 | | | | 86,808 | |
| Kinsale Capital Group, Inc. | | | 339,620 | | | | 86,746 | |
| Capitec Bank Holdings, Ltd. | | | 983,153 | | | | 84,276 | |
| Fukuoka Financial Group, Inc.3 | | | 4,700,100 | | | | 83,404 | |
| Focus Financial Partners, Inc., Class A2 | | | 2,549,002 | | | | 80,319 | |
| TMX Group, Ltd. | | | 862,202 | | | | 79,307 | |
| City Union Bank, Ltd. | | | 36,608,696 | | | | 77,565 | |
| Stifel Financial Corp. | | | 1,477,350 | | | | 76,689 | |
| Canara Bank | | | 26,973,076 | | | | 75,000 | |
| StepStone Group, Inc., Class A | | | 3,039,100 | | | | 74,488 | |
| Western Alliance Bancorporation | | | 1,100,128 | | | | 72,322 | |
| Glacier Bancorp, Inc. | | | 1,443,817 | | | | 70,935 | |
| Bridgepoint Group PLC | | | 32,728,364 | | | | 68,204 | |
| National Bank of Greece SA2 | | | 22,719,403 | | | | 67,077 | |
| Eastern Bankshares, Inc. | | | 3,267,276 | | | | 64,169 | |
| AUB Group, Ltd.1 | | | 5,126,659 | | | | 62,367 | |
| Valley National Bancorp | | | 5,495,000 | | | | 59,346 | |
| United Community Banks, Inc. | | | 1,789,000 | | | | 59,216 | |
| VZ Holding AG | | | 785,919 | | | | 55,023 | |
| AJ Bell PLC | | | 18,325,000 | | | | 55,020 | |
| Banca Generali SpA | | | 1,972,252 | | | | 54,563 | |
| The Bank of N.T. Butterfield & Son, Ltd. | | | 1,504,686 | | | | 48,842 | |
| Remgro, Ltd. | | | 6,502,281 | | | | 47,716 | |
| Bolsa Mexicana de Valores, SAB de CV, Series A | | | 26,040,000 | | | | 43,561 | |
| Allfunds Group PLC | | | 5,925,895 | | | | 43,440 | |
| Antin Infrastructure Partners SA | | | 1,964,300 | | | | 40,836 | |
| Aptus Value Housing Finance India, Ltd.2 | | | 10,588,171 | | | | 39,880 | |
| Webster Financial Corp. | | | 843,652 | | | | 38,133 | |
| Pine Labs Pte., Ltd.2,4,5 | | | 76,998 | | | | 38,039 | |
| Silvergate Capital Corp., Class A2 | | | 500,878 | | | | 37,741 | |
| Euronext NV | | | 585,333 | | | | 37,039 | |
| Enstar Group, Ltd.2 | | | 203,500 | | | | 34,512 | |
| Virtu Financial, Inc., Class A | | | 1,566,000 | | | | 32,526 | |
| Umpqua Holdings Corp. | | | 1,785,500 | | | | 30,514 | |
| Goosehead Insurance, Inc., Class A2 | | | 838,350 | | | | 29,879 | |
| Star Health & Allied Insurance Co., Ltd.2 | | | 3,400,000 | | | | 29,398 | |
| Victory Capital Holdings, Inc., Class A | | | 1,196,000 | | | | 27,879 | |
| PacWest Bancorp | | | 1,220,000 | | | | 27,572 | |
| Hilltop Holdings, Inc. | | | 1,000,000 | | | | 24,850 | |
| AssetMark Financial Holdings, Inc.2 | | | 1,350,000 | | | | 24,692 | |
| Moelis & Co., Class A | | | 719,000 | | | | 24,309 | |
| Nova Ljubljanska Banka dd (GDR) | | | 2,365,833 | | | | 24,029 | |
| The Tel Aviv Stock Exchange, Ltd. | | | 4,312,024 | | | | 22,319 | |
| eGuarantee, Inc. | | | 1,268,348 | | | | 21,910 | |
| ICICI Securities, Ltd. | | | 3,293,062 | | | | 21,008 | |
| Alpha Services and Holdings SA2 | | | 26,000,000 | | | | 20,249 | |
| Hiscox, Ltd. | | | 2,060,606 | | | | 20,146 | |
| NMI Holdings, Inc.2 | | | 950,000 | | | | 19,352 | |
| Radian Group, Inc. | | | 1,000,000 | | | | 19,290 | |
| WealthNavi, Inc.2,3 | | | 1,788,200 | | | | 19,144 | |
| Artisan Partners Asset Management, Inc., Class A | | | 705,000 | | | | 18,986 | |
| Qualitas Controladora, SAB de CV3 | | | 4,450,000 | | | | 18,351 | |
| Haci Ömer Sabanci Holding AS | | | 12,391,000 | | | | 17,233 | |
| Angel One, Ltd. | | | 921,071 | | | | 15,316 | |
| Piramal Enterprises, Ltd. | | | 1,335,000 | | | | 14,153 | |
| Oscar Health, Inc., Class A2,3 | | | 2,751,000 | | | | 13,728 | |
| Common stocks (continued) | | Shares | | | Value
(000) | |
| Financials (continued) | | | | | | | | |
| SiriusPoint, Ltd.2 | | | 2,464,299 | | | $ | 12,198 | |
| Selective Insurance Group, Inc. | | | 145,930 | | | | 11,879 | |
| Collector Bank AB2 | | | 4,629,130 | | | | 11,466 | |
| EFG International AG | | | 1,414,530 | | | | 11,179 | |
| Premium Group Co., Ltd. | | | 888,900 | | | | 10,925 | |
| Hellenic Exchanges - Athens Stock Exchange SA1 | | | 3,500,000 | | | | 10,361 | |
| PT Bank Raya Indonesia Tbk2 | | | 278,708,667 | | | | 10,000 | |
| Islandsbanki hf. | | | 11,632,054 | | | | 9,771 | |
| Linc AB2,3 | | | 2,358,208 | | | | 9,310 | |
| Funding Circle Holdings PLC2 | | | 14,713,073 | | | | 6,706 | |
| Discovery, Ltd.2 | | | 899,883 | | | | 5,196 | |
| Uzabase, Inc.2,3 | | | 465,000 | | | | 2,093 | |
| TCS Group Holding PLC (GDR)2,4,7 | | | 31,700 | | | | — | 6 |
| TCS Group Holding PLC (GDR)2,4 | | | 1,334,228 | | | | — | 6 |
| | | | | | | | 5,285,117 | |
| | | | | | | | | |
| Consumer staples 3.42% | | | | | | | | |
| Emmi AG1 | | | 318,222 | | | | 247,648 | |
| Grocery Outlet Holding Corp.1,2 | | | 5,915,153 | | | | 196,915 | |
| Simply Good Foods Co.1,2 | | | 5,770,500 | | | | 184,598 | |
| Milbon Co., Ltd.1 | | | 2,378,500 | | | | 104,902 | |
| BJ’s Wholesale Club Holdings, Inc.2 | | | 1,217,842 | | | | 88,671 | |
| Varun Beverages, Ltd. | | | 6,634,383 | | | | 84,866 | |
| Celsius Holdings, Inc.2 | | | 832,726 | | | | 75,512 | |
| Monde Nissin Corp. | | | 350,959,960 | | | | 72,757 | |
| Sovos Brands, Inc.1,2 | | | 5,050,900 | | | | 71,925 | |
| Raia Drogasil SA, ordinary nominative shares | | | 15,832,125 | | | | 66,711 | |
| Ocado Group PLC2 | | | 10,398,813 | | | | 53,998 | |
| AAK AB | | | 3,694,316 | | | | 48,710 | |
| Shop Apotheke Europe NV, non-registered shares1,2,3 | | | 1,142,620 | | | | 46,389 | |
| United Spirits, Ltd.2 | | | 4,506,665 | | | | 46,336 | |
| Scandinavian Tobacco Group A/S | | | 2,941,378 | | | | 42,441 | |
| Sok Marketler Ticaret AS, non-registered shares1,2 | | | 37,067,550 | | | | 41,357 | |
| Performance Food Group Co.2 | | | 928,000 | | | | 39,858 | |
| Nu Skin Enterprises, Inc., Class A | | | 1,100,000 | | | | 36,707 | |
| Freshpet, Inc.2 | | | 667,764 | | | | 33,448 | |
| Jonjee Hi-Tech Industrial and Commercial Holding Co., Ltd., Class A | | | 6,624,986 | | | | 29,743 | |
| Kotobuki Spirits Co., Ltd. | | | 499,000 | | | | 28,580 | |
| COSMOS Pharmaceutical Corp. | | | 287,909 | | | | 28,408 | |
| BidCorp, Ltd.3 | | | 1,640,857 | | | | 25,115 | |
| Fresh Del Monte Produce, Inc. | | | 1,028,000 | | | | 23,891 | |
| Avenue Supermarts, Ltd.2 | | | 417,313 | | | | 22,411 | |
| Fever-Tree Drinks PLC | | | 2,410,000 | | | | 22,347 | |
| Vector Group, Ltd. | | | 2,509,032 | | | | 22,105 | |
| Bakkafrost P/F | | | 517,500 | | | | 20,495 | |
| Royal Unibrew A/S | | | 280,000 | | | | 18,121 | |
| Hilton Food Group PLC | | | 2,327,506 | | | | 13,822 | |
| PZ Cussons PLC | | | 6,017,310 | | | | 13,034 | |
| Century Pacific Food, Inc. | | | 25,901,000 | | | | 9,918 | |
| Humble Group AB2 | | | 11,368,627 | | | | 9,409 | |
| Icelandic Salmon AS2,3 | | | 515,000 | | | | 7,704 | |
| Nomad Foods, Ltd.2 | | | 500,000 | | | | 7,100 | |
| TreeHouse Foods, Inc.2 | | | 152,200 | | | | 6,456 | |
| Dole PLC | | | 551,300 | | | | 4,024 | |
| Zur Rose Group AG2,3 | | | 54,100 | | | | 1,590 | |
| Beyond Meat, Inc.2,3 | | | 73,395 | | | | 1,040 | |
| | | | | | | | 1,899,062 | |
| | | | | | | | | |
| Energy 3.12% | | | | | | | | |
| New Fortress Energy, Inc., Class A | | | 4,116,300 | | | | 179,923 | |
| Northern Oil and Gas, Inc.1 | | | 6,054,000 | | | | 165,940 | |
| Coterra Energy, Inc. | | | 6,350,059 | | | | 165,864 | |
| Chesapeake Energy Corp. | | | 1,434,104 | | | | 135,107 | |
| MEG Energy Corp.2 | | | 11,431,657 | | | | 127,943 | |
| DT Midstream, Inc. | | | 2,420,877 | | | | 125,619 | |
| Gaztransport & Technigaz SA | | | 913,743 | | | | 101,092 | |
| Vallourec SA2 | | | 9,989,108 | | | | 96,289 | |
| Viper Energy Partners, LP | | | 2,555,470 | | | | 73,240 | |
| Common stocks (continued) | | Shares | | | Value
(000) | |
| Energy (continued) | | | | | | | | |
| Helmerich & Payne, Inc. | | | 1,817,270 | | | $ | 67,184 | |
| Pioneer Natural Resources Company | | | 268,053 | | | | 58,041 | |
| Golar LNG, Ltd.2 | | | 2,132,596 | | | | 53,144 | |
| Worley, Ltd. | | | 5,701,172 | | | | 46,352 | |
| Cactus, Inc., Class A | | | 1,149,091 | | | | 44,160 | |
| TechnipFMC PLC2 | | | 5,200,890 | | | | 43,999 | |
| Denbury, Inc.2 | | | 406,329 | | | | 35,050 | |
| Venture Global LNG, Inc., Series C2,4,5 | | | 4,240 | | | | 34,228 | |
| Subsea 7 SA | | | 3,742,357 | | | | 29,563 | |
| Savannah Energy PLC1,2,3 | | | 96,128,672 | | | | 29,272 | |
| Magnolia Oil & Gas Corp., Class A | | | 1,323,743 | | | | 26,223 | |
| Equitrans Midstream Corp. | | | 3,390,447 | | | | 25,361 | |
| Weatherford International2 | | | 706,648 | | | | 22,818 | |
| Headwater Exploration, Inc.2 | | | 5,105,000 | | | | 19,439 | |
| ProFrac Holding Corp., Class A2,3 | | | 1,194,734 | | | | 18,172 | |
| Championx Corp. | | | 462,625 | | | | 9,054 | |
| | | | | | | | 1,733,077 | |
| | | | | | | | | |
| Materials 3.02% | | | | | | | | |
| APL Apollo Tubes, Ltd.1 | | | 15,548,000 | | | | 198,170 | |
| LANXESS AG1 | | | 4,917,743 | | | | 144,010 | |
| JSR Corp. | | | 6,631,830 | | | | 126,378 | |
| Navin Fluorine International, Ltd. | | | 2,079,348 | | | | 114,025 | |
| CCL Industries, Inc., Class B, nonvoting shares | | | 2,262,200 | | | | 109,659 | |
| OZ Minerals, Ltd. | | | 6,303,841 | | | | 103,479 | |
| Perimeter Solutions SA1,2 | | | 11,791,546 | | | | 94,450 | |
| Deepak Fertilisers & Petrochemicals Corp., Ltd. | | | 6,039,256 | | | | 64,739 | |
| Summit Materials, Inc., Class A2 | | | 2,535,041 | | | | 60,739 | |
| H.B. Fuller Co. | | | 866,200 | | | | 52,059 | |
| ATI, Inc.2 | | | 1,868,650 | | | | 49,725 | |
| Livent Corp.2 | | | 1,530,893 | | | | 46,922 | |
| PI Industries, Ltd. | | | 1,212,000 | | | | 44,299 | |
| MMG, Ltd.2 | | | 148,596,000 | | | | 35,281 | |
| Lundin Mining Corp. | | | 6,434,519 | | | | 32,514 | |
| Yamato Kogyo Co., Ltd.3 | | | 1,043,900 | | | | 31,727 | |
| Toyo Gosei Co., Ltd.1,3 | | | 642,700 | | | | 28,289 | |
| FUJIMI INCORPORATED3 | | | 597,000 | | | | 25,022 | |
| Jindal Steel & Power, Ltd. | | | 4,763,387 | | | | 24,863 | |
| Labrador Iron Ore Royalty Corp.3 | | | 1,156,000 | | | | 24,194 | |
| Vinati Organics, Ltd. | | | 943,000 | | | | 24,161 | |
| Aluflexpack AG1,2,3 | | | 1,309,666 | | | | 23,652 | |
| Kansai Paint Co., Ltd. | | | 1,642,000 | | | | 23,282 | |
| Mayr-Melnhof Karton AG, non-registered shares | | | 171,841 | | | | 22,055 | |
| JCU Corp. | | | 1,066,300 | | | | 21,442 | |
| Indigo Paints, Ltd. | | | 1,103,244 | | | | 20,302 | |
| Shandong Sinocera Functional Material Co., Ltd., Class A | | | 4,713,974 | | | | 19,241 | |
| Nanofilm Technologies International, Ltd. | | | 12,438,970 | | | | 18,013 | |
| Re:NewCell AB1,2,3 | | | 2,702,272 | | | | 17,542 | |
| Berger Paints India, Ltd. | | | 1,930,816 | | | | 14,584 | |
| Alcoa Corp. | | | 350,000 | | | | 11,781 | |
| Recticel SA/NV | | | 873,200 | | | | 11,458 | |
| Materion Corp. | | | 121,538 | | | | 9,723 | |
| Gerdau SA (ADR) | | | 2,011,500 | | | | 9,092 | |
| Venator Materials PLC1,2 | | | 8,519,540 | | | | 7,497 | |
| Fuso Chemical Co., Ltd. | | | 283,300 | | | | 6,104 | |
| Alleima AB2 | | | 1,509,740 | | | | 4,734 | |
| Carbios SA2 | | | 105,815 | | | | 2,108 | |
| | | | | | | | 1,677,315 | |
| | | | | | | | | |
| Communication services 2.10% | | | | | | | | |
| Iridium Communications, Inc.2 | | | 4,845,068 | | | | 214,976 | |
| Iridium Communications, Inc.2,7 | | | 636,132 | | | | 28,225 | |
| Lions Gate Entertainment Corp., Class B2 | | | 18,041,147 | | | | 125,386 | |
| New York Times Co., Class A | | | 2,439,638 | | | | 70,140 | |
| JCDecaux SA2 | | | 5,841,330 | | | | 68,774 | |
| Frontier Communications Parent, Inc.2 | | | 2,609,825 | | | | 61,148 | |
| Pearson PLC | | | 5,591,034 | | | | 53,583 | |
| Viaplay Group AB, Class B2 | | | 2,662,395 | | | | 52,016 | |
| Common stocks (continued) | | Shares | | | Value
(000) | |
| Communication services (continued) | | | | | | | | |
| 4imprint Group PLC | | | 1,104,563 | | | $ | 41,611 | |
| Ascential PLC2 | | | 17,882,269 | | | | 41,067 | |
| Hemnet Group AB | | | 2,549,439 | | | | 32,459 | |
| JOYY, Inc., Class A (ADR) | | | 1,177,618 | | | | 30,618 | |
| YouGov PLC | | | 2,997,794 | | | | 29,210 | |
| Paradox Interactive AB3 | | | 1,744,220 | | | | 27,763 | |
| Rightmove PLC | | | 5,188,789 | | | | 27,522 | |
| Direct Marketing MIX, Inc.1 | | | 2,454,500 | | | | 27,521 | |
| Megacable Holdings, SAB de CV, ordinary participation certificates | | | 13,468,136 | | | | 27,138 | |
| TIM SA | | | 11,855,402 | | | | 26,549 | |
| CTS Eventim AG & Co. KGaA2 | | | 471,400 | | | | 19,647 | |
| Nextdoor Holdings, Inc., Class A2,3 | | | 6,859,318 | | | | 19,137 | |
| VTEX, Class A2,3 | | | 5,109,762 | | | | 18,906 | |
| Bandwidth, Inc., Class A2 | | | 1,329,018 | | | | 15,815 | |
| JYP Entertainment Corp. | | | 388,161 | | | | 15,789 | |
| PLAYSTUDIOS, Inc., Class A2 | | | 4,500,000 | | | | 15,705 | |
| Trustpilot Group PLC2 | | | 16,821,394 | | | | 14,149 | |
| Ubisoft Entertainment SA2 | | | 511,500 | | | | 14,043 | |
| Pebble Group PLC1,2 | | | 13,392,050 | | | | 13,532 | |
| Cable One, Inc. | | | 15,197 | | | | 12,964 | |
| MTN Group, Ltd. | | | 1,458,066 | | | | 9,573 | |
| Boat Rocker Media, Inc.2 | | | 2,611,926 | | | | 5,559 | |
| Playtika Holding Corp.2 | | | 429,090 | | | | 4,029 | |
| Huuuge, Inc.2,3 | | | 106,234 | | | | 488 | |
| Yandex NV, Class A2,4 | | | 1,530,000 | | | | — | 6 |
| | | | | | | | 1,165,042 | |
| | | | | | | | | |
| Real estate 1.45% | | | | | | | | |
| Embassy Office Parks REIT | | | 31,445,400 | | | | 133,529 | |
| Altus Group, Ltd.1 | | | 3,619,087 | | | | 117,322 | |
| DigitalBridge Group, Inc. REIT, Class A | | | 7,708,189 | | | | 96,429 | |
| Concentradora Fibra Danhos REIT, SA de CV3 | | | 57,954,482 | | | | 69,639 | |
| JHSF Participações SA1 | | | 47,722,472 | | | | 65,466 | |
| Mindspace Business Parks REIT | | | 9,000,000 | | | | 40,171 | |
| SRE Holdings Corp.1,2,3 | | | 1,290,828 | | | | 27,781 | |
| Macrotech Developers, Ltd.2 | | | 2,331,038 | | | | 26,215 | |
| K-Fast Holding AB, Class B1,2,3 | | | 12,909,607 | | | | 24,470 | |
| FirstService Corp.3 | | | 200,000 | | | | 23,807 | |
| ESR-Logos REIT | | | 93,830,358 | | | | 23,216 | |
| Corp. Inmobiliaria Vesta, SAB de CV | | | 11,183,823 | | | | 20,835 | |
| CIFI Ever Sunshine Services Group, Ltd.3 | | | 55,562,025 | | | | 20,341 | |
| PotlatchDeltic Corp. REIT | | | 379,300 | | | | 15,566 | |
| Zillow Group, Inc., Class C, nonvoting shares2 | | | 525,000 | | | | 15,020 | |
| Redwood Trust, Inc. REIT3 | | | 2,562,000 | | | | 14,706 | |
| Swedish Logistic Property AB, Class B2 | | | 4,739,069 | | | | 11,484 | |
| CTP NV | | | 1,092,105 | | | | 11,278 | |
| Genova Property Group AB1,2 | | | 2,126,731 | | | | 10,794 | |
| Cushman & Wakefield PLC2 | | | 862,000 | | | | 9,870 | |
| Fastighets AB Balder, Class B2 | | | 2,448,188 | | | | 9,676 | |
| Douglas Elliman, Inc. | | | 1,832,215 | | | | 7,512 | |
| LXP Industrial Trust REIT | | | 805,425 | | | | 7,378 | |
| Americold Realty Trust, Inc. REIT | | | 217,800 | | | | 5,358 | |
| | | | | | | | 807,863 | |
| | | | | | | | | |
| Utilities 0.60% | | | | | | | | |
| Black Hills Corp. | | | 1,290,379 | | | | 87,398 | |
| ACEN Corp. | | | 861,383,220 | | | | 82,369 | |
| Brookfield Infrastructure Corp., Class A, subordinate voting shares3 | | | 1,056,214 | | | | 42,995 | |
| ENN Energy Holdings, Ltd. | | | 3,166,000 | | | | 42,128 | |
| Nippon Gas Co., Ltd.3 | | | 2,848,600 | | | | 40,294 | |
| Neoenergia SA | | | 9,514,000 | | | | 26,985 | |
| SJW Group | | | 162,000 | | | | 9,331 | |
| Mytrah Energy, Ltd.1,2,4 | | | 10,418,000 | | | | 116 | |
| | | | | | | | 331,616 | |
| | | | | | | | | |
| Total common stocks (cost: $43,067,208,000) | | | | | | | 47,722,717 | |
| Preferred securities 1.27% | | Shares | | | Value
(000) | |
| Industrials 0.42% | | | | | | | | |
| Einride AB, Series B, preferred shares1,2,4,5 | | | 1,334,588 | | | $ | 60,860 | |
| Einride AB, Series A, preferred shares1,2,4,5 | | | 11,990 | | | | 547 | |
| Azul SA, preferred nominative shares (ADR)2,3 | | | 6,549,081 | | | | 53,310 | |
| Azul SA, preferred nominative shares2 | | | 771,000 | | | | 2,104 | |
| Relativity Space, Inc., Series D, preferred shares1,2,4,5 | | | 2,143,751 | | | | 39,166 | |
| Relativity Space, Inc., Series E, preferred shares1,2,4,5 | | | 464,197 | | | | 8,481 | |
| ABL Space Systems Co., Series B, preferred shares2,4,5 | | | 777,162 | | | | 44,920 | |
| WorkRise Technologies, Inc., Series E, preferred shares2,4,5 | | | 95,423 | | | | 21,696 | |
| | | | | | | | 231,084 | |
| | | | | | | | | |
| Information technology 0.36% | | | | | | | | |
| Skyryse, Inc., Series B, preferred shares1,2,4,5 | | | 1,649,110 | | | | 40,700 | |
| PsiQuantum Corp., Series D, preferred shares2,4,5 | | | 1,334,542 | | | | 36,059 | |
| Outreach Corp., Series G, preferred shares2,4,5 | | | 1,554,053 | | | | 35,557 | |
| SiFive, Inc., Series F, preferred shares2,4,5 | | | 3,451,632 | | | | 25,128 | |
| Yotpo, Ltd., Series F, preferred shares2,4,5 | | | 8,332,809 | | | | 13,666 | |
| Yotpo, Ltd., Series B, preferred shares2,4,5 | | | 1,111,347 | | | | 1,823 | |
| Yotpo, Ltd., Series C, preferred shares2,4,5 | | | 1,057,985 | | | | 1,735 | |
| Yotpo, Ltd., Series A-1, preferred shares2,4,5 | | | 709,592 | | | | 1,164 | |
| Yotpo, Ltd., Series A, preferred shares2,4,5 | | | 345,899 | | | | 567 | |
| Yotpo, Ltd., Series C-1, preferred shares2,4,5 | | | 293,302 | | | | 481 | |
| Yotpo, Ltd., Series D, preferred shares2,4,5 | | | 163,552 | | | | 268 | |
| Yotpo, Ltd., Series B-1, preferred shares2,4,5 | | | 130,625 | | | | 214 | |
| ANDPAD, Inc., Series D, preferred shares2,4,5 | | | 459,413 | | | | 18,411 | |
| Patreon, Inc., Series E, preferred shares2,4,5 | | | 698,208 | | | | 14,411 | |
| Patreon, Inc., Series Seed, preferred shares2,4,5 | | | 163,096 | | | | 3,366 | |
| Kandou Holding SA, Series D, preferred shares2,4,5 | | | 2,142,857 | | | | 3,986 | |
| | | | | | | | 197,536 | |
| | | | | | | | | |
| Health care 0.20% | | | | | | | | |
| Laronde, Inc., Series B, 6.00% preferred shares2,4,5 | | | 1,785,714 | | | | 43,822 | |
| KRY International AB, Series E, preferred shares2,4,5 | | | 114,059 | | | | 28,225 | |
| InSilico Medicine Cayman TopCo, Series D, preferred shares2,4,5 | | | 605,423 | | | | 23,684 | |
| Bluestar Genomics, Inc., Series C, noncumulative preferred shares, 5.00% 20221,2,4,5 | | | 1,531,102 | | | | 9,814 | |
| Artiva Biotherapeutics, Inc., Series B, preferred shares2,4,5 | | | 636,364 | | | | 6,555 | |
| PACT Pharma, Inc., Series C, 8.00% noncumulative preferred shares2,4,5 | | | 4,397,107 | | | | 616 | |
| | | | | | | | 112,716 | |
| | | | | | | | | |
| Financials 0.15% | | | | | | | | |
| PPRO Holding GMBS, Series B, 8.00% preferred shares1,2,4,5 | | | 13,618 | | | | 57,732 | |
| Pine Labs Pte., Ltd., Series J, cumulative preferred shares2,4,5 | | | 57,100 | | | | 28,209 | |
| | | | | | | | 85,941 | |
| | | | | | | | | |
| Consumer discretionary 0.07% | | | | | | | | |
| Cava Group, Inc., Series F, preferred shares2,4,5 | | | 664,364 | | | | 20,928 | |
| StockX, Inc., Series E-1, preferred shares2,4,5 | | | 222,222 | | | | 15,435 | |
| StockX, Inc., Series AA, preferred shares2,4,5 | | | 57,338 | | | | 3,983 | |
| StockX, Inc., Series B, preferred shares2,4,5 | | | 3,094 | | | | 215 | |
| | | | | | | | 40,561 | |
| | | | | | | | | |
| Real estate 0.07% | | | | | | | | |
| QuintoAndar, Ltd., Series E-1, preferred shares2,4,5 | | | 244,733 | | | | 37,752 | |
| | | | | | | | | |
| Total preferred securities (cost: $783,659,000) | | | | | | | 705,590 | |
| | | | | | | | | |
| Rights & warrants 0.20% | | | | | | | | |
| Information technology 0.12% | | | | | | | | |
| OPT Machine Vision Tech Co., Ltd., Class A, warrants, expire 20232,7 | | | 2,838,640 | | | | 63,037 | |
| Foursquare Labs, Inc., warrants, expire 20332,4,5 | | | 1,163,990 | | | | 55 | |
| | | | | | | | 63,092 | |
| | | | | | | | | |
| Industrials 0.07% | | | | | | | | |
| Warom Technology, Inc. Co., Class A, warrants, expire 20232,7 | | | 8,603,931 | | | | 26,322 | |
| Centre Testing International Group Co., Ltd., Class A, warrants, expire 20232,7 | | | 3,799,918 | | | | 10,900 | |
| Guangzhou Baiyun International Airport Co., Ltd., Class A, warrants, expire 20242,7 | | | 1,315,742 | | | | 2,644 | |
| Momentus, Inc., warrants, expire 20262 | | | 2,225,000 | | | | 400 | |
| | | | | | | | 40,266 | |
| Rights & warrants (continued) | | | | | | Shares | | | Value
(000) | |
| Materials 0.01% | | | | | | | | | | | | |
| Shandong Sinocera Functional Material Co., Ltd., Class A, warrants, expire 20232,7 | | 1,225,940 | | | $ | 5,004 | |
| | | | | | | | | | | | | |
| Total rights & warrants (cost: $146,526,000) | | | | | | | | | | | 108,362 | |
| | | | | | | | | | | | | |
| Convertible stocks 0.09% | | | | | | | | | | | | |
| Utilities 0.06% | | | | | | | | | | | | |
| TAE Technologies, Inc., Series G2, 4.00% cumulative convertible preferred shares4,5 | | 300,000 | | | | 30,000 | |
| | | | | | | | | | | | | |
| Information technology 0.03% | | | | | | | | | | | | |
| RealSelf, Inc., Series C, convertible preferred shares1,2,4,5 | | | | | | | 3,468,862 | | | | 10,163 | |
| Tarana Wireless, Inc., Series 6, noncumulative convertible preferred shares4,5 | | 14,888,589 | | | | 8,040 | |
| | | | | | | | | | | | 18,203 | |
| | | | | | | | | | | | | |
| Total convertible stocks (cost: $61,179,000) | | | | | | | | | | | 48,203 | |
| | | | | | | | | | | | | |
| Convertible bonds & notes 0.00% | | | | | | Principal amount
(000) | | | | | |
| Industrials 0.00% | | | | | | | | | | | | |
| Einride AB, convertible notes, 7.00% 20231,4,5 | | | | | | USD | 1,500 | | | | 1,895 | |
| | | | | | | | | | | | | |
| Total convertible bonds & notes (cost: $1,501,000) | | | | | | | | | | | 1,895 | |
| | | | | | | | | | | | | |
| Short-term securities 14.57% | | | | | | | Shares | | | | | |
| Money market investments 8.59% | | | | | | | | | | | | |
| Capital Group Central Cash Fund 2.81%1,8 | | | | | | | 47,762,957 | | | | 4,775,818 | |
| | | | | | | | | | | | | |
| | Weighted
average yield
at acquisition | | | Principal amount
(000) | | | | |
| Commercial paper 4.49% | | | | | | | | | | | | |
| Banque et Caisse d’Epargne de l’Etat 12/8/2022 | | | 3.066 | % | | USD | 87,400 | | | | 86,823 | |
| BNG Bank NV 10/3/20227 | | | 2.353 | | | | 150,000 | | | | 149,962 | |
| BNG Bank NV 10/14/20227 | | | 2.625 | | | | 200,000 | | | | 199,761 | |
| BNG Bank NV 10/17/20227 | | | 2.692 | | | | 100,000 | | | | 99,855 | |
| BNG Bank NV 10/19/20227 | | | 2.656 | | | | 50,000 | | | | 49,919 | |
| Caisse des Dépôts et Consignations 10/12/2022 | | | 2.414 | | | | 250,000 | | | | 249,747 | |
| DBS Bank, Ltd. 12/14/20227 | | | 3.481 | | | | 100,000 | | | | 99,253 | |
| Export Development Canada 11/21/2022 | | | 2.969 | | | | 100,000 | | | | 99,533 | |
| KfW 11/14/20227 | | | 2.971 | | | | 200,000 | | | | 199,319 | |
| KfW 12/13/20227 | | | 3.214 | | | | 50,000 | | | | 49,678 | |
| KfW 12/14/20227 | | | 3.412 | | | | 150,000 | | | | 149,017 | |
| LVMH Moët Hennessy Louis Vuitton, Inc. 12/1/20227 | | | 2.935 | | | | 77,250 | | | | 76,794 | |
| NRW.Bank 10/7/20227 | | | 2.509 | | | | 250,000 | | | | 249,853 | |
| NRW.Bank 10/11/20227 | | | 2.519 | | | | 150,000 | | | | 149,861 | |
| NRW.Bank 10/17/20227 | | | 2.861 | | | | 100,000 | | | | 99,855 | |
| Oesterreich Kontrollbank 10/17/2022 | | | 2.858 | | | | 51,500 | | | | 51,425 | |
| United Overseas Bank, Ltd. 12/8/20227 | | | 3.126 | | | | 87,400 | | | | 86,777 | |
| United Overseas Bank, Ltd. 12/12/20227 | | | 3.084 | | | | 100,000 | | | | 99,242 | |
| United Overseas Bank, Ltd. 12/13/20227 | | | 3.086 | | | | 150,000 | | | | 148,847 | |
| United Overseas Bank, Ltd. 12/16/20227 | | | 3.089 | | | | 100,000 | | | | 99,197 | |
| | | | | | | | | | | | 2,494,718 | |
| | | | | | | | | | | | | |
| | | | | | | | Shares | | | | | |
| Money market investments purchased with collateral from securities on loan 1.49% | | | | | | | | |
| Capital Group Central Cash Fund 2.81%1,8,9 | | | | | | | 2,910,012 | | | | 290,972 | |
| State Street Institutional U.S. Government Money Market Fund, Premier Class 2.94%8,9 | | | 199,400,000 | | | | 199,400 | |
| Goldman Sachs Financial Square Government Fund, Institutional Shares 2.93%8,9 | | | 166,100,000 | | | | 166,100 | |
| Invesco Short-Term Investments Trust – Government & Agency Portfolio, Institutional Class 2.88%8,9 | | | 66,575,613 | | | | 66,576 | |
| Short-term securities (continued) | | Shares | | | Value
(000) | |
| Money market investments purchased with collateral from securities on loan (continued) | | | | | | | | |
| Dreyfus Treasury Obligations Cash Management, Institutional Shares 2.85%8,9 | | | 58,100,000 | | | $ | 58,100 | |
| Morgan Stanley Institutional Liquidity Funds – Government Portfolio, Institutional Class 2.80%8,9 | | | 33,200,000 | | | | 33,200 | |
| BlackRock Liquidity Funds – FedFund, Institutional Shares 2.76%8,9 | | | 16,600,000 | | | | 16,600 | |
| | | | | | | | 830,948 | |
| | | | | | | | | |
| Total short-term securities (cost: $8,102,184,000) | | | | | | | 8,101,484 | |
| Total investment securities 101.99% (cost: $52,162,257,000) | | | | | | | 56,688,251 | |
| Other assets less liabilities (1.99)% | | | | | | | (1,108,107 | ) |
| | | | | | | | | |
| Net assets 100.00% | | | | | | $ | 55,580,144 | |
Investments in affiliates1
| | | Value of
affiliates at
10/1/2021
(000) | | | Additions
(000) | | | Reductions
(000) | | | Net
realized
gain (loss)
(000) | | | Net
unrealized
(depreciation)
appreciation
(000) | | | Value of
affiliates at
9/30/2022
(000) | | | Dividend
or interest
income
(000) | |
| Common stocks 23.01% | | | | | | | | | | | | | | | | | | | | | | | | | | | | |
| Industrials 6.62% | | | | | | | | | | | | | | | | | | | | | | | | | | | | |
| Saia, Inc.2 | | $ | 349,105 | | | $ | 103,842 | | | $ | — | | | $ | — | | | $ | (79,498 | ) | | $ | 373,449 | | | $ | — | |
| BayCurrent Consulting, Inc. | | | 624,379 | | | | 18,516 | | | | 53,725 | | | | 8,796 | | | | (301,299 | ) | | | 296,667 | | | | 2,995 | |
| Comfort Systems USA, Inc. | | | 137,040 | | | | 94,086 | | | | 37,033 | | | | (1,074 | ) | | | 55,828 | | | | 248,847 | | | | 1,351 | |
| Diploma PLC | | | 374,585 | | | | 296 | | | | 8,238 | | | | (4,156 | ) | | | (114,506 | ) | | | 247,981 | | | | 5,967 | |
| Armstrong World Industries, Inc. | | | 205,914 | | | | 76,020 | | | | — | | | | — | | | | (53,091 | ) | | | 228,843 | | | | 2,475 | |
| Arcosa, Inc. | | | 176,368 | | | | 18,694 | | | | — | | | | — | | | | 25,821 | | | | 220,883 | | | | 740 | |
| Japan Airport Terminal Co., Ltd.2 | | | 189,109 | | | | 60,264 | | | | 11,881 | | | | (2,069 | ) | | | (31,188 | ) | | | 204,235 | | | | — | |
| Visional, Inc.2 | | | 186,716 | | | | 6,282 | | | | — | | | | — | | | | (8,054 | ) | | | 184,944 | | | | — | |
| Harmonic Drive Systems, Inc.3 | | | 149,749 | | | | 87,721 | | | | 13,367 | | | | (12,426 | ) | | | (58,531 | ) | | | 153,146 | | | | 812 | |
| ATS Automation Tooling System, Inc.2 | | | — | | | | 200,771 | | | | — | | | | — | | | | (50,831 | ) | | | 149,940 | | | | — | |
| Wizz Air Holdings PLC2 | | | 259,859 | | | | 285,749 | | | | 107,325 | | | | (100,038 | ) | | | (213,847 | ) | | | 124,398 | | | | — | |
| EnPro Industries, Inc. | | | 72,321 | | | | 68,924 | | | | — | | | | — | | | | (17,548 | ) | | | 123,697 | | | | 1,446 | |
| Carel Industries SpA | | | 186,704 | | | | — | | | | 21,300 | | | | 9,917 | | | | (62,958 | ) | | | 112,363 | | | | 947 | |
| Alfen NV2 | | | 134,619 | | | | — | | | | 8,497 | | | | (2,206 | ) | | | (14,665 | ) | | | 109,251 | | | | — | |
| Japan Elevator Service Holdings Co., Ltd. | | | 163,396 | | | | — | | | | — | | | | — | | | | (71,814 | ) | | | 91,582 | | | | 816 | |
| dip Corp. | | | 91,426 | | | | 27,583 | | | | — | | | | — | | | | (33,963 | ) | | | 85,046 | | | | 1,437 | |
| Johns Lyng Group, Ltd. | | | 79,441 | | | | 13,116 | | | | — | | | | — | | | | (10,685 | ) | | | 81,872 | | | | 821 | |
| KEI Industries, Ltd. | | | — | | | | 62,117 | | | | — | | | | — | | | | 17,596 | | | | 79,713 | | | | 102 | |
| Instalco AB | | | 158,007 | | | | 3,002 | | | | — | | | | — | | | | (89,825 | ) | | | 71,184 | | | | 1,130 | |
| Pegasus Hava Tasimaciligi AS2 | | | 52,880 | | | | — | | | | 10,269 | | | | 1,599 | | | | 24,097 | | | | 68,307 | | | | — | |
| Marlowe PLC2,3 | | | 69,724 | | | | 9,520 | | | | — | | | | — | | | | (17,351 | ) | | | 61,893 | | | | — | |
| Montrose Environmental Group, Inc.2 | | | 95,694 | | | | 49,261 | | | | 24,695 | | | | (21,646 | ) | | | (43,969 | ) | | | 54,645 | | | | — | |
| DO & CO AG, non-registered shares2,3 | | | 63,241 | | | | — | | | | — | | | | — | | | | (11,831 | ) | | | 51,410 | | | | — | |
| Volution Group PLC | | | 37,413 | | | | 67,773 | | | | — | | | | — | | | | (54,232 | ) | | | 50,954 | | | | 848 | |
| Interface, Inc. | | | 71,524 | | | | — | | | | — | | | | — | | | | (29,082 | ) | | | 42,442 | | | | 189 | |
| Midac Holdings Co., Ltd.3 | | | 58,547 | | | | 11,976 | | | | — | | | | — | | | | (28,128 | ) | | | 42,395 | | | | 51 | |
| Antares Vision SpA2,3 | | | 67,179 | | | | — | | | | — | | | | — | | | | (29,602 | ) | | | 37,577 | | | | — | |
| Montana Aerospace AG2 | | | 98,830 | | | | 11,248 | | | | — | | | | — | | | | (75,390 | ) | | | 34,688 | | | | — | |
| Fasadgruppen Group AB | | | 66,194 | | | | 3,933 | | | | — | | | | — | | | | (40,330 | ) | | | 29,797 | | | | 458 | |
| Einride AB2,4,5 | | | 13,640 | | | | — | | | | — | | | | — | | | | 4,194 | | | | 17,834 | | | | — | |
| Azelio AB10 | | | 20,939 | | | | — | | | | 4,008 | | | | (24,441 | ) | | | 7,510 | | | | — | | | | — | |
| Barrett Business Services, Inc.10 | | | 46,577 | | | | — | | | | 39,544 | | | | 3,412 | | | | (10,445 | ) | | | — | | | | 183 | |
| Boyd Group Services, Inc.3,11 | | | 237,086 | | | | 21,580 | | | | 69,261 | | | | (22,232 | ) | | | (61,857 | ) | | | — | | | | 460 | |
| GVS SpA2,11 | | | 174,811 | | | | 28,257 | | | | 64,546 | | | | (6,317 | ) | | | (81,285 | ) | | | — | | | | — | |
| IMCD NV11 | | | 668,138 | | | | — | | | | 146,346 | | | | 70,510 | | | | (271,719 | ) | | | — | | | | 4,914 | |
Investments in affiliates1 (continued)
| | | Value of
affiliates at
10/1/2021
(000) | | | Additions
(000) | | | Reductions
(000) | | | Net
realized
gain (loss)
(000) | | | Net
unrealized
(depreciation)
appreciation
(000) | | | Value of
affiliates at
9/30/2022
(000) | | | Dividend
or interest
income
(000) | |
| Matson, Inc.11 | | $ | 159,322 | | | $ | 20,147 | | | $ | 58,954 | | | $ | 11,171 | | | $ | (55,951 | ) | | $ | — | | | $ | 2,495 | |
| Sun Country Airlines Holdings, Inc.2,11 | | | 104,947 | | | | 13,080 | | | | 48,563 | | | | (12,347 | ) | | | (33,822 | ) | | | — | | | | — | |
| | | | | | | | | | | | | | | | | | | | | | | | 3,679,983 | | | | | |
| Information technology 3.96% | | | | | | | | | | | | | | | | | | | | | | | | | | | | |
| eMemory Technology, Inc. | | | 425,376 | | | | 42,851 | | | | 21,755 | | | | 16,739 | | | | (235,811 | ) | | | 227,400 | | | | 3,038 | |
| ALTEN SA, non-registered shares | | | 218,256 | | | | 104,552 | | | | 45,261 | | | | (19,027 | ) | | | (67,703 | ) | | | 190,817 | | | | 2,692 | |
| Kulicke and Soffa Industries, Inc. | | | 277,553 | | | | 12,062 | | | | 8,098 | | | | (5,913 | ) | | | (91,353 | ) | | | 184,251 | | | | 3,354 | |
| Global Unichip Corp. | | | 122,936 | | | | 65,715 | | | | 11,301 | | | | (2,756 | ) | | | 9,274 | | | | 183,868 | | | | 2,564 | |
| Fabrinet, non-registered shares2 | | | 112,252 | | | | 92,643 | | | | — | | | | — | | | | (21,701 | ) | | | 183,194 | | | | — | |
| Keywords Studios PLC | | | 237,154 | | | | 3,325 | | | | 28,784 | | | | (11,573 | ) | | | (69,661 | ) | | | 130,461 | | | | 169 | |
| Dexerials Corp.3 | | | 63,639 | | | | 63,648 | | | | — | | | | — | | | | (11,017 | ) | | | 116,270 | | | | 2,357 | |
| Extreme Networks, Inc.2 | | | 52,435 | | | | 76,483 | | | | 22,231 | | | | (11,634 | ) | | | 17,962 | | | | 113,015 | | | | — | |
| Network International Holdings PLC2 | | | 215,255 | | | | 12,398 | | | | 40,239 | | | | (48,431 | ) | | | (30,277 | ) | | | 108,706 | | | | — | |
| Net One Systems Co., Ltd. | | | 226,584 | | | | 9,042 | | | | 47,996 | | | | (9,321 | ) | | | (78,824 | ) | | | 99,485 | | | | 3,062 | |
| Credo Technology Group Holding, Ltd.2,3 | | | — | | | | 58,768 | | | | — | | | | — | | | | 31,373 | | | | 90,141 | | | | — | |
| Tanla Platforms, Ltd. | | | 112,334 | | | | — | | | | — | | | | — | | | | (25,003 | ) | | | 87,331 | | | | 925 | |
| Money Forward, Inc.2 | | | 235,170 | | | | 42,349 | | | | 26,198 | | | | (48,094 | ) | | | (127,274 | ) | | | 75,953 | | | | — | |
| Bytes Technology Group PLC | | | 80,157 | | | | 24,222 | | | | — | | | | — | | | | (33,856 | ) | | | 70,523 | | | | 2,253 | |
| PAR Technology Corp.2,3 | | | 125,429 | | | | 6,227 | | | | — | | | | — | | | | (68,460 | ) | | | 63,196 | | | | — | |
| Mastek, Ltd. | | | — | | | | 58,352 | | | | — | | | | — | | | | (7,408 | ) | | | 50,944 | | | | 237 | |
| Crayon Group Holding ASA2,3 | | | 75,090 | | | | 60,519 | | | | 4,880 | | | | (4,864 | ) | | | (75,008 | ) | | | 50,857 | | | | — | |
| Megaport, Ltd.2,3 | | | 132,815 | | | | 10,408 | | | | 28,970 | | | | 14,002 | | | | (83,830 | ) | | | 44,425 | | | | — | |
| Zuken, Inc. | | | 59,358 | | | | 11,512 | | | | 4,302 | | | | (1,969 | ) | | | (20,476 | ) | | | 44,123 | | | | 569 | |
| Boku, Inc.2,5 | | | 53,644 | | | | — | | | | — | | | | — | | | | (28,265 | ) | | | 25,379 | | | | — | |
| SmartCraft ASA, Class A2 | | | 34,172 | | | | — | | | | — | | | | — | | | | (15,544 | ) | | | 18,628 | | | | — | |
| TDCX, Inc., Class A2 | | | — | | | | 16,015 | | | | — | | | | — | | | | 673 | | | | 16,688 | | | | — | |
| Softline Holding PLC (GDR)2,4,7 | | | — | | | | 79,875 | | | | — | | | | — | | | | (71,065 | ) | | | 8,810 | | | | — | |
| Softline Holding PLC (GDR)2,4 | | | — | | | | 75 | | | | — | | | | — | | | | (67 | ) | | | 8 | | | | — | |
| Cherry AG2,3 | | | 52,280 | | | | — | | | | 170 | | | | (238 | ) | | | (44,508 | ) | | | 7,364 | | | | — | |
| MotorK, Ltd.2 | | | — | | | | 17,278 | | | | — | | | | — | | | | (11,810 | ) | | | 5,468 | | | | — | |
| WeCommerce Holdings, Ltd., Class A2,3 | | | — | | | | 21,801 | | | | 576 | | | | (1,131 | ) | | | (17,034 | ) | | | 3,060 | | | | — | |
| 91APP, Inc.11 | | | 1,012 | | | | 94,730 | | | | 18,048 | | | | (32,669 | ) | | | (33,119 | ) | | | — | | | | 129 | |
| Appier Group, Inc.10 | | | 81,454 | | | | — | | | | 43,642 | | | | (55,578 | ) | | | 17,766 | | | | — | | | | — | |
| Avaya Holdings Corp.2,3,11 | | | 53,532 | | | | 72,050 | | | | 9,242 | | | | (119,901 | ) | | | 8,909 | | | | — | | | | — | |
| AvidXchange Holdings, Inc.2,11 | | | — | | | | 201,705 | | | | 75,995 | | | | (99,739 | ) | | | (5,377 | ) | | | — | | | | — | |
| Bottomline Technologies (DE), Inc.10 | | | 140,399 | | | | — | | | | 201,074 | | | | 37,298 | | | | 23,377 | | | | — | | | | — | |
| Computer Age Management Services, Ltd.11 | | | 128,344 | | | | — | | | | 63,714 | | | | 21,792 | | | | (43,698 | ) | | | — | | | | 946 | |
| Dock, Ltd.2,4,5,11 | | | 27,080 | | | | — | | | | — | | | | — | | | | 20,126 | | | | — | | | | — | |
| Dye & Durham, Ltd.3,11 | | | 121,192 | | | | 5,772 | | | | 37,736 | | | | (27,841 | ) | | | (30,945 | ) | | | — | | | | 232 | |
| eCloudvalley Digital Technology Co., Ltd.11 | | | 30,937 | | | | 6,339 | | | | — | | | | — | | | | (25,486 | ) | | | — | | | | 252 | |
| EcoOnline Holding AS10 | | | 29,071 | | | | — | | | | 22,344 | | | | (7,072 | ) | | | 345 | | | | — | | | | — | |
| GB Group PLC11 | | | 125,523 | | | | 4,053 | | | | 83,896 | | | | (7,916 | ) | | | (28,786 | ) | | | — | | | | 104 | |
| Hennge KK10 | | | 56,060 | | | | — | | | | 15,958 | | | | (29,775 | ) | | | (10,327 | ) | | | — | | | | — | |
| Ideagen PLC10 | | | 86,794 | | | | 10,402 | | | | 100,302 | | | | 10,869 | | | | (7,763 | ) | | | — | | | | 112 | |
| LPKF Laser & Electronics AG, non-registered shares10 | | | 44,674 | | | | — | | | | 21,384 | | | | (24,680 | ) | | | 1,390 | | | | — | | | | — | |
| Nagarro SE2,3,11 | | | 144,449 | | | | — | | | | 58,969 | | | | 23,021 | | | | (65,604 | ) | | | — | | | | — | |
| Netcompany Group AS, non-registered shares2,11 | | | 311,683 | | | | — | | | | 95,938 | | | | 56,239 | | | | (219,406 | ) | | | — | | | | — | |
| SHIFT, Inc.2,11 | | | 281,192 | | | | 31,760 | | | | 137,255 | | | | 38,150 | | | | (120,496 | ) | | | — | | | | — | |
Investments in affiliates1 (continued)
| | | Value of
affiliates at
10/1/2021
(000) | | | Additions
(000) | | | Reductions
(000) | | | Net
realized
gain (loss)
(000) | | | Net
unrealized
(depreciation)
appreciation
(000) | | | Value of
affiliates at
9/30/2022
(000) | | | Dividend
or interest
income
(000) | |
| Smaregi, Inc.10 | | $ | 34,016 | | | $ | — | | | $ | 8,246 | | | $ | (11,348 | ) | | $ | (14,422 | ) | | $ | — | | | $ | — | |
| Unifiedpost Group SA10 | | | 50,611 | | | | — | | | | 8,428 | | | | (50,179 | ) | | | 7,996 | | | | — | | | | — | |
| | | | | | | | | | | | | | | | | | | | | | | | 2,200,365 | | | | | |
| Consumer discretionary 4.20% | | | | | | | | | | | | | | | | | | | | | | | | | | | | |
| Tube Investments of India, Ltd. | | | 288,934 | | | | 21,054 | | | | 92,539 | | | | 23,499 | | | | 169,607 | | | | 410,555 | | | | 634 | |
| TopBuild Corp.2 | | | 411,907 | | | | 44,714 | | | | 27,834 | | | | 6,652 | | | | (86,087 | ) | | | 349,352 | | | | — | |
| YETI Holdings, Inc.2 | | | 518,842 | | | | 65,070 | | | | 8,136 | | | | (3,904 | ) | | | (375,253 | ) | | | 196,619 | | | | — | |
| Helen of Troy, Ltd.2 | | | 433,116 | | | | 60,079 | | | | 121,757 | | | | (45,500 | ) | | | (186,898 | ) | | | 139,040 | | | | — | |
| Kindred Group PLC (SDR) | | | 211,253 | | | | 59,967 | | | | 25,533 | | | | (25,557 | ) | | | (100,828 | ) | | | 119,302 | | | | 7,417 | |
| MakeMyTrip, Ltd., non-registered shares2 | | | 34,933 | | | | 76,137 | | | | — | | | | — | | | | 7,947 | | | | 119,017 | | | | — | |
| WH Smith PLC2 | | | 120,874 | | | | 55,198 | | | | — | | | | — | | | | (67,891 | ) | | | 108,181 | | | | — | |
| NEXTAGE Co., Ltd. | | | — | | | | 94,191 | | | | — | | | | — | | | | 6,199 | | | | 100,390 | | | | — | |
| Pets at Home Group PLC | | | 43,482 | | | | 126,175 | | | | — | | | | — | | | | (73,157 | ) | | | 96,500 | | | | 3,384 | |
| Bajaj Electricals, Ltd. | | | 126,568 | | | | — | | | | 9,381 | | | | 1,689 | | | | (22,839 | ) | | | 96,037 | | | | 245 | |
| Jack in the Box, Inc. | | | — | | | | 111,998 | | | | — | | | | — | | | | (18,914 | ) | | | 93,084 | | | | 1,527 | |
| Everi Holdings, Inc.2 | | | 170,435 | | | | — | | | | 39,195 | | | | 9,762 | | | | (61,193 | ) | | | 79,809 | | | | — | |
| Auction Technology Group PLC2 | | | 148,698 | | | | 23,679 | | | | — | | | | — | | | | (95,800 | ) | | | 76,577 | | | | — | |
| Golden Entertainment, Inc.2 | | | 55,286 | | | | 38,838 | | | | — | | | | — | | | | (27,946 | ) | | | 66,178 | | | | — | |
| Domino’s Pizza Group PLC | | | 129,598 | | | | — | | | | — | | | | — | | | | (68,994 | ) | | | 60,604 | | | | 3,133 | |
| Musti Group OYJ | | | 86,680 | | | | 8,426 | | | | — | | | | — | | | | (48,637 | ) | | | 46,469 | | | | 1,233 | |
| Snow Peak, Inc.3 | | | — | | | | 66,358 | | | | — | | | | — | | | | (19,958 | ) | | | 46,400 | | | | 266 | |
| Victoria PLC2,3 | | | — | | | | 59,123 | | | | — | | | | — | | | | (25,661 | ) | | | 33,462 | | | | — | |
| AcadeMedia AB | | | 38,581 | | | | 4,836 | | | | — | | | | — | | | | (15,161 | ) | | | 28,256 | | | | 1,098 | |
| JOANN, Inc.3 | | | 30,404 | | | | — | | | | — | | | | — | | | | (12,336 | ) | | | 18,068 | | | | 1,174 | |
| Lojas Quero-Quero SA | | | 44,684 | | | | 7,071 | | | | 4,920 | | | | (11,658 | ) | | | (19,021 | ) | | | 16,156 | | | | 325 | |
| Beazer Homes USA, Inc.2 | | | 28,632 | | | | — | | | | — | | | | — | | | | (12,582 | ) | | | 16,050 | | | | — | |
| Porch Group, Inc.2,3 | | | 113,369 | | | | 9,471 | | | | 20,311 | | | | (67,474 | ) | | | (22,635 | ) | | | 12,420 | | | | — | |
| Bike24 Holding AG2,3 | | | 90,361 | | | | — | | | | 6,837 | | | | (781 | ) | | | (75,608 | ) | | | 7,135 | | | | — | |
| BNN Technology PLC2,4 | | | — | 6 | | | — | | | | — | | | | — | | | | — | 6 | | | — | 6 | | | — | |
| BHG Group AB10 | | | 143,245 | | | | — | | | | 32,607 | | | | (52,715 | ) | | | (57,923 | ) | | | — | | | | — | |
| Cairn Homes PLC11 | | | 57,942 | | | | 3,083 | | | | 20,935 | | | | (595 | ) | | | (14,236 | ) | | | — | | | | 1,813 | |
| Cary Group AB10 | | | 79,878 | | | | — | | | | 47,951 | | | | (15,802 | ) | | | (16,125 | ) | | | — | | | | — | |
| Del Taco Restaurants, Inc.10 | | | 20,974 | | | | — | | | | 29,859 | | | | 3,106 | | | | 5,779 | | | | — | | | | 96 | |
| Desenio Group AB10 | | | 19,095 | | | | 12,550 | | | | 5,731 | | | | (56,158 | ) | | | 30,244 | | | | — | | | | — | |
| Gourmet Master Co., Ltd.10 | | | 49,381 | | | | — | | | | 34,236 | | | | (16,614 | ) | | | 1,469 | | | | — | | | | — | |
| Leslie’s, Inc.2,3,11 | | | 115,326 | | | | 96,356 | | | | 46,932 | | | | (24,914 | ) | | | (36,975 | ) | | | — | | | | — | |
| MADE.com Group PLC10 | | | 58,379 | | | | — | | | | 3,717 | | | | (66,656 | ) | | | 11,994 | | | | — | | | | — | |
| OneSpaWorld Holdings, Ltd.10 | | | 53,370 | | | | — | | | | 53,042 | | | | 7,401 | | | | (7,729 | ) | | | — | | | | — | |
| Purple Innovation, Inc., Class A10 | 80,885 | | | | — | | | | 34,552 | | | | (57,914 | ) | | | 11,581 | | | | — | | | | — | |
| RVRC Holding AB10 | | | 48,538 | | | | 1,770 | | | | 15,033 | | | | (42,257 | ) | | | 6,982 | | | | — | | | | 444 | |
| Watches of Switzerland Group PLC2,11 | | | 153,430 | | | | 52,708 | | | | 56,993 | | | | (29,409 | ) | | | (48,434 | ) | | | — | | | | — | |
| Westwing Group SE, non-registered shares2,3,11 | | | 44,293 | | | | 14,507 | | | | 10,398 | | | | (21,664 | ) | | | (24,855 | ) | | | — | | | | — | |
| zooplus AG, non-registered shares10 | | | 263,323 | | | | — | | | | 257,235 | | | | 213,610 | | | | (219,698 | ) | | | — | | | | — | |
| | | | | | | | | | | | | | | | | | | | | | | | 2,335,661 | | | | | |
| Health care 2.89% | | | | | | | | | | | | | | | | | | | | | | | | | | | | |
| Max Healthcare Institute, Ltd.2 | | | 176,975 | | | | 230,237 | | | | 100,479 | | | | 66,960 | | | | (37,808 | ) | | | 335,885 | | | | — | |
| Haemonetics Corp.2 | | | 35,041 | | | | 215,033 | | | | — | | | | — | | | | 52,991 | | | | 303,065 | | | | — | |
| Revance Therapeutics, Inc.2 | | | 125,722 | | | | 60,441 | | | | 18,675 | | | | (19,353 | ) | | | 22,341 | | | | 170,476 | | | | — | |
| Xenon Pharmaceuticals, Inc.2 | | | 30,854 | | | | 63,497 | | | | 4,937 | | | | (993 | ) | | | 53,000 | | | | 141,421 | | | | — | |
| Silk Road Medical, Inc.2 | | | 152,688 | | | | 568 | | | | — | | | | — | | | | (27,633 | ) | | | 125,623 | | | | — | |
Investments in affiliates1 (continued)
| | | Value of
affiliates at
10/1/2021
(000) | | | Additions
(000) | | | Reductions
(000) | | | Net
realized
gain (loss)
(000) | | | Net
unrealized
(depreciation)
appreciation
(000) | | | Value of
affiliates at
9/30/2022
(000) | | | Dividend
or interest
income
(000) | |
| CONMED Corp. | | $ | 114,514 | | | $ | 71,363 | | | $ | — | | | $ | — | | | $ | (62,536 | ) | | $ | 123,341 | | | $ | 915 | |
| Amvis Holdings, Inc. | | | 68,450 | | | | 80,411 | | | | 13,634 | | | | (5,540 | ) | | | (14,146 | ) | | | 115,541 | | | | 148 | |
| Addus HomeCare Corp.2 | | | 74,877 | | | | — | | | | — | | | | — | | | | 14,544 | | | | 89,421 | | | | — | |
| Ocumension Therapeutics2,3 | | | 88,719 | | | | 1,387 | | | | — | | | | — | | | | (41,129 | ) | | | 48,977 | | | | — | |
| Surgical Science Sweden AB2,3 | | | 89,512 | | | | — | | | | — | | | | — | | | | (45,890 | ) | | | 43,622 | | | | — | |
| New Horizon Health, Ltd.2,3 | | | 58,291 | | | | 34,720 | | | | — | | | | — | | | | (50,802 | ) | | | 42,209 | | | | — | |
| Medmix AG | | | 84,065 | | | | 34,591 | | | | 6,070 | | | | (9,088 | ) | | | (63,016 | ) | | | 40,482 | | | | 1,295 | |
| Nordhealth AS, Class A2 | | | 25,989 | | | | — | | | | — | | | | — | | | | (16,614 | ) | | | 9,375 | | | | — | |
| Precision BioSciences, Inc.2 | | | 49,264 | | | | 3,400 | | | | — | | | | — | | | | (43,934 | ) | | | 8,730 | | | | — | |
| Creo Medical Group PLC2 | | | 26,954 | | | | — | | | | — | | | | — | | | | (19,992 | ) | | | 6,962 | | | | — | |
| Acutus Medical, Inc.2,11 | | | 14,144 | | | | — | | | | 1,212 | | | | (13,280 | ) | | | 1,050 | | | | — | | | | — | |
| Adaptimmune Therapeutics PLC (ADR)10 | | | 41,374 | | | | — | | | | 17,333 | | | | (15,147 | ) | | | (8,894 | ) | | | — | | | | — | |
| Allakos, Inc.10 | | | 401,101 | | | | — | | | | 173,447 | | | | 82,236 | | | | (309,890 | ) | | | — | | | | — | |
| BICO Group AB, Class B10 | | | 192,639 | | | | 37,534 | | | | 42,897 | | | | (101,217 | ) | | | (86,059 | ) | | | — | | | | — | |
| Cellectis SA (ADR)2,3,11 | | | 27,923 | | | | 2,959 | | | | 6,508 | | | | (37,698 | ) | | | 14,924 | | | | — | | | | — | |
| Cellectis SA, non-registered shares2,3,11 | | | 15,170 | | | | 1,598 | | | | 3,595 | | | | (25,293 | ) | | | 13,889 | | | | — | | | | — | |
| Cortexyme, Inc.10 | | | 205,553 | | | | 19,079 | | | | 31,744 | | | | (23,204 | ) | | | (169,684 | ) | | | — | | | | — | |
| Genus PLC11 | | | 154,518 | | | | 123,782 | | | | 64,567 | | | | (79,171 | ) | | | (69,721 | ) | | | — | | | | 1,439 | |
| Mani, Inc.10 | | | 102,420 | | | | — | | | | 72,885 | | | | (28,692 | ) | | | (843 | ) | | | — | | | | 319 | |
| Metropolis Healthcare, Ltd.10 | | | 126,134 | | | | — | | | | 100,763 | | | | 53,712 | | | | (79,083 | ) | | | — | | | | 204 | |
| Pacific Biosciences of California, Inc.2,3,11 | | | 249,229 | | | | 41,212 | | | | 32,355 | | | | (24,422 | ) | | | (174,302 | ) | | | — | | | | — | |
| PolyPeptide Group AG11 | | | 306,892 | | | | 27,631 | | | | 118,148 | | | | (65,538 | ) | | | (136,696 | ) | | | — | | | | 818 | |
| Pulmonx Corp.10 | | | 99,107 | | | | 5,900 | | | | 48,761 | | | | (61,560 | ) | | | 5,314 | | | | — | | | | — | |
| Zealand Pharma A/S2,11 | | | 69,352 | | | | 1,001 | | | | 18,086 | | | | (24,021 | ) | | | (2,489 | ) | | | — | | | | — | |
| | | | | | | | | | | | | | | | | | | | | | | | 1,605,130 | | | | | |
| Financials 1.94% | | | | | | | | | | | | | | | | | | | | | | | | | | | | |
| Essent Group, Ltd. | | | 197,200 | | | | 75,821 | | | | 25,443 | | | | (539 | ) | | | (49,861 | ) | | | 197,178 | | | | 4,046 | |
| Trupanion, Inc.2,3 | | | 241,636 | | | | 8,695 | | | | 786 | | | | 626 | | | | (59,181 | ) | | | 190,990 | | | | — | |
| Aavas Financiers, Ltd.2 | | | 213,203 | | | | 4,001 | | | | 10,814 | | | | (1,730 | ) | | | (39,493 | ) | | | 165,167 | | | | — | |
| Independent Bank Group, Inc. | | | 157,257 | | | | 37,282 | | | | 37,893 | | | | (3,383 | ) | | | (20,283 | ) | | | 132,980 | | | | 3,621 | |
| Seacoast Banking Corporation of Florida | | | 138,854 | | | | 1,911 | | | | — | | | | — | | | | (15,102 | ) | | | 125,663 | | | | 2,488 | |
| IIFL Finance, Ltd. | | | 23,507 | | | | 70,351 | | | | — | | | | — | | | | 6,129 | | | | 99,987 | | | | 920 | |
| Patria Investments, Ltd., Class A | 91,511 | | | | 21,735 | | | | — | | | | — | | | | (23,020 | ) | | | 90,226 | | | | 4,456 | |
| AUB Group, Ltd. | | | — | | | | 83,492 | | | | — | | | | — | | | | (21,125 | ) | | | 62,367 | | | | 1,631 | |
| Hellenic Exchanges - Athens Stock Exchange SA | | | 13,967 | | | | — | | | | — | | | | — | | | | (3,606 | ) | | | 10,361 | | | | 568 | |
| Bridgepoint Group PLC11 | | | 254,040 | | | | 35,504 | | | | 31,740 | | | | (43,595 | ) | | | (146,005 | ) | | | — | | | | 3,588 | |
| SiriusPoint, Ltd.2,11 | | | 55,772 | | | | 21,943 | | | | 27,847 | | | | (34,904 | ) | | | (2,766 | ) | | | — | | | | — | |
| Uzabase, Inc.2,3,11 | | | 46,409 | | | | — | | | | 12,277 | | | | (23,871 | ) | | | (8,168 | ) | | | — | | | | — | |
| | | | | | | | | | | | | | | | | | | | | | | | 1,074,919 | | | | | |
| Consumer staples 1.61% | | | | | | | | | | | | | | | | | | | | | | | | | | | | |
| Emmi AG | | | 328,323 | | | | — | | | | — | | | | — | | | | (80,675 | ) | | | 247,648 | | | | 4,770 | |
| Grocery Outlet Holding Corp.2 | | | 127,554 | | | | 38,848 | | | | 70,242 | | | | 7,688 | | | | 93,067 | | | | 196,915 | | | | — | |
| Simply Good Foods Co.2 | | | 229,393 | | | | 30,920 | | | | 64,823 | | | | 10,684 | | | | (21,576 | ) | | | 184,598 | | | | — | |
| Milbon Co., Ltd. | | | 112,067 | | | | 25,406 | | | | — | | | | — | | | | (32,571 | ) | | | 104,902 | | | | 1,436 | |
| Sovos Brands, Inc.2 | | | 46,501 | | | | 25,020 | | | | — | | | | — | | | | 404 | | | | 71,925 | | | | — | |
| Shop Apotheke Europe NV, non-registered shares2,3 | | | 128,744 | | | | 27,080 | | | | — | | | | — | | | | (109,435 | ) | | | 46,389 | | | | — | |
| Sok Marketler Ticaret AS, non-registered shares2 | | | 35,839 | | | | 8,749 | | | | — | | | | — | | | | (3,231 | ) | | | 41,357 | | | | — | |
| Dole PLC11 | | | 63,125 | | | | 55,809 | | | | 65,254 | | | | (51,843 | ) | | | 2,187 | | | | — | | | | 1,469 | |
| | | | | | | | | | | | | | | | | | | | | | | | 893,734 | | | | | |
Investments in affiliates1 (continued)
| | | Value of
affiliates at
10/1/2021
(000) | | | Additions
(000) | | | Reductions
(000) | | | Net
realized
gain (loss)
(000) | | | Net
unrealized
(depreciation)
appreciation
(000) | | | Value of
affiliates at
9/30/2022
(000) | | | Dividend
or interest
income
(000) | |
| Energy 0.35% | | | | | | | | | | | | | | | | | | | | | | | | | | | | |
| Northern Oil and Gas, Inc. | | $ | 104,325 | | | $ | 23,768 | | | $ | — | | | $ | — | | | $ | 37,847 | | | $ | 165,940 | | | $ | 3,996 | |
| Savannah Energy PLC2,3 | | | 15,998 | | | | 8,234 | | | | — | | | | — | | | | 5,040 | | | | 29,272 | | | | — | |
| | | | | | | | | | | | | | | | | | | | | | | | 195,212 | | | | | |
| Materials 0.93% | | | | | | | | | | | | | | | | | | | | | | | | | | | | |
| APL Apollo Tubes, Ltd. | | | 159,233 | | | | 24,815 | | | | 9,428 | | | | (1,049 | ) | | | 24,599 | | | | 198,170 | | | | 684 | |
| LANXESS AG | | | 76,030 | | | | 204,779 | | | | — | | | | — | | | | (136,799 | ) | | | 144,010 | | | | 4,789 | |
| Perimeter Solutions SA2 | | | — | | | | 207,621 | | | | 85,597 | | | | (4,109 | ) | | | (23,465 | ) | | | 94,450 | | | | — | |
| Toyo Gosei Co., Ltd.3 | | | — | | | | 55,991 | | | | — | | | | — | | | | (27,702 | ) | | | 28,289 | | | | 137 | |
| Aluflexpack AG2,3 | | | 45,884 | | | | — | | | | — | | | | — | | | | (22,232 | ) | | | 23,652 | | | | — | |
| Re:NewCell AB2,3 | | | 61,257 | | | | 2,502 | | | | — | | | | — | | | | (46,217 | ) | | | 17,542 | | | | — | |
| Venator Materials PLC2 | | | 24,281 | | | | — | | | | — | | | | — | | | | (16,784 | ) | | | 7,497 | | | | — | |
| Deepak Fertilisers & Petrochemicals Corp., Ltd.11 | | | — | | | | 43,067 | | | | 6,176 | | | | 1,474 | | | | 26,374 | | | | — | | | | 738 | |
| JCU Corp.11 | | | 86,616 | | | | — | | | | 33,831 | | | | 2,396 | | | | (33,739 | ) | | | — | | | | 678 | |
| Nanofilm Technologies International, Ltd.11 | | | 105,677 | | | | 5,265 | | | | 44,198 | | | | (11,742 | ) | | | (36,989 | ) | | | — | | | | 377 | |
| Navin Fluorine International, Ltd.11 | | | 180,182 | | | | 1,920 | | | | 79,900 | | | | 47,759 | | | | (35,936 | ) | | | — | | | | 437 | |
| | | | | | | | | | | | | | | | | | | | | | | | 513,610 | | | | | |
| Communication services 0.07% | | | | | | | | | | | | | | | | | | | | | | | |
| Direct Marketing MIX, Inc. | | | 50,358 | | | | 10,033 | | | | 13,991 | | | | 558 | | | | (19,437 | ) | | | 27,521 | | | | 102 | |
| Pebble Group PLC2 | | | 28,975 | | | | — | | | | 5 | | | | (1 | ) | | | (15,437 | ) | | | 13,532 | | | | — | |
| JCDecaux SA2,11 | | | 151,710 | | | | 135,510 | | | | 68,333 | | | | (72,356 | ) | | | (77,757 | ) | | | — | | | | — | |
| Trustpilot Group PLC2,11 | | | 48,066 | | | | 26,811 | | | | 17,112 | | | | (9,700 | ) | | | (33,916 | ) | | | — | | | | — | |
| | | | | | | | | | | | | | | | | | | | | | | | 41,053 | | | | | |
| Real estate 0.44% | | | | | | | | | | | | | | | | | | | | | | | | | | | | |
| Altus Group, Ltd. | | | 172,723 | | | | 3,489 | | | | — | | | | — | | | | (58,890 | ) | | | 117,322 | | | | 1,642 | |
| JHSF Participações SA | | | 50,030 | | | | 2,165 | | | | — | | | | — | | | | 13,271 | | | | 65,466 | | | | 3,002 | |
| SRE Holdings Corp.2,3 | | | 82,123 | | | | 5,298 | | | | — | | | | — | | | | (59,640 | ) | | | 27,781 | | | | — | |
| K-Fast Holding AB, Class B2,3 | | | 81,175 | | | | 6,446 | | | | — | | | | — | | | | (63,151 | ) | | | 24,470 | | | | — | |
| Genova Property Group AB2 | | | 28,296 | | | | — | | | | — | | | | — | | | | (17,502 | ) | | | 10,794 | | | | — | |
| DigitalBridge Group, Inc. REIT, Class A11 | | | 145,014 | | | | 52,366 | | | | 4,794 | | | | (2,662 | ) | | | (93,495 | ) | | | — | | | | 77 | |
| Real Matters, Inc.10 | | | 50,520 | | | | — | | | | 33,355 | | | | (51,214 | ) | | | 34,049 | | | | — | | | | — | |
| | | | | | | | | | | | | | | | | | | | | | | | 245,833 | | | | | |
| Utilities 0.00% | | | | | | | | | | | | | | | | | | | | | | | | | | | | |
| Mytrah Energy, Ltd.2,4 | | | 140 | | | | — | | | | — | | | | — | | | | (24 | ) | | | 116 | | | | — | |
| Total common stocks | | | | | | | | | | | | | | | | | | | | | | | 12,785,616 | | | | | |
| Preferred securities 0.39% | | | | | | | | | | | | | | | | | | | | | | | | | | | | |
| Industrials 0.20% | | | | | | | | | | | | | | | | | | | | | | | | | | | | |
| Einride AB, Series B, preferred shares2,4,5 | | | 46,547 | | | | — | | | | — | | | | — | | | | 14,313 | | | | 60,860 | | | | — | |
| Einride AB, Series A, preferred shares2,4,5 | | | — | | | | 311 | | | | — | | | | — | | | | 236 | | | | 547 | | | | — | |
| Relativity Space, Inc., Series D, preferred shares2,4,5 | | | 48,953 | | | | — | | | | — | | | | — | | | | (9,787 | ) | | | 39,166 | | | | — | |
| Relativity Space, Inc., Series E, preferred shares2,4,5 | | | 10,600 | | | | — | | | | — | | | | — | | | | (2,119 | ) | | | 8,481 | | | | — | |
| | | | | | | | | | | | | | | | | | | | | | | | 109,054 | | | | | |
| Information technology 0.07% | | | | | | | | | | | | | | | | | | | | | | | | | | | | |
| Skyryse, Inc., Series B, preferred shares2,4,5 | | | — | | | | 40,700 | | | | — | | | | — | | | | — | 6 | | | 40,700 | | | | — | |
| Avidxchange Holdings, Inc., Series F, preferred shares10 | | | 141,386 | | | | — | | | | 105,844 | | | | — | | | | (35,542 | ) | | | — | | | | — | |
| | | | | | | | | | | | | | | | | | | | | | | | 40,700 | | | | | |
| Health care 0.02% | | | | | | | | | | | | | | | | | | | | | | | | | | | | |
| Bluestar Genomics, Inc., Series C, noncumulative preferred shares, 5.00% 20222,4,5 | | | 15,101 | | | | — | | | | — | | | | — | | | | (5,287 | ) | | | 9,814 | | | | — | |
Investments in affiliates1 (continued)
| | | Value of
affiliates at
10/1/2021
(000) | | | Additions
(000) | | | Reductions
(000) | | | Net
realized
gain (loss)
(000) | | | Net
unrealized
(depreciation)
appreciation
(000) | | | Value of
affiliates at
9/30/2022
(000) | | | Dividend
or interest
income
(000) | |
| Financials 0.10% | | | | | | | | | | | | | | | | | | | | | | | | | | | | |
| PPRO Holding GMBS, Series B, 8.00% preferred shares2,4,5 | | $ | 54,312 | | | $ | — | | | $ | — | | | $ | — | | | $ | 3,420 | | | $ | 57,732 | | | $ | — | |
| Total preferred securities | | | | | | | | | | | | | | | | | | | | | | | 217,300 | | | | | |
| Convertible stocks 0.02% | | | | | | | | | | | | | | | | | | | | | | | | | | | | |
| Information technology 0.02% | | | | | | | | | | | | | | | | | | | | | | | | | | | | |
| RealSelf, Inc., Series C, convertible preferred shares2,4,5 | | | 19,495 | | | | — | | | | — | | | | — | | | | (9,332 | ) | | | 10,163 | | | | — | |
| Convertible bonds & notes 0.00% | | | | | | | | | | | | | | | | | | | | | | | | | | | | |
| Industrials 0.00% | | | | | | | | | | | | | | | | | | | | | | | | | | | | |
| Einride AB, convertible notes, 7.00% 20234,5 | | | — | | | | 1,500 | | | | — | | | | — | | | | 395 | | | | 1,895 | | | | 72 | |
| Short-term securities 9.11% | | | | | | | | | | | | | | | | | | | | | | | | | | | | |
| Money market investments 8.59% | | | | | | | | | | | | | | | | | | | | | | | | | | | | |
| Capital Group Central Cash Fund 2.81%8 | | | 4,210,329 | | | | 8,191,541 | | | | 7,624,667 | | | | (1,114 | ) | | | (271 | ) | | | 4,775,818 | | | | 51,682 | |
| Money market investments purchased with collateral from securities on loan 0.52% | | | | | | | | | | | | | | | | | | | | | | | | | | | | |
| Capital Group Central Cash Fund 2.81%8,9 | | | 188,139 | | | | 102,83312 | | | | | | | | | | | | | | | | 290,972 | | | | — | 13 |
| Total short-term securities | | | | | | | | | | | | | | | | | | | | | | | 5,066,790 | | | | | |
| Total 32.53% | | | | | | | | | | | | | | $ | (1,364,875 | ) | | $ | (7,775,341 | ) | | $ | 18,081,764 | | | $ | 178,965 | |
Restricted securities5
| | | Acquisition
date(s) | | Cost
(000) | | | Value
(000) | | | Percent
of net
assets | |
| Einride AB, Series B, preferred shares1,2,4 | | 3/23/2021-5/6/2021 | | $ | 18,753 | | | $ | 60,860 | | | | .11 | % |
| Einride AB1,2,4 | | 7/16/2021-8/17/2021 | | | 8,938 | | | | 17,834 | | | | .03 | |
| Einride AB, convertible notes, 7.00% 20231,4 | | 1/7/2022 | | | 1,501 | | | | 1,895 | | | | .01 | |
| Einride AB, Series A, preferred shares1,2,4 | | 10/11/2021 | | | 312 | | | | 547 | | | | .00 | |
| VisEra Technologies Co., Ltd. | | 3/9/2021 | | | 93,821 | | | | 80,413 | | | | .14 | |
| Pine Labs Pte., Ltd.2,4 | | 5/12/2021 | | | 28,710 | | | | 38,039 | | | | .07 | |
| Pine Labs Pte., Ltd., Series J, cumulative preferred shares2,4 | | 5/12/2021 | | | 21,291 | | | | 28,209 | | | | .05 | |
| PPRO Holding GMBS, Series B, 8.00% preferred shares1,2,4 | | 1/28/2021 | | | 48,694 | | | | 57,732 | | | | .10 | |
| Relativity Space, Inc., Series D, preferred shares1,2,4 | | 11/20/2020 | | | 32,000 | | | | 39,166 | | | | .07 | |
| Relativity Space, Inc., Series E, preferred shares1,2,4 | | 5/27/2021 | | | 10,600 | | | | 8,481 | | | | .02 | |
| Dock, Ltd.2,4 | | 10/19/2020 | | | 26,000 | | | | 47,206 | | | | .09 | |
| ABL Space Systems Co., Series B, preferred shares2,4 | | 3/24/2021 | | | 35,000 | | | | 44,920 | | | | .08 | |
| Laronde, Inc., Series B, 6.00% preferred shares2,4 | | 8/10/2021 | | | 50,000 | | | | 43,822 | | | | .08 | |
| Skyryse, Inc., Series B, preferred shares1,2,4 | | 10/21/2021 | | | 40,700 | | | | 40,700 | | | | .07 | |
| QuintoAndar, Ltd., Series E-1, preferred shares2,4 | | 12/20/2021 | | | 50,000 | | | | 37,752 | | | | .07 | |
| PsiQuantum Corp., Series D, preferred shares2,4 | | 5/28/2021 | | | 35,000 | | | | 36,059 | | | | .06 | |
| Outreach Corp., Series G, preferred shares2,4 | | 5/27/2021 | | | 45,482 | | | | 35,557 | | | | .06 | |
| Venture Global LNG, Inc., Series C2,4 | | 5/1/2015 | | | 12,720 | | | | 34,228 | | | | .06 | |
| KRY International AB, Series E, preferred shares2,4 | | 5/13/2021 | | | 51,891 | | | | 28,225 | | | | .05 | |
| KRY International AB, Series A2,4 | | 5/13/2021 | | | 8,533 | | | | 4,886 | | | | .01 | |
| StockX, Inc., Series E-1, preferred shares2,4 | | 4/15/2021 | | | 20,000 | | | | 15,435 | | | | .03 | |
| StockX, Inc.2,4 | | 4/5/2021 | | | 14,682 | | | | 11,238 | | | | .02 | |
| StockX, Inc., Series AA, preferred shares2,4 | | 4/5/2021 | | | 5,203 | | | | 3,983 | | | | .01 | |
| StockX, Inc., Series B, preferred shares2,4 | | 4/5/2021 | | | 281 | | | | 215 | | | | .00 | |
| TAE Technologies, Inc., Series G2, 4.00% cumulative convertible preferred shares4 | | 7/7/2022 | | | 30,000 | | | | 30,000 | | | | .05 | |
Restricted securities5 (continued)
| | | Acquisition
date(s) | | Cost
(000) | | | Value
(000) | | | Percent
of net
assets | |
| Boku, Inc.1,2 | | 2/11/2021-9/21/2021 | | $ | 48,584 | | | $ | 25,379 | | | | .05 | % |
| SiFive, Inc., Series F, preferred shares2,4 | | 3/16/2022 | | | 25,000 | | | | 25,128 | | | | .05 | |
| Yotpo, Ltd., Series F, preferred shares2,4 | | 2/25/2021 | | | 18,329 | | | | 13,666 | | | | .03 | |
| Yotpo, Ltd.2,4 | | 3/16/2021 | | | 5,475 | | | | 4,297 | | | | .01 | |
| Yotpo, Ltd., Series B, preferred shares2,4 | | 3/16/2021 | | | 2,322 | | | | 1,823 | | | | .00 | |
| Yotpo, Ltd., Series C, preferred shares2,4 | | 3/16/2021 | | | 2,211 | | | | 1,735 | | | | .00 | |
| Yotpo, Ltd., Series A-1, preferred shares2,4 | | 3/16/2021 | | | 1,483 | | | | 1,164 | | | | .00 | |
| Yotpo, Ltd., Series A, preferred shares2,4 | | 3/16/2021 | | | 723 | | | | 567 | | | | .00 | |
| Yotpo, Ltd., Series C-1, preferred shares2,4 | | 3/16/2021 | | | 613 | | | | 481 | | | | .00 | |
| Yotpo, Ltd., Series D, preferred shares2,4 | | 3/16/2021 | | | 341 | | | | 268 | | | | .00 | |
| Yotpo, Ltd., Series B-1, preferred shares2,4 | | 3/16/2021 | | | 273 | | | | 214 | | | | .00 | |
| InSilico Medicine Cayman TopCo, Series D, preferred shares2,4 | | 5/13/2022-7/18/2022 | | | 23,685 | | | | 23,684 | | | | .04 | |
| Patreon, Inc., Series E, preferred shares2,4 | | 9/1/2020 | | | 11,944 | | | | 14,411 | | | | .02 | |
| Patreon, Inc., Class B2,4 | | 10/26/2020-10/27/2020 | | | 3,255 | | | | 3,921 | | | | .01 | |
| Patreon, Inc., Series Seed, preferred shares2,4 | | 9/16/2020 | | | 2,790 | | | | 3,366 | | | | .01 | |
| WorkRise Technologies, Inc., Series E, preferred shares2,4 | | 3/8/2021 | | | 40,000 | | | | 21,696 | | | | .04 | |
| Cava Group, Inc., Series F, preferred shares2,4 | | 3/26/2021 | | | 25,000 | | | | 20,928 | | | | .04 | |
| ANDPAD, Inc., Series D, preferred shares2,4 | | 6/30/2022 | | | 19,506 | | | | 18,411 | | | | .03 | |
| DPC Dash, Ltd.2,4 | | 12/6/2021 | | | 15,000 | | | | 10,835 | | | | .02 | |
| RealSelf, Inc., Series C, convertible preferred shares1,2,4 | | 4/18/2018 | | | 19,000 | | | | 10,163 | | | | .02 | |
| Bluestar Genomics, Inc., Series C, noncumulative preferred shares, 5.00% 20221,2,4 | | 4/26/2021 | | | 15,101 | | | | 9,814 | | | | .02 | |
| Tarana Wireless, Inc., Series 6, noncumulative convertible preferred shares4 | | 2/18/2022 | | | 12,179 | | | | 8,040 | | | | .01 | |
| Artiva Biotherapeutics, Inc., Series B, preferred shares2,4 | | 2/24/2021 | | | 7,000 | | | | 6,555 | | | | .01 | |
| Grove Collaborative Holdings, Inc., Class A2 | | 6/17/2022 | | | 26,000 | | | | 6,328 | | | | .01 | |
| Dreamfolks Services, Ltd.2 | | 8/23/2022 | | | 4,507 | | | | 4,704 | | | | .01 | |
| Kandou Holding SA, Series D, preferred shares2,4 | | 11/17/2021 | | | 15,000 | | | | 3,986 | | | | .01 | |
| Foursquare Labs, Inc., Series A2,4 | | 12/3/2013 | | | 20,000 | | | | 3,231 | | | | .01 | |
| Foursquare Labs, Inc., warrants, expire 20332,4 | | 12/3/2013 | | | — | 6 | | | 55 | | | | .00 | |
| PACT Pharma, Inc., Series C, 8.00% noncumulative preferred shares2,4 | | 2/7/2020 | | | 9,000 | | | | 616 | | | | .00 | |
| Total | | | | $ | 1,064,433 | | | $ | 992,868 | | | | 1.79 | % |
| | |
| 1 | Affiliate of the fund or part of the same “group of investment companies” as the fund, as defined under the Investment Company Act of 1940, as amended. |
| 2 | Security did not produce income during the last 12 months. |
| 3 | All or a portion of this security was on loan. The total value of all such securities was $1,261,635,000, which represented 2.27% of the net assets of the fund. Refer to Note 5 for more information on securities lending. |
| 4 | Value determined using significant unobservable inputs. |
| 5 | Restricted security, other than Rule 144A or Section 4(2), subject to legal or contractual restrictions on resale, including private placement and other securities not registered under the Securities Act of 1933. The total value of all such restricted securities was $992,868,000, which represented 1.79% of the net assets of the fund. |
| 6 | Amount less than one thousand. |
| 7 | Acquired in a transaction exempt from registration under Rule 144A or Section 4(2) of the Securities Act of 1933. May be resold in the U.S. in transactions exempt from registration, normally to qualified institutional buyers. The total value of all such securities was $2,152,132,000, which represented 3.87% of the net assets of the fund. |
| 8 | Rate represents the seven-day yield at 9/30/2022. |
| 9 | Security purchased with cash collateral from securities on loan. Refer to Note 5 for more information on securities lending. |
| 10 | Affiliated issuer during the reporting period but no longer held at 9/30/2022. |
| 11 | Affiliated issuer during the reporting period but no longer an affiliate at 9/30/2022. Refer to the investment portfolio for the security value at 9/30/2022. |
| 12 | Represents net activity. Refer to Note 5 for more information on securities lending. |
| 13 | Dividend income is included with securities lending income in the fund’s statement of operations and is not shown in this table. |
Key to abbreviations
ADR = American Depositary Receipts
CAD = Canadian dollars
CDI = CREST Depository Interest
GDR = Global Depositary Receipts
REIT = Real Estate Investment Trust
SDR = Swedish Depositary Receipts
USD = U.S. dollars
Financial statements
Statement of assets and liabilities
at September 30, 2022 | (dollars in thousands) |
| Assets: | | | | | | | | |
| Investment securities, at value (includes $1,261,635 of investment securities on loan): | | | | | | | | |
| Unaffiliated issuers (cost: $34,106,275) | | $ | 38,606,487 | | | | | |
| Affiliated issuers (cost: $18,055,982) | | | 18,081,764 | | | $ | 56,688,251 | |
| Cash | | | | | | | 11,373 | |
| Cash denominated in currencies other than U.S. dollars (cost: $23,716) | | | | | | | 23,715 | |
| Receivables for: | | | | | | | | |
| Sales of investments | | | 150,281 | | | | | |
| Sales of fund’s shares | | | 39,068 | | | | | |
| Dividends and interest | | | 55,890 | | | | | |
| Other | | | 5 | | | | 245,244 | |
| | | | | | | | 56,968,583 | |
| Liabilities: | | | | | | | | |
| Collateral for securities on loan | | | | | | | 830,948 | |
| Payables for: | | | | | | | | |
| Purchases of investments | | | 338,461 | | | | | |
| Repurchases of fund’s shares | | | 39,860 | | | | | |
| Investment advisory services | | | 29,624 | | | | | |
| Services provided by related parties | | | 9,913 | | | | | |
| Directors’ deferred compensation | | | 4,037 | | | | | |
| Non-U.S. taxes | | | 130,160 | | | | | |
| Other | | | 5,436 | | | | 557,491 | |
| Net assets at September 30, 2022 | | | | | | $ | 55,580,144 | |
| | | | | | | | | |
| Net assets consist of: | | | | | | | | |
| Capital paid in on shares of capital stock | | | | | | $ | 52,242,003 | |
| Total distributable earnings | | | | | | | 3,338,141 | |
| Net assets at September 30, 2022 | | | | | | $ | 55,580,144 | |
Refer to the notes to financial statements.
Financial statements (continued)
| Statement of assets and liabilities | |
| at September 30, 2022 (continued) | |
| | (dollars and shares in thousands, except per-share amounts) |
Total authorized capital stock — 2,000,000 shares,
$.01 par value (1,055,673 total shares outstanding)
| | | Net assets | | | Shares
outstanding | | | Net asset value
per share | |
| Class A | | $ | 23,552,446 | | | | 453,039 | | | $ | 51.99 | |
| Class C | | | 378,153 | | | | 8,919 | | | | 42.40 | |
| Class T | | | 11 | | | | — | * | | | 52.73 | |
| Class F-1 | | | 454,181 | | | | 8,880 | | | | 51.14 | |
| Class F-2 | | | 7,310,989 | | | | 136,523 | | | | 53.55 | |
| Class F-3 | | | 3,903,714 | | | | 73,345 | | | | 53.22 | |
| Class 529-A | | | 1,377,471 | | | | 26,933 | | | | 51.14 | |
| Class 529-C | | | 44,318 | | | | 1,023 | | | | 43.33 | |
| Class 529-E | | | 47,838 | | | | 980 | | | | 48.83 | |
| Class 529-T | | | 14 | | | | — | * | | | 52.59 | |
| Class 529-F-1 | | | 8 | | | | — | * | | | 52.48 | |
| Class 529-F-2 | | | 190,182 | | | | 3,641 | | | | 52.24 | |
| Class 529-F-3 | | | 9 | | | | — | * | | | 52.32 | |
| Class R-1 | | | 23,904 | | | | 541 | | | | 44.18 | |
| Class R-2 | | | 412,357 | | | | 9,324 | | | | 44.23 | |
| Class R-2E | | | 26,538 | | | | 528 | | | | 50.29 | |
| Class R-3 | | | 587,406 | | | | 12,089 | | | | 48.59 | |
| Class R-4 | | | 583,115 | | | | 11,318 | | | | 51.52 | |
| Class R-5E | | | 138,294 | | | | 2,630 | | | | 52.58 | |
| Class R-5 | | | 288,121 | | | | 5,272 | | | | 54.65 | |
| Class R-6 | | | 16,261,075 | | | | 300,688 | | | | 54.08 | |
| | |
| * | Amount less than one thousand. |
Refer to the notes to financial statements.
Financial statements (continued)
| Statement of operations | |
| for the year ended September 30, 2022 | (dollars in thousands) |
| | |
| Investment income: | | | | | | |
| Income: | | | | | | | | |
| Dividends (net of non-U.S. taxes of $36,169; also includes $178,893 from affiliates) | | $ | 644,514 | | | | | |
| Securities lending income (net of fees) | | | 27,333 | | | | | |
| Interest (net of non-U.S. taxes of $1; also includes $72 from affiliates) | | | 5,908 | | | $ | 677,755 | |
| Fees and expenses*: | | | | | | | | |
| Investment advisory services | | | 424,095 | | | | | |
| Distribution services | | | 101,010 | | | | | |
| Transfer agent services | | | 51,866 | | | | | |
| Administrative services | | | 21,027 | | | | | |
| 529 plan services | | | 1,270 | | | | | |
| Reports to shareholders | | | 2,181 | | | | | |
| Registration statement and prospectus | | | 1,803 | | | | | |
| Directors’ compensation | | | (948 | ) | | | | |
| Auditing and legal | | | 383 | | | | | |
| Custodian | | | 7,902 | | | | | |
| State and local taxes | | | 1 | | | | | |
| Other | | | 1,087 | | | | | |
| Total fees and expenses before waiver | | | 611,677 | | | | | |
| Less waiver of fees and expenses: | | | | | | | | |
| Investment advisory services waiver | | | 139 | | | | | |
| Total fees and expenses after waiver | | | | | | | 611,538 | |
| Net investment income | | | | | | | 66,217 | |
| | | | | | | | | |
| Net realized loss and unrealized depreciation: | | | | | | | | |
| Net realized gain (loss) on: | | | | | | | | |
| Investments (net of non-U.S. taxes of $62,982): | | | | | | | | |
| Unaffiliated issuers | | | 911,239 | | | | | |
| Affiliated issuers | | | (1,364,875 | ) | | | | |
| Currency transactions | | | (304 | ) | | | (453,940 | ) |
| Net unrealized depreciation on: | | | | | | | | |
| Investments (net of non-U.S. taxes of $128,100): | | | | | | | | |
| Unaffiliated issuers | | | (21,619,977 | ) | | | | |
| Affiliated issuers | | | (7,775,341 | ) | | | | |
| Currency translations | | | (1,864 | ) | | | (29,397,182 | ) |
| Net realized loss and unrealized depreciation | | | | | | | (29,851,122 | ) |
| Net decrease in net assets resulting from operations | | | | | | $ | (29,784,905 | ) |
| | |
| * | Additional information related to class-specific fees and expenses is included in the notes to financial statements. |
Refer to the notes to financial statements.
Financial statements (continued)
| Statements of changes in net assets | |
| | (dollars in thousands) |
| | |
| | | Year ended September 30, | |
| | | 2022 | | | 2021 | |
| Operations: | | | | | | | | |
| Net investment income (loss) | | $ | 66,217 | | | $ | (233,361 | ) |
| Net realized (loss) gain | | | (453,940 | ) | | | 7,680,933 | |
| Net unrealized (depreciation) appreciation | | | (29,397,182 | ) | | | 12,046,573 | |
| Net (decrease) increase in net assets resulting from operations | | | (29,784,905 | ) | | | 19,494,145 | |
| | | | | | | | | |
| Distributions paid to shareholders | | | (6,882,670 | ) | | | (1,036,458 | ) |
| | | | | | | | | |
| Net capital share transactions | | | 11,033,527 | | | | 8,057,307 | |
| | | | | | | | | |
| Total (decrease) increase in net assets | | | (25,634,048 | ) | | | 26,514,994 | |
| | | | | | | | | |
| Net assets: | | | | | | | | |
| Beginning of year | | | 81,214,192 | | | | 54,699,198 | |
| End of year | | $ | 55,580,144 | | | $ | 81,214,192 | |
Refer to the notes to financial statements.
Notes to financial statements
1. Organization
SMALLCAP World Fund, Inc. (the “fund”) is registered under the Investment Company Act of 1940, as amended (the “1940 Act”), as an open-end, diversified management investment company. The fund seeks to provide long-term growth of capital. Shareholders approved a proposal to reorganize the fund from a Maryland corporation to a Delaware statutory trust. The reorganization may be completed in the next year; however, the fund reserves the right to delay the implementation.
The fund has 21 share classes consisting of six retail share classes (Classes A, C, T, F-1, F-2 and F-3), seven 529 college savings plan share classes (Classes 529-A, 529-C, 529-E, 529-T, 529-F-1, 529-F-2 and 529-F-3) and eight retirement plan share classes (Classes R-1, R-2, R-2E, R-3, R-4, R-5E, R-5 and R-6). The 529 college savings plan share classes can be used to save for college education. The retirement plan share classes are generally offered only through eligible employer-sponsored retirement plans. The fund’s share classes are described further in the following table:
| Share class | | Initial sales charge | | Contingent deferred sales
charge upon redemption | | Conversion feature |
| Classes A and 529-A | | Up to 5.75% for Class A; up to 3.50% for Class 529-A | | None (except 1.00% for certain redemptions within 18 months of purchase without an initial sales charge) | | None |
| Classes C and 529-C | | None | | 1.00% for redemptions within one year of purchase | | Class C converts to Class A after eight years and Class 529-C converts to Class 529-A after five years |
| Class 529-E | | None | | None | | None |
| Classes T and 529-T* | | Up to 2.50% | | None | | None |
| Classes F-1, F-2, F-3, 529-F-1, 529-F-2 and 529-F-3 | | None | | None | | None |
| Classes R-1, R-2, R-2E, R-3, R-4, R-5E, R-5 and R-6 | | None | | None | | None |
| | |
| * | Class T and 529-T shares are not available for purchase. |
Holders of all share classes have equal pro rata rights to the assets, dividends and liquidation proceeds of the fund. Each share class has identical voting rights, except for the exclusive right to vote on matters affecting only its class. Share classes have different fees and expenses (“class-specific fees and expenses”), primarily due to different arrangements for distribution, transfer agent and administrative services. Differences in class-specific fees and expenses will result in differences in net investment income and, therefore, the payment of different per-share dividends by each share class.
2. Significant accounting policies
The fund is an investment company that applies the accounting and reporting guidance issued in Topic 946 by the U.S. Financial Accounting Standards Board. The fund’s financial statements have been prepared to comply with U.S. generally accepted accounting principles (“U.S. GAAP”). These principles require the fund’s investment adviser to make estimates and assumptions that affect reported amounts and disclosures. Actual results could differ from those estimates. Subsequent events, if any, have been evaluated through the date of issuance in the preparation of the financial statements. The fund follows the significant accounting policies described in this section, as well as the valuation policies described in the next section on valuation.
Security transactions and related investment income — Security transactions are recorded by the fund as of the date the trades are executed with brokers. Realized gains and losses from security transactions are determined based on the specific identified cost of the securities. In the event a security is purchased with a delayed payment date, the fund will segregate liquid assets sufficient to meet its payment obligations. Dividend income is recognized on the ex-dividend date and interest income is recognized on an accrual basis. Market discounts, premiums and original issue discounts on fixed-income securities are amortized daily over the expected life of the security.
Class allocations — Income, fees and expenses (other than class-specific fees and expenses), realized gains and losses and unrealized appreciation and depreciation are allocated daily among the various share classes based on their relative net assets. Class-specific fees and expenses, such as distribution, transfer agent and administrative services, are charged directly to the respective share class.
Distributions paid to shareholders — Income dividends and capital gain distributions are recorded on the ex-dividend date.
Currency translation — Assets and liabilities, including investment securities, denominated in currencies other than U.S. dollars are translated into U.S. dollars at the exchange rates supplied by one or more pricing vendors on the valuation date. Purchases and sales of investment securities and income and expenses are translated into U.S. dollars at the exchange rates on the dates of such transactions. The effects of changes in exchange rates on investment securities are included with the net realized gain or loss and net unrealized appreciation or depreciation on investments in the fund’s statement of operations. The realized gain or loss and unrealized appreciation or depreciation resulting from all other transactions denominated in currencies other than U.S. dollars are disclosed separately.
3. Valuation
Capital Research and Management Company (“CRMC”), the fund’s investment adviser, values the fund’s investments at fair value as defined by U.S. GAAP. The net asset value per share is calculated once daily as of the close of regular trading on the New York Stock Exchange, normally 4 p.m. New York time, each day the New York Stock Exchange is open.
Methods and inputs — The fund’s investment adviser uses the following methods and inputs to establish the fair value of the fund’s assets and liabilities. Use of particular methods and inputs may vary over time based on availability and relevance as market and economic conditions evolve.
Equity securities, including depositary receipts, are generally valued at the official closing price of, or the last reported sale price on, the exchange or market on which such securities are traded, as of the close of business on the day the securities are being valued or, lacking any sales, at the last available bid price. Prices for each security are taken from the principal exchange or market on which the security trades.
Fixed-income securities, including short-term securities, are generally valued at evaluated prices obtained from third-party pricing vendors. Vendors value such securities based on one or more of the inputs described in the following table. The table provides examples of inputs that are commonly relevant for valuing particular classes of fixed-income securities in which the fund is authorized to invest. However, these classifications are not exclusive, and any of the inputs may be used to value any other class of fixed-income security.
| Fixed-income class | | Examples of standard inputs |
| All | | Benchmark yields, transactions, bids, offers, quotations from dealers and trading systems, new issues, spreads and other relationships observed in the markets among comparable securities; and proprietary pricing models such as yield measures calculated using factors such as cash flows, financial or collateral performance and other reference data (collectively referred to as “standard inputs”) |
| Corporate bonds, notes & loans; convertible securities | | Standard inputs and underlying equity of the issuer |
| Bonds & notes of governments & government agencies | | Standard inputs and interest rate volatilities |
| Mortgage-backed; asset-backed obligations | | Standard inputs and cash flows, prepayment information, default rates, delinquency and loss assumptions, collateral characteristics, credit enhancements and specific deal information |
Securities with both fixed-income and equity characteristics, or equity securities traded principally among fixed-income dealers, are generally valued in the manner described for either equity or fixed-income securities, depending on which method is deemed most appropriate by the fund’s investment adviser. The Capital Group Central Cash Fund (“CCF”), a fund within the Capital Group Central Fund Series (“Central Funds”), is valued based upon a floating net asset value, which fluctuates with changes in the value of CCF’s portfolio securities. The underlying securities are valued based on the policies and procedures in CCF’s statement of additional information.
Securities and other assets for which representative market quotations are not readily available or are considered unreliable by the fund’s investment adviser are fair valued as determined in good faith under fair valuation guidelines adopted by the fund’s investment adviser and approved by the board of directors as further described. The investment adviser follows fair valuation guidelines, consistent with U.S. Securities and Exchange Commission rules and guidance, to consider relevant principles and factors when making fair value determinations. The investment adviser considers relevant indications of value that are reasonably and timely available to it in determining the fair value to be assigned to a particular security, such as the type and cost of the security, contractual or legal restrictions on resale of the security, relevant financial or business developments of the issuer, actively traded similar or related securities, dealer or broker quotes, conversion or exchange rights on the security, related corporate actions, significant events occurring after the close of trading in the security, and changes in overall market conditions. In addition, the closing prices of equity securities that trade in markets outside U.S. time zones may be adjusted to reflect significant events that occur after the close of local trading but before the net asset value of each share class of the fund is determined. Fair valuations of investments that are not actively trading involve judgment and may differ materially from valuations that would have been used had greater market activity occurred.
Processes and structure — The fund’s board of directors has designated the fund’s investment adviser to make fair value determinations, subject to board oversight. The investment adviser has established a Joint Fair Valuation Committee (the “Fair Valuation Committee”) to administer, implement and oversee the fair valuation process, and to make fair value decisions. The Fair Valuation Committee regularly reviews its own fair value decisions, as well as decisions made under its standing instructions to the investment adviser’s valuation team. The Fair Valuation Committee reviews changes in fair value measurements from period to period and may, as deemed appropriate, update the fair valuation guidelines to better reflect the results of back testing and address new or evolving issues. The Fair Valuation Committee reports any changes to the fair valuation guidelines to the board of directors. The fund’s board and audit committee also regularly review reports that describe fair value determinations and methods.
The fund’s investment adviser has also established a Fixed-Income Pricing Review Group to administer and oversee the fixed-income valuation process, including the use of fixed-income pricing vendors. This group regularly reviews pricing vendor information and market data. Pricing decisions, processes and controls over security valuation are also subject to additional internal reviews facilitated by the investment adviser’s global risk management group.
Classifications — The fund’s investment adviser classifies the fund’s assets and liabilities into three levels based on the inputs used to value the assets or liabilities. Level 1 values are based on quoted prices in active markets for identical securities. Level 2 values are based on significant observable market inputs, such as quoted prices for similar securities and quoted prices in inactive markets. Certain securities trading outside the U.S. may transfer between Level 1 and Level 2 due to valuation adjustments resulting from significant market movements following the close of local trading. Level 3 values are based on significant unobservable inputs that reflect the investment adviser’s determination of assumptions that market participants might reasonably use in valuing the securities. The valuation levels are not necessarily an indication of the risk or liquidity associated with the underlying investment. For example, U.S. government securities are reflected as Level 2 because the inputs used to determine fair value may not always be quoted prices in an active market. The following table presents the fund’s valuation levels as of September 30, 2022 (dollars in thousands):
| | | Investment securities |
| | | Level 1 | | | Level 2 | | | Level 3 | | | Total | |
| Assets: | | | | | | | | | | | | | | | | |
| Common stocks: | | | | | | | | | | | | | | | | |
| Industrials | | $ | 4,545,175 | | | $ | 5,566,928 | | | $ | 17,834 | | | $ | 10,129,937 | |
| Information technology | | | 4,905,089 | | | | 3,476,811 | | | | 67,473 | | | | 8,449,373 | |
| Consumer discretionary | | | 4,699,318 | | | | 3,423,212 | | | | 22,073 | | | | 8,144,603 | |
| Health care | | | 5,995,257 | | | | 2,085,994 | | | | 18,461 | | | | 8,099,712 | |
| Financials | | | 3,070,197 | | | | 2,176,881 | | | | 38,039 | | | | 5,285,117 | |
| Consumer staples | | | 858,961 | | | | 1,040,101 | | | | — | | | | 1,899,062 | |
| Energy | | | 1,396,281 | | | | 302,568 | | | | 34,228 | | | | 1,733,077 | |
| Materials | | | 508,355 | | | | 1,168,960 | | | | — | | | | 1,677,315 | |
| Communication services | | | 676,295 | | | | 488,747 | | | | — | 1 | | | 1,165,042 | |
| Real estate | | | 468,908 | | | | 338,955 | | | | — | | | | 807,863 | |
| Utilities | | | 166,709 | | | | 164,791 | | | | 116 | | | | 331,616 | |
| Preferred securities | | | 55,414 | | | | — | | | | 650,176 | | | | 705,590 | |
| Rights & warrants | | | 400 | | | | 107,907 | | | | 55 | | | | 108,362 | |
| Convertible stocks | | | — | | | | — | | | | 48,203 | | | | 48,203 | |
| Convertible bonds & notes | | | — | | | | — | | | | 1,895 | | | | 1,895 | |
| Short-term securities | | | 5,606,766 | | | | 2,494,718 | | | | — | | | | 8,101,484 | |
| Total | | $ | 32,953,125 | | | $ | 22,836,573 | | | $ | 898,553 | | | $ | 56,688,251 | |
| 1 | Amount less than one thousand. |
The following table reconciles the valuation of the fund’s Level 3 investment securities and related transactions for the year ended September 30, 2022 (dollars in thousands):
| | | Beginning
value at
10/1/2021 | | | Transfers
into
Level 32 | | | Purchases | | | Sales | | | Net
realized
gain3 | | | Unrealized
depreciation3 | | | Transfers
out of
Level 32 | | | Ending
value at
9/30/2022 | |
| Investment securities | | $ | 1,243,406 | | | $ | 220,540 | | | $ | 347,110 | | | $ | (236,148 | ) | | $ | 18,448 | | | $ | (519,977 | ) | | $ | (174,826 | ) | | $ | 898,553 | |
| | | | | | | | | | | | | | | | | | | | | | | | | | | | | | | | | |
| Net unrealized depreciation during the period on Level 3 investment securities held at September 30, 2022 | | | $ | (417,560 | ) |
| 2 | Transfers into or out of Level 3 are based on the beginning market value of the quarter in which they occurred. These transfers are the result of changes in the availability of pricing sources and/or in the observability of significant inputs used in valuing the securities. |
| 3 | Net realized gain and unrealized depreciation are included in the related amounts on investments in the fund’s statement of operations. |
Unobservable inputs — Valuation of the fund’s Level 3 securities is based on significant unobservable inputs that reflect the investment adviser’s determination of assumptions that market participants might reasonably use in valuing the securities. The following table provides additional information used by the fund’s investment adviser to fair value the fund’s Level 3 securities (dollars in thousands):
| | | Value at
9/30/2022 | | Valuation
techniques | | Unobservable
inputs | | Range
(if applicable) | | Weighted
average* | | Impact to
valuation from
an increase in
input† |
| | | | | Estimated recovery value | | N/A | | N/A | | N/A | | N/A |
| | | | | Transaction price | | N/A | | N/A | | N/A | | N/A |
| Discount for lack of certainty | | 5% | | 5% | | Decrease |
| | | | | Recent market information | | Quoted price | | N/A | | N/A | | N/A |
| Risk discount | | 50% | | 50% | | Decrease |
| Price drop of parent company | | N/A | | N/A | | N/A |
| Common stocks | | $198,224 | | | | Net adjustment based on market comparables movement (decrease) | | 5% | | 5% | | Decrease |
| | | | | Market comparable companies | | Price/Cash flow multiple | | 6.8x | | 6.8x | | Increase |
| Net adjustment based on market comparables movement (decrease) | | 17% - 69% | | 27% | | Decrease |
| EV/Sales multiple | | 1.5x - 8.7x | | 6.6% | | Increase |
| EV/Gross Profit multiple | | 21.4x | | 21.4x | | Increase |
| DLOM | | 16% - 24% | | 17% | | Decrease |
| Risk discount | | 25% | | 25% | | Decrease |
| | | | | Transaction price | | N/A | | N/A | | N/A | | N/A |
| Discount for lack of certainty | | 5% | | 5% | | Decrease |
| Net adjustment based on market comparables movement (decrease) | | 35% | | 35% | | Decrease |
| Discount to transaction price | | 15% - 20% | | 18% | | Decrease |
| Preferred securities | | 650,176 | | Market comparable companies | | EV/Gross Profit multiple | | 6.8x - 21.4x | | 16.1x | | Increase |
| EV/Sales multiple | | 1.5x - 15.2x | | 7.8x | | Increase |
| Net adjustment based on market comparables movement (decrease) | | 6% - 69% | | 41% | | Decrease |
| DLOM | | 10% | | 10% | | Decrease |
| | | | | Inputs to market comparables and discounted cash flow | | Weight ascribed to market comparables | | 50% | | 50% | | N/A |
| Weight ascribed to discounted cash flow | | 50% | | 50% | | N/A |
| | | | | Discounted cash flow | | Risk discount | | 10% -95% | | 46% | | Decrease |
| WACC | | 10% -20% | | 14% | | Decrease |
| Rights & warrants | | 55 | | Black-Scholes | | Underlying share price | | N/A | | N/A | | N/A |
| Implied volatility | | 30% | | 30% | | Increase |
| | | | | | | EV/Sales multiple | | 2.7x -5.2x | | 4.1x | | Increase |
| Convertible stocks | | 48,203 | | Market comparable companies | | Net adjustment based on market comparables movement (decrease) | | 35% | | 35% | | Decrease |
| Transaction price | | N/A | | N/A | | N/A |
| DLOM | | 17% | | 17% | | Decrease |
| Convertible bonds & notes | | 1,895 | | Transaction price | | N/A | | N/A | | N/A | | N/A |
| | | | Discount for lack of certainty | | 5% | | 5% | | Decrease |
| Total | $ | 898,553 | | | | | | | | | | |
| * | Weighted average is by relative fair value. |
| † | This column represents the directional change in fair value of the Level 3 securities that would result in an increase from the corresponding input. A decrease to the unobservable input would have the opposite effect. Significant increases and decreases in these inputs in isolation could result in significantly higher or lower fair value measurements. |
Key to abbreviations
DLOM = Discount for lack of marketability
EV = Enterprise value
WACC = Weighted average cost of capital
4. Risk factors
Investing in the fund may involve certain risks including, but not limited to, those described below.
Market conditions — The prices of, and the income generated by, the securities held by the fund may decline – sometimes rapidly or unpredictably – due to various factors, including events or conditions affecting the general economy or particular industries or companies; overall market changes; local, regional or global political, social or economic instability; governmental, governmental agency or central bank responses to economic conditions; and currency exchange rate, interest rate and commodity price fluctuations.
Economies and financial markets throughout the world are highly interconnected. Economic, financial or political events, trading and tariff arrangements, wars, terrorism, cybersecurity events, natural disasters, public health emergencies (such as the spread of infectious disease) and other circumstances in one country or region, including actions taken by governmental or quasi-governmental authorities in response to any of the foregoing, could have impacts on global economies or markets. As a result, whether or not the fund invests in securities of issuers located in or with significant exposure to the countries affected, the value and liquidity of the fund’s investments may be negatively affected by developments in other countries and regions.
Issuer risks — The prices of, and the income generated by, securities held by the fund may decline in response to various factors directly related to the issuers of such securities, including reduced demand for an issuer’s goods or services, poor management performance, major litigation, investigations or other controversies related to the issuer, changes in financial condition or credit rating, changes in government regulations affecting the issuer or its competitive environment and strategic initiatives such as mergers, acquisitions or dispositions and the market response to any such initiatives.
Investing in growth-oriented stocks — Growth-oriented common stocks and other equity-type securities (such as preferred stocks, convertible preferred stocks and convertible bonds) may involve larger price swings and greater potential for loss than other types of investments. These risks may be even greater in the case of smaller capitalization stocks.
Investing in small companies — Investing in smaller companies may pose additional risks. For example, it is often more difficult to value or dispose of small company stocks and more difficult to obtain information about smaller companies than about larger companies. Furthermore, smaller companies often have limited product lines, operating histories, markets and/or financial resources, may be dependent on one or a few key persons for management, and can be more susceptible to losses. Moreover, the prices of their stocks may be more volatile than stocks of larger, more established companies, particularly during times of market turmoil.
Investing outside the U.S. — Securities of issuers domiciled outside the U.S., or with significant operations or revenues outside the U.S., may lose value because of adverse political, social, economic or market developments (including social instability, regional conflicts, terrorism and war) in the countries or regions in which the issuers operate or generate revenue. These securities may also lose value due to changes in foreign currency exchange rates against the U.S. dollar and/or currencies of other countries. Issuers of these securities may be more susceptible to actions of foreign governments, such as nationalization, currency blockage or the imposition of price controls, sanctions, or punitive taxes, each of which could adversely impact the value of these securities. Securities markets in certain countries may be more volatile and/or less liquid than those in the U.S. Investments outside the U.S. may also be subject to different regulatory, legal, accounting, auditing, financial reporting and recordkeeping requirements, and may be more difficult to value, than those in the U.S.. In addition, the value of investments outside the U.S. may be reduced by foreign taxes, including foreign withholding taxes on interest and dividends. Further, there may be increased risks of delayed settlement of securities purchased or sold by the fund, which could impact the liquidity of the fund’s portfolio. The risks of investing outside the U.S. may be heightened in connection with investments in emerging markets.
Investing in emerging markets — Investing in emerging markets may involve risks in addition to and greater than those generally associated with investing in the securities markets of developed countries. For instance, emerging market countries tend to have less developed political, economic and legal systems than those in developed countries. Accordingly, the governments of these countries may be less stable and more likely to intervene in the market economy, for example, by imposing capital controls, nationalizing a company or industry, placing restrictions on foreign ownership and on withdrawing sale proceeds of securities from the country, and/or imposing punitive taxes that could adversely affect the prices of securities. Information regarding issuers in emerging markets may be limited, incomplete or inaccurate, and such issuers may not be subject to regulatory, accounting, auditing, and financial reporting and recordkeeping standards comparable to those to which issuers in more developed markets are subject. The fund’s rights with respect to its investments in emerging markets, if any, will generally be governed by local law, which may make it difficult or impossible for the fund to pursue legal remedies or to obtain and enforce judgments in local courts. In addition, the economies of these countries may be dependent on relatively few industries, may have limited access to capital and may be more susceptible to changes in local and global trade conditions and downturns in the world economy. Securities markets in these countries can also be relatively small and have substantially lower trading volumes. As a result, securities issued in these countries may be more volatile and less liquid, and may be more difficult to value, than securities issued in countries with more developed economies and/or markets. Less certainty with respect to security valuations may lead to additional challenges and risks in calculating the fund’s net asset value. Additionally, emerging markets are more likely to experience problems with the clearing and settling of trades and the holding of securities by banks, agents and depositories that are less established than those in developed countries.
Liquidity risk — Certain fund holdings may be or may become difficult or impossible to sell, particularly during times of market turmoil. Liquidity may be impacted by the lack of an active market for a holding, legal or contractual restrictions on resale, or the reduced number and capacity of market participants to make a market in such holding. Market prices for less liquid or illiquid holdings may be volatile or difficult to determine, and reduced liquidity may have an adverse impact on the market price of such holdings. During times of market turmoil, there have been, and may be, no buyers or sellers for securities in entire asset classes. Additionally, the sale of less liquid or illiquid holdings may involve substantial delays (including delays in settlement) and additional costs and the fund may be unable to sell such holdings when necessary to meet its liquidity needs, or to try to limit losses, or may be forced to sell at a loss.
Management — The investment adviser to the fund actively manages the fund’s investments. Consequently, the fund is subject to the risk that the methods and analyses, including models, tools and data, employed by the investment adviser in this process may be flawed or incorrect and may not produce the desired results. This could cause the fund to lose value or its investment results to lag relevant benchmarks or other funds with similar objectives.
5. Certain investment techniques
Securities lending — The fund has entered into securities lending transactions in which the fund earns income by lending investment securities to brokers, dealers or other institutions. Each transaction involves three parties: the fund, acting as the lender of the securities, a borrower, and a lending agent that acts as an intermediary.
Securities lending transactions are entered into by the fund under a securities lending agent agreement with the lending agent. The lending agent facilitates the exchange of securities between the fund and approved borrowers, ensures that securities loans are properly coordinated and documented, marks-to-market the value of collateral daily, secures additional collateral from a borrower if it falls below preset terms, and may reinvest cash collateral on behalf of the fund according to agreed parameters. The lending agent provides indemnification to the fund against losses resulting from a borrower default. Although risk is mitigated by the collateral and indemnification, the fund could experience a delay in recovering its securities and a potential loss of income or value if a borrower fails to return securities, collateral investments decline in value or the lending agent fails to perform.
The borrower is required to post highly liquid assets, such as cash or U.S. government securities, as collateral for the loan in an amount at least equal to the value of the securities loaned. Investments made with cash collateral are recognized as assets in the fund’s investment portfolio. The same amount is recorded as a liability in the fund’s statement of assets and liabilities. While securities are on loan, the fund will continue to receive the equivalent of the interest, dividends or other distributions paid by the issuer, as well as a portion of the interest on the investment of the collateral. Additionally, although the fund does not have the right to vote on securities while they are on loan, the fund has a right to consent on corporate actions and a right to recall loaned securities to vote. A borrower is obligated to return loaned securities at the conclusion of a loan or, during the pendency of a loan, on demand from the fund.
As of September 30, 2022, the total value of securities on loan was $1,261,635,000, and the total value of collateral received was $1,320,108,000. Collateral received includes cash of $830,948,000 and U.S. government securities of $489,160,000. Investment securities purchased from cash collateral are disclosed in the fund’s investment portfolio as short-term securities. Securities received as collateral are not recognized as fund assets. The contractual maturity of cash collateral received under the securities lending agreement is classified as overnight and continuous.
6. Taxation and distributions
Federal income taxation — The fund complies with the requirements under Subchapter M of the Internal Revenue Code applicable to regulated investment companies and intends to distribute substantially all of its net taxable income and net capital gains each year. The fund is not subject to income taxes to the extent such distributions are made. Therefore, no federal income tax provision is required.
As of and during the year ended September 30, 2022, the fund did not have a liability for any unrecognized tax benefits. The fund recognizes interest and penalties, if any, related to unrecognized tax benefits as income tax expense in the statement of operations. During the period, the fund did not incur any significant interest or penalties.
The fund’s tax returns are generally not subject to examination by federal, state and, if applicable, non-U.S. tax authorities after the expiration of each jurisdiction’s statute of limitations, which is typically three years after the date of filing but can be extended in certain jurisdictions.
Non-U.S. taxation — Dividend and interest income are recorded net of non-U.S. taxes paid. The fund may file withholding tax reclaims in certain jurisdictions to recover a portion of amounts previously withheld. As a result of rulings from European courts, the fund filed for additional reclaims related to prior years. These reclaims are recorded when the amount is known and there are no significant uncertainties on collectability. During the year ended September 30, 2022, the fund recognized $6,301,000 in reclaims (net of $395,000 in fees and the effect of realized gain or loss from currency translations) and $1,568,000 in interest related to European court rulings, which is included in dividend income and interest income, respectively, in the fund’s statement of operations. Gains realized by the fund on the sale of securities in certain countries, if any, may be subject to non-U.S. taxes. If applicable, the fund records an estimated deferred tax liability based on unrealized gains to provide for potential non-U.S. taxes payable upon the sale of these securities.
Distributions — Distributions determined on a tax basis may differ from net investment income and net realized gains for financial reporting purposes. These differences are due primarily to different treatment for items such as currency gains and losses; short-term capital gains and losses; capital losses related to sales of certain securities within 30 days of purchase; unrealized appreciation of certain investments in securities outside the U.S.; deferred expenses; cost of investments sold; non-U.S. taxes on capital gains; amortization of premiums and discounts and income on certain investments. The fiscal year in which amounts are distributed may differ from the year in which the net investment income and net realized gains are recorded by the fund for financial reporting purposes.
During the year ended September 30, 2022, the fund reclassified $4,167,000 from capital paid in on shares of capital stock to total distributable earnings to align financial reporting with tax reporting.
As of September 30, 2022, the tax basis components of distributable earnings, unrealized appreciation (depreciation) and cost of investments were as follows (dollars in thousands):
| Late year ordinary loss deferral1 | | $ | (44,671 | ) |
| Post-October capital loss deferral1 | | | (846,540 | ) |
| Gross unrealized appreciation on investments | | | 12,545,010 | |
| Gross unrealized depreciation on investments | | | (8,182,365 | ) |
| Net unrealized appreciation on investments | | | 4,362,645 | |
| Cost of investments | | | 52,325,606 | |
| 1 | These deferrals are considered incurred in the subsequent year. |
Tax-basis distributions paid to shareholders from long-term capital gains were as follows (dollars in thousands):
| | | Year ended September 30 |
| Share class | | 2022 | | | 2021 | |
| Class A | | $ | 3,186,223 | | | $ | 533,184 | |
| Class C | | | 69,187 | | | | 12,765 | |
| Class T | | | 2 | | | | — | 2 |
| Class F-1 | | | 66,368 | | | | 14,136 | |
| Class F-2 | | | 892,658 | | | | 127,813 | |
| Class F-3 | | | 458,716 | | | | 60,263 | |
| Class 529-A | | | 189,038 | | | | 32,362 | |
| Class 529-C | | | 8,227 | | | | 1,788 | |
| Class 529-E | | | 7,066 | | | | 1,256 | |
| Class 529-T | | | 2 | | | | — | 2 |
| Class 529-F-1 | | | 1 | | | | — | 2 |
| Class 529-F-23 | | | 23,295 | | | | 3,561 | |
| Class 529-F-33 | | | 1 | | | | — | 2 |
| Class R-1 | | | 3,472 | | | | 596 | |
| Class R-2 | | | 67,127 | | | | 12,517 | |
| Class R-2E | | | 4,067 | | | | 671 | |
| Class R-3 | | | 85,499 | | | | 16,023 | |
| Class R-4 | | | 81,892 | | | | 15,839 | |
| Class R-5E | | | 16,013 | | | | 1,654 | |
| Class R-5 | | | 39,887 | | | | 7,260 | |
| Class R-6 | | | 1,683,929 | | | | 194,770 | |
| Total | | $ | 6,882,670 | | | $ | 1,036,458 | |
| 2 | Amount less than one thousand. |
| 3 | Class 529-F-2 and 529-F-3 shares began investment operations on October 30, 2020. |
7. Fees and transactions with related parties
CRMC, the fund’s investment adviser, is the parent company of American Funds Distributors®, Inc. (“AFD”), the principal underwriter of the fund’s shares, and American Funds Service Company® (“AFS”), the fund’s transfer agent. CRMC, AFD and AFS are considered related parties to the fund.
Investment advisory services — The fund has an investment advisory and service agreement with CRMC that provides for monthly fees accrued daily. At the beginning of the year, these fees were based on a series of decreasing annual rates beginning with 0.800% on the first $1 billion of daily net assets and decreasing to 0.589% on such assets in excess of $44 billion. On September 14, 2021, the fund’s board of directors approved an amended investment advisory and service agreement effective December 1, 2021, decreasing the annual rates to 0.587% and 0.585% on daily net assets in excess of $55 billion and $71 billion, respectively. On September 13, 2022, the fund’s board of directors approved an amended investment advisory and service agreement effective December 1, 2022, decreasing the annual rate to 0.583% on daily net assets in excess of $89 billion. CRMC waived investment advisory services fees of $139,000 in advance of the amended investment advisory agreement effective December 1, 2021. CRMC does not intend to recoup this waiver. As a result, the fees shown on the fund’s statement of operations of $424,095,000 were reduced to $423,956,000, both of which were equivalent to an annualized rate of 0.605% of average daily net assets.
Class-specific fees and expenses — Expenses that are specific to individual share classes are accrued directly to the respective share class. The principal class-specific fees and expenses are further described below:
Distribution services — The fund has plans of distribution for all share classes, except Class F-2, F-3, 529-F-2, 529-F-3, R-5E, R-5 and R-6 shares. Under the plans, the board of directors approves certain categories of expenses that are used to finance activities primarily intended to sell fund shares and service existing accounts. The plans provide for payments, based on an annualized percentage of average daily net assets, ranging from 0.30% to 1.00% as noted in this section. In some cases, the board of directors has limited the amounts that may be paid to less than the maximum allowed by the plans. All share classes with a plan may use up to 0.25% of average daily net assets to pay service fees, or to compensate AFD for paying service fees, to firms that have entered into agreements with AFD to provide certain shareholder services. The remaining amounts available to be paid under each plan are paid to dealers to compensate them for their sales activities.
| Share class | | Currently approved limits | | Plan limits |
| Class A | | | 0.30 | % | | | 0.30 | % |
| Class 529-A | | | 0.30 | | | | 0.50 | |
| Classes C, 529-C and R-1 | | | 1.00 | | | | 1.00 | |
| Class R-2 | | | 0.75 | | | | 1.00 | |
| Class R-2E | | | 0.60 | | | | 0.85 | |
| Classes 529-E and R-3 | | | 0.50 | | | | 0.75 | |
| Classes T, F-1, 529-T, 529-F-1 and R-4 | | | 0.25 | | | | 0.50 | |
For Class A and 529-A shares, distribution-related expenses include the reimbursement of dealer and wholesaler commissions paid by AFD for certain shares sold without a sales charge. These share classes reimburse AFD for amounts billed within the prior 15 months but only to the extent that the overall annual expense limits are not exceeded. As of September 30, 2022, there were no unreimbursed expenses subject to reimbursement for Class A or 529-A shares.
Transfer agent services — The fund has a shareholder services agreement with AFS under which the fund compensates AFS for providing transfer agent services to each of the fund’s share classes. These services include recordkeeping, shareholder communications and transaction processing. In addition, the fund reimburses AFS for amounts paid to third parties for performing transfer agent services on behalf of fund shareholders.
Administrative services — The fund has an administrative services agreement with CRMC under which the fund compensates CRMC for providing administrative services to all share classes. Administrative services are provided by CRMC and its affiliates to help assist third parties providing non-distribution services to fund shareholders. These services include providing in-depth information on the fund and market developments that impact fund investments. Administrative services also include, but are not limited to, coordinating, monitoring and overseeing third parties that provide services to fund shareholders. The agreement provides the fund the ability to charge an administrative services fee at the annual rate of 0.05% of the average daily net assets attributable to each share class of the fund. Currently the fund pays CRMC an administrative services fee at the annual rate of 0.03% of the average daily net assets attributable to each share class of the fund for CRMC’s provision of administrative services.
529 plan services — Each 529 share class is subject to service fees to compensate the Virginia College Savings Plan (“Virginia529”) for its oversight and administration of the CollegeAmerica 529 college savings plan. The fees are based on the combined net assets invested in Class 529 and ABLE shares of the American Funds. Class ABLE shares are offered on other American Funds by Virginia529 through ABLEAmerica®, a tax-advantaged savings program for individuals with disabilities. Virginia529 is not considered a related party to the fund.
Prior to January 1, 2022, the quarterly fees were based on a series of decreasing annual rates beginning with 0.09% on the first $20 billion of the combined net assets invested in the American Funds and decreasing to 0.03% on such assets in excess of $100 billion. Effective January 1, 2022, the quarterly fees were amended to a series of decreasing annual rates beginning with 0.09% on the first $20 billion of the combined net assets invested in the American Funds and decreasing to 0.03% on such assets in excess of $75 billion. The fees for any given calendar quarter are accrued and calculated on the basis of the average net assets of Class 529 and ABLE shares of the American Funds for the last month of the prior calendar quarter. For the year ended September 30, 2022, the 529 plan services fees were $1,270,000, which were equivalent to 0.058% of the average daily net assets of each 529 share class.
For the year ended September 30, 2022, class-specific expenses under the agreements were as follows (dollars in thousands):
| Share class | | Distribution
services | | | Transfer agent
services | | | Administrative
services | | | 529 plan
services | |
| Class A | | | $78,383 | | | | $33,267 | | | | $9,370 | | | Not applicable | |
| Class C | | | 5,420 | | | | 572 | | | | 164 | | | Not applicable | |
| Class T | | | — | | | | — | * | | | — | * | | Not applicable | |
| Class F-1 | | | 1,522 | | | | 976 | | | | 188 | | | Not applicable | |
| Class F-2 | | | Not applicable | | | | 10,223 | | | | 2,764 | | | Not applicable | |
| Class F-3 | | | Not applicable | | | | 38 | | | | 1,435 | | | Not applicable | |
| Class 529-A | | | 4,113 | | | | 1,837 | | | | 549 | | | $1,058 | |
| Class 529-C | | | 657 | | | | 66 | | | | 20 | | | 38 | |
| Class 529-E | | | 324 | | | | 25 | | | | 19 | | | 37 | |
| Class 529-T | | | — | | | | — | * | | | — | * | | — | * |
| Class 529-F-1 | | | — | | | | — | * | | | — | * | | — | * |
| Class 529-F-2 | | | Not applicable | | | | 125 | | | | 71 | | | 137 | |
| Class 529-F-3 | | | Not applicable | | | | — | * | | | — | * | | — | * |
| Class R-1 | | | 301 | | | | 28 | | | | 9 | | | Not applicable | |
| Class R-2 | | | 4,189 | | | | 1,999 | | | | 167 | | | Not applicable | |
| Class R-2E | | | 226 | | | | 79 | | | | 11 | | | Not applicable | |
| Class R-3 | | | 3,910 | | | | 1,204 | | | | 235 | | | Not applicable | |
| Class R-4 | | | 1,965 | | | | 808 | | | | 236 | | | Not applicable | |
| Class R-5E | | | Not applicable | | | | 260 | | | | 51 | | | Not applicable | |
| Class R-5 | | | Not applicable | | | | 211 | | | | 121 | | | Not applicable | |
| Class R-6 | | | Not applicable | | | | 148 | | | | 5,617 | | | Not applicable | |
| Total class-specific expenses | | | $101,010 | | | | $51,866 | | | | $21,027 | | | $1,270 | |
| * | Amount less than one thousand. |
Directors’ deferred compensation — Directors who are unaffiliated with CRMC may elect to defer the cash payment of part or all of their compensation. These deferred amounts, which remain as liabilities of the fund, are treated as if invested in shares of the fund or other American Funds. These amounts represent general, unsecured liabilities of the fund and vary according to the total returns of the selected funds. Directors’ compensation of $(948,000) in the fund’s statement of operations reflects $272,000 in current fees (either paid in cash or deferred) and a net decrease of $1,220,000 in the value of the deferred amounts.
Affiliated officers and directors — Officers and certain directors of the fund are or may be considered to be affiliated with CRMC, AFD and AFS. No affiliated officers or directors received any compensation directly from the fund.
Investment in CCF — The fund holds shares of CCF, an institutional prime money market fund managed by CRMC. CCF invests in high-quality, short-term money market instruments. CCF is used as the primary investment vehicle for the fund’s short-term instruments. CCF shares are only available for purchase by CRMC, its affiliates, and other funds managed by CRMC or its affiliates, and are not available to the public. CRMC does not receive an investment advisory services fee from CCF.
Security transactions with related funds — The fund purchased investment securities from, and sold investment securities to, other funds managed by CRMC (or funds managed by certain affiliates of CRMC) under procedures adopted by the fund’s board of directors. The funds involved in such transactions are considered related by virtue of having a common investment adviser (or affiliated investment advisers), common directors and/or common officers. Each transaction was executed at the current market price of the security and no brokerage commissions or fees were paid in accordance with Rule 17a-7 of the 1940 Act. During the year ended September 30, 2022, the fund engaged in such purchase and sale transactions with related funds in the amounts of $667,753,000 and $569,346,000, respectively, which generated $285,095,000 of net realized gains from such sales.
Interfund lending — Pursuant to an exemptive order issued by the SEC, the fund, along with other CRMC-managed funds (or funds managed by certain affiliates of CRMC), may participate in an interfund lending program. The program provides an alternate credit facility that permits the funds to lend or borrow cash for temporary purposes directly to or from one another, subject to the conditions of the exemptive order. The fund did not lend or borrow cash through the interfund lending program at any time during the year ended September 30, 2022.
8. Committed line of credit
The fund participates with other funds managed by CRMC (or funds managed by certain affiliates of CRMC) in a $1.5 billion credit facility (the “line of credit”) to be utilized for temporary purposes to support shareholder redemptions. The fund has agreed to pay commitment fees on its pro-rata portion of the line of credit, which are reflected in other expenses in the fund’s statement of operations. The fund did not borrow on this line of credit at any time during the year ended September 30, 2022.
9. Indemnifications
The fund’s organizational documents provide board members and officers with indemnification against certain liabilities or expenses in connection with the performance of their duties to the fund. In the normal course of business, the fund may also enter into contracts that provide general indemnifications. The fund’s maximum exposure under these arrangements is unknown since it is dependent on future claims that may be made against the fund. The risk of material loss from such claims is considered remote. Insurance policies are also available to the fund’s board members and officers.
10. Capital share transactions
Capital share transactions in the fund were as follows (dollars and shares in thousands):
| | | Sales1 | | | Reinvestments of
distributions | | | Repurchases1 | | | Net increase
(decrease) | |
| Share class | | Amount | | | Shares | | | Amount | | | Shares | | | Amount | | | Shares | | | Amount | | | Shares | |
| | | | | | | | | | | | | | | | | | | | | | | | | |
| Year ended September 30, 2022 | | | | | | | | | | | |
| | | | | | | | | | | | |
| Class A | | $ | 2,421,112 | | | | 34,645 | | | $ | 3,146,250 | | | | 40,871 | | | $ | (3,690,285 | ) | | | (54,443 | ) | | $ | 1,877,077 | | | | 21,073 | |
| Class C | | | 66,264 | | | | 1,160 | | | | 68,902 | | | | 1,091 | | | | (167,718 | ) | | | (2,984 | ) | | | (32,552 | ) | | | (733 | ) |
| Class T | | | — | | | | — | | | | — | | | | — | | | | — | | | | — | | | | — | | | | — | |
| Class F-1 | | | 45,086 | | | | 654 | | | | 65,695 | | | | 867 | | | | (117,196 | ) | | | (1,743 | ) | | | (6,415 | ) | | | (222 | ) |
| Class F-2 | | | 2,927,107 | | | | 41,641 | | | | 870,184 | | | | 10,996 | | | | (2,324,879 | ) | | | (34,030 | ) | | | 1,472,412 | | | | 18,607 | |
| Class F-3 | | | 1,624,182 | | | | 23,394 | | | | 457,164 | | | | 5,818 | | | | (1,066,551 | ) | | | (15,796 | ) | | | 1,014,795 | | | | 13,416 | |
| Class 529-A | | | 168,539 | | | | 2,448 | | | | 189,018 | | | | 2,495 | | | | (243,193 | ) | | | (3,640 | ) | | | 114,364 | | | | 1,303 | |
| Class 529-C | | | 10,188 | | | | 176 | | | | 8,226 | | | | 127 | | | | (27,532 | ) | | | (469 | ) | | | (9,118 | ) | | | (166 | ) |
| Class 529-E | | | 4,479 | | | | 68 | | | | 7,065 | | | | 98 | | | | (9,950 | ) | | | (153 | ) | | | 1,594 | | | | 13 | |
| Class 529-T | | | — | | | | — | | | | 2 | | | | — | 2 | | | — | | | | — | | | | 2 | | | | — | 2 |
| Class 529-F-1 | | | — | | | | — | | | | 1 | | | | — | 2 | | | — | | | | — | | | | 1 | | | | — | 2 |
| Class 529-F-2 | | | 50,316 | | | | 727 | | | | 23,290 | | | | 302 | | | | (34,329 | ) | | | (493 | ) | | | 39,277 | | | | 536 | |
| Class 529-F-3 | | | — | | | | — | | | | 1 | | | | — | 2 | | | — | | | | — | | | | 1 | | | | — | 2 |
| Class R-1 | | | 5,640 | | | | 100 | | | | 3,379 | | | | 51 | | | | (4,431 | ) | | | (77 | ) | | | 4,588 | | | | 74 | |
| Class R-2 | | | 94,180 | | | | 1,611 | | | | 67,065 | | | | 1,018 | | | | (162,921 | ) | | | (2,679 | ) | | | (1,676 | ) | | | (50 | ) |
| Class R-2E | | | 8,789 | | | | 130 | | | | 4,067 | | | | 55 | | | | (13,993 | ) | | | (212 | ) | | | (1,137 | ) | | | (27 | ) |
| Class R-3 | | | 139,524 | | | | 2,147 | | | | 85,413 | | | | 1,184 | | | | (198,862 | ) | | | (3,008 | ) | | | 26,075 | | | | 323 | |
| Class R-4 | | | 125,246 | | | | 1,809 | | | | 81,883 | | | | 1,073 | | | | (197,736 | ) | | | (2,848 | ) | | | 9,393 | | | | 34 | |
| Class R-5E | | | 54,982 | | | | 776 | | | | 16,010 | | | | 206 | | | | (32,097 | ) | | | (463 | ) | | | 38,895 | | | | 519 | |
| Class R-5 | | | 45,010 | | | | 629 | | | | 39,865 | | | | 494 | | | | (98,277 | ) | | | (1,389 | ) | | | (13,402 | ) | | | (266 | ) |
| Class R-6 | | | 5,496,061 | | | | 76,309 | | | | 1,675,414 | | | | 20,985 | | | | (672,122 | ) | | | (9,916 | ) | | | 6,499,353 | | | | 87,378 | |
| Total net increase (decrease) | | $ | 13,286,705 | | | | 188,424 | | | $ | 6,808,894 | | | | 87,731 | | | $ | (9,062,072 | ) | | | (134,343 | ) | | $ | 11,033,527 | | | | 141,812 | |
Refer to the end of the table for footnotes.
| | | Sales1 | | | Reinvestments of distributions | | | Repurchases1 | | | Net increase
(decrease) | |
| Share class | | Amount | | | Shares | | | Amount | | | Shares | | | Amount | | | Shares | | | Amount | | | Shares | |
| | | | | | | | | | | | | | | | | | | | | | | | | |
| Year ended September 30, 2021 | | | | | | | | | | | | | | | | | | | |
| | | | | | | | | | | | | | | | | | | | |
| Class A | | $ | 4,132,944 | | | | 49,749 | | | $ | 526,551 | | | | 6,720 | | | $ | (3,620,822 | ) | | | (43,973 | ) | | $ | 1,038,673 | | | | 12,496 | |
| Class C | | | 130,503 | | | | 1,871 | | | | 12,733 | | | | 193 | | | | (185,707 | ) | | | (2,669 | ) | | | (42,471 | ) | | | (605 | ) |
| Class T | | | — | | | | — | | | | — | | | | — | | | | — | | | | — | | | | — | | | | — | |
| Class F-1 | | | 95,711 | | | | 1,180 | | | | 13,924 | | | | 180 | | | | (285,356 | ) | | | (3,459 | ) | | | (175,721 | ) | | | (2,099 | ) |
| Class F-2 | | | 4,160,688 | | | | 48,348 | | | | 124,564 | | | | 1,554 | | | | (2,566,109 | ) | | | (29,607 | ) | | | 1,719,143 | | | | 20,295 | |
| Class F-3 | | | 2,002,876 | | | | 23,569 | | | | 60,027 | | | | 755 | | | | (842,469 | ) | | | (10,024 | ) | | | 1,220,434 | | | | 14,300 | |
| Class 529-A | | | 256,517 | | | | 3,151 | | | | 32,349 | | | | 419 | | | | (276,976 | ) | | | (3,397 | ) | | | 11,890 | | | | 173 | |
| Class 529-C | | | 15,803 | | | | 225 | | | | 1,788 | | | | 27 | | | | (39,574 | ) | | | (561 | ) | | | (21,983 | ) | | | (309 | ) |
| Class 529-E | | | 8,495 | | | | 109 | | | | 1,255 | | | | 17 | | | | (11,995 | ) | | | (152 | ) | | | (2,245 | ) | | | (26 | ) |
| Class 529-T | | | — | | | | — | | | | — | 2 | | | — | 2 | | | — | | | | — | | | | — | 2 | | | — | 2 |
| Class 529-F-1 | | | 4,003 | | | | 58 | | | | — | 2 | | | — | 2 | | | (183,036 | ) | | | (2,779 | ) | | | (179,033 | ) | | | (2,721 | ) |
| Class 529-F-23 | | | 242,879 | | | | 3,498 | | | | 3,555 | | | | 45 | | | | (36,630 | ) | | | (438 | ) | | | 209,804 | | | | 3,105 | |
| Class 529-F-33 | | | 10 | | | | — | 2 | | | — | 2 | | | — | 2 | | | — | | | | — | | | | 10 | | | | — | 2 |
| Class R-1 | | | 6,407 | | | | 88 | | | | 585 | | | | 8 | | | | (7,729 | ) | | | (108 | ) | | | (737 | ) | | | (12 | ) |
| Class R-2 | | | 125,085 | | | | 1,739 | | | | 12,506 | | | | 182 | | | | (188,756 | ) | | | (2,655 | ) | | | (51,165 | ) | | | (734 | ) |
| Class R-2E | | | 12,544 | | | | 155 | | | | 671 | | | | 9 | | | | (12,306 | ) | | | (153 | ) | | | 909 | | | | 11 | |
| Class R-3 | | | 186,463 | | | | 2,407 | | | | 16,007 | | | | 216 | | | | (288,123 | ) | | | (3,710 | ) | | | (85,653 | ) | | | (1,087 | ) |
| Class R-4 | | | 163,088 | | | | 2,006 | | | | 15,838 | | | | 204 | | | | (299,064 | ) | | | (3,635 | ) | | | (120,138 | ) | | | (1,425 | ) |
| Class R-5E | | | 101,918 | | | | 1,189 | | | | 1,653 | | | | 21 | | | | (30,191 | ) | | | (361 | ) | | | 73,380 | | | | 849 | |
| Class R-5 | | | 73,282 | | | | 854 | | | | 7,258 | | | | 89 | | | | (110,242 | ) | | | (1,307 | ) | | | (29,702 | ) | | | (364 | ) |
| Class R-6 | | | 6,274,542 | | | | 71,646 | | | | 193,850 | | | | 2,401 | | | | (1,976,480 | ) | | | (24,589 | ) | | | 4,491,912 | | | | 49,458 | |
| Total net increase (decrease) | | $ | 17,993,758 | | | | 211,842 | | | $ | 1,025,114 | | | | 13,040 | | | $ | (10,961,565 | ) | | | (133,577 | ) | | $ | 8,057,307 | | | | 91,305 | |
| 1 | Includes exchanges between share classes of the fund. |
| 2 | Amount less than one thousand. |
| 3 | Class 529-F-2 and 529-F-3 shares began investment operations on October 30, 2020. |
11. Investment transactions
The fund engaged in purchases and sales of investment securities, excluding short-term securities and U.S. government obligations, if any, of $21,956,199,000 and $20,804,227,000, respectively, during the year ended September 30, 2022.
Financial highlights
| | | | | | (Loss) income from
investment operations1 | | | Dividends and distributions | | | | | | | | | | | | | | | | | | | |
| Year ended | | Net asset
value,
beginning
of year | | | Net
investment
(loss)
income | | | Net (losses)
gains on
securities
(both
realized and
unrealized) | | | Total from
investment
operations | | | Dividends
(from net
investment
income) | | | Distributions
(from capital
gains) | | | Total
dividends
and
distributions | | | Net asset
value,
end
of year | | | Total return2,3 | | | Net assets,
end of
year
(in millions) | | | Ratio of
expenses
to average net
assets before
reimbursement4 | | | Ratio of
expenses
to average net
assets after
reimbursement3,4 | | | Ratio of
net (loss)
income
to average
net assets3 | |
| Class A: | | | | | | | | | | | | | | | | | | | | | | | | | | | | | | | | | | | | | | | | | | | | | | | | | | | | |
| 9/30/2022 | | $ | 88.19 | | | $ | (.04 | ) | | $ | (28.76 | ) | | $ | (28.80 | ) | | $ | — | | | $ | (7.40 | ) | | $ | (7.40 | ) | | $ | 51.99 | | | | (35.39 | )% | | $ | 23,553 | | | | 1.01 | % | | | 1.01 | % | | | (.05 | )% |
| 9/30/2021 | | | 66.23 | | | | (.37 | ) | | | 23.60 | | | | 23.23 | | | | — | | | | (1.27 | ) | | | (1.27 | ) | | | 88.19 | | | | 35.35 | | | | 38,095 | | | | 1.02 | | | | 1.02 | | | | (.44 | ) |
| 9/30/2020 | | | 55.24 | | | | (.15 | ) | | | 13.63 | | | | 13.48 | | | | — | | | | (2.49 | ) | | | (2.49 | ) | | | 66.23 | | | | 24.98 | | | | 27,781 | | | | 1.06 | | | | 1.06 | | | | (.25 | ) |
| 9/30/2019 | | | 60.19 | | | | .05 | | | | (1.69 | ) | | | (1.64 | ) | | | — | | | | (3.31 | ) | | | (3.31 | ) | | | 55.24 | | | | (1.37 | ) | | | 23,203 | | | | 1.06 | | | | 1.06 | | | | .09 | |
| 9/30/2018 | | | 55.60 | | | | .04 | | | | 7.05 | | | | 7.09 | | | | — | | | | (2.50 | ) | | | (2.50 | ) | | | 60.19 | | | | 13.13 | | | | 24,203 | | | | 1.04 | | | | 1.04 | | | | .06 | |
| Class C: | | | | | | | | | | | | | | | | | | | | | | | | | | | | | | | | | | | | | | | | | | | | | | | | |
| 9/30/2022 | | | 73.86 | | | | (.46 | ) | | | (23.60 | ) | | | (24.06 | ) | | | — | | | | (7.40 | ) | | | (7.40 | ) | | | 42.40 | | | | (35.86 | ) | | | 378 | | | | 1.75 | | | | 1.75 | | | | (.81 | ) |
| 9/30/2021 | | | 56.04 | | | | (.82 | ) | | | 19.91 | | | | 19.09 | | | | — | | | | (1.27 | ) | | | (1.27 | ) | | | 73.86 | | | | 34.36 | | | | 713 | | | | 1.75 | | | | 1.75 | | | | (1.18 | ) |
| 9/30/2020 | | | 47.42 | | | | (.48 | ) | | | 11.59 | | | | 11.11 | | | | — | | | | (2.49 | ) | | | (2.49 | ) | | | 56.04 | | | | 24.07 | | | | 575 | | | | 1.79 | | | | 1.79 | | | | (.97 | ) |
| 9/30/2019 | | | 52.63 | | | | (.32 | ) | | | (1.58 | ) | | | (1.90 | ) | | | — | | | | (3.31 | ) | | | (3.31 | ) | | | 47.42 | | | | (2.13 | ) | | | 673 | | | | 1.82 | | | | 1.82 | | | | (.68 | ) |
| 9/30/2018 | | | 49.30 | | | | (.38 | ) | | | 6.21 | | | | 5.83 | | | | — | | | | (2.50 | ) | | | (2.50 | ) | | | 52.63 | | | | 12.23 | | | | 807 | | | | 1.83 | | | | 1.83 | | | | (.74 | ) |
| Class T: | | | | | | | | | | | | | | | | | | | | | | | | | | | | | | | | | | | | | | | | | | | | | | | | |
| 9/30/2022 | | | 89.14 | | | | .13 | | | | (29.14 | ) | | | (29.01 | ) | | | — | | | | (7.40 | ) | | | (7.40 | ) | | | 52.73 | | | | (35.21 | )5 | | | — | 6 | | | .76 | 5 | | | .76 | 5 | | | .19 | 5 |
| 9/30/2021 | | | 66.78 | | | | (.18 | ) | | | 23.81 | | | | 23.63 | | | | — | | | | (1.27 | ) | | | (1.27 | ) | | | 89.14 | | | | 35.64 | 5 | | | — | 6 | | | .79 | 5 | | | .79 | 5 | | | (.21 | )5 |
| 9/30/2020 | | | 55.54 | | | | — | 7 | | | 13.73 | | | | 13.73 | | | | — | | | | (2.49 | ) | | | (2.49 | ) | | | 66.78 | | | | 25.30 | 5 | | | — | 6 | | | .81 | 5 | | | .81 | 5 | | | — | 5,8 |
| 9/30/2019 | | | 60.35 | | | | .18 | | | | (1.68 | ) | | | (1.50 | ) | | | — | | | | (3.31 | ) | | | (3.31 | ) | | | 55.54 | | | | (1.14 | )5 | | | — | 6 | | | .82 | 5 | | | .82 | 5 | | | .33 | 5 |
| 9/30/2018 | | | 55.64 | | | | .15 | | | | 7.06 | | | | 7.21 | | | | — | | | | (2.50 | ) | | | (2.50 | ) | | | 60.35 | | | | 13.36 | 5 | | | — | 6 | | | .85 | 5 | | | .85 | 5 | | | .25 | 5 |
| Class F-1: | | | | | | | | | | | | | | | | | | | | | | | | | | | | | | | | | | | | | | | | | | | | | | | | |
| 9/30/2022 | | | 86.92 | | | | (.07 | ) | | | (28.31 | ) | | | (28.38 | ) | | | — | | | | (7.40 | ) | | | (7.40 | ) | | | 51.14 | | | | (35.41 | ) | | | 454 | | | | 1.05 | | | | 1.05 | | | | (.10 | ) |
| 9/30/2021 | | | 65.31 | | | | (.39 | ) | | | 23.27 | | | | 22.88 | | | | — | | | | (1.27 | ) | | | (1.27 | ) | | | 86.92 | | | | 35.31 | | | | 791 | | | | 1.05 | | | | 1.05 | | | | (.48 | ) |
| 9/30/2020 | | | 54.51 | | | | (.15 | ) | | | 13.44 | | | | 13.29 | | | | — | | | | (2.49 | ) | | | (2.49 | ) | | | 65.31 | | | | 24.96 | | | | 731 | | | | 1.08 | | | | 1.08 | | | | (.26 | ) |
| 9/30/2019 | | | 59.47 | | | | .03 | | | | (1.68 | ) | | | (1.65 | ) | | | — | | | | (3.31 | ) | | | (3.31 | ) | | | 54.51 | | | | (1.43 | ) | | | 703 | | | | 1.10 | | | | 1.10 | | | | .05 | |
| 9/30/2018 | | | 55.00 | | | | — | 7 | | | 6.97 | | | | 6.97 | | | | — | | | | (2.50 | ) | | | (2.50 | ) | | | 59.47 | | | | 13.06 | | | | 770 | | | | 1.09 | | | | 1.09 | | | | .01 | |
| Class F-2: | | | | | | | | | | | | | | | | | | | | | | | | | | | | | | | | | | | | | | | | | | | | | | | | |
| 9/30/2022 | | | 90.40 | | | | .14 | | | | (29.59 | ) | | | (29.45 | ) | | | — | | | | (7.40 | ) | | | (7.40 | ) | | | 53.55 | | | | (35.23 | ) | | | 7,311 | | | | .76 | | | | .76 | | | | .20 | |
| 9/30/2021 | | | 67.69 | | | | (.15 | ) | | | 24.13 | | | | 23.98 | | | | — | | | | (1.27 | ) | | | (1.27 | ) | | | 90.40 | | | | 35.69 | | | | 10,659 | | | | .76 | | | | .76 | | | | (.18 | ) |
| 9/30/2020 | | | 56.26 | | | | .01 | | | | 13.91 | | | | 13.92 | | | | — | | | | (2.49 | ) | | | (2.49 | ) | | | 67.69 | | | | 25.32 | | | | 6,608 | | | | .79 | | | | .79 | | | | .02 | |
| 9/30/2019 | | | 61.07 | | | | .20 | | | | (1.70 | ) | | | (1.50 | ) | | | — | | | | (3.31 | ) | | | (3.31 | ) | | | 56.26 | | | | (1.12 | ) | | | 4,909 | | | | .80 | | | | .80 | | | | .36 | |
| 9/30/2018 | | | 56.24 | | | | .20 | | | | 7.13 | | | | 7.33 | | | | — | | | | (2.50 | ) | | | (2.50 | ) | | | 61.07 | | | | 13.41 | | | | 4,459 | | | | .78 | | | | .78 | | | | .34 | |
| Class F-3: | | | | | | | | | | | | | | | | | | | | | | | | | | | | | | | | | | | | | | | | | | | | | | | | |
| 9/30/2022 | | | 89.80 | | | | .22 | | | | (29.40 | ) | | | (29.18 | ) | | | — | | | | (7.40 | ) | | | (7.40 | ) | | | 53.22 | | | | (35.14 | ) | | | 3,904 | | | | .65 | | | | .65 | | | | .32 | |
| 9/30/2021 | | | 67.18 | | | | (.07 | ) | | | 23.96 | | | | 23.89 | | | | — | | | | (1.27 | ) | | | (1.27 | ) | | | 89.80 | | | | 35.83 | | | | 5,382 | | | | .66 | | | | .66 | | | | (.08 | ) |
| 9/30/2020 | | | 55.80 | | | | .07 | | | | 13.80 | | | | 13.87 | | | | — | | | | (2.49 | ) | | | (2.49 | ) | | | 67.18 | | | | 25.44 | | | | 3,065 | | | | .68 | | | | .68 | | | | .12 | |
| 9/30/2019 | | | 60.54 | | | | .25 | | | | (1.68 | ) | | | (1.43 | ) | | | — | | | | (3.31 | ) | | | (3.31 | ) | | | 55.80 | | | | (1.02 | ) | | | 2,153 | | | | .70 | | | | .70 | | | | .46 | |
| 9/30/2018 | | | 55.74 | | | | .24 | | | | 7.06 | | | | 7.30 | | | | — | | | | (2.50 | ) | | | (2.50 | ) | | | 60.54 | | | | 13.49 | | | | 1,856 | | | | .71 | | | | .71 | | | | .41 | |
| Class 529-A: | | | | | | | | | | | | | | | | | | | | | | | | | | | | | | | | | | | | | | | | | | | | | | | | |
| 9/30/2022 | | | 86.91 | | | | (.05 | ) | | | (28.32 | ) | | | (28.37 | ) | | | — | | | | (7.40 | ) | | | (7.40 | ) | | | 51.14 | | | | (35.40 | ) | | | 1,378 | | | | 1.04 | | | | 1.04 | | | | (.08 | ) |
| 9/30/2021 | | | 65.29 | | | | (.38 | ) | | | 23.27 | | | | 22.89 | | | | — | | | | (1.27 | ) | | | (1.27 | ) | | | 86.91 | | | | 35.31 | | | | 2,227 | | | | 1.04 | | | | 1.04 | | | | (.47 | ) |
| 9/30/2020 | | | 54.51 | | | | (.16 | ) | | | 13.43 | | | | 13.27 | | | | — | | | | (2.49 | ) | | | (2.49 | ) | | | 65.29 | | | | 24.95 | | | | 1,662 | | | | 1.09 | | | | 1.09 | | | | (.28 | ) |
| 9/30/2019 | | | 59.47 | | | | .02 | | | | (1.67 | ) | | | (1.65 | ) | | | — | | | | (3.31 | ) | | | (3.31 | ) | | | 54.51 | | | | (1.43 | ) | | | 1,337 | | | | 1.12 | | | | 1.12 | | | | .03 | |
| 9/30/2018 | | | 55.01 | | | | — | 7 | | | 6.96 | | | | 6.96 | | | | — | | | | (2.50 | ) | | | (2.50 | ) | | | 59.47 | | | | 13.05 | | | | 1,430 | | | | 1.11 | | | | 1.11 | | | | — | 8 |
Refer to the end of the table for footnotes.
Financial highlights (continued)
| | | | | | (Loss) income from
investment operations1 | | | Dividends and distributions | | | | | | | | | | | | | | | | | | | |
| Year ended | | Net asset
value,
beginning
of year | | | Net
investment
(loss)
income | | | Net (losses)
gains on
securities
(both
realized and
unrealized) | | | Total from
investment
operations | | | Dividends
(from net
investment
income) | | | Distributions
(from capital
gains) | | | Total
dividends
and
distributions | | | Net asset
value,
end
of year | | | Total return2,3 | | | Net assets,
end of
year
(in millions) | | | Ratio of
expenses
to average net
assets before
reimbursement4 | | | Ratio of
expenses
to average net
assets after
reimbursement3,4 | | | Ratio of
net (loss)
income
to average
net assets3 | |
| Class 529-C: | | | | | | | | | | | | | | | | | | | | | | | | | | | | | | | | | | | | | | | | | | | | | | | | |
| 9/30/2022 | | $ | 75.34 | | | $ | (.51 | ) | | $ | (24.10 | ) | | $ | (24.61 | ) | | $ | — | | | $ | (7.40 | ) | | $ | (7.40 | ) | | $ | 43.33 | | | | (35.90 | )% | | $ | 44 | | | | 1.81 | % | | | 1.81 | % | | | (.87 | )% |
| 9/30/2021 | | | 57.17 | | | | (.86 | ) | | | 20.30 | | | | 19.44 | | | | — | | | | (1.27 | ) | | | (1.27 | ) | | | 75.34 | | | | 34.30 | | | | 89 | | | | 1.79 | | | | 1.79 | | | | (1.22 | ) |
| 9/30/2020 | | | 48.35 | | | | (.49 | ) | | | 11.80 | | | | 11.31 | | | | — | | | | (2.49 | ) | | | (2.49 | ) | | | 57.17 | | | | 24.02 | | | | 86 | | | | 1.84 | | | | 1.84 | | | | (.99 | ) |
| 9/30/2019 | | | 53.60 | | | | (.34 | ) | | | (1.60 | ) | | | (1.94 | ) | | | — | | | | (3.31 | ) | | | (3.31 | ) | | | 48.35 | | | | (2.17 | ) | | | 185 | | | | 1.86 | | | | 1.86 | | | | (.72 | ) |
| 9/30/2018 | | | 50.18 | | | | (.42 | ) | | | 6.34 | | | | 5.92 | | | | — | | | | (2.50 | ) | | | (2.50 | ) | | | 53.60 | | | | 12.19 | | | | 230 | | | | 1.88 | | | | 1.88 | | | | (.81 | ) |
| Class 529-E: | | | | | | | | | | | | | | | | | | | | | | | | | | | | | | | | | | | | | | | | | | | | | | | | |
| 9/30/2022 | | | 83.48 | | | | (.19 | ) | | | (27.06 | ) | | | (27.25 | ) | | | — | | | | (7.40 | ) | | | (7.40 | ) | | | 48.83 | | | | (35.53 | ) | | | 48 | | | | 1.25 | | | | 1.25 | | | | (.29 | ) |
| 9/30/2021 | | | 62.89 | | | | (.53 | ) | | | 22.39 | | | | 21.86 | | | | — | | | | (1.27 | ) | | | (1.27 | ) | | | 83.48 | | | | 35.04 | | | | 81 | | | | 1.26 | | | | 1.26 | | | | (.68 | ) |
| 9/30/2020 | | | 52.68 | | | | (.26 | ) | | | 12.96 | | | | 12.70 | | | | — | | | | (2.49 | ) | | | (2.49 | ) | | | 62.89 | | | | 24.70 | | | | 62 | | | | 1.28 | | | | 1.28 | | | | (.47 | ) |
| 9/30/2019 | | | 57.73 | | | | (.09 | ) | | | (1.65 | ) | | | (1.74 | ) | | | — | | | | (3.31 | ) | | | (3.31 | ) | | | 52.68 | | | | (1.64 | ) | | | 58 | | | | 1.31 | | | | 1.31 | | | | (.17 | ) |
| 9/30/2018 | | | 53.57 | | | | (.12 | ) | | | 6.78 | | | | 6.66 | | | | — | | | | (2.50 | ) | | | (2.50 | ) | | | 57.73 | | | | 12.82 | | | | 64 | | | | 1.32 | | | | 1.32 | | | | (.22 | ) |
| Class 529-T: | | | | | | | | | | | | | | | | | | | | | | | | | | | | | | | | | | | | | | | | | | | | | | | | |
| 9/30/2022 | | | 88.95 | | | | .10 | | | | (29.06 | ) | | | (28.96 | ) | | | — | | | | (7.40 | ) | | | (7.40 | ) | | | 52.59 | | | | (35.24 | )5 | | | — | 6 | | | .81 | 5 | | | .81 | 5 | | | .15 | 5 |
| 9/30/2021 | | | 66.67 | | | | (.22 | ) | | | 23.77 | | | | 23.55 | | | | — | | | | (1.27 | ) | | | (1.27 | ) | | | 88.95 | | | | 35.60 | 5 | | | — | 6 | | | .84 | 5 | | | .84 | 5 | | | (.26 | )5 |
| 9/30/2020 | | | 55.49 | | | | (.03 | ) | | | 13.70 | | | | 13.67 | | | | — | | | | (2.49 | ) | | | (2.49 | ) | | | 66.67 | | | | 25.21 | 5 | | | — | 6 | | | .85 | 5 | | | .85 | 5 | | | (.05 | )5 |
| 9/30/2019 | | | 60.32 | | | | .15 | | | | (1.67 | ) | | | (1.52 | ) | | | — | | | | (3.31 | ) | | | (3.31 | ) | | | 55.49 | | | | (1.17 | )5 | | | — | 6 | | | .87 | 5 | | | .87 | 5 | | | .28 | 5 |
| 9/30/2018 | | | 55.63 | | | | .13 | | | | 7.06 | | | | 7.19 | | | | — | | | | (2.50 | ) | | | (2.50 | ) | | | 60.32 | | | | 13.30 | 5 | | | — | 6 | | | .88 | 5 | | | .88 | 5 | | | .22 | 5 |
| Class 529-F-1: | | | | | | | | | | | | | | | | | | | | | | | | | | | | | | | | | | | | | | | | | | | | | | | | |
| 9/30/2022 | | | 88.82 | | | | .06 | | | | (29.00 | ) | | | (28.94 | ) | | | — | | | | (7.40 | ) | | | (7.40 | ) | | | 52.48 | | | | (35.28 | )5 | | | — | 6 | | | .87 | 5 | | | .87 | 5 | | | .09 | 5 |
| 9/30/2021 | | | 66.57 | | | | (.29 | ) | | | 23.81 | | | | 23.52 | | | | — | | | | (1.27 | ) | | | (1.27 | ) | | | 88.82 | | | | 35.60 | 5 | | | — | 6 | | | .80 | 5 | | | .80 | 5 | | | (.42 | )5 |
| 9/30/2020 | | | 55.41 | | | | (.03 | ) | | | 13.68 | | | | 13.65 | | | | — | | | | (2.49 | ) | | | (2.49 | ) | | | 66.57 | | | | 25.21 | | | | 181 | | | | .86 | | | | .86 | | | | (.05 | ) |
| 9/30/2019 | | | 60.26 | | | | .15 | | | | (1.69 | ) | | | (1.54 | ) | | | — | | | | (3.31 | ) | | | (3.31 | ) | | | 55.41 | | | | (1.22 | ) | | | 146 | | | | .88 | | | | .88 | | | | .27 | |
| 9/30/2018 | | | 55.58 | | | | .13 | | | | 7.05 | | | | 7.18 | | | | — | | | | (2.50 | ) | | | (2.50 | ) | | | 60.26 | | | | 13.31 | | | | 136 | | | | .89 | | | | .89 | | | | .22 | |
| |
| Class 529-F-2: | | | | | | | | | | | | | | | | | | | | | | | | | | | | | | | | | | | | | | | | | | | | | | | | |
| 9/30/2022 | | | 88.37 | | | | .14 | | | | (28.87 | ) | | | (28.73 | ) | | | — | | | | (7.40 | ) | | | (7.40 | ) | | | 52.24 | | | | (35.22 | ) | | | 190 | | | | .76 | | | | .76 | | | | .21 | |
| 9/30/20219,10 | | | 65.50 | | | | (.16 | ) | | | 24.30 | | | | 24.14 | | | | — | | | | (1.27 | ) | | | (1.27 | ) | | | 88.37 | | | | 37.11 | 11 | | | 274 | | | | .80 | 12 | | | .80 | 12 | | | (.21 | )12 |
| Class 529-F-3: | | | | | | | | | | | | | | | | | | | | | | | | | | | | | | | | | | | | | | | | | | | | | | | | |
| 9/30/2022 | | | 88.45 | | | | .17 | | | | (28.90 | ) | | | (28.73 | ) | | | — | | | | (7.40 | ) | | | (7.40 | ) | | | 52.32 | | | | (35.19 | ) | | | — | 6 | | | .71 | | | | .71 | | | | .25 | |
| 9/30/20219,10 | | | 65.50 | | | | (.09 | ) | | | 24.31 | | | | 24.22 | | | | — | | | | (1.27 | ) | | | (1.27 | ) | | | 88.45 | | | | 37.23 | 11 | | | — | 6 | | | .76 | 12 | | | .71 | 12 | | | (.12 | )12 |
| Class R-1: | | | | | | | | | | | | | | | | | | | | | | | | | | | | | | | | | | | | | | | | | | | | | | | | |
| 9/30/2022 | | | 76.62 | | | | (.45 | ) | | | (24.59 | ) | | | (25.04 | ) | | | — | | | | (7.40 | ) | | | (7.40 | ) | | | 44.18 | | | | (35.86 | ) | | | 24 | | | | 1.74 | | | | 1.74 | | | | (.77 | ) |
| 9/30/2021 | | | 58.09 | | | | (.85 | ) | | | 20.65 | | | | 19.80 | | | | — | | | | (1.27 | ) | | | (1.27 | ) | | | 76.62 | | | | 34.35 | | | | 36 | | | | 1.75 | | | | 1.75 | | | | (1.18 | ) |
| 9/30/2020 | | | 49.08 | | | | (.50 | ) | | | 12.00 | | | | 11.50 | | | | — | | | | (2.49 | ) | | | (2.49 | ) | | | 58.09 | | | | 24.07 | | | | 28 | | | | 1.79 | | | | 1.79 | | | | (.98 | ) |
| 9/30/2019 | | | 54.32 | | | | (.33 | ) | | | (1.60 | ) | | | (1.93 | ) | | | — | | | | (3.31 | ) | | | (3.31 | ) | | | 49.08 | | | | (2.12 | ) | | | 24 | | | | 1.82 | | | | 1.82 | | | | (.68 | ) |
| 9/30/2018 | | | 50.79 | | | | (.38 | ) | | | 6.41 | | | | 6.03 | | | | — | | | | (2.50 | ) | | | (2.50 | ) | | | 54.32 | | | | 12.26 | | | | 30 | | | | 1.81 | | | | 1.81 | | | | (.72 | ) |
Refer to the end of the table for footnotes.
Financial highlights (continued)
| | | | | | (Loss) income from
investment operations1 | | | Dividends and distributions | | | | | | | | | | | | | | | | | | | |
| Year ended | | Net asset
value,
beginning
of year | | | Net
investment
(loss)
income | | | Net (losses)
gains on
securities
(both
realized and
unrealized) | | | Total from
investment
operations | | | Dividends
(from net
investment
income) | | | Distributions
(from capital
gains) | | | Total
dividends
and
distributions | | | Net asset
value,
end
of year | | | Total return2,3 | | | Net assets,
end of
year
(in millions) | | | Ratio of
expenses
to average net
assets before
reimbursement4 | | | Ratio of
expenses
to average net
assets after
reimbursement3,4 | | | Ratio of
net (loss)
income
to average
net assets3 | |
| Class R-2: | | | | | | | | | | | | | | | | | | | | | | | | | | | | | | | | | | | | | | | | | | | | | | | | |
| 9/30/2022 | | $ | 76.71 | | | $ | (.48 | ) | | $ | (24.60 | ) | | $ | (25.08 | ) | | $ | — | | | $ | (7.40 | ) | | $ | (7.40 | ) | | $ | 44.23 | | | | (35.87 | )% | | $ | 412 | | | | 1.76 | % | | | 1.76 | % | | | (.81 | )% |
| 9/30/2021 | | | 58.16 | | | | (.85 | ) | | | 20.67 | | | | 19.82 | | | | — | | | | (1.27 | ) | | | (1.27 | ) | | | 76.71 | | | | 34.37 | | | | 719 | | | | 1.75 | | | | 1.75 | | | | (1.17 | ) |
| 9/30/2020 | | | 49.12 | | | | (.49 | ) | | | 12.02 | | | | 11.53 | | | | — | | | | (2.49 | ) | | | (2.49 | ) | | | 58.16 | | | | 24.09 | | | | 588 | | | | 1.78 | | | | 1.78 | | | | (.97 | ) |
| 9/30/2019 | | | 54.36 | | | | (.31 | ) | | | (1.62 | ) | | | (1.93 | ) | | | — | | | | (3.31 | ) | | | (3.31 | ) | | | 49.12 | | | | (2.12 | ) | | | 542 | | | | 1.79 | | | | 1.79 | | | | (.65 | ) |
| 9/30/2018 | | | 50.82 | | | | (.37 | ) | | | 6.41 | | | | 6.04 | | | | — | | | | (2.50 | ) | | | (2.50 | ) | | | 54.36 | | | | 12.28 | | | | 619 | | | | 1.79 | | | | 1.79 | | | | (.70 | ) |
| Class R-2E: | | | | | | | | | | | | | | | | | | | | | | | | | | | | | | | | | | | | | | | | | | | | | | | | |
| 9/30/2022 | | | 85.92 | | | | (.34 | ) | | | (27.89 | ) | | | (28.23 | ) | | | — | | | | (7.40 | ) | | | (7.40 | ) | | | 50.29 | | | | (35.67 | ) | | | 27 | | | | 1.46 | | | | 1.46 | | | | (.51 | ) |
| 9/30/2021 | | | 64.83 | | | | (.71 | ) | | | 23.07 | | | | 22.36 | | | | — | | | | (1.27 | ) | | | (1.27 | ) | | | 85.92 | | | | 34.76 | | | | 48 | | | | 1.46 | | | | 1.46 | | | | (.88 | ) |
| 9/30/2020 | | | 54.34 | | | | (.38 | ) | | | 13.36 | | | | 12.98 | | | | — | | | | (2.49 | ) | | | (2.49 | ) | | | 64.83 | | | | 24.46 | | | | 35 | | | | 1.48 | | | | 1.48 | | | | (.67 | ) |
| 9/30/2019 | | | 59.52 | | | | (.18 | ) | | | (1.69 | ) | | | (1.87 | ) | | | — | | | | (3.31 | ) | | | (3.31 | ) | | | 54.34 | | | | (1.82 | ) | | | 28 | | | | 1.50 | | | | 1.50 | | | | (.34 | ) |
| 9/30/2018 | | | 55.26 | | | | (.22 | ) | | | 6.98 | | | | 6.76 | | | | — | | | | (2.50 | ) | | | (2.50 | ) | | | 59.52 | | | | 12.61 | | | | 24 | | | | 1.50 | | | | 1.50 | | | | (.38 | ) |
| Class R-3: | | | | | | | | | | | | | | | | | | | | | | | | | | | | | | | | | | | | | | | | | | | | | | | | |
| 9/30/2022 | | | 83.16 | | | | (.23 | ) | | | (26.94 | ) | | | (27.17 | ) | | | — | | | | (7.40 | ) | | | (7.40 | ) | | | 48.59 | | | | (35.58 | ) | | | 587 | | | | 1.31 | | | | 1.31 | | | | (.35 | ) |
| 9/30/2021 | | | 62.68 | | | | (.57 | ) | | | 22.32 | | | | 21.75 | | | | — | | | | (1.27 | ) | | | (1.27 | ) | | | 83.16 | | | | 34.95 | | | | 978 | | | | 1.31 | | | | 1.31 | | | | (.73 | ) |
| 9/30/2020 | | | 52.54 | | | | (.28 | ) | | | 12.91 | | | | 12.63 | | | | — | | | | (2.49 | ) | | | (2.49 | ) | | | 62.68 | | | | 24.65 | | | | 806 | | | | 1.33 | | | | 1.33 | | | | (.52 | ) |
| 9/30/2019 | | | 57.60 | | | | (.10 | ) | | | (1.65 | ) | | | (1.75 | ) | | | — | | | | (3.31 | ) | | | (3.31 | ) | | | 52.54 | | | | (1.67 | ) | | | 757 | | | | 1.34 | | | | 1.34 | | | | (.20 | ) |
| 9/30/2018 | | | 53.47 | | | | (.14 | ) | | | 6.77 | | | | 6.63 | | | | — | | | | (2.50 | ) | | | (2.50 | ) | | | 57.60 | | | | 12.79 | | | | 852 | | | | 1.35 | | | | 1.35 | | | | (.25 | ) |
| Class R-4: | | | | | | | | | | | | | | | | | | | | | | | | | | | | | | | | | | | | | | | | | | | | | | | | |
| 9/30/2022 | | | 87.46 | | | | (.04 | ) | | | (28.50 | ) | | | (28.54 | ) | | | — | | | | (7.40 | ) | | | (7.40 | ) | | | 51.52 | | | | (35.38 | ) | | | 583 | | | | 1.01 | | | | 1.01 | | | | (.05 | ) |
| 9/30/2021 | | | 65.68 | | | | (.35 | ) | | | 23.40 | | | | 23.05 | | | | — | | | | (1.27 | ) | | | (1.27 | ) | | | 87.46 | | | | 35.37 | | | | 987 | | | | 1.01 | | | | 1.01 | | | | (.43 | ) |
| 9/30/2020 | | | 54.78 | | | | (.12 | ) | | | 13.51 | | | | 13.39 | | | | — | | | | (2.49 | ) | | | (2.49 | ) | | | 65.68 | | | | 25.03 | | | | 835 | | | | 1.02 | | | | 1.02 | | | | (.21 | ) |
| 9/30/2019 | | | 59.71 | | | | .06 | | | | (1.68 | ) | | | (1.62 | ) | | | — | | | | (3.31 | ) | | | (3.31 | ) | | | 54.78 | | | | (1.37 | ) | | | 791 | | | | 1.04 | | | | 1.04 | | | | .11 | |
| 9/30/2018 | | | 55.18 | | | | .03 | | | | 7.00 | | | | 7.03 | | | | — | | | | (2.50 | ) | | | (2.50 | ) | | | 59.71 | | | | 13.13 | | | | 894 | | | | 1.04 | | | | 1.04 | | | | .05 | |
| Class R-5E: | | | | | | | | | | | | | | | | | | | | | | | | | | | | | | | | | | | | | | | | | | | | | | | | |
| 9/30/2022 | | | 88.94 | | | | .11 | | | | (29.07 | ) | | | (28.96 | ) | | | — | | | | (7.40 | ) | | | (7.40 | ) | | | 52.58 | | | | (35.24 | ) | | | 138 | | | | .81 | | | | .81 | | | | .17 | |
| 9/30/2021 | | | 66.64 | | | | (.19 | ) | | | 23.76 | | | | 23.57 | | | | — | | | | (1.27 | ) | | | (1.27 | ) | | | 88.94 | | | | 35.63 | | | | 188 | | | | .80 | | | | .80 | | | | (.22 | ) |
| 9/30/2020 | | | 55.44 | | | | (.01 | ) | | | 13.70 | | | | 13.69 | | | | — | | | | (2.49 | ) | | | (2.49 | ) | | | 66.64 | | | | 25.28 | | | | 84 | | | | .82 | | | | .82 | | | | (.02 | ) |
| 9/30/2019 | | | 60.26 | | | | .18 | | | | (1.69 | ) | | | (1.51 | ) | | | — | | | | (3.31 | ) | | | (3.31 | ) | | | 55.44 | | | | (1.16 | ) | | | 39 | | | | .84 | | | | .84 | | | | .32 | |
| 9/30/2018 | | | 55.55 | | | | .18 | | | | 7.03 | | | | 7.21 | | | | — | | | | (2.50 | ) | | | (2.50 | ) | | | 60.26 | | | | 13.38 | | | | 28 | | | | .84 | | | | .84 | | | | .31 | |
| Class R-5: | | | | | | | | | | | | | | | | | | | | | | | | | | | | | | | | | | | | | | | | | | | | | | | | |
| 9/30/2022 | | | 92.04 | | | | .18 | | | | (30.17 | ) | | | (29.99 | ) | | | — | | | | (7.40 | ) | | | (7.40 | ) | | | 54.65 | | | | (35.18 | ) | | | 288 | | | | .70 | | | | .70 | | | | .25 | |
| 9/30/2021 | | | 68.86 | | | | (.11 | ) | | | 24.56 | | | | 24.45 | | | | — | | | | (1.27 | ) | | | (1.27 | ) | | | 92.04 | | | | 35.77 | | | | 510 | | | | .71 | | | | .71 | | | | (.13 | ) |
| 9/30/2020 | | | 57.16 | | | | .06 | | | | 14.13 | | | | 14.19 | | | | — | | | | (2.49 | ) | | | (2.49 | ) | | | 68.86 | | | | 25.40 | | | | 406 | | | | .72 | | | | .72 | | | | .09 | |
| 9/30/2019 | | | 61.94 | | | | .22 | | | | (1.69 | ) | | | (1.47 | ) | | | — | | | | (3.31 | ) | | | (3.31 | ) | | | 57.16 | | | | (1.06 | ) | | | 376 | | | | .74 | | | | .74 | | | | .40 | |
| 9/30/2018 | | | 56.99 | | | | .21 | | | | 7.24 | | | | 7.45 | | | | — | | | | (2.50 | ) | | | (2.50 | ) | | | 61.94 | | | | 13.46 | | | | 436 | | | | .75 | | | | .75 | | | | .36 | |
| Class R-6: | | | | | | | | | | | | | | | | | | | | | | | | | | | | | | | | | | | | | | | | | | | | | | | | |
| 9/30/2022 | | | 91.12 | | | | .23 | | | | (29.87 | ) | | | (29.64 | ) | | | — | | | | (7.40 | ) | | | (7.40 | ) | | | 54.08 | | | | (35.15 | ) | | | 16,261 | | | | .65 | | | | .65 | | | | .33 | |
| 9/30/2021 | | | 68.15 | | | | (.06 | ) | | | 24.30 | | | | 24.24 | | | | — | | | | (1.27 | ) | | | (1.27 | ) | | | 91.12 | | | | 35.84 | | | | 19,437 | | | | .66 | | | | .66 | | | | (.07 | ) |
| 9/30/2020 | | | 56.56 | | | | .08 | | | | 14.00 | | | | 14.08 | | | | — | | | | (2.49 | ) | | | (2.49 | ) | | | 68.15 | | | | 25.47 | | | | 11,166 | | | | .67 | | | | .67 | | | | .14 | |
| 9/30/2019 | | | 61.31 | | | | .26 | | | | (1.70 | ) | | | (1.44 | ) | | | — | | | | (3.31 | ) | | | (3.31 | ) | | | 56.56 | | | | (1.02 | ) | | | 8,031 | | | | .69 | | | | .69 | | | | .47 | |
| 9/30/2018 | | | 56.40 | | | | .25 | | | | 7.16 | | | | 7.41 | | | | — | | | | (2.50 | ) | | | (2.50 | ) | | | 61.31 | | | | 13.53 | | | | 7,039 | | | | .69 | | | | .69 | | | | .42 | |
Refer to the end of the table for footnotes.
Financial highlights (continued)
| | | Year ended September 30, |
| | | 2022 | | | 2021 | | | 2020 | | | 2019 | | | 2018 | |
| Portfolio turnover rate for all share classes13 | | | 32 | % | | | 30 | % | | | 38 | % | | | 39 | % | | | 35 | % |
| 1 | Based on average shares outstanding. |
| 2 | Total returns exclude any applicable sales charges, including contingent deferred sales charges. |
| 3 | This column reflects the impact, if any, of certain reimbursements from CRMC. During one of the years shown, CRMC reimbursed a portion of transfer agent services fees for Class 529-F-3 shares. |
| 4 | Ratios do not include expenses of any Central Funds. The fund indirectly bears its proportionate share of the expenses of any Central Funds. |
| 5 | All or a significant portion of assets in this class consisted of seed capital invested by CRMC and/or its affiliates. Fees for distribution services are not charged or accrued on these seed capital assets. If such fees were paid by the fund on seed capital assets, fund expenses would have been higher and net income and total return would have been lower. |
| 6 | Amount less than $1 million. |
| 7 | Amount less than $.01. |
| 8 | Amount less than .01%. |
| 9 | Based on operations for a period that is less than a full year. |
| 10 | Class 529-F-2 and 529-F-3 shares began investment operations on October 30, 2020. |
| 11 | Not annualized. |
| 12 | Annualized. |
| 13 | Rates do not include the fund’s portfolio activity with respect to any Central Funds. |
Refer to the notes to financial statements.
Report of Independent Registered Public Accounting Firm
To the Shareholders and Board of Directors of SMALLCAP World Fund, Inc.:
Opinion on the Financial Statements and Financial Highlights
We have audited the accompanying statement of assets and liabilities of SMALLCAP World Fund, Inc. (the “Fund”), including the investment portfolio, as of September 30, 2022, the related statement of operations for the year then ended, the statements of changes in net assets for each of the two years in the period then ended, the financial highlights for each of the five years in the period then ended, and the related notes. In our opinion, the financial statements and financial highlights present fairly, in all material respects, the financial position of the Fund as of September 30, 2022, and the results of its operations for the year then ended, the changes in its net assets for each of the two years in the period then ended, and the financial highlights for each of the five years in the period then ended, in conformity with accounting principles generally accepted in the United States of America.
Basis for Opinion
These financial statements and financial highlights are the responsibility of the Fund’s management. Our responsibility is to express an opinion on the Fund’s financial statements and financial highlights based on our audits. We are a public accounting firm registered with the Public Company Accounting Oversight Board (United States) (PCAOB) and are required to be independent with respect to the Fund in accordance with the U.S. federal securities laws and the applicable rules and regulations of the Securities and Exchange Commission and the PCAOB.
We conducted our audits in accordance with the standards of the PCAOB. Those standards require that we plan and perform the audit to obtain reasonable assurance about whether the financial statements and financial highlights are free of material misstatement, whether due to error or fraud. The Fund is not required to have, nor were we engaged to perform, an audit of its internal control over financial reporting. As part of our audits we are required to obtain an understanding of internal control over financial reporting but not for the purpose of expressing an opinion on the effectiveness of the Fund’s internal control over financial reporting. Accordingly, we express no such opinion.
Our audits included performing procedures to assess the risks of material misstatement of the financial statements and financial highlights, whether due to error or fraud, and performing procedures that respond to those risks. Such procedures included examining, on a test basis, evidence regarding the amounts and disclosures in the financial statements and financial highlights. Our audits also included evaluating the accounting principles used and significant estimates made by management, as well as evaluating the overall presentation of the financial statements and financial highlights. Our procedures included confirmation of securities owned as of September 30, 2022, by correspondence with the custodian and brokers; when replies were not received from brokers, we performed other auditing procedures. We believe that our audits provide a reasonable basis for our opinion.
Deloitte & Touche LLP
Costa Mesa, California
November 8, 2022
We have served as the auditor of one or more American Funds investment companies since 1956.
As a fund shareholder, you incur two types of costs: (1) transaction costs, such as initial sales charges on purchase payments and contingent deferred sales charges on redemptions (loads), and (2) ongoing costs, including management fees, distribution and service (12b-1) fees, and other expenses. This example is intended to help you understand your ongoing costs (in dollars) of investing in the fund so you can compare these costs with the ongoing costs of investing in other mutual funds. The example is based on an investment of $1,000 invested at the beginning of the period and held for the entire six-month period (April 1, 2022, through September 30, 2022).
Actual expenses:
The first line of each share class in the table on the following page provides information about actual account values and actual expenses. You may use the information in this line, together with the amount you invested, to estimate the expenses that you paid over the period. Simply divide your account value by $1,000 (for example, an $8,600 account value divided by $1,000 = 8.6), then multiply the result by the number in the first line under the heading titled “Expenses paid during period” to estimate the expenses you paid on your account during this period.
Hypothetical example for comparison purposes:
The second line of each share class in the table on the following page provides information about hypothetical account values and hypothetical expenses based on the actual expense ratio for the share class and an assumed rate of return of 5.00% per year before expenses, which is not the actual return of the share class. The hypothetical account values and expenses may not be used to estimate the actual ending account balance or expenses you paid for the period. You may use this information to compare the ongoing costs of investing in the fund and other funds. To do so, compare this 5.00% hypothetical example with the 5.00% hypothetical examples that appear in the shareholder reports of the other funds.
Notes:
Retirement plan participants may be subject to certain fees charged by the plan sponsor, and Class F-1, F-2, F-3, 529-F-1, 529-F-2 and 529-F-3 shareholders may be subject to fees charged by financial intermediaries, typically ranging from 0.75% to 1.50% of assets annually depending on services offered. You can estimate the impact of these fees by adding the amount of the fees to the total estimated expenses you paid on your account during the period as calculated above. In addition, your ending account value would be lower by the amount of these fees.
Note that the expenses shown in the table on the following page are meant to highlight your ongoing costs only and do not reflect any transactional costs, such as sales charges (loads). Therefore, the second line of each share class in the table is useful in comparing ongoing costs only and will not help you determine the relative total costs of owning different funds. In addition, if these transactional costs were included, your costs would have been higher.
Expense example (continued)
| | | Beginning
account value
4/1/2022 | | | Ending
account value
9/30/2022 | | | Expenses paid
during period* | | | Annualized
expense ratio | |
| Class A – actual return | | $ | 1,000.00 | | | $ | 769.30 | | | $ | 4.61 | | | | 1.04 | % |
| Class A – assumed 5% return | | | 1,000.00 | | | | 1,019.85 | | | | 5.27 | | | | 1.04 | |
| Class C – actual return | | | 1,000.00 | | | | 766.46 | | | | 7.88 | | | | 1.78 | |
| Class C – assumed 5% return | | | 1,000.00 | | | | 1,016.14 | | | | 9.00 | | | | 1.78 | |
| Class T – actual return | | | 1,000.00 | | | | 770.37 | | | | 3.42 | | | | .77 | |
| Class T – assumed 5% return | | | 1,000.00 | | | | 1,021.21 | | | | 3.90 | | | | .77 | |
| Class F-1 – actual return | | | 1,000.00 | | | | 769.30 | | | | 4.70 | | | | 1.06 | |
| Class F-1 – assumed 5% return | | | 1,000.00 | | | | 1,019.75 | | | | 5.37 | | | | 1.06 | |
| Class F-2 – actual return | | | 1,000.00 | | | | 770.26 | | | | 3.42 | | | | .77 | |
| Class F-2 – assumed 5% return | | | 1,000.00 | | | | 1,021.21 | | | | 3.90 | | | | .77 | |
| Class F-3 – actual return | | | 1,000.00 | | | | 770.77 | | | | 2.93 | | | | .66 | |
| Class F-3 – assumed 5% return | | | 1,000.00 | | | | 1,021.76 | | | | 3.35 | | | | .66 | |
| Class 529-A – actual return | | | 1,000.00 | | | | 769.19 | | | | 4.70 | | | | 1.06 | |
| Class 529-A – assumed 5% return | | | 1,000.00 | | | | 1,019.75 | | | | 5.37 | | | | 1.06 | |
| Class 529-C – actual return | | | 1,000.00 | | | | 766.20 | | | | 8.15 | | | | 1.84 | |
| Class 529-C – assumed 5% return | | | 1,000.00 | | | | 1,015.84 | | | | 9.30 | | | | 1.84 | |
| Class 529-E – actual return | | | 1,000.00 | | | | 768.49 | | | | 5.59 | | | | 1.26 | |
| Class 529-E – assumed 5% return | | | 1,000.00 | | | | 1,018.75 | | | | 6.38 | | | | 1.26 | |
| Class 529-T – actual return | | | 1,000.00 | | | | 770.22 | | | | 3.64 | | | | .82 | |
| Class 529-T – assumed 5% return | | | 1,000.00 | | | | 1,020.96 | | | | 4.15 | | | | .82 | |
| Class 529-F-1 – actual return | | | 1,000.00 | | | | 769.93 | | | | 3.90 | | | | .88 | |
| Class 529-F-1 – assumed 5% return | | | 1,000.00 | | | | 1,020.66 | | | | 4.46 | | | | .88 | |
| Class 529-F-2 – actual return | | | 1,000.00 | | | | 770.28 | | | | 3.42 | | | | .77 | |
| Class 529-F-2 – assumed 5% return | | | 1,000.00 | | | | 1,021.21 | | | | 3.90 | | | | .77 | |
| Class 529-F-3 – actual return | | | 1,000.00 | | | | 770.57 | | | | 3.20 | | | | .72 | |
| Class 529-F-3 – assumed 5% return | | | 1,000.00 | | | | 1,021.46 | | | | 3.65 | | | | .72 | |
| Class R-1 – actual return | | | 1,000.00 | | | | 766.61 | | | | 7.66 | | | | 1.73 | |
| Class R-1 – assumed 5% return | | | 1,000.00 | | | | 1,016.39 | | | | 8.74 | | | | 1.73 | |
| Class R-2 – actual return | | | 1,000.00 | | | | 766.55 | | | | 7.75 | | | | 1.75 | |
| Class R-2 – assumed 5% return | | | 1,000.00 | | | | 1,016.29 | | | | 8.85 | | | | 1.75 | |
| Class R-2E – actual return | | | 1,000.00 | | | | 767.68 | | | | 6.47 | | | | 1.46 | |
| Class R-2E – assumed 5% return | | | 1,000.00 | | | | 1,017.75 | | | | 7.38 | | | | 1.46 | |
| Class R-3 – actual return | | | 1,000.00 | | | | 768.21 | | | | 5.81 | | | | 1.31 | |
| Class R-3 – assumed 5% return | | | 1,000.00 | | | | 1,018.50 | | | | 6.63 | | | | 1.31 | |
| Class R-4 – actual return | | | 1,000.00 | | | | 769.40 | | | | 4.48 | | | | 1.01 | |
| Class R-4 – assumed 5% return | | | 1,000.00 | | | | 1,020.00 | | | | 5.11 | | | | 1.01 | |
| Class R-5E – actual return | | | 1,000.00 | | | | 770.23 | | | | 3.59 | | | | .81 | |
| Class R-5E – assumed 5% return | | | 1,000.00 | | | | 1,021.01 | | | | 4.10 | | | | .81 | |
| Class R-5 – actual return | | | 1,000.00 | | | | 770.57 | | | | 3.15 | | | | .71 | |
| Class R-5 – assumed 5% return | | | 1,000.00 | | | | 1,021.51 | | | | 3.60 | | | | .71 | |
| Class R-6 – actual return | | | 1,000.00 | | | | 770.69 | | | | 2.93 | | | | .66 | |
| Class R-6 – assumed 5% return | | | 1,000.00 | | | | 1,021.76 | | | | 3.35 | | | | .66 | |
| * | The “expenses paid during period” are equal to the “annualized expense ratio,” multiplied by the average account value over the period, multiplied by the number of days in the period, and divided by 365 (to reflect the one-half year period). |
We are required to advise you of the federal tax status of certain distributions received by shareholders during the fiscal year. The fund hereby designates the following amounts for the fund’s fiscal year ended September 30, 2022:
| Long-term capital gains | | $6,882,666,000 |
| Foreign taxes | | $0.09 per share |
| Foreign source income | | $0.42 per share |
Individual shareholders should refer to their Form 1099 or other tax information, which will be mailed in January 2023, to determine the calendar year amounts to be included on their 2022 tax returns. Shareholders should consult their tax advisors.
Approval of Investment Advisory and Service Agreement
The fund’s board has approved the continuation of the fund’s Investment Advisory and Service Agreement (the “agreement”) with Capital Research and Management Company (“CRMC”) for an additional one-year term through November 30, 2023. The agreement was amended to add an additional advisory fee breakpoint for when the fund’s net assets exceed $89 billion. The board approved the agreement following the recommendation of the fund’s Contracts Committee (the “committee”), which is composed of all the fund’s independent board members. The board and the committee determined in the exercise of their business judgment that the fund’s advisory fee structure was fair and reasonable in relation to the services provided, and that approving the agreement was in the best interests of the fund and its shareholders.
In reaching this decision, the board and the committee took into account their interactions with CRMC as well as information furnished to them throughout the year and otherwise provided to them, as well as information prepared specifically in connection with their review of the agreement, and were advised by their independent counsel with respect to the matters considered. They considered the following factors, among others, but did not identify any single issue or particular piece of information that, in isolation, was the controlling factor, and each board and committee member did not necessarily attribute the same weight to each factor.
1. Nature, extent and quality of services
The board and the committee considered the depth and quality of CRMC’s investment management process, including its global research capabilities; the experience, capability and integrity of its senior management and other personnel; the low turnover rates of its key personnel; the overall financial strength and stability of CRMC and the Capital Group organization; the resources and systems CRMC devotes to investment management (the manner in which the fund’s assets are managed, including liquidity management), financial, investment operations, compliance, trading, proxy voting, shareholder communications, and other services; and the ongoing evolution of CRMC’s organizational structure designed to maintain and strengthen these qualities. The board and the committee also considered the nature, extent and quality of administrative and shareholder services provided by CRMC to the fund under the agreement and other agreements, as well as the benefits to fund shareholders from investing in a fund that is part of a large family of funds. The board and the committee considered the risks assumed by CRMC in providing services to the fund, including operational, business, financial, reputational, regulatory and litigation risks. The board and the committee concluded that the nature, extent and quality of the services provided by CRMC have benefited and should continue to benefit the fund and its shareholders.
2. Investment results
The board and the committee considered the investment results of the fund in light of its objective. They compared the fund’s investment results with those of other funds (including funds that currently form the basis of the Lipper index for the category in which the fund is included) and data such as relevant market and fund indexes over various periods (including the fund’s lifetime) through March 31, 2022. They generally placed greater emphasis on investment results over longer term periods. On the basis of this evaluation and the board’s and the committee’s ongoing review of investment results, and considering the relative market conditions during certain reporting periods, the board and the committee concluded that the fund’s investment results have been satisfactory for renewal of the agreement, and that CRMC’s record in managing the fund indicated that its continued management should benefit the fund and its shareholders.
3. Advisory fees and total expenses
The board and the committee compared the advisory fees and total expense levels of the fund to those of other relevant funds. They observed that the fund’s advisory fees and expenses generally compared favorably to those of other similar funds included in the comparable Lipper category. The board and the committee also considered the breakpoint discounts in the fund’s advisory fee structure that reduce the level of fees charged by CRMC to the fund as fund assets increase. In addition, they reviewed information regarding the effective advisory fees charged to non-mutual fund clients by CRMC and its affiliates. They noted that, to the extent there were differences between the advisory fees paid by the fund and the advisory fees paid by those clients, the differences appropriately reflected the investment, operational, regulatory and market differences between advising the fund and the other clients. The board and the committee concluded that the fund’s cost structure was fair and reasonable in relation to the services provided, as well as in relation to the risks assumed by the adviser in sponsoring and managing the fund, and that the fund’s shareholders receive reasonable value in return for the advisory fees and other amounts paid to CRMC by the fund.
4. Ancillary benefits
The board and the committee considered a variety of other benefits that CRMC and its affiliates receive as a result of CRMC’s relationship with the fund and other American Funds, including fees for administrative services provided to certain share classes; fees paid to CRMC’s affiliated transfer agent; sales charges and distribution fees received and retained by the fund’s principal underwriter, an affiliate of CRMC; and possible ancillary benefits to CRMC and its institutional management affiliates in managing other investment vehicles. The board and the committee reviewed CRMC’s portfolio trading practices, noting that CRMC bears the cost of third-party research. The board and committee also noted that CRMC benefitted from the use of commissions from portfolio transactions made on behalf of the fund to facilitate payment to certain broker-dealers for research to comply with regulatory requirements applicable to these firms, with all such amounts reimbursed by CRMC. The board and the committee took these ancillary benefits into account in evaluating the reasonableness of the advisory fees and other amounts paid to CRMC by the fund.
5. Adviser financial information
The board and the committee reviewed information regarding CRMC’s costs of providing services to the American Funds, including personnel, systems and resources of investment, compliance, trading, accounting and other administrative operations. They considered CRMC’s costs and related cost allocation methodology as well as its track record of investing in technology, infrastructure and staff to maintain and expand services and capabilities, respond to industry and regulatory developments, and attract and retain qualified personnel. They noted information regarding the compensation structure for CRMC’s investment professionals. They reviewed information on the profitability of the investment adviser and its affiliates. The board and the committee also compared CRMC’s profitability and compensation data to the reported results and data of a number of large, publicly held investment management companies. The board and the committee noted the competitiveness and cyclicality of both the mutual fund industry and the capital markets, and the importance in that environment of CRMC’s long-term profitability for maintaining its independence, company culture and management continuity. They further considered the breakpoint discounts in the fund’s advisory fee structure and CRMC’s sharing of potential economies of scale, or efficiencies, through breakpoints and other fee reductions and costs voluntarily absorbed. The board and the committee concluded that the fund’s advisory fee structure reflected a reasonable sharing of benefits between CRMC and the fund’s shareholders.
Board of directors and other officers
Independent directors1
| Name and year of birth | | Year first
elected
a director
of the fund2 | | Principal occupation(s) during past five years | | Number of
portfolios in fund
complex overseen
by director3 | | Other directorships4
held by director |
| Joseph J. Bonner, 1955 | | 2019 | | President and CEO, Solana Beach Capital LLC (real estate advisory); Global Head of Real Estate, Board Member, The Interlink Group (private merchant bank) | | 3 | | Extra Space Storage |
| Mary Anne Dolan, 1947 | | 2008 | | Founder and President, MAD Ink (communications company); former Editor-in-Chief, The Los Angeles Herald Examiner (retired 1989) | | 10 | | None |
John G. Freund, MD, 1953
Chair of the Board | | 2000 | | Founder and former Managing Director, Skyline Ventures (a venture capital investor in health care companies);
Co-Founder of Intuitive Surgical, Inc. (1995–2000); Co-Founder and former CEO of Arixa Pharmaceuticals, Inc. (2016–2020) | | 6 | | Collegium Pharmaceutical, Inc.; SI – Bone, Inc.; Sutro Biopharma, Inc. |
| Yvonne L. Greenstreet, 1962 | | 2019 | | Chief Executive Officer, Alnylam Pharmaceuticals, Inc. | | 3 | | Pacira, Inc. (pharmaceuticals) |
| Linda Griego, 1947 | | 2015 | | Former President and CEO, Griego Enterprises, Inc. (business management company) | | 7 | | ViacomCBS Inc. |
| Leonade D. Jones, 1947 | | 1995 | | Retired; former Treasurer, The Washington Post Company (retired 1996) | | 10 | | None |
| Martin E. Koehler, 1957 | | 2021 | | Independent management consultant | | 6 | | None |
| Sharon I. Meers, 1965 | | 2017 | | Co-Founder and COO, Midi Health, Inc. (a women’s telehealth company); former Senior Director, Head of Strategic Partnerships, eBay Enterprise | | 7 | | None |
| Kenneth M. Simril, 1965 | | 2016 | | President and CEO, SCI Ingredients Holdings, Inc. (food manufacturing) | | 7 | | Bunge Limited (agricultural business and food company) |
| Christopher E. Stone, 1956 | | 2007 | | Professor of Practice of Public Integrity, University of Oxford, Blavatnik School of Government; former President, Open Society Foundations | | 9 | | None |
Interested directors5,6
Name, year of birth and
position with fund | | Year first
elected
a director
or officer
of the fund2 | | Principal occupation(s) during past five years
and positions held with affiliated entities or
the principal underwriter of the fund | | Number of
portfolios in fund
complex overseen
by director3 | | Other directorships4
held by director |
Brady L. Enright, 1967
Senior Vice President
and Director | | 2004 | | Partner — Capital World Investors, Capital Research and Management Company; Partner — Capital World Investors, Capital Bank and Trust Company7 | | 3 | | None |
Anne-Marie Peterson, 1972
Director | | 2019 | | Partner — Capital World Investors, Capital Research and Management Company | | 3 | | None |
The fund’s statement of additional information includes further details about fund directors and is available without charge upon request by calling American Funds Service Company at (800) 421-4225 or by visiting the Capital Group website at capitalgroup.com. The address for all directors and officers of the fund is 333 South Hope Street, Los Angeles, CA 90071, Attention: Secretary.
Refer to page 56 for footnotes.
Other officers6
Name, year of birth and
position with fund | | Year first
elected
an officer
of the fund2 | | Principal occupation(s) during past five years and positions held with affiliated entities
or the principal underwriter of the fund |
Julian N. Abdey, 1972
Co-President | | 2014 | | Partner — Capital International Investors, Capital Research and Management Company |
Jonathan Knowles, PhD, 1961
Co-President | | 2000 | | Partner — Capital World Investors, Capital International, Inc.7 |
Gregory W. Wendt, 1961
Co-President | | 1992 | | Partner — Capital Research Global Investors, Capital Research and Management Company |
Walt Burkley, 1966
Principal Executive Officer | | 2007 | | Senior Vice President and Senior Counsel — Fund Business Management Group, Capital Research and Management Company; Director, Capital Research Company7; Director, Capital Research and Management Company |
Michael W. Stockton, 1967
Executive Vice President | | 2014 | | Senior Vice President — Fund Business Management Group, Capital Research and Management Company |
Peter Eliot, 1971
Senior Vice President | | 2018 | | Partner — Capital International Investors, Capital Research and Management Company |
Bradford F. Freer, 1969
Senior Vice President | | 2008 | | Partner — Capital Research Global Investors, Capital Research and Management Company; Director, The Capital Group Companies, Inc.7 |
Leo Hee, 1971
Senior Vice President | | 2019 | | Partner — Capital World Investors, Capital International, Inc.7 |
Roz Hongsaranagon, 1979
Senior Vice President | | 2018 | | Partner — Capital World Investors, Capital Research and Management Company |
Harold H. La, 1970
Senior Vice President | | 2019 | | Partner — Capital Research Global Investors, Capital International, Inc.7 |
Dimitrije M. Mitrinovic, 1977
Senior Vice President | | 2019 | | Partner — Capital World Investors, Capital Research and Management Company |
Aidan O’Connell, 1968
Senior Vice President | | 2017 | | Partner — Capital Research Global Investors, Capital Research and Management Company |
Samir Parekh, 1974
Senior Vice President | | 2020 | | Partner — Capital International Investors, Capital International, Inc.7 |
Andraz Razen, 1975
Senior Vice President | | 2019 | | Partner — Capital World Investors, Capital Research Company7 |
Renaud H. Samyn, 1974
Senior Vice President | | 2020 | | Partner — Capital Research Global Investors, Capital International Inc.7 |
Arun Swaminathan, 1983
Senior Vice President | | 2020 | | Partner — Capital World Investors, Capital Research and Management Company |
Thatcher Thompson, 1969
Senior Vice President | | 2021 | | Partner — Capital World Investors, Capital Research and Management Company |
Michael Beckwith, 1971
Vice President | | 2019 | | Partner — Capital Research Global Investors, Capital Research and Management Company |
Shlok Melwani, 1981
Vice President | | 2021 | | Vice President — Capital Research Global Investors, Capital Research Company7 |
Other officers (continued)6
Name, year of birth and
position with fund | | Year first
elected
an officer
of the fund2 | | Principal occupation(s) during past five years and positions held with affiliated entities
or the principal underwriter of the fund |
Julie E. Lawton, 1973
Secretary | | 2010 | | Assistant Vice President — Fund Business Management Group, Capital Research and Management Company; Secretary, Capital Research Company7 |
Hong T. Le, 1978
Treasurer | | 2018 | | Vice President — Investment Operations, Capital Research and Management Company |
Sandra Chuon, 1972
Assistant Treasurer | | 2019 | | Vice President — Investment Operations, Capital Research and Management Company |
Brian C. Janssen, 1972
Assistant Treasurer | | 2016–2018, 2020 | | Senior Vice President — Investment Operations, Capital Research and Management Company |
| 1 | The term independent director refers to a director who is not an “interested person” of the fund within the meaning of the Investment Company Act of 1940. |
| 2 | Directors and officers of the fund serve until their resignation, removal or retirement. |
| 3 | Funds managed by Capital Research and Management Company or its affiliates. |
| 4 | This includes all directorships/trusteeships (other than those in the American Funds or other funds managed by Capital Research and Management Company or its affiliates) that are held by each trustee as a trustee or director of a public company or a registered investment company. Unless otherwise noted, all directorships/trusteeships are current. |
| 5 | The term interested director refers to a director who is an “interested person” within the meaning of the Investment Company Act of 1940, on the basis of their affiliation with the fund’s investment adviser, Capital Research and Management Company, or affiliated entities (including the fund’s principal underwriter). |
| 6 | All of the directors and/or officers listed, with the exception of Michael Beckwith, Shlok Melwani, Samir Parekh, Arun Swaminathan and Thatcher Thompson are officers and/or directors/trustees of one or more of the other funds for which Capital Research and Management Company serves as investment adviser. |
| 7 | Company affiliated with Capital Research and Management Company. |
This page was intentionally left blank.
This page was intentionally left blank.
This page was intentionally left blank.
Office of the fund
6455 Irvine Center Drive
Irvine, CA 92618-4518
Investment adviser
Capital Research and Management Company
333 South Hope Street
Los Angeles, CA 90071-1406
Transfer agent for shareholder accounts
American Funds Service Company
(Write to the address nearest you.)
P.O. Box 6007
Indianapolis, IN 46206-6007
P.O. Box 2280
Norfolk, VA 23501-2280
Custodian of assets
State Street Bank and Trust Company
One Lincoln Street
Boston, MA 02111-2900
Counsel
Dechert LLP
One Bush Street, Suite 1600
San Francisco, CA 94104-4446
Independent registered public accounting firm
Deloitte & Touche LLP
695 Town Center Drive
Suite 1000
Costa Mesa, CA 92626-7188
Principal underwriter
American Funds Distributors, Inc.
333 South Hope Street
Los Angeles, CA 90071-1406
Investors should carefully consider investment objectives, risks, charges and expenses. This and other important information is contained in the fund prospectus and summary prospectus, which can be obtained from your financial professional and should be read carefully before investing. You may also call American Funds Service Company (AFS) at (800) 421-4225 or visit the Capital Group website at capitalgroup.com.
“American Funds Proxy Voting Procedures and Principles” — which describes how we vote proxies relating to portfolio securities — is available on our website or upon request by calling AFS. The fund files its proxy voting record with the U.S. Securities and Exchange Commission (SEC) for the 12 months ended June 30 by August 31. The proxy voting record is available free of charge on the SEC website at sec.gov and on our website.
SMALLCAP World Fund files a complete list of its portfolio holdings with the SEC for the first and third quarters of each fiscal year on Form NPORT-P. The list of portfolio holdings is available free of charge on the SEC website and on our website.
This report is for the information of shareholders of SMALLCAP World Fund, but it also may be used as sales literature when preceded or accompanied by the current prospectus or summary prospectus, which gives details about charges, expenses, investment objectives and operating policies of the fund. If used as sales material after December 31, 2022, this report must be accompanied by an American Funds statistical update for the most recently completed calendar quarter.
MCSI has not approved, reviewed or produced this report, makes no express or implied warranties or representations and is not liable whatsoever for any data in the report. You may not redistribute the MSCI data or use it as a basis for other indices or investment products.
The S&P 500 Index (“Index”) is a product of S&P Dow Jones Indices LLC and/or its affiliates and has been licensed for use by Capital Group. Copyright © 2022 S&P Dow Jones Indices LLC, a division of S&P Global, and/or its affiliates. All rights reserved. Redistribution or reproduction in whole or in part is prohibited without written permission of S&P Dow Jones Indices LLC.
American Funds Distributors, Inc., member FINRA.
The Capital Advantage®
Since 1931, Capital Group, home of American Funds, has helped investors pursue long-term investment success. Our consistent approach — in combination with The Capital SystemTM — has resulted in superior outcomes.
| | Aligned with investor success |
| | We base our decisions on a long-term perspective, which we believe aligns our goals with the interests of our clients. Our portfolio managers average 27 years of investment industry experience, including 21 years at our company, reflecting a career commitment to our long-term approach.1 |
| | |
| | The Capital System |
| | The Capital System combines individual accountability with teamwork. Funds using The Capital System are divided into portions that are managed independently by investment professionals with diverse backgrounds, ages and investment approaches. An extensive global research effort is the backbone of our system. |
| | |
| | American Funds’ superior outcomes |
| | Equity funds have beaten their Lipper peer indexes in 90% of 10-year periods and 99% of 20-year periods.2 Fixed income funds have helped investors achieve diversification through attention to correlation between bonds and equities.3 Fund management fees have been among the lowest in the industry.4 |
| | 1 | Investment industry experience as of December 31, 2021. |
| | 2 | Based on Class F-2 share results for rolling calendar-year periods starting the first full calendar year after each fund’s inception through December 31, 2021. Periods covered are the shorter of the fund’s lifetime or since the comparable Lipper index inception date (except Capital Income Builder and SMALLCAP World Fund, for which the Lipper average was used). Expenses differ for each share class, so results will vary. |
| | 3 | Based on Class F-2 share results as of December 31, 2021. Thirteen of the 17 fixed income American Funds that have been in existence for the three-year period showed a three-year correlation below 0.3. S&P 500 Index was used as an equity market proxy. Correlation based on monthly total returns. Correlation is a statistical measure of how two securities move in relation to each other. A correlation ranges from –1 to 1. A positive correlation close to 1 implies that as one security moves, either up or down, the other security will move in “lockstep,” in the same direction. A negative correlation close to –1 indicates that the securities have moved in the opposite direction. |
| | 4 | On average, our management fees were in the lowest quintile 63% of the time, based on the 20-year period ended December 31, 2021, versus comparable Lipper categories, excluding funds of funds. |
Class F-2 shares were first offered on August 1, 2008. Class F-2 share results prior to the date of first sale are hypothetical based on the results of the original share class of the fund without a sales charge, adjusted for typical estimated expenses. Results for certain funds with an inception date after August 1, 2008, also include hypothetical returns because those funds’ Class F-2 shares sold after the funds’ date of first offering. Visit capitalgroup.com for more information on specific expense adjustments and the actual dates of first sale.
All Capital Group trademarks mentioned are owned by The Capital Group Companies, Inc., an affiliated company or fund. All other company and product names mentioned are the property of their respective companies.

ITEM 2 – Code of Ethics
The Registrant has adopted a Code of Ethics that applies to its Principal Executive Officer and Principal Financial Officer. The Registrant undertakes to provide to any person without charge, upon request, a copy of the Code of Ethics. Such request can be made by calling 800/421-4225 or to the Secretary of the Registrant, 6455 Irvine Center Drive, Irvine, California 92618.
ITEM 3 – Audit Committee Financial Expert
The Registrant’s board has determined that Linda Griego, a member of the Registrant’s audit committee, is an “audit committee financial expert” and "independent," as such terms are defined in this Item. This designation will not increase the designee’s duties, obligations or liability as compared to his or her duties, obligations and liability as a member of the audit committee and of the board, nor will it reduce the responsibility of the other audit committee members. There may be other individuals who, through education or experience, would qualify as "audit committee financial experts" if the board had designated them as such. Most importantly, the board believes each member of the audit committee contributes significantly to the effective oversight of the Registrant’s financial statements and condition.
ITEM 4 – Principal Accountant Fees and Services
| a) Audit Fees: | | |
| Audit | 2021 | 180,000 |
| | 2022 | 175,000 |
| | | |
| b) Audit-Related Fees: | | |
| | 2021 | 11,000 |
| | 2022 | 12,000 |
| | | |
| c) Tax Fees: | | |
| | 2021 | 36,000 |
| | 2022 | 56,000 |
| | The tax fees consist of professional services relating to the preparation of the Registrant’s tax returns. | |
| | | |
| d) All Other Fees: | | |
| | 2021 | None |
| | 2022 | None |
| | | |
| | Adviser and affiliates (includes only fees for non-audit services billed to the adviser and affiliates for engagements that relate directly to the operations and financial reporting of the Registrant and were subject to the pre-approval policies described below): | |
| a) Audit Fees: | | |
| | Not Applicable | |
| | | |
| b) Audit-Related Fees: | | |
| | 2021 | 1,400,000 |
| | 2022 | 2,114,000 |
| | The audit-related fees consist of assurance and related services relating to the examination of the Registrant’s transfer agent, principal underwriter and investment adviser conducted in accordance with Statement on Standards for Attestation Engagements Number 18 issued by the American Institute of Certified Public Accountants. | |
| | | |
| c) Tax Fees: | | |
| | 2021 | 1,000 |
| | 2022 | 394,000 |
| | The tax fees consist of consulting services relating to the Registrant’s investments. | |
| | | |
| | | |
| d) All Other Fees: | | |
| | 2021 | 2,000 |
| | 2022 | None |
| | The other fees consist of subscription services related to an accounting research tool. | |
| | | |
| | | |
| | All audit and permissible non-audit services that the Registrant’s audit committee considers compatible with maintaining the independent registered public accounting firm’s independence are required to be pre-approved by the committee. The pre-approval requirement will extend to all non-audit services provided to the Registrant, the investment adviser, and any entity controlling, controlled by, or under common control with the investment adviser that provides ongoing services to the Registrant, if the engagement relates directly to the operations and financial reporting of the Registrant. The committee will not delegate its responsibility to pre-approve these services to the investment adviser. The committee may delegate to one or more committee members the authority to review and pre-approve audit and permissible non-audit services. Actions taken under any such delegation will be reported to the full committee at its next meeting. The pre-approval requirement is waived with respect to non-audit services if certain conditions are met. The pre-approval requirement was not waived for any of the non-audit services listed above provided to the Registrant, adviser and affiliates. | |
| | | |
| | Aggregate non-audit fees paid to the Registrant’s auditors, including fees for all services billed to the Registrant, adviser and affiliates that provide ongoing services to the Registrant, were $1,450,000 for fiscal year 2021 and $2,577,000 for fiscal year 2022. The non-audit services represented by these amounts were brought to the attention of the committee and considered to be compatible with maintaining the auditors’ independence. | |
ITEM 5 – Audit Committee of Listed Registrants
Not applicable to this Registrant, insofar as the Registrant is not a listed issuer as defined in Rule 10A-3 under the Securities Exchange Act of 1934.
ITEM 6 – Schedule of Investments
Not applicable, insofar as the schedule is included as part of the report to shareholders filed under Item 1 of this Form.
ITEM 7 – Disclosure of Proxy Voting Policies and Procedures for Closed-End Management Investment Companies
Not applicable to this Registrant, insofar as the Registrant is not a closed-end management investment company.
ITEM 8 – Portfolio Managers of Closed-End Management Investment Companies
Not applicable to this Registrant, insofar as the Registrant is not a closed-end management investment company.
ITEM 9 – Purchases of Equity Securities by Closed-End Management Investment Company and Affiliated Purchasers
Not applicable to this Registrant, insofar as the Registrant is not a closed-end management investment company.
ITEM 10 – Submission of Matters to a Vote of Security Holders
There have been no material changes to the procedures by which shareholders may recommend nominees to the Registrant’s board of directors since the Registrant last submitted a proxy statement to its shareholders. The procedures are as follows. The Registrant has a nominating and governance committee comprised solely of persons who are not considered ‘‘interested persons’’ of the Registrant within the meaning of the Investment Company Act of 1940, as amended. The committee periodically reviews such issues as the board’s composition, responsibilities, committees, compensation and other relevant issues, and recommends any appropriate changes to the full board of directors. While the committee normally is able to identify from its own resources an ample number of qualified candidates, it will consider shareholder suggestions of persons to be considered as nominees to fill future vacancies on the board. Such suggestions must be sent in writing to the nominating and governance committee of the Registrant, c/o the Registrant’s Secretary, and must be accompanied by complete biographical and occupational data on the prospective nominee, along with a written consent of the prospective nominee for consideration of his or her name by the nominating and governance committee.
ITEM 11 – Controls and Procedures
| (a) | The Registrant’s Principal Executive Officer and Principal Financial Officer have concluded, based on their evaluation of the Registrant’s disclosure controls and procedures (as such term is defined in Rule 30a-3 under the Investment Company Act of 1940), that such controls and procedures are adequate and reasonably designed to achieve the purposes described in paragraph (c) of such rule. |
| | |
| (b) | There were no changes in the Registrant’s internal controls over financial reporting (as defined in Rule 30a-3(d) under the Investment Company Act of 1940) that occurred during the Registrant’s semi-annual period covered by this report that has materially affected, or is reasonably likely to materially affect, the Registrant’s internal control over financial reporting. |
ITEM 12 – Exhibits
| (a)(1) | The Code of Ethics that is the subject of the disclosure required by Item 2 is attached as an exhibit hereto. |
| | |
| (a)(2) | The certifications required by Rule 30a-2 of the Investment Company Act of 1940 and Sections 302 and 906 of the Sarbanes-Oxley Act of 2002 are attached as exhibits hereto. |
SIGNATURES
Pursuant to the requirements of the Securities Exchange Act of 1934 and the Investment Company Act of 1940, the Registrant has duly caused this report to be signed on its behalf by the undersigned, thereunto duly authorized.
| | SMALLCAP WORLD FUND, INC. |
| | |
| | By __/s/ Walter R. Burkley________________ |
| | Walter R. Burkley, Principal Executive Officer |
| | |
| | Date: November 30, 2022 |
Pursuant to the requirements of the Securities Exchange Act of 1934 and the Investment Company Act of 1940, this report has been signed below by the following persons on behalf of the Registrant and in the capacities and on the dates indicated.
| By _ /s/ Walter R. Burkley_____________ |
Walter R. Burkley, Principal Executive Officer |
| |
| Date: November 30, 2022 |
| By ___/s/ Hong T. Le__________________ |
Hong T. Le, Treasurer and Principal Financial Officer |
| |
| Date: November 30, 2022 |