UNITED STATES
SECURITIES AND EXCHANGE COMMISSION
Washington, D.C. 20549
FORM N-CSR
CERTIFIED SHAREHOLDER REPORT OF REGISTERED
MANAGEMENT INVESTMENT COMPANIES
Investment Company Act file number: | 811-06024 |
| |
Exact name of registrant as specified in charter: | Aberdeen Indonesia Fund, Inc. |
| |
Address of principal executive offices: | 1735 Market Street, 32nd Floor Philadelphia, PA 19103 |
| |
| |
Name and address of agent for service: | Ms. Andrea Melia Aberdeen Asset Management Inc. 1735 Market Street, 32nd Floor Philadelphia, PA 19103 |
| |
Registrant’s telephone number, including area code: | 866-839-5205 |
| |
Date of fiscal year end: | December 31 |
| |
Date of reporting period: | June 30, 2014 |
Item 1. Reports to Stockholders. –

Aberdeen’s Investor Relations Services
We invite you to enroll today.
As part of Aberdeen’s commitment to shareholders, we invite you to visit the Fund on the web at www.aberdeenif.com. From this page, you can view monthly fact sheets, portfolio manager commentary, distribution and performance information, updated daily fact sheets courtesy of Morningstar®, portfolio charting, and other timely data.
Enroll today
Did you know you can be among the first to receive information from your Fund?
Enroll in our e-mail services and be among the first to recieve information regarding your investments.
Please take a look at Aberdeen’s award-winning Closed-End Fund Talk Channel, where a series of fund manager webcasts and short films are posted. Visit Aberdeen’s Closed-End Fund Talk Channel at www.aberdeen-asset.us/aam.nsf/usClosed/aberdeentv.
Contact us:
1. Enroll in Investor Relations services at:
http://www.aberdeen-asset.us/aam.nsf/usclosed/email
2. Call us toll free at 1-866-839-5205 in the U.S., or
3. Email us at InvestorRelations@aberdeen-asset.com
4. Visit www.aberdeen-asset.us/cef
Stop the paper
Did you know that you can receive your shareholder reports online?
By enrolling in this convenient service, you will receive electronic versions of important Fund documents including annual reports, semi-annual reports, prospectuses, and proxy statements.
There’s never been a faster, simple or more environmentally-friendly way to receive your investment information.
To enroll in electronic delivery, follow these simple steps:
1. Go to http://www.aberdeen-asset.us/cef
2. Click on the link for “Email Services” which takes you here
http://www.aberdeen-asset.us/aam.nsf/usclosed/email
3. Click “Sign-up”
Please note that Aberdeen does not share our shareholder information with any other organizations. You can return to this site at any time to change your email address or edit your preferences.

Letter to Shareholders (unaudited)
Dear Shareholder,
We present this Semi-Annual Report which covers the activities of Aberdeen Indonesia Fund, Inc. (the “Fund”) for the six-month period ended June 30, 2014. The Fund’s primary investment objective is long-term capital appreciation with income as a secondary objective, which the Fund seeks to achieve by investing primarily in Indonesian equity and debt securities.
Total Return Performance
For the six-month period ended June 30, 2014, the total return to shareholders of the Fund net of fees, based on the net asset value (“NAV”) of the Fund, was 17.1%, assuming reinvestment of dividends and distributions versus a return of 22.2% for the Fund’s benchmark, the Morgan Stanley Capital International (MSCI) Indonesia Index (“MSCI Indonesia Index”)1. The Fund’s total return for the six months ended June 30, 2014 is based on the reported NAV on period end.
Share Price & NAV
For the six months ended June 30, 2014, based on market price, the Fund’s total return was 14.8%, assuming reinvestment of dividends and distributions. The Fund’s share price increased 14.8% over the period, from $8.26 on December 31, 2013 to $9.48 on June 30, 2014. The Fund’s share price on June 30, 2014 represented a discount of 10.6% to the NAV per share of $10.60 on that date, compared with a discount of 8.7% to the NAV per share of $9.05 on December 31, 2013.
Open Market Repurchase Program
The Fund’s policy is generally to buy back Fund shares on the open market when the Fund trades at certain discounts to NAV. During the six-month period ended June 30, 2014 and fiscal year ended December 31, 2013, the Fund did not repurchase any shares through this program.
Portfolio Holdings Disclosure
The Fund files its complete schedule of portfolio holdings with the SEC for the first and third quarters of each fiscal year on Form N-Q. The Fund’s Form N-Q filings are available on the SEC’s website at http://www.sec.gov and may be reviewed and copied at the SEC’s Public Reference Room in Washington, D.C. Information about the operation of the Public Reference Room may be obtained by calling 1-800-SEC-0330. The Fund makes the information on Form N-Q available to shareholders on the Fund’s website or upon request and without charge by calling Investor Relations toll-free at 1-866-839-5205.
Proxy Voting
A description of the policies and procedures that the Fund uses to determine how to vote proxies relating to portfolio securities, and information regarding how the Fund voted proxies relating to portfolio securities during the most recent twelve months ended June 30 is available by August 30 of the relevant year: (i) upon request
and without charge by calling Investor Relations toll-free at 1-866-839-5205; and (ii) on the SEC’s website at http://www.sec.gov.
Investor Relations Information
As part of our ongoing commitment to provide information to our shareholders, I invite you to visit the Fund on the web at www.aberdeenif.com. From this page, you can view monthly fact sheets, portfolio manager commentary, distribution and performance information, updated daily fact sheets courtesy of Morningstar®, and view portfolio charting and other timely data.
Please take a look at Aberdeen’s award-winning Closed-End Fund Talk Channel, where you can watch fund manager web casts and view our latest short films. For replays of recent broadcasts or to register for upcoming events, please visit Aberdeen’s Closed-End Fund Talk Channel at www.aberdeen-asset.us/aam.nsf/usClosed/aberdeentv.
Please ensure that you are enrolled in our email services, which feature timely news from Aberdeen portfolio managers located around the world. Enroll today at www.aberdeen-asset.us/aam.nsf/usclosed/email and be among the first to receive the latest closed-end fund news, announcements of upcoming fund manager web casts, films and other information. Please note that Aberdeen does not share our shareholder information with any other organizations.
Please contact Aberdeen Asset Management Inc. by:
· calling toll free at 1-866-839-5205 in the United States;
· emailing InvestorRelations@aberdeen-asset.com;
· visiting Aberdeen Closed-End Fund Center at
http://www.aberdeen-asset.us/aam.nsf/usClosed/home;
· visiting www.aberdeenif.com.
Yours sincerely,

Christian Pittard
President
1 The MSCI Indonesia Index is designed to measure the performance of the large cap and mid cap segments of the Indonesian market. The MSCI Indonesia Index is constructed based on the MSCI Global Investable Market Indexes Methodology and targets a free float-adjusted market capitalization coverage of 85%. Indexes are unmanaged and have been provided for comparison purposes only. No fees or expenses are reflected. You cannot invest directly in an index.
All amounts are U.S. Dollars unless otherwise stated.
| Aberdeen Indonesia Fund, Inc. | 1 |
Dividend Reinvestment and Direct Stock Purchase Plan (unaudited)
Computershare Trust Company, N.A. (“Computershare”), the Fund’s transfer agent, sponsors and administers a Dividend Reinvestment and Direct Stock Purchase Plan (the “Plan”), which is available to shareholders.
The Plan allows registered shareholders and first time investors to buy and sell shares and automatically reinvest dividends and capital gains through the transfer agent. This is a cost-effective way to invest in the Fund.
Please note that for both purchases and reinvestment purposes, shares will be purchased in the open market at the current share price and cannot be issued directly by the Fund.
For more information about the Plan and a brochure that includes the terms and conditions of the Plan, please call Computershare at 1-800-647-0584 or visit www.computershare.com/buyaberdeen.
Report of the Investment Adviser (unaudited)
Market review
The Indonesian stock market and its currency, the rupiah, rose during the six-month period ended June 30, 2014, as fears of an emerging market contagion dissipated amid investors’ election jubilance and improving economic data. Jakarta Governor Joko Widodo (Jokowi), favored by investors for his pro-reform stance and ability to kick-start infrastructure projects in Jakarta, announced his presidential run, which drove stocks higher. Gains were pared towards the end of the period when polls showed that his lead was narrowing. However, Jokowi was declared the winner of the election in July, which his rival, Prabowo Subianto, subsequently contested. The nation’s gross domestic product (GDP) growth data were also better than expected, despite the aggressive tightening by the central bank last year, and inflation eased, providing breathing space to hold rates steady. The overall trade balance improved as well, despite the implementation of a ban on raw mineral exports and adverse weather, which hampered palm oil yields.
Fund performance review
Fund performance for the reporting period was hindered primarily by overall stock selection. Within the financials sector, the Fund’s lack of exposure to Bank Rakyat Indonesia Tbk hindered performance as the bank registered strong results, with growth across interest and non-interest incomes, further bolstered by cost improvements. We are cautiously monitoring the company, as it has suffered from low asset quality in the past. The holding in Bank Permata Tbk PT also detracted from performance on the back of relatively weak results, as higher loan growth was countered by increased loan loss provisions, slowing profit growth. Nevertheless, we believe that its valuation remains attractive.
The holding in Multi Bintang Indonesia Tbk PT hampered Fund performance. As the brewer is a closely held corporation (i.e., it has a limited number of shareholders), some relatively small investors took profits on the shares due to their high valuation. However, its results were within our estimates.
Conversely, the Fund’s holding in Wintermar Offshore Marine Tbk PT aided performance as the company continued to benefit from strong demand for marine support vessels. The firm also upgraded its fleet as the Indonesian government continues to push for capital expenditure in a bid to increase oil production.
The underweight to Astra International Tbk PT also benefited Fund performance as competition in Indonesia’s automotive industry intensified after rival manufacturers – namely, Honda Motor, Suzuki Motor and Nissan Motor – challenged Astra’s leadership in the profitable multi-purpose vehicle (MPV) segment. The global economic slowdown also weighed on the company’s coal-related and palm oil businesses, which accounts for a third of earnings.
Shares of consumer products firm Mandom Indonesia Tbk PT performed well over the reporting period as its flagship Gatsby brand continued to see solid sales, and the firm also benefited from strong exports. Furthermore, management remained disciplined in controlling costs. Miner Vale Indonesia Tbk PT bolstered performance as it has local smelters to process nickel, allowing the company to continue shipments, while supply disruptions among competitors drove up the price.
Outlook
The ban on raw mineral shipments began in January and has weighed on exports; however, mining firms are investing significant sums into
2 | Aberdeen Indonesia Fund, Inc. | |
Report of the Investment Adviser (unaudited) (concluded)
building local smelters in an effort to boost longer-term supplies. Inflation is expected to soften further as the effects of the fuel hike in June 2013 levels off. We believe that measured electricity rate hikes from July onwards may also help to temper inflation expectations.
In politics, investor jubilance over Jokowi’s presidential win initially was tempered by his rival Prabowo’s legal challenge over the results to the constitutional court. However, on August 21, the Indonesian Constitutional Court confirmed Jokowi’s election, and the new president is scheduled to be inaugurated on October 20.
As long-term investors, we remain more focused on the implementation of reforms than the election outcome alone. Although we believe that Jokowi has credible policies for the country’s development, and there are numerous reasons to be optimistic over Indonesia’s future, he faces many challenges.
In our opinion, his first task will be to unite the country after its most divisive election battle in recent history. We feel that this would help
strengthen his mandate and garner more support within parliament. The next step would be the introduction of tough reforms that would start to pry away the corruption, cronyism and bureaucracy that stifle real progress. At the forefront for the economy is the need for cuts in fuel subsidies to fund vital infrastructure projects. But raising fuel prices without overburdening the poor will require pragmatic policies, in our view.
We have been investing in Indonesia for over 20 years, and these challenges are not new to us. We have achieved attractive returns over the long haul by investing only in companies that meet our strict quality controls. In our opinion, Indonesia has immense potential for development, especially with the right reforms in place, and we remain cautiously optimistic that the new president will succeed in implementing these changes.
Aberdeen Asset Management Asia Limited
| Aberdeen Indonesia Fund, Inc. | 3 |
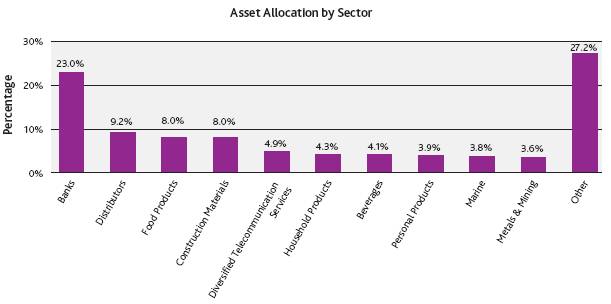
Portfolio Composition (unaudited)
The following chart summarizes the composition of the Fund’s portfolio, in Standard & Poor’s Global Industry Classification Standard (“GICS”) sectors, expressed as a percentage of net assets. The GICS structure consists of 10 sectors, 24 industry groups, 70 industries and 171 subindustries. An industry classification standard sector can include more than one industry group. As of June 30, 2014, the Fund did not have more than 25% of its assets invested in any industry group. The sectors, as classified by GICS Sectors, are comprised of several industries.
As of June 30, 2014, the Fund held 99.3% of its net assets in equities and 0.7% in other assets in excess of liabilities.
Top Ten Holdings (unaudited)
The following were the Fund’s top ten holdings as of June 30, 2014:
| | |
Name of Security | | Percentage of Net Assets |
| | |
Bank OCBC NISP Tbk PT | | 10.7% |
Bank Permata Tbk PT | | 9.6% |
Jardine Cycle & Carriage Ltd. | | 9.2% |
Holcim Indonesia Tbk PT | | 6.1% |
M.P. Evans Group PLC | | 4.9% |
Unilever Indonesia Tbk PT | | 4.3% |
Multi Bintang Indonesia Tbk PT | | 4.1% |
Mandom Indonesia Tbk PT | | 3.9% |
Wintermar Offshore Marine Tbk PT | | 3.8% |
Vale Indonesia Tbk PT | | 3.6% |
4 | Aberdeen Indonesia Fund, Inc. | |
Total Investment Return (unaudited)
The following table summarizes the average annual Fund performance compared to the MSCI Indonesia Index, the Fund’s benchmark, for the 1-year, 3-year, 5-year and 10-year periods ended June 30, 2014.
| | | | | | | | | | | | |
| | 1 Year | | | 3 Years | | | 5 Years | | | 10 Years | |
| | | | | | | | | | | | |
Net Asset Value (NAV) | | -7.3% | | | 2.9% | | | 18.9% | | | 18.6% | |
Market Value | | -6.4% | | | 2.0% | | | 17.9% | | | 17.2% | |
MCSI Indonesia Index | | -11.4% | | | -2.4% | | | 15.5% | | | 20.9% | |
Returns represent past performance. Total investment return at NAV is based on changes in the NAV of Fund shares and assumes reinvestment of dividends and distributions, if any, at market prices pursuant to the dividend reinvestment and direct stock purchase plan sponsored by the Fund’s transfer agent. All return data at NAV includes investment management fees, administrative fees (such as Director and legal fees) and custodial charges. Total investment return at market value is based on changes in the market price at which the Fund’s shares traded on the NYSE MKT during the period and assumes reinvestment of dividends and distributions, if any, at market prices pursuant to the dividend reinvestment program sponsored by the Fund’s transfer agent. The Fund’s total investment return is based on the reported NAV on each period end. Because the Fund’s shares trade in the stock market based on investor demand, the Fund may trade at a price higher or lower than its NAV. Therefore, returns are calculated based on both market price and NAV. Past performance is no guarantee of future results. The performance information provided does not reflect the deduction of taxes that a shareholder would pay on distributions received from the Fund. The current performance of the Fund may be lower or higher than the figures shown. The Fund’s yield, return, market price and NAV will fluctuate. Performance information current to the most recent month-end is available at www.aberdeenif.com or by calling 866-839-5205.
The annualized gross operating expense ratio based on the six-month period ended June 30, 2014 is 1.52%.
| Aberdeen Indonesia Fund, Inc. | 5 |
Portfolio of Investments (unaudited)
Shares | | Description | | Value
(US$) | |
LONG-TERM INVESTMENTS—99.3% | | | |
COMMON STOCKS—99.3% | | | |
INDONESIA—99.3% | | | |
AUTOMOBILES—2.8% | | | |
4,631,610 | | Astra International Tbk PT(a) | | $ 2,843,653 | |
BANKS—23.0% | | | |
2,950,000 | | Bank Central Asia Tbk PT(a) | | 2,739,448 | |
96,330,884 | | Bank OCBC NISP Tbk PT* | | 10,786,946 | |
87,261,894 | | Bank Permata Tbk PT(a) | | 9,607,069 | |
| | | | 23,133,463 | |
BEVERAGES—4.1% | | | |
44,500 | | Multi Bintang Indonesia Tbk PT(a) | | 4,085,946 | |
CAPITAL MARKETS—0.6% | | | |
1,386,000 | | Saratoga Investama Sedaya PT* | | 584,563 | |
CONSTRUCTION MATERIALS—8.0% | | | |
27,735,700 | | Holcim Indonesia Tbk PT(a) | | 6,137,794 | |
991,000 | | Indocement Tunggal Prakarsa Tbk PT(a) | | 1,884,606 | |
| | | | 8,022,400 | |
DISTRIBUTORS—9.2% | | | |
260,000 | | Jardine Cycle & Carriage Ltd.(a)(b) | | 9,240,384 | |
DIVERSIFIED TELECOMMUNICATION SERVICES—4.9% | | | |
12,852,800 | | Telekomunikasi Indonesia Persero Tbk PT(a) | | 2,673,415 | |
5,378,000 | | XL Axiata Tbk PT | | 2,313,606 | |
| | | | 4,987,021 | |
FOOD & STAPLES RETAILING—2.1% | | | |
8,787,600 | | Hero Supermarket Tbk PT*(a) | | 2,074,568 | |
FOOD PRODUCTS—8.0% | | | |
623,534 | | M.P. Evans Group PLC(c) | | 4,892,727 | |
1,003,000 | | Petra Foods Ltd. | | 3,137,140 | |
| | | | 8,029,867 | |
GAS UTILITIES—2.4% | | | |
5,125,500 | | Perusahaan Gas Negara Persero Tbk PT(a) | | 2,408,910 | |
HOUSEHOLD PRODUCTS—4.3% | | | |
1,768,000 | | Unilever Indonesia Tbk PT(a) | | 4,367,973 | |
MACHINERY—3.2% | | | |
1,650,000 | | United Tractors Tbk PT(a) | | 3,219,681 | |
MARINE—3.8% | | | |
38,732,047 | | Wintermar Offshore Marine Tbk PT | | 3,838,900 | |
METALS & MINING—3.6% | | | |
12,122,000 | | Vale Indonesia Tbk PT(a) | | 3,637,778 | |
MULTILINE RETAIL—2.1% | | | |
20,983,000 | | Ramayana Lestari Sentosa Tbk PT(a) | | 2,080,788 | |
6 | Aberdeen Indonesia Fund, Inc. | |
Portfolio of Investments (unaudited) (concluded)
Shares | | Description | | Value
(US$) | |
LONG-TERM INVESTMENTS (continued) | | | |
COMMON STOCKS (continued) | | | |
INDONESIA (continued) | | | |
OIL, GAS & CONSUMABLE FUELS—3.5% | | | |
1,528,000 | | Indo Tambangraya Megah Tbk PT(a) | | $ 3,480,472 | |
PERSONAL PRODUCTS—3.9% | | | |
2,975,800 | | Mandom Indonesia Tbk PT | | 3,903,306 | |
PHARMACEUTICALS—1.9% | | | |
125,000 | | Merck Tbk PT(d) | | 1,892,661 | |
SPECIALTY RETAIL—2.4% | | | |
32,812,000 | | Ace Hardware Indonesia Tbk PT(a) | | 2,437,344 | |
TEXTILES, APPAREL & LUXURY GOODS—3.3% | | | |
39,842,500 | | Sepatu Bata Tbk PT | | 3,344,014 | |
TRADING COMPANIES & DISTRIBUTORS—2.2% | | | |
5,993,000 | | AKR Corporindo Tbk PT(a) | | 2,187,510 | |
| | Total Common Stocks | | 99,801,202 | |
| | Total Long-Term Investments—99.3% (cost $67,171,906) | | 99,801,202 | |
| | Total Investments—99.3% (cost $67,171,906)(e) | | 99,801,202 | |
| | Other Assets in Excess of Liabilities—0.7% | | 719,032 | |
| | Net Assets—100.0% | | $100,520,234 | |
* | Non-income producing security. |
(a) | Fair Valued Security. Fair Values are determined pursuant to procedures approved by the Board of Directors. See Note 2(a) of the accompanying Notes to Financial Statements. |
(b) | Singapore listed security, but majority of the securities business is conducted in Indonesia. |
(c) | UK listed security, but majority of the securities business is conducted in Indonesia. |
(d) | Illiquid security. |
(e) | See Notes to Financial Statements for tax unrealized appreciation/depreciation of securities. |
See Notes to Financial Statements.
| Aberdeen Indonesia Fund, Inc. | 7 |
Statement of Assets and Liabilities (unaudited)
Assets | | | |
Investments, at value (cost $67,171,906) | | $ | 99,801,202 | |
Foreign currency, at value (cost $617,129) | | 619,111 | |
Cash | | 273,905 | |
Dividends receivable | | 167,701 | |
Receivable for investments sold | | 23,937 | |
Prepaid expenses | | 83 | |
Total assets | | 100,885,939 | |
Liabilities | | | |
Investment advisory fees payable (Note 3) | | 246,720 | |
Director fees payable | | 57,700 | |
Administration fees payable (Note 3) | | 20,256 | |
Investor relations fees payable (Note 3) | | 14,591 | |
Accrued expenses | | 26,438 | |
Total liabilities | | 365,705 | |
| | | |
Net Assets | | $ | 100,520,234 | |
Composition of Net Assets | | | |
Common stock (par value $.001 per share) (Note 5) | | $ | 9,485 | |
Paid-in capital in excess of par | | 63,297,278 | |
Accumulated net investment income | | 664,609 | |
Accumulated net realized gain from investment and foreign currency transactions | | 3,915,309 | |
Net unrealized appreciation on investments and other assets and liabilities denominated in foreign currencies | | 32,633,553 | |
Net Assets | | $ | 100,520,234 | |
Net asset value per common share based on 9,485,247 shares issued and outstanding | | $ | 10.60 | |
See Notes to Financial Statements.
8 | Aberdeen Indonesia Fund, Inc. | |
Statement of Operations (unaudited)
For the Six Months Ended June 30, 2014
Net Investment Income | | | |
Income: | | | |
Dividends (net of foreign withholding taxes of $255,950) | | $ 1,355,432 | |
Total investment income | | 1,355,432 | |
Expenses: | | | |
Investment advisory fee (Note 3) | | 464,574 | |
Directors’ fees and expenses | | 68,224 | |
Custodian’s fees and expenses | | 41,557 | |
Reports to shareholders and proxy solicitation | | 28,217 | |
Investor relations fees and expenses (Note 3) | | 28,083 | |
Administration fee (Note 3) | | 27,653 | |
Independent auditors’ fees and expenses | | 17,046 | |
Legal fees and expenses | | 14,869 | |
Insurance expense | | 14,726 | |
Transfer agent’s fees and expenses | | 11,468 | |
Miscellaneous | | 9,726 | |
Net expenses | | 726,143 | |
| | | |
Net Investment Income | | 629,289 | |
Net Realized/Unrealized Gain/(Loss) from Investments and Foreign Currency Related Transactions | | | |
Net realized gain/(loss) from: | | | |
Investment transactions | | 3,031,761 | |
Foreign currency transactions | | 12,208 | |
| | 3,043,969 | |
Net change in unrealized appreciation/(depreciation) on: | | | |
Investments | | 10,983,835 | |
Foreign currency translation | | 4,257 | |
| | 10,988,092 | |
Net realized and unrealized gain from investments and foreign currency related transactions | | 14,032,061 | |
Net Increase in Net Assets Resulting from Operations | | $ 14,661,350 | |
See Notes to Financial Statements.
| Aberdeen Indonesia Fund, Inc. | 9 |
Statements of Changes in Net Assets
| | For the
Six Months Ended
June 30, 2014
(unaudited) | | For the
Year Ended
December 31, 2013 | |
Increase/(Decrease) in Net Assets | | | | | |
Operations | | | | | |
Net investment income | | $ 629,289 | | $ 571,710 | |
Net realized gain from investment and foreign currency related transactions | | 3,043,969 | | 11,699,313 | |
Net change in unrealized appreciation/depreciation on investments and foreign currency translations | | 10,988,092 | | (35,998,367 | ) |
Net increase/(decrease) in net assets resulting from operations | | 14,661,350 | | (23,727,344 | ) |
Distributions to Shareholders From: | | | | | |
Net investment income | | – | | (613,695 | ) |
Net realized gains | | – | | (12,857,062 | ) |
Net decrease in net assets from distributions | | – | | (13,470,757 | ) |
Common Stock Transactions | | | | | |
Issuance of 0 and 1,213,325 shares, respectively, due to stock distribution (Note 5) | | – | | 15,081,631 | |
Change in net assets resulting from operations | | 14,661,350 | | (22,116,470 | ) |
Net Assets | | | | | |
Beginning of period | | 85,858,884 | | 107,975,354 | |
End of period (including accumulated net investment income of $664,609 and $35,320, respectively) | | $100,520,234 | | $85,858,884 | |
Amounts listed as “–” are $0 or round to $0.
See Notes to Financial Statements.
10 | Aberdeen Indonesia Fund, Inc. | |
Financial Highlights
| | For the Six Months Ended June 30, 2014 | | For the Fiscal Years Ended December 31, | |
| | (unaudited) | | 2013 | | 2012 | | 2011 | | 2010 | | 2009 | |
| | | | | | | | | | | | | |
Per Share Operating Performance(a) | | | | | | | | | | | | | |
Net asset value per common share, beginning of period | | $9.05 | | $13.05 | | $12.88 | | $14.39 | | $10.17 | | $5.68 | |
Net investment income | | 0.07 | | 0.06 | | 0.14 | | 0.16 | | 0.07 | | 0.06 | |
Net realized and unrealized gains (losses) on investments and foreign currency transactions | | 1.48 | | (2.54 | ) | 2.51 | | (0.51 | ) | 5.19 | | 5.63 | (b) |
Total from investment operations applicable to common shareholders | | 1.55 | | (2.48 | ) | 2.65 | | (0.35 | ) | 5.26 | | 5.69 | |
Dividends and distributions to shareholders: | | | | | | | | | | | | | |
Net investment income | | — | | (0.06 | ) | (0.11 | ) | (0.17 | ) | (0.07 | ) | (0.03 | ) |
Net realized gains | | — | | (1.36 | ) | (2.37 | ) | (0.99 | ) | (0.97 | ) | (1.17 | ) |
Total distributions | | — | | (1.42 | ) | (2.48 | ) | (1.16 | ) | (1.04 | ) | (1.20 | ) |
Capital Share Transactions: | | | | | | | | | | | | | |
Impact due to capital shares issued from stock distribution (Note 5) | | — | | (0.10 | ) | — | | — | | — | | — | |
Net asset value per common share, end of period | | $10.60 | | $9.05 | | $13.05 | | $12.88 | | $14.39 | | $10.17 | |
Market value, end of period | | $9.48 | | $8.26 | | $11.67 | | $11.78 | | $13.31 | | $9.50 | |
Total Investment Return Based on:(c) | | | | | | | | | | | | | |
Market value | | 14.77% | | (17.42% | ) | 19.00% | | (3.05% | ) | 51.35% | | 107.82% | |
Net asset value | | 17.13% | | (19.09% | ) | 21.71% | | (1.95% | ) | 52.85% | | 99.76% | |
Ratio to Average Net Assets Applicable to Common Shareholders/Supplementary Data | | | | | | | | | | | | | |
Net assets applicable to common shareholders, end of period (000 omitted) | | $100,520 | | $85,859 | | $107,975 | | $106,516 | | $119,035 | | $84,135 | |
Average net assets applicable to common shareholders (000 omitted) | | $96,029 | | $119,507 | | $118,819 | | $116,435 | | $105,572 | | $67,781 | |
Net operating expenses | | 1.52% | (d) | 1.43% | | 1.42% | | 1.43% | | 1.52% | | 1.57% | |
Net investment income | | 1.32% | (d) | 0.48% | | 0.96% | | 1.12% | | 0.54% | | 0.67% | |
Portfolio turnover | | 2.60% | | 11.97% | | 16.64% | | 5.15% | | 10.20% | | 88.34% | |
(a) | Based on average shares outstanding. |
| |
(b) | The investment adviser fully reimbursed the Fund for a loss on a transaction not meeting the Fund’s investment guidelines, which otherwise would have reduced the amount by $0.02. |
| |
(c) | Total investment return based on market value is calculated assuming that shares of the Fund’s common stock were purchased at the closing market price as of the beginning of the period, dividends, capital gains, and other distributions were reinvested as provided for in the Fund’s dividend reinvestment plan and then sold at the closing market price per share on the last day of the period. The computation does not reflect any sales commission investors may incur in purchasing or selling shares of the Fund. The total investment return based on the net asset value is similarly computed except that the Fund’s net asset value is substituted for the closing market value. |
| |
(d) | Annualized. |
| |
Amounts listed as “–” are $0 or round to $0.
See Notes to Financial Statements.
| Aberdeen Indonesia Fund, Inc. | 11 |
Notes to Financial Statements (unaudited)
1. Organization
Aberdeen Indonesia Fund, Inc. (the “Fund”) was incorporated in Maryland on January 8, 1990 and commenced investment operations on March 9, 1990. The Fund is registered under the Investment Company Act of 1940, as amended (the “1940 Act”), as a non-diversified closed-end, management investment company. The Fund trades on the NYSE MKT under the ticker symbol “IF”.
The Fund seeks long-term capital appreciation as a primary objective and income as a secondary objective by investing primarily in Indonesian equity and debt securities.
2. Summary of Significant Accounting Policies
The following is a summary of significant accounting policies followed by the Fund in the preparation of its financial statements. The policies conform to accounting principles generally accepted in the United States of America (“GAAP”). The preparation of financial statements requires management to make estimates and assumptions that affect the reported amounts of assets and liabilities, disclosure of contingent assets and liabilities at the date of the financial statements, and the reported amounts of income and expenses for the period. Actual results could differ from those estimates. The accounting records of the Fund are maintained in U.S. Dollars.
(a) Security Valuation:
The Fund values its securities at current market value or fair value consistent with regulatory requirements. “Fair value” is defined in the Fund’s valuation and liquidity procedures as the price that could be received to sell an asset or paid to transfer a liability in an orderly transaction between willing market participants without a compulsion to contract at the measurement date.
Equity securities that are traded on an exchange are valued at the last quoted sale price on the principal exchange on which the security is traded at the “Valuation Time” subject to application, when appropriate, of the valuation factors described in the paragraph below. The Valuation Time is as of the close of regular trading on the New York Stock Exchange (usually 4:00 p.m. Eastern Time). In the absence of a sale price, the security is valued at the mean of the bid/ask price quoted at the close on the principal exchange on which the security is traded. Securities traded on NASDAQ are valued at the NASDAQ official closing price. Closed-end funds and exchange-traded funds (“ETFs”) are valued at the market price of the security at the Valuation Time. A security using any of these pricing methodologies is determined to be a Level 1 investment.
Foreign equity securities that are traded on foreign exchanges that close prior to the Valuation Time are valued by applying valuation factors to the last sale price or the mean price as noted above. Valuation factors are provided by an independent pricing service provider. These valuation factors are used when pricing the Fund’s portfolio holdings to estimate
market movements between the time foreign markets close and the time the Fund values such foreign securities. These valuation factors are based on inputs such as depositary receipts, indices, futures, sector indices/ETFs, exchange rates, and local exchange opening and closing prices of each security. When prices with the application of valuation factors are utilized, the value assigned to the foreign securities may not be the same as quoted or published prices of the securities on their primary markets. A security that applies a valuation factor is determined to be a Level 2 investment because the exchange-traded price has been adjusted. Valuation factors are not utilized if the independent pricing service provider is unable to provide a valuation factor or if the valuation factor falls below a predetermined threshold; in such case, the security is determined to be a Level 1 investment.
In the event that a security’s market quotations are not readily available or are deemed unreliable (for reasons other than because the foreign exchange on which it trades closes before the Valuation Time), the security is valued at fair value as determined by the Fund’s Pricing Committee, taking into account the relevant factors and surrounding circumstances using valuation policies and procedures approved by the Fund’s Board of Directors. A security that has been fair valued by the Pricing Committee may be classified as Level 2 or Level 3 depending on the nature of the inputs.
In accordance with the authoritative guidance on fair value measurements and disclosures under GAAP, the Fund discloses the fair value of its investments using a three-level hierarchy that classifies the inputs to valuation techniques used to measure the fair value. The hierarchy assigns Level 1 measurements to valuations based upon unadjusted quoted prices in active markets for identical assets, Level 2 measurements to valuations based upon other significant observable inputs, including adjusted quoted prices in active markets for identical assets, and Level 3 measurements to valuations based upon unobservable inputs that are significant to the valuation. Observable inputs are inputs that reflect the assumptions market participants would use in pricing the asset or liability, which are based on market data obtained from sources independent of the reporting entity. Unobservable inputs are inputs that reflect the reporting entity’s own assumptions about the assumptions market participants would use in pricing the asset or liability developed based on the best information available in the circumstances. A financial instrument’s level within the fair value hierarchy is based upon the lowest level of any input that is significant to the fair value measurement. The three-level hierarchy of inputs is summarized below:
Level 1 – quoted prices in active markets for identical investments;
Level 2 – other significant observable inputs (including quoted prices for similar securities, interest rates, prepayment speeds, and credit risk); or
Level 3 – significant unobservable inputs (including the Fund’s own assumptions in determining the fair value of investments).
12 | Aberdeen Indonesia Fund, Inc. | |
Notes to Financial Statements (unaudited) (continued)
The following is a summary of the inputs used as of June 30, 2014 in valuing the Fund’s investments at fair value. The inputs or methodologies used for valuing securities are not necessarily an indication of the risk associated with investing in those securities. Please refer to the Portfolio of Investments for a detailed breakout of the security types:
Investments, at Value | | Level 1 | | Level 2 | | Level 3 | | Total |
Long-Term Investments | | | | | | | | |
Banks | | $10,786,946 | | $12,346,517 | | $– | | $23,133,463 |
Capital Markets | | 584,563 | | – | | – | | 584,563 |
Diversified Telecommunication Services | | 2,313,606 | | 2,673,415 | | – | | 4,987,021 |
Food Products | | 8,029,867 | | – | | – | | 8,029,867 |
Marine | | 3,838,900 | | – | | – | | 3,838,900 |
Personal Products | | 3,903,306 | | – | | – | | 3,903,306 |
Pharmaceuticals | | 1,892,661 | | – | | – | | 1,892,661 |
Textiles, Apparel & Luxury Goods | | 3,344,014 | | – | | – | | 3,344,014 |
Other | | – | | 50,087,407 | | – | | 50,087,407 |
Total | | $34,693,863 | | $65,107,339 | | $– | | $99,801,202 |
Amounts lists as “–” are $0 or round to $0.
For movements between the levels within the fair value hierarchy, the Fund has adopted a policy of recognizing transfers at the end of each period. During the six months ended June 30, 2014, a security issued by Multi Bintang Indonesia Tbk PT in the amount of $4,085,946 transferred from Level 1 to Level 2 because there was a valuation factor applied at June 30, 2014. Also, securities issued by Saratoga Investama Sedaua PT, Sepatu Bata Tbk PT, Wintermar Offshore Marine Tbk PT and XL Axiata Tbk PT in the amount of $584,563, $3,344,014, $3,838,900, $2,313,606, respectively, transferred from Level 2 to Level 1 because there was no valuation factor applied at June 30, 2014. For the six months ended June 30, 2014, there have been no significant changes to the fair valuation methodologies.
(b) Foreign Currency Translation:
Foreign securities, currencies, and other assets and liabilities denominated in foreign currencies are translated into U.S. Dollars at the exchange rate of said currencies against the U.S. Dollar, as of the Valuation Time, as provided by an independent pricing service approved by the Board.
Foreign currency amounts are translated into U.S. Dollars on the following basis:
(i) market value of investment securities, other assets and liabilities – at the exchange rates at the current daily rates of exchange at the Valuation Time; and
(ii) purchases and sales of investment securities, income and expenses – at the relevant rates of exchange prevailing on the respective dates of such transactions.
The Fund does not isolate that portion of gains and losses on investments in equity securities which is due to changes in the foreign
exchange rates from that which is due to changes in market prices of equity securities. Accordingly, realized and unrealized foreign currency gains and losses with respect to such securities are included in the reported net realized and unrealized gains and losses on investment transactions balances.
The Fund reports certain foreign currency related transactions and foreign taxes withheld on security transactions as components of realized gains for financial reporting purposes, whereas such foreign currency related transactions are treated as ordinary income for U.S. federal income tax purposes.
Net unrealized currency gains or losses from valuing foreign currency denominated assets and liabilities at period end exchange rates are reflected as a component of net unrealized appreciation/depreciation in value of investments, and translation of other assets and liabilities denominated in foreign currencies.
Net realized foreign exchange gains or losses represent foreign exchange gains and losses from transactions in foreign currencies and forward foreign currency contracts, exchange gains or losses realized between the trade date and settlement date on security transactions, and the difference between the amounts of interest and dividends recorded on the Fund’s books and the U.S. Dollar equivalent of the amounts actually received.
Foreign security and currency transactions may involve certain considerations and risks not typically associated with those of domestic origin, including unanticipated movements in the value of the foreign currency relative to the U.S. Dollar. When the U.S. Dollar rises in value against foreign currency, the Fund’s investments denominated in that currency will lose value because its currency is worth fewer U.S. Dollars; the opposite effect occurs if the U.S. Dollar falls in relative value.
| Aberdeen Indonesia Fund, Inc. | 13 |
Notes to Financial Statements (unaudited) (continued)
(c) Security Transactions, Investment Income and Expenses:
Security transactions are recorded on the trade date. Realized and unrealized gains/(losses) from security and currency transactions are calculated on the identified cost basis. Dividend income is recorded on the ex-dividend date except for certain dividends on foreign securities, which are recorded as soon as the Fund is informed after the ex-dividend date. Interest income and expenses are recorded on an accrual basis.
(d) Distributions:
On an annual basis, the Fund intends to distribute its net realized capital gains, if any, by way of a final distribution to be declared during the calendar quarter ending December 31. Dividends and distributions to shareholders are recorded on the ex-dividend date.
Dividends and distributions to shareholders are determined in accordance with federal income tax regulations, which may differ from GAAP. These differences are primarily due to differing treatments for foreign currencies and wash sales.
(e) Federal Income Taxes:
The Fund intends to continue to qualify as a “regulated investment company” by complying with the provisions available to certain investment companies, as defined in Subchapter M of the Internal Revenue Code of 1986, as amended, and to make distributions of net investment income and net realized capital gains sufficient to relieve the Fund from all, or substantially all, federal income taxes. Therefore, no federal income tax provision is required.
The Fund recognizes the tax benefits of uncertain tax positions only where the position is “more likely than not” to be sustained assuming examination by tax authorities. Management of the Fund has concluded that there are no significant uncertain tax positions that would require recognition in the financial statements. Since tax authorities can examine previously filed tax returns, the Fund’s U.S. federal and state tax returns for each of the four fiscal years up to the most recent fiscal year ended December 31, 2013 are subject to such review.
3. Agreements and Transactions with Affiliates
(a) Investment Adviser:
Aberdeen Asset Management Asia Limited (“AAMAL”) serves as the Fund’s investment adviser with respect to all investments. AAMAL is a direct wholly-owned subsidiary of Aberdeen Asset Management PLC. AAMAL receives as compensation for its advisory services from the Fund an annual fee, calculated weekly and paid quarterly, equal to 1.00% of the first $50 million of the Fund’s average weekly net assets, 0.95% of the next $50 million and 0.90% of amounts above
$100 million. For the six months ended June 30, 2014, AAMAL earned $464,574 for advisory services to the Fund.
(b) Fund Administration:
Effective April 1, 2014, Aberdeen Asset Management Inc. (“AAMI”), an affiliate AAMAL, is the Fund’s Administrator, pursuant to an Administration Agreement under which AAMI receives a fee from the Fund computed monthly and payable quarterly, at an annual fee rate of 0.08% of the Fund’s net monthly assets. For the period beginning April 1, 2014 and ended June 30, 2014, AAMI earned $20,256 from the Fund for administration services.
Prior to April 1, 2014, Brown Brothers Harriman and Co. (“BBH & Co.”) was the Administrator for the Fund and certain other funds advised by AAMAL and its affiliates (collectively the “Funds”). The Funds paid BBH & Co. a monthly administration and fund accounting service fee at an annual rate of 0.02% of the Funds’ aggregate assets up to $250 million, 0.015% for the next $250 million and 0.01% in excess of $500 million. The rate would have increased had BBH & Co. been retained to continue to serve as the Administrator to the Fund.
The Fund paid its pro rata portion of the fee based on its level of assets with a monthly minimum of $2,500. For the period beginning January 1, 2014 and ended March 31, 2014, BBH & Co. earned $7,397 from the Fund for administrative and fund accounting services.
(c) Investor Relations:
Under the terms of an Investor Relations Services Agreement, AAMI serves as the Fund’s investor relations services provider.
Pursuant to the terms of the Investor Relations Services Agreement, AAMI provides, among other things, objective and timely information to shareholders based on publicly-available information; provides information efficiently through the use of technology while offering shareholders immediate access to knowledgeable investor relations representatives; develops and maintains effective communications with investment professionals from a wide variety of firms; creates and maintains investor relations communication materials such as fund manager interviews, films and webcasts, published white papers, magazine articles and other relevant materials discussing the Fund’s investment results, portfolio positioning and outlook; develops and maintains effective communications with large institutional shareholders; responds to specific shareholder questions; and reports activities and results to the Board and management detailing insight into general shareholder sentiment.
For the six month period ended June 30, 2014, the Fund incurred fees of approximately $27,860 for investor relations services. Investor relations fees and expenses in the Statement of Operations include certain out-of-pocket expenses.
14 | Aberdeen Indonesia Fund, Inc. | |
Notes to Financial Statements (unaudited) (continued)
June 30, 2014
(d) Directors’ Purchase Plan:
Fifty percent (50%) of the annual retainer of the Independent Directors is invested in Fund shares and, at the option of each Independent Director, 100% of the annual retainer can be invested in shares of the Fund. During the six months ended June 30, 2014, there were no shares purchased pursuant to the Directors compensation plan. As of June 30, 2014, the Directors as a group owned less than 1% of the Fund’s outstanding shares.
4. Investment Transactions
Purchases and sales of investment securities (excluding short-term securities) for the six months ended June 30, 2014, were $2,776,564 and $13,459,298, respectively.
5. Capital
The authorized capital of the Fund is 100,000,000 shares of $0.001 par value common stock. As of June 30, 2014, there were 9,485,247 shares of common stock issued and outstanding.
On December 7, 2012, the Board of Directors announced that it declared the payment of an elective cash distribution to be paid in the amount of $2.27950 per share of common stock on January 31, 2013 to shareholders of record at the close of business on December 21, 2012. As announced, the distribution was payable in the Fund’s common stock. However, shareholders had the option to request that their distributions be paid in cash in lieu of common stock. The aggregate amount of cash distributions to all stockholders was limited to 20% of the aggregate dollar amount of the total distribution. Because cash distribution requests exceeded this limit, the Fund prorated the cash distribution among all stockholders who made such requests. Shareholders who requested cash distributions received $0.67042 per share or 29.41% of the distribution in cash and received the balance in the Fund’s common stock. For purposes of computing the stock portion of the dividend, the common stock distributed was valued at $12.43 per share, which equaled the average closing price of the Fund’s common shares on the NYSE MKT on January 23, 2013 and the two preceding trading days. Following the closing of the elective cash distribution, the Fund’s number of outstanding shares was 9,485,247.
6. Open Market Repurchase Program
The Board authorized, but does not require, Fund management to make open market purchases from time to time in an amount up to 10% of the Fund’s outstanding shares, in accordance with Rule 10b-18 under the Securities Exchange Act of 1934, as amended, and other applicable federal securities laws. Such purchases may be made when, in the reasonable judgment of Fund management, such repurchases may enhance shareholder value and when the Fund’s shares are trading at a discount to net asset value of 12% or more, subject to intraday
fluctuations that may result in repurchases at discounts below 12%. The Board has instructed Fund management to report repurchase activity to it regularly, and to post the number of shares repurchased on the Fund’s website on a monthly basis. For the six month period ended June 30, 2014, the Fund did not repurchase shares through this program.
7. Portfolio Investment Risks
(a) Risks Associated with Foreign Securities and Currencies:
Investments in securities of foreign issuers carry certain risks not ordinarily associated with investments in securities of U.S. issuers. These risks include future political and economic developments, and the possible imposition of exchange controls or other foreign governmental laws and restrictions. In addition, with respect to certain countries, there is the possibility of expropriation of assets, confiscatory taxation, and political or social instability or diplomatic developments, which could adversely affect investments in those countries.
Certain countries also may impose substantial restrictions on investments in their capital markets by foreign entities, including restrictions on investments in issuers of industries deemed sensitive to relevant national interests. These factors may limit the investment opportunities available and result in a lack of liquidity and high price volatility with respect to securities of issuers from developing countries. Foreign securities may also be harder to price than U.S. securities.
(b) Risks Associated with Indonesian Markets:
The limited liquidity of the Indonesian and other foreign securities markets may also affect the Fund’s ability to acquire or dispose of securities at a price and time that it wishes to do so. Accordingly, in periods of rising market prices, the Fund may be unable to participate in such price increases fully to the extent that it is unable to acquire desired portfolio positions quickly; conversely the Fund’s inability to dispose fully and promptly of positions in declining markets will cause its net asset value to decline as the value of unsold positions is marked to lower prices.
The Indonesian securities market is an emerging market characterized by a small number of company listings, high price volatility and a relatively illiquid secondary trading environment. These factors, coupled with restrictions on investment by foreigners and other factors, limit the supply of securities available for investment by the Fund. This will affect the rate at which the Fund is able to invest in Indonesian and other foreign securities, the purchase and sale prices for such securities and the timing of purchases and sales.
8. Contingencies
In the normal course of business, the Fund may provide general indemnifications pursuant to certain contracts and organizational
| Aberdeen Indonesia Fund, Inc. | 15 |
Notes to Financial Statements (unaudited) (concluded)
June 30, 2014
documents. The Fund’s maximum exposure under these arrangements is dependent on future claims that may be made against the Fund, and therefore, cannot be estimated; however, based on experience, the risk of loss from such claims is considered remote.
9. Tax Information
The U.S. federal income tax basis of the Fund’s investments and the net unrealized appreciation as of June 30, 2014 were as follows:
Cost | | Appreciation | | Depreciation | | Net
Unrealized
Appreciation | |
$67,171,906 | | $37,036,016 | | $(4,406,720) | | $32,629,296 | |
10. Subsequent Events
Management has evaluated the need for disclosures and/or adjustments resulting from subsequent events through the date the Financial Statements were issued. Based on this evaluation, no disclosures or adjustments were required to the Financial Statements as of June 30, 2014.
16 | Aberdeen Indonesia Fund, Inc. | |
Supplemental Information (unaudited)
Results of Annual Meeting of Shareholders
The Annual Meeting of Shareholders was held on Thursday, March 27, 2014 at 712 Fifth Avenue, 49th Floor, New York, New York. The description of the proposals and number of shares voted at the meeting are as follows:
1. To re-elect certain directors to the Board of Directors of the Fund:
| | Votes For | | Votes
Withheld | |
Lawrence J. Fox | | 4,196,748 | | 2,824,046 | |
Directors whose term of office continued beyond this meeting are as follows: Enrique R. Arzac, James J. Cattano and Steven N. Rappaport.
| Aberdeen Indonesia Fund, Inc. | 17 |
[THIS PAGE INTENTIONALLY LEFT BLANK]
[THIS PAGE INTENTIONALLY LEFT BLANK]
[THIS PAGE INTENTIONALLY LEFT BLANK]
Corporate Information
Directors Enrique R. Arzac, Chairman James J. Cattano Lawrence J. Fox Steven N. Rappaport Officers Christian Pittard, President Jeffrey Cotton, Vice President and Chief Compliance Officer Sofia Rosala, Deputy Chief Compliance Officer and Vice President Andrea Melia, Treasurer and Chief Financial Officer Megan Kennedy, Vice President and Secretary Alan Goodson, Vice President Joanne Irvine, Vice President Devan Kaloo, Vice President Jennifer Nichols, Vice President Nick Robinson, Vice President Lucia Sitar, Vice President Hugh Young, Vice President Sharon Ferrari, Assistant Treasurer Heather Hasson, Assistant Secretary Investment Adviser Aberdeen Asset Management Asia Limited
21 Church Street
#01-01 Capital Square Two
Singapore 049480 Administrator Aberdeen Asset Management Inc.
1735 Market Street, 32nd Floor
Philadelphia, PA 19103 | Custodian State Street Bank and Trust Company
1 Iron Street 5th Floor
Boston, MA 02210 Transfer Agent Computershare Trust Company, N.A.
P.O. Box 30170
College Station, TX 77842-3170 Independent Registered Public Accounting Firm PricewaterhouseCoopers LLP
300 Madison Avenue
New York, NY 10017 Legal Counsel Willkie Farr & Gallagher LLP
787 Seventh Avenue
New York, NY 10019 Investor Relations Aberdeen Asset Management Inc.
1735 Market Street, 32nd Floor
Philadelphia, PA 19103
1-866-839-5205
InvestorRelations@aberdeen-asset.com |

Aberdeen Asset Management Asia Limited
The accompanying Financial Statements as of June 30 2014, were not audited and accordingly, no opinion is expressed thereon.
Notice is hereby given in accordance with Section 23(c) of the Investment Company Act of 1940, as amended, that the Fund may purchase, from time to time, shares of its common stock in the open market.
Shares of Aberdeen Indonesia Fund, Inc. are traded on the NYSE MKT Exchange under the symbol “IF”. Information about the Fund’s net asset value and market price is available at www.aberdeenif.com.
This report, including the financial information herein, is transmitted to the shareholders of Aberdeen Indonesia Fund, Inc. for their general information only. It does not have regard to the specific investment objectives, financial situation and the particular needs of any specific person. Past performance is no guarantee of future returns.

*Diversification does not necessarily ensure return or protect against a loss.
Closed-end funds are traded on the secondary market through one of the stock exchanges. The Fund’s investment return and principal value will fluctuate so that an investor’s shares may be worth more or less than the original cost. Shares of closed-end funds may trade above (a premium) or below (a discount) the net asset value (NAV) of the fund’s portfolio. There is no assurance that the Fund will achieve its investment objective. Past performance does not guarantee future results. Foreign securities are more volatile, harder to price and less liquid than U.S. securities. They are subject to different accounting and regulatory standards, and political and economic risks. These risks may be enhanced in emerging market countries.
Aberdeen Asset Management (AAM) is the marketing name in the U.S. for the following affiliated, registered investment advisers: Aberdeen Asset Management Inc., Aberdeen Asset Managers Ltd, Aberdeen Asset Management Ltd and Aberdeen Asset Management Asia Ltd, each of which is wholly owned by Aberdeen Asset Management PLC. “Aberdeen” is a U.S. registered service trademark of Aberdeen Asset Management PLC.
IF-SEMI-ANNUAL
Item 2. Code of Ethics.
This item is inapplicable to semi-annual report on Form N-CSR.
Item 3. Audit Committee Financial Expert.
This item is inapplicable to semi-annual report on Form N-CSR.
Item 4. Principal Accountant Fees and Services.
This item is inapplicable to semi-annual report on Form N-CSR.
Item 5. Audit Committee of Listed Registrants.
This item is inapplicable to semi-annual report on Form N-CSR.
Item 6. Schedule of Investments.
(a) Schedule of Investments in securities of unaffiliated issuers as of close of the reporting period is included as part of the Report to Shareholders filed under Item 1 of this Form N-CSR.
(b) Not applicable.
Item 7. Disclosure of Proxy Voting Policies and Procedures for Closed-End Management Investment Companies.
This item is inapplicable to semi-annual report on Form N-CSR.
Item 8. Portfolio Managers of Closed-End Management Investment Companies.
(a) Not applicable to semi-annual report on Form N-CSR.
(b) During the period ended June 30, 2014, there were no changes in the Portfolio Managers.
Item 9. Purchases of Equity Securities by Closed-End Management Investment Company and Affiliated Purchasers.
Period | (a) Total Number of
Shares Purchased | (b) Average Price
Paid per Share | (c) Total Number
of Shares
Purchased as Part
of Publicly
Announced Plans
or Programs1 | (d) Maximum
Number of Shares
that May Yet Be
Purchased Under
the Plans or
Programs1 |
January 1 through January 31, 2014 | None | None | None | 827,192 |
February 1 through | None | None | None | 827,192 |
February 28, 2014 | | | | |
March 1 through March 31, 2014 | None | None | None | 827,192 |
April 1 through April 30, 2014 | None | None | None | 827,192 |
May 1 through May 31, 2014 | None | None | None | 827,192 |
June 1 through June 30, 2014 | None | None | None | 827,192 |
Total | None | None | None | -- |
1 The plan was authorized on December 6, 2011. The program authorizes management to make open market purchases from time to time in an amount up to 10% of the Fund’s outstanding shares. Such purchases may be made when the Fund’s shares are trading at a discount to net asset value of 12% or more. The plan does not have an expiration date. The number of shares in columns (c) and (d) represent the aggregate number of shares purchased under the plan at each month end and the total number of shares that may still be purchased under the plan at each month end, respectively.
Item 10. Submission of Matters to a Vote of Security Holders.
During the period ended June 30, 2014, there were no material changes to the procedures by which shareholders may recommend nominees to the Registrant’s Board of Directors.
Item 11. Controls and Procedures.
(a) The Registrant’s principal executive and principal financial officers, or persons performing similar functions, have concluded that the Registrant’s disclosure controls and procedures (as defined in Rule 30a-3(c) under the Investment Company Act of 1940 (the “Act”) (17 CFR 270.30a-3(c))) are effective, as of a date within 90 days of the filing date of the report that includes the disclosure required by this paragraph, based on the evaluation of these controls and procedures required by Rule 30a-3(b) under the Act (17 CFR 270.30a3(b)) and Rule 13a-15(b) or 15d-15(b) under the Securities Exchange Act of 1934, as amended (17 CFR 240.13a-15(b) or 240.15d15(b)).
(b) There were no changes in the Registrant’s internal control over financial reporting (as defined in Rule 30a-3(d) under the Act (17 CFR 270.30a-3(d))) that occurred during the Registrant’s last fiscal half-year that has materially affected, or is reasonably likely to materially affect, the Registrant’s internal control over financial reporting.
Item 12. Exhibits.
(a)(1) | Not applicable. |
| |
(a)(2) | Certifications pursuant to Rule 30a-2(a) under the Act and Section 302 of the Sarbanes-Oxley Act of 2002 are attached hereto |
| |
(a)(3) | Not applicable. |
| |
(b) | Certifications pursuant to Rule 30a-2(b) under the Act and Section 906 of the Sarbanes-Oxley Act of 2002 are attached hereto. |
SIGNATURES
Pursuant to the requirements of the Securities Exchange Act of 1934 and the Investment Company Act of 1940, the Registrant has duly caused this report to be signed on its behalf by the undersigned, thereunto duly authorized.
Aberdeen Indonesia Fund, Inc.
By: | /s/ Christian Pittard | |
| Christian Pittard, | |
| Principal Executive Officer of | |
| Aberdeen Indonesia Fund, Inc. | |
Date: September 3, 2014
Pursuant to the requirements of the Securities Exchange Act of 1934 and the Investment Company Act of 1940, this report has been signed below by the following persons on behalf of the Registrant and in the capacities and on the dates indicated.
By: | /s/ Christian Pittard | |
| Christian Pittard, | |
| Principal Executive Officer of | |
| Aberdeen Indonesia Fund, Inc. | |
Date: September 3, 2014
By: | /s/ Andrea Melia | |
| Andrea Melia, | |
| Principal Financial Officer of | |
| Aberdeen Indonesia Fund, Inc. | |
Date: September 3, 2014