UNITED STATES
SECURITIES AND EXCHANGE COMMISSION
Washington, D.C. 20549
FORM N-CSR
CERTIFIED SHAREHOLDER REPORT OF REGISTERED MANAGEMENT INVESTMENT COMPANIES
Investment Company Act file number: | 811-06024 |
| |
Exact name of registrant as specified in charter: | Aberdeen Indonesia Fund, Inc. |
| |
Address of principal executive offices: | 1735 Market Street, 32nd Floor Philadelphia, PA 19103 |
| |
Name and address of agent for service: | Ms. Andrea Melia Aberdeen Asset Management Inc. 1735 Market Street 32nd Floor Philadelphia, PA 19103 |
| |
Registrant’s telephone number, including area code: | 800-522-5465 |
| |
Date of fiscal year end: | December 31 |
| |
Date of reporting period: | June 30, 2013 |
Item 1 – Reports to Stockholders


Closed-end funds are traded on the secondary market through one of the stock exchanges. The Fund’s investment return and principal value will fluctuate so that an investor’s shares may be worth more or less than the original cost. Shares of closed-end funds may trade above (a premium) or below (a discount) the net asset value (NAV) of the fund’s portfolio. There is no assurance that the Fund will achieve its investment objective. Past performance does not guarantee future results. Foreign securities are more volatile, harder to price and less liquid than U.S. securities. They are subject to different accounting and regulatory standards, and political and economic risks. These risks may be enhanced in emerging market countries. Concentrating investments in the Asia-Pacific region subjects the fund to more volatility and greater risk of loss than geographically diverse funds.
Aberdeen Asset Management (AAM) is the marketing name in the U.S. for the following affiliated, registered investment advisers: Aberdeen Asset Management Inc., Aberdeen Asset Managers Limited, Aberdeen Asset Management Limited and Aberdeen Asset Management Asia Limited, each of which is wholly owned by Aberdeen Asset Management PLC. “Aberdeen” is a U.S. registered service trademark of Aberdeen Asset Management PLC.
Letter to Shareholders (unaudited)
Dear Shareholder,
We present this Semi-Annual Report which covers the activities of Aberdeen Indonesia Fund, Inc. (the “Fund”) for the six-month period ended June 30, 2013. The Fund’s primary investment objective is capital appreciation with income as a secondary objective, which the Fund seeks to achieve by investing primarily in Indonesian equity and debt securities.
Total Return Performance
For the six-month period ended June 30, 2013, the total return to shareholders of the Fund based on the net asset value (“NAV”) of the Fund, net of fees, was 2.22%, assuming reinvestment of dividends and distributions, versus a return of 6.05% for the Fund’s benchmark, the MSCI Indonesia Index.
Share Price and NAV
For the six-month period ended June 30, 2013, based on market price, the Fund’s total return was 1.29%, assuming reinvestment of dividends and distributions. The Fund’s share price increased 1.3% over the six months, from $11.67 on December 31, 2012 to $11.82 on June 30, 2013. The Fund’s share price on June 30, 2013 represented a discount of 11.4% to the NAV per share of $13.34 on that date, compared with a discount of 10.6% to the NAV per share of $13.05 on December 31, 2012.
Open Market Repurchase Program
The Fund’s policy is generally to buy back Fund shares on the open market when the Fund trades at certain discounts to NAV. During the six-month period ended June 30, 2013 and fiscal year ended December 31, 2012, the Fund did not repurchase any shares.
Portfolio Holdings Disclosure
The Fund files its complete schedule of portfolio holdings with the SEC for the first and third quarters of each fiscal year on Form N-Q. The Fund’s Forms N-Q are available on the SEC’s website at http://www.sec.gov and may be reviewed and copied at the SEC’s Public Reference Room in Washington, D.C. Information about the operation of the Public Reference Room may be obtained by calling 1-800-SEC-0330. The information on Form N-Q is also available to shareholders on the Fund’s website or upon request and without charge by calling Investor Relations toll-free at 1-866-839-5205.
Proxy Voting
A description of the policies and procedures that the Fund uses to determine how to vote proxies relating to portfolio securities, and
information regarding how the Fund voted proxies relating to portfolio securities during the most recent twelve months ended June 30 is available by August 30 of the relevant year: (i) upon request and without charge by calling Investor Relations toll-free at 1-866-839-5205; and (ii) on the SEC’s website at http://www.sec.gov.
Investor Relations Information
As part of our ongoing commitment to provide information to our shareholders, I invite you to visit the Fund on the web at www.aberdeenif.com. From this page, you can view monthly fact sheets and portfolio manager commentary, obtain distribution and performance information, view updated daily fact sheets courtesy of Morningstar®, conduct portfolio charting and view other timely data. Please take a look at Aberdeen’s award-winning Closed-End Fund Talk Channel, where you can watch fund manager web casts and view our latest short films. For replays of recent broadcasts or to register for upcoming events, please visit Aberdeen’s Closed-End Fund Talk Channel at www.aberdeenasset. us/aam.nsf/usClosed/aberdeentv.
Please ensure that you are enrolled in our email services, which feature timely news from Aberdeen portfolio managers located around the world. Enroll today at www.aberdeenasset. us/aam.nsf/usclosed/email and be among the first to receive the latest closed-end fund news, announcements of upcoming fund manager web casts, films and other information. Please note that Aberdeen does not share our shareholder information with any other organizations.
Please contact Aberdeen Asset Management Inc. by:
· Calling toll free at 1-866-839-5205 in the United States;
· Emailing InvestorRelations@aberdeen-asset.com;
· Visiting www.aberdeenif.com.
Yours sincerely,

Christian Pittard
President
| Aberdeen Indonesia Fund, Inc. | 1 |
Report of the Investment Adviser (unaudited)
Market Review
The Indonesian stock market rose for the six–month period ended June 30, 2013, despite increasing volatility towards period-end. Initially, equities rose amid still-healthy gross domestic product (GDP) growth, underpinned by robust foreign buying that propelled the market benchmark to successive highs.(1) Market sentiment was then roiled by worries that the U.S. Federal Reserve could curtail its bond-buying program in view of the recovering U.S. economy, triggering a major correction in June. Also, depressing equity prices were concerns over a prolonged credit crunch in China as Beijing grappled with “shadow banking.”(2) Foreign investors pulled out, causing the Indonesian stock market and the rupiah to fall sharply. Subsequent backpedalling by central banks in both China and the U.S. aided a late rebound, and the MSCI Indonesia Index,(3) the market benchmark, managed to hang on to its early gains in spite of the sell-off. Looking ahead, investor sentiment is likely to stay vulnerable to many of the same concerns from the past six-month period. Debt issues in the US are still unresolved, and the International Monetary Fund recently cut global growth estimates on continued weakness in the Eurozone. Domestically, though, Indonesia’s fundamentals remain relatively attractive. Jakarta’s minimum wage hike and the corresponding increase in disposable incomes should bode well for domestic demand. On the other hand, we believe the current account deficit is likely to persist into 2013 and continue to put pressure on the local currency.
Fund Performance Review
The Fund underperformed versus its benchmark, the MSCI Indonesia Index, for the reporting period, as overall negative stock selection outweighed the positive contribution of asset allocation.
Among the individual stock detractors was the Fund’s holding in Bank OCBC NISP, as the lender’s share price weakened despite its good fundamentals, with loan growth and asset quality still robust, in our view. The position in Holcim Indonesia also had a negative impact, as
the cement company’s first-quarter 2013 earnings slipped amid falling sales and rising costs. Additionally, Jardine Cycle and Carriage detracted from Fund performance as the company’s profits were hurt by intense competition and wage pressures, while weak demand and rising costs weighed on the heavy equipment, agriculture and infrastructure segments. Despite the cyclical weakness, we maintain our view that the company, through its interest in Indonesian conglomerate Astra International, is poised to benefit from the nation’s long-term growth potential.
Conversely, Multi Bintang Indonesia contributed to performance as the brewer’s shares were lifted by double-digit growth in its core beer business and good progress in the soft drinks segment. Also benefiting Fund performance was the holding in Astra International as its shares rallied in tandem with the market earlier in the year. Bank Permata’s shares also performed well, buoyed by continued growth in loans and net interest income, while its asset quality remained solid, in our view.
Outlook
Looking ahead, we believe that the Indonesian stock market will continue to be buffeted by concerns over the slowing economy. In particular, the government, which faces elections next year, may potentially need to balance both appeasing voters disgruntled by higher fuel prices and keeping the economy on its growth trajectory. In our opinion, doing neither raises the specter of widespread social unrest that has already affected other emerging markets, such as Brazil and Turkey. However, we feel there is room for some optimism. The Asian Development Bank believes that the country’s prospects remain intact and that it will emerge from its travails unscathed.(4) In the longer term, we believe that the cut in the fuel subsidy is a good thing: government revenue can be redeployed to improve the country’s creaky infrastructure, which is causing bottlenecks and hampering growth.
Aberdeen Asset Management Asia Limited
(1) | Source for GDP data: Badan Pusat Statistik Indonesia, June 2013. |
| |
(2) | A “shadow banking system” is composed of financial intermediaries involved in facilitating the creation of credit across the global financial system, but whose members are not subject to regulatory oversight. The shadow banking system also refers to unregulated activities by regulated institutions. |
| |
(3) | The MSCI Indonesia Index is designed to track the performance of Indonesian securities listed on the Indonesia Stock Exchange (IDX). The MSCI Indonesia Index is a price return index which takes into account the price performance of its constituents. The MSCI Indonesia Index is constructed based on the MSCI Global Investable Market Indices Methodology and targets a free float-adjusted market capitalization coverage of 85%. Indexes are unmanaged and have been provided for comparison purposes only. No fees or expenses are reflected. You cannot invest directly in an index. |
| |
(4) | Forecasts and estimates are offered as opinion and are not reflective of potential performance, are not guaranteed and actual events or results may differ materially. |
2 | Aberdeen Indonesia Fund, Inc. | |
Dividend Reinvestment and Cash Purchase Plan (unaudited)
Computershare Trust Company, N.A. (“Computershare”), the Fund’s transfer agent, sponsors and administers a Dividend Reinvestment and Direct Stock Purchase Plan (the “Plan”), which is available to shareholders.
The Plan allows registered shareholders and first time investors to buy and sell shares and automatically reinvest dividends and capital gains through the transfer agent. This may be a cost-effective way to invest in the Fund.
Please note that for both purchases and reinvestment purposes, shares will be purchased in the open market at the current share price and cannot be issued directly by the Fund.
For more information about the Plan and a brochure that includes the terms and conditions of the Plan, please call Computershare at 1-800-647-0584 or visit www.computershare.com/buyaberdeen.
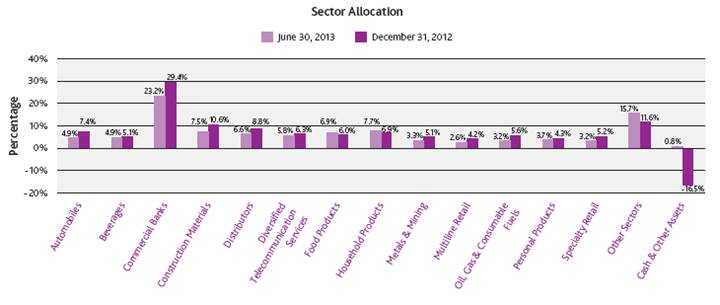
Portfolio Summary (unaudited)
June 30, 2013
The following chart summarizes the composition of the Fund’s portfolio, in industry classification standard sectors, expressed as a percentage of net assets. An industry classification standard sector can include more than one industry group. As of June 30, 2013, the Fund did not have more than 25% of its assets invested in any industry group. The sectors, as classified by S&P’s Global Industry Classification Standard Sectors, are comprised of several industry groups.
The following chart summarizes the composition of the Fund’s portfolio, in sector classification, expressed as a percentage of net assets.
| Aberdeen Indonesia Fund, Inc. | 3 |
Top 10 Equity Holdings (unaudited)
The following were the Fund’s top ten holdings, by Issuer, as of June 30, 2013.
| | | | | | | |
| | Holding | | Sector | | Percent of Net Assets | |
| | | | | | | |
1. | | PT Bank Permata Tbk | | Commercial Banks | | 10.1% | |
2. | | PT Bank OCBC NISP Tbk | | Commercial Banks | | 8.5% | |
3. | | PT Unilever Indonesia Tbk | | Household Products | | 7.7% | |
4. | | Jardine Cycle & Carriage Limited | | Distributors | | 6.6% | |
5. | | PT Holcim Indonesia Tb | | Construction Materials | | 5.8% | |
6. | | PT Astra International Tbk | | Automobiles | | 4.9% | |
7. | | PT Multi Bintang Indonesia Tbk | | Beverages | | 4.9% | |
8. | | MP Evans Group PLC | | Food Products | | 4.2% | |
9. | | PT Mandom Indonesia Tbk | | Personal Products | | 3.7% | |
10. | | PT Vale Indonesia Tbk | | Metals & Mining | | 3.3% | |
Average Annual Returns (unaudited)
The following table summarizes Fund performance compared to the MSCI Indonesia Index, the Fund’s benchmark, for the 1-year, 3-year, 5-year and 10-year periods ended June 30, 2013.
| | | | | | | | |
| | 1 Year | | 3 Years | | 5 Years | | 10 Years |
| | | | | | | | |
Net Asset Value (NAV) | | 13.89% | | 15.74% | | 14.26% | | 22.59% |
Market Value | | 10.73% | | 15.51% | | 14.86% | | 23.34% |
MSCI Indonesia Index | | 15.25% | | 11.66% | | 12.29% | | 25.86% |
Aberdeen Asset Management Asia Limited may waive fees and/or reimburse expenses, but has made no determination to do so. Returns represent past performance. Total investment return at net asset value is based on changes in the net asset value of Fund shares and assumes reinvestment of dividends and distributions, if any, at market prices pursuant to the dividend reinvestment program sponsored by the Fund’s transfer agent. Total investment return at market value is based on changes in the market price at which the shares traded on the NYSE MKT during the period and assumes reinvestment of dividends and distributions, if any, at market prices pursuant to the dividend reinvestment program sponsored by the Fund’s transfer agent. The Fund’s annual total return is based on the reported NAV on June 30, 2013. Because the Fund’s shares trade in the stock market based on investor demand, the Fund may trade at a price higher or lower than its NAV. Therefore, returns are calculated based on both market price and NAV. Past performance is no guarantee of future results. The performance information provided does not reflect the deduction of taxes that a shareholder would pay on distributions received from the Fund. The current performance of the Fund may be lower or higher than the figures shown. The Fund’s yield, return, market price and NAV will fluctuate. Performance information current to the most recent month-end is available by calling 866-839-5205.
The annualized gross and net expense ratios are 1.40%.
4 | Aberdeen Indonesia Fund, Inc. | |
Portfolio of Investments (unaudited)
No. of
Shares | | Description | | Value | |
LONG-TERM EQUITY SECURITIES—99.2% | | | |
INDONESIA—88.9% | | | |
AUTOMOBILES—4.9% | | | |
8,831,610 | | PT Astra International Tbk(a) | | $ 6,208,488 | |
BEVERAGES—4.9% | | | |
51,000 | | PT Multi Bintang Indonesia Tbk(a) | | 6,167,425 | |
COMMERCIAL BANKS—21.0% | | | |
3,030,000 | | PT Bank Central Asia Tbk(a) | | 3,037,520 | |
81,468,617 | | PT Bank OCBC NISP Tbk(b) | | 10,670,952 | |
76,993,816 | | PT Bank Permata Tbk(b) | | 12,799,980 | |
| | | | 26,508,452 | |
CONSTRUCTION MATERIALS—7.5% | | | |
29,969,000 | | PT Holcim Indonesia Tbk(a) | | 7,374,783 | |
881,000 | | PT Indocement Tunggal Prakarsa Tbk(a) | | 2,163,292 | |
| | | | 9,538,075 | |
DIVERSIFIED TELECOMMUNICATION SERVICES—5.8% | | | |
3,550,560 | | PT Telekomunikasi Indonesia Tbk(a) | | 3,954,111 | |
6,928,000 | | PT XL Axiata Tbk(a) | | 3,360,791 | |
| | | | 7,314,902 | |
FOOD & STAPLES RETAILING—1.2% | | | |
3,874,000 | | PT Hero Supermarket Tbk(a)(b) | | 1,472,411 | |
FOOD PRODUCTS—5.4% | | | |
655,240 | | MP Evans Group PLC(a)(c) | | 5,307,944 | |
11,200,000 | | PT Austindo Nusantara Jaya(b) | | 1,467,003 | |
| | | | 6,774,947 | |
GAS UTILITIES—2.9% | | | |
6,325,500 | | PT Perusahaan Gas Negara Persero Tbk(a) | | 3,656,712 | |
HOUSEHOLD PRODUCTS—7.7% | | | |
3,168,000 | | PT Unilever Indonesia Tbk(a) | | 9,784,151 | |
MACHINERY—2.2% | | | |
1,550,000 | | PT United Tractors Tbk(a) | | 2,829,678 | |
MARINE—1.8% | | | |
38,709,000 | | PT Wintermar Offshore Marine Tbk | | 2,262,088 | |
METALS & MINING—3.3% | | | |
20,732,000 | | PT Vale Indonesia Tbk(a) | | 4,207,585 | |
MULTILINE RETAIL—2.6% | | | |
24,983,000 | | PT Ramayana Lestari Sentosa Tbk(a)(b) | | 3,257,028 | |
OIL, GAS & CONSUMABLE FUELS—3.2% | | | |
1,454,500 | | PT Indo Tambangraya Megah(a) | | 4,109,262 | |
PERSONAL PRODUCTS—3.7% | | | |
4,179,000 | | PT Mandom Indonesia Tbk | | 4,736,902 | |
PHARMACEUTICALS—2.0% | | | |
125,000 | | PT Merck Tbk(d) | | 2,500,000 | |
| Aberdeen Indonesia Fund, Inc. | 5 |
Portfolio of Investments (unaudited) (continued)
No. of
Shares | | Description | | Value | |
SPECIALTY RETAIL—3.2% | | | |
53,812,000 | | PT Ace Hardware Indonesia Tbk(a) | | $ 4,002,328 | |
TEXTILES, APPAREL & LUXURY GOODS—2.9% | | | |
428,000 | | PT Sepatu Bata Tbk(d) | | 3,665,491 | |
TRADING COMPANIES & DISTRIBUTORS—2.7% | | | |
6,543,000 | | PT AKR Corporindo Tbk(a) | | 3,473,487 | |
| | Total Indonesia (cost $64,131,473) | | 112,469,412 | |
SINGAPORE—10.3% | | | |
COMMERCIAL BANKS—2.2% | | | |
169,660 | | Oversea-Chinese Banking Corp. Limited(a) | | 1,333,720 | |
91,013 | | United Overseas Bank Limited(a) | | 1,421,269 | |
| | | | 2,754,989 | |
DISTRIBUTORS—6.6% | | | |
249,000 | | Jardine Cycle & Carriage Limited(a)(e) | | 8,325,077 | |
FOOD PRODUCTS—1.5% | | | |
658,000 | | Petra Foods Limited(a) | | 1,964,479 | |
| | Total Singapore (cost $7,925,970) | | 13,044,545 | |
| | Total Long-Term Equity Securities (cost $72,057,443) | | 125,513,957 | |
Principal
Amount
(000’s) | | | | | |
SHORT-TERM INVESTMENT—0.7% | | | |
GRAND CAYMAN—0.7% | | | |
$843 | | Wells Fargo, overnight deposit, 0.03%, 07/01/13 (cost $843,000) | | 843,000 | |
| | Total Investments—99.9% (cost $72,900,443) | | 126,356,957 | |
| | Cash and Other Assets in Excess of Liabilities—0.1% | | 113,542 | |
| | Net Assets—100.0% | | $126,470,499 | |
(a) | Security was fair valued as of June 30, 2013. Security is valued at fair value as determined in good faith by, or under the direction of, the Board of Directors (the “Board”) under procedures established by the Board. See Note 2(a) of the accompanying Notes to Financial Statements. |
(b) | Non-income producing security. |
(c) | UK listed security, but majority of the securities business is conducted in Indonesia. |
(d) | Illiquid Security. |
(e) | Singapore listed security, but majority of the securities business is conducted in Indonesia. |
See Notes to Financial Statements.
6 | Aberdeen Indonesia Fund, Inc. | |
Statement of Assets and Liabilities (unaudited)
Assets | | | |
Investments, at value (Cost $72,900,443) | | $ | 126,356,957 | |
Cash (including $330,906 of foreign currencies with a cost of $332,665) | | 331,572 | |
Investments sold receivable | | 120,540 | |
Dividends receivable | | 115,422 | |
Total assets | | 126,924,491 | |
Liabilities | | | |
Investment advisory fees payable (Note 3) | | 319,762 | |
Directors’ fees payable | | 42,494 | |
Investor relations fees payable (Note 3) | | 14,763 | |
Administration fees payable (Note 3) | | 4,876 | |
Accrued expenses and other liabilities | | 72,097 | |
Total liabilities | | 453,992 | |
| | | |
Net Assets | | $ | 126,470,499 | |
Net Assets consist of | | | |
Capital stock, $0.001 par value (Note 5) | | $ | 9,485 | |
Paid-in capital | | 63,297,278 | |
Undistributed net investment income | | 763,160 | |
Accumulated net realized gain on investments and foreign currency related transactions | | 8,952,238 | |
Net unrealized appreciation on investments and foreign currency translation | | 53,448,338 | |
Net Assets applicable to shares outstanding | | $ | 126,470,499 | |
Net asset value per share, based on 9,485,247 shares issued and outstanding | | $ | 13.33 | (a) |
(a) The NAV shown differs from the reported NAV on June 30, 2013 due to financial statement rounding and/or financial statement adjustments.
See Notes to Financial Statements.
| Aberdeen Indonesia Fund, Inc. | 7 |
Statement of Operations (unaudited)
For the Six-Month Period Ended June 30, 2013
Investment Income | | | |
Income: | | | |
Dividends and other income | | $ 1,799,610 | |
Less: Foreign taxes withheld | | (214,652 | ) |
Total investment income | | 1,584,958 | |
Expenses: | | | |
Investment advisory fees (Note 3) | | 610,304 | |
Directors’ fees and expenses | | 64,289 | |
Custodian’s fees and expenses | | 60,814 | |
Reports to shareholders and proxy solicitation | | 29,435 | |
Investor relations fees and expenses (Note 3) | | 28,810 | |
Legal fees and expenses | | 27,223 | |
Independent auditor’s fees and expenses | | 16,316 | |
Administration fees (Note 3) | | 14,875 | |
Transfer agent’s fees and expenses | | 14,524 | |
Insurance expense | | 13,924 | |
Miscellaneous | | 9,870 | |
Total expenses | | 890,384 | |
| | | |
Net investment income | | 694,574 | |
Net Realized and Unrealized Gain/(Loss) on Investments and
Foreign Currency Related Transactions | | | |
Net realized gain/(loss) on: | | | |
Investment transactions | | 6,949,409 | |
Foreign currency transactions | | (34,979 | ) |
Net change in unrealized depreciation of investments and foreign currency translation | | (4,195,490 | ) |
Net realized and unrealized gain on investments and foreign currency transactions | | 2,718,940 | |
Net Increase in Net Assets Resulting from Operations | | $ 3,413,514 | |
See Notes to Financial Statements.
8 | Aberdeen Indonesia Fund, Inc. | |
Statements of Changes in Net Assets
| | For the
Six-Month Period
Ended
June 30, 2013
(unaudited) | | For the
Year Ended
December 31, 2012 | |
Increase/(Decrease) in Net Assets | | | | | |
Operations: | | | | | |
Net investment income | | $ 694,574 | | $ 1,136,885 | |
Net realized gain on investments and foreign currency related transactions | | 6,914,430 | | 20,006,901 | |
Net change in unrealized appreciation/(depreciation) on investments and foreign currency translations | | (4,195,490 | ) | 866,663 | |
Net increase in net assets resulting from operations | | 3,413,514 | | 22,010,449 | |
Dividends and distributions to shareholders from: | | | | | |
Net investment income | | — | | (922,815 | ) |
Net realized gain on investments | | — | | (19,627,948 | ) |
Total dividends and distributions to shareholders | | — | | (20,550,763 | ) |
Capital share transactions: | | | | | |
Issuance of 1,213,325 and 0 shares due to stock distribution (Note 5) | | 15,081,631 | | — | |
Total increase in net assets resulting from operations | | 18,495,145 | | 1,459,686 | |
Net Assets | | | | | |
Beginning of period | | 107,975,354 | | 106,515,668 | |
End of period* | | $126,470,499 | | $107,975,354 | |
* Includes undistributed net investment income of $763,160 and $68,586, respectively.
See Notes to Financial Statements.
| Aberdeen Indonesia Fund, Inc. | 9 |
Financial Highlights
| | For the
Six-Month
Period Ended
June 30, 2013 | | For the Fiscal Years Ended December 31, | |
| | (unaudited) | | 2012 | | 2011 | | 2010 | | 2009 | | 2008 | |
| | | | | | | | | | | | | |
PER SHARE OPERATING PERFORMANCE(a) | | | | | | | | | | | | | |
Net asset value, beginning of period | | $13.05 | | $12.88 | | $14.39 | | $10.17 | | $5.68 | | $12.89 | |
Net investment income | | 0.07 | | 0.14 | | 0.16 | | 0.07 | | 0.06 | | 0.09 | |
Net realized and unrealized gain/(loss) on investments and foreign currency related transactions | | 0.31 | | 2.51 | | (0.51 | ) | 5.19 | | 5.63 | (b) | (7.23 | ) |
Net increase/(decrease) in net assets resulting from operations | | 0.38 | | 2.65 | | (0.35 | ) | 5.26 | | 5.69 | | (7.14 | ) |
Dividends and distributions to shareholders: | | | | | | | | | | | | | |
Net investment income | | — | | (0.11 | ) | (0.17 | ) | (0.07 | ) | (0.03 | ) | (0.07 | ) |
Net realized gain | | — | | (2.37 | ) | (0.99 | ) | (0.97 | ) | (1.17 | ) | — | |
Total dividends and distributions to shareholders | | — | | (2.48 | ) | (1.16 | ) | (1.04 | ) | (1.20 | ) | (0.07 | ) |
Anti-dilutive impact due to stock distribution | | (0.10 | ) | — | | — | | — | | — | | — | |
Net asset value, end of period | | $13.33 | | $13.05 | | $12.88 | | $14.39 | | $10.17 | | $5.68 | |
Market value, end of period | | $11.82 | | $11.67 | | $11.78 | | $13.31 | | $9.50 | | $5.10 | |
Total Investment Return Based on:(c) | | | | | | | | | | | | | |
Market value | | 1.29% | | 19.00% | | (3.05% | ) | 51.35% | | 107.82% | | (56.94% | ) |
Net asset value | | 2.15% | (d) | 21.71% | | (1.95% | ) | 52.85% | | 99.76% | | (55.32% | ) |
Ratio/Supplementary Data | | | | | | | | | | | | | |
Net assets, end of period (000 omitted) | | $126,470 | | $107,975 | | $106,516 | | $119,035 | | $84,135 | | $47,002 | |
Average net assets (000 omitted) | | $128,625 | | $118,819 | | $116,435 | | $105,572 | | $67,781 | | $81,652 | |
Ratio of expenses to average net assets, net of fee waivers | | 1.40% | (e) | 1.42% | | 1.43% | | 1.52% | | 1.57% | | 1.62% | |
Ratio of net investment income to average net assets | | 1.09% | (e) | 0.96% | | 1.12% | | 0.54% | | 0.67% | | 0.95% | |
Portfolio turnover rate | | 6.32% | (f) | 16.64% | | 5.15% | | 10.20% | | 88.34% | | 33.05% | |
(a) | Based on average shares outstanding. |
| |
(b) | The investment adviser fully reimbursed the Fund for a loss on a transaction not meeting the Fund’s investment guidelines, which otherwise would have reduced the amount by $0.02. |
| |
(c) | Total investment return is calculated assuming a purchase of common stock on the first day and a sale on the last day of each reporting period. Dividends and distributions, if any, are assumed, for purposes of this calculation to be reinvested at prices obtained under the Fund’s dividend reinvestment plan. Total investment return does not reflect brokerage commissions. |
| |
(d) | The total return shown above includes the impact of financial statement rounding of the NAV per share. |
| |
(e) | Annualized. |
| |
(f) | Not annualized. |
See Notes to Financial Statements.
10 | Aberdeen Indonesia Fund, Inc. | |
Notes to Financial Statements (unaudited)
1. Organization
Aberdeen Indonesia Fund, Inc. (the “Fund”) was incorporated in Maryland on January 8, 1990 and commenced investment operations on March 9, 1990. The Fund is registered under the Investment Company Act of 1940, as amended (the “1940 Act”), as a closed-end, non-diversified management investment company. The Fund trades on the NYSE MKT under the ticker symbol “IF”.
The Fund seeks long-term capital appreciation as a primary objective and income as a secondary objective by investing primarily in Indonesian equity and debt securities.
2. Significant Accounting Policies
The following is a summary of significant accounting policies followed by the Fund in the preparation of its financial statements. The financial statements of the Fund are prepared in accordance with accounting principles generally accepted in the United States of America (“GAAP”). The preparation of financial statements requires management to make estimates and assumptions that affect the reported amounts of assets and liabilities, disclosure of contingent assets and liabilities at the date of the financial statements, and the reported amounts of income and expenses for the period. Actual results could differ from those estimates. The U.S. Dollar is used as both the functional and reporting currency.
(a) Security Valuation:
The Fund is required to value its securities at fair value, which is defined as the price that would be received to sell an asset or paid to transfer a liability in an orderly transaction between market participants at the measurement date.
Equity securities that are traded on an exchange are valued at the last quoted sale price on the principal exchange on which the security is traded at the “Valuation Time”, subject to application, when appropriate, of the valuation factors described in the paragraph below. The Valuation Time is as of the close of regular trading on the New York Stock Exchange (usually 4:00 p.m. Eastern Time). In the absence of a sale price, the security is valued at the mean of the bid/ask price quoted at the close on the principal exchange on which the security is traded. Securities traded on the NASDAQ are valued at the NASDAQ official closing price. Closed-end funds and exchange-traded funds (“ETFs”) are valued at the market price of the security at the Valuation Time. A security using any of these pricing methodologies is determined as a Level 1 investment.
Foreign equity securities that are traded on foreign exchanges that close prior to the Valuation Time are valued by applying valuation factors to the last sale price or the mean price as noted above. Valuation factors are provided by an independent pricing service provider. These valuation factors are used when pricing the Fund’s
portfolio holdings to estimate market movements between the time markets close and the time the Fund values such foreign securities. When the prices with the application of valuation factors are utilized, the value assigned to the foreign securities may not be the same as quoted or published prices of the securities on their primary markets. These valuation factors are based on inputs, such as depositary receipts, S&P 500 Index/S&P 500 Futures, Nikkei 225 Futures, sector indices/ETFs, exchange rates, and historical opening and closing prices of each security. If the pricing service is unable to provide a valuation factor, or if the valuation factor falls below a predetermined threshold, the security is valued at the last sale price. A security that applies a valuation factor is determined as a Level 2 investment. When no valuation factor is applied, the security is determined as a Level 1 investment.
In the event that a security’s market quotation is not readily available or is deemed unreliable, the fair value of a security is determined by the Fund’s Pricing Committee (which is appointed by the Board of Directors), taking into account the relevant factors and surrounding circumstances. A security that has been fair valued may be classified as Level 2 or Level 3 depending on the nature of the inputs.
In accordance with the authoritative guidance on fair value measurements and disclosures under GAAP, the Fund discloses the fair value of its investments in a hierarchy that classifies the inputs to valuation techniques used to measure the fair value. The hierarchy assigns Level 1 measurements to valuations based upon unadjusted quoted prices in active markets for identical assets, Level 2 measurements to valuations based upon adjusted quoted prices in active markets for identical assets and Level 3 measurements to valuations based upon unobservable inputs that are significant to the valuation. Observable inputs are inputs that reflect the assumptions market participants would use in pricing the asset or liability, which are based on market data obtained from sources independent of the reporting entity. Unobservable inputs are inputs that reflect the reporting entity’s own assumptions about the assumptions market participants would use in pricing the asset or liability developed based on the best information available in the circumstances. The three-tier hierarchy of inputs is summarized below:
Level 1 – quoted prices in active markets for identical investments;
Level 2 – other significant observable inputs (including quoted prices for similar securities, interest rates, prepayment speeds, credit risk,etc); or
Level 3 – significant unobservable inputs (including the Fund’s own assumptions in determining the fair value of investments).
A financial instrument’s level within the fair value hierarchy is based upon the lowest level of any input that is significant to the fair value measurement
| Aberdeen Indonesia Fund, Inc. | 11 |
Notes to Financial Statements (unaudited) (continued)
The following is a summary of the inputs used as of June 30, 2013 in valuing the Fund’s investments carried at fair value. The inputs or methodology used for valuing securities are not necessarily an indication of the risk associated with investing in those securities. Refer to the Portfolio of Investments for a detailed breakout of the security types:
Investments, at value | | Level 1 | | Level 2 | | Level 3 | | Balance as of
06/30/2013 | |
Long-Term Investments | | | | | | | | | |
Commercial Banks | | $23,470,932 | | $5,792,509 | | $ — | | $29,263,441 | |
Food Products | | 1,467,003 | | 5,307,944 | | — | | 6,774,947 | |
Marine | | 2,262,088 | | — | | — | | 2,262,088 | |
Other | | — | | 83,547,990 | | — | | 83,547,990 | |
Textiles, Apparel & Luxury Goods | | — | | — | | 3,665,491 | | 3,665,491 | |
Short-Term Investments | | — | | 843,000 | | — | | 843,000 | |
Total | | $27,200,023 | | $95,491,443 | | $3,665,491 | | $126,356,957 | |
Amounts listed as “–” are $0 or round to $0.
For movements between the levels within the fair value hierarchy, the Fund has adopted a policy of recognizing transfers at the end of each period. As described above, certain foreign securities are valued utilizing an independent pricing service to reflect any significant market movements between the time the Fund values such foreign securities and the earlier closing of foreign markets. For some securities, if the pricing service is unable to provide a valuation factor, the utilization of these procedures may result in transfers between Level 1 and Level 2. For the six-month period ended June 30, 2013, securities issued by PT Bank Permata Tbk and PT Wintermar Offshore Marine Tbk, in the amount of $12,799,980 and $2,262,088 respectively, transferred from Level 2 to Level 1 because there was not a fair value factor applied at June 30, 2013. During the six-month period ended June 30, 2013, the securities issued by PT Sepatu Bata Tbk, in the amount of $3,665,491, remained Level 3 as the security was not being actively priced and was fair valued by the Fund’s Pricing Committee using the last available mean price with no adjustment.
For the six-month period ended June 30, 2013, the securities issued by MP Evans Group PLC and Multi Bintang Indonesia, in the amount of $5,307,944 and $6,167,425, respectively, transferred from Level 1 to Level 2 because there was a fair value factor applied at June 30, 2013. For the six-month period ended June 30, 2013, there have been no significant changes to the fair valuation methodologies.
The following is a reconciliation of investments in which significant unobservable inputs (Level 3) were used in determining value:
Investments, at value | | Balance
as of
12/31/2012 | | Accrued
discounts/
premiums | | Realized
gain/(loss) | | Change in
unrealized
appreciation/
(depreciation) | | Capital
Contributed | | Distributions/
Sales | | Transfers
into Level 3 | | Transfers
out of
Level 3 | | Balance
as of
6/30/2013 | |
PT Sepatu Bata Tbk | | $2,509,157 | | $– | | $– | | $1,156,334 | | $– | | $– | | $– | | $– | | $3,665,491 | |
Total | | $2,509,157 | | $– | | $– | | $1,156,334 | | $– | | $– | | $– | | $– | | $3,665,491 | |
Change in unrealized appreciation/depreciation relating to Level 3 investments still held at June 30, 2013 is $1,156,334
12 | Aberdeen Indonesia Fund, Inc. | |
Notes to Financial Statements (unaudited) (continued)
(b) Short-Term Investment:
The Fund sweeps available cash into a short-term time deposit available through Brown Brothers Harriman & Co. (“BBH & Co.”), the Fund’s custodian. The short-term time deposit is a variable rate account classified as a short-term investment.
(c) Foreign Currency Transactions:
Foreign currency amounts are translated into U.S. Dollars on the following basis:
(I) market value of investment securities, other assets and liabilities at the rate of exchange at the Valuation Time; and
(II) purchases and sales of investment securities, income and expenses at the relevant rates of exchange prevailing on the respective dates of such transactions.
The Fund does not isolate that portion of gains and losses on investments in equity securities which is due to changes in the foreign exchange rates from that which is due to changes in market prices of equity securities. Accordingly, realized and unrealized foreign currency gains and losses with respect to such securities are included in the reported net realized and unrealized gains and losses on investment transactions balances.
The Fund reports certain foreign currency related transactions and foreign taxes withheld on security transactions as components of realized gains for financial reporting purposes, whereas such foreign currency related transactions are treated as ordinary income for U.S. federal income tax purposes.
Net unrealized currency gains or losses from valuing foreign currency denominated assets and liabilities at period-end exchange rates are reflected as a component of net unrealized appreciation/depreciation in value of investments, and translation of other assets and liabilities denominated in foreign currencies.
Net realized foreign currency transactions represent foreign exchange gains and losses from transactions in foreign currencies and forward foreign currency contracts, exchange gains or losses realized between the trade date and settlement date on security transactions, and the difference between the amounts of interest and dividends recorded on the Fund’s books and the U.S. Dollar equivalent of the amounts actually received.
Foreign security and currency transactions may involve certain considerations and risks not typically associated with those of domestic origin, including unanticipated movements in the value of the foreign currency relative to the U.S. Dollar. Generally, when the U.S. Dollar rises in value against a foreign currency, the Fund’s investments
denominated in that a currency will lose value because its currency is worth fewer U.S. Dollars; the opposite effect occurs if the U.S. Dollar falls in relative value.
(d) Security Transactions and Investment Income:
Securities transactions are recorded on the trade date. Realized and unrealized gains/(losses) from security and currency transactions are calculated on the identified cost basis. Dividend income is recorded on the ex-dividend date except for certain dividends on foreign securities, which are recorded as soon as the Fund is informed after the ex-dividend date. Interest income is recorded on an accrual basis. Expenses are recorded on an accrual basis.
(e) Distributions:
On an annual basis, the Fund intends to distribute its net realized capital gains, if any, by way of a final distribution to be declared during the calendar quarter ending December 31. Dividends and distributions to shareholders are recorded on the ex-dividend date. Dividends and distributions to shareholders are determined in accordance with federal income tax regulations, which may differ from GAAP. These differences are primarily due to differing treatments for foreign currencies.
(f) Federal Income Taxes:
The Fund intends to qualify or continue to qualify as a “regulated investment company” by complying with the provisions available to certain investment companies, as defined in Subchapter M of the Internal Revenue Code of 1986, as amended (“IRC”), and to make distributions of net investment income and net realized capital gains sufficient to relieve the Fund from all, or substantially all, federal income taxes. Therefore, no federal income tax provision is required.
The Fund recognizes the tax benefits of uncertain tax positions only where the position is “more likely than not” to be sustained assuming examination by tax authorities. Management of the Fund has concluded that there are no significant uncertain tax positions that would require recognition in the financial statements. Since tax authorities can examine previously filed tax returns, the Fund’s U.S. federal tax returns for each of the prior four years up to the year ended December 31, 2012 are subject to such review.
3. Agreements and Transactions With Affiliates
(a) Investment Adviser:
Aberdeen Asset Management Asia Limited (“AAMAL”) serves as the Fund’s investment adviser with respect to all investments. AAMAL is a direct wholly-owned subsidiary of Aberdeen Asset Management PLC. AAMAL receives as compensation for its advisory services from the Fund an annual fee, calculated weekly and paid quarterly, equal to
| Aberdeen Indonesia Fund, Inc. | 13 |
Notes to Financial Statements (unaudited) (continued)
1.00% of the first $50 million of the Fund’s average weekly net assets, 0.95% of the next $50 million and 0.90% of amounts above $100 million. For the six-month period ended June 30, 2013, AAMAL earned $610,304 for advisory services to the Fund.
(b) Fund Administration:
BBH & Co. is the Administrator for the Fund and certain other funds advised by AAMAL and its affiliates (collectively the “Funds”). The Funds pay BBH & Co. a monthly administration and fund accounting service fee at an annual rate of 0.02% of the Funds’ aggregate assets up to $250 million, 0.015% for the next $250 million and 0.01% in excess of $500 million.
Each Fund pays its pro rata portion of the fee based on its level of assets, with a monthly minimum of $2,500. For the six-month period ended June 30, 2013, BBH & Co. earned $14,875 from the Fund for administrative and fund accounting services.
(c) Investor Relations:
Under the terms of an Investor Relations Services Agreement, Aberdeen Asset Management Inc. (“AAMI”), an affiliate of AAMAL, provides investor relations services to the Fund and certain other funds advised by AAMAL or its affiliates.
Pursuant to the terms of the Investor Relations Services Agreement, AAMI, among other things, provides objective and timely information to shareholders based on publicly-available information; provides information efficiently through the use of technology while offering shareholders immediate access to knowledgeable investor relations representatives; develops and maintains effective communications with investment professionals from a wide variety of firms; creates and maintains investor relations communication materials such as fund manager interviews, films and webcasts, published white papers, magazine and articles and other relevant materials discussing the Fund’s investment results, portfolio positioning and outlook; develops and maintains effective communications with large institutional shareholders; responds to specific shareholder questions; and reports activities and results to the Board and management detailing insight into general shareholder sentiment.
For the six-month period ended June 30, 2013, the Fund paid fees of approximately $28,574 investor relations services. Investor relations fees and expenses in the Statement of Operations include certain out-of pocket expenses.
(d) Director Purchase Plan:
Fifty percent (50%) of the annual retainer of the Independent Directors is invested in Fund shares and, at the option of each Independent Director, 100% of the annual retainer can be invested in shares of the Fund. During
the six-month period ended June 30, 2013, there was no retainer paid to the Directors and therefore were no shares purchased pursuant to the Directors compensation plan. As of June 30, 2013, the Directors as a group owned less than 1% of the Fund’s outstanding shares.
4. Investment Transactions
For the six-month period ended June 30, 2013, Fund purchases and sales of securities, other than short-term investments, were $8,190,710 and $12,665,350, respectively.
5. Capital
The authorized capital stock of the Fund is 100,000,000 shares of common stock, $0.001 par value. As of June 30, 2013, the Fund had 9,485,247 shares issued and outstanding.
On December 7, 2012 the Board of Directors announced that it declared the payment of an elective cash distribution to be paid in the amount of $2.27950 per share of common stock on January 31, 2013 to shareholders of record at the close of business on December 21, 2012. As announced, the distribution was payable in the Fund’s common stock. However, shareholders had the option to request that their distributions be paid in cash in lieu of common stock. The aggregate amount of cash distributions to all stockholders was limited to 20% of the aggregate dollar amount of the total distribution. Because cash distribution requests exceeded this limit, the Fund prorated the cash distribution among all stockholders who made such requests. Shareholders who requested cash distributions received $0.67042 per share or 29.41% of the distribution in cash and received the balance in the Fund’s common stock. For purposes of computing the stock portion of the dividend, the common stock distributed was valued at $12.43 per share, which equaled the average closing price of the Fund’s common shares on the NYSE MKT on January 23, 2013 and the two preceding trading days. Following the closing of the elective cash distribution, the Fund’s number of outstanding shares was 9,485,247.
6. Open Market Repurchase Program
The Board authorized, but does not require, management to make open market purchases from time to time in an amount up to 10% of the Fund’s outstanding shares, in accordance with Rule 10b-18 under the Securities Exchange Act of 1934, as amended, and other applicable federal securities laws. Such purchases may be made when, in the reasonable judgment of management, such repurchases may enhance shareholder value and when the Fund’s shares are trading at a discount to net asset value of 12% or more, subject to intraday fluctuations that may result in repurchases at discounts below 12%. The Board has instructed management to report repurchase activity to it regularly, and to post the number of shares repurchased on the Fund’s website
14 | Aberdeen Indonesia Fund, Inc. | |
Notes to Financial Statements (unaudited) (concluded)
on a monthly basis. For the six-month period ended June 30, 2013, the Fund did not repurchase any shares through this program.
7. Portfolio Investment Risks
(a) Risks Associated with Foreign Securities and Currencies:
Investments in securities of foreign issuers carry certain risks not ordinarily associated with investments in securities of U.S. issuers. Such risks include, among others, currency risk, information risk and political risk. Currency risk results from securities denominated in currencies other than U.S. Dollars that are subject to changes in value due to fluctuations in exchange rates. Information risk arises with respect to foreign securities when key information about foreign issuers may be inaccurate or unavailable. Political risk includes future political and economic developments, and the possible imposition of exchange controls or other foreign governmental laws and restrictions. In addition, with respect to certain countries, there is the possibility of expropriation of assets, confiscatory taxation, political or social instability or diplomatic developments, which could adversely affect investments in those countries. Other risks of investing in foreign securities include liquidity and valuation risks.
Certain countries also may impose substantial restrictions on investments in their capital markets by foreign entities, including restrictions on investments in issuers of industries deemed sensitive to relevant national interests. These factors may limit the investment opportunities available and result in a lack of liquidity and high price volatility with respect to securities of issuers from developing countries.
Some countries require governmental approval for the repatriation of investment income, capital or the proceeds of sales of securities by foreign investors. In addition, if there is deterioration in a country’s balance of payments or for other reasons, a country may impose temporary restrictions on foreign capital remittances abroad. Amounts repatriated prior to the end of specified periods may be subject to taxes as imposed by a foreign country.
(b) Risks Associated with Indonesian Markets:
The limited liquidity of the Indonesian and other foreign securities markets may also affect the Fund’s ability to acquire or dispose of securities at a price and time that it wishes to do so. Accordingly, in periods of rising market prices, the Fund may be unable to participate in such price increases fully to the extent that it is unable to acquire desired portfolio positions quickly; conversely the Fund’s inability to dispose fully and promptly of positions in declining markets will cause its net asset value to decline as the value of unsold positions is marked to lower prices.
The Indonesian securities market is an emerging market characterized by a small number of company listings, high price volatility and a
relatively illiquid secondary trading environment. These factors, coupled with restrictions on investment by foreigners and other factors, limit the supply of securities available for investment by the Fund. This will affect the rate at which the Fund is able to invest in Indonesian and other foreign securities, the purchase and sale prices for such securities and the timing of purchases and sales.
(c) Risks Associated with European Markets:
A number of countries in Europe have experienced severe economic and financial difficulties. Many non-governmental issuers, and even certain governments, have defaulted on, or been forced to restructure, their debts; many other issuers have faced difficulties obtaining credit or refinancing existing obligations; financial institutions have in many cases required government or central bank support, have needed to raise capital, and/or have been impaired in their ability to extend credit; and financial markets in Europe and elsewhere have experienced extreme volatility and declines in asset values and liquidity. These difficulties may continue, worsen or spread within and without Europe whether or not the Fund invests in securities of issuers located in Europe or with significant exposure to European issuers or countries. These events could negatively affect the value and liquidity of the Fund’s investments.
8. Contingencies
In the normal course of business, the Fund may provide general indemnifications pursuant to certain contracts and organizational documents. The Fund’s maximum exposure under these arrangements is dependent on future claims that may be made against the Fund and, therefore, cannot be estimated; however, based on experience, the risk of loss from such claims is considered remote.
9. Tax Information
At June 30, 2013, the identified cost for federal income tax purposes, as well as the gross unrealized appreciation from investments for those securities having an excess of value over cost, gross unrealized depreciation from investments for those securities having an excess of cost over value and the net unrealized appreciation from investments were $72,900,443, $60,725,124, $(7,268,610) and $53,456,514, respectively.
10. Subsequent Events
Management has evaluated the need for disclosures and/or adjustments resulting from subsequent events through the date the financials statements were issued. Based on this evaluation, no adjustments were required to the financial statements as of June 30, 2013.
| Aberdeen Indonesia Fund, Inc. | 15 |
Proxy Voting Information (unaudited)
The Annual Meeting of Shareholders of the Fund was held on March 14, 2013 at 712 Fifth Avenue, New York, New York. The description of the proposals and number of shares voted at the meeting are as follows:
(1) To elect one Class I director to the Board of Directors of the Fund:
| | Votes For | | Votes
Withheld | |
James J. Cattano | | 4,167,818 | | 1,997,663 | |
Directors whose term of office continued beyond this meeting are as follows: Enrique R. Arzac, Lawrence J. Fox and Steven N. Rappaport.
16 | Aberdeen Indonesia Fund, Inc. | |
Corporate Information
Directors Enrique R. Arzac, Chairman James J. Cattano Lawrence J. Fox Steven N. Rappaport Officers Christian Pittard, President Jeffrey Cotton, Vice President and Chief Compliance Officer Andrea Melia, Treasurer and Chief Financial Officer Megan Kennedy, Vice President and Secretary Alan Goodson, Vice President Joanne Irvine, Vice President Devan Kaloo, Vice President Jennifer Nichols, Vice President Nick Robinson, Vice President Lucia Sitar, Vice President Hugh Young, Vice President Sharon Ferrari, Assistant Treasurer Heather Hasson, Assistant Secretary Investment Adviser Aberdeen Asset Management Asia Limited
21 Church Street
#01-01 Capital Square Two
Singapore 049480 | Administrator & Custodian Brown Brothers Harriman & Co.
40 Water Street
Boston, MA 02109 Shareholder Servicing Agent Computershare Trust Company, N.A.
P.O. Box 43078
Providence, RI 02940 Independent Registered Public Accounting Firm PricewaterhouseCoopers LLP
300 Madison Avenue
New York, NY 10017 Legal Counsel Willkie Farr & Gallagher LLP
787 Seventh Avenue
New York, NY 10019 Investor Relations Aberdeen Asset Management Inc. 1735 Market Street, 32nd Floor Philadelphia, PA 19103 1-866-839-5205
InvestorRelations@aberdeen-asset.com |

Aberdeen Asset Management Asia Limited
The accompanying Financial Statements as of June 30, 2013, were not audited and accordingly no opinion is expressed thereon.
Notice is hereby given in accordance with Section 23(c) of the Investment Company Act of 1940 that the Fund may purchase, from time to time, shares of its common stock in the open market.
Shares of Aberdeen Indonesia Fund, Inc. are traded on the NYSE MKT Exchange under the symbol “IF”. Information about the Fund’s net asset value and market price is available at www.aberdeenif.com.
This report, including the financial information herein, is transmitted to the shareholders of Aberdeen Indonesia Fund, Inc. for their general information only. It does not have regard to the specific investment objectives, financial situation and the particular needs of any specific person. Past performance is no guarantee of future returns.
An Invitation to Aberdeen’s Investor Relations
Your Fund on the Web
As part of our ongoing commitment to provide information to shareholders, Aberdeen invites you to visit your Fund on the web at www.aberdeenif.com.
From this page, you can view monthly fact sheets, read news from our portfolio managers, learn more about the Fund’s distributions and results, view daily fact sheets courtesy of Morningstar®, conduct portfolio charting and see other information designed to keep you up-to-date on your investment.
Aberdeen Closed-End Fund Talk Channel
Please take a look at Aberdeen’s award-winning Closed-End Fund Talk Channel, where you can watch portfolio manager web casts and our latest short films. For replays of recent broadcasts or to register for upcoming events, please visit our Closed-End Fund Talk Channel at
www.aberdeen-asset.us/aam.nsf/usClosed/aberdeentv.
E-mail Services
Make sure you are enrolled in our e-mail services, which feature timely news from Aberdeen’s portfolio managers located around the world.
Enroll today at www.aberdeen-asset.us /aam.nsf /usclosed/ email and be among the first to receive the latest news about your Fund.
Please contact Aberdeen Asset Management’s Investor Relations division by:
· Calling us toll free at 1-866-839-5205 in the U.S.
· E-mailing us at InvestorRelations@aberdeen-asset.com
· Visiting us on the web at www.aberdeen-asset.us/cef
Aberdeen Asset Management Inc.
1735 Market Street, 32nd Floor, Philadelphia, PA 19103
Telephone: 800 522 5465
aberdeen-asset.us/cef | 
|
Item 2 – Code of Ethics.
This item is inapplicable to semi-annual report on Form N-CSR.
Item 3 – Audit Committee Financial Expert.
This item is inapplicable to semi-annual report on Form N-CSR.
Item 4 – Principal Accountant Fees and Services.
This item is inapplicable to semi-annual report on Form N-CSR.
Item 5 – Audit Committee of Listed Registrants.
This item is inapplicable to semi-annual report on Form N-CSR.
Item 6 – Investments.
(a) Included as part of the Report to Shareholders filed under Item 1 of this Form N-CSR.
(b) Not applicable.
Item 7 – Disclosure of Proxy Voting Policies and Procedures for Closed-End Management Investment Companies.
This item is inapplicable to semi-annual report on Form N-CSR.
Item 8 - Portfolio Managers of Closed-End Management Investment Companies.
(a) This item is inapplicable to semi-annual report on Form N-CSR.
(b) During the period ended June 30, 2013, there were no changes in the Portfolio Managers identified in response to paragraph (a)(1) of this Item in the Registrant’s most recent Annual Report on Form N-CSR filed on March 8, 2013.
Item 9 – Purchases of Equity Securities by Closed-End Management Investment Company and Affiliated Purchasers.
REGISTRANT PURCHASES OF EQUITY SECURITIES
Period | (a)
Total Number of
Shares Purchased | (b)
Average Price Paid
per Share | (c)
Total Number of
Shares Purchased
as Part of Publicly
Announced Plans
or Programs 1 | (d)
Maximum Number
of Shares That May
Yet Be Purchased
Under the Plans or
Programs 1 |
January 1 through January 31, 2013 | 0 | 0 | 0 | 827,192 |
February 1 through February 28, 2013 | 0 | 0 | 0 | 827,192 |
March 1 through March 31, 2013 | 0 | 0 | 0 | 827,192 |
April 1 through April 30, 2013 | 0 | 0 | 0 | 827,192 |
May 1 through May 31, 2013 | 0 | 0 | 0 | 827,192 |
June 1 through June 30, 2013 | 0 | 0 | 0 | 827,192 |
Total | 0 | 0 | 0 | 827,192 |
1 The plan was authorized on December 6, 2011. The program authorizes management to make open market purchases from time to time in an amount up to 10% of the Fund’s outstanding shares. Such purchases may be made when the Fund’s shares are trading at a discount to net asset value of 12% or more. The plan does not have an expiration date.
Item 10 – Submission of Matters to a Vote of Security Holders.
During the period ended June 30, 2013, there were no material changes to the policies by which stockholders may recommend nominees to the Fund’s Board.
Item 11 – Controls and Procedures.
(a) It is the conclusion of the Registrant’s principal executive officer and principal financial officer that the effectiveness of the Registrant’s current disclosure controls and procedures (such disclosure controls and procedures having been evaluated within 90 days of the date of this filing) provide reasonable assurance that the information required to be disclosed by the Registrant has been recorded, processed, summarized and reported within the time period specified in the Commission’s rules and forms and that the information required to be disclosed by the Registrant has been accumulated and communicated to the Registrant’s principal executive officer and principal financial officer in order to allow timely decisions regarding required disclosure.
(b) There have been no changes in the Registrant’s internal control over financial reporting that occurred during the second fiscal quarter of the period covered by this report that have materially affected, or are reasonably likely to materially affect, the Registrant’s internal control over financial reporting.
Item 12 – Exhibits.
(a)(1) Not applicable.
(a)(2) Certifications pursuant to Rule 30a-2(a) under the Investment Company Act of 1940, as amended.
(a)(3) Not applicable.
(b) Certifications pursuant to Rule 30a-2(b) under the Investment Company Act of 1940, as amended.
SIGNATURES
Pursuant to the requirements of the Securities Exchange Act of 1934 and the Investment Company Act of 1940, the Registrant has duly caused this report to be signed on its behalf by the undersigned, thereunto duly authorized.
Aberdeen Indonesia Fund, Inc. |
| | |
| | |
By: | /s/ Christian Pittard | |
| Christian Pittard, | |
| Principal Executive Officer of | |
| Aberdeen Indonesia Fund, Inc. | |
| | |
Date: | September 6, 2013 | |
Pursuant to the requirements of the Securities Exchange Act of 1934 and the Investment Company Act of 1940, this report has been signed below by the following persons on behalf of the Registrant and in the capacities and on the dates indicated.
By: | /s/ Christian Pittard | |
| Christian Pittard, | |
| Principal Executive Officer of | |
| Aberdeen Indonesia Fund, Inc. | |
| | |
Date: | September 6, 2013 | |
| | |
| | |
By: | /s/ Andrea Melia | |
| Andrea Melia, | |
| Principal Financial Officer of | |
| Aberdeen Indonesia Fund, Inc. | |
| | |
Date: | September 6, 2013 | |
EXHIBIT LIST
12(a)(2) – Rule 30a-2(a) Certifications
12(b) – Rule 30a-2(b) Certifications