Exhibit 99.1

Bay Bancorp, Inc . Presentation to Annual Shareholders Meeting May 24, 2017 Joseph J. Thomas – President and CEO
2 This presentation contains forward - looking statements within the meaning of Section 21 E of the Securities Exchange Act of 1934 and the Private Securities Litigation Reform Act of 1995 concerning Bay Bancorp, Inc . ’ s plans, strategies, objectives, expectations, intentions, financial condition and results of operations . Statements that are not historical in nature, including those that include the words “anticipate”, “estimate”, “plan”, “focus”, “project”, “continue”, “ongoing”, “target”, “aim”, “expect”, “believe”, “intend”, “may”, “will”, “should”, “could”, or the negative of those words and other comparable words, and any financial projections used in connection with any discussion of future plans, strategies, objectives, actions, or events identify forward - looking statements . These forward - looking statements reflect management’s current views and intentions and are subject to known and unknown risks, uncertainties, assumptions and other factors that could cause the actual results to differ materially from those contemplated by the statements . The significant risks and uncertainties related to Bay Bancorp of which management is aware are discussed in detail in the periodic reports that Bay Bancorp files with the Securities and Exchange Commission (the “ SEC ” ), including in the “ Risk Factors ” section of its Annual Report on Form 10 - K for the year ended December 31 , 2016 . Investors are urged to review Bay Bancorp ’ s periodic reports, which are available at no charge through the SEC ’ s website at www . sec . gov and through Bay Bancorp’s website at www . baybankmd . com on the “ Investor Relations ” page . Bay Bancorp assumes no obligation to update any of these forward - looking statements to reflect a change in its views or events or circumstances that occur after the date of this presentation . Disclosure baybankmd.com
3 Agenda I. Overview of the Company I. Financial Results II. Summary baybankmd.com
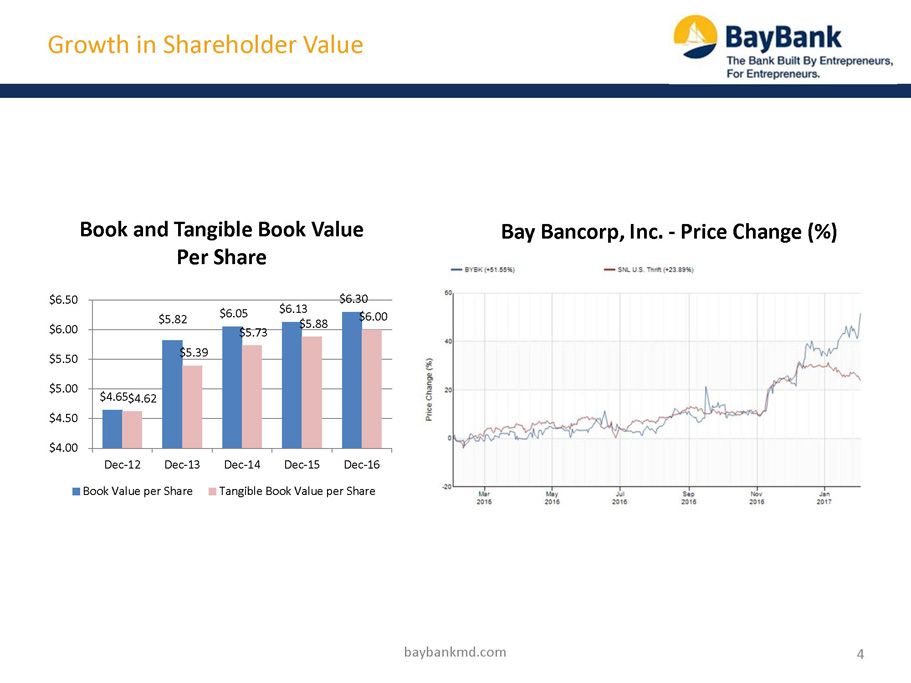
Growth in Shareholder Value baybankmd.com 4 $4.65 $5.82 $6.05 $6.13 $6.30 $ 4.62 $5.39 $5.73 $5.88 $6.00 $4.00 $4.50 $5.00 $5.50 $6.00 $6.50 Dec-12 Dec-13 Dec-14 Dec-15 Dec-16 Book and Tangible Book Value Per Share Book Value per Share Tangible Book Value per Share Bay Bancorp, Inc. - Price Change (%)

5 ▪ Financial Services Partners Fund I (FSPF) applies for and is approved for a shelf - charter by the Office of Thrift Supervision and the FDIC that can be used to acquired failed banks. ▪ Bay Bank, FSB was formed as a subsidiary of Jefferson Bancorp Inc. (JBI) by FSPF to purchase the assets and liabilities of Bay National Bank from the FDIC in July 2010 in a whole bank, no loss share transaction. ▪ Entered into a definitive agreement to acquire Carrollton Bancorp through a reverse merger transaction. Carrollton Bank was formed in 1903 and built a community bank franchise serving the Baltimore market. ▪ Following completion of the reverse merger, Carrollton Bank was rebranded and t h e holding company was renamed Bay Bancorp, Inc. and is listed on the NASDAQ under the ticker symbol “BYBK”. ▪ In May 2014, Bay Bank, FSB, purchased the assets and liabilities of Slavie FSB from the FDIC, adding nearly $124 million in assets, $90 million in loans and $110 million in deposits. Bay Bank retained Slavie’s Baltimore branch location in the transaction. ▪ Bay Bancorp rebrands itself under a new CEO as “the bank built by entrepreneurs for entrepreneurs,” relocates its corporate headquarters to Columbia, MD to better serve the Corridor, and achieves approximately $500 million in total assets. ▪ Bay Bancorp completes acquisition of Hopkins Bancorp. Hopkins is a 95 - year old bank with strong customer relationships in Pikesville market, boosting Bay’s position in Greater Baltimore to top 5 in deposits among local banks. The Evolution of Bay Bank 2009 2010 2012 2013 2014 baybankmd.com 2015 2016
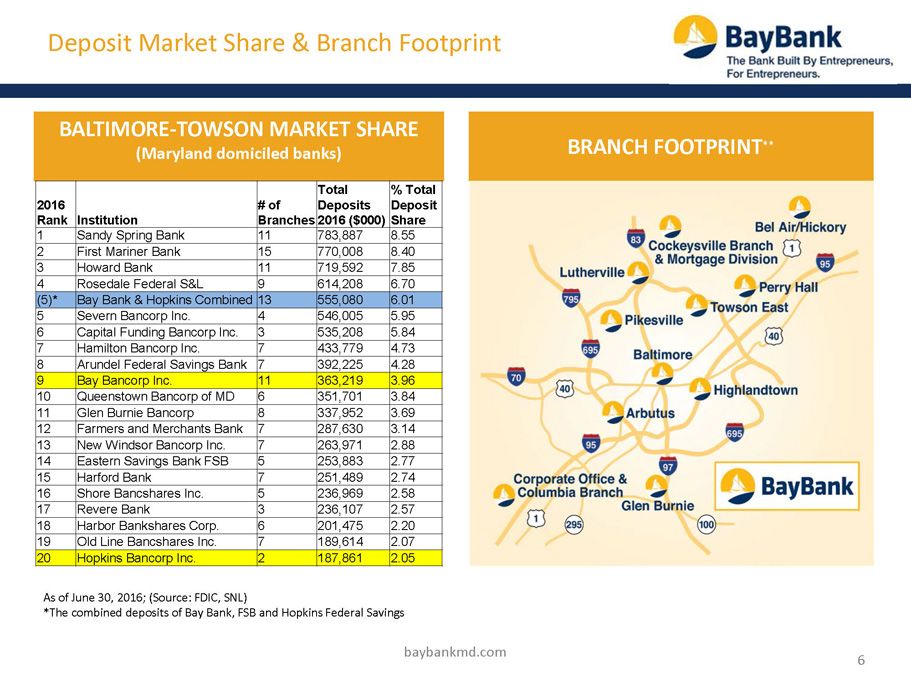
6 Deposit Market Share & Branch Footprint BALTIMORE - TOWSON MARKET SHARE (Maryland domiciled banks ) BRANCH FOOTPRINT ** baybankmd.com As of June 30, 2016; (Source: FDIC, SNL) *The combined deposits of Bay Bank, FSB and Hopkins Federal Savings 2016 Rank Institution # of Branches Total Deposits 2016 ($000) % Total Deposit Share 1 Sandy Spring Bank 11 783,887 8.55 2 First Mariner Bank 15 770,008 8.40 3 Howard Bank 11 719,592 7.85 4 Rosedale Federal S&L 9 614,208 6.70 ( 5 )* Bay Bank & Hopkins Combined 13 555,080 6.01 5 Severn Bancorp Inc. 4 546,005 5.95 6 Capital Funding Bancorp Inc. 3 535,208 5.84 7 Hamilton Bancorp Inc. 7 433,779 4.73 8 Arundel Federal Savings Bank 7 392,225 4.28 9 Bay Bancorp Inc. 11 363,219 3.96 10 Queenstown Bancorp of MD 6 351,701 3.84 11 Glen Burnie Bancorp 8 337,952 3.69 12 Farmers and Merchants Bank 7 287,630 3.14 13 New Windsor Bancorp Inc. 7 263,971 2.88 14 Eastern Savings Bank FSB 5 253,883 2.77 15 Harford Bank 7 251,489 2.74 16 Shore Bancshares Inc. 5 236,969 2.58 17 Revere Bank 3 236,107 2.57 18 Harbor Bankshares Corp. 6 201,475 2.20 19 Old Line Bancshares Inc. 7 189,614 2.07 20 Hopkins Bancorp Inc. 2 187,861 2.05

Baltimore Region Overview 7 baybankmd.com • Greater Baltimore has become a leading US metro areas for the start - up and growth of new businesses • The region’s educational attainment and research, strong incubator system, access to capital, supports growth • Strategically located in the Mid - Atlantic, Baltimore is the 26th largest city in the nation • Home to 13 colleges and universities • More than 60 federal agencies and research labs are within 30 miles, bringing substantial federal spending and jobs to the region • Thriving port and easy access via rail, air and highways • Professional sports teams, historic and cultural resources Entrepreneurial Climate Source: Economic Alliance of Greater Baltimore
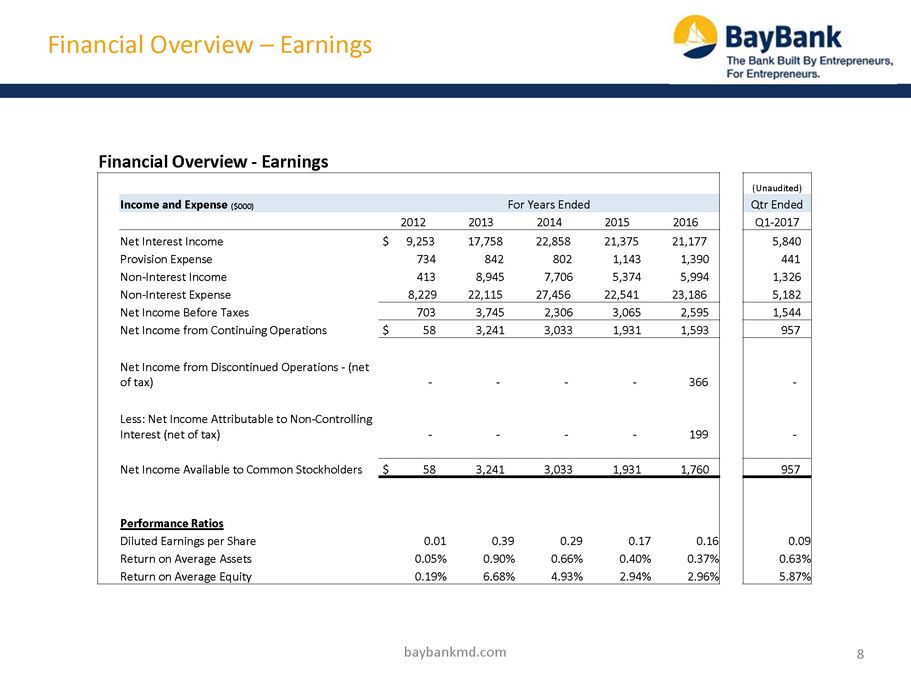
Financial Overview – Earnings 8 baybankmd.com Financial Overview - Earnings (Unaudited) Income and Expense ($000) For Years Ended Qtr Ended 2012 2013 2014 2015 2016 Q1 - 2017 Net Interest Income $ 9,253 17,758 22,858 21,375 21,177 5,840 Provision Expense 734 842 802 1,143 1,390 441 Non - Interest Income 413 8,945 7,706 5,374 5,994 1,326 Non - Interest Expense 8,229 22,115 27,456 22,541 23,186 5,182 Net Income Before Taxes 703 3,745 2,306 3,065 2,595 1,544 Net Income from Continuing Operations $ 58 3,241 3,033 1,931 1,593 957 Net Income from Discontinued Operations - (net of tax) - - - - 366 - Less: Net Income Attributable to Non - Controlling Interest (net of tax) - - - - 199 - Net Income Available to Common Stockholders $ 58 3,241 3,033 1,931 1,760 957 Performance Ratios Diluted Earnings per Share 0.01 0.39 0.29 0.17 0.16 0.09 Return on Average Assets 0.05% 0.90% 0.66% 0.40% 0.37% 0.63% Return on Average Equity 0.19% 6.68% 4.93% 2.94% 2.96% 5.87%

9 Core Pre - Provision Earnings baybankmd.com Bay Bancorp, Inc. (Consolidated) Financial Summary - Core Pre - Provision Earnings ($000) For the Years Ended Qtr Ended (unaudited) 2012 2013 2014 2015 2016 Q1 - 2017 Net Income Before Taxes $ 703 3,745 2,306 3,065 2,987 $ 1,544 Non - Core Adjustments: Less: Accelerated Accretion on acquired loans (1) (598) (1,566) (856) (47) (23) Gain on Acquisitions (2) (2,860) (524) - (893) - Income recognized from IRA Exit (3) (2,380) - - - Income recognized from Reverse Mortgage (6) (3,089) - Provision for Loan Loss 734 842 802 1,143 1,390 441 Plus: Amortization Expense on intangible assets - 791 993 854 791 235 Expense for Mergers and acquisitions (4) 916 2,042 1,028 22 1,758 150 Expense recognized from Reverse Mortgage (6) 2,849 - Other non - recurring expenses (5) - - 1,523 - - - Core Pre - tax, Pre - provision Net Income 2,353 3,962 2,181 4,228 5,745 2,346 Core Income Tax Expense (7) 894 1,506 829 1,607 2,183 892 Core Pre - Provision Net Income $ 1,459 2,456 1,352 2,621 3,562 $ 1,455 Key Core Pre - Provision Performance Ratios Diluted Earnings Per Share $ 0.25 0.26 0.12 0.24 0.33 $ 0.14 Return on Average Assets (annualized) 1.14% 0.69% 0.29% 0.54% 0.66% 0.94% Return on Average Equity (annualized) 4.86% 5.06% 2.20% 3.99% 5.38% 8.81% Net Interest Margin 7.43% 5.15% 4.94% 4.51% 4.13% 4.04% Non - Interest Income /Average Assets (annualized) 0.32% 1.53% 0.70% 0.94% 0.38% 0.86% Non - Interest Expense /Average Assets (annualized) 5.72% 5.38% 5.20% 4.50% 3.32% 3.11% Efficiency Ratio 75.66% 82.95% 91.64% 83.67% 76.87% 67.15%

10 Core Pre - Provision Earnings (Continued) Footnotes to core earnings baybankmd.com 1 Accelerated accretion from acquired loans – Acquired loans are carried net of purchase discount/premium which is amortized/accreted into earnings over the life of the loan. The discount/premium is accelerated and recognized as income or expense if the loan is paid off or otherwise settled prior to maturity. The income or expense acceleration is adjusted out of core earnings in this analysis. 2 Bargain purchase gain – Gain on acquisition/merger is the excess of the fair value of net assets acquired over consideration paid - 2013 Carrollton Merger, 2014 Slavie Acquisition and 2016 Hopkins Merger. 3 Individual Retirement Account (IRA) product line exit - The Company stopped offering IRAs and resigned as custodian for its existing IRAs. The IRA exit accelerated the recognition of the remaining interest rate mark - to - market. The income acceleration is adjusted out of core earnings in this analysis. 4 Merger/acquisition costs – These expenses primarily related to professional services, system conversions and integration of operations as well as other costs of completing the transactions. 5 Common stock award – A 2014 one - time award of common stock that vested immediately and was recognized as compensation expense for $1.07 million was adjusted out of core earnings in this analysis. 2014 Severance costs of $0.52 million recognized for executives due to a corporate reorganization were adjusted out of core earnings in this analysis. 6 Revenue and operating expense for reverse mortgage brokerage operation ( iReverse Home Loans) acquired through the Hopkins acquisition were excluded from core earnings for this analysis. 7 For comparison purposes, a consolidated tax rate of 38% was utilized for core income tax expense.
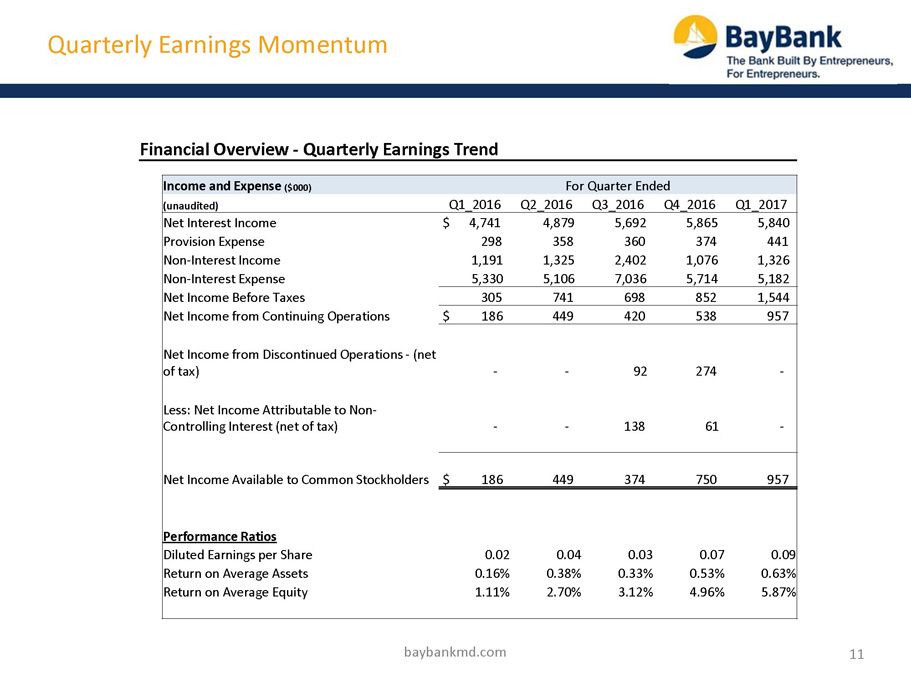
Quarterly Earnings Momentum 11 baybankmd.com Financial Overview - Quarterly Earnings Trend Income and Expense ($000) For Quarter Ended (unaudited) Q1_2016 Q2_2016 Q3_2016 Q4_2016 Q1_2017 Net Interest Income $ 4,741 4,879 5,692 5,865 5,840 Provision Expense 298 358 360 374 441 Non - Interest Income 1,191 1,325 2,402 1,076 1,326 Non - Interest Expense 5,330 5,106 7,036 5,714 5,182 Net Income Before Taxes 305 741 698 852 1,544 Net Income from Continuing Operations $ 186 449 420 538 957 Net Income from Discontinued Operations - (net of tax) - - 92 274 - Less: Net Income Attributable to Non - Controlling Interest (net of tax) - - 138 61 - Net Income Available to Common Stockholders $ 186 449 374 750 957 Performance Ratios Diluted Earnings per Share 0.02 0.04 0.03 0.07 0.09 Return on Average Assets 0.16% 0.38% 0.33% 0.53% 0.63% Return on Average Equity 1.11% 2.70% 3.12% 4.96% 5.87%
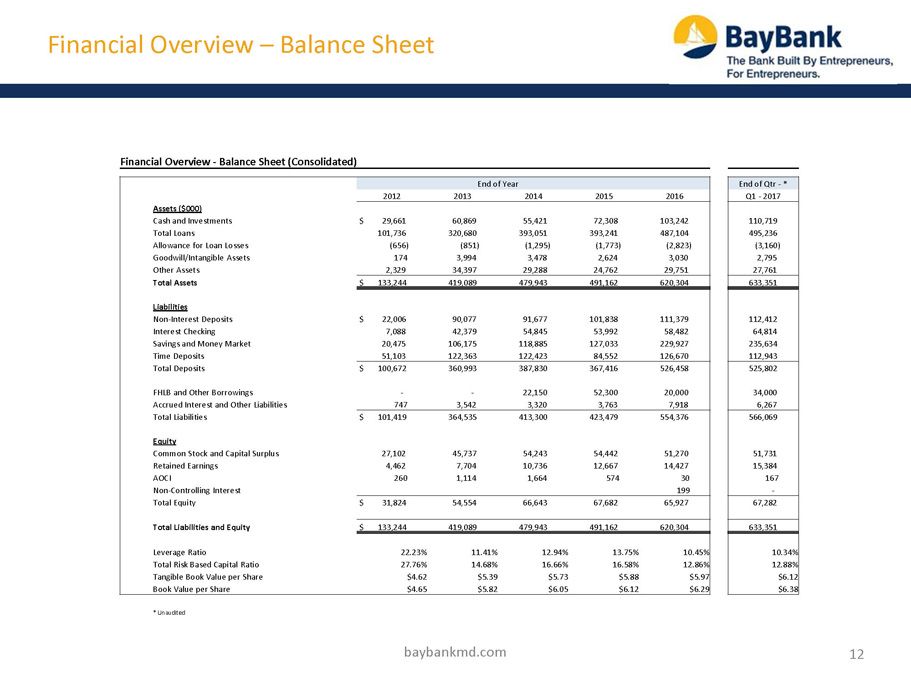
Financial Overview – Balance Sheet 12 baybankmd.com Financial Overview - Balance Sheet (Consolidated) End of Year End of Qtr - * 2012 2013 2014 2015 2016 Q1 - 2017 Assets ($000) Cash and Investments $ 29,661 60,869 55,421 72,308 103,242 110,719 Total Loans 101,736 320,680 393,051 393,241 487,104 495,236 Allowance for Loan Losses (656) (851) (1,295) (1,773) (2,823) (3,160) Goodwill/Intangible Assets 174 3,994 3,478 2,624 3,030 2,795 Other Assets 2,329 34,397 29,288 24,762 29,751 27,761 Total Assets $ 133,244 419,089 479,943 491,162 620,304 633,351 Liabilities Non - Interest Deposits $ 22,006 90,077 91,677 101,838 111,379 112,412 Interest Checking 7,088 42,379 54,845 53,992 58,482 64,814 Savings and Money Market 20,475 106,175 118,885 127,033 229,927 235,634 Time Deposits 51,103 122,363 122,423 84,552 126,670 112,943 Total Deposits $ 100,672 360,993 387,830 367,416 526,458 525,802 FHLB and Other Borrowings - - 22,150 52,300 20,000 34,000 Accrued Interest and Other Liabilities 747 3,542 3,320 3,763 7,918 6,267 Total Liabilities $ 101,419 364,535 413,300 423,479 554,376 566,069 Equity Common Stock and Capital Surplus 27,102 45,737 54,243 54,442 51,270 51,731 Retained Earnings 4,462 7,704 10,736 12,667 14,427 15,384 AOCI 260 1,114 1,664 574 30 167 Non - Controlling Interest 199 - Total Equity $ 31,824 54,554 66,643 67,682 65,927 67,282 Total Liabilities and Equity $ 133,244 419,089 479,943 491,162 620,304 633,351 Leverage Ratio 22.23% 11.41% 12.94% 13.75% 10.45% 10.34% Total Risk Based Capital Ratio 27.76% 14.68% 16.66% 16.58% 12.86% 12.88% Tangible Book Value per Share $4.62 $5.39 $5.73 $5.88 $5.97 $6.12 Book Value per Share $4.65 $5.82 $6.05 $6.12 $6.29 $6.38 * Unaudited
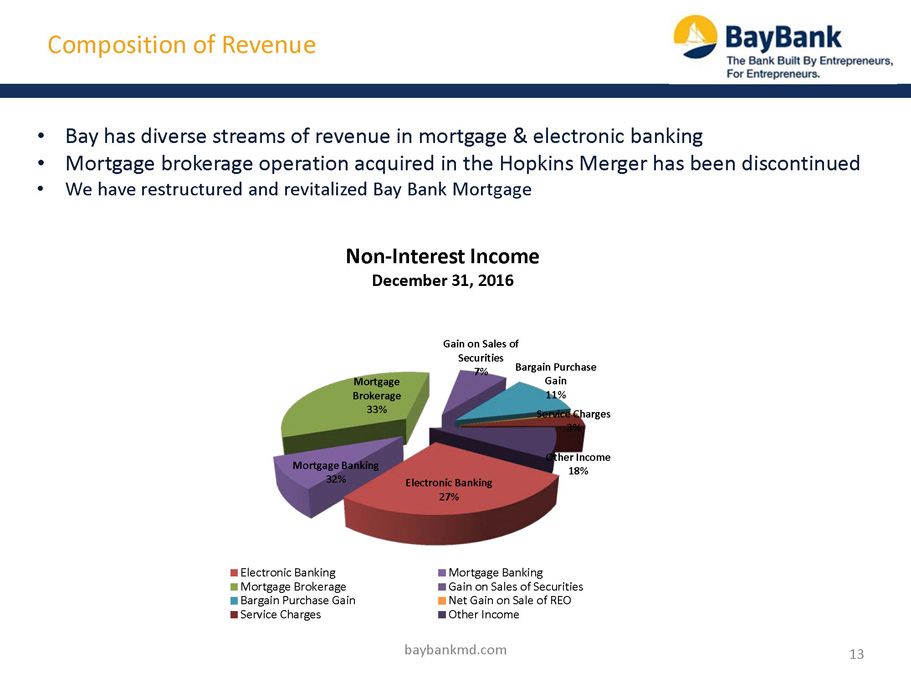
13 Composition of Revenue Non - Interest Income December 31, 2016 baybankmd.com Electronic Banking 27% Mortgage Banking 32% Mortgage Brokerage 33% Gain on Sales of Securities 7% Bargain Purchase Gain 11% Service Charges 3% Other Income 18% Electronic Banking Mortgage Banking Mortgage Brokerage Gain on Sales of Securities Bargain Purchase Gain Net Gain on Sale of REO Service Charges Other Income • Bay has diverse streams of revenue in mortgage & electronic banking • Mortgage brokerage operation acquired in the Hopkins Merger has been discontinued • We have restructured and revitalized Bay Bank Mortgage
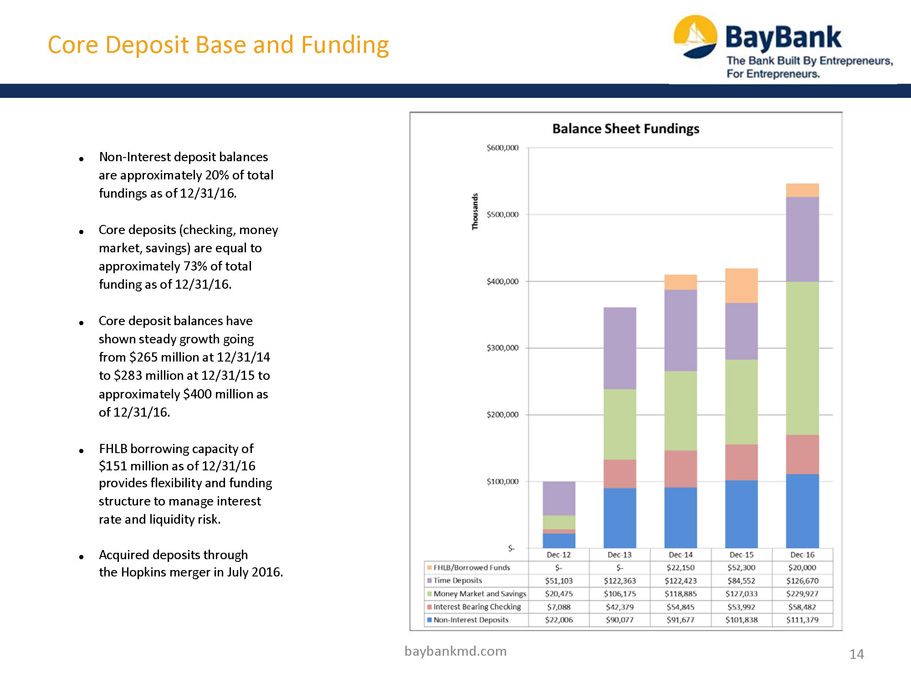
Core Deposit Base and Funding 14 baybankmd.com ● Non - Interest deposit balances are approximately 20% of total fundings as of 12/31/16. ● Core deposits (checking, money market, savings) are equal to approximately 73% of total funding as of 12/31/16. ● Core deposit balances have shown steady growth going from $265 million at 12/31/14 to $283 million at 12/31/15 to approximately $400 million as of 12/31/16. ● FHLB borrowing capacity of $151 million as of 12/31/16 provides flexibility and funding structure to manage interest rate and liquidity risk. ● Acquired deposits through the Hopkins merger in July 2016.
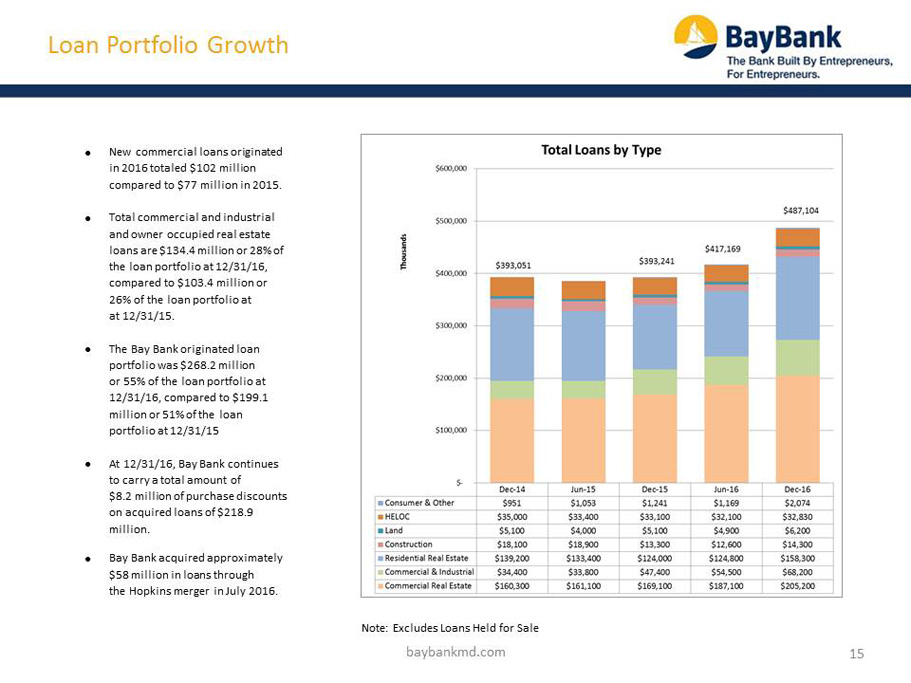
Loan Portfolio Growth 15 baybankmd.com Note: Excludes Loans Held for Sale ● New commercial loans originated in 2016 totaled $102 million compared to $77 million in 2015. ● Total commercial and industrial and owner occupied real estate loans are $134.4 million or 28% of the loan portfolio at 12/31/16, compared to $103.4 million or 26% of the loan portfolio at at 12/31/15. ● The Bay Bank originated loan portfolio was $268.2 million or 55% of the loan portfolio at 12/31/16, compared to $199.1 million or 51% of the loan portfolio at 12/31/15 ● At 12/31/16, Bay Bank continues to carry a total amount of $8.2 million of purchase discounts on acquired loans of $218.9 million. ● Bay Bank acquired approximately $58 million in loans through the Hopkins merger in July 2016.
16 Strategies in 2017 – Focus on Execution I. Optimize End - to - End Loan Process • Target Industry Groups • SBA/ Leasing / Asset Based Lending • Asset Purchase Strategies • Streamline & Track Credit Process II. Tap the Treasury Management Opportunities • Improve Treasury Services Sales • Merchant Processing / Payroll • Product & Pricing Redesign • Customer Profitability III. Enhance Client Relationship Penetration • Product Champions and Sales Sheets • Rapid Advance / Business Credit Card • Team Huddle Calendar • Onboarding Process for New Clients baybankmd.com IV. Deliver Differentiated Culture & Service to Clients • Inspire Alternative Solutions for Clients • Celebrate Service Culture • Reward Entrepreneurship by Teammates • Aggressive SEO and On - line Marketing V. Invest in Bay Bank Team with Training and Development • Develop Talent and Leadership Capabilities • Communicate Enterprise Activity and Goals • Enhance Staff Technology/Social Media IQ • Employee Communication Strategy

17 » Exceptional management team and board of directors that guides entrepreneurial culture and results orientation. » Vibrant, high - growth market filled with entrepreneurs along Baltimore Washington Corridor. » Balanced community banking strategy with diversified loan portfolio, low cost core deposits and strong fee - based products. » Innovative culture and business model to achieve high organic C&I loan and core deposit growth. » Improving expense structure and scale attributes to drive core profitability and returns to shareholders. » Strong balance sheet with high tier one capital ratio and moderate classified assets - to capital levels. » Proven and positioned to grow organically and via acquisition to become $100 million in market capitalization. Summary baybankmd.com
18 Contact Information Joseph J. Thomas, CFA President and CEO (410) 536 - 7336 jthomas@baybankmd.com 7151 Columbia Gateway Drive Suite A Columbia, MD 21046 baybankmd.com