UNITED STATES
SECURITIES AND EXCHANGE COMMISSION
WASHINGTON, D.C. 20549
FORM N-CSRS
CERTIFIED SHAREHOLDER REPORT OF
REGISTERED MANAGEMENT INVESTMENT COMPANIES
Investment Company Act file number: 811-6027
KAVILCO INCORPORATED
(Exact name of registrant as specified in charter)
600 University Street, Suite 3010
Seattle, Washington 98101-1129
(Address of principal executive offices) (Zip code)
Registrant's telephone number, including area code: (206) 624-6166
Date of fiscal year end: December 31, 2015
Date of reporting period: January 1, 2015-June 30, 2015
Kavilco Incorporated
2013 Report to Shareholders
June 30, 2015 (unaudited financial statements)
| ITEM 1. | HIGHLIGHTS FROM THE 2015 REPORT TO SHAREHOLDERS |
Note to SEC: Kavilco Incorporated is an Alaska Native Corporation that operates under the Investment Company Act of 1940. The Alaska Native Claims Settlement Act, which is our primary regulating authority, places numerous restrictions on the Company's stock. Kavilco's stock can only be transferred by court decree or gifting to a blood relative, and cannot be sold or used as collateral. The following discussion has been edited so that only letters from the CEO and CFO, shareholder meetings announcements, portfolio, and financial issues from Kavilco's report to shareholders are attached to the N-CSRS. Not included are general photos and descriptions, an In Memoriam listing of deceased original shareholders along with general information articles.
42nd Annual Meeting of Shareholders
Notice
The 42nd Annual Meeting of Shareholders is scheduled for Saturday, November 7, 2015 at The Landing in Ketchikan, Alaska.
Registration will take place from 11:00 a.m. to Noon in the Sunny Point conference room. The Shareholder meeting will be from 1:00 pm to 3:00 pm. The primary items of business are the approval of the Corporation's independent public accountants and the election of directors.
Directors whose terms are up for re-election this year are Louis L. Jones, Sr., President, Kenneth Gordon, Director, and Frederick O. Olsen, Jr., Director. The Board recommends re-election of all three members.
"Your Proxy Ballot and Statement will be mailed in October of this year and your vote is very important!" Even if you are unable to attend the Annual Meeting, we ask that you vote "discretionary" on the Management Proxy Ballot as soon as you receive it.
We urge you to come to the Annual Meeting of Shareholders. Attendance at the Shareholder meetings helps to maintain good communication and understanding amongst us all.
The Annual Shareholder Dinner will be held in the Sunny Point Conference Room on Saturday, November 7, 2015, in the evening at the Landing in Ketchikan for shareholders, their family, and guests; doors will open at 5:30 pm. There is no charge for dinner, as always.
The Kasaan Haida Heritage Foundation will be holding their auction at the Annual Shareholder Dinner again this year. If you have any items to donate or would like to volunteer to help out at the auction, please contact Jeane Breinig at jeane@gci.net.
Greetings to our Shareholders From your President
As we enter our 42nd year as a Corporation it is time to talk a little bit about Kasaan. Not everyone remembers the challenges Kavilco faced to become a Village Corporation. As a reminder I will enter this excerpt taken from "Kavilco Inc. The first 25 years."
Certificate of Eligibility Process
The Process needed to become certified as a Native Corporation was long and involved, because the forest service challenged our eligibility. The steps needed to complete this process were:
1. October 3, 1973, purported notice of appeal lodged by the Alaska Wildlife Federation and Sportsmen’s Council Inc., as well as the U.S. Forest Service.
2. As of October 30, 1973, 120 natives were certified as eligible to enroll as residents of Kasaan.
3. June 17, 1974, Appeals Board ruled in favor of Kavilco’s eligibility as a Native Corporation.
4. Village land application was filed December 16, 1974.
5. May 13-15, 1974, twenty-one respondents produced evidence as to residency. The residents who testified are as follows:
Pauline Eveline Blackstad Della Anne Dukes Laura Louise Jones Willard Lear Jones Alton Gaylord McAllister Harriet Amelia McAllister Ivan James McAllister Frederick Otilius Olsen, Sr. Robert Irvine Olsen Annabelle Peele David Son-I-Hat Peele | Rosemarie Ramiskey |
The magnitude of winning the appeal cannot be overstated and the twenty-one people who testified in the appeals process need to be acknowledged from time to time. Had the appeal been lost, Kavilco Inc would have become a “Native Group” a status defined in Section 2 (d) of the ANCSA.
As time goes by and Kavilco stock gets passed on to new generations of shareholders, the new generation, through no fault of their own, will know less and less about Kasaan. With that in mind I thought that in addition to speaking about the business side of Kavilco Incorporated in our annual report we would speak a little about life in Kasaan today.
There is a poem that was written in 1992 by J. Earnhart that pretty much describes what it is, and was like, to live in Kasaan. The poem is titled “If You’ve Ever Lived On An Island.” I have taken the liberty of substituting Kasaan for island and raven for foghorn.
If You’ve Ever Lived In Kasaan
If you’ve ever lived in the Village of Kasaan
if ever you’ve lived by the sea;
You’ll never return to the mainland
once your spirit has been set free.
If ever you’ve smelled the ocean
or tasted the salt in the air;
You’ll know you’ve discovered a haven
that is uncommon, precious and rare.
If ever you’ve seen the whales play
or watched the eagles in flight;
You’ll remember, again, why you live here
and why it feels so right.
If ever you’ve seen the sunset
as the ferry passed the shore;
You’ve seen the beauty of Kasaan
that will be with you forever more.
If ever you’ve heard the seagulls
the waves, the raven, the winds;
Then, you’ve heard the songs of Kasaan
and the peaceful message it sends.
Indeed, if you live in Kasaan
if you’re lucky to live by the sea;
You’ll never return to the mainland
as your spirit has been set free.
Restoration Led by Stormy Hamar, Lead Carver
Crew: Harley Bell-Holter, Carver -Eric Hamar, Carver - Justin Hendrix, Apprentice
A nearly half million dollar grant will speed restoration of Alaska’s oldest Haida longhouse. The structure was first built 130 years ago. Haida Chief Son-i-Hat built the original Clan House in the 1880s at the village of Old Kasaan. It’s on the eastern side of Southeast’s Prince of Wales Island, about 30 miles northwest of Ketchikan. It was called Naay I’waans, The Great House. Many know it as The Whale House for some of the carvings inside; it deteriorated, as wooden buildings in the rain forest do. The Civilian Conservation Corps (CCC), a depression-era employment program, rebuilt it in the late 1930s. The house badly needs repairs again.
The tribal government is partnering with Kavilco, and its cultural arm, the Kasaan Haida Heritage Foundation (KHHF) on this restoration project.
In late November, the Anchorage based Rasmussen Foundation awarded the project $450,000. In addition, funds from the tribal government and its partners are about enough to complete the work. The $450,000 award was mentioned in the national newspaper “USA Today” in the state by state headlines section of the paper.
The effort to stabilize the Whale House has been underway for around four years. But it picked up speed in the last two summers. The lead carver is Stormy Hamar is working with his son, carver Eric Hamar, carver Harley Bell-Holter, and apprentice Justin Hendrix.
One of the great parts of this project is that young people are getting involved. And it’s across all lines; Native, non-Native, it doesn’t matter. There’s been genuine interest not only in the carving by these young people but in all facets of Haida culture, story telling, singing of Haida songs and learning of the Haida language. The carving shed was extended an additional 20 feet and is now 80 feet long and 20 feet wide.
Kavilco Incorporated owns Naay I’waans also known as “The Great House” or Chief Son-i-Hat Whale House and the surrounding land. Having responsibility for the property, Kavilco contracted with MRV Architects in 2007 to perform a condition survey of the Whale House and eight nearby totem poles. In 2010, Kavilco and the Organized Village of Kasaan (OVK) developed a joint strategy to move forward on implementing this critical restoration work.
Through a grant funded by the National Park Service Historic Preservation Office (2010-2011), MRV and OVK drafted the “Son-i-Hat Whale House Renovation & Preservation Plan.” Kavilco and OVK formally approved this plan in October, 2011.
The Whale House and Totem Park were listed in the National Register of Historic Places in 2002. Because of a lack of maintenance by the U.S. Forest Service since the early 1940s, the Whale House and totems have fallen into disrepair and steady deterioration seriously threatened the only remaining Haida clan house in Southeast Alaska.
Throughout good weather and bad, work continues. When I took this snowy picture the crew was going about their chores and duties indifferent to the working conditions. I could not help but think about the Postman’s creed as I observed these men at work; needless to say I modified it a bit; I have a tendency to do that.
“Neither snow, nor rain, nor heat, nor gloom of night stays these devoted workers from the swift completion of their appointed duties.”
Stormy and his crew faced many challenges in the restoration project; as Stormy says “you can’t just Google how to restore a clan house and expect to find the answers.” On site engineering and ingenuity keeps the project moving.
The rededication ceremony is slated to take place on September 3, 2016 in Kasaan Alaska. If you are planning to attend, accommodations should be made sooner rather than later. A large crowed is expected as this is the oldest Haida Clan House in existence. We are hoping many of our Kavilco Shareholders can take in this celebration.
A tremendous amount of time and effort was and is needed to get this done. The first hurdle was a letter of understanding between the Organized Village of Kasaan and the Kasaan Haida Heritage Foundation a Kavilco Inc. nonprofit organization. The relationship between Kavilco and OVK has been and continues to be a good one with both entities doing what they can to make Kasaan a better place to live.
Sincerely
/s/ Louis L. Jones, Sr.
Louis L. Jones, Sr., President
Greetings to our Shareholders From Your CFO
Note 1 to the financial statements points out that since November 1, 1989 Kavilco has operated as a self-managed investment company. Actually, since 1980, the board of directors has been primarily responsible for the management of the portfolio. At each board meeting I present economic research and graphs that I feel have special relevance to the management of the portfolio. Although the research is gleaned from a number of sources, the primary publication I use for both economic research and financial market analysis is the Bank Credit Analyst (BCA).
To quote from the publication, “The Bank Credit Analyst is an independent monthly forecast and analysis of trends in major global investment markets, with particular emphasis on equities, business conditions, inflationary trends, interest rates, commodities and currencies." The BCA has an international following of financial institutions, governments, knowledgeable individual investors and investment managers. Following their recommendations and analysis has provided stellar earnings and avoided a number of devastating financial bubbles.
On occasion, when there is a major upheaval in the financial markets, the BCA will issue a special report. On May 19, 2015 BCA issued a special report entitled ‘Market Valuations And Returns: An Unpleasant Choice For U.S. Investors.’ We had an indepth review of this report at the July board meeting. The following are excerpts that apply to our portfolio strategy and the challenges going forward:
Investors who are worried about the economic environment and wish to have a conservative portfolio are forced to accept negative or meager returns in cash and government bonds.
Investors who are prepared to take some risk have to venture into equities, even though they are expensive by every metric, except compared to interest rates.
In the past, stocks typically were cheap when bonds were expensive and bonds were cheap when stocks were expensive. Currently, both markets are overextended together.
U.S. investors who are concerned with short-term returns have an incentive to stick with these overvalued markets, but should keep their running shoes by the door.
Considering Kavilco’s situation, interest-rate jitters are taking their toll on our portfolio. This includes utilities, real-estate investment trusts, and master limited partnerships. Coupled with the major decline in oil prices from June of last year, this had a major negative impact on the market value of our equity investments. Fortunately, changes in market value do not impact your dividend, but reductions in corporate bond interest rates do. Case in point, $1,250,000 Southern Power Company bonds will mature on July 15, 2015. These bonds were purchased in 2008 with a yield of 5.71%. The proceeds from the bond maturity will be reinvested in equities with a yield in the 3% to 3.5% range. Accordingly, there will be a reduction in income that will impact your dividend. This reinvestment battle has been going on for the last three years.
This has been another challenging year. With the Board’s guidance, we have done our best at negotiating this low interest rate environment and, for that, I am truly thankful for their support.
Sincerely,
/s/ Scott Burns
Scott Burns, Chief Financial Officer
Kavilco Incorporated
Financial Statements (unaudted) June 30, 2015
The unaudited financial statements for the six month period ending June 30, 2015 are included in this report.
The audited financial statements dated December 31, 2014, were sent to shareholders on February 25, 2015 and will not be duplicated here. A copy of the audited financial statements can be mailed to shareholders within three working days by contacting Kavilco's Corporate Secretary at 1-800-786-9574
STATEMENT OF ASSETS AND LIABILITIES
For six months ended June 30, 2015 (unaudited)
| ASSETS | |||||
| Investments in securities, at fair value (cost $33,694,388) | $ | 34,526,857 | |||
| Real estate at fair value (cost $1,054,089) | 4,207,633 | ||||
| Cash and cash equivalents | 146,980 | ||||
| Interest receivable | 276,948 | ||||
Dividends receivable | 19,707 | ||||
Premises and equipment, net | 17,871 | ||||
Prepaid expenses and other assets | 27,613 | ||||
Total assets | 39,223,609 | ||||
| LIABILITIES | |||||
| Accounts payable and accrued expenses | 16,642 | ||||
| Dividends payable | 95,249 | ||||
Total liabilities | 111,891 | ||||
| NET ASSETS | $ | 39,111,718 | |||
| Net assets consist of: | |||||
| |||||
Distributable earnings | $ | 4,413,434 | |||
Contributed Capital | 34,698,284 | ||||
| |||||
TOTAL Net assets | $ | 39,111,718 | |||
| Net asset value per share of Class A and Class B common stock ($39,111,718) divided by 12,000 shares outstanding) | $ | 3,259 | |||
Kavilco Incorporated
(An Investment Company)
Financial Statements
For six months ended June 30, 2015 (unaudited)
Principal Amount or Shares | Fair Value | |||
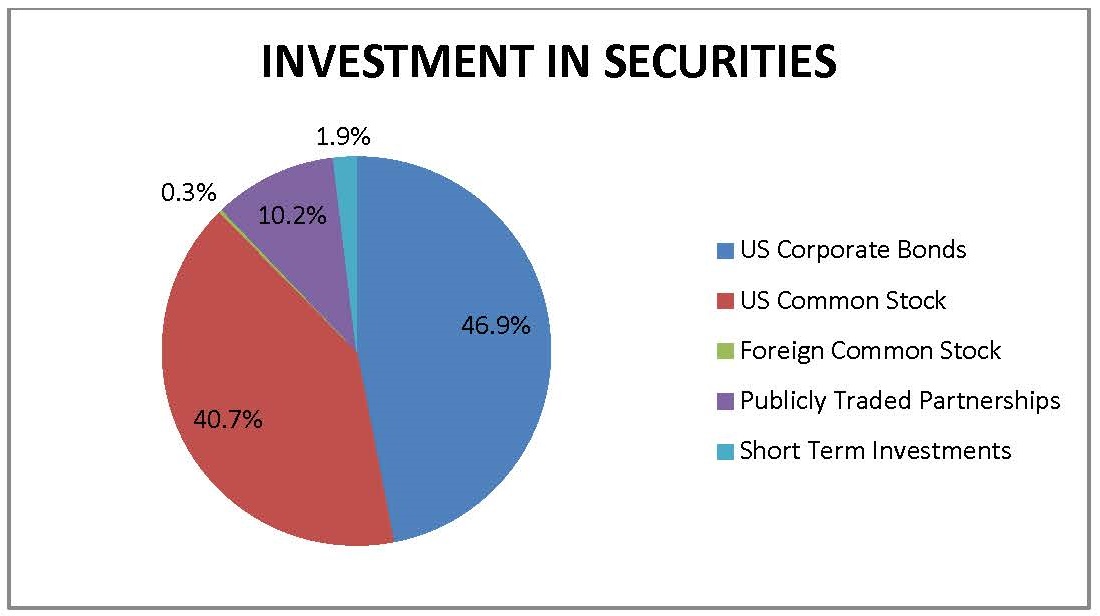
INVESTMENTS IN SECURITIES | ||||
U.S. Corporate Bonds - 46.9% | ||||
Chemical Industry - 4.7% | ||||
| E.I. DuPont de Nemour, 5.250%, due December 15, 2016 | 1,519,000 | $ 1,607,953 | ||
Communications - 7.0% | ||||
| CBS Corporation, 4.625%, due May 15, 2018 | 2,000,000 | 2,145.340 | ||
| Deutsche Telekom Int. Fin., 6.000%, due July 8, 2019 | 250,000 | 286,135 | ||
Total Communications | 2,431,475 | |||
| Consumer, Cyclical - 4.4% | ||||
| Target Corp., 5.875%, due July 15, 2016 | 1,000,000 | 1,053,640 | ||
| Avon Products, 6.500%, due March 1, 2019 | 500,000 | 482,500 | ||
Total Consumer, Cyclical | 1,536,140 | |||
| Consumer, Non-cyclical - 3.5% | ||||
| McDonald's Corp., 5.300%, due March 15, 2017 | 500,000 | 534,540 | ||
| Kraft Foods Inc., 6.500%, due August 11, 2017 | 250,000 | 275,195 | ||
| Yum! Brands Inc., 5.300%, due September 15, 2019 | 355,000 | 390,074 | ||
Total Consumer, Non-cyclical | 1,199,809 | |||
| Energy - 13.8% | ||||
| PPL Energy Supply LLC, 5.700%, due October 15, 2015 | 80,000 | 80,000 | ||
| Plains All American Pipeline, 6.125%, due January 15, 2017 | 1,345,000 | 1,437,738 | ||
| XTO Energy Inc., 6.250%, due August 1, 2017 | 1,000,000 | 1,104,460 | ||
| Kinder Morgan Energy Partners, 5.950%, due February 15, 2018 | 460,000 | 502,674 | ||
| Transocean Inc., 7.375%, due April 15, 2018 | 1,350,000 | 1,397,250 | ||
| Hess Corporation, 8.125%, due February 15, 2019 | 199,000 | 235,596 | ||
Total Energy | 4,757,718 | |||
| Financial - 1.0% | ||||
| American Express Credit Co., 5.300%, due December 2, 2015 | 117,000 | 119,241 | ||
| General Electric Capital Corp., 5.625%, due September 15, 2017 | 215,000 | 234,120 | ||
Total Financial | 353,361 | |||
| Paper & Forest Products Industry - 1.8% | ||||
| International Paper, 9.375%, due May 15, 2019 | 500,000 | 618,730 | ||
| Technology - 4.0% | ||||
| Cisco Systems Inc., 5.500%, due February 22, 2016 | 960,000 | 989,549 | ||
| Oracle Corp., 5.000%, due July 8, 2019 | 250,000 | 277,748 | ||
| Adobe Systems Inc., 4.750%, due February 1, 2020 | 100,000 | 110,109 | ||
Total Technology | 1,377,406 | |||
| Transportation - 1.7% | ||||
| FedEx Corp., 8.000%, due January 15, 2019 | 500,000 | 597,695 | ||
| Utilities - 5.0% | ||||
| Southern Power Company, 4.875%, due July 15, 2015 | 1,250,000 | 1,251,338 | ||
| Southern Electric Power, 5.550%, due January 15, 2017 | 174,000 | 184,685 | ||
| Metropolitan Edison, 7.700%, due January 15, 2019 | 250,000 | 292,878 | ||
Total Utilities | 1,728,900 | |||
Total U.S. Corporate Bonds (cost $15,365,724) | 16,209,186 | |||
| U.S. Common Stock - 40.7% | ||||
| Banking - 0.6% | ||||
| Wells Fargo & Co | 3,840 | 215,962 | ||
| Beverage (soft drink) - 0.5% | ||||
| The Coca Cola Company | 4,725 | 185,362 | ||
| Chemicals Specialty - 0.1% | ||||
| Terra Nitrogen Company LP | 225 | 27,245 | ||
| Computer Software & Services - 0.5% | ||||
| Microsoft Corp. | 3,640 | 160,706 | ||
| Drug Industry - 1.9% | ||||
| Bristol-Myers Squibb | 1,500 | 99,810 | ||
| Eli Lilly & Co. | 2,000 | 166,980 | ||
| Merck & Co. Inc. | 3,460 | 196,978 | ||
| Pfizer Inc. | 6,240 | 209,227 | ||
Total Drug Industry | 672,995 | |||
| Electric Utility - 10.9% | ||||
| Alliant Energy | 3,700 | 213,564 | ||
| American Electric Power | 3,540 | 187,514 | ||
| Avista Corp. | 2,000 | 61,300 | ||
| Centerpoint Energy Inc. | 13,000 | 247,390 | ||
| Consolidated Edison Inc. | 1,500 | 86,820 | ||
| Dominion Res Inc. VA | 2,700 | 180,549 | ||
| Duke Energy Corp. | 5,095 | 359,809 | ||
| Entergy Corporation | 2,870 | 202,335 | ||
| Eversource Energy | 4,981 | 226,187 | ||
| Exelon | 1,400 | 43,988 | ||
| Exxon Mobil Corp. | 2,320 | 193,024 | ||
| Firstenergy Corp. | 1,255 | 40,850 | ||
| NextEra Energy | 1,000 | 98,030 | ||
| One Gas, Inc. | 300 | 12,768 | ||
| Pepco Holdings Inc. | 7,080 | 190,735 | ||
| PPL Corporation | 4,945 | 145,729 | ||
| Public Service Enterprise Group Inc. | 5,500 | 216,040 | ||
| Scana Corp. | 700 | 35,455 | ||
| Southern Company | 12,530 | 525,007 | ||
| Talen Energy Corp. | 617 | 10,588 | ||
| Wisconsin Energy Corp. | 4,100 | 185,156 | ||
| Xcel Enerty Inc. | 9,540 | 306,997 | ||
Total Electric Utility | 3,769,835 | |||
| Electrical Equipment - 0.6% | ||||
| General Electric Co. | 8,000 | 212,560 | ||
| Exchange Traded Funds - 0.8% | ||||
| iShares Investment Grade Corp. Bonds | 640 | 74,061 | ||
| iShares S & P Preferred Stock Index Fund | 2,516 | 98,552 | ||
| SPDR Barclays Capital High Yield Bond ETF | 2,600 | 99,918 | ||
Total Exchange Traded Funds | 272,531 | |||
| Food Processing - 1.4% | ||||
| Kraft Foods Inc. | 4,900 | 417,186 | ||
| Mondelez International Inc. | 1,500 | 61,710 | ||
Total Food Processing | 478,896 | |||
| Heavy Truck & Equipment Makers - 0.6% | ||||
| Caterpillar Inc. | 2,340 | 198,479 | ||
| IT Services - 0.6% | ||||
| Paychex Inc. | 4,600 | 215,648 | ||
| Metals and Mining - 0.04% | ||||
| Silver Wheaton Corp. | 700 | 12,138 | ||
| Mutual Funds - 0.3% | ||||
| Blackrock Floating Rate Income Fund | 3,179 | 41,263 | ||
| John Hancock Preferred Income Fund | 3,284 | 63,677 | ||
Total Mutual Funds | 104,940 | |||
| Natural Gas Utility - 0.5% | ||||
| Atmos Energy Corp. | 1,500 | 76,920 | ||
| Piedmont Natural Gas Company Inc. | 2,700 | 95,337 | ||
Total Natural Gas Utility | 172,257 | |||
| Natural Gas (Diversified) - 0.1% | ||||
| ONEOK Inc. | 1,200 | 47,376 | ||
| Office Equipment - .2% | ||||
| Pitney Bowes Inc. | 3,000 | 62,430 | ||
| Oil Field Services and Equipment - 0.1% | ||||
| Diamond Offshore Drilling | 1,515 | 39,102 | ||
| Oil/Gas Distribution - 2.1% | ||||
| Kinder Morgan Inc. | 14,119 | 542,028 | ||
| Spectra Energy Corp. | 5,300 | 172,780 | ||
Total Oil/Gas Distribution | 714,808 | |||
| Petroleum Producing - 1.4% | ||||
| Chevron Corp | 1,800 | 173,646 | ||
| Hollyfrontier Corp. | 3,400 | 145,146 | ||
| Royal Dutch Shell | 2,800 | 160,580 | ||
Total Petroleum Producing | 479,372 | |||
| Real Estate Investment Trust - 9.3% | ||||
| AvalonBay Communities | 790 | 126,297 | ||
| Digital Realty | 1,500 | 100,020 | ||
| EPR Properties | 1,900 | 104,082 | ||
| HCP Inc. | 4,600 | 167,762 | ||
| Healthcare Reit Inc. | 4,310 | 282,865 | ||
| Healthcare Realty Trust Inc. | 2,300 | 53,498 | ||
| Highwoods Properties Inc. | 1,300 | 51,935 | ||
| Hospitality Properties Trust | 9,600 | 276,672 | ||
| Liberty Property Trust | 5,240 | 168,833 | ||
| LTC Properties Inc. | 4,830 | 200,928 | ||
| Mack Cali Rlty Corp. | 5,600 | 103,208 | ||
| National Retail Properties | 1,470 | 51,465 | ||
| Omega Healthcare Investors | 5,831 | 200,178 | ||
| Realty Income Corp. | 7,130 | 316,501 | ||
| Redwood Trust Inc | 2,600 | 40,820 | ||
| Sabra Health Care REIT Inc. | 1,960 | 50,450 | ||
| Senior Housing Properties Trust | 10,400 | 182,520 | ||
| Stag Industrial Inc. | 7,130 | 142,600 | ||
| Sun Communities | 3,180 | 196,619 | ||
| Ventas Inc. | 3,600 | 223,524 | ||
| Washington Real Estate Invt. | 6,600 | 1712708 | ||
Total Real Estate Investment Trust | 3,212,048 | |||
| Restaurant Industry - 0.6% | ||||
| McDonalds Corp. | 2,000 | 190,140 | ||
| Telecommunications Services - 7.5% | ||||
| AT&T | 29,570 | 1,050,326 | ||
| CenturyTel Inc. | 6,900 | 202,722 | ||
| Consolidated Communications | 9,600 | 201,696 | ||
| Frontier Communications Corp. | 192 | 950 | ||
| Verizon Communications Inc. | 24,540 | 1,143,809 | ||
Total Telecommunication Services | 2,599,504 | |||
Total US Common Stock (cost $13,701,495) | 14,044,334 | |||
| FOREIGN Common Stock - 0.3% | ||||
| CANADIAN Common Stock - Petroleum Industry - 0.02% | ||||
| Penn West Petroleum Ltd | 3,400 | 5,882 | ||
| CANADIAN Common Stock - Utilities - 0.02% | ||||
| Atlantic Power Corp. | 2,700 | 8,316 | ||
| FRANCE Common Stock - Drug Industry - 0.1% | ||||
| Sanofi-Aventis-ADR | 600 | 29,718 | ||
| NETHERLANDS Common Stock - Petroleum Industry - 0.04% | ||||
| Seadrill Ltd | 1,200 | 12,408 | ||
| BRITAIN Common Stock - Food Processing - 0.1% | ||||
| Unilever PLC | 800 | 34,368 | ||
Total FOREIGN Common Stock (cost $167,757) | 90,692 | |||
| Publicly Traded Partnerships - 10.2% | ||||
| Amerigas Partners LP | 7,230 | 330,483 | ||
| Boardwalk Pipeline Partners | 10,218 | 148,365 | ||
| Breitburn Energy Partners LP | 4,700 | 22,372 | ||
| Buckeye Partners LP | 6,472 | 478,475 | ||
| CVR Partners LP | 4,760 | 60,119 | ||
| Enbridge Energy Partners LP | 3,700 | 123,321 | ||
| Energy Transfer Partners LP | 8,312 | 433,886 | ||
| Enterprise Products Partners | 3,200 | 95,648 | ||
| KKR & Co. LP | 2,370 | 54,155 | ||
| Linn Energy LLC | 5,890 | 52,480 | ||
| Magellan Midstream Partners | 4,700 | 344,886 | ||
| Market West Partners LP | 2,000 | 112,760 | ||
| Nustar Energy LP Com | 4,100 | 243,335 | ||
| Plains All American Pipeline | 3,914 | 170,533 | ||
| Spectra Energy Partners LP | 3,466 | 159,783 | ||
| Suburban Propane Partners LP | 3,200 | 127,616 | ||
| Targa Resources Partners LP | 5,389 | 208,015 | ||
| TC Pipelines LP | 2,300 | 131,100 | ||
| Williams Partners LP | 4,541 | 219,921 | ||
Total Publicly Traded Partnerships (cost $3,794,020) | 3,517,253 | |||
| Short-Term Investments - 1.9% | ||||
Money Market Fund (Cost $665,392) | 665,392 | |||
TOTAL PORTFOLIO: | 100.0 % | $ 34,526,857 | ||
STATEMENT OF OPERATIONS
For six months ended June 30, 2014 (unaudited)
| Investment Income | |||||||
| $ | 425,610 | |||||
| 422,481 | ||||||
| 848,091 | ||||||
| Expenses | |||||||
| 162,163 | ||||||
| 121,422 | ||||||
| 42,304 | ||||||
| 32,563 | ||||||
| 32,121 | ||||||
| 22,923 | ||||||
| 15,509 | ||||||
| 429,005 | ||||||
| |||||||
| 419,086 | ||||||
| Unrealized Loss on Investments | |||||||
| (1,570,703) | ||||||
| (1,570,703) | ||||||
| Net Operating Income | (1,151,617 | ||||||
| Other Income and Expense, net | 82,080 | ||||||
| Net Increase in Net Assets Resulting from Operations | $ | 1,069,537 | |||||
| |||||||
STATEMENT OF CHANGES IN NET ASSETS
For six months ended June 30, 2014 (unaudited)
| Increase in Net Assets from Operations | June 30, 2015 | June 30, 2014 | |||||
| $419,086 | $485,727 | |||||
| 0 | 12,590 | |||||
| (1,570,703) | 1,022,069 | |||||
| 82,080 | 86,280 | |||||
| (1,069,537 | 1,606,666 | |||||
| Dividends and Distributions to Shareholders | (396,000) | (266,520) | |||||
| (1,465,537) | 1,340,146 | |||||
| |||||||
| Net Assets | |||||||
Beginning of year | 40,577,255 | 39,869,534 | |||||
Six months ended June 30, 2015 and 2014 (includes undistributed ordinary income of $427,354 and $486,195, respectively) | $39,111,718 | $41,209,680 | |||||
| |||||||
FINANCIAL HIGHLIGHTS
YEARS ENDED DECEMBER 31, 2010 TO 2014 AND THE SIX MONTHS ENDED JUNE 30, 2014 & 2015 (annualized)
Per share operating performance (for a share of Class A and Class B capital stock outstanding):
| Six Months Ended | Six Months Ended | Year Ended | Year Ended | Year Ended | Year Ended | Year Ended | |
| June 30,2015 | June 30, 2014 | 2014 | 2013 | 2012 | 2011 | 2010 | |
| Net asset value, beginning of year | 3,266 | 3,321 | 3,321 | 3,376 | 3,377 | 3,343 | 3,264 |
| Income from investment operations | |||||||
Net investment income | 35 | 40 | 80 | 80 | 70 | 70 | 73 |
Net realized and unrealized appreciation (depreciation) on investment transactions | (131) | 86 | (36) | (36) | 6 | 40 | 48 |
| 7 | 7 | 15 | 15 | 15 | 14 | 9 |
| 0 | 0 | 0 | 0 | 0 | 0 | 35 |
| (89) | 134 | 59 | 59 | 91 | 124 | 165 |
| Less dividends and distributions | (33) | (22) | (114) | (114) | (92) | (90) | (86) |
| Net asset value, end of year | 3,144 | 3,433 | 3,266 | 3,321 | 3,376 | 3,377 | 3,343 |
| Total return | -2.84% | 3.90% | 1.80% | 1.78% | 2.70% | 3.67% | 4.94% |
| Supplemental Data: | |||||||
Net assets, end of year (in thousands) | $39,122 | $41,210 | $39,870 | $39,870 | $40,531 | $40,532 | $40,123 |
| Ratio to average net assets: | |||||||
Expenses | 1.08% | 0.97% | 2.02% | 2.02% | 2.06% | 2.21% | 2.25% |
Net investment income | 1.05% | 1.20% | 2.39% | 2.39% | 2.08% | 2.08% | 2.22% |
| Portfolio turnover rate | 4.41% | 1.88% | 16.07% | 16.07% | 13.71% | 8.81% | 8.68% |
Kavilco Incorporated
NOTES to financial statement dated June 30, 2015
Note 1. Organization
Kavilco Incorporated ("the Company") is a village corporation within the Sealaska region organized on November 13, 1973, pursuant to the Alaska Native Claims Settlement Act ("ANCSA") of 1971. Under ANCSA, the Native claims to land in Alaska were settled in exchange for part of the state's land and compensation. Settlement benefits were given to Natives of Alaska villages in the form of ownership shares in village corporations that were organized pursuant to ANCSA. Kavilco Incorporated was organized for the purpose of securing and administering the land and benefits for the Natives of the Kasaan village in Alaska. Contributed capital includes receipts from the U.S. government and the state of Alaska under provisions of ANCSA.
On November 1, 1989, the Company began to operate as a self-managed, closed-end management investment company, as defined by the Investment Company Act of 1940 ("the Act"). The Company is subject to various restrictions imposed by the Act and the Internal Revenue Code, including restrictions on borrowing, dividend, and distribution policies, operations and reporting requirements. The Company's investment decisions, which focus primarily on fixed income investments, are made by management under the direction of the Board of Directors.
Note 2. Significant Accounting Policies
Use of Estimates
The preparation of financial statements in conformity with accounting principles generally accepted in the United States requires management to make estimates and assumptions that affect certain reported amounts and disclosures. Actual results could differ from those estimates.
Cash and Cash Equivalents
Cash and cash equivalents include cash on deposit with banks. The Company considers all highly liquid instruments with a maturity of three months or less to be cash equivalents. The Company has cash balances in excess of federally insured limits.
Valuation of Investments
All investments are recorded at their estimated fair value, as described in Note 3.
Investment Transactions and Income
Investment transactions are recorded on a trade date basis. Realized gains and losses from securities transactions are computed using the LIFO (last in first out) method. Interest income is recorded on an accrual basis as adjusted for the amortization of discounts and premiums using the effective interest method. Premiums and discounts, including original issue discounts, are amortized for both tax and financial reporting purposes. Dividend income is recorded as of the ex-dividend date. Unrealized gains and losses are included in the statement of operations.
Federal Income Taxes
The Company files income tax returns in the U.S. federal jurisdiction and Alaska State. Generally, the Company is subject to examination by U.S. federal and state income tax authorities for three years from the filing of a tax return.
The Company's policy is to continue to comply with the requirements of the Internal Revenue Code that are applicable to regulated investment companies and to distribute at least 90% of its net investment taxable income to its shareholders. Generally, no federal income tax provision is required for the Company.
The Company records a liability, if any, for unrecognized tax benefits resulting from uncertain income tax positions taken or expected to be taken in an income tax return. No liability has been recorded for uncertain tax positions, or related interest or penalties as of June 30, 2015.
Dividends and Distributions to Shareholders
Dividends and distributions to shareholders are recorded on the payable date. Dividends are generally declared and paid twice a year. Capital gain distributions are generally declared and paid annually. The timing and characterization of certain income and capital gains distributions are determined in accordance with federal tax regulations and may differ from those determined in accordance with accounting principles generally accepted in the United States.
Directors' Compensation and Expenses
Each member of the Board of Directors receives compensation for each board meeting attended during the year in addition to a per diem allowance. Directors are also reimbursed for such expenses as accommodation, airfare, and car rental related to board meetings. In addition to meeting related expenses, the Company pays for the medical insurance of certain directors.
Subsequent Events
The Company has evaluated subsequent events through the date these financial statements were available to be issued, and has determined that there are no events that would require adjustments or additional disclosures in the financial statements.
Note 3. Fair Value Measurements
Fair value is defined as an exit price, representing the amount that would be received to sell an asset or paid to transfer a liability in an orderly transaction between market participants. As such, fair value is a market-based measurement determined based on assumptions that market participants would use in pricing an asset or liability. There are three levels which prioritize the inputs used in measuring fair value as follows:
Level 1: Observable market inputs such as quoted prices (unadjusted) in active markets for identical assets or liabilities;
Level 2: Observable market inputs, other than quoted prices in active markets, that are observable either directly or indirectly; and
Level 3: Unobservable inputs where there is little or no market data, which require the reporting entity to develop its own assumptions.
An asset or liability's level within the fair value hierarchy is based on the lowest level of any input that is significant to the fair value measurement. The following is a description of the valuation methodologies used for assets measured at fair value, including a general description of the asset.
Equity securities (common stock)
Securities traded on a national securities exchange (or reported on the NASDAQ national market) are stated at the last reported sales price on the day of valuation. To the extent these securities are actively traded and valuation adjustments are not applied, they are categorized in Level 1 of the fair value hierarchy.
Corporate bonds
The fair value of corporate bonds is estimated using various techniques, which may consider recently executed transactions in securities of the issuer or comparable issuers, market price quotations (where observable), bond spreads, fundamental data relating to the issuer, and credit default swap spreads. Corporate bonds are generally categorized in Level 2 of the fair value hierarchy.
Publicly traded partnerships
Publicly traded partnerships consist of tax-advantage oil and gas processing and distribution companies. They do not pay state or federal corporate income tax. They are traded on a national securities exchange and are stated at the last reported sales price on the day of valuation. To the extent these securities are actively traded and valuation adjustments are not applied, they are categorized in Level 1 of the fair value hierarchy.
Real Estate
Real estate represents entitlement to the surface estate of real property, for which no readily available market quotation exists. Fair value of real estate is determined by management based on a Certified Forester's opinion as to the current value and status of the land, along with other factors. Other relevant factors include the lack of commercially viable timber due to previous harvest, amount of capital expenditures required for the future growth of timber, location of the property, recent sales of similar real property in the region and market demand and supply for this type of real property during the valuation process. Real estate is included in Level 3 of the fair value hierarchy.
The following table presents information about the Company's investments in securities and real estate measured at fair value as of June 30, 2015:
| Level 1 | Level 2 | Level 3 | Balance | |||||||||
| ||||||||||||
Investments in Securities | ||||||||||||
US Corporate Bonds | $ | - | $ | 16,209,186 | $ | - | $ | 16,209,186 | ||||
US Common stock | 14,044,334 | - | - | 14,044,334 | ||||||||
Foreign Common Stock | 90,692 | - | - | 90,692 | ||||||||
Publicly Traded Partnerships | 3,517,253 | - | - | 3,517,253 | ||||||||
Money Market Fund | 665,392 | - | 665,392 | |||||||||
| $ | 18,317,671 | $ | 16,209,186 | $ | $ | 37,526,857 | |||||
| ||||||||||||
Real Estate | $ | $ | $ | 4,207,633 | $ | 4,207,633 | ||||||
The Company recognizes transfers between Level 1 and 2 at the end of the reporting period. As of June 30, 2015, no significant transfers between Level 1 or 2 occurred.
At June 30, 2015, there were no realized gain (loss), changes in unrealized gain (loss), cost or purchases, proceeds from sales or transfers in or out of Level 3 at the end of the reporting period.
Note 4. Real Estate
At June 30, 2015, the Company owns fee title to the surface estate of 22,946 acres of real estate. In 1979, the Company received entitlement under Section 12(a) of ANCSA to the surface estate of real property totaling 23,055 acres. In 1987, 194 acres of this property was distributed to the shareholders. The Company received an additional 89.24 acres during 2002 in the process of closing out a timber sale contract.
As of June 30, 2015, there is no commercial viable timber on the real estate and the Company has no outstanding timber agreements. The last harvest and sale of timber from this land was in 2001.
The financial statements include real estate valued at $4,207,633 at June 30, 2015, the value of which was determined by an independent appraisal on December 31, 2014. The Board of Directors approved this fair value estimate of the real estate. The Company has the real estate appraised on an annual basis.
Note 5. Trading Risk
In the normal course of business, the Company enters into financial transactions involving instruments where there is risk of potential loss due to changes in the market (market risk), or failure of the other party to the transaction to perform (credit risk).
Market risk is the potential change in value caused by fluctuations in market prices of an underlying financial instrument. Subsequent market fluctuations may require selling investments at prices that differ from the values reflected on the statement of assets and liabilities. Market risk is directly impacted by the volatility and liquidity in the markets in which financial instruments are traded. The Company's exposure to market risk may be increased in that a significant portion of its assets may be invested in a relatively small number of investment positions at any one time. Accordingly, appreciation or depreciation in value of investment positions may have a more significant effect on the value of the Company's portfolio than would be the case in a more diversified or hedged portfolio.
Credit risk is the possibility that a loss may occur due to the failure of the counterparty to perform according to the terms of a contract. The Company's exposure to credit risk associated with counterparty nonperformance includes cash deposits that may exceed applicable insurance limits. The Company seeks to control such credit risk by maintaining deposits with only high quality financial institutions and trading exchange traded financial instruments, which generally do not give rise to significant counterparty exposure due to the requirements of the individual exchanges.
Note 6. Investment Transactions
Purchases of investment securities (consisting of corporate obligations, common stock, and publicly traded partnerships) aggregated $2,891,148 for the six months ended June 30, 2015, and sales and maturities of investment securities (consisting of corporate bonds) aggregated $1,500,000 for the six months ended June 30, 2015.
The U.S. federal income tax basis of the Company's investments is the same as for financial reporting purposes. The gross unrealized appreciation and gross unrealized depreciation for U.S. federal income tax purposes is $2,393,335, and $1,560,710, respectively, for the six months ended June 30, 2015.
Note 7. Premises and Equipment
The following is a summary of premises and equipment at June 30, 2015:
Building | $ | 170,601 | |||||
Furniture, fixtures, and equipment | 70,803 | ||||||
| 241,404 | |||||||
Less accumulated depreciation | (223,533) | ||||||
| $ | 17,871 | ||||||
Buildings and equipment are recorded at cost less accumulated depreciation. Depreciation is computed on the straight-line method over the estimated useful lives of the related assets, which range from 5 to 15 years. Depreciation expense was $2,887 for the six months ended June 30, 2015.
Note 8. Lease Obligation
The Company leases office space under a non-cancelable operating lease agreement, which terminates September 30, 2016. Future minimum lease commitments under this non-cancelable operating lease are as follows:
| |||||||
2015 | 17,754 | ||||||
2016 | 27,277 | ||||||
| $ | 45,031 | ||||||
Rent expense for the six months ended June 30, 2015 was $19,192. .
Note 9. Net Assets
Upon organization of the Company, 100 shares of common stock (Class A) were issued to each qualified shareholder enrolled in the Company pursuant to ANCSA. The Company utilized a roll comprising 120 Alaska Natives eligible to receive stock certificates as certified by the U.S. Secretary of the Interior. Under the provisions of ANCSA, stock dividends paid or other stock grants are restricted, and the stock may not be sold, pledged, assigned, or otherwise alienated, except in certain circumstances by court decree or death, unless approved by a majority of the shareholders. The stock carries voting rights only if the holder hereof is an eligible Alaska Native. Nonvoting common stock (Class B) is issued to non-Native persons who inherit stock or are gifted stock.
The Company's capital structure is as follows:
Common stock:
Class A, no par value - Authorized, 1,000,000 shares; issued and outstanding, 11,482.83 shares
Class B, no par value - Authorized, 500,000 shares; issued and outstanding, 517.17 shares
Note 10. Dividends and Distributions to Shareholders
On March 6, 2015, a distribution of $33.00 per share was declared. The dividend was paid on March 16, 2015 to shareholders of record on March 9, 2015.
The tax character of distributions paid during the six months ended June 30, 2015 and the years ended December 31, 2014 and 2013 were as follows:
June 30, 2015 | 2014 | 2013 | |||||
Distributions paid from: | |||||||
Ordinary income | $ | 266,520 | $ | 1,110,892 | $ | 1,367,671 | |
Long-term capital gain | 128,350 | ||||||
| $ | 266,520 | $ | 1,239,242 | $ | 1,367,671 | ||
As of June 30, 2015 and December 31, 2014 and December 31, 2013, the components of distributable earnings on a tax basis were as follows:
June 30, 2015 | 2014 | 2013 | ||||||||
Undistributed ordinary income | $ | 427,354 | $ | 322,188 | $ | 168,118 | ||||
Net unrealized appreciation on: | ||||||||||
Investments | 832,536 | 2,393,720 | 2,253,085 | |||||||
Real estate | 3,153,544 | 3,153,544 | 2,740,528 | |||||||
| $ | 4,413,434 | $ | 5,869,452 | $ | 5,161,731 | |||||
Note 11. Schedule of Investments
Investments are categorized by type, country, and industry. The industry category represents management's belief as to the most meaningful presentation of the classification of the principal business of the investees. The percentage of net assets is computed by dividing the fair value of each category by net assets.
Note 12. Pension Plan
Employees of the Company are covered by a defined contribution pension plan. The Company contributes 20% of each participant's compensation to the plan. The Company's contributions for the six months ended June 30, 2015 totaled $20,998.
Note 13. Other Income and Expense
The Company earned income of $75,480 for the six months ended June 30, 2015, as a result of ANCSA Section 7(i) which requires regional corporations to distribute 70% of any net revenues derived from timber resources and the subsurface estate to other regional corporations who then redistribute under Section 7(j) 50% of such amounts to the village corporations and at-large shareholders.
Other income also includes $6,600 of lease income for the six months ended June 30, 2015.
~ Kavilco's Mission Statement ~
To honor the vision and unselfish actions of our Kasaan Haida ancestors and elders, the goals of Kavilco Incorporated are to provide dividends and to preserve the assets for all generations.
Officers & Directors
Louis Jones, Sr., President
Marie Miller, Vice President
Laird A. Jones, Secretary
Scott Burns, Chief Financial Officer
Jeane Breinig, Director
Kenneth Gordon, Director
Eleanor Hadden, Director
Ramona Hamar, Director
Frederick O. Olsen, Jr., Director
Melanie Young, Director
32 Years of Dividend Distributions
| 1980 INITIAL DISTRIBUTION | $3,000,000 |
| 1981 Debenture | 1,200,000 |
| 1981 Alaska Native Fund | 283,282 |
| 1982 Debenture | 1,200,000 |
| 1983 Alaska Native Fund | 69,940 |
| 1983 Debenture | 1,200,000 |
| 1984 Debenture | 1,200,000 |
| 1984 Dividend | 120,000 |
| 1985 Debenture | 1,200,000 |
| 1986 Dividend | 120,000 |
| 1986 Debenture | 1,200,000 |
| 1987 Debenture | 1,200,000 |
| 1987 Property Dividend | 236,066 |
| 1987 Dividend | 120,000 |
| 1988 Debenture | 1,200,000 |
| 1989 Debenture | 1,200,000 |
| 1989 Dividend | 240,000 |
| 1990 Debenture | 1,200,000 |
| 1990 Dividend | 600,000 |
| 1991 Dividends | 1,080,000 |
| 1992 Dividends | 960,000 |
| 1993 Dividends | 1,214,400 |
| 1994 Dividends | 1,248,300 |
| 1995 Dividends | 1,728,000 |
| 1996 Dividends | 1,927,680 |
| 1997 Dividends | 1,992,000 |
| 1998 Dividends | 1,956,003 |
| 1999 Dividends | 2,027,167 |
| 2000 Dividends | 1,811,000 |
| 2001 Dividends | 1,932,000 |
| 2002 Dividends | 1,764,000 |
| 2003 Dividends | 1,650,000 |
| 2004 Dividends | 1,215,000 |
| 2005 Dividends | 1,009,200 |
| 2006 Dividends | 1,065,000 |
| 2007 Dividends | 1,188,001 |
| 2008 Dividends | 1,140,000 |
| 2009 Dividends | 1,236,000 |
| 2010 Dividends | 1,032,000 |
| 2011 Dividends | 1,080,000 |
| 2012 Dividends | 1,085,899 |
| 2013 Dividends | 1,369,200 |
| 2014 Dividends | 1,239,240 |
| Total Distributions | $50,739,378 |
Per 120 Original Shareholders | $422,828 |
| ITEM 2. | CODE OF ETHICS. |
Not applicable when filing a semi-annual report to shareholders.
| ITEM 3. | AUDIT COMMITTEE FINANCIAL EXPERT. |
Not applicable when filing a semi-annual report to shareholders.
| ITEM 4. | PRINCIPAL ACCOUNTANT FEES AND SERVICES. |
Not applicable when filing a semi-annual report to shareholders.
| ITEM 5. | AUDIT COMMITTEE OF LISTED REGISTRANTS. |
Not applicable when filing a semi-annual report to shareholders.
| ITEM 6. | SCHEDULE OF INVESTMENTS. |
Please see Schedule of Investments contained in the Report to Shareholders filed under Item 1 of this Form N-CSRS.
| ITEM 7. | DISCLOSURE OF PROXY VOTING POLICIES AND PROCEDURES FOR CLOSED-END MANAGEMENT INVESTMENT COMPANIES. |
Not applicable when filing a semi-annual report to shareholders.
| ITEM 8. | PORTFOLIO MANAGERS OF CLOSED-END MANAGEMENT INVESTMENT COMPANIES. |
Not applicable when filing a semi-annual report to shareholders.
| ITEM 9. | PURCHASES OF EQUITY SECURITIES BY CLOSED-END MANAGEMENT INVESTMENT COMPANY AND AFFILIATED PURCHASERS. |
The Alaska Native Claims Settlement Act (ANCSA), which is our primary regulating authority, places numerous restrictions on the Company's stock. Kavilco's stock was given to its shareholders. It can only be transferred by court decree or gifting to a blood relative and cannot be sold or used as collateral. There is no provision in the ANCSA regulations for repurchase of shares.
| ITEM 10. | SUBMISSION OF MATTERS TO A VOTE OF SECURITY HOLDERS. |
No matters were voted on by shareholders during the period covered by this report.
| ITEM 11. | CONTROLS AND PROCEDURES. |
(a) The registrant's President and Chief Financial Officer have concluded that the registrant's disclosure controls and procedures (as defined in Rule 30a-3(c) under the Investment Company Act of 1940, as amended) are effective at the reasonable assurance level based on their evaluation of these controls and procedures as of a date within 90 days of the filing date of this document.
(b) There were no changes in the registrant's internal controls over financial reporting that occurred during the second fiscal quarter of the period that has materially affected, or is reasonably likely to materially affect, the registrant's internal control over financial reporting.
| ITEM 12. | EXHIBITS. |
The following exhibits are attached to this Form N-CSRS:
EXHIBIT NO. | DESCRIPTION OF EXHIBIT | |
12(a)(1) | Certification of President | |
12(a)(2) | Certification of Chief Financial Officer | |
SIGNATURES
Pursuant to the requirements of the Securities Exchange Act of 1934 and the Investment Company Act of 1940, the registrant has duly caused this report to be signed on its behalf by the undersigned, thereunto duly authorized.
(Registrant): Kavilco Incorporated | ||
By: | /s/ Louis L. Jones | |
| Louis L. Jones | ||
| President | ||
Date: August 28, 2015
Pursuant to the requirements of the Securities Exchange Act of 1934 and the Investment Company Act of 1940, this report has been signed below by the following persons on behalf of the registrant and in the capacities and on the dates indicated.
By: | /s/ Scott Burns | |
| Scott Burns | ||
| Chief Financial Officer | ||
Date: August 24, 2015 | ||