UNITED STATES
SECURITIES AND EXCHANGE COMMISSION
WASHINGTON, D.C. 20549
FORM N-CSRS
CERTIFIED SHAREHOLDER REPORT OF
REGISTERED MANAGEMENT INVESTMENT COMPANIES
Investment Company Act file number: 811-6027
KAVILCO INCORPORATED
(Exact name of registrant as specified in charter)
1000 Second Avenue, Suite 3320
Seattle, Washington 98104
(Address of principal executive offices) (Zip code)
Registrant's telephone number, including area code: (206) 624-6166
Date of fiscal year end: December 31, 2017
Date of reporting period: January 1, 2017-June 30, 2017
Kavilco Incorporated
Report to Shareholders
2017
June 30, 2017 (unaudited financial statements)
| ITEM 1. | HIGHLIGHTS FROM THE 2016 REPORT TO SHAREHOLDERS |
Note to SEC: Kavilco Incorporated is an Alaska Native Corporation that operates under the Investment Company Act of 1940. The Alaska Native Claims Settlement Act, which is our primary regulating authority, places numerous restrictions on the Company's stock. Kavilco's stock can only be transferred by court decree or gifting to a blood relative, and cannot be sold or used as collateral. The following discussion has been edited so that only letters from the CEO and CFO, shareholder meetings announcements, portfolio, and financial issues from Kavilco's report to shareholders are attached to the N-CSRS. Not included are general photos and descriptions, an In Memoriam listing of deceased original shareholders.
44th Annual Meeting of Shareholders
Notice
The 44th Annual Meeting of Shareholders is scheduled for Saturday, November 4, 2017 at The Landing in Ketchikan, Alaska.
Registration will take place from 11:00 a.m. to Noon in the Sunny Point conference room. The Shareholder meeting will be from 1:00 pm to 3:00 pm. The primary items of business are the approval of the Corporation's independent public accountants and the election of Directors.
Directors who are up for re-election this year are Ramona Hamar, Director, Jeane Breinig, Director, and Marie Miller, Vice President. The Board recommends re-election of all three members.
"Your Proxy Ballot and Statement will be mailed in October of this year." If you are unable to attend the Annual Meeting in Ketchikan, it is very important that you MAIL YOUR BALLOT IN, we ask that you vote "discretionary" on the Management Ballot.
We urge you to come to the Annual Meeting of Shareholders. Attendance at the Shareholder meetings helps to maintain good communication and understanding.
The Annual Shareholder Dinner will be held in the Sunny Point Conference Room on Saturday, November 4, 2017, in the evening at The Landing in Ketchikan for shareholders, their family, and guests; doors will open at 5:30 pm. There is no charge for dinner, as always. The Kasaan Haida Heritage Foundation will be holding their auction at the Annual Shareholder Dinner again this year. If you have any items to donate or would like to volunteer to help out at the auction, please contact Jeane Breinig at jeane@gci.net.
Greetings To Our Shareholders From Your President
Every year upon returning to Kasaan I am always met with good people, good fishing and a few surprises. This year, the Kavilco residence welcomed me with a backed up septic tank. Upon inspection it was determined that the septic tank had a wooden lid that was rotted and plugging up the tanks. Once I got this cleaned up and the lid replaced, I could finally settle into the island. In addition to sewage problems, many improvements were made in the doublewide this year and last, a list of which would be a bit too long for this report. Suffice to say, my living conditions in Kasaan have improved tremendously with still more that can be done without investing $150,000 (doublewide replacement) a cost of $1,250 per original shareholder.
I reflected on the Whale House rededication ceremony in Kasaan last summer and still felt a feeling of pride to have been a part of it. It is estimated that well over 1000 people attended and took part in this historic occasion. DVD's of this occasion are still available from the Organized Village of Kasaan (OVK) at their website at kasaan.org or by contacting them at 907.542.2230.
The Kavilco Board of Directors came to Kasaan for their July 2017 meeting. The Board met with representatives from the City of Kasaan and the Organized Village of Kasaan (OVK) who provided updates to the Board on several items. One item of note was that OVK indicated that they had taken out time to clean the cemetery, and Kavilco is very grateful that they took this initiative. Board member Eleanor Hadden later provided the Board with a summary of a current webinar she took called "Who's taking care of Gramma's Grave." Topics included "why it is important to document the cemetery, mapping, photographing, gathering historical information (stories), noting the condition of the markers with good records, prioritizing work like brushing, removing trees, stabilizing the area, and what not to use when cleaning the head and foot stones.
I look forward to overseeing things in Kasaan for the remainder of the summer and invite you all to visit your home in Kasaan. Ha'w'aa, gunalch'ee, thank you one and all.
Sincerely,/s/ Louis L. Jones, Sr.
Louis L. Jones, Sr., President
Greetings To Our Shareholders From Your CFO
To understand why Kavilco's earnings have been declining over the past decade a brief history lesson is needed. In late 2008, when the economy was in crisis and there was still uncertainty regarding the viability of the U.S. financial sector, the Federal Reserve began a strategy to lower interest rates. The plan was to buy trillions of dollars' worth of long-term treasury bonds and mortgage backed securities on the open market. The increased demand for these fixed-income products proved very successful in achieving the desired results, as the yields on the 10 and 30-year treasuries along with all fixed income products declined to historic lows in 2016.
Concurrent with the Feds strategy, the Board adopted a bond ladder strategy, that is, to invest in corporate bonds across an eight year yield curve. This reduces the reinvestment risk of having to roll over the entire portfolio at one time and smooths out earnings. This was a very successful strategy until the major decline in interest rates as detailed above.
When the ladder strategy was employed, long dated bonds were purchased first because their interest rates were higher than short-term bonds. Now the bonds are maturing, putting added pressure on income. The only alternative to the bond reinvestment risk is to purchase dividend yielding stocks, unfortunately, maturing bond yields are substantially higher than stocks. Case in point, $1.345 million of Plains All American Pipeline bonds matured in January with a yield of 5.97%. The proceeds were reinvested in stocks with yields in the 3% to 4% range, hence lower investment income.
Why reinvest in stocks as opposed to bonds? As noted in the 2016 Report to Shareholders, Kavilco's strategy over the last six years was TINA, There Is No Alternative. No matter how high the valuations have become, or how pitiful the underlying economic fundamental may be, Kavilco has no choice but to keep investing and holding dividend paying stocks.
What is the likelihood that interest rates increase to pre 2016 levels and provide a better return for Kavilco's portfolio? Once again, the financial markets are in uncharted territory. There are two conflicting Federal Reserve Board strategies in play. Because of the aforementioned financial crisis, the Fed's balance sheet has expanded from $1 trillion to $4.5 trillion. Fixed income securities need to be sold to rectify this situation, meaning greater supply in the market place, which would help depress prices and raise rates. At the same time the Fed plans on tightening monetary policy by raising rates. Can the market handle both the monetary tightening and an increase in short term interest rates at the same time? No one can predict exactly how the Fed's strategy will play out.
The impact on the foregoing analysis on investment income compared to June 30, 2016 is that investment earnings are down $83,238. Starting in June this reduction in income will get worse because $3,065,000 of high yielding corporate bonds have or will be redeemed.
We are now into year six with each year becoming more challenging than the previous one. Fortunately for Kavilco and me, the Board is up the financial challenges that have ensured 37 years of continuous dividend distributions.
/s/ Scott Burns
Scott Burns, Chief Financial Officer
Financial Statements (Unaudited) June 30, 2017
The unaudited financial statements for the six months ending June 30, 2017 are included in this report.
The audited financial statements dated December 31, 2016 were sent to shareholders on February 24, 2017 and will not be duplicated here. A copy of the audited financial statements can be mailed to shareholders within three working days by contacting Kavilco's Corporate Secretary at 1.800.786.9574 or 206.624.6166.
STATEMENT OF ASSETS AND LIABILITIES
| ASSETS | |||||
| Investments in securities, at fair value (cost $33,898,722) | $ | 35,031,991 | |||
| Real estate at fair value (cost $1,054,089) | 5,776,759 | ||||
| Cash and cash equivalents | 86,973 | ||||
| Interest receivable | 118,234 | ||||
Premises and equipment, net | 19,087 | ||||
Prepaid expenses and other assets | 33,621 | ||||
Total assets | 41,066,665 | ||||
| LIABILITIES | |||||
| Accounts payable and accrued expenses | 27,613 | ||||
| Dividends payable | 145,227 | ||||
Total liabilities | 172,840 | ||||
| NET ASSETS | $ | 40,893,825 | |||
| Net assets consist of: | |||||
| |||||
Distributable earnings | $ | 10,233,779 | |||
Contributed Capital | 30,660,046 | ||||
| |||||
TOTAL Net assets | $ | 40,893,825 | |||
| Net asset value per share of Class A and Class B common stock ($40,893,825) divided by 12,000 shares outstanding) | $ | 3,408 | |||
Financial Statements (UnaudIted) June 30, 2017
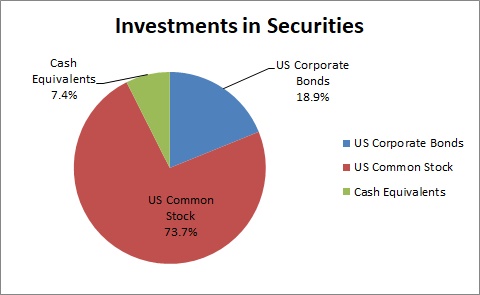
SCHEDULE OF INVESTMENTS
| Principal Amount or Shares | Fair Value | |||||
| U.S. Corporate Bonds 18.9% | ||||||
| American Depository Receipts - 0.8% | ||||||
| Deutsche Telekom, 6.000%, due July 8, 2019 | 250,000 | 269,430 | ||||
| Total American Depository Receipts: | 269,430 | |||||
| Communications - 5.9% | ||||||
| Viacom, Inc., 4.625%, due May 15, 2018 | 2,000,000 | 2,051,660 | ||||
| Total Communications: | 2,051,660 | |||||
| Consumer Staples - 1.8% | ||||||
| Kraft Foods, Inc., 6.500%, due August 11, 2017 | 250,000 | 251,147 | ||||
| Yum! Brands, Inc., 5.300%, due September 15, 2019 | 355,000 | 374,525 | ||||
| Total Consumer Staples: | 625,672 | |||||
| Energy - 4.8% | ||||||
| Hess Corp., 8.125%, due February 15, 2019 | 199,000 | 216,016 | ||||
| Kinder Morgan Energy Partners, 5.950%, due February 15, 2018 | 460,000 | 471,367 | ||||
| XTO Energy, Inc., 6.250%, August 1, 2017 | 1,000,000 | 1,003,470 | ||||
| Total Energy: | 1,690,853 | |||||
| Financials 0.6% | ||||||
| General Electric Capital Corp., 5.625%, due September 15, 2017 | 215,000 | 216,759 | ||||
| Total Financials: | 216,759 | |||||
| Industrials - 1.6% | ||||||
| International Paper, 9.375%, due May 15, 2019 | 500,000 | 564,435 | ||||
| Total Industrials: | 564,435 | |||||
| Information Technology 1.1% | ||||||
| Adobe Systems, Inc., 4.750%, due February 1, 2020 | 100,000 | 107,269 | ||||
| Oracle Corp., 5.000%, due July 08, 2019 | 250,000 | 266,293 | ||||
| Total Information Technology: | 373,562 | |||||
| Transportation 1.6% | ||||||
| FedEx Corp., 8.000%, due January 15, 2019 | 500,000 | 545,055 | ||||
| Total Transportation: | 545,055 | |||||
| Utilities 0.8% | ||||||
| Metropolitan Edison, 7.700%, due January 15, 2019 | 250,000 | 269,805 | ||||
| Total Utilities: | 269,805 | |||||
Total - US Corporate Bonds (Cost $6,393,216) | $6,607,231 | |||||
| U.S. Common Stock 73.7% | ||||||
| American Depository Receipts 1.9% | ||||||
| Atlantic Power Corp. | 2,700 | 6,480 | ||||
| Eaton Corp, PLC | 1,400 | 108,962 | ||||
| Enbridge Inc. | 5,215 | 207,609 | ||||
| Invesco Ltd. | 3,300 | 116,127 | ||||
| Obsidian Energy Ltd. | 3,400 | 4,318 | ||||
| Royal Dutch Shell, PLC | 2,800 | 152,404 | ||||
| Sanofis-Aventis | 600 | 28,746 | ||||
| Seadrill Ltd. | 1,200 | 433 | ||||
| Unilever PLC | 800 | 43,296 | ||||
| Wheaton Precious Metals Corp. | 700 | 13,923 | ||||
| Total American Depository Receipts: | 682,298 | |||||
| Consumer Discretionary 0.3% | ||||||
| Lamar Advertising Company | 1,350 | 99,319 | ||||
| Total ConsumerDiscretionary: | 99,319 | |||||
| Consumer Staples 3.5% | ||||||
| Coca Cola Company | 11,600 | 520,260 | ||||
| Kraft Heinz Company, The | 4,900 | 419,636 | ||||
| Mondelez International, Inc. | 1,500 | 64,785 | ||||
| Procter & Gamble Co. | 2,400 | 209,160 | ||||
| Total Consumer Staples: | 1,213,841 | |||||
| Energy 2.7% | ||||||
| Chevron Corp. | 3,600 | 375,588 | ||||
| Diamond Offshore Drilling, Inc. | 1,515 | 16,407 | ||||
| Exxon Mobil Corp. | 2,400 | 193,752 | ||||
| Hollyfrontier Corp | 3,400 | 93,398 | ||||
| Kinder Morgan, Inc. | 14,119 | 270,520 | ||||
| Total Energy: | 949,665 | |||||
| Financials 16.9% | ||||||
| AvalonBay Communities, Inc. | 1,200 | 230,604 | ||||
| Care Capital Properties, Inc. | 900 | 24,030 | ||||
| Digital Realty Trust, Inc. | 2,350 | 265,432 | ||||
| EPR Properties | 1,900 | 136,553 | ||||
| Equity Ressidential Properties Trust Int. | 1,500 | 98,745 | ||||
| Essex Property Trust | 400 | 102,908 | ||||
| HCP, Inc. | 4,600 | 147,016 | ||||
| Healthcare Realty Trust, Inc. | 5,425 | 185,264 | ||||
| Highwoods Properties, Inc. | 1,300 | 65,923 | ||||
| Hospitality Properties Trust | 13,400 | 390,610 | ||||
| Liberty Properties Trust | 11,140 | 453,509 | ||||
| LTC Properties, Inc. | 4,830 | 248,214 | ||||
| Mack Cali Rlty Corp. | 5,600 | 151,984 | ||||
| National Retail Properties, Inc. | 1,470 | 57,477 | ||||
| Omega Healthcare Investors, Inc. | 5,831 | 192,540 | ||||
| Quality Care Properties, Inc. | 920 | 16,845 | ||||
| Realty Income Corp. | 10,530 | 581,045 | ||||
| Redwood Trust, Inc. | 2,600 | 44,304 | ||||
| RMR Group, Inc., The | 274 | 13,330 | ||||
| Sabra Healthcare REIT, Inc. | 1,960 | 47,236 | ||||
| Senior Housing Properties Trust | 10,400 | 212,576 | ||||
| Stag Industrial, Inc. | 10,830 | 298,908 | ||||
| Sun Communities, Inc. | 3,180 | 278,854 | ||||
| T Rowe Price Group, Inc. | 2,900 | 215,209 | ||||
| Ventas, Inc. | 7,200 | 500,256 | ||||
| Washington REIT | 6,600 | 210,540 | ||||
| Wells Fargo & Co. | 3,840 | 212,774 | ||||
| Welltower, Inc | 7,310 | 547,154 | ||||
| Total Financials: | 5,929,840 | |||||
| Healthcare 3.5% | ||||||
| Amgen Inc. | 1,240 | 213,565 | ||||
| Bristol-Myers Squibb | 6,900 | 384,468 | ||||
| Merck & Co., Inc. | 3,125 | 200,281 | ||||
| Pfizer, Inc. | 12,500 | 419,875 | ||||
| Total Healthcare: | 1,218,189 | |||||
| Industrials 3.1% | ||||||
| Boeing Co. | 1,220 | 241,255 | ||||
| Caterpillar, Inc. | 2,140 | 229,964 | ||||
| General Electric | 13,430 | 362,744 | ||||
| Pitney Bowes, Inc. | 3,000 | 45,300 | ||||
| United Parcel Service | 1,900 | 210,121 | ||||
| Total Industrials: | 1,089,384 | |||||
| Information Technology 3.0% | ||||||
| Cisco Systems, Inc. | 12,810 | 400,953 | ||||
| International Business Machines (IBM) Corp. | 1,150 | 176,905 | ||||
| Paychex, Inc. | 8,325 | 474,026 | ||||
| Total Information Technology: | 1,051,884 | |||||
| Master Limited Partnerships 8.9% | ||||||
| Amerigas Partners LP | 7,230 | 326,579 | ||||
| Boardwalk Pipeline Partners LP | 10,218 | 184,026 | ||||
| Buckeye Partners LP | 6,472 | 413,755 | ||||
| CVR Partners LP | 4,760 | 16,612 | ||||
| Enbridge Energy Partners LP | 3,700 | 59,200 | ||||
| Energy Transfer Partners LP | 12,468 | 254,223 | ||||
| Enterprise Products Partners LP | 11,200 | 303,296 | ||||
| KKR and Co. LP | 2,370 | 44,082 | ||||
| Magellan Midstream Partners LP | 6,200 | 440,876 | ||||
| MPLX LP | 2,180 | 72,812 | ||||
| Nustar Energy LP | 4,100 | 191,183 | ||||
| Plains All American Pipeline LP | 3,914 | 102,821 | ||||
| Spectra Energy Partners LP | 4,866 | 294,551 | ||||
| Suburban Propane Partners LP | 3,200 | 76,128 | ||||
| TC Pipelines LP | 2,300 | 126,500 | ||||
| Terra Nitrogen Company LP | 225 | 19,319 | ||||
| Williams Partners LP | 4,541 | 182,140 | ||||
| Total Master Limited Partnerships: | 3,108,103 | |||||
| Mutual Funds 1.1% | ||||||
| Blackrock Global Floating Rate Income Fund | 3,179 | 44,411 | ||||
| John Hancock Preferred Income Fund | 3,284 | 71,788 | ||||
| iShares Investment Grade Corp. Bonds | 640 | 77,126 | ||||
| iShares US Preferred ETF | 2,516 | 98,552 | ||||
| SPDR Barclays High Yield Bond ETF | 2,600 | 96,720 | ||||
| Total Mutual Funds: | 388,597 | |||||
| Telecommunication Services 7.9% | ||||||
| AT & T, Inc. | 29,570 | 1,115,676 | ||||
| Centurylink, Inc. | 6,900 | 164,772 | ||||
| Consolidated Communications | 9,600 | 206,112 | ||||
| Frontier Communications Corp. | 192 | 223 | ||||
| Verizon Communications | 28,300 | 1,263,878 | ||||
| Total Telecommunication Services: | 2,750,661 | |||||
| Utilities 20.9% | ||||||
| Aliant Energy Corp. | 9,900 | 397,683 | ||||
| American Electric Power, Inc. | 6,740 | 468,228 | ||||
| Atmos Energy Corp. | 1,500 | 124,425 | ||||
| Avista Corp. | 2,000 | 84,920 | ||||
| Centerpoint Energy, Inc. | 16,200 | 443,556 | ||||
| Consolidated Edison, Inc. | 6,900 | 557,658 | ||||
| Dominion Res, Inc. | 8,300 | 636,029 | ||||
| Duke Energy Corp. | 9,095 | 760,251 | ||||
| Entergy Corp. | 2,870 | 220,330 | ||||
| Eversource Energy | 10,481 | 636,302 | ||||
| Exelon Corp. | 1,400 | 50,498 | ||||
| Firstenergy Corp. | 1,255 | 36,596 | ||||
| NextEra Energy | 2,500 | 350,325 | ||||
| PPL Corp. | 10,445 | 403,804 | ||||
| Public Service Enterprise Group, Inc. | 12,000 | 516,120 | ||||
| Scana Corp. | 700 | 46,907 | ||||
| Southern Company | 12,530 | 599,936 | ||||
| WEC Energy Group, Inc. | 9,240 | 567,151 | ||||
| Xcel Energy, Inc. | 9,540 | 437,695 | ||||
| Total Utilities: | 7,338,414 | |||||
Total US Common Stock (Cost $24,900,941) | 25,820,195 | |||||
| Cash Equivalents 7.4% | ||||||
Total Cash Equivalents (Cost $2,604,565) | $2,604,565 | |||||
TOTAL INVESTMENT IN SECURITIES (Cost $33,898,722) | $35,031,991 | |||||
Financial Statements (Unaudited) June 30, 2017
STATEMENT OF OPERATIONS
| Investment Income | |||||||
| $ | 230,942 | |||||
| 519,048 | ||||||
| 749,990 | ||||||
| Expenses | |||||||
| 188,319 | ||||||
| 125,260 | ||||||
| 29,792 | ||||||
| 40,949 | ||||||
| 37,335 | ||||||
| 25,158 | ||||||
| 5,452 | ||||||
| 452,265 | ||||||
| |||||||
| 297,725 | ||||||
| Realized and Unrealized Gain (Decrease) on Investments | |||||||
| 38,222 | ||||||
Net change in unrealized appreciation on investments | (202,430) | ||||||
| (164,208) | ||||||
| Net Operating Income | 133,517 | ||||||
| Other Income and Expense, net | 64,380 | ||||||
| Net Increase in Net Assets Resulting from Operations | $ | 197,897 | |||||
| |||||||
STATEMENT OF CHANGES IN NET ASSETS
Financial Statements (Unaudted) June 30, 2017
| Increase (Decrease) in Net Assets from Operations | June 30, 2017 | June 30, 2016 | |||||
| $297,725 | $419,941 | |||||
| 38,222 | (191,927) | |||||
| (202,430) | 3,553,704) | |||||
| 64,380 | 105,482 | |||||
| 197,897 | 3,887,200 | |||||
| Dividends and Distributions to Shareholders | (204,000) | (252,000) | |||||
| (6,103) | 3,635,200 | |||||
| |||||||
| Net Assets | |||||||
Beginning of year | 40,899,928 | 37,153,698 | |||||
Six months ended June 30, 2017 and 2016 (includes undistributed ordinary income of $4,377,840 and $269,216, respectively) | $40,893,825 | $40,788,898 | |||||
| |||||||
FINANCIAL HIGHLIGHTS
Financial Statements (Unaudted) June 30, 2017
Per share operating performance (for a share of Class A and Class B capital stock outstanding):
| Six Months Ended | Six Months Ended | Year Ended | Year Ended | Year Ended | Year Ended | Year Ended | |
| June 30,2017 | June 30,2016 | 2016 | 2015 | 2014 | 2013 | 2012 | |
| Net asset value, beginning of year | 3,408 | 3,096 | 3,096 | 3,381 | 3,321 | 3,376 | 3,377 |
| Income from investment and real estate operations | |||||||
Net investment income | 25 | 35 | 68 | 72 | 83 | 80 | 70 |
Net realized and unrealized appreciation (depreciation) on investment and real estate transactions | (14) | 280 | 335 | (267) | 64 | (36) | 6 |
Net other income | 5 | 7 | 14 | 17 | 16 | 15 | 15 |
| 16 | 322 | 417 | (178) | 63 | 59 | 91 |
| Less dividends and distributions | (17) | (21) | (105) | (107) | (103) | (114) | (92) |
| Net asset value, end of year | 3,407 | 3,397 | 3,408 | 3,096 | 3,381 | 3,321 | 3,376 |
| Total return | .48% | 9.48% | 13.47% | (5.77%) | 4.82% | 1.78% | 2.70% |
| Supplemental Data: | |||||||
Net assets, end of year (in thousands) | $40,894 | $40,789 | $40,900 | $37,154 | $40,577 | $39,870 | $40,531 |
| Ratio to average net assets: | |||||||
Expenses | 1.11% | 1.06% | 2.09% | 2.29% | 2.03% | 2.02% | 2.06% |
Net investment income | .73% | 1.08% | 2.10% | 2.24% | 2.46% | 2.39% | 2.08% |
| Portfolio turnover rate | 10.80% | 3.60% | 15.39% | 8.85% | 11.00% | 16.07% | 13.71% |
Financial Statements (Unaudited) June 30, 2017 ~ Notes
Note 1. Organization
Kavilco Incorporated ("the Company") is a village corporation within the Sealaska region organized on November 13, 1973, pursuant to the Alaska Native Claims Settlement Act ("ANCSA") of 1971. Under ANCSA, the Native claims to land in Alaska were settled in exchange for part of the state's land and compensation. Settlement benefits were given to Natives of Alaska villages in the form of ownership shares in village corporations that were organized pursuant to ANCSA. The Company was organized for the purpose of securing and administering the land and benefits for the Natives of the Kasaan village in Alaska. Contributed capital includes receipts from the U.S. government and the state of Alaska under provisions of ANCSA.
On November 1, 1989, the Company began to operate as a self-managed, closed-end management investment company, as defined by the Investment Company Act of 1940 ("the Act"). The Company is subject to various restrictions imposed by the Act and the Internal Revenue Code, including restrictions on borrowing, dividend, and distribution policies, operations and reporting requirements. The Company's investment decisions, which focus primarily on large-cap dividend equity investments and on fixed income investments, are made by management under the direction of the Board of Directors.
Note 2. Significant Accounting Policies
Use of Estimates
The preparation of financial statements in conformity with accounting principles generally accepted in the United States requires management to make estimates and assumptions that affect certain reported amounts and disclosures. Actual results could differ from those estimates.
Cash and Cash Equivalents
Cash and cash equivalents include cash on deposit with banks. The Company considers all highly liquid instruments with a maturity of three months or less to be cash equivalents. The Company has cash balances in excess of federally insured limits.
Valuation of Investments
All investments are recorded at their estimated fair value, as described in Note 3.
Investment Transactions and Income
Investment transactions are recorded on a trade date basis. Realized gains and losses from securities transactions are computed using the LIFO (last in first out) method. Interest income is recorded on an accrual basis as adjusted for the amortization of discounts and premiums using the effective interest method. Premiums and discounts, including original issue discounts, are amortized for both tax and financial reporting purposes. Dividend income is recorded as of the ex-dividend date. Unrealized gains and losses are included in the statement of operations.
Federal Income Taxes
The Company files income tax returns in the U.S. federal jurisdiction and Alaska State.
The Company's policy is to continue to comply with the requirements of the Internal Revenue Code that are applicable to regulated investment companies and to distribute at least 90% of its net investment taxable income to its shareholders. Generally, no federal income tax provision is required for the Company.
The Company records a liability, if any, for unrecognized tax benefits resulting from uncertain income tax positions taken or expected to be taken in an income tax return. No liability has been recorded for uncertain tax positions, or related interest or penalties as of June 30, 2017.
Dividends and Distributions to Shareholders
Dividends and distributions to shareholders are recorded on the payable date. Dividends are generally declared and paid twice a year. Capital gain distributions are generally declared and paid annually. The timing and characterization of certain income and capital gains distributions are determined in accordance with federal tax regulations and may differ from those determined in accordance with accounting principles generally accepted in the United States.
Directors' Compensation and Expenses
Each member of the Board of Directors receives compensation for each board meeting attended during the year in addition to a per diem allowance. Directors are also reimbursed for such expenses as accommodation, airfare, and car rental related to board meetings. In addition to meeting related expenses, the Company pays for the medical insurance of certain directors.
Note 3. Fair Value Measurements
Fair value is defined as an exit price, representing the amount that would be received to sell an asset or paid to transfer a liability in an orderly transaction between market participants. As such, fair value is a market-based measurement determined based on assumptions that market participants would use in pricing an asset or liability. There are three levels which prioritize the inputs used in measuring fair value as follows:
Level 1: Observable market inputs such as quoted prices (unadjusted) in active markets for identical assets or liabilities;
Level 2: Observable market inputs, other than quoted prices in active markets, that are observable either directly or indirectly; and
Level 3: Unobservable inputs where there is little or no market data, which require the reporting entity to develop its own assumptions.
An asset or liability's level within the fair value hierarchy is based on the lowest level of any input that is significant to the fair value measurement. The following is a description of the valuation methodologies used for assets measured at fair value, including a general description of the asset.
Equity securities (common stock)
Securities traded on a national securities exchange (or reported on the NASDAQ national market) are stated at the last reported sales price on the day of valuation. To the extent these securities are actively traded and valuation adjustments are not applied, they are categorized in Level 1 of the fair value hierarchy.
Corporate bonds
The fair value of corporate bonds is estimated using various techniques, which may consider recently executed transactions in securities of the issuer or comparable issuers, market price quotations (where observable), bond spreads, fundamental data relating to the issuer, and credit default swap spreads. Corporate bonds are generally categorized in Level 2 of the fair value hierarchy.
Real Estate
Real estate represents entitlement to the surface estate of real property, for which no readily available market quotation exists. Fair value of real estate is determined by management based on a Certified Forester's opinion as to the current value and status of the land, along with other factors. Other relevant factors include the lack of commercially viable timber due to previous harvest, amount of capital expenditures required for the future growth of timber, location of the property, recent sales of similar real property in the region and market demand and supply for this type of real property during the valuation process. Real estate is included in Level 3 of the fair value hierarchy.
The following table presents information about the Company's investments in securities and real estate measured at fair value as of June 30, 2017:
| Level 1 | Level 2 | Level 3 | Balance | |||||||||
| ||||||||||||
Investments in Securities | ||||||||||||
US Corporate Bonds | $ | - | $ | 6,607,231 | $ | - | $ | 6,607,231 | ||||
US Common stock | 25,820,195 | - | - | 25,820,195 | ||||||||
Money Market Fund | 2,604,565 | - | 2,604,565 | |||||||||
| $ | 28,424,760 | $ | 6,607,231 | $ | $ | 35,031,991 | |||||
| ||||||||||||
Real Estate | $ | $ | $ | 5,776,759 | $ | 5,776,759 | ||||||
The Company recognizes transfers between Level 1 and 2 at the end of the reporting period. As of June 30, 2017, no significant transfers between Level 1 or 2 occurred.
At June 30, 2017, there were no realized gain (loss), cost or purchases, proceeds from sales or transfers in or out of Level 3 at the end of the reporting period. Refer to Note 4 (Real Estate) for a description of the fair value of real estate and any unrealized gain (loss) during the periods presented in these financial statements
Note 4. Real Estate
At June 30, 2017, the Company owns fee title to the surface estate of 22,946 acres of real estate located in southeast Alaska.
As of June 30, 2017, there is no commercial viable timber on the real estate and the Company has no outstanding timber agreements. The last harvest and sale of timber from this land was in 2001.
The financial statements include real estate valued at $5,776,759 in 2016, the value of which was determined by an independent appraisal. There was no change in the value at June 30, 2017 from December 31, 2016.
Note 5. Trading Risk
In the normal course of business, the Company enters into financial transactions involving instruments where there is risk of potential loss due to changes in the market (market risk), or failure of the other party to the transaction to perform (credit risk).
Market risk is the potential change in value caused by fluctuations in market prices of an underlying financial instrument. Subsequent market fluctuations may require selling investments at prices that differ from the values reflected on the statement of assets and liabilities. Market risk is directly impacted by the volatility and liquidity in the markets in which financial instruments are traded. The Company's exposure to market risk may be increased in that a significant portion of its assets may be invested in a relatively small number of investment positions at any one time. Accordingly, appreciation or depreciation in value of investment positions may have a more significant effect on the value of the Company's portfolio than would be the case in a more diversified or hedged portfolio.
Credit risk is the possibility that a loss may occur due to the failure of the counterparty to perform according to the terms of a contract. The Company's exposure to credit risk associated with counterparty nonperformance includes cash deposits that may exceed applicable insurance limits. The Company seeks to control such credit risk by maintaining deposits with only high quality financial institutions and trading exchange traded financial instruments, which generally do not give rise to significant counterparty exposure due to the requirements of the individual exchanges.
Note 6. Investment Transactions
Purchases of investment securities (common stock, and publicly traded partnerships) aggregated $6,265,899 for the six month period ended June 30, 2017, and sales and maturities of investment securities (consisting of corporate bonds and common stock) aggregated $3,431,775 for the six month period ended June 30, 2017.
The U.S. federal income tax basis of the Company's investments is the same as for financial reporting purposes. The gross unrealized appreciation and gross unrealized depreciation for U.S. federal income tax purposes is $3,049,545, and $1,916,249, respectively, for the six months ended June 30, 2017.
Note 7. Premises and Equipment
The following is a summary of premises and equipment at June 30, 2017:
Building | $ | 170,601 | |||||
Furniture, fixtures, and equipment | 77,391 | ||||||
| 247,992 | |||||||
Less accumulated depreciation | (228,905) | ||||||
| $ | 19,087 | ||||||
All assets are recorded at cost less accumulated depreciation. Depreciation is computed on the straight-line method over the estimated useful lives of the related assets, which range from 5 to 15 years. Depreciation expense was $2,505 for the six months ended June 30, 2017.
Note 8. Lease Obligation
The Company leases office space under a non-cancelable operating lease agreement, which terminates September 30, 2016. On October 1, 2016, The Company re-located its corporate office, and entered into a new non-cancelable operating lease agreement which terminates September 30, 2021. Pursuant to the lease agreement, The Company paid a lease deposit of $3,528 which will be credited to the last month's rent. Future minimum lease commitments under this non-cancelable operating lease are as follows:
2017 | 19140 |
2018 | 39,150 |
2019 | 40,310 |
2020 | 41,470 |
2021 | 31,755 | ||||||
| $ | 171,825 | ||||||
Rent expense for the six months ended June 30, 2017 was $23,825.
Note 9. Net Assets
Upon organization of the Company, 100 shares of common stock (Class A) were issued to each qualified shareholder enrolled in the Company pursuant to ANCSA. The Company utilized a roll comprising 120 Alaska Natives eligible to receive stock certificates as certified by the U.S. Secretary of the Interior. Under the provisions of ANCSA, stock dividends paid or other stock grants are restricted, and the stock may not be sold, pledged, assigned, or otherwise alienated, except in certain circumstances by court decree or death, unless approved by a majority of the shareholders. The stock carries voting rights only if the holder hereof is an eligible Alaska Native. Nonvoting common stock (Class B) is issued to non-Native persons who inherit stock or are gifted stock.
The Company's capital structure is as follows:
Common stock:
Class A, no par value - Authorized, 1,000,000 shares; issued and outstanding, 11,212.83 shares
Class B, no par value - Authorized, 500,000 shares; issued and outstanding, 787.17 shares
Note 10. Dividends and Distributions to Shareholders
On March 3, 2017, a distribution of $17.00 per share was declared. The dividend was paid on March 16, 2017 to shareholders of record on March 6, 2017.
The tax character of distributions paid during the six months ended June 30, 2017 and the years ended December 31, 2016 and 2015 were as follows:
June 30, 2017 | 2016 | 2015 | ||||||
Distributions paid from: | ||||||||
Ordinary income | $ | 156,718 | $ | 764,133 | $ | 1,233,297 | ||
Long-term capital gain | 47,282 | 495,868 | 50,704 | |||||
| $ | 204,000 | $ | 1,260,001 | $ | 1,284,001 | |||
As of June 30, 2017 and December 31, 2016 and December 31, 2015, the components of distributable earnings on a tax basis were as follows:
June 30, 2017 | 2016 | 2015 | ||||||||
Undistributed ordinary income | $ | 4,377,840 | $ | 4,586,373 | $ | 187,720 | ||||
Net unrealized appreciation on: | ||||||||||
Investments | 1,133,269 | 1,335,699 | (885,850) | |||||||
Real estate | 4,722,670 | 4,722,670 | 3,153,544 | |||||||
| $ | 10,233,779 | $ | 10,644,742 | $ | 2,455,414 | |||||
Note 11. Schedule of Investments
Investments are categorized by type, country, and industry. The industry category represents management's belief as to the most meaningful presentation of the classification of the principal business of the investees. The percentage of net assets is computed by dividing the fair value of each category by net assets.
Note 12. Pension Plan
Employees of the Company are covered by a defined contribution pension plan. The Company contributes 20% of each participant's compensation to the plan. The Company's contributions for the six months ended June 30, 2017 totaled $16,256.
Note 13. Other Income and Expense
The Company earned income of $57,120 for the six months ended June 30, 2017, as a result of ANCSA Section 7(i) which requires regional corporations to distribute 70% of any net revenues derived from timber resources and the subsurface estate to other regional corporations who then redistribute under Section 7(j) 50% of such amounts to the village corporations and at-large shareholders.
Other income also includes $7,260 of lease income for the six months ended June 30, 2017.
Officers & Directors
Louis Jones, Sr., President
Marie Miller, Vice President
Laird A. Jones, Secretary
Scott Burns, Chief Financial Officer
Jeane Breinig, Director
Kenneth Gordon, Director
Eleanor Hadden, Director
Ramona Hamar, Director
Frederick O. Olsen, Jr., Director
Melanie Young, Director
32 Years of Dividend Distributions
| 1980 INITIAL DISTRIBUTION | $3,000,000 |
| 1981 Debenture | 1,200,000 |
| 1981 Alaska Native Fund | 283,282 |
| 1982 Debenture | 1,200,000 |
| 1983 Alaska Native Fund | 69,940 |
| 1983 Debenture | 1,200,000 |
| 1984 Debenture | 1,200,000 |
| 1984 Dividend | 120,000 |
| 1985 Debenture | 1,200,000 |
| 1986 Dividend | 120,000 |
| 1986 Debenture | 1,200,000 |
| 1987 Debenture | 1,200,000 |
| 1987 Property Dividend | 236,066 |
| 1987 Dividend | 120,000 |
| 1988 Debenture | 1,200,000 |
| 1989 Debenture | 1,200,000 |
| 1989 Dividend | 240,000 |
| 1990 Debenture | 1,200,000 |
| 1990 Dividend | 600,000 |
| 1991 Dividends | 1,080,000 |
| 1992 Dividends | 960,000 |
| 1993 Dividends | 1,214,400 |
| 1994 Dividends | 1,248,300 |
| 1995 Dividends | 1,728,000 |
| 1996 Dividends | 1,927,680 |
| 1997 Dividends | 1,992,000 |
| 1998 Dividends | 1,956,003 |
| 1999 Dividends | 2,027,167 |
| 2000 Dividends | 1,811,000 |
| 2001 Dividends | 1,932,000 |
| 2002 Dividends | 1,764,000 |
| 2003 Dividends | 1,650,000 |
| 2004 Dividends | 1,215,000 |
| 2005 Dividends | 1,009,200 |
| 2006 Dividends | 1,065,000 |
| 2007 Dividends | 1,188,001 |
| 2008 Dividends | 1,140,000 |
| 2009 Dividends | 1,236,000 |
| 2010 Dividends | 1,032,000 |
| 2011 Dividends | 1,080,000 |
| 2012 Dividends | 1,085,899 |
| 2013 Dividends | 1,369,200 |
| 2014 Dividends | 1,239,240 |
| 2015 Dividends | 1,284,000 |
| 2016 Dividends | 1,260,000 |
| Total Distributions | $53,283,376 |
Per 120 Original Shareholders | $444,028 |
| ITEM 2. | CODE OF ETHICS. |
Not applicable when filing a semi-annual report to shareholders.
| ITEM 3. | AUDIT COMMITTEE FINANCIAL EXPERT. |
Not applicable when filing a semi-annual report to shareholders.
| ITEM 4. | PRINCIPAL ACCOUNTANT FEES AND SERVICES. |
Not applicable when filing a semi-annual report to shareholders.
| ITEM 5. | AUDIT COMMITTEE OF LISTED REGISTRANTS. |
Not applicable when filing a semi-annual report to shareholders.
| ITEM 6. | SCHEDULE OF INVESTMENTS. |
Please see Schedule of Investments contained in the Report to Shareholders filed under Item 1 of this Form N-CSRS.
| ITEM 7. | DISCLOSURE OF PROXY VOTING POLICIES AND PROCEDURES FOR CLOSED-END MANAGEMENT INVESTMENT COMPANIES. |
Not applicable when filing a semi-annual report to shareholders.
| ITEM 8. | PORTFOLIO MANAGERS OF CLOSED-END MANAGEMENT INVESTMENT COMPANIES. |
Not applicable when filing a semi-annual report to shareholders.
| ITEM 9. | PURCHASES OF EQUITY SECURITIES BY CLOSED-END MANAGEMENT INVESTMENT COMPANY AND AFFILIATED PURCHASERS. |
The Alaska Native Claims Settlement Act (ANCSA), which is our primary regulating authority, places numerous restrictions on the Company's stock. Kavilco's stock was given to its shareholders. It can only be transferred by court decree or gifting to a blood relative and cannot be sold or used as collateral. There is no provision in the ANCSA regulations for repurchase of shares.
| ITEM 10. | SUBMISSION OF MATTERS TO A VOTE OF SECURITY HOLDERS. |
No matters were voted on by shareholders during the period covered by this report.
| ITEM 11. | CONTROLS AND PROCEDURES. |
(a) The registrant's President and Chief Financial Officer have concluded that the registrant's disclosure controls and procedures (as defined in Rule 30a-3(c) under the Investment Company Act of 1940, as amended) are effective at the reasonable assurance level based on their evaluation of these controls and procedures as of a date within 90 days of the filing date of this document.
(b) There were no changes in the registrant's internal controls over financial reporting that occurred during the second fiscal quarter of the period that has materially affected, or is reasonably likely to materially affect, the registrant's internal control over financial reporting.
| ITEM 12. | EXHIBITS. |
The following exhibits are attached to this Form N-CSRS:
EXHIBIT NO. | DESCRIPTION OF EXHIBIT | |
12(a)(1) | Certification of President | |
12(a)(2) | Certification of Chief Financial Officer | |
SIGNATURES
Date: August 29, 2017
Pursuant to the requirements of the Securities Exchange Act of 1934 and the Investment Company Act of 1940, the registrant has duly caused this report to be signed on its behalf by the undersigned, thereunto duly authorized.
By: /s/ Louis L. Jones, Sr.
Louis L. Jones, Sr.
President
___________________________________
Date: August 29, 2017
Pursuant to the requirements of the Securities Exchange Act of 1934 and the Investment Company Act of 1940, this report has been signed below by the following persons on behalf of the registrant and in the capacities and on the dates indicated.
By: /s/ Scott Burns
Scott Burns
Chief Financial Officer