UNITED STATES
SECURITIES AND EXCHANGE COMMISSION
Washington, D.C. 20549
FORM 10-Q
(Mark One)
| x | | QUARTERLY REPORT PURSUANT TO SECTION 13 OR 15(d) OF THE SECURITIES EXCHANGE ACT OF 1934 |
For the quarterly period ended June 30, 2003
OR
| ¨ | | TRANSITION REPORT PURSUANT TO SECTION 13 OR 15(d) OF THE SECURITIES EXCHANGE ACT OF 1934 |
For the transition period from to
Commission file number 001-13309
VARCO INTERNATIONAL, INC.
(Exact name of registrant as specified in its charter)
Delaware (State or other jurisdiction of incorporation or organization) | | 76-0252850 (I.R.S. Employer Identification No.) |
| |
2000 W. Sam Houston Parkway South, Suite 1700, Houston, Texas (Address of principal executive offices) | | 77042 (Zip Code) |
(281) 953-2200
(Registrant’s telephone number, including area code)
None
(Former name, former address and former fiscal year, if changed since last report)
Indicate by check mark whether the registrant (1) has filed all reports required to be filed by Section 13 or 15(d) of the Securities Exchange Act of 1934 during the preceding 12 months (or for such shorter period that the registrant was required to file such reports), and (2) has been subject to such filing requirements for the past 90 days. YES x NO ¨
Indicate by check mark whether the registrant is an accelerated filer (as defined in Rule 12b-2 of the Exchange Act). YES x NO ¨
The Registrant had 97,448,846 shares of common stock outstanding as of July 31, 2003.
VARCO INTERNATIONAL, INC.
INDEX
i
PART I—FINANCIAL INFORMATION
Item 1. Financial Statements
2
VARCO INTERNATIONAL, INC.
CONSOLIDATED BALANCE SHEETS
| | | June 30,
2003 (Unaudited)
| | | December 31,
2002
| |
| | | | | | | |
| | | (in thousands) | |
| ASSETS | | | | | | | | |
Current assets: | | | | | | | | |
Cash and cash equivalents | | $ | 99,048 | | | $ | 105,997 | |
Accounts receivable, net | | | 339,622 | | | | 323,456 | |
Inventory, net | | | 310,211 | | | | 279,958 | |
Deferred tax assets | | | 16,790 | | | | 15,727 | |
Prepaid expenses and other | | | 19,596 | | | | 22,840 | |
| | |
|
|
| |
|
|
|
Total current assets | | | 785,267 | | | | 747,978 | |
| | |
|
|
| |
|
|
|
Net property and equipment, net | | | 452,953 | | | | 450,131 | |
Identified intangibles, net | | | 33,217 | | | | 32,918 | |
Goodwill, net | | | 427,643 | | | | 418,659 | |
Other assets, net | | | 13,230 | | | | 11,374 | |
| | |
|
|
| |
|
|
|
Total assets | | $ | 1,712,310 | | | $ | 1,661,060 | |
| | |
|
|
| |
|
|
|
| LIABILITIES AND EQUITY | | | | | | | | |
Current liabilities: | | | | | | | | |
Accounts payable | | $ | 96,713 | | | $ | 90,604 | |
Accrued liabilities | | | 112,780 | | | | 111,430 | |
Income taxes payable | | | 4,876 | | | | 9,252 | |
Current portion of long-term debt and short-term borrowings | | | 8,222 | | | | 7,045 | |
| | |
|
|
| |
|
|
|
Total current liabilities | | | 222,591 | | | | 218,331 | |
Long-term debt | | | 452,776 | | | | 460,883 | |
Pension liabilities and post-retirement obligations | | | 25,374 | | | | 24,899 | |
Deferred taxes payable | | | 37,870 | | | | 35,252 | |
Other liabilities | | | 2,317 | | | | 1,413 | |
| | |
|
|
| |
|
|
|
Total liabilities | | | 740,928 | | | | 740,778 | |
| | |
|
|
| |
|
|
|
Common stockholders’ equity: | | | | | | | | |
Common stock, $.01 par value, 200,000,000 shares authorized, 98,868,215 shares issued and 97,443,515 shares outstanding at June 30, 2003 (98,416,012 shares issued and 96,991,312 shares outstanding at December 31, 2002) | | | 989 | | | | 984 | |
Paid in capital | | | 531,812 | | | | 525,782 | |
Retained earnings | | | 463,404 | | | | 427,355 | |
Accumulated other comprehensive loss | | | (9,493 | ) | | | (18,509 | ) |
Less: treasury stock at cost (1,424,700 shares) | | | (15,330 | ) | | | (15,330 | ) |
| | |
|
|
| |
|
|
|
Total common stockholders’ equity | | | 971,382 | | | | 920,282 | |
| | |
|
|
| |
|
|
|
Total liabilities and equity | | $ | 1,712,310 | | | $ | 1,661,060 | |
| | |
|
|
| |
|
|
|
See notes to unaudited consolidated financial statements.
3
VARCO INTERNATIONAL, INC.
UNAUDITED CONSOLIDATED STATEMENTS OF INCOME
| | | Three Months Ended
June 30,
| | | Six Months Ended
June 30,
| |
| | | 2003
| | | 2002 (restated)
| | | 2003
| | | 2002 (restated)
| |
| | | (in thousands, except per share data) | |
Revenue | | $ | 357,457 | | | $ | 336,053 | | | $ | 724,934 | | | $ | 646,621 | |
Costs and expenses: | | | | | | | | | | | | | | | | |
Costs of services and products sold | | | 265,789 | | | | 240,254 | | | | 529,651 | | | | 461,351 | |
Selling, general and administrative | | | 44,554 | | | | 38,407 | | | | 91,669 | | | | 76,372 | |
Research and engineering costs | | | 16,239 | | | | 14,464 | | | | 31,187 | | | | 27,245 | |
Merger, transaction and litigation costs | | | — | | | | — | | | | — | | | | 2,829 | |
| | |
|
|
| |
|
|
| |
|
|
| |
|
|
|
Operating profit | | | 30,875 | | | | 42,928 | | | | 72,427 | | | | 78,824 | |
Other expense (income): | | | | | | | | | | | | | | | | |
Interest expense | | | 7,815 | | | | 6,046 | | | | 15,714 | | | | 12,114 | |
Interest income | | | (208 | ) | | | (198 | ) | | | (560 | ) | | | (349 | ) |
Other, net | | | 122 | | | | 3,665 | | | | 1,921 | | | | 6,112 | |
| | |
|
|
| |
|
|
| |
|
|
| |
|
|
|
Income before income taxes | | | 23,146 | | | | 33,415 | | | | 55,352 | | | | 60,947 | |
Provision for income taxes | | | 8,031 | | | | 12,352 | | | | 19,303 | | | | 22,597 | |
| | |
|
|
| |
|
|
| |
|
|
| |
|
|
|
Net income | | $ | 15,115 | | | $ | 21,063 | | | $ | 36,049 | | | $ | 38,350 | |
| | |
|
|
| |
|
|
| |
|
|
| |
|
|
|
Earnings per common share: | | | | | | | | | | | | | | | | |
Basic earnings per common share | | $ | 0.16 | | | $ | 0.22 | | | $ | 0.37 | | | $ | 0.40 | |
| | |
|
|
| |
|
|
| |
|
|
| |
|
|
|
Dilutive earnings per common share | | $ | 0.15 | | | $ | 0.22 | | | $ | 0.37 | | | $ | 0.39 | |
| | |
|
|
| |
|
|
| |
|
|
| |
|
|
|
Weighted average number of common shares outstanding: | | | | | | | | | | | | | | | | |
Basic | | | 97,365 | | | | 96,670 | | | | 97,251 | | | | 96,404 | |
| | |
|
|
| |
|
|
| |
|
|
| |
|
|
|
Dilutive | | | 98,424 | | | | 97,715 | | | | 98,197 | | | | 97,278 | |
| | |
|
|
| |
|
|
| |
|
|
| |
|
|
|
See notes to unaudited consolidated financial statements.
4
VARCO INTERNATIONAL, INC.
UNAUDITED CONSOLIDATED STATEMENTS OF CASH FLOWS
| | | Six Months Ended
June 30,
| |
| | | 2003
| | | 2002 (restated)
| |
| | | (in thousands) | |
Cash flows from operating activities: | | | | | | | | |
Net income | | $ | 36,049 | | | $ | 38,350 | |
Adjustments to reconcile net income to net cash provided by operating activities: | | | | | | | | |
Depreciation and amortization | | | 32,692 | | | | 28,657 | |
Other non-cash charges | | | 7,549 | | | | 6,463 | |
Changes in assets and liabilities, net of effects from acquisitions: | | | | | | | | |
Accounts receivable | | | (16,440 | ) | | | 17,954 | |
Inventory | | | (32,092 | ) | | | (27,132 | ) |
Prepaid expenses and other assets | | | 3,267 | | | | 1,761 | |
Accounts payable, accrued liabilities, and pension liabilities | | | 6,956 | | | | (29,648 | ) |
Federal and foreign income taxes payable | | | (3,577 | ) | | | (11,140 | ) |
| | |
|
|
| |
|
|
|
Net cash provided by operating activities | | | 34,404 | | | | 25,265 | |
| | |
|
|
| |
|
|
|
Cash flows provided by (used for) investing activities: | | | | | | | | |
Capital expenditures | | | (21,492 | ) | | | (25,878 | ) |
Business acquisitions, net of cash acquired | | | (18,511 | ) | | | (11,548 | ) |
Other | | | 176 | | | | (1,511 | ) |
| | |
|
|
| |
|
|
|
Net cash used for investing activities | | | (39,827 | ) | | | (38,937 | ) |
| | |
|
|
| |
|
|
|
Cash flows provided by (used for) financing activities: | | | | | | | | |
Borrowings under financing agreements | | | 63 | | | | — | |
Principal payments under financing agreements | | | (6,825 | ) | | | (5,520 | ) |
Proceeds from sale of common stock, net | | | 5,236 | | | | 6,610 | |
| | |
|
|
| |
|
|
|
Net cash provided by (used for) financing activities | | | (1,526 | ) | | | 1,090 | |
| | |
|
|
| |
|
|
|
Net decrease in cash and cash equivalents | | | (6,949 | ) | | | (12,582 | ) |
Cash and cash equivalents: | | | | | | | | |
Beginning of period | | | 105,997 | | | | 57,499 | |
| | |
|
|
| |
|
|
|
End of period | | $ | 99,048 | | | $ | 44,917 | |
| | |
|
|
| |
|
|
|
Supplemental disclosure of cash flow information: | | | | | | | | |
Cash paid during the six month period for: | | | | | | | | |
Interest | | $ | 15,877 | | | $ | 12,070 | |
| | |
|
|
| |
|
|
|
Taxes | | $ | 22,528 | | | $ | 36,452 | |
| | |
|
|
| |
|
|
|
See notes to unaudited consolidated financial statements.
5
VARCO INTERNATIONAL, INC.
Notes to Unaudited Consolidated Financial Statements
For the Three and Six Months Ended June 30, 2003 and 2002
and as of December 31, 2002
1. Organization and Basis of Presentation of Interim Consolidated Financial Statements
The accompanying unaudited consolidated financial statements of Varco International, Inc. (the “Company”) and its wholly-owned subsidiaries have been prepared pursuant to the rules and regulations of the Securities and Exchange Commission. Certain information in footnote disclosures normally included in financial statements prepared in accordance with accounting principles generally accepted in the United States have been condensed or omitted pursuant to these rules and regulations. The unaudited consolidated financial statements included in this report reflect all the adjustments, consisting of normal recurring accruals, and accruals associated with theCompany’s acquisition of substantially all of the oilfield services business of ICO, Inc. in September 2002, which the Company considers necessary for a fair presentation of the results of operations for the interim periods covered and for the financial condition of the Company at the date of the interim balance sheet. Results for the interim periods are not necessarily indicative of results for the year.
The financial statements included in this report should be read in conjunction with the Company’s 2002 audited consolidated financial statements and accompanying notes included in the Company’s 2002 Form 10-K/A, filed under the Securities Exchange Act of 1934, as amended.
2. Revenue Recognition for Bill and Hold Transactions
Prior to January 1, 2003, the Company recognized revenue on bill and hold transactions when the related product had been completed and was ready to be shipped, title and risk of loss had passed to the customer and the Company believed that the other criteria set forth in Staff Accounting Bulletin (SAB) 101 had been satisfied. Beginning January 1, 2003, the Company recognizes revenue on bill and hold transactions only when delivery has occurred and all other conditions for revenue recognition have been met. If revenue from all bill and hold transactions occurring during the three years ended December 31, 2002 was recognized upon shipment of the related product, rather than on the date previously recognized, the Company’s financial results for fiscal years 2000, 2001 and 2002 would not be materially affected. While the Company has not restated its financial results for these annual periods, it has restated its financial results for all quarterly periods in 2001 and 2002 to reflect recognition of revenue on bill and hold transactions upon shipment. The restated information is disclosed in the Company’s 2002 Form 10-K/A in Footnote 14 of the Notes to Consolidated Financial Statements. Restated results for the three and six months ended June 30, 2002 are reflected in this report.
3. Acquisitions
The Company completed six acquisitions in the six months ended June 30, 2003. The combined purchase price for these acquisitions was approximately $15,900,000, including cash consideration of $15,050,000, noncash consideration of $450,000, and accrued liabilities of $400,000. Goodwill associated with these transactions was approximately $7,000,000. Cash paid in 2003 for 2002 acquisitions was approximately $3,461,000.
4. Inventory
At June 30, 2003 and December 31, 2002, inventories consisted of the following (in thousands):
| | | June 30,
2003
| | | December 31,
2002
| |
Raw materials | | $ | 88,990 | | | $ | 83,660 | |
Work in process | | | 94,177 | | | | 65,192 | |
Finished goods | | | 168,490 | | | | 170,640 | |
Inventory reserves | | | (41,446 | ) | | | (39,534 | ) |
| | |
|
|
| |
|
|
|
Inventory, net | | $ | 310,211 | | | $ | 279,958 | |
| | |
|
|
| |
|
|
|
6
5. Comprehensive Income
Comprehensive income for the three and six months ended June 30, 2003 and 2002 was as follows (in thousands):
| | | Three Months Ended
June 30,
| | Six Months Ended
June 30,
| |
| | | 2003
| | | 2002 (restated)
| | 2003
| | | 2002 (restated)
| |
Comprehensive income: | | | | | | | | | | | | | | | |
Net income | | $ | 15,115 | | | $ | 21,063 | | $ | 36,049 | | | $ | 38,350 | |
Amortization of gain on interest rate contract | | | (68 | ) | | | — | | | (68 | ) | | | — | |
Cumulative translation adjustment | | | 6,426 | | | | 665 | | | 9,084 | | | | (1,183 | ) |
| | |
|
|
| |
|
| |
|
|
| |
|
|
|
Total comprehensive income | | $ | 21,473 | | | $ | 21,728 | | $ | 45,065 | | | $ | 37,167 | |
| | |
|
|
| |
|
| |
|
|
| |
|
|
|
6. Accounting For Stock-Based Compensation
In 2003, the Company’s Board of Directors and stockholders approved amendments to the Amended and Restated 1996 Equity Participation Plan, now known as the 2003 Equity Participation Plan. The amendments included an increase in the number of authorized shares of common stock to be granted to officers, key employees of the Company, and non-employee members of the Board of Directors from 7,650,000 to 12,150,000 shares. Options granted under the plan to key employees are generally exercisable in installments over three years starting one year from the date of grant and expire ten years from the date of grant. Options granted under the plan to non-employee members of the Board of Directors are exercisable in installments over four year periods starting one year from the date of grant and expire ten years from the date of grant.
Options outstanding under plans the Company assumed in connection with acquisitions will maintain the terms under which the options were granted. These terms allow options granted to key employees and non-employee directors to be vested in installments from one to five years starting one year from the date of grant and expire ten years from the date of grant.
The Company accounts for its stock-based employee compensation plans using the intrinsic value method. If the Company had accounted for its stock-based employee compensation plans using the alternative fair value method, the Company’s pro forma net income and earnings per common share would have been as follows (in thousands, except per share data):
Pro forma net income and earnings per common share
| | Three Months Ended
June 30,
| | Six Months Ended
June 30,
|
| | | 2003
| | 2002 (restated)
| | 2003
| | 2002 (restated)
|
Net income, as reported | | $ | 15,115 | | $ | 21,063 | | $ | 36,049 | | $ | 38,350 |
Stock-based employee compensation cost, net of related tax effects | | | 2,098 | | | 1,849 | | | 3,899 | | | 3,580 |
| | |
|
| |
|
| |
|
| |
|
|
Pro forma net income | | $ | 13,017 | | $ | 19,214 | | $ | 32,150 | | $ | 34,770 |
| | |
|
| |
|
| |
|
| |
|
|
Earnings per common share: | | | | | | | | | | | | |
Basic earnings per common share, as reported | | $ | 0.16 | | $ | 0.22 | | $ | 0.37 | | $ | 0.40 |
| | |
|
| |
|
| |
|
| |
|
|
Basic earnings per common share, pro forma | | $ | 0.13 | | $ | 0.20 | | $ | 0.33 | | $ | 0.36 |
Dilutive earnings per common share, as reported | | $ | 0.15 | | $ | 0.22 | | $ | 0.37 | | $ | 0.39 |
| | |
|
| |
|
| |
|
| |
|
|
Dilutive earnings per common share, pro forma | | $ | 0.13 | | $ | 0.20 | | $ | 0.33 | | $ | 0.36 |
| | |
|
| |
|
| |
|
| |
|
|
Weighted average number of common shares outstanding: | | | | | | | | | | | | |
Basic | | | 97,365 | | | 96,670 | | | 97,251 | | | 96,404 |
| | |
|
| |
|
| |
|
| |
|
|
Dilutive | | | 98,424 | | | 97,715 | | | 98,197 | | | 97,278 |
| | |
|
| |
|
| |
|
| |
|
|
7
7. Business Segments
The Company is organized into the following business segments based on the products and services it offers: Drilling Equipment Sales, Tubular Services, Drilling Services, and Coiled Tubing & Wireline Products.
Drilling Equipment Sales: This segment manufactures and sells systems and equipment for rotating and handling pipe on drilling rigs; a complete line of conventional drilling rig tools and equipment, including pipe handling tools, hoisting equipment and rotary equipment; pressure control and motion compensation equipment; and flow devices. Customers include major oil and gas companies and drilling contractors.
Tubular Services: This segment provides internal coating products and services for tubular goods; inspection and quality assurance services for tubular goods; and fiberglass and composite pipe. Additionally, the Tubular Services business sells and rents proprietary equipment used to inspect tubular products at steel mills. The Tubular Services business also provides technical inspection services and quality assurance services for in-service pipelines used to transport oil and gas. Customers include major oil and gas companies, independent producers, national oil companies, drilling contractors, oilfield supply stores, major pipeline operators, and steel mills.
Drilling Services: This segment consists of the sale and rental of technical equipment used in, and the provision of services related to, the separation of drill cuttings (solids) from fluids used in the oil and gas drilling processes, and the sale of computer based drilling instrumentation, as well as conventional drilling rig instrumentation. Customers include major oil and gas companies, independent producers, national oil companies and drilling contractors.
Coiled Tubing & Wireline Products: This segment consists of the sale of highly-engineered coiled tubing equipment, related pressure control equipment, pressure pumping equipment, wireline equipment and related tools to companies engaged in oil and gas well drilling and completion and remediation services. Customers include major oil and gas service companies, as well as national oil companies.
The Company evaluates the performance of its operating segments at the operating profit level which consists of income before interest expense (income), other expense (income), nonrecurring items and income taxes. Intersegment sales and transfers are not significant.
Summarized unaudited information for the Company’s reportable segments is contained in the following table. Other operating profit (loss) includes corporate expenses and certain identified intangible amortization not allocated to product lines. Operating profit excludes merger, transaction and litigation costs of $2,829,000 in the six months ended June 30, 2002, which consisted of severance costs from employment agreements associated with the May 2000 merger of Varco International, Inc. and Tuboscope, Inc.
| | | Three Months Ended
June 30,
| | | Six Months Ended
June 30,
| |
| | | 2003
| | | 2002 (restated)
| | | 2003
| | | 2002
(restated)
| |
| | | (in thousands) | | | (in thousands) | |
Revenue: | | | | | | | | | | | | | | | | |
Drilling Equipment Sales | | $ | 123,056 | | | $ | 133,440 | | | $ | 262,235 | | | $ | 243,716 | |
Tubular Services | | | 107,999 | | | | 76,394 | | | | 212,757 | | | | 151,433 | |
Drilling Services | | | 69,879 | | | | 66,419 | | | | 139,339 | | | | 137,671 | |
Coiled Tubing & Wireline Products | | | 56,523 | | | | 59,800 | | | | 110,603 | | | | 113,801 | |
| | |
|
|
| |
|
|
| |
|
|
| |
|
|
|
Total | | $ | 357,457 | | | $ | 336,053 | | | $ | 724,934 | | | $ | 646,621 | |
| | |
|
|
| |
|
|
| |
|
|
| |
|
|
|
Operating Profit: | | | | | | | | | | | | | | | | |
Drilling Equipment Sales | | $ | 6,496 | | | $ | 21,768 | | | $ | 24,213 | | | $ | 36,415 | |
Tubular Services | | | 15,372 | | | | 11,040 | | | | 28,491 | | | | 21,488 | |
Drilling Services | | | 11,543 | | | | 10,765 | | | | 24,953 | | | | 25,902 | |
Coiled Tubing & Wireline Products | | | 11,036 | | | | 12,124 | | | | 21,893 | | | | 22,091 | |
Other | | | (13,572 | ) | | | (12,769 | ) | | | (27,123 | ) | | | (24,243 | ) |
| | |
|
|
| |
|
|
| |
|
|
| |
|
|
|
Total | | $ | 30,875 | | | $ | 42,928 | | | $ | 72,427 | | | $ | 81,653 | |
| | |
|
|
| |
|
|
| |
|
|
| |
|
|
|
8. Unaudited Condensed Consolidating Financial Information
On February 25, 1998, the Company issued $100,000,000 of 7½% Senior Notes due 2008 (“2008 Notes”). On May 1, 2001, the Company issued $200,000,000 of 7¼% Senior Notes due 2011 (“2011 Notes”). On November 19, 2002, the Company issued $150,000,000 of 5½% Senior Notes due 2012 (“2012 Notes”). The 2008 Notes, 2011 Notes, and 2012 Notes are
8
fully and unconditionally guaranteed, on a joint and several basis, by certain wholly-owned subsidiaries of the Company (collectively “Guarantor Subsidiaries” and individually “Guarantor”). Each of the guarantees is an unsecured obligation of the Guarantor and rankspari passuwith the guarantees provided by and the obligations of such Guarantor Subsidiaries under the credit agreement and with all existing and future unsecured indebtedness of such Guarantor for borrowed money that is not, by its terms, expressly subordinated in right of payment to such guarantee.
The following condensed consolidating balance sheet as of June 30, 2003 and related condensed consolidating statements of income and cash flows for the six months ended June 30, 2003 should be read in conjunction with the notes to these unaudited consolidated financial statements.
9
VARCO INTERNATIONAL, INC.
Notes to Unaudited Consolidated Financial Statements (cont’d)
| 8. | | Unaudited Condensed Consolidating Financial Information (cont’d) |
Balance Sheet
| | | June 30, 2003
| |
| | | Varco
International,
Inc.
(Parent Company
only)
| | | Guarantor
Subsidiaries
| | | Non- Guarantor
Subsidiaries
| | | Eliminations
| | | Varco International,
Inc.
| |
| | | (in thousands) | |
| ASSETS | | | | | | | | | | | | | | | | | | | | |
Current assets: | | | | | | | | | | | | | | | | | | | | |
Cash and cash equivalents | | $ | 7,789 | | | $ | 54,149 | | | $ | 37,110 | | | $ | — | | | $ | 99,048 | |
Accounts receivable, net | | | 253,363 | | | | 1,501,754 | | | | 1,257,701 | | | | (2,673,196 | ) | | | 339,622 | |
Inventory, net | | | — | | | | 194,447 | | | | 115,764 | | | | — | | | | 310,211 | |
Deferred tax asset | | | — | | | | 15,910 | | | | 880 | | | | — | | | | 16,790 | |
Other current assets | | | — | | | | 8,920 | | | | 10,676 | | | | — | | | | 19,596 | |
| | |
|
|
| |
|
|
| |
|
|
| |
|
|
| |
|
|
|
Total current assets | | | 261,152 | | | | 1,775,180 | | | | 1,422,131 | | | | (2,673,196 | ) | | | 785,267 | |
Investment in subsidiaries | | | 1,296,040 | | | | 557,697 | | | | — | | | | (1,853,737 | ) | | | — | |
Property and equipment, net | | | — | | | | 304,707 | | | | 148,246 | | | | — | | | | 452,953 | |
Identified intangibles, net | | | — | | | | 29,437 | | | | 3,780 | | | | — | | | | 33,217 | |
Goodwill, net | | | — | | | | 294,021 | | | | 133,622 | | | | — | | | | 427,643 | |
Other assets, net | | | 3,760 | | | | 6,064 | | | | 3,406 | | | | — | | | | 13,230 | |
| | |
|
|
| |
|
|
| |
|
|
| |
|
|
| |
|
|
|
Total assets | | $ | 1,560,952 | | | $ | 2,967,106 | | | $ | 1,711,185 | | | $ | (4,526,933 | ) | | $ | 1,712,310 | |
| | |
|
|
| |
|
|
| |
|
|
| |
|
|
| |
|
|
|
| LIABILITIES AND EQUITY | | | | | | | | | | | | | | | | | | | | |
Current liabilities: | | | | | | | | | | | | | | | | | | | | |
Accounts payable | | $ | 117,994 | | | $ | 1,573,608 | | | $ | 1,078,307 | | | $ | (2,673,196 | ) | | $ | 96,713 | |
Accrued liabilities | | | 6,383 | | | | 66,075 | | | | 40,322 | | | | — | | | | 112,780 | |
Income taxes payable | | | — | | | | 7,012 | | | | (2,136 | ) | | | — | | | | 4,876 | |
Current portion of long-term debt | | | — | | | | 4,633 | | | | 3,589 | | | | — | | | | 8,222 | |
| | |
|
|
| |
|
|
| |
|
|
| |
|
|
| |
|
|
|
Total current liabilities | | | 124,377 | | | | 1,651,328 | | | | 1,120,082 | | | | (2,673,196 | ) | | | 222,591 | |
Long-term debt | | | 449,870 | | | | 2,049 | | | | 857 | | | | — | | | | 452,776 | |
Pension liabilities | | | 15,323 | | | | — | | | | 10,051 | | | | — | | | | 25,374 | |
Deferred taxes payable | | | — | | | | 17,689 | | | | 20,181 | | | | — | | | | 37,870 | |
Other liabilities | | | — | | | | — | | | | 2,317 | | | | — | | | | 2,317 | |
| | |
|
|
| |
|
|
| |
|
|
| |
|
|
| |
|
|
|
Total liabilities | | | 589,570 | | | | 1,671,066 | | | | 1,153,488 | | | | (2,673,196 | ) | | | 740,928 | |
| | | | | |
Common stockholders’ equity: | | | | | | | | | | | | | | | | | | | | |
Common stock | | | 989 | | | | — | | | | — | | | | — | | | | 989 | |
Paid in capital | | | 531,812 | | | | 735,251 | | | | 255,234 | | | | (990,485 | ) | | | 531,812 | |
Retained earnings | | | 463,404 | | | | 561,847 | | | | 310,898 | | | | (872,745 | ) | | | 463,404 | |
Accumulated other comprehensive loss | | | (9,493 | ) | | | (1,058 | ) | | | (8,435 | ) | | | 9,493 | | | | (9,493 | ) |
Treasury stock | | | (15,330 | ) | | | — | | | | — | | | | — | | | | (15,330 | ) |
| | |
|
|
| |
|
|
| |
|
|
| |
|
|
| |
|
|
|
Total common stockholders’ equity | | | 971,382 | | | | 1,296,040 | | | | 557,697 | | | | (1,853,737 | ) | | | 971,382 | |
| | |
|
|
| |
|
|
| |
|
|
| |
|
|
| |
|
|
|
Total liabilities and equity | | $ | 1,560,952 | | | $ | 2,967,106 | | | $ | 1,711,185 | | | $ | (4,526,933 | ) | | $ | 1,712,310 | |
| | |
|
|
| |
|
|
| |
|
|
| |
|
|
| |
|
|
|
10
| 8. | | Unaudited Condensed Consolidating Financial Information (cont’d) |
Balance Sheet
| | | Year Ended December 31, 2002
| |
| | | Varco
International,
Inc. (Parent Company
Only)
| | | Guarantor
Subsidiaries
| | | Non-Guarantor
Subsidiaries
| | | Eliminations
| | | Varco
International,
Inc.
| |
| | | (In thousands) | |
| ASSETS | | | | | | | | | | | | | | | | | | | | |
Current assets: | | | | | | | | | | | | | | | | | | | | |
Cash and cash equivalents | | $ | 4,221 | | | $ | 63,547 | | | $ | 38,229 | | | $ | — | | | $ | 105,997 | |
Accounts receivable, net | | | 272,340 | | | | 1,147,297 | | | | 1,072,233 | | | | (2,168,414 | ) | | | 323,456 | |
Inventory, net | | | — | | | | 193,787 | | | | 86,171 | | | | — | | | | 279,958 | |
Other current assets | | | — | | | | 26,057 | | | | 12,510 | | | | — | | | | 38,567 | |
| | |
|
|
| |
|
|
| |
|
|
| |
|
|
| |
|
|
|
Total current assets | | | 276,561 | | | | 1,430,688 | | | | 1,209,143 | | | | (2,168,414 | ) | | | 747,978 | |
Investment in subsidiaries | | | 1,228,861 | | | | 521,277 | | | | — | | | | (1,750,138 | ) | | | — | |
Property and equipment, net | | | — | | | | 304,013 | | | | 146,118 | | | | — | | | | 450,131 | |
Identifiable intangibles, net | | | — | | | | 29,160 | | | | 3,758 | | | | — | | | | 32,918 | |
Goodwill, net | | | — | | | | 285,788 | | | | 132,871 | | | | — | | | | 418,659 | |
Other assets, net | | | 3,860 | | | | 3,689 | | | | 3,825 | | | | — | | | | 11,374 | |
| | |
|
|
| |
|
|
| |
|
|
| |
|
|
| |
|
|
|
Total assets | | $ | 1,509,282 | | | $ | 2,574,615 | | | $ | 1,495,715 | | | $ | (3,918,552 | ) | | $ | 1,661,060 | |
| | |
|
|
| |
|
|
| |
|
|
| |
|
|
| |
|
|
|
| LIABILITIES AND EQUITY | | | | | | | | | | | | | | | | | | | | |
Current liabilities: | | | | | | | | | | | | | | | | | | | | |
Accounts payable | | $ | 118,009 | | | $ | 1,244,406 | | | $ | 896,603 | | | $ | (2,168,414 | ) | | $ | 90,604 | |
Accrued liabilities | | | 6,264 | | | | 66,831 | | | | 38,335 | | | | — | | | | 111,430 | |
Income taxes | | | — | | | | 9,348 | | | | (96 | ) | | | — | | | | 9,252 | |
Current portion of long-term debt | | | — | | | | 2,353 | | | | 4,692 | | | | — | | | | 7,045 | |
| | |
|
|
| |
|
|
| |
|
|
| |
|
|
| |
|
|
|
Total current liabilities | | | 124,273 | | | | 1,322,938 | | | | 939,534 | | | | (2,168,414 | ) | | | 218,331 | |
Long-term debt | | | 449,839 | | | | 6,191 | | | | 4,853 | | | | — | | | | 460,883 | |
Pension liabilities | | | 14,888 | | | | — | | | | 10,011 | | | | — | | | | 24,899 | |
Deferred taxes payable | | | — | | | | 15,919 | | | | 19,333 | | | | — | | | | 35,252 | |
Other liabilities | | | — | | | | 706 | | | | 707 | | | | — | | | | 1,413 | |
| | |
|
|
| |
|
|
| |
|
|
| |
|
|
| |
|
|
|
Total liabilities | | | 589,000 | | | | 1,345,754 | | | | 974,438 | | | | (2,168,414 | ) | | | 740,778 | |
Common stock | | | 984 | | | | — | | | | — | | | | — | | | | 984 | |
Paid in capital | | | 525,782 | | | | 720,068 | | | | 254,917 | | | | (974,985 | ) | | | 525,782 | |
Retained earnings | | | 427,355 | | | | 509,851 | | | | 283,811 | | | | (793,662 | ) | | | 427,355 | |
Cumulative translation adjustment | | | (18,509 | ) | | | (1,058 | ) | | | (17,451 | ) | | | 18,509 | | | | (18,509 | ) |
Treasury stock | | | (15,330 | ) | | | — | | | | — | | | | — | | | | (15,330 | ) |
| | |
|
|
| |
|
|
| |
|
|
| |
|
|
| |
|
|
|
Total common stockholders’ equity | | | 920,282 | | | | 1,228,861 | | | | 521,277 | | | | (1,750,138 | ) | | | 920,282 | |
| | |
|
|
| |
|
|
| |
|
|
| |
|
|
| |
|
|
|
Total liabilities and equity | | $ | 1,509,282 | | | $ | 2,574,615 | | | $ | 1,495,715 | | | $ | (3,918,552 | ) | | $ | 1,661,060 | |
| | |
|
|
| |
|
|
| |
|
|
| |
|
|
| |
|
|
|
11
VARCO INTERNATIONAL, INC.
Notes to Unaudited Consolidated Financial Statements (cont’d)
| 8. | | Unaudited Condensed Consolidating Financial Information (cont’d) |
Statements of Income
| | | Three Months Ended June 30, 2003
| |
| | | Varco
International,
Inc. (Parent Company
only)
| | | Guarantor
Subsidiaries
| | | Non- Guarantor
Subsidiaries
| | | Eliminations
| | | Varco International,
Inc.
| |
| | | (in thousands) | |
Revenue | | $ | — | | | $ | 260,367 | | | $ | 135,708 | | | $ | (38,618 | ) | | $ | 357,457 | |
Cost of Sales | | | — | | | | 195,377 | | | | 109,030 | | | | (38,618 | ) | | | 265,789 | |
Selling, general and administrative | | | — | | | | 31,424 | | | | 13,130 | | | | — | | | | 44,554 | |
Research and engineering costs | | | — | | | | 14,349 | | | | 1,890 | | | | — | | | | 16,239 | |
| | |
|
|
| |
|
|
| |
|
|
| |
|
|
| |
|
|
|
Total costs | | | — | | | | 241,150 | | | | 124,050 | | | | (38,618 | ) | | | 326,582 | |
| | |
|
|
| |
|
|
| |
|
|
| |
|
|
| |
|
|
|
Operating profit | | | — | | | | 19,217 | | | | 11,658 | | | | — | | | | 30,875 | |
Other expenses (income) | | | 325 | | | | (231 | ) | | | (180 | ) | | | — | | | | (86 | ) |
Interest expense | | | 7,564 | | | | 32 | | | | 219 | | | | — | | | | 7,815 | |
| | |
|
|
| |
|
|
| |
|
|
| |
|
|
| |
|
|
|
Income (loss) before taxes | | | (7,889 | ) | | | 19,416 | | | | 11,619 | | | | — | | | | 23,146 | |
Provision for taxes | | | — | | | | 4,704 | | | | 3,327 | | | | — | | | | 8,031 | |
Equity in net income of subsidiaries | | | 23,004 | | | | 8,292 | | | | — | | | | (31,296 | ) | | | — | |
| | |
|
|
| |
|
|
| |
|
|
| |
|
|
| |
|
|
|
Net income | | $ | 15,115 | | | $ | 23,004 | | | $ | 8,292 | | | $ | (31,296 | ) | | $ | 15,115 | |
| | |
|
|
| |
|
|
| |
|
|
| |
|
|
| |
|
|
|
| | | Three Months Ended June 30, 2002
|
| | | Varco
International,
Inc. (Parent Company
only)
| | | Guarantor
Subsidiaries
| | | Non- Guarantor
Subsidiaries
| | Eliminations
| | | Varco International,
Inc.
|
| | | (in thousands) |
Revenue | | $ | — | | | $ | 243,577 | | | $ | 134,704 | | $ | (42,228 | ) | | $ | 336,053 |
Cost of Sales | | | — | | | | 185,274 | | | | 97,208 | | | (42,228 | ) | | | 240,254 |
Selling, general and administrative | | | 120 | | | | 26,582 | | | | 11,705 | | | — | | | | 38,407 |
Research and engineering costs | | | — | | | | 12,994 | | | | 1,470 | | | — | | | | 14,464 |
| | |
|
|
| |
|
|
| |
|
| |
|
|
| |
|
|
Total costs | | | 120 | | | | 224,850 | | | | 110,383 | | | (42,228 | ) | | | 293,125 |
| | |
|
|
| |
|
|
| |
|
| |
|
|
| |
|
|
Operating profit | | | (120 | ) | | | 18,727 | | | | 24,321 | | | — | | | | 42,928 |
Other expenses (income) | | | 347 | | | | (332 | ) | | | 3,452 | | | — | | | | 3,467 |
Interest expense | | | 5,511 | | | | 170 | | | | 365 | | | — | | | | 6,046 |
| | |
|
|
| |
|
|
| |
|
| |
|
|
| |
|
|
Income (loss) before taxes | | | (5,978 | ) | | | 18,889 | | | | 20,504 | | | — | | | | 33,415 |
Provision for taxes | | | — | | | | 4,268 | | | | 8,084 | | | — | | | | 12,352 |
Equity in net income of subsidiaries | | | 27,041 | | | | 12,420 | | | | — | | | (39,461 | ) | | | — |
| | |
|
|
| |
|
|
| |
|
| |
|
|
| |
|
|
Net income | | $ | 21,063 | | | $ | 27,041 | | | $ | 12,420 | | $ | (39,461 | ) | | $ | 21,063 |
| | |
|
|
| |
|
|
| |
|
| |
|
|
| |
|
|
12
| 8. | | Unaudited Condensed Consolidating Financial Information (cont’d) |
Statements of Income
| | | Six Months Ended June 30, 2003
|
| | | Varco
International,
Inc.
(Parent Company
only)
| | | Guarantor
Subsidiaries
| | | Non-Guarantor
Subsidiaries
| | Eliminations
| | | Varco International,
Inc.
|
| | | (in thousands) |
Revenue | | $ | — | | | $ | 541,303 | | | $ | 272,224 | | $ | (88,593 | ) | | $ | 724,934 |
Cost of Sales | | | — | | | | 418,863 | | | | 199,381 | | | (88,593 | ) | | | 529,651 |
Selling, general and administrative | | | — | | | | 65,191 | | | | 26,478 | | | — | | | | 91,669 |
Research and engineering costs | | | — | | | | 27,663 | | | | 3,524 | | | — | | | | 31,187 |
| | |
|
|
| |
|
|
| |
|
| |
|
|
| |
|
|
Total costs | | | — | | | | 511,717 | | | | 229,383 | | | (88,593 | ) | | | 652,507 |
| | |
|
|
| |
|
|
| |
|
| |
|
|
| |
|
|
Operating profit | | | — | | | | 29,586 | | | | 42,841 | | | — | | | | 72,427 |
Other expenses (income) | | | 825 | | | | (308 | ) | | | 844 | | | — | | | | 1,361 |
Interest expense | | | 15,122 | | | | 176 | | | | 416 | | | — | | | | 15,714 |
| | |
|
|
| |
|
|
| |
|
| |
|
|
| |
|
|
Income (loss) before taxes | | | (15,947 | ) | | | 29,718 | | | | 41,581 | | | — | | | | 55,352 |
Provision for taxes | | | — | | | | 4,809 | | | | 14,494 | | | — | | | | 19,303 |
Equity in net income of subsidiaries | | | 51,996 | | | | 27,087 | | | | — | | | (79,083 | ) | | | — |
| | |
|
|
| |
|
|
| |
|
| |
|
|
| |
|
|
Net income | | $ | 36,049 | | | $ | 51,996 | | | $ | 27,087 | | $ | (79,083 | ) | | $ | 36,049 |
| | |
|
|
| |
|
|
| |
|
| |
|
|
| |
|
|
| | | Six Months Ended June 30, 2002
|
| | | Varco
International,
Inc.
(Parent Company
only)
| | | Guarantor
Subsidiaries
| | Non-Guarantor
Subsidiaries
| | Eliminations
| | | Varco International,
Inc.
|
| | | (in thousands) |
Revenue | | $ | — | | | $ | 466,785 | | $ | 266,015 | | $ | 86,179 | | | $ | 646,621 |
Cost of Sales | | | — | | | | 356,715 | | | 190,815 | | | (86,179 | ) | | | 461,351 |
Selling, general and administrative | | | (1,060 | ) | | | 55,234 | | | 22,198 | | | — | | | | 76,372 |
Research and engineering costs | | | — | | | | 24,010 | | | 3,235 | | | — | | | | 27,245 |
| | |
|
|
| |
|
| |
|
| |
|
|
| |
|
|
Merger, transaction, and litigation costs | | | — | | | | 2,826 | | | 3 | | | — | | | | 2,829 |
| | |
|
|
| |
|
| |
|
| |
|
|
| |
|
|
Total costs | | | (1,060 | ) | | | 438,785 | | | 216,251 | | | (86,179 | ) | | | 567,797 |
| | |
|
|
| |
|
| |
|
| |
|
|
| |
|
|
Operating profit | | | 1,060 | | | | 28,000 | | | 49,764 | | | — | | | | 78,824 |
Other expenses (income) | | | 719 | | | | 60 | | | 4,984 | | | — | | | | 5,763 |
Interest expense | | | 11,028 | | | | 343 | | | 743 | | | — | | | | 12,114 |
| | |
|
|
| |
|
| |
|
| |
|
|
| |
|
|
Income (loss) before taxes | | | (10,687 | ) | | | 27,597 | | | 44,037 | | | — | | | | 60,947 |
Provision for taxes | | | — | | | | 6,217 | | | 16,380 | | | — | | | | 22,597 |
Equity in net income of subsidiaries | | | 49,037 | | | | 27,657 | | | — | | | (76,694 | ) | | | — |
| | |
|
|
| |
|
| |
|
| |
|
|
| |
|
|
Net income | | $ | 38,350 | | | $ | 49,037 | | $ | 27,657 | | $ | (76,694 | ) | | $ | 38,350 |
| | |
|
|
| |
|
| |
|
| |
|
|
| |
|
|
13
VARCO INTERNATIONAL, INC.
Notes to Unaudited Consolidated Financial Statements (cont’d)
8. Unaudited Condensed Consolidating Financial Information (cont’d)
Statement of Cash Flows
| | | Six Months Ended June 30, 2003
| |
| | | Varco
International,
Inc.
(Parent Company
Only)
| | | Guarantor
Subsidiaries
| | | Non-Guarantor
Subsidiaries
| | | Eliminations
| | Varco
International,
Inc.
| |
| | | (in thousands) | |
Net cash provided by (used for) operating Activities | | $ | (574 | ) | | $ | 24,818 | | | $ | 10,160 | | | $ | — | | $ | 34,404 | |
Net cash used for investing activities: | | | | | | | | | | | | | | | | | | | |
Capital expenditures | | | — | | | | (14,896 | ) | | | (6,596 | ) | | | — | | | (21,492 | ) |
Business acquisitions, net of cash acquired | | | — | | | | (18,194 | ) | | | (317 | ) | | | — | | | (18,511 | ) |
Other | | | — | | | | — | | | | 176 | | | | — | | | 176 | |
| | |
|
|
| |
|
|
| |
|
|
| |
|
| |
|
|
|
Net cash used for investing activities | | | — | | | | (33,090 | ) | | | (6,737 | ) | | | — | | | (39,827 | ) |
Cash flows provided by (used for) financing activities: | | | | | | | | | | | | | | | | | | | |
Net payments under financing agreements | | | (1,094 | ) | | | (1,126 | ) | | | (4,542 | ) | | | — | | | (6,762 | ) |
Net proceeds from sale of common stock | | | 5,236 | | | | — | | | | — | | | | — | | | 5,236 | |
| | |
|
|
| |
|
|
| |
|
|
| |
|
| |
|
|
|
Net cash provided by (used for) financing activities | | | 4,142 | | | | (1,126 | ) | | | (4,542 | ) | | | — | | | (1,526 | ) |
| | |
|
|
| |
|
|
| |
|
|
| |
|
| |
|
|
|
Net increase (decrease) in cash and cash equivalents | | | 3,568 | | | | (9,398 | ) | | | (1,119 | ) | | | — | | | (6,949 | ) |
Beginning of period | | | 4,221 | | | | 63,547 | | | | 38,229 | | | | — | | | 105,997 | |
| | |
|
|
| |
|
|
| |
|
|
| |
|
| |
|
|
|
End of period | | $ | 7,789 | | | $ | 54,149 | | | $ | 37,110 | | | $ | — | | $ | 99,048 | |
| | |
|
|
| |
|
|
| |
|
|
| |
|
| |
|
|
|
| | | Six Months Ended June 30, 2002
| |
| | | Varco
International,
Inc.
(Parent Company
Only)
| | | Guarantor
Subsidiaries
| | | Non-Guarantor
Subsidiaries
| | | Eliminations
| | Varco
International,
Inc.
| |
| | | (in thousands) | |
Net cash provided by (used for) operating activities | | $ | (7,344 | ) | | $ | 11,770 | | | $ | 20,839 | | | | — | | $ | 25,265 | |
Net cash used for investing activities: | | | | | | | | | | | | | | | | | | | |
Capital expenditures | | | — | | | | (17,613 | ) | | | (8,265 | ) | | | — | | | (25,878 | ) |
Business acquisitions, net of cash acquired | | | — | | | | (1,317 | ) | | | (10,231 | ) | | | — | | | (11,548 | ) |
Other | | | | | | | — | | | | (1,511 | ) | | | — | | | (1,511 | ) |
| | |
|
|
| |
|
|
| |
|
|
| |
|
| |
|
|
|
Net cash used for investing activities | | | — | | | | (18,930 | ) | | | (20,007 | ) | | | — | | | (38,937 | ) |
Cash flows provided by (used for) financing activities: | | | | | | | | | | | | | | | | | | | |
Net payments under financing agreements | | | (4 | ) | | | (946 | ) | | | (4,570 | ) | | | — | | | (5,520 | ) |
Net proceeds from sale of common stock | | | 6,610 | | | | — | | | | — | | | | — | | | 6,610 | |
| | |
|
|
| |
|
|
| |
|
|
| |
|
| |
|
|
|
Net cash provided by (used for) financing activities | | | 6,606 | | | | (946 | ) | | | (4,570 | ) | | | — | | | 1,090 | |
| | |
|
|
| |
|
|
| |
|
|
| |
|
| |
|
|
|
Net decrease in cash and cash equivalents | | | (738 | ) | | | (8,106 | ) | | | (3,738 | ) | | | — | | | (12,582 | ) |
Beginning of period | | | 5,562 | | | | 25,137 | | | | 26,800 | | | | — | | | 57,499 | |
| | |
|
|
| |
|
|
| |
|
|
| |
|
| |
|
|
|
End of period | | $ | 4,824 | | | $ | 17,031 | | | $ | 23,062 | | | $ | — | | $ | 44,917 | |
| | |
|
|
| |
|
|
| |
|
|
| |
|
| |
|
|
|
14
9. New Accounting Standards
In August 2001, the Financial Accounting Standards Board (FASB) issued statement of Financial Accounting Standard No 143, “Accounting for Asset Retirement Obligations,” (SFAS 143). SFAS 143 requires a company to recognize a liability associated with a legal obligation to retire or remove any tangible long-lived assets. SFAS 143 is effective beginning in 2003 and did not have a material impact on the Company’s financial position or results of operations.
In July 2002, the FASB issued Statement of Financial Accounting Standards No. 146, “Accounting for Costs Associated with Exit or Disposal Activities” (SFAS 146) which addresses financial accounting and reporting costs associated with exit or disposal activities and nullifies EITF Issue No. 94-3, “Liability Recognition for Certain Employee Termination Benefits and Other Costs to Exit An Activity (including Certain Costs Incurred in a Restructuring).” SFAS 146 requires that a liability for a cost associated with an exit or disposal activity be recognized when the liability is incurred. Under Issue 94-3, a liability for an exit cost was recognized at the date of an entity’s commitment to an exit plan. The provisions of this statement are effective for exit or disposal activities that are initiated after December 31, 2002. If the Company had early adopted statement SFAS 146, it would not have affected the Company’s accounting for restructuring activities which occurred in the third quarter of 2002.
In January 2003, FASB Interpretation No. 46, Consolidation of Variable Interest Entities (“FIN 46”) was issued. FIN 46 requires the consolidation of variable interest entities (“VIE”) in which an enterprise absorbs a majority of the entity’s expected losses, receives a majority of the entity’s expected residual returns, or both, as a result of ownership, contractual or other financial interests in the entity.
The Company has interests in VIE’s. Based on preliminary evaluation, the Company expects to begin consolidating certain of the VIE’s effective July 1, 2003, because it believes it is the VIE’s primary beneficiary under FIN 46’s requirements. If the Company had consolidated the VIE beginning January 1, 2002, property and equipment reported at December 31, 2002, would have been increased by $5.8 million, net of accumulated depreciation of $0.8 million, long-term borrowings would have been increased by $6.3 million and a minority interest of $0.2 million would have been reported.
15
Item 2. Management’s Discussion and Analysis of Results of Operations and Financial Condition
General Operating Environment
The worldwide and North America quarterly average rig count increased 19% (from 1,678 to 1,996) and 29% (from 953 to 1,231), respectively, in the second quarter of 2003 compared to the second quarter 2002. The average per barrel price of West Texas Intermediate Crude increased 11% (from $26.24 to $29.23) and natural gas prices increased 67% (from $3.38 to $5.64) in the second quarter of 2003 compared to the same period of 2002. The Company’s Tubular Services and Drilling Services businesses benefited from the increase in the 2003 rig count, from the Company’s September 2002 acquisition of substantially all of the oilfield services business of ICO, Inc., and from other smaller acquisitions. As a result, revenues for these rose 25% or $35.1 million compared to the second quarter of 2002. Most of the increase was from the ICO acquisition and the smaller acquisitions. Revenues from the Company’s Drilling Equipment Sales and Coiled Tubing & Wireline Products divisions declined 7% or $13.7 million from the second quarter of 2002 compared to the second quarter of 2003. The Company shipped a high level of both drilling equipment and well remediation equipment in the second quarter of 2002, which did not recur in the most recent quarter.
The following graph details U.S., Canada, and International rig activity, West Texas Intermediate crude and natural gas prices for the past fourteen quarters on a quarterly basis:
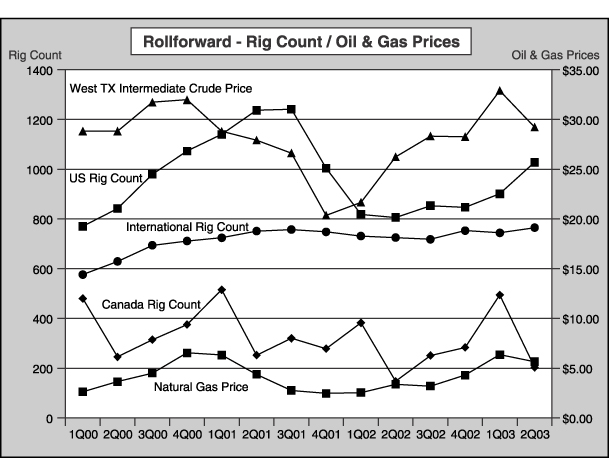
| Source: | | Rig Count: Baker Hughes, Inc. (www.bakerhughes.com) |
| | | West Texas Intermediate Crude Price & Natural Gas Price: Department of Energy, Energy Information Administration (www.eia.doe.gov). |
16
Results of Operations
Three and Six Months Ended June 30, 2003 and 2002
Revenue.Revenue was $357.5 million and $724.9 million for the second quarter and first half of 2003, an increase of $21.4 million (or 6%) and $78.3 million (or 12%) compared to the second quarter and first half of 2002, respectively. The increases were due primarily to an increase in North America services business revenue and the Company’s acquisition of substantially all of the oilfield services business of ICO Inc. in September 2002. These increases were offset by a decline in Drilling Equipment Sales and Coiled Tubing & Wireline Products in the second quarter of 2003 compared to the second quarter of 2002 due to lower shipments of drilling equipment units. The following table summarizes revenue by segment (in thousands):
| | | Three Months Ended
June 30,
| | Six Months Ended
June 30,
|
| | | 2003
| | 2002
| | 2003
| | 2002
|
| | | | | (restated) | | | | (restated) |
Revenue: | | | | | | | | | | | | |
Drilling Equipment Sales | | $ | 123,056 | | $ | 133,440 | | $ | 262,235 | | $ | 243,716 |
Tubular Services | | | 107,999 | | | 76,394 | | | 212,757 | | | 151,433 |
Drilling Services | | | 69,879 | | | 66,419 | | | 139,339 | | | 137,671 |
Coiled Tubing & Wireline Products | | | 56,523 | | | 59,800 | | | 110,603 | | | 113,801 |
| | |
|
| |
|
| |
|
| |
|
|
Total | | $ | 357,457 | | $ | 336,053 | | $ | 724,934 | | $ | 646,621 |
| | |
|
| |
|
| |
|
| |
|
|
Drilling Equipment Sales revenue was $123.1 million and $262.2 million for the second quarter and first six months of 2003, representing a decrease of $10.4 million (8%) and an increase of $18.5 million (8%) compared to the second quarter and first six months of 2002, respectively. The decrease in the second quarter of 2003 was primarily related to lower shipments related to Drilling Equipment units in the second quarter of 2003 compared to 2002, offset to some degree by greater revenue from Drilling Equipment rental, repairs, and services. The year over year increase resulted from higher shipments of equipment, primarily from the Company’s Shaffer and MIL divisions in the first quarter 2003. New orders for the three months ended June 30, 2003 were $131.0 million compared to $90.9 million for the same period of 2002, while backlog at June 30, 2003 was $187.6 million compared to $194.8 million at June 30, 2002. Sequentially, backlog increased by $7.9 million at June 30, 2003 compared to March 31, 2003.
Tubular Services revenue was $108.0 million and $212.8 million for the second quarter and first half of 2003, representing an increase of $31.6 million (41%) and $61.3 million (41%) compared to the second quarter and first half of 2002. The 2003 increases were due primarily to higher drilling activity, the acquisition of ICO’s oilfield services business in September 2002, and other smaller acquisitions. These increases were offset slightly by lower pipeline inspection revenue in the second quarter of 2003 compared to the prior year period.
Drilling Services revenue was $69.9 million and $139.3 million for the second quarter and first half of 2003, representing an increase of $3.5 million (5%) and $1.7 million (1%) compared to the same periods of 2002. The second quarter 2003 increase in revenue was due to increases in North America Solids Control Services and Instrumentation Services attributed to the 29% increase in rig activity in North America in the second quarter of 2003 compared to the second quarter of 2002. This increase was offset somewhat by lower instrumentation and V-ICIS equipment sales.
Coiled Tubing and Wireline Products revenue was $56.5 million and $110.6 million for the second quarter and first half of 2003, decreases of $3.3 million (5%) and $3.2 million (3%) compared to the same periods of 2002. The decreases were due to lower sales from the Company’s Hydra Rig coiled tubing unit operations in the first half of 2003 compared to the first half of 2002. Backlog for this segment was at $45.6 million at June 30, 2003 compared to $49.1 million at December 31, 2002.
Gross Profit.Gross profit was $91.7 million (25.6% of revenue) and $195.3 million (26.9% of revenue) for the second quarter and first half of 2003 compared to $95.8 million (28.5% of revenue) and $185.3 million (28.7% of revenue) for the same periods of 2002.
The second quarter 2003 results included the recognition of $6.3 million of anticipated losses on a $30 million land drilling rig construction contract expected to be shipped in late 2003 or early 2004. The loss was the result of additional costs due to delays and the structural complexity of the rig that has required substantially more material, fabrication, engineering, and design work than originally planned. The declines in gross profit percentages were due to the $6.3 million loss on the drilling rig contract and a decline in Drilling Equipment margins as a result of lower margins on equipment installation projects.
Selling, General, and Administrative Costs. Selling, general, and administrative costs were $44.6 million (12.5% of revenue) and $91.7 million (12.6% of revenue) for the three and six month periods ending June 30, 2003 compared to $38.4 million (11.4% of
17
revenue) and $76.4 million (11.8% of revenue) for the same periods of 2002. Expenses were higher in the first six months of 2003 compared to the first six months of 2002 due to the acquisitions completed in 2002, greater selling costs associated with the increase in revenue in Drilling Equipment operations, and higher insurance and employee compensation and benefit costs in 2003 compared to 2002.
Research and Engineering Costs. Research and engineering costs were $16.2 million and $31.2 million for the second quarter and first half of 2003, representing increases of $1.8 million and $3.9 million over the same periods of 2002. The increases were spread amongst the Company’s four major operating segments, due to technology development and sustaining engineering initiatives underway within the groups, and higher insurance and employee compensation and benefit costs in 2003 compared to 2002.
Merger, Transaction, and Litigation Costs.During the first quarter of 2002 the Company incurred $2.8 million of severance costs resulting from early termination of employment agreements for several senior executives arising out of the May 2000 merger between Varco International, Inc., a California corporation, and the Company.
Operating Profit.Operating profit was $30.9 million and $72.4 million for the three and six months ended June 30, 2003, compared to $42.9 million and $78.8 million for the same periods of 2002. The changes in operating profit were due to the factors discussed above.
Interest Expense.Interest expense was $7.8 million and $15.7 million for the three and six months ended June 30, 2003, compared to $6.0 million and $12.1 million for the three and six months ended June 30, 2002. The increases in interest expense were due to the greater average outstanding debt balances as a result of the $150.0 million 5½% Senior Notes issued in November 2002.
Other Expense (Income).Other expense consists of interest income, foreign exchange, and other expense (income). Net other expense was a gain of $0.1 million for the three months ended June 30, 2003 and a loss of $1.4 million for the first six months of 2003. These results compared to net expenses of $3.5 million and $5.8 million for the same periods of 2002. Results for 2002 included foreign exchange losses of $2.4 million in the second quarter of 2002 primarily due to the strengthening of the Euro and British pound sterling and $1.2 million in the first quarter of 2002 related to the revaluation of the Argentina peso. The second quarter of 2003 results included foreign exchange gains of $0.7 million primarily related to a stronger U.S. dollar against the British pound sterling.
Provision for Income Taxes. The Company’s effective tax rate for the second quarter and first half of 2003 was 34.7% and 34.9% respectively, compared to 37% for the second quarter and first half of 2002. These rates vary from the domestic rate of 35%, due to charges not allowed under domestic and foreign jurisdictions, foreign earnings subject to tax rates differing from domestic rates, the benefit from the increased utilization of the extraterritorial income provisions and the resolution of a tax audit in 2003.
Net Income.Net income for the second quarter and first half of 2003 was $15.1 million and $36.0 million compared to $21.1 million and $38.4 million for the same periods of 2002. The changes in 2003 results compared to 2002 were due to the factors discussed above.
Financial Condition and Liquidity
June 30, 2003
For the six months ended June 30, 2003, cash provided by operating activities was $34.4 million compared to $25.3 million provided by operating activities for the six months ended June 30, 2002. Cash was provided by operations in 2003 through net income of $36.0 million plus non-cash charges of $40.2 million, a decrease in other current assets of $3.3 million and an increase in accounts payable and accrued liabilities of $7.0 million. These items were offset to some extent by an increase in accounts receivable of $16.4 million, an increase in inventory of $32.1 million and a decrease in income taxes payable of $3.6 million. Accounts receivable increased $16.4 million in the first six months of 2003 due to higher revenue (up $3.0 million) in the second quarter of 2003 compared to the fourth quarter of 2002, and slightly higher days sales outstanding balances (84.1 days outstanding at December 31, 2002 compared to 86.3 days outstanding at June 30, 2003). The increase in inventory was related primarily to the Company’s initiative to increase its on-hand availability of drilling equipment spare parts, construction of a $30 million land rig, and construction of equipment for future sales related to the Drilling Equipment and Coiled Tubing & Wireline Products segments.
For the six months ended June 30, 2003, the Company used $39.8 million for investing activities compared to $38.9 million for the same period of 2002. The Company used $18.5 million to make business acquisitions (see Note 3 of Notes to Unaudited Consolidated Financial Statements). Capital spending of $21.5 million was primarily related to the construction of rental and operating equipment and facility upgrades for manufacturing operations.
18
For the six months ended June 30, 2003, the Company used $1.5 million of cash from financing activities compared to the generation of $1.1 million of cash for the six months ending June 30, 2002. Cash was primarily used in 2003 to pay off $6.8 million of debt, offset by proceeds from the exercise of stock options of $5.2 million.
At June 30, 2003, the Company had $99.0 million in cash and cash equivalents and current and long-term debt of $461.0 million. At December 31, 2002, the Company had cash and cash equivalents of $106.0 million and current and long-term debt of $467.9 million. The Company’s outstanding debt at June 30, 2003 consisted of $149.3 million of 5 1/2% Senior Notes due 2012, $201.3 million of 7 1/4% Senior Notes due 2011, $99.3 million of 7 1/2% Senior Notes due 2008 and other debt of $11.1 million.
On January 30, 2002, the Company entered into a new credit agreement with a syndicate of banks that provided up to $125.0 million of funds under a new revolving credit facility. In addition, the Company also obtained a bilateral letter of credit facility that provided up to $5.0 million of funds. The agreement was amended in the third quarter of 2002 to increase the available funds to $150.0 million. At June 30, 2003, there were $145.1 million of funds available under the revolving credit facility and $3.1 million of funds available under the bilateral letter of credit facility with $4.9 million and $1.9 million being used for letters of credit, under the revolving credit facility and bilateral letter of credit facility, respectively.
The Company believes that its June 30, 2003 cash and cash equivalents, its credit facility and cash flow from continuing operations will be sufficient to meet its capital expenditures and its operating cash needs for the foreseeable future.
19
Critical Accounting Policies and Estimates
In preparing the financial statements, the Company makes assumptions, estimates and judgments that affect the amounts reported. The Company periodically evaluates its estimates and judgments related to bad debts and inventory obsolescence; impairments of long-lived assets, including goodwill; reserves for product warranty claims; and assumptions related to pension and postretirement plans. Note 2 to the Notes to Consolidated Financial Statements in the Company’s Annual Report on Form 10-K/A for the year ended December 31, 2002 contains the accounting policies governing each of these matters. The Company’s estimates are based on historical experience and on its future expectations that it believes are reasonable; the combination of these factors forms the basis for making judgments about the carrying values of assets and liabilities that are not readily apparent from other sources. Actual results are likely to differ from the Company’s current estimates and those differences may be material.
The Company’s products and services are generally sold based upon purchase orders or contracts with the customer that include fixed or determinable prices and that do not include right of return or other similar provisions or other significant post delivery obligations. The Company records revenue at the time the product is shipped to the customer. Customer advances or deposits are deferred and recognized as revenue when the Company has completed all of its performance obligations related to the sale. The Company also recognized revenue and related costs when services are performed. The amounts billed for shipping and handling costs are included in cost of sales.
In prior periods, the Company recognized revenue on bill and hold transactions when the related product had been completed and was ready to be shipped, title and risk of loss had passed to the customer and the Company believed that the other criteria set forth in Staff Accounting Bulletin (SAB) 101 had been satisfied. Beginning January 1, 2002, the Company recognizes revenue on bill and hold transactions only when delivery has occurred and all other conditions for revenue recognition have been met. If revenue from all bill and hold transactions occurring during the three years ended December 31, 2002 was recognized upon shipment of the related product, rather than on the date previously recognized, the Company’s financial results for fiscal years 2000, 2001 and 2002 would not be materially affected. While the Company has not restated its financial results for these annual periods, it has restated its financial results for all quarterly periods in 2001 and 2002, including the second quarter of 2002, to reflect recognition of revenue on bill and hold transactions upon shipment. The restated results for the second quarter of 2002 are reflected in this report.
Reserves for bad debts are determined on a specific identification basis when the Company believes that the required payment of specific amounts owed to it is not probable. A substantial portion of the Company’s revenues come from international oil companies, international oilfield service companies, and government-owned or government-controlled oil companies. Therefore, the Company has significant receivables in many foreign jurisdictions. If worldwide oil and gas drilling activity or changes in economic conditions in foreign jurisdictions deteriorate, the Company’s customers may be unable to repay these receivables, and additional allowances could be required.
Reserves for inventory obsolescence are determined based on historical usage of inventory on-hand as well as the Company’s future expectations related to requirements to provide spare parts for its substantial installed base and new products. Changes in worldwide oil and gas drilling activity and the development of new technologies associated with the drilling industry could require the Company to record additional allowances to reduce the value of inventory to the lower of its cost or net realizable value.
Accruals for warranty claims are provided based on historical experience at the time of sale. Product warranties generally cover periods from one to three years. The Company’s accruals for warranty claims are affected by the size of the Company’s installed base of products currently under warranty, as well as new products delivered to the market. If actual experience proves different from historical estimates, changes to the Company’s provision rates may be required.
Long-lived assets, which include property and equipment, goodwill, and identified intangible assets comprise a significant amount of the Company’s total assets. The Company makes judgments and estimates in conjunction with the carrying value of these assets, including amounts to be capitalized, depreciation and amortization methods and useful lives. Additionally, the carrying values of these assets are reviewed for impairment periodically or whenever events or changes in circumstances indicate that the carrying amounts may not be recoverable. An impairment loss is recorded in the period in which it is determined that the carrying amount is not recoverable. This requires the Company to make long-term forecasts of its future revenues and costs related to the assets subject to review. These forecasts require assumptions about demand for the Company’s products and services, future market conditions and technological developments. Significant and unanticipated changes to these assumptions or the intended use of these assets could require a provision for impairment in a future period.
The Company sponsors several pension and postretirement plans. The Company has two defined benefit pension plans covering substantially all of its employees in Germany, plans providing healthcare benefits to certain retired executives and employees (Retiree Medical Plan), and a supplemental executive retirement plan. All of the plans are unfunded. See
20
additional disclosure in Note 9 to the Notes to Consolidated Financial Statements in the Company’s Annual Report on Form 10-K/A for the year ended December 31, 2002.
The Company accounts for its defined benefit pension plans and its nonpension postretirement benefit plans using actuarial models required by Statement of Financial Accounting Standards (SFAS) No. 87, “Employers’ Accounting for Pensions” and SFAS NO. 106, “Employers’ Accounting for Postretirement Benefits Other Than Pensions,” respectively.
A significant element in determining the Company’s expense in accordance with SFAS No. 87 and SFAS No. 106 is the discount rate. The discount rate is an estimate of the current interest rate at which the pension and postretirement liabilities could be effectively settled at the end of the year. In estimating this rate, the Company looks to rates of return on high-quality, fixed-income investments currently available and expected to be available during the period to maturity of the pension and postretirement benefit obligation. Changes in the discount rates over the past three years have not materially affected pension expense and the net effect of changes in the discount rate, as well as the net effect of other changes in actuarial assumptions and experience, have been deferred in accordance with SFAS No. 87 and SFAS No 106. The Company’s discount rates ranged from 6.5% to 6.75% at December 31, 2002. For 2003, the Company does not expect any changes in its discount rates and expects pension expense to be approximately $3.4 million.
Additionally, the health care cost trend rate can have a significant effect on the Company’s expense for the Retiree Medical Plan as reported in accordance with SFAS No. 106. The Company, in conjunction with its actuary reviews external data on its own historical trends for health care costs to determine the health care cost trend rates. The assumed health care cost trend rate for 2002 is 11% and is assumed to decrease gradually to 5% for 2008 and remain at that level thereafter. An increase of the health care cost trend rates by one percentage point each year would increase the accumulated postretirement benefit obligation as of December 31, 2002 by $1,205,056 and the aggregate of the service and interest cost components of net periodic postretirement benefit cost for 2002 by $77,000.
Forward Looking Statements
This Quarterly Report on Form 10-Q contains forward-looking statements within the meaning of Section 27A of the Securities Act of 1933 and Section 21E of the Securities Exchange Act of 1934. The forward-looking statements are those that do not state historical facts and are inherently subject to risk and uncertainties. The forward-looking statements contained herein are based on current expectations and entail various risks and uncertainties that could cause actual results to differ materially from those projected in the forward-looking statements. Such risks and uncertainties include, among others, the cyclical nature of the oilfield services industry, general economic and political conditions, risks associated with growth through acquisitions and other factors discussed in the Company’s Annual Report on Form 10-K/A for the year ended December 31, 2002 under the caption “Factors Affecting Future Operating Results.” In addition, the Company’s backlog is based upon anticipated revenues from customer orders that the Company believes are firm. In accordance with industry practice, orders or commitments to purchase the Company’s products generally can be cancelled by customers at any time. In addition, orders and commitments are sometimes modified before or during manufacturing of the products. The level of backlog at any particular time is not necessarily indicative of the future operating performance of the Company.
New Accounting Standards
In August 2001, the Financial Accounting Standards Board (FASB) issued statement of Financial Accounting Standard No 143, “Accounting for Asset Retirement Obligations,” (SFAS 143). SFAS 143 requires a company to recognize a liability associated with a legal obligation to retire or remove any tangible long-lived assets. SFAS 143 is effective beginning in 2003 and did not have a material impact on the Company’s financial position or results of operations.
In July 2002, the FASB issued Statement of Financial Accounting Standards No. 146, “Accounting for Costs Associated with Exit or Disposal Activities” (SFAS 146) which addresses financial accounting and reporting costs associated with exit or disposal activities and nullifies EITF Issue No. 94-3, “Liability Recognition for Certain Employee Termination Benefits and Other Costs to Exit An Activity (including Certain Costs Incurred in a Restructuring).” SFAS 146 requires that a liability for a cost associated with an exit or disposal activity be recognized when the liability is incurred. Under Issue 94-3, a liability for an exit cost was recognized at the date of an entity’s commitment to an exit plan. The provisions of this statement are effective for exit or disposal activities that are initiated after December 31, 2002. If the Company had early adopted statement SFAS 146, it would not have affected the Company’s accounting for restructuring activities which occurred in the third quarter of 2002.
In January 2003, FASB Interpretation No. 46, Consolidation of Variable Interest Entities (“FIN 46”) was issued. FIN 46 requires the consolidation of variable interest entities (“VIE”) in which an enterprise absorbs a majority of the entity’s expected losses, receives a majority of the entity’s expected residual returns, or both, as a result of ownership, contractual or other financial interests in the entity.
21
The Company has interests in VIE’s. Based upon preliminary evaluation, the Company expects to begin consolidating certain of the VIE’s effective July 1, 2003, because it believes it is the VIE’s primary beneficiary under FIN 46’s requirements. If the Company had consolidated the VIE beginning January 1, 2002, property and equipment reported at December 31, 2002, would have been increased by $5.8 million, net of accumulated depreciation of $0.8 million, long-term borrowings would have been increased by $6.3 million and a minority interest of $0.2 million would have been reported.
Item 3. Quantitative & Qualitative Disclosure About Market Risk
The Company conducts operations in various countries around the world and is exposed to market risk from changes in interest rates and changes in foreign currency rates. The Company does not believe that it has a material exposure to market risk. The Company does not enter into interest rate or foreign currency transactions for speculative purposes.
Interest Rates
The Company has historically managed its exposure to interest rate changes by using a combination of fixed rate debt, variable rate debt, and interest swap and collar agreements in its total debt portfolio. At June 30, 2003, the Company had $461.0 million of outstanding debt. Fixed rate debt included $149.3 million of the 2012 Notes at a fixed interest rate of 5 ½%, $201.3 million of the 2011 Notes at a fixed interest rate of 7¼% and $99.3 million of the 2008 Notes at a fixed interest rate of 7 ½%.
As of June 30, 2003, the Company had three interest rate swap agreements with an aggregate notional amount of $100.0 million associated with the Company’s 2008 Notes. Under this agreement, the Company receives interest at a fixed rate of 7 ½% and pays interest at a floating rate of six-month LIBOR plus a weighted average spread of approximately 4.675%. The swap agreements will settle semi-annually and will terminate in February 2008.
Foreign Currency Exchange Rates
With respect to foreign currency fluctuations, the Company uses natural hedges to minimize the effect of rate fluctuations. When natural hedges are not sufficient, generally it is the Company’s policy to enter into forward foreign exchange contracts to hedge significant transactions for periods consistent with the underlying risk. The Company had no forward foreign exchange contracts outstanding at June 30, 2003.
The Company has market risk sensitive instruments denominated in foreign currencies totaling $5.8 million as of June 30, 2003, excluding trade receivables and payables, which approximate fair value. These market risk sensitive instruments consisted of cash balances and overdraft facilities. The Company estimates that a hypothetical 10% movement of foreign currency exchange rates would affect net income by $.4 million.
Because the Company operates in virtually every oil and gas exploration and production region in the world, it conducts a portion of its business in currencies other than the U.S. dollar. The functional currency for some of the Company’s international operations is the applicable local currency. Although some of the Company’s international revenues are denominated in the local currency, the effects of foreign currency fluctuations are partly mitigated because local expenses of such foreign operations are also generally denominated in the same currency. During the quarters ended June 30, 2003, and 2002, the Company reported foreign currency gain (loss) of $0.7 million and ($2.4) million, respectively. The gain or losses were primarily due to exchange rate fluctuations related to monetary asset balances denominated in currencies other than the functional currency.
Assets and liabilities of those foreign subsidiaries are translated using the exchange rates in effect at the balance sheet date, resulting in translation adjustments that are reflected in accumulated other comprehensive loss in the common stockholders’ equity section of the Company’s balance sheet. The Company recorded currency translation gains of $6.4 million for the quarter ended June 30, 2003 and translation gains of $0.7 million for the quarter ended June 30, 2002, related to these translations.
22
Item 4. Controls and Procedures
The Company maintains disclosure controls and procedures that are designed to ensure that information required to be disclosed in the Company’s Securities Exchange Act of 1934 reports is recorded, processed, summarized and reported within the time periods specified in the SEC’s rules and forms, and that such information is accumulated and communicated to the Company’s management, including its Chief Executive Officer and Chief Financial Officer, as appropriate, to allow timely decisions regarding required disclosure. In designing and evaluating the disclosure controls and procedures, management recognized that any controls and procedures, no matter how well designed and operated, can provide only reasonable assurance of achieving the desired control objectives, and management necessarily was required to apply its judgment in evaluating the cost-benefit relationship of possible controls and procedures.
As required by SEC Rule 13a-15(b), the Company carried out an evaluation, under the supervision and with the participation of the management, including the Company’s Chief Executive Officer and Chief Financial Officer, of the effectiveness of the design and operation of the Company’s disclosure controls and procedures as of the end of the quarter covered by this report. Based on the foregoing, the Company’s Chief Executive Officer and Chief Financial Officer concluded that the Company’s disclosure controls and procedures were effective at the reasonable assurance level.
There has been no change in the Company’s internal controls over financial reporting during the Company’s most recent fiscal quarter that has materially affected, or is reasonably likely to materially affect, the Company’s internal controls over financial reporting.
23
PART II—OTHER INFORMATION
Item 4.Submission of Matters to vote of security holders.
The Annual Meeting of Stockholders of the Company was held May 15, 2003 for the following reasons:
Proposal One: The election of the members of the Company’s Board of Directors.
Name
| | For
| | Withhold
|
George Boyadjieff | | 90,295,633 | | 2,985,159 |
George S. Dotson | | 86,889,098 | | 6,391,694 |
Richard A. Kertson | | 90,296,809 | | 2,983,983 |
John F. Lauletta | | 89,801,740 | | 3,479,052 |
Eric L. Mattson | | 90,834,282 | | 2,446,510 |
L.E. Simmons | | 57,146,406 | | 36,134,386 |
Jeffery A. Smisek | | 91,011,073 | | 2,269,719 |
Douglas E. Swanson | | 91,012,753 | | 2,268,039 |
Eugene R. White | | 90,231,806 | | 3,048,986 |
James D. Woods | | 90,995,128 | | 2,285,664 |
Proposal Two: To approve an amendment and restatement of the Company’s Amended and Restated 1996 Equity Participation Plan, now known as the 2003 Equity Participation Plan that, among other things, (i) increases the number of shares of the Company’s common stock that may be issued under the plan by 4,500,000 shares from 7,650,000 shares to 12,150,000 shares, and (ii) modifies the annual limits on the amount of shares or cash awards that may be granted to any person
For
| | Against
| | Abstain
|
77,684,214 | | 15,543,908 | | 52,670 |
Proposal Three: To approve an amendment of the Company’s Employee Stock Purchase Plan that increases the number of shares of the Company’s common stock that may be issued thereunder by 350,000 shares from 648,172 shares to 998,172 shares
For
| | Against
| | Abstain
|
91,883,031 | | 1,357,804 | | 39,957 |
Proposal Four: To ratify the selection of Ernst & Young LLP as the Company’s independent auditors for the fiscal year ending December 31, 2003.
For
| | Against
| | Abstain
|
90,207,886 | | 3,041,192 | | 31,714 |
Item 6.Exhibits and reports on Form 8-K
a. Exhibits
Reference is hereby made to the Exhibit Index commencing on Page 26.
b. Reports on Form 8-K during the quarter ended June 30, 2003.
There were no reports filed on Form 8-K for the quarter ended June 30, 2003.
24
SIGNATURES
Pursuant to the requirements of the Securities Exchange Act of 1934, the registrant has duly caused this report to be signed on its behalf by the undersigned thereunto duly authorized.
| | | VARCO INTERNATIONAL, INC. (Registrant) |
Date: August 13, 2003 | | | | /s/ CLAY C. WILLIAMS
|
| | | | | Clay C. Williams Vice President and Chief Financial Officer, (Duly Authorized Officer, Principal Financial and Accounting Officer) |
25
EXHIBIT INDEX
Exhibit
No.
| | Description
| | Note No.
|
3.1 | | Third Amended and Restated Certificate of Incorporation of Varco International, Inc., dated May 30, 2000. | | (Note 1) |
| | |
3.2 | | Third Amended and Restated Bylaws. | | (Note 1) |
| | |
3.3 | | Certificate of Designations of Series A Junior Participating Preferred Stock of Varco International, Inc., dated November 30, 2000. | | (Note 1) |
| | |
4.1 | | Rights Agreement, dated as of November 29, 2000, by and between the Company and Chase Mellon Shareholder Services, L.L.C., as Rights Agent, which includes the form of Certificate of Designations of the Series A Junior Participating Preferred Stock of Varco International, Inc. as Exhibit A, the form of Right Certificate as Exhibit B, and the Summary of Rights to Purchase Preferred Shares as Exhibit C. | | (Note 1) |
| | |
4.2 | | Purchase Agreement dated as of October 1, 1991 between the Company and Baker Hughes Incorporated regarding certain registration rights. | | (Note 2) |
| | |
4.3 | | Registration Rights Agreement dated April 24, 1996 among the Company, SCF III, L.P., D.O.S. Partners L.P., Panmell (Holdings), Ltd. and Zink Industries Limited. | | (Note 3) |
| | |
4.4 | | Registration Rights Agreement dated March 7, 1997 among the Company and certain stockholders of Fiber Glass Systems, Inc. | | (Note 4) |
| | |
4.5 | | Indenture, dated as of February 25, 1998, between the Company, the Guarantors named therein and The Bank of New York as trustee, relating to $100,000,000 aggregate principal amount of 7½% Senior Notes due 2008; Specimen Certificate of 7½% Senior Notes due 2008 (private notes); and Specimen Certificate at 7½% Senior Notes due 2008 (public notes). | | (Note 5) |
| | |
4.6 | | Indenture, dated as of May 1, 2001, among the Company, the Guarantors named therein and The Bank of New York as trustee, relating to $200,000,000 aggregate principal amount of 7¼% Senior Notes due 2011; Specimen Certificate of 7¼% Senior Notes due 2011 (private notes); and Specimen Certificate of 7¼% Senior Notes due 2011 (public notes). | | (Note 6) |
| | |
4.7 | | Indenture, dated as of November 19, 2002, between the Company, the guarantors named therein and The Bank of New York Trust Company of Florida as trustee, relating to $150,000,000 aggregate principal amount of 5.5% Senior Notes due 2012 (private notes) Specimen Certificate of 5.5% Senior Notes due 2012 (private notes); and Specimen Certificate of 5.5% Senior Notes due 2012 (public notes). | | (Note 7) |
| | |
4.8 | | Registration Rights Agreement dated as of November 19, 2002, among the Company and Salomon Smith Barney Inc. | | (Note 7) |
| | |
10.1 | | Credit Agreement, dated as of January 30, 2002, among the Company, as the Borrower, Wells Fargo Bank Texas, National Association, as Administrative Agent, Bank One, NA, as Syndication Agent, Credit Suisse First Boston, Cayman Islands Branch, as Documentation Agent, and the other Banks a party thereto. | | (Note 8) |
| | |
10.2* | | Varco International, Inc. Deferred Compensation Plan (effective January 1, 2003) | | (Note 23) |
| | |
10.3* | | 2003 Equity Participation Plan of Varco International, Inc. | | |
| | |
10.3.1* | | Form of Non-qualified Stock Option Agreement for Employees and Consultants; Form of Non-qualified Stock Option Agreement for Independent Directors. | | (Note 22) |
| | |
10.4* | | Amended and Restated Stock Option Plan for Key Employees of Tuboscope Vetco International Corporation; Form of Revised Incentive Stock Option Agreement; and Form of Revised Non-Qualified Stock Option Agreement. | | (Note 9) |
26
Exhibit
No.
| | Description
| | Note No.
|
| | |
10.5* | | Stock Option Plan for Non-Employee Directors; Amendment to Stock Option Plan for Non-Employee Directors; and Form of Stock Option Agreement. | | (Note 10) |
| | |
10.6* | | Amendment and Restatement of the Varco International, Inc. Supplemental Executive Retirement Plan (effective as of November 15, 2001) | | (Note 23) |
| | |
10.7 | | Lease dated March 7, 1975, as amended | | (Note 11) |
| | |
10.7.1 | | Agreement dated as of January 1, 1982, with respect to Lease included as Exhibit 10.8 | | (Note 12) |
| | |
10.7.2 | | Agreement dated as of January 1, 1984, with respect to Lease included as Exhibit 10.8 | | (Note 13) |
| | |
10.7.3 | | Agreement dated as of February 8, 1985, with respect to Lease included as Exhibit 10.8 | | (Note 13) |
| | |
10.7.4 | | Agreement dated as of April 12, 1985, with respect to Lease included as Exhibit 10.8 | | (Note 14) |
| | |
10.7.5 | | Amendment dated as of January 11, 1996, with respect to Lease included as Exhibit 10.8 | | (Note 15) |
| | |
10.8 | | Standard Industrial Lease-Net dated September 29, 1988 for the premises at 743 N. Eckhoff, Orange, California | | (Note 16) |
| | |
10.8.1 | | First amendment dated as of January 11, 1996 to Lease included as Exhibit 10.9 | | (Note 15) |
| | |
10.9* | | The Varco International, Inc. 1990 Stock Option Plan, as amended | | (Note 17) |
| | |
10.9.1* | | Amendments to the Varco International, Inc. 1990 Stock Option Plan | | (Note 18) |
| | |
10.10* | | Varco International, Inc. 1994 Directors’ Stock Option Plan | | (Note 15) |
| | |
10.10.1* | | Amendment to Varco International, Inc. 1994 Directors’ Stock Option Plan | | (Note 19) |
| | |
10.11* | | Amendment and Restatement of the Varco International, Inc. Executive Retiree Medical Plan (effective as of November 15, 2001) | | (Note 23) |
| | |
10.12 | | Master Leasing Agreement, dated December 18, 1995 between the Company and Heller Financial Leasing, Inc. | | (Note 20) |
| | |
10.13* | | Form of Executive Agreement of certain members of senior management | | (Note 21) |
| | |
10.13.1* | | Form of First Amendment to Executive Agreements | | (Note 21) |
| | |
10.14* | | Executive Agreement of John F. Lauletta | | (Note 21) |
| | |
10.15* | | Executive Agreement of Joseph C. Winkler | | (Note 21) |
| | |
10.16* | | Agreement with George Boyadjieff dated November 29, 2002 | | (Note 23) |
| | |
10.17* | | Form of Indemnity Agreement | | (Note 21) |
| | |
31.1 | | Rule 13a-14(a)/15d-14(a) Certification of Chief Executive Officer | | |
| | |
31.2 | | Rule 13a-14(a)/15d-14(a) Certification of Chief Financial Officer | | |
| | |
32.1(+) | | Section 1350 Certification of Chief Executive Officer | | |
| | |
32.2(+) | | Section 1350 Certification of Chief Financial Officer | | |
27
For purposes of this list of exhibits and the notes below, the term “Company” refers to the registrant, Varco International, Inc., a Delaware corporation formerly known as Tuboscope Inc., and the term “Varco” refers to Varco International, Inc., a California corporation which merged with and into the registrant on May 30, 2000.
| (*) | | Management contract, compensation plan or arrangement. |
| (+) | | In accordance with SEC Release No. 33-8212, this exhibit is being furnished, and is not being filed as part of this Report or as a separate disclosure document, and is not being incorporated by reference into any Securities Act of 1933 registration statement. |
Table of Contents
Note 1 | | Incorporated by reference to the Company’s Annual Report on Form 10-K for the fiscal year ended December 31, 2000, filed on March 9, 2001. |
| |
Note 2 | | Incorporated by reference to the Company’s Registration Statement on Form S-1 (No. 33-43525), filed on October 24, 1991. |
| |
Note 3 | | Incorporated by reference to the Company’s Current Report on Form 8-K, filed on January 16, 1996. |
| |
Note 4 | | Incorporated by reference to the Company’s Current Report on 8-K, filed on March 20, 1997. |
| |
Note 5 | | Incorporated by reference to the Company’s Registration Statement on Form S-4 (No. 333-51115), filed on April 27, 1998. |
| |
Note 6 | | Incorporated by reference to the Company’s Registration Statement on Form S-4 (No. 333-64226), filed on June 29, 2001. |
| |
Note 7 | | Incorporated by reference to the Company’s Registration Statement on Form S-4 (No. 333-102162), filed on December 23, 2002. |
| |
Note 8 | | Incorporated by reference to the Company’s Annual Report on Form 10-K for the fiscal year ended December 31, 2001, filed on March 11, 2002. |
| |
Note 9 | | Incorporated by reference to the Company’s Registration Statement on Form S-8 (No. 33-72150), filed on November 24, 1993. |
| |
Note 10 | | Incorporated by reference to the Company’s Registration Statement on Form S-8 (No. 33-72072), filed on November 23, 1993. |
| |
Note 11 | | Incorporated by reference to Varco’s Annual Report on Form 10-K for the year ended December 31, 1981, filed on March 18, 1982. |
| |
Note 12 | | Incorporated by reference to Varco’s Annual Report on Form 10-K for the fiscal year ended December 31, 1982, filed on March 29, 1983. |
| |
Note 13 | | Incorporated by reference to Varco’s Annual Report on Form 10-K for the fiscal year ended December 31, 1984, filed on March 29, 1985. |
| |
Note 14 | | Incorporated by reference to Varco’s Quarterly Report on Form 10-Q for the fiscal quarter ended June 30, 1985, filed on July 30, 1985. |
| |
Note 15 | | Incorporated by reference to Varco’s Annual Report on Form 10-K for the fiscal year ended December 31, 1995, filed on March 29, 1996. |
| |
Note 16 | | Incorporated by reference to Varco’s Annual Report on Form 10-K for the fiscal year ended December 31, 1988, filed on March 30, 1989. |
| |
Note 17 | | Incorporated by reference to Varco’s Registration Statement on Form S-8, Registration No. 333-21681, filed on February 12, 1997. |
| |
Note 18 | | Incorporated by reference to Varco’s Annual Report on Form 10-K for the year ended December 31, 1999, filed on March 24, 2000. |
| |
Note 19 | | Incorporated by reference to Varco’s Annual Report on Form 10-K for the fiscal year ended December 31, 1997, filed on March 26, 1998. |
| |
Note 20 | | Incorporated by reference to the Company’s Annual Report on Form 10-K for the fiscal year ended December 31, 1995, filed on March 21, 1996. |
28
| |
Note 21 | | Incorporated by reference to the Company’s Registration Statement of Form S-4 (333-34582), filed on April 12, 2000. |
| |
Note 22 | | Incorporated by reference to the Company’s Quarterly Report on Form 10-Q for the fiscal quarter ended September 30, 2002, filed on November 8, 2002. |
| |
Note 23 | | Incorporated by reference to the Company’s Annual Report on Form 10-K for the fiscal year ended December 31, 2002, filed on March 28, 2003. |
29