UNITED STATES
SECURITIES AND EXCHANGE COMMISSION
WASHINGTON, D.C. 20549
FORM N-CSR
CERTIFIED SHAREHOLDER REPORT OF REGISTERED MANAGEMENT
INVESTMENT COMPANIES
Investment Company Act file number 811-6001
Oppenheimer Global Opportunities Fund
(Exact name of registrant as specified in charter)
6803 South Tucson Way, Centennial, Colorado 80112-3924
(Address of principal executive offices) (Zip code)
Arthur S. Gabinet
OFI Global Asset Management, Inc.
225 Liberty Street, New York, New York 10281-1008
(Name and address of agent for service)
Registrant’s telephone number, including area code: (303) 768-3200
Date of fiscal year end: September 30
Date of reporting period: 9/30/2015
Item 1. Reports to Stockholders.
Table of Contents
Class A Shares
AVERAGE ANNUAL TOTAL RETURNS AT 9/30/15
| | | | | | |
| | | Class A Shares of the Fund | | |
| | | Without Sales Charge | | With Sales Charge | | MSCI All Country (AC)
World Index |
1-Year | | 2.22% | | -3.66% | | -6.66% |
|
5-Year | | 7.74 | | 6.47 | | 6.82 |
|
10-Year | | 7.15 | | 6.52 | | 4.58 |
|
Performance data quoted represents past performance, which does not guarantee future results. The investment return and principal value of an investment in the Fund will fluctuate so that an investor’s shares, when redeemed, may be worth more or less than their original cost. Fund returns include changes in share price, reinvested distributions, and a 5.75% maximum applicable sales charge except where “without sales charge” is indicated. Current performance may be lower or higher than the performance quoted. Returns do not consider capital gains or income taxes on an individual’s investment. For performance data current to the most recent month-end, visit oppenheimerfunds.com or call 1.800.CALL OPP (225.5677).
2 OPPENHEIMER GLOBAL OPPORTUNITIES FUND
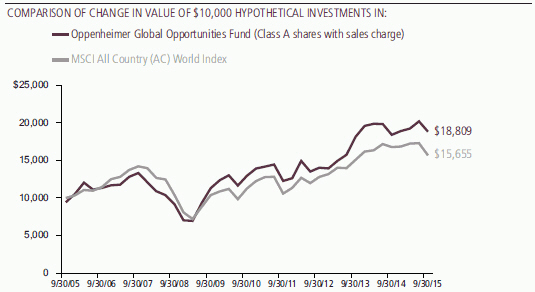
Fund Performance Discussion
The Fund’s Class A shares (without sales charge) generated a return of 2.22% during the reporting period, outperforming its benchmark, the MSCI All Country (AC) World Index (the “Index”), which returned -6.66%. We seek to invest in revolutionary innovation for the 21st century because we believe it should lead to above average earnings growth over the long term. We favor technologies that we believe are poised to benefit from secular tailwinds, businesses with wide moats around them (often because they own valuable intellectual property), and companies that we think have the potential to deliver meaningful growth over sustained periods.
The Fund’s Class A shares (without sales charge) produced a positive absolute return and outperformed the negative return of the Index in what was a difficult market environment. The Fund’s outperformance is primarily due to the composition of the Fund. We believe that we are in a slow growth world. There is still a sizable debt hangover from the financial crisis. Furthermore, most of the money borrowed and spent by governments during that period was not put to very productive use. (For instance, we have excess capacity in
many industries, particularly heavy industries, at the same time that we have crumbling infrastructure in the U.S.) As a result, many companies—especially in older industries—may be facing futures with little earnings growth for some time to come. Others, however, are growing quite nicely. In response to this, market activity has been largely driven by momentum. Price levels have moved down in the correction that occurred over the third quarter of 2015, but valuations have diverged. It is as though investors have narrowed their focus to
3 OPPENHEIMER GLOBAL OPPORTUNITIES FUND
those companies that do offer substantial growth potential and are not interested in the rest. In our opinion, most companies are fairly priced. The Fund, with its emphasis on innovative growth, has outperformed the Index in this environment. The Fund outperformed the Index in seven out of ten sectors, led by stock selection and an overweight position in health care, an underweight position in the energy sector, and stock selection in the materials and financials sectors. The Fund underperformed the Index within consumer staples due primarily to an underweight position and within information technology due to stock selection.
MARKET OVERVIEW
Numerous concerns resulted in market volatility during the reporting period, including the impact of slowing Chinese growth on commodities prices and the global economy, Greece’s debt situation, the strength of the U.S. dollar, along with the timing and impact of U.S. interest rate hikes. These factors created risk on/risk off market environments, which tend to obscure fundamentals and increase market volatility. Emerging markets were probably the most noteworthy area of concern in the reporting period, declining by 19.28%, as measured by the MSCI Emerging Markets Index. This continues a weak pattern that began all the way back in the spring of 2011. Since then, emerging markets have declined by roughly 35% in U.S. dollar terms.
FUND REVIEW
The top three performing holdings of the Fund this reporting period were Fingerprint Cards AB, Genmab AS and Anacor Pharmaceuticals, Inc.
Fingerprint Cards is a Swedish company founded in 1997 that has become the leader in fingerprint recognition technology for mobile phones. The recent rapid growth in the number of mobile phones with touch ID has been very positive for Fingerprint Cards. The company has evolved from a perpetually cash-starved start-up into a profitable business.
Genmab AS is a biotechnology company based in Denmark that develops human antibody therapeutics for the treatment of cancer. Genmab has a number of technology and discovery partnerships with large biotechnology/big cap pharmaceutical companies. It partnered with Johnson & Johnson in the U.S. for the launch of Daratumumab, a treatment for multiple myeloma, and receives a royalty on Arzerra from GlaxoSmithKline.
Anacor Pharmaceuticals, in the U.S., is a boron chemical company. Some of the compounds that contain boron have drying properties and Anacor uses its technology to produce various treatments for fungal and skin conditions. Its recent launch of Kerydin, for treatment of toenail infections, has had a strong start. In addition, Anacor had very
4 OPPENHEIMER GLOBAL OPPORTUNITIES FUND
good results in Phase Three trials for a psoriasis drug it is developing. The potential addressable market is sizable so, should the drug be approved, it would be very positive for Anacor.
Detractors from performance this reporting period included Advanced Micro Devices, Inc. (“AMD”), Stratasys Ltd. and MorphoSys AG.
AMD is a U.S. company that designs and markets microprocessors for computers. Over the past year, the company has disappointed as it has lost competitive ground to its two major rivals, Intel and Nvidia. AMD is planning to launch a new processor, Zen, in 2016, that has the potential to close the competitive gap. At current valuations, we think that potential, or optionality, is very attractively priced.
In terms of Stratasys, although we remain believers in the long-run success of 3D printing, we think near term over capacity has developed in the plastic printer sector. Therefore we sold our position in 3D printing company Stratasys. We will continue to monitor the sector and may seek opportunities when the situation improves.
MorphoSys is a German biotechnology company specializing in the use of human antibodies for the treatment of a wide variety of diseases. During the reporting period, the company experienced a setback in their drug development efforts with its partner Celgene. Despite this, we find appeal in the company’s technology platform. It has a variety of projects that hold promise for commercialization.
STRATEGY & OUTLOOK
We seek to invest in companies that are leading the way in the constant transformation of the economy. We seek businesses that are addressing secular growth markets, whose intellectual property provides them with competitive advantages. We favor companies domiciled in the G-7 countries—where that property is well protected—who address global markets. We find most such companies in the health care, information technology and consumer discretionary sectors, so the bulk of the Fund is currently invested in them. To balance the high price volatility that is often the norm for early stage, high growth companies, we also invest in more defensive companies that one would typically describe as blue chip names. With this approach, our turnover is relatively low.
| | |

| | 
Frank V. Jennings, Ph.D. Portfolio Manager |
5 OPPENHEIMER GLOBAL OPPORTUNITIES FUND
Top Holdings and Allocations
TOP TEN COMMON STOCK HOLDINGS
| | |
Nektar Therapeutics | | 9.5% |
Fingerprint Cards AB, Cl. B | | 3.1 |
Genmab AS | | 2.7 |
IP Group plc | | 2.4 |
Pandora AS | | 2.3 |
Novozymes AS, Cl. B | | 2.1 |
Cepheid | | 2.1 |
Tesla Motors, Inc. | | 2.0 |
SuperGroup plc | | 2.0 |
MorphoSys AG | | 2.0 |
Portfolio holdings and allocations are subject to change. Percentages are as of September 30, 2015, and are based on net assets. For more current Fund holdings, please visit oppenheimerfunds.com.
TOP TEN GEOGRAPHICAL HOLDINGS
| | |
United States | | 45.8% |
United Kingdom | | 14.1 |
Denmark | | 9.1 |
Germany | | 8.0 |
Japan | | 7.2 |
France | | 5.9 |
Sweden | | 5.1 |
Belgium | | 1.3 |
Finland | | 1.1 |
Netherlands | | 0.7 |
Portfolio holdings and allocation are subject to change. Percentages are as of September 30, 2015, and are based on total market value of investments.
REGIONAL ALLOCATION
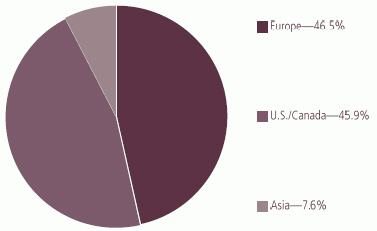
Portfolio holdings and allocations are subject to change. Percentages are as of September 30, 2015, and are based on the total market value of investments.
6 OPPENHEIMER GLOBAL OPPORTUNITIES FUND
Share Class Performance
AVERAGE ANNUAL TOTAL RETURNS WITHOUT SALES CHARGE AS OF 9/30/15
| | | | | | | | | | | | | | | | | | | | | | | | |
| | | Inception
Date | | | | | 1-Year | | | | | 5-Year | | | | | 10-Year | | | |
Class A (OPGIX) | | | 10/22/90 | | | | | | 2.22% | | | | | | 7.74% | | | | | | 7.15% | | | |
Class B (OGGIX) | | | 10/10/95 | | | | | | 1.42% | | | | | | 6.82% | | | | | | 6.63% | | | |
Class C (OGICX) | | | 12/1/93 | | | | | | 1.45% | | | | | | 6.93% | | | | | | 6.35% | | | |
Class I (OGIIX) | | | 1/27/12 | | | | | | 2.67% | | | | | | 9.10%* | | | | | | N/A | | | |
Class R (OGINX) | | | 3/1/01 | | | | | | 1.95% | | | | | | 7.40% | | | | | | 6.80% | | | |
Class Y (OGIYX) | | | 2/1/01 | | | | | | 2.46% | | | | | | 8.03% | | | | | | 7.48% | | | |
AVERAGE ANNUAL TOTAL RETURNS WITH SALES CHARGE AS OF 9/30/15 |
| | | Inception
Date | | | | | 1-Year | | | | | 5-Year | | | | | 10-Year | | | |
Class A (OPGIX) | | | 10/22/90 | | | | | | -3.66% | | | | | | 6.47% | | | | | | 6.52% | | | |
Class B (OGGIX) | | | 10/10/95 | | | | | | -3.58% | | | | | | 6.51% | | | | | | 6.63% | | | |
Class C (OGICX) | | | 12/1/93 | | | | | | 0.45% | | | | | | 6.93% | | | | | | 6.35% | | | |
Class I (OGIIX) | | | 1/27/12 | | | | | | 2.67% | | | | | | 9.10% | * | | | | | N/A | | | |
Class R (OGINX) | | | 3/1/01 | | | | | | 1.95% | | | | | | 7.40% | | | | | | 6.80% | | | |
Class Y (OGIYX) | | | 2/1/01 | | | | | | 2.46% | | | | | | 8.03% | | | | | | 7.48% | | | |
* Shows performance since inception.
Performance data quoted represents past performance, which does not guarantee future results. The investment return and principal value of an investment in the Fund will fluctuate so that an investor’s shares, when redeemed, may be worth more or less than their original cost. Current performance may be lower or higher than the performance quoted. Returns do not consider capital gains or income taxes on an individual’s investment. For performance data current to the most recent month-end, visit oppenheimerfunds.com or call 1.800.CALL OPP (225.5677). Fund returns include changes in share price, reinvested distributions, and the applicable sales charge: for Class A shares, the current maximum initial sales charge of 5.75%; for Class B shares, the contingent deferred sales charge of 5% (1-year) and 2% (5-year); and for Class C shares, the contingent deferred sales charge (“CDSC”) of 1% for the 1-year period. Prior to 7/1/14, Class R shares were named Class N shares. Beginning 7/1/14, new purchases of Class R shares will no longer be subject to a CDSC upon redemption (any CDSC will remain in effect for purchases prior to 7/1/14). There is no sales charge for Class I and Class Y shares. Because Class B shares convert to Class A shares 72 months after purchase, the 10-year return for Class B shares uses Class A performance for the period after conversion.
The Fund’s performance is compared to the performance of the MSCI All Country (AC) World Index, a free float-adjusted market capitalization weighted index that is designed to measure the equity market performance of developed and emerging markets. The Index is unmanaged and cannot be purchased directly by investors. While index comparisons may be useful to provide a benchmark for the Fund’s performance, it must be noted that the Fund’s investments are not limited to the investments comprising the Index. Index performance
7 OPPENHEIMER GLOBAL OPPORTUNITIES FUND
includes reinvestment of income, but does not reflect transaction costs, fees, expenses or taxes. Index performance is shown for illustrative purposes only as a benchmark for the Fund’s performance, and does not predict or depict performance of the Fund. The Fund’s performance reflects the effects of the Fund’s business and operating expenses.
The Fund’s investment strategy and focus can change over time. The mention of specific fund holdings does not constitute a recommendation by OppenheimerFunds, Inc. or its affiliates.
Before investing in any of the Oppenheimer funds, investors should carefully consider a fund’s investment objectives, risks, charges and expenses. Fund prospectuses and summary prospectuses contain this and other information about the funds, and may be obtained by asking your financial advisor, visiting oppenheimerfunds.com, or calling 1.800.CALL OPP (225.5677). Read prospectuses and summary prospectuses carefully before investing.
Shares of Oppenheimer funds are not deposits or obligations of any bank, are not guaranteed by any bank, are not insured by the FDIC or any other agency, and involve investment risks, including the possible loss of the principal amount invested.
8 OPPENHEIMER GLOBAL OPPORTUNITIES FUND
Fund Expenses
Fund Expenses. As a shareholder of the Fund, you incur two types of costs: (1) transaction costs, which may include sales charges (loads) on purchase payments and/or contingent deferred sales charges on redemptions; and (2) ongoing costs, including management fees; distribution and service fees; and other Fund expenses. These examples are intended to help you understand your ongoing costs (in dollars) of investing in the Fund and to compare these costs with the ongoing costs of investing in other mutual funds.
The examples are based on an investment of $1,000.00 invested at the beginning of the period and held for the entire 6-month period ended September 30, 2015.
Actual Expenses. The first section of the table provides information about actual account values and actual expenses. You may use the information in this section for the class of shares you hold, together with the amount you invested, to estimate the expense that you paid over the period. Simply divide your account value by $1,000.00 (for example, an $8,600.00 account value divided by $1,000.00 = 8.60), then multiply the result by the number in the first section under the heading entitled “Expenses Paid During 6 Months Ended September 30, 2015” to estimate the expenses you paid on your account during this period.
Hypothetical Example for Comparison Purposes. The second section of the table provides information about hypothetical account values and hypothetical expenses based on the Fund’s actual expense ratio for each class of shares, and an assumed rate of return of 5% per year for each class before expenses, which is not the Fund’s actual return. The hypothetical account values and expenses may not be used to estimate the actual ending account balance or expenses you paid for the period. You may use this information to compare the ongoing costs of investing in the Fund and other funds. To do so, compare this 5% hypothetical example for the class of shares you hold with the 5% hypothetical examples that appear in the shareholder reports of the other funds.
Please note that the expenses shown in the table are meant to highlight your ongoing costs only and do not reflect any transactional costs, such as front-end or contingent deferred sales charges (loads). Therefore, the “hypothetical” section of the table is useful in comparing ongoing costs only, and will not help you determine the relative total costs of owning different funds. In addition, if these transactional costs were included, your costs would have been higher.
9 OPPENHEIMER GLOBAL OPPORTUNITIES FUND
| | | | | | | | | | | | |
| Actual | | Beginning
Account
Value
April 1, 2015 | | | | Ending Account Value
September 30, 2015 | | | | Expenses Paid During 6 Months Ended
September 30, 2015 | | |
Class A | | $ 1,000.00 | | | | $ 978.40 | | | | $ 5.87 | | |
Class B | | 1,000.00 | | | | 974.60 | | | | 9.65 | | |
Class C | | 1,000.00 | | | | 974.60 | | | | 9.60 | | |
Class I | | 1,000.00 | | | | 980.60 | | | | 3.68 | | |
Class R | | 1,000.00 | | | | 977.00 | | | | 7.11 | | |
Class Y | | 1,000.00 | | | | 979.60 | | | | 4.63 | | |
| | | | | | |
Hypothetical (5% return before expenses) | | | | | | | | | | | | |
Class A | | 1,000.00 | | | | 1,019.15 | | | | 5.99 | | |
Class B | | 1,000.00 | | | | 1,015.34 | | | | 9.85 | | |
Class C | | 1,000.00 | | | | 1,015.39 | | | | 9.80 | | |
Class I | | 1,000.00 | | | | 1,021.36 | | | | 3.76 | | |
Class R | | 1,000.00 | | | | 1,017.90 | | | | 7.26 | | |
Class Y | | 1,000.00 | | | | 1,020.41 | | | | 4.72 | | |
Expenses are equal to the Fund’s annualized expense ratio for that class, multiplied by the average account value over the period, multiplied by 183/365 (to reflect the one-half year period). Those annualized expense ratios, excluding indirect expenses from affiliated funds, based on the 6-month period ended September 30, 2015 are as follows:
| | | | | | |
| Class | | Expense Ratios | | | |
Class A | | | 1.18 | % | | |
Class B | | | 1.94 | | | |
Class C | | | 1.93 | | | |
Class I | | | 0.74 | | | |
Class R | | | 1.43 | | | |
Class Y | | | 0.93 | | | |
The expense ratios reflect voluntary and/or contractual waivers and/or reimbursements of expenses by the Fund’s Manager. Some of these undertakings may be modified or terminated at any time, as indicated in the Fund’s prospectus. The “Financial Highlights” tables in the Fund’s financial statements, included in this report, also show the gross expense ratios, without such waivers or reimbursements and reduction to custodian expenses, if applicable.
10 OPPENHEIMER GLOBAL OPPORTUNITIES FUND
STATEMENT OF INVESTMENTS September 30, 2015
| | | | | | | | |
| | | Shares | | | Value | |
| |
Common Stocks—95.1% | |
| |
Consumer Discretionary—21.3% | |
| |
Automobiles—2.0% | |
Tesla Motors, Inc.1 | | | 250,000 | | | $ | 62,100,000 | |
|
| |
Diversified Consumer Services—0.6% | |
Sotheby’s | | | 600,000 | | | | 19,188,000 | |
|
| |
Hotels, Restaurants & Leisure—2.8% | |
Chipotle Mexican Grill, Inc.,
Cl. A1 | | | 70,000 | | | | 50,417,500 | |
| |
| InterContinental Hotels Group plc | | | 1,000,000 | | | | 34,583,100 | |
| | | | | | | | |
| | | | | | | 85,000,600 | |
|
| |
Household Durables—1.0% | |
iRobot Corp.1 | | | 1,000,000 | | | | 29,140,000 | |
|
| |
Internet & Catalog Retail—3.4% | |
ASKUL Corp. | | | 600,000 | | | | 22,839,037 | |
| |
ASOS plc1 | | | 700,000 | | | | 29,345,136 | |
| |
Rakuten, Inc. | | | 2,000,000 | | | | 25,649,569 | |
| |
Shutterfly, Inc.1 | | | 500,000 | | | | 17,875,000 | |
| |
Yoox SpA, Cl. A1 | | | 300,000 | | | | 9,053,154 | |
| | | | | | | | |
| | | | | | | 104,761,896 | |
|
| |
Leisure Products—0.1% | |
LeapFrog Enterprises, Inc.,
Cl. A1,2 | | | 3,500,000 | | | | 2,497,250 | |
|
| |
Media—4.3% | | | | | | | | |
Axel Springer SE | | | 400,000 | | | | 22,301,109 | |
| |
CyberAgent, Inc. | | | 800,000 | | | | 31,339,563 | |
| |
| DreamWorks Animation SKG, Inc., Cl. A1 | | | 1,400,000 | | | | 24,430,000 | |
| |
Entertainment One Ltd. | | | 4,000,000 | | | | 15,044,625 | |
| |
Schibsted ASA, Cl. A | | | 150,000 | | | | 5,095,208 | |
| |
Technicolor SA | | | 5,000,000 | | | | 34,556,260 | |
| | | | | | | | |
| | | | | | | 132,766,765 | |
|
| |
Specialty Retail—4.3% | |
Jin Co. Ltd. | | | 600,000 | | | | 28,288,223 | |
| |
L’Occitane International SA | | | 8,000,000 | | | | 16,742,707 | |
| |
SuperGroup plc1 | | | 3,000,000 | | | | 61,937,058 | |
| |
Urban Outfitters, Inc.1 | | | 800,000 | | | | 23,504,000 | |
| | | | | | | | |
| | | | | | | 130,471,988 | |
| | | | | | | | |
| | | Shares | | | Value | |
| |
Textiles, Apparel & Luxury Goods—2.8% | |
| Global Brands Group Holding Ltd.1 | | | 35,000,000 | | | $ | 7,281,240 | |
| |
Mulberry Group plc1 | | | 500,000 | | | | 6,818,015 | |
| |
Pandora AS | | | 600,000 | | | | 70,198,022 | |
| | | | | | | | |
| | | | | | | 84,297,277 | |
|
| |
Consumer Staples—1.7% | | | | | | | | |
| |
Food & Staples Retailing—0.6% | | | | | |
Fresh Market, Inc. (The)1 | | | 800,000 | | | | 18,072,000 | |
|
| |
Personal Products—1.1% | | | | | | | | |
Dr. Ci:Labo Co. Ltd. | | | 1,800,000 | | | | 33,984,863 | |
|
| |
Financials—5.3% | | | | | | | | |
| |
Capital Markets—4.2% | | | | | | | | |
Allied Minds plc1 | | | 2,000,000 | | | | 10,678,941 | |
| |
IP Group plc1 | | | 20,785,545 | | | | 72,514,424 | |
| |
Rothschild & Co. | | | 1,500,000 | | | | 43,648,805 | |
| | | | | | | | |
| | | | | | | 126,842,170 | |
|
| |
Diversified Financial Services—1.1% | |
IG Group Holdings plc | | | 3,000,000 | | | | 34,996,183 | |
|
| |
Health Care—30.5% | | | | | | | | |
| |
Biotechnology—11.7% | |
3-D Matrix Ltd.1 | | | 900,000 | | | | 8,065,999 | |
| |
Abcam plc | | | 1,000,000 | | | | 8,806,919 | |
| |
Ablynx NV1 | | | 1,150,000 | | | | 14,820,263 | |
| |
Anacor Pharmaceuticals, Inc.1 | | | 500,000 | | | | 58,855,000 | |
| |
Arrowhead Research Corp.1,2 | | | 3,000,000 | | | | 17,280,000 | |
| |
Cepheid1 | | | 1,400,000 | | | | 63,280,000 | |
| |
Exact Sciences Corp.1 | | | 500,000 | | | | 8,995,000 | |
| |
Genmab AS1 | | | 900,000 | | | | 82,734,608 | |
| |
Halozyme Therapeutics, Inc.1 | | | 1,000,000 | | | | 13,430,000 | |
| |
Innate Pharma SA1 | | | 1,000,000 | | | | 15,041,033 | |
| |
Rigel Pharmaceuticals, Inc.1,2 | | | 5,000,000 | | | | 12,350,000 | |
11 OPPENHEIMER GLOBAL OPPORTUNITIES FUND
|
| STATEMENT OF INVESTMENTS Continued |
| | | | | | | | |
| | | Shares | | | Value | |
| |
Biotechnology (Continued) | |
| |
Seattle Genetics, Inc.1 | | | 1,400,000 | | | $ | 53,984,000 | |
| | | | | | | | |
| | | | | | | 357,642,822 | |
|
| |
Health Care Equipment & Supplies—2.7% | |
Carl Zeiss Meditec AG | | | 1,000,000 | | | | 27,932,568 | |
| |
Consort Medical plc2 | | | 2,856,109 | | | | 40,452,110 | |
| |
Ion Beam Applications | | | 400,000 | | | | 12,925,107 | |
| | | | | | | | |
| | | | | | | 81,309,785 | |
|
| |
Health Care Technology—1.3% | |
M3, Inc. | | | 2,000,000 | | | | 39,899,059 | |
|
| |
Life Sciences Tools & Services—2.7% | |
Bruker Corp.1 | | | 1,400,000 | | | | 23,002,000 | |
| |
MorphoSys AG1 | | | 900,000 | | | | 59,974,189 | |
| | | | | | | | |
| | | | | | | 82,976,189 | |
|
| |
Pharmaceuticals—12.1% | |
| GW Pharmaceuticals plc, ADR1 | | | 100,000 | | | | 9,137,000 | |
| |
H. Lundbeck AS1 | | | 2,000,000 | | | | 53,376,941 | |
| |
Merck KGaA | | | 200,000 | | | | 17,706,141 | |
| |
Nektar Therapeutics1,2 | | | 26,400,000 | | | | 289,344,000 | |
| | | | | | | | |
| | | | | | | 369,564,082 | |
|
| |
Industrials—9.9% | | | | | | | | |
| |
Aerospace & Defense—2.3% | |
Boeing Co. (The) | | | 300,000 | | | | 39,285,000 | |
| |
Hexcel Corp. | | | 700,000 | | | | 31,402,000 | |
| | | | | | | | |
| | | | | | | 70,687,000 | |
|
| |
Electrical Equipment—1.2% | |
Blue Solutions1 | | | 360,000 | | | | 8,866,304 | |
| |
OSRAM Licht AG | | | 500,000 | | | | 25,833,850 | |
| | | | | | | | |
| | | | | | | 34,700,154 | |
|
| |
Machinery—4.6% | |
| Albany International Corp., Cl. A | | | 400,000 | | | | 11,444,000 | |
| |
Arcam AB1,2 | | | 3,148,808 | | | | 55,486,323 | |
| |
KUKA AG | | | 400,000 | | | | 30,625,515 | |
| |
SLM Solutions Group AG1,2 | | | 1,450,000 | | | | 23,845,147 | |
| |
Spirax-Sarco Engineering plc | | | 464,285 | | | | 19,710,691 | |
| | | | | | | | |
| | | | | | | 141,111,676 | |
| | | | | | | | |
| | | Shares | | | Value | |
| |
Professional Services—1.8% | |
Acacia Research Corp. | | | 2,500,000 | | | $ | 22,700,000 | |
| |
Bureau Veritas SA | | | 450,000 | | | | 9,493,741 | |
| |
Teleperformance | | | 300,000 | | | | 22,754,101 | |
| | | | | | | | |
| | | | | | | 54,947,842 | |
|
| |
Information Technology—20.6% | |
| |
Communications Equipment—1.1% | |
Nokia OYJ | | | 5,000,000 | | | | 34,255,165 | |
|
| |
Electronic Equipment, Instruments, & Components—5.3% | |
Coherent, Inc.1 | | | 900,000 | | | | 49,230,000 | |
| |
Corning, Inc. | | | 1,000,000 | | | | 17,120,000 | |
| |
Fingerprint Cards AB, Cl. B1 | | | 2,600,000 | | | | 96,064,849 | |
| | | | | | | | |
| | | | | | | 162,414,849 | |
|
| |
Internet Software & Services—3.6% | |
| Alibaba Group Holding Ltd., Sponsored ADR1 | | | 181,000 | | | | 10,673,570 | |
| |
Angie’s List, Inc.1 | | | 2,000,000 | | | | 10,080,000 | |
| |
Criteo SA, Sponsored ADR1 | | | 500,000 | | | | 18,770,000 | |
| |
Hortonworks, Inc.1 | | | 97,520 | | | | 2,134,713 | |
| |
Pandora Media, Inc.1 | | | 1,000,000 | | | | 21,340,000 | |
| |
Yahoo!, Inc.1 | | | 1,600,000 | | | | 46,256,000 | |
| | | | | | | | |
| | | | | | | 109,254,283 | |
|
| |
IT Services—0.9% | | | | | | | | |
VeriFone Systems, Inc.1 | | | 1,000,000 | | | | 27,730,000 | |
|
| |
Semiconductors & Semiconductor Equipment— 5.2% | |
Advanced Micro Devices, Inc.1 | | | 32,000,000 | | | | 55,040,000 | |
| |
Cree, Inc.1 | | | 500,000 | | | | 12,115,000 | |
| |
| Fairchild Semiconductor International, Inc., Cl. A1 | | | 3,500,000 | | | | 49,140,000 | |
| |
Synaptics, Inc.1 | | | 500,000 | | | | 41,230,000 | |
| | | | | | | | |
| | | | | | | 157,525,000 | |
|
| |
Software—3.7% | | | | | | | | |
Gemalto NV | | | 300,000 | | | | 19,471,470 | |
| |
PTC, Inc.1 | | | 1,200,000 | | | | 38,088,000 | |
12 OPPENHEIMER GLOBAL OPPORTUNITIES FUND
| | | | | | | | |
| | | | | | | |
| | | Shares | | | Value | |
| |
Software (Continued) | |
| |
Qlik Technologies, Inc.1 | | | 1,000,000 | | | $ | 36,450,000 | |
| |
SDL plc | | | 2,000,000 | | | | 9,849,128 | |
| |
WANdisco plc1,2 | | | 4,000,000 | | | | 7,568,681 | |
| | | | | | | | |
| | | | | | | 111,427,279 | |
| |
Technology Hardware, Storage & Peripherals— 0.8% | |
Xaar plc | | | 3,000,000 | | | | 25,444,247 | |
|
| |
Materials—5.0% | | | | | | | | |
| |
Chemicals—5.0% | | | | | | | | |
Croda International plc | | | 500,000 | | | | 20,536,404 | |
| |
Novozymes AS, Cl. B | | | 1,500,000 | | | | 65,505,072 | |
| |
Symrise AG | | | 500,000 | | | | 30,034,501 | |
| |
Toray Industries, Inc. | | | 3,000,000 | | | | 26,000,168 | |
| |
Umicore SA | | | 300,000 | | | | 11,560,405 | |
| | | | | | | | |
| | | | | | | 153,636,550 | |
|
| |
Telecommunication Services—0.8% | |
| |
Diversified Telecommunication Services—0.8% | |
Vivendi SA | | | 1,000,000 | | | | 23,674,954 | |
| | | | | | | | |
Total Common Stocks | | | | | | | | |
(Cost $2,372,962,977) | | | | 2,902,319,928 | |
| | | | | | | | |
| | | Principal
Amount | | | Value | |
| |
Foreign Government Obligation—0.5% | |
| |
United Kingdom—0.5% | |
| United Kingdom Treasury Bonds, 2% Bonds, 1/22/16 (Cost $15,607,176) | | | GBP10,000,000 | | | $ | 15,272,860 | |
| | |
| | | Shares | | | | |
| |
| Investment Company—2.3% | | | | | |
| |
| Oppenheimer Institutional Money Market Fund, Cl. E, 0.18%2,3 (Cost $71,266,170) | | | 71,266,170 | | | | 71,266,170 | |
| |
| Total Investments,at Value (Cost $2,459,836,323) | | | 97.9 | % | | | 2,988,858,958 | |
| |
| Net Other Assets (Liabilities) | | | 2.1 | | | | 64,891,038 | |
| | | | |
Net Assets | | | 100.0 | % | | $ | 3,053,749,996 | |
| | | | |
Footnotes to Statement of Investments
1. Non-income producing security.
2. Is or was an affiliate, as defined in the Investment Company Act of 1940, as amended, at or during the reporting period, by virtue of the Fund owning at least 5% of the voting securities of the issuer or as a result of the Fund and the issuer having the same investment adviser. Transactions during the reporting period in which the issuer was an affiliate are as follows:
| | | | | | | | | | | | | | | | |
| | | Shares
September 30,
2014 | | | Gross
Additions | | | Gross
Reductions | | | Shares
September 30,
2015 | |
Arcam AB | | | 1,200,000 | | | | 1,948,808 | | | | — | | | | 3,148,808 | |
Arrowhead Research Corp. | | | — | | | | 3,000,000 | | | | — | | | | 3,000,000 | |
Consort Medical plc | | | 1,757,606 | | | | 1,098,503a | | | | — | | | | 2,856,109 | |
LeapFrog Enterprises, Inc., Cl. A | | | 2,500,000 | | | | 1,000,000 | | | | — | | | | 3,500,000 | |
Nektar Therapeutics | | | 24,400,000 | | | | 2,200,000 | | | | 200,000 | | | | 26,400,000 | |
Oppenheimer Institutional Money | | | | | | | | | | | | | | | | |
Market Fund, Cl. E | | | 102,792,833 | | | | 580,455,796 | | | | 611,982,459 | | | | 71,266,170 | |
Rigel Pharmaceuticals, Inc. | | | 5,000,000 | | | | — | | | | — | | | | 5,000,000 | |
SLM Solutions Group AG | | | 750,000 | | | | 700,000 | | | | — | | | | 1,450,000 | |
WANdisco plc | | | 1,000,000 | | | | 3,000,000 | | | | — | | | | 4,000,000 | |
13 OPPENHEIMER GLOBAL OPPORTUNITIES FUND
|
| STATEMENT OF INVESTMENTS Continued |
Footnotes to Statement of Investments (Continued)
| | | | | | | | | | | | |
| | | Value | | | Income | | | Realized Loss | |
| |
Arcam AB | | $ | 55,486,323 | | | $ | — | | | $ | — | |
Arrowhead Research Corp. | | | 17,280,000 | | | | — | | | | — | |
Consort Medical plc | | | 40,452,110 | | | | 788,095 | | | | — | |
LeapFrog Enterprises, Inc., Cl. A | | | 2,497,250 | | | | — | | | | — | |
Nektar Therapeutics | | | 289,344,000 | | | | — | | | | 3,393,132 | |
Oppenheimer Institutional Money Market Fund, Cl. E | | | 71,266,170 | | | | 127,025 | | | | — | |
Rigel Pharmaceuticals, Inc. | | | 12,350,000 | | | | — | | | | — | |
SLM Solutions Group AG | | | 23,845,147 | | | | — | | | | — | |
WANdisco plc | | | 7,568,681 | | | | — | | | | — | |
| | | | |
Total | | $ | 520,089,681 | | | $ | 915,120 | | | $ | 3,393,132 | |
| | | | |
a. All of portion is the result of a corporate action.
3. Rate shown is the 7-day yield at period end.
Distribution of investments representing geographic holdings, as a percentage of total investments at value, is as follows:
| | | | | | | | | | |
| Geographic Holdings (Unaudited) | | Value | | | Percent | | | |
|
United States | | $ | 1,369,794,633 | | | | 45.8 | % | | |
United Kingdom | | | 422,695,522 | | | | 14.1 | | | |
Denmark | | | 271,814,644 | | | | 9.1 | | | |
Germany | | | 238,253,021 | | | | 8.0 | | | |
Japan | | | 216,066,481 | | | | 7.2 | | | |
France | | | 176,805,197 | | | | 5.9 | | | |
Sweden | | | 151,551,172 | | | | 5.1 | | | |
Belgium | | | 39,305,774 | | | | 1.3 | | | |
Finland | | | 34,255,165 | | | | 1.1 | | | |
Netherlands | | | 19,471,470 | | | | 0.7 | | | |
Luxembourg | | | 16,742,707 | | | | 0.6 | | | |
China | | | 10,673,570 | | | | 0.4 | | | |
Italy | | | 9,053,154 | | | | 0.3 | | | |
Hong Kong | | | 7,281,240 | | | | 0.2 | | | |
Norway | | | 5,095,208 | | | | 0.2 | | | |
| | | |
Total | | $ | 2,988,858,958 | | | | 100.0 | % | | |
| | | |
| | | | | | | | | | | | | | |
| Forward Currency Exchange Contracts as of September 30, 2015 | | |
| | | | | | | | | | | | | | | | | | | | | | |
| Counterparty | | Settlement
Month(s) | | Currency
Purchased
(000’s) | | | Currency Sold (000’s) | | | Unrealized
Appreciation | | | Unrealized
Depreciation | |
| |
BOA | | 04/2016 - 07/2016 | | USD | | | 80,714 | | | DKK | | | 552,680 | | | $ | — | | | $ | 2,555,016 | |
BOA | | 07/2016 | | USD | | | 100,896 | | | SEK | | | 834,100 | | | | 465,665 | | | | — | |
DEU | | 12/2015 | | USD | | | 200,881 | | | DKK | | | 1,212,000 | | | | 19,097,024 | | | | — | |
DEU | | 12/2015 - 07/2016 | | USD | | | 452,779 | | | EUR | | | 383,785 | | | | 28,095,502 | | | | 5,174,168 | |
DEU | | 12/2015 - 04/2016 | | USD | | | 398,902 | | | GBP | | | 259,880 | | | | 8,424,177 | | | | 2,492,259 | |
DEU | | 12/2015 | | USD | | | 201,414 | | | JPY | | | 24,261,000 | | | | — | | | | 993,762 | |
| | | | | | | | | | | | | | | | | | |
Total Unrealized Appreciation and Depreciation | | | | | | | | | $ | 56,082,368 | | | $ | 11,215,205 | |
| | | | | | | | | | | | | | | | | | |
Glossary:
Counterparty Abbreviations
| | |
| BOA | | Bank of America NA |
| DEU | | Deutsche Bank AG |
14 OPPENHEIMER GLOBAL OPPORTUNITIES FUND
Currency abbreviations indicate amounts reporting in currencies
| | |
| DKK | | Danish Krone |
| EUR | | Euro |
| GBP | | British Pound Sterling |
| JPY | | Japanese Yen |
| SEK | | Swedish Krona |
See accompanying Notes to Financial Statements.
15 OPPENHEIMER GLOBAL OPPORTUNITIES FUND
STATEMENT OF ASSETS AND LIABILITIES September 30, 2015
| | | | |
Assets | | | | |
Investments, at value—see accompanying statement of investments: | | | | |
Unaffiliated companies (cost $1,806,171,678) | | $ | 2,468,769,277 | |
Affiliated companies (cost $653,664,645) | | | 520,089,681 | |
| | | | 2,988,858,958 | |
Cash | | | 4,912,245 | |
Cash—foreign currencies (cost $234,608) | | | 234,476 | |
Unrealized appreciation on forward currency exchange contracts | | | 56,082,368 | |
Receivables and other assets: | | | | |
Investments sold | | | 14,484,347 | |
Interest and dividends | | | 3,288,611 | |
Shares of beneficial interest sold | | | 1,445,947 | |
Other | | | 281,680 | |
Total assets | | | 3,069,588,632 | |
| | | | |
Liabilities | | | | |
Unrealized depreciation on forward currency exchange contracts | | | 11,215,205 | |
Payables and other liabilities: | | | | |
Shares of beneficial interest redeemed | | | 3,390,199 | |
Trustees’ compensation | | | 597,059 | |
Distribution and service plan fees | | | 555,212 | |
Shareholder communications | | | 16,352 | |
Other | | | 64,609 | |
Total liabilities | | | 15,838,636 | |
Net Assets | | $ | 3,053,749,996 | |
| | | | |
| | | | |
| |
Composition of Net Assets | | | | |
Par value of shares of beneficial interest | | $ | 78,523 | |
Additional paid-in capital | | | 2,569,868,811 | |
Accumulated net investment loss | | | (74,885,372 | ) |
Accumulated net realized loss on investments and foreign currency transactions | | | (15,235,536 | ) |
Net unrealized appreciation on investments and translation of assets and liabilities denominated in foreign currencies | | | 573,923,570 | |
Net Assets | | $ | 3,053,749,996 | |
| | | | |
| | | | |
16 OPPENHEIMER GLOBAL OPPORTUNITIES FUND
| | |
Net Asset Value Per Share | | |
Class A Shares: | | |
| |
Net asset value and redemption price per share (based on net assets of $2,118,294,890 and 53,741,553 shares of
beneficial interest outstanding) | | $39.42 |
| |
| Maximum offering price per share (net asset value plus sales charge of 5.75% of offering price) | | $41.82 |
|
| |
Class B Shares: | | |
| |
Net asset value, redemption price (excludes applicable contingent deferred sales charge) and offering price per share
(based on net assets of $34,617,096 and 969,416 shares of beneficial interest outstanding) | | $35.71 |
|
| |
Class C Shares: | | |
| |
Net asset value, redemption price (excludes applicable contingent deferred sales charge) and offering price per share
(based on net assets of $385,550,160 and 10,784,656 shares of beneficial interest outstanding) | | $35.75 |
|
| |
Class I Shares: | | |
| |
Net asset value, redemption price and offering price per share (based on net assets of $69,700,211 and 1,745,350 shares of
beneficial interest outstanding) | | $39.93 |
|
| |
Class R Shares: | | |
| |
Net asset value, redemption price (excludes applicable contingent deferred sales charge) and offering price per share
(based on net assets of $85,547,327 and 2,239,858 shares of beneficial interest outstanding) | | $38.19 |
|
| |
Class Y Shares: | | |
| |
Net asset value, redemption price and offering price per share (based on net assets of $360,040,312 and 9,041,698 shares
of beneficial interest outstanding) | | $39.82 |
See accompanying Notes to Financial Statements.
17 OPPENHEIMER GLOBAL OPPORTUNITIES FUND
STATEMENT OF OPERATIONS For the Year Ended September 30, 2015
| | | | |
Investment Income | | | | |
Dividends: | | | | |
Unaffiliated companies (net of foreign withholding taxes of $1,235,414) | | $ | 16,362,789 | |
Affiliated companies | | | 915,120 | |
Interest | | | 6,073 | |
Total investment income | | | 17,283,982 | |
Expenses | | | | |
Management fees | | | 23,426,849 | |
Distribution and service plan fees: | | | | |
Class A | | | 5,610,557 | |
Class B | | | 456,660 | |
Class C | | | 4,157,772 | |
Class R | | | 457,352 | |
Transfer and shareholder servicing agent fees: | | | | |
Class A | | | 5,060,209 | |
Class B | | | 100,877 | |
Class C | | | 916,823 | |
Class I | | | 20,105 | |
Class R | | | 201,956 | |
Class Y | | | 879,280 | |
Shareholder communications: | | | | |
Class A | | | 44,855 | |
Class B | | | 3,354 | |
Class C | | | 7,332 | |
Class I | | | 161 | |
Class R | | | 925 | |
Class Y | | | 2,360 | |
Custodian fees and expenses | | | 145,212 | |
Trustees’ compensation | | | 51,169 | |
Borrowing fees | | | 10,318 | |
Other | | | 118,686 | |
Total expenses | | | 41,672,812 | |
Less waivers and reimbursements of expenses | | | (100,427) | |
Net expenses | | | 41,572,385 | |
Net Investment Loss | | | (24,288,403) | |
18 OPPENHEIMER GLOBAL OPPORTUNITIES FUND
| | | | |
Realized and Unrealized Gain (Loss) | | | | |
Net realized gain (loss) on: | | | | |
Investments from: | | | | |
Unaffiliated companies | | $ | 183,379,949 | |
Affiliated companies | | | (3,393,132) | |
Foreign currency transactions | | | 215 | |
| | | | |
Net realized gain | | | 179,987,032 | |
| |
Net change in unrealized appreciation/depreciation on: | | | | |
Investments | | | (76,530,464) | |
Translation of assets and liabilities denominated in foreign currencies | | | 208,067 | |
| | | | |
Net change in unrealized appreciation/depreciation | | | (76,322,397) | |
| |
Net Increase in Net Assets Resulting from Operations | | $ | 79,376,232 | |
| | | | |
See accompanying Notes to Financial Statements.
19 OPPENHEIMER GLOBAL OPPORTUNITIES FUND
STATEMENTS OF CHANGES IN NET ASSETS
| | | | | | | | | | |
| | | Year Ended
September 30, 2015 | | Year Ended September 30, 2014 | |
Operations | | | | | | | | | | |
Net investment loss | | $ | (24,288,403 | ) | | | | $ | (8,877,307) | |
Net realized gain | | | 179,987,032 | | | | | | 165,822,225 | |
Net change in unrealized appreciation/depreciation | | | (76,322,397 | ) | | | | | (129,951,103) | |
Net increase in net assets resulting from operations | | | 79,376,232 | | | | | | 26,993,815 | |
| | | | | | | | | | |
Dividends and/or Distributions to Shareholders | | | | | | | | | | |
Dividends from net investment income: | | | | | | | | | | |
Class A | | | (6,275,736 | ) | | | | | — | |
Class B | | | — | | | | | | — | |
Class C | | | — | | | | | | — | |
Class I | | | (415,153 | ) | | | | | — | |
Class R1 | | | — | | | | | | — | |
Class Y | | | (2,196,159 | ) | | | | | — | |
| | | (8,887,048 | ) | | | | | — | |
| | | | | | | | | | |
Beneficial Interest Transactions | | | | | | | | | | |
Net increase (decrease) in net assets resulting from beneficial interest transactions: | | | | | | | | | | |
Class A | | | (225,384,156 | ) | | | | | 76,648,283 | |
Class B | | | (23,973,455 | ) | | | | | (23,864,409) | |
Class C | | | (42,085,243 | ) | | | | | 27,636,143 | |
Class I | | | 13,614,144 | | | | | | 24,201,483 | |
Class R1 | | | (7,545,804 | ) | | | | | (9,934,257) | |
Class Y | | | (59,103,242 | ) | | | | | 101,724,991 | |
| | | (344,477,756 | ) | | | | | 196,412,234 | |
Net Assets | | | | | | | | | | |
Total increase (decrease) | | | (273,988,572 | ) | | | | | 223,406,049 | |
Beginning of period | | | 3,327,738,568 | | | | | | 3,104,332,519 | |
| End of period (including accumulated net investment loss of $74,885,372 and $41,710,136, respectively) | | $ | 3,053,749,996 | | | | | $ | 3,327,738,568 | |
| | | | | | | | | | |
| | | | | | | | | | |
1. Effective July 1, 2014, Class N shares were renamed Class R. See Note 1 of the accompanying Notes.
See accompanying Notes to Financial Statements.
20 OPPENHEIMER GLOBAL OPPORTUNITIES FUND
FINANCIAL HIGHLIGHTS
| | | | | | | | | | | | | | | | | | | | |
| Class A | | Year Ended
September
30, 2015 | | | Year Ended
September
30, 2014 | | | Year Ended
September
30, 2013 | | | Year Ended
September
28, 20121 | | | Year Ended
September 30, 2011 | |
| |
Per Share Operating Data | | | | | | | | | | | | | | | | |
| Net asset value, beginning of period | | $ | 38.67 | | | $ | 38.11 | | | $ | 29.80 | | | $ | 26.21 | | | $ | 27.96 | |
| |
| Income (loss) from investment operations: | | | | | | | | | | | | | | | | |
| Net investment income (loss)2 | | | (0.27) | | | | (0.07) | | | | (0.07) | | | | 0.09 | | | | 0.05 | |
| Net realized and unrealized gain (loss) | | | 1.13 | | | | 0.63 | | | | 8.71 | | | | 3.65 | | | | (1.52) | |
| | | | |
| Total from investment operations | | | 0.86 | | | | 0.56 | | | | 8.64 | | | | 3.74 | | | | (1.47) | |
| |
| Dividends and/or distributions to shareholders: | | | | | | | | | | | | | | | | |
| Dividends from net investment income | | | (0.11) | | | | 0.00 | | | | (0.33) | | | | (0.15) | | | | (0.28) | |
| |
| Net asset value, end of period | | $ | 39.42 | | | $ | 38.67 | | | $ | 38.11 | | | $ | 29.80 | | | $ | 26.21 | |
| | | | |
|
| |
Total Return, at Net Asset Value3 | | | 2.22% | | | | 1.47% | | | | 29.36% | | | | 14.35% | | | | (5.36)% | |
|
| |
Ratios/Supplemental Data | | | | | | | | | | | | | | | | | | | | |
| Net assets, end of period (in thousands) | | $ | 2,118,295 | | | $ | 2,293,999 | | | $ | 2,192,080 | | | $ | 1,863,475 | | | $ | 1,723,787 | |
| |
| Average net assets (in thousands) | | $ | 2,299,089 | | | $ | 2,422,818 | | | $ | 1,896,481 | | | $ | 1,838,208 | | | $ | 2,060,976 | |
| |
| Ratios to average net assets:4 | | | | | | | | | | | | |
| Net investment income (loss) | | | (0.66)% | | | | (0.17)% | | | | (0.23)% | | | | 0.31% | | | | 0.18% | |
| Expenses excluding interest and fees from borrowings | | | 1.18% | | | | 1.17% | | | | 1.21% | | | | 1.22% | | | | 1.20% | |
| Interest and fees from borrowings | | | 0.00%5 | | | | 0.00% | | | | 0.00% | | | | 0.00% | | | | 0.00% | |
| | | | |
| Total expenses6 | | | 1.18% | | | | 1.17% | | | | 1.21% | | | | 1.22% | | | | 1.20% | |
| Expenses after payments, waivers and/or reimbursements and reduction to custodian expenses | | | 1.18% | | | | 1.17% | | | | 1.21% | | | | 1.22% | | | | 1.20% | |
| |
| Portfolio turnover rate | | | 16% | | | | 16% | | | | 27% | | | | 57% | | | | 41% | |
1. September 28, 2012 represents the last business day of the Fund’s reporting period.
2. Per share amounts calculated based on the average shares outstanding during the period.
3. Assumes an initial investment on the business day before the first day of the fiscal period, with all dividends and distributions reinvested in additional shares on the reinvestment date, and redemption at the net asset value calculated on the last business day of the fiscal period. Sales charges are not reflected in the total returns. Total returns are not annualized for periods less than one full year. Returns do not reflect the deduction of taxes that a shareholder would pay on fund distributions or the redemption of fund shares. The returns do not include adjustments in accordance with generally accepted accounting principles required at the period end for financial reporting purposes.
4. Annualized for periods less than one full year.
5. Less than 0.005%.
6. Total expenses including indirect expenses from affiliated fund fees and expenses were as follows:
| | | | | | |
| | Year Ended September 30, 2015 | | 1.18% | | |
| | Year Ended September 30, 2014 | | 1.17% | |
| | Year Ended September 30, 2013 | | 1.21% | |
| | Year Ended September 28, 2012 | | 1.22% | |
| | Year Ended September 30, 2011 | | 1.20% | |
See accompanying Notes to Financial Statements.
21 OPPENHEIMER GLOBAL OPPORTUNITIES FUND
|
| FINANCIAL HIGHLIGHTS Continued |
| | | | | | | | | | | | | | | | | | | | |
| Class B | | Year Ended
September
30, 2015 | | | Year Ended
September
30, 2014 | | | Year Ended
September
30, 2013 | | | Year Ended
September
28, 20121 | | | Year Ended
September
30, 2011 | |
| |
Per Share Operating Data | | | | | | | | | | | | | | | | | | | | |
Net asset value, beginning of period | | $ | 35.21 | | | $ | 34.98 | | | $ | 27.32 | | | $ | 24.10 | | | $ | 25.73 | |
| |
Income (loss) from investment operations: | | | | | | | | | | | | | | | | | | | | |
Net investment loss2 | | | (0.53) | | | | (0.38) | | | | (0.33) | | | | (0.16) | | | | (0.20) | |
Net realized and unrealized gain (loss) | | | 1.03 | | | | 0.61 | | | | 8.02 | | | | 3.38 | | | | (1.40) | |
| | | | |
Total from investment operations | | | 0.50 | | | | 0.23 | | | | 7.69 | | | | 3.22 | | | | (1.60) | |
| |
Dividends and/or distributions to shareholders: | | | | | | | | | | | | | | | | | | | | |
Dividends from net investment income | | | 0.00 | | | | 0.00 | | | | (0.03) | | | | 0.00 | | | | (0.03) | |
| |
Net asset value, end of period | | $ | 35.71 | | | $ | 35.21 | | | $ | 34.98 | | | $ | 27.32 | | | $ | 24.10 | |
| | | | |
|
| |
Total Return, at Net Asset Value3 | | | 1.42% | | | | 0.66% | | | | 28.17% | | | | 13.36% | | | | (6.25)% | |
|
| |
Ratios/Supplemental Data | | | | | | | | | | | | | | | | | | | | |
Net assets, end of period (in thousands) | | $ | 34,617 | | | $ | 57,192 | | | $ | 79,296 | | | $ | 87,841 | | | $ | 111,026 | |
| |
Average net assets (in thousands) | | $ | 45,754 | | | $ | 71,794 | | | $ | 76,488 | | | $ | 102,521 | | | $ | 145,805 | |
| |
Ratios to average net assets:4 | | | | | | | | | | | | | | | | | | | | |
Net investment loss | | | (1.43)% | | | | (1.04)% | | | | (1.14)% | | | | (0.59)% | | | | (0.73)% | |
Expenses excluding interest and fees from borrowings | | | 1.94% | | | | 2.01% | | | | 2.27% | | | | 2.24% | | | | 2.21% | |
Interest and fees from borrowings | | | 0.00%5 | | | | 0.00% | | | | 0.00% | | | | 0.00% | | | | 0.00% | |
| | | | |
Total expenses6 | | | 1.94% | | | | 2.01% | | | | 2.27% | | | | 2.24% | | | | 2.21% | |
| Expenses after payments, waivers and/or reimbursements and reduction to custodian expenses | | | 1.94% | | | | 1.99% | | | | 2.14% | | | | 2.11% | | | | 2.12% | |
| |
Portfolio turnover rate | | | 16% | | | | 16% | | | | 27% | | | | 57% | | | | 41% | |
1. September 28, 2012 represents the last business day of the Fund’s reporting period.
2. Per share amounts calculated based on the average shares outstanding during the period.
3. Assumes an initial investment on the business day before the first day of the fiscal period, with all dividends and distributions reinvested in additional shares on the reinvestment date, and redemption at the net asset value calculated on the last business day of the fiscal period. Sales charges are not reflected in the total returns. Total returns are not annualized for periods less than one full year. Returns do not reflect the deduction of taxes that a shareholder would pay on fund distributions or the redemption of fund shares. The returns do not include adjustments in accordance with generally accepted accounting principles required at the period end for financial reporting purposes.
4. Annualized for periods less than one full year.
5. Less than 0.005%.
6. Total expenses including indirect expenses from affiliated fund fees and expenses were as follows:
| | | | | | |
| | Year Ended September 30, 2015 | | | 1.94 | % |
| | Year Ended September 30, 2014 | | | 2.01 | % |
| | Year Ended September 30, 2013 | | | 2.27 | % |
| | Year Ended September 28, 2012 | | | 2.24 | % |
| | Year Ended September 30, 2011 | | | 2.21 | % |
See accompanying Notes to Financial Statements.
22 OPPENHEIMER GLOBAL OPPORTUNITIES FUND
| | | | | | | | | | | | | | | | | | | | |
| Class C | | Year Ended September 30, 2015 | | | Year Ended September 30, 2014 | | | Year Ended September 30, 2013 | | | Year Ended September 28, 20121 | | | Year Ended September 30, 2011 | |
| |
Per Share Operating Data | | | | | | | | | | | | | | | | | | | | |
Net asset value, beginning of period | | $ | 35.24 | | | $ | 34.99 | | | $ | 27.39 | | | $ | 24.13 | | | $ | 25.78 | |
| |
Income (loss) from investment operations: | | | | | | | | | | | | | | | | | | | | |
Net investment loss2 | | | (0.52) | | | | (0.34) | | | | (0.29) | | | | (0.12) | | | | (0.16) | |
Net realized and unrealized gain (loss) | | | 1.03 | | | | 0.59 | | | | 8.02 | | | | 3.38 | | | | (1.40) | |
| | | | |
Total from investment operations | | | 0.51 | | | | 0.25 | | | | 7.73 | | | | 3.26 | | | | (1.56) | |
| |
Dividends and/or distributions to shareholders: | | | | | | | | | | | | | | | | | | | | |
Dividends from net investment income | | | 0.00 | | | | 0.00 | | | | (0.13) | | | | 0.00 | | | | (0.09) | |
| |
Net asset value, end of period | | $ | 35.75 | | | $ | 35.24 | | | $ | 34.99 | | | $ | 27.39 | | | $ | 24.13 | |
| | | | |
|
| |
Total Return, at Net Asset Value3 | | | 1.45% | | | | 0.72% | | | | 28.35% | | | | 13.51% | | | | (6.08)% | |
|
| |
Ratios/Supplemental Data | | | | | | | | | | | | | | | | | | | | |
Net assets, end of period (in thousands) | | $ | 385,550 | | | $ | 420,778 | | | $ | 392,294 | | | $ | 340,428 | | | $ | 327,817 | |
| |
Average net assets (in thousands) | | $ | 416,534 | | | $ | 438,648 | | | $ | 342,250 | | | $ | 345,798 | | | $ | 394,340 | |
| |
Ratios to average net assets:4 | | | | | | | | | | | | | | | | | | | | |
Net investment loss | | | (1.41)% | | | | (0.93)% | | | | (0.98)% | | | | (0.44)% | | | | (0.58)% | |
Expenses excluding interest and fees from borrowings | | | 1.94% | | | | 1.92% | | | | 1.97% | | | | 1.97% | | | | 1.96% | |
Interest and fees from borrowings | | | 0.00%5 | | | | 0.00% | | | | 0.00% | | | | 0.00% | | | | 0.00% | |
| | | | |
Total expenses6 | | | 1.94% | | | | 1.92% | | | | 1.97% | | | | 1.97% | | | | 1.96% | |
| Expenses after payments, waivers and/or reimbursements and reduction to custodian expenses | | | 1.94% | | | | 1.92% | | | | 1.97% | | | | 1.97% | | | | 1.96% | |
| |
Portfolio turnover rate | | | 16% | | | | 16% | | | | 27% | | | | 57% | | | | 41% | |
1. September 28, 2012 represents the last business day of the Fund’s reporting period.
2. Per share amounts calculated based on the average shares outstanding during the period.
3. Assumes an initial investment on the business day before the first day of the fiscal period, with all dividends and distributions reinvested in additional shares on the reinvestment date, and redemption at the net asset value calculated on the last business day of the fiscal period. Sales charges are not reflected in the total returns. Total returns are not annualized for periods less than one full year. Returns do not reflect the deduction of taxes that a shareholder would pay on fund distributions or the redemption of fund shares. The returns do not include adjustments in accordance with generally accepted accounting principles required at the period end for financial reporting purposes.
4. Annualized for periods less than one full year.
5. Less than 0.005%.
6. Total expenses including indirect expenses from affiliated fund fees and expenses were as follows:
| | | | | | |
| | Year Ended September 30, 2015 | | | 1.94 | % |
| | Year Ended September 30, 2014 | | | 1.92 | % |
| | Year Ended September 30, 2013 | | | 1.97 | % |
| | Year Ended September 28, 2012 | | | 1.97 | % |
| | Year Ended September 30, 2011 | | | 1.96 | % |
See accompanying Notes to Financial Statements.
23 OPPENHEIMER GLOBAL OPPORTUNITIES FUND
|
| FINANCIAL HIGHLIGHTS Continued |
| | | | | | | | | | | | | | | | |
| Class I | | Year Ended September 30, 2015 | | | Year Ended September 30, 2014 | | | Year Ended September 30, 2013 | | | Period Ended September 28, 20121,2 | |
| |
Per Share Operating Data | | | | | | | | | | | | | | | | |
Net asset value, beginning of period | | $ | 39.18 | | | $ | 38.45 | | | $ | 30.07 | | | $ | 29.69 | |
| |
Income (loss) from investment operations: | | | | | | | | | | | | | | | | |
Net investment income (loss)3 | | | (0.09) | | | | 0.13 | | | | 0.03 | | | | 0.10 | |
Net realized and unrealized gain | | | 1.13 | | | | 0.60 | | | | 8.82 | | | | 0.28 | |
| | | | |
Total from investment operations | | | 1.04 | | | | 0.73 | | | | 8.85 | | | | 0.38 | |
| |
Dividends and/or distributions to shareholders: | | | | | | | | | | | | | | | | |
Dividends from net investment income | | | (0.29) | | | | 0.00 | | | | (0.47) | | | | 0.00 | |
| |
Net asset value, end of period | | $ | 39.93 | | | $ | 39.18 | | | $ | 38.45 | | | $ | 30.07 | |
| | | | |
|
| |
Total Return, at Net Asset Value4 | | | 2.67% | | | | 1.90% | | | | 29.97% | | | | 1.28% | |
|
| |
Ratios/Supplemental Data | | | | | | | | | | | | | | | | |
Net assets, end of period (in thousands) | | $ | 69,700 | | | $ | 55,279 | | | $ | 32,235 | | | $ | 1,400 | |
| |
Average net assets (in thousands) | | $ | 67,065 | | | $ | 48,088 | | | $ | 20,251 | | | $ | 272 | |
| |
Ratios to average net assets:5 | | | | | | | | | | | | | | | | |
Net investment income (loss) | | | (0.21)% | | | | 0.32% | | | | 0.10% | | | | 0.53% | |
Expenses excluding interest and fees from borrowings | | | 0.75% | | | | 0.74% | | | | 0.76% | | | | 0.76% | |
Interest and fees from borrowings | | | 0.00%6 | | | | 0.00% | | | | 0.00% | | | | 0.00% | |
| | | | |
Total expenses7 | | | 0.75% | | | | 0.74% | | | | 0.76% | | | | 0.76% | |
| Expenses after payments, waivers and/or reimbursements and reduction to custodian expenses | | | 0.75% | | | | 0.74% | | | | 0.76% | | | | 0.76% | |
| |
Portfolio turnover rate | | | 16% | | | | 16% | | | | 27% | | | | 57% | |
1. September 28, 2012 represents the last business day of the Fund’s reporting period.
2. For the period from January 27, 2012 (inception of offering) to September 28, 2012.
3. Per share amounts calculated based on the average shares outstanding during the period.
4. Assumes an initial investment on the business day before the first day of the fiscal period, with all dividends and distributions reinvested in additional shares on the reinvestment date, and redemption at the net asset value calculated on the last business day of the fiscal period. Sales charges are not reflected in the total returns. Total returns are not annualized for periods less than one full year. Returns do not reflect the deduction of taxes that a shareholder would pay on fund distributions or the redemption of fund shares. The returns do not include adjustments in accordance with generally accepted accounting principles required at the period end for financial reporting purposes.
5. Annualized for periods less than one full year.
6. Less than 0.005%.
7. Total expenses including indirect expenses from affiliated fund fees and expenses were as follows:
| | | | | | |
| | Year Ended September 30, 2015 | | 0.75% | | |
| | Year Ended September 30, 2014 | | 0.74% | |
| | Year Ended September 30, 2013 | | 0.76% | |
| | Period Ended September 28, 2012 | | 0.76% | |
See accompanying Notes to Financial Statements.
24 OPPENHEIMER GLOBAL OPPORTUNITIES FUND
| | | | | | | | | | | | | | | | | | | | |
| Class R | | Year Ended September 30, 2015 | | | Year Ended September 30, 2014 | | | Year Ended September 30, 2013 | | | Year Ended September 28, 20121 | | | Year Ended September 30, 2011 | |
| |
Per Share Operating Data | | | | | | | | | | | | | | | | | | | | |
Net asset value, beginning of period | | $ | 37.46 | | | $ | 37.02 | | | $ | 28.96 | | | $ | 25.47 | | | $ | 27.19 | |
| |
Income (loss) from investment operations: | | | | | | | | | | | | | | | | | | | | |
Net investment loss2 | | | (0.36) | | | | (0.18) | | | | (0.18) | | | | (0.01) | | | | (0.04) | |
Net realized and unrealized gain (loss) | | | 1.09 | | | | 0.62 | | | | 8.47 | | | | 3.56 | | | | (1.48) | |
| | | | |
Total from investment operations | | | 0.73 | | | | 0.44 | | | | 8.29 | | | | 3.55 | | | | (1.52) | |
| |
Dividends and/or distributions to shareholders: | | | | | | | | | | | | | | | | | | | | |
Dividends from net investment income | | | 0.00 | | | | 0.00 | | | | (0.23) | | | | (0.06) | | | | (0.20) | |
| |
Net asset value, end of period | | $ | 38.19 | | | $ | 37.46 | | | $ | 37.02 | | | $ | 28.96 | | | $ | 25.47 | |
| | | | |
|
| |
Total Return, at Net Asset Value3 | | | 1.95% | | | | 1.19% | | | | 28.88% | | | | 13.96% | | | | (5.68)% | |
| |
Ratios/Supplemental Data | | | | | | | | | | | | | | | | | | | | |
Net assets, end of period (in thousands) | | $ | 85,548 | | | $ | 91,043 | | | $ | 99,915 | | | $ | 91,603 | | | $ | 85,798 | |
| |
Average net assets (in thousands) | | $ | 91,765 | | | $ | 101,911 | | | $ | 90,808 | | | $ | 90,891 | | | $ | 100,460 | |
| |
Ratios to average net assets:4 | | | | | | | | | | | | | | | | | | | | |
Net investment loss | | | (0.91)% | | | | (0.46)% | | | | (0.57)% | | | | (0.04)% | | | | (0.15)% | |
Expenses excluding interest and fees from borrowings | | | 1.43% | | | | 1.45% | | | | 1.56% | | | | 1.57% | | | | 1.54% | |
Interest and fees from borrowings | | | 0.00%5 | | | | 0.00% | | | | 0.00% | | | | 0.00% | | | | 0.00% | |
| | | | |
Total expenses6 | | | 1.43% | | | | 1.45% | | | | 1.56% | | | | 1.57% | | | | 1.54% | |
| Expenses after payments, waivers and/or reimbursements and reduction to custodian expenses | | | 1.43% | | | | 1.45% | | | | 1.56% | | | | 1.57% | | | | 1.53% | |
| |
Portfolio turnover rate | | | 16% | | | | 16% | | | | 27% | | | | 57% | | | | 41% | |
1. September 28, 2012 represents the last business day of the Fund’s reporting period.
2. Per share amounts calculated based on the average shares outstanding during the period.
3. Assumes an initial investment on the business day before the first day of the fiscal period, with all dividends and distributions reinvested in additional shares on the reinvestment date, and redemption at the net asset value calculated on the last business day of the fiscal period. Sales charges are not reflected in the total returns. Total returns are not annualized for periods less than one full year. Returns do not reflect the deduction of taxes that a shareholder would pay on fund distributions or the redemption of fund shares. The returns do not include adjustments in accordance with generally accepted accounting principles required at the period end for financial reporting purposes.
4. Annualized for periods less than one full year.
5. Less than 0.005%.
6. Total expenses including indirect expenses from affiliated fund fees and expenses were as follows:
| | | | | | |
| | Year Ended September 30, 2015 | | | 1.43 | % |
| | Year Ended September 30, 2014 | | | 1.45 | % |
| | Year Ended September 30, 2013 | | | 1.56 | % |
| | Year Ended September 28, 2012 | | | 1.57 | % |
| | Year Ended September 30, 2011 | | | 1.54 | % |
See accompanying Notes to Financial Statements.
25 OPPENHEIMER GLOBAL OPPORTUNITIES FUND
|
| FINANCIAL HIGHLIGHTS Continued |
| | | | | | | | | | | | | | | | | | | | |
| Class Y | | Year Ended September 30, 2015 | | | Year Ended September 30, 2014 | | | Year Ended September
30, 2013 | | | Year Ended
September
28, 20121 | | | Year Ended
September
30, 2011 | |
| |
Per Share Operating Data | | | | | | | | | | | | | | | | | | | | |
Net asset value, beginning of period | | $ | 39.07 | | | $ | 38.40 | | | $ | 30.04 | | | $ | 26.43 | | | $ | 28.20 | |
| |
Income (loss) from investment operations: | | | | | | | | | | | | | | | | | | | | |
Net investment income (loss)2 | | | (0.17) | | | | 0.04 | | | | 0.01 | | | | 0.18 | | | | 0.14 | |
Net realized and unrealized gain (loss) | | | 1.13 | | | | 0.63 | | | | 8.77 | | | | 3.67 | | | | (1.54) | |
| | | | |
Total from investment operations | | | 0.96 | | | | 0.67 | | | | 8.78 | | | | 3.85 | | | | (1.40) | |
| |
Dividends and/or distributions to shareholders: | | | | | | | | | | | | | | | | | | | | |
Dividends from net investment income | | | (0.21) | | | | 0.00 | | | | (0.42) | | | | (0.24) | | | | (0.37) | |
| |
Net asset value, end of period | | $ | 39.82 | | | $ | 39.07 | | | $ | 38.40 | | | $ | 30.04 | | | $ | 26.43 | |
| | | | |
|
| |
Total Return, at Net Asset Value3 | | | 2.46% | | | | 1.75% | | | | 29.69% | | | | 14.68% | | | | (5.11)% | |
|
| |
Ratios/Supplemental Data | | | | | | | | | | | | | | | | | | | | |
Net assets, end of period (in thousands) | | $ | 360,040 | | | $ | 409,448 | | | $ | 308,513 | | | $ | 243,585 | | | $ | 178,978 | |
| |
Average net assets (in thousands) | | $ | 399,477 | | | $ | 405,921 | | | $ | 252,615 | | | $ | 217,386 | | | $ | 196,576 | |
| |
Ratios to average net assets:4 | | | | | | | | | | | | | | | | | | | | |
Net investment income (loss) | | | (0.41)% | | | | 0.10% | | | | 0.04% | | | | 0.60% | | | | 0.48% | |
Expenses excluding interest and fees from borrowings | | | 0.94% | | | | 0.92% | | | | 0.95% | | | | 0.93% | | | | 0.92% | |
Interest and fees from borrowings | | | 0.00%5 | | | | 0.00% | | | | 0.00% | | | | 0.00% | | | | 0.00% | |
| | | | |
Total expenses6 | | | 0.94% | | | | 0.92% | | | | 0.95% | | | | 0.93% | | | | 0.92% | |
| Expenses after payments, waivers and/or reimbursements and reduction to custodian expenses | | | 0.94% | | | | 0.92% | | | | 0.95% | | | | 0.93% | | | | 0.92% | |
| |
Portfolio turnover rate | | | 16% | | | | 16% | | | | 27% | | | | 57% | | | | 41% | |
1. September 28, 2012 represents the last business day of the Fund’s reporting period.
2. Per share amounts calculated based on the average shares outstanding during the period.
3. Assumes an initial investment on the business day before the first day of the fiscal period, with all dividends and distributions reinvested in additional shares on the reinvestment date, and redemption at the net asset value calculated on the last business day of the fiscal period. Sales charges are not reflected in the total returns. Total returns are not annualized for periods less than one full year. Returns do not reflect the deduction of taxes that a shareholder would pay on fund distributions or the redemption of fund shares. The returns do not include adjustments in accordance with generally accepted accounting principles required at the period end for financial reporting purposes.
4. Annualized for periods less than one full year.
5. Less than 0.005%.
6. Total expenses including indirect expenses from affiliated fund fees and expenses were as follows:
| | | | | | |
| | Year Ended September 30, 2015 | | | 0.94 | % |
| | Year Ended September 30, 2014 | | | 0.92 | % |
| | Year Ended September 30, 2013 | | | 0.95 | % |
| | Year Ended September 28, 2012 | | | 0.93 | % |
| | Year Ended September 30, 2011 | | | 0.92 | % |
See accompanying Notes to Financial Statements.
26 OPPENHEIMER GLOBAL OPPORTUNITIES FUND
NOTES TO FINANCIAL STATEMENTS September 30, 2015
1. Organization
Oppenheimer Global Opportunities Fund (the “Fund”) is a diversified open-end management investment company registered under the Investment Company Act of 1940 (“1940 Act”), as amended. The Fund’s investment objective is to seek capital appreciation. The Fund’s investment adviser is OFI Global Asset Management, Inc. (“OFI Global” or the “Manager”), a wholly-owned subsidiary of OppenheimerFunds, Inc. (“OFI” or the “Sub-Adviser”). The Manager has entered into a sub-advisory agreement with OFI.
The Fund offers Class A, Class C, Class I, Class R and Class Y shares, and previously offered Class B shares for new purchase through June 29, 2012. Subsequent to that date, no new purchases of Class B shares are permitted, however reinvestment of dividend and/or capital gain distributions and exchanges of Class B shares into and from other Oppenheimer funds are allowed. As of July 1, 2014, Class N shares were renamed Class R shares. Class N shares subject to a contingent deferred sales charge (“CDSC”) on July 1, 2014, continue to be subject to a CDSC after the shares were renamed. Purchases of Class R shares occurring on or after July 1, 2014, are not subject to a CDSC upon redemption. Class A shares are sold at their offering price, which is normally net asset value plus a front-end sales charge. Class C and Class R shares are sold, and Class B shares were sold, without a front-end sales charge but may be subject to a contingent deferred sales charge (“CDSC”). Class R shares are sold only through retirement plans. Retirement plans that offer Class R shares may impose charges on those accounts. Class I and Class Y shares are sold to certain institutional investors or intermediaries without either a front-end sales charge or a CDSC, however, the intermediaries may impose charges on their accountholders who beneficially own Class I and Class Y shares. All classes of shares have identical rights and voting privileges with respect to the Fund in general and exclusive voting rights on matters that affect that class alone. Earnings, net assets and net asset value per share may differ due to each class having its own expenses, such as transfer and shareholder servicing agent fees and shareholder communications, directly attributable to that class. Class A, B, C and R shares have separate distribution and/or service plans under which they pay fees. Class I and Class Y shares do not pay such fees. Class B shares will automatically convert to Class A shares 72 months after the date of purchase.
The following is a summary of significant accounting policies followed in the Fund’s preparation of financial statements in accordance with accounting principles generally accepted in the United States (“U.S. GAAP”).
2. Significant Accounting Policies
Security Valuation. All investments in securities are recorded at their estimated fair value, as described in Note 3.
Reporting Period End Date. The last day of the Fund’s reporting period is the last day the New York Stock Exchange was open for trading during the period. The Fund’s financial statements have been presented through that date to maintain consistency with the Fund’s net asset value calculations used for shareholder transactions.
27 OPPENHEIMER GLOBAL OPPORTUNITIES FUND
2. Significant Accounting Policies (Continued)
Foreign Currency Translation. The Fund’s accounting records are maintained in U.S. dollars. The values of securities denominated in foreign currencies and amounts related to the purchase and sale of foreign securities and foreign investment income are translated into U.S. dollars as of the close of the New York Stock Exchange (the “Exchange”), normally 4:00 P.M. Eastern time, on each day the Exchange is open for trading. Foreign exchange rates may be valued primarily using a reliable bank, dealer or service authorized by the Board of Trustees.
Reported net realized gains and losses from foreign currency transactions arise from sales of portfolio securities, sales and maturities of short-term securities, sales of foreign currencies, exchange rate fluctuations between the trade and settlement dates on securities transactions, and the difference between the amounts of dividends, interest, and foreign withholding taxes recorded on the Fund’s books and the U.S. dollar equivalent of the amounts actually received or paid. Net unrealized appreciation and depreciation on the translation of assets and liabilities denominated in foreign currencies arise from changes in the values of assets and liabilities, including investments in securities at fiscal period end, resulting from changes in exchange rates.
The effect of changes in foreign currency exchange rates on investments is separately identified from the fluctuations arising from changes in market values of securities held and reported with all other foreign currency gains and losses in the Fund’s Statement of Operations.
Allocation of Income, Expenses, Gains and Losses. Income, expenses (other than those attributable to a specific class), gains and losses are allocated on a daily basis to each class of shares based upon the relative proportion of net assets represented by such class. Operating expenses directly attributable to a specific class are charged against the operations of that class.
Dividends and Distributions to Shareholders. Dividends and distributions to shareholders, which are determined in accordance with income tax regulations and may differ from U.S. generally accepted accounting principles, are recorded on the ex-dividend date. Income and capital gain distributions, if any, are declared and paid annually or at other times as deemed necessary by the Manager.
Investment Income. Dividend income is recorded on the ex-dividend date or upon ex-dividend notification in the case of certain foreign dividends where the ex-dividend date may have passed. Non-cash dividends included in dividend income, if any, are recorded at the fair market value of the securities received. Interest income is recognized on an accrual basis. Discount and premium, which are included in interest income on the Statement of Operations, are amortized or accreted daily.
Custodian Fees. “Custodian fees and expenses” in the Statement of Operations may include interest expense incurred by the Fund on any cash overdrafts of its custodian account during the period. Such cash overdrafts may result from the effects of failed trades in portfolio securities and from cash outflows resulting from unanticipated shareholder redemption
28 OPPENHEIMER GLOBAL OPPORTUNITIES FUND
2. Significant Accounting Policies (Continued)
activity. The Fund pays interest to its custodian on such cash overdrafts, to the extent they are not offset by positive cash balances maintained by the Fund, based on the negative rolling average balance at an average Federal Funds Rate plus 0.50%. The “Reduction to custodian expenses” line item, if applicable, represents earnings on cash balances maintained by the Fund during the period. Such interest expense and other custodian fees may be paid with these earnings.
Security Transactions. Security transactions are recorded on the trade date. Realized gains and losses on securities sold are determined on the basis of identified cost.
Indemnifications. The Fund’s organizational documents provide current and former Trustees and officers with a limited indemnification against liabilities arising in connection with the performance of their duties to the Fund. In the normal course of business, the Fund may also enter into contracts that provide general indemnifications. The Fund’s maximum exposure under these arrangements is unknown as this would be dependent on future claims that may be made against the Fund. The risk of material loss from such claims is considered remote.
Federal Taxes. The Fund intends to comply with provisions of the Internal Revenue Code applicable to regulated investment companies and to distribute substantially all of its investment company taxable income, including any net realized gain on investments not offset by capital loss carryforwards, if any, to shareholders. Therefore, no federal income or excise tax provision is required. The Fund files income tax returns in U.S. federal and applicable state jurisdictions. The statute of limitations on the Fund’s tax return filings generally remains open for the three preceding fiscal reporting period ends.
The tax components of capital shown in the following table represent distribution requirements the Fund must satisfy under the income tax regulations, losses the Fund may be able to offset against income and gains realized in future years and unrealized appreciation or depreciation of securities and other investments for federal income tax purposes.
| | | | | | | | | | | | |
Undistributed Net Investment Income | | Undistributed Long-Term Gain | | | Accumulated Loss Carryforward1,2 | | | Net Unrealized Appreciation Based on cost of Securities and Other Investments for Federal Income Tax Purposes | |
$4,332,274 | | | $14,967,272 | | | | $— | | | | $465,087,920 | |
1. During the reporting period, the Fund utilized $163,109,291 of capital loss carryforward to offset capital gains realized in that fiscal year.
2. During the previous reporting period, the Fund utilized $176,672,419 of capital loss carryforward to offset capital gains realized in that fiscal year.
29 OPPENHEIMER GLOBAL OPPORTUNITIES FUND
NOTES TO FINANCIAL STATEMENTS Continued
2. Significant Accounting Policies (Continued)
Net investment income (loss) and net realized gain (loss) may differ for financial statement and tax purposes. The character of dividends and distributions made during the fiscal year from net investment income or net realized gains are determined in accordance with federal income tax requirements, which may differ from the character of net investment income or net realized gains presented in those financial statements in accordance with GAAP. Also, due to timing of dividends and distributions, the fiscal year in which amounts are distributed may differ from the fiscal year in which the income or net realized gain was recorded by the Fund.
Accordingly, the following amounts have been reclassified for the reporting period. Net assets of the Fund were unaffected by the reclassifications.
| | | | | | | | |
Increase to Paid-in Capital | | Reduction to Accumulated
Net Investment
Loss | | | Increase to Accumulated Net
Realized Loss on
Investments3 | |
$1,910,254 | | | $215 | | | | $1,910,469 | |
3. $1,910,254, all of which was long-term capital gain, was distributed in connection with Fund share redemptions.
The tax character of distributions paid during the reporting periods:
| | | | | | | | |
| | | Year Ended | | | Year Ended | |
| | | September 30, 2015 | | | September 30, 2014 | |
Distributions paid from: | | | | | | | | |
Ordinary income | | $ | 8,887,048 | | | $ | — | |
The aggregate cost of securities and other investments and the composition of unrealized appreciation and depreciation of securities and other investments for federal income tax purposes at period end are noted in the following table. The primary difference between book and tax appreciation or depreciation of securities and other investments, if applicable, is attributable to the tax deferral of losses or tax realization of financial statement unrealized gain or loss.
| | | | |
Federal tax cost of securities | | $ | 2,540,346,818 | |
Federal tax cost of other investments | | | 28,559,763 | |
| | | | |
Total federal tax cost | | $ | 2,568,906,581 | |
| | | | |
Gross unrealized appreciation | | $ | 927,404,941 | |
Gross unrealized depreciation | | | (462,317,021) | |
| | | | |
Net unrealized appreciation | | $ | 465,087,920 | |
| | | | |
Use of Estimates. The preparation of financial statements in conformity with accounting principles generally accepted in the United States of America requires management to make estimates and assumptions that affect the reported amounts of assets and liabilities and disclosure of contingent assets and liabilities at the date of the financial statements and the reported amounts of increases and decreases in net assets from operations during the reporting period. Actual results could differ from those estimates.
30 OPPENHEIMER GLOBAL OPPORTUNITIES FUND
3. Securities Valuation
The Fund calculates the net asset value of its shares as of the close of the New York Stock Exchange (the “Exchange”), normally 4:00 P.M. Eastern time, on each day the Exchange is open for trading.
The Fund’s Board has adopted procedures for the valuation of the Fund’s securities and has delegated the day-to-day responsibility for valuation determinations under those procedures to the Manager. The Manager has established a Valuation Committee which is responsible for determining a “fair valuation” for any security for which market quotations are not “readily available.” The Valuation Committee’s fair valuation determinations are subject to review, approval and ratification by the Fund’s Board at its next regularly scheduled meeting covering the calendar quarter in which the fair valuation was determined.
Valuation Methods and Inputs
Securities are valued using unadjusted quoted market prices, when available, as supplied primarily by third party pricing services or dealers.
The following methodologies are used to determine the market value or the fair value of the types of securities described below:
Securities traded on a registered U.S. securities exchange (including exchange-traded derivatives other than futures and futures options) are valued based on the last sale price of the security reported on the principal exchange on which it is traded, prior to the time when the Fund’s assets are valued. In the absence of a sale, the security is valued at the mean between the bid and asked price on the principal exchange or, if not available from the principal exchange, obtained from two dealers. If bid and asked prices are not available from either the exchange or two dealers, the security is valued by using one of the following methodologies (listed in order of priority): (1) using a bid from the principal exchange, (2) the mean between the bid and asked price as provided by a single dealer, or (3) a bid from a single dealer. A security of a foreign issuer traded on a foreign exchange, but not listed on a registered U.S. securities exchange, is valued based on the last sale price on the principal exchange on which the security is traded, as identified by the third party pricing service used by the Manager, prior to the time when the Fund’s assets are valued. If the last sale price is unavailable, the security is valued at the most recent official closing price on the principal exchange on which it is traded. If the last sales price or official closing price for a foreign security is not available, the security is valued at the mean between the bid and asked price per the exchange or, if not available from the exchange, obtained from two dealers. If bid and asked prices are not available from either the exchange or two dealers, the security is valued by using one of the following methodologies (listed in order of priority): (1) using a bid from the exchange, (2) the mean between the bid and asked price as provided by a single dealer, or (3) a bid from a single dealer.
Shares of a registered investment company that are not traded on an exchange are valued at that investment company’s net asset value per share.
Corporate and government debt securities (of U.S. or foreign issuers) and municipal debt securities, event-linked bonds, loans, mortgage-backed securities, collateralized mortgage obligations, and asset-backed securities are valued at the mean between the “bid” and
31 OPPENHEIMER GLOBAL OPPORTUNITIES FUND
NOTES TO FINANCIAL STATEMENTS Continued
3. Securities Valuation (Continued)
“asked” prices utilizing evaluated prices obtained from third party pricing services or broker-dealers who may use matrix pricing methods to determine the evaluated prices.
Short-term money market type debt securities with a remaining maturity of sixty days or less are valued at cost adjusted by the amortization of discount or premium to maturity (amortized cost), which approximates market value. Short-term debt securities with a remaining maturity in excess of sixty days are valued at the mean between the “bid” and “asked” prices utilizing evaluated prices obtained from third party pricing services or broker-dealers.
Forward foreign currency exchange contracts are valued utilizing current and forward currency rates obtained from third party pricing services. When the settlement date of a contract is an interim date for which a quotation is not available, interpolated values are derived using the nearest dated forward currency rate.
A description of the standard inputs that may generally be considered by the third party pricing vendors in determining their evaluated prices is provided below.
| | |
| Security Type | | Standard inputs generally considered by third-party pricing vendors |
| Corporate debt, government debt, municipal, mortgage-backed and asset-backed securities | | Reported trade data, broker-dealer price quotations, benchmark yields, issuer spreads on comparable securities, the credit quality, yield, maturity, and other appropriate factors. |
Loans | | Information obtained from market participants regarding reported trade data and broker-dealer price quotations. |
Event-linked bonds | | Information obtained from market participants regarding reported trade data and broker-dealer price quotations. |
If a market value or price cannot be determined for a security using the methodologies described above, or if, in the “good faith” opinion of the Manager, the market value or price obtained does not constitute a “readily available market quotation,” or a significant event has occurred that would materially affect the value of the security, the security is fair valued either (i) by a standardized fair valuation methodology applicable to the security type or the significant event as previously approved by the Valuation Committee and the Fund’s Board or (ii) as determined in good faith by the Manager’s Valuation Committee. The Valuation Committee considers all relevant facts that are reasonably available, through either public information or information available to the Manager, when determining the fair value of a security. Fair value determinations by the Manager are subject to review, approval and ratification by the Fund’s Board at its next regularly scheduled meeting covering the calendar quarter in which the fair valuation was determined. Those fair valuation standardized methodologies include, but are not limited to, valuing securities at the last sale price or initially at cost and subsequently adjusting the value based on: changes in company specific fundamentals, changes in an appropriate securities index, or changes in the value of similar securities which may be further adjusted for any discounts related to security-specific resale restrictions. When possible, such methodologies use observable market inputs such as unadjusted quoted prices of similar securities, observable interest rates, currency rates and yield curves. The methodologies used for valuing securities are not necessarily an indication of
32 OPPENHEIMER GLOBAL OPPORTUNITIES FUND
3. Securities Valuation (Continued)
the risks associated with investing in those securities nor can it be assured that the Fund can obtain the fair value assigned to a security if it were to sell the security.
To assess the continuing appropriateness of security valuations, the Manager, or its third party service provider who is subject to oversight by the Manager, regularly compares prior day prices, prices on comparable securities, and sale prices to the current day prices and challenges those prices exceeding certain tolerance levels with the third party pricing service or broker source. For those securities valued by fair valuations, whether through a standardized fair valuation methodology or a fair valuation determination, the Valuation Committee reviews and affirms the reasonableness of the valuations based on such methodologies and fair valuation determinations on a regular basis after considering all relevant information that is reasonably available.
Classifications
Each investment asset or liability of the Fund is assigned a level at measurement date based on the significance and source of the inputs to its valuation. Various data inputs are used in determining the value of each of the Fund’s investments as of the reporting period end. These data inputs are categorized in the following hierarchy under applicable financial accounting standards:
1) Level 1-unadjusted quoted prices in active markets for identical assets or liabilities (including securities actively traded on a securities exchange)
2) Level 2-inputs other than unadjusted quoted prices that are observable for the asset or liability (such as unadjusted quoted prices for similar assets and market corroborated inputs such as interest rates, prepayment speeds, credit risks, etc.)
3) Level 3-significant unobservable inputs (including the Manager’s own judgments about assumptions that market participants would use in pricing the asset or liability).
The inputs used for valuing securities are not necessarily an indication of the risks associated with investing in those securities.
The table below categorizes amounts that are included in the Fund’s Statement of Assets and Liabilities at period end based on valuation input level:
| | | | | | | | | | | | | | | | |
| | | | | | | | | Level 3— | | | | |
| | | Level 1— | | | Level 2— | | | Significant | | | | |
| | | Unadjusted | | | Other Significant | | | Unobservable | | | | |
| | | Quoted Prices | | | Observable Inputs | | | Inputs | | | Value | |
Assets Table | | | | | | | | | | | | | | | | |
Investments, at Value: | | | | | | | | | | | | | | | | |
Common Stocks | | | | | | | | | | | | | | | | |
Consumer Discretionary | | $ | 229,151,750 | | | $ | 421,072,026 | | | $ | — | | | $ | 650,223,776 | |
Consumer Staples | | | 18,072,000 | | | | 33,984,863 | | | | — | | | | 52,056,863 | |
Financials | | | — | | | | 161,838,353 | | | | — | | | | 161,838,353 | |
Health Care | | | 549,657,000 | | | | 381,734,937 | | | | — | | | | 931,391,937 | |
Industrials | | | 104,831,000 | | | | 196,615,672 | | | | — | | | | 301,446,672 | |
Information Technology | | | 435,397,283 | | | | 192,653,540 | | | | — | | | | 628,050,823 | |
Materials | | | — | | | | 153,636,550 | | | | — | | | | 153,636,550 | |
Telecommunication Services | | | — | | | | 23,674,954 | | | | — | | | | 23,674,954 | |
33 OPPENHEIMER GLOBAL OPPORTUNITIES FUND
NOTES TO FINANCIAL STATEMENTS Continued
3. Securities Valuation (Continued)
| | | | | | | | | | | | | | | | |
| | | | | | | | | Level 3— | | | | |
| | | Level 1— | | | Level 2— | | | Significant | | | | |
| | | Unadjusted | | | Other Significant | | | Unobservable | | | | |
| | | Quoted Prices | | | Observable Inputs | | | Inputs | | | Value | |
Investments, at Value: (Continued) | | | | | | | | | | | | | | | | |
Foreign Government Obligation | | $ | — | | | $ | 15,272,860 | | | $ | — | | | $ | 15,272,860 | |
Investment Company | | | 71,266,170 | | | | — | | | | — | | | | 71,266,170 | |
| | | | |
Total Investments, at Value | | | 1,408,375,203 | | | | 1,580,483,755 | | | | — | | | | 2,988,858,958 | |
Other Financial Instruments: | | | | | | | | | | | | | | | | |
Forward currency exchange contracts | | | — | | | | 56,082,368 | | | | — | | | | 56,082,368 | |
| | | | |
Total Assets | | $ | 1,408,375,203 | | | $ | 1,636,566,123 | | | $ | — | | | $ | 3,044,941,326 | |
| | | | |
| | | | |
Liabilities Table | | | | | | | | | | | | | | | | |
Other Financial Instruments: | | | | | | | | | | | | | | | | |
Forward currency exchange contracts | | $ | — | | | $ | (11,215,205 | ) | | $ | — | | | $ | (11,215,205) | |
| | | | |
Total Liabilities | | $ | — | | | $ | (11,215,205 | ) | | $ | — | | | $ | (11,215,205) | |
| | | | |
Forward currency exchange contracts and futures contracts, if any, are reported at their unrealized appreciation/depreciation at measurement date, which represents the change in the contract’s value from trade date. All additional assets and liabilities included in the above table are reported at their market value at measurement date.
4. Investments and Risks
Risks of Foreign Investing. The Fund may invest in foreign securities which are subject to special risks. Securities traded in foreign markets may be less liquid and more volatile than those traded in U.S. markets. Foreign issuers are usually not subject to the same accounting and disclosure requirements that U.S. companies are subject to, which may make it difficult for the Fund to evaluate a foreign company’s operations or financial condition. A change in the value of a foreign currency against the U.S. dollar will result in a change in the U.S. dollar value of investments denominated in that foreign currency and in the value of any income or distributions the Fund may receive on those investments. The value of foreign investments may be affected by exchange control regulations, foreign taxes, higher transaction and other costs, delays in the settlement of transactions, changes in economic or monetary policy in the United States or abroad, expropriation or nationalization of a company’s assets, or other political and economic factors. In addition, due to the inter-relationship of global economies and financial markets, changes in political and economic factors in one country or region could adversely affect conditions in another country or region. Investments in foreign securities may also expose the Fund to time-zone arbitrage risk. Foreign securities may trade on weekends or other days when the Fund does not price its shares. At times, the Fund may emphasize investments in a particular country or region and may be subject to greater risks from adverse events that occur in that country or region. Foreign securities and foreign currencies held in foreign banks and securities depositories may be subject to limited or no regulatory oversight.
34 OPPENHEIMER GLOBAL OPPORTUNITIES FUND
4. Investments and Risks (Continued)
Risks of Investing in the Underlying Funds. The Fund invests in other mutual funds advised by the Manager. The Underlying Funds are registered open-end management investment companies under the 1940 Act, as amended. The Manager is the investment adviser of, and the Sub-Adviser provides investment and related advisory services to, the Underlying Funds. The Fund’s Investments in Underlying Funds are included in the Statement of Investments. Shares of Underlying Funds are valued at their net asset value per share. As a shareholder, the Fund is subject to its proportional share of the Underlying Funds’ expenses, including their management fee.
Each of the Underlying Funds in which the Fund invests has its own investment risks, and those risks can affect the value of the Fund’s investments and therefore the value of the Fund’s shares. To the extent that the Fund invests more of its assets in one Underlying Fund than in another, the Fund will have greater exposure to the risks of that Underlying Fund.
Investment in Oppenheimer Institutional Money Market Fund. The Fund is permitted to invest daily available cash balances in a money market Affiliated Fund. The Fund may invest the available cash in Class E shares of Oppenheimer Institutional Money Market Fund (“IMMF”) to seek current income while preserving liquidity or for defensive purposes. IMMF is regulated as a money market fund under the Investment Company Act of 1940, as amended.
Equity Security Risk. Stocks and other equity securities fluctuate in price. The value of the Fund’s portfolio may be affected by changes in the equity markets generally. Equity markets may experience significant short-term volatility and may fall sharply at times. Different markets may behave differently from each other and U.S. equity markets may move in the opposite direction from one or more foreign stock markets. Adverse events in any part of the equity or fixed-income markets may have unexpected negative effects on other market segments.
The prices of individual equity securities generally do not all move in the same direction at the same time and a variety of factors can affect the price of a particular company’s securities. These factors may include, but are not limited to, poor earnings reports, a loss of customers, litigation against the company, general unfavorable performance of the company’s sector or industry, or changes in government regulations affecting the company or its industry.
Sovereign Debt Risk. The Fund invests in sovereign debt securities, which are subject to certain special risks. These risks include, but are not limited to, the risk that a governmental entity may delay or refuse, or otherwise be unable, to pay interest or repay the principal on its sovereign debt. There may also be no legal process for collecting sovereign debt that a government does not pay or bankruptcy proceedings through which all or part of such sovereign debt may be collected. In addition, a restructuring or default of sovereign debt may also cause additional impacts to the financial markets, such as downgrades to credit ratings, reduced liquidity and increased volatility, among others.
35 OPPENHEIMER GLOBAL OPPORTUNITIES FUND
NOTES TO FINANCIAL STATEMENTS Continued
5. Market Risk Factors
The Fund’s investments in securities and/or financial derivatives may expose the fund to various market risk factors:
Commodity Risk. Commodity risk relates to the change in value of commodities or commodity indexes as they relate to increases or decreases in the commodities market. Commodities are physical assets that have tangible properties. Examples of these types of assets are crude oil, heating oil, metals, livestock, and agricultural products.
Credit Risk. Credit risk relates to the ability of the issuer of debt to meet interest and principal payments, or both, as they come due. In general, lower-grade, higher-yield debt securities are subject to credit risk to a greater extent than lower-yield, higher-quality securities.
Equity Risk. Equity risk relates to the change in value of equity securities as they relate to increases or decreases in the general market.
Foreign Exchange Rate Risk. Foreign exchange rate risk relates to the change in the U.S. dollar value of a security held that is denominated in a foreign currency. The U.S. dollar value of a foreign currency denominated security will decrease as the dollar appreciates against the currency, while the U.S. dollar value will increase as the dollar depreciates against the currency.
Interest Rate Risk. Interest rate risk refers to the fluctuations in value of fixed-income securities resulting from the inverse relationship between price and yield. For example, an increase in general interest rates will tend to reduce the market value of already issued fixed-income investments, and a decline in general interest rates will tend to increase their value. In addition, debt securities with longer maturities, which tend to have higher yields, are subject to potentially greater fluctuations in value from changes in interest rates than obligations with shorter maturities.
Volatility Risk. Volatility risk refers to the magnitude of the movement, but not the direction of the movement, in a financial instrument’s price over a defined time period. Large increases or decreases in a financial instrument’s price over a relative time period typically indicate greater volatility risk, while small increases or decreases in its price typically indicate lower volatility risk.
6. Use of Derivatives
The Fund’s investment objective not only permits the Fund to purchase investment securities, it also allows the Fund to enter into various types of derivatives contracts, including, but not limited to, futures contracts, forward currency exchange contracts, credit default swaps, interest rate swaps, total return swaps, variance swaps and purchased and written options. In doing so, the Fund will employ strategies in differing combinations to permit it to increase, decrease, or change the level or types of exposure to market risk factors. These instruments may allow the Fund to pursue its objectives more quickly and efficiently than if it were to make direct purchases or sales of securities capable of effecting a similar response to market factors. Such contracts may be entered into through a bilateral over-the-counter (“OTC”) transaction, or through a securities or futures exchange and cleared through a clearinghouse.
Derivatives may have little or no initial cash investment relative to their market value exposure and therefore can produce significant gains or losses in excess of their cost due to
36 OPPENHEIMER GLOBAL OPPORTUNITIES FUND
6. Use of Derivatives (Continued)
unanticipated changes in the market risk factors and the overall market. This use of embedded leverage allows the Fund to increase its market value exposure relative to its net assets and can substantially increase the volatility of the Fund’s performance. In instances where the Fund is using derivatives to decrease, or hedge, exposures to market risk factors for securities held by the Fund, there are also risks that those derivatives may not perform as expected resulting in losses for the combined or hedged positions. Some derivatives have the potential for unlimited loss, regardless of the size of the Fund’s initial investment.
Additional associated risks from investing in derivatives also exist and potentially could have significant effects on the valuation of the derivative and the Fund. Typically, the associated risks are not the risks that the Fund is attempting to increase or decrease exposure to, per its investment objectives, but are the additional risks from investing in derivatives. Examples of these associated risks are liquidity risk, which is the risk that the Fund will not be able to sell the derivative in the open market in a timely manner, and counterparty credit risk, which is the risk that the counterparty will not fulfill its obligation to the Fund.
The Fund’s actual exposures to these market risk factors and associated risks during the period are discussed in further detail, by derivative type, below.
Forward Currency Exchange Contracts
The Fund may enter into forward currency exchange contracts (“forward contracts”) for the purchase or sale of a foreign currency at a negotiated rate at a future date. Such contracts are traded in the OTC inter-bank currency dealer market.
Forward contracts are reported on a schedule following the Statement of Investments. The unrealized appreciation (depreciation) is reported in the Statement of Assets and Liabilities as a receivable (or payable) and in the Statement of Operations within the change in unrealized appreciation (depreciation). At contract close, the difference between the original cost of the contract and the value at the close date is recorded as a realized gain (loss) in the Statement of Operations.
The Fund has entered into forward contracts with the obligation to sell specified foreign currencies in the future at a currently negotiated forward rate in order to decrease exposure to foreign exchange rate risk associated with foreign currency denominated securities held by the Fund.
During the reporting period, the Fund had daily average contract amounts on forward contracts to sell of $979,173,270.
Additional associated risk to the Fund includes counterparty credit risk. Counterparty credit risk arises from the possibility that the counterparty to a forward contract will default and fail to perform its obligations to the Fund.
Counterparty Credit Risk. Derivative positions are subject to the risk that the counterparty will not fulfill its obligation to the Fund. The Fund intends to enter into derivative transactions with counterparties that the Manager believes to be creditworthy at the time of the transaction.
The Fund’s risk of loss from counterparty credit risk on OTC derivatives is generally limited to the aggregate unrealized gain netted against any collateral held by the Fund. For OTC
37 OPPENHEIMER GLOBAL OPPORTUNITIES FUND
NOTES TO FINANCIAL STATEMENTS Continued
6. Use of Derivatives (Continued)
options purchased, the Fund bears the risk of loss of the amount of the premiums paid plus the positive change in market values net of any collateral held by the Fund should the counterparty fail to perform under the contracts. Options written by the Fund do not typically give rise to counterparty credit risk, as options written generally obligate the Fund and not the counterparty to perform.
To reduce counterparty risk with respect to OTC transactions, the Fund has entered into master netting arrangements, established within the Fund’s International Swap and Derivatives Association, Inc. (“ISDA”) master agreements, which allow the Fund to make (or to have an entitlement to receive) a single net payment in the event of default (close-out netting) for outstanding payables and receivables with respect to certain OTC positions in swaps, options, swaptions, and forward currency exchange contracts for each individual counterparty. In addition, the Fund may require that certain counterparties post cash and/or securities in collateral accounts to cover their net payment obligations for those derivative contracts subject to ISDA master agreements. If the counterparty fails to perform under these contracts and agreements, the cash and/or securities will be made available to the Fund.
ISDA master agreements include credit related contingent features which allow counterparties to OTC derivatives to terminate derivative contracts prior to maturity in the event that, for example, the Fund’s net assets decline by a stated percentage or the Fund fails to meet the terms of its ISDA master agreements, which would cause the Fund to accelerate payment of any net liability owed to the counterparty.
For financial reporting purposes, the Fund does not offset derivative assets and derivative liabilities that are subject to netting arrangements in the Statement of Assets and Liabilities. Bankruptcy or insolvency laws of a particular jurisdiction may impose restrictions on or prohibitions against the right of offset in bankruptcy, insolvency or other events.
The Fund’s risk of loss from counterparty credit risk on exchange-traded derivatives cleared through a clearinghouse and for centrally cleared swaps is generally considered lower than as compared to OTC derivatives. However, counterparty credit risk exists with respect to initial and variation margin deposited/paid by the Fund that is held in futures commission merchant, broker and/or clearinghouse accounts for such exchange-traded derivatives and for centrally cleared swaps.
With respect to centrally cleared swaps, such transactions will be submitted for clearing, and if cleared, will be held in accounts at futures commission merchants or brokers that are members of clearinghouses. While brokers, futures commission merchants and clearinghouses are required to segregate customer margin from their own assets, in the event that a broker, futures commission merchant or clearinghouse becomes insolvent or goes into bankruptcy and at that time there is a shortfall in the aggregate amount of margin held by the broker, futures commission merchant or clearinghouse for all its customers, U.S. bankruptcy laws will typically allocate that shortfall on a pro-rata basis across all the broker’s, futures commission merchant’s or clearinghouse’s customers, potentially resulting in losses to the Fund.
There is the risk that a broker, futures commission merchant or clearinghouse will decline to clear a transaction on the Fund’s behalf, and the Fund may be required to pay a termination fee to the executing broker with whom the Fund initially enters into the transaction. Clearinghouses may also be permitted to terminate centrally cleared swaps at
38 OPPENHEIMER GLOBAL OPPORTUNITIES FUND
6. Use of Derivatives (Continued)
any time. The Fund is also subject to the risk that the broker or futures commission merchant will improperly use the Fund’s assets deposited/paid as initial or variation margin to satisfy payment obligations of another customer. In the event of a default by another customer of the broker or futures commission merchant, the Fund might not receive its variation margin payments from the clearinghouse, due to the manner in which variation margin payments are aggregated for all customers of the broker/futures commission merchant.
Collateral and margin requirements differ by type of derivative. Margin requirements are established by the broker, futures commission merchant or clearinghouse for exchange-traded and cleared derivatives, including centrally cleared swaps. Brokers, futures commission merchants and clearinghouses can ask for margin in excess of the regulatory minimum, or increase the margin amount, in certain circumstances.
Collateral terms are contract specific for OTC derivatives. For derivatives traded under an ISDA master agreement, the collateral requirements are typically calculated by netting the mark to market amount for each transaction under such agreement and comparing that amount to the value of any collateral currently pledged by the Fund or the counterparty.
For financial reporting purposes, cash collateral that has been pledged to cover obligations of the Fund, if any, is reported separately on the Statement of Assets and Liabilities as cash pledged as collateral. Non-cash collateral pledged by the Fund, if any, is noted in the Statement of Investments. Generally, the amount of collateral due from or to a party must exceed a minimum transfer amount threshold (e.g. $250,000) before a transfer has to be made. To the extent amounts due to the Fund from its counterparties are not fully collateralized, contractually or otherwise, the Fund bears the risk of loss from counterparty nonperformance.
The following table presents by counterparty the Fund’s OTC derivative assets net of the related collateral pledged by the Fund at period end:
| | | | | | | | | | | | | | | | | | | | |
| | | Gross Amounts Not Offset in the Statement of | |
| | | | | | Assets & Liabilities | | | | |
| Counterparty | | Gross Amounts Not Offset in
the Statement of Assets &
Liabilities* | | | Financial
Instruments
Available for
Offset | | | Financial
Instruments
Collateral
Received** | | | Cash Collateral
Received** | | | Net Amount | |
| |
Bank of America NA | | $ | 465,665 | | | $ | (465,665 | ) | | $ | — | | | $ | — | | | $ | — | |
Deutsche Bank AG | | | 55,616,703 | | | | (8,660,189 | ) | | | — | | | | — | | | | 46,956,514 | |
| | | | |
| | $ | 56,082,368 | | | $ | (9,125,854 | ) | | $ | — | | | $ | — | | | $ | 46,956,514 | |
| | | | |
*OTC derivatives are reported gross on the Statement of Assets and Liabilities. Exchange traded options and margin related to centrally cleared swaps and futures are excluded from these reported amounts.
**Reported collateral posted for the benefit of the Fund within this table is limited to the net outstanding amount due from an individual counterparty. The collateral posted for the benefit of the Fund may exceed these amounts.
The following table presents by counterparty the Fund’s OTC derivative liabilities net of the related collateral pledged by the Fund at period end:
39 OPPENHEIMER GLOBAL OPPORTUNITIES FUND
|
| NOTES TO FINANCIAL STATEMENTS Continued |
6. Use of Derivatives (Continued)
| | | | | | | | | | | | | | | | | | | | |
| | | Gross Amounts Not Offset in the Statement of | |
| | | | | | Assets & Liabilities | | | | |
| Counterparty | | Gross Amounts Not Offset in
the Statement of Assets &
Liabilities* | | | Financial
Instruments
Available for
Offset | | | Financial
Instruments
Collateral
Pledged** | | | Cash Collateral
Pledged** | | | Net Amount | |
| |
Bank of America NA | | $ | (2,555,016) | | | $ | 465,665 | | | $ | — | | | $ | — | | | $ | (2,089,351) | |
Deutsche Bank AG | | | (8,660,189) | | | | 8,660,189 | | | | — | | | | — | | | | — | |
| | | | |
| | $ | (11,215,205 | ) | | $ | 9,125,854 | | | $ | — | | | $ | — | | | $ | (2,089,351) | |
| | | | |
*OTC derivatives are reported gross on the Statement of Assets and Liabilities. Exchange traded options and margin related to centrally cleared swaps and futures are excluded from these reported amounts.
**Reported collateral pledged within this table is limited to the net outstanding amount due from the Fund. The securities pledged as collateral by the Fund as reported on the Statements of Investments may exceed these amounts.
The following table presents the valuations of derivative instruments by risk exposure as reported within the Statement of Assets and Liabilities at period end:
| | | | | | | | | | | | |
| | | Asset Derivatives | | | Liability Derivatives | |
Derivatives Not Accounted for as Hedging Instruments | | Statement of Assets and Liabilities Location | | Value | | | Statement of Assets and Liabilities Location | | Value | |
| |
Forward exchange contracts | | Unrealized appreciation on forward currency exchange contracts | | $ | 56,082,368 | | | Unrealized depreciation on forward currency exchange contracts | | $ | 11,215,205 | |
The effect of derivative instruments on the Statement of Operations is as follows:
| | | | |
| Amount of Change in Unrealized Gain or (Loss) Recognized on Derivatives |
|
| Derivatives Not Accounted for as | | Translation of assets and liabilities | | |
| Hedging Instruments | | denominated in foreign currencies | | Total |
|
Forward exchange contracts | | $44,867,163 | | $44,867,163 |
7. Shares of Beneficial Interest
The Fund has authorized an unlimited number of $0.001 par value shares of beneficial interest of each class. Transactions in shares of beneficial interest were as follows:
| | | | | | | | | | | | | | | | | | |
| | | Year Ended September 30, 2015 | | | Year Ended September 30, 2014 | | | |
| | | Shares | | | Amount | | | Shares | | | Amount | | | |
|
Class A | | | | | | | | | | | | | | | | | | |
Sold | | | 7,232,357 | | | $ | 291,862,897 | | | | 16,934,925 | | | $ | 681,254,286 | | | |
Dividends and/or distributions reinvested | | | 147,847 | | | | 5,882,813 | | | | 1 | | | | 15 | | | |
Redeemed | | | (12,960,524 | ) | | | (523,129,866 | ) | | | (15,139,874 | ) | | | (604,606,018 | ) | | |
| | | |
Net increase (decrease) | | | (5,580,320 | ) | | $ | (225,384,156 | ) | | | 1,795,052 | | | $ | 76,648,283 | | | |
| | | |
40 OPPENHEIMER GLOBAL OPPORTUNITIES FUND
7. Shares of Beneficial Interest (Continued)
| | | | | | | | | | | | | | | | | | |
| | | Year Ended September 30, 2015 | | | Year Ended September 30, 2014 | | | |
| | | Shares | | | Amount | | | Shares | | | Amount | | | |
|
Class B | | | | | | | | | | | | | | | | | | |
Sold | | | 17,598 | | | $ | 639,282 | | | | 129,165 | | | $ | 4,785,565 | | | |
Dividends and/or distributions reinvested | | | — | | | | — | | | | — | | | | — | | | |
Redeemed | | | (672,669 | ) | | | (24,612,737 | ) | | | (771,639 | ) | | | (28,649,974 | ) | | |
| | | |
Net decrease | | | (655,071 | ) | | $ | (23,973,455 | ) | | | (642,474 | ) | | $ | (23,864,409 | ) | | |
| | | |
|
|
Class C | | | | | | | | | | | | | | | | | | |
Sold | | | 990,586 | | | $ | 36,634,952 | | | | 2,520,044 | | | $ | 93,788,149 | | | |
Dividends and/or distributions reinvested | | | — | | | | — | | | | — | | | | — | | | |
Redeemed | | | (2,145,023 | ) | | | (78,720,195 | ) | | | (1,792,265 | ) | | | (66,152,006 | ) | | |
| | | |
Net increase (decrease) | | | (1,154,437 | ) | | $ | (42,085,243 | ) | | | 727,779 | | | $ | 27,636,143 | | | |
| | | |
|
|
Class I | | | | | | | | | | | | | | | | | | |
Sold | | | 731,883 | | | $ | 29,932,228 | | | | 729,652 | | | $ | 30,621,055 | | | |
Dividends and/or distributions reinvested | | | 10,161 | | | | 408,156 | | | | — | | | | — | | | |
Redeemed | | | (407,479 | ) | | | (16,726,240 | ) | | | (157,291 | ) | | | (6,419,572 | ) | | |
| | | |
Net increase | | | 334,565 | | | $ | 13,614,144 | | | | 572,361 | | | $ | 24,201,483 | | | |
| | | |
|
|
Class R1 | | | | | | | | | | | | | | | | | | |
Sold | | | 689,220 | | | $ | 26,987,090 | | | | 734,545 | | | $ | 28,925,143 | | | |
Dividends and/or distributions reinvested | | | — | | | | — | | | | — | | | | — | | | |
Redeemed | | | (879,471 | ) | | | (34,532,894 | ) | | | (1,003,283 | ) | | | (38,859,400 | ) | | |
| | | |
Net decrease | | | (190,251 | ) | | $ | (7,545,804 | ) | | | (268,738 | ) | | $ | (9,934,257 | ) | | |
| | | |
|
|
Class Y | | | | | | | | | | | | | | | | | | |
Sold | | | 2,721,463 | | | $ | 110,164,701 | | | | 6,010,151 | | | $ | 246,729,102 | | | |
Dividends and/or distributions reinvested | | | 47,100 | | | | 1,889,655 | | | | — | | | | — | | | |
Redeemed | | | (4,206,508 | ) | | | (171,157,598 | ) | | | (3,564,277 | ) | | | (145,004,111 | ) | | |
| | | |
Net increase (decrease) | | | (1,437,945 | ) | | $ | (59,103,242 | ) | | | 2,445,874 | | | $ | 101,724,991 | | | |
| | | |
1. Effective July 1, 2014, Class N shares were renamed Class R. See Note 1.
8. Purchases and Sales of Securities
The aggregate cost of purchases and proceeds from sales of securities, other than short-term obligations and investments in IMMF, for the reporting period were as follows:
| | | | | | | | |
| | | Purchases | | | Sales | |
| |
Investment securities | | | $518,113,730 | | | | $909,499,767 | |
41 OPPENHEIMER GLOBAL OPPORTUNITIES FUND
|
| NOTES TO FINANCIAL STATEMENTS Continued |
9. Fees and Other Transactions with Affiliates
Management Fees. Under the investment advisory agreement, the Fund pays the Manager a management fee based on the daily net assets of the Fund at an annual rate as shown in the following table:
| | | | |
| Fee Schedule | | | |
Up to $250 million | | | 0.80% | |
Next $250 million | | | 0.77 | |
Next $500 million | | | 0.75 | |
Next $1 billion | | | 0.69 | |
Next $1.5 billion | | | 0.67 | |
Next $2.5 billion | | | 0.65 | |
Over $6 billion | | | 0.63 | |
The Fund’s effective management fee for the reporting period was 0.71% of average annual net assets before any applicable waivers.
Sub-Adviser Fees. The Manager has retained the Sub-Adviser to provide the day-to-day portfolio management of the Fund. Under the Sub-Advisory Agreement, the Manager pays the Sub-Adviser an annual fee in monthly installments, equal to a percentage of the investment management fee collected by the Manager from the Fund, which shall be calculated after any investment management fee waivers. The fee paid to the Sub-Adviser is paid by the Manager, not by the Fund.
Transfer Agent Fees. OFI Global (the “Transfer Agent”) serves as the transfer and shareholder servicing agent for the Fund. The Fund pays the Transfer Agent a fee based on annual net assets. Fees incurred and average net assets for each class with respect to these services are detailed in the Statement of Operations and Financial Highlights, respectively.
Sub-Transfer Agent Fees. The Transfer Agent has retained Shareholder Services, Inc., a wholly-owned subsidiary of OFI (the “Sub-Transfer Agent”), to provide the day-to-day transfer agent and shareholder servicing of the Fund. Under the Sub-Transfer Agency Agreement, the Transfer Agent pays the Sub-Transfer Agent an annual fee in monthly installments, equal to a percentage of the transfer agent fee collected by the Transfer Agent from the Fund, which shall be calculated after any applicable fee waivers. The fee paid to the Sub-Transfer Agent is paid by the Transfer Agent, not by the Fund.
Trustees’ Compensation. The Fund’s Board of Trustees (“Board”) has adopted a compensation deferral plan for Independent Trustees that enables Trustees to elect to defer receipt of all or a portion of the annual compensation they are entitled to receive from the Fund. For purposes of determining the amount owed to the Trustee under the plan, deferred amounts are treated as though equal dollar amounts had been invested in shares of the Fund or in other Oppenheimer funds selected by the Trustee. The Fund purchases shares of the funds selected for deferral by the Trustee in amounts equal to his or her deemed investment, resulting in a Fund asset equal to the deferred compensation liability. Such assets are included as a component of “Other” within the asset section of the Statement of Assets and
42 OPPENHEIMER GLOBAL OPPORTUNITIES FUND
9. Fees and Other Transactions with Affiliates (Continued)
Liabilities. Deferral of Trustees’ fees under the plan will not affect the net assets of the Fund and will not materially affect the Fund’s assets, liabilities or net investment income per share. Amounts will be deferred until distributed in accordance with the compensation deferral plan.
Distribution and Service Plan (12b-1) Fees. Under its General Distributor’s Agreement with the Fund, OppenheimerFunds Distributor, Inc. (the “Distributor”) acts as the Fund’s principal underwriter in the continuous public offering of the Fund’s classes of shares.
Service Plan for Class A Shares. The Fund has adopted a Service Plan (the “Plan”) for Class A shares pursuant to Rule 12b-1 under the 1940 Act. Under the Plan, the Fund reimburses the Distributor for a portion of its costs incurred for services provided to accounts that hold Class A shares. Reimbursement is made periodically at an annual rate of up to 0.25% of the daily net assets of Class A shares of the Fund. The Distributor currently uses all of those fees to pay dealers, brokers, banks and other financial institutions periodically for providing personal service and maintenance of accounts of their customers that hold Class A shares. Any unreimbursed expenses the Distributor incurs with respect to Class A shares in any fiscal year cannot be recovered in subsequent periods. Fees incurred by the Fund under the Plan are detailed in the Statement of Operations.
Distribution and Service Plans for Class B, Class C and Class R Shares. The Fund has adopted Distribution and Service Plans (the “Plans”) for Class B, Class C and Class R shares pursuant to Rule 12b-1 under the 1940 Act to compensate the Distributor for distributing those share classes, maintaining accounts and providing shareholder services. Under the Plans, the Fund pays the Distributor an annual asset-based sales charge of 0.75% on Class B and Class C shares’ daily net assets and 0.25% on Class R shares’ daily net assets. The Fund also pays a service fee under the Plans at an annual rate of 0.25% of daily net assets. The Plans continue in effect from year to year only if the Fund’s Board of Trustees votes annually to approve their continuance at an in person meeting called for that purpose. Fees incurred by the Fund under the Plans are detailed in the Statement of Operations.
Sales Charges. Front-end sales charges and CDSC do not represent expenses of the Fund. They are deducted from the proceeds of sales of Fund shares prior to investment or from redemption proceeds prior to remittance, as applicable. The sales charges retained by the Distributor from the sale of shares and the CDSC retained by the Distributor on the redemption of shares is shown in the following table for the period indicated.
| | | | | | | | | | | | | | | | | | | | |
| | | | | | Class A | | | Class B | | | Class C | | | Class R | |
| | | Class A | | | Contingent | | | Contingent | | | Contingent | | | Contingent | |
| | | Front-End | | | Deferred Sales | | | Deferred Sales | | | Deferred Sales | | | Deferred Sales | |
| | | Sales Charges | | | Charges | | | Charges | | | Charges | | | Charges | |
| | | Retained by | | | Retained by | | | Retained by | | | Retained by | | | Retained by | |
| Year Ended | | Distributor | | | Distributor | | | Distributor | | | Distributor | | | Distributor | |
| |
September 30, 2015 | | | $388,133 | | | | $13,665 | | | | $45,220 | | | | $24,694 | | | | $1,185 | |
43 OPPENHEIMER GLOBAL OPPORTUNITIES FUND
NOTES TO FINANCIAL STATEMENTS Continued
9. Fees and Other Transactions with Affiliates (Continued)
Waivers and Reimbursements of Expenses. The Manager will waive fees and/or reimburse Fund expenses in an amount equal to the indirect management fees incurred through the Fund’s investment in IMMF. During the reporting period, the Manager waived fees and/or reimbursed the Fund $100,427 for IMMF management fees.
Waivers and/or reimbursements may be modified or terminated as set forth according to the terms in the prospectus.
10. Borrowings and Other Financing
Joint Credit Facility. A number of mutual funds managed by the Manager participate in a $1.28 billion revolving credit facility (the “Facility”) intended to provide short-term financing, if necessary, subject to certain restrictions in connection with atypical redemption activity. Expenses and fees related to the Facility are paid by the participating funds and are disclosed separately or as other expenses on the Statement of Operations. The Fund did not utilize the Facility during the reporting period.
11. Pending Litigation
In 2009, several putative class action lawsuits were filed and later consolidated before the U.S. District Court for the District of Colorado against OppenheimerFunds, Inc. (“OFI”), OppenheimerFunds Distributor, Inc. (“OFDI”), and Oppenheimer Rochester California Municipal Fund, a fund advised by OFI Global Asset Management, Inc. and distributed by the Distributor (the “California Fund”), in connection with the California Fund’s investment performance. The plaintiffs asserted claims against OFI, OFDI and certain present and former trustees and officers of the California Fund under the federal securities laws, alleging, among other things, that the disclosure documents of the California Fund contained misrepresentations and omissions and the investment policies of the California Fund were not followed. Plaintiffs in the suit filed an amended complaint and defendants filed a motion to dismiss. In 2011, the court issued an order which granted in part and denied in part the defendants’ motion to dismiss. In 2012, plaintiffs filed a motion, which defendants opposed, to certify a class and appoint class representatives and class counsel. In March 2015, the court granted plaintiffs’ motion for class certification. In May 2015, the U.S. Court of Appeals for the Tenth Circuit vacated the class certification order and remanded the matter to the district court for further proceedings. In July 2015, the district court held an evidentiary hearing on plaintiffs’ motion for class certification.
OFI and OFDI believe the suit is without merit; that it is premature to render any opinion as to the likelihood of an outcome unfavorable to them in the suit; and that no estimate can yet be made as to the amount or range of any potential loss. Furthermore, OFI believes that the suit should not impair the ability of OFI or OFDI to perform their respective duties to the Fund and that the outcome of the suit should not have any material effect on the operations of any of the Oppenheimer funds.
44 OPPENHEIMER GLOBAL OPPORTUNITIES FUND
REPORT OF INDEPENDENT REGISTERED PUBLIC ACCOUNTING FIRM
The Board of Trustees and Shareholders of Oppenheimer Global Opportunities Fund:
We have audited the accompanying statement of assets and liabilities of Oppenheimer Global Opportunities Fund, including the statement of investments, as of September 30, 2015, and the related statement of operations for the year then ended, the statements of changes in net assets for each of the years in the two-year period then ended, and the financial highlights for each of the years or periods in the five-year period then ended. These financial statements and financial highlights are the responsibility of the Fund’s management. Our responsibility is to express an opinion on these financial statements and financial highlights based on our audits.
We conducted our audits in accordance with the standards of the Public Company Accounting Oversight Board (United States). Those standards require that we plan and perform the audit to obtain reasonable assurance about whether the financial statements and financial highlights are free of material misstatement. An audit includes examining, on a test basis, evidence supporting the amounts and disclosures in the financial statements. Our procedures included confirmation of securities owned as of September 30, 2015, by correspondence with the custodian and transfer agent. An audit also includes assessing the accounting principles used and significant estimates made by management, as well as evaluating the overall financial statement presentation. We believe that our audits provide a reasonable basis for our opinion.
In our opinion, the financial statements and financial highlights referred to above present fairly, in all material respects, the financial position of Oppenheimer Global Opportunities Fund as of September 30, 2015, the results of its operations for the year then ended, the changes in its net assets for each of the years in the two-year period then ended, and the financial highlights for each of the years or periods in the five-year period then ended, in conformity with U.S. generally accepted accounting principles.
KPMG LLP
Denver, Colorado
November 25, 2015
45 OPPENHEIMER GLOBAL OPPORTUNITIES FUND
FEDERAL INCOME TAX INFORMATION Unaudited
In early 2015, if applicable, shareholders of record received information regarding all dividends and distributions paid to them by the Fund during calendar year 2014.
Dividends, if any, paid by the Fund during the reporting period which are not designated as capital gain distributions should be multiplied by the maximum amount allowable but not less than 69.13% to arrive at the amount eligible for the corporate dividend-received deduction.
A portion, if any, of the dividends paid by the Fund during the reporting period which are not designated as capital gain distributions are eligible for lower individual income tax rates to the extent that the Fund has received qualified dividend income as stipulated by recent tax legislation. The maximum amount allowable but not less than $18,386,298 of the Fund’s fiscal year taxable income may be eligible for the lower individual income tax rates. In early 2015, shareholders of record received information regarding the percentage of distributions that are eligible for lower individual income tax rates.
Recent tax legislation allows a regulated investment company to designate distributions not designated as capital gain distributions, as either interest related dividends or short-term capital gain dividends, both of which are exempt from the U.S. withholding tax applicable to non U.S. taxpayers. For the reporting period, the maximum amount allowable but not less than $14,403 of the ordinary distributions to be paid by the Fund qualifies as an interest related dividend.
The Fund has elected the application of Section 853 of the Internal Revenue Code to permit shareholders to take a federal income tax credit or deduction, at their option, on a per share basis. The maximum amount allowable but not less than $968,017 of foreign income taxes were paid by the Fund during the reporting period. A separate notice will be mailed to each shareholder, which will reflect the proportionate share of such foreign taxes which must be treated by shareholders as gross income for federal income tax purposes.
Gross income of the maximum amount allowable but not less than $2,594,120 was derived from sources within foreign countries or possessions of the United States.
The foregoing information is presented to assist shareholders in reporting distributions received from the Fund to the Internal Revenue Service. Because of the complexity of the federal regulations which may affect your individual tax return and the many variations in state and local tax regulations, we recommend that you consult your tax advisor for specific guidance.
46 OPPENHEIMER GLOBAL OPPORTUNITIES FUND
BOARD APPROVAL OF THE FUND’S INVESTMENT ADVISORY AND SUB-ADVISORY AGREEMENTS Unaudited
The Fund has entered into an investment advisory agreement with OFI Global Asset Management, Inc. (“OFI Global” or the “Adviser”), a wholly-owned subsidiary of OppenheimerFunds, Inc. (“OFI” or the “Sub-Adviser”) (“OFI Global” and “OFI” together the “Managers”) and OFI Global has entered into a sub-advisory agreement with OFI whereby OFI provides investment sub-advisory services to the Fund (collectively, the “Agreements”). Each year, the Board of Trustees (the “Board”), including a majority of the independent Trustees, is required to determine whether to approve the terms of the Agreements and the renewal thereof. The Investment Company Act of 1940, as amended, requires that the Board request and evaluate, and that the Managers provide, such information as may be reasonably necessary to evaluate the terms of the Agreements. The Board employs an independent consultant to prepare a report that provides information, including comparative information that the Board requests for that purpose. In addition to in-person meetings focused on this evaluation, the Board receives information throughout the year regarding Fund services, fees, expenses and performance.
The Adviser, Sub-Adviser and the independent consultant provided information to the Board on the following factors: (i) the nature, quality and extent of the Managers’ services, (ii) the comparative investment performance of the Fund and the Managers, (iii) the fees and expenses of the Fund, including comparative fee and expense information, (iv) the profitability of the Managers and their affiliates, including an analysis of the cost of providing services, (v) whether economies of scale are realized as the Fund grows and whether fee levels reflect these economies of scale for Fund investors and (vi) other benefits to the Managers from their relationship with the Fund. The Board was aware that there are alternatives to retaining the Managers.
Outlined below is a summary of the principal information considered by the Board as well as the Board’s conclusions.
Nature, Quality and Extent of Services. The Board considered information about the nature, quality and extent of the services provided to the Fund and information regarding the Managers’ key personnel who provide such services. The Managers’ duties include providing the Fund with the services of the portfolio manager and the Sub-Adviser’s investment team, who provide research, analysis and other advisory services in regard to the Fund’s investments; and securities trading services. OFI Global is responsible for oversight of third-party service providers; monitoring compliance with applicable Fund policies and procedures and adherence to the Fund’s investment restrictions; risk management; and oversight of the Sub-Adviser. OFI Global is also responsible for providing certain administrative services to the Fund as well. Those services include providing and supervising all administrative and clerical personnel who are necessary in order to provide effective corporate administration for the Fund; compiling and maintaining records with respect to the Fund’s operations; preparing and filing reports required by the U.S. Securities and Exchange Commission; preparing periodic reports regarding the operations of the Fund for its shareholders; preparing proxy materials for shareholder meetings; and preparing the registration statements required by federal and state securities laws for the sale of the Fund’s shares. OFI Global also provides the Fund with office space, facilities and equipment.
The Board also considered the quality of the services provided and the quality of the Managers’ resources that are available to the Fund. The Board took account of the fact that
47 OPPENHEIMER GLOBAL OPPORTUNITIES FUND
|
| BOARD APPROVAL OF THE FUND’S INVESTMENT ADVISORY AND SUB-ADVISORY AGREEMENTS Unaudited / Continued |
the Sub-Adviser has had over fifty years of experience as an investment adviser and that its assets under management rank it among the top mutual fund managers in the United States. The Board evaluated the Managers’ advisory, administrative, accounting, legal, compliance services and risk management, and information the Board has received regarding the experience and professional qualifications of the Managers’ key personnel and the size and functions of its staff. In its evaluation of the quality of the portfolio management services provided, the Board considered the experience of Frank Jennings, the portfolio manager for the Fund, and the Sub-Adviser’s investment team and analysts. The Board members also considered the totality of their experiences with the Managers as directors or trustees of the Fund and other funds advised by the Managers. The Board considered information regarding the quality of services provided by affiliates of the Managers, which the Board members have become knowledgeable about through their experiences with the Managers and in connection with the renewal of the Fund’s service agreements. The Board concluded, in light of the Managers’ experience, reputation, personnel, operations and resources that the Fund benefits from the services provided under the Agreements.
Investment Performance of the Managers and the Fund. Throughout the year, the Managers provided information on the investment performance of the Fund, the Adviser and the Sub-Adviser, including comparative performance information. The Board also reviewed information, prepared by the Managers and by the independent consultant, comparing the Fund’s historical performance to relevant benchmarks or market indices and to the performance of other retail funds in the world stock category. The Board noted that the Fund’s three-year and ten-year performance was better than its category median although its one-year and five-year performance was below its category median.
Fees and Expenses of the Fund. The Board reviewed the fees paid to the Adviser and the other expenses borne by the Fund. The Board also considered the comparability of the fees charged and the services provided to the Fund to the fees and services for other clients or accounts advised by the Adviser. The independent consultant provided comparative data in regard to the fees and expenses of the Fund and other retail front-end load world stock funds with comparable asset levels and distribution features. The Board noted that the Fund’s contractual management fees and total expenses were lower than its peer group median and category median.
Economies of Scale and Profits Realized by the Managers. The Board considered information regarding the Managers’ costs in serving as the Fund’s investment adviser and sub-adviser, including the costs associated with the personnel and systems necessary to manage the Fund, and information regarding the Managers’ profitability from their relationship with the Fund. The Board also considered that the Managers must be able to pay and retain experienced professional personnel at competitive rates to provide quality services to the Fund. The Board reviewed whether the Managers may realize economies of scale in managing and supporting the Fund. The Board noted that the Fund currently has management fee breakpoints, which are intended to share with Fund shareholders economies of scale that may exist as the Fund’s assets grow
Other Benefits to the Managers. In addition to considering the profits realized by the Managers, the Board considered information that was provided regarding the direct and indirect benefits the Managers receive as a result of their relationship with the Fund,
48 OPPENHEIMER GLOBAL OPPORTUNITIES FUND
including compensation paid to the Managers’ affiliates and research provided to the Adviser in connection with permissible brokerage arrangements (soft dollar arrangements).
Conclusions. These factors were also considered by the independent Trustees meeting separately from the full Board, assisted by experienced counsel to the Fund and to the independent Trustees. Fund counsel and the independent Trustees’ counsel are independent of the Managers within the meaning and intent of the Securities and Exchange Commission Rules.
Based on its review of the information it received and its evaluations described above, the Board, including a majority of the independent Trustees, decided to continue the Agreements through September 30, 2016. In arriving at its decision, the Board did not identify any factor or factors as being more important than others, but considered all of the above information, and considered the terms and conditions of the Agreements, including the management fees, in light of all the surrounding circumstances.
49 OPPENHEIMER GLOBAL OPPORTUNITIES FUND
PORTFOLIO PROXY VOTING POLICIES AND PROCEDURES; UPDATES TO STATEMENTS OF INVESTMENTS Unaudited
The Fund has adopted Portfolio Proxy Voting Policies and Procedures under which the Fund votes proxies relating to securities (“portfolio proxies”) held by the Fund. A description of the Fund’s Portfolio Proxy Voting Policies and Procedures is available (i) without charge, upon request, by calling the Fund toll-free at 1.800.CALL OPP (225.5677), (ii) on the Fund’s website at www.oppenheimerfunds.com, and (iii) on the SEC’s website at www.sec.gov. In addition, the Fund is required to file Form N-PX, with its complete proxy voting record for the 12 months ended June 30th, no later than August 31st of each year. The Fund’s voting record is available (i) without charge, upon request, by calling the Fund toll-free at 1.800.CALL OPP (225.5677), and (ii) in the Form N-PX filing on the SEC’s website at www.sec.gov.
The Fund files its complete schedule of portfolio holdings with the SEC for the first quarter and the third quarter of each fiscal year on Form N-Q. The Fund’s Form N-Q filings are available on the SEC’s website at www.sec.gov. Those forms may be reviewed and copied at the SEC’s Public Reference Room in Washington, D.C. Information on the operation of the Public Reference Room may be obtained by calling 1-800-SEC-0330.
Householding—Delivery of Shareholder Documents
This is to inform you about OppenheimerFunds’ “householding” policy. If more than one member of your household maintains an account in a particular fund, OppenheimerFunds will mail only one copy of the fund’s prospectus (or, if available, the fund’s summary prospectus), annual and semiannual report and privacy policy. The consolidation of these mailings, called householding, benefits your fund through reduced mailing expense, and benefits you by reducing the volume of mail you receive from OppenheimerFunds. Householding does not affect the delivery of your account statements.
Please note that we will continue to household these mailings for as long as you remain an OppenheimerFunds shareholder, unless you request otherwise. If you prefer to receive multiple copies of these materials, please call us at 1.800.CALL-OPP (225-5677). You may also notify us in writing or via email. We will begin sending you individual copies of the prospectus (or, if available, the summary prospectus), reports and privacy policy within 30 days of receiving your request to stop householding.
50 OPPENHEIMER GLOBAL OPPORTUNITIES FUND
TRUSTEES AND OFFICERS Unaudited
| | |
Name, Position(s) Held with
the Fund, Length of Service,
Year of Birth | | Principal Occupation(s) During the Past 5 Years; Other Trusteeships/Directorships Held; Number of Portfolios in the Fund Complex Currently Overseen |
| |
| INDEPENDENT TRUSTEES | | The address of each Trustee in the chart below is 6803 S. Tucson Way, Centennial, Colorado 80112-3924. Each Trustee serves for an indefinite term, or until his or her resignation, retirement, death or removal. |
| |
Brian F. Wruble, Chairman of the Board of
Trustees (since 2007), Trustee
(since 2005)
Year of Birth: 1943 | | Director and Vice Chairman of Community Foundation of the Florida Keys (non-profit) (since July 2012); Trustee of the Board of Trustees, The Jackson Laboratory (non-profit) (1991-2011 and since May 2014); Chairman Emeritus (since August 2011) of The Jackson Laboratory (non-profit); Director of Special Value Opportunities Fund, LLC (registered investment company) (affiliate of the Sub-Adviser’s parent company) (since September 2004); Member of Zurich Insurance Group’s Investment Management Advisory Council (insurance) (since 2004); Treasurer (since 2007) and Trustee of the Institute for Advanced Study (non-profit educational institute) (since May 1992); General Partner of Odyssey Partners, L.P. (hedge fund) (September 1995-December 2007); Special Limited Partner of Odyssey Investment Partners, LLC (private equity investment) (January 1999-September 2004). Oversees 53 portfolios in the OppenheimerFunds complex. Mr. Wruble has served on the Boards of certain Oppenheimer funds since April 2001, during which time he has become familiar with the Fund’s (and other Oppenheimer funds’) financial, accounting, regulatory and investment matters and has contributed to the Boards’ deliberations. |
| |
David K. Downes, Trustee (since 2007) Year of Birth: 1940 | | Director of THL Credit Inc. (since June 2009); Chief Executive Officer and Board Member of Community Capital Management (investment management company) (since January 2004); President of The Community Reinvestment Act Qualified Investment Fund (investment management company) (since 2004); Director of Actua Corporation (information technology company) (since October 2003); formerly, Independent Chairman GSK Employee Benefit Trust (April 2006-June 2013); Director of Correctnet (January 2006-2007); Independent Chairman of the Board of Trustees of Quaker Investment Trust (registered investment company) (2004-2007); Chief Operating Officer and Chief Financial Officer of Lincoln National Investment Companies, Inc. (subsidiary of Lincoln National Corporation, a publicly traded company) and Delaware Investments U.S., Inc. (investment management subsidiary of Lincoln National Corporation) (1993-2003); President, Chief Executive Officer and Trustee of Delaware Investment Family of Funds (1993-2003); President and Board Member of Lincoln National Convertible Securities Funds, Inc. and the Lincoln National Income Funds, TDC (1993-2003); Chairman and Chief Executive Officer of Retirement Financial Services, Inc. (registered transfer agent and investment adviser and subsidiary of Delaware Investments U.S., Inc.) (1993-2003); President and Chief Executive Officer of Delaware Service Company, Inc. (1995- 2003); Chief Administrative Officer, Chief Financial Officer, Vice Chairman and Director of Equitable Capital Management Corporation (investment subsidiary of Equitable Life Assurance Society) (1985-1992); Corporate Controller of Merrill Lynch Company (financial services holding company) (1977-1985); held the following positions at the Colonial Penn Group, Inc. (insurance company): Corporate Budget Director (1974-1977), Assistant Treasurer (1972-1974) and Director of Corporate Taxes (1969-1972); held the following positions at Price Waterhouse Company (financial services firm): Tax Manager (1967-1969), Tax Senior (1965-1967) and Staff Accountant (1963-1965); United States Marine |
51 OPPENHEIMER GLOBAL OPPORTUNITIES FUND
|
| TRUSTEES AND OFFICERS Unaudited / Continued |
| | |
David K. Downes, Continued | | Corps (1957-1959). Oversees 53 portfolios in the OppenheimerFunds complex. Mr. Downes has served on the Boards of certain Oppenheimer funds since December 2005, during which time he has become familiar with the Fund’s (and other Oppenheimer funds’) financial, accounting, regulatory and investment matters and has contributed to the Boards’ deliberations. |
| |
Matthew P. Fink, Trustee (since 2005) Year of Birth: 1941 | | Trustee of the Committee for Economic Development (policy research foundation) (2005-2011); Director of ICI Education Foundation (education foundation) (October 1991-August 2006); President of the Investment Company Institute (trade association) (October 1991-June 2004); Director of ICI Mutual Insurance Company (insurance company) (October 1991-June 2004); Author of The Rise of Mutual Funds: An Insider’s View published by Oxford University Press (second edition 2010). Oversees 53 portfolios in the OppenheimerFunds complex. Mr. Fink has served on the Boards of certain Oppenheimer funds since January 2005, during which time he has become familiar with the Fund’s (and other Oppenheimer funds’) financial, accounting, regulatory and investment matters and has contributed to the Boards’ deliberations. |
| |
Edmund P. Giambastiani, Jr., Trustee (since 2013) Year of Birth: 1948 | | Advisory Board Member of the Maxwell School of Citizenship and Public Affairs of Syracuse University (since April 2012); Director of Mercury Defense Systems Inc. (information technology) (August 2011-February 2013); Trustee of the U.S. Naval Academy Foundation (since November 2010); Advisory Board Member of the Massachusetts Institute of Technology Lincoln Laboratory (federally-funded research development center) (since May 2010); Director of The Boeing Company (aerospace and defense) (since October 2009); Trustee of MITRE Corporation (federally-funded research development center) (since September 2008); Independent Director of QinetiQ Group Plc (defense technology and security) (February 2008-August 2011); Director of Monster Worldwide, Inc. (online career services) (since January 2008, Lead Director since June 2011); Chairman of Alenia North America, Inc. (military and defense products) (January 2008-October 2009); Director of SRA International, Inc. (information technology and services) (January 2008-July 2011); President of Giambastiani Group LLC (national security and energy consulting) (since October 2007); United States Navy, career nuclear submarine officer (June 1970-October 2007), Vice Chairman of the Joint Chiefs of Staff (2005-October 2007), Supreme Allied Commander of NATO Commander Transformation (2003-2005), Commander, U.S. Joint Forces Command (2002-2005). Since his retirement from the U.S. Navy in October 2007, Admiral Giambastiani has also served on numerous U.S. Government advisory boards, investigations and task forces for the Secretaries of Defense, State and Interior and the Central Intelligence Agency. Oversees 53 portfolios in the OppenheimerFunds complex. Admiral Giambastiani has served on the Boards of certain Oppenheimer funds since February 2013, including as an Advisory Board Member for certain Oppenheimer funds, during which time he has become familiar with the Fund’s (and other Oppenheimer funds’) financial, accounting, regulatory and investment matters and has contributed to the Boards’ deliberations. For purposes of this report, Admiral Giambastiani is identified as a Trustee. |
| |
Elizabeth Krentzman, Trustee (since 2014) Year of Birth: 1959 | | Advisory Board Member of the Securities and Exchange Commission Historical Society (since 2007); held the following positions at Deloitte & Touche LLP: Principal and Chief Regulatory Advisor for Asset Management Services (2007 - 2014) and U.S. Mutual Fund Leader (2011 - 2014); General Counsel of the Investment Company Institute (trade association) (June 2004 - April 2007); held |
52 OPPENHEIMER GLOBAL OPPORTUNITIES FUND
| | |
Elizabeth Krentzman, Continued | | the following positions at Deloitte & Touche LLP: National Director of the Investment Management Regulatory Consulting Practice (1997 - 2004), Principal (2003 - 2004), Director (1998 - 2003) and Senior Manager (1997 - 1998); Assistant Director of the Division of Investment Management - Office of Disclosure and Investment Adviser Regulation (1996 - 1997) and various positions with the Division of Investment Management – Office of Regulatory Policy (1991 - 1996) of the U.S. Securities and Exchange Commission; Associate at Ropes & Gray (1987 - 1991); former Chair of the Investment Management Subcommittee of the Washington, D.C. Bar. Oversees 53 portfolios in the OppenheimerFunds complex. Ms. Krentzman has served on the Boards of certain Oppenheimer funds since August 2014, during which time she has become familiar with the Fund’s (and other Oppenheimer funds’) financial, accounting, regulatory and investment matters and has contributed to the Boards’ deliberations. |
| |
Mary F. Miller, Trustee (since 2004) Year of Birth: 1942 | | Trustee of International House (not-for-profit) (since June 2007); Trustee of the American Symphony Orchestra (not-for-profit) (October 1998-November 2011); and Senior Vice President and General Auditor of American Express Company (financial services company) (July 1998-February 2003). Oversees 53 portfolios in the OppenheimerFunds complex. Ms. Miller has served on the Boards of certain Oppenheimer funds since August 2004, during which time she has become familiar with the Fund’s (and other Oppenheimer funds’) financial, accounting, regulatory and investment matters and has contributed to the Boards’ deliberations. |
| |
Joel W. Motley, Trustee (since 2002) Year of Birth: 1952 | | Director of Greenwall Foundation (since October 2013); Member of the Vestry of Trinity Wall Street (since April 2012); Director of Southern Africa Legal Services Foundation (since March 2012); Board Member of Pulitzer Center for Crisis Reporting (non-profit journalism) (since March 2011); Managing Director of Public Capital Advisors, LLC (privately-held financial advisor) (since January 2006); Managing Director of Carmona Motley, Inc. (privately-held financial advisor) (since January 2002); Director of Columbia Equity Financial Corp. (privately-held financial advisor) (2002-2007); Managing Director of Carmona Motley Hoffman Inc. (privately-held financial advisor) (January 1998-December 2001); Member of the Finance and Budget Committee of the Council on Foreign Relations, Member of the Investment Committee and Board of Human Rights Watch (since July 2000) and Member of the Investment Committee and Board of Historic Hudson Valley (since February 2010). Oversees 53 portfolios in the OppenheimerFunds complex. Mr. Motley has served on the Boards of certain Oppenheimer funds since October 2002, during which time he has become familiar with the Fund’s (and other Oppenheimer funds’) financial, accounting, regulatory and investment matters and has contributed to the Boards’ deliberations. |
| |
Joanne Pace, Trustee (since 2012) Year of Birth: 1958 | | Board Director of Horizon Blue Cross Blue Shield of New Jersey (since November 2012); Advisory Board Director of The Alberleen Group LLC (since March, 2012); Advisory Council Member of 100 Women in Hedge Funds (non-profit) (since December, 2012); Advisory Council Member of Morgan Stanley Children’s Hospital (non-profit) (since May, 2012); Board Director of The Komera Project (non-profit) (since April, 2012); Advisory Board Director of The Agile Trading Group LLC (2012-2013); New York Advisory Board Director of Peace First (non-profit) (2010-2013); Senior Advisor of SECOR Asset Management, LP (2010- 2011); Managing Director and Chief Operating Officer of Morgan Stanley |
53 OPPENHEIMER GLOBAL OPPORTUNITIES FUND
|
| TRUSTEES AND OFFICERS Unaudited / Continued |
| | |
Joanne Pace, Continued | | Investment Management (2006-2010); Partner and Chief Operating Officer of FrontPoint Partners, LLC (hedge fund) (2005-2006); held the following positions at Credit Suisse: Managing Director (2003-2005); Global Head of Human Resources and member of Executive Board and Operating Committee (2004- 2005), Global Head of Operations and Product Control (2003-2004); held the following positions at Morgan Stanley: Managing Director (1997-2003), Controller and Principal Accounting Officer (1999-2003); Chief Financial Officer (temporary assignment) for the Oversight Committee, Long Term Capital Management (1998-1999). Lead Independent Director and Chair of the Audit and Nominating Committee of The Global Chartist Fund, LLC of Oppenheimer Asset Management (2011-2012); Board Director of Managed Funds Association (2008-2010); Board Director of Morgan Stanley Foundation (2007-2010) and Investment Committee Chair (2008-2010). Oversees 53 portfolios in the OppenheimerFunds complex. Ms. Pace has served on the Boards of certain Oppenheimer funds since November 2012, including as an Advisory Board Member for certain Oppenheimer funds, during which time she has become familiar with the Fund’s (and other Oppenheimer funds’) financial, accounting, regulatory and investment matters and has contributed to the Board’s deliberations. For purposes of this report, Ms. Pace is identified as a Trustee. |
| |
Daniel Vandivort, Trustee (since 2014) Year of Birth: 1954 | | Chairman and Lead Independent Director/Trustee (March 2010-September 2014), Chairman of the Audit Committee (March 2009-September 2014) and Director/Trustee (December 2008-September 2014) of the Board of Directors/Trustees of Value Line Funds; Trustee, Board of Trustees of Huntington Disease Foundation of America (June 2007-December 2013): Trustee, Board of Trustees, RIM Retirement Savings Plan (2005-2007); President and Chief Investment Officer, Robeco Investment Management, formerly known as Weiss Peck and Greer (January 2005-June 2007); Member, Management Committee of Robeco Investment Management (2001-2007); Chairman and Trustee of the Board of Trustees of Weiss, Peck and Greer Funds (2004-2005); Managing Director and Head of Fixed Income, Weiss, Peck and Greer (November 1994- January 2005); Managing Director and Head of Fixed Income, CS First Boston Investment Management (January 1992-November 1994); Director, Global Product Development, First Boston Asset Management (November 1989-January 1992); Vice President, Fixed Income Sales, First Boston Corp. (May 1984- November 1989). Oversees 53 portfolios in the OppenheimerFunds complex. Mr. Vandivort has served on the Boards of certain Oppenheimer funds since 2014, during which time he has become familiar with the Fund’s (and other Oppenheimer funds’) financial, accounting, regulatory and investment matters and has contributed to the Boards’ deliberations. |
|
| |
| INTERESTED TRUSTEES | | Mr. Glavin is an “Interested Trustee” because he is affiliated with the Manager and the Sub-Adviser by virtue of his positions as director of the Sub-Adviser, and as a shareholder of the Sub-Adviser’s parent company. As a Trustee, he serves for an indefinite term, or until his resignation, retirement, death or removal. Mr. Glavin’s address is 225 Liberty Street, New York, New York 10281-1008. Mr. Steinmetz is an “Interested Trustee” because he is affiliated with the Manager and the Sub-Adviser by virtue of his positions as Chairman of the Sub- Adviser and officer and director of the Manager. Both as a Trustee and as an officer, Mr. Steinmetz serves for an indefinite term, or until his resignation, retirement, death or removal. Mr. Steinmetz’s address is 225 Liberty Street, New York, New York 10281-1008. |
54 OPPENHEIMER GLOBAL OPPORTUNITIES FUND
| | |
William F. Glavin, Jr., Trustee (since 2013), Year of Birth: 1958 | | Chairman of the Sub-Adviser (July 2014 –December 2014 and December 2009- December 2012) and Director of the Sub-Adviser (since January 2009); Chairman, Director and Chief Executive Officer (January 2013-June 2014) of the Manager; President of the Manager (January 2013-May 2013); Chief Executive Officer (January 2009-December 2012); President of the Sub-Adviser (May 2009-December 2012); Management Director (June 2009-June 2014), President (December 2009-June 2014) and Chief Executive Officer (January 2011-June 2014) of Oppenheimer Acquisition Corp. (“OAC”) (the Sub-Adviser’s parent holding company); Director of Oppenheimer Real Asset Management, Inc. (March 2010-June 2014); Executive Vice President (March 2006-February 2009) and Chief Operating Officer (July 2007-February 2009) of Massachusetts Mutual Life Insurance Company (OAC’s parent company); Director (May 2004-March 2006) and Chief Operating Officer and Chief Compliance Officer (May 2004- January 2005), President (January 2005-March 2006) and Chief Executive Officer (June 2005-March 2006) of Babson Capital Management LLC; Director (March 2005-March 2006), President (May 2003-March 2006) and Chief Compliance Officer (July 2005-March 2006) of Babson Capital Securities, Inc. (a broker-dealer); President (May 2003-March 2006) of Babson Investment Company, Inc.; Director (May 2004-August 2006) of Babson Capital Europe Limited; Director (May 2004-October 2006) of Babson Capital Guernsey Limited; Director (May 2004-March 2006) of Babson Capital Management LLC; Non- Executive Director (March 2005-March 2007) of Baring Asset Management Limited; Director (February 2005-June 2006) Baring Pension Trustees Limited; Director and Treasurer (December 2003-November 2006) of Charter Oak Capital Management, Inc.; Director (May 2006-September 2006) of C.M. Benefit Insurance Company; Director (May 2008-June 2009) and Executive Vice President (June 2007-July 2009) of C.M. Life Insurance Company; President (March 2006-May 2007) of MassMutual Assignment Company; Director (January 2005-December 2006), Deputy Chairman (March 2005-December 2006) and President (February 2005-March 2005) of MassMutual Holdings (Bermuda) Limited; Director (May 2008-June 2009) and Executive Vice President (June 2007-July 2009) of MML Bay State Life Insurance Company; Chief Executive Officer and President (April 2007-January 2009) of MML Distributors, LLC; and Chairman (March 2006-December 2008) and Chief Executive Officer (May 2007-December 2008) of MML Investors Services, Inc. An officer of 91 portfolios in the OppenheimerFunds complex. Mr. Glavin has served on the Boards of certain Oppenheimer funds since December 2009, during which time he has become familiar with the Fund’s (and other Oppenheimer funds’) financial, accounting, regulatory and investment matters and has contributed to the Boards’ deliberations. |
| |
Arthur P. Steinmetz, Trustee (since 2015), President
and Principal Executive Officer
(since 2014) Year of Birth: 1958 | | Chairman of the Sub-Adviser (since January 2015); CEO and Chairman of the Manager (since July 2014), President of the Manager (since May 2013), a Director of the Manager (since January 2013), Director of the Sub-Adviser (since July 2014), President, Management Director and CEO of Oppenheimer Acquisition Corp. (the Sub-Adviser’s parent holding company) (since July 2014), and President and Director of OFI SteelPath, Inc. (since January 2013). Chief Investment Officer of the OppenheimerFunds advisory entities from (January 2013-December 2013); Executive Vice President of the Manager (January 2013- May 2013); Chief Investment Officer of the Sub-Adviser (October 2010- December 2012); Chief Investment Officer, Fixed-Income, of the Sub-Adviser (April 2009-October 2010); Executive Vice President of the Sub-Adviser (October |
55 OPPENHEIMER GLOBAL OPPORTUNITIES FUND
|
| TRUSTEES AND OFFICERS Unaudited / Continued |
| | |
Arthur P. Steinmetz, Continued | | 2009-December 2012); Director of Fixed Income of the Sub-Adviser (January 2009-April 2009); and a Senior Vice President of the Sub-Adviser (March 1993- September 2009). An officer of 91 portfolios in the OppenheimerFunds complex. |
|
| |
| OTHER OFFICERS OF THE FUND | | The addresses of the Officers in the chart below are as follows: for Messrs. Jennings, Gabinet, Mss. Sexton and Picciotto, 225 Liberty Street, New York, New York 10281-1008, for Mr. Wixted, 6803 S. Tucson Way, Centennial, Colorado 80112-3924. Each Officer serves for an indefinite term or until his or her resignation, retirement, death or removal. |
| |
Frank Jennings, Ph.D., Vice President (since 1995) Year of Birth: 1947 | | Senior Vice President of the Sub-Adviser (since February 2006) and Vice President of the Sub-Adviser (September 1995-January 2006). A portfolio manager and officer in the OppenheimerFunds complex. |
| |
Arthur S. Gabinet, Secretary and Chief Legal Officer (since 2011) Year of Birth: 1958 | | Executive Vice President, Secretary and General Counsel of the Manager (since January 2013); General Counsel OFI SteelPath, Inc. (since January 2013); Executive Vice President (May 2010-December 2012) and General Counsel (since January 2011) of the Sub-Adviser; General Counsel of the Distributor (since January 2011); General Counsel of Centennial Asset Management Corporation (January 2011-December 2012); Executive Vice President (January 2011-December 2012) and General Counsel of HarbourView Asset Management Corporation (since January 2011); Assistant Secretary (since January 2011) and Director (since January 2011) of OppenheimerFunds International Ltd. and OppenheimerFunds plc; Director of Oppenheimer Real Asset Management, Inc. (January 2011-December 2012) and General Counsel (since January 2011); Executive Vice President (January 2011-December 2011) and General Counsel of Shareholder Financial Services, Inc. and Shareholder Services, Inc. (since January 2011); Executive Vice President (January 2011-December 2012) and General Counsel of OFI Private Investments Inc. (since January 2011); Vice President of OppenheimerFunds Legacy Program (January 2011-December 2011); Executive Vice President (January 2011-December 2012) and General Counsel of OFI Institutional Asset Management, Inc. (since January 2011); General Counsel, Asset Management of the Sub-Adviser (May 2010-December 2010); Principal, The Vanguard Group (November 2005-April 2010); District Administrator, U.S. Securities and Exchange Commission (January 2003-October 2005). An officer of 91 portfolios in the OppenheimerFunds complex. |
| |
Jennifer Sexton, Vice President and Chief
Business Officer (since 2014) Year of Birth: 1969 | | Senior Vice President of OppenheimerFunds Distributor, Inc. (since June 2014); Vice President of OppenheimerFunds Distributor, Inc. (April 2006-June 2014); Vice President of the Sub-Adviser (January 1998-March 2006); Assistant Vice President of the Sub-Adviser (October 1991-December 1998). An officer of 91 portfolios in the OppenheimerFunds complex. |
| |
Mary Ann Picciotto, Chief Compliance Officer and
Chief Anti-Money Laundering Officer
(since 2014) Year of Birth: 1973 | | Senior Vice President and Chief Compliance Officer of the Manager (since March 2014); Chief Compliance Officer of the Sub-Adviser, OFI SteelPath, Inc., OFI Global Trust Company, OFI Global Institutional, Inc., Oppenheimer Real Asset Management, Inc., OFI Private Investments, Inc., Harborview Asset Management Corporation, Trinity Investment Management Corporation, and Shareholder Services, Inc. (since March 2014); Managing Director of Morgan Stanley Investment Management Inc. and certain of its various affiliated entities; Chief Compliance Officer of various Morgan Stanley Funds (May 2010-January 2014); |
56 OPPENHEIMER GLOBAL OPPORTUNITIES FUND
| | |
Mary Ann Picciotto, Continued | | Chief Compliance Officer of Morgan Stanley Investment Management Inc. (April 2007-January 2014). An officer of 91 portfolios in the OppenheimerFunds complex. |
| |
Brian W. Wixted, Treasurer and Principal Financial & Accounting Officer (since 1999) Year of Birth: 1959 | | Senior Vice President of the Manager (since January 2013); Treasurer of the Sub- Adviser, HarbourView Asset Management Corporation, Shareholder Financial Services, Inc., Shareholder Services, Inc., and Oppenheimer Real Asset Management, Inc. (March 1999-June 2008), OFI Private Investments, Inc. (March 2000-June 2008), OppenheimerFunds International Ltd. and OppenheimerFunds plc (since May 2000), OFI Institutional Asset Management, Inc. (November 2000-June 2008), and OppenheimerFunds Legacy Program (charitable trust program established by the Sub-Adviser) (June 2003-December 2011); Treasurer and Chief Financial Officer of OFI Trust Company (since May 2000); Assistant Treasurer of Oppenheimer Acquisition Corporation (March 1999-June 2008). An officer of 91 portfolios in the OppenheimerFunds complex. |
The Fund’s Statement of Additional Information contains additional information about the Fund’s Trustees and Officers and is available without charge upon request, by calling 1.800.CALL OPP (225.5677).
57 OPPENHEIMER GLOBAL OPPORTUNITIES FUND
OPPENHEIMER GLOBAL OPPORTUNITIES FUND
| | |
Manager | | OFI Global Asset Management, Inc. |
| |
Sub-Adviser | | OppenheimerFunds, Inc. |
| |
Distributor | | OppenheimerFunds Distributor, Inc. |
| |
Transfer and Shareholder | | OFI Global Asset Management, Inc. |
Servicing Agent | | |
| |
Sub-Transfer Agent | | Shareholder Services, Inc. |
| | DBA OppenheimerFunds Services |
| |
Independent Registered | | KPMG LLP |
Public Accounting Firm | | |
| |
Legal Counsel | | Kramer Levin Naftalis & Frankel LLP |
© 2015 OppenheimerFunds, Inc. All rights reserved.
58 OPPENHEIMER GLOBAL OPPORTUNITIES FUND
PRIVACY POLICY NOTICE
As an Oppenheimer fund shareholder, you are entitled to know how we protect your personal information and how we limit its disclosure.
Information Sources
We obtain nonpublic personal information about our shareholders from the following sources:
| ● | | Applications or other forms |
| ● | | When you create a user ID and password for online account access |
| ● | | When you enroll in eDocs Direct, our electronic document delivery service |
| ● | | Your transactions with us, our affiliates or others |
| ● | | A software program on our website, often referred to as a “cookie,” which indicates which parts of our site you’ve visited |
| ● | | When you set up challenge questions to reset your password online |
If you visit oppenheimerfunds.com and do not log on to the secure account information areas, we do not obtain any personal information about you. When you do log on to a secure area, we do obtain your user ID and password to identify you. We also use this information to provide you with products and services you have requested, to inform you about products and services that you may be interested in and assist you in other ways.
We do not collect personal information through our website unless you willingly provide it to us, either directly by email or in those areas of the website that request information. In order to update your personal information (including your mailing address, email address and phone number) you must first log on and visit your user profile.
If you have set your browser to warn you before accepting cookies, you will receive the warning message with each cookie. You can refuse cookies by turning them off in your browser. However, doing so may limit your access to certain sections of our website.
We use cookies to help us improve and manage our website. For example, cookies help us recognize new versus repeat visitors to the site, track the pages visited, and enable some special features on the website. This data helps us provide a better service for our website visitors.
Protection of Information
We do not disclose any non-public personal information (such as names on a customer list) about current or former customers to anyone, except as permitted by law.
Disclosure of Information
Copies of confirmations, account statements and other documents reporting activity in your fund accounts are made available to your financial advisor (as designated by you). We may also use details about you and your investments to help us, our financial service affiliates, or firms that jointly market their financial products and services with ours, to better serve your investment needs or suggest financial services or educational material that may be of interest to you. If this requires us to provide you with an opportunity to “opt in” or “opt out” of such information sharing with a firm not affiliated with us, you will receive notification on how to do so, before any such sharing takes place.
Right of Refusal
We will not disclose your personal information to unaffiliated third parties (except as permitted by law), unless we first offer you a reasonable opportunity to refuse or “opt out” of such disclosure.
59 OPPENHEIMER GLOBAL OPPORTUNITIES FUND
Internet Security and Encryption
In general, the email services provided by our website are encrypted and provide a secure and private means of communication with us. To protect your own privacy, confidential and/or personal information should only be communicated via email when you are advised that you are using a secure website. As a security measure, we do not include personal or account information in non-secure emails, and we advise you not to send such information to us in non-secure emails. Instead, you may take advantage of the secure features of our website to encrypt your email correspondence. To do this, you will need to use a browser that supports Secure Sockets Layer (SSL) protocol.
We do not guarantee or warrant that any part of our website, including files available for download, are free of viruses or other harmful code. It is your responsibility to take appropriate precautions, such as use of an anti-virus software package, to protect your computer hardware and software.
| ● | | All transactions, including redemptions, exchanges and purchases, are secured by SSL and 256-bit encryption. SSL is used to establish a secure connection between your PC and OppenheimerFunds’ server. It transmits information in an encrypted and scrambled format. |
| ● | | Encryption is achieved through an electronic scrambling technology that uses a “key” to code and then decode the data. Encryption acts like the cable converter box you may have on your television set. It scrambles data with a secret code so that no one can make sense of it while it is being transmitted. When the data reaches its destination, the same software unscrambles the data. |
| ● | | You can exit the secure area by either closing your browser, or for added security, you can use the Log Out button before you close your browser. |
Other Security Measures
We maintain physical, electronic and procedural safeguards to protect your personal account information. Our employees and agents have access to that information only so that they may offer you products or provide services, for example, when responding to your account questions.
How You Can Help
You can also do your part to keep your account information private and to prevent unauthorized transactions. If you obtain a user ID and password for your account, do not allow it to be used by anyone else. Also, take special precautions when accessing your account on a computer used by others.
Who We Are
This joint notice describes the privacy policies of the Oppenheimer funds, OppenheimerFunds, Inc., each of its investment adviser subsidiaries, OppenheimerFunds Distributor, Inc. and OFI Global Trust Co. It applies to all Oppenheimer fund accounts you presently have, or may open in the future, using your Social Security number—whether or not you remain a shareholder of our funds. This notice was last updated March 2015. In the event it is updated or changed, we will post an updated notice on our website at oppenheimerfunds.com. If you have any questions about this privacy policy, write to us at P.O. Box 5270, Denver, CO 80217-5270, email us by clicking on the Contact Us section of our website at oppenheimerfunds.com or call us at 1.800.CALL OPP (225.5677).
60 OPPENHEIMER GLOBAL OPPORTUNITIES FUND
THIS PAGE INTENTIONALLY LEFT BLANK.
61 OPPENHEIMER GLOBAL OPPORTUNITIES FUND
THIS PAGE INTENTIONALLY LEFT BLANK.
62 OPPENHEIMER GLOBAL OPPORTUNITIES FUND
THIS PAGE INTENTIONALLY LEFT BLANK.
63 OPPENHEIMER GLOBAL OPPORTUNITIES FUND
| | |
| |  |
| |
| | Visit us at oppenheimerfunds.com for 24-hr access
to account information and transactions or call us at
800 CALL OPP (800 225 5677) for 24-hr automated
information and automated transactions. Representatives
also available Mon–Fri 8am–8pm ET. |
| |
| Visit Us | | |
| oppenheimerfunds.com | | |
| |
| Call Us | | |
| 800 225 5677 | | |
| |
| Follow Us | | |
 | | Oppenheimer funds are distributed by OppenheimerFunds Distributor, Inc. |
| | 225 Liberty Street, New York, NY 10281-1008 |
| | © 2015 OppenheimerFunds Distributor, Inc. All rights reserved. |
| | RA0215.001.0915 November 23, 2015 |
Item 2. Code of Ethics.
The registrant has adopted a code of ethics that applies to the registrant’s principal executive officer, principal financial officer, principal accounting officer or controller or persons performing similar functions.
Item 3. Audit Committee Financial Expert.
The Board of Trustees of the registrant has determined that David Downes, the Board’s Audit Committee Chairman, is an audit committee financial expert and that Mr. Downes is “independent” for purposes of this Item 3.
Item 4. Principal Accountant Fees and Services.
The principal accountant for the audit of the registrant’s annual financial statements billed $29,400 in fiscal 2015 and $25,600 in fiscal 2014.
The principal accountant for the audit of the registrant’s annual financial statements billed no such fees in fiscal 2015 and no such fees in fiscal 2014.
The principal accountant for the audit of the registrant’s annual financial statements billed $185,479 in fiscal 2015 and $1,042,959 in fiscal 2014 to the registrant’s investment adviser or any entity controlling, controlled by, or under common control with the adviser that provides ongoing services to the registrant.
Such services include: Internal control reviews, GIPS attestation procedures, system conversion testing, and corporate restructuring
The principal accountant for the audit of the registrant’s annual financial statements billed no such fees in fiscal 2015 and no such fees in fiscal 2014.
The principal accountant for the audit of the registrant’s annual financial statements billed $628,126 in fiscal 2015 and $467,462 in fiscal 2014 to the registrant’s investment adviser or any entity controlling, controlled by, or under common control with the adviser that provides ongoing services to the registrant.
Such services include: tax compliance, tax planning and tax advice. Tax compliance generally involves preparation of original and amended tax returns, claims for a refund and tax payment-planning services. Tax planning and tax advice includes assistance with tax audits and appeals, tax advice related to mergers and acquisitions and requests for rulings or technical advice from taxing authorities.
The principal accountant for the audit of the registrant’s annual financial statements billed no such fees in fiscal 2015 and no such fees in fiscal 2014.
The principal accountant for the audit of the registrant’s annual financial statements billed no such fees in fiscal 2015 and no such fees in fiscal 2014 to the registrant’s investment adviser or any entity controlling, controlled by, or under common control with the adviser that provides ongoing services to the registrant.
Such fees would include the cost to the principal accountant of attending audit committee meetings and consultations regarding the registrant’s retirement plan with respect to its Trustees.
| (e) | (1) During its regularly scheduled periodic meetings, the registrant’s audit committee will pre-approve all audit, audit-related, tax and other services to be provided by the principal accountants of the registrant. |
The audit committee has delegated pre-approval authority to its Chairman for any subsequent new engagements that arise between regularly scheduled meeting dates provided that any fees such pre-approved are presented to the audit committee at its next regularly scheduled meeting.
Under applicable laws, pre-approval of non-audit services may be waived provided that: 1) the aggregate amount of all such services provided constitutes no more than five percent of the total amount of fees paid by the registrant to its principal accountant during the fiscal year in which services are provided 2) such services were not recognized by the registrant at the time of engagement as non-audit services and 3) such services are promptly brought to the attention of the audit committee of the registrant and approved prior to the completion of the audit.
(2) 0%
| (f) | Not applicable as less than 50%. |
| (g) | The principal accountant for the audit of the registrant’s annual financial statements billed $813,605 in fiscal 2015 and $1,510,421 in fiscal 2014 to the registrant and the registrant’s investment adviser or any entity controlling, controlled by, or under common control with the adviser that provides ongoing services to the registrant related to non-audit fees. Those billings did not include any prohibited non-audit services as defined by the Securities Exchange Act of 1934. |
| (h) | The registrant’s audit committee of the board of Trustees has considered whether the provision of non-audit services that were rendered to the registrant’s investment adviser, and any entity controlling, controlled by, or under common control with the investment adviser that provides ongoing services to the registrant that were not pre-approved pursuant to paragraph (c)(7)(ii) of Rule 2-01 of Regulation S-X is compatible with maintaining the principal accountant’s independence. No such services were rendered. |
Item 5. Audit Committee of Listed Registrants
Not applicable.
Item 6. Schedule of Investments.
a) Not applicable. The complete schedule of investments is included in Item 1 of this Form N-CSR.
b) Not applicable.
Item 7. Disclosure of Proxy Voting Policies and Procedures for Closed-End Management Investment Companies.
Not applicable.
Item 8. Portfolio Managers of Closed-End Management Investment Companies.
Not applicable.
Item 9. Purchases of Equity Securities by Closed-End Management Investment Company and Affiliated Purchasers.
Not applicable.
Item 10. Submission of Matters to a Vote of Security Holders.
The Fund’s Governance Committee Provisions with Respect to Nominations of Directors/Trustees to the Respective Boards
None
Item 11. Controls and Procedures.
Based on their evaluation of the registrant’s disclosure controls and procedures (as defined in rule 30a-3(c) under the Investment Company Act of 1940 (17 CFR 270.30a-3(c)) as of 9/30/2015, the registrant’s principal executive officer and principal financial officer found the registrant’s disclosure controls and procedures to provide reasonable assurances that information required to be disclosed by the registrant in the reports that it files under the Securities Exchange Act of 1934 (a) is accumulated and communicated to registrant’s management, including its principal executive officer and principal financial officer, to allow timely decisions regarding required disclosure, and (b) is recorded, processed, summarized and reported, within the time periods specified in the rules and forms adopted by the U.S. Securities and Exchange Commission.
There have been no changes in the registrant’s internal controls over financial reporting that occurred during the registrant’s second fiscal quarter of the period covered by this report that have materially affected, or are reasonably likely to materially affect, the registrant’s internal control over financial reporting.
Item 12. Exhibits.
| (a) | (1) Exhibit attached hereto. |
| | (2) Exhibits attached hereto. |
| (b) | Exhibit attached hereto. |
SIGNATURES
Pursuant to the requirements of the Securities Exchange Act of 1934 and the Investment Company Act of 1940, the registrant has duly caused this report to be signed on its behalf by the undersigned, thereunto duly authorized.
Oppenheimer Global Opportunities Fund
| | |
| By: | | /s / Arthur P. Steinmetz |
| | Arthur P. Steinmetz |
| | Principal Executive Officer |
| Date: | | 11/17/2015 |
Pursuant to the requirements of the Securities Exchange Act of 1934 and the Investment Company Act of 1940, this report has been signed below by the following persons on behalf of the registrant and in the capacities and on the dates indicated.
| | |
| By: | | /s/ Arthur P. Steinmetz |
| | Arthur P. Steinmetz |
| | Principal Executive Officer |
| Date: | | 11/17/2015 |
| | |
| By: | | /s/ Brian W. Wixted |
| | Brian W. Wixted |
| | Principal Financial Officer |
| Date: | | 11/17/2015 |