UNITED STATES
SECURITIES AND EXCHANGE COMMISSION
WASHINGTON, D.C. 20549
FORM N-CSR
CERTIFIED SHAREHOLDER REPORT OF REGISTERED
MANAGEMENT INVESTMENT COMPANIES
Investment Company Act file number 811-6001
Oppenheimer Global Opportunities Fund
(Exact name of registrant as specified in charter)
6803 South Tucson Way, Centennial, Colorado 80112-3924
(Address of principal executive offices) (Zip code)
Cynthia Lo Bessette
OFI Global Asset Management, Inc.
225 Liberty Street, New York, New York 10281-1008
(Name and address of agent for service)
Registrant’s telephone number, including area code: (303) 768-3200
Date of fiscal year end: September 30
Date of reporting period: 9/30/2018
Item 1. Reports to Stockholders.
Annual Report 9/30/2018 Oppenheimer Fund® The Right Way to Invest Oppenheimer Global Opportunities Fund
An Important Update
On October 18, 2018, Massachusetts Mutual Life Insurance Company, an indirect corporate parent of OppenheimerFunds, Inc. and its subsidiaries OFI Global Asset Management, Inc., OFI SteelPath, Inc. and OFI Advisors, LLC, announced that it has entered into an agreement whereby Invesco Ltd., a global investment management company, will acquire OppenheimerFunds, Inc. As of the date of this report, the transaction is expected to close in the second quarter of 2019, pending necessary regulatory and other third-party approvals. This is subject to change.
Table of Contents
Class A Shares
AVERAGE ANNUAL TOTAL RETURNS AT 9/30/18
| | | | | | | | | | | | | | | |
| | | Class A Shares of the Fund | | |
| | Without Sales Charge | | With Sales Charge | | MSCI All Country (AC)
World Index |
| 1-Year | | | | 25.09 | % | | | | 17.89 | % | | | | 9.77 | % |
| 5-Year | | | | 17.02 | | | | | 15.64 | | | | | 8.67 | |
| 10-Year | | | | 15.82 | | | | | 15.14 | | | | | 8.19 | |
Performance data quoted represents past performance, which does not guarantee future results. The investment return and principal value of an investment in the Fund will fluctuate so that an investor’s shares, when redeemed, may be worth more or less than their original cost. Fund returns include changes in share price, reinvested distributions, and a 5.75% maximum applicable sales charge except where “without sales charge” is indicated. Current performance may be lower or higher than the performance quoted. Returns do not consider capital gains or income taxes on an individual’s investment. Returns for periods of less than one year are cumulative and not annualized. For performance data current to the most recent month-end, visit oppenheimerfunds.com or call 1.800.CALL OPP (225.5677). See Fund prospectuses and summary prospectuses for more information on share classes and sales charges.
3 OPPENHEIMER GLOBAL OPPORTUNITIES FUND
Fund Performance Discussion
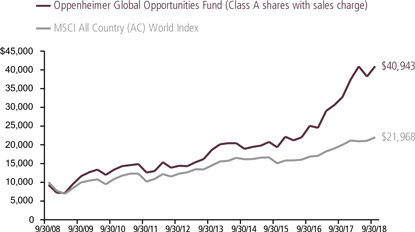
The Fund’s Class A shares (without sales charge) generated a return of 25.09% during the one-year reporting period ending September 30, 2018, significantly outperforming its benchmark, the MSCI All Country World Index (the “Index”), which returned 9.77%.
The Fund has some clear sector preferences that reflect the sorts of ideas that we find appealing. We manage a forward-looking portfolio, attuned to the long-term technological, cultural and demographic trends of the 21st century. The big ideas of the 20th century are not the big ideas of the 21st. In our portfolio, you can see this vividly. We have substantial overweight positions to sectors where innovation is proliferating, such as in Health Care and Information Technology. Those were, in fact, the biggest areas of outperformance for the Fund versus the Index this reporting period. The Fund also outperformed in the Financials,
Communication Services, Utilities, Materials, Real Estate, and Consumer Staples sectors. Apart from our Communication Services holdings, where stock selection drove results, the rest were largely shaped by sector underweights.
During the reporting period, the Fund underperformed in the Consumer Discretionary, Energy, and Industrials sectors. Our results in Consumer Discretionary and Industrials were driven by our stock selection results. We underperformed in Energy due to our lack of exposure to the sector.
COMPARISON OF CHANGE IN VALUE OF $10,000 HYPOTHETICAL INVESTMENTS IN:
4 OPPENHEIMER GLOBAL OPPORTUNITIES FUND
MARKET OVERVIEW
The year ended September 30, 2018, was a modestly positive one for world markets, though calendar 2018 has had more ups and downs than 2017 did. We also had a good year, for which we are pleased. Overall, there is plenty of economic strength and that appears to have some staying power. However, there are some issues that we are watching closely. Trade tension is one. While a reconfigured North American Free Trade agreement has calmed things in the Americas, trade remains a difficult issue with China, and to a lesser extent greater Asia. A long running, deep dispute has potential to harm risk appetites, growth and productivity across the world.
In addition, interest rates have been rising this year. The Federal Reserve has been normalizing its policy via a reduction in its balance sheet and by raising the federal funds rate. Though rates are by no means high, this process nearly always ushers in at least some slowing of economic growth and eventually more challenging financial markets. It is also worth noting that, over the last few decades, when a new Fed chair takes the helm, markets have had a tendency to be more uncertain, and volatile.
All that said, we continue to find many things to do. We live in an era, akin, we believe, to the industrial revolution, where major change is affecting the way we live, work and play.
There remains much more to come, and we plan to earn meaningful rewards from this
over the long-term, as we have for more than 20-years managing this portfolio.
FUND REVIEW
The top three performing holdings of the Fund this reporting period were Nektar Therapeutics, Advanced Micro Devices, Inc., and Arrowhead Pharmaceuticals, Inc.
Nektar Therapeutics had a steady stream of good news over the first half of the reporting period. During the first quarter of 2018, Nektar announced that they were entering into an agreement with Bristol Myers Squibb Inc. (BMY), to jointly develop NKTR-214 in combination with Opdivo, BMY’s immuno-oncology drug. The deal involves a $1 billion upfront cash payment to Nektar and the purchase of more than 8 million shares of Nektar by BMY. Any profits from the venture will be split, with Nektar receiving 65% of the proceeds. The share price responded nicely, to say the least. Nektar Therapeutics is a long-term holding and it rose strongly this reporting period despite a hard correction in the second quarter of 2018. We continue to be big believers in the company. A lot of great ideas get buffeted around on the path to great success. Patience is needed to reap large rewards.
Advanced Micro Devices (AMD) shares performed strongly this reporting period. The reason is one we have been waiting for the world to catch on to. AMD’s business model and technology capabilities are now highly competitive more or less across the board.
5 OPPENHEIMER GLOBAL OPPORTUNITIES FUND
Gaming chips we have believed would see large demand increases as gaming went portable, and they have.
Arrowhead Pharmaceuticals is a biotechnology company that develops treatments for life threatening, genetically caused diseases. During the reporting period, Arrowhead announced strong earnings and also that it would be proceeding with Phase 1 trials for two key drugs. The share price reacted favorably to these announcements.
Detractors from performance this reporting period included the S&P 500 Index and Nasdaq put options we purchased, Genmab A/S, and Iconix Brand Group, Inc.
We bought puts on the S&P 500 Index and Nasdaq in the early part of 2018. These puts declined in value in response to the rise in those markets during the reporting period. Part of the reasoning for buying the puts was because they were cheap. Hedging equity risk is not usually very cheap, so there was an element of pure value buying. Cheap insurance makes sense if you can get it.
Genmab experienced a pipeline setback when they announced that the development of an oncology drug with Roche would be terminated. Despite this, we continue to see significant opportunity for Genmab to capture other opportunities with Darzalex.
Iconix Brand Group is an owner of the rights to various well-known brands like London Fog, Danskin and Fieldcrest, among others.
In October, Walmart announced they were ending their licensing agreement for the Danskin brand, which put Iconix close to violating some of their debt covenants. A sharp drop in its share price ensued.
STRATEGY & OUTLOOK
We remain largely focused on investments in companies with sizable, transformational growth potential. Many are in relatively early stages of that development. Some of our holdings will only be moderately successful, some may even flop. However, we believe it is likely that a good percentage of them can become substantial, and our ownership can be meaningfully rewarded. This requires patience. Emerging companies, some of the best we’ve ever seen, have experienced setbacks or encounter periods of difficulty. Patience is a critical part of our ability to be successful. If a stock is rocketing higher, then it is probably too late to be buying it. We want to be early, before the path to success has become clear to the world. That involves a lot of waiting. Tariffs are not likely to be applied to a company with a cure for a deadly form of cancer, but it can create some bumps along a path of ownership.
| | |

| | 
Frank V. Jennings, Ph. D. Portfolio Manager |
6 OPPENHEIMER GLOBAL OPPORTUNITIES FUND
Top Holdings and Allocations
| | |
TOP TEN COMMON STOCK HOLDINGS |
| | |
Advanced Micro Devices, Inc. | | 7.5% |
Nektar Therapeutics, Cl. A | | 7.4 |
Coherent, Inc. | | 2.1 |
Exact Sciences Corp. | | 2.0 |
Eurofins Scientific SE | | 1.7 |
3D Systems Corp. | | 1.5 |
Arrowhead Pharmaceuticals, Inc. | | 1.5 |
Nintendo Co. Ltd. | | 1.5 |
PTC, Inc. | | 1.3 |
H. Lundbeck AS | | 1.3 |
Portfolio holdings and allocations are subject to change. Percentages are as of September 30, 2018, and are based on net assets.
| | |
TOP TEN GEOGRAPHICAL HOLDINGS |
| | |
United States | | 49.7% |
Japan | | 10.3 |
United Kingdom | | 9.8 |
Germany | | 6.5 |
Denmark | | 4.1 |
Sweden | | 3.4 |
France | | 3.2 |
Italy | | 2.6 |
Spain | | 2.0 |
Luxembourg | | 1.7 |
Portfolio holdings and allocation are subject to change. Percentages are as of September 30, 2018, and are based on total market value of investments.
SECTOR ALLOCATION
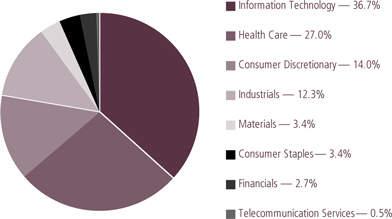
Portfolio holdings and allocations are subject to change. Percentages are as of September 30, 2018, and are based on the total market value of common stocks.
For more current Fund holdings, please visit oppenheimerfunds.com.
7 OPPENHEIMER GLOBAL OPPORTUNITIES FUND
Share Class Performance
| | | | | | | | | | | | | | | | |
AVERAGE ANNUAL TOTAL RETURNS WITHOUT SALES CHARGE AS OF 9/30/18 | |
| | | Inception
Date | | | 1-Year | | | 5-Year | | | 10-Year | |
| | | | |
Class A (OPGIX) | | | 10/22/90 | | | | 25.09 | % | | | 17.02 | % | | | 15.82 | % |
Class C (OGICX) | | | 12/1/93 | | | | 24.15 | | | | 16.15 | | | | 14.95 | |
Class I (OGIIX) | | | 1/27/12 | | | | 25.61 | | | | 17.52 | | | | 17.60 | * |
Class R (OGINX) | | | 3/1/01 | | | | 24.79 | | | | 16.72 | | | | 15.48 | |
Class Y (OGIYX) | | | 2/1/01 | | | | 25.40 | | | | 17.32 | | | | 16.13 | |
|
AVERAGE ANNUAL TOTAL RETURNS WITH SALES CHARGE AS OF 9/30/18 | |
| | | Inception
Date | | | 1-Year | | | 5-Year | | | 10-Year | |
| | | | |
Class A (OPGIX) | | | 10/22/90 | | | | 17.89 | % | | | 15.64 | % | | | 15.14 | % |
Class C (OGICX) | | | 12/1/93 | | | | 23.15 | | | | 16.15 | | | | 14.95 | |
Class I (OGIIX) | | | 1/27/12 | | | | 25.61 | | | | 17.52 | | | | 17.60 | * |
Class R (OGINX) | | | 3/1/01 | | | | 24.79 | | | | 16.72 | | | | 15.48 | |
Class Y (OGIYX) | | | 2/1/01 | | | | 25.40 | | | | 17.32 | | | | 16.13 | |
| * | Shows performance since inception. |
Performance data quoted represents past performance, which does not guarantee future results. The investment return and principal value of an investment in the Fund will fluctuate so that an investor’s shares, when redeemed, may be worth more or less than their original cost. Current performance may be lower or higher than the performance quoted. Returns do not consider capital gains or income taxes on an individual’s investment. For performance data current to the most recent month-end, visit oppenheimerfunds.com or call 1.800. CALL OPP (225.5677). Fund returns include changes in share price, reinvested distributions, and the applicable sales charge: for Class A shares, the current maximum initial sales charge of 5.75% and for Class C shares, the contingent deferred sales charge of 1% for the 1-year period. There is no sales charge for Class I, Class R and Class Y shares. Returns for periods of less than one year are cumulative and not annualized. See Fund prospectuses and summary prospectuses for more information on share classes and sales charges.
The Fund’s performance is compared to the performance of the MSCI All Country (AC) World Index, a free float-adjusted market capitalization weighted index that is designed to measure the equity market performance of developed and emerging markets. The Index is unmanaged and cannot be purchased directly by investors. While index comparisons may be useful to provide a benchmark for the Fund’s performance, it must be noted that the Fund’s investments are not limited to the investments comprising the Index. Index performance includes reinvestment of income, but does not reflect transaction costs, fees, expenses or taxes. Index performance is shown for illustrative purposes only as a benchmark for the Fund’s performance, and does not predict or depict performance of the Fund. The Fund’s performance reflects the effects of the Fund’s business and operating expenses.
The views in the Fund Performance Discussion represent the opinions of this Fund’s portfolio manager(s) and are not intended as investment advice or to predict or depict the performance
8 OPPENHEIMER GLOBAL OPPORTUNITIES FUND
of any investment. These views are as of the close of business on September 30, 2018, and are subject to change based on subsequent developments. The Fund’s portfolio and strategies are subject to change.
Before investing in any of the Oppenheimer funds, investors should carefully consider a fund’s investment objectives, risks, charges and expenses. Fund prospectuses and summary prospectuses contain this and other information about the funds, and may be obtained by asking your financial advisor, visiting oppenheimerfunds.com, or calling 1.800.CALL OPP (225.5677). Read prospectuses and summary prospectuses carefully before investing.
Shares of Oppenheimer funds are not deposits or obligations of any bank, are not guaranteed by any bank, are not insured by the FDIC or any other agency, and involve investment risks, including the possible loss of the principal amount invested.
9 OPPENHEIMER GLOBAL OPPORTUNITIES FUND
Fund Expenses
Fund Expenses. As a shareholder of the Fund, you incur two types of costs: (1) transaction costs, which may include sales charges (loads) on purchase payments and/or contingent deferred sales charges on redemptions; and (2) ongoing costs, including management fees; distribution and service fees; and other Fund expenses. These examples are intended to help you understand your ongoing costs (in dollars) of investing in the Fund and to compare these costs with the ongoing costs of investing in other mutual funds.
The examples are based on an investment of $1,000.00 invested at the beginning of the period and held for the entire 6-month period ended September 30, 2018.
Actual Expenses. The first section of the table provides information about actual account values and actual expenses. You may use the information in this section for the class of shares you hold, together with the amount you invested, to estimate the expense that you paid over the period. Simply divide your account value by $1,000.00 (for example, an $8,600.00 account value divided by $1,000.00 = 8.60), then multiply the result by the number in the first section under the heading entitled “Expenses Paid During 6 Months Ended September 30, 2018” to estimate the expenses you paid on your account during this period.
Hypothetical Example for Comparison Purposes. The second section of the table provides information about hypothetical account values and hypothetical expenses based on the Fund’s actual expense ratio for each class of shares, and an assumed rate of return of 5% per year for each class before expenses, which is not the Fund’s actual return. The hypothetical account values and expenses may not be used to estimate the actual ending account balance or expenses you paid for the period. You may use this information to compare the ongoing costs of investing in the Fund and other funds. To do so, compare this 5% hypothetical example for the class of shares you hold with the 5% hypothetical examples that appear in the shareholder reports of the other funds.
Please note that the expenses shown in the table are meant to highlight your ongoing costs only and do not reflect any transactional costs, such as front-end or contingent deferred sales charges (loads). Therefore, the “hypothetical” section of the table is useful in comparing ongoing costs only, and will not help you determine the relative total costs of owning different funds. In addition, if these transactional costs were included, your costs would have been higher.
10 OPPENHEIMER GLOBAL OPPORTUNITIES FUND
| | | | | | |
| Actual | | Beginning
Account
Value
April 1, 2018 | | Ending
Account
Value
September 30, 2018 | | Expenses
Paid During
6 Months Ended
September 30, 2018 |
| Class A | | $ 1,000.00 | | $ 1,000.60 | | $ 5.58 |
| Class C | | 1,000.00 | | 996.80 | | 9.40 |
| Class I | | 1,000.00 | | 1,002.70 | | 3.57 |
| Class R | | 1,000.00 | | 999.50 | | 6.89 |
| Class Y | | 1,000.00 | | 1,001.90 | | 4.38 |
| |
Hypothetical (5% return before expenses) | | |
| Class A | | 1,000.00 | | 1,019.50 | | 5.63 |
| Class C | | 1,000.00 | | 1,015.69 | | 9.49 |
| Class I | | 1,000.00 | | 1,021.51 | | 3.60 |
| Class R | | 1,000.00 | | 1,018.20 | | 6.95 |
| Class Y | | 1,000.00 | | 1,020.71 | | 4.42 |
Expenses are equal to the Fund’s annualized expense ratio for that class, multiplied by the average account value over the period, multiplied by 183/365 (to reflect the one-half year period). Those annualized expense ratios, excluding indirect expenses from affiliated funds, based on the 6-month period ended September 30, 2018 are as follows:
| | | | |
| Class | | | Expense Ratios | |
Class A | | | 1.11 | % |
Class C | | | 1.87 | |
Class I | | | 0.71 | |
Class R | | | 1.37 | |
Class Y | | | 0.87 | |
The expense ratios reflect voluntary and/or contractual waivers and/or reimbursements of expenses by the Fund’s Manager and Transfer Agent. Some of these undertakings may be modified or terminated at any time, as indicated in the Fund’s prospectus. The “Financial Highlights” tables in the Fund’s financial statements, included in this report, also show the gross expense ratios, without such waivers or reimbursements and reduction to custodian expenses, if applicable.
|
| 11 OPPENHEIMER GLOBAL OPPORTUNITIES FUND |
STATEMENT OF INVESTMENTS September 30, 2018
| | | | | | | | |
| | | Shares | | | Value | |
| Common Stocks—98.4% | | | | | | | | |
| Consumer Discretionary—13.8% | |
| Auto Components—1.0% | |
| Brembo SpA | | | 2,000,000 | | | $ | 26,166,727 | |
| Cie Plastic Omnium SA | | | 1,500,000 | | | | 56,522,290 | |
| Continental AG | | | 100,000 | | | | 17,407,559 | |
| | | | | | | 100,096,576 | |
| Automobiles—0.4% | | | | | | | | |
Ferrari NV | | | 300,000 | | | | 41,073,000 | |
| Diversified Consumer Services—0.3% | | | | | | | | |
Sotheby’s1 | | | 600,000 | | | | 29,514,000 | |
| Entertainment���0.4% | | | | | | | | |
Technicolor SA1,2 | | | 29,700,000 | | | | 35,552,473 | |
| Hotels, Restaurants & Leisure—1.5% | | | | | | | | |
| InterContinental Hotels Group plc | | | 797,872 | | | | 49,663,404 | |
| Paddy Power Betfair plc | | | 400,000 | | | | 33,809,973 | |
| Shake Shack, Inc., Cl. A1 | | | 1,000,000 | | | | 63,010,000 | |
| | | | | | | 146,483,377 | |
| Household Durables—2.2% | | | | | | | | |
| Bang & Olufsen AS1 | | | 2,000,000 | | | | 46,153,604 | |
| De’ Longhi SpA | | | 1,000,000 | | | | 31,368,530 | |
| iRobot Corp.1 | | | 900,000 | | | | 98,928,000 | |
| Nikon Corp. | | | 2,000,000 | | | | 37,579,495 | |
| | | | | | | 214,029,629 | |
| Interactive Media & Services—0.9% | | | | | | | | |
Twitter, Inc.1 | | | 3,000,000 | | | | 85,380,000 | |
| Internet & Catalog Retail—3.9% | | | | | | | | |
| AO World plc1 | | | 20,000,000 | | | | 36,481,435 | |
| ASKUL Corp. | | | 1,600,000 | | | | 48,021,540 | |
| ASOS plc1 | | | 700,000 | | | | 52,405,945 | |
| Baozun, Inc., Sponsored ADR1 | | | 1,000,000 | | | | 48,580,000 | |
| boohoo.com plc1 | | | 30,000,000 | | | | 91,505,286 | |
| Boozt AB1,2,3 | | | 3,750,000 | | | | 31,581,431 | |
| Rakuten, Inc. | | | 6,000,000 | | | | 45,983,160 | |
| SRP Groupe SA1,3 | | | 500,000 | | | | 3,283,314 | |
| Zalando SE1,3 | | | 600,000 | | | | 23,323,785 | |
| | | | | | | 381,165,896 | |
| Media—1.4% | | | | | | | | |
| CyberAgent, Inc. | | | 1,600,000 | | | | 85,125,896 | |
| Schibsted ASA, Cl. A | | | 900,000 | | | | 33,794,597 | |
|
| 12 OPPENHEIMER GLOBAL OPPORTUNITIES FUND |
| | | | | | | | |
| | | Shares | | | Value | |
| Media (Continued) | |
| Stroeer SE & Co. KGaA | | | 300,000 | | | $ | 17,141,374 | |
| | | | | | | 136,061,867 | |
| Specialty Retail—0.3% | | | | | | | | |
JINS, Inc. | | | 600,000 | | | | 32,000,576 | |
| Textiles, Apparel & Luxury Goods—1.5% | | | | | | | | |
| Brunello Cucinelli SpA | | | 1,500,000 | | | | 58,408,222 | |
| Moncler SpA | | | 1,000,000 | | | | 43,029,123 | |
| Mulberry Group plc | | | 500,000 | | | | 2,437,039 | |
| OVS SpA1,3 | | | 3,000,000 | | | | 8,603,380 | |
| Pandora AS | | | 600,000 | | | | 37,507,125 | |
| | | | | | | 149,984,889 | |
| Consumer Staples—3.4% | | | | | | | | |
| Food & Staples Retailing—0.7% | | | | | | | | |
Rite Aid Corp.1 | | | 50,000,000 | | | | 64,000,000 | |
| Food Products—1.5% | | | | | | | | |
| Ebro Foods SA | | | 2,000,000 | | | | 43,677,695 | |
| Marine Harvest ASA | | | 4,000,000 | | | | 92,663,993 | |
| Wessanen | | | 1,000,000 | | | | 12,215,647 | |
| | | | | | | 148,557,335 | |
| Personal Products—1.2% | | | | | | | | |
| Ci:z Holdings Co. Ltd. | | | 1,800,000 | | | | 66,614,594 | |
| Midsona AB, Cl. B | | | 1,000,000 | | | | 7,706,046 | |
| Ontex Group NV | | | 2,000,000 | | | | 42,592,297 | |
| | | | | | | 116,912,937 | |
| Financials—2.6% | | | | | | | | |
| Capital Markets—1.1% | | | | | | | | |
| Allied Minds plc1 | | | 10,000,000 | | | | 9,426,280 | |
| IP Group plc1 | | | 20,785,545 | | | | 34,984,312 | |
| Rothschild & Co. | | | 1,500,000 | | | | 63,567,486 | |
| | | | | | | 107,978,078 | |
| Commercial Banks—0.3% | | | | | | | | |
| Banco Comercial Portugues SA, Cl. R1 | | | 100,000,000 | | | | 29,561,145 | |
| Diversified Financial Services—0.3% | | | | | | | | |
IG Group Holdings plc | | | 3,000,000 | | | | 24,782,808 | |
| Real Estate Investment Trusts (REITs)—0.5% | | | | | | | | |
| British Land Co. plc (The) | | | 4,000,000 | | | | 32,134,362 | |
| Unibail-Rodamco-Westfield | | | 100,000 | | | | 20,085,743 | |
| | | | | | | 52,220,105 | |
|
| 13 OPPENHEIMER GLOBAL OPPORTUNITIES FUND |
STATEMENT OF INVESTMENTS Continued
| | | | | | | | |
| | | Shares | | | Value | |
| Real Estate Management & Development—0.4% | | | | | | | | |
| Capital & Counties Properties plc | | | 8,761,192 | | | $ | 30,387,919 | |
| Purplebricks Group plc1 | | | 4,000,000 | | | | 11,993,798 | |
| | | | | | | | 42,381,717 | |
| Health Care—26.6% | | | | | | | | |
| Biotechnology—7.7% | | | | | | | | |
| Abcam plc | | | 1,000,000 | | | | 18,664,277 | |
| Arrowhead Pharmaceuticals, Inc.1,2 | | | 7,800,000 | | | | 149,526,000 | |
| Bavarian Nordic AS1 | | | 800,000 | | | | 21,070,305 | |
| Exact Sciences Corp.1 | | | 2,500,000 | | | | 197,300,000 | |
| Genmab AS1 | | | 600,000 | | | | 94,306,031 | |
| Halozyme Therapeutics, Inc.1 | | | 1,000,000 | | | | 18,170,000 | |
| Hansa Medical AB1 | | | 1,492,945 | | | | 56,526,716 | |
| Innate Pharma SA1 | | | 1,000,000 | | | | 5,356,689 | |
| Karo Pharma AB | | | 7,400,000 | | | | 26,298,331 | |
| Oncopeptides AB1,3 | | | 2,000,000 | | | | 36,150,197 | |
| PeptiDream, Inc.1 | | | 3,000,000 | | | | 119,630,993 | |
| Rigel Pharmaceuticals, Inc.1 | | | 5,000,000 | | | | 16,050,000 | |
| | | | | | | | 759,049,539 | |
| Health Care Equipment & Supplies—4.8% | | | | | | | | |
| Align Technology, Inc.1 | | | 300,000 | | | | 117,366,000 | |
| Biocartis NV1,2,3 | | | 3,000,000 | | | | 42,910,861 | |
| Carl Zeiss Meditec AG | | | 1,000,000 | | | | 84,132,857 | |
| Consort Medical plc2 | | | 2,856,109 | | | | 44,305,855 | |
| Fisher & Paykel Healthcare Corp. Ltd. | | | 3,000,000 | | | | 29,928,721 | |
| Ion Beam Applications1 | | | 400,000 | | | | 8,170,187 | |
| Jeol Ltd.2 | | | 2,500,000 | | | | 54,274,029 | |
| Nevro Corp.1 | | | 1,500,000 | | | | 85,500,000 | |
| | | | | | | | 466,588,510 | |
| Health Care Providers & Services—0.6% | | | | | | | | |
| Amplifon SpA | | | 2,000,000 | | | | 44,396,770 | |
| Xvivo Perfusion AB1 | | | 1,000,000 | | | | 16,481,341 | |
| | | | | | | | 60,878,111 | |
| Health Care Technology—0.9% | | | | | | | | |
| M3, Inc. | | | 4,000,000 | | | | 90,697,770 | |
| Life Sciences Tools & Services—3.2% | | | | | | | | |
| Bruker Corp. | | | 1,400,000 | | | | 46,830,000 | |
| Eurofins Scientific SE | | | 300,000 | | | | 170,067,648 | |
| MorphoSys AG1 | | | 900,000 | | | | 96,242,224 | |
| | | | | | | | 313,139,872 | |
| Pharmaceuticals—9.4% | | | | | | | | |
| GW Pharmaceuticals plc, ADR1 | | | 100,000 | | | | 17,274,000 | |
| H. Lundbeck AS | | | 2,000,000 | | | | 123,376,053 | |
| Nektar Therapeutics, Cl. A1,2 | | | 12,000,000 | | | | 731,520,000 | |
14 OPPENHEIMER GLOBAL OPPORTUNITIES FUND
| | | | | | | | |
| | | Shares | | | Value | |
| Pharmaceuticals (Continued) | | | | | | | | |
| Recipharm AB, Cl. B1 | | | 2,000,000 | | | $ | 31,945,574 | |
| Xeris Pharmaceuticals, Inc.1,2 | | | 1,000,000 | | | | 17,580,000 | |
| | | | | | | 921,695,627 | |
| Industrials—12.1% | | | | | | | | |
| Aerospace & Defense—2.8% | | | | | | | | |
| Boeing Co. (The) | | | 300,000 | | | | 111,570,000 | |
| Hexcel Corp. | | | 700,000 | | | | 46,935,000 | |
| United Technologies Corp. | | | 800,000 | | | | 111,848,000 | |
| | | | | | | 270,353,000 | |
| Air Freight & Couriers—0.2% | | | | | | | | |
| Expeditors International of Washington, Inc. | | | 250,000 | | | | 18,382,500 | |
| Commercial Services & Supplies—1.2% | | | | | | | | |
| Rentokil Initial plc | | | 15,000,000 | | | | 62,169,461 | |
| Rollins, Inc. | | | 1,000,000 | | | | 60,690,000 | |
| | | | | | | 122,859,461 | |
| Construction & Engineering—0.6% | | | | | | | | |
| Ferrovial SA | | | 3,000,000 | | | | 62,033,880 | |
| Electrical Equipment—2.3% | | | | | | | | |
| Emerson Electric Co. | | | 653,224 | | | | 50,023,894 | |
| Mersen SA | | | 1,000,000 | | | | 35,120,673 | |
| Nidec Corp. | | | 300,000 | | | | 43,169,228 | |
| Schneider Electric SE | | | 500,000 | | | | 40,226,278 | |
| Sensata Technologies Holding plc1 | | | 600,000 | | | | 29,730,000 | |
| Vicor Corp.1 | | | 500,000 | | | | 23,000,000 | |
| | | | | | | 221,270,073 | |
| Machinery—3.1% | | | | | | | | |
| Albany International Corp., Cl. A | | | 400,000 | | | | 31,800,000 | |
| Aumann AG3 | | | 500,000 | | | | 34,586,868 | |
| FANUC Corp. | | | 200,000 | | | | 37,715,941 | |
| Rational AG | | | 80,000 | | | | 57,947,907 | |
| Singulus Technologies AG1 | | | 60,177 | | | | 1,065,531 | |
| SLM Solutions Group AG1,2 | | | 2,000,000 | | | | 48,531,889 | |
| Spirax-Sarco Engineering plc | | | 464,285 | | | | 44,156,046 | |
| THK Co. Ltd. | | | 2,000,000 | | | | 50,926,690 | |
| | | | | | | 306,730,872 | |
| Professional Services—0.7% | | | | | | | | |
| Acacia Research Corp.1,2 | | | 2,500,000 | | | | 8,000,000 | |
| Teleperformance | | | 300,000 | | | | 56,590,885 | |
| | | | | | | 64,590,885 | |
| Trading Companies & Distributors—1.2% | | | | | | | | |
| AddTech AB, Cl. B | | | 1,000,000 | | | | 21,298,160 | |
|
| 15 OPPENHEIMER GLOBAL OPPORTUNITIES FUND |
STATEMENT OF INVESTMENTS Continued
| | | | | | | | |
| | | Shares | | | Value | |
| Trading Companies & Distributors (Continued) | | | | | | | | |
| Beijer Ref AB | | | 2,000,000 | | | $ | 41,978,775 | |
| Indutrade AB | | | 2,000,000 | | | | 54,111,907 | |
| | | | | | | 117,388,842 | |
| Information Technology—36.1% | | | | | | | | |
| Communications Equipment—0.6% | | | | | | | | |
Nokia OYJ | | | 10,000,000 | | | | 55,460,641 | |
| Electronic Equipment, Instruments, & Components—6.2% | | | | | | | | |
| Basler AG2 | | | 200,000 | | | | 38,054,449 | |
| Cognex Corp. | | | 1,200,000 | | | | 66,984,000 | |
| Coherent, Inc.1 | | | 1,200,000 | | | | 206,628,000 | |
| Corning, Inc. | | | 1,000,000 | | | | 35,300,000 | |
| Dolby Laboratories, Inc., Cl. A | | | 800,000 | | | | 55,976,000 | |
| Gooch & Housego plc | | | 715,955 | | | | 16,540,904 | |
| Littelfuse, Inc. | | | 400,000 | | | | 79,156,000 | |
| Next Biometrics Group AS1,2 | | | 1,231,400 | | | | 8,714,538 | |
| Optex Group Co. Ltd.2 | | | 2,000,000 | | | | 39,398,327 | |
| Yaskawa Electric Corp. | | | 2,000,000 | | | | 59,328,294 | |
| | | | | | | 606,080,512 | |
| Internet Software & Services—0.2% | | | | | | | | |
| Alarm.com Holdings, Inc.1 | | | 400,000 | | | | 22,960,000 | |
| | | |
| IT Services—1.9% | | | | | | | | |
| Amadeus IT Group SA | | | 400,000 | | | | 37,118,144 | |
| BasWare OYJ1,2 | | | 1,000,000 | | | | 41,334,495 | |
| First Derivatives plc | | | 1,200,000 | | | | 64,536,363 | |
| FleetCor Technologies, Inc.1 | | | 200,000 | | | | 45,568,000 | |
| | | | | | | 188,557,002 | |
| Semiconductors & Semiconductor Equipment—14.4% | | | | | | | | |
| Advanced Micro Devices, Inc.1 | | | 24,000,000 | | | | 741,360,000 | |
| AIXTRON SE1 | | | 4,000,000 | | | | 40,406,546 | |
| Applied Materials, Inc. | | | 2,000,000 | | | | 77,300,000 | |
| Cree, Inc.1 | | | 1,000,000 | | | | 37,870,000 | |
| Disco Corp. | | | 200,000 | | | | 33,425,013 | |
| First Solar, Inc.1 | | | 2,000,000 | | | | 96,840,000 | |
| Infineon Technologies AG | | | 1,000,000 | | | | 22,720,407 | |
| IQE plc1,2 | | | 70,000,000 | | | | 74,856,580 | |
| Manz AG1,2 | | | 453,040 | | | | 19,170,226 | |
| Nordic Semiconductor ASA1 | | | 5,750,358 | | | | 33,216,743 | |
| ON Semiconductor Corp.1 | | | 2,000,000 | | | | 36,860,000 | |
| PDF Solutions, Inc.1,2 | | | 3,000,000 | | | | 27,090,000 | |
| PVA TePla AG1,2 | | | 2,775,000 | | | | 45,114,776 | |
| QUALCOMM, Inc. | | | 1,000,000 | | | | 72,030,000 | |
STMicroelectronics NV | | | 1,000,000 | | | | 18,191,725 | |
|
| 16 OPPENHEIMER GLOBAL OPPORTUNITIES FUND |
| | | | | | | | |
| | | Shares | | | Value | |
| Semiconductors & Semiconductor Equipment (Continued) | | | | | | | | |
| Veeco Instruments, Inc.1,2 | | | 4,000,000 | | | $ | 41,000,000 | |
| | | | | | | 1,417,452,016 | |
| Software—11.0% | | | | | | | | |
| BlackBerry Ltd.1 | | | 4,000,000 | | | | 45,520,000 | |
| Blue Prism Group plc1 | | | 3,000,000 | | | | 92,864,835 | |
| Cloudera, Inc.1 | | | 3,000,000 | | | | 52,950,000 | |
| EVR Holdings plc1,2 | | | 68,750,000 | | | | 4,592,180 | |
| FireEye, Inc.1 | | | 6,000,000 | | | | 102,000,000 | |
| Frontier Developments plc1,2 | | | 2,850,529 | | | | 49,566,338 | |
| Globant SA1 | | | 300,000 | | | | 17,697,000 | |
| Hortonworks, Inc.1,2 | | | 4,000,000 | | | | 91,240,000 | |
| Manhattan Associates, Inc.1 | | | 1,000,000 | | | | 54,600,000 | |
| Nintendo Co. Ltd. | | | 400,000 | | | | 145,997,000 | |
| PTC, Inc.1 | | | 1,200,000 | | | | 127,428,000 | |
| Red Hat, Inc.1 | | | 600,000 | | | | 81,768,000 | |
| Rovio Entertainment OYJ2,3 | | | 4,700,000 | | | | 24,910,188 | |
| SDL plc | | | 2,000,000 | | | | 12,433,690 | |
| ServiceNow, Inc.1 | | | 300,000 | | | | 58,689,000 | |
| Tableau Software, Inc., Cl. A1 | | | 200,000 | | | | 22,348,000 | |
| WANdisco plc1,2 | | | 5,835,399 | | | | 48,678,371 | |
| Zendesk, Inc.1 | | | 600,000 | | | | 42,600,000 | |
| | | | | | | 1,075,882,602 | |
| Technology Hardware, Storage & Peripherals—1.8% | | | | | | | | |
| 3D Systems Corp.1,2 | | | 8,000,000 | | | | 151,200,000 | |
| Tobii AB1 | | | 3,000,000 | | | | 14,995,387 | |
| Xaar plc2 | | | 4,000,000 | | | | 8,546,816 | |
| | | | | | | 174,742,203 | |
| Materials—3.3% | | | | | | | | |
| Chemicals—2.2% | | | | | | | | |
| Croda International plc | | | 482,758 | | | | 32,689,791 | |
| Novozymes AS, Cl. B | | | 1,500,000 | | | | 82,167,208 | |
| Symrise AG | | | 500,000 | | | | 45,621,021 | |
| Toray Industries, Inc. | | | 3,000,000 | | | | 22,539,634 | |
| Umicore SA | | | 600,000 | | | | 33,517,237 | |
| | | | | | | 216,534,891 | |
| Containers & Packaging—0.4% | | | | | | | | |
Sealed Air Corp. | | | 1,000,000 | | | | 40,150,000 | |
| Metals & Mining—0.7% | | | | | | | | |
| Antofagasta plc | | | 2,000,000 | | | | 22,235,540 | |
| thyssenkrupp AG | | | 2,000,000 | | | | 50,523,394 | |
| | | | | | | 72,758,934 | |
|
| 17 OPPENHEIMER GLOBAL OPPORTUNITIES FUND |
STATEMENT OF INVESTMENTS Continued
| | | | | | | | | | | | | | | | | | | | | | | | |
| | | | | | | | | | | | | | | Shares | | | Value | |
| Telecommunication Services—0.5% | | | | | | | | | | | | | | | | | | | | | |
| Wireless Telecommunication Services—0.5% | | | | | | | | | | | | | | | | | |
Masmovil Ibercom SA1 | | | | | | | | | | | | | | | | | | | 450,000 | | | $ | 51,860,071 | |
Total Common Stocks (Cost $6,683,138,549) | | | | | | | | | | | | | | | | 9,655,834,222 | |
| | | | | | Exercise
Price | | | Expiration Date | | | Notional
Amount
(000’s) | | | Contracts (000’s) | | | | |
| Exchange-Traded Options Purchased—0.1% | | | | | | | | | | | | | | | | | |
PowerShares QQQ Trust, | | | | | | | | | | | | | | | | | | | | | | | | |
Series 1 Exchange Traded | | | | | | | | | | | | | | | | | | | | | | | | |
| Fund Put1 | | | USD | | | | 155.000 | | | | 1/18/19 | | | | USD 1,300,530 | | | | USD 70 | | | | 7,490,000 | |
PowerShares QQQ Trust, | | | | | | | | | | | | | | | | | | | | | | | | |
Series 1 Exchange Traded | | | | | | | | | | | | | | | | | | | | | | | | |
| Fund Put1 | | | USD | | | | 135.000 | | | | 1/18/19 | | | | USD 1,300,530 | | | | USD 70 | | | | 2,450,000 | |
S&P 500 Index Put1 | | | USD | | | | 2,275.000 | | | | 12/21/18 | | | | USD 2,331,184 | | | | USD 8 | | | | 3,144,000 | |
Total Exchange-Traded Options Purchased (Cost $210,459,711) | | | | | | | | | | | | 13,084,000 | |
| | | | | | |
| | | | | | | | | | | | | | | Shares | | | | |
| Investment Company—1.9% | | | | | | | | | | | | | | | | | | | | | | | | |
Oppenheimer Institutional Government Money Market Fund, Cl. E, 1.95%2,4 | | | | | | | | | |
| (Cost $190,033,341) | | | | | | | | | | | | | | | | | | | 190,033,341 | | | | 190,033,341 | |
| Total Investments, at Value (Cost $7,083,631,601) | | | | | | | | 100.4% | | | | 9,858,951,563 | |
Net Other Assets (Liabilities) | | | | | | | | | | | | | | | | | | | (0.4) | | | | (41,959,810 | ) |
| Net Assets | | | | | | | | | | | | | | | | | | | 100.0% | | | $ | 9,816,991,753 | |
| | | | | | | | | | | | | | | | | | | | |
Footnotes to Statement of Investments
1. Non-income producing security.
2. Is or was an affiliate, as defined in the Investment Company Act of 1940, as amended, at or during the reporting period, by virtue of the Fund owning at least 5% of the voting securities of the issuer or as a result of the Fund and the issuer having the same investment adviser. Transactions during the reporting period in which the issuer was an affiliate are as follows:
| | | | | | | | | | | | | | | | |
| | | Shares
September 30,
2017 | | | Gross
Additions | | | Gross
Reductions | | | Shares
September 30,
2018 | |
Common Stock | | | | | | | | | | | | | | | | |
Biotechnology | | | | | | | | | | | | | | | | |
Arrowhead Pharmaceuticals, Inc. | | | 3,000,000 | | | | 4,800,000 | | | | — | | | | 7,800,000 | |
Electronic Equipment, Instruments, & Components | | | | | | | | | | | | | | | | |
Basler AG | | | — | | | | 200,000 | | | | — | | | | 200,000 | |
Next Biometrics Group AS | | | 660,000 | | | | 571,400 | a | | | — | | | | 1,231,400 | |
Optex Group Co. Ltd. | | | — | | | | 2,000,000 | a | | | — | | | | 2,000,000 | |
Entertainment | | | | | | | | | | | | | | | | |
Technicolor SA | | | 10,000,000 | | | | 19,700,000 | | | | — | | | | 29,700,000 | |
Health Care Equipment & Supplies | | | | | | | | | | | | | | | | |
Biocartis NV | | | — | | | | 3,000,000 | | | | — | | | | 3,000,000 | |
Consort Medical plc | | | 2,856,109 | | | | — | | | | — | | | | 2,856,109 | |
Jeol Ltd. | | | — | | | | 5,000,000 | | | | 2,500,000 | a | | | 2,500,000 | |
|
| 18 OPPENHEIMER GLOBAL OPPORTUNITIES FUND |
Footnotes to Statement of Investments (Continued)
| | | | | | | | | | | | | | | | |
| | | Shares
September 30,
2017 | | | Gross Additions | | | Gross
Reductions | | | Shares
September 30,
2018 | |
Internet & Catalog Retail | | | | | | | | | | | | | | | | |
Boozt AB | | | — | | | | 3,750,000 | | | | — | | | | 3,750,000 | |
IT Services | | | | | | | | | | | | | | | | |
BasWare OYJ | | | 500,000 | | | | 500,000 | | | | — | | | | 1,000,000 | |
Machinery | | | | | | | | | | | | | | | | |
SLM Solutions Group AG | | | 1,200,000 | | | | 800,000 | | | | — | | | | 2,000,000 | |
Pharmaceuticals | | | | | | | | | | | | | | | | |
Nektar Therapeutics, Cl. A | | | 24,225,000 | | | | 1,904,904 | | | | 14,129,904 | | | | 12,000,000 | |
Xeris Pharmaceuticals, Inc.b | | | — | | | | 1,000,000 | | | | — | | | | 1,000,000 | |
Professional Services | | | | | | | | | | | | | | | | |
Acacia Research Corp. | | | 2,500,000 | | | | — | | | | — | | | | 2,500,000 | |
Semiconductors & Semiconductor Equipment | | | | | | | | | | | | | | | | |
IQE plc | | | — | | | | 70,000,000 | | | | — | | | | 70,000,000 | |
Manz AG | | | — | | | | 453,040 | | | | — | | | | 453,040 | |
PDF Solutions, Inc. | | | — | | | | 3,000,000 | | | | — | | | | 3,000,000 | |
PVA TePla AG | | | — | | | | 2,775,000 | | | | — | | | | 2,775,000 | |
Veeco Instruments, Inc. | | | — | | | | 4,000,000 | | | | — | | | | 4,000,000 | |
Software | | | | | | | | | | | | | | | | |
EVR Holdings plc | | | — | | | | 68,750,000 | | | | — | | | | 68,750,000 | |
Frontier Developments plc | | | — | | | | 2,850,529 | | | | — | | | | 2,850,529 | |
Hortonworks, Inc.b | | | 2,000,000 | | | | 2,000,000 | | | | — | | | | 4,000,000 | |
Rovio Entertainment OYJ | | | 500,000 | | | | 4,200,000 | | | | — | | | | 4,700,000 | |
WANdisco plc | | | 5,276,000 | | | | 559,399 | | | | — | | | | 5,835,399 | |
Technology Hardware, Storage & Peripherals | | | | | | | | | | | | | | | | |
3D Systems Corp. | | | 2,000,000 | | | | 6,000,000 | | | | — | | | | 8,000,000 | |
Xaar plc | | | 4,000,000 | | | | — | | | | — | | | | 4,000,000 | |
Textiles, Apparel & Luxury Goods | | | | | | | | | | | | | | | | |
Iconix Brand Group, Inc. | | | 6,000,000 | | | | — | | | | 6,000,000 | | | | — | |
Investment Company | | | | | | | | | | | | | | | | |
Oppenheimer Institutional | | | | | | | | | | | | | | | | |
Government Money Market Fund, Cl. E | | | 16,324,804 | | | | 2,178,030,660 | | | | 2,004,322,123 | | | | 190,033,341 | |
| | | | |
| | | Value | | | Income | | | Realized Gain (Loss) | | | Change in
Unrealized
Gain (Loss) | |
Common Stock | | | | | | | | | | | | | | | | |
Biotechnology | | | | | | | | | | | | | | | | |
Arrowhead Pharmaceuticals, Inc. | | $
| 149,526,000
|
| | $ | — | | | $ | — | | | $ | 116,649,262 | |
Electronic Equipment, | | | | | | | | | | | | | | | | |
Instruments, & Components | | | | | | | | | | | | | | | | |
Basler AG | | | 38,054,449 | | | | 352,621 | | | | — | | | | (7,823,273 | ) |
Next Biometrics Group AS | | | 8,714,538 | | | | — | | | | — | | | | 1,661,868 | |
Optex Group Co. Ltd. | | | 39,398,327 | | | | 244,388 | | | | — | | | | (14,767,608 | ) |
Entertainment | | | | | | | | | | | | | | | | |
Technicolor SA | | | 35,552,473 | | | | — | | | | — | | | | (22,439,235 | ) |
|
| 19 OPPENHEIMER GLOBAL OPPORTUNITIES FUND |
STATEMENT OF INVESTMENTS Continued
Footnotes to Statement of Investments (Continued)
| | | | | | | | | | | | | | | | |
| | | Value | | | Income | | | Realized Gain (Loss) | | | Change in
Unrealized Gain (Loss) | |
Health Care Equipment & Supplies | | | | | | | | | | | | | | | | |
Biocartis NV | | $ | 42,910,861 | | | $ | — | | | $ | — | | | $ | (897,940) | |
Consort Medical plc | | | 44,305,855 | | | | 803,035 | | | | — | | | | 2,701,680 | |
Jeol Ltd. | | | 54,274,029 | | | | 308,440 | | | | — | | | | 10,351,707 | |
Internet & Catalog Retail | | | | | | | | | | | | | | | | |
Boozt AB | | | 31,581,431 | | | | — | | | | — | | | | (1,901,329) | |
IT Services | | | | | | | | | | | | | | | | |
BasWare OYJ | | | 41,334,495 | | | | — | | | | — | | | | (9,266,662) | |
Machinery | | | | | | | | | | | | | | | | |
SLM Solutions Group AG | | | 48,531,889 | | | | — | | | | — | | | | (43,091,272) | |
Pharmaceuticals | | | | | | | | | | | | | | | | |
Nektar Therapeutics, Cl. A | | | 731,520,000 | | | | — | | | | 561,491,059 | | | | 255,058,055 | |
Xeris Pharmaceuticals, Inc.b | | | — | c | | | — | | | | — | | | | 1,735,609 | |
Professional Services | | | | | | | | | | | | | | | | |
Acacia Research Corp. | | | 8,000,000 | | | | — | | | | — | | | | (3,375,000) | |
Semiconductors & | | | | | | | | | | | | | | | | |
Semiconductor Equipment | | | | | | | | | | | | | | | | |
IQE plc | | | 74,856,580 | | | | — | | | | — | | | | (45,492,209) | |
Manz AG | | | 19,170,226 | | | | — | | | | — | | | | 320,284 | |
PDF Solutions, Inc. | | | 27,090,000 | | | | — | | | | — | | | | (11,141,824) | |
PVA TePla AG | | | 45,114,776 | | | | — | | | | — | | | | 5,656,246 | |
Veeco Instruments, Inc. | | | 41,000,000 | | | | — | | | | — | | | | (25,318,248) | |
Software | | | | | | | | | | | | | | | | |
EVR Holdings plc | | | 4,592,180 | | | | — | | | | — | | | | (6,142,281) | |
Frontier Developments plc | | | 49,566,338 | | | | — | | | | — | | | | (6,434,207) | |
Hortonworks, Inc. b | | | — | c | | | — | | | | — | | | | 21,172,584 | |
Rovio Entertainment OYJ | | | 24,910,188 | | | | 443,847 | | | | — | | | | (15,665,677) | |
WANdisco plc | | | 48,678,371 | | | | — | | | | — | | | | (12,391,821) | |
Technology Hardware, Storage & Peripherals | | | | | | | | | | | | | | | | |
3D Systems Corp. | | | 151,200,000 | | | | — | | | | — | | | | 59,949,159 | |
Xaar plc | | | 8,546,816 | | | | 414,317 | | | | — | | | | (15,334,728) | |
Textiles, Apparel & Luxury Goods | | | | | | | | | | | | | | | | |
Iconix Brand Group, Inc. | | | — | | | | — | | | | (44,174,812) | | | | 14,372,888 | |
Investment Company | | | | | | | | | | | | | | | | |
Oppenheimer Institutional | | | | | | | | | | | | | | | | |
Government Money Market Fund, | | | | | | | | | | | | | | | | |
Cl. E | | | 190,033,341 | | | | 2,845,951 | | | | — | | | | — | |
| | | | |
Total | | $
| 1,958,463,163
|
| | $
| 5,412,599
|
| | $ | 517,316,247 | | | $ | 248,146,028 | |
| | | | |
a. All or a portion is the result of a corporate action.
b. No longer an affiliate at period end.
c. The security is no longer an affiliate, therefore, the value has been excluded from this table.
3. Represents securities sold under Rule 144A, which are exempt from registration under the Securities Act of 1933, as amended. These securities have been determined to be liquid under guidelines established by the Board of Trustees. These securities amount to $205,350,024 or 2.09% of the Fund’s net assets at period end.
|
| 20 OPPENHEIMER GLOBAL OPPORTUNITIES FUND |
Footnotes to Statement of Investments (Continued)
4. Rate shown is the 7-day yield at period end.
Distribution of investments representing geographic holdings, as a percentage of total investments at value, is as follows:
| | | | | | | | |
| Geographic Holdings (Unaudited) | | Value | | | Percent | |
United States | | $ | 4,901,362,735 | | | | 49.7 | % |
Japan | | | 1,012,428,181 | | | | 10.3 | |
United Kingdom | | | 968,078,094 | | | | 9.8 | |
Germany | | | 641,990,813 | | | | 6.5 | |
Denmark | | | 404,580,326 | | | | 4.1 | |
Sweden | | | 339,073,865 | | | | 3.4 | |
France | | | 316,305,831 | | | | 3.2 | |
Italy | | | 253,045,753 | | | | 2.6 | |
Spain | | | 194,689,790 | | | | 2.0 | |
Luxembourg | | | 170,067,648 | | | | 1.7 | |
Norway | | | 168,389,872 | | | | 1.7 | |
Belgium | | | 127,190,582 | | | | 1.3 | |
Finland | | | 121,705,323 | | | | 1.2 | |
China | | | 48,580,000 | | | | 0.5 | |
Canada | | | 45,520,000 | | | | 0.5 | |
Ireland | | | 33,809,973 | | | | 0.4 | |
New Zealand | | | 29,928,721 | | | | 0.3 | |
Portugal | | | 29,561,145 | | | | 0.3 | |
Chile | | | 22,235,539 | | | | 0.2 | |
Switzerland | | | 18,191,725 | | | | 0.2 | |
Netherlands | | | 12,215,647 | | | | 0.1 | |
| | | | | | | | |
Total | | $ | 9,858,951,563 | | | | 100.0 | % |
| | | | | | | | |
See accompanying Notes to Financial Statements.
|
| 21 OPPENHEIMER GLOBAL OPPORTUNITIES FUND |
STATEMENT OF ASSETS AND LIABILITIES September 30, 2018
| | | | |
| Assets | | | | |
| Investments, at value—see accompanying statement of investments: | | | | |
| Unaffiliated companies (cost $5,592,814,792) | | $ | 7,900,488,400 | |
| Affiliated companies (cost $1,490,816,809) | | | 1,958,463,163 | |
| | | | |
| | | 9,858,951,563 | |
| Cash | | | 8,009,794 | |
| Cash—foreign currencies (cost $3,300,930) | | | 3,300,939 | |
| Receivables and other assets: | | | | |
| Shares of beneficial interest sold | | | 21,753,241 | |
| Dividends | | | 8,847,890 | |
| Other | | | 360,873 | |
| | | | |
| Total assets | | | 9,901,224,300 | |
| | | | |
| Liabilities | | | | |
| Payables and other liabilities: | | | | |
| Investments purchased | | | 71,949,068 | |
| Shares of beneficial interest redeemed | | | 10,398,274 | |
| Distribution and service plan fees | | | 1,105,883 | |
| Trustees’ compensation | | | 544,642 | |
| Shareholder communications | | | 27,014 | |
| Other | | | 207,666 | |
| | | | |
| Total liabilities | | | 84,232,547 | |
| | |
Net Assets | | $ | 9,816,991,753 | |
| | | | |
| | | | |
| Composition of Net Assets | | | | |
| |
| Par value of shares of beneficial interest | | $ | 131,888 | |
| |
| Additional paid-in capital | | | 6,275,973,981 | |
| |
| Accumulated net investment loss | | | (20,544,415) | |
| |
| Accumulated net realized gain on investments and foreign currency transactions | | | 786,168,985 | |
| Net unrealized appreciation on investments and translation of assets and liabilities denominated in foreign currencies | | | 2,775,261,314 | |
| | | | |
Net Assets | | $ | 9,816,991,753 | |
| | | | |
|
| 22 OPPENHEIMER GLOBAL OPPORTUNITIES FUND |
| | | | |
| Net Asset Value Per Share | | | | |
| Class A Shares: | | | | |
| |
| Net asset value and redemption price per share (based on net assets of $4,124,481,438 and 54,983,625 shares of beneficial interest outstanding) | | | $75.01 | |
| |
| Maximum offering price per share (net asset value plus sales charge of 5.75% of offering price) | | | $79.59 | |
| |
| Class C Shares: | | | | |
| |
| Net asset value, redemption price (excludes applicable contingent deferred sales charge) and offering price per share (based on net assets of $955,892,774 and 14,489,845 shares of beneficial interest outstanding) | | | $65.97 | |
| |
| Class I Shares: | | | | |
| |
| Net asset value, redemption price and offering price per share (based on net assets of $1,403,832,032 and 18,372,469 shares of beneficial interest outstanding) | | | $76.41 | |
| |
| Class R Shares: | | | | |
| |
| Net asset value, redemption price (excludes applicable contingent deferred sales charge) and offering price per share (based on net assets of $276,789,491 and 3,841,275 shares of beneficial interest outstanding) | | | $72.06 | |
| |
| Class Y Shares: | | | | |
| |
| Net asset value, redemption price and offering price per share (based on net assets of $3,055,996,018 and 40,201,141 shares of beneficial interest outstanding) | | | $76.02 | |
See accompanying Notes to Financial Statements.
|
| 23 OPPENHEIMER GLOBAL OPPORTUNITIES FUND |
STATEMENT OF
OPERATIONS For the Year Ended September 30, 2018
| | | | |
| Investment Income | | | | |
| Dividends: | | | | |
| Unaffiliated companies (net of foreign withholding taxes of $5,638,566) | | $ | 61,398,123 | |
| Affiliated companies (net of foreign withholding taxes of $211,592) | | | 5,412,599 | |
| Interest | | | 412,896 | |
| | | | |
| Total investment income | | | 67,223,618 | |
| Expenses | | | | |
Management fees | | | 55,599,792 | |
| Distribution and service plan fees: | | | | |
| Class A | | | 9,540,375 | |
| Class B1 | | | 46,259 | |
| Class C | | | 8,514,612 | |
| Class R | | | 1,240,054 | |
| Transfer and shareholder servicing agent fees: | | | | |
| Class A | | | 7,875,526 | |
| Class B1 | | | 9,711 | |
| Class C | | | 1,708,668 | |
| Class I | | | 322,955 | |
| Class R | | | 499,062 | |
| Class Y | | | 4,424,868 | |
| Shareholder communications: | | | | |
| Class A | | | 35,656 | |
| Class B1 | | | 653 | |
| Class C | | | 8,515 | |
| Class I | | | 33,609 | |
| Class R | | | 1,677 | |
| Class Y | | | 19,539 | |
| Custodian fees and expenses | | | 394,306 | |
| Borrowing fees | | | 240,337 | |
| Trustees’ compensation | | | 117,314 | |
Other | | | 184,676 | |
| | �� | | |
Total expenses | | | 90,818,164 | |
Less waivers and reimbursements of expenses | | | (394,299) | |
| | | | |
Net expenses | | | 90,423,865 | |
Net Investment Loss | | | (23,200,247) | |
|
| 24 OPPENHEIMER GLOBAL OPPORTUNITIES FUND |
| | | | |
| Realized and Unrealized Gain (Loss) | | | | |
Net realized gain (loss) on: | | | | |
Investment transactions in: | | | | |
Unaffiliated companies | | $ | 380,124,247 | |
Affiliated companies | | | 517,316,247 | |
Foreign currency transactions | | | (679,627) | |
| | | | |
| Net realized gain | | | 896,760,867 | |
Net change in unrealized appreciation/depreciation on: | | | | |
Investment transactions in: | | | | |
Unaffiliated companies | | | 434,979,873 | |
Affiliated companies | | | 248,146,028 | |
Translation of assets and liabilities denominated in foreign currencies | | | (126,238) | |
| | | | |
| Net change in unrealized appreciation/depreciation | | | 682,999,663 | |
Net Increase in Net Assets Resulting from Operations | | $ | 1,556,560,283 | |
| | | | |
1. Effective June 1, 2018, all Class B shares converted to Class A shares.
See accompanying Notes to Financial Statements.
|
| 25 OPPENHEIMER GLOBAL OPPORTUNITIES FUND |
STATEMENTS OF CHANGES IN NET ASSETS
| | | | | | | | |
| | | Year Ended
September 30, 2018 | | | Year Ended
September 30, 2017 | |
| Operations | | | | | | | | |
| Net investment loss | | $ | (23,200,247) | | | $ | (20,632,359) | |
| Net realized gain | | | 896,760,867 | | | | 238,030,156 | |
| Net change in unrealized appreciation/depreciation | | | 682,999,663 | | | | 1,018,479,306 | |
| | | | |
Net increase in net assets resulting from operations | | | 1,556,560,283 | | | | 1,235,877,103 | |
| Dividends and/or Distributions to Shareholders | | | | | | | | |
| Dividends from net investment income: | | | | | | | | |
| Class A | | | — | | | | (6,341,952) | |
| Class B1 | | | — | | | | — | |
| Class C | | | — | | | | — | |
| Class I | | | — | | | | (869,379) | |
| Class R | | | — | | | | (153,977) | |
| Class Y | | | — | | | | (3,223,850) | |
| | | | |
| | | — | | | | (10,589,158) | |
| Distributions from net realized gain: | | | | | | | | |
| Class A | | | (81,359,783) | | | | (171,785,186) | |
| Class B1 | | | (242,438) | | | | (1,513,021) | |
| Class C | | | (19,404,043) | | | | (36,239,637) | |
| Class I | | | (18,407,270) | | | | (9,011,793) | |
| Class R | | | (5,250,874) | | | | (9,337,663) | |
| Class Y | | | (35,315,115) | | | | (42,595,721) | |
| | | | |
| | | (159,979,523) | | | | (270,483,021) | |
| Beneficial Interest Transactions | | | | | | | | |
| Net increase (decrease) in net assets resulting from beneficial interest transactions: | | | | | | | | |
| Class A | | | 338,869,573 | | | | 9,385,732 | |
| Class B1 | | | (13,771,456) | | | | (14,284,268) | |
| Class C | | | 164,705,464 | | | | 67,479,218 | |
| Class I | | | 565,630,111 | | | | 470,463,581 | |
| Class R | | | 32,801,467 | | | | 42,236,538 | |
| Class Y | | | 1,483,585,255 | | | | 494,405,602 | |
| | | | |
| | | 2,571,820,414 | | | | 1,069,686,403 | |
| Net Assets | | | | | | | | |
| Total increase | | | 3,968,401,174 | | | | 2,024,491,327 | |
| Beginning of period | | | 5,848,590,579 | | | | 3,824,099,252 | |
| | | | |
End of period (including accumulated net investment loss of $20,544,415 and $31,697,700, respectively) | | $ | 9,816,991,753 | | | $ | 5,848,590,579 | |
| | | | |
1. Effective June 1, 2018, all Class B shares converted to Class A shares.
See accompanying Notes to Financial Statements.
26 OPPENHEIMER GLOBAL OPPORTUNITIES FUND
FINANCIAL HIGHLIGHTS
| | | | | | | | | | | | | | | | | | | | |
| Class A | | Year Ended September 30, 2018 | | | Year Ended September 30, 2017 | | | Year Ended September 30, 2016 | | | Year Ended September 30, 2015 | | | Year Ended September 30, 2014 | |
| Per Share Operating Data | | | | | | | | | | | | | | | | | | | | |
| Net asset value, beginning of period | | | $61.40 | | | | $50.76 | | | | $39.42 | | | | $38.67 | | | | $38.11 | |
| |
| Income (loss) from investment operations: | | | | | | | | | | | | | | | | | | | | |
| Net investment loss1 | | | (0.22) | | | | (0.23) | | | | (0.17) | | | | (0.27) | | | | (0.07) | |
| Net realized and unrealized gain | | | 15.42 | | | | 14.49 | | | | 11.81 | | | | 1.13 | | | | 0.63 | |
| | | | |
| Total from investment operations | | | 15.20 | | | | 14.26 | | | | 11.64 | | | | 0.86 | | | | 0.56 | |
| |
| Dividends and/or distributions to shareholders: | | | | | | | | | | | | | | | | | | | | |
| Dividends from net investment income | | | 0.00 | | | | (0.13) | | | | (0.05) | | | | (0.11) | | | | 0.00 | |
| Distributions from net realized gain | | | (1.59) | | | | (3.49) | | | | (0.25) | | | | 0.00 | | | | 0.00 | |
| | | | |
| Total dividends and/or distributions to shareholders | | | (1.59) | | | | (3.62) | | | | (0.30) | | | | (0.11) | | | | 0.00 | |
| |
| Net asset value, end of period | | | $75.01 | | | | $61.40 | | | | $50.76 | | | | $39.42 | | |
| $38.67
|
|
| | | | |
| | | | | | | | | | | | | | | | | | | | |
| Total Return, at Net Asset Value2 | | | 25.09% | | | | 30.48% | | | | 29.66% | | | | 2.22% | | | | 1.47% | |
| | | | | | | | | | | | | | | | | | | | |
| Ratios/Supplemental Data | | | | | | | | | | | | | | | | | | | | |
| Net assets, end of period (in thousands) | | | $4,124,481 | | | | $3,085,024 | | | | $2,529,288 | | | | $2,118,295 | | | | $2,293,999 | |
| |
| Average net assets (in thousands) | | | $3,935,760 | | | | $2,689,282 | | | | $2,281,847 | | | | $2,299,089 | | | | $2,422,818 | |
| |
| Ratios to average net assets:3 | | | | | | | | | | | | | | | | | | | | |
| Net investment loss | | | (0.31)% | | | | (0.43)% | | | | (0.39)% | | | | (0.66)% | | | | (0.17)% | |
| Expenses excluding specific expenses listed below | | | 1.12% | | | | 1.17% | | | | 1.18% | | | | 1.18% | | | | 1.17% | |
| Interest and fees from borrowings | | | 0.00%4 | | | | 0.00%4 | | | | 0.00%4 | | | | 0.00%4 | | | | 0.00% | |
| | | | |
| Total expenses5 | | | 1.12% | | | | 1.17% | | | | 1.18% | | | | 1.18% | | | | 1.17% | |
| Expenses after payments, waivers and/or reimbursements and reduction to custodian expenses | | | 1.12%6 | | | | 1.15% | | | | 1.18%6 | | | | 1.18%6 | | | | 1.17%6 | |
| |
| Portfolio turnover rate | | | 21% | | | | 18% | | | | 26% | | | | 16% | | | | 16% | |
1. Per share amounts calculated based on the average shares outstanding during the period.
2. Assumes an initial investment on the business day before the first day of the fiscal period, with all dividends and distributions reinvested in additional shares on the reinvestment date, and redemption at the net asset value calculated on the last business day of the fiscal period. Sales charges are not reflected in the total returns. Total returns are not annualized for periods less than one full year. Returns do not reflect the deduction of taxes that a shareholder would pay on fund distributions or the redemption of fund shares.
3. Annualized for periods less than one full year.
4. Less than 0.005%.
5. Total expenses including indirect expenses from affiliated fund fees and expenses were as follows:
| | | | | | |
| | | | | | |
| | Year Ended September 30, 2018 | | | 1.12% | |
| | Year Ended September 30, 2017 | | | 1.17% | |
| | Year Ended September 30, 2016 | | | 1.18% | |
| | Year Ended September 30, 2015 | | | 1.18% | |
| | Year Ended September 30, 2014 | | | 1.17% | |
6. Waiver was less than 0.005%.
See accompanying Notes to Financial Statements.
27 OPPENHEIMER GLOBAL OPPORTUNITIES FUND
FINANCIAL HIGHLIGHTS Continued
| | | | | | | | | | | | | | | | | | | | |
| Class C | | Year Ended
September 30, 2018 | | | Year Ended
September 30, 2017 | | | Year Ended
September 30, 2016 | | | Year Ended
September 30, 2015 | | | Year Ended
September 30, 2014 | |
| Per Share Operating Data | | | | | | | | | | | | | | | | | | | | |
| Net asset value, beginning of period | | | $54.57 | | | | $45.72 | | | | $35.75 | | | | $35.24 | | | | $34.99 | |
| |
| Income (loss) from investment operations: | | | | | | | | | | | | | | | | | | | | |
| Net investment loss1 | | | (0.67) | | | | (0.56) | | | | (0.45) | | | | (0.52) | | | | (0.34) | |
| Net realized and unrealized gain | | | 13.66 | | | | 12.90 | | | | 10.67 | | | | 1.03 | | | | 0.59 | |
| | | | |
| Total from investment operations | | | 12.99 | | | | 12.34 | | | | 10.22 | | | | 0.51 | | | | 0.25 | |
| |
| Dividends and/or distributions to shareholders: | | | | | | | | | | | | | | | | | | | | |
| Dividends from net investment income | | | 0.00 | | | | 0.00 | | | | 0.00 | | | | 0.00 | | | | 0.00 | |
| Distributions from net realized gain | | | (1.59) | | | | (3.49) | | | | (0.25) | | | | 0.00 | | | | 0.00 | |
| | | | |
| Total dividends and/or distributions to shareholders | | | (1.59) | | | | (3.49) | | | | (0.25) | | | | 0.00 | | | | 0.00 | |
| |
| Net asset value, end of period | | | $65.97 | | | | $54.57 | | | | $45.72 | | | | $35.75 | | | | $35.24 | |
| | | | |
| | | | | | | | | | | | | | | | | | | | |
| Total Return, at Net Asset Value2 | | | 24.15% | | | | 29.47% | | | | 28.71% | | | | 1.45% | | | | 0.72% | |
| | | | | | | | | | | | | | | | | | | | |
| Ratios/Supplemental Data | | | | | | | | | | | | | | | | | | | | |
| Net assets, end of period (in thousands) | | | $955,893 | | | | $648,270 | | | | $475,199 | | | | $385,550 | | | | $420,778 | |
| |
| Average net assets (in thousands) | | | $854,873 | | | | $533,915 | | | | $421,487 | | | | $416,534 | | | | $438,648 | |
| |
| Ratios to average net assets:3 | | | | | | | | | | | | | | | | | | | | |
| Net investment loss | | | (1.06)% | | | | (1.18)% | | | | (1.14)% | | | | (1.41)% | | | | (0.93)% | |
| Expenses excluding specific expenses listed below | | | 1.87% | | | | 1.92% | | | | 1.94% | | | | 1.94% | | | | 1.92% | |
| Interest and fees from borrowings | | | 0.00%4 | | | | 0.00%4 | | | | 0.00%4 | | | | 0.00%4 | | | | 0.00% | |
| | | | |
| Total expenses5 | | | 1.87% | | | | 1.92% | | | | 1.94% | | | | 1.94% | | | | 1.92% | |
| Expenses after payments, waivers and/or reimbursements and reduction to custodian expenses | | | 1.87%6 | | | | 1.91% | | | | 1.94%6 | | | | 1.94%6 | | | | 1.92%6 | |
| |
| Portfolio turnover rate | | | 21% | | | | 18% | | | | 26% | | | | 16% | | | | 16% | |
1. Per share amounts calculated based on the average shares outstanding during the period.
2. Assumes an initial investment on the business day before the first day of the fiscal period, with all dividends and distributions reinvested in additional shares on the reinvestment date, and redemption at the net asset value calculated on the last business day of the fiscal period. Sales charges are not reflected in the total returns. Total returns are not annualized for periods less than one full year. Returns do not reflect the deduction of taxes that a shareholder would pay on fund distributions or the redemption of fund shares.
3. Annualized for periods less than one full year.
4. Less than 0.005%.
5. Total expenses including indirect expenses from affiliated fund fees and expenses were as follows:
| | | | | | |
| | Year Ended September 30, 2018 | | 1.87% | | |
| | Year Ended September 30, 2017 | | 1.92% | | |
| | Year Ended September 30, 2016 | | 1.94% | | |
| | Year Ended September 30, 2015 | | 1.94% | | |
| | Year Ended September 30, 2014 | | 1.92% | | |
6. Waiver was less than 0.005%.
See accompanying Notes to Financial Statements.
28 OPPENHEIMER GLOBAL OPPORTUNITIES FUND
| | | | | | | | | | | | | | | | | | | | |
| Class I | | Year Ended
September 30, 2018 | | | Year Ended
September
30, 2017 | | | Year Ended
September
30, 2016 | | | Year Ended
September
30, 2015 | | | Year Ended
September
30, 2014 | |
| | | | | | |
| Per Share Operating Data | | | | | | | | | | | | | | | | | | | | |
| Net asset value, beginning of period | | | $62.26 | | | | $51.43 | | | | $39.93 | | | | $39.18 | | | | $38.45 | |
| Income (loss) from investment operations: | | | | | | | | | | | | | | | | | | | | |
| Net investment income (loss)1 | | | 0.07 | | | | 0.002 | | | | 0.02 | | | | (0.09) | | | | 0.13 | |
| Net realized and unrealized gain | | | 15.67 | | | | 14.66 | | | | 11.97 | | | | 1.13 | | | | 0.60 | |
| | | | |
| Total from investment operations | | | 15.74 | | | | 14.66 | | | | 11.99 | | | | 1.04 | | | | 0.73 | |
| Dividends and/or distributions to shareholders: | | | | | | | | | | | | | | | | | | | | |
| Dividends from net investment income | | | 0.00 | | | | (0.34) | | | | (0.24) | | | | (0.29) | | | | 0.00 | |
| Distributions from net realized gain | | | (1.59) | | | | (3.49) | | | | (0.25) | | | | 0.00 | | | | 0.00 | |
| | | | |
| Total dividends and/or distributions to shareholders | | | (1.59) | | | | (3.83) | | | | (0.49) | | | | (0.29) | | | | 0.00 | |
| Net asset value, end of period | | | $76.41 | | | | $62.26 | | | | $51.43 | | | | $39.93 | | | | $39.18 | |
| | | | |
| | | | | | | | | | | | | | | | | | | | |
| | | | | | |
| Total Return, at Net Asset Value3 | | | 25.61% | | | | 31.01% | | | | 30.21% | | | | 2.67% | | | | 1.90% | |
| | | | | | | | | | | | | | | | | | | | |
| | | | | | |
| Ratios/Supplemental Data | | | | | | | | | | | | | | | | | | | | |
| Net assets, end of period (in thousands) | | | $1,403,832 | | | | $662,176 | | | | $127,643 | | | | $69,700 | | | | $55,279 | |
| Average net assets (in thousands) | | | $1,079,770 | | | | $225,454 | | | | $89,556 | | | | $67,065 | | | | $48,088 | |
| Ratios to average net assets:4 | | | | | | | | | | | | | | | | | | | | |
| Net investment income (loss) | | | 0.10% | | | | 0.01% | | | | 0.04% | | | | (0.21)% | | | | 0.32% | |
| Expenses excluding specific expenses listed | | | | | | | | | | | | | | | | | | | | |
| below | | | 0.71% | | | | 0.73% | | | | 0.75% | | | | 0.75% | | | | 0.74% | |
| Interest and fees from borrowings | | | 0.00%5 | | | | 0.00%5 | | | | 0.00%5 | | | | 0.00%5 | | | | 0.00% | |
| | | | |
| Total expenses6 | | | 0.71% | | | | 0.73% | | | | 0.75% | | | | 0.75% | | | | 0.74% | |
| Expenses after payments, waivers and/or | | | | | | | | | | | | | | | | | | | | |
| reimbursements and reduction to custodian | | | | | | | | | | | | | | | | | | | | |
| expenses | | | 0.71%7 | | | | 0.73%7 | | | | 0.75%7 | | | | 0.75%7 | | | | 0.74%7 | |
| Portfolio turnover rate | | | 21% | | | | 18% | | | | 26% | | | | 16% | | | | 16% | |
1. Per share amounts calculated based on the average shares outstanding during the period.
2. Less than $0.005 per share.
3. Assumes an initial investment on the business day before the first day of the fiscal period, with all dividends and distributions reinvested in additional shares on the reinvestment date, and redemption at the net asset value calculated on the last business day of the fiscal period. Sales charges are not reflected in the total returns. Total returns are not annualized for periods less than one full year. Returns do not reflect the deduction of taxes that a shareholder would pay on fund distributions or the redemption of fund shares.
4. Annualized for periods less than one full year.
5. Less than 0.005%.
6. Total expenses including indirect expenses from affiliated fund fees and expenses were as follows:
| | | | | | |
| | Year Ended September 30, 2018 | | 0.71% | | |
| | Year Ended September 30, 2017 | | 0.73% | | |
| | Year Ended September 30, 2016 | | 0.75% | | |
| | Year Ended September 30, 2015 | | 0.75% | | |
| | Year Ended September 30, 2014 | | 0.74% | | |
7. Waiver was less than 0.005%.
See accompanying Notes to Financial Statements.
|
| 29 OPPENHEIMER GLOBAL OPPORTUNITIES FUND |
FINANCIAL HIGHLIGHTS Continued
| | | | | | | | | | | | | | | | | | | | |
| Class R | | Year Ended
September 30, 2018 | | | Year Ended
September 30, 2017 | | | Year Ended
September 30, 2016 | | | Year Ended
September
30, 2015 | | | Year Ended
September 30, 2014 | |
| |
| Per Share Operating Data | | | | | | | | | | | | | | | | | | | | |
| Net asset value, beginning of period | | | $59.18 | | | | $49.10 | | | | $38.19 | | | | $37.46 | | | | $37.02 | |
| |
| Income (loss) from investment operations: | | | | | | | | | | | | | | | | | | | | |
| Net investment loss1 | | | (0.39) | | | | (0.35) | | | | (0.27) | | | | (0.36) | | | | (0.18) | |
| Net realized and unrealized gain | | | 14.86 | | | | 13.98 | | | | 11.43 | | | | 1.09 | | | | 0.62 | |
| | | | |
| Total from investment operations | | | 14.47 | | | | 13.63 | | | | 11.16 | | | | 0.73 | | | | 0.44 | |
| |
| Dividends and/or distributions to shareholders: | | | | | | | | | | | | | | | | | | | | |
| Dividends from net investment income | | | 0.00 | | | | (0.06) | | | | 0.00 | | | | 0.00 | | | | 0.00 | |
| Distributions from net realized gain | | | (1.59) | | | | (3.49) | | | | (0.25) | | | | 0.00 | | | | 0.00 | |
| | | | |
| Total dividends and/or distributions to shareholders | | | (1.59) | | | | (3.55) | | | | (0.25) | | | | 0.00 | | | | 0.00 | |
| Net asset value, end of period | | | $72.06 | | | | $59.18 | | | | $49.10 | | | | $38.19 | | | | $37.46 | |
| | | | |
|
| |
| Total Return, at Net Asset Value2 | | | 24.79% | | | | 30.15% | | | | 29.34% | | | | 1.95% | | | | 1.19% | |
|
| |
| Ratios/Supplemental Data | |
| Net assets, end of period (in thousands) | | | $276,790 | | | | $199,696 | | | | $123,310 | | | | $85,548 | | | | $91,043 | |
| |
| Average net assets (in thousands) | | | $249,508 | | | | $156,671 | | | | $100,670 | | | | $91,765 | | | | $101,911 | |
| |
| Ratios to average net assets:3 | | | | | | | | | | | | | | | | | | | | |
| Net investment loss | | | (0.56)% | | | | (0.67)% | | | | (0.64)% | | | | (0.91)% | | | | (0.46)% | |
| Expenses excluding specific expenses listed below | | | 1.37% | | | | 1.42% | | | | 1.44% | | | | 1.43% | | | | 1.45% | |
| Interest and fees from borrowings | | | 0.00%4 | | | | 0.00%4 | | | | 0.00%4 | | | | 0.00%4 | | | | 0.00% | |
| | | | |
| Total expenses5 | | | 1.37% | | | | 1.42% | | | | 1.44% | | | | 1.43% | | | | 1.45% | |
| Expenses after payments, waivers and/or reimbursements and reduction to custodian expenses | | | 1.37%6 | | | | 1.41% | | | | 1.44%6 | | | | 1.43%6 | | | | 1.45%6 | |
| |
| Portfolio turnover rate | | | 21% | | | | 18% | | | | 26% | | | | 16% | | | | 16% | |
1. Per share amounts calculated based on the average shares outstanding during the period.
2. Assumes an initial investment on the business day before the first day of the fiscal period, with all dividends and distributions reinvested in additional shares on the reinvestment date, and redemption at the net asset value calculated on the last business day of the fiscal period. Sales charges are not reflected in the total returns. Total returns are not annualized for periods less than one full year. Returns do not reflect the deduction of taxes that a shareholder would pay on fund distributions or the redemption of fund shares.
3. Annualized for periods less than one full year.
4. Less than 0.005%.
5. Total expenses including indirect expenses from affiliated fund fees and expenses were as follows:
| | | | | | |
| | | | | | |
| | Year Ended September 30, 2018 | | | 1.37% | |
| | Year Ended September 30, 2017 | | | 1.42% | |
| | Year Ended September 30, 2016 | | | 1.44% | |
| | Year Ended September 30, 2015 | | | 1.43% | |
| | Year Ended September 30, 2014 | | | 1.45% | |
6. Waiver was less than 0.005%.
See accompanying Notes to Financial Statements.
30 OPPENHEIMER GLOBAL OPPORTUNITIES FUND
| | | | | | | | | | | | | | | | | | | | |
| Class Y | | Year Ended
September
30, 2018 | | | Year Ended
September 30, 2017 | | | Year Ended
September 30, 2016 | | | Year Ended
September 30, 2015 | | | Year Ended
September 30, 2014 | |
| Per Share Operating Data | | | | | | | | | | | | | | | | | | | | |
| Net asset value, beginning of period | | | $62.05 | | | | $51.28 | | | | $39.82 | | | | $39.07 | | | | $38.40 | |
| |
| Income (loss) from investment operations: | | | | | | | | | | | | | | | | | | | | |
| Net investment income (loss)1 | | | (0.05) | | | | (0.09) | | | | (0.06) | | | | (0.17) | | | | 0.04 | |
| Net realized and unrealized gain | | | 15.61 | | | | 14.61 | | | | 11.92 | | | | 1.13 | | | | 0.63 | |
| | | | |
| Total from investment operations | | | 15.56 | | | | 14.52 | | | | 11.86 | | | | 0.96 | | | | 0.67 | |
| |
| Dividends and/or distributions to shareholders: | | | | | | | | | | | | | | | | | | | | |
| Dividends from net investment income | | | 0.00 | | | | (0.26) | | | | (0.15) | | | | (0.21) | | | | 0.00 | |
| Distributions from net realized gain | | | (1.59) | | | | (3.49) | | | | (0.25) | | | | 0.00 | | | | 0.00 | |
| | | | |
| Total dividends and/or distributions to shareholders | | | (1.59) | | | | (3.75) | | | | (0.40) | | | | (0.21) | | | | 0.00 | |
| |
| Net asset value, end of period | | | $76.02 | | | | $62.05 | | | | $51.28 | | | | $39.82 | | | | $39.07 | |
| | | | |
| | | | | | | | | | | | | | | | | | | | |
| Total Return, at Net Asset Value2 | | | 25.40% | | | | 30.79% | | | | 29.98% | | | | 2.46% | | | | 1.75% | |
| | | | | | | | | | | | | | | | | | | | |
| Ratios/Supplemental Data | | | | | | | | | | | | | | | | | | | | |
| Net assets, end of period (in thousands) | | | $3,055,996 | | | | $1,241,346 | | | | $544,742 | | | | $360,040 | | | | $409,448 | |
| |
| Average net assets (in thousands) | | | $2,230,923 | | | | $919,307 | | | | $422,088 | | | | $399,477 | | | | $405,921 | |
| |
| Ratios to average net assets:3 | | | | | | | | | | | | | | | | | | | | |
| Net investment income (loss) | | | (0.07)% | | | | (0.16)% | | | | (0.14)% | | | | (0.41)% | | | | 0.10% | |
| Expenses excluding specific expenses listed below | | | 0.87% | | | | 0.92% | | | | 0.94% | | | | 0.94% | | | | 0.92% | |
| Interest and fees from borrowings | | | 0.00%4 | | | | 0.00%4 | | | | 0.00%4 | | | | 0.00%4 | | | | 0.00% | |
| | | | |
| Total expenses5 | | | 0.87% | | | | 0.92% | | | | 0.94% | | | | 0.94% | | | | 0.92% | |
| Expenses after payments, waivers and/or reimbursements and reduction to custodian expenses | | | 0.87%6 | | | | 0.91% | | | | 0.94%6 | | | | 0.94%6 | | | | 0.92%6 | |
| |
| Portfolio turnover rate | | | 21% | | | | 18% | | | | 26% | | | | 16% | | | | 16% | |
1. Per share amounts calculated based on the average shares outstanding during the period.
2. Assumes an initial investment on the business day before the first day of the fiscal period, with all dividends and distributions reinvested in additional shares on the reinvestment date, and redemption at the net asset value calculated on the last business day of the fiscal period. Sales charges are not reflected in the total returns. Total returns are not annualized for periods less than one full year. Returns do not reflect the deduction of taxes that a shareholder would pay on fund distributions or the redemption of fund shares.
3. Annualized for periods less than one full year.
4. Less than 0.005%.
5. Total expenses including indirect expenses from affiliated fund fees and expenses were as follows:
| | | | | | |
| | | | | | |
| | Year Ended September 30, 2018 | | | 0.87% | |
| | Year Ended September 30, 2017 | | | 0.92% | |
| | Year Ended September 30, 2016 | | | 0.94% | |
| | Year Ended September 30, 2015 | | | 0.94% | |
| | Year Ended September 30, 2014 | | | 0.92% | |
6. Waiver was less than 0.005%.
See accompanying Notes to Financial Statements.
31 OPPENHEIMER GLOBAL OPPORTUNITIES FUND
NOTES TO FINANCIAL STATEMENTS September 30, 2018
1. Organization
Oppenheimer Global Opportunities Fund (the “Fund”) is a diversified open-end management investment company registered under the Investment Company Act of 1940 (“1940 Act”), as amended. The Fund’s investment objective is to seek capital appreciation. The Fund’s investment adviser is OFI Global Asset Management, Inc. (“OFI Global” or the “Manager”), a wholly-owned subsidiary of OppenheimerFunds, Inc. (“OFI” or the “Sub-Adviser”). The Manager has entered into a sub-advisory agreement with OFI.
The Fund offers Class A, Class C, Class I, Class R and Class Y shares, and previously offered Class B shares for new purchase through June 29, 2012. Subsequent to that date, no new purchases of Class B shares were permitted. Reinvestment of dividend and/or capital gain distributions and exchanges of Class B shares into and from other Oppenheimer funds were permitted through May 31, 2018. Effective June 1, 2018 (the “Conversion Date”), all Class B shares converted to Class A shares. Class A shares are sold at their offering price, which is normally net asset value plus a front-end sales charge. Class C and Class R shares are sold, and Class B shares were sold, without a front-end sales charge but may be subject to a contingent deferred sales charge (“CDSC”). Class R shares are sold only through retirement plans. Retirement plans that offer Class R shares may impose charges on those accounts. Class I and Class Y shares are sold to certain institutional investors or intermediaries without either a front-end sales charge or a CDSC, however, the intermediaries may impose charges on their accountholders who beneficially own Class I and Class Y shares. All classes of shares have identical rights and voting privileges with respect to the Fund in general and exclusive voting rights on matters that affect that class alone. Earnings, net assets and net asset value per share may differ due to each class having its own expenses, such as transfer and shareholder servicing agent fees and shareholder communications, directly attributable to that class. Class A, C and R shares have, and Class B shares had, separate distribution and/or service plans under which they pay, and Class B shares paid, fees. Class I and Class Y shares do not pay such fees. Previously issued Class B shares automatically converted to Class A shares 72 months after the date of purchase.
The following is a summary of significant accounting policies followed in the Fund’s preparation of financial statements in accordance with accounting principles generally accepted in the United States (“U.S. GAAP”).
2. Significant Accounting Policies
Security Valuation. All investments in securities are recorded at their estimated fair value, as described in Note 3.
Foreign Currency Translation. The books and records of the Fund are maintained in U.S. dollars. Any foreign currency amounts are translated into U.S. dollars on the following basis:
(1) Value of investment securities, other assets and liabilities — at the exchange rates prevailing at market close as described in Note 3.
(2) Purchases and sales of investment securities, income and expenses — at the rates of exchange prevailing on the respective dates of such transactions.
32 OPPENHEIMER GLOBAL OPPORTUNITIES FUND
2. Significant Accounting Policies (Continued)
Although the net assets and the values are presented at the foreign exchange rates at market close, the Fund does not isolate the portion of the results of operations resulting from changes in foreign exchange rates on investments from the fluctuations arising from changes in prices of securities held. Such fluctuations are included with the net realized and unrealized gains or losses from investments shown in the Statement of Operations.
For securities, which are subject to foreign withholding tax upon disposition, realized and unrealized gains or losses on such securities are recorded net of foreign withholding tax.
Reported net realized foreign exchange gains or losses arise from sales of foreign currencies, currency gains or losses realized between the trade and settlement dates on securities transactions, the difference between the amounts of dividends, interest, and foreign withholding tax reclaims recorded on the Fund’s books, and the U.S. dollar equivalent of the amounts actually received or paid. Net unrealized foreign exchange gains and losses arise from changes in the value of assets and liabilities other than investments in securities, resulting from changes in the exchange rate.
Allocation of Income, Expenses, Gains and Losses. Income, expenses (other than those attributable to a specific class), gains and losses are allocated on a daily basis to each class of shares based upon the relative proportion of net assets represented by such class. Operating expenses directly attributable to a specific class are charged against the operations of that class.
Dividends and Distributions to Shareholders. Dividends and distributions to shareholders, which are determined in accordance with income tax regulations and may differ from U.S. GAAP, are recorded on the ex-dividend date. Income and capital gain distributions, if any, are declared and paid annually or at other times as determined necessary by the Manager.
Investment Income. Dividend income is recorded on the ex-dividend date or upon ex-dividend notification in the case of certain foreign dividends where the ex-dividend date may have passed. Non-cash dividends included in dividend income, if any, are recorded at the fair value of the securities received. Withholding taxes on foreign dividends, if any, and capital gains taxes on foreign investments, if any, have been provided for in accordance with the Fund’s understanding of the applicable tax rules and regulations. Interest income, if any, is recognized on an accrual basis. Discount and premium, which are included in interest income on the Statement of Operations, are amortized or accreted daily.
Return of Capital Estimates. Distributions received from the Fund’s investments in Real Estate Investments Trusts (REITs), generally are comprised of income and return of capital. The Fund records investment income and return of capital based on estimates. Such estimates are based on historical information available from each REIT and other industry sources. These estimates may subsequently be revised based on information received from REITs after their tax reporting periods are concluded.
|
| 33 OPPENHEIMER GLOBAL OPPORTUNITIES FUND |
NOTES TO FINANCIAL STATEMENTS Continued
2. Significant Accounting Policies (Continued)
Custodian Fees. “Custodian fees and expenses” in the Statement of Operations may include interest expense incurred by the Fund on any cash overdrafts of its custodian account during the period. Such cash overdrafts may result from the effects of failed trades in portfolio securities and from cash outflows resulting from unanticipated shareholder redemption activity. The Fund pays interest to its custodian on such cash overdraft at a rate equal to the Prime Rate plus 0.35%. The “Reduction to custodian expenses” line item, if applicable, represents earnings on cash balances maintained by the Fund during the period. Such interest expense and other custodian fees may be paid with these earnings.
Security Transactions. Security transactions are recorded on the trade date. Realized gains and losses on securities sold are determined on the basis of identified cost.
Indemnifications. The Fund’s organizational documents provide current and former Trustees and officers with a limited indemnification against liabilities arising in connection with the performance of their duties to the Fund. In the normal course of business, the Fund may also enter into contracts that provide general indemnifications. The Fund’s maximum exposure under these arrangements is unknown as this would be dependent on future claims that may be made against the Fund. The risk of material loss from such claims is considered remote.
Federal Taxes. The Fund intends to comply with provisions of the Internal Revenue Code applicable to regulated investment companies and to distribute substantially all of its investment company taxable income, including any net realized gain on investments not offset by capital loss carryforwards, if any, to shareholders. Therefore, no federal income or excise tax provision is required. The Fund files income tax returns in U.S. federal and applicable state jurisdictions. The statute of limitations on the Fund’s tax return filings generally remains open for the three preceding fiscal reporting period ends. The Fund has analyzed its tax positions for the fiscal year ended September 30, 2018, including open tax years, and does not believe there are any uncertain tax positions requiring recognition in the Fund’s financial statements.
The tax components of capital shown in the following table represent distribution requirements the Fund must satisfy under the income tax regulations, losses the Fund may be able to offset against income and gains realized in future years and unrealized appreciation or depreciation of securities and other investments for federal income tax purposes.
| | | | | | | | | | | | |
Undistributed
Net Investment
Income | | Undistributed
Long-Term
Gain | | | Accumulated
Loss
Carryforward1, 2 | | | Net Unrealized
Appreciation
Based on cost of
Securities and
Other Investments
for Federal Income
Tax Purposes | |
$93,442,047 | | | $587,379,108 | | | | $— | | | | $2,860,575,326 | |
1. During the reporting period, the Fund did not utilize any capital loss carryforward.
2. During the previous reporting period, the Fund did not utilize any capital loss carryforward.
|
| 34 OPPENHEIMER GLOBAL OPPORTUNITIES FUND |
2. Significant Accounting Policies (Continued)
Net investment income (loss) and net realized gain (loss) may differ for financial statement and tax purposes. The character of dividends and distributions made during the fiscal year from net investment income or net realized gains are determined in accordance with federal income tax requirements, which may differ from the character of net investment income or net realized gains presented in those financial statements in accordance with U.S. GAAP. Also, due to timing of dividends and distributions, the fiscal year in which amounts are distributed may differ from the fiscal year in which the income or net realized gain was recorded by the Fund.
Accordingly, the following amounts have been reclassified for the reporting period. Net assets of the Fund were unaffected by the reclassifications.
| | | | | | | | |
Increase
to Paid-in Capital | | Reduction to Accumulated
Net Investment
Loss | | | Reduction
to Accumulated Net
Realized Gain
on Investments3 | |
$86,772,547 | | | $34,353,532 | | | | $121,126,079 | |
3. $86,561,558, including $77,313,397 of long-term capital gain, was distributed in connection with Fund share redemptions.
The tax character of distributions paid during the reporting periods:
| | | | | | | | |
| | | Year Ended
September 30, 2018 | | | Year Ended
September 30, 2017 | |
Distributions paid from: | | | | | | | | |
Ordinary income | | $ | 13,432,135 | | | $ | 35,019,239 | |
Long-term capital gain | | | 146,547,388 | | | | 246,052,940 | |
| | | | |
Total | | $ | 159,979,523 | | | $ | 281,072,179 | |
| | | | |
The aggregate cost of securities and other investments and the composition of unrealized appreciation and depreciation of securities and other investments for federal income tax purposes at period end are noted in the following table. The primary difference between book and tax appreciation or depreciation of securities and other investments, if applicable, is attributable to the tax deferral of losses or tax realization of financial statement unrealized gain or loss.
| | | | |
Federal tax cost of securities | | $ | 7,103,665,434 | |
Federal tax cost of other investments | | | (102,046,915) | |
| | | | |
Total federal tax cost | | $ | 7,001,618,519 | |
| | | | |
Gross unrealized appreciation | | $ | 3,900,734,867 | |
Gross unrealized depreciation | | | (1,040,159,541) | |
| | | | |
Net unrealized appreciation | | $ | 2,860,575,326 | |
| | | | |
Use of Estimates. The preparation of financial statements in conformity with U.S. GAAP requires management to make estimates and assumptions that affect the reported amounts of assets and liabilities and disclosure of contingent assets and liabilities at the date of the
|
| 35 OPPENHEIMER GLOBAL OPPORTUNITIES FUND |
NOTES TO FINANCIAL STATEMENTS Continued
2. Significant Accounting Policies (Continued)
financial statements and the reported amounts of increases and decreases in net assets from operations during the reporting period. Actual results could differ from those estimates.
New Accounting Pronouncement. In March 2017, Financial Accounting Standards Board (“FASB”) issued Accounting Standards Update (“ASU”), ASU 2017-08. This provides guidance related to the amortization period for certain purchased callable debt securities held at a premium. The ASU is effective for annual periods beginning after December 15, 2018, and interim periods within those annual periods. The Manager is evaluating the impacts of these changes on the financial statements.
3. Securities Valuation
The Fund calculates the net asset value of its shares as of 4:00 P.M. Eastern Time, on each day the New York Stock Exchange (the “Exchange”) is open for trading, except in the case of a scheduled early closing of the Exchange, in which case the Fund will calculate net asset value of the shares as of the scheduled early closing time of the Exchange.
The Fund’s Board has adopted procedures for the valuation of the Fund’s securities and has delegated the day-to-day responsibility for valuation determinations under those procedures to the Manager. The Manager has established a Valuation Committee which is responsible for determining a fair valuation for any security for which market quotations are not readily available. The Valuation Committee’s fair valuation determinations are subject to review, approval and ratification by the Fund’s Board at least quarterly or more frequently, if necessary.
Valuation Methods and Inputs
Securities are valued primarily using unadjusted quoted market prices, when available, as supplied by third party pricing services or broker-dealers.
The following methodologies are used to determine the market value or the fair value of the types of securities described below:
Equity securities traded on a securities exchange (including exchange-traded derivatives other than futures and futures options) are valued based on the official closing price on the principal exchange on which the security is traded, as identified by the Manager, prior to the time when the Fund’s assets are valued. If the official closing price is unavailable, the security is valued at the last sale price on the principal exchange on which it is traded, or if no sales occurred, the security is valued at the mean between the quoted bid and asked prices. Over-the-counter equity securities are valued at the last published sale price, or if no sales occurred, at the mean between the quoted bid and asked prices. Events occurring after the close of trading on foreign exchanges may result in adjustments to the valuation of foreign securities to more accurately reflect their fair value as of the time when the Fund’s assets are valued.
Shares of a registered investment company that are not traded on an exchange are valued at that investment company’s net asset value per share.
Securities for which market quotations are not readily available, or when a significant event
|
| 36 OPPENHEIMER GLOBAL OPPORTUNITIES FUND |
3. Securities Valuation (Continued)
has occurred that would materially affect the value of the security, are fair valued either (i) by a standardized fair valuation methodology applicable to the security type or the significant event as previously approved by the Valuation Committee and the Fund’s Board or (ii) as determined in good faith by the Manager’s Valuation Committee. The Valuation Committee considers all relevant facts that are reasonably available, through either public information or information available to the Manager, when determining the fair value of a security. Those standardized fair valuation methodologies include, but are not limited to, valuing securities at the last sale price or initially at cost and subsequently adjusting the value based on: changes in company specific fundamentals, changes in an appropriate securities index, or changes in the value of similar securities which may be further adjusted for any discounts related to security-specific resale restrictions. When possible, such methodologies use observable market inputs such as unadjusted quoted prices of similar securities, observable interest rates, currency rates and yield curves. The methodologies used for valuing securities are not necessarily an indication of the risks associated with investing in those securities nor can it be assured that the Fund can obtain the fair value assigned to a security if it were to sell the security.
Classifications
Each investment asset or liability of the Fund is assigned a level at measurement date based on the significance and source of the inputs to its valuation. Various data inputs may be used in determining the value of each of the Fund’s investments as of the reporting period end. These data inputs are categorized in the following hierarchy under applicable financial accounting standards:
1) Level 1-unadjusted quoted prices in active markets for identical assets or liabilities (including securities actively traded on a securities exchange)
2) Level 2-inputs other than unadjusted quoted prices that are observable for the asset or liability (such as unadjusted quoted prices for similar assets and market corroborated inputs such as interest rates, prepayment speeds, credit risks, etc.)
3) Level 3-significant unobservable inputs (including the Manager’s own judgments about assumptions that market participants would use in pricing the asset or liability).
The inputs used for valuing securities are not necessarily an indication of the risks associated with investing in those securities.
The Fund classifies each of its investments in investment companies which are publicly offered as Level 1. Investment companies that are not publicly offered, if any, are classified as Level 2 in the fair value hierarchy.
The table below categorizes amounts that are included in the Fund’s Statement of Assets and Liabilities at period end based on valuation input level:
|
| 37 OPPENHEIMER GLOBAL OPPORTUNITIES FUND |
NOTES TO FINANCIAL STATEMENTS Continued
3. Securities Valuation (Continued)
| | | | | | | | | | | | | | | | |
| | | Level 1—
Unadjusted
Quoted Prices | | | Level 2—
Other Significant Observable Inputs | | | Level 3—
Significant Unobservable
Inputs | | | Value | |
Assets Table | | | | | | | | | | | | | | | | |
Investments, at Value: | | | | | | | | | | | | | | | | |
Common Stocks | | | | | | | | | | | | | | | | |
Consumer Discretionary | | $ | 375,088,380 | | | $ | 976,253,903 | | | $ | — | | | $ | 1,351,342,283 | |
Consumer Staples | | | 64,000,000 | | | | 265,470,272 | | | | — | | | | 329,470,272 | |
Financials | | | 63,567,486 | | | | 193,356,367 | | | | — | | | | 256,923,853 | |
Health Care | | | 1,397,116,000 | | | | 1,214,933,429 | | | | — | | | | 2,612,049,429 | |
Industrials | | | 540,511,283 | | | | 643,098,230 | | | | — | | | | 1,183,609,513 | |
Information Technology | | | 2,490,962,000 | | | | 1,050,172,976 | | | | — | | | | 3,541,134,976 | |
Materials | | | 40,150,000 | | | | 289,293,825 | | | | — | | | | 329,443,825 | |
Telecommunication Services | | | — | | | | 51,860,071 | | | | — | | | | 51,860,071 | |
Exchange-Traded Options Purchased | | | 13,084,000 | | | | — | | | | — | | | | 13,084,000 | |
Investment Company | | | 190,033,341 | | | | — | | | | — | | | | 190,033,341 | |
| | | | |
Total Assets | | $ | 5,174,512,490 | | | $ | 4,684,439,073 | | | $ | — | | | $ | 9,858,951,563 | |
| | | | |
Forward currency exchange contracts and futures contracts, if any, are reported at their unrealized appreciation/depreciation at measurement date, which represents the change in the contract’s value from trade date. All additional assets and liabilities included in the above table are reported at their market value at measurement date.
The table below shows the transfers between Level 1 and Level 2. The Fund’s policy is to recognize transfers in and transfers out as of the beginning of the reporting period.
| | | | | | | | | | | | | | | | |
| | | Transfers into
Level 1* | | | Transfers out
of Level 1** | | | Transfers into
Level 2** | | | Transfers out of
Level 2* | |
Assets Table | | | | | | | | | | | | | | | | |
Investments, at Value: | | | | | | | | | | | | | | | | |
Common Stocks | | | | | | | | | | | | | | | | |
Consumer Discretionary | | $ | 22,923,890 | | | $ | (30,067,536) | | | $ | 30,067,536 | | | $ | (22,923,890) | |
Financials | | | 56,739,596 | | | | – | | | | – | | | | (56,739,596) | |
Health Care | | | – | | | | (30,398,468) | | | | 30,398,468 | | | | – | |
Industrials | | | 50,491,121 | | | | – | | | | – | | | | (50,491,121) | |
Information | | | | | | | | | | | | | | | | |
Technology | | | – | | | | (58,858,620) | | | | 58,858,620 | | | | – | |
Total Assets | | $ | 130,154,607 | | | $ | (119,324,624) | | | $ | 119,324,624 | | | $ | (130,154,607) | |
* Transfers from Level 2 to Level 1 are a result of the availability of quoted prices from an active market which were not available and have become available.
** Transfers from Level 1 to Level 2 are a result of a change in pricing methodology to the use of a valuation determined based on observable market information other than quoted prices from an active market due to a lack of available unadjusted quoted prices.
|
| 38 OPPENHEIMER GLOBAL OPPORTUNITIES FUND |
4. Investments and Risks
Risks of Foreign Investing. The Fund may invest in foreign securities which are subject to special risks. Securities traded in foreign markets may be less liquid and more volatile than those traded in U.S. markets. Foreign issuers are usually not subject to the same accounting and disclosure requirements that U.S. companies are subject to, which may make it difficult for the Fund to evaluate a foreign company’s operations or financial condition. A change in the value of a foreign currency against the U.S. dollar will result in a change in the U.S. dollar value of investments denominated in that foreign currency and in the value of any income or distributions the Fund may receive on those investments. The value of foreign investments may be affected by exchange control regulations, foreign taxes, higher transaction and other costs, delays in the settlement of transactions, changes in economic or monetary policy in the United States or abroad, expropriation or nationalization of a company’s assets, or other political and economic factors. In addition, due to the inter-relationship of global economies and financial markets, changes in political and economic factors in one country or region could adversely affect conditions in another country or region. Investments in foreign securities may also expose the Fund to time-zone arbitrage risk. Foreign securities may trade on weekends or other days when the Fund does not price its shares. At times, the Fund may emphasize investments in a particular country or region and may be subject to greater risks from adverse events that occur in that country or region. Foreign securities and foreign currencies held in foreign banks and securities depositories may be subject to limited or no regulatory oversight.
Investments in Affiliated Funds. The Fund is permitted to invest in other mutual funds advised by the Manager (“Affiliated Funds”). Affiliated Funds are open-end management investment companies registered under the 1940 Act, as amended. The Manager is the investment adviser of, and the Sub-Adviser provides investment and related advisory services to, the Affiliated Funds. When applicable, the Fund’s investments in Affiliated Funds are included in the Statement of Investments. Shares of Affiliated Funds are valued at their net asset value per share. As a shareholder, the Fund is subject to its proportional share of the Affiliated Funds’ expenses, including their management fee. The Manager will waive fees and/or reimburse Fund expenses in an amount equal to the indirect management fees incurred through the Fund’s investment in the Affiliated Funds.
Each of the Affiliated Funds in which the Fund invests has its own investment risks, and those risks can affect the value of the Fund’s investments and therefore the value of the Fund’s shares. To the extent that the Fund invests more of its assets in one Affiliated Fund than in another, the Fund will have greater exposure to the risks of that Affiliated Fund.
Investments in Money Market Instruments. The Fund is permitted to invest its free cash balances in money market instruments to provide liquidity or for defensive purposes. The Fund may invest in money market instruments by investing in Class E shares of Oppenheimer Institutional Government Money Market Fund (“IGMMF”), which is an Affiliated Fund. IGMMF is regulated as a money market fund under the 1940 Act, as amended. The Fund may also invest in money market instruments directly or in other affiliated or unaffiliated money market funds.
|
| 39 OPPENHEIMER GLOBAL OPPORTUNITIES FUND |
NOTES TO FINANCIAL STATEMENTS Continued
4. Investments and Risks (Continued)
Equity Security Risk. Stocks and other equity securities fluctuate in price. The value of the Fund’s portfolio may be affected by changes in the equity markets generally. Equity markets may experience significant short-term volatility and may fall sharply at times. Different markets may behave differently from each other and U.S. equity markets may move in the opposite direction from one or more foreign stock markets. Adverse events in any part of the equity or fixed-income markets may have unexpected negative effects on other market segments.
The prices of individual equity securities generally do not all move in the same direction at the same time and a variety of factors can affect the price of a particular company’s securities. These factors may include, but are not limited to, poor earnings reports, a loss of customers, litigation against the company, general unfavorable performance of the company’s sector or industry, or changes in government regulations affecting the company or its industry.
5. Market Risk Factors
The Fund’s investments in securities and/or financial derivatives may expose the Fund to various market risk factors:
Commodity Risk. Commodity risk relates to the change in value of commodities or commodity indexes as they relate to increases or decreases in the commodities market. Commodities are physical assets that have tangible properties. Examples of these types of assets are crude oil, heating oil, metals, livestock, and agricultural products.
Credit Risk. Credit risk relates to the ability of the issuer of debt to meet interest and principal payments, or both, as they come due. In general, lower-grade, higher-yield debt securities are subject to credit risk to a greater extent than lower-yield, higher-quality securities.
Equity Risk. Equity risk relates to the change in value of equity securities as they relate to increases or decreases in the general market.
Foreign Exchange Rate Risk. Foreign exchange rate risk relates to the change in the U.S. dollar value of a security held that is denominated in a foreign currency. The U.S. dollar value of a foreign currency denominated security will decrease as the dollar appreciates against the currency, while the U.S. dollar value will increase as the dollar depreciates against the currency.
Interest Rate Risk. Interest rate risk refers to the fluctuations in value of fixed-income securities resulting from the inverse relationship between price and yield. For example, an increase in general interest rates will tend to reduce the market value of already issued fixed-income investments, and a decline in general interest rates will tend to increase their value. In addition, debt securities with longer maturities, which tend to have higher yields, are subject to potentially greater fluctuations in value from changes in interest rates than obligations with shorter maturities.
Volatility Risk. Volatility risk refers to the magnitude of the movement, but not the direction of the movement, in a financial instrument’s price over a defined time period. Large increases or decreases in a financial instrument’s price over a relative time period typically indicate greater volatility risk, while small increases or decreases in its price
|
| 40 OPPENHEIMER GLOBAL OPPORTUNITIES FUND |
5. Market Risk Factors (Continued)
typically indicate lower volatility risk.
6. Use of Derivatives
The Fund’s investment objective not only permits the Fund to purchase investment securities, it also allows the Fund to enter into various types of derivatives contracts, including, but not limited to, futures contracts, forward currency exchange contracts, credit default swaps, interest rate swaps, total return swaps, variance swaps and purchased and written options. In doing so, the Fund will employ strategies in differing combinations to permit it to increase, decrease, or change the level or types of exposure to market risk factors. These instruments may allow the Fund to pursue its objectives more quickly and efficiently than if it were to make direct purchases or sales of securities capable of effecting a similar response to market factors. Such contracts may be entered into through a bilateral over-the-counter (“OTC”) transaction, or through a securities or futures exchange and cleared through a clearinghouse.
Derivatives may have little or no initial cash investment relative to their market value exposure and therefore can produce significant gains or losses in excess of their cost due to changes in the market risk factors and the overall market. This use of embedded leverage allows the Fund to increase its market value exposure relative to its net assets and can substantially increase the volatility of the Fund’s performance. In instances where the Fund is using derivatives to decrease, or hedge, exposures to market risk factors for securities held by the Fund, there are also risks that those derivatives may not perform as expected resulting in losses for the combined or hedged positions. Some derivatives have the potential for unlimited loss, regardless of the size of the Fund’s initial investment.
Additional associated risks from investing in derivatives also exist and potentially could have significant effects on the valuation of the derivative and the Fund. Typically, the associated risks are not the risks that the Fund is attempting to increase or decrease exposure to, per its investment objectives, but are the additional risks from investing in derivatives. Examples of these associated risks are liquidity risk, which is the risk that the Fund will not be able to sell the derivative in the open market in a timely manner, and counterparty credit risk, which is the risk that the counterparty will not fulfill its obligation to the Fund.
The Fund’s actual exposures to these market risk factors and associated risks during the period are discussed in further detail, by derivative type, below.
Option Activity
The Fund may buy and sell put and call options, or write put and call options. When an option is written, the Fund receives a premium and becomes obligated to sell or purchase the underlying security, currency or other underlying financial instrument at a fixed price, upon exercise of the option.
Options can be traded through an exchange or through a privately negotiated arrangement with a dealer in an OTC transaction. Options traded through an exchange are generally cleared through a clearinghouse (such as The Options Clearing Corporation). The difference between the premium received or paid, and market value of the option, is recorded as
|
| 41 OPPENHEIMER GLOBAL OPPORTUNITIES FUND |
NOTES TO FINANCIAL STATEMENTS Continued
6. Use of Derivatives (Continued)
unrealized appreciation or depreciation. The net change in unrealized appreciation or depreciation is reported in the Statement of Operations. When an option is exercised, the cost of the security purchased or the proceeds of the security sale are adjusted by the amount of premium received or paid. Upon the expiration or closing of the option transaction, a gain or loss is reported in the Statement of Operations.
Index/Security Options. The Fund may purchase or write call and put options on individual equity securities and/or equity indexes to increase or decrease exposure to equity risk. A purchased call or written put option becomes more valuable as the price of the underlying financial instrument appreciates relative to the strike price. A purchased put or written call option becomes more valuable as the price of the underlying financial instrument depreciates relative to the strike price.
During the reporting period, the Fund had an ending monthly average market value of $71,922,231 on purchased put options.
Options written, if any, are reported in a schedule following the Statement of Investments and as a liability in the Statement of Assets and Liabilities. Securities held in collateral accounts to cover potential obligations with respect to outstanding written options are noted in the Statement of Investments.
The risk in writing a call option is the market price of the underlying security increasing above the strike price and the option being exercised. The Fund must then purchase the underlying security at the higher market price and deliver it for the strike price or, if it owns the underlying security, deliver it at the strike price and forego any benefit from the increase in the price of the underlying security above the strike price. The risk in writing a put option is the market price of the underlying security decreasing below the strike price and the option being exercised. The Fund must then purchase the underlying security at the strike price when the market price of the underlying security is below the strike price. Alternatively, the Fund could also close out a written option position, in which case the risk is that the closing transaction will require a premium to be paid by the Fund that is greater than the premium the Fund received. When writing options, the Fund has the additional risk that there may be an illiquid market where the Fund is unable to close the contract. The risk in buying an option is that the Fund pays a premium for the option, and the option may be worth less than the premium paid or expire worthless.
Additional associated risks to the Fund include counterparty credit risk and liquidity risk.
During the period, the Fund had no written options outstanding.
Counterparty Credit Risk. Derivative positions are subject to the risk that the counterparty will not fulfill its obligation to the Fund. The Fund intends to enter into derivative transactions with counterparties that the Manager believes to be creditworthy at the time of the transaction.
For financial reporting purposes, the Fund does not offset derivative assets and derivative liabilities that are subject to netting arrangements in the Statement of Assets and Liabilities. Bankruptcy or insolvency laws of a particular jurisdiction may impose restrictions on or prohibitions against the right of offset in bankruptcy, insolvency or other events.
|
| 42 OPPENHEIMER GLOBAL OPPORTUNITIES FUND |
6. Use of Derivatives (Continued)
The Fund’s risk of loss from counterparty credit risk on exchange-traded derivatives cleared through a clearinghouse and for centrally cleared swaps is generally considered lower than as compared to OTC derivatives. However, counterparty credit risk exists with respect to initial and variation margin deposited/paid by the Fund that is held in futures commission merchant, broker and/or clearinghouse accounts for such exchange-traded derivatives and for centrally cleared swaps.
With respect to centrally cleared swaps, such transactions will be submitted for clearing, and if cleared, will be held in accounts at futures commission merchants or brokers that are members of clearinghouses. While brokers, futures commission merchants and clearinghouses are required to segregate customer margin from their own assets, in the event that a broker, futures commission merchant or clearinghouse becomes insolvent or goes into bankruptcy and at that time there is a shortfall in the aggregate amount of margin held by the broker, futures commission merchant or clearinghouse for all its customers, U.S. bankruptcy laws will typically allocate that shortfall on a pro-rata basis across all the broker’s, futures commission merchant’s or clearinghouse’s customers, potentially resulting in losses to the Fund.
There is the risk that a broker, futures commission merchant or clearinghouse will decline to clear a transaction on the Fund’s behalf, and the Fund may be required to pay a termination fee to the executing broker with whom the Fund initially enters into the transaction. Clearinghouses may also be permitted to terminate centrally cleared swaps at any time. The Fund is also subject to the risk that the broker or futures commission merchant will improperly use the Fund’s assets deposited/paid as initial or variation margin to satisfy payment obligations of another customer. In the event of a default by another customer of the broker or futures commission merchant, the Fund might not receive its variation margin payments from the clearinghouse, due to the manner in which variation margin payments are aggregated for all customers of the broker/futures commission merchant.
Collateral and margin requirements differ by type of derivative. Margin requirements are established by the broker, futures commission merchant or clearinghouse for exchange-traded and cleared derivatives, including centrally cleared swaps. Brokers, futures commission merchants and clearinghouses can ask for margin in excess of the regulatory minimum, or increase the margin amount, in certain circumstances.
For financial reporting purposes, cash collateral that has been pledged to cover obligations of the Fund, if any, is reported separately on the Statement of Assets and Liabilities as cash pledged as collateral. Non-cash collateral pledged by the Fund, if any, is noted in the Statement of Investments. Generally, the amount of collateral due from or to a party must exceed a minimum transfer amount threshold (e.g., $250,000) before a transfer has to be made. To the extent amounts due to the Fund from its counterparties are not fully collateralized, contractually or otherwise, the Fund bears the risk of loss from counterparty nonperformance.
The following table presents the valuations of derivative instruments by risk exposure as reported within the Statement of Assets and Liabilities at period end:
|
| 43 OPPENHEIMER GLOBAL OPPORTUNITIES FUND |
NOTES TO FINANCIAL STATEMENTS Continued
6. Use of Derivatives (Continued)
| | | | | | | | |
| | | | | Asset Derivatives | |
Derivatives
Not Accounted
for as Hedging
Instruments | | | | Statement of Assets and Liabilities Location | | Value | |
Equity contracts | | | | Investments, at value | | $ | 13,084,000* | |
* Amounts relate to purchased option contracts and purchased swaption contracts, if any.
The effect of derivative instruments on the Statement of Operations is as follows:
| | |
Amount of Change in Unrealized Gain or (Loss) Recognized on Derivatives |
Derivatives
Not Accounted
for as Hedging
Instruments | | Investment
transactions
in unaffiliated
companies* |
Equity contracts | | $ (155,843,866) |
* Includes purchased option contracts and purchased swaption contracts, if any.
7. Shares of Beneficial Interest
The Fund has authorized an unlimited number of $0.001 par value shares of beneficial interest of each class. Transactions in shares of beneficial interest were as follows:
| | | | | | | | | | | | | | | | |
| | | Year Ended September 30, 2018 | | | Year Ended September 30, 2017 | |
| | | Shares | | | Amount | | | Shares | | | Amount | |
| |
Class A | | | | | | | | | | | | | | | | |
Sold1 | | | 17,920,320 | | | $ | 1,291,353,372 | | | | 12,845,036 | | | $ | 689,529,029 | |
Dividends and/or | | | | | | | | | | | | | | | | |
distributions reinvested | | | 1,171,207 | | | | 78,014,115 | | | | 3,664,535 | | | | 168,641,915 | |
Redeemed | | | (14,355,593 | ) | | | (1,030,497,914 | ) | | | (16,090,664 | ) | | | (848,785,212) | |
| | | | |
Net increase | | | 4,735,934 | | | $ | 338,869,573 | | | | 418,907 | | | $ | 9,385,732 | |
| | | | |
|
| |
Class B | | | | | | | | | | | | | | | | |
Sold | | | 7,161 | | | $ | 431,966 | | | | 36,492 | | | $ | 1,676,378 | |
Dividends and/or | | | | | | | | | | | | | | | | |
distributions reinvested | | | 4,113 | | | | 242,117 | | | | 36,050 | | | | 1,481,645 | |
Redeemed1 | | | (232,919 | ) | | | (14,445,539 | ) | | | (374,698 | ) | | | (17,442,291) | |
| | | | |
Net decrease | | | (221,645 | ) | | $ | (13,771,456 | ) | | | (302,156 | ) | | $ | (14,284,268) | |
| | | | |
|
| |
Class C | | | | | | | | | | | | | | | | |
Sold | | | 4,734,454 | | | $ | 300,369,062 | | | | 3,206,848 | | | $ | 154,804,246 | |
Dividends and/or | | | | | | | | | | | | | | | | |
distributions reinvested | | | 321,479 | | | | 18,947,952 | | | | 825,299 | | | | 33,961,054 | |
Redeemed | | | (2,446,177 | ) | | | (154,611,550 | ) | | | (2,546,846 | ) | | | (121,286,082) | |
| | | | |
Net increase | | | 2,609,756 | | | $ | 164,705,464 | | | | 1,485,301 | | | $ | 67,479,218 | |
| | | | |
|
| 44 OPPENHEIMER GLOBAL OPPORTUNITIES FUND |
7. Shares of Beneficial Interest (Continued)
| | | | | | | | | | | | | | | | |
| | | Year Ended September 30, 2018 | | | Year Ended September 30, 2017 | |
| | | Shares | | | Amount | | | Shares | | | Amount | |
Class I | | | | | | | | | | | | | | | | |
| Sold | | | 10,754,298 | | | $ | 788,859,896 | | | | 8,550,974 | | | $ | 493,648,356 | |
| Dividends and/or | | | | | | | | | | | | | | | | |
| distributions reinvested | | | 271,883 | | | | 18,387,430 | | | | 210,880 | | | | 9,810,127 | |
| Redeemed | | | (3,288,890) | | | | (241,617,215) | | | | (608,443) | | | | (32,994,902) | |
| | | | |
| Net increase | | | 7,737,291 | | | $ | 565,630,111 | | | | 8,153,411 | | | $ | 470,463,581 | |
| | | | |
|
| |
Class R | | | | | | | | | | | | | | | | |
| Sold | | | 1,542,993 | | | $ | 106,428,754 | | | | 1,554,429 | | | $ | 79,709,586 | |
| Dividends and/or | | | | | | | | | | | | | | | | |
| distributions reinvested | | | 78,463 | | | | 5,031,063 | | | | 200,888 | | | | 8,929,478 | |
| Redeemed | | | (1,154,543) | | | | (78,658,350) | | | | (892,117) | | | | (46,402,526) | |
| | | | |
| Net increase | | | 466,913 | | | $ | 32,801,467 | | | | 863,200 | | | $ | 42,236,538 | |
| | | | |
|
| |
Class Y | | | | | | | | | | | | | | | | |
| Sold | | | 29,296,240 | | | $ | 2,148,536,852 | | | | 19,224,392 | | | $ | 1,050,284,787 | |
| Dividends and/or | | | | | | | | | | | | | | | | |
| distributions reinvested | | | 468,415 | | | | 31,557,107 | | | | 896,719 | | | | 41,625,712 | |
| Redeemed | | | (9,568,661) | | | | (696,508,704) | | | | (10,738,468) | | | | (597,504,897) | |
| | | | |
| Net increase | | | 20,195,994 | | | $ | 1,483,585,255 | | | | 9,382,643 | | | $ | 494,405,602 | |
| | | | |
1. All outstanding Class B shares converted to Class A shares on June 1, 2018
8. Purchases and Sales of Securities
The aggregate cost of purchases and proceeds from sales of securities, other than short-term obligations and investments in IGMMF, for the reporting period were as follows:
| | | | | | | | |
| | | Purchases | | | Sales | |
| |
| Investment securities | | $ | 4,011,487,017 | | | $ | 1,699,987,136 | |
9. Fees and Other Transactions with Affiliates
Management Fees. Under the investment advisory agreement, the Fund pays the Manager a management fee based on the daily net assets of the Fund at an annual rate as shown in the following table:
| | | | | | | | | | | | | | | | |
| | | Fee Schedule Through October 31, 2018 | | | | | | Fee Schedule Effective November 1, 2018 | |
| | Up to $250 million | | | 0.80% | | | | | | | Up to $250 million | | | 0.80% | |
| | Next $250 million | | | 0.77 | | | | | | | Next $250 million | | | 0.77 | |
| | Next $500 million | | | 0.75 | | | | | | | Next $500 million | | | 0.75 | |
| | Next $1.0 billion | | | 0.69 | | | | | | | Next $1.0 billion | | | 0.69 | |
| | Next $1.5 billion | | | 0.67 | | | | | | | Next $1.5 billion | | | 0.67 | |
| | Next $2.5 billion | | | 0.65 | | | | | | | Next $2.5 billion | | | 0.65 | |
| | Over $6.0 billion | | | 0.63 | | | | | | | Next $4.0 billion | | | 0.63 | |
| | | | | | | | | | | | Over $10 billion | | | 0.61 | |
The Fund’s effective management fee for the reporting period was 0.67% of average annual net assets before any applicable waivers.
|
| 45 OPPENHEIMER GLOBAL OPPORTUNITIES FUND |
NOTES TO FINANCIAL STATEMENTS Continued
9. Fees and Other Transactions with Affiliates (Continued)
Sub-Adviser Fees. The Manager has retained the Sub-Adviser to provide the day-to-day portfolio management of the Fund. Under the Sub-Advisory Agreement, the Manager pays the Sub-Adviser an annual fee in monthly installments, equal to a percentage of the investment management fee collected by the Manager from the Fund, which shall be calculated after any investment management fee waivers. The fee paid to the Sub-Adviser is paid by the Manager, not by the Fund.
Transfer Agent Fees. OFI Global (the “Transfer Agent”) serves as the transfer and shareholder servicing agent for the Fund. The Fund pays the Transfer Agent a fee based on annual net assets, which shall be calculated after any applicable fee waivers. Fees incurred and average net assets for each class with respect to these services are detailed in the Statement of Operations and Financial Highlights, respectively.
Sub-Transfer Agent Fees. The Transfer Agent has retained Shareholder Services, Inc., a wholly-owned subsidiary of OFI (the “Sub-Transfer Agent”), to provide the day-to-day transfer agent and shareholder servicing of the Fund. Under the Sub-Transfer Agency Agreement, the Transfer Agent pays the Sub-Transfer Agent an annual fee in monthly installments, equal to a percentage of the transfer agent fee collected by the Transfer Agent from the Fund, which shall be calculated after any applicable fee waivers. The fee paid to the Sub-Transfer Agent is paid by the Transfer Agent, not by the Fund.
Trustees’ Compensation. The Fund has adopted an unfunded retirement plan (the “Plan”) for the Fund’s Independent Trustees. Benefits are based on years of service and fees paid to each Trustee during their period of service. The Plan was frozen with respect to adding new participants effective December 31, 2006 (the “Freeze Date”) and existing Plan Participants as of the Freeze Date will continue to receive accrued benefits under the Plan. Active Independent Trustees as of the Freeze Date have each elected a distribution method with respect to their benefits under the Plan.
During the reporting period, the Fund’s projected benefit obligations, payments to retired Trustees and accumulated liability were as follows:
| | | | |
Projected Benefit Obligations Increased | | $ | — | |
Payments Made to Retired Trustees | | | 25,972 | |
Accumulated Liability as of September 30, 2018 | | | 223,967 | |
The Fund’s Board of Trustees (“Board”) has adopted a compensation deferral plan for Independent Trustees that enables Trustees to elect to defer receipt of all or a portion of the annual compensation they are entitled to receive from the Fund. For purposes of determining the amount owed to the Trustee under the plan, deferred amounts are treated as though equal dollar amounts had been invested in shares of the Fund or in other Oppenheimer funds selected by the Trustee. The Fund purchases shares of the funds selected for deferral by the Trustee in amounts equal to his or her deemed investment, resulting in a Fund asset equal
|
| 46 OPPENHEIMER GLOBAL OPPORTUNITIES FUND |
9. Fees and Other Transactions with Affiliates (Continued)
to the deferred compensation liability. Such assets are included as a component of “Other” within the asset section of the Statement of Assets and Liabilities. Deferral of Trustees’ fees under the plan will not affect the net assets of the Fund and will not materially affect the Fund’s assets, liabilities or net investment income per share. Amounts will be deferred until distributed in accordance with the compensation deferral plan.
Distribution and Service Plan (12b-1) Fees. Under its General Distributor’s Agreement with the Fund, OppenheimerFunds Distributor, Inc. (the “Distributor”) acts as the Fund’s principal underwriter in the continuous public offering of the Fund’s classes of shares.
Service Plan for Class A Shares. The Fund has adopted a Service Plan (the “Plan”) for Class A shares pursuant to Rule 12b-1 under the 1940 Act. Under the Plan, the Fund reimburses the Distributor for a portion of its costs incurred for services provided to accounts that hold Class A shares. Reimbursement is made periodically at an annual rate of up to 0.25% of the daily net assets of Class A shares of the Fund. The Distributor currently uses all of those fees to pay dealers, brokers, banks and other financial institutions periodically for providing personal service and maintenance of accounts of their customers that hold Class A shares. Any unreimbursed expenses the Distributor incurs with respect to Class A shares in any fiscal year cannot be recovered in subsequent periods. Fees incurred by the Fund under the Plan are detailed in the Statement of Operations.
Distribution and Service Plans for Class B, Class C and Class R Shares. The Fund has adopted Distribution and Service Plans (the “Plans”) for Class C and Class R shares, and had previously adopted a similar plan for Class B shares, pursuant to Rule 12b-1 under the 1940 Act to compensate the Distributor for distributing those share classes, maintaining accounts and providing shareholder services. Under the Plans, the Fund pays the Distributor an annual asset-based sales charge of 0.75% on Class C shares’ daily net assets and 0.25% on Class R shares’ daily net assets. The Fund paid the Distributor an annual asset-based sales charge of 0.75% on Class B shares prior to their Conversion Date. The Fund also pays a service fee under the Plans at an annual rate of 0.25% of daily net assets and previously paid this fee for Class B prior to their Conversion Date. The Plans continue in effect from year to year only if the Fund’s Board of Trustees votes annually to approve their continuance at an in person meeting called for that purpose. Fees incurred by the Fund under the Plans are detailed in the Statement of Operations.
Sales Charges. Front-end sales charges and CDSC do not represent expenses of the Fund. They are deducted from the proceeds of sales of Fund shares prior to investment or from redemption proceeds prior to remittance, as applicable. The sales charges retained by the Distributor from the sale of shares and the CDSC retained by the Distributor on the redemption of shares is shown in the following table for the period indicated.
|
| 47 OPPENHEIMER GLOBAL OPPORTUNITIES FUND |
NOTES TO FINANCIAL STATEMENTS Continued
9. Fees and Other Transactions with Affiliates (Continued)
| | | | | | | | | | | | | | | | | | | | |
| Year Ended | | Class A
Front-End
Sales Charges
Retained by
Distributor | | | Class A
Contingent
Deferred
Sales Charges
Retained by
Distributor | | | Class B1
Contingent
Deferred
Sales Charges
Retained by
Distributor | | | Class C
Contingent
Deferred
Sales Charges
Retained by
Distributor | | | Class R
Contingent
Deferred
Sales Charges
Retained by
Distributor | |
September 30, 2018 | | | $1,659,208 | | | | $2,072 | | | | $2,286 | | | | $103,498 | | | | $— | |
1. Effective June 1, 2018, all Class B shares converted to Class A shares.
Waivers and Reimbursements of Expenses. Effective for the period January 1, 2017 through December 31, 2017, the Transfer Agent voluntarily waived and/or reimbursed Fund expenses in an amount equal to 0.015% of average annual net assets for Classes A, B, C, R and Y.
During the reporting period, the Transfer Agent waived fees and/or reimbursed the Fund for transfer agent and shareholder servicing agent fees as follows:
| | | | |
Class A | | | $126,533 | |
Class B1 | | | 389 | |
Class C | | | 26,706 | |
Class R | | | 7,984 | |
Class Y | | | 53,929 | |
1. Effective June 1, 2018, all Class B shares converted to Class A shares.
The Manager will waive fees and/or reimburse Fund expenses in an amount equal to the indirect management fees incurred through the Fund’s investment in IGMMF. During the reporting period, the Manager waived fees and/or reimbursed the Fund $178,758 for IGMMF management fees. This fee waiver and/or expense reimbursement may not be amended or withdrawn for one year from the date of the Fund’s prospectus, unless approved by the Board.
10. Borrowings and Other Financing
Joint Credit Facility. A number of mutual funds managed by the Manager participate in a $1.95 billion revolving credit facility (the “Facility”) intended to provide short-term financing, if necessary, subject to certain restrictions in connection with atypical redemption activity. Expenses and fees related to the Facility are paid by the participating funds and are disclosed separately or as other expenses on the Statement of Operations. The Fund did not utilize the Facility during the reporting period.
11. Subsequent Event
On October 18, 2018, Massachusetts Mutual Life Insurance Company (“MassMutual”), an indirect corporate parent of the Sub-Adviser and the Manager announced that it has entered into a definitive agreement, whereby Invesco Ltd. (“Invesco”), a global investment management company, will acquire the Sub-Adviser. As of the time of the announcement, the
|
| 48 OPPENHEIMER GLOBAL OPPORTUNITIES FUND |
11. Subsequent Event (Continued)
transaction is expected to close in the second quarter of 2019, pending necessary regulatory and other third-party approvals. This is subject to change.
|
| 49 OPPENHEIMER GLOBAL OPPORTUNITIES FUND |
REPORT OF INDEPENDENT REGISTERED PUBLIC ACCOUNTING FIRM
To the Shareholders and Board of Trustees
Oppenheimer Global Opportunities Fund:
Opinion on the Financial Statements
We have audited the accompanying statement of assets and liabilities of Oppenheimer Global Opportunities Fund (the “Fund”), including the statement of investments, as of September 30, 2018, the related statement of operations for the year then ended, the statements of changes in net assets for each of the years in the two year period then ended, and the related notes (collectively, the “financial statements”) and the financial highlights for each of the years in the five year period then ended. In our opinion, the financial statements and financial highlights present fairly, in all material respects, the financial position of the Fund as of September 30, 2018, the results of its operations for the year then ended, the changes in its net assets for each of the years in the two year period then ended, and the financial highlights for each of the years in the five year period then ended, in conformity with U.S. generally accepted accounting principles.
Basis for Opinion
These financial statements and financial highlights are the responsibility of the Fund’s management. Our responsibility is to express an opinion on these financial statements and financial highlights based on our audits. We are a public accounting firm registered with the Public Company Accounting Oversight Board (United States) (“PCAOB”) and are required to be independent with respect to the Fund in accordance with the U.S. federal securities laws and the applicable rules and regulations of the Securities and Exchange Commission and the PCAOB.
We conducted our audits in accordance with the standards of the PCAOB. Those standards require that we plan and perform the audit to obtain reasonable assurance about whether the financial statements and financial highlights are free of material misstatement, whether due to error or fraud. Our audits included performing procedures to assess the risks of material misstatement of the financial statements and financial highlights, whether due to error or fraud, and performing procedures that respond to those risks. Such procedures included examining, on a test basis, evidence regarding the amounts and disclosures in the financial statements and financial highlights. Such procedures also included confirmation of securities owned as of September 30, 2018, by correspondence with the custodian, brokers and the transfer agent, or by other appropriate auditing procedures. Our audits also included evaluating the accounting principles used and significant estimates made by management, as well as evaluating the overall presentation of the financial statements and financial highlights. We believe that our audits provide a reasonable basis for our opinion.
KPMGLLP
We have not been able to determine the specific year that we began serving as the auditor of one or more Oppenheimer Funds investment companies, however we are aware that we have served as the auditor of one or more Oppenheimer Funds investment companies since at least 1969.
Denver, Colorado
November 21, 2018
|
| 50 OPPENHEIMER GLOBAL OPPORTUNITIES FUND |
FEDERAL INCOME TAX INFORMATION Unaudited
In early 2018, if applicable, shareholders of record received information regarding all dividends and distributions paid to them by the Fund during calendar year 2017.
Capital gain distributions of $1.45564 per share were paid to Class A, Class B, Class C, Class I, Class R and Class Y shareholders, respectively, on December 7, 2017. Whether received in stock or in cash, the capital gain distribution should be treated by shareholders as a gain from the sale of the capital assets held for more than one year (long-term capital gains).
Dividends, if any, paid by the Fund during the reporting period which are not designated as capital gain distributions should be multiplied by the maximum amount allowable but not less than 11.01% to arrive at the amount eligible for the corporate dividend-received deduction.
A portion, if any, of the dividends paid by the Fund during the reporting period which are not designated as capital gain distributions are eligible for lower individual income tax rates to the extent that the Fund has received qualified dividend income as stipulated by recent tax legislation. The maximum amount allowable but not less than $58,285,863 of the Fund’s fiscal year taxable income may be eligible for the lower individual income tax rates. In early 2018, shareholders of record received information regarding the percentage of distributions that are eligible for lower individual income tax rates.
Recent tax legislation allows a regulated investment company to designate distributions not designated as capital gain distributions, as either interest related dividends or short-term capital gain dividends, both of which are exempt from the U.S. withholding tax applicable to non U.S. taxpayers. For the reporting period, the maximum amount allowable but not less than $102,757,349 of the short-term capital gain distribution to be paid by the Fund qualifies as a short-term capital gain dividend.
The foregoing information is presented to assist shareholders in reporting distributions received from the Fund to the Internal Revenue Service. Because of the complexity of the federal regulations which may affect your individual tax return and the many variations in state and local tax regulations, we recommend that you consult your tax advisor for specific guidance.
|
| 51 OPPENHEIMER GLOBAL OPPORTUNITIES FUND |
BOARD APPROVAL OF THE FUND’S INVESTMENT ADVISORY
AND SUB-ADVISORY AGREEMENTS Unaudited
The Fund has entered into an investment advisory agreement with OFI Global Asset Management, Inc. (“OFI Global” or the “Adviser”), a wholly-owned subsidiary of OppenheimerFunds, Inc. (“OFI” or the “Sub-Adviser”) (“OFI Global” and “OFI” together the “Managers”) and OFI Global has entered into a sub-advisory agreement with OFI whereby OFI provides investment sub-advisory services to the Fund (collectively, the “Agreements”). Each year, the Board of Trustees (the “Board”), including a majority of the independent Trustees, is required to determine whether to approve the terms of the Agreements and the renewal thereof. The Investment Company Act of 1940, as amended, requires that the Board request and evaluate, and that the Managers provide, such information as may be reasonably necessary to evaluate the terms of the Agreements. The Board employs an independent consultant to prepare a report that provides information, including comparative information that the Board requests for that purpose. In addition to in-person meetings focused on this evaluation, the Board receives information throughout the year regarding Fund services, fees, expenses and performance.
The Managers and the independent consultant provided information to the Board on the following factors: (i) the nature, quality and extent of the Managers’ services, (ii) the comparative investment performance of the Fund and the Managers, (iii) the fees and expenses of the Fund, including comparative fee and expense information, (iv) the profitability of the Managers and their affiliates, including an analysis of the cost of providing services, (v) whether economies of scale are realized as the Fund grows and whether fee levels reflect these economies of scale for Fund investors and (vi) other benefits to the Managers from their relationship with the Fund. The Board was aware that there are alternatives to retaining the Managers.
Outlined below is a summary of the principal information considered by the Board as well as the Board’s conclusions.
Nature, Quality and Extent of Services. The Board considered information about the nature, quality and extent of the services provided to the Fund and information regarding the Managers’ key personnel who provide such services. The Managers’ duties include providing the Fund with the services of the Sub-Adviser’s portfolio manager and investment team, who provide research, analysis and other advisory services in regard to the Fund’s investments; and securities trading services. OFI Global is responsible for oversight of third-party service providers; monitoring compliance with applicable Fund policies and procedures and adherence to the Fund’s investment restrictions; risk management; and oversight of the Sub-Adviser. OFI Global is also responsible for providing certain administrative services to the Fund. Those services include providing and supervising all administrative and clerical personnel who are necessary in order to provide effective corporate administration for the Fund; compiling and maintaining records with respect to the Fund’s operations; preparing and filing reports required by the U.S. Securities and Exchange Commission; preparing periodic reports regarding the operations of the Fund for its shareholders; preparing proxy materials for shareholder meetings; and preparing the registration statements required by federal and state securities laws for the sale of the Fund’s shares. OFI Global also provides the Fund with office space, facilities and equipment.
|
| 52 OPPENHEIMER GLOBAL OPPORTUNITIES FUND |
The Board also considered the quality of the services provided and the quality of the Managers’ resources that are available to the Fund. The Board took account of the fact that the Sub-Adviser has over fifty years of experience as an investment adviser and that its assets under management rank it among the top mutual fund managers in the United States. The Board evaluated the Managers’ advisory, administrative, accounting, legal, compliance and risk management services, among other services, and information the Board has received regarding the experience and professional qualifications of the Managers’ key personnel and the size and functions of their staff. In its evaluation of the quality of the portfolio management services provided, the Board considered the experience of Frank Jennings, the portfolio manager for the Fund, and the Sub-Adviser’s investment team and analysts. The Board members also considered the totality of their experiences with the Managers as directors or trustees of the Fund and other funds advised by the Managers. The Board considered information regarding the quality of services provided by affiliates of the Managers, which the Board members have become knowledgeable about through their experiences with the Managers and in connection with the review or renewal of the Fund’s service agreements or service providers. The Board concluded, in light of the Managers’ experience, reputation, personnel, operations and resources that the Fund benefits from the services provided under the Agreements.
Investment Performance of the Managers and the Fund. Throughout the year, the Managers provided information on the investment performance of the Fund, the Adviser and the Sub-Adviser, including comparative performance information. The Board also reviewed information, prepared by the Managers and by the independent consultant, comparing the Fund’s historical performance to relevant benchmarks or market indices and to the performance of other retail funds in the world small/mid stock category. The Board noted that the Fund’s one-year, three-year, five-year and ten-year performance was better than its category median.
Fees and Expenses of the Fund. The Board reviewed the fees paid to the Adviser and the other expenses borne by the Fund. The Board noted that the Adviser, not the Fund, pays the Sub-Adviser’s fee under the sub-advisory agreement. The independent consultant provided comparative data in regard to the fees and expenses of the Fund and other retail front-end load world small/mid stock funds with comparable asset levels and distribution features. The Board noted that the Fund’s contractual management fee and total expenses were lower than its peer group median and category median.
Economies of Scale and Profits Realized by the Managers. The Board considered information regarding the Managers’ costs in serving as the Fund’s investment adviser and sub-adviser, including the costs associated with the personnel and systems necessary to manage the Fund, and information regarding the Managers’ profitability from their relationship with the Fund. The Board also considered that the Managers must be able to pay and retain experienced professional personnel at competitive rates to provide quality services to the Fund. The Board reviewed whether the Managers may realize economies of scale in managing and supporting the Fund. The Board noted that the Fund currently has management fee breakpoints, which are intended to share with Fund shareholders economies of scale that may exist as the Fund’s assets grow. Based on the Board’s
|
| 53 OPPENHEIMER GLOBAL OPPORTUNITIES FUND |
BOARD APPROVAL OF THE FUND’S INVESTMENT ADVISORY
AND SUB-ADVISORY AGREEMENTS Unaudited / Continued
evaluation, the Manager agreed to a revised breakpoint schedule as negotiated by the Board that, effective November 1, 2018, a new breakpoint will be added to the advisory fee schedule, whereby the Fund will pay the Manager an advisory fee at an annual rate of 0.61% of average annual net assets over $10 billion.
Other Benefits to the Managers. In addition to considering the profits realized by the Managers, the Board considered information that was provided regarding the direct and indirect benefits the Managers receive as a result of their relationship with the Fund, including compensation paid to the Managers’ affiliates and research provided to the Adviser in connection with permissible brokerage arrangements (soft dollar arrangements).
Conclusions. These factors were also considered by the independent Trustees meeting separately from the full Board, assisted by experienced counsel to the Fund and to the independent Trustees. Fund counsel and the independent Trustees’ counsel are independent of the Managers within the meaning and intent of the Securities and Exchange Commission Rules.
Based on its review of the information it received and its evaluations described above, the Board, including a majority of the independent Trustees, decided to continue the Agreements through September 30, 2019. In arriving at its decision, the Board did not identify any factor or factors as being more important than others, but considered all of the above information, and considered the terms and conditions of the Agreements, including the management fees, in light of all the surrounding circumstances.
54 OPPENHEIMER GLOBAL OPPORTUNITIES FUND
PORTFOLIO PROXY VOTING POLICIES AND GUIDELINES;
UPDATES TO STATEMENT OF INVESTMENTS Unaudited
The Fund has adopted Portfolio Proxy Voting Policies and Guidelines under which the Fund votes proxies relating to securities (“portfolio proxies”) held by the Fund. A description of the Fund’s Portfolio Proxy Voting Policies and Guidelines is available (i) without charge, upon request, by calling the Fund toll-free at 1.800.CALL OPP (225.5677), (ii) on the Fund’s website at www.oppenheimerfunds.com, and (iii) on the SEC’s website at www.sec.gov. In addition, the Fund is required to file Form N-PX, with its complete proxy voting record for the 12 months ended June 30th, no later than August 31st of each year. The Fund’s voting record is available (i) without charge, upon request, by calling the Fund toll-free at 1.800.CALL OPP (225.5677), and (ii) in the Form N-PX filing on the SEC’s website at www.sec.gov.
The Fund files its complete schedule of portfolio holdings with the SEC for the first quarter and the third quarter of each fiscal year on Form N-Q. The Fund’s Form N-Q filings are available on the SEC’s website at www.sec.gov. Those forms may be reviewed and copied at the SEC’s Public Reference Room in Washington, D.C. Information on the operation of the Public Reference Room may be obtained by calling 1-800-SEC-0330.
Householding—Delivery of Shareholder Documents
This is to inform you about OppenheimerFunds’ “householding” policy. If more than one member of your household maintains an account in a particular fund, OppenheimerFunds will mail only one copy of the fund’s prospectus (or, if available, the fund’s summary prospectus), annual and semiannual report and privacy policy. The consolidation of these mailings, called householding, benefits your fund through reduced mailing expense, and benefits you by reducing the volume of mail you receive from OppenheimerFunds. Householding does not affect the delivery of your account statements.
Please note that we will continue to household these mailings for as long as you remain an OppenheimerFunds shareholder, unless you request otherwise. If you prefer to receive multiple copies of these materials, please call us at 1.800.CALL-OPP (225-5677). You may also notify us in writing or via email. We will begin sending you individual copies of the prospectus (or, if available, the summary prospectus), reports and privacy policy within 30 days of receiving your request to stop householding.
|
| 55 OPPENHEIMER GLOBAL OPPORTUNITIES FUND |
TRUSTEES AND OFFICERS Unaudited
| | |
| Name, Position(s) Held with the Fund, Length of Service, Year of Birth | | Principal Occupation(s) During the Past 5 Years; Other Trusteeships/ Directorships Held. |
| |
| INDEPENDENT TRUSTEES | | The address of each Trustee in the chart below is 6803 S. Tucson Way, Centennial, Colorado 80112-3924. Each Trustee serves for an indefinite term, or until his or her resignation, retirement, death or removal. Each of the Trustees in the chart below oversees 47 portfolios in the OppenheimerFunds complex. |
| |
Brian F. Wruble, Chairman of the Board of Trustees (since 2007), Trustee (since 2005) Year of Birth: 1943 | | Governor of Community Foundation of the Florida Keys (non-profit) (since July 2012); Director of TCP Capital, Inc. (registered business development company) (since November 2015); Chairman Emeritus of the Board of Trustees (since August 2011), Chairman of the Board of Trustees (August 2007-August 2011), Trustee of the Board of Trustees (since August 1991) of The Jackson Laboratory (non-profit); Member of Zurich Insurance Group’s Investment Management Advisory Council (insurance) (October 2004-February 2017); Treasurer (since 2007) and Trustee (since May 1992) of the Institute for Advanced Study (non-profit educational institute); Director of Special Value Opportunities Fund, LLC (registered investment company) (affiliate of the Sub-Adviser’s parent company) (September 2004-June 2015); General Partner of Odyssey Partners, L.P. (hedge fund) (September 1995-December 2007); Special Limited Partner of Odyssey Investment Partners, LLC (private equity investment) (January 1999-September 2004). Mr. Wruble has served on the Boards of certain Oppenheimer funds since April 2001, during which time he has become familiar with the Fund’s (and other Oppenheimer funds’) financial, accounting, regulatory and investment matters and has contributed to the Board’s deliberations. |
| |
Beth Ann Brown, Trustee (since 2016) Year of Birth: 1968 | | Director, Board of Directors of Caron Engineering Inc. (since January 2018); Advisor, Board of Advisors of Caron Engineering Inc. (December 2014-December 2017); Independent Consultant (since September 2012); held the following positions at Columbia Management Investment Advisers LLC: Head of Intermediary Distribution (2008-2012), Managing Director, Strategic Relations (2005-2008), Managing Director, Head of National Accounts (2004-2005); Senior Vice President, National Account Manager (2002-2004), Senior Vice President, Key Account Manager (1999-2002) and Vice President, Key Account Manager (1996-1999) of Liberty Funds Distributor, Inc.; President and Director, of Acton Shapleigh Youth Conservation Corps (non -profit) (2012-2015); and Vice President and Director of Grahamtastic Connection (non-profit) (since May 2013). Ms. Brown has served on the Boards of certain Oppenheimer funds since January 2016, during which time she has become familiar with the Fund’s (and other Oppenheimer funds’) financial, accounting, regulatory and investment matters and has contributed to the Board’s deliberations. |
| |
Edmund P. Giambastiani, Jr., Trustee (since 2013) Year of Birth: 1948 | | Director of THL Credit, Inc. (since November 2016) (alternative credit investment manager); Advisory Board Member of the Maxwell School of Citizenship and Public Affairs of Syracuse University (April 2012-September 2016); Director of Mercury Defense Systems Inc. (information technology) (August 2011-February 2013); Trustee of the U.S. Naval Academy Foundation Athletic & Scholarship Program (since November 2010); Advisory Board Member of the Massachusetts Institute of Technology Lincoln Laboratory (federally-funded research development) (since May 2010); Director of The Boeing Company (aerospace and defense) (since October |
|
| 56 OPPENHEIMER GLOBAL OPPORTUNITIES FUND |
| | |
| |
Edmund P. Giambastiani, Jr., Continued | | 2009); Trustee of MITRE Corporation (federally-funded research development) (since September 2008); Independent Director of QinetiQ Group Plc (defense technology and security) (February 2008-August 2011); Chairman of Monster Worldwide, Inc. (career services) (March 2015-November 2016), Director of Monster Worldwide, Inc. (career services) (February 2008-June 2011); Lead Director (June 2011-March 2015); Chairman of Alenia North America, Inc. (military and defense products) (January 2008-October 2009); Director of SRA International, Inc. (information technology and services) (January 2008-July 2011); President of Giambastiani Group LLC (national security and energy consulting) (since October 2007); United States Navy, career nuclear submarine officer (June 1970-October 2007); Seventh Vice Chairman of the Joint Chiefs of Staff (2005-October 2007); Supreme Allied Commander of NATO Allied Command Transformation (2003-2005) and Commander, U.S. Joint Forces Command (2002-2005). Since his retirement from the U.S. Navy in October 2007, Admiral Giambastiani has also served on numerous U.S. Government advisory boards, investigations and task forces for the Secretaries of Defense, State and Interior and the Central Intelligence Agency. He recently completed serving as a federal commissioner on the Military Compensation and Retirement Modernization Commission. Admiral Giambastiani has served on the Boards of certain Oppenheimer funds since February 2013, during which time he has become familiar with the Fund’s (and other Oppenheimer funds’) financial, accounting, regulatory and investment matters and has contributed to the Board’s deliberations. |
| |
Elizabeth Krentzman, Trustee (since 2014) Year of Birth: 1959 | | Trustee of the University of Florida National Board Foundation (since September 2017); Member of the Cartica Funds Board of Directors (private investment funds) (since January 2017); Member of the University of Florida Law Center Association, Inc. Board of Trustees and Audit Committee Member (since April 2016); Member of University of Florida Law Advisory Board, Washington, DC Alumni Group (since 2015); Advisory Board Member of the Securities and Exchange Commission Historical Society (since 2007); held the following positions at Deloitte & Touche LLP: Principal and Chief Regulatory Advisor for Asset Management Services (2007 - 2014) and U.S. Mutual Fund Leader (2011 - 2014); General Counsel of the Investment Company Institute (trade association) (June 2004 - April 2007); held the following positions at Deloitte & Touche LLP: National Director of the Investment Management Regulatory Consulting Practice (1997 - 2004), Principal (2003 - 2004), Director (1998 - 2003) and Senior Manager (1997 - 1998); Assistant Director of the Division of Investment Management – Office of Disclosure and Investment Adviser Regulation of the U.S. Securities and Exchange Commission (1996 - 1997) and various positions with the Division of Investment Management – Office of Regulatory Policy (1991 - 1996) of the U.S. Securities and Exchange Commission; Associate at Ropes & Gray LLP (1987 – 1991). Ms. Krentzman has served on the Boards of certain Oppenheimer funds since August 2014, during which time she has become familiar with the Fund’s (and other Oppenheimer funds’) financial, accounting, regulatory and investment matters and has contributed to the Board’s deliberations. |
| |
Mary F. Miller, Trustee (since 2004) Year of Birth: 1942 | | Trustee of International House (not-for-profit) (since June 2007); Trustee of the American Symphony Orchestra (not-for-profit) (October 1998-November 2011); and Senior Vice President and General Auditor of American Express Company (financial services company) (July 1998-February 2003). Ms. Miller has served on the Boards of certain Oppenheimer funds since August 2004, during which time she has become familiar with the Fund’s (and other Oppenheimer funds’) financial, accounting, regulatory and investment matters and has contributed to the Board’s deliberations. |
57 OPPENHEIMER GLOBAL OPPORTUNITIES FUND
TRUSTEES AND OFFICERS Unaudited / Continued
| | |
Joel W. Motley, Trustee (since 2002) Year of Birth: 1952 | | Director of Office of Finance Federal Home Loan Bank (since September 2016); Director of Greenwall Foundation (since October 2013); Member of Board and Investment Committee of The Greenwall Foundation (since April 2013); Member of the Vestry of Trinity Wall Street (since April 2012); Director of Southern Africa Legal Services Foundation (since March 2012); Board Member and Investment Committee Member of Pulitzer Center for Crisis Reporting (non-profit journalism) (since March 2011); Managing Director of Public Capital Advisors, LLC (privately-held financial advisor) (since January 2006); Managing Director of Carmona Motley, Inc. (privately-held financial advisor) (since January 2002); Director of Columbia Equity Financial Corp. (privately-held financial advisor) (2002-2007); Managing Director of Carmona Motley Hoffman Inc. (privately-held financial advisor) (January 1998-December 2001); Member of the Finance and Budget Committee of the Council on Foreign Relations, Member of the Investment Committee and Board of Human Rights Watch (since July 2000) and Member of the Investment Committee and Board of Historic Hudson Valley (since February 2010). Mr. Motley has served on the Boards of certain Oppenheimer funds since October 2002, during which time he has become familiar with the Fund’s (and other Oppenheimer funds’) financial, accounting, regulatory and investment matters and has contributed to the Board’s deliberations. |
| |
Joanne Pace, Trustee (since 2012) Year of Birth: 1958 | | Advisory Board Director of Massey Quick Simon & Co. (wealth management), LLC (since October 2014); Board Director of Horizon Blue Cross Blue Shield of New Jersey (healthcare) (since November 2012); Advisory Board Director of The Alberleen Group LLC (investment banking) (since March 2012); Governing Council Member (since 2016) and Chair of Education Committee (since 2017) of Independent Directors Council (IDC) (since 2016); Board Member of 100 Women in Finance (non-profit) (since January 2015); Advisory Council Member of Morgan Stanley Children’s Hospital (non-profit) (since May 2012); Director of The Komera Project (non-profit) (April 2012-2016); New York Advisory Board Director of Peace First (non-profit) (March 2010-2013); Senior Advisor of SECOR Asset Management, LP (2010-2011); Managing Director and Chief Operating Officer of Morgan Stanley Investment Management (2006-2010); Partner and Chief Operating Officer of FrontPoint Partners, LLC (hedge fund) (2005-2006); held the following positions at Credit Suisse (investment banking): Managing Director (2003-2005); Global Head of Human Resources and member of Executive Board and Operating Committee (2004-2005), Global Head of Operations and Product Control (2003-2004); held the following positions at Morgan Stanley: Managing Director (1997-2003), Controller and Principal Accounting Officer (1999-2003); Chief Financial Officer (temporary assignment) for the Oversight Committee, Long Term Capital Management (1998-1999). Lead Independent Director and Chair of the Audit and Nominating Committee of The Global Chartist Fund, LLC of Oppenheimer Asset Management (2011-2012); Board Director of Managed Funds Association (2008-2010); Board Director of Morgan Stanley Foundation (2007-2010) and Investment Committee Chair (2008-2010). Ms. Pace has served on the Boards of certain Oppenheimer funds since November 2012, during which time she has become familiar with the Fund’s (and other Oppenheimer funds’) financial, accounting, regulatory and investment matters and has contributed to the Board’s deliberations. |
58 OPPENHEIMER GLOBAL OPPORTUNITIES FUND
| | |
Daniel Vandivort, Trustee (since 2014) Year of Birth: 1954 | | Chairman and Lead Independent Director/Trustee (March 2010-September 2014), Chairman of the Audit Committee (March 2009-September 2014) and Director/Trustee (December 2008-September 2014) of the Board of Directors/ Trustees of Value Line Funds; Trustee (since January 2015) and Treasurer and Chairman of the Audit Committee and Finance Committee (since January 2016) of Board of Trustees of Huntington Disease Foundation of America; Trustee, Board of Trustees, RIM Retirement Savings Plan (2005-2007); President and Chief Investment Officer, Robeco Investment Management, formerly known as Weiss Peck and Greer (January 2005-June 2007); Member, Management Committee of Robeco Investment Management (2001-2007); Chairman and Trustee of the Board of Trustees of Weiss, Peck and Greer Funds (2004-2005); Managing Director and Head of Fixed Income, Weiss, Peck and Greer (November 1994-January 2005); Managing Director and Head of Fixed Income, CS First Boston Investment Management (January 1992-November 1994); Director, Global Product Development, First Boston Asset Management (November 1989-January 1992); Vice President, Fixed Income Sales, First Boston Corp. (May 1984-November 1989). Mr. Vandivort has served on the Boards of certain Oppenheimer funds since 2014, during which time he has become familiar with the Fund’s (and other Oppenheimer funds’) financial, accounting, regulatory and investment matters and has contributed to the Board’s deliberations. |
|
| INTERESTED TRUSTEE AND OFFICER | | Mr. Steinmetz is an “Interested Trustee” because he is affiliated with the Manager and the Sub-Adviser by virtue of his positions as Chairman and director of the Sub-Adviser and officer and director of the Manager. Both as a Trustee and as an officer, Mr. Steinmetz serves for an indefinite term, or until his resignation, retirement, death or removal. Mr. Steinmetz’s address is 225 Liberty Street, New York, New York 10281-1008. Mr. Steinmetz is an officer of 105 portfolios in the OppenheimerFunds complex. |
| |
Arthur P. Steinmetz, Trustee (since 2015), President and Principal Executive Officer (since 2014) Year of Birth: 1958 | | Chairman of OppenheimerFunds, Inc. (since January 2015); CEO and Chairman of OFI Global Asset Management, Inc. (since July 2014), President of OFI Global Asset Management, Inc. (since May 2013), a Director of OFI Global Asset Management, Inc. (since January 2013), Director of OppenheimerFunds, Inc. (since July 2014), President, Management Director and CEO of Oppenheimer Acquisition Corp. (OppenheimerFunds, Inc.‘s parent holding company) (since July 2014), and President and Director of OFI SteelPath, Inc. (since January 2013). Chief Investment Officer of the OppenheimerFunds advisory entities (January 2013-December 2013); Executive Vice President of OFI Global Asset Management, Inc. (January 2013-May 2013); Chief Investment Officer of OppenheimerFunds, Inc. (October 2010-December 2012); Chief Investment Officer, Fixed-Income, of OppenheimerFunds, Inc. (April 2009-October 2010); Executive Vice President of OppenheimerFunds, Inc. (October 2009-December 2012); Director of Fixed Income of OppenheimerFunds, Inc. (January 2009-April 2009); and a Senior Vice President of OppenheimerFunds, Inc. (March 1993-September 2009). |
|
| OTHER OFFICERS OF THE FUND | | The addresses of the Officers in the chart below are as follows: for Mr. Jennings, Mss. Lo Bessette, Foxson and Picciotto, 225 Liberty Street, New York, New York 10281-1008, for Mr. Petersen, 6803 S. Tucson Way, Centennial, Colorado 80112-3924. Each Officer serves for an indefinite term or until his or her resignation, retirement, death or removal. |
| |
Frank Jennings, Ph.D., Vice President (since 1995) Year of Birth: 1947 | | Senior Vice President of the Sub-Adviser (since February 2006) and Vice President of the Sub-Adviser (September 1995-January 2006). |
59 OPPENHEIMER GLOBAL OPPORTUNITIES FUND
TRUSTEES AND OFFICERS Unaudited / Continued
| | |
| |
Cynthia Lo Bessette, Secretary and Chief Legal Officer (since 2016) Year of Birth: 1969 | | Executive Vice President, General Counsel and Secretary of OFI Global Asset Management, Inc. (since February 2016); Senior Vice President and Deputy General Counsel of OFI Global Asset Management, Inc. (March 2015-February 2016); Chief Legal Officer of OppenheimerFunds, Inc. and OppenheimerFunds Distributor, Inc. (since February 2016); Vice President, General Counsel and Secretary of Oppenheimer Acquisition Corp. (since February 2016); General Counsel of OFI SteelPath, Inc., OFI Advisors, LLC and Index Management Solutions, LLC (since February 2016); Chief Legal Officer of OFI Global Institutional, Inc., HarbourView Asset Management Corporation, OFI Global Trust Company, Oppenheimer Real Asset Management, Inc., OFI Private Investments Inc., Shareholder Services, Inc. and Trinity Investment Management Corporation (since February 2016); Corporate Counsel (February 2012-March 2015) and Deputy Chief Legal Officer (April 2013-March 2015) of Jennison Associates LLC; Assistant General Counsel (April 2008-September 2009) and Deputy General Counsel (October 2009-February 2012) of Lord Abbett & Co. LLC. |
| |
Jennifer Foxson, Vice President and Chief Business Officer (since 2014) Year of Birth: 1969 | | Senior Vice President of OppenheimerFunds Distributor, Inc. (since June 2014); Vice President of OppenheimerFunds Distributor, Inc. (April 2006-June 2014); Vice President of OppenheimerFunds, Inc. (January 1998-March 2006); Assistant Vice President of OppenheimerFunds, Inc. (October 1991-December 1998). |
| |
Mary Ann Picciotto, Chief Compliance Officer and Chief Anti-Money Laundering Officer (since 2014) Year of Birth: 1973 | | Senior Vice President and Chief Compliance Officer of OFI Global Asset Management, Inc. (since March 2014); Chief Compliance Officer of OppenheimerFunds, Inc., OFI SteelPath, Inc., OFI Global Institutional, Inc., Oppenheimer Real Asset Management, Inc., OFI Private Investments Inc., Harborview Asset Management Corporation, Trinity Investment Management Corporation, and Shareholder Services, Inc. (since March 2014); Managing Director of Morgan Stanley Investment Management Inc. and certain of its various affiliated entities; Chief Compliance Officer of various Morgan Stanley Funds (May 2010-January 2014); Chief Compliance Officer of Morgan Stanley Investment Management Inc. (April 2007-January 2014). |
| |
Brian S. Petersen, Treasurer and Principal Financial & Accounting Officer (since 2016) Year of Birth: 1970 | | Senior Vice President of OFI Global Asset Management, Inc. (since January 2017); Vice President of OFI Global Asset Management, Inc. (January 2013-January 2017); Vice President of OppenheimerFunds, Inc. (February 2007-December 2012); Assistant Vice President of OppenheimerFunds, Inc. (August 2002-2007). |
The Fund’s Statement of Additional Information contains additional information about the Fund’s Trustees and Officers and is available without charge upon request by calling 1.800.CALL OPP (225.5677).
60 OPPENHEIMER GLOBAL OPPORTUNITIES FUND
OPPENHEIMER GLOBAL OPPORTUNITIES FUND
| | |
| Manager | | OFI Global Asset Management, Inc. |
| |
| Sub-Adviser | | OppenheimerFunds, Inc. |
| |
| Distributor | | OppenheimerFunds Distributor, Inc. |
| |
| Transfer and Shareholder Servicing Agent | | OFI Global Asset Management, Inc. |
| |
| Sub-Transfer Agent | | Shareholder Services, Inc. |
| | DBA OppenheimerFunds Services |
| |
| Independent Registered Public Accounting Firm | | KPMG LLP |
| |
| Legal Counsel | | Kramer Levin Naftalis & Frankel LLP |
|
| © 2018 OppenheimerFunds, Inc. All rights reserved. |
61 OPPENHEIMER GLOBAL OPPORTUNITIES FUND
PRIVACY NOTICE
As an Oppenheimer fund shareholder, you are entitled to know how we protect your personal information and how we limit its disclosure.
Information Sources
We obtain non-public personal information about our shareholders from the following sources:
| ● | | Applications or other forms. |
| ● | | When you create a user ID and password for online account access. |
| ● | | When you enroll in eDocs Direct,SM our electronic document delivery service. |
| ● | | Your transactions with us, our affiliates or others. |
| ● | | Technologies on our website, including: “cookies” and web beacons, which are used to collect data on the pages you visit and the features you use. |
If you visit oppenheimerfunds.com and do not log on to the secure account information areas, we do not obtain any personal information about you. When you do log on to a secure area, we do obtain your user ID and password to identify you. We also use this information to provide you with products and services you have requested, to inform you about products and services that you may be interested in and assist you in other ways.
We do not collect personal information through our website unless you willingly provide it to us, either directly by email or in those areas of the website that request information. In order to update your personal information (including your mailing address, email address and phone number) you must first log on and visit your user profile.
If you have set your browser to warn you before accepting cookies, you will receive the warning message with each cookie. You can refuse cookies by turning them off in your browser. However, doing so may limit your access to certain sections of our website.
We use cookies to help us improve and manage our website. For example, cookies help us recognize new versus repeat visitors to the site, track the pages visited, and enable some special features on the website. This data helps us provide better service for our website visitors.
Protection of Information
We do not disclose any non-public personal information (such as names on a customer list) about current or former customers to anyone, except as permitted by law.
Disclosure of Information
Copies of confirmations, account statements and other documents reporting activity in your fund accounts are made available to your financial advisor (as designated by you). We may also use details about you and your investments to help us, our financial service affiliates, or firms that jointly market their financial products and services with ours, to better serve your investment needs or suggest educational material that may be of interest to you. If this requires us to provide you with an opportunity to “opt in” or “opt out” of such information sharing with a firm not affiliated with us, you will receive notification on how to do so, before any such sharing takes place.
Right of Refusal
We will not disclose your personal information to unaffiliated third parties (except as permitted by law), unless we first offer you a reasonable opportunity to refuse or “opt out” of such disclosure.
62 OPPENHEIMER GLOBAL OPPORTUNITIES FUND
Internet Security and Encryption
In general, the email services provided by our website are encrypted and provide a secure and private means of communication with us. To protect your own privacy, confidential and/ or personal information should only be communicated via email when you are advised that you are using a secure website.
As a security measure, we do not include personal or account information in non-secure emails, and we advise you not to send such information to us in non-secure emails. Instead, you may take advantage of the secure features of our website to encrypt your email correspondence. To do this, you will need to use a browser that supports Secure Sockets Layer (SSL) protocol.
| ● | | All transactions conducted via our websites, including redemptions, exchanges and purchases, are secured by the highest encryption standards available. SSL is used to establish a secure connection between your PC and OppenheimerFunds’ server. It transmits information in an encrypted and scrambled format. |
| ● | | Encryption is achieved through an electronic scrambling technology that uses a “key” to code and then decode the data. Encryption acts like the cable converter box you may have on your television set. It scrambles data with a secret code so that no one can make sense of it while it is being transmitted. When the data reaches its destination, the same software unscrambles the data. |
| ● | | You can exit the secure area by closing your browser or, for added security, you can use the Log Out button before you close your browser. |
Other Security Measures
We maintain physical, electronic and procedural safeguards to protect your personal account information. Our employees and agents have access to that information only so that they may offer you products or provide services, for example, when responding to your account questions.
How You Can Help
You can also do your part to keep your account information private and to prevent unauthorized transactions. If you obtain a user ID and password for your account, safeguard that information. Strengthening your online credentials–your online security profile–typically your user name, password, and security questions and answers, can be one of your most important lines of defense on the Internet. For additional information on how you can help prevent identity theft, visit https://www. oppenheimerfunds.com/security.
Who We Are
This joint notice describes the privacy policies of the Oppenheimer funds, OppenheimerFunds, Inc., each of its investment adviser subsidiaries, OppenheimerFunds Distributor, Inc. and OFI Global Trust Co. It applies to all Oppenheimer fund accounts you presently have, or may open in the future, using your Social Security number—whether or not you remain a shareholder of our funds. This notice was last updated as of November 2017. In the event it is updated or changed, we will post an updated notice on our website at oppenheimerfunds.com. If you have any questions about this privacy policy, email us by clicking on the Contact Us section of our website at oppenheimerfunds.com, write to us at P.O. Box 5270, Denver, CO 80217-5270, or call us at 800 CALL OPP (225 5677).
63 OPPENHEIMER GLOBAL OPPORTUNITIES FUND
| | | | |
| | 
| | |
| | |
| | Visit us at oppenheimerfunds.com for 24-hr access to account information and transactions or call us at 800.CALL OPP (800.225.5677) for 24-hr automated information and automated transactions. Representatives also available Mon–Fri 8am-8pm ET. | | |
| | |
Visit Us oppenheimerfunds.com | | | | |
| | |
Call Us 800 225 5677 | | | | |
| | |
Follow Us 
| | Oppenheimer funds are distributed by OppenheimerFunds Distributor, Inc. 225 Liberty Street, New York, NY 10281-1008 © 2018 OppenheimerFunds Distributor, Inc. All rights reserved. RA0215.001.0918 November 21, 2018 | | |
Item 2. Code of Ethics.
The registrant has adopted a code of ethics that applies to the registrant’s principal executive officer, principal financial officer, principal accounting officer or controller or persons performing similar functions.
Item 3. Audit Committee Financial Expert.
The Board of Trustees of the registrant has determined that Joanne Pace, the Board’s Audit Committee Chairwoman, is an audit committee financial expert and that Ms. Pace is “independent” for purposes of this Item 3.
Item 4. Principal Accountant Fees and Services.
The principal accountant for the audit of the registrant’s annual financial statements billed $40,800 in fiscal 2018 and $37,600 in fiscal 2017.
The principal accountant for the audit of the registrant’s annual financial statements billed $3,500 in fiscal 2018 and $8,500 in fiscal 2017.
The principal accountant for the audit of the registrant’s annual financial statements billed $297,836 in fiscal 2018 and $386,986 in fiscal 2017 to the registrant’s investment adviser or any entity controlling, controlled by, or under common control with the adviser that provides ongoing services to the registrant.
Such services include: Internal control reviews, GIPS attestation procedures, CP Conduit fees, incremental and additional audit services
The principal accountant for the audit of the registrant’s annual financial statements billed no such fees in fiscal 2018 and no such fees in fiscal 2017.
The principal accountant for the audit of the registrant’s annual financial statements billed $534,826 in fiscal 2018 and $286,402 in fiscal 2017 to the registrant’s investment adviser or any entity controlling, controlled by, or under common control with the adviser that provides ongoing services to the registrant.
Such services include: tax compliance, tax planning and tax advice. Tax compliance generally involves preparation of original and amended tax returns, claims for a refund and tax payment-planning services. Tax planning and tax advice includes assistance with tax audits and appeals, tax advice related to mergers and acquisitions and requests for rulings or technical advice from taxing authorities.
The principal accountant for the audit of the registrant’s annual financial statements billed no such fees in fiscal 2018 and no such fees in fiscal 2017.
The principal accountant for the audit of the registrant’s annual financial statements billed no such fees in fiscal 2018 and no such fees in fiscal 2017 to the registrant’s investment adviser or any entity controlling, controlled by, or under common control with the adviser that provides ongoing services to the registrant.
Such fees would include the cost to the principal accountant of attending audit committee meetings and consultations regarding the registrant’s retirement plan with respect to its Trustees.
| (e) | (1) During its regularly scheduled periodic meetings, the registrant’s audit committee will pre-approve all audit, audit-related, tax and other services to be provided by the principal accountants of the registrant. |
The audit committee has delegated pre-approval authority to its Chairwoman for any subsequent new engagements that arise between regularly scheduled meeting dates provided that any fees such pre-approved are presented to the audit committee at its next regularly scheduled meeting.
Under applicable laws, pre-approval of non-audit services may be waived provided that: 1) the aggregate amount of all such services provided constitutes no more than five percent of the total amount of fees paid by the registrant to its principal accountant during the fiscal year in which services are provided 2) such services were not recognized by the registrant at the time of engagement as non-audit services and 3) such services are promptly brought to the attention of the audit committee of the registrant and approved prior to the completion of the audit.
(2) 0%
| (f) | Not applicable as less than 50%. |
| (g) | The principal accountant for the audit of the registrant’s annual financial statements billed $836,162 in fiscal 2018 and $681,888 in fiscal 2017 to the registrant and the registrant’s investment adviser or any entity controlling, controlled by, or under common control with the adviser that provides ongoing services to the registrant related to non-audit fees. Those billings did not include any prohibited non-audit services as defined by the Securities Exchange Act of 1934. |
| (h) | The registrant’s audit committee of the board of Trustees has considered whether the provision of non-audit services that were rendered to the registrant’s investment adviser, and any entity controlling, controlled by, or under common control with the investment adviser that provides ongoing services to the registrant that were not pre-approved pursuant to paragraph (c)(7)(ii) of Rule 2-01 of Regulation S-X is compatible with maintaining the principal accountant’s independence. No such services were rendered. |
Item 5. Audit Committee of Listed Registrants
Not applicable.
Item 6. Schedule of Investments.
a) Not applicable. The complete schedule of investments is included in Item 1 of this Form N-CSR.
b) Not applicable.
Item 7. Disclosure of Proxy Voting Policies and Procedures for Closed-End Management Investment Companies.
Not applicable.
Item 8. Portfolio Managers of Closed-End Management Investment Companies.
Not applicable.
Item 9. Purchases of Equity Securities by Closed-End Management Investment Company and Affiliated Purchasers.
Not applicable.
Item 10. Submission of Matters to a Vote of Security Holders.
The Fund’s Governance Committee Provisions with Respect to Nominations of Directors/Trustees to the Respective Boards
None
Item 11. Controls and Procedures.
Based on their evaluation of the registrant’s disclosure controls and procedures (as defined in rule 30a-3(c) under the Investment Company Act of 1940 (17 CFR 270.30a-3(c)) as of 9/30/2018, the registrant’s principal executive officer and principal financial officer found the registrant’s disclosure controls and procedures to provide reasonable assurances that information required to be disclosed by the registrant in the reports that it files under the Securities Exchange Act of 1934 (a) is accumulated and communicated to registrant’s management, including its principal executive officer and principal financial officer, to allow timely decisions regarding required disclosure, and (b) is recorded, processed, summarized and reported, within the time periods specified in the rules and forms adopted by the U.S. Securities and Exchange Commission.
There have been no changes in the registrant’s internal controls over financial reporting that occurred during the registrant’s second fiscal quarter of the period covered by this report that have materially affected, or are reasonably likely to materially affect, the registrant’s internal control over financial reporting.
Item 12. Disclosure of Securities Lending Activities for Closed-End Management Investment Companies.
Not applicable.
Item 13. Exhibits.
| (a) | (1) Exhibit attached hereto. |
| | (2) Exhibits attached hereto. |
SIGNATURES
Pursuant to the requirements of the Securities Exchange Act of 1934 and the Investment Company Act of 1940, the registrant has duly caused this report to be signed on its behalf by the undersigned, thereunto duly authorized.
Oppenheimer Global Opportunities Fund
| | |
| By: | | /s/ Arthur P. Steinmetz |
| | Arthur P. Steinmetz |
| | Principal Executive Officer |
Date: 11/16/2018
Pursuant to the requirements of the Securities Exchange Act of 1934 and the Investment Company Act of 1940, this report has been signed below by the following persons on behalf of the registrant and in the capacities and on the dates indicated.
| | |
| By: | | /s/ Arthur P. Steinmetz |
| | Arthur P. Steinmetz |
| | Principal Executive Officer |
Date: 11/16/2018
| | |
| By: | | /s/ Brian S. Petersen |
| | Brian S. Petersen |
| | Principal Financial Officer |
Date: 11/16/2018