United States
Securities and Exchange Commission
Washington, D.C. 20549
Form N-CSR
Certified Shareholder Report of Registered Management Investment Companies
811-6061
(Investment Company Act File Number)
Federated Index Trust
_______________________________________________________________
(Exact Name of Registrant as Specified in Charter)
Federated Investors Funds
4000 Ericsson Drive
Warrendale, Pennsylvania 15086-7561
(Address of Principal Executive Offices)
(412) 288-1900
(Registrant's Telephone Number)
John W. McGonigle, Esquire
Federated Investors Tower
1001 Liberty Avenue
Pittsburgh, Pennsylvania 15222-3779
(Name and Address of Agent for Service)
(Notices should be sent to the Agent for Service)
Date of Fiscal Year End: 10/31/2010
Date of Reporting Period: 10/31/2010
Item 1. Reports to Stockholders
Federated Max-Cap Index Fund
A Portfolio of Federated Index Trust
ANNUAL SHAREHOLDER REPORTOctober 31, 2010
Institutional Shares
Institutional Service Shares
Class C Shares
Class K Shares
(Effective December 31, 2010, the Fund's Class K Shares will be redesignated as Class R Shares)
FINANCIAL HIGHLIGHTS
SHAREHOLDER EXPENSE EXAMPLE
MANAGEMENT'S DISCUSSION OF FUND PERFORMANCE
PORTFOLIO OF INVESTMENTS SUMMARY TABLE
PORTFOLIO OF INVESTMENTS
STATEMENT OF ASSETS AND LIABILITIES
STATEMENT OF OPERATIONS
STATEMENT OF CHANGES IN NET ASSETS
NOTES TO FINANCIAL STATEMENTS
REPORT OF INDEPENDENT REGISTERED PUBLIC ACCOUNTING FIRM
BOARD OF TRUSTEES AND TRUST OFFICERS
EVALUATION AND APPROVAL OF ADVISORY CONTRACT
VOTING PROXIES ON FUND PORTFOLIO SECURITIES
QUARTERLY PORTFOLIO SCHEDULE
Financial Highlights – Institutional Shares
(For a Share Outstanding Throughout Each Period)
| Year Ended October 31 | 2010 | 2009 | 2008 | 2007 | 2006 |
| Net Asset Value, Beginning of Period | $11.76 | $15.62 | $28.48 | $27.36 | $24.47 |
| Income From Investment Operations: | | | | | |
| Net investment income | 0.201 | 0.241 | 0.401 | 0.45 | 0.42 |
| Net realized and unrealized gain (loss) on investments, futures contracts and foreign currency transactions | 1.66 | 0.53 | (9.67) | 3.12 | 3.40 |
| TOTAL FROM INVESTMENT OPERATIONS | 1.86 | 0.77 | (9.27) | 3.57 | 3.82 |
| Less Distributions: | | | | | |
| Distributions from net investment income | (0.21) | (0.25) | (0.40) | (0.45) | (0.41) |
| Distributions from net realized gain on investments, futures contracts and foreign currency transactions | (0.59) | (4.38) | (3.21) | (2.00) | (0.52) |
| TOTAL DISTRIBUTIONS | (0.80) | (4.63) | (3.61) | (2.45) | (0.93) |
| Regulatory Settlement Proceeds | — | — | 0.022 | — | — |
| Net Asset Value, End of Period | $12.82 | $11.76 | $15.62 | $28.48 | $27.36 |
| Total Return3 | 16.38% | 9.78% | (36.23)%2 | 14.13% | 15.99% |
| Ratios to Average Net Assets: | | | | | |
| Net expenses | 0.35% | 0.35% | 0.35% | 0.35% | 0.35% |
| Net investment income | 1.65% | 2.24% | 1.84% | 1.63% | 1.63% |
| Expense waiver/reimbursement4 | 0.09% | 0.10% | 0.07% | 0.03% | 0.17% |
| Supplemental Data: | | | | | |
| Net assets, end of period (000 omitted) | $208,399 | $170,766 | $215,731 | $651,327 | $660,249 |
| Portfolio turnover | 34% | 31% | 47% | 49% | 42% |
| 1 | Per share numbers have been calculated using the average shares method. |
| 2 | During the year, the Fund received a regulatory settlement from an unaffiliated third party, which had an impact of 0.08% on the total return. |
| 3 | Based on net asset value. |
| 4 | This expense decrease is reflected in both the net expense and net investment income ratios shown above. |
See Notes which are an integral part of the Financial Statements
Annual Shareholder Report1
Financial Highlights – Institutional Service Shares
(For a Share Outstanding Throughout Each Period)
| Year Ended October 31 | 2010 | 2009 | 2008 | 2007 | 2006 |
| Net Asset Value, Beginning of Period | $11.71 | $15.58 | $28.41 | $27.30 | $24.42 |
| Income From Investment Operations: | | | | | |
| Net investment income | 0.161 | 0.201 | 0.331 | 0.35 | 0.34 |
| Net realized and unrealized gain (loss) on investments, futures contracts and foreign currency transactions | 1.66 | 0.52 | (9.64) | 3.12 | 3.40 |
| TOTAL FROM INVESTMENT OPERATIONS | 1.82 | 0.72 | (9.31) | 3.47 | 3.74 |
| Less Distributions: | | | | | |
| Distributions from net investment income | (0.17) | (0.21) | (0.33) | (0.36) | (0.34) |
| Distributions from net realized gain on investments, futures contracts and foreign currency transactions | (0.59) | (4.38) | (3.21) | (2.00) | (0.52) |
| TOTAL DISTRIBUTIONS | (0.76) | (4.59) | (3.54) | (2.36) | (0.86) |
| Regulatory Settlement Proceeds | — | — | 0.022 | — | — |
| Net Asset Value, End of Period | $12.77 | $11.71 | $15.58 | $28.41 | $27.30 |
| Total Return3 | 16.10% | 9.42% | (36.41)%2 | 13.78% | 15.63% |
| Ratios to Average Net Assets: | | | | | |
| Net expenses | 0.65% | 0.65% | 0.65% | 0.65% | 0.65% |
| Net investment income | 1.36% | 1.90% | 1.54% | 1.33% | 1.34% |
| Expense waiver/reimbursement4 | 0.38% | 0.41% | 0.32% | 0.29% | 0.29% |
| Supplemental Data: | | | | | |
| Net assets, end of period (000 omitted) | $231,807 | $227,316 | $235,167 | $490,722 | $526,622 |
| Portfolio turnover | 34% | 31% | 47% | 49% | 42% |
| 1 | Per share numbers have been calculated using the average shares method. |
| 2 | During the year, the Fund received a regulatory settlement from an unaffiliated third party, which had an impact of 0.08% on the total return. |
| 3 | Based on net asset value. |
| 4 | This expense decrease is reflected in both the net expense and net investment income ratios shown above. |
See Notes which are an integral part of the Financial Statements
Annual Shareholder Report2
Financial Highlights – Class C Shares
(For a Share Outstanding Throughout Each Period)
| Year Ended October 31 | 2010 | 2009 | 2008 | 2007 | 2006 |
| Net Asset Value, Beginning of Period | $11.65 | $15.53 | $28.32 | $27.23 | $24.35 |
| Income From Investment Operations: | | | | | |
| Net investment income | 0.071 | 0.121 | 0.171 | 0.15 | 0.15 |
| Net realized and unrealized gain (loss) on investments, futures contracts and foreign currency transactions | 1.64 | 0.51 | (9.60) | 3.10 | 3.41 |
| TOTAL FROM INVESTMENT OPERATIONS | 1.71 | 0.63 | (9.43) | 3.25 | 3.56 |
| Less Distributions: | | | | | |
| Distributions from net investment income | (0.08) | (0.13) | (0.17) | (0.16) | (0.16) |
| Distributions from net realized gain on investments, futures contracts and foreign currency transactions | (0.59) | (4.38) | (3.21) | (2.00) | (0.52) |
| TOTAL DISTRIBUTIONS | (0.67) | (4.51) | (3.38) | (2.16) | (0.68) |
| Regulatory Settlement Proceeds | — | — | 0.022 | — | — |
| Net Asset Value, End of Period | $12.69 | $11.65 | $15.53 | $28.32 | $27.23 |
| Total Return3 | 15.11% | 8.55% | (36.87)%2 | 12.91% | 14.86% |
| Ratios to Average Net Assets: | | | | | |
| Net expenses | 1.43% | 1.43% | 1.41% | 1.40% | 1.35% |
| Net investment income | 0.58% | 1.14% | 0.78% | 0.59% | 0.64% |
| Expense waiver/reimbursement4 | 0.07% | 0.09% | 0.05% | 0.02% | 0.02% |
| Supplemental Data: | | | | | |
| Net assets, end of period (000 omitted) | $31,722 | $32,489 | $35,288 | $75,531 | $78,043 |
| Portfolio turnover | 34% | 31% | 47% | 49% | 42% |
| 1 | Per share numbers have been calculated using the average shares method. |
| 2 | During the year, the Fund received a regulatory settlement from an unaffiliated third party, which had an impact of 0.08% on the total return. |
| 3 | Based on net asset value, which does not reflect the sales charge, redemption fee or contingent deferred sales charge, if applicable. |
| 4 | This expense decrease is reflected in both the net expense and net investment income ratios shown above. |
See Notes which are an integral part of the Financial Statements
Annual Shareholder Report3
Financial Highlights – Class K Shares
(For a Share Outstanding Throughout Each Period)
| Year Ended October 31 | 2010 | 2009 | 2008 | 2007 | 2006 |
| Net Asset Value, Beginning of Period | $11.71 | $15.58 | $28.41 | $27.30 | $24.43 |
| Income From Investment Operations: | | | | | |
| Net investment income | 0.111 | 0.151 | 0.241 | 0.23 | 0.22 |
| Net realized and unrealized gain (loss) on investments, futures contracts and foreign currency transactions | 1.65 | 0.53 | (9.65) | 3.13 | 3.41 |
| TOTAL FROM INVESTMENT OPERATIONS | 1.76 | 0.68 | (9.41) | 3.36 | 3.63 |
| Less Distributions: | | | | | |
| Distributions from net investment income | (0.12) | (0.17) | (0.23) | (0.25) | (0.24) |
| Distributions from net realized gain on investments, futures contracts and foreign currency transactions | (0.59) | (4.38) | (3.21) | (2.00) | (0.52) |
| TOTAL DISTRIBUTIONS | (0.71) | (4.55) | (3.44) | (2.25) | (0.76) |
| Regulatory Settlement Proceeds | — | — | 0.022 | — | — |
| Net Asset Value, End of Period | $12.76 | $11.71 | $15.58 | $28.41 | $27.30 |
| Total Return3 | 15.51% | 8.94% | (36.72)%2 | 13.29% | 15.14% |
| Ratios to Average Net Assets: | | | | | |
| Net expenses | 1.10% | 1.10% | 1.10% | 1.10% | 1.10% |
| Net investment income | 0.91% | 1.42% | 1.11% | 0.88% | 0.85% |
| Expense waiver/reimbursement4 | 0.06% | 0.09% | 0.05% | 0.02% | 0.02% |
| Supplemental Data: | | | | | |
| Net assets, end of period (000 omitted) | $30,980 | $25,796 | $21,739 | $73,702 | $76,756 |
| Portfolio turnover | 34% | 31% | 47% | 49% | 42% |
| 1 | Per share numbers have been calculated using the average shares method. |
| 2 | During the year, the Fund received a regulatory settlement from an unaffiliated third party, which had an impact of 0.08% on the total return. |
| 3 | Based on net asset value. |
| 4 | This expense decrease is reflected in both the net expense and net investment income ratios shown above. |
See Notes which are an integral part of the Financial Statements
Annual Shareholder Report4
Shareholder Expense Example (unaudited)
As a shareholder of the Fund, you incur two types of costs: (1) transaction costs, including sales charges (loads) on purchase or redemption payments; and (2) ongoing costs, including management fees and to the extent applicable, distribution (12b-1) fees and/or shareholder services fees and other Fund expenses. This Example is intended to help you to understand your ongoing costs (in dollars) of investing in the Fund and to compare these costs with the ongoing costs of investing in other mutual funds. It is based on an investment of $1,000 invested at the beginning of the period and held for the entire period from May 1, 2010 to October 31, 2010.
ACTUAL EXPENSES
The first section of the table below provides information about actual account values and actual expenses. You may use the information in this section, together with the amount you invested, to estimate the expenses that you incurred over the period. Simply divide your account value by $1,000 (for example, an $8,600 account value divided by $1,000 = 8.6), then multiply the result by the number in the first section under the heading entitled “Expenses Paid During Period” to estimate the expenses attributable to your investment during this period.
HYPOTHETICAL EXAMPLE FOR COMPARISON PURPOSES
The second section of the table below provides information about hypothetical account values and hypothetical expenses based on the Fund's actual expense ratio and an assumed rate of return of 5% per year before expenses, which is not the Fund's actual return. Thus, you should not use the hypothetical account values and expenses to estimate the actual ending account balance or your expenses for the period. Rather, these figures are required to be provided to enable you to compare the ongoing costs of investing in the Fund with other funds. To do so, compare this 5% hypothetical example with the 5% hypothetical examples that appear in the shareholder reports of the other funds.
Annual Shareholder Report
5
Please note that the expenses shown in the table are meant to highlight your ongoing costs only and do not reflect any transaction costs, such as sales charges (loads) on purchase or redemption payments. Therefore, the second section of the table is useful in comparing ongoing costs only, and will not help you determine the relative total costs of owning different funds. In addition, if these transaction costs were included, your costs would have been higher. | Beginning
Account Value
5/1/2010 | Ending
Account Value
10/31/2010 | Expenses Paid
During Period1 |
| Actual: | | | |
| Institutional Shares | $1,000 | $1,007.10 | $1.77 |
| Institutional Service Shares | $1,000 | $1,005.60 | $3.29 |
| Class C Shares | $1,000 | $1,001.60 | $7.21 |
| Class K Shares | $1,000 | $1,002.60 | $5.55 |
Hypothetical (assuming a 5% return
before expenses): | | | |
| Institutional Shares | $1,000 | $1,023.44 | $1.79 |
| Institutional Service Shares | $1,000 | $1,021.93 | $3.31 |
| Class C Shares | $1,000 | $1,018.00 | $7.27 |
| Class K Shares | $1,000 | $1,019.66 | $5.60 |
| 1 | Expenses are equal to the Fund's annualized net expense ratios, multiplied by the average account value over the period, multiplied by 184/365 (to reflect the one-half-year period). The annualized net expense ratios are as follows: |
| Institutional Shares | 0.35% |
| Institutional Service Shares | 0.65% |
| Class C Shares | 1.43% |
| Class K Shares | 1.10% |
Annual Shareholder Report6
Performance data quoted represents past performance which is no guarantee of future results. Investment return and principal value will fluctuate so that an investor's shares, when redeemed, may be worth more or less than their original cost. Mutual fund performance changes over time and current performance may be lower or higher than what is stated. For current to the most recent month-end performance and after-tax returns, visit FederatedInvestors.com or call 1-800-341-7400.
Management's Discussion of Fund Performance (unaudited)
The Fund's Institutional Shares, Institutional Service Shares, Class C Shares and Class K Shares produced total returns of 16.38%, 16.10%, 15.11% and 15.51%, respectively, based on net asset value for the 12-month reporting period ended October 31, 2010. The Fund's benchmark, the Standard & Poor's 500® Index (S&P 500),1 posted a total return of 16.52% for the same period. The total return of the Fund's shares reflects the impact of actual cash flows, transaction costs and other expenses.
MARKET OVERVIEW
The global economic recovery that began in 2009 continued on its choppy course in 2010, delivering mixed but slowly improving economic data and gradual, if uneven, improvement of investor sentiment. The risks of a double-dip recession continued to recede, but the economy remained mired in a slow-growth environment. In the United States, the National Bureau of Economic Research declared that the “Great Recession” ended in June 2009. Spanning December 2007 to June 2009, this marked the longest reported recession since the Great Depression. The high levels of volatility experienced in global equity markets throughout 2009 continued into 2010 as mixed economic data and lingering credit issues caused stocks to trade in both directions. But by the end of the first quarter, most markets had managed to post gains. The second quarter, in contrast, brought higher levels of volatility and a “flight to quality” as investor sentiment was dominated by fears of a double-dip recession. Global equity markets saw negative quarterly returns – and for many markets, the first significant downturn since the bull market began in March 2009. In the third quarter, economic data turned less negative and strong corporate earnings reports became
| 1 | The S&P 500 is a market capitalization-weighted index of 500 stocks designed to measure performance of the broad domestic economy through changes in the aggregate market value of 500 stocks representing all major industries. The index is unmanaged and, unlike the Fund, is not affected by cash flows. Investments cannot be made in an index. “Standard & Poor's,®” “S&P,®” “S&P 500,®” “Standard & Poor's 500” and “500” are trademarks of The McGraw-Hill Companies, Inc. and have been licensed for use by Federated Securities Corp. The Fund is not sponsored, endorsed, sold or promoted by, or affiliated with, Standard & Poor's (S&P). S&P makes no representation or warranty, express or implied, to the owners of the Fund or any member of the public regarding the advisability of investing in securities generally, or in the Fund particularly, or the ability of the S&P 500 to track general stock market performance. |
Annual Shareholder Report
7
increasingly consistent. These factors, along with attractive valuations and expectations for additional quantitative easing, drove equity markets higher, with most markets recapturing their second quarter losses. Stocks continued their rally into the beginning of the fourth quarter, closing out the 12-month period in positive territory. FUND PERFORMANCE
Against this backdrop, all of the 10 sectors2 within the S&P 500 recorded positive returns during the period. Consumer Discretionary led the way, advancing 33.48%, followed by Industrials, up 28.65%, and Telecommunication Services, up 24.84%. The Financials sector, although in positive territory, posted the weakest results, up 4.85%. Akamai Technologies, Inc. (Information Technology), Titanium Metals Corp. (Materials) and Priceline.com, Inc. (Consumer Discretionary) were the strongest performing individual stocks in the index, while Dean Foods Co. (Consumer Staples), Apollo Group, Inc. and H&R Block, Inc. (both Consumer Discretionary) were the worst performers for the period.
The enhanced index portion of the Fund outperformed the S&P 500 by 0.55%, contributing positively to the Fund's overall performance. Portfolio management of the enhanced portion of the Fund primarily entails overweighting and underweighting stocks relative to the S&P 500 based on quantitative factors and substitution strategies. Investment strategies based on earning announcements, momentum and external financing factors contributed positively to performance. Stock substitution strategies based on relative value, events, mergers and acquisitions also had a positive impact. Strategies based on earnings quality and earnings sustainability factors detracted from performance.
POSITIONING AND STRATEGY
The Fund utilized S&P 500 futures to provide equity exposure on the Fund's cash balances. While over the long term this strategy anticipates that the S&P 500 futures will mirror the performance of the S&P 500, pricing disparity can occur in the short term and the Fund can benefit from or be harmed by trading futures instead of stocks when money moves in or out of the Fund. During the reporting period, the trading of futures contracts had a negligible impact on the Fund's performance.
| 2 | Sector classifications are based upon the classification of the Standard & Poor's Global Industry Classification Standard (SPGIC). |
Annual Shareholder Report8
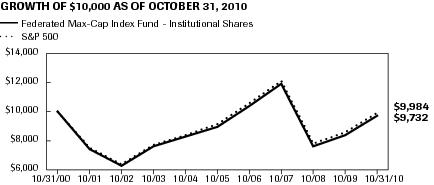
GROWTH OF A $10,000 INVESTMENT – INSTITUTIONAL SHARES
The graph below illustrates the hypothetical investment of $10,0001 in Federated Max-Cap Index Fund (Institutional Shares) (the “Fund”) from October 31, 2000 to October 31, 2010, compared to the Standard & Poor's 500 Index (S&P 500).2
| Average Annual Total Returns for the Period Ended 10/31/2010 | |
| 1 Year | 16.38% |
| 5 Years | 1.52% |
| 10 Years | -0.27% |
Performance data quoted represents past performance which is no guarantee of future results. Investment return and principal value will fluctuate so that an investor's shares, when redeemed, may be worth more or less than their original cost. Mutual fund performance changes over time and current performance may be lower or higher than what is stated. For current to the most recent month-end performance and after-tax returns, visit FederatedInvestors.com or call 1-800-341-7400. Returns shown do not reflect the deduction of taxes that a shareholder would pay on Fund distributions or the redemption of Fund shares. Mutual funds are not obligations of or guaranteed by any bank and are not federally insured.
| 1 | The Fund's performance assumes the reinvestment of all dividends and distributions. The S&P 500 has been adjusted to reflect reinvestment of dividends on securities in the index. |
| 2 | The S&P 500 is not adjusted to reflect taxes, expenses or other fees that the Securities and Exchange Commission (SEC) requires to be reflected in the Fund's performance. The S&P 500 is unmanaged and, unlike the Fund, is not affected by cash flows. It is not possible to invest directly in an index. |
Annual Shareholder Report9
GROWTH OF A $10,000 INVESTMENT – INSTITUTIONAL SERVICE SHARES
The graph below illustrates the hypothetical investment of $10,0001 in Federated Max-Cap Index Fund (Institutional Service Shares) (the “Fund”) from October 31, 2000 to October 31, 2010, compared to the Standard & Poor's 500 Index (S&P 500).2
| Average Annual Total Returns for the Period Ended 10/31/2010 | |
| 1 Year | 16.10% |
| 5 Years | 1.23% |
| 10 Years | -0.56% |
Performance data quoted represents past performance which is no guarantee of future results. Investment return and principal value will fluctuate so that an investor's shares, when redeemed, may be worth more or less than their original cost. Mutual fund performance changes over time and current performance may be lower or higher than what is stated. For current to the most recent month-end performance and after-tax returns, visit FederatedInvestors.com or call 1-800-341-7400. Returns shown do not reflect the deduction of taxes that a shareholder would pay on Fund distributions or the redemption of Fund shares. Mutual funds are not obligations of or guaranteed by any bank and are not federally insured.
| 1 | The Fund's performance assumes the reinvestment of all dividends and distributions. The S&P 500 has been adjusted to reflect reinvestment of dividends on securities in the index. |
| 2 | The S&P 500 is not adjusted to reflect taxes, expenses or other fees that the SEC requires to be reflected in the Fund's performance. The S&P 500 is unmanaged and, unlike the Fund, is not affected by cash flows. It is not possible to invest directly in an index. |
Annual Shareholder Report10
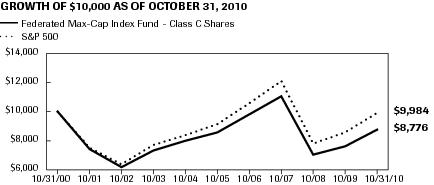
GROWTH OF A $10,000 INVESTMENT – CLASS C SHARES
The graph below illustrates the hypothetical investment of $10,0001 in Federated Max-Cap Index Fund (Class C Shares) (the “Fund”) from October 31, 2000 to October 31, 2010, compared to the Standard & Poor's 500 Index (S&P 500).2
| Average Annual Total Returns3 for the Period Ended 10/31/2010 | |
| 1 Year | 14.11% |
| 5 Years | 0.46% |
| 10 Years | -1.30% |
Performance data quoted represents past performance which is no guarantee of future results. Investment return and principal value will fluctuate so that an investor's shares, when redeemed, may be worth more or less than their original cost. Mutual fund performance changes over time and current performance may be lower or higher than what is stated. For current to the most recent month-end performance and after-tax returns, visit FederatedInvestors.com or call 1-800-341-7400. Returns shown do not reflect the deduction of taxes that a shareholder would pay on Fund distributions or the redemption of Fund shares. Mutual funds are not obligations of or guaranteed by any bank and are not federally insured. Total returns shown the maximum contingent deferred sales charge of 1.00%, as applicable.
| 1 | Represents a hypothetical investment of $10,000 in the Fund. A 1.00% contingent deferred sales charge would be applied to any redemption less than one year from the purchase date. The Fund's performance assumes the reinvestment of all dividends and distributions. The S&P 500 has been adjusted to reflect reinvestment of dividends on securities in the index. |
| 2 | The S&P 500 is not adjusted to reflect taxes, sales charges, expenses or other fees that the SEC requires to be reflected in the Fund's performance. The S&P 500 is unmanaged and, unlike the Fund, is not affected by cash flows. It is not possible to invest directly in an index. |
| 3 | Total returns quoted reflect all applicable contingent deferred sales charges. |
Annual Shareholder Report11
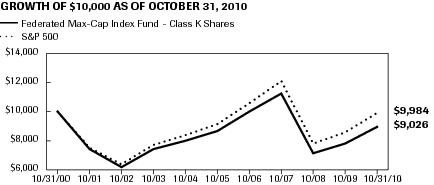
GROWTH OF A $10,000 INVESTMENT – CLASS K SHARES
The Fund's Class K Shares commenced operations on April 8, 2003. The Fund offers three other classes of shares: Institutional Shares, Institutional Service Shares and Class C Shares. For the period prior to commencement of operations of the Class K Shares, the performance information shown is for the Fund's Institutional Shares, adjusted to reflect the expenses of Class K Shares. The graph below illustrates the hypothetical investment of $10,0001 in Federated Max-Cap Index Fund (Class K Shares) (the “Fund”) from October 31, 2000 to October 31, 2010, compared to the Standard & Poor's 500 (S&P 500).2
| Average Annual Total Returns for the Period Ended 10/31/2010 | |
| 1 Year | 15.51% |
| 5 Years | 0.76% |
| 10 Years | -1.02% |
Performance data quoted represents past performance which is no guarantee of future results. Investment return and principal value will fluctuate so that an investor's shares, when redeemed, may be worth more or less than their original cost. Mutual fund performance changes over time and current performance may be lower or higher than what is stated. For current to the most recent month-end performance and after-tax returns, visit FederatedInvestors.com or call 1-800-341-7400. Returns shown do not reflect the deduction of taxes that a shareholder would pay on Fund distributions or the redemption of Fund shares. Mutual funds are not obligations of or guaranteed by any bank and are not federally insured.
| 1 | The Fund's performance assumes the reinvestment of all dividends and distributions. The S&P 500 has been adjusted to reflect reinvestment of dividends on securities in the index. |
| 2 | The S&P 500 is not adjusted to reflect taxes, expenses or other fees that the SEC requires to be reflected in the Fund's performance. The S&P 500 is unmanaged and, unlike the Fund, is not affected by cash flows. It is not possible to invest directly in an index. |
Annual Shareholder Report12
Portfolio of Investments Summary Table (unaudited)
At October 31, 2010, the Fund's sector composition1 for its equity securities investments was as follows:
| Sector | Percentage of
Total Net Assets |
| Information Technology | 18.9% |
| Financials | 15.2% |
| Health Care | 11.2% |
| Energy | 11.1% |
| Consumer Staples | 11.0% |
| Industrials | 10.5% |
| Consumer Discretionary | 10.4% |
| Utilities | 3.6% |
| Materials | 3.5% |
| Telecommunication Services | 3.2% |
| Other Securities2 | 0.1% |
| Derivative Contracts3 | 0.1% |
| Cash Equivalents4 | 1.5% |
| Other Assets and Liabilities — Net5 | (0.3)% |
| TOTAL6 | 100.0% |
| 1 | Except for Other Securities, Derivative Contracts, Cash Equivalents and Other Assets and Liabilities, sector classifications are based upon, and individual portfolio securities are assigned to, the classifications of the Global Industry Classification Standard (GICS) except that the Manager assigns a classification to securities not classified by the GICS and to securities for which the Manager does not have access to the classification made by the GICS. |
| 2 | Other Securities include an exchange-traded fund and a warrant. |
| 3 | Based upon net unrealized appreciation (depreciation) or value of the derivative contracts, as applicable. Derivative contracts may consist of futures, forwards, options and swaps. The impact of a derivative contract on the Fund's performance may be larger than its unrealized appreciation (depreciation) may indicate. In many cases, the notional value or notional principal amount of a derivative contract may provide a better indication of the contract's significance to the portfolio. More complete information regarding the Fund's direct investments in derivative contracts, including unrealized appreciation (depreciation) and notional values or amounts of such contracts, can be found in the table at the end of the Portfolio of Investments included in this Report. |
| 4 | Cash Equivalents include any investments in money market mutual funds and/or overnight repurchase agreements. |
| 5 | Assets, other than investments in securities and derivative contracts, less liabilities. See Statement of Assets and Liabilities. |
| 6 | The Fund purchases index futures contracts to efficiently manage cash flows resulting from shareholder purchases and redemptions, dividend and capital gain payments to shareholders and corporate actions while maintaining exposure to the Standard & Poor's 500 Composite Stock Price (S&P 500) Index and minimizing trading costs. Taking into consideration these open index futures contracts, the Fund's effective total exposure to the S&P 500 Index is effectively 100.2%. |
Annual Shareholder Report13
Portfolio of Investments
October 31, 2010
| Shares | | | Value |
| | COMMON STOCKS – 98.6%;1 | |
| | Consumer Discretionary – 10.4% | |
| 3,319 | | Abercrombie & Fitch Co., Class A | 142,252 |
| 16,457 | 2 | Amazon.com, Inc. | 2,717,709 |
| 4,813 | 2 | Apollo Group, Inc., Class A | 180,391 |
| 2,188 | 2 | AutoNation, Inc. | 50,805 |
| 1,076 | 2 | AutoZone, Inc. | 255,690 |
| 18,311 | 2 | Bed Bath & Beyond, Inc. | 803,853 |
| 22,512 | | Best Buy Co., Inc. | 967,566 |
| 3,407 | 2 | Big Lots, Inc. | 106,878 |
| 11,226 | | Block (H&R), Inc. | 132,354 |
| 28,677 | | CBS Corp. (New), Class B | 485,502 |
| 8,239 | 2 | CarMax, Inc. | 255,327 |
| 16,131 | | Carnival Corp. | 696,375 |
| 11,008 | | Coach, Inc. | 550,400 |
| 122,289 | | Comcast Corp., Class A | 2,516,708 |
| 10,945 | | Comcast Corp., Special Class A | 211,567 |
| 12,890 | | D.R. Horton, Inc. | 134,572 |
| 35,570 | 2 | DIRECTV Group, Inc., Class A | 1,545,872 |
| 5,170 | | Darden Restaurants, Inc. | 236,321 |
| 2,435 | | DeVRY, Inc. | 116,539 |
| 12,963 | 2 | Discovery Communications, Inc., Class A | 578,279 |
| 309 | 2 | Discovery Communications, Inc., Class C | 12,008 |
| 9,283 | 2 | Eastman Kodak Co. | 43,723 |
| 7,789 | | Expedia, Inc. | 225,492 |
| 6,134 | | Family Dollar Stores, Inc. | 283,207 |
| 150,101 | 2 | Ford Motor Co. | 2,120,927 |
| 8,189 | | Fortune Brands, Inc. | 442,615 |
| 5,407 | 2 | GameStop Corp. | 106,302 |
| 11,140 | | Gannett Co., Inc. | 132,009 |
| 18,760 | | Gap (The), Inc. | 356,628 |
| 8,613 | | Genuine Parts Co. | 412,218 |
| 9,418 | 2 | Goodyear Tire & Rubber Co. | 96,252 |
| 1,948 | 2 | Gymboree Corp. | 126,737 |
| 18,520 | | Harley-Davidson, Inc. | 568,194 |
| 3,099 | 2 | Harman International Industries, Inc. | 103,971 |
| 5,265 | | Hasbro, Inc. | 243,506 |
Annual Shareholder Report14
| Shares | | | Value |
| 78,191 | | Home Depot, Inc. | 2,414,538 |
| 11,268 | | International Game Technology | 175,668 |
| 18,311 | 2 | Interpublic Group Cos., Inc. | 189,519 |
| 29,268 | | Johnson Controls, Inc. | 1,027,892 |
| 13,171 | 2 | Kohl's Corp. | 674,355 |
| 19,582 | | Leggett and Platt, Inc. | 399,081 |
| 7,225 | | Lennar Corp., Class A | 104,835 |
| 12,035 | | Limited Brands, Inc. | 353,709 |
| 64,347 | | Lowe's Cos., Inc. | 1,372,521 |
| 19,890 | | Macy's, Inc. | 470,200 |
| 12,884 | 2 | Madison Square Garden, Inc. | 267,858 |
| 11,573 | | Marriott International, Inc., Class A | 428,780 |
| 13,754 | | Mattel, Inc. | 320,881 |
| 41,215 | | McDonald's Corp. | 3,205,290 |
| 11,411 | | McGraw-Hill Cos., Inc. | 429,624 |
| 1,597 | | Meredith Corp. | 54,218 |
| 4,949 | 2 | New York Times Co., Class A | 37,959 |
| 10,296 | | Newell Rubbermaid, Inc. | 181,724 |
| 107,744 | | News Corp., Inc. | 1,557,978 |
| 828 | | News Corp., Inc., Class B | 13,314 |
| 17,872 | | Nike, Inc., Class B | 1,455,496 |
| 7,803 | | Nordstrom, Inc. | 300,493 |
| 5,252 | 2 | O'Reilly Automotive, Inc. | 307,242 |
| 13,531 | 2 | Office Depot, Inc. | 60,754 |
| 11,554 | | Omnicom Group, Inc. | 507,914 |
| 10,754 | | Penney (J.C.) Co., Inc. | 335,310 |
| 2,647 | | Polo Ralph Lauren Corp., Class A | 256,441 |
| 1,822 | 2 | Priceline.com, Inc. | 686,548 |
| 17,012 | 2 | Pulte Group, Inc. | 133,544 |
| 4,863 | | RadioShack Corp. | 97,892 |
| 10,831 | | Ross Stores, Inc. | 638,921 |
| 3,390 | | Scripps Networks Interactive | 172,517 |
| 1,598 | 2 | Sears Holdings Corp. | 115,024 |
| 6,617 | | Stanley Black & Decker, Inc. | 410,055 |
| 27,198 | | Staples, Inc. | 556,743 |
| 48,985 | | Starbucks Corp. | 1,395,093 |
| 8,711 | | Starwood Hotels & Resorts Worldwide, Inc. | 471,613 |
| 25,264 | | TJX Cos., Inc. | 1,159,365 |
Annual Shareholder Report15
| Shares | | | Value |
| 34,790 | | Target Corp. | 1,806,993 |
| 4,748 | | Tiffany & Co. | 251,644 |
| 16,126 | | Time Warner Cable, Inc. | 933,212 |
| 62,763 | | Time Warner, Inc. | 2,040,425 |
| 4,908 | 2 | Urban Outfitters, Inc. | 151,019 |
| 3,231 | | V.F. Corp. | 268,948 |
| 34,874 | | Viacom, Inc., Class B | 1,345,788 |
| 87,397 | | Walt Disney Co. | 3,155,906 |
| 214 | | Washington Post Co., Class B | 86,060 |
| 3,488 | | Whirlpool Corp. | 264,495 |
| 8,077 | | Wyndham Worldwide Corp. | 232,214 |
| 3,035 | | Wynn Resorts Ltd. | 325,261 |
| 17,419 | | Yum! Brands, Inc. | 863,286 |
| | TOTAL | 52,424,909 |
| | Consumer Staples – 11.0% | |
| 5,928 | | Alberto-Culver Co. | 221,055 |
| 77,652 | | Altria Group, Inc. | 1,973,914 |
| 28,583 | | Archer-Daniels-Midland Co. | 952,386 |
| 16,963 | | Avon Products, Inc. | 516,523 |
| 3,810 | | Brown-Forman Corp., Class B | 231,686 |
| 60,823 | | CVS Caremark Corp. | 1,831,989 |
| 7,313 | | Campbell Soup Co. | 265,096 |
| 5,129 | | Clorox Co. | 341,335 |
| 13,705 | 2 | Coca-Cola Enterprises, Inc. | 329,057 |
| 19,074 | | Colgate-Palmolive Co. | 1,470,987 |
| 20,359 | | ConAgra Foods, Inc. | 457,874 |
| 6,398 | 2 | Constellation Brands, Inc., Class A | 126,233 |
| 26,104 | | Costco Wholesale Corp. | 1,638,548 |
| 25,991 | 2 | Dean Foods Co. | 270,306 |
| 12,008 | | Dr. Pepper Snapple Group, Inc. | 438,892 |
| 5,997 | | Estee Lauder Cos., Inc., Class A | 426,807 |
| 26,598 | | General Mills, Inc. | 998,489 |
| 11,961 | | H.J. Heinz Co. | 587,405 |
| 14,864 | | Hershey Foods Corp. | 735,619 |
| 2,499 | | Hormel Foods Corp. | 114,754 |
| 10,188 | | Kellogg Co. | 512,049 |
| 15,219 | | Kimberly-Clark Corp. | 963,972 |
| 78,590 | | Kraft Foods, Inc., Class A | 2,536,099 |
Annual Shareholder Report16
| Shares | | | Value |
| 32,479 | | Kroger Co. | 714,538 |
| 5,779 | | Lorillard, Inc. | 493,180 |
| 5,065 | | McCormick & Co., Inc. | 223,974 |
| 14,850 | | Mead Johnson Nutrition Co. | 873,477 |
| 5,998 | | Molson Coors Brewing Co., Class B | 283,286 |
| 74,961 | | PepsiCo, Inc. | 4,894,953 |
| 84,106 | | Philip Morris International, Inc. | 4,920,201 |
| 132,189 | | Procter & Gamble Co. | 8,403,255 |
| 6,337 | | Reynolds American, Inc. | 411,271 |
| 7,605 | | SUPERVALU, Inc. | 82,058 |
| 32,256 | | Safeway, Inc. | 738,662 |
| 52,210 | | Sara Lee Corp. | 748,169 |
| 4,512 | | Smucker (J.M.) Co. | 290,031 |
| 29,045 | | Sysco Corp. | 855,666 |
| 105,848 | | The Coca-Cola Co. | 6,490,599 |
| 13,918 | | Tyson Foods, Inc., Class A | 216,425 |
| 84,666 | | Wal-Mart Stores, Inc. | 4,586,357 |
| 45,120 | | Walgreen Co. | 1,528,666 |
| 12,453 | 2 | Whole Foods Market, Inc. | 495,007 |
| | TOTAL | 55,190,850 |
| | Energy – 11.1% | |
| 27,998 | | Anadarko Petroleum Corp. | 1,723,837 |
| 15,937 | | Apache Corp. | 1,609,956 |
| 19,404 | | Baker Hughes, Inc. | 898,987 |
| 11,908 | | CONSOL Energy, Inc. | 437,738 |
| 4,018 | | Cabot Oil & Gas Corp., Class A | 116,442 |
| 9,344 | 2 | Cameron International Corp. | 408,800 |
| 29,744 | | Chesapeake Energy Corp. | 645,445 |
| 96,274 | | Chevron Corp. | 7,953,195 |
| 73,299 | | ConocoPhillips | 4,353,961 |
| 15,136 | 2 | Denbury Resources, Inc. | 257,615 |
| 20,435 | | Devon Energy Corp. | 1,328,684 |
| 2,566 | | Diamond Offshore Drilling, Inc. | 169,767 |
| 11,634 | | EOG Resources, Inc. | 1,113,606 |
| 6,541 | | EQT Corp. | 244,895 |
| 28,593 | | El Paso Corp. | 379,143 |
| 233,568 | | Exxon Mobil Corp. | 15,525,265 |
| 5,119 | 2 | FMC Technologies, Inc. | 369,080 |
Annual Shareholder Report17
| Shares | | | Value |
| 37,466 | | Halliburton Co. | 1,193,667 |
| 6,860 | | Helmerich & Payne, Inc. | 293,471 |
| 12,392 | | Hess Corp. | 781,068 |
| 33,590 | | Marathon Oil Corp. | 1,194,796 |
| 4,100 | 2 | Mariner Energy, Inc. | 102,172 |
| 4,590 | | Massey Energy Co. | 193,101 |
| 7,617 | | Murphy Oil Corp. | 496,324 |
| 12,976 | 2 | Nabors Industries Ltd. | 271,198 |
| 23,754 | | National-Oilwell, Inc. | 1,277,015 |
| 7,207 | | Noble Energy, Inc. | 587,226 |
| 37,823 | | Occidental Petroleum Corp. | 2,974,022 |
| 12,095 | | Peabody Energy Corp. | 639,825 |
| 5,221 | | Pioneer Natural Resources, Inc. | 364,426 |
| 7 | 2 | Precision Drilling Corp. | 55 |
| 11,048 | | QEP Resources, Inc. | 364,915 |
| 6,078 | | Range Resources Corp. | 227,256 |
| 4,278 | 2 | Rowan Cos., Inc. | 140,746 |
| 61,376 | | Schlumberger Ltd. | 4,289,569 |
| 12,926 | 2 | Southwestern Energy Co. | 437,545 |
| 29,373 | | Spectra Energy Corp. | 698,196 |
| 5,519 | | Sunoco, Inc. | 206,797 |
| 6,623 | | Tesoro Petroleum Corp. | 85,834 |
| 37,686 | | Valero Energy Corp. | 676,464 |
| 27,230 | | Williams Cos., Inc. | 585,990 |
| | TOTAL | 55,618,094 |
| | Financials – 15.2% | |
| 16,055 | | AON Corp. | 638,186 |
| 15,673 | | Ace Ltd. | 931,290 |
| 27,999 | | Aflac, Inc. | 1,564,864 |
| 22,514 | | Allstate Corp. | 686,452 |
| 47,448 | | American Express Co. | 1,967,194 |
| 5,054 | 2 | American International Group, Inc. | 212,319 |
| 9,310 | | Ameriprise Financial, Inc. | 481,234 |
| 5,198 | | Apartment Investment & Management Co., Class A | 121,165 |
| 4,882 | | Assurant, Inc. | 193,034 |
| 3,412 | | Avalonbay Communities, Inc. | 362,730 |
| 31,690 | | BB&T Corp. | 741,863 |
| 460,545 | | Bank of America Corp. | 5,268,635 |
Annual Shareholder Report18
| Shares | | | Value |
| 45,221 | | Bank of New York Mellon Corp. | 1,133,238 |
| 80,616 | 2 | Berkshire Hathaway, Inc. | 6,413,809 |
| 5,586 | | Boston Properties, Inc. | 481,457 |
| 10,919 | 2 | CB Richard Ellis Services, Inc. | 200,364 |
| 2,516 | | CME Group, Inc. | 728,759 |
| 26,459 | | Capital One Financial Corp. | 986,127 |
| 42,485 | | Charles Schwab Corp. | 654,269 |
| 14,539 | | Chubb Corp. | 843,553 |
| 6,087 | | Cincinnati Financial Corp. | 179,201 |
| 1,185,646 | 2 | Citigroup, Inc. | 4,944,144 |
| 8,080 | | Comerica, Inc. | 289,102 |
| 23,411 | | Discover Financial Services | 413,204 |
| 7,510 | 2 | E*Trade Group, Inc. | 107,393 |
| 11,943 | | Equity Residential Properties Trust | 580,788 |
| 4,938 | | Federated Investors, Inc. | 123,006 |
| 36,375 | | Fifth Third Bancorp | 456,870 |
| 9,029 | 2 | First Horizon National Corp. | 91,106 |
| 10,377 | | Franklin Resources, Inc. | 1,190,242 |
| 22,463 | 2 | Genworth Financial, Inc., Class A | 254,730 |
| 25,296 | | Goldman Sachs Group, Inc. | 4,071,391 |
| 12,717 | | HCP, Inc. | 457,939 |
| 20,454 | | Hartford Financial Services Group, Inc. | 490,487 |
| 5,399 | | Health Care REIT, Inc. | 275,889 |
| 29,425 | | Host Marriott Corp. | 467,563 |
| 22,697 | | Hudson City Bancorp, Inc. | 264,420 |
| 32,318 | | Huntington Bancshares, Inc. | 183,243 |
| 2,792 | 2 | InterContinentalExchange, Inc. | 320,717 |
| 21,544 | | Invesco Ltd. | 495,512 |
| 189,759 | | JPMorgan Chase & Co. | 7,140,631 |
| 7,196 | | Janus Capital Group, Inc. | 75,990 |
| 40,717 | | KeyCorp | 333,472 |
| 15,884 | | Kimco Realty Corp. | 273,681 |
| 7,196 | | Legg Mason, Inc. | 223,292 |
| 7,502 | | Leucadia National Corp. | 190,701 |
| 14,502 | | Lincoln National Corp. | 355,009 |
| 12,424 | | Loews Corp. | 490,500 |
| 3,258 | | M&T Bank Corp. | 243,536 |
| 26,467 | | Marsh & McLennan Cos., Inc. | 661,146 |
Annual Shareholder Report19
| Shares | | | Value |
| 23,638 | | Marshall & Ilsley Corp. | 139,701 |
| 40,747 | | MetLife, Inc. | 1,643,327 |
| 7,690 | | Moody's Corp. | 208,091 |
| 62,694 | | Morgan Stanley | 1,559,200 |
| 5,545 | 2 | NASDAQ Stock Market, Inc. | 116,556 |
| 18,398 | | NYSE Euronext | 563,715 |
| 12,329 | | Northern Trust Corp. | 611,888 |
| 24,120 | | PNC Financial Services Group | 1,300,068 |
| 13,736 | | People's United Financial, Inc. | 169,090 |
| 6,824 | | Plum Creek Timber Co., Inc. | 251,396 |
| 14,458 | | Principal Financial Group | 388,053 |
| 31,481 | | Progressive Corp., OH | 666,138 |
| 27,141 | | Prologis | 370,475 |
| 21,366 | | Prudential Financial, Inc. | 1,123,424 |
| 6,426 | | Public Storage, Inc. | 637,588 |
| 51,480 | | Regions Financial Corp. | 324,324 |
| 18,464 | 2 | SLM Corp. | 219,722 |
| 10,908 | | Simon Property Group, Inc. | 1,047,386 |
| 18,696 | | State Street Corp. | 780,745 |
| 22,956 | | SunTrust Banks, Inc. | 574,359 |
| 18,690 | | T. Rowe Price Group, Inc. | 1,032,996 |
| 21,715 | | The Travelers Cos., Inc. | 1,198,668 |
| 3,646 | | Torchmark Corp. | 208,843 |
| 90,341 | | U.S. Bancorp | 2,184,445 |
| 14,825 | | Unum Group | 332,376 |
| 8,908 | | Ventas, Inc. | 477,112 |
| 7,417 | | Vornado Realty Trust | 648,172 |
| 239,793 | | Wells Fargo & Co. | 6,253,801 |
| 29,193 | | Weyerhaeuser Co. | 473,510 |
| 13,650 | | XL Group PLC | 288,698 |
| 6,655 | | Zions Bancorp | 137,492 |
| | TOTAL | 76,186,806 |
| | Health Care – 11.2% | |
| 70,898 | | Abbott Laboratories | 3,638,485 |
| 19,053 | | Aetna, Inc. | 568,923 |
| 13,464 | | Allergan, Inc. | 974,928 |
| 22,981 | | AmerisourceBergen Corp. | 754,236 |
| 50,980 | 2 | Amgen, Inc. | 2,915,546 |
Annual Shareholder Report20
| Shares | | | Value |
| 4,873 | | Bard (C.R.), Inc. | 405,044 |
| 28,174 | | Baxter International, Inc. | 1,434,057 |
| 8,915 | | Becton, Dickinson & Co. | 673,261 |
| 9,014 | 2 | Biogen Idec, Inc. | 565,268 |
| 57,186 | 2 | Boston Scientific Corp. | 364,847 |
| 81,071 | | Bristol-Myers Squibb Co. | 2,180,810 |
| 12,449 | | CIGNA Corp. | 438,080 |
| 14,401 | | Cardinal Health, Inc. | 499,571 |
| 13,051 | 2 | CareFusion Corp. | 315,051 |
| 17,176 | 2 | Celgene Corp. | 1,066,114 |
| 2,750 | 2 | Cephalon, Inc. | 182,710 |
| 3,281 | 2 | Cerner Corp. | 288,170 |
| 6,662 | 2 | Coventry Health Care, Inc. | 156,024 |
| 3,810 | 2 | DaVita, Inc. | 273,368 |
| 5,364 | | Dentsply International, Inc. | 168,376 |
| 46,657 | | Eli Lilly & Co. | 1,642,326 |
| 23,863 | 2 | Express Scripts, Inc., Class A | 1,157,833 |
| 15,048 | 2 | Forest Laboratories, Inc., Class A | 497,336 |
| 10,946 | 2 | Genzyme Corp. | 789,535 |
| 31,282 | 2 | Gilead Sciences, Inc. | 1,240,957 |
| 12,973 | 2 | Hospira, Inc. | 771,634 |
| 7,743 | 2 | Humana, Inc. | 451,339 |
| 1,464 | 2 | Intuitive Surgical, Inc. | 384,959 |
| 127,628 | | Johnson & Johnson | 8,126,075 |
| 36,524 | 2 | King Pharmaceuticals, Inc. | 516,449 |
| 3,787 | 2 | Laboratory Corp. of America Holdings | 307,959 |
| 6,878 | 2 | Life Technologies Corp. | 345,138 |
| 13,876 | | McKesson HBOC, Inc. | 915,538 |
| 27,260 | 2 | Medco Health Solutions, Inc. | 1,431,968 |
| 53,123 | | Medtronic, Inc. | 1,870,461 |
| 124,267 | | Merck & Co., Inc. | 4,508,407 |
| 11,383 | 2 | Mylan Laboratories, Inc. | 231,303 |
| 3,644 | | Patterson Cos., Inc. | 100,757 |
| 5,567 | | PerkinElmer, Inc. | 130,546 |
| 345,486 | | Pfizer, Inc. | 6,011,456 |
| 7,494 | 2 | Psychiatric Solutions, Inc. | 252,548 |
| 5,411 | | Quest Diagnostics, Inc. | 265,897 |
| 13,646 | 2 | St. Jude Medical, Inc. | 522,642 |
Annual Shareholder Report21
| Shares | | | Value |
| 13,011 | | Stryker Corp. | 643,914 |
| 18,967 | 2 | Tenet Healthcare Corp. | 82,696 |
| 18,525 | 2 | Thermo Fisher Scientific, Inc. | 952,555 |
| 59,159 | | UnitedHealth Group, Inc. | 2,132,682 |
| 4,823 | 2 | Varian Medical Systems, Inc. | 304,910 |
| 3,424 | 2 | Waters Corp. | 253,821 |
| 3,986 | 2 | Watson Pharmaceuticals, Inc. | 185,947 |
| 21,193 | 2 | Wellpoint, Inc. | 1,151,628 |
| 10,325 | 2 | Zimmer Holdings, Inc. | 489,818 |
| | TOTAL | 56,533,903 |
| | Industrials – 10.5% | |
| 32,576 | | 3M Co. | 2,743,551 |
| 5,078 | | Avery Dennison Corp. | 184,585 |
| 8,487 | 2 | Babcock & Wilcox Co. | 193,673 |
| 27,790 | | Boeing Co. | 1,963,086 |
| 6,199 | | C.H. Robinson Worldwide, Inc. | 436,906 |
| 18,069 | | CSX Corp. | 1,110,340 |
| 32,408 | | Caterpillar, Inc. | 2,547,269 |
| 4,915 | | Cintas Corp. | 135,015 |
| 9,073 | | Cummins, Inc. | 799,331 |
| 26,124 | | Danaher Corp. | 1,132,737 |
| 17,263 | | Deere & Co. | 1,325,798 |
| 11,207 | | Donnelley (R.R.) & Sons Co. | 206,769 |
| 7,514 | | Dover Corp. | 398,993 |
| 1,871 | | Dun & Bradstreet Corp. | 139,221 |
| 8,073 | | Eaton Corp. | 717,125 |
| 35,115 | | Emerson Electric Co. | 1,927,813 |
| 6,582 | | Equifax, Inc. | 218,062 |
| 11,094 | | Expeditors International Washington, Inc. | 547,600 |
| 5,742 | | Fastenal Co. | 295,598 |
| 11,783 | | FedEx Corp. | 1,033,605 |
| 2,124 | | Flowserve Corp. | 212,400 |
| 7,325 | | Fluor Corp. | 352,992 |
| 18,434 | | General Dynamics Corp. | 1,255,724 |
| 492,635 | | General Electric Co. | 7,892,013 |
| 4,705 | | Goodrich (B.F.) Co. | 386,139 |
| 2,192 | | Grainger (W.W.), Inc. | 271,874 |
| 32,137 | | Honeywell International, Inc. | 1,513,974 |
Annual Shareholder Report22
| Shares | | | Value |
| 10,320 | | ITT Corp. | 487,001 |
| 24,625 | | Illinois Tool Works, Inc. | 1,125,363 |
| 7,622 | | Iron Mountain, Inc. | 166,083 |
| 4,634 | 2 | Jacobs Engineering Group, Inc. | 178,919 |
| 5,417 | | L-3 Communications Holdings, Inc. | 391,053 |
| 19,544 | | Lockheed Martin Corp. | 1,393,292 |
| 13,366 | | Masco Corp. | 142,482 |
| 14,330 | | Norfolk Southern Corp. | 881,152 |
| 16,031 | | Northrop Grumman Corp. | 1,013,320 |
| 13,597 | | PACCAR, Inc. | 696,982 |
| 4,382 | | Pall Corp. | 186,980 |
| 6,028 | | Parker-Hannifin Corp. | 461,443 |
| 7,778 | | Pitney Bowes, Inc. | 170,649 |
| 5,869 | | Precision Castparts Corp. | 801,588 |
| 7,930 | 2 | Quanta Services, Inc. | 155,904 |
| 25,380 | | Raytheon Co. | 1,169,510 |
| 11,435 | | Republic Services, Inc. | 340,877 |
| 5,621 | | Robert Half International, Inc. | 152,385 |
| 12,115 | | Rockwell Automation, Inc. | 755,613 |
| 14,363 | | Rockwell Collins | 869,105 |
| 3,462 | | Roper Industries, Inc. | 240,367 |
| 2,366 | | Ryder System, Inc. | 103,513 |
| 2,677 | | Snap-On, Inc. | 136,527 |
| 57,510 | | Southwest Airlines Co. | 791,338 |
| 3,237 | 2 | Stericycle, Inc. | 232,222 |
| 12,389 | | Textron Inc. | 257,939 |
| 23,347 | | Tyco International Ltd. | 893,723 |
| 18,609 | | Union Pacific Corp. | 1,631,637 |
| 45,351 | | United Parcel Service, Inc. | 3,053,936 |
| 43,669 | | United Technologies Corp. | 3,265,131 |
| 23,609 | | Waste Management, Inc. | 843,313 |
| | TOTAL | 52,931,540 |
| | Information Technology – 18.9% | |
| 12,468 | 2 | ADC Telecommunications, Inc. | 158,219 |
| 3,878 | 2 | AOL Inc. | 103,465 |
| 19,616 | 2 | Adobe Systems, Inc. | 552,190 |
| 26,146 | 2 | Advanced Micro Devices, Inc. | 191,650 |
| 13,063 | 2 | Agilent Technologies, Inc. | 454,592 |
Annual Shareholder Report23
| Shares | | | Value |
| 7,519 | 2 | Akamai Technologies, Inc. | 388,507 |
| 11,371 | | Altera Corp. | 354,889 |
| 6,543 | | Amphenol Corp., Class A | 328,001 |
| 12,751 | | Analog Devices, Inc. | 429,326 |
| 41,775 | 2 | Apple, Inc. | 12,568,844 |
| 65,953 | | Applied Materials, Inc. | 815,179 |
| 9,105 | 2 | Autodesk, Inc. | 329,419 |
| 18,373 | | Automatic Data Processing, Inc. | 816,129 |
| 9,746 | 2 | BMC Software, Inc. | 443,053 |
| 19,082 | | Broadcom Corp. | 777,401 |
| 15,155 | | CA, Inc. | 351,748 |
| 267,916 | 2,3 | Cisco Systems, Inc. | 6,116,522 |
| 8,171 | 2 | Citrix Systems, Inc. | 523,516 |
| 18,404 | 2 | Cognizant Technology Solutions Corp. | 1,199,757 |
| 9,229 | | Computer Sciences Corp. | 452,682 |
| 8,782 | 2 | Compuware Corp. | 87,908 |
| 58,164 | | Corning, Inc. | 1,063,238 |
| 62,835 | 2 | Dell, Inc. | 903,567 |
| 95,303 | 2 | EMC Corp. | 2,002,316 |
| 54,780 | 2 | eBay, Inc. | 1,632,992 |
| 12,107 | 2 | Electronic Arts, Inc. | 191,896 |
| 6,039 | 2 | FLIR Systems, Inc. | 168,126 |
| 9,864 | | Fidelity National Information Services, Inc. | 267,314 |
| 6,515 | | First American Financial Corp. | 91,471 |
| 2,026 | 2 | First Solar, Inc. | 278,940 |
| 6,482 | 2 | Fiserv, Inc. | 353,399 |
| 11,482 | 2 | Google Inc. | 7,038,351 |
| 4,796 | | Harris Corp. | 216,731 |
| 113,185 | | Hewlett-Packard Co. | 4,760,561 |
| 59,393 | | IBM Corp. | 8,528,835 |
| 265,719 | | Intel Corp. | 5,332,980 |
| 10,551 | 2 | Intuit, Inc. | 506,448 |
| 19,949 | 2 | JDS Uniphase Corp. | 209,664 |
| 11,226 | | Jabil Circuit, Inc. | 172,207 |
| 22,375 | 2 | Juniper Networks, Inc. | 724,726 |
| 17,413 | | KLA-Tencor Corp. | 621,992 |
| 49 | 2 | L-1 Identity Solutions, Inc. | 578 |
| 23,225 | 2 | LSI Logic Corp. | 121,699 |
Annual Shareholder Report24
| Shares | | | Value |
| 3,642 | 2 | Lexmark International Group, Class A | 138,505 |
| 9,439 | | Linear Technology Corp. | 304,219 |
| 8,626 | 2 | MEMC Electronic Materials, Inc. | 110,585 |
| 3,608 | | Mastercard, Inc. | 866,136 |
| 8,867 | 2 | McAfee, Inc. | 419,409 |
| 7,790 | | Microchip Technology, Inc. | 250,682 |
| 39,657 | 2 | Micron Technology, Inc. | 327,963 |
| 348,087 | | Microsoft Corp. | 9,273,038 |
| 5,247 | | Molex, Inc. | 106,514 |
| 5,138 | 2 | Monster Worldwide, Inc. | 92,792 |
| 87,558 | 2 | Motorola, Inc. | 713,598 |
| 21,137 | 2 | NVIDIA Corp. | 254,278 |
| 10,559 | | National Semiconductor Corp. | 144,658 |
| 21,468 | 2 | NetApp, Inc. | 1,143,171 |
| 5,537 | 2 | Netezza Corp. | 149,278 |
| 13,755 | 2 | Novell, Inc. | 81,567 |
| 4,221 | 2 | Novellus Systems, Inc. | 123,295 |
| 180,441 | | Oracle Corp. | 5,304,965 |
| 11,985 | | Paychex, Inc. | 331,985 |
| 3,845 | 2 | Qlogic Corp. | 67,557 |
| 75,108 | | Qualcomm, Inc. | 3,389,624 |
| 7,149 | 2 | Red Hat, Inc. | 302,117 |
| 31,635 | 2 | SAIC, Inc. | 491,608 |
| 4,381 | 2 | Salesforce.com, Inc. | 508,503 |
| 10,657 | 2 | Sandisk Corp. | 400,490 |
| 29,209 | 2 | Symantec Corp. | 472,602 |
| 14,706 | | Tellabs, Inc. | 100,295 |
| 7,592 | 2 | Teradata Corp. | 298,821 |
| 7,901 | 2 | Teradyne, Inc. | 88,807 |
| 54,134 | | Texas Instruments, Inc. | 1,600,742 |
| 7,630 | | Total System Services, Inc. | 119,104 |
| 6,378 | 2 | Verisign, Inc. | 221,636 |
| 19,017 | | Visa, Inc., Class A | 1,486,559 |
| 17,837 | 2 | Western Digital Corp. | 571,141 |
| 24,455 | | Western Union Co. | 430,408 |
| 63,248 | | Xerox Corp. | 740,002 |
| 10,845 | | Xilinx, Inc. | 290,754 |
Annual Shareholder Report25
| Shares | | | Value |
| 52,093 | 2 | Yahoo, Inc. | 860,055 |
| | TOTAL | 95,208,491 |
| | Materials – 3.5% | |
| 4,228 | | AK Steel Holding Corp. | 53,231 |
| 9,113 | | Air Products & Chemicals, Inc. | 774,332 |
| 3,479 | | Airgas, Inc. | 246,766 |
| 43,648 | | Alcoa, Inc. | 573,098 |
| 3,657 | | Allegheny Technologies, Inc. | 192,687 |
| 3,418 | | Ball Corp. | 219,983 |
| 7,838 | | Bemis Co., Inc. | 248,935 |
| 2,614 | | CF Industries Holdings, Inc. | 320,293 |
| 6,277 | | Cliffs Natural Resources, Inc. | 409,260 |
| 43,433 | | Dow Chemical Co. | 1,339,039 |
| 43,366 | | Du Pont (E.I.) de Nemours & Co. | 2,050,345 |
| 6,232 | | Eastman Chemical Co. | 489,648 |
| 14,726 | | Ecolab, Inc. | 726,286 |
| 2,711 | | FMC Corp. | 198,174 |
| 21,581 | | Freeport-McMoran Copper & Gold, Inc. | 2,043,289 |
| 3,409 | | International Flavors & Fragrances, Inc. | 170,995 |
| 21,296 | | International Paper Co. | 538,363 |
| 11,496 | | MeadWestvaco Corp. | 295,792 |
| 21,658 | | Monsanto Co. | 1,286,918 |
| 18,436 | | Newmont Mining Corp. | 1,122,199 |
| 21,845 | | Nucor Corp. | 834,916 |
| 6,155 | 2 | Owens-Illinois, Inc. | 172,525 |
| 7,003 | | PPG Industries, Inc. | 537,130 |
| 10,140 | 2 | Pactiv Corp. | 336,445 |
| 14,052 | | Praxair, Inc. | 1,283,510 |
| 7,184 | | Sealed Air Corp. | 166,310 |
| 3,641 | | Sherwin-Williams Co. | 265,684 |
| 4,593 | | Sigma-Aldrich Corp. | 291,288 |
| 4,209 | 2 | Titanium Metals Corp. | 82,749 |
| 6,633 | | United States Steel Corp. | 283,826 |
| 5,678 | | Vulcan Materials Co. | 207,304 |
| | TOTAL | 17,761,320 |
| | Telecommunication Services – 3.2% | |
| 272,419 | | AT&T, Inc. | 7,763,942 |
| 19,619 | 2 | American Tower Systems Corp. | 1,012,537 |
Annual Shareholder Report26
| Shares | | | Value |
| 12,131 | | CenturyLink, Inc. | 501,981 |
| 53,039 | | Frontier Communications Corp. | 465,683 |
| 9,992 | 2 | MetroPCS Communications, Inc. | 104,017 |
| 115,450 | | Qwest Communications International, Inc. | 761,970 |
| 161,674 | 2 | Sprint Nextel Corp. | 666,097 |
| 2,441 | 2 | Syniverse Holdings, Inc. | 74,426 |
| 132,709 | | Verizon Communications, Inc. | 4,309,061 |
| 26,949 | | Windstream Corp. | 341,174 |
| | TOTAL | 16,000,888 |
| | Utilities – 3.6% | |
| 24,546 | 2 | AES Corp. | 293,079 |
| 6,365 | | Allegheny Energy, Inc. | 147,668 |
| 11,058 | | Ameren Corp. | 320,461 |
| 21,336 | | American Electric Power Co., Inc. | 798,820 |
| 8,520 | | CMS Energy Corp. | 156,598 |
| 17,634 | | CenterPoint Energy, Inc. | 292,019 |
| 10,507 | | Consolidated Edison Co. | 522,408 |
| 15,858 | | Constellation Energy Group, Inc. | 479,546 |
| 15,350 | | DTE Energy Co. | 717,766 |
| 21,900 | | Dominion Resources, Inc. | 951,774 |
| 50,610 | | Duke Energy Corp. | 921,608 |
| 12,169 | | Edison International | 449,036 |
| 8,624 | | Entergy Corp. | 642,747 |
| 32,798 | | Exelon Corp. | 1,338,814 |
| 22,581 | | FirstEnergy Corp. | 820,142 |
| 10,889 | | Integrys Energy Group, Inc. | 579,186 |
| 10,483 | | NICOR, Inc. | 499,305 |
| 9,784 | 2 | NRG Energy, Inc. | 194,799 |
| 15,453 | | NextEra Energy, Inc. | 850,533 |
| 23,755 | | NiSource, Inc. | 411,199 |
| 6,702 | | Northeast Utilities Co. | 209,639 |
| 5,053 | | ONEOK, Inc. | 251,740 |
| 18,229 | | PG&E Corp. | 871,711 |
| 24,392 | | PPL Corp. | 656,145 |
| 8,421 | | Pepco Holdings, Inc. | 162,188 |
| 3,962 | | Pinnacle West Capital Corp. | 163,076 |
| 10,966 | | Progress Energy, Inc. | 493,470 |
| 23,514 | | Public Service Enterprises Group, Inc. | 760,678 |
Annual Shareholder Report27
| Shares | | | Value |
| 4,186 | | SCANA Corp. | 170,956 |
| 9,224 | | Sempra Energy | 493,300 |
| 31,058 | | Southern Co. | 1,176,167 |
| 33,399 | | TECO Energy, Inc. | 587,488 |
| 4,429 | | Wisconsin Energy Corp. | 263,703 |
| 17,194 | | Xcel Energy, Inc. | 410,249 |
| | TOTAL | 18,058,018 |
| | TOTAL COMMON STOCKS
(IDENTIFIED COST $228,969,324) | 495,914,819 |
| | EXCHANGE-TRADED FUND – 0.1% | |
| 3,317 | | SPDR Trust, Series 1
(IDENTIFIED COST $288,551) | 393,164 |
| | WARRANT – 0.0% | |
| | Consumer Discretionary – 0.0% | |
| 30,369 | 2 | Ford Motor Co., Del, Warrants, Expiration Date 1/1/2013
(IDENTIFIED COST $151,845) | 172,496 |
| | MUTUAL FUND – 1.5% | |
| 7,425,034 | 4,5 | Federated Prime Value Obligations Fund, Institutional Shares, 0.22%
(AT NET ASSET VALUE) | 7,425,034 |
| | TOTAL INVESTMENTS — 100.2%
(IDENTIFIED COST $236,834,754)6 | 503,905,513 |
| | OTHER ASSETS AND LIABILITIES - NET — (0.2)%7 | (997,003) |
| | TOTAL NET ASSETS — 100% | $502,908,510 |
At October 31, 2010, the Fund had the following outstanding long futures contracts:1
| Description | Number of
Contracts | Notional
Value | Expiration
Date | Unrealized
Appreciation |
| 2S&P 500 E-Mini Index Long Futures | 59 | $3,480,115 | December 2010 | $240,428 |
| 2S&P 500 Index Long Futures | 18 | $5,308,650 | December 2010 | $383,781 |
| UNREALIZED APPRECIATION ON FUTURES CONTRACTS | $624,209 |
Unrealized Appreciation on Futures Contracts is included in “Other Assets and Liabilities – Net.”
| 1 | The Fund purchases index futures contracts to efficiently manage cash flows resulting from shareholder purchases and redemptions, dividend and capital gain payments to shareholders and corporate actions while maintaining exposure to the S&P 500 Index and minimizing trading costs. The underlying face amount, at value, of open index futures contracts is $8,788,765 at October 31, 2010, which represents 1.7% of total net assets. Taking into consideration these open index futures contracts, the Fund's effective total exposure to the S&P 500 Index is 100.2%. |
| 2 | Non-income producing security. |
| 3 | Pledged as collateral to ensure the Fund is able to satisfy the obligations of its outstanding futures contracts. |
Annual Shareholder Report28
| 4 | Affiliated company. |
| 5 | 7-Day net yield. |
| 6 | The cost of investments for federal tax purposes amounts to $257,153,299. |
| 7 | Assets, other than investments in securities, less liabilities. See Statement of Assets and Liabilities. |
Note: The categories of investments are shown as a percentage of total net assets at October 31, 2010.
Various inputs are used in determining the value of the Fund's investments. These inputs are summarized in the three broad levels listed below:
Level 1 — quoted prices in active markets for identical securities
Level 2 — other significant observable inputs (including quoted prices for similar securities, interest rates, prepayment speeds, credit risk, etc.)
Level 3 — significant unobservable inputs (including the Fund's own assumptions in determining the fair value of investments)
The inputs or methodology used for valuing securities are not an indication of the risk associated with investing in those securities.
As of October 31, 2010, all investments of the Fund utilized Level 1 inputs in valuing the Fund's assets carried at fair value.
The following acronym is used throughout this portfolio:
| REIT | — Real Estate Investment Trust |
See Notes which are an integral part of the Financial Statements
Annual Shareholder Report29
Statement of Assets and Liabilities
October 31, 2010
| Assets: | | |
| Total investments in securities, at value including $7,425,034 of investments in an affiliated issuer (Note 5) (identified cost $236,834,754) | | $503,905,513 |
| Cash | | 39,742 |
| Restricted cash (Note 2) | | 595,000 |
| Income receivable | | 568,832 |
| Receivable for investments sold | | 1,063,730 |
| Receivable for shares sold | | 378,318 |
| Receivable for daily variation margin | | 3,702 |
| TOTAL ASSETS | | 506,554,837 |
| Liabilities: | | |
| Payable for investments purchased | $1,933,438 | |
| Payable for shares redeemed | 1,521,938 | |
| Payable for distribution services fee (Note 5) | 43,482 | |
| Payable for shareholder services fee (Note 5) | 58,742 | |
| Accrued expenses | 88,727 | |
| TOTAL LIABILITIES | | 3,646,327 |
| Net assets for 39,339,621 shares outstanding | | $502,908,510 |
| Net Assets Consist of: | | |
| Paid-in capital | | $228,168,896 |
| Net unrealized appreciation of investments and futures contracts | | 267,694,968 |
| Accumulated net realized gain on investments and futures contracts | | 6,951,765 |
| Undistributed net investment income | | 92,881 |
| TOTAL NET ASSETS | | $502,908,510 |
| Net Asset Value, Offering Price and Redemption Proceeds Per Share | | |
| Institutional Shares: | | |
| Net asset value per share ($208,399,469 ÷ 16,255,308 shares outstanding), no par value, unlimited shares authorized | | $12.82 |
| Institutional Service Shares: | | |
| Net asset value per share ($231,806,689 ÷ 18,158,164 shares outstanding), no par value, unlimited shares authorized | | $12.77 |
| Class C Shares: | | |
| Net asset value per share ($31,722,181 ÷ 2,499,051 shares outstanding), no par value, unlimited shares authorized | | $12.69 |
| Offering price per share | | $12.69 |
| Redemption proceeds per share (99.00/100 of $12.69) | | $12.56 |
| Class K Shares: | | |
| Net asset value per share ($30,980,171 ÷ 2,427,098 shares outstanding), no par value, unlimited shares authorized | | $12.76 |
See Notes which are an integral part of the Financial Statements
Annual Shareholder Report30
Statement of Operations
Year Ended October 31, 2010
| Investment Income: | | | |
| Dividends (including $20,460 received from an affiliated issuer (Note 5) and net of foreign taxes withheld of $829) | | | $9,434,437 |
| Interest | | | 29,649 |
| TOTAL INCOME | | | 9,464,086 |
| Expenses: | | | |
| Management fee (Note 5) | | $1,413,578 | |
| Custodian fees | | 71,171 | |
| Transfer and dividend disbursing agent fees and expenses — Institutional Shares | | 114,023 | |
| Transfer and dividend disbursing agent fees and expenses — Institutional Service Shares | | 251,564 | |
| Transfer and dividend disbursing agent fees and expenses — Class C Shares | | 41,699 | |
| Transfer and dividend disbursing agent fees and expenses — Class K Shares | | 84,561 | |
| Directors'/Trustees' fees | | 1,481 | |
| Auditing fees | | 22,531 | |
| Legal fees | | 6,499 | |
| Portfolio accounting fees | | 121,726 | |
| Distribution services fee — Institutional Service Shares (Note 5) | | 697,875 | |
| Distribution services fee — Class C Shares (Note 5) | | 246,230 | |
| Distribution services fee — Class K Shares (Note 5) | | 144,590 | |
| Shareholder services fee — Institutional Service Shares (Note 5) | | 550,736 | |
| Shareholder services fee — Class C Shares (Note 5) | | 79,040 | |
| Account administration fee — Institutional Service Shares | | 23,400 | |
| Account administration fee — Class C Shares | | 2,625 | |
| Share registration costs | | 56,647 | |
| Printing and postage | | 45,516 | |
| Insurance premiums | | 5,162 | |
| Miscellaneous | | 6,952 | |
| TOTAL EXPENSES | | 3,987,606 | |
Annual Shareholder Report31
Statement of Operations — continued| Waivers and Reimbursements (Note 5): | | | |
| Waiver/reimbursement of management fee | $(279,186) | | |
| Waiver of distribution services fee — Institutional Service Shares | (574,136) | | |
| Waiver of distribution services fee — Class C Shares | (1,025) | | |
| Reimbursement of transfer and dividend disbursing agent fees and expenses — Institutional Shares | (39,202) | | |
| Reimbursement of transfer and dividend disbursing agent fees and expenses — Institutional Service Shares | (152,467) | | |
| TOTAL WAIVERS AND REIMBURSEMENTS | | $(1,046,016) | |
| Net expenses | | | $2,941,590 |
| Net investment income | | | 6,522,496 |
| Realized and Unrealized Gain on Investments and Futures Contracts: | | | |
| Net realized gain on investments | | | 29,591,275 |
| Net realized gain on futures contracts | | | 1,410,244 |
| Net change in unrealized appreciation of investments | | | 34,179,839 |
| Net change in unrealized appreciation of futures contracts | | | 618,119 |
| Net realized and unrealized gain on investments and futures contracts | | | 65,799,477 |
| Change in net assets resulting from operations | | | $72,321,973 |
See Notes which are an integral part of the Financial Statements
Annual Shareholder Report32
Statement of Changes in Net Assets
| Year Ended October 31 | 2010 | 2009 |
| Increase (Decrease) in Net Assets | | |
| Operations: | | |
| Net investment income | $6,522,496 | $8,248,451 |
| Net realized gain on investments and futures contracts | 31,001,519 | 23,880,823 |
| Net change in unrealized appreciation/depreciation of investments and futures contracts | 34,797,958 | 2,261,987 |
| CHANGE IN NET ASSETS RESULTING FROM OPERATIONS | 72,321,973 | 34,391,261 |
| Distributions to Shareholders: | | |
| Distributions from net investment income | | |
| Institutional Shares | (3,088,320) | (3,775,602) |
| Institutional Service Shares | (3,315,659) | (4,333,598) |
| Class C Shares | (215,656) | (397,397) |
| Class K Shares | (285,755) | (354,764) |
| Distributions from net realized gain on investments and futures contracts | | |
| Institutional Shares | (8,513,387) | (56,191,382) |
| Institutional Service Shares | (11,320,879) | (64,280,396) |
| Class C Shares | (1,640,357) | (9,695,845) |
| Class K Shares | (1,291,207) | (6,106,130) |
| CHANGE IN NET ASSETS RESULTING FROM DISTRIBUTIONS TO SHAREHOLDERS | (29,671,220) | (145,135,114) |
| Share Transactions: | | |
| Proceeds from sale of shares | 111,654,754 | 102,657,151 |
| Net asset value of shares issued to shareholders in payment of distributions declared | 26,485,694 | 128,301,688 |
| Cost of shares redeemed | (134,248,764) | (171,774,998) |
| CHANGE IN NET ASSETS RESULTING FROM SHARE TRANSACTIONS | 3,891,684 | 59,183,841 |
| Change in net assets | 46,542,437 | (51,560,012) |
| Net Assets: | | |
| Beginning of period | 456,366,073 | 507,926,085 |
| End of period (including undistributed net investment income of $92,881 and $476,177, respectively) | $502,908,510 | $456,366,073 |
See Notes which are an integral part of the Financial Statements
Annual Shareholder Report33
Notes to Financial Statements
October 31, 2010
1. ORGANIZATION
Federated Index Trust (the “Trust”) is registered under the Investment Company Act of 1940, as amended (the “Act”), as an open-end management investment company. The Trust consists of two portfolios. The financial statements included herein are only those of Federated Max-Cap Index Fund (the “Fund”), a diversified portfolio. The financial statements of the other portfolio are presented separately. The assets of each portfolio are segregated and a shareholder's interest is limited to the portfolio in which shares are held. Each portfolio pays its own expenses. The Fund offers four classes of shares: Institutional Shares, Institutional Service Shares, Class C Shares and Class K Shares. All shares of the Fund have equal rights with respect to voting, except on class-specific matters. The investment objective of the Fund is to provide investment results that generally correspond to the aggregate price and dividend performance of publicly traded common stocks comprising the Standard & Poor's 500 Index (S&P 500).
2. SIGNIFICANT ACCOUNTING POLICIES
The following is a summary of significant accounting policies consistently followed by the Fund in the preparation of its financial statements. These policies are in conformity with U.S. generally accepted accounting principles (GAAP).
Investment Valuation
In calculating its net asset value (NAV), the Fund generally values investments as follows:
- Equity securities listed on an exchange or traded through a regulated market system are valued at their last reported sale price or official closing price in their principal exchange or market.
- Shares of other mutual funds are valued based upon their reported NAVs.
- Derivative contracts listed on exchanges are valued at their reported settlement or closing price.
- Over-the-counter (OTC) derivative contracts are fair valued using price evaluations provided by a pricing service approved by the Board of Trustees (the “Trustees”).
- Fixed-income securities acquired with remaining maturities of 60 days or less are valued at their cost (adjusted for the accretion of any discount or amortization of any premium).
- Fixed-income securities acquired with remaining maturities greater than 60 days are fair valued using price evaluations provided by a pricing service approved by the Trustees.
If the Fund cannot obtain a price or price evaluation from a pricing service for an investment, the Fund may attempt to value the investment based upon the mean of bid and asked quotations or fair value the investment based on price evaluations, from one or more dealers. If any price, quotation, price evaluation or other pricing source is not readily available when the NAV is calculated, the Fund uses the fair value of the investment determined in accordance with the procedures described below. There can be no assurance that the Fund could purchase or sell an investment at the price used to calculate the Fund's NAV.
Fair Valuation and Significant Events Procedures
The Trustees have authorized the use of pricing services to provide evaluations of the current fair value of certain investments for purposes of calculating the NAV. Factors considered by pricing services in evaluating an investment include the yields or prices of investments of comparable quality, coupon, maturity, call rights and other potential prepayments, terms and Annual Shareholder Report
34
type, reported transactions, indications as to values from dealers and general market conditions. Some pricing services provide a single price evaluation reflecting the bid-side of the market for an investment (a “bid” evaluation). Other pricing services offer both bid evaluations and price evaluations indicative of a price between the prices bid and asked for the investment (a “mid” evaluation). The Fund normally uses bid evaluations for U.S. Treasury and Agency securities and mortgage-backed securities. The Fund normally uses mid evaluations for other types of fixed-income securities and OTC derivative contracts. In the event that market quotations and price evaluations are not available for an investment, the fair value of the investment is determined in accordance with procedures adopted by the Trustees.The Trustees also have adopted procedures requiring an investment to be priced at its fair value whenever the Manager determines that a significant event affecting the value of the investment has occurred between the time as of which the price of the investment would otherwise be determined and the time as of which the NAV is computed. An event is considered significant if there is both an affirmative expectation that the investment's value will change in response to the event and a reasonable basis for quantifying the resulting change in value. Examples of significant events that may occur after the close of the principal market on which a security is traded, or after the time of a price evaluation provided by a pricing service or a dealer, include:
- With respect to securities traded in foreign markets, significant trends in U.S. equity markets or in the trading of foreign securities index futures or options contracts;
- With respect to price evaluations of fixed-income securities determined before the close of regular trading on the NYSE, actions by the Federal Reserve Open Market Committee and other significant trends in U.S. fixed-income markets;
- Political or other developments affecting the economy or markets in which an issuer conducts its operations or its securities are traded; and
- Announcements concerning matters such as acquisitions, recapitalizations, litigation developments, a natural disaster affecting the issuer's operations or regulatory changes or market developments affecting the issuer's industry.
The Trustees have approved the use of a pricing service to determine the fair value of equity securities traded principally in foreign markets when the Manager determines that there has been a significant trend in the U.S. equity markets or in index futures trading. For other significant events, the Fund may seek to obtain more current quotations or price evaluations from alternative pricing sources. If a reliable alternative pricing source is not available, the Fund will determine the fair value of the investment using another method approved by the Trustees.
Repurchase Agreements
It is the policy of the Fund to require the other party to a repurchase agreement to transfer to the Fund's custodian or sub-custodian eligible securities or cash with a market value (after transaction costs) at least equal to the repurchase price to be paid under the repurchase agreement. The eligible securities are transferred to accounts with the custodian or sub-custodian in which the Fund holds a “securities entitlement” and exercises “control” as those terms are defined in the Uniform Commercial Code. The Fund has established procedures for monitoring the market value of the transferred securities and requiring the transfer of additional eligible securities if necessary to equal at least the repurchase price. These procedures also allow the other party to require securities to be transferred from the account to the extent that their market value exceeds the repurchase price or in exchange for other eligible securities of equivalent market value.
Annual Shareholder Report
35
The insolvency of the other party or other failure to repurchase the securities may delay the disposition of the underlying securities or cause the Fund to receive less than the full repurchase price. Under the terms of the repurchase agreement, any amounts received by the Fund in excess of the repurchase price and related transaction costs must be remitted to the other party.The Fund may enter into repurchase agreements in which eligible securities are transferred into joint trading accounts maintained by the custodian or sub-custodian for investment companies and other clients advised by the Fund's Manager and its affiliates. The Fund will participate on a pro rata basis with the other investment companies and clients in its share of the securities transferred under such repurchase agreements and in its share of proceeds from any repurchase or other disposition of such securities.
Investment Income, Gains and Losses, Expenses and Distributions
Investment transactions are accounted for on a trade-date basis. Realized gains and losses from investment transactions are recorded on an identified-cost basis. Interest income and expenses are accrued daily. Dividend income and distributions to shareholders are recorded on the ex-dividend date. Foreign dividends are recorded on the ex-dividend date or when the Fund is informed of the ex-dividend date. Distributions of net investment income are declared and paid quarterly. Non-cash dividends included in dividend income, if any, are recorded at fair value. Investment income, realized and unrealized gains and losses and certain fund-level expenses are allocated to each class based on relative average daily net assets, except that Institutional Shares, Institutional Service Shares, Class C Shares and Class K Shares may bear distribution services fees, shareholder services fees, account administration fees and certain transfer and dividend disbursing agent fees unique to those classes. Dividends are declared separately for each class. No class has preferential dividend rights; differences in per share dividend rates are generally due to differences in separate class expenses.
Premium and Discount Amortization
All premiums and discounts on fixed-income securities are amortized/accreted for financial statement purposes.
Federal Taxes
It is the Fund's policy to comply with the Subchapter M provision of the Internal Revenue Code and to distribute to shareholders each year substantially all of its income. Accordingly, no provision for federal income tax is necessary. As of and during the year ended October 31, 2010, the Fund did not have a liability for any uncertain tax positions. The Fund recognizes interest and penalties, if any, related to tax liabilities as income tax expense in the Statement of Operations. As of October 31, 2010, tax years 2007 through 2010 remain subject to examination by the Fund's major tax jurisdictions, which include the United States of America and the Commonwealth of Massachusetts.
The Fund may be subject to taxes imposed by governments of countries in which it invests. Such taxes are generally based on either income or gains earned or repatriated. The Fund accrues and applies such taxes to net investment income, net realized gains and net unrealized gains as income and/or gains are earned.
Annual Shareholder Report
36
When-Issued and Delayed Delivery TransactionsThe Fund may engage in when-issued or delayed delivery transactions. The Fund records when-issued securities on the trade date and maintains security positions such that sufficient liquid assets will be available to make payment for the securities purchased. Securities purchased on a when-issued or delayed delivery basis are marked to market daily and begin earning interest on the settlement date. Losses may occur on these transactions due to changes in market conditions or the failure of counterparties to perform under the contract.
Futures Contracts
The Fund purchases stock index futures contracts to manage cash flows, maintain exposure to the S&P 500 index and to potentially reduce transaction costs. Upon entering into a stock index futures contract with a broker, the Fund is required to deposit in a segregated account a specified amount of cash or U.S. government securities which is shown as Restricted Cash in the Statement of Assets and Liabilities. Futures contracts are valued daily and unrealized gains or losses are recorded in a “variation margin” account. Daily, the Fund receives from or pays to the broker a specified amount of cash based upon changes in the variation margin account. When a contract is closed, the Fund recognizes a realized gain or loss. Futures contracts have market risks, including the risk that the change in the value of the contract may not correlate with the changes in the value of the underlying securities. There is minimal counterparty risk to the Fund since futures are exchange traded and the exchange's clearinghouse, as counterparty to all exchange-traded futures, guarantees the futures against default.
Futures contracts outstanding at period end are listed after the Fund's Portfolio of Investments.
Additional Disclosure Related to Derivative Instruments
| Fair Value of Derivative Instruments |
| Asset |
| Statement of
Assets and
Liabilities
Location | Fair
Value |
Derivatives not accounted for as hedging instruments
under ASC Topic 815 | | |
| Equity contracts | Receivable for daily
variation margin | $624,209* |
| * | Includes cumulative appreciation/depreciation of futures contracts as reported in the footnotes to the Portfolio of Investments. Only the current day's variation margin is reported within the Statement of Assets and Liabilities. |
The Effect of Derivative Instruments on the Statement of Operations for the Year Ended October 31, 2010
| Amount of Realized Gain or (Loss) on Derivatives Recognized in Income |
| Futures |
| Equity contracts | $1,410,244 |
Annual Shareholder Report37
| Change in Unrealized Appreciation or (Depreciation) on Derivatives Recognized in Income |
| Futures |
| Equity contracts | $618,119 |
Other
The preparation of financial statements in conformity with GAAP requires management to make estimates and assumptions that affect the amounts of assets, liabilities, expenses and revenues reported in the financial statements. Actual results could differ from those estimated.
3. SHARES OF BENEFICIAL INTEREST
The following tables summarize share activity:
| Year Ended October 31 | 2010 | 2009 |
| Institutional Shares: | Shares | Amount | Shares | Amount |
| Shares sold | 4,606,458 | $55,317,600 | 3,444,923 | $34,864,106 |
| Shares issued to shareholders in payment of distributions declared | 740,728 | 8,898,455 | 4,499,308 | 46,459,648 |
| Shares redeemed | (3,614,701) | (44,417,624) | (7,230,984) | (78,055,302) |
NET CHANGE RESULTING
FROM INSTITUTIONAL SHARE TRANSACTIONS | 1,732,485 | $19,798,431 | 713,247 | $3,268,452 |
| Year Ended October 31 | 2010 | 2009 |
| Institutional Service Shares: | Shares | Amount | Shares | Amount |
| Shares sold | 3,228,763 | $39,282,804 | 4,801,839 | $49,770,581 |
| Shares issued to shareholders in payment of distributions declared | 1,198,207 | 14,327,402 | 6,480,538 | 66,606,787 |
| Shares redeemed | (5,677,741) | (68,585,094) | (6,965,941) | (73,901,298) |
NET CHANGE RESULTING
FROM INSTITUTIONAL SERVICE SHARE TRANSACTIONS | (1,250,771) | $(14,974,888) | 4,316,436 | $42,476,070 |
| Year Ended October 31 | 2010 | 2009 |
| Class C Shares: | Shares | Amount | Shares | Amount |
| Shares sold | 411,911 | $4,961,082 | 702,419 | $7,375,683 |
| Shares issued to shareholders in payment of distributions declared | 142,101 | 1,685,436 | 860,557 | 8,795,453 |
| Shares redeemed | (843,580) | (10,127,744) | (1,047,128) | (11,077,920) |
NET CHANGE RESULTING
FROM CLASS C SHARE TRANSACTIONS | (289,568) | $(3,481,226) | 515,848 | $5,093,216 |
Annual Shareholder Report38
| Year Ended October 31 | 2010 | 2009 |
| Class K Shares: | Shares | Amount | Shares | Amount |
| Shares sold | 1,011,452 | $12,093,268 | 1,015,338 | $10,646,781 |
| Shares issued to shareholders in payment of distributions declared | 131,783 | 1,574,401 | 626,491 | 6,439,800 |
| Shares redeemed | (918,586) | (11,118,302) | (834,412) | (8,740,478) |
NET CHANGE RESULTING
FROM CLASS K SHARE TRANSACTIONS | 224,649 | $2,549,367 | 807,417 | $8,346,103 |
NET CHANGE RESULTING
FROM TOTAL FUND SHARE TRANSACTIONS | 416,795 | $3,891,684 | 6,352,948 | $59,183,841 |
4. FEDERAL TAX INFORMATION
The timing and character of income and capital gain distributions are determined in accordance with income tax regulations, which may differ from GAAP. These differences are due to differing treatments for regulatory settlement proceeds and dividend redesignation.
For the year ended October 31, 2010, permanent differences identified and reclassified among the components of net assets were as follows:
| Increase (Decrease) |
| Paid-In Capital | Undistributed
Net Investment
Income (Loss) | Accumulated
Net Realized
Gain (Loss) |
| $(4,759) | $(402) | $5,161 |
Net investment income (loss), net realized gains (losses) and net assets were not affected by this reclassification.
The tax character of distributions as reported on the Statement of Changes in Net Assets for the years ended October 31, 2010 and 2009, was as follows:
| 2010 | 2009 |
| Ordinary income | $6,905,390 | $8,861,361 |
| Long-term capital gains | $22,765,830 | $136,273,753 |
As of October 31, 2010, the components of distributable earnings on a tax basis were as follows:
| Undistributed ordinary income1 | $5,175,377 |
| Undistributed long-term capital gains | $22,812,023 |
| Net unrealized appreciation | $246,752,214 |
| 1 | For tax purposes, short-term capital gains are treated as ordinary income for distribution purposes. |
The difference between book-basis and tax-basis net unrealized appreciation/depreciation is attributable in part to differing treatments for the deferral of losses on wash sales and return of capital adjustments.
Annual Shareholder Report
39
At October 31, 2010, the cost of investments for federal tax purposes was $257,153,299. The net unrealized appreciation of investments for federal tax purposes excluding any unrealized appreciation resulting from futures contracts was $246,752,214. This consists of net unrealized appreciation from investments for those securities having an excess of value over cost of $250,334,298 and net unrealized depreciation from investments for those securities having an excess of cost over value of $3,582,084.5. MANAGEMENT FEE AND OTHER TRANSACTIONS WITH AFFILIATES
Management Fee
Federated Equity Management Company of Pennsylvania is the Fund's manager (the “Manager”). The management agreement between the Fund and the Manager provides for an annual fee equal to 0.30% of the Fund's average daily net assets. Subject to the terms described in the Expense Limitation note, the Manager may voluntarily choose to waive any portion of its fee. For the year ended October 31, 2010, the Manager voluntarily waived $267,961 of its fee. In addition, an affiliate of the Manager reimbursed $191,669 of transfer and dividend disbursing agent fees and expenses.
Distribution Services Fee
The Fund has adopted a Distribution Plan (the “Plan”) pursuant to Rule 12b-1 under the Act. Under the terms of the Plan, the Fund will compensate Federated Securities Corp. (FSC), the principal distributor, from the daily net assets of the Fund's Institutional Service Shares, Class C Shares and Class K Shares to finance activities intended to result in the sale of these shares. The Plan provides that the Fund may incur distribution expenses at the following percentages of average daily net assets annually, to compensate FSC:
| Share Class Name | Percentage of Average Daily
Net Assets of Class |
| Institutional Service Shares | 0.30% |
| Class C Shares | 0.75% |
| Class K Shares | 0.50% |
Subject to the terms described in the Expense Limitation note, FSC may voluntarily choose to waive any portion of its fee. For the year ended October 31, 2010, FSC voluntarily waived $575,161 of its fee. When FSC receives fees, it may pay some or all of them to financial intermediaries whose customers purchase shares. For the year ended October 31, 2010, FSC retained $216,896 of fees paid by the Fund.
Sales Charges
Front-end sales charges and contingent deferred sales charges (CDSC) do not represent expenses of the Fund. They are deducted from the proceeds of sales of Fund shares prior to investment or from redemption proceeds prior to remittance, as applicable. For the year ended October 31, 2010, FSC retained $578 of CDSC relating to redemptions of Class C Shares.
Annual Shareholder Report
40
Shareholder Services FeeThe Fund may pay fees (“Service Fees”) up to 0.25% of the average daily net assets of the Fund's Institutional Shares, Institutional Service Shares and Class C Shares to financial intermediaries or to Federated Shareholder Services Company (FSSC) for providing services to shareholders and maintaining shareholder accounts. Subject to the terms described in the Expense Limitation note, FSSC may voluntarily reimburse the Fund for Service Fees. For the year ended October 31, 2010, FSSC did not receive any fees paid by the Fund. For the year ended October 31, 2010, the Fund's Institutional Shares did not incur Service Fees.
Expense Limitation
The Manager and its affiliates (which may include FSC and FSSC) have voluntarily agreed to waive their fees and/or reimburse expenses so that the total annual fund operating expenses (as shown in the financial highlights) paid by the Fund's Institutional Shares, Institutional Service Shares, Class C Shares and Class K Shares (after the voluntary waivers and reimbursements) will not exceed 0.35%, 0.65%, 1.43% and 1.10% (the “Fee Limit”), respectively, through the later of (the “Termination Date”): (a) December 31, 2011; or (b) the date of the Fund's next effective Prospectus. While the Manager and its affiliates currently do not anticipate terminating or increasing these arrangements prior to the Termination Date, these arrangements may only be terminated or the Fee Limit increased prior to the Termination Date with the agreement of the Trustees.
General
Certain Officers and Trustees of the Fund are Officers and Directors or Trustees of the above companies.
Transactions Involving Affiliated Holdings
Affiliated holdings are mutual funds which are managed by the Manager or an affiliate of the Manager. The Manager has agreed to reimburse the Fund for certain investment adviser fees as a result of transactions in other affiliated mutual funds. For the year ended October 31, 2010, the Manager reimbursed $11,225. Transactions involving affiliated holdings during the year ended October 31, 2010, were as follows:
| Affiliate | Balance of
Shares Held
10/31/2009 | Purchases/
Additions | Sales/
Reductions | Balance of
Shares Held
10/31/2010 | Value | Dividend
Income |
| Federated Prime Value Obligations Fund, Institutional Shares | 1,637,330 | 107,217,060 | 101,429,356 | 7,425,034 | $7,425,034 | $20,460 |
6. Investment TRANSACTIONS
Purchases and sales of investments, excluding long-term U.S. government securities and short-term obligations for the year ended October 31, 2010, were as follows:
| Purchases | $155,980,640 |
| Sales | $168,178,907 |
Annual Shareholder Report41
7. INTERFUND LENDING
Pursuant to an Exemptive Order issued by the Securities and Exchange Commission, the Fund, along with other funds advised by subsidiaries of Federated Investors, Inc., may participate in an interfund lending program. This program provides an alternative credit facility allowing the Fund to borrow from other participating affiliated funds. As of October 31, 2010, there were no outstanding loans. During the year ended October 31, 2010, the program was not utilized.
8. Legal Proceedings
Since February, 2004, Federated Investors, Inc. and related entities (collectively, “Federated”), have been named as defendants in several lawsuits that are now pending in the United States District Court for the Western District of Pennsylvania. These lawsuits have been consolidated into a single action alleging excessive advisory fees involving one of the Federated-sponsored mutual funds (“Federated Funds”). Federated and its counsel have been defending this litigation. Additional lawsuits based upon similar allegations may be filed in the future. The potential impact of these lawsuits, all of which seek monetary damages, attorneys' fees and expenses, and future potential similar suits is uncertain. Although we do not believe that these lawsuits will have a material adverse effect on the Federated Funds, there can be no assurance that these suits, ongoing adverse publicity and/or other developments resulting from the allegations in these matters will not result in increased redemptions, or reduced sales, of shares of the Federated Funds or other adverse consequences for the Federated Funds.
9. Subsequent events
Effective December 31, 2010, Class K Shares will be redesignated as Class R Shares.
Management has evaluated subsequent events through the date the financial statements were issued, and determined that no additional events have occurred that require disclosure.
10. FEDERAL TAX INFORMATION (UNAUDITED)
For the year ended October 31, 2010, the amount of long-term capital gains designated by the Fund was $22,765,830.
For the fiscal year ended October 31, 2010, 100.0% of total ordinary income distributions made by the Fund are qualifying dividends which may be subject to a maximum tax rate of 15%, as provided for by the Jobs and Growth Tax Relief Act of 2003. Complete information is reported in conjunction with the reporting of your distributions on Form 1099-DIV.
Of the ordinary income distributions made by the Fund during the year ended October 31, 2010, 100.0% qualify for the dividend received deduction available to corporate shareholders.
Annual Shareholder Report42
Report of Independent Registered Public Accounting Firm
TO THE BOARD OF Trustees OF Federated Index Trust AND SHAREHOLDERS OF Federated max-Cap Index fund:
We have audited the accompanying statement of assets and liabilities of Federated Max-Cap Index Fund (the “Fund”) (one of the portfolios constituting Federated Index Trust), including the portfolio of investments, as of October 31, 2010, and the related statement of operations for the year then ended, the statement of changes in net assets for each of the two years in the period then ended, and the financial highlights for each of the five years in the period then ended. These financial statements and financial highlights are the responsibility of the Fund's management. Our responsibility is to express an opinion on these financial statements and financial highlights based on our audits.
We conducted our audits in accordance with standards of the Public Company Accounting Oversight Board (United States). Those standards require that we plan and perform the audit to obtain reasonable assurance about whether the financial statements and financial highlights are free of material misstatement. We were not engaged to perform an audit of the Fund's internal control over financial reporting. Our audits included consideration of internal control over financial reporting as a basis for designing audit procedures that are appropriate in the circumstances, but not for the purpose of expressing an opinion on the effectiveness of the Fund's internal control over financial reporting. Accordingly, we express no such opinion. An audit also includes examining, on a test basis, evidence supporting the amounts and disclosures in the financial statements and financial highlights, assessing the accounting principles used and significant estimates made by management, and evaluating the overall financial statement presentation. Our procedures included confirmation of securities owned as of October 31, 2010, by correspondence with the custodian and others, or by other appropriate auditing procedures where replies from others were not received. We believe that our audits provide a reasonable basis for our opinion.
In our opinion, the financial statements and financial highlights referred to above present fairly, in all material respects, the financial position of Federated Max-Cap Index Fund, a portfolio of Federated Index Trust, at October 31, 2010, the results of its operations for the year then ended, the changes in its net assets for each of the two years in the period then ended, and the financial highlights for each of the five years in the period then ended, in conformity with U.S. generally accepted accounting principles.
Boston, Massachusetts
December 20, 2010
Annual Shareholder Report43
Board of Trustees and Trust Officers
The Board of Trustees is responsible for managing the Trust's business affairs and for exercising all the Trust's powers except those reserved for the shareholders. The following tables give information about each Trustee and the senior officers of the Fund. Where required, the tables separately list Trustees who are “interested persons” of the Fund (i.e., “Interested” Trustees) and those who are not (i.e., “Independent” Trustees). Unless otherwise noted, the address of each person listed is Federated Investors Tower, 1001 Liberty Avenue, Pittsburgh, PA 15222. The address of all Independent Trustees listed is 4000 Ericsson Drive, Warrendale, PA 15086-7561; Attention: Mutual Fund Board. As of December 31, 2009, the Trust comprised two portfolio(s), and the Federated Fund Family consisted of 43 investment companies (comprising 145 portfolios). Unless otherwise noted, each Officer is elected annually. Unless otherwise noted, each Trustee oversees all portfolios in the Federated Fund Family and serves for an indefinite term. The Fund's Statement of Additional Information includes additional information about Trust Trustees and is available, without charge and upon request, by calling 1-800-341-7400.
Interested TRUSTEES Background
Name
Birth Date
Positions Held with Trust
Date Service Began | Principal Occupation(s) for Past Five Years,
Other Directorships Held and Previous Position(s) |
John F. Donahue*
Birth Date: July 28, 1924
Trustee
Began serving: January 1990 | Principal Occupations: Director or Trustee of the Federated Fund Family; Chairman and Director, Federated Investors, Inc.; Chairman of the Federated Fund Family's Executive Committee.
Previous Positions: Chairman of the Federated Fund Family; Trustee, Federated Investment Management Company; Chairman and Director, Federated Investment Counseling. |
J. Christopher Donahue*
Birth Date: April 11, 1949
PRESIDENT AND Trustee
Began serving: January 1990 | Principal Occupations: Principal Executive Officer and President of the Federated Fund Family; Director or Trustee of some of the Funds in the Federated Fund Family; President, Chief Executive Officer and Director, Federated Investors, Inc.; Chairman and Trustee, Federated Investment Management Company; Trustee, Federated Investment Counseling; Chairman and Director, Federated Global Investment Management Corp.; Chairman, Federated Equity Management Company of Pennsylvania and Passport Research, Ltd. (investment advisory subsidiary of Federated); Trustee, Federated Shareholder Services Company; Director, Federated Services Company.
Previous Positions: President, Federated Investment Counseling; President and Chief Executive Officer, Federated Investment Management Company, Federated Global Investment Management Corp. and Passport Research, Ltd. |
| * | Family relationships and reasons for “interested” status: John F. Donahue is the father of J. Christopher Donahue; both are “interested” due to their beneficial ownership of shares of Federated Investors, Inc. and the positions they hold with Federated and its subsidiaries. |
Annual Shareholder Report44
INDEPENDENT TRUSTEES Background
Name
Birth Date
Positions Held with Trust
Date Service Began | Principal Occupation(s) for Past Five Years,
Other Directorships Held, Previous Position(s) and Qualifications |
John T. Conroy, Jr., Ph.D.
Birth Date: June 23, 1937
Trustee
Began serving: August 1991 | Principal Occupations: Director or Trustee of the Federated Fund Family; Chairman of the Board, Investment Properties Corporation; Partner or Trustee in private real estate ventures in Southwest Florida; Assistant Professor in Theology, Blessed Edmund Rice School for Pastoral Ministry.
Previous Positions: President, Investment Properties Corporation; Senior Vice President, John R. Wood and Associates, Inc., Realtors; President, Naples Property Management, Inc. and Northgate Village Development Corporation.
Qualifications: Business management and director experience. |
Nicholas P. Constantakis, CPA
Birth Date: September 3, 1939
Trustee
Began serving: February 1998 | Principal Occupation: Director or Trustee of the Federated Fund Family.
Other Directorship Held: Director and Chairman of the Audit Committee, Michael Baker Corporation (architecture, engineering and construction services).
Previous Position: Partner, Andersen Worldwide SC.
Qualifications: Public accounting and director experience. |
John F. Cunningham
Birth Date: March 5, 1943
Trustee
Began serving: January 1999 | Principal Occupation: Director or Trustee of the Federated Fund Family.
Other Directorships Held: Chairman, President and Chief Executive Officer, Cunningham & Co., Inc. (strategic business consulting); Trustee Associate, Boston College.
Previous Positions: Director, Redgate Communications and EMC Corporation (computer storage systems); Chairman of the Board and Chief Executive Officer, Computer Consoles, Inc.; President and Chief Operating Officer, Wang Laboratories; Director, First National Bank of Boston; Director, Apollo Computer, Inc.
Qualifications: Business management and director experience. |
Maureen Lally-Green
Birth Date: July 5, 1949
Trustee
Began serving: August 2009 | Principal Occupations: Director or Trustee of the Federated Fund Family; Director, Office of Church Relations, Diocese of Pittsburgh; Adjunct Professor of Law, Duquesne University School of Law.
Other Directorships Held: Director, Auberle; Trustee, St. Francis University; Director, Ireland Institute of Pittsburgh; Director, UPMC Mercy Hospital; Regent, St. Vincent Seminary; Director, Epilepsy Foundation of Western and Central Pennsylvania; Director, Saint Thomas More Society, Allegheny County; Director, Carlow University.
Previous Position: Pennsylvania Superior Court Judge.
Qualifications: Legal and director experience. |
Annual Shareholder Report45
Name
Birth Date
Positions Held with Trust
Date Service Began | Principal Occupation(s) for Past Five Years,
Other Directorships Held, Previous Position(s) and Qualifications |
Peter E. Madden
Birth Date: March 16, 1942
Trustee
Began serving: August 1991 | Principal Occupation: Director or Trustee, and Chairman of the Board of Directors or Trustees, of the Federated Fund Family.
Other Directorship Held: Board of Overseers, Babson College.
Previous Positions: Representative, Commonwealth of Massachusetts General Court; President, Chief Operating Officer and Director, State Street Bank and Trust Company and State Street Corporation (retired); Director, VISA USA and VISA International; Chairman and Director, Massachusetts Bankers Association; Director, Depository Trust Corporation; Director, The Boston Stock Exchange.
Qualifications: Business management, mutual fund services and director experience. |
Charles F. Mansfield, Jr.
Birth Date: April 10, 1945
Trustee
Began serving: January 1999 | Principal Occupations: Director or Trustee and Chairman of the Audit Committee of the Federated Fund Family; Management Consultant.
Previous Positions: Chief Executive Officer, PBTC International Bank; Partner, Arthur Young & Company (now Ernst & Young LLP); Chief Financial Officer of Retail Banking Sector, Chase Manhattan Bank; Senior Vice President, HSBC Bank USA (formerly, Marine Midland Bank); Vice President, Citibank; Assistant Professor of Banking and Finance, Frank G. Zarb School of Business, Hofstra University; Executive Vice President, DVC Group, Inc. (marketing, communications and technology).
Qualifications: Banking, business management, public accounting and director experience. |
R. James Nicholson
Birth Date: February 4, 1938
Trustee
Began serving: January 2008 | Principal Occupations: Director or Trustee of the Federated Fund Family; Senior Counsel, Brownstein Hyatt Farber Schrek, P.C.; Former Secretary of the U.S. Dept. of Veterans Affairs; Former U.S. Ambassador to the Holy See; Former Chairman of the Republican National Committee.
Other Directorships Held: Director, Horatio Alger Association; Director, The Daniels Fund.
Previous Positions: Colonel, U.S. Army Reserve; Partner, Calkins, Kramer, Grimshaw and Harring, P.C.; General Counsel, Colorado Association of Housing and Building; Chairman and CEO, Nicholson Enterprises, Inc. (real estate holding company); Chairman and CEO, Renaissance Homes of Colorado.
Qualifications: Legal, government, business management and mutual fund director experience. |
Annual Shareholder Report46
Name
Birth Date
Positions Held with Trust
Date Service Began | Principal Occupation(s) for Past Five Years,
Other Directorships Held, Previous Position(s) and Qualifications |
Thomas M. O'Neill
Birth Date: June 14, 1951
Trustee
Began serving: October 2006 | Principal Occupations: Director or Trustee of the Federated Fund Family; Sole Proprietor, Navigator Management Company (investment and strategic consulting).
Other Directorships Held: Board of Overseers, Children's Hospital of Boston; Visiting Committee on Athletics, Harvard College.
Previous Positions: Chief Executive Officer and President, Managing Director and Chief Investment Officer, Fleet Investment Advisors; President and Chief Executive Officer, Aeltus Investment Management, Inc.; General Partner, Hellman, Jordan Management Co., Boston, MA; Chief Investment Officer, The Putnam Companies, Boston, MA; Credit Analyst and Lending Officer, Fleet Bank; Director and Consultant, EZE Castle Software (investment order management software); Director, Midway Pacific (lumber).
Qualifications: Business management, mutual fund, director and investment experience. |
John S. Walsh
Birth Date: November 28, 1957
Trustee
Began serving: January 1999 | Principal Occupations: Director or Trustee of the Federated Fund Family; President and Director, Heat Wagon, Inc. (manufacturer of construction temporary heaters); President and Director, Manufacturers Products, Inc. (distributor of portable construction heaters); President, Portable Heater Parts, a division of Manufacturers Products, Inc.
Previous Position: Vice President, Walsh & Kelly, Inc.
Qualifications: Business management and director experience. |
James F. Will
Birth Date: October 12, 1938
Trustee
Began serving: April 2006 | Principal Occupations: Director or Trustee of the Federated Fund Family; formerly, Vice Chancellor and President, Saint Vincent College.
Other Directorships Held: Trustee, Saint Vincent College; Director, Alleghany Corporation; Trustee, Wheeling Jesuit University; Director, Liberty Tire Recycling.
Previous Positions: Chairman, President and Chief Executive Officer, Armco, Inc.; President and Chief Executive Officer, Cyclops Industries; President and Chief Operating Officer, Kaiser Steel Corporation.
Qualifications: Business management, education and director experience. |
Annual Shareholder Report47
OFFICERS
Name
Birth Date
Address
Positions Held with Trust
Date Service Began | Principal Occupation(s) for Past Five Years
and Previous Position(s) |
John W. McGonigle
Birth Date: October 26, 1938
EXECUTIVE VICE PRESIDENT AND SECRETARY
Began serving: February 1990 | Principal Occupations: Executive Vice President and Secretary of the Federated Fund Family; Vice Chairman, Executive Vice President, Secretary and Director, Federated Investors, Inc.
Previous Positions: Trustee, Federated Investment Management Company and Federated Investment Counseling; Director, Federated Global Investment Management Corp., Federated Services Company and Federated Securities Corp. |
Richard A. Novak
Birth Date: December 25, 1963
TREASURER
Began serving: January 2006 | Principal Occupations: Principal Financial Officer and Treasurer of the Federated Fund Family; Senior Vice President, Federated Administrative Services; Financial and Operations Principal for Federated Securities Corp., Edgewood Services, Inc. and Southpointe Distribution Services, Inc.
Previous Positions: Controller of Federated Investors, Inc.; Vice President, Finance of Federated Services Company; held various financial management positions within The Mercy Hospital of Pittsburgh; Auditor, Arthur Andersen & Co. |
Richard B. Fisher
Birth Date: May 17, 1923
VICE PRESIDENT
Began serving: February 1990 | Principal Occupations: Vice Chairman or Vice President of some of the Funds in the Federated Fund Family; Vice Chairman, Federated Investors, Inc.; Chairman, Federated Securities Corp.
Previous Positions: President and Director or Trustee of some of the Funds in the Federated Fund Family; Executive Vice President, Federated Investors, Inc.; Director and Chief Executive Officer, Federated Securities Corp. |
Brian P. Bouda
Birth Date: February 28, 1947
CHIEF COMPLIANCE OFFICER AND SENIOR VICE PRESIDENT
Began serving: August 2004 | Principal Occupations: Senior Vice President and Chief Compliance Officer of the Federated Fund Family; Vice President and Chief Compliance Officer of Federated Investors, Inc. and Chief Compliance Officer of its subsidiaries. Mr. Bouda joined Federated in 1999 and is a member of the American Bar Association and the State Bar Association of Wisconsin. |
Stephen F. Auth
Birth Date: September 3, 1956
450 Lexington Avenue
Suite 3700
New York, NY 10017-3943
CHIEF INVESTMENT OFFICER
Began serving: November 2002 | Principal Occupations: Mr. Auth is Chief Investment Officer of this Fund and various other Funds in the Federated Fund Family; Executive Vice President, Federated Investment Counseling, Federated Global Investment Management Corp. and Federated Equity Management Company of Pennsylvania.
Previous Positions: Executive Vice President, Federated Investment Management Company, and Passport Research, Ltd. (investment advisory subsidiary of Federated); Senior Vice President, Global Portfolio Management Services Division; Senior Vice President, Federated Investment Management Company and Passport Research, Ltd.; Senior Managing Director and Portfolio Manager, Prudential Investments. |
Annual Shareholder Report48
Evaluation and Approval of Advisory Contract – May 2010
Federated Max-Cap Index Fund (the “Fund”)
The Fund's Board reviewed the Fund's investment advisory and subadvisory contracts at meetings held in May 2010. The Board's decision regarding these contracts reflects the exercise of its business judgment on whether to continue the existing arrangements.
In this connection, the Federated funds' Board had previously appointed a Senior Officer, whose duties include specified responsibilities relating to the process by which advisory fees are to be charged to a Federated fund. The Senior Officer has the authority to retain consultants, experts, or staff as may be reasonably necessary to assist in the performance of his duties, reports directly to the Board, and may be terminated only with the approval of a majority of the independent members of the Board. The Senior Officer prepared and furnished to the Board an independent, written evaluation that covered topics discussed below. The Board considered that evaluation, along with other information, in deciding to approve the advisory and subadvisory contracts.
During its review of these contracts, the Board considered compensation and benefits received by the Adviser and subadviser. This included the fees received for services provided to the Fund by other entities in the Federated organization and research services (if any) received by the Adviser and subadviser from brokers that execute Federated fund trades, as well as advisory fees. The Board is also familiar with and considered judicial decisions concerning allegedly excessive investment advisory fees, which have indicated that the following factors may be relevant to an Adviser's fiduciary duty with respect to its receipt of compensation from a fund: the nature and quality of the services provided by the Adviser, including the performance of the Fund; the Adviser's cost of providing the services; the extent to which the Adviser may realize “economies of scale” as the Fund grows larger; any indirect benefits that may accrue to the Adviser and its affiliates as a result of the Adviser's relationship with the Fund; performance and expenses of comparable funds; and the extent to which the independent Board members are fully informed about all facts the Board deems relevant bearing on the Adviser's services and fees. The Board further considered management fees (including any components thereof) charged to institutional and other clients of the Adviser for what might be viewed as like services, and the cost to the Adviser and its affiliates of supplying services pursuant to the management fee agreements, excluding any intra-corporate profit and profit margins of the Adviser and its affiliates for supplying such services. Information regarding the subadviser's customary fee schedules was included in the materials furnished by the subadviser in connection with the Board's review. The Board was aware of these factors and was guided by them in its review of the Fund's advisory and subadvisory contracts to the extent it considered them to be appropriate and relevant, as discussed further below.
Annual Shareholder Report
49
The Board considered and weighed these circumstances in light of its substantial accumulated experience in governing the Fund and working with Federated on matters relating to the Federated funds, and was assisted in its deliberations by independent legal counsel. Throughout the year, the Board has requested and received substantial and detailed information about the Fund and the Federated organization that was in addition to the extensive materials that comprise and accompany the Senior Officer's evaluation. Federated provided much of this information at each regular meeting of the Board, and furnished additional reports in connection with the particular meeting at which the Board's formal review of the advisory and subadvisory contracts occurred. Between regularly scheduled meetings, the Board also received information on particular matters as the need arose. Thus, the Board's consideration of the advisory and subadvisory contracts included review of the Senior Officer's evaluation, accompanying data and additional reports covering such matters as: the Adviser's and subadviser's profitability, investment philosophy, revenue, personnel and processes; investment and operating strategies; the Fund's short- and long-term performance (in absolute terms, both on a gross basis and net of expenses, as well as in relationship to its particular investment program and certain competitor or “peer group” funds and/or other benchmarks, as appropriate), and comments on the reasons for performance; the Fund's investment objectives; the Fund's expenses (including the advisory fee itself and the overall expense structure of the Fund, both in absolute terms and relative to similar and/or competing funds, with due regard for contractual or voluntary expense limitations); the use and allocation of brokerage commissions derived from trading the Fund's portfolio securities (if any); and the nature, quality and extent of the advisory and other services provided to the Fund by the Adviser, the subadviser, and their affiliates. The Board also considered the preferences and expectations of Fund shareholders and their relative sophistication; the continuing state of competition in the mutual fund industry and market practices; the range of comparable fees for similar funds in the mutual fund industry; the Fund's relationship to the Federated family of funds which include a comprehensive array of funds with different investment objectives, policies and strategies which are available for exchange without the incurrence of additional sales charges; compliance and audit reports concerning the Federated funds, the Federated companies that service them, and the subadviser (including communications from regulatory agencies), as well as Federated's and/or the subadviser's responses to any issues raised therein; and relevant developments in the mutual fund industry and how the Federated funds and/or Federated are responding to them. The Board's evaluation process is evolutionary. The criteria considered and the emphasis placed on relevant criteria change in recognition of changing circumstances in the mutual fund marketplace.Annual Shareholder Report
50
With respect to the Fund's performance and expenses in particular, the Board has found the use of comparisons to other mutual funds with comparable investment programs to be relevant, given the high degree of competition in the mutual fund business. The Board focused on comparisons with other similar mutual funds more heavily than non-mutual fund products or services because it is believed that they are more relevant. For example, other mutual funds are the products most like the Fund, they are readily available to Fund shareholders as alternative investment vehicles, and they are the type of investment vehicle in fact chosen and maintained by the Fund's investors. The range of their fees and expenses therefore appears to be a generally reliable indication of what consumers have found to be reasonable in the precise marketplace in which the Fund competes. The Fund's ability to deliver competitive performance when compared to its peer group was a useful indicator of how the Adviser and subadviser are executing the Fund's investment program, which in turn assisted the Board in reaching a conclusion that the nature, extent, and quality of the Adviser's and subadviser's investment management services were such as to warrant continuation of the advisory and subadvisory contracts. In this regard, the Senior Officer has reviewed Federated's and the subadviser's fees for providing advisory services to products outside the Federated family of funds (e.g., institutional and separate accounts). He concluded that mutual funds and institutional accounts are inherently different products. Those differences included, but are not limited to, different types of targeted investors, being subject to different laws and regulations, different legal structures, different average account sizes, different associated costs, different portfolio management techniques made necessary by different cash flows, and portfolio manager time spent in review of securities pricing. The Senior Officer did not consider these fee schedules to be determinative in judging the appropriateness of mutual fund advisory contracts.The Senior Officer reviewed reports compiled by Federated, using data supplied by independent fund ranking organizations, regarding the performance of, and fees charged by, other mutual funds, noting his view that comparisons to fund peer groups are relevant in judging the reasonableness of proposed fees.
The Fund's performance fell below the median of the relevant peer group for the one-year, three-year and five-year periods covered by the report. The Board discussed the Fund's performance with the Adviser and recognized the efforts being undertaken by the Adviser and subadviser. The Board will continue to monitor these efforts and the performance of the Fund.
The Board also received financial information about Federated, including reports on the compensation and benefits Federated derived from its relationships with the Federated funds. These reports covered not only the fees under the advisory contracts, but also fees received by Federated's subsidiaries for providing other services to the Federated funds under separate contracts (e.g., for serving as the Federated funds' administrator). The reports also discussed any indirect benefit Federated may derive from its receipt of research Annual Shareholder Report
51
services from brokers who execute Federated fund trades. In addition, the Board considered the fact that, in order for a fund to be competitive in the marketplace, Federated and its affiliates frequently waived fees and/or reimbursed expenses and have disclosed to fund investors and/or indicated to the Board their intention to do so in the future, where appropriate. Moreover, the Board receives regular reports regarding the institution or elimination of these voluntary waivers. The Board also received financial information about the subadviser, as well as reports that discussed any indirect benefit the subadviser may derive from its receipt of research services from brokers who execute Fund trades.Federated furnished reports, requested by the Senior Officer, that reported revenues on a fund-by-fund basis and made estimates of the allocation of expenses on a fund-by-fund basis, using allocation methodologies specified by the Senior Officer. The Senior Officer noted that, although they may apply consistent allocation processes, the inherent difficulties in allocating costs (and the unavoidable arbitrary aspects of that exercise) and the lack of consensus on how to allocate those costs may render such allocation reports unreliable. The Board received similar revenue and cost information about the Fund from the subadviser. The allocation reports were considered in the analysis by the Board but were determined to be of limited use.
The Board and the Senior Officer also reviewed a report compiled by Federated comparing profitability information for Federated and the subadviser to other publicly held fund management companies. In this regard, the Senior Officer noted the limited availability of such information, but nonetheless concluded that Federated's and the subadviser's profit margins did not appear to be excessive and the Board agreed.
The Senior Officer's evaluation also discussed the notion of possible realization of “economies of scale” as a fund grows larger. The Board considered in this regard that the Adviser has made significant and long-term investments in areas that support all of the Federated funds, such as personnel and processes for the portfolio management, compliance, and risk management functions; and systems technology; and that the benefits of these efforts (as well as any economies, should they exist) were likely to be enjoyed by the fund complex as a whole. Finally, the Board also noted the absence of any applicable regulatory or industry guidelines on this subject, which (as discussed in the Senior Officer's evaluation) is compounded by the lack of any common industry practice or general pattern with respect to structuring fund advisory fees with “breakpoints” that serve to reduce the fee as the fund attains a certain size. The Senior Officer did not recommend institution of breakpoints in pricing Federated's fund advisory services at this time.
Annual Shareholder Report
52
It was noted in the materials for the Board meeting that, for the period covered by the report, the Fund's investment advisory fee, after waivers and expense reimbursements, if any, was above the median of the relevant peer group. The Board reviewed the fees and other expenses of the Fund with the Adviser and was satisfied that the overall expense structure of the Fund remained competitive. The Board will continue to monitor advisory fees and other expenses borne by the Fund.The Senior Officer's evaluation noted his belief that the information and observations contained in his evaluation supported a finding that the proposed management fees are reasonable, and that Federated appeared to provide appropriate administrative services to the Fund for the fees paid. Under these circumstances, no changes were recommended to, and no objection was raised to, the continuation of the Fund's advisory and subadvisory contracts. The Board concluded that the nature, quality and scope of services provided the Fund by the Adviser and its affiliates, and by the subadviser, were satisfactory.
In its decision to continue an existing investment advisory contract, the Board was mindful of the potential disruptions of the Fund's operations and various risks, uncertainties and other effects that could occur as a result of a decision to terminate or not renew an advisory contract. In particular, the Board recognized that many shareholders have invested in the Fund on the strength of the Adviser's industry standing and reputation and with the expectation that the Adviser will have a continuing role in providing advisory services to the Fund. Thus, the Board's approval of the advisory contract reflected the fact that it is the shareholders who have effectively selected the Adviser by virtue of having invested in the Fund.
The Board based its decision to approve the advisory and subadvisory contracts on the totality of the circumstances and relevant factors and with a view to past and future long-term considerations. Not all of the factors and considerations identified above were necessarily relevant to the Fund, nor did the Board consider any one of them to be determinative. With respect to the factors that were relevant, the Board's decision to approve the contract reflects its determination that Federated's performance and actions provided a satisfactory basis to support the decision to continue the existing arrangements.
Annual Shareholder Report53
Voting Proxies on Fund Portfolio Securities
A description of the policies and procedures that the Fund uses to determine how to vote proxies, if any, relating to securities held in the Fund's portfolio is available, without charge and upon request, by calling 1-800-341-7400. A report on “Form N-PX” of how the Fund voted any such proxies during the most recent 12-month period ended June 30 is available from Federated's website at FederatedInvestors.com. To access this information from the “Products” section of the website, click on the “Prospectuses and Regulatory Reports” link under “Related Information,” then select the appropriate link opposite the name of the Fund; or select the name of the Fund and from the Fund's page, click on the “Prospectuses and Regulatory Reports” link. Form N-PX filings are also available at the SEC's website at www.sec.gov.
Quarterly Portfolio Schedule
The Fund files with the SEC a complete schedule of its portfolio holdings, as of the close of the first and third quarters of its fiscal year, on “Form N-Q.” These filings are available on the SEC's website at www.sec.gov and may be reviewed and copied at the SEC's Public Reference Room in Washington, DC. (Call 1-800-SEC-0330 for information on the operation of the Public Reference Room.) You may also access this information from the “Products” section of Federated's website at FederatedInvestors.com by clicking on “Portfolio Holdings” under “Related Information,” then selecting the appropriate link opposite the name of the Fund; or select the name of the Fund and from the Fund's page, click on the “Portfolio Holdings” link.
Annual Shareholder Report54
Mutual funds are not bank deposits or obligations, are not guaranteed by any bank and are not insured or guaranteed by the U.S. government, the Federal Deposit Insurance Corporation, the Federal Reserve Board or any other government agency. Investment in mutual funds involves investment risk, including the possible loss of principal.
This Report is authorized for distribution to prospective investors only when preceded or accompanied by the Fund's Prospectus, which contains facts concerning its objective and policies, management fees, expenses and other information.
Federated Max-Cap Index Fund
Federated Investors Funds
4000 Ericsson Drive
Warrendale, PA 15086-7561
Contact us at FederatedInvestors.com
or call 1-800-341-7400.
Federated Securities Corp., Distributor
Cusip 31420E106
Cusip 31420E403
Cusip 31420E502
Cusip 31420E809
29454 (12/10)
Federated is a registered mark of Federated Investors, Inc.
2010 © Federated Investors, Inc.
Federated Mid-Cap Index Fund
A Portfolio of Federated Index Trust
ANNUAL SHAREHOLDER REPORTOctober 31, 2010
Institutional Service Shares
FINANCIAL HIGHLIGHTS
SHAREHOLDER EXPENSE EXAMPLE
MANAGEMENT'S DISCUSSION OF FUND PERFORMANCE
PORTFOLIO OF INVESTMENTS SUMMARY TABLE
PORTFOLIO OF INVESTMENTS
STATEMENT OF ASSETS AND LIABILITIES
STATEMENT OF OPERATIONS
STATEMENT OF CHANGES IN NET ASSETS
NOTES TO FINANCIAL STATEMENTS
REPORT OF INDEPENDENT REGISTERED PUBLIC ACCOUNTING FIRM
BOARD OF TRUSTEES AND TRUST OFFICERS
EVALUATION AND APPROVAL OF ADVISORY CONTRACT
VOTING PROXIES ON FUND PORTFOLIO SECURITIES
QUARTERLY PORTFOLIO SCHEDULE
Financial Highlights – Institutional Service Shares
(For a Share Outstanding Throughout Each Period)
| Year Ended October 31 | 2010 | 2009 | 2008 | 2007 | 2006 |
| Net Asset Value, Beginning of Period | $16.01 | $14.06 | $25.79 | $23.49 | $22.19 |
| Income From Investment Operations: | | | | | |
| Net investment income | 0.16 | 0.17 | 0.24 | 0.34 | 0.30 |
| Net realized and unrealized gain (loss) on investments and futures contracts | 4.16 | 2.21 | (8.69) | 3.37 | 2.48 |
| TOTAL FROM INVESTMENT OPERATIONS | 4.32 | 2.38 | (8.45) | 3.71 | 2.78 |
| Less Distributions: | | | | | |
| Distributions from net investment income | (0.16) | (0.20) | (0.22) | (0.35) | (0.32) |
| Distributions from net realized gain on investments and futures contracts | — | (0.23) | (3.06) | (1.06) | (1.16) |
| TOTAL DISTRIBUTIONS | (0.16) | (0.43) | (3.28) | (1.41) | (1.48) |
| Net Asset Value, End of Period | $20.17 | $16.01 | $14.06 | $25.79 | $23.49 |
| Total Return1 | 27.07%2 | 17.80% | (36.58)% | 16.59% | 12.91% |
| Ratios to Average Net Assets: | | | | | |
| Net expenses | 0.54% | 0.54%3 | 0.49% | 0.49% | 0.49% |
| Net investment income | 0.88% | 1.27% | 1.13% | 1.41% | 1.33% |
| Expense waiver/reimbursement4 | 0.19% | 0.21% | 0.21% | 0.19% | 0.21% |
| Supplemental Data: | | | | | |
| Net assets, end of period (000 omitted) | $883,235 | $731,613 | $604,507 | $1,257,048 | $1,202,627 |
| Portfolio turnover | 12% | 18% | 19% | 17% | 13% |
| 1 | Based on net asset value. |
| 2 | During the year, the Fund received a regulatory settlement from an unaffiliated third party, which had an impact of 0.06% on the total return. (See Notes to Financial Statements, Note 8.) |
| 3 | The net expense ratio is calculated without reduction for expense offset arrangements. The net expense ratio is 0.54% for the year ended October 31, 2009, after taking into account this expense reduction. |
| 4 | This expense decrease is reflected in both the net expense and the net investment income ratios shown above. |
See Notes which are an integral part of the Financial Statements
Annual Shareholder Report1
Shareholder Expense Example (unaudited)
As a shareholder of the Fund, you incur ongoing costs, including management fees and to the extent applicable, distribution (12b-1) fees and/or shareholder services fees and other Fund expenses. This Example is intended to help you to understand your ongoing costs (in dollars) of investing in the Fund and to compare these costs with the ongoing costs of investing in other mutual funds. It is based on an investment of $1,000 invested at the beginning of the period and held for the entire period from May 1, 2010 to October 31, 2010.
ACTUAL EXPENSES
The first section of the table below provides information about actual account values and actual expenses. You may use the information in this section, together with the amount you invested, to estimate the expenses that you incurred over the period. Simply divide your account value by $1,000 (for example, an $8,600 account value divided by $1,000 = 8.6), then multiply the result by the number in the first section under the heading entitled “Expenses Paid During Period” to estimate the expenses attributable to your investment during this period.
HYPOTHETICAL EXAMPLE FOR COMPARISON PURPOSES
The second section of the table below provides information about hypothetical account values and hypothetical expenses based on the Fund's actual expense ratio and an assumed rate of return of 5% per year before expenses, which is not the Fund's actual return. Thus, you should not use the hypothetical account values and expenses to estimate the actual ending account balance or your expenses for the period. Rather, these figures are required to be provided to enable you to compare the ongoing costs of investing in the Fund with other funds. To do so, compare this 5% hypothetical example with the 5% hypothetical examples that appear in the shareholder reports of the other funds.
Annual Shareholder Report
2
Please note that the expenses shown in the table are meant to highlight your ongoing costs only. Therefore, the second section of the table is useful in comparing ongoing costs only, and will not help you determine the relative total costs of owning different funds. | Beginning
Account Value
5/1/2010 | Ending
Account Value
10/31/2010 | Expenses Paid
During Period1 |
| Actual | $1,000 | $1,012.50 | $2.74 |
Hypothetical (assuming a 5% return
before expenses) | $1,000 | $1,022.48 | $2.75 |
| 1 | Expenses are equal to the Fund's annualized net expense ratio of 0.54%, multiplied by the average account value over the period, multiplied by 184/365 (to reflect the one-half-year period). |
Annual Shareholder Report3
Performance data quoted represents past performance which is no guarantee of future results. Investment return and principal value will fluctuate so that an investor's shares, when redeemed, may be worth more or less than their original cost. Mutual fund performance changes over time and current performance may be lower or higher than what is stated. For current to the most recent month-end performance and after-tax returns, visit FederatedInvestors.com or call 1-800-341-7400.
Management's Discussion of Fund Performance (unaudited)
The Fund produced a total return of 27.07%, based on net asset value, during the 12-month reporting period ended October 31, 2010. The Fund's benchmark, the Standard and Poor's MidCap 400 Index (the “S&P 400”),1 posted a total return of 27.64% for the same period. The total return of the Fund's shares reflects the impact of actual cash flows, transaction costs and other expenses.
Market Overview
The global economic recovery that began in 2009 continued on its choppy course in 2010, delivering mixed but slowly improving economic data and gradual, if uneven, improvement of investor sentiment. The risks of a double-dip recession continued to recede, but the economy remained mired in a slow-growth environment. In the United States, the National Bureau of Economic Research declared that the “Great Recession” ended in June 2009. Spanning December 2007 to June 2009, this marked the longest reported recession since the Great Depression. The high levels of volatility experienced in global equity markets throughout 2009 continued into 2010 as mixed economic data and lingering credit issues caused stocks to trade in both directions. But by the end of the first quarter, most markets had managed to post gains. The second quarter, in contrast, brought higher levels of volatility and a “flight to quality” as investor sentiment was dominated by fears of a double-dip recession. Global equity markets saw negative quarterly returns – and for many markets, the first significant downturn since the bull market began in March 2009. In the third quarter, economic data turned less negative and strong corporate earnings reports became increasingly consistent. These factors, along with attractive valuations and expectations for additional quantitative easing, drove equity markets higher, with most markets recapturing their second quarter losses. Stocks continued their rally into the beginning of the fourth quarter, closing out the 12-month period in positive territory.
| 1 | The S&P 400 is a market-capitalization-weighted index of common stocks representing all major industries in the mid-range of the U.S. stock market. The index is unmanaged, and investments cannot be made in an index. “Standard & Poor's,” “S&P®,” “S&P MidCap 400 Index” and “Standard and Poor's MidCap 400 Index” are trademarks of The McGraw-Hill Companies, Inc. and have been licensed for use by Federated Securities Corp. The Fund is not sponsored, endorsed, sold or promoted by, or affiliated with, Standard & Poor's (S&P). S&P makes no representation or warranty, express or implied, to the owners of the Fund or any member of the public regarding the advisability of investing in securities generally or in the Fund particularly or the ability of the S&P 400 Index to track general stock market performance. |
Annual Shareholder Report4
FUND PERFORMANCE
Against this backdrop, all of the 10 sectors2 within the S&P 400 recorded strong positive returns during the period. Materials led the way, advancing 36.57%, followed by Information Technology up 33.70% and Consumer Discretionary up 30.39%. The Financials sector posted the weakest results, returning 23.31%. Consumer Discretionary stocks Netflix Inc. and Sotheby's and Information Technology stock F5 Networks Inc. were the strongest performing individual stocks in the index, while Corinthian Colleges Inc. (Consumer Staples), Dynegy Inc. (Utilities) and Comstock Resources Inc. (Energy) were the worst performers for the period.
POSITIONING AND STRATEGY
The Fund utilized S&P 400 futures to provide equity exposure on the Fund's cash balances. While over the long term this strategy anticipates that the S&P 400 futures will mirror the performance of the S&P 400, pricing disparity can occur in the short term and the Fund can benefit from or be harmed by trading futures instead of stocks when money moves in or out of the Fund. During the reporting period, the trading of futures contracts had a negligible impact on the Fund's performance.
| 2 | Sector classifications are based upon the classification of the Standard & Poor's Global Industry Classification Standard (SPGICS). |
Annual Shareholder Report5
GROWTH OF A $10,000 INVESTMENT – Institutional Service Shares
The graph below illustrates the hypothetical investment of $10,0001 in Federated Mid-Cap Index Fund (Institutional Service Shares) (the “Fund”) from October 31, 2000 to October 31, 2010 compared to the S&P MidCap 400 Index (S&P 400).2
| Average Annual Total Returns for the Period Ended 10/31/2010 | |
| 1 Year | 27.07% |
| 5 Years | 4.56% |
| 10 Years | 5.62% |
Performance data quoted represents past performance which is no guarantee of future results. Investment return and principal value will fluctuate so that an investor's shares, when redeemed, may be worth more or less than their original cost. Mutual fund performance changes over time and current performance may be lower or higher than what is stated. For current to the most recent month-end performance and after-tax returns, visit FederatedInvestors.com or call 1-800-341-7400. Returns shown do not reflect the deduction of taxes that a shareholder would pay on Fund distributions or the redemption of Fund shares. Mutual funds are not obligations of or guaranteed by any bank and are not federally insured.
| 1 | The Fund's performance assumes the reinvestment of all dividends and distributions. The S&P 400 has been adjusted to reflect reinvestment of dividends on securities in the index. |
| 2 | The S&P 400 is not adjusted to reflect expenses or other fees that the Securities and Exchange Commission requires to be reflected in the Fund's performance. The index is unmanaged and, unlike the Fund, is not affected by cash flows. It is not possible to invest directly in an index. |
Annual Shareholder Report6
Portfolio of Investments Summary Table (unaudited)
At October 31, 2010, the Fund's sector composition1 for its equity securities investments was as follows:
| Sector | Percentage of
Total Net Assets |
| Financials | 19.1% |
| Information Technology | 16.4% |
| Industrials | 15.3% |
| Consumer Discretionary | 13.9% |
| Health Care | 11.1% |
| Materials | 6.5% |
| Energy | 6.2% |
| Utilities | 6.1% |
| Consumer Staples | 3.7% |
| Telecommunication Services | 0.8% |
| Securities Lending Collateral2 | 8.0% |
| Cash Equivalents3 | 1.5% |
| Derivative Contracts4 | 0.1% |
| Other Assets and Liabilities — Net5 | (8.7)% |
| TOTAL6 | 100.0% |
| 1 | Except for Securities Lending Collateral, Cash Equivalents, Derivative Contracts and Other Assets and Liabilities, sector classifications are based upon, and individual portfolio securities are assigned to, the classifications of the Global Industry Classification Standard (GICS), except that the Manager assigns a classification to securities not classified by the GICS and to securities for which the Manager does not have access to the classification made by the GICS. |
| 2 | Cash collateral received from lending portfolio securities which is invested in short-term investments such as repurchase agreements or money market mutual funds. |
| 3 | Cash Equivalents includes any investments in money market mutual funds and/or overnight repurchase agreements (other than those representing Securities Lending Collateral). |
| 4 | Based upon net unrealized appreciation (depreciation) or value of the derivative contracts as applicable. Derivative contracts may consist of futures, forwards, options and swaps. The impact of a derivative contract on the Fund's performance may be larger than its unrealized appreciation (depreciation) may indicate. In many cases, the notional value or amount of a derivative contract may provide a better indication of the contract's significance to the portfolio. More complete information regarding the Fund's direct investments in derivative contracts, including unrealized appreciation (depreciation) and notional values or amounts of such contracts, can be found in the table at the end of the Portfolio of Investments included in this Report. |
| 5 | Assets, other than investments in securities and derivative contracts, less liabilities. See Statement of Assets and Liabilities. |
| 6 | The Fund purchases index futures contracts to efficiently manage cash flows resulting from shareholder purchases and redemptions, dividend and capital gain payments to shareholders and corporate actions while maintaining exposure to the Standard & Poor's MidCap 400 Index (S&P 400) and minimizing trading costs. Taking into consideration these open index futures contracts, the Fund's effective total exposure to the S&P 400 is effectively 100.2%. |
Annual Shareholder Report7
Portfolio of Investments
October 31, 2010
Principal
Amount
or Shares | | | Value |
| | COMMON STOCKS – 99.1%;1 | |
| | Consumer Discretionary – 13.9% | |
| 39,302 | 2 | 99 Cents Only Stores | 606,037 |
| 62,043 | | Aaron's, Inc. | 1,170,131 |
| 71,715 | | Advance Auto Parts, Inc. | 4,660,041 |
| 78,683 | 2 | Aeropostale, Inc. | 1,918,292 |
| 165,846 | | American Eagle Outfitters, Inc. | 2,655,194 |
| 34,056 | | American Greetings Corp., Class A | 659,665 |
| 50,243 | 2 | AnnTaylor Stores Corp. | 1,170,662 |
| 45,906 | 2 | Bally Technologies, Inc. | 1,656,288 |
| 33,180 | 3 | Barnes & Noble, Inc. | 497,036 |
| 25,573 | | Bob Evans Farms, Inc. | 733,945 |
| 97,034 | 2,3 | BorgWarner, Inc. | 5,444,578 |
| 46,549 | 2 | Boyd Gaming Corp. | 386,822 |
| 86,004 | | Brinker International, Inc. | 1,594,514 |
| 56,018 | 2 | Career Education Corp. | 982,556 |
| 50,631 | 2 | Cheesecake Factory, Inc. | 1,474,375 |
| 152,760 | | Chicos Fas, Inc. | 1,484,827 |
| 26,475 | 2 | Chipotle Mexican Grill, Inc. | 5,565,310 |
| 51,458 | 2 | Coldwater Creek, Inc. | 173,413 |
| 54,952 | 2 | Collective Brands, Inc. | 842,414 |
| 74,732 | 2 | Corinthian Colleges, Inc. | 390,101 |
| 74,951 | 2 | Dick's Sporting Goods, Inc. | 2,160,088 |
| 108,048 | 2,3 | Dollar Tree, Inc. | 5,543,943 |
| 60,944 | 2 | Dreamworks Animation SKG, Inc. | 2,151,323 |
| 58,900 | 2 | Dress Barn, Inc. | 1,351,166 |
| 132,485 | | Foot Locker, Inc. | 2,110,486 |
| 45,166 | 2 | Fossil, Inc. | 2,664,342 |
| 119,111 | | Gentex Corp. | 2,379,838 |
| 53,957 | | Guess ?, Inc. | 2,100,006 |
| 81,574 | 2 | Hanesbrands, Inc. | 2,023,035 |
| 32,259 | | Harte-Hanks | 389,689 |
| 23,441 | 2,3 | ITT Educational Services, Inc. | 1,512,648 |
| 24,587 | | International Speedway Corp., Class A | 561,567 |
| 54,301 | 2,3 | J. Crew Group, Inc. | 1,737,089 |
| 61,442 | | KB HOME | 645,755 |
Annual Shareholder Report8
Principal
Amount
or Shares | | | Value |
| 121,652 | 2,3 | LKQ Corp. | 2,644,714 |
| 48,756 | 2 | Lamar Advertising Co. | 1,657,216 |
| 35,681 | 2 | Life Time Fitness, Inc. | 1,289,155 |
| 32,160 | | M.D.C. Holdings, Inc. | 828,120 |
| 25,342 | | Matthews International Corp., Class A | 836,793 |
| 47,857 | 2 | Mohawk Industries, Inc. | 2,744,120 |
| 4,966 | 2,3 | NVR, Inc. | 3,115,718 |
| 36,998 | 2,3 | NetFlix, Inc. | 6,419,153 |
| 26,481 | 2 | Panera Bread Co. | 2,370,314 |
| 100,897 | | PetSmart, Inc. | 3,776,575 |
| 56,470 | | Phillips Van Heusen Corp. | 3,463,870 |
| 49,082 | | Regis Corp. | 1,003,727 |
| 56,155 | | Rent-A-Center, Inc. | 1,411,737 |
| 37,644 | | Ryland Group, Inc. | 563,907 |
| 137,166 | 2,3 | Saks, Inc. | 1,528,029 |
| 20,262 | | Scholastic Corp. | 596,716 |
| 53,680 | 2 | Scientific Games Holdings Corp. | 424,072 |
| 210,045 | | Service Corp. International | 1,739,173 |
| 57,031 | | Sothebys Holdings, Inc., Class A | 2,500,239 |
| 11,765 | | Strayer Education, Inc. | 1,645,100 |
| 36,062 | | Thor Industries, Inc. | 1,135,592 |
| 34,258 | 2 | Timberland Co., Class A | 718,733 |
| 122,922 | 2 | Toll Brothers, Inc. | 2,205,221 |
| 61,708 | | Tractor Supply Co. | 2,443,637 |
| 53,711 | | Tupperware Brands Corp. | 2,406,790 |
| 29,892 | 2,3 | Under Armour, Inc., Class A | 1,395,359 |
| 49,493 | 2 | WMS Industries, Inc. | 2,159,380 |
| 37,911 | 2 | Warnaco Group, Inc. | 2,013,453 |
| 274,093 | | Wendy's / Arby's Group, Inc. | 1,260,828 |
| 39,539 | | Wiley (John) & Sons, Inc., Class A | 1,706,503 |
| 92,225 | | Williams-Sonoma, Inc. | 2,985,323 |
| | TOTAL | 122,386,443 |
| | Consumer Staples – 3.7% | |
| 73,106 | | Alberto-Culver Co. | 2,726,123 |
| 46,396 | 2 | BJ's Wholesale Club, Inc. | 1,936,105 |
| 60,467 | | Church and Dwight, Inc. | 3,981,752 |
| 64,170 | | Corn Products International, Inc. | 2,730,433 |
Annual Shareholder Report9
Principal
Amount
or Shares | | | Value |
| 59,760 | 2 | Energizer Holdings, Inc. | 4,468,853 |
| 64,925 | | Flowers Foods, Inc. | 1,654,289 |
| 97,749 | 2,3 | Green Mountain Coffee, Inc. | 3,224,740 |
| 58,526 | 2 | Hansen Natural Corp. | 2,997,116 |
| 16,491 | | Lancaster Colony Corp. | 822,571 |
| 46,765 | 2 | Ralcorp Holdings, Inc. | 2,902,236 |
| 36,227 | | Ruddick Corp. | 1,264,322 |
| 141,396 | 2 | Smithfield Foods, Inc. | 2,368,383 |
| 20,835 | | Tootsie Roll Industries, Inc. | 546,919 |
| 20,557 | | Universal Corp. | 851,882 |
| | TOTAL | 32,475,724 |
| | Energy – 6.2% | |
| 137,935 | | Arch Coal, Inc. | 3,391,822 |
| 47,412 | 2 | Atwood Oceanics, Inc. | 1,541,364 |
| 39,178 | 2 | Bill Barrett Corp. | 1,478,970 |
| 71,615 | | Cimarex Energy Co. | 5,496,451 |
| 40,402 | 2 | Comstock Resources, Inc. | 902,985 |
| 29,144 | 2 | Dril-Quip, Inc. | 2,013,850 |
| 53,789 | 2,3 | Exterran Holdings, Inc. | 1,353,869 |
| 96,515 | 2 | Forest Oil Corp. | 2,965,906 |
| 89,932 | | Frontier Oil Corp. | 1,191,599 |
| 89,911 | 2 | Helix Energy Solutions Group, Inc. | 1,140,971 |
| 87,423 | 2 | Mariner Energy, Inc. | 2,178,581 |
| 113,784 | 2 | Newfield Exploration Co. | 6,783,802 |
| 46,078 | 2 | Oceaneering International, Inc. | 2,850,846 |
| 22,544 | | Overseas Shipholding Group, Inc. | 753,646 |
| 68,309 | 2 | Patriot Coal Corp. | 921,488 |
| 131,491 | | Patterson-UTI Energy, Inc. | 2,552,240 |
| 119,305 | 2 | Plains Exploration & Production Co. | 3,325,030 |
| 149,173 | 2 | Pride International, Inc. | 4,522,925 |
| 100,293 | 2,3 | Quicksilver Resources, Inc. | 1,501,386 |
| 105,940 | | Southern Union Co. | 2,662,272 |
| 67,133 | 2 | Superior Energy Services, Inc. | 1,854,214 |
| 43,744 | | Tidewater, Inc. | 2,017,911 |
| 33,790 | 2 | Unit Corp. | 1,325,582 |
| | TOTAL | 54,727,710 |
Annual Shareholder Report10
Principal
Amount
or Shares | | | Value |
| | Financials – 19.1% | |
| 142,902 | | AMB Property Corp. | 4,028,407 |
| 43,380 | 2 | Affiliated Managers Group | 3,713,762 |
| 46,365 | | Alexandria Real Estate Equities, Inc. | 3,406,900 |
| 67,405 | | American Financial Group, Inc. | 2,061,245 |
| 165,773 | | Apollo Investment Corp. | 1,821,845 |
| 147,655 | | Associated Banc Corp. | 1,870,789 |
| 70,175 | | Astoria Financial Corp. | 871,573 |
| 54,536 | | BRE Properties, Inc., Class A | 2,341,230 |
| 62,300 | | Bancorpsouth, Inc. | 821,737 |
| 41,076 | | Bank of Hawaii Corp. | 1,774,072 |
| 103,584 | | Berkley, W. R. Corp. | 2,850,632 |
| 99,221 | | Brown & Brown | 2,211,636 |
| 57,045 | | Camden Property Trust | 2,828,862 |
| 66,987 | | Cathay Bancorp, Inc. | 911,023 |
| 39,500 | | City National Corp. | 2,037,015 |
| 63,201 | | Commerce Bancshares, Inc. | 2,328,325 |
| 50,507 | | Corporate Office Properties Trust | 1,792,493 |
| 88,204 | | Cousins Properties, Inc. | 653,592 |
| 51,589 | | Cullen Frost Bankers, Inc. | 2,705,327 |
| 214,253 | | Duke Realty Corp. | 2,671,735 |
| 100,539 | | Eaton Vance Corp. | 2,892,507 |
| 35,535 | 3 | Equity One, Inc. | 664,505 |
| 25,830 | | Essex Property Trust, Inc. | 2,917,757 |
| 47,865 | | Everest Re Group Ltd. | 4,034,062 |
| 52,293 | | Federal Realty Investment Trust | 4,286,980 |
| 193,852 | | Fidelity National Financial, Inc., Class A | 2,595,678 |
| 177,905 | | First Niagara Financial Group, Inc. | 2,108,174 |
| 92,731 | | FirstMerit Corp. | 1,593,119 |
| 168,242 | | Fulton Financial Corp. | 1,571,380 |
| 89,606 | | Gallagher (Arthur J.) & Co. | 2,523,305 |
| 21,595 | 3 | Greenhill & Co., Inc. | 1,677,284 |
| 98,143 | | HCC Insurance Holdings, Inc. | 2,598,827 |
| 38,225 | 3 | Hanover Insurance Group, Inc. | 1,729,681 |
| 60,659 | | Highwoods Properties, Inc. | 2,009,633 |
| 105,054 | | Hospitality Properties Trust | 2,396,282 |
| 45,165 | | International Bancshares Corp. | 773,676 |
| 105,279 | | Jefferies Group, Inc. | 2,519,326 |
Annual Shareholder Report11
Principal
Amount
or Shares | | | Value |
| 36,309 | | Jones Lang LaSalle, Inc. | 2,834,281 |
| 96,865 | | Liberty Property Trust | 3,241,103 |
| 110,725 | | Macerich Co. (The) | 4,939,442 |
| 67,703 | | Mack-Cali Realty Corp. | 2,273,467 |
| 30,102 | | Mercury General Corp. | 1,278,733 |
| 105,373 | | Nationwide Health Properties, Inc. | 4,302,380 |
| 370,670 | 3 | New York Community Bancorp, Inc. | 6,275,443 |
| 89,423 | | Newalliance Bancshares, Inc. | 1,152,662 |
| 219,648 | | Old Republic International Corp. | 2,899,354 |
| 80,746 | | Omega Healthcare Investors | 1,857,158 |
| 27,119 | | PacWest Bancorp | 472,684 |
| 34,079 | | Potlatch Corp. | 1,160,390 |
| 39,600 | | Prosperity Bancshares, Inc. | 1,231,164 |
| 73,116 | | Protective Life Corp. | 1,752,591 |
| 84,860 | | Raymond James Financial, Inc. | 2,394,749 |
| 68,301 | | Rayonier, Inc. | 3,565,312 |
| 93,505 | | Realty Income Corp. | 3,205,351 |
| 69,458 | | Regency Centers Corp. | 2,929,738 |
| 62,087 | | Reinsurance Group of America | 3,108,696 |
| 125,219 | | SEI Investments Co. | 2,773,601 |
| 66,566 | | SL Green Realty Corp. | 4,374,718 |
| 35,743 | 2,3 | SVB Financial Group | 1,549,102 |
| 108,449 | | Senior Housing Properties Trust | 2,590,847 |
| 39,767 | | StanCorp Financial Group, Inc. | 1,706,004 |
| 669,689 | | Synovus Financial Corp. | 1,446,528 |
| 107,967 | | TCF Financial Corp. | 1,420,846 |
| 54,253 | | Transatlantic Holdings, Inc. | 2,853,708 |
| 48,480 | | Trustmark Corp. | 1,070,923 |
| 152,780 | | UDR, Inc. | 3,434,494 |
| 42,805 | | Unitrin, Inc. | 1,040,161 |
| 137,522 | | Valley National Bancorp | 1,834,537 |
| 72,417 | | Waddell & Reed Financial, Inc., Class A | 2,105,162 |
| 95,539 | | Washington Federal, Inc. | 1,435,951 |
| 56,098 | | Webster Financial Corp. Waterbury | 960,398 |
| 102,543 | | Weingarten Realty Investors | 2,474,363 |
| 24,735 | | WestAmerica Bancorp. | 1,237,245 |
Annual Shareholder Report12
Principal
Amount
or Shares | | | Value |
| 77,991 | | Wilmington Trust Corp. | 554,516 |
| | TOTAL | 168,332,178 |
| | Health Care – 11.1% | |
| 139,276 | 2 | Allscripts Healthcare Solutions, Inc. | 2,658,779 |
| 58,930 | 3 | Beckman Coulter, Inc. | 3,137,433 |
| 16,500 | 2 | Bio Rad Laboratories, Inc., Class A | 1,495,230 |
| 56,502 | 2 | Charles River Laboratories International, Inc. | 1,851,571 |
| 80,333 | 2 | Community Health Systems, Inc. | 2,416,417 |
| 55,065 | 2 | Covance, Inc. | 2,587,504 |
| 96,325 | 2 | Edwards Lifesciences Corp. | 6,156,131 |
| 98,223 | 2 | Endo Pharmaceuticals Holdings, Inc. | 3,608,713 |
| 41,428 | 2 | Gen-Probe, Inc. | 2,006,358 |
| 213,507 | 2 | Health Management Association, Class A | 1,710,191 |
| 82,913 | 2 | Health Net, Inc. | 2,229,531 |
| 77,741 | 2,3 | Henry Schein, Inc. | 4,365,157 |
| 54,122 | | Hill-Rom Holdings, Inc. | 2,097,227 |
| 220,795 | 2 | Hologic, Inc. | 3,537,136 |
| 49,111 | 2,3 | IDEXX Laboratories, Inc. | 2,944,696 |
| 59,554 | 2 | Immucor, Inc. | 1,036,240 |
| 33,749 | 2 | Kindred Healthcare, Inc. | 463,036 |
| 53,250 | 2 | Kinetic Concepts, Inc. | 2,025,097 |
| 45,924 | 2 | LifePoint Hospitals, Inc. | 1,557,742 |
| 83,475 | | Lincare Holdings, Inc. | 2,188,714 |
| 40,475 | 2 | MEDNAX Inc. | 2,396,525 |
| 50,127 | 2 | Masimo Corp. | 1,512,332 |
| 51,274 | | Medicis Pharmaceutical Corp., Class A | 1,525,401 |
| 28,431 | 2 | Mettler-Toledo International, Inc. | 3,711,951 |
| 100,560 | 3 | Omnicare, Inc. | 2,425,507 |
| 53,974 | | Owens & Minor, Inc. | 1,537,180 |
| 70,260 | | Perrigo Co. | 4,628,729 |
| 101,346 | | Pharmaceutical Product Development, Inc. | 2,615,740 |
| 48,592 | 2 | Psychiatric Solutions, Inc. | 1,637,550 |
| 128,822 | 2,3 | ResMed, Inc. | 4,105,557 |
| 50,729 | | Steris Corp. | 1,735,946 |
| 31,526 | | Techne Corp. | 1,920,564 |
| 33,828 | | Teleflex, Inc. | 1,885,911 |
| 49,803 | 2 | Thoratec Laboratories Corp. | 1,625,570 |
Annual Shareholder Report13
Principal
Amount
or Shares | | | Value |
| 42,314 | 2,3 | United Therapeutics Corp. | 2,538,840 |
| 82,669 | | Universal Health Services, Inc., Class B | 3,411,750 |
| 73,404 | 2 | VCA Antech, Inc. | 1,517,261 |
| 172,399 | 2 | Vertex Pharmaceuticals, Inc. | 6,608,054 |
| 36,254 | 2 | Wellcare Health Plans, Inc. | 1,007,136 |
| | TOTAL | 98,420,407 |
| | Industrials – 15.3% | |
| 79,254 | 2 | AGCO Corp. | 3,365,917 |
| 90,642 | | AMETEK, Inc. | 4,899,200 |
| 37,009 | | Acuity Brands, Inc. | 1,853,041 |
| 98,916 | 2 | Aecom Technology Corp. | 2,620,285 |
| 114,372 | 2,3 | AirTran Holdings, Inc. | 846,353 |
| 30,482 | 2 | Alaska Air Group, Inc. | 1,609,450 |
| 35,041 | | Alexander and Baldwin, Inc. | 1,206,462 |
| 28,278 | 2,3 | Alliant Techsystems, Inc. | 2,155,915 |
| 87,032 | 2 | BE Aerospace, Inc. | 3,199,296 |
| 40,059 | | Baldor Electric Co. | 1,683,279 |
| 39,562 | | Brinks Co. (The) | 933,663 |
| 68,825 | | Bucyrus International, Inc. | 4,691,112 |
| 51,895 | | Carlisle Cos., Inc. | 1,819,958 |
| 19,515 | 2 | Clean Harbors, Inc. | 1,375,807 |
| 46,415 | | Con-way, Inc. | 1,532,159 |
| 61,062 | 2 | Copart, Inc. | 2,067,559 |
| 29,279 | | Corporate Executive Board Co. | 914,676 |
| 94,025 | 2 | Corrections Corp. of America | 2,413,622 |
| 39,572 | | Crane Co. | 1,514,025 |
| 43,268 | | Deluxe Corp. | 884,398 |
| 65,020 | | Donaldson Co., Inc. | 3,167,774 |
| 39,897 | 2 | FTI Consulting, Inc. | 1,414,748 |
| 39,403 | | GATX Corp. | 1,247,499 |
| 44,513 | | Gardner Denver, Inc. | 2,573,742 |
| 51,253 | | Graco, Inc. | 1,763,616 |
| 29,118 | | Granite Construction, Inc. | 704,073 |
| 38,539 | | HNI Corp. | 950,372 |
| 68,484 | | Harsco Corp. | 1,587,459 |
| 51,063 | | Hubbell, Inc., Class B | 2,758,423 |
| 75,612 | | Hunt (J.B.) Transportation Services, Inc. | 2,719,007 |
Annual Shareholder Report14
Principal
Amount
or Shares | | | Value |
| 69,329 | | IDEX Corp. | 2,501,390 |
| 171,436 | 2,3 | Jet Blue Airways Corp. | 1,196,623 |
| 87,922 | | Joy Global, Inc. | 6,238,066 |
| 132,995 | | KBR, Inc. | 3,378,073 |
| 87,329 | 2 | Kansas City Southern Industries, Inc. | 3,826,757 |
| 69,805 | | Kennametal, Inc. | 2,383,143 |
| 45,965 | 2 | Kirby Corp. | 1,976,035 |
| 39,271 | 2 | Korn/Ferry International | 692,348 |
| 42,412 | | Landstar System, Inc. | 1,595,539 |
| 38,917 | | Lennox International, Inc. | 1,595,986 |
| 36,113 | | Lincoln Electric Holdings | 2,158,113 |
| 37,906 | | MSC Industrial Direct Co. | 2,158,368 |
| 70,034 | | Manpower, Inc. | 3,832,961 |
| 48,710 | | Miller Herman, Inc. | 936,693 |
| 26,317 | | Mine Safety Appliances Co. | 741,087 |
| 42,814 | 2 | Navigant Consulting, Inc. | 391,748 |
| 28,899 | 3 | Nordson Corp. | 2,254,700 |
| 77,115 | 2 | OshKosh Truck Corp. | 2,275,664 |
| 83,999 | | Pentair, Inc. | 2,749,287 |
| 32,756 | | Regal Beloit Corp. | 1,890,349 |
| 35,693 | | Rollins, Inc. | 929,803 |
| 42,620 | | SPX Corp. | 2,858,097 |
| 71,811 | 2 | Shaw Group, Inc. | 2,194,544 |
| 92,676 | 2,3 | Terex Corp. | 2,080,576 |
| 44,481 | 2 | Thomas & Betts Corp. | 1,937,148 |
| 68,115 | | Timken Co. | 2,821,323 |
| 38,568 | | Towers Watson & Company | 1,983,167 |
| 67,443 | | Trinity Industries, Inc. | 1,532,979 |
| 71,362 | 2 | URS Corp. | 2,778,123 |
| 50,922 | 2 | United Rentals, Inc. | 956,824 |
| 18,183 | | Valmont Industries, Inc. | 1,433,730 |
| 40,785 | | Wabtec Corp. | 1,910,369 |
| 65,780 | 2 | Waste Connections, Inc. | 2,679,877 |
| 23,845 | | Watsco, Inc. | 1,334,605 |
| 37,791 | | Werner Enterprises, Inc. | 805,704 |
| 49,953 | | Woodward Governor Co. | 1,565,527 |
| | TOTAL | 135,048,216 |
Annual Shareholder Report15
Principal
Amount
or Shares | | | Value |
| | Information Technology – 16.4% | |
| 28,387 | 2 | ACI Worldwide, Inc. | 691,791 |
| 85,830 | 2 | ADC Telecommunications, Inc. | 1,089,183 |
| 90,843 | 2 | AOL Inc. | 2,423,691 |
| 68,225 | 2 | Acxiom Corp. | 1,197,349 |
| 53,352 | | Adtran, Inc. | 1,721,669 |
| 13,593 | 2 | Advent Software, Inc. | 730,216 |
| 44,793 | 2,3 | Alliance Data Systems Corp. | 2,719,831 |
| 77,402 | 2,3 | Ansys, Inc. | 3,502,441 |
| 100,267 | 2 | Arrow Electronics, Inc. | 2,968,906 |
| 391,607 | 2 | Atmel Corp. | 3,469,638 |
| 129,156 | 2 | Avnet, Inc. | 3,846,266 |
| 107,492 | | Broadridge Financial Solutions | 2,364,824 |
| 79,761 | 2,3 | CIENA Corp. | 1,107,880 |
| 225,518 | 2 | Cadence Design Systems, Inc. | 1,910,138 |
| 80,724 | 2 | CommScope, Inc. | 2,555,722 |
| 105,775 | 2 | Convergys Corp. | 1,197,373 |
| 88,775 | | CoreLogic, Inc. | 1,559,777 |
| 91,920 | 2,3 | Cree, Inc. | 4,714,577 |
| 30,629 | | DST Systems, Inc. | 1,325,317 |
| 55,905 | | Diebold, Inc. | 1,713,488 |
| 33,884 | 2 | Digital River, Inc. | 1,262,518 |
| 38,801 | 2,3 | Equinix, Inc. | 3,268,596 |
| 68,439 | 2 | F5 Networks, Inc. | 8,055,270 |
| 39,449 | 3 | FactSet Research Systems | 3,462,833 |
| 35,657 | | Fair Isaac & Co., Inc. | 857,194 |
| 105,845 | 2 | Fairchild Semiconductor International, Inc., Class A | 1,192,873 |
| 88,897 | | First American Financial Corp. | 1,248,114 |
| 61,714 | 2 | Gartner Group, Inc., Class A | 1,955,717 |
| 67,840 | | Global Payments, Inc. | 2,643,046 |
| 73,194 | | Henry Jack & Associates, Inc. | 1,987,949 |
| 78,821 | 2 | Informatica Corp. | 3,207,227 |
| 132,832 | 2 | Ingram Micro, Inc., Class A | 2,345,813 |
| 134,944 | 2 | Integrated Device Technology, Inc. | 794,820 |
| 59,849 | 2 | International Rectifier Corp. | 1,390,292 |
| 105,557 | | Intersil Holding Corp. | 1,381,741 |
| 34,393 | 2 | Itron, Inc. | 2,090,063 |
| 105,676 | 2 | Lam Research Corp. | 4,838,904 |
Annual Shareholder Report16
Principal
Amount
or Shares | | | Value |
| 79,212 | | Lender Processing Services | 2,284,474 |
| 68,175 | 2 | MICROS Systems Corp. | 3,094,463 |
| 100,306 | 2 | MSCI, Inc., Class A | 3,595,970 |
| 19,189 | 2 | ManTech International Corp., Class A | 752,401 |
| 93,214 | 2 | Mentor Graphics Corp. | 1,006,711 |
| 136,728 | 2 | NCR Corp. | 1,875,908 |
| 50,088 | | National Instruments Corp. | 1,742,562 |
| 63,878 | 2 | NeuStar, Inc., Class A | 1,648,691 |
| 98,171 | 2 | Parametric Technology Corp. | 2,107,731 |
| 40,300 | | Plantronics, Inc. | 1,445,964 |
| 72,279 | 2 | Polycom, Inc. | 2,441,585 |
| 51,899 | 2 | Quest Software, Inc. | 1,358,197 |
| 232,649 | 2 | RF Micro Devices, Inc. | 1,696,011 |
| 81,666 | 2,3 | Rackspace Hosting Inc. | 2,038,383 |
| 60,300 | 2 | Riverbed Technology, Inc. | 3,469,662 |
| 87,882 | 2 | Rovi Corp. | 4,451,223 |
| 36,212 | 2 | SRA International, Inc. | 724,602 |
| 52,956 | 2 | Semtech Corp. | 1,133,788 |
| 37,982 | 2 | Silicon Laboratories, Inc. | 1,515,482 |
| 152,127 | 2 | Skyworks Solutions, Inc. | 3,485,230 |
| 59,705 | | Solera Holdings, Inc. | 2,868,825 |
| 126,512 | 2 | Synopsys, Inc. | 3,236,177 |
| 39,664 | 2 | Tech Data Corp. | 1,705,155 |
| 139,513 | 2 | Tibco Software, Inc. | 2,681,440 |
| 101,412 | 2,3 | Trimble Navigation Ltd. | 3,634,606 |
| 69,619 | 2 | ValueClick, Inc. | 957,958 |
| 158,843 | 2,3 | Vishay Intertechnology, Inc. | 1,794,926 |
| 48,239 | 2 | Zebra Technologies Corp., Class A | 1,725,991 |
| | TOTAL | 145,267,163 |
| | Materials – 6.5% | |
| 77,697 | | Albemarle Corp. | 3,894,951 |
| 57,409 | | Aptargroup, Inc. | 2,576,516 |
| 67,042 | | Ashland, Inc. | 3,461,379 |
| 55,604 | | Cabot Corp. | 1,891,648 |
| 37,417 | | Carpenter Technology Corp. | 1,334,290 |
| 96,713 | | Commercial Metals Corp. | 1,342,376 |
| 41,787 | | Cytec Industries, Inc. | 2,069,292 |
Annual Shareholder Report17
Principal
Amount
or Shares | | | Value |
| 26,487 | | Greif, Inc., Class A | 1,555,846 |
| 37,784 | 2,3 | Intrepid Potash, Inc. | 1,297,125 |
| 110,213 | 2,3 | Louisiana-Pacific Corp. | 853,049 |
| 57,447 | | Lubrizol Corp. | 5,887,743 |
| 38,802 | 3 | Martin Marietta Materials | 3,122,785 |
| 15,799 | | Minerals Technologies, Inc. | 926,927 |
| 8,450 | | Newmarket Corp. | 1,001,494 |
| 67,497 | | Olin Corp. | 1,349,265 |
| 88,192 | | Packaging Corp. of America | 2,154,531 |
| 110,388 | | RPM International, Inc. | 2,286,136 |
| 63,251 | | Reliance Steel & Aluminum Co. | 2,647,054 |
| 33,194 | | Rock-Tenn Co. | 1,887,079 |
| 39,357 | | Scotts Co. | 2,101,664 |
| 42,329 | | Sensient Technologies Corp. | 1,367,650 |
| 45,800 | | Silgan Holdings, Inc. | 1,545,750 |
| 85,568 | | Sonoco Products Co. | 2,866,528 |
| 184,670 | | Steel Dynamics, Inc. | 2,681,408 |
| 91,935 | | Temple-Inland, Inc. | 1,904,893 |
| 83,804 | | Valspar Corp. | 2,690,108 |
| 48,775 | | Worthington Industries, Inc. | 751,135 |
| | TOTAL | 57,448,622 |
| | Telecommunication Services – 0.8% | |
| 171,525 | 2 | Cincinnati Bell, Inc. | 420,236 |
| 59,131 | 2 | Syniverse Holdings, Inc. | 1,802,904 |
| 128,552 | 2 | TW Telecom, Inc. | 2,365,357 |
| 60,459 | | Telephone and Data System, Inc. | 2,105,787 |
| 18,805 | | Telephone and Data System, Inc. — Special Common Shares | 560,953 |
| | TOTAL | 7,255,237 |
| | Utilities – 6.1% | |
| 66,373 | | AGL Resources, Inc. | 2,605,804 |
| 94,337 | | Alliant Energy Corp. | 3,446,131 |
| 116,911 | | Aqua America, Inc. | 2,517,094 |
| 76,726 | | Atmos Energy Corp. | 2,259,581 |
| 33,460 | | Black Hills Corp. | 1,065,366 |
| 51,557 | | Cleco Corp. | 1,612,187 |
| 101,226 | | DPL, Inc. | 2,641,999 |
| 87,664 | 2,3 | Dynegy, Inc. | 406,761 |
Annual Shareholder Report18
Principal
Amount
or Shares | | | Value |
| 61,172 | | Energen Corp. | 2,730,718 |
| 115,693 | | Great Plains Energy, Inc. | 2,201,638 |
| 79,682 | | Hawaiian Electric Industries, Inc. | 1,796,032 |
| 41,061 | | Idacorp, Inc. | 1,511,045 |
| 159,969 | | MDU Resources Group, Inc. | 3,188,182 |
| 88,158 | | NSTAR | 3,677,070 |
| 200,090 | | NV Energy, Inc. | 2,733,229 |
| 69,580 | | National Fuel Gas Co. | 3,839,424 |
| 83,028 | | OGE Energy Corp. | 3,666,517 |
| 73,035 | | PNM Resources, Inc. | 861,083 |
| 149,379 | | Questar Corp. | 2,534,962 |
| 93,636 | | UGI Corp. | 2,817,507 |
| 68,909 | | Vectren Corp. | 1,886,728 |
| 43,327 | | WGL Holdings, Inc. | 1,670,256 |
| 94,184 | | Westar Energy, Inc. | 2,382,855 |
| | TOTAL | 54,052,169 |
| | TOTAL COMMON STOCKS
(IDENTIFIED COST $771,216,418) | 875,413,869 |
| | MUTUAL FUND – 1.5% | |
| 12,938,320 | 4,5 | Federated Prime Value Obligations Fund, Institutional Shares, 0.22%
(AT NET ASSET VALUE) | 12,938,320 |
| | Repurchase Agreement – 8.0% | |
| $70,663,000 | | Interest in $6,270,000,000 joint repurchase agreement 0.23%, dated 10/29/2010 under which Bank of America, N.A. will repurchase securities provided as collateral for $6,270,120,175 on 11/1/2010. The securities provided as collateral at the end of the period were U.S. Government Agency securities with various maturities to 12/1/2038 and the market value of those underlying securities was $6,395,522,579. (Purchased with proceeds from securities lending collateral.) (AT COST) | 70,663,000 |
| | TOTAL INVESTMENTS — 108.6%
(IDENTIFIED COST $854,817,738)6 | 959,015,189 |
| | OTHER ASSETS AND LIABILITIES - NET — (8.6)%7 | (75,780,103) |
| | TOTAL NET ASSETS — 100% | $883,235,086 |
Annual Shareholder Report
19
At October 31, 2010, the Fund had the following outstanding futures contracts:1| Description | Number of
Contracts | Notional
Value | Expiration
Date | Unrealized
Appreciation |
| 2S&P MidCap 400 Index Long Futures | 178 | $14,729,500 | December 2010 | $969,078 |
Unrealized Appreciation on Futures Contracts is included in “Other Assets and
Liabilities — Net.”
| 1 | The Fund purchases index futures contracts to efficiently manage cash flows resulting from shareholder purchases and redemptions, dividend and capital gain payments to shareholders and corporate actions while maintaining exposure to the S&P MidCap 400 Index and minimizing trading costs. The underlying face amount, at value, of open index futures contracts is $14,729,500 at October 31, 2010, which represents 1.7% of total net assets. Taking into consideration these open index futures contracts, the Fund's effective total exposure to the S&P MidCap 400 Index is 100.2%. |
| 2 | Non-income producing security. |
| 3 | All or a portion of these securities are temporarily on loan to unaffiliated broker/dealers. |
| 4 | Affiliated company. |
| 5 | 7-Day net yield. |
| 6 | The cost of investments for federal tax purposes amounts to $868,271,867. |
| 7 | Assets, other than investments in securities, less liabilities. See Statement of Assets and Liabilities. |
Note: The categories of investments are shown as a percentage of total net assets at October 31, 2010.
Various inputs are used in determining the value of the Fund's investments. These inputs are summarized in the three broad levels listed below:
Level 1 — quoted prices in active markets for identical securities
Level 2 — other significant observable inputs (including quoted prices for similar securities, interest rates, prepayment speeds, credit risk, etc.)
Level 3 — significant unobservable inputs (including the Fund's own assumptions in determining the fair value of investments)
The inputs or methodology used for valuing securities are not an indication of the risk associated with investing in those securities.
Annual Shareholder Report
20
The following is a summary of the inputs used, as of October 31, 2010, in valuing the Fund's assets carried at fair value:| Valuation Inputs | | | | |
| Level 1 —
Quoted
Prices and
Investments in
Mutual Funds | Level 2 —
Other
Significant
Observable
Inputs | Level 3 —
Significant
Unobservable
Inputs | Total |
| Equity Securities: | | | | |
| Common Stock | | | | |
| Domestic | $871,379,807 | $ — | $ — | $871,379,807 |
| International | 4,034,062 | — | — | 4,034,062 |
| Mutual Fund | 12,938,320 | — | — | 12,938,320 |
| Repurchase Agreement | — | 70,663,000 | — | 70,663,000 |
| TOTAL SECURITIES | $888,352,189 | $70,663,000 | $ — | $959,015,189 |
| OTHER FINANCIAL INSTRUMENTS* | $969,078 | $ — | $ — | $969,078 |
| * | Other financial instruments include futures contracts. |
See Notes which are an integral part of the Financial Statements
Annual Shareholder Report21
Statement of Assets and Liabilities
October 31, 2010
| Assets: | | |
| Total investments in securities, at value including $12,938,320 of investments in an affiliated issuer (Note 5) and $68,906,136 of securities loaned (identified cost $854,817,738) | | $959,015,189 |
| Restricted cash (Note 2) | | 1,217,000 |
| Income receivable | | 475,817 |
| Receivable for investments sold | | 123,713 |
| Receivable for shares sold | | 721,953 |
| Receivable for daily variation margin | | 70,472 |
| TOTAL ASSETS | | 961,624,144 |
| Liabilities: | | |
| Payable for shares redeemed | 7,512,380 | |
| Payable for collateral due to broker for securities lending | 70,663,000 | |
| Payable for shareholder services fee (Note 5) | 153,646 | |
| Accrued expenses | 60,032 | |
| TOTAL LIABILITIES | | 78,389,058 |
| Net assets for 43,799,832 shares outstanding | | $883,235,086 |
| Net Assets Consist of: | | |
| Paid-in capital | | $773,004,179 |
| Net unrealized appreciation of investments and futures contracts | | 105,166,529 |
| Accumulated net realized gain on investments and futures contracts | | 4,461,440 |
| Undistributed net investment income | | 602,938 |
| TOTAL NET ASSETS | | $883,235,086 |
| Net Asset Value, Offering Price and Redemption Proceeds Per Share: | | |
| $883,235,086 ÷ 43,799,832 shares outstanding, no par value, unlimited shares authorized | | $20.17 |
See Notes which are an integral part of the Financial Statements
Annual Shareholder Report22
Statement of Operations
Year Ended October 31, 2010
| Investment Income: | | | |
| Dividends (including $45,330 received from an affiliated issuer (Note 5)) | | | $11,609,642 |
| Interest received from securities loaned | | | 149,347 |
| TOTAL INCOME | | | 11,758,989 |
| Expenses: | | | |
| Management fee (Note 5) | | $3,291,514 | |
| Custodian fees | | 45,831 | |
| Transfer and dividend disbursing agent fees and expenses | | 454,155 | |
| Directors'/Trustees' fees | | 2,938 | |
| Auditing fees | | 22,530 | |
| Legal fees | | 6,534 | |
| Portfolio accounting fees | | 106,560 | |
| Shareholder services fee (Note 5) | | 1,989,938 | |
| Account administration fee | | 25,220 | |
| Share registration costs | | 33,091 | |
| Printing and postage | | 41,185 | |
| Insurance premiums | | 5,734 | |
| Miscellaneous | | 19,237 | |
| TOTAL EXPENSES | | 6,044,467 | |
| Waiver and Reimbursement (Note 5): | | | |
| Waiver/reimbursement of management fee | $(1,560,631) | | |
| Net expenses | | | 4,483,836 |
| Net investment income | | | 7,275,153 |
| Realized and Unrealized Gain on Investments and Futures Contracts: | | | |
| Net realized gain on investments | | | 23,326,752 |
| Net realized gain on futures contracts | | | 2,856,115 |
| Net change in unrealized depreciation of investments | | | 157,303,548 |
| Net change in unrealized depreciation of futures contracts | | | 1,872,014 |
| Net realized and unrealized gain on investments and futures contracts | | | 185,358,429 |
| Change in net assets resulting from operations | | | $192,633,582 |
See Notes which are an integral part of the Financial Statements
Annual Shareholder Report23
Statement of Changes in Net Assets
| Year Ended October 31 | 2010 | 2009 |
| Increase (Decrease) in Net Assets | | |
| Operations: | | |
| Net investment income | $7,275,153 | $7,929,499 |
| Net realized gain (loss) on investments and futures contracts | 26,182,867 | (10,490,727) |
| Net change in unrealized appreciation/depreciation of investments and futures contracts | 159,175,562 | 115,103,647 |
| CHANGE IN NET ASSETS RESULTING FROM OPERATIONS | 192,633,582 | 112,542,419 |
| Distributions to Shareholders: | | |
| Distributions from net investment income | (7,165,311) | (9,096,406) |
| Distributions from net realized gain on investments and futures contracts | — | (10,286,805) |
| CHANGE IN NET ASSETS RESULTING FROM DISTRIBUTIONS TO SHAREHOLDERS | (7,165,311) | (19,383,211) |
| Share Transactions: | | |
| Proceeds from sale of shares | 165,308,529 | 190,845,569 |
| Net asset value of shares issued to shareholders in payment of distributions declared | 6,531,444 | 17,635,104 |
| Cost of shares redeemed | (205,708,087) | (174,533,601) |
| CHANGE IN NET ASSETS RESULTING FROM SHARE TRANSACTIONS | (33,868,114) | 33,947,072 |
| Regulatory Settlement Proceeds: | | |
| Net increase from regulatory settlement (Note 8) | 21,693 | — |
| Change in net assets | 151,621,850 | 127,106,280 |
| Net Assets: | | |
| Beginning of period | 731,613,236 | 604,506,956 |
| End of period (including undistributed net investment income of $602,938 and $493,096, respectively) | $883,235,086 | $731,613,236 |
See Notes which are an integral part of the Financial Statements
Annual Shareholder Report24
Notes to Financial Statements
October 31, 2010
1. ORGANIZATION
Federated Index Trust (the “Trust”) is registered under the Investment Company Act of 1940, as amended (the “Act”), as an open-end management investment company. The Trust consists of two portfolios. The financial statements included herein are only those of Federated Mid-Cap Index Fund (the “Fund”), a diversified portfolio. The financial statements of the other portfolio are presented separately. The assets of each portfolio are segregated and a shareholder's interest is limited to the portfolio in which shares are held. Each portfolio pays its own expenses. The investment objective of the Fund is to provide investment results generally corresponding to the aggregate price and dividend performance of the publicly traded common stocks that comprise the mid-level stock capitalization sector of the U.S. equity market. This group of stocks is known as the S&P MidCap 400 Index.
2. SIGNIFICANT ACCOUNTING POLICIES
The following is a summary of significant accounting policies consistently followed by the Fund in the preparation of its financial statements. These policies are in conformity with U.S. generally accepted accounting principles (GAAP).
Investment Valuation
In calculating its net asset value (NAV), the Fund generally values investments as follows:
- Equity securities listed on an exchange or traded through a regulated market system are valued at their last reported sale price or official closing price in their principal exchange or market.
- Derivative contracts listed on exchanges are valued at their reported settlement or closing price.
- Over-the-counter (OTC) derivative contracts are fair valued using price evaluations provided by a pricing service approved by the Board of Trustees (the “Trustees”).
- Shares of other mutual funds are valued based upon their reported NAVs.
- Fixed-income securities acquired with remaining maturities greater than 60 days are fair valued using price evaluations provided by a pricing service approved by the Trustees.
- Fixed-income securities acquired with remaining maturities of 60 days or less are valued at their cost (adjusted for the accretion of any discount or amortization of any premium).
If the Fund cannot obtain a price or price evaluation from a pricing service for an investment, the Fund may attempt to value the investment based upon the mean of bid and asked quotations or fair value the investment based on price evaluations, from one or more dealers. If any price, quotation, price evaluation or other pricing source is not readily available when the NAV is calculated, the Fund uses the fair value of the investment determined in accordance with the procedures described below. There can be no assurance that the Fund could purchase or sell an investment at the price used to calculate the Fund's NAV.
Fair Valuation and Significant Events Procedures
The Trustees have authorized the use of pricing services to provide evaluations of the current fair value of certain investments for purposes of calculating the NAV. Factors considered by pricing services in evaluating an investment include the yields or prices of investments of comparable quality, coupon, maturity, call rights and other potential prepayments, terms and type, reported transactions, indications as to values from dealers and general market conditions. Some pricing services provide a single price evaluation reflecting the bid-side of Annual Shareholder Report
25
the market for an investment (a “bid” evaluation). Other pricing services offer both bid evaluations and price evaluations indicative of a price between the prices bid and asked for the investment (a “mid” evaluation). The Fund normally uses bid evaluations for U.S. Treasury and Agency securities, mortgage-backed securities and municipal securities. The Fund normally uses mid evaluations for other types of fixed-income securities and OTC derivative contracts. In the event that market quotations and price evaluations are not available for an investment, the fair value of the investment is determined in accordance with procedures adopted by the Trustees.The Trustees also have adopted procedures requiring an investment to be priced at its fair value whenever the Manager determines that a significant event affecting the value of the investment has occurred between the time as of which the price of the investment would otherwise be determined and the time as of which the NAV is computed. An event is considered significant if there is both an affirmative expectation that the investment's value will change in response to the event and a reasonable basis for quantifying the resulting change in value. Examples of significant events that may occur after the close of the principal market on which a security is traded, or after the time of a price evaluation provided by a pricing service or a dealer, include:
- With respect to securities traded in foreign markets, significant trends in U.S. equity markets or in the trading of foreign securities index futures or options contracts;
- With respect to price evaluations of fixed-income securities determined before the close of regular trading on the NYSE, actions by the Federal Reserve Open Market Committee and other significant trends in U.S. fixed-income markets;
- Political or other developments affecting the economy or markets in which an issuer conducts its operations or its securities are traded; and
- Announcements concerning matters such as acquisitions, recapitalizations, litigation developments, a natural disaster affecting the issuer's operations or regulatory changes or market developments affecting the issuer's industry.
The Trustees have approved the use of a pricing service to determine the fair value of equity securities traded principally in foreign markets when the Manager determines that there has been a significant trend in the U.S. equity markets or in index futures trading. For other significant events, the Fund may seek to obtain more current quotations or price evaluations from alternative pricing sources. If a reliable alternative pricing source is not available, the Fund will determine the fair value of the investment using another method approved by the Trustees.
Repurchase Agreements
It is the policy of the Fund to require the other party to a repurchase agreement to transfer to the Fund's custodian or sub-custodian eligible securities or cash with a market value (after transaction costs) at least equal to the repurchase price to be paid under the repurchase agreement. The eligible securities are transferred to accounts with the custodian or sub-custodian in which the Fund holds a “securities entitlement” and exercises “control” as those terms are defined in the Uniform Commercial Code. The Fund has established procedures for monitoring the market value of the transferred securities and requiring the transfer of additional eligible securities if necessary to equal at least the repurchase price. These procedures also allow the other party to require securities to be transferred from the account to the extent that their market value exceeds the repurchase price or in exchange for other eligible securities of equivalent market value.
Annual Shareholder Report
26
The insolvency of the other party or other failure to repurchase the securities may delay the disposition of the underlying securities or cause the Fund to receive less than the full repurchase price. Under the terms of the repurchase agreement, any amounts received by the Fund in excess of the repurchase price and related transaction costs must be remitted to the other party.The Fund may enter into repurchase agreements in which eligible securities are transferred into joint trading accounts maintained by the custodian or sub-custodian for investment companies and other clients advised by the Fund's Manager and its affiliates. The Fund will participate on a pro rata basis with the other investment companies and clients in its share of the securities transferred under such repurchase agreements and in its share of proceeds from any repurchase or other disposition of such securities.
Investment Income, Gains and Losses, Expenses and Distributions
Investment transactions are accounted for on a trade-date basis. Realized gains and losses from investment transactions are recorded on an identified-cost basis. Interest income and expenses are accrued daily. Dividend income and distributions to shareholders are recorded on the ex-dividend date. Foreign dividends are recorded on the ex-dividend date or when the Fund is informed of the ex-dividend date. Distributions of net investment income are declared and paid quarterly. Non-cash dividends included in dividend income, if any, are recorded at fair value.
Premium and Discount Amortization
All premiums and discounts on fixed-income securities are amortized/accreted for financial statement purposes.
Federal Taxes
It is the Fund's policy to comply with the Subchapter M provision of the Internal Revenue Code and to distribute to shareholders each year substantially all of its income. Accordingly, no provision for federal income tax is necessary. As of and during the year ended October 31, 2010, the Fund did not have a liability for any uncertain tax positions. The Fund recognizes interest and penalties, if any, related to tax liabilities as income tax expense in the Statement of Operations. As of October 31, 2010, tax years 2007 through 2010 remain subject to examination by the Fund's major tax jurisdictions, which include the United States of America and the Commonwealth of Massachusetts.
When-Issued and Delayed Delivery Transactions
The Fund may engage in when-issued or delayed delivery transactions. The Fund records when-issued securities on the trade date and maintains security positions such that sufficient liquid assets will be available to make payment for the securities purchased. Securities purchased on a when-issued or delayed delivery basis are marked to market daily and begin earning interest on the settlement date. Losses may occur on these transactions due to changes in market conditions or the failure of counterparties to perform under the contract.
Futures Contracts
The Fund purchases stock index futures contracts to manage cash flows, maintain exposure to the S&P MidCap 400 Index and to potentially reduce transaction costs. Upon entering into a stock index futures contract with a broker, the Fund is required to deposit in a segregated account a specified amount of cash or U.S. government securities which is shown as Restricted Cash in the Statement of Assets and Liabilities. Futures contracts are valued daily and unrealized gains or losses are recorded in a “variation margin” account. Daily, the Fund Annual Shareholder Report
27
receives from or pays to the broker a specified amount of cash based upon changes in the variation margin account. When a contract is closed, the Fund recognizes a realized gain or loss. Futures contracts have market risks, including the risk that the change in the value of the contract may not correlate with the changes in the value of the underlying securities. There is minimal counterparty risk to the Fund since futures are exchange traded and the exchange's clearinghouse, as counterparty to all exchange traded futures, guarantees the futures against default.Futures contracts outstanding at period end are listed after the Fund's Portfolio of Investments.
Securities Lending
The Fund participates in a securities lending program providing for the lending of equity securities to qualified brokers. The Fund normally receives cash collateral for securities loaned that is invested in an affiliated money market fund or in short-term securities including repurchase agreements. Collateral is maintained at a minimum level of 100% of the market value of investments loaned, plus interest, if applicable. Earnings on collateral are allocated between the securities lending agent, as a fee for its services under the program, and the Fund, according to agreed-upon rates.
As of October 31, 2010, securities subject to this type of arrangement and related collateral were as follows:
Market Value of
Securities Loaned | Market Value
of Collateral |
| $68,906,136 | $70,663,000 |
Additional Disclosure Related to Derivative Instruments
| Fair Value of Derivative Instruments |
| | Asset |
| | | Statement of
Assets and
Liabilities
Location | Fair
Value |
Derivatives not accounted for as hedging
instruments under ASC Topic 815 | | |
| Equity contracts | | | Receivable for daily variation margin | $969,078* |
| * | Includes cumulative appreciation/depreciation of futures contracts as reported in the footnotes to the Portfolio of Investments. Only the current day's variation margin is reported within the Statement of Assets and Liabilities. |
The Effect of Derivative Instruments on the Statement of Operations for the Year Ended October 31, 2010
| Amount of Realized Gain or (Loss) on Derivatives Recognized in Income |
| | | | Futures |
| Equity contracts | | | | $2,856,115 |
Annual Shareholder Report28
| Change in Unrealized Appreciation or (Depreciation) on Derivatives Recognized in Income |
| | | | Futures |
| Equity contracts | | | | $1,872,014 |
Other
The preparation of financial statements in conformity with GAAP requires management to make estimates and assumptions that affect the amounts of assets, liabilities, expenses and revenues reported in the financial statements. Actual results could differ from those estimated.
3. SHARES OF BENEFICIAL INTEREST
The following table summarizes share activity:
| Year Ended October 31 | 2010 | 2009 |
| Shares sold | 8,936,529 | 14,162,284 |
| Shares issued to shareholders in payment of distributions declared | 351,968 | 1,392,990 |
| Shares redeemed | (11,177,296) | (12,857,231) |
| NET CHANGE RESULTING FROM FUND SHARE TRANSACTIONS | (1,888,799) | 2,698,043 |
4. FEDERAL TAX INFORMATION
The timing and character of income and capital gain distributions are determined in accordance with income tax regulations, which may differ from GAAP. These differences are due to differing treatments for regulatory settlement proceeds.
For the year ended October 31, 2010, permanent differences identified and reclassified among the components of net assets were as follows:
| Increase (Decrease) |
| Paid-In Capital | Accumulated
Net Realized
Gain (Loss) |
| $(21,693) | $21,693 |
Net investment income (loss), net realized gains (losses), and net assets were not affected by this reclassification.
The tax character of distributions as reported on the Statement of Changes in Net Assets for the years ended October 31, 2010 and 2009, was as follows:
| 2010 | 2009 |
| Ordinary income | $7,165,311 | $ 9,096,406 |
| Long-term capital gains | $ — | $ 10,286,805 |
Annual Shareholder Report
29
As of October 31, 2010, the components of distributable earnings on a tax basis were as follows:| Undistributed ordinary income | $602,938 |
| Undistributed long-term capital gain | $18,884,647 |
| Net unrealized appreciation | $90,743,322 |
The difference between book-basis and tax-basis net unrealized appreciation/depreciation is attributable to differing treatments for the deferral of losses on wash sales and transactions in certain securities on loan.
At October 31, 2010, the cost of investments for federal tax purposes was $868,271,867. The net unrealized appreciation of investments for federal tax purposes excluding any unrealized appreciation resulting from futures contracts was $90,743,322. This consists of net unrealized appreciation from investments for those securities having an excess of value over cost of $184,873,111 and net unrealized depreciation from investments for those securities having an excess of cost over value of $94,129,789.
The Fund used capital loss carryforwards of $7,515,948 to offset taxable capital gains realized during the year ended October 31, 2010.
5. management FEE AND OTHER TRANSACTIONS WITH AFFILIATES
Management Fee
Federated Equity Management Company of Pennsylvania is the Fund's manager (the “Manager”). The management agreement between the Fund and the Manager provides for an annual fee equal to 0.40% of the Fund's average daily net assets. Subject to the terms described in the Expense Limitation note, the Manager may voluntarily choose to waive any portion of its fee. For the year ended October 31, 2010, the Manager voluntarily waived $1,488,893 of its fee.
Shareholder Services Fee
The Fund may pay fees (“Service Fees”) up to 0.25% of the average daily net assets of the Fund's Shares to financial intermediaries or to Federated Shareholder Services Company (FSSC) for providing services to shareholders and maintaining shareholder accounts. Financial intermediaries may include a company affiliated with management of Federated Investors, Inc. A financial intermediary affiliated with management of Federated Investors, Inc. received $2,014 of Service Fees for the year ended October 31, 2010. Subject to the terms described in the Expense Limitation note, FSSC may voluntarily reimburse the Fund for Service Fees. For the year ended October 31, 2010, FSSC received $7,121 of fees paid by the Fund.
Expense Limitation
The Manager and its affiliates (FSSC) have voluntarily agreed to waive their fees and/or reimburse expenses so that the total annual fund operating expenses (as shown in the financial highlights) paid by the Fund (after the voluntary waivers and reimbursements)
will not exceed 0.54% (the “Fee Limit”) through the later of (the “Termination Date”):
(a) December 31, 2011; or (b) the date of the Fund's next effective Prospectus. While the Manager and its affiliates currently do not anticipate terminating or increasing this arrangement prior to the Termination Date, this arrangement may only be terminated or the Fee Limit increased prior to the Termination Date with the agreement of the Trustees.
Annual Shareholder Report
30
GeneralCertain Officers and Trustees of the Fund are Officers and Directors or Trustees of the above companies.
Transactions Involving Affiliated Holdings
Affiliated holdings are mutual funds which are managed by the Manager or an affiliate of the Manager. The Manger has agreed to reimburse the Fund for certain investment manager fees as a result of transactions in other affiliated mutual funds. For the year ended October 31,
2010, the Manager reimbursed $71,738. Transactions involving affiliated holdings during the year ended October 31, 2010, were as follows:
| Affiliate | Balance of
Shares Held
10/31/2009 | Purchases/
Additions | Sales/
Reductions | Balance of
Shares Held
10/31/2010 | Value | Dividend
Income |
| Federated Prime Value Obligations Fund, Institutional Shares | 137,718,135 | 244,916,508 | 369,696,323 | 12,938,320 | $12,938,320 | $45,330 |
6. Investment TRANSACTIONS
Purchases and sales of investments, excluding long-term U.S. government securities and short-term obligations for the year ended October 31, 2010, were as follows:
| Purchases | $96,860,939 |
| Sales | $102,346,620 |
7. INTERFUND LENDING
Pursuant to an Exemptive Order issued by the Securities and Exchange Commission (SEC), the Fund, along with other funds advised by subsidiaries of Federated Investors, Inc., may participate in an interfund lending program. This program provides an alternative credit facility allowing the Fund to borrow from other participating affiliated funds. As of October 31, 2010, there were no outstanding loans. During the year ended October 31, 2010, the program was not utilized.
8. REGULATORY SETTLEMENT PROCEEDS
The Fund received $21,693 in settlement of administrative proceedings against other unaffiliated third parties involving findings by the SEC of market timing and/or late trading of mutual funds. The settlement is recorded as an increase to paid-in capital in the accompanying financial statements.
Annual Shareholder Report
31
9. Legal ProceedingsSince February, 2004, Federated Investors, Inc. and related entities (collectively, “Federated”), have been named as defendants in several lawsuits that are now pending in the United States District Court for the Western District of Pennsylvania. These lawsuits have been consolidated into a single action alleging excessive advisory fees involving one of the Federated-sponsored mutual funds (“Federated Funds”). Federated and its counsel have been defending this litigation. Additional lawsuits based upon similar allegations may be filed in the future. The potential impact of these lawsuits, all of which seek monetary damages, attorneys' fees and expenses, and future potential similar suits is uncertain. Although we do not believe that these lawsuits will have a material adverse effect on the Federated Funds, there can be no assurance that these suits, ongoing adverse publicity and/or other developments resulting from the allegations in these matters will not result in increased redemptions, or reduced sales, of shares of the Federated Funds or other adverse consequences for the Federated Funds.
10. FEDERAL TAX INFORMATION (UNAUDITED)
For the fiscal year ended October 31, 2010, 100.0% of total ordinary income distributions made by the Fund are qualifying dividends which may be subject to a maximum tax rate of 15%, as provided for by the Jobs and Growth Tax Relief Act of 2003. Complete information is reported in conjunction with the reporting of your distributions on Form 1099-DIV.
Of the ordinary income distributions made by the Fund during the year ended October 31, 2010, 100.0% qualify for the dividend received deduction available to corporate shareholders.
Annual Shareholder Report32
Report of Independent Registered Public Accounting Firm
TO THE BOARD OF Trustees OF Federated Index Trust AND SHAREHOLDERS OF Federated Mid-Cap Index fund:
We have audited the accompanying statement of assets and liabilities of Federated Mid-Cap Index Fund (the “Fund”) (one of the portfolios constituting Federated Index Trust), including the portfolio of investments, as of October 31, 2010, and the related statement of operations for the year then ended, the statement of changes in net assets for each of the two years in the period then ended and the financial highlights for each of the five years in the period then ended. These financial statements and financial highlights are the responsibility of the Fund's management. Our responsibility is to express an opinion on these financial statements and financial highlights based on our audits.
We conducted our audits in accordance with standards of the Public Company Accounting Oversight Board (United States). Those standards require that we plan and perform the audit to obtain reasonable assurance about whether the financial statements and financial highlights are free of material misstatement. We were not engaged to perform an audit of the Fund's internal control over financial reporting. Our audits included consideration of internal control over financial reporting as a basis for designing audit procedures that are appropriate in the circumstances, but not for the purpose of expressing an opinion on the effectiveness of the Fund's internal control over financial reporting. Accordingly, we express no such opinion. An audit also includes examining, on a test basis, evidence supporting the amounts and disclosures in the financial statements and financial highlights, assessing the accounting principles used and significant estimates made by management and evaluating the overall financial statement presentation. Our procedures included confirmation of securities owned as of October 31, 2010, by correspondence with the custodian and others. We believe that our audits provide a reasonable basis for our opinion.
In our opinion, the financial statements and financial highlights referred to above present fairly, in all material respects, the financial position of Federated Mid-Cap Index Fund, a portfolio of Federated Index Trust, at October 31, 2010, the results of its operations for the year then ended, the changes in its net assets for each of the two years in the period then ended and the financial highlights for each of the five years in the period then ended, in conformity with U.S. generally accepted accounting principles.
Boston, Massachusetts
December 20, 2010
Annual Shareholder Report33
Board of Trustees and Trust Officers
The Board of Trustees is responsible for managing the Trust's business affairs and for exercising all the Trust's powers except those reserved for the shareholders. The following tables give information about each Trustee and the senior officers of the Fund. Where required, the tables separately list Trustees who are “interested persons” of the Fund (i.e., “Interested” Trustees) and those who are not (i.e., “Independent” Trustees). Unless otherwise noted, the address of each person listed is Federated Investors Tower, 1001 Liberty Avenue, Pittsburgh, PA 15222. The address of all Independent Trustees listed is 4000 Ericsson Drive, Warrendale, PA 15086-7561; Attention: Mutual Fund Board. As of December 31, 2009, the Trust comprised two portfolio(s), and the Federated Fund Family consisted of 43 investment companies (comprising 145 portfolios). Unless otherwise noted, each Officer is elected annually. Unless otherwise noted, each Trustee oversees all portfolios in the Federated Fund Family and serves for an indefinite term. The Fund's Statement of Additional Information includes additional information about Trust Trustees and is available, without charge and upon request, by calling 1-800-341-7400.
Interested Trustees Background
Name
Birth Date
Positions Held with Trust
Date Service Began | Principal Occupation(s) for Past Five Years,
Other Directorships Held and Previous Position(s) |
John F. Donahue*
Birth Date: July 28, 1924
Trustee
Began serving: January 1990 | Principal Occupations: Director or Trustee of the Federated Fund Family; Chairman and Director, Federated Investors, Inc.; Chairman of the Federated Fund Family's Executive Committee.
Previous Positions: Chairman of the Federated Fund Family; Trustee, Federated Investment Management Company; Chairman and Director, Federated Investment Counseling. |
J. Christopher Donahue*
Birth Date: April 11, 1949
PRESIDENT AND Trustee
Began serving: January 1990 | Principal Occupations: Principal Executive Officer and President of the Federated Fund Family; Director or Trustee of some of the Funds in the Federated Fund Family; President, Chief Executive Officer and Director, Federated Investors, Inc.; Chairman and Trustee, Federated Investment Management Company; Trustee, Federated Investment Counseling; Chairman and Director, Federated Global Investment Management Corp.; Chairman, Federated Equity Management Company of Pennsylvania and Passport Research, Ltd. (investment advisory subsidiary of Federated); Trustee, Federated Shareholder Services Company; Director, Federated Services Company.
Previous Positions: President, Federated Investment Counseling; President and Chief Executive Officer, Federated Investment Management Company, Federated Global Investment Management Corp. and Passport Research, Ltd. |
| * | Family relationships and reasons for “interested” status: John F. Donahue is the father of J. Christopher Donahue; both are “interested” due to their beneficial ownership of shares of Federated Investors, Inc. and the positions they hold with Federated and its subsidiaries. |
Annual Shareholder Report34
INDEPENDENT Trustees Background
Name
Birth Date
Positions Held with Trust
Date Service Began | Principal Occupation(s) for Past Five Years,
Other Directorships Held, Previous Position(s) and Qualifications |
John T. Conroy, Jr., Ph.D.
Birth Date: June 23, 1937
Trustee
Began serving: August 1991 | Principal Occupations: Director or Trustee of the Federated Fund Family; Chairman of the Board, Investment Properties Corporation; Partner or Trustee in private real estate ventures in Southwest Florida; Assistant Professor in Theology, Blessed Edmund Rice School for Pastoral Ministry.
Previous Positions: President, Investment Properties Corporation; Senior Vice President, John R. Wood and Associates, Inc., Realtors; President, Naples Property Management, Inc. and Northgate Village Development Corporation.
Qualifications: Business management and director experience. |
Nicholas P. Constantakis, CPA
Birth Date: September 3, 1939
Trustee
Began serving: February 1998 | Principal Occupation: Director or Trustee of the Federated Fund Family.
Other Directorship Held: Director and Chairman of the Audit Committee, Michael Baker Corporation (architecture, engineering and construction services).
Previous Position: Partner, Andersen Worldwide SC.
Qualifications: Public accounting and director experience. |
John F. Cunningham
Birth Date: March 5, 1943
Trustee
Began serving: January 1999 | Principal Occupation: Director or Trustee of the Federated Fund Family.
Other Directorships Held: Chairman, President and Chief Executive Officer, Cunningham & Co., Inc. (strategic business consulting); Trustee Associate, Boston College.
Previous Positions: Director, Redgate Communications and EMC Corporation (computer storage systems); Chairman of the Board and Chief Executive Officer, Computer Consoles, Inc.; President and Chief Operating Officer, Wang Laboratories; Director, First National Bank of Boston; Director, Apollo Computer, Inc.
Qualifications: Business management and director experience. |
Maureen Lally-Green
Birth Date: July 5, 1949
Trustee
Began serving: August 2009 | Principal Occupations: Director or Trustee of the Federated Fund Family; Director, Office of Church Relations, Diocese of Pittsburgh; Adjunct Professor of Law, Duquesne University School of Law.
Other Directorships Held: Director, Auberle; Trustee, St. Francis University; Director, Ireland Institute of Pittsburgh; Director, UPMC Mercy Hospital; Regent, St. Vincent Seminary; Director, Epilepsy Foundation of Western and Central Pennsylvania; Director, Saint Thomas More Society, Allegheny County; Director, Carlow University.
Previous Position: Pennsylvania Superior Court Judge.
Qualifications: Legal and director experience. |
Annual Shareholder Report35
Name
Birth Date
Positions Held with Trust
Date Service Began | Principal Occupation(s) for Past Five Years,
Other Directorships Held, Previous Position(s) and Qualifications |
Peter E. Madden
Birth Date: March 16, 1942
Trustee
Began serving: August 1991 | Principal Occupation: Director or Trustee, and Chairman of the Board of Directors or Trustees, of the Federated Fund Family.
Other Directorship Held: Board of Overseers, Babson College.
Previous Positions: Representative, Commonwealth of Massachusetts General Court; President, Chief Operating Officer and Director, State Street Bank and Trust Company and State Street Corporation (retired); Director, VISA USA and VISA International; Chairman and Director, Massachusetts Bankers Association; Director, Depository Trust Corporation; Director, The Boston Stock Exchange.
Qualifications: Business management, mutual fund services and director experience. |
Charles F. Mansfield, Jr.
Birth Date: April 10, 1945
Trustee
Began serving: January 1999 | Principal Occupations: Director or Trustee and Chairman of the Audit Committee of the Federated Fund Family; Management Consultant.
Previous Positions: Chief Executive Officer, PBTC International Bank; Partner, Arthur Young & Company (now Ernst & Young LLP); Chief Financial Officer of Retail Banking Sector, Chase Manhattan Bank; Senior Vice President, HSBC Bank USA (formerly, Marine Midland Bank); Vice President, Citibank; Assistant Professor of Banking and Finance, Frank G. Zarb School of Business, Hofstra University; Executive Vice President, DVC Group, Inc. (marketing, communications and technology).
Qualifications: Banking, business management, public accounting and director experience. |
R. James Nicholson
Birth Date: February 4, 1938
Trustee
Began serving: January 2008 | Principal Occupations: Director or Trustee of the Federated Fund Family; Senior Counsel, Brownstein Hyatt Farber Schrek, P.C.; Former Secretary of the U.S. Dept. of Veterans Affairs; Former U.S. Ambassador to the Holy See; Former Chairman of the Republican National Committee.
Other Directorships Held: Director, Horatio Alger Association; Director, The Daniels Fund.
Previous Positions: Colonel, U.S. Army Reserve; Partner, Calkins, Kramer, Grimshaw and Harring, P.C.; General Counsel, Colorado Association of Housing and Building; Chairman and CEO, Nicholson Enterprises, Inc. (real estate holding company); Chairman and CEO, Renaissance Homes of Colorado.
Qualifications: Legal, government, business management and mutual fund director experience. |
Annual Shareholder Report36
Name
Birth Date
Positions Held with Trust
Date Service Began | Principal Occupation(s) for Past Five Years,
Other Directorships Held, Previous Position(s) and Qualifications |
Thomas M. O'Neill
Birth Date: June 14, 1951
Trustee
Began serving: October 2006 | Principal Occupations: Director or Trustee of the Federated Fund Family; Sole Proprietor, Navigator Management Company (investment and strategic consulting).
Other Directorships Held: Board of Overseers, Children's Hospital of Boston; Visiting Committee on Athletics, Harvard College.
Previous Positions: Chief Executive Officer and President, Managing Director and Chief Investment Officer, Fleet Investment Advisors; President and Chief Executive Officer, Aeltus Investment Management, Inc.; General Partner, Hellman, Jordan Management Co., Boston, MA; Chief Investment Officer, The Putnam Companies, Boston, MA; Credit Analyst and Lending Officer, Fleet Bank; Director and Consultant, EZE Castle Software (investment order management software); Director, Midway Pacific (lumber).
Qualifications: Business management, mutual fund, director and investment experience. |
John S. Walsh
Birth Date: November 28, 1957
Trustee
Began serving: January 1999 | Principal Occupations: Director or Trustee of the Federated Fund Family; President and Director, Heat Wagon, Inc. (manufacturer of construction temporary heaters); President and Director, Manufacturers Products, Inc. (distributor of portable construction heaters); President, Portable Heater Parts, a division of Manufacturers Products, Inc.
Previous Position: Vice President, Walsh & Kelly, Inc.
Qualifications: Business management and director experience. |
James F. Will
Birth Date: October 12, 1938
Trustee
Began serving: April 2006 | Principal Occupations: Director or Trustee of the Federated Fund Family; formerly, Vice Chancellor and President, Saint Vincent College.
Other Directorships Held: Trustee, Saint Vincent College; Director, Alleghany Corporation; Trustee, Wheeling Jesuit University; Director, Liberty Tire Recycling.
Previous Positions: Chairman, President and Chief Executive Officer, Armco, Inc.; President and Chief Executive Officer, Cyclops Industries; President and Chief Operating Officer, Kaiser Steel Corporation.
Qualifications: Business management, education and director experience. |
Annual Shareholder Report37
OFFICERS
Name
Birth Date
Address
Positions Held with Trust
Date Service Began | Principal Occupation(s) for Past Five Years
and Previous Position(s) |
John W. McGonigle
Birth Date: October 26, 1938
EXECUTIVE VICE PRESIDENT AND SECRETARY
Began serving: February 1990 | Principal Occupations: Executive Vice President and Secretary of the Federated Fund Family; Vice Chairman, Executive Vice President, Secretary and Director, Federated Investors, Inc.
Previous Positions: Trustee, Federated Investment Management Company and Federated Investment Counseling; Director, Federated Global Investment Management Corp., Federated Services Company and Federated Securities Corp. |
Richard A. Novak
Birth Date: December 25, 1963
TREASURER
Began serving: January 2006 | Principal Occupations: Principal Financial Officer and Treasurer of the Federated Fund Family; Senior Vice President, Federated Administrative Services; Financial and Operations Principal for Federated Securities Corp., Edgewood Services, Inc. and Southpointe Distribution Services, Inc.
Previous Positions: Controller of Federated Investors, Inc.; Vice President, Finance of Federated Services Company; held various financial management positions within The Mercy Hospital of Pittsburgh; Auditor, Arthur Andersen & Co. |
Richard B. Fisher
Birth Date: May 17, 1923
VICE PRESIDENT
Began serving: February 1990 | Principal Occupations: Vice Chairman or Vice President of some of the Funds in the Federated Fund Family; Vice Chairman, Federated Investors, Inc.; Chairman, Federated Securities Corp.
Previous Positions: President and Director or Trustee of some of the Funds in the Federated Fund Family; Executive Vice President, Federated Investors, Inc.; Director and Chief Executive Officer, Federated Securities Corp. |
Brian P. Bouda
Birth Date: February 28, 1947
CHIEF COMPLIANCE OFFICER AND SENIOR VICE PRESIDENT
Began serving: August 2004 | Principal Occupations: Senior Vice President and Chief Compliance Officer of the Federated Fund Family; Vice President and Chief Compliance Officer of Federated Investors, Inc. and Chief Compliance Officer of its subsidiaries. Mr. Bouda joined Federated in 1999 and is a member of the American Bar Association and the State Bar Association of Wisconsin. |
Stephen F. Auth
Birth Date: September 3, 1956
450 Lexington Avenue
Suite 3700
New York, NY 10017-3943
CHIEF INVESTMENT OFFICER
Began serving: November 2002 | Principal Occupations: Mr. Auth is Chief Investment Officer of this Fund and various other Funds in the Federated Fund Family; Executive Vice President, Federated Investment Counseling, Federated Global Investment Management Corp. and Federated Equity Management Company of Pennsylvania.
Previous Positions: Executive Vice President, Federated Investment Management Company, and Passport Research, Ltd. (investment advisory subsidiary of Federated); Senior Vice President, Global Portfolio Management Services Division; Senior Vice President, Federated Investment Management Company and Passport Research, Ltd.; Senior Managing Director and Portfolio Manager, Prudential Investments. |
Annual Shareholder Report38
Evaluation and Approval of Advisory Contract – May 2010
Federated Mid-Cap Index Fund (the “Fund”)
The Fund's Board reviewed the Fund's investment advisory and subadvisory contracts at meetings held in May 2010. The Board's decision regarding these contracts reflects the exercise of its business judgment on whether to continue the existing arrangements.
In this connection, the Federated funds' Board had previously appointed a Senior Officer, whose duties include specified responsibilities relating to the process by which advisory fees are to be charged to a Federated fund. The Senior Officer has the authority to retain consultants, experts, or staff as may be reasonably necessary to assist in the performance of his duties, reports directly to the Board, and may be terminated only with the approval of a majority of the independent members of the Board. The Senior Officer prepared and furnished to the Board an independent, written evaluation that covered topics discussed below. The Board considered that evaluation, along with other information, in deciding to approve the advisory and subadvisory contracts.
During its review of these contracts, the Board considered compensation and benefits received by the Adviser and subadviser. This included the fees received for services provided to the Fund by other entities in the Federated organization and research services (if any) received by the Adviser and subadviser from brokers that execute Federated fund trades, as well as advisory fees. The Board is also familiar with and considered judicial decisions concerning allegedly excessive investment advisory fees, which have indicated that the following factors may be relevant to an Adviser's fiduciary duty with respect to its receipt of compensation from a fund: the nature and quality of the services provided by the Adviser, including the performance of the Fund; the Adviser's cost of providing the services; the extent to which the Adviser may realize “economies of scale” as the Fund grows larger; any indirect benefits that may accrue to the Adviser and its affiliates as a result of the Adviser's relationship with the Fund; performance and expenses of comparable funds; and the extent to which the independent Board members are fully informed about all facts the Board deems relevant bearing on the Adviser's services and fees. The Board further considered management fees (including any components thereof) charged to institutional and other clients of the Adviser for what might be viewed as like services, and the cost to the Adviser and its affiliates of supplying services pursuant to the management fee agreements, excluding any intra-corporate profit and profit margins of the Adviser and its affiliates for supplying such services. Information regarding the subadviser's customary fee schedules was included in the materials furnished by the subadviser in connection with the Board's review. The Board was aware of these factors and was guided by them in its review of the Fund's advisory and subadvisory contracts to the extent it considered them to be appropriate and relevant, as discussed further below.
Annual Shareholder Report
39
The Board considered and weighed these circumstances in light of its substantial accumulated experience in governing the Fund and working with Federated on matters relating to the Federated funds, and was assisted in its deliberations by independent legal counsel. Throughout the year, the Board has requested and received substantial and detailed information about the Fund and the Federated organization that was in addition to the extensive materials that comprise and accompany the Senior Officer's evaluation. Federated provided much of this information at each regular meeting of the Board, and furnished additional reports in connection with the particular meeting at which the Board's formal review of the advisory and subadvisory contracts occurred. Between regularly scheduled meetings, the Board also received information on particular matters as the need arose. Thus, the Board's consideration of the advisory and subadvisory contracts included review of the Senior Officer's evaluation, accompanying data and additional reports covering such matters as: the Adviser's and subadviser's profitability, investment philosophy, revenue, personnel and processes; investment and operating strategies; the Fund's short- and long-term performance (in absolute terms, both on a gross basis and net of expenses, as well as in relationship to its particular investment program and certain competitor or “peer group” funds and/or other benchmarks, as appropriate), and comments on the reasons for performance; the Fund's investment objectives; the Fund's expenses (including the advisory fee itself and the overall expense structure of the Fund, both in absolute terms and relative to similar and/or competing funds, with due regard for contractual or voluntary expense limitations); the use and allocation of brokerage commissions derived from trading the Fund's portfolio securities (if any); and the nature, quality and extent of the advisory and other services provided to the Fund by the Adviser, the subadviser, and their affiliates. The Board also considered the preferences and expectations of Fund shareholders and their relative sophistication; the continuing state of competition in the mutual fund industry and market practices; the range of comparable fees for similar funds in the mutual fund industry; the Fund's relationship to the Federated family of funds which include a comprehensive array of funds with different investment objectives, policies and strategies which are available for exchange without the incurrence of additional sales charges; compliance and audit reports concerning the Federated funds, the Federated companies that service them, and the subadviser (including communications from regulatory agencies), as well as Federated's and/or the subadviser's responses to any issues raised therein; and relevant developments in the mutual fund industry and how the Federated funds and/or Federated are responding to them. The Board's evaluation process is evolutionary. The criteria considered and the emphasis placed on relevant criteria change in recognition of changing circumstances in the mutual fund marketplace.Annual Shareholder Report
40
With respect to the Fund's performance and expenses in particular, the Board has found the use of comparisons to other mutual funds with comparable investment programs to be relevant, given the high degree of competition in the mutual fund business. The Board focused on comparisons with other similar mutual funds more heavily than non-mutual fund products or services because it is believed that they are more relevant. For example, other mutual funds are the products most like the Fund, they are readily available to Fund shareholders as alternative investment vehicles, and they are the type of investment vehicle in fact chosen and maintained by the Fund's investors. The range of their fees and expenses therefore appears to be a generally reliable indication of what consumers have found to be reasonable in the precise marketplace in which the Fund competes. The Fund's ability to deliver competitive performance when compared to its peer group was a useful indicator of how the Adviser and subadviser are executing the Fund's investment program, which in turn assisted the Board in reaching a conclusion that the nature, extent, and quality of the Adviser's and subadviser's investment management services were such as to warrant continuation of the advisory and subadvisory contracts. In this regard, the Senior Officer has reviewed Federated's and the subadviser's fees for providing advisory services to products outside the Federated family of funds (e.g., institutional and separate accounts). He concluded that mutual funds and institutional accounts are inherently different products. Those differences included, but are not limited to, different types of targeted investors, being subject to different laws and regulations, different legal structures, different average account sizes, different associated costs, different portfolio management techniques made necessary by different cash flows, and portfolio manager time spent in review of securities pricing. The Senior Officer did not consider these fee schedules to be determinative in judging the appropriateness of mutual fund advisory contracts.The Senior Officer reviewed reports compiled by Federated, using data supplied by independent fund ranking organizations, regarding the performance of, and fees charged by, other mutual funds, noting his view that comparisons to fund peer groups are relevant in judging the reasonableness of proposed fees.
For the periods covered by the report, the Fund's performance for the three-year period was above the median of the relevant peer group, and the Fund's performance fell below the median of the relevant peer group for the one-year and five-year periods. The Board discussed the Fund's performance with the Adviser and recognized the efforts being undertaken by the Adviser and subadviser. The Board will continue to monitor these efforts and the performance of the Fund.
The Board also received financial information about Federated, including reports on the compensation and benefits Federated derived from its relationships with the Federated funds. These reports covered not only the fees under the advisory contracts, but also fees received by Federated's subsidiaries for providing other services to the Federated funds under separate contracts Annual Shareholder Report
41
(e.g., for serving as the Federated funds' administrator). The reports also discussed any indirect benefit Federated may derive from its receipt of research services from brokers who execute Federated fund trades. In addition, the Board considered the fact that, in order for a fund to be competitive in the marketplace, Federated and its affiliates frequently waived fees and/or reimbursed expenses and have disclosed to fund investors and/or indicated to the Board their intention to do so in the future, where appropriate. Moreover, the Board receives regular reports regarding the institution or elimination of these voluntary waivers. The Board also received financial information about the subadviser, as well as reports that discussed any indirect benefit the subadviser may derive from its receipt of research services from brokers who execute Fund trades.Federated furnished reports, requested by the Senior Officer, that reported revenues on a fund-by-fund basis and made estimates of the allocation of expenses on a fund-by-fund basis, using allocation methodologies specified by the Senior Officer. The Senior Officer noted that, although they may apply consistent allocation processes, the inherent difficulties in allocating costs (and the unavoidable arbitrary aspects of that exercise) and the lack of consensus on how to allocate those costs may render such allocation reports unreliable. The Board received similar revenue and cost information about the Fund from the subadviser. The allocation reports were considered in the analysis by the Board but were determined to be of limited use.
The Board and the Senior Officer also reviewed a report compiled by Federated comparing profitability information for Federated and the subadviser to other publicly held fund management companies. In this regard, the Senior Officer noted the limited availability of such information, but nonetheless concluded that Federated's and the subadviser's profit margins did not appear to be excessive and the Board agreed.
The Senior Officer's evaluation also discussed the notion of possible realization of “economies of scale” as a fund grows larger. The Board considered in this regard that the Adviser has made significant and long-term investments in areas that support all of the Federated funds, such as personnel and processes for the portfolio management, compliance, and risk management functions; and systems technology; and that the benefits of these efforts (as well as any economies, should they exist) were likely to be enjoyed by the fund complex as a whole. Finally, the Board also noted the absence of any applicable regulatory or industry guidelines on this subject, which (as discussed in the Senior Officer's evaluation) is compounded by the lack of any common industry practice or general pattern with respect to structuring fund advisory fees with “breakpoints” that serve to reduce the fee as the fund attains a certain size. The Senior Officer did not recommend institution of breakpoints in pricing Federated's fund advisory services at this time.
Annual Shareholder Report
42
It was noted in the materials for the Board meeting that, for the period covered by the report, the Fund's investment advisory fee, after waivers and expense reimbursements, if any, was above the median of the relevant peer group. The Board reviewed the fees and other expenses of the Fund with the Adviser and was satisfied that the overall expense structure of the Fund remained competitive. The Board will continue to monitor advisory fees and other expenses borne by the Fund.The Senior Officer's evaluation noted his belief that the information and observations contained in his evaluation supported a finding that the proposed management fees are reasonable, and that Federated appeared to provide appropriate administrative services to the Fund for the fees paid. Under these circumstances, no changes were recommended to, and no objection was raised to, the continuation of the Fund's advisory and subadvisory contracts. The Board concluded that the nature, quality and scope of services provided the Fund by the Adviser and its affiliates, and by the subadviser, were satisfactory.
In its decision to continue an existing investment advisory contract, the Board was mindful of the potential disruptions of the Fund's operations and various risks, uncertainties and other effects that could occur as a result of a decision to terminate or not renew an advisory contract. In particular, the Board recognized that many shareholders have invested in the Fund on the strength of the Adviser's industry standing and reputation and with the expectation that the Adviser will have a continuing role in providing advisory services to the Fund. Thus, the Board's approval of the advisory contract reflected the fact that it is the shareholders who have effectively selected the Adviser by virtue of having invested in the Fund.
The Board based its decision to approve the advisory and subadvisory contracts on the totality of the circumstances and relevant factors and with a view to past and future long-term considerations. Not all of the factors and considerations identified above were necessarily relevant to the Fund, nor did the Board consider any one of them to be determinative. With respect to the factors that were relevant, the Board's decision to approve the contract reflects its determination that Federated's performance and actions provided a satisfactory basis to support the decision to continue the existing arrangements.
Annual Shareholder Report43
Voting Proxies on Fund Portfolio Securities
A description of the policies and procedures that the Fund uses to determine how to vote proxies, if any, relating to securities held in the Fund's portfolio is available, without charge and upon request, by calling 1-800-341-7400. A report on “Form N-PX” of how the Fund voted any such proxies during the most recent 12-month period ended June 30 is available from Federated's website at FederatedInvestors.com. To access this information from the “Products” section of the website, click on the “Prospectuses and Regulatory Reports” link under “Related Information,” then select the appropriate link opposite the name of the Fund; or select the name of the Fund and from the Fund's page, click on the “Prospectuses and Regulatory Reports” link. Form N-PX filings are also available at the SEC's website at www.sec.gov.
Quarterly Portfolio Schedule
The Fund files with the SEC a complete schedule of its portfolio holdings, as of the close of the first and third quarters of its fiscal year, on “Form N-Q.” These filings are available on the SEC's website at www.sec.gov and may be reviewed and copied at the SEC's Public Reference Room in Washington, DC. (Call 1-800-SEC-0330 for information on the operation of the Public Reference Room.) You may also access this information from the “Products” section of Federated's website at FederatedInvestors.com by clicking on “Portfolio Holdings” under “Related Information,” then selecting the appropriate link opposite the name of the Fund; or select the name of the Fund and from the Fund's page, click on the “Portfolio Holdings” link.
Annual Shareholder Report44
Mutual funds are not bank deposits or obligations, are not guaranteed by any bank and are not insured or guaranteed by the U.S. government, the Federal Deposit Insurance Corporation, the Federal Reserve Board or any other government agency. Investment in mutual funds involves investment risk, including the possible loss of principal.
This Report is authorized for distribution to prospective investors only when preceded or accompanied by the Fund's Prospectus, which contains facts concerning its objective and policies, management fees, expenses and other information.
Federated Mid-Cap Index Fund
Federated Investors Funds
4000 Ericsson Drive
Warrendale, PA 15086-7561
Contact us at FederatedInvestors.com
or call 1-800-341-7400.
Federated Securities Corp., Distributor
Cusip 31420E205
29455 (12/10)
Federated is a registered mark of Federated Investors, Inc.
2010 © Federated Investors, Inc.
Item 2. Code of Ethics
(a) As of the end of the period covered by this report, the registrant has adopted a code of ethics (the "Section 406 Standards for Investment Companies - Ethical Standards for Principal Executive and Financial Officers") that applies to the registrant's Principal Executive Officer and Principal Financial Officer; the registrant's Principal Financial Officer also serves as the Principal Accounting Officer.
(c) Not Applicable
(d) Not Applicable
(e) Not Applicable
(f)(3) The registrant hereby undertakes to provide any person, without charge, upon request, a copy of the code of ethics. To request a copy of the code of ethics, contact the registrant at 1-800-341-7400, and ask for a copy of the Section 406 Standards for Investment Companies - Ethical Standards for Principal Executive and Financial Officers.
Item 3. Audit Committee Financial Expert
The registrant's Board has determined that each of the following members of the Board's Audit Committee is an “audit committee financial expert,” and is "independent," for purposes of this Item: Nicholas P. Constantakis, Charles F. Mansfield, Jr. and Thomas M. O’Neill.
Item 4. Principal Accountant Fees and Services
(a) Audit Fees billed to the registrant for the two most recent fiscal years:
Fiscal year ended 2010 - $45,000
Fiscal year ended 2009 - $45,000
(b) Audit-Related Fees billed to the registrant for the two most recent fiscal years:
Fiscal year ended 2010 - $62
Fiscal year ended 2009 - $0
Audit Committee meeting.
Amount requiring approval of the registrant’s audit committee pursuant to paragraph (c)(7)(ii) of Rule 2-01 of Regulation S-X, $0 and $0 respectively.
(c) Tax Fees billed to the registrant for the two most recent fiscal years:
Fiscal year ended 2010 - $0
Fiscal year ended 2009 - $0
Amount requiring approval of the registrant’s audit committee pursuant to paragraph (c)(7)(ii) of Rule 2-01 of Regulation S-X, $0 and $0 respectively.
(d) All Other Fees billed to the registrant for the two most recent fiscal years:
Fiscal year ended 2010 - $0
Fiscal year ended 2009 - $0
Amount requiring approval of the registrant’s audit committee pursuant to paragraph (c)(7)(ii) of Rule 2-01 of Regulation S-X, $17,375 and $6,044 respectively. Fiscal year ended 2010- Service fee for analysis of potential Passive Foreign Investment Company holdings. Fiscal year ended 2009- Service fee for analysis of potential Passive Foreign Investment Company holdings.
(e)(1) Audit Committee Policies regarding Pre-approval of Services.
The Audit Committee is required to pre-approve audit and non-audit services performed by the independent auditor in order to assure that the provision of such services do not impair the auditor’s independence. Unless a type of service to be provided by the independent auditor has received general pre-approval, it will require specific pre-approval by the Audit Committee. Any proposed services exceeding pre-approved cost levels will require specific pre-approval by the Audit Committee.
Certain services have the general pre-approval of the Audit Committee. The term of the general pre-approval is 12 months from the date of pre-approval, unless the Audit Committee specifically provides for a different period. The Audit Committee will annually review the services that may be provided by the independent auditor without obtaining specific pre-approval from the Audit Committee and may grant general pre-approval for such services. The Audit Committee will revise the list of general pre-approved services from time to time, based on subsequent determinations. The Audit Committee will not delegate its responsibilities to pre-approve services performed by the independent auditor to management.
The Audit Committee has delegated pre-approval authority to its Chairman. The Chairman will report any pre-approval decisions to the Audit Committee at its next scheduled meeting. The Committee will designate another member with such pre-approval authority when the Chairman is unavailable.
AUDIT SERVICES
The annual Audit services engagement terms and fees will be subject to the specific pre-approval of the Audit Committee. The Audit Committee must approve any changes in terms, conditions and fees resulting from changes in audit scope, registered investment company (RIC) structure or other matters.
In addition to the annual Audit services engagement specifically approved by the Audit Committee, the Audit Committee may grant general pre-approval for other Audit Services, which are those services that only the independent auditor reasonably can provide. The Audit Committee has pre-approved certain Audit services, all other Audit services must be specifically pre-approved by the Audit Committee.
AUDIT-RELATED SERVICES
Audit-related services are assurance and related services that are reasonably related to the performance of the audit or review of the Company’s financial statements or that are traditionally performed by the independent auditor. The Audit Committee believes that the provision of Audit-related services does not impair the independence of the auditor, and has pre-approved certain Audit-related services, all other Audit-related services must be specifically pre-approved by the Audit Committee.
TAX SERVICES
The Audit Committee believes that the independent auditor can provide Tax services to the Company such as tax compliance, tax planning and tax advice without impairing the auditor’s independence. However, the Audit Committee will not permit the retention of the independent auditor in connection with a transaction initially recommended by the independent auditor, the purpose of which may be tax avoidance and the tax treatment of which may not be supported in the Internal Revenue Code and related regulations. The Audit Committee has pre-approved certain Tax services, all Tax services involving large and complex transactions must be specifically pre-approved by the Audit Committee.
ALL OTHER SERVICES
With respect to the provision of services other than audit, review or attest services the pre-approval requirement is waived if:
| (1) | The aggregate amount of all such services provided constitutes no more than five percent of the total amount of revenues paid by the registrant, the registrant’s adviser (not including any sub-adviser whose role is primarily portfolio management and is subcontracted with or overseen by another investment adviser), and any entity controlling, controlled by, or under common control with the investment adviser that provides ongoing services to the registrant to its accountant during the fiscal year in which the services are provided; |
| (2) | Such services were not recognized by the registrant, the registrant’s adviser (not including any sub-adviser whose role is primarily portfolio management and is subcontracted with or overseen by another investment adviser), and any entity controlling, controlled by, or under common control with the investment adviser that provides ongoing services to the registrant at the time of the engagement to be non-audit services; and |
| (3) | Such services are promptly brought to the attention of the Audit Committee of the issuer and approved prior to the completion of the audit by the Audit Committee or by one or more members of the Audit Committee who are members of the board of directors to whom authority to grant such approvals has been delegated by the Audit Committee. |
The Audit Committee may grant general pre-approval to those permissible non-audit services classified as All Other services that it believes are routine and recurring services, and would not impair the independence of the auditor.
The SEC’s rules and relevant guidance should be consulted to determine the precise definitions of prohibited non-audit services and the applicability of exceptions to certain of the prohibitions.
PRE-APPROVAL FEE LEVELS
Pre-approval fee levels for all services to be provided by the independent auditor will be established annually by the Audit Committee. Any proposed services exceeding these levels will require specific pre-approval by the Audit Committee.
PROCEDURES
Requests or applications to provide services that require specific approval by the Audit Committee will be submitted to the Audit Committee by both the independent auditor and the Principal Accounting Officer and/or Internal Auditor, and must include a joint statement as to whether, in their view, the request or application is consistent with the SEC’s rules on auditor independence.
(e)(2) Percentage of services identified in items 4(b) through 4(d) that were approved by the registrants audit committee pursuant to paragraph (c)(7)(i)(C) of Rule 2-01 of Regulation S-X:
4(b)
Fiscal year ended 2010 – 0%
Fiscal year ended 2009 - 0%
Percentage of services provided to the registrants investment adviser and any entity controlling, controlled by, or under common control with the investment adviser that provides ongoing services to the registrant that were approved by the registrants audit committee pursuant to paragraph (c)(7)(i)(C) of Rule 2-01 of Regulation S-X, 0% and 0% respectively.
4(c)
Fiscal year ended 2010 – 0%
Fiscal year ended 2009 – 0%
Percentage of services provided to the registrants investment adviser and any entity controlling, controlled by, or under common control with the investment adviser that provides ongoing services to the registrant that were approved by the registrants audit committee pursuant to paragraph (c)(7)(i)(C) of Rule 2-01 of Regulation S-X, 0% and 0% respectively.
4(d)
Fiscal year ended 2010 – 0%
Fiscal year ended 2009 – 0%
Percentage of services provided to the registrants investment adviser and any entity controlling, controlled by, or under common control with the investment adviser that provides ongoing services to the registrant that were approved by the registrants audit committee pursuant to paragraph (c)(7)(i)(C) of Rule 2-01 of Regulation S-X, 0% and 0% respectively.
| (g) | Non-Audit Fees billed to the registrant, the registrant’s investment adviser, and certain entities controlling, controlled by or under common control with the investment adviser: |
Fiscal year ended 2010 - $254,797
Fiscal year ended 2009 - $158,726
(h) The registrant’s Audit Committee has considered that the provision of non-audit services that were rendered to the registrant’s adviser (not including any sub-adviser whose role is primarily portfolio management and is subcontracted with or overseen by another investment adviser), and any entity controlling, controlled by, or under common control with the investment adviser that provides ongoing services to the registrant that were not pre-approved pursuant to paragraph (c)(7)(ii) of Rule 2-01 of Regulation S-X is compatible with maintaining the principal accountant’s independence.
Item 5. Audit Committee of Listed Registrants
Not Applicable
Item 6. Schedule of Investments
Not Applicable
| Item 7. | Disclosure of Proxy Voting Policies and Procedures for Closed-End Management Investment Companies |
| Item 8. | Portfolio Managers of Closed-End Management Investment Companies |
| Item 9. | Purchases of Equity Securities by Closed-End Management Investment Company and Affiliated Purchasers |
Item 10. Submission of Matters to a Vote of Security Holders
Not Applicable
Item 11. Controls and Procedures
(a) The registrant’s President and Treasurer have concluded that the
registrant’s disclosure controls and procedures (as defined in rule 30a-3(c) under the Act) are effective in design and operation and are sufficient to form the basis of the certifications required by Rule 30a-(2) under the Act, based on their evaluation of these disclosure controls and procedures within 90 days of the filing date of this report on Form N-CSR.
(b) There were no changes in the registrant’s internal control over financial reporting (as defined in rule 30a-3(d) under the Act) during the last fiscal quarter that have materially affected, or are reasonably likely to materially affect, the registrant’s internal control over financial reporting.
Item 12. Exhibits
SIGNATURES
Pursuant to the requirements of the Securities Exchange Act of 1934 and the Investment Company Act of 1940, the registrant has duly caused this report to be signed on its behalf by the undersigned, thereunto duly authorized.
| Registrant | Federated Index Trust | |
| | | | |
By | | /s/Richard A. Novak | |
| | | Richard A. Novak, Principal Financial Officer | |
| | | | |
| Date | | December 20, 2010_______ | |
Pursuant to the requirements of the Securities Exchange Act of 1934 and the Investment Company Act of 1940, this report has been signed below by the following persons on behalf of the registrant and in the capacities and on the dates indicated.
| By: | /s/J. Christopher Donahue | |
| | J. Christopher Donahue, Principal Executive Officer | |
| | | |
| Date | December 20, 2010 | |
By | | /s/Richard A. Novak | |
| | | Richard A. Novak, Principal Financial Officer | |
| | | | |
| Date | | December 20, 2010 | |