UNITED STATES
SECURITIES AND EXCHANGE COMMISSION
Washington, D.C. 20549
FORM N-CSR
CERTIFIED SHAREHOLDER REPORT OF REGISTERED
MANAGEMENT INVESTMENT COMPANIES
Investment Company Act file number | 811-6067 |
|
DIMENSIONAL INVESTMENT GROUP INC. |
(Exact name of registrant as specified in charter) |
|
1299 Ocean Avenue, Santa Monica, CA | | 90401 |
(Address of principal executive offices) | | (Zip code) |
|
Catherine L. Newell, Esquire, Vice President and Secretary Dimensional Investment Group Inc., 1299 Ocean Avenue, Santa Monica, CA 90401 |
(Name and address of agent for service) |
|
Registrant’s telephone number, including area code: | 310-395-8005 | |
|
Date of fiscal year end: | October 31 | |
|
Date of reporting period: | October 31, 2008 | |
| | | | | | | | |
ITEM 1. REPORTS TO STOCKHOLDERS.
DIMENSIONAL INVESTMENT GROUP INC.
U.S. Large Company Institutional Index Portfolio
Annual Report
Period Ended October 31, 2008

Dimensional Fund Advisors
6300 Bee Cave Road, Building One
Austin, TX 78746
December 2008
Dear Fellow Shareholder,
This has been a challenging year for investors. After drifting lower throughout the spring and summer, stock markets around the world plummeted in mid September on news that the ongoing credit crisis was driving some leading financial services companies toward failure. As the effects of this distress rippled through the financial world, investors became increasingly anxious and stock prices continued to decline sharply. In the month of October, the S&P 500 Index fell 16.8% or 196 points—its worst-ever monthly point decline.
Markets like this test investors' resolve. It is difficult to stick with a long-term investment plan when one sees the dramatic effects of high market volatility on a portfolio's value. Very few people are having a positive investment experience right now. But investors who have based their approach on a sensible risk/return framework tend to be in better shape than those who have not.
The recent market turbulence illustrates the reason why Dimensional believes that markets are efficient. History has shown time and again that prices cannot be predicted in public equity markets. This "random walk" makes diversification very important. Although the broad diversification in our portfolios didn't prevent negative performance this year, we believe it helped our shareholders avoid the extreme losses experienced by investors who concentrated their holdings in individual companies, industry sectors, or markets.
The unpredictability of stock prices also makes it important for investors to take a hard look at their own portfolios and determine how much risk and what types of risk they should take. Investors who hold asset mixes that accurately reflect their tolerance for risk are better able to withstand down markets.
Nobody knows when the capital markets will recover, but over time we can expect them to again offer a premium to investors who are willing to invest in relatively risky assets such as stocks. My view is that investors who have already paid for risk should stay invested and earn the return that can be expected when markets turn around. If markets continue to be so volatile, it's also important to understand that pulling money out of stocks, even for short periods of time, can result in significant missed opportunities.
All of us at Dimensional take our job as the steward of your assets very seriously and hope to have the opportunity to serve you for many years to come.
Sincerely,

David G. Booth
Chairman and Chief Executive Officer
[THIS PAGE INTENTIONALLY LEFT BLANK]
ANNUAL REPORT
Table of Contents
| Letter to Shareholders | | Page | |
| Definitions of Abbreviations and Footnotes | | | 1 | | |
|
| Dimensional Investment Group Inc. — U.S. Large Company Institutional Index Portfolio | |
|
| Performance Chart | | | 2 | | |
|
| Management's Discussion and Analysis | | | 3 | | |
|
| Disclosure of Fund Expenses | | | 5 | | |
|
| Disclosure of Portfolio Holdings | | | 6 | | |
|
| Statement of Assets and Liabilities | | | 7 | | |
|
| Statements of Operations | | | 8 | | |
|
| Statements of Changes in Net Assets | | | 9 | | |
|
| Financial Highlights | | | 10 | | |
|
| Notes to Financial Statements | | | 11 | | |
|
| Report of Independent Registered Public Accounting Firm | | | 15 | | |
|
| The DFA Investment Trust Company — The U.S. Large Company Series | |
|
| Performance Chart | | | 16 | | |
|
| Disclosure of Fund Expenses | | | 17 | | |
|
| Disclosure of Portfolio Holdings | | | 18 | | |
|
| Summary Schedule of Portfolio Holdings | | | 19 | | |
|
| Statement of Assets and Liabilities | | | 22 | | |
|
| Statements of Operations | | | 23 | | |
|
| Statements of Changes in Net Assets | | | 24 | | |
|
| Financial Highlights | | | 25 | | |
|
| Notes to Financial Statements | | | 26 | | |
|
| Report of Independent Registered Public Accounting Firm | | | 31 | | |
|
| Fund Management | | | 32 | | |
|
| Voting Proxies on Fund Portfolio Securities | | | 39 | | |
|
| Notice to Shareholders | | | 40 | | |
|
This report is submitted for the information of the Fund's shareholders. It is not authorized for distribution to prospective investors unless preceded or accompanied by an effective prospectus.
i
[THIS PAGE INTENTIONALLY LEFT BLANK]
DIMENSIONAL INVESTMENT GROUP INC.
THE DFA INVESTMENT TRUST COMPANY
DEFINITIONS OF ABBREVIATIONS AND FOOTNOTES
Statement of Assets and Liabilities/Summary Schedule of Portfolio Holdings
Investment Abbreviations
FNMA Federal National Mortgage Association
STRIP Separate Trading of Registered Interest and Principal Securities
Investment Footnotes
† See Note B to Financial Statements.
** Calculated as a percentage of total net assets. Percentages shown parenthetically next to the category headings have been calculated as a percentage of total investments. "Other Securities" are those securities that are not among the top 50 holdings of the Fund or do not represent more than 1.0% of the net assets of the Fund. Some of the individual securities within this category may include Total or Partial Securities on Loan and/or Non-Income Producing Securities.
* Non-Income Producing Securities.
# Total or Partial Securities on Loan.
@ Security purchased with cash proceeds from Securities on Loan.
(y) The rate shown is the effective yield.
§ Affiliated Fund.
Financial Highlights
(A) Computed using average shares outstanding.
(B) Annualized
(C) Non-Annualized
(D) Represents the combined ratios for the respective portfolio and its respective pro-rata share of its Master Fund Series.
All Statements and Schedules
— Amounts designated as — are either zero or rounded to zero.
REITs Real Estate Investment Trusts
SEC Securities and Exchange Commission
1
DIMENSIONAL INVESTMENT GROUP INC.
PERFORMANCE CHART
2
DIMENSIONAL INVESTMENT GROUP INC.
MANAGEMENT'S DISCUSSION AND ANALYSIS
On September 16, 2008, at a regular meeting of the Board of Directors/Trustees (the "Board") of the funds covered by this report, the Board voted to change the fiscal and tax year ends of the funds from November 30 to October 31. Therefore, the following discussion generally covers the 11-month period ended October 31, 2008.
U.S. Equity Market Review 11 Months Ended October 31, 2008
U.S. equity markets experienced high levels of volatility during the 11-month fiscal year ended October 31, 2008. The behavior of equity markets has been driven in large part by the contraction of lending in credit markets. In addition to heightened volatility, the cross-sectional dispersion of stock returns in equity markets has increased relative to previous levels, and returns even within each asset class have differed greatly. Dimensional Fund Advisors believes that a security's risk characteristics determine its expected return. Among the most important factors explaining differences in the behavior of diversified equity portfolios are company size and company value/growth characteristics of the portfolio holdings. Size is measured by market capitalization, and "value" classification is a function of stock price relative to one or more fundamental characteristics. Compared to other stocks, value stocks often have lower market value rela tive to their earnings, dividends, and book value.
For the 11 months ended October 31, 2008, small company stocks slightly outperformed large companies, and mid cap companies underperformed both small and large cap companies. The performance of the Russell Microcap Index® was -33.59%, the Russell 2000 Index® was –29.07%, CRSP 6-10 Index was –32.90%, and MSCI USA Small Cap 1750 Index was –32.21%. Large cap value stocks, as measured by the Russell 1000 Value Index®, slightly outperformed large cap growth stocks, as measured by the Russell 1000 Growth Index®. The value premium was larger among small cap stocks.
Total Return for 11 Months Ended October 31, 2008
| Russell 2000 Index® (small cap companies) | | | –29.07 | % | |
| Russell Midcap Index® (mid cap companies) | | | –37.70 | % | |
| Russell 1000 Index® (large cap companies) | | | –33.99 | % | |
| Russell 3000 Value Index® | | | –32.90 | % | |
| Russell 3000 Growth Index® | | | –34.45 | % | |
When the large, mid, and small cap market segments are further divided by value and growth characteristics, the distinction in performance within sectors was equally significant.
Total Return for 11 Months Ended October 31, 2008
| Russell 1000 Value Index® (large cap value companies) | | | –33.55 | % | |
| Russell 1000 Growth Index® (large cap growth companies) | | | –34.54 | % | |
| Russell Midcap Value Index® (mid cap value companies) | | | –35.42 | % | |
| Russell Midcap Growth Index® (mid cap growth companies) | | | –40.01 | % | |
| Russell 2500 Value Index® (small/mid cap value companies) | | | –29.10 | % | |
| Russell 2500 Growth Index® (small/mid cap growth companies) | | | –37.30 | % | |
| Russell 2000 Value Index® (small cap value companies) | | | –24.91 | % | |
| Russell 2000 Growth Index® (small cap growth companies) | | | –33.26 | % | |
Source: Russell data copyright© Russell Investment Group 1995-2008, all rights reserved.
Differences in returns for the various Dimensional U.S. equity funds over the 11 months ended October 31, 2008 were attributable primarily to differences in value/growth and size characteristics as well as the exclusion of REIT securities from most Dimensional portfolios, except for the DFA Real Estate Securities Portfolio and portfolios investing in the U.S. Large Company Series. Moreover, the portfolio construction approach used by Dimensional Fund Advisors generally resulted in portfolios with greater emphasis on value or small company characteristics relative to widely used index benchmarks.
3
Master-Feeder Structure
The portfolio described below, called a "Feeder Fund," does not buy individual securities directly; instead, the portfolio invests in a corresponding fund called a "Master Fund." The Master Fund, in turn, purchases stocks, bonds, and/or other securities.
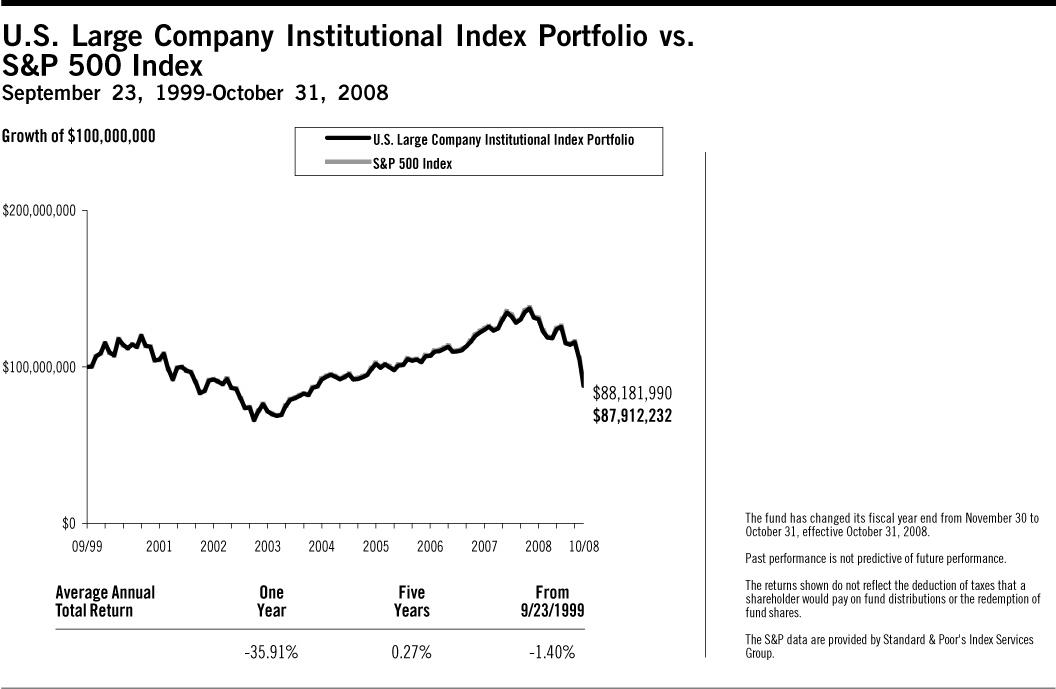
U.S. Large Company Institutional Index Portfolio
The U.S. Large Company Institutional Index Portfolio seeks to produce returns similar to those of the S&P 500® Index by purchasing shares of a Master Fund that invests in S&P 500® Index stocks in approximately the same proportions as they are represented in the S&P 500® Index. The Master Fund essentially was fully invested in equities throughout the year: average cash levels for the 11 months ended October 31, 2008 were in general less than 1% of assets.
For the 11 months ended October 31, 2008, total returns were -33.10% for the Portfolio and 33.31% for the S&P 500® Index. The securities in the Master Fund closely tracked the investment results of the S&P 500 Index®. The better relative performance of the Portfolio was primarily due to the flexible trading approach employed by the Master Fund to gain exposure to the performance of the S&P 500 Index® during periods of index reconstitution.
4
DIMENSIONAL INVESTMENT GROUP INC.
U.S. LARGE COMPANY INSTITUTIONAL INDEX PORTFOLIO
DISCLOSURE OF FUND EXPENSES
(Unaudited)
The following Expense Table is shown so that you can understand the impact of fees on your investment. All mutual funds have operating expenses. As a shareholder of the fund, you incur ongoing costs, which include costs for portfolio management, administrative services, and shareholder reports, among others. Operating expenses, legal and audit services, which are deducted from a fund's gross income, directly reduce the investment return of the fund. A fund's expenses are expressed as a percentage of its average net assets. This figure is known as the expense ratio. The following examples are intended to help you understand the ongoing costs, in dollars, of investing in the fund and to compare these costs with those of other mutual funds. The examples are based on an investment of $1,000 made at the beginning of the period shown and held for the entire period.
The Expense Table below illustrates your fund's costs in two ways.
Actual Fund Return
This section helps you to estimate the actual expenses after fee waivers that you paid over the period. The "Ending Account Value" shown is derived from the fund's actual return and "Expenses Paid During Period" reflect the dollar amount that would have been paid by an investor who started with $1,000 in the fund. You may use the information here, together with the amount you invested, to estimate the expenses that you paid over the period.
To do so, simply divide your account value by $1,000 (for example, a $7,500 account value divided by $1,000 = 7.5), then multiply the result by the number given for your fund under the heading "Expenses Paid During Period."
Hypothetical Example for Comparison Purposes
This section is intended to help you compare your fund's costs with those of other mutual funds. The hypothetical "Ending Account Value" and "Expenses Paid During Period" are derived from the fund's actual expense ratio and an assumed 5% annual return before expenses. In this case, because the return used is not the fund's actual return, the results do not apply to your investment. The example is useful in making comparisons because the SEC requires all mutual funds to calculate expenses based on a 5% annual return. You can assess your fund's cost by comparing this hypothetical example with the hypothetical examples that appear in shareholder reports of other funds.
Please note that the expenses shown in the table are meant to highlight and help you compare ongoing costs only and do not reflect any transactional costs, if applicable. The "Annualized Expense Ratio" represents the actual expenses for the six-month period indicated.
Six Months Ended October 31, 2008
EXPENSE TABLE
| | | Beginning
Account
Value
05/01/08 | | Ending
Account
Value
10/31/08 | | Annualized
Expense
Ratio* | | Expenses
Paid
During
Period* | |
| Actual Fund Return | | $ | 1,000.00 | | | $ | 708.90 | | | | 0.10 | % | | $ | 0.43 | | |
| Hypothetical 5% Annual Return | | $ | 1,000.00 | | | $ | 1,024.63 | | | | 0.10 | % | | $ | 0.51 | | |
* Expenses are equal to the fund's annualized expense ratio for the six-month period, multiplied by the average account value over the period, multiplied by the number of days in the most recent six-month period (184), then divided by the number of days in the year (366) to reflect the six-month period. The Portfolio is a Feeder Fund. The expenses shown reflect the direct expenses of the Feeder Fund and the indirect payment of the Feeder Fund's portion of the expenses of its Master Fund.
5
DIMENSIONAL INVESTMENT GROUP INC.
U.S. LARGE COMPANY INSTITUTIONAL INDEX PORTFOLIO
DISCLOSURE OF PORTFOLIO HOLDINGS
(Unaudited)
The SEC requires that all Funds file a complete Schedule of Investments with the SEC for their first and third fiscal quarters on Form N-Q. For Dimensional Investment Group Inc., this would be for the fiscal quarters ending January 31 and July 31. The Form N-Q filing must be made within 60 days of the end of the quarter. Dimensional Investment Group Inc. filed its most recent Form N-Q with the SEC on October 30, 2008. It is available upon request, without charge, by calling collect: (310) 395-8005 or by mailing a request to Dimensional Fund Advisors LP, 1299 Ocean Avenue, Santa Monica, California 90401, or by visiting the SEC's website at http://www.sec.gov, or they may be reviewed and copied at the SEC's Public Reference Room in Washington, D.C. (call 1-800-732-0330 for information on the operation of the Public Reference Room).
PORTFOLIO HOLDINGS
The SEC requires that all Funds present their categories of portfolio holdings in a table, chart or graph format in their annual and semi-annual shareholder reports, whether or not a Schedule of Investments is utilized. The following table, which presents portfolio holdings as a percent of total investments before short-term investments and collateral for loaned securities, is provided in compliance with such requirement.
The categories of industry classification for the Affiliated Investment Company are represented in the Disclosure of Portfolio Holdings, which are included elsewhere within the report. Refer to the Summary Schedule of Portfolio Holdings for the underlying Master Fund's holdings which reflect the investments by category.
| Affiliated Investment Company | | | 100.0 | % | |
6
DIMENSIONAL INVESTMENT GROUP INC.
U.S. LARGE COMPANY INSTITUTIONAL INDEX PORTFOLIO
STATEMENT OF ASSETS AND LIABILITIES
OCTOBER 31, 2008
(Amounts in thousands, except share and per share amounts)
| ASSETS: | |
Investment in The U.S. Large Company Series of The DFA Investment Trust Company
(Affiliated Investment Company) at Value† | | $ | 729,288 | | |
| Receivables: | |
| Affiliated Investment Company | | | 69 | | |
| Fund Shares Sold | | | 475 | | |
| Prepaid Expenses and Other Assets | | | 20 | | |
| Total Assets | | | 729,852 | | |
| LIABILITIES: | |
| Payables: | |
| Fund Shares Redeemed | | | 544 | | |
| Due to Advisor | | | 21 | | |
| Accrued Expenses and Other Liabilities | | | 69 | | |
| Total Liabilities | | | 634 | | |
| NET ASSETS | | $ | 729,218 | | |
| SHARES OUTSTANDING, $0.01 PAR VALUE (1) | | | 95,705,362 | | |
| NET ASSET VALUE, OFFERING AND REDEMPTION PRICE PER SHARE | | $ | 7.62 | | |
| Investment in Affiliated Investment Company at Cost | | $ | 781,916 | | |
| NET ASSETS CONSIST OF: | |
| Paid-In Capital | | $ | 904,455 | | |
| Undistributed Net Investment Income (Distributions in Excess of Net Investment Income) | | | 3,125 | | |
| Accumulated Net Realized Gain (Loss) | | | (125,734 | ) | |
| Net Unrealized Appreciation (Depreciation) | | | (52,628 | ) | |
| NET ASSETS | | $ | 729,218 | | |
| (1) NUMBER OF SHARES AUTHORIZED | | | 200,000,000 | | |
See accompanying Notes to Financial Statements.
7
DIMENSIONAL INVESTMENT GROUP INC.
U.S. LARGE COMPANY INSTITUTIONAL INDEX PORTFOLIO
STATEMENTS OF OPERATIONS
(Amounts in thousands)
| | | Period
Dec. 1, 2007
to
Oct. 31, 2008 | | Year
Ended
Nov. 30,
2007 | |
| Investment Income | |
| Dividends | | $ | 18,074 | | | $ | 18,154 | | |
| Interest | | | 425 | | | | 793 | | |
| Income from Securities Lending | | | 379 | | | | 182 | | |
| Expenses Allocated from Affiliated Investment Company | | | (363 | ) | | | (406 | ) | |
| Total Investment Income | | | 18,515 | | | | 18,723 | | |
| Expenses | |
| Administrative Services Fees | | | 429 | | | | 478 | | |
| Accounting & Transfer Agent Fees | | | 24 | | | | 25 | | |
| Filing Fees | | | 47 | | | | 37 | | |
| Shareholders' Reports | | | 47 | | | | 63 | | |
| Directors'/Trustees' Fees & Expenses | | | — | | | | 5 | | |
| Professional Fees | | | 25 | | | | 23 | | |
| Other | | | 8 | | | | 2 | | |
| Total Expenses | | | 580 | | | | 633 | | |
Fees Waived, Expenses Reimbursed, and/or Previously Waived Fees
Recovered by Advisor (Note C) | | | (84 | ) | | | (84 | ) | |
| Net Expenses | | | 496 | | | | 549 | | |
| Net Investment Income (Loss) | | | 18,019 | | | | 18,174 | | |
| Realized and Unrealized Gain (Loss) | |
| Net Realized Gain (Loss) on: | |
| Investment Securities Sold | | | (22,091 | ) | | | 2,354 | | |
| Futures | | | (4,079 | ) | | | 441 | | |
| Change in Unrealized Appreciation (Depreciation) of: | |
| Investment Securities | | | (342,835 | ) | | | 48,691 | | |
| Futures | | | 682 | | | | (119 | ) | |
| Net Realized and Unrealized Gain (Loss) | | | (368,323 | ) | | | 51,367 | | |
| Net Increase (Decrease) in Net Assets Resulting from Operations | | $ | (350,304 | ) | | $ | 69,541 | | |
Investment Income and Realized and Unrealized Gain (Loss) were allocated from the Portfolio's Master Fund (Affiliated Investment Company).
See accompanying Notes to Financial Statements.
8
DIMENSIONAL INVESTMENT GROUP INC.
U.S. LARGE COMPANY INSTITUTIONAL INDEX PORTFOLIO
STATEMENTS OF CHANGES IN NET ASSETS
(Amounts in thousands)
| | | Period
Dec. 1, 2007
to
Oct. 31, 2008 | | Year
Ended
Nov. 30,
2007 | | Year
Ended
Nov. 30,
2006 | |
| Increase (Decrease) in Net Assets | |
| Operations: | |
| Net Investment Income (Loss) | | $ | 18,019 | | | $ | 18,174 | | | $ | 14,644 | | |
| Net Realized Gain (Loss) on: | |
| Investment Securities Sold | | | (22,091 | ) | | | 2,354 | | | | (2,133 | ) | |
| Futures | | | (4,079 | ) | | | 441 | | | | 927 | | |
| Change in Unrealized Appreciation (Depreciation) of: | |
| Investment Securities | | | (342,835 | ) | | | 48,691 | | | | 93,381 | | |
| Futures | | | 682 | | | | (119 | ) | | | (395 | ) | |
Net Increase (Decrease) in Net Assets Resulting
from Operations | | | (350,304 | ) | | | 69,541 | | | | 106,424 | | |
| Distributions From: | |
| Net Investment Income | | | (19,755 | ) | | | (17,347 | ) | | | (13,807 | ) | |
| Total Distributions | | | (19,755 | ) | | | (17,347 | ) | | | (13,807 | ) | |
| Capital Share Transactions (1): | |
| Shares Issued | | | 224,711 | | | | 178,336 | | | | 189,192 | | |
| Shares Issued in Lieu of Cash Distributions | | | 19,426 | | | | 16,995 | | | | 13,527 | | |
| Shares Redeemed | | | (147,002 | ) | | | (122,788 | ) | | | (110,526 | ) | |
| Net Increase (Decrease) from Capital Share Transactions | | | 97,135 | | | | 72,543 | | | | 92,193 | | |
| Total Increase (Decrease) in Net Assets | | | (272,924 | ) | | | 124,737 | | | | 184,810 | | |
| Net Assets | |
| Beginning of Period | | | 1,002,142 | | | | 877,405 | | | | 692,595 | | |
| End of Period | | $ | 729,218 | | | $ | 1,002,142 | | | $ | 877,405 | | |
| (1) Shares Issued and Redeemed: | |
| Shares Issued | | | 22,832 | | | | 15,525 | | | | 18,690 | | |
| Shares Issued in Lieu of Cash Distributions | | | 1,861 | | | | 1,500 | | | | 1,360 | | |
| Shares Redeemed | | | (15,126 | ) | | | (10,622 | ) | | | (10,867 | ) | |
| | | 9,567 | | | | 6,403 | | | | 9,183 | | |
Undistributed Net Investment Income
(Distributions in Excess of Net Investment Income) | | $ | 3,125 | | | $ | 4,861 | | | $ | 4,034 | | |
See accompanying Notes to Financial Statements.
9
DIMENSIONAL INVESTMENT GROUP INC.
U.S. LARGE COMPANY INSTITUTIONAL INDEX PORTFOLIO
FINANCIAL HIGHLIGHTS
(for a share outstanding throughout each period)
| | | Period
Dec. 1, 2007
to
Oct. 31, 2008 | | Year
Ended
Nov. 30,
2007 | | Year
Ended
Nov. 30,
2006 | | Year
Ended
Nov. 30,
2005 | | Year
Ended
Nov. 30,
2004 | | Year
Ended
Nov. 30,
2003 | |
Net Asset Value, Beginning
of Period | | $ | 11.63 | | | $ | 11.00 | | | $ | 9.82 | | | $ | 9.23 | | | $ | 8.32 | | | $ | 7.36 | | |
| Income from Investment Operations | |
| Net Investment Income (Loss) | | | 0.20 | (A) | | | 0.22 | (A) | | | 0.19 | (A) | | | 0.17 | | | | 0.17 | | | | 0.13 | | |
Net Gains (Losses) (Realized
and Unrealized) | | | (3.99 | ) | | | 0.62 | | | | 1.18 | | | | 0.61 | | | | 0.88 | | | | 0.95 | | |
Total from Investment
Operations | | | (3.79 | ) | | | 0.84 | | | | 1.37 | | | | 0.78 | | | | 1.05 | | | | 1.08 | | |
| Less Distributions | |
| Net Investment Income | | | (0.22 | ) | | | (0.21 | ) | | | (0.19 | ) | | | (0.19 | ) | | | (0.14 | ) | | | (0.12 | ) | |
| Total Distributions | | | (0.22 | ) | | | (0.21 | ) | | | (0.19 | ) | | | (0.19 | ) | | | (0.14 | ) | | | (0.12 | ) | |
| Net Asset Value, End of Period | | $ | 7.62 | | | $ | 11.63 | | | $ | 11.00 | | | $ | 9.82 | | | $ | 9.23 | | | $ | 8.32 | | |
| Total Return | | | (33.10 | )%(C) | | | 7.71 | % | | | 14.11 | % | | | 8.50 | % | | | 12.66 | % | | | 14.94 | % | |
Net Assets, End of Period
(thousands) | | $ | 729,218 | | | $ | 1,002,142 | | | $ | 877,405 | | | $ | 692,595 | | | $ | 534,285 | | | $ | 398,955 | | |
Ratio of Expenses to
Average Net Assets (D) | | | 0.10 | %(B) | | | 0.10 | % | | | 0.10 | % | | | 0.10 | % | | | 0.10 | % | | | 0.11 | % | |
Ratio of Expenses to Average
Net Assets (Excluding Waivers
and Assumption of Expenses
and/or Recovery of Previously
Waived Fees) (D) | | | 0.11 | %(B) | | | 0.11 | % | | | 0.11 | % | | | 0.14 | % | | | 0.15 | % | | | 0.16 | % | |
Ratio of Net Investment Income
to Average Net Assets | | | 2.10 | %(B) | | | 1.90 | % | | | 1.90 | % | | | 1.82 | % | | | 1.96 | % | | | 1.69 | % | |
See Page 1 for the Definitions of Abbreviations and Footnotes.
See accompanying Notes to Financial Statements.
10
DIMENSIONAL INVESTMENT GROUP INC.
U.S. LARGE COMPANY INSTITUTIONAL INDEX PORTFOLIO
NOTES TO FINANCIAL STATEMENTS
A. Organization:
Dimensional Investment Group Inc. (the "Fund") is an open-end management investment company registered under the Investment Company Act of 1940, whose shares are offered to institutional investors, retirement plans and clients of registered investment advisors. The Fund consists of fifteen portfolios, of which the U.S. Large Company Institutional lndex Portfolio (the "Portfolio") is presented in this report.
The Portfolio primarily invests its assets in The U.S. Large Company Series (the "Series"), a corresponding series of The DFA Investment Trust Company. At October 31, 2008, the Portfolio owned 22% of the Series. The financial statements of the Series are included elsewhere in this report and should be read in conjunction with the financial statements of the Portfolio.
At a regular meeting of the Board of Directors/Trustees (the "Board") on September 16, 2008, the Board voted to change the fiscal and tax year ends of the Portfolio from November 30 to October 31.
B. Significant Accounting Policies:
The following significant accounting policies are in conformity with accounting principles generally accepted in the United States of America. Such policies are consistently followed by the Fund in preparation of its financial statements. The preparation of financial statements in accordance with accounting principles generally accepted in the United States of America requires management to make estimates and assumptions that affect the reported amounts of assets and liabilities and disclosure of contingent assets and liabilities at the date of the financial statements and the reported amounts of increases and decreases in net assets from operations during the reporting period. Actual results could differ from those estimates and those differences could be material.
1. Security Valuation: The Portfolio's investment reflects its proportionate interest in the net assets of the Series.
Adoption of Statement of Financial Accounting Standards No. 157 "Fair Value Measurements" ("FAS 157")
In September 2006, the Financial Accounting Standards Board issued FAS 157 effective for fiscal years beginning after November 15, 2007. This standard clarifies the definition of fair value for financial reporting, establishes a framework for measuring fair value and requires additional disclosures about the use of fair value measurements. The Funds have adopted FAS 157 as of December 1, 2007. The three levels of the fair value hierarchy under FAS 157 are described below:
• Level 1 – quoted prices in active markets for identical securities
• Level 2 – other significant observable inputs (including quoted prices for similar securities, interest rates, prepayment speeds, credit risk, etc.)
• Level 3 – significant unobservable inputs (including the Portfolio's own assumptions in determining the fair value of investments)
The inputs or methodology used for valuing securities are not necessarily an indication of the risk associated with investing in those securities. A summary of the inputs used to value the Portfolio's net assets as of October 31, 2008 is listed below (in thousands).
| | | Valuation Inputs | |
| | | Investments in
Securities
(Market Value) | |
| | | Level 1 | | Level 2 | | Level 3 | | Total | |
| U.S. Large Company Institutional Index Portfolio | | $ | 729,288 | | | | — | | | | — | | | $ | 729,288 | | |
11
2. Deferred Compensation Plan: Each eligible Director of the Fund may elect participation in the Deferred Compensation Plan (the "Plan"). Under the Plan, effective January 1, 2002, such Directors may defer payment of all or a portion of their total fees earned as a Director. These deferred amounts may be treated as though such amounts had been invested in shares of the following funds: U.S. Large Cap Value Portfolio; U.S. Core Equity 1 Portfolio; U.S. Core Equity 2 Portfolio; U.S. Vector Equity Portfolio; U.S. Micro Cap Portfolio; DFA International Value Portfolio; International Core Equity Portfolio; Emerging Markets Portfolio; Emerging Markets Core Equity Portfolio; and/or DFA Two-Year Global Fixed Income Portfolio. Contributions made under the Plan and the change in unrealized a ppreciation (depreciation) and income, are included in Other Expenses for the period ended October 31, 2008 and are included in Directors'/Trustees' Fees & Expenses for the year ended November 30, 2007. At October 31, 2008, the total liability for deferred compensation to Directors is included in Accrued Expenses and Other Liabilities on the Statement of Assets and Liabilities in the amount of $14 (in thousands).
Each Director has the option to receive their distribution of proceeds in one of the following methods upon one year's notice: lump sum; annual installments over a period of agreed upon years; or semi-annual installments over a period of agreed upon years. As of October 31, 2008, none of the Directors have requested distribution of proceeds.
3. Other: The Portfolio recognizes its pro-rata share, on a daily basis, of net investment income and realized and unrealized gains and losses of investment securities and futures from the Series, which is treated as a partnership for federal income tax purposes. Dividend income and distributions to shareholders are recorded on the ex-dividend date. Distributions received on securities that represent a return of capital or capital gain are recorded as a reduction of cost of investments or as a realized gain, respectively. The Portfolio estimates the character of distributions received that may be considered return of capital distributions. Expenses directly attributable to the Portfolio are directly charged. Common expenses of the Fund are allocated using methods approved by the Bo ard of Directors/Trustees, generally based on average net assets.
C. Investment Advisor:
Dimensional Fund Advisors LP ("Dimensional" or the "Advisor") provides administrative services to the Portfolio, including supervision of services provided by others, providing information to the shareholders and to the Board of Directors/Trustees, and other administrative services. The Advisor provides investment advisory services to the Series. For the period December 1, 2007 to October 31, 2008, the Portfolio's administrative services fees were accrued daily and paid monthly to the Advisor at an effective annual rate of 0.05% of average daily net assets.
Pursuant to the Fee Waiver and Expense Assumption Agreement for the Portfolio, the Advisor has contractually agreed to waive its administration fee to the extent necessary to reduce the Portfolio's expenses to the extent that its total direct and indirect expenses (including the expenses the Portfolio bears as a shareholder of the Series) exceed 0.10% of its average daily net assets on an annualized basis. At any time that the total direct and indirect expenses of the Portfolio are less than 0.10% of its average daily net assets on an annualized basis, the Advisor retains the right to recover any fees previously waived to the extent that such recovery will not cause the Portfolio's total direct and indirect expenses to exceed 0.10% of its average daily net assets on an annualized basis. The Portfolio is not obligated to reimburse the Advisor for fees waived by the Advisor more than thirty-six months before the date of such recovery. The Fee Waiver and Expense Assumption Agreement will remain in effect for a period of one year from April 1, 2008 to April 1, 2009, and shall continue in effect from year to year thereafter unless terminated by the Fund or the Advisor. At October 31, 2008, approximately $292 (in thousands) of previously waived fees are subject to future recovery by the Advisor over various periods not exceeding October 31, 2011.
Fees Paid to Officers and Directors/Trustees:
Certain Officers and Directors/Trustees of the Advisor are also Officers and Directors/Trustees of the Fund; however, such Officers and Directors/Trustees (with the exception of the Chief Compliance Officer ("CCO")) receive no compensation from the Fund. For the period December 1, 2007 to October 31, 2008, the total related amounts paid by the Fund to the CCO were $25 (in thousands). The total related amounts paid by the Portfolio are included in Other Expenses on the Statement of Operations.
12
D. Federal Income Taxes:
The Portfolio has qualified and intends to continue to qualify as a regulated investment company under Subchapter M of the Internal Revenue Code for federal income tax purposes and to distribute substantially all of its taxable income and net capital gains to its shareholders. Accordingly, no provision has been made for federal income taxes.
Distributions from net investment income and net realized capital gains are determined in accordance with U.S. federal income tax regulations, which may differ from those amounts determined under accounting principles generally accepted in the United States of America. These book/tax differences are either temporary or permanent in nature. To the extent these differences are permanent, they are charged or credited to paid-in capital, undistributed net investment income or accumulated net realized gains, as appropriate, in the period that the differences arise. There were no permanent differences as of October 31, 2008.
The tax character of dividends and distributions declared and paid during the years ended November 30, 2006, November 30, 2007 and the period December 1, 2007 to October 31, 2008 were as follows (amounts in thousands):
| | | Net Investment
Income and
Short-Term
Capital Gains | | Long-Term
Capital Gains | | Total | |
| | 2006 | | | $ | 13,807 | | | | — | | | $ | 13,807 | | |
| | 2007 | | | | 17,347 | | | | — | | | | 17,347 | | |
| | 2008 | | | | 19,755 | | | | — | | | | 19,755 | | |
As of October 31, 2008, the components of distributable earnings/(accumulated losses) were as follows (amounts in thousands):
Undistributed
Net Investment
Income and
Short-Term
Capital Gains | | Capital
Loss
Carryforwards | | Total Net
Distributable
Earnings/
(Accumulated
Losses) | |
| $ | 3,139 | | | $ | (98,922 | ) | | $ | (95,783 | ) | |
For federal income tax purposes, the Fund measures its capital loss carryforwards annually at October 31, its fiscal year end. Capital loss carryforwards may be carried forward and applied against future capital gains. As of October 31, 2008, the Portfolio had capital loss carryforward available to offset future realized capital gains through the indicated expiration dates (amounts in thousands):
| Expires on October 31, | | | |
| 2009 | | 2010 | | 2011 | | 2013 | | 2014 | | 2016 | | Total | |
| $ | 50,824 | | | $ | 14,821 | | | $ | 13,996 | | | $ | 1,702 | | | $ | 1,944 | | | $ | 15,635 | | | $ | 98,922 | | |
At October 31, 2008, the total cost and aggregate gross unrealized appreciation and (depreciation) of securities for federal income tax purposes were different from amounts reported for financial reporting purposes (amounts in thousands):
Federal
Tax Cost | | Unrealized
Appreciation | | Unrealized
(Depreciation) | | Net
Unrealized
Appreciation
(Depreciation) | |
| $ | 807,201 | | | $ | 65,751 | | | $ | (143,664 | ) | | $ | (77,913 | ) | |
In June 2006, the Financial Accounting Standards Board (FASB) issued FASB Interpretation 48 ("FIN 48"), "Accounting for Uncertainty in Income Taxes." This standard defines the threshold for recognizing the benefits of tax-return positions in the financial statements as "more-likely-than-not" to be sustained by the taxing authority and requires measurement of a tax position meeting the more-likely-than-not criterion, based on the largest benefit that is more than 50 percent likely to be realized. Management has analyzed the Portfolio's tax positions to be taken on the federal income tax returns for all open tax years (tax years ended November 30, 2005 through the period ended October 31, 2008), for purposes of implementing FIN 48, and has concluded that no provision for income tax is required in the Portfolio's financial statements.
13
E. Line of Credit:
The Fund, together with other Dimensional-advised portfolios, has entered into a $250 million unsecured discretionary line of credit effective June 30, 2003 with an affiliate of its domestic custodian bank. Each portfolio is permitted to borrow, subject to its investment limitations, up to a maximum of $250 million, as long as total borrowings under the line of credit do not exceed $250 million in the aggregate. Borrowings under the line are charged interest at the then current Federal Funds Rate plus 1%. Each portfolio is individually, and not jointly, liable for its particular advances under the line of credit. There is no commitment fee on the unused portion of the line of credit. The agreement for the discretionary line of credit may be terminated by either party at any time. The line of credit is scheduled to expire on June 23, 2009. There were no borrowings by the Portfolio under this line of credit during the period ended October 31, 2008.
The Fund, together with other Dimensional-advised portfolios, has also entered into an additional $500 million unsecured line of credit effective January 15, 2008 with its international custodian bank. Each portfolio is permitted to borrow, subject to its investment limitations, up to a maximum of $500 million as long as total borrowings under the line of credit do not exceed $500 million in the aggregate. Each portfolio is individually, and not jointly, liable for its particular advances under the line of credit. Borrowings under the line of credit are charged interest at rates agreed to by the parties at the time of borrowing. There is no commitment fee on the unused portion of the line of credit. The agreement of the line of credit expires on January 15, 2009. There were no borrowings by the Portfolio under this line of credit during the period ended October 31, 2008.
F. Indemnitees; Contractual Obligations:
Under the Fund's organizational documents, its officers and directors are indemnified against certain liabilities arising out of the performance of their duties to the Fund.
In the normal course of business, the Fund enters into contracts that contain a variety of representations and warranties which provide general indemnification. The Fund's maximum exposure under these arrangements is unknown as this would involve future claims that may be made against the Fund and/or its affiliates that have not yet occurred. However, based on experience, the Fund expects the risk of loss to be remote.
G. Recently Issued Accounting Standards and Interpretation:
In March 2008, Statement of Financial Accounting Standards No. 161, Disclosures about Derivative Instruments and Hedging Activities ("FAS 161"), was issued and is effective for fiscal years beginning after November 15, 2008. FAS 161 defines new disclosures of derivative instruments and hedging activities. Management is currently evaluating the implications of FAS 161. At this time, its impact on the Portfolio's financial statements has not been determined.
H. Other:
At October 31, 2008, two shareholders held approximately 93% of the outstanding shares of the Portfolio. One or more of the shareholders may be omnibus accounts, which typically hold shares for the benefit of several other underlying investors.
14
REPORT OF INDEPENDENT REGISTERED PUBLIC ACCOUNTING FIRM
To the Shareholders of U.S. Large Company Institutional Index Portfolio and
Board of Directors of Dimensional Investment Group Inc.:
In our opinion, the accompanying statement of assets and liabilities, and the related statements of operations and of changes in net assets and the financial highlights present fairly, in all material respects, the financial position of U.S. Large Company Institutional Index Portfolio (one of the portfolios constituting Dimensional Investment Group Inc., hereafter referred to as the "Portfolio") at October 31, 2008, the results of its operations, the changes in its net assets and the financial highlights for each of the periods indicated, in conformity with accounting principles generally accepted in the United States of America. These financial statements and financial highlights (hereafter referred to as "financial statements") are the responsibility of the Portfolio's management; our responsibility is to express an opinion on these financial statements based on our audits. We conducted our audits of these financial statements in accordanc e with the standards of the Public Company Accounting Oversight Board (United States). Those standards require that we plan and perform the audit to obtain reasonable assurance about whether the financial statements are free of material misstatement. An audit includes examining, on a test basis, evidence supporting the amounts and disclosures in the financial statements, assessing the accounting principles used and significant estimates made by management, and evaluating the overall financial statement presentation. We believe that our audits, which included confirmation of securities at October 31, 2008 by correspondence with the transfer agent of the investee fund, provide a reasonable basis for our opinion.
PricewaterhouseCoopers LLP
Philadelphia, Pennsylvania
December 22, 2008
15
THE DFA INVESTMENT TRUST COMPANY
PERFORMANCE CHART
16
THE DFA INVESTMENT TRUST COMPANY
THE U.S. LARGE COMPANY SERIES
DISCLOSURE OF FUND EXPENSES
(Unaudited)
The following Expense Table is shown so that you can understand the impact of fees on your investment. All mutual funds have operating expenses. As a shareholder of the fund, you incur ongoing costs, which include costs for portfolio management, administrative services, and shareholder reports, among others. Operating expenses, legal and audit services, which are deducted from a fund's gross income, directly reduce the investment return of the fund. A fund's expenses are expressed as a percentage of its average net assets. This figure is known as the expense ratio. The following examples are intended to help you understand the ongoing costs, in dollars, of investing in the fund and to compare these costs with those of other mutual funds. The examples are based on an investment of $1,000 made at the beginning of the period shown and held for the entire period.
The Expense Table below illustrates your fund's costs in two ways.
Actual Fund Return
This section helps you to estimate the actual expenses after fee waivers that you paid over the period. The "Ending Account Value" shown is derived from the fund's actual return and "Expenses Paid During Period" reflect the dollar amount that would have been paid by an investor who started with $1,000 in the fund. You may use the information here, together with the amount you invested, to estimate the expenses that you paid over the period.
To do so, simply divide your account value by $1,000 (for example, a $7,500 account value divided by $1,000 = 7.5), then multiply the result by the number given for your fund under the heading "Expenses Paid During Period."
Hypothetical Example for Comparison Purposes
This section is intended to help you compare your fund's costs with those of other mutual funds. The hypothetical "Ending Account Value" and "Expenses Paid During Period" are derived from the fund's actual expense ratio and an assumed 5% annual return before expenses. In this case, because the return used is not the fund's actual return, the results do not apply to your investment. The example is useful in making comparisons because the SEC requires all mutual funds to calculate expenses based on a 5% annual return. You can assess your fund's cost by comparing this hypothetical example with the hypothetical examples that appear in shareholder reports of other funds.
Please note that the expenses shown in the table are meant to highlight and help you compare ongoing costs only and do not reflect any transactional costs, if applicable. The "Annualized Expense Ratio" represents the actual expenses for the six-month period indicated.
Six Months Ended October 31, 2008
EXPENSE TABLE
| | | Beginning
Account
Value
05/01/08 | | Ending
Account
Value
10/31/08 | | Annualized
Expense
Ratio* | | Expenses
Paid
During
Period* | |
| Actual Fund Return | | $ | 1,000.00 | | | $ | 709.20 | | | | 0.04 | % | | $ | 0.17 | | |
| Hypothetical 5% Annual Return | | $ | 1,000.00 | | | $ | 1,024.94 | | | | 0.04 | % | | $ | 0.20 | | |
* Expenses are equal to the fund's annualized expense ratio for the six-month period, multiplied by the average account value over the period, multiplied by the number of days in the most recent six-month period (184), then divided by the number of days in the year (366) to reflect the six-month period.
17
THE DFA INVESTMENT TRUST COMPANY
THE U.S. LARGE COMPANY SERIES
DISCLOSURE OF PORTFOLIO HOLDINGS
(Unaudited)
The SEC requires that all Funds file a complete Schedule of Investments with the SEC for their first and third fiscal quarters on Form N-Q. For The DFA Investment Trust Company, this would be for the fiscal quarters ending January 31 and July 31. The Form N-Q filing must be made within 60 days of the end of the quarter. The DFA Investment Trust Company filed its most recent Form N-Q with the SEC on October 30, 2008. It is available upon request, without charge, by calling collect: (310) 395-8005 or by mailing a request to Dimensional Fund Advisors LP, 1299 Ocean Avenue, Santa Monica, California 90401, or by visiting the SEC's website at http://www.sec.gov, or they may be reviewed and copied at the SEC's Public Reference Room in Washington, D.C. (call 1-800-732-0330 for information on the operation of the Public Reference Room).
SEC regulations permit a fund to include in its reports to shareholders a "Summary Schedule of Portfolio Holdings" in lieu of a full Schedule of Investments. The Summary Schedule of Portfolio Holdings reports the fund's 50 largest holdings in unaffiliated issuers and any investments that exceed one percent of the fund's net assets at the end of the reporting period. The amendments also require that the Summary Schedule of Portfolio Holdings identify each category of investments that are held.
The fund is required to file a complete Schedule of Investments with the SEC on Form N-CSR within ten days after mailing the annual and semi-annual reports to shareholders. It will be available upon request, without charge, by calling collect: (310) 395-8005 or by mailing a request to Dimensional Fund Advisors LP, 1299 Ocean Avenue, Santa Monica, California 90401, or by visiting the SEC's website at http://www.sec.gov, or they may be reviewed and copied at the SEC's Public Reference Room in Washington, D.C. (call 1-800-732-0330 for information on the operation of the Public Reference Room).
PORTFOLIO HOLDINGS
The SEC requires that all Funds present their categories of portfolio holdings in a table, chart or graph format in their annual and semi-annual shareholder reports, whether or not a Schedule of Investments is utilized. The following table, which presents portfolio holdings as a percent of total investments before short-term investments and collateral for loaned securities, is provided in compliance with such requirement. The categories shown below represent broad industry sectors. Each industry sector consists of one or more specific industry classifications.
Consumer
Discretionary | | Consumer
Staples | | Energy | | Financials | | Health
Care | | Industrials | | Information
Technology | | Materials | | REITs | | Telecommunication
Services | | Utilities | | Total | |
| | 8.2 | % | | | 12.9 | % | | | 13.2 | % | | | 13.9 | % | | | 13.8 | % | | | 11.0 | % | | | 15.8 | % | | | 3.1 | % | | | 1.0 | % | | | 3.3 | % | | | 3.8 | % | | | 100.0 | % | |
18
THE U.S. LARGE COMPANY SERIES
SUMMARY SCHEDULE OF PORTFOLIO HOLDINGS
October 31, 2008
| | | Shares | | Value† | | Percentage
of Net Assets** | |
| COMMON STOCKS — (80.9%) | |
| Consumer Discretionary — (6.8%) | |
| Comcast Corp. Class A | | | 1,109,388 | | | $ | 17,483,955 | | | | 0.5 | % | |
| Disney (Walt) Co. | | | 713,351 | | | | 18,475,791 | | | | 0.6 | % | |
| # Home Depot, Inc. | | | 645,698 | | | | 15,232,016 | | | | 0.5 | % | |
| # McDonald's Corp. | | | 427,563 | | | | 24,768,725 | | | | 0.8 | % | |
| Other Securities | | | | | | | 194,135,666 | | | | 5.9 | % | |
| Total Consumer Discretionary | | | | | | | 270,096,153 | | | | 8.3 | % | |
| Consumer Staples — (10.4%) | |
| Altria Group, Inc. | | | 783,038 | | | | 15,026,499 | | | | 0.5 | % | |
| # Anheuser-Busch Companies, Inc. | | | 273,354 | | | | 16,956,149 | | | | 0.5 | % | |
| # Coca-Cola Co. | | | 755,726 | | | | 33,297,288 | | | | 1.0 | % | |
| # CVS Caremark Corp. | | | 545,607 | | | | 16,722,855 | | | | 0.5 | % | |
| Kraft Foods, Inc. | | | 577,134 | | | | 16,817,685 | | | | 0.5 | % | |
| PepsiCo, Inc. | | | 595,156 | | | | 33,929,844 | | | | 1.0 | % | |
| Philip Morris International, Inc. | | | 783,600 | | | | 34,063,092 | | | | 1.0 | % | |
| Procter & Gamble Co. | | | 1,153,540 | | | | 74,449,472 | | | | 2.3 | % | |
| # Wal-Mart Stores, Inc. | | | 852,470 | | | | 47,576,351 | | | | 1.5 | % | |
| Other Securities | | | | | | | 125,064,458 | | | | 3.8 | % | |
| Total Consumer Staples | | | | | | | 413,903,693 | | | | 12.6 | % | |
| Energy — (10.6%) | |
| # Chevron Corp. | | | 781,038 | | | | 58,265,435 | | | | 1.8 | % | |
| ConocoPhillips | | | 577,777 | | | | 30,055,960 | | | | 0.9 | % | |
| Exxon Mobil Corp. | | | 1,974,580 | | | | 146,355,870 | | | | 4.5 | % | |
| Occidental Petroleum Corp. | | | 310,624 | | | | 17,252,057 | | | | 0.5 | % | |
| # Schlumberger, Ltd. | | | 456,045 | | | | 23,554,724 | | | | 0.7 | % | |
| Other Securities | | | | | | | 148,426,806 | | | | 4.5 | % | |
| Total Energy | | | | | | | 423,910,852 | | | | 12.9 | % | |
| Financials — (11.3%) | |
| Bank of America Corp. | | | 1,906,573 | | | | 46,081,869 | | | | 1.4 | % | |
| # Citigroup, Inc. | | | 2,070,150 | | | | 28,257,547 | | | | 0.9 | % | |
| JPMorgan Chase & Co. | | | 1,400,511 | | | | 57,771,079 | | | | 1.8 | % | |
| The Goldman Sachs Group, Inc. | | | 165,164 | | | | 15,277,670 | | | | 0.5 | % | |
| # U.S. Bancorp | | | 662,268 | | | | 19,742,209 | | | | 0.6 | % | |
| # Wells Fargo & Co. | | | 1,257,952 | | | | 42,833,266 | | | | 1.3 | % | |
| Other Securities | | | | | | | 241,149,085 | | | | 7.3 | % | |
| Total Financials | | | | | | | 451,112,725 | | | | 13.8 | % | |
| Health Care — (11.2%) | |
| Abbott Laboratories | | | 586,042 | | | | 32,320,216 | | | | 1.0 | % | |
| * Amgen, Inc. | | | 402,228 | | | | 24,089,435 | | | | 0.7 | % | |
| # Bristol-Myers Squibb Co. | | | 752,581 | | | | 15,465,540 | | | | 0.5 | % | |
| #* Gilead Sciences, Inc. | | | 349,719 | | | | 16,034,616 | | | | 0.5 | % | |
| # Johnson & Johnson | | | 1,062,370 | | | | 65,165,776 | | | | 2.0 | % | |
| # Medtronic, Inc. | | | 428,938 | | | | 17,299,070 | | | | 0.5 | % | |
| # Merck & Co., Inc. | | | 814,494 | | | | 25,208,589 | | | | 0.8 | % | |
| Pfizer, Inc. | | | 2,562,692 | | | | 45,385,275 | | | | 1.4 | % | |
| # Wyeth | | | 506,924 | | | | 16,312,814 | | | | 0.5 | % | |
| Other Securities | | | | | | | 189,450,712 | | | | 5.7 | % | |
| Total Health Care | | | | | | | 446,732,043 | | | | 13.6 | % | |
19
THE U.S. LARGE COMPANY SERIES
CONTINUED
| | | Shares | | Value† | | Percentage
of Net Assets** | |
| Industrials — (8.9%) | |
| # 3M Co. | | | 265,731 | | | $ | 17,086,503 | | | | 0.5 | % | |
| # Boeing Co. | | | 281,415 | | | | 14,709,562 | | | | 0.4 | % | |
| # General Electric Co. | | | 3,990,157 | | | | 77,847,963 | | | | 2.4 | % | |
| # United Parcel Service, Inc. | | | 383,268 | | | | 20,228,885 | | | | 0.6 | % | |
| United Technologies Corp. | | | 366,615 | | | | 20,149,160 | | | | 0.6 | % | |
| Other Securities | | | | | | | 203,312,668 | | | | 6.3 | % | |
| Total Industrials | | | | | | | 353,334,741 | | | | 10.8 | % | |
| Information Technology — (12.5%) | |
| #* Apple, Inc. | | | 336,779 | | | | 36,234,053 | | | | 1.1 | % | |
| #* Cisco Sytems, Inc. | | | 2,245,688 | | | | 39,905,876 | | | | 1.2 | % | |
| #* Google, Inc. | | | 90,851 | | | | 32,182,844 | | | | 1.0 | % | |
| # Hewlett-Packard Co. | | | 931,064 | | | | 35,641,130 | | | | 1.1 | % | |
| # Intel Corp. | | | 2,137,289 | | | | 34,196,624 | | | | 1.0 | % | |
| # International Business Machines Corp. | | | 515,063 | | | | 47,885,407 | | | | 1.5 | % | |
| # Microsoft Corp. | | | 2,985,078 | | | | 66,656,792 | | | | 2.0 | % | |
| * Oracle Corp. | | | 1,489,655 | | | | 27,245,790 | | | | 0.8 | % | |
| QUALCOMM, Inc. | | | 623,836 | | | | 23,867,965 | | | | 0.7 | % | |
| Other Securities | | | | | | | 155,843,856 | | | | 4.9 | % | |
| Total Information Technology | | | | | | | 499,660,337 | | | | 15.3 | % | |
| Materials — (2.5%) | |
| # Monsanto Co. | | | 209,091 | | | | 18,604,917 | | | | 0.6 | % | |
| Other Securities | | | | | | | 82,742,804 | | | | 2.5 | % | |
| Total Materials | | | | | | | 101,347,721 | | | | 3.1 | % | |
| Real Estate Investment Trusts — (0.9%) | |
| Total Real Estate Investment Trusts | | | | | | | 34,307,409 | | | | 1.0 | % | |
| Telecommunication Services — (2.7%) | |
| AT&T, Inc. | | | 2,240,314 | | | | 59,973,206 | | | | 1.8 | % | |
| Verizon Communications, Inc. | | | 1,082,609 | | | | 32,121,009 | | | | 1.0 | % | |
| Other Securities | | | | | | | 14,620,434 | | | | 0.5 | % | |
| Total Telecommunication Services | | | | | | | 106,714,649 | | | | 3.3 | % | |
| Utilities — (3.1%) | |
| Total Utilities | | | | | | | 121,394,214 | | | | 3.7 | % | |
| TOTAL COMMON STOCKS | | | | | | | 3,222,514,537 | | | | 98.4 | % | |
| | | Face
Amount | | | | | |
| | | (000) | | | | | |
| TEMPORARY CASH INVESTMENTS — (0.9%) | |
Repurchase Agreement, PNC Capital Markets, Inc. 0.94%,11/03/08
(Collateralized by $36,525,000 FNMA 5.00%, 06/01/23,
valued at $34,569,468) to be repurchased at $34,058,668 | | $ | 34,056 | | | | 34,056,000 | | | | 1.0 | % | |
20
THE U.S. LARGE COMPANY SERIES
CONTINUED
| | | Shares | | Value† | | Percentage
of Net Assets** | |
| SECURITIES LENDING COLLATERAL — (18.2%) | |
| §@ DFA Short Term Investment Fund LP | | | 665,250,501 | | | $ | 665,250,501 | | | | 20.3 | % | |
| @ PNC Demand Deposit Account 0.22% | | | 10,000,000 | | | | 10,000,000 | | | | 0.3 | % | |
| | | Face
Amount | | | | | |
| | | (000) | | | | | |
@ Repurchase Agreement, Deutsche Bank Securitites 0.24%, 11/03/08
(Collateralized by $66,764,882 FNMA, rates ranging from 5.000% to 7.000%,
maturities ranging from 05/01/18 to 12/01/37 & U.S. Treasury STRIP, rates ranging from
0.569%(y) to 1.359%(y), maturities ranging from 11/30/08 to 11/30/09, valued at
$51,835,339) to be repurchased at $50,489,596 | | $ | 50,489 | | | | 50,488,600 | | | | 1.6 | % | |
| TOTAL SECURITIES LENDING COLLATERAL | | | | | | | 725,739,101 | | | | 22.2 | % | |
TOTAL INVESTMENTS — (100.0%)
(Cost $4,182,606,777) | | | | | | $ | 3,982,309,638 | | | | 121.6 | % | |
See accompanying Notes to Financial Statements.
21
THE DFA INVESTMENT TRUST COMPANY
THE U.S. LARGE COMPANY SERIES
STATEMENT OF ASSETS AND LIABILITIES
OCTOBER 31, 2008
(Amounts in thousands)
| ASSETS: | |
| Investments at Value (including $712,279 of securities on loan) | | $ | 3,222,515 | | |
| Temporary Cash Investments at Value & Cost | | | 34,056 | | |
| Collateral Received from Securities on Loan at Value & Cost | | | 725,739 | | |
| Cash | | | 4,084 | | |
| Receivables: | |
| Investment Securities Sold | | | 2,153 | | |
| Dividends and Interest | | | 4,961 | | |
| Fund Shares Sold | | | 5,691 | | |
| Securities Lending Income | | | 367 | | |
| Fund Margin Variation | | | 200 | | |
| Prepaid Expenses and Other Assets | | | 20 | | |
| Total Assets | | | 3,999,786 | | |
| LIABILITIES: | |
| Payables: | |
| Upon Return of Securities Loaned | | | 725,739 | | |
| Fund Shares Redeemed | | | 70 | | |
| Due to Advisor | | | 69 | | |
| Accrued Expenses and Other Liabilities | | | 256 | | |
| Total Liabilities | | | 726,134 | | |
| NET ASSETS | | $ | 3,273,652 | | |
| Investments at Cost | | $ | 3,422,812 | | |
See accompanying Notes to Financial Statements.
22
THE DFA INVESTMENT TRUST COMPANY
THE U.S. LARGE COMPANY SERIES
STATEMENTS OF OPERATIONS
(Amounts in thousands)
| | | Period
Dec. 1, 2007
to
Oct. 31, 2008 | | Year
Ended
Nov. 30,
2007 | |
| Investment Income | |
| Dividends | | $ | 82,686 | | | $ | 91,440 | | |
| Interest | | | 1,937 | | | | 3,944 | | |
| Income from Securities Lending | | | 1,741 | | | | 927 | | |
| Total Investment Income | | | 86,364 | | | | 96,311 | | |
| Expenses | |
| Investment Advisory Services Fees | | | 981 | | | | 1,201 | | |
| Accounting & Transfer Agent Fees | | | 403 | | | | 491 | | |
| S&P 500® Fees | | | 87 | | | | 86 | | |
| Custodian Fees | | | 58 | | | | 62 | | |
| Shareholders' Reports | | | 38 | | | | 52 | | |
| Directors'/Trustees' Fees & Expenses | | | — | | | | 7 | | |
| Professional Fees | | | 74 | | | | 119 | | |
| Other | | | 18 | | | | 31 | | |
| Total Expenses | | | 1,659 | | | | 2,049 | | |
| Net Investment Income (Loss) | | | 84,705 | | | | 94,262 | | |
| Realized and Unrealized Gain (Loss) | |
| Net Realized Gain (Loss) on: | |
| Investment Securities Sold | | | (126,174 | ) | | | 10,206 | | |
| Futures | | | (22,232 | ) | | | 3,585 | | |
| In-Kind Redemptions | | | 24,362 | * | | | 529,199 | * | |
| Change in Unrealized Appreciation (Depreciation) of: | |
| Investment Securities | | | (1,591,847 | ) | | | (217,829 | ) | |
| Futures | | | 1,195 | | | | (216 | ) | |
| Net Realized and Unrealized Gain (Loss) | | | (1,714,696 | ) | | | 324,945 | | |
| Net Increase (Decrease) in Net Assets Resulting from Operations | | $ | (1,629,991 | ) | | $ | 419,207 | | |
* See Note J in the Notes to Financial Statements.
See accompanying Notes to Financial Statements.
23
THE DFA INVESTMENT TRUST COMPANY
THE U.S. LARGE COMPANY SERIES
STATEMENTS OF CHANGES IN NET ASSETS
(Amounts in thousands)
| | | Period
Dec. 1, 2007
to
Oct. 31, 2008 | | Year
Ended
Nov. 30,
2007 | | Year
Ended
Nov. 30,
2006 | |
| Increase (Decrease) in Net Assets | |
| Operations: | |
| Net Investment Income (Loss) | | $ | 84,705 | | | $ | 94,262 | | | $ | 87,710 | | |
| Net Realized Gain (Loss) on: | |
| Investment Securities Sold | | | (126,174 | ) | | | 10,206 | | | | (8,634 | ) | |
| Futures | | | (22,232 | ) | | | 3,585 | | | | 6,769 | | |
| In-Kind Redemptions | | | 24,362 | * | | | 529,199 | * | | | — | | |
| Change in Unrealized Appreciation (Depreciation) of: | |
| Investment Securities | | | (1,591,847 | ) | | | (217,829 | ) | | | 523,721 | | |
| Futures | | | 1,195 | | | | (216 | ) | | | (1,050 | ) | |
Net Increase (Decrease) in Net Assets Resulting
from Operations | | | (1,629,991 | ) | | | 419,207 | | | | 608,516 | | |
| Transactions in Interest: | |
| Contributions | | | 696,520 | | | | 616,294 | | | | 753,004 | | |
| Withdrawals | | | (299,226 | )* | | | (1,482,132 | )* | | | (647,252 | ) | |
| Net Increase from Transactions in Interest | | | 397,294 | | | | (865,838 | ) | | | 105,752 | | |
| Total Increase (Decrease) in Net Assets | | | (1,232,697 | ) | | | (446,631 | ) | | | 714,268 | | |
| Net Assets | |
| Beginning of Period | | | 4,506,349 | | | | 4,952,980 | | | | 4,238,712 | | |
| End of Period | | $ | 3,273,652 | | | $ | 4,506,349 | | | $ | 4,952,980 | | |
* See Note J in the Notes to Financial Statements.
See accompanying Notes to Financial Statements.
24
THE DFA INVESTMENT TRUST COMPANY
THE U.S. LARGE COMPANY SERIES
FINANCIAL HIGHLIGHTS
| | | Period
Dec. 1, 2007
to
Oct. 31, 2008 | | Year
Ended
Nov. 30,
2007 | | Year
Ended
Nov. 30,
2006 | | Year
Ended
Nov. 30,
2005 | | Year
Ended
Nov. 30,
2004 | | Year
Ended
Nov. 30,
2003 | |
| Total Return | | | (33.10 | )%(C) | | | 7.77 | % | | | 14.25 | % | | | 8.51 | % | | | 12.77 | % | | | 15.05 | % | |
Net Assets, End of
Period (thousands) | | $ | 3,273,652 | | | $ | 4,506,349 | | | $ | 4,952,980 | | | $ | 4,238,712 | | | $ | 3,493,919 | | | $ | 3,000,997 | | |
Ratio of Expenses to
Average Net Assets | | | 0.04 | %(B) | | | 0.04 | % | | | 0.04 | % | | | 0.05 | % | | | 0.05 | % | | | 0.05 | % | |
Ratio of Net Investment
Income to Average
Net Assets | | | 2.16 | %(B) | | | 1.96 | % | | | 1.95 | % | | | 1.87 | % | | | 1.99 | % | | | 1.75 | % | |
| Portfolio Turnover Rate | | | 6 | %(C) | | | 13 | %* | | | 4 | % | | | 6 | % | | | 2 | % | | | 8 | % | |
See Page 1 for the Definitions of Abbreviations and Footnotes.
* Excluding security sales due to the In-Kind Redemptions, the portfolio turnover rate would have been 5%. See Note J in the Notes to Financial Statements.
See accompanying Notes to Financial Statements.
25
THE DFA INVESTMENT TRUST COMPANY
THE U.S. LARGE COMPANY SERIES
NOTES TO FINANCIAL STATEMENTS
A. Organization:
The DFA Investment Trust Company (the "Trust") is an open-end management investment company registered under the Investment Company Act of 1940. The Trust consists of eighteen investment portfolios, of which The U.S. Large Company Series (the "Series") is presented in this report.
At a regular meeting of the Board of Directors/Trustees (the "Board") on September 16, 2008, the Board voted to change the fiscal and tax year ends of the Series from November 30 to October 31.
B. Significant Accounting Policies:
The following significant accounting policies are in conformity with accounting principles generally accepted in the United States of America. Such policies are consistently followed by the Trust in preparation of its financial statements. The preparation of financial statements in accordance with accounting principles generally accepted in the United States of America requires management to make estimates and assumptions that affect the reported amounts of assets and liabilities and disclosure of contingent assets and liabilities at the date of the financial statements and the reported amounts of increases and decreases in net assets from operations during the reporting period. Actual results could differ from those estimates and those differences could be material.
1. Security Valuation: Securities held by the Series (including over-the-counter securities) are valued at the last quoted sale price of the day. Securities held by the Series that are listed on Nasdaq are valued at the Nasdaq Official Closing Price ("NOCP"). If there is no last reported sale price or NOCP for the day, the Series values the securities at the mean of the most recent quoted bid and asked prices. Price information on listed securities is taken from the exchange where the security is primarily traded. Generally, securities issued by open-end investment companies are valued using their respective net asset values or public offering prices, as appropriate, for purchase orders placed at the close of the New York Stock Exchange (NYSE).
Securities for which no market quotations are readily available (including restricted securities), or for which market quotations have become unreliable, are valued in good faith at fair value in accordance with procedures adopted by the Board of Directors/Trustees. Fair value pricing may also be used if events that have a significant effect on the value of an investment (as determined in the discretion of the Investment Committee of the Advisor) occur before the net asset value is calculated. When fair value pricing is used, the prices of securities used by the Series may differ from the quoted or published prices for the same securities on their primary markets or exchanges.
Futures contracts held by the Series are valued using the settlement price established each day on the exchange on which they are traded.
Adoption of Statement of Financial Accounting Standards No. 157 "Fair Value Measurements" ("FAS 157")
In September 2006, the Financial Accounting Standards Board issued FAS 157 effective for fiscal years beginning after November 15, 2007. This standard clarifies the definition of fair value for financial reporting, establishes a framework for measuring fair value and requires additional disclosures about the use of fair value measurements. The Funds have adopted FAS 157 as of December 1, 2007. The three levels of the fair value hierarchy under FAS 157 are described below:
• Level 1 – quoted prices in active markets for identical securities
• Level 2 – other significant observable inputs (including quoted prices for similar securities, interest rates, prepayment speeds, credit risk, etc.)
• Level 3 – significant unobservable inputs (including the Series' own assumptions in determining the fair value of investments)
26
The inputs or methodology used for valuing securities are not necessarily an indication of the risk associated with investing in those securities. A summary of the inputs used to value the Series' net assets as of October 31, 2008 is listed below (in thousands).
| | | Valuation Inputs | |
| | | Investments in
Securities
(Market Value) | | Other Financial
Instruments
(Unrealized
Appreciation/
Depreciation)* | |
| | | Level 1 | | Level 2 | | Level 3 | | Total | | Level 1 | | Level 2 | | Level 3 | | Total | |
| The U.S. Large Company Series | | $ | 3,222,515 | | | $ | 759,795 | | | | — | | | $ | 3,982,310 | | | $ | 2,377 | | | | — | | | | — | | | $ | 2,377 | | |
* Other financial instruments are derivative instruments not reflected in the Schedule of Investments, such as futures, forwards and swaps which are valued at the unrealized appreciation/depreciation on the investment.
2. Deferred Compensation Plan: Each eligible Trustee of the Trust may elect participation in the Deferred Compensation Plan (the "Plan"). Under the Plan, effective January 1, 2002, such Trustees may defer payment of all or a portion of their total fees earned as a Trustee. These deferred amounts may be treated as though such amounts had been invested in shares of the following funds: U.S. Large Cap Value Portfolio; U.S. Core Equity 1 Portfolio; U.S. Core Equity 2 Portfolio; U.S. Vector Equity Portfolio; U.S. Micro Cap Portfolio; DFA International Value Portfolio; International Core Equity Portfolio; Emerging Markets Portfolio; Emerging Markets Core Equity Portfolio; and/or DFA Two-Year Global Fixed Income Portfolio. Contributions made under the Plan and the change in unrealized app reciation (depreciation) are included in Other Expenses on October 31, 2008 and are included in Directors'/Trustees' Fees & Expenses on November 30, 2007. At October 31, 2008, the total liability for deferred compensation to Trustees is included in Accrued Expenses and Other Liabilities on the Statement of Assets and Liabilities in the amount of $62 (in thousands).
Each Trustee has the option to receive their distribution of proceeds in one of the following methods upon one year's notice: lump sum; annual installments over a period of agreed upon years; or semi-annual installments over a period of agreed upon years. As of October 31, 2008, none of the Trustees have requested distribution of proceeds.
3. Other: Security transactions are accounted for as of the trade date. Costs used in determining realized gains and losses on the sale of investment securities are on the basis of identified cost. Dividend income and distributions to shareholders are recorded on the ex-dividend date. Distributions received on securities that represent a return of capital or capital gains are recorded as a reduction of cost of investments or as a realized gain, respectively. The Series estimate the character of distributions received that may be considered return of capital distributions or capital gain distributions. Interest income is recorded on the accrual basis. Discount and premium on securities purchased are amortized over the lives of the respective securities utilizing the effective intere st method. Expenses directly attributable to a Series are directly charged. Common expenses of the Trust are allocated using methods approved by the Board of Directors/Trustees, generally based on average net assets.
C. Investment Advisor:
Dimensional Fund Advisors LP ("Dimensional" or the "Advisor") provides investment advisory services to the Series. For the period December 1, 2007 to October 31, 2008, the Series' investment advisory services fees were accrued daily and paid monthly to the Advisor based on an effective annual rate of 0.025% of average daily net assets.
Fees Paid to Officers and Directors/Trustees:
Certain Officers and Directors/Trustees of the Advisor are also Officers and Directors/Trustees of the Trust; however, such Officers and Directors/Trustees (with the exception of the Chief Compliance Officer ("CCO")) receive no compensation from the Trust. For the period December 1, 2007 to October 31, 2008, the total related amounts paid by the Trust to the CCO were $106 (in thousands). The total related amounts paid by the Series are included in Other Expenses on the Statement of Operations.
27
D. Purchases and Sales of Securities:
For the period December 1, 2007 to October 31, 2008, the Series made the following purchases and sales of investment securities, other than short-term securities and U.S. government securities (amounts in thousands):
| Purchases | | $ | 712,184 | | |
| Sales | | | 245,176 | | |
There were no purchases or sales of long-term U.S. government securities.
E. Federal Income Taxes:
No provision for federal income taxes is required since the Series is treated as a partnership for federal income tax purposes. Any net investment income and realized and unrealized gains or losses have been deemed to have been "passed down" to its partners.
At October 31, 2008, the total cost and aggregate gross unrealized appreciation and (depreciation) of securities for federal income tax purposes were different from amounts reported for financial reporting purposes (amounts in thousands):
Federal
Tax Cost | | Unrealized
Appreciation | | Unrealized
(Depreciation) | | Net
Unrealized
Appreciation
(Depreciation) | |
| $ | 4,340,356 | | | $ | 574,021 | | | $ | (932,067 | ) | | $ | (358,046 | ) | |
In June 2006, the Financial Accounting Standards Board (FASB) issued FASB Interpretation 48 ("FIN 48"), "Accounting for Uncertainty in Income Taxes." This standard defines the threshold for recognizing the benefits of tax-return positions in the financial statements as "more-likely-than-not" to be sustained by the taxing authority and requires measurement of a tax position meeting the more-likely-than-not criterion, based on the largest benefit that is more than 50 percent likely to be realized. Management has analyzed the Series' tax positions to be taken on the federal income tax returns for all open tax years (tax years ended November 30, 2005 through the period ended October 31, 2008), for purposes of implementing FIN 48, and has concluded that no provision for income tax is required in the Series' financial statements.
F. Financial Instruments:
In accordance with the Series' investment objectives and policies, the Series may invest in certain financial instruments that have off-balance sheet risk in excess of the amounts recognized in the financial statements and concentrations of credit and market risk. These instruments and their significant corresponding risks are described below:
1. Repurchase Agreements: The Series may purchase money market instruments subject to the counterparty's agreement to repurchase them at an agreed upon date and price. The counterparty will be required on a daily basis to maintain the value of the collateral subject to the agreement at not less than the repurchase price (including accrued interest). The agreements are conditioned upon the collateral being deposited under the Federal Reserve book-entry system with the Trust's custodian or a third party sub-custodian. In the event of default or bankruptcy by the other party to the agreement, retention of the collateral may be subject to legal proceedings. All open repurchase agreements were entered into on October 31, 2008.
2. Futures Contracts: During the period December 1, 2007 to October 31, 2008, the Series entered into futures contracts in accordance with its investment objectives. Upon entering into a futures contract, the Series deposits cash with a broker, equal to the minimum "initial margin" requirements of the exchange on which the contract is traded. Subsequent payments are received from or paid to the broker each day, based on the daily fluctuation in the market value of the contract. These receipts or payments are known as "variation margin" and are recorded daily by the Series as unrealized gains or losses until the contracts are closed. When the contracts are closed, the Series records a realized gain or loss equal to the difference between the value of the contract at the time it was opened and the value at the time it was closed.
At October 31, 2008, the Series had outstanding 155 long futures contracts of the S&P 500 Index®, all of which expire on December 19, 2008. The value of such contracts on October 31, 2008 was $37,483 (in thousands), which resulted in an unrealized gain of $2,377 (in thousands). Approximately $3,836 (in thousands) of cash has been segregated as collateral for the open futures contracts and has been accounted for as cash on the Statement of Assets and Liabilities.
28
Risks may arise upon entering into futures contracts from potential imperfect price correlations between the futures contracts and the underlying securities, from the possibility of an illiquid secondary market for these instruments and from the possibility that the Series could lose more than the initial margin requirements.
G. Line of Credit:
The Trust, together with other Dimensional-advised portfolios, has entered into a $250 million unsecured discretionary line of credit effective June 30, 2003 with an affiliate of its domestic custodian bank. Each portfolio is permitted to borrow, subject to its investment limitations, up to a maximum of $250 million, as long as total borrowings under the line of credit do not exceed $250 million in the aggregate. Borrowings under the line of credit are charged interest at the then current Federal Funds Rate plus 1%. Each portfolio is individually, and not jointly, liable for its particular advances under the line of credit. There is no commitment fee on the unused portion of the line of credit. The agreement for the discretionary line of credit may be terminated by either party at any time. The line of credit is scheduled to expire on June 23, 2009. There were no borrowings by the Series under this line of credit during the period ended Octo ber 31, 2008.
The Trust, together with other Dimensional-advised portfolios, has also entered into an additional $500 million unsecured line of credit effective January 15, 2008 with its international custodian bank. Each portfolio is permitted to borrow, subject to its investment limitations, up to a maximum of $500 million, as long as total borrowings under the line of credit do not exceed $500 million in the aggregate. Each portfolio is individually, and not jointly, liable for its particular advances under the line of credit. Borrowings under the line of credit are charged interest at rates agreed to by the parties at the time of borrowing. There is no commitment fee on the unused portion of the line of credit. The agreement of the line of credit expires on January 15, 2009. There were no borrowings by the Series under this line of credit during the period ended October 31, 2008.
H. Securities Lending:
As of October 31, 2008, the Series had securities on loan to brokers/dealers, for which the Series held cash collateral. The Series invests the cash collateral, as described below, and records a liability for the return of the collateral, during the period the securities are on loan. Loans of securities are expected at all times to be secured by collateral equal to at least (i) 100% of the current market value of the loaned securities with respect to securities of the U.S. government or its agencies, (ii) 102% of the current market value of the loaned securities with respect to U.S. securities, and (iii) 105% of the current market value of the loaned securities with respect to foreign securities. However, daily market fluctuations could cause the Series' collateral to be lower or higher than the expected thresholds. If this were to occur, the collateral would be adjusted the next business day to ensure adequate collateralization. In the even t of default or bankruptcy by the other party to the agreement, realization and/or retention of the collateral may be subject to legal proceedings. If the borrower fails to return loaned securities, and cash collateral being maintained by the borrower is insufficient to cover the value of loaned securities and provided such collateral insufficiency is not the result of investment losses, the lending agent has agreed to pay the amount of the shortfall to the Series or, at the option of the lending agent, to replace the securities.
Subject to the Series' investment policy, the cash collateral received by the Series from securities on loan is invested in securities of the U.S. government or its agencies, repurchase agreements collateralized by securities of the U.S. government or its agencies or shares of the DFA Short Term Investment Fund LP. Agencies include both agency debentures and agency mortgage backed securities. In addition, each Series will be able to terminate the loan at any time and will receive reasonable interest on the loan, as well as amounts equal to any dividends, interest or other distributions on the loaned securities. However, dividend income received from loaned securities may not be eligible to be taxed at qualified dividend income rates.
I. Indemnitees; Contractual Obligations:
Under the Trust's organizational documents, its officers and directors are indemnified against certain liabilities arising out of the performance of their duties to the Trust.
In the normal course of business, the Trust enters into contracts that contain a variety of representations and warranties which provide general indemnification. The Trust's maximum exposure under these arrangements is unknown as this would involve future claims that may be made against the Trust and/or its affiliates that have not yet occurred. However, based on experience, the Trust expects the risk of loss to be remote.
29
J. In-Kind Redemptions:
In accordance with guidelines described in the Series' prospectus, the Series may distribute portfolio securities rather than cash as payment for a redemption of fund shares (In-Kind redemption). For financial reporting purposes, the Series recognizes a gain on In-Kind redemptions to the extent the value of the distributed securities on the date of redemption exceeds the cost of those securities. Gains and losses realized on In-Kind redemptions are not recognized for tax purposes and are reclassified from undistributed realized gain (loss) to paid-in capital. During the period December 1, 2007 to October 31, 2008, the Series realized $24,362 (in thousands) of net gain.
During the year ended November 30, 2007, The U.S. Large Company Series distributed securities in lieu of cash for shareholder redemptions. The value of the redemption was $1,099,445 (in thousands) which resulted in a realized gain of $529,199 (in thousands) to the Series.
K. Recently Issued Accounting Standards and Interpretation:
In March 2008, Statement of Financial Accounting Standards No. 161, Disclosures about Derivative Instruments and Hedging Activities ("FAS 161"), was issued and is effective for fiscal years beginning after November 15, 2008. FAS 161 defines new disclosures of derivative instruments and hedging activities. Management is currently evaluating the implications of FAS 161. At this time, its impact on the Series' financial statements has not been determined.
30
REPORT OF INDEPENDENT REGISTERED PUBLIC ACCOUNTING FIRM
To the Shareholders of The U.S. Large Company Series and
Board of Trustees of The DFA Investment Trust Company:
In our opinion, the accompanying statements of assets and liabilities, including the summary schedules of portfolio holdings, and the related statements of operations and of changes in net assets and the financial highlights presents fairly, in all material respects, the financial position of The U.S. Large Company Series (one of the series constituting The DFA Investment Trust Company, hereafter referred to as the "Series") at October 31, 2008, the results of its operations, the changes in its net assets and the financial highlights for each of the periods indicated, in conformity with accounting principles generally accepted in the United States of America. These financial statements and financial highlights (hereafter referred to as "financial statements") are the responsibility of the Series' management; our responsibility is to express an opinion on these financial statements based on our audits. We conducted our audits of these financi al statements in accordance with the standards of the Public Company Accounting Oversight Board (United States). Those standards require that we plan and perform the audit to obtain reasonable assurance about whether the financial statements are free of material misstatement. An audit includes examining, on a test basis, evidence supporting the amounts and disclosures in the financial statements, assessing the accounting principles used and significant estimates made by management, and evaluating the overall financial statement presentation. We believe that our audits, which included confirmation of securities at October 31, 2008 by correspondence with the custodian and brokers, provide a reasonable basis for our opinion.
PricewaterhouseCoopers LLP
Philadelphia, Pennsylvania
December 22, 2008
31
FUND MANAGEMENT
Trustees/Directors
Each Board of Trustees/Directors of The DFA Investment Trust Company Inc. ("DFAITC"), DFA Investment Dimensions Group Inc. ("DFAIDG"), Dimensional Investment Group Inc. ("DIG") and Dimensional Emerging Markets Value Fund Inc. ("DEM") (each, the "Fund" and collectively, the "Funds") is responsible for establishing the Funds' policies and for overseeing the management of the Funds. The Trustees/Directors of the Funds, including all of the disinterested Directors, have adopted written procedures to monitor potential conflicts of interest that might develop between portfolios of the Funds (the "Feeder Portfolios") that invest in certain series of DFAITC or DEM (the "Master Funds").
Each Board has two standing committees, an Audit Committee and a Portfolio Performance and Service Review Committee (the "Performance Committee"). The Audit Committee is comprised of George M. Constantinides, Roger G. Ibbotson and Abbie J. Smith. Each member of the Audit Committee is a disinterested Director. The Audit Committee oversees the Fund's accounting and financial reporting policies and practices, the Fund's internal controls, the Fund's financial statements and the independent audits thereof and performs other oversight functions as requested by the Board. The Audit Committee recommends the appointment of each Fund's independent registered certified public accounting firm and also acts as a liaison between the Fund's independent registered certified public accounting firm and the full Board. There were three Audit Committee meetings held during the fiscal year ended October 31, 2008.
Each Board's Performance Committee is comprised of Messrs. Constantinides and Ibbotson, Ms. Smith, John P. Gould, Myron S. Scholes and Robert C. Merton. Each member of the Fund's Performance Committee is a disinterested Director. The Performance Committee regularly reviews and monitors the investment performance of the Fund's series and reviews the performance of the Fund's service providers. There were five Performance Committee meetings held during the fiscal year ended October 31, 2008.
Certain biographical information for each disinterested Trustee/Director and each interested Trustee/Director of the Funds is set forth in the tables below, including a description of each Trustee/Director's experience as a Trustee/Director of the Funds and as a director or trustee of other funds, as well as other recent professional experience.
The statements of additional information (together, "SAI") of the Funds include additional information about each Trustee/Director. You may obtain copies of the SAI and prospectus of each Fund advised by Dimensional Fund Advisors LP by calling collect (310) 395-8005 or by mailing a request to Dimensional Fund Advisors LP, 1299 Ocean Avenue, Santa Monica, California 90401. Prospectuses are also available at www.dimensional.com.
Name, Position
with the Fund,
Address and Age | | Term of Office1 and
Length of Service | | Portfolios within the
DFA Fund Complex2
Overseen | | Principal Occupation(s) During Past 5 Years and
Other Directorships of Public Companies Held | |
| | | Disinterested Trustees/Directors | |
|
George M. Constantinides
Director of DFAIDG, DIG and DEM.
Trustee of DFAITC.
The University of Chicago Booth School of Business
5807 S. Woodlawn Avenue Chicago, IL 60637
Age: 61 | | DFAITC - since 1993
DFAIDG - since 1983
DIG - since 1993
DEM - since 1993 | | 96 portfolios in 4 investment companies | | Leo Melamed Professor of Finance, The University of Chicago Booth School of Business. | |
|
32
Name, Position
with the Fund,
Address and Age | | Term of Office1 and
Length of Service | | Portfolios within the
DFA Fund Complex2
Overseen | | Principal Occupation(s) During Past 5 Years and
Other Directorships of Public Companies Held | |
John P. Gould
Director of DFAIDG, DIG and DEM.
Trustee of DFAITC.
The University of Chicago Booth School of Business
5807 S. Woodlawn Avenue
Chicago, IL 60637
Age: 69 | | DFAITC - since 1993
DFAIDG - since 1986
DIG - since 1993
DEM - since 1993 | | 96 portfolios in 4 investment companies | | Steven G. Rothmeier Distinguished Service Professor of Economics, The University of Chicago Booth School of Business (since 1965). Member of the Boards of Milwaukee Mutual Insurance Company (since 1997) and UNext.com (1999-2006). Member Competitive Markets Advisory Committee, Chicago Mercantile Exchange (futures trading exchange) (since 2004). Formerly, Senior Vice-President, Lexecon Inc. (economics, law, strategy and finance consulting) (1994-2004). Formerly, President, Cardean University (division of UNext.com) (1999-2001). Trustee, Harbor Fund (registered investment company) (14 Portfolios) (since 1994). | |
|
Roger G. Ibbotson
Director of DFAIDG, DIG and DEM.
Trustee of DFAITC.
Yale School of Management
P.O. Box 208200
New Haven, CT 06520-8200
Age: 65 | | DFAITC - since 1993
DFAIDG - since 1981
DIG - since 1993
DEM - since 1993 | | 96 portfolios in 4 investment companies | | Professor in Practice of Finance, Yale School of Management (since 1984). Director, BIRR Portfolio Analysis, Inc. (software products) (since 1990). Chairman, CIO and Partner, Zebra Capital Management, LLC (hedge fund manager) (since 2001).
Consultant to Morningstar, Inc. (since 2006). Formerly, Chairman, Ibbotson Associates, Inc., Chicago, IL (software data publishing and consulting) (1977-2006). | |
|
Robert C. Merton
Director of DFAIDG, DIG and DEM.
Trustee of DFAITC.
Harvard Business School
353 Baker Library
Soldiers Field
Boston, MA 02163
Age: 64 | | DFAITC - since 2003
DFAIDG - since 2003
DIG - since 2003
DEM - since 2003 | | 96 portfolios in 4 investment companies | | John and Natty McArthur University Professor, Graduate School of Business Administration, Harvard University (since 1998). George Fisher Baker Professor of Business Administration, Graduate School of Business Administration, Harvard University (1988-1998), Co-founder, Chief Science Officer and Director, Trinsum Group, a successor to Integrated Finance Limited (since 2002). Director, MF Risk, Inc. (risk management software) (since 2001). Director, Peninsula Banking Group (bank) (since 2003). Director, Community First Financial Group (bank holding company) (since 2003). Advisory Board Member, Alpha Simplex Group (hedge fund) (since 2001). Member Competitive Markets Advisory Council, Chicago Mercantile Exchange (futures trading exchange) (since 2004). Formerly, Advisory Board Member, NuServe (insurance software) (2001-2003). Director, Vical Incorporated (biopharmaceutical product development) (since 2002). | |
|
Myron S. Scholes
Director of DFAIDG, DIG and DEM.
Trustee of DFAITC.
Platinum Grove Asset Management, L.P.
Reckson Executive Park
1100 King Street
Building 4
Rye Brook, NY 10573
Age: 67 | | DFAITC - since 1993
DFAIDG - since 1981
DIG - since 1993
DEM - since 1993 | | 96 portfolios in 4 investment companies | | Frank E. Buck Professor Emeritus of Finance, Stanford University (since 1981). Chairman, Platinum Grove Asset Management, L.P. (hedge fund) (formerly, Oak Hill Platinum Partners) (since 1999). Formerly, Managing Partner, Oak Hill Capital Management (private equity firm) (until 2004). Chairman, Oak Hill Platinum Partners (hedge fund) (since 2004). Director, Chicago Mercantile Exchange (since 2001). Director, American Century Fund Complex (registered investment companies) (37 Portfolios) (since 1981); and Director, Chicago Mercantile Exchange Holdings Inc. (since 2000). | |
|
Abbie J. Smith
Director of DFAIDG, DIG and DEM.
Trustee of DFAITC.
The University of Chicago Booth School of Business
5807 S. Woodlawn Avenue
Chicago, IL 60637
Age: 55 | | DFAITC - since 2000
DFAIDG - since 2000
DIG - since 2000
DEM - since 2000 | | 96 portfolios in 4 investment companies | | Boris and Irene Stern Professor of Accounting, The University of Chicago Booth School of Business (since 1980), Formerly, Marvin Bower Fellow, Harvard Business School (9/01 to 8/02). Director, HNI Corporation (formerly known as HON Industries Inc.) (office furniture) (since 2000) and Director, Ryder System Inc. (transportation, logistics and supply-chain management) (since 2003). | |
|
33
Name, Position
with the Fund,
Address and Age | | Term of Office1 and
Length of Service | | Portfolios within the
DFA Fund Complex2
Overseen | | Principal Occupation(s) During Past 5 Years and
Other Directorships of Public Companies Held | |
| | | Interested Trustees/Directors* | |
|
David G. Booth
Chairman, Director, Chief Executive Officer and President of DFAIDG, DIG and DEM. Chairman, Trustee, Chief Executive Officer, Chief Investment Officer and President of DFAITC.
1299 Ocean Avenue
Santa Monica, CA 90401
Age: 61 | | DFAITC - since 1993
DFAIDG - since 1981
DIG - since 1992
DEM - since 1993 | | 96 portfolios in 4 investment companies | | Chairman, Director/Trustee, President, Chief Executive Officer and formerly Chief Investment Officer of the following companies: Dimensional Holdings Inc., Dimensional Fund Advisors LP, DFA Securities Inc., Dimensional Fund Advisors Canada Inc., DFAIDG, DIG, DEM and DFAITC. Director of Dimensional Fund Advisors Ltd, and formerly Chief Investment Officer. Director, President and formerly Chief Investment Officer of DFA Australia Ltd. Director of Dimensional Funds PLC and Dimensional Fund II PLC. Director, Chief Executive Officer and formerly Chief Investment Officer of Dimensional Fund Advisors Canada Inc. (All Chief Investment Officer positions held starting 1/03 through 3/07 except for Dimensional Fund Advisors Canada Inc., which was from 6/03 through 3/07, and Dimensional Holdings Inc., which was from 10/06 through 3/07.)
Limited Partner, Oak Hill Partners, Director, T he University of Chicago Booth School of Business. Formerly, Director, SA Funds (registered investment company). Formerly Director, Assante Corporation (investment management) (until 2002). | |
|
Rex A. Sinquefield
The Show Me Institute
7777 Bonhomme Ave.,
Suite 2150 St. Louis, MO 63105
Age: 64 | | DFAITC - since 1993
DFAIDG - since 1981
DIG - since 1992
DEM - since 1993 | | 96 portfolios in 4 investment companies | | Director/Trustee (and prior to 2006 Chairman, and prior to 2003, Chief Investment Officer) of Dimensional Fund Advisors LP, DFA Securities Inc., DFAIDG, DIG, DEM and DFAITC. Director of Dimensional Holdings Inc. Prior to 2006, Director of Dimensional Fund Advisors Ltd, Director (and prior to 1/1/2003, Chief Investment Officer) of DFA Australia Ltd. Director of Dimensional Funds PLC and Dimensional Fund Advisors Canada Inc.
Trustee, St. Louis University (since 2003). Life Trustee and Member of Investment Committee, DePaul University. Director, The German St. Vincent Orphan Home. Member of Investment Committee, Archdiocese of St. Louis. Trustee and Member of Investment Committee, St. Louis Art Institute (since 2005). President and Director, The Show Me Institute (since 2006). Trustee, St. Louis Symphony Orchestra (since 2005). Trustee, Missouri Botanical Garden (since 2005 ). | |
|
1 Each Trustee/Director holds office for an indefinite term until his or her successor is elected and qualified.
2 Each Trustee/Director is a director or trustee of each of the four registered investment companies within the DFA Fund Complex, which includes the Funds.
* Interested Directors are described as such because they are deemed to be "interested persons," as that term is defined under the Investment Company Act of 1940, as amended, due to their positions with Dimensional Fund Advisors LP.
34
Officers
The name, age, information regarding positions with the Funds and the principal occupation for each officer of the Funds are set forth below. Each officer listed below holds the same office (except as otherwise noted) in the following entities: Dimensional Fund Advisors LP (prior to November 3, 2006, Dimensional Fund Advisors Inc.) ("Dimensional"), DFA Securities Inc., DFAIDG, DIG, DFAITC and DEM (collectively, the "DFA Entities"). The address of each officer is: Dimensional Fund Advisors LP, 1299 Ocean Avenue, Santa Monica, California 90401, unless otherwise indicated.
Name, Position with the Fund
and Age | | Term of Office1
and Length of
Service | | Principal Occupation(s) During Past 5 Years | |
| | | Officers | |
|
April A. Aandal
Vice President
Age: 35 | | Since 2008 | | Vice President of all the DFA Entities. | |
|
Darryl D. Avery
Vice President
Age: 42 | | Since 2005 | | Vice President of all the DFA Entities. From June 2002 to January 2005, institutional client service representative of Dimensional. | |
|
Arthur H. Barlow
Vice President
Age: 52 | | Since 1993 | | Vice President of all the DFA Entities. Formerly, Vice President of DFA Australia Limited and Dimensional Fund Advisors Ltd. | |
|
Scott A. Bosworth
Vice President
Age: 39 | | Since 2007 | | Vice President of all the DFA Entities. Regional Director of Dimensional (since November 1997). | |
|
Valerie A. Brown
Vice President and Assistant Secretary
Age: 41 | | Since 2001 | | Vice President and Assistant Secretary of all the DFA Entities, DFA Australia Limited, Dimensional Fund Advisors Ltd., and since June 2003, Dimensional Fund Advisors Canada Inc. | |
|
David P. Butler
Vice President
Age: 44 | | Since 2007 | | Vice President of all the DFA Entities. Director of US Financial Services of Dimensional (since January 2005). Formerly, Regional Director of Dimensional Fund Advisors LP (January 1995 to January 2005). | |
|
Patrick Carter
Vice President
Age: 46 | | Since 2007 | | Vice President of all the DFA Entities. Regional Director of Dimensional (since March 2006). Formerly, Director of Merrill Lynch Retirement Group (December 1998 to March 2006). | |
|
Stephen A. Clark
Vice President
Age: 36 | | Since 2004 | | Vice President of all the DFA Entities, April 2001 to April 2004, Portfolio Manager of Dimensional. | |
|
Robert P. Cornell
Vice President
Age: 59 | | Since 2007 | | Vice President of all the DFA Entities. Regional Director of Financial Services Group of Dimensional (since August 1993). | |
|
Christopher S. Crossan
Vice President and Chief Compliance Officer
Age: 42 | | Since 2004 | | Vice President and Chief Compliance Officer of all the DFA Entities. Formerly, Senior Compliance Officer, INVESCO Institutional, Inc. and its affiliates (August 2000 to January 2004). | |
|
James L. Davis
Vice President
Age: 51 | | Since 1999 | | Vice President of all the DFA Entities. Formerly, Vice President of DFA Australia Limited and Dimensional Fund Advisors Ltd. | |
|
Robert T. Deere
Vice President
Age: 51 | | Since 1994 | | Vice President of all the DFA Entities and DFA Australia Limited. | |
|
Robert W. Dintzner
Vice President
Age: 38 | | Since 2001 | | Vice President of all the DFA Entities. Prior to April 2001, marketing supervisor and marketing coordinator for Dimensional. | |
|
35
Name, Position with the Fund
and Age | | Term of Office1
and Length of
Service | | Principal Occupation(s) During Past 5 Years | |
Kenneth Elmgren
Vice President
Age: 54 | | Since 2007 | | Vice President of all the DFA Entities. Formerly, Managing Principal of Beverly Capital (May 2004 to September 2006); Principal of Wydown Capital (September 2001 to May 2004). | |
|
Richard A. Eustice
Vice President and Assistant Secretary
Age: 43 | | Since 1998 | | Vice President and Assistant Secretary of all the DFA Entities and DFA Australia Limited. Formerly, Vice President of Dimensional Fund Advisors Ltd. | |
|
Eugene F. Fama, Jr.
Vice President
Age: 47 | | Since 1993 | | Vice President of all the DFA Entities. Formerly, Vice President of DFA Australia Limited and Dimensional Fund Advisors Ltd. | |
|
Gretchen A. Flicker
Vice President
Age: 37 | | Since 2004 | | Vice President of all the DFA Entities. Prior to April 2004, institutional client service representative of Dimensional. | |
|
Jed S. Fogdall
Vice President
Age: 34 | | Since 2008 | | Vice President of all the DFA Entities. Portfolio Manager for Dimensional (since September 2004). Prior to September 2004, Staff Engineer at the Boeing Company (1997-2004); Graduate Student at the University of California, Los Angeles (2002-2003). | |
|
Glenn S. Freed
Vice President
Age: 46 | | Since 2001 | | Vice President of all the DFA Entities. | |
|
Mark R. Gochnour
Vice President
Age: 41 | | Since 2007 | | Vice President of all the DFA Entities. Regional Director of Dimensional. | |
|
Henry F. Gray
Vice President
Age: 41 | | Since 2000 | | Vice President of all the DFA Entities. Prior to July 2000, Portfolio Manager of Dimensional. Formerly, Vice President of DFA Australia Limited. | |
|
John T. Gray
Vice President
Age: 34 | | Since 2007 | | Vice President of all the DFA Entities. Formerly, Regional Director of Dimensional (January 2005 to February 2007). | |
|
Darla Hastings
Vice President
Age: 53 | | Since 2007 | | Vice President of all the DFA Entities. Chief Marketing Officer of Dimensional. Formerly, Senior Vice President, Customer Experience for Benchmark Assisted Living (May 2005 to April 2006); Executive Vice President and Chief Marketing Officer of State Street Corporation (September 2001 to October 2005). | |
|
Joel H. Hefner
Vice President
Age: 40 | | Since 2007 | | Vice President of all the DFA Entities. Regional Director of Dimensional (since June 1998). | |
|
Julie Henderson
Vice President and Fund Controller
Age: 34 | | Since 2005 | | Vice President and Fund Controller of all the DFA Entities. Formerly, Senior Manager at PricewaterhouseCoopers LLP (July 1996 to April 2005). | |
|
Kevin Hight
Vice President
Age: 40 | | Since 2005 | | Vice President of all the DFA Entities. Formerly, Regional Director of Dimensional (since March 2003 to March 2005). | |
|
Christine W. Ho
Vice President
Age: 40 | | Since 2004 | | Vice President of all the DFA Entities. Prior to April 2004, Assistant Controller of Dimensional. | |
|
Jeff J. Jeon
Vice President
Age: 34 | | Since 2004 | | Vice President of all the DFA Entities. Prior to April 2004, Counsel of Dimensional. | |
|
Patrick M. Keating
Vice President
Age: 53 | | Since 2003 | | Vice President of all the DFA Entities and Chief Operating Officer of Dimensional. Director, Vice President and Chief Privacy Officer of Dimensional Fund Advisors Canada Inc. Director of DFA Australia Limited. | |
|
36
Name, Position with the Fund
and Age | | Term of Office1
and Length of
Service | | Principal Occupation(s) During Past 5 Years | |
Joseph F. Kolerich
Vice President
Age: 36 | | Since 2004 | | Vice President of all the DFA Entities. From April 2001 to April 2004, Portfolio Manager for Dimensional. | |
|
Michael F. Lane
Vice President
Age: 41 | | Since 2004 | | Vice President of all the DFA Entities. Formerly, Vice President of Advisor Services at TIAA-CREF (July 2001 to September 2004). | |
|
Kristina M. LaRusso
Vice President
Age: 33 | | Since 2006 | | Vice President of all DFA Entities. Formerly, Operations Supervisor of Dimensional (March 2003 to December 2006). | |
|
Inmoo Lee
Vice President
Age: 42 | | Since 2007 | | Vice President of all the DFA Entities. Associate Professor Department of Finance and Accounting, Business School, National University of Singapore (July 2004 to present); Associate Professor, College of Business Administration, Korea University (September 2001 to May 2006). | |
|
Juliet Lee
Vice President
Age: 37 | | Since 2005 | | Vice President of all the DFA Entities. Human Resources Manager of Dimensional (since January 2004). Formerly, Assistant Vice President for Metropolitan West Asset Management LLC (February 2001 to December 2003). | |
|
Aaron M. Marcus
Vice President & Head of Global Human Resources
Age: 38 | | Since 2008 | | Vice President and Head of Global Human Resources of Dimensional. Formerly, Global Head of Recruiting and Vice President of Goldman Sachs & Co. (June 2006 to January 2008); Global Co-Head of HR of the Equities & FICC Division, and Vice President of Goldman Sachs & Co. (May 2005 to May 2006); Head of Americas Campus Recruiting and Vice President of Goldman Sachs & Co. (April 2003 to May 2005). | |
|
David R. Martin
Vice President, Chief Financial Officer and Treasurer
Age: 51 | | Since 2007 | | Vice President, Chief Financial Officer and Treasurer of all the DFA Entities. Director, Vice President, Chief Financial Officer and Treasurer of Dimensional Fund Advisors Ltd. and DFA Australia Limited. Chief Financial Officer, Treasurer, and Vice President of Dimensional Fund Advisors Canada Inc. Director of Dimensional Funds PLC and Dimensional Funds II PLC. Formerly, Executive Vice President and Chief Financial Officer of Janus Capital Group Inc. (June 2005 to March 2007); Senior Vice President of Finance at Charles Schwab & Co., Inc. (March 1999 to May 2005). | |
|
Catherine L. Newell
Vice President and Secretary
Age: 44 | | Vice President since 1997 and Secretary since 2000 | | Vice President and Secretary of all the DFA Entities. Director, Vice President and Assistant Secretary of DFA Australia Limited (since February 2002, April 1997 and May 2002, respectively). Vice President and Secretary of Dimensional Fund Advisors Canada Inc. (since June 2003). Director, Dimensional Funds PLC and Dimensional Funds II PLC (since January 2002). Formerly, Assistant Secretary of all DFA Entities and Dimensional Fund Advisors Ltd. | |
|
Gerard K. O'Reilly
Vice President
Age: 31 | | Since 2007 | | Vice President of all the DFA Entities. Formerly, Research Associate of Dimensional Fund Advisors LP (2004 to 2006); Research Assistant in PhD program, Aeronautics Department California Institute of Technology (1998 to 2004). | |
|
Carmen Palafox
Vice President
Age: 34 | | Since 2006 | | Vice President of all the DFA Entities. Operations Manager of Dimensional Fund Advisors LP (since May 1996). | |
|
Sonya Park
Vice President
Age: 36 | | Since 2005 | | Vice President of all the DFA Entities. From February 2002 to January 2005, institutional client service representative of Dimensional. | |
|
David A. Plecha
Vice President
Age: 47 | | Since 1993 | | Vice President of all the DFA Entities, DFA Australia Limited and Dimensional Fund Advisors Ltd.. | |
|
Ted Randall
Vice President
Age: 35 | | Since 2008 | | Vice President of all the DFA Entities. Formerly, Research Associate of Dimensional (2006-2008). Systems Developer of Dimensional (2001-2006). | |
|
37
Name, Position with the Fund
and Age | | Term of Office1
and Length of
Service | | Principal Occupation(s) During Past 5 Years | |
Eduardo A. Repetto
Vice President and Chief Investment Officer
Age: 41 | | Since 2002 | | Chief Investment Officer (beginning March 2007) and Vice President of all the DFA Entities, DFA Australia Limited and Dimensional Fund Advisors Canada Inc. Formerly, Research Associate for Dimensional (June 2000 to April 2002). | |
|
L. Jacobo Rodriguez
Vice President
Age: 37 | | Since 2005 | | Vice President of all the DFA Entities. From August 2004 to July 2005, institutional client service representative of Dimensional. Formerly, Financial Services Analyst, Cato Institute (September 2001 to June 2004); Book Review Editor, Cato Journal, Cato Institute (May 1996 to June 2004). | |
|
David E. Schneider
Vice President
Age: 62 | | Since 2001 | | Vice President of all the DFA Entities. Currently, Director of Institutional Services. | |
|
Ted R. Simpson
Vice President
Age: 40 | | Since 2007 | | Vice President of all the DFA Entities. Regional Director of Dimensional (since December 2002). | |
|
Bryce D. Skaff
Vice President
Age: 33 | | Since 2007 | | Vice President of all the DFA Entities. Formerly, Regional Director of Dimensional (December 1999 to January 2007). | |
|
Grady M. Smith
Vice President
Age: 51 | | Since 2004 | | Vice President of all the DFA Entities. Prior to April 2004, Portfolio Manager of Dimensional. | |
|
Carl G. Snyder
Vice President
Age: 45 | | Since 2000 | | Vice President of all the DFA Entities. Formerly, Vice President of DFA Australia Limited. | |
|
Lawrence R. Spieth
Vice President
Age: 60 | | Since 2004 | | Vice President of all the DFA Entities. Prior to April 2004, Regional Director of Dimensional. | |
|
Bradley G. Steiman
Vice President
Age: 35 | | Since 2004 | | Vice President of all the DFA Entities and Director and Vice President of Dimensional Fund Advisors Canada Inc. | |
|
Karen E. Umland
Vice President
Age: 42 | | Since 1997 | | Vice President of all the DFA Entities, DFA Australia Limited, Dimensional Fund Advisors Ltd., and since June 2003, Dimensional Fund Advisors Canada Inc. | |
|
Carol W. Wardlaw
Vice President
Age: 49 | | Since 2004 | | Vice President of all the DFA Entities. Prior to April 2004, Regional Director of Dimensional. | |
|
Weston J. Wellington
Vice President
Age: 57 | | Since 1997 | | Vice President of all the DFA Entities. Formerly, Vice President of DFA Australia Limited. | |
|
Daniel M. Wheeler
Vice President
Age: 63 | | Since 2001 | | Vice President of all the DFA Entities. Prior to 2001 and currently, Director of Financial Advisors Services of Dimensional. Director of Dimensional Fund Advisors Ltd. (since October 2003) and President of Dimensional Fund Advisors Canada Inc. (since June 2003). | |
|
Ryan Wiley
Vice President
Age: 32 | | Since 2007 | | Vice President of all the DFA Entities. Senior Trader of Dimensional. Formerly, Portfolio Manager (2006 to 2007); Trader (2001 to 2006). | |
|
Paul E. Wise
Vice President
Age: 53 | | Since 2005 | | Vice President of all the DFA Entities. Chief Technology Officer for Dimensional (since 2004). Formerly, Principal of Turnbuckle Management Group (January 2002 to August 2004). | |
|
1 Each officer holds office for an indefinite term at the pleasure of the Boards of Trustee/Directors and until his or her successor is elected and qualified.
38
VOTING PROXIES ON FUND PORTFOLIO SECURITIES
A description of the policies and procedures that the Trust uses in voting proxies relating to securities held in the portfolio is available without charge, upon request, by calling collect: (310) 395-8005. Information regarding how the Advisor votes these proxies is available from the EDGAR database on the SEC's website at http://www.sec.gov and from the Advisor's website at http://www.dimensional.com and reflects the twelve-month period beginning July 1st and ending June 30th.
39
NOTICE TO SHAREHOLDERS
(Unaudited)
For shareholders that do not have an October 31, 2008 tax year end, this notice is for informational purposes only. For shareholders with an October 31, 2008 tax year end, please consult your tax advisor as to the pertinence of this notice. For the period December 1, 2007 to October 31, 2008, each portfolio is designating the following items with regard to distributions paid during the period.
| Dimensional Investment Group Inc. | | Net
Investment
Income
Distributions | | Total
Distributions | | Qualifying
For Corporate
Dividends Received
Deduction(1) | | Qualifying
Dividend
Income(2) | | Qualifying
Interest
Income(3) | |
| U.S. Large Company Institutional Index Portfolio | | | 100 | % | | | 100 | % | | | 75 | % | | | 75 | % | | | 4 | % | |
(1) Qualifying dividends represent dividends which qualify for the corporate dividends received deduction and is reflected as a percentage of ordinary Income distributions (the total of short-term capital gain and net investment income distributions).
(2) The percentage in this column represents the amount of "Qualifying Dividend Income" as created by the Jobs and Growth Tax Relief Reconciliation Act of 2003 and is reflected as a percentage of ordinary income distributions (the total of short-term capital gain and net investment income distributions). It is the intention of each of the aforementioned funds to designate the maximum amount permitted by law.
(3) The percentage in this column represents the amount of "Qualifying Interest Income" as created by The American Jobs Creation Act of 2004. The information is reflected as a percentage of ordinary income distributions (the total of short-term capital gain and net investment income distributions).
40

DFA103108-006A
DFA INVESTMENT DIMENSIONS GROUP INC.
DIMENSIONAL INVESTMENT GROUP INC.
THE DFA INVESTMENT TRUST COMPANY
Annual Report
Period Ended October 31, 2008
Dimensional Fund Advisors
6300 Bee Cave Road, Building One
Austin, TX 78746
December 2008
Dear Fellow Shareholder,
This has been a challenging year for investors. After drifting lower throughout the spring and summer, stock markets around the world plummeted in mid September on news that the ongoing credit crisis was driving some leading financial services companies toward failure. As the effects of this distress rippled through the financial world, investors became increasingly anxious and stock prices continued to decline sharply. In the month of October, the S&P 500 Index fell 16.8% or 196 points—its worst-ever monthly point decline.
Markets like this test investors' resolve. It is difficult to stick with a long-term investment plan when one sees the dramatic effects of high market volatility on a portfolio's value. Very few people are having a positive investment experience right now. But investors who have based their approach on a sensible risk/return framework tend to be in better shape than those who have not.
The recent market turbulence illustrates the reason why Dimensional believes that markets are efficient. History has shown time and again that prices cannot be predicted in public equity markets. This "random walk" makes diversification very important. Although the broad diversification in our portfolios didn't prevent negative performance this year, we believe it helped our shareholders avoid the extreme losses experienced by investors who concentrated their holdings in individual companies, industry sectors, or markets.
The unpredictability of stock prices also makes it important for investors to take a hard look at their own portfolios and determine how much risk and what types of risk they should take. Investors who hold asset mixes that accurately reflect their tolerance for risk are better able to withstand down markets.
Nobody knows when the capital markets will recover, but over time we can expect them to again offer a premium to investors who are willing to invest in relatively risky assets such as stocks. My view is that investors who have already paid for risk should stay invested and earn the return that can be expected when markets turn around. If markets continue to be so volatile, it's also important to understand that pulling money out of stocks, even for short periods of time, can result in significant missed opportunities.
All of us at Dimensional take our job as the steward of your assets very seriously and hope to have the opportunity to serve you for many years to come.
Sincerely,
David G. Booth
Chairman and Chief Executive Officer
[THIS PAGE INTENTIONALLY LEFT BLANK]
ANNUAL REPORT
Table of Contents
| Letter to Shareholders | | Page | |
| Definitions of Abbreviations and Footnotes | | | 1 | | |
|
| DFA Investment Dimensions Group Inc. | |
|
| Performance Charts | | | 3 | | |
|
| Management's Discussion and Analysis | | | 16 | | |
|
| Disclosure of Fund Expenses | | | 34 | | |
|
| Disclosure of Portfolio Holdings | | | 40 | | |
|
| Schedules of Investments/Summary Schedules of Portfolio Holdings | |
|
| U.S. Large Company Portfolio | | | 42 | | |
|
| Enhanced U.S. Large Company Portfolio | | | 42 | | |
|
| U.S. Large Cap Value Portfolio | | | 42 | | |
|
| U.S. Targeted Value Portfolio | | | 43 | | |
|
| U.S. Small Cap Value Portfolio | | | 46 | | |
|
| U.S. Core Equity 1 Portfolio | | | 47 | | |
|
| U.S. Core Equity 2 Portfolio | | | 50 | | |
|
| U.S. Vector Equity Portfolio | | | 53 | | |
|
| T.A. U.S. Core Equity 2 Portfolio | | | 56 | | |
|
| U.S. Small Cap Portfolio | | | 59 | | |
|
| U.S. Micro Cap Portfolio | | | 59 | | |
|
| DFA Real Estate Securities Portfolio | | | 60 | | |
|
| Large Cap International Portfolio | | | 62 | | |
|
| International Core Equity Portfolio | | | 65 | | |
|
| T.A. World ex U.S. Core Equity Portfolio | | | 69 | | |
|
| International Small Company Portfolio | | | 74 | | |
|
| Japanese Small Company Portfolio | | | 74 | | |
|
| Asia Pacific Small Company Portfolio | | | 74 | | |
|
| United Kingdom Small Company Portfolio | | | 75 | | |
|
| Continental Small Company Portfolio | | | 75 | | |
|
| DFA International Real Estate Securities Portfolio | | | 76 | | |
|
| DFA Global Real Estate Securities Portfolio | | | 79 | | |
|
| DFA International Small Cap Value Portfolio | | | 80 | | |
|
| International Vector Equity Portfolio | | | 84 | | |
|
| Emerging Markets Portfolio | | | 87 | | |
|
| Emerging Markets Small Cap Portfolio | | | 87 | | |
|
| Emerging Markets Core Equity Portfolio | | | 88 | | |
|
| DFA One-Year Fixed Income Portfolio | | | 91 | | |
|
| DFA Two-Year Global Fixed Income Portfolio | | | 91 | | |
|
| DFA Selectively Hedged Global Fixed Income Portfolio | | | 92 | | |
|
| DFA Five-Year Government Portfolio | | | 95 | | |
|
| DFA Five-Year Global Fixed Income Portfolio | | | 96 | | |
|
| DFA Intermediate Government Fixed Income Portfolio | | | 98 | | |
|
| DFA Inflation-Protected Securities Portfolio | | | 99 | | |
|
| DFA Short-Term Municipal Bond Portfolio | | | 100 | | |
|
| DFA California Short-Term Municipal Bond Portfolio | | | 104 | | |
|
| Statements of Assets and Liabilities | | | 107 | | |
|
| Statements of Operations | | | 116 | | |
|
| Statements of Changes in Net Assets | | | 125 | | |
|
| Financial Highlights | | | 141 | | |
|
| Notes to Financial Statements | | | 158 | | |
|
| Report of Independent Registered Public Accounting Firm | | | 185 | | |
|
i
Table of Contents
Continued
| | | Page | |
| Dimensional Investment Group Inc. — DFA International Value Portfolio | |
|
| Performance Charts | | | 186 | | |
|
| Management's Discussion and Analysis | | | 187 | | |
|
| Disclosure of Fund Expenses | | | 190 | | |
|
| Disclosure of Portfolio Holdings | | | 191 | | |
|
| Statement of Assets and Liabilities | | | 192 | | |
|
| Statements of Operations | | | 193 | | |
|
| Statements of Changes in Net Assets | | | 194 | | |
|
| Financial Highlights | | | 195 | | |
|
| Notes to Financial Statements | | | 197 | | |
|
| Report of Independent Registered Public Accounting Firm | | | 203 | | |
|
ii
Table of Contents
Continued
| The DFA Investment Trust Company | |
|
| | | Page | |
| Performance Charts | | | 204 | | |
|
| Management's Discussion and Analysis | | | 210 | | |
|
| Disclosure of Fund Expenses | | | 219 | | |
|
| Disclosure of Portfolio Holdings | | | 222 | | |
|
| Schedules of Investments/Summary Schedules of Portfolio Holdings | |
|
| The U.S. Large Company Series | | | 224 | | |
|
| The Enhanced U.S. Large Company Series | | | 227 | | |
|
| The U.S. Large Cap Value Series | | | 229 | | |
|
| The U.S. Small Cap Value Series | | | 232 | | |
|
| The U.S. Small Cap Series | | | 235 | | |
|
| The U.S. Micro Cap Series | | | 238 | | |
|
| The DFA International Value Series | | | 241 | | |
|
| The Japanese Small Company Series | | | 244 | | |
|
| The Asia Pacific Small Company Series | | | 246 | | |
|
| The United Kingdom Small Company Series | | | 248 | | |
|
| The Continental Small Company Series | | | 250 | | |
|
| The Canadian Small Company Series | | | 253 | | |
|
| The Emerging Markets Series | | | 255 | | |
|
| The Emerging Markets Small Cap Series | | | 258 | | |
|
| The DFA One-Year Fixed Income Series | | | 261 | | |
|
| The DFA Two-Year Global Fixed Income Series | | | 263 | | |
|
| Statements of Assets and Liabilities | | | 265 | | |
|
| Statements of Operations | | | 269 | | |
|
| Statements of Changes in Net Assets | | | 273 | | |
|
| Financial Highlights | | | 281 | | |
|
| Notes to Financial Statements | | | 288 | | |
|
| Report of Independent Registered Public Accounting Firm | | | 304 | | |
|
| Fund Management | | | 305 | | |
|
| Voting Proxies on Fund Portfolio Securities | | | 312 | | |
|
| Notice to Shareholders | | | 313 | | |
|
| Board Approval of Investment Advisory Agreement | | | 314 | | |
|
This report is submitted for the information of the Fund's shareholders. It is not authorized for distribution to prospective investors unless preceded or accompanied by an effective prospectus.
iii
[THIS PAGE INTENTIONALLY LEFT BLANK]
DFA INVESTMENT DIMENSIONS GROUP INC.
DIMENSIONAL INVESTMENT GROUP INC.
THE DFA INVESTMENT TRUST COMPANY
DEFINITIONS OF ABBREVIATIONS AND FOOTNOTES
Schedules of Investments/Summary Schedules of Portfolio Holdings
Investment Abbreviations
ADR American Depositary Receipt
AMBAC American Municipal Bond Assurance Corporation
ETM Escrowed to Maturity
FGIC Federal Guaranty Insurance Corporation
FSA Financial Security Assurance
FHLMC Federal Home Loan Mortgage Corporation
FNMA Federal National Mortgage Association
GNMA Government National Mortgage Association
GO General Obligation
MBIA Municipal Bond Insurance Association
P.L.C. Public Liability Company
RB Revenue Bond
REIT Real Estate Investment Trust
SA Special Assessment
SPDR Standard & Poor's Depository Receipts
STRB Special Tax Revenue Bond
STRIP Separate Trading of Registered Interest and Principal of Securities
TAN Tax Anticipation Note
TECP Tax Exempt Commercial Paper
TRAN Tax and Revenue Anticipation Note
Investment Footnotes
† See Note B to Financial Statements.
†† Securities have generally been fair valued. See Note B to Financial Statements.
** Calculated as a percentage of total net assets. Percentages shown parenthetically next to the category headings have been calculated as a percentage of total investments. "Other Securities" are those securities that are not among the top 50 holdings of the Fund or do not represent more than 1.0% of the net assets of the Fund. Some of the individual securities within this category may include Total or Partial Securities on Loan and/or Non-Income Producing Securities.
* Non-Income Producing Securities.
# Total or Partial Securities on Loan.
^ Denominated in local currency or the Euro, unless otherwise noted.
@ Security purchased with cash proceeds from Securities on Loan.
(r) The adjustable rate shown is effective as of October 31, 2008.
(y) The rate shown is the effective yield.
(t) Face Amount denominated in Australian Dollars.
(g) Face Amount denominated in British Pounds.
(c) Face Amount denominated in Canadian Dollars.
(d) Face Amount denominated in Denmark Krone.
(e) Face Amount denominated in Euro.
(j) Face Amount denominated in Japanese Yen.
(z) Face Amount denominated in New Zealand Dollars.
(n) Face Amount denominated in Norwegian Krone.
(s) Face Amount denominated in Swedish Krona.
(f) Face Amount denominated in Swiss Francs.
(u) Face Amount denominated in United States Dollars.
§ Affiliated Fund.
v Security segregated as collateral for the Open Futures Contracts.
1
DEFINITIONS OF ABBREVIATIONS AND FOOTNOTES
Continued
Financial Highlights
(A) Computed using average shares outstanding.
(B) Annualized
(C) Non-Annualized
(D) Represents the combined ratios for the respective portfolio and its respective pro-rata share of its Master Fund Series.
(E) Because of commencement of operations and related preliminary transaction costs, these ratios are not necessarily indicative of future ratios.
N/A Does not apply to this fund.
All Statements and Schedules
— Amounts designated as — are either zero or rounded to zero.
SEC Securities and Exchange Commission
REITs Real Estate Investment Trusts
(a) Commencement of Operations.
2
DFA INVESTMENT DIMENSIONS GROUP INC.
PERFORMANCE CHARTS
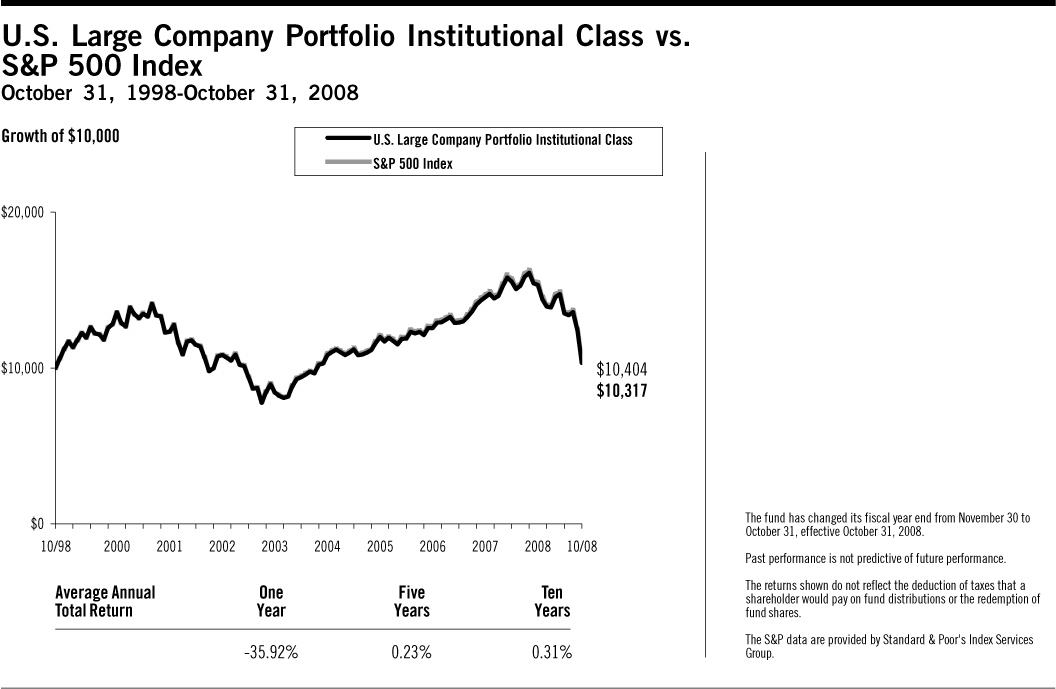
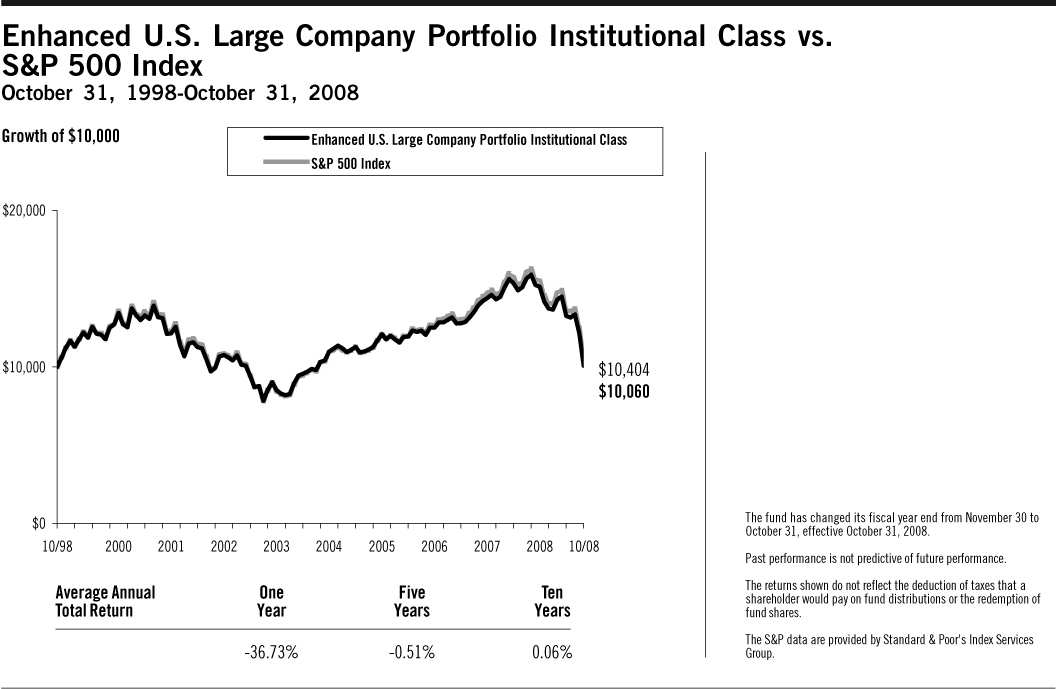
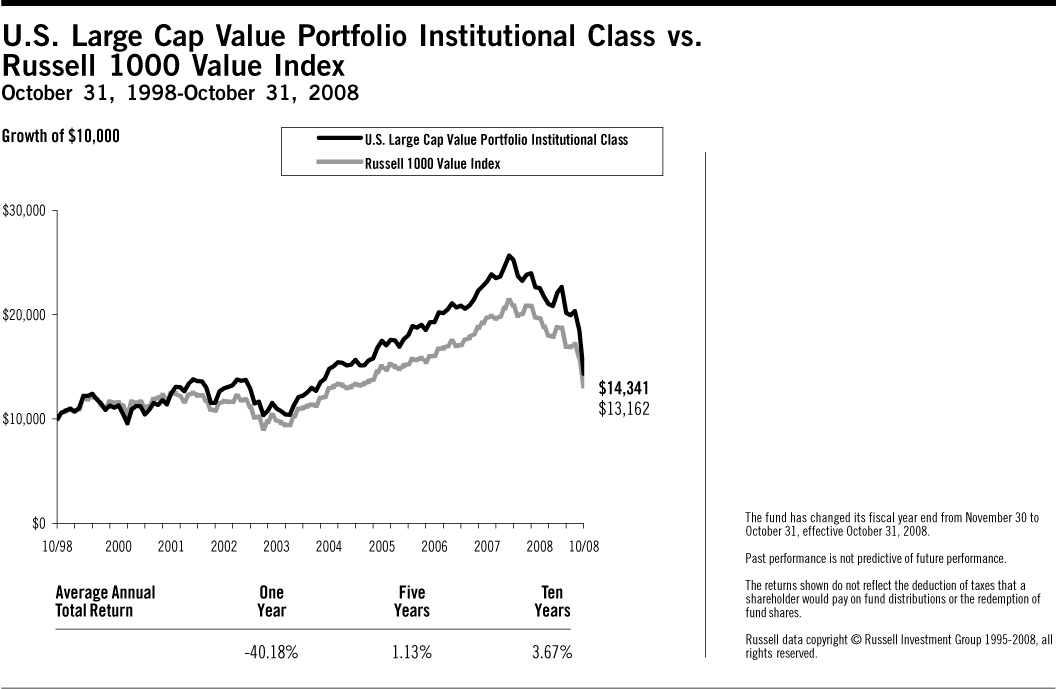
3
DFA INVESTMENT DIMENSIONS GROUP INC.
PERFORMANCE CHARTS

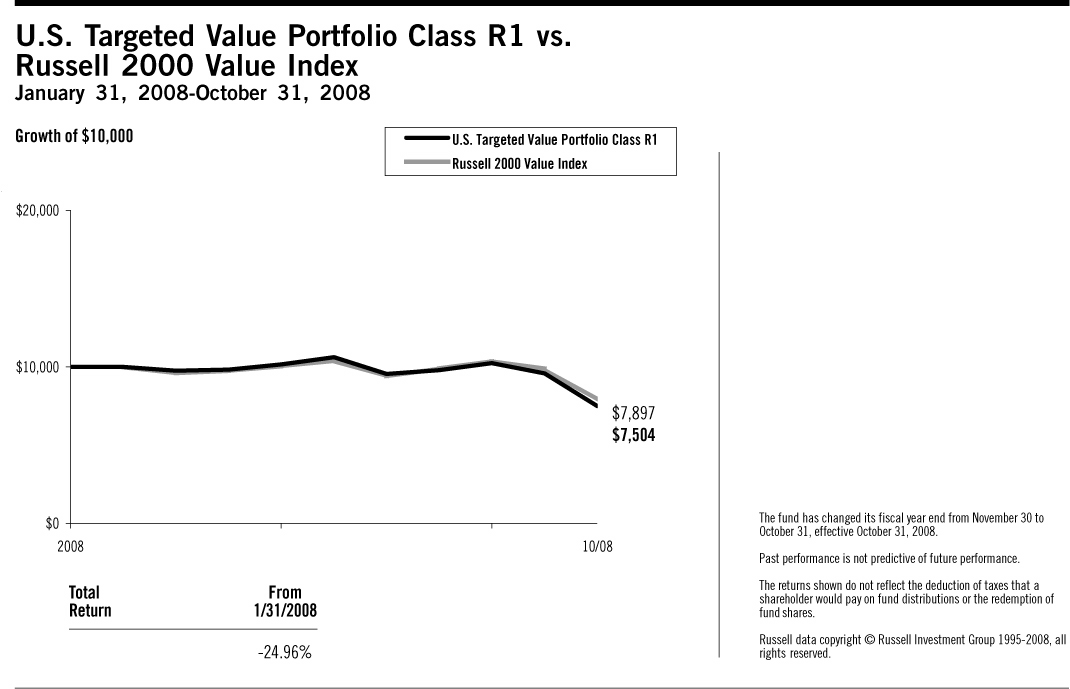
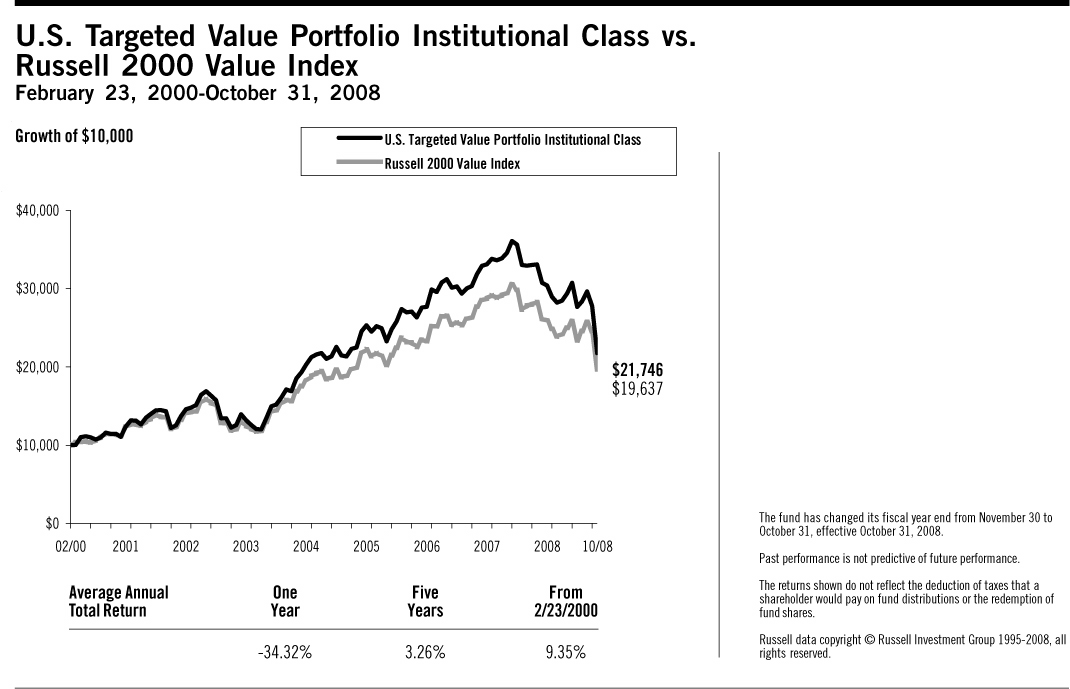
4
DFA INVESTMENT DIMENSIONS GROUP INC.
PERFORMANCE CHARTS
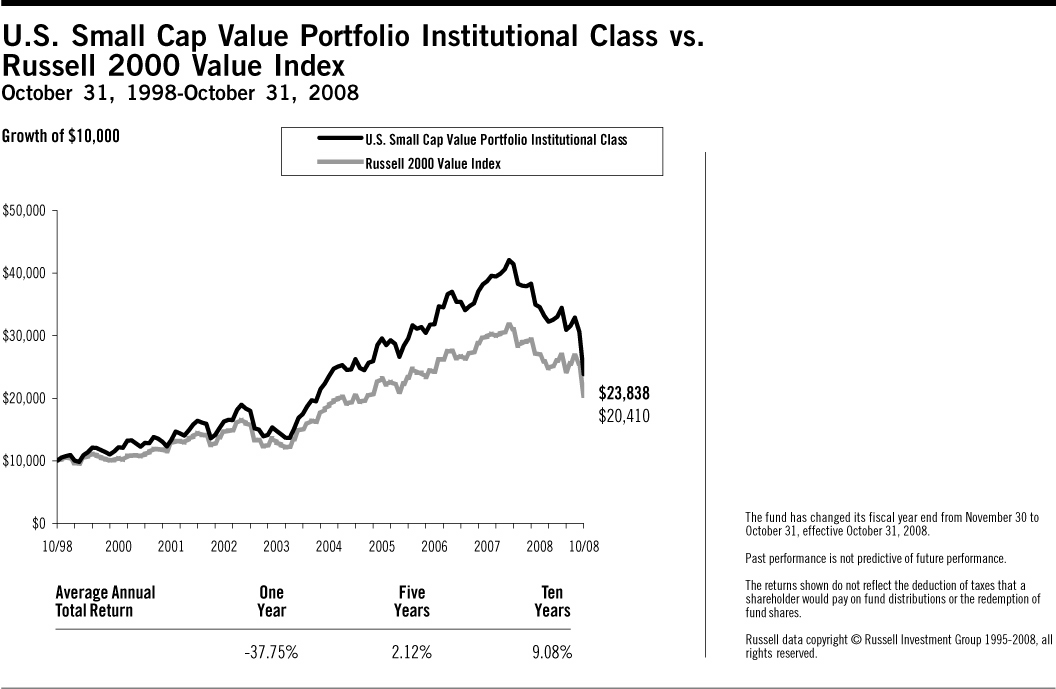

5
DFA INVESTMENT DIMENSIONS GROUP INC.
PERFORMANCE CHARTS

6
DFA INVESTMENT DIMENSIONS GROUP INC.
PERFORMANCE CHARTS

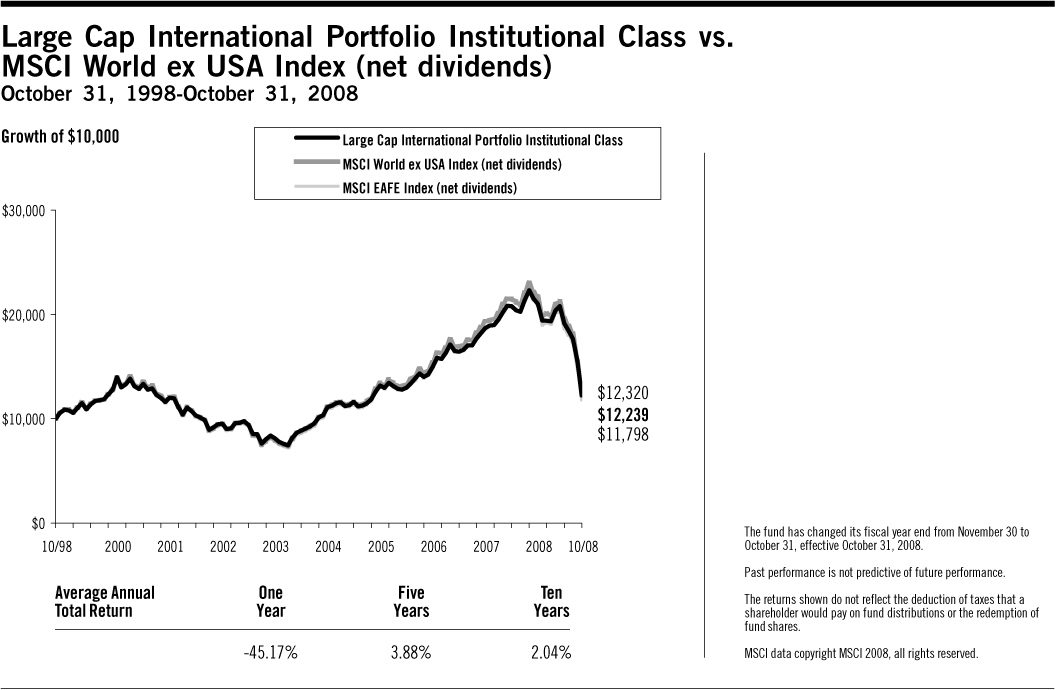
7
DFA INVESTMENT DIMENSIONS GROUP INC.
PERFORMANCE CHARTS
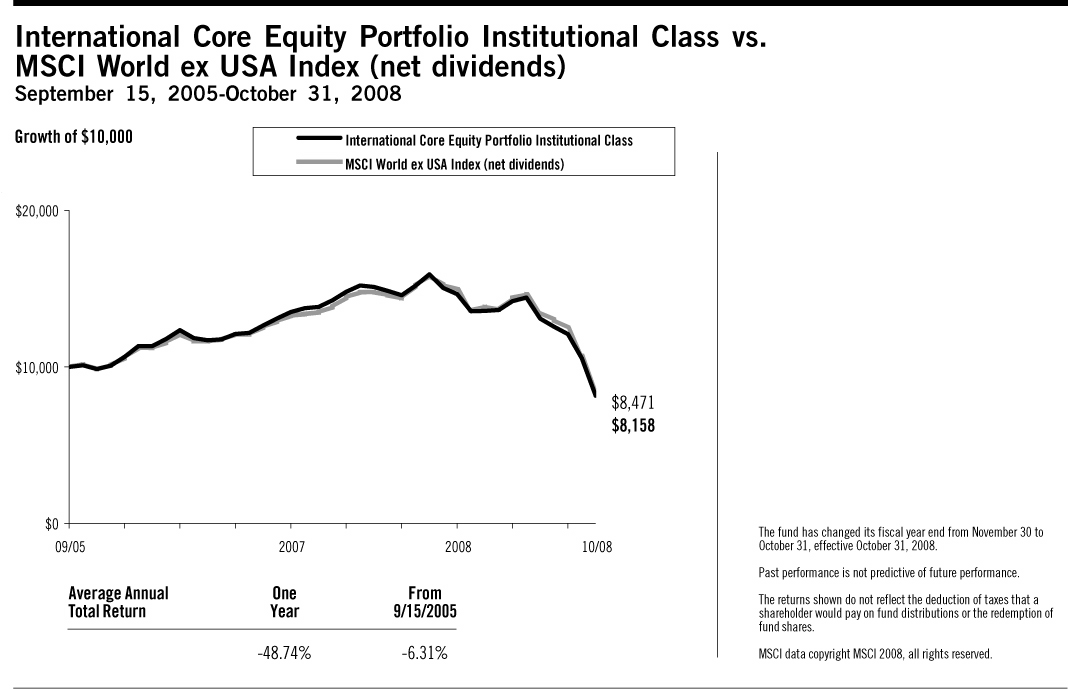
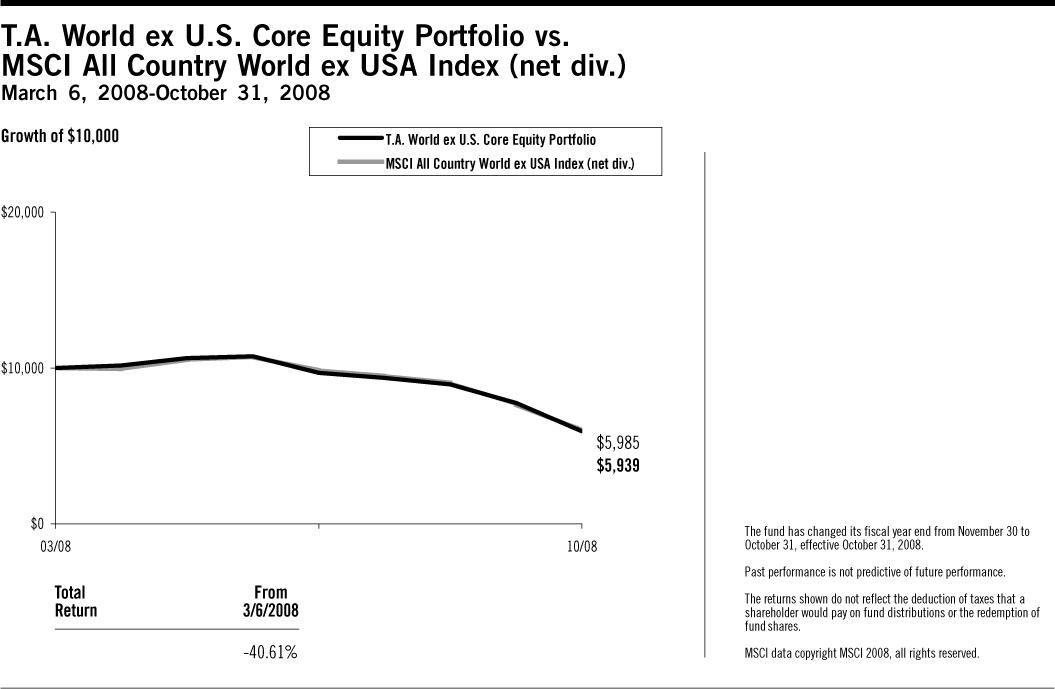
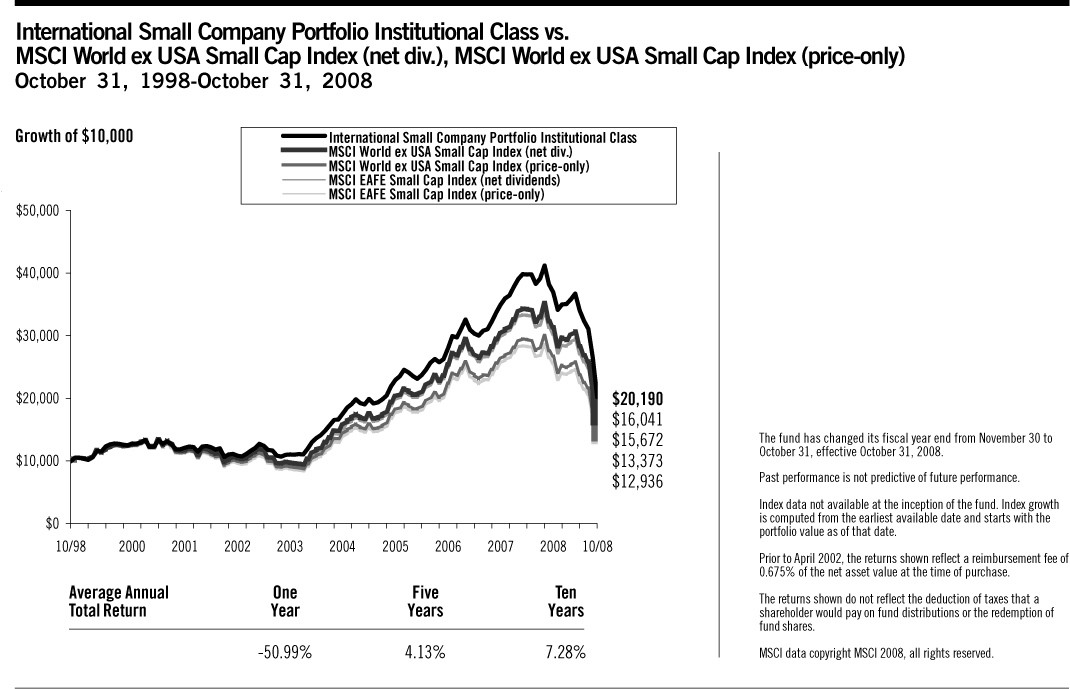
8
DFA INVESTMENT DIMENSIONS GROUP INC.
PERFORMANCE CHARTS
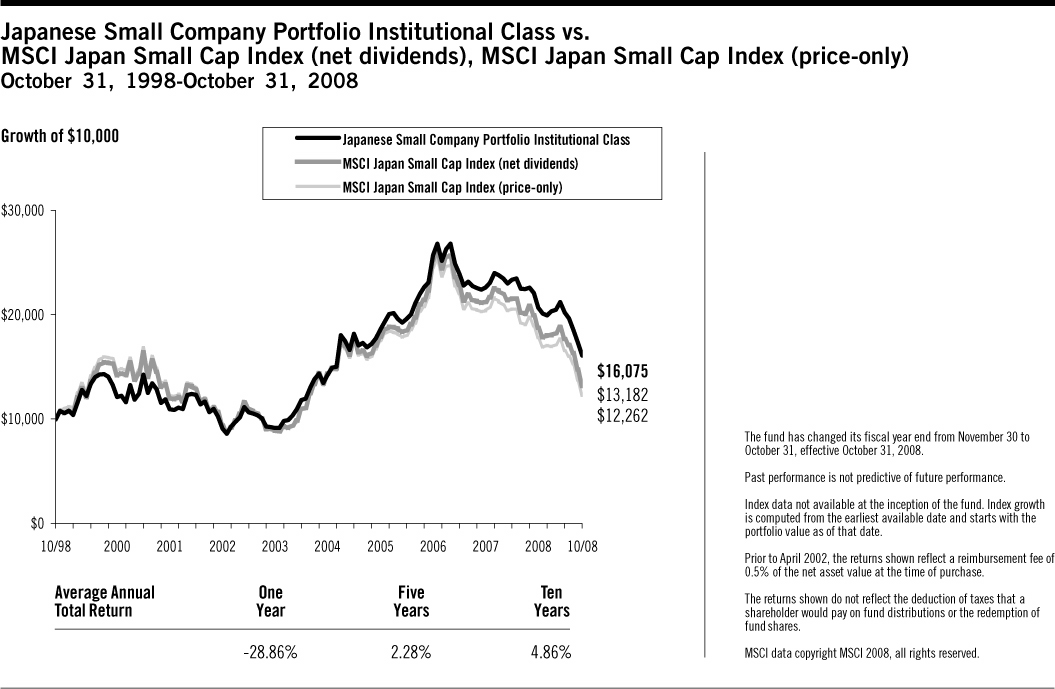


9
DFA INVESTMENT DIMENSIONS GROUP INC.
PERFORMANCE CHARTS
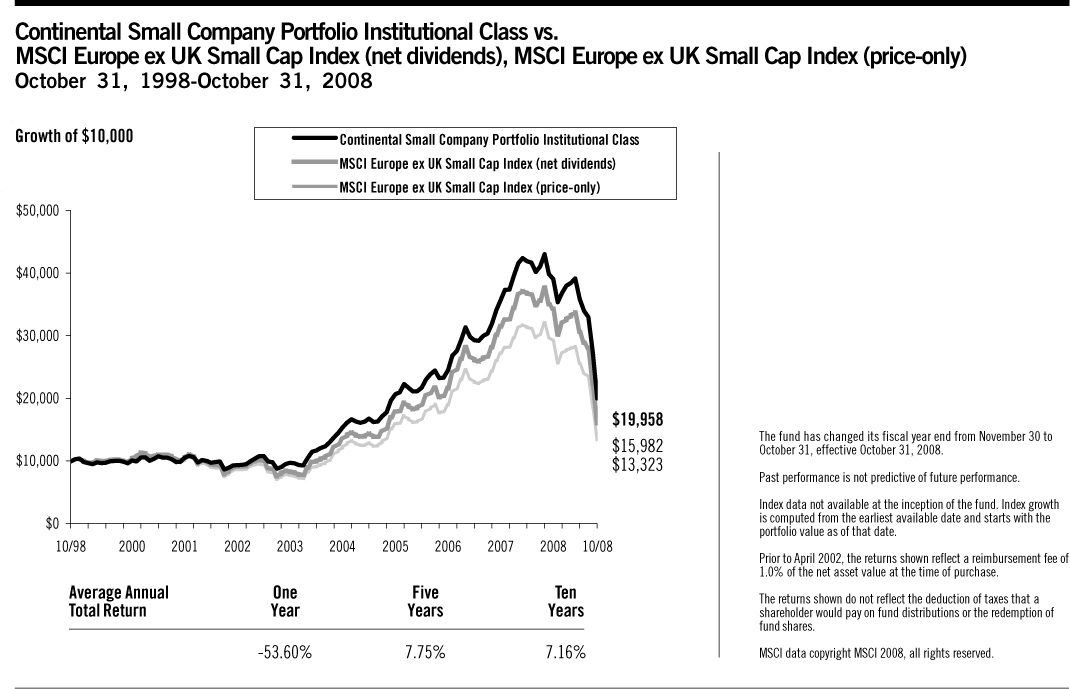
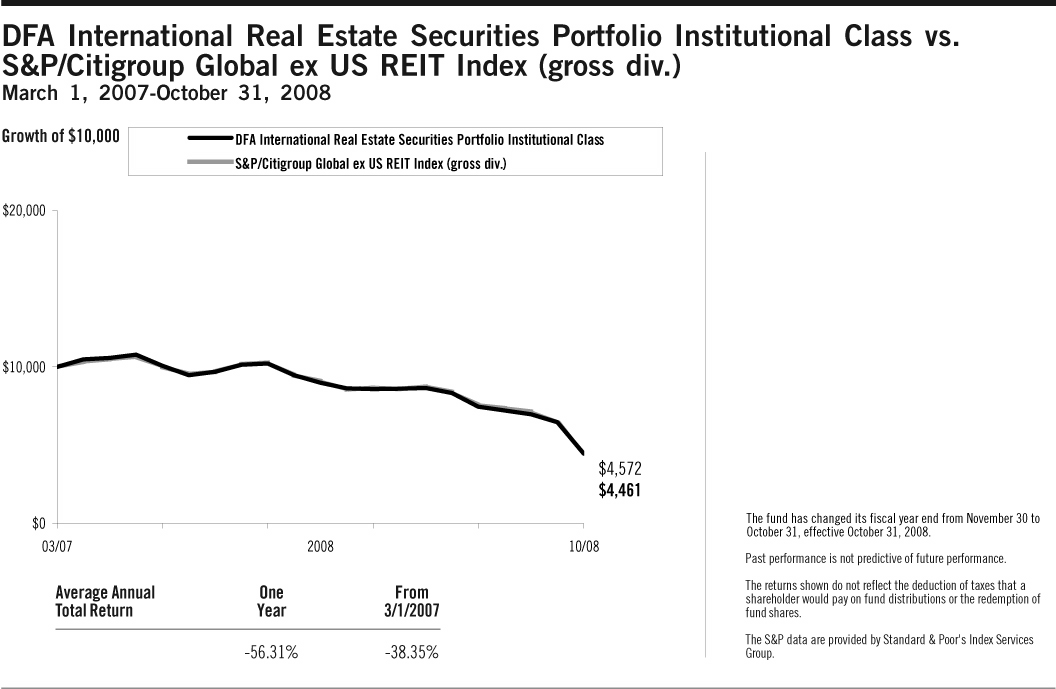

10
DFA INVESTMENT DIMENSIONS GROUP INC.
PERFORMANCE CHARTS
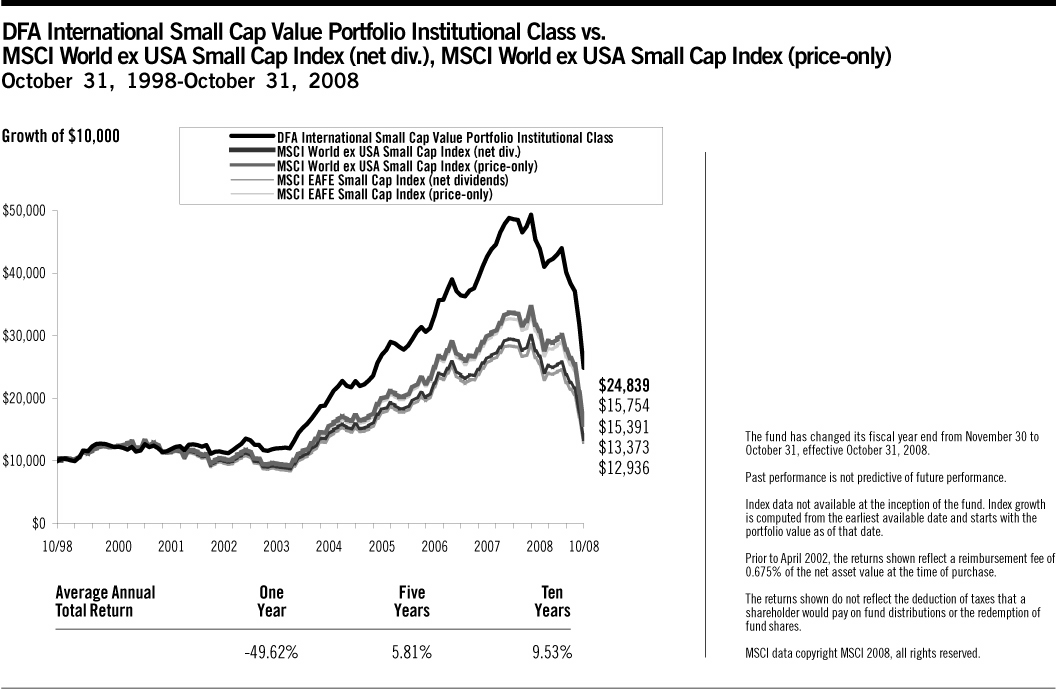

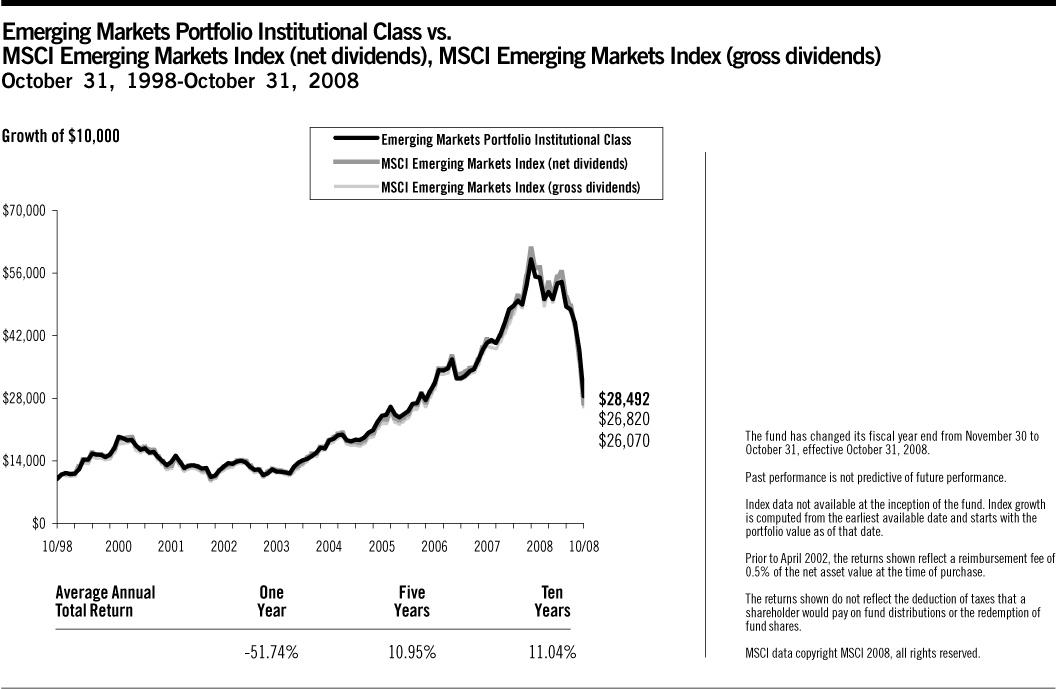
11
DFA INVESTMENT DIMENSIONS GROUP INC.
PERFORMANCE CHARTS

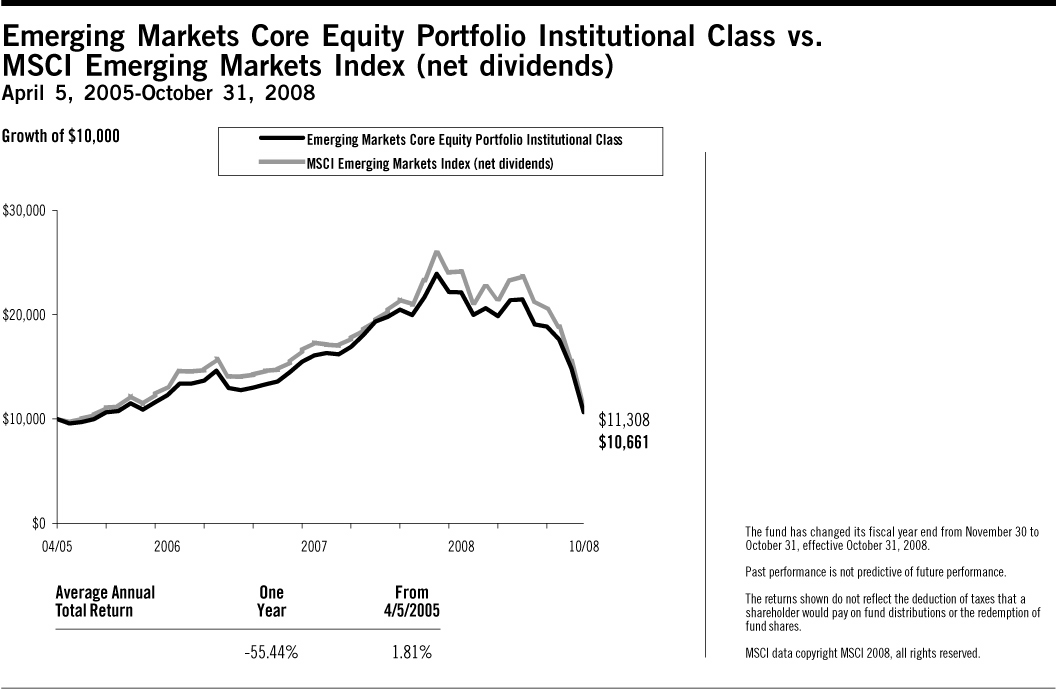
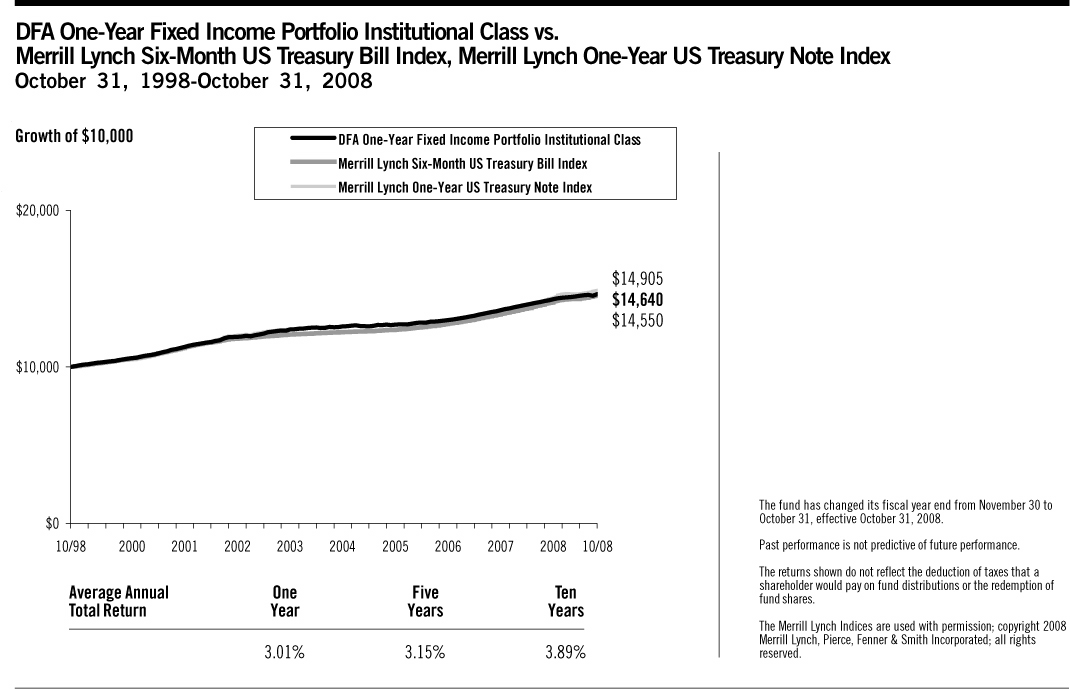
12
DFA INVESTMENT DIMENSIONS GROUP INC.
PERFORMANCE CHARTS
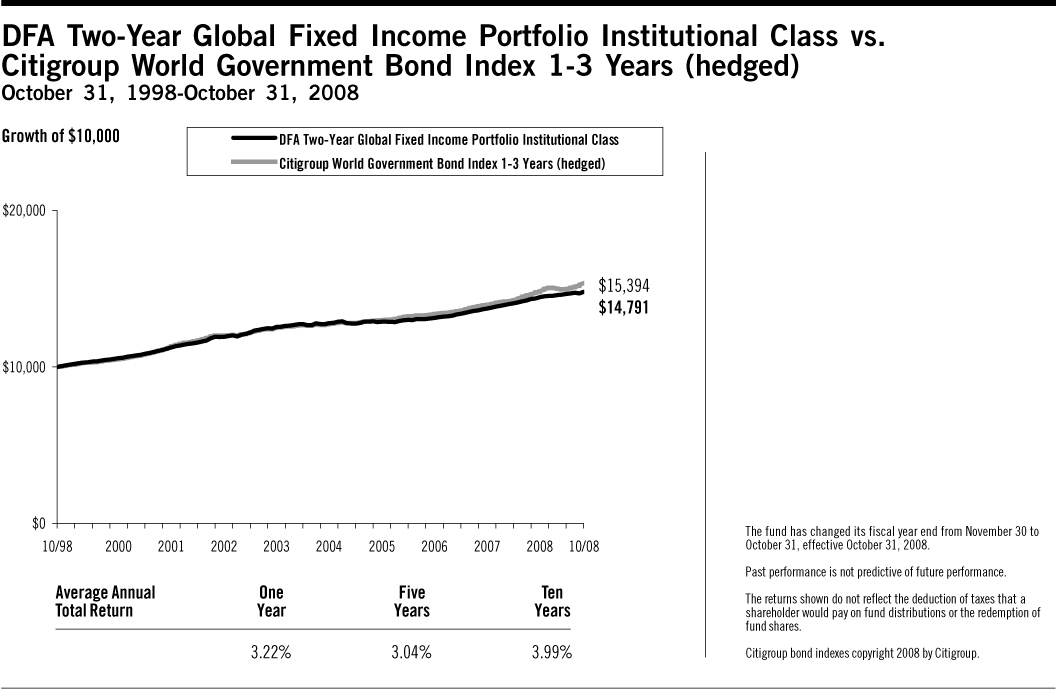

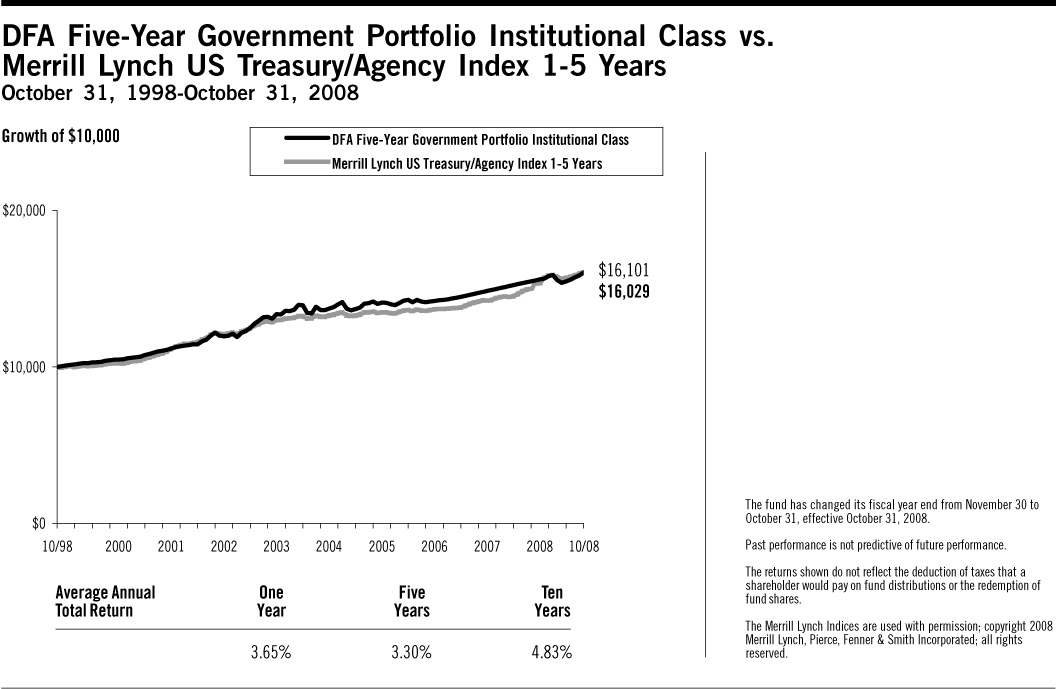
13
DFA INVESTMENT DIMENSIONS GROUP INC.
PERFORMANCE CHARTS

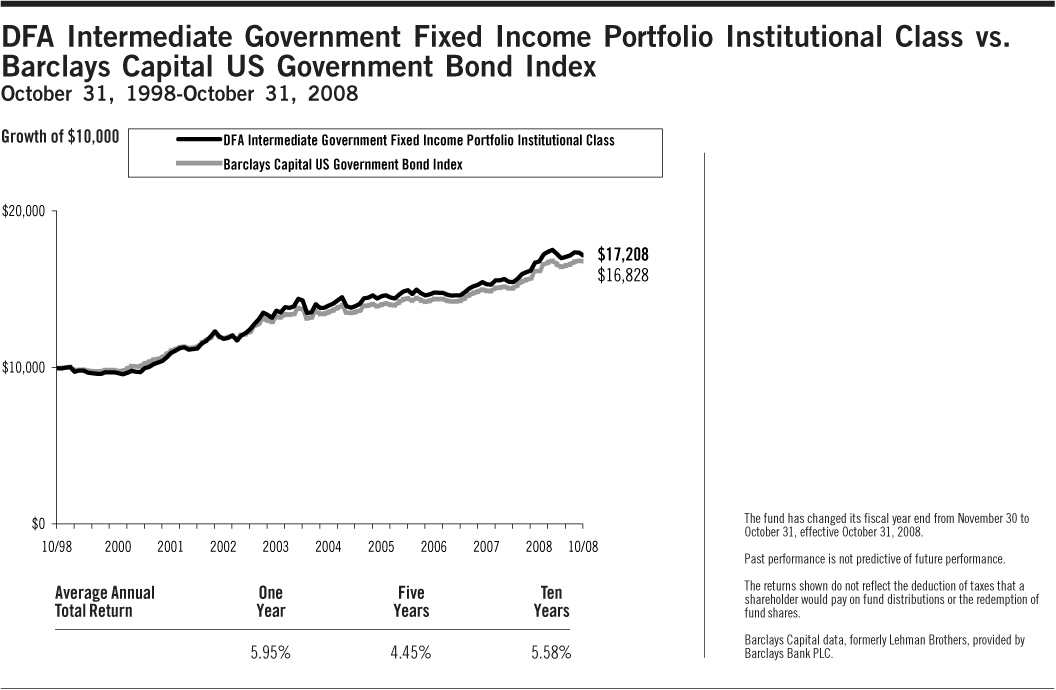
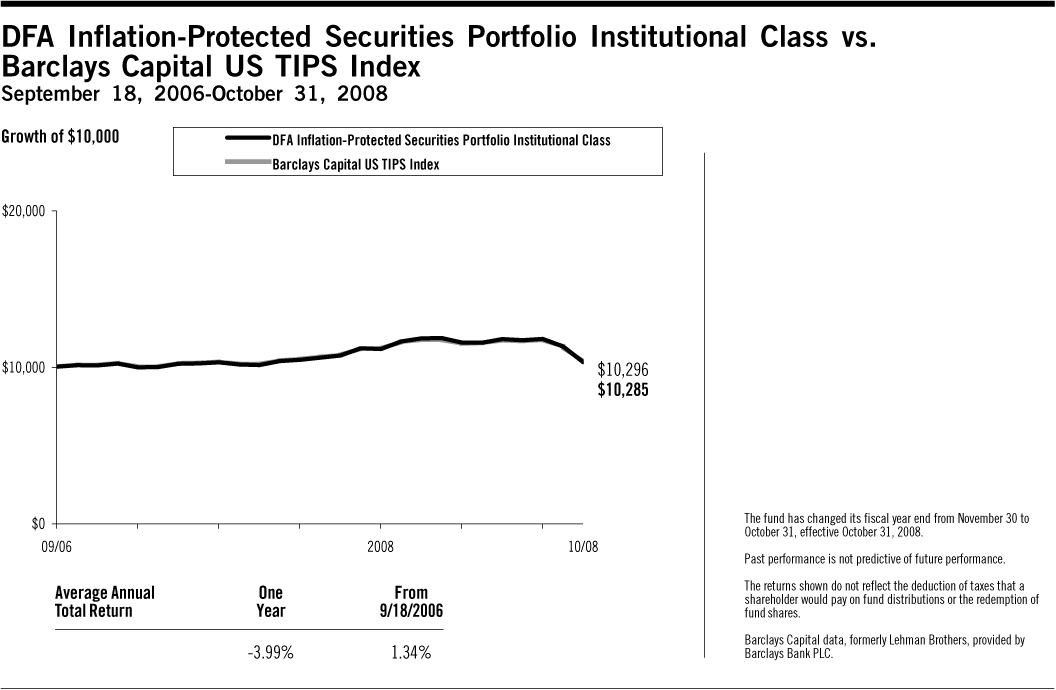
14
DFA INVESTMENT DIMENSIONS GROUP INC.
PERFORMANCE CHARTS

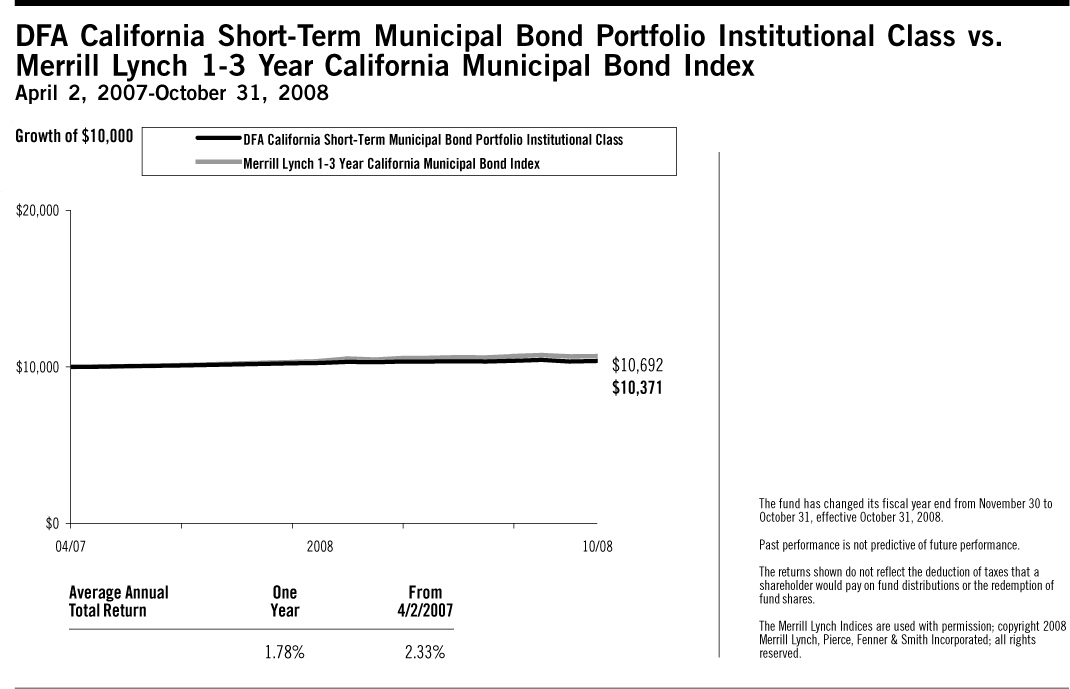
15
DFA INVESTMENT DIMENSIONS GROUP INC.
MANAGEMENT'S DISCUSSION AND ANALYSIS
On September 16, 2008, at a regular meeting of the Board of Directors/Trustees (the "Board") of the funds covered by this report, the Board voted to change the fiscal and tax year ends of the funds from November 30 to October 31. Therefore, the following discussion generally covers the 11-month period ended October 31, 2008.
U.S. Equity Market Review 11 Months Ended October 31, 2008
U.S. equity markets experienced high levels of volatility during the 11-month fiscal year ended October 31, 2008. The behavior of equity markets has been driven in large part by the contraction of lending in credit markets. In addition to heightened volatility, the cross-sectional dispersion of stock returns in equity markets has increased relative to previous levels, and returns even within each asset class have differed greatly. Dimensional Fund Advisors believes that a security's risk characteristics determine its expected return. Among the most important factors explaining differences in the behavior of diversified equity portfolios are company size and company value/growth characteristics of the portfolio holdings. Size is measured by market capitalization, and "value" classification is a function of stock price relative to one or more fundamental characteristics. Compared to other stocks, value stocks often have lower market value rela tive to their earnings, dividends, and book value.
For the 11 months ended October 31, 2008, small company stocks slightly outperformed large companies, and mid cap companies underperformed both small and large cap companies. The performance of the Russell Microcap Index® was –33.59%, the Russell 2000 Index® was –29.07%, CRSP 6-10 Index was –32.90%, and MSCI USA Small Cap 1750 Index was –32.21%. Large cap value stocks, as measured by the Russell 1000 Value Index®, slightly outperformed large cap growth stocks, as measured by the Russell 1000 Growth Index®. The value premium was larger among small cap stocks.
Total Return for 11 Months Ended October 31, 2008
| Russell 2000 Index® (small cap companies) | | | –29.07 | % | |
| Russell Midcap Index® (mid cap companies) | | | –37.70 | % | |
| Russell 1000 Index® (large cap companies) | | | –33.99 | % | |
| Russell 3000 Value Index® | | | –32.90 | % | |
| Russell 3000 Growth Index® | | | –34.45 | % | |
When the large, mid, and small cap market segments are further divided by value and growth characteristics, the distinction in performance within sectors was equally significant.
Total Return for 11 Months Ended October 31, 2008
| Russell 1000 Value Index® (large cap value companies) | | | –33.55 | % | |
| Russell 1000 Growth Index® (large cap growth companies) | | | –34.54 | % | |
| Russell Midcap Value Index® (mid cap value companies) | | | –35.42 | % | |
| Russell Midcap Growth Index® (mid cap growth companies) | | | –40.01 | % | |
| Russell 2500 Value Index® (small/mid cap value companies) | | | –29.10 | % | |
| Russell 2500 Growth Index® (small/mid cap growth companies) | | | –37.30 | % | |
| Russell 2000 Value Index® (small cap value companies) | | | –24.91 | % | |
| Russell 2000 Growth Index® (small cap growth companies) | | | –33.26 | % | |
Source: Russell data copyright © Russell Investment Group 1995-2008, all rights reserved.
Differences in returns for the various Dimensional U.S. equity funds over the 11 months ended October 31, 2008 were attributable primarily to differences in value/growth and size characteristics as well as the exclusion of REIT securities from most Dimensional portfolios, except for the DFA Real Estate Securities Portfolio and portfolios investing in the U.S. Large Company Series. Moreover, the portfolio construction approach used by Dimensional Fund Advisors generally resulted in portfolios with greater emphasis on value or small company characteristics relative to widely used index benchmarks.
16
Master-Feeder Structure
Certain portfolios described below, called "Feeder Funds," do not buy individual securities directly; instead, these portfolios invest in corresponding funds called "Master Funds." Master Funds, in turn, purchase stocks, bonds, and/or other securities.
Domestic Equity Portfolios' Performance Overview
U.S. Large Company Portfolio
The U.S. Large Company Portfolio seeks to approximate the returns of the S&P 500 Index® by purchasing shares of a Master Fund that invests in S&P 500 Index® stocks in approximately the same proportions as they are represented in the S&P 500 Index®. The Master Fund was mostly invested in equities throughout the year: average cash levels for the 11 months ended October 31, 2008 were in general less than 1% of the Master Fund's assets.
For the 11 months ended October 31, 2008, total returns were –33.14% for the Portfolio and –33.31% for the S&P 500 Index®. The securities in the Master Fund closely tracked the investment results of the Index. The better relative performance of the Portfolio was primarily due to the flexible trading approach employed by the Portfolio to gain exposure to the performance of the Index during periods of index reconstitution.
Enhanced U.S. Large Company Portfolio
The Enhanced U.S. Large Company Portfolio seeks to outperform the total return performance of the S&P 500 Index® by purchasing shares of a Master Fund that uses an "enhanced cash" strategy. This strategy combines investment in high-grade, short-term fixed income instruments with an overlay of S&P 500 Index® futures contracts or swaps. For the 11 months ended October 31, 2008, approximately 98% of the overlay instruments consisted of S&P 500 Index futures contracts. Swaps and ETFs completed the equity exposure for the last month of the fiscal year. The behavior of S&P 500 Index futures contracts and ETFs linked to the S&P 500 Index is determined principally by the performance of the S&P 500 Index. For the 11 months ended October 31, 2008, total return was –33.89% for the Portfolio and –33.31% for the S&P 500 Index. Relative to the S&P 500 Index, underperformance was mostl y due to returns of the fixed income securities in the Master Fund as well as differences in costs between the Portfolio and the Index.
U.S. Large Cap Value Portfolio
The U.S. Large Cap Value Portfolio seeks to capture the returns of U.S. large company value stocks by purchasing shares of a Master Fund that invests in such stocks. The investment strategy employs a disciplined, quantitative approach, emphasizing broad diversification and consistent exposure to large cap value stocks, but does not attempt to closely track a specific equity index. The Master Fund held approximately 200 stocks as of October 31, 2008, and was mostly invested in equities throughout the year: average cash levels for the 11 months ended October 31, 2008 were in general less than 1% of the Master Fund's assets.
As a result of the Master Fund's diversified investment approach, performance was determined principally by broad structural trends in the U.S. equity market, rather than by the behavior of a limited number of stocks. For the 11 months ended October 31, 2008, large cap value stocks generally outperformed large cap growth stocks. Total returns were –33.31% for the S&P 500 Index®, –33.55% for the Russell 1000 Value Index®, and –36.63% for the Portfolio. Relative to the Russell 1000 Value Index®, underperformance of the Portfolio was primarily due to the Master Fund's lower-exposure to stocks with neutral value/growth characteristics as measured by book-to-market ("BtM") ratio, and weighting and composition differences of consumer discretionary and consumer staples stocks due to structural differences in the eligible universe of the Master Fund as compared to the Index. Less value- oriented stocks in the middle BtM quartiles, which represented approximately 11% of the Master Fund compared to approximately 47% of the Index, outperformed value stocks in the highest BtM quartile by more than 17 percentage points. Stocks held by the Master Fund in the consumer discretionary sector, which represented approximately 16% of the Master Fund compared to approximately 8% of the Index, underperformed similar stocks in the Index by about 8 percentage points. Stocks held by the Master Fund in the consumer staples sector, which represented approximately 5% of the Master
17
Fund compared to 9% of the Index, underperformed similar stocks held by the Index by approximately 20 percentage points.
U.S. Targeted Value Portfolio
The U.S. Targeted Value Portfolio seeks to capture the returns of U.S. small and mid capitalization value stocks. The investment strategy employs a disciplined, quantitative approach, emphasizing broad diversification and consistent exposure to small and mid cap value stocks, but does not attempt to track closely a specific equity index. As of October 31, 2008, the Portfolio held approximately 1,520 stocks, and was mostly invested in equities throughout the year: average cash levels for the 11 months ended October 31, 2008 were in general approximately 1% of the Portfolio's assets.
As a result of the Portfolio's diversified investment approach, performance was determined principally by broad structural trends in the U.S. equity market, rather than the behavior of a limited number of stocks. For the 11 months ended October 31, 2008, the size premium was not strong; micro cap and mid cap stocks underperformed large and small cap stocks. Value stocks generally outperformed growth stocks. Total returns were –29.07% for the Russell 2000 Index®, –24.91% for the Russell 2000 Value Index®, –35.42% for the Russell Midcap Value Index®, and –29.27% for the Portfolio.
Relative to the Russell 2000 Value Index®, underperformance of the Portfolio for the fiscal year was primarily due to its underperformance in the first five to six weeks of the third quarter following the annual reconstitution of the Russell indexes. During this period, declining financial stocks added to the Index reversed course and rallied, while surging energy stocks removed from the Index slumped. The Portfolio held a different composition of financials and energy stocks than the Index and thus underperformed by over 3 percentage points during this period. A lower exposure to stocks with neutral value/growth characteristics as measured by book-to-market ratios also contributed to the Portfolio's underperformance. Mid cap stocks held by the Portfolio underperformed similar stocks held by the Index by approximately 14 percentage points, which also contributed to the underperformance.
U.S. Targeted Value Portfolio R1
The U.S. Targeted Value Portfolio R1 seeks to capture the returns of U.S. small and mid capitalization value stocks. The investment strategy employed by the U.S. Targeted Value Portfolio R1 is a disciplined, quantitative approach, emphasizing broad diversification and consistent exposure to small and mid cap value stocks, but does not attempt to track closely a specific equity index. As of October 31, 2008, the Master Fund held approximately 1,520 stocks, and was mostly invested in equities throughout the period from the Portfolio's inception on January 31, 2008: average cash levels for the period ended October 31, 2008 were in general approximately 1% of the Portfolio's assets.
As a result of the Portfolio's diversified investment approach, performance was determined principally by broad structural trends in the U.S. equity market, rather than the behavior of a limited number of stocks. For the period from the Portfolio's inception on January 31, 2008 through October 31, 2008, total returns were –23.83% for the Russell 2000 Index®, –21.03% for the Russell 2000 Value Index®, –31.58% for the Russell Midcap Value Index®, and –24.96% for the U.S. Targeted Value Portfolio R1.
Relative to the Russell 2000 Value Index®, underperformance of the Portfolio for the period since inception was primarily due to its underperformance in the first five to six weeks of the third quarter following the annual reconstitution of the Russell indexes. During this period, declining financial stocks added to the Index reversed course and rallied, while surging energy stocks removed from the Index slumped. The Portfolio held a different composition of financials and energy stocks than the Index and thus underperformed by over 3 percentage points during this period. A lower exposure to stocks with neutral value/growth characteristics as measured by book-to-market ratios also contributed to the Portfolio's underperformance. Mid cap stocks held by the Portfolio underperformed similar stocks held by the Index by approximately 16 percentage points, which also contributed to the underperformance.
U.S. Targeted Value Portfolio R2
The U.S. Targeted Value Portfolio R2 seeks to capture the returns of U.S. small and mid capitalization value stocks. The investment strategy employed by the U.S. Targeted Value Portfolio R2 is a disciplined, quantitative approach, emphasizing broad diversification and consistent exposure to small and mid cap value stocks, but does not attempt to
18
track closely a specific equity index. As of October 31, 2008, the Master Fund held approximately 1,520 stocks, and was mostly invested in equities throughout the period from the Portfolio's inception on June 30, 2008: average cash levels for the period ended October 31, 2008 were in general approximately 1% of the Portfolio's assets.
As a result of the Portfolio's diversified investment approach, performance was determined principally by broad structural trends in the U.S. equity market, rather than the behavior of a limited number of stocks. For the period from the Portfolio's inception on June 30, 2008 through October 31, 2008, total returns were –21.68% for the Russell 2000 Index®, –16.01% for the Russell 2000 Value Index®, –28.57% for the Russell Midcap Value Index®, and –21.40% for the U.S. Targeted Value Portfolio R2.
Relative to the Russell 2000 Value Index®, underperformance of the Portfolio for the fiscal year was primarily due to its underperformance in the first five to six weeks of the third quarter following the annual reconstitution of the Russell indexes. During this period, declining financial stocks added to the Index reversed course and rallied, while surging energy stocks removed from the Index slumped. The Portfolio held a different composition of financials and energy stocks than the Index and thus underperformed by over 3 percentage points during this period. Mid cap stocks held by the Portfolio underperformed similar stocks held by the Index by approximately 5 percentage points, which also contributed to the underperformance.
U.S. Small Cap Value Portfolio
The U.S. Small Cap Value Portfolio seeks to capture the returns of U.S. small company value stocks by purchasing shares of a Master Fund that invests in such stocks. The investment strategy employs a disciplined, quantitative approach, emphasizing broad diversification and consistent exposure to small company value stocks, but does not attempt to track closely a specific equity index. As of October 31, 2008, the Master Fund held about 2,130 stocks and was mostly invested in equities throughout the year: average cash levels for the 11 months ended October 31, 2008 were in general less than 1% of the Master Fund's assets.
As a result of the Master Fund's diversified investment approach, performance was determined principally by broad structural trends in the U.S. equity market, rather than the behavior of a limited number of stocks. For the 11 months ended October 31, 2008, the size premium was not strong; micro cap and mid cap stocks underperformed large and small cap stocks. Value stocks generally outperformed growth stocks. Total returns were –29.07% for the Russell 2000 Index®, –24.91% for the Russell 2000 Value Index®, and –31.80% for the Portfolio.
Relative to the Russell 2000 Value Index®, underperformance of the Portfolio for the fiscal year was primarily due to the Master Fund's underperformance in the first five to six weeks of the third quarter following the annual reconstitution of the Russell indexes. During this period, declining financial stocks added to the Index reversed course and rallied, while surging energy stocks removed from the Index slumped. The Master Fund did not hold the same composition of financials and energy stocks as the Index and thus underperformed by more than 3 percentage points during this period. Composition differences among the largest and smallest stocks held in the Master Fund as compared to the Index, and a greater exposure to stocks with the most pronounced value characteristics as measured by book-to-market ("BtM") ratio, also contributed to the Master Fund underperformance. Micro cap stocks held by the Master Fund, which accounted for approximately 34% of the Portfolio compared to 23% of the Index, underperformed similarly sized stocks held by the Index by approximately 6 percentage points. In addition, value stocks in the highest BtM quartile, which accounted for approximately 59% of the Master Fund compared to approximately 39% of the Index, underperformed the Index by approximately 10 percentage points.
U.S. Core Equity 1 Portfolio
The U.S. Core Equity 1 Portfolio seeks to capture the returns of the total U.S. market universe, with increased exposure to smaller company stocks and those stocks with value characteristics as measured by book-to-market ("BtM") ratio. The investment strategy employs a disciplined, quantitative approach, emphasizing wide diversification and comprehensive exposure to U.S. stocks, but does not attempt to track closely a specific equity index. As of October 31, 2008, the Portfolio held about 3,520 stocks and was mostly invested in equities throughout the year: average cash levels for the 11 months ended October 31, 2008 were in general less than 1% of the Portfolio's assets.
19
As a result of the Portfolio's total market orientation, performance was determined principally by broad structural trends in the U.S. equity market, rather than by the behavior of a limited number of stocks. For the 11 months ended October 31, 2008, the size premium was not strong; micro cap and mid cap stocks underperformed large and small cap stocks. Value stocks generally outperformed growth stocks. Total returns were –33.31% for the S&P 500 Index®, –33.62% for the Russell 3000 Index®, and –32.85% for the Portfolio. Compared to the Russell 3000 Index®, the better relative performance of the Portfolio was primarily due to the Portfolio's higher allocation to value stocks. Value stocks owned by the Portfolio in the highest BtM quartile, which represented approximately 33% of the Portfolio compared to approximately 26% of the Index, outperformed those held in the Index by 3 per centage points.
U.S. Core Equity 2 Portfolio
The U.S. Core Equity 2 Portfolio seeks to capture the returns of the total U.S. market universe with greater exposure to smaller company stocks and those stocks with value characteristics as measured by book-to-market ("BtM") ratio than the U.S. Core Equity 1 Portfolio. The investment strategy employs a disciplined, quantitative approach, emphasizing wide diversification and comprehensive exposure to U.S. stocks, but does not attempt to track closely a specific equity index. As of October 31, 2008, the Portfolio held about 3,530 stocks and essentially was fully invested in equities throughout the year: average cash levels for the 11 months ended October 31, 2008 were in general less than 1% of assets.
As a result of the Portfolio's total market orientation, performance was determined principally by broad structural trends in the U.S. equity market, rather than by the behavior of a limited number of stocks. For the 11 months ended October 31, 2008, the size premium was not strong; micro cap and mid cap stocks underperformed large and small cap stocks. Value stocks generally outperformed growth stocks. Total returns were –33.31% for the S&P 500 Index®, –33.62% for the Russell 3000 Index®, and –33.16% for the Portfolio. Compared to the Russell 3000 Index®, the better relative performance of the Portfolio was primarily due to the Portfolio's higher allocation to value stocks. Value stocks owned by the Portfolio in the two highest BtM quartiles, which represented approximately 72% of the Portfolio compared to approximately 51% of the Russell 3000 Index®, outperforme d those held in the Index. Financial stocks representing approximately 20% of the Portfolio outperformed financials representing approximately 15% of the Index by approximately 7 percentage points.
U.S. Vector Equity Portfolio
The U.S. Vector Equity Portfolio seeks to capture the returns of a broadly diversified basket of U.S. stocks with stronger exposure to smaller company stocks and those stocks with value characteristics as measured by book-to-market ratio than the U.S. Core Equity 2 Portfolio. The investment strategy employs a disciplined, quantitative approach, emphasizing broad diversification, but does not attempt to track closely a specific equity index. As of October 31, 2008, the Portfolio held about 3,380 stocks and essentially was fully invested in equities throughout the year: average cash levels for the 11 months ended October 31, 2008 were in general less than 1% of assets.
As a result of the Portfolio's diversified investment approach, performance was determined principally by broad structural trends in the U.S. equity market, rather than by the behavior of a limited number of stocks. For the 11 months ended October 31, 2008, the size premium was not strong; micro cap and mid cap stocks underperformed large and small cap stocks. Value stocks generally outperformed growth stocks. Total returns were –33.17% for the Russell 2500 Index®, –29.10% for the Russell 2500 Value Index®, and –33.29% for the Portfolio. Relative to the Russell 2500 Index®, underperformance of the Portfolio was primarily due to differences in expenses between the Portfolio and the Index. Results for the Index are not diminished by management and administrative expenses associated with running a live portfolio. Greater exposure to large cap stocks, which comprised approximately 23% o f the Portfolio compared to less than 1% of the Index and lagged the performance of similar stocks in the Index by approximately 32 percentage points, also contributed to the Portfolio's underperformance.
T.A. U.S. Core Equity 2 Portfolio
The T.A. U.S. Core Equity 2 Portfolio seeks to capture the returns of the total U.S. market universe, with increased exposure to smaller company stocks and those stocks with value characteristics as measured by book-to-market ("BtM") ratio, while minimizing federal income tax implications of investment decisions. The investment strategy employs
20
a disciplined, quantitative approach, emphasizing wide diversification and comprehensive exposure to U.S. stocks, but does not attempt to track closely a specific equity index. As of October 31, 2008, the Portfolio held about 2,840 stocks and essentially was fully invested in equities throughout the year: the average cash level for the 11 months ended October 31, 2008 was in general approximately 1% of assets.
As a result of the Portfolio's total market orientation, performance was determined principally by broad structural trends in the U.S. equity market, rather than by the behavior of a limited number of stocks. For the 11 months ended October 31, 2008, the size premium was not strong; micro cap and mid cap stocks underperformed large and small cap stocks. Value stocks generally outperformed growth stocks. Total returns were –33.31% for the S&P 500 Index®, –33.62% for the Russell 3000 Index® and –32.16% for the Portfolio. Compared to the Russell 3000 Index®, the better relative performance of the Portfolio was primarily due to the Portfolio's higher allocation to value stocks. Value stocks owned by the Portfolio in the highest BtM quartile, which represented approximately 40% of the Portfolio compared to approximately 26% of the Index, outperformed similar stocks held in the Index by approximately 6 percentage points. Financial stocks held by the Portfolio outperformed financials held by the Russell 3000 Index® by approximately 12 percentage points.
U.S. Small Cap Portfolio
The U.S. Small Cap Portfolio seeks to capture the returns of U.S. small company stocks by purchasing shares of a Master Fund that invests in such stocks. The investment strategy employs a disciplined, quantitative approach, emphasizing broad diversification and consistent exposure to small company stocks, but does not attempt to track closely a specific equity index. As of October 31, 2008, the Master Fund held approximately 2,480 stocks and was mostly invested in equities throughout the year: average cash levels for the 11 months ended October 31, 2008 were in general less than 1% of the Master Fund's assets.
As a result of the Master Fund's diversified investment approach, performance was determined principally by broad structural trends in the U.S. equity market, rather than the behavior of a limited number of stocks. For the 11 months ended October 31, 2008, the size premium was not strong; micro cap and mid cap stocks underperformed large and small cap stocks. Value stocks generally outperformed growth stocks. Total returns were –29.07% for the Russell 2000 Index®, –33.59% for the Russell Microcap Index, and –30.67% for the Portfolio. Relative to the Russell 2000 Index®, the underperformance of the Portfolio for the fiscal year was primarily due to the Master Fund's higher allocation to micro cap stocks, which underperformed small cap stocks, and due to the better performance of mid cap stocks in the Index.
U.S. Micro Cap Portfolio
The U.S. Micro Cap Portfolio seeks to capture the returns of very small U.S. company stocks by purchasing shares of a Master Fund that invests in such stocks. The investment strategy employs a disciplined, quantitative approach, emphasizing broad diversification and consistent exposure to very small company stocks, but does not attempt to track closely a specific equity index. As of October 31, 2008, the Master Fund held approximately 2,440 stocks and was mostly invested in equities throughout the year: average cash levels for the 11 months ended October 31, 2008 were in general less than 1% of the Master Fund's assets.
As a result of the Master Fund's diversified investment approach, performance was determined principally by broad structural trends in the U.S. equity market, rather than by the behavior of a limited number of stocks. For the 11 months ended October 31, 2008, the size premium was not strong; micro cap and mid cap stocks underperformed large and small cap stocks. Value stocks generally outperformed growth stocks.Within the broad universe of smaller capitalization stocks, mid caps outperformed micro caps. Total returns were –29.07% for the Russell 2000 Index®, –33.59% for the Russell Microcap Index, and –31.33% for the Portfolio. Relative to the Russell 2000 Index®, the underperformance of the Portfolio was primarily due to the Master Fund's weighting differences among micro cap stocks held in the Master Fund compared to the Index. The smallest micro cap stocks, which accounted for approximately 58% of the Master Fund compared to approximately 20% of the Index, underperformed the Russell 2000 Index® by approximately 4 percentage points.
21
DFA Real Estate Securities Portfolio
The DFA Real Estate Securities Portfolio is designed to capture the returns of a broadly diversified portfolio of real estate securities (e.g., REITs), but does not attempt to track closely a specific index. As of October 31, 2008, the Portfolio held approximately 100 stocks, and was mostly invested in equities throughout the year: for the 11 months ended October 31, 2008 average cash levels were in general less than 1% of the Portfolio's assets.
As a result of the Portfolio's diversified approach, performance was determined principally by structural trends in the real estate securities market, rather than the behavior of a limited number of stocks. For the 11 months ended October 31, 2008, the REIT sector slightly underperformed broad U.S. equity market indices. Total returns were –33.31% for the S&P 500 Index®, –35.18% for the Dow Jones Wilshire REIT Index, and –34.46% for the Portfolio. Relative to the Dow Jones Wilshire REIT Index, the better relative performance of the Portfolio was attributable to a larger exposure to self storage REITs. On average, these securities represented 6% of the Portfolio compared to 5% of the Index and outperformed the Index by approximately 38 percentage points. Composition differences between the smallest stocks held by the Portfolio compared to the Index also contributed to the Portfolio's better performance.
International Equity Market Review 11 Months Ended October 31, 2008
International equity markets, affected by credit and liquidity problems similar to those experienced in the U.S., experienced high levels of volatility and broadly negative returns for the period under review. Due to the strengthening of the U.S. dollar vs. most developed countries' currencies (with the exception of the Japanese Yen and the Hong Kong dollar), the performance numbers when expressed in U.S. dollars were lower than when expressed in local currencies for all of the largest country constituents of the MSCI World ex USA Index, with the exception of Japan and Hong Kong. Overall, currency exchange rate changes reduced the returns expressed in U.S. dollars: total return for the MSCI World ex USA Index (net dividends) was –37.82% in local currency and –44.37% in U.S. dollars.
Total Returns for 11 Months Ended October 31, 2008
| Ten Largest Foreign Developed Markets by Market Cap (BB) | | Local
Currency
Return | | U.S. Dollar
Return | |
| Japan ($2,111) | | | –43.55 | % | | | –36.33 | % | |
| United Kingdom ($1,758) | | | –29.61 | % | | | –44.68 | % | |
| France ($872) | | | –36.80 | % | | | –45.40 | % | |
| Canada ($786) | | | –25.69 | % | | | –38.91 | % | |
| Germany ($705) | | | –37.97 | % | | | –46.42 | % | |
| Switzerland ($704) | | | –30.05 | % | | | –32.39 | % | |
| Australia ($513) | | | –35.10 | % | | | –51.58 | % | |
| Spain ($331) | | | –40.19 | % | | | –48.33 | % | |
| Italy ($301) | | | –43.34 | % | | | –51.06 | % | |
| Netherlands ($206) | | | –41.65 | % | | | –49.59 | % | |
Country market capitalizations (in parentheses) are in USD billions. Source: Returns are of MSCI indices net of foreign withholding taxes on dividends. Country market capitalizations are based on country carve-outs of the MSCI All-Country World Investable Market Index. MSCI data copyright MSCI 2008, all rights reserved.
22
Small company stocks were the poorest-performing asset classes in international markets, while large company growth stocks had the best relative results.
Total Returns for 11 Months Ended October 31, 2008
| | | U.S. Dollar
Return | |
| MSCI World ex USA Small Cap Index | | | –50.30 | % | |
| MSCI World ex USA Value Index | | | –45.31 | % | |
| MSCI World ex USA Index | | | –44.37 | % | |
| MSCI World ex USA Growth Index | | | –43.47 | % | |
Source: MSCI indices are net of foreign withholding taxes on dividends, copyright MSCI 2008, all rights reserved.
Losses in emerging markets were worse, on average, than in developed country markets, although results varied widely among individual countries. For the 11 months under review, total returns in U.S. dollars were –53.02% for the MSCI Emerging Markets Index (net dividends) and –44.37% for the MSCI World ex USA Index (net dividends).
Total Returns for 11 Months Ended October 31, 2008
| Country | | U.S. Dollar
Return | |
| Argentina | | | –55.00 | % | |
| Brazil | | | –51.21 | % | |
| Chile | | | –36.59 | % | |
| China | | | –59.33 | % | |
| Czech Republic | | | –40.25 | % | |
| Hungary | | | –58.65 | % | |
| India | | | –61.19 | % | |
| Indonesia | | | –59.87 | % | |
| Israel | | | –23.01 | % | |
| Malaysia | | | –40.52 | % | |
| Mexico | | | –44.05 | % | |
| Philippines | | | –49.76 | % | |
| Poland | | | –51.90 | % | |
| South Africa | | | –47.38 | % | |
| South Korea | | | –55.75 | % | |
| Taiwan | | | –43.57 | % | |
| Thailand | | | –51.81 | % | |
| Turkey | | | –59.24 | % | |
Source: Returns are of MSCI indices net of foreign withholding taxes on dividends, copyright MSCI 2008, all rights reserved.
Master-Feeder Structure
Certain portfolios described below, called "Feeder Funds," do not buy individual securities directly; instead, these portfolios invest in corresponding funds called a "Master Fund." The Master Funds, in turn, purchase stocks, bonds, and/or other securities.
International Equity Portfolios' Performance Overview
Large Cap International Portfolio
The Large Cap International Portfolio seeks to capture the returns of international large company stocks. The investment strategy employs a disciplined, quantitative approach, emphasizing broad diversification and consistent exposure to large cap stocks, but does not attempt to track closely a specific equity index. The Portfolio held
23
approximately 1,330 stocks in 22 developed country markets as of October 31, 2008, and was mostly invested in equities throughout the year: average cash levels for the 11 months ended October 31, 2008 were in general less than 1% of the Portfolio's assets.
As a result of the Portfolio's diversified investment approach, performance was determined principally by broad structural trends in the international equity markets rather than the behavior of a limited number of stocks. For the 11 months ended October 31, 2008, international large cap stocks generally outperformed international small cap stocks. Total returns were –44.81% for the MSCI EAFE Index (net dividends), –44.37% for the MSCI World ex USA Index (net dividends), and –43.14% for the Portfolio. Relative to the MSCI EAFE Index (net dividends), the better performance of the Portfolio was primarily due to composition differences among financial stocks and stocks with lower market capitalizations held by the Portfolio compared to the Index. Financial stocks held by the Portfolio outperformed those held by the Index by approximately 2 percentage points. Stocks held by the Portfolio in the second largest quintile by market cap italizations also outperformed those held by the Index by approximately 2 percentage points.
International Core Equity Portfolio
The International Core Equity Portfolio seeks to capture the returns of the broad universe of international stocks, with increased exposure to smaller company stocks and stocks with value characteristics as measured by book-to-market ratio. The investment strategy employs a disciplined, quantitative approach, emphasizing broad diversification and comprehensive exposure to developed country stocks, but does not attempt to track closely a specific equity index. The Portfolio held about 4,820 stocks in 22 developed country markets as of October 31, 2008, and was mostly invested in equities throughout the year: average cash levels for the 11 months ended October 31, 2008 were in general less than 1% of the Portfolio's assets.
As a result of the Portfolio's diversified investment approach, performance was determined principally by broad structural trends in the international equity markets rather than the behavior of a limited number of stocks. For the 11 months ended October 31, 2008, total returns were –44.37% for the MSCI World ex USA Index (net dividends) and –45.76% for the Portfolio. The underperformance of the Portfolio as compared to the Index was primarily due to a larger allocation of the Portfolio to micro cap stocks. Micro cap stocks, which represented approximately 16% of the Portfolio compared to less than 1% of the Index, underperformed the Index by approximately 2 percentage points. To a lesser extent, underperformance to the Index was attributable to a smaller allocation by the Portfolio to health care stocks, which outperformed the Index by more than 16 percentage points. Health care stocks comprised approximately 4% of the Portfolio, c ompared to 6% of the Index.
T.A. World ex U.S. Core Equity Portfolio
The T.A. World ex U.S. Core Equity Portfolio seeks to capture the returns of a broadly diversified basket of international stocks in developed and emerging markets, with increased exposure to smaller company stocks and those stocks with value characteristics as measured by book-to-market ratio. The Portfolio also seeks to lower tax exposure by minimizing the realization of short-term capital gains and non-qualified dividend income. The investment strategy employs a disciplined, quantitative approach, emphasizing broad diversification, but does not attempt to track closely a specific equity index. As of October 31, 2008, the Portfolio held approximately 3,310 stocks in 39 developed and emerging markets and was mostly invested in equities throughout the period: average cash levels from the Portfolio's inception on March 6, 2008 through October 31, 2008 were in general approximately 3% of the Portfolio's assets.
As a result of the Portfolio's diversified investment approach, performance was determined principally by broad structural trends in the international equity markets, rather than by the behavior of a limited number of stocks. For the period from the Portfolio's inception on March 6, 2008 through October 31, 2008, total returns were –40.15% for the MSCI All Country World ex USA Index, and –40.61% for the Portfolio. Relative to the Index, underperformance of the Portfolio was primarily due to differences in expenses between the Portfolio and the Index and due to the Portfolio's greater exposure to micro cap stocks. Results for the Index are not diminished by management and administrative expenses associated with running a live portfolio. Micro cap stocks comprised approximately 15% of the Portfolio compared to 1% of the Index and underperformed the Index. A smaller allocation by the Portfolio to health care stocks,
24
which outperformed the Index by a wide margin, also contributed to the Portfolio's underperformance. Health care stocks comprised about 4% of the Portfolio, compared to 6% of the Index.
International Small Company Portfolio
The International Small Company Portfolio seeks to capture the returns of international small company stocks by purchasing shares of five Master Funds that invest individually in Canada, the United Kingdom, Europe (excluding the U.K.), Japan, and Asia Pacific. The investment strategy employs a disciplined, quantitative approach, emphasizing broad diversification and consistent exposure to small company stocks, but does not attempt to track closely a specific equity index. As of October 31, 2008, the Master Funds held approximately 4,070 stocks in 22 developed country markets and were mostly invested in equities throughout the year: the combined average cash levels for the 11 months ended October 31, 2008 were in general less than 1% of the Portfolio's assets.
As a result of the Master Funds' diversified investment approach, performance was determined principally by broad structural trends in international equity markets, rather than the behavior of a limited number of stocks. For the 11 months ended October 31, 2008, international small company stocks underperformed international large company stocks. Total returns were –49.91% for the MSCI EAFE Small Cap Index (net dividends), –51.10% for the MSCI EAFE Small Cap Index (price-only), –50.30 for the MSCI World ex USA Small Cap Index (net dividends), –51.45% for the MSCI World ex USA Small Cap Index (price-only), and –47.13% for the Portfolio. The Indexes net of foreign withholding taxes on dividends do not have ten years of performance. The Portfolio intends to include the price-only Indexes for performance comparison purposes until the net-dividends Indexes have at least ten years of data to report.
Relative to both the MSCI EAFE Small Cap Index (net dividends) and the MSCI World ex USA Small Cap Index (net dividends), the outperformance of the Portfolio was primarily due to composition differences in value stocks between the Master Funds and the Indexes. Value stocks held by the Master Funds outperformed similar stocks in both Indexes by approximately 5 percentage points. Small and micro cap stocks held by the Master Funds outperformed similar stocks held by both Indexes, which also contributed to its better relative performance.
Japanese Small Company Portfolio
The Japanese Small Company Portfolio seeks to capture the returns of Japanese small company stocks by purchasing shares of a Master Fund that invests in such stocks. The investment strategy employs a disciplined, quantitative approach, emphasizing broad diversification and consistent exposure to small company stocks, but does not attempt to track closely a specific equity index. As of October 31, 2008, the Master Fund held approximately 1,240 stocks and average cash levels for the 11 months ended October 31, 2008 were in general less than 1% of the Master Fund's assets.
As a result of the Master Fund's diversified investment approach, performance was determined principally by broad structural trends in the Japanese equity market, rather than the behavior of a limited number of stocks. For the 11 months ended October 31, 2008, Japanese small company stocks outperformed Japanese large company stocks. Total returns were –36.36% for the MSCI Japan Large Cap Index (net dividends), –33.92% for the MSCI Japan Small Cap Index (net dividends), –35.17% for the MSCI Japan Small Cap Index (price-only) and –27.16% for the Portfolio. The Index net of foreign withholding taxes on dividends does not have ten years of performance. The Portfolio intends to include the price-only Index for performance comparison purposes until the net-dividends Index has at least ten years of data to report.
Relative to the MSCI Japan Small Cap Index (net dividends), the better relative performance of the Portfolio was due to the Master Fund's larger allocation to value stocks, which outperformed the Index by approximately 10 percentage points. Value stocks held by the Master Fund, which accounted for approximately 21% of the Master Fund compared to 13% of the Index, outperformed similar stocks in the Index by approximately 5 percentage points. Small cap and micro cap stocks held by the Master Fund outperformed similar stocks in the MSCI Japan Small Cap Index (net dividends), which also contributed to its better performance.
25
Asia Pacific Small Company Portfolio
The Asia Pacific Small Company Portfolio seeks to capture the returns of small company stocks in developed Asia Pacific markets, excluding Japan, by purchasing shares of a Master Fund that invests in such stocks. The investment strategy employs a disciplined, quantitative approach, emphasizing broad diversification and consistent exposure to small company stocks, but does not attempt to track closely a specific equity index. As of October 31, 2008, the Master Fund held approximately 950 stocks, and assets were allocated mainly among four countries: Australia, Hong Kong, New Zealand, and Singapore (approximately 62%, 17%, 8%, and 12%, respectively). Country allocations are determined by utilizing the approximate weights of individual securities within a universe of Asia Pacific small company stocks. The allocations do not represent a forecast of future performance and are subject to change. Average cash levels for the 11 months ended October 31, 2008 were in general approximately 1% of the Master Fund's assets.
As a result of the Master Fund's diversified investment approach, performance was determined principally by broad structural trends in Asia Pacific equity markets rather than the behavior of a limited number of stocks. For the 11 months ended October 31, 2008, Asia Pacific small company stocks underperformed Asia Pacific large company stocks. Total returns were –50.78% for the MSCI Pacific ex Japan Large Cap Index (net dividends), –62.96% for the MSCI Pacific ex Japan Small Cap Index (net dividends), –64.17% for the MSCI Pacific ex Japan Small Cap Index (price-only), and –57.94% for the Portfolio. The Index net of foreign withholding taxes on dividends does not have ten years of performance. The Portfolio intends to include the price-only Index for performance comparison purposes until the net-dividends Index has at least ten years of data to report.
Relative to the MSCI Pacific ex Japan Small Company Index (net dividends), the better relative performance of the Portfolio was primarily due to the Master Fund's composition differences among stocks with larger market capitalizations. Small cap stocks with higher market capitalizations held by the Master Fund outperformed similar size stocks held by the Index by approximately 6 percentage points. The Master Fund's larger allocation to energy stocks, which comprised about 10% of the Portfolio compared to 8% of the Index and outperformed the overall Index, also contributed to the Portfolio's better performance.
United Kingdom Small Company Portfolio
The United Kingdom Small Company Portfolio seeks to capture the returns of U.K. small company stocks by purchasing shares of a Master Fund that invests in such stocks. The investment strategy employs a disciplined, quantitative approach, emphasizing broad diversification and consistent exposure to small company stocks, but does not attempt to track closely a specific equity index. As of October 31, 2008, the Master Fund held approximately 380 stocks, and average cash levels for the 11 months ended October 31, 2008 were in general approximately 1% of the Master Fund's assets.
As a result of the Master Fund's diversified investment approach, performance was determined principally by broad structural trends in the U.K. equity market, rather than the behavior of a limited number of stocks. For the 11 months ended October 31, 2008, U.K. small company stocks underperformed U.K. large company stocks. Total returns were –43.64% for the MSCI U.K. Large Cap Index (net dividends), –53.13% for the MSCI U.K. Small Cap Index (net dividends), –54.52% for the MSCI U.K. Small Cap Index (price-only) and –50.97% for the Portfolio. The Index net of foreign withholding taxes on dividends does not have ten years of performance. The Portfolio intends to include the price-only Index for performance comparison purposes until the net-dividends Index has at least ten years of data to report.
Relative to the MSCI U.K. Small Cap Index (net dividends), the better relative performance of the Portfolio was primarily due to the lower allocation by the Master Fund to financials, 13% vs. 17%. Financial stocks held by the Master Fund outperformed similar stocks in the Index by approximately 5 percentage points.
Continental Small Company Portfolio
The Continental Small Company Portfolio seeks to capture the returns of small company stocks in developed markets of Europe, excluding the U.K., by purchasing shares of a Master Fund that invests in such stocks. The investment strategy employs a disciplined, quantitative approach, emphasizing broad diversification and consistent exposure to
26
small company stocks, but does not attempt to track closely a specific equity index. As of October 31, 2008, the Master Fund held approximately 1,150 stocks in 15 developed continental European countries, and average cash levels for the 11 months ended October 31, 2008 were in general less than 1% of the Master Fund's assets. Country allocations reflect the approximate weights of individual securities within a universe of continental European small company stocks. Country allocations do not represent a forecast of future performance and are subject to change.
As a result of the Master Fund's diversified investment approach, performance was determined principally by broad structural trends in the continental European equity markets, excluding the U.K., rather than the behavior of a limited number of stocks. For the 11 months ended October 31, 2008, continental European small company stocks underperformed continental European large company stocks. Total returns were –46.25% for the MSCI Europe ex U.K. Large Cap Index (net dividends), –54.30% for the MSCI Europe ex U.K Small Cap Index (net dividends), –55.24% for the MSCI Europe ex U.K. Small Cap Index (price-only), and –49.89% for the Portfolio. The Index net of foreign withholding taxes on dividends does not have ten years of performance. The Portfolio intends to include the price-only Index for performance comparison purposes until the net-dividends Index has at least ten years of data to report.
Relative to the MSCI Europe ex U.K. Small Cap Index (net dividends), the better performance of the Portfolio was primarily due to the Master Fund's composition differences for financial and industrial stocks. Financial stocks held by the Master Fund outperformed those held by the Index by approximately 13 percentage points, while industrial stocks held by the Master Fund outperformed similar stocks in the Index by approximately 4 percentage points.
DFA International Real Estate Securities Portfolio
DFA International Real Estate Securities Portfolio is designed to capture the returns of a broadly diversified portfolio of real estate securities in international markets, but does not attempt to track closely a specific index. As of October 31, 2008, the Portfolio held approximately 170 stocks in 16 developed and emerging countries, and average cash levels for the 11 months ended October 31, 2008 were in general less than 1% of the Portfolio's assets.
As a result of the Portfolio's diversified approach, performance was determined principally by structural trends in international real estate securities markets, rather than the behavior of a limited number of stocks. For the 11 months ended October 31, 2008, total returns were –51.66% for the S&P Global ex US REIT Index (gross dividends) and –52.85% for the Portfolio. Relative to the Index, the underperformance of the Portfolio was mainly attributable to a lower exposure to large cap REIT securities, which outperformed the overall Index. Large cap REITs represented approximately 46% of the Portfolio, compared to 55% of the Index.
DFA Global Real Estate Securities Portfolio
DFA Global Real Estate Securities Portfolio, a fund of funds, is designed to capture the returns of a broadly diversified portfolio of real estate securities in U.S. and international markets, but does not attempt to track closely a specific index. As of October 31, 2008, the Portfolio invested in the DFA International Real Estate Securities Portfolio and the DFA Real Estate Securiites Portfolio (the "Underlying Funds").
As a result of the Portfolio's diversified approach, performance was determined principally by structural trends in global real estate securities markets, rather than the behavior of a limited number of stocks. For the period from the Portfolio's inception on June 4, 2008 through October 31, 2008, total returns were –40.35% for the S&P Global REIT Index (gross dividends) and –39.60% for the Portfolio. Relative to the Index, the better performance of the Portfolio was primarily due to the Underlying Funds' greater allocation to U.S. REITs, which outperformed the Index, and a lower allocation to Australian REITs, which underperformed the Index. U.S. REITs comprised approximately 60% of the Underlying Funds compared to 52% of the Index, while Australian REITs comprised 11% of the Underlying Funds compared to 16% of the Index.
DFA International Small Cap Value Portfolio
The DFA International Small Cap Value Portfolio seeks to capture the returns of international small company value stocks. The investment strategy employs a disciplined, quantitative approach, emphasizing broad diversification
27
and consistent exposure to small company value stocks, but does not attempt to track closely a specific equity index. As of October 31, 2008, the Portfolio held approximately 2,260 stocks in 22 developed countries, and average cash levels for the 11 months ended October 31, 2008 were in general less than 1% of the Portfolio's assets.
As a result of the Portfolio's diversified investment approach, performance was determined principally by broad structural trends in international equity markets, rather than the behavior of a limited number of stocks. For the 11 months ended October 31, 2008, total returns were –49.91% for the MSCI EAFE Small Cap Index (net dividends), –51.10% for the MSCI EAFE Small Cap Index (price-only), –50.30% for the MSCI World ex USA Small Cap Index (net dividends), –51.45% for the MSCI World ex USA Small Cap Index (price-only), and –45.17% for the Portfolio. The Indexes net of foreign withholding taxes on dividends do not have ten years of performance. The Portfolio intends to include the price-only Indexes for performance comparison purposes until the net-dividends Indexes have at least ten years of data to report.
Relative to the MSCI EAFE Small Cap Index and the MSCI World ex USA Small Cap Index (both net dividends), the outperformance of the Portfolio was primarily due to composition differences in Japanese stocks between the Portfolio and the Indexes. Japanese stocks in the Portfolio outperformed Japanese stocks in the benchmarks by about 15%.
International Vector Equity Portfolio
The International Vector Equity Portfolio seeks to capture the returns of a broadly diversified basket of international stocks, with stronger exposure to smaller company stocks and those stocks with value characteristics as measured by book-to-market ratio than the International Core Equity Portfolio. The investment strategy employs a disciplined, quantitative approach, emphasizing broad diversification, but does not attempt to track closely a specific equity index. The Portfolio held approximately 2,280 stocks in 22 developed country markets as of October 31, 2008 and was mostly invested in equities throughout the year: average cash levels for the period from the Portfolio's inception on August 14, 2008 through October 31, 2008 were in general approximately 4.5% of the Portfolio's assets.
As a result of the Portfolio's diversified investment approach, performance was determined principally by broad structural trends in the international equity markets, rather than by the behavior of a limited number of stocks. For the period from the Portfolio's inception on August 14, 2008 through October 31, 2008, total returns were –31.88% for the MSCI World ex USA Index and –32.60% for the Portfolio. Relative to the Index, the underperformance of the Portfolio was primarily due to its greater exposure to micro cap stocks. Micro caps, which accounted for approximately 25% of the Portfolio and less than 1% of the Index, underperformed the Index. A smaller allocation by the Portfolio to health care stocks, which comprised approximately 4% of the Portfolio compared to 8% of the Index, also contributed to the Portfolio's underperformance.
Emerging Markets Portfolio
The Emerging Markets Portfolio seeks to capture the returns of large company stocks in selected emerging markets by purchasing shares of a Master Fund investing in such firms. The investment strategy employs a disciplined, quantitative approach, emphasizing broad diversification and consistent exposure to large company emerging markets stocks, but does not attempt to track closely a specific equity index. As of October 31, 2008, the Master Fund held approximately 520 stocks in 17 emerging countries, and average cash levels for the 11 months ended October 31, 2008 were in general less than 1% of the Master Fund's assets.
As a result of the Master Fund's diversified approach, performance was determined principally by broad structural trends in emerging country stock markets, rather than the behavior of a limited number of stocks. For the 11 months ended October 31, 2008, total returns were –52.88% for the MSCI Emerging Markets Index (gross dividends), –53.02% for the MSCI Emerging Markets Index (net dividends), and –48.37% for the Portfolio. The Index net of foreign withholding taxes on dividends does not have ten years of performance. The Portfolio intends to include the Index gross of foreign withholding taxes on dividends for performance comparison purposes until the net-dividends Index has at least ten years of data to report.
Relative to the MSCI Emerging Markets Index (net dividends), the better performance of the Portfolio was primarily due to the Master Fund's lower allocation to China and Russia, which underperformed the overall Index; and
28
a greater allocation to Mexico and Israel, which outperformed the Index. On average, Chinese stocks represented approximately 7% of the Master Fund for the period under review compared to 15% in the Index. The Master Fund does not purchase Russian stocks, which represented approximately 10% of the Index. Israeli stocks represented approximately 4% of the Master Fund, compared to 2% of the Index; while Mexican stocks represented approximately 9% of the Master Fund, compared to 5% of the Index.
Emerging Markets Small Cap Portfolio
The Emerging Markets Small Cap Portfolio seeks to capture the returns of small company stocks in selected emerging markets by purchasing shares of a Master Fund that invests in such stocks. The investment strategy employs a disciplined, quantitative approach, emphasizing broad diversification and consistent exposure to emerging markets small company stocks, but does not attempt to track closely a specific equity index. As of October 31, 2008, the Master Fund held approximately 1,840 stocks in 16 emerging countries, and average cash levels for the 11 months ended October 31, 2008 were in general less than 1% of the Master Fund's assets.
As a result of the Master Fund's diversified investment approach, performance was determined principally by broad structural trends in emerging country stock markets, rather than the behavior of a limited number of stocks. For the 11 months ended October 31, 2008, emerging markets small company stocks generally underperformed emerging markets large company stocks. Total returns were –52.88% for the MSCI Emerging Markets Index (gross dividends), –53.02% for the MSCI Emerging Markets Index (net dividends), and –57.00% for the Portfolio. The Index net of foreign withholding taxes on dividends does not have ten years of performance. The Portfolio intends to include the Index gross of foreign withholding taxes on dividends for performance comparison purposes until the net-dividends Index has at least ten years of data to report.
Relative to the MSCI Emerging Markets Index (net dividends), underperformance of the Portfolio was primarily due to the Master Fund's greater allocation to stocks with lower market capitalizations, which underperformed larger stocks. On average, small cap stocks represented approximately 99% of the Master Fund for the period under review, compared to 22% in the Index. A greater exposure to Indian stocks, which represented approximately 12% of the Master Fund compared to 7% of the Index and underperformed the Index by more than 8 percentage points, also contributed to the Master Fund's underperformance.
Emerging Markets Core Equity Portfolio
The Emerging Markets Core Equity Portfolio seeks to capture the returns of the broad universe of emerging market stocks with increased exposure to smaller company stocks and those stocks with value characteristics as measured by book-to-market ratio. The investment strategy employs a disciplined, quantitative approach, emphasizing broad diversification and consistent exposure to stocks in emerging market countries, but does not attempt to track closely a specific equity index. As of October 31, 2008, the Portfolio held approximately 2,520 stocks in 17 emerging countries, and average cash levels for the 11 months ended October 31, 2008 were in general less than 1% of the Portfolio's assets.
As a result of the Portfolio's diversified investment approach, performance was determined principally by broad structural trends in the international equity markets rather than the behavior of a limited number of stocks. For the 11 months ended October 31, 2008, total returns were –52.88% for the MSCI Emerging Markets Index (gross dividends), –53.02% for the MSCI Emerging Markets Index (net dividends), and –51.93% for the Portfolio. Relative to the MSCI Emerging Markets Index (net dividends), the better performance of the Portfolio was primarily due to a lower allocation by the Portfolio to Chinese stocks and no allocation to Russian stocks, both of which underperformed the Index. On average, Chinese stocks represented approximately 10% of the Portfolio for the period under review compared to 15% in the Index. The Portfolio does not purchase Russian stocks, which represented approximately 10% of the MSCI Emerging Markets Inde x.
29
Fixed Income Market Review 11 Months Ended October 31, 2008
U.S. and international credit markets experienced extreme levels of volatility in the fiscal year ended October 31, 2008, as defaults in the subprime and related mortgage markets and the subsequent bankruptcy of leading underwriter Lehman Brothers caused credit spreads to widen sharply. Risk aversion caused a severe tightening of credit across all maturities and quality ranges both in the U.S. and international fixed income markets and a spike in interbank lending rates. To encourage lending, the U.S. Federal Reserve lowered the target rate for federal funds from 4.50% on November 30, 2007 to 1.00% by October 31, 2008 and pumped billions of dollars of liquidity into the financial system through various loan programs and capital injections into banks. Central banks around the world took similar actions to loosen credit markets. The three-month London Interbank Offered Rate ("LIBOR"), a widely used benchmark of short-term interest rates, spike d sharply higher late in the period but fell 210 basis points during the 11 months ended October 31, 2008, while the yield on ten-year U.S. Treasury notes rose just 1 basis point. The yield curve, V-shaped to start the year, ended the year with an upward slope as yields on short-term instruments fell below those with longer maturities.
| | | 11/30/07 | | 10/31/08 | | Change | |
| Three-Month LIBOR (yield) | | | 5.13 | % | | | 3.03 | % | | | –41.02 | % | |
| Ten-Year U.S. Treasury Notes (yield) | | | 3.94 | % | | | 3.95 | % | | | 0.30 | % | |
Source: Bloomberg. "Change" values are calculated prior to rounding.
There is generally an inverse relationship between interest rates and bond prices, such that bond prices fall when interest rates rise. For the fiscal year under review, changes in interest rates and bond prices were more pronounced in some parts of the yield curve than others. As a result of an extreme flight to higher-quality debt in the aftermath of the bank and mortgage crisis, total return for fixed income strategies was primarily a function of credit quality. For the 11 months ended October 31, 2008, total returns were 2.24% for three-month U.S. Treasury bills, 7.25% for five-year U.S. Treasury notes, and 5.02% for thirty-year U.S. Treasury bonds.
Some of Dimensional's fixed income strategies are based on a shifting-maturity strategy that identifies the maturity range with the highest risk-adjusted expected return. When the yield curve is flat or inverted, short-term securities are believed to offer the most attractive opportunity on a risk-adjusted basis. When the yield curve is upwardly sloped, maturities are lengthened to achieve higher returns associated with longer maturities. During the period under review, weighted average maturities of most Portfolios lengthened, reflecting upwardly sloped yield curves in the U.S.
Fixed Income Portfolio Performance Overview
DFA One-Year Fixed Income Portfolio
The DFA One-Year Fixed Income Portfolio seeks to maximize risk-adjusted total returns from a universe of high-quality fixed income securities with an average maturity of one year or less by purchasing shares of a Master Fund that invests in these securities. The investment strategy shifts maturities based on changes in the yield curve. Using current prices, the strategy creates a matrix of expected returns from different buy and sell strategies, and identifies the maturity range for the highest risk-adjusted expected returns according to the variable maturity model. Maturities are shifted if premiums can be documented. The average maturity of the Master Fund increased during the 11 months under review, from approximately 30 days on November 30, 2007, to 265 days on October 31, 2008.
For the 11 months ended October 31, 2008, total returns were 2.68% for the Portfolio, 3.34% for the Merrill Lynch Six-Month US Treasury Bill Index, and 3.84% for the Merrill Lynch One-Year US Treasury Note Index. The Portfolio underperformed both Indexes primarily due to the Master Fund's structural differences with the Indexes. The Master Fund had high exposure to corporate and agency debt, which underperformed Treasury debt during the period of significantly widening credit spreads.
DFA Two-Year Global Fixed Income Portfolio
The DFA Two-Year Global Fixed Income Portfolio seeks to maximize risk-adjusted total returns from a universe of U.S. and foreign government securities, high-quality corporate securities, and currency-hedged global fixed income
30
instruments maturing in two years or less by purchasing shares of a Master Fund that invests in these securities. Eligible countries include but are not limited to Australia, Canada, Denmark, France, Germany, Japan, the Netherlands, Sweden, Switzerland, the United Kingdom, and the United States. The investment strategy shifts maturities based on changes in the yield curve. Using current prices, the strategy creates a matrix of expected returns from different buy and sell strategies, and identifies the maturity range for the highest risk-adjusted expected returns according to the variable maturity model. Maturities are shifted if premiums can be documented. The average maturity of the Master Fund increased from 0.46 years on November 30, 2007 to 0.74 years on October 31, 2008.
For the 11 months ended October 31, 2008, total returns were 2.93% for the Portfolio and 4.38% for the Citigroup World Government Bond Index 1-3 Years (hedged). Relative to the Index, underperformance of the Portfolio was primarily due to the Master Fund's structural and maturity differences with the Index. A higher exposure to corporate debt, which underperformed government debt as credit spreads widened significantly, led to the underperformance relative to the government-only benchmark. The Master Fund had a duration of 0.73 on October 31, 2008 compared to 1.84 years for the Index, which limited returns in the falling interest rate environment.
DFA Selectively Hedged Global Fixed Income Portfolio
The DFA Selectively Hedged Global Fixed Income Portfolio seeks to maximize risk-adjusted total returns from a universe of U.S. and foreign government securities, high-quality corporate securities, and global fixed income instruments maturing in two years or less. It hedges foreign currency exposure on a selective basis to capture the higher interest rate returns that may be offered in foreign yield curves. Eligible countries include but are not limited to Australia, Canada, Denmark, the EMU countries, Japan, Sweden, Switzerland, the United Kingdom, and the United States. The investment strategy shifts maturities based on changes in the yield curve. Using current prices, the strategy creates a matrix of expected returns from different buy and sell strategies, and identifies the maturity range for the highest risk-adjusted expected returns according to the variable maturity model. Maturities are shifted if premiums can be documented. The avera ge maturity of the Portfolio increased from 0.15 years on January 31, 2007 (the first month end following its January 9, 2008 inception) to 0.47 years on October 31, 2008.
For the period from the Portfolio's inception on January 9, 2008 through October 31, 2008, total returns were –10.67% for the DFA Selectively Hedged Global Fixed Income Portfolio, 3.62% for the Citigroup World Government Bond Index 1-3 Years (hedged) and –0.95% for the Citigroup World Government Bond Index 1-3 Years (unhedged). Relative to the Citigroup World Government Bond Index 1-3 Years (hedged) , underperformance of the Portfolio was primarily due to currency movements. The Portfolio had a large allocation to unhedged securities during a period when the U.S. dollar rallied significantly, thus the Portfolio underperformed the fully hedged Index. Relative to the Citigroup World Government Bond Index 1-3 Years (unhedged), the Portfolio had no exposure to the Japanese Yen (a relatively strong currency) and overweight exposures to weaker currencies such as the Australian Dollar and New Zealand Dollar.
DFA Five-Year Government Portfolio
The DFA Five-Year Government Portfolio seeks to maximize risk-adjusted total returns from a universe of U.S. government and government agency securities maturing in five years or less. The investment strategy shifts maturities based on changes in the yield curve. Using current prices, the strategy creates a matrix of expected returns from different buy and sell strategies, and identifies the maturity range for the highest risk-adjusted expected returns according to the variable maturity model. Maturities are shifted if premiums can be documented. The average maturity of the Portfolio increased from 0.05 years on November 30, 2007 to 3.46 years on October 31, 2008.
For the 11 months ended October 31, 2008, total returns were 3.25% for the Portfolio, 4.73% for the Barclays Capital US Government Bond Index Intermediate, and 5.22% for the Merrill Lynch US Treasury/Agency Index 1-5 Years. Relative to both Indexes, underperformance of the Portfolio was due to maturity differences in the first two quarters of the year. At the beginning of the period, the Portfolio had a much shorter duration than each Index, as the yield curve remained inverted and was negatively affected by sharply declining interest rates. The Portfolio duration was significantly extended in February to take advantage of the rising expected term premium and steepening of the yield curve. However, interest rates rose sharply in April and May when the duration of the Portfolio was already longer than that of each
31
Index. This underperformance more than offset the outperformance of the Portfolio due to higher allocation to Treasury versus agency instruments during the second part of the period, when credit spreads widened significantly.
DFA Five-Year Global Fixed Income Portfolio
The DFA Five-Year Global Fixed Income Portfolio seeks to maximize risk adjusted total returns from a universe of U.S. and foreign government securities, high-quality corporate securities, and currency-hedged global fixed income instruments maturing in five years or less. Eligible countries include but are not limited to Australia, Canada, Denmark, France, Germany, Japan, the Netherlands, Sweden, Switzerland, the United Kingdom, and the United States. The investment strategy shifts maturities based on changes in the yield curve. Using current prices, the strategy creates a matrix of expected returns from different buy and sell strategies, and identifies the maturity range for the highest risk-adjusted expected returns according to the variable maturity model. Maturities are shifted if premiums can be documented. The average maturity of the Portfolio increased from 1.13 years on November 30, 2007 to 2.46 years on October 31, 2008.
For the 11 months ended October 31, 2008, total returns were 1.40% for the Portfolio and 4.73% for the Citigroup World Government Bond Index 1-5 Years (hedged). Relative to the Index, underperformance of the Portfolio was primarily due to structural differences with the Index. A higher exposure to corporate debt, which underperformed government debt as credit spreads widened significantly, led to the underperformance relative to the government-only benchmark.
DFA Intermediate Government Fixed Income Portfolio
The DFA Intermediate Government Fixed Income Portfolio seeks to provide a market rate of return and current income from investing generally in U.S. Treasury and government agency issues with maturities of between five and fifteen years. The investment strategy maintains a relatively constant average maturity. The average maturity of the Portfolio rose slightly, from 6.17 years on November 30, 2007 to 6.37 years on October 31, 2008.
For the 11 months ended October 31, 2008, total returns were 2.73% for the Portfolio and 3.96% for the Barclays Capital U.S. Government Bond Index. Relative to the Index, the Portfolio underperformance was primarily due to structural differences with the Index. The Portfolio had higher exposure to agency debt, which underperformed Treasury debt during the period of widening credit spreads.
DFA Inflation-Protected Securities Portfolio
The DFA Inflation-Protected Securities Portfolio seeks to provide inflation protection and current income from investing generally in inflation-protected securities issued by the US government and its agencies and instrumentalities with maturities of between five and twenty years. The average maturity of the Portfolio fell slightly, from 8.78 years on November 30, 2007 to 8.60 years on October 31, 2008.
For the 11 months ended October 31, 2008, total returns were –7.90% for the Portfolio and –7.77% for the Barclays Capital U.S. TIPS Index. Relative to the Index, underperformance of the Portfolio was primarily due to differences in expenses between the Portfolio and the Index. Results for the Barclays U.S.TIPS Index are not diminished by management and administrative expenses associated with running a live portfolio.
DFA Short-Term Municipal Bond Portfolio
The DFA Short-Term Municipal Bond Portfolio seeks to provide a market rate of return from a universe of higher-quality municipal securities providing current income exempt from federal personal income tax. The weighted average maturity of the Portfolio generally will not exceed three years. The average maturity of the Portfolio increased from 0.31 years on November 30, 2007 to 1.53 years on October 31, 2008.
For the 11 months ended October 31, 2008, total returns were 1.63% for the Portfolio, 3.46% for the Barclays Capital Municipal Bond Index 3 Years, and 3.73% for the Barclays Capital Municipal Bond Index 1 Year. Relative to both Indexes, underperformance of the Portfolio was primarily due to its shorter duration compared to both Indexes for most of the fiscal year. The Portfolio maintained a short duration during the period of falling interest rates on municipal bonds of one to five years in maturity.
32
DFA California Short-Term Municipal Bond Portfolio
The DFA California Short-Term Municipal Bond Portfolio seeks to provide a market rate of return from a universe of higher-quality municipal securities providing current income exempt from federal personal income taxes and California state personal income taxes. The weighted average maturity of the Portfolio generally will not exceed three years. The average maturity increased from 0.55 years on November 30, 2007 to 2.12 years on October 31, 2008.
For the 11 months ended October 31, 2008, total returns were 1.45% for the Portfolio and 3.73% for the Merrill Lynch California Municipal Bond Index 1-3 Years. Relative to the Index, the Portfolio underperformance was primarily due to shorter duration than the Index. The Portfolio maintained a short duration during the period of falling interest rates on municipal bonds of one to five years in maturity.
Sources: Citigroup bond indexes copyright 2008 by Citigroup. Barclays Capital data, formerly Lehman Brothers, provided by Barclays Bank PLC. The Merrill Lynch Indices are used with permission; copyright 2008 Merrill Lynch, Pierce, Fenner & Smith Incorporated; all rights reserved.
33
DFA INVESTMENT DIMENSIONS GROUP INC.
DISCLOSURE OF FUND EXPENSES
(Unaudited)
The following Expense Tables are shown so that you can understand the impact of fees on your investment. All mutual funds have operating expenses. As a shareholder of the fund, you incur ongoing costs, which include costs for portfolio management, administrative services, and shareholder reports, among others. Operating expenses, legal and audit services, which are deducted from a fund's gross income, directly reduce the investment return of the fund. A fund's expenses are expressed as a percentage of its average net assets. This figure is known as the expense ratio. The following examples are intended to help you understand the ongoing costs, in dollars, of investing in the fund and to compare these costs with those of other mutual funds. The examples are based on an investment of $1,000 made at the beginning of the period shown and held for the entire period.
The Expense Tables below illustrate your fund's costs in two ways.
Actual Fund Return
This section helps you to estimate the actual expenses after fee waivers that you paid over the period. The "Ending Account Value" shown is derived from the fund's actual return and "Expenses Paid During Period" reflect the dollar amount that would have been paid by an investor who started with $1,000 in the fund. You may use the information here, together with the amount you invested, to estimate the expenses that you paid over the period.
To do so, simply divide your account value by $1,000 (for example, a $7,500 account value divided by $1,000 = 7.5), then multiply the result by the number given for your fund under the heading "Expenses Paid During Period."
Hypothetical Example for Comparison Purposes
This section is intended to help you compare your fund's costs with those of other mutual funds. The hypothetical "Ending Account Value" and "Expenses Paid During Period" are derived from the fund's actual expense ratio and an assumed 5% annual return before expenses. In this case, because the return used is not the fund's actual return, the results do not apply to your investment. The example is useful in making comparisons because the SEC requires all mutual funds to calculate expenses based on a 5% annual return. You can assess your fund's cost by comparing this hypothetical example with the hypothetical examples that appear in shareholder reports of other funds.
Please note that the expenses shown in the tables are meant to highlight and help you compare ongoing costs only and do not reflect any transactional costs, if applicable. The "Annualized Expense Ratio" represents the actual expenses for the six-month period indicated.
Six Months Ended October 31, 2008
EXPENSE TABLES
| U.S. Large Company Portfolio** | | Beginning
Account
Value
05/01/08 | | Ending
Account
Value
10/31/08 | | Annualized
Expense
Ratio* | | Expenses
Paid
During
Period* | |
| Actual Fund Return | |
| Institutional Class Shares | | $ | 1,000.00 | | | $ | 709.00 | | | | 0.15 | % | | $ | 0.64 | | |
| Hypothetical 5% Annual Return | |
| Institutional Class Shares | | $ | 1,000.00 | | | $ | 1,024.38 | | | | 0.15 | % | | $ | 0.76 | | |
34
| Enhanced U.S. Large Company Portfolio** | | Beginning
Account
Value
05/01/08 | | Ending
Account
Value
10/31/08 | | Annualized
Expense
Ratio* | | Expenses
Paid
During
Period* | |
| Actual Fund Return | |
| Institutional Class Shares | | $ | 1,000.00 | | | $ | 703.60 | | | | 0.26 | % | | $ | 1.11 | | |
| Hypothetical 5% Annual Return | |
| Institutional Class Shares | | $ | 1,000.00 | | | $ | 1,023.83 | | | | 0.26 | % | | $ | 1.32 | | |
| U.S. Large Cap Value Portfolio** | | | | | | | | | | | | | | | | | |
| Actual Fund Return | |
| Institutional Class Shares | | $ | 1,000.00 | | | $ | 648.00 | | | | 0.28 | % | | $ | 1.16 | | |
| Hypothetical 5% Annual Return | |
| Institutional Class Shares | | $ | 1,000.00 | | | $ | 1,023.73 | | | | 0.28 | % | | $ | 1.42 | | |
| U.S. Targeted Value Portfolio | | | | | | | | | | | | | | | | | |
| Actual Fund Return | |
| Class R1 Shares | | $ | 1,000.00 | | | $ | 739.20 | | | | 0.50 | % | | $ | 2.19 | | |
| Class R2 Shares**** | | $ | 1,000.00 | | | $ | 786.00 | | | | 0.66 | % | | $ | 2.00 | | |
| Institutional Class Shares | | $ | 1,000.00 | | | $ | 739.80 | | | | 0.40 | % | | $ | 1.75 | | |
| Hypothetical 5% Annual Return | |
| Class R1 Shares | | $ | 1,000.00 | | | $ | 1,022.62 | | | | 0.50 | % | | $ | 2.54 | | |
| Class R2 Shares**** | | $ | 1,000.00 | | | $ | 1,021.82 | | | | 0.66 | % | | $ | 3.35 | | |
| Institutional Class Shares | | $ | 1,000.00 | | | $ | 1,023.13 | | | | 0.40 | % | | $ | 2.03 | | |
| U.S. Small Cap Value Portfolio** | | | | | | | | | | | | | | | | | |
| Actual Fund Return | |
| Institutional Class Shares | | $ | 1,000.00 | | | $ | 721.50 | | | | 0.52 | % | | $ | 2.25 | | |
| Hypothetical 5% Annual Return | |
| Institutional Class Shares | | $ | 1,000.00 | | | $ | 1,022.52 | | | | 0.52 | % | | $ | 2.64 | | |
| U.S. Core Equity 1 Portfolio | | | | | | | | | | | | | | | | | |
| Actual Fund Return | |
| Institutional Class Shares | | $ | 1,000.00 | | | $ | 708.40 | | | | 0.21 | % | | $ | 0.90 | | |
| Hypothetical 5% Annual Return | |
| Institutional Class Shares | | $ | 1,000.00 | | | $ | 1,024.08 | | | | 0.21 | % | | $ | 1.07 | | |
| U.S. Core Equity 2 Portfolio | | | | | | | | | | | | | | | | | |
| Actual Fund Return | |
| Institutional Class Shares | | $ | 1,000.00 | | | $ | 706.10 | | | | 0.23 | % | | $ | 0.99 | | |
| Hypothetical 5% Annual Return | |
| Institutional Class Shares | | $ | 1,000.00 | | | $ | 1,023.98 | | | | 0.23 | % | | $ | 1.17 | | |
| U.S. Vector Equity Portfolio | | | | | | | | | | | | | | | | | |
| Actual Fund Return | |
| Institutional Class Shares | | $ | 1,000.00 | | | $ | 704.20 | | | | 0.34 | % | | $ | 1.46 | | |
| Hypothetical 5% Annual Return | |
| Institutional Class Shares | | $ | 1,000.00 | | | $ | 1,023.43 | | | | 0.34 | % | | $ | 1.73 | | |
| T.A. U.S. Core Equity 2 Portfolio | | | | | | | | | | | | | | | | | |
| Actual Fund Return | |
| Institutional Class Shares | | $ | 1,000.00 | | | $ | 714.70 | | | | 0.29 | % | | $ | 1.25 | | |
| Hypothetical 5% Annual Return | |
| Institutional Class Shares | | $ | 1,000.00 | | | $ | 1,023.68 | | | | 0.29 | % | | $ | 1.48 | | |
35
| U.S. Small Cap Portfolio** | | Beginning
Account
Value
05/01/08 | | Ending
Account
Value
10/31/08 | | Annualized
Expense
Ratio* | | Expenses
Paid
During
Period* | |
| Actual Fund Return | |
| Institutional Class Shares | | $ | 1,000.00 | | | $ | 745.00 | | | | 0.37 | % | | $ | 1.62 | | |
| Hypothetical 5% Annual Return | |
| Institutional Class Shares | | $ | 1,000.00 | | | $ | 1,023.28 | | | | 0.37 | % | | $ | 1.88 | | |
| U.S. Micro Cap Portfolio** | | | | | | | | | | | | | | | | | |
| Actual Fund Return | |
| Institutional Class Shares | | $ | 1,000.00 | | | $ | 750.20 | | | | 0.52 | % | | $ | 2.29 | | |
| Hypothetical 5% Annual Return | |
| Institutional Class Shares | | $ | 1,000.00 | | | $ | 1,022.52 | | | | 0.52 | % | | $ | 2.64 | | |
| DFA Real Estate Securities Portfolio | | | | | | | | | | | | | | | | | |
| Actual Fund Return | |
| Institutional Class Shares | | $ | 1,000.00 | | | $ | 642.60 | | | | 0.33 | % | | $ | 1.36 | | |
| Hypothetical 5% Annual Return | |
| Institutional Class Shares | | $ | 1,000.00 | | | $ | 1,023.48 | | | | 0.33 | % | | $ | 1.68 | | |
| Large Cap International Portfolio | | | | | | | | | | | | | | | | | |
| Actual Fund Return | |
| Institutional Class Shares | | $ | 1,000.00 | | | $ | 600.90 | | | | 0.30 | % | | $ | 1.21 | | |
| Hypothetical 5% Annual Return | |
| Institutional Class Shares | | $ | 1,000.00 | | | $ | 1,023.63 | | | | 0.30 | % | | $ | 1.53 | | |
| International Core Equity Portfolio | | | | | | | | | | | | | | | | | |
| Actual Fund Return | |
| Institutional Class Shares | | $ | 1,000.00 | | | $ | 574.80 | | | | 0.41 | % | | $ | 1.62 | | |
| Hypothetical 5% Annual Return | |
| Institutional Class Shares | | $ | 1,000.00 | | | $ | 1,023.08 | | | | 0.41 | % | | $ | 2.08 | | |
| T.A. World ex U.S. Core Equity Portfolio | | | | | | | | | | | | | | | | | |
| Actual Fund Return | |
| Institutional Class Shares | | $ | 1,000.00 | | | $ | 557.80 | | | | 0.60 | % | | $ | 2.35 | | |
| Hypothetical 5% Annual Return | |
| Institutional Class Shares | | $ | 1,000.00 | | | $ | 1,022.12 | | | | 0.60 | % | | $ | 3.05 | | |
| International Small Company Portfolio*** | | | | | | | | | | | | | | | | | |
| Actual Fund Return | |
| Institutional Class Shares | | $ | 1,000.00 | | | $ | 564.60 | | | | 0.55 | % | | $ | 2.16 | | |
| Hypothetical 5% Annual Return | |
| Institutional Class Shares | | $ | 1,000.00 | | | $ | 1,022.37 | | | | 0.55 | % | | $ | 2.80 | | |
| Japanese Small Company Portfolio** | | | | | | | | | | | | | | | | | |
| Actual Fund Return | |
| Institutional Class Shares | | $ | 1,000.00 | | | $ | 785.30 | | | | 0.59 | % | | $ | 2.65 | | |
| Hypothetical 5% Annual Return | |
| Institutional Class Shares | | $ | 1,000.00 | | | $ | 1,022.17 | | | | 0.59 | % | | $ | 3.00 | | |
36
| Asia Pacific Small Company Portfolio** | | Beginning
Account
Value
05/01/08 | | Ending
Account
Value
10/31/08 | | Annualized
Expense
Ratio* | | Expenses
Paid
During
Period* | |
| Actual Fund Return | |
| Institutional Class Shares | | $ | 1,000.00 | | | $ | 454.10 | | | | 0.62 | % | | $ | 2.27 | | |
| Hypothetical 5% Annual Return | |
| Institutional Class Shares | | $ | 1,000.00 | | | $ | 1,022.02 | | | | 0.62 | % | | $ | 3.15 | | |
| United Kingdom Small Company Portfolio** | | | | | | | | | | | | | | | | | |
| Actual Fund Return | |
| Institutional Class Shares | | $ | 1,000.00 | | | $ | 540.90 | | | | 0.59 | % | | $ | 2.29 | | |
| Hypothetical 5% Annual Return | |
| Institutional Class Shares | | $ | 1,000.00 | | | $ | 1,022.17 | | | | 0.59 | % | | $ | 3.00 | | |
| Continental Small Company Portfolio** | | | | | | | | | | | | | | | | | |
| Actual Fund Return | |
| Institutional Class Shares | | $ | 1,000.00 | | | $ | 519.60 | | | | 0.59 | % | | $ | 2.25 | | |
| Hypothetical 5% Annual Return | |
| Institutional Class Shares | | $ | 1,000.00 | | | $ | 1,022.17 | | | | 0.59 | % | | $ | 3.00 | | |
| DFA International Real Estate Securities Portfolio | | | | | | | | | | | | | | | | | |
| Actual Fund Return | |
| Institutional Class Shares | | $ | 1,000.00 | | | $ | 515.20 | | | | 0.45 | % | | $ | 1.71 | | |
| Hypothetical 5% Annual Return | |
| Institutional Class Shares | | $ | 1,000.00 | | | $ | 1,022.87 | | | | 0.45 | % | | $ | 2.29 | | |
| DFA Global Real Estate Securities Portfolio***;**** | | | | | | | | | | | | | | | | | |
| Actual Fund Return | |
| Institutional Class Shares | | $ | 1,000.00 | | | $ | 604.00 | | | | 0.54 | % | | $ | 1.77 | | |
| Hypothetical 5% Annual Return | |
| Institutional Class Shares | | $ | 1,000.00 | | | $ | 1,022.42 | | | | 0.54 | % | | $ | 2.75 | | |
| DFA International Small Cap Value Portfolio | | | | | | | | | | | | | | | | | |
| Actual Fund Return | |
| Institutional Class Shares | | $ | 1,000.00 | | | $ | 577.70 | | | | 0.69 | % | | $ | 2.74 | | |
| Hypothetical 5% Annual Return | |
| Institutional Class Shares | | $ | 1,000.00 | | | $ | 1,021.67 | | | | 0.69 | % | | $ | 3.51 | | |
| International Vector Equity Portfolio**** | | | | | | | | | | | | | | | | | |
| Actual Fund Return | |
| Institutional Class Shares | | $ | 1,000.00 | | | $ | 674.00 | | | | 0.60 | % | | $ | 1.08 | | |
| Hypothetical 5% Annual Return | |
| Institutional Class Shares | | $ | 1,000.00 | | | $ | 1,022.12 | | | | 0.60 | % | | $ | 3.05 | | |
| Emerging Markets Portfolio** | | | | | | | | | | | | | | | | | |
| Actual Fund Return | |
| Institutional Class Shares | | $ | 1,000.00 | | | $ | 530.60 | | | | 0.60 | % | | $ | 2.31 | | |
| Hypothetical 5% Annual Return | |
| Institutional Class Shares | | $ | 1,000.00 | | | $ | 1,022.12 | | | | 0.60 | % | | $ | 3.05 | | |
37
| Emerging Markets Small Cap Portfolio** | | Beginning
Account
Value
05/01/08 | | Ending
Account
Value
10/31/08 | | Annualized
Expense
Ratio* | | Expenses
Paid
During
Period* | |
| Actual Fund Return | |
| Institutional Class Shares | | $ | 1,000.00 | | | $ | 464.60 | | | | 0.78 | % | | $ | 2.87 | | |
| Hypothetical 5% Annual Return | |
| Institutional Class Shares | | $ | 1,000.00 | | | $ | 1,021.22 | | | | 0.78 | % | | $ | 3.96 | | |
| Emerging Markets Core Equity Portfolio | | | | | | | | | | | | | | | | | |
| Actual Fund Return | |
| Institutional Class Shares | | $ | 1,000.00 | | | $ | 498.70 | | | | 0.66 | % | | $ | 2.49 | | |
| Hypothetical 5% Annual Return | |
| Institutional Class Shares | | $ | 1,000.00 | | | $ | 1,021.82 | | | | 0.66 | % | | $ | 3.35 | | |
| DFA One-Year Fixed Income Portfolio** | | | | | | | | | | | | | | | | | |
| Actual Fund Return | |
| Institutional Class Shares | | $ | 1,000.00 | | | $ | 1,012.20 | | | | 0.18 | % | | $ | 0.91 | | |
| Hypothetical 5% Annual Return | |
| Institutional Class Shares | | $ | 1,000.00 | | | $ | 1,024.23 | | | | 0.18 | % | | $ | 0.92 | | |
| DFA Two-Year Global Fixed Income Portfolio** | | | | | | | | | | | | | | | | | |
| Actual Fund Return | |
| Institutional Class Shares | | $ | 1,000.00 | | | $ | 1,014.00 | | | | 0.18 | % | | $ | 0.91 | | |
| Hypothetical 5% Annual Return | |
| Institutional Class Shares | | $ | 1,000.00 | | | $ | 1,024.23 | | | | 0.18 | % | | $ | 0.92 | | |
| DFA Selectively Hedged Global Fixed Income Portfolio | | | | | | | | | | | | | | | | | |
| Actual Fund Return | |
| Institutional Class Shares | | $ | 1,000.00 | | | $ | 874.40 | | | | 0.24 | % | | $ | 1.13 | | |
| Hypothetical 5% Annual Return | |
| Institutional Class Shares | | $ | 1,000.00 | | | $ | 1,023.93 | | | | 0.24 | % | | $ | 1.22 | | |
| DFA Five-Year Government Portfolio | | | | | | | | | | | | | | | | | |
| Actual Fund Return | |
| Institutional Class Shares | | $ | 1,000.00 | | | $ | 1,032.20 | | | | 0.23 | % | | $ | 1.17 | | |
| Hypothetical 5% Annual Return | |
| Institutional Class Shares | | $ | 1,000.00 | | | $ | 1,023.98 | | | | 0.23 | % | | $ | 1.17 | | |
| DFA Five-Year Global Fixed Income Portfolio | | | | | | | | | | | | | | | | | |
| Actual Fund Return | |
| Institutional Class Shares | | $ | 1,000.00 | | | $ | 1,006.40 | | | | 0.28 | % | | $ | 1.41 | | |
| Hypothetical 5% Annual Return | |
| Institutional Class Shares | | $ | 1,000.00 | | | $ | 1,023.73 | | | | 0.28 | % | | $ | 1.42 | | |
| DFA Intermediate Government Fixed Income Portfolio | | | | | | | | | | | | | | | | | |
| Actual Fund Return | |
| Institutional Class Shares | | $ | 1,000.00 | | | $ | 994.80 | | | | 0.13 | % | | $ | 0.65 | | |
| Hypothetical 5% Annual Return | |
| Institutional Class Shares | | $ | 1,000.00 | | | $ | 1,024.48 | | | | 0.13 | % | | $ | 0.66 | | |
38
| DFA Inflation-Protected Securites Portfolio | | Beginning
Account
Value
05/01/08 | | Ending
Account
Value
10/31/08 | | Annualized
Expense
Ratio* | | Expenses
Paid
During
Period* | |
| Actual Fund Return | |
| Institutional Class Shares | | $ | 1,000.00 | | | $ | 891.00 | | | | 0.15 | % | | $ | 0.71 | | |
| Hypothetical 5% Annual Return | |
| Institutional Class Shares | | $ | 1,000.00 | | | $ | 1,024.38 | | | | 0.15 | % | | $ | 0.76 | | |
| DFA Short-Term Municipal Bond Portfolio | | | | | | | | | | | | | | | | | |
| Actual Fund Return | |
| Institutional Class Shares | | $ | 1,000.00 | | | $ | 1,005.70 | | | | 0.23 | % | | $ | 1.16 | | |
| Hypothetical 5% Annual Return | |
| Institutional Class Shares | | $ | 1,000.00 | | | $ | 1,023.98 | | | | 0.23 | % | | $ | 1.17 | | |
| DFA California Short-Term Municipal Bond Portfolio | | | | | | | | | | | | | | | | | |
| Actual Fund Return | |
| Institutional Class Shares | | $ | 1,000.00 | | | $ | 1,003.30 | | | | 0.27 | % | | $ | 1.36 | | |
| Hypothetical 5% Annual Return | |
| Institutional Class Shares | | $ | 1,000.00 | | | $ | 1,023.78 | | | | 0.27 | % | | $ | 1.37 | | |
* Expenses are equal to the fund's annualized expense ratio for the six-month period, multiplied by the average account value over the period, multiplied by the number of days in the most recent six-month period (184), then divided by the number of days in the year (366) to reflect the six-month period.
** The Portfolio is a Feeder Fund. The expenses shown reflect the direct expenses of the Feeder Fund and the indirect payment of the Feeder Fund's portion of the expenses of its Master Fund.
*** The Portfolio is a Fund of Funds. The expenses shown reflect the direct expenses of the Fund of Funds and the indirect payment of the Fund of Funds' portion of the expenses of its Master Funds.
**** U.S. Targeted Value Portfolio Class R2 Shares commenced operations on June 30, 2008, DFA Global Real Estate Securities Portfolio commenced operations on June 4, 2008 and International Vector Equity Portfolio commenced operations on August 14, 2008. Expenses are equal to the fund's annualized expense ratio for the period, multiplied by the average account value over the period, multiplied by the number of days since inception (U.S. Targeted Value Portfolio Class R2 Shares 124 days, DFA Global Real Estate Securities Portfolio 150 days and International Vector Equity Portfolio 79 days), then divided by the number of days in the year (366) to reflect the period. The "Ending Account Value" is derived from the fund's share class actual return since inception. The "Hypothetical 5% Annual Return" information reflects the 184 day period for the six-months ended October 31, 2008 to allow for comparability.
39
DFA INVESTMENT DIMENSIONS GROUP INC.
DISCLOSURE OF PORTFOLIO HOLDINGS
(Unaudited)
The SEC requires that all Funds file a complete Schedule of Investments with the SEC for their first and third fiscal quarters on Form N-Q. For DFA Investment Dimensions Group Inc., this would be for the fiscal quarters ending January 31 and July 31. The Form N-Q filing must be made within 60 days of the end of the quarter. DFA Investment Dimensions Group Inc. filed its most recent Form N-Q with the SEC on October 30, 2008. It is available upon request, without charge, by calling collect: (310) 395-8005 or by mailing a request to Dimensional Fund Advisors LP, 1299 Ocean Avenue, Santa Monica, California 90401, or by visiting the SEC's website at http://www.sec.gov, or they may be reviewed and copied at the SEC's Public Reference Room in Washington, D.C. (call 1-800-732-0330 for information on the operation of the Public Reference Room).
SEC regulations permit a fund to include in its reports to shareholders a "Summary Schedule of Portfolio Holdings" in lieu of a full Schedule of Investments. The Summary Schedule of Portfolio Holdings reports the fund's 50 largest holdings in unaffiliated issuers and any investments that exceed one percent of the fund's net assets at the end of the reporting period. The amendments also require that the Summary Schedule of Portfolio Holdings identify each category of investments that are held.
The fund is required to file a complete Schedule of Investments with the SEC on Form N-CSR within ten days after mailing the annual and semi-annual reports to shareholders. It will be available upon request, without charge, by calling collect: (310) 395-8005 or by mailing a request to Dimensional Fund Advisors LP, 1299 Ocean Avenue, Santa Monica, California 90401, or by visiting the SEC's website at http://www.sec.gov, or they may be reviewed and copied at the SEC's Public Reference Room in Washington, D.C. (call 1-800-732-0330 for information on the operation of the Public Reference Room).
PORTFOLIO HOLDINGS
The SEC requires that all Funds present their categories of portfolio holdings in a table, chart or graph format in their annual and semi-annual shareholder reports, whether or not a Schedule of Investments is utilized. The following table, which presents portfolio holdings as a percent of total investments before short-term investments and collateral for loaned securities, is provided in compliance with such requirement. The categories shown below represent broad industry sectors. Each industry sector consists of one or more specific industry classifications.
The categories of industry classification for the Affiliated Investment Companies are represented in the Disclosure of Portfolio Holdings, which are included elsewhere within the report. Refer to the Schedule of Investments/Summary Schedule of Portfolio Holdings for each of the underlying Master Funds' holdings which reflect the investments by category or country.
FEEDER FUNDS
| | | Affiliated Investment Companies | |
| U.S. Large Company Portfolio | | | 100.0 | % | |
| Enhanced U.S. Large Company Portfolio | | | 100.0 | % | |
| U.S. Large Cap Value Portfolio | | | 100.0 | % | |
| U.S. Small Cap Value Portfolio | | | 100.0 | % | |
| U.S. Small Cap Portfolio | | | 100.0 | % | |
| U.S. Micro Cap Portfolio | | | 100.0 | % | |
| International Small Company Portfolio | | | 100.0 | % | |
| Japanese Small Company Portfolio | | | 100.0 | % | |
| Asia Pacific Small Company Portfolio | | | 100.0 | % | |
| United Kingdom Small Company Portfolio | | | 100.0 | % | |
| Continental Small Company Portfolio | | | 100.0 | % | |
| DFA Global Real Estate Securities Portfolio | | | 100.0 | % | |
| Emerging Markets Portfolio | | | 100.0 | % | |
| Emerging Markets Small Cap Portfolio | | | 100.0 | % | |
| DFA One-Year Fixed Income Portfolio | | | 100.0 | % | |
| DFA Two-Year Global Fixed Income Portfolio | | | 100.0 | % | |
40
DISCLOSURE OF PORTFOLIO HOLDINGS
CONTINUED
DOMESTIC AND INTERNATIONAL EQUITY PORTFOLIOS
| | | Consumer
Discretionary | | Consumer
Staples | | Energy | | Financials | | Health
Care | | Industrials | | Information
Technology | |
U.S. Targeted Value
Portfolio | | | 14.4 | % | | | 4.6 | % | | | 6.5 | % | | | 28.3 | % | | | 7.1 | % | | | 14.7 | % | | | 16.7 | % | |
| U.S. Core Equity 1 Portfolio | | | 11.5 | % | | | 9.4 | % | | | 9.9 | % | | | 16.9 | % | | | 12.7 | % | | | 12.8 | % | | | 15.2 | % | |
| U.S. Core Equity 2 Portfolio | | | 12.5 | % | | | 8.6 | % | | | 10.4 | % | | | 20.3 | % | | | 10.6 | % | | | 14.0 | % | | | 12.2 | % | |
| U.S. Vector Equity Portfolio | | | 13.8 | % | | | 6.4 | % | | | 9.7 | % | | | 25.6 | % | | | 9.1 | % | | | 14.3 | % | | | 12.5 | % | |
T.A. U.S. Core Equity 2
Portfolio | | | 13.2 | % | | | 6.4 | % | | | 11.7 | % | | | 17.5 | % | | | 10.8 | % | | | 15.4 | % | | | 13.0 | % | |
DFA Real Estate Securities
Portfolio | | | — | | | | — | | | | — | | | | — | | | | — | | | | — | | | | — | | |
Large Cap International
Portfolio | | | 9.5 | % | | | 9.7 | % | | | 10.2 | % | | | 23.6 | % | | | 9.3 | % | | | 10.8 | % | | | 5.1 | % | |
International Core Equity
Portfolio | | | 13.6 | % | | | 8.0 | % | | | 8.5 | % | | | 27.2 | % | | | 5.0 | % | | | 15.5 | % | | | 4.9 | % | |
T.A. World ex U.S. Core
Equity Portfolio | | | 12.1 | % | | | 7.2 | % | | | 8.8 | % | | | 25.5 | % | | | 4.8 | % | | | 16.0 | % | | | 5.7 | % | |
DFA International Real Estate
Securities Portfolio | | | — | | | | — | | | | — | | | | 0.2 | % | | | — | | | | — | | | | — | | |
DFA International Small Cap
Value Portfolio | | | 16.6 | % | | | 8.8 | % | | | 4.0 | % | | | 23.2 | % | | | 2.7 | % | | | 23.4 | % | | | 5.8 | % | |
International Vector Equity
Portfolio | | | 13.7 | % | | | 6.6 | % | | | 7.7 | % | | | 26.6 | % | | | 3.7 | % | | | 18.3 | % | | | 5.9 | % | |
Emerging Markets Core
Equity Portfolio | | | 8.9 | % | | | 7.6 | % | | | 10.4 | % | | | 21.6 | % | | | 3.3 | % | | | 10.1 | % | | | 9.6 | % | |
| | | Materials | | REITs | | Telecommunication
Services | | Utilities | | Other | | Total | |
U.S. Targeted Value
Portfolio | | | 5.7 | % | | | — | | | | 1.2 | % | | | 0.1 | % | | | 0.7 | % | | | 100.0 | % | |
| U.S. Core Equity 1 Portfolio | | | 4.6 | % | | | — | | | | 2.9 | % | | | 4.1 | % | | | — | | | | 100.0 | % | |
| U.S. Core Equity 2 Portfolio | | | 5.0 | % | | | — | | | | 3.6 | % | | | 2.8 | % | | | — | | | | 100.0 | % | |
| U.S. Vector Equity Portfolio | | | 4.7 | % | | | — | | | | 2.5 | % | | | 1.4 | % | | | — | | | | 100.0 | % | |
T.A. U.S. Core Equity 2
Portfolio | | | 5.0 | % | | | — | | | | 4.2 | % | | | 2.8 | % | | | — | | | | 100.0 | % | |
DFA Real Estate Securities
Portfolio | | | — | | | | 100.0 | % | | | — | | | | — | | | | — | | | | 100.0 | % | |
Large Cap International
Portfolio | | | 8.8 | % | | | — | | | | 6.1 | % | | | 6.9 | % | | | — | | | | 100.0 | % | |
International Core Equity
Portfolio | | | 10.1 | % | | | — | | | | 3.7 | % | | | 3.5 | % | | | — | | | | 100.0 | % | |
T.A. World ex U.S. Core
Equity Portfolio | | | 11.8 | % | | | — | | | | 4.1 | % | | | 4.0 | % | | | — | | | | 100.0 | % | |
DFA International Real Estate
Securities Portfolio | | | — | | | | 99.8 | % | | | — | | | | — | | | | — | | | | 100.0 | % | |
DFA International Small Cap
Value Portfolio | | | 14.6 | % | | | 0.2 | % | | | 0.2 | % | | | 0.4 | % | | | 0.1 | % | | | 100.0 | % | |
International Vector Equity
Portfolio | | | 12.7 | % | | | — | | | | 2.7 | % | | | 2.1 | % | | | — | | | | 100.0 | % | |
Emerging Markets Core
Equity Portfolio | | | 14.7 | % | | | — | | | | 9.6 | % | | | 4.1 | % | | | 0.1 | % | | | 100.0 | % | |
FIXED INCOME PORTFOLIOS
| | | Corporate | | Government | | Foreign
Corporate | | Foreign
Government | | Muni
Insured | |
DFA Selectively Hedged Global
Fixed Income Portfolio | | | 13.9 | % | | | 6.7 | % | | | 50.7 | % | | | 24.5 | % | | | — | | |
DFA Five-Year Government
Portfolio | | | — | | | | 100.0 | % | | | — | | | | — | | | | — | | |
DFA Five-Year Global Fixed
Income Portfolio | | | 29.6 | % | | | 40.9 | % | | | 14.6 | % | | | 11.5 | % | | | — | | |
DFA Intermediate Government
Fixed Income Portfolio | | | — | | | | 100.0 | % | | | — | | | | — | | | | — | | |
DFA Inflation-Protected Securities
Portfolio | | | — | | | | 100.0 | % | | | — | | | | — | | | | — | | |
DFA Short-Term Municipal Bond
Portfolio | | | — | | | | — | | | | — | | | | — | | | | 20.1 | % | |
DFA California Short-Term
Municipal Bond Portfolio | | | — | | | | — | | | | — | | | | — | | | | 42.1 | % | |
| | | Muni G.O.
Local | | Muni G.O.
State | | Muni
Revenue | | Supranational | | Total | |
DFA Selectively Hedged Global
Fixed Income Portfolio | | | — | | | | — | | | | — | | | | 4.2 | % | | | 100.0 | % | |
DFA Five-Year Government
Portfolio | | | — | | | | — | | | | — | | | | — | | | | 100.0 | % | |
DFA Five-Year Global Fixed
Income Portfolio | | | — | | | | — | | | | — | | | | 3.4 | % | | | 100.0 | % | |
DFA Intermediate Government
Fixed Income Portfolio | | | — | | | | — | | | | — | | | | — | | | | 100.0 | % | |
DFA Inflation-Protected Securities
Portfolio | | | — | | | | — | | | | — | | | | — | | | | 100.0 | % | |
DFA Short-Term Municipal Bond
Portfolio | | | 20.4 | % | | | 24.3 | % | | | 35.2 | % | | | — | | | | 100.0 | % | |
DFA California Short-Term
Municipal Bond Portfolio | | | 14.9 | % | | | 17.0 | % | | | 26.0 | % | | | — | | | | 100.0 | % | |
41
DFA INVESTMENT DIMENSIONS GROUP INC.
SCHEDULES OF INVESTMENTS
October 31, 2008
U.S. LARGE COMPANY PORTFOLIO
| | | Value† | |
| AFFILIATED INVESTMENT COMPANY — (100.0%) | |
Investment in The U.S. Large Company Series of
The DFA Investment Trust Company | | $ | 2,544,364,144 | | |
TOTAL INVESTMENTS IN AFFILIATED
INVESTMENT COMPANY (Cost $2,882,359,550) | | $ | 2,544,364,144 | | |
ENHANCED U.S. LARGE COMPANY PORTFOLIO
| | | Shares | | Value† | |
| AFFILIATED INVESTMENT COMPANY — (100.0%) | |
Investment in The Enhanced U.S. Large Company Series of
The DFA Investment Trust Company | | | 33,170,337 | | | $ | 200,348,835 | | |
TOTAL INVESTMENTS IN AFFILIATED
INVESTMENT COMPANY (Cost $260,777,271) | | | | $ | 200,348,835 | | |
U.S. LARGE CAP VALUE PORTFOLIO
| | | Shares | | Value† | |
| AFFILIATED INVESTMENT COMPANY — (100.0%) | |
Investment in The U.S. Large Cap Value Series of
The DFA Investment Trust Company | | | 393,166,650 | | | $ | 5,331,339,774 | | |
TOTAL INVESTMENTS IN AFFILIATED
INVESTMENT COMPANY (Cost $7,153,911,937) | | | | $ | 5,331,339,774 | | |
See accompanying Notes to Financial Statements.
42
U.S. TARGETED VALUE PORTFOLIO
SUMMARY SCHEDULE OF PORTFOLIO HOLDINGS
October 31, 2008
| | | Shares | | Value† | | Percentage
of Net Assets** | |
| COMMON STOCKS — (78.8%) | |
| Consumer Discretionary — (11.3%) | |
| Foot Locker, Inc. | | | 200,981 | | | $ | 2,938,342 | | | | 0.3 | % | |
| # Leggett & Platt, Inc. | | | 149,747 | | | | 2,599,608 | | | | 0.3 | % | |
| *# Mohawk Industries, Inc. | | | 88,140 | | | | 4,264,213 | | | | 0.5 | % | |
| * Toll Brothers, Inc. | | | 244,919 | | | | 5,662,527 | | | | 0.7 | % | |
| Other Securities | | | | | | | 106,586,904 | | | | 12.0 | % | |
| Total Consumer Discretionary | | | | | | | 122,051,594 | | | | 13.8 | % | |
| Consumer Staples — (3.8%) | |
| Casey's General Stores, Inc. | | | 86,244 | | | | 2,604,569 | | | | 0.3 | % | |
| * Constellation Brands, Inc. Class A | | | 249,583 | | | | 3,129,771 | | | | 0.4 | % | |
| Corn Products International, Inc. | | | 109,727 | | | | 2,668,561 | | | | 0.3 | % | |
| PepsiAmericas, Inc. | | | 160,714 | | | | 3,042,316 | | | | 0.3 | % | |
| Other Securities | | | | | | | 29,134,688 | | | | 3.3 | % | |
| Total Consumer Staples | | | | | | | 40,579,905 | | | | 4.6 | % | |
| Energy — (5.0%) | |
| # Cimarex Energy Co. | | | 115,417 | | | | 4,669,772 | | | | 0.5 | % | |
| Rowan Companies, Inc. | | | 140,833 | | | | 2,554,711 | | | | 0.3 | % | |
| Tidewater, Inc. | | | 79,728 | | | | 3,476,938 | | | | 0.4 | % | |
| * Unit Corp. | | | 74,546 | | | | 2,798,457 | | | | 0.3 | % | |
| Other Securities | | | | | | | 40,530,415 | | | | 4.6 | % | |
| Total Energy | | | | | | | 54,030,293 | | | | 6.1 | % | |
| Financials — (22.4%) | |
| # American Capital, Ltd. | | | 188,801 | | | | 2,652,654 | | | | 0.3 | % | |
| American Financial Group, Inc. | | | 165,364 | | | | 3,758,724 | | | | 0.4 | % | |
| # Associated Banc-Corp. | | | 118,535 | | | | 2,614,882 | | | | 0.3 | % | |
| Comerica, Inc. | | | 139,100 | | | | 3,837,769 | | | | 0.4 | % | |
| Fidelity National Financial, Inc. | | | 266,110 | | | | 2,397,651 | | | | 0.3 | % | |
| First American Corp. | | | 122,304 | | | | 2,496,225 | | | | 0.3 | % | |
| # First Niagara Financial Group, Inc. | | | 172,435 | | | | 2,719,300 | | | | 0.3 | % | |
| FirstMerit Corp. | | | 105,428 | | | | 2,458,581 | | | | 0.3 | % | |
| Hanover Insurance Group, Inc. | | | 78,550 | | | | 3,083,087 | | | | 0.4 | % | |
| HCC Insurance Holdings, Inc. | | | 150,975 | | | | 3,330,508 | | | | 0.4 | % | |
| # National Penn Bancshares, Inc. | | | 172,975 | | | | 2,930,196 | | | | 0.3 | % | |
| # NewAlliance Bancshares, Inc. | | | 215,412 | | | | 2,972,686 | | | | 0.3 | % | |
| Odyssey Re Holdings Corp. | | | 88,247 | | | | 3,480,462 | | | | 0.4 | % | |
| Old Republic International Corp. | | | 303,792 | | | | 2,797,924 | | | | 0.3 | % | |
| Prosperity Bancshares, Inc. | | | 95,483 | | | | 3,170,990 | | | | 0.4 | % | |
| *# Reinsurance Group of America, Inc. Class A | | | 73,713 | | | | 2,752,443 | | | | 0.3 | % | |
| # Synovus Financial Corp. | | | 439,500 | | | | 4,540,035 | | | | 0.5 | % | |
| Transatlantic Holdings, Inc. | | | 79,194 | | | | 3,393,463 | | | | 0.4 | % | |
| Trustmark Corp. | | | 124,506 | | | | 2,554,863 | | | | 0.3 | % | |
| W. R. Berkley Corp. | | | 174,315 | | | | 4,579,255 | | | | 0.5 | % | |
| # Zions Bancorporation | | | 99,983 | | | | 3,810,352 | | | | 0.4 | % | |
| Other Securities | | | | | | | 175,934,780 | | | | 19.9 | % | |
| Total Financials | | | | | | | 242,266,830 | | | | 27.4 | % | |
| Health Care — (5.9%) | |
| * King Pharmaceuticals, Inc. | | | 386,181 | | | | 3,394,531 | | | | 0.4 | % | |
| Omnicare, Inc. | | | 177,137 | | | | 4,883,667 | | | | 0.6 | % | |
| Other Securities | | | | | | | 54,891,124 | | | | 6.2 | % | |
| Total Health Care | | | | | | | 63,169,322 | | | | 7.2 | % | |
43
U.S. TARGETED VALUE PORTFOLIO
CONTINUED
| | | Shares | | Value† | | Percentage
of Net Assets** | |
| Industrials — (11.3%) | |
| IKON Office Solutions, Inc. | | | 165,200 | | | $ | 2,846,396 | | | | 0.3 | % | |
| Ryder System, Inc. | | | 88,461 | | | | 3,504,825 | | | | 0.4 | % | |
| Other Securities | | | | | | | 115,854,005 | | | | 13.1 | % | |
| Total Industrials | | | | | | | 122,205,226 | | | | 13.8 | % | |
| Information Technology — (13.3%) | |
| * Arrow Electronics, Inc. | | | 173,349 | | | | 3,024,940 | | | | 0.4 | % | |
| * Avnet, Inc. | | | 216,911 | | | | 3,631,090 | | | | 0.4 | % | |
| Fidelity National Information Services, Inc. | | | 269,900 | | | | 4,072,791 | | | | 0.5 | % | |
| * Ingram Micro, Inc. | | | 252,180 | | | | 3,361,559 | | | | 0.4 | % | |
| * Integrated Device Technology, Inc. | | | 385,805 | | | | 2,453,720 | | | | 0.3 | % | |
| Intersil Corp. | | | 193,627 | | | | 2,650,754 | | | | 0.3 | % | |
| Jabil Circuit, Inc. | | | 311,612 | | | | 2,620,657 | | | | 0.3 | % | |
| * Micron Technology, Inc. | | | 533,700 | | | | 2,513,727 | | | | 0.3 | % | |
| Other Securities | | | | | | | 119,483,192 | | | | 13.4 | % | |
| Total Information Technology | | | | | | | 143,812,430 | | | | 16.3 | % | |
| Materials — (4.8%) | |
| Lubrizol Corp. | | | 67,185 | | | | 2,524,812 | | | | 0.3 | % | |
| MeadWestavco Corp. | | | 264,464 | | | | 3,710,430 | | | | 0.4 | % | |
| The Valspar Corp. | | | 123,568 | | | | 2,526,966 | | | | 0.3 | % | |
| Other Securities | | | | | | | 43,042,736 | | | | 4.9 | % | |
| Total Materials | | | | | | | 51,804,944 | | | | 5.9 | % | |
| Telecommunication Services — (1.0%) | |
| CenturyTel, Inc. | | | 156,983 | | | | 3,941,843 | | | | 0.5 | % | |
| Other Securities | | | | | | | 6,502,405 | | | | 0.7 | % | |
| Total Telecommunication Services | | | | | | | 10,444,248 | | | | 1.2 | % | |
| Utilities — (0.0%) | |
| Total Utilities | | | | | | | 390,432 | | | | 0.1 | % | |
| TOTAL COMMON STOCKS | | | | | | | 850,755,224 | | | | 96.4 | % | |
| EXCHANGE-TRADED FUND — (0.5%) | |
| iShares Russell 2000 Value Index Fund | | | 100,000 | | | | 5,272,000 | | | | 0.6 | % | |
| RIGHTS/WARRANTS — (0.0%) | |
| TOTAL RIGHTS/WARRANTS | | | | | | | 1,566 | | | | 0.0 | % | |
| TEMPORARY CASH INVESTMENTS — (1.4%) | |
| BlackRock Liquidity Funds Tempcash Portfolio-Institutional Shares | | | 10,542,691 | | | | 10,542,691 | | | | 1.2 | % | |
| | | Face
Amount | | | | | |
| | | (000) | | | | | |
Repurchase Agreement, PNC Capital Markets, Inc. 0.94%, 11/03/08
(Collateralized by $5,680,000 FNMA 4.50%, 10/01/35,
valued at $4,270,602) to be repurchased at $4,205,329 | | $ | 4,205 | | | | 4,205,000 | | | | 0.5 | % | |
| TOTAL TEMPORARY CASH INVESTMENTS | | | | | | | 14,747,691 | | | | 1.7 | % | |
44
U.S. TARGETED VALUE PORTFOLIO
CONTINUED
| | | Shares | | Value† | | Percentage
of Net Assets** | |
| SECURITIES LENDING COLLATERAL — (19.3%) | |
| §@ DFA Short Term Investment Fund LP | | | 191,509,364 | | | $ | 191,509,364 | | | | 21.7 | % | |
| | | Face
Amount | | | | | |
| | | (000) | | | | | |
@ Repurchase Agreement, Deutsche Bank Securitites 0.24%, 11/03/08
(Collateralized by $21,984,204 FNMA, rates ranging from 5.000% to 7.500%,
maturities ranging from 04/01/21 to 04/01/38 & U.S. Treasury STRIP 4.620%(y),
02/15/17, valued at $17,684,779) to be repurchased at $17,215,719 | | $ | 17,215 | | | | 17,215,376 | | | | 1.9 | % | |
| TOTAL SECURITIES LENDING COLLATERAL | | | | | 208,724,740 | | | | 23.6 | % | |
TOTAL INVESTMENTS — (100.0%)
(Cost $1,422,350,932) | | | | $ | 1,079,501,221 | | | | 122.3 | % | |
See accompanying Notes to Financial Statements.
45
DFA INVESTMENT DIMENSIONS GROUP INC.
SCHEDULE OF INVESTMENTS
October 31, 2008
U.S. SMALL CAP VALUE PORTFOLIO
| | | Shares | | Value† | |
| AFFILIATED INVESTMENT COMPANY — (100.0%) | |
Investment in The U.S. Small Cap Value Series of
The DFA Investment Trust Company | | | 443,285,380 | | | $ | 5,505,604,420 | | |
TOTAL INVESTMENTS IN AFFILIATED
INVESTMENT COMPANY (Cost $7,888,262,917) | | | | $ | 5,505,604,420 | | |
See accompanying Notes to Financial Statements.
46
U.S. CORE EQUITY 1 PORTFOLIO
SUMMARY SCHEDULE OF PORTFOLIO HOLDINGS
October 31, 2008
| | | Shares | | Value† | | Percentage
of Net Assets** | |
| COMMON STOCKS — (82.5%) | |
| Consumer Discretionary — (9.7%) | |
| Comcast Corp. Class A | | | 225,473 | | | $ | 3,553,454 | | | | 0.3 | % | |
| Disney (Walt) Co. | | | 231,700 | | | | 6,001,030 | | | | 0.5 | % | |
| McDonald's Corp. | | | 93,280 | | | | 5,403,710 | | | | 0.4 | % | |
| Time Warner, Inc. | | | 441,219 | | | | 4,451,900 | | | | 0.4 | % | |
| Other Securities | | | | | | | 133,727,081 | | | | 10.0 | % | |
| Total Consumer Discretionary | | | | | | | 153,137,175 | | | | 11.6 | % | |
| Consumer Staples — (7.7%) | |
| Coca-Cola Co. | | | 178,024 | | | | 7,843,737 | | | | 0.6 | % | |
| CVS Caremark Corp. | | | 178,250 | | | | 5,463,362 | | | | 0.4 | % | |
| Kraft Foods, Inc. | | | 202,630 | | | | 5,904,638 | | | | 0.5 | % | |
| PepsiCo, Inc. | | | 131,460 | | | | 7,494,535 | | | | 0.6 | % | |
| Philip Morris International, Inc. | | | 101,420 | | | | 4,408,727 | | | | 0.3 | % | |
| Procter & Gamble Co. | | | 240,632 | | | | 15,530,389 | | | | 1.2 | % | |
| Wal-Mart Stores, Inc. | | | 252,348 | | | | 14,083,542 | | | | 1.1 | % | |
| Other Securities | | | | | | | 61,451,738 | | | | 4.6 | % | |
| Total Consumer Staples | | | | | | | 122,180,668 | | | | 9.3 | % | |
| Energy — (8.1%) | |
| Apache Corp. | | | 46,356 | | | | 3,816,489 | | | | 0.3 | % | |
| Chevron Corp. | | | 250,560 | | | | 18,691,776 | | | | 1.4 | % | |
| ConocoPhillips | | | 184,185 | | | | 9,581,304 | | | | 0.7 | % | |
| Devon Energy Corp. | | | 61,200 | | | | 4,948,632 | | | | 0.4 | % | |
| Exxon Mobil Corp. | | | 351,494 | | | | 26,052,735 | | | | 2.0 | % | |
| Occidental Petroleum Corp. | | | 64,024 | | | | 3,555,893 | | | | 0.3 | % | |
| Other Securities | | | | | | | 61,071,209 | | | | 4.6 | % | |
| Total Energy | | | | | | | 127,718,038 | | | | 9.7 | % | |
| Financials — (14.0%) | |
| Bank of America Corp. | | | 485,245 | | | | 11,728,372 | | | | 0.9 | % | |
| Bank of New York Mellon Corp. | | | 137,358 | | | | 4,477,871 | | | | 0.4 | % | |
| JPMorgan Chase & Co. | | | 557,133 | | | | 22,981,736 | | | | 1.8 | % | |
| The Goldman Sachs Group, Inc. | | | 50,853 | | | | 4,703,903 | | | | 0.4 | % | |
| U.S. Bancorp | | | 167,665 | | | | 4,998,094 | | | | 0.4 | % | |
| Wells Fargo & Co. | | | 359,335 | | | | 12,235,357 | | | | 0.9 | % | |
| Other Securities | | | | | | | 161,364,819 | | | | 12.0 | % | |
| Total Financials | | | | | | | 222,490,152 | | | | 16.8 | % | |
| Health Care — (10.5%) | |
| Abbott Laboratories | | | 108,855 | | | | 6,003,353 | | | | 0.5 | % | |
| * Amgen, Inc. | | | 101,485 | | | | 6,077,937 | | | | 0.5 | % | |
| Bristol-Myers Squibb Co. | | | 192,708 | | | | 3,960,149 | | | | 0.3 | % | |
| Eli Lilly & Co. | | | 109,044 | | | | 3,687,868 | | | | 0.3 | % | |
| * Genentech, Inc. | | | 67,348 | | | | 5,585,843 | | | | 0.4 | % | |
| Johnson & Johnson | | | 218,766 | | | | 13,419,106 | | | | 1.0 | % | |
| Medtronic, Inc. | | | 87,072 | | | | 3,511,614 | | | | 0.3 | % | |
| Merck & Co., Inc. | | | 209,268 | | | | 6,476,845 | | | | 0.5 | % | |
| Pfizer, Inc. | | | 783,318 | | | | 13,872,562 | | | | 1.1 | % | |
| Other Securities | | | | | | | 103,572,946 | | | | 7.7 | % | |
| Total Health Care | | | | | | | 166,168,223 | | | | 12.6 | % | |
47
U.S. CORE EQUITY 1 PORTFOLIO
CONTINUED
| | | Shares | | Value† | | Percentage
of Net Assets** | |
| Industrials — (10.6%) | |
| 3M Co. | | | 59,135 | | | $ | 3,802,381 | | | | 0.3 | % | |
| Boeing Co. | | | 71,388 | | | | 3,731,451 | | | | 0.3 | % | |
| Burlington Northern Santa Fe Corp. | | | 45,345 | | | | 4,038,426 | | | | 0.3 | % | |
| General Electric Co. | | | 629,008 | | | | 12,271,946 | | | | 0.9 | % | |
| Union Pacific Corp. | | | 70,320 | | | | 4,695,266 | | | | 0.4 | % | |
| United Parcel Service, Inc. | | | 66,937 | | | | 3,532,935 | | | | 0.3 | % | |
| United Technologies Corp. | | | 76,735 | | | | 4,217,356 | | | | 0.3 | % | |
| Other Securities | | | | | | | 131,051,532 | | | | 9.9 | % | |
| Total Industrials | | | | | | | 167,341,293 | | | | 12.7 | % | |
| Information Technology — (12.3%) | |
| * Apple, Inc. | | | 87,024 | | | | 9,362,912 | | | | 0.7 | % | |
| * Cisco Sytems, Inc. | | | 567,434 | | | | 10,083,302 | | | | 0.8 | % | |
| * Google, Inc. | | | 23,084 | | | | 8,295,466 | | | | 0.6 | % | |
| Hewlett-Packard Co. | | | 190,999 | | | | 7,311,442 | | | | 0.6 | % | |
| Intel Corp. | | | 489,356 | | | | 7,829,696 | | | | 0.6 | % | |
| International Business Machines Corp. | | | 104,430 | | | | 9,708,857 | | | | 0.8 | % | |
| Microsoft Corp. | | | 702,700 | | | | 15,691,291 | | | | 1.2 | % | |
| * Oracle Corp. | | | 421,735 | | | | 7,713,533 | | | | 0.6 | % | |
| QUALCOMM, Inc. | | | 122,323 | | | | 4,680,078 | | | | 0.4 | % | |
| Other Securities | | | | | | | 115,169,634 | | | | 8.5 | % | |
| Total Information Technology | | | | | | | 195,846,211 | | | | 14.8 | % | |
| Materials — (3.8%) | |
| Total Materials | | | | | | | 60,697,020 | | | | 4.6 | % | |
| Other — (0.0%) | |
| Total Other | | | | | | | 351 | | | | 0.0 | % | |
| Telecommunication Services — (2.4%) | |
| AT&T, Inc. | | | 614,512 | | | | 16,450,486 | | | | 1.3 | % | |
| Verizon Communications, Inc. | | | 374,011 | | | | 11,096,906 | | | | 0.9 | % | |
| Other Securities | | | | | | | 11,180,287 | | | | 0.7 | % | |
| Total Telecommunication Services | | | | | | | 38,727,679 | | | | 2.9 | % | |
| Utilities — (3.4%) | |
| Total Utilities | | | | | | | 54,493,355 | | | | 4.1 | % | |
| TOTAL COMMON STOCKS | | | | | | | 1,308,800,165 | | | | 99.1 | % | |
| RIGHTS/WARRANTS — (0.0%) | |
| TOTAL RIGHTS/WARRANTS | | | | | | | 1,008 | | | | 0.0 | % | |
| TEMPORARY CASH INVESTMENTS — (1.9%) | |
| BlackRock Liquidity Funds Tempcash Portfolio-Institutional Shares | | | 24,034,464 | | | | 24,034,464 | | | | 1.8 | % | |
| | | Face
Amount | | | | | |
| | | (000) | | | | | |
Repurchase Agreement, PNC Capital Markets, Inc. 0.94%, 11/03/08
(Collateralized by $8,735,000 FNMA 6.50%, 08/01/36,
valued at $6,514,899) to be repurchased at $6,415,503 | | $ | 6,415 | | | | 6,415,000 | | | | 0.5 | % | |
| TOTAL TEMPORARY CASH INVESTMENTS | | | | | | | 30,449,464 | | | | 2.3 | % | |
48
U.S. CORE EQUITY 1 PORTFOLIO
CONTINUED
| | | Shares | | Value† | | Percentage
of Net Assets** | |
| SECURITIES LENDING COLLATERAL — (15.6%) | |
| §@ DFA Short Term Investment Fund LP | | | 226,901,386 | | | $ | 226,901,386 | | | | 17.2 | % | |
| | | Face
Amount | | | | | |
| | | (000) | | | | | |
@ Repurchase Agreement, Deutsche Bank Securitites 0.24%, 11/03/08
(Collateralized by $21,187,234 FNMA, 7.000%, maturities ranging from
02/01/38 to 09/01/38 & U.S. Treasury STRIP 0.539%(y), 05/15/09, valued at
$21,027,361) to be repurchased at $20,469,370 | | $ | 20,469 | | | | 20,468,962 | | | | 1.5 | % | |
| TOTAL SECURITIES LENDING COLLATERAL | | | | | 247,370,348 | | | | 18.7 | % | |
TOTAL INVESTMENTS — (100.0%)
(Cost $2,069,274,721) | | | | $ | 1,586,620,985 | | | | 120.1 | % | |
See accompanying Notes to Financial Statements.
49
U.S. CORE EQUITY 2 PORTFOLIO
SUMMARY SCHEDULE OF PORTFOLIO HOLDINGS
October 31, 2008
| | | Shares | | Value† | | Percentage
of Net Assets** | |
| COMMON STOCKS — (82.7%) | |
| Consumer Discretionary — (10.5%) | |
| Comcast Corp. Class A | | | 561,542 | | | $ | 8,849,902 | | | | 0.4 | % | |
| Disney (Walt) Co. | | | 627,312 | | | | 16,247,381 | | | | 0.7 | % | |
| Home Depot, Inc. | | | 252,200 | | | | 5,949,398 | | | | 0.3 | % | |
| # Lowe's Companies, Inc. | | | 409,000 | | | | 8,875,300 | | | | 0.4 | % | |
| Time Warner, Inc. | | | 1,103,320 | | | | 11,132,499 | | | | 0.5 | % | |
| Other Securities | | | | | | | 261,456,076 | | | | 10.2 | % | |
| Total Consumer Discretionary | | | | | | | 312,510,556 | | | | 12.5 | % | |
| Consumer Staples — (7.1%) | |
| Altria Group, Inc. | | | 409,900 | | | | 7,865,981 | | | | 0.3 | % | |
| Coca-Cola Co. | | | 145,713 | | | | 6,420,115 | | | | 0.3 | % | |
| CVS Caremark Corp. | | | 476,985 | | | | 14,619,590 | | | | 0.6 | % | |
| Kraft Foods, Inc. | | | 456,138 | | | | 13,291,861 | | | | 0.5 | % | |
| Philip Morris International, Inc. | | | 130,500 | | | | 5,672,835 | | | | 0.2 | % | |
| Procter & Gamble Co. | | | 571,788 | | | | 36,903,198 | | | | 1.5 | % | |
| Wal-Mart Stores, Inc. | | | 404,300 | | | | 22,563,983 | | | | 0.9 | % | |
| Other Securities | | | | | | | 105,265,480 | | | | 4.2 | % | |
| Total Consumer Staples | | | | | | | 212,603,043 | | | | 8.5 | % | |
| Energy — (8.4%) | |
| Apache Corp. | | | 79,063 | | | | 6,509,257 | | | | 0.3 | % | |
| Chevron Corp. | | | 594,814 | | | | 44,373,124 | | | | 1.8 | % | |
| ConocoPhillips | | | 467,578 | | | | 24,323,408 | | | | 1.0 | % | |
| Devon Energy Corp. | | | 137,600 | | | | 11,126,336 | | | | 0.5 | % | |
| Exxon Mobil Corp. | | | 403,184 | | | | 29,883,998 | | | | 1.2 | % | |
| Marathon Oil Corp. | | | 200,388 | | | | 5,831,291 | | | | 0.2 | % | |
| Occidental Petroleum Corp. | | | 157,660 | | | | 8,756,436 | | | | 0.4 | % | |
| Other Securities | | | | | | | 120,660,868 | | | | 4.6 | % | |
| Total Energy | | | | | | | 251,464,718 | | | | 10.0 | % | |
| Financials — (16.9%) | |
| Bank of America Corp. | | | 1,303,336 | | | | 31,501,631 | | | | 1.3 | % | |
| Bank of New York Mellon Corp. | | | 328,970 | | | | 10,724,422 | | | | 0.4 | % | |
| # BB&T Corp. | | | 183,469 | | | | 6,577,364 | | | | 0.3 | % | |
| Chubb Corp. | | | 111,344 | | | | 5,769,846 | | | | 0.2 | % | |
| # Citigroup, Inc. | | | 795,672 | | | | 10,860,923 | | | | 0.4 | % | |
| JPMorgan Chase & Co. | | | 1,242,660 | | | | 51,259,725 | | | | 2.1 | % | |
| MetLife, Inc. | | | 184,484 | | | | 6,128,558 | | | | 0.3 | % | |
| PNC Financial Services Group, Inc. | | | 104,703 | | | | 6,980,549 | | | | 0.3 | % | |
| The Goldman Sachs Group, Inc. | | | 119,024 | | | | 11,009,720 | | | | 0.5 | % | |
| The Travelers Companies, Inc. | | | 177,178 | | | | 7,538,924 | | | | 0.3 | % | |
| Wells Fargo & Co. | | | 852,801 | | | | 29,037,874 | | | | 1.2 | % | |
| Other Securities | | | | | | | 324,558,109 | | | | 12.8 | % | |
| Total Financials | | | | | | | 501,947,645 | | | | 20.1 | % | |
| Health Care — (8.8%) | |
| Johnson & Johnson | | | 142,350 | | | | 8,731,749 | | | | 0.4 | % | |
| Pfizer, Inc. | | | 1,930,512 | | | | 34,189,368 | | | | 1.4 | % | |
| * WellPoint, Inc. | | | 164,028 | | | | 6,375,768 | | | | 0.3 | % | |
| Other Securities | | | | | | | 212,260,096 | | | | 8.3 | % | |
| Total Health Care | | | | | | | 261,556,981 | | | | 10.4 | % | |
50
U.S. CORE EQUITY 2 PORTFOLIO
CONTINUED
| | | Shares | | Value† | | Percentage
of Net Assets** | |
| Industrials — (11.5%) | |
| Burlington Northern Santa Fe Corp. | | | 115,466 | | | $ | 10,283,402 | | | | 0.4 | % | |
| CSX Corp. | | | 136,600 | | | | 6,245,352 | | | | 0.3 | % | |
| FedEx Corp. | | | 98,823 | | | | 6,460,060 | | | | 0.3 | % | |
| General Electric Co. | | | 2,250,267 | | | | 43,902,709 | | | | 1.8 | % | |
| Norfolk Southern Corp. | | | 125,758 | | | | 7,537,935 | | | | 0.3 | % | |
| Raytheon Co. | | | 116,144 | | | | 5,936,120 | | | | 0.3 | % | |
| Union Pacific Corp. | | | 170,600 | | | | 11,390,962 | | | | 0.5 | % | |
| United Technologies Corp. | | | 110,124 | | | | 6,052,415 | | | | 0.3 | % | |
| Other Securities | | | | | | | 244,065,721 | | | | 9.5 | % | |
| Total Industrials | | | | | | | 341,874,676 | | | | 13.7 | % | |
| Information Technology — (10.0%) | |
| * Cisco Sytems, Inc. | | | 332,162 | | | | 5,902,519 | | | | 0.3 | % | |
| * EMC Corp. | | | 489,850 | | | | 5,770,433 | | | | 0.2 | % | |
| Hewlett-Packard Co. | | | 213,714 | | | | 8,180,972 | | | | 0.3 | % | |
| Intel Corp. | | | 458,292 | | | | 7,332,672 | | | | 0.3 | % | |
| International Business Machines Corp. | | | 77,144 | | | | 7,172,078 | | | | 0.3 | % | |
| Microsoft Corp. | | | 526,939 | | | | 11,766,548 | | | | 0.5 | % | |
| Other Securities | | | | | | | 253,046,723 | | | | 10.1 | % | |
| Total Information Technology | | | | | | | 299,171,945 | | | | 12.0 | % | |
| Materials — (4.2%) | |
| Dow Chemical Co. | | | 309,988 | | | | 8,267,380 | | | | 0.3 | % | |
| Other Securities | | | | | | | 115,890,083 | | | | 4.7 | % | |
| Total Materials | | | | | | | 124,157,463 | | | | 5.0 | % | |
| Other — (0.0%) | |
| Total Other | | | | | | | 531 | | | | 0.0 | % | |
| Telecommunication Services — (2.9%) | |
| AT&T, Inc. | | | 1,399,392 | | | | 37,461,724 | | | | 1.5 | % | |
| Verizon Communications, Inc. | | | 927,164 | | | | 27,508,956 | | | | 1.1 | % | |
| Other Securities | | | | | | | 22,747,101 | | | | 0.9 | % | |
| Total Telecommunication Services | | | | | | | 87,717,781 | | | | 3.5 | % | |
| Utilities — (2.4%) | |
| Total Utilities | | | | | | | 70,985,858 | | | | 2.8 | % | |
| TOTAL COMMON STOCKS | | | | | | | 2,463,991,197 | | | | 98.5 | % | |
| RIGHTS/WARRANTS — (0.0%) | |
| TOTAL RIGHTS/WARRANTS | | | | | | | 2,881 | | | | 0.0 | % | |
| TEMPORARY CASH INVESTMENTS — (1.7%) | |
| BlackRock Liquidity Funds Tempcash Portfolio-Institutional Shares | | | 39,057,782 | | | | 39,057,782 | | | | 1.6 | % | |
| | | Face
Amount | | | | | |
| | | (000) | | | | | |
Repurchase Agreement, PNC Capital Markets, Inc. 0.94%, 11/03/08
(Collateralized by $18,325,000 FNMA 6.50%, 11/01/36,
valued at $12,299,695) to be repurchased at $12,116,949 | | $ | 12,116 | | | | 12,116,000 | | | | 0.5 | % | |
| TOTAL TEMPORARY CASH INVESTMENTS | | | | | | | 51,173,782 | | | | 2.1 | % | |
51
U.S. CORE EQUITY 2 PORTFOLIO
CONTINUED
| | | Shares | | Value† | | Percentage
of Net Assets** | |
| SECURITIES LENDING COLLATERAL — (15.6%) | |
| §@ DFA Short Term Investment Fund LP | | | 424,648,738 | | | $ | 424,648,738 | | | | 17.0 | % | |
| | | Face
Amount | | | | | |
| | | (000) | | | | | |
@ Repurchase Agreement, Deutsche Bank Securities 0.24%, 11/03/08
(Collateralized by $89,440,377 FNMA, rates ranging from 4.000% to 7.000%,
maturities ranging from 07/01/13 to 09/01/38 & U.S. Treasury STRIP 3.255%(y),
11/15/14, valued at $39,378,458) to be repurchased at $38,333,129 | | $ | 38,332 | | | | 38,332,365 | | | | 1.5 | % | |
| TOTAL SECURITIES LENDING COLLATERAL | | | | | 462,981,103 | | | | 18.5 | % | |
TOTAL INVESTMENTS — (100.0%)
(Cost $4,015,165,938) | | | | $ | 2,978,148,963 | | | | 119.1 | % | |
See accompanying Notes to Financial Statements.
52
U.S. VECTOR EQUITY PORTFOLIO
SUMMARY SCHEDULE OF PORTFOLIO HOLDINGS
October 31, 2008
| | | Shares | | Value† | | Percentage
of Net Assets** | |
| COMMON STOCKS — (81.2%) | |
| Consumer Discretionary — (11.3%) | |
| Comcast Corp. Class A | | | 191,618 | | | $ | 3,019,900 | | | | 0.4 | % | |
| Disney (Walt) Co. | | | 86,800 | | | | 2,248,120 | | | | 0.3 | % | |
| Fortune Brands, Inc. | | | 65,022 | | | | 2,479,939 | | | | 0.3 | % | |
| # Leggett & Platt, Inc. | | | 124,300 | | | | 2,157,848 | | | | 0.3 | % | |
| Macy's, Inc. | | | 192,090 | | | | 2,360,786 | | | | 0.3 | % | |
| # Pulte Homes, Inc. | | | 215,650 | | | | 2,402,341 | | | | 0.3 | % | |
| *# Sears Holdings Corp. | | | 47,129 | | | | 2,721,228 | | | | 0.3 | % | |
| Time Warner, Inc. | | | 400,981 | | | | 4,045,898 | | | | 0.5 | % | |
| * Toll Brothers, Inc. | | | 100,300 | | | | 2,318,936 | | | | 0.3 | % | |
| Other Securities | | | | | | | 93,073,223 | | | | 10.7 | % | |
| Total Consumer Discretionary | | | | | | | 116,828,219 | | | | 13.7 | % | |
| Consumer Staples — (5.2%) | |
| CVS Caremark Corp. | | | 87,809 | | | | 2,691,346 | | | | 0.3 | % | |
| Kraft Foods, Inc. | | | 111,928 | | | | 3,261,582 | | | | 0.4 | % | |
| Molson Coors Brewing Co. | | | 69,336 | | | | 2,590,393 | | | | 0.3 | % | |
| Philip Morris International, Inc. | | | 46,200 | | | | 2,008,314 | | | | 0.2 | % | |
| Procter & Gamble Co. | | | 74,000 | | | | 4,775,960 | | | | 0.6 | % | |
| Wal-Mart Stores, Inc. | | | 42,300 | | | | 2,360,763 | | | | 0.3 | % | |
| Other Securities | | | | | | | 36,529,357 | | | | 4.3 | % | |
| Total Consumer Staples | | | | | | | 54,217,715 | | | | 6.4 | % | |
| Energy — (7.7%) | |
| Chevron Corp. | | | 95,200 | | | | 7,101,920 | | | | 0.8 | % | |
| # Cimarex Energy Co. | | | 51,000 | | | | 2,063,460 | | | | 0.3 | % | |
| ConocoPhillips | | | 153,600 | | | | 7,990,272 | | | | 1.0 | % | |
| Devon Energy Corp. | | | 37,100 | | | | 2,999,906 | | | | 0.4 | % | |
| Exxon Mobil Corp. | | | 66,600 | | | | 4,936,392 | | | | 0.6 | % | |
| Other Securities | | | | | | | 54,303,996 | | | | 6.2 | % | |
| Total Energy | | | | | | | 79,395,946 | | | | 9.3 | % | |
| Financials — (20.8%) | |
| American Financial Group, Inc. | | | 93,949 | | | | 2,135,461 | | | | 0.3 | % | |
| Bank of America Corp. | | | 402,170 | | | | 9,720,449 | | | | 1.2 | % | |
| Chubb Corp. | | | 45,208 | | | | 2,342,679 | | | | 0.3 | % | |
| Comerica, Inc. | | | 70,829 | | | | 1,954,172 | | | | 0.2 | % | |
| Discover Financial Services | | | 218,650 | | | | 2,678,462 | | | | 0.3 | % | |
| Hanover Insurance Group, Inc. | | | 49,548 | | | | 1,944,759 | | | | 0.2 | % | |
| HCC Insurance Holdings, Inc. | | | 93,600 | | | | 2,064,816 | | | | 0.3 | % | |
| JPMorgan Chase & Co. | | | 335,981 | | | | 13,859,216 | | | | 1.6 | % | |
| # M&T Bank Corp. | | | 34,200 | | | | 2,773,620 | | | | 0.3 | % | |
| # Marshall & Ilsley Corp. | | | 120,880 | | | | 2,179,466 | | | | 0.3 | % | |
| MetLife, Inc. | | | 67,240 | | | | 2,233,713 | | | | 0.3 | % | |
| *# Reinsurance Group of America, Inc. Class A | | | 50,772 | | | | 1,895,826 | | | | 0.2 | % | |
| The Travelers Companies, Inc. | | | 73,100 | | | | 3,110,405 | | | | 0.4 | % | |
| Unum Group | | | 161,075 | | | | 2,536,931 | | | | 0.3 | % | |
| W. R. Berkley Corp. | | | 76,900 | | | | 2,020,163 | | | | 0.3 | % | |
| Wells Fargo & Co. | | | 144,829 | | | | 4,931,427 | | | | 0.6 | % | |
| Other Securities | | | | | | | 156,591,684 | | | | 18.2 | % | |
| Total Financials | | | | | | | 214,973,249 | | | | 25.3 | % | |
53
U.S. VECTOR EQUITY PORTFOLIO
CONTINUED
| | | Shares | | Value† | | Percentage
of Net Assets** | |
| Health Care — (7.4%) | |
| * King Pharmaceuticals, Inc. | | | 239,100 | | | $ | 2,101,689 | | | | 0.3 | % | |
| Omnicare, Inc. | | | 75,400 | | | | 2,078,778 | | | | 0.3 | % | |
| Pfizer, Inc. | | | 309,722 | | | | 5,485,177 | | | | 0.7 | % | |
| Other Securities | | | | | | | 67,087,683 | | | | 7.7 | % | |
| Total Health Care | | | | | | | 76,753,327 | | | | 9.0 | % | |
| Industrials — (11.5%) | |
| *# Delta Air Lines, Inc. | | | 197,928 | | | | 2,173,249 | | | | 0.3 | % | |
| General Electric Co. | | | 267,064 | | | | 5,210,419 | | | | 0.6 | % | |
| Norfolk Southern Corp. | | | 32,700 | | | | 1,960,038 | | | | 0.2 | % | |
| Southwest Airlines Co. | | | 334,016 | | | | 3,934,708 | | | | 0.5 | % | |
| Union Pacific Corp. | | | 51,400 | | | | 3,431,978 | | | | 0.4 | % | |
| Other Securities | | | | | | | 102,637,494 | | | | 12.0 | % | |
| Total Industrials | | | | | | | 119,347,886 | | | | 14.0 | % | |
| Information Technology — (10.2%) | |
| * Computer Sciences Corp. | | | 75,645 | | | | 2,281,453 | | | | 0.3 | % | |
| * Ingram Micro, Inc. | | | 146,989 | | | | 1,959,363 | | | | 0.2 | % | |
| Xerox Corp. | | | 341,520 | | | | 2,738,990 | | | | 0.3 | % | |
| Other Securities | | | | | | | 98,123,501 | | | | 11.6 | % | |
| Total Information Technology | | | | | | | 105,103,307 | | | | 12.4 | % | |
| Materials — (3.9%) | |
| International Paper Co. | | | 135,900 | | | | 2,340,198 | | | | 0.3 | % | |
| Other Securities | | | | | | | 38,305,203 | | | | 4.5 | % | |
| Total Materials | | | | | | | 40,645,401 | | | | 4.8 | % | |
| Other — (0.0%) | |
| Total Other | | | | | | | 4,587 | | | | 0.0 | % | |
| Telecommunication Services — (2.0%) | |
| AT&T, Inc. | | | 270,720 | | | | 7,247,174 | | | | 0.9 | % | |
| Verizon Communications, Inc. | | | 150,079 | | | | 4,452,844 | | | | 0.5 | % | |
| Other Securities | | | | | | | 8,714,314 | | | | 1.0 | % | |
| Total Telecommunication Services | | | | | | | 20,414,332 | | | | 2.4 | % | |
| Utilities — (1.2%) | |
| Total Utilities | | | | | | | 12,102,730 | | | | 1.4 | % | |
| TOTAL COMMON STOCKS | | | | | | | 839,786,699 | | | | 98.7 | % | |
| RIGHTS/WARRANTS — (0.0%) | |
| TOTAL RIGHTS/WARRANTS | | | | | | | 741 | | | | 0.0 | % | |
| TEMPORARY CASH INVESTMENTS — (1.1%) | |
| BlackRock Liquidity Funds Tempcash Portfolio-Institutional Shares | | | 7,273,369 | | | | 7,273,369 | | | | 0.9 | % | |
| | | Face
Amount | | | | | |
| | | (000) | | | | | |
Repurchase Agreement, PNC Capital Markets, Inc. 0.94%, 11/03/08
(Collateralized by $6,075,000 FNMA 6.50%, 09/01/36,
valued at $4,160,073) to be repurchased at $4,097,321 | | $ | 4,097 | | | | 4,097,000 | | | | 0.5 | % | |
| TOTAL TEMPORARY CASH INVESTMENTS | | | | | | | 11,370,369 | | | | 1.4 | % | |
54
U.S. VECTOR EQUITY PORTFOLIO
CONTINUED
| | | Shares | | Value† | | Percentage
of Net Assets** | |
| SECURITIES LENDING COLLATERAL — (17.7%) | |
| §@ DFA Short Term Investment Fund LP | | | 167,844,450 | | | $ | 167,844,450 | | | | 19.7 | % | |
| | | Face
Amount | | | | | |
| | | (000) | | | | | |
@ Repurchase Agreement, Deutsche Bank Securities 0.24%, 11/03/08
(Collateralized by $15,821,273 FNMA 7.000%, maturities ranging from
10/01/37 to 08/01/38 & U.S. Treasury STRIP 1.573%(y), 05/15/11, valued at
$15,553,185) to be repurchased at $15,140,683 | | $ | 15,140 | | | | 15,140,381 | | | | 1.8 | % | |
| TOTAL SECURITIES LENDING COLLATERAL | | | | | 182,984,831 | | | | 21.5 | % | |
TOTAL INVESTMENTS — (100.0%)
(Cost $1,440,038,705) | | | | $ | 1,034,142,640 | | | | 121.6 | % | |
See accompanying Notes to Financial Statements.
55
T.A. U.S. CORE EQUITY 2 PORTFOLIO
SUMMARY SCHEDULE OF PORTFOLIO HOLDINGS
October 31, 2008
| | | Shares | | Value† | | Percentage
of Net Assets** | |
| COMMON STOCKS — (87.3%) | |
| Consumer Discretionary — (11.6%) | |
| # Carnival Corp. | | | 62,000 | | | $ | 1,574,800 | | | | 0.3 | % | |
| Comcast Corp. Class A | | | 136,640 | | | | 2,153,446 | | | | 0.4 | % | |
| Disney (Walt) Co. | | | 184,592 | | | | 4,780,933 | | | | 0.8 | % | |
| *# Sears Holdings Corp. | | | 25,050 | | | | 1,446,387 | | | | 0.3 | % | |
| Time Warner, Inc. | | | 272,900 | | | | 2,753,561 | | | | 0.5 | % | |
| Other Securities | | | | | | | 62,907,602 | | | | 10.6 | % | |
| Total Consumer Discretionary | | | | | | | 75,616,729 | | | | 12.9 | % | |
| Consumer Staples — (5.6%) | |
| CVS Caremark Corp. | | | 51,200 | | | | 1,569,280 | | | | 0.3 | % | |
| Kraft Foods, Inc. | | | 145,760 | | | | 4,247,446 | | | | 0.7 | % | |
| Philip Morris International, Inc. | | | 33,900 | | | | 1,473,633 | | | | 0.3 | % | |
| Procter & Gamble Co. | | | 50,396 | | | | 3,252,558 | | | | 0.6 | % | |
| Reynolds American, Inc. | | | 28,800 | | | | 1,410,048 | | | | 0.3 | % | |
| Other Securities | | | | | | | 24,423,803 | | | | 4.0 | % | |
| Total Consumer Staples | | | | | | | 36,376,768 | | | | 6.2 | % | |
| Energy — (10.0%) | |
| Apache Corp. | | | 22,600 | | | | 1,860,658 | | | | 0.3 | % | |
| Chevron Corp. | | | 148,511 | | | | 11,078,921 | | | | 1.9 | % | |
| ConocoPhillips | | | 146,430 | | | | 7,617,289 | | | | 1.3 | % | |
| Devon Energy Corp. | | | 35,400 | | | | 2,862,444 | | | | 0.5 | % | |
| Exxon Mobil Corp. | | | 141,724 | | | | 10,504,583 | | | | 1.8 | % | |
| Hess Corp. | | | 27,700 | | | | 1,667,817 | | | | 0.3 | % | |
| Marathon Oil Corp. | | | 68,000 | | | | 1,978,800 | | | | 0.3 | % | |
| Other Securities | | | | | | | 27,686,448 | | | | 4.7 | % | |
| Total Energy | | | | | | | 65,256,960 | | | | 11.1 | % | |
| Financials — (15.4%) | |
| Bank of America Corp. | | | 238,944 | | | | 5,775,276 | | | | 1.0 | % | |
| Bank of New York Mellon Corp. | | | 70,350 | | | | 2,293,410 | | | | 0.4 | % | |
| # BB&T Corp. | | | 48,740 | | | | 1,747,329 | | | | 0.3 | % | |
| Chubb Corp. | | | 29,760 | | | | 1,542,163 | | | | 0.3 | % | |
| Citigroup, Inc. | | | 116,200 | | | | 1,586,130 | | | | 0.3 | % | |
| JPMorgan Chase & Co. | | | 137,236 | | | | 5,660,985 | | | | 1.0 | % | |
| MetLife, Inc. | | | 52,634 | | | | 1,748,501 | | | | 0.3 | % | |
| PNC Financial Services Group, Inc. | | | 33,700 | | | | 2,246,779 | | | | 0.4 | % | |
| State Street Corp. | | | 31,200 | | | | 1,352,520 | | | | 0.2 | % | |
| The Goldman Sachs Group, Inc. | | | 32,210 | | | | 2,979,425 | | | | 0.5 | % | |
| The Travelers Companies, Inc. | | | 41,600 | | | | 1,770,080 | | | | 0.3 | % | |
| Wells Fargo & Co. | | | 163,900 | | | | 5,580,795 | | | | 1.0 | % | |
| Other Securities | | | | | | | 65,547,195 | | | | 11.1 | % | |
| Total Financials | | | | | | | 99,830,588 | | | | 17.1 | % | |
| Health Care — (9.3%) | |
| * Amgen, Inc. | | | 25,205 | | | | 1,509,527 | | | | 0.3 | % | |
| Johnson & Johnson | | | 43,375 | | | | 2,660,623 | | | | 0.5 | % | |
| Pfizer, Inc. | | | 361,965 | | | | 6,410,400 | | | | 1.1 | % | |
| * WellPoint, Inc. | | | 48,400 | | | | 1,881,308 | | | | 0.3 | % | |
| Other Securities | | | | | | | 48,245,641 | | | | 8.2 | % | |
| Total Health Care | | | | | | | 60,707,499 | | | | 10.4 | % | |
56
T.A. U.S. CORE EQUITY 2 PORTFOLIO
CONTINUED
| | | Shares | | Value† | | Percentage
of Net Assets** | |
| Industrials — (13.4%) | |
| Burlington Northern Santa Fe Corp. | | | 34,200 | | | $ | 3,045,852 | | | | 0.5 | % | |
| CSX Corp. | | | 40,100 | | | | 1,833,372 | | | | 0.3 | % | |
| FedEx Corp. | | | 24,600 | | | | 1,608,102 | | | | 0.3 | % | |
| General Electric Co. | | | 635,490 | | | | 12,398,410 | | | | 2.1 | % | |
| Norfolk Southern Corp. | | | 36,900 | | | | 2,211,786 | | | | 0.4 | % | |
| Northrop Grumman Corp. | | | 28,200 | | | | 1,322,298 | | | | 0.2 | % | |
| Raytheon Co. | | | 37,400 | | | | 1,911,514 | | | | 0.3 | % | |
| Union Pacific Corp. | | | 50,100 | | | | 3,345,177 | | | | 0.6 | % | |
| Other Securities | | | | | | | 59,400,897 | | | | 10.2 | % | |
| Total Industrials | | | | | | | 87,077,408 | | | | 14.9 | % | |
| Information Technology — (11.3%) | |
| * Google, Inc. | | | 6,800 | | | | 2,443,648 | | | | 0.4 | % | |
| Hewlett-Packard Co. | | | 119,380 | | | | 4,569,866 | | | | 0.8 | % | |
| International Business Machines Corp. | | | 26,866 | | | | 2,497,732 | | | | 0.4 | % | |
| Microsoft Corp. | | | 85,150 | | | | 1,901,400 | | | | 0.3 | % | |
| Xerox Corp. | | | 171,643 | | | | 1,376,577 | | | | 0.3 | % | |
| Other Securities | | | | | | | 60,392,005 | | | | 10.3 | % | |
| Total Information Technology | | | | | | | 73,181,228 | | | | 12.5 | % | |
| Materials — (4.5%) | |
| Dow Chemical Co. | | | 91,700 | | | | 2,445,639 | | | | 0.4 | % | |
| International Paper Co. | | | 87,800 | | | | 1,511,916 | | | | 0.3 | % | |
| Other Securities | | | | | | | 25,286,329 | | | | 4.3 | % | |
| Total Materials | | | | | | | 29,243,884 | | | | 5.0 | % | |
| Telecommunication Services — (3.7%) | |
| AT&T, Inc. | | | 419,352 | | | | 11,226,053 | | | | 1.9 | % | |
| Verizon Communications, Inc. | | | 234,539 | | | | 6,958,772 | | | | 1.2 | % | |
| Other Securities | | | | | | | 5,647,926 | | | | 1.0 | % | |
| Total Telecommunication Services | | | | | | | 23,832,751 | | | | 4.1 | % | |
| Utilities — (2.5%) | |
| Total Utilities | | | | | | | 16,034,284 | | | | 2.7 | % | |
| TOTAL COMMON STOCKS | | | | | | | 567,158,099 | | | | 96.9 | % | |
| TEMPORARY CASH INVESTMENTS — (4.4%) | |
| BlackRock Liquidity Funds Tempcash Portfolio-Institutional Shares | | | 25,606,781 | | | | 25,606,781 | | | | 4.4 | % | |
| | | Face
Amount | | | | | |
| | | (000) | | | | | |
Repurchase Agreement, PNC Capital Markets, Inc. 0.94%, 11/03/08
(Collateralized by $2,955,000 FHLMC 4.50%, 05/01/23,
valued at $2,810,944) to be repurchased at $2,769,217 | | $ | 2,769 | | | | 2,769,000 | | | | 0.5 | % | |
| TOTAL TEMPORARY CASH INVESTMENTS | | | | | | | 28,375,781 | | | | 4.9 | % | |
57
T.A. U.S. CORE EQUITY 2 PORTFOLIO
CONTINUED
| | | Shares | | Value† | | Percentage
of Net Assets** | |
| SECURITIES LENDING COLLATERAL — (8.3%) | |
| §@ DFA Short Term Investment Fund LP | | | 49,612,774 | | | $ | 49,612,774 | | | | 8.5 | % | |
| | | Face
Amount | | | | | |
| | | (000) | | | | | |
@ Repurchase Agreement, Deutsche Bank Securitites 0.24%, 11/03/08
(Collateralized by $16,519,401 FNMA, 4.056%(r), 09/01/44 & 5.062%(r),
04/01/35, valued at $4,438,280) to be repurchased at $4,309,096 | | $ | 4,309 | | | | 4,309,010 | | | | 0.7 | % | |
| TOTAL SECURITIES LENDING COLLATERAL | | | | | 53,921,784 | | | | 9.2 | % | |
TOTAL INVESTMENTS — (100.0%)
(Cost $830,460,510) | | | | $ | 649,455,664 | | | | 111.0 | % | |
See accompanying Notes to Financial Statements.
58
DFA INVESTMENT DIMENSIONS GROUP INC.
SCHEDULES OF INVESTMENTS
October 31, 2008
U.S. SMALL CAP PORTFOLIO
| | | Shares | | Value† | |
| AFFILIATED INVESTMENT COMPANY — (100.0%) | |
Investment in The U.S. Small Cap Series of
The DFA Investment Trust Company | | | 200,917,016 | | | $ | 2,067,436,095 | | |
TOTAL INVESTMENTS IN AFFILIATED
INVESTMENT COMPANY (Cost $2,660,195,176) | | | | $ | 2,067,436,095 | | |
U.S. MICRO CAP PORTFOLIO
| | | Shares | | Value† | |
| AFFILIATED INVESTMENT COMPANY — (100.0%) | |
Investment in The U.S. Micro Cap Series of
The DFA Investment Trust Company | | | 440,564,264 | | | $ | 2,925,346,713 | | |
TOTAL INVESTMENTS IN AFFILIATED
INVESTMENT COMPANY (Cost $3,771,170,089) | | | | $ | 2,925,346,713 | | |
See accompanying Notes to Financial Statements.
59
DFA REAL ESTATE SECURITIES PORTFOLIO
SUMMARY SCHEDULE OF PORTFOLIO HOLDINGS
October 31, 2008
| | | Shares | | Value† | | Percentage
of Net Assets** | |
| COMMON STOCKS — (77.2%) | |
| Real Estate Investment Trusts — (77.2%) | |
| # Alexander's, Inc. | | | 53,600 | | | $ | 18,760,000 | | | | 1.1 | % | |
| # Alexandria Real Estate Equities, Inc. | | | 285,850 | | | | 19,872,292 | | | | 1.1 | % | |
| # AMB Property Corp. | | | 890,665 | | | | 21,402,680 | | | | 1.2 | % | |
| # American Campus Communites, Inc. | | | 524,073 | | | | 13,615,417 | | | | 0.8 | % | |
| Apartment Investment & Management Co. Class A | | | 845,777 | | | | 12,373,718 | | | | 0.7 | % | |
| # AvalonBay Communities, Inc. | | | 694,491 | | | | 49,322,751 | | | | 2.8 | % | |
| # BioMed Realty Trust, Inc. | | | 640,052 | | | | 8,992,731 | | | | 0.5 | % | |
| # Boston Properties, Inc. | | | 1,081,264 | | | | 76,639,992 | | | | 4.4 | % | |
| # BRE Properties, Inc. Class A | | | 455,615 | | | | 15,859,958 | | | | 0.9 | % | |
| # Camden Property Trust | | | 474,409 | | | | 15,992,327 | | | | 0.9 | % | |
| # Commercial Net Lease Realty | | | 694,904 | | | | 12,390,138 | | | | 0.7 | % | |
| # Corporate Office Properties Trust | | | 468,215 | | | | 14,556,804 | | | | 0.8 | % | |
| # Developers Diversified Realty Corp. | | | 1,109,894 | | | | 14,617,304 | | | | 0.8 | % | |
| # Digital Realty Trust, Inc. | | | 651,017 | | | | 21,796,049 | | | | 1.3 | % | |
| # Douglas Emmett, Inc. | | | 1,094,588 | | | | 16,528,279 | | | | 1.0 | % | |
| # Duke Realty Corp. | | | 1,360,836 | | | | 19,201,396 | | | | 1.1 | % | |
| # Entertainment Properties Trust | | | 293,279 | | | | 10,983,299 | | | | 0.6 | % | |
| # Equity Lifestyle Properties, Inc. | | | 219,957 | | | | 9,235,994 | | | | 0.5 | % | |
| # Equity One, Inc. | | | 688,376 | | | | 12,025,929 | | | | 0.7 | % | |
| # Equity Residential | | | 2,448,939 | | | | 85,541,439 | | | | 4.9 | % | |
| # Essex Property Trust, Inc. | | | 232,700 | | | | 22,641,710 | | | | 1.3 | % | |
| # Federal Realty Investment Trust | | | 525,752 | | | | 32,212,825 | | | | 1.8 | % | |
| # General Growth Properties, Inc. | | | 2,436,909 | | | | 10,088,803 | | | | 0.6 | % | |
| # HCP, Inc. | | | 1,984,351 | | | | 59,391,625 | | | | 3.4 | % | |
| # Health Care REIT, Inc. | | | 1,205,343 | | | | 53,649,817 | | | | 3.1 | % | |
| # Healthcare Realty Trust, Inc. | | | 599,336 | | | | 15,313,035 | | | | 0.9 | % | |
| # Highwood Properties, Inc. | | | 713,956 | | | | 17,720,388 | | | | 1.0 | % | |
| # Home Properties, Inc. | | | 284,870 | | | | 11,534,386 | | | | 0.7 | % | |
| # Host Marriott Corp. | | | 4,841,068 | | | | 50,056,643 | | | | 2.9 | % | |
| # Kilroy Realty Corp. | | | 291,393 | | | | 9,368,285 | | | | 0.5 | % | |
| # Kimco Realty Corp. | | | 2,403,470 | | | | 54,270,353 | | | | 3.1 | % | |
| # Liberty Property Trust | | | 842,753 | | | | 20,099,659 | | | | 1.2 | % | |
| # Mack-Cali Realty Corp. | | | 590,631 | | | | 13,419,136 | | | | 0.8 | % | |
| # Nationwide Health Properties, Inc. | | | 878,024 | | | | 26,200,236 | | | | 1.5 | % | |
| # Omega Healthcare Investors, Inc. | | | 799,148 | | | | 12,043,160 | | | | 0.7 | % | |
| # ProLogis | | | 2,407,390 | | | | 33,703,460 | | | | 1.9 | % | |
| # Public Storage | | | 1,530,366 | | | | 124,724,829 | | | | 7.1 | % | |
| # Realty Income Corp. | | | 942,948 | | | | 21,800,958 | | | | 1.3 | % | |
| # Regency Centers Corp. | | | 635,182 | | | | 25,064,282 | | | | 1.4 | % | |
| Senior Housing Properties Trust | | | 1,037,630 | | | | 19,891,367 | | | | 1.1 | % | |
| # Simon Property Group, Inc. | | | 2,039,432 | | | | 136,703,127 | | | | 7.8 | % | |
| # SL Green Realty Corp. | | | 528,009 | | | | 22,197,498 | | | | 1.3 | % | |
| # Tanger Factory Outlet Centers, Inc. | | | 282,200 | | | | 10,207,174 | | | | 0.6 | % | |
| # Taubman Centers, Inc. | | | 472,061 | | | | 15,681,866 | | | | 0.9 | % | |
| # The Macerich Co. | | | 672,166 | | | | 19,775,124 | | | | 1.1 | % | |
| # UDR, Inc. | | | 1,171,872 | | | | 23,156,191 | | | | 1.3 | % | |
| # Ventas, Inc. | | | 1,269,328 | | | | 45,771,968 | | | | 2.6 | % | |
| # Vornado Realty Trust | | | 1,397,280 | | | | 98,578,104 | | | | 5.6 | % | |
| # Washington REIT | | | 465,224 | | | | 13,947,416 | | | | 0.8 | % | |
| # Weingarten Realty Investors | | | 760,057 | | | | 15,543,166 | | | | 0.9 | % | |
| Other Securities | | | | | | | 200,320,334 | | | | 11.6 | % | |
| TOTAL COMMON STOCKS | | | | | | | 1,704,785,422 | | | | 97.6 | % | |
60
DFA REAL ESTATE SECURITIES PORTFOLIO
CONTINUED
| | | Face
Amount | | Value† | | Percentage
of Net Assets** | |
| | | (000) | | | | | |
| TEMPORARY CASH INVESTMENTS — (2.3%) | |
Repurchase Agreement, PNC Capital Markets, Inc. 0.94%, 11/03/08
(Collateralized by $59,350,000 FNMA 5.50%, 08/01/37,
valued at $52,765,741) to be repurchased at $51,986,072 | | $ | 51,982 | | | $ | 51,982,000 | | | | 3.0 | % | |
| | | Shares | | | | | |
| SECURITIES LENDING COLLATERAL — (20.5%) | |
| § @ DFA Short Term Investment Fund LP | | | 415,012,034 | | | | 415,012,034 | | | | 23.7 | % | |
| @ PNC Demand Deposit Account 0.22% | | | 10,000,000 | | | | 10,000,000 | | | | 0.6 | % | |
| | | Face
Amount | | | | | |
| | | (000) | | | | | |
@ Repurchase Agreement, Deutsche Bank Securitites 0.2353%, 11/03/08
(Collateralized by $32,836,313 FNMA, rates ranging from
5.000% to 7.000%, maturities ranging from 06/01/20 to 07/01/38 & U.S. Treasury
STRIP 1.140%(y), 07/15/09, valued at $28,074,497) to be repurchased at
$27,360,683 | | $ | 27,360 | | | | 27,360,147 | | | | 1.6 | % | |
| TOTAL SECURITIES LENDING COLLATERAL | | | | | | | 452,372,181 | | | | 25.9 | % | |
TOTAL INVESTMENTS — (100.0%)
(Cost $2,682,434,016) | | | | | | $ | 2,209,139,603 | | | | 126.5 | % | |
See accompanying Notes to Financial Statements.
61
LARGE CAP INTERNATIONAL PORTFOLIO
SUMMARY SCHEDULE OF PORTFOLIO HOLDINGS
October 31, 2008
| | | Shares | | Value†† | | Percentage
of Net Assets** | |
| AUSTRALIA — (4.9%) | |
| COMMON STOCKS — (4.9%) | |
| # BHP Billiton, Ltd. | | | 343,037 | | | $ | 6,590,158 | | | | 0.6 | % | |
| Commonwealth Bank of Australia | | | 182,537 | | | | 4,989,790 | | | | 0.4 | % | |
| Other Securities | | | | | | | 54,324,268 | | | | 4.5 | % | |
| TOTAL — AUSTRALIA | | | | | | | 65,904,216 | | | | 5.5 | % | |
| AUSTRIA — (0.2%) | |
| COMMON STOCKS — (0.2%) | |
| Other Securities | | | | | | | 3,329,607 | | | | 0.3 | % | |
| BELGIUM — (0.4%) | |
| COMMON STOCKS — (0.4%) | |
| Other Securities | | | | | | | 5,970,724 | | | | 0.5 | % | |
| RIGHTS/WARRANTS — (0.0%) | |
| Other Securities | | | | | | | 7 | | | | 0.0 | % | |
| TOTAL — BELGIUM | | | | | | | 5,970,731 | | | | 0.5 | % | |
| CANADA — (7.3%) | |
| COMMON STOCKS — (7.3%) | |
| Bank of Nova Scotia | | | 145,927 | | | | 4,865,848 | | | | 0.4 | % | |
| EnCana Corp. | | | 109,200 | | | | 5,547,429 | | | | 0.5 | % | |
| # Manulife Financial Corp. | | | 219,590 | | | | 4,394,351 | | | | 0.4 | % | |
| Royal Bank of Canada | | | 205,268 | | | | 7,977,062 | | | | 0.7 | % | |
| # Toronto Dominion Bank | | | 112,415 | | | | 5,308,771 | | | | 0.4 | % | |
| Other Securities | | | | | | | 70,028,025 | | | | 5.7 | % | |
| TOTAL — CANADA | | | | | | | 98,121,486 | | | | 8.1 | % | |
| DENMARK — (0.8%) | |
| COMMON STOCKS — (0.8%) | |
| Other Securities | | | | | | | 11,000,404 | | | | 0.9 | % | |
| FINLAND — (1.1%) | |
| COMMON STOCKS — (1.1%) | |
| Nokia Oyj | | | 303,533 | | | | 4,649,581 | | | | 0.4 | % | |
| Other Securities | | | | | | | 9,710,169 | | | | 0.8 | % | |
| TOTAL — FINLAND | | | | | | | 14,359,750 | | | | 1.2 | % | |
| FRANCE — (8.2%) | |
| COMMON STOCKS — (8.2%) | |
| BNP Paribas SA | | | 117,049 | | | | 8,451,097 | | | | 0.7 | % | |
| # France Telecom SA | | | 214,253 | | | | 5,402,517 | | | | 0.5 | % | |
| GDF Suez | | | 139,979 | | | | 6,230,981 | | | | 0.5 | % | |
| Sanofi - Aventis | | | 106,578 | | | | 6,752,479 | | | | 0.6 | % | |
| Total SA | | | 222,818 | | | | 12,257,994 | | | | 1.0 | % | |
| Total SA Sponsored ADR | | | 77,100 | | | | 4,274,424 | | | | 0.4 | % | |
| Vivendi SA | | | 169,296 | | | | 4,425,249 | | | | 0.4 | % | |
| Other Securities | | | | | | | 62,501,324 | | | | 5.0 | % | |
| TOTAL — FRANCE | | | | | | | 110,296,065 | | | | 9.1 | % | |
| GERMANY — (6.4%) | |
| COMMON STOCKS — (6.4%) | |
| Deutsche Telekom AG | | | 343,650 | | | | 5,102,668 | | | | 0.4 | % | |
| E.ON AG | | | 218,479 | | | | 8,361,378 | | | | 0.7 | % | |
62
LARGE CAP INTERNATIONAL PORTFOLIO
CONTINUED
| | | Shares | | Value†† | | Percentage
of Net Assets** | |
| # RWE AG Series A | | | 62,262 | | | $ | 5,177,570 | | | | 0.4 | % | |
| Siemens AG | | | 72,863 | | | | 4,376,979 | | | | 0.4 | % | |
| # Volkswagen AG | | | 11,739 | | | | 7,105,324 | | | | 0.6 | % | |
| Other Securities | | | | | | | 56,723,925 | | | | 4.7 | % | |
| TOTAL — GERMANY | | | | | | | 86,847,844 | | | | 7.2 | % | |
| GREECE — (0.4%) | |
| COMMON STOCKS — (0.4%) | |
| Other Securities | | | | | | | 5,453,742 | | | | 0.4 | % | |
| HONG KONG — (1.7%) | |
| COMMON STOCKS — (1.7%) | |
| Other Securities | | | | | | | 22,673,002 | | | | 1.9 | % | |
| IRELAND — (0.3%) | |
| COMMON STOCKS — (0.3%) | |
| Other Securities | | | | | | | 4,486,874 | | | | 0.4 | % | |
| ITALY — (2.8%) | |
| COMMON STOCKS — (2.8%) | |
| Eni SpA | | | 254,648 | | | | 6,077,981 | | | | 0.5 | % | |
| Other Securities | | | | | | | 31,628,934 | | | | 2.6 | % | |
| TOTAL COMMON STOCKS | | | | | | | 37,706,915 | | | | 3.1 | % | |
| PREFERRED STOCKS — (0.0%) | |
| Other Securities | | | | | | | 13,402 | | | | 0.0 | % | |
| TOTAL — ITALY | | | | | | | 37,720,317 | | | | 3.1 | % | |
| JAPAN — (20.6%) | |
| COMMON STOCKS — (20.6%) | |
| # Mitsubishi UFJ Financial Group, Inc. | | | 679,972 | | | | 4,273,061 | | | | 0.4 | % | |
| Mitsubishi UFJ Financial Group, Inc. ADR | | | 937,000 | | | | 5,874,990 | | | | 0.5 | % | |
| Nintendo Co., Ltd. | | | 14,900 | | | | 4,787,494 | | | | 0.4 | % | |
| Takeda Pharmaceutical Co., Ltd. | | | 119,600 | | | | 5,942,351 | | | | 0.5 | % | |
| Tokyo Electric Power Co., Ltd | | | 177,800 | | | | 5,035,387 | | | | 0.4 | % | |
| Toyota Motor Corp. | | | 308,600 | | | | 12,051,114 | | | | 1.0 | % | |
| Other Securities | | | | | | | 239,619,308 | | | | 19.8 | % | |
| TOTAL — JAPAN | | | | | | | 277,583,705 | | | | 23.0 | % | |
| NETHERLANDS — (2.4%) | |
| COMMON STOCKS — (2.4%) | |
| # Royal Dutch Shell P.L.C. Series A | | | 292,228 | | | | 8,099,675 | | | | 0.7 | % | |
| Unilever NV | | | 201,479 | | | | 4,855,542 | | | | 0.4 | % | |
| Other Securities | | | | | | | 19,333,488 | | | | 1.6 | % | |
| TOTAL — NETHERLANDS | | | | | | | 32,288,705 | | | | 2.7 | % | |
| NEW ZEALAND — (0.1%) | |
| COMMON STOCKS — (0.1%) | |
| Other Securities | | | | | | | 1,044,384 | | | | 0.1 | % | |
| NORWAY — (0.7%) | |
| COMMON STOCKS — (0.7%) | |
| Other Securities | | | | | | | 9,431,422 | | | | 0.8 | % | |
| PORTUGAL — (0.2%) | |
| COMMON STOCKS — (0.2%) | |
| Other Securities | | | | | | | 2,784,120 | | | | 0.2 | % | |
| SINGAPORE — (0.9%) | |
| COMMON STOCKS — (0.9%) | |
| Other Securities | | | | | | | 12,232,479 | | | | 1.0 | % | |
63
LARGE CAP INTERNATIONAL PORTFOLIO
CONTINUED
| | | Shares | | Value†† | | Percentage
of Net Assets** | |
| SPAIN — (3.3%) | |
| COMMON STOCKS — (3.3%) | |
| # Banco Bilbao Vizcaya Argentaria SA Sponsored ADR | | | 497,300 | | | $ | 5,768,680 | | | | 0.5 | % | |
| Banco Santander Central Hispano SA | | | 544,921 | | | | 5,893,412 | | | | 0.5 | % | |
| Telefonica SA | | | 373,461 | | | | 6,914,612 | | | | 0.6 | % | |
| Other Securities | | | | | | | 25,680,324 | | | | 2.1 | % | |
| TOTAL — SPAIN | | | | | | | 44,257,028 | | | | 3.7 | % | |
| SWEDEN — (1.5%) | |
| COMMON STOCKS — (1.5%) | |
| Other Securities | | | | | | | 19,943,389 | | | | 1.6 | % | |
| SWITZERLAND — (6.8%) | |
| COMMON STOCKS — (6.8%) | |
| # Credit Suisse Group AG | | | 125,914 | | | | 4,708,412 | | | | 0.4 | % | |
| Nestle SA | | | 541,678 | | | | 21,064,228 | | | | 1.7 | % | |
| Novartis AG | | | 226,191 | | | | 11,481,006 | | | | 1.0 | % | |
| Novartis AG ADR | | | 115,300 | | | | 5,879,147 | | | | 0.5 | % | |
| Roche Holding AG Genusschein | | | 99,745 | | | | 15,253,688 | | | | 1.3 | % | |
| Other Securities | | | | | | | 33,111,215 | | | | 2.7 | % | |
| TOTAL — SWITZERLAND | | | | | | | 91,497,696 | | | | 7.6 | % | |
| UNITED KINGDOM — (16.9%) | |
| COMMON STOCKS — (16.9%) | |
| Anglo American P.L.C. | | | 181,454 | | | | 4,552,906 | | | | 0.4 | % | |
| AstraZeneca P.L.C. | | | 162,199 | | | | 6,873,742 | | | | 0.6 | % | |
| BG Group P.L.C. | | | 411,075 | | | | 6,044,420 | | | | 0.5 | % | |
| BP P.L.C. | | | 2,022,519 | | | | 16,486,512 | | | | 1.4 | % | |
| BP P.L.C. Sponsored ADR | | | 102,600 | | | | 5,099,220 | | | | 0.4 | % | |
| British American Tobacco P.L.C. | | | 263,805 | | | | 7,235,980 | | | | 0.6 | % | |
| GlaxoSmithKline P.L.C. | | | 598,100 | | | | 11,497,837 | | | | 1.0 | % | |
| HSBC Holdings P.L.C. | | | 1,160,007 | | | | 13,739,360 | | | | 1.1 | % | |
| # HSBC Holdings P.L.C. Sponsored ADR | | | 117,000 | | | | 6,903,000 | | | | 0.6 | % | |
| Rio Tinto P.L.C. | | | 109,101 | | | | 5,096,337 | | | | 0.4 | % | |
| Royal Dutch Shell P.L.C. Series B | | | 290,465 | | | | 7,875,011 | | | | 0.7 | % | |
| Tesco P.L.C. | | | 1,166,959 | | | | 6,393,892 | | | | 0.5 | % | |
| Vodafone Group P.L.C. | | | 5,464,272 | | | | 10,511,697 | | | | 0.9 | % | |
| Other Securities | | | | | | | 119,302,568 | | | | 9.8 | % | |
| TOTAL — UNITED KINGDOM | | | | | | | 227,612,482 | | | | 18.9 | % | |
| | | Face
Amount | |
Value† | | | |
| | | (000) | | | | | |
| TEMPORARY CASH INVESTMENTS — (1.4%) | |
Repurchase Agreement, PNC Capital Markets, Inc. 0.94%,
11/03/08 (Collateralized by $28,375,000 FNMA 6.50%,
09/01/36, valued at $19,430,795) to be repurchased at $19,143,499 | | $ | 19,142 | | | | 19,142,000 | | | | 1.6 | % | |
| | | Shares | | | | | |
| SECURITIES LENDING COLLATERAL — (10.7%) | |
| § @ DFA Short Term Investment Fund LP | | | 140,369,383 | | | | 140,369,383 | | | | 11.6 | % | |
| | | Face
Amount | | | | | |
| | | (000) | | | | | |
@ Repurchase Agreement, Deutsche Bank Securities, 0.25%,
11/03/08 (Collateralized by $6,457,299 FHLMC 5.000%, 06/01/36; FNMA,
rates ranging from 4.056%(r) to 5.520%(r), maturities ranging from 05/01/17 to
09/01/44; & GNMA 7.000%, 09/15/37, valued at $3,669,481) to be
repurchased at $3,597,605 | | $ | 3,598 | | | | 3,597,530 | | | | 0.3 | % | |
| TOTAL SECURITIES LENDING COLLATERAL | | | | | | | 143,966,913 | | | | 11.9 | % | |
TOTAL INVESTMENTS — (100.0%)
(Cost $1,631,735,454) | | | | | | $ | 1,347,948,361 | | | | 111.7 | % | |
See accompanying Notes to Financial Statements.
64
INTERNATIONAL CORE EQUITY PORTFOLIO
SUMMARY SCHEDULE OF PORTFOLIO HOLDINGS
October 31, 2008
| | | Shares | | Value†† | | Percentage
of Net Assets** | |
| AUSTRALIA — (4.2%) | |
| COMMON STOCKS — (4.2%) | |
| Australia & New Zealand Banking Group, Ltd. | | | 381,728 | | | $ | 4,474,804 | | | | 0.2 | % | |
| Commonwealth Bank of Australia | | | 218,637 | | | | 5,976,612 | | | | 0.3 | % | |
| # National Australia Bank, Ltd. | | | 311,746 | | | | 5,058,423 | | | | 0.3 | % | |
| Other Securities | | | | | | | 81,982,376 | | | | 4.1 | % | |
| TOTAL COMMON STOCKS | | | | | | | 97,492,215 | | | | 4.9 | % | |
| PREFERRED STOCKS — (0.0%) | |
| Other Securities | | | | | | | 13,012 | | | | 0.0 | % | |
| RIGHTS/WARRANTS — (0.0%) | |
| Other Securities | | | | | | | 426 | | | | 0.0 | % | |
| TOTAL — AUSTRALIA | | | | | | | 97,505,653 | | | | 4.9 | % | |
| AUSTRIA — (0.5%) | |
| COMMON STOCKS — (0.5%) | |
| Other Securities | | | | | | | 11,663,866 | | | | 0.6 | % | |
| BELGIUM — (0.8%) | |
| COMMON STOCKS — (0.8%) | |
| Other Securities | | | | | | | 17,547,577 | | | | 0.9 | % | |
| RIGHTS/WARRANTS — (0.0%) | |
| Other Securities | | | | | | | 808 | | | | 0.0 | % | |
| TOTAL — BELGIUM | | | | | | | 17,548,385 | | | | 0.9 | % | |
| CANADA — (6.4%) | |
| COMMON STOCKS — (6.4%) | |
| # Bank of Montreal | | | 138,673 | | | | 4,949,566 | | | | 0.3 | % | |
| Canadian Imperial Bank of Commerce | | | 114,980 | | | | 5,214,309 | | | | 0.3 | % | |
| # Manulife Financial Corp. | | | 259,273 | | | | 5,188,472 | | | | 0.3 | % | |
| Royal Bank of Canada | | | 162,793 | | | | 6,326,412 | | | | 0.3 | % | |
| # Toronto Dominion Bank | | | 144,760 | | | | 6,836,256 | | | | 0.4 | % | |
| Other Securities | | | | | | | 121,113,506 | | | | 6.0 | % | |
| TOTAL COMMON STOCKS | | | | | | | 149,628,521 | | | | 7.6 | % | |
| RIGHTS/WARRANTS — (0.0%) | |
| Other Securities | | | | | | | 6,772 | | | | 0.0 | % | |
| TOTAL — CANADA | | | | | | | 149,635,293 | | | | 7.6 | % | |
| DENMARK — (0.7%) | |
| COMMON STOCKS — (0.7%) | |
| Other Securities | | | | | | | 16,762,156 | | | | 0.8 | % | |
| FINLAND — (1.4%) | |
| COMMON STOCKS — (1.4%) | |
| Other Securities | | | | | | | 32,702,512 | | | | 1.6 | % | |
| FRANCE — (6.2%) | |
| COMMON STOCKS — (6.2%) | |
| # AXA SA Sponsored ADR | | | 299,136 | | | | 5,596,835 | | | | 0.3 | % | |
| # BNP Paribas SA | | | 157,004 | | | | 11,335,902 | | | | 0.6 | % | |
| France Telecom SA Sponsored ADR | | | 212,700 | | | | 5,385,564 | | | | 0.3 | % | |
| Sanofi - Aventis ADR | | | 194,695 | | | | 6,156,256 | | | | 0.3 | % | |
65
INTERNATIONAL CORE EQUITY PORTFOLIO
CONTINUED
| | | Shares | | Value†† | | Percentage
of Net Assets** | |
| # Societe Generale Paris | | | 92,394 | | | $ | 5,035,940 | | | | 0.3 | % | |
| Total SA Sponsored ADR | | | 85,527 | | | | 4,741,617 | | | | 0.3 | % | |
| Vivendi SA | | | 198,776 | | | | 5,195,831 | | | | 0.3 | % | |
| Other Securities | | | | | | | 100,877,449 | | | | 4.9 | % | |
| TOTAL COMMON STOCKS | | | | | | | 144,325,394 | | | | 7.3 | % | |
| RIGHTS/WARRANTS — (0.0%) | |
| Other Securities | | | | | | | 145 | | | | 0.0 | % | |
| TOTAL — FRANCE | | | | | | | 144,325,539 | | | | 7.3 | % | |
| GERMANY — (5.8%) | |
| COMMON STOCKS — (5.8%) | |
| DaimlerChrysler AG | | | 169,947 | | | | 5,838,570 | | | | 0.3 | % | |
| Deutsche Telekom AG | | | 292,612 | | | | 4,344,833 | | | | 0.2 | % | |
| E. ON AG | | | 125,088 | | | | 4,787,225 | | | | 0.3 | % | |
| # E. ON AG Sponsered ADR | | | 218,470 | | | | 8,301,860 | | | | 0.4 | % | |
| Munchener Rueckversicherungs-Gesellschaft AG | | | 43,657 | | | | 5,667,540 | | | | 0.3 | % | |
| Siemens AG Sponsored ADR | | | 108,800 | | | | 6,544,320 | | | | 0.3 | % | |
| # Volkswagen AG | | | 20,427 | | | | 12,363,954 | | | | 0.6 | % | |
| Other Securities | | | | | | | 86,271,520 | | | | 4.4 | % | |
| TOTAL — GERMANY | | | | | | | 134,119,822 | | | | 6.8 | % | |
| GREECE — (0.9%) | |
| COMMON STOCKS — (0.9%) | |
| Other Securities | | | | | | | 21,194,024 | | | | 1.1 | % | |
| HONG KONG — (1.5%) | |
| COMMON STOCKS — (1.5%) | |
| Other Securities | | | | | | | 36,041,691 | | | | 1.8 | % | |
| RIGHTS/WARRANTS — (0.0%) | |
| Other Securities | | | | | | | 1,160 | | | | 0.0 | % | |
| TOTAL — HONG KONG | | | | | | | 36,042,851 | | | | 1.8 | % | |
| IRELAND — (0.6%) | |
| COMMON STOCKS — (0.6%) | |
| Other Securities | | | | | | | 13,301,072 | | | | 0.7 | % | |
| ITALY — (2.9%) | |
| COMMON STOCKS — (2.9%) | |
| Eni SpA Sponsored ADR | | | 109,650 | | | | 5,268,683 | | | | 0.3 | % | |
| Intesa Sanpaolo SpA | | | 1,218,119 | | | | 4,458,186 | | | | 0.2 | % | |
| UniCredito Italiano SpA | | | 2,105,907 | | | | 5,155,308 | | | | 0.3 | % | |
| Other Securities | | | | | | | 52,467,523 | | | | 2.6 | % | |
| TOTAL COMMON STOCKS | | | | | | | 67,349,700 | | | | 3.4 | % | |
| RIGHTS/WARRANTS — (0.0%) | |
| Other Securities | | | | | | | 848 | | | | 0.0 | % | |
| TOTAL — ITALY | | | | | | | 67,350,548 | | | | 3.4 | % | |
| JAPAN — (18.8%) | |
| COMMON STOCKS — (18.8%) | |
| Honda Motor Co., Ltd. Sponsored ADR | | | 196,469 | | | | 4,866,537 | | | | 0.3 | % | |
| Mitsubishi UFJ Financial Group, Inc. | | | 983,100 | | | | 6,177,970 | | | | 0.3 | % | |
| Toyota Motor Corp. Sponsored ADR | | | 160,569 | | | | 12,217,695 | | | | 0.6 | % | |
| Other Securities | | | | | | | 412,798,247 | | | | 20.8 | % | |
| TOTAL — JAPAN | | | | | | | 436,060,449 | | | | 22.0 | % | |
66
INTERNATIONAL CORE EQUITY PORTFOLIO
CONTINUED
| | | Shares | | Value†† | | Percentage
of Net Assets** | |
| NETHERLANDS — (2.3%) | |
| COMMON STOCKS — (2.3%) | |
| Unilever NV | | | 181,970 | | | $ | 4,385,385 | | | | 0.2 | % | |
| Other Securities | | | | | | | 50,427,221 | | | | 2.6 | % | |
| TOTAL — NETHERLANDS | | | | | | | 54,812,606 | | | | 2.8 | % | |
| NEW ZEALAND — (0.2%) | |
| COMMON STOCKS — (0.2%) | |
| Other Securities | | | | | | | 4,154,118 | | | | 0.2 | % | |
| NORWAY — (0.7%) | |
| COMMON STOCKS — (0.7%) | |
| Other Securities | | | | | | | 17,463,667 | | | | 0.9 | % | |
| PORTUGAL — (0.4%) | |
| COMMON STOCKS — (0.4%) | |
| Other Securities | | | | | | | 8,761,847 | | | | 0.4 | % | |
| SINGAPORE — (1.0%) | |
| COMMON STOCKS — (1.0%) | |
| Other Securities | | | | | | | 23,238,665 | | | | 1.2 | % | |
| RIGHTS/WARRANTS — (0.0%) | |
| Other Securities | | | | | | | 214 | | | | 0.0 | % | |
| TOTAL — SINGAPORE | | | | | | | 23,238,879 | | | | 1.2 | % | |
| SPAIN — (3.0%) | |
| COMMON STOCKS — (3.0%) | |
| # Banco Bilbao Vizcaya Argentaria SA Sponsored ADR | | | 675,217 | | | | 7,832,517 | | | | 0.4 | % | |
| # Banco Santander SA Sponsored ADR | | | 1,096,296 | | | | 11,774,219 | | | | 0.6 | % | |
| Other Securities | | | | | | | 49,825,762 | | | | 2.5 | % | |
| TOTAL — SPAIN | | | | | | | 69,432,498 | | | | 3.5 | % | |
| SWEDEN — (1.8%) | |
| COMMON STOCKS — (1.8%) | |
| Other Securities | | | | | | | 41,412,497 | | | | 2.1 | % | |
| SWITZERLAND — (6.3%) | |
| COMMON STOCKS — (6.3%) | |
| Credit Suisse Group Sponsered ADR | | | 346,715 | | | | 12,967,141 | | | | 0.7 | % | |
| Holcim, Ltd. | | | 143,085 | | | | 8,127,119 | | | | 0.4 | % | |
| Nestle SA | | | 454,270 | | | | 17,665,194 | | | | 0.9 | % | |
| Novartis AG ADR | | | 277,502 | | | | 14,149,827 | | | | 0.7 | % | |
| Roche Holding AG Genusschein | | | 82,873 | | | | 12,673,507 | | | | 0.7 | % | |
| Swiss Re | | | 120,001 | | | | 5,004,482 | | | | 0.3 | % | |
| Zurich Financial SVCS AG | | | 49,623 | | | | 10,067,397 | | | | 0.5 | % | |
| Other Securities | | | | | | | 64,983,095 | | | | 3.1 | % | |
| TOTAL COMMON STOCKS | | | | | | | 145,637,762 | | | | 7.3 | % | |
| RIGHTS/WARRANTS — (0.0%) | |
| Other Securities | | | | | | | 13 | | | | 0.0 | % | |
| TOTAL — SWITZERLAND | | | | | | | 145,637,775 | | | | 7.3 | % | |
| UNITED KINGDOM — (15.8%) | |
| COMMON STOCKS — (15.8%) | |
| Aviva P.L.C. | | | 998,599 | | | | 5,956,647 | | | | 0.3 | % | |
| BAE Systems P.L.C. | | | 774,999 | | | | 4,356,236 | | | | 0.2 | % | |
| BP P.L.C. Sponsored ADR | | | 568,076 | | | | 28,233,377 | | | | 1.4 | % | |
67
INTERNATIONAL CORE EQUITY PORTFOLIO
CONTINUED
| | | Shares | | Value†† | | Percentage
of Net Assets** | |
| Cadbury P.L.C. Sponsored ADR | | | 122,368 | | | $ | 4,525,169 | | | | 0.2 | % | |
| HSBC Holdings P.L.C. Sponsered ADR | | | 470,156 | | | | 27,739,204 | | | | 1.4 | % | |
| # Lloyds TSB Group P.L.C. Sponsored ADR | | | 373,194 | | | | 4,717,172 | | | | 0.3 | % | |
| # Pearson P.L.C. Sponsored ADR | | | 607,283 | | | | 6,145,704 | | | | 0.3 | % | |
| Royal Dutch Shell P.L.C. ADR | | | 531,903 | | | | 29,408,917 | | | | 1.5 | % | |
| RSA Insurance Group P.L.C. | | | 2,543,937 | | | | 5,657,292 | | | | 0.3 | % | |
| Standard Chartered P.L.C. | | | 283,281 | | | | 4,681,789 | | | | 0.3 | % | |
| Tesco P.L.C. | | | 1,092,470 | | | | 5,985,759 | | | | 0.3 | % | |
| Vodafone Group P.L.C. Sponsored ADR | | | 1,012,331 | | | | 19,507,618 | | | | 1.0 | % | |
| Other Securities | | | | | | | 219,058,591 | | | | 11.0 | % | |
| TOTAL — UNITED KINGDOM | | | | | | | 365,973,475 | | | | 18.5 | % | |
| | | | |
Value† | | | |
| UNITED STATES — (0.0%) | |
| COMMON STOCKS — (0.0%) | |
| Other Securities | | | | | | | 21,366 | | | | 0.0 | % | |
| | | Face
Amount | | | | | |
| | | (000) | | | | | |
| TEMPORARY CASH INVESTMENTS — (2.7%) | |
Repurchase Agreement, PNC Capital Markets, Inc. 0.94%,
11/03/08 (Collateralized by $82,025,000 FHLMC 6.50%,
09/01/37 & FNMA 5.00%, 06/01/22, valued at $64,525,760) to be
repurchased at $63,573,980 | | $ | 63,569 | | | | 63,569,000 | | | | 3.2 | % | |
| | | Shares | | | | | |
| SECURITIES LENDING COLLATERAL — (15.1%) | |
| § @ DFA Short Term Investment Fund LP | | | 347,448,412 | | | | 347,448,412 | | | | 17.5 | % | |
| | | Face
Amount | | | | | |
| | | (000) | | | | | |
@ Repurchase Agreement, Deutsche Bank Securities 0.25%,
11/03/08 (Collateralized by $2,664,954 FHLMC 5.000%,
04/01/35, valued at $1,781,614) to be repurchased at $1,746,716 | | $ | 1,747 | | | | 1,746,680 | | | | 0.1 | % | |
| TOTAL SECURITIES LENDING COLLATERAL | | | | | | | 349,195,092 | | | | 17.6 | % | |
TOTAL INVESTMENTS — (100.0%)
(Cost $3,602,027,045) | | | | | | $ | 2,321,884,990 | | | | 117.2 | % | |
See accompanying Notes to Financial Statements.
68
T.A. WORLD EX U.S. CORE EQUITY PORTFOLIO
SUMMARY SCHEDULE OF PORTFOLIO HOLDINGS
October 31, 2008
| | | Shares | | Value†† | | Percentage
of Net Assets** | |
| AUSTRALIA — (3.8%) | |
| COMMON STOCKS — (3.8%) | |
| Commonwealth Bank of Australia | | | 19,740 | | | $ | 539,608 | | | | 0.3 | % | |
| National Australia Bank, Ltd. | | | 29,710 | | | | 482,078 | | | | 0.2 | % | |
| Other Securities | | | | | | | 8,708,638 | | | | 3.8 | % | |
| TOTAL — AUSTRALIA | | | | | | | 9,730,324 | | | | 4.3 | % | |
| AUSTRIA — (0.4%) | |
| COMMON STOCKS — (0.4%) | |
| Other Securities | | | | | | | 1,086,447 | | | | 0.5 | % | |
| BELGIUM — (0.7%) | |
| COMMON STOCKS — (0.7%) | |
| Other Securities | | | | | | | 1,819,624 | | | | 0.8 | % | |
| BRAZIL — (2.4%) | |
| COMMON STOCKS — (1.2%) | |
| Other Securities | | | | | | | 3,053,810 | | | | 1.3 | % | |
| PREFERRED STOCKS — (1.2%) | |
| Other Securities | | | | | | | 3,178,674 | | | | 1.4 | % | |
| TOTAL — BRAZIL | | | | | | | 6,232,484 | | | | 2.7 | % | |
| CANADA — (5.6%) | |
| COMMON STOCKS — (5.6%) | |
| # Bank of Montreal | | | 13,373 | | | | 477,314 | | | | 0.2 | % | |
| # Barrick Gold Corp. | | | 19,700 | | | | 450,454 | | | | 0.2 | % | |
| EnCana Corp. | | | 9,815 | | | | 498,608 | | | | 0.2 | % | |
| Petro-Canada | | | 17,700 | | | | 442,610 | | | | 0.2 | % | |
| Sun Life Financial, Inc. | | | 20,884 | | | | 491,215 | | | | 0.2 | % | |
| Toronto Dominion Bank | | | 12,200 | | | | 576,142 | | | | 0.3 | % | |
| Other Securities | | | | | | | 11,527,653 | | | | 5.0 | % | |
| TOTAL — CANADA | | | | | | | 14,463,996 | | | | 6.3 | % | |
| CHILE — (0.3%) | |
| COMMON STOCKS — (0.3%) | |
| Other Securities | | | | | | | 665,736 | | | | 0.3 | % | |
| CHINA — (2.1%) | |
| COMMON STOCKS — (2.1%) | |
| Other Securities | | | | | | | 5,527,255 | | | | 2.4 | % | |
| CZECH REPUBLIC — (0.1%) | |
| COMMON STOCKS — (0.1%) | |
| Other Securities | | | | | | | 231,480 | | | | 0.1 | % | |
| DENMARK — (0.6%) | |
| COMMON STOCKS — (0.6%) | |
| Other Securities | | | | | | | 1,457,922 | | | | 0.6 | % | |
| FINLAND — (1.3%) | |
| COMMON STOCKS — (1.3%) | |
| UPM-Kymmene Oyj | | | 37,082 | | | | 524,352 | | | | 0.2 | % | |
| Other Securities | | | | | | | 2,716,595 | | | | 1.2 | % | |
| TOTAL — FINLAND | | | | | | | 3,240,947 | | | | 1.4 | % | |
69
T.A. WORLD EX U.S. CORE EQUITY PORTFOLIO
CONTINUED
| | | Shares | | Value†† | | Percentage
of Net Assets** | |
| FRANCE — (5.5%) | |
| COMMON STOCKS — (5.5%) | |
| AXA SA Sponsored ADR | | | 31,600 | | | $ | 591,236 | | | | 0.3 | % | |
| # BNP Paribas SA | | | 13,644 | | | | 985,115 | | | | 0.4 | % | |
| Compagnie Generale des Establissements Michelin Series B | | | 8,990 | | | | 462,725 | | | | 0.2 | % | |
| France Telecom SA Sponsored ADR | | | 23,020 | | | | 582,866 | | | | 0.3 | % | |
| # Societe Generale Paris | | | 10,539 | | | | 574,429 | | | | 0.3 | % | |
| Total SA Sponsored ADR | | | 11,800 | | | | 654,192 | | | | 0.3 | % | |
| Vivendi SA | | | 19,527 | | | | 510,419 | | | | 0.2 | % | |
| Other Securities | | | | | | | 9,742,299 | | | | 4.2 | % | |
| TOTAL — FRANCE | | | | | | | 14,103,281 | | | | 6.2 | % | |
| GERMANY — (5.0%) | |
| COMMON STOCKS — (5.0%) | |
| E.ON AG | | | 28,282 | | | | 1,082,376 | | | | 0.5 | % | |
| # Munchener Rueckversicherungs-Gesellschaft AG | | | 4,151 | | | | 538,882 | | | | 0.2 | % | |
| Siemens AG Sponsored ADR | | | 15,500 | | | | 932,325 | | | | 0.4 | % | |
| # Volkswagen AG | | | 927 | | | | 561,090 | | | | 0.3 | % | |
| Other Securities | | | | | | | 9,677,722 | | | | 4.2 | % | |
| TOTAL — GERMANY | | | | | | | 12,792,395 | | | | 5.6 | % | |
| GREECE — (1.0%) | |
| COMMON STOCKS — (1.0%) | |
| Other Securities | | | | | | | 2,534,171 | | | | 1.1 | % | |
| HONG KONG — (1.4%) | |
| COMMON STOCKS — (1.4%) | |
| Other Securities | | | | | | | 3,722,936 | | | | 1.6 | % | |
| HUNGARY — (0.1%) | |
| COMMON STOCKS — (0.1%) | |
| Other Securities | | | | | | | 322,637 | | | | 0.1 | % | |
| INDIA — (1.2%) | |
| COMMON STOCKS — (1.2%) | |
| Other Securities | | | | | | | 3,219,409 | | | | 1.4 | % | |
| INDONESIA — (0.2%) | |
| COMMON STOCKS — (0.2%) | |
| Other Securities | | | | | | | 607,351 | | | | 0.3 | % | |
| IRELAND — (0.4%) | |
| COMMON STOCKS — (0.4%) | |
| Other Securities | | | | | | | 1,179,681 | | | | 0.5 | % | |
| ISRAEL — (0.3%) | |
| COMMON STOCKS — (0.3%) | |
| Other Securities | | | | | | | 747,222 | | | | 0.3 | % | |
| ITALY — (2.4%) | |
| COMMON STOCKS — (2.4%) | |
| Banco Popolare Scarl | | | 40,766 | | | | 508,554 | | | | 0.2 | % | |
| Intesa Sanpaolo SpA | | | 129,677 | | | | 474,604 | | | | 0.2 | % | |
| UniCredito Italiano SpA | | | 228,020 | | | | 558,198 | | | | 0.3 | % | |
| Other Securities | | | | | | | 4,692,490 | | | | 2.0 | % | |
| TOTAL — ITALY | | | | | | | 6,233,846 | | | | 2.7 | % | |
| JAPAN — (15.7%) | |
| COMMON STOCKS — (15.7%) | |
| Honda Motor Co., Ltd. Sponsored ADR | | | 23,500 | | | | 582,095 | | | | 0.3 | % | |
70
T.A. WORLD EX U.S. CORE EQUITY PORTFOLIO
CONTINUED
| | | Shares | | Value†† | | Percentage
of Net Assets** | |
| Mitsubishi UFJ Financial Group, Inc. | | | 76,440 | | | $ | 480,362 | | | | 0.2 | % | |
| Sony Corp. Sponsored ADR | | | 19,300 | | | | 448,532 | | | | 0.2 | % | |
| Toyota Motor Corp. Sponsored ADR | | | 14,000 | | | | 1,065,260 | | | | 0.5 | % | |
| Other Securities | | | | | | | 37,842,139 | | | | 16.5 | % | |
| TOTAL — JAPAN | | | | | | | 40,418,388 | | | | 17.7 | % | |
| MALAYSIA — (0.5%) | |
| COMMON STOCKS — (0.5%) | |
| Other Securities | | | | | | | 1,346,632 | | | | 0.6 | % | |
| MEXICO — (0.8%) | |
| COMMON STOCKS — (0.8%) | |
| Other Securities | | | | | | | 2,016,825 | | | | 0.9 | % | |
| NETHERLANDS — (1.9%) | |
| COMMON STOCKS — (1.9%) | |
| Koninklijke Philips Electronics NV ADR | | | 29,400 | | | | 543,900 | | | | 0.2 | % | |
| Other Securities | | | | | | | 4,233,713 | | | | 1.9 | % | |
| TOTAL — NETHERLANDS | | | | | | | 4,777,613 | | | | 2.1 | % | |
| NEW ZEALAND — (0.2%) | |
| COMMON STOCKS — (0.2%) | |
| Other Securities | | | | | | | 466,791 | | | | 0.2 | % | |
| NORWAY — (0.5%) | |
| COMMON STOCKS — (0.5%) | |
| Other Securities | | | | | | | 1,413,922 | | | | 0.6 | % | |
| PHILIPPINES — (0.1%) | |
| COMMON STOCKS — (0.1%) | |
| Other Securities | | | | | | | 233,520 | | | | 0.1 | % | |
| POLAND — (0.3%) | |
| COMMON STOCKS — (0.3%) | |
| Other Securities | | | | | | | 827,727 | | | | 0.4 | % | |
| PORTUGAL — (0.4%) | |
| COMMON STOCKS — (0.4%) | |
| Other Securities | | | | | | | 1,040,815 | | | | 0.5 | % | |
| SINGAPORE — (0.8%) | |
| COMMON STOCKS — (0.8%) | |
| Other Securities | | | | | | | 2,049,974 | | | | 0.9 | % | |
| SOUTH AFRICA — (1.3%) | |
| COMMON STOCKS — (1.3%) | |
| Other Securities | | | | | | | 3,280,854 | | | | 1.4 | % | |
| SOUTH KOREA — (2.4%) | |
| COMMON STOCKS — (2.4%) | |
| Samsung Electronics Co., Ltd. | | | 1,174 | | | | 494,963 | | | | 0.2 | % | |
| Other Securities | | | | | | | 5,678,359 | | | | 2.5 | % | |
| TOTAL — SOUTH KOREA | | | | | | | 6,173,322 | | | | 2.7 | % | |
| SPAIN — (2.6%) | |
| COMMON STOCKS — (2.6%) | |
| Banco Bilbao Vizcaya Argentaria SA Sponsored ADR | | | 57,320 | | | | 664,912 | | | | 0.3 | % | |
71
T.A. WORLD EX U.S. CORE EQUITY PORTFOLIO
CONTINUED
| | | Shares | | Value†† | | Percentage
of Net Assets** | |
| Banco Santander SA Sponsored ADR | | | 136,720 | | | $ | 1,468,373 | | | | 0.7 | % | |
| Other Securities | | | | | | | 4,598,926 | | | | 2.0 | % | |
| TOTAL — SPAIN | | | | | | | 6,732,211 | | | | 3.0 | % | |
| SWEDEN — (1.4%) | |
| COMMON STOCKS — (1.4%) | |
| Other Securities | | | | | | | 3,486,442 | | | | 1.5 | % | |
| SWITZERLAND — (5.4%) | |
| COMMON STOCKS — (5.4%) | |
| Credit Suisse Group AG Sponsored ADR | | | 25,100 | | | | 938,740 | | | | 0.4 | % | |
| Holcim, Ltd. | | | 13,487 | | | | 766,051 | | | | 0.4 | % | |
| Nestle SA | | | 18,357 | | | | 713,849 | | | | 0.3 | % | |
| Novartis AG ADR | | | 31,390 | | | | 1,600,576 | | | | 0.7 | % | |
| Roche Holding AG Genusschein | | | 9,111 | | | | 1,393,317 | | | | 0.6 | % | |
| Swiss Re | | | 20,457 | | | | 853,132 | | | | 0.4 | % | |
| Syngenta AG ADR | | | 24,400 | | | | 912,072 | | | | 0.4 | % | |
| Zurich Financial SVCS AG | | | 4,733 | | | | 960,220 | | | | 0.4 | % | |
| Other Securities | | | | | | | 5,767,474 | | | | 2.5 | % | |
| TOTAL — SWITZERLAND | | | | | | | 13,905,431 | | | | 6.1 | % | |
| TAIWAN — (1.7%) | |
| COMMON STOCKS — (1.7%) | |
| Other Securities | | | | | | | 4,257,972 | | | | 1.9 | % | |
| THAILAND — (0.2%) | |
| COMMON STOCKS — (0.2%) | |
| Other Securities | | | | | | | 437,983 | | | | 0.2 | % | |
| TURKEY — (0.2%) | |
| COMMON STOCKS — (0.2%) | |
| Other Securities | | | | | | | 610,457 | | | | 0.3 | % | |
| UNITED KINGDOM — (14.2%) | |
| COMMON STOCKS — (14.2%) | |
| Anglo American P.L.C. | | | 19,719 | | | | 494,774 | | | | 0.2 | % | |
| Aviva P.L.C. | | | 86,584 | | | | 516,474 | | | | 0.2 | % | |
| BP P.L.C. Sponsored ADR | | | 69,320 | | | | 3,445,204 | | | | 1.5 | % | |
| # HSBC Holdings P.L.C. Sponsored ADR | | | 41,700 | | | | 2,460,300 | | | | 1.1 | % | |
| Legal and General Group P.L.C. | | | 419,828 | | | | 482,840 | | | | 0.2 | % | |
| Pearson P.L.C. Sponsored ADR | | | 59,132 | | | | 598,416 | | | | 0.3 | % | |
| Royal Dutch Shell P.L.C. ADR | | | 66,499 | | | | 3,676,730 | | | | 1.6 | % | |
| SABmiller P.L.C. | | | 27,479 | | | | 436,470 | | | | 0.2 | % | |
| Standard Chartered P.L.C. | | | 46,344 | | | | 765,928 | | | | 0.3 | % | |
| Vodafone Group P.L.C. Sponsored ADR | | | 115,900 | | | | 2,233,393 | | | | 1.0 | % | |
| Xstrata P.L.C. | | | 25,820 | | | | 441,633 | | | | 0.2 | % | |
| Other Securities | | | | | | | 20,977,885 | | | | 9.2 | % | |
| TOTAL — UNITED KINGDOM | | | | | | | 36,530,047 | | | | 16.0 | % | |
| | | Face
Amount | |
Value† | | | |
| | | (000) | | | | | |
| TEMPORARY CASH INVESTMENTS — (4.1%) | |
Repurchase Agreement, PNC Capital Markets, Inc. 0.94%,
11/03/08 (Collateralized by $14,505,000 FNMA 4.50%,
10/01/35, valued at $10,905,825) to be repurchased at $10,741,841 | | $ | 10,741 | | | | 10,741,000 | | | | 4.7 | % | |
| | | Shares | | | | | |
| SECURITIES LENDING COLLATERAL — (10.5%) | |
| § @ DFA Short Term Investment Fund LP | | | 17,302,533 | | | | 17,302,533 | | | | 7.6 | % | |
72
T.A. WORLD EX U.S. CORE EQUITY PORTFOLIO
CONTINUED
| | | Face
Amount | | Value† | | Percentage
of Net Assets** | |
| | | (000) | | | | | |
@ Repurchase Agreement, Deutsche Bank Securities 0.25%,
11/03/08 (Collateralized by $10,204,997 FHLMC, rates ranging from
5.000% to 7.000%, maturities ranging from 05/01/37 to 08/01/37 & FNMA
rates ranging from 5.580%(r) to 6.080%(r), maturities ranging from 07/01/16 to
06/01/18, valued at $9,876,876) to be repurchased at $9,683,414 | | $ | 9,683 | | | $ | 9,683,212 | | | | 4.2 | % | |
| TOTAL SECURITIES LENDING COLLATERAL | | | | | 26,985,745 | | | | 11.8 | % | |
TOTAL INVESTMENTS — (100.0%)
(Cost $345,360,419) | | | | $ | 257,652,815 | | | | 112.8 | % | |
See accompanying Notes to Financial Statements.
73
DFA INVESTMENT DIMENSIONS GROUP INC.
SCHEDULES OF INVESTMENTS
October 31, 2008
INTERNATIONAL SMALL COMPANY PORTFOLIO
| | | | | Value† | |
| AFFILIATED INVESTMENT COMPANIES — (99.7%) | |
Investment in The Continental Small Company Series
of The DFA Investment Trust Company | | | | $ | 1,013,296,693 | | |
Investment in The Japanese Small Company Series
of The DFA Investment Trust Company | | | | | 926,342,271 | | |
Investment in The United Kingdom Small Company Series
of The DFA Investment Trust Company | | | | | 527,886,882 | | |
Investment in The Asia Pacific Small Company Series
of The DFA Investment Trust Company | | | | | 376,154,223 | | |
Investment in The Canadian Small Company Series
of The DFA Investment Trust Company | | | | | 232,873,073 | | |
TOTAL INVESTMENTS IN AFFILIATED
INVESTMENT COMPANIES (Cost $4,383,237,585) | | | | | 3,076,553,142 | | |
| | | Face
Amount | | | |
| | | (000) | | | |
| TEMPORARY CASH INVESTMENTS — (0.3%) | |
Repurchase Agreement, PNC Capital Markets, Inc. 0.94%, 11/03/08
(Collateralized by $15,175,000 FNMA 6.50%, 11/01/36, valued
at $10,185,423) to be repurchased at $10,033,786
(Cost $10,033,000) | | $ | 10,033 | | | | 10,033,000 | | |
| TOTAL INVESTMENTS — (100.0%) (Cost $4,393,270,585) | | | | $ | 3,086,586,142 | | |
JAPANESE SMALL COMPANY PORTFOLIO
| | | Value† | |
| AFFILIATED INVESTMENT COMPANY — (100.0%) | |
Investment in The Japanese Small Company Series of
The DFA Investment Trust Company | | $ | 133,439,370 | | |
TOTAL INVESTMENTS IN AFFILIATED
INVESTMENT COMPANY (Cost $257,466,439) | | $ | 133,439,370 | | |
ASIA PACIFIC SMALL COMPANY PORTFOLIO
| | | Value† | |
| AFFILIATED INVESTMENT COMPANY — (100.0%) | |
Investment in The Asia Pacific Small Company Series of
The DFA Investment Trust Company | | $ | 64,067,407 | | |
TOTAL INVESTMENTS IN AFFILIATED
INVESTMENT COMPANY (Cost $108,804,262) | | $ | 64,067,407 | | |
See accompanying Notes to Financial Statements.
74
DFA INVESTMENT DIMENSIONS GROUP INC.
SCHEDULES OF INVESTMENTS
October 31, 2008
UNITED KINGDOM SMALL COMPANY PORTFOLIO
| | | Value† | |
| AFFILIATED INVESTMENT COMPANY — (100.0%) | |
Investment in The United Kingdom Small Company Series of
The DFA Investment Trust Company | | $ | 25,891,380 | | |
TOTAL INVESTMENTS IN AFFILIATED
INVESTMENT COMPANY (Cost $38,132,428) | | $ | 25,891,380 | | |
CONTINENTAL SMALL COMPANY PORTFOLIO
| | | Value† | |
| AFFILIATED INVESTMENT COMPANY — (100.0%) | |
Investment in The Continental Small Company Series of
The DFA Investment Trust Company | | $ | 94,026,779 | | |
TOTAL INVESTMENTS IN AFFILIATED
INVESTMENT COMPANY (Cost $133,728,859) | | $ | 94,026,779 | | |
See accompanying Notes to Financial Statements.
75
DFA INTERNATIONAL REAL ESTATE SECURITIES PORTFOLIO
SUMMARY SCHEDULE OF PORTFOLIO HOLDINGS
October 31, 2008
| | | Shares | | Value†† | | Percentage
of Net Assets** | |
| AUSTRALIA — (16.7%) | |
| COMMON STOCKS — (16.6%) | |
| # CFS Retail Property Trust | | | 7,364,831 | | | $ | 9,906,670 | | | | 2.5 | % | |
| # Commonwealth Property Office Fund | | | 7,178,199 | | | | 6,343,056 | | | | 1.6 | % | |
| Dexus Property Group | | | 13,075,135 | | | | 6,515,902 | | | | 1.7 | % | |
| # Goodman Group | | | 7,261,426 | | | | 4,581,400 | | | | 1.2 | % | |
| # GPT Group | | | 11,153,642 | | | | 5,581,733 | | | | 1.4 | % | |
| # ING Office Fund | | | 5,625,492 | | | | 4,124,894 | | | | 1.1 | % | |
| # Stockland Trust Group | | | 5,647,688 | | | | 15,187,074 | | | | 3.9 | % | |
| Westfield Group Stapled | | | 1,920,573 | | | | 21,212,203 | | | | 5.4 | % | |
| Other Securities | | | | | | | 10,698,060 | | | | 2.6 | % | |
| TOTAL COMMON STOCKS | | | | | | | 84,150,992 | | | | 21.4 | % | |
| RIGHTS/WARRANTS — (0.1%) | |
| Other Securities | | | | | | | 505,691 | | | | 0.1 | % | |
| Total — Australia | | | | | | | 84,656,683 | | | | 21.5 | % | |
| BELGIUM — (1.5%) | |
| COMMON STOCKS — (1.5%) | |
| # Befimmo S.C.A. | | | 32,146 | | | | 2,413,524 | | | | 0.6 | % | |
| Cofinimmo SA | | | 25,700 | | | | 3,202,471 | | | | 0.8 | % | |
| Other Securities | | | | | | | 1,976,198 | | | | 0.5 | % | |
| TOTAL — BELGIUM | | | | | | | 7,592,193 | | | | 1.9 | % | |
| CANADA — (4.3%) | |
| COMMON STOCKS — (4.3%) | |
| Boardwalk REIT | | | 87,766 | | | | 1,885,953 | | | | 0.5 | % | |
| # Canadian REIT | | | 103,500 | | | | 2,228,346 | | | | 0.6 | % | |
| # RioCan REIT | | | 381,018 | | | | 5,313,957 | | | | 1.3 | % | |
| Other Securities | | | | | | | 12,125,604 | | | | 3.1 | % | |
| TOTAL — CANADA | | | | | | | 21,553,860 | | | | 5.5 | % | |
| FRANCE — (10.0%) | |
| COMMON STOCKS — (10.0%) | |
| # Fonciere des Regions | | | 66,071 | | | | 4,369,035 | | | | 1.1 | % | |
| * ICADE | | | 87,009 | | | | 5,200,857 | | | | 1.3 | % | |
| Klepierre SA | | | 365,804 | | | | 8,425,865 | | | | 2.1 | % | |
| # Mercialys | | | 97,412 | | | | 3,172,462 | | | | 0.8 | % | |
| Societe Immobiliere de Location pour l'Industrie et le Commerce | | | 60,852 | | | | 5,424,481 | | | | 1.4 | % | |
| # Unibail-Rodamco | | | 129,358 | | | | 19,401,738 | | | | 4.9 | % | |
| Other Securities | | | | | | | 4,451,087 | | | | 1.2 | % | |
| TOTAL — FRANCE | | | | | | | 50,445,525 | | | | 12.8 | % | |
| GERMANY — (0.1%) | |
| COMMON STOCKS — (0.1%) | |
| Other Securities | | | | | | | 511,634 | | | | 0.1 | % | |
| GREECE — (0.0%) | |
| COMMON STOCKS — (0.0%) | |
| Other Securities | | | | | | | 227,087 | | | | 0.1 | % | |
| HONG KONG — (2.7%) | |
| COMMON STOCKS — (2.7%) | |
| The Link REIT | | | 6,400,165 | | | | 11,443,596 | | | | 2.9 | % | |
| Other Securities | | | | | | | 2,268,162 | | | | 0.6 | % | |
| TOTAL — HONG KONG | | | | | | | 13,711,758 | | | | 3.5 | % | |
76
DFA INTERNATIONAL REAL ESTATE SECURITIES PORTFOLIO
CONTINUED
| | | Shares | | Value†† | | Percentage
of Net Assets** | |
| ITALY — (0.1%) | |
| COMMON STOCKS — (0.1%) | |
| Other Securities | | | | | | $ | 497,941 | | | | 0.1 | % | |
| JAPAN — (14.7%) | |
| COMMON STOCKS — (14.7%) | |
| Frontier Real Estate Investment Corp. | | | 484 | | | | 2,648,561 | | | | 0.7 | % | |
| # Global One Real Estate Investment Co. | | | 319 | | | | 2,580,221 | | | | 0.7 | % | |
| # Japan Logistics Fund, Inc. | | | 462 | | | | 2,920,583 | | | | 0.7 | % | |
| # Japan Prime Realty Investment Corp. | | | 1,875 | | | | 3,331,005 | | | | 0.8 | % | |
| Japan Real Estate Investment Corp. | | | 1,358 | | | | 12,025,225 | | | | 3.1 | % | |
| Japan Retail Fund Investment | | | 1,355 | | | | 4,893,715 | | | | 1.2 | % | |
| # MORI TRUST Sogo REIT, Inc. | | | 354 | | | | 2,769,751 | | | | 0.7 | % | |
| Nippon Building Fund, Inc. | | | 1,672 | | | | 16,066,232 | | | | 4.1 | % | |
| Nomura Real Estate Office Fund, Inc. | | | 894 | | | | 5,082,586 | | | | 1.3 | % | |
| ORIX JREIT, Inc. | | | 733 | | | | 3,360,201 | | | | 0.9 | % | |
| TOKYU REIT, Inc. | | | 467 | | | | 2,690,753 | | | | 0.7 | % | |
| Other Securities | | | | | | | 16,186,296 | | | | 4.0 | % | |
| TOTAL — JAPAN | | | | | | | 74,555,129 | | | | 18.9 | % | |
| NETHERLANDS — (4.2%) | |
| COMMON STOCKS — (4.2%) | |
| # Corio NV | | | 144,323 | | | | 7,712,591 | | | | 2.0 | % | |
| # Eurocommercial Properties NV | | | 70,694 | | | | 2,341,013 | | | | 0.6 | % | |
| # Nieuwe Steen Investments NV | | | 109,669 | | | | 1,914,617 | | | | 0.5 | % | |
| VastNed Retail NV | | | 49,511 | | | | 2,532,978 | | | | 0.6 | % | |
| # Wereldhave NV | | | 71,538 | | | | 5,945,914 | | | | 1.5 | % | |
| Other Securities | | | | | | | 688,381 | | | | 0.2 | % | |
| TOTAL — NETHERLANDS | | | | | | | 21,135,494 | | | | 5.4 | % | |
| NEW ZEALAND — (0.8%) | |
| COMMON STOCKS — (0.8%) | |
| Other Securities | | | | | | | 4,005,784 | | | | 1.0 | % | |
| SINGAPORE — (3.4%) | |
| COMMON STOCKS — (3.4%) | |
| Ascendas REIT | | | 3,069,000 | | | | 3,415,111 | | | | 0.9 | % | |
| # Capitacommercial Trust | | | 2,992,000 | | | | 2,055,438 | | | | 0.5 | % | |
| # CapitaMall Trust | | | 3,666,000 | | | | 4,861,512 | | | | 1.2 | % | |
| # Suntec REIT | | | 3,996,000 | | | | 1,912,816 | | | | 0.5 | % | |
| Other Securities | | | | | | | 4,839,238 | | | | 1.2 | % | |
| TOTAL — SINGAPORE | | | | | | | 17,084,115 | | | | 4.3 | % | |
| SOUTH AFRICA — (0.8%) | |
| COMMON STOCKS — (0.8%) | |
| Other Securities | | | | | | | 4,188,948 | | | | 1.1 | % | |
| TAIWAN — (0.3%) | |
| COMMON STOCKS — (0.3%) | |
| Other Securities | | | | | | | 1,780,200 | | | | 0.4 | % | |
77
DFA INTERNATIONAL REAL ESTATE SECURITIES PORTFOLIO
CONTINUED
| | | Shares | | Value†† | | Percentage
of Net Assets** | |
| UNITED KINGDOM — (16.3%) | |
| COMMON STOCKS — (16.3%) | |
| # British Land Co. P.L.C. | | | 1,625,177 | | | $ | 16,205,586 | | | | 4.1 | % | |
| # Brixton P.L.C. | | | 1,259,022 | | | | 3,386,515 | | | | 0.9 | % | |
| Derwent London P.L.C. | | | 487,068 | | | | 5,704,786 | | | | 1.4 | % | |
| # Great Portland Estates P.L.C. | | | 607,438 | | | | 2,704,977 | | | | 0.7 | % | |
| Hammerson P.L.C. | | | 892,614 | | | | 10,287,830 | | | | 2.6 | % | |
| Land Securities Group P.L.C. | | | 952,578 | | | | 16,908,947 | | | | 4.3 | % | |
| # Liberty International P.L.C. | | | 931,695 | | | | 10,366,618 | | | | 2.6 | % | |
| Segro P.L.C | | | 1,435,663 | | | | 6,481,362 | | | | 1.6 | % | |
| # Shaftesbury P.L.C. | | | 798,081 | | | | 4,292,786 | | | | 1.1 | % | |
| Workspace Group P.L.C. | | | 1,167,408 | | | | 1,879,159 | | | | 0.5 | % | |
| Other Securities | | | | | | | 4,089,285 | | | | 1.1 | % | |
| TOTAL — UNITED KINGDOM | | | | | | | 82,307,851 | | | | 20.9 | % | |
| | | Face
Amount | | Value† | | | |
| | | (000) | | | | | |
| TEMPORARY CASH INVESTMENTS — (3.2%) | |
Repurchase Agreement, PNC Capital Markets, Inc. 0.94%,
11/03/08 (Collateralized by $21,075,000 FHLMC 6.04%(r),
11/01/36, valued at $16,196,322) to be repurchased at $15,955,250 | | $ | 15,954 | | | | 15,954,000 | | | | 4.0 | % | |
| | | Shares | | | | | |
| SECURITIES LENDING COLLATERAL — (20.9%) | |
| §@ DFA Short Term Investment Fund LP | | | 105,065,461 | | | | 105,065,461 | | | | 26.6 | % | |
| | | Face
Amount | | | | | |
| | | (000) | | | | | |
@ Repurchase Agreement, Deutsche Bank Securities 0.25%,
11/03/08 (Collateralized by $836,357 GNMA 7.000%,
10/15/37, valued at $710,583) to be repurchased at $696,665 | | $ | 697 | | | | 696,650 | | | | 0.2 | % | |
| TOTAL SECURITIES LENDING COLLATERAL | | | | | | | 105,762,111 | | | | 26.8 | % | |
TOTAL INVESTMENTS — (100.0%)
(Cost $895,393,423) | | | | | | $ | 505,970,313 | | | | 128.3 | % | |
See accompanying Notes to Financial Statements.
78
DFA INVESTMENT DIMENSIONS GROUP INC.
SCHEDULE OF INVESTMENTS
October 31, 2008
DFA GLOBAL REAL ESTATE SECURITIES PORTFOLIO
| | | Shares | | Value† | |
| AFFILIATED INVESTMENT COMPANIES — (98.1%) | |
Investment in DFA Real Estate Securities Portfolio
of DFA Investment Dimensions Group Inc. | | | 3,310,442 | | | $ | 53,496,743 | | |
Investment in DFA International Real Estate Securities Portfolio
of DFA Investment Dimensions Group Inc. | | | 8,527,697 | | | | 35,645,773 | | |
TOTAL INVESTMENTS IN AFFILIATED
INVESTMENT COMPANIES (Cost $123,810,257) | | | | | | | 89,142,516 | | |
| TEMPORARY CASH INVESTMENTS — (1.9%) | |
BlackRock Liquidity Funds Tempcash Portfolio
Institutional Shares | | | 1,304,825 | | | | 1,304,825 | | |
| | | Face
Amount | | | |
| | | (000) | | | |
Repurchase Agreement, PNC Capital Markets, Inc. 0.94%, 11/03/08
(Collateralized by $515,000 FNMA 5.058%(r), 01/01/36, valued
at $424,023) to be repurchased at $416,033 | | $ | 416 | | | | 416,000 | | |
| TOTAL TEMPORARY CASH INVESTMENTS (Cost $1,720,825) | | | | | | | 1,720,825 | | |
TOTAL INVESTMENTS — (100.0%)
(Cost $125,531,082) | | | | | | $ | 90,863,341 | | |
See accompanying Notes to Financial Statements.
79
DFA INTERNATIONAL SMALL CAP VALUE PORTFOLIO
SUMMARY SCHEDULE OF PORTFOLIO HOLDINGS
October 31, 2008
| | | Shares | | Value†† | | Percentage
of Net Assets** | |
| AUSTRALIA — (6.4%) | |
| COMMON STOCKS — (6.4%) | |
| # ABB Grain, Ltd. | | | 3,459,149 | | | $ | 18,900,326 | | | | 0.4 | % | |
| Adelaide Brighton, Ltd. | | | 10,413,560 | | | | 15,840,859 | | | | 0.3 | % | |
| # Bendigo Bank, Ltd. | | | 1,955,248 | | | | 17,248,687 | | | | 0.4 | % | |
| # Centennial Coal Co., Ltd. | | | 8,324,154 | | | | 19,574,833 | | | | 0.4 | % | |
| # Futuris Corp., Ltd. | | | 20,327,287 | | | | 15,862,354 | | | | 0.3 | % | |
| #* Iluka Resources, Ltd. | | | 7,300,377 | | | | 17,652,841 | | | | 0.4 | % | |
| Other Securities | | | | | | | 246,528,858 | | | | 5.1 | % | |
| TOTAL COMMON STOCKS | | | | | | | 351,608,758 | | | | 7.3 | % | |
| PREFERRED STOCKS — (0.0%) | |
| Other Securities | | | | | | | 733,871 | | | | 0.0 | % | |
| RIGHTS/WARRANTS — (0.0%) | |
| Other Securities | | | | | | | 16,851 | | | | 0.0 | % | |
| TOTAL — AUSTRALIA | | | | | | | 352,359,480 | | | | 7.3 | % | |
| AUSTRIA — (0.6%) | |
| COMMON STOCKS — (0.6%) | |
| Other Securities | | | | | | | 32,159,265 | | | | 0.7 | % | |
| BELGIUM — (1.4%) | |
| COMMON STOCKS — (1.4%) | |
| Tessenderlo Chemie NV | | | 466,977 | | | | 18,473,203 | | | | 0.4 | % | |
| Other Securities | | | | | | | 57,841,952 | | | | 1.2 | % | |
| TOTAL COMMON STOCKS | | | | | | | 76,315,155 | | | | 1.6 | % | |
| RIGHTS/WARRANTS — (0.0%) | |
| Other Securities | | | | | | | 119 | | | | 0.0 | % | |
| TOTAL — BELGIUM | | | | | | | 76,315,274 | | | | 1.6 | % | |
| CANADA — (6.6%) | |
| COMMON STOCKS — (6.6%) | |
| #* Celestica, Inc. | | | 3,826,647 | | | | 18,509,377 | | | | 0.4 | % | |
| # Dorel Industries, Inc. Class B | | | 842,000 | | | | 18,512,404 | | | | 0.4 | % | |
| IAMGOLD Corp. | | | 5,817,473 | | | | 19,306,307 | | | | 0.4 | % | |
| # Laurentian Bank of Canada | | | 699,800 | | | | 23,735,024 | | | | 0.5 | % | |
| #* MDS, Inc. | | | 2,377,727 | | | | 24,836,624 | | | | 0.5 | % | |
| * Saskatchewan Wheat Pool, Inc. | | | 2,453,600 | | | | 15,572,920 | | | | 0.3 | % | |
| * Sino-Forest Corp. | | | 2,670,606 | | | | 24,993,309 | | | | 0.5 | % | |
| Other Securities | | | | | | | 217,567,111 | | | | 4.6 | % | |
| TOTAL COMMON STOCKS | | | | | | | 363,033,076 | | | | 7.6 | % | |
| RIGHTS/WARRANTS — (0.0%) | |
| Other Securities | | | | | | | 94,042 | | | | 0.0 | % | |
| TOTAL — CANADA | | | | | | | 363,127,118 | | | | 7.6 | % | |
| DENMARK — (0.5%) | |
| COMMON STOCKS — (0.5%) | |
| Other Securities | | | | | | | 29,405,124 | | | | 0.6 | % | |
80
DFA INTERNATIONAL SMALL CAP VALUE PORTFOLIO
CONTINUED
| | | Shares | | Value†† | | Percentage
of Net Assets** | |
| FINLAND — (1.7%) | |
| COMMON STOCKS — (1.7%) | |
| Pohjola Bank P.L.C. | | | 1,697,460 | | | $ | 22,838,591 | | | | 0.5 | % | |
| Rautaruukki Oyj Series K | | | 1,108,900 | | | | 18,097,353 | | | | 0.4 | % | |
| Other Securities | | | | | | | 55,566,570 | | | | 1.1 | % | |
| TOTAL — FINLAND | | | | | | | 96,502,514 | | | | 2.0 | % | |
| FRANCE — (5.0%) | |
| COMMON STOCKS — (5.0%) | |
| Arkema | | | 886,609 | | | | 20,292,990 | | | | 0.4 | % | |
| Atos Origin SA | | | 770,786 | | | | 17,898,781 | | | | 0.4 | % | |
| Havas SA | | | 8,111,619 | | | | 16,185,139 | | | | 0.3 | % | |
| Nexans SA | | | 593,945 | | | | 33,878,598 | | | | 0.7 | % | |
| # Valeo SA | | | 1,231,192 | | | | 21,446,258 | | | | 0.5 | % | |
| Other Securities | | | | | | | 166,817,762 | | | | 3.5 | % | |
| TOTAL COMMON STOCKS | | | | | | | 276,519,528 | | | | 5.8 | % | |
| RIGHTS/WARRANTS — (0.0%) | |
| Other Securities | | | | | | | 10,323 | | | | 0.0 | % | |
| TOTAL — FRANCE | | | | | | | 276,529,851 | | | | 5.8 | % | |
| GERMANY — (4.2%) | |
| COMMON STOCKS — (4.2%) | |
| Bilfinger Berger AG | | | 765,357 | | | | 34,624,746 | | | | 0.7 | % | |
| # Norddeutsche Affinerie AG | | | 1,148,031 | | | | 36,759,501 | | | | 0.8 | % | |
| Other Securities | | | | | | | 163,967,124 | | | | 3.4 | % | |
| TOTAL — GERMANY | | | | | | | 235,351,371 | | | | 4.9 | % | |
| GREECE — (0.7%) | |
| COMMON STOCKS — (0.7%) | |
| Other Securities | | | | | | | 37,945,742 | | | | 0.8 | % | |
| HONG KONG — (1.7%) | |
| COMMON STOCKS — (1.7%) | |
| Other Securities | | | | | | | 93,544,387 | | | | 1.9 | % | |
| RIGHTS/WARRANTS — (0.0%) | |
| Other Securities | | | | | | | 125,641 | | | | 0.0 | % | |
| TOTAL — HONG KONG | | | | | | | 93,670,028 | | | | 1.9 | % | |
| IRELAND — (0.7%) | |
| COMMON STOCKS — (0.7%) | |
| Other Securities | | | | | | | 35,843,627 | | | | 0.7 | % | |
| ITALY — (2.0%) | |
| COMMON STOCKS — (2.0%) | |
| Other Securities | | | | | | | 111,372,860 | | | | 2.3 | % | |
| RIGHTS/WARRANTS — (0.0%) | |
| Other Securities | | | | | | | 53,628 | | | | 0.0 | % | |
| TOTAL — ITALY | | | | | | | 111,426,488 | | | | 2.3 | % | |
81
DFA INTERNATIONAL SMALL CAP VALUE PORTFOLIO
CONTINUED
| | | Shares | | Value†† | | Percentage
of Net Assets** | |
| JAPAN — (28.5%) | |
| COMMON STOCKS — (28.5%) | |
| # Fukuyama Transporting Co., Ltd. | | | 3,858,000 | | | $ | 16,390,383 | | | | 0.4 | % | |
| # Nishimatsu Construction Co., Ltd. | | | 8,152,073 | | | | 16,773,450 | | | | 0.4 | % | |
| The Akita Bank, Ltd. | | | 3,688,000 | | | | 15,332,981 | | | | 0.3 | % | |
| # The Bank of Iwate, Ltd. | | | 306,100 | | | | 19,024,720 | | | | 0.4 | % | |
| The Oita Bank, Ltd. | | | 2,581,000 | | | | 16,020,518 | | | | 0.3 | % | |
| Tochigi Bank, Ltd. | | | 2,756,000 | | | | 16,977,990 | | | | 0.4 | % | |
| Yamagata Bank, Ltd. | | | 2,542,000 | | | | 15,279,704 | | | | 0.3 | % | |
| Yodogawa Steel Works, Ltd. | | | 3,670,000 | | | | 15,299,877 | | | | 0.3 | % | |
| Other Securities | | | | | | | 1,451,081,495 | | | | 30.2 | % | |
| TOTAL — JAPAN | | | | | | | 1,582,181,118 | | | | 33.0 | % | |
| MALAYSIA — (0.0%) | |
| COMMON STOCKS — (0.0%) | |
| RIGHTS/WARRANTS — (0.0%) | |
| Other Securities | | | | | | | 7,861 | | | | 0.0 | % | |
| NETHERLANDS — (1.5%) | |
| COMMON STOCKS — (1.5%) | |
| # Nutreco Holding NV | | | 796,046 | | | | 25,380,852 | | | | 0.5 | % | |
| Other Securities | | | | | | | 59,743,258 | | | | 1.3 | % | |
| TOTAL — NETHERLANDS | | | | | | | 85,124,110 | | | | 1.8 | % | |
| NEW ZEALAND — (0.3%) | |
| COMMON STOCKS — (0.3%) | |
| Other Securities | | | | | | | 16,280,792 | | | | 0.3 | % | |
| NORWAY — (0.9%) | |
| COMMON STOCKS — (0.9%) | |
| Other Securities | | | | | | | 51,234,535 | | | | 1.1 | % | |
| PORTUGAL — (0.1%) | |
| COMMON STOCKS — (0.1%) | |
| Other Securities | | | | | | | 7,866,555 | | | | 0.2 | % | |
| SINGAPORE — (1.0%) | |
| COMMON STOCKS — (1.0%) | |
| Other Securities | | | | | | | 56,959,045 | | | | 1.2 | % | |
| SPAIN — (1.3%) | |
| COMMON STOCKS — (1.3%) | |
| Ebro Puleva SA | | | 1,492,857 | | | | 19,410,492 | | | | 0.4 | % | |
| Other Securities | | | | | | | 51,246,716 | | | | 1.1 | % | |
| TOTAL — SPAIN | | | | | | | 70,657,208 | | | | 1.5 | % | |
| SWEDEN — (1.4%) | |
| COMMON STOCKS — (1.4%) | |
| Other Securities | | | | | | | 79,331,557 | | | | 1.6 | % | |
| SWITZERLAND — (4.9%) | |
| COMMON STOCKS — (4.9%) | |
| Baloise-Holding AG | | | 316,202 | | | | 16,905,585 | | | | 0.4 | % | |
| # Clariant AG | | | 3,311,053 | | | | 20,541,277 | | | | 0.4 | % | |
| # PSP Swiss Property AG | | | 588,827 | | | | 25,475,734 | | | | 0.5 | % | |
| # Valiant Holding AG | | | 91,408 | | | | 15,749,650 | | | | 0.3 | % | |
| Other Securities | | | | | | | 191,863,986 | | | | 4.0 | % | |
| TOTAL — SWITZERLAND | | | | | | | 270,536,232 | | | | 5.6 | % | |
82
DFA INTERNATIONAL SMALL CAP VALUE PORTFOLIO
CONTINUED
| | | Shares | | Value†† | | Percentage
of Net Assets** | |
| UNITED KINGDOM — (12.1%) | |
| COMMON STOCKS — (12.1%) | |
| Amlin P.L.C. | | | 9,708,370 | | | $ | 49,712,470 | | | | 1.0 | % | |
| # Bellway P.L.C. | | | 3,481,205 | | | | 30,327,447 | | | | 0.6 | % | |
| Bodycote P.L.C. | | | 10,063,146 | | | | 20,143,033 | | | | 0.4 | % | |
| # Bovis Homes Group P.L.C. | | | 4,184,856 | | | | 22,875,171 | | | | 0.5 | % | |
| Brit Insurance Holdings P.L.C. | | | 11,179,422 | | | | 32,878,013 | | | | 0.7 | % | |
| Catlin Group, Ltd. | | | 5,850,701 | | | | 32,694,578 | | | | 0.7 | % | |
| Close Brothers Group P.L.C. | | | 1,903,664 | | | | 16,564,440 | | | | 0.4 | % | |
| Greene King P.L.C. | | | 3,287,988 | | | | 16,979,635 | | | | 0.4 | % | |
| Hiscox, Ltd. | | | 10,621,831 | | | | 42,088,960 | | | | 0.9 | % | |
| Millennium and Copthorne Hotels P.L.C. | | | 4,451,429 | | | | 15,172,030 | | | | 0.3 | % | |
| # Redrow P.L.C. | | | 5,051,879 | | | | 16,896,263 | | | | 0.4 | % | |
| Signet Group, Ltd. | | | 1,714,191 | | | | 16,791,841 | | | | 0.4 | % | |
| Tomkins P.L.C. | | | 13,525,823 | | | | 24,826,600 | | | | 0.5 | % | |
| Other Securities | | | | | | | 334,245,161 | | | | 6.8 | % | |
| TOTAL — UNITED KINGDOM | | | | | | | 672,195,642 | | | | 14.0 | % | |
| | | Face
Amount | |
Value† | | | |
| | | (000) | | | | | |
| TEMPORARY CASH INVESTMENTS — (1.0%) | |
Repurchase Agreement, PNC Capital Markets, Inc. 0.94%,
11/03/08 (Collateralized by $65,225,000 FHLMC 6.50%,
08/01/37, valued at $56,734,250) to be repurchased at $55,897,378 | | $ | 55,893 | | | | 55,893,000 | | | | 1.2 | % | |
| | | Shares | | | | | |
| SECURITIES LENDING COLLATERAL — (15.5%) | |
| § @ DFA Short Term Investment Fund LP | | | 856,409,702 | | | | 856,409,702 | | | | 17.8 | % | |
| | | Face
Amount | | | | | |
| | | (000) | | | | | |
@ Repurchase Agreement, Deutsche Bank Securities, 0.25%, 11/03/08,
(Collateralized by $4,824,647 FNMA 5.000%, 03/01/38,
valued at $4,464,254) to be repurchased at $4,376,811 | | $ | 4,377 | | | | 4,376,720 | | | | 0.1 | % | |
| TOTAL SECURITIES LENDING COLLATERAL | | | | | | | 860,786,422 | | | | 17.9 | % | |
TOTAL INVESTMENTS — (100.0%)
(Cost $8,099,711,332) | | | | | | $ | 5,549,689,959 | | | | 115.6 | % | |
See accompanying Notes to Financial Statements.
83
INTERNATIONAL VECTOR EQUITY PORTFOLIO
SUMMARY SCHEDULE OF PORTFOLIO HOLDINGS
October 31, 2008
| | | Shares | | Value†† | | Percentage
of Net Assets** | |
| AUSTRALIA — (4.5%) | |
| COMMON STOCKS — (4.5%) | |
| Other Securities | | | | | | $ | 3,290,385 | | | | 4.9 | % | |
| AUSTRIA — (0.6%) | |
| COMMON STOCKS — (0.6%) | |
| Other Securities | | | | | | | 421,411 | | | | 0.6 | % | |
| BELGIUM — (1.0%) | |
| COMMON STOCKS — (1.0%) | |
| Other Securities | | | | | | | 714,318 | | | | 1.1 | % | |
| CANADA — (7.3%) | |
| COMMON STOCKS — (7.3%) | |
| # Bank of Montreal | | | 5,900 | | | | 210,585 | | | | 0.3 | % | |
| Petro-Canada | | | 6,000 | | | | 150,037 | | | | 0.2 | % | |
| Sun Life Financial, Inc. | | | 10,600 | | | | 249,324 | | | | 0.4 | % | |
| Other Securities | | | | | | | 4,673,880 | | | | 7.0 | % | |
| TOTAL — CANADA | | | | | | | 5,283,826 | | | | 7.9 | % | |
| DENMARK — (0.7%) | |
| COMMON STOCKS — (0.7%) | |
| Other Securities | | | | | | | 516,387 | | | | 0.8 | % | |
| FINLAND — (2.0%) | |
| COMMON STOCKS — (2.0%) | |
| Stora Enso Oyj Series R | | | 22,412 | | | | 208,419 | | | | 0.3 | % | |
| UPM-Kymmene Oyj | | | 20,032 | | | | 283,259 | | | | 0.4 | % | |
| Other Securities | | | | | | | 985,280 | | | | 1.5 | % | |
| TOTAL — FINLAND | | | | | | | 1,476,958 | | | | 2.2 | % | |
| FRANCE — (5.9%) | |
| COMMON STOCKS — (5.9%) | |
| # BNP Paribas SA | | | 3,174 | | | | 229,167 | | | | 0.4 | % | |
| Capgemini SA | | | 5,104 | | | | 164,450 | | | | 0.3 | % | |
| # Compagnie de Saint-Gobain | | | 3,471 | | | | 133,935 | | | | 0.2 | % | |
| Lafarge SA | | | 2,289 | | | | 151,320 | | | | 0.2 | % | |
| # Societe Generale Paris | | | 2,527 | | | | 137,734 | | | | 0.2 | % | |
| Total SA Sponsored ADR | | | 3,100 | | | | 171,864 | | | | 0.3 | % | |
| Vivendi SA | | | 5,001 | | | | 130,722 | | | | 0.2 | % | |
| Other Securities | | | | | | | 3,183,827 | | | | 4.7 | % | |
| TOTAL — FRANCE | | | | | | | 4,303,019 | | | | 6.5 | % | |
| GERMANY — (5.5%) | |
| COMMON STOCKS — (5.5%) | |
| Bayerische Motoren Werke AG | | | 6,217 | | | | 157,654 | | | | 0.2 | % | |
| E.ON AG | | | 7,938 | | | | 303,794 | | | | 0.5 | % | |
| * Infineon Technologies AG ADR | | | 61,232 | | | | 191,656 | | | | 0.3 | % | |
| Siemens AG Sponsored ADR | | | 2,800 | | | | 168,420 | | | | 0.3 | % | |
| Other Securities | | | | | | | 3,153,833 | | | | 4.7 | % | |
| TOTAL — GERMANY | | | | | | | 3,975,357 | | | | 6.0 | % | |
| GREECE — (1.5%) | |
| COMMON STOCKS — (1.5%) | |
| Alpha Bank A.E. | | | 12,756 | | | | 186,237 | | | | 0.3 | % | |
84
INTERNATIONAL VECTOR EQUITY PORTFOLIO
CONTINUED
| | | Shares | | Value†† | | Percentage
of Net Assets** | |
| Piraeus Bank S.A. | | | 10,797 | | | $ | 136,967 | | | | 0.2 | % | |
| Other Securities | | | | | | | 764,207 | | | | 1.1 | % | |
| TOTAL — GREECE | | | | | | | 1,087,411 | | | | 1.6 | % | |
| HONG KONG — (1.3%) | |
| COMMON STOCKS — (1.3%) | |
| Other Securities | | | | | | | 912,216 | | | | 1.4 | % | |
| IRELAND — (0.6%) | |
| COMMON STOCKS — (0.6%) | |
| Other Securities | | | | | | | 421,582 | | | | 0.6 | % | |
| ITALY — (3.2%) | |
| COMMON STOCKS — (3.2%) | |
| Banco Popolare Scarl | | | 21,525 | | | | 268,523 | | | | 0.4 | % | |
| Telecom Italia SpA Sponsored ADR | | | 17,560 | | | | 200,184 | | | | 0.3 | % | |
| Unione di Banche Italiane ScpA | | | 7,655 | | | | 129,141 | | | | 0.2 | % | |
| Other Securities | | | | | | | 1,690,907 | | | | 2.5 | % | |
| TOTAL — ITALY | | | | | | | 2,288,755 | | | | 3.4 | % | |
| JAPAN — (21.3%) | |
| COMMON STOCKS — (21.3%) | |
| Honda Motor Co., Ltd. Sponsored ADR | | | 5,400 | | | | 133,758 | | | | 0.2 | % | |
| Toyota Motor Corp. Sponsored ADR | | | 2,500 | | | | 190,225 | | | | 0.3 | % | |
| Other Securities | | | | | | | 15,080,093 | | | | 22.6 | % | |
| TOTAL — JAPAN | | | | | | | 15,404,076 | | | | 23.1 | % | |
| NETHERLANDS — (2.1%) | |
| COMMON STOCKS — (2.1%) | |
| Koninklijke DSM NV | | | 4,860 | | | | 135,343 | | | | 0.2 | % | |
| Other Securities | | | | | | | 1,398,865 | | | | 2.1 | % | |
| TOTAL — NETHERLANDS | | | | | | | 1,534,208 | | | | 2.3 | % | |
| NEW ZEALAND — (0.2%) | |
| COMMON STOCKS — (0.2%) | |
| Other Securities | | | | | | | 161,539 | | | | 0.2 | % | |
| NORWAY — (0.7%) | |
| COMMON STOCKS — (0.7%) | |
| Other Securities | | | | | | | 527,836 | | | | 0.8 | % | |
| PORTUGAL — (0.5%) | |
| COMMON STOCKS — (0.5%) | |
| Other Securities | | | | | | | 358,261 | | | | 0.5 | % | |
| SINGAPORE — (0.9%) | |
| COMMON STOCKS — (0.9%) | |
| Other Securities | | | | | | | 656,478 | | | | 1.0 | % | |
| SPAIN — (2.9%) | |
| COMMON STOCKS — (2.9%) | |
| Banco Bilbao Vizcaya Argentaria SA Sponsored ADR | | | 10,892 | | | | 126,347 | | | | 0.2 | % | |
| # Banco Santander SA Sponsored ADR | | | 29,720 | | | | 319,193 | | | | 0.5 | % | |
| Other Securities | | | | | | | 1,624,979 | | | | 2.4 | % | |
| TOTAL — SPAIN | | | | | | | 2,070,519 | | | | 3.1 | % | |
85
INTERNATIONAL VECTOR EQUITY PORTFOLIO
CONTINUED
| | | Shares | | Value†† | | Percentage
of Net Assets** | |
| SWEDEN — (1.5%) | |
| COMMON STOCKS — (1.5%) | |
| Other Securities | | | | | | $ | 1,109,505 | | | | 1.7 | % | |
| SWITZERLAND — (6.5%) | |
| COMMON STOCKS — (6.5%) | |
| # Adecco SA | | | 3,737 | | | | 129,999 | | | | 0.2 | % | |
| * Compagnie Financiere Richemont SA Series A | | | 6,448 | | | | 135,554 | | | | 0.2 | % | |
| Credit Suisse Group AG Sponsored ADR | | | 9,496 | | | | 355,150 | | | | 0.5 | % | |
| Holcim, Ltd. | | | 6,399 | | | | 363,458 | | | | 0.6 | % | |
| Nestle SA | | | 3,632 | | | | 141,238 | | | | 0.2 | % | |
| Novartis AG ADR | | | 4,500 | | | | 229,455 | | | | 0.4 | % | |
| Roche Holding AG Genusschein | | | 1,233 | | | | 188,559 | | | | 0.3 | % | |
| Swatch Group AG | | | 848 | | | | 132,325 | | | | 0.2 | % | |
| Swiss Re | | | 3,169 | | | | 132,159 | | | | 0.2 | % | |
| Zurich Financial SVCS AG | | | 2,043 | | | | 414,479 | | | | 0.6 | % | |
| Other Securities | | | | | | | 2,437,265 | | | | 3.6 | % | |
| TOTAL — SWITZERLAND | | | | | | | 4,659,641 | | | | 7.0 | % | |
| UNITED KINGDOM — (15.5%) | |
| COMMON STOCKS — (15.5%) | |
| Aviva P.L.C. | | | 31,530 | | | | 188,077 | | | | 0.3 | % | |
| Barclays P.L.C. | | | 45,647 | | | | 130,851 | | | | 0.2 | % | |
| BP P.L.C. Sponsored ADR | | | 11,884 | | | | 590,635 | | | | 0.9 | % | |
| HSBC Holdings P.L.C. Sponsored ADR | | | 9,436 | | | | 556,724 | | | | 0.8 | % | |
| International Power P.L.C. | | | 51,369 | | | | 183,773 | | | | 0.3 | % | |
| Kingfisher P.L.C. | | | 80,758 | | | | 149,059 | | | | 0.2 | % | |
| Legal and General Group P.L.C. | | | 197,426 | | | | 227,058 | | | | 0.3 | % | |
| Royal Dutch Shell P.L.C. ADR | | | 14,348 | | | | 793,301 | | | | 1.2 | % | |
| RSA Insurance Group P.L.C. | | | 79,072 | | | | 175,843 | | | | 0.3 | % | |
| SABmiller P.L.C. | | | 11,345 | | | | 180,201 | | | | 0.3 | % | |
| Sainsbury (J.) P.L.C. | | | 35,804 | | | | 163,559 | | | | 0.3 | % | |
| Standard Chartered P.L.C. | | | 21,476 | | | | 354,934 | | | | 0.5 | % | |
| Vodafone Group P.L.C. Sponsored ADR | | | 31,000 | | | | 597,370 | | | | 0.9 | % | |
| Xstrata P.L.C. | | | 10,486 | | | | 179,356 | | | | 0.3 | % | |
| Other Securities | | | | | | | 6,772,673 | | | | 10.0 | % | |
| TOTAL — UNITED KINGDOM | | | | | | | 11,243,414 | | | | 16.8 | % | |
| | | Face
Amount | |
Value† | | | |
| | | (000) | | | | | |
| TEMPORARY CASH INVESTMENTS — (7.1%) | |
Repurchase Agreement, PNC Capital Markets, Inc. 0.94%,
11/03/08 (Collateralized by $7,325,000 FHLMC 5.50%,
09/15/32, valued at $5,204,672) to be repurchased at $5,127,402 | | $ | 5,127 | | | | 5,127,000 | | | | 7.7 | % | |
| | | Shares | | | | | |
| SECURITIES LENDING COLLATERAL — (6.7%) | |
| § @ DFA Short Term Investment Fund LP | | | 2,860,330 | | | | 2,860,330 | | | | 4.3 | % | |
| | | Face
Amount | | | | | |
| | | (000) | | | | | |
@ Repurchase Agreement, Deutsche Bank Securities 0.18%,
11/03/08 (Collateralized by $2,073,846 FNMA 5.125%,
04/15/11, valued at $2,113,951) to be repurchased at $2,032,089 | | $ | 2,032 | | | | 2,032,059 | | | | 3.0 | % | |
| TOTAL SECURITIES LENDING COLLATERAL | | | | | | | 4,892,389 | | | | 7.3 | % | |
TOTAL INVESTMENTS — (100.0%)
(Cost $89,320,612) | | | | | | $ | 72,436,491 | | | | 108.5 | % | |
See accompanying Notes to Financial Statements.
86
DFA INVESTMENT DIMENSIONS GROUP INC.
SCHEDULES OF INVESTMENTS
October 31, 2008
EMERGING MARKETS PORTFOLIO
| | | Value† | |
| AFFILIATED INVESTMENT COMPANY — (100.0%) | |
Investment in The Emerging Markets Series of
The DFA Investment Trust Company | | $ | 1,508,865,682 | | |
TOTAL INVESTMENTS IN AFFILIATED
INVESTMENT COMPANY (Cost $1,146,106,855) | | $ | 1,508,865,682 | | |
EMERGING MARKETS SMALL CAP PORTFOLIO
| | | Value† | |
| AFFILIATED INVESTMENT COMPANY — (100.0%) | |
Investment in The Emerging Markets Small Cap Series of
The DFA Investment Trust Company | | $ | 547,573,803 | | |
TOTAL INVESTMENTS IN AFFILIATED
INVESTMENT COMPANY (Cost $790,237,740) | | $ | 547,573,803 | | |
See accompanying Notes to Financial Statements.
87
EMERGING MARKETS CORE EQUITY PORTFOLIO
SUMMARY SCHEDULE OF PORTFOLIO HOLDINGS
October 31, 2008
| | | Shares | | Value†† | | Percentage
of Net Assets** | |
| BRAZIL — (11.2%) | |
| COMMON STOCKS — (4.5%) | |
| Companhia Siderurgica Nacional SA Sponsored ADR | | | 445,284 | | | $ | 6,055,862 | | | | 0.5 | % | |
| Companhia Vale do Rio Doce ADR | | | 560,690 | | | | 7,356,253 | | | | 0.6 | % | |
| Petroleo Brasileiro SA ADR (71654V101) | | | 419,036 | | | | 9,248,124 | | | | 0.8 | % | |
| Petroleo Brasileiro SA ADR (71654V408) | | | 304,110 | | | | 8,177,518 | | | | 0.7 | % | |
| Other Securities | | | | | | | 30,670,565 | | | | 2.7 | % | |
| TOTAL COMMON STOCKS | | | | | | | 61,508,322 | | | | 5.3 | % | |
| PREFERRED STOCKS — (6.7%) | |
| Banco Bradesco SA Sponsored ADR | | | 809,450 | | | | 9,470,565 | | | | 0.8 | % | |
| Banco Itau Holding Financeira SA ADR | | | 557,000 | | | | 6,160,420 | | | | 0.5 | % | |
| Companhia Vale do Rio Doce Sponsored ADR | | | 486,200 | | | | 5,693,402 | | | | 0.5 | % | |
| Gerdau SA Sponsored ADR | | | 678,100 | | | | 4,346,621 | | | | 0.4 | % | |
| Investimentos Itau SA | | | 1,852,047 | | | | 6,154,968 | | | | 0.5 | % | |
| Unibanco-Uniao de Bancos Brasileiros SA ADR | | | 163,766 | | | | 10,330,359 | | | | 0.9 | % | |
| Usinas Siderurgicas de Minas Gerais SA Series A | | | 330,300 | | | | 4,268,821 | | | | 0.4 | % | |
| Other Securities | | | | | | | 46,172,990 | | | | 4.0 | % | |
| TOTAL PREFERRED STOCKS | | | | | | | 92,598,146 | | | | 8.0 | % | |
| TOTAL — BRAZIL | | | | | | | 154,106,468 | | | | 13.3 | % | |
| CHILE — (2.1%) | |
| COMMON STOCKS — (2.1%) | |
| Other Securities | | | | | | | 29,381,915 | | | | 2.5 | % | |
| CHINA — (11.8%) | |
| COMMON STOCKS — (11.8%) | |
| # Bank of China, Ltd. | | | 13,954,000 | | | | 4,074,412 | | | | 0.4 | % | |
| # China Construction Bank Corp. | | | 16,423,000 | | | | 8,147,109 | | | | 0.7 | % | |
| # China Life Insurance Co., Ltd. ADR | | | 159,456 | | | | 6,317,647 | | | | 0.6 | % | |
| China Mobile, Ltd. Sponsored ADR | | | 318,041 | | | | 13,958,819 | | | | 1.2 | % | |
| # China Petroleum and Chemical Corp. (Sinopec) ADR | | | 88,600 | | | | 5,761,658 | | | | 0.5 | % | |
| # China Telecom Corp., Ltd. ADR | | | 178,921 | | | | 6,306,965 | | | | 0.6 | % | |
| # China Unicom Hong Kong, Ltd. ADR | | | 497,782 | | | | 7,173,039 | | | | 0.6 | % | |
| CNOOC, Ltd. ADR | | | 195,076 | | | | 15,935,758 | | | | 1.4 | % | |
| # Industrial and Commercial Bank of China (Asia), Ltd. | | | 21,941,000 | | | | 10,323,691 | | | | 0.9 | % | |
| PetroChina Co., Ltd. ADR | | | 255,073 | | | | 19,023,344 | | | | 1.7 | % | |
| Other Securities | | | | | | | 64,692,777 | | | | 5.4 | % | |
| TOTAL COMMON STOCKS | | | | | | | 161,715,219 | | | | 14.0 | % | |
| RIGHTS/WARRANTS — (0.0%) | |
| Other Securities | | | | | | | 18 | | | | 0.0 | % | |
| TOTAL — CHINA | | | | | | | 161,715,237 | | | | 14.0 | % | |
| CZECH REPUBLIC — (1.0%) | |
| COMMON STOCKS — (1.0%) | |
| CEZ A.S. | | | 119,417 | | | | 5,222,839 | | | | 0.4 | % | |
| Other Securities | | | | | | | 8,416,690 | | | | 0.8 | % | |
| TOTAL — CZECH REPUBLIC | | | | | | | 13,639,529 | | | | 1.2 | % | |
| HUNGARY — (0.7%) | |
| COMMON STOCKS — (0.7%) | |
| # MOL Hungarian Oil & Gas NYRT | | | 67,986 | | | | 3,678,169 | | | | 0.3 | % | |
| Other Securities | | | | | | | 5,347,108 | | | | 0.5 | % | |
| TOTAL — HUNGARY | | | | | | | 9,025,277 | | | | 0.8 | % | |
88
EMERGING MARKETS CORE EQUITY PORTFOLIO
CONTINUED
| | | Shares | | Value†† | | Percentage
of Net Assets** | |
| INDIA — (8.3%) | |
| COMMON STOCKS — (8.3%) | |
| ICICI Bank, Ltd. Sponsored ADR | | | 265,553 | | | $ | 4,538,301 | | | | 0.4 | % | |
| Infosys Technologies, Ltd. | | | 216,263 | | | | 6,253,677 | | | | 0.6 | % | |
| Reliance Communications, Ltd. | | | 858,243 | | | | 3,927,113 | | | | 0.4 | % | |
| Reliance Industries, Ltd. | | | 492,942 | | | | 13,925,905 | | | | 1.2 | % | |
| Other Securities | | | | | | | 85,205,141 | | | | 7.3 | % | |
| TOTAL COMMON STOCKS | | | | | | | 113,850,137 | | | | 9.9 | % | |
| PREFERRED STOCKS — (0.0%) | |
| Other Securities | | | | | | | 4,864 | | | | 0.0 | % | |
| TOTAL — INDIA | | | | | | | 113,855,001 | | | | 9.9 | % | |
| INDONESIA — (1.8%) | |
| COMMON STOCKS — (1.8%) | |
| Other Securities | | | | | | | 24,765,120 | | | | 2.1 | % | |
| ISRAEL — (2.9%) | |
| COMMON STOCKS — (2.9%) | |
| Teva Pharmaceutical Industries, Ltd. Sponsored ADR | | | 365,580 | | | | 15,676,070 | | | | 1.4 | % | |
| Other Securities | | | | | | | 24,110,482 | | | | 2.0 | % | |
| TOTAL — ISRAEL | | | | | | | 39,786,552 | | | | 3.4 | % | |
| MALAYSIA — (3.7%) | |
| COMMON STOCKS — (3.7%) | |
| Other Securities | | | | | | | 51,107,676 | | | | 4.4 | % | |
| RIGHTS/WARRANTS — (0.0%) | |
| Other Securities | | | | | | | 13,758 | | | | 0.0 | % | |
| TOTAL — MALAYSIA | | | | | | | 51,121,434 | | | | 4.4 | % | |
| MEXICO — (5.6%) | |
| COMMON STOCKS — (5.6%) | |
| America Movil S.A.B. de C.V. Series L ADR | | | 345,275 | | | | 10,682,809 | | | | 0.9 | % | |
| Cemex S.A.B. de C.V. Sponsored ADR | | | 691,959 | | | | 5,231,210 | | | | 0.5 | % | |
| Fomento Economico Mexicano S.A.B. de C.V. Sponsored ADR | | | 255,840 | | | | 6,470,194 | | | | 0.6 | % | |
| # Grupo Elektra S.A. de C.V. | | | 173,466 | | | | 4,691,232 | | | | 0.4 | % | |
| Grupo Televisa S.A. de C.V. Sponsored ADR | | | 281,120 | | | | 4,964,579 | | | | 0.4 | % | |
| *# Organizacion Soriana S.A.B. de C.V. Series B | | | 1,753,000 | | | | 3,524,392 | | | | 0.3 | % | |
| # Telefonos de Mexico S.A.B. de C.V. Sponsored ADR | | | 223,825 | | | | 4,010,944 | | | | 0.3 | % | |
| # Wal-Mart de Mexico S.A.B. de C.V. Series V | | | 1,491,439 | | | | 3,998,807 | | | | 0.3 | % | |
| Other Securities | | | | | | | 32,655,405 | | | | 2.9 | % | |
| TOTAL — MEXICO | | | | | | | 76,229,572 | | | | 6.6 | % | |
| PHILIPPINES — (0.6%) | |
| COMMON STOCKS — (0.6%) | |
| Other Securities | | | | | | | 8,306,988 | | | | 0.7 | % | |
| POLAND — (2.2%) | |
| COMMON STOCKS — (2.2%) | |
| Bank Pekao SA | | | 97,129 | | | | 4,417,546 | | | | 0.4 | % | |
| Polski Koncern Naftowy Orlen SA | | | 443,752 | | | | 4,524,939 | | | | 0.4 | % | |
| Telekomunikacja Polska SA | | | 474,790 | | | | 3,587,594 | | | | 0.3 | % | |
| Other Securities | | | | | | | 18,294,860 | | | | 1.6 | % | |
| TOTAL — POLAND | | | | | | | 30,824,939 | | | | 2.7 | % | |
| SINGAPORE — (0.0%) | |
| COMMON STOCKS — (0.0%) | |
| Other Securities | | | | | | | 30,724 | | | | 0.0 | % | |
89
EMERGING MARKETS CORE EQUITY PORTFOLIO
CONTINUED
| | | Shares | | Value†† | | Percentage
of Net Assets** | |
| SOUTH AFRICA — (8.3%) | |
| COMMON STOCKS — (8.3%) | |
| # ABSA Group, Ltd. | | | 340,644 | | | $ | 3,563,965 | | | | 0.3 | % | |
| MTN Group, Ltd. | | | 607,384 | | | | 6,820,384 | | | | 0.6 | % | |
| Naspers, Ltd. Series N | | | 304,267 | | | | 5,065,523 | | | | 0.4 | % | |
| Sanlam, Ltd. | | | 2,765,031 | | | | 4,537,679 | | | | 0.4 | % | |
| Sasol, Ltd. Sponsored ADR | | | 346,200 | | | | 10,015,566 | | | | 0.9 | % | |
| Standard Bank Group, Ltd. | | | 887,882 | | | | 7,050,040 | | | | 0.6 | % | |
| Other Securities | | | | | | | 77,418,553 | | | | 6.7 | % | |
| TOTAL — SOUTH AFRICA | | | | | | | 114,471,710 | | | | 9.9 | % | |
| SOUTH KOREA — (9.3%) | |
| COMMON STOCKS — (9.3%) | |
| # POSCO ADR | | | 81,540 | | | | 5,478,673 | | | | 0.5 | % | |
| Samsung Electronics Co., Ltd. | | | 38,414 | | | | 16,195,483 | | | | 1.4 | % | |
| Other Securities | | | | | | | 105,217,713 | | | | 9.1 | % | |
| TOTAL — SOUTH KOREA | | | | | | | 126,891,869 | | | | 11.0 | % | |
| TAIWAN — (9.7%) | |
| COMMON STOCKS — (9.7%) | |
| AU Optronics Corp. Sponsored ADR | | | 647,118 | | | | 4,465,113 | | | | 0.4 | % | |
| Formosa Chemicals & Fiber Co., Ltd. | | | 2,276,830 | | | | 3,680,731 | | | | 0.3 | % | |
| Taiwan Semiconductor Manufacturing Co., Ltd. | | | 5,033,477 | | | | 7,323,992 | | | | 0.7 | % | |
| Other Securities | | | | | | | 117,157,356 | | | | 10.1 | % | |
| TOTAL — TAIWAN | | | | | | | 132,627,192 | | | | 11.5 | % | |
| THAILAND — (1.6%) | |
| COMMON STOCKS — (1.6%) | |
| Other Securities | | | | | | | 21,709,671 | | | | 1.9 | % | |
| RIGHTS/WARRANTS — (0.0%) | |
| Other Securities | | | | | | | 16,299 | | | | 0.0 | % | |
| TOTAL — THAILAND | | | | | | | 21,725,970 | | | | 1.9 | % | |
| TURKEY — (1.7%) | |
| COMMON STOCKS — (1.7%) | |
| Other Securities | | | | | | | 22,693,417 | | | | 2.0 | % | |
| | | Face
Amount | |
Value† | | | |
| | | (000) | | | | | |
| TEMPORARY CASH INVESTMENTS — (3.1%) | |
Repurchase Agreement, PNC Capital Markets, Inc. 0.94%,
11/03/08 (Collateralized by $49,865,000 FNMA 6.00%,
03/01/37, valued at $42,858,267) to be repurchased at $42,224,307 | | $ | 42,221 | | | | 42,221,000 | | | | 3.7 | % | |
| | | Shares | | | | | |
| SECURITIES LENDING COLLATERAL — (14.4%) | |
| §@ DFA Short Term Investment Fund LP | | | 195,457,469 | | | | 195,457,469 | | | | 16.9 | % | |
| | | Face
Amount | | | | | |
| | | (000) | | | | | |
@ Repurchase Agreement, Deutsche Bank Securities 0.25%, 11/03/08
(Collateralized by $2,665,959 FHLMC 5.500%, 09/01/38,
valued at $2,607,977) to be repurchased at $2,556,893 | | $ | 2,557 | | | | 2,556,840 | | | | 0.2 | % | |
| TOTAL SECURITIES LENDING COLLATERAL | | | | | | | 198,014,309 | | | | 17.1 | % | |
TOTAL INVESTMENTS — (100.0%)
(Cost $1,903,771,272) | | | | | | $ | 1,371,434,223 | | | | 118.7 | % | |
See accompanying Notes to Financial Statements.
90
DFA INVESTMENT DIMENSIONS GROUP INC.
SCHEDULES OF INVESTMENTS
October 31, 2008
DFA ONE-YEAR FIXED INCOME PORTFOLIO
| | | Shares | | Value† | |
| AFFILIATED INVESTMENT COMPANY — (100.0%) | |
Investment in The DFA One-Year Fixed Income Series of
The DFA Investment Trust Company | | | 320,437,336 | | | $ | 3,194,749,812 | | |
TOTAL INVESTMENTS IN AFFILIATED
INVESTMENT COMPANY (Cost $3,188,446,253) | | | | $ | 3,194,749,812 | | |
| | | | | | |
DFA TWO-YEAR GLOBAL FIXED INCOME PORTFOLIO
| | | Shares | | Value† | |
| AFFILIATED INVESTMENT COMPANY — (100.0%) | |
Investment in The DFA Two-Year Global Fixed Income Series of
The DFA Investment Trust Company | | | 302,256,100 | | | $ | 3,125,328,074 | | |
TOTAL INVESTMENTS IN AFFILIATED
INVESTMENT COMPANY (Cost $3,038,123,715) | | | | $ | 3,125,328,074 | | |
| | | | | | |
See accompanying Notes to Financial Statements.
91
DFA SELECTIVELY HEDGED GLOBAL FIXED INCOME PORTFOLIO
SCHEDULE OF INVESTMENTS
October 31, 2008
| | | Face
Amount^ | | Value† | |
| | | (000) | | | |
| AUSTRALIA — (6.2%) | |
| BONDS — (6.2%) | |
Australia & New Zealand
Banking Group, Ltd.
5.750%, 11/10/08 | | | 5,146 | | | $ | 3,419,403 | | |
National Australia Bank, Ltd.
(c) 4.750%, 11/28/08 | | | 450 | | | | 373,463 | | |
| (g) 4.250%, 12/30/08 | | | 215 | | | | 344,875 | | |
National Australia Bank,
Ltd. Floating Rate Note
(r)(e) 4.917%, 07/27/09 | | | 2,500 | | | | 3,132,614 | | |
Toyota Finance Australia
5.260%, 12/19/08 | | | 4,800 | | | | 3,186,655 | | |
Westpac Banking Corp.
Floating Rate Note
(r)(e) 5.011%, 12/22/09 | | | 1,750 | | | | 2,191,052 | | |
| TOTAL — AUSTRALIA | | | | | | | 12,648,062 | | |
| AUSTRIA — (0.9%) | |
| BONDS — (0.9%) | |
Oesterreichischen Kontrollbank AG
(g) 6.000%, 06/15/09 | | | 1,060 | | | | 1,732,382 | | |
| CANADA — (2.3%) | |
| BONDS — (2.3%) | |
Canadian Government
(e) 4.500%, 04/28/09 | | | 3,218 | | | | 4,100,874 | | |
Export Development Canada
(z) 6.500%, 02/23/09 | | | 1,000 | | | | 581,227 | | |
| TOTAL — CANADA | | | | | | | 4,682,101 | | |
| DENMARK — (2.3%) | |
| BONDS — (2.3%) | |
Denmark, Kingdom of
6.000%, 11/15/09 | | | 2,600 | | | | 450,711 | | |
Kommunekredit
5.500%, 08/13/09 | | | 24,700 | | | | 4,225,278 | | |
| TOTAL — DENMARK | | | | | | | 4,675,989 | | |
| FRANCE — (4.0%) | |
| BONDS — (4.0%) | |
BNP Paribas Finance, Inc.
Floating Rate Note
(r) 5.463%, 04/14/10 | | | 3,850 | | | | 4,878,963 | | |
Caisse D'Amortissement de la
Dette Sociale
(z) 7.000%, 01/30/09 | | | 5,692 | | | | 3,313,923 | | |
| TOTAL — FRANCE | | | | | | | 8,192,886 | | |
| | | Face
Amount^ | | Value† | |
| | | (000) | | | |
| GERMANY — (7.0%) | |
| BONDS — (7.0%) | |
Deutsche Bank AG
(n) 4.500%, 05/15/09 | | | 20,600 | | | $ | 3,022,422 | | |
Kreditanstalt fuer Wiederaufbau
(s) 3.750%, 01/28/09 | | | 22,000 | | | | 2,824,752 | | |
| (t) 6.125%, 02/05/09 | | | 1,200 | | | | 798,518 | | |
| (z) 6.000%, 07/15/09 | | | 3,300 | | | | 1,914,931 | | |
Landwirtschaftliche Rentenbank
(z) 5.700%, 03/26/09 | | | 2,987 | | | | 1,731,929 | | |
| 3.375%, 09/22/09 | | | 2,300 | | | | 2,912,888 | | |
L-Bank Landeskreditbank
Baden-Wuerttemberg Foerderbank
(c) 4.500%, 01/26/09 | | | 800 | | | | 665,562 | | |
Norddeutsche Landesbank
Girozentrale AG
(j) 0.450%, 01/19/09 | | | 32,000 | | | | 324,482 | | |
| TOTAL — GERMANY | | | | | | | 14,195,484 | | |
| IRELAND — (2.7%) | |
| BONDS — (2.7%) | |
General Electric Capital Corp.
Floating Rate Note
(g)(r) 6.228%, 02/01/10 | | | 3,600 | | | | 5,537,280 | | |
| JAPAN — (1.0%) | |
| BONDS — (1.0%) | |
Toyota Motor Credit Corp.
(g) 4.000%, 12/11/08 | | | 1,220 | | | | 1,959,484 | | |
| NETHERLANDS — (5.7%) | |
| BONDS — (5.7%) | |
Bank Nederlandse Gemeenten
(g) 4.625%, 12/07/08 | | | 255 | | | | 410,577 | | |
| (z) 5.250%, 06/17/09 | | | 4,272 | | | | 2,465,525 | | |
Nederlandse Waterschapsbank N.V.
(g) 4.625%, 12/30/08 | | | 1,962 | | | | 3,160,671 | | |
Rabobank Nederland
(s) 2.250%, 05/08/09 | | | 11,100 | | | | 1,410,410 | | |
| 3.750%, 09/15/09 | | | 3,310 | | | | 4,179,293 | | |
| TOTAL — NETHERLANDS | | | | | | | 11,626,476 | | |
| NORWAY — (3.1%) | |
| BONDS — (3.1%) | |
Eksportfinans
(z) 6.700%, 02/19/09 | | | 2,600 | | | | 1,512,607 | | |
Kommunalbanken
(z) 6.700%, 03/16/09 | | | 3,400 | | | | 1,977,803 | | |
| (t) 5.350%, 06/15/09 | | | 2,635 | | | | 1,752,139 | | |
| 5.000%, 07/14/09 | | | 7,000 | | | | 1,036,183 | | |
| TOTAL — NORWAY | | | | | | | 6,278,732 | | |
92
DFA SELECTIVELY HEDGED GLOBAL FIXED INCOME PORTFOLIO
CONTINUED
| | | Face
Amount^ | | Value† | |
| | | (000) | | | |
| SPAIN — (1.4%) | |
| BONDS — (1.4%) | |
Santander International Debt SA
Floating Rate Note
(r) 5.008%, 10/21/09 | | | 2,200 | | | $ | 2,748,162 | | |
SUPRANATIONAL ORGANIZATION
OBLIGATIONS — (4.0%) | |
| BONDS — (4.0%) | |
European Investment Bank
(g) 6.250%, 12/07/08 | | | 800 | | | | 1,290,005 | | |
| (s) 4.000%, 04/15/09 | | | 6,000 | | | | 769,760 | | |
Nordic Investment Bank
(g) 5.750%, 11/06/08 | | | 710 | | | | 1,142,689 | | |
World Bank (International Bank for
Reconstruction & Development)
(z) 5.500%, 11/03/08 | | | 425 | | | | 247,520 | | |
| (t) 4.850%, 01/29/09 | | | 2,633 | | | | 1,746,064 | | |
| (z) 6.375%, 07/15/09 | | | 5,200 | | | | 3,024,827 | | |
TOTAL — SUPRANATIONAL
ORGANIZATION OBLIGATIONS | | | | | | | 8,220,865 | | |
| SWEDEN — (7.2%) | |
| BONDS — (7.2%) | |
City of Stockholm
3.375%, 03/08/10 | | | 10,000 | | | | 1,268,167 | | |
Kommuninvest
(t) 4.900%, 04/20/09 | | | 8,550 | | | | 5,647,234 | | |
Svensk Exportkredit AB
(z) 6.752%, 03/17/09 | | | 1,155 | | | | 672,241 | | |
Sweden Government Bond
4.000%, 12/01/09 | | | 11,000 | | | | 1,436,521 | | |
Swedish Export Credit Corp.
(z) 6.000%, 12/19/08 | | | 880 | | | | 511,624 | | |
| (d) 5.375%, 10/15/09 | | | 30,000 | | | | 5,124,455 | | |
| TOTAL — SWEDEN | | | | | | | 14,660,242 | | |
| UNITED KINGDOM — (6.9%) | |
| BONDS — (6.9%) | |
Bank of England
(e) 3.000%, 01/27/09 | | | 1,320 | | | | 1,675,173 | | |
Bank of Scotland
4.500%, 12/17/08 | | | 560 | | | | 895,991 | | |
BP Capital Markets P.L.C.
5.125%, 12/07/08 | | | 1,625 | | | | 2,616,651 | | |
| 5.375%, 01/09/09 | | | 2,080 | | | | 3,352,838 | | |
Network Rail Finance P.L.C.
4.875%, 03/06/09 | | | 3,370 | | | | 5,442,747 | | |
| TOTAL — UNITED KINGDOM | | | | | | | 13,983,400 | | |
| | | Face
Amount | | Value† | |
| | | (000) | | | |
| UNITED STATES — (41.6%) | |
| AGENCY OBLIGATIONS — (6.5%) | |
Federal Farm Credit Bank
2.750%, 05/04/10 | | $ | 2,000 | | | $ | 1,984,586 | | |
Federal Home Loan Bank
4.250%, 06/11/10 | | | 1,300 | | | | 1,319,618 | | |
| 2.750%, 06/18/10 | | | 6,300 | | | | 6,248,182 | | |
| 3.500%, 07/16/10 | | | 2,300 | | | | 2,308,547 | | |
| 3.375%, 08/13/10 | | | 1,300 | | | | 1,302,307 | | |
| TOTAL AGENCY OBLIGATIONS | | | | | | | 13,163,240 | | |
| BONDS — (13.7%) | |
Banco Santander SA Floating Rate Note
(r) 4.731%, 03/16/09 | | | 500 | | | | 632,029 | | |
Bank of America Corp.
4.500%, 08/01/10 | | | 1,472 | | | | 1,432,160 | | |
Bank of New York Mellon Corp.
Floating Rate Note
(r) 3.495%, 02/05/10 | | | 600 | | | | 588,239 | | |
Deutsche Bank AG Floating Rate Note
(r) 4.579%, 09/08/09 | | | 2,000 | | | | 2,520,552 | | |
General Electric Capital Corp.
(g) 4.500%, 12/15/08 | | | 175 | | | | 280,455 | | |
Georgia Power Co. Floating Rate Note
(r) 3.400%, 03/17/10 | | | 500 | | | | 498,223 | | |
IBM International Group
Floating Rate Note
(r) 3.584%, 07/29/09 | | | 200 | | | | 199,177 | | |
John Deere Capital Corp.
Floating Rate Note
(r) 2.999%, 10/16/09 | | | 2,100 | | | | 2,106,342 | | |
| (r) 3.530%, 02/26/10 | | | 500 | | | | 468,972 | | |
JPMorgan Chase & Co.
Floating Rate Note
(r) 5.255%, 11/19/09 | | | 600 | | | | 598,996 | | |
| (r) 2.748%, 05/07/10 | | | 1,500 | | | | 1,443,875 | | |
| (r) 2.810%, 05/07/10 | | | 3,600 | | | | 3,457,890 | | |
Paccar Financial Corp.
Floating Rate Note
(r) 4.966%, 09/21/09 | | | 300 | | | | 299,410 | | |
Paccar Financial Europe
Floating Rate Note
(r) 4.858%, 09/29/09 | | | 400 | | | | 503,237 | | |
Toyota Motor Credit Corp.
(n) 4.625%, 01/22/10 | | | 4,200 | | | | 599,877 | | |
Wachovia Corp. Floating Rate Note
(r) 5.465%, 11/24/09 | | | 500 | | | | 485,755 | | |
Wal-Mart Stores, Inc.
6.875%, 08/10/09 | | | 2,050 | | | | 2,113,517 | | |
| 4.000%, 01/15/10 | | | 2,500 | | | | 2,512,945 | | |
Wells Fargo Bank & Co.
4.200%, 01/15/10 | | | 1,500 | | | | 1,477,824 | | |
Wells Fargo Bank & Co.
Floating Rate Note
(r) 2.861%, 03/23/10 | | | 5,800 | | | | 5,652,216 | | |
| TOTAL BONDS | | | | | | | 27,871,691 | | |
93
DFA SELECTIVELY HEDGED GLOBAL FIXED INCOME PORTFOLIO
CONTINUED
| | | Face
Amount | | Value† | |
| | | (000) | | | |
CERTIFICATES OF DEPOSIT
INTEREST BEARING — (6.4%) | |
ABN-AMRO Bank NV
3.035%, 02/13/09 | | $ | 7,500 | | | $ | 7,487,250 | | |
Barclays Bank P.L.C.
3.430%, 07/10/09 | | | 2,000 | | | | 1,995,772 | | |
| 3.430%, 08/07/09 | | | 1,000 | | | | 997,732 | | |
BNP Paribas Finance, Inc.
3.190%, 08/14/09 | | | 1,500 | | | | 1,493,779 | | |
UBS AG
3.390%, 07/13/09 | | | 900 | | | | 897,832 | | |
TOTAL CERTIFICATES OF DEPOSIT
INTEREST BEARING | | | | | | | 12,872,365 | | |
| COMMERCIAL PAPER — (15.0%) | |
Abbey National North America
2.970%, 02/09/09 | | | 1,400 | | | | 1,386,964 | | |
| 2.990%, 02/20/09 | | | 1,500 | | | | 1,484,371 | | |
Bank of America Corp.
2.980%, 03/09/09 | | | 3,000 | | | | 2,963,773 | | |
Bank of Scotland P.L.C.
3.003%, 01/08/09 | | | 1,900 | | | | 1,888,682 | | |
| 3.045%, 01/12/09 | | | 4,000 | | | | 3,974,507 | | |
Nordea North America, Inc.
3.030%, 05/05/09 | | | 6,000 | | | | 5,901,730 | | |
| 3.000%, 05/11/09 | | | 1,500 | | | | 1,474,640 | | |
| | | Face
Amount | | Value† | |
| | | (000) | | | |
Royal Bank of Scotland P.L.C.
3.000%, 02/04/09 | | $ | 6,500 | | | $ | 6,442,696 | | |
Societe Generale North America
3.005%, 02/12/09 | | | 3,000 | | | | 2,971,166 | | |
| 3.100%, 05/01/09 | | | 2,000 | | | | 1,967,948 | | |
| TOTAL COMMERCIAL PAPER | | | | | | | 30,456,477 | | |
| TOTAL — UNITED STATES | | | | | | | 84,363,773 | | |
TEMPORARY CASH
INVESTMENTS — (3.7%) | |
Repurchase Agreement, PNC Capital
Markets, Inc. 0.94%, 11/03/08
(Collateralized by $48,180,000
FNMA 3.50%, 03/25/33,
valued at $7,545,649) to be
repurchased at $7,434,582 | | $ | 7,434 | | | | 7,434,000 | | |
TOTAL INVESTMENTS — (100.0%)
(Cost $231,706,349) | | | | | | $ | 202,939,318 | | |
See accompanying Notes to Financial Statements.
94
DFA FIVE-YEAR GOVERNMENT PORTFOLIO
SCHEDULE OF INVESTMENTS
October 31, 2008
| | | Face
Amount | | Value† | |
| | | (000) | | | |
| AGENCY OBLIGATIONS — (50.3%) | |
Federal Home Loan Bank
2.625%, 05/20/11 | | $ | 50,200 | | | $ | 49,280,989 | | |
| 3.375%, 06/24/11 | | | 6,300 | | | | 6,268,809 | | |
| 5.375%, 08/19/11 | | | 50,000 | | | | 52,356,100 | | |
| 3.750%, 09/09/11 | | | 40,000 | | | | 40,321,960 | | |
| 3.625%, 09/16/11 | | | 50,000 | | | | 50,232,650 | | |
| 4.875%, 11/18/11 | | | 50,000 | | | | 51,893,650 | | |
| 5.750%, 05/15/12 | | | 150,000 | | | | 157,443,600 | | |
| 4.625%, 10/10/12 | | | 100,000 | | | | 101,599,200 | | |
Federal Home Loan Bank Discount Note
(y) 2.516%, 04/16/09 | | | 35,000 | | | | 34,638,065 | | |
Tennessee Valley Authority
5.625%, 01/18/11 | | | 10,930 | | | | 11,416,942 | | |
| TOTAL AGENCY OBLIGATIONS | | | | | | | 555,451,965 | | |
| U.S. TREASURY OBLIGATIONS — (49.7%) | |
U.S. Treasury Notes
4.375%, 08/15/12 | | | 51,200 | | | | 55,516,006 | | |
| 4.125%, 08/31/12 | | | 246,400 | | | | 264,995,562 | | |
| 4.250%, 09/30/12 | | | 211,000 | | | | 228,193,124 | | |
| TOTAL U.S. TREASURY OBLIGATIONS | | | | | | | 548,704,692 | | |
| TEMPORARY CASH INVESTMENTS — (0.0%) | |
Repurchase Agreement, PNC Capital Markets, Inc. 0.94%, 11/03/08
(Collateralized by $500,000 FHLMC 6.275%(r), 09/01/36, valued at
$374,310) to be repurchased at $366,029 | | | 366 | | | | 366,000 | | |
TOTAL INVESTMENTS — (100.0%)
(Cost $1,099,202,383) | | | | | | $ | 1,104,522,657 | | |
See accompanying Notes to Financial Statements.
95
DFA FIVE-YEAR GLOBAL FIXED INCOME PORTFOLIO
SCHEDULE OF INVESTMENTS
October 31, 2008
| | | Face
Amount^ | | Value† | |
| | | (000) | | | |
| AUSTRIA — (3.8%) | |
| BONDS — (3.8%) | |
Oesterreichischen Kontrollbank AG
(j) 1.800%, 03/22/10 | | | 1,578,000 | | | $ | 16,251,269 | | |
PfandBriefstelle der Oesterreichischen
Landes-Hypothekenbanken
(j) 1.600%, 02/15/11 | | | 10,546,000 | | | | 108,619,518 | | |
| TOTAL — AUSTRIA | | | | | | | 124,870,787 | | |
| CANADA — (0.9%) | |
| BONDS — (0.9%) | |
Ontario, Province of
(j) 1.875%, 01/25/10 | | | 2,910,000 | | | | 29,944,819 | | |
| DENMARK — (0.9%) | |
| BONDS — (0.9%) | |
Kommunekredit
(f) 3.000%, 11/19/08 | | | 33,000 | | | | 28,460,501 | | |
| FRANCE — (1.0%) | |
| BONDS — (1.0%) | |
Dexia Municipal Agency
(f) 4.000%, 03/08/10 | | | 18,000 | | | | 15,438,217 | | |
Total Capital SA
(f) 1.625%, 07/12/11 | | | 9,650 | | | | 8,114,903 | | |
| (u) 5.000%, 05/22/12 | | | 9,900 | | | | 10,181,388 | | |
| TOTAL — FRANCE | | | | | | | 33,734,508 | | |
| GERMANY — (5.4%) | |
| BONDS — (5.4%) | |
Bayerische Landesbank
(f) 3.125%, 02/10/09 | | | 8,000 | | | | 6,907,738 | | |
| (j) 1.000%, 09/20/10 | | | 2,950,000 | | | | 30,053,735 | | |
Kreditanstalt fuer Wiederaufbau
(s) 3.750%, 01/28/09 | | | 15,560 | | | | 1,997,870 | | |
| (j) 1.750%, 03/23/10 | | | 3,090,000 | | | | 31,832,646 | | |
| (j) 1.850%, 09/20/10 | | | 3,580,000 | | | | 37,093,503 | | |
Norddeutsche Landesbank
Girozentrale AG
(j) 0.900%, 02/08/10 | | | 6,700,000 | | | | 68,097,600 | | |
| TOTAL — GERMANY | | | | | | | 175,983,092 | | |
| JAPAN — (2.2%) | |
| BONDS — (2.2%) | |
Japan Finance Corp. for
Municipal Enterprises
1.550%, 02/21/12 | | | 7,050,000 | | | | 73,083,259 | | |
| NETHERLANDS — (3.4%) | |
| BONDS — (3.4%) | |
Nederlandse Waterschapsbank NV
(f) 3.500%, 10/29/09 | | | 3,000 | | | | 2,602,490 | | |
Rabobank Nederland
(s) 2.250%, 05/08/09 | | | 37,000 | | | | 4,701,365 | | |
| (j) 0.800%, 02/03/11 | | | 10,185,000 | | | | 102,852,475 | | |
| TOTAL — NETHERLANDS | | | | | | | 110,156,330 | | |
| | | Face
Amount^ | | Value† | |
| | | (000) | | | |
| NORWAY — (2.7%) | |
| BONDS — (2.7%) | |
Eksportfinans
(f) 2.000%, 03/17/09 | | | 17,000 | | | | $14,619,209 | | |
| (j) 1.800%, 06/21/10 | | | 7,298,000 | | | | 75,296,009 | | |
| TOTAL — NORWAY | | | | | | | 89,915,218 | | |
| SPAIN — (0.9%) | |
| BONDS — (0.9%) | |
Instituto de Credito Oficial
(j) 1.500%, 09/20/12 | | | 2,980,000 | | | | 30,934,433 | | |
SUPRANATIONAL ORGANIZATION
OBLIGATIONS — (3.3%) | |
| BONDS — (3.3%) | |
African Development Bank
(j) 1.950%, 03/23/10 | | | 1,000,000 | | | | 10,303,065 | | |
European Investment Bank
(j) 1.250%, 09/20/12 | | | 9,475,000 | | | | 97,595,578 | | |
Oresundsbro Konsortiet
(s) 6.000%, 04/20/09 | | | 9,000 | | | | 1,163,844 | | |
TOTAL — SUPRANATIONAL
ORGANIZATION OBLIGATIONS | | | | | | | 109,062,487 | | |
| SWEDEN — (1.1%) | |
| BONDS — (1.1%) | |
Kommuninvest
(t) 5.050%, 02/24/09 | | | 11,650 | | | | 7,729,407 | | |
| 4.100%, 05/11/09 | | | 156,000 | | | | 20,004,165 | | |
| (f) 2.250%, 12/14/09 | | | 9,260 | | | | 7,931,517 | | |
| TOTAL — SWEDEN | | | | | | | 35,665,089 | | |
| SWITZERLAND — (0.2%) | |
| BONDS — (0.2%) | |
UBS AG
0.875%, 12/29/09 | | | 6,700 | | | | 5,508,906 | | |
| UNITED STATES — (73.3%) | |
| AGENCY OBLIGATIONS — (31.9%) | |
Federal Farm Credit Bank
4.250%, 07/08/13 | | | 50,000 | | | | 49,804,050 | | |
Federal Home Loan Bank
2.625%, 05/20/11 | | | 50,000 | | | | 49,084,650 | | |
| 5.375%, 08/19/11 | | | 50,000 | | | | 52,356,100 | | |
| 3.625%, 09/16/11 | | | 50,000 | | | | 50,232,650 | | |
| 4.875%, 11/18/11 | | | 119,500 | | | | 124,025,823 | | |
| 5.750%, 05/15/12 | | | 50,000 | | | | 52,481,200 | | |
| 3.625%, 05/29/13 | | | 37,500 | | | | 36,447,412 | | |
Federal Home Loan Bank
Discount Note
(y) 2.387%, 03/30/09 | | | 53,000 | | | | 52,541,179 | | |
Federal Home Loan
Mortgage Corporation
6.000%, 06/15/11 | | | 50,000 | | | | 53,499,850 | | |
| 3.875%, 06/29/11 | | | 100,000 | | | | 101,783,000 | | |
| 4.750%, 03/05/12 | | | 100,000 | | | | 103,244,800 | | |
96
DFA FIVE-YEAR GLOBAL FIXED INCOME PORTFOLIO
CONTINUED
| | | Face
Amount | | Value† | |
| | | (000) | | | |
Federal National Mortgage Association
6.000%, 05/15/11 | | | $50,000 | | | | $53,080,350 | | |
| 5.375%, 11/15/11 | | | 57,100 | | | | 60,184,257 | | |
| 5.000%, 02/16/12 | | | 50,000 | | | | 51,943,550 | | |
| 6.125%, 03/15/12 | | | 50,000 | | | | 54,057,800 | | |
| 4.875%, 05/18/12 | | | 100,000 | | | | 102,474,500 | | |
| TOTAL AGENCY OBLIGATIONS | | | | | | | 1,047,241,171 | | |
| BONDS — (32.7%) | |
3M Co.
4.375%, 08/15/13 | | | 9,600 | | | | 9,459,907 | | |
American Express Credit Floating
Rate Note
(r) 5.858%, 04/06/09 | | | 20,000 | | | | 19,222,457 | | |
American International Group, Inc.
(j) 1.400%, 04/03/12 | | | 5,000,000 | | | | 29,284,083 | | |
Bank of America Corp.
4.900%, 05/01/13 | | | 54,265 | | | | 50,195,396 | | |
Citigroup Funding, Inc. Floating
Rate Note
(r) 5.449%, 10/22/09 | | | 90,000 | | | | 87,371,190 | | |
CME Group, Inc. Floating Rate Note
(r) 3.300%, 08/06/10 | | | 15,400 | | | | 15,386,833 | | |
General Electric Capital Corp.
(j) 1.450%, 11/10/11 | | | 8,000,000 | | | | 71,064,054 | | |
| 4.800%, 05/01/13 | | | 34,800 | | | | 31,274,273 | | |
Georgia Power Co. Floating Rate Note
(r) 3.400%, 03/17/10 | | | 9,400 | | | | 9,366,592 | | |
Hewlett-Packard Co. Floating
Rate Note
(r) 5.051%, 06/15/10 | | | 80,000 | | | | 77,884,720 | | |
John Deere Capital Corp. Floating
Rate Note
(r) 3.530%, 02/26/10 | | | 87,900 | | | | 82,445,278 | | |
JPMorgan Chase & Co.
4.750%, 05/01/13 | | | 15,000 | | | | 13,901,085 | | |
JPMorgan Chase & Co. Floating
Rate Note
(r) 5.255%, 11/19/09 | | | 90,000 | | | | 89,849,340 | | |
Merck & Co., Inc.
4.375%, 02/15/13 | | | 30,506 | | | | 29,476,911 | | |
| | | Face
Amount | | Value† | |
| | | (000) | | | |
Paccar Financial Corp. Floating
Rate Note
(r) 5.494%, 12/03/10 | | | $47,900 | | | | $47,752,085 | | |
| (r) 3.438%, 04/01/11 | | | 37,000 | | | | 36,861,287 | | |
Toyota Motor Credit Corp.
(j) 0.550%, 06/30/10 | | | 4,423,000 | | | | 44,680,292 | | |
| (j) 1.300%, 03/16/12 | | | 6,490,000 | | | | 66,593,158 | | |
Wachovia Corp. Floating Rate Note
(r) 5.465%, 11/24/09 | | | 95,000 | | | | 92,293,355 | | |
Wal-Mart Stores, Inc.
4.250%, 04/15/13 | | | 18,500 | | | | 17,978,726 | | |
| 7.250%, 06/01/13 | | | 47,800 | | | | 51,299,581 | | |
Wells Fargo Bank & Co.
5.250%, 10/23/12 | | | 87,700 | | | | 83,920,130 | | |
| 4.375%, 01/31/13 | | | 17,000 | | | | 15,695,318 | | |
| TOTAL BONDS | | | | | | | 1,073,256,051 | | |
| U.S. TREASURY OBLIGATIONS — (8.7%) | |
U.S. Treasury Notes
4.375%, 08/15/12 | | | 57,700 | | | | 62,563,937 | | |
| 4.125%, 08/31/12 | | | 58,000 | | | | 62,377,202 | | |
| 4.250%, 09/30/12 | | | 148,300 | | | | 160,384,077 | | |
TOTAL U.S. TREASURY
OBLIGATIONS | | | | | �� | | 285,325,216 | | |
| TOTAL — UNITED STATES | | | | | | | 2,405,822,438 | | |
TEMPORARY CASH
INVESTMENTS — (0.9%) | |
Repurchase Agreement, PNC Capital
Markets, Inc. 0.94%, 11/03/08
(Collateralized by $35,875,000
FNMA 5.058%(r) 01/01/36,
valued at $29,537,510) to be
repurchased at $29,100,279 | | $ | 29,098 | | | | 29,098,000 | | |
TOTAL INVESTMENTS — (100.0%)
(Cost $3,187,150,477) | | | | | | $ | 3,282,239,867 | | |
See accompanying Notes to Financial Statements.
97
DFA INTERMEDIATE GOVERNMENT FIXED INCOME PORTFOLIO
SCHEDULE OF INVESTMENTS
October 31, 2008
| | | Face
Amount | | Value† | |
| | | (000) | | | |
| AGENCY OBLIGATIONS — (65.0%) | |
Federal Farm Credit Bank
6.700%, 11/22/10 | | $ | 2,000 | | | $ | 2,136,120 | | |
| 6.135%, 12/13/10 | | | 4,000 | | | | 4,228,512 | | |
| 6.000%, 03/07/11 | | | 9,000 | | | | 9,521,415 | | |
| 6.740%, 04/11/11 | | | 1,000 | | | | 1,076,401 | | |
| 4.800%, 05/24/11 | | | 3,300 | | | | 3,406,395 | | |
| 6.300%, 06/06/11 | | | 2,800 | | | | 2,999,567 | | |
| 4.250%, 07/11/11 | | | 13,600 | | | | 13,868,178 | | |
| 4.350%, 11/02/11 | | | 8,000 | | | | 8,196,144 | | |
| 4.200%, 11/07/11 | | | 6,650 | | | | 6,784,363 | | |
| 4.300%, 11/23/11 | | | 5,500 | | | | 5,625,460 | | |
| 6.260%, 12/02/11 | | | 2,000 | | | | 2,158,838 | | |
| 4.950%, 12/22/11 | | | 9,000 | | | | 9,373,464 | | |
| 5.230%, 02/14/12 | | | 12,000 | | | | 12,599,088 | | |
| 4.500%, 03/14/12 | | | 8,500 | | | | 8,730,673 | | |
| 4.625%, 03/16/12 | | | 7,000 | | | | 7,217,259 | | |
| 5.000%, 06/01/12 | | | 4,295 | | | | 4,471,052 | | |
| 4.480%, 08/24/12 | | | 12,000 | | | | 12,215,352 | | |
| 6.280%, 11/26/12 | | | 3,000 | | | | 3,236,370 | | |
| 4.400%, 01/03/13 | | | 11,000 | | | | 11,089,298 | | |
| 4.150%, 05/15/13 | | | 10,000 | | | | 9,940,160 | | |
| 5.580%, 07/03/13 | | | 23,000 | | | | 24,193,677 | | |
| 3.880%, 07/08/13 | | | 7,000 | | | | 6,861,050 | | |
| 4.920%, 08/26/13 | | | 4,125 | | | | 4,219,805 | | |
| 4.710%, 10/18/13 | | | 7,000 | | | | 7,086,646 | | |
| 4.900%, 01/16/14 | | | 5,700 | | | | 5,798,536 | | |
| 5.300%, 02/18/14 | | | 12,000 | | | | 12,414,084 | | |
| 5.250%, 06/05/14 | | | 14,400 | | | | 14,805,029 | | |
| 4.375%, 06/30/14 | | | 3,915 | | | | 3,852,564 | | |
| 8.160%, 09/30/14 | | | 3,615 | | | | 4,233,942 | | |
| 4.700%, 12/10/14 | | | 4,000 | | | | 3,969,460 | | |
| 4.375%, 02/17/15 | | | 14,300 | | | | 13,918,376 | | |
| 6.030%, 03/21/16 | | | 4,700 | | | | 4,964,239 | | |
| 5.050%, 03/08/17 | | | 10,000 | | | | 9,699,000 | | |
| 5.625%, 08/18/17 | | | 4,000 | | | | 4,082,184 | | |
| 5.100%, 09/03/19 | | | 9,000 | | | | 8,817,300 | | |
| 5.320%, 09/03/19 | | | 21,300 | | | | 21,249,093 | | |
| 5.150%, 11/15/19 | | | 11,200 | | | | 11,012,053 | | |
| 4.670%, 05/07/20 | | | 5,600 | | | | 5,256,894 | | |
| 5.350%, 08/07/20 | | | 6,700 | | | | 6,663,961 | | |
| 5.250%, 03/02/21 | | | 6,100 | | | | 5,992,786 | | |
| 5.220%, 02/22/22 | | | 5,000 | | | | 4,872,180 | | |
| 5.210%, 12/19/22 | | | 21,200 | | | | 20,554,269 | | |
Federal Home Loan Bank
5.875%, 02/15/11 | | | 7,000 | | | | 7,374,885 | | |
| 4.500%, 05/13/11 | | | 2,045 | | | | 2,099,201 | | |
| 6.000%, 05/13/11 | | | 10,205 | | | | 10,863,651 | | |
| 7.200%, 06/14/11 | | | 3,000 | | | | 3,282,213 | | |
| 5.750%, 08/15/11 | | | 12,000 | | | | 12,731,304 | | |
| 5.000%, 10/13/11 | | | 25,000 | | | | 26,062,300 | | |
| 5.625%, 11/15/11 | | | 5,000 | | | | 5,302,245 | | |
| 5.625%, 02/15/12 | | | 6,100 | | | | 6,478,517 | | |
| 5.750%, 05/15/12 | | | 16,300 | | | | 17,108,871 | | |
| 4.625%, 08/15/12 | | | 15,175 | | | | 15,533,828 | | |
| 4.500%, 11/15/12 | | | 20,000 | | | | 20,262,620 | | |
| 5.126%, 02/28/13 | | | 5,615 | | | | 5,811,093 | | |
| | | Face
Amount | | Value† | |
| | | (000) | | | |
| 3.875%, 06/14/13 | | $ | 12,600 | | | $ | 12,366,308 | | |
| 5.375%, 06/14/13 | | | 52,400 | | | | 54,683,592 | | |
| 4.500%, 09/16/13 | | | 11,000 | | | | 11,046,464 | | |
| 6.395%, 06/03/14 | | | 5,200 | | | | 5,636,332 | | |
| 5.250%, 06/18/14 | | | 14,000 | | | | 14,386,162 | | |
| 6.700%, 06/25/14 | | | 12,500 | | | | 13,730,587 | | |
| 4.500%, 11/14/14 | | | 4,000 | | | | 3,930,528 | | |
| 4.875%, 03/11/16 | | | 13,600 | | | | 13,416,876 | | |
| 5.375%, 09/09/16 | | | 6,000 | | | | 6,039,570 | | |
| 4.625%, 09/11/20 | | | 11,200 | | | | 10,428,802 | | |
| 5.000%, 03/12/21 | | | 5,200 | | | | 5,014,724 | | |
| 5.000%, 12/10/21 | | | 39,500 | | | | 37,726,292 | | |
| 5.750%, 06/10/22 | | | 19,500 | | | | 19,953,355 | | |
| 4.750%, 03/10/23 | | | 22,200 | | | | 20,504,453 | | |
Tennessee Valley Authority
6.790%, 05/23/12 | | | 37,600 | | | | 40,937,451 | | |
| 6.000%, 03/15/13 | | | 28,100 | | | | 29,958,815 | | |
| 4.750%, 08/01/13 | | | 12,500 | | | | 12,626,963 | | |
| 6.250%, 12/15/17 | | | 10,000 | | | | 10,506,990 | | |
| TOTAL AGENCY OBLIGATIONS | | | | | | | 799,196,229 | | |
| U.S. TREASURY OBLIGATIONS — (34.3%) | |
U.S. Treasury Bonds
11.250%, 02/15/15 | | | 15,500 | | | | 22,019,687 | | |
| 10.625%, 08/15/15 | | | 11,000 | | | | 15,434,375 | | |
| 9.875%, 11/15/15 | | | 11,600 | | | | 15,928,250 | | |
| 9.250%, 02/15/16 | | | 9,000 | | | | 12,017,808 | | |
| 7.250%, 05/15/16 | | | 6,000 | | | | 7,172,814 | | |
| 7.500%, 11/15/16 | | | 10,800 | | | | 13,095,000 | | |
| 9.000%, 11/15/18 | | | 12,200 | | | | 16,612,972 | | |
| 8.125%, 08/15/19 | | | 3,800 | | | | 4,901,704 | | |
| 8.750%, 08/15/20 | | | 3,200 | | | | 4,337,251 | | |
| 8.125%, 05/15/21 | | | 29,100 | | | | 38,030,062 | | |
| 7.250%, 08/15/22 | | | 16,200 | | | | 20,007,000 | | |
| 7.625%, 11/15/22 | | | 12,500 | | | | 15,962,888 | | |
U.S. Treasury Notes
5.750%, 08/15/10 | | | 600 | | | | 646,125 | | |
| 4.875%, 02/15/12 | | | 62,800 | | | | 68,741,445 | | |
| 4.375%, 08/15/12 | | | 54,700 | | | | 59,311,046 | | |
| 4.000%, 11/15/12 | | | 9,700 | | | | 10,381,270 | | |
| 3.875%, 02/15/13 | | | 27,600 | | | | 29,161,111 | | |
| 3.625%, 05/15/13 | | | 7,700 | | | | 8,030,861 | | |
| 4.250%, 08/15/13 | | | 30,100 | | | | 32,223,465 | | |
| 4.000%, 02/15/14 | | | 18,500 | | | | 19,581,103 | | |
| 4.875%, 08/15/16 | | | 8,200 | | | | 8,738,765 | | |
| TOTAL U.S. TREASURY OBLIGATIONS | | | | | | | 422,335,002 | | |
| TEMPORARY CASH INVESTMENTS — (0.7%) | |
Repurchase Agreement, PNC Capital
Markets, Inc. 0.94%, 11/03/08
(Collateralized by $8,365,000
FNMA 5.00%, 08/25/18,
valued at $8,630,727) to be
repurchased at $8,500,666 | | | 8,500 | | | | 8,500,000 | | |
TOTAL INVESTMENTS — (100.0%)
(Cost $1,198,954,801) | | | | | | $ | 1,230,031,231 | | |
See accompanying Notes to Financial Statements.
98
DFA INFLATION-PROTECTED SECURITIES PORTFOLIO
SCHEDULE OF INVESTMENTS
October 31, 2008
| | | Face
Amount | | Value† | |
| | | (000) | | | |
| U.S. TREASURY OBLIGATIONS — (99.6%) | |
U.S. Treasury Inflation Notes
3.000%, 07/15/12 | | $ | 2,100 | | | $ | 2,496,005 | | |
| 1.875%, 07/15/13 | | | 35,700 | | | | 39,845,374 | | |
| 2.000%, 01/15/14 | | | 30,600 | | | | 33,225,294 | | |
| 2.000%, 07/15/14 | | | 31,700 | | | | 33,604,584 | | |
| 1.625%, 01/15/15 | | | 28,200 | | | | 28,317,580 | | |
| 1.875%, 07/15/15 | | | 26,500 | | | | 26,318,968 | | |
| 2.000%, 01/15/16 | | | 30,550 | | | | 29,753,192 | | |
| 2.500%, 07/15/16 | | | 23,200 | | | | 23,171,582 | | |
| 2.375%, 01/15/17 | | | 28,400 | | | | 28,130,918 | | |
| 2.625%, 07/15/17 | | | 25,200 | | | | 24,962,013 | | |
| 1.625%, 01/15/18 | | | 27,000 | | | | 24,482,380 | | |
| 1.375%, 07/15/18 | | | 13,300 | | | | 11,543,086 | | |
| 2.375%, 01/15/25 | | | 21,700 | | | | 21,947,483 | | |
| 2.000%, 01/15/26 | | | 18,400 | | | | 16,755,248 | | |
| 2.375%, 01/15/27 | | | 12,300 | | | | 11,617,562 | | |
| 1.750%, 01/15/28 | | | 14,200 | | | | 11,693,572 | | |
| TOTAL U.S. TREASURY OBLIGATIONS | | | | | | | 367,864,841 | | |
| TEMPORARY CASH INVESTMENTS — (0.4%) | |
Repurchase Agreement, PNC Capital Markets, Inc. 0.94%, 11/03/08
(Collateralized by $2,115,000 FHLMC 6.584%(r), 03/01/37, valued
at $1,478,222) to be repurchased at $1,455,114 | | | 1,455 | | | | 1,455,000 | | |
TOTAL INVESTMENTS — (100.0%)
(Cost $416,950,888) | | | | | | $ | 369,319,841 | | |
See accompanying Notes to Financial Statements.
99
DFA SHORT-TERM MUNICIPAL BOND PORTFOLIO
SCHEDULE OF INVESTMENTS
October 31, 2008
| | | Face
Amount | | Value�� | |
| | | (000) | | | |
| MUNICIPAL BONDS — (98.8%) | |
| ALABAMA — (0.4%) | |
Alabama State Federal Highway Finance
Authority (RB) Series A (MBIA)
5.000%, 03/01/09 | | $ | 4,000 | | | $ | 4,037,920 | | |
| ARIZONA — (0.4%) | |
Maricopa County Unified School
District (GO)
7.400%, 07/01/10 | | | 3,485 | | | | 3,749,442 | | |
| ARKANSAS — (0.7%) | |
Arkansas State (GO) Series A
5.500%, 08/01/09 | | | 3,885 | | | | 3,992,848 | | |
Fort Smith Water & Sewer (RB)
Series A (FSA)
5.000%, 10/01/09 | | | 2,850 | | | | 2,939,348 | | |
| TOTAL ARKANSAS | | | | | | | 6,932,196 | | |
| CALIFORNIA — (3.1%) | |
California State (GO)
5.250%, 11/01/09 | | | 7,695 | | | | 7,909,537 | | |
California State Department Water
Resources Power Supply
(RB) (ETM) Series A
5.125%, 05/01/12 | | | 1,900 | | | | 2,061,785 | | |
California State Economic Recovery
(GO) Series A
5.000%, 01/01/11 | | | 9,100 | | | | 9,465,183 | | |
California State Economic Recovery
(GO) Series A (MBIA)
5.000%, 07/01/12 | | | 8,400 | | | | 8,846,124 | | |
Los Angeles Wastewater (TECP)
4.500%, 11/03/08 | | | 2,500 | | | | 2,500,000 | | |
| TOTAL CALIFORNIA | | | | | | | 30,782,629 | | |
| COLORADO — (1.0%) | |
Arapahoe County School District
(GO) (FSA)
5.000%, 12/15/10 | | | 9,000 | | | | 9,419,850 | | |
| CONNECTICUT — (2.7%) | |
City of Stamford (GO)
5.000%, 07/15/09 | | | 2,000 | | | | 2,048,140 | | |
Connecticut State (GO)
5.000%, 03/15/12 | | | 5,000 | | | | 5,279,550 | | |
Connecticut State (GO) Series C
5.000%, 12/15/09 | | | 4,000 | | | | 4,133,360 | | |
Connecticut State (GO) Series G (MBIA)
4.500%, 03/15/09 | | | 5,600 | | | | 5,654,040 | | |
Connecticut State (RB) Series A
5.000%, 06/30/09 | | | 5,000 | | | | 5,111,500 | | |
Connecticut State Health & Educational
Facility Authority (GO) Series B (MBIA)
5.000%, 12/01/12 | | | 4,000 | | | | 4,249,200 | | |
| TOTAL CONNECTICUT | | | | | | | 26,475,790 | | |
| | | Face
Amount | | Value† | |
| | | (000) | | | |
| DELAWARE — (2.6%) | |
Delaware State (GO)
5.000%, 08/01/12 | | $ | 11,370 | | | $ | 12,044,127 | | |
Delaware State (GO) Series B
5.000%, 02/01/11 | | | 7,470 | | | | 7,818,924 | | |
| 5.000%, 02/01/12 | | | 5,000 | | | | 5,274,550 | | |
| TOTAL DELAWARE | | | | | | | 25,137,601 | | |
| FLORIDA — (6.8%) | |
Broward County Sales Tax
Revenue (TECP)
1.800%, 12/05/08 | | | 2,624 | | | | 2,624,656 | | |
Florida Municipal Power
Agency (TECP)
1.450%, 11/04/08 | | | 25,818 | | | | 25,818,000 | | |
Florida State Board of Education
(GO) Series C
4.000%, 06/01/09 | | | 4,000 | | | | 4,051,200 | | |
Florida State Board of Education
(GO) Series D
5.000%, 06/01/13 | | | 13,085 | | | | 13,771,701 | | |
Florida State Department of
Environmental Protection
Preservation (RB) Series A (MBIA)
5.000%, 07/01/11 | | | 5,330 | | | | 5,570,809 | | |
| 5.000%, 07/01/11 | | | 5,130 | | | | 5,318,015 | | |
Florida State Department of
Environmental Protection
Preservation (RB) Series B (MBIA)
5.000%, 07/01/11 | | | 5,800 | | | | 6,012,570 | | |
Gainesville Utilities Systems (RB)
Series C (FSA)
5.000%, 10/01/09 | | | 4,000 | | | | 4,119,160 | | |
| TOTAL FLORIDA | | | | | | | 67,286,111 | | |
| GEORGIA — (3.6%) | |
Georgia State (GO) Series B
6.250%, 04/01/09 | | | 2,000 | | | | 2,037,820 | | |
Georgia State (GO) Series C
5.500%, 07/01/12 | | | 8,400 | | | | 9,058,140 | | |
Georgia State (GO) Series D
5.800%, 11/01/09 | | | 2,010 | | | | 2,091,485 | | |
| 5.000%, 08/01/12 | | | 7,100 | | | | 7,538,922 | | |
Henry County School District
(GO) Series A
5.000%, 04/01/13 | | | 14,000 | | | | 14,879,480 | | |
| TOTAL GEORGIA | | | | | | | 35,605,847 | | |
| HAWAII — (0.2%) | |
City & County of Honolulu (GO) (ETM)
Series A (MBIA)
5.000%, 03/01/10 | | | 1,255 | | | | 1,301,673 | | |
City & County of Honolulu
(GO) Series A (MBIA)
5.000%, 03/01/10 | | | 745 | | | | 768,751 | | |
| TOTAL HAWAII | | | | | | | 2,070,424 | | |
100
DFA SHORT-TERM MUNICIPAL BOND PORTFOLIO
CONTINUED
| | | Face
Amount | | Value† | |
| | | (000) | | | |
| ILLINOIS — (2.2%) | |
Chicago Metropolitan Water Reclamation
District - Greater Chicago (GO)
5.500%, 12/01/08 | | $ | 2,000 | | | $ | 2,005,420 | | |
City of Chicago (GO) Series A (FSA)
5.000%, 01/01/13 | | | 8,150 | | | | 8,602,488 | | |
Illinois Education Facilities Authority (TECP)
1.600%, 11/05/08 | | | 8,000 | | | | 8,000,080 | | |
Illinois State (GO) First Series (FSA)
5.500%, 04/01/09 | | | 3,000 | | | | 3,046,050 | | |
| TOTAL ILLINOIS | | | | | | | 21,654,038 | | |
| IOWA — (0.4%) | |
City of Des Moines (GO) Series B
5.000%, 06/01/09 | | | 3,680 | | | | 3,748,190 | | |
| KANSAS — (0.6%) | |
Johnson County Unified School District
(GO) Series A (MBIA)
5.000%, 10/01/11 | | | 5,770 | | | | 6,077,137 | | |
| KENTUCKY — (1.5%) | |
Kentucky Asset Liability Commission
(RB) First Series (MBIA)
5.000%, 09/01/11 | | | 14,300 | | | | 14,945,359 | | |
| MARYLAND — (6.8%) | |
Howard County Maryland (GO)
(TECP) Series D
1.550%, 12/11/08 | | | 4,000 | | | | 4,000,400 | | |
Maryland Health & Higher
Educational Facilities Authority
(TECP) - Johns Hopkins Hospital
3.500%, 11/03/08 | | | 16,500 | | | | 16,500,000 | | |
| 4.000%, 11/17/08 | | | 8,500 | | | | 8,505,865 | | |
| 1.500%, 12/03/08 | | | 2,600 | | | | 2,600,312 | | |
Maryland Health & Higher
Educational Facilities Authority
(TECP) - Johns Hopkins University
1.600%, 11/07/08 | | | 4,625 | | | | 4,625,139 | | |
| 1.550%, 12/05/08 | | | 5,600 | | | | 5,600,448 | | |
Maryland State (GO)
5.250%, 02/15/12 | | | 5,000 | | | | 5,330,750 | | |
Maryland State (GO) Series B
5.250%, 02/01/09 | | | 5,000 | | | | 5,043,400 | | |
| 5.000%, 02/15/13 | | | 14,000 | | | | 14,907,060 | | |
| TOTAL MARYLAND | | | | | | | 67,113,374 | | |
| MASSACHUSETTS — (5.8%) | |
Harvard University (TECP) Series EE
1.400%, 12/04/08 | | | 23,600 | | | | 23,600,000 | | |
Massachusetts School Building Authority (TECP)
1.520%, 12/04/08 | | | 4,700 | | | | 4,700,470 | | |
| 1.570%, 12/11/08 | | | 20,000 | | | | 20,003,400 | | |
Massachusetts Water Resources (TECP)
1.500%, 11/06/08 | | | 4,000 | | | | 4,000,080 | | |
| 1.520%, 12/08/08 | | | 5,000 | | | | 5,000,550 | | |
| TOTAL MASSACHUSETTS | | | | | | | 57,304,500 | | |
| | | Face
Amount | | Value† | |
| | | (000) | | | |
| MICHIGAN — (1.4%) | |
Kent County (GO) Series A
5.000%, 11/01/09 | | $ | 7,235 | | | $ | 7,463,771 | | |
Utica Community Schools (GO)
4.000%, 05/01/09 | | | 6,000 | | | | 6,065,100 | | |
| TOTAL MICHIGAN | | | | | | | 13,528,871 | | |
| MINNESOTA — (3.4%) | |
City of Minneapolis (GO)
5.000%, 12/01/10 | | | 6,840 | | | | 7,156,282 | | |
Minnesota State (GO)
5.000%, 08/01/09 | | | 2,600 | | | | 2,668,900 | | |
University of Minnesota Board of
Regents (TECP)
1.950%, 11/04/08 | | | 23,800 | | | | 23,800,476 | | |
| TOTAL MINNESOTA | | | | | | | 33,625,658 | | |
| MISSISSIPPI — (0.8%) | |
Mississippi State (GO) Series A
5.375%, 12/01/12 | | | 3,350 | | | | 3,595,589 | | |
Mississippi State (GO) Series B
5.000%, 10/01/09 | | | 4,000 | | | | 4,113,280 | | |
| TOTAL MISSISSIPPI | | | | | | | 7,708,869 | | |
| NEBRASKA — (0.8%) | |
Omaha Public Power District (TECP)
1.550%, 12/09/08 | | | 8,000 | | | | 8,000,320 | | |
| NEVADA — (8.2%) | |
Clark County (GO) (AMBAC)
5.000%, 11/01/11 | | | 5,010 | | | | 5,272,374 | | |
Clark County (GO) Series A (FSA)
4.000%, 06/01/09 | | | 3,540 | | | | 3,587,153 | | |
Clark County School District (GO) Series A
5.000%, 06/15/09 | | | 7,000 | | | | 7,137,550 | | |
Clark County School District (GO)
Series A (AMBAC)
4.500%, 06/15/11 | | | 11,000 | | | | 11,405,460 | | |
Clark County School District (GO)
Series F (FSA)
5.000%, 06/15/09 | | | 5,245 | | | | 5,344,812 | | |
Las Vegas Valley Water District (GO)
Series B (MBIA)
5.250%, 06/01/09 | | | 2,830 | | | | 2,886,600 | | |
Las Vegas Valley Water District (TECP)
1.400%, 11/03/08 | | | 21,000 | | | | 21,000,000 | | |
Nevada State (GO)
5.000%, 06/01/13 | | | 12,990 | | | | 13,705,229 | | |
Nevada State (GO) Series A
5.000%, 02/01/10 | | | 10,045 | | | | 10,371,563 | | |
| TOTAL NEVADA | | | | | | | 80,710,741 | | |
| NEW JERSEY — (3.0%) | |
Monmouth County (GO)
4.250%, 09/15/12 | | | 5,115 | | | | 5,310,342 | | |
New Jersey State (GO) (ETM)
5.250%, 08/01/12 | | | 8,400 | | | | 9,011,016 | | |
101
DFA SHORT-TERM MUNICIPAL BOND PORTFOLIO
CONTINUED
| | | Face
Amount | | Value† | |
| | | (000) | | | |
New Jersey Transportation Trust Fund
Authority (RB) Series B (FGIC)
5.250%, 12/15/09 | | $ | 6,130 | | | $ | 6,299,801 | | |
New Jersey Transportation Trust Fund
Authority (RB) Series B (FSA)
5.500%, 12/15/11 | | | 6,035 | | | | 6,373,020 | | |
Princeton University (TECP)
1.550%, 11/05/08 | | | 2,830 | | | | 2,830,028 | | |
| TOTAL NEW JERSEY | | | | | | | 29,824,207 | | |
| NEW MEXICO — (2.3%) | |
New Mexico State (GO)
5.000%, 03/01/12 | | | 10,260 | | | | 10,820,606 | | |
New Mexico State Severance Tax
(RB) (MBIA)
5.000%, 07/01/10 | | | 11,385 | | | | 11,790,761 | | |
| TOTAL NEW MEXICO | | | | | | | 22,611,367 | | |
| NEW YORK — (3.3%) | |
Nassau County Interim Finance Authority
(RB) Series A (AMBAC)
5.000%, 11/15/09 | | | 3,415 | | | | 3,521,514 | | |
New York City (GO) Series G
5.000%, 08/01/10 | | | 5,040 | | | | 5,200,675 | | |
New York City (GO) Series H
5.000%, 08/01/12 | | | 3,000 | | | | 3,110,430 | | |
New York Power Authority (TECP)
1.550%, 11/12/08 | | | 4,400 | | | | 4,399,340 | | |
| 1.470%, 11/13/08 | | | 8,000 | | | | 7,998,480 | | |
New York State Thruway Authority (RB)
(ETM) Series A (MBIA)
5.000%, 04/01/09 | | | 3,500 | | | | 3,550,715 | | |
New York State Tollway Authority (RB) (MBIA)
5.000%, 01/01/10 | | | 5,000 | | | | 5,137,300 | | |
| TOTAL NEW YORK | | | | | | | 32,918,454 | | |
| NORTH CAROLINA — (4.9%) | |
Durham County (GO)
5.500%, 04/01/09 | | | 3,000 | | | | 3,047,910 | | |
Guilford County (GO) Series C
5.000%, 10/01/12 | | | 8,040 | | | | 8,545,877 | | |
North Carolina State (GO) Series A
5.000%, 03/01/09 | | | 4,000 | | | | 4,043,680 | | |
| 5.000%, 03/01/11 | | | 13,000 | | | | 13,644,150 | | |
| 5.000%, 06/01/11 | | | 10,000 | | | | 10,529,400 | | |
Wake County (GO)
4.500%, 03/01/13 | | | 7,800 | | | | 8,167,458 | | |
| TOTAL NORTH CAROLINA | | | | | | | 47,978,475 | | |
| OHIO — (2.2%) | |
Ohio State (GO) Series E
5.000%, 09/15/11 | | | 10,470 | | | | 11,019,047 | | |
Ohio State (RB) Series II-A
5.000%, 12/01/08 | | | 5,000 | | | | 5,011,150 | | |
Ohio State Building Authority (RB) (FSA)
5.000%, 10/01/09 | | | 2,755 | | | | 2,837,071 | | |
Ohio State Common Schools
(GO) Series A
5.000%, 09/15/09 | | | 2,565 | | | | 2,638,564 | | |
| TOTAL OHIO | | | | | | | 21,505,832 | | |
| | | Face
Amount | | Value† | |
| | | (000) | | | |
| OREGON — (0.6%) | |
Salem-Keizer School District No. 24J
(GO) (FSA)
5.000%, 06/15/09 | | $ | 6,055 | | | $ | 6,160,539 | | |
| PENNSYLVANIA — (3.0%) | |
Commonwealth of Pennsylvania
(GO) First Series
5.000%, 08/01/11 | | | 13,000 | | | | 13,685,230 | | |
Commonwealth of Pennsylvania
(GO) First Series (MBIA)
5.000%, 01/01/10 | | | 3,500 | | | | 3,612,735 | | |
| 5.250%, 02/01/13 | | | 5,755 | | | | 6,155,260 | | |
Commonwealth of Pennsylvania
(GO) First Series A
5.000%, 11/01/10 | | | 3,000 | | | | 3,135,120 | | |
Commonwealth of Pennsylvania
(GO) Second Series (FGIC)
5.000%, 10/01/09 | | | 2,950 | | | | 3,034,901 | | |
| TOTAL PENNSYLVANIA | | | | | | | 29,623,246 | | |
| SOUTH CAROLINA — (1.5%) | |
Richland County School District No. 2
(GO) Series B (FGIC)
5.000%, 02/01/10 | | | 1,500 | | | | 1,548,765 | | |
South Carolina Public Service Authority
(TECP)
1.650%, 01/16/09 | | | 11,000 | | | | 11,000,990 | | |
South Carolina State (GO) Series B
5.000%, 04/01/09 | | | 1,900 | | | | 1,925,973 | | |
| TOTAL SOUTH CAROLINA | | | | | | | 14,475,728 | | |
| TENNESSEE — (3.7%) | |
Hamilton County (GO)
5.000%, 03/01/11 | | | 5,700 | | | | 5,969,325 | | |
| 5.000%, 03/01/12 | | | 5,095 | | | | 5,376,703 | | |
Metropolitan Government
Nashville & Davidson County (GO)
5.000%, 11/15/08 | | | 2,000 | | | | 2,001,740 | | |
Shelby County (GO) Series A
5.000%, 04/01/09 | | | 4,195 | | | | 4,249,241 | | |
Tennessee School Bond Authority (TECP)
1.650%, 11/06/08 | | | 3,400 | | | | 3,400,068 | | |
| 3.350%, 11/10/08 | | | 15,000 | | | | 15,003,150 | | |
| TOTAL TENNESSEE | | | | | | | 36,000,227 | | |
| TEXAS — (14.6%) | |
Austin Texas Combined Utility
Systems (TECP)
1.550%, 11/03/08 | | | 25,600 | | | | 25,600,000 | | |
City of Dallas (GO)
4.750%, 02/15/10 | | | 11,675 | | | | 12,025,250 | | |
El Paso Waterworks & Sewer
System (TECP) Series A
3.500%, 11/03/08 | | | 5,000 | | | | 5,000,000 | | |
Houston Texas (GO) (TECP)
Series E-2
1.630%, 01/15/09 | | | 12,000 | | | | 11,999,400 | | |
102
DFA SHORT-TERM MUNICIPAL BOND PORTFOLIO
CONTINUED
| | | Face
Amount | | Value† | |
| | | (000) | | | |
Houston Texas Water & Sewer (TECP)
1.550%, 11/06/08 | | $ | 5,000 | | | $ | 5,000,050 | | |
Katy Independent School District
(GO) Series A
5.000%, 02/15/12 | | | 7,465 | | | | 7,922,679 | | |
San Antonio Electric & Gas (TECP)
1.700%, 11/03/08 | | | 3,800 | | | | 3,799,208 | | |
San Antonio Water System (TECP)
1.550%, 11/06/08 | | | 14,000 | | | | 14,000,140 | | |
Texas A&M University (RB) Series B
5.000%, 05/15/09 | | | 4,000 | | | | 4,065,440 | | |
Texas Municipal Power Agency (TECP)
2.750%, 11/04/08 | | | 7,470 | | | | 7,470,299 | | |
| 4.250%, 11/04/08 | | | 16,180 | | | | 16,181,294 | | |
Texas State (GO) Series B
5.000%, 08/01/09 | | | 4,000 | | | | 4,098,200 | | |
Texas State University Systems
(RB) (FSA)
5.000%, 03/15/09 | | | 2,245 | | | | 2,270,930 | | |
Texas Tech University Board of
Regents (TECP)
1.700%, 11/03/08 | | | 8,300 | | | | 8,300,000 | | |
University of Texas Board of
Regents (TECP)
2.000%, 11/05/08 | | | 15,805 | | | | 15,805,474 | | |
| TOTAL TEXAS | | | | | | | 143,538,364 | | |
| UTAH — (1.8%) | |
Salt Lake County (GO)
5.000%, 06/15/12 | | | 10,060 | | | | 10,672,553 | | |
Utah State (GO) Series A
5.000%, 07/01/12 | | | 6,440 | | | | 6,822,922 | | |
| TOTAL UTAH | | | | | | | 17,495,475 | | |
| VIRGINIA — (3.1%) | |
Fairfax Country (GO) Series A
5.000%, 06/01/09 | | | 3,465 | | | | 3,533,815 | | |
Virginia Commonwealth Transportation
Board (RB)
5.000%, 10/01/09 | | | 5,000 | | | | 5,144,800 | | |
| 5.000%, 09/27/12 | | | 4,040 | | | | 4,285,915 | | |
| | | Face
Amount | | Value† | |
| | | (000) | | | |
Virginia State Public Building Authority
(RB) Series A
5.000%, 08/01/09 | | $ | 4,000 | | | $ | 4,099,120 | | |
Virginia State Public School Authority
(RB) (ETM) Series I
5.250%, 08/01/09 | | | 25 | | | | 25,676 | | |
Virginia State Public School Authority
(RB) Series B
5.000%, 08/01/11 | | | 9,595 | | | | 10,098,162 | | |
Virginia State Public School Authority
(RB) Series I
5.250%, 08/01/09 | | | 3,475 | | | | 3,566,393 | | |
| TOTAL VIRGINIA | | | | | | | 30,753,881 | | |
| WASHINGTON — (1.2%) | |
Grant County Public Utility District No. 2
Priest Rapids (RB) Series H (FSA)
5.000%, 01/01/10 | | | 2,000 | | | | 2,063,960 | | |
Seattle Municipal Light & Power
(RB) (FSA)
4.000%, 08/01/09 | | | 5,940 | | | | 6,040,624 | | |
Snohomish County School District
No. 15 Edmonds (GO) Series A (FSA)
4.500%, 06/01/09 | | | 3,500 | | | | 3,556,945 | | |
| TOTAL WASHINGTON | | | | | | | 11,661,529 | | |
| WISCONSIN — (0.2%) | |
Wisconsin State (GO) Series 1 (MBIA)
5.250%, 05/01/09 | | | 2,000 | | | | 2,033,140 | | |
| TOTAL MUNICIPAL BONDS | | | | | | | 972,495,331 | | |
| | | Shares | | | |
TEMPORARY CASH
INVESTMENTS — (1.2%) | |
BlackRock Liquidity Funds
MuniFund Portfolio | | | 11,540,177 | | | | 11,540,177 | | |
TOTAL INVESTMENTS — (100.0%)
(Cost $988,646,468) | | | | | | $ | 984,035,508 | | |
See accompanying Notes to Financial Statements.
103
DFA CALIFORNIA SHORT-TERM MUNICIPAL BOND PORTFOLIO
SCHEDULE OF INVESTMENTS
October 31, 2008
| | | Face
Amount | | Value† | |
| | | (000) | | | |
| MUNICIPAL BONDS — (96.6%) | |
| CALIFORNIA — (96.6%) | |
Anaheim Union High School District
(GO) Series A (FSA)
5.000%, 08/01/12 | | $ | 1,275 | | | $ | 1,368,228 | | |
Berkeley California University School
District (TRAN)
4.000%, 11/28/08 | | | 4,700 | | | | 4,706,392 | | |
California Communities Note Program
Series B
3.000%, 07/31/09 | | | 4,500 | | | | 4,530,555 | | |
California Educational Facilities
Authority (RB) Series A
5.000%, 04/01/13 | | | 2,250 | | | | 2,425,680 | | |
California Infrastructure & Economic
Development Bank (RB) (FSA)
5.250%, 07/01/13 | | | 2,000 | | | | 2,181,380 | | |
California Infrastructure & Economic
Development Bank (RB)
Series A (AMBAC)
5.000%, 10/01/10 | | | 2,000 | | | | 2,077,260 | | |
California State (GO)
4.000%, 06/01/09 | | | 565 | | | | 570,322 | | |
| 5.000%, 09/01/09 | | | 1,865 | | | | 1,911,439 | | |
| 5.000%, 02/01/10 | | | 1,500 | | | | 1,537,440 | | |
| 5.000%, 03/01/10 | | | 3,000 | | | | 3,077,880 | | |
| 5.250%, 09/01/10 | | | 550 | | | | 569,976 | | |
| 5.000%, 10/01/10 | | | 2,000 | | | | 2,066,360 | | |
| 4.000%, 02/01/11 | | | 1,000 | | | | 1,011,930 | | |
| 5.250%, 03/01/11 | | | 800 | | | | 831,832 | | |
| 5.000%, 04/01/11 | | | 3,000 | | | | 3,105,660 | | |
| 5.000%, 06/01/11 | | | 500 | | | | 518,530 | | |
| 5.000%, 10/01/11 | | | 2,215 | | | | 2,305,350 | | |
| 5.000%, 04/01/12 | | | 1,500 | | | | 1,558,395 | | |
California State Department of Transportation
(RB) Series A (MBIA)
5.000%, 02/01/11 | | | 1,125 | | | | 1,173,071 | | |
California State Department of
Water Resources (RB) Series A
5.500%, 05/01/09 | | | 1,100 | | | | 1,119,778 | | |
| 5.500%, 05/01/10 | | | 700 | | | | 730,086 | | |
California State Department of Water
Resources (RB) Series A (FSA)
5.250%, 05/01/11 | | | 1,450 | | | | 1,524,820 | | |
California State Department of Water
Resources (RB) Series A (MBIA)
5.250%, 05/01/09 | | | 420 | | | | 426,833 | | |
California State Department Water
Resources Power Supply (RB)
(ETM) Series A
5.125%, 05/01/12 | | | 1,850 | | | | 2,007,528 | | |
California State Department Water
Resources Power Supply
(RB) Series A (MBIA)
5.000%, 05/01/11 | | | 1,000 | | | | 1,038,600 | | |
| | | Face
Amount | | Value† | |
| | | (000) | | | |
California State Economic Recovery
(GO) Series A
3.000%, 07/01/09 | | $ | 330 | | | $ | 332,673 | | |
| 4.000%, 07/01/09 | | | 940 | | | | 953,705 | | |
| 5.000%, 07/01/09 | | | 2,535 | | | | 2,588,412 | | |
| 5.000%, 01/01/10 | | | 1,585 | | | | 1,635,324 | | |
| 5.000%, 01/01/11 | | | 2,500 | | | | 2,600,325 | | |
| 3.500%, 07/01/11 | | | 1,075 | | | | 1,084,213 | | |
| 5.000%, 07/01/11 | | | 1,000 | | | | 1,046,470 | | |
California State Economic Recovery
(GO) Series A (MBIA)
5.000%, 07/01/12 | | | 2,475 | | | | 2,606,447 | | |
| 5.250%, 07/01/13 | | | 3,810 | | | | 4,065,270 | | |
Chabot-Las Positas Comminity
College District (GO) (AMBAC)
5.000%, 08/01/11 | | | 1,010 | | | | 1,063,772 | | |
Charter Oak Unified School District
(GO) Series B (FSA)
5.000%, 07/01/13 | | | 2,805 | | | | 3,029,232 | | |
City & County of San Francisco
(GO) (FSA)
4.000%, 06/15/09 | | | 1,200 | | | | 1,218,312 | | |
City & County of San Francisco
(GO) Series A (AMBAC)
5.000%, 06/15/12 | | | 1,600 | | | | 1,697,984 | | |
City & County of San Francisco
(GO) Series R-1 (FGIC)
5.000%, 06/15/12 | | | 3,855 | | | | 4,081,635 | | |
City of Los Angeles (GO) (MBIA)
4.000%, 09/01/10 | | | 1,000 | | | | 1,023,110 | | |
Coast Community College District
(GO) Series A (MBIA)
4.500%, 08/01/09 | | | 1,000 | | | | 1,020,600 | | |
Compton Community Redevelopment
Agency (TAN) Series A (AMBAC)
5.000%, 08/01/09 | | | 1,700 | | | | 1,733,626 | | |
Dublin San Ramon Service
District & East Bay Municipal
Utility District (TECP) Series A
1.450%, 11/13/08 | | | 5,000 | | | | 4,999,250 | | |
East Bay Municipal Utility District,
Water System (TECP)
1.450%, 11/13/08 | | | 400 | | | | 399,940 | | |
| 1.480%, 12/01/08 | | | 500 | | | | 500,065 | | |
El Camino Community College District
(GO) Series A (MBIA)
5.000%, 08/01/13 | | | 2,915 | | | | 3,151,873 | | |
| 5.000%, 08/01/13 | | | 3,060 | | | | 3,308,656 | | |
El Monte Union High School District
(GO) Series A (FSA)
5.000%, 06/01/13 | | | 2,185 | | | | 2,366,486 | | |
Foothill Eastern Transportation Corridor
Agency (RB) (MBIA)
4.600%, 01/15/09 | | | 280 | | | | 280,974 | | |
104
DFA CALIFORNIA SHORT-TERM MUNICIPAL BOND PORTFOLIO
CONTINUED
| | | Face
Amount | | Value† | |
| | | (000) | | | |
Foothill-De Anza Community College
District (GO) Series B
5.250%, 08/01/13 | | $ | 2,000 | | | $ | 2,184,380 | | |
| 5.250%, 08/01/13 | | | 3,675 | | | | 4,013,798 | | |
Fremont Union High School District
(GO) Series B
5.500%, 09/01/09 | | | 500 | | | | 516,900 | | |
Fresno (RB) Series A-1 (AMBAC)
6.250%, 09/01/10 | | | 300 | | | | 317,478 | | |
Industry Public Facilities Authority
(TAN) (MBIA)
4.500%, 05/01/10 | | | 700 | | | | 713,636 | | |
Long Beach Bond Finance Authority
(TAN) (AMBAC)
5.375%, 08/01/12 | | | 1,585 | | | | 1,721,801 | | |
Long Beach Gas Utility (TECP)
1.370%, 11/05/08 | | | 1,900 | | | | 1,900,057 | | |
| 4.550%, 11/12/08 | | | 1,600 | | | | 1,601,008 | | |
Los Angeles County Capital Asset
Leasing Corp. (RB) Series A (AMBAC)
4.000%, 12/01/09 | | | 520 | | | | 528,746 | | |
Los Angeles County Metropolitan
Transportation Authority (RB)
(ETM) Series A (FSA)
5.000%, 07/01/11 | | | 2,500 | | | | 2,676,250 | | |
Los Angeles County Metropolitan
Transportation Authority (RB)
Series C (AMBAC)
6.000%, 07/01/11 | | | 580 | | | | 622,995 | | |
Los Angeles County Public Works Financing
Authority (RB) Series A (MBIA)
5.000%, 12/01/09 | | | 1,300 | | | | 1,335,958 | | |
Los Angeles Department of
Water & Power (RB) Series A-1
5.000%, 07/01/09 | | | 3,600 | | | | 3,675,600 | | |
Los Angeles Department of
Water & Power (RB) Series A-1 (MBIA)
5.000%, 07/01/11 | | | 460 | | | | 483,299 | | |
Los Angeles Department of
Water & Power (TECP)
3.500%, 12/10/08 | | | 400 | | | | 400,848 | | |
Los Angeles Unified School District
(GO) (AMBAC)
5.000%, 07/01/11 | | | 175 | | | | 183,635 | | |
Los Angeles Unified School District
(GO) (MBIA)
5.500%, 07/01/12 | | | 800 | | | | 858,112 | | |
Los Angeles Unified School District
(GO) Series A (FGIC)
6.000%, 07/01/11 | | | 1,000 | | | | 1,074,660 | | |
Los Angeles Unified School District
(GO) Series A (MBIA)
5.250%, 07/01/12 | | | 3,600 | | | | 3,830,796 | | |
Los Angeles Unified School District
(GO) Series H
5.000%, 07/01/09 | | | 1,000 | | | | 1,021,200 | | |
Los Angeles Wastewater (TECP)
4.500%, 11/03/08 | | | 5,500 | | | | 5,500,000 | | |
| | | Face
Amount | | Value† | |
| | | (000) | | | |
Metropolitan Water District of
Southern California (RB)
5.750%, 07/01/09 | | $ | 300 | | | $ | 308,040 | | |
Milpitas Unified School District (TRAN)
4.000%, 12/12/08 | | | 2,150 | | | | 2,155,526 | | |
Mountain View-Whisman School District
(GO) Series D (MBIA)
5.000%, 06/01/12 | | | 1,480 | | | | 1,602,263 | | |
Municipal Improvement Corp. of
Los Angeles (TECP)
4.250%, 11/17/08 | | | 5,800 | | | | 5,804,988 | | |
North City West School Facilities
Financing Authority (STRB)
Series C (AMBAC)
5.000%, 09/01/09 | | | 300 | | | | 306,057 | | |
Norwalk Redevelopment Agency
(TAN) Series A (MBIA)
4.000%, 10/01/10 | | | 670 | | | | 685,430 | | |
Peralta Community College District
(GO) Series A (FGIC)
8.000%, 08/01/09 | | | 300 | | | | 313,122 | | |
Riverside County Transportation
Commission (TECP)
1.420%, 11/14/08 | | | 1,000 | | | | 999,820 | | |
Sacramento Municipal Utility District
(RB) Series S (FSA)
5.000%, 11/15/08 | | | 1,550 | | | | 1,551,457 | | |
Sacramento Transportation Authority
(RB) Series A
4.000%, 10/01/09 | | | 1,400 | | | | 1,431,990 | | |
San Diego County Water Authority (TECP)
1.450%, 02/05/09 | | | 2,650 | | | | 2,649,285 | | |
San Francisco City & County Public
Utilities Commission (RB) Series A (FSA)
5.000%, 11/01/12 | | | 4,810 | | | | 5,111,395 | | |
San Joaquin County Transportation
Authority (TECP)
1.400%, 11/06/08 | | | 800 | | | | 800,032 | | |
San Jose Financing Authority (TECP)
1.480%, 11/05/08 | | | 3,700 | | | | 3,700,111 | | |
San Jose Unified School District
(GO) (FGIC)
5.000%, 08/01/11 | | | 1,300 | | | | 1,367,470 | | |
| 5.000%, 08/01/12 | | | 5,000 | | | | 5,291,000 | | |
San Leandro Unified School District
(GO) Series A (FSA)
6.000%, 08/01/10 | | | 615 | | | | 649,003 | | |
San Mateo County Community
College District (GO) Series A
4.500%, 09/01/13 | | | 2,000 | | | | 2,086,140 | | |
Sonoma County (RB) Series A (FGIC)
4.000%, 09/01/12 | | | 1,950 | | | | 2,002,806 | | |
University of California (RB)
Series A (AMBAC)
5.000%, 05/15/11 | | | 1,140 | | | | 1,198,505 | | |
University of California (RB)
Series E (MBIA)
5.000%, 05/15/13 | | | 1,560 | | | | 1,655,176 | | |
105
DFA CALIFORNIA SHORT-TERM MUNICIPAL BOND PORTFOLIO
CONTINUED
| | | Face
Amount | | Value† | |
| | | (000) | | | |
University of California (RB) Series J (MBIA)
5.000%, 05/15/12 | | $ | 450 | | | $ | 476,046 | | |
University of California (TECP) Series A
1.450%, 11/12/08 | | | 900 | | | | 899,874 | | |
| 1.420%, 12/10/08 | | | 2,900 | | | | 2,900,058 | | |
| TOTAL MUNICIPAL BONDS | | | | | | | 172,270,430 | | |
| TEMPORARY CASH INVESTMENTS — (3.4%) | |
Repurchase Agreement, PNC Capital Markets, Inc. 0.94%, 11/03/08
(Collateralized by $8,290,000 FHLMC 6.275%(r), 09/01/36, valued at $6,206,064)
to be repurchased at $6,114,479 | | | 6,114 | | | | 6,114,000 | | |
TOTAL INVESTMENTS — (100.0%)
(Cost $179,433,299) | | | | | | $ | 178,384,430 | | |
See accompanying Notes to Financial Statements.
106
DFA INVESTMENT DIMENSIONS GROUP INC.
STATEMENTS OF ASSETS AND LIABILITIES
OCTOBER 31, 2008
(Amounts in thousands, except share and per share amounts)
| | | U.S.
Large
Company
Portfolio | | Enhanced
U.S. Large
Company
Portfolio | | U.S.
Large Cap
Value
Portfolio | | U.S
Targeted
Value Portfolio | |
| ASSETS: | |
| Investments in Affiliated Investment Companies at Value | | $ | 2,544,364 | | | $ | 200,349 | | | $ | 5,331,340 | | | | — | | |
Investments at Value (including $0, $0, $0 and $202,129 of
securities on loan, respectively) | | | — | | | | — | | | | — | | | $ | 856,029 | | |
| Temporary Cash Investments at Value & Cost | | | — | | | | — | | | | — | | | | 14,748 | | |
| Collateral Received from Securities on Loan at Value & Cost | | | — | | | | — | | | | — | | | | 208,725 | | |
| Cash | | | — | | | | — | | | | — | | | | 2,600 | | |
| Receivables: | |
Investment Securities/Affiliated Investment
Companies Sold | | | — | | | | — | | | | — | | | | 1,662 | | |
| Dividends and Interest | | | — | | | | — | | | | — | | | | 474 | | |
| Securities Lending Income | | | — | | | | — | | | | — | | | | 472 | | |
| Fund Shares Sold | | | 10,551 | | | | 133 | | | | 11,454 | | | | 8,710 | | |
| Fund Margin Variation | | | — | | | | — | | | | — | | | | 3 | | |
| Prepaid Expenses and Other Assets | | | 26 | | | | 21 | | | | 83 | | | | 49 | | |
| Total Assets | | | 2,554,941 | | | | 200,503 | | | | 5,342,877 | | | | 1,093,472 | | |
| LIABILITIES: | |
| Payables: | |
| Upon Return of Securities Loaned | | | — | | | | — | | | | — | | | | 208,725 | | |
Investment Securities/Affiliated Investment
Companies Purchased | | | 5,691 | | | | 65 | | | | 2,282 | | | | — | | |
| Fund Shares Redeemed | | | 4,860 | | | | 68 | | | | 9,172 | | | | 1,648 | | |
| Due to Advisor | | | 210 | | | | 26 | | | | 667 | | | | 252 | | |
| Accrued Expenses and Other Liabilities | | | 142 | | | | 13 | | | | 308 | | | | 85 | | |
| Total Liabilities | | | 10,903 | | | | 172 | | | | 12,429 | | | | 210,710 | | |
| NET ASSETS | | $ | 2,544,038 | | | $ | 200,331 | | | $ | 5,330,448 | | | $ | 882,762 | | |
NET ASSET VALUE, OFFERING AND REDEMPTION
PRICE PER SHARE: | | | | | |
Class R1 Shares — based on net assets of $0; $0;
$0; and $25,599 and shares outstanding of 0;
0; 0; and 3,446,723, respectively | | | N/A | | | | N/A | | | | N/A | | | $ | 7.43 | | |
| NUMBER OF SHARES AUTHORIZED | | | 25,000,000 | * | | | 25,000,000 | * | | | 25,000,000 | * | | | 25,000,000 | | |
Class R2 Shares — based on net assets of $0; $0;
$0; and $1,715 and shares outstanding of 0;
0; 0; and 219,184, respectively | | | N/A | | | | N/A | | | | N/A | | | $ | 7.83 | | |
| NUMBER OF SHARES AUTHORIZED | | | 25,000,000 | * | | | 25,000,000 | * | | | 25,000,000 | * | | | 25,000,000 | | |
Institutional Class Shares — based on net assets of
$2,544,038; $200,331; $5,330,448; and $855,448 and
shares outstanding of 89,053,472; 30,950,038;
365,508,917; and 78,947,361, respectively | | $ | 28.57 | | | $ | 6.47 | | | $ | 14.58 | | | $ | 10.84 | | |
| NUMBER OF SHARES AUTHORIZED | | | 200,000,000 | | | | 150,000,000 | | | | 500,000,000 | | | | 100,000,000 | | |
| Investments in Affiliated Investment Companies at Cost | | $ | 2,882,360 | | | $ | 260,777 | | | $ | 7,153,912 | | | $ | — | | |
| Investments at Cost | | $ | — | | | $ | — | | | $ | — | | | $ | 1,198,879 | | |
| NET ASSETS CONSIST OF: | |
| Paid-In Capital | | $ | 3,086,272 | | | $ | 351,325 | | | $ | 7,319,838 | | | $ | 1,225,817 | | |
Undistributed Net Investment Income (Distributions in
Excess of Net Investment Income) | | | 10,863 | | | | 15,378 | | | | 25,004 | | | | 2,098 | | |
| Accumulated Net Realized Gain (Loss) | | | (215,101 | ) | | | (165,525 | ) | | | (191,822 | ) | | | (2,306 | ) | |
| Net Unrealized Appreciation (Depreciation) | | | (337,996 | ) | | | (847 | ) | | | (1,822,572 | ) | | | (342,847 | ) | |
| NET ASSETS | | $ | 2,544,038 | | | $ | 200,331 | | | $ | 5,330,448 | | | $ | 882,762 | | |
* Share class has not yet commenced operations. See Organization note in Notes to Financial Statements.
See accompanying Notes to Financial Statements.
107
DFA INVESTMENT DIMENSIONS GROUP INC.
STATEMENTS OF ASSETS AND LIABILITIES
OCTOBER 31, 2008
(Amounts in thousands, except share and per share amounts)
| | | U.S.
Small Cap
Value
Portfolio | | U.S.
Core
Equity 1
Portfolio | | U.S.
Core
Equity 2
Portfolio | | U.S.
Vector
Equity
Portfolio | |
| ASSETS: | |
| Investments in Affiliated Investment Companies at Value | | $ | 5,505,604 | | | | — | | | | — | | | | — | | |
Investments at Value (including $0, $242,859, $452,044, and
$178,676 of securities on loan, respectively) | | | — | | | $ | 1,308,801 | | | $ | 2,463,994 | | | $ | 839,788 | | |
| Temporary Cash Investments at Value & Cost | | | — | | | | 30,450 | | | | 51,174 | | | | 11,370 | | |
| Collateral Received from Securities on Loan at Value & Cost | | | — | | | | 247,370 | | | | 462,981 | | | | 182,985 | | |
| Receivables: | |
Investment Securities/Affiliated Investment
Companies Sold | | | 26 | | | | 270 | | | | 993 | | | | 728 | | |
| Dividends and Interest | | | — | | | | 1,483 | | | | 2,944 | | | | 750 | | |
| Securities Lending Income | | | — | | | | 345 | | | | 749 | | | | 395 | | |
| Fund Shares Sold | | | 17,835 | | | | 8,364 | | | | 14,002 | | | | 3,811 | | |
| Fund Margin Variation | | | — | | | | 2 | | | | 1 | | | | — | | |
| Prepaid Expenses and Other Assets | | | 38 | | | | 89 | | | | 114 | | | | 41 | | |
| Total Assets | | | 5,523,503 | | | | 1,597,174 | | | | 2,996,952 | | | | 1,039,868 | | |
| LIABILITIES: | |
| Payables: | |
| Upon Return of Securities Loaned | | | — | | | | 247,370 | | | | 462,981 | | | | 182,985 | | |
Investment Securities/Affiliated Investment
Companies Purchased | | | 13,987 | | | | 14,944 | | | | 27,057 | | | | 3,160 | | |
| Fund Shares Redeemed | | | 3,874 | | | | 14,019 | | | | 5,306 | | | | 2,816 | | |
| Due to Advisor | | | 1,397 | | | | 179 | | | | 396 | | | | 211 | | |
| Accrued Expenses and Other Liabilities | | | 300 | | | | 100 | | | | 184 | | | | 73 | | |
| Total Liabilities | | | 19,558 | | | | 276,612 | | | | 495,924 | | | | 189,245 | | |
| NET ASSETS | | $ | 5,503,945 | | | $ | 1,320,562 | | | $ | 2,501,028 | | | $ | 850,623 | | |
NET ASSET VALUE, OFFERING AND REDEMPTION
PRICE PER SHARE: | |
Institutional Class Shares — based on net assets of
$5,503,945; $1,320,562; $2,501,028; and $850,623 and
shares outstanding of 337,185,867; 169,004,276;
323,552,903; and 113,754,843, respectively | | $ | 16.32 | | | $ | 7.81 | | | $ | 7.73 | | | $ | 7.48 | | |
| NUMBER OF SHARES AUTHORIZED | | | 650,000,000 | | | | 200,000,000 | | | | 400,000,000 | | | | 200,000,000 | | |
| Investments in Affiliated Investment Companies at Cost | | $ | 7,888,263 | | | $ | — | | | $ | — | | | $ | — | | |
| Investments at Cost | | $ | — | | | $ | 1,791,454 | | | $ | 3,501,011 | | | $ | 1,245,684 | | |
| NET ASSETS CONSIST OF: | |
| Paid-In Capital | | $ | 7,245,757 | | | $ | 1,825,549 | | | $ | 3,599,193 | | | $ | 1,268,589 | | |
Undistributed Net Investment Income (Distributions in
Excess of Net Investment Income) | | | 31,701 | | | | 257 | | | | 399 | | | | 3,637 | | |
| Accumulated Net Realized Gain (Loss) | | | (391,234 | ) | | | (22,593 | ) | | | (61,548 | ) | | | (15,707 | ) | |
| Net Unrealized Appreciation (Depreciation) | | | (1,382,279 | ) | | | (482,651 | ) | | | (1,037,016 | ) | | | (405,896 | ) | |
| NET ASSETS | | $ | 5,503,945 | | | $ | 1,320,562 | | | $ | 2,501,028 | | | $ | 850,623 | | |
See accompanying Notes to Financial Statements.
108
DFA INVESTMENT DIMENSIONS GROUP INC.
STATEMENTS OF ASSETS AND LIABILITIES
OCTOBER 31, 2008
(Amounts in thousands, except share and per share amounts)
| | | T.A. U.S.
Core
Equity 2
Portfolio | | U.S.
Small
Cap
Portfolio | | U.S.
Micro
Cap
Portfolio | | DFA
Real Estate
Securities
Portfolio | |
| ASSETS: | |
| Investments in Affiliated Investment Companies at Value | | | — | | | $ | 2,067,436 | | | $ | 2,925,347 | | | | — | | |
Investments at Value (including $52,439, $0, $0 and
$461,107* of securities on loan, respectively) | | $ | 567,158 | | | | — | | | | — | | | $ | 1,704,785 | | |
| Temporary Cash Investments at Value & Cost | | | 28,376 | | | | — | | | | — | | | | 51,982 | | |
| Collateral Received from Securities on Loan at Value & Cost | | | 53,922 | | | | — | | | | — | | | | 452,372 | * | |
| Receivables: | |
Investment Securities/Affiliated Investment
Companies Sold | | | 188 | | | | 5,766 | | | | 1,558 | | | | — | | |
| Dividends and Interest | | | 655 | | | | — | | | | — | | | | 3,974 | | |
| Securities Lending Income | | | 102 | | | | — | | | | — | | | | 426 | | |
| Fund Shares Sold | | | 13,833 | | | | 7,554 | | | | 3,188 | | | | 5,588 | | |
| Fund Margin Variation | | | 1 | | | | — | | | | — | | | | 10 | | |
| Prepaid Expenses and Other Assets | | | 53 | | | | 70 | | | | 40 | | | | 34 | | |
| Total Assets | | | 664,288 | | | | 2,080,826 | | | | 2,930,133 | | | | 2,219,171 | | |
| LIABILITIES: | |
| Payables: | |
| Upon Return of Securities Loaned | | | 53,922 | | | | — | | | | — | | | | 452,372 | * | |
Investment Securities/Affiliated Investment
Companies Purchased | | | 20,889 | | | | 33 | | | | 17 | | | | 17,236 | | |
| Fund Shares Redeemed | | | 4,170 | | | | 13,288 | | | | 4,729 | | | | 1,974 | | |
| Due to Advisor | | | 94 | | | | 550 | | | | 1,000 | | | | 467 | | |
| Accrued Expenses and Other Liabilities | | | 48 | | | | 106 | | | | 162 | | | | 161 | | |
| Total Liabilities | | | 79,123 | | | | 13,977 | | | | 5,908 | | | | 472,210 | | |
| NET ASSETS | | $ | 585,165 | | | $ | 2,066,849 | | | $ | 2,924,225 | | | $ | 1,746,961 | | |
NET ASSET VALUE, OFFERING AND REDEMPTION
PRICE PER SHARE: | |
Institutional Class Shares — based on net assets of
$585,165; $2,066,849; $2,924,225; and $1,746,961 and
shares outstanding of 92,807,845; 154,770,228;
318,183,127; and 108,092,811, respectively | | $ | 6.31 | | | $ | 13.35 | | | $ | 9.19 | | | $ | 16.16 | | |
| NUMBER OF SHARES AUTHORIZED | | | 100,000,000 | | | | 400,000,000 | | | | 650,000,000 | | | | 250,000,000 | | |
| Investments in Affiliated Investment Companies at Cost | | $ | — | | | $ | 2,660,195 | | | $ | 3,771,170 | | | $ | — | | |
| Investments at Cost | | $ | 748,162 | | | $ | — | | | $ | — | | | $ | 2,178,080 | | |
| NET ASSETS CONSIST OF: | |
| Paid-In Capital | | $ | 771,729 | | | $ | 2,768,732 | | | $ | 3,723,054 | | | $ | 2,286,125 | | |
Undistributed Net Investment Income (Distributions in
Excess of Net Investment Income) | | | 1,827 | | | | 7,754 | | | | 36,069 | | | | 34,213 | | |
| Accumulated Net Realized Gain (Loss) | | | (7,388 | ) | | | (387,660 | ) | | | (462,795 | ) | | | (100,092 | ) | |
| Net Unrealized Appreciation (Depreciation) | | | (181,003 | ) | | | (321,977 | ) | | | (372,103 | ) | | | (473,285 | ) | |
| NET ASSETS | | $ | 585,165 | | | $ | 2,066,849 | | | $ | 2,924,225 | | | $ | 1,746,961 | | |
* Securities Lending Collateral is less than the market value of securities loaned due to market increases on October 31, 2008. Collateral was subsequently adjusted on November 3, 2008 and the Portfolio remained in compliance.
See accompanying Notes to Financial Statements.
109
DFA INVESTMENT DIMENSIONS GROUP INC.
STATEMENTS OF ASSETS AND LIABILITIES
OCTOBER 31, 2008
(Amounts in thousands, except share and per share amounts)
| | | Large
Cap
International
Portfolio | | International
Core
Equity
Portfolio | | T.A. World
ex U.S. Core
Equity
Portfolio | | International
Small
Company
Portfolio | |
| ASSETS: | |
| Investments in Affiliated Investment Companies at Value | | | — | | | | — | | | | — | | | $ | 3,076,553 | | |
Investments at Value (including $141,210, $311,374, $23,881,
and $0 of securities on loan, respectively) | | $ | 1,184,839 | | | $ | 1,909,121 | | | $ | 219,926 | | | | — | | |
| Temporary Cash Investments at Value & Cost | | | 19,142 | | | | 63,569 | | | | 10,741 | | | | 10,033 | | |
| Collateral Received from Securities on Loan at Value & Cost | | | 143,967 | | | | 349,195 | | | | 26,986 | | | | — | | |
| Foreign Currencies at Value | | | 5,773 | | | | 12,789 | | | | 9,873 | | | | — | | |
| Cash | | | 15 | | | | 16 | | | | 102 | | | | 15 | | |
| Receivables: | |
| Investment Securities/Affiliated Investment Company Sold | | | — | | | | 1,111 | | | | 14 | | | | — | | |
| Dividends, Interest, and Tax Reclaims | | | 4,579 | | | | 7,061 | | | | 426 | | | | — | | |
| Securities Lending Income | | | 217 | | | | 601 | | | | 31 | | | | — | | |
| Fund Shares Sold | | | 4,752 | | | | 16,571 | | | | 5,479 | | | | 6,271 | | |
| Fund Margin Variation | | | — | | | | 15 | | | | 1 | | | | — | | |
| Prepaid Expenses and Other Assets | | | 52 | | | | 126 | | | | 17 | | | | 76 | | |
| Deferred Offering Costs | | | — | | | | — | | | | 15 | | | | — | | |
| Total Assets | | | 1,363,336 | | | | 2,360,175 | | | | 273,611 | | | | 3,092,948 | | |
| LIABILITIES: | |
| Payables: | |
| Upon Return of Securities Loaned | | | 143,967 | | | | 349,195 | | | | 26,986 | | | | — | | |
Investment Securities/Affiliated Investment
Companies Purchased | | | 9,909 | | | | 25,674 | | | | 17,554 | | | | — | | |
| Fund Shares Redeemed | | | 2,182 | | | | 3,304 | | | | 662 | | | | 7,234 | | |
| Due to Advisor | | | 270 | | | | 569 | | | | 33 | | | | 1,099 | | |
| Accrued Expenses and Other Liabilities | | | 148 | | | | 384 | | | | 58 | | | | 242 | | |
| Total Liabilities | | | 156,476 | | | | 379,126 | | | | 45,293 | | | | 8,575 | | |
| NET ASSETS | | $ | 1,206,860 | | | $ | 1,981,049 | | | $ | 228,318 | | | $ | 3,084,373 | | |
NET ASSET VALUE, OFFERING AND REDEMPTION
PRICE PER SHARE: | |
Institutional Class Shares — based on net assets of
$1,206,860; $1,981,049; $228,318; and $3,084,373 and
shares outstanding of 81,473,186; 265,577,510;
39,055,733; and 306,355,912; respectively | | $ | 14.81 | | | $ | 7.46 | | | $ | 5.85 | | | $ | 10.07 | | |
| NUMBER OF SHARES AUTHORIZED | | | 200,000,000 | | | | 250,000,000 | | | | 100,000,000 | | | | 500,000,000 | | |
| Investments in Affiliated Investment Companies at Cost | | $ | — | | | $ | — | | | $ | — | | | $ | 4,383,238 | | |
| Investments at Cost | | $ | 1,468,627 | | | $ | 3,189,263 | | | $ | 307,633 | | | $ | — | | |
| Foreign Currencies at Cost | | $ | 5,762 | | | $ | 12,667 | | | $ | 9,909 | | | $ | — | | |
| NET ASSETS CONSIST OF: | |
| Paid-In Capital | | $ | 1,510,715 | | | $ | 3,272,773 | | | $ | 317,280 | | | $ | 4,508,252 | | |
Undistributed Net Investment Income (Distributions in
Excess of Net Investment Income) | | | 449 | | | | (485 | ) | | | 1,014 | | | | 8,898 | | |
| Accumulated Net Realized Gain (Loss) | | | (20,632 | ) | | | (11,384 | ) | | | (2,290 | ) | | | (126,628 | ) | |
| Net Unrealized Foreign Exchange Gain (Loss) | | | 105 | | | | 150 | | | | 56 | | | | 536 | | |
| Net Unrealized Appreciation (Depreciation) | | | (283,777 | ) | | | (1,280,005 | ) | | | (87,742 | ) | | | (1,306,685 | ) | |
| NET ASSETS | | $ | 1,206,860 | | | $ | 1,981,049 | | | $ | 228,318 | | | $ | 3,084,373 | | |
See accompanying Notes to Financial Statements.
110
DFA INVESTMENT DIMENSIONS GROUP INC.
STATEMENTS OF ASSETS AND LIABILITIES
OCTOBER 31, 2008
(Amounts in thousands, except share and per share amounts)
| | | Japanese
Small
Company
Portfolio | | Asia
Pacific
Small
Company
Portfolio | | United
Kingdom
Small
Company
Portfolio | | Continental
Small
Company
Portfolio | |
| ASSETS: | |
| Investments in Affiliated Investment Companies at Value | | $ | 133,439 | | | $ | 64,067 | | | $ | 25,891 | | | $ | 94,027 | | |
| Receivables: | |
| Affiliated Investment Companies Sold | | | 138 | | | | — | | | | 24 | | | | — | | |
| Fund Shares Sold | | | 84 | | | | 290 | | | | 65 | | | | 203 | | |
| Prepaid Expenses and Other Assets | | | 6 | | | | 12 | | | | 7 | | | | 11 | | |
| Total Assets | | | 133,667 | | | | 64,369 | | | | 25,987 | | | | 94,241 | | |
| LIABILITIES: | |
| Payables: | |
| Affiliated Companies Purchased | | | — | | | | 142 | | | | — | | | | 55 | | |
| Fund Shares Redeemed | | | 222 | | | | 148 | | | | 89 | | | | 148 | | |
| Due to Advisor | | | 43 | | | | 11 | | | | 4 | | | | 22 | | |
| Accrued Expenses and Other Liabilities | | | 29 | | | | 24 | | | | 11 | | | | 28 | | |
| Total Liabilities | | | 294 | | | | 325 | | | | 104 | | | | 253 | | |
| NET ASSETS | | $ | 133,373 | | | $ | 64,044 | | | $ | 25,883 | | | $ | 93,988 | | |
NET ASSET VALUE, OFFERING AND REDEMPTION
PRICE PER SHARE: | |
Institutional Class Shares — based on net assets of
$133,373; $64,044; $25,883; and $93,988 and shares
outstanding of 11,140,291; 5,487,486; 1,813,838;
and 8,760,711, respectively | | $ | 11.97 | | | $ | 11.67 | | | $ | 14.27 | | | $ | 10.73 | | |
| NUMBER OF SHARES AUTHORIZED | | | 50,000,000 | | | | 50,000,000 | | | | 70,000,000 | | | | 50,000,000 | | |
| Investments in Affiliated Investment Companies at Cost | | $ | 257,466 | | | $ | 108,804 | | | $ | 38,132 | | | $ | 133,729 | | |
| NET ASSETS CONSIST OF: | |
| Paid-In Capital | | $ | 327,247 | | | $ | 138,918 | | | $ | 39,094 | | | $ | 150,264 | | |
Undistributed Net Investment Income (Distributions in
Excess of Net Investment Income) | | | 964 | | | | 412 | | | | (41 | ) | | | (43 | ) | |
| Accumulated Net Realized Gain (Loss) | | | (70,888 | ) | | | (30,530 | ) | | | (940 | ) | | | (16,553 | ) | |
| Net Unrealized Foreign Exchange Gain (Loss) | | | 77 | | | | (19 | ) | | | 11 | | | | 22 | | |
| Net Unrealized Appreciation (Depreciation) | | | (124,027 | ) | | | (44,737 | ) | | | (12,241 | ) | | | (39,702 | ) | |
| NET ASSETS | | $ | 133,373 | | | $ | 64,044 | | | $ | 25,883 | | | $ | 93,988 | | |
See accompanying Notes to Financial Statements.
111
DFA INVESTMENT DIMENSIONS GROUP INC.
STATEMENTS OF ASSETS AND LIABILITIES
OCTOBER 31, 2008
(Amounts in thousands, except share and per share amounts)
| | | DFA
International
Real Estate
Securities
Portfolio | | DFA
Global
Real Estate
Securities
Portfolio | | DFA
International
Small Cap
Value
Portfolio | | International
Vector
Equity
Portfolio | |
| ASSETS: | |
Investments in Affiliated Investment
Companies at Value | | | — | | | $ | 89,142 | | | | — | | | | — | | |
Investments at Value (including $101,389, $0, $785,384,
and $4,472 of securities on loan, respectively) | | $ | 384,254 | | | | — | | | $ | 4,633,011 | | | $ | 62,417 | | |
| Temporary Cash Investments at Value & Cost | | | 15,954 | | | | 1,721 | | | | 55,893 | | | | 5,127 | | |
Collateral Received from Securities on Loan
at Value & Cost | | | 105,762 | | | | — | | | | 860,786 | | | | 4,892 | | |
| Foreign Currencies at Value | | | 12,166 | | | | — | | | | 60,130 | | | | 4,553 | | |
| Cash | | | 15 | | | | — | | | | 15 | | | | 16 | | |
| Receivables: | |
Investment Securities/Affiliated Investment
Companies Sold | | | 6 | | | | — | | | | 56,314 | | | | — | | |
| Dividends, Interest, and Tax Reclaims | | | 2,771 | | | | 3 | | | | 22,846 | | | | 112 | | |
| Securities Lending Income | | | 156 | | | | — | | | | 1,441 | | | | 5 | | |
| Fund Shares Sold | | | 4,116 | | | | 1,433 | | | | 5,964 | | | | 3,890 | | |
| Fund Margin Variation | | | — | | | | — | | | | 28 | | | | 1 | | |
| Prepaid Expenses and Other Assets | | | 19 | | | | 4 | | | | 78 | | | | — | | |
| Deferred Offering Costs | | | — | | | | 23 | | | | — | | | | 17 | | |
| Total Assets | | | 525,219 | | | | 92,326 | | | | 5,696,506 | | | | 81,030 | | |
| LIABILITIES: | |
| Payables: | |
| Upon Return of Securities Loaned | | | 105,762 | | | | — | | | | 860,786 | | | | 4,892 | | |
Investment Securities/Affiliated Investment
Companies Purchased | | | 23,794 | | | | 1,536 | | | | 24,814 | | | | 9,131 | | |
| Fund Shares Redeemed | | | 998 | | | | 105 | | | | 7,882 | | | | 210 | | |
| Due to Advisor | | | 123 | | | | 3 | | | | 2,743 | | | | 3 | | |
| Accrued Expenses and Other Liabilities | | | 62 | | | | 10 | | | | 533 | | | | 20 | | |
| Total Liabilities | | | 130,739 | | | | 1,654 | | | | 896,758 | | | | 14,256 | | |
| NET ASSETS | | $ | 394,480 | | | $ | 90,672 | | | $ | 4,799,748 | | | $ | 66,774 | | |
NET ASSET VALUE, OFFERING AND
REDEMPTION PRICE PER SHARE: | |
Institutional Class Shares — based on net assets of
$394,480; $90,672; $4,799,748; and $66,774 and
shares outstanding of 94,352,429; 15,007,588;
443,580,863; and 9,906,755, respectively | | $ | 4.18 | | | $ | 6.04 | | | $ | 10.82 | | | $ | 6.74 | | |
| NUMBER OF SHARES AUTHORIZED | | | 100,000,000 | | | | 100,000,000 | | | | 650,000,000 | | | | 100,000,000 | | |
Investments in Affiliated Investment
Companies at Cost | | $ | — | | | $ | 123,810 | | | $ | — | | | $ | — | | |
| Investments at Cost | | $ | 773,677 | | | $ | — | | | $ | 7,183,033 | | | $ | 79,302 | | |
| Foreign Currencies at Cost | | $ | 12,120 | | | $ | — | | | $ | 62,477 | | | $ | 4,570 | | |
| NET ASSETS CONSIST OF: | |
| Paid-In Capital | | $ | 793,503 | | | $ | 125,614 | | | $ | 7,326,261 | | | $ | 83,455 | | |
Undistributed Net Investment Income
(Distributions in Excess of Net Investment
Income) | | | 4,089 | | | | 6 | | | | 681 | | | | 232 | | |
| Accumulated Net Realized Gain (Loss) | | | (13,625 | ) | | | (280 | ) | | | 24,680 | | | | (27 | ) | |
| Net Unrealized Foreign Exchange Gain (Loss) | | | (110 | ) | | | — | | | | 467 | | | | 15 | | |
| Net Unrealized Appreciation (Depreciation) | | | (389,377 | ) | | | (34,668 | ) | | | (2,552,341 | ) | | | (16,901 | ) | |
| NET ASSETS | | $ | 394,480 | | | $ | 90,672 | | | $ | 4,799,748 | | | $ | 66,774 | | |
See accompanying Notes to Financial Statements.
112
DFA INVESTMENT DIMENSIONS GROUP INC.
STATEMENTS OF ASSETS AND LIABILITIES
OCTOBER 31, 2008
(Amounts in thousands, except share and per share amounts)
| | | Emerging
Markets
Portfolio | | Emerging
Markets
Small Cap
Portfolio | | Emerging
Markets
Core Equity
Portfolio | | DFA
One-Year
Fixed Income
Portfolio | |
| ASSETS: | |
| Investments in Affiliated Investment Companies at Value | | $ | 1,508,866 | | | $ | 547,574 | | | | — | | | $ | 3,194,750 | | |
Investments at Value (including $0, $0, $169,619 and
$0 of securities on loan, respectively) | | | — | | | | — | | | $ | 1,131,199 | | | | — | | |
| Temporary Cash Investments at Value & Cost | | | — | | | | — | | | | 42,221 | | | | — | | |
Collateral Received from Securities on Loan at
Value & Cost | | | — | | | | — | | | | 198,014 | | | | — | | |
| Foreign Currencies at Value | | | — | | | | — | | | | 4,474 | | | | — | | |
| Cash | | | — | | | | — | | | | 2,210 | | | | — | | |
| Receivables: | |
Investment Securities/Affiliated Investment
Companies Sold | | | — | | | | 61 | | | | 23,549 | | | | 12,121 | | |
| Dividends, Interest, and Tax Reclaims | | | — | | | | — | | | | 1,531 | | | | — | | |
| Securities Lending Income | | | — | | | | — | | | | 399 | | | | — | | |
| Fund Shares Sold | | | 2,849 | | | | 902 | | | | 6,524 | | | | 2,621 | | |
| Fund Margin Variation | | | — | | | | — | | | | 4 | | | | — | | |
| Prepaid Expenses and Other Assets | | | 49 | | | | 38 | | | | 51 | | | | 80 | | |
| Total Assets | | | 1,511,764 | | | | 548,575 | | | | 1,410,176 | | | | 3,209,572 | | |
| LIABILITIES: | |
| Payables: | |
| Upon Return of Securities Loaned | | | — | | | | — | | | | 198,014 | | | | — | | |
Investment Securities/Affiliated Investment
Companies Purchased | | | 1,112 | | | | — | | | | 53,372 | | | | — | | |
| Fund Shares Redeemed | | | 1,737 | | | | 963 | | | | 2,435 | | | | 14,742 | | |
| Due to Advisor | | | 534 | | | | 230 | | | | 549 | | | | 278 | | |
| Deferred Thailand Capital Gains Tax | | | — | | | | — | | | | 32 | | | | — | | |
| Accrued Expenses and Other Liabilities | | | 121 | | | | 53 | | | | 248 | | | | 132 | | |
| Total Liabilities | | | 3,504 | | | | 1,246 | | | | 254,650 | | | | 15,152 | | |
| NET ASSETS | | $ | 1,508,260 | | | $ | 547,329 | | | $ | 1,155,526 | | | $ | 3,194,420 | | |
NET ASSET VALUE, OFFERING AND REDEMPTION
PRICE PER SHARE: | |
Institutional Class Shares — based on net assets of
$1,508,260; $547,329; $1,155,526; and $3,194,420 and
shares outstanding of 88,471,250; 58,668,179;
116,956,956; and 314,095,040, respectively | | $ | 17.05 | | | $ | 9.33 | | | $ | 9.88 | | | $ | 10.17 | | |
| NUMBER OF SHARES AUTHORIZED | | | 250,000,000 | | | | 150,000,000 | | | | 200,000,000 | | | | 550,000,000 | | |
| Investments in Affiliated Investment Companies at Cost | | $ | 1,146,107 | | | $ | 790,238 | | | $ | — | | | $ | 3,188,446 | | |
| Investments at Cost | | $ | — | | | $ | — | | | $ | 1,663,536 | | | $ | — | | |
| Foreign Currencies at Cost | | $ | — | | | $ | — | | | $ | 4,440 | | | $ | — | | |
| NET ASSETS CONSIST OF: | |
| Paid-In Capital | | $ | 1,118,962 | | | $ | 808,770 | | | $ | 1,752,134 | | | $ | 3,226,008 | | |
Undistributed Net Investment Income (Distributions in
Excess of Net Investment Income) | | | 5,826 | | | | 3,451 | | | | (45 | ) | | | 9,703 | | |
| Accumulated Net Realized Gain (Loss) | | | 21,653 | | | | (22,350 | ) | | | (64,275 | ) | | | (29,929 | ) | |
| Deferred Thailand Capital Gains Tax | | | (808 | ) | | | 215 | | | | (32 | ) | | | — | | |
| Net Unrealized Foreign Exchange Gain (Loss) | | | (132 | ) | | | (93 | ) | | | 43 | | | | — | | |
| Net Unrealized Appreciation (Depreciation) | | | 362,759 | | | | (242,664 | ) | | | (532,299 | ) | | | (11,362 | ) | |
| NET ASSETS | | $ | 1,508,260 | | | $ | 547,329 | | | $ | 1,155,526 | | | $ | 3,194,420 | | |
See accompanying Notes to Financial Statements.
113
DFA INVESTMENT DIMENSIONS GROUP INC.
STATEMENTS OF ASSETS AND LIABILITIES
OCTOBER 31, 2008
(Amounts in thousands, except share and per share amounts)
| | | DFA
Two-Year
Global
Fixed Income
Portfolio | | DFA
Selectively
Hedged Global
Fixed Income
Portfolio | | DFA
Five-Year
Government
Portfolio | | DFA
Five-Year
Global
Fixed Income
Portfolio | |
| ASSETS: | |
| Investments in Affiliated Investment Companies at Value | | $ | 3,125,328 | | | | — | | | | — | | | | — | | |
| Investments at Value | | | — | | | $ | 195,505 | | | $ | 1,104,157 | | | $ | 3,253,142 | | |
| Temporary Cash Investments at Value & Cost | | | — | | | | 7,434 | | | | 366 | | | | 29,098 | | |
| Foreign Currencies at Value | | | — | | | | 3,470 | | | | — | | | | 24 | | |
| Cash | | | — | | | | 15 | | | | 4,943 | | | | 15 | | |
| Receivables: | |
Investment Securities/Affiliated Investment
Companies Sold | | | 1,654 | | | | — | | | | — | | | | 58,000 | | |
| Interest | | | — | | | | 2,819 | | | | 10,413 | | | | 32,074 | | |
| Forward Currency Contracts | | | — | | | | — | | | | — | | | | 1,203 | | |
| Fund Shares Sold | | | 7,452 | | | | 4,526 | | | | 844 | | | | 7,298 | | |
| Unrealized Gain on Forward Currency Contracts | | | — | | | | — | | | | — | | | | 9,689 | | |
| Prepaid Expenses and Other Assets | | | 49 | | | | 35 | | | | 39 | | | | 102 | | |
| Deferred Offering Costs | | | — | | | | 8 | | | | — | | | | — | | |
| Total Assets | | | 3,134,483 | | | | 213,812 | | | | 1,120,762 | | | | 3,390,645 | | |
| LIABILITIES: | |
| Payables: | |
Investment Securities/Affiliated Investment
Companies Purchased | | | — | | | | 6,721 | | | | — | | | | 40,728 | | |
| Fund Shares Redeemed | | | 9,106 | | | | 8,873 | | | | 5,461 | | | | 18,584 | | |
| Due to Advisor | | | 265 | | | | 27 | | | | 193 | | | | 722 | | |
| Unrealized Loss on Forward Currency Contracts | | | — | | | | 6 | | | | — | | | | 11,118 | | |
| Accrued Expenses and Other Liabilities | | | 127 | | | | 20 | | | | 71 | | | | 236 | | |
| Total Liabilities | | | 9,498 | | | | 15,647 | | | | 5,725 | | | | 71,388 | | |
| NET ASSETS | | $ | 3,124,985 | | | $ | 198,165 | | | $ | 1,115,037 | | | $ | 3,319,257 | | |
NET ASSET VALUE, OFFERING AND REDEMPTION
PRICE PER SHARE: | |
Institutional Class Shares — based on net assets of
$3,124,985; $198,165; $1,115,037; and $3,319,257 and
shares outstanding of 301,660,122; 22,252,618;
106,754,230; and 310,647,953, respectively | | $ | 10.36 | | | $ | 8.91 | | | $ | 10.44 | | | $ | 10.68 | | |
| NUMBER OF SHARES AUTHORIZED | | | 550,000,000 | | | | 100,000,000 | | | | 250,000,000 | | | | 500,000,000 | | |
| Investments in Affiliated Investment Companies at Cost | | $ | 3,038,124 | | | $ | — | | | $ | — | | | $ | — | | |
| Investments at Cost | | $ | — | | | $ | 224,272 | | | $ | 1,098,837 | | | $ | 3,158,053 | | |
| Foreign Currencies at Cost | | $ | — | | | $ | 3,543 | | | $ | — | | | $ | 24 | | |
| NET ASSETS CONSIST OF: | |
| Paid-In Capital | | $ | 3,025,272 | | | $ | 227,473 | | | $ | 1,124,194 | | | $ | 3,262,247 | | |
Undistributed Net Investment Income (Distributions in
Excess of Net Investment Income) | | | 78,106 | | | | 4 | | | | 5,139 | | | | 1,377 | | |
| Accumulated Net Realized Gain (Loss) | | | (22,911 | ) | | | — | | | | (19,616 | ) | | | (37,996 | ) | |
| Net Unrealized Foreign Exchange Gain (Loss) | | | — | | | | (472 | ) | | | — | | | | (1,460 | ) | |
| Net Unrealized Appreciation (Depreciation) | | | 44,518 | | | | (28,840 | ) | | | 5,320 | | | | 95,089 | | |
| NET ASSETS | | $ | 3,124,985 | | | $ | 198,165 | | | $ | 1,115,037 | | | $ | 3,319,257 | | |
See accompanying Notes to Financial Statements.
114
DFA INVESTMENT DIMENSIONS GROUP INC.
STATEMENTS OF ASSETS AND LIABILITIES
OCTOBER 31, 2008
(Amounts in thousands, except share and per share amounts)
| | | DFA
Intermediate
Government
Fixed Income
Portfolio | | DFA
Inflation-
Protected
Securities
Portfolio | | DFA
Short-Term
Municipal Bond
Portfolio | | DFA
California
Short-Term
Municipal Bond
Portfolio | |
| ASSETS: | |
| Investments at Value | | $ | 1,221,531 | | | $ | 367,865 | | | $ | 972,495 | | | $ | 172,270 | | |
| Temporary Cash Investments at Value & Cost | | | 8,500 | | | | 1,455 | | | | 11,540 | | | | 6,114 | | |
| Cash | | | — | | | | — | | | | — | | | | 1 | | |
| Receivables: | |
| Interest | | | 18,704 | | | | 2,485 | | | | 9,330 | | | | 2,195 | | |
| Fund Shares Sold | | | 764 | | | | 796 | | | | 2,035 | | | | 546 | | |
| Prepaid Expenses and Other Assets | | | 81 | | | | 44 | | | | 36 | | | | 4 | | |
| Total Assets | | | 1,249,580 | | | | 372,645 | | | | 995,436 | | | | 181,130 | | |
| LIABILITIES: | |
| Payables: | |
| Fund Shares Redeemed | | | 863 | | | | 834 | | | | 3,291 | | | | 172 | | |
| Due to Advisor | | | 112 | | | | 33 | | | | 170 | | | | 30 | | |
| Accrued Expenses and Other Liabilities | | | 91 | | | | 31 | | | | 57 | | | | 13 | | |
| Total Liabilities | | | 1,066 | | | | 898 | | | | 3,518 | | | | 215 | | |
| NET ASSETS | | $ | 1,248,514 | | | $ | 371,747 | | | $ | 991,918 | | | $ | 180,915 | | |
NET ASSET VALUE, OFFERING AND REDEMPTION
PRICE PER SHARE: | |
Institutional Class Shares — based on net assets of
$1,248,514; $371,747; $991,918; and $180,915 and
shares outstanding of 107,096,886; 39,507,737;
99,027,721; and 18,091,754, respectively | | $ | 11.66 | | | $ | 9.41 | | | $ | 10.02 | | | $ | 10.00 | | |
| NUMBER OF SHARES AUTHORIZED | | | 250,000,000 | | | | 100,000,000 | | | | 200,000,000 | | | | 100,000,000 | | |
| Investments at Cost | | $ | 1,190,455 | | | $ | 415,496 | | | $ | 977,106 | | | $ | 173,319 | | |
| NET ASSETS CONSIST OF: | |
| Paid-In Capital | | $ | 1,200,760 | | | $ | 415,010 | | | $ | 994,376 | | | $ | 181,548 | | |
Undistributed Net Investment Income (Distributions in
Excess of Net Investment Income) | | | 10,384 | | | | 3,952 | | | | 2,170 | | | | 439 | | |
| Accumulated Net Realized Gain (Loss) | | | 6,294 | | | | 416 | | | | (17 | ) | | | (23 | ) | |
| Net Unrealized Appreciation (Depreciation) | | | 31,076 | | | | (47,631 | ) | | | (4,611 | ) | | | (1,049 | ) | |
| NET ASSETS | | $ | 1,248,514 | | | $ | 371,747 | | | $ | 991,918 | | | $ | 180,915 | | |
See accompanying Notes to Financial Statements.
115
DFA INVESTMENT DIMENSIONS GROUP INC.
STATEMENTS OF OPERATIONS
(Amounts in thousands)
| | | U.S. Large
Company
Portfolio* | | Enhanced
U.S. Large Company
Portfolio | | U.S. Large Cap Value
Portfolio | | U.S. Targeted
Value Portfolio | |
| | | Period Dec. 1,
2007 to
Oct. 31, 2008 | | Year Ended
Nov. 30,
2007 | | Period Dec. 1,
2007 to
Oct. 31, 2008 | | Year Ended
Nov. 30,
2007 | | Period Dec. 1,
2007 to
Oct. 31, 2008 | | Year Ended
Nov. 30,
2007 | | Period Dec. 1,
2007 to
Oct. 31, 2008 | | Year Ended
Nov. 30,
2007 | |
| Investment Income | |
Income Distributions Received from Affiliated
Investment Companies | | | — | | | | — | | | $ | 12,465 | | | $ | 10,384 | | | $ | 129,590 | | | $ | 107,865 | | | | — | | | $ | 1,151 | | |
| Dividends | | $ | 63,263 | | | $ | 61,012 | | | | — | | | | — | | | | — | | | | — | | | $ | 10,639 | | | | 3,501 | | |
| Interest | | | 1,479 | | | | 2,667 | | | | — | | | | — | | | | — | | | | — | | | | 394 | | | | 307 | | |
| Income from Securities Lending | | | 1,337 | | | | 611 | | | | — | | | | — | | | | — | | | | — | | | | 2,353 | | | | 252 | | |
Expenses Allocated from Affiliated
Investment Company | | | (1,269 | ) | | | (1,362 | ) | | | — | | | | — | | | | — | | | | — | | | | — | | | | — | | |
| Total Investment Income | | | 64,810 | | | | 62,928 | | | | 12,465 | | | | 10,384 | | | | 129,590 | | | | 107,865 | | | | 13,386 | | | | 5,211 | | |
| Expenses | |
| Investment Advisory Services Fees | | | — | | | | — | | | | — | | | | — | | | | — | | | | — | | | | 750 | | | | 269 | | |
| Administrative Services Fees | | | 2,852 | | | | 3,049 | | | | 380 | | | | 548 | | | | 9,628 | | | | 11,232 | | | | 1,875 | | | | 865 | | |
| Accounting & Transfer Agent Fees | | | 55 | | | | 56 | | | | 16 | | | | 18 | | | | 105 | | | | 113 | | | | 104 | | | | 49 | | |
| Shareholder Servicing Fees — | |
| Class R1 Shares | | | — | | | | — | | | | — | | | | — | | | | — | | | | — | | | | 26 | | | | — | | |
| Class R2 Shares | | | — | | | | — | | | | — | | | | — | | | | — | | | | — | | | | 2 | | | | — | | |
| Custodian Fees | | | — | | | | — | | | | — | | | | — | | | | — | | | | — | | | | 34 | | | | 14 | | |
| Filing Fees | | | 142 | | | | 106 | | | | 35 | | | | 30 | | | | 285 | | | | 214 | | | | 103 | | | | 32 | | |
| Shareholders' Reports | | | 115 | | | | 74 | | | | 10 | | | | 10 | | | | 242 | | | | 127 | | | | 67 | | | | 51 | | |
| Directors'/Trustees' Fees & Expenses | | | — | | | | 23 | | | | — | | | | 1 | | | | — | | | | 68 | | | | — | | | | 3 | | |
| Professional Fees | | | 24 | | | | 43 | | | | 4 | | | | 6 | | | | 49 | | | | 97 | | | | 16 | | | | 23 | | |
| Other | | | 22 | | | | 12 | | | | 2 | | | | 4 | | | | 40 | | | | 24 | | | | 20 | | | | 19 | | |
| Total Expenses | | | 3,210 | | | | 3,363 | | | | 447 | | | | 617 | | | | 10,349 | | | | 11,875 | | | | 2,997 | | | | 1,325 | | |
Fees Waived, Expenses Reimbursed,
and/or Previously Waived Fees
Recovered by Advisor (Note C) | | | 31 | | | | 89 | | | | — | | | | — | | | | — | | | | — | | | | — | | | | — | | |
| Net Expenses | | | 3,241 | | | | 3,452 | | | | 447 | | | | 617 | | | | 10,349 | | | | 11,875 | | | | 2,997 | | | | 1,325 | | |
| Net Investment Income (Loss) | | | 61,569 | | | | 59,476 | | | | 12,018 | | | | 9,767 | | | | 119,241 | | | | 95,990 | | | | 10,389 | | | | 3,886 | | |
| Realized and Unrealized Gain (Loss) | |
Capital Gain Distributions Received from
Affiliated Investment Companies | | | — | | | | — | | | | 8,681 | | | | 26,075 | | | | — | | | | 346,023 | | | | — | | | | 26,668 | | |
| Net Realized Gain (Loss) on: | |
Investment Securities Sold/Affiliated
Investment Companies Shares Sold | | | (104,970 | ) | | | 3,775 | | | | (11,592 | ) | | | 3,051 | | | | (63,378 | ) | | | (16,877 | ) | | | (2,137 | ) | | | (2,825 | ) | |
| Futures | | | (17,555 | ) | | | 714 | | | | — | | | | — | | | | — | | | | — | | | | — | | | | — | | |
Change in Unrealized Appreciation
(Depreciation) of: | |
Investment Securities/Affiliated Investment
Companies Shares | | | (1,194,131 | ) | | | 164,399 | | | | (116,750 | ) | | | (13,649 | ) | | | (2,981,497 | ) | | | (537,538 | ) | | | (319,766 | ) | | | (75,837 | ) | |
| Futures | | | 521 | | | | (288 | ) | | | — | | | | — | | | | — | | | | — | | | | 3 | | | | — | | |
| Net Realized and Unrealized Gain (Loss) | | | (1,316,135 | ) | | | 168,600 | | | | (119,661 | ) | | | 15,477 | | | | (3,044,875 | ) | | | (208,392 | ) | | | (321,900 | ) | | | (51,994 | ) | |
Net Increase (Decrease) in Net Assets
Resulting from Operations | | $ | (1,254,566 | ) | | $ | 228,076 | | | $ | (107,643 | ) | | $ | 25,244 | | | $ | (2,925,634 | ) | | $ | (112,402 | ) | | $ | (311,511 | ) | | $ | (48,108 | ) | |
* Investment Income and Realized and Unrealized Gain (Loss) were allocated from the Portfolio's Master Fund (Affiliated Investment Company).
See accompanying Notes to Financial Statements.
116
DFA INVESTMENT DIMENSIONS GROUP INC.
STATEMENTS OF OPERATIONS
(Amounts in thousands)
| | | U.S. Small Cap
Value Portfolio | | U.S. Core
Equity 1 Portfolio | | U.S. Core
Equity 2 Portfolio | | U.S. Vector
Equity Portfolio | |
| | | Period Dec. 1,
2007 to
Oct. 31, 2008 | | Year Ended
Nov. 30,
2007 | | Period Dec. 1,
2007 to
Oct. 31, 2008 | | Year Ended
Nov. 30,
2007 | | Period Dec. 1,
2007 to
Oct. 31, 2008 | | Year Ended
Nov. 30,
2007 | | Period Dec. 1,
2007 to
Oct. 31, 2008 | | Year Ended
Nov. 30,
2007 | |
| Investment Income | |
Income Distributions Received from
Affiliated Investment Company | | $ | 82,415 | | | $ | 120,998 | | | | — | | | | — | | | | — | | | | — | | | | — | | | | — | | |
| Dividends | | | — | | | | — | | | $ | 22,861 | | | $ | 15,988 | | | $ | 48,563 | | | $ | 36,771 | | | $ | 15,666 | | | $ | 10,726 | | |
| Interest | | | — | | | | — | | | | 377 | | | | 399 | | | | 567 | | | | 1,317 | | | | 273 | | | | 570 | | |
| Income from Securities Lending | | | — | | | | — | | | | 2,192 | | | | 499 | | | | 5,011 | | | | 1,608 | | | | 2,677 | | | | 736 | | |
| Total Investment Income | | | 82,415 | | | | 120,998 | | | | 25,430 | | | | 16,886 | | | | 54,141 | | | | 39,696 | | | | 18,616 | | | | 12,032 | | |
| Expenses | |
| Investment Advisory Services Fees | | | — | | | | — | | | | 2,182 | | | | 1,662 | | | | 5,405 | | | | 4,471 | | | | 2,790 | | | | 2,203 | | |
| Administrative Services Fees | | | 21,131 | | | | 28,167 | | | | — | | | | — | | | | — | | | | — | | | | — | | | | — | | |
| Accounting & Transfer Agent Fees | | | 117 | | | | 141 | | | | 162 | | | | 127 | | | | 321 | | | | 261 | | | | 123 | | | | 100 | | |
| Custodian Fees | | | — | | | | — | | | | 38 | | | | 43 | | | | 51 | | | | 73 | | | | 31 | | | | 51 | | |
| Filing Fees | | | 156 | | | | 151 | | | | 113 | | | | 62 | | | | 221 | | | | 222 | | | | 90 | | | | 68 | | |
| Shareholders' Reports | | | 296 | | | | 233 | | | | 33 | | | | 8 | | | | 88 | | | | 25 | | | | 44 | | | | 14 | | |
| Directors'/Trustees' Fees & Expenses | | | — | | | | 44 | | | | — | | | | 3 | | | | — | | | | 8 | | | | — | | | | 2 | | |
| Professional Fees | | | 51 | | | | 126 | | | | 30 | | | | 21 | | | | 63 | | | | 44 | | | | 23 | | | | 14 | | |
| Organizational & Offering Costs | | | — | | | | — | | | | — | | | | — | | | | — | | | | — | | | | — | | | | 3 | | |
| Other | | | 14 | | | | 39 | | | | 32 | | | | 4 | | | | 62 | | | | 12 | | | | 33 | | | | 5 | | |
| Total Expenses | | | 21,765 | | | | 28,901 | | | | 2,590 | | | | 1,930 | | | | 6,211 | | | | 5,116 | | | | 3,134 | | | | 2,460 | | |
Fees Waived, Expenses Reimbursed,
and/or Previously Waived Fees
Recovered by Advisor (Note C) | | | — | | | | — | | | | — | | | | 28 | | | | — | | | | 48 | | | | — | | | | 69 | | |
| Net Expenses | | | 21,765 | | | | 28,901 | | | | 2,590 | | | | 1,958 | | | | 6,211 | | | | 5,164 | | | | 3,134 | | | | 2,529 | | |
| Net Investment Income (Loss) | | | 60,650 | | | | 92,097 | | | | 22,840 | | | | 14,928 | | | | 47,930 | | | | 34,532 | | | | 15,482 | | | | 9,503 | | |
| Realized and Unrealized Gain (Loss) | |
Capital Gain Distributions Received from
Affiliated Investment Company | | | 1,046,424 | | | | 875,446 | | | | — | | | | — | | | | — | | | | — | | | | — | | | | — | | |
| Net Realized Gain (Loss) on: | |
Investment Securities Sold/Affiliated
Investment Company Shares Sold | | | (209,110 | ) | | | (37,370 | ) | | | (19,218 | ) | | | (3,304 | ) | | | (45,734 | ) | | | (15,734 | ) | | | (13,893 | ) | | | (1,810 | ) | |
Change in Unrealized Appreciation
(Depreciation) of: | |
Investment Securities/Affiliated
Investment Company Shares | | | (3,538,529 | ) | | | (1,754,043 | ) | | | (553,125 | ) | | | 15,592 | | | | (1,104,305 | ) | | | (32,306 | ) | | | (400,041 | ) | | | (41,111 | ) | |
| Futures | | | — | | | | — | | | | 2 | | | | — | | | | 1 | | | | — | | | | — | | | | — | | |
| Net Realized and Unrealized Gain (Loss) | | | (2,701,215 | ) | | | (915,967 | ) | | | (572,341 | ) | | | 12,288 | | | | (1,150,038 | ) | | | (48,040 | ) | | | (413,934 | ) | | | (42,921 | ) | |
Net Increase (Decrease) in Net Assets
Resulting from Operations | | $ | (2,640,565 | ) | | $ | (823,870 | ) | | $ | (549,501 | ) | | $ | 27,216 | | | $ | (1,102,108 | ) | | $ | (13,508 | ) | | $ | (398,452 | ) | | $ | (33,418 | ) | |
See accompanying Notes to Financial Statements.
117
DFA INVESTMENT DIMENSIONS GROUP INC.
STATEMENTS OF OPERATIONS
(Amounts in thousands)
| | | T.A. U.S. Core
Equity 2 Portfolio | | U.S. Small
Cap Portfolio | | U.S. Micro
Cap Portfolio | | DFA Real Estate
Securities Portfolio | |
| | | Period Dec. 1,
2007 to
Oct. 31, 2008 | | Period Oct. 4,
2007(a) to
Nov. 30, 2007 | | Period Dec. 1,
2007 to
Oct. 31, 2008 | | Year Ended
Nov. 30,
2007 | | Period Dec. 1,
2007 to
Oct. 31, 2008 | | Year Ended
Nov. 30,
2007 | | Period Dec. 1,
2007 to
Oct. 31, 2008 | | Year Ended
Nov. 30,
2007 | |
| Investment Income | |
Income Distributions Received from
Affiliated Investment Companies | | | — | | | | — | | | $ | 29,572 | | | $ | 44,797 | | | $ | 48,586 | | | $ | 66,185 | | | | — | | | | — | | |
| Dividends | | $ | 6,442 | | | $ | 127 | | | | — | | | | — | | | | — | | | | — | | | $ | 73,675 | | | $ | 65,263 | | |
| Interest | | | 271 | | | | 62 | | | | — | | | | — | | | | — | | | | — | | | | 288 | | | | 842 | | |
| Income from Securities Lending | | | 612 | | | | 2 | | | | — | | | | — | | | | — | | | | — | | | | 2,306 | | | | 771 | | |
| Total Investment Income | | | 7,325 | | | | 191 | | | | 29,572 | | | | 44,797 | | | | 48,586 | | | | 66,185 | | | | 76,269 | | | | 66,876 | | |
| Expenses | |
| Investment Advisory Services Fees | | | 789 | | | | 18 | | | | — | | | | — | | | | — | | | | — | | | | 6,845 | | | | 8,671 | | |
| Administrative Services Fees | | | — | | | | — | | | | 7,938 | | | | 11,208 | | | | 14,755 | | | | 20,325 | | | | — | | | | — | | |
| Accounting & Transfer Agent Fees | | | 58 | | | | 4 | | | | 48 | | | | 60 | | | | 67 | | | | 83 | | | | 276 | | | | 339 | | |
| Custodian Fees | | | 29 | | | | 11 | | | | — | | | | — | | | | — | | | | — | | | | 28 | | | | 36 | | |
| Filing Fees | | | 92 | | | | 3 | | | | 106 | | | | 61 | | | | 128 | | | | 127 | | | | 123 | | | | 121 | | |
| Shareholders' Reports | | | 9 | | | | — | | | | 96 | | | | 78 | | | | 159 | | | | 141 | | | | 139 | | | | 106 | | |
| Directors'/Trustees' Fees & Expenses | | | — | | | | 3 | | | | — | | | | 15 | | | | — | | | | 17 | | | | — | | | | 22 | | |
| Professional Fees | | | 8 | | | | — | | | | 16 | | | | 63 | | | | 28 | | | | 71 | | | | 49 | | | | 68 | | |
| Organizational & Offering Costs | | | 31 | | | | 9 | | | | — | | | | — | | | | — | | | | — | | | | — | | | | — | | |
| Other | | | 14 | | | | — | | | | 8 | | | | 21 | | | | 15 | | | | 21 | | | | 63 | | | | 28 | | |
| Total Expenses | | | 1,030 | | | | 48 | | | | 8,212 | | | | 11,506 | | | | 15,152 | | | | 20,785 | | | | 7,523 | | | | 9,391 | | |
Fees Waived, Expenses Reimbursed,
and/or Previously Waived Fees
Recovered by Advisor (Note C) | | | 24 | | | | (24 | ) | | | — | | | | — | | | | — | | | | — | | | | — | | | | — | | |
| Net Expenses | | | 1,054 | | | | 24 | | | | 8,212 | | | | 11,506 | | | | 15,152 | | | | 20,785 | | | | 7,523 | | | | 9,391 | | |
| Net Investment Income (Loss) | | | 6,271 | | | | 167 | | | | 21,360 | | | | 33,291 | | | | 33,434 | | | | 45,400 | | | | 68,746 | | | | 57,485 | | |
| Realized and Unrealized Gain (Loss) | |
| Capital Gain Distributions Received from: | |
| Affiliated Investment Companies | | | — | | | | — | | | | 243,531 | | | | 216,208 | | | | 379,091 | | | | 436,439 | | | | — | | | | — | | |
| Investment Securities | | | — | | | | — | | | | — | | | | — | | | | — | | | | — | | | | 42,861 | | | | 41,558 | | |
| Net Realized Gain (Loss) on: | |
Investment Securities Sold/Affiliated
Investment Companies Shares Sold | | | (7,078 | ) | | | (310 | ) | | | (116,947 | ) | | | 2,061 | | | | (130,372 | ) | | | (3,367 | ) | | | (142,397 | ) | | | 181,105 | | |
| Futures | | | — | | | | — | | | | — | | | | — | | | | — | | | | — | | | | (1,472 | ) | | | — | | |
Change in Unrealized Appreciation
(Depreciation) of: | |
Investment Securities/Affiliated
Investment Companies Shares | | | (179,572 | ) | | | (1,432 | ) | | | (1,073,797 | ) | | | (321,609 | ) | | | (1,674,701 | ) | | | (655,320 | ) | | | (893,193 | ) | | | (762,357 | ) | |
| Futures | | | 1 | | | | — | | | | — | | | | — | | | | — | | | | — | | | | 10 | | | | — | | |
Net Realized and Unrealized
Gain (Loss) | | | (186,649 | ) | | | (1,742 | ) | | | (947,213 | ) | | | (103,340 | ) | | | (1,425,982 | ) | | | (222,248 | ) | | | (994,191 | ) | | | (539,694 | ) | |
Net Increase (Decrease) in Net Assets
Resulting from Operations | | $ | (180,378 | ) | | $ | (1,575 | ) | | $ | (925,853 | ) | | $ | (70,049 | ) | | $ | (1,392,548 | ) | | $ | (176,848 | ) | | $ | (925,445 | ) | | $ | (482,209 | ) | |
See page 1 & 2 for the Definitions of Abbreviations and Footnotes.
See accompanying Notes to Financial Statements.
118
DFA INVESTMENT DIMENSIONS GROUP INC.
STATEMENTS OF OPERATIONS
(Amounts in thousands)
| | | Large Cap
International
Portfolio | | International
Core Equity
Portfolio | | T.A. World ex U.S.
Core Equity
Portfolio | | International
Small Company
Portfolio** | |
| | | Period Dec. 1,
2007 to
Oct. 31, 2008 | | Year Ended
Nov. 30,
2007 | | Period Dec. 1,
2007 to
Oct. 31, 2008 | | Year Ended
Nov. 30,
2007 | | Period March 6,
2008(a) to
Oct. 31, 2008 | | Period Dec. 1,
2007 to
Oct. 31, 2008 | | Year Ended
Nov. 30,
2007 | |
| Investment Income | |
Net Investment Income Received from
Affiliated Investment Companies: | | | |
| Income Distributions | | | — | | | | — | | | | — | | | | — | | | $ | 740 | | | | — | | | | — | | |
Dividends (Net of Foreign Taxes Withheld of $0, $0,
$0, $0, $0, $10,118, and $6,923, respectively) | | | — | | | | — | | | | — | | | | — | | | | — | | | $ | 134,751 | | | $ | 116,289 | | |
| Interest | | | — | | | | — | | | | — | | | | — | | | | — | | | | 724 | | | | 886 | | |
| Income from Securities Lending | | | — | | | | — | | | | — | | | | — | | | | — | | | | 21,115 | | | | 20,303 | | |
Expenses Allocated from Affiliated
Investment Company | | | — | | | | — | | | | — | | | | — | | | | — | | | | (6,281 | ) | | | (7,403 | ) | |
Total Net Investment Income Received from
Affiliated Investment Companies | | | — | | | | — | | | | — | | | | — | | | | 740 | | | | 150,309 | | | | 130,075 | | |
| Fund Investment Income | |
Dividends (Net of Foreign Taxes Withheld of $5,538,
$4,510, $7,639, $3,297, $118, $0, and $0, respectively) | | $ | 58,020 | | | $ | 54,192 | | | $ | 78,613 | | | $ | 41,557 | | | | 1,658 | | | | — | | | | — | | |
| Interest | | | 260 | | | | 350 | | | | 460 | | | | 797 | | | | 55 | | | | 295 | | | | 391 | | |
| Income from Securities Lending | | | 3,484 | | | | 2,853 | | | | 6,958 | | | | 3,111 | | | | 78 | | | | — | | | | — | | |
| Total Fund Investment Income | | | 61,764 | | | | 57,395 | | | | 86,031 | | | | 45,465 | | | | 1,791 | | | | 295 | | | | 391 | | |
| Fund Expenses | |
| Investment Advisory Services Fees | | | 4,438 | | | | 4,910 | | | | 7,918 | | | | 5,482 | | | | 264 | | | | — | | | | — | | |
| Administrative Services Fees | | | — | | | | — | | | | — | | | | — | | | | — | | | | 18,152 | | | | 21,375 | | |
| Accounting & Transfer Agent Fees | | | 224 | | | | 241 | | | | 276 | | | | 194 | | | | 24 | | | | 78 | | | | 85 | | |
| Custodian Fees | | | 267 | | | | 281 | | | | 590 | | | | 515 | | | | 181 | | | | — | | | | — | | |
| Filing Fees | | | 66 | | | | 63 | | | | 194 | | | | 146 | | | | 16 | | | | 137 | | | | 96 | | |
| Shareholders' Reports | | | 105 | | | | 71 | | | | 94 | | | | 32 | | | | 2 | | | | 192 | | | | 113 | | |
| Directors'/Trustees' Fees & Expenses | | | — | | | | 16 | | | | — | | | | 12 | | | | — | | | | — | | | | 49 | | |
| Professional Fees | | | 44 | | | | 44 | | | | 56 | | | | 31 | | | | 2 | | | | 50 | | | | 72 | | |
| Organizational & Offering Costs | | | — | | | | — | | | | — | | | | — | | | | 34 | | | | — | | | | — | | |
| Other | | | 43 | | | | 37 | | | | 65 | | | | 18 | | | | 4 | | | | 35 | | | | 19 | | |
| Total Expenses | | | 5,187 | | | | 5,663 | | | | 9,193 | | | | 6,430 | | | | 527 | | | | 18,644 | | | | 21,809 | | |
Fees Waived, Expenses Reimbursed,
and/or Previously Waived Fees
Recovered by Advisor (Note C) | | | — | | | | — | | | | — | | | | — | | | | (167 | ) | | | — | | | | — | | |
| Net Expenses | | | 5,187 | | | | 5,663 | | | | 9,193 | | | | 6,430 | | | | 360 | | | | 18,644 | | | | 21,809 | | |
| Net Investment Income (Loss) | | | 56,577 | | | | 51,732 | | | | 76,838 | | | | 39,035 | | | | 2,171 | | | | 131,960 | | | | 108,657 | | |
| Realized and Unrealized Gain (Loss) | |
| Net Realized Gain (Loss) on: | |
| Investment Securities Sold | | | (19,013 | ) | | | 37,442 | | | | (11,335 | ) | | | 24,982 | | | | (2,290 | ) | | | (120,455 | ) | | | 331,045 | | |
| Futures | | | — | | | | — | | | | — | | | | — | | | | — | | | | (569 | ) | | | — | | |
| Foreign Currency Transactions | | | (1,346 | ) | | | 174 | | | | (911 | ) | | | 105 | | | | 6 | | | | (3,640 | ) | | | 1,035 | | |
| In-Kind Redemptions | | | 14,987 | * | | | — | | | | 7,590 | * | | | — | | | | — | | | | — | | | | — | | |
| Change in Unrealized Appreciation (Depreciation) of: | |
| Investment Securities and Foreign Currency | | | (1,012,012 | ) | | | 231,080 | | | | (1,484,029 | ) | | | 105,889 | | | | (87,743 | ) | | | (2,759,513 | ) | | | 162,772 | | |
| Futures | | | — | | | | — | | | | 15 | | | | — | | | | 1 | | | | (1 | ) | | | — | | |
Translation of Foreign Currency
Denominated Amounts | | | 65 | | | | (44 | ) | | | 73 | | | | 59 | | | | 56 | | | | 188 | | | | 160 | | |
| Net Realized and Unrealized Gain (Loss) | | | (1,017,319 | ) | | | 268,652 | | | | (1,488,597 | ) | | | 131,035 | | | | (89,970 | ) | | | (2,883,990 | ) | | | 495,012 | | |
Net Increase (Decrease) in Net Assets
Resulting from Operations | | $ | (960,742 | ) | | $ | 320,384 | | | $ | (1,411,759 | ) | | $ | 170,070 | | | $ | (87,799 | ) | | $ | (2,752,030 | ) | | $ | 603,669 | | |
* See Note N in the Notes to Financial Statements.
** Investment Income and Realized and Unrealized Gain (Loss) were allocated from the Portfolio's Master Funds (Affiliated Investment Companies).
See page 1 & 2 for the Definitions of Abbreviations and Footnotes.
See accompanying Notes to Financial Statements.
119
DFA INVESTMENT DIMENSIONS GROUP INC.
STATEMENTS OF OPERATIONS
(Amounts in thousands)
| | | Japanese
Small Company
Portfolio* | | Asia Pacific
Small Company
Portfolio* | | United Kingdom
Small Company
Portfolio* | | Continental
Small Company
Portfolio* | |
| | | Period Dec. 1,
2007 to
Oct. 31, 2008 | | Year Ended
Nov. 30,
2007 | | Period Dec. 1,
2007 to
Oct. 31, 2008 | | Year Ended
Nov. 30,
2007 | | Period Dec. 1,
2007 to
Oct. 31, 2008 | | Year Ended
Nov. 30,
2007 | | Period Dec. 1,
2007 to
Oct. 31, 2008 | | Year Ended
Nov. 30,
2007 | |
| Investment Income | |
Net Investment Income Received from
Affiliated Investment Companies: | |
Dividends (Net of Foreign Taxes Withheld
of $247, $207, $92, $53, $3, $0,
$636, and $378, respectively) | | $ | 3,300 | | | $ | 2,749 | | | $ | 4,282 | | | $ | 3,613 | | | $ | 1,366 | | | $ | 1,127 | | | $ | 4,361 | | | $ | 2,959 | | |
| Interest | | | 8 | | | | 34 | | | | 22 | | | | 34 | | | | 4 | | | | 3 | | | | 26 | | | | 16 | | |
| Income from Securities Lending | | | 1,179 | | | | 1,431 | | | | 685 | | | | 614 | | | | 18 | | | | 3 | | | | 673 | | | | 491 | | |
Expenses Allocated from
Affiliated Investment Companies | | | (214 | ) | | | (272 | ) | | | (164 | ) | | | (174 | ) | | | (43 | ) | | | (49 | ) | | | (193 | ) | | | (209 | ) | |
Total Net Investment Income
Received from Affiliated
Investment Companies | | | 4,273 | | | | 3,942 | | | | 4,825 | | | | 4,087 | | | | 1,345 | | | | 1,084 | | | | 4,867 | | | | 3,257 | | |
| Expenses | |
| Administrative Services Fees | | | 650 | | | | 814 | | | | 446 | | | | 454 | | | | 139 | | | | 158 | | | | 556 | | | | 599 | | |
| Accounting & Transfer Agent Fees | | | 15 | | | | 16 | | | | 14 | | | | 14 | | | | 12 | | | | 14 | | | | 14 | | | | 15 | | |
| Filing Fees | | | 17 | | | | 20 | | | | 20 | | | | 21 | | | | 15 | | | | 15 | | | | 22 | | | | 21 | | |
| Shareholders' Reports | | | 6 | | | | 5 | | | | 6 | | | | 4 | | | | 2 | | | | 1 | | | | 6 | | | | 4 | | |
| Directors'/Trustees' Fees & Expenses | | | — | | | | 1 | | | | — | | | | 2 | | | | — | | | | — | | | | — | | | | 2 | | |
| Professional Fees | | | 34 | | | | 5 | | | | 26 | | | | 3 | | | | 10 | | | | 2 | | | | 30 | | | | 3 | | |
| Other | | | 3 | | | | 4 | | | | 9 | | | | 2 | | | | 4 | | | | 4 | | | | 5 | | | | 3 | | |
| Total Expenses | | | 725 | | | | 865 | | | | 521 | | | | 500 | | | | 182 | | | | 194 | | | | 633 | | | | 647 | | |
Fees Waived, Expenses Reimbursed,
and/or Previously Waived Fees
Recovered by Advisor (Note C) | | | — | | | | 5 | | | | 4 | | | | 34 | | | | (19 | ) | | | (9 | ) | | | — | | | | 56 | | |
| Net Expenses | | | 725 | | | | 870 | | | | 525 | | | | 534 | | | | 163 | | | | 185 | | | | 633 | | | | 703 | | |
| Net Investment Income (Loss) | | | 3,548 | | | | 3,072 | | | | 4,300 | | | | 3,553 | | | | 1,182 | | | | 899 | | | | 4,234 | | | | 2,554 | | |
| Realized and Unrealized Gain (Loss) | |
| Net Realized Gain (Loss) on: | |
| Investment Securities Sold | | | (22,824 | ) | | | (7,840 | ) | | | (21,574 | ) | | | 4,912 | | | | (771 | ) | | | 1,545 | | | | (16,519 | ) | | | 7,620 | | |
| Futures | | | (10 | ) | | | — | | | | (34 | ) | | | — | | | | — | | | | — | | | | (16 | ) | | | — | | |
| Foreign Currency Transactions | | | (46 | ) | | | (35 | ) | | | (193 | ) | | | 93 | | | | (77 | ) | | | 13 | | | | (16 | ) | | | 39 | | |
Change in Unrealized Appreciation
(Depreciation) of: | |
| Investment Securities and Foreign Currency | | | (35,124 | ) | | | 365 | | | | (69,553 | ) | | | 32,175 | | | | (24,744 | ) | | | (2,123 | ) | | | (81,292 | ) | | | 4,064 | | |
| Futures | | | — | | | | — | | | | — | | | | — | | | | — | | | | — | | | | 1 | | | | — | | |
Translation of Foreign Currency
Denominated Amounts | | | 60 | | | | 19 | | | | (15 | ) | | | (2 | ) | | | 11 | | | | — | | | | (30 | ) | | | 10 | | |
Net Realized and Unrealized
Gain (Loss) | | | (57,944 | ) | | | (7,491 | ) | | | (91,369 | ) | | | 37,178 | | | | (25,581 | ) | | | (565 | ) | | | (97,872 | ) | | | 11,733 | | |
Net Increase (Decrease) in Net Assets
Resulting from Operations | | $ | (54,396 | ) | | $ | (4,419 | ) | | $ | (87,069 | ) | | $ | 40,731 | | | $ | (24,399 | ) | | $ | 334 | | | $ | (93,638 | ) | | $ | 14,287 | | |
* Investment Income and Realized and Unrealized Gain (Loss) were allocated from each Portfolio's respective Master Fund (Affiliated Investment Companies).
See accompanying Notes to Financial Statements.
120
DFA INVESTMENT DIMENSIONS GROUP INC.
STATEMENTS OF OPERATIONS
(Amounts in thousands)
| | | DFA
International
Real Estate Securities
Portfolio | | DFA Global
Real Estate
Securities
Portfolio | | DFA
International
Small Cap Value
Portfolio | | International
Vector
Equity
Portfolio | |
| | | Period Dec. 1,
2007 to
Oct. 31, 2008 | | Period March 1,
2007(a) to
Nov. 30, 2007 | | Period June 4,
2008(a) to
Oct. 31, 2008 | | Period Dec. 1,
2007 to
Oct. 31, 2008 | | Year Ended
Nov. 30,
2007 | | Period August 14,
2008(a) to
Oct. 31, 2008 | |
| Investment Income | |
Income Distributions Received from Affiliated
Investment Companies | | | — | | | | — | | | $ | 24 | | | | — | | | | — | | | | — | | |
Dividends (Net of Foreign Taxes Withheld of
$3,569, $521, $0, $18,096, $12,474 and
$9, respectively) | | $ | 23,281 | | | $ | 4,873 | | | | — | | | $ | 247,081 | | | $ | 197,369 | | | $ | 271 | | |
| Interest | | | 144 | | | | 210 | | | | 8 | | | | 1,361 | | | | 1,792 | | | | 16 | | |
| Income from Securities Lending | | | 1,002 | | | | 119 | | | | — | | | | 22,024 | | | | 18,729 | | | | 8 | | |
| Total Investment Income | | | 24,427 | | | | 5,202 | | | | 32 | | | | 270,466 | | | | 217,890 | | | | 295 | | |
| Expenses | |
| Investment Advisory Services Fees | | | 1,513 | | | | 456 | | | | — | | | | 44,953 | | | | 52,077 | | | | 37 | | |
| Administrative Services Fees | | | — | | | | — | | | | 98 | | | | — | | | | — | | | | — | | |
| Accounting & Transfer Agent Fees | | | 71 | | | | 33 | | | | 5 | | | | 803 | | | | 903 | | | | 6 | | |
| Custodian Fees | | | 123 | | | | 64 | | | | — | | | | 1,206 | | | | 1,557 | | | | 41 | | |
| Filing Fees | | | 113 | | | | 29 | | | | 5 | | | | 190 | | | | 142 | | | | 3 | | |
| Shareholders' Reports | | | 47 | | | | 4 | | | | — | | | | 277 | | | | 173 | | | | — | | |
| Directors'/Trustees' Fees & Expenses | | | — | | | | 3 | | | | — | | | | — | | | | 73 | | | | — | | |
| Professional Fees | | | 12 | | | | 2 | | | | 3 | | | | 164 | | | | 182 | | | | 1 | | |
| Organizational & Offering Costs | | | 16 | | | | 30 | | | | 17 | | | | — | | | | — | | | | 5 | | |
| Other | | | 21 | | | | 3 | | | | 3 | | | | 172 | | | | 144 | | | | 1 | | |
| Total Expenses | | | 1,916 | | | | 624 | | | | 131 | | | | 47,765 | | | | 55,251 | | | | 94 | | |
Fees Waived, Expenses Reimbursed, and/or
Previously Waived Fees Recovered by
Advisor (Note C) | | | — | | | | — | | | | (89 | ) | | | — | | | | — | | | | (45 | ) | |
| Net Expenses | | | 1,916 | | | | 624 | | | | 42 | | | | 47,765 | | | | 55,251 | | | | 49 | | |
| Net Investment Income (Loss) | | | 22,511 | | | | 4,578 | | | | (10 | ) | | | 222,701 | | | | 162,639 | | | | 246 | | |
| Realized and Unrealized Gain (Loss) | |
| Net Realized Gain (Loss) on: | |
| Investment Securities Sold | | | (13,579 | ) | | | (3 | ) | | | (280 | ) | | | 28,945 | | | | 682,920 | | | | (27 | ) | |
| Futures | | | — | | | | — | | | | — | | | | (1,804 | ) | | | — | | | | — | | |
| Foreign Currency Transactions | | | (521 | ) | | | 9 | | | | — | | | | (3,478 | ) | | | 3,452 | | | | (19 | ) | |
| Change in Unrealized Appreciation (Depreciation) of: | |
| Investment Securities and Foreign Currency | | | (363,676 | ) | | | (25,701 | ) | | | (34,668 | ) | | | (4,209,886 | ) | | | (197,398 | ) | | | (16,902 | ) | |
| Futures | | | — | | | | — | | | | — | | | | 28 | | | | — | | | | 1 | | |
Translation of Foreign Currency Denominated
Amounts | | | (124 | ) | | | 14 | | | | — | | | | 112 | | | | 46 | | | | 15 | | |
| Net Realized and Unrealized Gain (Loss) | | | (377,900 | ) | | | (25,681 | ) | | | (34,948 | ) | | | (4,186,083 | ) | | | 489,020 | | | | (16,932 | ) | |
Net Increase (Decrease) in Net Assets
Resulting from Operations | | $ | (355,389 | ) | | $ | (21,103 | ) | | $ | (34,958 | ) | | $ | (3,963,382 | ) | | $ | 651,659 | | | $ | (16,686 | ) | |
See page 1 & 2 for the Definitions of Abbreviations and Footnotes.
See accompanying Notes to Financial Statements.
121
DFA INVESTMENT DIMENSIONS GROUP INC.
STATEMENTS OF OPERATIONS
(Amounts in thousands)
| | | Emerging Markets
Portfolio** | | Emerging Markets
Small Cap
Portfolio** | | Emerging Markets
Core Equity
Portfolio | | DFA One-Year
Fixed Income
Portfolio | |
| | | Period Dec. 1,
2007 to
Oct. 31, 2008 | | Year Ended
Nov. 30,
2007 | | Period Dec. 1,
2007 to
Oct. 31, 2008 | | Year Ended
Nov. 30,
2007 | | Period Dec. 1,
2007 to
Oct. 31, 2008 | | Year Ended
Nov. 30,
2007 | | Period Dec. 1,
2007 to
Oct. 31, 2008 | | Year Ended
Nov. 30,
2007 | |
| Investment Income | |
Income Distributions Received from
Affiliated Investment Company | | | — | | | | — | | | | — | | | | — | | | | — | | | | — | | | $ | 106,184 | | | $ | 152,964 | | |
Dividends (Net of Foreign Taxes Withheld of
$8,215, $7,381, $5,238, $2,250, $2,921, $3,240
and $0, $0, respectively) | | $ | 76,217 | | | $ | 74,859 | | | $ | 31,689 | | | $ | 23,439 | | | $ | 48,922 | | | $ | 31,103 | | | | — | | | | — | | |
| Interest | | | 200 | | | | 492 | | | | 107 | | | | 222 | | | | 152 | | | | 384 | | | | — | | | | — | | |
| Income from Securities Lending | | | 3,743 | | | | 3,023 | | | | 3,587 | | | | 2,665 | | | | 3,582 | | | | 1,784 | | | | — | | | | — | | |
Expenses Allocated from Affiliated Investment
Companies | | | (4,600 | ) | | | (5,391 | ) | | | (3,191 | ) | | | (3,633 | ) | | | — | | | | — | | | | — | | | | — | | |
| Total Investment Income | | | 75,560 | | | | 72,983 | | | | 32,192 | | | | 22,693 | | | | 52,656 | | | | 33,271 | | | | 106,184 | | | | 152,964 | | |
| Expenses | |
| Investment Advisory Services Fees | | | — | | | | — | | | | — | | | | — | | | | 8,838 | | | | 7,247 | | | | — | | | | — | | |
| Administrative Services Fees | | | 10,054 | | | | 11,536 | | | | 4,706 | | | | 5,248 | | | | — | | | | — | | | | 3,110 | | | | 3,019 | | |
| Accounting & Transfer Agent Fees | | | 50 | | | | 52 | | | | 27 | | | | 29 | | | | 204 | | | | 168 | | | | 57 | | | | 54 | | |
| Custodian Fees | | | — | | | | — | | | | — | | | | — | | | | 1,127 | | | | 1,061 | | | | — | | | | — | | |
| Filing Fees | | | 91 | | | | 48 | | | | 62 | | | | 65 | | | | 85 | | | | 47 | | | | 155 | | | | 136 | | |
| Shareholders' Reports | | | 125 | | | | 101 | | | | 51 | | | | 43 | | | | 100 | | | | 16 | | | | 119 | | | | 70 | | |
| Directors'/Trustees' Fees & Expenses | | | — | | | | 23 | | | | — | | | | 16 | | | | — | | | | 10 | | | | — | | | | 15 | | |
| Professional Fees | | | 33 | | | | 40 | | | | 17 | | | | 15 | | | | 65 | | | | 34 | | | | 26 | | | | 38 | | |
| Other | | | 21 | | | | 19 | | | | 12 | | | | 9 | | | | 51 | | | | 33 | | | | 22 | | | | 9 | | |
| Total Expenses | | | 10,374 | | | | 11,819 | | | | 4,875 | | | | 5,425 | | | | 10,470 | | | | 8,616 | | | | 3,489 | | | | 3,341 | | |
| Net Investment Income (Loss) | | | 65,186 | | | | 61,164 | | | | 27,317 | | | | 17,268 | | | | 42,186 | | | | 24,655 | | | | 102,695 | | | | 149,623 | | |
| Realized and Unrealized Gain (Loss) | |
| Net Realized Gain (Loss) on: | |
| Investment Securities Sold | | | 25,666 | | | | 138,572 | | | | (21,877 | ) | | | 98,170 | | | | (64,050 | ) | | | 7,602 | | | | (1,880 | ) | | | (1,012 | ) | |
| Futures | | | (348 | ) | | | — | | | | (404 | ) | | | — | | | | — | | | | — | | | | — | | | | — | | |
| Foreign Currency Transactions | | | (820 | ) | | | (116 | ) | | | (1,270 | ) | | | (319 | ) | | | (1,282 | ) | | | (348 | ) | | | — | | | | — | | |
| In-Kind Redemptions | | | — | | | | — | | | | — | | | | — | | | | 1,902 | * | | | — | | | | — | | | | — | | |
Change in Unrealized Appreciation
(Depreciation) of: | |
| Investment Securities and Foreign Currency | | | (1,562,393 | ) | | | 809,069 | | | | (754,950 | ) | | | 268,054 | | | | (1,113,650 | ) | | | 426,503 | | | | (12,482 | ) | | | 3,935 | | |
| Futures | | | 30 | | | | — | | | | 9 | | | | — | | | | 4 | | | | — | | | | — | | | | — | | |
Translation of Foreign Currency Denominated
Amounts | | | (130 | ) | | | (26 | ) | | | (175 | ) | | | 74 | | | | 30 | | | | (1 | ) | | | — | | | | — | | |
Change in Deferred Thailand Capital
Gains Tax | | | 2,600 | | | | (825 | ) | | | 1,394 | | | | (451 | ) | | | 1,150 | | | | (772 | ) | | | — | | | | — | | |
| Net Realized and Unrealized Gain (Loss) | | | (1,535,395 | ) | | | 946,674 | | | | (777,273 | ) | | | 365,528 | | | | (1,175,896 | ) | | | 432,984 | | | | (14,362 | ) | | | 2,923 | | |
Net Increase (Decrease) in Net Assets
Resulting from Operations | | $ | (1,470,209 | ) | | $ | 1,007,838 | | | $ | (749,956 | ) | | $ | 382,796 | | | $ | (1,133,710 | ) | | $ | 457,639 | | | $ | 88,333 | | | $ | 152,546 | | |
* See Note N in the Notes to Financial Statements.
** Investment Income and Realized and Unrealized Gain (Loss) were allocated from each Portfolio's respective Master Fund (Affiliated Investment Companies).
See accompanying Notes to Financial Statements.
122
DFA INVESTMENT DIMENSIONS GROUP INC.
STATEMENTS OF OPERATIONS
(Amounts in thousands)
| | | DFA Two-Year
Global Fixed Income
Portfolio | | DFA Selectively
Hedged Global
Fixed Income
Portfolio | | DFA Five-Year
Government Portfolio | | DFA Five-Year
Global Fixed Income
Portfolio | |
| | | Period Dec. 1,
2007 to
Oct. 31, 2008 | | Year Ended
Nov. 30,
2007 | | Period Jan. 9,
2008(a) to
Oct. 31, 2008 | | Period Dec. 1,
2007 to
Oct. 31, 2008 | | Year Ended
Nov. 30,
2007 | | Period Dec. 1,
2007 to
Oct. 31, 2008 | | Year Ended
Nov. 30,
2007 | |
| Investment Income | |
Income Distributions Received from
Affiliated Investment Company | | $ | 123,831 | | | $ | 74,674 | | | | — | | | | — | | | | — | | | | — | | | | — | | |
| Interest | | | — | | | | — | | | $ | 5,608 | | | $ | 33,093 | | | $ | 54,069 | | | $ | 92,242 | | | $ | 95,585 | | |
| Total Investment Income | | | 123,831 | | | | 74,674 | | | | 5,608 | | | | 33,093 | | | | 54,069 | | | | 92,242 | | | | 95,585 | | |
| Expenses | |
| Investment Advisory Services Fees | | | — | | | | — | | | | 184 | | | | 2,205 | | | | 2,146 | | | | 8,193 | | | | 7,265 | | |
| Administrative Services Fees | | | 2,920 | | | | 2,761 | | | | — | | | | — | | | | — | | | | — | | | | — | | |
| Accounting & Transfer Agent Fees | | | 54 | | | | 49 | | | | 34 | | | | 143 | | | | 138 | | | | 391 | | | | 344 | | |
| Custodian Fees | | | — | | | | — | | | | 12 | | | | 12 | | | | 13 | | | | 211 | | | | 285 | | |
| Filing Fees | | | 112 | | | | 100 | | | | 28 | | | | 59 | | | | 61 | | | | 127 | | | | 131 | | |
| Shareholders' Reports | | | 123 | | | | 78 | | | | 3 | | | | 52 | | | | 35 | | | | 138 | | | | 67 | | |
| Directors'/Trustees' Fees & Expenses | | | — | | | | 13 | | | | — | | | | — | | | | 6 | | | | — | | | | 24 | | |
| Professional Fees | | | 25 | | | | 35 | | | | 2 | | | | 25 | | | | 24 | | | | 71 | | | | 58 | | |
| Organizational & Offering Costs | | | — | | | | — | | | | 32 | | | | — | | | | — | | | | — | | | | — | | |
| Other | | | 27 | | | | 10 | | | | 3 | | | | 17 | | | | 9 | | | | 50 | | | | 21 | | |
| Total Expenses | | | 3,261 | | | | 3,046 | | | | 298 | | | | 2,513 | | | | 2,432 | | | | 9,181 | | | | 8,195 | | |
| Net Investment Income (Loss) | | | 120,570 | | | | 71,628 | | | | 5,310 | | | | 30,580 | | | | 51,637 | | | | 83,061 | | | | 87,390 | | |
| Realized and Unrealized Gain (Loss) | |
| Net Realized Gain (Loss) on: | |
Investment Securities Sold/Affiliated
Investment Company Shares Sold | | | (784 | ) | | | (792 | ) | | | 84 | | | | 2,704 | | | | — | | | | (7,737 | ) | | | (13,531 | ) | |
| Foreign Currency Transactions | | | — | | | | — | | | | (7,531 | ) | | | — | | | | — | | | | (17,965 | ) | | | (29,264 | ) | |
| Change in Unrealized Appreciation (Depreciation) of: | |
Investment Securities/Affiliated Investment
Company Shares and Foreign Currency | | | (28,565 | ) | | | 65,338 | | | | (28,840 | ) | | | 4,964 | | | | 645 | | | | 8,004 | | | | 31,164 | | |
Translation of Foreign Currency
Denominated Amounts | | | — | | | | — | | | | (472 | ) | | | — | | | | — | | | | (14,921 | ) | | | 67,297 | | |
| Net Realized and Unrealized Gain (Loss) | | | (29,349 | ) | | | 64,546 | | | | (36,759 | ) | | | 7,668 | | | | 645 | | | | (32,619 | ) | | | 55,666 | | |
Net Increase (Decrease) in Net Assets
Resulting from Operations | | $ | 91,221 | | | $ | 136,174 | | | $ | (31,449 | ) | | $ | 38,248 | | | $ | 52,282 | | | $ | 50,442 | | | $ | 143,056 | | |
See page 1 & 2 for the Definitions of Abbreviations and Footnotes.
See accompanying Notes to Financial Statements.
123
DFA INVESTMENT DIMENSIONS GROUP INC.
STATEMENTS OF OPERATIONS
(Amounts in thousands)
| | | DFA
Intermediate Government
Fixed Income
Portfolio | | DFA
Inflation-Protected
Securities Portfolio | | DFA Short-Term
Municipal Bond
Portfolio | | DFA California
Short-Term Municipal
Bond Portfolio | |
| | | Period Dec. 1,
2007 to
Oct. 31, 2008 | | Year Ended
Nov. 30,
2007 | | Period Dec. 1,
2007 to
Oct. 31, 2008 | | Year Ended
Nov. 30,
2007 | | Period Dec. 1,
2007 to
Oct. 31, 2008 | | Year Ended
Nov. 30,
2007 | | Period Dec. 1,
2007 to
Oct. 31, 2008 | | Period April 2,
2007(a) to
Nov. 30, 2007 | |
| Investment Income | |
| Interest | | $ | 57,408 | | | $ | 52,592 | | | $ | 22,691 | | | $ | 4,412 | | | $ | 20,534 | | | $ | 27,485 | | | $ | 4,041 | | | $ | 1,633 | | |
| Total Investment Income | | | 57,408 | | | | 52,592 | | | | 22,691 | | | | 4,412 | | | | 20,534 | | | | 27,485 | | | | 4,041 | | | | 1,633 | | |
| Expenses | |
| Investment Advisory Services Fees | | | 1,254 | | | | 1,086 | | | | 316 | | | | 92 | | | | 1,813 | | | | 1,666 | | | | 318 | | | | 93 | | |
| Accounting & Transfer Agent Fees | | | 160 | | | | 139 | | | | 54 | | | | 30 | | | | 120 | | | | 112 | | | | 36 | | | | 18 | | |
| Custodian Fees | | | 14 | | | | 12 | | | | 4 | | | | 2 | | | | 12 | | | | 12 | | | | 3 | | | | 2 | | |
| Filing Fees | | | 70 | | | | 74 | | | | 41 | | | | 16 | | | | 50 | | | | 47 | | | | 38 | | | | 11 | | |
| Shareholders' Reports | | | 49 | | | | 23 | | | | 20 | | | | 6 | | | | 28 | | | | 15 | | | | 4 | | | | 1 | | |
| Directors'/Trustees' Fees & Expenses | | | — | | | | 12 | | | | — | | | | 2 | | | | — | | | | 3 | | | | — | | | | 1 | | |
| Professional Fees | | | 27 | | | | 23 | | | | 7 | | | | 3 | | | | 19 | | | | 16 | | | | 3 | | | | 6 | | |
| Organizational & Offering Costs | | | — | | | | — | | | | — | | | | 43 | | | | — | | | | — | | | | 11 | | | | 23 | | |
| Other | | | 20 | | | | 6 | | | | 9 | | | | 1 | | | | 15 | | | | 5 | | | | 6 | | | | 1 | | |
| Total Expenses | | | 1,594 | | | | 1,375 | | | | 451 | | | | 195 | | | | 2,057 | | | | 1,876 | | | | 419 | | | | 156 | | |
Fees Waived, Expenses Reimbursed,
and/or Previously Waived Fees
Recovered by Advisor (Note C) | | | — | | | | — | | | | 31 | | | | (11 | ) | | | — | | | | — | | | | 16 | | | | (16 | ) | |
| Net Expenses | | | 1,594 | | | | 1,375 | | | | 482 | | | | 184 | | | | 2,057 | | | | 1,876 | | | | 435 | | | | 140 | | |
| Net Investment Income (Loss) | | | 55,814 | | | | 51,217 | | | | 22,209 | | | | 4,228 | | | | 18,477 | | | | 25,609 | | | | 3,606 | | | | 1,493 | | |
| Realized and Unrealized Gain (Loss) | |
| Net Realized Gain (Loss) on: | |
| Investment Securities Sold | | | 6,370 | | | | 99 | | | | 416 | | | | — | | | | — | | | | — | | | | (19 | ) | | | (4 | ) | |
Change in Unrealized Appreciation
(Depreciation) of Investment Securities
and Foreign Currency | | | (24,474 | ) | | | 43,651 | | | | (60,021 | ) | | | 11,920 | | | | (3,435 | ) | | | 2,926 | | | | (1,259 | ) | | | 210 | | |
Net Realized and Unrealized
Gain (Loss) | | | (18,104 | ) | | | 43,750 | | | | (59,605 | ) | | | 11,920 | | | | (3,435 | ) | | | 2,926 | | | | (1,278 | ) | | | 206 | | |
Net Increase (Decrease) in Net Assets
Resulting from Operations | | $ | 37,710 | | | $ | 94,967 | | | $ | (37,396 | ) | | $ | 16,148 | | | $ | 15,042 | | | $ | 28,535 | | | $ | 2,328 | | | $ | 1,699 | | |
See page 1 & 2 for the Definitions of Abbreviations and Footnotes.
See accompanying Notes to Financial Statements.
124
DFA INVESTMENT DIMENSIONS GROUP INC.
STATEMENTS OF CHANGES IN NET ASSETS
(Amounts in thousands)
| | | U.S. Large
Company
Portfolio | | Enhanced
U.S. Large Company
Portfolio | |
| | | Period
Dec. 1,
2007 to
Oct. 31,
2008 | | Year
Ended
Nov. 30,
2007 | | Year
Ended
Nov. 30,
2006 | | Period
Dec. 1,
2007 to
Oct. 31,
2008 | | Year
Ended
Nov. 30,
2007 | | Year
Ended
Nov. 30,
2006 | |
| Increase (Decrease) in Net Assets | |
| Operations: | |
| Net Investment Income (Loss) | | $ | 61,569 | | | $ | 59,476 | | | $ | 45,195 | | | $ | 12,018 | | | $ | 9,767 | | | $ | 3,907 | | |
| Capital Gain Distributions Received from Affiliated Investment Companies | | | — | | | | — | | | | — | | | | 8,681 | | | | 26,075 | | | | 4,136 | | |
| Net Realized Gain (Loss) on: | |
| Investment Securities Sold/Affiliated Investment Companies Shares Sold | | | (104,970 | ) | | | 3,775 | | | | (8,405 | ) | | | (11,592 | ) | | | 3,051 | | | | 277 | | |
| Futures | | | (17,555 | ) | | | 714 | | | | 2,338 | | | | — | | | | — | | | | — | | |
| Change in Unrealized Appreciation (Depreciation) of: | |
| Investment Securities/Affiliated Investment Companies Shares | | | (1,194,131 | ) | | | 164,399 | | | | 297,153 | | | | (116,750 | ) | | | (13,649 | ) | | | 32,933 | | |
| Futures | | | 521 | | | | (288 | ) | | | (1,669 | ) | | | — | | | | — | | | | — | | |
| Net Increase (Decrease) in Net Assets Resulting from Operations | | | (1,254,566 | ) | | | 228,076 | | | | 334,612 | | | | (107,643 | ) | | | 25,244 | | | | 41,253 | | |
| Distributions From: | |
| Net Investment Income: | |
| Institutional Class Shares | | | (67,060 | ) | | | (55,847 | ) | | | (41,748 | ) | | | (10,906 | ) | | | (11,397 | ) | | | (5,651 | ) | |
| Net Short-Term Gains: | |
| Institutional Class Shares | | | — | | | | — | | | | — | | | | (4,842 | ) | | | (11,623 | ) | | | — | | |
| Net Long-Term Gains: | |
| Institutional Class Shares | | | — | | | | — | | | | — | | | | (17,601 | ) | | | (1,991 | ) | | | — | | |
| Total Distributions | | | (67,060 | ) | | | (55,847 | ) | | | (41,748 | ) | | | (33,349 | ) | | | (25,011 | ) | | | (5,651 | ) | |
| Capital Share Transactions (1): | |
| Shares Issued | | | 1,128,680 | | | | 906,212 | | | | 832,648 | | | | 75,527 | | | | 93,808 | | | | 105,090 | | |
| Shares Issued in Lieu of Cash Distributions | | | 59,339 | | | | 51,856 | | | | 39,758 | | | | 32,429 | | | | 24,050 | | | | 5,584 | | |
| Shares Redeemed | | | (738,188 | ) | | | (583,275 | ) | | | (384,587 | ) | | | (103,683 | ) | | | (128,257 | ) | | | (112,603 | ) | |
| Net Increase (Decrease) from Capital Share Transactions | | | 449,831 | | | | 374,793 | | | | 487,819 | | | | 4,273 | | | | (10,399 | ) | | | (1,929 | ) | |
| Total Increase (Decrease) in Net Assets | | | (871,795 | ) | | | 547,022 | | | | 780,683 | | | | (136,719 | ) | | | (10,166 | ) | | | 33,673 | | |
| Net Assets | |
| Beginning of Period | | | 3,415,833 | | | | 2,868,811 | | | | 2,088,128 | | | | 337,050 | | | | 347,216 | | | | 313,543 | | |
| End of Period | | $ | 2,544,038 | | | $ | 3,415,833 | | | $ | 2,868,811 | | | $ | 200,331 | | | $ | 337,050 | | | $ | 347,216 | | |
| (1) Shares Issued and Redeemed: | |
| Shares Issued | | | 29,917 | | | | 21,005 | | | | 21,866 | | | | 9,136 | | | | 8,538 | | | | 10,401 | | |
| Shares Issued in Lieu of Cash Distributions | | | 1,514 | | | | 1,222 | | | | 1,066 | | | | 3,364 | | | | 2,263 | | | | 570 | | |
| Shares Redeemed | | | (20,702 | ) | | | (13,462 | ) | | | (10,136 | ) | | | (12,436 | ) | | | (11,632 | ) | | | (11,186 | ) | |
| | | | 10,729 | | | | 8,765 | | | | 12,796 | | | | 64 | | | | (831 | ) | | | (215 | ) | |
Undistributed Net Investment Income (Distributions in Excess of
Net Investment Income) | | $ | | 10,863 | | $ | 16,354 | | | $ | 12,725 | | | $ | 15,378 | | | $ | 4 | | | $ | 1,634 | | |
See accompanying Notes to Financial Statements.
125
DFA INVESTMENT DIMENSIONS GROUP INC.
STATEMENTS OF CHANGES IN NET ASSETS
(Amounts in thousands)
| | | U.S. Large
Cap Value
Portfolio | |
U.S. Targeted
Value Portfolio | |
| | | Period
Dec. 1,
2007 to
Oct. 31,
2008 | | Year
Ended
Nov. 30,
2007 | | Year
Ended
Nov. 30,
2006 | | Period
Dec. 1,
2007 to
Oct. 31,
2008 | | Year
Ended
Nov. 30,
2007 | | Year
Ended
Nov. 30,
2006 | |
| Increase (Decrease) in Net Assets | |
| Operations: | |
| Net Investment Income (Loss) | | $ | 119,241 | | | $ | 95,990 | | | $ | 82,268 | | | $ | 10,389 | | | $ | 3,886 | | | $ | 2,256 | | |
| Capital Gain Distributions Received from Affiliated Investment Companies | | | — | | | | 346,023 | | | | 138,196 | | | | — | | | | 26,668 | | | | 16,223 | | |
| Net Realized Gain (Loss) on | |
| Investment Securities Sold/Affiliated Investment Companies Shares Sold | | | (63,378 | ) | | | (16,877 | ) | | | 1,724 | | | | (2,137 | ) | | | (2,825 | ) | | | 250 | | |
| Change in Unrealized Appreciation (Depreciation) of: | |
| Investment Securities/Affiliated Investment Companies Shares | | | (2,981,497 | ) | | | (537,538 | ) | | | 642,594 | | | | (319,766 | ) | | | (75,837 | ) | | | 14,804 | | |
| Futures | | | — | | | | — | | | | — | | | | 3 | | | | — | | | | — | | |
| Net Increase (Decrease) in Net Assets Resulting from Operations | | | (2,925,634 | ) | | | (112,402 | ) | | | 864,782 | | | | (311,511 | ) | | | (48,108 | ) | | | 33,533 | | |
| Distributions From: | |
| Net Investment Income: | |
| Class R1 Shares | | | — | | | | — | | | | — | | | | (351 | ) | | | — | | | | — | | |
| Class R2 Shares | | | — | | | | — | | | | — | | | | (10 | ) | | | — | | | | — | | |
| Institutional Class Shares | | | (113,742 | ) | | | (88,197 | ) | | | (71,162 | ) | | | (7,766 | ) | | | (3,642 | ) | | | (2,666 | ) | |
| Net Short-Term Gains: | |
| Institutional Class Shares | | | (304 | ) | | | (10,685 | ) | | | (9,775 | ) | | | — | | | | (5,313 | ) | | | (4,163 | ) | |
| Net Long-Term Gains: | |
| Institutional Class Shares | | | (315,650 | ) | | | (127,166 | ) | | | (1,645 | ) | | | (14,019 | ) | | | (11,902 | ) | | | (10,180 | ) | |
| Total Distributions | | | (429,696 | ) | | | (226,048 | ) | | | (82,582 | ) | | | (22,146 | ) | | | (20,857 | ) | | | (17,009 | ) | |
| Capital Share Transactions (1): | |
| Shares Issued | | | 2,629,415 | | | | 2,547,717 | | | | 2,237,439 | | | | 975,465 | | | | 500,717 | * | | | 49,909 | | |
| Shares Issued in Lieu of Cash Distributions | | | 398,086 | | | | 203,411 | | | | 72,993 | | | | 21,294 | | | | 18,152 | | | | 13,833 | | |
| Shares Redeemed | | | (1,877,275 | ) | | | (1,287,212 | ) | | | (728,629 | ) | | | (335,145 | ) | | | (110,437 | ) | | | (37,523 | ) | |
| Net Increase (Decrease) from Capital Share Transactions | | | 1,150,226 | | | | 1,463,916 | | | | 1,581,803 | | | | 661,614 | | | | 408,432 | | | | 26,219 | | |
| Total Increase (Decrease) in Net Assets | | | (2,205,104 | ) | | | 1,125,466 | | | | 2,364,003 | | | | 327,957 | | | | 339,467 | | | | 42,743 | | |
| Net Assets | |
| Beginning of Period | | | 7,535,552 | | | | 6,410,086 | | | | 4,046,083 | | | | 554,805 | | | | 215,338 | | | | 172,595 | | |
| End of Period | | $ | 5,330,448 | | | $ | 7,535,552 | | | $ | 6,410,086 | | | $ | 882,762 | | | $ | 554,805 | | | $ | 215,338 | | |
| (1) Shares Issued and Redeemed: | |
| Shares Issued | | | 131,947 | | | | 97,946 | | | | 96,122 | | | | 71,448 | | | | 28,579 | | | | 2,870 | | |
| Shares Issued in Lieu of Cash Distributions | | | 17,729 | | | | 8,025 | | | | 3,257 | | | | 1,447 | | | | 1,060 | | | | 876 | | |
| Shares Redeemed | | | (92,441 | ) | | | (50,063 | ) | | | (31,524 | ) | | | (25,199 | ) | | | (6,247 | ) | | | (2,182 | ) | |
| | | | 57,235 | | | | 55,908 | | | | 67,855 | | | | 47,696 | | | | 23,392 | | | | 1,564 | | |
Undistributed Net Investment Income (Distributions in Excess of
Net Investment Income) | | $ | 25,004 | | | $ | 23,690 | | | $ | 21,790 | | | $ | 2,098 | | | $ | 794 | | | $ | 225 | | |
* Includes $6,246 in capital contributions related to the liquidation of The U.S. Targeted Value Series. See Organization note within the Notes to Financial Statements.
See accompanying Notes to Financial Statements.
126
DFA INVESTMENT DIMENSIONS GROUP INC.
STATEMENTS OF CHANGES IN NET ASSETS
(Amounts in thousands)
| | | U.S. Small
Cap Value Portfolio | | U.S. Core
Equity 1 Portfolio | |
| | | Period
Dec. 1,
2007 to
Oct. 31,
2008 | | Year
Ended
Nov. 30,
2007 | | Year
Ended
Nov. 30,
2006 | | Period
Dec. 1,
2007 to
Oct. 31,
2008 | | Year
Ended
Nov. 30,
2007 | | Year
Ended
Nov. 30,
2006 | |
| Increase (Decrease) in Net Assets | |
| Operations: | |
| Net Investment Income (Loss) | | $ | 60,650 | | | $ | 92,097 | | | $ | 72,762 | | | $ | 22,840 | | | $ | 14,928 | | | $ | 5,932 | | |
| Capital Gain Distributions Received from Affiliated Investment Company | | | 1,046,424 | | | | 875,446 | | | | 658,949 | | | | — | | | | — | | | | — | | |
Net Realized Gain (Loss) on
Investment Securities Sold/Affiliated Investment Company Shares Sold | | | (209,110 | ) | | | (37,370 | ) | | | (4,180 | ) | | | (19,218 | ) | | | (3,304 | ) | | | 1,503 | | |
| Change in Unrealized Appreciation (Depreciation) of: | |
| Investment Securities/Affiliated Investment Company Shares | | | (3,538,529 | ) | | | (1,754,043 | ) | | | 697,484 | | | | (553,125 | ) | | | 15,592 | | | | 52,372 | | |
| Futures | | | — | | | | — | | | | — | | | | 2 | | | | — | | | | — | | |
| Net Increase (Decrease) in Net Assets Resulting from Operations | | | (2,640,565 | ) | | | (823,870 | ) | | | 1,425,015 | | | | (549,501 | ) | | | 27,216 | | | | 59,807 | | |
| Distributions From: | |
| Net Investment Income: | |
| Institutional Class Shares | | | (74,354 | ) | | | (85,546 | ) | | | (58,998 | ) | | | (22,927 | ) | | | (14,899 | ) | | | (5,955 | ) | |
| Net Short-Term Gains: | |
| Institutional Class Shares | | | — | | | | (72,477 | ) | | | (34,788 | ) | | | — | | | | (578 | ) | | | (13 | ) | |
| Net Long-Term Gains: | |
| Institutional Class Shares | | | (746,639 | ) | | | (592,599 | ) | | | (507,342 | ) | | | — | | | | (1,040 | ) | | | — | | |
| Total Distributions | | | (820,993 | ) | | | (750,622 | ) | | | (601,128 | ) | | | (22,927 | ) | | | (16,517 | ) | | | (5,968 | ) | |
| Capital Share Transactions (1): | |
| Shares Issued | | | 1,857,448 | | | | 2,756,160 | | | | 1,772,199 | | | | 1,087,323 | | | | 609,131 | | | | 487,106 | | |
| Shares Issued in Lieu of Cash Distributions | | | 798,952 | | | | 722,554 | | | | 575,437 | | | | 21,544 | | | | 16,079 | | | | 5,909 | | |
| Shares Redeemed | | | (2,493,743 | ) | | | (1,839,654 | ) | | | (1,357,479 | ) | | | (425,908 | ) | | | (78,148 | ) | | | (18,175 | ) | |
| Net Increase (Decrease) from Capital Share Transactions | | | 162,657 | | | | 1,639,060 | | | | 990,157 | | | | 682,959 | | | | 547,062 | | | | 474,840 | | |
| Total Increase (Decrease) in Net Assets | | | (3,298,901 | ) | | | 64,568 | | | | 1,814,044 | | | | 110,531 | | | | 557,761 | | | | 528,679 | | |
| Net Assets | |
| Beginning of Period | | | 8,802,846 | | | | 8,738,278 | | | | 6,924,234 | | | | 1,210,031 | | | | 652,270 | | | | 123,591 | | |
| End of Period | | $ | 5,503,945 | | | $ | 8,802,846 | | | $ | 8,738,278 | | | $ | 1,320,562 | | | $ | 1,210,031 | | | $ | 652,270 | | |
| (1) Shares Issued and Redeemed: | |
| Shares Issued | | | 84,519 | | | | 93,005 | | | | 60,848 | | | | 107,874 | | | | 50,720 | | | | 45,767 | | |
| Shares Issued in Lieu of Cash Distributions | | | 34,137 | | | | 24,691 | | | | 21,722 | | | | 2,264 | | | | 1,371 | | | | 550 | | |
| Shares Redeemed | | | (113,726 | ) | | | (62,068 | ) | | | (46,827 | ) | | | (43,396 | ) | | | (6,544 | ) | | | (1,697 | ) | |
| | | | 4,930 | | | | 55,628 | | | | 35,743 | | | | 66,742 | | | | 45,547 | | | | 44,620 | | |
Undistributed Net Investment Income (Distributions in Excess of
Net Investment Income) | | $ | 31,701 | | | $ | 8,847 | | | $ | 8,394 | | | $ | 257 | | | $ | 344 | | | $ | 366 | | |
See accompanying Notes to Financial Statements.
127
DFA INVESTMENT DIMENSIONS GROUP INC.
STATEMENTS OF CHANGES IN NET ASSETS
(Amounts in thousands)
| | | U.S. Core
Equity 2 Portfolio | | U.S. Vector
Equity Portfolio | |
| | | Period
Dec. 1,
2007 to
Oct. 31,
2008 | | Year
Ended
Nov. 30,
2007 | | Year
Ended
Nov. 30,
2006 | | Period
Dec. 1,
2007 to
Oct. 31,
2008 | | Year
Ended
Nov. 30,
2007 | | Year
Ended
Nov. 30,
2006 | |
| Increase (Decrease) in Net Assets | |
| Operations: | |
| Net Investment Income (Loss) | | $ | 47,930 | | | $ | 34,532 | | | $ | 9,455 | | | $ | 15,482 | | | $ | 9,503 | | | | 2,530 | | |
| Net Realized Gain (Loss) on Investment Securities Sold | | | (45,734 | ) | | | (15,734 | ) | | | 2,921 | | | | (13,893 | ) | | | (1,810 | ) | | | 6,315 | | |
| Change in Unrealized Appreciation (Depreciation) of: | |
| Investment Securities | | | (1,104,305 | ) | | | (32,306 | ) | | | 95,057 | | | | (400,041 | ) | | | (41,111 | ) | | | 35,256 | | |
| Futures | | | 1 | | | | — | | | | — | | | | — | | | | — | | | | — | | |
| Net Increase (Decrease) in Net Assets Resulting from Operations | | | (1,102,108 | ) | | | (13,508 | ) | | | 107,433 | | | | (398,452 | ) | | | (33,418 | ) | | | 44,101 | | |
| Distributions From: | |
| Net Investment Income: | |
| Institutional Class Shares | | | (48,004 | ) | | | (34,490 | ) | | | (9,388 | ) | | | (14,964 | ) | | | (7,650 | ) | | | (1,296 | ) | |
| Net Short-Term Gains: | |
| Institutional Class Shares | | | — | | | | (1,625 | ) | | | (20 | ) | | | — | | | | (6,329 | ) | | | — | | |
| Net Long-Term Gains: | |
| Institutional Class Shares | | | — | | | | (1,516 | ) | | | — | | | | — | | | | — | | | | — | | |
| Total Distributions | | | (48,004 | ) | | | (37,631 | ) | | | (9,408 | ) | | | (14,964 | ) | | | (13,979 | ) | | | (1,296 | ) | |
| Capital Share Transactions (1): | |
| Shares Issued | | | 1,647,226 | | | | 2,019,061 | | | | 957,339 | | | | 599,481 | | | | 689,895 | | | | 388,675 | | |
| Shares Issued in Lieu of Cash Distributions | | | 47,199 | | | | 37,027 | | | | 9,288 | | | | 14,671 | | | | 13,800 | | | | 1,293 | | |
| Shares Redeemed | | | (982,705 | ) | | | (281,839 | ) | | | (30,420 | ) | | | (309,855 | ) | | | (99,868 | ) | | | (29,461 | ) | |
| Net Increase (Decrease) from Capital Share Transactions | | | 711,720 | | | | 1,774,249 | | | | 936,207 | | | | 304,297 | | | | 603,827 | | | | 360,507 | | |
| Total Increase (Decrease) in Net Assets | | | (438,392 | ) | | | 1,723,110 | | | | 1,034,232 | | | | (109,119 | ) | | | 556,430 | | | | 403,312 | | |
| Net Assets | |
| Beginning of Period | | | 2,939,420 | | | | 1,216,310 | | | | 182,078 | | | | 959,742 | | | | 403,312 | | | | — | | |
| End of Period | | $ | 2,501,028 | | | $ | 2,939,420 | | | $ | 1,216,310 | | | $ | 850,623 | | | $ | 959,742 | | | $ | 403,312 | | |
| (1) Shares Issued and Redeemed: | |
| Shares Issued | | | 166,628 | | | | 165,360 | | | | 88,583 | | | | 59,904 | | | | 57,308 | | | | 36,777 | | |
| Shares Issued in Lieu of Cash Distributions | | | 5,013 | | | | 3,137 | | | | 852 | | | | 1,411 | | | | 1,170 | | | | 121 | | |
| Shares Redeemed | | | (97,859 | ) | | | (23,138 | ) | | | (2,811 | ) | | | (31,898 | ) | | | (8,342 | ) | | | (2,696 | ) | |
| | | | 73,782 | | | | 145,359 | | | | 86,624 | | | | 29,417 | | | | 50,136 | | | | 34,202 | | |
Undistributed Net Investment Income (Distributions in Excess of
Net Investment Income) | | $ | 399 | | | $ | 473 | | | $ | 581 | | | $ | 3,637 | | | $ | 3,119 | | | $ | 1,276 | | |
See accompanying Notes to Financial Statements.
128
DFA INVESTMENT DIMENSIONS GROUP INC.
STATEMENTS OF CHANGES IN NET ASSETS
(Amounts in thousands)
| | | T.A. U.S.
Core Equity 2
Portfolio | | U.S. Small
Cap Portfolio | |
| | | Period
Dec. 1,
2007 to
Oct. 31,
2008 | | Period
Oct. 4,
2007(a) to
Nov. 30,
2007 | | Period
Dec. 1,
2007 to
Oct. 31,
2008 | | Year
Ended
Nov. 30,
2007 | | Year
Ended
Nov. 30,
2006 | |
| Increase (Decrease) in Net Assets | |
| Operations: | |
| Net Investment Income (Loss) | | $ | 6,271 | | | $ | 167 | | | $ | 21,360 | | | $ | 33,291 | | | $ | 24,118 | | |
| Capital Gain Distributions Received from Affiliated Investment Companies | | | — | | | | — | | | | 243,531 | | | | 216,208 | | | | 170,953 | | |
| Net Realized Gain (Loss) on | |
| Investment Securities Sold/Affiliated Investment Companies Shares Sold | | | (7,078 | ) | | | (310 | ) | | | (116,947 | ) | | | 2,061 | | | | (5,181 | ) | |
| Change in Unrealized Appreciation (Depreciation) of: | |
| Investment Securities/Affiliated Investment Companies Shares | | | (179,572 | ) | | | (1,432 | ) | | | (1,073,797 | ) | | | (321,609 | ) | | | 233,973 | | |
| Futures | | | 1 | | | | — | | | | — | | | | — | | | | — | | |
| Net Increase (Decrease) in Net Assets Resulting from Operations | | | (180,378 | ) | | | (1,575 | ) | | | (925,853 | ) | | | (70,049 | ) | | | 423,863 | | |
| Distributions From: | |
| Net Investment Income: | |
| Institutional Class Shares | | | (4,648 | ) | | | — | | | | (26,222 | ) | | | (32,047 | ) | | | (18,099 | ) | |
| Net Short-Term Gains: | |
| Institutional Class Shares | | | — | | | | — | | | | (8,922 | ) | | | (34,803 | ) | | | (31,411 | ) | |
| Net Long-Term Gains: | |
| Institutional Class Shares | | | — | | | | — | | | | (173,725 | ) | | | (134,723 | ) | | | (117,599 | ) | |
| Total Distributions | | | (4,648 | ) | | | — | | | | (208,869 | ) | | | (201,573 | ) | | | (167,109 | ) | |
| Capital Share Transactions (1): | |
| Shares Issued | | | 995,838 | | | | 120,639 | | | | 937,947 | | | | 727,472 | | | | 724,661 | | |
| Shares Issued in Lieu of Cash Distributions | | | 4,587 | | | | — | | | | 204,052 | | | | 197,467 | | | | 164,466 | | |
| Shares Redeemed | | | (336,741 | ) | | | (12,557 | ) | | | (1,225,521 | ) | | | (665,423 | ) | | | (490,352 | ) | |
| Net Increase (Decrease) from Capital Share Transactions | | | 663,684 | | | | 108,082 | | | | (83,522 | ) | | | 259,516 | | | | 398,775 | | |
| Total Increase (Decrease) in Net Assets | | | 478,658 | | | | 106,507 | | | | (1,218,244 | ) | | | (12,106 | ) | | | 655,529 | | |
| Net Assets | |
| Beginning of Period | | | 106,507 | | | | — | | | | 3,285,093 | | | | 3,297,199 | | | | 2,641,670 | | |
| End of Period | | $ | 585,165 | | | $ | 106,507 | | | $ | 2,066,849 | | | $ | 3,285,093 | | | $ | 3,297,199 | | |
| (1) Shares Issued and Redeemed: | |
| Shares Issued | | | 125,252 | | | | 12,664 | | | | 54,875 | | | | 33,265 | | | | 34,475 | | |
| Shares Issued in Lieu of Cash Distributions | | | 543 | | | | — | | | | 10,771 | | | | 9,289 | | | | 8,437 | | |
| Shares Redeemed | | | (44,316 | ) | | | (1,335 | ) | | | (70,022 | ) | | | (30,180 | ) | | | (23,449 | ) | |
| | | | 81,479 | | | | 11,329 | | | | (4,376 | ) | | | 12,374 | | | | 19,463 | | |
Undistributed Net Investment Income
(Distributions in Excess of Net
Investment Income) | | $ | 1,827 | | | $ | 173 | | | $ | 7,754 | | | $ | 3,498 | | | $ | 4,811 | | |
See page 1 & 2 for the Definitions of Abbreviations and Footnotes.
See accompanying Notes to Financial Statements.
129
DFA INVESTMENT DIMENSIONS GROUP INC.
STATEMENTS OF CHANGES IN NET ASSETS
(Amounts in thousands)
| | | U.S. Micro
Cap Portfolio | | DFA Real Estate
Securities
Portfolio | |
| | | Period
Dec. 1,
2007 to
Oct. 31,
2008 | | Year
Ended
Nov. 30,
2007 | | Year
Ended
Nov. 30,
2006 | | Period
Dec. 1,
2007 to
Oct. 31,
2008 | | Year
Ended
Nov. 30,
2007 | | Year
Ended
Nov. 30,
2006 | |
| Increase (Decrease) in Net Assets | |
| Operations: | |
| Net Investment Income (Loss) | | $ | 33,434 | | | $ | 45,400 | | | $ | 28,402 | | | $ | 68,746 | | | $ | 57,485 | | | $ | 50,355 | | |
| Capital Gain Distributions Received from: | |
| Affiliated Investment Companies | | | 379,091 | | | | 436,439 | | | | 409,412 | | | | — | | | | — | | | | — | | |
| Investment Securities | | | — | | | | — | | | | — | | | | 42,861 | | | | 41,558 | | | | 17,858 | | |
| Net Realized Gain (Loss) on: | |
| Investment Securities Sold/Affiliated Investment Companies Shares Sold | | | (130,372 | ) | | | (3,367 | ) | | | (7,358 | ) | | | (142,397 | ) | | | 181,105 | | | | 75,136 | | |
| Futures | | | — | | | | — | | | | — | | | | (1,472 | ) | | | — | | | | — | | |
| Change in Unrealized Appreciation (Depreciation) of: | |
| Investment Securities/Affiliated Investment Companies Shares | | | (1,674,701 | ) | | | (655,320 | ) | | | 160,973 | | | | (893,193 | ) | | | (762,357 | ) | | | 610,102 | | |
| Futures | | | — | | | | — | | | | — | | | | 10 | | | | — | | | | — | | |
| Net Increase (Decrease) in Net Assets Resulting from Operations | | | (1,392,548 | ) | | | (176,848 | ) | | | 591,429 | | | | (925,445 | ) | | | (482,209 | ) | | | 753,451 | | |
| Distributions From: | |
| Net Investment Income: | |
| Institutional Class Shares | | | (42,596 | ) | | | (40,532 | ) | | | (20,854 | ) | | | (31,389 | ) | | | (62,692 | ) | | | (79,145 | ) | |
| Net Short-Term Gains: | |
| Institutional Class Shares | | | (40,254 | ) | | | (62,657 | ) | | | (72,770 | ) | | | (3,305 | ) | | | (2,939 | ) | | | — | | |
| Net Long-Term Gains: | |
| Institutional Class Shares | | | (350,779 | ) | | | (324,224 | ) | | | (208,506 | ) | | | (200,903 | ) | | | (70,533 | ) | | | (28,912 | ) | |
| Total Distributions | | | (433,629 | ) | | | (427,413 | ) | | | (302,130 | ) | | | (235,597 | ) | | | (136,164 | ) | | | (108,057 | ) | |
| Capital Share Transactions (1): | |
| Shares Issued | | | 799,061 | | | | 1,088,866 | | | | 1,028,184 | | | | 946,371 | | | | 1,093,839 | | | | 711,130 | | |
| Shares Issued in Lieu of Cash Distributions | | | 425,522 | | | | 415,408 | | | | 289,242 | | | | 232,037 | | | | 133,705 | | | | 105,884 | | |
| Shares Redeemed | | | (1,174,552 | ) | | | (1,023,645 | ) | | | (732,233 | ) | | | (941,862 | ) | | | (774,740 | ) | | | (462,032 | ) | |
| Net Increase (Decrease) from Capital Share Transactions | | | 50,031 | | | | 480,629 | | | | 585,193 | | | | 236,546 | | | | 452,804 | | | | 354,982 | | |
| Total Increase (Decrease) in Net Assets | | | (1,776,146 | ) | | | (123,632 | ) | | | 874,492 | | | | (924,496 | ) | | | (165,569 | ) | | | 1,000,376 | | |
| Net Assets | |
| Beginning of Period | | | 4,700,371 | | | | 4,824,003 | | | | 3,949,511 | | | | 2,671,457 | | | | 2,837,026 | | | | 1,836,650 | | |
| End of Period | | $ | 2,924,225 | | | $ | 4,700,371 | | | $ | 4,824,003 | | | $ | 1,746,961 | | | $ | 2,671,457 | | | $ | 2,837,026 | | |
| (1) Shares Issued and Redeemed: | |
| Shares Issued | | | 65,963 | | | | 68,282 | | | | 65,144 | | | | 41,914 | | | | 34,996 | | | | 24,946 | | |
| Shares Issued in Lieu of Cash Distributions | | | 32,229 | | | | 26,806 | | | | 19,632 | | | | 9,889 | | | | 4,257 | | | | 3,849 | | |
| Shares Redeemed | | | (97,545 | ) | | | (64,141 | ) | | | (46,421 | ) | | | (41,934 | ) | | | (24,958 | ) | | | (16,184 | ) | |
| | | | 647 | | | | 30,947 | | | | 38,355 | | | | 9,869 | | | | 14,295 | | | | 12,611 | | |
Undistributed Net Investment Income (Distributions in Excess of
Net Investment Income) | | $ | 36,069 | | | $ | 6,812 | | | $ | 4,469 | | | $ | 34,213 | | | $ | 161 | | | $ | (209 | ) | |
See accompanying Notes to Financial Statements.
130
DFA INVESTMENT DIMENSIONS GROUP INC.
STATEMENTS OF CHANGES IN NET ASSETS
(Amounts in thousands)
| | | Large Cap
International
Portfolio | | International
Core Equity
Portfolio | |
| | | Period
Dec. 1,
2007 to
Oct. 31,
2008 | | Year
Ended
Nov. 30,
2007 | | Year
Ended
Nov. 30,
2006 | | Period
Dec. 1,
2007 to
Oct. 31,
2008 | | Year
Ended
Nov. 30,
2007 | | Year
Ended
Nov. 30,
2006 | |
| Increase (Decrease) in Net Assets | |
| Operations: | |
| Net Investment Income (Loss) | | $ | 56,577 | | | $ | 51,732 | | | $ | 35,857 | | | $ | 76,838 | | | $ | 39,035 | | | $ | 10,384 | | |
| Net Realized Gain (Loss) on: | |
| Investment Securities Sold | | | (19,013 | ) | | | 37,442 | | | | 16,379 | | | | (11,335 | ) | | | 24,982 | | | | 2,392 | | |
| Foreign Currency Transactions | | | (1,346 | ) | | | 174 | | | | 17 | | | | (911 | ) | | | 105 | | | | (150 | ) | |
| In-Kind Redemptions | | | 14,987 | * | | | — | | | | — | | | | 7,590 | * | | | — | | | | — | | |
| Change in Unrealized Appreciation (Depreciation) of: | |
| Investment Securities and Foreign Currency | | | (1,012,012 | ) | | | 231,080 | | | | 286,181 | | | | (1,484,029 | ) | | | 105,889 | | | | 96,717 | | |
| Futures | | | — | | | | — | | | | — | | | | 15 | | | | — | | | | — | | |
| Translation of Foreign Currency Denominated Amounts | | | 65 | | | | (44 | ) | | | 147 | | | | 73 | | | | 59 | | | | 21 | | |
| Net Increase (Decrease) in Net Assets Resulting from Operations | | | (960,742 | ) | | | 320,384 | | | | 338,581 | | | | (1,411,759 | ) | | | 170,070 | | | | 109,364 | | |
| Distributions From: | |
| Net Investment Income: | |
| Institutional Class Shares | | | (53,392 | ) | | | (51,063 | ) | | | (40,654 | ) | | | (76,637 | ) | | | (38,518 | ) | | | (9,763 | ) | |
| Net Short-Term Gains: | |
| Institutional Class Shares | | | — | | | | — | | | | — | | | | (7,592 | ) | | | (2,252 | ) | | | — | | |
| Net Long-Term Gains: | |
| Institutional Class Shares | | | (28,968 | ) | | | — | | | | — | | | | (17,164 | ) | | | (205 | ) | | | — | | |
| Total Distributions | | | (82,360 | ) | | | (51,063 | ) | | | (40,654 | ) | | | (101,393 | ) | | | (40,975 | ) | | | (9,763 | ) | |
| Capital Share Transactions (1): | |
| Shares Issued | | | 534,434 | | | | 529,554 | | | | 389,496 | | | | 1,729,052 | | | | 1,460,555 | | | | 641,548 | | |
| Shares Issued in Lieu of Cash Distributions | | | 78,686 | | | | 47,880 | | | | 37,524 | | | | 97,113 | | | | 39,306 | | | | 9,439 | | |
| Shares Redeemed | | | (587,338 | )* | | | (295,814 | ) | | | (177,163 | ) | | | (674,151 | )* | | | (137,846 | ) | | | (20,760 | ) | |
| Net Increase (Decrease) from Capital Share Transactions | | | 25,782 | | | | 281,620 | | | | 249,857 | | | | 1,152,014 | | | | 1,362,015 | | | | 630,227 | | |
| Total Increase (Decrease) in Net Assets | | | (1,017,320 | ) | | | 550,941 | | | | 547,784 | | | | (361,138 | ) | | | 1,491,110 | | | | 729,828 | | |
| Net Assets | |
| Beginning of Period | | | 2,224,180 | | | | 1,673,239 | | | | 1,125,455 | | | | 2,342,187 | | | | 851,077 | | | | 121,249 | | |
| End of Period | | $ | 1,206,860 | | | $ | 2,224,180 | | | $ | 1,673,239 | | | $ | 1,981,049 | | | $ | 2,342,187 | | | $ | 851,077 | | |
| (1) Shares Issued and Redeemed: | |
| Shares Issued | | | 24,768 | | | | 20,502 | | | | 18,097 | | | | 156,232 | | | | 103,681 | | | | 55,322 | | |
| Shares Issued in Lieu of Cash Distributions | | | 3,394 | | | | 1,862 | | | | 1,796 | | | | 8,456 | | | | 2,819 | | | | 820 | | |
| Shares Redeemed | | | (28,525 | ) | | | (11,428 | ) | | | (8,223 | ) | | | (62,282 | ) | | | (9,741 | ) | | | (1,765 | ) | |
| | | | (363 | ) | | | 10,936 | | | | 11,670 | | | | 102,406 | | | | 96,759 | | | | 54,377 | | |
Undistributed Net Investment Income (Distributions in Excess of
Net Investment Income) | | $ | 449 | | | $ | (1,254 | ) | | $ | (1,125 | ) | | $ | (485 | ) | | $ | 1,609 | | | $ | 860 | | |
* See Note N in the Notes to Financial Statements.
See accompanying Notes to Financial Statements.
131
DFA INVESTMENT DIMENSIONS GROUP INC.
STATEMENTS OF CHANGES IN NET ASSETS
(Amounts in thousands)
| | | T.A. World
ex U.S.
Core Equity
Portfolio | | International
Small Company
Portfolio | | Japanese
Small Company
Portfolio | |
| | | Period
Mar. 6,
2008(a) to
Oct. 31,
2008 | | Period
Dec. 1,
2007 to
Oct. 31,
2008 | | Year
Ended
Nov. 30,
2007 | | Year
Ended
Nov. 30,
2006 | | Period
Dec. 1,
2007 to
Oct. 31,
2008 | | Year
Ended
Nov. 30,
2007 | | Year
Ended
Nov. 30,
2006 | |
| Increase (Decrease) in Net Assets | |
| Operations: | |
| Net Investment Income (Loss) | | $ | 2,171 | | | $ | 131,960 | | | $ | 108,657 | | | $ | 76,419 | | | $ | 3,548 | | | $ | 3,072 | | | $ | 2,264 | | |
| Net Realized Gain (Loss) on: | |
| Investment Securities Sold | | | (2,290 | ) | | | (120,455 | ) | | | 331,045 | | | | 164,696 | | | | (22,824 | ) | | | (7,840 | ) | | | (2,237 | ) | |
| Futures | | | — | | | | (569 | ) | | | — | | | | — | | | | (10 | ) | | | — | | | | — | | |
| Foreign Currency Transactions | | | 6 | | | | (3,640 | ) | | | 1,035 | | | | (124 | ) | | | (46 | ) | | | (35 | ) | | | (10 | ) | |
| Change in Unrealized Appreciation (Depreciation) of: | |
| Investment Securities and Foreign Currency | | | (87,743 | ) | | | (2,759,513 | ) | | | 162,772 | | | | 653,248 | | | | (35,124 | ) | | | 365 | | | | (6,622 | ) | |
| Futures | | | 1 | | | | (1 | ) | | | — | | | | — | | | | — | | | | — | | | | — | | |
| Translation of Foreign Currency Denominated Amounts | | | 56 | | | | 188 | | | | 160 | | | | 329 | | | | 60 | | | | 19 | | | | 30 | | |
Net Increase (Decrease) in Net Assets Resulting from
Operations | | | (87,799 | ) | | | (2,752,030 | ) | | | 603,669 | | | | 894,568 | | | | (54,396 | ) | | | (4,419 | ) | | | (6,575 | ) | |
| Distributions From: | |
| Net Investment Income: | |
| Institutional Class Shares | | | (1,192 | ) | | | (132,809 | ) | | | (114,210 | ) | | | (72,041 | ) | | | (3,574 | ) | | | (2,759 | ) | | | (2,258 | ) | |
| Net Short-Term Gains: | |
| Institutional Class Shares | | | — | | | | (36,135 | ) | | | (28,033 | ) | | | (13,690 | ) | | | — | | | | — | | | | — | | |
| Net Long-Term Gains: | |
| Institutional Class Shares | | | — | | | | (278,291 | ) | | | (129,328 | ) | | | (118,813 | ) | | | — | | | | — | | | | — | | |
| Total Distributions | | | (1,192 | ) | | | (447,235 | ) | | | (271,571 | ) | | | (204,544 | ) | | | (3,574 | ) | | | (2,759 | ) | | | (2,258 | ) | |
| Capital Share Transactions (1): | |
| Shares Issued | | | 408,243 | | | | 1,327,412 | | | | 1,085,538 | | | | 1,415,453 | | | | 32,726 | | | | 102,980 | | | | 58,289 | | |
| Shares Issued in Lieu of Cash Distributions | | | 1,155 | | | | 430,141 | | | | 258,985 | | | | 194,947 | | | | 3,367 | | | | 2,746 | | | | 2,247 | | |
| Shares Redeemed | | | (92,089 | ) | | | (1,071,124 | ) | | | (625,483 | ) | | | (479,584 | ) | | | (43,830 | ) | | | (68,425 | ) | | | (52,741 | ) | |
Net Increase (Decrease) from Capital Share
Transactions | | | 317,309 | | | | 686,429 | | | | 719,040 | | | | 1,130,816 | | | | (7,737 | ) | | | 37,301 | | | | 7,795 | | |
| Total Increase (Decrease) in Net Assets | | | 228,318 | | | | (2,512,836 | ) | | | 1,051,138 | | | | 1,820,840 | | | | (65,707 | ) | | | 30,123 | | | | (1,038 | ) | |
| Net Assets | |
| Beginning of Period | | | — | | | | 5,597,209 | | | | 4,546,071 | | | | 2,725,231 | | �� | | 199,080 | | | | 168,957 | | | | 169,995 | | |
| End of Period | | $ | 228,318 | | | $ | 3,084,373 | | | $ | 5,597,209 | | | $ | 4,546,071 | | | $ | 133,373 | | | $ | 199,080 | | | $ | 168,957 | | |
| (1) Shares Issued and Redeemed: | |
| Shares Issued | | | 51,464 | | | | 83,183 | | | | 52,082 | | | | 80,962 | | | | 2,312 | | | | 5,861 | | | | 3,085 | | |
| Shares Issued in Lieu of Cash Distributions | | | 124 | | | | 24,110 | | | | 13,230 | | | | 11,924 | | | | 220 | | | | 157 | | | | 122 | | |
| Shares Redeemed | | | (12,532 | ) | | | (70,097 | ) | | | (30,074 | ) | | | (27,283 | ) | | | (3,276 | ) | | | (3,939 | ) | | | (2,859 | ) | |
| | | | 39,056 | | | | 37,196 | | | | 35,238 | | | | 65,603 | | | | (744 | ) | | | 2,079 | | | | 348 | | |
Undistributed Net Investment Income (Distributions in Excess
of Net Investment Income) | | $ | 1,014 | | | $ | 8,898 | | | $ | 6,151 | | | $ | 11,888 | | | $ | 964 | | | $ | 894 | | | $ | 489 | | |
See page 1 & 2 for the Definitions of Abbreviations and Footnotes.
See accompanying Notes to Financial Statements.
132
DFA INVESTMENT DIMENSIONS GROUP INC.
STATEMENTS OF CHANGES IN NET ASSETS
(Amounts in thousands)
| | | Asia Pacific
Small Company
Portfolio | | United Kingdom
Small Company
Portfolio | |
| | | Period
Dec. 1,
2007 to
Oct. 31,
2008 | | Year
Ended
Nov. 30,
2007 | | Year
Ended
Nov. 30,
2006 | | Period
Dec. 1,
2007 to
Oct. 31,
2008 | | Year
Ended
Nov. 30,
2007 | | Year
Ended
Nov. 30,
2006 | |
| Increase (Decrease) in Net Assets | |
| Operations: | |
| Net Investment Income (Loss) | | $ | 4,300 | | | $ | 3,553 | | | $ | 2,007 | | | $ | 1,182 | | | $ | 899 | | | $ | 552 | | |
| Net Realized Gain (Loss) on: | |
| Investment Securities Sold | | | (21,574 | ) | | | 4,912 | | | | (863 | ) | | | (771 | ) | | | 1,545 | | | | 1,355 | | |
| Futures | | | (34 | ) | | | — | | | | — | | | | — | | | | — | | | | — | | |
| Foreign Currency Transactions | | | (193 | ) | | | 93 | | | | (40 | ) | | | (77 | ) | | | 13 | | | | 10 | | |
Change in Unrealized Appreciation (Depreciation) of:
Investment Securities and Foreign Currency | | | (69,553 | ) | | | 32,175 | | | | 16,555 | | | | (24,744 | ) | | | (2,123 | ) | | | 7,425 | | |
| Translation of Foreign Currency Denominated Amounts | | | (15 | ) | | | (2 | ) | | | 1 | | | | 11 | | | | — | | | | — | | |
| Net Increase (Decrease) in Net Assets Resulting from Operations | | | (87,069 | ) | | | 40,731 | | | | 17,660 | | | | (24,399 | ) | | | 334 | | | | 9,342 | | |
| Distributions From: | |
| Net Investment Income: | |
| Institutional Class Shares | | | (4,433 | ) | | | (3,089 | ) | | | (1,662 | ) | | | (1,104 | ) | | | (1,097 | ) | | | (594 | ) | |
| Return of Capital | | | — | | | | — | | | | — | | | | (19 | ) | | | — | | | | — | | |
| Net Short-Term Gains: | |
| Institutional Class Shares | | | — | | | | — | | | | — | | | | (123 | ) | | | (217 | ) | | | (167 | ) | |
| Net Long-Term Gains: | |
| Institutional Class Shares | | | — | | | | — | | | | — | | | | (1,311 | ) | | | (1,092 | ) | | | (851 | ) | |
| Total Distributions | | | (4,433 | ) | | | (3,089 | ) | | | (1,662 | ) | | | (2,557 | ) | | | (2,406 | ) | | | (1,612 | ) | |
| Capital Share Transactions (1): | |
| Shares Issued | | | 51,749 | | | | 58,296 | | | | 23,659 | | | | 25,474 | | | | 11,009 | | | | 4,976 | | |
| Shares Issued in Lieu of Cash Distributions | | | 4,090 | | | | 3,008 | | | | 1,630 | | | | 2,517 | | | | 2,404 | | | | 1,611 | | |
| Shares Redeemed | | | (46,600 | ) | | | (24,176 | ) | | | (8,677 | ) | | | (12,291 | ) | | | (6,010 | ) | | | (3,087 | ) | |
| Net Increase (Decrease) from Capital Share Transactions | | | 9,239 | | | | 37,128 | | | | 16,612 | | | | 15,700 | | | | 7,403 | | | | 3,500 | | |
| Total Increase (Decrease) in Net Assets | | | (82,263 | ) | | | 74,770 | | | | 32,610 | | | | (11,256 | ) | | | 5,331 | | | | 11,230 | | |
| Net Assets | |
| Beginning of Period | | | 146,307 | | | | 71,537 | | | | 38,927 | | | | 37,139 | | | | 31,808 | | | | 20,578 | | |
| End of Period | | $ | 64,044 | | | $ | 146,307 | | | $ | 71,537 | | | $ | 25,883 | | | $ | 37,139 | | | $ | 31,808 | | |
| (1) Shares Issued and Redeemed: | |
| Shares Issued | | | 2,384 | | | | 2,409 | | | | 1,385 | | | | 1,087 | | | | 327 | | | | 178 | | |
| Shares Issued in Lieu of Cash Distributions | | | 168 | | | | 131 | | | | 103 | | | | 96 | | | | 74 | | | | 65 | | |
| Shares Redeemed | | | (2,157 | ) | | | (979 | ) | | | (505 | ) | | | (556 | ) | | | (179 | ) | | | (113 | ) | |
| | | | 395 | | | | 1,561 | | | | 983 | | | | 627 | | | | 222 | | | | 130 | | |
Undistributed Net Investment Income (Distributions in Excess of
Net Investment Income) | | $ | 412 | | | $ | 621 | | | $ | 163 | | | $ | (41 | ) | | $ | (171 | ) | | | — | | |
See accompanying Notes to Financial Statements.
133
DFA INVESTMENT DIMENSIONS GROUP INC.
STATEMENTS OF CHANGES IN NET ASSETS
(Amounts in thousands)
| | | Continental
Small Company
Portfolio | | DFA
International
Real Estate
Securities
Portfolio | |
| | | Period
Dec. 1,
2007 to
Oct. 31,
2008 | | Year
Ended
Nov. 30,
2007 | | Year
Ended
Nov. 30,
2006 | | Period
Dec. 1,
2007 to
Oct. 31,
2008 | | Period
March 1,
2007(a) to
Nov. 30,
2007 | |
| Increase (Decrease) in Net Assets | |
| Operations: | |
| Net Investment Income (Loss) | | $ | 4,234 | | | $ | 2,554 | | | $ | 1,251 | | | $ | 22,511 | | | $ | 4,578 | | |
| Net Realized Gain (Loss) on: | |
| Investment Securities Sold | | | (16,519 | ) | | | 7,620 | | | | 2,501 | | | | (13,579 | ) | | | (3 | ) | |
| Futures | | | (16 | ) | | | — | | | | — | | | | — | | | | — | | |
| Foreign Currency Transactions | | | (16 | ) | | | 39 | | | | — | | | | (521 | ) | | | 9 | | |
Change in Unrealized Appreciation (Depreciation) of:
Investment Securities and Foreign Currency | | | (81,292 | ) | | | 4,064 | | | | 22,126 | | | | (363,676 | ) | | | (25,701 | ) | |
| Futures | | | 1 | | | | — | | | | — | | | | — | | | | — | | |
| Translation of Foreign Currency Denominated Amounts | | | (30 | ) | | | 10 | | | | 6 | | | | (124 | ) | | | 14 | | |
| Net Increase (Decrease) in Net Assets Resulting from Operations | | | (93,638 | ) | | | 14,287 | | | | 25,884 | | | | (355,389 | ) | | | (21,103 | ) | |
| Distributions From: | |
| Net Investment Income: | |
| Institutional Class Shares | | | (3,979 | ) | | | (2,638 | ) | | | (1,315 | ) | | | (19,783 | ) | | | (2,361 | ) | |
| Return of Capital | | | (97 | ) | | | — | | | | — | | | | — | | | | — | | |
| Net Short-Term Gains: | |
| Institutional Class Shares | | | (347 | ) | | | (549 | ) | | | (152 | ) | | | — | | | | — | | |
| Net Long-Term Gains: | |
| Institutional Class Shares | | | (6,764 | ) | | | (1,842 | ) | | | (5,105 | ) | | | — | | | | — | | |
| Total Distributions | | | (11,187 | ) | | | (5,029 | ) | | | (6,572 | ) | | | (19,783 | ) | | | (2,361 | ) | |
| Capital Share Transactions (1): | |
| Shares Issued | | | 72,836 | | | | 94,168 | | | | 23,819 | | | | 580,235 | | | | 375,453 | | |
| Shares Issued in Lieu of Cash Distributions | | | 10,871 | | | | 4,921 | | | | 6,468 | | | | 19,359 | | | | 2,263 | | |
| Shares Redeemed | | | (55,803 | ) | | | (27,699 | ) | | | (11,399 | ) | | | (166,782 | ) | | | (17,412 | ) | |
| Net Increase (Decrease) from Capital Share Transactions | | | 27,904 | | | | 71,390 | | | | 18,888 | | | | 432,812 | | | | 360,304 | | |
| Total Increase (Decrease) in Net Assets | | | (76,921 | ) | | | 80,648 | | | | 38,200 | | | | 57,640 | | | | 336,840 | | |
| Net Assets | |
| Beginning of Period | | | 170,909 | | | | 90,261 | | | | 52,061 | | | | 336,840 | | | | — | | |
| End of Period | | $ | 93,988 | | | $ | 170,909 | | | $ | 90,261 | | | $ | 394,480 | | | $ | 336,840 | | |
| (1) Shares Issued and Redeemed: | |
| Shares Issued | | | 3,830 | | | | 4,007 | | | | 1,338 | | | | 81,466 | | | | 37,594 | | |
| Shares Issued in Lieu of Cash Distributions | | | 539 | | | | 227 | | | | 429 | | | | 2,444 | | | | 239 | | |
| Shares Redeemed | | | (3,056 | ) | | | (1,195 | ) | | | (657 | ) | | | (25,570 | ) | | | (1,821 | ) | |
| | | | 1,313 | | | | 3,039 | | | | 1,110 | | | | 58,340 | | | | 36,012 | | |
Undistributed Net Investment Income (Distributions in Excess of Net
Investment Income) | | $ | (43 | ) | | $ | (198 | ) | | $ | (32 | ) | | $ | 4,089 | | | $ | 1,877 | | |
See page 1 & 2 for the Definitions of Abbreviations and Footnotes.
See accompanying Notes to Financial Statements.
134
DFA INVESTMENT DIMENSIONS GROUP INC.
STATEMENTS OF CHANGES IN NET ASSETS
(Amounts in thousands)
| | | DFA Global
Real Estate
Securities
Portfolio | | DFA International
Small Cap Value
Portfolio | | International
Vector Equity
Portfolio | | Emerging Markets
Portfolio | |
| | | Period
June 4,
2008(a) to
Oct. 31,
2008 | | Period
Dec. 1,
2007 to
Oct. 31,
2008 | | Year
Ended
Nov. 30,
2007 | | Year
Ended
Nov. 30,
2006 | | Period
August 14,
2008(a) to
Oct. 31,
2008 | | Period
Dec. 1,
2007 to
Oct. 31,
2008 | | Year
Ended
Nov. 30,
2007 | | Year
Ended
Nov. 30,
2006 | |
| Increase (Decrease) in Net Assets | |
| Operations: | |
| Net Investment Income (Loss) | | $ | (10 | ) | | $ | 222,701 | | | $ | 162,639 | | | $ | 100,905 | | | $ | 246 | | | $ | 65,186 | | | $ | 61,164 | | | $ | 44,476 | | |
| Net Realized Gain (Loss) on: | |
| Investment Securities Sold | | | (280 | ) | | | 28,945 | | | | 682,920 | | | | 407,891 | | | | (27 | ) | | | 25,666 | | | | 138,572 | | | | 27,573 | | |
| Futures | | | — | | | | (1,804 | ) | | | — | | | | — | | | | — | | | | (348 | ) | | | — | | | | — | | |
| Foreign Currency Transactions | | | — | | | | (3,478 | ) | | | 3,452 | | | | 944 | | | | (19 | ) | | | (820 | ) | | | (116 | ) | | | (570 | ) | |
Change in Unrealized Appreciation
(Depreciation) of: | |
| Investment Securities and Foreign Currency | | | (34,668 | ) | | | (4,209,886 | ) | | | (197,398 | ) | | | 940,331 | | | | (16,902 | ) | | | (1,562,393 | ) | | | 809,069 | | | | 471,238 | | |
| Futures | | | — | | | | 28 | | | | — | | | | — | | | | 1 | | | | 30 | | | | — | | | | — | | |
Translation of Foreign Currency
Denominated Amounts | | | — | | | | 112 | | | | 46 | | | | 622 | | | | 15 | | | | (130 | ) | | | (26 | ) | | | (23 | ) | |
Change in Deferred Thailand Capital
Gains Tax | | | — | | | | — | | | | — | | | | — | | | | — | | | | 2,600 | | | | (825 | ) | | | 883 | | |
Net Increase (Decrease) in Net
Assets Resulting from Operations | | | (34,958 | ) | | | (3,963,382 | ) | | | 651,659 | | | | 1,450,693 | | | | (16,686 | ) | | | (1,470,209 | ) | | | 1,007,838 | | | | 543,577 | | |
| Distributions From: | |
| Net Investment Income: | |
| Institutional Class Shares | | | — | | | | (245,481 | ) | | | (179,161 | ) | | | (99,195 | ) | | | — | | | | (63,916 | ) | | | (50,360 | ) | | | (53,784 | ) | |
| Net Short-Term Gains: | |
| Institutional Class Shares | | | — | | | | (65,513 | ) | | | (22,039 | ) | | | (25,926 | ) | | | — | | | | (855 | ) | | | — | | | | — | | |
| Net Long-Term Gains: | |
| Institutional Class Shares | | | — | | | | (533,622 | ) | | | (365,355 | ) | | | (160,786 | ) | | | — | | | | (126,608 | ) | | | (14,375 | ) | | | — | | |
| Total Distributions | | | — | | | | (844,616 | ) | | | (566,555 | ) | | | (285,907 | ) | | | — | | | | (191,379 | ) | | | (64,735 | ) | | | (53,784 | ) | |
| Capital Share Transactions (1): | |
| Shares Issued | | | 144,246 | | | | 2,492,365 | | | | 2,243,987 | | | | 1,837,883 | | | | 88,814 | | | | 564,637 | | | | 654,824 | | | | 660,484 | | |
| Shares Issued in Lieu of Cash Distributions | | | — | | | | 812,456 | | | | 539,597 | | | | 270,084 | | | | — | | | | 160,500 | | | | 52,208 | | | | 43,208 | | |
| Shares Redeemed | | | (18,616 | ) | | | (1,877,934 | ) | | | (1,420,896 | ) | | | (668,114 | ) | | | (5,354 | ) | | | (943,731 | ) | | | (606,683 | ) | | | (653,681 | ) | |
Net Increase (Decrease) from
Capital Share Transactions | | | 125,630 | | | | 1,426,887 | | | | 1,362,688 | | | | 1,439,853 | | | | 83,460 | | | | (218,594 | ) | | | 100,349 | | | | 50,011 | | |
| Total Increase (Decrease) in Net Assets | | | 90,672 | | | | (3,381,111 | ) | | | 1,447,792 | | | | 2,604,639 | | | | 66,774 | | | | (1,880,182 | ) | | | 1,043,452 | | | | 539,804 | | |
| Net Assets | |
| Beginning of Period | | | — | | | | 8,180,859 | | | | 6,733,067 | | | | 4,128,428 | | | | — | | | | 3,388,442 | | | | 2,344,990 | | | | 1,805,186 | | |
| End of Period | | $ | 90,672 | | | $ | 4,799,748 | | | $ | 8,180,859 | | | $ | 6,733,067 | | | $ | 66,774 | | | $ | 1,508,260 | | | $ | 3,388,442 | | | $ | 2,344,990 | | |
| (1) Shares Issued and Redeemed: | |
| Shares Issued | | | 17,468 | | | | 143,771 | | | | 98,177 | | | | 94,173 | | | | 10,648 | | | | 20,801 | | | | 21,863 | | | | 29,503 | | |
| Shares Issued in Lieu of Cash Distributions | | | — | | | | 43,511 | | | | 25,571 | | | | 15,209 | | | | — | | | | 5,181 | | | | 1,846 | | | | 2,071 | | |
| Shares Redeemed | | | (2,460 | ) | | | (114,727 | ) | | | (62,812 | ) | | | (34,273 | ) | | | (741 | ) | | | (33,697 | ) | | | (19,853 | ) | | | (30,000 | ) | |
| | | | 15,008 | | | | 72,555 | | | | 60,936 | | | | 75,109 | | | | 9,907 | | | | (7,715 | ) | | | 3,856 | | | | 1,574 | | |
Undistributed Net Investment Income
(Distributions in Excess of Net
Investment Income) | | $ | 6 | | | $ | 681 | | | $ | 33,083 | | | $ | 14,322 | | | $ | 232 | | | $ | 5,826 | | | $ | 10,896 | | | $ | 3,623 | | |
See page 1 & 2 for the Definitions of Abbreviations and Footnotes.
See accompanying Notes to Financial Statements.
135
DFA INVESTMENT DIMENSIONS GROUP INC.
STATEMENTS OF CHANGES IN NET ASSETS
(Amounts in thousands)
| | | Emerging Markets
Small Cap
Portfolio | | Emerging Markets
Core Equity
Portfolio | |
| | | Period
Dec. 1,
2007 to
Oct. 31,
2008 | | Year
Ended
Nov. 30,
2007 | | Year
Ended
Nov. 30,
2006 | | Period
Dec. 1,
2007 to
Oct. 31,
2008 | | Year
Ended
Nov. 30,
2007 | | Year
Ended
Nov. 30,
2006 | |
| Increase (Decrease) in Net Assets | |
| Operations: | |
| Net Investment Income (Loss) | | $ | 27,317 | | | $ | 17,268 | | | $ | 12,622 | | | $ | 42,186 | | | $ | 24,655 | | | $ | 9,949 | | |
| Net Realized Gain (Loss) on: | |
| Investment Securities Sold | | | (21,877 | ) | | | 98,170 | | | | 56,591 | | | | (64,050 | ) | | | 7,602 | | | | 3,174 | | |
| Futures | | | (404 | ) | | | — | | | | — | | | | — | | | | — | | | | — | | |
| Foreign Currency Transactions | | | (1,270 | ) | | | (319 | ) | | | (457 | ) | | | (1,282 | ) | | | (348 | ) | | | (915 | ) | |
| In-Kind Redemptions | | | — | | | | — | | | | — | | | | 1,902 | * | | | — | | | | — | | |
Change in Unrealized Appreciation
(Depreciation) of: | |
Investment Securities and
Foreign Currency | | | (754,950 | ) | | | 268,054 | | | | 149,128 | | | | (1,113,650 | ) | | | 426,503 | | | | 134,318 | | |
| Futures | | | 9 | | | | — | | | | — | | | | 4 | | | | — | | | | — | | |
Translation of Foreign Currency
Denominated Amounts | | | (175 | ) | | | 74 | | | | 5 | | | | 30 | | | | (1 | ) | | | 18 | | |
| Change in Deferred Thailand Capital Gains Tax | | | 1,394 | | | | (451 | ) | | | (387 | ) | | | 1,150 | | | | (772 | ) | | | (380 | ) | |
| Net Increase (Decrease) in Net Assets Resulting from Operations | | | (749,956 | ) | | | 382,796 | | | | 217,502 | | | | (1,133,710 | ) | | | 457,639 | | | | 146,164 | | |
| Distributions From: | |
| Net Investment Income: | |
| Institutional Class Shares | | | (24,950 | ) | | | (13,632 | ) | | | (11,250 | ) | | | (40,942 | ) | | | (23,343 | ) | | | (8,470 | ) | |
| Return of Capital | | | — | | | | — | | | | — | | | | (204 | ) | | | — | | | | — | | |
| Net Short-Term Gains: | |
| Institutional Class Shares | | | (7,087 | ) | | | (5,938 | ) | | | (3,016 | ) | | | (1,827 | ) | | | (1,657 | ) | | | (80 | ) | |
| Net Long-Term Gains: | |
| Institutional Class Shares | | | (83,694 | ) | | | (46,706 | ) | | | (8,357 | ) | | | (5,265 | ) | | | (1,602 | ) | | | — | | |
| Total Distributions | | | (115,731 | ) | | | (66,276 | ) | | | (22,623 | ) | | | (48,238 | ) | | | (26,602 | ) | | | (8,550 | ) | |
| Capital Share Transactions (1): | |
| Shares Issued | | | 293,300 | | | | 507,036 | | | | 275,906 | | | | 940,532 | | | | 857,837 | | | | 545,478 | | |
| Shares Issued in Lieu of Cash Distributions | | | 95,251 | | | | 60,107 | | | | 20,057 | | | | 47,045 | | | | 25,903 | | | | 8,399 | | |
| Shares Redeemed | | | (433,687 | ) | | | (264,459 | ) | | | (134,272 | ) | | | (479,569 | )* | | | (307,447 | ) | | | (87,918 | ) | |
| Net Increase (Decrease) from Capital Share Transactions | | | (45,136 | ) | | | 302,684 | | | | 161,691 | | | | 508,008 | | | | 576,293 | | | | 465,959 | | |
| Total Increase (Decrease) in Net Assets | | | (910,823 | ) | | | 619,204 | | | | 356,570 | | | | (673,940 | ) | | | 1,007,330 | | | | 603,573 | | |
| Net Assets | |
| Beginning of Period | | | 1,458,152 | | | | 838,948 | | | | 482,378 | | | | 1,829,466 | | | | 822,136 | | | | 218,563 | | |
| End of Period | | $ | 547,329 | | | $ | 1,458,152 | | | $ | 838,948 | | | $ | 1,155,526 | | | $ | 1,829,466 | | | $ | 822,136 | | |
| (1) Shares Issued and Redeemed: | |
| Shares Issued | | | 17,412 | | | | 23,711 | | | | 18,155 | | | | 59,236 | | | | 46,855 | | | | 41,437 | | |
| Shares Issued in Lieu of Cash Distributions | | | 4,649 | | | | 3,382 | | | | 1,441 | | | | 3,094 | | | | 1,454 | | | | 655 | | |
| Shares Redeemed | | | (24,805 | ) | | | (12,406 | ) | | | (8,956 | ) | | | (31,680 | ) | | | (16,331 | ) | | | (6,704 | ) | |
| | | | (2,744 | ) | | | 14,687 | | | | 10,640 | | | | 30,650 | | | | 31,978 | | | | 35,388 | | |
Undistributed Net Investment Income (Distributions in Excess of Net
Investment Income) | | $ | 3,451 | | | $ | 2,393 | | | $ | 935 | | | $ | (45 | ) | | $ | (11 | ) | | $ | 1,260 | | |
* See Note N in the Notes to Financial Statements.
See accompanying Notes to Financial Statements.
136
DFA INVESTMENT DIMENSIONS GROUP INC.
STATEMENTS OF CHANGES IN NET ASSETS
(Amounts in thousands)
| | | DFA One-Year
Fixed Income
Portfolio | | DFA Two-Year
Global Fixed Income
Portfolio | |
| | | Period
Dec. 1,
2007 to
Oct. 31,
2008 | | Year
Ended
Nov. 30,
2007 | | Year
Ended
Nov. 30,
2006 | | Period
Dec. 1,
2007 to
Oct. 31,
2008 | | Year
Ended
Nov. 30,
2007 | | Year
Ended
Nov. 30,
2006 | |
| Increase (Decrease) in Net Assets | |
| Operations: | |
| Net Investment Income (Loss) | | $ | 102,695 | | | $ | 149,623 | | | $ | 88,286 | | | $ | 120,570 | | | $ | 71,628 | | | $ | 15,882 | | |
| Net Realized Gain (Loss) on Affiliated Investment Company Shares Sold | | | (1,880 | ) | | | (1,012 | ) | | | (5,010 | ) | | | (784 | ) | | | (792 | ) | | | (1,259 | ) | |
| Change in Unrealized Appreciation (Depreciation) of | |
| Affiliated Investment Company Shares | | | (12,482 | ) | | | 3,935 | | | | 19,409 | | | | (28,565 | ) | | | 65,338 | | | | 81,636 | | |
| Net Increase (Decrease) in Net Assets Resulting from Operations | | | 88,333 | | | | 152,546 | | | | 102,685 | | | | 91,221 | | | | 136,174 | | | | 96,259 | | |
| Distributions From: | |
| Net Investment Income: | |
| Institutional Class Shares | | | (102,391 | ) | | | (149,471 | ) | | | (88,029 | ) | | | (99,225 | ) | | | (78,938 | ) | | | (28,485 | ) | |
| Net Short-Term Gains: | |
| Institutional Class Shares | | | — | | | | — | | | | — | | | | (300 | ) | | | — | | | | — | | |
| Net Long-Term Gains: | |
| Institutional Class Shares | | | — | | | | — | | | | — | | | | (299 | ) | | | — | | | | — | | |
| Total Distributions | | | (102,391 | ) | | | (149,471 | ) | | | (88,029 | ) | | | (99,824 | ) | | | (78,938 | ) | | | (28,485 | ) | |
| Capital Share Transactions (1): | |
| Shares Issued | | | 1,593,555 | | | | 2,045,675 | | | | 1,537,273 | | | | 860,433 | | | | 1,087,521 | | | | 873,041 | | |
| Shares Issued in Lieu of Cash Distributions | | | 100,257 | | | | 146,025 | | | | 86,450 | | | | 98,963 | | | | 78,258 | | | | 28,271 | | |
| Shares Redeemed | | | (1,714,911 | ) | | | (1,383,749 | ) | | | (1,173,712 | ) | | | (923,706 | ) | | | (548,739 | ) | | | (538,333 | ) | |
| Net Increase (Decrease) from Capital Share Transactions | | | (21,099 | ) | | | 807,951 | | | | 450,011 | | | | 35,690 | | | | 617,040 | | | | 362,979 | | |
| Total Increase (Decrease) in Net Assets | | | (35,157 | ) | | | 811,026 | | | | 464,667 | | | | 27,087 | | | | 674,276 | | | | 430,753 | | |
| Net Assets | |
| Beginning of Period | | | 3,229,577 | | | | 2,418,551 | | | | 1,953,884 | | | | 3,097,898 | | | | 2,423,622 | | | | 1,992,869 | | |
| End of Period | | $ | 3,194,420 | | | $ | 3,229,577 | | | $ | 2,418,551 | | | $ | 3,124,985 | | | $ | 3,097,898 | | | $ | 2,423,622 | | |
| (1) Shares Issued and Redeemed: | |
| Shares Issued | | | 156,545 | | | | 200,504 | | | | 151,526 | | | | 83,111 | | | | 105,633 | | | | 87,913 | | |
| Shares Issued in Lieu of Cash Distributions | | | 9,865 | | | | 14,346 | | | | 8,532 | | | | 9,614 | | | | 7,641 | | | | 2,892 | | |
| Shares Redeemed | | | (168,625 | ) | | | (135,669 | ) | | | (115,658 | ) | | | (89,218 | ) | | | (53,359 | ) | | | (54,202 | ) | |
| | | | (2,215 | ) | | | 79,181 | | | | 44,400 | | | | 3,507 | | | | 59,915 | | | | 36,603 | | |
Undistributed Net Investment Income (Distributions in Excess of Net
Investment Income) | | $ | 9,703 | | | $ | 545 | | | $ | 393 | | | $ | 78,106 | | | $ | 206 | | | $ | 7,516 | | |
See accompanying Notes to Financial Statements.
137
DFA INVESTMENT DIMENSIONS GROUP INC.
STATEMENTS OF CHANGES IN NET ASSETS
(Amounts in thousands)
| | | DFA
Selectively
Hedged
Global Fixed
Income
Portfolio | | DFA Five-Year
Government
Portfolio | | DFA
Five-Year
Global Fixed Income
Portfolio | |
| | | Period
Jan. 9,
2008(a) to
Oct. 31,
2008 | | Period
Dec. 1,
2007 to
Oct. 31,
2008 | | Year
Ended
Nov. 30,
2007 | | Year
Ended
Nov. 30,
2006 | | Period
Dec. 1,
2007 to
Oct. 31,
2008 | | Year
Ended
Nov. 30,
2007 | | Year
Ended
Nov. 30,
2006 | |
| Increase (Decrease) in Net Assets | |
| Operations: | |
| Net Investment Income (Loss) | | $ | 5,310 | | | $ | 30,580 | | | $ | 51,637 | | | $ | 38,415 | | | $ | 83,061 | | | $ | 87,390 | | | $ | 55,362 | | |
Net Realized Gain (Loss) on:
Investment Securities Sold | | | 84 | | | | 2,704 | | | | — | | | | (14,641 | ) | | | (7,737 | ) | | | (13,531 | ) | | | (28,108 | ) | |
| Foreign Currency Transactions | | | (7,531 | ) | | | — | | | | — | | | | — | | | | (17,965 | ) | | | (29,264 | ) | | | 8,867 | | |
| Change in Unrealized Appreciation (Depreciation) of: | |
| Investment Securities and Foreign Currency | | | (28,840 | ) | | | 4,964 | | | | 645 | | | | 13,579 | | | | 8,004 | | | | 31,164 | | | | 88,329 | | |
| Translation of Foreign Currency Denominated Amounts | | | (472 | ) | | | — | | | | — | | | | — | | | | (14,921 | ) | | | 67,297 | | | | (42,594 | ) | |
Net Increase (Decrease) in Net Assets Resulting from
Operations | | | (31,449 | ) | | | 38,248 | | | | 52,282 | | | | 37,353 | | | | 50,442 | | | | 143,056 | | | | 81,856 | | |
| Distributions From: | |
| Net Investment Income: | |
| Institutional Class Shares | | | — | | | | (38,626 | ) | | | (49,378 | ) | | | (34,242 | ) | | | (96,473 | ) | | | (60,967 | ) | | | (54,715 | ) | |
| Return of Capital | | | (68 | ) | | | — | | | | — | | | | — | | | | (5,349 | ) | | | — | | | | (4,812 | ) | |
| Total Distributions | | | (68 | ) | | | (38,626 | ) | | | (49,378 | ) | | | (34,242 | ) | | | (101,822 | ) | | | (60,967 | ) | | | (59,527 | ) | |
| Capital Share Transactions (1): | |
| Shares Issued | | | 300,770 | | | | 358,924 | | | | 467,057 | | | | 404,371 | | | | 1,006,419 | | | | 1,355,752 | | | | 1,042,354 | | |
| Shares Issued in Lieu of Cash Distributions | | | 68 | | | | 37,437 | | | | 48,237 | | | | 33,604 | | | | 96,878 | | | | 58,427 | | | | 57,853 | | |
| Shares Redeemed | | | (71,156 | ) | | | (497,555 | ) | | | (233,710 | ) | | | (257,812 | ) | | | (1,217,579 | ) | | | (399,133 | ) | | | (434,545 | ) | |
Net Increase (Decrease) from Capital Share
Transactions | | | 229,682 | | | | (101,194 | ) | | | 281,584 | | | | 180,163 | | | | (114,282 | ) | | | 1,015,046 | | | | 665,662 | | |
| Total Increase (Decrease) in Net Assets | | | 198,165 | | | | (101,572 | ) | | | 284,488 | | | | 183,274 | | | | (165,662 | ) | | | 1,097,135 | | | | 687,991 | | |
| Net Assets | |
| Beginning of Period | | | — | | | | 1,216,609 | | | | 932,121 | | | | 748,847 | | | | 3,484,919 | | | | 2,387,784 | | | | 1,699,793 | | |
| End of Period | | $ | 198,165 | | | $ | 1,115,037 | | | $ | 1,216,609 | | | $ | 932,121 | | | $ | 3,319,257 | | | $ | 3,484,919 | | | $ | 2,387,784 | | |
| (1) Shares Issued and Redeemed: | |
| Shares Issued | | | 29,751 | | | | 34,739 | | | | 44,986 | | | | 39,056 | | | | 93,497 | | | | 126,584 | | | | 100,867 | | |
| Shares Issued in Lieu of Cash Distributions | | | 7 | | | | 3,640 | | | | 4,674 | | | | 3,260 | | | | 9,019 | | | | 5,452 | | | | 5,639 | | |
| Shares Redeemed | | | (7,505 | ) | | | (48,135 | ) | | | (22,517 | ) | | | (24,883 | ) | | | (113,277 | ) | | | (37,300 | ) | | | (42,022 | ) | |
| | | | 22,253 | | | | (9,756 | ) | | | 27,143 | | | | 17,433 | | | | (10,761 | ) | | | 94,736 | | | | 64,484 | | |
Undistributed Net Investment Income (Distributions in
Excess of Net Investment Income) | | $ | 4 | | | $ | 5,139 | | | $ | 13,185 | | | $ | 10,926 | | | $ | 1,377 | | | $ | 35,427 | | | $ | 43,308 | | |
See page 1 & 2 for the Definitions of Abbreviations and Footnotes.
See accompanying Notes to Financial Statements.
138
DFA INVESTMENT DIMENSIONS GROUP INC.
STATEMENTS OF CHANGES IN NET ASSETS
(Amounts in thousands)
| | | DFA
Intermediate Government
Fixed Income
Portfolio | | DFA
Inflation-Protected
Securities
Portfolio | |
| | | Period
Dec. 1,
2007 to
Oct. 31,
2008 | | Year
Ended
Nov. 30,
2007 | | Year
Ended
Nov. 30,
2006 | | Period
Dec. 1,
2007 to
Oct. 31,
2008 | | Year
Ended
Nov. 30,
2007 | | Period
Sept. 18,
2006(a) to
Nov. 30,
2006 | |
| Increase (Decrease) in Net Assets | |
| Operations: | |
| Net Investment Income (Loss) | | $ | 55,814 | | | $ | 51,217 | | | $ | 30,134 | | | $ | 22,209 | | | $ | 4,228 | | | $ | 48 | | |
| Net Realized Gain (Loss) on Investment Securities Sold | | | 6,370 | | | | 99 | | | | 272 | | | | 416 | | | | — | | | | — | | |
| Change in Unrealized Appreciation (Depreciation) of Investment Securities | | | (24,474 | ) | | | 43,651 | | | | 9,248 | | | | (60,021 | ) | | | 11,920 | | | | 470 | | |
| Net Increase (Decrease) in Net Assets Resulting from Operations | | | 37,710 | | | | 94,967 | | | | 39,654 | | | | (37,396 | ) | | | 16,148 | | | | 518 | | |
| Distributions From: | |
| Net Investment Income: | |
| Institutional Class Shares | | | (59,933 | ) | | | (46,222 | ) | | | (25,780 | ) | | | (19,588 | ) | | | (2,996 | ) | | | — | | |
| Net Short-Term Gains: | |
| Institutional Class Shares | | | — | | | | — | | | | (43 | ) | | | — | | | | — | | | | — | | |
| Net Long-Term Gains: | |
| Institutional Class Shares | | | (112 | ) | | | (310 | ) | | | (2,647 | ) | | | — | | | | — | | | | — | | |
| Total Distributions | | | (60,045 | ) | | | (46,532 | ) | | | (28,470 | ) | | | (19,588 | ) | | | (2,996 | ) | | | — | | |
| Capital Share Transactions (1): | |
| Shares Issued | | | 443,281 | | | | 484,902 | | | | 462,820 | | | | 273,593 | | | | 197,991 | | | | 35,082 | | |
| Shares Issued in Lieu of Cash Distributions | | | 56,181 | | | | 42,284 | | | | 25,656 | | | | 19,520 | | | | 2,996 | | | | — | | |
| Shares Redeemed | | | (543,466 | ) | | | (132,160 | ) | | | (91,806 | ) | | | (104,785 | ) | | | (8,035 | ) | | | (1,301 | ) | |
| Net Increase (Decrease) from Capital Share Transactions | | | (44,004 | ) | | | 395,026 | | | | 396,670 | | | | 188,328 | | | | 192,952 | | | | 33,781 | | |
| Total Increase (Decrease) in Net Assets | | | (66,339 | ) | | | 443,461 | | | | 407,854 | | | | 131,344 | | | | 206,104 | | | | 34,299 | | |
| Net Assets | |
| Beginning of Period | | | 1,314,853 | | | | 871,392 | | | | 463,538 | | | | 240,403 | | | | 34,299 | | | | — | | |
| End of Period | | $ | 1,248,514 | | | $ | 1,314,853 | | | $ | 871,392 | | | $ | 371,747 | | | $ | 240,403 | | | $ | 34,299 | | |
| (1) Shares Issued and Redeemed: | |
| Shares Issued | | | 37,222 | | | | 42,833 | | | | 41,320 | | | | 25,237 | | | | 19,382 | | | | 3,495 | | |
| Shares Issued in Lieu of Cash Distributions | | | 4,761 | | | | 3,751 | | | | 2,296 | | | | 1,803 | | | | 298 | | | | — | | |
| Shares Redeemed | | | (45,743 | ) | | | (11,629 | ) | | | (8,199 | ) | | | (9,793 | ) | | | (786 | ) | | | (128 | ) | |
| | | | (3,760 | ) | | | 34,955 | | | | 35,417 | | | | 17,247 | | | | 18,894 | | | | 3,367 | | |
Undistributed Net Investment Income (Distributions in Excess of Net
Investment Income) | | $ | 10,384 | | | $ | 14,503 | | | $ | 9,508 | | | $ | 3,952 | | | $ | 1,299 | | | $ | 56 | | |
See page 1 & 2 for the Definitions of Abbreviations and Footnotes.
See accompanying Notes to Financial Statements.
139
DFA INVESTMENT DIMENSIONS GROUP INC.
STATEMENTS OF CHANGES IN NET ASSETS
(Amounts in thousands)
| | | DFA
Short-Term
Municipal Bond
Portfolio | | DFA
California
Short-Term
Municipal Bond
Portfolio | |
| | | Period
Dec. 1,
2007 to
Oct. 31,
2008 | | Year
Ended
Nov. 30,
2007 | | Year
Ended
Nov. 30,
2006 | | Period
Dec. 1,
2007 to
Oct. 31,
2008 | | Period
April 2,
2007(a) to
Nov. 30,
2007 | |
| Increase (Decrease) in Net Assets | |
| Operations: | |
| Net Investment Income (Loss) | | $ | 18,477 | | | $ | 25,609 | | | $ | 16,753 | | | $ | 3,606 | | | $ | 1,493 | | |
| Net Realized Gain (Loss) on Investment Securities Sold | | | — | | | | — | | | | — | | | | (19 | ) | | | (4 | ) | |
| Change in Unrealized Appreciation (Depreciation) of Investment Securities | | | (3,435 | ) | | | 2,926 | | | | 1,352 | | | | (1,259 | ) | | | 210 | | |
| Net Increase (Decrease) in Net Assets Resulting from Operations | | | 15,042 | | | | 28,535 | | | | 18,105 | | | | 2,328 | | | | 1,699 | | |
| Distributions From: | |
| Net Investment Income: | |
| Institutional Class Shares | | | (18,834 | ) | | | (24,969 | ) | | | (16,050 | ) | | | (3,577 | ) | | | (1,116 | ) | |
| Total Distributions | | | (18,834 | ) | | | (24,969 | ) | | | (16,050 | ) | | | (3,577 | ) | | | (1,116 | ) | |
| Capital Share Transactions (1): | |
| Shares Issued | | | 411,057 | | | | 452,239 | | | | 315,794 | | | | 152,527 | | | | 143,647 | | |
| Shares Issued in Lieu of Cash Distributions | | | 18,360 | | | | 24,353 | | | | 15,654 | | | | 3,453 | | | | 1,060 | | |
| Shares Redeemed | | | (382,133 | ) | | | (229,674 | ) | | | (147,104 | ) | | | (102,799 | ) | | | (16,307 | ) | |
| Net Increase (Decrease) from Capital Share Transactions | | | 47,284 | | | | 246,918 | | | | 184,344 | | | | 53,181 | | | | 128,400 | | |
| Total Increase (Decrease) in Net Assets | | | 43,492 | | | | 250,484 | | | | 186,399 | | | | 51,932 | | | | 128,983 | | |
| Net Assets | |
| Beginning of Period | | | 948,426 | | | | 697,942 | | | | 511,543 | | | | 128,983 | | | | — | | |
| End of Period | | $ | 991,918 | | | $ | 948,426 | | | $ | 697,942 | | | $ | 180,915 | | | $ | 128,983 | | |
| (1) Shares Issued and Redeemed: | |
| Shares Issued | | | 40,917 | | | | 45,158 | | | | 31,649 | | | | 15,158 | | | | 14,330 | | |
| Shares Issued in Lieu of Cash Distributions | | | 1,829 | | | | 2,434 | | | | 1,571 | | | | 344 | | | | 106 | | |
| Shares Redeemed | | | (38,066 | ) | | | (22,928 | ) | | | (14,747 | ) | | | (10,222 | ) | | | (1,624 | ) | |
| | | | 4,680 | | | | 24,664 | | | | 18,473 | | | | 5,280 | | | | 12,812 | | |
Undistributed Net Investment Income (Distributions in Excess of Net
Investment Income) | | $ | 2,170 | | | $ | 2,527 | | | $ | 1,887 | | | $ | 439 | | | $ | 399 | | |
See page 1 & 2 for the Definitions of Abbreviations and Footnotes.
See accompanying Notes to Financial Statements.
140
DFA INVESTMENT DIMENSIONS GROUP INC.
FINANCIAL HIGHLIGHTS
(for a share outstanding throughout each period)
| | | U.S. Large Company Portfolio | |
| | | Period
Dec. 1,
2007 to
Oct. 31,
2008 | | Year
Ended
Nov. 30,
2007 | | Year
Ended
Nov. 30,
2006 | | Year
Ended
Nov. 30,
2005 | | Year
Ended
Nov. 30,
2004 | | Year
Ended
Nov. 30,
2003 | |
| Net Asset Value, Beginning of Period | | $ | 43.61 | | | $ | 41.24 | | | $ | 36.79 | | | $ | 34.59 | | | $ | 31.16 | | | $ | 27.56 | | |
| Income From Investment Operations | |
| Net Investment Income (Loss) | | | 0.72 | (A) | | | 0.80 | (A) | | | 0.71 | (A) | | | 0.60 | | | | 0.61 | | | | 0.47 | | |
Net Gains (Losses) on Securities
(Realized and Unrealized) | | | (14.96 | ) | | | 2.33 | | | | 4.41 | | | | 2.28 | | | | 3.31 | | | | 3.57 | | |
| Total From Investment Operations | | | (14.24 | ) | | | 3.13 | | | | 5.12 | | | | 2.88 | | | | 3.92 | | | | 4.04 | | |
| Less Distributions | |
| Net Investment Income | | | (0.80 | ) | | | (0.76 | ) | | | (0.67 | ) | | | (0.68 | ) | | | (0.49 | ) | | | (0.44 | ) | |
| Net Realized Gains | | | — | | | | — | | | | — | | | | — | | | | — | | | | — | | |
| Total Distributions | | | (0.80 | ) | | | (0.76 | ) | | | (0.67 | ) | | | (0.68 | ) | | | (0.49 | ) | | | (0.44 | ) | |
| Net Asset Value, End of Period | | $ | 28.57 | | | $ | 43.61 | | | $ | 41.24 | | | $ | 36.79 | | | $ | 34.59 | | | $ | 31.16 | | |
| Total Return | | | (33.14 | )%(C) | | | 7.66 | % | | | 14.12 | % | | | 8.41 | % | | | 12.68 | % | | | 14.90 | % | |
| Net Assets, End of Period (thousands) | | $ | 2,544,038 | | | $ | 3,415,833 | | | $ | 2,868,811 | | | $ | 2,088,128 | | | $ | 1,440,869 | | | $ | 1,017,265 | | |
Ratio of Expenses to Average Net
Assets (D) | | | 0.15 | %(B) | | | 0.15 | % | | | 0.15 | % | | | 0.15 | % | | | 0.15 | % | | | 0.15 | % | |
Ratio of Expenses to Average Net Assets
(Excluding Waivers and Assumption
of Expenses and/or Recovery of
Previously Waived Fees) (D) | | | 0.15 | %(B) | | | 0.15 | % | | | 0.19 | % | | | 0.30 | % | | | 0.30 | % | | | 0.30 | % | |
Ratio of Net Investment Income to
Average Net Assets | | | 2.05 | %(B) | | | 1.85 | % | | | 1.85 | % | | | 1.78 | % | | | 1.92 | % | | | 1.66 | % | |
| | | Enhanced U.S. Large Company Portfolio | |
| | | Period
Dec. 1,
2007 to
Oct. 31,
2008 | | Year
Ended
Nov. 30,
2007 | | Year
Ended
Nov. 30,
2006 | | Year
Ended
Nov. 30,
2005 | | Year
Ended
Nov. 30,
2004 | | Year
Ended
Nov. 30,
2003 | |
| Net Asset Value, Beginning of Period | | $ | 10.91 | | | $ | 10.95 | | | $ | 9.82 | | | $ | 9.35 | | | $ | 8.42 | | | $ | 7.41 | | |
| Income From Investment Operations | |
| Net Investment Income (Loss) | | | 0.39 | (A) | | | 0.30 | (A) | | | 0.12 | (A) | | | 0.29 | | | | 0.09 | | | | 0.10 | | |
Net Gains (Losses) on Securities
(Realized and Unrealized) | | | (3.74 | ) | | | 0.45 | | | | 1.19 | | | | 0.37 | | | | 0.94 | | | | 1.02 | | |
| Total From Investment Operations | | | (3.35 | ) | | | 0.75 | | | | 1.31 | | | | 0.66 | | | | 1.03 | | | | 1.12 | | |
| Less Distributions | |
| Net Investment Income | | | (0.36 | ) | | | (0.36 | ) | | | (0.18 | ) | | | (0.19 | ) | | | (0.10 | ) | | | (0.11 | ) | |
| Net Realized Gains | | | (0.73 | ) | | | (0.43 | ) | | | — | | | | — | | | | — | | | | — | | |
| Total Distributions | | | (1.09 | ) | | | (0.79 | ) | | | (0.18 | ) | | | (0.19 | ) | | | (0.10 | ) | | | (0.11 | ) | |
| Net Asset Value, End of Period | | $ | 6.47 | | | $ | 10.91 | | | $ | 10.95 | | | $ | 9.82 | | | $ | 9.35 | | | $ | 8.42 | | |
| Total Return | | | (33.89 | )%(C) | | | 7.13 | % | | | 13.52 | % | | | 7.08 | % | | | 12.28 | % | | | 15.39 | % | |
| Net Assets, End of Period (thousands) | | $ | 200,331 | | | $ | 337,050 | | | $ | 347,216 | | | $ | 313,543 | | | $ | 221,744 | | | $ | 141,489 | | |
Ratio of Expenses to Average Net
Assets (D) | | | 0.25 | %(B) | | | 0.25 | % | | | 0.26 | % | | | 0.34 | % | | | 0.37 | % | | | 0.36 | % | |
Ratio of Expenses to Average Net Assets
(Excluding Waivers and Assumption
of Expenses and/or Recovery of
Previously Waived Fees) (D) | | | 0.25 | %(B) | | | 0.25 | % | | | 0.26 | % | | | 0.34 | % | | | 0.37 | % | | | 0.36 | % | |
Ratio of Net Investment Income to
Average Net Assets | | | 4.74 | %(B) | | | 2.67 | % | | | 1.19 | % | | | 3.11 | % | | | 0.95 | % | | | 1.32 | % | |
See page 1 & 2 for the Definitions of Abbreviations and Footnotes.
See accompanying Notes to Financial Statements.
141
DFA INVESTMENT DIMENSIONS GROUP INC.
FINANCIAL HIGHLIGHTS
(for a share outstanding throughout each period)
| | | U.S. Large Cap Value Portfolio | |
| | | Period
Dec. 1,
2007 to
Oct. 31,
2008 | | Year
Ended
Nov. 30,
2007 | | Year
Ended
Nov. 30,
2006 | | Year
Ended
Nov. 30,
2005 | | Year
Ended
Nov. 30,
2004 | | Year
Ended
Nov. 30,
2003 | |
| Net Asset Value, Beginning of Period | | $ | 24.44 | | | $ | 25.40 | | | $ | 21.93 | | | $ | 19.37 | | | $ | 16.14 | | | $ | 13.63 | | |
| Income From Investment Operations | |
| Net Investment Income (Loss) | | | 0.36 | (A) | | | 0.33 | (A) | | | 0.38 | (A) | | | 0.30 | | | | 0.16 | | | | 0.20 | | |
| Net Gains (Losses) on Securities (Realized and Unrealized) | | | (8.83 | ) | | | (0.43 | ) | | | 3.50 | | | | 2.49 | | | | 3.28 | | | | 2.50 | | |
| Total From Investment Operations | | | (8.47 | ) | | | (0.10 | ) | | | 3.88 | | | | 2.79 | | | | 3.44 | | | | 2.70 | | |
| Less Distributions | |
| Net Investment Income | | | (0.35 | ) | | | (0.32 | ) | | | (0.35 | ) | | | (0.23 | ) | | | (0.21 | ) | | | (0.19 | ) | |
| Net Realized Gains | | | (1.04 | ) | | | (0.54) | | | | (0.06 | ) | | | — | | | | — | | | | — | | |
| Total Distributions | | | (1.39 | ) | | | (0.86 | ) | | | (0.41 | ) | | | (0.23 | ) | | | (0.21 | ) | | | (0.19 | ) | |
| Net Asset Value, End of Period | | $ | 14.58 | | | $ | 24.44 | | | $ | 25.40 | | | $ | 21.93 | | | $ | 19.37 | | | $ | 16.14 | | |
| Total Return | | | (36.63 | )%(C) | | | (0.49 | )% | | | 17.97 | % | | | 14.49 | % | | | 21.48 | % | | | 20.10 | % | |
| Net Assets, End of Period (thousands) | | $ | 5,330,448 | | | $ | 7,535,552 | | | $ | 6,410,086 | | | $ | 4,046,083 | | | $ | 2,630,361 | | | $ | 1,709,428 | | |
| Ratio of Expenses to Average Net Assets | | | 0.28 | %(B)(D) | | | 0.27 | %(D) | | | 0.28 | %(D) | | | 0.30 | %(D) | | | 0.32 | %(D) | | | 0.31 | %(D) | |
| Ratio of Net Investment Income to Average Net Assets | | | 1.86 | %(B) | | | 1.28 | % | | | 1.64 | % | | | 1.48 | % | | | 0.89 | % | | | 1.46 | % | |
| Portfolio Turnover Rate | | | N/A | | | | N/A | | | | N/A | | | | N/A | | | | N/A | | | | N/A | | |
| | | U.S.
Targeted
Value
Portfolio-
Class R1
Shares | |
| | | Period
Jan. 31,
2008(a)
to Oct. 31,
2008 | |
| Net Asset Value, Beginning of Period | | $ | 10.00 | | |
| Income From Investment Operations | |
| Net Investment Income (Loss) | | | 0.09 | (A) | |
| Net Gains (Losses) on Securities (Realized and Unrealized) | | | (2.56 | ) | |
| Total From Investment Operations | | | (2.47 | ) | |
| Less Distributions | |
| Net Investment Income | | | (0.10 | ) | |
| Net Realized Gains | | | — | | |
| Total Distributions | | | (0.10 | ) | |
| Net Asset Value, End of Period | | $ | 7.43 | | |
| Total Return | | | (24.96 | )%(C) | |
| Net Assets, End of Period (thousands) | | $ | 25,599 | | |
| Ratio of Expenses to Average Net Assets | | | 0.50 | %(B)(E) | |
| Ratio of Net Investment Income to Average Net Assets | | | 1.24 | %(B)(E) | |
| Portfolio Turnover Rate | | | 20 | %(C) | |
See page 1 & 2 for the Definitions of Abbreviations and Footnotes.
See accompanying Notes to Financial Statements.
142
DFA INVESTMENT DIMENSIONS GROUP INC.
FINANCIAL HIGHLIGHTS
(for a share outstanding throughout each period)
| | | U.S.
Targeted
Value
Portfolio-
Class R2
Shares | |
| | | Period
June 30,
2008(a)
to Oct. 31,
2008 | |
| Net Asset Value, Beginning of Period | | $ | 10.00 | | |
| Income From Investment Operations | |
| Net Investment Income (Loss) | | | 0.04 | (A) | |
| Net Gains (Losses) on Securities (Realized and Unrealized) | | | (2.17 | ) | |
| Total From Investment Operations | | | (2.13 | ) | |
| Less Distributions | |
| Net Investment Income | | | (0.04 | ) | |
| Net Realized Gains | | | — | | |
| Total Distributions | | | (0.04 | ) | |
| Net Asset Value, End of Period | | $ | 7.83 | | |
| Total Return | | | (21.40 | )%(C) | |
| Net Assets, End of Period (thousands) | | $ | 1,715 | | |
| Ratio of Expenses to Average Net Assets | | | 0.66 | %(B)(E) | |
Ratio of Expenses to Average Net Assets (Excluding Waivers and
Assumption of Expenses and/or Recovery of Previously Waived Fees) | | | 0.66 | %(B)(E) | |
| Ratio of Net Investment Income to Average Net Assets | | | 1.35 | %(B)(E) | |
| Portfolio Turnover Rate | | | 20 | %(C) | |
| | | U.S. Targeted Value Portfolio-
Institutional Class Shares | |
| | | Period
Dec. 1,
2007 to
Oct. 31,
2008 | | Year
Ended
Nov. 30,
2007 | | Year
Ended
Nov. 30,
2006 | | Year
Ended
Nov. 30,
2005 | | Year
Ended
Nov. 30,
2004 | | Year
Ended
Nov. 30,
2003 | |
| Net Asset Value, Beginning of Period | | $ | 15.89 | | | $ | 18.69 | | | $ | 17.33 | | | $ | 17.09 | | | $ | 15.14 | | | $ | 12.41 | | |
| Income From Investment Operations | |
| Net Investment Income (Loss) | | | 0.18 | (A) | | | 0.20 | (A) | | | 0.21 | (A) | | | 0.32 | | | | 0.86 | | | | 0.05 | | |
| Net Gains (Losses) on Securities (Realized and Unrealized) | | | (4.68 | ) | | | (1.32 | ) | | | 2.84 | | | | 1.59 | | | | 2.88 | | | | 4.12 | | |
| Total From Investment Operations | | | (4.50 | ) | | | (1.12 | ) | | | 3.05 | | | | 1.91 | | | | 3.74 | | | | 4.17 | | |
| Less Distributions | |
| Net Investment Income | | | (0.15 | ) | | | (0.20 | ) | | | (0.25 | ) | | | (0.23 | ) | | | (0.90 | ) | | | (0.09 | ) | |
| Net Realized Gains | | | (0.40 | ) | | | (1.48 | ) | | | (1.44 | ) | | | (1.44 | ) | | | (0.89 | ) | | | (1.35 | ) | |
| Total Distributions | | | (0.55 | ) | | | (1.68 | ) | | | (1.69 | ) | | | (1.67 | ) | | | (1.79 | ) | | | (1.44 | ) | |
| Net Asset Value, End of Period | | $ | 10.84 | | | $ | 15.89 | | | $ | 18.69 | | | $ | 17.33 | | | $ | 17.09 | | | $ | 15.14 | | |
| Total Return | | | (29.27 | )%(C) | | | (6.59 | )% | | | 19.48 | % | | | 12.17 | % | | | 27.36 | % | | | 38.43 | % | |
| Net Assets, End of Period (thousands) | | $ | 855,448 | | | $ | 554,805 | | | $ | 215,338 | | | $ | 172,595 | | | $ | 159,325 | | | $ | 96,924 | | |
| Ratio of Expenses to Average Net Assets | | | 0.40 | %(B) | | | 0.41 | %(D)** | | | 0.46 | %(D) | | | 0.47 | %(D) | | | 0.50 | %(D) | | | 0.47 | %(D) | |
Ratio of Expenses to Average Net Assets (Excluding Waivers and
Assumption of Expenses and/or Recovery of Previously Waived Fees) | | | 0.40 | %(B) | | | 0.41 | %(D)** | | | 0.46 | %(D) | | | 0.47 | %(D) | | | 0.48 | %(D) | | | 0.48 | %(D) | |
| Ratio of Net Investment Income to Average Net Assets | | | 1.39 | %(B) | | | 1.12 | % | | | 1.19 | % | | | 1.91 | % | | | 0.27 | % | | | 0.41 | % | |
| Portfolio Turnover Rate | | | 20 | %(C) | | | 9 | %(C)* | | | N/A | | | | N/A | | | | N/A | | | | N/A | | |
* For the period March 30, 2007 through November 30, 2007. Effective March 30, 2007, the U.S. Targeted Value Portfolio invests directly in securities rather than through the Series.
** Represents the combined ratios for the respective portfolio and for the period December 1, 2006 through March 29, 2007, its respective pro-rata share of its Master Fund Series.
See page 1 & 2 for the Definitions of Abbreviations and Footnotes.
See accompanying Notes to Financial Statements.
143
DFA INVESTMENT DIMENSIONS GROUP INC.
FINANCIAL HIGHLIGHTS
(for a share outstanding throughout each period)
| | | U.S. Small Cap Value Portfolio | |
| | | Period
Dec. 1,
2007 to
Oct. 31,
2008 | | Year
Ended
Nov. 30,
2007 | | Year
Ended
Nov. 30,
2006 | | Year
Ended
Nov. 30,
2005 | | Year
Ended
Nov. 30,
2004 | | Year
Ended
Nov. 30,
2003 | |
| Net Asset Value, Beginning of Period | | $ | 26.49 | | | $ | 31.59 | | | $ | 28.74 | | | $ | 27.71 | | | $ | 23.26 | | | $ | 17.70 | | |
| Income From Investment Operations | |
| Net Investment Income (Loss) | | | 0.18 | (A) | | | 0.30 | (A) | | | 0.28 | (A) | | | 0.29 | | | | 0.30 | | | | 0.08 | | |
Net Gains (Losses) on Securities
(Realized and Unrealized) | | | (7.86 | ) | | | (2.72 | ) | | | 5.06 | | | | 2.66 | | | | 5.73 | | | | 7.21 | | |
| Total From Investment Operations | | | (7.68 | ) | | | (2.42 | ) | | | 5.34 | | | | 2.95 | | | | 6.03 | | | | 7.29 | | |
| Less Distributions | |
| Net Investment Income | | | (0.22 | ) | | | (0.28 | ) | | | (0.23 | ) | | | (0.26 | ) | | | (0.38 | ) | | | (0.07 | ) | |
| Net Realized Gains | | | (2.27 | ) | | | (2.40) | | | | (2.26 | ) | | | (1.66 | ) | | | (1.20 | ) | | | (1.66 | ) | |
| Total Distributions | | | (2.49 | ) | | | (2.68) | | | | (2.49 | ) | | | (1.92 | ) | | | (1.58 | ) | | | (1.73 | ) | |
| Net Asset Value, End of Period | | $ | 16.32 | | | $ | 26.49 | | | $ | 31.59 | | | $ | 28.74 | | | $ | 27.71 | | | $ | 23.26 | | |
| Total Return | | | (31.80 | )%(C) | | | (8.41 | )% | | | 20.29 | % | | | 11.32 | % | | | 27.46 | % | | | 45.92 | % | |
| Net Assets, End of Period (thousands) | | $ | 5,503,945 | | | $ | 8,802,846 | | | $ | 8,738,278 | | | $ | 6,924,234 | | | $ | 5,795,166 | | | $ | 4,209,747 | | |
Ratio of Expenses to Average Net
Assets | | | 0.52 | %(B)(D) | | | 0.52 | %(D) | | | 0.53 | %(D) | | | 0.55 | %(D) | | | 0.56 | %(D) | | | 0.56 | %(D) | |
Ratio of Expenses to Average Net Assets
(Excluding Waivers and Assumption
of Expenses and/or Recovery of
Previously Waived Fees) | | | 0.52 | %(B)(D) | | | 0.52 | %(D) | | | 0.53 | %(D) | | | 0.55 | %(D) | | | 0.56 | %(D) | | | 0.56 | %(D) | |
Ratio of Net Investment Income to
Average Net Assets | | | 0.86 | %(B) | | | 0.98 | % | | | 0.94 | % | | | 1.04 | % | | | 0.04 | % | | | 0.46 | % | |
| Portfolio Turnover Rate | | | N/A | | | | N/A | | | | N/A | | | | N/A | | | | N/A | | | | N/A | | |
| | | U.S. Core Equity 1 Portfolio | |
| | | Period
Dec. 1,
2007 to
Oct. 31,
2008 | | Year
Ended
Nov. 30,
2007 | | Year
Ended
Nov. 30,
2006 | | Period
Sept. 15,
2005(a)
to
Nov. 30,
2005 | |
| Net Asset Value, Beginning of Period | | $ | 11.83 | | | $ | 11.50 | | | $ | 10.22 | | | $ | 10.00 | | |
| Income From Investment Operations | |
| Net Investment Income (Loss) | | | 0.17 | (A) | | | 0.19 | (A) | | | 0.17 | (A) | | | 0.03 | | |
Net Gains (Losses) on Securities
(Realized and Unrealized) | | | (4.03 | ) | | | 0.35 | | | | 1.28 | | | | 0.19 | | |
| Total From Investment Operations | | | (3.86 | ) | | | 0.54 | | | | 1.45 | | | | 0.22 | | |
| Less Distributions | |
| Net Investment Income | | | (0.16 | ) | | | (0.18 | ) | | | (0.17 | ) | | | — | | |
| Net Realized Gains | | | — | | | | (0.03 | ) | | | — | | | | — | | |
| Total Distributions | | | (0.16 | ) | | | (0.21 | ) | | | (0.17 | ) | | | — | | |
| Net Asset Value, End of Period | | $ | 7.81 | | | $ | 11.83 | | | $ | 11.50 | | | $ | 10.22 | | |
| Total Return | | | (32.85 | )%(C) | | | 4.68 | % | | | 14.35 | % | | | 2.20 | %(C) | |
| Net Assets, End of Period (thousands) | | $ | 1,320,562 | | | $ | 1,210,031 | | | $ | 652,270 | | | $ | 123,591 | | |
Ratio of Expenses to Average Net
Assets | | | 0.20 | %(B) | | | 0.20 | % | | | 0.23 | % | | | 0.23 | %(B)(E) | |
Ratio of Expenses to Average Net Assets
(Excluding Waivers and Assumption
of Expenses and/or Recovery of
Previously Waived Fees) | | | 0.20 | %(B) | | | 0.20 | % | | | 0.23 | % | | | 0.37 | %(B)(E) | |
Ratio of Net Investment Income to
Average Net Assets | | | 1.78 | %(B) | | | 1.53 | % | | | 1.52 | % | | | 1.85 | %(B)(E) | |
| Portfolio Turnover Rate | | | 5 | %(C) | | | 10 | % | | | 6 | % | | | 0 | %(C) | |
See page 1 & 2 for the Definitions of Abbreviations and Footnotes.
See accompanying Notes to Financial Statements.
144
DFA INVESTMENT DIMENSIONS GROUP INC.
FINANCIAL HIGHLIGHTS
(for a share outstanding throughout each period)
| | | U.S. Core Equity 2 Portfolio | |
| | | Period
Dec. 1,
2007 to
Oct. 31,
2008 | |
Year
Ended
Nov. 30,
2007 | |
Year
Ended
Nov. 30,
2006 | | Period
Sept. 15,
2005(a)
to
Nov. 30,
2005 | |
| Net Asset Value, Beginning of Period | | $ | 11.77 | | | $ | 11.65 | | | $ | 10.24 | | | $ | 10.00 | | |
| Income From Investment Operations | |
| Net Investment Income (Loss) | | | 0.17 | (A) | | | 0.19 | (A) | | | 0.17 | (A) | | | 0.03 | | |
| Net Gains (Losses) on Securities (Realized and Unrealized) | | | (4.04 | ) | | | 0.13 | | | | 1.40 | | | | 0.21 | | |
| Total From Investment Operations | | | (3.87 | ) | | | 0.32 | | | | 1.57 | | | | 0.24 | | |
| Less Distributions | |
| Net Investment Income | | | (0.17 | ) | | | (0.17 | ) | | | (0.16 | ) | | | — | | |
| Net Realized Gains | | | — | | | | (0.03 | ) | | | — | | | | — | | |
| Total Distributions | | | (0.17 | ) | | | (0.20 | ) | | | (0.16 | ) | | | — | | |
| Net Asset Value, End of Period | | $ | 7.73 | | | $ | 11.77 | | | $ | 11.65 | | | $ | 10.24 | | |
| Total Return | | | (33.16 | )%(C) | | | 2.78 | % | | | 15.50 | % | | | 2.40 | %(C) | |
| Net Assets, End of Period (thousands) | | $ | 2,501,028 | | | $ | 2,939,420 | | | $ | 1,216,310 | | | $ | 182,078 | | |
| Ratio of Expenses to Average Net Assets | | | 0.23 | %(B) | | | 0.23 | % | | | 0.26 | % | | | 0.26 | %(B)(E) | |
Ratio of Expenses to Average Net Assets (Excluding Waivers and
Assumption of Expenses and/or Recovery of Previously Waived Fees) | | | 0.23 | %(B) | | | 0.23 | % | | | 0.26 | % | | | 0.38 | %(B)(E) | |
| Ratio of Net Investment Income to Average Net Assets | | | 1.77 | %(B) | | | 1.55 | % | | | 1.55 | % | | | 1.92 | %(B)(E) | |
| Portfolio Turnover Rate | | | 8 | %(C) | | | 7 | % | | | 5 | % | | | 0 | %(C) | |
| | | U.S. Vector Equity Portfolio | |
| | | Period
Dec. 1,
2007 to
Oct. 31,
2008 | |
Year
Ended
Nov. 30,
2007 | | Period
Dec. 30,
2005(a)
to
Nov. 30,
2006 | |
| Net Asset Value, Beginning of Period | | $ | 11.38 | | | $ | 11.79 | | | $ | 10.00 | | |
| Income From Investment Operations | |
| Net Investment Income (Loss) | | | 0.15 | (A) | | | 0.16 | (A) | | | 0.13 | (A) | |
| Net Gains (Losses) on Securities (Realized and Unrealized) | | | (3.89 | ) | | | (0.25 | ) | | | 1.73 | | |
| Total From Investment Operations | | | (3.74 | ) | | | (0.09 | ) | | | 1.86 | | |
| Less Distributions | |
| Net Investment Income | | | (0.16 | ) | | | (0.14 | ) | | | (0.07 | ) | |
| Net Realized Gains | | | — | | | | (0.18 | ) | | | — | | |
| Total Distributions | | | (0.16 | ) | | | (0.32 | ) | | | (0.07 | ) | |
| Net Asset Value, End of Period | | $ | 7.48 | | | $ | 11.38 | | | $ | 11.79 | | |
| Total Return | | | (33.29 | )%(C) | | | (0.87 | )% | | | 18.65 | %(C) | |
| Net Assets, End of Period (thousands) | | $ | 850,623 | | | $ | 959,742 | | | $ | 403,312 | | |
| Ratio of Expenses to Average Net Assets | | | 0.34 | %(B) | | | 0.34 | % | | | 0.36 | %(B)(E) | |
Ratio of Expenses to Average Net Assets (Excluding Waivers and
Assumption of Expenses and/or Recovery of Previously Waived Fees) | | | 0.34 | %(B) | | | 0.33 | % | | | 0.39 | %(B)(E) | |
| Ratio of Net Investment Income to Average Net Assets | | | 1.66 | %(B) | | | 1.29 | % | | | 1.24 | %(B)(E) | |
| Portfolio Turnover Rate | | | 11 | %(C) | | | 14 | % | | | 24 | %(C) | |
See page 1 & 2 for the Definitions of Abbreviations and Footnotes.
See accompanying Notes to Financial Statements.
145
DFA INVESTMENT DIMENSIONS GROUP INC.
FINANCIAL HIGHLIGHTS
(for a share outstanding throughout each period)
| | | T.A. U.S. Core Equity 2 Portfolio | |
| | | Period
Dec. 1,
2007 to
Oct. 31,
2008 | | Period
Oct. 4, 2007(a)
to
Nov. 30, 2007 | |
| Net Asset Value, Beginning of Period | | $ | 9.40 | | | $ | 10.00 | | |
| Income From Investment Operations | |
| Net Investment Income (Loss) | | | 0.13 | (A) | | | 0.02 | (A) | |
Net Gains (Losses) on Securities
(Realized and Unrealized) | | | (3.12 | ) | | | (0.62 | ) | |
| Total From Investment Operations | | | (2.99 | ) | | | (0.60 | ) | |
| Less Distributions | |
| Net Investment Income | | | (0.10 | ) | | | — | | |
| Net Realized Gains | | | — | | | | — | | |
| Tax Return of Capital | | | — | | | | — | | |
| Total Distributions | | | (0.10 | ) | | | — | | |
| Net Asset Value, End of Period | | $ | 6.31 | | | $ | 9.40 | | |
| Total Return | | | (32.16 | )%(C) | | | (6.00 | )%(C) | |
| Net Assets, End of Period (thousands) | | $ | 585,165 | | | $ | 106,507 | | |
| Ratio of Expenses to Average Net Assets | | | 0.29 | %(B) | | | 0.30 | %(B)(E) | |
Ratio of Expenses to Average Net Assets
(Excluding Waivers and Assumption of
Expenses and/or Recovery of Previously
Waived Fees) | | | 0.29 | %(B) | | | 0.60 | %(B)(E) | |
Ratio of Net Investment Income to Average Net
Assets | | | 1.75 | %(B) | | | 2.09 | %(B)(E) | |
| Portfolio Turnover Rate | | | 9 | %(C) | | | 0 | %(C) | |
| | | U.S. Small Cap Portfolio | |
| | | Period
Dec. 1,
2007 to
Oct. 31,
2008 | | Year
Ended
Nov. 30,
2007 | | Year
Ended
Nov. 30,
2006 | | Year
Ended
Nov. 30,
2005 | | Year
Ended
Nov. 30,
2004 | | Year
Ended
Nov. 30,
2003 | |
| Net Asset Value, Beginning of Period | | $ | 20.64 | | | $ | 22.46 | | | $ | 20.75 | | | $ | 19.13 | | | $ | 16.52 | | | $ | 11.97 | | |
| Income From Investment Operations | |
| Net Investment Income (Loss) | | | 0.14 | (A) | | | 0.21 | (A) | | | 0.17 | (A) | | | 0.15 | | | | 0.05 | | | | 0.06 | | |
Net Gains (Losses) on Securities
(Realized and Unrealized) | | | (6.08 | ) | | | (0.66 | ) | | | 2.84 | | | | 1.75 | | | | 2.67 | | | | 4.65 | | |
| Total From Investment Operations | | | (5.94 | ) | | | (0.45 | ) | | | 3.01 | | | | 1.90 | | | | 2.72 | | | | 4.71 | | |
| Less Distributions | |
| Net Investment Income | | | (0.17 | ) | | | (0.21 | ) | | | (0.13 | ) | | | (0.13 | ) | | | (0.10 | ) | | | (0.07 | ) | |
| Net Realized Gains | | | (1.18 | ) | | | (1.16 | ) | | | (1.17 | ) | | | (0.15 | ) | | | — | | | | (0.09 | ) | |
| Tax Return of Capital | | | — | | | | — | | | | — | | | | — | | | | (0.01 | ) | | | — | | |
| Total Distributions | | | (1.35 | ) | | | (1.37) | | | | (1.30 | ) | | | (0.28 | ) | | | (0.11 | ) | | | (0.16 | ) | |
| Net Asset Value, End of Period | | $ | 13.35 | | | $ | 20.64 | | | $ | 22.46 | | | $ | 20.75 | | | $ | 19.13 | | | $ | 16.52 | | |
| Total Return | | | (30.67 | )%(C) | | | (2.17 | )% | | | 15.49 | % | | | 10.04 | % | | | 16.59 | % | | | 39.89 | % | |
| Net Assets, End of Period (thousands) | | $ | 2,066,849 | | | $ | 3,285,093 | | | $ | 3,297,199 | | | $ | 2,641,670 | | | $ | 2,137,970 | | | $ | 1,134,027 | | |
| Ratio of Expenses to Average Net Assets | | | 0.38 | %(B)(D) | | | 0.38 | %(D) | | | 0.38 | %(D) | | | 0.40 | %(D) | | | 0.41 | %(D) | | | 0.42 | %(D) | |
Ratio of Expenses to Average Net Assets
(Excluding Waivers and Assumption of
Expenses and/or Recovery of Previously
Waived Fees) | | | 0.38 | %(B)(D) | | | 0.38 | %(D) | | | 0.38 | %(D) | | | 0.40 | %(D) | | | 0.41 | %(D) | | | 0.42 | %(D) | |
Ratio of Net Investment Income to Average Net
Assets | | | 0.86 | %(B) | | | 0.95 | % | | | 0.82 | % | | | 0.78 | % | | | 0.22 | % | | | 0.52 | % | |
| Portfolio Turnover Rate | | | N/A | | | | N/A | | | | N/A | | | | N/A | | | | N/A | | | | N/A | | |
See page 1 & 2 for the Definitions of Abbreviations and Footnotes.
See accompanying Notes to Financial Statements.
146
DFA INVESTMENT DIMENSIONS GROUP INC.
FINANCIAL HIGHLIGHTS
(for a share outstanding throughout each period)
| | | U.S. Micro Cap Portfolio | |
| | | Period
Dec. 1,
2007 to
Oct. 31,
2008 | | Year
Ended
Nov. 30,
2007 | | Year
Ended
Nov. 30,
2006 | | Year
Ended
Nov. 30,
2005 | | Year
Ended
Nov. 30,
2004 | | Year
Ended
Nov. 30,
2003 | |
Net Asset Value, Beginning of
Period | | $ | 14.80 | | | $ | 16.83 | | | $ | 15.91 | | | $ | 15.06 | | | $ | 13.34 | | | $ | 9.07 | | |
| Income From Investment Operations | |
| Net Investment Income (Loss) | | | 0.10 | (A) | | | 0.14 | (A) | | | 0.10 | (A) | | | 0.07 | | | | 0.19 | | | | 0.03 | | |
Net Gains (Losses) on
Securities (Realized and
Unrealized) | | | (4.32 | ) | | | (0.69 | ) | | | 2.04 | | | | 1.43 | | | | 1.93 | | | | 4.40 | | |
Total From Investment
Operations | | | (4.22 | ) | | | (0.55 | ) | | | 2.14 | | | | 1.50 | | | | 2.12 | | | | 4.43 | | |
| Less Distributions | |
| Net Investment Income | | | (0.13 | ) | | | (0.13 | ) | | | (0.08 | ) | | | (0.06 | ) | | | (0.22 | ) | | | (0.02 | ) | |
| Net Realized Gains | | | (1.26 | ) | | | (1.35 | ) | | | (1.14 | ) | | | (0.59 | ) | | | (0.18 | ) | | | (0.14 | ) | |
| Total Distributions | | | (1.39 | ) | | | (1.48 | ) | | | (1.22 | ) | | | (0.65 | ) | | | (0.40 | ) | | | (0.16 | ) | |
| Net Asset Value, End of Period | | $ | 9.19 | | | $ | 14.80 | | | $ | 16.83 | | | $ | 15.91 | | | $ | 15.06 | | | $ | 13.34 | | |
| Total Return | | | (31.33 | )%(C) | | | (3.63 | )% | | | 14.52 | % | | | 10.33 | % | | | 16.34 | % | | | 49.69 | % | |
Net Assets, End of Period
(thousands) | | $ | 2,924,225 | | | $ | 4,700,371 | | | $ | 4,824,003 | | | $ | 3,949,511 | | | $ | 3,214,520 | | | $ | 2,622,847 | | |
Ratio of Expenses to Average Net
Assets | | | 0.53 | %(B)(D) | | | 0.52 | %(D) | | | 0.53 | %(D) | | | 0.55 | %(D) | | | 0.56 | %(D) | | | 0.56 | %(D) | |
Ratio of Net Investment Income to
Average Net Assets | | | 0.91 | %(B) | | | 0.89 | % | | | 0.64 | % | | | 0.48 | % | | | 0.06 | % | | | 0.25 | % | |
| Portfolio Turnover Rate | | | N/A | | | | N/A | | | | N/A | | | | N/A | | | | N/A | | | | N/A | | |
| | | DFA Real Estate Securities Portfolio | |
| | | Period
Dec. 1,
2007 to
Oct. 31,
2008 | | Year
Ended
Nov. 30,
2007 | | Year
Ended
Nov. 30,
2006 | | Year
Ended
Nov. 30,
2005 | | Year
Ended
Nov. 30,
2004 | | Year
Ended
Nov. 30,
2003 | |
Net Asset Value, Beginning of
Period | | $ | 27.20 | | | $ | 33.80 | | | $ | 25.75 | | | $ | 23.02 | | | $ | 18.80 | | | $ | 14.91 | | |
| Income From Investment Operations | |
| Net Investment Income (Loss) | | | 0.64 | (A) | | | 0.62 | (A) | | | 0.64 | (A) | | | 0.82 | | | | 0.62 | | | | 0.64 | | |
Net Gains (Losses) on
Securities (Realized and
Unrealized) | | | (9.28 | ) | | | (5.64 | ) | | | 8.84 | | | | 3.33 | | | | 4.47 | | | | 4.08 | | |
Total From Investment
Operations | | | (8.64 | ) | | | (5.02 | ) | | | 9.48 | | | | 4.15 | | | | 5.09 | | | | 4.72 | | |
| Less Distributions | |
| Net Investment Income | | | (0.30 | ) | | | (0.70 | ) | | | (1.02 | ) | | | (0.86 | ) | | | (0.71 | ) | | | (0.75 | ) | |
| Net Realized Gains | | | (2.10 | ) | | | (0.88 | ) | | | (0.41 | ) | | | (0.56 | ) | | | (0.16 | ) | | | (0.08 | ) | |
| Total Distributions | | | (2.40 | ) | | | (1.58 | ) | | | (1.43 | ) | | | (1.42 | ) | | | (0.87 | ) | | | (0.83 | ) | |
| Net Asset Value, End of Period | | $ | 16.16 | | | $ | 27.20 | | | $ | 33.80 | | | $ | 25.75 | | | $ | 23.02 | | | $ | 18.80 | | |
| Total Return | | | (34.46 | )%(C) | | | (15.45 | )% | | | 38.23 | % | | | 18.81 | % | | | 29.44 | % | | | 33.48 | % | |
Net Assets, End of Period
(thousands) | | $ | 1,746,961 | | | $ | 2,671,457 | | | $ | 2,837,026 | | | $ | 1,836,650 | | | $ | 1,308,898 | | | $ | 783,405 | | |
Ratio of Expenses to Average Net
Assets | | | 0.33 | %(B) | | | 0.33 | % | | | 0.33 | % | | | 0.37 | % | | | 0.39 | % | | | 0.41 | % | |
Ratio of Net Investment Income to
Average Net Assets | | | 3.01 | %(B) | | | 1.99 | % | | | 2.25 | % | | | 3.11 | % | | | 3.61 | % | | | 4.19 | % | |
| Portfolio Turnover Rate | | | 13 | %(C) | | | 17 | % | | | 10 | % | | | 3 | % | | | 6 | % | | | 2 | % | |
See page 1 & 2 for the Definitions of Abbreviations and Footnotes.
See accompanying Notes to Financial Statements.
147
DFA INVESTMENT DIMENSIONS GROUP INC.
FINANCIAL HIGHLIGHTS
(for a share outstanding throughout each period)
| | | Large Cap International Portfolio | |
| | | Period
Dec. 1,
2007 to
Oct. 31,
2008 | |
Year
Ended
Nov. 30,
2007 | |
Year
Ended
Nov. 30,
2006 | |
Year
Ended
Nov. 30,
2005 | |
Year
Ended
Nov. 30,
2004 | |
Year
Ended
Nov. 30,
2003 | |
| Net Asset Value, Beginning of Period | | $ | 27.18 | | | $ | 23.60 | | | $ | 19.00 | | | $ | 17.31 | | | $ | 14.65 | | | $ | 12.10 | | |
| Income From Investment Operations | |
| Net Investment Income (Loss) | | | 0.68 | (A) | | | 0.68 | (A) | | | 0.55 | (A) | | | 0.44 | | | | 0.31 | | | | 0.25 | | |
Net Gains (Losses) on Securities
(Realized and Unrealized) | | | (12.06 | ) | | | 3.57 | | | | 4.68 | | | | 1.72 | | | | 2.86 | | | | 2.51 | | |
| Total From Investment Operations | | | (11.38 | ) | | | 4.25 | | | | 5.23 | | | | 2.16 | | | | 3.17 | | | | 2.76 | | |
| Less Distributions | |
| Net Investment Income | | | (0.64 | ) | | | (0.67 | ) | | | (0.63 | ) | | | (0.47 | ) | | | (0.51 | ) | | | (0.21 | ) | |
| Net Realized Gains | | | (0.35 | ) | | | — | | | | — | | | | — | | | | — | | | | — | | |
| Total Distributions | | | (0.99 | ) | | | (0.67) | | | | (0.63 | ) | | | (0.47 | ) | | | (0.51 | ) | | | (0.21 | ) | |
| Net Asset Value, End of Period | | $ | 14.81 | | | $ | 27.18 | | | $ | 23.60 | | | $ | 19.00 | | | $ | 17.31 | | | $ | 14.65 | | |
| Total Return | | | (43.14 | )%(C) | | | 18.18 | % | | | 28.00 | % | | | 12.73 | % | | | 22.09 | % | | | 23.32 | % | |
| Net Assets, End of Period (thousands) | | $ | 1,206,860 | | | $ | 2,224,180 | | | $ | 1,673,239 | | | $ | 1,125,455 | | | $ | 844,883 | | | $ | 504,123 | | |
| Ratio of Expenses to Average Net Assets | | | 0.29 | %(B) | | | 0.29 | % | | | 0.29 | % | | | 0.37 | % | | | 0.41 | % | | | 0.43 | % | |
Ratio of Expenses to Average Net Assets
(Excluding Waivers and Assumption of
Expenses and/or Recovery of
Previously Waived Fees) | | | 0.29 | %(B) | | | 0.29 | % | | | 0.29 | % | | | 0.37 | % | | | 0.41 | % | | | 0.43 | % | |
Ratio of Net Investment Income to
Average Net Assets | | | 3.18 | %(B) | | | 2.62 | % | | | 2.56 | % | | | 2.41 | % | | | 2.07 | % | | | 2.10 | % | |
| Portfolio Turnover Rate | | | 12 | %(C) | | | 5 | % | | | 4 | % | | | 4 | % | | | 1 | % | | | 1 | % | |
| | | International Core Equity Portfolio | | T.A World
ex U.S. Core
Equity
Portfolio | |
| | | Period
Dec. 1,
2007 to
Oct. 31,
2008 | |
Year
Ended
Nov. 30,
2007 | |
Year
Ended
Nov. 30,
2006 | | Period
Sept. 15,
2005(a)
to
Nov. 30,
2005 | | Period
March 6,
2008(a)
to
Oct. 31,
2008 | |
| Net Asset Value, Beginning of Period | | $ | 14.35 | | | $ | 12.82 | | | $ | 10.07 | | | $ | 10.00 | | | $ | 10.00 | | |
| Income From Investment Operations | |
| Net Investment Income (Loss) | | | 0.37 | (A) | | | 0.35 | (A) | | | 0.28 | (A) | | | 0.04 | (A) | | | 0.15 | (A) | |
Net Gains (Losses) on Securities
(Realized and Unrealized) | | | (6.76 | ) | | | 1.54 | | | | 2.71 | | | | 0.03 | | | | (4.15 | ) | |
| Total From Investment Operations | | | (6.39 | ) | | | 1.89 | | | | 2.99 | | | | 0.07 | | | | (4.00 | ) | |
| Less Distributions | |
| Net Investment Income | | | (0.35 | ) | | | (0.32 | ) | | | (0.24 | ) | | | — | | | | (0.15 | ) | |
| Net Realized Gains | | | (0.15 | ) | | | (0.04 | ) | | | — | | | | — | | | | — | | |
| Total Distributions | | | (0.50 | ) | | | (0.36 | ) | | | (0.24 | ) | | | — | | | | (0.15 | ) | |
| Net Asset Value, End of Period | | $ | 7.46 | | | $ | 14.35 | | | $ | 12.82 | | | $ | 10.07 | | | $ | 5.85 | | |
| Total Return | | | (45.76 | )%(C) | | | 14.83 | % | | | 30.06 | % | | | 0.70 | %(C) | | | (40.61 | )%(C) | |
| Net Assets, End of Period (thousands) | | $ | 1,981,049 | | | $ | 2,342,187 | | | $ | 851,077 | | | $ | 121,249 | | | $ | 228,318 | | |
| Ratio of Expenses to Average Net Assets | | | 0.41 | %(B) | | | 0.41 | % | | | 0.48 | % | | | 0.49 | %(B)(E) | | | 0.60 | %(B)(E) | |
Ratio of Expenses to Average Net Assets
(Excluding Waivers and Assumption of
Expenses and/or Recovery of
Previously Waived Fees) | | | 0.41 | %(B) | | | 0.41 | % | | | 0.46 | % | | | 0.90 | %(B)(E) | | | 0.85 | %(B)(E) | |
Ratio of Net Investment Income to
Average Net Assets | | | 3.39 | %(B) | | | 2.49 | % | | | 2.35 | % | | | 1.89 | %(B)(E) | | | 3.27 | %(B)(E) | |
| Portfolio Turnover Rate | | | 4 | %(C) | | | 4 | % | | | 2 | % | | | 0 | %(C) | | | 2 | %(C) | |
See page 1 & 2 for the Definitions of Abbreviations and Footnotes.
See accompanying Notes to Financial Statements.
148
DFA INVESTMENT DIMENSIONS GROUP INC.
FINANCIAL HIGHLIGHTS
(for a share outstanding throughout each period)
| | | International Small Company Portfolio | |
| | | Period
Dec. 1,
2007 to
Oct. 31,
2008 | | Year
Ended
Nov. 30,
2007 | | Year
Ended
Nov. 30,
2006 | | Year
Ended
Nov. 30,
2005 | | Year
Ended
Nov. 30,
2004 | | Year
Ended
Nov. 30,
2003 | |
| Net Asset Value, Beginning of Period | | $ | 20.80 | | | $ | 19.43 | | | $ | 16.19 | | | $ | 14.12 | | | $ | 11.00 | | | $ | 7.41 | | |
| Income From Investment Operations | |
| Net Investment Income (Loss) | | | 0.44 | (A) | | | 0.43 | (A) | | | 0.36 | (A) | | | 0.31 | (A) | | | 0.22 | | | | 0.16 | | |
Net Gains (Losses) on Securities
(Realized and Unrealized) | | | (9.55 | ) | | | 2.07 | | | | 4.02 | | | | 2.38 | | | | 3.24 | | | | 3.57 | | |
| Total From Investment Operations | | | (9.11 | ) | | | 2.50 | | | | 4.38 | | | | 2.69 | | | | 3.46 | | | | 3.73 | | |
| Less Distributions | |
| Net Investment Income | | | (0.45 | ) | | | (0.46 | ) | | | (0.36 | ) | | | (0.29 | ) | | | (0.34 | ) | | | (0.14 | ) | |
| Net Realized Gains | | | (1.17 | ) | | | (0.67) | | | | (0.78 | ) | | | (0.33 | ) | | | — | | | | — | | |
| Total Distributions | | | (1.62 | ) | | | (1.13) | | | | (1.14 | ) | | | (0.62 | ) | | | (0.34 | ) | | | (0.14 | ) | |
| Net Asset Value, End of Period | | $ | 10.07 | | | $ | 20.80 | | | $ | 19.43 | | | $ | 16.19 | | | $ | 14.12 | | | $ | 11.00 | | |
| Total Return | | | (47.13 | )%(C) | | | 13.29 | % | | | 28.51 | % | | | 19.74 | % | | | 32.10 | % | | | 51.28 | % | |
| Net Assets, End of Period (thousands) | | $ | 3,084,373 | | | $ | 5,597,209 | | | $ | 4,546,071 | | | $ | 2,725,231 | | | $ | 1,658,184 | | | $ | 909,887 | | |
Ratio of Expenses to Average Net
Assets (D) | | | 0.55 | %(B) | | | 0.55 | % | | | 0.56 | % | | | 0.64 | % | | | 0.69 | % | | | 0.71 | % | |
Ratio of Expenses to Average Net Assets
(Excluding Waivers and Assumption of
Expenses and/or Recovery of
Previously Waived Fees) (D) | | | 0.55 | %(B) | | | 0.55 | % | | | 0.56 | % | | | 0.64 | % | | | 0.69 | % | | | 0.71 | % | |
Ratio of Net Investment Income to
Average Net Assets | | | 2.90 | %(B) | | | 2.03 | % | | | 2.04 | % | | | 2.05 | % | | | 1.82 | % | | | 1.97 | % | |
| | | Japanese Small Company Portfolio | |
| | | Period
Dec. 1,
2007 to
Oct. 31,
2008 | | Year
Ended
Nov. 30,
2007 | | Year
Ended
Nov. 30,
2006 | | Year
Ended
Nov. 30,
2005 | | Year
Ended
Nov. 30,
2004 | | Year
Ended
Nov. 30,
2003 | |
| Net Asset Value, Beginning of Period | | $ | 16.75 | | | $ | 17.23 | | | $ | 17.97 | | | $ | 13.99 | | | $ | 10.80 | | | $ | 7.49 | | |
| Income From Investment Operations | |
| Net Investment Income (Loss) | | | 0.29 | (A) | | | 0.27 | (A) | | | 0.22 | (A) | | | 0.16 | (A) | | | 0.22 | | | | 0.05 | | |
Net Gains (Losses) on Securities
(Realized and Unrealized) | | | (4.78 | ) | | | (0.52 | ) | | | (0.73 | ) | | | 4.00 | | | | 3.16 | | | | 3.35 | | |
| Total From Investment Operations | | | (4.49 | ) | | | (0.25 | ) | | | (0.51 | ) | | | 4.16 | | | | 3.38 | | | | 3.40 | | |
| Less Distributions | |
| Net Investment Income | | | (0.29 | ) | | | (0.23 | ) | | | (0.23 | ) | | | (0.18 | ) | | | (0.19 | ) | | | (0.09 | ) | |
| Net Realized Gains | | | — | | | | — | | | | — | | | | — | | | | — | | | | — | | |
| Total Distributions | | | (0.29 | ) | | | (0.23 | ) | | | (0.23 | ) | | | (0.18 | ) | | | (0.19 | ) | | | (0.09 | ) | |
| Net Asset Value, End of Period | | $ | 11.97 | | | $ | 16.75 | | | $ | 17.23 | | | $ | 17.97 | | | $ | 13.99 | | | $ | 10.80 | | |
| Total Return | | | (27.16 | )%(C) | | | (1.51 | )% | | | (2.94 | )% | | | 30.13 | % | | | 31.79 | % | | | 46.01 | % | |
| Net Assets, End of Period (thousands) | | $ | 133,373 | | | $ | 199,080 | | | $ | 168,957 | | | $ | 169,995 | | | $ | 65,879 | | | $ | 22,713 | | |
Ratio of Expenses to Average Net
Assets (D) | | | 0.58 | %(B) | | | 0.56 | % | | | 0.61 | % | | | 0.68 | % | | | 0.73 | % | | | 0.75 | % | |
Ratio of Expenses to Average Net Assets
(Excluding Waivers and Assumption of
Expenses and/or Recovery of
Previously Waived Fees) (D) | | | 0.58 | %(B) | | | 0.56 | % | | | 0.58 | % | | | 0.68 | % | | | 0.79 | % | | | 0.85 | % | |
Ratio of Net Investment Income to
Average Net Assets | | | 2.18 | %(B) | | | 1.51 | % | | | 1.19 | % | | | 1.03 | % | | | 1.01 | % | | | 1.18 | % | |
See page 1 & 2 for the Definitions of Abbreviations and Footnotes.
See accompanying Notes to Financial Statements.
149
DFA INVESTMENT DIMENSIONS GROUP INC.
FINANCIAL HIGHLIGHTS
(for a share outstanding throughout each period)
| | | Asia Pacific Small Company Portfolio | |
| | | Period
Dec. 1,
2007 to
Oct. 31,
2008 | | Year
Ended
Nov. 30,
2007 | | Year
Ended
Nov. 30,
2006 | | Year
Ended
Nov. 30,
2005 | | Year
Ended
Nov. 30,
2004 | | Year
Ended
Nov. 30,
2003 | |
| Net Asset Value, Beginning of Period | | $ | 28.73 | | | $ | 20.26 | | | $ | 15.28 | | | $ | 14.54 | | | $ | 12.10 | | | $ | 7.92 | | |
| Income From Investment Operations | |
| Net Investment Income (Loss) | | | 0.83 | (A) | | | 0.79 | (A) | | | 0.64 | (A) | | | 0.70 | | | | 0.50 | | | | (0.13 | ) | |
Net Gains (Losses) on Securities
(Realized and Unrealized) | | | (17.04 | ) | | | 8.43 | | | | 4.92 | | | | 0.54 | | | | 2.58 | | | | 4.69 | | |
| Total From Investment Operations | | | (16.21 | ) | | | 9.22 | | | | 5.56 | | | | 1.24 | | | | 3.08 | | | | 4.56 | | |
| Less Distributions | |
| Net Investment Income | | | (0.85 | ) | | | (0.75 | ) | | | (0.58 | ) | | | (0.50 | ) | | | (0.64 | ) | | | (0.38 | ) | |
| Net Realized Gains | | | — | | | | — | | | | — | | | | — | | | | — | | | | — | | |
| Return of Capital | | | — | | | | — | | | | — | | | | — | | | | — | | | | — | | |
| Total Distributions | | | (0.85 | ) | | | (0.75) | | | | (0.58 | ) | | | (0.50 | ) | | | (0.64 | ) | | | (0.38 | ) | |
| Net Asset Value, End of Period | | $ | 11.67 | | | $ | 28.73 | | | $ | 20.26 | | | $ | 15.28 | | | $ | 14.54 | | | $ | 12.10 | | |
| Total Return | | | (57.94 | )%(C) | | | 46.55 | % | | | 37.52 | % | | | 8.81 | % | | | 26.73 | % | | | 60.57 | % | |
| Net Assets, End of Period (thousands) | | $ | 64,044 | | | $ | 146,307 | | | $ | 71,537 | | | $ | 38,927 | | | $ | 26,735 | | | $ | 20,378 | | |
| Ratio of Expenses to Average Net Assets(D) | | | 0.62 | %(B) | | | 0.62 | % | | | 0.64 | % | | | 0.74 | % | | | 0.80 | % | | | 0.78 | % | |
Ratio of Expenses to Average Net Assets
(Excluding Waivers and Assumption of
Expenses and/or Recovery of Previously
Waived Expenses)(D) | | | 0.61 | %(B) | | | 0.59 | % | | | 0.64 | % | | | 0.86 | % | | | 0.96 | % | | | 0.88 | % | |
Ratio of Net Investment Income to Average
Net Assets | | | 3.85 | %(B) | | | 3.13 | % | | | 3.68 | % | | | 3.89 | % | | | 3.29 | % | | | 2.87 | % | |
| | | United Kingdom Small Company Portfolio | |
| | | Period
Dec. 1,
2007 to
Oct. 31,
2008 | | Year
Ended
Nov. 30,
2007 | | Year
Ended
Nov. 30,
2006 | | Year
Ended
Nov. 30,
2005 | | Year
Ended
Nov. 30,
2004 | | Year
Ended
Nov. 30,
2003 | |
| Net Asset Value, Beginning of Period | | $ | 31.29 | | | $ | 32.97 | | | $ | 24.65 | | | $ | 23.47 | | | $ | 19.26 | | | $ | 14.24 | | |
| Income From Investment Operations | |
| Net Investment Income (Loss) | | | 0.77 | (A) | | | 0.78 | (A) | | | 0.61 | (A) | | | 0.64 | (A) | | | 0.48 | | | | 0.62 | | |
Net Gains (Losses) on Securities
(Realized and Unrealized) | | | (15.84 | ) | | | (0.08 | ) | | | 9.61 | | | | 2.15 | | | | 4.87 | | | | 5.26 | | |
| Total From Investment Operations | | | (15.07 | ) | | �� | 0.70 | | | | 10.22 | | | | 2.79 | | | | 5.35 | | | | 5.88 | | |
| Less Distributions | |
| Net Investment Income | | | (0.72 | ) | | | (1.03 | ) | | | (0.68 | ) | | | (0.59 | ) | | | (1.14 | ) | | | (0.54 | ) | |
| Net Realized Gains | | | (1.22 | ) | | | (1.35 | ) | | | (1.22 | ) | | | (1.02 | ) | | | — | | | | (0.32 | ) | |
| Return of Capital | | | (0.01 | ) | | | — | | | | — | | | | — | | | | — | | | | — | | |
| Total Distributions | | | (1.95 | ) | | | (2.38 | ) | | | (1.90 | ) | | | (1.61 | ) | | | (1.14 | ) | | | (0.86 | ) | |
| Net Asset Value, End of Period | | $ | 14.27 | | | $ | 31.29 | | | $ | 32.97 | | | $ | 24.65 | | | $ | 23.47 | | | $ | 19.26 | | |
| Total Return | | | (50.97 | )%(C) | | | 1.94 | % | | | 44.15 | % | | | 12.35 | % | | | 29.05 | % | | | 44.01 | % | |
| Net Assets, End of Period (thousands) | | $ | 25,883 | | | $ | 37,139 | | | $ | 31,808 | | | $ | 20,578 | | | $ | 15,816 | | | $ | 12,209 | | |
| Ratio of Expenses to Average Net Assets(D) | | | 0.59 | %(B) | | | 0.59 | % | | | 0.60 | % | | | 0.70 | % | | | 0.74 | % | | | 0.73 | % | |
Ratio of Expenses to Average Net Assets
(Excluding Waivers and Assumption of
Expenses and/or Recovery of Previously
Waived Expenses)(D) | | | 0.65 | %(B) | | | 0.62 | % | | | 0.67 | % | | | 0.89 | % | | | 1.04 | % | | | 0.96 | % | |
Ratio of Net Investment Income to Average
Net Assets | | | 3.41 | %(B) | | | 2.28 | % | | | 2.20 | % | | | 2.70 | % | | | 2.21 | % | | | 2.83 | % | |
See page 1 & 2 for the Definitions of Abbreviations and Footnotes.
See accompanying Notes to Financial Statements.
150
DFA INVESTMENT DIMENSIONS GROUP INC.
FINANCIAL HIGHLIGHTS
(for a share outstanding throughout each period)
| | | Continental Small Company Portfolio | |
| | | Period
Dec. 1,
2007 to
Oct. 31,
2008 | | Year
Ended
Nov. 30,
2007 | | Year
Ended
Nov. 30,
2006 | | Year
Ended
Nov. 30,
2005 | | Year
Ended
Nov. 30,
2004 | | Year
Ended
Nov. 30,
2003 | |
| Net Asset Value, Beginning of Period | | $ | 22.95 | | | $ | 20.47 | | | $ | 15.78 | | | $ | 14.12 | | | $ | 12.60 | | | $ | 8.93 | | |
| Income From Investment Operations | |
| Net Investment Income (Loss) | | | 0.52 | (A) | | | 0.40 | (A) | | | 0.31 | (A) | | | 0.21 | | | | 0.17 | | | | 0.49 | | |
Net Gains (Losses) on Securities
(Realized and Unrealized) | | | (11.32 | ) | | | 3.00 | | | | 6.28 | | | | 2.28 | | | | 3.64 | | | | 3.83 | | |
| Total From Investment Operations | | | (10.80 | ) | | | 3.40 | | | | 6.59 | | | | 2.49 | | | | 3.81 | | | | 4.32 | | |
| Less Distributions | |
| Net Investment Income | | | (0.45 | ) | | | (0.38 | ) | | | (0.34 | ) | | | (0.30 | ) | | | (0.50 | ) | | | (0.22 | ) | |
| Net Realized Gains | | | (0.96 | ) | | | (0.54 | ) | | | (1.56 | ) | | | (0.53 | ) | | | (1.79 | ) | | | (0.43 | ) | |
| Return of Capital | | | (0.01 | ) | | | — | | | | — | | | | — | | | | — | | | | — | | |
| Total Distributions | | | (1.42 | ) | | | (0.92 | ) | | | (1.90 | ) | | | (0.83 | ) | | | (2.29 | ) | | | (0.65 | ) | |
| Net Asset Value, End of Period | | $ | 10.73 | | | $ | 22.95 | | | $ | 20.47 | | | $ | 15.78 | | | $ | 14.12 | | | $ | 12.60 | | |
| Total Return | | | (49.89 | )%(C) | | | 16.99 | % | | | 46.33 | % | | | 18.42 | % | | | 35.91 | % | | | 52.10 | % | |
| Net Assets, End of Period (thousands) | | $ | 93,988 | | | $ | 170,909 | | | $ | 90,261 | | | $ | 52,061 | | | $ | 33,839 | | | $ | 24,376 | | |
| Ratio of Expenses to Average Net Assets | | | 0.59 | %(B)(D) | | | 0.61 | %(D) | | | 0.62 | %(D) | | | 0.71 | %(D) | | | 0.73 | %(D) | | | 0.77 | %(D) | |
Ratio of Expenses to Average Net Assets
(Excluding Waivers and Assumption of
Expenses and/or Recovery of Previously
Waived Fees) | | | 0.59 | %(B)(D) | | | 0.57 | %(D) | | | 0.61 | %(D) | | | 0.78 | %(D) | | | 0.87 | %(D) | | | 0.88 | %(D) | |
Ratio of Net Investment Income (Loss) to
Average Net Assets | | | 3.04 | %(B) | | | 1.70 | % | | | 1.78 | % | | | 1.77 | % | | | 1.56 | % | | | 2.07 | % | |
| Portfolio Turnover Rate | | | N/A | | | | N/A | | | | N/A | | | | N/A | | | | N/A | | | | N/A | | |
| | | DFA International Real Estate
Securities Portfolio | | DFA Global Real
Estate Securities
Portfolio | |
| | | Period
Dec. 1,
2007 to
Oct. 31,
2008 | | Period
March 1, 2007(a)
to
Nov. 30, 2007 | | Period
June 4,
2008(a) to
Oct. 31,
2008 | |
| Net Asset Value, Beginning of Period | | $ | 9.35 | | | $ | 10.00 | | | $ | 10.00 | | |
| Income From Investment Operations | |
| Net Investment Income (Loss) | | | 0.34 | (A) | | | 0.23 | (A) | | | — | (A) | |
Net Gains (Losses) on Securities
(Realized and Unrealized) | | | (5.08 | ) | | | (0.76 | ) | | | (3.96 | ) | |
| Total From Investment Operations | | | (4.74 | ) | | | (0.53 | ) | | | (3.96 | ) | |
| Less Distributions | |
| Net Investment Income | | | (0.43 | ) | | | (0.12 | ) | | | — | | |
| Net Realized Gains | | | — | | | | — | | | | — | | |
| Return of Capital | | | — | | | | — | | | | — | | |
| Total Distributions | | | (0.43 | ) | | | (0.12 | ) | | | — | | |
| Net Asset Value, End of Period | | $ | 4.18 | | | $ | 9.35 | | | $ | 6.04 | | |
| Total Return | | | (52.85 | )%(C) | | | (5.38 | )%(C) | | | (39.60 | )%(C) | |
| Net Assets, End of Period (thousands) | | $ | 394,480 | | | $ | 336,840 | | | $ | 90,672 | | |
| Ratio of Expenses to Average Net Assets | | | 0.44 | %(B) | | | 0.48 | %(B)(E) | | | 0.54 | %(B)(D)(E) | |
Ratio of Expenses to Average Net Assets
(Excluding Waivers and Assumption of
Expenses and/or Recovery of Previously
Waived Fees) | | | 0.44 | %(B) | | | 0.48 | %(B)(E) | | | 0.86 | %(B)(D)(E) | |
Ratio of Net Investment Income (Loss) to
Average Net Assets | | | 5.20 | %(B) | | | 3.50 | %(B)(E) | | | (0.04 | )%(B)(E) | |
| Portfolio Turnover Rate | | | 1 | %(C) | | | 2 | %(C) | | | N/A | | |
See page 1 & 2 for the Definitions of Abbreviations and Footnotes.
See accompanying Notes to Financial Statements.
151
DFA INVESTMENT DIMENSIONS GROUP INC.
FINANCIAL HIGHLIGHTS
(for a share outstanding throughout each period)
| | | DFA International Small Cap Value Portfolio | | International
Vector Equity
Portfolio | |
| | | Period
Dec. 1,
2007 to
Oct. 31,
2008 | | Year
Ended
Nov. 30,
2007 | | Year
Ended
Nov. 30,
2006 | | Year
Ended
Nov. 30,
2005 | | Year
Ended
Nov. 30,
2004 | | Year
Ended
Nov. 30,
2003 | | Period
August 14,
2008(a) to
Oct. 31,
2008 | |
Net Asset Value,
Beginning of Period | | $ | 22.05 | | | $ | 21.71 | | | $ | 17.57 | | | $ | 15.16 | | | $ | 11.52 | | | $ | 7.42 | | | $ | 10.00 | | |
| Income From Investment | |
| Operations | |
Net Investment Income
(Loss) | | | 0.52 | (A) | | | 0.46 | (A) | | | 0.36 | (A) | | | 0.40 | (A) | | | 0.23 | | | | 0.16 | | | | 0.06 | (A) | |
Net Gains (Losses) on
Securities (Realized
and Unrealized) | | | (9.60 | ) | | | 1.66 | | | | 4.95 | | | | 2.77 | | | | 3.85 | | | | 4.09 | | | | (3.32 | ) | |
Total From Investment
Operations | | | (9.08 | ) | | | 2.12 | | | | 5.31 | | | | 3.17 | | | | 4.08 | | | | 4.25 | | | | (3.26 | ) | |
| Less Distributions | |
| Net Investment Income | | | (0.58 | ) | | | (0.53) | | | | (0.38 | ) | | | (0.36 | ) | | | (0.35 | ) | | | (0.15 | ) | | | — | | |
| Net Realized Gains | | | (1.57 | ) | | | (1.25) | | | | (0.79 | ) | | | (0.40 | ) | | | (0.09 | ) | | | — | | | | — | | |
| Total Distributions | | | (2.15 | ) | | | (1.78) | | | | (1.17 | ) | | | (0.76 | ) | | | (0.44 | ) | | | (0.15 | ) | | | — | | |
Net Asset Value, End of
Period | | $ | 10.82 | | | $ | 22.05 | | | $ | 21.71 | | | $ | 17.57 | | | $ | 15.16 | | | $ | 11.52 | | | $ | 6.74 | | |
| Total Return | | | (45.17 | )%(C) | | | 10.25 | % | | | 31.73 | % | | | 21.75 | % | | | 36.34 | % | | | 58.44 | % | | | (32.60 | )%(C) | |
Net Assets, End of Period
(thousands) | | $ | 4,799,748 | | | $ | 8,180,859 | | | $ | 6,733,067 | | | $ | 4,128,428 | | | $ | 2,215,523 | | | $ | 1,095,697 | | | $ | 66,774 | | |
Ratio of Expenses to
Average Net Assets | | | 0.69 | %(B) | | | 0.69 | % | | | 0.70 | % | | | 0.75 | % | | | 0.78 | % | | | 0.81 | % | | | 0.60 | %(B)(E) | |
Ratio of Expenses to Average
Net Assets (Excluding
Waivers and Assumption of
Expenses and/or Recovery
of Previously Waived Fees) | | | 0.69 | %(B) | | | 0.69 | % | | | 0.70 | % | | | 0.75 | % | | | 0.78 | % | | | 0.81 | % | | | 1.15 | %(B)(E) | |
Ratio of Net Investment
Income to Average
Net Assets | | | 3.22 | %(B) | | | 2.03 | % | | | 1.85 | % | | | 2.44 | % | | | 1.63 | % | | | 1.75 | % | | | 3.01 | %(B)(E) | |
| Portfolio Turnover Rate | | | 16 | %(C) | | | 18 | % | | | 14 | % | | | 13 | % | | | 10 | % | | | 10 | % | | | 0 | %(C) | |
| | | Emerging Markets Portfolio | |
| | | Period
Dec. 1,
2007 to
Oct. 31,
2008 | | Year
Ended
Nov. 30,
2007 | | Year
Ended
Nov. 30,
2006 | | Year
Ended
Nov. 30,
2005 | | Year
Ended
Nov. 30,
2004 | | Year
Ended
Nov. 30,
2003 | |
Net Asset Value,
Beginning of Period | | $ | 35.23 | | | $ | 25.40 | | | $ | 19.89 | | | $ | 15.61 | | | $ | 11.87 | | | $ | 8.65 | | |
| Income From Investment | |
| Operations | |
Net Investment Income
(Loss) | | | 0.70 | (A) | | | 0.64 | (A) | | | 0.48 | (A) | | | 0.58 | (A) | | | 0.27 | | | | 0.16 | | |
Net Gains (Losses) on
Securities (Realized
and Unrealized) | | | (16.85 | ) | | | 9.88 | | | | 5.61 | | | | 4.13 | | | | 3.80 | | | | 3.18 | | |
Total From Investment
Operations | | | (16.15 | ) | | | 10.52 | | | | 6.09 | | | | 4.71 | | | | 4.07 | | | | 3.34 | | |
| Less Distributions | |
| Net Investment Income | | | (0.69 | ) | | | (0.53) | | | | (0.58 | ) | | | (0.43 | ) | | | (0.33 | ) | | | (0.12 | ) | |
| Net Realized Gains | | | (1.34 | ) | | | (0.16) | | | | — | | | | — | | | | — | | | | — | | |
| Total Distributions | | | (2.03 | ) | | | (0.69) | | | | (0.58 | ) | | | (0.43 | ) | | | (0.33 | ) | | | (0.12 | ) | |
Net Asset Value, End of
Period | | $ | 17.05 | | | $ | 35.23 | | | $ | 25.40 | | | $ | 19.89 | | | $ | 15.61 | | | $ | 11.87 | | |
| Total Return | | | (48.37 | )%(C) | | | 42.08 | % | | | 31.31 | % | | | 30.65 | % | | | 34.95 | % | | | 39.13 | % | |
Net Assets, End of Period
(thousands) | | $ | 1,508,260 | | | $ | 3,388,442 | | | $ | 2,344,990 | | | $ | 1,805,186 | | | $ | 1,131,778 | | | $ | 594,076 | | |
Ratio of Expenses to
Average Net Assets | | | 0.60 | %(B)(D) | | | 0.60 | %(D) | | | 0.61 | %(D) | | | 0.69 | %(D) | | | 0.74 | %(D) | | | 0.78 | %(D) | |
Ratio of Expenses to Average
Net Assets (Excluding
Waivers and Assumption of
Expenses and/or Recovery
of Previously Waived Fees) | | | 0.60 | %(B)(D) | | | 0.60 | %(D) | | | 0.61 | %(D) | | | 0.69 | %(D) | | | 0.74 | %(D) | | | 0.78 | %(D) | |
Ratio of Net Investment
Income to Average
Net Assets | | | 2.59 | %(B) | | | 2.12 | % | | | 2.13 | % | | | 3.28 | % | | | 2.20 | % | | | 1.79 | % | |
| Portfolio Turnover Rate | | | N/A | | | | N/A | | | | N/A | | | | N/A | | | | N/A | | | | N/A | | |
See page 1 & 2 for the Definitions of Abbreviations and Footnotes.
See accompanying Notes to Financial Statements.
152
DFA INVESTMENT DIMENSIONS GROUP INC.
FINANCIAL HIGHLIGHTS
(for a share outstanding throughout each period)
| | | Emerging Markets Small Cap Portfolio | |
| | | Period
Dec. 1,
2007 to
Oct. 31,
2008 | | Year
Ended
Nov. 30,
2007 | | Year
Ended
Nov. 30,
2006 | | Year
Ended
Nov. 30,
2005 | | Year
Ended
Nov. 30,
2004 | | Year
Ended
Nov. 30,
2003 | |
| Net Asset Value, Beginning of Period | | $ | 23.74 | | | $ | 17.96 | | | $ | 13.37 | | | $ | 11.44 | | | $ | 8.74 | | | $ | 5.89 | | |
| Income From Investment Operations | |
| Net Investment Income (Loss) | | | 0.44 | (A) | | | 0.31 | (A) | | | 0.30 | (A) | | | 0.27 | (A) | | | 0.11 | | | | 0.10 | | |
Net Gains (Losses) on Securities
(Realized and Unrealized) | | | (12.95 | ) | | | 6.86 | | | | 4.86 | | | | 2.37 | | | | 2.85 | | | | 2.88 | | |
| Total From Investment Operations | | | (12.51 | ) | | | 7.17 | | | | 5.16 | | | | 2.64 | | | | 2.96 | | | | 2.98 | | |
| Less Distributions | |
| Net Investment Income | | | (0.41 | ) | | | (0.26 | ) | | | (0.26 | ) | | | (0.22 | ) | | | (0.19 | ) | | | (0.07 | ) | |
| Net Realized Gains | | | (1.49 | ) | | | (1.13 | ) | | | (0.31 | ) | | | (0.49 | ) | | | (0.07 | ) | | | (0.06 | ) | |
| Total Distributions | | | (1.90 | ) | | | (1.39) | | | | (0.57 | ) | | | (0.71 | ) | | | (0.26 | ) | | | (0.13 | ) | |
| Net Asset Value, End of Period | | $ | 9.33 | | | $ | 23.74 | | | $ | 17.96 | | | $ | 13.37 | | | $ | 11.44 | | | $ | 8.74 | | |
| Total Return | | | (57.00 | )%(C) | | | 42.58 | % | | | 39.95 | % | | | 24.27 | % | | | 34.55 | % | | | 51.84 | % | |
| Net Assets, End of Period (thousands) | | $ | 547,329 | | | $ | 1,458,152 | | | $ | 838,948 | | | $ | 482,378 | | | $ | 190,028 | | | $ | 84,353 | | |
Ratio of Expenses to Average Net
Assets | | | 0.77 | %(B)(D) | | | 0.78 | %(D) | | | 0.81 | %(D) | | | 0.97 | %(D) | | | 1.04 | %(D) | | | 1.12 | %(D) | |
Ratio of Expenses to Average Net Assets
(Excluding Waivers and Assumption of
Expenses and/or Recovery of
Previously Waived Fees) | | | 0.77 | %(B)(D) | | | 0.78 | %(D) | | | 0.81 | %(D) | | | 0.97 | %(D) | | | 1.04 | %(D) | | | 1.12 | %(D) | |
Ratio of Net Investment Income to
Average Net Assets | | | 2.61 | %(B) | | | 1.48 | % | | | 1.92 | % | | | 2.21 | % | | | 1.41 | % | | | 1.81 | % | |
| Portfolio Turnover Rate | | | N/A | | | | N/A | | | | N/A | | | | N/A | | | | N/A | | | | N/A | | |
| | | Emerging Markets Core Equity Portfolio | |
| | | Period
Dec. 1,
2007 to
Oct. 31,
2008 | | Year
Ended
Nov. 30,
2007 | | Year
Ended
Nov. 30,
2006 | | Period
April 5,
2005(a)
to
Nov. 30,
2005 | |
| Net Asset Value, Beginning of Period | | $ | 21.20 | | | $ | 15.13 | | | $ | 11.54 | | | $ | 10.00 | | |
| Income From Investment Operations | |
| Net Investment Income (Loss) | | | 0.43 | (A) | | | 0.35 | (A) | | | 0.27 | (A) | | | 0.10 | | |
Net Gains (Losses) on Securities
(Realized and Unrealized) | | | (11.27 | ) | | | 6.10 | | | | 3.54 | | | | 1.51 | | |
| Total From Investment Operations | | | (10.84 | ) | | | 6.45 | | | | 3.81 | | | | 1.61 | | |
| Less Distributions | |
| Net Investment Income | | | (0.40 | ) | | | (0.32) | | | | (0.22 | ) | | | (0.07 | ) | |
| Net Realized Gains | | | (0.08 | ) | | | (0.06) | | | | — | | | | — | | |
| Total Distributions | | | (0.48 | ) | | | (0.38) | | | | (0.22 | ) | | | (0.07 | ) | |
| Net Asset Value, End of Period | | $ | 9.88 | | | $ | 21.20 | | | $ | 15.13 | | | $ | 11.54 | | |
| Total Return | | | (51.93 | )%(C) | | | 43.20 | % | | | 33.39 | % | | | 16.12 | %(C) | |
| Net Assets, End of Period (thousands) | | $ | 1,155,526 | | | $ | 1,829,466 | | | $ | 822,136 | | | $ | 218,563 | | |
Ratio of Expenses to Average Net
Assets | | | 0.65 | %(B) | | | 0.65 | % | | | 0.74 | % | | | 1.00 | %(B)(E) | |
Ratio of Expenses to Average Net Assets
(Excluding Waivers and Assumption of
Expenses and/or Recovery of
Previously Waived Fees) | | | 0.65 | %(B) | | | 0.65 | % | | | 0.72 | % | | | 1.09 | %(B)(E) | |
Ratio of Net Investment Income to
Average Net Assets | | | 2.62 | %(B) | | | 1.87 | % | | | 2.02 | % | | | 1.79 | %(B)(E) | |
| Portfolio Turnover Rate | | | 3 | %(C) | | | 2 | % | | | 6 | % | | | 2 | %(C) | |
See page 1 & 2 for the Definitions of Abbreviations and Footnotes.
See accompanying Notes to Financial Statements.
153
DFA INVESTMENT DIMENSIONS GROUP INC.
FINANCIAL HIGHLIGHTS
(for a share outstanding throughout each period)
| | | DFA One-Year Fixed Income Portfolio | |
| | | Period
Dec. 1,
2007 to
Oct. 31,
2008 | | Year
Ended
Nov. 30,
2007 | | Year
Ended
Nov. 30,
2006 | | Year
Ended
Nov. 30,
2005 | | Year
Ended
Nov. 30,
2004 | | Year
Ended
Nov. 30,
2003 | |
Net Asset Value, Beginning of
Period | | $ | 10.21 | | | $ | 10.20 | | | $ | 10.14 | | | $ | 10.20 | | | $ | 10.30 | | | $ | 10.39 | | |
| Income From Investment | |
| Operations | |
| Net Investment Income (Loss) | | | 0.31 | (A) | | | 0.51 | (A) | | | 0.40 | (A) | | | 0.28 | | | | 0.25 | | | | 0.16 | | |
Net Gains (Losses) on
Securities (Realized and
Unrealized) | | | (0.04 | ) | | | 0.01 | | | | 0.06 | | | | (0.05 | ) | | | (0.10 | ) | | | 0.03 | | |
Total From Investment
Operations | | | 0.27 | | | | 0.52 | | | | 0.46 | | | | 0.23 | | | | 0.15 | | | | 0.19 | | |
| Less Distributions | |
| Net Investment Income | | | (0.31 | ) | | | (0.51 | ) | | | (0.40 | ) | | | (0.29 | ) | | | (0.25 | ) | | | (0.16 | ) | |
| Net Realized Gains | | | — | | | | — | | | | — | | | | — | | | | — | | | | (0.12 | ) | |
| Total Distributions | | | (0.31 | ) | | | (0.51) | | | | (0.40 | ) | | | (0.29 | ) | | | (0.25 | ) | | | (0.28 | ) | |
Net Asset Value,
End of Period | | $ | 10.17 | | | $ | 10.21 | | | $ | 10.20 | | | $ | 10.14 | | | $ | 10.20 | | | $ | 10.30 | | |
| Total Return | | | 2.68 | %(C) | | | 5.20 | % | | | 4.58 | % | | | 2.24 | % | | | 1.08 | % | | | 1.85 | % | |
Net Assets, End of Period
(thousands) | | $ | 3,194,420 | | | $ | 3,229,577 | | | $ | 2,418,551 | | | $ | 1,953,884 | | | $ | 1,738,574 | | | $ | 1,454,736 | | |
Ratio of Expenses to Average Net
Assets (D) | | | 0.18 | %(B) | | | 0.18 | % | | | 0.18 | % | | | 0.19 | % | | | 0.20 | % | | | 0.20 | % | |
Ratio of Net Investment Income
to Average Net Assets | | | 3.30 | %(B) | | | 4.96 | % | | | 3.89 | % | | | 2.78 | % | | | 1.40 | % | | | 1.45 | % | |
| | | DFA Two-Year Global Fixed Income Portfolio | |
| | | Period
Dec. 1,
2007 to
Oct. 31,
2008 | | Year
Ended
Nov. 30,
2007 | | Year
Ended
Nov. 30,
2006 | | Year
Ended
Nov. 30,
2005 | | Year
Ended
Nov. 30,
2004 | | Year
Ended
Nov. 30,
2003 | |
Net Asset Value, Beginning of
Period | | $ | 10.39 | | | $ | 10.17 | | | $ | 9.88 | | | $ | 9.92 | | | $ | 10.08 | | | $ | 10.19 | | |
| Income From Investment | |
| Operations | |
| Net Investment Income (Loss) | | | 0.39 | (A) | | | 0.27 | (A) | | | 0.07 | (A) | | | 0.31 | | | | 0.25 | | | | 0.22 | | |
Net Gains (Losses) on
Securities (Realized and
Unrealized) | | | (0.09 | ) | | | 0.24 | | | | 0.36 | | | | (0.14 | ) | | | (0.14 | ) | | | 0.01 | | |
Total From Investment
Operations | | | 0.30 | | | | 0.51 | | | | 0.43 | | | | 0.17 | | | | 0.11 | | | | 0.23 | | |
| Less Distributions | |
| Net Investment Income | | | (0.33 | ) | | | (0.29) | | | | (0.14 | ) | | | (0.21 | ) | | | (0.27 | ) | | | (0.34 | ) | |
| Net Realized Gains | | | — | | | | — | | | | — | | | | — | | | | — | | | | — | | |
| Total Distributions | | | (0.33 | ) | | | (0.29) | | | | (0.14 | ) | | | (0.21 | ) | | | (0.27 | ) | | | (0.34 | ) | |
Net Asset Value,
End of Period | | $ | 10.36 | | | $ | 10.39 | | | $ | 10.17 | | | $ | 9.88 | | | $ | 9.92 | | | $ | 10.08 | | |
| Total Return | | | 2.93 | %(C) | | | 5.06 | % | | | 4.41 | % | | | 1.77 | % | | | 1.08 | % | | | 2.26 | % | |
Net Assets, End of Period
(thousands) | | $ | 3,124,985 | | | $ | 3,097,898 | | | $ | 2,423,622 | | | $ | 1,992,869 | | | $ | 1,674,972 | | | $ | 1,195,072 | | |
Ratio of Expenses to Average Net
Assets (D) | | | 0.18 | %(B) | | | 0.18 | % | | | 0.19 | % | | | 0.21 | % | | | 0.23 | % | | | 0.25 | % | |
Ratio of Net Investment Income
to Average Net Assets | | | 4.12 | %(B) | | | 2.59 | % | | | 0.72 | % | | | 3.25 | % | | | 1.35 | % | | | 1.68 | % | |
See page 1 & 2 for the Definitions of Abbreviations and Footnotes.
See accompanying Notes to Financial Statements.
154
DFA INVESTMENT DIMENSIONS GROUP INC.
FINANCIAL HIGHLIGHTS
(for a share outstanding throughout each period)
| | | DFA Selectively
Hedged Global
Fixed Income
Portfolio | |
| | | Period
Jan. 9,
2008(a) to
Oct. 31,
2008 | |
| Net Asset Value, Beginning of Period | | $ | 10.00 | | |
| Income From Investment Operations | |
| Net Investment Income (Loss) | | | 0.33 | (A) | |
| Net Gains (Losses) on Securities (Realized and Unrealized) | | | (1.39 | ) | |
| Total From Investment Operations | | | (1.06 | ) | |
| Less Distributions | |
| Net Investment Income | | | — | | |
| Net Realized Gains | | | — | | |
| Return of Capital | | | (0.03 | ) | |
| Total Distributions | | | (0.03 | ) | |
| Net Asset Value, End of Period | | $ | 8.91 | | |
| Total Return | | | (10.67 | )%(C) | |
| Net Assets, End of Period (thousands) | | $ | 198,165 | | |
| Ratio of Expenses to Average Net Assets | | | 0.24 | %(B)(E) | |
| Ratio of Net Investment Income to Average Net Assets | | | 4.32 | %(B)(E) | |
| Portfolio Turnover Rate | | | 21 | %(C) | |
| | | DFA Five-Year Government Portfolio | |
| | | Period
Dec. 1,
2007 to
Oct. 31,
2008 | | Year
Ended
Nov. 30,
2007 | | Year
Ended
Nov. 30,
2006 | | Year
Ended
Nov. 30,
2005 | | Year
Ended
Nov. 30,
2004 | | Year
Ended
Nov. 30,
2003 | |
| Net Asset Value, Beginning of Period | | $ | 10.44 | | | $ | 10.43 | | | $ | 10.41 | | | $ | 10.64 | | | $ | 11.11 | | | $ | 11.05 | | |
| Income From Investment Operations | |
| Net Investment Income (Loss) | | | 0.26 | (A) | | | 0.50 | (A) | | | 0.46 | (A) | | | 0.35 | | | | 0.33 | | | | 0.34 | | |
| Net Gains (Losses) on Securities (Realized and Unrealized) | | | 0.07 | | | | 0.01 | | | | (0.02 | ) | | | (0.24 | ) | | | (0.01 | ) | | | 0.10 | | |
| Total From Investment Operations | | | 0.33 | | | | 0.51 | | | | 0.44 | | | | 0.11 | | | | 0.32 | | | | 0.44 | | |
| Less Distributions | |
| Net Investment Income | | | (0.33 | ) | | | (0.50 | ) | | | (0.42 | ) | | | (0.34 | ) | | | (0.41 | ) | | | (0.38 | ) | |
| Net Realized Gains | | | — | | | | — | | | | — | | | | — | | | | (0.38 | ) | | | — | | |
| Return of Capital | | | — | | | | — | | | | — | | | | — | | | | — | | | | — | | |
| Total Distributions | | | (0.33 | ) | | | (0.50 | ) | | | (0.42 | ) | | | (0.34 | ) | | | (0.79 | ) | | | (0.38 | ) | |
| Net Asset Value, End of Period | | $ | 10.44 | | | $ | 10.44 | | | $ | 10.43 | | | $ | 10.41 | | | $ | 10.64 | | | $ | 11.11 | | |
| Total Return | | | 3.25 | %(C) | | | 4.98 | % | | | 4.36 | % | | | 1.02 | % | | | 3.02 | % | | | 4.02 | % | |
| Net Assets, End of Period (thousands) | | $ | 1,115,037 | | | $ | 1,216,609 | | | $ | 932,121 | | | $ | 748,847 | | | $ | 542,634 | | | $ | 402,992 | | |
| Ratio of Expenses to Average Net Assets | | | 0.23 | %(B) | | | 0.23 | % | | | 0.23 | % | | | 0.25 | % | | | 0.27 | % | | | 0.27 | % | |
| Ratio of Net Investment Income to Average Net Assets | | | 2.77 | %(B) | | | 4.81 | % | | | 4.45 | % | | | 3.47 | % | | | 3.21 | % | | | 3.20 | % | |
| Portfolio Turnover Rate | | | 79 | %(C) | | | 0 | % | | | 86 | % | | | 36 | % | | | 45 | % | | | 149 | % | |
See page 1 & 2 for the Definitions of Abbreviations and Footnotes.
See accompanying Notes to Financial Statements.
155
DFA INVESTMENT DIMENSIONS GROUP INC.
FINANCIAL HIGHLIGHTS
(for a share outstanding throughout each period)
| | | DFA Five-Year Global Fixed Income Portfolio | |
| | | Period
Dec. 1,
2007 to
Oct. 31,
2008 | | Year
Ended
Nov. 30,
2007 | | Year
Ended
Nov. 30,
2006 | | Year
Ended
Nov. 30,
2005 | | Year
Ended
Nov. 30,
2004 | | Year
Ended
Nov. 30,
2003 | |
| Net Asset Value, Beginning of Period | | $ | 10.84 | | | $ | 10.53 | | | $ | 10.48 | | | $ | 10.50 | | | $ | 10.92 | | | $ | 10.93 | | |
| Income From Investment Operations | |
| Net Investment Income (Loss) | | | 0.25 | (A) | | | 0.32 | (A) | | | 0.28 | (A) | | | 0.34 | (A) | | | 0.26 | | | | 0.33 | | |
Net Gains (Losses) on Securities
(Realized and Unrealized) | | | (0.10 | ) | | | 0.20 | | | | 0.12 | | | | (0.11 | ) | | | 0.06 | | | | 0.15 | | |
| Total From Investment Operations | | | 0.15 | | | | 0.52 | | | | 0.40 | | | | 0.23 | | | | 0.32 | | | | 0.48 | | |
| Less Distributions | |
| Net Investment Income | | | (0.30 | ) | | | (0.21 | ) | | | (0.33 | ) | | | (0.25 | ) | | | (0.32 | ) | | | (0.39 | ) | |
| Net Realized Gains | | | — | | | | — | | | | — | | | | — | | | | (0.42 | ) | | | (0.10 | ) | |
| Return of Capital | | | (0.01 | ) | | | — | | | | (0.02 | ) | | | — | | | | — | | | | — | | |
| Total Distributions | | | (0.31 | ) | | | (0.21) | | | | (0.35 | ) | | | (0.25 | ) | | | (0.74 | ) | | | (0.49 | ) | |
| Net Asset Value, End of Period | | $ | 10.68 | | | $ | 10.84 | | | $ | 10.53 | | | $ | 10.48 | | | $ | 10.50 | | | $ | 10.92 | | |
| Total Return | | | 1.40 | %(C) | | | 5.00 | % | | | 3.89 | % | | | 2.15 | % | | | 3.04 | % | | | 4.45 | % | |
| Net Assets, End of Period (thousands) | | $ | 3,319,257 | | | $ | 3,484,919 | | | $ | 2,387,784 | | | $ | 1,699,793 | | | $ | 1,205,578 | | | $ | 969,439 | | |
Ratio of Expenses to Average
Net Assets | | | 0.28 | %(B) | | | 0.28 | % | | | 0.29 | % | | | 0.33 | % | | | 0.34 | % | | | 0.34 | % | |
Ratio of Net Investment Income to
Average Net Assets | | | 2.53 | %(B) | | | 3.01 | % | | | 2.72 | % | | | 3.22 | % | | | 3.12 | % | | | 3.23 | % | |
| Portfolio Turnover Rate | | | 55 | %(C) | | | 108 | % | | | 92 | % | | | 69 | % | | | 90 | % | | | 103 | % | |
| | | DFA Intermediate Government Fixed Income Portfolio | |
| | | Period
Dec. 1,
2007 to
Oct. 31,
2008 | | Year
Ended
Nov. 30,
2007 | | Year
Ended
Nov. 30,
2006 | | Year
Ended
Nov. 30,
2005 | | Year
Ended
Nov. 30,
2004 | | Year
Ended
Nov. 30,
2003 | |
| Net Asset Value, Beginning of Period | | $ | 11.86 | | | $ | 11.48 | | | $ | 11.45 | | | $ | 11.79 | | | $ | 12.14 | | | $ | 12.39 | | |
| Income From Investment Operations | |
| Net Investment Income (Loss) | | | 0.49 | (A) | | | 0.54 | (A) | | | 0.53 | (A) | | | 0.52 | | | | 0.55 | | | | 0.62 | | |
Net Gains (Losses) on Securities
(Realized and Unrealized) | | | (0.17 | ) | | | 0.35 | | | | 0.05 | | | | (0.29 | ) | | | (0.05 | ) | | | (0.02 | ) | |
| Total From Investment Operations | | | 0.32 | | | | 0.89 | | | | 0.58 | | | | 0.23 | | | | 0.50 | | | | 0.60 | | |
| Less Distributions | |
| Net Investment Income | | | (0.52 | ) | | | (0.51 | ) | | | (0.49 | ) | | | (0.53 | ) | | | (0.56 | ) | | | (0.65 | ) | |
| Net Realized Gains | | | — | | | | — | | | | (0.06 | ) | | | (0.04 | ) | | | (0.29 | ) | | | (0.20 | ) | |
| Return of Capital | | | — | | | | — | | | | — | | | | — | | | | — | | | | — | | |
| Total Distributions | | | (0.52 | ) | | | (0.51 | ) | | | (0.55 | ) | | | (0.57 | ) | | | (0.85 | ) | | | (0.85 | ) | |
| Net Asset Value, End of Period | | $ | 11.66 | | | $ | 11.86 | | | $ | 11.48 | | | $ | 11.45 | | | $ | 11.79 | | | $ | 12.14 | | |
| Total Return | | | 2.73 | %(C) | | | 8.06 | % | | | 5.31 | % | | | 1.87 | % | | | 4.21 | % | | | 4.86 | % | |
| Net Assets, End of Period (thousands) | | $ | 1,248,514 | | | $ | 1,314,853 | | | $ | 871,392 | | | $ | 463,538 | | | $ | 373,108 | | | $ | 316,234 | | |
Ratio of Expenses to Average
Net Assets | | | 0.13 | %(B) | | | 0.13 | % | | | 0.14 | % | | | 0.15 | % | | | 0.17 | % | | | 0.17 | % | |
Ratio of Net Investment Income to
Average Net Assets | | | 4.44 | %(B) | | | 4.72 | % | | | 4.72 | % | | | 4.61 | % | | | 4.72 | % | | | 4.91 | % | |
| Portfolio Turnover Rate | | | 14 | %(C) | | | 0 | % | | | 3 | % | | | 16 | % | | | 6 | % | | | 23 | % | |
See page 1 & 2 for the Definitions of Abbreviations and Footnotes.
See accompanying Notes to Financial Statements.
156
DFA INVESTMENT DIMENSIONS GROUP INC.
FINANCIAL HIGHLIGHTS
(for a share outstanding throughout each period)
| | | DFA Inflation-Protected
Securities Portfolio | |
| | | Period
Dec. 1,
2007 to
Oct. 31,
2008 | | Year
Ended
Nov. 30,
2007 | | Period
Sept. 18, 2006(a)
to
Nov. 30, 2006 | |
Net Asset Value,
Beginning of Period | | $ | 10.80 | | | $ | 10.19 | | | $ | 10.00 | | |
| Income From Investment Operations | |
| Net Investment Income (Loss) | | | 0.70 | (A) | | | 0.45 | (A) | | | 0.02 | (A) | |
Net Gains (Losses) on Securities
(Realized and Unrealized) | | | (1.48 | ) | | | 0.50 | | | | 0.17 | | |
Total From Investment
Operations | | | (0.78 | ) | | | 0.95 | | | | 0.19 | | |
| Less Distributions | |
| Net Investment Income | | | (0.61 | ) | | | (0.34) | | | | — | | |
| Total Distributions | | | (0.61 | ) | | | (0.34) | | | | — | | |
| Net Asset Value, End of Period | | $ | 9.41 | | | $ | 10.80 | | | $ | 10.19 | | |
| Total Return | | | (7.90 | )%(C) | | | 9.59 | % | | | 1.90 | %(C) | |
Net Assets, End of Period
(thousands) | | $ | 371,747 | | | $ | 240,403 | | | $ | 34,299 | | |
Ratio of Expenses to Average
Net Assets | | | 0.15 | %(B) | | | 0.20 | % | | | 0.20 | %(B)(E) | |
Ratio of Expenses to Average
Net Assets (Excluding Waivers
and Assumption of Expenses
and/or Recovery of Previously
Waived Fees) | | | 0.14 | %(B) | | | 0.21 | % | | | 0.60 | %(B)(E) | |
Ratio of Net Investment Income
to Average Net Assets | | | 7.01 | %(B) | | | 4.58 | % | | | 0.94 | %(B)(E) | |
| Portfolio Turnover Rate | | | 3 | %(C) | | | 0 | % | | | 0 | %(C) | |
| | | DFA Short-Term Municipal Bond Portfolio | | DFA California Short-Term
Municipal Bond Portfolio | |
| | | Period
Dec. 1,
2007 to
Oct. 31,
2008 | | Year
Ended
Nov. 30,
2007 | | Year
Ended
Nov. 30,
2006 | | Year
Ended
Nov. 30,
2005 | | Year
Ended
Nov. 30,
2004 | | Year
Ended
Nov. 30,
2003 | | Period
Dec. 1,
2007 to
Oct. 31,
2008 | | Period
April 2, 2007(a)
to
Nov. 30, 2007 | |
Net Asset Value,
Beginning of Period | | $ | 10.05 | | | $ | 10.02 | | | $ | 9.99 | | | $ | 10.09 | | | $ | 10.13 | | | $ | 9.97 | | | $ | 10.07 | | | $ | 10.00 | | |
| Income From Investment Operations | |
| Net Investment Income (Loss) | | | 0.19 | (A) | | | 0.31 | (A) | | | 0.28 | (A) | | | 0.22 | | | | 0.17 | | | | 0.16 | | | | 0.21 | (A) | | | 0.20 | (A) | |
Net Gains (Losses) on Securities
(Realized and Unrealized) | | | (0.03 | ) | | | 0.02 | | | | 0.02 | | | | (0.11 | ) | | | (0.04 | ) | | | 0.15 | | | | (0.06 | ) | | | 0.02 | | |
Total From Investment
Operations | | | 0.16 | | | | 0.33 | | | | 0.30 | | | | 0.11 | | | | 0.13 | | | | 0.31 | | | | 0.15 | | | | 0.22 | | |
| Less Distributions | |
| Net Investment Income | | | (0.19 | ) | | | (0.30 | ) | | | (0.27 | ) | | | (0.21 | ) | | | (0.17 | ) | | | (0.15 | ) | | | (0.22 | ) | | | (0.15 | ) | |
| Total Distributions | | | (0.19 | ) | | | (0.30 | ) | | | (0.27 | ) | | | (0.21 | ) | | | (0.17 | ) | | | (0.15 | ) | | | (0.22 | ) | | | (0.15 | ) | |
| Net Asset Value, End of Period | | $ | 10.02 | | | $ | 10.05 | | | $ | 10.02 | | | $ | 9.99 | | | $ | 10.09 | | | $ | 10.13 | | | $ | 10.00 | | | $ | 10.07 | | |
| Total Return | | | 1.63 | %(C) | | | 3.38 | % | | | 3.01 | % | | | 1.11 | % | | | 1.27 | % | | | 3.17 | % | | | 1.45 | %(C) | | | 2.23 | %(C) | |
Net Assets, End of Period
(thousands) | | $ | 991,918 | | | $ | 948,426 | | | $ | 697,942 | | | $ | 511,543 | | | $ | 381,709 | | | $ | 213,389 | | | $ | 180,915 | | | $ | 128,983 | | |
Ratio of Expenses to Average
Net Assets | | | 0.23 | %(B) | | | 0.23 | % | | | 0.26 | % | | | 0.30 | % | | | 0.30 | % | | | 0.30 | % | | | 0.27 | %(B) | | | 0.30 | %(B)(E) | |
Ratio of Expenses to Average
Net Assets (Excluding Waivers
and Assumption of Expenses
and/or Recovery of Previously
Waived Fees) | | | 0.23 | %(B) | | | 0.23 | % | | | 0.24 | % | | | 0.29 | % | | | 0.33 | % | | | 0.34 | % | | | 0.26 | %(B) | | | 0.33 | %(B)(E) | |
Ratio of Net Investment Income
to Average Net Assets | | | 2.04 | %(B) | | | 3.07 | % | | | 2.77 | % | | | 2.22 | % | | | 1.73 | % | | | 1.60 | % | | | 2.27 | %(B) | | | 3.22 | %(B)(E) | |
| Portfolio Turnover Rate | | | 1 | %(C) | | | 0 | % | | | 0 | % | | | 2 | % | | | 6 | % | | | 0 | % | | | 17 | %(C) | | | 7 | %(C) | |
See page 1 & 2 for the Definitions of Abbreviations and Footnotes.
See accompanying Notes to Financial Statements.
157
DFA INVESTMENT DIMENSIONS GROUP INC.
NOTES TO FINANCIAL STATEMENTS
A. Organization:
DFA Investment Dimensions Group Inc. (the "Fund") is an open-end management investment company registered under the Investment Company Act of 1940, whose shares are generally offered to institutional investors, retirement plans and clients of registered investment advisors. The Fund consists of fifty-six operational portfolios, of which thirty-six (the "Portfolios") are included in this report and the remaining twenty are presented in separate reports.
Of the Portfolios, sixteen (the "Feeder Funds") invest in a series of The DFA Investment Trust Company, with the exception of the DFA Global Real Estate Securities Portfolio which invests in portfolios of the DFA Investment Dimensions Group Inc., (the "Master Funds"):
| Feeder Funds | | Master Funds | | Percentage
Ownership
at 10/31/08 | |
| U.S. Large Company Portfolio | | The U.S. Large Company Series | | | 78 | % | |
|
| Enhanced U.S. Large Company Portfolio | | The Enhanced U.S. Large Company Series | | | 100 | % | |
|
| U.S. Large Cap Value Portfolio | | The U.S. Large Cap Value Series | | | 79 | % | |
|
| U.S. Small Cap Value Portfolio | | The U.S. Small Cap Value Series | | | 100 | % | |
|
| U.S. Small Cap Portfolio | | The U.S. Small Cap Series | | | 100 | % | |
|
| U.S. Micro Cap Portfolio | | The U.S. Micro Cap Series | | | 100 | % | |
|
| International Small Company Portfolio | | The Japanese Small Company Series | | | 87 | % | |
|
| | | The Asia Pacific Small Company Series | | | 85 | % | |
|
| | | The United Kingdom Small Company Series | | | 95 | % | |
|
| | | The Continental Small Company Series | | | 91 | % | |
|
| | | The Canadian Small Company Series | | | 100 | % | |
|
| Japanese Small Company Portfolio | | The Japanese Small Company Series | | | 13 | % | |
|
| Asia Pacific Small Company Portfolio | | The Asia Pacific Small Company Series | | | 15 | % | |
|
| United Kingdom Small Company Portfolio | | The United Kingdom Small Company Series | | | 5 | % | |
|
| Continental Small Company Portfolio | | The Continental Small Company Series | | | 8 | % | |
|
| DFA Global Real Estate Securities Portfolio | | DFA Real Estate Securities Portfolio | | | 3 | % | |
|
| | | DFA International Real Estate Securities Portfolio | | | 9 | % | |
|
| Emerging Markets Portfolio | | The Emerging Markets Series | | | 93 | % | |
|
| Emerging Markets Small Cap Portfolio | | The Emerging Markets Small Cap Series | | | 97 | % | |
|
| DFA One-Year Fixed Income Portfolio | | The DFA One-Year Fixed Income Series | | | 99 | % | |
|
| DFA Two-Year Global Fixed Income Portfolio | | The DFA Two-Year Global Fixed Income Series. | | | 96 | % | |
|
Each Feeder Fund invests primarily in a corresponding Master Fund, with the exception of the International Small Company Portfolio and the DFA Global Real Estate Securities Portfolio, which invest in the Master Funds indicated. The International Small Company Portfolio and the DFA Global Real Estate Securities Portfolio also invest in short-term temporary cash investments.
The financial statements of the Master Funds are included elsewhere in this report and should be read in conjunction with the financial statements of the Feeder Funds.
Prior to March 30, 2007, the U.S. Targeted Value Portfolio invested substantially all of its assets in shares of The U.S. Targeted Value Series. At the close of business on March 29, 2007, the U.S. Targeted Value Portfolio received its prorata share of cash and securities from The U.S. Targeted Value Series in a complete liquidation of its interest in the Series. Effective March 30, 2007, the U.S. Targeted Value Portfolio invests directly in securities rather than through the Series and maintains the same investment objective.
On January 31, 2008, Class R1 Shares and on June 30, 2008, Class R2 Shares of U.S. Targeted Value Portfolio commenced operations. The Class R1 Shares and Class R2 Shares of each Portfolio of the Fund (except the U.S. Small Cap Value Portfolio, T.A. U.S. Core Equity 2 Portfolio, U.S. Micro Cap Portfolio, T.A. World ex U.S. Core Equity
158
Portfolio, Japanese Small Company Portfolio, Asia Pacific Small Company Portfolio, United Kingdom Small Company Portfolio, Continental Small Company Portfolio, DFA Global Real Estate Securities Portfolio, DFA International Small Cap Value Portfolio, International Vector Equity Portfolio, Emerging Markets Small Cap Portfolio, DFA Selectively Hedged Global Fixed Income Portfolio, DFA Short-Term Municipal Bond Portfolio and DFA California Short-Term Municipal Bond Portfolio) contained in this report, had not commenced operations as of October 31, 2008. Class R1 and Class R2 Shares of each Portfolio have 25,000,000 authorized shares.
At a regular meeting of the Board of Directors/Trustees (the "Board") on September 16, 2008, the Board voted to change the fiscal and tax year ends of the Portfolios from November 30 to October 31.
B. Significant Accounting Policies:
The following significant accounting policies are in conformity with accounting principles generally accepted in the United States of America. Such policies are consistently followed by the Fund in preparation of its financial statements. The preparation of financial statements in accordance with accounting principles generally accepted in the United States of America requires management to make estimates and assumptions that affect the reported amounts of assets and liabilities and disclosure of contingent assets and liabilities at the date of the financial statements and the reported amounts of increases and decreases in net assets from operations during the reporting period. Actual results could differ from those estimates and those differences could be material.
1. Security Valuation: Securities held by U.S. Targeted Value Portfolio, U.S. Core Equity 1 Portfolio, U.S. Core Equity 2 Portfolio, U.S. Vector Equity Portfolio, T.A. U.S. Core Equity 2 Portfolio and DFA Real Estate Securities Portfolio (the "Domestic Equity Portfolios") and Large Cap International Portfolio, International Core Equity Portfolio, T.A. World ex U.S. Core Equity Portfolio, DFA International Real Estate Securities Portfolio, DFA International Small Cap Value Portfolio, International Vector Equity Portfolio, and Emerging Markets Core Equity Portfolio (the "International Equity Portfolios"), including over-the-counter securities, are valued at the last quoted sale price of the day. Securities held by the Domestic Equity Portfolios and the International Equity Portfolios that are listed on Nasdaq are valued at the Nasdaq Official Closing Price ("NOCP"). If there is no last reported sale price or NOCP for the day , the Domestic Equity Portfolios and International Equity Portfolios value the securities at the mean of the most recent quoted bid and asked prices. Price information on listed securities is taken from the exchange where the security is primarily traded. Generally, securities issued by open-end investment companies are valued using their respective net asset values or public offering prices, as appropriate, for purchase orders placed at the close of the New York Stock Exchange (NYSE).
Securities for which no market quotations are readily available (including restricted securities), or for which market quotations have become unreliable, are valued in good faith at fair value in accordance with procedures adopted by the Board of Directors/Trustees. Fair value pricing may also be used if events that have a significant effect on the value of an investment (as determined in the discretion of the Investment Committee of the Advisor) occur before the net asset value is calculated. When fair value pricing is used, the prices of securities used by the Domestic Equity Portfolios and International Equity Portfolios may differ from the quoted or published prices for the same securities on their primary markets or exchanges.
The International Equity Portfolios will also apply a fair value price in the circumstances described below. Generally, trading in foreign securities markets is completed each day at various times prior to the close of the NYSE. For example, trading in the Japanese securities markets is completed each day at the close of the Tokyo Stock Exchange (normally, 11:00 p.m. PT), which is fourteen hours prior to the close of the NYSE (normally, 1:00 p.m. PT) and the time that the net asset values of the International Equity Portfolios are computed. Due to the time differences between the closings of the relevant foreign securities exchanges and the time the International Equity Portfolios price their shares at the close of the NYSE, the International Equity Portfolios will fair value their foreign investments when it is determined that the market quotations for the foreign investments are either unreliable or not readily available. The fair value pr ices will attempt to reflect the impact of the U.S. financial markets' perceptions and trading activities on the International Equity Portfolios' foreign investments since the last closing prices of the foreign investments were calculated on their primary foreign securities markets or exchanges. For these purposes, the Board of Directors/Trustees of the Fund have determined that movements in relevant indices or other appropriate market indicators, after the close of the Tokyo Stock Exchange or the London Stock Exchange, demonstrate that market quotations may be unreliable. Fair valuation
159
of portfolio securities may occur on a daily basis. The fair value pricing by the International Equity Portfolios utilizes data furnished by an independent pricing service (and that data draws upon, among other information, the market values of foreign investments). The fair value prices of portfolio securities generally will be used when it is determined that the use of such prices will have a material impact on the net asset value of an International Equity Portfolio. When an International Equity Portfolio uses fair value pricing, the values assigned to the International Equity Portfolio's foreign investments may not be the quoted or published prices of the investments on their primary markets or exchanges.
Securities held by DFA Selectively Hedged Global Fixed Income Portfolio, DFA Five-Year Government Portfolio, DFA Five-Year Global Fixed Income Portfolio, DFA Intermediate Government Fixed Income Portfolio, DFA Inflation-Protected Securities Portfolio, DFA Short-Term Municipal Bond Portfolio and DFA California Short-Term Municipal Bond Portfolio (the "Fixed Income Portfolios"), are valued on the basis of prices provided by one or more pricing services or other reasonably reliable sources including broker/dealers that typically handle the purchase and sale of such securities. Securities which are traded over-the-counter and on a stock exchange generally will be valued according to the broadest and most representative market, and it is expected that for bonds and other fixed income securities, this ordinarily will be the over-the-counter market. Securities for which quotations are not readily available (including restricted securities), or for which market quotations have become unreliable, are valued in good faith at fair value in accordance with procedures adopted by the Board of Directors/Trustees.
Master Fund shares held by the Feeder Funds are valued at their respective daily net asset values, or for U.S. Large Company Portfolio, International Small Company Portfolio, Japanese Small Company Portfolio, Asia Pacific Small Company Portfolio, United Kingdom Small Company Portfolio, Continental Small Company Portfolio, DFA Global Real Estate Securities Portfolio, Emerging Markets Portfolio, and Emerging Markets Small Cap Portfolio, their investments reflect each of their proportionate interest in the net assets of their corresponding Master Funds.
Adoption of Statement of Financial Accounting Standards No. 157 "Fair Value Measurements" ("FAS 157")
In September 2006, the Financial Accounting Standards Board issued FAS 157 effective for fiscal years beginning after November 15, 2007. This standard clarifies the definition of fair value for financial reporting, establishes a framework for measuring fair value and requires additional disclosures about the use of fair value measurements. The Funds have adopted FAS 157 as of December 1, 2007 and/or inception date if funds commenced operations prior to adoption date. The three levels of the fair value hierarchy under FAS 157 are described below:
• Level 1 – quoted prices in active markets for identical securities
• Level 2 – other significant observable inputs (including quoted prices for similar securities, interest rates, prepayment speeds, credit risk, etc.)
• Level 3 – significant unobservable inputs (including the Portfolios' own assumptions in determining the fair value of investments)
The inputs or methodology used for valuing securities are not necessarily an indication of the risk associated with investing in those securities. A summary of the inputs used to value the Portfolios' net assets as of October 31, 2008 is listed below (in thousands).
| | | Valuation Inputs | |
| | | Investments in
Securities
(Market Value) | | Other Financial
Instruments
(Unrealized
Appreciation/
Depreciation)* | |
| | | Level 1 | | Level 2 | | Level 3 | | Total | | Level 1 | | Level 2 | | Level 3 | | Total | |
| U.S. Large Company Portfolio | | $ | 2,544,364 | | | | — | | | | — | | | $ | 2,544,364 | | | | — | | | | — | | | | — | | | | — | | |
| Enhanced U.S. Large Company Portfolio | | | 200,349 | | | | — | | | | — | | | | 200,349 | | | | — | | | | — | | | | — | | | | — | | |
| U.S. Large Cap Value Portfolio | | | 5,331,340 | | | | — | | | | — | | | | 5,331,340 | | | | — | | | | — | | | | — | | | | — | | |
| U.S. Targeted Value Portfolio | | | 866,568 | | | $ | 212,933 | | | | — | | | | 1,079,501 | | | $ | 3 | | | | — | | | | — | | | $ | 3 | | |
| U.S. Small Cap Value Portfolio | | | 5,505,604 | | | | — | | | | — | | | | 5,505,604 | | | | — | | | | — | | | | — | | | | — | | |
| U.S. Core Equity 1 Portfolio | | | 1,332,827 | | | | 253,794 | | | | — | | | | 1,586,621 | | | | 2 | | | | — | | | | — | | | | 2 | | |
| U.S. Core Equity 2 Portfolio | | | 2,503,023 | | | | 475,126 | | | | — | | | | 2,978,149 | | | | 1 | | | | — | | | | — | | | | 1 | | |
| U.S. Vector Equity Portfolio | | | 847,039 | | | | 187,104 | | | | — | | | | 1,034,143 | | | | — | | | | — | | | | — | | | | — | | |
160
| | | Valuation Inputs | |
| | | Investments in
Securities
(Market Value) | | Other Financial
Instruments
(Unrealized
Appreciation/
Depreciation)* | |
| | | Level 1 | | Level 2 | | Level 3 | | Total | | Level 1 | | Level 2 | | Level 3 | | Total | |
| T.A. U.S. Core Equity 2 Portfolio | | $ | 592,765 | | | $ | 56,691 | | | | — | | | $ | 649,456 | | | $ | 1 | | | | — | | | | — | | | $ | 1 | | |
| U.S. Small Cap Portfolio | | | 2,067,436 | | | | — | | | | — | | | | 2,067,436 | | | | — | | | | — | | | | — | | | | — | | |
| U.S. Micro Cap Portfolio | | | 2,925,347 | | | | — | | | | — | | | | 2,925,347 | | | | — | | | | — | | | | — | | | | — | | |
| DFA Real Estate Securities Portfolio | | | 1,704,710 | | | | 504,430 | | | | — | | | | 2,209,140 | | | | 10 | | | | — | | | | — | | | | 10 | | |
| Large Cap International Portfolio | | | 222,000 | | | | 1,125,948 | | | | — | | | | 1,347,948 | | | | — | | | | — | | | | — | | | | — | | |
| International Core Equity Portfolio | | | 525,783 | | | | 1,796,102 | | | | — | | | | 2,321,885 | | | | 15 | | | | — | | | | — | | | | 15 | | |
| T.A. World ex U.S. Core Equity Portfolio | | | 63,189 | | | | 194,464 | | | | — | | | | 257,653 | | | | 1 | | | | — | | | | — | | | | 1 | | |
| International Small Company Portfolio | | | 3,076,553 | | | | 10,033 | | | | — | | | | 3,086,586 | | | | — | | | | — | | | | — | | | | — | | |
| Japanese Small Company Portfolio | | | 133,439 | | | | — | | | | — | | | | 133,439 | | | | — | | | | — | | | | — | | | | — | | |
| Asia Pacific Small Company Portfolio | | | 64,067 | | | | — | | | | — | | | | 64,067 | | | | — | | | | — | | | | — | | | | — | | |
| United Kingdom Small Company Portfolio | | | 25,891 | | | | — | | | | — | | | | 25,891 | | | | — | | | | — | | | | — | | | | — | | |
| Continental Small Company Portfolio | | | 94,027 | | | | — | | | | — | | | | 94,027 | | | | — | | | | — | | | | — | | | | — | | |
DFA International Real Estate Securities
Portfolio | | | 22,709 | | | | 483,261 | | | | — | | | | 505,970 | | | | — | | | | — | | | | — | | | | — | | |
| DFA Global Real Estate Securities Portfolio | | | 90,447 | | | | 416 | | | | — | | | | 90,863 | | | | — | | | | — | | | | — | | | | — | | |
DFA International Small Cap Value
Portfolio | | | 377,307 | | | | 5,172,383 | | | | — | | | | 5,549,690 | | | | 28 | | | | — | | | | — | | | | 28 | | |
| International Vector Equity Portfolio | | | 12,665 | | | | 59,771 | | | | — | | | | 72,436 | | | | 1 | | | | — | | | | — | | | | 1 | | |
| Emerging Markets Portfolio | | | 1,508,866 | | | | — | | | | — | | | | 1,508,866 | | | | — | | | | — | | | | — | | | | — | | |
| Emerging Markets Small Cap Portfolio | | | 547,574 | | | | — | | | | — | | | | 547,574 | | | | — | | | | — | | | | — | | | | — | | |
| Emerging Markets Core Equity Portfolio | | | 432,520 | | | | 938,914 | | | | — | | | | 1,371,434 | | | | 4 | | | | — | | | | — | | | | 4 | | |
| DFA One-Year Fixed Income Portfolio | | | 3,194,750 | | | | — | | | | — | | | | 3,194,750 | | | | — | | | | — | | | | — | | | | — | | |
| DFA Two-Year Global Fixed Income Portfolio | | | 3,125,328 | | | | — | | | | — | | | | 3,125,328 | | | | — | | | | — | | | | — | | | | — | | |
DFA Selectively Hedged Global Fixed
Income Portfolio | | | — | | | | 202,939 | | | | — | | | | 202,939 | | | | — | | | $ | (6 | ) | | | — | | | | (6 | ) | |
| DFA Five-Year Government Portfolio | | | — | | | | 1,104,523 | | | | — | | | | 1,104,523 | | | | — | | | | — | | | | — | | | | — | | |
DFA Five-Year Global Fixed Income
Portfolio | | | — | | | | 3,282,240 | | | | — | | | | 3,282,240 | | | | — | | | | (1,429 | ) | | | — | | | | (1,429 | ) | |
DFA Intermediate Government Fixed
Income Portfolio | | | — | | | | 1,230,031 | | | | — | | | | 1,230,031 | | | | — | | | | — | | | | — | | | | — | | |
DFA Inflation-Protected Securities
Portfolio | | | — | | | | 369,320 | | | | — | | | | 369,320 | | | | — | | | | — | | | | — | | | | — | | |
| DFA Short-Term Municipal Bond Portfolio | | | 11,540 | | | | 972,496 | | | | — | | | | 984,036 | | | | — | | | | — | | | | — | | | | — | | |
DFA California Short-Term Municipal
Bond Portfolio | | | — | | | | 178,384 | | | | — | | | | 178,384 | | | | — | | | | — | | | | — | | | | — | | |
* Other financial instruments are derivative instruments not reflected in the Schedule of Investments, such as futures, and forwards which are valued at the unrealized appreciation/depreciation on the investment.
2. Foreign Currency Translation: Securities and other assets and liabilities of the International Equity Portfolios, the DFA Selectively Hedged Global Fixed Income Portfolio, and the DFA Five-Year Global Fixed Income Portfolio whose values are initially expressed in foreign currencies are translated to U.S. dollars using the mean between the most recently quoted bid and asked prices for the U.S. dollar as quoted by generally recognized reliable sources. Dividend and interest income and certain expenses are translated to U.S. dollars at the rate of exchange on their respective accrual dates. Receivables and payables denominated in foreign currencies are marked to market daily based on daily exchange rates and exchange gains or losses are realized upon ultimate receipt or disbursement. DFA Selectively Hedged Global Fixed Income Portfolio and DFA Five-Year Global Fixed Income Portfolio also enter into forward foreign currency contracts solely for the purpose of hedging against fluctuations in currency exchange rates. These contracts are marked to market daily based on daily forward exchange rates. The DFA Selectively Hedged Global Fixed Income Portfolio may hedge the currency exposure of its foreign securities or leave some or all of the currency exposure unhedged.
The International Equity Portfolios do not isolate the effect of fluctuation in foreign exchange rates from the effect of fluctuations in the market prices of securities whether realized or unrealized. However, the DFA Selectively
161
Hedged Global Fixed Income Portfolio, and the DFA Five-Year Global Fixed Income Portfolio do isolate the effect of fluctuations in foreign currency rates when determining the realized gain or loss upon the sale or maturity of foreign currency denominated debt obligations pursuant to U.S. Federal income tax regulations; such amounts are categorized as foreign exchange gain or loss for both financial reporting and income tax reporting purposes.
Realized gains or losses on foreign currency transactions represent net foreign exchange gains or losses from the disposition of foreign currencies, currency gains or losses realized between the trade and settlement dates on securities transactions, and the difference between amounts of interest, dividends and foreign withholding taxes recorded on the books of the International Equity Portfolios, the DFA Selectively Hedged Global Fixed Income Portfolio, and the DFA Five-Year Global Fixed Income Portfolio and the U.S. dollar equivalent amounts actually received or paid.
3. Deferred Compensation Plan: Each eligible Director of the Fund may elect participation in the Deferred Compensation Plan (the "Plan"). Under the Plan, effective January 1, 2002, such Directors may defer payment of all or a portion of their total fees earned as a Director. These deferred amounts may be treated as though such amounts had been invested in shares of the following funds: U.S. Large Cap Value Portfolio; U.S. Core Equity 1 Portfolio; U.S. Core Equity 2 Portfolio; U.S. Vector Equity Portfolio; U.S. Micro Cap Portfolio; DFA International Value Portfolio; International Core Equity Portfolio; Emerging Markets Portfolio; Emerging Markets Core Equity Portfolio; and/or DFA Two-Year Global Fixed Income Portfolio. Contributions made under the Plan and the change in unrealized appreciation (depreciation) and income, are included in Other Expenses for the period ended October 31, 2008 and are included in Directors'/Trust ees' Fees & Expenses for the year ended November 30, 2007.
Each Director has the option to receive their distribution of proceeds in one of the following methods upon one year's notice: lump sum; annual installments over a period of agreed upon years; or semi-annual installments over a period of agreed upon years. As of October 31, 2008, none of the Directors have requested distribution of proceeds.
4. Other: Security transactions are accounted for as of the trade date. Costs used in determining realized gains and losses on the sale of investment securities/affiliated investment companies are on the basis of identified cost. Dividend income and distributions to shareholders are recorded on the ex-dividend date. Distributions received on securities and from investment in affiliated investment companies that represent a return of capital or capital gain are recorded as a reduction of cost of investments or as a realized gain, respectively. The Portfolios estimate the character of distributions received that may be considered return of capital distributions. Interest income is recorded on an accrual basis. Discount and premium on debt securities purchased are amortized over the lives of the respective securities utilizing the effective interest method. Expenses directly attributable to a Portfolio are directly charged. C ommon expenses of the Fund or Portfolios are allocated using methods approved by the Board of Directors/Trustees, generally based on average net assets.
Class R1 Shares, Class R2 Shares and Institutional Class Shares have equal rights to assets and earnings of the Portfolio. Income, gains and losses, and common expenses of the Portfolio are allocated to each class of shares based on its relative net assets. Each class will bear its own class-specific expenses, if any.
The U.S. Large Company Portfolio, International Small Company Portfolio, Japanese Small Company Portfolio, Asia Pacific Small Company Portfolio, United Kingdom Small Company Portfolio, Continental Small Company Portfolio, Emerging Markets Portfolio, and Emerging Markets Small Cap Portfolio each recognize their pro-rata share of net investment income and realized and unrealized gains/losses on a daily basis, from their respective Master Funds, which are treated as partnerships for federal income tax purposes.
The Portfolios may be subject to taxes imposed by countries in which they invest, with respect to their investments in issuers existing or operating in such countries. Such taxes are generally based on income earned or repatriated and capital gains realized on the sale of such investments. The Portfolios accrue such taxes when the related income or capital gains are earned or throughout the holding period. Some countries require governmental approval for the repatriation of investment income, capital or the proceeds of sales earned by foreign investors. In addition, if there is a deterioration in a country's balance of payments or for other reasons, a country may impose temporary restrictions on foreign capital remittances abroad.
162
The Emerging Markets Core Equity Portfolio's investments in Thailand and the investments in Thailand held by the Master Funds of Emerging Markets Portfolio and Emerging Markets Small Cap Portfolio are subject to a 15% governmental capital gains tax. Such taxes are due upon sale of individual securities. The Emerging Markets Core Equity Portfolio and the Master Funds of Emerging Markets Portfolio and Emerging Markets Small Cap Portfolio accrues for taxes on the capital gains throughout the holding period based on the unrealized gain of the underlying securities. These funds are also subject to a 10% governmental capital gains tax on short-term capital gains for investments in India. Such taxes are due upon sale of individual securities. The taxes for the capital gains are accrued when the capital gains are earned.
C. Investment Advisor and Administrator:
Dimensional Fund Advisors LP ("Dimensional" or the "Advisor") provides investment advisory services to all Portfolios except the Feeder Funds. The Advisor provides administrative services to the Feeder Funds, including supervision of services provided by others, providing information to shareholders and the Board of Directors/Trustees, and other administrative services.
For the period December 1, 2007 to October 31, 2008, the Portfolios' investment advisory services fees were accrued daily and paid monthly to the Advisor based on the following effective annual rates of average daily net assets:
| U.S. Targeted Value Portfolio | | | 0.10 | % | |
|
| U.S. Core Equity 1 Portfolio | | | 0.17 | % | |
|
| U.S. Core Equity 2 Portfolio | | | 0.20 | % | |
|
| U.S. Vector Equity Portfolio | | | 0.30 | % | |
|
| T.A. U.S. Core Equity 2 Portfolio | | | 0.22 | % | |
|
| DFA Real Estate Securities Portfolio | | | 0.30 | % | |
|
| Large Cap International Portfolio | | | 0.25 | % | |
|
| International Core Equity Portfolio | | | 0.35 | % | |
|
| T.A. World ex U.S. Core Equity Portfolio | | | 0.40 | % | |
|
| DFA International Real Estate Securities Portfolio | | | 0.35 | % | |
|
| DFA International Small Cap Value Portfolio | | | 0.65 | % | |
|
| International Vector Equity Portfolio | | | 0.45 | % | |
|
| Emerging Markets Core Equity Portfolio | | | 0.55 | % | |
|
| DFA Selectively Hedged Global Fixed Income Portfolio | | | 0.15 | % | |
|
| DFA Five-Year Government Portfolio | | | 0.20 | % | |
|
| DFA Five-Year Global Fixed Income Portfolio | | | 0.25 | % | |
|
| DFA Intermediate Government Fixed Income Portfolio | | | 0.10 | % | |
|
| DFA Inflation-Protected Securities Portfolio | | | 0.10 | % | |
|
| DFA Short-Term Municipal Bond Portfolio | | | 0.20 | % | |
|
| DFA California Short-Term Municipal Bond Portfolio | | | 0.20 | % | |
|
For the period December 1, 2007 to October 31, 2008, the Feeder Funds' and the U.S. Targeted Value Portfolio administrative services fees were accrued daily and paid monthly to the Advisor based on the following effective annual rates of average daily net assets:
| U.S. Large Company Portfolio | | | 0.095 | % | |
|
| Enhanced U.S. Large Company Portfolio | | | 0.15 | % | |
|
| U.S. Large Cap Value Portfolio | | | 0.15 | % | |
|
| U.S. Targeted Value Portfolio | | | 0.25 | % | |
|
| U.S. Small Cap Value Portfolio | | | 0.30 | % | |
|
| U.S. Small Cap Portfolio | | | 0.32 | % | |
|
| U.S. Micro Cap Portfolio | | | 0.40 | % | |
|
| International Small Company Portfolio | | | 0.40 | % | |
|
| Japanese Small Company Portfolio | | | 0.40 | % | |
|
| Asia Pacific Small Company Portfolio | | | 0.40 | % | |
|
| United Kingdom Small Company Portfolio | | | 0.40 | % | |
|
163
| Continental Small Company Portfolio | | | 0.40 | % | |
|
| DFA Global Real Estate Securities Portfolio | | | 0.35 | % | |
|
| Emerging Markets Portfolio | | | 0.40 | % | |
|
| Emerging Markets Small Cap Portfolio | | | 0.45 | % | |
|
| DFA One-Year Fixed Income Portfolio | | | 0.10 | % | |
|
| DFA Two-Year Global Fixed Income Portfolio | | | 0.10 | % | |
|
Pursuant to a Fee Waiver and Expense Assumption Agreement, the Advisor has contractually agreed to waive certain fees, including administration/advisory fees, and in certain instances, assume certain expenses of the Portfolios, as described in the notes below. The Fee Waiver and Expense Assumption Agreement for the Portfolios below will remain in effect through April 1, 2009, and shall continue in effect from year to year thereafter unless terminated by the Fund or the Advisor. For the period December 1, 2007 to October 31, 2008, the Portfolios had expense limits based on a percentage of average net assets on an annualized basis, and the Advisor recovered previously waived fees and/or expenses assumed as listed below (amounts in thousands). Previously waived fees subject to future recovery by the Advisor are also reflected below (amounts in thousands). The Portfolios are not obligated to reimburse the Advisor for fees previously waived or ex penses previously assumed by the Advisor more than thirty-six months before the date of recovery.
| Institutional Class Shares | | Expense
Limits | | Recovery
of Previously
Waived Fees/
Expenses Assumed | | Previously
Waived Fees/
Expenses Assumed
Subject to Future
Recovery | |
| U.S. Large Company Portfolio (1) | | | 0.15 | % | | $ | 31 | | | $ | 1,308 | | |
| U.S. Targeted Value Portfolio (1) | | | 0.50 | % | | | — | | | | — | | |
| U.S. Core Equity 1 Portfolio (2) | | | 0.23 | % | | | — | | | | — | | |
| U.S. Core Equity 2 Portfolio (2) | | | 0.26 | % | | | — | | | | — | | |
| U.S. Vector Equity Portfolio (2) | | | 0.36 | % | | | — | | | | — | | |
| T.A. U.S. Core Equity 2 Portfolio (2) | | | 0.30 | % | | | 24 | | | | — | | |
| International Core Equity Portfolio (2) | | | 0.49 | % | | | — | | | | — | | |
| T.A. World ex U.S. Core Equity Portfolio (3) | | | 0.60 | % | | | — | | | | 167 | | |
| International Small Company Portfolio (4) | | | 0.45 | % | | | — | | | | — | | |
| Japanese Small Company Portfolio (4) | | | 0.47 | % | | | — | | | | — | | |
| Asia Pacific Small Company Portfolio (4) | | | 0.47 | % | | | 4 | | | | 46 | | |
| United Kingdom Small Company Portfolio (4) | | | 0.47 | % | | | — | | | | 49 | | |
| Continental Small Company Portfolio (4) | | | 0.47 | % | | | — | | | | 11 | | |
| DFA International Real Estate Securities Portfolio (5) | | | 0.65 | % | | | — | | | | — | | |
| DFA Global Real Estate Securities Portfolio (6) | | | 0.55 | % | | | — | | | | 89 | | |
| International Vector Equity Portfolio (5) | | | 0.60 | % | | | — | | | | 45 | | |
| Emerging Markets Core Equity Portfolio (5) | | | 0.85 | % | | | — | | | | — | | |
| DFA Selectively Hedged Global Fixed Income Portfolio (5) | | | 0.25 | % | | | — | | | | — | | |
| DFA Inflation-Protected Securities Portfolio (5) | | | 0.20 | % | | | 31 | | | | — | | |
| DFA Short-Term Municipal Bond Portfolio (7) | | | 0.30 | % | | | — | | | | — | | |
| DFA California Short-Term Municipal Bond Portfolio (5) | | | 0.30 | % | | | 16 | | | | — | | |
| Class R1 Shares | |
| U.S. Targeted Value Portfolio (8) | | | 0.62 | % | | | — | | | | — | | |
| Class R2 Shares | |
| U.S. Targeted Value Portfolio (9) | | | 0.77 | % | | | — | | | | — | | |
(1) The Advisor has contractually agreed to waive its administration fee and to assume each Portfolio's direct and indirect expenses (including, for U.S. Large Company Portfolio, the expenses the Portfolio bears as a shareholder of its Master Fund) to the extent necessary to limit the expenses of each Portfolio to the rates listed above as a percentage of average net assets on an annualized basis. At any time that the annualized expenses of a Portfolio are less than the rate listed above for such Portfolio, the Advisor retains the right to recover any fees previously waived and/or expenses previously assumed to the extent that such recovery will not cause the Portfolio's annualized expenses to exceed the applicable percentage of average net assets on an annualized basis, as listed above.
164
(2) The Advisor has contractually agreed to waive all or a portion of its advisory fee and assume the Portfolio's expenses (excluding the expenses the Portfolio incurs indirectly through investment in other investment companies) ("Portfolio Expenses") to the extent necessary to limit the Portfolio Expenses of each Portfolio to the rates listed above as a percentage of average net assets on an annualized basis. At any time that the annualized Portfolio Expenses of a Portfolio are less than the rates listed above for such Portfolio, the Advisor retains the right to recover any fees previously waived and/or expenses previously assumed to the extent that such recovery will not cause the Portfolio's annualized Portfolio Expenses to exceed the applicable percentage of average net assets on an annualized basis, as listed above.
(3) The Advisor has contractually agreed to waive all or a portion of the Portfolio's advisory fee to the extent necessary to limit the total advisory fees paid by the Portfolio to the Advisor directly or indirectly (the proportionate share of the advisory fees paid by the Portfolio through its investment in other funds managed by the Advisor) to 0.40% of the Portfolio's average net assets on an annualized basis. The Advisor has also contractually agreed to waive all or a portion of its advisory fee and to assume the expenses of the Portfolio (including the expenses that the Portfolio bears as a shareholder of other funds managed by the Advisor but excluding the expenses that the Portfolio incurs indirectly through its investment in unaffiliated investment companies) ("Portfolio Expenses") to the extent necessary to limit the Portfolio Expenses of the Portfolio to the rate listed above as a percentage of average net assets on an annualized b asis. At any time that the annualized expenses of the Portfolio are less than the rate listed above for the Portfolio, the Advisor retains the right to recover any fees previously waived and/or expenses previously assumed to the extent that such recovery will not cause the Portfolio's annualized expenses to exceed the applicable percentage of average net assets on an annualized basis, as listed above.
(4) The Advisor has contractually agreed to waive its administration fee and to assume the Portfolio's other direct expenses (for International Small Company, not including expenses incurred through its investment in other investment companies) to the extent necessary to limit the direct expenses of the Portfolio to the rates listed above as a percentage of average net assets on an annualized basis. The Fee Waiver and Expense Assumption Agreement does not include the indirect expenses each Portfolio bears as a shareholder of its Master Funds. At any time that the direct expenses of the Portfolio are less than the rates listed above as a percentage of average net assets on an annualized basis, the Advisor retains the right to recover any fees previously waived and/or expenses previously assumed to the extent that such recovery will not cause the Portfolio's direct expenses to exceed the applicable percentage of average net assets on an annual ized basis, as listed above.
(5) The Advisor has contractually agreed to waive all or a portion of its advisory fee and to assume the Portfolio's expenses (excluding the expenses the Portfolio incurs indirectly through investment in other investment companies) ("Portfolio Expenses") to the extent necessary to limit the Portfolio Expenses of the Portfolio to the rate listed above as a percentage of average net assets on an annualized basis. At any time that the annualized Portfolio Expenses of the Portfolio are less than the rate listed above as a percentage of average net assets on an annualized basis, the Advisor retains the right to recover any fees previously waived and/or expenses previously assumed to the extent that such recovery will not cause the Portfolio's annualized Portfolio Expenses to exceed the applicable percentage of average net assets on an annualized basis, as listed above.
(6) The Advisor has contractually agreed to waive all or a portion of its advisory fee and to assume the expenses of the Portfolio (including the expenses that the Portfolio bears as a shareholder of other investment companies managed by the Advisor but excluding the expenses that the Portfolio incurs indirectly through its investment in unaffiliated investment companies) ("Portfolio Expenses") to the extent necessary to limit the Portfolio Expenses of the Portfolio to the rate listed above as a percentage of average net assets on an annualized basis. At any time that the annualized Portfolio Expenses of the Portfolio are less than the rate listed above as a percentage of average net assets on an annualized basis, the Advisor retains the right to recover any fees previously waived and/or expenses previously assumed to the extent that such recovery will not cause the Portfolio's annualized Portfolio Expenses to exceed the applicable percentag e of average net assets on an annualized basis, as listed above.
(7) The Advisor has contractually agreed to waive all or a portion of its advisory fee to the extent necessary to reduce the Portfolio's expenses (not including expenses incurred through its investment in other investment companies) ("Portfolio Expenses") up to the amount of its total advisory fee when its Portfolio Expenses exceed the rate listed above as a percentage of average net assets on an annualized basis. At any time that the annualized Portfolio Expenses of the Portfolio are less than the rate listed above as a percentage of average net assets on an annualized basis, the Advisor retains the right to recover any fees previously waived to the extent that such recovery
165
will not cause the Portfolio's annualized Portfolio Expenses to exceed the applicable percentage of average net assets on an annualized basis, as listed above.
(8) The Advisor has contractually agreed to waive its administration fee and to assume the Portfolio's direct and indirect expenses (excluding the expenses the Portfolio incurs indirectly through investment in other investment companies) ("Portfolio Expenses") to the extent necessary to limit the Portfolio Expenses of the Class R1 shares to the rate listed above as a percentage of average net assets on an annualized basis. At any time that the Class R1 Shares' annualized expenses are less than the rate listed above as a percentage of average net assets on an annualized basis, the Advisor retains the right to recover any fees previously waived and/or expenses previously assumed to the extent that such recovery will not cause the Portfolio's annualized expenses to exceed the applicable percentage of average net assets on an annualized basis, as listed above.
(9) The Advisor has contractually agreed to waive its administration fee and to assume the Portfolio's direct and indirect expenses (excluding the expenses the Portfolio incurs indirectly through investment in other investment companies) ("Portfolio Expenses") to the extent necessary to limit the Portfolio Expenses of the Class R2 shares to the rate listed above as a percentage of average net assets on an annualized basis. At any time that the Class R2 Shares' annualized expenses are less than the rate listed above as a percentage of average net assets on an annualized basis, the Advisor retains the right to recover any fees previously waived and/or expenses previously assumed to the extent that such recovery will not cause the Portfolio's annualized expenses to exceed the applicable percentage of average net assets on an annualized basis, as listed above.
Fees Paid to Officers and Directors/Trustees:
Certain Officers and Directors/Trustees of the Advisor are also Officers and Directors/Trustees of the Fund; however, such Officers and Directors/Trustees (with the exception of the Chief Compliance Officer ("CCO")) receive no compensation from the Fund. For the period December 1, 2007 to October 31, 2008, the total related amounts paid by the Fund to the CCO were $159 (in thousands). The total related amounts paid by each of the Portfolios are included in Other Expenses on the Statement of Operations.
D. Deferred Compensation:
At October 31, 2008, the total liability for deferred compensation to Directors/Trustees is included in Accrued Expenses and Other Liabilities on the Statement of Assets and Liabilities as follows (amounts in thousands):
| U.S. Large Company Portfolio | | $ | 48 | | |
|
| Enhanced U.S. Large Company Portfolio | | | 4 | | |
|
| U.S. Large Cap Value Portfolio | | | 102 | | |
|
| U.S. Targeted Value Portfolio | | | 12 | | |
|
| U.S. Small Cap Value Portfolio | | | 112 | | |
|
| U.S. Core Equity 1 Portfolio | | | 20 | | |
|
| U.S. Core Equity 2 Portfolio | | | 43 | | |
|
| U.S. Vector Equity Portfolio | | | 15 | | |
|
| T.A. U.S. Core Equity 2 Portfolio | | | 6 | | |
|
| U.S. Small Cap Portfolio | | | 39 | | |
|
| U.S. Micro Cap Portfolio | | | 59 | | |
|
| DFA Real Estate Securities Portfolio | | | 36 | | |
|
| Large Cap International Portfolio | | | 28 | | |
|
| International Core Equity Portfolio | | | 36 | | |
|
| T.A. World ex U.S. Core Equity Portfolio | | | 1 | | |
|
| International Small Company Portfolio | | | 72 | | |
|
| Japanese Small Company Portfolio | | | 3 | | |
|
| Asia Pacific Small Company Portfolio | | | 2 | | |
|
| United Kingdom Small Company Portfolio | | | 1 | | |
|
| Continental Small Company Portfolio | | | 2 | | |
|
| DFA International Real Estate Securities Portfolio | | | 7 | | |
|
| DFA Global Real Estate Securities Portfolio | | | 1 | | |
|
| DFA International Small Cap Value Portfolio | | | 110 | | |
|
| International Vector Equity Portfolio | | | 1 | | |
|
| Emerging Markets Portfolio | | | 40 | | |
|
| Emerging Markets Small Cap Portfolio | | | 17 | | |
|
166
| Emerging Markets Core Equity Portfolio | | $ | 26 | | |
|
| DFA One-Year Fixed Income Portfolio | | | 50 | | |
|
| DFA Two-Year Global Fixed Income Portfolio | | | 46 | | |
|
| DFA Selectively Hedged Global Fixed Income Portfolio | | | 2 | | |
|
| DFA Five-Year Government Portfolio | | | 18 | | |
|
| DFA Five-Year Global Fixed Income Portfolio | | | 52 | | |
|
| DFA Intermediate Government Fixed Income Portfolio | | | 20 | | |
|
| DFA Inflation-Protected Securities Portfolio | | | 5 | | |
|
| DFA Short-Term Municipal Bond Portfolio | | | 14 | | |
|
| DFA California Short-Term Municipal Bond Portfolio | | | 3 | | |
|
E. Purchases and Sales of Securities:
For the period December 1, 2007 to October 31, 2008, the Portfolios made the following purchases and sales of investment securities, other than short-term securities (amounts in thousands):
| | | U.S. Government
Securities | | Other Investment
Securities | |
| | | Purchases | | Sales | | Purchases | | Sales | |
| U.S. Targeted Value Portfolio | | | — | | | | — | | | $ | 784,517 | | | $ | 158,943 | | |
| U.S. Core Equity 1 Portfolio | | | — | | | | — | | | | 772,070 | | | | 72,872 | | |
| U.S. Core Equity 2 Portfolio | | | — | | | | — | | | | 919,025 | | | | 227,552 | | |
| U.S. Vector Equity Portfolio | | | — | | | | — | | | | 435,193 | | | | 108,303 | | |
| T.A. U.S. Core Equity 2 Portfolio | | | — | | | | — | | | | 677,938 | | | | 33,387 | | |
| DFA Real Estate Securities Portfolio | | | — | | | | — | | | | 400,916 | | | | 320,606 | | |
| Large Cap International Portfolio | | | — | | | | — | | | | 241,566 | | | | 239,872 | | |
| International Core Equity Portfolio | | | — | | | | — | | | | 1,184,486 | | | | 104,660 | | |
| T.A. World ex U.S. Core Equity Portfolio | | | — | | | | — | | | | 309,525 | | | | 1,929 | | |
| DFA International Real Estate Securities Portfolio | | | — | | | | — | | | | 431,110 | | | | 4,259 | | |
| DFA International Small Cap Value Portfolio | | | — | | | | — | | | | 1,875,427 | | | | 1,208,690 | | |
| International Vector Equity Portfolio | | | — | | | | — | | | | 79,180 | | | | 26 | | |
| Emerging Markets Core Equity Portfolio | | | — | | | | — | | | | 540,578 | | | | 57,542 | | |
| DFA Selectively Hedged Global Fixed Income Portfolio | | $ | 37,094 | | | $ | 24,036 | | | | 244,577 | | | | 300 | | |
| DFA Five-Year Government Portfolio | | | 1,739,252 | | | | 665,887 | | | | — | | | | — | | |
| DFA Five-Year Global Fixed Income Portfolio | | | 2,485,545 | | | | 1,190,998 | | | | 691,937 | | | | 497,073 | | |
| DFA Intermediate Government Fixed Income Portfolio | | | 186,175 | | | | 233,806 | | | | — | | | | — | | |
| DFA Inflation-Protected Securities Portfolio | | | 186,535 | | | | 11,081 | | | | — | | | | — | | |
| DFA Short-Term Municipal Bond Portfolio | | | — | | | | — | | | | 479,417 | | | | 4,018 | | |
| DFA California Short-Term Municipal Bond Portfolio | | | — | | | | — | | | | 143,843 | | | | 17,733 | | |
F. Federal Income Taxes:
Each Portfolio has qualified and intends to continue to qualify as a regulated investment company under Subchapter M of the Internal Revenue Code for federal income tax purposes and to distribute substantially all of its taxable income and net capital gains to its shareholders. Accordingly, no provision has been made for federal income taxes.
Distributions from net investment income and net realized capital gains are determined in accordance with U.S. federal income tax regulations, which may differ from those amounts determined under accounting principles generally accepted in the United States of America. These book/tax differences are either temporary or permanent in nature. To the extent these differences are permanent, they are charged or credited to paid-in capital, undistributed net investment income or accumulated net realized gains, as appropriate, in the period that the differences arise. Accordingly, the following permanent differences as of October 31, 2008, primarily attributable to net realized gains on securities considered to be "passive foreign investment companies", non-deductible offering costs, foreign bond bifurcation, the utilization of accumulated earnings and profits distributed to shareholders on redemptions of shares as part of the dividends paid
167
deduction for income tax purposes and distribution redesignations, were reclassified to the following accounts. These reclassifications had no effect on net assets or net asset value per share (amounts in thousands):
| | | Increase
(Decrease)
Paid-In Capital | | Increase
(Decrease)
Undistributed
Net Investment
Income | | Increase
(Decrease)
Accumulated
Net Realized
Gains (Losses) | |
| Enhanced U.S. Large Company Portfolio | | $ | (14,673 | ) | | $ | 14,691 | | | $ | (18 | ) | |
| U.S. Large Cap Value Portfolio | | | 4,199 | | | | (4,185 | ) | | | (14 | ) | |
| U.S. Targeted Value Portfolio | | | 940 | | | | (958 | ) | | | 18 | | |
| U.S. Small Cap Value Portfolio | | | 1,317,651 | | | | 36,758 | | | | (1,354,409 | ) | |
| T.A. U.S. Core Equity 2 Portfolio | | | (31 | ) | | | 31 | | | | — | | |
| U.S. Small Cap Portfolio | | | 553,289 | | | | 9,195 | | | | (562,484 | ) | |
| U.S. Micro Cap Portfolio | | | 700,277 | | | | 38,521 | | | | (738,798 | ) | |
| DFA Real Estate Securities Portfolio | | | — | | | | (3,305 | ) | | | 3,305 | | |
| Large Cap International Portfolio | | | 15,899 | | | | (1,482 | ) | | | (14,417 | ) | |
| International Core Equity Portfolio | | | 8,889 | | | | (2,295 | ) | | | (6,594 | ) | |
| T.A. World ex U.S. Core Equity Portfolio | | | (29 | ) | | | 35 | | | | (6 | ) | |
| International Small Company Portfolio | | | — | | | | 3,596 | | | | (3,596 | ) | |
| Japanese Small Company Portfolio | | | (623 | ) | | | 96 | | | | 527 | | |
| Asia Pacific Small Company Portfolio | | | — | | | | (76 | ) | | | 76 | | |
| United Kingdom Small Company Portfolio | | | 14 | | | | 71 | | | | (85 | ) | |
| Continental Small Company Portfolio | | | 4 | | | | (3 | ) | | | (1 | ) | |
| DFA International Real Estate Securities Portfolio | | | (5 | ) | | | (516 | ) | | | 521 | | |
| DFA Global Real Estate Securities Portfolio | | | (16 | ) | | | 16 | | | | — | | |
| DFA International Small Cap Value Portfolio | | | 7,876 | | | | (9,622 | ) | | | 1,746 | | |
| International Vector Equity Portfolio | | | (5 | ) | | | (14 | ) | | | 19 | | |
| Emerging Markets Portfolio | | | 7,132 | | | | (6,340 | ) | | | (792 | ) | |
| Emerging Markets Small Cap Portfolio | | | 45 | | | | (1,309 | ) | | | 1,264 | | |
| Emerging Markets Core Equity Portfolio | | | 1,698 | | | | (1,074 | ) | | | (624 | ) | |
| DFA One-Year Fixed Income Portfolio | | | (8,854 | ) | | | 8,854 | | | | — | | |
| DFA Two-Year Global Fixed Income Portfolio | | | (63,279 | ) | | | 62,999 | | | | 280 | | |
| DFA Selectively Hedged Global Fixed Income Portfolio | | | (2,209 | ) | | | (5,238 | ) | | | 7,447 | | |
| DFA Five-Year Global Fixed Income Portfolio | | | (5,349 | ) | | | (15,289 | ) | | | 20,638 | | |
| DFA Inflation-Protected Securities Portfolio | | | (32 | ) | | | 32 | | | | — | | |
| DFA California Short-Term Municipal Bond Portfolio | | | (11 | ) | | | 11 | | | | — | | |
The tax character of dividends and distributions declared and paid during the years ended November 30, 2006, November 30, 2007 and the period December 1, 2007 to October 31, 2008 were as follows (amounts in thousands):
| | | Net Investment
Income
and Short-Term
Capital Gains | |
Long-Term
Capital Gains | |
Total | |
| U.S. Large Company Portfolio | |
| 2006 | | $ | 41,748 | | | | — | | | $ | 41,748 | | |
| 2007 | | | 55,847 | | | | — | | | | 55,847 | | |
| 2008 | | | 67,060 | | | | — | | | | 67,060 | | |
| Enhanced U.S. Large Company Portfolio | |
| 2006 | | | 5,651 | | | | — | | | | 5,651 | | |
| 2007 | | | 23,020 | | | $ | 1,991 | | | | 25,011 | | |
| 2008 | | | 15,756 | | | | 17,593 | | | | 33,349 | | |
| U.S. Large Cap Value Portfolio | |
| 2006 | | | 83,776 | | | | 5,642 | | | | 89,418 | | |
| 2007 | | | 105,066 | | | | 146,660 | | | | 251,726 | | |
| 2008 | | | 118,438 | | | | 315,456 | | | | 433,894 | | |
168
| | | Net Investment
Income
and Short-Term
Capital Gains | |
Long-Term
Capital Gains | |
Total | |
| U.S. Targeted Value Portfolio | |
| 2006 | | $ | 7,089 | | | $ | 10,659 | | | $ | 17,748 | | |
| 2007 | | | 9,597 | | | | 12,911 | | | | 22,508 | | |
| 2008 | | | 9,084 | | | | 14,001 | | | | 23,085 | | |
| U.S. Small Cap Value Portfolio | |
| 2006 | | | 99,305 | | | | 537,712 | | | | 637,017 | | |
| 2007 | | | 168,338 | | | | 643,084 | | | | 811,422 | | |
| 2008 | | | 73,038 | | | | 747,955 | | | | 820,993 | | |
| U.S. Core Equity 1 Portfolio | |
| 2006 | | | 5,968 | | | | — | | | | 5,968 | | |
| 2007 | | | 15,517 | | | | 1,000 | | | | 16,517 | | |
| 2008 | | | 22,927 | | | | — | | | | 22,927 | | |
| U.S. Core Equity 2 Portfolio | |
| 2006 | | | 9,408 | | | | — | | | | 9,408 | | |
| 2007 | | | 36,180 | | | | 1,451 | | | | 37,631 | | |
| 2008 | | | 48,004 | | | | — | | | | 48,004 | | |
| U.S. Vector Equity Portfolio | |
| 2006 | | | 1,296 | | | | — | | | | 1,296 | | |
| 2007 | | | 13,979 | | | | — | | | | 13,979 | | |
| 2008 | | | 14,964 | | | | — | | | | 14,964 | | |
| T.A. U.S. Core Equity 2 Portfolio | |
| 2007 | | | — | | | | — | | | | — | | |
| 2008 | | | 4,648 | | | | — | | | | 4,648 | | |
| U.S. Small Cap Portfolio | |
| 2006 | | | 49,510 | | | | 117,599 | | | | 167,109 | | |
| 2007 | | | 70,394 | | | | 144,164 | | | | 214,558 | | |
| 2008 | | | 35,218 | | | | 173,651 | | | | 208,869 | | |
| U.S. Micro Cap Portfolio | |
| 2006 | | | 97,962 | | | | 222,188 | | | | 320,150 | | |
| 2007 | | | 109,408 | | | | 344,357 | | | | 453,765 | | |
| 2008 | | | 82,937 | | | | 350,692 | | | | 433,629 | | |
| DFA Real Estate Securities Portfolio | |
| 2006 | | | 59,687 | | | | 48,370 | | | | 108,057 | | |
| 2007 | | | 65,631 | | | | 77,963 | | | | 143,594 | | |
| 2008 | | | 34,694 | | | | 200,903 | | | | 235,597 | | |
| Large Cap International Portfolio | |
| 2006 | | | 40,702 | | | | — | | | | 40,702 | | |
| 2007 | | | 52,781 | | | | 909 | | | | 53,690 | | |
| 2008 | | | 54,328 | | | | 28,913 | | | | 83,241 | | |
| International Core Equity Portfolio | |
| 2006 | | | 9,763 | | | | — | | | | 9,763 | | |
| 2007 | | | 40,770 | | | | 205 | | | | 40,975 | | |
| 2008 | | | 85,639 | | | | 17,053 | | | | 102,692 | | |
169
| | | Net Investment
Income
and Short-Term
Capital Gains | |
Long-Term
Capital Gains | |
Total | |
| T.A. World ex U.S. Core Equity Portfolio | |
| 2008 | | $ | 1,192 | | | | — | | | $ | 1,192 | | |
| International Small Company Portfolio | |
| 2006 | | | 90,178 | | | $ | 123,568 | | | | 213,746 | | |
| 2007 | | | 147,606 | | | | 139,397 | | | | 287,003 | | |
| 2008 | | | 167,345 | | | | 279,890 | | | | 447,235 | | |
| Japanese Small Company Portfolio | |
| 2006 | | | 2,258 | | | | — | | | | 2,258 | | |
| 2007 | | | 2,759 | | | | — | | | | 2,759 | | |
| 2008 | | | 3,574 | | | | — | | | | 3,574 | | |
| Asia Pacific Small Company Portfolio | |
| 2006 | | | 1,662 | | | | — | | | | 1,662 | | |
| 2007 | | | 3,089 | | | | — | | | | 3,089 | | |
| 2008 | | | 4,433 | | | | — | | | | 4,433 | | |
| | | Net Investment
Income
and Short-Term
Capital Gains | | Long-Term
Capital Gains | | Return of
Capital | | Total | |
| United Kingdom Small Company Portfolio | |
| 2006 | | $ | 799 | | | $ | 888 | | | | — | | | $ | 1,687 | | |
| 2007 | | | 1,360 | | | | 1,153 | | | | — | | | | 2,513 | | |
| 2008 | | | 1,227 | | | | 1,311 | | | $ | 19 | | | | 2,557 | | |
| Continental Small Company Portfolio | |
| 2006 | | | 1,559 | | | | 5,185 | | | | — | | | | 6,744 | | |
| 2007 | | | 3,386 | | | | 2,271 | | | | — | | | | 5,657 | | |
| 2008 | | | 4,326 | | | | 6,764 | | | | 97 | | | | 11,187 | | |
| DFA International Real Estate Securities Portfolio | |
| 2006 | | | — | | | | — | | | | — | | | | — | | |
| 2007 | | | 2,768 | | | | — | | | | — | | | | 2,768 | | |
| 2008 | | | 19,791 | | | | — | | | | — | | | | 19,791 | | |
| DFA Global Real Estate Securities Portfolio | |
| 2008 | | | — | | | | — | | | | — | | | | — | | |
| DFA International Small Cap Value Portfolio | |
| 2006 | | | 132,360 | | | | 176,381 | | | | — | | | | 308,741 | | |
| 2007 | | | 218,066 | | | | 401,394 | | | | — | | | | 619,460 | | |
| 2008 | | | 318,023 | | | | 534,468 | | | | — | | | | 852,491 | | |
| International Vector Equity Portfolio | |
| 2008 | | | — | | | | — | | | | — | | | | — | | |
| Emerging Markets Portfolio | |
| 2006 | | | 55,765 | | | | 587 | | | | — | | | | 56,352 | | |
| 2007 | | | 54,872 | | | | 23,352 | | | | — | | | | 78,224 | | |
| 2008 | | | 70,205 | | | | 128,306 | | | | — | | | | 198,511 | | |
170
| | | Net Investment
Income
and Short-Term
Capital Gains | | Long-Term
Capital Gains | | Return of
Capital | | Total | |
| Emerging Markets Small Cap Portfolio | |
| 2006 | | $ | 15,659 | | | $ | 11,803 | | | | — | | | $ | 27,462 | | |
| 2007 | | | 21,595 | | | | 53,499 | | | | — | | | | 75,094 | | |
| 2008 | | | 32,090 | | | | 83,686 | | | | — | | | | 115,776 | | |
| Emerging Markets Core Equity Portfolio | |
| 2006 | | | 9,153 | | | | 83 | | | | — | | | | 9,236 | | |
| 2007 | | | 26,413 | | | | 1,966 | | | | — | | | | 28,379 | | |
| 2008 | | | 42,769 | | | | 5,265 | | | $ | 204 | | | | 48,238 | | |
| DFA One-Year Fixed Income Portfolio | |
| 2006 | | | 88,029 | | | | — | | | | — | | | | 88,029 | | |
| 2007 | | | 149,471 | | | | — | | | | — | | | | 149,471 | | |
| 2008 | | | 102,391 | | | | — | | | | — | | | | 102,391 | | |
| DFA Two-Year Global Fixed Income Portfolio | |
| 2006 | | | 28,485 | | | | — | | | | — | | | | 28,485 | | |
| 2007 | | | 78,938 | | | | — | | | | — | | | | 78,938 | | |
| 2008 | | | 99,528 | | | | 296 | | | | — | | | | 99,824 | | |
| DFA Selectively Hedged Global Fixed Income Portfolio | |
| 2008 | | | — | | | | — | | | | 68 | | | | 68 | | |
| DFA Five-Year Government Portfolio | |
| 2006 | | | 34,242 | | | | — | | | | — | | | | 34,242 | | |
| 2007 | | | 49,378 | | | | — | | | | — | | | | 49,378 | | |
| 2008 | | | 38,626 | | | | — | | | | — | | | | 38,626 | | |
| DFA Five-Year Global Fixed Income Portfolio | |
| 2006 | | | 54,715 | | | | — | | | | 4,812 | | | | 59,527 | | |
| 2007 | | | 60,967 | | | | — | | | | — | | | | 60,967 | | |
| 2008 | | | 96,473 | | | | — | | | | 5,349 | | | | 101,822 | | |
| DFA Intermediate Government Fixed Income Portfolio | |
| 2006 | | | 25,823 | | | | 2,647 | | | | — | | | | 28,470 | | |
| 2007 | | | 46,222 | | | | 310 | | | | — | | | | 46,532 | | |
| 2008 | | | 59,933 | | | | 112 | | | | — | | | | 60,045 | | |
| DFA Inflation-Protected Securities Portfolio | |
| 2006 | | | — | | | | — | | | | — | | | | — | | |
| 2007 | | | 2,996 | | | | — | | | | — | | | | 2,996 | | |
| 2008 | | | 19,588 | | | | — | | | | — | | | | 19,588 | | |
| DFA Short-Term Municipal Bond Portfolio | |
| 2006 | | | 16,050 | | | | — | | | | — | | | | 16,050 | | |
| 2007 | | | 24,969 | | | | — | | | | — | | | | 24,969 | | |
| 2008 | | | 18,834 | | | | — | | | | — | | | | 18,834 | | |
| DFA California Short-Term Municipal Bond Portfolio | |
| 2007 | | | 1,116 | | | | — | | | | — | | | | 1,116 | | |
| 2008 | | | 3,577 | | | | — | | | | — | | | | 3,577 | | |
171
At October 31, 2008, the following net investment income and short-term capital gains and long-term capital gains distributions designated for federal income tax purposes are due to the utilization of accumulated earnings and profits distributed to shareholders upon redemption of shares (amounts in thousands):
| | | Net Investment
Income
and Short-Term
Capital Gains | | Long-Term
Capital Gains | | Total | |
| U.S. Large Cap Value Portfolio | | $ | 4,198 | | | | — | | | $ | 4,198 | | |
| U.S. Targeted Value Portfolio | | | 939 | | | | — | | | | 939 | | |
| Large Cap International Portfolio | | | 881 | | | | — | | | | 881 | | |
| International Core Equity Portfolio | | | 1,299 | | | | — | | | | 1,299 | | |
| DFA International Real Estate Securities Portfolio | | | 8 | | | | — | | | | 8 | | |
| DFA International Small Cap Value Portfolio | | | 7,029 | | | $ | 846 | | | | 7,875 | | |
| Emerging Markets Portfolio | | | 5,434 | | | | 1,698 | | | | 7,132 | | |
| Emerging Markets Small Cap Portfolio | | | 45 | | | | — | | | | 45 | | |
At October 31, 2008, the components of distributable earnings (accumulated losses) were as follows (amounts in thousands):
| | | Undistributed
Net Investment
Income and
Short-Term
Capital Gains | | Undistributed
Long-Term
Capital Gains | | Capital
Loss
Carryforward | | Total Net
Distributable
Earnings
(Accumulated
Losses) | |
| U.S. Large Company Portfolio | | $ | 10,911 | | | | — | | | $ | (129,796 | ) | | $ | (118,885 | ) | |
| Enhanced U.S. Large Company Portfolio | | | 17,552 | | | | — | | | | (116,138 | )* | | | (98,586 | ) | |
| U.S. Large Cap Value Portfolio | | | 30,999 | | | | — | | | | — | | | | 30,999 | | |
| U.S. Targeted Value Portfolio | | | 2,111 | | | | — | | | | (998 | ) | | | 1,113 | | |
| U.S. Small Cap Value Portfolio | | | 32,013 | | | | — | | | | (371,019 | ) | | | (339,006 | ) | |
| U.S. Core Equity 1 Portfolio | | | 280 | | | | — | | | | (21,910 | ) | | | (21,630 | ) | |
| U.S. Core Equity 2 Portfolio | | | 443 | | | | — | | | | (57,743 | ) | | | (57,300 | ) | |
| U.S. Vector Equity Portfolio | | | 3,652 | | | | — | | | | (14,463 | ) | | | (10,811 | ) | |
| T.A. U.S. Core Equity 2 Portfolio | | | 1,833 | | | | — | | | | (7,282 | ) | | | (5,449 | ) | |
| U.S. Small Cap Portfolio | | | 7,870 | | | | — | | | | (380,119 | ) | | | (372,249 | ) | |
| U.S. Micro Cap Portfolio | | | 36,230 | | | | — | | | | (453,532 | ) | | | (417,302 | ) | |
| DFA Real Estate Securities Portfolio | | | 34,249 | | | | — | | | | (70,758 | ) | | | (36,509 | ) | |
| Large Cap International Portfolio | | | 2,829 | | | | — | | | | (19,004 | ) | | | (16,175 | ) | |
| International Core Equity Portfolio | | | 563 | | | | — | | | | (10,739 | ) | | | (10,176 | ) | |
| T.A. World ex U.S. Core Equity Portfolio | | | 1,016 | | | | — | | | | (2,250 | ) | | | (1,234 | ) | |
| International Small Company Portfolio | | | 13,366 | | | | — | | | | (125,946 | ) | | | (112,580 | ) | |
| Japanese Small Company Portfolio | | | 1,084 | | | | — | | | | (68,241 | ) | | | (67,157 | ) | |
| Asia Pacific Small Company Portfolio | | | 1,077 | | | | — | | | | (30,387 | ) | | | (29,310 | ) | |
| United Kingdom Small Company Portfolio | | | — | | | | — | | | | (931 | ) | | | (931 | ) | |
| Continental Small Company Portfolio | | | — | | | | — | | | | (16,513 | ) | | | (16,513 | ) | |
| DFA International Real Estate Securities Portfolio | | | 5,091 | | | | — | | | | (13,492 | ) | | | (8,401 | ) | |
| DFA Global Real Estate Securities Portfolio | | | 13 | | | | — | | | | — | | | | 13 | | |
| DFA International Small Cap Value Portfolio | | | 13,995 | | | $ | 25,188 | | | | — | | | | 39,183 | | |
| International Vector Equity Portfolio | | | 232 | | | | — | | | | (27 | ) | | | 205 | | |
| Emerging Markets Portfolio | | | 5,867 | | | | 20,944 | | | | — | | | | 26,811 | | |
| Emerging Markets Small Cap Portfolio | | | 3,552 | | | | — | | | | (21,881 | ) | | | (18,329 | ) | |
| Emerging Markets Core Equity Portfolio | | | — | | | | — | | | | (62,950 | ) | | | (62,950 | ) | |
| DFA One-Year Fixed Income Portfolio | | | 9,752 | | | | — | | | | (13,882 | ) | | | (4,130 | ) | |
| DFA Two-Year Global Fixed Income Portfolio | | | 84,596 | | | | — | | | | (22,911 | ) | | | 61,685 | | |
DFA Selectively Hedged Global Fixed Income
Portfolio | | | — | | | | — | | | | — | | | | — | | |
| DFA Five-Year Government Portfolio | | | 5,156 | | | | — | | | | (19,566 | ) | | | (14,410 | ) | |
| DFA Five-Year Global Fixed Income Portfolio | | | — | | | | — | | | | (37,996 | ) | | | (37,996 | ) | |
172
| | | Undistributed
Net Investment
Income and
Short-Term
Capital Gains | | Undistributed
Long-Term
Capital Gains | | Capital
Loss
Carryforward | | Total Net
Distributable
Earnings
(Accumulated
Losses) | |
| DFA Intermediate Government Fixed Income Portfolio | | $ | 10,404 | | | $ | 6,294 | | | | — | | | $ | 16,698 | | |
| DFA Inflation-Protected Securities Portfolio | | | 4,009 | | | | 364 | | | | — | | | | 4,373 | | |
| DFA Short-Term Municipal Bond Portfolio | | | 2,185 | | | | — | | | $ | (17 | ) | | | 2,168 | | |
| DFA California Short-Term Municipal Bond Portfolio | | | 442 | | | | — | | | | (23 | ) | | | 419 | | |
For federal income tax purposes, the Fund measures its capital loss carryforwards annually at October 31, its fiscal year end. Capital loss carryforwards may be carried forward and applied against future capital gains. As of October 31, 2008, the following Portfolios had capital loss carryforwards available to offset future realized capital gains through the indicated expiration dates (amounts in thousands):
| | | 2009 | | 2010 | | 2011 | | 2012 | | 2013 | | 2014 | | 2015 | | 2016 | | Total | |
| U.S. Large Company Portfolio | | | — | | | | — | | | $ | 27,798 | | | | — | | | $ | 5,485 | | | $ | 8,867 | | | | — | | | $ | 87,646 | | | $ | 129,796 | | |
| Enhanced U.S. Large Company Portfolio | | | — | | | | — | | | | — | | | | — | | | | — | | | | — | | | | — | | | | 116,138 | * | | | 116,138 | * | |
| U.S. Targeted Value Portfolio | | | — | | | | — | | | | — | | | | — | | | | — | | | | — | | | | — | | | | 998 | | | | 998 | | |
| U.S. Small Cap Value Portfolio | | | — | | | | — | | | | — | | | | — | | | | — | | | | — | | | | — | | | | 371,019 | | | | 371,019 | | |
| U.S. Core Equity 1 Portfolio | | | — | | | | — | | | | — | | | | — | | | | — | | | | — | | | $ | 3,266 | | | | 18,644 | | | | 21,910 | | |
| U.S. Core Equity 2 Portfolio | | | — | | | | — | | | | — | | | | — | | | | — | | | | — | | | | 15,562 | | | | 42,181 | | | | 57,743 | | |
| U.S. Vector Equity Portfolio | | | — | | | | — | | | | — | | | | — | | | | — | | | | — | | | | 1,759 | | | | 12,704 | | | | 14,463 | | |
| T.A. U.S. Core Equity 2 Portfolio | | | — | | | | — | | | | — | | | | — | | | | — | | | | — | | | | 310 | | | | 6,972 | | | | 7,282 | | |
| U.S. Small Cap Portfolio | | | — | | | | — | | | | — | | | | — | | | | — | | | | — | | | | — | | | | 380,119 | | | | 380,119 | | |
| U.S. Micro Cap Portfolio | | | — | | | | — | | | | — | | | | — | | | | — | | | | — | | | | — | | | | 453,532 | | | | 453,532 | | |
| DFA Real Estate Securities Portfolio | | | — | | | | — | | | | — | | | | — | | | | — | | | | — | | | | — | | | | 70,758 | | | | 70,758 | | |
| Large Cap International Portfolio | | | — | | | | — | | | | — | | | | — | | | | — | | | | — | | | | — | | | | 19,004 | | | | 19,004 | | |
| International Core Equity Portfolio | | | — | | | | — | | | | — | | | | — | | | | — | | | | — | | | | — | | | | 10,739 | | | | 10,739 | | |
| T.A. World ex U.S. Core Equity Portfolio | | | — | | | | — | | | | — | | | | — | | | | — | | | | — | | | | — | | | | 2,250 | | | | 2,250 | | |
| International Small Company Portfolio | | | — | | | | — | | | | — | | | | — | | | | — | | | | — | | | | — | | | | 125,946 | | | | 125,946 | | |
| Japanese Small Company Portfolio | | $ | 3,508 | | | $ | 4,453 | | | | 19,912 | | | $ | 3,801 | | | | 3,055 | | | | 2,451 | | | | 8,004 | | | | 23,057 | | | | 68,241 | | |
| Asia Pacific Small Company Portfolio | | | — | | | | — | | | | 5,837 | | | | 1,150 | | | | 907 | | | | 864 | | | | — | | | | 21,629 | | | | 30,387 | | |
| United Kingdom Small Company Portfolio | | | — | | | | — | | | | — | | | | — | | | | — | | | | — | | | | — | | | | 931 | | | | 931 | | |
| Continental Small Company Portfolio | | | — | | | | — | | | | — | | | | — | | | | — | | | | — | | | | — | | | | 16,513 | | | | 16,513 | | |
| DFA International Real Estate Securities Portfolio | | | — | | | | — | | | | — | | | | — | | | | — | | | | — | | | | 46 | | | | 13,446 | | | | 13,492 | | |
| International Vector Equity Portfolio | | | — | | | | — | | | | — | | | | — | | | | — | | | | — | | | | — | | | | 27 | | | | 27 | | |
| Emerging Markets Small Cap Portfolio | | | — | | | | — | | | | — | | | | — | | | | — | | | | — | | | | — | | | | 21,881 | | | | 21,881 | | |
| Emerging Markets Core Equity Portfolio | | | — | | | | — | | | | — | | | | — | | | | — | | | | — | | | | — | | | | 62,950 | | | | 62,950 | | |
| DFA One-Year Fixed Income Portfolio | | | — | | | | — | | | | — | | | | 1,119 | | | | 4,660 | | | | — | | | | 6,830 | | | | 1,273 | | | | 13,882 | | |
| DFA Two-Year Global Fixed Income Portfolio | | | — | | | | — | | | | — | | | | 3,018 | | | | 10,707 | | | | 8,622 | | | | — | | | | 564 | | | | 22,911 | | |
| DFA Five-Year Government Portfolio | | | — | | | | — | | | | — | | | | — | | | | 4,975 | | | | 14,591 | | | | — | | | | — | | | | 19,566 | | |
| DFA Five-Year Global Fixed Income Portfolio | | | — | | | | — | | | | — | | | | 4,667 | | | | 12,384 | | | | 15,882 | | | | — | | | | 5,063 | | | | 37,996 | | |
| DFA Short-Term Municipal Bond Portfolio | | | — | | | | — | | | | — | | | | 17 | | | | — | | | | — | | | | — | | | | — | | | | 17 | | |
| DFA California Short-Term Municipal Bond Portfolio | | | — | | | | — | | | | — | | | | — | | | | — | | | | — | | | | 4 | | | | 19 | | | | 23 | | |
* As a result of The Enhanced U.S. Large Company Series "Check the Box" election on 11/1/2008, a $116,138,144 capital loss carryover was transferred to the Enhanced U.S. Large Company Portfolio. Per limitations within Internal Revenue Code Section 381(c)(3), the Portfolio will not be able to apply any of this until the tax year ended 10/31/2009 or the first taxable year ending after the date of the transfer. Any unused portion of the loss will expire in 2016.
During the period ended October 31, 2008, the following Portfolio utilized capital loss carryforwards to offset realized capital gains for federal income tax purposes (amounts in thousands):
| DFA Five-Year Government Portfolio | | $ | 2,704 | | |
For the period ended October 31, 2008, the Japanese Small Company Portfolio had capital loss carryforward expirations of $632 (in thousands).
Some of the Portfolios' investments and investments held by the Master Funds are in securities considered to be "passive foreign investment companies" for which any unrealized appreciation (depreciation) (mark to market) and/or realized gains are required to be included in distributable net investment income for federal income tax purposes. At October 31, 2008, the following Portfolios had cumulative unrealized appreciation (depreciation)
173
(mark to market) to be included in distributable net investment income for federal tax purposes. For the period December 1, 2007 to October 31, 2008, realized gains on the sale of passive foreign investment companies have been reclassified from accumulated net realized gains to accumulated net investment income for federal tax purposes. Amounts listed below are in thousands.
| | | Mark to Market | | Realized Gains | |
| Large Cap International Portfolio | | $ | 2,082 | | | $ | 15 | | |
| International Core Equity Portfolio | | | 74 | | | | 30 | | |
| T.A. World ex U.S. Core Equity Portfolio | | | — | | | | — | | |
| International Small Company Portfolio | | | 4,396 | | | | 4,189 | | |
| Japanese Small Company Portfolio | | | 117 | | | | 142 | | |
| Asia Pacific Small Company Portfolio | | | 664 | | | | — | | |
| United Kingdom Small Company Portfolio | | | 41 | | | | 147 | | |
| Continental Small Company Portfolio | | | — | | | | 2 | | |
| DFA International Real Estate Securities Portfolio | | | 980 | | | | — | | |
| DFA International Small Cap Value Portfolio | | | 13,204 | | | | — | | |
| Emerging Markets Portfolio | | | — | | | | — | | |
| Emerging Markets Small Cap Portfolio | | | 85 | | | | — | | |
| Emerging Markets Core Equity Portfolio | | | — | | | | 4 | | |
At October 31, 2008, the total cost and aggregate gross unrealized appreciation and (depreciation) of securities for federal income tax purposes were different from amounts reported for financial reporting purposes (amounts in thousands):
| | | Federal
Tax Cost | | Unrealized
Appreciation | | Unrealized
(Depreciation) | | Net
Unrealized
Appreciation
(Depreciation) | |
| U.S. Large Company Portfolio | | $ | 2,968,522 | | | $ | 174,688 | | | $ | (597,988 | ) | | $ | (423,300 | ) | |
| Enhanced U.S. Large Company Portfolio | | | 199,118 | | | | — | | | | (847 | ) | | | (847 | ) | |
| U.S. Large Cap Value Portfolio | | | 7,351,627 | | | | — | | | | (2,020,287 | ) | | | (2,020,287 | ) | |
| U.S. Targeted Value Portfolio | | | 1,423,657 | | | | 25,538 | | | | (369,693 | ) | | | (344,155 | ) | |
| U.S. Small Cap Value Portfolio | | | 6,914,394 | | | | 491,296 | | | | (1,923,659 | ) | | | (1,432,363 | ) | |
| U.S. Core Equity 1 Portfolio | | | 2,069,956 | | | | 31,426 | | | | (514,761 | ) | | | (483,335 | ) | |
| U.S. Core Equity 2 Portfolio | | | 4,018,970 | | | | 72,791 | | | | (1,113,612 | ) | | | (1,040,821 | ) | |
| U.S. Vector Equity Portfolio | | | 1,441,282 | | | | 28,840 | | | | (435,979 | ) | | | (407,139 | ) | |
| T.A. U.S. Core Equity 2 Portfolio | | | 830,565 | | | | 9,148 | | | | (190,257 | ) | | | (181,109 | ) | |
| U.S. Small Cap Portfolio | | | 2,413,619 | | | | 226,160 | | | | (564,608 | ) | | | (338,448 | ) | |
| U.S. Micro Cap Portfolio | | | 3,317,977 | | | | 524,174 | | | | (918,987 | ) | | | (394,813 | ) | |
| DFA Real Estate Securities Portfolio | | | 2,711,758 | | | | 131,561 | | | | (634,180 | ) | | | (502,619 | ) | |
| Large Cap International Portfolio | | | 1,635,446 | | | | 115,579 | | | | (403,077 | ) | | | (287,498 | ) | |
| International Core Equity Portfolio | | | 3,602,731 | | | | 27,637 | | | | (1,308,483 | ) | | | (1,280,846 | ) | |
| T.A. World ex U.S. Core Equity Portfolio | | | 345,399 | | | | 1,546 | | | | (89,292 | ) | | | (87,746 | ) | |
| International Small Company Portfolio | | | 4,398,350 | | | | 173,738 | | | | (1,484,960 | ) | | | (1,311,222 | ) | |
| Japanese Small Company Portfolio | | | 260,231 | | | | 41,157 | | | | (167,908 | ) | | | (126,751 | ) | |
| Asia Pacific Small Company Portfolio | | | 109,611 | | | | 35,693 | | | | (81,347 | ) | | | (45,654 | ) | |
| United Kingdom Small Company Portfolio | | | 38,182 | | | | 16,871 | | | | (29,154 | ) | | | (12,283 | ) | |
| Continental Small Company Portfolio | | | 133,809 | | | | 42,755 | | | | (82,538 | ) | | | (39,783 | ) | |
| DFA International Real Estate Securities Portfolio | | | 896,506 | | | | 72 | | | | (390,608 | ) | | | (390,536 | ) | |
| DFA Global Real Estate Securities Portfolio | | | 125,816 | | | | — | | | | (34,953 | ) | | | (34,953 | ) | |
| DFA International Small Cap Value Portfolio | | | 8,113,396 | | | | 302,755 | | | | (2,866,461 | ) | | | (2,563,706 | ) | |
| International Vector Equity Portfolio | | | 89,321 | | | | 692 | | | | (17,577 | ) | | | (16,885 | ) | |
| Emerging Markets Portfolio | | | 1,145,368 | | | | 502,115 | | | | (139,543 | ) | | | 362,572 | | |
| Emerging Markets Small Cap Portfolio | | | 790,782 | | | | 17,626 | | | | (260,871 | ) | | | (243,245 | ) | |
174
| | | Federal
Tax Cost | | Unrealized
Appreciation | | Unrealized
(Depreciation) | | Net
Unrealized
Appreciation
(Depreciation) | |
| Emerging Markets Core Equity Portfolio | | $ | 1,905,091 | | | $ | 50,619 | | | $ | (584,276 | ) | | $ | (533,657 | ) | |
| DFA One-Year Fixed Income Portfolio | | | 3,205,402 | | | | — | | | | (11,362 | ) | | | (11,362 | ) | |
| DFA Two-Year Global Fixed Income Portfolio | | | 3,080,276 | | | | 44,355 | | | | — | | | | 44,355 | | |
| DFA Selectively Hedged Global Fixed Income Portfolio | | | 231,706 | | | | — | | | | (28,767 | ) | | | (28,767 | ) | |
| DFA Five-Year Government Portfolio | | | 1,099,253 | | | | 11,516 | | | | (6,246 | ) | | | 5,270 | | |
| DFA Five-Year Global Fixed Income Portfolio | | | 3,187,150 | | | | 170,078 | | | | (74,988 | ) | | | 95,090 | | |
DFA Intermediate Government Fixed Income
Portfolio | | | 1,198,955 | | | | 40,231 | | | | (9,155 | ) | | | 31,076 | | |
| DFA Inflation-Protected Securities Portfolio | | | 416,951 | | | | — | | | | (47,631 | ) | | | (47,631 | ) | |
| DFA Short-Term Municipal Bond Portfolio | | | 988,646 | | | | 1,398 | | | | (6,009 | ) | | | (4,611 | ) | |
| DFA California Short-Term Municipal Bond Portfolio | | | 179,433 | | | | 317 | | | | (1,366 | ) | | | (1,049 | ) | |
In June 2006, the Financial Accounting Standards Board (FASB) issued FASB Interpretation 48 ("FIN 48"), "Accounting for Uncertainty in Income Taxes." This standard defines the threshold for recognizing the benefits of tax-return positions in the financial statements as "more-likely-than-not" to be sustained by the taxing authority and requires measurement of a tax position meeting the more-likely-than-not criterion, based on the largest benefit that is more than 50 percent likely to be realized. Management has analyzed the Portfolios' tax positions to be taken on the federal income tax returns for all open tax years (tax years ended November 30, 2005 through the period ended October 31, 2008, depending on the Portfolios' inception date), for purposes of implementing FIN 48, and has concluded that no provision for income tax is required in the Portfolios' financial statements.
For the Portfolios that adopted the provisions of FIN 48 during the fiscal year ended November 30, 2007, management has analyzed the Portfolios' tax positions taken on federal income tax returns for all open tax years (tax years ended November 30, 2005 through the period ended October 31, 2008), for purposes of implementing FIN 48, and has concluded that no provision for income tax is required in the Portfolios' financial statements. Management is not aware of any events that are reasonably possible to occur in the next twelve months that would result in the amount of any unrecognized tax benefits significantly increasing or decreasing for any of the Portfolios.
On October 22, 2008, The U.S. Micro Cap Series and The U.S. Small Cap Value Series and on October 25, 2008 The U.S. Small Cap Series, each a master fund in a RIC/RIC master feeder structure each with a RIC feeder ("the Portfolios"), having 100% investment in their respective master fund, have each made a "Check-the-box" election for federal income tax purposes pursuant to Treasury Regulation § 301.7701-3, to change their federal entity classifications from a corporation taxable as a regulated investment company to a disregarded entity. As a result of this election for tax purposes, each master fund is deemed to have liquidated and distributed all of its assets and liabilities to its owners, the respective portfolios (the RIC feeders), with the respective portfolios deemed the surviving entities. The final tax year end of the Master Funds was October 21, 2008 for The U.S. Micro Cap Series and The U.S. Small Cap Value Series and October 2 4, 2008 for The U.S. Small Cap Series. For Federal income tax purposes, pursuant to Code §337(a), each of the master funds recognizes no gain or loss and, pursuant to Code §332(a), each of the Portfolios recognizes no gain or loss on the deemed liquidation. However, pursuant to IRC §332 (c), each of the aforementioned Portfolios has recognized the master fund's deemed dividend, which was distributed as part of the deemed liquidating distribution, as taxable income.
Pursuant to Code §§ 334(b)(1) and 1223, each of the Portfolios will maintain each respective master fund's holding period and tax basis in the assets deemed transferred to the respective Portfolio.
175
Each aforementioned master fund had book/tax differences upon its deemed liquidation. The following summary of permanent differences occurred as of the respective effective "Check the Box" election date (amounts in thousands).
| | | Increase
(Decrease)
Paid-In
Capital | | Unrealized
Appreciation
(Depreciation)
Investment
Securities | | Increase
(Decrease)
Undistributed
Net Investment
Income | | Increase
(Decrease)
Accumulated
Net Realized
Gains (Losses) | |
| The U.S. Micro Cap Series | | $ | (1,265,661 | ) | | $ | 1,255,055 | | | $ | 59 | | | $ | 10,547 | | |
| The U.S. Small Cap Value Series | | | (3,245,134 | ) | | | 3,217,140 | | | | 113 | | | | 27,881 | | |
| The U.S. Small Cap Series | | | (1,198,194 | ) | | | 1,190,062 | | | | 42 | | | | 8,090 | | |
Each of the Portfolios impacted by the "Check the Box" election will also have permanent book/tax differences resulting from the transaction. Listed below are those permanent differences impacting each respective Portfolio. These permanent differences for each portfolio and their respective master fund include items, such as, the reversal of the portfolio's cumulative deferred wash sale losses relative to trades in the master fund and the transfer of the master fund's deferred wash sale losses to the portfolio, the recording of the master fund's and the reversal of the portfolio's unrealized appreciation/depreciation on investment securities, and the transfer of the master fund's cumulative deferred officers' compensation. For financial statement purposes, these adjustments did not result in any changes to each respective fund's net assets or net asset value per share (amounts in thousands).
| | | Increase
(Decrease)
Paid-In
Capital | | Unrealized
Appreciation
(Depreciation)
Investment
Securities | | Increase
(Decrease)
Undistributed
Net Investment
Income | | Increase
(Decrease)
Accumulated
Net Realized
Gains (Losses) | |
| U.S. Micro Cap Portfolio | | $ | (658,120 | ) | | $ | 473,720 | | | $ | (102 | ) | | $ | 184,502 | | |
| U.S. Small Cap Value Portfolio | | | (1,345,309 | ) | | | 1,000,380 | | | | (200 | ) | | | 345,129 | | |
| U.S. Small Cap Portfolio | | | (409,380 | ) | | | 270,782 | | | | (77 | ) | | | 138,675 | | |
For financial reporting purposes, this transaction had no impact on the net assets of the respective funds.
G. Capital Share Transactions:
The capital share transactions by class were as follows (amounts in thousands):
| | | Period
Dec. 1, 2007
to
Oct. 31, 2008 | | Year
Ended
Nov. 30, 2007 | |
| U.S. Targeted Value Portfolio | | Amount | | Shares | | Amount | | Shares | |
| Class R1 Shares* | |
| Shares Issued | | $ | 41,494 | | | | 4,172 | | | | N/A | | | | N/A | | |
| Shares Issued in Lieu of Cash Distributions | | | 351 | | | | 36 | | | | N/A | | | | N/A | | |
| Shares Redeemed | | | (7,142 | ) | | | (761 | ) | | | N/A | | | | N/A | | |
| Net Increase (Decrease)—Class R1 Shares | | $ | 34,703 | | | | 3,447 | | | | N/A | | | | N/A | | |
176
| | | Period
Dec. 1, 2007
to
Oct. 31, 2008 | | Year
Ended
Nov. 30, 2007 | |
| U.S. Targeted Value Portfolio | | Amount | | Shares | | Amount | | Shares | |
| Class R2 Shares** | |
| Shares Issued | | $ | 3,032 | | | | 306 | | | | N/A | | | | N/A | | |
| Shares Issued in Lieu of Cash Distributions | | | 10 | | | | 1 | | | | N/A | | | | N/A | | |
| Shares Redeemed | | | (799 | ) | | | (88 | ) | | | N/A | | | | N/A | | |
| Net Increase (Decrease)—Class R2 Shares | | $ | 2,243 | | | | 219 | | | | N/A | | | | N/A | | |
| Institutional Class Shares | |
| Shares Issued | | $ | 930,939 | | | | 66,970 | | | $ | 500,717 | | | | 28,579 | | |
| Shares Issued in Lieu of Cash Distributions | | | 20,933 | | | | 1,410 | | | | 18,152 | | | | 1,060 | | |
| Shares Redeemed | | | (327,204 | ) | | | (24,350 | ) | | | (110,437 | ) | | | (6,247 | ) | |
| Net Increase (Decrease)—Institutional Class Shares | | $ | 624,668 | | | | 44,030 | | | $ | 408,432 | | | | 23,392 | | |
* Class R1 Shares commenced operations on January 31, 2008.
** Class R2 Shares commenced operations on June 30, 2008.
H. Financial Instruments:
In accordance with the Portfolios' investment objectives and policies, the Portfolios may invest, either directly or indirectly through their investment in a corresponding Master Fund, in certain financial instruments that have off-balance sheet risk in excess of the amounts recognized in the financial statements and concentrations of credit risk. These instruments and their significant corresponding risks are described below:
1. Repurchase Agreements: The Portfolios may purchase money market instruments subject to the counterparty's agreement to repurchase them at an agreed upon date and price. The counterparty will be required on a daily basis to maintain the value of the collateral subject to the agreement at not less than the repurchase price (including accrued interest). The agreements are conditioned upon the collateral being deposited under the Federal Reserve book-entry system with the Fund's custodian or a third party sub-custodian. In the event of default or bankruptcy by the other party to the agreement, retention of the collateral may be subject to legal proceedings. All open repurchase agreements were entered into on October 31, 2008.
2. Forward Currency Contracts: The DFA Selectively Hedged Global Fixed Income Portfolio and DFA Five-Year Global Fixed Income Portfolio may enter into forward foreign currency contracts only to hedge against adverse changes in the relationship of the U.S. dollar to foreign currencies. At October 31, 2008, the DFA Selectively Hedged Global Fixed Income Portfolio and the DFA Five-Year Global Fixed Income Portfolio had entered into the following contracts and the net unrealized foreign exchange gain/(loss) is reflected in the accompanying financial statements (amounts in thousands):
DFA Selectively Hedged Global Fixed Income Portfolio
Settlement
Date | | Currency
Amount | | Currency Sold | | Contract
Amount | | Value at
Oct. 31, 2008 | | Unrealized
Foreign
Exchange
Gain (Loss) | |
| | 11/25/08 | | | | 32,077 | | | Japanese Yen | | $ | 320 | | | $ | 326 | | | $ | (6 | ) | |
| | | | | | | | |
177
DFA Five-Year Global Fixed Income Portfolio
Settlement
Date | | Currency
Amount | | Currency Sold | | Contract
Amount | | Value at
Oct. 31, 2008 | | Unrealized
Foreign
Exchange
Gain (Loss) | |
| 11/10/08 | | | 32,839,797 | | | Japanese Yen | | $ | 339,787 | | | $ | 333,484 | | | $ | 6,303 | | |
| 11/19/08 | | | 11,770 | | | Australian Dollar | | | 7,905 | | | | 7,807 | | | | 98 | | |
| 11/19/08 | | | 21,579,524 | | | Japanese Yen | | | 215,054 | | | | 219,208 | | | | (4,154 | ) | |
| 11/19/08 | | | 220,256 | | | Swedish Krona | | | 29,544 | | | | 28,367 | | | | 1,177 | | |
| 11/19/08 | | | 106,104 | | | Swiss Franc | | | 93,628 | | | | 91,517 | | | | 2,111 | | |
| 11/25/08 | | | 36,806,497 | | | Japanese Yen | | | 367,001 | | | | 373,965 | | | | (6,964 | ) | |
| | | | | | | | | $ | 1,052,919 | | | $ | 1,054,348 | | | $ | (1,429 | ) | |
Risks may arise upon entering into these contracts from the potential inability of counterparties to meet the terms of their contracts and from unanticipated movements in the value of foreign currency relative to the U.S. dollar.
3. Foreign Market Risks: Investments in foreign markets may involve certain considerations and risks not typically associated with investments in the United States of America, including the possibility of future political and economic developments and the level of foreign governmental supervision and regulation of foreign securities markets. These markets are generally smaller, less liquid and more volatile than the major securities markets in the United States of America. Consequently, acquisition and disposition of securities held by the Portfolios may be inhibited.
4. Futures Contracts: During the period ended October 31, 2008, the Portfolios entered into futures contracts in accordance with their investment objectives. Upon entering into a futures contract, the Portfolios deposit cash or pledge U.S. Government securities to a broker, equal to the minimum "initial margin" requirements of the exchange on which the contract is traded. Subsequent payments are received from or paid to the broker each day, based on the daily fluctuation in the market value of the contract. These receipts or payments are known as "variation margin" and are recorded daily by the Portfolios as unrealized gains or losses until the contracts are closed. When the contracts are closed, the Portfolios record a realized gain or loss equal to the difference between the value of the contract at the time it was opened and the value at the time it was closed.
Risks may arise upon entering into futures contracts from potential imperfect price correlations between the futures contracts and the underlying securities, from the possibility of an illiquid secondary market for these instruments and from the possibility that the Series could lose more than the initial margin requirements.
At October 31, 2008, the following funds had outstanding futures contracts (dollar amounts in thousands):
| Fund | | Description | | Expiration
Date | | Number of
Contracts | | Contract
Value | | Unrealized
Gain (Loss) | | Approximate
Cash
Collateral | |
| U.S. Targeted Value Portfolio | | S&P 500 Index® | | 12/19/2008 | | | 20 | | | $ | 4,837 | | | $ | 3 | | | $ | 495 | | |
| U.S. Core Equity 1 Portfolio | | S&P 500 Index® | | 12/19/2008 | | | 20 | | | | 4,837 | | | | 2 | | | | 495 | | |
| U.S. Core Equity 2 Portfolio | | S&P 500 Index® | | 12/19/2008 | | | 6 | | | | 1,451 | | | | 1 | | | | 149 | | |
| T.A. U.S. Core Equity 2 Portfolio | | S&P 500 Index® | | 12/19/2008 | | | 10 | | | | 2,418 | | | | 1 | | | | 248 | | |
| DFA Real Estate Securities Portfolio | | S&P 500 Index® | | 12/19/2008 | | | 80 | | | | 19,346 | | | | 10 | | | | 1,980 | | |
| International Core Equity Portfolio | | S&P 500 Index® | | 12/19/2008 | | | 125 | | | | 30,228 | | | | 15 | | | | 3,094 | | |
T.A. World ex U.S. Core
Equity Portfolio | | S&P 500 Index® | | 12/19/2008 | | | 12 | | | | 2,902 | | | | 1 | | | | 297 | | |
DFA International Small Cap
Value Portfolio | | S&P 500 Index® | | 12/19/2008 | | | 229 | | | | 55,378 | | | | 28 | | | | 5,668 | | |
| International Vector Equity Portfolio | | S&P 500 Index® | | 12/19/2008 | | | 8 | | | | 1,935 | | | | 1 | | | | 198 | | |
Emerging Markets Core
Equity Portfolio | | S&P 500 Index® | | 12/19/2008 | | | 33 | | | | 7,980 | | | | 4 | | | | 817 | | |
5. Treasury Inflation-Protected Securities (TIPS): The DFA Inflation-Protected Securities Portfolio may purchase TIPS which are securities issued by the U.S. Treasury. Because the interest and/or principal payments on an inflation-protected security are adjusted periodically for changes in inflation, the income distributed by the Portfolio may be irregular. In addition, the current market value of inflation-protected securities is not guaranteed and will fluctuate.
178
I. Line of Credit:
The Fund, together with other Dimensional-advised portfolios, has entered into a $250 million unsecured discretionary line of credit effective June 30, 2003 with an affiliate of its domestic custodian bank. Each portfolio is permitted to borrow, subject to its investment limitations, up to a maximum of $250 million, as long as total borrowings under the line of credit do not exceed $250 million in the aggregate. Borrowings under the line of credit are charged interest at the then current Federal Funds Rate plus 1%. Each portfolio is individually, and not jointly, liable for its particular advances under the line of credit. There is no commitment fee on the unused portion of the line of credit. The agreement for the discretionary line of credit may be terminated by either party at any time. The line of credit is scheduled to expire on June 23, 2009.
For the period ended October 31, 2008, borrowings by the Portfolios under this line of credit were as follows (amounts in thousands, except percentages and days):
| | | Weighted
Average
Interest Rate | | Weighted
Average
Loan Balance | | Number of
Days
Outstanding | | Interest
Expense
Incurred | | Maximum Amount
Borrowed During
the Period | |
| U.S. Targeted Value Portfolio | | | 3.49 | % | | $ | 512 | | | | 6 | | | | — | | | $ | 753 | | |
| U.S. Core Equity 1 Portfolio | | | 3.27 | % | | | 3,701 | | | | 16 | | | $ | 5 | | | | 9,542 | | |
| U.S. Core Equity 2 Portfolio | | | 3.75 | % | | | 7,388 | | | | 18 | | | | 14 | | | | 13,919 | | |
| U.S. Vector Equity Portfolio | | | 4.69 | % | | | 10,157 | | | | 12 | | | | 16 | | | | 37,588 | | |
| T.A. U.S. Core Equity 2 Portfolio | | | 3.32 | % | | | 2,290 | | | | 23 | | | | 5 | | | | 9,804 | | |
| DFA Real Estate Securities Portfolio | | | 3.39 | % | | | 9,167 | | | | 46 | | | | 40 | | | | 24,998 | | |
| DFA Global Real Estate Securities Portfolio | | | 3.05 | % | | | 712,818 | | | | 18 | | | | 1 | | | | 2,818 | | |
There were no outstanding borrowings by the Portfolios under this line of credit at October 31, 2008.
The Fund, together with other Dimensional-advised portfolios, has also entered into an additional $500 million unsecured line of credit effective January 15, 2008 with its international custodian bank. Each portfolio is permitted to borrow, subject to its investment limitations, up to a maximum of $500 million, as long as total borrowings under the line of credit do not exceed $500 million in the aggregate. Each portfolio is individually, and not jointly, liable for its particular advances under the line of credit. Borrowings under the line of credit are charged interest at rates agreed to by the parties at the time of borrowing. There is no commitment fee on the unused portion of the line of credit. The agreement for the line of credit expires on January 15, 2009.
For the period ended October 31, 2008, borrowings by the Portfolios under this line of credit were as follows (amounts in thousands, except percentages and days):
| | | Weighted
Average
Interest Rate | | Weighted
Average
Loan Balance | | Number of
Days
Outstanding | | Interest
Expense
Incurred | | Maximum Amount
Borrowed During
the Period | |
| U.S. Core Equity 2 Portfolio | | | 4.91 | % | | $ | 17,023 | | | | 1 | | | $ | 2 | | | $ | 17,023 | | |
| Large Cap International Portfolio | | | 2.65 | % | | | 2,917 | | | | 19 | | | | 4 | | | | 5,357 | | |
| International Core Equity Portfolio | | | 3.07 | % | | | 1,049 | | | | 8 | | | | 1 | | | | 3,544 | | |
| T.A. World ex U.S. Core Equity Portfolio | | | 2.75 | % | | | 757 | | | | 5 | | | | — | | | | 2,094 | | |
| International Small Company Portfolio | | | 2.43 | % | | | 5,070 | | | | 20 | | | | 7 | | | | 22,542 | | |
DFA International Real Estate
Securities Portfolio | | | 1.91 | % | | | 1,759 | | | | 9 | | | | 1 | | | | 1,630 | | |
| DFA International Small Cap Value Portfolio | | | 2.49 | % | | | 13,232 | | | | 36 | | | | 33 | | | | 62,321 | | |
| Emerging Markets Core Equity Portfolio | | | 3.16 | % | | | 1,216 | | | | 31 | | | | 3 | | | | 3,744 | | |
There were no outstanding borrowings by the Portfolios under this line of credit at October 31, 2008.
J. Securities Lending:
As of October 31, 2008, some of the Portfolios had securities on loan to brokers/dealers, for which each Portfolio held cash collateral. Each Portfolio invests the cash collateral, as described below, and records a liability for the return of the collateral, during the period the securities are on loan. Loans of securities are expected at all times to be secured by collateral equal to at least (i) 100% of the current market value of the loaned securities with respect
179
to securities of the U.S. government or its agencies, (ii) 102% of the current market value of the loaned securities with respect to U.S. securities, and (iii) 105% of the current market value of the loaned securities with respect to foreign securities. However, daily market fluctuations could cause the Portfolios' collateral to be lower or higher than the expected thresholds. If this were to occur, the collateral would be adjusted the next business day to ensure adequate collateralization. In the event of default or bankruptcy by the other party to the agreement, realization and/or retention of the collateral may be subject to legal proceedings. If the borrower fails to return loaned securities, and cash collateral being maintained by the borrower is insufficient to cover the value of loaned securities and provided such collateral insufficiency is not the result of investment losses, the lending agent has agreed to pay the amount of the sho rtfall to the Portfolio or, at the option of the lending agent, to replace the securities.
Subject to each Portfolios' investment policy, the cash collateral received by the Portfolio from securities on loan is invested in securities of the U.S. government or its agencies, repurchase agreements collateralized by securities of the U.S. government or its agencies or shares of the DFA Short Term Investment Fund LP. Agencies include both agency debentures and agency mortgage backed securities. In addition, each Portfolio will be able to terminate the loan at any time and will receive reasonable interest on the loan, as well as amounts equal to any dividends, interest or other distributions on the loaned securities. However, dividend income received from loaned securities may not be eligible to be taxed at qualified dividend income rates.
K. Shareholder Servicing Fees:
The Class R1 Shares pay a shareholder servicing fee in the amount of 0.10% and Class R2 Shares pay a shareholder servicing fee in the amount of 0.25% of their annual average net assets to compensate service agents that provide shareholder servicing, record keeping, account maintenance and other services to investors in the U.S. Targeted Value Portfolio Class R1 and Class R2 Shares.
L. Indemnitees; Contractual Obligations:
Under the Fund's organizational documents, its officers and directors are indemnified against certain liabilities arising out of the performance of their duties to the Fund.
In the normal course of business, the Fund enters into contracts that contain a variety of representations and warranties which provide general indemnification. The Fund's maximum exposure under these arrangements is unknown as this would involve future claims that may be made against the Fund and/or its affiliates that have not yet occurred. However, based on experience, the Fund expects the risk of loss to be remote.
M. Recently Issued Accounting Standards and Interpretation:
In March 2008, Statement of Financial Accounting Standards No. 161, Disclosures about Derivative Instruments and Hedging Activities ("FAS 161"), was issued and is effective for fiscal years beginning after November 15, 2008. FAS 161 defines new disclosures of derivative instruments and hedging activities. Management is currently evaluating the implications of FAS 161. At this time, its impact on the Portfolios' financial statements has not been determined.
N. In-Kind Redemptions:
In accordance with guidelines described in the Portfolios' prospectus, the fund may distribute portfolio securities rather than cash as payment for a redemption of fund shares (in-kind redemption). For financial reporting purposes, the fund recognizes a gain on in-kind redemptions to the extent the value of the distributed securities on the date of redemption exceeds the cost of those securities. Gains and losses realized on in-kind redemptions are not recognized for tax purposes and are reclassified from undistributed realized gain (loss) to paid-in capital.
During the period December 1, 2007 to October 31, 2008, the following Portfolios realized net gains of in-kind redemptions (amounts in thousands):
| Large Cap International Portfolio | | $ | 14,987 | | |
| International Core Equity Portfolio | | | 7,590 | | |
| Emerging Markets Core Equity Portfolio | | | 1,902 | | |
180
O. Other:
At October 31, 2008, the following number of shareholders held the following approximate percentages of outstanding shares of the Portfolios. One or more of the shareholders may be omnibus accounts, which typically hold shares for the benefit of several other underlying investors.
| | | Number of
Shareholders | | Approximate
Percentage
of Outstanding
Shares | |
| U.S. Large Company Portfolio — Institutional Class Shares | | | 3 | | | | 71 | % | |
| Enhanced U.S. Large Company Portfolio — Institutional Class Shares | | | 3 | | | | 77 | % | |
| U.S. Large Cap Value Portfolio — Institutional Class Shares | | | 3 | | | | 73 | % | |
| U.S. Targeted Value Portfolio — Class R1 Shares | | | 1 | | | | 100 | % | |
| U.S. Targeted Value Portfolio — Class R2 Shares | | | 1 | | | | 94 | % | |
| U.S. Targeted Value Portfolio — Institutional Class Shares | | | 2 | | | | 44 | % | |
| U.S. Small Cap Value Portfolio — Institutional Class Shares | | | 1 | | | | 41 | % | |
| U.S. Core Equity 1 Portfolio — Institutional Class Shares | | | 2 | | | | 56 | % | |
| U.S. Core Equity 2 Portfolio — Institutional Class Shares | | | 4 | | | | 77 | % | |
| U.S. Vector Equity Portfolio — Institutional Class Shares | | | 3 | | | | 77 | % | |
| T.A. U.S. Core Equity 2 Portfolio — Institutional Class Shares | | | 3 | | | | 91 | % | |
| U.S. Small Cap Portfolio — Institutional Class Shares | | | 3 | | | | 53 | % | |
| U.S. Micro Cap Portfolio — Institutional Class Shares | | | 2 | | | | 53 | % | |
| DFA Real Estate Securities Portfolio — Institutional Class Shares | | | 2 | | | | 69 | % | |
| Large Cap International Portfolio — Institutional Class Shares | | | 2 | | | | 77 | % | |
| International Core Equity Portfolio — Institutional Class Shares | | | 3 | | | | 65 | % | |
| T.A. World ex U.S. Core Equity Portfolio — Institutional Class Shares | | | 2 | | | | 85 | % | |
| International Small Company Portfolio — Institutional Class Shares | | | 2 | | | | 51 | % | |
| Japanese Small Company Portfolio — Institutional Class Shares | | | 4 | | | | 71 | % | |
| Asia Pacific Small Company Portfolio — Institutional Class Shares | | | 3 | | | | 81 | % | |
| United Kingdom Small Company Portfolio — Institutional Class Shares | | | 1 | | | | 66 | % | |
| Continental Small Company Portfolio — Institutional Class Shares | | | 3 | | | | 70 | % | |
| DFA International Real Estate Securities Portfolio — Institutional Class Shares | | | 2 | | | | 68 | % | |
| DFA Global Real Estate Securities Portfolio — Institutional Class Shares | | | 3 | | | | 95 | % | |
| DFA International Small Cap Value Portfolio — Institutional Class Shares | | | 2 | | | | 47 | % | |
| International Vector Equity Portfolio — Institutional Class Shares | | | 3 | | | | 97 | % | |
| Emerging Markets Portfolio — Institutional Class Shares | | | 1 | | | | 41 | % | |
| Emerging Markets Small Cap Portfolio — Institutional Class Shares | | | 2 | | | | 54 | % | |
| Emerging Markets Core Equity Portfolio — Institutional Class Shares | | | 3 | | | | 75 | % | |
| DFA One-Year Fixed Income Portfolio — Institutional Class Shares | | | 3 | | | | 81 | % | |
| DFA Two-Year Global Fixed Income Portfolio — Institutional Class Shares | | | 2 | | | | 80 | % | |
DFA Selectively Hedged Global Fixed Income Portfolio — Institutional
Class Shares | | | 3 | | | | 88 | % | |
| DFA Five-Year Government Portfolio — Institutional Class Shares | | | 3 | | | | 74 | % | |
| DFA Five-Year Global Fixed Income Portfolio — Institutional Class Shares | | | 3 | | | | 73 | % | |
DFA Intermediate Government Fixed Income Portfolio — Institutional
Class Shares | | | 2 | | | | 78 | % | |
| DFA Inflation-Protected Securities Portfolio — Institutional Class Shares | | | 2 | | | | 81 | % | |
| DFA Short-Term Municipal Bond Portfolio — Institutional Class Shares | | | 3 | | | | 76 | % | |
| DFA California Short-Term Municipal Bond Portfolio — Institutional Class Shares | | | 3 | | | | 93 | % | |
P. Subsequent Event Note:
On November 1, 2008, The DFA International Value Series, a master fund in a RIC/RIC master feeder structure with five RIC feeders and two direct client investors, made a "Check-the-box" election for federal income tax purposes pursuant to Treasury Regulation § 301.7701-3, to change its federal entity classification from a corporation taxable as a regulated investment company to a partnership. As a result of this election, the master fund is deemed to have distributed all of its assets and liabilities, in a taxable transaction, to its shareholders in liquidation of the master fund. Immediately thereafter, the shareholders contributed all of the distributed assets and liabilities to a newly formed partnership. The final tax year end of The DFA International Value Series was October 31, 2008. For
181
Federal income tax purposes, pursuant to Code §336(a), the master fund recognizes gain or loss as if the master's investment securities were sold to its shareholders and, pursuant to Code §331, each of the Portfolios recognizes gain or loss as if it liquidated its investment in the master. For tax purposes, pursuant to Code § 334(a), each of the Portfolio's will take a fair market value basis in the securities deemed received by them and a new holding period for those securities commences on the deemed liquidation date.
The master fund had book/tax differences upon its deemed liquidation. The following summary of permanent differences occurred as of the respective effective "Check the Box" election date.
Increase
(Decrease)
Paid-In
Capital | | Unrealized
Appreciation
(Depreciation)
Investment
Securities | | Increase
(Decrease)
Undistributed
Net Investment
Income | | Increase
(Decrease)
Accumulated
Net Realized
Gains (Losses) | |
| $ | (2,187,614,395 | ) | | $ | 2,319,051,847 | | | $ | (602,214 | ) | | $ | (130,835,238 | ) | |
As a result of the transaction, The DFA International Value Series recognized a ($2,309,440,866) and ($718,733) capital and currency loss respectively for tax year ended October 31, 2008. Additionally, the fund has written off $2,178,493,687 of expired capital loss carryover as a permanent book/tax reporting difference decreasing paid in capital.
Each Portfolio impacted by the "Check the Box" election also has a permanent book/tax difference resulting from the transaction. Listed below is the permanent difference impacting each respective Portfolio. For financial statement purposes, this adjustment did not result in any changes to each respective fund's net assets or net asset value per share.
| | | Unrealized
Appreciation
(Depreciation)
Investment
Securities | | Increase
(Decrease)
Accumulated
Net Realized
Gains (Losses) | |
| DFA International Value Portfolio | | $ | 1,598,039,236 | | | $ | (1,598,039,236 | ) | |
| DFA International Value Portfolio II | | | 49,859,737 | | | | (49,859,737 | ) | |
| DFA International Value Portfolio III | | | 155,866,882 | | | | (155,866,882 | ) | |
| DFA International Value Portfolio IV | | | 82,052,198 | | | | (82,052,198 | ) | |
| LWAS/DFA International High Book To Market Portfolio | | | (19,800,535 | ) | | | 19,800,535 | | |
For financial reporting purposes, this transaction had no impact on the net assets of the respective funds.
On November 1, 2008, The Enhanced U.S. Large Company Series, a master fund in a RIC/RIC master feeder structure and The Enhanced U.S. Large Company Portfolio ("the Portfolio"), having 100% investment in its respective master fund, made a "Check-the-box" election for federal income tax purposes pursuant to Treasury Regulation §301.7701-3, to change its federal entity classification from a corporation taxable as a regulated investment company to a disregarded entity. As a result of this election for tax purposes, the master fund is deemed to have liquidated and distributed all of its assets and liabilities to its owner, the portfolio, with the portfolio deemed the surviving entity. The final tax year end of the Master Fund was October 31, 2008. For Federal income tax purposes, pursuant to Code §337(a), the Master Fund did not recognize any gain or loss and, pursuant to Code §332(a), the Portfolio did not recognize any gain or lo ss on the deemed liquidation. However, pursuant to IRC §332 (c), the Portfolio has recognized the master fund's deemed dividend, which was distributed as part of the deemed liquidating distribution, as taxable income.
Pursuant to Code §§ 334(b(1) and 1223, the Portfolio will maintain the Master Fund's holding period and tax basis in the assets deemed transferred to the Portfolio.
182
The master fund had book/tax differences upon its deemed liquidation. The following summary of permanent differences occurred as of the respective effective "Check the Box" election date.
Increase
(Decrease)
Paid-In
Capital | | Unrealized
Appreciation
(Depreciation)
Investment
Securities | | Increase
(Decrease)
Undistributed
Net Investment
Income | | Increase
(Decrease)
Accumulated
Net Realized
Gains (Losses) | |
| $ | (117,037,950 | ) | | $ | 52,451,710 | | | $ | (425,031 | ) | | $ | 65,011,271 | | |
The Portfolio will also have permanent book/tax differences resulting from the "Check the Box" election. Listed below are those permanent differences impacting the Portfolio. These permanent differences include items, such as, the transfer of the master fund's capital loss carryover to the Portfolio, the reversal of the Portfolio's cumulative deferred wash sale losses relative to trades in the master fund and the transfer of the master fund's deferred wash sale losses to the Portfolio, the recording of the master fund's and the reversal of the Portfolio's unrealized appreciation/depreciation on investment securities, and the transfer of the master fund's cumulative deferred officers' compensation. For financial statement purposes, these adjustments did not result in any changes to the fund's net assets or net asset value per share.
Increase
(Decrease)
Paid-In
Capital | | Unrealized
Appreciation
(Depreciation)
Investment
Securities | | Increase
(Decrease)
Undistributed
Net Investment
Income | | Increase
(Decrease)
Accumulated
Net Realized
Gains (Losses) | |
| $ | 64,118,768 | | | $ | 59,581,296 | | | $ | (429,063 | ) | | $ | (123,271,001 | ) | |
For financial reporting purposes, this transaction had no impact on the net assets of the the fund.
On November 1, 2008, The DFA One-Year Fixed Income Series and The DFA Two-Year Global Fixed Income Series, each a master fund in a RIC/RIC master feeder structure with RIC feeders, underlying fund of fund investors (Two Year Global Fixed Income Series) and direct client investors, have each made a "Check-the-box" election for federal income tax purposes pursuant to Treasury Regulation § 301.7701-3, to change their federal entity classifications from a corporation taxable as a regulated investment company to a partnership. As a result of this election, for tax purposes, the master funds are deemed to have distributed all of their assets and liabilities to their shareholders in liquidation of the master fund. Since each master fund has a shareholder owning 80% or more of the fund's shares, and also has shareholders owning less than 80%, each fund's respective transaction creates a non-taxable transaction, pursuant to Internal Revenue Code §332 for those owning more than 80%, and a taxable transaction, pursuant to Internal Revenue Code §331, for those shareholders owning less than 80%. Immediately after the deemed liquidation, the shareholders contributed all of the distributed assets and liabilities to newly formed partnerships. The final tax year end of the Master Funds was October 31, 2008.
For Federal income tax purposes, pursuant to Code §336(a), the master fund recognizes gain or loss relative to the investment of the less than 80% shareholders as if the master's investment securities were sold to those shareholders and, pursuant to Code §331, each of those shareholders recognizes gain or loss as if it liquidated its investment in the master. Pursuant to Code§ 334(a), each of these shareholders will take a fair market value basis in the securities deemed received by them and a new holding period for those securities commences on the deemed liquidation date. In regards to the shareholders owning 80% or more of the master fund, pursuant to Internal Revenue Code § 332 (a), the shareholder will not recognize any gain or loss on the deemed liquidation. However, pursuant to IRC §332(c), a portion of the deemed distribution, which otherwise would have been tax-free as discussed above, since it is utilized b y the master fund to satisfy its dividends paid deduction for the tax year, must be recognized and treated as a dividend by the 80% or greater shareholder. Pursuant to IRC §§ 334(b)(1) and 1223, the 80% or greater shareholder's basis and holding period in the securities received in liquidation is the same as it was in the possession of the master. However, any security distributed in satisfaction of the master's final dividend would have a basis equal to their fair market value and would be deemed acquired on the liquidation date.
183
Each master fund had book/tax differences upon its deemed liquidation. The following summary of permanent differences occurred as of the respective effective "Check the Box" election date.
| | | Increase
(Decrease)
Paid-In
Capital | | Unrealized
Appreciation
(Depreciation)
Investment
Securities | | Increase
(Decrease)
Undistributed
Net Investment
Income | | Increase
(Decrease)
Accumulated
Net Realized
Gains (Losses) | |
The DFA One-Year Fixed Income
Series | | $ | (27,616,090 | ) | | $ | 11,473,625 | | | $ | 49,753 | | | $ | 16,092,712 | | |
The DFA Two-Year Global Fixed
Income Series | | | 21,245,521 | | | | (39,613,298 | ) | | | (6,979,642 | ) | | | 25,347,419 | | |
Each Portfolio impacted by the "Check the Box" election also has permanent book/tax differences resulting from the transaction. Listed below are the permanent differences impacting each respective Portfolio. For financial statement purposes, this adjustment did not result in any changes to each respective fund's net assets or net asset value per share.
| | | Increase
(Decrease)
Paid-In
Capital | | Unrealized
Appreciation
(Depreciation)
Investment
Securities | | Increase
(Decrease)
Undistributed
Net Investment
Income | | Increase
(Decrease)
Accumulated
Net Realized
Gains (Losses) | |
DFA One-Year Fixed Income
Portfolio | | $ | 23,017,604 | | | $ | (17,665,726 | ) | | | — | | | $ | (5,351,878 | ) | |
DFA Two-Year Global Fixed
Income Portfolio | | | 58,589,854 | | | | (42,686,199 | ) | | $ | (6,443,265 | ) | | | (9,460,390 | ) | |
| Global 60/40 Portfolio | | | — | | | | (3,046,638 | ) | | | — | | | | 3,046,638 | | |
| Global 25/75 Portfolio | | | — | | | | (1,370,411 | ) | | | — | | | | 1,370,411 | | |
The Global 60/40 Portfolio and the Global 25/75 Portfolio, each representing a less than 80% owner of The DFA Two-Year Global Fixed Income Series, recognized $3,046,638 and $1,370,411 of net capital gain respectively for their tax year ended October 31, 2008, pursuant to IRC §331.
For financial reporting purposes, this transaction had no impact on the net assets of the respective funds.
184
REPORT OF INDEPENDENT REGISTERED PUBLIC ACCOUNTING FIRM
To the Shareholders of the Portfolios, as defined, and
Board of Directors of DFA Investment Dimensions Group Inc.:
In our opinion, the accompanying statements of assets and liabilities, including the schedules of investments/summary schedules of portfolio holdings, and the related statements of operations and of changes in net assets and the financial highlights present fairly, in all material respects, the financial position of U.S. Large Company Portfolio, Enhanced U.S. Large Company Portfolio, U.S. Large Cap Value Portfolio, U.S. Targeted Value Portfolio, U.S. Small Cap Value Portfolio, U.S. Core Equity 1 Portfolio, U.S. Core Equity 2 Portfolio, U.S. Vector Equity Portfolio, T.A. U.S. Core Equity 2 Portfolio, U.S. Small Cap Portfolio, U.S. Micro Cap Portfolio, DFA Real Estate Securities Portfolio, Large Cap International Portfolio, International Core Equity Portfolio and T.A. World ex U.S. Core Equity Portfolio. International Small Company Portfolio, Japanese Small Company Portfolio, Asia Pacific Small Company Portfolio, United Kingdom Small Company P ortfolio, Continental Small Company Portfolio, DFA International Real Estate Securities Portfolio, DFA Global Real Estate Securities Portfolio, DFA International Small Cap Value Portfolio, International Vector Equity Portfolio, Emerging Markets Portfolio, Emerging Markets Small Cap Portfolio, Emerging Markets Core Equity Portfolio, DFA One-Year Fixed Income Portfolio, DFA Two-Year Global Fixed Income Portfolio, DFA Selectively Hedged Global Fixed Income Portfolio, DFA Five-Year Government Portfolio, DFA Five-Year Global Fixed Income Portfolio, DFA Intermediate Government Fixed Income Portfolio, DFA Inflation-Protected Securities Portfolio, DFA Short-Term Municipal Bond Portfolio and DFA California Short-Term Municipal Bond Portfolio (constituting portfolios within DFA Investment Dimensions Group Inc., hereafter referred to as the "Portfolios") at October 31, 2008, the results of each of their operations, the changes in each of their net assets and their financial highlights for each of the periods indicated, in conformity with accounting principles generally accepted in the United States of America. These financial statements and financial highlights (hereafter referred to as "financial statements") are the responsibility of the Portfolios' management; our responsibility is to express an opinion on these financial statements based on our audits. We conducted our audits of these financial statements in accordance with the standards of the Public Company Accounting Oversight Board (United States). Those standards require that we plan and perform the audits to obtain reasonable assurance about whether the financial statements are free of material misstatement. An audit includes examining, on a test basis, evidence supporting the amounts and disclosures in the financial statements, assessing the accounting principles used and significant estimates made by management, and evaluating the overall financial statement presentation. We believe that our audits, which included confirmation of securities at October 31, 2008 by correspondence with the custodians, brokers, and the transfer agent of the investee funds, provide a reasonable basis for our opinion.
PricewaterhouseCoopers LLP
Philadelphia, Pennsylvania
December 22, 2008
185
DIMENSIONAL INVESTMENT GROUP INC.
PERFORMANCE CHARTS
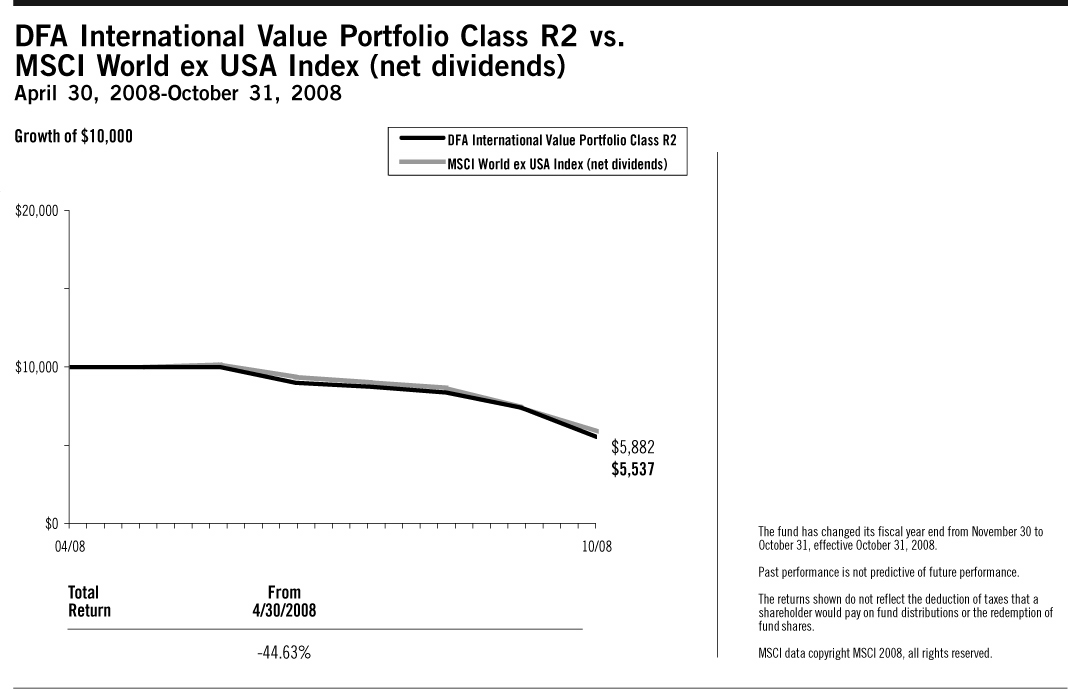
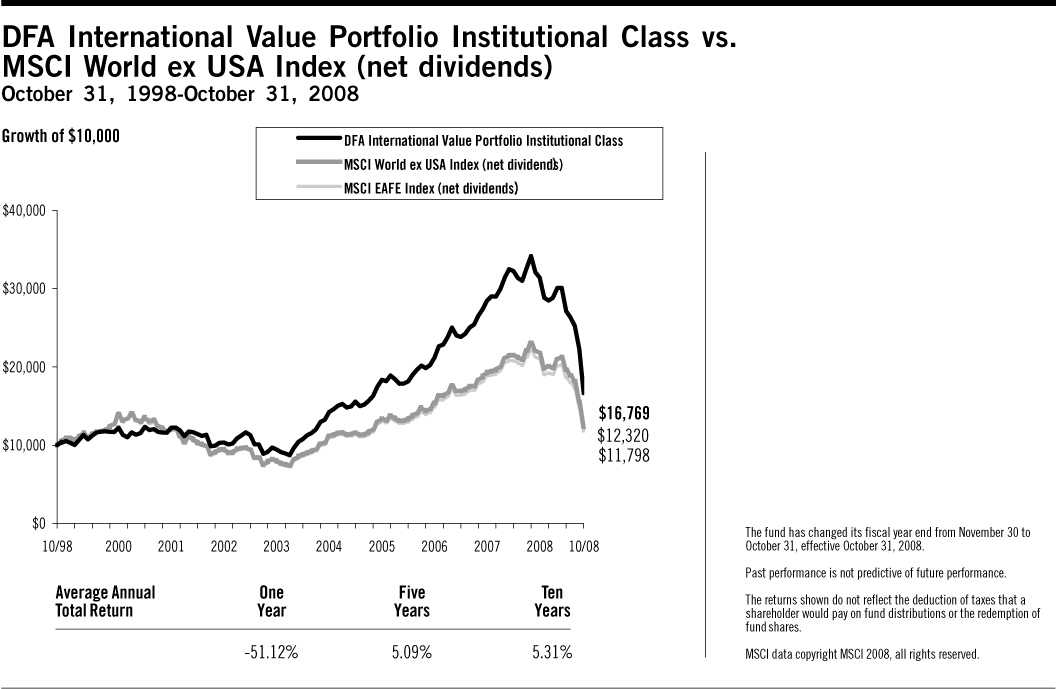
186
DIMENSIONAL INVESTMENT GROUP INC.
MANAGEMENT'S DISCUSSION AND ANALYSIS
On September 16, 2008, at a regular meeting of the Board of Directors/Trustees (the "Board") of the funds covered by this report, the Board voted to change the fiscal and tax year ends of the funds from November 30 to October 31. Therefore, the following discussion generally covers the 11-month period ended October 31, 2008.
International Equity Market Review 11 Months Ended October 31, 2008
International equity markets, affected by credit and liquidity problems similar to those experienced in the U.S., experienced high levels of volatility and broadly negative returns for the period under review. Due to the strengthening of the U.S. dollar vs. most developed countries' currencies (with the exception of the Japanese Yen and the Hong Kong dollar), the performance numbers when expressed in U.S. dollars were lower than when expressed in local currencies for all of the largest country constituents of the MSCI World ex USA Index, with the exception of Japan and Hong Kong. Overall, currency exchange rate changes reduced the returns expressed in U.S. dollars: total return for the MSCI World ex USA Index (net dividends) was –37.82% in local currency and –44.37% in U.S. dollars.
Total Returns for 11 Months Ended October 31, 2008
| Ten Largest Foreign Developed Markets by Market Cap (BB) | | Local
Currency
Return | | U.S. Dollar
Return | |
| Japan ($2,111) | | | –43.55 | % | | | –36.33 | % | |
| United Kingdom ($1,758) | | | –29.61 | % | | | –44.68 | % | |
| France ($872) | | | –36.80 | % | | | –45.40 | % | |
| Canada ($786) | | | –25.69 | % | | | –38.91 | % | |
| Germany ($705) | | | –37.97 | % | | | –46.42 | % | |
| Switzerland ($704) | | | –30.05 | % | | | –32.39 | % | |
| Australia ($513) | | | –35.10 | % | | | –51.58 | % | |
| Spain ($331) | | | –40.19 | % | | | –48.33 | % | |
| Italy ($301) | | | –43.34 | % | | | –51.06 | % | |
| Netherlands ($206) | | | –41.65 | % | | | –49.59 | % | |
Country market capitalizations (in parentheses) are in USD billions. Source: Returns are of MSCI indices net of foreign withholding taxes on dividends. Country market capitalizations are based on country carve-outs of the MSCI All-Country World Investable Market Index. MSCI data copyright MSCI 2008, all rights reserved.
Small company stocks were the poorest-performing asset classes in international markets, while large company growth stocks had the best relative results.
Total Returns for 11 Months Ended October 31, 2008
| | | U.S. Dollar
Return | |
| MSCI World ex USA Small Cap Index | | | –50.30 | % | |
| MSCI World ex USA Value Index | | | –45.31 | % | |
| MSCI World ex USA Index | | | –44.37 | % | |
| MSCI World ex USA Growth Index | | | –43.47 | % | |
Source: MSCI indices are net of foreign withholding taxes on dividends, copyright MSCI 2008, all rights reserved.
Losses in emerging markets were worse, on average, than in developed country markets, although results varied widely among individual countries. For the 11 months under review, total returns in U.S. dollars were –53.02% for the MSCI Emerging Markets Index (net dividends) and –44.37% for the MSCI World ex USA Index (net dividends).
187
Total Returns for 11 Months Ended October 31, 2008
| Country | | U.S. Dollar
Return | |
| Argentina | | | –55.00 | % | |
| Brazil | | | –51.21 | % | |
| Chile | | | –36.59 | % | |
| China | | | –59.33 | % | |
| Czech Republic | | | –40.25 | % | |
| Hungary | | | –58.65 | % | |
| India | | | –61.19 | % | |
| Indonesia | | | –59.87 | % | |
| Israel | | | –23.01 | % | |
| Malaysia | | | –40.52 | % | |
| Mexico | | | –44.05 | % | |
| Philippines | | | –49.76 | % | |
| Poland | | | –51.90 | % | |
| South Africa | | | –47.38 | % | |
| South Korea | | | –55.75 | % | |
| Taiwan | | | –43.57 | % | |
| Thailand | | | –51.81 | % | |
| Turkey | | | –59.24 | % | |
Source: Returns are of MSCI indices net of foreign withholding taxes on dividends, copyright MSCI 2008, all rights reserved.
Master-Feeder Structure
The Portfolio described below, called a "Feeder Fund," does not buy individual securities directly; instead, the Portfolio invests in a corresponding fund called a "Master Fund." The Master Fund, in turn, purchases stocks, bonds, and/or other securities.
International Equity Portfolio Performance Overview
International Value Portfolio
The International Value Portfolio seeks to capture the returns of international large company value stocks by purchasing shares of a Master Fund that invests in such stocks. The investment strategy employs a disciplined, quantitative approach, emphasizing broad diversification and consistent exposure to large cap value stocks, but does not attempt to track closely a specific equity index. As of October 31, 2008, the Master Fund held approximately 530 stocks in 22 developed countries, and essentially was fully invested in equities throughout the year average cash levels for the 11 months ended October 31, 2008 were in general less than 1% of the Master Fund's assets.
As a result of the Master Fund's diversified investment approach, performance principally was determined by broad structural trends in global equity markets, rather than the behavior of a limited number of stocks. For the 11 months ended October 31, 2008, growth stocks generally outperformed value stocks in international markets. Total returns were –44.81% for the MSCI EAFE Index (net dividends), –44.37% for the MSCI World ex US Index (net dividends), and –47.96% for the Portfolio. Relative to the MSCI World ex US Index (net dividends), the underperformance of the Portfolio was primarily due to the Master Fund's greater allocation to value stocks in general and financial stocks in particular, both of which underperformed the Index. Value stocks, which accounted for approximately 69% of the Master Fund compared to 28% of the Index, underperformed the Index by approximately 4 percentage points. Financials, which accounted for 44% of the Master Fund compared to 25% of the Index, underperformed the Index by approximately 8 percentage points. A lower allocation to health care stocks, which accounted for less than 1% of the Master Fund compared to 6% of the Index and outperformed the Index by approximately 22 percentage points, also contributed to the underperformance.
188
International Value Portfolio Class R2
The International Value Portfolio Class R2 seeks to capture the returns of international large company value stocks by purchasing shares of a Master Fund that invests in such stocks. The investment strategy employs a disciplined, quantitative approach, emphasizing broad diversification and consistent exposure to large cap value stocks, but does not attempt to track closely a specific equity index. As of October 31, 2008, the Master Fund held approximately 530 stocks in 22 developed countries, and essentially was fully invested in equities throughout the year: average cash levels for the period from the Portfolio's inception on April 30, 2008 through October 31, 2008 were in general less than 1% of the Master Fund's assets.
As a result of the Master Fund's diversified investment approach, performance principally was determined by broad structural trends in global equity markets, rather than the behavior of a limited number of stocks. For the period from the Portfolio's inception on April 30, 2008 through the period ended October 31, 2008, total returns were –41.21% for the MSCI EAFE Index (net dividends), –41.18% for the MSCI World ex USA Index (net dividends), and –44.63% for the International Value Portfolio R2. Relative to the MSCI World ex USA Index (net dividends), the underperformance of the Portfolio was primarily due to a greater allocation to value stocks in general and financial stocks in particular, both of which underperformed the Index. Value stocks, which accounted for approximately 69% of the Portfolio compared to 28% of the Index, underperformed the Index by approximately 4 percentage points. Financials, which accounted for 44% of the Portfolio compared to 25% of the Index, underperformed the Index by approximately 8 percentage points. A lower allocation to health care stocks, which accounted for less than 1% of the Portfolio compared to 6% of the Index and outperformed the Index by approximately 26 percentage points, also contributed to the underperformance.
189
DIMENSIONAL INVESTMENT GROUP INC.
DFA INTERNATIONAL VALUE PORTFOLIO
DISCLOSURE OF FUND EXPENSES
(Unaudited)
The following Expense Table is shown so that you can understand the impact of fees on your investment. All mutual funds have operating expenses. As a shareholder of the fund, you incur ongoing costs, which include costs for portfolio management, administrative services, and shareholder reports, among others. Operating expenses, legal and audit services, which are deducted from a fund's gross income, directly reduce the investment return of the fund. A fund's expenses are expressed as a percentage of its average net assets. This figure is known as the expense ratio. The following examples are intended to help you understand the ongoing costs, in dollars, of investing in the fund and to compare these costs with those of other mutual funds. The examples are based on an investment of $1,000 made at the beginning of the period shown and held for the entire period.
The Expense Table below illustrates your fund's costs in two ways.
Actual Fund Return
This section helps you to estimate the actual expenses after fee waivers that you paid over the period. The "Ending Account Value" shown is derived from the fund's actual return and "Expenses Paid During Period" reflect the dollar amount that would have been paid by an investor who started with $1,000 in the fund. You may use the information here, together with the amount you invested, to estimate the expenses that you paid over the period.
To do so, simply divide your account value by $1,000 (for example, a $7,500 account value divided by $1,000 = 7.5), then multiply the result by the number given for your fund under the heading "Expenses Paid During Period."
Hypothetical Example for Comparison Purposes
This section is intended to help you compare your fund's costs with those of other mutual funds. The hypothetical "Ending Account Value" and "Expenses Paid During Period" are derived from the fund's actual expense ratio and an assumed 5% annual return before expenses. In this case, because the return used is not the fund's actual return, the results do not apply to your investment. The example is useful in making comparisons because the SEC requires all mutual funds to calculate expenses based on a 5% annual return. You can assess your fund's cost by comparing this hypothetical example with the hypothetical examples that appear in shareholder reports of other funds.
Please note that the expenses shown in the table are meant to highlight and help you compare ongoing costs only and do not reflect any transactional costs, if applicable. The "Annualized Expense Ratio" represents the actual expenses for the six-month period indicated.
Six Months Ended October 31, 2008
EXPENSE TABLE
| | | Beginning
Account
Value
05/01/08 | | Ending
Account
Value
10/31/08 | | Annualized
Expense
Ratio* | | Expenses
Paid
During
Period* | |
| Actual Fund Return | |
| Class R2 Shares | | $ | 1,000.00 | | | $ | 553.70 | | | | 0.73 | % | | $ | 2.85 | | |
| Institutional Class Shares | | $ | 1,000.00 | | | $ | 554.90 | | | | 0.44 | % | | $ | 1.72 | | |
| Hypothetical 5% Annual Return | |
| Class R2 Shares | | $ | 1,000.00 | | | $ | 1,021.47 | | | | 0.73 | % | | $ | 3.71 | | |
| Institutional Class Shares | | $ | 1,000.00 | | | $ | 1,022.92 | | | | 0.44 | % | | $ | 2.24 | | |
* Expenses are equal to the fund's annualized expense ratio for the six-month period, multiplied by the average account value over the period, multiplied by the number of days in the most recent six-month period (184), then divided by the number of days in the year (366) to reflect the six-month period. The Portfolio is a Feeder Fund. The expenses shown reflect the direct expenses of the Feeder Fund and the indirect payment of the Feeder Fund's portion of the expenses of its Master Fund.
190
DIMENSIONAL INVESTMENT GROUP INC.
DFA INTERNATIONAL VALUE PORTFOLIO
DISCLOSURE OF PORTFOLIO HOLDINGS
(Unaudited)
The SEC requires that all Funds file a complete Schedule of Investments with the SEC for their first and third fiscal quarters on Form N-Q. For Dimensional Investment Group Inc., this would be for the fiscal quarters ending January 31 and July 31. The Form N-Q filing must be made within 60 days of the end of the quarter. Dimensional Investment Group Inc. filed its most recent Form N-Q with the SEC on October 30, 2008. It is available upon request, without charge, by calling collect: (310) 395-8005 or by mailing a request to Dimensional Fund Advisors LP, 1299 Ocean Avenue, Santa Monica, California 90401, or by visiting the SEC's website at http://www.sec.gov, or they may be reviewed and copied at the SEC's Public Reference Room in Washington, D.C. (call 1-800-732-0330 for information on the operation of the Public Reference Room).
PORTFOLIO HOLDINGS
The SEC requires that all Funds present their categories of portfolio holdings in a table, chart or graph format in their annual and semi-annual shareholder reports, whether or not a Schedule of Investments is utilized. The following table, which presents portfolio holdings as a percent of total investments before short-term investments and collateral for loaned securities, is provided in compliance with such requirement.
The categories of industry classification for the Affiliated Investment Company is represented in the Disclosure of Portfolio Holdings, which is included elsewhere within the report. Refer to the Summary Schedule of Portfolio Holdings for the underlying Master Fund's holdings which reflects the investments by country.
| Affiliated Investment Company | | | 100.0 | % | |
191
DIMENSIONAL INVESTMENT GROUP INC.
DFA INTERNATIONAL VALUE PORTFOLIO
STATEMENT OF ASSETS AND LIABILITIES
OCTOBER 31, 2008
(Amounts in thousands, except share and per share amounts)
| ASSETS: | |
Investment in The DFA International Value Series of The DFA Investment Trust Company
(Affiliated Investment Company) (293,975,874 Shares) at Value† | | $ | 3,354,265 | | |
| Receivable for Fund Shares Sold | | | 11,851 | | |
| Prepaid Expenses and Other Assets | | | 63 | | |
| Total Assets | | | 3,366,179 | | |
| LIABILITIES: | |
| Payables: | |
| Affiliated Investment Company Shares Purchased | | | 7,704 | | |
| Fund Shares Redeemed | | | 4,147 | | |
| Due to Advisor | | | 596 | | |
| Accrued Expenses and Other Liabilities | | | 287 | | |
| Total Liabilities | | | 12,734 | | |
| NET ASSETS | | $ | 3,353,445 | | |
| NET ASSET VALUE, OFFERING AND REDEMPTION PRICE PER SHARE: | |
| Class R2 Shares — based on net assets of $3,372 and shares outstanding of 652,972 | | $ | 5.16 | | |
| NUMBER OF SHARES AUTHORIZED | | | 25,000,000 | | |
Institutional Class Shares — based on net assets of $3,350,073 and shares
outstanding of 267,206,005 | | $ | 12.54 | | |
| NUMBER OF SHARES AUTHORIZED | | | 300,000,000 | | |
| Investment in Affiliated Investment Company at Cost | | $ | 4,952,304 | | |
| NET ASSETS CONSIST OF: | |
| Paid-In Capital | | $ | 4,736,953 | | |
| Undistributed Net Investment Income (Distributions in Excess of Net Investment Income) | | | 9,456 | | |
| Accumulated Net Realized Gain (Loss) | | | (1,392,964 | ) | |
| Net Unrealized Appreciation (Depreciation) | | | — | | |
| NET ASSETS | | $ | 3,353,445 | | |
See accompanying Notes to Financial Statements.
192
DIMENSIONAL INVESTMENT GROUP INC.
DFA INTERNATIONAL VALUE PORTFOLIO
STATEMENTS OF OPERATIONS
(Amounts in thousands)
| | | Period
Dec.1,
2007 to
Oct. 31,
2008 | | Year
Ended
Nov. 30,
2007 | |
| Investment Income | |
| Income Distributions Received from Affiliated Investment Company | | $ | 203,802 | | | $ | 172,644 | | |
| Expenses | |
| Administrative Services Fees | | | 10,005 | | | | 11,144 | | |
| Accounting & Transfer Agent Fees | | | 86 | | | | 88 | | |
| Shareholder Servicing Fees — Class R2 Shares | | | 3 | | | | — | | |
| Filing Fees | | | 138 | | | | 131 | | |
| Shareholders' Reports | | | 162 | | | | 101 | | |
| Directors'/Trustees' Fees & Expenses | | | — | | | | 49 | | |
| Professional Fees | | | 145 | | | | 128 | | |
| Other | | | 41 | | | | 18 | | |
| Total Expenses | | | 10,580 | | | | 11,659 | | |
| Net Investment Income (Loss) | | | 193,222 | | | | 160,985 | | |
| Net Realized and Unrealized Gain (Loss) | |
| Capital Gain Distributions Received from Affiliated Investment Company | | | 414,722 | | | | 120,165 | | |
| Net Realized Gain (Loss) on Affiliated Investment Company Shares Sold | | | (146,811 | ) | | | (11,416 | ) | |
Change in Unrealized Appreciation (Depreciation) of Affiliated Investment
Company Shares | | | (3,538,228 | ) | | | 529,397 | | |
| Net Realized and Unrealized Gain (Loss) | | | (3,270,317 | ) | | | 638,146 | | |
| Net Increase (Decrease) in Net Assets Resulting from Operations | | $ | (3,077,095 | ) | | $ | 799,131 | | |
See accompanying Notes to Financial Statements.
193
DIMENSIONAL INVESTMENT GROUP INC.
DFA INTERNATIONAL VALUE PORTFOLIO
STATEMENTS OF CHANGES IN NET ASSETS
(Amounts in thousands)
| | | Period
Dec.1,
2007 to
Oct. 31,
2008 | | Year
Ended
Nov. 30,
2007 | | Year
Ended
Nov. 30,
2006 | |
| Increase (Decrease) in Net Assets | |
| Operations: | |
| Net Investment Income (Loss) | | $ | 193,222 | | | $ | 160,985 | | | $ | 112,132 | | |
Capital Gain Distributions Received from Affiliated
Investment Company | | | 414,722 | | | | 120,165 | | | | 73,938 | | |
Net Realized Gain (Loss) on Affiliated Investment
Company Shares Sold | | | (146,811 | ) | | | (11,416 | ) | | | (4,741 | ) | |
Change in Unrealized Appreciation (Depreciation) of
Affiliated Investment Company Shares | | | (3,538,228 | ) | | | 529,397 | | | | 835,662 | | |
Net Increase (Decrease) in Net Assets Resulting
from Operations | | | (3,077,095 | ) | | | 799,131 | | | | 1,016,991 | | |
| Distributions From: | |
| Net Investment Income: | |
| Class R2 Shares | | | (218 | ) | | | — | | | | — | | |
| Institutional Class Shares | | | (203,735 | ) | | | (140,110 | ) | | | (110,180 | ) | |
| Net Short-Term Gains: | |
| Institutional Class Shares | | | (14,929 | ) | | | (9,341 | ) | | | (6,639 | ) | |
| Net Long-Term Gains: | |
| Institutional Class Shares | | | (106,397 | ) | | | (65,358 | ) | | | (43,737 | ) | |
| Total Distributions | | | (325,279 | ) | | | (214,809 | ) | | | (160,556 | ) | |
| Capital Share Transactions: | |
| Shares Issued | | | 1,701,392 | | | | 2,157,333 | | | | 1,498,950 | | |
| Shares Issued in Lieu of Cash Distributions | | | 301,997 | | | | 192,509 | | | | 141,308 | | |
| Shares Redeemed | | | (1,509,639 | ) | | | (1,128,154 | ) | | | (559,091 | ) | |
Net Increase (Decrease) from Capital Share
Transactions | | | 493,750 | | | | 1,221,688 | | | | 1,081,167 | | |
| Total Increase (Decrease) in Net Assets | | | (2,908,624 | ) | | | 1,806,010 | | | | 1,937,602 | | |
| Net Assets | |
| Beginning of Period | | | 6,262,069 | | | | 4,456,059 | | | | 2,518,457 | | |
| End of Period | | $ | 3,353,445 | | | $ | 6,262,069 | | | $ | 4,456,059 | | |
| | | | | | | | | | | | | | |
Undistributed Net Investment Income (Distributions in
Excess of Net Investment Income) | | $ | 9,456 | | | $ | 20,513 | | | $ | 6,029 | | |
See accompanying Notes to Financial Statements.
194
DIMENSIONAL INVESTMENT GROUP INC.
DFA INTERNATIONAL VALUE PORTFOLIO
FINANCIAL HIGHLIGHTS
(for a share outstanding throughout the period)
Class R2 Shares
| | | Period April 30,
2008(a) to
Oct. 31, 2008 | |
Net Asset Value, Beginning of
Period | | $ | 10.00 | | |
| Income from Investment Operations | |
Net Investment Income
(Loss) | | | 0.25 | (A) | |
Net Gains (Losses) (Realized
and Unrealized) | | | (4.46 | ) | |
Total from Investment
Operations | | | (4.21 | ) | |
| Less Distributions | |
| Net Investment Income | | | (0.63 | ) | |
| Net Realized Gains | | | — | | |
| Total Distributions | | | (0.63 | ) | |
| Net Asset Value, End of Period | | $ | 5.16 | | |
| Total Return | | | (44.63 | )%(C) | |
Net Assets, End of Period
(thousands) | | $ | 3,372 | | |
Ratio of Expenses to
Average Net Assets (D) | | | 0.73 | %(B)(E) | |
Ratio of Net Investment Income
to Average Net Assets | | | 7.47 | %(B)(E) | |
See page 1 & 2 for the Definitions of Abbreviations and Footnotes.
See accompanying Notes to Financial Statements.
195
DIMENSIONAL INVESTMENT GROUP INC.
DFA INTERNATIONAL VALUE PORTFOLIO
FINANCIAL HIGHLIGHTS
(for a share outstanding throughout each period)
Institutional Class Shares
| | | Period
Dec.1,
2007 to
Oct. 31,
2008 | | Year
Ended
Nov. 30,
2007 | | Year
Ended
Nov. 30,
2006 | | Year
Ended
Nov. 30,
2005 | | Year
Ended
Nov. 30,
2004 | | Year
Ended
Nov. 30,
2003 | |
Net Asset Value, Beginning of
Period | | $ | 25.51 | | | $ | 22.71 | | | $ | 17.67 | | | $ | 15.73 | | | $ | 12.20 | | | $ | 9.19 | | |
| Income from Investment Operations | |
| Net Investment Income (Loss) | | | 0.74 | (A) | | | 0.72 | (A) | | | 0.66 | (A) | | | 0.48 | | | | 0.26 | | | | 0.22 | | |
Net Gains (Losses) (Realized
and Unrealized) | | | (12.44 | ) | | | 3.09 | | | | 5.37 | | | | 1.89 | | | | 3.58 | | | | 3.02 | | |
Total from Investment
Operations | | | (11.70 | ) | | | 3.81 | | | | 6.03 | | | | 2.37 | | | | 3.84 | | | | 3.24 | | |
| Less Distributions | |
| Net Investment Income | | | (0.78 | ) | | | (0.63 | ) | | | (0.65 | ) | | | (0.42 | ) | | | (0.31 | ) | | | (0.23 | ) | |
| Net Realized Gains | | | (0.49 | ) | | | (0.38 | ) | | | (0.34 | ) | | | (0.01 | ) | | | — | | | | — | | |
| Total Distributions | | | (1.27 | ) | | | (1.01 | ) | | | (0.99 | ) | | | (0.43 | ) | | | (0.31 | ) | | | (0.23 | ) | |
| Net Asset Value, End of Period | | $ | 12.54 | | | $ | 25.51 | | | $ | 22.71 | | | $ | 17.67 | | | $ | 15.73 | | | $ | 12.20 | | |
| Total Return | | | (47.96 | )%(C) | | | 17.09 | % | | | 35.39 | % | | | 15.40 | % | | | 31.86 | % | | | 35.92 | % | |
Net Assets, End of Period
(thousands) | | $ | 3,350,073 | | | $ | 6,262,069 | | | $ | 4,456,059 | | | $ | 2,518,457 | | | $ | 1,431,989 | | | $ | 748,319 | | |
Ratio of Expenses to Average
Net Assets (D) | | | 0.44 | %(B) | | | 0.44 | % | | | 0.44 | % | | | 0.48 | % | | | 0.51 | % | | | 0.52 | % | |
Ratio of Net Investment Income to
Average Net Assets | | | 3.86 | %(B) | | | 2.89 | % | | | 3.25 | % | | | 2.86 | % | | | 1.87 | % | | | 2.26 | % | |
See page 1 & 2 for the Definitions of Abbreviations and Footnotes.
See accompanying Notes to Financial Statements.
196
DIMENSIONAL INVESTMENT GROUP INC.
DFA INTERNATIONAL VALUE PORTFOLIO
NOTES TO FINANCIAL STATEMENTS
A. Organization:
Dimensional Investment Group Inc. (the "Fund") is an open-end management investment company registered under the Investment Company Act of 1940, whose shares are generally offered to institutional investors, retirement plans and clients of registered investment advisors. The Fund consists of fifteen portfolios, of which the DFA International Value Portfolio (the "Portfolio") is presented in this section of the report.
The Portfolio primarily invests its assets in The DFA International Value Series (the "Series"), a corresponding series of The DFA Investment Trust Company. At October 31, 2008, the Portfolio owned 71% of the outstanding shares of the Series. The financial statements of the Series are included elsewhere in this report and should be read in conjunction with the financial statements of the Portfolio.
Class R2 shares commenced operations on April 30, 2008. As of October 31, 2008, Class R1 shares has 25,000,000 authorized shares and has not commenced operations.
At a regular meeting of the Board of Directors/Trustees (the "Board") on September 16, 2008, the Board voted to change the fiscal and tax year ends of the Portfolio from November 30 to October 31.
B. Significant Accounting Policies:
The following significant accounting policies are in conformity with accounting principles generally accepted in the United States of America. Such policies are consistently followed by the Fund in preparation of its financial statements. The preparation of financial statements in accordance with accounting principles generally accepted in the United States of America requires management to make estimates and assumptions that affect the reported amounts of assets and liabilities and disclosure of contingent assets and liabilities at the date of the financial statements and the reported amounts of increases and decreases in net assets from operations during the reporting period. Actual results could differ from those estimates and those differences could be material.
1. Security Valuation: The shares of the Series held by the Portfolio are valued at their respective daily net asset value.
Adoption of Statement of Financial Accounting Standards No. 157 "Fair Value Measurements" ("FAS 157")
In September 2006, the Financial Accounting Standards Board issued FAS 157 effective for fiscal years beginning after November 15, 2007. This standard clarifies the definition of fair value for financial reporting, establishes a framework for measuring fair value and requires additional disclosures about the use of fair value measurements. The Funds adopted FAS 157 as of December 1, 2007. The three levels of the fair value hierarchy under FAS 157 are described below:
• Level 1 – quoted prices in active markets for identical securities
• Level 2 – other significant observable inputs (including quoted prices for similar securities, interest rates, prepayment speeds, credit risk, etc.)
• Level 3 – significant unobservable inputs (including the Portfolio's own assumptions in determining the fair value of investments)
197
The inputs or methodology used for valuing securities are not necessarily an indication of the risk associated with investing in those securities. A summary of the inputs used to value the Portfolio's net assets as of October 31, 2008 is listed below (in thousands).
| | | Valuation Inputs | |
| | | Investments in
Securities
(Market Value) | |
| | | Level 1 | | Level 2 | | Level 3 | | Total | |
| DFA International Value Portfolio | | $ | 3,354,265 | | | | — | | | | — | | | $ | 3,354,265 | | |
2. Deferred Compensation Plan: Each eligible Director of the Fund may elect participation in the Deferred Compensation Plan (the "Plan"). Under the Plan, effective January 1, 2002, such Directors may defer payment of all or a portion of their total fees earned as a Director. These deferred amounts may be treated as though such amounts had been invested in shares of the following funds: U.S. Large Cap Value Portfolio; U.S. Core Equity 1 Portfolio; U.S. Core Equity 2 Portfolio; U.S. Vector Equity Portfolio; U.S. Micro Cap Portfolio; DFA International Value Portfolio; International Core Equity Portfolio; Emerging Markets Portfolio; Emerging Markets Core Equity Portfolio; and/or DFA Two-Year Global Fixed Income Portfolio. Contributions made under the Plan and the change in unreali zed appreciation (depreciation) and income, are included in Other Expenses for the period ended October 31, 2008 and are included in Directors'/Trustees' Fees & Expenses for the year ended November 30, 2007. At October 31, 2008, the total liability for deferred compensation to Directors is included in Accrued Expenses and Other Liabilities in the amount of $80 (in thousands).
Each Director has the option to receive their distribution of proceeds in one of the following methods upon one year's notice: lump sum; annual installments over a period of agreed upon years; or semi-annual installments over a period of agreed upon years. As of October 31, 2008, none of the Directors have requested distribution of proceeds.
3. Other: Security transactions are accounted for as of the trade date. Costs used in determining realized gains and losses on the sale of affiliated investment company shares are on the basis of identified cost. Dividend income and distributions to shareholders are recorded on the ex-dividend date. Distributions received from investment in affiliated investment company that represent a return of capital or capital gain are recorded as a reduction of cost of investments or as a realized gain, respectively. Expenses directly attributable to the Portfolio or to the Series are directly charged. Common expenses of the Fund or Portfolios are allocated using methods approved by the Board of Directors/Trustees, generally based on average net assets.
Class R2 Shares and Institutional Class Shares have equal rights to assets and earnings of the Portfolio. Income, gains and losses, and common expenses of the Portfolio are allocated to each class of shares based on its relative net assets. Each class will bear its own class-specific expenses, if any.
C. Investment Advisor:
Dimensional Fund Advisors LP ("Dimensional" or the "Advisor") provides administrative services to the Portfolio, including supervision of services provided by others, providing information to the shareholders and to the Board of Directors/Trustees, and other administrative services. The Advisor provides investment advisory services to the Series. For the period December 1, 2007 to October 31, 2008, the Portfolio's administrative services fees were accrued daily and paid monthly to the Advisor based on an effective annual rate of 0.20% of average daily net assets.
Pursuant to the Expense Assumption Agreement for the Class R2 shares of the DFA International Value Portfolio, the Advisor has contractually agreed to assume the Portfolio's direct expenses (excluding administrative fees and custodian fees) to the extent necessary to limit the expenses of the Class R2 shares of the Portfolio to 0.79% of its average net assets on an annualized basis. At any time that the annualized expenses of the Portfolio are less than 0.79% of its average net assets on an annualized basis, the Advisor retains the right to recover any fees previously waived and/or expenses previously assumed to the extent that such recovery will not cause the annualized expenses to exceed 0.79% of its average net assets on an annualized basis. The Portfolio is not obligated to reimburse the advisor for fees previously waived or expenses previously assumed by the Advisor more than thirty-six months before the date of such reimbursement.
The Expense Assumption Agreement will remain in effect until April 1, 2009 and shall continue to remain in effect for year to year thereafter unless terminated by the Fund or the Advisor. At October 31, 2008, there were no fees subject to future recovery by the Advisor.
198
Fees Paid to Officers and Directors/Trustees:
Certain Officers and Directors/Trustees of the Advisor are also Officers and Directors/Trustees of the Fund; however, such Officers and Directors/Trustees (with the exception of the Chief Compliance Officer ("CCO")) receive no compensation from the Fund. For the period December 1, 2007 to October 31, 2008, the total related amounts paid by the Fund to the CCO were $25 (in thousands). The total related amounts paid by the Portfolio are included in Other Expenses on the Statement of Operations.
D. Federal Income Taxes:
The Portfolio has qualified and intends to continue to qualify as a regulated investment company under Subchapter M of the Internal Revenue Code for federal income tax purposes and to distribute substantially all of its taxable income and net capital gains to its shareholders. Accordingly, no provision has been made for federal income taxes.
Distributions from net investment income and from net realized capital gains are determined in accordance with U.S. federal income tax regulations, which may differ from those amounts determined under accounting principles generally accepted in the United States of America. These book/tax differences are either temporary or permanent in nature. To the extent these differences are permanent, they are charged or credited to paid-in capital, undistributed net investment income, accumulated net realized gains or unrealized appreciation, as appropriate, in the period that the differences arise. Accordingly, the following permanent differences as of October 31, 2008, primarily attributable to a reclassification of distributions, were reclassified to the following accounts. These reclassifications had no effect on net assets or net asset value per share (amounts in thousands):
Increase
(Decrease)
Undistributed
Net Investment
Income | | Increase
(Decrease)
Accumulated
Net Realized
Gains (Losses) | |
| $ | (326 | ) | | $ | 326 | | |
The tax character of dividends and distributions declared and paid during the years ended November 30, 2006, November 30, 2007 and the period December 1, 2007 to October 31, 2008 were as follows (amounts in thousands):
| | | Net Investment
Income and
Short-Term
Capital Gains | | Long-Term
Capital Gains | | Total | |
| 2006 | | $ | 120,187 | | | $ | 45,625 | | | $ | 165,812 | | |
| 2007 | | | 156,076 | | | | 69,683 | | | | 225,759 | | |
| 2008 | | | 218,970 | | | | 106,309 | | | | 325,279 | | |
At October 31, 2008, the components of distributable earnings (accumulated losses) were as follows (amounts in thousands):
Undistributed
Net Investment
Income and
Short-Term
Capital Gains | | Undistributed
Long-Term
Capital Gains | | Capital Loss
Caryforward | | Total Net
Distributable
Earnings
(Accumulated
Losses) | |
| $ | 9,535 | | | | — | | | $ | (1,392,964 | ) | | $ | (1,383,429 | ) | |
For federal income tax purposes, the Fund measures its capital loss carryforwards annually at October 31, its fiscal year end. Capital loss carryforwards may be carried forward and applied against future capital gains. As of October 31, 2008, the Portfolio had capital loss carryforwards in the amount of $1,392,964 to offset future realized capital gains expiring in 2016.
199
At October 31, 2008, the total cost and aggregate gross unrealized appreciation and (depreciation) of securities for federal income tax purposes were different from amounts reported for financial reporting purposes (amounts in thousands):
Federal
Tax Cost | |
Unrealized
Appreciation | |
Unrealized
(Depreciation) | | Net
Unrealized
Appreciation
(Depreciation) | |
| $ | 3,352,915 | | | | — | | | | — | | | | — | | |
In June 2006, the Financial Accounting Standards Board (FASB) issued FASB Interpretation 48 ("FIN 48"), "Accounting for Uncertainty in Income Taxes." This standard defines the threshold for recognizing the benefits of tax-return positions in the financial statements as "more-likely-than-not" to be sustained by the taxing authority and requires measurement of a tax position meeting the more-likely-than-not criterion, based on the largest benefit that is more than 50 percent likely to be realized. Management has analyzed the Portfolios' tax positions to be taken on the federal income tax returns for all open tax years (tax years ended November 30, 2005 through the period ended October 31, 2008), for purposes of implementing FIN 48, and has concluded that no provision for income tax is required in the Portfolios' financial statements.
E. Capital Share Transactions:
The capital share transactions by class were as follows (amounts in thousands):
| | | Period
Dec. 1, 2007
to
Oct. 31, 2008 | | Year
Ended
Nov. 30, 2007 | |
| | | Amount | | Shares | | Amount | | Shares | |
| Class R2 Shares* | |
| Shares Issued | | $ | 5,585 | | | | 703 | | | | N/A | | | | N/A | | |
| Shares Issued in Lieu of Cash Distributions | | | 218 | | | | 25 | | | | N/A | | | | N/A | | |
| Shares Redeemed | | | (624 | ) | | | (75 | ) | | | N/A | | | | N/A | | |
| Net Increase (Decrease)—Class R2 Shares | | $ | 5,179 | | | | 653 | | | | N/A | | | | N/A | | |
| Institutional Class Shares | |
| Shares Issued | | $ | 1,695,807 | | | | 84,544 | | | $ | 2,157,333 | | | | 86,715 | | |
| Shares Issued in Lieu of Cash Distributions | | | 301,779 | | | | 13,697 | | | | 192,509 | | | | 7,988 | | |
| Shares Redeemed | | | (1,509,015 | ) | | | (76,488 | ) | | | (1,128,154 | ) | | | (45,424 | ) | |
| Net Increase (Decrease)—Institutional Class Shares | | $ | 488,571 | | | | 21,753 | | | $ | 1,221,688 | | | | 49,279 | | |
* Class R2 Shares commenced operations on April 30, 2008.
F. Line of Credit:
The Fund, together with other Dimensional-advised portfolios, has entered into a $250 million unsecured discretionary line of credit effective June 30, 2003 with an affiliate of its domestic custodian bank. Each portfolio is permitted to borrow, subject to its investment limitations, up to a maximum of $250 million, as long as total borrowings under the line of credit do not exceed $250 million in the aggregate. Borrowings under the line of credit are charged interest at the current overnight Federal Funds Rate plus 1%. Each portfolio is individually, and not jointly, liable for its particular advances under the line of credit. There is no commitment fee on the unused portion of the line of credit. The agreement for the discretionary line of credit may be terminated by either party at any time. The line of credit is scheduled to expire on June 23, 2009. There were no borrowings by the Portfolio under this line of credit during the period end ed October 31, 2008.
200
The Fund, together with other Dimensional-advised portfolios, has also entered into an additional $500 million unsecured line of credit effective January 15, 2008 with its international custodian bank. Each portfolio is permitted to borrow, subject to its investment limitations, up to a maximum of $500 million, as long as total borrowings under the line of credit do not exceed $500 million in the aggregate. Each portfolio is individually, and not jointly, liable for its particular advances under the line of credit. Borrowings under the line of credit are charged interest at rates agreed to by the parties at the time of borrowing. There is no commitment fee on the unused portion of the line of credit. The agreement of the line of credit expires on January 15, 2009. There were no borrowings by the Portfolio under this line of credit during the period ended October 31, 2008.
G. Shareholder Servicing Fees:
The Class R2 Shares pay a shareholder servicing fee in the amount of 0.25% of their annual average net assets to compensate service agents that provide shareholder servicing, record keeping, account maintenance and other services to investors in the DFA International Value Portfolio Class R2 Shares.
H. Indemnitees; Contractual Obligations:
Under the Fund's organizational documents, its officers and directors are indemnified against certain liabilities arising out of the performance of their duties to the Fund.
In the normal course of business, the Fund enters into contracts that contain a variety of representations and warranties which provide general indemnification. The Fund's maximum exposure under these arrangements is unknown as this would involve future claims that may be made against the Fund and/or its affiliates that have not yet occurred. However, based on experience, the Fund expects the risk of loss to be remote.
I. Recently Issued Accounting Standards and Interpretation:
In March 2008, Statement of Financial Accounting Standards No. 161, Disclosures about Derivative Instruments and Hedging Activities ("FAS 161"), was issued and is effective for fiscal years beginning after November 15, 2008. FAS 161 defines new disclosures of derivative instruments and hedging activities. Management is currently evaluating the implications of FAS 161. At this time, its impact on the Portfolios' financial statements has not been determined.
J. Other:
At October 31, 2008, two shareholders held approximately 87% of the outstanding shares of Class R2 shares of the Portfolio and two shareholders held approximately 48% of the outstanding shares of the Institutional Class shares of the Portfolio. One or more of the shareholders is an omnibus account, which typically holds shares for the benefit of several other underlying investors.
K. Subsequent Event Note:
On November 1, 2008, The DFA International Value Series, a master fund in a RIC/RIC master feeder structure with five RIC feeders and two direct client investors, made a "Check-the-box" election for federal income tax purposes pursuant to Treasury Regulation § 301.7701-3, to change its federal entity classification from a corporation taxable as a regulated investment company to a partnership. As a result of this election, the master fund is deemed to have distributed all of its assets and liabilities, in a taxable transaction, to its shareholders in liquidation of the master fund. Immediately thereafter, the shareholders contributed all of the distributed assets and liabilities to a newly formed partnership. The final tax year end of The DFA International Value Series was October 31, 2008. For Federal income tax purposes, pursuant to Code §336(a), the master fund recognizes gain or loss as if the master's investment securities were sold to its shareholders and, pursuant to Code §331, each of the Portfolios recognizes gain or loss as if it liquidated its investment in the master. For tax purposes, pursuant to Code § 334(a), each of the Portfolio's will take a fair market value basis in the securities deemed received by them and a new holding period for those securities commences on the deemed liquidation date.
201
The master fund had book/tax differences upon its deemed liquidation. The following summary of permanent differences occurred as of the respective effective "Check the Box" election date.
Increase
(Decrease)
Paid-In
Capital | | Unrealized
Appreciation
(Depreciation)
Investment
Securities | | Increase
(Decrease)
Undistributed
Net Investment
Income | | Increase
(Decrease)
Accumulated
Net Realized
Gains (Losses) | |
| $ | (2,187,614,395 | ) | | $ | 2,319,051,847 | | | $ | (602,214 | ) | | $ | (130,835,238 | ) | |
As a result of the transaction, The DFA International Value Series recognized a ($2,309,440,866) and ($718,733) capital and currency loss respectively for tax year ended October 31, 2008. Additionally, the fund has written off $2,178,493,687 of expired capital loss carryover as a permanent book/tax reporting difference decreasing paid in capital.
Each Portfolio impacted by the "Check the Box" election also has a permanent book/tax difference resulting from the transaction. Listed below is the permanent difference impacting each respective Portfolio. For financial statement purposes, this adjustment did not result in any changes to each respective fund's net assets or net asset value per share.
| | | Unrealized
Appreciation
(Depreciation)
Investment
Securities | | Increase
(Decrease)
Accumulated
Net Realized
Gains (Losses) | |
| DFA International Value Portfolio | | $ | 1,598,039,236 | | | $ | (1,598,039,236 | ) | |
| DFA International Value Portfolio II | | | 49,859,737 | | | | (49,859,737 | ) | |
| DFA International Value Portfolio III | | | 155,866,882 | | | | (155,866,882 | ) | |
| DFA International Value Portfolio IV | | | 82,052,198 | | | | (82,052,198 | ) | |
| LWAS/DFA International High Book To Market Portfolio | | | (19,800,535 | ) | | | 19,800,535 | | |
For financial reporting purposes, this transaction had no impact on the net assets of the respective funds.
202
REPORT OF INDEPENDENT REGISTERED PUBLIC ACCOUNTING FIRM
To the Shareholders of DFA International Value Portfolio and
Board of Directors of Dimensional Investment Group Inc.:
In our opinion, the accompanying statement of assets and liabilities, and the related statements of operations and of changes in net assets and the financial highlights present fairly, in all material respects, the financial position of DFA International Value Portfolio (one of the portfolios constituting Dimensional Investment Group Inc., hereafter referred to as the "Portfolio") at October 31, 2008, the results of its operations, the changes in its net assets and the financial highlights for each of the periods indicated, in conformity with accounting principles generally accepted in the United States of America. These financial statements and financial highlights (hereafter referred to as "financial statements") are the responsibility of the Portfolio's management; our responsibility is to express an opinion on these financial statements based on our audits. We conducted our audits of these financial statements in accordance with the Stan dards of the Public Company Accounting Oversight Board (United States). Those standards require that we plan and perform the audit to obtain reasonable assurance about whether the financial statements are free of material misstatement. An audit includes examining, on a test basis, evidence supporting the amounts and disclosures in the financial statements, assessing the accounting principles used and significant estimates made by management, and evaluating the overall financial statement presentation. We believe that our audits, which included confirmation of securities at October 31, 2008 by correspondence with the transfer agent of the investee fund, provide a reasonable basis for our opinion.
PricewaterhouseCoopers LLP
Philadelphia, Pennsylvania
December 22, 2008
203
THE DFA INVESTMENT TRUST COMPANY
PERFORMANCE CHARTS


204
THE DFA INVESTMENT TRUST COMPANY
PERFORMANCE CHARTS
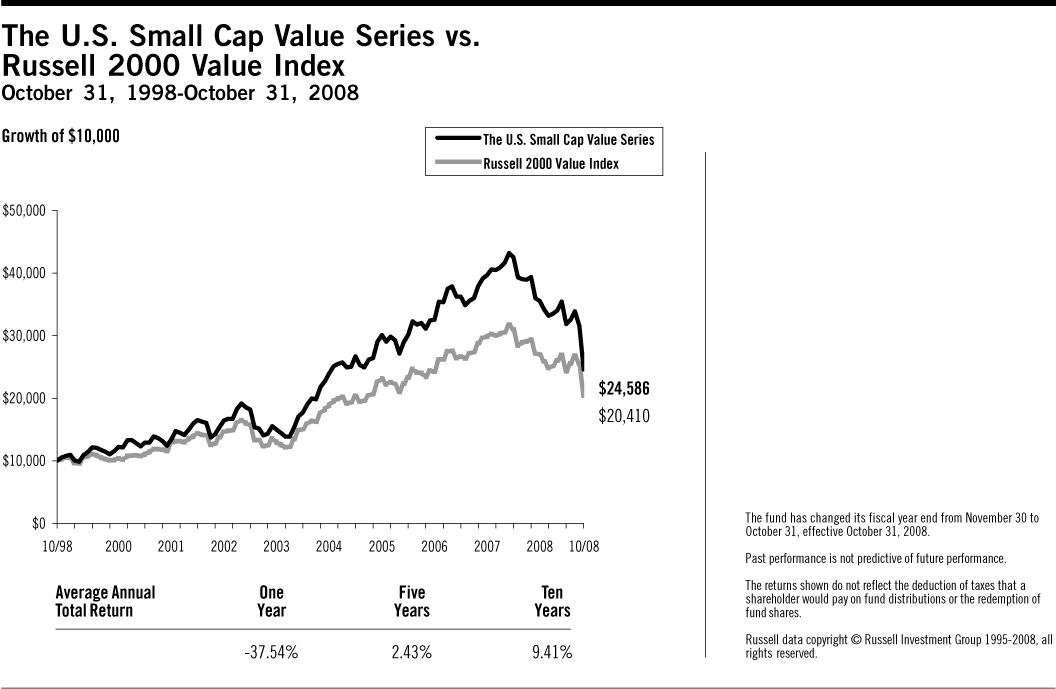
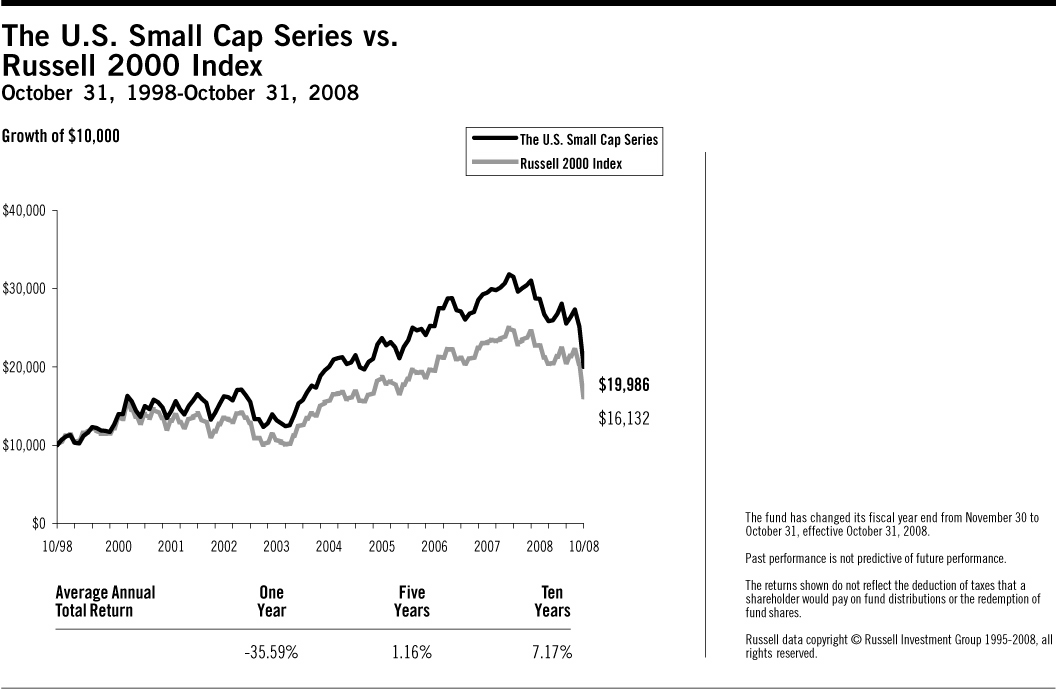
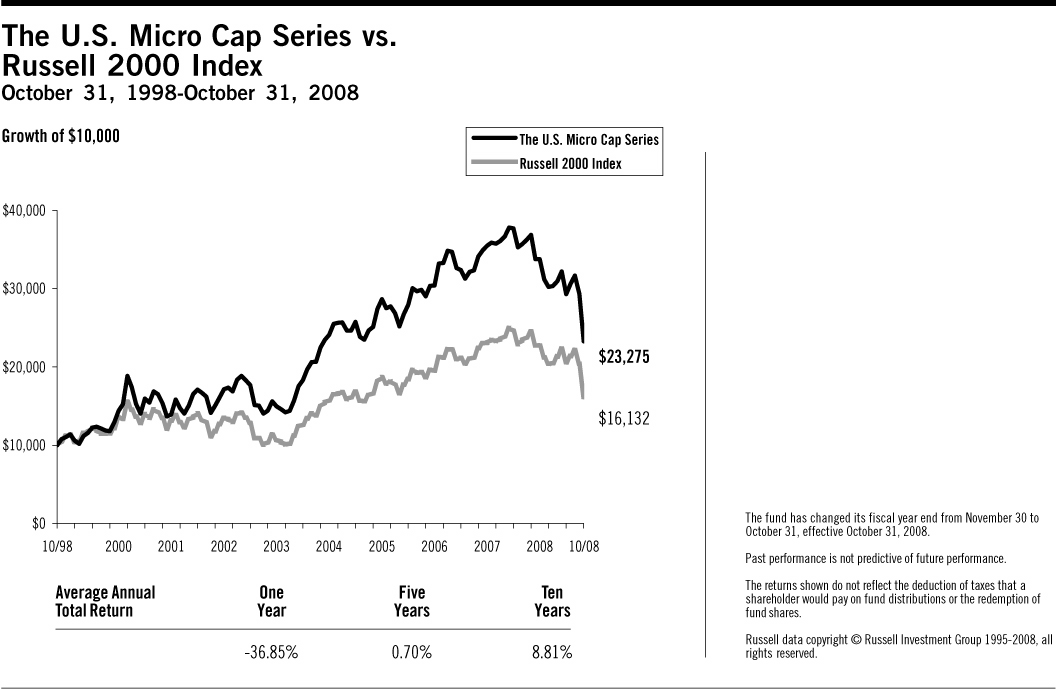
205
THE DFA INVESTMENT TRUST COMPANY
PERFORMANCE CHARTS

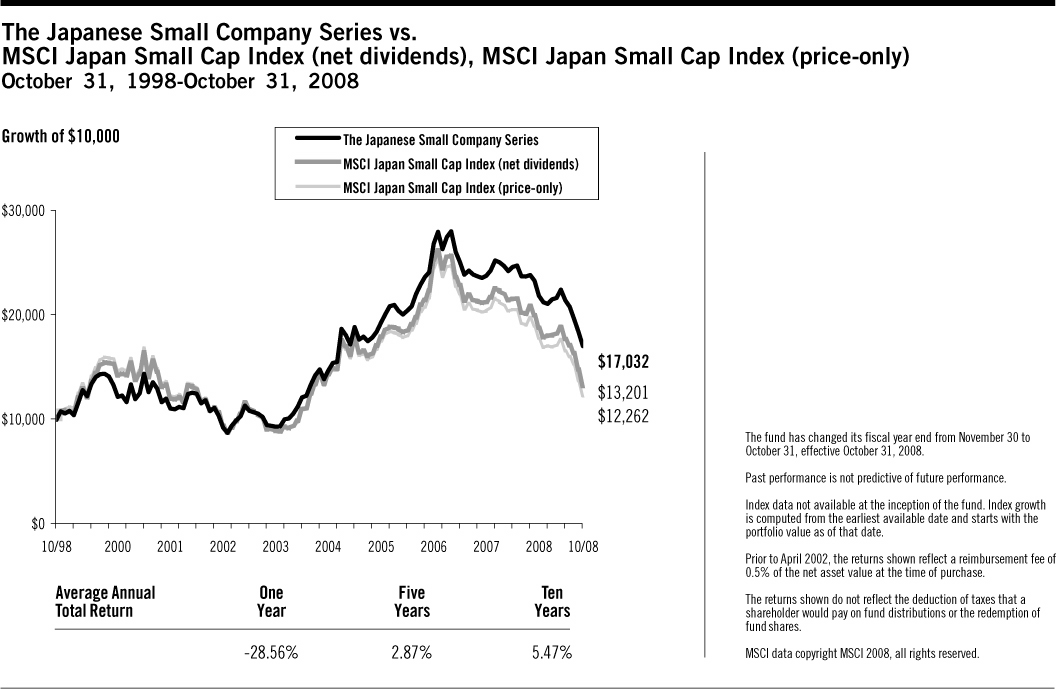
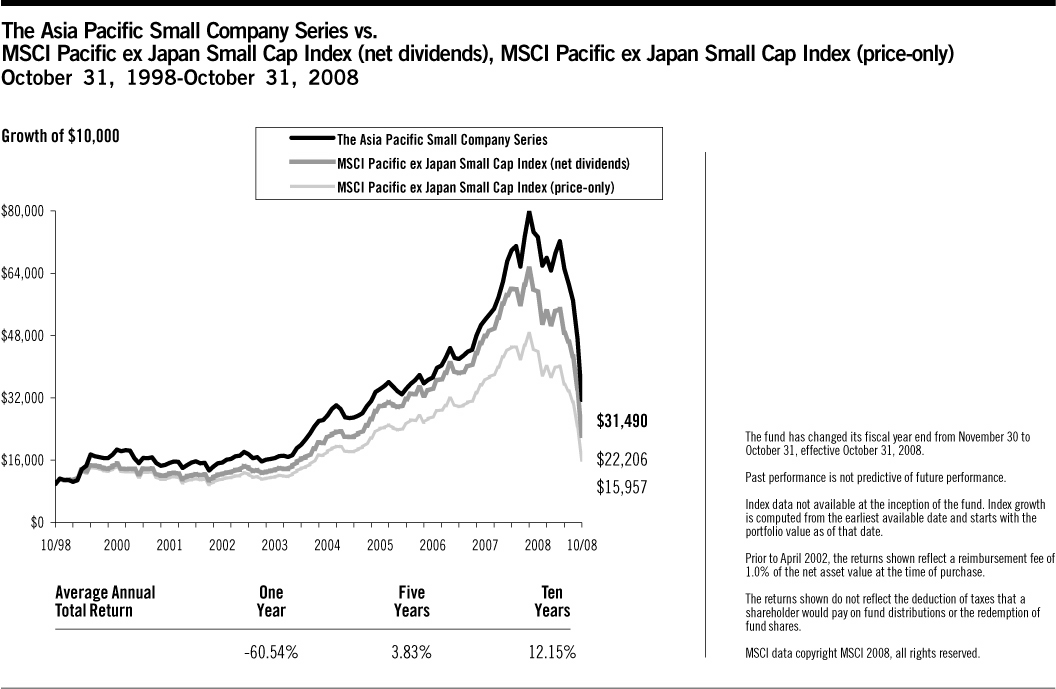
206
THE DFA INVESTMENT TRUST COMPANY
PERFORMANCE CHARTS
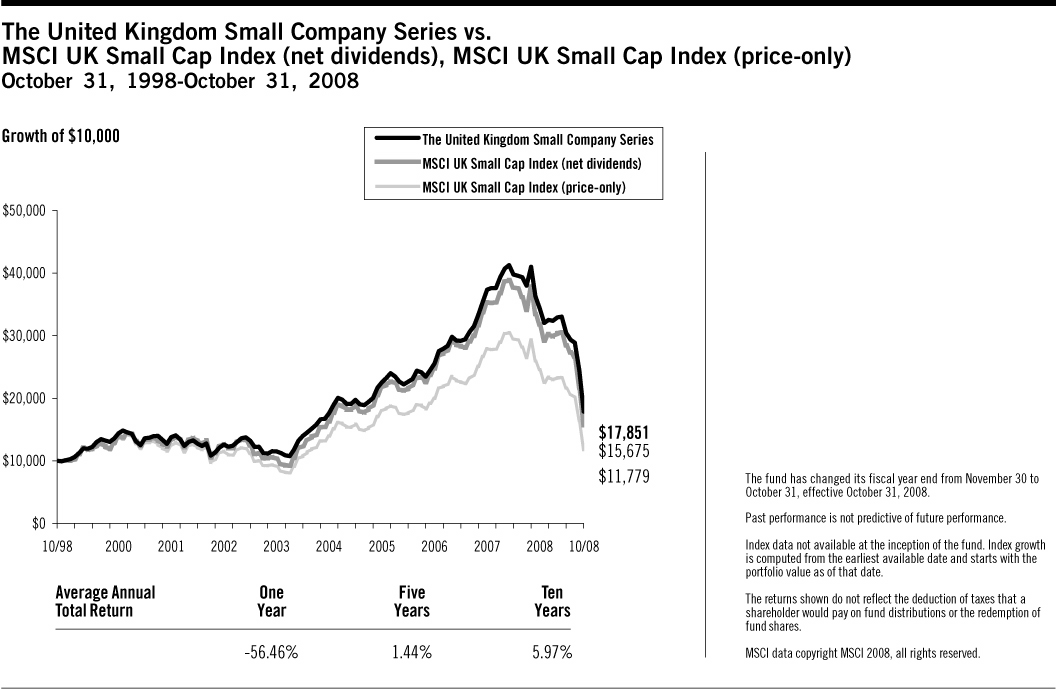
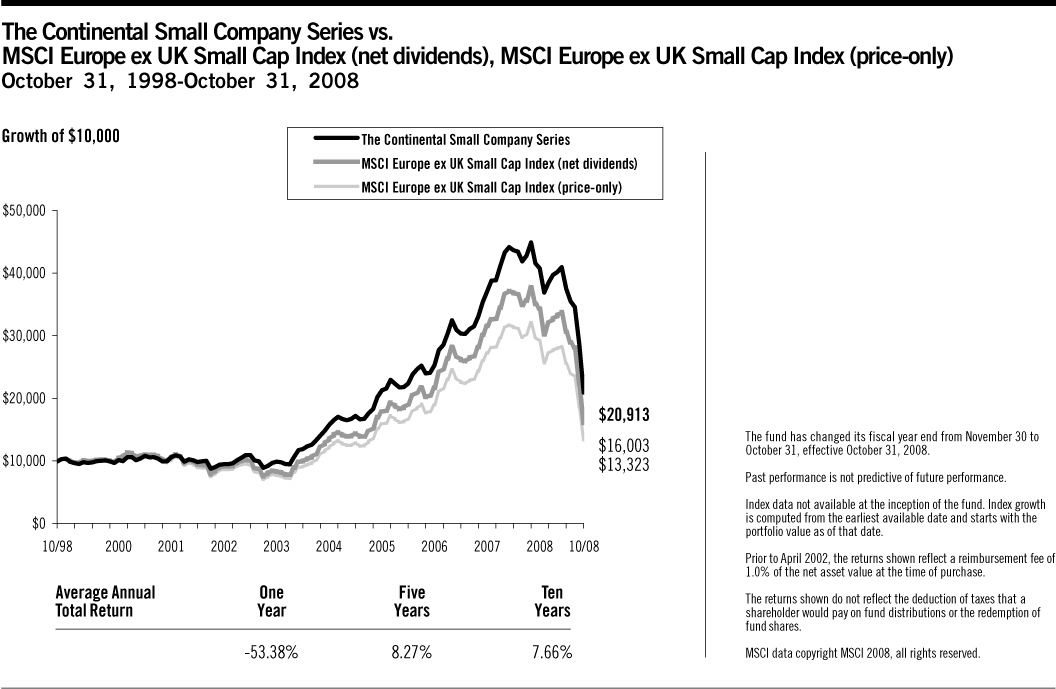
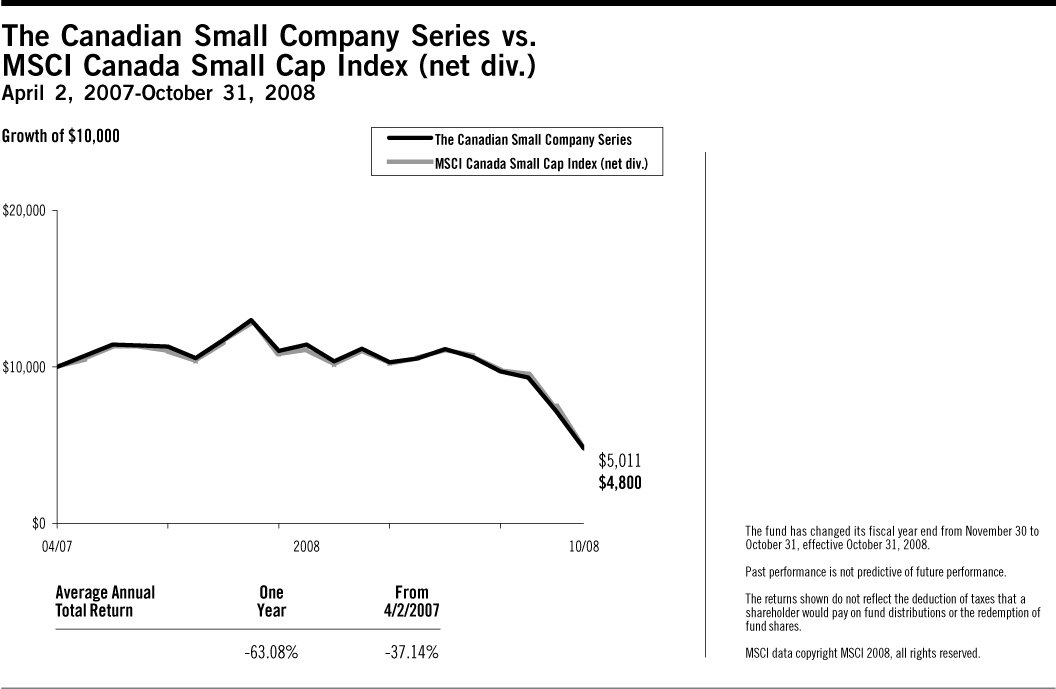
207
THE DFA INVESTMENT TRUST COMPANY
PERFORMANCE CHARTS


208
THE DFA INVESTMENT TRUST COMPANY
PERFORMANCE CHART
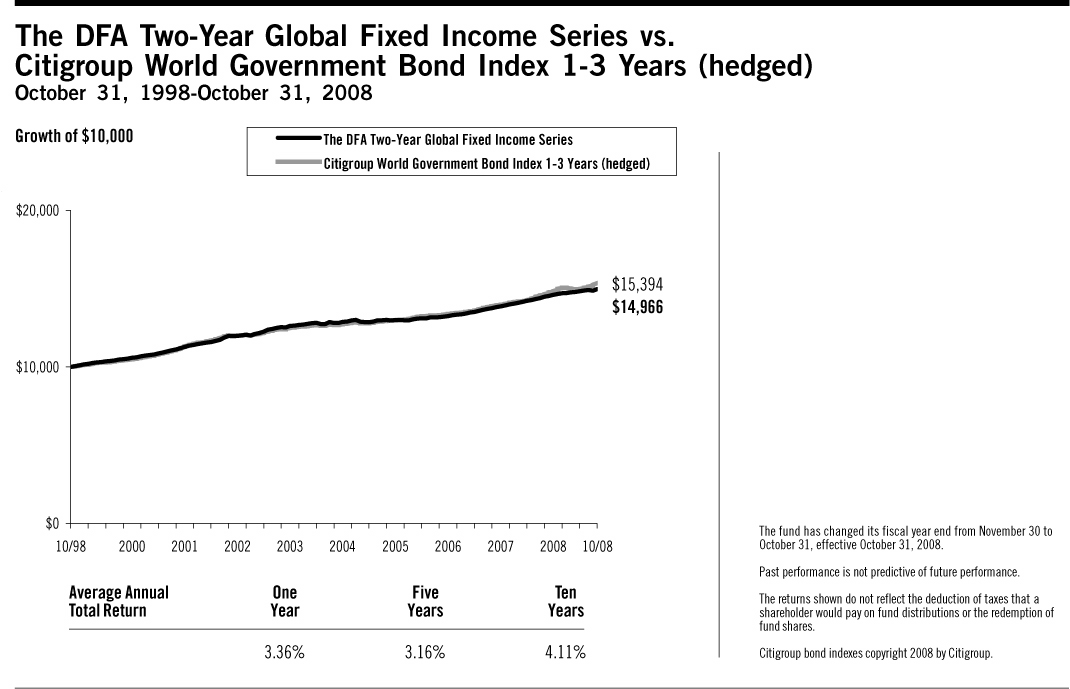
209
THE DFA INVESTMENT TRUST COMPANY
MANAGEMENT'S DISCUSSION AND ANALYSIS
On September 16, 2008, at a regular meeting of the Board of Directors/Trustees (the "Board") of the funds covered by this report, the Board voted to change the fiscal and tax year ends of the funds from November 30 to October 31. Therefore, the following discussion generally covers the 11-month period ended October 31, 2008.
U.S. Equity Market Review 11 Months Ended October 31, 2008
U.S. equity markets experienced high levels of volatility during the 11-month fiscal year ended October 31, 2008. The behavior of equity markets has been driven in large part by the contraction of lending in credit markets. In addition to heightened volatility, the cross-sectional dispersion of stock returns in equity markets has increased relative to previous levels, and returns even within each asset class have differed greatly. Dimensional Fund Advisors believes that a security's risk characteristics determines its expected return. Among the most important factors explaining differences in the behavior of diversified equity portfolios are company size and company value/growth characteristics of the portfolio holdings. Size is measured by market capitalization, and "value" classification is a function of stock price relative to one or more fundamental characteristics. Compared to other stocks, value stocks often have lower market value rel ative to their earnings, dividends, and book value.
For the 11 months ended October 31, 2008, small company stocks slightly outperformed large companies, and mid cap companies underperformed both small and large cap companies. The performance of the Russell Microcap Index was –33.59%, the Russell 2000 Index was –29.07%, CRSP 6-10 Index was –32.90%, and MSCI USA Small Cap 1750 Index was –32.21%. Large cap value stocks, as measured by the Russell 1000 Value Index, slightly outperformed large cap growth stocks, as measured by the Russell 1000 Growth Index. The value premium was larger among small cap stocks.
Total Return for 11 Months Ended October 31, 2008
| Russell 2000 Index® (small cap companies) | | | –29.07 | % | |
| Russell Midcap Index® (mid cap companies) | | | –37.70 | % | |
| Russell 1000 Index® (large cap companies) | | | –33.99 | % | |
| Russell 3000 Value Index® | | | –32.90 | % | |
| Russell 3000 Growth Index® | | | –34.45 | % | |
When the large, mid, and small cap market segments are further divided by value and growth characteristics, the distinction in performance within sectors was equally significant.
Total Return for 11 Months Ended October 31, 2008
| Russell 1000 Value Index® (large cap value companies) | | | –33.55 | % | |
| Russell 1000 Growth Index® (large cap growth companies) | | | –34.54 | % | |
| Russell Midcap Value Index® (mid cap value companies) | | | –35.42 | % | |
| Russell Midcap Growth Index® (mid cap growth companies) | | | –40.01 | % | |
| Russell 2500 Value Index® (small/mid cap value companies) | | | –29.10 | % | |
| Russell 2500 Growth Index® (small/mid cap growth companies) | | | –37.30 | % | |
| Russell 2000 Value Index® (small cap value companies) | | | –24.91 | % | |
| Russell 2000 Growth Index® (small cap growth companies) | | | –33.26 | % | |
Source: Russell data copyright © Russell Investment Group 1995-2008, all rights reserved.
Differences in returns for the various Dimensional U.S. equity funds over the 11 months ended October 31, 2008 were attributable primarily to differences in value/growth and size characteristics as well as the exclusion of REIT securities from most Dimensional portfolios, except for the DFA Real Estate Securities Portfolio and portfolios investing in the U.S. Large Company Series. Moreover, the portfolio construction approach used by Dimensional Fund Advisors generally resulted in portfolios with greater emphasis on value or small company characteristics relative to widely used index benchmarks.
210
Domestic Equity Series' Performance Overview
The U.S. Large Company Series
The U.S. Large Company Series seeks to approximate the returns of the S&P 500 Index® by investing in S&P 500 Index® stocks in approximately the same proportions as they are represented in the S&P 500 Index®. The Series was mostly invested in equities throughout the year: average cash levels for the 11 months ended October 31, 2008 were in general less than 1% of the Master Fund's assets.
For the 11 months ended October 31, 2008, total returns were –33.10% for the Series and –33.31% for the S&P 500 Index®. The securities in the Series closely tracked the investment results of the S&P 500 Index®.
The Enhanced U.S. Large Company Series
The Enhanced U.S. Large Company Series seeks to achieve a total return that exceeds the total return performance of the S&P 500 Index® through an "enhanced cash" strategy. This strategy combines investment in high-grade, short-term fixed income instruments with an overlay of S&P 500 Index® futures contracts or swaps. For the 11 months ended October 31, 2008, approximately 98% of the overlay instruments consisted of S&P 500 Index futures contracts. Swaps and ETFs completed the equity exposure for the last month of the fiscal year. The behavior of S&P 500 Index futures contracts and ETFs linked to the S&P 500 Index is determined principally by the performance of the S&P 500 Index. For the year ended October 31, 2008, total return was –33.77% for the Series and –33.31% for the S&P 500 Index. Relative to the S&P 500 Index, underperformance was mostly due to returns of the fi xed income securities in the Master Fund as well as differences in costs between the Portfolio and the Index.
The U.S. Large Cap Value Series
The U.S. Large Cap Value Series seeks to capture the returns of U.S. large company value stocks. The investment strategy employs a disciplined, quantitative approach, emphasizing broad diversification and consistent exposure to large cap value stocks, but does not attempt to track closely a specific equity index. The Series held approximately 210 stocks as of October 31, 2008, and was mostly invested in equities throughout the year: average cash levels for the 11 months ended October 31, 2008 were in general less than 1% of the Series' assets.
As a result of the Series' diversified investment approach, performance was determined principally by broad structural trends in the U.S. equity market, rather than by the behavior of a limited number of stocks. For the 11 months ended October 31, 2008, large company stocks generally underperformed small company stocks and value stocks generally outperformed growth stocks. Total returns were –33.31% for the S&P 500 Index®, –33.55% for the Russell 1000 Value Index® and –36.53% for the Series.
Relative to the Russell 1000 Value Index®, underperformance of the Series was primarily due to lower exposure to stocks with neutral value/growth characteristics as measured by book-to-market ("BtM") ratio, and weighting and composition differences of consumer discretionary and consumer staples stocks due to structural differences in eligible universe of the Series compared to the Index. Less value-oriented stocks in the middle BtM quartiles, which represented approximately 11% of the Series compared to approximately 47% of the Index, outperformed value stocks in the highest BtM quartile by more than 17 percentage points. Stocks held by the Series in the consumer discretionary sector, which represented approximately 16% of the Series compared to approximately 8% of the Index, underperformed similar stocks in the Index by about 8 percentage points. Stocks held by the Series in the consumer staples sector, which represented appr oximately 5% of the Series compared to 9% of the Index, underperformed similar stocks held by the Index by approximately 20 percentage points.
The U.S. Small Cap Value Series
The U.S. Small Cap Value Series seeks to capture the returns of U.S. small company value stocks. The investment strategy employs a disciplined, quantitative approach, emphasizing broad diversification and consistent exposure to small company value stocks, but does not attempt to track closely a specific equity index. As of October 31, 2008, the Series held about 2,130 stocks and was mostly invested in equities throughout the year: average cash levels for the 11 months ended October 31, 2008 were in general approximately 1% of the Series' assets.
211
As a result of the Series' diversified investment approach, performance was determined principally by broad structural trends in the U.S. equity market, rather than the behavior of a limited number of stocks. For the 11 months ended October 31, 2008, the size premium was not strong; micro cap and mid cap stocks underperformed large and small cap stocks. Value stocks generally outperformed growth stocks. Total returns were –29.07% for the Russell 2000 Index®, –24.91% for the Russell 2000 Value Index®,and –31.60% for the Series.
Relative to the Russell 2000 Value Index®, underperformance of the Series for the fiscal year was primarily due to its underperformance in the first five to six weeks of the third quarter following the annual reconstitution of the Russell indexes. During this period, declining financial stocks added to the Index reversed course and rallied while surging energy stocks removed from the Index slumped. The Series did not hold the same composition of financials and energy stocks as the Index and thus underperformed by more than 3 percentage points during this period. Composition differences among the largest and smallest stocks held in the Series compared to the Index and a greater exposure to stocks with the most pronounced value characteristics as measured by book-to-market ("BtM") ratio also contributed to the Series' underperformance. Micro cap stocks held by the Series, which accounted for approximately 34% of the Series compa red to 23% of the Index, underperformed similar size stocks held by the Index by approximately 6 percentage points. In addition, value stocks in the highest BtM quartile, which accounted for approximately 59% of the Series compared to approximately 39% of the Index, underperformed the Index by approximately 10 percentage points.
The U.S. Small Cap Series
The U.S. Small Cap Series seeks to capture the returns of U.S. small company stocks. The investment strategy employs a disciplined, quantitative approach, emphasizing broad diversification and consistent exposure to small company stocks, but does not attempt to track closely a specific equity index. As of October 31, 2008, the Series held approximately 2,480 stocks, and was mostly invested in equities throughout the year: average cash levels for the 11 months ended October 31, 2008 were in general less than 1% of the Series' assets.
As a result of the Series' diversified investment approach, performance was determined principally by broad structural trends in the U.S. equity market, rather than the behavior of a limited number of stocks. For the 11 months ended October 31, 2008, the size premium was not strong; micro cap and mid cap stocks underperformed large and small cap stocks. Value stocks generally outperformed growth stocks. Total returns were –29.07% for the Russell 2000 Index®, –33.59% for the Russell Microcap Index, and –30.44% for the Series. Relative to the Index, the underperformance of the Portfolio for the fiscal year was primarily due to the Portfolio's higher allocation to micro cap stocks, which underperformed small cap stocks, and the better performance of mid cap stocks in the benchmark.
The U.S. Micro Cap Series
The U.S. Micro Cap Series seeks to capture the returns of very small U.S. company stocks. The investment strategy employs a disciplined, quantitative approach, emphasizing broad diversification and consistent exposure to very small company stocks, but does not attempt to track closely a specific equity index. As of October 31, 2008, the Series held approximately 2,440 stocks, and was mostly invested in equities throughout the year: average cash levels for the 11 months ended October 31, 2008 were in general less than 1% of the Series' assets.
As a result of the Series' diversified investment approach, performance was determined principally by broad structural trends in the U.S. equity market, rather than by the behavior of a limited number of stocks. For the 11 months ended October 31, 2008, the size premium was not strong, micro cap and mid cap stocks underperformed large and small cap stocks and value stocks generally outperformed growth stocks.Within the broad universe of smaller capitalization stocks, mid caps outperformed micro caps. Total returns were –29.07% for the Index, –33.59% for the Russell Microcap Index, and –31.08% for the Series. Relative to the Russell 2000 Index®, the underperformance of the Series was primarily due to weighting differences among micro cap stocks held in the Series compared to the Index. Micro cap stocks, which accounted for approximately 58% of the Series compared to approximately 20% of the Index, underperformed the Index by approximately 4 percentage points.
212
International Equity Market Review 11 Months Ended October 31, 2008
International equity markets, affected by credit and liquidity problems similar to those experienced in the U.S., experienced high levels of volatility and broadly negative returns for the period under review. Due to the strengthening of the U.S. dollar vs. most developed countries' currencies (with the exception of the Japanese Yen and the Hong Kong dollar), the performance numbers when expressed in U.S. dollars were lower than when expressed in local currencies for all of the largest country constituents of the MSCI World ex USA Index, with the exception of Japan and Hong Kong. Overall, currency exchange rate changes reduced the returns expressed in U.S. dollars: total return for the MSCI World ex USA Index (net dividends) was –37.82% in local currency and –44.37% in U.S. dollars.
Total Returns for 11 Months Ended October 31, 2008
| Ten Largest Foreign Developed Markets by Market Cap (BB) | | Local
Currency
Return | | U.S. Dollar
Return | |
| Japan ($2,111) | | | –43.55 | % | | | –36.33 | % | |
| United Kingdom ($1,758) | | | –29.61 | % | | | –44.68 | % | |
| France ($872) | | | –36.80 | % | | | –45.40 | % | |
| Canada ($786) | | | –25.69 | % | | | –38.91 | % | |
| Germany ($705) | | | –37.97 | % | | | –46.42 | % | |
| Switzerland ($704) | | | –30.05 | % | | | –32.39 | % | |
| Australia ($513) | | | –35.10 | % | | | –51.58 | % | |
| Spain ($331) | | | –40.19 | % | | | –48.33 | % | |
| Italy ($301) | | | –43.34 | % | | | –51.06 | % | |
| Netherlands ($206) | | | –41.65 | % | | | –49.59 | % | |
Country market capitalizations (in parentheses) are in USD billions. Source: Returns are of MSCI indices net of foreign withholding taxes on dividends. Country market capitalizations are based on country carve-outs of the MSCI All-Country World Investable Market Index. MSCI data copyright MSCI 2008, all rights reserved.
Small company stocks were the poorest-performing asset classes in international markets, while large company growth stocks had the best relative results.
Total Returns for 11 Months Ended October 31, 2008
| | | U.S. Dollar
Return | |
| MSCI World ex USA Small Cap Index | | | –50.30 | % | |
| MSCI World ex USA Value Index | | | –45.31 | % | |
| MSCI World ex USA Index | | | –44.37 | % | |
| MSCI World ex USA Growth Index | | | –43.47 | % | |
Source: MSCI indices are net of foreign withholding taxes on dividends, copyright MSCI 2008, all rights reserved.
Losses in emerging markets were worse, on average, than in developed country markets, although results varied widely among individual countries. For the 11 months under review, total returns in U.S. dollars were –53.02% for the MSCI Emerging Markets Index (net dividends) and –44.37% for the MSCI World ex USA Index (net dividends).
213
Total Returns for 11 Months Ended October 31, 2008
| Country | | U.S. Dollar
Return | |
| Argentina | | | –55.00 | % | |
| Brazil | | | –51.21 | % | |
| Chile | | | –36.59 | % | |
| China | | | –59.33 | % | |
| Czech Republic | | | –40.25 | % | |
| Hungary | | | –58.65 | % | |
| India | | | –61.19 | % | |
| Indonesia | | | –59.87 | % | |
| Israel | | | –23.01 | % | |
| Malaysia | | | –40.52 | % | |
| Mexico | | | –44.05 | % | |
| Philippines | | | –49.76 | % | |
| Poland | | | –51.90 | % | |
| South Africa | | | –47.38 | % | |
| South Korea | | | –55.75 | % | |
| Taiwan | | | –43.57 | % | |
| Thailand | | | –51.81 | % | |
| Turkey | | | –59.24 | % | |
Source: Returns are of MSCI indices net of foreign withholding taxes on dividends, copyright MSCI 2008, all rights reserved.
International Equity Portfolio Performance Overview
The DFA International Value Series
The DFA International Value Series seeks to capture the returns of international large company value stocks. The investment strategy employs a disciplined, quantitative approach, emphasizing broad diversification and consistent exposure to large cap value stocks, but does not attempt to track closely a specific equity index. The Series held approximately 530 stocks in 22 developed-country markets, as of October 31, 2008, and essentially was fully invested in equities throughout the year: average cash levels for the 11 months ended October 31, 2008 were in general less than 1% of the Series' assets.
As a result of the Series' diversified investment approach, performance principally was determined by broad structural trends in global equity markets, rather than the behavior of a limited number of stocks. For the 11 months ended October 31, 2008, growth stocks generally outperformed value stocks in international markets. Total returns were –44.81% for the MSCI EAFE Index (net dividends), –44.37% for the MSCI World ex US Index (net dividends), and –47.87% for the Series. Relative to the MSCI World ex US Index (net dividends), the underperformance of the Series was primarily due to a greater allocation to value stocks in general and financial stocks in particular, both of which underperformed the Index. Value stocks, which accounted for approximately 69% of the Series compared to 28% of the Index, underperformed the Index by approximately 4 percentage points. Financials, which accounted for 44% of the Series compared to 25% o f the Index, underperformed the Index by approximately 8 percentage points. A lower allocation to health care stocks, which accounted for less than 1% of the Series compared to 6% of the Index and outperformed the Index by approximately 22 percentage points, also contributed to the underperformance.
The Japanese Small Company Series
The Japanese Small Company Series seeks to capture the returns of Japanese small company stocks. The investment strategy employs a disciplined, quantitative approach, emphasizing broad diversification and consistent exposure to small company stocks, but does not attempt to track closely a specific equity index. As of October 31, 2008, the Series held approximately 1,240 stocks and average cash levels for the 11 months ended October 31, 2008 were in general less than 1% of the Series' assets.
214
As a result of the Series' diversified investment approach, performance was determined principally by broad structural trends in the Japanese equity market, rather than the behavior of a limited number of stocks. For the 11 months ended October 31, 2008, Japanese small company stocks outperformed Japanese large company stocks. Total returns were –36.36% for the MSCI Japan Large Cap Index (net dividends), –33.92% for the MSCI Japan Small Cap Index (net dividends), –35.17% for the MSCI Japan Small Cap Index (price-only) and –26.87% for the Series. The Index net of foreign withholding taxes on dividends does not have ten years of performance. The Series intends to include the price-only Index for performance comparison purposes until the net-dividends Index has at least ten years of data to report.
Relative to the MSCI Japan Small Cap Index (net dividends), the better relative performance of the Series was due to a larger allocation to value stocks, which outperformed the Index by approximately 10 percentage points. Value stocks held by the Series, which accounted for approximately 21% of the Series compared to 13% of the Index, outperformed similar stocks in the Index by approximately 5 percentage points. Small cap and micro cap stocks held by the Series outperformed similar stocks in the MSCI Japan Small Cap Index (net dividends), which also contributed to the Series' better performance.
The Asia Pacific Small Company Series
The Asia Pacific Small Company Series seeks to capture the returns of small company stocks in developed Asia Pacific markets, excluding Japan. The investments strategy employs a disciplined, quantitative approach, emphasizing broad diversification and consistent exposure to small company stocks, but does not attempt to track closely a specific equity index. As of October 31, 2008, the Series held approximately 950 stocks, and assets were allocated mainly among four countries: Australia, Hong Kong, New Zealand, and Singapore (approximately 62%, 17%, 8%, and 12%, respectively). Country allocations are determined by utilizing the approximate weights of individual securities within a universe of Asia Pacific small company stocks. The allocations do not represent a forecast of future performance and are subject to change. Average cash levels for the 11 months ended October 31, 2008 were in general approximately 1% of the Series' assets.
As a result of the Series' diversified investment approach, performance was determined principally by broad structural trends in Asia Pacific equity markets rather than the behavior of a limited number of stocks. For the 11 months ended October 31, 2008, Asia Pacific small company stocks underperformed Asia Pacific large company stocks. Total returns were –50.78% for the MSCI Pacific ex Japan Large Cap Index (net dividends), –62.96% for the MSCI Pacific ex Japan Small Cap Index (net dividends), –64.17% for the MSCI Pacific ex Japan Small Cap Index (price-only), and –57.75% for the Series. The Index net of foreign withholding taxes on dividends does not have ten years of performance. The Series intends to include the price-only Index for performance comparison purposes until the net-dividends Index has at least ten years of data to report.
Relative to the MSCI Pacific ex Japan Small Company Index (net dividends), the better relative performance of the Series was primarily due to composition differences among stocks with larger market capitalizations. Small cap stocks with higher market capitalizations held by the Series outperformed similar size stocks held by the Index by approximately 6 percentage points. The Series' larger allocation to energy stocks, which comprised about 10% of the Series compared to 8% of the Index and outperformed the overall Index, also contributed to its better performance.
The United Kingdom Small Company Series
The United Kingdom Small Company Series seeks to capture the returns of U.K. small company stocks. The investment strategy employs a disciplined, quantitative approach, emphasizing broad diversification and consistent exposure to small company stocks, but does not attempt to track closely a specific equity index. As of October 31, 2008, the Series held approximately 380 stocks and average cash levels for the 11 months ended October 31, 2008 were in general approximately 1% of the Series' assets.
As a result of the Series' diversified investment approach, performance was determined principally by broad structural trends in the U.K. equity market, rather than the behavior of a limited number of stocks. For the 11 months ended October 31, 2008, U.K. small company stocks underperformed U.K. large company stocks. Total returns were –43.64% for the MSCI U.K. Large Cap Index (net dividends), –53.13% for the MSCI U.K. Small Cap Index (net dividends), –54.52% for the MSCI U.K. Small Cap Index (price-only) and –50.77% for the Series. The Index net of foreign withholding
215
taxes on dividends does not have ten years of performance. The Series intends to include the price-only Index for performance comparison purposes until the net-dividends Index has at least ten years of data to report.
Relative to the MSCI U.K. Small Cap Index (net dividends), the better relative performance of the Series was primarily due to the lower allocation by the Portfolio to financials, 13% vs. 17%. Financial stocks held by the Portfolio outperformed similar stocks in the Index by approximately 5 percentage points.
The Continental Small Company Series
The Continental Small Company Series seeks to capture the returns of small company stocks in developed markets of Europe, excluding the U.K., by purchasing shares of The Continental Small Company Series, a Series that invests in such stocks. The investment strategy employs a disciplined, quantitative approach, emphasizing broad diversification and consistent exposure to small company stocks, but does not attempt to track closely a specific equity index. As of October 31, 2008, the Series held approximately 1,150 stocks in 15 developed continental European countries and average cash levels for the 11 months ended October 31, 2008 were in general less than 1% of the Master Fund's assets. Country allocations reflect the approximate weights of individual securities within a universe of continental European small company stocks. Country allocations do not represent a forecast of future performance and are subject to change.
As a result of the Series' diversified investment approach, performance was determined principally by broad structural trends in the continental European equity markets, excluding the U.K., rather than the behavior of a limited number of stocks. For the 11 months ended October 31, 2008, continental European small company stocks underperformed continental European large company stocks. Total returns were –47.06% for the large cap MSCI Europe ex U.K. Index (net dividends), –54.30% for the MSCI Europe ex U.K Small Cap Index (net dividends), –55.24% for the MSCI Europe ex U.K Small Cap Index (price-only), and –49.66% for the Series. The Index net of foreign withholding taxes on dividends does not have ten years of performance. The Series intends to include the price-only Index for performance comparison purposes until the net-dividends Index has at least ten years of data to report.
Relative to the MSCI Europe ex U.K. Small Cap Index (net dividends), the better performance of the Series was primarily due to composition differences for financial and industrial stocks. Financial stocks held by the Series outperformed those held by the Index by approximately 13 percentage points, while industrial stocks held by the Series outperformed similar stocks in the Index by approximately 4 percentage points.
The Canadian Small Company Series
The Canadian Small Company Series seeks to capture the returns of Canadian small company stocks. The investment strategy employs a disciplined, quantitative approach, emphasizing broad diversification and consistent exposure to small company stocks, but does not attempt to track closely a specific equity index. As of October 31, 2008, the Series held approximately 330 stocks, and was mostly invested in equities throughout the year: the average cash levels for the 11 months ended October 31, 2008 were in general approximately 1% of the Series' assets.
As a result of the Series' diversified investment approach, performance was determined principally by broad structural trends in the Canadian equity market, rather than the behavior of a limited number of stocks. For the 11 months ended October 31, 2008, Canadian small company stocks underperformed Canadian large company stocks. Total returns were –38.53% for the MSCI Canada Large Cap Index (net dividends), –53.63% for the MSCI Canada Small Cap Index (net dividends), –54.48% for the MSCI Canada Small Cap Index (price-only) and –56.44% for the Series. The Index net of foreign withholding taxes on dividends does not have ten years of performance. The Series intends to include the price-only Index for performance comparison purposes until the net-dividends Index has at least ten years of data to report.
Relative to the MSCI Canada Small Cap Index (net dividends), underperformance of the Series was primarily due to a greater allocation to materials stocks than the Index and a lower allocation to energy stocks. Materials stocks, which accounted for approximately 35% of the Series compared to 27% of the Index, underperformed the Index by approximately 15 percentage points. Energy stocks, which accounted for 24% of the Series compared to 30% of the Index, outperformed the Index by approximately 10 percentage points.
216
The Emerging Markets Series
The Emerging Markets Series seeks to capture the returns of large company stocks in selected emerging markets. The investment strategy employs a disciplined, quantitative approach, emphasizing broad diversification and consistent exposure to large company emerging markets stocks, but does not attempt to track closely a specific equity index. As of October 31, 2008, the Series held approximately 520 stocks in 17 emerging countries, and average cash levels for the 11 months ended October 31, 2008 were in general less than 1% of the Series' assets.
As a result of the Series' diversified approach, performance was determined principally by broad structural trends in emerging country stock markets, rather than the behavior of a limited number of stocks. For the 11 months ended October 31, 2008, total returns were –52.88% for the MSCI Emerging Markets Index (gross dividends), –53.02% for the MSCI Emerging Markets Index (net dividends), and –48.15% for the Series. The Index net of foreign withholding taxes on dividends does not have ten years of performance. The Series intends to include the Index gross of foreign withholding taxes on dividends for performance comparison purposes until the net-dividends Index has at least ten years of data to report.
Relative to the MSCI Emerging Markets Index (net dividends), the better performance of the Series was primarily due to a lower allocation to China and Russia, which underperformed the overall Index, and a greater allocation to Mexico and Israel, which outperformed the Index. On average, Chinese stocks represented approximately 7% of the Series for the period under review compared to 15% in the Index. The Series does not purchase Russian stocks, which represented approximately 10% of the Index. Israeli stocks represented approximately 4% of the Series, compared to 2% of the Index; while Mexican stocks represented approximately 9% of the Series, compared to 5% of the Index.
The Emerging Markets Small Cap Series
The Emerging Markets Small Cap Series seeks to capture the returns of small company stocks in selected emerging markets. The investment strategy employs a disciplined, quantitative approach, emphasizing broad diversification and consistent exposure to emerging markets small company stocks, but does not attempt to track closely a specific equity index. As of October 31, 2008, the Series held approximately 1,840 stocks in 16 emerging countries, and average cash levels for the 11 months ended October 31, 2008 were in general less than 1% of the Series' assets.
As a result of the Series' diversified investment approach, performance was determined principally by broad structural trends in emerging country stock markets, rather than the behavior of a limited number of stocks. For the 11 months ended October 31, 2008, emerging markets small company stocks generally underperformed emerging markets large company stocks. Total returns were –52.88% for the MSCI Emerging Markets Index (gross dividends), –53.02% for the MSCI Emerging Markets Index (net dividends), and –56.84% for the Series. The Index net of foreign withholding taxes on dividends does not have ten years of performance. The Series intends to include the Index gross of foreign withholding taxes on dividends for performance comparison purposes until the net-dividends Index has at least ten years of data to report.
Relative to the MSCI Emerging Markets Index (net dividends), underperformance of the Series was primarily due to a greater allocation to stocks with lower market capitalizations, which underperformed the Index. On average, small cap stocks with lower market capitalizations represented approximately 64% of the Series for the period under review, compared to 3% in the Index.
Fixed Income Market Review 11 Months Ended October 31, 2008
U.S. and international credit markets experienced extreme levels of volatility in the fiscal year ended October 31, 2008, as defaults in the subprime and related mortgage markets and the subsequent bankruptcy of leading underwriter Lehman Brothers caused credit spreads to widen sharply. Risk aversion caused a severe tightening of credit across all maturities and quality ranges both in the U.S. and international fixed income markets and a spike in interbank lending rates. To encourage lending, the U.S. Federal Reserve lowered the target rate for federal funds from 4.50% on November 30, 2007 to 1.00% by October 31, 2008 and pumped billions of dollars of liquidity into the financial system through various loan programs and capital injections into banks. Central banks around the world took similar actions to loosen credit markets. The three-month London Interbank Offered Rate ("LIBOR"), a widely used benchmark of short-term interest rates,
217
spiked sharply higher late in the period but fell 210 basis points during the 11 months ended October 31, 2008, while the yield on ten-year U.S. Treasury notes rose just 1 basis point. The yield curve, V-shaped to start the year, ended the year with an upward slope as yields on short-term instruments fell below those with longer maturities.
| | | 11/30/07 | | 10/31/08 | | Change | |
| Three-Month LIBOR (yield) | | | 5.13 | % | | | 3.03 | % | | | –41.02 | % | |
| Ten-Year U.S. Treasury Notes (yield) | | | 3.94 | % | | | 3.95 | % | | | 0.30 | % | |
Source: Bloomberg. "Change" values are calculated prior to rounding.
There is generally an inverse relationship between interest rates and bond prices, such that bond prices fall when interest rates rise. For the fiscal year under review, changes in interest rates and bond prices were more pronounced in some parts of the yield curve than others. As a result of an extreme flight to higher-quality debt in the aftermath of the bank and mortgage crisis, total return for fixed income strategies was primarily a function of credit quality. For the 11 months ended October 31, 2008, total returns were 2.24% for three-month U.S. Treasury bills, 7.25% for five-year U.S. Treasury notes, and 5.02% for thirty-year U.S. Treasury bonds.
Some of the Advisor's fixed income strategies are based on a shifting-maturity strategy that identifies the maturity range with the highest risk-adjusted expected return. When the yield curve is flat or inverted, short-term securities are believed to offer the most attractive opportunity on a risk-adjusted basis. When the yield curve is upwardly sloped, maturities are lengthened to achieve higher returns associated with longer maturities. During the period under review, weighted average maturities of most Portfolios lengthened, reflecting upwardly sloped yield curves in the U.S.
Fixed Income Portfolio Performance Overview
The DFA One-Year Fixed Income Series
The DFA One-Year Fixed Income Series seeks to maximize risk-adjusted total returns from a universe of high-quality fixed income securities with an average maturity of one year or less. The investment strategy shifts maturities based on changes in the yield curve. Using current prices, the strategy creates a matrix of expected returns from different buy and sell strategies, and identifies the maturity range for the highest risk-adjusted expected returns according to the variable maturity model. Maturities are shifted if premiums can be documented. The average maturity of the Series increased during the 11 months under review, from approximately 30 days on November 30, 2007, to 265 days on October 31, 2008.
For the 11 months ended October 31, 2008, total returns were 2.79% for the Series, 3.34% for the for the Merrill Lynch Six-Month US Treasury Bill Index, and 3.84% for the Merrill Lynch One-Year US Treasury Note Index. The Series underperformed both Indexes primarily due to structural differences with the Indexes. The Series had high exposure to corporate and agency debt, which underperformed Treasury debt during the period of significantly widening credit spreads.
The DFA Two-Year Global Fixed Income Series
The DFA Two-Year Global Fixed Income Series seeks to maximize risk-adjusted total returns from a universe of U.S. and foreign government securities, high quality corporate securities, and currency-hedged global fixed income instruments, maturing in two years or less. Eligible countries include but are not limited to the Australia, Canada, Denmark, France, Germany, Japan, the Netherlands, Sweden, Switzerland, the United Kingdom, and the United States. The investment strategy shifts maturities based on changes in the yield curve. Using current prices, the strategy creates a matrix of expected returns from different buy and sell strategies, and identifies the maturity range for the highest risk adjusted expected returns according to the variable maturity model. Maturities are shifted if premiums can be documented. The average maturity of the Series increased from 0.46 years on November 30, 2007 to 0.74 years on October 31, 2008.
For the 11 months ended October 31, 2008, total returns were 3.02% for the Series and 4.38% for the Citigroup World Government Bond Index 1-3 Years (hedged). Relative to the Index, underperformance of the Series was primarily due to structural and maturity differences with the Index. A higher exposure to corporate debt, which underperformed government debt as credit spreads widened significantly, led to the underperformance relative to the government-only benchmark. The Series had a duration of 0.73 on October 31, 2008 compared to 1.84 years for the Index, which limited returns in the falling interest rate environment.
218
THE DFA INVESTMENT TRUST COMPANY
DISCLOSURE OF FUND EXPENSES
(Unaudited)
The following Expense Tables are shown so that you can understand the impact of fees on your investment. All mutual funds have operating expenses. As a shareholder of the fund, you incur ongoing costs, which include costs for portfolio management, administrative services, and shareholder reports, among others. Operating expenses, legal and audit services, which are deducted from a fund's gross income, directly reduce the investment return of the fund. A fund's expenses are expressed as a percentage of its average net assets. This figure is known as the expense ratio. The following examples are intended to help you understand the ongoing costs, in dollars, of investing in the fund and to compare these costs with those of other mutual funds. The examples are based on an investment of $1,000 made at the beginning of the period shown and held for the entire period.
The Expense Tables below illustrate your fund's costs in two ways.
Actual Fund Return
This section helps you to estimate the actual expenses after fee waivers that you paid over the period. The "Ending Account Value" shown is derived from the fund's actual return and "Expenses Paid During Period" reflect the dollar amount that would have been paid by an investor who started with $1,000 in the fund. You may use the information here, together with the amount you invested, to estimate the expenses that you paid over the period.
To do so, simply divide your account value by $1,000 (for example, a $7,500 account value divided by $1,000 = 7.5), then multiply the result by the number given for your fund under the heading "Expenses Paid During Period."
Hypothetical Example for Comparison Purposes
This section is intended to help you compare your fund's costs with those of other mutual funds. The hypothetical "Ending Account Value" and "Expenses Paid During Period" are derived from the fund's actual expense ratio and an assumed 5% annual return before expenses. In this case, because the return used is not the fund's actual return, the results do not apply to your investment. The example is useful in making comparisons because the SEC requires all mutual funds to calculate expenses based on a 5% annual return. You can assess your fund's cost by comparing this hypothetical example with the hypothetical examples that appear in shareholder reports of other funds.
Please note that the expenses shown in the tables are meant to highlight and help you compare ongoing costs only and do not reflect any transactional costs, if applicable. The "Annualized Expense Ratio" represents the actual expenses for the six-month period indicated.
Six Months Ended October 31, 2008
EXPENSE TABLES
| The U.S. Large Company Series | | Beginning
Account
Value
05/01/08 | | Ending
Account
Value
10/31/08 | | Annualized
Expense
Ratio* | | Expenses
Paid
During
Period* | |
| Actual Fund Return | | $ | 1,000.00 | | | $ | 709.20 | | | | 0.04 | % | | $ | 0.17 | | |
| Hypothetical 5% Annual Return | | $ | 1,000.00 | | | $ | 1,024.94 | | | | 0.04 | % | | $ | 0.20 | | |
| The Enhanced U.S. Large Company Series | |
| Actual Fund Return | | $ | 1,000.00 | | | $ | 704.50 | | | | 0.08 | % | | $ | 0.34 | | |
| Hypothetical 5% Annual Return | | $ | 1,000.00 | | | $ | 1,024.73 | | | | 0.08 | % | | $ | 0.41 | | |
219
| The U.S. Large Cap Value Series | | Beginning
Account
Value
05/01/08 | | Ending
Account
Value
10/31/08 | | Annualized
Expense
Ratio* | | Expenses
Paid
During
Period* | |
| Actual Fund Return | | $ | 1,000.00 | | | $ | 648.60 | | | | 0.11 | % | | $ | 0.46 | | |
| Hypothetical 5% Annual Return | | $ | 1,000.00 | | | $ | 1,024.58 | | | | 0.11 | % | | $ | 0.56 | | |
| The U.S. Small Cap Value Series | |
| Actual Fund Return | | $ | 1,000.00 | | | $ | 722.90 | | | | 0.21 | % | | $ | 0.91 | | |
| Hypothetical 5% Annual Return | | $ | 1,000.00 | | | $ | 1,024.08 | | | | 0.21 | % | | $ | 1.07 | | |
| The U.S. Small Cap Series | |
| Actual Fund Return | | $ | 1,000.00 | | | $ | 746.70 | | | | 0.04 | % | | $ | 0.18 | | |
| Hypothetical 5% Annual Return | | $ | 1,000.00 | | | $ | 1,024.94 | | | | 0.04 | % | | $ | 0.20 | | |
| The U.S. Micro Cap Series | |
| Actual Fund Return | | $ | 1,000.00 | | | $ | 751.90 | | | | 0.11 | % | | $ | 0.48 | | |
| Hypothetical 5% Annual Return | | $ | 1,000.00 | | | $ | 1,024.58 | | | | 0.11 | % | | $ | 0.56 | | |
| The DFA International Value Series | |
| Actual Fund Return | | $ | 1,000.00 | | | $ | 555.50 | | | | 0.23 | % | | $ | 0.90 | | |
| Hypothtical 5% Annual Return | | $ | 1,000.00 | | | $ | 1,023.98 | | | | 0.23 | % | | $ | 1.17 | | |
| The Japanese Small Company Series | |
| Actual Fund Return | | $ | 1,000.00 | | | $ | 786.90 | | | | 0.13 | % | | $ | 0.58 | | |
| Hypothetical 5% Annual Return | | $ | 1,000.00 | | | $ | 1,024.48 | | | | 0.13 | % | | $ | 0.66 | | |
| The Asia Pacific Small Company Series | |
| Actual Fund Return | | $ | 1,000.00 | | | $ | 455.10 | | | | 0.15 | % | | $ | 0.55 | | |
| Hypothetical 5% Annual Return | | $ | 1,000.00 | | | $ | 1,024.38 | | | | 0.15 | % | | $ | 0.76 | | |
| The United Kingdom Small Company Series | |
| Actual Fund Return | | $ | 1,000.00 | | | $ | 542.10 | | | | 0.12 | % | | $ | 0.47 | | |
| Hypothetical 5% Annual Return | | $ | 1,000.00 | | | $ | 1,024.53 | | | | 0.12 | % | | $ | 0.61 | | |
| The Continental Small Company Series | |
| Actual Fund Return | | $ | 1,000.00 | | | $ | 520.70 | | | | 0.14 | % | | $ | 0.54 | | |
| Hypothetical 5% Annual Return | | $ | 1,000.00 | | | $ | 1,024.43 | | | | 0.14 | % | | $ | 0.71 | | |
| The Canadian Small Company Series | |
| Actual Fund Return | | $ | 1,000.00 | | | $ | 455.40 | | | | 0.17 | % | | $ | 0.62 | | |
| Hypothetical 5% Annual Return | | $ | 1,000.00 | | | $ | 1,024.28 | | | | 0.17 | % | | $ | 0.87 | | |
| The Emerging Markets Series | |
| Actual Fund Return | | $ | 1,000.00 | | | $ | 531.80 | | | | 0.18 | % | | $ | 0.69 | | |
| Hypothetical 5% Annual Return | | $ | 1,000.00 | | | $ | 1,024.23 | | | | 0.18 | % | | $ | 0.92 | | |
| The Emerging Markets Small Cap Series | |
| Actual Fund Return | | $ | 1,000.00 | | | $ | 465.70 | | | | 0.31 | % | | $ | 1.14 | | |
| Hypothetical 5% Annual Return | | $ | 1,000.00 | | | $ | 1,023.58 | | | | 0.31 | % | | $ | 1.58 | | |
220
| The DFA One-Year Fixed Income Series | | Beginning
Account
Value
05/01/08 | | Ending
Account
Value
10/31/08 | | Annualized
Expense
Ratio* | | Expenses
Paid
During
Period* | |
| Actual Fund Return | | $ | 1,000.00 | | | $ | 1,013.00 | | | | 0.07 | % | | $ | 0.35 | | |
| Hypothetical 5% Annual Return | | $ | 1,000.00 | | | $ | 1,024.78 | | | | 0.07 | % | | $ | 0.36 | | |
| The DFA Two-Year Global Fixed Income Series | |
| Actual Fund Return | | $ | 1,000.00 | | | $ | 1,014.20 | | | | 0.07 | % | | $ | 0.35 | | |
| Hypothetical 5% Annual Return | | $ | 1,000.00 | | | $ | 1,024.78 | | | | 0.07 | % | | $ | 0.36 | | |
* Expenses are equal to the fund's annualized expense ratio for the six-month period, multiplied by the average account value over the period, multiplied by the number of days in the most recent six-month period (184), then divided by the number of days in the year (366) to reflect the six-month period.
221
THE DFA INVESTMENT TRUST COMPANY
DISCLOSURE OF PORTFOLIO HOLDINGS
(Unaudited)
The SEC requires that all Funds file a complete Schedule of Investments with the SEC for their first and third fiscal quarters on Form N-Q. For The DFA Investment Trust Company, this would be for the fiscal quarters ending January 31 and July 31. The Form N-Q filing must be made within 60 days of the end of the quarter. The DFA Investment Trust Company filed its most recent Form N-Q with the SEC on October 30, 2008. It is available upon request, without charge, by calling collect: (310) 395-8005 or by mailing a request to Dimensional Fund Advisors LP, 1299 Ocean Avenue, Santa Monica, California 90401, or by visiting the SEC's website at http://www.sec.gov, or they may be reviewed and copied at the SEC's Public Reference Room in Washington, D.C. (call 1-800-732-0330 for information on the operation of the Public Reference Room).
SEC regulations permit a fund to include in its reports to shareholders a "Summary Schedule of Portfolio Holdings" in lieu of a full Schedule of Investments. The Summary Schedule of Portfolio Holdings reports the fund's 50 largest holdings in unaffiliated issuers and any investments that exceed one percent of the fund's net assets at the end of the reporting period. The amendments also require that the Summary Schedule of Portfolio Holdings identify each category of investments that are held.
The fund is required to file a complete Schedule of Investments with the SEC on Form N-CSR within ten days after mailing the annual and semi-annual reports to shareholders. It will be available upon request, without charge, by calling collect: (310) 395-8005 or by mailing a request to Dimensional Fund Advisors LP, 1299 Ocean Avenue, Santa Monica, California 90401, or by visiting the SEC's website at http://www.sec.gov, or they may be reviewed and copied at the SEC's Public Reference Room in Washington, D.C. (call 1-800-732-0330 for information on the operation of the Public Reference Room).
PORTFOLIO HOLDINGS
The SEC requires that all Funds present their categories of portfolio holdings in a table, chart or graph format in their annual and semi-annual shareholder reports, whether or not a Schedule of Investments is utilized. The following table, which presents portfolio holdings as a percent of total investments before short-term investments and collateral for loaned securities, is provided in compliance with such requirement. The categories shown below represent broad industry sectors. Each industry sector consists of one or more specific industry classifications.
222
DOMESTIC AND INTERNATIONAL EQUITY PORTFOLIOS
| | | Consumer
Discretionary | | Consumer
Staples | | Energy | | Financials | | Health
Care | | Industrials | | Information
Technology | |
The U.S. Large Company
Series | | | 8.2 | % | | | 12.9 | % | | | 13.2 | % | | | 13.9 | % | | | 13.8 | % | | | 11.0 | % | | | 15.8 | % | |
The U.S. Large Cap Value
Series | | | 12.6 | % | | | 5.5 | % | | | 15.1 | % | | | 30.8 | % | | | 1.8 | % | | | 17.4 | % | | | 4.6 | % | |
The U.S. Small Cap Value
Series | | | 14.4 | % | | | 3.4 | % | | | 5.6 | % | | | 27.5 | % | | | 7.2 | % | | | 19.0 | % | | | 17.3 | % | |
| The U.S. Small Cap Series | | | 17.0 | % | | | 4.1 | % | | | 4.4 | % | | | 18.3 | % | | | 12.5 | % | | | 18.2 | % | | | 17.1 | % | |
| The U.S. Micro Cap Series | | | 14.7 | % | | | 5.4 | % | | | 3.9 | % | | | 20.0 | % | | | 12.4 | % | | | 17.1 | % | | | 19.1 | % | |
The DFA International Value
Series | | | 12.2 | % | | | 5.1 | % | | | 5.5 | % | | | 41.4 | % | | | 0.5 | % | | | 10.0 | % | | | 3.6 | % | |
The Japanese Small
Company Series | | | 20.8 | % | | | 11.5 | % | | | 1.4 | % | | | 10.7 | % | | | 4.7 | % | | | 27.6 | % | | | 10.8 | % | |
The Asia Pacific Small
Company Series | | | 20.7 | % | | | 6.4 | % | | | 9.4 | % | | | 12.3 | % | | | 8.7 | % | | | 21.5 | % | | | 4.5 | % | |
The United Kingdom Small
Company Series | | | 17.0 | % | | | 4.4 | % | | | 6.7 | % | | | 16.8 | % | | | 3.5 | % | | | 34.0 | % | | | 12.1 | % | |
The Continental Small
Company Series | | | 14.3 | % | | | 8.3 | % | | | 3.4 | % | | | 18.7 | % | | | 8.8 | % | | | 25.2 | % | | | 8.1 | % | |
The Canadian Small
Company Series | | | 13.7 | % | | | 3.3 | % | | | 22.5 | % | | | 8.4 | % | | | 7.0 | % | | | 7.8 | % | | | 8.8 | % | |
| The Emerging Markets Series | | | 6.8 | % | | | 9.9 | % | | | 11.1 | % | | | 16.8 | % | | | 4.8 | % | | | 8.1 | % | | | 11.8 | % | |
The Emerging Small Cap
Series | | | 18.0 | % | | | 12.5 | % | | | 1.1 | % | | | 13.7 | % | | | 4.2 | % | | | 17.5 | % | | | 9.6 | % | |
| | | Materials | | REITs | | Telecommunication
Services | | Utilities | | Other | | Total | |
The U.S. Large Company
Series | | | 3.1 | % | | | 1.0 | % | | | 3.3 | % | | | 3.8 | % | | | — | | | | 100.0 | % | |
The U.S. Large Cap Value
Series | | | 3.4 | % | | | — | | | | 8.7 | % | | | 0.1 | % | | | — | | | | 100.0 | % | |
The U.S. Small Cap Value
Series | | | 4.5 | % | | | — | | | | 0.4 | % | | | 0.7 | % | | | — | | | | 100.0 | % | |
| The U.S. Small Cap Series | | | 4.4 | % | | | — | | | | 0.7 | % | | | 3.2 | % | | | 0.1 | % | | | 100.0 | % | |
| The U.S. Micro Cap Series | | | 4.1 | % | | | — | | | | 1.0 | % | | | 2.3 | % | | | — | | | | 100.0 | % | |
The DFA International Value
Series | | | 9.3 | % | | | — | | | | 9.0 | % | | | 3.4 | % | | | — | | | | 100.0 | % | |
The Japanese Small
Company Series | | | 11.3 | % | | | — | | | | — | | | | 1.0 | % | | | 0.2 | % | | | 100.0 | % | |
The Asia Pacific Small
Company Series | | | 10.4 | % | | | 0.2 | % | | | 1.6 | % | | | 4.3 | % | | | — | | | | 100.0 | % | |
The United Kingdom Small
Company Series | | | 3.7 | % | | | 0.4 | % | | | 0.7 | % | | | 0.7 | % | | | — | | | | 100.0 | % | |
The Continental Small
Company Series | | | 8.8 | % | | | — | | | | 0.9 | % | | | 3.5 | % | | | — | | | | 100.0 | % | |
The Canadian Small
Company Series | | | 27.5 | % | | | — | | | | — | | | | 1.0 | % | | | — | | | | 100.0 | % | |
| The Emerging Markets Series | | | 14.2 | % | | | — | | | | 11.4 | % | | | 4.9 | % | | | 0.2 | % | | | 100.0 | % | |
The Emerging Small Cap
Series | | | 18.5 | % | | | — | | | | 0.7 | % | | | 4.0 | % | | | 0.2 | % | | | 100.0 | % | |
FIXED INCOME PORTFOLIOS
| | | Corporate | | Government | | Foreign
Corporate | | Foreign
Government | | Muni
Insured | |
The Enhanced U.S. Large
Company Series | | | 38.3 | % | | | 37.4 | % | | | 14.8 | % | | | 9.5 | % | | | — | | |
The DFA One-Year Fixed Income
Series | | | 18.4 | % | | | 37.4 | % | | | 41.0 | % | | | 3.2 | % | | | — | | |
The DFA Two-Year Global Fixed
Income Series | | | 21.8 | % | | | 29.9 | % | | | 38.0 | % | | | 8.7 | % | | | — | | |
| | | Muni G.O.
Local | | Muni G.O.
State | | Muni
Revenue | | Supranational | | Total | |
The Enhanced U.S. Large
Company Series | | | — | | | | — | | | | — | | | | — | | | | 100.0 | % | |
The DFA One-Year Fixed Income
Series | | | — | | | | — | | | | — | | | | — | | | | 100.0 | % | |
The DFA Two-Year Global Fixed
Income Series | | | — | | | | — | | | | — | | | | 1.6 | % | | | 100.0 | % | |
223
THE U.S. LARGE COMPANY SERIES
SUMMARY SCHEDULE OF PORTFOLIO HOLDINGS
October 31, 2008
| | | Shares | | Value† | | Percentage
of Net Assets** | |
| COMMON STOCKS — (80.9%) | |
| Consumer Discretionary — (6.8%) | |
| Comcast Corp. Class A | | | 1,109,388 | | | $ | 17,483,955 | | | | 0.5 | % | |
| Disney (Walt) Co. | | | 713,351 | | | | 18,475,791 | | | | 0.6 | % | |
| # Home Depot, Inc. | | | 645,698 | | | | 15,232,016 | | | | 0.5 | % | |
| # McDonald's Corp. | | | 427,563 | | | | 24,768,725 | | | | 0.8 | % | |
| Other Securities | | | | | | | 194,135,666 | | | | 5.9 | % | |
| Total Consumer Discretionary | | | | | | | 270,096,153 | | | | 8.3 | % | |
| Consumer Staples — (10.4%) | |
| Altria Group, Inc. | | | 783,038 | | | | 15,026,499 | | | | 0.5 | % | |
| # Anheuser-Busch Companies, Inc. | | | 273,354 | | | | 16,956,149 | | | | 0.5 | % | |
| # Coca-Cola Co. | | | 755,726 | | | | 33,297,288 | | | | 1.0 | % | |
| # CVS Caremark Corp. | | | 545,607 | | | | 16,722,855 | | | | 0.5 | % | |
| Kraft Foods, Inc. | | | 577,134 | | | | 16,817,685 | | | | 0.5 | % | |
| PepsiCo, Inc. | | | 595,156 | | | | 33,929,844 | | | | 1.0 | % | |
| Philip Morris International, Inc. | | | 783,600 | | | | 34,063,092 | | | | 1.0 | % | |
| Procter & Gamble Co. | | | 1,153,540 | | | | 74,449,472 | | | | 2.3 | % | |
| # Wal-Mart Stores, Inc. | | | 852,470 | | | | 47,576,351 | | | | 1.5 | % | |
| Other Securities | | | | | | | 125,064,458 | | | | 3.8 | % | |
| Total Consumer Staples | | | | | | | 413,903,693 | | | | 12.6 | % | |
| Energy — (10.6%) | |
| # Chevron Corp. | | | 781,038 | | | | 58,265,435 | | | | 1.8 | % | |
| ConocoPhillips | | | 577,777 | | | | 30,055,960 | | | | 0.9 | % | |
| Exxon Mobil Corp. | | | 1,974,580 | | | | 146,355,870 | | | | 4.5 | % | |
| Occidental Petroleum Corp. | | | 310,624 | | | | 17,252,057 | | | | 0.5 | % | |
| # Schlumberger, Ltd. | | | 456,045 | | | | 23,554,724 | | | | 0.7 | % | |
| Other Securities | | | | | | | 148,426,806 | | | | 4.5 | % | |
| Total Energy | | | | | | | 423,910,852 | | | | 12.9 | % | |
| Financials — (11.3%) | |
| Bank of America Corp. | | | 1,906,573 | | | | 46,081,869 | | | | 1.4 | % | |
| # Citigroup, Inc. | | | 2,070,150 | | | | 28,257,547 | | | | 0.9 | % | |
| JPMorgan Chase & Co. | | | 1,400,511 | | | | 57,771,079 | | | | 1.8 | % | |
| The Goldman Sachs Group, Inc. | | | 165,164 | | | | 15,277,670 | | | | 0.5 | % | |
| # U.S. Bancorp | | | 662,268 | | | | 19,742,209 | | | | 0.6 | % | |
| # Wells Fargo & Co. | | | 1,257,952 | | | | 42,833,266 | | | | 1.3 | % | |
| Other Securities | | | | | | | 241,149,085 | | | | 7.3 | % | |
| Total Financials | | | | | | | 451,112,725 | | | | 13.8 | % | |
| Health Care — (11.2%) | |
| Abbott Laboratories | | | 586,042 | | | | 32,320,216 | | | | 1.0 | % | |
| * Amgen, Inc. | | | 402,228 | | | | 24,089,435 | | | | 0.7 | % | |
| # Bristol-Myers Squibb Co. | | | 752,581 | | | | 15,465,540 | | | | 0.5 | % | |
| #* Gilead Sciences, Inc. | | | 349,719 | | | | 16,034,616 | | | | 0.5 | % | |
| # Johnson & Johnson | | | 1,062,370 | | | | 65,165,776 | | | | 2.0 | % | |
| # Medtronic, Inc. | | | 428,938 | | | | 17,299,070 | | | | 0.5 | % | |
| # Merck & Co., Inc. | | | 814,494 | | | | 25,208,589 | | | | 0.8 | % | |
| Pfizer, Inc. | | | 2,562,692 | | | | 45,385,275 | | | | 1.4 | % | |
| # Wyeth | | | 506,924 | | | | 16,312,814 | | | | 0.5 | % | |
| Other Securities | | | | | | | 189,450,712 | | | | 5.7 | % | |
| Total Health Care | | | | | | | 446,732,043 | | | | 13.6 | % | |
224
THE U.S. LARGE COMPANY SERIES
CONTINUED
| | | Shares | | Value† | | Percentage
of Net Assets** | |
| Industrials — (8.9%) | |
| # 3M Co. | | | 265,731 | | | $ | 17,086,503 | | | | 0.5 | % | |
| # Boeing Co. | | | 281,415 | | | | 14,709,562 | | | | 0.4 | % | |
| # General Electric Co. | | | 3,990,157 | | | | 77,847,963 | | | | 2.4 | % | |
| # United Parcel Service, Inc. | | | 383,268 | | | | 20,228,885 | | | | 0.6 | % | |
| United Technologies Corp. | | | 366,615 | | | | 20,149,160 | | | | 0.6 | % | |
| Other Securities | | | | | | | 203,312,668 | | | | 6.3 | % | |
| Total Industrials | | | | | | | 353,334,741 | | | | 10.8 | % | |
| Information Technology — (12.5%) | |
| #* Apple, Inc. | | | 336,779 | | | | 36,234,053 | | | | 1.1 | % | |
| #* Cisco Sytems, Inc. | | | 2,245,688 | | | | 39,905,876 | | | | 1.2 | % | |
| #* Google, Inc. | | | 90,851 | | | | 32,182,844 | | | | 1.0 | % | |
| # Hewlett-Packard Co. | | | 931,064 | | | | 35,641,130 | | | | 1.1 | % | |
| # Intel Corp. | | | 2,137,289 | | | | 34,196,624 | | | | 1.0 | % | |
| # International Business Machines Corp. | | | 515,063 | | | | 47,885,407 | | | | 1.5 | % | |
| # Microsoft Corp. | | | 2,985,078 | | | | 66,656,792 | | | | 2.0 | % | |
| * Oracle Corp. | | | 1,489,655 | | | | 27,245,790 | | | | 0.8 | % | |
| QUALCOMM, Inc. | | | 623,836 | | | | 23,867,965 | | | | 0.7 | % | |
| Other Securities | | | | | | | 155,843,856 | | | | 4.9 | % | |
| Total Information Technology | | | | | | | 499,660,337 | | | | 15.3 | % | |
| Materials — (2.5%) | |
| # Monsanto Co. | | | 209,091 | | | | 18,604,917 | | | | 0.6 | % | |
| Other Securities | | | | | | | 82,742,804 | | | | 2.5 | % | |
| Total Materials | | | | | | | 101,347,721 | | | | 3.1 | % | |
| Real Estate Investment Trusts — (0.9%) | |
| Total Real Estate Investment Trusts | | | | | | | 34,307,409 | | | | 1.0 | % | |
| Telecommunication Services — (2.7%) | |
| AT&T, Inc. | | | 2,240,314 | | | | 59,973,206 | | | | 1.8 | % | |
| Verizon Communications, Inc. | | | 1,082,609 | | | | 32,121,009 | | | | 1.0 | % | |
| Other Securities | | | | | | | 14,620,434 | | | | 0.5 | % | |
| Total Telecommunication Services | | | | | | | 106,714,649 | | | | 3.3 | % | |
| Utilities — (3.1%) | |
| Total Utilities | | | | | | | 121,394,214 | | | | 3.7 | % | |
| TOTAL COMMON STOCKS | | | | | | | 3,222,514,537 | | | | 98.4 | % | |
| | | Face
Amount | | | | | |
| | | (000) | | | | | |
| TEMPORARY CASH INVESTMENTS — (0.9%) | |
Repurchase Agreement, PNC Capital Markets, Inc. 0.94%,11/03/08
(Collateralized by $36,525,000 FNMA 5.00%, 06/01/23,
valued at $34,569,468) to be repurchased at $34,058,668 | | $ | 34,056 | | | | 34,056,000 | | | | 1.0 | % | |
225
THE U.S. LARGE COMPANY SERIES
CONTINUED
| | | Shares | | Value† | | Percentage
of Net Assets** | |
| SECURITIES LENDING COLLATERAL — (18.2%) | |
| §@ DFA Short Term Investment Fund LP | | | 665,250,501 | | | $ | 665,250,501 | | | | 20.3 | % | |
| @ PNC Demand Deposit Account 0.22% | | | 10,000,000 | | | | 10,000,000 | | | | 0.3 | % | |
| | | Face
Amount | | | | | |
| | | (000) | | | | | |
@ Repurchase Agreement, Deutsche Bank Securitites 0.24%, 11/03/08
(Collateralized by $66,764,882 FNMA, rates ranging from 5.000% to 7.000%,
maturities ranging from 05/01/18 to 12/01/37 & U.S. Treasury STRIP, rates ranging from
0.569%(y) to 1.359%(y), maturities ranging from 11/30/08 to 11/30/09, valued at
$51,835,339) to be repurchased at $50,489,596 | | $ | 50,489 | | | | 50,488,600 | | | | 1.6 | % | |
| TOTAL SECURITIES LENDING COLLATERAL | | | | | | | 725,739,101 | | | | 22.2 | % | |
TOTAL INVESTMENTS — (100.0%)
(Cost $4,182,606,777) | | | | | | $ | 3,982,309,638 | | | | 121.6 | % | |
See accompanying Notes to Financial Statements.
226
THE ENHANCED U.S. LARGE COMPANY SERIES
SCHEDULE OF INVESTMENTS
October 31, 2008
| | | Face
Amount^ | | Value† | |
| | | (000) | | | |
| AUSTRALIA — (1.6%) | |
| BONDS — (1.6%) | |
General Electric Capital Australia
6.250%, 03/30/09 | | | 5,000 | | | $ | 3,267,770 | | |
| CANADA — (3.6%) | |
| BONDS — (3.6%) | |
Ontario, Province of
(u) 3.125%, 09/08/10 | | | 7,000 | | | | 7,109,382 | | |
| GERMANY — (3.6%) | |
| BONDS — (3.6%) | |
Norddeutsche Landesbank
Girozentrale AG
(j) 0.450%, 01/19/09 | | | 700,000 | | | | 7,098,040 | | |
| SWEDEN — (2.6%) | |
| BONDS — (2.6%) | |
Kommuninvest
(t) 5.000%, 11/25/08 | | | 2,300 | | | | 1,527,700 | | |
Svensk Exportkredit AB
(u) 4.000%, 06/15/10 | | | 3,700 | | | | 3,705,428 | | |
| TOTAL — SWEDEN | | | | | | | 5,233,128 | | |
| UNITED KINGDOM — (1.3%) | |
| BONDS — (1.3%) | |
BP Capital Markets P.L.C.
(u) 4.875%, 03/15/10 | | | 2,500 | | | | 2,491,877 | | |
| UNITED STATES — (86.8%) | |
| AGENCY OBLIGATIONS — (35.4%) | |
Federal Farm Credit Bank
2.750%, 05/04/10 | | | 3,600 | | | | 3,572,255 | | |
Federal Home Loan Bank
2.375%, 04/30/10 | | | 1,400 | | | | 1,381,730 | | |
| 4.875%, 05/14/10 | | | 5,800 | | | | 5,937,054 | | |
| 4.250%, 06/11/10 | | | 6,900 | | | | 7,004,128 | | |
| 3.500%, 07/16/10 | | | 3,800 | | | | 3,814,121 | | |
| 3.375%, 08/13/10 | | | 9,900 | | | | 9,917,572 | | |
Federal Home Loan Bank Discount Note
v(y) 2.695%, 01/07/09 | | | 17,000 | | | | 16,967,462 | | |
| v 1.950%, 01/26/09 | | | 2,000 | | | | 1,995,053 | | |
Federal Home Loan Mortgage
Corporation
2.375%, 05/28/10 | | | 8,000 | | | | 7,913,200 | | |
Federal National Mortgage Association
4.125%, 05/15/10 | | | 6,100 | | | | 6,179,019 | | |
| 2.375%, 05/20/10 | | | 3,500 | | | | 3,458,899 | | |
Federal National Mortgage Association
Discount Note
v 2.350%, 01/12/09 | | | 2,000 | | | | 1,995,878 | | |
| TOTAL AGENCY OBLIGATIONS | | | | | | | 70,136,371 | | |
| | | Face
Amount^ | | Value† | |
| | | (000) | | | |
| BONDS — (26.8%) | |
Citigroup Funding, Inc.
Floating Rate Note
(r) 5.449%, 10/22/09 | | | 9,000 | | | $ | 8,737,119 | | |
CME Group, Inc.
Floating Rate Note
(r) 3.300%, 08/06/10 | | | 7,000 | | | | 6,994,015 | | |
Georgia Power Co.
Floating Rate Note
(r) 3.400%, 03/17/10 | | | 6,500 | | | | 6,476,899 | | |
IBM International Group
Floating Rate Note
(r) 3.584%, 07/29/09 | | | 3,400 | | | | 3,386,012 | | |
John Deere Capital Corp.
Floating Rate Note
(r) 3.530%, 02/26/10 | | | 7,000 | | | | 6,565,608 | | |
JPMorgan Chase & Co.
Floating Rate Note
(r) 5.255%, 11/19/09 | | | 6,800 | | | | 6,788,617 | | |
Paccar Financial Corp.
Floating Rate Note
(r) 4.966%, 09/21/09 | | | 2,500 | | | | 2,495,085 | | |
Wal-Mart Stores, Inc.
6.875%, 08/10/09 | | | 7,500 | | | | 7,732,380 | | |
Wells Fargo Bank & Co.
4.625%, 08/09/10 | | | 4,000 | | | | 3,983,428 | | |
| TOTAL BONDS | | | | | | | 53,159,163 | | |
CERTIFICATES OF DEPOSIT
INTEREST BEARING — (3.5%) | |
Royal Bank of Scotland P.L.C.
3.110%, 01/23/09 | | | 7,000 | | | | 6,992,526 | | |
| COMMERCIAL PAPER — (16.2%) | |
AT&T, Inc.
1.250%, 11/10/08 | | | 5,000 | | | | 4,998,334 | | |
KFW
1.250%, 11/05/08 | | | 5,500 | | | | 5,498,862 | | |
Novartis Finance Corp.
0.970%, 11/05/08 | | | 4,500 | | | | 4,499,069 | | |
NSTAR Electric Company
1.050%, 11/10/08 | | | 5,500 | | | | 5,498,396 | | |
Pitney Bowes, Inc.
1.000%, 11/13/08 | | | 5,000 | | | | 4,997,052 | | |
Societe Generale North America
3.100%, 05/01/09 | | | 3,000 | | | | 2,951,922 | | |
Westpac Banking Corp.
3.020%, 09/04/09 | | | 3,800 | | | | 3,696,940 | | |
| TOTAL COMMERCIAL PAPER | | | | | | | 32,140,575 | | |
227
THE ENHANCED U.S. LARGE COMPANY SERIES
CONTINUED
| | | Shares | | Value† | |
| EXCHANGE-TRADED FUND — (2.2%) | |
| SPDR Trust Series I | | | 44,100 | | | $ | 4,275,054 | | |
| TOTAL — UNITED STATES | | | | | 166,703,689 | | |
| | | Shares | | Value† | |
| TEMPORARY CASH INVESTMENTS — (3.2%) | |
BlackRock Liquidity Funds Tempcash
Portfolio-Institutional Shares | | | 5,372,454 | | | $ | 5,372,454 | | |
| | | Face
Amount | | | |
| | | (000) | | | |
Repurchase Agreement, PNC Capital
Markets, Inc. 0.94%, 11/03/08
(Collateralized by $1,055,000
FNMA 5.00%, 06/01/23,
valued at $1,010,854) to be
repurchased at $995,078 | | $ | 995 | | | | 995,000 | | |
TOTAL TEMPORARY CASH
INVESTMENTS | | | | | 6,367,454 | | |
TOTAL INVESTMENTS — (100.0%)
(Cost $199,118,479) | | | | $ | 198,271,340 | | |
See accompanying Notes to Financial Statements.
228
THE U.S. LARGE CAP VALUE SERIES
SUMMARY SCHEDULE OF PORTFOLIO HOLDINGS
October 31, 2008
| | | Shares | | Value† | | Percentage
of Net Assets** | |
| COMMON STOCKS — (88.7%) | |
| Consumer Discretionary — (11.6%) | |
| CBS Corp. Class B | | | 5,590,306 | | | $ | 54,281,871 | | | | 0.8 | % | |
| Comcast Corp. Class A | | | 12,216,542 | | | | 192,532,702 | | | | 2.9 | % | |
| # Comcast Corp. Special Class A Non-Voting | | | 3,110,315 | | | | 47,961,057 | | | | 0.7 | % | |
| * Liberty Media Corp. - Entertainment Class A | | | 3,864,672 | | | | 62,221,219 | | | | 0.9 | % | |
| # Time Warner, Inc. | | | 18,369,180 | | | | 185,345,026 | | | | 2.7 | % | |
| # Tyco Electronics, Ltd. | | | 1,537,111 | | | | 29,881,438 | | | | 0.4 | % | |
| Other Securities | | | | | | | 292,496,695 | | | | 4.4 | % | |
| Total Consumer Discretionary | | | | | | | 864,720,008 | | | | 12.8 | % | |
| Consumer Staples — (4.9%) | |
| Archer-Daniels-Midland Co. | | | 1,219,060 | | | | 25,271,114 | | | | 0.4 | % | |
| # Coca-Cola Enterprises, Inc. | | | 3,519,272 | | | | 35,368,684 | | | | 0.5 | % | |
| Kraft Foods, Inc. | | | 5,533,321 | | | | 161,240,974 | | | | 2.4 | % | |
| Molson Coors Brewing Co. | | | 755,890 | | | | 28,240,050 | | | | 0.4 | % | |
| Other Securities | | | | | | | 116,481,392 | | | | 1.7 | % | |
| Total Consumer Staples | | | | | | | 366,602,214 | | | | 5.4 | % | |
| Energy — (13.4%) | |
| # Anadarko Petroleum Corp. | | | 3,422,156 | | | | 120,802,107 | | | | 1.8 | % | |
| # Apache Corp. | | | 2,051,191 | | | | 168,874,555 | | | | 2.5 | % | |
| # Chesapeake Energy Corp. | | | 2,496,221 | | | | 54,841,975 | | | | 0.8 | % | |
| # ConocoPhillips | | | 4,659,773 | | | | 242,401,391 | | | | 3.6 | % | |
| # Devon Energy Corp. | | | 1,962,942 | | | | 158,723,490 | | | | 2.4 | % | |
| Marathon Oil Corp. | | | 2,640,550 | | | | 76,840,005 | | | | 1.1 | % | |
| Other Securities | | | | | | | 177,364,431 | | | | 2.6 | % | |
| Total Energy | | | | | | | 999,847,954 | | | | 14.8 | % | |
| Financials — (27.3%) | |
| Allstate Corp. | | | 2,540,615 | | | | 67,046,830 | | | | 1.0 | % | |
| # Bank of America Corp. | | | 7,236,574 | | | | 174,907,994 | | | | 2.6 | % | |
| # Capital One Financial Corp. | | | 1,668,884 | | | | 65,286,742 | | | | 1.0 | % | |
| # Chubb Corp. | | | 1,620,173 | | | | 83,957,365 | | | | 1.2 | % | |
| # Cincinnati Financial Corp. | | | 1,305,789 | | | | 33,937,456 | | | | 0.5 | % | |
| CNA Financial Corp. | | | 1,896,282 | | | | 29,506,148 | | | | 0.4 | % | |
| JPMorgan Chase & Co. | | | 7,213,911 | | | | 297,573,829 | | | | 4.4 | % | |
| Loews Corp. | | | 3,808,002 | | | | 126,463,746 | | | | 1.9 | % | |
| # M&T Bank Corp. | | | 440,052 | | | | 35,688,217 | | | | 0.5 | % | |
| # Merrill Lynch & Co., Inc. | | | 1,408,640 | | | | 26,186,618 | | | | 0.4 | % | |
| # MetLife, Inc. | | | 5,000,810 | | | | 166,126,908 | | | | 2.5 | % | |
| # Morgan Stanley | | | 2,999,997 | | | | 52,409,948 | | | | 0.8 | % | |
| # New York Community Bancorp, Inc. | | | 2,223,800 | | | | 34,824,708 | | | | 0.5 | % | |
| # Prudential Financial, Inc. | | | 1,829,600 | | | | 54,888,000 | | | | 0.8 | % | |
| # SunTrust Banks, Inc. | | | 945,360 | | | | 37,946,750 | | | | 0.6 | % | |
| The Travelers Companies, Inc. | | | 5,075,909 | | | | 215,979,928 | | | | 3.2 | % | |
| Unum Group | | | 2,404,389 | | | | 37,869,127 | | | | 0.6 | % | |
| Other Securities | | | | | | | 492,099,070 | | | | 7.3 | % | |
| Total Financials | | | | | | | 2,032,699,384 | | | | 30.2 | % | |
| Health Care — (1.6%) | |
| *# WellPoint, Inc. | | | 1,694,537 | | | | 65,866,653 | | | | 1.0 | % | |
| Other Securities | | | | | | | 52,007,419 | | | | 0.8 | % | |
| Total Health Care | | | | | | | 117,874,072 | | | | 1.8 | % | |
229
THE U.S. LARGE CAP VALUE SERIES
CONTINUED
| | | Shares | | Value† | | Percentage
of Net Assets** | |
| Industrials — (15.4%) | |
| *# Allied Waste Industries, Inc. | | | 2,682,276 | | | $ | 27,949,316 | | | | 0.4 | % | |
| # Burlington Northern Santa Fe Corp. | | | 2,178,273 | | | | 193,996,993 | | | | 2.9 | % | |
| # CSX Corp. | | | 3,309,804 | | | | 151,324,239 | | | | 2.2 | % | |
| FedEx Corp. | | | 432,063 | | | | 28,243,958 | | | | 0.4 | % | |
| # Norfolk Southern Corp. | | | 3,154,102 | | | | 189,056,874 | | | | 2.8 | % | |
| # Northrop Grumman Corp. | | | 2,590,384 | | | | 121,463,106 | | | | 1.8 | % | |
| # Southwest Airlines Co. | | | 5,076,220 | | | | 59,797,872 | | | | 0.9 | % | |
| Union Pacific Corp. | | | 4,066,600 | | | | 271,526,882 | | | | 4.0 | % | |
| Other Securities | | | | | | | 105,722,697 | | | | 1.7 | % | |
| Total Industrials | | | | | | | 1,149,081,937 | | | | 17.1 | % | |
| Information Technology — (3.7%) | |
| *# Computer Sciences Corp. | | | 1,361,543 | | | | 41,064,137 | | | | 0.6 | % | |
| *# Symantec Corp. | | | 2,636,076 | | | | 33,161,836 | | | | 0.5 | % | |
| Xerox Corp. | | | 3,605,491 | | | | 28,916,038 | | | | 0.4 | % | |
| Other Securities | | | | | | | 170,627,649 | | | | 2.6 | % | |
| Total Information Technology | | | | | | | 273,769,660 | | | | 4.1 | % | |
| Materials — (3.0%) | |
| # Dow Chemical Co. | | | 2,427,760 | | | | 64,748,359 | | | | 1.0 | % | |
| # International Paper Co. | | | 1,643,445 | | | | 28,300,123 | | | | 0.4 | % | |
| # Weyerhaeuser Co. | | | 1,415,829 | | | | 54,112,984 | | | | 0.8 | % | |
| Other Securities | | | | | | | 78,273,714 | | | | 1.1 | % | |
| Total Materials | | | | | | | 225,435,180 | | | | 3.3 | % | |
| Telecommunication Services — (7.7%) | |
| # AT&T, Inc. | | | 9,749,000 | | | | 260,980,730 | | | | 3.9 | % | |
| # Verizon Communications, Inc. | | | 8,542,208 | | | | 253,447,311 | | | | 3.7 | % | |
| Other Securities | | | | | | | 58,656,568 | | | | 0.9 | % | |
| Total Telecommunication Services | | | | | | | 573,084,609 | | | | 8.5 | % | |
| Utilities — (0.1%) | |
| Total Utilities | | | | | | | 4,787,743 | | | | 0.1 | % | |
| TOTAL COMMON STOCKS | | | | | | | 6,607,902,761 | | | | 98.1 | % | |
| | | Face
Amount | | | | | |
| | | (000) | | | | | |
| TEMPORARY CASH INVESTMENTS — (1.9%) | |
Repurchase Agreement, PNC Capital Markets, Inc. 0.94%, 11/03/08
(Collateralized by $130,825,000 FNMA 5.50%, 05/01/37 & 6.00%, 05/01/38,
valued at $146,641,902) to be repurchased at $144,481,317 | | $ | 144,470 | | | | 144,470,000 | | | | 2.1 | % | |
230
THE U.S. LARGE CAP VALUE SERIES
CONTINUED
| | | Shares | | Value† | | Percentage
of Net Assets** | |
| SECURITIES LENDING COLLATERAL — (9.4%) | |
| §@ DFA Short Term Investment Fund LP | | | 641,002,721 | | | $ | 641,002,721 | | | | 9.5 | % | |
| @ PNC Demand Deposit Account 0.22% | | | 10,000,000 | | | | 10,000,000 | | | | 0.2 | % | |
| | | Face
Amount | | | | | |
| | | (000) | | | | | |
@ Repurchase Agreement, Deutsche Bank Securitites 0.24%, 11/03/08
(Collateralized by $65,652,304 FNMA, rates ranging from 5.500% to 7.000%,
maturities ranging from 07/01/33 to 09/01/38 & U.S. Treasury STRIP 0.599%(y),
02/15/09, valued at $49,188,211) to be repurchased at $48,070,107 | | $ | 48,069 | | | | 48,069,158 | | | | 0.7 | % | |
| TOTAL SECURITIES LENDING COLLATERAL | | | | | | | 699,071,879 | | | | 10.4 | % | |
TOTAL INVESTMENTS — (100.0%)
(Cost $9,331,596,076) | | | | | | $ | 7,451,444,640 | | | | 110.6 | % | |
See accompanying Notes to Financial Statements.
231
THE U.S. SMALL CAP VALUE SERIES
SUMMARY SCHEDULE OF PORTFOLIO HOLDINGS
October 31, 2008
| | | Shares | | Value† | | Percentage
of Net Assets** | |
| COMMON STOCKS — (83.4%) | |
| Consumer Discretionary — (11.9%) | |
| # American Greetings Corp. Class A | | | 1,904,200 | | | $ | 22,241,056 | | | | 0.4 | % | |
| # Bob Evans Farms, Inc. | | | 1,322,901 | | | | 27,622,173 | | | | 0.5 | % | |
| *# Jarden Corp. | | | 1,406,615 | | | | 25,037,747 | | | | 0.5 | % | |
| # Scholastic Corp. | | | 1,773,991 | | | | 32,943,013 | | | | 0.6 | % | |
| *# Zale Corp. | | | 1,488,264 | | | | 25,389,784 | | | | 0.5 | % | |
| Other Securities | | | | | | | 631,061,425 | | | | 11.4 | % | |
| Total Consumer Discretionary | | | | | | | 764,295,198 | | | | 13.9 | % | |
| Consumer Staples — (3.2%) | |
| *# Hain Celestial Group, Inc. | | | 1,305,774 | | | | 30,346,188 | | | | 0.6 | % | |
| Seaboard Corp. | | | 18,484 | | | | 24,768,560 | | | | 0.5 | % | |
| # Universal Corp. | | | 754,474 | | | | 29,869,626 | | | | 0.6 | % | |
| Other Securities | | | | | | | 124,021,987 | | | | 2.1 | % | |
| Total Consumer Staples | | | | | | | 209,006,361 | | | | 3.8 | % | |
| Energy — (4.5%) | |
| *# Comstock Resources, Inc. | | | 568,074 | | | | 28,074,217 | | | | 0.5 | % | |
| * Encore Acquisition Co. | | | 781,016 | | | | 24,328,648 | | | | 0.5 | % | |
| * Stone Energy Corp. | | | 974,813 | | | | 29,575,826 | | | | 0.6 | % | |
| * Whiting Petroleum Corp. | | | 500,221 | | | | 26,006,490 | | | | 0.5 | % | |
| Other Securities | | | | | | | 184,237,941 | | | | 3.2 | % | |
| Total Energy | | | | | | | 292,223,122 | | | | 5.3 | % | |
| Financials — (22.7%) | |
| * Argo Group International Holdings, Ltd. | | | 674,606 | | | | 21,519,931 | | | | 0.4 | % | |
| # Brookline Bancorp, Inc. | | | 2,214,827 | | | | 25,913,476 | | | | 0.5 | % | |
| # Chemical Financial Corp. | | | 826,061 | | | | 21,700,622 | | | | 0.4 | % | |
| Delphi Financial Group, Inc. Class A | | | 1,497,269 | | | | 23,581,987 | | | | 0.4 | % | |
| # First Niagara Financial Group, Inc. | | | 3,669,543 | | | | 57,868,693 | | | | 1.1 | % | |
| Harleysville Group, Inc. | | | 1,092,091 | | | | 34,488,234 | | | | 0.6 | % | |
| Infinity Property & Casualty Corp. | | | 614,512 | | | | 24,469,868 | | | | 0.5 | % | |
| MB Financial, Inc. | | | 1,096,148 | | | | 32,566,557 | | | | 0.6 | % | |
| # National Penn Bancshares, Inc. | | | 1,947,592 | | | | 32,992,208 | | | | 0.6 | % | |
| * Navigators Group, Inc. | | | 570,373 | | | | 28,809,540 | | | | 0.5 | % | |
| # NewAlliance Bancshares, Inc. | | | 3,421,707 | | | | 47,219,557 | | | | 0.9 | % | |
| # Prosperity Bancshares, Inc. | | | 1,106,919 | | | | 36,760,780 | | | | 0.7 | % | |
| # Provident Financial Services, Inc. | | | 2,524,606 | | | | 37,010,724 | | | | 0.7 | % | |
| Selective Insurance Group, Inc. | | | 1,945,426 | | | | 46,203,867 | | | | 0.9 | % | |
| # Susquehanna Bancshares, Inc. | | | 2,051,230 | | | | 31,773,553 | | | | 0.6 | % | |
| # Umpqua Holdings Corp. | | | 1,592,927 | | | | 27,111,618 | | | | 0.5 | % | |
| # United Fire & Casualty Co. | | | 1,130,390 | | | | 26,191,136 | | | | 0.5 | % | |
| Other Securities | | | | | | | 904,996,792 | | | | 16.1 | % | |
| Total Financials | | | | | | | 1,461,179,143 | | | | 26.5 | % | |
| Health Care — (6.6%) | |
| Alpharma, Inc. Class A | | | 1,472,500 | | | | 46,103,975 | | | | 0.9 | % | |
| *# CONMED Corp. | | | 861,645 | | | | 22,575,099 | | | | 0.4 | % | |
| * Kindred Healthcare, Inc. | | | 1,758,075 | | | | 25,474,507 | | | | 0.5 | % | |
| Other Securities | | | | | | | 334,466,347 | | | | 6.0 | % | |
| Total Health Care | | | | | | | 428,619,928 | | | | 7.8 | % | |
232
THE U.S. SMALL CAP VALUE SERIES
CONTINUED
| | | Shares | | Value† | | Percentage
of Net Assets** | |
| Industrials — (14.8%) | |
| *# Alaska Air Group, Inc. | | | 998,489 | | | $ | 24,662,678 | | | | 0.5 | % | |
| # Applied Industrial Technologies, Inc. | | | 1,450,550 | | | | 29,286,605 | | | | 0.5 | % | |
| # Arkansas Best Corp. | | | 860,090 | | | | 25,106,027 | | | | 0.5 | % | |
| # Briggs & Stratton Corp. | | | 2,077,065 | | | | 32,734,544 | | | | 0.6 | % | |
| * Esterline Technologies Corp. | | | 1,050,823 | | | | 37,882,169 | | | | 0.7 | % | |
| IKON Office Solutions, Inc. | | | 3,449,107 | | | | 59,428,114 | | | | 1.1 | % | |
| # Regal-Beloit Corp. | | | 979,413 | | | | 31,889,687 | | | | 0.6 | % | |
| * Republic Airways Holdings, Inc. | | | 1,682,318 | | | | 25,150,654 | | | | 0.5 | % | |
| # Trinity Industries, Inc. | | | 1,524,225 | | | | 25,728,918 | | | | 0.5 | % | |
| # Watts Water Technologies, Inc. | | | 909,616 | | | | 24,041,151 | | | | 0.4 | % | |
| # Werner Enterprises, Inc. | | | 2,808,495 | | | | 55,102,672 | | | | 1.0 | % | |
| Other Securities | | | | | | | 583,830,089 | | | | 10.4 | % | |
| Total Industrials | | | | | | | 954,843,308 | | | | 17.3 | % | |
| Information Technology — (14.6%) | |
| * Benchmark Electronics, Inc. | | | 2,841,081 | | | | 34,064,561 | | | | 0.6 | % | |
| * Coherent, Inc. | | | 1,102,339 | | | | 27,889,177 | | | | 0.5 | % | |
| * MKS Instruments, Inc. | | | 2,124,394 | | | | 39,407,509 | | | | 0.7 | % | |
| * MPS Group, Inc. | | | 3,486,300 | | | | 27,158,277 | | | | 0.5 | % | |
| *# Skyworks Solutions, Inc. | | | 5,636,470 | | | | 40,188,031 | | | | 0.7 | % | |
| * Sycamore Networks, Inc. | | | 6,557,032 | | | | 21,900,487 | | | | 0.4 | % | |
| Other Securities | | | | | | | 748,429,732 | | | | 13.7 | % | |
| Total Information Technology | | | | | | | 939,037,774 | | | | 17.1 | % | |
| Materials — (4.2%) | |
| # Westlake Chemical Corp. | | | 1,245,569 | | | | 22,706,723 | | | | 0.4 | % | |
| Other Securities | | | | | | | 246,046,065 | | | | 4.5 | % | |
| Total Materials | | | | | | | 268,752,788 | | | | 4.9 | % | |
| Other — (0.0%) | |
| Total Other | | | | | | | 701,790 | | | | 0.0 | % | |
| Telecommunication Services — (0.3%) | |
| Total Telecommunication Services | | | | | | | 21,365,833 | | | | 0.4 | % | |
| Utilities — (0.6%) | |
| Total Utilities | | | | | | | 37,343,547 | | | | 0.7 | % | |
| TOTAL COMMON STOCKS | | | | | | | 5,377,368,792 | | | | 97.7 | % | |
| RIGHTS/WARRANTS — (0.0%) | |
| TOTAL RIGHTS/WARRANTS | | | | | | | 13,361 | | | | 0.0 | % | |
| | | Face
Amount | | | | | |
| | | (000) | | | | | |
| TEMPORARY CASH INVESTMENTS — (1.6%) | |
Repurchase Agreement, PNC Capital Markets, Inc. 0.94%, 11/03/08
(Collateralized by $102,925,000 FNMA 5.00%, 08/25/18,
valued at $106,194,565) to be repurchased at $104,630,195 | | $ | 104,622 | | | | 104,622,000 | | | | 1.9 | % | |
233
THE U.S. SMALL CAP VALUE SERIES
CONTINUED
| | | Shares | | Value† | | Percentage
of Net Assets** | |
| SECURITIES LENDING COLLATERAL — (15.0%) | |
| §@ DFA Short Term Investment Fund LP | | | 883,621,350 | | | $ | 883,621,350 | | | | 16.0 | % | |
| @ PNC Demand Deposit Account 0.22% | | | 10,000,000 | | | | 10,000,000 | | | | 0.2 | % | |
| | | Face
Amount | | | | | |
| | | (000) | | | | | |
@ Repurchase Agreement, Deutsche Bank Securitites 0.24%, 11/03/08
(Collateralized by $96,893,468 FNMA, rates ranging from 5.500% to 7.000%,
maturities ranging from 07/01/33 to 10/01/38 & U.S. Treasury STRIP 1.710%(y),
11/15/09 & 4.810%(y), 08/15/18, valued at $71,913,412) to be repurchased at
70,034,901 | | $ | 70,034 | | | | 70,033,515 | | | | 1.3 | % | |
| TOTAL SECURITIES LENDING COLLATERAL | | | | | | | 963,654,865 | | | | 17.5 | % | |
TOTAL INVESTMENTS — (100.0%)
(Cost $7,857,832,882) | | | | | | $ | 6,445,659,018 | | | | 117.1 | % | |
See accompanying Notes to Financial Statements.
234
THE U.S. SMALL CAP SERIES
SUMMARY SCHEDULE OF PORTFOLIO HOLDINGS
October 31, 2008
| | | Shares | | Value† | | Percentage
of Net Assets** | |
| COMMON STOCKS — (79.7%) | |
| Consumer Discretionary — (13.8%) | |
| # American Axle & Manufacturing Holdings, Inc. | | | 1,125,583 | | | $ | 4,040,843 | | | | 0.2 | % | |
| # Cooper Tire & Rubber Co. | | | 1,248,791 | | | | 9,528,275 | | | | 0.5 | % | |
| Finish Line, Inc. Class A | | | 613,086 | | | | 5,867,233 | | | | 0.3 | % | |
| # Furniture Brands International, Inc. | | | 1,071,088 | | | | 6,094,491 | | | | 0.3 | % | |
| # Group 1 Automotive, Inc. | | | 440,812 | | | | 4,430,161 | | | | 0.2 | % | |
| # La-Z-Boy, Inc. | | | 1,020,700 | | | | 5,899,646 | | | | 0.3 | % | |
| # Matthews International Corp. Class A | | | 90,967 | | | | 4,059,857 | | | | 0.2 | % | |
| # Media General, Inc. Class A | | | 555,071 | | | | 4,235,192 | | | | 0.2 | % | |
| Modine Manufacturing Co. | | | 740,935 | | | | 5,482,919 | | | | 0.3 | % | |
| *# Netflix, Inc. | | | 195,382 | | | | 4,837,658 | | | | 0.2 | % | |
| * RC2 Corp. | | | 344,107 | | | | 4,370,159 | | | | 0.2 | % | |
| Stage Stores, Inc. | | | 891,446 | | | | 6,873,049 | | | | 0.3 | % | |
| # Superior Industries International, Inc. | | | 431,867 | | | | 6,175,698 | | | | 0.3 | % | |
| Other Securities | | | | | | | 278,947,043 | | | | 13.5 | % | |
| Total Consumer Discretionary | | | | | | | 350,842,224 | | | | 17.0 | % | |
| Consumer Staples — (3.5%) | |
| Casey's General Stores, Inc. | | | 137,677 | | | | 4,157,845 | | | | 0.2 | % | |
| *# Chattem, Inc. | | | 54,784 | | | | 4,145,505 | | | | 0.2 | % | |
| Other Securities | | | | | | | 79,255,382 | | | | 3.8 | % | |
| Total Consumer Staples | | | | | | | 87,558,732 | | | | 4.2 | % | |
| Energy — (3.4%) | |
| # USEC, Inc. | | | 1,349,307 | | | | 5,572,638 | | | | 0.3 | % | |
| Other Securities | | | | | | | 80,752,714 | | | | 3.9 | % | |
| Total Energy | | | | | | | 86,325,352 | | | | 4.2 | % | |
| Financials — (14.2%) | |
| American Equity Investment Life Holding Co. | | | 1,022,703 | | | | 4,622,618 | | | | 0.2 | % | |
| First Niagara Financial Group, Inc. | | | 305,149 | | | | 4,812,200 | | | | 0.2 | % | |
| Horace Mann Educators Corp. | | | 928,504 | | | | 7,390,892 | | | | 0.4 | % | |
| * LaBranche & Co., Inc. | | | 719,750 | | | | 4,484,042 | | | | 0.2 | % | |
| * ProAssurance Corp. | | | 91,350 | | | | 5,019,682 | | | | 0.3 | % | |
| * SVB Financial Group | | | 88,886 | | | | 4,573,185 | | | | 0.2 | % | |
| # Westamerica Bancorporation | | | 81,557 | | | | 4,669,138 | | | | 0.2 | % | |
| Other Securities | | | | | | | 325,655,923 | | | | 15.8 | % | |
| Total Financials | | | | | | | 361,227,680 | | | | 17.5 | % | |
| Health Care — (10.1%) | |
| *# Amedisys, Inc. | | | 77,134 | | | | 4,351,129 | | | | 0.2 | % | |
| * Celera Corp. | | | 486,795 | | | | 5,505,651 | | | | 0.3 | % | |
| *# Haemonetics Corp. | | | 74,847 | | | | 4,420,464 | | | | 0.2 | % | |
| *# NuVasive, Inc. | | | 97,252 | | | | 4,579,597 | | | | 0.2 | % | |
| Owens & Minor, Inc. | | | 119,100 | | | | 5,153,457 | | | | 0.3 | % | |
| # Valeant Pharmaceuticals International | | | 250,587 | | | | 4,703,518 | | | | 0.2 | % | |
| Other Securities | | | | | | | 226,442,860 | | | | 10.9 | % | |
| Total Health Care | | | | | | | 255,156,676 | | | | 12.3 | % | |
| Industrials — (14.1%) | |
| # CLAROC, Inc. | | | 139,800 | | | | 4,947,522 | | | | 0.2 | % | |
| Curtiss-Wright Corp. | | | 116,200 | | | | 4,287,780 | | | | 0.2 | % | |
| G & K Services, Inc. Class A | | | 225,665 | | | | 5,097,772 | | | | 0.3 | % | |
| # Granite Construction, Inc. | | | 121,200 | | | | 4,323,204 | | | | 0.2 | % | |
| # Heartland Express, Inc. | | | 264,941 | | | | 4,064,195 | | | | 0.2 | % | |
| IKON Office Solutions, Inc. | | | 297,560 | | | | 5,126,959 | | | | 0.3 | % | |
235
THE U.S. SMALL CAP SERIES
CONTINUED
| | | Shares | | Value† | | Percentage
of Net Assets** | |
| *# NCI Building Systems, Inc. | | | 234,062 | | | $ | 4,355,894 | | | | 0.2 | % | |
| *# PHH Corp. | | | 1,090,949 | | | | 8,793,049 | | | | 0.4 | % | |
| # Rollins, Inc. | | | 292,175 | | | | 5,133,515 | | | | 0.3 | % | |
| *# School Specialty, Inc. | | | 223,928 | | | | 4,702,488 | | | | 0.2 | % | |
| * Teledyne Technologies, Inc. | | | 95,800 | | | | 4,365,606 | | | | 0.2 | % | |
| Other Securities | | | | | | | 303,410,210 | | | | 14.7 | % | |
| Total Industrials | | | | | | | 358,608,194 | | | | 17.4 | % | |
| Information Technology — (13.4%) | |
| * Exar Corp. | | | 850,992 | | | | 5,684,627 | | | | 0.3 | % | |
| InfoSpace, Inc. | | | 655,004 | | | | 5,613,384 | | | | 0.3 | % | |
| *# Microsemi Corp. | | | 193,402 | | | | 4,204,559 | | | | 0.2 | % | |
| * Vignette Corp. | | | 527,254 | | | | 4,281,302 | | | | 0.2 | % | |
| * Zoran Corp. | | | 809,353 | | | | 6,588,133 | | | | 0.3 | % | |
| Other Securities | | | | | | | 314,548,511 | | | | 15.2 | % | |
| Total Information Technology | | | | | | | 340,920,516 | | | | 16.5 | % | |
| Materials — (3.9%) | |
| # Gibraltar Industries, Inc. | | | 302,619 | | | | 4,009,702 | | | | 0.2 | % | |
| # Silgan Holdings, Inc. | | | 92,969 | | | | 4,326,777 | | | | 0.2 | % | |
| Spartech Corp. | | | 637,365 | | | | 4,053,641 | | | | 0.2 | % | |
| Other Securities | | | | | | | 85,355,238 | | | | 4.1 | % | |
| Total Materials | | | | | | | 97,745,358 | | | | 4.7 | % | |
| Other — (0.0%) | |
| Total Other | | | | | | | 60,929 | | | | 0.0 | % | |
| Telecommunication Services — (0.7%) | |
| Total Telecommunication Services | | | | | | | 16,937,504 | | | | 0.8 | % | |
| Utilities — (2.6%) | |
| New Jersey Resources Corp. | | | 111,150 | | | | 4,139,226 | | | | 0.2 | % | |
| # WGL Holdings, Inc. | | | 130,372 | | | | 4,196,675 | | | | 0.2 | % | |
| Other Securities | | | | | | | 58,286,657 | | | | 2.8 | % | |
| Total Utilities | | | | | | | 66,622,558 | | | | 3.2 | % | |
| TOTAL COMMON STOCKS | | | | | | | 2,022,005,723 | | | | 97.8 | % | |
| RIGHTS/WARRANTS — (0.0%) | |
| TOTAL RIGHTS/WARRANTS | | | | | | | 5,269 | | | | 0.0 | % | |
| | | Face
Amount | | | | | |
| | | (000) | | | | | |
| TEMPORARY CASH INVESTMENTS — (2.1%) | |
Repurchase Agreement, PNC Capital Markets, Inc. 0.94%, 11/03/08
(Collateralized by $82,815,000 FNMA 5.11%(r), 01/01/36,
valued at $53,960,447) to be repurchased at $53,164,164 | | $ | 53,160 | | | | 53,160,000 | | | | 2.6 | % | |
236
THE U.S. SMALL CAP SERIES
CONTINUED
| | | Shares | | Value† | | Percentage
of Net Assets** | |
| SECURITIES LENDING COLLATERAL — (18.2%) | |
| §@ DFA Short Term Investment Fund LP | | | 423,607,839 | | | $ | 423,607,839 | | | | 20.5 | % | |
| @ PNC Demand Deposit Account 0.22% | | | 10,000,000 | | | | 10,000,000 | | | | 0.5 | % | |
| | | Face
Amount | | | | | |
| | | (000) | | | | | |
@ Repurchase Agreement, Deutsche Bank Securitites 0.24%, 11/03/08
(Collateralized by $36,131,387 FNMA, rates ranging from 6.000% to 7.000%,
maturities ranging from 08/01/36 to 11/01/37 & U.S. Treasury STRIP, rates ranging from
1.423%(y) to 4.623%(y), maturities ranging from 11/15/10 to 02/15/17, valued at
$28,847,755) to be repurchased at $28,107,400 | | $ | 28,107 | | | | 28,106,849 | | | | 1.3 | % | |
| TOTAL SECURITIES LENDING COLLATERAL | | | | | | | 461,714,688 | | | | 22.3 | % | |
TOTAL INVESTMENTS - (100.0%)
(Cost $2,867,896,535) | | | | | | $ | 2,536,885,680 | | | | 122.7 | % | |
See accompanying Notes to Financial Statements.
237
THE U.S. MICRO CAP SERIES
SUMMARY SCHEDULE OF PORTFOLIO HOLDINGS
October 31, 2008
| | | Shares | | Value† | | Percentage
of Net Assets** | |
| COMMON STOCKS — (81.5%) | |
| Consumer Discretionary — (12.5%) | |
| # ArvinMeritor, Inc. | | | 3,137,462 | | | $ | 18,573,775 | | | | 0.5 | % | |
| # Brunswick Corp. | | | 2,156,278 | | | | 7,482,285 | | | | 0.2 | % | |
| # Cox Radio, Inc. | | | 1,269,099 | | | | 6,916,590 | | | | 0.2 | % | |
| # Penske Automotive Group, Inc. | | | 1,152,883 | | | | 9,442,112 | | | | 0.3 | % | |
| # Ryland Group, Inc. | | | 502,072 | | | | 9,433,933 | | | | 0.3 | % | |
| # Sonic Automotive, Inc. | | | 1,282,597 | | | | 6,579,723 | | | | 0.2 | % | |
| *# TiVo, Inc. | | | 939,095 | | | | 6,451,583 | | | | 0.2 | % | |
| Other Securities | | | | | | | 373,665,567 | | | | 10.6 | % | |
| Total Consumer Discretionary | | | | | | | 438,545,568 | | | | 12.5 | % | |
| Consumer Staples — (4.4%) | |
| # Chiquita Brands International, Inc. | | | 1,589,717 | | | | 21,699,637 | | | | 0.6 | % | |
| *# Green Mountain Coffee, Inc. | | | 229,200 | | | | 6,644,508 | | | | 0.2 | % | |
| *# USANA Health Services, Inc. | | | 174,170 | | | | 6,608,010 | | | | 0.2 | % | |
| Other Securities | | | | | | | 120,435,991 | | | | 3.4 | % | |
| Total Consumer Staples | | | | | | | 155,388,146 | | | | 4.4 | % | |
| Energy — (3.0%) | |
| * Harvest Natural Resources, Inc. | | | 964,097 | | | | 8,185,184 | | | | 0.2 | % | |
| *# Mariner Energy, Inc. | | | 767,892 | | | | 11,049,966 | | | | 0.3 | % | |
| * Petroleum Development Corp. | | | 491,060 | | | | 10,169,853 | | | | 0.3 | % | |
| Other Securities | | | | | | | 75,241,165 | | | | 2.2 | % | |
| Total Energy | | | | | | | 104,646,168 | | | | 3.0 | % | |
| Financials — (16.3%) | |
| BancFirst Corp. | | | 152,633 | | | | 7,692,703 | | | | 0.2 | % | |
| # Central Pacific Financial Corp. | | | 1,071,063 | | | | 16,708,583 | | | | 0.5 | % | |
| # City Holding Co. | | | 174,419 | | | | 7,297,691 | | | | 0.2 | % | |
| # Community Bank System, Inc. | | | 282,197 | | | | 7,040,815 | | | | 0.2 | % | |
| Financial Federal Corp. | | | 272,250 | | | | 6,302,587 | | | | 0.2 | % | |
| Infinity Property & Casualty Corp. | | | 159,371 | | | | 6,346,153 | | | | 0.2 | % | |
| * Navigators Group, Inc. | | | 150,925 | | | | 7,623,222 | | | | 0.2 | % | |
| # NBT Bancorp, Inc. | | | 305,924 | | | | 8,529,161 | | | | 0.3 | % | |
| # PacWest Bancorp | | | 1,007,063 | | | | 25,166,504 | | | | 0.7 | % | |
| The Phoenix Companies, Inc. | | | 2,668,100 | | | | 17,262,607 | | | | 0.5 | % | |
| WesBanco, Inc. | | | 244,944 | | | | 6,657,578 | | | | 0.2 | % | |
| Other Securities | | | | | | | 456,676,093 | | | | 12.9 | % | |
| Total Financials | | | | | | | 573,303,697 | | | | 16.3 | % | |
| Health Care — (10.2%) | |
| * Amsurg Corp. | | | 297,081 | | | | 7,409,200 | | | | 0.2 | % | |
| * CONMED Corp. | | | 266,279 | | | | 6,976,510 | | | | 0.2 | % | |
| Datascope Corp. | | | 151,010 | | | | 7,576,172 | | | | 0.2 | % | |
| * Gentiva Health Services, Inc. | | | 273,736 | | | | 7,431,932 | | | | 0.2 | % | |
| Other Securities | | | | | | | 329,931,811 | | | | 9.4 | % | |
| Total Health Care | | | | | | | 359,325,625 | | | | 10.2 | % | |
| Industrials — (13.3%) | |
| * Alaska Air Group, Inc. | | | 546,500 | | | | 13,498,550 | | | | 0.4 | % | |
| *# Axsys Technologies, Inc. | | | 101,363 | | | | 6,692,999 | | | | 0.2 | % | |
| # Healthcare Services Group, Inc. | | | 410,100 | | | | 6,791,256 | | | | 0.2 | % | |
| Kelly Services, Inc. Class A | | | 1,184,737 | | | | 16,870,655 | | | | 0.5 | % | |
| # Raven Industries, Inc. | | | 349,469 | | | | 11,249,407 | | | | 0.3 | % | |
| SkyWest, Inc. | | | 1,074,109 | | | | 16,552,020 | | | | 0.5 | % | |
| Other Securities | | | | | | | 393,445,841 | | | | 11.2 | % | |
| Total Industrials | | | | | | | 465,100,728 | | | | 13.3 | % | |
238
THE U.S. MICRO CAP SERIES
CONTINUED
| | | Shares | | Value† | | Percentage
of Net Assets** | |
| Information Technology — (15.5%) | |
| * Applied Micro Circuits Corp. | | | 2,438,511 | | | $ | 12,460,791 | | | | 0.4 | % | |
| Black Box Corp. | | | 312,624 | | | | 9,506,896 | | | | 0.3 | % | |
| * Cabot Microelectronics Corp. | | | 234,301 | | | | 6,731,468 | | | | 0.2 | % | |
| * Entegris, Inc. | | | 5,110,889 | | | | 13,748,291 | | | | 0.4 | % | |
| * Insight Enterprises, Inc. | | | 1,369,813 | | | | 13,328,280 | | | | 0.4 | % | |
| *# L-1 Identity Solutions, Inc. | | | 2,755,074 | | | | 22,591,607 | | | | 0.7 | % | |
| MAXIMUS, Inc. | | | 212,800 | | | | 6,796,832 | | | | 0.2 | % | |
| * RealNetworks, Inc. | | | 1,853,418 | | | | 7,932,629 | | | | 0.2 | % | |
| * Sykes Enterprises, Inc. | | | 403,892 | | | | 6,446,116 | | | | 0.2 | % | |
| * Vishay Intertechnology, Inc. | | | 3,213,163 | | | | 13,848,733 | | | | 0.4 | % | |
| Other Securities | | | | | | | 428,747,115 | | | | 12.1 | % | |
| Total Information Technology | | | | | | | 542,138,758 | | | | 15.5 | % | |
| Materials — (3.7%) | |
| # AMCOL International Corp. | | | 271,602 | | | | 6,662,397 | | | | 0.2 | % | |
| Arch Chemicals, Inc. | | | 231,263 | | | | 6,560,931 | | | | 0.2 | % | |
| Louisiana-Pacific Corp. | | | 2,892,020 | | | | 13,881,696 | | | | 0.4 | % | |
| Other Securities | | | | | | | 101,036,135 | | | | 2.9 | % | |
| Total Materials | | | | | | | 128,141,159 | | | | 3.7 | % | |
| Other — (0.0%) | |
| Total Other | | | | | | | 180,680 | | | | 0.0 | % | |
| Telecommunication Services — (0.8%) | |
| * Premiere Global Services, Inc. | | | 690,525 | | | | 6,870,724 | | | | 0.2 | % | |
| Other Securities | | | | | | | 19,807,941 | | | | 0.6 | % | |
| Total Telecommunication Services | | | | | | | 26,678,665 | | | | 0.8 | % | |
| Utilities — (1.8%) | |
| # California Water Service Group | | | 204,531 | | | | 7,682,184 | | | | 0.2 | % | |
| MGE Energy, Inc. | | | 205,779 | | | | 7,331,906 | | | | 0.2 | % | |
| Other Securities | | | | | | | 48,883,191 | | | | 1.4 | % | |
| Total Utilities | | | | | | | 63,897,281 | | | | 1.8 | % | |
| TOTAL COMMON STOCKS | | | | | | | 2,857,346,475 | | | | 81.5 | % | |
| RIGHTS/WARRANTS — (0.0%) | |
| TOTAL RIGHTS/WARRANTS | | | | | | | 6,872 | | | | 0.0 | % | |
| TEMPORARY CASH INVESTMENTS — (1.9%) | |
| BlackRock Liquidity Funds Tempcash Portfolio-Institutional Shares | | | 51,833,986 | | | | 51,833,986 | | | | 1.5 | % | |
| | | Face
Amount | | | | | |
| | | (000) | | | | | |
Repurchase Agreement, PNC Capital Markets, Inc. 0.94%, 11/03/08
(Collateralized by $19,025,000 FNMA 6.50%, 08/01/36,
valued at $14,189,577) to be repurchased at $13,978,095 | | $ | 13,977 | | | | 13,977,000 | | | | 0.4 | % | |
| TOTAL TEMPORARY CASH INVESTMENTS | | | | | | | 65,810,986 | | | | 1.9 | % | |
239
THE U.S. MICRO CAP SERIES
CONTINUED
| | | Shares | | Value† | | Percentage
of Net Assets** | |
| SECURITIES LENDING COLLATERAL — (16.6%) | |
| §@ DFA Short Term Investment Fund LP | | | 534,979,627 | | | $ | 534,979,627 | | | | 15.2 | % | |
| | | Face
Amount | | | | | |
| | | (000) | | | | | |
@ Repurchase Agreement, Deutsche Bank Securitites 0.24%, 11/03/08
(Collateralized by $67,424,373 FNMA, rates ranging from 5.000% to 7.000%,
maturities ranging from 07/01/32 to 08/01/38 & U.S. Treasury STRIP 0.566%(y),
11/15/08, valued at $49,299,172) to be repurchased at $47,982,801 | | $ | 47,982 | | | | 47,981,844 | | | | 1.4 | % | |
| TOTAL SECURITIES LENDING COLLATERAL | | | | | 582,961,471 | | | | 16.6 | % | |
TOTAL INVESTMENTS — (100.0%)
(Cost $3,891,675,999) | | | | $ | 3,506,125,804 | | | | 100.0 | % | |
See accompanying Notes to Financial Statements.
240
THE DFA INTERNATIONAL VALUE SERIES
SUMMARY SCHEDULE OF PORTFOLIO HOLDINGS
October 31, 2008
| | | Shares | | Value†† | | Percentage
of Net Assets** | |
| AUSTRALIA — (4.7%) | |
| COMMON STOCKS — (4.7%) | |
| Australia & New Zealand Banking Group, Ltd. | | | 3,302,749 | | | $ | 38,716,458 | | | | 0.8 | % | |
| Commonwealth Bank of Australia | | | 2,119,091 | | | | 57,926,994 | | | | 1.2 | % | |
| # National Australia Bank, Ltd. | | | 3,087,538 | | | | 50,098,709 | | | | 1.1 | % | |
| Other Securities | | | | | | | 107,641,792 | | | | 2.3 | % | |
| TOTAL — AUSTRALIA | | | | | | | 254,383,953 | | | | 5.4 | % | |
| AUSTRIA — (0.5%) | |
| COMMON STOCKS — (0.5%) | |
| Other Securities | | | | | | | 28,305,261 | | | | 0.6 | % | |
| BELGIUM — (0.5%) | |
| COMMON STOCKS — (0.5%) | |
| Other Securities | | | | | | | 29,328,450 | | | | 0.6 | % | |
| RIGHTS/WARRANTS — (0.0%) | |
| Other Securities | | | | | | | 256 | | | | 0.0 | % | |
| TOTAL — BELGIUM | | | | | | | 29,328,706 | | | | 0.6 | % | |
| CANADA — (5.9%) | |
| COMMON STOCKS — (5.9%) | |
| # Barrick Gold Corp. | | | 1,226,832 | | | | 28,052,344 | | | | 0.6 | % | |
| # EnCana Corp. | | | 560,598 | | | | 28,478,732 | | | | 0.6 | % | |
| Petro-Canada | | | 1,205,300 | | | | 30,140,000 | | | | 0.6 | % | |
| Sun Life Financial, Inc. | | | 1,262,400 | | | | 29,693,056 | | | | 0.6 | % | |
| Other Securities | | | | | | | 200,692,451 | | | | 4.4 | % | |
| TOTAL — CANADA | | | | | | | 317,056,583 | | | | 6.8 | % | |
| DENMARK — (0.9%) | |
| COMMON STOCKS — (0.9%) | |
| Other Securities | | | | | | | 46,987,354 | | | | 1.0 | % | |
| FINLAND — (1.0%) | |
| COMMON STOCKS — (1.0%) | |
| Other Securities | | | | | | | 52,418,538 | | | | 1.1 | % | |
| FRANCE — (8.5%) | |
| COMMON STOCKS — (8.5%) | |
| # AXA SA | | | 2,818,397 | | | | 53,842,817 | | | | 1.2 | % | |
| # BNP Paribas SA | | | 1,558,158 | | | | 112,501,123 | | | | 2.4 | % | |
| # Compagnie de Saint-Gobain | | | 580,915 | | | | 22,415,677 | | | | 0.5 | % | |
| Vivendi SA | | | 2,482,257 | | | | 64,884,026 | | | | 1.4 | % | |
| Other Securities | | | | | | | 208,936,536 | | | | 4.3 | % | |
| TOTAL — FRANCE | | | | | | | 462,580,179 | | | | 9.8 | % | |
| GERMANY — (8.8%) | |
| COMMON STOCKS — (8.8%) | |
| Allianz SE | | | 442,712 | | | | 33,313,833 | | | | 0.7 | % | |
| # Daimler AG | | | 1,684,003 | | | | 57,854,323 | | | | 1.2 | % | |
| # Deutsche Bank AG | | | 774,190 | | | | 28,921,349 | | | | 0.6 | % | |
| # Deutsche Telekom AG | | | 2,621,866 | | | | 38,930,629 | | | | 0.8 | % | |
| Deutsche Telekom AG Sponsored ADR | | | 2,705,150 | | | | 40,171,477 | | | | 0.9 | % | |
| E.ON AG | | | 1,781,013 | | | | 68,160,893 | | | | 1.5 | % | |
| # E.ON AG Sponsored ADR | | | 1,091,708 | | | | 41,484,904 | | | | 0.9 | % | |
241
THE DFA INTERNATIONAL VALUE SERIES
CONTINUED
| | | Shares | | Value†† | | Percentage
of Net Assets** | |
| Munchener Rueckversicherungs-Gesellschaft AG | | | 388,934 | | | $ | 50,491,309 | | | | 1.1 | % | |
| Other Securities | | | | | | | 114,673,630 | | | | 2.4 | % | |
| TOTAL — GERMANY | | | | | | | 474,002,347 | | | | 10.1 | % | |
| GREECE — (0.3%) | |
| COMMON STOCKS — (0.3%) | |
| Other Securities | | | | | | | 14,142,756 | | | | 0.3 | % | |
| HONG KONG — (2.5%) | |
| COMMON STOCKS — (2.5%) | |
| # Cheung Kong Holdings, Ltd. | | | 3,224,000 | | | | 30,955,317 | | | | 0.7 | % | |
| Hutchison Whampoa, Ltd. | | | 5,472,000 | | | | 29,569,976 | | | | 0.6 | % | |
| Sun Hung Kai Properties, Ltd. | | | 2,528,000 | | | | 22,148,070 | | | | 0.5 | % | |
| Other Securities | | | | | | | 54,353,926 | | | | 1.1 | % | |
| TOTAL — HONG KONG | | | | | | | 137,027,289 | | | | 2.9 | % | |
| IRELAND — (0.3%) | |
| COMMON STOCKS — (0.3%) | |
| Other Securities | | | | | | | 16,882,601 | | | | 0.4 | % | |
| ITALY — (1.9%) | |
| COMMON STOCKS — (1.9%) | |
| UniCredito Italiano SpA | | | 10,088,794 | | | | 24,697,595 | | | | 0.5 | % | |
| Other Securities | | | | | | | 78,187,153 | | | | 1.7 | % | |
| TOTAL — ITALY | | | | | | | 102,884,748 | | | | 2.2 | % | |
| JAPAN — (13.3%) | |
| COMMON STOCKS — (13.3%) | |
| FUJIFILM Holdings Corp. | | | 1,077,300 | | | | 24,799,840 | | | | 0.5 | % | |
| Hitachi, Ltd. | | | 6,574,000 | | | | 30,865,283 | | | | 0.7 | % | |
| Tokio Marine Holdings, Inc. | | | 1,457,311 | | | | 44,952,061 | | | | 1.0 | % | |
| Other Securities | | | | | | | 621,977,287 | | | | 13.2 | % | |
| TOTAL — JAPAN | | | | | | | 722,594,471 | | | | 15.4 | % | |
| NETHERLANDS — (3.5%) | |
| COMMON STOCKS — (3.5%) | |
| # ArcelorMittal | | | 1,877,993 | | | | 48,755,658 | | | | 1.0 | % | |
| ING Groep NV | | | 3,093,625 | | | | 29,019,312 | | | | 0.6 | % | |
| Koninklijke Philips Electronics NV | | | 3,192,970 | | | | 59,005,541 | | | | 1.3 | % | |
| Other Securities | | | | | | | 50,984,660 | | | | 1.1 | % | |
| TOTAL — NETHERLANDS | | | | | | | 187,765,171 | | | | 4.0 | % | |
| NEW ZEALAND — (0.1%) | |
| COMMON STOCKS — (0.1%) | |
| Other Securities | | | | | | | 7,460,246 | | | | 0.2 | % | |
| NORWAY — (0.8%) | |
| COMMON STOCKS — (0.8%) | |
| Other Securities | | | | | | | 42,910,368 | | | | 0.9 | % | |
| PORTUGAL — (0.1%) | |
| COMMON STOCKS — (0.1%) | |
| Other Securities | | | | | | | 6,541,713 | | | | 0.1 | % | |
| SINGAPORE — (1.1%) | |
| COMMON STOCKS — (1.1%) | |
| Other Securities | | | | | | | 57,732,771 | | | | 1.2 | % | |
| SPAIN — (4.2%) | |
| COMMON STOCKS — (4.2%) | |
| # Banco Santander Central Hispano SA | | | 7,025,356 | | | | 75,980,397 | | | | 1.6 | % | |
| # Banco Santander SA Sponsored ADR | | | 3,044,700 | | | | 32,700,078 | | | | 0.7 | % | |
| Repsol YPF SA | | | 1,204,043 | | | | 22,895,968 | | | | 0.5 | % | |
242
THE DFA INTERNATIONAL VALUE SERIES
CONTINUED
| | | Shares | | Value†† | | Percentage
of Net Assets** | |
| Repsol YPF SA Sponsored ADR | | | 1,285,700 | | | $ | 24,582,584 | | | | 0.5 | % | |
| Other Securities | | | | | | | 68,834,633 | | | | 1.5 | % | |
| TOTAL — SPAIN | | | | | | | 224,993,660 | | | | 4.8 | % | |
| SWEDEN — (2.4%) | |
| COMMON STOCKS — (2.4%) | |
| # Nordea Bank AB | | | 4,247,718 | | | | 34,046,034 | | | | 0.7 | % | |
| Other Securities | | | | | | | 94,071,267 | | | | 2.0 | % | |
| TOTAL — SWEDEN | | | | | | | 128,117,301 | | | | 2.7 | % | |
| SWITZERLAND — (5.9%) | |
| COMMON STOCKS — (5.9%) | |
| * Compagnie Financiere Richemont SA Series A | | | 1,125,900 | | | | 23,669,433 | | | | 0.5 | % | |
| Credit Suisse Group AG | | | 1,755,349 | | | | 65,639,295 | | | | 1.4 | % | |
| # Credit Suisse Group AG Sponsored ADR | | | 591,859 | | | | 22,135,527 | | | | 0.5 | % | |
| Holcim, Ltd. | | | 435,033 | | | | 24,709,544 | | | | 0.5 | % | |
| Swiss Re | | | 725,996 | | | | 30,276,699 | | | | 0.6 | % | |
| Zurich Financial SVCS AG | | | 300,246 | | | | 60,913,201 | | | | 1.3 | % | |
| Other Securities | | | | | | | 92,813,720 | | | | 2.0 | % | |
| TOTAL — SWITZERLAND | | | | | | | 320,157,419 | | | | 6.8 | % | |
| UNITED KINGDOM — (17.2%) | |
| COMMON STOCKS — (17.2%) | |
| Anglo American P.L.C. | | | 1,329,421 | | | | 33,356,819 | | | | 0.7 | % | |
| Aviva P.L.C. | | | 6,571,996 | | | | 39,201,982 | | | | 0.8 | % | |
| # Barclays P.L.C. Sponsored ADR | | | 2,197,790 | | | | 23,670,198 | | | | 0.5 | % | |
| # HSBC Holdings P.L.C. Sponsored ADR | | | 2,176,243 | | | | 128,398,337 | | | | 2.7 | % | |
| Kingfisher P.L.C. | | | 12,172,495 | | | | 22,467,306 | | | | 0.5 | % | |
| Royal Dutch Shell P.L.C. ADR | | | 1,294,780 | | | | 71,588,386 | | | | 1.5 | % | |
| RSA Insurance Group P.L.C. | | | 12,939,111 | | | | 28,774,426 | | | | 0.6 | % | |
| Vodafone Group P.L.C. | | | 56,881,367 | | | | 109,423,488 | | | | 2.3 | % | |
| Vodafone Group P.L.C. Sponsored ADR | | | 6,370,018 | | | | 122,750,247 | | | | 2.6 | % | |
| William Morrison Supermarkets P.L.C. | | | 6,906,878 | | | | 29,409,035 | | | | 0.6 | % | |
| Other Securities | | | | | | | 324,025,564 | | | | 7.1 | % | |
| TOTAL — UNITED KINGDOM | | | | | | | 933,065,788 | | | | 19.9 | % | |
| | | Face
Amount | | Value† | | | |
| | | (000) | | | | | |
| TEMPORARY CASH INVESTMENTS — (1.6%) | |
Repurchase Agreement, PNC Capital Markets, Inc. 0.94%,
11/03/08 (Collateralized by $92,080,000 FHLMC 4.50%,
05/01/23, valued at $87,591,100) to be repurchased at $86,299,760 | | $ | 86,293 | | | | 86,293,000 | | | | 1.8 | % | |
| | | Shares | | | | | |
| SECURITIES LENDING COLLATERAL — (14.0%) | |
| §@ DFA Short Term Investment Fund LP | | | 757,347,231 | | | | 757,347,231 | | | | 16.1 | % | |
| | | Face
Amount | | | | | |
| | | (000) | | | | | |
@ Repurchase Agreement, Deutsche Bank Securities 0.25%,
11/03/08 (Collateralized by $3,471,793 FHLMC 7.000%,
08/01/37, valued at $2,958,290) to be repurchased at $2,900,344 | | $ | 2,900 | | | | 2,900,284 | | | | 0.1 | % | |
| TOTAL SECURITIES LENDING COLLATERAL | | | | | | | 760,247,515 | | | | 16.2 | % | |
TOTAL INVESTMENTS — (100.0%)
(Cost $7,723,320,604) | | | | | | $ | 5,413,879,738 | | | | 115.2 | % | |
See accompanying Notes to Financial Statements.
243
THE JAPANESE SMALL COMPANY SERIES
SUMMARY SCHEDULE OF PORTFOLIO HOLDINGS
October 31, 2008
| | | Shares | | Value†† | | Percentage
of Net Assets** | |
| COMMON STOCKS — (74.8%) | |
| Consumer Discretionary — (15.7%) | |
| # Chofu Seisakusho Co., Ltd. | | | 124,300 | | | $ | 2,715,167 | | | | 0.3 | % | |
| # DOUTOR NICHIRES Holdings Co., Ltd. | | | 175,286 | | | | 2,728,294 | | | | 0.3 | % | |
| Kanto Auto Works, Ltd. | | | 237,000 | | | | 2,879,846 | | | | 0.3 | % | |
| # Matsuya Co., Ltd. | | | 179,700 | | | | 3,806,351 | | | | 0.4 | % | |
| Nissan Shatai Co., Ltd. | | | 510,300 | | | | 3,332,970 | | | | 0.3 | % | |
| # PanaHome Corp. | | | 519,200 | | | | 3,079,083 | | | | 0.3 | % | |
| Sumitomo Forestry Co., Ltd. | | | 440,766 | | | | 2,892,042 | | | | 0.3 | % | |
| Other Securities | | | | | | | 197,161,791 | | | | 18.4 | % | |
| Total Consumer Discretionary | | | | | | | 218,595,544 | | | | 20.6 | % | |
| Consumer Staples — (8.6%) | |
| # Fancl Corp. | | | 238,100 | | | | 2,985,237 | | | | 0.3 | % | |
| Fuji Oil Co., Ltd. | | | 296,500 | | | | 3,403,727 | | | | 0.3 | % | |
| Heiwado Co., Ltd. | | | 198,600 | | | | 2,955,905 | | | | 0.3 | % | |
| # Hokuto Corp. | | | 110,300 | | | | 2,921,277 | | | | 0.3 | % | |
| # Life Corp. | | | 183,900 | | | | 3,363,423 | | | | 0.3 | % | |
| Morinaga Milk Industry Co., Ltd. | | | 852,000 | | | | 2,755,994 | | | | 0.3 | % | |
| Nippon Flour Mills Co., Ltd. | | | 604,000 | | | | 2,769,324 | | | | 0.3 | % | |
| # Ryoshoku, Ltd. | | | 149,500 | | | | 2,851,547 | | | | 0.3 | % | |
| # Snow Brand Milk Products Co., Ltd. | | | 900,000 | | | | 3,411,961 | | | | 0.3 | % | |
| The Nisshin Oillio Group, Ltd. | | | 585,000 | | | | 2,767,054 | | | | 0.3 | % | |
| # Unicharm Petcare Corp. | | | 97,300 | | | | 3,433,347 | | | | 0.3 | % | |
| Other Securities | | | | | | | 86,240,387 | | | | 8.0 | % | |
| Total Consumer Staples | | | | | | | 119,859,183 | | | | 11.3 | % | |
| Energy — (1.1%) | |
| Total Energy | | | | | | | 14,514,185 | | | | 1.4 | % | |
| Financials — (7.9%) | |
| Kiyo Holdings, Inc. | | | 2,135,900 | | | | 3,449,129 | | | | 0.3 | % | |
| Shikoku Bank, Ltd. | | | 742,000 | | | | 3,396,954 | | | | 0.3 | % | |
| The Akita Bank, Ltd. | | | 666,400 | | | | 2,770,580 | | | | 0.3 | % | |
| # The Bank of Ikeda, Ltd. | | | 70,300 | | | | 2,820,573 | | | | 0.3 | % | |
| # The Bank of Iwate, Ltd. | | | 63,300 | | | | 3,934,220 | | | | 0.4 | % | |
| # The Fukui Bank, Ltd. | | | 841,000 | | | | 2,862,494 | | | | 0.3 | % | |
| The Oita Bank, Ltd. | | | 491,900 | | | | 3,053,271 | | | | 0.3 | % | |
| Toho Bank, Ltd. | | | 759,200 | | | | 3,231,050 | | | | 0.3 | % | |
| # Yamagata Bank, Ltd. | | | 584,500 | | | | 3,513,370 | | | | 0.3 | % | |
| Other Securities | | | | | | | 80,587,065 | | | | 7.5 | % | |
| Total Financials | | | | | | | 109,618,706 | | | | 10.3 | % | |
| Health Care — (3.6%) | |
| # Hogy Medical Co., Ltd. | | | 54,500 | | | | 3,010,223 | | | | 0.3 | % | |
| Kaken Pharmaceutical Co., Ltd. | | | 387,000 | | | | 3,214,136 | | | | 0.3 | % | |
| # Mochida Pharmaceutical Co., Ltd. | | | 409,900 | | | | 3,842,649 | | | | 0.4 | % | |
| # Nipro Corp. | | | 201,100 | | | | 3,083,037 | | | | 0.3 | % | |
| Other Securities | | | | | | | 37,337,087 | | | | 3.4 | % | |
| Total Health Care | | | | | | | 50,487,132 | | | | 4.7 | % | |
| Industrials — (20.9%) | |
| # Aeon Delight Co., Ltd. | | | 139,000 | | | | 3,424,202 | | | | 0.3 | % | |
| Chudenko Corp. | | | 209,200 | | | | 3,139,609 | | | | 0.3 | % | |
| # Daiseki Co., Ltd. | | | 147,263 | | | | 3,354,018 | | | | 0.3 | % | |
| # Fukuyama Transporting Co., Ltd. | | | 912,400 | | | | 3,876,253 | | | | 0.4 | % | |
| Hitachi Transport System, Ltd. | | | 313,000 | | | | 4,185,718 | | | | 0.4 | % | |
244
THE JAPANESE SMALL COMPANY SERIES
CONTINUED
| | | Shares | | Value†† | | Percentage
of Net Assets** | |
| Kyowa Exeo Corp. | | | 345,000 | | | $ | 3,382,599 | | | | 0.3 | % | |
| # Miura Co., Ltd. | | | 141,400 | | | | 2,904,502 | | | | 0.3 | % | |
| Moshi Moshi Hotline, Inc. | | | 119,450 | | | | 2,850,086 | | | | 0.3 | % | |
| # Okumura Corp. | | | 750,400 | | | | 2,941,288 | | | | 0.3 | % | |
| # Takara Standard Co., Ltd. | | | 515,000 | | | | 2,759,215 | | | | 0.3 | % | |
| # Takasago Thermal Engineering Co., Ltd. | | | 292,000 | | | | 2,735,364 | | | | 0.3 | % | |
| Other Securities | | | | | | | 254,297,826 | | | | 23.8 | % | |
| Total Industrials | | | | | | | 289,850,680 | | | | 27.3 | % | |
| Information Technology — (8.0%) | |
| * IT Holdings Corp. | | | 292,801 | | | | 3,160,478 | | | | 0.3 | % | |
| # Net One Systems Co., Ltd. | | | 1,889 | | | | 3,081,215 | | | | 0.3 | % | |
| Other Securities | | | | | | | 104,504,448 | | | | 9.8 | % | |
| Total Information Technology | | | | | | | 110,746,141 | | | | 10.4 | % | |
| Materials — (8.3%) | |
| # Daio Paper Corp. | | | 424,500 | | | | 3,204,902 | | | | 0.3 | % | |
| Kureha Corp. | | | 627,500 | | | | 2,783,997 | | | | 0.3 | % | |
| Nihon Parkerizing Co., Ltd. | | | 230,000 | | | | 2,712,223 | | | | 0.3 | % | |
| # Nippon Paint Co., Ltd. | | | 759,200 | | | | 2,928,416 | | | | 0.3 | % | |
| Other Securities | | | | | | | 104,085,095 | | | | 9.7 | % | |
| Total Materials | | | | | | | 115,714,633 | | | | 10.9 | % | |
| Utilities — (0.7%) | |
| # Okinawa Electric Power Co., Ltd. | | | 59,571 | | | | 3,492,510 | | | | 0.3 | % | |
| # Saibu Gas Co., Ltd. | | | 1,296,000 | | | | 3,199,312 | | | | 0.3 | % | |
| Other Securities | | | | | | | 3,316,530 | | | | 0.3 | % | |
| Total Utilities | | | | | | | 10,008,352 | | | | 0.9 | % | |
| TOTAL COMMON STOCKS | | | | | | | 1,039,394,556 | | | | 97.8 | % | |
| | | Face
Amount | | | | | |
| | | (000) | | | | | |
| TEMPORARY CASH INVESTMENTS — (0.7%) | |
Repurchase Agreement, PNC Capital Markets, Inc. 0.94%,
11/04/08 (Collateralized by $60,170,000 FNMA 3.50%,
03/25/33, valued at $9,423,447) to be repurchased at $9,284,970 | | $ | 9,284 | | | | 9,284,000 | | | | 0.8 | % | |
| | | Shares | | | | | |
| SECURITIES LENDING COLLATERAL — (24.5%) | |
| §@ DFA Short Term Investment Fund LP | | | 337,066,073 | | | | 337,066,073 | | | | 31.7 | % | |
| | | Face
Amount | | | | | |
| | | (000) | | | | | |
@ Repurchase Agreement, Deutsche Bank Securities 0.25%,
11/03/08 (Collateralized by $3,100,925 FNMA 5.000%,
03/01/38, valued at $2,869,291) to be repurchased at $2,813,089 | | $ | 2,813 | | | | 2,813,030 | | | | 0.3 | % | |
| TOTAL SECURITIES LENDING COLLATERAL | | | | | | | 339,879,103 | | | | 32.0 | % | |
TOTAL INVESTMENTS — (100.0%)
(Cost $1,830,699,372) | | | | | | $ | 1,388,557,659 | | | | 130.6 | % | |
See accompanying Notes to Financial Statements.
245
THE ASIA PACIFIC SMALL COMPANY SERIES
SUMMARY SCHEDULE OF PORTFOLIO HOLDINGS
October 31, 2008
| | | Shares | | Value†† | | Percentage
of Net Assets** | |
| AUSTRALIA — (46.7%) | |
| COMMON STOCKS — (46.6%) | |
| ABB Grain, Ltd. | | | 763,384 | | | $ | 4,171,028 | | | | 1.0 | % | |
| Adelaide Brighton, Ltd. | | | 1,663,662 | | | | 2,530,723 | | | | 0.6 | % | |
| Ansell, Ltd. | | | 707,058 | | | | 5,948,225 | | | | 1.4 | % | |
| # APA Group | | | 1,864,187 | | | | 3,632,942 | | | | 0.8 | % | |
| #* Arrow Energy NL | | | 2,386,137 | | | | 3,979,725 | | | | 0.9 | % | |
| * Austar United Communications, Ltd. | | | 4,173,099 | | | | 2,502,765 | | | | 0.6 | % | |
| # Australian Infrastructure Fund | | | 2,080,653 | | | | 2,254,652 | | | | 0.5 | % | |
| #* Australian Pharmaceutical Industries, Ltd. | | | 5,455,541 | | | | 2,023,375 | | | | 0.5 | % | |
| * Australian Worldwide Exploration, Ltd. | | | 2,356,893 | | | | 3,937,002 | | | | 0.9 | % | |
| # AWB, Ltd. | | | 1,641,462 | | | | 2,870,752 | | | | 0.7 | % | |
| # Bank of Queensland, Ltd. | | | 503,041 | | | | 4,502,753 | | | | 1.0 | % | |
| # Beach Petroleum, Ltd. | | | 4,877,374 | | | | 3,168,055 | | | | 0.7 | % | |
| # Cabcharge Australia, Ltd. | | | 518,843 | | | | 2,386,955 | | | | 0.5 | % | |
| Campbell Brothers, Ltd. | | | 233,990 | | | | 3,746,476 | | | | 0.9 | % | |
| # Centennial Coal Co., Ltd. | | | 1,532,031 | | | | 3,602,679 | | | | 0.8 | % | |
| # ConnectEast Group, Ltd. | | | 6,869,141 | | | | 3,329,685 | | | | 0.8 | % | |
| # Corporate Express Australia, Ltd. | | | 598,416 | | | | 2,007,382 | | | | 0.5 | % | |
| # David Jones, Ltd. | | | 2,441,858 | | | | 5,029,306 | | | | 1.1 | % | |
| Downer EDI, Ltd. | | | 1,176,627 | | | | 3,821,175 | | | | 0.9 | % | |
| DUET Group | | | 2,275,133 | | | | 3,630,540 | | | | 0.8 | % | |
| # Futuris Corp., Ltd. | | | 3,162,221 | | | | 2,467,632 | | | | 0.6 | % | |
| Goodman Fielder, Ltd. | | | 1,734,935 | | | | 1,925,362 | | | | 0.4 | % | |
| # Great Southern, Ltd. | | | 9,302,784 | | | | 2,234,762 | | | | 0.5 | % | |
| # Healthscope, Ltd. | | | 1,045,042 | | | | 3,019,036 | | | | 0.7 | % | |
| # Hills Industries, Ltd. | | | 752,110 | | | | 1,941,101 | | | | 0.4 | % | |
| * Iluka Resources, Ltd. | | | 1,928,003 | | | | 4,662,051 | | | | 1.1 | % | |
| # JB Hi-Fi, Ltd. | | | 446,741 | | | | 2,622,426 | | | | 0.6 | % | |
| # Monadelphous Group, Ltd. | | | 367,505 | | | | 1,967,933 | | | | 0.5 | % | |
| New Hope Corp., Ltd. | | | 2,882,889 | | | | 6,666,028 | | | | 1.5 | % | |
| * Paladin Energy, Ltd. | | | 1,398,252 | | | | 2,142,210 | | | | 0.5 | % | |
| # Paperlinx, Ltd. | | | 3,074,208 | | | | 2,862,987 | | | | 0.7 | % | |
| # Perpetual Trustees Australia, Ltd. | | | 126,142 | | | | 2,937,413 | | | | 0.7 | % | |
| * Portman, Ltd. | | | 382,760 | | | | 5,457,083 | | | | 1.2 | % | |
| Primary Health Care, Ltd. | | | 970,723 | | | | 2,971,817 | | | | 0.7 | % | |
| # Ramsay Health Care, Ltd. | | | 373,766 | | | | 2,524,745 | | | | 0.6 | % | |
| # Reece Australia, Ltd. | | | 239,537 | | | | 2,782,776 | | | | 0.6 | % | |
| # Sigma Pharmaceuticals, Ltd. | | | 3,396,704 | | | | 2,849,702 | | | | 0.7 | % | |
| #* Sino Gold Mining, Ltd. | | | 970,623 | | | | 2,235,635 | | | | 0.5 | % | |
| # Spark Infrastructure Group, Ltd. | | | 3,056,075 | | | | 2,986,371 | | | | 0.7 | % | |
| # Ten Network Holdings, Ltd. | | | 2,173,092 | | | | 1,976,324 | | | | 0.5 | % | |
| Tower Australia Group, Ltd. | | | 1,383,603 | | | | 1,936,280 | | | | 0.4 | % | |
| # United Group, Ltd. | | | 338,003 | | | | 2,144,813 | | | | 0.5 | % | |
| # West Australian Newspapers Holdings, Ltd. | | | 593,823 | | | | 2,449,666 | | | | 0.6 | % | |
| Other Securities | | | | | | | 134,966,367 | | | | 30.1 | % | |
| TOTAL COMMON STOCKS | | | | | | | 269,806,715 | | | | 61.2 | % | |
| PREFERRED STOCKS — (0.1%) | |
| Other Securities | | | | | | | 200,165 | | | | 0.0 | % | |
| RIGHTS/WARRANTS — (0.0%) | |
| Other Securities | | | | | | | 6,517 | | | | 0.0 | % | |
| TOTAL — AUSTRALIA | | | | | | | 270,013,397 | | | | 61.2 | % | |
246
THE ASIA PACIFIC SMALL COMPANY SERIES
CONTINUED
| | | Shares | | Value†† | | Percentage
of Net Assets** | |
| HONG KONG — (12.6%) | |
| COMMON STOCKS — (12.6%) | |
| # Cafe de Coral Holdings, Ltd. | | | 1,330,000 | | | $ | 2,089,725 | | | | 0.5 | % | |
| Other Securities | | | | | | | 70,821,340 | | | | 16.0 | % | |
| TOTAL COMMON STOCKS | | | | | | | 72,911,065 | | | | 16.5 | % | |
| RIGHTS/WARRANTS — (0.0%) | |
| Other Securities | | | | | | | 47,393 | | | | 0.0 | % | |
| TOTAL — HONG KONG | | | | | | | 72,958,458 | | | | 16.5 | % | |
| MALAYSIA — (0.0%) | |
| COMMON STOCKS — (0.0%) | |
| Other Securities | | | | | | | 3,633 | | | | 0.0 | % | |
| NEW ZEALAND — (5.6%) | |
| COMMON STOCKS — (5.6%) | |
| # Fisher & Paykel Healthcare Corp. | | | 2,502,844 | | | | 4,362,699 | | | | 1.0 | % | |
| Infratil, Ltd. | | | 1,740,707 | | | | 1,953,504 | | | | 0.4 | % | |
| Port of Tauranga, Ltd. | | | 566,944 | | | | 2,183,706 | | | | 0.5 | % | |
| # Ryman Healthcare, Ltd. | | | 2,353,608 | | | | 2,136,229 | | | | 0.5 | % | |
| # Sky City Entertainment Group, Ltd. | | | 1,929,556 | | | | 3,724,524 | | | | 0.8 | % | |
| Other Securities | | | | | | | 18,274,950 | | | | 4.2 | % | |
| TOTAL — NEW ZEALAND | | | | | | | 32,635,612 | | | | 7.4 | % | |
| SINGAPORE — (8.8%) | |
| COMMON STOCKS — (8.8%) | |
| # Singapore Post, Ltd. | | | 6,289,900 | | | | 3,016,431 | | | | 0.7 | % | |
| Other Securities | | | | | | | 47,724,176 | | | | 10.8 | % | |
| TOTAL COMMON STOCKS | | | | | | | 50,740,607 | | | | 11.5 | % | |
| RIGHTS/WARRANTS — (0.0%) | |
| Other Securities | | | | | | | 10,265 | | | | 0.0 | % | |
| TOTAL — SINGAPORE | | | | | | | 50,750,872 | | | | 11.5 | % | |
| | | Face
Amount | | Value† | | | |
| | | (000) | | | | | |
| TEMPORARY CASH INVESTMENTS — (1.9%) | |
Repurchase Agreement, PNC Capital Markets, Inc. 0.94%,
11/03/08 (Collateralized by $14,515,000 FHLMC 6.04%(r),
11/01/36, valued at $11,154,905) to be repurchased at $10,988,861 | | $ | 10,988 | | | | 10,988,000 | | | | 2.5 | % | |
| | | Shares | | | | | |
| SECURITIES LENDING COLLATERAL — (24.4%) | |
| § @ DFA Short Term Investment Fund LP | | | 139,002,499 | | | | 139,002,499 | | | | 31.5 | % | |
| | | Face
Amount | | | | | |
| | | (000) | | | | | |
@ Repurchase Agreement, Deutsche Bank Securities 0.25%,
11/03/08 (Collateralized by $2,652,260 FNMA 5.000%,
03/01/38, valued at $2,454,141) to be repurchased at $2,406,070 | | $ | 2,406 | | | | 2,406,020 | | | | 0.6 | % | |
| TOTAL SECURITIES LENDING COLLATERAL | | | | | | | 141,408,519 | | | | 32.1 | % | |
TOTAL INVESTMENTS — (100.0%)
(Cost $841,787,919) | | | | | | $ | 578,758,491 | | | | 131.2 | % | |
See accompanying Notes to Financial Statements.
247
THE UNITED KINGDOM SMALL COMPANY SERIES
SUMMARY SCHEDULE OF PORTFOLIO HOLDINGS
October 31, 2008
| | | Shares | | Value†† | | Percentage
of Net Assets** | |
| COMMON STOCKS — (93.3%) | |
| Consumer Discretionary — (16.8%) | |
| Bellway P.L.C. | | | 406,536 | | | $ | 3,541,647 | | | | 0.6 | % | |
| Taylor Nelson Sofres P.L.C. | | | 1,742,993 | | | | 6,878,955 | | | | 1.2 | % | |
| The Berkeley Group Holdings P.L.C. | | | 300,929 | | | | 3,623,265 | | | | 0.6 | % | |
| United Business Media P.L.C. | | | 818,599 | | | | 5,326,802 | | | | 0.9 | % | |
| # WH Smith P.LC. | | | 588,205 | | | | 3,536,482 | | | | 0.6 | % | |
| William Hill P.L.C. | | | 1,129,837 | | | | 3,473,901 | | | | 0.6 | % | |
| Other Securities | | | | | | | 69,737,880 | | | | 12.3 | % | |
| Total Consumer Discretionary | | | | | | | 96,118,932 | | | | 16.8 | % | |
| Consumer Staples — (4.0%) | |
| Total Consumer Staples | | | | | | | 22,882,738 | | | | 4.0 | % | |
| Energy — (6.1%) | |
| * Dana Petroleum P.L.C. | | | 326,327 | | | | 5,249,797 | | | | 0.9 | % | |
| #* Imperial Energy Corp. P.L.C. | | | 289,203 | | | | 3,957,481 | | | | 0.7 | % | |
| * Premier Oil P.L.C. | | | 320,409 | | | | 3,841,181 | | | | 0.7 | % | |
| * Soco International P.L.C. | | | 281,540 | | | | 6,486,038 | | | | 1.1 | % | |
| Other Securities | | | | | | | 15,497,580 | | | | 2.7 | % | |
| Total Energy | | | | | | | 35,032,077 | | | | 6.1 | % | |
| Financials — (16.0%) | |
| # Aberdeen Asset Management P.L.C. | | | 2,590,854 | | | | 3,912,615 | | | | 0.7 | % | |
| Amlin P.L.C. | | | 1,765,553 | | | | 9,040,653 | | | | 1.6 | % | |
| Brit Insurance Holdings P.L.C. | | | 1,289,236 | | | | 3,791,566 | | | | 0.7 | % | |
| Catlin Group, Ltd. | | | 977,375 | | | | 5,461,715 | | | | 1.0 | % | |
| Close Brothers Group P.L.C. | | | 481,680 | | | | 4,191,265 | | | | 0.7 | % | |
| Hiscox, Ltd. | | | 1,535,730 | | | | 6,085,323 | | | | 1.1 | % | |
| IG Group Holdings P.L.C. | | | 1,197,446 | | | | 5,594,476 | | | | 1.0 | % | |
| Intermediate Capital Group P.L.C. | | | 326,494 | | | | 5,089,854 | | | | 0.9 | % | |
| Jardine Lloyd Thompson Group P.L.C. | | | 781,443 | | | | 5,574,035 | | | | 1.0 | % | |
| Provident Financial P.L.C. | | | 465,600 | | | | 5,935,143 | | | | 1.0 | % | |
| Other Securities | | | | | | | 36,503,089 | | | | 6.3 | % | |
| Total Financials | | | | | | | 91,179,734 | | | | 16.0 | % | |
| Health Care — (3.2%) | |
| SSL International P.L.C. | | | 745,205 | | | | 5,033,003 | | | | 0.9 | % | |
| Other Securities | | | | | | | 13,096,124 | | | | 2.3 | % | |
| Total Health Care | | | | | | | 18,129,127 | | | | 3.2 | % | |
| Industrials — (31.6%) | |
| Aggreko P.L.C. | | | 513,764 | | | | 3,595,118 | | | | 0.6 | % | |
| Arriva P.L.C. | | | 556,301 | | | | 5,381,893 | | | | 0.9 | % | |
| Atkins WS P.L.C. | | | 425,663 | | | | 3,656,381 | | | | 0.6 | % | |
| Babcock International Group P.L.C. | | | 853,247 | | | | 5,338,849 | | | | 0.9 | % | |
| Carillion P.L.C. | | | 1,523,518 | | | | 5,110,129 | | | | 0.9 | % | |
| * Charter International P.L.C. | | | 626,781 | | | | 4,085,268 | | | | 0.7 | % | |
| De La Rue P.L.C. | | | 603,748 | | | | 8,709,548 | | | | 1.5 | % | |
| Go-Ahead Group P.L.C. | | | 175,345 | | | | 3,840,315 | | | | 0.7 | % | |
| Hays P.L.C. | | | 4,810,460 | | | | 5,281,079 | | | | 0.9 | % | |
| Homeserve P.L.C. | | | 228,007 | | | | 4,681,612 | | | | 0.8 | % | |
| IMI P.L.C. | | | 1,137,010 | | | | 5,053,118 | | | | 0.9 | % | |
| Intertek Group P.L.C. | | | 588,823 | | | | 6,973,480 | | | | 1.2 | % | |
| Michael Page International P.L.C. | | | 1,235,568 | | | | 4,002,170 | | | | 0.7 | % | |
| Mitie Group P.L.C. | | | 1,208,230 | | | | 3,671,360 | | | | 0.6 | % | |
| National Express Group P.L.C. | | | 454,582 | | | | 4,187,578 | | | | 0.7 | % | |
248
THE UNITED KINGDOM SMALL COMPANY SERIES
CONTINUED
| | | Shares | | Value†† | | Percentage
of Net Assets** | |
| Qinetiq P.L.C. | | | 1,922,010 | | | $ | 5,282,500 | | | | 0.9 | % | |
| Spirax-Sarco Engineering P.L.C. | | | 304,500 | | | | 3,951,612 | | | | 0.7 | % | |
| Tomkins P.L.C. | | | 2,633,868 | | | | 4,834,455 | | | | 0.9 | % | |
| Ultra Electronics Holdings P.L.C. | | | 267,145 | | | | 4,739,088 | | | | 0.8 | % | |
| VT Group P.L.C. | | | 677,021 | | | | 5,453,608 | | | | 1.0 | % | |
| Other Securities | | | | | | | 82,196,386 | | | | 14.7 | % | |
| Total Industrials | | | | | | | 180,025,547 | | | | 31.6 | % | |
| Information Technology — (10.9%) | |
| ARM Holdings P.L.C. | | | 4,708,219 | | | | 7,340,704 | | | | 1.3 | % | |
| Aveva Group P.L.C. | | | 275,408 | | | | 3,510,900 | | | | 0.6 | % | |
| Electrocomponents P.L.C. | | | 1,576,293 | | | | 3,615,175 | | | | 0.6 | % | |
| Halma P.L.C. | | | 1,486,473 | | | | 3,930,626 | | | | 0.7 | % | |
| Misys P.L.C. | | | 1,982,492 | | | | 3,549,838 | | | | 0.6 | % | |
| Rotork P.L.C. | | | 352,833 | | | | 4,227,935 | | | | 0.7 | % | |
| Spectris P.L.C. | | | 499,879 | | | | 4,012,371 | | | | 0.7 | % | |
| Other Securities | | | | | | | 31,853,442 | | | | 5.7 | % | |
| Total Information Technology | | | | | | | 62,040,991 | | | | 10.9 | % | |
| Materials — (3.4%) | |
| Croda International P.L.C. | | | 484,717 | | | | 4,002,048 | | | | 0.7 | % | |
| Other Securities | | | | | | | 15,693,593 | | | | 2.7 | % | |
| Total Materials | | | | | | | 19,695,641 | | | | 3.4 | % | |
| Telecommunication Services — (0.6%) | |
| Total Telecommunication Services | | | | | | | 3,644,901 | | | | 0.6 | % | |
| Utilities — (0.7%) | |
| Northumbrian Water Group P.L.C. | | | 701,411 | | | | 3,524,870 | | | | 0.6 | % | |
| Other Securities | | | | | | | 217,845 | | | | 0.1 | % | |
| Total Utilities | | | | | | | 3,742,715 | | | | 0.7 | % | |
| TOTAL COMMON STOCKS | | | | | | | 532,492,403 | | | | 93.3 | % | |
| RIGHTS/WARRANTS — (0.0%) | |
| TOTAL RIGHTS/WARRANTS | | | | | | | — | | | | 0.0 | % | |
| | | Face
Amount | | | | | |
| | | (000) | | | | | |
| TEMPORARY CASH INVESTMENTS — (1.9%) | |
Repurchase Agreement, PNC Capital Markets, Inc. 0.94%,
11/03/08 (Collateralized by $13,960,000 FHLMC 6.04%(r),
11/01/36, valued at $10,728,382) to be repurchased at $10,567,828 | | $ | 10,567 | | | | 10,567,000 | | | | 1.9 | % | |
| | | Shares | | | | | |
| SECURITIES LENDING COLLATERAL — (4.8%) | |
| § @ DFA Short Term Investment Fund LP | | | 23,622,602 | | | | 23,622,602 | | | | 4.1 | % | |
| | | Face
Amount | | | | | |
| | | (000) | | | | | |
@ Repurchase Agreement, Deutsche Bank Securities 0.25%,
11/03/08 (Collateralized by $4,025,415 FHLMC 6.500%,
04/01/38 & 7.000%, 02/01/38, valued at $3,914,679)
to be repurchased at $3,838,000 | | $ | 3,838 | | | | 3,837,920 | | | | 0.7 | % | |
| TOTAL SECURITIES LENDING COLLATERAL | | | | | | | 27,460,522 | | | | 4.8 | % | |
TOTAL INVESTMENTS — (100.0%)
(Cost $862,575,872) | | | | | | $ | 570,519,925 | | | | 100.0 | % | |
See accompanying Notes to Financial Statements.
249
THE CONTINENTAL SMALL COMPANY SERIES
SUMMARY SCHEDULE OF PORTFOLIO HOLDINGS
October 31, 2008
| | | Shares | | Value†† | | Percentage
of Net Assets** | |
| AUSTRIA — (2.3%) | |
| COMMON STOCKS — (2.3%) | |
| Other Securities | | | | | | $ | 30,741,228 | | | | 2.8 | % | |
| BELGIUM — (3.4%) | |
| COMMON STOCKS — (3.4%) | |
| Ackermans & van Haaren NV | | | 81,854 | | | | 4,697,164 | | | | 0.4 | % | |
| Bekaert SA | | | 56,746 | | | | 5,583,963 | | | | 0.5 | % | |
| Other Securities | | | | | | | 35,670,679 | | | | 3.2 | % | |
| TOTAL COMMON STOCKS | | | | | | | 45,951,806 | | | | 4.1 | % | |
| RIGHTS/WARRANTS — (0.0%) | |
| Other Securities | | | | | | | 7,843 | | | | 0.0 | % | |
| TOTAL — BELGIUM | | | | | | | 45,959,649 | | | | 4.1 | % | |
| DENMARK — (1.8%) | |
| COMMON STOCKS — (1.8%) | |
| Other Securities | | | | | | | 24,826,614 | | | | 2.2 | % | |
| FINLAND — (5.5%) | |
| COMMON STOCKS — (5.5%) | |
| Elisa Oyj | | | 251,636 | | | | 3,785,238 | | | | 0.4 | % | |
| KCI Konecranes Oyj | | | 243,819 | | | | 4,143,341 | | | | 0.4 | % | |
| M-Real Oyj Series B | | | 4,696,142 | | | | 7,217,917 | | | | 0.7 | % | |
| Nokian Renkaat Oyj | | | 325,926 | | | | 4,261,240 | | | | 0.4 | % | |
| Other Securities | | | | | | | 53,944,844 | | | | 4.7 | % | |
| TOTAL — FINLAND | | | | | | | 73,352,580 | | | | 6.6 | % | |
| FRANCE — (11.2%) | |
| COMMON STOCKS — (11.2%) | |
| Arkema | | | 199,362 | | | | 4,563,061 | | | | 0.4 | % | |
| # Bourbon SA | | | 147,476 | | | | 4,158,267 | | | | 0.4 | % | |
| * Gemalto NV | | | 144,058 | | | | 4,036,115 | | | | 0.4 | % | |
| # Neopost SA | | | 57,823 | | | | 4,841,088 | | | | 0.4 | % | |
| # Nexans SA | | | 92,377 | | | | 5,269,180 | | | | 0.5 | % | |
| SCOR SE | | | 268,815 | | | | 4,404,167 | | | | 0.4 | % | |
| Societe BIC SA | | | 84,787 | | | | 4,478,545 | | | | 0.4 | % | |
| * UbiSoft Entertainment SA | | | 98,014 | | | | 5,180,944 | | | | 0.5 | % | |
| # Valeo SA | | | 232,962 | | | | 4,057,989 | | | | 0.4 | % | |
| # Zodiac SA | | | 105,911 | | | | 4,141,283 | | | | 0.4 | % | |
| Other Securities | | | | | | | 105,350,371 | | | | 9.3 | % | |
| TOTAL COMMON STOCKS | | | | | | | 150,481,010 | | | | 13.5 | % | |
| RIGHTS/WARRANTS — (0.0%) | |
| Other Securities | | | | | | | 6,078 | | | | 0.0 | % | |
| TOTAL — FRANCE | | | | | | | 150,487,088 | | | | 13.5 | % | |
| GERMANY — (12.8%) | |
| COMMON STOCKS — (12.8%) | |
| # Aareal Bank AG | | | 965,964 | | | | 7,669,414 | | | | 0.7 | % | |
| Bilfinger Berger AG | | | 130,384 | | | | 5,898,571 | | | | 0.5 | % | |
| # Douglas Holding AG | | | 100,341 | | | | 3,774,315 | | | | 0.4 | % | |
| DVB Bank SE | | | 173,470 | | | | 5,700,167 | | | | 0.5 | % | |
| MVV Energie AG | | | 136,685 | | | | 5,376,434 | | | | 0.5 | % | |
| Norddeutsche Affinerie AG | | | 150,696 | | | | 4,825,227 | | | | 0.4 | % | |
| *# QIAGEN NV | | | 549,765 | | | | 7,835,387 | | | | 0.7 | % | |
| Rhoen-Klinikum AG | | | 284,706 | | | | 6,123,128 | | | | 0.6 | % | |
| *# SGL Carbon AG | | | 217,830 | | | | 4,276,121 | | | | 0.4 | % | |
250
THE CONTINENTAL SMALL COMPANY SERIES
CONTINUED
| | | Shares | | Value†† | | Percentage
of Net Assets** | |
| Stada Arzneimittel AG | | | 173,213 | | | $ | 5,284,135 | | | | 0.5 | % | |
| Wincor Nixdorf AG | | | 112,151 | | | | 4,871,414 | | | | 0.5 | % | |
| Other Securities | | | | | | | 109,518,871 | | | | 9.7 | % | |
| TOTAL — GERMANY | | | | | | | 171,153,184 | | | | 15.4 | % | |
| GREECE — (3.1%) | |
| COMMON STOCKS — (3.1%) | |
| Bank of Greece | | | 73,229 | | | | 4,716,234 | | | | 0.4 | % | |
| Other Securities | | | | | | | 37,377,271 | | | | 3.4 | % | |
| TOTAL — GREECE | | | | | | | 42,093,505 | | | | 3.8 | % | |
| IRELAND — (2.7%) | |
| COMMON STOCKS — (2.7%) | |
| * Aryzta AG | | | 175,745 | | | | 6,265,167 | | | | 0.6 | % | |
| DCC P.L.C. | | | 308,989 | | | | 4,824,869 | | | | 0.4 | % | |
| * Dragon Oil P.L.C. | | | 1,438,888 | | | | 3,734,083 | | | | 0.3 | % | |
| Other Securities | | | | | | | 21,415,664 | | | | 2.0 | % | |
| TOTAL — IRELAND | | | | | | | 36,239,783 | | | | 3.3 | % | |
| ITALY — (7.1%) | |
| COMMON STOCKS — (7.1%) | |
| Credito Bergamasco SpA | | | 133,144 | | | | 3,943,643 | | | | 0.4 | % | |
| # Societe Cattolica di Assicurazoni Scrl SpA | | | 158,551 | | | | 5,803,375 | | | | 0.5 | % | |
| Other Securities | | | | | | | 85,228,395 | | | | 7.6 | % | |
| TOTAL COMMON STOCKS | | | | | | | 94,975,413 | | | | 8.5 | % | |
| RIGHTS/WARRANTS — (0.0%) | |
| Other Securities | | | | | | | 15,365 | | | | 0.0 | % | |
| TOTAL — ITALY | | | | | | | 94,990,778 | | | | 8.5 | % | |
| NETHERLANDS — (5.3%) | |
| COMMON STOCKS — (5.3%) | |
| # Boskalis Westminster CVA | | | 133,054 | | | | 4,392,541 | | | | 0.4 | % | |
| Imtech NV | | | 248,834 | | | | 3,801,534 | | | | 0.3 | % | |
| Nutreco Holding NV | | | 139,331 | | | | 4,442,381 | | | | 0.4 | % | |
| Other Securities | | | | | | | 58,352,687 | | | | 5.3 | % | |
| TOTAL — NETHERLANDS | | | | | | | 70,989,143 | | | | 6.4 | % | |
| NORWAY — (2.6%) | |
| COMMON STOCKS — (2.6%) | |
| Other Securities | | | | | | | 34,313,876 | | | | 3.1 | % | |
| PORTUGAL — (1.3%) | |
| COMMON STOCKS — (1.3%) | |
| Jeronimo Martins SGPS SA | | | 731,945 | | | | 3,735,278 | | | | 0.3 | % | |
| Other Securities | | | | | | | 13,665,456 | | | | 1.3 | % | |
| TOTAL — PORTUGAL | | | | | | | 17,400,734 | | | | 1.6 | % | |
| SPAIN — (5.4%) | |
| COMMON STOCKS — (5.4%) | |
| Ebro Puleva SA | | | 304,797 | | | | 3,963,045 | | | | 0.4 | % | |
| # SOS Cuetara SA | | | 346,559 | | | | 4,826,405 | | | | 0.4 | % | |
| Other Securities | | | | | | | 63,227,800 | | | | 5.7 | % | |
| TOTAL — SPAIN | | | | | | | 72,017,250 | | | | 6.5 | % | |
| SWEDEN — (3.9%) | |
| COMMON STOCKS — (3.9%) | |
| # Elekta AB Series B | | | 302,500 | | | | 3,825,462 | | | | 0.3 | % | |
| Other Securities | | | | | | | 47,841,632 | | | | 4.3 | % | |
| TOTAL — SWEDEN | | | | | | | 51,667,094 | | | | 4.6 | % | |
251
THE CONTINENTAL SMALL COMPANY SERIES
CONTINUED
| | | Shares | | Value†† | | Percentage
of Net Assets** | |
| SWITZERLAND — (11.7%) | |
| COMMON STOCKS — (11.6%) | |
| Bank Sarasin & Cie Series B | | | 172,644 | | | $ | 5,080,646 | | | | 0.5 | % | |
| Banque Privee Edmond de Rothschild SA | | | 157 | | | | 4,058,816 | | | | 0.4 | % | |
| Berner Kantonalbank | | | 24,383 | | | | 4,770,531 | | | | 0.4 | % | |
| Clariant AG | | | 756,817 | | | | 4,695,179 | | | | 0.4 | % | |
| # Galenica Holding AG | | | 15,281 | | | | 4,620,503 | | | | 0.4 | % | |
| Kuoni Reisen Holding AG | | | 13,201 | | | | 3,867,768 | | | | 0.4 | % | |
| # Luzerner Kantonalbank AG | | | 18,055 | | | | 3,824,786 | | | | 0.3 | % | |
| PSP Swiss Property AG | | | 141,111 | | | | 6,105,200 | | | | 0.6 | % | |
| Romande Energie Holding SA | | | 2,758 | | | | 4,765,169 | | | | 0.4 | % | |
| Valiant Holding AG | | | 57,514 | | | | 9,909,695 | | | | 0.9 | % | |
| Other Securities | | | | | | | 104,289,550 | | | | 9.3 | % | |
| TOTAL COMMON STOCKS | | | | | | | 155,987,843 | | | | 14.0 | % | |
| PREFERRED STOCKS — (0.1%) | |
| Other Securities | | | | | | | 663,447 | | | | 0.1 | % | |
| TOTAL — SWITZERLAND | | | | | | | 156,651,290 | | | | 14.1 | % | |
| | | Face
Amount | | Value† | | | |
| | | (000) | | | | | |
| TEMPORARY CASH INVESTMENTS — (2.3%) | |
Repurchase Agreement, PNC Capital Markets, Inc. 0.94%,
11/03/08 (Collateralized by $32,575,000 FNMA 5.00%,
05/01/23, valued at $30,970,983) to be repurchased at $30,514,390 | | $ | 30,512 | | | | 30,512,000 | | | | 2.8 | % | |
| | | Shares | | | | | |
| SECURITIES LENDING COLLATERAL — (17.6%) | |
| § @ DFA Short Term Investment Fund LP | | | 235,721,235 | | | | 235,721,235 | | | | 21.2 | % | |
| | | Face
Amount | | | | | |
| | | (000) | | | | | |
@ Repurchase Agreement, Deutsche Bank Securities 0.25%,
11/03/08 (Collateralized by $323,792 FNMA 5.000%,
03/01/38, valued at $299,605) to be repurchased at $293,736 | | $ | 294 | | | | 293,730 | | | | 0.0 | % | |
| TOTAL SECURITIES LENDING COLLATERAL | | | | | | | 236,014,965 | | | | 21.2 | % | |
TOTAL INVESTMENTS — (100.0%)
(Cost $1,640,244,915) | | | | | | $ | 1,339,410,761 | | | | 120.5 | % | |
See accompanying Notes to Financial Statements.
252
THE CANADIAN SMALL COMPANY SERIES
SUMMARY SCHEDULE OF PORTFOLIO HOLDINGS
October 31, 2008
| | | Shares | | Value†† | | Percentage
of Net Assets** | |
| COMMON STOCKS — (77.1%) | |
| Consumer Discretionary — (10.6%) | |
| Astral Media, Inc. Class A | | | 179,347 | | | $ | 4,147,018 | | | | 1.8 | % | |
| Cogeco Cable, Inc. | | | 59,756 | | | | 1,549,799 | | | | 0.7 | % | |
| Corus Entertainment, Inc. Class B | | | 266,300 | | | | 3,115,266 | | | | 1.3 | % | |
| Dorel Industries, Inc. Class B | | | 102,100 | | | | 2,244,794 | | | | 1.0 | % | |
| Quebecor, Inc. Class B | | | 154,693 | | | | 2,524,526 | | | | 1.1 | % | |
| Reitmans Canada, Ltd. | | | 182,700 | | | | 2,182,759 | | | | 0.9 | % | |
| * RONA, Inc. | | | 417,385 | | | | 4,068,924 | | | | 1.7 | % | |
| # Torstar Corp. Class B | | | 163,800 | | | | 1,569,642 | | | | 0.7 | % | |
| Other Securities | | | | | | | 9,904,801 | | | | 4.2 | % | |
| Total Consumer Discretionary | | | | | | | 31,307,529 | | | | 13.4 | % | |
| Consumer Staples — (2.3%) | |
| Jean Coutu Group PJC, Inc. Class A | | | 451,200 | | | | 2,728,987 | | | | 1.2 | % | |
| Maple Leaf Foods, Inc. | | | 254,000 | | | | 1,742,786 | | | | 0.7 | % | |
| Other Securities | | | | | | | 2,362,630 | | | | 1.0 | % | |
| Total Consumer Staples | | | | | | | 6,834,403 | | | | 2.9 | % | |
| Energy — (17.1%) | |
| * Birchcliff Energy, Ltd. | | | 326,600 | | | | 1,609,561 | | | | 0.7 | % | |
| * Crew Energy, Inc. | | | 240,536 | | | | 1,353,052 | | | | 0.6 | % | |
| * Fairborne Energy, Ltd. | | | 230,900 | | | | 1,373,561 | | | | 0.6 | % | |
| *# First Calgary Petroleums, Ltd. Class A | | | 884,300 | | | | 2,553,193 | | | | 1.1 | % | |
| *# Galleon Energy, Inc. Class A | | | 250,037 | | | | 1,333,890 | | | | 0.6 | % | |
| *# Nuvista Energy, Ltd. | | | 250,321 | | | | 2,228,445 | | | | 1.0 | % | |
| # Pason Systems, Inc. | | | 219,400 | | | | 2,251,703 | | | | 1.0 | % | |
| *# ProEx Energy, Ltd. | | | 192,800 | | | | 1,981,907 | | | | 0.9 | % | |
| Savanna Energy Services Corp. | | | 215,313 | | | | 1,786,385 | | | | 0.8 | % | |
| ShawCor, Ltd. | | | 207,300 | | | | 3,138,824 | | | | 1.4 | % | |
| # Trican Well Service, Ltd. | | | 288,471 | | | | 2,704,490 | | | | 1.2 | % | |
| *# TriStar Oil and Gas, Ltd. | | | 366,841 | | | | 3,119,655 | | | | 1.3 | % | |
| *# Uranium One, Inc. | | | 1,767,600 | | | | 1,495,853 | | | | 0.6 | % | |
| Other Securities | | | | | | | 23,814,669 | | | | 10.0 | % | |
| Total Energy | | | | | | | 50,745,188 | | | | 21.8 | % | |
| Financials — (6.5%) | |
| # AGF Management, Ltd. Class B | | | 323,111 | | | | 3,557,356 | | | | 1.5 | % | |
| # Canadian Western Bank | | | 199,000 | | | | 3,044,520 | | | | 1.3 | % | |
| Home Capital Group, Inc. | | | 111,700 | | | | 2,586,532 | | | | 1.1 | % | |
| Laurentian Bank of Canada | | | 88,500 | | | | 3,001,643 | | | | 1.3 | % | |
| # Northbridge Financial Corp. | | | 73,600 | | | | 1,827,024 | | | | 0.8 | % | |
| Other Securities | | | | | | | 5,125,815 | | | | 2.2 | % | |
| Total Financials | | | | | | | 19,142,890 | | | | 8.2 | % | |
| Health Care — (5.5%) | |
| Biovail Corp. | | | 484,920 | | | | 4,168,067 | | | | 1.8 | % | |
| *# MDS, Inc. | | | 437,208 | | | | 4,566,870 | | | | 2.0 | % | |
| Other Securities | | | | | | | 7,476,097 | | | | 3.2 | % | |
| Total Health Care | | | | | | | 16,211,034 | | | | 7.0 | % | |
| Industrials — (6.1%) | |
| Russel Metals, Inc. | | | 195,900 | | | | 3,518,821 | | | | 1.5 | % | |
| * Stantec, Inc. | | | 154,600 | | | | 2,481,963 | | | | 1.1 | % | |
| Toromont Industries, Ltd. | | | 214,900 | | | | 4,066,929 | | | | 1.7 | % | |
| Transcontinental, Inc. Class A | | | 226,928 | | | | 2,296,956 | | | | 1.0 | % | |
| Other Securities | | | | | | | 5,573,885 | | | | 2.4 | % | |
| Total Industrials | | | | | | | 17,938,554 | | | | 7.7 | % | |
253
THE CANADIAN SMALL COMPANY SERIES
CONTINUED
| | | Shares | | Value†† | | Percentage
of Net Assets** | |
| Information Technology — (6.7%) | |
| * Celestica, Inc. | | | 750,707 | | | $ | 3,631,147 | | | | 1.6 | % | |
| *# MacDonald Dettweiler & Associates, Ltd. | | | 96,900 | | | | 1,738,942 | | | | 0.7 | % | |
| *# Open Text Corp. | | | 181,300 | | | | 4,596,804 | | | | 2.0 | % | |
| Other Securities | | | | | | | 10,016,633 | | | | 4.3 | % | |
| Total Information Technology | | | | | | | 19,983,526 | | | | 8.6 | % | |
| Materials — (21.5%) | |
| *# Alamos Gold, Inc. | | | 327,500 | | | | 1,350,431 | | | | 0.6 | % | |
| *# Canfor Corp. | | | 310,074 | | | | 1,767,368 | | | | 0.8 | % | |
| CCL Industries, Inc. Class B | | | 93,600 | | | | 2,329,710 | | | | 1.0 | % | |
| # Harry Winston Diamond Corp. | | | 219,100 | | | | 2,135,921 | | | | 0.9 | % | |
| * HudBay Minerals, Inc. | | | 440,721 | | | | 1,989,150 | | | | 0.9 | % | |
| IAMGOLD Corp. | | | 1,117,000 | | | | 3,706,961 | | | | 1.6 | % | |
| Methanex Corp. | | | 213,400 | | | | 2,423,833 | | | | 1.0 | % | |
| # Nova Chemicals Corp. | | | 262,000 | | | | 3,401,892 | | | | 1.5 | % | |
| * Pan Amer Silver Corp. | | | 213,700 | | | | 2,436,106 | | | | 1.0 | % | |
| *# Silver Standard Resources, Inc. | | | 223,892 | | | | 1,905,859 | | | | 0.8 | % | |
| * Thompson Creek Metals Company, Inc. | | | 445,400 | | | | 2,642,172 | | | | 1.1 | % | |
| West Fraser Timber Co., Ltd. | | | 116,616 | | | | 3,097,053 | | | | 1.3 | % | |
| Other Securities | | | | | | | 34,515,479 | | | | 14.9 | % | |
| Total Materials | | | | | | | 63,701,935 | | | | 27.4 | % | |
| Telecommunication Services — (0.0%) | |
| Total Telecommunication Services | | | | | | | 71,683 | | | | 0.0 | % | |
| Utilities — (0.8%) | |
| *# Canadian Hydro Developers, Inc. | | | 492,100 | | | | 1,343,242 | | | | 0.6 | % | |
| Other Securities | | | | | | | 977,641 | | | | 0.4 | % | |
| Total Utilities | | | | | | | 2,320,883 | | | | 1.0 | % | |
| TOTAL COMMON STOCKS | | | | | | | 228,257,625 | | | | 98.0 | % | |
| RIGHTS/WARRANTS — (0.0%) | |
| TOTAL RIGHTS/WARRANTS | | | | | | | 79,661 | | | | 0.0 | % | |
| | | Face
Amount | | | | | |
| | | (000) | | | | | |
| TEMPORARY CASH INVESTMENTS — (0.8%) | |
Repurchase Agreement, PNC Capital Markets, Inc. 0.94%,
11/03/08 (Collateralized by $3,775,000 FNMA 6.50%,
11/01/36, valued at $2,533,771) to be repurchased at $2,496,196 | | $ | 2,496 | | | | 2,496,000 | | | | 1.1 | % | |
| | | Shares | | | | | |
| SECURITIES LENDING COLLATERAL — (22.1%) | |
| §@ DFA Short Term Investment Fund LP | | | 64,287,911 | | | | 64,287,911 | | | | 27.6 | % | |
| | | Face
Amount | | | | | |
| | | (000) | | | | | |
@ Repurchase Agreement, Deutsche Bank Securities 0.25%,
11/03/08 (Collateralized by $3,087,765 FHLMC 7.000%,
02/01/38 & FNMA 4.056%(r), 09/01/44, valued at $1,123,163)
to be repurchased at $1,101,163 | | $ | 1,101 | | | | 1,101,140 | | | | 0.5 | % | |
| TOTAL SECURITIES LENDING COLLATERAL | | | | | | | 65,389,051 | | | | 28.1 | % | |
TOTAL INVESTMENTS — (100.0%)
(Cost $582,126,285) | | | | | | $ | 296,222,337 | | | | 127.2 | % | |
See accompanying Notes to Financial Statements.
254
THE EMERGING MARKETS SERIES
SUMMARY SCHEDULE OF PORTFOLIO HOLDINGS
October 31, 2008
| | | Shares | | Value†† | | Percentage
of Net Assets** | |
| ARGENTINA — (0.3%) | |
| COMMON STOCKS — (0.3%) | |
| Other Securities | | | | | | $ | 5,584,351 | | | | 0.3 | % | |
| BRAZIL — (16.0%) | |
| COMMON STOCKS — (6.5%) | |
| Perdigao SA ADR | | | 457,126 | | | | 13,370,936 | | | | 0.8 | % | |
| Petroleo Brasilerio SA ADR (71654V101) | | | 1,934,642 | | | | 42,697,549 | | | | 2.7 | % | |
| Petroleo Brasilerio SA ADR (71654V408) | | | 1,223,746 | | | | 32,906,530 | | | | 2.0 | % | |
| Other Securities | | | | | | | 23,939,591 | | | | 1.5 | % | |
| TOTAL COMMON STOCKS | | | | | | | 112,914,606 | | | | 7.0 | % | |
| PREFERRED STOCKS — (9.5%) | |
| Banci Itau Holding Financeira SA | | | 1,507,125 | | | | 16,278,202 | | | | 1.0 | % | |
| Banco Bradesco SA | | | 1,636,841 | | | | 18,774,751 | | | | 1.2 | % | |
| Companhia Vale do Rio Doce Series A | | | 2,173,591 | | | | 25,212,251 | | | | 1.6 | % | |
| Gerdau SA Sponsored ADR | | | 2,037,600 | | | | 13,061,016 | | | | 0.8 | % | |
| # Sadia SA ADR | | | 1,234,266 | | | | 7,479,652 | | | | 0.5 | % | |
| # Votorantim Celulose e Papel SA Sponsored ADR | | | 1,181,000 | | | | 11,916,290 | | | | 0.7 | % | |
| Other Securities | | | | | | | 72,895,252 | | | | 4.4 | % | |
| TOTAL PREFERRED STOCKS | | | | | | | 165,617,414 | | | | 10.2 | % | |
| TOTAL — BRAZIL | | | | | | | 278,532,020 | | | | 17.2 | % | |
| CHILE — (3.2%) | |
| COMMON STOCKS — (3.2%) | |
| # Empresa Nacional de Electricidad SA Sponsored ADR | | | 262,585 | | | | 9,768,162 | | | | 0.6 | % | |
| Enersis SA Sponsored ADR | | | 1,398,003 | | | | 20,131,243 | | | | 1.3 | % | |
| # Sociedad Quimica y Minera de Chile SA Sponsored ADR | | | 349,195 | | | | 7,996,566 | | | | 0.5 | % | |
| Other Securities | | | | | | | 17,647,476 | | | | 1.0 | % | |
| TOTAL — CHILE | | | | | | | 55,543,447 | | | | 3.4 | % | |
| CHINA — (4.8%) | |
| COMMON STOCKS — (4.8%) | |
| # Bank of China, Ltd. | | | 60,844,000 | | | | 17,765,768 | | | | 1.1 | % | |
| China Resources Enterprise, Ltd. | | | 7,139,000 | | | | 14,213,048 | | | | 0.9 | % | |
| Citic Pacific, Ltd. | | | 17,336,000 | | | | 14,098,717 | | | | 0.9 | % | |
| # Industrial and Commercial Bank of China (Asia), Ltd. | | | 30,590,000 | | | | 14,393,223 | | | | 0.9 | % | |
| Other Securities | | | | | | | 22,976,599 | | | | 1.3 | % | |
| TOTAL — CHINA | | | | | | | 83,447,355 | | | | 5.1 | % | |
| CZECH REPUBLIC — (1.9%) | |
| COMMON STOCKS — (1.9%) | |
| CEZ A.S. | | | 323,973 | | | | 14,169,330 | | | | 0.9 | % | |
| Telefonica 02 Czech Republic A.S. | | | 704,007 | | | | 15,044,164 | | | | 0.9 | % | |
| Other Securities | | | | | | | 4,619,080 | | | | 0.3 | % | |
| TOTAL — CZECH REPUBLIC | | | | | | | 33,832,574 | | | | 2.1 | % | |
| HUNGARY — (2.3%) | |
| COMMON STOCKS — (2.3%) | |
| *# OTP Bank NYRT | | | 719,020 | | | | 11,908,444 | | | | 0.7 | % | |
| # Richter Gedeon NYRT | | | 115,808 | | | | 16,000,427 | | | | 1.0 | % | |
| Other Securities | | | | | | | 12,648,235 | | | | 0.8 | % | |
| TOTAL — HUNGARY | | | | | | | 40,557,106 | | | | 2.5 | % | |
255
THE EMERGING MARKETS SERIES
CONTINUED
| | | Shares | | Value†† | | Percentage
of Net Assets** | |
| INDIA — (9.4%) | |
| COMMON STOCKS — (9.4%) | |
| HDFC Bank, Ltd. | | | 386,733 | | | $ | 8,227,909 | | | | 0.5 | % | |
| Hindustan Unilever, Ltd. | | | 1,921,894 | | | | 8,736,163 | | | | 0.5 | % | |
| Infosys Technologies, Ltd. | | | 657,429 | | | | 19,010,875 | | | | 1.2 | % | |
| Infosys Technologies, Ltd. Sponsored ADR | | | 250,600 | | | | 7,347,592 | | | | 0.5 | % | |
| Reliance Industries, Ltd. | | | 1,030,847 | | | | 29,122,041 | | | | 1.8 | % | |
| Other Securities | | | | | | | 89,772,216 | | | | 5.5 | % | |
| TOTAL COMMON STOCKS | | | | | | | 162,216,796 | | | | 10.0 | % | |
| PREFERRED STOCKS — (0.0%) | |
| Other Securities | | | | | | | 347,069 | | | | 0.0 | % | |
| TOTAL — INDIA | | | | | | | 162,563,865 | | | | 10.0 | % | |
| INDONESIA — (2.1%) | |
| COMMON STOCKS — (2.1%) | |
| PT Astra International Tbk | | | 15,468,561 | | | | 12,876,057 | | | | 0.8 | % | |
| PT Telekomunikasi Indonesia Tbk | | | 15,037,640 | | | | 7,523,134 | | | | 0.5 | % | |
| Other Securities | | | | | | | 16,756,269 | | | | 1.0 | % | |
| TOTAL — INDONESIA | | | | | | | 37,155,460 | | | | 2.3 | % | |
| ISRAEL — (5.3%) | |
| COMMON STOCKS — (5.3%) | |
| Bank Hapoalim B.M. | | | 6,655,731 | | | | 15,071,355 | | | | 0.9 | % | |
| Bank Leumi Le-Israel | | | 5,633,015 | | | | 14,777,977 | | | | 0.9 | % | |
| Israel Chemicals, Ltd. | | | 837,943 | | | | 8,451,396 | | | | 0.5 | % | |
| Teva Pharmaceutical Industries, Ltd. Sponsored ADR | | | 869,167 | | | | 37,269,881 | | | | 2.3 | % | |
| Other Securities | | | | | | | 16,808,772 | | | | 1.1 | % | |
| TOTAL — ISRAEL | | | | | | | 92,379,381 | | | | 5.7 | % | |
| MALAYSIA — (4.0%) | |
| COMMON STOCKS — (4.0%) | |
| Other Securities | | | | | | | 69,964,680 | | | | 4.3 | % | |
| MEXICO — (8.6%) | |
| COMMON STOCKS — (8.6%) | |
| Alfa S.A.B. de C.V. Series A | | | 3,812,637 | | | | 7,822,313 | | | | 0.5 | % | |
| # America Movil S.A.B. de C.V. Series L | | | 19,036,559 | | | | 29,485,030 | | | | 1.8 | % | |
| Grupo Mexico S.A.B. de C.V. Series B | | | 21,157,195 | | | | 16,590,332 | | | | 1.0 | % | |
| # Telefonos de Mexico S.A.B. de C.V. | | | 10,416,800 | | | | 9,309,749 | | | | 0.6 | % | |
| # Wal-Mart de Mexico S.A.B. de C.V. Series V | | | 4,692,980 | | | | 12,582,694 | | | | 0.8 | % | |
| Other Securities | | | | | | | 73,148,266 | | | | 4.5 | % | |
| TOTAL — MEXICO | | | | | | | 148,938,384 | | | | 9.2 | % | |
| PHILIPPINES — (0.7%) | |
| COMMON STOCKS — (0.7%) | |
| Other Securities | | | | | | | 11,676,420 | | | | 0.7 | % | |
| POLAND — (1.4%) | |
| COMMON STOCKS — (1.4%) | |
| Bank Pekao SA | | | 163,030 | | | | 7,414,805 | | | | 0.5 | % | |
| Telekomunikacja Polska SA | | | 1,112,400 | | | | 8,405,484 | | | | 0.5 | % | |
| Other Securities | | | | | | | 8,202,531 | | | | 0.5 | % | |
| TOTAL — POLAND | | | | | | | 24,022,820 | | | | 1.5 | % | |
| SINGAPORE — (0.0%) | |
| COMMON STOCKS — (0.0%) | |
| Other Securities | | | | | | | 138,173 | | | | 0.0 | % | |
256
THE EMERGING MARKETS SERIES
CONTINUED
| | | Shares | | Value†† | | Percentage
of Net Assets** | |
| SOUTH AFRICA — (7.1%) | |
| COMMON STOCKS — (7.1%) | |
| MTN Group, Ltd. | | | 1,745,306 | | | $ | 19,598,239 | | | | 1.2 | % | |
| Sasol, Ltd. Sponsored ADR | | | 1,363,425 | | | | 39,443,885 | | | | 2.4 | % | |
| Other Securities | | | | | | | 63,499,905 | | | | 3.9 | % | |
| TOTAL — SOUTH AFRICA | | | | | | | 122,542,029 | | | | 7.5 | % | |
| SOUTH KOREA — (10.2%) | |
| COMMON STOCKS — (10.2%) | |
| # POSCO | | | 46,060 | | | | 12,686,282 | | | | 0.8 | % | |
| Samsung Electronics Co., Ltd. | | | 97,139 | | | | 40,954,158 | | | | 2.5 | % | |
| Samsung Electronics Co., Ltd. ADR | | | 52,988 | | | | 10,979,734 | | | | 0.7 | % | |
| SK Telecom Co., Ltd. | | | 56,085 | | | | 8,901,750 | | | | 0.5 | % | |
| Other Securities | | | | | | | 103,339,470 | | | | 6.4 | % | |
| TOTAL — SOUTH KOREA | | | | | | | 176,861,394 | | | | 10.9 | % | |
| TAIWAN — (7.6%) | |
| COMMON STOCKS — (7.6%) | |
| Formosa Chemicals & Fiber Co., Ltd. | | | 4,610,141 | | | | 7,452,770 | | | | 0.5 | % | |
| Formosa Plastics Corp. | | | 4,721,167 | | | | 7,967,558 | | | | 0.5 | % | |
| Hon Hai Precision Industry Co., Ltd. | | | 3,761,458 | | | | 9,079,012 | | | | 0.6 | % | |
| Nan Ya Plastic Corp. | | | 6,878,218 | | | | 9,532,403 | | | | 0.6 | % | |
| Taiwan Semiconductor Manufacturing Co., Ltd. | | | 22,275,436 | | | | 32,412,010 | | | | 2.0 | % | |
| Other Securities | | | | | | | 65,276,976 | | | | 3.9 | % | |
| TOTAL — TAIWAN | | | | | | | 131,720,729 | | | | 8.1 | % | |
| THAILAND — (1.1%) | |
| COMMON STOCKS — (1.1%) | |
| Other Securities | | | | | | | 18,868,229 | | | | 1.2 | % | |
| TURKEY — (2.3%) | |
| COMMON STOCKS — (2.3%) | |
| * Koc Holding A.S. Series B | | | 3,943,304 | | | | 7,357,239 | | | | 0.5 | % | |
| Other Securities | | | | | | | 33,128,805 | | | | 2.0 | % | |
| TOTAL — TURKEY | | | | | | | 40,486,044 | | | | 2.5 | % | |
| | | | | Value† | | | |
| SECURITIES LENDING COLLATERAL — (11.7%) | |
| §@ DFA Short Term Investment Fund LP | | | 191,178,954 | | | | 191,178,954 | | | | 11.7 | % | |
| | | Face
Amount | | | | | |
| | | (000) | | | | | |
@ Repurchase Agreement, Deutsche Bank Securities 0.25%, 11/03/08
(Collateralized by $25,549,645 FHLMC, rates ranging from 5.296%(r) to 6.000%,
maturities ranging from 12/01/26 to 03/01/33 & FNMA 5.520%(r), 05/01/17,
valued at $12,757,896) to be repurchased at $12,508,001 | | $ | 12,508 | | | | 12,507,740 | | | | 0.8 | % | |
| TOTAL SECURITIES LENDING COLLATERAL | | | | | | | 203,686,694 | | | | 12.5 | % | |
TOTAL INVESTMENTS — (100.0%)
(Cost $1,345,667,600) | | | | | | $ | 1,738,501,155 | | | | 107.0 | % | |
See accompanying Notes to Financial Statements.
257
EMERGING MARKETS SMALL CAP SERIES
SUMMARY SCHEDULE OF PORTFOLIO HOLDINGS
October 31, 2008
| | | Shares | | Value†† | | Percentage
of Net Assets** | |
| ARGENTINA — (0.2%) | |
| COMMON STOCKS — (0.2%) | |
| Other Securities | | | | | | $ | 1,164,071 | | | | 0.2 | % | |
| BRAZIL — (8.1%) | |
| COMMON STOCKS — (2.2%) | |
| # Perdigao SA ADR | | | 71,200 | | | | 2,082,600 | | | | 0.4 | % | |
| Other Securities | | | | | | | 12,364,849 | | | | 2.1 | % | |
| TOTAL COMMON STOCKS | | | | | | | 14,447,449 | | | | 2.5 | % | |
| PREFERRED STOCKS — (5.9%) | |
| # Braskem SA Preferred A Sponsored ADR | | | 301,000 | | | | 2,597,630 | | | | 0.5 | % | |
| Companhia Paranaense de Energia-Copel Series B | | | 213,400 | | | | 2,346,267 | | | | 0.4 | % | |
| Duratex SA | | | 245,400 | | | | 2,050,192 | | | | 0.4 | % | |
| Eletropaulo Metropolita SA Preferred A | | | 248,500 | | | | 2,695,477 | | | | 0.5 | % | |
| Klabin SA | | | 1,412,700 | | | | 2,438,725 | | | | 0.4 | % | |
| * Net Servicos de Comunicacao SA | | | 400,902 | | | | 2,548,082 | | | | 0.5 | % | |
| # Sadia SA ADR | | | 300,000 | | | | 1,818,000 | | | | 0.3 | % | |
| Suzano Papel e Celullose SA | | | 390,634 | | | | 2,316,938 | | | | 0.4 | % | |
| Ultrapar Participacoes SA | | | 263,040 | | | | 4,856,497 | | | | 0.9 | % | |
| Votorantim Celulose e Papel SA Sponsored ADR | | | 155,700 | | | | 1,571,013 | | | | 0.3 | % | |
| Other Securities | | | | | | | 12,622,333 | | | | 2.1 | % | |
| TOTAL PREFERRED STOCKS | | | | | | | 37,861,154 | | | | 6.7 | % | |
| TOTAL — BRAZIL | | | | | | | 52,308,603 | | | | 9.2 | % | |
| CHILE — (1.6%) | |
| COMMON STOCKS — (1.6%) | |
| Vina de Concha y Toro SA | | | 1,108,893 | | | | 1,537,488 | | | | 0.3 | % | |
| Other Securities | | | | | | | 8,768,006 | | | | 1.5 | % | |
| TOTAL — CHILE | | | | | | | 10,305,494 | | | | 1.8 | % | |
| CHINA — (12.1%) | |
| COMMON STOCKS — (12.1%) | |
| *# Brilliance China Automotive Holdings, Ltd. | | | 56,178,000 | | | | 2,350,029 | | | | 0.4 | % | |
| # China Travel International Investment Hong Kong, Ltd. | | | 31,457,000 | | | | 4,461,497 | | | | 0.8 | % | |
| # China Yurun Food Group, Ltd. | | | 2,622,000 | | | | 3,116,419 | | | | 0.6 | % | |
| # COSCO International Holdings, Ltd. | | | 8,765,000 | | | | 1,593,992 | | | | 0.3 | % | |
| Guangdong Investment, Ltd. | | | 5,402,000 | | | | 1,653,440 | | | | 0.3 | % | |
| # HKC (Holdings), Ltd. | | | 44,456,657 | | | | 2,449,056 | | | | 0.4 | % | |
| # Hopson Development Holdings, Ltd. | | | 8,710,000 | | | | 2,910,370 | | | | 0.5 | % | |
| # Hunan Non-Ferrous Metal Corp., Ltd. | | | 38,500,000 | | | | 3,456,212 | | | | 0.6 | % | |
| Minmetals Resources, Ltd. | | | 18,446,000 | | | | 1,823,354 | | | | 0.3 | % | |
| *# Semiconductor Manufacturing International Corp. | | | 250,445,000 | | | | 4,633,222 | | | | 0.8 | % | |
| # Shenzhen International Holdings, Ltd. | | | 142,816,800 | | | | 4,820,659 | | | | 0.9 | % | |
| Shenzhen Investment, Ltd. | | | 37,424,000 | | | | 3,877,399 | | | | 0.7 | % | |
| # Sinolink Worldwide Holdings, Ltd. | | | 28,341,300 | | | | 1,627,306 | | | | 0.3 | % | |
| TPV Technology, Ltd. | | | 25,626,000 | | | | 5,087,794 | | | | 0.9 | % | |
| Weiqiao Textile Co., Ltd. | | | 7,951,500 | | | | 1,629,863 | | | | 0.3 | % | |
| # Xinao Gas Holdings, Ltd. | | | 2,178,000 | | | | 1,898,232 | | | | 0.3 | % | |
| Other Securities | | | | | | | 30,651,622 | | | | 5.4 | % | |
| TOTAL COMMON STOCKS | | | | | | | 78,040,466 | | | | 13.8 | % | |
| RIGHTS/WARRANTS — (0.0%) | |
| Other Securities | | | | | | | 125 | | | | 0.0 | % | |
| TOTAL — CHINA | | | | | | | 78,040,591 | | | | 13.8 | % | |
258
EMERGING MARKETS SMALL CAP SERIES
CONTINUED
| | | Shares | | Value†† | | Percentage
of Net Assets** | |
| HUNGARY — (0.5%) | |
| COMMON STOCKS — (0.5%) | |
| Other Securities | | | | | | $ | 3,422,363 | | | | 0.6 | % | |
| INDIA — (9.9%) | |
| COMMON STOCKS — (9.9%) | |
| REI Agro, Ltd. | | | 102,217 | | | | 1,970,959 | | | | 0.4 | % | |
| Sterling Biotech, Ltd. | | | 469,728 | | | | 1,728,903 | | | | 0.3 | % | |
| Other Securities | | | | | | | 60,136,546 | | | | 10.6 | % | |
| TOTAL COMMON STOCKS | | | | | | | 63,836,408 | | | | 11.3 | % | |
| PREFERRED STOCKS — (0.0%) | |
| Other Securities | | | | | | | 31,078 | | | | 0.0 | % | |
| TOTAL — INDIA | | | | | | | 63,867,486 | | | | 11.3 | % | |
| INDONESIA — (2.5%) | |
| COMMON STOCKS — (2.5%) | |
| PT Lippo Karawaci Tbk | | | 35,036,250 | | | | 1,936,510 | | | | 0.4 | % | |
| Other Securities | | | | | | | 14,266,111 | | | | 2.5 | % | |
| TOTAL — INDONESIA | | | | | | | 16,202,621 | | | | 2.9 | % | |
| ISRAEL — (3.1%) | |
| COMMON STOCKS — (3.1%) | |
| Clal Insurance Enterprise Holdings, Ltd. | | | 318,868 | | | | 2,800,707 | | | | 0.5 | % | |
| * Harel Insurance Investments & Finances, Ltd. | | | 110,689 | | | | 3,508,586 | | | | 0.6 | % | |
| Super-Sol, Ltd. Series B | | | 449,336 | | | | 1,913,512 | | | | 0.3 | % | |
| Other Securities | | | | | | | 11,647,932 | | | | 2.1 | % | |
| TOTAL — ISRAEL | | | | | | | 19,870,737 | | | | 3.5 | % | |
| MALAYSIA — (6.2%) | |
| COMMON STOCKS — (6.2%) | |
| Other Securities | | | | | | | 39,825,576 | | | | 7.0 | % | |
| PREFERRED STOCKS — (0.0%) | |
| Other Securities | | | | | | | 11,462 | | | | 0.0 | % | |
| RIGHTS/WARRANTS — (0.0%) | |
| Other Securities | | | | | | | 42,061 | | | | 0.0 | % | |
| TOTAL — MALAYSIA | | | | | | | 39,879,099 | | | | 7.0 | % | |
| MEXICO — (6.5%) | |
| COMMON STOCKS — (6.5%) | |
| * Corporacion GEO S.A.B. de C.V. Series B | | | 1,330,000 | | | | 1,842,930 | | | | 0.3 | % | |
| Embotelladora Arca S.A.B. de C.V., Mexico | | | 1,909,100 | | | | 4,026,654 | | | | 0.7 | % | |
| *# Empresas ICA S.A.B. de C.V. | | | 1,463,608 | | | | 2,104,274 | | | | 0.4 | % | |
| * Empresas ICA S.A.B. de C.V. Sponsored ADR | | | 681,589 | | | | 3,946,400 | | | | 0.7 | % | |
| Grupo Aeroportuario del Sureste S.A.B. de C.V. ADR | | | 62,500 | | | | 2,015,000 | | | | 0.4 | % | |
| Grupo Cementos de Chihuahua S.A.B. de C.V. | | | 829,200 | | | | 2,190,364 | | | | 0.4 | % | |
| Grupo Continental S.A.B. de C.V. | | | 3,339,259 | | | | 5,190,222 | | | | 0.9 | % | |
| *# Industrias CH S.A.B. de C.V. Series B | | | 3,429,248 | | | | 6,982,421 | | | | 1.2 | % | |
| # TV Azteca S.A.B. de C.V. Series A | | | 6,581,300 | | | | 3,145,521 | | | | 0.6 | % | |
| Other Securities | | | | | | | 10,422,594 | | | | 1.8 | % | |
| TOTAL — MEXICO | | | | | | | 41,866,380 | | | | 7.4 | % | |
| PHILIPPINES — (1.3%) | |
| COMMON STOCKS — (1.3%) | |
| Other Securities | | | | | | | 8,481,196 | | | | 1.5 | % | |
259
EMERGING MARKETS SMALL CAP SERIES
CONTINUED
| | | Shares | | Value†† | | Percentage
of Net Assets** | |
| POLAND — (3.0%) | |
| COMMON STOCKS — (3.0%) | |
| Orbis SA | | | 137,403 | | | $ | 1,878,478 | | | | 0.3 | % | |
| Other Securities | | | | | | | 17,203,332 | | | | 3.1 | % | |
| TOTAL — POLAND | | | | | | | 19,081,810 | | | | 3.4 | % | |
| SOUTH AFRICA — (4.6%) | |
| COMMON STOCKS — (4.6%) | |
| Dimension Data Holdings P.L.C. | | | 3,458,471 | | | | 1,839,958 | | | | 0.3 | % | |
| Grindrod, Ltd. | | | 1,607,864 | | | | 2,306,240 | | | | 0.4 | % | |
| JD Group, Ltd. | | | 1,161,251 | | | | 3,341,238 | | | | 0.6 | % | |
| Tongaat-Hulett, Ltd. | | | 658,375 | | | | 3,656,941 | | | | 0.7 | % | |
| Wilson Bayly Holme-Ovcon, Ltd. | | | 166,336 | | | | 1,946,463 | | | | 0.4 | % | |
| Other Securities | | | | | | | 16,614,219 | | | | 2.9 | % | |
| TOTAL — SOUTH AFRICA | | | | | | | 29,705,059 | | | | 5.3 | % | |
| SOUTH KOREA — (8.9%) | |
| COMMON STOCKS — (8.9%) | |
| Other Securities | | | | | | | 57,307,326 | | | | 10.1 | % | |
| TAIWAN — (11.0%) | |
| COMMON STOCKS — (11.0%) | |
| Other Securities | | | | | | | 70,758,628 | | | | 12.5 | % | |
| THAILAND — (2.2%) | |
| COMMON STOCKS — (2.2%) | |
| Other Securities | | | | | | | 13,825,645 | | | | 2.4 | % | |
| RIGHTS/WARRANTS — (0.0%) | |
| Other Securities | | | | | | | 12,273 | | | | 0.0 | % | |
| TOTAL — THAILAND | | | | | | | 13,837,918 | | | | 2.4 | % | |
| TURKEY — (2.0%) | |
| COMMON STOCKS — (2.0%) | |
| Eczacibasi Ilac Sanayi ve Ticaret A.S. | | | 2,612,880 | | | | 2,048,255 | | | | 0.4 | % | |
| Other Securities | | | | | | | 11,123,078 | | | | 1.9 | % | |
| TOTAL — TURKEY | | | | | | | 13,171,333 | | | | 2.3 | % | |
| | | | | Value† | | | |
| SECURITIES LENDING COLLATERAL — (16.3%) | |
| §@ DFA Short Term Investment Fund LP | | | 100,787,757 | | | | 100,787,757 | | | | 17.8 | % | |
| | | Face
Amount | | | | | |
| | | (000) | | | | | |
@ Repurchase Agreement, Deutsche Bank Securities 0.25%, 11/03/08
(Collateralized by $5,778,377 FHLMC 7.000%, 10/01/38 & FNMA 4.056%(r),
09/01/44, valued at $4,431,941) to be repurchased at $4,345,131 | | $ | 4,345 | | | | 4,345,040 | | | | 0.8 | % | |
| TOTAL SECURITIES LENDING COLLATERAL | | | | | | | 105,132,797 | | | | 18.6 | % | |
TOTAL INVESTMENTS — (100.0%)
(Cost $886,201,062) | | | | | | $ | 644,403,512 | | | | 113.8 | % | |
See accompanying Notes to Financial Statements.
260
THE DFA ONE-YEAR FIXED INCOME SERIES
SCHEDULE OF INVESTMENTS
October 31, 2008
| | | Face
Amount | | Value† | |
| | | (000) | | | |
| AGENCY OBLIGATIONS — (36.3%) | |
Federal Farm Credit Bank
2.750%, 05/04/10 | | $ | 118,300 | | | $ | 117,388,262 | | |
Federal Home Loan Bank
2.375%, 04/30/10 | | | 12,000 | | | | 11,843,400 | | |
| 4.875%, 05/14/10 | | | 108,200 | | | | 110,756,766 | | |
| 4.250%, 06/11/10 | | | 134,100 | | | | 136,123,703 | | |
| 2.750%, 06/18/10 | | | 76,200 | | | | 75,573,255 | | |
Federal Home Loan Mortgage
Corporation
2.875%, 04/30/10 | | | 136,000 | | | | 135,323,264 | | |
| 2.375%, 05/28/10 | | | 106,300 | | | | 105,146,645 | | |
| 2.875%, 06/28/10 | | | 75,000 | | | | 74,761,125 | | |
Federal National Mortgage
Association
2.500%, 04/09/10 | | | 70,000 | | | | 69,354,320 | | |
| 4.125%, 05/15/10 | | | 102,500 | | | | 103,827,785 | | |
| 2.375%, 05/20/10 | | | 124,500 | | | | 123,037,997 | | |
| 7.125%, 06/15/10 | | | 98,500 | | | | 104,633,989 | | |
| TOTAL AGENCY OBLIGATIONS | | | | | | | 1,167,770,511 | | |
| BONDS — (21.2%) | |
American Express Centurion
Floating Rate Note
(r) 5.561%, 06/12/09 | | | 91,700 | | | | 89,395,304 | | |
Bank of New York Mellon Corp.
Floating Rate Note
(r) 3.495%, 02/05/10 | | | 89,000 | | | | 87,255,511 | | |
Citigroup Funding, Inc.
Floating Rate Note
(r) 5.449%, 10/22/09 | | | 80,400 | | | | 78,051,596 | | |
CME Group, Inc.
Floating Rate Note
(r) 3.300%, 08/06/10 | | | 100,000 | | | | 99,914,500 | | |
Deutsche Bank AG
Floating Rate Note
(r) 2.909%, 06/18/10 | | | 100,000 | | | | 99,922,100 | | |
General Electric Capital Corp.
Floating Rate Note
(r) 5.390%, 01/05/09 | | | 10,385 | | | | 10,353,450 | | |
| (r) 2.776%, 05/10/10 | | | 10,200 | | | | 9,884,137 | | |
JPMorgan Chase & Co.
Floating Rate Note
(r) 5.255%, 11/19/09 | | | 92,000 | | | | 91,845,992 | | |
Manitoba, Province of
4.450%, 04/12/10 | | | 5,450 | | | | 5,618,198 | | |
Wachovia Corp.
Floating Rate Note
(r) 5.465%, 11/24/09 | | | 93,000 | | | | 90,350,337 | | |
Wal-Mart Stores, Inc.
4.125%, 07/01/10 | | | 19,343 | | | | 19,418,515 | | |
| TOTAL BONDS | | | | | | | 682,009,640 | | |
| | | Face
Amount | | Value† | |
| | | (000) | | | |
CERTIFICATES OF DEPOSIT
INTEREST BEARING — (10.9%) | |
Abbey National North America
3.060%, 06/04/09 | | $ | 55,000 | | | $ | 54,784,389 | | |
ABN-AMRO Bank NV
3.070%, 01/28/09 | | | 43,000 | | | | 42,946,259 | | |
| 3.035%, 02/13/09 | | | 60,000 | | | | 59,898,000 | | |
Barclays Bank P.L.C.
3.430%, 07/10/09 | | | 80,000 | | | | 79,830,872 | | |
| 3.430%, 08/07/09 | | | 22,000 | | | | 21,950,108 | | |
Royal Bank of Scotland P.L.C.
3.110%, 01/23/09 | | | 45,000 | | | | 44,951,953 | | |
UBS AG
3.390%, 07/13/09 | | | 45,000 | | | | 44,891,591 | | |
TOTAL CERTIFICATES OF DEPOSIT
INTEREST BEARING | | | | | | | 349,253,172 | | |
| COMMERCIAL PAPER — (28.8%) | |
ANZ National (International), Ltd.
3.070%, 09/04/09 | | | 30,000 | | | | 29,186,367 | | |
Australia & New Zealand Bank
3.111%, 07/31/09 | | | 10,000 | | | | 9,759,608 | | |
Bank of Nova Scotia
2.680%, 11/12/08 | | | 14,650 | | | | 14,642,265 | | |
Bank of Scotland P.L.C.
2.950%, 12/04/08 | | | 100,000 | | | | 99,754,440 | | |
| 3.055%, 01/15/09 | | | 6,000 | | | | 5,959,859 | | |
Danske Corp.
2.695%, 11/13/08 | | | 78,000 | | | | 77,954,846 | | |
Dexia Delaware LLC
2.815%, 11/10/08 | | | 80,000 | | | | 79,964,976 | | |
| 2.815%, 11/12/08 | | | 23,000 | | | | 22,987,626 | | |
KFW
1.270%, 11/04/08 | | | 45,000 | | | | 44,992,548 | | |
| 1.250%, 11/05/08 | | | 50,000 | | | | 49,989,655 | | |
Nordea North America, Inc.
3.000%, 05/11/09 | | | 43,000 | | | | 42,273,012 | | |
| 2.900%, 05/22/09 | | | 15,000 | | | | 14,731,870 | | |
| 3.000%, 06/01/09 | | | 45,000 | | | | 44,155,989 | | |
Royal Bank of Canada
2.660%, 11/13/08 | | | 102,000 | | | | 101,940,952 | | |
Royal Bank of Scotland P.L.C.
3.040%, 01/05/09 | | | 24,000 | | | | 23,864,393 | | |
| 3.000%, 02/04/09 | | | 34,000 | | | | 33,700,256 | | |
Societe Generale North America
3.100%, 05/01/09 | | | 19,000 | | | | 18,695,504 | | |
| 3.145%, 05/01/09 | | | 44,000 | | | | 43,294,851 | | |
Svenska Handelsbanken
2.700%, 11/13/08 | | | 51,025 | | | | 50,995,462 | | |
UBS Finance Delaware LLC
3.225%, 05/22/09 | | | 17,000 | | | | 16,696,120 | | |
Westpac Banking Corp.
3.020%, 09/04/09 | | | 103,000 | | | | 100,206,527 | | |
| TOTAL COMMERCIAL PAPER | | | | | | | 925,747,126 | | |
261
THE DFA ONE-YEAR FIXED INCOME SERIES
CONTINUED
| | | Face
Amount | | Value† | |
| | | (000) | | | |
| TEMPORARY CASH INVESTMENTS — (2.8%) | |
Repurchase Agreement, PNC Capital Markets, Inc. 0.94%, 11/03/08 (Collateralized by $96,885,000
FHLMC 4.50%, 05/01/23, valued at $92,161,856) to be repurchased at $90,806,113 | | $ | 90,799 | | | $ | 90,799,000 | | |
| TOTAL INVESTMENTS — (100.0%) (Cost $3,227,053,074) | | | | $ | 3,215,579,449 | | |
See accompanying Notes to Financial Statements.
262
THE DFA TWO-YEAR GLOBAL FIXED INCOME SERIES
SCHEDULE OF INVESTMENTS
October 31, 2008
| | | Face
Amount^ | | Value† | |
| | | (000) | | | |
| AUSTRIA — (1.5%) | |
| BONDS — (1.5%) | |
PFandBriefstelle der Oesterriechischen
Landes-Hypothekenbanken
(f) 3.000%, 01/19/09 | | | 54,575 | | | $ | 47,084,149 | | |
| CANADA — (3.1%) | |
| BONDS — (3.1%) | |
Ontario, Province of
(u) 3.125%, 09/08/10 | | | 100,000 | | | | 101,562,600 | | |
| GERMANY — (6.1%) | |
| BONDS — (6.1%) | |
DSL Bank AG
(j) 1.750%, 10/07/09 | | | 5,760,000 | | | | 58,984,365 | | |
Landesbank Baden-Wurttemberg
(f) 3.000%, 12/22/08 | | | 5,000 | | | | 4,312,223 | | |
L-Bank Landeskreditbank
Baden-Wuerttemberg
Foerderbank
(u) 4.250%, 09/15/10 | | | 25,000 | | | | 25,710,450 | | |
Norddeutsche Landesbank
Girozentrale AG
(j) 0.450%, 01/19/09 | | | 10,718,000 | | | | 108,681,129 | | |
| TOTAL — GERMANY | | | | | | | 197,688,167 | | |
| NETHERLANDS — (0.5%) | |
| BONDS — (0.5%) | |
Bank Nederlandse Gemeenten
(f) 2.000%, 12/30/08 | | | 4,000 | | | | 3,445,563 | | |
Rabobank Nederland
(f) 3.500%, 12/29/08 | | | 15,500 | | | | 13,380,709 | | |
| TOTAL — NETHERLANDS | | | | | | | 16,826,272 | | |
| SPAIN — (1.8%) | |
| BONDS — (1.8%) | |
Instituto de Credito Oficial
(j) 0.800%, 09/28/09 | | | 5,638,000 | | | | 57,237,290 | | |
SUPRANATIONAL ORGANIZATION
OBLIGATIONS — (1.6%) | |
| BONDS — (1.6%) | |
Inter-American Development Bank
(j) 1.900%, 07/08/09 | | | 5,000,000 | | | | 51,102,122 | | |
| SWEDEN — (0.2%) | |
| BONDS — (0.2%) | |
Kommuninvest
(t) 5.000%, 11/25/08 | | | 9,900 | | | | 6,575,752 | | |
| UNITED STATES — (82.8%) | |
| AGENCY OBLIGATIONS — (29.2%) | |
Federal Farm Credit Bank
2.750%, 05/04/10 | | | 20,100 | | | | 19,945,089 | | |
| | | Face
Amount^ | | Value† | |
| | | (000) | | | |
Federal Home Loan Bank
4.875%, 05/14/10 | | | 89,200 | | | $ | 91,307,796 | | |
| 4.250%, 06/11/10 | | | 125,100 | | | | 126,987,884 | | |
| 2.750%, 06/18/10 | | | 103,400 | | | | 102,549,535 | | |
| 3.500%, 07/16/10 | | | 20,000 | | | | 20,074,320 | | |
| 3.375%, 08/13/10 | | | 102,300 | | | | 102,481,582 | | |
Federal Home Loan Mortgage
Corporation
2.875%, 04/30/10 | | | 23,000 | | | | 22,885,552 | | |
| 2.375%, 05/28/10 | | | 50,000 | | | | 49,457,500 | | |
| 2.875%, 06/28/10 | | | 115,000 | | | | 114,633,725 | | |
Federal National Mortgage
Association
4.125%, 05/15/10 | | | 105,400 | | | | 106,765,352 | | |
| 2.375%, 05/20/10 | | | 80,000 | | | | 79,060,560 | | |
| 7.125%, 06/15/10 | | | 100,000 | | | | 106,227,400 | | |
| TOTAL AGENCY OBLIGATIONS | | | | | | | 942,376,295 | | |
| BONDS — (21.1%) | |
American Express Centurion
Floating Rate Note
(r) 5.561%, 06/12/09 | | | 84,000 | | | | 81,888,828 | | |
Bank of America Corp.
4.500%, 08/01/10 | | | 5,092 | | | | 4,954,185 | | |
Bank of New York Mellon Corp.
Floating Rate Note
(r) 3.495%, 02/05/10 | | | 97,400 | | | | 95,490,863 | | |
CME Group, Inc.
Floating Rate Note
(r) 3.300%, 08/06/10 | | | 25,000 | | | | 24,978,625 | | |
Deutche Bank AG
Floating Rate Note
(r) 3.565%, 02/16/10 | | | 90,000 | | | | 90,013,410 | | |
General Electric Capital Corp.
(j) 0.750%, 02/05/09 | | | 4,497,000 | | | | 45,430,154 | | |
| (f) 2.250%, 02/09/09 | | | 21,000 | | | | 17,801,742 | | |
Georgia Power Co.
Floating Rate Note
(r) 3.400%, 03/17/10 | | | 67,500 | | | | 67,260,105 | | |
JPMorgan Chase & Co.
Floating Rate Note
(r) 5.255%, 11/19/09 | | | 90,000 | | | | 89,849,340 | | |
Wachovia Corp.
Floating Rate Note
(r) 5.500%, 02/23/09 | | | 45,000 | | | | 44,507,250 | | |
| (r) 5.465%, 11/24/09 | | | 50,000 | | | | 48,575,450 | | |
Wells Fargo Bank & Co.
4.625%, 08/09/10 | | | 6,500 | | | | 6,473,070 | | |
Wells Fargo Bank & Co.
Floating Rate Note
(r) 5.380%, 09/23/09 | | | 65,000 | | | | 63,703,705 | | |
| TOTAL BONDS | | | | | | | 680,926,727 | | |
263
THE DFA TWO-YEAR GLOBAL FIXED INCOME SERIES
CONTINUED
| | | Face
Amount | | Value† | |
| | | (000) | | | |
CERTIFICATES OF DEPOSIT
INTEREST BEARING — (14.5%) | |
ABN-AMRO Bank NV
3.070%, 01/28/09 | | $ | 77,000 | | | $ | 76,903,765 | | |
Barclays Bank P.L.C.
3.430%, 07/10/09 | | | 60,000 | | | | 59,873,154 | | |
| 3.430%, 08/07/09 | | | 40,000 | | | | 39,909,288 | | |
BNP Paribas Finance, Inc.
3.040%, 01/20/09 | | | 23,000 | | | | 22,972,200 | | |
| 3.190%, 08/14/09 | | | 76,000 | | | | 75,684,798 | | |
Royal Bank of Scotland P.L.C.
3.110%, 01/23/09 | | | 94,000 | | | | 93,899,636 | | |
UBS AG
3.390%, 07/13/09 | | | 100,000 | | | | 99,759,090 | | |
TOTAL CERTIFICATES OF DEPOSIT
INTEREST BEARING | | | | | | | 469,001,931 | | |
| COMMERCIAL PAPER — (18.0%) | |
Abbey National North America
2.970%, 01/12/09 | | | 33,000 | | | | 32,789,681 | | |
| 2.970%, 02/09/09 | | | 20,000 | | | | 19,813,768 | | |
| 2.990%, 02/20/09 | | | 14,000 | | | | 13,854,133 | | |
Australia & New Zealand Bank
3.111%, 07/31/09 | | | 60,000 | | | | 58,557,648 | | |
Bank of Scotland P.L.C.
2.950%, 12/04/08 | | | 20,000 | | | | 19,950,888 | | |
| 3.045%, 01/12/09 | | | 17,000 | | | | 16,891,654 | | |
CME Group, Inc.
2.285%, 11/03/08 | | | 73,000 | | | | 72,990,933 | | |
Danske Corp.
3.980%, 11/03/08 | | | 55,000 | | | | 54,993,169 | | |
KFW
1.270%, 11/04/08 | | | 20,000 | | | | 19,996,688 | | |
| 1.250%, 11/05/08 | | | 64,000 | | | | 63,986,758 | | |
| | | Face
Amount | | Value† | |
| | | (000) | | | |
National Australia Funding
4.500%, 12/04/08 | | $ | 5,000 | | | $ | 4,987,722 | | |
| 3.000%, 01/02/09 | | | 10,000 | | | | 9,946,520 | | |
Nordea North America, Inc.
4.090%, 11/03/08 | | | 25,000 | | | | 24,996,895 | | |
| 2.855%, 01/28/09 | | | 24,000 | | | | 23,805,326 | | |
| 3.030%, 05/05/09 | | | 25,000 | | | | 24,590,543 | | |
| 3.000%, 05/11/09 | | | 4,000 | | | | 3,932,373 | | |
Paccar Financial Corp.
1.800%, 11/03/08 | | | 22,148 | | | | 22,145,249 | | |
Societe Generale North America
3.005%, 02/12/09 | | | 35,000 | | | | 34,663,605 | | |
| 3.100%, 05/01/09 | | | 34,000 | | | | 33,455,113 | | |
| 3.100%, 05/08/09 | | | 12,000 | | | | 11,800,290 | | |
| 3.030%, 05/18/09 | | | 13,000 | | | | 12,772,200 | | |
| TOTAL COMMERCIAL PAPER | | | | | | | 580,921,156 | | |
| TOTAL — UNITED STATES | | | | | | | 2,673,226,109 | | |
TEMPORARY CASH
INVESTMENTS — (2.4%) | |
Repurchase Agreement, PNC Capital
Markets, Inc. 0.94%, 11/03/08
(Collateralized by $101,715,000
FHLMC, rates ranging from 4.50%
to 6.584%(r), maturities ranging
from 05/01/23 to 03/01/37 &
FNMA 5.50%, 02/25/36,
valued at $80,250,299) to be
repurchased at $79,065,193 | | | 79,059 | | | | 79,059,000 | | |
TOTAL INVESTMENTS — (100.0%)
(Cost $3,183,845,566) | | | | | | $ | 3,230,361,461 | | |
See accompanying Notes to Financial Statements.
264
THE DFA INVESTMENT TRUST COMPANY
STATEMENTS OF ASSETS AND LIABILITIES
OCTOBER 31, 2008
(Amounts in thousands, except share and per share amounts)
| | | The U.S.
Large
Company
Series | | The Enhanced
U.S. Large
Company
Series | | The U.S.
Large Cap
Value
Series | | The U.S.
Small Cap
Value
Series | |
| ASSETS: | |
Investments at Value (including $712,279, $0, $690,374,
and $903,683 of securities on loan, respectively) | | $ | 3,222,515 | | | $ | 191,904 | | | $ | 6,607,903 | | | $ | 5,377,382 | | |
| Temporary Cash Investments at Value & Cost | | | 34,056 | | | | 6,367 | | | | 144,470 | | | | 104,622 | | |
Collateral Received from Securities on Loan at Value &
Cost | | | 725,739 | | | | — | | | | 699,072 | | | | 963,655 | | |
| Foreign Currencies at Value | | | — | | | | 2 | | | | — | | | | — | | |
| Cash | | | 4,084 | | | | — | | | | — | | | | — | | |
| Receivables: | |
| Investment Securities Sold | | | 2,153 | | | | — | | | | 10,617 | | | | 2,974 | | |
| Dividends and Interest | | | 4,961 | | | | 1,440 | | | | 12,718 | | | | 4,173 | | |
| Securities Lending Income | | | 367 | | | | — | | | | 1,430 | | | | 2,269 | | |
| Fund Shares Sold | | | 5,691 | | | | 65 | | | | 4,995 | | | | 13,961 | | |
| Fund Margin Variation | | | 200 | | | | 1,175 | | | | 29 | | | | 26 | | |
| Prepaid Expenses and Other Assets | | | 20 | | | | 17 | | | | 7 | | | | 7 | | |
| Total Assets | | | 3,999,786 | | | | 200,970 | | | | 7,481,241 | | | | 6,469,069 | | |
| LIABILITIES: | |
| Payables: | |
| Upon Return of Securities Loaned | | | 725,739 | | | | — | | | | 699,072 | | | | 963,655 | | |
| Investment Securities Purchased | | | — | | | | — | | | | 41,685 | | | | — | | |
| Fund Shares Redeemed | | | 70 | | | | — | | | | 136 | | | | — | | |
| Due to Advisor | | | 69 | | | | 9 | | | | 570 | | | | 931 | | |
| Forward Currency Contracts | | | — | | | | 16 | | | | — | | | | — | | |
| Unrealized Loss on Forward Currency Contracts | | | — | | | | 429 | | | | — | | | | — | | |
| Accrued Expenses and Other Liabilities | | | 256 | | | | 17 | | | | 415 | | | | 348 | | |
| Total Liabilities | | | 726,134 | | | | 471 | | | | 741,878 | | | | 964,934 | | |
| NET ASSETS | | $ | 3,273,652 | | | $ | 200,499 | | | $ | 6,739,363 | | | $ | 5,504,135 | | |
| SHARES OUTSTANDING, $0.01 PAR VALUE (1) | | | N/A | | | | 33,170,337 | | | | 497,037,187 | | | | 443,285,380 | | |
NET ASSET VALUE, OFFERING AND
REDEMPTION PRICE PER SHARE | | | N/A | | | $ | 6.04 | | | $ | 13.56 | | | $ | 12.42 | | |
| Investments at Cost | | $ | 3,422,812 | | | $ | 192,751 | | | $ | 8,488,055 | | | $ | 6,789,556 | | |
| NET ASSETS CONSIST OF: | |
| Paid-In Capital | | | N/A | | | $ | 200,499 | | | $ | 9,162,464 | | | $ | 5,504,135 | | |
Undistributed Net Investment Income (Distributions in
Excess of Net Investment Income) | | | N/A | | | | — | | | | (68 | ) | | | — | | |
| Accumulated Net Realized Gain (Loss) | | | N/A | | | | — | | | | (542,910 | ) | | | — | | |
| Net Unrealized Foreign Exchange Gain (Loss) | | | N/A | | | | — | | | | — | | | | — | | |
| Net Unrealized Appreciation (Depreciation) | | | N/A | | | | — | | | | (1,880,123 | ) | | | — | | |
| NET ASSETS | | | N/A | | | $ | 200,499 | | | $ | 6,739,363 | | | $ | 5,504,135 | | |
| (1) NUMBER OF SHARES AUTHORIZED | | | N/A | | | | Unlimited | | | | Unlimited | | | | Unlimited | | |
See accompanying Notes to Financial Statements.
265
THE DFA INVESTMENT TRUST COMPANY
STATEMENTS OF ASSETS AND LIABILITIES
OCTOBER 31, 2008
(Amounts in thousands, except share and per share amounts)
| | | The U.S.
Small
Cap
Series | | The U.S.
Micro
Cap
Series | | The DFA
International
Value
Series | | The Japanese
Small
Company
Series | |
| ASSETS: | |
Investments at Value (including $448,727, $557,841, $717,470
and $320,166 of securities on loan, respectively) | | $ | 2,022,011 | | | $ | 2,857,354 | | | $ | 4,567,339 | | | $ | 1,039,395 | | |
| Temporary Cash Investments at Value & Cost | | | 53,160 | | | | 65,811 | | | | 86,293 | | | | 9,284 | | |
Collateral Received from Securities on Loan at Value &
Cost | | | 461,715 | | | | 582,961 | | | | 760,248 | | | | 339,879 | | |
| Foreign Currencies at Value | | | — | | | | — | | | | 14,156 | | | | 3,755 | | |
| Cash | | | 1 | | | | — | | | | 15 | | | | 15 | | |
| Receivables: | |
| Investment Securities Sold | | | 3,053 | | | | 5,196 | | | | 38,170 | | | | 22,536 | | |
| Dividends, Interest, and Tax Reclaims | | | 1,266 | | | | 1,826 | | | | 15,310 | | | | 9,110 | | |
| Securities Lending Income | | | 1,567 | | | | 2,293 | | | | 1,186 | | | | 760 | | |
| Fund Shares Sold | | | 32 | | | | 17 | | | | 10,712 | | | | — | | |
| Fund Margin Variation | | | — | | | | — | | | | 19 | | | | — | | |
| Prepaid Expenses and Other Assets | | | 3 | | | | 29 | | | | 7 | | | | 1 | | |
| Total Assets | | | 2,542,808 | | | | 3,515,487 | | | | 5,493,455 | | | | 1,424,735 | | |
| LIABILITIES: | |
| Payables: | |
| Upon Return of Securities Loaned | | | 461,715 | | | | 582,961 | | | | 760,248 | | | | 339,879 | | |
| Investment Securities Purchased | | | 8,382 | | | | 6,909 | | | | 31,085 | | | | 21,593 | | |
| Fund Shares Redeemed | | | 5,766 | | | | 1,559 | | | | 510 | | | | 137 | | |
| Due to Advisor | | | 54 | | | | 250 | | | | 853 | | | | 86 | | |
| Accrued Expenses and Other Liabilities | | | 134 | | | | 184 | | | | 422 | | | | 76 | | |
| Total Liabilities | | | 476,051 | | | | 591,863 | | | | 793,118 | | | | 361,771 | | |
| NET ASSETS | | | 2,066,757 | | | | 2,923,624 | | | | 4,700,337 | | | | 1,062,964 | | |
| SHARES OUTSTANDING, $0.01 PAR VALUE (1) | | | 200,917,016 | | | | 440,564,264 | | | | 412,114,828 | | | | N/A | | |
NET ASSET VALUE, OFFERING AND
REDEMPTION PRICE PER SHARE | | $ | 10.29 | | | $ | 6.64 | | | $ | 11.41 | | | | N/A | | |
| Investments at Cost | | $ | 2,353,022 | | | $ | 3,242,904 | | | $ | 6,876,780 | | | $ | 1,481,536 | | |
| Foreign Currencies at Cost | | $ | — | | | $ | — | | | $ | 14,875 | | | $ | 3,813 | | |
| NET ASSETS CONSIST OF: | |
| Paid-In Capital | | $ | 2,066,757 | | | $ | 2,923,624 | | | $ | 4,700,337 | | | | N/A | | |
Undistributed Net Investment Income (Distributions in
Excess of Net Investment Income) | | | — | | | | — | | | | — | | | | N/A | | |
| Accumulated Net Realized Gain (Loss) | | | — | | | | — | | | | — | | | | N/A | | |
| Net Unrealized Foreign Exchange Gain (Loss) | | | — | | | | — | | | | — | | | | N/A | | |
| Net Unrealized Appreciation (Depreciation) | | | — | | | | — | | | | — | | | | N/A | | |
| NET ASSETS | | $ | 2,066,757 | | | $ | 2,923,624 | | | $ | 4,700,337 | | | | N/A | | |
| (1) NUMBER OF SHARES AUTHORIZED | | | Unlimited | | | | Unlimited | | | | Unlimited | | | | N/A | | |
See accompanying Notes to Financial Statements.
266
THE DFA INVESTMENT TRUST COMPANY
STATEMENTS OF ASSETS AND LIABILITIES
OCTOBER 31, 2008
(Amounts in thousands)
| | | The
Asia Pacific
Small
Company
Series | | The United
Kingdom
Small
Company
Series | | The
Continental
Small
Company
Series | | The
Canadian
Small
Company
Series | |
| ASSETS: | |
Investments at Value (including $102,837, $24,696, $223,217
and $50,836 of securities on loan, respectively) | | $ | 426,362 | | | $ | 532,492 | | | $ | 1,072,884 | | | $ | 228,337 | | |
| Temporary Cash Investments at Value & Cost | | | 10,988 | | | | 10,567 | | | | 30,512 | | | | 2,496 | | |
Collateral Received from Securities on
Loan at Value & Cost | | | 141,409 | | | | 27,461 | | | | 236,015 | | | | 65,389 | | |
| Foreign Currencies at Value | | | 3,948 | | | | 3,798 | | | | 13,178 | | | | 1,816 | | |
| Cash | | | 16 | | | | 16 | | | | 16 | | | | 16 | | |
| Receivables: | |
| Investment Securities Sold | | | 3,420 | | | | 9,649 | | | | 1,386 | | | | — | | |
| Dividends, Interest, and Tax Reclaims | | | 1,356 | | | | 3,003 | | | | 2,673 | | | | 138 | | |
| Securities Lending Income | | | 373 | | | | 52 | | | | 525 | | | | 119 | | |
| Fund Shares Sold | | | 142 | | | | — | | | | 55 | | | | — | | |
| Fund Margin Variation | | | 3 | | | | 1 | | | | 9 | | | | — | | |
| Prepaid Expenses and Other Assets | | | 1 | | | | 1 | | | | 2 | | | | — | | |
| Total Assets | | | 588,018 | | | | 587,040 | | | | 1,357,255 | | | | 298,311 | | |
| LIABILITIES: | |
| Payables: | |
| Upon Return of Securities Loaned | | | 141,409 | | | | 27,461 | | | | 236,015 | | | | 65,389 | | |
| Investment Securities Purchased | | | 5,272 | | | | 4,060 | | | | 9,436 | | | | — | | |
| Fund Shares Redeemed | | | — | | | | 24 | | | | — | | | | — | | |
| Due to Advisor | | | 43 | | | | 54 | | | | 104 | | | | 22 | | |
| Accrued Expenses and Other Liabilities | | | 57 | | | | 51 | | | | 115 | | | | 27 | | |
| Total Liabilities | | | 146,781 | | | | 31,650 | | | | 245,670 | | | | 65,438 | | |
| NET ASSETS | | $ | 441,237 | | | $ | 555,390 | | | $ | 1,111,585 | | | $ | 232,873 | | |
| Investments at Cost | | $ | 689,392 | | | $ | 824,548 | | | $ | 1,373,718 | | | $ | 514,241 | | |
| Foreign Currencies at Cost | | $ | 3,820 | | | $ | 3,835 | | | $ | 13,582 | | | $ | 1,774 | | |
See accompanying Notes to Financial Statements.
267
THE DFA INVESTMENT TRUST COMPANY
STATEMENTS OF ASSETS AND LIABILITIES
OCTOBER 31, 2008
(Amounts in thousands, except share and per share amounts)
| | | The
Emerging
Markets
Series | | The Emerging
Markets
Small Cap
Series | | The DFA
One-Year
Fixed Income
Series | | The DFA
Two-Year Global
Fixed Income
Series | |
| ASSETS: | |
Investments at Value (including $180,629, $64,837, $0,
and $0 of securities on loan, respectively) | | $ | 1,534,814 | | | $ | 539,271 | | | $ | 3,124,780 | | | $ | 3,151,302 | | |
| Temporary Cash Investments at Value & Cost | | | — | | | | — | | | | 90,799 | | | | 79,059 | | |
Collateral Received from Securities on Loan at Value &
Cost | | | 203,687 | | | | 105,133 | | | | — | | | | — | | |
| Foreign Currencies at Value | | | 13,010 | | | | 1,277 | | | | — | | | | 27 | | |
| Cash | | | 643 | | | | 1,353 | | | | — | | | | 16 | | |
| Receivables: | |
| Investment Securities Sold | | | 165,128 | | | | 36,416 | | | | — | | | | 23,187 | | |
| Dividends, Interest, and Tax Reclaims | | | 2,223 | | | | 883 | | | | 22,211 | | | | 25,490 | | |
| Securities Lending Income | | | 383 | | | | 273 | | | | — | | | | — | | |
| Fund Shares Sold | | | 1,445 | | | | — | | | | — | | | | 31 | | |
| Forward Currency Contracts | | | — | | | | — | | | | — | | | | 3,382 | | |
| Fund Margin Variation | | | 32 | | | | 10 | | | | — | | | | — | | |
| Unrealized Gain on Forward Currency Contracts | | | — | | | | — | | | | — | | | | 60 | | |
| Prepaid Expenses and Other Assets | | | 3 | | | | 1 | | | | 3 | | | | 2 | | |
| Total Assets | | | 1,921,368 | | | | 684,617 | | | | 3,237,793 | | | | 3,282,556 | | |
| LIABILITIES: | |
| Payables: | |
| Upon Return of Securities Loaned | | | 203,687 | | | | 105,133 | | | | — | | | | — | | |
| Investment Securities Purchased | | | 90,830 | | | | 7,661 | | | | — | | | | — | | |
| Fund Shares Redeemed | | | — | | | | 61 | | | | 12,121 | | | | 10,397 | | |
| Due to Advisor | | | 144 | | | | 106 | | | | 141 | | | | 139 | | |
| Loan Payable | | | 1,079 | | | | 4,963 | | | | — | | | | — | | |
| Distribution Payable | | | — | | | | — | | | | — | | | | 212 | | |
| Unrealized Loss on Forward Currency Contracts | | | — | | | | — | | | | — | | | | 6,792 | | |
| Deferred Thailand Capital Gains Tax | | | 788 | | | | 159 | | | | — | | | | — | | |
| Accrued Expenses and Other Liabilities | | | 316 | | | | 155 | | | | 159 | | | | 168 | | |
| Total Liabilities | | | 296,844 | | | | 118,238 | | | | 12,421 | | | | 17,708 | | |
| NET ASSETS | | $ | 1,624,524 | | | $ | 566,379 | | | $ | 3,225,372 | | | $ | 3,264,848 | | |
| SHARES OUTSTANDING, $0.01 PAR VALUE (1) | | | N/A | | | | N/A | | | | 323,580,687 | | | | 315,819,698 | | |
NET ASSET VALUE, OFFERING AND
REDEMPTION PRICE PER SHARE | | | N/A | | | | N/A | | | $ | 9.97 | | | $ | 10.34 | | |
| Investments at Cost | | $ | 1,141,981 | | | $ | 781,068 | | | $ | 3,136,254 | | | $ | 3,104,787 | | |
| Foreign Currencies at Cost | | $ | 12,929 | | | $ | 1,270 | | | $ | — | | | $ | 33 | | |
| NET ASSETS CONSIST OF: | |
| Paid-In Capital | | | N/A | | | | N/A | | | $ | 3,225,372 | | | $ | 3,264,848 | | |
Undistributed Net Investment Income (Distributions in
Excess of Net Investment Income) | | | N/A | | | | N/A | | | | — | | | | — | | |
| Accumulated Net Realized Gain (Loss) | | | N/A | | | | N/A | | | | — | | | | — | | |
| Net Unrealized Foreign Exchange Gain (Loss) | | | N/A | | | | N/A | | | | — | | | | — | | |
| Net Unrealized Appreciation (Depreciation) | | | N/A | | | | N/A | | | | — | | | | — | | |
| NET ASSETS | | | N/A | | | | N/A | | | $ | 3,225,372 | | | $ | 3,264,848 | | |
| (1) NUMBER OF SHARES AUTHORIZED | | | N/A | | | | N/A | | | | Unlimited | | | | Unlimited | | |
See accompanying Notes to Financial Statements.
268
THE DFA INVESTMENT TRUST COMPANY
STATEMENTS OF OPERATIONS
(Amounts in thousands)
| | | The U.S.
Large
Company
Series | | The Enhanced
U.S. Large
Company
Series | | The U.S.
Large Cap
Value
Series | | The U.S.
Small Cap
Value
Series | |
| | | Period Dec. 1,
2007 to
Oct. 31, 2008 | | Year Ended
Nov. 30,
2007 | | Period Dec. 1,
2007 to
Oct. 31, 2008 | | Year Ended
Nov. 30,
2007 | | Period Dec. 1,
2007 to
Oct. 31, 2008 | | Year Ended
Nov. 30,
2007 | | Period Dec. 1,
2007 to
Oct. 31, 2008 | | Year Ended
Nov. 30,
2007 | |
| Investment Income | |
| Dividends | | $ | 82,686 | | | $ | 91,440 | | | | — | | | | — | | | $ | 166,659 | | | $ | 152,304 | | | $ | 90,145 | | | $ | 134,714 | | |
| Interest | | | 1,937 | | | | 3,944 | | | $ | 7,246 | | | $ | 13,326 | | | | 1,529 | | | | 4,285 | | | | 1,880 | | | | 4,032 | | |
| Income from Securities Lending | | | 1,741 | | | | 927 | | | | — | | | | — | | | | 7,486 | | | | 2,119 | | | | 19,073 | | | | 11,899 | | |
| Total Investment Income | | | 86,364 | | | | 96,311 | | | | 7,246 | | | | 13,326 | | | | 175,674 | | | | 158,708 | | | | 111,098 | | | | 150,645 | | |
| Expenses | |
| Investment Advisory Services Fees | | | 981 | | | | 1,201 | | | | 127 | | | | 183 | | | | 8,436 | | | | 10,188 | | | | 14,090 | | | | 19,951 | | |
| Accounting & Transfer Agent Fees | | | 403 | | | | 491 | | | | 43 | | | | 56 | | | | 847 | | | | 1,011 | | | | 711 | | | | 995 | | |
| S&P 500® Fees | | | 87 | | | | 86 | | | | 6 | | | | 6 | | | | — | | | | — | | | | — | | | | — | | |
| Custodian Fees | | | 58 | | | | 62 | | | | 16 | | | | 36 | | | | 90 | | | | 108 | | | | 112 | | | | 156 | | |
| Shareholders' Reports | | | 38 | | | | 52 | | | | 2 | | | | 4 | | | | 82 | | | | 103 | | | | 67 | | | | 105 | | |
| Directors'/Trustees' Fees & Expenses | | | — | | | | 7 | | | | — | | | | 1 | | | | — | | | | 94 | | | | — | | | | 44 | | |
| Professional Fees | | | 74 | | | | 119 | | | | 5 | | | | 5 | | | | 166 | | | | 157 | | | | 140 | | | | 165 | | |
| Other | | | 18 | | | | 31 | | | | 1 | | | | 2 | | | | 37 | | | | 56 | | | | 14 | | | | 60 | | |
| Total Expenses | | | 1,659 | | | | 2,049 | | | | 200 | | | | 293 | | | | 9,658 | | | | 11,717 | | | | 15,134 | | | | 21,476 | | |
| Net Investment Income (Loss) | | | 84,705 | | | | 94,262 | | | | 7,046 | | | | 13,033 | | | | 166,016 | | | | 146,991 | | | | 95,964 | | | | 129,169 | | |
| Realized and Unrealized Gain (Loss) | |
| Net Realized Gain (Loss) on: | |
| Investment Securities Sold | | | (126,174 | ) | | | 10,206 | | | | 136 | | | | (538 | ) | | | (422,637 | ) | | | (118,412 | ) | | | (1,368,521 | ) | | | 1,072,520 | | |
| Futures | | | (22,232 | ) | | | 3,585 | | | | (59,413 | ) | | | 28,285 | | | | (1,861 | ) | | | — | | | | (5,590 | ) | | | — | | |
| Foreign Currency Transactions | | | — | | | | — | | | | 13,155 | | | | (882 | ) | | | — | | | | — | | | | — | | | | — | | |
| Swap Contracts | | | — | | | | — | | | | (6,832 | ) | | | 1,469 | | | | — | | | | — | | | | — | | | | — | | |
| In-Kind Redemptions | | | 24,362 | * | | | 529,199 | * | | | — | | | | — | | | | 52,271 | * | | | — | | | | 40,823 | * | | | — | | |
Change in Unrealized Appreciation
(Depreciation) of: | | | |
Investment Securities and Foreign
Currency | | | (1,591,847 | ) | | | (217,829 | ) | | | (13,359 | ) | | | 2,487 | | | | (3,601,292 | ) | | | (150,559 | ) | | | (1,383,083 | ) | | | (1,994,517 | ) | |
| Futures | | | 1,195 | | | | (216 | ) | | | (49,959 | ) | | | (21,293 | ) | | | 29 | | | | — | | | | 26 | | | | — | | |
| Swap Contracts | | | — | | | | — | | | | 860 | | | | (1,162 | ) | | | — | | | | — | | | | — | | | | — | | |
Translation of Foreign Currency
Denominated Amounts | | | — | | | | — | | | | 1,286 | | | | 4,461 | | | | — | | | | — | | | | — | | | | — | | |
Net Realized and Unrealized
Gain (Loss) | | | (1,714,696 | ) | | | 324,945 | | | | (114,126 | ) | | | 12,827 | | | | (3,973,490 | ) | | | (268,971 | ) | | | (2,716,345 | ) | | | (921,997 | ) | |
Net Increase (Decrease) in Net Assets
Resulting from Operations | | $ | (1,629,991 | ) | | $ | 419,207 | | | $ | (107,080 | ) | | $ | 25,860 | | | $ | (3,807,474 | ) | | $ | (121,980 | ) | | $ | (2,620,381 | ) | | $ | (792,828 | ) | |
* See Note K in the Notes to Financial Statements.
See accompanying Notes to Financial Statements.
269
THE DFA INVESTMENT TRUST COMPANY
STATEMENTS OF OPERATIONS
(Amounts in thousands)
| | | The U.S.
Small Cap
Series | | The U.S.
Micro Cap
Series | | The DFA
International Value
Series | | The Japanese
Small Company
Series | |
| | | Period Dec. 1,
2007 to
Oct. 31, 2008 | | Year Ended
Nov. 30,
2007 | | Period Dec. 1,
2007 to
Oct. 31, 2008 | | Year Ended
Nov. 30,
2007 | | Period Dec. 1,
2007 to
Oct. 31, 2008 | | Year Ended
Nov. 30,
2007 | | Period Dec. 1,
2007 to
Oct. 31, 2008 | | Year Ended
Nov. 30,
2007 | |
| Investment Income | |
Dividends (Net of Foreign Taxes
Withheld of $0, $0, $0, $0, $28,938,
$23,649, $1,868, and $1,557,
respectively) | | $ | 27,505 | | | $ | 39,537 | | | $ | 40,416 | | | $ | 50,822 | | | $ | 300,627 | | | $ | 278,708 | | | $ | 24,935 | | | $ | 20,711 | | |
| Interest | | | 501 | | | | 1,116 | | | | 704 | | | | 1,662 | | | | 1,071 | | | | 2,113 | | | | 55 | | | | 262 | | |
| Income from Securities Lending | | | 13,953 | | | | 10,235 | | | | 22,040 | | | | 19,931 | | | | 19,332 | | | | 14,342 | | | | 8,859 | | | | 10,705 | | |
| Total Investment Income | | | 41,959 | | | | 50,888 | | | | 63,160 | | | | 72,415 | | | | 321,030 | | | | 295,163 | | | | 33,849 | | | | 31,678 | | |
| Expenses | |
| Investment Advisory Services Fees | | | 805 | | | | 1,150 | | | | 3,690 | | | | 5,082 | | | | 14,643 | | | | 18,039 | | | | 1,220 | | | | 1,524 | | |
| Accounting & Transfer Agent Fees | | | 282 | | | | 394 | | | | 381 | | | | 516 | | | | 739 | | | | 900 | | | | 143 | | | | 174 | | |
| Custodian Fees | | | 68 | | | | 87 | | | | 64 | | | | 100 | | | | 914 | | | | 1,185 | | | | 178 | | | | 262 | | |
| Shareholders' Reports | | | 26 | | | | 40 | | | | 35 | | | | 53 | | | | 78 | | | | 84 | | | | 13 | | | | 15 | | |
| Directors'/Trustees' Fees & Expenses | | | — | | | | 17 | | | | — | | | | 21 | | | | — | | | | 97 | | | | — | | | | 9 | | |
| Professional Fees | | | 54 | | | | 60 | | | | 74 | | | | 82 | | | | 171 | | | | 139 | | | | 26 | | | | 25 | | |
| Other | | | 72 | | | | 38 | | | | 12 | | | | 32 | | | | 98 | | | | 106 | | | | 23 | | | | 29 | | |
| Total Expenses | | | 1,307 | | | | 1,786 | | | | 4,256 | | | | 5,886 | | | | 16,643 | | | | 20,550 | | | | 1,603 | | | | 2,038 | | |
| Net Investment Income (Loss) | | | 40,652 | | | | 49,102 | | | | 58,904 | | | | 66,529 | | | | 304,387 | | | | 274,613 | | | | 32,246 | | | | 29,640 | | |
| Realized and Unrealized Gain (Loss) | |
| Net Realized Gain (Loss) on: | |
| Investment Securities Sold | | | (592,739 | ) | | | 303,991 | | | | (735,401 | ) | | | 379,499 | | | | 137,811 | | | | 654,522 | | | | (68,518 | ) | | | 51,317 | | |
| Futures | | | — | | | | — | | | | — | | | | — | | | | (1,153 | ) | | | — | | | | (16 | ) | | | — | | |
| Foreign Currency Transactions | | | — | | | | — | | | | — | | | | — | | | | (4,593 | ) | | | 2,498 | | | | (321 | ) | | | (227 | ) | |
| In-Kind Redemptions | | | 55,442 | * | | | — | | | | — | | | | — | | | | 103,024 | * | | | — | | | | 1,625 | * | | | — | | |
Change in Unrealized Appreciation
(Depreciation) of: | | | |
Investment Securities and Foreign
Currency | | | (493,743 | ) | | | (417,060 | ) | | | (702,735 | ) | | | (602,264 | ) | | | (5,026,911 | ) | | | 403,307 | | | | (374,750 | ) | | | (103,081 | ) | |
| Futures | | | — | | | | — | | | | — | | | | — | | | | 19 | | | | — | | | | — | | | | — | | |
Translation of Foreign Currency
Denominated Amounts | | | — | | | | — | | | | — | | | | — | | | | (76 | ) | | | (180 | ) | | | 495 | | | | 144 | | |
Net Realized and Unrealized
Gain (Loss) | | | (1,031,040 | ) | | | (113,069 | ) | | | (1,438,136 | ) | | | (222,765 | ) | | | (4,791,879 | ) | | | 1,060,147 | | | | (441,485 | ) | | | (51,847 | ) | |
Net Increase (Decrease) in Net Assets
Resulting from Operations | | $ | (990,388 | ) | | $ | (63,967 | ) | | $ | (1,379,232 | ) | | $ | (156,236 | ) | | $ | (4,487,492 | ) | | $ | 1,334,760 | | | $ | (409,239 | ) | | $ | (22,207 | ) | |
* See Note K in the Notes to Financial Statements.
See accompanying Notes to Financial Statements.
270
THE DFA INVESTMENT TRUST COMPANY
STATEMENTS OF OPERATIONS
(Amounts in thousands)
| | | The Asia Pacific
Small Company
Series | | The United Kingdom
Small Company
Series | | The Continental
Small Company
Series | | The Canadian
Small Company
Series | |
| | | Period Dec. 1,
2007 to
Oct. 31, 2008 | | Year Ended
Nov. 30,
2007 | | Period Dec. 1,
2007 to
Oct. 31, 2008 | | Year Ended
Nov. 30,
2007 | | Period Dec. 1,
2007 to
Oct. 31, 2008 | | Year Ended
Nov. 30,
2007 | | Period Dec. 1,
2007 to
Oct. 31, 2008 | | Year Ended
Nov. 30,
2007 | |
| Investment Income | |
Dividends (Net of Foreign Taxes
Withheld of $724, $469, $61, $0,
$8,313, $5,790, $467, and $69,
respectively) | | $ | 33,506 | | | $ | 32,140 | | | $ | 34,689 | | | $ | 34,869 | | | $ | 56,505 | | | $ | 43,799 | | | $ | 2,679 | | | $ | 394 | | |
| Interest | | | 176 | | | | 306 | | | | 108 | | | | 103 | | | | 332 | | | | 244 | | | | 134 | | | | 100 | | |
| Income from Securities Lending | | | 5,337 | | | | 5,485 | | | | 447 | | | | 108 | | | | 8,718 | | | | 7,366 | | | | 990 | | | | 105 | | |
| Total Investment Income | | | 39,019 | | | | 37,931 | | | | 35,244 | | | | 35,080 | | | | 65,555 | | | | 51,409 | | | | 3,803 | | | | 599 | | |
| Expenses | |
| Investment Advisory Services Fees | | | 871 | | | | 1,016 | | | | 899 | | | | 1,234 | | | | 1,806 | | | | 2,231 | | | | 330 | | | | 81 | | |
| Accounting & Transfer Agent Fees | | | 109 | | | | 123 | | | | 111 | | | | 145 | | | | 200 | | | | 242 | | | | 55 | | | | 24 | | |
| Custodian Fees | | | 247 | | | | 355 | | | | 67 | | | | 81 | | | | 419 | | | | 523 | | | | 184 | | | | 101 | | |
| Shareholders' Reports | | | 9 | | | | 9 | | | | 10 | | | | 12 | | | | 19 | | | | 21 | | | | 4 | | | | 1 | | |
| Directors'/Trustees' Fees & Expenses | | | — | | | | 12 | | | | — | | | | 13 | | | | — | | | | 24 | | | | — | | | | 3 | | |
| Professional Fees | | | 20 | | | | 15 | | | | 21 | | | | 20 | | | | 40 | | | | 35 | | | | 8 | | | | 2 | | |
| Organizational & Offering Costs | | | — | | | | — | | | | — | | | | — | | | | — | | | | — | | | | — | | | | 1 | | |
| Other | | | 23 | | | | 21 | | | | 9 | | | | 19 | | | | 26 | | | | 37 | | | | 10 | | | | 3 | | |
| Total Expenses | | | 1,279 | | | | 1,551 | | | | 1,117 | | | | 1,524 | | | | 2,510 | | | | 3,113 | | | | 591 | | | | 216 | | |
| Net Investment Income (Loss) | | | 37,740 | | | | 36,380 | | | | 34,127 | | | | 33,556 | | | | 63,045 | | | | 48,296 | | | | 3,212 | | | | 383 | | |
| Realized and Unrealized Gain (Loss) | |
| Net Realized Gain (Loss) on: | |
| Investment Securities Sold | | | (38,746 | ) | | | 111,215 | | | | 10,543 | | | | 42,995 | | | | (48,434 | ) | | | 151,648 | | | | (20,515 | ) | | | 1,663 | | |
| Futures | | | (283 | ) | | | — | | | | — | | | | — | | | | (358 | ) | | | — | | | | — | | | | — | | |
| Foreign Currency Transactions | | | (1,429 | ) | | | 874 | | | | (1,788 | ) | | | 397 | | | | (76 | ) | | | 559 | | | | (433 | ) | | | (413 | ) | |
| In-Kind Redemptions | | | 4,018 | * | | | — | | | | 6,873 | * | | | — | | | | 16,564 | * | | | — | | | | (2,616 | )* | | | — | | |
Change in Unrealized Appreciation
(Depreciation) of: | | | |
Investment Securities and Foreign
Currency | | | (649,251 | ) | | | 232,165 | | | | (643,213 | ) | | | (51,516 | ) | | | (1,158,591 | ) | | | 126,217 | | | | (279,292 | ) | | | (6,570 | ) | |
| Futures | | | 3 | | | | — | | | | 1 | | | | — | | | | 9 | | | | — | | | | — | | | | — | | |
Translation of Foreign Currency
Denominated Amounts | | | (121 | ) | | | (25 | ) | | | 222 | | | | (10 | ) | | | (386 | ) | | | 83 | | | | (6 | ) | | | (2 | ) | |
Nets Realized and Unrealized
Gain (Loss) | | | (685,809 | ) | | | 344,229 | | | | (627,362 | ) | | | (8,134 | ) | | | (1,191,272 | ) | | | 278,507 | | | | (302,862 | ) | | | (5,322 | ) | |
Net Increase (Decrease) in Net Assets
Resulting from Operations | | $ | (648,069 | ) | | $ | 380,609 | | | $ | (593,235 | ) | | $ | 25,422 | | | $ | (1,128,227 | ) | | $ | 326,803 | | | $ | (299,650 | ) | | $ | (4,939 | ) | |
* See Note K in the Notes to Financial Statements.
See accompanying Notes to Financial Statements.
271
THE DFA INVESTMENT TRUST COMPANY
STATEMENTS OF OPERATIONS
(Amounts in thousands)
| | | The Emerging
Markets Series | | The Emerging
Markets Small Cap
Series | | The DFA
One-Year Fixed
Income Series | | The DFA
Two-Year Global
Fixed Income Series | |
| | | Period Dec. 1,
2007 to
Oct. 31, 2008 | | Year Ended
Nov. 30,
2007 | | Period Dec. 1,
2007 to
Oct. 31, 2008 | | Year Ended
Nov. 30,
2007 | | Period Dec. 1,
2007 to
Oct. 31, 2008 | | Year Ended
Nov. 30,
2007 | | Period Dec. 1,
2007 to
Oct. 31, 2008 | | Year Ended
Nov. 30,
2007 | |
| Investment Income | |
Dividends (Net of Foreign Taxes
Withheld of $8,965, $7,660, $3,030,
$2,372, $0, $0 $0, and $0,
respectively) | | $ | 83,157 | | | $ | 78,304 | | | $ | 32,883 | | | $ | 24,713 | | | | — | | | | — | | | | — | | | | — | | |
| Interest | | | 218 | | | | 517 | | | | 112 | | | | 235 | | | $ | 104,131 | | | $ | 159,010 | | | $ | 88,609 | | | $ | 105,338 | | |
| Income from Securities Lending | | | 4,081 | | | | 3,188 | | | | 3,727 | | | | 2,805 | | | | — | | | | — | | | | — | | | | — | | |
| Total Investment Income | | | 87,456 | | | | 82,009 | | | | 36,722 | | | | 27,753 | | | | 104,131 | | | | 159,010 | | | | 88,609 | | | | 105,338 | | |
| Expenses | |
| Investment Advisory Services Fees | | | 2,744 | | | | 3,029 | | | | 2,174 | | | | 2,461 | | | | 1,563 | | | | 1,510 | | | | 1,546 | | | | 1,468 | | |
| Accounting & Transfer Agent Fees | | | 292 | | | | 318 | | | | 130 | | | | 144 | | | | 324 | | | | 313 | | | | 326 | | | | 310 | | |
| Custodian Fees | | | 1,784 | | | | 2,142 | | | | 915 | | | | 1,113 | | | | 35 | | | | 37 | | | | 182 | | | | 284 | | |
| Shareholders' Reports | | | 30 | | | | 28 | | | | 12 | | | | 11 | | | | 33 | | | | 28 | | | | 32 | | | | 28 | | |
| Directors'/Trustees' Fees & Expenses | | | — | | | | 25 | | | | — | | | | 15 | | | | — | | | | 15 | | | | — | | | | 15 | | |
| Professional Fees | | | 94 | | | | 55 | | | | 51 | | | | 46 | | | | 58 | | | | 45 | | | | 59 | | | | 44 | | |
| Other | | | 76 | | | | 65 | | | | 34 | | | | 42 | | | | 23 | | | | 16 | | | | 25 | | | | 16 | | |
| Total Expenses | | | 5,020 | | | | 5,662 | | | | 3,316 | | | | 3,832 | | | | 2,036 | | | | 1,964 | | | | 2,170 | | | | 2,165 | | |
| Net Investment Income (Loss) | | | 82,436 | | | | 76,347 | | | | 33,406 | | | | 23,921 | | | | 102,095 | | | | 157,046 | | | | 86,439 | | | | 103,173 | | |
| Realized and Unrealized Gain (Loss) | |
| Net Realized Gain (Loss) on: | |
| Investment Securities Sold | | | (59,927 | ) | | | 143,019 | | | | (9,181 | ) | | | 107,316 | | | | (1,438 | ) | | | (74 | ) | | | 62 | | | | (3,439 | ) | |
| Futures | | | (361 | ) | | | — | | | | (439 | ) | | | — | | | | — | | | | — | | | | — | | | | — | | |
| Foreign Currency Transactions | | | (1,036 | ) | | | (111 | ) | | | (1,324 | ) | | | (336 | ) | | | — | | | | — | | | | 77,256 | | | | (32,540 | ) | |
Change in Unrealized Appreciation
(Depreciation) of: | | | | | |
Investment Securities and Foreign
Currency | | | (1,612,126 | ) | | | 859,017 | | | | (796,299 | ) | | | 279,364 | | | | (8,430 | ) | | | (2,138 | ) | | | (51,296 | ) | | | 24,384 | | |
| Futures | | | 32 | | | | — | | | | 10 | | | | — | | | | — | | | | — | | | | — | | | | — | | |
Translation of Foreign Currency
Denominated Amounts | | | (139 | ) | | | (27 | ) | | | (182 | ) | | | 76 | | | | — | | | | — | | | | (11,788 | ) | | | 56,392 | | |
Change in Deferred Thailand Capital
Gains Tax | | | 2,797 | | | | (884 | ) | | | 1,377 | | | | (450 | ) | | | — | | | | — | | | | — | | | | — | | |
Net Realized and Unrealized
Gain (Loss) | | | (1,670,760 | ) | | | 1,001,014 | | | | (806,038 | ) | | | 385,970 | | | | (9,868 | ) | | | (2,212 | ) | | | 14,234 | | | | 44,797 | | |
Net Increase (Decrease) in Net Assets
Resulting from Operations | | $ | (1,588,324 | ) | | $ | 1,077,361 | | | $ | (772,632 | ) | | $ | 409,891 | | | $ | 92,227 | | | $ | 154,834 | | | $ | 100,673 | | | $ | 147,970 | | |
See accompanying Notes to Financial Statements.
272
THE DFA INVESTMENT TRUST COMPANY
STATEMENTS OF CHANGES IN NET ASSETS
(Amounts in thousands)
| | | The U.S.
Large Company
Series | | The Enhanced
U.S. Large Company
Series | |
| | | Period
Dec. 1,
2007 to
Oct. 31,
2008 | | Year
Ended
Nov. 30,
2007 | | Year
Ended
Nov. 30,
2006 | | Period
Dec. 1,
2007 to
Oct. 31,
2008 | | Year
Ended
Nov. 30,
2007 | | Year
Ended
Nov. 30,
2006 | |
| Increase (Decrease) in Net Assets | |
| Operations: | |
| Net Investment Income (Loss) | | $ | 84,705 | | | $ | 94,262 | | | $ | 87,710 | | | $ | 7,046 | | | $ | 13,033 | | | $ | 11,543 | | |
| Net Realized Gain (Loss) on: | |
| Investment Securities Sold | | | (126,174 | ) | | | 10,206 | | | | (8,634 | ) | | | 136 | | | | (538 | ) | | | (2,115 | ) | |
| Futures | | | (22,232 | ) | | | 3,585 | | | | 6,769 | | | | (59,413 | ) | | | 28,285 | | | | 8,831 | | |
| Foreign Currency Transactions | | | — | | | | — | | | | — | | | | 13,155 | | | | (882 | ) | | | (790 | ) | |
| Swap Contracts | | | — | | | | — | | | | — | | | | (6,832 | ) | | | 1,469 | | | | 1,860 | | |
| In-Kind Redemptions | | | 24,362 | * | | | 529,199 | * | | | — | | | | — | | | | — | | | | — | | |
| Change in Unrealized Appreciation (Depreciation) of: | |
| Investment Securities and Foreign Currency | | | (1,591,847 | ) | | | (217,829 | ) | | | 523,721 | | | | (13,359 | ) | | | 2,487 | | | | 11,808 | | |
| Futures | | | 1,195 | | | | (216 | ) | | | (1,050 | ) | | | (49,959 | ) | | | (21,293 | ) | | | 16,928 | | |
| Swap Contracts | | | — | | | | — | | | | — | | | | 860 | | | | (1,162 | ) | | | (613 | ) | |
Translation of Foreign Currency
Denominated Amounts | | | — | | | | — | | | | — | | | | 1,286 | | | | 4,461 | | | | (5,635 | ) | |
Net Increase (Decrease) in Net Assets
Resulting from Operations | | | (1,629,991 | ) | | | 419,207 | | | | 608,516 | | | | (107,080 | ) | | | 25,860 | | | | 41,817 | | |
| Distributions From: | |
| Net Investment Income | | | — | | | | — | | | | — | | | | (12,465 | ) | | | (10,384 | ) | | | (4,468 | ) | |
| Net Short-Term Gains | | | — | | | | — | | | | — | | | | (4,443 | ) | | | (11,623 | ) | | | — | | |
| Net Long-Term Gains | | | — | | | | — | | | | — | | | | (4,238 | ) | | | (14,452 | ) | | | (4,136 | ) | |
| Total Distributions | | | — | | | | — | | | | — | | | | (21,146 | ) | | | (36,459 | ) | | | (8,604 | ) | |
| Capital Share Transactions (1): | |
| Shares Issued | | | — | | | | — | | | | — | | | | 49,523 | | | | 57,240 | | | | 55,264 | | |
| Shares Issued in Lieu of Cash Distributions | | | — | | | | — | | | | — | | | | 20,505 | | | | 35,498 | | | | 8,537 | | |
| Shares Redeemed | | | — | | | | — | | | | — | | | | (78,419 | ) | | | (92,306 | ) | | | (63,339 | ) | |
Net Increase (Decrease) from Capital Share
Transactions | | | — | | | | — | | | | — | | | | (8,391 | ) | | | 432 | | | | 462 | | |
| Transactions in Interest: | |
| Contributions | | | 696,520 | | | | 616,294 | | | | 753,004 | | | | — | | | | — | | | | — | | |
| Withdrawals | | | (299,226 | )* | | | (1,482,132 | )* | | | (647,252 | ) | | | — | | | | — | | | | — | | |
Net Increase (Decrease) from
Transactions in Interest | | | 397,294 | | | | (865,838 | ) | | | 105,752 | | | | — | | | | — | | | | — | | |
| Total Increase (Decrease) in Net Assets | | | (1,232,697 | ) | | | (446,631 | ) | | | 714,268 | | | | (136,617 | ) | | | (10,167 | ) | | | 33,675 | | |
| Net Assets | |
| Beginning of Period | | | 4,506,349 | | | | 4,952,980 | | | | 4,238,712 | | | | 337,116 | | | | 347,283 | | | | 313,608 | | |
| End of Period | | $ | 3,273,652 | | | $ | 4,506,349 | | | $ | 4,952,980 | | | $ | 200,499 | | | $ | 337,116 | | | $ | 347,283 | | |
| (1) Shares Issued and Redeemed: | |
| Shares Issued | | | N/A | | | | N/A | | | | N/A | | | | 6,462 | | | | 5,792 | | | | 5,851 | | |
| Shares Issued in Lieu of Cash Distributions | | | N/A | | | | N/A | | | | N/A | | | | 2,355 | | | | 3,725 | | | | 916 | | |
| Shares Redeemed | | | N/A | | | | N/A | | | | N/A | | | | (10,078 | ) | | | (9,298 | ) | | | (6,751 | ) | |
| | | | N/A | | | | N/A | | | | N/A | | | | (1,261 | ) | | | 219 | | | | 16 | | |
Undistributed Net Investment Income (Distributions
in Excess of Net Investment Income) | | | N/A | | | | N/A | | | | N/A | | | $ | | — | | $ | 7,339 | | | $ | 7,107 | | |
* See Note K in the Notes to Financial Statements.
See accompanying Notes to Financial Statements.
273
THE DFA INVESTMENT TRUST COMPANY
STATEMENTS OF CHANGES IN NET ASSETS
(Amounts in thousands)
| | | The U.S.
Large Cap Value
Series | | The U.S.
Small Cap Value
Series | |
| | | Period
Dec. 1,
2007 to
Oct. 31,
2008 | | Year
Ended
Nov. 30,
2007 | | Year
Ended
Nov. 30,
2006 | | Period
Dec. 1,
2007 to
Oct. 31,
2008 | | Year
Ended
Nov. 30,
2007 | | Year
Ended
Nov. 30,
2006 | |
| Increase (Decrease) in Net Assets | |
| Operations: | |
| Net Investment Income (Loss) | | $ | 166,016 | | | $ | 146,991 | | | $ | 119,373 | | | $ | 95,964 | | | $ | 129,169 | | | $ | 103,401 | | |
| Net Realized Gain (Loss) on: | |
| Investment Securities Sold | | | (422,637 | ) | | | (118,412 | ) | | | 477,934 | | | | (1,368,521 | ) | | | 1,072,520 | | | | 945,679 | | |
| Futures | | | (1,861 | ) | | | — | | | | — | | | | (5,590 | ) | | | — | | | | — | | |
| In-Kind Redemptions | | | 52,271 | * | | | — | | | | — | | | | 40,823 | * | | | — | | | | — | | |
| Change in Unrealized Appreciation (Depreciation) of: | |
| Investment Securities | | | (3,601,292 | ) | | | (150,559 | ) | | | 631,814 | | | | (1,383,083 | ) | | | (1,994,517 | ) | | | 517,884 | | |
| Futures | | | 29 | | | | — | | | | — | | | | 26 | | | | — | | | | — | | |
Net Increase (Decrease) in Net Assets
Resulting from Operations | | | (3,807,474 | ) | | | (121,980 | ) | | | 1,229,121 | | | | (2,620,381 | ) | | | (792,828 | ) | | | 1,566,964 | | |
| Distributions From: | |
| Net Investment Income | | | (168,022 | ) | | | (146,268 | ) | | | (127,544 | ) | | | (82,415 | ) | | | (128,093 | ) | | | (104,797 | ) | |
| Net Short-Term Gains | | | — | | | | (14,058 | ) | | | (14,160 | ) | | | — | | | | (77,426 | ) | | | (37,843 | ) | |
| Net Long-Term Gains | | | — | | | | (463,917 | ) | | | (186,026 | ) | | | (1,046,424 | ) | | | (868,641 | ) | | | (678,973 | ) | |
| Total Distributions | | | (168,022 | ) | | | (624,243 | ) | | | (327,730 | ) | | | (1,128,839 | ) | | | (1,074,160 | ) | | | (821,613 | ) | |
| Capital Share Transactions (1): | |
| Shares Issued | | | 1,370,762 | | | | 1,783,358 | | | | 1,997,675 | | | | 450,728 | | | | 1,462,057 | | | | 899,678 | | |
| Shares Issued in Lieu of Cash Distributions | | | 165,455 | | | | 600,794 | | | | 317,835 | | | | 1,107,669 | | | | 1,046,092 | | | | 795,998 | | |
| Shares Redeemed | | | (980,680 | )* | | | (344,913 | ) | | | (182,182 | ) | | | (1,110,537 | )* | | | (1,280,078 | ) | | | (523,514 | ) | |
Net Increase (Decrease) from Capital Share
Transactions | | | 555,537 | | | | 2,039,239 | | | | 2,133,328 | | | | 447,860 | | | | 1,228,071 | | | | 1,172,162 | | |
| Total Increase (Decrease) in Net Assets | | | (3,419,959 | ) | | | 1,293,016 | | | | 3,034,719 | | | | (3,301,360 | ) | | | (638,917 | ) | | | 1,917,513 | | |
| Net Assets | |
| Beginning of Period | | | 10,159,322 | | | | 8,866,306 | | | | 5,831,587 | | | | 8,805,495 | | | | 9,444,412 | | | | 7,526,899 | | |
| End of Period | | $ | 6,739,363 | | | $ | 10,159,322 | | | $ | 8,866,306 | | | $ | 5,504,135 | | | $ | 8,805,495 | | | $ | 9,444,412 | | |
| (1) Shares Issued and Redeemed: | |
| Shares Issued | | | 74,071 | | | | 75,958 | | | | 92,566 | | | | 26,847 | | | | 62,384 | | | | 37,774 | | |
| Shares Issued in Lieu of Cash Distributions | | | 9,754 | | | | 26,704 | | | | 15,344 | | | | 62,197 | | | | 45,298 | | | | 36,792 | | |
| Shares Redeemed | | | (52,609 | ) | | | (15,046 | ) | | | (8,564 | ) | | | (66,466 | ) | | | (55,385 | ) | | | (22,249 | ) | |
| | | | 31,216 | | | | 87,616 | | | | 99,346 | | | | 22,578 | | | | 52,297 | | | | 52,317 | | |
Undistributed Net Investment Income (Distributions
in Excess of Net Investment Income) | | $ | (68 | ) | | $ | 1,938 | | | $ | 1,485 | | | $ | — | | | $ | 2,904 | | | $ | 1,847 | | |
* See Note K in the Notes to Financial Statements.
See accompanying Notes to Financial Statements.
274
THE DFA INVESTMENT TRUST COMPANY
STATEMENTS OF CHANGES IN NET ASSETS
(Amounts in thousands)
| | | The U.S.
Small Cap
Series | | The U.S.
Micro Cap
Series | |
| | | Period
Dec. 1,
2007 to
Oct. 31,
2008 | | Year
Ended
Nov. 30,
2007 | | Year
Ended
Nov. 30,
2006 | | Period
Dec. 1,
2007 to
Oct. 31,
2008 | | Year
Ended
Nov. 30,
2007 | | Year
Ended
Nov. 30,
2006 | |
| Increase (Decrease) in Net Assets | |
| Operations: | |
| Net Investment Income (Loss) | | $ | 40,652 | | | $ | 49,102 | | | $ | 36,669 | | | $ | 58,904 | | | $ | 66,529 | | | $ | 45,889 | | |
| Net Realized Gain (Loss) on: | |
| Investment Securities Sold | | | (592,739 | ) | | | 303,991 | | | | 237,752 | | | | (735,401 | ) | | | 379,499 | | | | 436,862 | | |
| In-Kind Redemptions | | | 55,442 | * | | | — | | | | — | | | | — | | | | — | | | | — | | |
| Change in Unrealized Appreciation (Depreciation) of | |
| Investment Securities | | | (493,743 | ) | | | (417,060 | ) | | | 201,127 | | | | (702,735 | ) | | | (602,264 | ) | | | 125,507 | | |
Net Increase (Decrease) in Net Assets
Resulting from Operations | | | (990,388 | ) | | | (63,967 | ) | | | 475,548 | | | | (1,379,232 | ) | | | (156,236 | ) | | | 608,258 | | |
| Distributions From: | |
| Net Investment Income | | | (32,004 | ) | | | (49,031 | ) | | | (37,137 | ) | | | (48,587 | ) | | | (66,185 | ) | | | (46,539 | ) | |
| Net Short-Term Gains | | | (7,560 | ) | | | (37,237 | ) | | | (34,285 | ) | | | (31,555 | ) | | | (61,220 | ) | | | (72,770 | ) | |
| Net Long-Term Gains | | | (258,983 | ) | | | (200,073 | ) | | | (153,072 | ) | | | (347,536 | ) | | | (375,219 | ) | | | (336,642 | ) | |
| Total Distributions | | | (298,547 | ) | | | (286,341 | ) | | | (224,494 | ) | | | (427,678 | ) | | | (502,624 | ) | | | (455,951 | ) | |
| Capital Share Transactions (1): | |
| Shares Issued | | | 419,139 | | | | 368,763 | | | | 463,046 | | | | 162,504 | | | | 424,272 | | | | 516,783 | | |
| Shares Issued in Lieu of Cash Distributions | | | 293,730 | | | | 282,015 | | | | 221,851 | | | | 419,924 | | | | 490,524 | | | | 443,063 | | |
| Shares Redeemed | | | (947,890 | )* | | | (328,261 | ) | | | (211,846 | ) | | | (554,101 | ) | | | (379,775 | ) | | | (238,645 | ) | |
Net Increase (Decrease) from Capital Share
Transactions | | | (235,021 | ) | | | 322,517 | | | | 473,051 | | | | 28,327 | | | | 535,021 | | | | 721,201 | | |
| Total Increase (Decrease) in Net Assets | | | (1,523,956 | ) | | | (27,791 | ) | | | 724,105 | | | | (1,778,583 | ) | | | (123,839 | ) | | | 873,508 | | |
| Net Assets | |
| Beginning of Period | | | 3,590,713 | | | | 3,618,504 | | | | 2,894,399 | | | | 4,702,207 | | | | 4,826,046 | | | | 3,952,538 | | |
| End of Period | | $ | 2,066,757 | | | $ | 3,590,713 | | | $ | 3,618,504 | | | $ | 2,923,624 | | | $ | 4,702,207 | | | $ | 4,826,046 | | |
| (1) Shares Issued and Redeemed: | |
| Shares Issued | | | 31,353 | | | | 21,414 | | | | 27,493 | | | | 18,399 | | | | 37,031 | | | | 44,880 | | |
| Shares Issued in Lieu of Cash Distributions | | | 20,124 | | | | 16,905 | | | | 14,136 | | | | 44,183 | | | | 44,051 | | | | 41,073 | | |
| Shares Redeemed | | | (72,110 | ) | | | (18,741 | ) | | | (12,687 | ) | | | (63,944 | ) | | | (33,095 | ) | | | (20,711 | ) | |
| | | | (20,633 | ) | | | 19,578 | | | | 28,942 | | | | (1,362 | ) | | | 47,987 | | | | 65,242 | | |
Undistributed Net Investment Income (Distributions in
Excess of Net Investment Income) | | $ | — | | | $ | 890 | | | $ | 819 | | | $ | — | | | $ | 1,383 | | | $ | 1,039 | | |
* See Note K in the Notes to Financial Statements.
See accompanying Notes to Financial Statements.
275
THE DFA INVESTMENT TRUST COMPANY
STATEMENTS OF CHANGES IN NET ASSETS
(Amounts in thousands)
| | | The DFA
International Value
Series | | The Japanese
Small Company
Series | |
| | | Period
Dec. 1,
2007 to
Oct. 31,
2008 | | Year
Ended
Nov. 30,
2007 | | Year
Ended
Nov. 30,
2006 | | Period
Dec. 1,
2007 to
Oct. 31,
2008 | | Year
Ended
Nov. 30,
2007 | | Year
Ended
Nov. 30,
2006 | |
| Increase (Decrease) in Net Assets | |
| Operations: | |
| Net Investment Income (Loss) | | $ | 304,387 | | | $ | 274,613 | | | $ | 193,174 | | | $ | 32,246 | | | $ | 29,640 | | | $ | 23,044 | | |
| Net Realized Gain (Loss) on: | |
| Investment Securities Sold | | | 137,811 | | | | 654,522 | | | | 201,700 | | | | (68,518 | ) | | | 51,317 | | | | 62,821 | | |
| Futures | | | (1,153 | ) | | | — | | | | — | | | | (16 | ) | | | — | | | | — | | |
| Foreign Currency Transactions | | | (4,593 | ) | | | 2,498 | | | | 378 | | | | (321 | ) | | | (227 | ) | | | (83 | ) | |
| In-Kind Redemptions | | | 103,024 | * | | | — | | | | — | | | | 1,625 | * | | | — | | | | — | | |
| Change in Unrealized Appreciation (Depreciation) of: | |
| Investment Securities and Foreign Currency | | | (5,026,911 | ) | | | 403,307 | | | | 1,351,708 | | | | (374,750 | ) | | | (103,081 | ) | | | (135,957 | ) | |
| Futures | | | 19 | | | | — | | | | — | | | | — | | | | — | | | | — | | |
Translation of Foreign Currency
Denominated Amounts | | | (76 | ) | | | (180 | ) | | | 486 | | | | 495 | | | | 144 | | | | 218 | | |
Net Increase (Decrease) in Net Assets
Resulting from Operations | | | (4,487,492 | ) | | | 1,334,760 | | | | 1,747,446 | | | | (409,239 | ) | | | (22,207 | ) | | | (49,957 | ) | |
| Distributions From: | |
| Net Investment Income | | | (293,386 | ) | | | (278,093 | ) | | | (202,210 | ) | | | — | | | | — | | | | — | | |
| Net Short-Term Gains | | | (22,542 | ) | | | (14,957 | ) | | | (11,375 | ) | | | — | | | | — | | | | — | | |
| Net Long-Term Gains | | | (614,160 | ) | | | (185,943 | ) | | | (115,307 | ) | | | — | | | | — | | | | — | | |
| Total Distributions | | | (930,088 | ) | | | (478,993 | ) | | | (328,892 | ) | | | — | | | | — | | | | — | | |
| Capital Share Transactions (1): | |
| Shares Issued | | | 927,878 | | | | 1,731,698 | | | | 1,589,921 | | | | — | | | | — | | | | — | | |
| Shares Issued in Lieu of Cash Distributions | | | 916,898 | | | | 465,562 | | | | 307,948 | | | | — | | | | — | | | | — | | |
| Shares Redeemed | | | (1,365,580 | )* | | | (871,558 | ) | | | (226,869 | ) | | | — | | | | — | | | | — | | |
Net Increase (Decrease) from Capital Share
Transactions | | | 479,196 | | | | 1,325,702 | | | | 1,671,000 | | | | — | | | | — | | | | — | | |
| Transactions in Interest: | |
| Contributions | | | — | | | | — | | | | — | | | | 64,727 | | | | 227,009 | | | | 334,524 | | |
| Withdrawals | | | — | | | | — | | | | — | | | | (97,345 | )* | | | (85,703 | ) | | | (50,274 | ) | |
Net Increase (Decrease) from
Transactions in Interest | | | — | | | | — | | | | — | | | | (32,618 | ) | | | 141,306 | | | | 284,250 | | |
| Total Increase (Decrease) in Net Assets | | | (4,938,384 | ) | | | 2,181,469 | | | | 3,089,554 | | | | (441,857 | ) | | | 119,099 | | | | 234,293 | | |
| Net Assets | |
| Beginning of Period | | | 9,638,721 | | | | 7,457,252 | | | | 4,367,698 | | | | 1,504,821 | | | | 1,385,722 | | | | 1,151,429 | | |
| End of Period | | $ | 4,700,337 | | | $ | 9,638,721 | | | $ | 7,457,252 | | | $ | 1,062,964 | | | $ | 1,504,821 | | | $ | 1,385,722 | | |
| (1) Shares Issued and Redeemed: | |
| Shares Issued | | | 50,328 | | | | 72,431 | | | | 80,546 | | | | N/A | | | | N/A | | | | N/A | | |
| Shares Issued in Lieu of Cash Distributions | | | 45,073 | | | | 20,227 | | | | 16,678 | | | | N/A | | | | N/A | | | | N/A | | |
| Shares Redeemed | | | (77,527 | ) | | | (36,444 | ) | | | (11,688 | ) | | | N/A | | | | N/A | | | | N/A | | |
| | | | 17,874 | | | | 56,214 | | | | 85,536 | | | | N/A | | | | N/A | | | | N/A | | |
Undistributed Net Investment Income (Distributions in
Excess of Net Investment Income) | | $ | — | | | $ | 9,727 | | | $ | (7,523 | ) | | | N/A | | | | N/A | | | | N/A | | |
* See Note K in the Notes to Financial Statements.
See accompanying Notes to Financial Statements.
276
THE DFA INVESTMENT TRUST COMPANY
STATEMENTS OF CHANGES IN NET ASSETS
(Amounts in thousands)
| | | The Asia Pacific
Small Company
Series | | The United Kingdom
Small Company
Series | |
| | | Period
Dec. 1,
2007 to
Oct. 31,
2008 | | Year
Ended
Nov. 30,
2007 | | Year
Ended
Nov. 30,
2006 | | Period
Dec. 1,
2007 to
Oct. 31,
2008 | | Year
Ended
Nov. 30,
2007 | | Year
Ended
Nov. 30,
2006 | |
| Increase (Decrease) in Net Assets | |
| Operations: | |
| Net Investment Income (Loss) | | $ | 37,740 | | | $ | 36,380 | | | $ | 23,806 | | | $ | 34,127 | | | $ | 33,556 | | | $ | 23,984 | | |
| Net Realized Gain (Loss) on: | |
| Investment Securities Sold | | | (38,746 | ) | | | 111,215 | | | | 37,029 | | | | 10,543 | | | | 42,995 | | | | 30,432 | | |
| Futures | | | (283 | ) | | | — | | | | — | | | | — | | | | — | | | | — | | |
| Foreign Currency Transactions | | | (1,429 | ) | | | 874 | | | | (442 | ) | | | (1,788 | ) | | | 397 | | | | 359 | | |
| In-Kind Redemptions | | | 4,018 | * | | | — | | | | — | | | | 6,873 | * | | | — | | | | — | | |
Change in Unrealized Appreciation
(Depreciation) of: | | | |
Investment Securities and
Foreign Currency | | | (649,251 | ) | | | 232,165 | | | | 130,890 | | | | (643,213 | ) | | | (51,516 | ) | | | 275,001 | | |
| Futures | | | 3 | | | | — | | | | — | | | | 1 | | | | — | | | | — | | |
Translation of Foreign Currency
Denominated Amounts | | | (121 | ) | | | (25 | ) | | | 15 | | | | 222 | | | | (10 | ) | | | 23 | | |
Net Increase (Decrease) in Net Assets
Resulting from Operations | | | (648,069 | ) | | | 380,609 | | | | 191,298 | | | | (593,235 | ) | | | 25,422 | | | | 329,799 | | |
| Transactions in Interest: | |
| Contributions | | | 50,371 | | | | 123,444 | | | | 171,488 | | | | 52,563 | | | | 36,898 | | | | 158,726 | | |
| Withdrawals | | | (166,219 | )* | | | (48,526 | ) | | | (9,082 | ) | | | (62,518 | )* | | | (21,566 | ) | | | (13,737 | ) | |
Net Increase (Decrease) from
Transactions in Interest | | | (115,848 | ) | | | 74,918 | | | | 162,406 | | | | (9,955 | ) | | | 15,332 | | | | 144,989 | | |
Total Increase (Decrease) in
Net Assets | | | (763,917 | ) | | | 455,527 | | | | 353,704 | | | | (603,190 | ) | | | 40,754 | | | | 474,788 | | |
| Net Assets | |
| Beginning of Period | | | 1,205,154 | | | | 749,627 | | | | 395,923 | | | | 1,158,580 | | | | 1,117,826 | | | | 643,038 | | |
| End of Period | | $ | 441,237 | | | $ | 1,205,154 | | | $ | 749,627 | | | $ | 555,390 | | | $ | 1,158,580 | | | $ | 1,117,826 | | |
* See Note K in the Notes to Financial Statements.
See accompanying Notes to Financial Statements.
277
THE DFA INVESTMENT TRUST COMPANY
STATEMENTS OF CHANGES IN NET ASSETS
(Amounts in thousands)
| | | The Continental
Small Company
Series | | The Canadian
Small Company
Series | |
| | | Period
Dec. 1,
2007 to
Oct. 31,
2008 | | Year
Ended
Nov. 30,
2007 | | Year
Ended
Nov. 30,
2006 | | Period
Dec. 1,
2007 to
Oct. 31,
2008 | | Period
April 2,
2007(a) to
Nov. 30,
2007 | |
| Increase (Decrease) in Net Assets | |
| Operations: | |
| Net Investment Income (Loss) | | $ | 63,045 | | | $ | 48,296 | | | $ | 32,787 | | | $ | 3,212 | | | $ | 383 | | |
| Net Realized Gain (Loss) on: | |
| Investment Securities Sold | | | (48,434 | ) | | | 151,648 | | | | 46,115 | | | | (20,515 | ) | | | 1,663 | | |
| Futures | | | (358 | ) | | | — | | | | — | | | | — | | | | — | | |
| Foreign Currency Transactions | | | (76 | ) | | | 559 | | | | (3 | ) | | | (433 | ) | | | (413 | ) | |
| In-Kind Redemptions | | | 16,564 | * | | | — | | | | — | | | | (2,616 | )* | | | — | | |
Change in Unrealized Appreciation
(Depreciation) of: | |
Investment Securities and
Foreign Currency | | | (1,158,591 | ) | | | 126,217 | | | | 455,015 | | | | (279,292 | ) | | | (6,570 | ) | |
| Futures | | | 9 | | | | — | | | | — | | | | — | | | | — | | |
Translation of Foreign Currency
Denominated Amounts | | | (386 | ) | | | 83 | | | | 130 | | | | (6 | ) | | | (2 | ) | |
Net Increase (Decrease) in Net Assets
Resulting from Operations | | | (1,128,227 | ) | | | 326,803 | | | | 534,044 | | | | (299,650 | ) | | | (4,939 | ) | |
| Transactions in Interest: | |
| Contributions | | | 131,960 | | | | 103,548 | | | | 375,913 | | | | 341,843 | | | | 222,468 | | |
| Withdrawals | | | (148,270 | )* | | | (49,423 | ) | | | (16,701 | ) | | | (22,849 | )* | | | (4,000 | ) | |
Net Increase (Decrease) from
Transactions in Interest | | | (16,310 | ) | | | 54,125 | | | | 359,212 | | | | 318,994 | | | | 218,468 | | |
Total Increase (Decrease) in
Net Assets | | | (1,144,537 | ) | | | 380,928 | | | | 893,256 | | | | 19,344 | | | | 213,529 | | |
| Net Assets | |
| Beginning of Period | | | 2,256,122 | | | | 1,875,194 | | | | 981,938 | | | | 213,529 | | | | — | | |
| End of Period | | $ | 1,111,585 | | | $ | 2,256,122 | | | $ | 1,875,194 | | | $ | 232,873 | | | $ | 213,529 | | |
* See Note K in the Notes to Financial Statements.
See page 1 & 2 for the Definitions of Abbreviations and Footnotes.
See accompanying Notes to Financial Statements.
278
THE DFA INVESTMENT TRUST COMPANY
STATEMENTS OF CHANGES IN NET ASSETS
(Amounts in thousands)
| | | The Emerging
Markets Series | | The Emerging
Markets Small Cap
Series | |
| | | Period
Dec. 1,
2007 to
Oct. 31,
2008 | | Year
Ended
Nov. 30,
2007 | | Year
Ended
Nov. 30,
2006 | | Period
Dec. 1,
2007 to
Oct. 31,
2008 | | Year
Ended
Nov. 30,
2007 | | Year
Ended
Nov. 30,
2006 | |
| Increase (Decrease) in Net Assets | |
| Operations: | |
| Net Investment Income (Loss) | | $ | 82,436 | | | $ | 76,347 | | | $ | 54,451 | | | $ | 33,406 | | | $ | 23,921 | | | $ | 17,070 | | |
| Net Realized Gain (Loss) on: | |
| Investment Securities Sold | | | (59,927 | ) | | | 143,019 | | | | 28,277 | | | | (9,181 | ) | | | 107,316 | | | | 65,664 | | |
| Futures | | | (361 | ) | | | — | | | | — | | | | (439 | ) | | | — | | | | — | | |
| Foreign Currency Transactions | | | (1,036 | ) | | | (111 | ) | | | (585 | ) | | | (1,324 | ) | | | (336 | ) | | | (496 | ) | |
Change in Unrealized Appreciation
(Depreciation) of: | |
| Investment Securities and Foreign Currency | | | (1,612,126 | ) | | | 859,017 | | | | 484,776 | | | | (796,299 | ) | | | 279,364 | | | | 160,217 | | |
| Futures | | | 32 | | | | — | | | | — | | | | 10 | | | | — | | | | — | | |
Translation of Foreign Currency Denominated
Amounts | | | (139 | ) | | | (27 | ) | | | (23 | ) | | | (182 | ) | | | 76 | | | | 6 | | |
| Change in Deferred Thailand Capital Gains Tax | | | 2,797 | | | | (884 | ) | | | 902 | | | | 1,377 | | | | (450 | ) | | | (475 | ) | |
Net Increase (Decrease) in Net Assets
Resulting from Operations | | | (1,588,324 | ) | | | 1,077,361 | | | | 567,798 | | | | (772,632 | ) | | | 409,891 | | | | 241,986 | | |
| Transactions in Interest: | |
| Contributions | | | 197,789 | | | | 481,891 | | | | 455,977 | | | | 137,703 | | | | 360,040 | | | | 181,431 | | |
| Withdrawals | | | (692,731 | ) | | | (266,433 | ) | | | (461,369 | ) | | | (324,263 | ) | | | (147,889 | ) | | | (65,159 | ) | |
Net Increase (Decrease) from Transactions
in Interest | | | (494,942 | ) | | | 215,458 | | | | (5,392 | ) | | | (186,560 | ) | | | 212,151 | | | | 116,272 | | |
| Total Increase (Decrease) in Net Assets | | | (2,083,266 | ) | | | 1,292,819 | | | | 562,406 | | | | (959,192 | ) | | | 622,042 | | | | 358,258 | | |
| Net Assets | |
| Beginning of Period | | | 3,707,790 | | | | 2,414,971 | | | | 1,852,565 | | | | 1,525,571 | | | | 903,529 | | | | 545,271 | | |
| End of Period | | $ | 1,624,524 | | | $ | 3,707,790 | | | $ | 2,414,971 | | | $ | 566,379 | | | $ | 1,525,571 | | | $ | 903,529 | | |
See accompanying Notes to Financial Statements.
279
THE DFA INVESTMENT TRUST COMPANY
STATEMENTS OF CHANGES IN NET ASSETS
(Amounts in thousands)
| | | The DFA
One-Year Fixed
Income Series | | The DFA
Two-Year Global
Fixed Income Series | |
| | | Period
Dec. 1,
2007 to
Oct. 31,
2008 | | Year
Ended
Nov. 30,
2007 | | Year
Ended
Nov. 30,
2006 | | Period
Dec. 1,
2007 to
Oct. 31,
2008 | | Year
Ended
Nov. 30,
2007 | | Year
Ended
Nov. 30,
2006 | |
| Increase (Decrease) in Net Assets | |
| Operations: | |
| Net Investment Income (Loss) | | $ | 102,095 | | | $ | 157,046 | | | $ | 94,187 | | | $ | 86,439 | | | $ | 103,173 | | | $ | 72,520 | | |
| Net Realized Gain (Loss) on: | |
| Investment Securities Sold | | | (1,438 | ) | | | (74 | ) | | | (4,503 | ) | | | 62 | | | | (3,439 | ) | | | (15,021 | ) | |
| Foreign Currency Transactions | | | — | | | | — | | | | — | | | | 77,256 | | | | (32,540 | ) | | | 1,152 | | |
Change in Unrealized Appreciation
(Depreciation) of: | |
| Investment Securities and Foreign Currency | | | (8,430 | ) | | | (2,138 | ) | | | 16,421 | | | | (51,296 | ) | | | 24,384 | | | | 91,272 | | |
Translation of Foreign Currency Denominated
Amounts | | | — | | | | — | | | | — | | | | (11,788 | ) | | | 56,392 | | | | (46,235 | ) | |
Net Increase (Decrease) in Net Assets
Resulting from Operations | | | 92,227 | | | | 154,834 | | | | 106,105 | | | | 100,673 | | | | 147,970 | | | | 103,688 | | |
| Distributions From: | |
| Net Investment Income | | | (106,601 | ) | | | (152,964 | ) | | | (90,843 | ) | | | (130,982 | ) | | | (79,311 | ) | | | (19,326 | ) | |
| Total Distributions | | | (106,601 | ) | | | (152,964 | ) | | | (90,843 | ) | | | (130,982 | ) | | | (79,311 | ) | | | (19,326 | ) | |
| Capital Share Transactions (1): | |
| Shares Issued | | | 749,285 | | | | 1,322,342 | | | | 1,068,203 | | | | 243,154 | | | | 722,901 | | | | 511,783 | | |
| Shares Issued in Lieu of Cash Distributions | | | 104,347 | | | | 148,906 | | | | 89,382 | | | | 129,852 | | | | 78,772 | | | | 19,113 | | |
| Shares Redeemed | | | (843,030 | ) | | | (663,105 | ) | | | (707,260 | ) | | | (379,944 | ) | | | (137,011 | ) | | | (114,719 | ) | |
Net Increase (Decrease) from Capital Share
Transactions | | | 10,602 | | | | 808,143 | | | | 450,325 | | | | (6,938 | ) | | | 664,662 | | | | 416,177 | | |
| Total Increase (Decrease) in Net Assets | | | (3,772 | ) | | | 810,013 | | | | 465,587 | | | | (37,247 | ) | | | 733,321 | | | | 500,539 | | |
| Net Assets | |
| Beginning of Period | | | 3,229,144 | | | | 2,419,131 | | | | 1,953,544 | | | | 3,302,095 | | | | 2,568,774 | | | | 2,068,235 | | |
| End of Period | | $ | 3,225,372 | | | $ | 3,229,144 | | | $ | 2,419,131 | | | $ | 3,264,848 | | | $ | 3,302,095 | | | $ | 2,568,774 | | |
| (1) Shares Issued and Redeemed: | |
| Shares Issued | | | 75,046 | | | | 132,195 | | | | 107,376 | | | | 23,371 | | | | 69,860 | | | | 51,248 | | |
| Shares Issued in Lieu of Cash Distributions | | | 10,474 | | | | 14,922 | | | | 8,997 | | | | 12,552 | | | | 7,641 | | | | 1,908 | | |
| Shares Redeemed | | | (84,607 | ) | | | (66,333 | ) | | | (71,080 | ) | | | (36,525 | ) | | | (13,289 | ) | | | (11,439 | ) | |
| | | | 913 | | | | 80,784 | | | | 45,293 | | | | (602 | ) | | | 64,212 | | | | 41,717 | | |
Undistributed Net Investment Income (Distributions in
Excess of Net Investment Income) | | $ | — | | | $ | 13,397 | | | $ | 9,315 | | | $ | — | | | $ | 40,415 | | | $ | 52,411 | | |
See accompanying Notes to Financial Statements.
280
THE DFA INVESTMENT TRUST COMPANY
FINANCIAL HIGHLIGHTS
(for a share outstanding throughout each period)
| | | The U.S. Large Company Series | |
| | | Period
Dec. 1,
2007 to
Oct. 31,
2008 | | Year
Ended
Nov. 30,
2007 | | Year
Ended
Nov. 30,
2006 | | Year
Ended
Nov. 30,
2005 | | Year
Ended
Nov. 30,
2004 | | Year
Ended
Nov. 30,
2003 | |
| Net Asset Value, Beginning of Period | | | N/A | | | | N/A | | | | N/A | | | | N/A | | | | N/A | | | | N/A | | |
| Income From Investment Operations | |
| Net Investment Income (Loss) | | | — | | | | — | | | | — | | | | — | | | | — | | | | — | | |
Net Gains (Losses) on Securities
(Realized and Unrealized) | | | — | | | | — | | | | — | | | | — | | | | — | | | | — | | |
| Total From Investment Operations | | | — | | | | — | | | | — | | | | — | | | | — | | | | — | | |
| Less Distributions | |
| Net Investment Income | | | — | | | | — | | | | — | | | | — | | | | — | | | | — | | |
| Net Realized Gains | | | — | | | | — | | | | — | | | | — | | | | — | | | | — | | |
| Total Distributions | | | — | | | | — | | | | — | | | | — | | | | — | | | | — | | |
| Net Asset Value, End of Period | | | N/A | | | | N/A | | | | N/A | | | | N/A | | | | N/A | | | | N/A | | |
| Total Return | | | (33.10 | )%(C) | | | 7.77 | % | | | 14.25 | % | | | 8.51 | % | | | 12.77 | % | | | 15.05 | % | |
Net Assets, End of Period
(thousands) | | $ | 3,273,652 | | | $ | 4,506,349 | | | $ | 4,952,980 | | | $ | 4,238,712 | | | $ | 3,493,919 | | | $ | 3,000,997 | | |
Ratio of Expenses to Average
Net Assets | | | 0.04 | %(B) | | | 0.04 | % | | | 0.04 | % | | | 0.05 | % | | | 0.05 | % | | | 0.05 | % | |
Ratio of Net Investment Income
to Average Net Assets | | | 2.16 | %(B) | | | 1.96 | % | | | 1.95 | % | | | 1.87 | % | | | 1.99 | % | | | 1.75 | % | |
| Portfolio Turnover Rate | | | 6 | %(C) | | | 13 | %* | | | 4 | % | | | 6 | % | | | 2 | % | | | 8 | % | |
| | | The Enhanced U.S. Large Company Series | |
| | | Period
Dec. 1,
2007 to
Oct. 31,
2008 | | Year
Ended
Nov. 30,
2007 | | Year
Ended
Nov. 30,
2006 | | Year
Ended
Nov. 30,
2005 | | Year
Ended
Nov. 30,
2004 | | Year
Ended
Nov. 30,
2003 | |
| Net Asset Value, Beginning of Period | | $ | 9.79 | | | $ | 10.15 | | | $ | 9.17 | | | $ | 8.83 | | | $ | 7.94 | | | $ | 6.97 | | |
| Income From Investment Operations | |
| Net Investment Income (Loss) | | | 0.21 | (A) | | | 0.35 | (A) | | | 0.33 | (A) | | | 0.27 | (A) | | | 0.08 | | | | 0.15 | | |
Net Gains (Losses) on Securities
(Realized and Unrealized) | | | (3.34 | ) | | | 0.35 | | | | 0.90 | | | | 0.36 | | | | 0.91 | | | | 0.93 | | |
| Total From Investment Operations | | | (3.13 | ) | | | 0.70 | | | | 1.23 | | | | 0.63 | | | | 0.99 | | | | 1.08 | | |
| Less Distributions | |
| Net Investment Income | | | (0.37 | ) | | | (0.29 | ) | | | (0.13 | ) | | | (0.29 | ) | | | (0.10 | ) | | | (0.11 | ) | |
| Net Realized Gains | | | (0.25 | ) | | | (0.77 | ) | | | (0.12 | ) | | | — | | | | — | | | | — | | |
| Total Distributions | | | (0.62 | ) | | | (1.06 | ) | | | (0.25 | ) | | | (0.29 | ) | | | (0.10 | ) | | | (0.11 | ) | |
| Net Asset Value, End of Period | | $ | 6.04 | | | $ | 9.79 | | | $ | 10.15 | | | $ | 9.17 | | | $ | 8.83 | | | $ | 7.94 | | |
| Total Return | | | (33.77 | )%(C) | | | 7.37 | % | | | 13.69 | % | | | 7.21 | % | | | 12.50 | % | | | 15.71 | % | |
Net Assets, End of Period
(thousands) | | $ | 200,499 | | | $ | 337,116 | | | $ | 347,283 | | | $ | 313,608 | | | $ | 221,780 | | | $ | 141,478 | | |
Ratio of Expenses to Average
Net Assets | | | 0.08 | %(B) | | | 0.08 | % | | | 0.08 | % | | | 0.17 | % | | | 0.18 | % | | | 0.18 | % | |
Ratio of Net Investment Income
to Average Net Assets | | | 2.78 | %(B) | | | 3.57 | % | | | 3.52 | % | | | 2.96 | % | | | 1.59 | % | | | 1.44 | % | |
| Portfolio Turnover Rate | | | 76 | %(C) | | | 92 | % | | | 134 | % | | | 57 | % | | | 125 | % | | | 138 | % | |
See page 1 & 2 for the Definitions of Abbreviations and Footnotes.
* Excluding security sales due to the In-Kind Redemptions the portfolio turnover rate would have been 5%. See Note K in the Notes to Financial Statements.
See accompanying Notes to Financial Statements.
281
THE DFA INVESTMENT TRUST COMPANY
FINANCIAL HIGHLIGHTS
(for a share outstanding throughout each period)
| | | The U.S. Large Cap Value Series | |
| | | Period
Dec. 1,
2007 to
Oct. 31,
2008 | | Year
Ended
Nov. 30,
2007 | | Year
Ended
Nov. 30,
2006 | | Year
Ended
Nov. 30,
2005 | | Year
Ended
Nov. 30,
2004 | | Year
Ended
Nov. 30,
2003 | |
Net Asset Value,
Beginning of Period | | $ | 21.81 | | | $ | 23.44 | | | $ | 20.91 | | | $ | 18.55 | | | $ | 15.41 | | | $ | 13.01 | | |
Income From
Investment Operations | |
Net Investment
Income (Loss) | | | 0.35 | (A) | | | 0.34 | (A) | | | 0.36 | (A) | | | 0.29 | | | | 0.23 | | | | 0.21 | | |
Net Gains (Losses)
on Securities
(Realized and
Unrealized) | | | (8.25 | ) | | | (0.38 | ) | | | 3.27 | | | | 2.41 | | | | 3.09 | | | | 2.41 | | |
Total From Investment
Operations | | | (7.90 | ) | | | (0.04 | ) | | | 3.63 | | | | 2.70 | | | | 3.32 | | | | 2.62 | | |
| Less Distributions | |
| Net Investment Income | | | (0.35 | ) | | | (0.33 | ) | | | (0.38 | ) | | | (0.32 | ) | | | (0.18 | ) | | | (0.22 | ) | |
| Net Realized Gains | | | — | | | | (1.26 | ) | | | (0.72 | ) | | | (0.02 | ) | | | — | | | | — | | |
| Total Distributions | | | (0.35 | ) | | | (1.59 | ) | | | (1.10 | ) | | | (0.34 | ) | | | (0.18 | ) | | | (0.22 | ) | |
Net Asset Value,
End of Period | | $ | 13.56 | | | $ | 21.81 | | | $ | 23.44 | | | $ | 20.91 | | | $ | 18.55 | | | $ | 15.41 | | |
| Total Return | | | (36.53 | )%(C) | | | (0.32 | )% | | | 18.16 | % | | | 14.66 | % | | | 21.68 | % | | | 20.34 | % | |
Net Assets, End of
Period (thousands) | | $ | 6,739,363 | | | $ | 10,159,322 | | | $ | 8,866,306 | | | $ | 5,831,587 | | | $ | 3,919,913 | | | $ | 2,510,662 | | |
Ratio of Expenses to
Average Net Assets | | | 0.11 | %(B) | | | 0.11 | % | | | 0.12 | % | | | 0.14 | % | | | 0.15 | % | | | 0.15 | % | |
Ratio of Net Investment
Income to Average
Net Assets | | | 1.97 | %(B) | | | 1.44 | % | | | 1.68 | % | | | 1.56 | % | | | 1.41 | % | | | 1.62 | % | |
| Portfolio Turnover Rate | | | 19 | %(C) | | | 9 | % | | | 13 | % | | | 9 | % | | | 7 | % | | | 7 | % | |
| | | The U.S. Small Cap Value Series | |
| | | Period
Dec. 1,
2007 to
Oct. 31,
2008 | | Year
Ended
Nov. 30,
2007 | | Year
Ended
Nov. 30,
2006 | | Year
Ended
Nov. 30,
2005 | | Year
Ended
Nov. 30,
2004 | | Year
Ended
Nov. 30,
2003 | |
Net Asset Value,
Beginning of Period | | $ | 20.93 | | | $ | 25.64 | | | $ | 23.81 | | | $ | 23.78 | | | $ | 20.20 | | | $ | 15.04 | | |
Income From
Investment Operations | |
Net Investment
Income (Loss) | | | 0.21 | (A) | | | 0.31 | (A) | | | 0.29 | (A) | | | 0.17 | | | | 0.16 | | | | 0.12 | | |
Net Gains (Losses)
on Securities
(Realized and
Unrealized) | | | (6.03 | ) | | | (2.14 | ) | | | 4.11 | | | | 2.35 | | | | 5.09 | | | | 6.29 | | |
Total From Investment
Operations | | | (5.82 | ) | | | (1.83 | ) | | | 4.40 | | | | 2.52 | | | | 5.25 | | | | 6.41 | | |
| Less Distributions | |
| Net Investment Income | | | (0.18 | ) | | | (0.31 | ) | | | (0.30 | ) | | | (0.31 | ) | | | (0.08 | ) | | | (0.12 | ) | |
| Net Realized Gains | | | (2.51 | ) | | | (2.57 | ) | | | (2.27 | ) | | | (2.18 | ) | | | (1.59 | ) | | | (1.13 | ) | |
| Total Distributions | | | (2.69 | ) | | | (2.88 | ) | | | (2.57 | ) | | | (2.49 | ) | | | (1.67 | ) | | | (1.25 | ) | |
Net Asset Value,
End of Period | | $ | 12.42 | | | $ | 20.93 | | | $ | 25.64 | | | $ | 23.81 | | | $ | 23.78 | | | $ | 20.20 | | |
| Total Return | | | (31.60 | )%(C) | | | (8.11 | )% | | | 20.63 | % | | | 11.67 | % | | | 27.87 | % | | | 46.31 | % | |
Net Assets, End of
Period (thousands) | | $ | 5,504,135 | | | $ | 8,805,495 | | | $ | 9,444,412 | | | $ | 7,526,899 | | | $ | 6,294,902 | | | $ | 4,518,054 | | |
Ratio of Expenses to
Average Net Assets | | | 0.21 | %(B) | | | 0.22 | % | | | 0.22 | % | | | 0.24 | % | | | 0.25 | % | | | 0.25 | % | |
Ratio of Net Investment
Income to Average
Net Assets | | | 1.36 | %(B) | | | 1.30 | % | | | 1.24 | % | | | 0.75 | % | | | 0.78 | % | | | 0.75 | % | |
| Portfolio Turnover Rate | | | 32 | %(C) | | | 28 | % | | | 27 | % | | | 27 | % | | | 26 | % | | | 35 | % | |
See page 1 & 2 for the Definitions of Abbreviations and Footnotes.
See accompanying Notes to Financial Statements.
282
THE DFA INVESTMENT TRUST COMPANY
FINANCIAL HIGHLIGHTS
(for a share outstanding throughout each period)
| | | The U.S. Small Cap Series | |
| | | Period
Dec. 1,
2007 to
Oct. 31,
2008 | | Year
Ended
Nov. 30,
2007 | | Year
Ended
Nov. 30,
2006 | | Year
Ended
Nov. 30,
2005 | | Year
Ended
Nov. 30,
2004 | | Year
Ended
Nov. 30,
2003 | |
Net Asset Value,
Beginning of Period | | $ | 16.21 | | | $ | 17.92 | | | $ | 16.73 | | | $ | 16.09 | | | $ | 13.84 | | | $ | 9.93 | | |
Income From
Investment Operations | |
Net Investment
Income (Loss) | | | 0.19 | (A) | | | 0.22 | (A) | | | 0.19 | (A) | | | 0.15 | | | | 0.12 | | | | 0.08 | | |
Net Gains (Losses) on
Securities (Realized
and Unrealized) | | | (4.73 | ) | | | (0.53 | ) | | | 2.27 | | | | 1.44 | | | | 2.22 | | | | 3.92 | | |
Total From Investment
Operations | | | (4.54 | ) | | | (0.31 | ) | | | 2.46 | | | | 1.59 | | | | 2.34 | | | | 4.00 | | |
| Less Distributions | |
| Net Investment Income | | | (0.15 | ) | | | (0.22 | ) | | | (0.19 | ) | | | (0.18 | ) | | | (0.08 | ) | | | (0.09 | ) | |
| Net Realized Gains | | | (1.23 | ) | | | (1.18 | ) | | | (1.08 | ) | | | (0.77 | ) | | | (0.01 | ) | | | — | | |
| Total Distributions | | | (1.38 | ) | | | (1.40 | ) | | | (1.27 | ) | | | (0.95 | ) | | | (0.09 | ) | | | (0.09 | ) | |
Net Asset Value,
End of Period | | $ | 10.29 | | | $ | 16.21 | | | $ | 17.92 | | | $ | 16.73 | | | $ | 16.09 | | | $ | 13.84 | | |
| Total Return | | | (30.44 | )%(C) | | | (1.86 | )% | | | 15.90 | % | | | 10.40 | % | | | 16.99 | % | | | 40.32 | % | |
Net Assets, End of
Period (thousands) | | $ | 2,066,757 | | | $ | 3,590,713 | | | $ | 3,618,504 | | | $ | 2,894,399 | | | $ | 2,321,090 | | | $ | 1,468,486 | | |
Ratio of Expenses to
Average Net Assets | | | 0.05 | %(B) | | | 0.05 | % | | | 0.05 | % | | | 0.07 | % | | | 0.07 | % | | | 0.08 | % | |
Ratio of Net Investment
Income to Average
Net Assets | | | 1.51 | %(B) | | | 1.28 | % | | | 1.13 | % | | | 0.94 | % | | | 0.85 | % | | | 0.84 | % | |
| Portfolio Turnover Rate | | | 27 | %(C) | | | 23 | % | | | 18 | % | | | 21 | % | | | 16 | % | | | 16 | % | |
| | | The U.S. Micro Cap Series | |
| | | Period
Dec. 1,
2007 to
Oct. 31,
2008 | | Year
Ended
Nov. 30,
2007 | | Year
Ended
Nov. 30,
2006 | | Year
Ended
Nov. 30,
2005 | | Year
Ended
Nov. 30,
2004 | | Year
Ended
Nov. 30,
2003 | |
Net Asset Value,
Beginning of Period | | $ | 10.64 | | | $ | 12.25 | | | $ | 12.02 | | | $ | 11.92 | | | $ | 10.48 | | | $ | 7.11 | | |
Income From
Investment Operations | |
Net Investment
Income (Loss) | | | 0.13 | (A) | | | 0.15 | (A) | | | 0.12 | (A) | | | 0.09 | | | | 0.07 | | | | 0.05 | | |
Net Gains (Losses) on
Securities (Realized
and Unrealized) | | | (3.14 | ) | | | (0.50 | ) | | | 1.48 | | | | 1.10 | | | | 1.65 | | | | 3.47 | | |
Total From Investment
Operations | | | (3.01 | ) | | | (0.35 | ) | | | 1.60 | | | | 1.19 | | | | 1.72 | | | | 3.52 | | |
| Less Distributions | |
| Net Investment Income | | | (0.11 | ) | | | (0.15 | ) | | | (0.12 | ) | | | (0.10 | ) | | | (0.05 | ) | | | (0.05 | ) | |
| Net Realized Gains | | | (0.88 | ) | | | (1.11 | ) | | | (1.25 | ) | | | (0.99 | ) | | | (0.23 | ) | | | (0.10 | ) | |
| Total Distributions | | | (0.99 | ) | | | (1.26 | ) | | | (1.37 | ) | | | (1.09 | ) | | | (0.28 | ) | | | (0.15 | ) | |
Net Asset Value,
End of Period | | $ | 6.64 | | | $ | 10.64 | | | $ | 12.25 | | | $ | 12.02 | | | $ | 11.92 | | | $ | 10.48 | | |
| Total Return | | | (31.08 | )%(C) | | | (3.24 | )% | | | 15.00 | % | | | 10.77 | % | | | 16.83 | % | | | 50.34 | % | |
Net Assets, End of
Period (thousands) | | $ | 2,923,624 | | | $ | 4,702,207 | | | $ | 4,826,046 | | | $ | 3,952,538 | | | $ | 3,216,440 | | | $ | 2,624,043 | | |
Ratio of Expenses to
Average Net Assets | | | 0.12 | %(B) | | | 0.12 | % | | | 0.12 | % | | | 0.14 | % | | | 0.15 | % | | | 0.15 | % | |
Ratio of Net Investment
Income to Average
Net Assets | | | 1.59 | %(B) | | | 1.31 | % | | | 1.04 | % | | | 0.80 | % | | | 0.64 | % | | | 0.68 | % | |
| Portfolio Turnover Rate | | | 22 | %(C) | | | 21 | % | | | 22 | % | | | 24 | % | | | 27 | % | | | 19 | % | |
See page 1 & 2 for the Definitions of Abbreviations and Footnotes.
See accompanying Notes to Financial Statements.
283
THE DFA INVESTMENT TRUST COMPANY
FINANCIAL HIGHLIGHTS
(for a share outstanding throughout each period)
| | | The DFA International Value Series | |
| | | Period
Dec. 1,
2007 to
Oct. 31,
2008 | | Year
Ended
Nov. 30,
2007 | | Year
Ended
Nov. 30,
2006 | | Year
Ended
Nov. 30,
2005 | | Year
Ended
Nov. 30,
2004 | | Year
Ended
Nov. 30,
2003 | |
| Net Asset Value, Beginning of Period | | $ | 24.45 | | | $ | 22.06 | | | $ | 17.30 | | | $ | 16.04 | | | $ | 12.40 | | | $ | 9.33 | | |
| Income From Investment Operations | |
| Net Investment Income (Loss) | | | 0.73 | (A) | | | 0.73 | (A) | | | 0.65 | (A) | | | 0.43 | | | | 0.33 | | | | 0.27 | | |
| Net Gains (Losses) on Securities (Realized and Unrealized) | | | (11.45 | ) | | | 2.98 | | | | 5.27 | | | | 1.95 | | | | 3.61 | | | | 3.06 | | |
| Total From Investment Operations | | | (10.72 | ) | | | 3.71 | | | | 5.92 | | | | 2.38 | | | | 3.94 | | | | 3.33 | | |
| Less Distributions | |
| Net Investment Income | | | (0.71 | ) | | | (0.73 | ) | | | (0.67 | ) | | | (0.52 | ) | | | (0.30 | ) | | | (0.25 | ) | |
| Net Realized Gains | | | (1.61 | ) | | | (0.59 | ) | | | (0.49 | ) | | | (0.60 | ) | | | — | | | | (0.01 | ) | |
| Total Distributions | | | (2.32 | ) | | | (1.32 | ) | | | (1.16 | ) | | | (1.12 | ) | | | (0.30 | ) | | | (0.26 | ) | |
| Net Asset Value, End of Period | | $ | 11.41 | | | $ | 24.45 | | | $ | 22.06 | | | $ | 17.30 | | | $ | 16.04 | | | $ | 12.40 | | |
| Total Return | | | (47.87 | )%(C) | | | 17.32 | % | | | 35.73 | % | | | 15.61 | % | | | 32.15 | % | | | 36.24 | % | |
| Net Assets, End of Period (thousands) | | $ | 4,700,337 | | | $ | 9,638,721 | | | $ | 7,457,252 | | | $ | 4,367,698 | | | $ | 2,804,043 | | | $ | 1,604,778 | | |
| Ratio of Expenses to Average Net Assets | | | 0.23 | %(B) | | | 0.23 | % | | | 0.23 | % | | | 0.27 | % | | | 0.28 | % | | | 0.30 | % | |
| Ratio of Net Investment Income to Average Net Assets | | | 4.15 | %(B) | | | 3.04 | % | | | 3.29 | % | | | 2.71 | % | | | 2.35 | % | | | 2.61 | % | |
| Portfolio Turnover Rate | | | 16 | %(C) | | | 16 | % | | | 8 | % | | | 10 | % | | | 15 | % | | | 14 | % | |
See page 1 & 2 for the Definitions of Abbreviations and Footnotes.
See accompanying Notes to Financial Statements.
284
THE DFA INVESTMENT TRUST COMPANY
FINANCIAL HIGHLIGHTS
| | | The Japanese Small Company Series | |
| | | Period
Dec. 1,
2007 to
Oct. 31,
2008 | | Year
Ended
Nov. 30,
2007 | | Year
Ended
Nov. 30,
2006 | | Year
Ended
Nov. 30,
2005 | | Year
Ended
Nov. 30,
2004 | | Year
Ended
Nov. 30,
2003 | |
| Total Return | | | (26.87 | )%(C) | | | (1.16 | )% | | | (2.28 | )% | | | 31.03 | % | | | 32.73 | % | | | 47.87 | % | |
Net Assets, End of
Period (thousands) | | $ | 1,062,964 | | | $ | 1,504,821 | | | $ | 1,385,722 | | | $ | 1,151,429 | | | $ | 605,132 | | | $ | 283,699 | | |
Ratio of Expenses to
Average Net Assets | | | 0.13 | %(B) | | | 0.13 | % | | | 0.14 | % | | | 0.22 | % | | | 0.27 | % | | | 0.28 | % | |
Ratio of Net Investment
Income to Average
Net Assets | | | 2.64 | %(B) | | | 1.94 | % | | | 1.68 | % | | | 1.51 | % | | | 1.45 | % | | | 1.41 | % | |
| Portfolio Turnover Rate | | | 10 | %(C) | | | 9 | % | | | 9 | % | | | 6 | % | | | 5 | % | | | 16 | % | |
| | | The United Kingdom Small Company Series | |
| | | Period
Dec. 1,
2007 to
Oct. 31,
2008 | | Year
Ended
Nov. 30,
2007 | | Year
Ended
Nov. 30,
2006 | | Year
Ended
Nov. 30,
2005 | | Year
Ended
Nov. 30,
2004 | | Year
Ended
Nov. 30,
2003 | |
| Total Return | | | (50.77 | )%(C) | | | 2.42 | % | | | 44.80 | % | | | 12.88 | % | | | 29.68 | % | | | 44.65 | % | |
Net Assets, End of
Period (thousands) | | $ | 555,390 | | | $ | 1,158,580 | | | $ | 1,117,826 | | | $ | 643,038 | | | $ | 377,763 | | | $ | 160,917 | | |
Ratio of Expenses to
Average Net Assets | | | 0.12 | %(B) | | | 0.12 | % | | | 0.13 | % | | | 0.22 | % | | | 0.27 | % | | | 0.26 | % | |
Ratio of Net Investment
Income to Average
Net Assets | | | 3.79 | %(B) | | | 2.72 | % | | | 2.70 | % | | | 3.19 | % | | | 2.70 | % | | | 3.25 | % | |
| Portfolio Turnover Rate | | | 25 | %(C) | | | 12 | % | | | 8 | % | | | 12 | % | | | 7 | % | | | 7 | % | |
| | | The Asia Pacific Small Company Series | |
| | | Period
Dec. 1,
2007 to
Oct. 31,
2008 | | Year
Ended
Nov. 30,
2007 | | Year
Ended
Nov. 30,
2006 | | Year
Ended
Nov. 30,
2005 | | Year
Ended
Nov. 30,
2004 | | Year
Ended
Nov. 30,
2003 | |
| Total Return | | | (57.75 | )%(C) | | | 47.23 | % | | | 38.26 | % | | | 9.30 | % | | | 27.40 | % | | | 61.47 | % | |
Net Assets, End of
Period (thousands) | | $ | 441,237 | | | $ | 1,205,154 | | | $ | 749,627 | | | $ | 395,923 | | | $ | 282,999 | | | $ | 156,765 | | |
Ratio of Expenses to
Average Net Assets | | | 0.15 | %(B) | | | 0.15 | % | | | 0.17 | % | | | 0.27 | % | | | 0.32 | % | | | 0.31 | % | |
Ratio of Net Investment
Income to Average
Net Assets | | | 4.33 | %(B) | | | 3.58 | % | | | 4.19 | % | | | 4.33 | % | | | 3.82 | % | | | 3.35 | % | |
| Portfolio Turnover Rate | | | 20 | %(C) | | | 25 | % | | | 14 | % | | | 10 | % | | | 11 | % | | | 15 | % | |
| | | The Continental Small Company Series | |
| | | Period
Dec. 1,
2007 to
Oct. 31,
2008 | | Year
Ended
Nov. 30,
2007 | | Year
Ended
Nov. 30,
2006 | | Year
Ended
Nov. 30,
2005 | | Year
Ended
Nov. 30,
2004 | | Year
Ended
Nov. 30,
2003 | |
| Total Return | | | (49.66 | )%(C) | | | 17.49 | % | | | 47.10 | % | | | 18.97 | % | | | 36.57 | % | | | 52.86 | % | |
Net Assets, End of
Period (thousands) | | $ | 1,111,585 | | | $ | 2,256,122 | | | $ | 1,875,194 | | | $ | 981,938 | | | $ | 654,644 | | | $ | 448,407 | | |
Ratio of Expenses to
Average Net Assets | | | 0.14 | %(B) | | | 0.14 | % | | | 0.15 | % | | | 0.24 | % | | | 0.26 | % | | | 0.30 | % | |
Ratio of Net Investment
Income to Average
Net Assets | | | 3.49 | %(B) | | | 2.16 | % | | | 2.27 | % | | | 2.16 | % | | | 2.09 | % | | | 2.49 | % | |
| Portfolio Turnover Rate | | | 18 | %(C) | | | 12 | % | | | 7 | % | | | 18 | % | | | 9 | % | | | 11 | % | |
See page 1 & 2 for the Definitions of Abbreviations and Footnotes.
See accompanying Notes to Financial Statements.
285
THE DFA INVESTMENT TRUST COMPANY
FINANCIAL HIGHLIGHTS
| | | The Canadian Small
Company Series | |
| | | Period
Dec. 1,
2007 to
Oct. 31,
2008 | | Period
April 2, 2007(a)
to
Nov. 30, 2007 | |
| Total Return | | | (56.44 | )%(C) | | | 10.20 | %(C) | |
| Net Assets, End of Period (thousands) | | $ | 232,873 | | | $ | 213,529 | | |
| Ratio of Expenses to Average Net Assets | | | 0.18 | %(B) | | | 0.26 | %(B)(E) | |
| Ratio of Net Investment Income to Average Net Assets | | | 0.97 | %(B) | | | 0.47 | %(B)(E) | |
| Portfolio Turnover Rate | | | 21 | %(C) | | | 6 | %(C) | |
| | | The Emerging Markets Series | |
| | | Period
Dec. 1,
2007 to
Oct. 31,
2008 | | Year
Ended
Nov. 30,
2007 | | Year
Ended
Nov. 30,
2006 | | Year
Ended
Nov. 30,
2005 | | Year
Ended
Nov. 30,
2004 | | Year
Ended
Nov. 30,
2003 | |
| Total Return | | | (48.15 | )%(C) | | | 42.62 | % | | | 31.87 | % | | | 31.23 | % | | | 35.47 | % | | | 39.67 | % | |
Net Assets, End of
Period (thousands) | | $ | 1,624,524 | | | $ | 3,707,790 | | | $ | 2,414,971 | | | $ | 1,852,565 | | | $ | 1,160,262 | | | $ | 607,561 | | |
Ratio of Expenses to
Average Net Assets | | | 0.18 | %(B) | | | 0.19 | % | | | 0.20 | % | | | 0.27 | % | | | 0.31 | % | | | 0.34 | % | |
Ratio of Net Investment
Income to Average
Net Assets | | | 3.00 | %(B) | | | 2.52 | % | | | 2.54 | % | | | 3.70 | % | | | 2.63 | % | | | 2.23 | % | |
| Portfolio Turnover Rate | | | 19 | %(C) | | | 7 | % | | | 11 | % | | | 9 | % | | | 2 | % | | | 1 | % | |
| | | The Emerging Markets Small Cap Series | |
| | | Period
Dec. 1,
2007 to
Oct. 31,
2008 | | Year
Ended
Nov. 30,
2007 | | Year
Ended
Nov. 30,
2006 | | Year
Ended
Nov. 30,
2005 | | Year
Ended
Nov. 30,
2004 | | Year
Ended
Nov. 30,
2003 | |
| Total Return | | | (56.84 | )%(C) | | | 43.32 | % | | | 40.55 | % | | | 24.85 | % | | | 35.22 | % | | | 52.80 | % | |
Net Assets, End of
Period (thousands) | | $ | 566,379 | | | $ | 1,525,571 | | | $ | 903,529 | | | $ | 545,271 | | | $ | 237,865 | | | $ | 117,744 | | |
Ratio of Expenses to
Average Net Assets | | | 0.30 | %(B) | | | 0.31 | % | | | 0.34 | % | | | 0.49 | % | | | 0.52 | % | | | 0.54 | % | |
Ratio of Net Investment
Income to Average
Net Assets | | | 3.07 | %(B) | | | 1.94 | % | | | 2.39 | % | | | 2.70 | % | | | 1.93 | % | | | 2.44 | % | |
| Portfolio Turnover Rate | | | 19 | %(C) | | | 16 | % | | | 18 | % | | | 8 | % | | | 11 | % | | | 6 | % | |
See page 1 & 2 for the Definitions of Abbreviations and Footnotes.
See accompanying Notes to Financial Statements.
286
THE DFA INVESTMENT TRUST COMPANY
FINANCIAL HIGHLIGHTS
(for a share outstanding throughout each period)
| | | The DFA One-Year Fixed Income Series | |
| | | Period
Dec. 1,
2007 to
Oct. 31,
2008 | | Year
Ended
Nov. 30,
2007 | | Year
Ended
Nov. 30,
2006 | | Year
Ended
Nov. 30,
2005 | | Year
Ended
Nov. 30,
2004 | | Year
Ended
Nov. 30,
2003 | |
Net Asset Value,
Beginning of Period | | $ | 10.01 | | | $ | 10.00 | | | $ | 9.94 | | | $ | 10.00 | | | $ | 10.10 | | | $ | 10.19 | | |
Income From
Investment Operations | |
Net Investment
Income (Loss) | | | 0.30 | (A) | | | 0.53 | (A) | | | 0.42 | (A) | | | 0.30 | | | | 0.16 | | | | 0.15 | | |
Net Gains (Losses) on
Securities (Realized
and Unrealized) | | | (0.03 | ) | | | (0.01 | ) | | | 0.04 | | | | (0.07 | ) | | | (0.04 | ) | | | 0.04 | | |
Total From Investment
Operations | | | 0.27 | | | | 0.52 | | | | 0.46 | | | | 0.23 | | | | 0.12 | | | | 0.19 | | |
| Less Distributions | |
| Net Investment Income | | | (0.31 | ) | | | (0.51 | ) | | | (0.40 | ) | | | (0.29 | ) | | | (0.15 | ) | | | (0.16 | ) | |
| Net Realized Gains | | | — | | | | — | | | | — | | | | — | | | | (0.07 | ) | | | (0.12 | ) | |
| Tax Return of Capital | | | — | | | | — | | | | — | | | | — | | | | — | | | | — | | |
| Total Distributions | | | (0.31 | ) | | | (0.51 | ) | | | (0.40 | ) | | | (0.29 | ) | | | (0.22 | ) | | | (0.28 | ) | |
Net Asset Value,
End of Period | | $ | 9.97 | | | $ | 10.01 | | | $ | 10.00 | | | $ | 9.94 | | | $ | 10.00 | | | $ | 10.10 | | |
| Total Return | | | 2.79 | %(C) | | | 5.31 | % | | | 4.72 | % | | | 2.32 | % | | | 1.21 | % | | | 1.95 | % | |
Net Assets, End of
Period (thousands) | | $ | 3,225,372 | | | $ | 3,229,144 | | | $ | 2,419,131 | | | $ | 1,953,544 | | | $ | 1,739,484 | | | $ | 1,455,374 | | |
Ratio of Expenses to
Average Net Assets | | | 0.07 | %(B) | | | 0.07 | % | | | 0.07 | % | | | 0.09 | % | | | 0.09 | % | | | 0.09 | % | |
Ratio of Net Investment
Income to Average
Net Assets | | | 3.26 | %(B) | | | 5.20 | % | | | 4.15 | % | | | 3.04 | % | | | 1.63 | % | | | 1.51 | % | |
| Portfolio Turnover Rate | | | 31 | %(C) | | | 28 | % | | | 28 | % | | | 40 | % | | | 154 | % | | | 143 | % | |
| | | The DFA Two-Year Global Fixed Income Series | |
| | | Period
Dec. 1,
2007 to
Oct. 31,
2008 | | Year
Ended
Nov. 30,
2007 | | Year
Ended
Nov. 30,
2006 | | Year
Ended
Nov. 30,
2005 | | Year
Ended
Nov. 30,
2004 | | Year
Ended
Nov. 30,
2003 | |
Net Asset Value,
Beginning of Period | | $ | 10.44 | | | $ | 10.19 | | | $ | 9.83 | | | $ | 9.99 | | | $ | 10.13 | | | $ | 10.22 | | |
Income From
Investment Operations | |
Net Investment
Income (Loss) | | | 0.27 | (A) | | | 0.36 | (A) | | | 0.31 | (A) | | | 0.29 | (A) | | | 0.12 | | | | 0.25 | | |
Net Gains (Losses) on
Securities (Realized
and Unrealized) | | | 0.04 | | | | 0.16 | | | | 0.13 | | | | (0.10 | ) | | | — | | | | (0.01 | ) | |
Total From Investment
Operations | | | 0.31 | | | | 0.52 | | | | 0.44 | | | | 0.19 | | | | 0.12 | | | | 0.24 | | |
| Less Distributions | |
| Net Investment Income | | | (0.41 | ) | | | (0.27 | ) | | | (0.08 | ) | | | (0.33 | ) | | | (0.15 | ) | | | (0.19 | ) | |
| Net Realized Gains | | | — | | | | — | | | | — | | | | — | | | | (0.11 | ) | | | (0.14 | ) | |
| Tax Return of Capital | | | — | | | | — | | | | — | | | | (0.02 | ) | | | — | | | | — | | |
| Total Distributions | | | (0.41 | ) | | | (0.27 | ) | | | (0.08 | ) | | | (0.35 | ) | | | (0.26 | ) | | | (0.33 | ) | |
Net Asset Value,
End of Period | | $ | 10.34 | | | $ | 10.44 | | | $ | 10.19 | | | $ | 9.83 | | | $ | 9.99 | | | $ | 10.13 | | |
| Total Return | | | 3.02 | %(C) | | | 5.15 | % | | | 4.52 | % | | | 1.92 | % | | | 1.22 | % | | | 2.36 | % | |
Net Assets, End of
Period (thousands) | | $ | 3,264,848 | | | $ | 3,302,095 | | | $ | 2,568,774 | | | $ | 2,068,235 | | | $ | 1,707,132 | | | $ | 1,195,610 | | |
Ratio of Expenses to
Average Net Assets | | | 0.07 | %(B) | | | 0.07 | % | | | 0.08 | % | | | 0.10 | % | | | 0.11 | % | | | 0.13 | % | |
Ratio of Net Investment
Income to Average
Net Assets | | | 2.79 | %(B) | | | 3.51 | % | | | 3.12 | % | | | 2.96 | % | | | 1.96 | % | | | 1.78 | % | |
| Portfolio Turnover Rate | | | 17 | %(C) | | | 95 | % | | | 111 | % | | | 59 | % | | | 131 | % | | | 144 | % | |
See page 1 & 2 for the Definitions of Abbreviations and Footnotes.
See accompanying Notes to Financial Statements.
287
THE DFA INVESTMENT TRUST COMPANY
NOTES TO FINANCIAL STATEMENTS
A. Organization:
The DFA Investment Trust Company (the "Trust") is an open-end management investment company registered under the Investment Company Act of 1940. The Trust consists of eighteen investment portfolios, of which sixteen are included in this section of the report, (collectively, the "Series") and two are presented in separate reports.
Domestic Equity Portfolios
The U.S. Large Company Series
The Enhanced U.S. Large Company Series
The U.S. Large Cap Value Series
The U.S. Small Cap Value Series
The U.S. Small Cap Series
The U.S. Micro Cap Series
Fixed Income Portfolios
The DFA One-Year Fixed Income Series
The DFA Two-Year Global Fixed Income Series
International Equity Portfolios
The DFA International Value Series
The Japanese Small Company Series
The Asia Pacific Small Company Series
The United Kingdom Small Company Series
The Continental Small Company Series
The Canadian Small Company Series
The Emerging Markets Series
The Emerging Markets Small Cap Series
At a regular meeting of the Board of Directors/Trustees (the "Board") on September 16, 2008, the Board voted to change the fiscal and tax year ends of the Series from November 30 to October 31.
B. Significant Accounting Policies:
The following significant accounting policies are in conformity with accounting principles generally accepted in the United States of America. Such policies are consistently followed by the Trust in preparation of its financial statements. The preparation of financial statements in accordance with accounting principles generally accepted in the United States of America requires management to make estimates and assumptions that affect the reported amounts of assets and liabilities and disclosure of contingent assets and liabilities at the date of the financial statements and the reported amounts of increases and decreases in net assets from operations during the reporting period. Actual results could differ from those estimates and those differences could be material.
1. Security Valuation: Securities held by the Domestic Equity Portfolios and the International Equity Portfolios, including over-the-counter securities, are valued at the last quoted sale price of the day. Securities held by the Domestic Equity Portfolios and the International Equity Portfolios that are listed on Nasdaq are valued at the Nasdaq Official Closing Price ("NOCP"). If there is no last reported sale price or NOCP for the day, the Domestic Equity Portfolios and International Equity Portfolios value the securities at the mean of the most recent quoted bid and asked prices. Price information on listed securities is taken from the exchange where the security is primarily traded. Generally, securities issued by open-end investment companies are valued using their respective n et asset values or public offering prices, as appropriate, for purchase orders placed at the close of the New York Stock Exchange (NYSE).
Securities for which no market quotations are readily available (including restricted securities), or for which market quotations have become unreliable, are valued in good faith at fair value in accordance with procedures adopted by the Board of Directors/Trustees. Fair value pricing may also be used if events that have a significant effect on the value of an investment (as determined in the discretion of the Investment Committee of the Advisor) occur before the net asset value is calculated. When fair value pricing is used, the prices of securities used by the Domestic Equity Portfolios and International Equity Portfolios may differ from the quoted or published prices for the same securities on their primary markets or exchanges.
The International Equity Portfolios will also apply a fair value price in the circumstances described below. Generally, trading in foreign securities markets is completed each day at various times prior to the close of the NYSE.
288
For example, trading in the Japanese securities markets is completed each day at the close of the Tokyo Stock Exchange (normally, 11:00 p.m. PT), which is fourteen hours prior to the close of the NYSE (normally, 1:00 p.m. PT) and the time that the net asset values of the International Equity Portfolios are computed. Due to the time differences between the closings of the relevant foreign securities exchanges and the time the International Equity Portfolios price their shares at the close of the NYSE, the International Equity Portfolios will fair value their foreign investments when it is determined that the market quotations for the foreign investments are either unreliable or not readily available. The fair value prices will attempt to reflect the impact of the U.S. financial markets' perceptions and trading activities on the International Equity Portfolios' foreign investments since the last closing prices of the foreign investments were c alculated on their primary foreign securities markets or exchanges. For these purposes, the Board of Directors/Trustees of the Trust have determined that movements in relevant indices or other appropriate market indicators, after the close of the Tokyo Stock Exchange or the London Stock Exchange, demonstrate that market quotations may be unreliable. Fair valuation of portfolio securities may occur on a daily basis. The fair value pricing by the International Equity Portfolios utilizes data furnished by an independent pricing service (and that data draws upon, among other information, the market values of foreign investments). The fair value prices of portfolio securities generally will be used when it is determined that the use of such prices will have a material impact on the net asset value of an International Equity Portfolio. When an International Equity Portfolio uses fair value pricing, the values assigned to the International Equity Portfolio's foreign investments may not be the quoted or published pr ices of the investments on their primary markets or exchanges.
Fixed income instruments held by The Enhanced U.S. Large Company Series and the Fixed Income Portfolios, are valued on the basis of prices provided by one or more pricing services or other reasonably reliable sources including broker/dealers that typically handle the purchase and sale of such securities. Securities which are traded over-the counter and on a stock exchange generally will be valued according to the broadest and most representative market, and it is expected that for bonds and other fixed income securities, this ordinarily will be the over-the-counter market. Securities for which quotations are not readily available (including restricted securities), or for which market quotations have become unreliable, are valued in good faith at fair value in accordance with procedures adopted by the Board of Directors/Trustees.
Futures contracts held by the Series are valued using the settlement price established each day on the exchange on which they are traded.
Adoption of Statement of Financial Accounting Standards No. 157 "Fair Value Measurements" ("FAS 157")
In September 2006, the Financial Accounting Standards Board issued FAS 157 effective for fiscal years beginning after November 15, 2007. This standard clarifies the definition of fair value for financial reporting, establishes a framework for measuring fair value and requires additional disclosures about the use of fair value measurements. The Funds have adopted FAS 157 as of December 1, 2007. The three levels of the fair value hierarchy under FAS 157 are described below:
• Level 1 – quoted prices in active markets for identical securities
• Level 2 – other significant observable inputs (including quoted prices for similar securities, interest rates, prepayment speeds, credit risk, etc.)
• Level 3 – significant unobservable inputs (including the Series' own assumptions in determining the fair value of investments)
289
The inputs or methodology used for valuing securities are not necessarily an indication of the risk associated with investing in those securities. A summary of the inputs used to value the Series' net assets as of October 31, 2008 is listed below (in thousands).
| | | Valuation Inputs | |
| | | Investments in
Securities
(Market Value) | | Other Financial
Instruments
(Unrealized
Appreciation/
Depreciation)* | |
| | | Level 1 | | Level 2 | | Level 3 | | Total | | Level 1 | | Level 2 | | Level 3 | | Total | |
| The U.S. Large Company Series | | $ | 3,222,515 | | | $ | 759,795 | | | | — | | | $ | 3,982,310 | | | $ | 2,377 | | | | — | | | | — | | | $ | 2,377 | | |
The Enhanced U.S. Large
Company Series | | | 9,647 | | | | 188,624 | | | | — | | | | 198,271 | | | | (51,127 | ) | | $ | (429 | ) | | | — | | | | (51,556 | ) | |
| The U.S. Large Cap Value Series | | | 6,607,903 | | | | 843,542 | | | | — | | | | 7,451,445 | | | | 29 | | | | — | | | | — | | | | 29 | | |
| The U.S. Small Cap Value Series | | | 5,376,431 | | | | 1,069,228 | | | | — | | | | 6,445,659 | | | | 26 | | | | — | | | | — | | | | 26 | | |
| The U.S. Small Cap Series | | | 2,020,927 | | | | 515,959 | | | | — | | | | 2,536,886 | | | | — | | | | — | | | | — | | | | — | | |
| The U.S. Micro Cap Series | | | 2,908,954 | | | | 597,172 | | | | — | | | | 3,506,126 | | | | — | | | | — | | | | — | | | | — | | |
| The DFA International Value Series | | | 1,004,378 | | | | 4,409,502 | | | | — | | | | 5,413,880 | | | | 19 | | | | — | | | | — | | | | 19 | | |
The Japanese Small
Company Series | | | 1,816 | | | | 1,386,742 | | | | — | | | | 1,388,558 | | | | — | | | | — | | | | — | | | | — | | |
The Asia Pacific Small
Company Series | | | 3,430 | | | | 575,328 | | | | — | | | | 578,758 | | | | 3 | | | | — | | | | — | | | | 3 | | |
The United Kingdom Small
Company Series | | | 7,156 | | | | 563,364 | | | | — | | | | 570,520 | | | | 1 | | | | — | | | | — | | | | 1 | | |
The Continental Small
Company Series | | | 11,975 | | | | 1,327,436 | | | | — | | | | 1,339,411 | | | | 9 | | | | — | | | | — | | | | 9 | | |
The Canadian Small
Company Series | | | 228,337 | | | | 67,885 | | | | — | | | | 296,222 | | | | — | | | | — | | | | — | | | | — | | |
| The Emerging Markets Series | | | 610,934 | | | | 1,127,567 | | | | — | | | | 1,738,501 | | | | 32 | | | | — | | | | — | | | | 32 | | |
The Emerging Markets
Small Cap Series | | | 122,194 | | | | 522,210 | | | | — | | | | 644,404 | | | | 10 | | | | — | | | | — | | | | 10 | | |
The DFA One-Year Fixed
Income Series | | | — | | | | 3,215,579 | | | | — | | | | 3,215,579 | | | | — | | | | — | | | | — | | | | — | | |
The DFA Two-Year Global Fixed
Income Series | | | — | | | | 3,230,361 | | | | — | | | | 3,230,361 | | | | — | | | | (6,732 | ) | | | — | | | | (6,732 | ) | |
* Other financial instruments are derivative instruments not reflected in the Schedule of Investments, such as futures, and forwards which are valued at the unrealized appreciation/depreciation on the investment.
2. Foreign Currency Translation: Securities and other assets and liabilities of The Enhanced U.S. Large Company Series, the International Equity Portfolios and The DFA Two-Year Global Fixed Income Series, whose values are initially expressed in foreign currencies, are translated to U.S. dollars using the mean between the most recently quoted bid and asked prices for the U.S. dollar as quoted by generally recognized reliable sources. Dividend and interest income and certain expenses are translated to U.S. dollars at the rate of exchange on their respective accrual dates. Receivables and payables denominated in foreign currencies are marked to market daily based on daily exchange rates and exchange gains or losses are realized upon ultimate receipt or disbursement. The Enhanced U.S. Large Company Series and The DFA Two-Year Global Fixed Income Series also enter into forward foreign currency contracts solely for the purpose of hedging against fluctuations in currency exchange rates. These contracts are also marked to market daily based on daily exchange rates.
The International Equity Portfolios do not isolate the effect of fluctuations in foreign exchange rates from the effect of fluctuations in the market prices of securities held whether realized or unrealized. However, The Enhanced U.S. Large Company Series and The DFA Two-Year Global Fixed Income Series do isolate the effect of fluctuations in foreign currency rates when determining the realized gain or loss upon the sale or maturity of foreign currency denominated debt obligations pursuant to U.S. federal income tax regulations; such amounts are categorized as foreign exchange gain or loss for both financial reporting and income tax reporting purposes.
290
Realized gains or losses on foreign currency transactions represent net foreign exchange gains or losses from the disposition of foreign currencies, currency gains or losses realized between the trade and settlement dates on securities transactions, and the difference between amounts of interest, dividends and foreign withholding taxes recorded on the books of The Enhanced U.S. Large Company Series, the International Equity Portfolios and The DFA Two-Year Global Fixed Income Series and the U.S. dollar equivalent amounts actually received or paid.
3. Deferred Compensation Plan: Each eligible Trustee of the Trust may elect participation in the Deferred Compensation Plan (the "Plan"). Under the Plan, effective January 1, 2002, such Trustees may defer payment of all or a portion of their total fees earned as a Trustee. These deferred amounts may be treated as though such amounts had been invested in shares of the following funds: U.S. Large Cap Value Portfolio; U.S. Core Equity 1 Portfolio; U.S. Core Equity 2 Portfolio; U.S. Vector Equity Portfolio; U.S. Micro Cap Portfolio; DFA International Value Portfolio; International Core Equity Portfolio; Emerging Markets Portfolio; Emerging Markets Core Equity Portfolio; and/or DFA Two-Year Global Fixed Income Portfolio. Contributions made under the Plan and the change in unrealized app reciation (depreciation) and income, are included in Other Expenses for the period ended October 31, 2008 and are included in Directors'/Trustees' Fees & Expenses for the year ended November 30, 2007.
Each Trustee has the option to receive their distribution of proceeds in one of the following methods upon one year's notice: lump sum; annual installments over a period of agreed upon years; or semi-annual installments over a period of agreed upon years. As of October 31, 2008, none of the Trustees have requested distribution of proceeds.
4. Other: Security transactions are accounted for as of the trade date. Costs used in determining realized gains and losses on the sale of investment securities are on the basis of identified cost. Dividend income and distributions to shareholders are recorded on the ex-dividend date. Distributions received on securities that represent a return of capital or capital gain are recorded as a reduction of cost of investments or as a realized gain, respectively. The Series estimate the character of distributions received that may be considered return of capital distributions. Interest income is recorded on an accrual basis. Discount and premium on securities purchased are amortized over the lives of the respective securities, utilizing the effective interest method. Expenses directly at tributable to a Series are directly charged. Common expenses of the Trust or Series are allocated using methods approved by the Board of Directors/Trustees, generally based on average net assets.
The International Portfolios may be subject to taxes imposed by countries in which they invest, with respect to their investments in issuers existing or operating in such countries. Such taxes are generally based on income earned or repatriated and capital gains realized on the sale of such investments. The funds accrue such taxes when the related income or capital gains are earned or throughout the holding period. Some countries require governmental approval for the repatriation of investment income, capital or the proceeds of sales earned by foreign investors. In addition, if there is a deterioration in a country's balance of payments or for other reasons, a country may impose temporary restrictions on foreign capital remittances abroad.
The Emerging Markets Series and The Emerging Markets Small Cap Series investments in Thailand are subject to a 15% governmental capital gains tax. Such taxes are due upon sale of individual securities. The Emerging Markets Series and The Emerging Markets Small Cap Series accrue for taxes on the capital gains throughout the holding period based on the unrealized gain of the underlying securities. These funds are also subject to a 10% governmental capital gains tax on short-term capital gains for investments in India. Such taxes are due upon sale of individual securities. The taxes for the capital gains are accrued when the capital gains are earned.
C. Investment Advisor:
Dimensional Fund Advisors LP ("Dimensional" or the "Advisor") provides investment advisory services to the Trust. For the period December 1, 2007 to October 31, 2008, the Series' investment advisory services fees were accrued daily and paid monthly to the Advisor based on the following effective annual rates of average daily net assets:
| The U.S. Large Company Series | | | 0.025 | % | |
|
| The Enhanced U.S. Large Company Series | | | 0.05 | % | |
|
| The U.S. Large Cap Value Series | | | 0.10 | % | |
|
| The U.S. Small Cap Value Series | | | 0.20 | % | |
|
291
| The U.S. Small Cap Series | | | 0.03 | % | |
|
| The U.S. Micro Cap Series | | | 0.10 | % | |
|
| The DFA International Value Series | | | 0.20 | % | |
|
| The Japanese Small Company Series | | | 0.10 | % | |
|
| The Asia Pacific Small Company Series | | | 0.10 | % | |
|
| The United Kingdom Small Company Series | | | 0.10 | % | |
|
| The Continental Small Company Series | | | 0.10 | % | |
|
| The Canadian Small Company Series | | | 0.10 | % | |
|
| The Emerging Markets Series | | | 0.10 | % | |
|
| The Emerging Markets Small Cap Series | | | 0.20 | % | |
|
| The DFA One-Year Fixed Income Series | | | 0.05 | % | |
|
| The DFA Two-Year Global Fixed Income Series | | | 0.05 | % | |
|
Fees Paid to Officers and Directors/Trustees:
Certain Officers and Directors/Trustees of the Advisor are also Officers and Directors/Trustees of the Trust; however, such Officers and Directors/Trustees (with the exception of the Chief Compliance Officer ("CCO")) receive no compensation from the Trust. For period December 1, 2007 to October 31, 2008, the total related amounts paid by the Trust to the CCO were $106 (in thousands). The total related amounts paid by each of the Series are included in Other Expenses on the Statement of Operations.
D. Deferred Compensation:
At October 31, 2008, the total liability for deferred compensation to Directors/Trustees is included in Accrued Expenses and Other Liabilities on the Statement of Assets and Liabilities as follows (amounts in thousands):
| The U.S. Large Company Series | | $ | 62 | | |
| The Enhanced U.S. Large Company Series | | | 4 | | |
| The U.S. Large Cap Value Series | | | 134 | | |
| The U.S. Small Cap Value Series | | | 112 | | |
| The U.S. Small Cap Series | | | 43 | | |
| The U.S. Micro Cap Series | | | 59 | | |
| The DFA International Value Series | | | 117 | | |
| The Japanese Small Company Series | | | 19 | | |
| The Asia Pacific Small Company Series | | | 14 | | |
| The United Kingdom Small Company Series | | | 14 | | |
| The Continental Small Company Series | | | 29 | | |
| The Canadian Small Company Series | | | 5 | | |
| The Emerging Markets Series | | | 44 | | |
| The Emerging Markets Small Cap Series | | | 17 | | |
| The DFA One-Year Fixed Income Series | | | 50 | | |
| The DFA Two-Year Global Fixed Income Series | | | 49 | | |
E. Purchases and Sales of Securities:
For the period December 1, 2007 to October 31, 2008, the Series made the following purchases and sales of investment securities, other than short-term securities (amounts in thousands):
| | | U.S. Government
Securities | | Other Investment
Securities | |
| | | Purchases | | Sales | | Purchases | | Sales | |
| The U.S. Large Company Series | | | — | | | | — | | | $ | 712,184 | | | $ | 245,176 | | |
| The Enhanced U.S. Large Company Series | | $ | 103,147 | | | $ | 54,126 | | | | 77,937 | | | | 87,948 | | |
| The U.S. Large Cap Value Series | | | — | | | | — | | | | 2,227,129 | | | | 1,690,939 | | |
292
| | | U.S. Government
Securities | | Other Investment
Securities | |
| | | Purchases | | Sales | | Purchases | | Sales | |
| The U.S. Small Cap Value Series | | | — | | | | — | | | $ | 2,404,320 | | | $ | 2,957,018 | | |
| The U.S. Small Cap Series | | | — | | | | — | | | | 785,077 | | | | 1,246,407 | | |
| The U.S. Micro Cap Series | | | — | | | | — | | | | 876,260 | | | | 1,252,839 | | |
| The DFA International Value Series | | | — | | | | — | | | | 1,266,540 | | | | 1,523,257 | | |
| The Japanese Small Company Series | | | — | | | | — | | | | 130,404 | | | | 143,170 | | |
| The Asia Pacific Small Company Series | | | — | | | | — | | | | 186,360 | | | | 282,035 | | |
| The United Kingdom Small Company Series | | | — | | | | — | | | | 254,559 | | | | 246,764 | | |
| The Continental Small Company Series | | | — | | | | — | | | | 359,725 | | | | 350,354 | | |
| The Canadian Small Company Series | | | — | | | | — | | | | 385,418 | | | | 73,101 | | |
| The Emerging Markets Series | | | — | | | | — | | | | 564,288 | | | | 1,065,835 | | |
| The Emerging Markets Small Cap Series | | | — | | | | — | | | | 222,594 | | | | 390,326 | | |
| The DFA One-Year Fixed Income Series | | $ | 1,376,350 | | | $ | 206,075 | | | | 368,562 | | | | 159,474 | | |
| The DFA Two-Year Global Fixed Income Series | | | 943,936 | | | | — | | | | 526,783 | | | | 390,100 | | |
F. Federal Income Taxes:
It is the intention of The Enhanced U.S. Large Company Series, The U.S. Large Cap Value Series, The U.S. Small Cap Value Series, The U.S. Small Cap Series, The U.S. Micro Cap Series, The DFA International Value Series, The DFA One-Year Fixed Income Series and The DFA Two-Year Global Fixed Income Series each to continue to qualify as a regulated investment company under Subchapter M of the Internal Revenue Code and to distribute substantially all of their taxable income and capital gains to its shareholders.
The U.S. Large Company Series, The Japanese Small Company Series, The Asia Pacific Small Company Series, The United Kingdom Small Company Series, The Continental Small Company Series, The Canadian Small Company Series, The Emerging Markets Series and The Emerging Markets Small Cap Series are treated as partnerships for federal income tax purposes and therefore, no provision for federal income taxes is required. Any net investment income and realized and unrealized gains and losses have been deemed to have been "passed down" to their respective partners.
Distributions from net investment income and net realized capital gains are determined in accordance with U.S. federal income tax regulations, which may differ from those amounts determined under accounting principles generally accepted in the United States of America. These book/tax differences are either temporary or permanent in nature. To the extent these differences are permanent, they are charged or credited to paid-in capital, undistributed net investment income or accumulated net realized gains, as appropriate, in the period that the differences arise. Accordingly, the following permanent differences as of October 31, 2008, primarily attributable to in-kind transactions, were reclassified to the following accounts. These reclassifications had no effect on net assets or net asset value per share (amounts in thousands):
| | | Increase
(Decrease)
Paid-In Capital | | Increase
(Decrease)
Undistributed
Net Investment
Income | | Increase
(Decrease)
Accumulated
Net Realized
Gains (Losses) | |
| The Enhanced U.S. Large Company Series | | $ | 14,673 | | | $ | (1,589 | ) | | $ | (13,084 | ) | |
| The U.S. Large Cap Value Series | | | 52,271 | | | | — | | | | (52,271 | ) | |
| The U.S. Small Cap Value Series | | | 416,268 | | | | (12,720 | ) | | | (403,548 | ) | |
| The U.S. Small Cap Series | | | 95,343 | | | | (8,349 | ) | | | (86,994 | ) | |
| The U.S. Micro Cap Series | | | 137,317 | | | | (9,684 | ) | | | (127,633 | ) | |
| The DFA International Value Series | | | 123,628 | | | | (20,126 | ) | | | (103,502 | ) | |
| The DFA One-Year Fixed Income Series | | | 8,941 | | | | (8,941 | ) | | | — | | |
| The DFA Two-Year Global Fixed Income Series | | | 66,118 | | | | 11,108 | | | | (77,226 | ) | |
293
The tax character of dividends and distributions declared and paid during the years ended November 30, 2006, November 30, 2007, and the period December 1, 2007 to October 31, 2008 were as follows (amounts in thousands):
| | | Net Investment
Income and
Short-Term
Capital Gains | | Long-Term
Capital Gains | | Total | |
| The Enhanced U.S. Large Company Series | |
| 2006 | | $ | 4,468 | | | $ | 4,136 | | | $ | 8,604 | | |
| 2007 | | | 22,007 | | | | 14,452 | | | | 36,459 | | |
| 2008 | | | 31,658 | | | | 4,162 | | | | 35,820 | | |
| The U.S. Large Cap Value Series | |
| 2006 | | | 141,704 | | | | 186,026 | | | | 327,730 | | |
| 2007 | | | 160,367 | | | | 463,876 | | | | 624,243 | | |
| 2008 | | | 168,022 | | | | — | | | | 168,022 | | |
| The U.S. Small Cap Value Series | |
| 2006 | | | 142,640 | | | | 678,973 | | | | 821,613 | | |
| 2007 | | | 205,518 | | | | 868,642 | | | | 1,074,160 | | |
| 2008 | | | 113,153 | | | | 1,391,671 | | | | 1,504,824 | | |
| The U.S. Small Cap Series | |
| 2006 | | | 71,422 | | | | 153,072 | | | | 224,494 | | |
| 2007 | | | 86,268 | | | | 200,073 | | | | 286,341 | | |
| 2008 | | | 47,794 | | | | 290,788 | | | | 338,582 | | |
| The U.S. Micro Cap Series | |
| 2006 | | | 119,309 | | | | 336,642 | | | | 455,951 | | |
| 2007 | | | 127,405 | | | | 375,219 | | | | 502,624 | | |
| 2008 | | | 116,845 | | | | 448,150 | | | | 564,995 | | |
| The DFA International Value Series | |
| 2006 | | | 213,585 | | | | 115,307 | | | | 328,892 | | |
| 2007 | | | 293,050 | | | | 185,943 | | | | 478,993 | | |
| 2008 | | | 336,790 | | | | 613,845 | | | | 950,635 | | |
| The DFA One-Year Fixed Income Series | |
| 2006 | | | 90,843 | | | | — | | | | 90,843 | | |
| 2007 | | | 152,964 | | | | — | | | | 152,964 | | |
| 2008 | | | 106,601 | | | | — | | | | 106,601 | | |
| The DFA Two-Year Global Fixed Income Series | |
| 2006 | | | 19,326 | | | | — | | | | 19,326 | | |
| 2007 | | | 79,311 | | | | — | | | | 79,311 | | |
| 2008 | | | 130,982 | | | | — | | | | 130,982 | | |
294
At October 31, 2008, the components of distributable earnings (accumulated losses) were as follows (amounts in thousands):
| | | Undistributed
Net Investment
Income and
Short-Term
Capital Gains | | Undistributed
Long-Term
Capital Gains | | Capital
Loss
Carryforward | | Total Net
Distributable
Earnings
(Accumulated
Losses) | |
| The U.S. Large Cap Value Series | | $ | 66 | | | | — | | | $ | (542,039 | ) | | $ | (541,973 | ) | |
For federal income tax purposes, the Trust measures its capital loss carryforwards annually at October 31, its fiscal year end. Capital loss carryforwards may be carried forward and applied against future capital gains. As of October 31, 2008, the following Series' had capital loss carryforwards available to offset future realized capital gains through the indicated expiration dates (amounts in thousands):
| | | Expires on October 31, | | | |
| | | 2012 | | 2013 | | 2014 | | 2015 | | 2016 | | Total | |
| The U.S. Large Cap Value Series | | | — | | | | — | | | | — | | | $ | 118,411 | | | $ | 423,628 | | | $ | 542,039 | | |
Some of the Series' investments are in securities considered to be "passive foreign investment companies" for which any unrealized appreciation (depreciation) (mark to market) and/or realized gains are required to be included in distributable net investment income for federal income tax purposes. At October 31, 2008, the following Series' had cumulative unrealized appreciation (depreciation) (mark to market) to be included in distributable net investment income for federal tax purposes. For the period December 1, 2007 to October 31, 2008, realized gains on the sale of passive foreign investment companies have been reclassified from accumulated net realized gains to accumulated net investment income for federal tax purposes. Amounts listed below are in thousands.
| | | Mark to Market | | Realized Gains | |
| The Japanese Small Company Series | | $ | 801 | | | $ | 1,131 | | |
| The Asia Pacific Small Company Series | | | 108 | | | | 188 | | |
| The United Kingdom Small Company Series | | | 4,045 | | | | 3,276 | | |
| The Continental Small Company Series | | | 669 | | | | 25 | | |
| The Emerging Markets Series | | | 108 | | | | — | | |
| The Emerging Markets Small Cap Series | | | 199 | | | | — | | |
At October 31, 2008, the total cost and aggregate gross unrealized appreciation and (depreciation) of securities for federal income tax purposes were different from amounts reported for financial reporting purposes (amounts in thousands):
| | | Federal Tax
Cost | | Unrealized
Appreciation | | Unrealized
(Depreciation) | | Net
Unrealized
Appreciation
(Depreciation) | |
| The U.S. Large Company Series | | $ | 4,340,356 | | | $ | 574,021 | | | $ | (932,067 | ) | | $ | (358,046 | ) | |
| The U.S. Large Cap Value Series | | | 9,332,438 | | | | 582,282 | | | | (2,463,275 | ) | | | (1,880,993 | ) | |
| The Japanese Small Company Series | | | 1,832,932 | | | | 50,880 | | | | (495,254 | ) | | | (444,374 | ) | |
| The Asia Pacific Small Company Series | | | 841,797 | | | | 34,402 | | | | (297,440 | ) | | | (263,038 | ) | |
| The United Kingdom Small Company Series | | | 862,577 | | | | 40,352 | | | | (332,409 | ) | | | (292,057 | ) | |
| The Continental Small Company Series | | | 1,640,246 | | | | 150,203 | | | | (451,038 | ) | | | (300,835 | ) | |
| The Canadian Small Company Series | | | 582,126 | | | | 554 | | | | (286,458 | ) | | | (285,904 | ) | |
| The Emerging Markets Series | | | 1,346,314 | | | | 480,062 | | | | (87,875 | ) | | | 392,187 | | |
| The Emerging Markets Small Cap Series | | | 886,204 | | | | 52,560 | | | | (294,360 | ) | | | (241,800 | ) | |
In June 2006, the Financial Accounting Standards Board (FASB) issued FASB Interpretation 48 ("FIN 48"), "Accounting for Uncertainty in Income Taxes." This standard defines the threshold for recognizing the benefits of tax-return positions in the financial statements as "more-likely-than-not" to be sustained by the taxing authority and requires measurement of a tax position meeting the more-likely-than-not criterion, based on the largest benefit that is more than 50 percent likely to be realized. Management has analyzed the Series' tax positions to be taken on the
295
federal income tax returns for all open tax years (tax years ended November 30, 2005 through the period ended October 31, 2008), for purposes of implementing FIN 48, and has concluded that no provision for income tax is required in the Series' financial statements.
On October 22, 2008, The U.S. Micro Cap Series and The U.S. Small Cap Value Series and on October 25, 2008 The U.S. Small Cap Series, each a master fund in a RIC/RIC master feeder structure each with a RIC feeder ("the Portfolios"), having 100% investment in their respective master fund, have each made a "Check-the-box" election for federal income tax purposes pursuant to Treasury Regulation § 301.7701-3, to change their federal entity classifications from a corporation taxable as a regulated investment company to a disregarded entity. As a result of this election for tax purposes, each master fund is deemed to have liquidated and distributed all of its assets and liabilities to its owners, the respective portfolios (the RIC feeders), with the respective portfolios deemed the surviving entities. The final tax year end of the Master Funds was October 21, 2008 for The U.S. Micro Cap Series and The U.S. Small Cap Value Series and October 2 4, 2008 for The U.S. Small Cap Series. For Federal income tax purposes, pursuant to Code §337(a), each of the master funds recognizes no gain or loss and, pursuant to Code §332(a), each of the Portfolios recognizes no gain or loss, on the deemed liquidation. However, pursuant to IRC §332 (c), each of the aforementioned Portfolios, has recognized the master fund's deemed dividend, which was distributed as part of the deemed liquidating distribution, as taxable income.
Pursuant to Code §§ 334(b)(1) and 1223, each of the Portfolios will maintain each respective master fund's holding period and tax basis in the assets deemed transferred to the respective Portfolio.
Each aforementioned master fund had book/tax differences upon its deemed liquidation. The following summary of permanent differences occurred as of the respective effective "Check the Box" election date (amounts in thousands).
| | | Increase
(Decrease)
Paid-In
Capital | | Unrealized
Appreciation
(Depreciation)
Investment
Securities | | Increase
(Decrease)
Undistributed
Net Investment
Income | | Increase
(Decrease)
Accumulated
Net Realized
Gains (Losses) | |
| The U.S. Micro Cap Series | | $ | (1,265,661 | ) | | $ | 1,255,055 | | | $ | 59 | | | $ | 10,547 | | |
| The U.S. Small Cap Value Series | | | (3,245,134 | ) | | | 3,217,140 | | | | 113 | | | | 27,881 | | |
| The U.S. Small Cap Series | | | (1,198,194 | ) | | | 1,190,062 | | | | 42 | | | | 8,090 | | |
Each of the Portfolios impacted by the "Check the Box" election will also have permanent book/tax differences resulting from the transaction. Listed below are those permanent differences impacting each respective Portfolio. These permanent differences for each portfolio and their respective master fund include items, such as, the reversal of the portfolio's cumulative deferred wash sale losses relative to trades in the master fund and the transfer of the master fund's deferred wash sale losses to the portfolio, the recording of the master fund's and the reversal of the portfolio's unrealized appreciation/depreciation on investment securities, and the transfer of the master fund's cumulative deferred officers' compensation. For financial statement purposes, these adjustments did not result in any changes to each respective fund's net assets or net asset value per share (amounts in thousands).
| | | Increase
(Decrease)
Paid-in
Capital | | Unrealized
Appreciation
(Depreciation)
Investment
Securities | | Increase
(Decrease)
Undistributed
Net Investment
Income | | Increase
(Decrease)
Accumulated
Net Realized
Gain(Losses) | |
| U.S. Micro Cap Portfolio | | $ | (658,120 | ) | | $ | 473,720 | | | $ | (102 | ) | | $ | 184,502 | | |
| U.S. Small Cap Value Portfolio | | | (1,345,309 | ) | | | 1,000,380 | | | | (200 | ) | | | 345,129 | | |
| U.S. Small Cap Portfolio | | | (409,380 | ) | | | 270,782 | | | | (77 | ) | | | 138,675 | | |
For financial reporting purposes, this transaction had no impact on the net assets of the respective funds.
296
G. Financial Instruments:
In accordance with the Series' investment objectives and policies, the Series may invest in certain financial instruments that have off-balance sheet risk in excess of the amounts recognized in the financial statements and concentrations of credit and market risk. These instruments and their significant corresponding risks are described below:
1. Repurchase Agreements: The Series may purchase money market instruments subject to the counterparty's agreement to repurchase them at an agreed upon date and price. The counterparty will be required on a daily basis to maintain the value of the collateral subject to the agreement at not less than the repurchase price (including accrued interest). The agreements are conditioned upon the collateral being deposited under the Federal Reserve book-entry system with the Trust's custodian or a third party sub-custodian. In the event of default or bankruptcy by the other party to the agreement, retention of the collateral may be subject to legal proceedings. All open repurchase agreements were entered into on October 31, 2008.
2. Forward Currency Contracts: The Enhanced U.S. Large Company Series and The DFA Two-Year Global Fixed Income Series may enter into forward foreign currency contracts only to hedge against adverse changes in the relationship of the U.S. dollar to foreign currencies. At October 31, 2008, The Enhanced U.S. Large Company Series and The DFA Two-Year Global Fixed Income Series had entered into the following contracts and the net unrealized foreign exchange gain/(Ioss) is reflected in the accompanying financial statements (amounts in thousands):
The Enhanced U.S. Large Company Series
| Settlement Date | | Currency
Amount | | Currency Sold | | Contract
Amount | | Value at
Oct. 31,
2008 | | Unrealized
Foreign
Exchange
Gain (Loss) | |
| 11/06/08 | | | 7,498 | | | Australian Dollar | | $ | 4,669 | | | $ | 4,980 | | | $ | (311 | ) | |
| 11/14/08 | | | 701,504 | | | Japanese Yen | | | 7,007 | | | | 7,125 | | | | (118 | ) | |
| | | | | $ | 11,676 | | | $ | 12,105 | | | $ | (429 | ) | |
| | | | | | | | |
The DFA Two-Year Global Fixed Income Series
| Settlement Date | | Currency
Amount | | Currency Sold | | Contract
Amount | | Value at
Oct. 31,
2008 | | Unrealized
Foreign
Exchange
Gain (Loss) | |
| 11/06/08 | | | 10,114 | | | Australian Dollar | | $ | 6,304 | | | $ | 6,717 | | | $ | (413 | ) | |
| 11/06/08 | | | 101,659 | | | Swiss Franc | | | 87,285 | | | | 87,667 | | | | (382 | ) | |
| 11/20/08 | | | 31,781,634 | | | Japanese Yen | | | 316,916 | | | | 322,853 | | | | (5,937 | ) | |
| | | | | $ | 410,505 | | | $ | 417,237 | | | $ | (6,732 | ) | |
Risks may arise upon entering into these contracts from the potential inability of counterparties to meet the terms of their contracts and from unanticipated movements in the value of foreign currency relative to the U.S. dollar.
3. Foreign Markets Risks: Investments in foreign markets may involve certain consideration and risks not typically associated with investments in the United States of America, including the possibility of future political and economic developments and the level of foreign government supervision and regulation of foreign securities markets. These markets are generally smaller, less liquid and more volatile than the major securities markets in the United States of America. Consequently, acquisition and disposition of securities by the Master Funds may be inhibited.
4. Futures Contracts: During the period ended October 31, 2008, the Series entered into futures contracts in accordance with their investment objectives. Upon entering into a futures contract, the Series deposit cash or pledge U.S. Government securities to a broker, equal to the minimum "initial margin" requirements of the exchange on which the contract is traded. Subsequent payments are received from or paid to the broker each day, based on the daily fluctuation in the market value of the contract. These receipts or payments are known as "variation margin" and are recorded daily by the Series as unrealized gains or losses until the contracts are closed. When the contracts are closed, the Series record a realized gain or loss equal to the difference between the value of the contrac t at the time it was opened and the value at the time it was closed.
297
Risks may arise upon entering into futures contracts from potential imperfect price correlations between the futures contracts and the underlying securities, from the possibility of an illiquid secondary market for these instruments and from the possibility that the Series could lose more than the initial margin requirements.
At October 31, 2008, the following funds had the following outstanding futures contracts (dollar amounts in thousands):
| Fund | | Description | | Expiration
Date | | Number of
Contracts | | Contract
Value | | Unrealized
Gain (Loss) | | Approximate
Cash
Collateral | |
| The U.S. Large Company Series | | S&P 500 Index® | | 12/19/2008 | | | 155 | | | $ | 37,483 | | | $ | 2,377 | | | $ | 3,836 | | |
| The Enhanced U.S. Large Company Series* | | S&P 500 Index® | | 12/19/2008 | | | 810 | | | | 195,878 | | | | (51,127 | ) | | | — | | |
| The U.S. Large Cap Value Series | | S&P 500 Index® | | 12/19/2008 | | | 235 | | | | 56,829 | | | | 29 | | | | 5,816 | | |
| The U.S. Small Cap Value Series | | S&P 500 Index® | | 12/19/2008 | | | 215 | | | | 51,992 | | | | 26 | | | | 5,321 | | |
The DFA International
Value Series | | S&P 500 Index® | | 12/19/2008 | | | 156 | | | | 37,725 | | | | 19 | | | | 3,861 | | |
The Asia Pacific
Small Company Series | | S&P 500 Index® | | 12/19/2008 | | | 22 | | | | 5,320 | | | | 3 | | | | 545 | | |
The United Kingdom
Small Company Series | | S&P 500 Index® | | 12/19/2008 | | | 12 | | | | 2,902 | | | | 1 | | | | 297 | | |
The Continental
Small Company Series | | S&P 500 Index® | | 12/19/2008 | | | 79 | | | | 19,104 | | | | 9 | | | | 1,955 | | |
| The Emerging Markets Series | | S&P 500 Index® | | 12/19/2008 | | | 266 | | | | 64,325 | | | | 32 | | | | 6,584 | | |
The Emerging Markets
Small Cap Series | | S&P 500 Index® | | 12/19/2008 | | | 79 | | | | 19,104 | | | | 10 | | | | 1,955 | | |
* Some of Enhanced's securties have been segregated as collateral for the open futures contracts. See Schedule of Investments.
H. Line of Credit:
The Trust, together with other Dimensional-advised portfolios, has entered into a $250 million unsecured discretionary line of credit effective June 30, 2003 with an affiliate of its domestic custodian bank. Each portfolio is permitted to borrow, subject to its investment limitations, up to a maximum of $250 million, as long as total borrowings under the line of credit do not exceed $250 million in the aggregate. Borrowings under the line of credit are charged interest at the then current Federal Funds Rate plus 1%. Each portfolio is individually, and not jointly, liable for its particular advances under the line of credit. There is no commitment fee on the unused portion of the line of credit. The agreement for the discretionary line of credit may be terminated by either party at any time. The line of credit is scheduled to expire on June 23, 2009.
For the period December 1, 2007 to October 31, 2008, borrowings by the Series under this line of credit were as follows (amounts in thousands, except percentages and days):
| | | Weighted
Average
Interest Rate | | Weighted
Average
Loan Balance | | Number of
Days
Outstanding | | Interest
Expense
Incurred | | Maximum Amount
Borrowed During
the Period | |
| The U.S. Large Company Series | | | 3.85 | % | | $ | 7,724 | | | | 5 | | | $ | 4 | | | $ | 14,811 | | |
| The U.S. Large Cap Value Series | | | 4.03 | % | | | 5,774 | | | | 4 | | | | 3 | | | | 5,880 | | |
| The U.S. Small Cap Value Series | | | 4.54 | % | | | 9,025 | | | | 12 | | | | 14 | | | | 32,000 | | |
| The U.S. Small Cap Series | | | 4.74 | % | | | 21,400 | | | | 25 | | | | 70 | | | | 75,420 | | |
| The U.S. Micro Cap Series | | | 3.78 | % | | | 4,070 | | | | 20 | | | | 9 | | | | 12,307 | | |
There were no outstanding borrowings by the Series under this line of credit during the period December 1, 2007 to October 31, 2008.
298
The Trust, together with other Dimensional-advised portfolios, has also entered into an additional $500 million unsecured line of credit effective January 15, 2008 with its international custodian bank. Each portfolio is permitted to borrow, subject to its investment limitations, up to a maximum of $500 million, as long as total borrowings under the line of credit do not exceed $500 million in the aggregate. Each portfolio is individually, and not jointly, liable for its particular advances under the line of credit. Borrowings under the line of credit are charged interest at rates agreed to by the parties at the time of borrowing. There is no commitment fee on the unused portion of the line of credit. The agreement for the line of credit expires on January 15, 2009.
For the period December 1, 2007 to October 31, 2008, borrowings by the Series under this line of credit were as follows (amounts in thousands, except percentages and days):
| | | Weighted
Average
Interest Rate | | Weighted
Average
Loan Balance | | Number of
Days
Outstanding | | Interest
Expense
Incurred | | Maximum Amount
Borrowed During
the Period | |
| The DFA International Value Series | | | 3.68 | % | | $ | 8,004 | | | | 31 | | | $ | 25 | | | $ | 27,822 | | |
| The Japanese Small Company Series | | | 3.08 | % | | | 1,444 | | | | 29 | | | | 4 | | | | 5,273 | | |
| The Asia Pacific Small Company Series | | | 3.61 | % | | | 2,912 | | | | 15 | | | | 4 | | | | 6,179 | | |
| The United Kingdom Small Company Series | | | 3.50 | % | | | 681 | | | | 10 | | | | 1 | | | | 4,103 | | |
| The Continental Small Company Series | | | 4.09 | % | | | 971 | | | | 11 | | | | 1 | | | | 3,466 | | |
| The Canadian Small Company Series | | | 3.72 | % | | | 2,074 | | | | 1 | | | | — | | | | 2,074 | | |
| The Emerging Markets Series | | | 3.52 | % | | | 6,846 | | | | 56 | | | | 37 | | | | 18,238 | | |
| The Emerging Markets Small Cap Series | | | 3.21 | % | | | 2,143 | | | | 39 | | | | 7 | | | | 5,337 | | |
At October 31, 2008, The Emerging Markets Series and The Emerging Markets Small Cap Series had loans outstanding in the amounts of $1,079 and $4,963, respectively.
I. Securities Lending:
As of October 31, 2008, some of the Series had securities on loan to brokers/dealers, for which each Series held cash collateral. Each Series invests the cash collateral, as described below, and records a liability for the return of the collateral, during the period the securities are on loan. Loans of securities are expected at all times to be secured by collateral equal to at least (i) 100% of the current market value of the loaned securities with respect to securities of the U.S. government or its agencies, (ii) 102% of the current market value of the loaned securities with respect to U.S. securities, and (iii) 105% of the current market value of the loaned securities with respect to foreign securities. However, daily market fluctuations could cause the Series' collateral to be lower or higher than the expected thresholds. If this were to occur, the collateral would be adjusted the next business day to ensure adequate collateralization. I n the event of default or bankruptcy by the other party to the agreement, realization and/or retention of the collateral may be subject to legal proceedings. If the borrower fails to return loaned securities, and cash collateral being maintained by the borrower is insufficient to cover the value of loaned securities and provided such collateral insufficiency is not the result of investment losses, the lending agent has agreed to pay the amount of the shortfall to the Series or, at the option of the lending agent, to replace the securities.
Subject to each Series' investment policy, the cash collateral received by the Series from securities on loan is invested in securities of the U.S. government or its agencies, repurchase agreements collateralized by securities of the U.S. government or its agencies or shares of the DFA Short Term Investment Fund LP. Agencies include both agency debentures and agency mortgage backed securities. In addition, each Series will be able to terminate the loan at any time and will receive reasonable interest on the loan, as well as amounts equal to any dividends, interest or other distributions on the loaned securities. However, dividend income received from loaned securities may not be eligible to be taxed at qualified dividend income rates.
J. Indemnitees; Contractual Obligations:
Under the Trust's organizational documents, its officers and directors are indemnified against certain liabilities arising out of the performance of their duties to the Trust.
In the normal course of business, the Trust enters into contracts that contain a variety of representations and warranties which provide general indemnification. The Trust's maximum exposure under these arrangements is
299
unknown as this would involve future claims that may be made against the Trust and/or its affiliates that have not yet occurred. However, based on experience, the Trust expects the risk of loss to be remote.
K. In-Kind Redemptions:
In accordance with guidelines described in the Series' prospectus, the fund may distribute portfolio securities rather than cash as payment for a redemption of fund shares (in-kind redemption). For financial reporting purposes, the fund recognizes a gain on in-kind redemptions to the extent the value of the distributed securities on the date of redemption exceeds the cost of those securities. Gains and losses realized on in-kind redemptions are not recognized for tax purposes and are reclassified from undistributed realized gain (loss) to paid-in capital.
During the period December 1, 2007 to October 31, 2008, the following Series realized net gains (losses) of in-kind redemptions (amounts in thousands):
| The U.S. Large Company Series | | $ | 24,362 | | |
| The U.S. Large Cap Value Series | | | 52,271 | | |
| The U.S. Small Cap Value Series | | | 40,823 | | |
| The U.S. Small Cap Series | | | 55,442 | | |
| The DFA International Value Series | | | 103,024 | | |
| The Japanese Small Company Series | | | 1,625 | | |
| The Asia Pacific Small Company Series | | | 4,018 | | |
| The United Kingdom Small Company Series | | | 6,873 | | |
| The Continental Small Company Series | | | 16,564 | | |
| The Canadian Small Company Series | | | (2,616 | ) | |
During the year ended November 30, 2007, The U.S. Large Company Series distributed securities in lieu of cash for shareholder redemptions. The value of the redemption was $1,099,445 (in thousands) which resulted in a realized gain of $529,199 (in thousands) to the Series.
L. Recently Issued Accounting Standards and Interpretation:
In March 2008, Statement of Financial Accounting Standards No. 161, Disclosures about Derivative Instruments and Hedging Activities ("FAS 161"), was issued and is effective for fiscal years beginning after November 15, 2008. FAS 161 defines new disclosures of derivative instruments and hedging activities. Management is currently evaluating the implications of FAS 161. At this time, its impact on the Series' financial statements has not been determined.
M. Subsequent Event Note:
On November 1, 2008, The DFA International Value Series, a master fund in a RIC/RIC master feeder structure with five RIC feeders and two direct client investors, made a "Check-the-box" election for federal income tax purposes pursuant to Treasury Regulation § 301.7701-3, to change its federal entity classification from a corporation taxable as a regulated investment company to a partnership. As a result of this election, the master fund is deemed to have distributed all of its assets and liabilities, in a taxable transaction, to its shareholders in liquidation of the master fund. Immediately thereafter, the shareholders contributed all of the distributed assets and liabilities to a newly formed partnership. The final tax year end of The DFA International Value Series was October 31, 2008. For Federal income tax purposes, pursuant to Code §336(a), the master fund recognizes gain or loss as if the master's investment securities were sold to its shareholders and, pursuant to Code §331, each of the Portfolios recognizes gain or loss as if it liquidated its investment in the master. For tax purposes, pursuant to Code § 334(a), each of the Portfolio's will take a fair market value basis in the securities deemed received by them and a new holding period for those securities commences on the deemed liquidation date.
300
The master fund had book/tax differences upon its deemed liquidation. The following summary of permanent differences occurred as of the respective effective "Check the Box" election date.
Increase
(Decrease)
Paid-In
Capital | | Unrealized
Appreciation
(Depreciation)
Investment
Securities | | Increase
(Decrease)
Undistributed
Net Investment
Income | | Increase
(Decrease)
Accumulated
Net Realized
Gains (Losses) | |
| $ | (2,187,614,395 | ) | | $ | 2,319,051,847 | | | $ | (602,214 | ) | | $ | (130,835,238 | ) | |
As a result of the transaction, The DFA International Value Series recognized a ($2,309,440,866) and ($718,733) capital and currency loss respectively for tax year ended October 31, 2008. Additionally, the fund has written off $2,178,493,687 of expired capital loss carryover as a permanent book/tax reporting difference decreasing paid in capital.
Each Portfolio impacted by the "Check the Box" election also has a permanent book/tax difference resulting from the transaction. Listed below is the permanent difference impacting each respective Portfolio. For financial statement purposes, this adjustment did not result in any changes to each respective fund's net assets or net asset value per share.
| | | Unrealized
Appreciation
(Depreciation)
Investment
Securities | | Increase
(Decrease)
Accumulated
Net Realized
Gains (Losses) | |
| DFA International Value Portfolio | | $ | 1,598,039,236 | | | $ | (1,598,039,236 | ) | |
| DFA International Value Portfolio II | | | 49,859,737 | | | | (49,859,737 | ) | |
| DFA International Value Portfolio III | | | 155,866,882 | | | | (155,866,882 | ) | |
| DFA International Value Portfolio IV | | | 82,052,198 | | | | (82,052,198 | ) | |
| LWAS/DFA International High Book To Market Portfolio | | | (19,800,535 | ) | | | 19,800,535 | | |
For financial reporting purposes, this transaction had no impact on the net assets of the respective funds.
On November 1, 2008, The Enhanced U.S. Large Company Series, a master fund in a RIC/RIC master feeder structure and The Enhanced U.S. Large Company Portfolio ("the Portfolio"), having 100% investment in its respective master fund, made a "Check-the-box" election for federal income tax purposes pursuant to Treasury Regulation §301.7701-3, to change its federal entity classification from a corporation taxable as a regulated investment company to a disregarded entity. As a result of this election for tax purposes, the master fund is deemed to have liquidated and distributed all of its assets and liabilities to its owner, the portfolio, with the portfolio deemed the surviving entity. The final tax year end of the Master Fund was October 31, 2008. For Federal income tax purposes, pursuant to Code §337(a), the Master Fund did not recognize any gain or loss and, pursuant to Code §332(a), the Portfolio did not recognize any gain or lo ss on the deemed liquidation. However, pursuant to IRC §332 (c), the Portfolio has recognized the master fund's deemed dividend, which was distributed as part of the deemed liquidating distribution, as taxable income.
Pursuant to Code §§ 334(b(1) and 1223, the Portfolio will maintain the Master Fund's holding period and tax basis in the assets deemed transferred to the Portfolio.
The master fund had book/tax differences upon its deemed liquidation. The following summary of permanent differences occurred as of the respective effective "Check the Box" election date.
Increase
(Decrease)
Paid-In
Capital | | Unrealized
Appreciation
(Depreciation)
Investment
Securities | | Increase
(Decrease)
Undistributed
Net Investment
Income | | Increase
(Decrease)
Accumulated
Net Realized
Gains (Losses) | |
| $ | (117,037,950 | ) | | $ | 52,451,710 | | | $ | (425,031 | ) | | $ | 65,011,271 | | |
301
The Portfolio will also have permanent book/tax differences resulting from the "Check the Box" election. Listed below are those permanent differences impacting the Portfolio. These permanent differences include items, such as, the transfer of the master fund's capital loss carryover to the Portfolio, the reversal of the Portfolio's cumulative deferred wash sale losses relative to trades in the master fund and the transfer of the master fund's deferred wash sale losses to the Portfolio, the recording of the master fund's and the reversal of the Portfolio's unrealized appreciation/depreciation on investment securities, and the transfer of the master fund's cumulative deferred officers' compensation. For financial statement purposes, these adjustments did not result in any changes to the fund's net assets or net asset value per share.
Increase
(Decrease)
Paid-In
Capital | | Unrealized
Appreciation
(Depreciation)
Investment
Securities | | Increase
(Decrease)
Undistributed
Net Investment
Income | | Increase
(Decrease)
Accumulated
Net Realized
Gains (Losses) | |
| $ | 64,118,768 | | | $ | 59,581,296 | | | $ | (429,063 | ) | | $ | (123,271,001 | ) | |
For financial reporting purposes, this transaction had no impact on the net assets of the the fund.
On November 1, 2008, The DFA One-Year Fixed Income Series and The DFA Two-Year Global Fixed Income Series, each a master fund in a RIC/RIC master feeder structure with RIC feeders, underlying fund of fund investors (Two Year Global Fixed Income Series) and direct client investors, have each made a "Check-the-box" election for federal income tax purposes pursuant to Treasury Regulation § 301.7701-3, to change their federal entity classifications from a corporation taxable as a regulated investment company to a partnership. As a result of this election, for tax purposes, the master funds are deemed to have distributed all of their assets and liabilities to their shareholders in liquidation of the master fund. Since each master fund has a shareholder owning 80% or more of the fund's shares, and also has shareholders owning less than 80%, each fund's respective transaction creates a non-taxable transaction, pursuant to Internal Revenue Code §332 for those owning more than 80%, and a taxable transaction, pursuant to Internal Revenue Code §331, for those shareholders owning less than 80%. Immediately after the deemed liquidation, the shareholders contributed all of the distributed assets and liabilities to newly formed partnerships. The final tax year end of the Master Funds was October 31, 2008.
For Federal income tax purposes, pursuant to Code §336(a), the master fund recognizes gain or loss relative to the investment of the less than 80% shareholders as if the master's investment securities were sold to those shareholders and, pursuant to Code §331, each of those shareholders recognizes gain or loss as if it liquidated its investment in the master. Pursuant to Code§ 334(a), each of these shareholders will take a fair market value basis in the securities deemed received by them and a new holding period for those securities commences on the deemed liquidation date. In regards to the shareholders owning 80% or more of the master fund, pursuant to Internal Revenue Code § 332 (a), the shareholder will not recognize any gain or loss on the deemed liquidation. However, pursuant to IRC §332(c), a portion of the deemed distribution, which otherwise would have been tax-free as discussed above, since it is utilized b y the master fund to satisfy its dividends paid deduction for the tax year, must be recognized and treated as a dividend by the 80% or greater shareholder. Pursuant to IRC §§ 334(b)(1) and 1223, the 80% or greater shareholder's basis and holding period in the securities received in liquidation is the same as it was in the possession of the master. However, any security distributed in satisfaction of the master's final dividend would have a basis equal to their fair market value and would be deemed acquired on the liquidation date.
Each master fund had book/tax differences upon its deemed liquidation. The following summary of permanent differences occurred as of the respective effective "Check the Box" election date.
| | | Increase
(Decrease)
Paid-In
Capital | | Unrealized
Appreciation
(Depreciation)
Investment
Securities | | Increase
(Decrease)
Undistributed
Net Investment
Income | | Increase
(Decrease)
Accumulated
Net Realized
Gains (Losses) | |
The DFA One-Year Fixed Income
Series | | $ | (27,616,090 | ) | | $ | 11,473,625 | | | $ | 49,753 | | | $ | 16,092,712 | | |
The DFA Two-Year Global Fixed
Income Series | | | 21,245,521 | | | | (39,613,298 | ) | | | (6,979,642 | ) | | | 25,347,419 | | |
302
Each Portfolio impacted by the "Check the Box" election also has permanent book/tax differences resulting from the transaction. Listed below are the permanent differences impacting each respective Portfolio. For financial statement purposes, this adjustment did not result in any changes to each respective fund's net assets or net asset value per share.
| | | Increase
(Decrease)
Paid-In
Capital | | Unrealized
Appreciation
(Depreciation)
Investment
Securities | | Increase
(Decrease)
Undistributed
Net Investment
Income | | Increase
(Decrease)
Accumulated
Net Realized
Gains (Losses) | |
DFA One-Year Fixed Income
Portfolio | | $ | 23,017,604 | | | $ | (17,665,726 | ) | | | — | | | $ | (5,351,878 | ) | |
DFA Two-Year Global Fixed
Income Portfolio | | | 58,589,854 | | | | (42,686,199 | ) | | $ | (6,443,265 | ) | | | (9,460,390 | ) | |
| Global 60/40 Portfolio | | | — | | | | (3,046,638 | ) | | | — | | | | 3,046,638 | | |
| Global 25/75 Portfolio | | | — | | | | (1,370,411 | ) | | | — | | | | 1,370,411 | | |
The Global 60/40 Portfolio and the Global 25/75 Portfolio, each representing a less than 80% owner of The DFA Two-Year Global Fixed Income Series, recognized $3,046,638 and $1,370,411 of net capital gain respectively for their tax year ended October 31, 2008, pursuant to IRC §331.
For financial reporting purposes, this transaction had no impact on the net assets of the respective funds.
303
REPORT OF INDEPENDENT REGISTERED PUBLIC ACCOUNTING FIRM
To the Shareholders of the Series, as defined, and
Board of Trustees of The DFA Investment Trust Company:
In our opinion, the accompanying statements of assets and liabilities, including the schedules of investments/
summary schedules of portfolio holdings, and the related statements of operations and of changes in net assets and the financial highlights present fairly, in all material respects, the financial position of The U.S. Large Company Series, The Enhanced U.S. Large Company Series, The U.S. Large Cap Value Series, The U.S. Small Cap Value Series, The U.S. Small Cap Series, The U.S. Micro Cap Series, The DFA International Value Series, The Japanese Small Company Series, The Asia Pacific Small Company Series, The United Kingdom Small Company Series, The Continental Small Company Series, The Canadian Small Company Series, The Emerging Markets Series, The Emerging Markets Small Cap Series, The DFA One-Year Fixed Income Series and The DFA Two-Year Global Fixed Income Series (constituting portfolios within The DFA Investment Trust Company, hereafter referred to as the "Series") at October 31, 2008, the results of each of their operations, the changes in each of their net assets and the financial highlights for each of the periods indicated, in conformity with accounting principles generally accepted in the United States of America. These financial statements and financial highlights (hereafter referred to as "financial statements") are the responsibility of the Series' management; our responsibility is to express an opinion on these financial statements based on our audits. We conducted our audits of these financial statements in accordance with the standards of the Public Company Accounting Oversight Board (United States). Those standards require that we plan and perform the audit to obtain reasonable assurance about whether the financial statements are free of material misstatement. An audit includes examining, on a test basis, evidence supporting the amounts and disclosures in the financial statements, assessing the accounting principles u sed and significant estimates made by management, and evaluating the overall financial statement presentation. We believe that our audits, which included confirmation of securities at October 31, 2008 by correspondence with the custodians and brokers, provide a reasonable basis for our opinion.
PricewaterhouseCoopers LLP
Philadelphia, Pennsylvania
December 22, 2008
304
FUND MANAGEMENT
Trustees/Directors
Each Board of Trustees/Directors of The DFA Investment Trust Company Inc. ("DFAITC"), DFA Investment Dimensions Group Inc. ("DFAIDG"), Dimensional Investment Group Inc. ("DIG") and Dimensional Emerging Markets Value Fund Inc. ("DEM") (each, the "Fund" and collectively, the "Funds") is responsible for establishing the Funds' policies and for overseeing the management of the Funds. The Trustees/Directors of the Funds, including all of the disinterested Directors, have adopted written procedures to monitor potential conflicts of interest that might develop between portfolios of the Funds (the "Feeder Portfolios") that invest in certain series of DFAITC or DEM (the "Master Funds").
Each Board has two standing committees, an Audit Committee and a Portfolio Performance and Service Review Committee (the "Performance Committee"). The Audit Committee is comprised of George M. Constantinides, Roger G. Ibbotson and Abbie J. Smith. Each member of the Audit Committee is a disinterested Director. The Audit Committee oversees the Fund's accounting and financial reporting policies and practices, the Fund's internal controls, the Fund's financial statements and the independent audits thereof and performs other oversight functions as requested by the Board. The Audit Committee recommends the appointment of each Fund's independent registered certified public accounting firm and also acts as a liaison between the Fund's independent registered certified public accounting firm and the full Board. There were three Audit Committee meetings held during the fiscal year ended October 31, 2008.
Each Board's Performance Committee is comprised of Messrs. Constantinides and Ibbotson, Ms. Smith, John P. Gould, Myron S. Scholes and Robert C. Merton. Each member of the Fund's Performance Committee is a disinterested Director. The Performance Committee regularly reviews and monitors the investment performance of the Fund's series and reviews the performance of the Fund's service providers. There were five Performance Committee meetings held during the fiscal year ended October 31, 2008.
Certain biographical information for each disinterested Trustee/Director and each interested Trustee/Director of the Funds is set forth in the tables below, including a description of each Trustee/Director's experience as a Trustee/Director of the Funds and as a director or trustee of other funds, as well as other recent professional experience.
The statements of additional information (together, "SAI") of the Funds include additional information about each Trustee/Director. You may obtain copies of the SAI and prospectus of each Fund advised by Dimensional Fund Advisors LP by calling collect (310) 395-8005 or by mailing a request to Dimensional Fund Advisors LP, 1299 Ocean Avenue, Santa Monica, California 90401. Prospectuses are also available at www.dimensional.com.
Name, Position
with the Fund,
Address and Age | | Term of Office1 and
Length of Service | | Portfolios within the
DFA Fund Complex2
Overseen | | Principal Occupation(s) During Past 5 Years and
Other Directorships of Public Companies Held | |
| | | Disinterested Trustees/Directors | |
|
George M. Constantinides
Director of DFAIDG, DIG and DEM.
Trustee of DFAITC.
The University of Chicago Booth School of Business
5807 S. Woodlawn Avenue Chicago, IL 60637
Age: 61 | | DFAITC - since 1993
DFAIDG - since 1983
DIG - since 1993
DEM - since 1993 | | 96 portfolios in 4 investment companies | | Leo Melamed Professor of Finance, The University of Chicago Booth School of Business. | |
|
305
Name, Position
with the Fund,
Address and Age | | Term of Office1 and
Length of Service | | Portfolios within the
DFA Fund Complex2
Overseen | | Principal Occupation(s) During Past 5 Years and
Other Directorships of Public Companies Held | |
John P. Gould
Director of DFAIDG, DIG and DEM.
Trustee of DFAITC.
The University of Chicago Booth School of Business
5807 S. Woodlawn Avenue
Chicago, IL 60637
Age: 69 | | DFAITC - since 1993
DFAIDG - since 1986
DIG - since 1993
DEM - since 1993 | | 96 portfolios in 4 investment companies | | Steven G. Rothmeier Distinguished Service Professor of Economics, The University of Chicago Booth School of Business (since 1965). Member of the Boards of Milwaukee Mutual Insurance Company (since 1997) and UNext.com (1999-2006). Member Competitive Markets Advisory Committee, Chicago Mercantile Exchange (futures trading exchange) (since 2004). Formerly, Senior Vice-President, Lexecon Inc. (economics, law, strategy and finance consulting) (1994-2004). Formerly, President, Cardean University (division of UNext.com) (1999-2001). Trustee, Harbor Fund (registered investment company) (14 Portfolios) (since 1994). | |
|
Roger G. Ibbotson
Director of DFAIDG, DIG and DEM.
Trustee of DFAITC.
Yale School of Management
P.O. Box 208200
New Haven, CT 06520-8200
Age: 65 | | DFAITC - since 1993
DFAIDG - since 1981
DIG - since 1993
DEM - since 1993 | | 96 portfolios in 4 investment companies | | Professor in Practice of Finance, Yale School of Management (since 1984). Director, BIRR Portfolio Analysis, Inc. (software products) (since 1990). Chairman, CIO and Partner, Zebra Capital Management, LLC (hedge fund manager) (since 2001).
Consultant to Morningstar, Inc. (since 2006). Formerly, Chairman, Ibbotson Associates, Inc., Chicago, IL (software data publishing and consulting) (1977-2006). | |
|
Robert C. Merton
Director of DFAIDG, DIG and DEM.
Trustee of DFAITC.
Harvard Business School
353 Baker Library
Soldiers Field
Boston, MA 02163
Age: 64 | | DFAITC - since 2003
DFAIDG - since 2003
DIG - since 2003
DEM - since 2003 | | 96 portfolios in 4 investment companies | | John and Natty McArthur University Professor, Graduate School of Business Administration, Harvard University (since 1998). George Fisher Baker Professor of Business Administration, Graduate School of Business Administration, Harvard University (1988-1998), Co-founder, Chief Science Officer and Director, Trinsum Group, a successor to Integrated Finance Limited (since 2002). Director, MF Risk, Inc. (risk management software) (since 2001). Director, Peninsula Banking Group (bank) (since 2003). Director, Community First Financial Group (bank holding company) (since 2003). Advisory Board Member, Alpha Simplex Group (hedge fund) (since 2001). Member Competitive Markets Advisory Council, Chicago Mercantile Exchange (futures trading exchange) (since 2004). Formerly, Advisory Board Member, NuServe (insurance software) (2001-2003). Director, Vical Incorporated (biopharmaceutical product development) (since 2002). | |
|
Myron S. Scholes
Director of DFAIDG, DIG and DEM.
Trustee of DFAITC.
Platinum Grove Asset Management, L.P.
Reckson Executive Park
1100 King Street
Building 4
Rye Brook, NY 10573
Age: 67 | | DFAITC - since 1993
DFAIDG - since 1981
DIG - since 1993
DEM - since 1993 | | 96 portfolios in 4 investment companies | | Frank E. Buck Professor Emeritus of Finance, Stanford University (since 1981). Chairman, Platinum Grove Asset Management, L.P. (hedge fund) (formerly, Oak Hill Platinum Partners) (since 1999). Formerly, Managing Partner, Oak Hill Capital Management (private equity firm) (until 2004). Chairman, Oak Hill Platinum Partners (hedge fund) (since 2004). Director, Chicago Mercantile Exchange (since 2001). Director, American Century Fund Complex (registered investment companies) (37 Portfolios) (since 1981); and Director, Chicago Mercantile Exchange Holdings Inc. (since 2000). | |
|
Abbie J. Smith
Director of DFAIDG, DIG and DEM.
Trustee of DFAITC.
The University of Chicago Booth School of Business
5807 S. Woodlawn Avenue
Chicago, IL 60637
Age: 55 | | DFAITC - since 2000
DFAIDG - since 2000
DIG - since 2000
DEM - since 2000 | | 96 portfolios in 4 investment companies | | Boris and Irene Stern Professor of Accounting, The University of Chicago Booth School of Business (since 1980), Formerly, Marvin Bower Fellow, Harvard Business School (9/01 to 8/02). Director, HNI Corporation (formerly known as HON Industries Inc.) (office furniture) (since 2000) and Director, Ryder System Inc. (transportation, logistics and supply-chain management) (since 2003). | |
|
306
Name, Position
with the Fund,
Address and Age | | Term of Office1 and
Length of Service | | Portfolios within the
DFA Fund Complex2
Overseen | | Principal Occupation(s) During Past 5 Years and
Other Directorships of Public Companies Held | |
| | | Interested Trustees/Directors* | |
|
David G. Booth
Chairman, Director, Chief Executive Officer and President of DFAIDG, DIG and DEM. Chairman, Trustee, Chief Executive Officer, Chief Investment Officer and President of DFAITC.
1299 Ocean Avenue
Santa Monica, CA 90401
Age: 61 | | DFAITC - since 1993
DFAIDG - since 1981
DIG - since 1992
DEM - since 1993 | | 96 portfolios in 4 investment companies | | Chairman, Director/Trustee, President, Chief Executive Officer and formerly Chief Investment Officer of the following companies: Dimensional Holdings Inc., Dimensional Fund Advisors LP, DFA Securities Inc., Dimensional Fund Advisors Canada Inc., DFAIDG, DIG, DEM and DFAITC. Director of Dimensional Fund Advisors Ltd, and formerly Chief Investment Officer. Director, President and formerly Chief Investment Officer of DFA Australia Ltd. Director of Dimensional Funds PLC and Dimensional Fund II PLC. Director, Chief Executive Officer and formerly Chief Investment Officer of Dimensional Fund Advisors Canada Inc. (All Chief Investment Officer positions held starting 1/03 through 3/07 except for Dimensional Fund Advisors Canada Inc., which was from 6/03 through 3/07, and Dimensional Holdings Inc., which was from 10/06 through 3/07.)
Limited Partner, Oak Hill Partners, Director, T he University of Chicago Booth School of Business. Formerly, Director, SA Funds (registered investment company). Formerly Director, Assante Corporation (investment management) (until 2002). | |
|
Rex A. Sinquefield
The Show Me Institute
7777 Bonhomme Ave.,
Suite 2150 St. Louis, MO 63105
Age: 64 | | DFAITC - since 1993
DFAIDG - since 1981
DIG - since 1992
DEM - since 1993 | | 96 portfolios in 4 investment companies | | Director/Trustee (and prior to 2006 Chairman, and prior to 2003, Chief Investment Officer) of Dimensional Fund Advisors LP, DFA Securities Inc., DFAIDG, DIG, DEM and DFAITC. Director of Dimensional Holdings Inc. Prior to 2006, Director of Dimensional Fund Advisors Ltd, Director (and prior to 1/1/2003, Chief Investment Officer) of DFA Australia Ltd. Director of Dimensional Funds PLC and Dimensional Fund Advisors Canada Inc.
Trustee, St. Louis University (since 2003). Life Trustee and Member of Investment Committee, DePaul University. Director, The German St. Vincent Orphan Home. Member of Investment Committee, Archdiocese of St. Louis. Trustee and Member of Investment Committee, St. Louis Art Institute (since 2005). President and Director, The Show Me Institute (since 2006). Trustee, St. Louis Symphony Orchestra (since 2005). Trustee, Missouri Botanical Garden (since 2005 ). | |
|
1 Each Trustee/Director holds office for an indefinite term until his or her successor is elected and qualified.
2 Each Trustee/Director is a director or trustee of each of the four registered investment companies within the DFA Fund Complex, which includes the Funds.
* Interested Directors are described as such because they are deemed to be "interested persons," as that term is defined under the Investment Company Act of 1940, as amended, due to their positions with Dimensional Fund Advisors LP.
307
Officers
The name, age, information regarding positions with the Funds and the principal occupation for each officer of the Funds are set forth below. Each officer listed below holds the same office (except as otherwise noted) in the following entities: Dimensional Fund Advisors LP (prior to November 3, 2006, Dimensional Fund Advisors Inc.) ("Dimensional"), DFA Securities Inc., DFAIDG, DIG, DFAITC and DEM (collectively, the "DFA Entities"). The address of each officer is: Dimensional Fund Advisors LP, 1299 Ocean Avenue, Santa Monica, California 90401, unless otherwise indicated.
Name, Position with the Fund
and Age | | Term of Office1
and Length of
Service | | Principal Occupation(s) During Past 5 Years | |
| | | Officers | |
|
April A. Aandal
Vice President
Age: 35 | | Since 2008 | | Vice President of all the DFA Entities. | |
|
Darryl D. Avery
Vice President
Age: 42 | | Since 2005 | | Vice President of all the DFA Entities. From June 2002 to January 2005, institutional client service representative of Dimensional. | |
|
Arthur H. Barlow
Vice President
Age: 52 | | Since 1993 | | Vice President of all the DFA Entities. Formerly, Vice President of DFA Australia Limited and Dimensional Fund Advisors Ltd. | |
|
Scott A. Bosworth
Vice President
Age: 39 | | Since 2007 | | Vice President of all the DFA Entities. Regional Director of Dimensional (since November 1997). | |
|
Valerie A. Brown
Vice President and Assistant Secretary
Age: 41 | | Since 2001 | | Vice President and Assistant Secretary of all the DFA Entities, DFA Australia Limited, Dimensional Fund Advisors Ltd., and since June 2003, Dimensional Fund Advisors Canada Inc. | |
|
David P. Butler
Vice President
Age: 44 | | Since 2007 | | Vice President of all the DFA Entities. Director of US Financial Services of Dimensional (since January 2005). Formerly, Regional Director of Dimensional Fund Advisors LP (January 1995 to January 2005). | |
|
Patrick Carter
Vice President
Age: 46 | | Since 2007 | | Vice President of all the DFA Entities. Regional Director of Dimensional (since March 2006). Formerly, Director of Merrill Lynch Retirement Group (December 1998 to March 2006). | |
|
Stephen A. Clark
Vice President
Age: 36 | | Since 2004 | | Vice President of all the DFA Entities, April 2001 to April 2004, Portfolio Manager of Dimensional. | |
|
Robert P. Cornell
Vice President
Age: 59 | | Since 2007 | | Vice President of all the DFA Entities. Regional Director of Financial Services Group of Dimensional (since August 1993). | |
|
Christopher S. Crossan
Vice President and Chief Compliance Officer
Age: 42 | | Since 2004 | | Vice President and Chief Compliance Officer of all the DFA Entities. Formerly, Senior Compliance Officer, INVESCO Institutional, Inc. and its affiliates (August 2000 to January 2004). | |
|
James L. Davis
Vice President
Age: 51 | | Since 1999 | | Vice President of all the DFA Entities. Formerly, Vice President of DFA Australia Limited and Dimensional Fund Advisors Ltd. | |
|
Robert T. Deere
Vice President
Age: 51 | | Since 1994 | | Vice President of all the DFA Entities and DFA Australia Limited. | |
|
Robert W. Dintzner
Vice President
Age: 38 | | Since 2001 | | Vice President of all the DFA Entities. Prior to April 2001, marketing supervisor and marketing coordinator for Dimensional. | |
|
308
Name, Position with the Fund
and Age | | Term of Office1
and Length of
Service | | Principal Occupation(s) During Past 5 Years | |
Kenneth Elmgren
Vice President
Age: 54 | | Since 2007 | | Vice President of all the DFA Entities. Formerly, Managing Principal of Beverly Capital (May 2004 to September 2006); Principal of Wydown Capital (September 2001 to May 2004). | |
|
Richard A. Eustice
Vice President and Assistant Secretary
Age: 43 | | Since 1998 | | Vice President and Assistant Secretary of all the DFA Entities and DFA Australia Limited. Formerly, Vice President of Dimensional Fund Advisors Ltd. | |
|
Eugene F. Fama, Jr.
Vice President
Age: 47 | | Since 1993 | | Vice President of all the DFA Entities. Formerly, Vice President of DFA Australia Limited and Dimensional Fund Advisors Ltd. | |
|
Gretchen A. Flicker
Vice President
Age: 37 | | Since 2004 | | Vice President of all the DFA Entities. Prior to April 2004, institutional client service representative of Dimensional. | |
|
Jed S. Fogdall
Vice President
Age: 34 | | Since 2008 | | Vice President of all the DFA Entities. Portfolio Manager for Dimensional (since September 2004). Prior to September 2004, Staff Engineer at the Boeing Company (1997-2004); Graduate Student at the University of California, Los Angeles (2002-2003). | |
|
Glenn S. Freed
Vice President
Age: 46 | | Since 2001 | | Vice President of all the DFA Entities. | |
|
Mark R. Gochnour
Vice President
Age: 41 | | Since 2007 | | Vice President of all the DFA Entities. Regional Director of Dimensional. | |
|
Henry F. Gray
Vice President
Age: 41 | | Since 2000 | | Vice President of all the DFA Entities. Prior to July 2000, Portfolio Manager of Dimensional. Formerly, Vice President of DFA Australia Limited. | |
|
John T. Gray
Vice President
Age: 34 | | Since 2007 | | Vice President of all the DFA Entities. Formerly, Regional Director of Dimensional (January 2005 to February 2007). | |
|
Darla Hastings
Vice President
Age: 53 | | Since 2007 | | Vice President of all the DFA Entities. Chief Marketing Officer of Dimensional. Formerly, Senior Vice President, Customer Experience for Benchmark Assisted Living (May 2005 to April 2006); Executive Vice President and Chief Marketing Officer of State Street Corporation (September 2001 to October 2005). | |
|
Joel H. Hefner
Vice President
Age: 40 | | Since 2007 | | Vice President of all the DFA Entities. Regional Director of Dimensional (since June 1998). | |
|
Julie Henderson
Vice President and Fund Controller
Age: 34 | | Since 2005 | | Vice President and Fund Controller of all the DFA Entities. Formerly, Senior Manager at PricewaterhouseCoopers LLP (July 1996 to April 2005). | |
|
Kevin Hight
Vice President
Age: 40 | | Since 2005 | | Vice President of all the DFA Entities. Formerly, Regional Director of Dimensional (since March 2003 to March 2005). | |
|
Christine W. Ho
Vice President
Age: 40 | | Since 2004 | | Vice President of all the DFA Entities. Prior to April 2004, Assistant Controller of Dimensional. | |
|
Jeff J. Jeon
Vice President
Age: 34 | | Since 2004 | | Vice President of all the DFA Entities. Prior to April 2004, Counsel of Dimensional. | |
|
Patrick M. Keating
Vice President
Age: 53 | | Since 2003 | | Vice President of all the DFA Entities and Chief Operating Officer of Dimensional. Director, Vice President and Chief Privacy Officer of Dimensional Fund Advisors Canada Inc. Director of DFA Australia Limited. | |
|
309
Name, Position with the Fund
and Age | | Term of Office1
and Length of
Service | | Principal Occupation(s) During Past 5 Years | |
Joseph F. Kolerich
Vice President
Age: 36 | | Since 2004 | | Vice President of all the DFA Entities. From April 2001 to April 2004, Portfolio Manager for Dimensional. | |
|
Michael F. Lane
Vice President
Age: 41 | | Since 2004 | | Vice President of all the DFA Entities. Formerly, Vice President of Advisor Services at TIAA-CREF (July 2001 to September 2004). | |
|
Kristina M. LaRusso
Vice President
Age: 33 | | Since 2006 | | Vice President of all DFA Entities. Formerly, Operations Supervisor of Dimensional (March 2003 to December 2006). | |
|
Inmoo Lee
Vice President
Age: 42 | | Since 2007 | | Vice President of all the DFA Entities. Associate Professor Department of Finance and Accounting, Business School, National University of Singapore (July 2004 to present); Associate Professor, College of Business Administration, Korea University (September 2001 to May 2006). | |
|
Juliet Lee
Vice President
Age: 37 | | Since 2005 | | Vice President of all the DFA Entities. Human Resources Manager of Dimensional (since January 2004). Formerly, Assistant Vice President for Metropolitan West Asset Management LLC (February 2001 to December 2003). | |
|
Aaron M. Marcus
Vice President & Head of Global Human Resources
Age: 38 | | Since 2008 | | Vice President and Head of Global Human Resources of Dimensional. Formerly, Global Head of Recruiting and Vice President of Goldman Sachs & Co. (June 2006 to January 2008); Global Co-Head of HR of the Equities & FICC Division, and Vice President of Goldman Sachs & Co. (May 2005 to May 2006); Head of Americas Campus Recruiting and Vice President of Goldman Sachs & Co. (April 2003 to May 2005). | |
|
David R. Martin
Vice President, Chief Financial Officer and Treasurer
Age: 51 | | Since 2007 | | Vice President, Chief Financial Officer and Treasurer of all the DFA Entities. Director, Vice President, Chief Financial Officer and Treasurer of Dimensional Fund Advisors Ltd. and DFA Australia Limited. Chief Financial Officer, Treasurer, and Vice President of Dimensional Fund Advisors Canada Inc. Director of Dimensional Funds PLC and Dimensional Funds II PLC. Formerly, Executive Vice President and Chief Financial Officer of Janus Capital Group Inc. (June 2005 to March 2007); Senior Vice President of Finance at Charles Schwab & Co., Inc. (March 1999 to May 2005). | |
|
Catherine L. Newell
Vice President and Secretary
Age: 44 | | Vice President since 1997 and Secretary since 2000 | | Vice President and Secretary of all the DFA Entities. Director, Vice President and Assistant Secretary of DFA Australia Limited (since February 2002, April 1997 and May 2002, respectively). Vice President and Secretary of Dimensional Fund Advisors Canada Inc. (since June 2003). Director, Dimensional Funds PLC and Dimensional Funds II PLC (since January 2002). Formerly, Assistant Secretary of all DFA Entities and Dimensional Fund Advisors Ltd. | |
|
Gerard K. O'Reilly
Vice President
Age: 31 | | Since 2007 | | Vice President of all the DFA Entities. Formerly, Research Associate of Dimensional Fund Advisors LP (2004 to 2006); Research Assistant in PhD program, Aeronautics Department California Institute of Technology (1998 to 2004). | |
|
Carmen Palafox
Vice President
Age: 34 | | Since 2006 | | Vice President of all the DFA Entities. Operations Manager of Dimensional Fund Advisors LP (since May 1996). | |
|
Sonya Park
Vice President
Age: 36 | | Since 2005 | | Vice President of all the DFA Entities. From February 2002 to January 2005, institutional client service representative of Dimensional. | |
|
David A. Plecha
Vice President
Age: 47 | | Since 1993 | | Vice President of all the DFA Entities, DFA Australia Limited and Dimensional Fund Advisors Ltd.. | |
|
Ted Randall
Vice President
Age: 35 | | Since 2008 | | Vice President of all the DFA Entities. Formerly, Research Associate of Dimensional (2006-2008). Systems Developer of Dimensional (2001-2006). | |
|
310
Name, Position with the Fund
and Age | | Term of Office1
and Length of
Service | | Principal Occupation(s) During Past 5 Years | |
Eduardo A. Repetto
Vice President and Chief Investment Officer
Age: 41 | | Since 2002 | | Chief Investment Officer (beginning March 2007) and Vice President of all the DFA Entities, DFA Australia Limited and Dimensional Fund Advisors Canada Inc. Formerly, Research Associate for Dimensional (June 2000 to April 2002). | |
|
L. Jacobo Rodriguez
Vice President
Age: 37 | | Since 2005 | | Vice President of all the DFA Entities. From August 2004 to July 2005, institutional client service representative of Dimensional. Formerly, Financial Services Analyst, Cato Institute (September 2001 to June 2004); Book Review Editor, Cato Journal, Cato Institute (May 1996 to June 2004). | |
|
David E. Schneider
Vice President
Age: 62 | | Since 2001 | | Vice President of all the DFA Entities. Currently, Director of Institutional Services. | |
|
Ted R. Simpson
Vice President
Age: 40 | | Since 2007 | | Vice President of all the DFA Entities. Regional Director of Dimensional (since December 2002). | |
|
Bryce D. Skaff
Vice President
Age: 33 | | Since 2007 | | Vice President of all the DFA Entities. Formerly, Regional Director of Dimensional (December 1999 to January 2007). | |
|
Grady M. Smith
Vice President
Age: 51 | | Since 2004 | | Vice President of all the DFA Entities. Prior to April 2004, Portfolio Manager of Dimensional. | |
|
Carl G. Snyder
Vice President
Age: 45 | | Since 2000 | | Vice President of all the DFA Entities. Formerly, Vice President of DFA Australia Limited. | |
|
Lawrence R. Spieth
Vice President
Age: 60 | | Since 2004 | | Vice President of all the DFA Entities. Prior to April 2004, Regional Director of Dimensional. | |
|
Bradley G. Steiman
Vice President
Age: 35 | | Since 2004 | | Vice President of all the DFA Entities and Director and Vice President of Dimensional Fund Advisors Canada Inc. | |
|
Karen E. Umland
Vice President
Age: 42 | | Since 1997 | | Vice President of all the DFA Entities, DFA Australia Limited, Dimensional Fund Advisors Ltd., and since June 2003, Dimensional Fund Advisors Canada Inc. | |
|
Carol W. Wardlaw
Vice President
Age: 49 | | Since 2004 | | Vice President of all the DFA Entities. Prior to April 2004, Regional Director of Dimensional. | |
|
Weston J. Wellington
Vice President
Age: 57 | | Since 1997 | | Vice President of all the DFA Entities. Formerly, Vice President of DFA Australia Limited. | |
|
Daniel M. Wheeler
Vice President
Age: 63 | | Since 2001 | | Vice President of all the DFA Entities. Prior to 2001 and currently, Director of Financial Advisors Services of Dimensional. Director of Dimensional Fund Advisors Ltd. (since October 2003) and President of Dimensional Fund Advisors Canada Inc. (since June 2003). | |
|
Ryan Wiley
Vice President
Age: 32 | | Since 2007 | | Vice President of all the DFA Entities. Senior Trader of Dimensional. Formerly, Portfolio Manager (2006 to 2007); Trader (2001 to 2006). | |
|
Paul E. Wise
Vice President
Age: 53 | | Since 2005 | �� | Vice President of all the DFA Entities. Chief Technology Officer for Dimensional (since 2004). Formerly, Principal of Turnbuckle Management Group (January 2002 to August 2004). | |
|
1 Each officer holds office for an indefinite term at the pleasure of the Boards of Trustee/Directors and until his or her successor is elected and qualified.
311
VOTING PROXIES ON FUND PORTFOLIO SECURITIES
A description of the policies and procedures that the Fund and the Trust use in voting proxies relating to securities held in the portfolios is available without charge, upon request, by calling collect: (310) 395-8005. Information regarding how the Advisor votes these proxies is available from the EDGAR database on the SEC's website at http://www.sec.gov and from the Advisor's website at http://www.dimensional.com and reflects the twelve-month period beginning July 1st and ending June 30th.
312
NOTICE TO SHAREHOLDERS
(Unaudited)
For shareholders that do not have an October 31, 2008 tax year end, this notice is for informational purposes only. For shareholders with an October 31, 2008 tax year end, please consult your tax advisor as to the pertinence of this notice. For the period December 1, 2007 to October 31, 2008, each Portfolio/Series is designating the following items with regard to distributions paid during the period.
| DFA Investment Dimensions Group Inc. | | Net
Investment
Income
Distributions | | Short-Term
Capital Gain
Distributions | | Long-Term
Capital Gain
Distributions | | Return
of
Capital | | Tax-Exempt
Interest | | Total
Distributions | |
| U.S. Large Company Portfolio | | | 100 | % | | | — | | | | — | | | | — | | | | — | | | | 100 | % | |
| Enhanced U.S. Large Company Portfolio | | | 46 | % | | | 1 | % | | | 53 | % | | | — | | | | — | | | | 100 | % | |
| U.S. Large Cap Value Portfolio | | | 27 | % | | | — | | | | 73 | % | | | — | | | | — | | | | 100 | % | |
| U.S. Targeted Value Portfolio | | | 39 | % | | | — | | | | 61 | % | | | — | | | | — | | | | 100 | % | |
| U.S. Small Cap Value Portfolio | | | 9 | % | | | — | | | | 91 | % | | | — | | | | — | | | | 100 | % | |
| U.S. Core Equity 1 Portfolio | | | 100 | % | | | — | | | | — | | | | — | | | | — | | | | 100 | % | |
| U.S. Core Equity 2 Portfolio | | | 100 | % | | | — | | | | — | | | | — | | | | — | | | | 100 | % | |
| U.S. Vector Equity Portfolio | | | 100 | % | | | — | | | | — | | | | — | | | | — | | | | 100 | % | |
| T.A. U.S. Core Equity 2 Portfolio | | | 100 | % | | | — | | | | — | | | | — | | | | — | | | | 100 | % | |
| U. S Small Cap Portfolio | | | 16 | % | | | 1 | % | | | 83 | % | | | — | | | | — | | | | 100 | % | |
| U.S. Micro Cap Portfolio | | | 17 | % | | | 2 | % | | | 81 | % | | | — | | | | — | | | | 100 | % | |
| DFA Real Estate Securities Portfolio | | | 15 | % | | | — | | | | 86 | % | | | — | | | | — | | | | 100 | % | |
| Large Cap International Portfolio | | | 65 | % | | | — | | | | 35 | % | | | — | | | | — | | | | 100 | % | |
| International Core Equity Portfolio | | | 76 | % | | | 7 | % | | | 17 | % | | | — | | | | — | | | | 100 | % | |
| T.A. World ex U.S. Core Equity Portfolio | | | 100 | % | | | — | | | | — | | | | — | | | | — | | | | 100 | % | |
| International Small Company Portfolio | | | 29 | % | | | 8 | % | | | 63 | % | | | — | | | | — | | | | 100 | % | |
| Japanese Small Company Portfolio | | | 100 | % | | | — | | | | — | | | | — | | | | — | | | | 100 | % | |
| Asia Pacific Small Company Portfolio | | | 100 | % | | | — | | | | — | | | | — | | | | — | | | | 100 | % | |
| United Kingdom Small Company Portfolio | | | 43 | % | | | 5 | % | | | 51 | % | | | 1 | % | | | — | | | | 100 | % | |
| Continental Small Company Portfolio | | | 36 | % | | | 3 | % | | | 60 | % | | | 1 | % | | | — | | | | 100 | % | |
| DFA International Real Estate Securities Portfolio | | | 100 | % | | | — | | | | — | | | | — | | | | — | | | | 100 | % | |
| DFA Global Real Estate Securities Portfolio | | | — | | | | — | | | | — | | | | — | | | | — | | | | 100 | % | |
| DFA International Small Cap Value Portfolio | | | 30 | % | | | 7 | % | | | 63 | % | | | — | | | | — | | | | 100 | % | |
| International Vector Equity Portfolio | | | — | | | | — | | | | — | | | | — | | | | — | | | | 100 | % | |
| Emerging Markets Portfolio | | | 35 | % | | | — | | | | 65 | % | | | — | | | | — | | | | 100 | % | |
| Emerging Markets Small Cap Portfolio | | | 22 | % | | | 6 | % | | | 72 | % | | | — | | | | — | | | | 100 | % | |
| Emerging Markets Core Equity Portfolio | | | 85 | % | | | 4 | % | | | 11 | % | | | — | | | | — | | | | 100 | % | |
| DFA One-Year Fixed Income Portfolio | | | 100 | % | | | — | | | | — | | | | — | | | | — | | | | 100 | % | |
| DFA Two-Year Global Fixed Income Portfolio | | | 99 | % | | | — | | | | 1 | % | | | — | | | | — | | | | 100 | % | |
DFA Selectively Hedged Global Fixed Income
Portfolio | | | — | | | | — | | | | — | | | | 100 | % | | | — | | | | 100 | % | |
| DFA Five-Year Government Portfolio | | | 100 | % | | | — | | | | — | | | | — | | | | — | | | | 100 | % | |
| DFA Five-Year Global Fixed Income Portfolio | | | 95 | % | | | — | | | | — | | | | 5 | % | | | — | | | | 100 | % | |
DFA Intermediate Government Fixed Income
Portfolio | | | 99 | % | | | — | | | | 1 | % | | | — | | | | — | | | | 100 | % | |
| DFA Inflation-Protected Securities Portfolio | | | 100 | % | | | — | | | | — | | | | — | | | | — | | | | 100 | % | |
| DFA Short-Term Municipal Bond Portfolio | | | — | | | | — | | | | — | | | | — | | | | 100 | % | | | 100 | % | |
DFA California Short-Term Municipal Bond
Portfolio | | | — | | | | — | | | | — | | | | — | | | | 100 | % | | | 100 | % | |
| Dimensional Investment Group Inc. | |
| DFA International Value Portfolio | | | 67 | % | | | — | | | | — | | | | 33 | % | | | — | | | | 100 | % | |
| The DFA Investment Trust Company | |
| The U.S. Large Cap Value Series | | | 100 | % | | | — | | | | — | | | | — | | | | — | | | | 100 | % | |
| The Enhanced U.S. Large Company Series | | | 76 | % | | | 12 | % | | | 12 | % | | | — | | | | — | | | | 100 | % | |
| The DFA International Value Series | | | 33 | % | | | 2 | % | | | 65 | % | | | — | | | | — | | | | 100 | % | |
| The DFA One-Year Fixed Income Series | | | 100 | % | | | — | | | | — | | | | — | | | | — | | | | 100 | % | |
| The DFA Two-Year Global Fixed Income Series | | | 100 | % | | | — | | | | — | | | | — | | | | — | | | | 100 | % | |
| DFA Investment Dimensions Group Inc. | | Qualifying
For Corporate
Dividends
Received
Deduction(1) | | Qualifying
Dividend
Income(2) | | U.S.
Government
Interest(3) | | Foreign
Tax
Credit(4) | | Qualifying
Interest
Income(5) | | Qualifying
Short-
Term
Capital Gain(6) | |
| U.S. Large Company Portfolio | | | 100 | % | | | 18 | % | | | — | | | | — | | | | 4 | % | | | — | | |
| Enhanced U.S. Large Company Portfolio | | | — | | | | — | | | | 7 | % | | | — | | | | 19 | % | | | 3 | % | |
| U.S. Large Cap Value Portfolio | | | 87 | % | | | 87 | % | | | — | | | | — | | | | 1 | % | | | — | | |
| U.S. Targeted Value Portfolio | | | 93 | % | | | 94 | % | | | — | | | | — | | | | 1 | % | | | — | | |
| U.S. Small Cap Value Portfolio | | | 65 | % | | | 72 | % | | | — | | | | — | | | | 1 | % | | | — | | |
| U.S. Core Equity 1 Portfolio | | | 81 | % | | | 78 | % | | | — | | | | — | | | | 2 | % | | | — | | |
| U.S. Core Equity 2 Portfolio | | | 83 | % | | | 81 | % | | | — | | | | — | | | | 1 | % | | | — | | |
| U.S. Vector Equity Portfolio | | | 83 | % | | | 79 | % | | | — | | | | — | | | | 2 | % | | | — | | |
| T.A. U.S. Core Equity 2 Portfolio | | | 62 | % | | | 61 | % | | | — | | | | — | | | | 5 | % | | | — | | |
| U. S Small Cap Portfolio | | | 60 | % | | | 50 | % | | | — | | | | — | | | | 1 | % | | | 5 | % | |
| U.S. Micro Cap Portfolio | | | 40 | % | | | 90 | % | | | — | | | | — | | | | 1 | % | | | 10 | % | |
| DFA Real Estate Securities Portfolio | | | — | | | | — | | | | — | | | | — | | | | 1 | % | | | — | | |
| Large Cap International Portfolio | | | 1 | % | | | 61 | % | | | — | | | | 8 | % | | | 1 | % | | | — | | |
| International Core Equity Portfolio | | | 4 | % | | | 66 | % | | | — | | | | 6 | % | | | 1 | % | | | 9 | % | |
| T.A. World ex U.S. Core Equity Portfolio | | | 16 | % | | | 46 | % | | | — | | | | 10 | % | | | 2 | % | | | — | | |
| International Small Company Portfolio | | | — | | | | 19 | % | | | — | | | | 5 | % | | | 1 | % | | | 21 | % | |
| Japanese Small Company Portfolio | | | — | | | | 66 | % | | | — | | | | — | | | | 1 | % | | | — | | |
| Asia Pacific Small Company Portfolio | | | 1 | % | | | 13 | % | | | — | | | | — | | | | 19 | % | | | — | | |
| United Kingdom Small Company Portfolio | | | — | | | | 100 | % | | | — | | | | — | | | | 1 | % | | | 10 | % | |
| Continental Small Company Portfolio | | | — | | | | 47 | % | | | — | | | | 9 | % | | | 1 | % | | | 7 | % | |
| DFA International Real Estate Securities Portfolio | | | 2 | % | | | 25 | % | | | — | | | | 14 | % | | | 1 | % | | | — | | |
| DFA Global Real Estate Securities Portfolio | | | — | | | | — | | | | — | | | | — | | | | — | | | | — | | |
| DFA International Small Cap Value Portfolio | | | 1 | % | | | 62 | % | | | — | | | | 4 | % | | | 1 | % | | | 21 | % | |
| International Vector Equity Portfolio | | | — | | | | — | | | | — | | | | — | | | | 6 | % | | | — | | |
| Emerging Markets Portfolio | | | — | | | | 60 | % | | | — | | | | 13 | % | | | 1 | % | | | 1 | % | |
| Emerging Markets Small Cap Portfolio | | | 12 | % | | | 62 | % | | | — | | | | 12 | % | | | 1 | % | | | 22 | % | |
| Emerging Markets Core Equity Portfolio | | | 1 | % | | | 58 | % | | | — | | | | 13 | % | | | 1 | % | | | 4 | % | |
| DFA One-Year Fixed Income Portfolio | | | — | | | | — | | | | — | | | | — | | | | 100 | % | | | — | | |
| DFA Two-Year Global Fixed Income Portfolio | | | — | | | | — | | | | 3 | % | | | — | | | | 48 | % | | | 1 | % | |
DFA Selectively Hedged Global Fixed Income
Portfolio | | | — | | | | — | | | | — | | | | — | | | | — | | | | — | | |
| DFA Five-Year Government Portfolio | | | — | | | | — | | | | 100 | % | | | — | | | | 100 | % | | | — | | |
| DFA Five-Year Global Fixed Income Portfolio | | | — | | | | — | | | | 22 | % | | | — | | | | 63 | % | | | — | | |
DFA Intermediate Government Fixed Income
Portfolio | | | — | | | | — | | | | 100 | % | | | — | | | | 100 | % | | | — | | |
| DFA Inflation-Protected Securities Portfolio | | | — | | | | — | | | | 30 | % | | | — | | | | 100 | % | | | — | | |
| DFA Short-Term Municipal Bond Portfolio | | | — | | | | — | | | | — | | | | — | | | | — | | | | — | | |
DFA California Short-Term Municipal Bond
Portfolio | | | — | | | | — | | | | — | | | | — | | | | 100 | % | | | — | | |
| Dimensional Investment Group Inc. | |
| DFA International Value Portfolio | | | — | | | | 61 | % | | | — | | | | — | | | | 1 | % | | | — | | |
| The DFA Investment Trust Company | |
| The U.S. Large Cap Value Series | | | 85 | % | | | 84 | % | | | — | | | | — | | | | 1 | % | | | — | | |
| The Enhanced U.S. Large Company Series | | | — | | | | — | | | | 6 | % | | | — | | | | 20 | % | | | 26 | % | |
| The DFA International Value Series | | | 6 | % | | | 58 | % | | | — | | | | — | | | | — | | | | 7 | % | |
| The DFA One-Year Fixed Income Series | | | — | | | | — | | | | 7 | % | | | — | | | | 100 | % | | | — | | |
| The DFA Two-Year Global Fixed Income Series | | | — | | | | — | | | | 2 | % | | | — | | | | 48 | % | | | — | | |
(1) Qualifying dividends represent dividends which qualify for the corporate dividends received deduction and is reflected as a percentage of ordinary Income distributions (the total of short-term capital gain and net investment income distributions).
(2) The percentage in this column represents the amount of "Qualifying Dividend Income" as created by the Jobs and Growth Tax Relief Reconciliation Act of 2003 and is reflected as a percentage of ordinary income distributions (the total of short-term capital gain and net investment income distributions). It is the intention of each of the aforementioned funds to designate the maximum amount permitted by law.
(3) "U.S. Government Interest" represents the amount of interest that was derived from direct U.S. Government obligations and distributed during the fiscal year. This amount is reflected as a percentage of total ordinary income distributions (the total of short-term capital gain and net investment income distributions). Generally, interest from direct U.S. Government obligations is exempt from state income tax. However, for residents of California, Connecticut and New York, the statutory threshold requirements were satisfied for DFA Five-Year Government Portfolio, DFA Intermediate Government Fixed Income Portfolio, and DFA Inflation-Protected Securities Portfolio to permit exemption of these amounts from state income for these funds.
(4) Foreign Tax Credit represent dividends which qualify for the foreign tax credit pass through and is reflected as a percentage of investment company taxable income (the total of short-term capital gain and net investment income distributions).
(5) The percentage in this column represents the amount of "Qualifying Interest Income" as created by The American Jobs Creation Act of 2004. The information is reflected as a percentage of ordinary income distributions (the total of short-term capital gain and net investment income distributions).
(6) The percentage in this column represents the amount of "Qualifying Short-Term Capital Gain" as created by The American Jobs Creation Act of 2004. The information is reflected as a percentage of ordinary income distributions (the total of short-term capital gain and net investment income distributions).
313
BOARD APPROVAL OF INVESTMENT ADVISORY AGREEMENT
At Board meetings held on December 14, 2007 and March 20, 2008 (collectively, the "Meeting"), the Board considered the initial approval of the investment advisory agreement and sub-advisory agreements for DFA Global Real Estate Securities Portfolio (the "Real Estate Portfolio"). For the Real Estate Portfolio, Dimensional Fund Advisors Ltd. or DFA Australia Limited each serve as a sub-advisor. (The investment advisory agreements and the sub-advisory agreements are referred to as the "Advisory Agreements," and the Advisor and sub-advisors are referred to as the "Advisor").
At the Meeting, the Board considered a variety of factors when considering the approval of the Advisory Agreements for the Real Estate Portfolio, including: (i) the nature, extent and quality of services that will be provided by the Advisor to the Real Estate Portfolio, including the resources of the Advisor to be dedicated to the Real Estate Portfolio; (ii) the performance of the Advisor; (iii) the fees and expenses that will be borne by the Real Estate Portfolio; (iv) the profitability realized by the Advisor from its relationship with the Real Estate Portfolio; (v) whether economies of scale will be realized by the Advisor with respect to the Real Estate Portfolio as it grows larger, and the extent to which the economies of scale are reflected in the level of the advisory fees charged for the benefit of investors; (vi) comparisons of the services to be rendered and the amounts to be paid under other advisory contracts; and (vii) any benef its to be derived by the Advisor from its relationship with the Real Estate Portfolio.
When considering the nature, extent and quality of the services that will be provided by the Advisor to the Real Estate Portfolio, and the resources of the Advisor dedicated to the Real Estate Portfolio, the Board reviewed the experience and expertise of the Advisor's investment professionals who will furnish management services to the Real Estate Portfolio. The Board also evaluated the Advisor's investment advisory capabilities and the portfolio management process described for the Real Estate Portfolio. The Board noted that the services that were proposed to be provided to the Real Estate Portfolio were consistent with the range of services currently provided to other investment portfolios managed by the Advisor. The Board concluded that the nature, extent and quality of services that the Advisor was proposing to provide to the Real Estate Portfolio appeared to be consistent with the Real Estate Portfolio's anticipated operational requirem ents.
The Board also considered the proposed fees and projected expenses for the Real Estate Portfolio, and compared the fees to be charged to the Real Estate Portfolio by the Advisor to the fees charged by the Advisor to other relevant investment portfolios managed by the Advisor, and to the fees charged other mutual funds managed by third parties in the Real Estate Portfolio's anticipated peer group for comparable services. The Board concluded, among other things, that the proposed advisory fee and anticipated total expenses of the Real Estate Portfolio appeared to compare favorably to expected peer mutual funds managed by others and to other investment portfolios managed by the Advisor, and that the proposed advisory fee for the Real Estate Portfolio was fair, both on an absolute basis and in comparison with other funds likely to be in the Real Estate Portfolio's peer group. The Board also concluded that, given that the Real Estate Portfolio's proposed advisory fee likely ranking among the lowest of its peer funds, economies of scale and the reflection of such economies of scale in the level of advisory fee charged were inapplicable to the Real Estate Portfolio at the present time.
The Board also noted that, as the Real Estate Portfolio had not yet commenced investment operations, there was no investment performance for either the Real Estate Portfolio or the Advisor in managing the Real Estate Portfolio for the Board to evaluate. Furthermore, the Board noted that the Advisor could not report any financial results from its relationship with the Real Estate Portfolio because the Real Estate Portfolio had not yet commenced investment operations, and thus, the Board could not evaluate profitability.
After full consideration of the factors discussed above, with no single factor identified as being of paramount importance, the Board, including the Independent Board Members, with the assistance of independent counsel, concluded that the approval of the Advisory Agreements for the Real Estate Portfolio was in the best interests of the Real Estate Portfolio and its shareholders.
At the Board meeting held on June 26, 2008 (the "June Meeting"), the Board considered the initial approval of the investment advisory agreement and sub-advisory agreements for International Vector Equity Portfolio (the "International Portfolio"). For the International Portfolio, Dimensional Fund Advisors Ltd. and DFA Australia Limited
314
each serves as a sub-advisor. (The investment advisory agreements and the sub-advisory agreements are referred to as the "Advisory Agreements," and the Advisor and sub-advisors are referred to as the "Advisor").
At the June Meeting, the Board considered a variety of factors when considering the approval of the Advisory Agreements for the International Portfolio, including: (i) the nature, extent and quality of services that will be provided by the Advisor to the International Portfolio, including the resources of the Advisor to be dedicated to the International Portfolio; (ii) the performance of the Advisor; (iii) the fees and expenses that will be borne by the International Portfolio; (iv) the profitability realized by the Advisor from its relationship with the International Portfolio; (v) whether economies of scale will be realized by the Advisor with respect to the International Portfolio as it grows larger, and the extent to which the economies of scale are reflected in the level of the advisory fees charged for the benefit of investors; (vi) comparisons of the services to be rendered and the amounts to be paid under other advisory contracts; an d (vii) any benefits to be derived by the Advisor from its relationship with the International Portfolio.
When considering the nature, extent and quality of the services that will be provided by the Advisor to the International Portfolio, and the resources of the Advisor dedicated to the International Portfolio, the Board reviewed the experience and expertise of the Advisor's investment professionals who will furnish management services to the International Portfolio. The Board also evaluated the Advisor's investment advisory capabilities and the portfolio management process described for the International Portfolio. The Board noted that the services that were proposed to be provided to the International Portfolio were consistent with the range of services currently provided to other investment portfolios managed by the Advisor. The Board concluded that the nature, extent and quality of services that the Advisor was proposing to provide to the International Portfolio appeared to be consistent with the International Portfolio's anticipated operat ional requirements.
The Board also considered the proposed fees and projected expenses for the International Portfolio, and compared the fees to be charged to the International Portfolio by the Advisor to the fees charged by the Advisor to other relevant investment portfolios managed by the Advisor, and to the fees charged other mutual funds managed by third parties in the International Portfolio's anticipated peer group for comparable services. The Board concluded, among other things, that the proposed advisory fee and anticipated total expenses of the International Portfolio appeared to compare favorably to expected peer mutual funds managed by others and to other investment portfolios managed by the Advisor, and that the proposed advisory fee for the International Portfolio was fair, both on an absolute basis and in comparison with other funds likely to be in the International Portfolio's peer group. The Board also concluded that, given that the Internationa l Portfolio's proposed advisory fee likely ranking among the lowest of its peer funds, economies of scale and the reflection of such economies of scale in the level of advisory fee charged were inapplicable to the International Portfolio at the present time.
The Board also noted that, as the International Portfolio had not yet commenced investment operations, there was no investment performance for either the International Portfolio or the Advisor in managing the International Portfolio for the Board to evaluate. Furthermore, the Board noted that the Advisor could not report any financial results from its relationship with the International Portfolio because the International Portfolio had not yet commenced investment operations, and thus, the Board could not evaluate profitability.
After full consideration of the factors discussed above, with no single factor identified as being of paramount importance, the Board, including the Independent Board Members, with the assistance of independent counsel, concluded that the approval of the Advisory Agreements for the International Portfolio was in the best interests of the International Portfolio and its shareholders.
315
[THIS PAGE INTENTIONALLY LEFT BLANK]
[THIS PAGE INTENTIONALLY LEFT BLANK]
[THIS PAGE INTENTIONALLY LEFT BLANK]

DFA103108-001A
DIMENSIONAL INVESTMENT GROUP INC.
LWAS/DFA U.S. High Book to Market Portfolio
LWAS/DFA Two-Year Fixed Income Portfolio
LWAS/DFA Two-Year Government Portfolio
DFA INVESTMENT DIMENSIONS GROUP INC.
LWAS/DFA International High Book
to Market Portfolio
Annual Report
Period Ended October 31, 2008
Dimensional Fund Advisors
6300 Bee Cave Road, Building One
Austin, TX 78746
December 2008
Dear Fellow Shareholder,
This has been a challenging year for investors. After drifting lower throughout the spring and summer, stock markets around the world plummeted in mid September on news that the ongoing credit crisis was driving some leading financial services companies toward failure. As the effects of this distress rippled through the financial world, investors became increasingly anxious and stock prices continued to decline sharply. In the month of October, the S&P 500 Index fell 16.8% or 196 points—its worst-ever monthly point decline.
Markets like this test investors' resolve. It is difficult to stick with a long-term investment plan when one sees the dramatic effects of high market volatility on a portfolio's value. Very few people are having a positive investment experience right now. But investors who have based their approach on a sensible risk/return framework tend to be in better shape than those who have not.
The recent market turbulence illustrates the reason why Dimensional believes that markets are efficient. History has shown time and again that prices cannot be predicted in public equity markets. This "random walk" makes diversification very important. Although the broad diversification in our portfolios didn't prevent negative performance this year, we believe it helped our shareholders avoid the extreme losses experienced by investors who concentrated their holdings in individual companies, industry sectors, or markets.
The unpredictability of stock prices also makes it important for investors to take a hard look at their own portfolios and determine how much risk and what types of risk they should take. Investors who hold asset mixes that accurately reflect their tolerance for risk are better able to withstand down markets.
Nobody knows when the capital markets will recover, but over time we can expect them to again offer a premium to investors who are willing to invest in relatively risky assets such as stocks. My view is that investors who have already paid for risk should stay invested and earn the return that can be expected when markets turn around. If markets continue to be so volatile, it's also important to understand that pulling money out of stocks, even for short periods of time, can result in significant missed opportunities.
All of us at Dimensional take our job as the steward of your assets very seriously and hope to have the opportunity to serve you for many years to come.
Sincerely,
David G. Booth
Chairman and Chief Executive Officer
[THIS PAGE INTENTIONALLY LEFT BLANK]
ANNUAL REPORT
Table of Contents
| Letter to Shareholders | | Page | |
| Definitions of Abbreviations and Footnotes | | | 1 | | |
|
| Dimensional Investment Group Inc. | |
|
| Performance Charts | | | 2 | | |
|
| Management's Discussion and Analysis | | | 3 | | |
|
| Disclosure of Fund Expenses | | | 6 | | |
|
| Disclosure of Portfolio Holdings | | | 7 | | |
|
| Schedules of Investments | |
|
| LWAS/DFA Two-Year Fixed Income Portfolio | | | 8 | | |
|
| LWAS/DFA Two-Year Government Portfolio | | | 9 | | |
|
| Statements of Assets and Liabilities | | | 10 | | |
|
| Statements of Operations | | | 12 | | |
|
| Statements of Changes in Net Assets | | | 13 | | |
|
| Financial Highlights | | | 14 | | |
|
| Notes to Financial Statements | | | 16 | | |
|
| Report of Independent Registered Public Accounting Firm | | | 22 | | |
|
| DFA Investment Dimensions Group Inc. | |
|
| Performance Chart | | | 23 | | |
|
| Management's Discussion and Analysis | | | 24 | | |
|
| Disclosure of Fund Expenses | | | 26 | | |
|
| Disclosure of Portfolio Holdings | | | 27 | | |
|
| Statement of Assets and Liabilities | | | 28 | | |
|
| Statements of Operations | | | 29 | | |
|
| Statements of Changes in Net Assets | | | 30 | | |
|
| Financial Highlights | | | 31 | | |
|
| Notes to Financial Statements | | | 32 | | |
|
| Report of Independent Registered Public Accounting Firm | | | 37 | | |
|
| The DFA Investment Trust Company | |
|
| Performance Charts | | | 38 | | |
|
| Disclosure of Fund Expenses | | | 39 | | |
|
| Disclosure of Portfolio Holdings | | | 40 | | |
|
| Summary Schedules of Portfolio Holdings | |
|
| The U.S. Large Cap Value Series | | | 41 | | |
|
| The DFA International Value Series | | | 44 | | |
|
| Statements of Assets and Liabilities | | | 47 | | |
|
| Statements of Operations | | | 48 | | |
|
| Statements of Changes in Net Assets | | | 49 | | |
|
| Financial Highlights | | | 50 | | |
|
| Notes to Financial Statements | | | 51 | | |
|
| Report of Independent Registered Public Accounting Firm | | | 59 | | |
|
| Fund Management | | | 60 | | |
|
| Voting Proxies on Fund Portfolio Securities | | | 67 | | |
|
| Notice to Shareholders | | | 68 | | |
|
This report is submitted for the information of the Fund's shareholders. It is not authorized for distribution to prospective investors unless preceded or accompanied by an effective prospectus.
i
[THIS PAGE INTENTIONALLY LEFT BLANK]
DIMENSIONAL INVESTMENT GROUP INC.
DFA INVESTMENT DIMENSIONS GROUP INC.
THE DFA INVESTMENT TRUST COMPANY
DEFINITIONS OF ABBREVIATIONS AND FOOTNOTES
Statements of Assets and Liabilities/Schedules of Investments/Summary Schedules of Portfolio Holdings
Investment Abbreviations
ADR American Depositary Receipt
FHLMC Federal Home Loan Mortgage Corporation
FNMA Federal National Mortgage Association
Investment Footnotes
† See Note B to Financial Statements.
†† Securities have generally been fair valued. See Note B to Financial Statements.
** Calculated as a percentage of total net assets. Percentages shown parenthetically next to the category headings have been calculated as a percentage of total investments. "Other Securities" are those securities that are not among the top 50 holdings of the Fund or do not represent more than 1.0% of the net assets of the Fund. Some of the individual securities within this category may include Total or Partial Securities on Loan and/or Non-Income Producing Securities.
* Non-Income Producing Securities.
# Total or Partial Securities on Loan.
@ Security purchased with cash proceeds from Securities on Loan.
(r) The adjustable rate shown is effective as of October 31, 2008.
§ Affiliated Fund.
Financial Highlights
(A) Computed using average shares outstanding.
(B) Annualized
(C) Non-Annualized
(D) Represents the combined ratios for the respective portfolio and its respective pro-rata share of its Master Fund Series.
All Statements and Schedules
— Amounts designated as — are either zero or rounded to zero.
SEC Securities and Exchange Commission
1
DIMENSIONAL INVESTMENT GROUP INC.
PERFORMANCE CHARTS
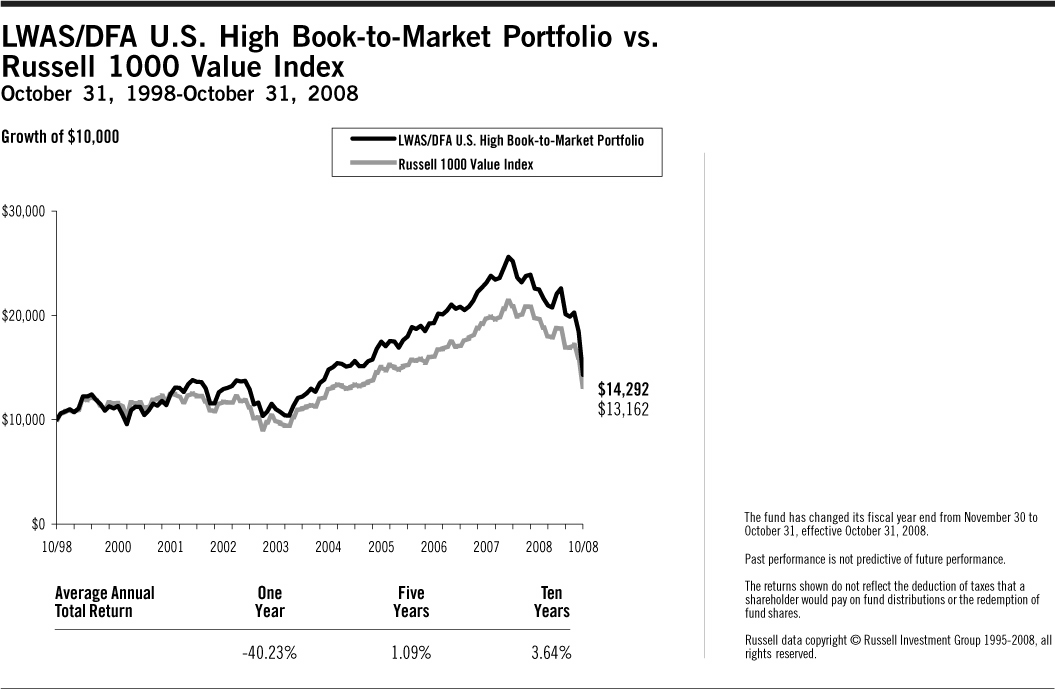


2
DIMENSIONAL INVESTMENT GROUP INC.
MANAGEMENT'S DISCUSSION AND ANALYSIS
On September 16, 2008, at a regular meeting of the Board of Directors/Trustees (the "Board") of the funds covered by this report, the Board voted to change the fiscal and tax year ends of the funds from November 30 to October 31. Therefore, the following discussion generally covers the 11-month period ended October 31, 2008.
U.S. Equity Market Review 11 Months Ended October 31, 2008
U.S. equity markets experienced high levels of volatility during the 11-month fiscal year ended October 31, 2008. The behavior of equity markets has been driven in large part by the contraction of lending in credit markets. In addition to heightened volatility, the cross-sectional dispersion of stock returns in equity markets has increased relative to previous levels, and returns even within each asset class have differed greatly. Dimensional Fund Advisors believes that a security's risk characteristics determine its expected return. Among the most important factors explaining differences in the behavior of diversified equity portfolios are company size and company value/growth characteristics of the portfolio holdings. Size is measured by market capitalization, and "value" classification is a function of stock price relative to one or more fundamental characteristics. Compared to other stocks, value stocks often have lower market value rela tive to their earnings, dividends, and book value.
For the 11 months ended October 31, 2008, small company stocks slightly outperformed large companies, and mid cap companies underperformed both small and large cap companies. The performance of the Russell Microcap Index® was –33.59%, the Russell 2000 Index® was –29.07%, CRSP 6-10 Index was –32.90%, and MSCI USA Small Cap 1750 Index was –32.21%. Large cap value stocks, as measured by the Russell 1000 Value Index®, slightly outperformed large cap growth stocks, as measured by the Russell 1000 Growth Index®. The value premium was larger among small cap stocks.
Total Return for 11 Months Ended October 31, 2008
| Russell 2000 Index® (small cap companies) | | | –29.07 | % | |
| Russell Midcap Index® (mid cap companies) | | | –37.70 | % | |
| Russell 1000 Index® (large cap companies) | | | –33.99 | % | |
| Russell 3000 Value Index® | | | –32.90 | % | |
| Russell 3000 Growth Index® | | | –34.45 | % | |
When the large, mid, and small cap market segments are further divided by value and growth characteristics, the distinction in performance within sectors was equally significant.
Total Return for 11 Months Ended October 31, 2008
| Russell 1000 Value Index® (large cap value companies) | | | –33.55 | % | |
| Russell 1000 Growth Index® (large cap growth companies) | | | –34.54 | % | |
| Russell Midcap Value Index® (mid cap value companies) | | | –35.42 | % | |
| Russell Midcap Growth Index® (mid cap growth companies) | | | –40.01 | % | |
| Russell 2500 Value Index® (small/mid cap value companies) | | | –29.10 | % | |
| Russell 2500 Growth Index® (small/mid cap growth companies) | | | –37.30 | % | |
| Russell 2000 Value Index® (small cap value companies) | | | –24.91 | % | |
| Russell 2000 Growth Index® (small cap growth companies) | | | –33.26 | % | |
Source: Russell data copyright © Russell Investment Group 1995-2008, all rights reserved.
Differences in returns for the various Dimensional U.S. equity funds over the 11 months ended October 31, 2008 were attributable primarily to differences in value/growth and size characteristics as well as the exclusion of REIT securities from most Dimensional portfolios, except for the DFA Real Estate Securities Portfolio and portfolios investing in the U.S. Large Company Series. Moreover, the portfolio construction approach used by Dimensional Fund Advisors generally resulted in portfolios with greater emphasis on value or small company characteristics relative to widely used index benchmarks.
3
Master-Feeder Structure
Certain portfolios described below, called "Feeder Funds," do not buy individual securities directly; instead, these portfolios invest in corresponding funds called "Master Funds." Master Funds, in turn, purchase stocks, bonds, and/or other securities.
Domestic Equity Portfolios Performance Overview
LWAS/DFA U.S. High Book to Market Portfolio
The LWAS/DFA U.S. High Book to Market Portfolio seeks to capture the returns of U.S. large company value stocks by purchasing shares of a Master Fund that invests in such stocks. The investment strategy employs a disciplined, quantitative approach, emphasizing broad diversification and consistent exposure to large cap value stocks, but does not attempt to track closely a specific equity index. The Master Fund held approximately 210 stocks as of October 31, 2008, and was mostly invested in equities throughout the year: average cash levels for the 11 months ended October 31, 2008 were in general less than 1% of the Master Fund's assets.
As a result of the Master Fund's diversified investment approach, performance was determined principally by broad structural trends in the U.S. equity market, rather than by the behavior of a limited number of stocks. For the 11 months ended October 31, 2008, large company stocks generally underperformed small company stocks, and value stocks generally outperformed growth stocks. Total returns were –33.31% for the S&P 500 Index®, –33.55% for the Russell 1000 Value Index® and –36.69% for the Master Fund's Portfolio. Relative to the Russell 1000 Value Index®, underperformance of the Portfolio was primarily due to the Master Fund's lower exposure to stocks with neutral or growth price characteristics as measured by book-to-market "BtM" ratio, and due to weighting and composition differences between consumer discretionary and consumer staples stocks held by the Master Fund and those held by the Index. More growth-oriented stocks in the middle BtM quartiles, which represented approximately 11% of the Master Fund compared to approximately 47% of the Index, outperformed value stocks in the highest BtM quartile by more than 15 percentage points. Stocks held by the Master Fund in the consumer discretionary sector, which represented approximately 16% of the Master Fund compared to approximately 8% of the Russell 1000 Value Index®, underperformed the Index by about 13 percentage points. Stocks held by the Master Fund in the consumer staples sector, which represented approximately 5% of the Master Fund compared to 9% of the Index, underperformed similar stocks held by the Index by approximately 20 percentage points.
Fixed Income Market Review 11 Months Ended October 31, 2008
U.S. and international credit markets experienced extreme levels of volatility in the fiscal year ended October 31, 2008, as defaults in the subprime and related mortgage markets and the subsequent bankruptcy of leading underwriter Lehman Brothers caused credit spreads to widen sharply. Risk aversion caused a severe tightening of credit across all maturities and quality ranges both in the U.S. and international fixed income markets and a spike in interbank lending rates. To encourage lending, the U.S. Federal Reserve lowered the target rate for federal funds from 4.50% on November 30, 2007 to 1.00% by October 31, 2008 and pumped billions of dollars of liquidity into the financial system through various loan programs and capital injections into banks. Central banks around the world took similar actions to loosen credit markets. The three-month London Interbank Offered Rate ("LIBOR"), a widely used benchmark of short-term interest rates, spike d sharply higher late in the period but fell 210 basis points during the 11 months ended October 31, 2008, while the yield on ten-year U.S. Treasury notes rose just 1 basis point. The yield curve, V-shaped to start the year, ended the year with an upward slope as yields on short-term instruments fell below those with longer maturities.
| | | 11/30/07 | | 10/31/08 | | Change | |
| Three-Month LIBOR (yield) | | | 5.13 | % | | | 3.03 | % | | | –41.02 | % | |
| Ten-Year U.S. Treasury Notes (yield) | | | 3.94 | % | | | 3.95 | % | | | 0.30 | % | |
Source: Bloomberg. "Change" values are calculated prior to rounding.
4
There is generally an inverse relationship between interest rates and bond prices, such that bond prices fall when interest rates rise. For the fiscal year under review, changes in interest rates and bond prices were more pronounced in some parts of the yield curve than others. As a result of an extreme flight to higher-quality debt in the aftermath of the bank and mortgage crisis, total return for fixed income strategies was primarily a function of credit quality. For the 11 months ended October 31, 2008, total returns were 2.24% for three-month U.S. Treasury bills, 7.25% for five-year U.S. Treasury notes, and 5.02% for thirty-year U.S. Treasury bonds.
Some of the Advisor's fixed income strategies are based on a shifting-maturity strategy that identifies the maturity range with the highest risk-adjusted expected return. When the yield curve is flat or inverted, short-term securities are believed to offer the most attractive opportunity on a risk-adjusted basis. When the yield curve is upwardly sloped, maturities are lengthened to achieve higher returns associated with longer maturities. During the period under review, weighted average maturities of most Portfolios lengthened, reflecting upwardly sloped yield curves in the U.S.
LWAS/DFA Two-Year Fixed Income Portfolio
The LWAS/DFA Two-Year Fixed Income Portfolio seeks to maximize risk-adjusted total returns from a universe of high-quality fixed income securities maturing in two years or less. The investment strategy shifts maturities based on changes in the yield curve. Using current prices, the strategy creates a matrix of expected returns from different buy and sell strategies, and identifies the maturity range for the highest risk-adjusted expected returns. Maturities are shifted if premiums can be documented. Average maturity of the Portfolio increased from 0.07 years on November 30, 2007, to 0.89 years on October 31, 2008.
For the 11 months ended October 31, 2008, total returns were 2.46% for the Portfolio and 2.48% for the Merrill Lynch U.S. Corporate and Government Index 1-3 Years. Relative to the Index, the underperformance of the Portfolio was primarily due to to differences in expenses between the Portfolio and the Index. Results for the Index are not diminished by management and administrative expenses associated with running a live portfolio.
LWAS/DFA Two-Year Government Portfolio
The LWAS/DFA Two-Year Government Portfolio seeks to maximize risk-adjusted total returns from a universe of U.S. government securities maturing in two years or less. The investment strategy shifts maturities based on changes in the yield curve. Using current prices, the strategy creates a matrix of expected returns from different buy and sell strategies, and identifies the maturity range for the highest risk-adjusted expected returns. Maturities are shifted if premiums can be documented. Average maturity of the Portfolio increased from 0.04 years on November 30, 2007, to 1.42 years on October 31, 2008.
For the 11 months ended October 31, 2008, total returns were 2.13% for the Portfolio and 4.67% for the Merrill Lynch U.S. Treasury/Agency Index 1-3 Years. Relative to the Index, Portfolio underperformance was primarily due to maturity differences in the first half of the fiscal year. At the beginning of the period, the Portfolio had a much shorter duration than the Index, as the yield curve remained inverted. The Portfolio duration was significantly extended in May, when interest rates rose sharply, which hurt performance.
5
DIMENSIONAL INVESTMENT GROUP INC.
DISCLOSURE OF FUND EXPENSES
(Unaudited)
The following Expense Tables are shown so that you can understand the impact of fees on your investment. All mutual funds have operating expenses. As a shareholder of the fund, you incur ongoing costs, which include costs for portfolio management, administrative services, and shareholder reports, among others. Operating expenses, legal and audit services, which are deducted from a fund's gross income, directly reduce the investment return of the fund. A fund's expenses are expressed as a percentage of its average net assets. This figure is known as the expense ratio. The following examples are intended to help you understand the ongoing costs, in dollars, of investing in the fund and to compare these costs with those of other mutual funds. The examples are based on an investment of $1,000 made at the beginning of the period shown and held for the entire period.
The Expense Tables below illustrate your fund's costs in two ways.
Actual Fund Return
This section helps you to estimate the actual expenses after fee waivers that you paid over the period. The "Ending Account Value" shown is derived from the fund's actual return and "Expenses Paid During Period" reflect the dollar amount that would have been paid by an investor who started with $1,000 in the fund. You may use the information here, together with the amount you invested, to estimate the expenses that you paid over the period.
To do so, simply divide your account value by $1,000 (for example, a $7,500 account value divided by $1,000 = 7.5), then multiply the result by the number given for your fund under the heading "Expenses Paid During Period."
Hypothetical Example for Comparison Purposes
This section is intended to help you compare your fund's costs with those of other mutual funds. The hypothetical "Ending Account Value" and "Expenses Paid During Period" are derived from the fund's actual expense ratio and an assumed 5% annual return before expenses. In this case, because the return used is not the fund's actual return, the results do not apply to your investment. The example is useful in making comparisons because the SEC requires all mutual funds to calculate expenses based on a 5% annual return. You can assess your fund's cost by comparing this hypothetical example with the hypothetical examples that appear in shareholder reports of other funds.
Please note that the expenses shown in the tables are meant to highlight and help you compare ongoing costs only and do not reflect any transactional costs, if applicable. The "Annualized Expense Ratio" represents the actual expenses for the six-month period indicated.
Six Months Ended October 31, 2008
EXPENSE TABLES
| LWAS/DFA U.S. High Book to Market Portfolio** | | Beginning
Account
Value
05/01/08 | | Ending
Account
Value
10/31/08 | | Annualized
Expense
Ratio* | | Expenses
Paid
During
Period* | |
| Actual Fund Return | | $ | 1,000.00 | | | $ | 647.50 | | | | 0.33 | % | | $ | 1.37 | | |
| Hypothetical 5% Annual Return | | $ | 1,000.00 | | | $ | 1,023.48 | | | | 0.33 | % | | $ | 1.68 | | |
| LWAS/DFA Two-Year Fixed Income Portfolio | |
| Actual Fund Return | | $ | 1,000.00 | | | $ | 1,010.20 | | | | 0.31 | % | | $ | 1.57 | | |
| Hypothetical 5% Annual Return | | $ | 1,000.00 | | | $ | 1,023.58 | | | | 0.31 | % | | $ | 1.58 | | |
| LWAS/DFA Two-Year Government Portfolio | |
| Actual Fund Return | | $ | 1,000.00 | | | $ | 1,008.50 | | | | 0.30 | % | | $ | 1.51 | | |
| Hypothetical 5% Annual Return | | $ | 1,000.00 | | | $ | 1,023.63 | | | | 0.30 | % | | $ | 1.53 | | |
* Expenses are equal to the fund's annualized expense ratio for the six-month period, multiplied by the average account value over the period, multiplied by the number of days in the most recent six-month period (184), then divided by the number of days in the year (366) to reflect the six-month period.
** The Portfolio is a Feeder Fund. The expenses shown reflect the direct expenses of the Feeder Fund and the indirect payment of the Feeder Fund's portion of the expenses of its Master Fund.
6
DIMENSIONAL INVESTMENT GROUP INC.
DISCLOSURE OF PORTFOLIO HOLDINGS
(Unaudited)
The SEC requires that all Funds file a complete Schedule of Investments with the SEC for their first and third fiscal quarters on Form N-Q. For Dimensional Investment Group Inc., this would be for the fiscal quarters ending January 31 and July 31. The Form N-Q filing must be made within 60 days of the end of the quarter. Dimensional Investment Group Inc. filed its most recent Form N-Q with the SEC on October 30, 2008. It is available upon request, without charge, by calling collect: (310) 395-8005 or by mailing a request to Dimensional Fund Advisors LP, 1299 Ocean Avenue, Santa Monica, California 90401, or by visiting the SEC's website at http://www.sec.gov, or they may be reviewed and copied at the SEC's Public Reference Room in Washington, D.C. (call 1-800-732-0330 for information on the operation of the Public Reference Room).
PORTFOLIO HOLDINGS
The SEC requires that all Funds present their categories of portfolio holdings in a table, chart or graph format in their annual and semi-annual shareholder reports, whether or not a Schedule of Investments is utilized. The following tables, which presents portfolio holdings as a percent of total investments before short-term investments and collateral for loaned securities, are provided in compliance with such requirement. The categories shown below represent broad industry sectors. Each industry sector consists of one or more specific industry classifications.
The categories of industry classification for the Affiliated Investment Company are represented in the Disclosure of Portfolio Holdings, which are included elsewhere within the report. Refer to the Summary Schedule of Portfolio Holdings for the underlying Master Fund's holdings which reflect the investments by category.
FEEDER FUND
| | | Affiliated
Investment
Company | |
| LWAS/DFA U.S. High Book to Market Portfolio | | | 100.0 | % | |
FIXED INCOME PORTFOLIOS
| | | Corporate | | Government | | Foreign
Corporate | | Foreign
Government | | Total | |
| LWAS/DFA Two-Year Fixed Income Portfolio | | | 26.7 | % | | | 43.7 | % | | | 29.6 | % | | | — | | | | 100.0 | % | |
| LWAS/DFA Two-Year Government Portfolio | | | — | | | | 100.0 | % | | | — | | | | — | | | | 100.0 | % | |
7
LWAS/DFA TWO-YEAR FIXED INCOME PORTFOLIO
SCHEDULE OF INVESTMENTS
October 31, 2008
| | | Face
Amount | | Value† | |
| | | (000) | | | |
| AGENCY OBLIGATIONS — (43.2%) | |
Federal Farm Credit Bank
2.750%, 05/04/10 | | $ | 900 | | | $ | 893,064 | | |
Federal Home Loan Bank
2.375%, 04/30/10 | | | 1,400 | | | | 1,381,730 | | |
| 4.875%, 05/14/10 | | | 2,500 | | | | 2,559,075 | | |
| 2.750%, 06/18/10 | | | 4,400 | | | | 4,363,810 | | |
| 3.500%, 07/16/10 | | | 2,500 | | | | 2,509,290 | | |
| 3.375%, 08/13/10 | | | 4,900 | | | | 4,908,697 | | |
Federal Home Loan
Mortgage Corporation
2.875%, 04/30/10 | | | 4,800 | | | | 4,776,115 | | |
| 2.375%, 05/28/10 | | | 4,000 | | | | 3,956,600 | | |
| 2.875%, 06/28/10 | | | 3,000 | | | | 2,990,445 | | |
Federal National Mortgage Association
4.125%, 05/15/10 | | | 2,300 | | | | 2,329,794 | | |
| 2.375%, 05/20/10 | | | 2,500 | | | | 2,470,643 | | |
| 7.125%, 06/15/10 | | | 2,800 | | | | 2,974,367 | | |
| TOTAL AGENCY OBLIGATIONS | | | | | | | 36,113,630 | | |
| BONDS — (24.7%) | |
American Express Centurion
Floating Rate Note
(r) 5.561%, 06/12/09 | | | 2,100 | | | | 2,047,221 | | |
Bank of New York Mellon Corp.
Floating Rate Note
(r) 3.495%, 02/05/10 | | | 2,400 | | | | 2,352,958 | | |
BP Capital Markets P.L.C.
4.875%, 03/15/10 | | | 1,000 | | | | 996,751 | | |
Citigroup Funding, Inc.
Floating Rate Note
(r) 5.449%, 10/22/09 | | | 2,200 | | | | 2,135,740 | | |
CME Group, Inc. Floating Rate Note
(r) 3.300%, 08/06/10 | | | 600 | | | | 599,487 | | |
General Electric Capital Corp.
7.375%, 01/19/10 | | | 2,100 | | | | 2,127,397 | | |
JPMorgan Chase & Co.
Floating Rate Note
(r) 5.255%, 11/19/09 | | | 2,400 | | | | 2,395,982 | | |
Paccar Financial Corp.
Floating Rate Note
(r) 4.966%, 09/21/09 | | | 1,450 | | | | 1,447,149 | | |
Wachovia Corp. Floating Rate Note
(r) 5.465%, 11/24/09 | | | 2,000 | | | | 1,943,018 | | |
Wal-Mart Stores, Inc.
6.875%, 08/10/09 | | | 2,400 | | | | 2,474,362 | | |
Wells Fargo & Co. Floating Rate Note
(r) 5.091%, 09/15/09 | | | 2,200 | | | | 2,155,001 | | |
| TOTAL BONDS | | | | | | | 20,675,066 | | |
| | | Face
Amount | | Value† | |
| | | (000) | | | |
CERTIFICATES OF DEPOSIT
INTEREST BEARING — (11.6%) | |
ABN-AMRO Bank NV
3.035%, 02/13/09 | | $ | 2,500 | | | $ | 2,495,750 | | |
Barclays Bank P.L.C.
3.430%, 07/10/09 | | | 2,400 | | | | 2,394,926 | | |
BNP Paribas Finance, Inc.
3.130%, 08/06/09 | | | 1,400 | | | | 1,393,690 | | |
| 3.190%, 08/14/09 | | | 1,100 | | | | 1,095,438 | | |
Royal Bank of Scotland P.L.C.
3.110%, 01/23/09 | | | 2,300 | | | | 2,297,544 | | |
TOTAL CERTIFICATES OF DEPOSIT
INTEREST BEARING | | | | | | | 9,677,348 | | |
| COMMERCIAL PAPER — (19.3%) | |
Abbey National North America
2.990%, 02/20/09 | | | 2,200 | | | | 2,177,078 | | |
AstraZeneca P.L.C.
2.670%, 11/12/08 | | | 1,200 | | | | 1,199,532 | | |
Bank of America Corp.
2.980%, 03/09/09 | | | 2,400 | | | | 2,371,018 | | |
Bank of Scotland P.L.C.
3.045%, 01/12/09 | | | 2,500 | | | | 2,484,067 | | |
Danske Corp.
3.750%, 12/16/08 | | | 2,000 | | | | 1,993,021 | | |
Nordea North America, Inc.
3.000%, 05/11/09 | | | 1,300 | | | | 1,278,021 | | |
Societe Generale North America
3.100%, 05/01/09 | | | 2,200 | | | | 2,164,742 | | |
UBS Finance Delaware LLC
3.100%, 02/11/09 | | | 2,500 | | | | 2,476,217 | | |
| TOTAL COMMERCIAL PAPER | | | | | | | 16,143,696 | | |
| TEMPORARY CASH INVESTMENTS — (1.2%) | |
Repurchase Agreement, PNC Capital
Markets, Inc. 0.94%, 11/03/08
(Collateralized by $1,105,000
FHLMC 4.50%, 05/01/23,
valued at $1,051,131) to be
repurchased at $1,031,081 | | | 1,031 | | | | 1,031,000 | | |
TOTAL INVESTMENTS — (100.0%)
(Cost $84,063,035) | | | | | | $ | 83,640,740 | | |
See accompanying Notes to Financial Statements.
8
LWAS/DFA TWO-YEAR GOVERNMENT PORTFOLIO
SCHEDULE OF INVESTMENTS
October 31, 2008
| | | Face
Amount | | Value† | |
| | | (000) | | | |
| AGENCY OBLIGATIONS — (99.4%) | |
Federal Farm Credit Bank
2.750%, 05/04/10 | | $ | 29,300 | | | $ | 29,074,185 | | |
| 4.750%, 05/07/10 | | | 5,000 | | | | 5,107,520 | | |
Federal Home Loan Bank
2.750%, 03/12/10 | | | 50,000 | | | | 49,677,050 | | |
| 2.375%, 04/30/10 | | | 18,300 | | | | 18,061,185 | | |
| 4.800%, 05/14/10 | | | 11,000 | | | | 11,259,930 | | |
| 3.000%, 06/11/10 | | | 800 | | | | 797,173 | | |
| 4.250%, 06/11/10 | | | 2,000 | | | | 2,030,182 | | |
| 2.750%, 06/18/10 | | | 8,600 | | | | 8,529,265 | | |
| 3.500%, 07/16/10 | | | 1,900 | | | | 1,907,060 | | |
| 3.375%, 08/13/10 | | | 1,200 | | | | 1,202,130 | | |
| 3.375%, 09/10/10 | | | 500 | | | | 500,928 | | |
Federal Home Loan Bank Discount Note
3.212%, 01/05/09 | | | 4,100 | | | | 4,092,395 | | |
| TOTAL AGENCY OBLIGATIONS | | | | | | | 132,239,003 | | |
| TEMPORARY CASH INVESTMENTS — (0.6%) | |
Repurchase Agreement, PNC Capital Markets, Inc. 0.94%, 11/03/08 (Collateralized by $1,020,000
FNMA 5.50%, 02/25/36, valued at $754,224) to be repurchased at $742,058 | | | 742 | | | | 742,000 | | |
TOTAL INVESTMENTS — (100.0%)
(Cost $133,507,918) | | | | | | $ | 132,981,003 | | |
See accompanying Notes to Financial Statements.
9
DIMENSIONAL INVESTMENT GROUP INC.
LWAS/DFA U.S. HIGH BOOK TO MARKET PORTFOLIO
STATEMENT OF ASSETS AND LIABILITIES
OCTOBER 31, 2008
(Amounts in thousands, except share and per share amounts)
| ASSETS: | |
Investment in The U.S. Large Cap Value Series of The DFA Investment Trust Company
(Affiliated Investment Company) (5,050,480 Shares) at Value† | | $ | 68,485 | | |
| Receivables: | |
| Affiliated Investment Company Shares Sold | | | 34 | | |
| Fund Shares Sold | | | 2 | | |
| Prepaid Expenses and Other Assets | | | 5 | | |
| Total Assets | | | 68,526 | | |
| LIABILITIES: | |
| Payables: | |
| Fund Shares Redeemed | | | 36 | | |
| Due to Advisor | | | 1 | | |
| Accrued Expenses and Other Liabilities | | | 27 | | |
| Total Liabilities | | | 64 | | |
| NET ASSETS | | $ | 68,462 | | |
| SHARES OUTSTANDING, $0.01 PAR VALUE (1) | | | 7,571,162 | | |
| NET ASSET VALUE, OFFERING AND REDEMPTION PRICE PER SHARE | | $ | 9.04 | | |
| Investment in Affiliated Investment Company at Cost | | $ | 66,090 | | |
| NET ASSETS CONSIST OF: | |
| Paid-In Capital | | $ | 78,769 | | |
| Undistributed Net Investment Income (Distributions in Excess of Net Investment Income) | | | 366 | | |
| Accumulated Net Realized Gain (Loss) | | | (13,068 | ) | |
| Net Unrealized Appreciation (Depreciation) | | | 2,395 | | |
| NET ASSETS | | $ | 68,462 | | |
| (1) NUMBER OF SHARES AUTHORIZED | | | 200,000,000 | | |
See accompanying Notes to Financial Statements.
10
DIMENSIONAL INVESTMENT GROUP INC.
STATEMENTS OF ASSETS AND LIABILITIES
OCTOBER 31, 2008
(Amounts in thousands, except share and per share amounts)
| | | LWAS/DFA
Two-Year
Fixed Income
Portfolio | | LWAS/DFA
Two-Year
Government
Portfolio | |
| ASSETS: | |
| Investments at Value | | $ | 82,610 | | | $ | 132,239 | | |
| Temporary Cash Investments at Value & Cost | | | 1,031 | | | | 742 | | |
| Receivables: | |
| Interest | | | 667 | | | | 1,119 | | |
| Fund Shares Sold | | | — | | | | 24 | | |
| Prepaid Expenses and Other Assets | | | 5 | | | | 5 | | |
| Total Assets | | | 84,313 | | | | 134,129 | | |
| LIABILITIES: | |
| Payables: | |
| Fund Shares Redeemed | | | 217 | | | | 298 | | |
| Due to Advisor | | | 11 | | | | 17 | | |
| Accrued Expenses and Other Liabilities | | | 20 | | | | 29 | | |
| Total Liabilities | | | 248 | | | | 344 | | |
| NET ASSETS | | $ | 84,065 | | | $ | 133,785 | | |
| SHARES OUTSTANDING, $0.01 PAR VALUE (1) | | | 8,545,184 | | | | 13,655,655 | | |
| NET ASSET VALUE, OFFERING AND REDEMPTION PRICE PER SHARE | | $ | 9.84 | | | $ | 9.80 | | |
| Investments at Cost | | $ | 83,032 | | | $ | 132,766 | | |
| NET ASSETS CONSIST OF: | |
| Paid-In Capital | | $ | 85,212 | | | $ | 134,553 | | |
Undistributed Net Investment Income (Distributions in Excess of
Net Investment Income) | | | 418 | | | | 598 | | |
| Accumulated Net Realized Gain (Loss) | | | (1,143 | ) | | | (839 | ) | |
| Net Unrealized Appreciation (Depreciation) | | | (422 | ) | | | (527 | ) | |
| NET ASSETS | | $ | 84,065 | | | $ | 133,785 | | |
| (1) NUMBER OF SHARES AUTHORIZED | | | 200,000,000 | | | | 200,000,000 | | |
See accompanying Notes to Financial Statements.
11
DIMENSIONAL INVESTMENT GROUP INC.
STATEMENTS OF OPERATIONS
(Amounts in thousands)
| | | LWAS/DFA
U.S. High
Book to Market
Portfolio | | LWAS/DFA
Two-Year
Fixed Income
Portfolio | | LWAS/DFA
Two-Year
Government
Portfolio | |
| | | Period Dec. 1,
2007 to
Oct. 31, 2008 | | Year Ended
Nov. 30,
2007 | | Period Dec. 1,
2007 to
Oct. 31, 2008 | | Year Ended
Nov. 30,
2007 | | Period Dec. 1,
2007 to
Oct. 31, 2008 | | Year Ended
Nov. 30,
2007 | |
| Investment Income | |
Income Distributions Received from
Affiliated Investment Company | | $ | 1,834 | | | $ | 1,814 | | | | — | | | | — | | | | — | | | | — | | |
| Interest | | | — | | | | — | | | $ | 2,826 | | | $ | 4,824 | | | $ | 3,428 | | | $ | 4,319 | | |
| Total Investment Income | | | 1,834 | | | | 1,814 | | | | 2,826 | | | | 4,824 | | | | 3,428 | | | | 4,319 | | |
| Expenses | |
| Investment Advisory Services Fees | | | — | | | | — | | | | 127 | | | | 138 | | | | 172 | | | | 130 | | |
| Administrative Services Fees | | | 10 | | | | 13 | | | | — | | | | — | | | | — | | | | — | | |
| Accounting & Transfer Agent Fees | | | 13 | | | | 14 | | | | 28 | | | | 31 | | | | 31 | | | | 30 | | |
| Shareholder Servicing Fees | | | 142 | | | | 194 | | | | 68 | | | | 73 | | | | 92 | | | | 70 | | |
| Filing Fees | | | 15 | | | | 17 | | | | 15 | | | | 17 | | | | 18 | | | | 18 | | |
| Shareholders' Reports | | | 13 | | | | 17 | | | | 11 | | | | 12 | | | | 14 | | | | 10 | | |
| Custodian Fees | | | — | | | | — | | | | 4 | | | | 5 | | | | 2 | | | | 3 | | |
| Professional Fees | | | 6 | | | | 5 | | | | 3 | | | | 2 | | | | 5 | | | | 2 | | |
| Other | | | 4 | | | | 3 | | | | 3 | | | | 3 | | | | 5 | | | | 3 | | |
| Total Expenses | | | 203 | | | | 263 | | | | 259 | | | | 281 | | | | 339 | | | | 266 | | |
| Net Investment Income (Loss) | | | 1,631 | | | | 1,551 | | | | 2,567 | | | | 4,543 | | | | 3,089 | | | | 4,053 | | |
| Realized and Unrealized Gain (Loss) | |
Capital Gain Distributions Received from
Affiliated Investment Company | | | — | | | | 6,681 | | | | — | | | | — | | | | — | | | | — | | |
Net Realized Gain (Loss) on Investment
Securities Sold/Affiliated Investment
Company Shares Sold | | | (2,340 | ) | | | 136 | | | | (14 | ) | | | (2 | ) | | | (22 | ) | | | (1 | ) | |
Change in Unrealized Appreciation (Depreciation)
of Investment Securities/Affiliated Investment
Company Shares | | | (40,590 | ) | | | (8,837 | ) | | | (360 | ) | | | (24 | ) | | | (560 | ) | | | 97 | | |
| Net Realized and Unrealized Gain (Loss) | | | (42,930 | ) | | | (2,020 | ) | | | (374 | ) | | | (26 | ) | | | (582 | ) | | | 96 | | |
Net Increase (Decrease) in Net Assets Resulting
from Operations | | $ | (41,299 | ) | | $ | (469 | ) | | $ | 2,193 | | | $ | 4,517 | | | $ | 2,507 | | | $ | 4,149 | | |
See accompanying Notes to Financial Statements.
12
DIMENSIONAL INVESTMENT GROUP INC.
STATEMENTS OF CHANGES IN NET ASSETS
(Amounts in thousands)
| | | LWAS/DFA
U.S. High
Book to Market
Portfolio | | LWAS/DFA
Two-Year
Fixed Income
Portfolio | | LWAS/DFA
Two-Year
Government
Portfolio | |
| | | Period
Dec. 1,
2007 to
Oct. 31,
2008 | |
Year
Ended
Nov. 30,
2007 | |
Year
Ended
Nov. 30,
2006 | | Period
Dec. 1,
2007 to
Oct. 31,
2008 | | Year
Ended
Nov. 30,
2007 | | Year
Ended
Nov. 30,
2006 | | Period
Dec. 1,
2007 to
Oct. 31,
2008 | | Year
Ended
Nov. 30,
2007 | | Year
Ended
Nov. 30,
2006 | |
| Increase (Decrease) in Net Assets | |
| Operations: | |
| Net Investment Income (Loss) | | $ | 1,631 | | | $ | 1,551 | | | $ | 1,779 | | | $ | 2,567 | | | $ | 4,543 | | | $ | 2,959 | | | $ | 3,089 | | | $ | 4,053 | | | $ | 2,534 | | |
Capital Gain Distributions Received from
Affiliated Investment Company | | | — | | | | 6,681 | | | | 3,546 | | | | — | | | | — | | | | — | | | | — | | | | — | | | | — | | |
Net Realized Gain (Loss) on Investment
Securities Sold/Affiliated Investment
Company Shares Sold | | | (2,340 | ) | | | 136 | | | | 407 | | | | (14 | ) | | | (2 | ) | | | (203 | ) | | | (22 | ) | | | (1 | ) | | | (59 | ) | |
Change in Unrealized Appreciation
(Depreciation) of Investment
Securities/Affiliated Investment
Company Shares | | | (40,590 | ) | | | (8,837 | ) | | | 13,488 | | | | (360 | ) | | | (24 | ) | | | 901 | | | | (560 | ) | | | 97 | | | | 715 | | |
Net Increase (Decrease) in Net Assets
Resulting from Operations | | | (41,299 | ) | | | (469 | ) | | | 19,220 | | | | 2,193 | | | | 4,517 | | | | 3,657 | | | | 2,507 | | | | 4,149 | | | | 3,190 | | |
| Distributions From: | |
| Net Investment Income | | | (1,652 | ) | | | (1,533 | ) | | | (1,658 | ) | | | (3,304 | ) | | | (4,369 | ) | | | (2,600 | ) | | | (3,616 | ) | | | (3,767 | ) | | | (2,246 | ) | |
| Net Short-Term Gains | | | (16 | ) | | | (506 | ) | | | (251 | ) | | | — | | | | — | | | | — | | | | — | | | | — | | | | — | | |
| Net Long-Term Gains | | | (6,421 | ) | | | (3,294 | ) | | | (81 | ) | | | — | | | | — | | | | — | | | | — | | | | — | | | | — | | |
| Total Distributions | | | (8,089 | ) | | | (5,333 | ) | | | (1,990 | ) | | | (3,304 | ) | | | (4,369 | ) | | | (2,600 | ) | | | (3,616 | ) | | | (3,767 | ) | | | (2,246 | ) | |
| Capital Share Transactions (1): | |
| Shares Issued | | | 12,180 | | | | 11,690 | | | | 17,138 | | | | 9,071 | | | | 18,206 | | | | 13,580 | | | | 51,236 | | | | 50,978 | | | | 16,187 | | |
Shares Issued in Lieu of
Cash Distributions | | | 6,808 | | | | 4,529 | | | | 1,683 | | | | 2,785 | | | | 3,631 | | | | 2,178 | | | | 2,696 | | | | 3,311 | | | | 2,051 | | |
| Shares Redeemed | | | (20,971 | ) | | | (15,567 | ) | | | (14,379 | ) | | | (23,122 | ) | | | (11,625 | ) | | | (10,932 | ) | | | (29,376 | ) | | | (17,281 | ) | | | (14,942 | ) | |
Net Increase (Decrease) from
Capital Share Transactions | | | (1,983 | ) | | | 652 | | | | 4,442 | | | | (11,266 | ) | | | 10,212 | | | | 4,826 | | | | 24,556 | | | | 37,008 | | | | 3,296 | | |
Total Increase (Decrease) in
Net Assets | | | (51,371 | ) | | | (5,150 | ) | | | 21,672 | | | | (12,377 | ) | | | 10,360 | | | | 5,883 | | | | 23,447 | | | | 37,390 | | | | 4,240 | | |
| Net Assets | |
| Beginning of Period | | | 119,833 | | | | 124,983 | | | | 103,311 | | | | 96,442 | | | | 86,082 | | | | 80,199 | | | | 110,338 | | | | 72,948 | | | | 68,708 | | |
| End of Period | | $ | 68,462 | | | $ | 119,833 | | | $ | 124,983 | | | $ | 84,065 | | | $ | 96,442 | | | $ | 86,082 | | | $ | 133,785 | | | $ | 110,338 | | | $ | 72,948 | | |
| (1) Shares Issued and Redeemed: | |
| Shares Issued | | | 1,117 | | | | 714 | | | | 1,171 | | | | 920 | | | | 1,837 | | | | 1,382 | | | | 5,221 | | | | 5,179 | | | | 1,662 | | |
| Shares Issued in Lieu of Cash Distributions | | | 487 | | | | 285 | | | | 119 | | | | 283 | | | | 369 | | | | 223 | | | | 276 | | | | 339 | | | | 211 | | |
| Shares Redeemed | | | (1,841 | ) | | | (955 | ) | | | (956 | ) | | | (2,346 | ) | | | (1,175 | ) | | | (1,113 | ) | | | (2,993 | ) | | | (1,758 | ) | | | (1,530 | ) | |
| | | | (237 | ) | | | 44 | | | | 334 | | | | (1,143 | ) | | | 1,031 | | | | 492 | | | | 2,504 | | | | 3,760 | | | | 343 | | |
Undistributed Net Investment Income
(Distributions in Excess of Net
Investment Income) | | $ | 366 | | | $ | 395 | | | $ | 442 | | | $ | 418 | | | $ | 1,155 | | | $ | 981 | | | $ | 598 | | | $ | 1,125 | | | $ | 839 | | |
See accompanying Notes to Financial Statements.
13
DIMENSIONAL INVESTMENT GROUP INC.
LWAS/DFA U.S. HIGH BOOK TO MARKET PORTFOLIO
FINANCIAL HIGHLIGHTS
(for a share outstanding throughout each period)
| | | Period
Dec. 1,
2007 to
Oct. 31,
2008 | | Year
Ended
Nov. 30,
2007 | | Year
Ended
Nov. 30,
2006 | | Year
Ended
Nov. 30,
2005 | | Year
Ended
Nov. 30,
2004 | | Year
Ended
Nov. 30,
2003 | |
Net Asset Value,
Beginning of Period | | $ | 15.35 | | | $ | 16.10 | | | $ | 13.91 | | | $ | 12.28 | | | $ | 10.23 | | | $ | 8.74 | | |
| Income from Investment Operations | |
Net Investment
Income (Loss) | | | 0.21 | (A) | | | 0.20 | (A) | | | 0.23 | (A) | | | 0.19 | | | | 0.10 | | | | 0.13 | | |
Net Gains (Losses)
(Realized and
Unrealized) | | | (5.48 | ) | | | (0.26 | ) | | | 2.23 | | | | 1.57 | | | | 2.08 | | | | 1.59 | | |
Total from Investment
Operations | | | (5.27 | ) | | | (0.06 | ) | | | 2.46 | | | | 1.76 | | | | 2.18 | | | | 1.72 | | |
| Less Distributions | |
| Net Investment Income | | | (0.21 | ) | | | (0.20 | ) | | | (0.22 | ) | | | (0.13 | ) | | | (0.13 | ) | | | (0.12 | ) | |
| Net Realized Gains | | | (0.83 | ) | | | (0.49 | ) | | | (0.05 | ) | | | — | | | | — | | | | (0.11 | ) | |
| Total Distributions | | | (1.04 | ) | | | (0.69 | ) | | | (0.27 | ) | | | (0.13 | ) | | | (0.13 | ) | | | (0.23 | ) | |
Net Assets Value,
End of Period | | $ | 9.04 | | | $ | 15.35 | | | $ | 16.10 | | | $ | 13.91 | | | $ | 12.28 | | | $ | 10.23 | | |
| Total Return | | | (36.69 | )%(C) | | | (0.51 | )% | | | 17.90 | % | | | 14.44 | % | | | 21.45 | % | | | 20.18 | % | |
Net Assets, End of Period
(thousands) | | $ | 68,462 | | | $ | 119,833 | | | $ | 124,983 | | | $ | 103,311 | | | $ | 92,494 | | | $ | 76,487 | | |
Ratio of Expenses to
Average Net Assets (D) | | | 0.33 | %(B) | | | 0.32 | % | | | 0.32 | % | | | 0.34 | % | | | 0.35 | % | | | 0.36 | % | |
Ratio of Net Investment
Income to Average
Net Assets | | | 1.72 | %(B) | | | 1.20 | % | | | 1.54 | % | | | 1.43 | % | | | 0.87 | % | | | 1.39 | % | |
See page 1 for the Definitions of Abbreviations and Footnotes.
See accompanying Notes to Financial Statements.
14
DIMENSIONAL INVESTMENT GROUP INC.
FINANCIAL HIGHLIGHTS
(for a share outstanding throughout each period)
| | | LWAS/DFA Two-Year Fixed Income Portfolio | | LWAS/DFA Two-Year Government Portfolio | |
| | | Period
Dec. 1,
2007 to
Oct. 31,
2008 | | Year
Ended
Nov. 30,
2007 | | Year
Ended
Nov. 30,
2006 | | Year
Ended
Nov. 30,
2005 | | Year
Ended
Nov. 30,
2004 | | Year
Ended
Nov. 30,
2003 | | Period
Dec. 1,
2007 to
Oct. 31,
2008 | | Year
Ended
Nov. 30,
2007 | | Year
Ended
Nov. 30,
2006 | | Year
Ended
Nov. 30,
2005 | | Year
Ended
Nov. 30,
2004 | | Year
Ended
Nov. 30,
2003 | |
| Net Asset Value, Beginning of Period | | $ | 9.95 | | | $ | 9.94 | | | $ | 9.82 | | | $ | 9.90 | | | $ | 10.17 | | | $ | 10.40 | | | $ | 9.89 | | | $ | 9.87 | | | $ | 9.75 | | | $ | 9.83 | | | $ | 10.13 | | | $ | 10.46 | | |
| Income from Investment Operations | |
| Net Investment Income (Loss) | | | 0.28 | (A) | | | 0.49 | (A) | | | 0.35 | (A) | | | 0.27 | | | | 0.16 | | | | 0.23 | | | | 0.24 | (A) | | | 0.46 | (A) | | | 0.34 | (A) | | | 0.26 | | | | 0.17 | | | | 0.16 | | |
Net Gains (Losses) on Securities
(Realized and Unrealized) | | | (0.04 | ) | | | — | | | | 0.08 | | | | (0.11 | ) | | | (0.08 | ) | | | (0.01 | ) | | | (0.03 | ) | | | 0.01 | | | | 0.08 | | | | (0.10 | ) | | | (0.06 | ) | | | 0.06 | | |
| Total from Investment Operations | | | 0.24 | | | | 0.49 | | | | 0.43 | | | | 0.16 | | | | 0.08 | | | | 0.22 | | | | 0.21 | | | | 0.47 | | | | 0.42 | | | | 0.16 | | | | 0.11 | | | | 0.22 | | |
| Less Distributions | |
| Net Investment Income | | | (0.35 | ) | | | (0.48 | ) | | | (0.31 | ) | | | (0.24 | ) | | | (0.14 | ) | | | (0.22 | ) | | | (0.30 | ) | | | (0.45 | ) | | | (0.30 | ) | | | (0.24 | ) | | | (0.15 | ) | | | (0.20 | ) | |
| Net Realized Gains | | | — | | | | — | | | | — | | | | — | | | | (0.21 | ) | | | (0.23 | ) | | | — | | | | — | | | | — | | | | — | | | | (0.26 | ) | | | (0.35 | ) | |
| Total Distributions | | | (0.35 | ) | | | (0.48 | ) | | | (0.31 | ) | | | (0.24 | ) | | | (0.35 | ) | | | (0.45 | ) | | | (0.30 | ) | | | (0.45 | ) | | | (0.30 | ) | | | (0.24 | ) | | | (0.41 | ) | | | (0.55 | ) | |
| Net Asset Value, End of Period | | $ | 9.84 | | | $ | 9.95 | | | $ | 9.94 | | | $ | 9.82 | | | $ | 9.90 | | | $ | 10.17 | | | $ | 9.80 | | | $ | 9.89 | | | $ | 9.87 | | | $ | 9.75 | | | $ | 9.83 | | | $ | 10.13 | | |
| Total Return | | | 2.46 | %(C) | | | 5.03 | % | | | 4.47 | % | | | 1.65 | % | | | 0.85 | % | | | 2.15 | % | | | 2.13 | %(C) | | | 4.85 | % | | | 4.42 | % | | | 1.67 | % | | | 1.10 | % | | | 2.11 | % | |
| Net Assets, End of Period (thousands) | | $ | 84,065 | | | $ | 96,442 | | | $ | 86,082 | | | $ | 80,199 | | | $ | 80,584 | | | $ | 73,101 | | | $ | 133,785 | | | $ | 110,338 | | | $ | 72,948 | | | $ | 68,708 | | | $ | 69,853 | | | $ | 85,140 | | |
| Ratio of Expenses to Average Net Assets | | | 0.31 | %(B) | | | 0.31 | % | | | 0.31 | % | | | 0.36 | % | | | 0.38 | % | | | 0.37 | % | | | 0.30 | %(B) | | | 0.31 | % | | | 0.32 | % | | | 0.37 | % | | | 0.36 | % | | | 0.35 | % | |
Ratio of Net Investment Income to
Average Net Assets | | | 3.04 | %(B) | | | 4.94 | % | | | 3.57 | % | | | 2.72 | % | | | 1.65 | % | | | 1.72 | % | | | 2.69 | %(B) | | | 4.66 | % | | | 3.45 | % | | | 2.67 | % | | | 1.63 | % | | | 1.57 | % | |
| Portfolio Turnover Rate | | | 20 | %(C) | | | 22 | % | | | 15 | % | | | 48 | % | | | 152 | % | | | 171 | % | | | 7 | %(C) | | | 0 | % | | | 29 | % | | | 44 | % | | | 142 | % | | | 216 | % | |
See page 1 for the Definitions of Abbreviations and Footnotes.
See accompanying Notes to Financial Statements.
15
DIMENSIONAL INVESTMENT GROUP INC.
NOTES TO FINANCIAL STATEMENTS
A. Organization:
Dimensional Investment Group Inc. (the "Fund") is an open-end management investment company registered under the Investment Company Act of 1940, whose shares are generally offered to institutional investors, retirement plans and clients of registered investment advisors. The Fund consists of fifteen portfolios, of which three (the "Portfolios") are presented in this report.
The LWAS/DFA U.S. High Book to Market Portfolio ("Feeder Fund") primarily invests its assets in The U.S. Large Cap Value Series (the "Series"), a corresponding Series of The DFA Investment Trust Company. At October 31, 2008, the Portfolio owned 1% of the outstanding shares of the Series.
The financial statements of the Series are included elsewhere in this report and should be read in conjunction with the financial statements of the Feeder Fund.
At a regular meeting of the Board of Directors/Trustees (the "Board") on September 16, 2008, the Board voted to change the fiscal and tax year ends of the Portfolios from November 30 to October 31.
B. Significant Accounting Policies:
The following significant accounting policies are in conformity with accounting principles generally accepted in the United States of America. Such policies are consistently followed by the Fund in preparation of its financial statements. The preparation of financial statements in accordance with accounting principles generally accepted in the United States of America requires management to make estimates and assumptions that affect the reported amounts of assets and liabilities and disclosure of contingent assets and liabilities at the date of the financial statements and the reported amounts of increases and decreases in net assets from operations during the reporting period. Actual results could differ from those estimates and those differences could be material.
1. Security Valuation: The shares of The U.S. Large Cap Value Series held by the LWAS/DFA U.S. High Book to Market Portfolio are valued at its daily net asset value. Securities held by the LWAS/DFA Two-Year Fixed Income Portfolio and the LWAS/DFA Two-Year Government Portfolio are valued on the basis of prices provided by one or more pricing services or other reasonably reliable sources including broker/dealers that typically handle the purchase and sale of such securities. Securities which are traded over-the counter and on a stock exchange generally will be valued according to the broadest and most representative market, and it is expected that for bonds and other fixed income securities, this ordinarily will be the over-the-counter market. Securities for which quotations are not readily available, (including restricted securities), or for which market quotations have become unreliable, are valued in good faith at fair value in accordance with procedures adopted by the Board of Directors/Trustees. Fair value pricing may also be used if events that have a significant effect on the value of an investment (as determined in the discretion of the Investment Committee of the Advisor) occur before the net asset value is calculated. When fair value pricing is used, the prices of securities used by the Portfolios may differ from the quoted or published prices for the same securities on their primary markets or exchanges.
Adoption of Statement of Financial Accounting Standards No. 157 "Fair Value Measurements" ("FAS 157")
In September 2006, the Financial Accounting Standards Board issued FAS 157 effective for fiscal years beginning after November 15, 2007. This standard clarifies the definition of fair value for financial reporting, establishes a framework for measuring fair value and requires additional disclosures about the use of fair value measurements. The Funds have adopted FAS 157 as of December 1, 2007. The three levels of the fair value hierarchy under FAS 157 are described below:
• Level 1 – quoted prices in active markets for identical securities
• Level 2 – other significant observable inputs (including quoted prices for similar securities, interest rates, prepayment speeds, credit risk, etc.)
• Level 3 – significant unobservable inputs (including the Portfolios' own assumptions in determining the fair value of investments)
16
The inputs or methodology used for valuing securities are not necessarily an indication of the risk associated with investing in those securities. A summary of the inputs used to value the Portfolios' net assets as of October 31, 2008 is listed below (in thousands).
| | | Valuation Inputs | |
| | | Investments in
Securities
(Market Value) | |
| | | Level 1 | | Level 2 | | Level 3 | | Total | |
| LWAS/DFA U.S. High Book to Market Portfolio | | $ | 68,485 | | | | — | | | | — | | | $ | 68,485 | | |
| LWAS/DFA Two-Year Fixed Income Portfolio | | | — | | | $ | 83,641 | | | | — | | | | 83,641 | | |
| LWAS/DFA Two-Year Government Portfolio | | | — | | | | 132,981 | | | | — | | | | 132,981 | | |
2. Deferred Compensation Plan: Each eligible Director of the Fund may elect participation in the Deferred Compensation Plan (the "Plan"). Under the Plan, effective January 1, 2002, such Directors may defer payment of all or a portion of their total fees earned as a Director. These deferred amounts may be treated as though such amounts had been invested in shares of the following funds: U.S. Large Cap Value Portfolio; U.S. Core Equity 1 Portfolio; U.S. Core Equity 2 Portfolio; U.S. Vector Equity Portfolio; U.S. Micro Cap Portfolio; DFA International Value Portfolio; International Core Equity Portfolio; Emerging Markets Portfolio; Emerging Markets Core Equity Portfolio; and/or DFA Two- Year Global Fixed Income Portfolio. Contributions made under the Plan and the change in unrealized appreciation (depreciation) and income, are included in Other Expenses for the period ended October 31, 2008.
Each Director has the option to receive their distribution of proceeds in one of the following methods upon one year's notice: lump sum; annual installments over a period of agreed upon years; or semi-annual installments over a period of agreed upon years. As of October 31, 2008, none of the Directors have requested distribution of proceeds.
3. Other: Security transactions are accounted for as of the trade date. Costs used in determining realized gains and losses on the sale of investment securities/affiliated investment company shares are on the basis of identified cost. Dividend income and distributions to shareholders are recorded on the ex-dividend date. Interest income is recorded on the accrual basis. Discount and premium on debt securities purchased are amortized over the lives of the respective securities utilizing the effective interest method. Expenses directly attributable to the Portfolios are directly charged. Common expenses of the Fund are allocated using methods approved by the Board of Directors/Trustees, generally based on average net assets.
C. Investment Advisor:
Dimensional Fund Advisors LP ("Dimensional" or the "Advisor") provides administrative services to one of the Portfolios, including supervision of services provided by others, providing information to the shareholders and to the Board of Directors/Trustees, and other administrative services. The Advisor provides investment advisory services to two of the Portfolios. For the period December 1, 2007 to October 31, 2008, the Portfolios' administrative services fees or investment advisory services fees were accrued daily and paid monthly to the Advisor based on the following effective annual rates of average daily net assets:
| | | Administrative
Services Fees | | Advisory
Services Fees | |
| LWAS/DFA U.S. High Book to Market Portfolio | | | 0.01 | % | | | — | | |
| LWAS/DFA Two-Year Fixed Income Portfolio | | | — | | | | 0.15 | % | |
| LWAS/DFA Two-Year Government Portfolio | | | — | | | | 0.15 | % | |
In addition, pursuant to a Client Service Agreement with LWI Financial Inc. ("LWIF"), the Portfolios pay fees to LWIF at the following effective annual rates of their average daily net assets:
| | | Shareholder
Servicing Fees | |
| LWAS/DFA U.S. High Book to Market Portfolio | | | 0.15 | % | |
| LWAS/DFA Two-Year Fixed Income Portfolio | | | 0.08 | % | |
| LWAS/DFA Two-Year Government Portfolio | | | 0.08 | % | |
17
Fees Paid to Officers and Directors/Trustees:
Certain Officers and Directors/Trustees of the Advisor are also Officers and Directors/Trustees of the Fund; however, such Officers and Directors/Trustees (with the exception of the Chief Compliance Officer ("CCO")) receive no compensation from the Fund. For the period December 1, 2007 to October 31, 2008, the total related amounts paid by the Fund to the CCO were $25 (in thousands). The total related amounts paid by each of the Portfolios are included in Other Expenses on the Statement of Operations.
D. Deferred Compensation:
At October 31, 2008, the total liability for deferred compensation to Directors/Trustees is included in Accrued Expenses and Other Liabilities on the Statement of Assets and Liabilities as follows (amounts in thousands):
| LWAS/DFA U.S. High Book to Market Portfolio | | $ | 2 | | |
| LWAS/DFA Two-Year Fixed Income Portfolio | | | 1 | | |
| LWAS/DFA Two-Year Government Portfolio | | | 2 | | |
E. Purchases and Sales of Securities:
For the period December 1, 2007 to October 31, 2008, the Portfolios made the following purchases and sales of investment securities, other than short-term securities (amounts in thousands):
| | | U.S. Government
Securities | | Other Investment
Securities | |
| | | Purchases | | Sales | | Purchases | | Sales | |
| LWAS/DFA Two-Year Fixed Income Portfolio | | $ | 39,651 | | | $ | 3,465 | | | $ | 13,608 | | | $ | 3,596 | | |
| LWAS/DFA Two-Year Government Portfolio | | | 133,235 | | | | 4,480 | | | | — | | | | — | | |
F. Federal Income Taxes:
Each Portfolio has qualified and intends to continue to qualify as a regulated investment company under Subchapter M of the Internal Revenue Code for federal income tax purposes and to distribute substantially all of its taxable income and net capital gains to its shareholders. Accordingly, no provision has been made for federal income taxes.
Distributions from net investment income and net realized capital gains are determined in accordance with U.S. federal income tax regulations, which may differ from those amounts determined under accounting principles generally accepted in the United States of America. These book/tax differences are either temporary or permanent in nature. To the extent these differences are permanent, they are charged or credited to paid-in capital, undistributed net investment income or accumulated net realized gains, as appropriate, in the period that the differences arise. Accordingly, the following permanent differences as of October 31, 2008, primarily attributable to the recharacterizations of distributions from realized gains (losses) to undistributed net investment income were reclassified to the following accounts. These reclassifications had no effect on net asset value per share (amounts in thousands):
| | | Increase
(Decrease)
Undistributed
Net Investment
Income | | Increase
(Decrease)
Accumulated
Net Realized
Gains/(Losses) | |
| LWAS/DFA U.S. High Book to Market Portfolio | | $ | (8 | ) | | $ | 8 | | |
The tax character of dividends and distributions declared and paid during the years ended November 30, 2006, November 30, 2007 and the period December 1, 2007 to October 31, 2008 were as follows (amounts in thousands):
| | | Net Investment
Income
and Short-Term
Capital Gains | | Long-Term
Capital Gains | | Total | |
LWAS/DFA U.S. High Book to Market Portfolio
2006 | | $ | 2,002 | | | $ | 217 | | | $ | 2,219 | | |
| 2007 | | | 2,104 | | | | 3,541 | | | | 5,645 | | |
| 2008 | | | 1,668 | | | | 6,420 | | | | 8,088 | | |
18
| | | Net Investment
Income
and Short-Term
Capital Gains | | Long-Term
Capital Gains | | Total | |
LWAS/DFA Two-Year Fixed Income Portfolio
2006 | | | $2,600 | | | | — | | | | $2,600 | | |
| 2007 | | | 4,369 | | | | — | | | | 4,369 | | |
| 2008 | | | 3,304 | | | | — | | | | 3,304 | | |
LWAS/DFA Two-Year Government Portfolio
2006 | | | 2,246 | | | | — | | | | 2,246 | | |
| 2007 | | | 3,767 | | | | — | | | | 3,767 | | |
| 2008 | | | 3,616 | | | | — | | | | 3,616 | | |
At October 31, 2008, the components of distributable earnings/(accumulated losses) were as follows (amounts in thousands):
| | | Undistributed
Net
Investment
Income and
Short-Term
Capital Gains | | Undistributed
Long-Term
Capital Gains | | Capital
Loss
Carryforward | | Total Net
Distributable
Earnings/
(Accumulated
Losses) | |
| LWAS/DFA U.S. High Book to Market Portfolio | | $ | 368 | | | | — | | | $ | (1,337 | ) | | $ | (969 | ) | |
| LWAS/DFA Two-Year Fixed Income Portfolio | | | 419 | | | | — | | | | (1,143 | ) | | | (724 | ) | |
| LWAS/DFA Two-Year Government Portfolio | | | 600 | | | | — | | | | (833 | ) | | | (233 | ) | |
For federal income tax purposes, the Fund measures its capital loss carryforwards annually at October 31, its fiscal year end. Capital loss carryforwards may be carried forward and applied against future capital gains. As of October 31, 2008, the following Portfolios had capital loss carryforwards available to offset future realized capital gains through the indicated expiration dates (amounts in thousands):
| | | Expires on October 31, | | | |
| | | 2012 | | 2013 | | 2014 | | 2015 | | 2016 | | Total | |
| LWAS/DFA U.S. High Book to Market Portfolio | | | — | | | | — | | | | — | | | | — | | | $ | 1,337 | | | $ | 1,337 | | |
| LWAS/DFA Two-Year Fixed Income Portfolio | | $ | 454 | | | $ | 470 | | | $ | 202 | | | $ | 3 | | | | 14 | | | | 1,143 | | |
| LWAS/DFA Two-Year Government Portfolio | | | 393 | | | | 364 | | | | 53 | | | | 1 | | | | 22 | | | | 833 | | |
At October 31, 2008, the total cost and aggregate gross unrealized appreciation and (depreciation) of securities for federal income tax purposes were different from amounts reported for financial reporting purposes (amounts in thousands):
| | | Federal
Tax Cost | | Unrealized
Appreciation | | Unrealized
(Depreciation) | | Net
Unrealized
Appreciation
(Depreciation) | |
| LWAS/DFA U.S. High Book to Market Portfolio | | $ | 77,820 | | | $ | 2,395 | | | $ | (11,731 | ) | | $ | (9,336 | ) | |
| LWAS/DFA Two-Year Fixed Income Portfolio | | | 84,063 | | | | 51 | | | | (418 | ) | | | (367 | ) | |
| LWAS/DFA Two-Year Government Portfolio | | | 133,514 | | | | 53 | | | | (586 | ) | | | (533 | ) | |
In June 2006, the Financial Accounting Standards Board (FASB) issued FASB Interpretation 48 ("FIN 48"), "Accounting for Uncertainty in Income Taxes." This standard defines the threshold for recognizing the benefits of tax-return positions in the financial statements as "more-likely-than-not" to be sustained by the taxing authority and requires measurement of a tax position meeting the more-likely-than-not criterion, based on the largest benefit that is more than 50 percent likely to be realized. Management has analyzed the Portfolios' tax positions to be taken on the federal income tax returns for all open tax years (tax years ended November 30, 2005 through the period ended October 31, 2008), for purposes of implementing FIN 48, and has concluded that no provision for income tax is required in the Portfolios' financial statements.
19
G. Financial Instruments:
In accordance with the Portfolios' investment objectives and policies, the Portfolios may invest in certain financial instruments that have off-balance sheet risk in excess of the amounts recognized in the Financial Statements and concentrations of credit and market risk. The instruments and its significant corresponding risks are described below:
Repurchase Agreements: The LWAS/DFA Two-Year Fixed Income Portfolio and the LWAS/DFA Two-Year Government Portfolio may purchase money market instruments subject to the counterparty's agreement to repurchase them at an agreed upon date and price. The counterparty will be required on a daily basis to maintain the value of the collateral subject to the agreement at not less than the repurchase price (including accrued interest). The agreements are conditioned upon the collateral being deposited under the Federal Reserve book-entry system or with the Fund's custodian or a third party sub-custodian. In the event of default or bankruptcy by the other party to the agreement, retention of the collateral may be subject to legal proceedings. All open repurchase agreements were entered into on October 31, 2008.
H. Line of Credit:
The Fund, together with other Dimensional-advised portfolios, has entered into a $250 million unsecured discretionary line of credit effective June 30, 2003 with an affiliate of its domestic custodian bank. Each portfolio is permitted to borrow, subject to its investment limitations, up to a maximum of $250 million, as long as total borrowings under the line of credit do not exceed $250 million in the aggregate. Borrowings under the line of credit are charged interest at the then current Federal Funds Rate plus 1%. Each portfolio is individually, and not jointly, liable for its particular advances under the line of credit. There is no commitment fee on the unused portion of the line of credit. The agreement for the discretionary line of credit may be terminated by either party at any time. The line of credit is scheduled to expire on June 23, 2009. There were no borrowings by the Portfolios under this line of credit during the period ended O ctober 31, 2008.
The Fund, together with other Dimensional-advised portfolios, has also entered into an additional $500 million unsecured line of credit effective January 15, 2008 with its international custodian bank. Each portfolio is permitted to borrow, subject to its investment limitations, up to a maximum of $500 million, as long as total borrowings under the line of credit do not exceed $500 million in the aggregate. Each portfolio is individually, and not jointly, liable for its particular advances under the line of credit. Borrowings under the line of credit are charged interest at rates agreed to by the parties at the time of borrowing. There is no commitment fee on the unused portion of the line of credit. The agreement for the line of credit expires on January 15, 2009. There were no borrowings by the Portfolios under this line of credit during the period ended October 31, 2008.
I. Indemnitees; Contractual Obligations:
Under the Fund's organizational documents, its officers and directors are indemnified against certain liabilities arising out of the performance of their duties to the Fund.
In the normal course of business, the Fund enters into contracts that contain a variety of representations and warranties which provide general indemnification. The Fund's maximum exposure under these arrangements is unknown as this would involve future claims that may be made against the Fund and/or its affiliates that have not yet occurred. However, based on experience, the Fund expects the risk of loss to be remote.
J. Recently Issued Accounting Standards and Interpretation:
In March 2008, Statement of Financial Accounting Standards No. 161, Disclosures about Derivative Instruments and Hedging Activities ("FAS 161"), was issued and is effective for fiscal years beginning after November 15, 2008. FAS 161 defines new disclosures of derivative instruments and hedging activities. Management is currently evaluating the implications of FAS 161. At this time, its impact on the Portfolios' financial statements has not been determined.
20
K. Other:
At October 31, 2008, the following number of shareholders held the following approximate percentages of outstanding shares of the Portfolios. One or more of the shareholders is an omnibus account, which typically hold shares for the benefit of several other underlying investors.
| | | Number of
Shareholders | | Approximate Percentage
of Outstanding Shares | |
| LWAS/DFA U.S. High Book to Market Portfolio | | | 2 | | | | 96 | % | |
| LWAS/DFA Two-Year Fixed Income Portfolio | | | 2 | | | | 89 | % | |
| LWAS/DFA Two-Year Government Portfolio | | | 2 | | | | 95 | % | |
21
REPORT OF INDEPENDENT REGISTERED PUBLIC ACCOUNTING FIRM
To the Shareholders of the Portfolios, as defined, and
Board of Directors of Dimensional Investment Group Inc.:
In our opinion, the accompanying statement of assets and liabilities of LWAS/DFA U.S. High Book to Market Portfolio, and the statements of assets and liabilities, including the schedules of investments, of LWAS/DFA Two-Year Fixed Income Portfolio and LWAS/DFA Two-Year Government Portfolio, and the related statements of operations and of changes in net assets and the financial highlights present fairly, in all material respects, the financial position of LWAS/DFA U.S. High Book to Market Portfolio, LWAS/DFA Two-Year Fixed Income Portfolio and LWAS/DFA Two-Year Government Portfolio, (constituting portfolios within Dimensional Investment Group Inc., hereafter referred to as the "Portfolios") at October 31, 2008, the results of each of their operations, the changes in each of their net assets and the financial highlights for each of the periods indicated, in conformity with accounting principles generally accepted in the United States of America . These financial statements and financial highlights (hereafter referred to as "financial statements") are the responsibility of the Portfolios' management; our responsibility is to express an opinion on these financial statements based on our audits. We conducted our audits of these financial statements in accordance with the standards of the Public Company Accounting Oversight Board (United States). Those standards require that we plan and perform the audit to obtain reasonable assurance about whether the financial statements are free of material misstatement. An audit includes examining, on a test basis, evidence supporting the amounts and disclosures in the financial statements, assessing the accounting principles used and significant estimates made by management, and evaluating the overall financial statement presentation. We believe that our audits, which included confirmation of securities at October 31, 2008 by correspondence with the custodian, and by correspondence with the transfer agent of the i nvestee fund, provide a reasonable basis for our opinion.
PricewaterhouseCoopers LLP
Philadelphia, Pennsylvania
December 22, 2008
22
DFA INVESTMENT DIMENSIONS GROUP INC.
PERFORMANCE CHART
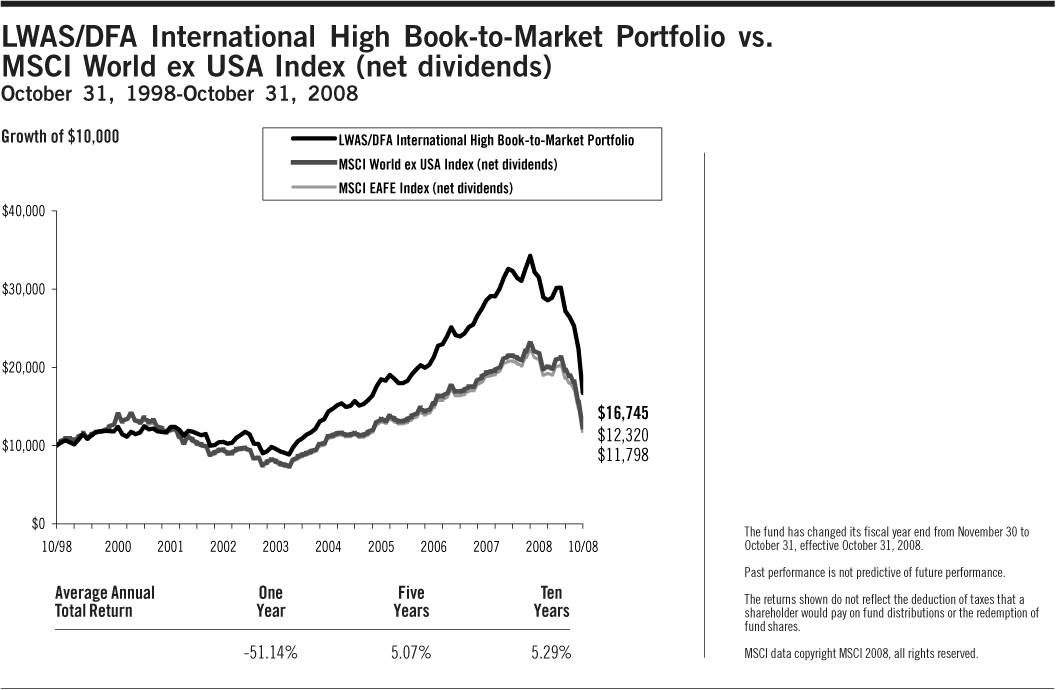
23
DFA INVESTMENT DIMENSIONS GROUP INC.
MANAGEMENT'S DISCUSSION AND ANALYSIS
On September 16, 2008, at a regular meeting of the Board of Directors/Trustees (the "Board") of the funds covered by this report, the Board voted to change the fiscal and tax year ends of the funds from November 30 to October 31. Therefore, the following discussion generally covers the 11-month period ended October 31, 2008.
International Equity Market Review 11 Months Ended October 31, 2008
International equity markets, affected by credit and liquidity problems similar to those experienced in the U.S., experienced high levels of volatility and broadly negative returns for the period under review. Due to the strengthening of the U.S. dollar vs. most developed countries' currencies (with the exception of the Japanese Yen and the Hong Kong dollar), the performance numbers when expressed in U.S. dollars were lower than when expressed in local currencies for all of the largest country constituents of the MSCI World ex USA Index, with the exception of Japan and Hong Kong. Overall, currency exchange rate changes reduced the returns expressed in U.S. dollars: total return for the MSCI World ex USA Index (net dividends) was –37.82% in local currency and –44.37% in U.S. dollars.
Total Returns for 11 Months Ended October 31, 2008
| Ten Largest Foreign Developed Markets by Market Cap (BB) | | Local
Currency
Return | | U.S. Dollar
Return | |
| Japan ($2,111) | | | –43.55 | % | | | –36.33 | % | |
| United Kingdom ($1,758) | | | –29.61 | % | | | –44.68 | % | |
| France ($872) | | | –36.80 | % | | | –45.40 | % | |
| Canada ($786) | | | –25.69 | % | | | –38.91 | % | |
| Germany ($705) | | | –37.97 | % | | | –46.42 | % | |
| Switzerland ($704) | | | –30.05 | % | | | –32.39 | % | |
| Australia ($513) | | | –35.10 | % | | | –51.58 | % | |
| Spain ($331) | | | –40.19 | % | | | –48.33 | % | |
| Italy ($301) | | | –43.34 | % | | | –51.06 | % | |
| Netherlands ($206) | | | –41.65 | % | | | –49.59 | % | |
Country market capitalizations (in parentheses) are in USD billions. Source: Returns are of MSCI indices net of foreign withholding taxes on dividends. Country market capitalizations are based on country carve-outs of the MSCI All-Country World Investable Market Index. MSCI data copyright MSCI 2008, all rights reserved.
Small company stocks were the poorest-performing asset classes in international markets, while large company growth stocks had the best relative results.
Total Returns for 11 Months Ended October 31, 2008
| | | U.S. Dollar
Return | |
| MSCI World ex USA Small Cap Index | | | –50.30 | % | |
| MSCI World ex USA Value Index | | | –45.31 | % | |
| MSCI World ex USA Index | | | –44.37 | % | |
| MSCI World ex USA Growth Index | | | –43.47 | % | |
Source: MSCI indices are net of foreign withholding taxes on dividends, copyright MSCI 2008, all rights reserved.
Losses in emerging markets were worse, on average, than in developed country markets, although results varied widely among individual countries. For the 11 months under review, total returns in U.S. dollars were –53.02% for the MSCI Emerging Markets Index (net dividends) and –44.37% for the MSCI World ex USA Index (net dividends).
24
Total Returns for 11 Months Ended October 31, 2008
| Country | | U.S. Dollar
Return | |
| Argentina | | | –55.00 | % | |
| Brazil | | | –51.21 | % | |
| Chile | | | –36.59 | % | |
| China | | | –59.33 | % | |
| Czech Republic | | | –40.25 | % | |
| Hungary | | | –58.65 | % | |
| India | | | –61.19 | % | |
| Indonesia | | | –59.87 | % | |
| Israel | | | –23.01 | % | |
| Malaysia | | | –40.52 | % | |
| Mexico | | | –44.05 | % | |
| Philippines | | | –49.76 | % | |
| Poland | | | –51.90 | % | |
| South Africa | | | –47.38 | % | |
| South Korea | | | –55.75 | % | |
| Taiwan | | | –43.57 | % | |
| Thailand | | | –51.81 | % | |
| Turkey | | | –59.24 | % | |
Source: Returns are of MSCI indices net of foreign withholding taxes on dividends, copyright MSCI 2008, all rights reserved.
Master-Feeder Structure
The portfolio described below, called a "Feeder Fund," does not buy individual securities directly; instead, the portfolio invests in a corresponding fund called a "Master Fund." The Master Fund, in turn, purchases stocks, bonds, and/or other securities.
LWAS/DFA International High Book to Market Portfolio
The LWAS/DFA International High Book to Market Portfolio seeks to capture the returns of international large company value stocks by purchasing shares of a Master Fund that invests in such stocks. The investment strategy employs a disciplined, quantitative approach, emphasizing broad diversification and consistent exposure to large cap value stocks, but does not attempt to track closely a specific equity index. As of October 31, 2008, the Master Fund held approximately 530 stocks in 22 developed-country markets, and essentially was fully invested in equities throughout the year: cash levels for the 11 months ended October 31, 2008 were in general less than 1% of the Master Fund's assets.
As a result of the Master Fund's diversified investment approach, performance principally was determined by broad structural trends in global equity markets, rather than the behavior of a limited number of stocks. For the 11 months ended October 31, 2008, total returns were –44.81% for the MSCI EAFE Index (net dividends), –44.37% for the MSCI World ex USA Index (net dividends), and –47.99% for the Master Fund's Portfolio. Relative to both Indexes, the underperformance of the Portfolio was primarily due to a greater allocation to value stocks in general and financial stocks in particular, both of which underperformed the Indexes. Value stocks, which accounted for approximately 69% of the Master Fund compared to 28% of the Indexes, underperformed both Indexes by approximately 4 percentage points. Financials, which accounted for 44% of the Master Fund compared to 25% of the Indexes, underperformed both Indexes by approximately 8 percentage points. A lower allocation to health care stocks, which accounted for less than 1% of the Master Fund compared to 6% of the Indexes and outperformed both Indexes by approximately 22 percentage points, also contributed to the underperformance.
25
DFA INVESTMENT DIMENSIONS GROUP INC.
LWAS/DFA INTERNATIONAL HIGH BOOK TO MARKET PORTFOLIO
DISCLOSURE OF FUND EXPENSES
(Unaudited)
The following Expense Table is shown so that you can understand the impact of fees on your investment. All mutual funds have operating expenses. As a shareholder of the fund, you incur ongoing costs, which include costs for portfolio management, administrative services, and shareholder reports, among others. Operating expenses, legal and audit services, which are deducted from a fund's gross income, directly reduce the investment return of the fund. A fund's expenses are expressed as a percentage of its average net assets. This figure is known as the expense ratio. The following examples are intended to help you understand the ongoing costs, in dollars, of investing in the fund and to compare these costs with those of other mutual funds. The examples are based on an investment of $1,000 made at the beginning of the period shown and held for the entire period.
The Expense Table below illustrate your fund's costs in two ways.
Actual Fund Return
This section helps you to estimate the actual expenses after fee waivers that you paid over the period. The "Ending Account Value" shown is derived from the fund's actual return and "Expenses Paid During Period" reflect the dollar amount that would have been paid by an investor who started with $1,000 in the fund. You may use the information here, together with the amount you invested, to estimate the expenses that you paid over the period.
To do so, simply divide your account value by $1,000 (for example, a $7,500 account value divided by $1,000 = 7.5), then multiply the result by the number given for your fund under the heading "Expenses Paid During Period."
Hypothetical Example for Comparison Purposes
This section is intended to help you compare your fund's costs with those of other mutual funds. The hypothetical "Ending Account Value" and "Expenses Paid During Period" are derived from the fund's actual expense ratio and an assumed 5% annual return before expenses. In this case, because the return used is not the fund's actual return, the results do not apply to your investment. The example is useful in making comparisons because the SEC requires all mutual funds to calculate expenses based on a 5% annual return. You can assess your fund's cost by comparing this hypothetical example with the hypothetical examples that appear in shareholder reports of other funds.
Please note that the expenses shown in the table. are meant to highlight and help you compare ongoing costs only and do not reflect any transactional costs, if applicable. The "Annualized Expense Ratio" represents the actual expenses for the six-month period indicated.
Six Months Ended October 31, 2008
EXPENSE TABLE
| | | Beginning
Account
Value
05/01/08 | | Ending
Account
Value
10/31/08 | | Annualized
Expense
Ratio* | | Expenses
Paid
During
Period* | |
| Actual Fund Return | | $ | 1,000.00 | | | $ | 554.90 | | | | 0.46 | % | | $ | 1.80 | | |
| Hypothetical 5% Annual Return | | $ | 1,000.00 | | | $ | 1,022.82 | | | | 0.46 | % | | $ | 2.34 | | |
* Expenses are equal to the fund's annualized expense ratio for the six-month period, multiplied by the average account value over the period, multiplied by the number of days in the most recent six-month period (184), then divided by the number of days in the year (366) to reflect the six-month period. The Portfolio is a Feeder Fund. The expenses shown reflect the direct expenses of the Feeder Fund and the indirect payment of the Feeder Fund's portion of the expenses of its Master Fund.
26
DFA INVESTMENT DIMENSIONS GROUP INC.
LWAS/DFA INTERNATIONAL HIGH BOOK TO MARKET PORTFOLIO
DISCLOSURE OF PORTFOLIO HOLDINGS
(Unaudited)
The SEC requires that all Funds file a complete Schedule of Investments with the SEC for their first and third fiscal quarters on Form N-Q. For DFA Investment Dimensions Group Inc., this would be for the fiscal quarters ending January 31 and July 31. The Form N-Q filing must be made within 60 days of the end of the quarter. DFA Investment Dimensions Group Inc. filed its most recent Form N-Q with the SEC on October 30, 2008. It is available upon request, without charge, by calling collect: (310) 395-8005 or by mailing a request to Dimensional Fund Advisors LP, 1299 Ocean Avenue, Santa Monica, California 90401, or by visiting the SEC's website at http://www.sec.gov, or they may be reviewed and copied at the SEC's Public Reference Room in Washington, D.C. (call 1-800-732-0330 for information on the operation of the Public Reference Room).
PORTFOLIO HOLDINGS
The SEC requires that all Funds present their categories of portfolio holdings in a table, chart or graph format in their annual and semi-annual shareholder reports, whether or not a Schedule of Investments is utilized. The following table, which presents portfolio holdings as a percent of total investments before short-term investments and collateral for loaned securities, is provided in compliance with such requirement.
The categories of industry classification for the Affiliated Investment Company are represented in the Disclosure of Portfolio Holdings, which are included elsewhere within the report. Refer to the Summary Schedule of Portfolio Holdings for the underlying Master Fund's holdings which reflect the investments by country.
| Affiliated Investment Company | | | 100.0 | % | |
27
DFA INVESTMENT DIMENSIONS GROUP INC.
LWAS/DFA INTERNATIONAL HIGH BOOK TO MARKET PORTFOLIO
STATEMENT OF ASSETS AND LIABILITIES
OCTOBER 31, 2008
(Amounts in thousands, except share and per share amounts)
| ASSETS: | |
Investment in The DFA International Value Series of The DFA Investment Trust Company
(Affiliated Investment Company) (7,392,735 Shares) at Value† | | $ | 84,351 | | |
| Receivables: | |
| Affiliated Investment Company Shares Sold | | | 366 | | |
| Fund Shares Sold | | | 2 | | |
| Prepaid Expenses and Other Assets | | | 5 | | |
| Total Assets | | | 84,724 | | |
| LIABILITIES: | |
| Payables: | |
| Fund Shares Redeemed | | | 368 | | |
| Due to Advisor | | | 1 | | |
| Accrued Expenses and Other Liabilities | | | 36 | | |
| Total Liabilities | | | 405 | | |
| NET ASSETS | | $ | 84,319 | | |
| SHARES OUTSTANDING, $0.01 PAR VALUE (1) | | | 7,397,461 | | |
| NET ASSET VALUE, OFFERING AND REDEMPTION PRICE PER SHARE | | $ | 11.40 | | |
| Investment in Affiliated Investment Company at Cost | | $ | 64,551 | | |
| NET ASSETS CONSIST OF: | |
| Paid-In Capital | | $ | 57,641 | | |
| Undistributed Net Investment Income (Distributions in Excess of Net Investment Income) | | | 244 | | |
| Accumulated Net Realized Gain (Loss) | | | 26,434 | | |
| Net Unrealized Appreciation (Depreciation) | | | — | | |
| NET ASSETS | | $ | 84,319 | | |
| (1) NUMBER OF SHARES AUTHORIZED | | | 100,000,000 | | |
See accompanying Notes to Financial Statements.
28
DFA INVESTMENT DIMENSIONS GROUP INC.
LWAS/DFA INTERNATIONAL HIGH BOOK TO MARKET PORTFOLIO
STATEMENTS OF OPERATIONS
(Amounts in thousands)
| | | Period
Dec. 1,
2007 to
Oct. 31,
2008 | | Year
Ended
Nov. 30,
2007 | |
| Investment Income | |
| Income Distributions Received from Affiliated Investment Company | | $ | 5,374 | | | $ | 5,658 | | |
| Expenses | |
| Administrative Services Fees | | | 13 | | | | 19 | | |
| Accounting & Transfer Agent Fees | | | 13 | | | | 15 | | |
| Shareholder Servicing Fees | | | 256 | | | | 358 | | |
| Filing Fees | | | 13 | | | | 18 | | |
| Shareholders' Reports | | | 18 | | | | 25 | | |
| Directors'/Trustees' Fees & Expenses | | | — | | | | 1 | | |
| Professional Fees | | | 5 | | | | 4 | | |
| Other | | | 5 | | | | 3 | | |
| Total Expenses | | | 323 | | | | 443 | | |
| Net Investment Income (Loss) | | | 5,051 | | | | 5,215 | | |
| Realized and Unrealized Gain (Loss) | |
| Capital Gain Distributions Received from Affiliated Investment Company | | | 12,068 | | | | 4,751 | | |
| Net Realized Gain (Loss) on Affiliated Investment Company Shares Sold | | | (159 | ) | | | 7,417 | | |
Change in Unrealized Appreciation (Depreciation) of
Affiliated Investment Company Shares | | | (98,856 | ) | | | 12,046 | | |
| Net Realized and Unrealized Gain (Loss) | | | (86,947 | ) | | | 24,214 | | |
| Net Increase (Decrease) in Net Assets Resulting from Operations | | $ | (81,896 | ) | | $ | 29,429 | | |
See accompanying Notes to Financial Statements.
29
DFA INVESTMENT DIMENSIONS GROUP INC.
LWAS/DFA INTERNATIONAL HIGH BOOK TO MARKET PORTFOLIO
STATEMENTS OF CHANGES IN NET ASSETS
(Amounts in thousands)
| | | Period
Dec. 1,
2007 to
Oct. 31,
2008 | | Year
Ended
Nov. 30,
2007 | | Year
Ended
Nov. 30,
2006 | |
| Increase (Decrease) in Net Assets | |
| Operations: | |
| Net Investment Income (Loss) | | $ | 5,051 | | | $ | 5,215 | | | $ | 5,125 | | |
Capital Gain Distributions Received from Affiliated Investment
Company | | | 12,068 | | | | 4,751 | | | | 3,904 | | |
Net Realized Gain (Loss) on Affiliated Investment Company
Shares Sold | | | (159 | ) | | | 7,417 | | | | 1,269 | | |
Change in Unrealized Appreciation (Depreciation) of Affiliated
Investment Company Shares | | | (98,856 | ) | | | 12,046 | | | | 38,680 | | |
Net Increase (Decrease) in Net Assets Resulting from
Operations | | | (81,896 | ) | | | 29,429 | | | | 48,978 | | |
| Distributions From: | |
| Net Investment Income | | | (5,330 | ) | | | (4,570 | ) | | | (5,176 | ) | |
| Net Short-Term Gains | | | (1,075 | ) | | | (1,512 | ) | | | (634 | ) | |
| Net Long-Term Gains | | | (10,361 | ) | | | (3,475 | ) | | | (5,714 | ) | |
| Total Distributions | | | (16,766 | ) | | | (9,557 | ) | | | (11,524 | ) | |
| Capital Share Transactions (1): | |
| Shares Issued | | | 13,918 | | | | 12,669 | | | | 22,569 | | |
| Shares Issued in Lieu of Cash Distributions | | | 14,298 | | | | 8,135 | | | | 9,828 | | |
| Shares Redeemed | | | (30,474 | ) | | | (35,421 | ) | | | (28,649 | ) | |
| Net Increase (Decrease) from Capital Share Transactions | | | (2,258 | ) | | | (14,617 | ) | | | 3,748 | | |
| Total Increase (Decrease) in Net Assets | | | (100,920 | ) | | | 5,255 | | | | 41,202 | | |
| Net Assets | |
| Beginning of Period | | | 185,239 | | | | 179,984 | | | | 138,782 | | |
| End of Period | | $ | 84,319 | | | $ | 185,239 | | | $ | 179,984 | | |
| (1) Shares Issued and Redeemed: | |
| Shares Issued | | | 875 | | | | 540 | | | | 1,185 | | |
| Shares Issued in Lieu of Cash Distributions | | | 690 | | | | 359 | | | | 550 | | |
| Shares Redeemed | | | (1,785 | ) | | | (1,504 | ) | | | (1,449 | ) | |
| | | | (220 | ) | | | (605 | ) | | | 286 | | |
Undistributed Net Investment Income (Distributions in Excess
of Net Investment Income) | | $ | 244 | | | $ | 522 | | | $ | 139 | | |
See accompanying Notes to Financial Statements.
30
DFA INVESTMENT DIMENSIONS GROUP INC.
LWAS/DFA INTERNATIONAL HIGH BOOK TO MARKET PORTFOLIO
FINANCIAL HIGHLIGHTS
(for a share outstanding throughout each period)
| | | Period
Dec. 1,
2007 to
Oct. 31,
2008 | | Year
Ended
Nov. 30,
2007 | | Year
Ended
Nov. 30,
2006 | | Year
Ended
Nov. 30,
2005 | | Year
Ended
Nov. 30,
2004 | | Year
Ended
Nov. 30,
2003 | |
Net Asset Value,
Beginning of Period | | $ | 24.32 | | | $ | 21.89 | | | $ | 17.49 | | | $ | 15.93 | | | $ | 12.55 | | | $ | 9.61 | | |
| Income from Investment Operations | |
Net Investment
Income (Loss) | | | 0.66 | (A) | | | 0.65 | (A) | | | 0.61 | (A) | | | 0.48 | | | | 0.27 | | | | 0.24 | | |
Net Gains (Losses)
(Realized and
Unrealized) | | | (11.36 | ) | | | 2.98 | | | | 5.23 | | | | 1.87 | | | | 3.63 | | | | 3.07 | | |
Total from Investment
Operations | | | (10.70 | ) | | | 3.63 | | | | 5.84 | | | | 2.35 | | | | 3.90 | | | | 3.31 | | |
| Less Distributions | |
| Net Investment Income | | | (0.70 | ) | | | (0.58 | ) | | | (0.63 | ) | | | (0.43 | ) | | | (0.51 | ) | | | (0.24 | ) | |
| Net Realized Gains | | | (1.52 | ) | | | (0.62 | ) | | | (0.81 | ) | | | (0.36 | ) | | | (0.01 | ) | | | (0.13 | ) | |
| Total Distributions | | | (2.22 | ) | | | (1.20 | ) | | | (1.44 | ) | | | (0.79 | ) | | | (0.52 | ) | | | (0.37 | ) | |
Net Asset Value,
End of Period | | $ | 11.40 | | | $ | 24.32 | | | $ | 21.89 | | | $ | 17.49 | | | $ | 15.93 | | | $ | 12.55 | | |
| Total Return | | | (47.99 | )%(C) | | | 17.05 | % | | | 35.40 | % | | | 15.32 | % | | | 31.89 | % | | | 35.96 | % | |
Net Assets, End of Period
(thousands) | | $ | 84,319 | | | $ | 185,239 | | | $ | 179,984 | | | $ | 138,782 | | | $ | 130,397 | | | $ | 109,942 | | |
Ratio of Expenses to
Average Net Assets (D) | | | 0.47 | %(B) | | | 0.46 | % | | | 0.47 | % | | | 0.50 | % | | | 0.52 | % | | | 0.55 | % | |
Ratio of Net Investment
Income to Average
Net Assets | | | 3.74 | %(B) | | | 2.76 | % | | | 3.14 | % | | | 2.88 | % | | | 1.88 | % | | | 2.20 | % | |
See page 1 for the Definitions of Abbreviations and Footnotes.
See accompanying Notes to Financial Statements.
31
DFA INVESTMENT DIMENSIONS GROUP INC.
LWAS/DFA INTERNATIONAL HIGH BOOK TO MARKET PORTFOLIO
NOTES TO FINANCIAL STATEMENTS
A. Organization:
DFA Investment Dimensions Group Inc. (the "Fund") is an open-end management investment company registered under the Investment Company Act of 1940, whose shares are offered to institutional investors, retirement plans and clients of registered investment advisors. The Fund consists of fifty-six operational portfolios, of which the LWAS/DFA International High Book to Market Portfolio ("the Portfolio") is presented in this report.
The Portfolio primarily invests its assets in The DFA International Value Series (the "Series"), a corresponding series of The DFA Investment Trust Company. At October 31, 2008, the Portfolio owned 2% of the outstanding shares of the Series.
The financial statements of the Series are included elsewhere in this report and should be read in conjunction with these financial statements.
At a regular meeting of the Board of Directors/Trustees (the "Board") on September 16, 2008, the Board voted to change the fiscal and tax year ends of the Portfolio from November 30 to October 31.
B. Significant Accounting Policies:
The following significant accounting policies are in conformity with accounting principles generally accepted in the United States of America. Such policies are consistently followed by the Fund in preparation of its financial statements. The preparation of financial statements in accordance with accounting principles generally accepted in the United States of America requires management to make estimates and assumptions that affect the reported amounts of assets and liabilities and disclosure of contingent assets and liabilities at the date of the financial statements and the reported amounts of increases and decreases in net assets from operations during the reporting period. Actual results could differ from those estimates and those differences could be material.
1. Security Valuation: The shares of the Series held by the Portfolio are valued at its daily net asset value.
Adoption of Statement of Financial Accounting Standards No. 157 "Fair Value Measurements" ("FAS 157")
In September 2006, the Financial Accounting Standards Board issued FAS 157 effective for fiscal years beginning after November 15, 2007. This standard clarifies the definition of fair value for financial reporting, establishes a framework for measuring fair value and requires additional disclosures about the use of fair value measurements. The Funds have adopted FAS 157 as of December 1, 2007. The three levels of the fair value hierarchy under FAS 157 are described below:
• Level 1 – quoted prices in active markets for identical securities
• Level 2 – other significant observable inputs (including quoted prices for similar securities, interest rates, prepayment speeds, credit risk, etc.)
• Level 3 – significant unobservable inputs (including the Portfolio's own assumptions in determining the fair value of investments)
The inputs or methodology used for valuing securities are not necessarily an indication of the risk associated with investing in those securities. A summary of the inputs used to value the Portfolio's net assets as of October 31, 2008 is listed below (in thousands).
| | | Valuation Inputs | |
| | | Investments in
Securities
(Market Value) | |
| | | Level 1 | | Level 2 | | Level 3 | | Total | |
| LWAS/DFA International High Book to Market Portfolio | | $ | 84,351 | | | | — | | | | — | | | $ | 84,351 | | |
32
2. Deferred Compensation Plan: Each eligible Director of the Fund may elect participation in the Deferred Compensation Plan (the "Plan"). Under the Plan, effective January 1, 2002, such Directors may defer payment of all or a portion of their total fees earned as a Director. These deferred amounts may be treated as though such amounts had been invested in shares of the following funds: U.S. Large Cap Value Portfolio; U.S. Core Equity 1 Portfolio; U.S. Core Equity 2 Portfolio; U.S. Vector Equity Portfolio; U.S. Micro Cap Portfolio; DFA International Value Portfolio; International Core Equity Portfolio; Emerging Markets Portfolio; Emerging Markets Core Equity Portfolio; and/or DFA Two-Year Global Fixed Income Portfolio. Contributions made under the Plan and the change in unrealized a ppreciation (depreciation) and income, are included in Other Expenses for the period ended October 31, 2008 and are included in Directors'/Trustees' Fees & Expenses for the year ended November 30, 2007. At October 31, 2008, the total liability for deferred compensation to Directors is included in Accrued Expenses and Other Liabilities in the amount of $2 (in thousands).
Each Director has the option to receive their distribution of proceeds in one of the following methods upon one year's notice: lump sum; annual installments over a period of agreed upon years; or semi-annual installments over a period of agreed upon years. As of October 31, 2008, none of the Directors have requested distribution of proceeds.
3. Other: Security transactions are accounted for as of the trade date. Costs used in determining realized gains and losses on the sale of affiliated investment company shares are on the basis of identified cost. Dividend income and distributions to shareholders are recorded on the ex-dividend date. Distributions received from the investment in affiliated investment company that represent a return of capital or capital gain are recorded as a reduction of cost of investments or a realized gain, respectively. Expenses directly attributable to the Portfolio are directly charged. Common expenses of the Fund are allocated using methods approved by the Board of Directors/Trustees, generally based on average net assets.
C. Investment Advisor:
Dimensional Fund Advisors LP ("Dimensional" or the "Advisor") provides administrative services to the Portfolio, including supervision of services provided by others, providing information to the shareholders and to the Board of Directors/Trustees, and other administrative services. The Advisor provides investment advisory services to the Series. For the period December 1, 2007 to October 31, 2008, the Portfolio's administrative services fees were accrued daily and paid monthly to the Advisor based on an effective annual rate of 0.01% of average daily net assets.
In addition, pursuant to a Client Service Agreement with LWI Financial Inc. ("LWIF"), the Portfolio pays a Shareholder Servicing fee to LWIF at the effective annual rate of 0.19% of its average daily net assets.
Fees Paid to Officers and Directors/Trustees:
Certain Officers and Directors/Trustees of the Advisor are also Officers and Directors/Trustees of the Fund; however, such Officers and Directors/Trustees (with the exception of the Chief Compliance Officer ("CCO")) receive no compensation from the Fund. For the period December 1, 2007 to October 31, 2008, the total related amounts paid by the Fund to the CCO were $159 (in thousands). The total related amount paid by the Portfolio is included in Other Expenses on the Statement of Operations.
D. Federal Income Taxes:
The Portfolio has qualified and intends to continue to qualify as a regulated investment company under Subchapter M of the Internal Revenue Code for federal income tax purposes and to distribute substantially all of its taxable income and net capital gains to its shareholders.
Distributions from net investment income and net realized capital gains are determined in accordance with U.S. federal income tax regulations, which may differ from those amounts determined under accounting principles generally accepted in the United States of America. These book/tax differences are either temporary or permanent in nature. To the extent these differences are permanent they are charged, or credited to paid-in capital, undistributed net investment income or accumulated net realized gains, as appropriate, in the period that the differences arise. Accordingly, the following permanent differences as of October 31, 2008, primarily attributable to the utilization of
33
accumulated earnings and profits distributed to shareholders on redemptions of shares as part of the dividends paid deduction for income tax purposes were reclassified to the following accounts. These reclassifications had no effect on net asset value per share (amounts in thousands):
| | | Increase
(Decrease)
Undistributed
Net Investment
Income | | Increase
(Decrease)
Accumulated
Net Realized
Gains/(Losses) | |
| LWAS/DFA International High Book to Market Portfolio | | $ | 1 | | | $ | (1 | ) | |
The tax character of dividends and distributions declared and paid during the years ended November 30, 2006, November 30, 2007 and the period December 1, 2007 to October 31, 2008 were as follows (amounts in thousands):
| | | Net Investment
Income
and Short-Term
Capital Gains | |
Long-Term
Capital Gain | |
Total | |
| 2006 | | $ | 6,063 | | | $ | 5,851 | | | $ | 11,914 | | |
| 2007 | | | 6,376 | | | | 3,987 | | | | 10,363 | | |
| 2008 | | | 6,405 | | | | 10,361 | | | | 16,766 | | |
At October 31, 2008, the components of distributable earnings/(accumulated losses) were as follows (amounts in thousands):
| | | Undistributed
Net
Investment
Income and
Short-Term
Capital Gains | | Undistributed
Long-Term
Capital Gains | | Total Net
Distributable
Earnings/
(Accumulated
Losses) | |
| | $ | 247 | | | $ | 26,433 | | | $ | 26,680 | | |
For federal income tax purposes, the Fund measures its capital loss carryforwards annually at October 31, its fiscal year end. Capital loss carryforwards may be carried forward and applied against future capital gains. As of October 31, 2008, the Portfolio had no capital loss carryforwards available to offset future realized capital gains.
At October 31, 2008, the total cost and aggregate gross unrealized appreciation and (depreciation) of securities for federal income tax purposes were different from amounts reported for financial reporting purposes (amounts in thousands):
| | | Federal
Tax Cost | | Unrealized
Appreciation | | Unrealized
(Depreciation) | | Net
Unrealized
Appreciation
(Depreciation) | |
| | $ | 84,317 | | | | — | | | | — | | | | — | | |
In June 2006, the Financial Accounting Standards Board (FASB) issued FASB Interpretation 48 ("FIN 48"), "Accounting for Uncertainty in Income Taxes." This standard defines the threshold for recognizing the benefits of tax-return positions in the financial statements as "more-likely-than-not" to be sustained by the taxing authority and requires measurement of a tax position meeting the more-likely-than-not criterion, based on the largest benefit that is more than 50 percent likely to be realized. Management has analyzed the Portfolio's tax positions to be taken on the federal income tax returns for all open tax years (tax years ended November 30, 2005 through the period ended October 31, 2008), for purposes of implementing FIN 48, and has concluded that no provision for income tax is required in the Portfolio's financial statements.
E. Line of Credit:
The Fund, together with other Dimensional-advised portfolios, has entered into a $250 million unsecured discretionary line of credit effective June 30, 2003 with an affiliate of its domestic custodian bank. Each portfolio is permitted to borrow, subject to its investment limitations, up to a maximum of $250 million, as long as total borrowings
34
under the line of credit do not exceed $250 million in the aggregate. Borrowings under the line of credit are charged interest at the current Federal Funds Rate plus 1%. Each portfolio is individually, and not jointly, liable for its particular advances under the line of credit. There is no commitment fee on the unused portion of the line of credit. The agreement for the discretionary line of credit may be terminated by either party at any time. The line of credit is scheduled to expire on June 23, 2009. There were no borrowings by the Portfolio under this line of credit during the period ended October 31, 2008.
The Fund, together with other Dimensional-advised portfolios, has also entered into an additional $500 million unsecured line of credit effective January 15, 2008 with its international custodian bank. Each portfolio is permitted to borrow, subject to its investment limitations, up to a maximum of $500 million, as long as total borrowings under the line of credit do not exceed $500 million in the aggregate. Each portfolio is individually, and not jointly, liable for its particular advances under the line of credit. Borrowings under the line of credit are charged interest at rates agreed to by the parties at the time of borrowing. There is no commitment fee on the unused portion of the line of credit. The agreement for the line of credit expires on January 15, 2009. There were no borrowings by the Portfolio under this line of credit during the period ended October 31, 2008.
F. Indemnitees; Contractual Obligations:
Under the Fund's organizational documents, its officers and directors are indemnified against certain liabilities arising out of the performance of their duties to the Fund.
In the normal course of business, the Fund enters into contracts that contain a variety of representations and warranties which provide general indemnification. The Fund's maximum exposure under these arrangements is unknown as this would involve future claims that may be made against the Fund and/or its affiliates that have not yet occurred. However, based on experience, the Fund expects the risk of loss to be remote.
G. Recently Issued Accounting Standards and Interpretation:
In March 2008, Statement of Financial Accounting Standards No. 161, Disclosures about Derivative Instruments and Hedging Activities ("FAS 161"), was issued and is effective for fiscal years beginning after November 15, 2008. FAS 161 defines new disclosures of derivative instruments and hedging activities. Management is currently evaluating the implications of FAS 161. At this time, its impact on the Portfolio's financial statements has not been determined.
H. Other:
At October 31, 2008, two shareholders held approximately 95% of the outstanding shares of the Portfolio. One or more of the shareholders is an omnibus account, which typically hold shares for the benefit of several other underlying investors.
I. Subsequent Event Note:
On November 1, 2008, The DFA International Value Series, a master fund in a RIC/RIC master feeder structure with five RIC feeders and two direct client investors, made a "Check-the-box" election for federal income tax purposes pursuant to Treasury Regulation § 301.7701-3, to change its federal entity classification from a corporation taxable as a regulated investment company to a partnership. As a result of this election, the master fund is deemed to have distributed all of its assets and liabilities, in a taxable transaction, to its shareholders in liquidation of the master fund. Immediately thereafter, the shareholders contributed all of the distributed assets and liabilities to a newly formed partnership. The final tax year end of The DFA International Value Series was October 31, 2008. For Federal income tax purposes, pursuant to Code §336(a), the master fund recognizes gain or loss as if the master's investment securities were sold to its shareholders and, pursuant to Code §331, each of the Portfolios recognizes gain or loss as if it liquidated its investment in the master. For tax purposes, pursuant to Code § 334(a), each of the Portfolio's will take a fair market value basis in the securities deemed received by them and a new holding period for those securities commences on the deemed liquidation date.
35
The master fund had book/tax differences upon its deemed liquidation. The following summary of permanent differences occurred as of the respective effective "Check the Box" election date.
| | | Increase
(Decrease)
Paid-in Capital | | Unrealized
Appreciation
(Depreciation)
Investment
Securities | | Increase
(Decrease)
Undistributed
Net Investment
Income | | Increase
(Decrease)
Accumulated
Net Realized
Gains(Losses) | |
| | $ | (2,187,614,395 | ) | | $ | 2,319,051,847 | | | $ | (602,214 | ) | | $ | (130,835,238 | ) | |
As a result of the transaction, The DFA International Value Series recognized a ($2,309,440,866) and ($718,733) capital and currency loss respectively for tax year ended October 31, 2008. Additionally, the Series has written off $2,178,493,687 of expired capital loss carryover as a permanent book/tax reporting difference decreasing paid in capital.
Each Portfolio impacted by the "Check the Box" election also has a permanent book/tax difference resulting from the transaction. Listed below is the permanent difference impacting each respective Portfolio. For financial statement purposes, this adjustment did not result in any changes to each respective fund's net assets or net asset value per share.
| | | Unrealized
Appreciation
(Depreciation)
Investment
Securities | | Increase
(Decrease)
Accumulated
Net Realized
Gains(Losses) | |
| DFA International Value Portfolio | | $ | 1,598,039,236 | | | $ | (1,598,039,236 | ) | |
| DFA International Value Portfolio II | | | 49,859,737 | | | | (49,859,737 | ) | |
| DFA International Value Portfolio III | | �� | 155,866,882 | | | | (155,866,882 | ) | |
| DFA International Value Portfolio IV | | | 82,052,198 | | | | (82,052,198 | ) | |
| LWAS/DFA International High Book To Market Portfolio | | | (19,800,535 | ) | | | 19,800,535 | | |
For financial reporting purposes, this transaction had no impact on the net assets of the respective funds.
36
REPORT OF INDEPENDENT REGISTERED PUBLIC ACCOUNTING FIRM
To the Shareholders of LWAS/DFA International High Book to Market Portfolio and
Board of Directors of DFA Investment Dimensions Group Inc.:
In our opinion, the accompanying statement of assets and liabilities, and the related statements of operations and of changes in net assets and the financial highlights present fairly, in all material respects, the financial position of LWAS/DFA International High Book to Market Portfolio (one of the portfolios constituting DFA Investment Dimensions Group Inc., hereafter referred to as the "Portfolio") at October 31, 2008, the results of its operations, the changes in its net assets and the financial highlights for each of the periods indicated, in conformity with accounting principles generally accepted in the United States of America. These financial statements and financial highlights (hereafter referred to as "financial statements") are the responsibility of the Portfolio's management; our responsibility is to express an opinion on these financial statements based on our audits. We conducted our audits of these financial statements in ac cordance with the standards of the Public Company Accounting Oversight Board (United States). Those standards require that we plan and perform the audit to obtain reasonable assurance about whether the financial statements are free of material misstatement. An audit includes examining, on a test basis, evidence supporting the amounts and disclosures in the financial statements, assessing the accounting principles used and significant estimates made by management, and evaluating the overall financial statement presentation. We believe that our audits, which included confirmation of securities at October 31, 2008 by correspondence with the transfer agent of the investee fund, provide a reasonable basis for our opinion.
PricewaterhouseCoopers LLP
Philadelphia, Pennsylvania
December 22, 2008
37
THE DFA INVESTMENT TRUST COMPANY
PERFORMANCE CHARTS

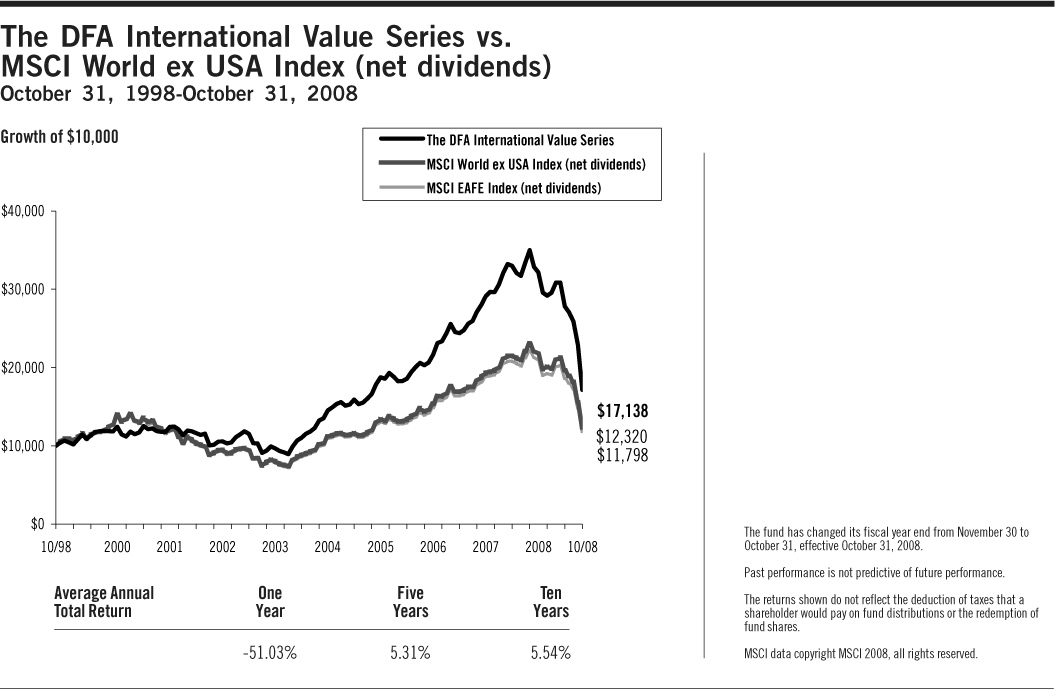
38
THE DFA INVESTMENT TRUST COMPANY
DISCLOSURE OF FUND EXPENSES
(Unaudited)
The following Expense Tables are shown so that you can understand the impact of fees on your investment. All mutual funds have operating expenses. As a shareholder of the fund, you incur ongoing costs, which include costs for portfolio management, administrative services, and shareholder reports, among others. Operating expenses, legal and audit services, which are deducted from a fund's gross income, directly reduce the investment return of the fund. A fund's expenses are expressed as a percentage of its average net assets. This figure is known as the expense ratio. The following examples are intended to help you understand the ongoing costs, in dollars, of investing in the fund and to compare these costs with those of other mutual funds. The examples are based on an investment of $1,000 made at the beginning of the period shown and held for the entire period.
The Expense Tables below illustrate your fund's costs in two ways.
Actual Fund Return
This section helps you to estimate the actual expenses after fee waivers that you paid over the period. The "Ending Account Value" shown is derived from the fund's actual return and "Expenses Paid During Period" reflect the dollar amount that would have been paid by an investor who started with $1,000 in the fund. You may use the information here, together with the amount you invested, to estimate the expenses that you paid over the period.
To do so, simply divide your account value by $1,000 (for example, a $7,500 account value divided by $1,000 = 7.5), then multiply the result by the number given for your fund under the heading "Expenses Paid During Period."
Hypothetical Example for Comparison Purposes
This section is intended to help you compare your fund's costs with those of other mutual funds. The hypothetical "Ending Account Value" and "Expenses Paid During Period" are derived from the fund's actual expense ratio and an assumed 5% annual return before expenses. In this case, because the return used is not the fund's actual return, the results do not apply to your investment. The example is useful in making comparisons because the SEC requires all mutual funds to calculate expenses based on a 5% annual return. You can assess your fund's cost by comparing this hypothetical example with the hypothetical examples that appear in shareholder reports of other funds.
Please note that the expenses shown in the tables are meant to highlight and help you compare ongoing costs only and do not reflect any transactional costs, if applicable. The "Annualized Expense Ratio" represents the actual expenses for the six-month period indicated.
Six Months Ended October 31, 2008
EXPENSE TABLES
| The U.S. Large Cap Value Series | | Beginning
Account
Value
05/01/08 | | Ending
Account
Value
10/31/08 | | Annualized
Expense
Ratio* | | Expenses
Paid
During
Period* | |
| Actual Fund Return | | $ | 1,000.00 | | | $ | 648.60 | | | | 0.11 | % | | $ | 0.46 | | |
| Hypothetical 5% Annual Return | | $ | 1,000.00 | | | $ | 1,024.58 | | | | 0.11 | % | | $ | 0.56 | | |
| The DFA International Value Series | |
| Actual Fund Return | | $ | 1,000.00 | | | $ | 555.50 | | | | 0.23 | % | | $ | 0.90 | | |
| Hypothetical 5% Annual Return | | $ | 1,000.00 | | | $ | 1,023.98 | | | | 0.23 | % | | $ | 1.17 | | |
* Expenses are equal to the fund's annualized expense ratio for the six-month period, multiplied by the average account value over the period, multiplied by the number of days in the most recent six-month period (184), then divided by the number of days in the year (366) to reflect the six-month period.
39
THE DFA INVESTMENT TRUST COMPANY
DISCLOSURE OF PORTFOLIO HOLDINGS
(Unaudited)
The SEC requires that all Funds file a complete Schedule of Investments with the SEC for their first and third fiscal quarters on Form N-Q. For The DFA Investment Trust Company, this would be for the fiscal quarters ending January 31 and July 31. The Form N-Q filing must be made within 60 days of the end of the quarter. The DFA Investment Trust Company filed its most recent Form N-Q with the SEC on October 30, 2008. It is available upon request, without charge, by calling collect: (310) 395-8005 or by mailing a request to Dimensional Fund Advisors LP, 1299 Ocean Avenue, Santa Monica, California 90401, or by visiting the SEC's website at http://www.sec.gov, or they may be reviewed and copied at the SEC's Public Reference Room in Washington, D.C. (call 1-800-732-0330 for information on the operation of the Public Reference Room).
SEC regulations permit a fund to include in its reports to shareholders a "Summary Schedule of Portfolio Holdings" in lieu of a full Schedule of Investments. The Summary Schedule of Portfolio Holdings reports the fund's 50 largest holdings in unaffiliated issuers and any investments that exceed one percent of the fund's net assets at the end of the reporting period. The amendments also require that the Summary Schedule of Portfolio Holdings identify each category of investments that are held.
The fund is required to file a complete Schedule of Investments with the SEC on Form N-CSR within ten days after mailing the annual and semi-annual reports to shareholders. It will be available upon request, without charge, by calling collect: (310) 395-8005 or by mailing a request to Dimensional Fund Advisors LP, 1299 Ocean Avenue, Santa Monica, California 90401, or by visiting the SEC's website at http://www.sec.gov, or they may be reviewed and copied at the SEC's Public Reference Room in Washington, D.C. (call 1-800-732-0330 for information on the operation of the Public Reference Room).
PORTFOLIO HOLDINGS
The SEC requires that all Funds present their categories of portfolio holdings in a table, chart or graph format in their annual and semi-annual shareholder reports, whether or not a Schedule of Investments is utilized. The following table, which presents portfolio holdings as a percent of total investments before short-term investments and collateral for loaned securities, is provided in compliance with such requirement. The categories shown below represent broad industry sectors. Each industry sector consists of one or more specific industry classifications.
DOMESTIC AND INTERNATIONAL EQUITY PORTFOLIOS
| | | Consumer
Discretionary | | Consumer
Staples | | Energy | | Financials | | Health
Care | | Industrials | | Information
Technology | | Materials | | Telecommunication
Services | | Utilities | | Total | |
The U.S. Large
Cap Value
Series | | | 12.6 | % | | | 5.5 | % | | | 15.1 | % | | | 30.8 | % | | | 1.8 | % | | | 17.4 | % | | | 4.6 | % | | | 3.4 | % | | | 8.7 | % | | | 0.1 | % | | | 100.0 | % | |
The DFA
International
Value Series | | | 12.2 | % | | | 5.1 | % | | | 5.5 | % | | | 41.4 | % | | | 0.5 | % | | | 10.0 | % | | | 3.6 | % | | | 9.3 | % | | | 9.0 | % | | | 3.4 | % | | | 100.0 | % | |
40
THE U.S. LARGE CAP VALUE SERIES
SUMMARY SCHEDULE OF PORTFOLIO HOLDINGS
October 31, 2008
| | | Shares | | Value† | | Percentage
of Net Assets** | |
| COMMON STOCKS — (88.7%) | |
| Consumer Discretionary — (11.6%) | |
| CBS Corp. Class B | | | 5,590,306 | | | $ | 54,281,871 | | | | 0.8 | % | |
| Comcast Corp. Class A | | | 12,216,542 | | | | 192,532,702 | | | | 2.9 | % | |
| # Comcast Corp. Special Class A Non-Voting | | | 3,110,315 | | | | 47,961,057 | | | | 0.7 | % | |
| * Liberty Media Corp. - Entertainment Class A | | | 3,864,672 | | | | 62,221,219 | | | | 0.9 | % | |
| # Time Warner, Inc. | | | 18,369,180 | | | | 185,345,026 | | | | 2.7 | % | |
| # Tyco Electronics, Ltd. | | | 1,537,111 | | | | 29,881,438 | | | | 0.4 | % | |
| Other Securities | | | | | | | 292,496,695 | | | | 4.4 | % | |
| Total Consumer Discretionary | | | | | | | 864,720,008 | | | | 12.8 | % | |
| Consumer Staples — (4.9%) | |
| Archer-Daniels-Midland Co. | | | 1,219,060 | | | | 25,271,114 | | | | 0.4 | % | |
| # Coca-Cola Enterprises, Inc. | | | 3,519,272 | | | | 35,368,684 | | | | 0.5 | % | |
| Kraft Foods, Inc. | | | 5,533,321 | | | | 161,240,974 | | | | 2.4 | % | |
| Molson Coors Brewing Co. | | | 755,890 | | | | 28,240,050 | | | | 0.4 | % | |
| Other Securities | | | | | | | 116,481,392 | | | | 1.7 | % | |
| Total Consumer Staples | | | | | | | 366,602,214 | | | | 5.4 | % | |
| Energy — (13.4%) | |
| # Anadarko Petroleum Corp. | | | 3,422,156 | | | | 120,802,107 | | | | 1.8 | % | |
| # Apache Corp. | | | 2,051,191 | | | | 168,874,555 | | | | 2.5 | % | |
| # Chesapeake Energy Corp. | | | 2,496,221 | | | | 54,841,975 | | | | 0.8 | % | |
| # ConocoPhillips | | | 4,659,773 | | | | 242,401,391 | | | | 3.6 | % | |
| # Devon Energy Corp. | | | 1,962,942 | | | | 158,723,490 | | | | 2.4 | % | |
| Marathon Oil Corp. | | | 2,640,550 | | | | 76,840,005 | | | | 1.1 | % | |
| Other Securities | | | | | | | 177,364,431 | | | | 2.6 | % | |
| Total Energy | | | | | | | 999,847,954 | | | | 14.8 | % | |
| Financials — (27.3%) | |
| Allstate Corp. | | | 2,540,615 | | | | 67,046,830 | | | | 1.0 | % | |
| # Bank of America Corp. | | | 7,236,574 | | | | 174,907,994 | | | | 2.6 | % | |
| # Capital One Financial Corp. | | | 1,668,884 | | | | 65,286,742 | | | | 1.0 | % | |
| # Chubb Corp. | | | 1,620,173 | | | | 83,957,365 | | | | 1.2 | % | |
| # Cincinnati Financial Corp. | | | 1,305,789 | | | | 33,937,456 | | | | 0.5 | % | |
| CNA Financial Corp. | | | 1,896,282 | | | | 29,506,148 | | | | 0.4 | % | |
| JPMorgan Chase & Co. | | | 7,213,911 | | | | 297,573,829 | | | | 4.4 | % | |
| Loews Corp. | | | 3,808,002 | | | | 126,463,746 | | | | 1.9 | % | |
| # M&T Bank Corp. | | | 440,052 | | | | 35,688,217 | | | | 0.5 | % | |
| # Merrill Lynch & Co., Inc. | | | 1,408,640 | | | | 26,186,618 | | | | 0.4 | % | |
| # MetLife, Inc. | | | 5,000,810 | | | | 166,126,908 | | | | 2.5 | % | |
| # Morgan Stanley | | | 2,999,997 | | | | 52,409,948 | | | | 0.8 | % | |
| # New York Community Bancorp, Inc. | | | 2,223,800 | | | | 34,824,708 | | | | 0.5 | % | |
| # Prudential Financial, Inc. | | | 1,829,600 | | | | 54,888,000 | | | | 0.8 | % | |
| # SunTrust Banks, Inc. | | | 945,360 | | | | 37,946,750 | | | | 0.6 | % | |
| The Travelers Companies, Inc. | | | 5,075,909 | | | | 215,979,928 | | | | 3.2 | % | |
| Unum Group | | | 2,404,389 | | | | 37,869,127 | | | | 0.6 | % | |
| Other Securities | | | | | | | 492,099,070 | | | | 7.3 | % | |
| Total Financials | | | | | | | 2,032,699,384 | | | | 30.2 | % | |
| Health Care — (1.6%) | |
| *# WellPoint, Inc. | | | 1,694,537 | | | | 65,866,653 | | | | 1.0 | % | |
| Other Securities | | | | | | | 52,007,419 | | | | 0.8 | % | |
| Total Health Care | | | | | | | 117,874,072 | | | | 1.8 | % | |
41
THE U.S. LARGE CAP VALUE SERIES
CONTINUED
| | | Shares | | Value† | | Percentage
of Net Assets** | |
| Industrials — (15.4%) | |
| *# Allied Waste Industries, Inc. | | | 2,682,276 | | | $ | 27,949,316 | | | | 0.4 | % | |
| # Burlington Northern Santa Fe Corp. | | | 2,178,273 | | | | 193,996,993 | | | | 2.9 | % | |
| # CSX Corp. | | | 3,309,804 | | | | 151,324,239 | | | | 2.2 | % | |
| FedEx Corp. | | | 432,063 | | | | 28,243,958 | | | | 0.4 | % | |
| # Norfolk Southern Corp. | | | 3,154,102 | | | | 189,056,874 | | | | 2.8 | % | |
| # Northrop Grumman Corp. | | | 2,590,384 | | | | 121,463,106 | | | | 1.8 | % | |
| # Southwest Airlines Co. | | | 5,076,220 | | | | 59,797,872 | | | | 0.9 | % | |
| Union Pacific Corp. | | | 4,066,600 | | | | 271,526,882 | | | | 4.0 | % | |
| Other Securities | | | | | | | 105,722,697 | | | | 1.7 | % | |
| Total Industrials | | | | | | | 1,149,081,937 | | | | 17.1 | % | |
| Information Technology — (3.7%) | |
| *# Computer Sciences Corp. | | | 1,361,543 | | | | 41,064,137 | | | | 0.6 | % | |
| *# Symantec Corp. | | | 2,636,076 | | | | 33,161,836 | | | | 0.5 | % | |
| Xerox Corp. | | | 3,605,491 | | | | 28,916,038 | | | | 0.4 | % | |
| Other Securities | | | | | | | 170,627,649 | | | | 2.6 | % | |
| Total Information Technology | | | | | | | 273,769,660 | | | | 4.1 | % | |
| Materials — (3.0%) | |
| # Dow Chemical Co. | | | 2,427,760 | | | | 64,748,359 | | | | 1.0 | % | |
| # International Paper Co. | | | 1,643,445 | | | | 28,300,123 | | | | 0.4 | % | |
| # Weyerhaeuser Co. | | | 1,415,829 | | | | 54,112,984 | | | | 0.8 | % | |
| Other Securities | | | | | | | 78,273,714 | | | | 1.1 | % | |
| Total Materials | | | | | | | 225,435,180 | | | | 3.3 | % | |
| Telecommunication Services — (7.7%) | |
| # AT&T, Inc. | | | 9,749,000 | | | | 260,980,730 | | | | 3.9 | % | |
| # Verizon Communications, Inc. | | | 8,542,208 | | | | 253,447,311 | | | | 3.7 | % | |
| Other Securities | | | | | | | 58,656,568 | | | | 0.9 | % | |
| Total Telecommunication Services | | | | | | | 573,084,609 | | | | 8.5 | % | |
| Utilities — (0.1%) | |
| Total Utilities | | | | | | | 4,787,743 | | | | 0.1 | % | |
| TOTAL COMMON STOCKS | | | | | | | 6,607,902,761 | | | | 98.1 | % | |
| | | Face
Amount | | | | | |
| | | (000) | | | | | |
| TEMPORARY CASH INVESTMENTS — (1.9%) | |
Repurchase Agreement, PNC Capital Markets, Inc. 0.94%, 11/03/08
(Collateralized by $130,825,000 FNMA 5.50%, 05/01/37 & 6.00%, 05/01/38,
valued at $146,641,902) to be repurchased at $144,481,317 | | $ | 144,470 | | | | 144,470,000 | | | | 2.1 | % | |
42
THE U.S. LARGE CAP VALUE SERIES
CONTINUED
| | | Shares | | Value† | | Percentage
of Net Assets** | |
| SECURITIES LENDING COLLATERAL — (9.4%) | |
| §@ DFA Short Term Investment Fund LP | | | 641,002,721 | | | $ | 641,002,721 | | | | 9.5 | % | |
| @ PNC Demand Deposit Account 0.22% | | | 10,000,000 | | | | 10,000,000 | | | | 0.2 | % | |
| | | Face
Amount | | | | | |
| | | (000) | | | | | |
@ Repurchase Agreement, Deutsche Bank Securitites 0.24%, 11/03/08
(Collateralized by $65,652,304 FNMA, rates ranging from 5.500% to 7.000%,
maturities ranging from 07/01/33 to 09/01/38 & U.S. Treasury STRIP 0.599%(y),
02/15/09, valued at $49,188,211) to be repurchased at $48,070,107 | | $ | 48,069 | | | | 48,069,158 | | | | 0.7 | % | |
| TOTAL SECURITIES LENDING COLLATERAL | | | | | | | 699,071,879 | | | | 10.4 | % | |
TOTAL INVESTMENTS — (100.0%)
(Cost $9,331,596,076) | | | | | | $ | 7,451,444,640 | | | | 110.6 | % | |
See accompanying Notes to Financial Statements.
43
THE DFA INTERNATIONAL VALUE SERIES
SUMMARY SCHEDULE OF PORTFOLIO HOLDINGS
October 31, 2008
| | | Shares | | Value†† | | Percentage
of Net Assets** | |
| AUSTRALIA — (4.7%) | |
| COMMON STOCKS — (4.7%) | |
| Australia & New Zealand Banking Group, Ltd. | | | 3,302,749 | | | $ | 38,716,458 | | | | 0.8 | % | |
| Commonwealth Bank of Australia | | | 2,119,091 | | | | 57,926,994 | | | | 1.2 | % | |
| # National Australia Bank, Ltd. | | | 3,087,538 | | | | 50,098,709 | | | | 1.1 | % | |
| Other Securities | | | | | | | 107,641,792 | | | | 2.3 | % | |
| TOTAL — AUSTRALIA | | | | | | | 254,383,953 | | | | 5.4 | % | |
| AUSTRIA — (0.5%) | |
| COMMON STOCKS — (0.5%) | |
| Other Securities | | | | | | | 28,305,261 | | | | 0.6 | % | |
| BELGIUM — (0.5%) | |
| COMMON STOCKS — (0.5%) | |
| Other Securities | | | | | | | 29,328,450 | | | | 0.6 | % | |
| RIGHTS/WARRANTS — (0.0%) | |
| Other Securities | | | | | | | 256 | | | | 0.0 | % | |
| TOTAL — BELGIUM | | | | | | | 29,328,706 | | | | 0.6 | % | |
| CANADA — (5.9%) | |
| COMMON STOCKS — (5.9%) | |
| # Barrick Gold Corp. | | | 1,226,832 | | | | 28,052,344 | | | | 0.6 | % | |
| # EnCana Corp. | | | 560,598 | | | | 28,478,732 | | | | 0.6 | % | |
| Petro-Canada | | | 1,205,300 | | | | 30,140,000 | | | | 0.6 | % | |
| Sun Life Financial, Inc. | | | 1,262,400 | | | | 29,693,056 | | | | 0.6 | % | |
| Other Securities | | | | | | | 200,692,451 | | | | 4.4 | % | |
| TOTAL — CANADA | | | | | | | 317,056,583 | | | | 6.8 | % | |
| DENMARK — (0.9%) | |
| COMMON STOCKS — (0.9%) | |
| Other Securities | | | | | | | 46,987,354 | | | | 1.0 | % | |
| FINLAND — (1.0%) | |
| COMMON STOCKS — (1.0%) | |
| Other Securities | | | | | | | 52,418,538 | | | | 1.1 | % | |
| FRANCE — (8.5%) | |
| COMMON STOCKS — (8.5%) | |
| # AXA SA | | | 2,818,397 | | | | 53,842,817 | | | | 1.2 | % | |
| # BNP Paribas SA | | | 1,558,158 | | | | 112,501,123 | | | | 2.4 | % | |
| # Compagnie de Saint-Gobain | | | 580,915 | | | | 22,415,677 | | | | 0.5 | % | |
| Vivendi SA | | | 2,482,257 | | | | 64,884,026 | | | | 1.4 | % | |
| Other Securities | | | | | | | 208,936,536 | | | | 4.3 | % | |
| TOTAL — FRANCE | | | | | | | 462,580,179 | | | | 9.8 | % | |
| GERMANY — (8.8%) | |
| COMMON STOCKS — (8.8%) | |
| Allianz SE | | | 442,712 | | | | 33,313,833 | | | | 0.7 | % | |
| # Daimler AG | | | 1,684,003 | | | | 57,854,323 | | | | 1.2 | % | |
| # Deutsche Bank AG | | | 774,190 | | | | 28,921,349 | | | | 0.6 | % | |
| # Deutsche Telekom AG | | | 2,621,866 | | | | 38,930,629 | | | | 0.8 | % | |
| Deutsche Telekom AG Sponsored ADR | | | 2,705,150 | | | | 40,171,477 | | | | 0.9 | % | |
| E.ON AG | | | 1,781,013 | | | | 68,160,893 | | | | 1.5 | % | |
| # E.ON AG Sponsored ADR | | | 1,091,708 | | | | 41,484,904 | | | | 0.9 | % | |
44
THE DFA INTERNATIONAL VALUE SERIES
CONTINUED
| | | Shares | | Value†† | | Percentage
of Net Assets** | |
| Munchener Rueckversicherungs-Gesellschaft AG | | | 388,934 | | | $ | 50,491,309 | | | | 1.1 | % | |
| Other Securities | | | | | | | 114,673,630 | | | | 2.4 | % | |
| TOTAL — GERMANY | | | | | | | 474,002,347 | | | | 10.1 | % | |
| GREECE — (0.3%) | |
| COMMON STOCKS — (0.3%) | |
| Other Securities | | | | | | | 14,142,756 | | | | 0.3 | % | |
| HONG KONG — (2.5%) | |
| COMMON STOCKS — (2.5%) | |
| # Cheung Kong Holdings, Ltd. | | | 3,224,000 | | | | 30,955,317 | | | | 0.7 | % | |
| Hutchison Whampoa, Ltd. | | | 5,472,000 | | | | 29,569,976 | | | | 0.6 | % | |
| Sun Hung Kai Properties, Ltd. | | | 2,528,000 | | | | 22,148,070 | | | | 0.5 | % | |
| Other Securities | | | | | | | 54,353,926 | | | | 1.1 | % | |
| TOTAL — HONG KONG | | | | | | | 137,027,289 | | | | 2.9 | % | |
| IRELAND — (0.3%) | |
| COMMON STOCKS — (0.3%) | |
| Other Securities | | | | | | | 16,882,601 | | | | 0.4 | % | |
| ITALY — (1.9%) | |
| COMMON STOCKS — (1.9%) | |
| UniCredito Italiano SpA | | | 10,088,794 | | | | 24,697,595 | | | | 0.5 | % | |
| Other Securities | | | | | | | 78,187,153 | | | | 1.7 | % | |
| TOTAL — ITALY | | | | | | | 102,884,748 | | | | 2.2 | % | |
| JAPAN — (13.3%) | |
| COMMON STOCKS — (13.3%) | |
| FUJIFILM Holdings Corp. | | | 1,077,300 | | | | 24,799,840 | | | | 0.5 | % | |
| Hitachi, Ltd. | | | 6,574,000 | | | | 30,865,283 | | | | 0.7 | % | |
| Tokio Marine Holdings, Inc. | | | 1,457,311 | | | | 44,952,061 | | | | 1.0 | % | |
| Other Securities | | | | | | | 621,977,287 | | | | 13.2 | % | |
| TOTAL — JAPAN | | | | | | | 722,594,471 | | | | 15.4 | % | |
| NETHERLANDS — (3.5%) | |
| COMMON STOCKS — (3.5%) | |
| # ArcelorMittal | | | 1,877,993 | | | | 48,755,658 | | | | 1.0 | % | |
| ING Groep NV | | | 3,093,625 | | | | 29,019,312 | | | | 0.6 | % | |
| Koninklijke Philips Electronics NV | | | 3,192,970 | | | | 59,005,541 | | | | 1.3 | % | |
| Other Securities | | | | | | | 50,984,660 | | | | 1.1 | % | |
| TOTAL — NETHERLANDS | | | | | | | 187,765,171 | | | | 4.0 | % | |
| NEW ZEALAND — (0.1%) | |
| COMMON STOCKS — (0.1%) | |
| Other Securities | | | | | | | 7,460,246 | | | | 0.2 | % | |
| NORWAY — (0.8%) | |
| COMMON STOCKS — (0.8%) | |
| Other Securities | | | | | | | 42,910,368 | | | | 0.9 | % | |
| PORTUGAL — (0.1%) | |
| COMMON STOCKS — (0.1%) | |
| Other Securities | | | | | | | 6,541,713 | | | | 0.1 | % | |
| SINGAPORE — (1.1%) | |
| COMMON STOCKS — (1.1%) | |
| Other Securities | | | | | | | 57,732,771 | | | | 1.2 | % | |
| SPAIN — (4.2%) | |
| COMMON STOCKS — (4.2%) | |
| # Banco Santander Central Hispano SA | | | 7,025,356 | | | | 75,980,397 | | | | 1.6 | % | |
| # Banco Santander SA Sponsored ADR | | | 3,044,700 | | | | 32,700,078 | | | | 0.7 | % | |
| Repsol YPF SA | | | 1,204,043 | | | | 22,895,968 | | | �� | 0.5 | % | |
45
THE DFA INTERNATIONAL VALUE SERIES
CONTINUED
| | | Shares | | Value†† | | Percentage
of Net Assets** | |
| Repsol YPF SA Sponsored ADR | | | 1,285,700 | | | $ | 24,582,584 | | | | 0.5 | % | |
| Other Securities | | | | | | | 68,834,633 | | | | 1.5 | % | |
| TOTAL — SPAIN | | | | | | | 224,993,660 | | | | 4.8 | % | |
| SWEDEN — (2.4%) | |
| COMMON STOCKS — (2.4%) | |
| # Nordea Bank AB | | | 4,247,718 | | | | 34,046,034 | | | | 0.7 | % | |
| Other Securities | | | | | | | 94,071,267 | | | | 2.0 | % | |
| TOTAL — SWEDEN | | | | | | | 128,117,301 | | | | 2.7 | % | |
| SWITZERLAND — (5.9%) | |
| COMMON STOCKS — (5.9%) | |
| * Compagnie Financiere Richemont SA Series A | | | 1,125,900 | | | | 23,669,433 | | | | 0.5 | % | |
| Credit Suisse Group AG | | | 1,755,349 | | | | 65,639,295 | | | | 1.4 | % | |
| # Credit Suisse Group AG Sponsored ADR | | | 591,859 | | | | 22,135,527 | | | | 0.5 | % | |
| Holcim, Ltd. | | | 435,033 | | | | 24,709,544 | | | | 0.5 | % | |
| Swiss Re | | | 725,996 | | | | 30,276,699 | | | | 0.6 | % | |
| Zurich Financial SVCS AG | | | 300,246 | | | | 60,913,201 | | | | 1.3 | % | |
| Other Securities | | | | | | | 92,813,720 | | | | 2.0 | % | |
| TOTAL — SWITZERLAND | | | | | | | 320,157,419 | | | | 6.8 | % | |
| UNITED KINGDOM — (17.2%) | |
| COMMON STOCKS — (17.2%) | |
| Anglo American P.L.C. | | | 1,329,421 | | | | 33,356,819 | | | | 0.7 | % | |
| Aviva P.L.C. | | | 6,571,996 | | | | 39,201,982 | | | | 0.8 | % | |
| # Barclays P.L.C. Sponsored ADR | | | 2,197,790 | | | | 23,670,198 | | | | 0.5 | % | |
| # HSBC Holdings P.L.C. Sponsored ADR | | | 2,176,243 | | | | 128,398,337 | | | | 2.7 | % | |
| Kingfisher P.L.C. | | | 12,172,495 | | | | 22,467,306 | | | | 0.5 | % | |
| Royal Dutch Shell P.L.C. ADR | | | 1,294,780 | | | | 71,588,386 | | | | 1.5 | % | |
| RSA Insurance Group P.L.C. | | | 12,939,111 | | | | 28,774,426 | | | | 0.6 | % | |
| Vodafone Group P.L.C. | | | 56,881,367 | | | | 109,423,488 | | | | 2.3 | % | |
| Vodafone Group P.L.C. Sponsored ADR | | | 6,370,018 | | | | 122,750,247 | | | | 2.6 | % | |
| William Morrison Supermarkets P.L.C. | | | 6,906,878 | | | | 29,409,035 | | | | 0.6 | % | |
| Other Securities | | | | | | | 324,025,564 | | | | 7.1 | % | |
| TOTAL — UNITED KINGDOM | | | | | | | 933,065,788 | | | | 19.9 | % | |
| | | Face
Amount | | Value† | | | |
| | | (000) | | | | | |
| TEMPORARY CASH INVESTMENTS — (1.6%) | |
Repurchase Agreement, PNC Capital Markets, Inc. 0.94%,
11/03/08 (Collateralized by $92,080,000 FHLMC 4.50%,
05/01/23, valued at $87,591,100) to be repurchased at $86,299,760 | | $ | 86,293 | | | | 86,293,000 | | | | 1.8 | % | |
| | | Shares | | | | | |
| SECURITIES LENDING COLLATERAL — (14.0%) | |
| §@ DFA Short Term Investment Fund LP | | | 757,347,231 | | | | 757,347,231 | | | | 16.1 | % | |
| | | Face
Amount | | | | | |
| | | (000) | | | | | |
@ Repurchase Agreement, Deutsche Bank Securities 0.25%,
11/03/08 (Collateralized by $3,471,793 FHLMC 7.000%,
08/01/37, valued at $2,958,290) to be repurchased at $2,900,344 | | $ | 2,900 | | | | 2,900,284 | | | | 0.1 | % | |
| TOTAL SECURITIES LENDING COLLATERAL | | | | | | | 760,247,515 | | | | 16.2 | % | |
TOTAL INVESTMENTS — (100.0%)
(Cost $7,723,320,604) | | | | | | $ | 5,413,879,738 | | | | 115.2 | % | |
See accompanying Notes to Financial Statements.
46
THE DFA INVESTMENT TRUST COMPANY
STATEMENTS OF ASSETS AND LIABILITIES
OCTOBER 31, 2008
(Amounts in thousands, except share and per share amounts)
| | | The U.S. Large
Cap Value
Series | | The DFA
International
Value Series | |
| ASSETS: | |
Investments at Value (including $690,374 and $717,470 of
securities on loan, respectively) | | $ | 6,607,903 | | | $ | 4,567,339 | | |
| Temporary Cash Investments at Value & Cost | | | 144,470 | | | | 86,293 | | |
| Collateral Received from Securities on Loan at Value & Cost | | | 699,072 | | | | 760,248 | | |
| Foreign Currencies at Value | | | — | | | | 14,156 | | |
| Cash | | | — | | | | 15 | | |
| Receivables: | |
| Investment Securities Sold | | | 10,617 | | | | 38,170 | | |
| Dividends, Interest, and Tax Reclaims | | | 12,718 | | | | 15,310 | | |
| Securities Lending Income | | | 1,430 | | | | 1,186 | | |
| Fund Shares Sold | | | 4,995 | | | | 10,712 | | |
| Fund Margin Variation | | | 29 | | | | 19 | | |
| Prepaid Expenses and Other Assets | | | 7 | | | | 7 | | |
| Total Assets | | | 7,481,241 | | | | 5,493,455 | | |
| LIABILITIES: | |
| Payables: | |
| Upon Return of Securities Loaned | | | 699,072 | | | | 760,248 | | |
| Investment Securities Purchased | | | 41,685 | | | | 31,085 | | |
| Fund Shares Redeemed | | | 136 | | | | 510 | | |
| Due to Advisor | | | 570 | | | | 853 | | |
| Accrued Expenses and Other Liabilities | | | 415 | | | | 422 | | |
| Total Liabilities | | | 741,878 | | | | 793,118 | | |
| NET ASSETS | | $ | 6,739,363 | | | $ | 4,700,337 | | |
SHARES OUTSTANDING, $0.01 PAR VALUE
(Unlimited Number of Shares Authorized) | | | 497,037,187 | | | | 412,114,828 | | |
| NET ASSET VALUE, OFFERING AND REDEMPTION PRICE PER SHARE | | $ | 13.56 | | | $ | 11.41 | | |
| Investments at Cost | | $ | 8,488,055 | | | $ | 6,876,780 | | |
| Foreign Currencies at Cost | | $ | — | | | $ | 14,875 | | |
| NET ASSETS CONSIST OF: | |
| Paid-In Capital | | $ | 9,162,464 | | | $ | 4,700,337 | | |
Undistributed Net Investment Income (Distributions in Excess of Net
Investment Income) | | | (68 | ) | | | — | | |
| Accumulated Net Realized Gain (Loss) | | | (542,910 | ) | | | — | | |
| Net Unrealized Foreign Exchange Gain (Loss) | | | — | | | | — | | |
| Net Unrealized Appreciation (Depreciation) | | | (1,880,123 | ) | | | — | | |
| NET ASSETS | | $ | 6,739,363 | | | $ | 4,700,337 | | |
See accompanying Notes to Financial Statements.
47
THE DFA INVESTMENT TRUST COMPANY
STATEMENTS OF OPERATIONS
(Amounts in thousands)
| | | The U.S. Large
Cap Value
Series | | The DFA
International
Value Series | |
| | | Period
Dec. 1,
2007 to
Oct. 31,
2008 | | Year
Ended
Nov. 30,
2007 | | Period
Dec. 1,
2007 to
Oct. 31,
2008 | | Year
Ended
Nov. 30,
2007 | |
| Investment Income | |
Dividends (Net of Foreign Taxes Withheld of $0, $0, $28,938
and $23,649, respectively) | | $ | 166,659 | | | $ | 152,304 | | | $ | 300,627 | | | $ | 278,708 | | |
| Interest | | | 1,529 | | | | 4,285 | | | | 1,071 | | | | 2,113 | | |
| Income from Securities Lending | | | 7,486 | | | | 2,119 | | | | 19,332 | | | | 14,342 | | |
| Total Investment Income | | | 175,674 | | | | 158,708 | | | | 321,030 | | | | 295,163 | | |
| Expenses | |
| Investment Advisory Services Fees | | | 8,436 | | | | 10,188 | | | | 14,643 | | | | 18,039 | | |
| Accounting & Transfer Agent Fees | | | 847 | | | | 1,011 | | | | 739 | | | | 900 | | |
| Custodian Fees | | | 90 | | | | 108 | | | | 914 | | | | 1,185 | | |
| Shareholders' Reports | | | 82 | | | | 103 | | | | 78 | | | | 84 | | |
| Directors'/Trustees' Fees & Expenses | | | — | | | | 94 | | | | — | | | | 97 | | |
| Professional Fees | | | 166 | | | | 157 | | | | 171 | | | | 139 | | |
| Other | | | 37 | | | | 56 | | | | 98 | | | | 106 | | |
| Total Expenses | | | 9,658 | | | | 11,717 | | | | 16,643 | | | | 20,550 | | |
| Net Investment Income (Loss) | | | 166,016 | | | | 146,991 | | | | 304,387 | | | | 274,613 | | |
| Realized and Unrealized Gain (Loss) | |
| Net Realized Gain (Loss) on: | |
| Investment Securities Sold | | | (422,637 | ) | | | (118,412 | ) | | | 137,811 | | | | 654,522 | | |
| Futures | | | (1,861 | ) | | | — | | | | (1,153 | ) | | | — | | |
| Foreign Currency Transactions | | | — | | | | — | | | | (4,593 | ) | | | 2,498 | | |
| In-Kind Redemptions | | | 52,271 | * | | | — | | | | 103,024 | * | | | — | | |
| Change in Unrealized Appreciation (Depreciation) of: | |
| Investment Securities and Foreign Currency | | | (3,601,292 | ) | | | (150,559 | ) | | | (5,026,911 | ) | | | 403,307 | | |
| Futures | | | 29 | | | | — | | | | 19 | | | | — | | |
| Translation of Foreign Currency Denominated Amounts | | | — | | | | — | | | | (76 | ) | | | (180 | ) | |
| Net Realized and Unrealized Gain (Loss) | | | (3,973,490 | ) | | | (268,971 | ) | | | (4,791,879 | ) | | | 1,060,147 | | |
Net Increase (Decrease) in Net Assets Resulting from
Operations | | $ | (3,807,474 | ) | | $ | (121,980 | ) | | $ | (4,487,492 | ) | | $ | 1,334,760 | | |
| | | | | | | | | | | | | | | | | | |
* See Note K in the Notes to Financial Statements.
See accompanying Notes to Financial Statements.
48
THE DFA INVESTMENT TRUST COMPANY
STATEMENTS OF CHANGES IN NET ASSETS
(Amounts in thousands)
| | | The U.S. Large Cap Value
Series | | The DFA International Value
Series | |
| | | Period
Dec. 1,
2007 to
Oct. 31,
2008 | | Year
Ended
Nov. 30,
2007 | | Year
Ended
Nov. 30,
2006 | | Period
Dec. 1,
2007 to
Oct. 31,
2008 | | Year
Ended
Nov. 30,
2007 | | Year
Ended
Nov. 30,
2006 | |
| Increase (Decrease) in Net Assets | |
| Operations: | |
| Net Investment Income (Loss) | | $ | 166,016 | | | $ | 146,991 | | | $ | 119,373 | | | $ | 304,387 | | | $ | 274,613 | | | $ | 193,174 | | |
| Net Realized Gain (Loss) on: | |
| Investment Securities Sold | | | (422,637 | ) | | | (118,412 | ) | | | 477,934 | | | | 137,811 | | | | 654,522 | | | | 201,700 | | |
| Futures | | | (1,861 | ) | | | — | | | | — | | | | (1,153 | ) | | | — | | | | — | | |
| Foreign Currency Transactions | | | — | | | | — | | | | — | | | | (4,593 | ) | | | 2,498 | | | | 378 | | |
| In-Kind Redemptions | | | 52,271 | * | | | — | | | | — | | | | 103,024 | * | | | — | | | | — | | |
Change in Unrealized Appreciation
(Depreciation) of: | |
Investment Securities and Foreign
Currency | | | (3,601,292 | ) | | | (150,559 | ) | | | 631,814 | | | | (5,026,911 | ) | | | 403,307 | | | | 1,351,708 | | |
| Futures | | | 29 | | | | — | | | | — | | | | 19 | | | | — | | | | — | | |
Translation of Foreign Currency
Denominated Amounts | | | — | | | | — | | | | — | | | | (76 | ) | | | (180 | ) | | | 486 | | |
Net Increase (Decrease) in Net Assets
Resulting from Operations | | | (3,807,474 | ) | | | (121,980 | ) | | | 1,229,121 | | | | (4,487,492 | ) | | | 1,334,760 | | | | 1,747,446 | | |
| Distributions From: | |
| Net Investment Income | | | (168,022 | ) | | | (146,268 | ) | | | (127,544 | ) | | | (293,386 | ) | | | (278,093 | ) | | | (202,210 | ) | |
| Net Short-Term Gains | | | — | | | | (14,058 | ) | | | (14,160 | ) | | | (22,542 | ) | | | (14,957 | ) | | | (11,375 | ) | |
| Net Long-Term Gains | | | — | | | | (463,917 | ) | | | (186,026 | ) | | | (614,160 | ) | | | (185,943 | ) | | | (115,307 | ) | |
| Total Distributions | | | (168,022 | ) | | | (624,243 | ) | | | (327,730 | ) | | | (930,088 | ) | | | (478,993 | ) | | | (328,892 | ) | |
| Capital Share Transactions (1): | |
| Shares Issued | | | 1,370,762 | | | | 1,783,358 | | | | 1,997,675 | | | | 927,878 | | | | 1,731,698 | | | | 1,589,921 | | |
Shares Issued in Lieu of Cash
Distributions | | | 165,455 | | | | 600,794 | | | | 317,835 | | | | 916,898 | | | | 465,562 | | | | 307,948 | | |
| Shares Redeemed | | | (980,680 | )* | | | (344,913 | ) | | | (182,182 | ) | | | (1,365,580 | )* | | | (871,558 | ) | | | (226,869 | ) | |
Net Increase (Decrease) from
Capital Share Transactions | | | 555,537 | | | | 2,039,239 | | | | 2,133,328 | | | | 479,196 | | | | 1,325,702 | | | | 1,671,000 | | |
Total Increase (Decrease) in
Net Assets | | | (3,419,959 | ) | | | 1,293,016 | | | | 3,034,719 | | | | (4,938,384 | ) | | | 2,181,469 | | | | 3,089,554 | | |
| Net Assets | |
| Beginning of Period | | | 10,159,322 | | | | 8,866,306 | | | | 5,831,587 | | | | 9,638,721 | | | | 7,457,252 | | | | 4,367,698 | | |
| End of Period | | $ | 6,739,363 | | | $ | 10,159,322 | | | $ | 8,866,306 | | | $ | 4,700,337 | | | $ | 9,638,721 | | | $ | 7,457,252 | | |
| (1) Shares Issued and Redeemed: | |
| Shares Issued | | | 74,071 | | | | 75,958 | | | | 92,566 | | | | 50,328 | | | | 72,431 | | | | 80,546 | | |
Shares Issued in Lieu of Cash
Distributions | | | 9,754 | | | | 26,704 | | | | 15,344 | | | | 45,073 | | | | 20,227 | | | | 16,678 | | |
| Shares Redeemed | | | (52,609 | ) | | | (15,046 | ) | | | (8,564 | ) | | | (77,527 | ) | | | (36,444 | ) | | | (11,688 | ) | |
| | | | 31,216 | | | | 87,616 | | | | 99,346 | | | | 17,874 | | | | 56,214 | | | | 85,536 | | |
Undistributed Net Investment Income
(Distributions in Excess of Net
Investment Income) | | $ | (68 | ) | | $ | 1,938 | | | $ | 1,485 | | | $ | | — | | $ | 9,727 | | | $ | (7,523 | ) | |
* See Note K in the Notes to Financial Statements.
See accompanying Notes to Financial Statements.
49
THE DFA INVESTMENT TRUST COMPANY
FINANCIAL HIGHLIGHTS
(for a share outstanding throughout each period)
| | | The U.S. Large Cap Value Series | | The DFA International Value Series | |
| | | Period
Dec. 1,
2007 to
Oct. 31,
2008 | | Year
Ended
Nov. 30,
2007 | | Year
Ended
Nov. 30,
2006 | | Year
Ended
Nov. 30,
2005 | | Year
Ended
Nov. 30,
2004 | | Year
Ended
Nov. 30,
2003 | | Period
Dec. 1,
2007 to
Oct. 31,
2008 | | Year
Ended
Nov. 30,
2007 | | Year
Ended
Nov. 30,
2006 | | Year
Ended
Nov. 30,
2005 | | Year
Ended
Nov. 30,
2004 | | Year
Ended
Nov. 30,
2003 | |
Net Asset Value,
Beginning of Period | | $ | 21.81 | | | $ | 23.44 | | | $ | 20.91 | | | $ | 18.55 | | | $ | 15.41 | | | $ | 13.01 | | | $ | 24.45 | | | $ | 22.06 | | | $ | 17.30 | | | $ | 16.04 | | | $ | 12.40 | | | $ | 9.33 | | |
Income from Investment
Operations | |
Net Investment Income
(Loss) | | | 0.35 | (A) | | | 0.34 | (A) | | | 0.36 | (A) | | | 0.29 | | | | 0.23 | | | | 0.21 | | | | 0.73 | (A) | | | 0.73 | (A) | | | 0.65 | (A) | | | 0.43 | | | | 0.33 | | | | 0.27 | | |
Net Gains (Losses) on
Securities (Realized
and Unrealized) | | | (8.25 | ) | | | (0.38 | ) | | | 3.27 | | | | 2.41 | | | | 3.09 | | | | 2.41 | | | | (11.45 | ) | | | 2.98 | | | | 5.27 | | | | 1.95 | | | | 3.61 | | | | 3.06 | | |
Total from Investment
Operations | | | (7.90 | ) | | | (0.04 | ) | | | 3.63 | | | | 2.70 | | | | 3.32 | | | | 2.62 | | | | (10.72 | ) | | | 3.71 | | | | 5.92 | | | | 2.38 | | | | 3.94 | | | | 3.33 | | |
| Less Distributions | |
| Net Investment Income | | | (0.35 | ) | | | (0.33 | ) | | | (0.38 | ) | | | (0.32 | ) | | | (0.18 | ) | | | (0.22 | ) | | | (0.71 | ) | | | (0.73 | ) | | | (0.67 | ) | | | (0.52 | ) | | | (0.30 | ) | | | (0.25 | ) | |
| Net Realized Gains | | | — | | | | (1.26 | ) | | | (0.72 | ) | | | (0.02 | ) | | | — | | | | — | | | | (1.61 | ) | | | (0.59 | ) | | | (0.49 | ) | | | (0.60 | ) | | | — | | | | (0.01 | ) | |
| Total Distributions | | | (0.35 | ) | | | (1.59 | ) | | | (1.10 | ) | | | (0.34 | ) | | | (0.18 | ) | | | (0.22 | ) | | | (2.32 | ) | | | (1.32 | ) | | | (1.16 | ) | | | (1.12 | ) | | | (0.30 | ) | | | (0.26 | ) | |
Net Asset Value, End of
Period | | $ | 13.56 | | | $ | 21.81 | | | $ | 23.44 | | | $ | 20.91 | | | $ | 18.55 | | | $ | 15.41 | | | $ | 11.41 | | | $ | 24.45 | | | $ | 22.06 | | | $ | 17.30 | | | $ | 16.04 | | | $ | 12.40 | | |
| Total Return | | | (36.53 | )%(C) | | | (0.32 | )% | | | 18.16 | % | | | 14.66 | % | | | 21.68 | % | | | 20.34 | % | | | (47.87 | )%(C) | | | 17.32 | % | | | 35.73 | % | | | 15.61 | % | | | 32.15 | % | | | 36.24 | % | |
Net Assets, End of
Period (thousands) | | $ | 6,739,363 | | | $ | 10,159,322 | | | $ | 8,866,306 | | | $ | 5,831,587 | | | $ | 3,919,913 | | | $ | 2,510,662 | | | $ | 4,700,337 | | | $ | 9,638,721 | | | $ | 7,457,252 | | | $ | 4,367,698 | | | $ | 2,804,043 | | | $ | 1,604,778 | | |
Ratio of Expenses to
Average Net Assets | | | 0.11 | %(B) | | | 0.11 | % | | | 0.12 | % | | | 0.14 | % | | | 0.15 | % | | | 0.15 | % | | | 0.23 | %(B) | | | 0.23 | % | | | 0.23 | % | | | 0.27 | % | | | 0.28 | % | | | 0.30 | % | |
Ratio of Net Investment
Income to Average
Net Assets | | | 1.97 | %(B) | | | 1.44 | % | | | 1.68 | % | | | 1.56 | % | | | 1.41 | % | | | 1.62 | % | | | 4.15 | %(B) | | | 3.04 | % | | | 3.29 | % | | | 2.71 | % | | | 2.35 | % | | | 2.61 | % | |
| Portfolio Turnover Rate | | | 19 | %(C) | | | 9 | % | | | 13 | % | | | 9 | % | | | 7 | % | | | 7 | % | | | 16 | %(C) | | | 16 | % | | | 8 | % | | | 10 | % | | | 15 | % | | | 14 | % | |
See page 1 for the Definitions of Abbreviations and Footnotes.
See accompanying Notes to Financial Statements.
50
THE DFA INVESTMENT TRUST COMPANY
NOTES TO FINANCIAL STATEMENTS
A. Organization:
The DFA Investment Trust Company (the "Trust") is an open-end management investment company registered under the Investment Company Act of 1940. The Trust consists of eighteen investment portfolios, of which two (the "Series") are presented in this report.
At a regular meeting of the Board of Directors/Trustees (the "Board") on September 16, 2008, the Board voted to change the fiscal and tax year ends of the Series from November 30 to October 31.
B. Significant Accounting Policies:
The following significant accounting policies are in conformity with accounting principles generally accepted in the United States of America. Such policies are consistently followed by the Trust in preparation of its financial statements. The preparation of financial statements in accordance with accounting principles generally accepted in the United States of America requires management to make estimates and assumptions that affect the reported amounts of assets and liabilities and disclosure of contingent assets and liabilities at the date of the financial statements and the reported amounts of increases and decreases in net assets from operations during the reporting period. Actual results could differ from those estimates and those differences could be material.
1. Security Valuation: Securities held by the Series (including over-the-counter securities) are valued at the last quoted sale price of the day. Securities held by the Series that are listed on Nasdaq are valued at the Nasdaq Official Closing Price ("NOCP"). If there is no last reported sale price or NOCP for the day, the Series value the securities at the mean of the most recent quoted bid and asked prices. Price information on listed securities is taken from the exchange where the security is primarily traded. Generally, securities issued by open-end investment companies are valued using their respective net asset values or public offering prices, as appropriate, for purchase orders placed at the close of the New York Stock Exchange (NYSE).
Securities for which no market quotations are readily available (including restricted securities), or for which market quotations have become unreliable, are valued in good faith at fair value in accordance with procedures adopted by the Board of Directors/Trustees. Fair value pricing may also be used if events that have a significant effect on the value of an investment (as determined in the discretion of the Investment Committee of the Advisor) occur before the net asset value is calculated. When fair value pricing is used, the prices of securities used by the Series may differ from the quoted or published prices for the same securities on their primary markets or exchanges.
The DFA International Value Series (the "International Series") will also fair value price in the circumstances described below. Generally, trading in foreign securities markets is completed each day at various times prior to the close of the NYSE. For example, trading in the Japanese securities markets is completed each day at the close of the Tokyo Stock Exchange (normally 11:00 p.m. PT), which is fourteen hours prior to the close of the NYSE (normally 1:00 p.m. PT) and the time that the net asset value of the International Series is computed. Due to the time differences between the closings of the relevant foreign securities exchanges and the time the International Series prices its shares at the close of the NYSE, the International Series will fair value its foreign investments when it is determined that the market quotations for the foreign investments are either unreliable or not readily available. The fair value prices will attempt to reflect the impact of the U.S. financial markets' perceptions and trading activities on the International Series' foreign investments since the last closing prices of the foreign investments were calculated on their primary foreign securities markets or exchanges. For these purposes, the Board of Directors/Trustees of the International Series has determined that movements in relevant indices or other appropriate market indicators, after the close of the Tokyo Stock Exchange or the London Stock Exchange, demonstrate that market quotations may be unreliable. Fair valuation of portfolio securities may occur on a daily basis. The fair value pricing by the International Series utilizes data furnished by an independent pricing service (and that data draws upon, among other information, the market values of foreign investments). The fair value prices of portfolio securities generally will be used when it is determined that the use of such prices will have a material impact on the net asset value of the Internation al Series. When the International Series uses fair value pricing, the values assigned to the International Series' foreign investments may not be the quoted or published prices of the investments on their primary markets or exchanges.
51
Futures contracts held by the Series are valued using the settlement price established each day on the exchange on which they are traded.
Adoption of Statement of Financial Accounting Standards No. 157 "Fair Value Measurements" ("FAS 157")
In September 2006, the Financial Accounting Standards Board issued FAS 157 effective for fiscal years beginning after November 15, 2007. This standard clarifies the definition of fair value for financial reporting, establishes a framework for measuring fair value and requires additional disclosures about the use of fair value measurements. The Funds have adopted FAS 157 as of December 1, 2007. The three levels of the fair value hierarchy under FAS 157 are described below:
• Level 1 – quoted prices in active markets for identical securities
• Level 2 – other significant observable inputs (including quoted prices for similar securities, interest rates, prepayment speeds, credit risk, etc.)
• Level 3 – significant unobservable inputs (including the Series' own assumptions in determining the fair value of investments)
The inputs or methodology used for valuing securities are not necessarily an indication of the risk associated with investing in those securities. A summary of the inputs used to value the Series' net assets as of October 31, 2008 is listed below (in thousands).
| | | Valuation Inputs | |
| | |
Investments in
Securities
(Market Value) | | Other Financial
Instruments
(Unrealized
Appreciation/
Depreciation)* | |
| | | Level 1 | | Level 2 | | Level 3 | | Total | | Level 1 | | Level 2 | | Level 3 | | Total | |
| The U.S. Large Cap Value Series | | $ | 6,607,903 | | | $ | 843,542 | | | | — | | | $ | 7,451,445 | | | $ | 29 | | | | — | | | | — | | | $ | 29 | | |
| The DFA International Value Series | | | 1,004,378 | | | | 4,409,502 | | | | — | | | | 5,413,880 | | | | 19 | | | | — | | | | — | | | | 19 | | |
* Other financial instruments are derivative instruments not reflected in the Schedule of Investments, such as futures, forwards and swaps which are valued at the unrealized appreciation/depreciation on the investment.
2. Foreign Currency Translation: Securities and other assets and liabilities of The DFA International Value Series whose values are initially expressed in foreign currencies, are translated to U.S. dollars using the mean between the most recently quoted bid and asked prices for the U.S. dollar as quoted by generally recognized reliable sources. Dividend and interest income and certain expenses are translated to U.S. dollars at the rate of exchange on their respective accrual dates. Receivables and payables denominated in foreign currencies are marked to market daily based on daily exchange rates, and exchange gains or losses are realized upon ultimate receipt or disbursement.
The DFA International Value Series does not isolate the effect of fluctuations in foreign exchange rates from the effect of fluctuations in the market prices of securities held whether realized or unrealized.
Realized gains or losses on foreign currency transactions represent net foreign exchange gains or losses from the disposition of foreign currencies, currency gains or losses realized between the trade and settlement dates on securities transactions, and the difference between amounts of interest, dividends and foreign withholding taxes recorded on The DFA International Value Series books and the U.S. dollar equivalent amounts actually received or paid.
3. Deferred Compensation Plan: Each eligible Trustee of the Trust may elect participation in the Deferred Compensation Plan (the "Plan"). Under the Plan, effective January 1, 2002, such Trustees may defer payment of all or a portion of their total fees earned as a Trustee. These deferred amounts may be treated as though such amounts had been invested in shares of the following funds: U.S. Large Cap Value Portfolio; U.S. Core Equity 1 Portfolio; U.S. Core Equity 2 Portfolio; U.S. Vector Equity Portfolio; U.S. Micro Cap Portfolio; DFA International Value Portfolio; International Core Equity Portfolio; Emerging Markets Portfolio; Emerging Markets Core Equity Portfolio; and/or DFA Two-Year Global Fixed Income Portfolio. Contributions made under the Plan and the change in unrealized app reciation (depreciation) and income, are included in Other Expenses for the period ended October 31, 2008 and are included in Directors'/Trustees' Fees & Expenses for the year ended November 30, 2007.
Each Trustee has the option to receive their distribution of proceeds in one of the following methods upon one year's notice: lump sum; annual installments over a period of agreed upon years; or semi-annual installments over a period of agreed upon years. As of October 31, 2008, none of the Trustees have requested distribution of proceeds.
52
4. Other: Security transactions are accounted for as of the trade date. Costs used in determining realized gains and losses on the sale of investment securities are on the basis of identified cost. Dividend income and distributions to shareholders are recorded on the ex-dividend date. Distributions received on securities that represent a return of capital or capital gain are recorded as a reduction of cost of investments or as a realized gain, respectively. The Series estimate the character of distributions received that may be considered return of capital distributions. Interest income is recorded on the accrual basis. Discount and premium on securities purchased are amortized over the lives of the respective securities utilizing the effective interest method. Expenses directly at tributable to a Series are directly charged. Common expenses of the Trust or Series are allocated using methods approved by the Board of Directors/Trustees, generally based on average net assets.
The DFA International Value Series may be subject to taxes imposed by countries in which it invests, with respect to its investments in issuers existing or operating in such countries. Such taxes are generally based on income earned or repatriated and capital gains realized on the sale of such investments. The DFA International Value Series accrues such taxes when the related income or capital gains are earned or throughout the holding period. Some countries require governmental approval for the repatriation of investment income, capital or the proceeds of sales of foreign investors. In addition, if there is a deterioration in a country's balance of payments or for other reasons, a country may impose temporary restrictions on foreign capital remittances abroad.
C. Investment Advisor:
Dimensional Fund Advisors LP ("Dimensional" or the "Advisor") provides investment advisory services to the Series. For the period December 1, 2007 to October 31, 2008, the investment advisory services fees were accrued daily and paid monthly to the Advisor based on an effective annual rate of 0.10% and 0.20% of average daily net assets for The U.S. Large Cap Value Series and The DFA International Value Series, respectively.
Fees Paid to Officers and Directors/Trustees:
Certain Officers and Directors/Trustees of the Advisor are also Officers and Directors/Trustees of the Funds; however, such Officers and Directors/Trustees (with the exception of the Chief Compliance Officer ("CCO")) receive no compensation from the Trust. For the period December 1, 2007 to October 31, 2008, the total related amounts paid by the Trust to the CCO were $106 (in thousands). The total related amounts paid by each of the Series are included in Other Expenses on the Statement of Operations.
D. Deferred Compensation:
At October 31, 2008, the total liability for deferred compensation to Directors/Trustees is included in Accrued Expenses and Other Liabilities on the Statement of Assets and Liabilities as follows (amounts in thousands):
| The U.S. Large Cap Value Series | | $ | 134 | | |
| The DFA International Value Series | | | 117 | | |
E. Purchases and Sales of Securities:
For the period December 1, 2007 to October 31, 2008, the Series made the following purchases and sales of investment securities, other than short-term investments and U.S. government securities (amounts in thousands):
| | | Purchases | | Sales | |
| The U.S. Large Cap Value Series | | $ | 2,227,129 | | | $ | 1,690,939 | | |
| The DFA International Value Series | | | 1,266,540 | | | | 1,523,257 | | |
There were no purchases or sales of long-term U.S. government securities.
F. Federal Income Taxes:
Each Series has qualified and intends to continue to qualify as a regulated investment company under Subchapter M of the Internal Revenue Code for federal income tax purposes and to distribute substantially all of its taxable income and net capital gains to its shareholders.
53
Distributions from net investment income and net realized capital gains are determined in accordance with U.S. federal income tax regulations, which may differ from those amounts determined under accounting principles generally accepted in the United States of America. These book/tax differences are either temporary or permanent in nature. To the extent these differences are permanent, they are charged or credited to paid-in capital, undistributed net investment income or accumulated net realized gains, as appropriate, in the period that the differences arise. Accordingly, the following permanent differences as of October 31, 2008, primarily attributable to net realized gains on securities considered to be "passive foreign investment companies" were reclassified to the following accounts. These reclassifications had no effect on net assets or net asset value per share. (amounts in thousands):
| | | Increase
(Decrease)
Paid-in
Capital | | Increase
(Decrease)
Undistributed
Net Investment
Income | | Increase
(Decrease)
Accumulated
Net Realized
Gains/(Losses) | |
| The U.S. Large Cap Value Series | | $ | 52,271 | | | | — | | | $ | (52,271 | ) | |
| The DFA International Value Series | | | 123,628 | | | $ | (20,126 | ) | | | (103,502 | ) | |
The tax character of dividends and distributions declared and paid during the years ended November 30, 2006, November 30, 2007 and the period December 1, 2007 to October 31, 2008 were as follows (amounts in thousands):
| | | Net Investment
Income and
Short-Term
Capital Gains | |
Long-Term
Capital Gains | |
Total | |
The U.S. Large Cap Value Series
2006 | | $ | 141,704 | | | $ | 186,026 | | | $ | 327,730 | | |
| 2007 | | | 160,367 | | | | 463,876 | | | | 624,243 | | |
| 2008 | | | 168,022 | | | | — | | | | 168,022 | | |
The DFA International Value Series
2006 | | | 213,585 | | | | 115,307 | | | | 328,892 | | |
| 2007 | | | 293,050 | | | | 185,943 | | | | 478,993 | | |
| 2008 | | | 336,790 | | | | 613,845 | | | | 950,635 | | |
At October 31, 2008, the components of distributable earnings/(accumulated losses) were as follows (amounts in thousands):
| | | Undistributed
Net Investment
Income and
Short-Term
Capital Gains | | Undistributed
Long-Term
Capital Gains | | Capital Loss
Carryforward | | Total Net
Distributable
Earnings/
(Accumulated
Losses) | |
| The U.S. Large Cap Value Series | | $ | 66 | | | | — | | | $ | (542,039 | ) | | $ | 541,973 | | |
For federal income tax purposes, the Trust measures its capital loss carryforwards annually at October 31, its fiscal year end. Capital loss carryforwards may be carried forward and applied against future capital gains. As of October 31, 2008, The U.S. Large Cap Value Series had a capital loss carryforward available to offset future realized capital gains through the indicated expiration date (amount in thousands).
| | | Expires on October 31, | | | |
| | | 2015 | | 2016 | | Total | |
| | $ | 118,411 | | | $ | 423,628 | | | $ | 542,039 | | |
At October 31, 2008, the total cost and aggregate gross unrealized appreciation and (depreciation) of securities for federal income tax purposes were different from amounts reported for financial reporting purposes (amounts in thousands):
| | | Federal
Tax Cost | | Unrealized
Appreciation | | Unrealized
(Depreciation) | | Net
Unrealized
Appreciation
(Depreciation) | |
| The U.S. Large Cap Value Series | | $ | 9,332,438 | | | $ | 582,282 | | | $ | (2,463,275 | ) | | $ | (1,880,993 | ) | |
54
In June 2006, the Financial Accounting Standards Board (FASB) issued FASB Interpretation 48 ("FIN 48"), "Accounting for Uncertainty in Income Taxes." This standard defines the threshold for recognizing the benefits of tax-return positions in the financial statements as "more-likely-than-not" to be sustained by the taxing authority and requires measurement of a tax position meeting the more-likely-than-not criterion, based on the largest benefit that is more than 50 percent likely to be realized. Management has analyzed the Series' tax positions to be taken on the federal income tax returns for all open tax years (tax years ended November 30, 2005 through the period ended October 31, 2008), for purposes of implementing FIN 48, and has concluded that no provision for income tax is required in the Series' financial statements.
G. Financial Instruments:
In accordance with the Series' investment objectives and policies, the Series may invest in certain financial instruments that have off-balance sheet risk in excess of the amounts recognized in the financial statements and concentrations of credit and market risk. These instruments and their significant corresponding risks are described below:
1. Repurchase Agreements: The Series may purchase money market instruments subject to the counterparty's agreement to repurchase them at an agreed upon date and price. The counterparty will be required on a daily basis to maintain the value of the collateral subject to the agreement at not less than the repurchase price (including accrued interest). The agreements are conditioned upon the collateral being deposited under the Federal Reserve book-entry system with the Trust's custodian or a third party sub-custodian. In the event of default or bankruptcy by the other party to the agreement, retention of the collateral may be subject to legal proceedings. All open repurchase agreements were entered into on October 31, 2008.
2. Foreign Market Risks: Investments in foreign markets may involve certain consideration and risks not typically associated with investments in the United States of America, including the possibility of future political and economic developments and the level of foreign government supervision and regulation of foreign securities markets. These markets are generally smaller, less liquid and more volatile than the major securities markets in the United States of America. Consequently, acquisition and disposition of securities by the Series may be inhibited.
3. Futures Contracts: During the period December 1, 2007 to October 31, 2008, the Series entered into futures contracts in accordance with their investment objectives. Upon entering into a futures contract, the Series deposit cash or pledge U.S. Government securities to a broker, equal to the minimum "initial margin" requirements of the exchange on which the contract is traded. Subsequent payments are received from or paid to the broker each day, based on the daily fluctuation in the market value of the contract. These receipts or payments are known as "variation margin" and are recorded daily by the Series as unrealized gains or losses until the contracts are closed. When the contracts are closed, the Series record a realized gain or loss equal to the difference between the v alue of the contract at the time it was opened and the value at the time it was closed.
Risks may arise upon entering into futures contracts from potential imperfect price correlations between the futures contracts and the underlying securities, from the possibility of an illiquid secondary market for these instruments and from the possibility that the Series could lose more than the initial margin requirements. At October 31, 2008, the Series had the following outstanding futures contracts (dollar amounts in thousands):
| | | Description | | Expiration Date | | Number of
Contracts | | Contract
Value | | Unrealized
Gain (Loss) | | Approximate Cash
Collateral | |
The U.S. Large Cap
Value Series | | S&P 500 Index® | | December 19, 2008 | | | 235 | | | $ | 56,829 | | | $ | 29 | | | $ | 5,816 | | |
The DFA International
Value Series | | S&P 500 Index® | | December 19, 2008 | | | 156 | | | | 37,725 | | | | 19 | | | | 3,861 | | |
55
H. Line of Credit:
The Series, together with other Dimensional-advised portfolios, has entered into a $250 million unsecured discretionary line of credit effective June 30, 2003 with an affiliate of its domestic custodian bank. Each portfolio is permitted to borrow, subject to its investment limitations, up to a maximum of $250 million, as long as total borrowings under the line of credit do not exceed $250 million in the aggregate. Borrowings under the line of credit are charged interest at the then current Federal Funds Rate plus 1%. Each portfolio is individually, and not jointly, liable for its particular advances under the line of credit. There is no commitment fee on the unused portion of the line of credit. The agreement for the discretionary line of credit may be terminated by either party at any time. The line of credit is scheduled to expire on June 23, 2009.
For the period December 1, 2007 to October 31, 2008, borrowings under this line of credit by the Series were as follows (amounts in thousands, except percentages and days):
| | | Weighted
Average
Interest Rate | | Weighted
Average
Loan Balance | | Number of
Days
Outstanding | | Interest
Expense
Incurred | | Maximum Amount
Borrowed During
the Period | |
| The U.S. Large Cap Value Series | | | 4.03 | % | | $ | 5,774 | | | | 4 | | | $ | 3 | | | $ | 5,880 | | |
There were no outstanding borrowings by the Series under this line of credit at October 31, 2008.
The Series, together with other Dimensional-advised portfolios, has also entered into an additional $500 million unsecured line of credit effective January 15, 2008 with its international custodian bank. Each portfolio is permitted to borrow, subject to its investment limitations, up to a maximum of $500 million, as long as total borrowings under the line of credit do not exceed $500 million in the aggregate. Each portfolio is individually, and not jointly, liable for its particular advances under the line of credit. Borrowings under the line of credit are charged interest at rates agreed to by the parties at the time of borrowing. There is no commitment fee on the unused portion of the line of credit. The agreement for the line of credit expires on January 15, 2009.
For the period December 1, 2007 to October 31, 2008, borrowings under this line of credit by the Series were as follows (amounts in thousands, except percentages and days):
| | | Weighted
Average
Interest Rate | | Weighted
Average
Loan Balance | | Number of
Days
Outstanding | | Interest
Expense
Incurred | | Maximum Amount
Borrowed During
the Period | |
| The DFA International Value Series | | | 3.68 | % | | $ | 8,004 | | | | 31 | | | $ | 25 | | | $ | 27,822 | | |
There were no outstanding borrowings by the Series under this line of credit at October 31, 2008.
I. Securities Lending:
As of October 31, 2008, some of the Series had securities on loan to brokers/dealers, for which each Series held cash collateral. Each Series invests the cash collateral, as described below, and records a liability for the return of the collateral, during the period the securities are on loan. Loans of securities are expected at all times to be secured by collateral equal to at least (i) 100% of the current market value of the loaned securities with respect to securities of the U.S. government or its agencies, (ii) 102% of the current market value of the loaned securities with respect to U.S. securities, and (iii) 105% of the current market value of the loaned securities with respect to foreign securities. However, daily market fluctuations could cause the Series' collateral to be lower or higher than the expected thresholds. If this were to occur, the collateral would be adjusted the next business day to ensure adequate collateralization. I n the event of default or bankruptcy by the other party to the agreement, realization and/or retention of the collateral may be subject to legal proceedings. If the borrower fails to return loaned securities, and cash collateral being maintained by the borrower is insufficient to cover the value of loaned securities and provided such collateral insufficiency is not the result of investment losses, the lending agent has agreed to pay the amount of the shortfall to the Series or, at the option of the lending agent, to replace the securities.
Subject to each Series' investment policy, the cash collateral received by the Series from securities on loan is invested in securities of the U.S. government or its agencies, repurchase agreements collateralized by securities of
56
the U.S. government or its agencies or shares of the DFA Short Term Investment Fund LP. Agencies include both agency debentures and agency mortgage backed securities. In addition, each Series will be able to terminate the loan at any time and will receive reasonable interest on the loan, as well as amounts equal to any dividends, interest or other distributions on the loaned securities. However, dividend income received from loaned securities may not be eligible to be taxed at qualified dividend income rates.
J. Indemnitees; Contractual Obligations:
Under the Trust's organizational documents, its officers and trustees are indemnified against certain liabilities arising out of the performance of their duties to the Trust.
In the normal course of business, the Trust enters into contracts that contain a variety of representations and warranties which provide general indemnification. The Trust's maximum exposure under these arrangements is unknown as this would involve future claims that may be made against the Trust and/or its affiliates that have not yet occurred. However, based on experience, the Trust expects the risk of loss to be remote.
K. In-Kind Redemptions:
In accordance with guidelines described in the Series' prospectus, the Series may distribute portfolio securities rather than cash as payment for a redemption of fund shares (in-kind redemption). For financial reporting purposes, the Series recognizes a gain on in-kind redemptions to the extent the value of the distributed securities on the date of redemption exceeds the cost of those securities. Gains and losses realized on in-kind redemptions are not recognized for tax purposes and are reclassified from undistributed realized gain (loss) to paid-in capital. During the period December 1, 2007 to October 31, 2008, The U.S. Large Cap Value Series and The DFA International Value Series realized $52,271 and $103,024 (in thousands) of net gain.
L. Recently Issued Accounting Standards and Interpretation:
In March 2008, Statement of Financial Accounting Standards No. 161, Disclosures about Derivative Instruments and Hedging Activities ("FAS 161"), was issued and is effective for fiscal years beginning after November 15, 2008. FAS 161 defines new disclosures of derivative instruments and hedging activities. Management is currently evaluating the implications of FAS 161. At this time, its impact on the Series' financial statements has not been determined.
M. Subsequent Event Note:
On November 1, 2008, The DFA International Value Series, a master fund in a RIC/RIC master feeder structure with five RIC feeders and two direct client investors, made a "Check-the-box" election for federal income tax purposes pursuant to Treasury Regulation § 301.7701-3, to change its federal entity classification from a corporation taxable as a regulated investment company to a partnership. As a result of this election, the master fund is deemed to have distributed all of its assets and liabilities, in a taxable transaction, to its shareholders in liquidation of the master fund. Immediately thereafter, the shareholders contributed all of the distributed assets and liabilities to a newly formed partnership. The final tax year end of The DFA International Value Series was October 31, 2008. For Federal income tax purposes, pursuant to Code §336(a), the master fund recognizes gain or loss as if the master's investment securities were sold to its shareholders and, pursuant to Code §331, each of the Portfolios recognizes gain or loss as if it liquidated its investment in the master. For tax purposes, pursuant to Code § 334(a), each of the Portfolio's will take a fair market value basis in the securities deemed received by them and a new holding period for those securities commences on the deemed liquidation date.
57
The master fund had book/tax differences upon its deemed liquidation. The following summary of permanent differences occurred as of the respective effective "Check the Box" election date.
| | | Increase
(Decrease)
Paid-in Capital | | Unrealized
Appreciation
(Depreciation)
Investment
Securities | | Increase
(Decrease)
Undistributed
Net Investment
Income | | Increase
(Decrease)
Accumulated
Net Realized
Gains(Losses) | |
| | $ | (2,187,614,395 | ) | | $ | 2,319,051,847 | | | $ | (602,214 | ) | | $ | (130,835,238 | ) | |
As a result of the transaction, The DFA International Value Series recognized a ($2,309,440,866) and ($718,733) capital and currency loss respectively for tax year ended October 31, 2008. Additionally, the Series has written off $2,178,493,687 of expired capital loss carryover as a permanent book/tax reporting difference decreasing paid in capital.
Each Portfolio impacted by the "Check the Box" election also has a permanent book/tax difference resulting from the transaction. Listed below is the permanent difference impacting each respective Portfolio. For financial statement purposes, this adjustment did not result in any changes to each respective fund's net assets or net asset value per share.
| | | Unrealized
Appreciation
(Depreciation)
Investment
Securities | | Increase
(Decrease)
Accumulated
Net Realized
Gains(Losses) | |
| DFA International Value Portfolio | | $ | 1,598,039,236 | | | $ | (1,598,039,236 | ) | |
| DFA International Value Portfolio II | | | 49,859,737 | | | | (49,859,737 | ) | |
| DFA International Value Portfolio III | | | 155,866,882 | | | | (155,866,882 | ) | |
| DFA International Value Portfolio IV | | | 82,052,198 | | | | (82,052,198 | ) | |
| LWAS/DFA International High Book To Market Portfolio | | | (19,800,535 | ) | | | 19,800,535 | | |
For financial reporting purposes, this transaction had no impact on the net assets of the respective funds.
58
REPORT OF INDEPENDENT REGISTERED PUBLIC ACCOUNTING FIRM
To the Shareholders of the Series, as defined, and
Board of Trustees of The DFA Investment Trust Company:
In our opinion, the accompanying statements of assets and liabilities, including the summary schedules of portfolio holdings, and the related statements of operations and of changes in net assets and the financial highlights present fairly, in all material respects, the financial position of The U.S. Large Cap Value Series and The DFA International Value Series (constituting portfolios within The DFA Investment Trust Company, hereafter referred to as the "Series") at October 31, 2008, the results of each of their operations, the changes in each of their net assets and the financial highlights for each of the periods indicated, in conformity with accounting principles generally accepted in the United States of America. These financial statements and financial highlights (hereafter referred to as "financial statements") are the responsibility of the Series' management; our responsibility is to express an opinion on these financial statements b ased on our audits. We conducted our audits of these financial statements in accordance with the standards of the Public Company Accounting Oversight Board (United States). Those standards require that we plan and perform the audit to obtain reasonable assurance about whether the financial statements are free of material misstatement. An audit includes examining, on a test basis, evidence supporting the amounts and disclosures in the financial statements, assessing the accounting principles used and significant estimates made by management, and evaluating the overall financial statement presentation. We believe that our audits, which included confirmation of securities at October 31, 2008 by correspondence with the custodians and brokers, provide a reasonable basis for our opinion.
PricewaterhouseCoopers LLP
Philadelphia, Pennsylvania
December 22, 2008
59
FUND MANAGEMENT
Trustees/Directors
Each Board of Trustees/Directors of The DFA Investment Trust Company Inc. ("DFAITC"), DFA Investment Dimensions Group Inc. ("DFAIDG"), Dimensional Investment Group Inc. ("DIG") and Dimensional Emerging Markets Value Fund Inc. ("DEM") (each, the "Fund" and collectively, the "Funds") is responsible for establishing the Funds' policies and for overseeing the management of the Funds. The Trustees/Directors of the Funds, including all of the disinterested Directors, have adopted written procedures to monitor potential conflicts of interest that might develop between portfolios of the Funds (the "Feeder Portfolios") that invest in certain series of DFAITC or DEM (the "Master Funds").
Each Board has two standing committees, an Audit Committee and a Portfolio Performance and Service Review Committee (the "Performance Committee"). The Audit Committee is comprised of George M. Constantinides, Roger G. Ibbotson and Abbie J. Smith. Each member of the Audit Committee is a disinterested Director. The Audit Committee oversees the Fund's accounting and financial reporting policies and practices, the Fund's internal controls, the Fund's financial statements and the independent audits thereof and performs other oversight functions as requested by the Board. The Audit Committee recommends the appointment of each Fund's independent registered certified public accounting firm and also acts as a liaison between the Fund's independent registered certified public accounting firm and the full Board. There were three Audit Committee meetings held during the fiscal year ended October 31, 2008.
Each Board's Performance Committee is comprised of Messrs. Constantinides and Ibbotson, Ms. Smith, John P. Gould, Myron S. Scholes and Robert C. Merton. Each member of the Fund's Performance Committee is a disinterested Director. The Performance Committee regularly reviews and monitors the investment performance of the Fund's series and reviews the performance of the Fund's service providers. There were five Performance Committee meetings held during the fiscal year ended October 31, 2008.
Certain biographical information for each disinterested Trustee/Director and each interested Trustee/Director of the Funds is set forth in the tables below, including a description of each Trustee/Director's experience as a Trustee/Director of the Funds and as a director or trustee of other funds, as well as other recent professional experience.
The statements of additional information (together, "SAI") of the Funds include additional information about each Trustee/Director. You may obtain copies of the SAI and prospectus of each Fund advised by Dimensional Fund Advisors LP by calling collect (310) 395-8005 or by mailing a request to Dimensional Fund Advisors LP, 1299 Ocean Avenue, Santa Monica, California 90401. Prospectuses are also available at www.dimensional.com.
Name, Position
with the Fund,
Address and Age | | Term of Office1 and
Length of Service | | Portfolios within the
DFA Fund Complex2
Overseen | | Principal Occupation(s) During Past 5 Years and
Other Directorships of Public Companies Held | |
| | | Disinterested Trustees/Directors | |
|
George M. Constantinides
Director of DFAIDG, DIG and DEM.
Trustee of DFAITC.
The University of Chicago Booth School of Business
5807 S. Woodlawn Avenue Chicago, IL 60637
Age: 61 | | DFAITC - since 1993
DFAIDG - since 1983
DIG - since 1993
DEM - since 1993 | | 96 portfolios in 4 investment companies | | Leo Melamed Professor of Finance, The University of Chicago Booth School of Business. | |
|
60
Name, Position
with the Fund,
Address and Age | | Term of Office1 and
Length of Service | | Portfolios within the
DFA Fund Complex2
Overseen | | Principal Occupation(s) During Past 5 Years and
Other Directorships of Public Companies Held | |
John P. Gould
Director of DFAIDG, DIG and DEM.
Trustee of DFAITC.
The University of Chicago Booth School of Business
5807 S. Woodlawn Avenue
Chicago, IL 60637
Age: 69 | | DFAITC - since 1993
DFAIDG - since 1986
DIG - since 1993
DEM - since 1993 | | 96 portfolios in 4 investment companies | | Steven G. Rothmeier Distinguished Service Professor of Economics, The University of Chicago Booth School of Business (since 1965). Member of the Boards of Milwaukee Mutual Insurance Company (since 1997) and UNext.com (1999-2006). Member Competitive Markets Advisory Committee, Chicago Mercantile Exchange (futures trading exchange) (since 2004). Formerly, Senior Vice-President, Lexecon Inc. (economics, law, strategy and finance consulting) (1994-2004). Formerly, President, Cardean University (division of UNext.com) (1999-2001). Trustee, Harbor Fund (registered investment company) (14 Portfolios) (since 1994). | |
|
Roger G. Ibbotson
Director of DFAIDG, DIG and DEM.
Trustee of DFAITC.
Yale School of Management
P.O. Box 208200
New Haven, CT 06520-8200
Age: 65 | | DFAITC - since 1993
DFAIDG - since 1981
DIG - since 1993
DEM - since 1993 | | 96 portfolios in 4 investment companies | | Professor in Practice of Finance, Yale School of Management (since 1984). Director, BIRR Portfolio Analysis, Inc. (software products) (since 1990). Chairman, CIO and Partner, Zebra Capital Management, LLC (hedge fund manager) (since 2001).
Consultant to Morningstar, Inc. (since 2006). Formerly, Chairman, Ibbotson Associates, Inc., Chicago, IL (software data publishing and consulting) (1977-2006). | |
|
Robert C. Merton
Director of DFAIDG, DIG and DEM.
Trustee of DFAITC.
Harvard Business School
353 Baker Library
Soldiers Field
Boston, MA 02163
Age: 64 | | DFAITC - since 2003
DFAIDG - since 2003
DIG - since 2003
DEM - since 2003 | | 96 portfolios in 4 investment companies | | John and Natty McArthur University Professor, Graduate School of Business Administration, Harvard University (since 1998). George Fisher Baker Professor of Business Administration, Graduate School of Business Administration, Harvard University (1988-1998), Co-founder, Chief Science Officer and Director, Trinsum Group, a successor to Integrated Finance Limited (since 2002). Director, MF Risk, Inc. (risk management software) (since 2001). Director, Peninsula Banking Group (bank) (since 2003). Director, Community First Financial Group (bank holding company) (since 2003). Advisory Board Member, Alpha Simplex Group (hedge fund) (since 2001). Member Competitive Markets Advisory Council, Chicago Mercantile Exchange (futures trading exchange) (since 2004). Formerly, Advisory Board Member, NuServe (insurance software) (2001-2003). Director, Vical Incorporated (biopharmaceutical product development) (since 2002). | |
|
Myron S. Scholes
Director of DFAIDG, DIG and DEM.
Trustee of DFAITC.
Platinum Grove Asset Management, L.P.
Reckson Executive Park
1100 King Street
Building 4
Rye Brook, NY 10573
Age: 67 | | DFAITC - since 1993
DFAIDG - since 1981
DIG - since 1993
DEM - since 1993 | | 96 portfolios in 4 investment companies | | Frank E. Buck Professor Emeritus of Finance, Stanford University (since 1981). Chairman, Platinum Grove Asset Management, L.P. (hedge fund) (formerly, Oak Hill Platinum Partners) (since 1999). Formerly, Managing Partner, Oak Hill Capital Management (private equity firm) (until 2004). Chairman, Oak Hill Platinum Partners (hedge fund) (since 2004). Director, Chicago Mercantile Exchange (since 2001). Director, American Century Fund Complex (registered investment companies) (37 Portfolios) (since 1981); and Director, Chicago Mercantile Exchange Holdings Inc. (since 2000). | |
|
Abbie J. Smith
Director of DFAIDG, DIG and DEM.
Trustee of DFAITC.
The University of Chicago Booth School of Business
5807 S. Woodlawn Avenue
Chicago, IL 60637
Age: 55 | | DFAITC - since 2000
DFAIDG - since 2000
DIG - since 2000
DEM - since 2000 | | 96 portfolios in 4 investment companies | | Boris and Irene Stern Professor of Accounting, The University of Chicago Booth School of Business (since 1980), Formerly, Marvin Bower Fellow, Harvard Business School (9/01 to 8/02). Director, HNI Corporation (formerly known as HON Industries Inc.) (office furniture) (since 2000) and Director, Ryder System Inc. (transportation, logistics and supply-chain management) (since 2003). | |
|
61
Name, Position
with the Fund,
Address and Age | | Term of Office1 and
Length of Service | | Portfolios within the
DFA Fund Complex2
Overseen | | Principal Occupation(s) During Past 5 Years and
Other Directorships of Public Companies Held | |
| | | Interested Trustees/Directors* | |
|
David G. Booth
Chairman, Director, Chief Executive Officer and President of DFAIDG, DIG and DEM. Chairman, Trustee, Chief Executive Officer, Chief Investment Officer and President of DFAITC.
1299 Ocean Avenue
Santa Monica, CA 90401
Age: 61 | | DFAITC - since 1993
DFAIDG - since 1981
DIG - since 1992
DEM - since 1993 | | 96 portfolios in 4 investment companies | | Chairman, Director/Trustee, President, Chief Executive Officer and formerly Chief Investment Officer of the following companies: Dimensional Holdings Inc., Dimensional Fund Advisors LP, DFA Securities Inc., Dimensional Fund Advisors Canada Inc., DFAIDG, DIG, DEM and DFAITC. Director of Dimensional Fund Advisors Ltd, and formerly Chief Investment Officer. Director, President and formerly Chief Investment Officer of DFA Australia Ltd. Director of Dimensional Funds PLC and Dimensional Fund II PLC. Director, Chief Executive Officer and formerly Chief Investment Officer of Dimensional Fund Advisors Canada Inc. (All Chief Investment Officer positions held starting 1/03 through 3/07 except for Dimensional Fund Advisors Canada Inc., which was from 6/03 through 3/07, and Dimensional Holdings Inc., which was from 10/06 through 3/07.)
Limited Partner, Oak Hill Partners, Director, T he University of Chicago Booth School of Business. Formerly, Director, SA Funds (registered investment company). Formerly Director, Assante Corporation (investment management) (until 2002). | |
|
Rex A. Sinquefield
The Show Me Institute
7777 Bonhomme Ave.,
Suite 2150 St. Louis, MO 63105
Age: 64 | | DFAITC - since 1993
DFAIDG - since 1981
DIG - since 1992
DEM - since 1993 | | 96 portfolios in 4 investment companies | | Director/Trustee (and prior to 2006 Chairman, and prior to 2003, Chief Investment Officer) of Dimensional Fund Advisors LP, DFA Securities Inc., DFAIDG, DIG, DEM and DFAITC. Director of Dimensional Holdings Inc. Prior to 2006, Director of Dimensional Fund Advisors Ltd, Director (and prior to 1/1/2003, Chief Investment Officer) of DFA Australia Ltd. Director of Dimensional Funds PLC and Dimensional Fund Advisors Canada Inc.
Trustee, St. Louis University (since 2003). Life Trustee and Member of Investment Committee, DePaul University. Director, The German St. Vincent Orphan Home. Member of Investment Committee, Archdiocese of St. Louis. Trustee and Member of Investment Committee, St. Louis Art Institute (since 2005). President and Director, The Show Me Institute (since 2006). Trustee, St. Louis Symphony Orchestra (since 2005). Trustee, Missouri Botanical Garden (since 2005 ). | |
|
1 Each Trustee/Director holds office for an indefinite term until his or her successor is elected and qualified.
2 Each Trustee/Director is a director or trustee of each of the four registered investment companies within the DFA Fund Complex, which includes the Funds.
* Interested Directors are described as such because they are deemed to be "interested persons," as that term is defined under the Investment Company Act of 1940, as amended, due to their positions with Dimensional Fund Advisors LP.
62
Officers
The name, age, information regarding positions with the Funds and the principal occupation for each officer of the Funds are set forth below. Each officer listed below holds the same office (except as otherwise noted) in the following entities: Dimensional Fund Advisors LP (prior to November 3, 2006, Dimensional Fund Advisors Inc.) ("Dimensional"), DFA Securities Inc., DFAIDG, DIG, DFAITC and DEM (collectively, the "DFA Entities"). The address of each officer is: Dimensional Fund Advisors LP, 1299 Ocean Avenue, Santa Monica, California 90401, unless otherwise indicated.
Name, Position with the Fund
and Age | | Term of Office1
and Length of
Service | | Principal Occupation(s) During Past 5 Years | |
| | | Officers | |
|
April A. Aandal
Vice President
Age: 35 | | Since 2008 | | Vice President of all the DFA Entities. | |
|
Darryl D. Avery
Vice President
Age: 42 | | Since 2005 | | Vice President of all the DFA Entities. From June 2002 to January 2005, institutional client service representative of Dimensional. | |
|
Arthur H. Barlow
Vice President
Age: 52 | | Since 1993 | | Vice President of all the DFA Entities. Formerly, Vice President of DFA Australia Limited and Dimensional Fund Advisors Ltd. | |
|
Scott A. Bosworth
Vice President
Age: 39 | | Since 2007 | | Vice President of all the DFA Entities. Regional Director of Dimensional (since November 1997). | |
|
Valerie A. Brown
Vice President and Assistant Secretary
Age: 41 | | Since 2001 | | Vice President and Assistant Secretary of all the DFA Entities, DFA Australia Limited, Dimensional Fund Advisors Ltd., and since June 2003, Dimensional Fund Advisors Canada Inc. | |
|
David P. Butler
Vice President
Age: 44 | | Since 2007 | | Vice President of all the DFA Entities. Director of US Financial Services of Dimensional (since January 2005). Formerly, Regional Director of Dimensional Fund Advisors LP (January 1995 to January 2005). | |
|
Patrick Carter
Vice President
Age: 46 | | Since 2007 | | Vice President of all the DFA Entities. Regional Director of Dimensional (since March 2006). Formerly, Director of Merrill Lynch Retirement Group (December 1998 to March 2006). | |
|
Stephen A. Clark
Vice President
Age: 36 | | Since 2004 | | Vice President of all the DFA Entities, April 2001 to April 2004, Portfolio Manager of Dimensional. | |
|
Robert P. Cornell
Vice President
Age: 59 | | Since 2007 | | Vice President of all the DFA Entities. Regional Director of Financial Services Group of Dimensional (since August 1993). | |
|
Christopher S. Crossan
Vice President and Chief Compliance Officer
Age: 42 | | Since 2004 | | Vice President and Chief Compliance Officer of all the DFA Entities. Formerly, Senior Compliance Officer, INVESCO Institutional, Inc. and its affiliates (August 2000 to January 2004). | |
|
James L. Davis
Vice President
Age: 51 | | Since 1999 | | Vice President of all the DFA Entities. Formerly, Vice President of DFA Australia Limited and Dimensional Fund Advisors Ltd. | |
|
Robert T. Deere
Vice President
Age: 51 | | Since 1994 | | Vice President of all the DFA Entities and DFA Australia Limited. | |
|
Robert W. Dintzner
Vice President
Age: 38 | | Since 2001 | | Vice President of all the DFA Entities. Prior to April 2001, marketing supervisor and marketing coordinator for Dimensional. | |
|
63
Name, Position with the Fund
and Age | | Term of Office1
and Length of
Service | | Principal Occupation(s) During Past 5 Years | |
Kenneth Elmgren
Vice President
Age: 54 | | Since 2007 | | Vice President of all the DFA Entities. Formerly, Managing Principal of Beverly Capital (May 2004 to September 2006); Principal of Wydown Capital (September 2001 to May 2004). | |
|
Richard A. Eustice
Vice President and Assistant Secretary
Age: 43 | | Since 1998 | | Vice President and Assistant Secretary of all the DFA Entities and DFA Australia Limited. Formerly, Vice President of Dimensional Fund Advisors Ltd. | |
|
Eugene F. Fama, Jr.
Vice President
Age: 47 | | Since 1993 | | Vice President of all the DFA Entities. Formerly, Vice President of DFA Australia Limited and Dimensional Fund Advisors Ltd. | |
|
Gretchen A. Flicker
Vice President
Age: 37 | | Since 2004 | | Vice President of all the DFA Entities. Prior to April 2004, institutional client service representative of Dimensional. | |
|
Jed S. Fogdall
Vice President
Age: 34 | | Since 2008 | | Vice President of all the DFA Entities. Portfolio Manager for Dimensional (since September 2004). Prior to September 2004, Staff Engineer at the Boeing Company (1997-2004); Graduate Student at the University of California, Los Angeles (2002-2003). | |
|
Glenn S. Freed
Vice President
Age: 46 | | Since 2001 | | Vice President of all the DFA Entities. | |
|
Mark R. Gochnour
Vice President
Age: 41 | | Since 2007 | | Vice President of all the DFA Entities. Regional Director of Dimensional. | |
|
Henry F. Gray
Vice President
Age: 41 | | Since 2000 | | Vice President of all the DFA Entities. Prior to July 2000, Portfolio Manager of Dimensional. Formerly, Vice President of DFA Australia Limited. | |
|
John T. Gray
Vice President
Age: 34 | | Since 2007 | | Vice President of all the DFA Entities. Formerly, Regional Director of Dimensional (January 2005 to February 2007). | |
|
Darla Hastings
Vice President
Age: 53 | | Since 2007 | | Vice President of all the DFA Entities. Chief Marketing Officer of Dimensional. Formerly, Senior Vice President, Customer Experience for Benchmark Assisted Living (May 2005 to April 2006); Executive Vice President and Chief Marketing Officer of State Street Corporation (September 2001 to October 2005). | |
|
Joel H. Hefner
Vice President
Age: 40 | | Since 2007 | | Vice President of all the DFA Entities. Regional Director of Dimensional (since June 1998). | |
|
Julie Henderson
Vice President and Fund Controller
Age: 34 | | Since 2005 | | Vice President and Fund Controller of all the DFA Entities. Formerly, Senior Manager at PricewaterhouseCoopers LLP (July 1996 to April 2005). | |
|
Kevin Hight
Vice President
Age: 40 | | Since 2005 | | Vice President of all the DFA Entities. Formerly, Regional Director of Dimensional (since March 2003 to March 2005). | |
|
Christine W. Ho
Vice President
Age: 40 | | Since 2004 | | Vice President of all the DFA Entities. Prior to April 2004, Assistant Controller of Dimensional. | |
|
Jeff J. Jeon
Vice President
Age: 34 | | Since 2004 | | Vice President of all the DFA Entities. Prior to April 2004, Counsel of Dimensional. | |
|
Patrick M. Keating
Vice President
Age: 53 | | Since 2003 | | Vice President of all the DFA Entities and Chief Operating Officer of Dimensional. Director, Vice President and Chief Privacy Officer of Dimensional Fund Advisors Canada Inc. Director of DFA Australia Limited. | |
|
64
Name, Position with the Fund
and Age | | Term of Office1
and Length of
Service | | Principal Occupation(s) During Past 5 Years | |
Joseph F. Kolerich
Vice President
Age: 36 | | Since 2004 | | Vice President of all the DFA Entities. From April 2001 to April 2004, Portfolio Manager for Dimensional. | |
|
Michael F. Lane
Vice President
Age: 41 | | Since 2004 | | Vice President of all the DFA Entities. Formerly, Vice President of Advisor Services at TIAA-CREF (July 2001 to September 2004). | |
|
Kristina M. LaRusso
Vice President
Age: 33 | | Since 2006 | | Vice President of all DFA Entities. Formerly, Operations Supervisor of Dimensional (March 2003 to December 2006). | |
|
Inmoo Lee
Vice President
Age: 42 | | Since 2007 | | Vice President of all the DFA Entities. Associate Professor Department of Finance and Accounting, Business School, National University of Singapore (July 2004 to present); Associate Professor, College of Business Administration, Korea University (September 2001 to May 2006). | |
|
Juliet Lee
Vice President
Age: 37 | | Since 2005 | | Vice President of all the DFA Entities. Human Resources Manager of Dimensional (since January 2004). Formerly, Assistant Vice President for Metropolitan West Asset Management LLC (February 2001 to December 2003). | |
|
Aaron M. Marcus
Vice President & Head of Global Human Resources
Age: 38 | | Since 2008 | | Vice President and Head of Global Human Resources of Dimensional. Formerly, Global Head of Recruiting and Vice President of Goldman Sachs & Co. (June 2006 to January 2008); Global Co-Head of HR of the Equities & FICC Division, and Vice President of Goldman Sachs & Co. (May 2005 to May 2006); Head of Americas Campus Recruiting and Vice President of Goldman Sachs & Co. (April 2003 to May 2005). | |
|
David R. Martin
Vice President, Chief Financial Officer and Treasurer
Age: 51 | | Since 2007 | | Vice President, Chief Financial Officer and Treasurer of all the DFA Entities. Director, Vice President, Chief Financial Officer and Treasurer of Dimensional Fund Advisors Ltd. and DFA Australia Limited. Chief Financial Officer, Treasurer, and Vice President of Dimensional Fund Advisors Canada Inc. Director of Dimensional Funds PLC and Dimensional Funds II PLC. Formerly, Executive Vice President and Chief Financial Officer of Janus Capital Group Inc. (June 2005 to March 2007); Senior Vice President of Finance at Charles Schwab & Co., Inc. (March 1999 to May 2005). | |
|
Catherine L. Newell
Vice President and Secretary
Age: 44 | | Vice President since 1997 and Secretary since 2000 | | Vice President and Secretary of all the DFA Entities. Director, Vice President and Assistant Secretary of DFA Australia Limited (since February 2002, April 1997 and May 2002, respectively). Vice President and Secretary of Dimensional Fund Advisors Canada Inc. (since June 2003). Director, Dimensional Funds PLC and Dimensional Funds II PLC (since January 2002). Formerly, Assistant Secretary of all DFA Entities and Dimensional Fund Advisors Ltd. | |
|
Gerard K. O'Reilly
Vice President
Age: 31 | | Since 2007 | | Vice President of all the DFA Entities. Formerly, Research Associate of Dimensional Fund Advisors LP (2004 to 2006); Research Assistant in PhD program, Aeronautics Department California Institute of Technology (1998 to 2004). | |
|
Carmen Palafox
Vice President
Age: 34 | | Since 2006 | | Vice President of all the DFA Entities. Operations Manager of Dimensional Fund Advisors LP (since May 1996). | |
|
Sonya Park
Vice President
Age: 36 | | Since 2005 | | Vice President of all the DFA Entities. From February 2002 to January 2005, institutional client service representative of Dimensional. | |
|
David A. Plecha
Vice President
Age: 47 | | Since 1993 | | Vice President of all the DFA Entities, DFA Australia Limited and Dimensional Fund Advisors Ltd.. | |
|
Ted Randall
Vice President
Age: 35 | | Since 2008 | | Vice President of all the DFA Entities. Formerly, Research Associate of Dimensional (2006-2008). Systems Developer of Dimensional (2001-2006). | |
|
65
Name, Position with the Fund
and Age | | Term of Office1
and Length of
Service | | Principal Occupation(s) During Past 5 Years | |
Eduardo A. Repetto
Vice President and Chief Investment Officer
Age: 41 | | Since 2002 | | Chief Investment Officer (beginning March 2007) and Vice President of all the DFA Entities, DFA Australia Limited and Dimensional Fund Advisors Canada Inc. Formerly, Research Associate for Dimensional (June 2000 to April 2002). | |
|
L. Jacobo Rodriguez
Vice President
Age: 37 | | Since 2005 | | Vice President of all the DFA Entities. From August 2004 to July 2005, institutional client service representative of Dimensional. Formerly, Financial Services Analyst, Cato Institute (September 2001 to June 2004); Book Review Editor, Cato Journal, Cato Institute (May 1996 to June 2004). | |
|
David E. Schneider
Vice President
Age: 62 | | Since 2001 | | Vice President of all the DFA Entities. Currently, Director of Institutional Services. | |
|
Ted R. Simpson
Vice President
Age: 40 | | Since 2007 | | Vice President of all the DFA Entities. Regional Director of Dimensional (since December 2002). | |
|
Bryce D. Skaff
Vice President
Age: 33 | | Since 2007 | | Vice President of all the DFA Entities. Formerly, Regional Director of Dimensional (December 1999 to January 2007). | |
|
Grady M. Smith
Vice President
Age: 51 | | Since 2004 | | Vice President of all the DFA Entities. Prior to April 2004, Portfolio Manager of Dimensional. | |
|
Carl G. Snyder
Vice President
Age: 45 | | Since 2000 | | Vice President of all the DFA Entities. Formerly, Vice President of DFA Australia Limited. | |
|
Lawrence R. Spieth
Vice President
Age: 60 | | Since 2004 | | Vice President of all the DFA Entities. Prior to April 2004, Regional Director of Dimensional. | |
|
Bradley G. Steiman
Vice President
Age: 35 | | Since 2004 | | Vice President of all the DFA Entities and Director and Vice President of Dimensional Fund Advisors Canada Inc. | |
|
Karen E. Umland
Vice President
Age: 42 | | Since 1997 | | Vice President of all the DFA Entities, DFA Australia Limited, Dimensional Fund Advisors Ltd., and since June 2003, Dimensional Fund Advisors Canada Inc. | |
|
Carol W. Wardlaw
Vice President
Age: 49 | | Since 2004 | | Vice President of all the DFA Entities. Prior to April 2004, Regional Director of Dimensional. | |
|
Weston J. Wellington
Vice President
Age: 57 | | Since 1997 | | Vice President of all the DFA Entities. Formerly, Vice President of DFA Australia Limited. | |
|
Daniel M. Wheeler
Vice President
Age: 63 | | Since 2001 | | Vice President of all the DFA Entities. Prior to 2001 and currently, Director of Financial Advisors Services of Dimensional. Director of Dimensional Fund Advisors Ltd. (since October 2003) and President of Dimensional Fund Advisors Canada Inc. (since June 2003). | |
|
Ryan Wiley
Vice President
Age: 32 | | Since 2007 | | Vice President of all the DFA Entities. Senior Trader of Dimensional. Formerly, Portfolio Manager (2006 to 2007); Trader (2001 to 2006). | |
|
Paul E. Wise
Vice President
Age: 53 | | Since 2005 | | Vice President of all the DFA Entities. Chief Technology Officer for Dimensional (since 2004). Formerly, Principal of Turnbuckle Management Group (January 2002 to August 2004). | |
|
1 Each officer holds office for an indefinite term at the pleasure of the Boards of Trustee/Directors and until his or her successor is elected and qualified.
66
VOTING PROXIES ON FUND PORTFOLIO SECURITIES
A description of the policies and procedures that the Fund and the Trust use in voting proxies relating to securities held in the portfolios is available without charge, upon request, by calling collect: (310) 395-8005. Information regarding how the Advisor votes these proxies is available from the EDGAR database on the SEC's website at http://www.sec.gov and from the Advisor's website at http://www.dimensional.com and reflects the twelve-month period beginning July 1st and ending June 30th.
67
NOTICE TO SHAREHOLDERS
(Unaudited)
For shareholders that do not have a October 31, 2008 tax year end, this notice is for informational purposes only. For shareholders with an October 31, 2008 tax year end, please consult your tax advisor as to the pertinence of this notice. For the period December 1, 2007 to October 31, 2008, each portfolio is designating the following items with regard to distributions paid during the period.
| Dimensional Investment Group Inc. | | Net
Investment
Income
Distributions | | Short-Term
Capital Gain
Distributions | | Long-Term
Capital Gain
Distributions | | Total
Distributions | | Qualifying
For Corporate
Dividends Received
Deduction(1) | | Qualifying
Dividend
Income(2) | | U.S.
Government
Interest(3) | | Foreign
Tax
Credit(4) | | Qualifying
Interest
Income(5) | | Qualifying
Short-Term
Capital Gains(6) | |
| LWAS/DFA U.S. High Book to Market Portfolio | | | 21 | % | | | 1 | % | | | 79 | % | | | 100 | % | | | — | | | | 94 | % | | | — | | | | — | | | | 1 | % | | | 1 | % | |
| LWAS/DFA Two-Year Fixed Income Portfolio | | | 100 | % | | | — | | | | — | | | | 100 | % | | | — | | | | — | | | | 5 | % | | | — | | | | 100 | % | | | — | | |
| LWAS/DFA Two-Year Government Portfolio | | | 100 | % | | | — | | | | — | | | | 100 | % | | | — | | | | — | | | | 91 | % | | | — | | | | 100 | % | | | — | | |
| DFA Investment Dimensions Group Inc. | |
| LWAS/DFA International High Book to Market Portfolio | | | 34 | % | | | 4 | % | | | 62 | % | | | 100 | % | | | — | | | | 60 | % | | | — | | | | — | | | | 1 | % | | | 10 | % | |
| The DFA Investment Trust Company | |
| The U.S. Large Cap Value Series | | | 100 | % | | | — | | | | — | | | | 100 | % | | | 85 | % | | | 84 | % | | | — | | | | — | | | | 1 | % | | | — | | |
| The DFA International Value Series | | | 33 | % | | | 2 | % | | | 65 | % | | | 100 | % | | | 6 | % | | | 58 | % | | | — | | | | — | | | | — | | | | 7 | % | |
(1) Qualifying dividends represent dividends which qualify for the corporate dividends received deduction and is reflected as a percentage of ordinary income distributions (the total of short-term capital gain and net investment income distributions).
(2) The percentage in this column represents the amount of "Qualifying Dividend Income" as created by the Jobs and Growth Tax Relief Reconciliation Act of 2003 and is reflected as a percentage of ordinary income distributions (the total of short-term capital gain and net investment income distributions). It is the intention of each of the aforementioned funds to designate the maximum amount permitted by law.
(3) "U.S. Government Interest" represents the amount of interest that was derived from direct U.S. Government obligations and distributed during the fiscal year. This amount is reflected as a percentage of total ordinary income distributions (the total of short-term capital gain and net investment income distributions). Generally, interest from direct U.S. Government obligations is exempt from state income tax. However, for residents of California, Connecticut and New York, the statutory threshold requirements were not satisfied for LWAS/DFA Two-Year Fixed Income Portfolio to permit exemption of these amounts from state income for this fund.
(4) Foreign Tax Credit represent dividends which qualify for the foreign tax credit pass through and is reflected as a percentage of investment company taxable income (the total of short-term capital gain and net investment income distributions).
(5) The percentage in this column represents the amount of "Qualifying Interest Income" as created by The American Jobs Creation Act of 2004. The information is reflected as a percentage of ordinary income distributions (the total of short-term capital gain and net investment income distributions).
(6) The percentage in this column represents the amount of "Qualifying Short-Term Capital Gain" as created by The American Jobs Creation Act of 2004. The information is reflected as a percentage of ordinary income distributions (the total of short-term capital gain and net investment income distributions).
68

DFA103108-003A
DIMENSIONAL INVESTMENT GROUP INC.
Global Equity Portfolio
Global 60/40 Portfolio
Global 25/75 Portfolio
Annual Report
Period Ended October 31, 2008
Dimensional Fund Advisors
6300 Bee Cave Road, Building One
Austin, TX 78746
December 2008
Dear Fellow Shareholder,
This has been a challenging year for investors. After drifting lower throughout the spring and summer, stock markets around the world plummeted in mid September on news that the ongoing credit crisis was driving some leading financial services companies toward failure. As the effects of this distress rippled through the financial world, investors became increasingly anxious and stock prices continued to decline sharply. In the month of October, the S&P 500 Index fell 16.8% or 196 points—its worst-ever monthly point decline.
Markets like this test investors' resolve. It is difficult to stick with a long-term investment plan when one sees the dramatic effects of high market volatility on a portfolio's value. Very few people are having a positive investment experience right now. But investors who have based their approach on a sensible risk/return framework tend to be in better shape than those who have not.
The recent market turbulence illustrates the reason why Dimensional believes that markets are efficient. History has shown time and again that prices cannot be predicted in public equity markets. This "random walk" makes diversification very important. Although the broad diversification in our portfolios didn't prevent negative performance this year, we believe it helped our shareholders avoid the extreme losses experienced by investors who concentrated their holdings in individual companies, industry sectors, or markets.
The unpredictability of stock prices also makes it important for investors to take a hard look at their own portfolios and determine how much risk and what types of risk they should take. Investors who hold asset mixes that accurately reflect their tolerance for risk are better able to withstand down markets.
Nobody knows when the capital markets will recover, but over time we can expect them to again offer a premium to investors who are willing to invest in relatively risky assets such as stocks. My view is that investors who have already paid for risk should stay invested and earn the return that can be expected when markets turn around. If markets continue to be so volatile, it's also important to understand that pulling money out of stocks, even for short periods of time, can result in significant missed opportunities.
All of us at Dimensional take our job as the steward of your assets very seriously and hope to have the opportunity to serve you for many years to come.
Sincerely,
David G. Booth
Chairman and Chief Executive Officer
[THIS PAGE INTENTIONALLY LEFT BLANK]
DIMENSIONAL INVESTMENT GROUP INC.
ANNUAL REPORT
Table of Contents
| Letter to Shareholders | | Page | |
| Definitions of Abbreviations and Footnotes | | | 1 | | |
|
| Performance Charts | | | 2 | | |
|
| Management's Discussion and Analysis | | | 4 | | |
|
| Disclosure of Fund Expenses | | | 7 | | |
|
| Disclosure of Portfolio Holdings | | | 9 | | |
|
| Schedules of Investments | |
|
| Global Equity Portfolio | | | 10 | | |
|
| Global 60/40 Portfolio | | | 11 | | |
|
| Global 25/75 Portfolio | | | 13 | | |
|
| Statements of Assets and Liabilities | | | 14 | | |
|
| Statements of Operations | | | 15 | | |
|
| Statements of Changes in Net Assets | | | 16 | | |
|
| Financial Highlights | | | 17 | | |
|
| Notes to Financial Statements | | | 21 | | |
|
| Report of Independent Registered Public Accounting Firm | | | 31 | | |
|
| Fund Management | | | 32 | | |
|
| Voting Proxies on Fund Portfolio Securities | | | 39 | | |
|
| Notice to Shareholders | | | 40 | | |
|
This report is submitted for the information of the Funds' shareholders. It is not authorized for distribution to prospective investors unless preceded or accompanied by an effective prospectus.
i
[THIS PAGE INTENTIONALLY LEFT BLANK]
DIMENSIONAL INVESTMENT GROUP INC.
DEFINITIONS OF ABBREVIATIONS AND FOOTNOTES
Schedules of Investments
Investment Abbreviations
FNMA Federal National Mortgage Association
Investment Footnotes
† See Note B to Financial Statements.
(r) The adjustable rate shown is efffective as of October 31, 2008.
Financial Highlights
(A) Computed using average shares outstanding.
(B) Annualized
(C) Non-Annualized
(D) Represents the combined ratios for the respective portfolio and its respective pro-rata share of its Master Fund Series.
(E) Because of commencement of operations and related preliminary transaction costs, these ratios are not necessarily indicative of future ratios.
All Statements and Schedules
— Amounts designated as — are either zero or rounded to zero.
SEC Securities and Exchange Commission
N/A Does not apply to this fund.
(a) Commencement of Operations.
1
DIMENSIONAL INVESTMENT GROUP INC.
PERFORMANCE CHARTS

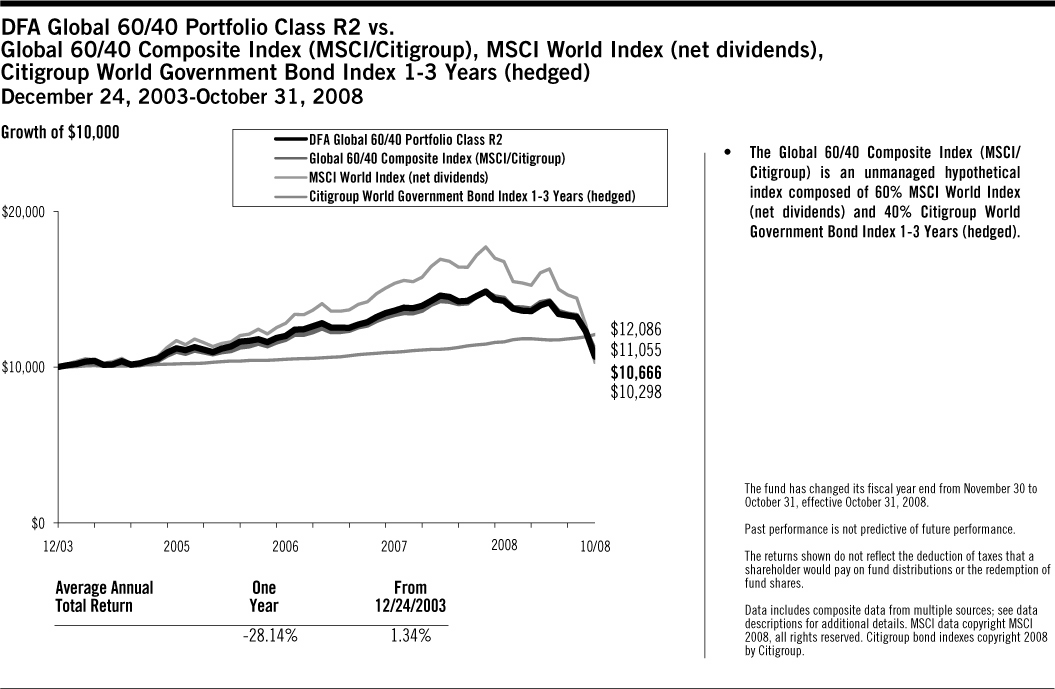
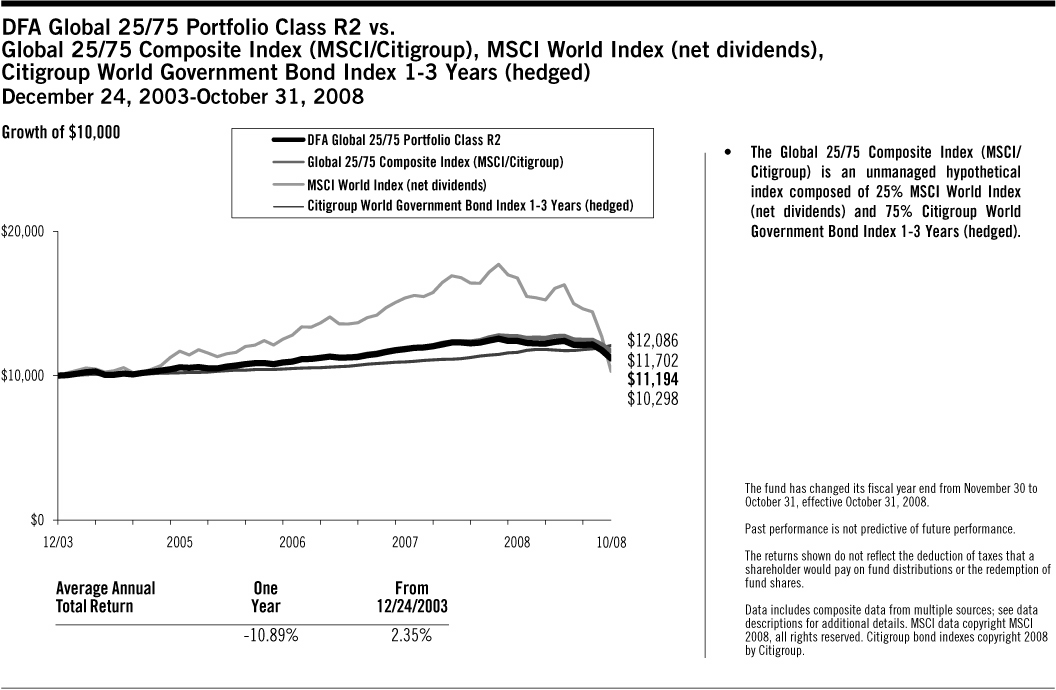
2
DIMENSIONAL INVESTMENT GROUP INC.
PERFORMANCE CHARTS

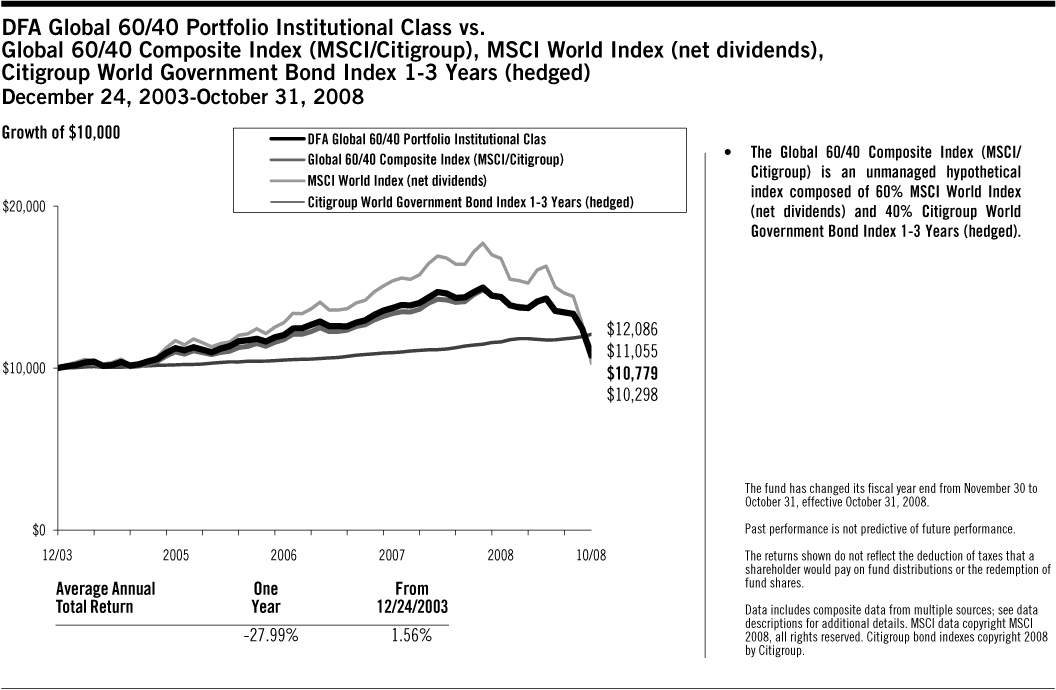
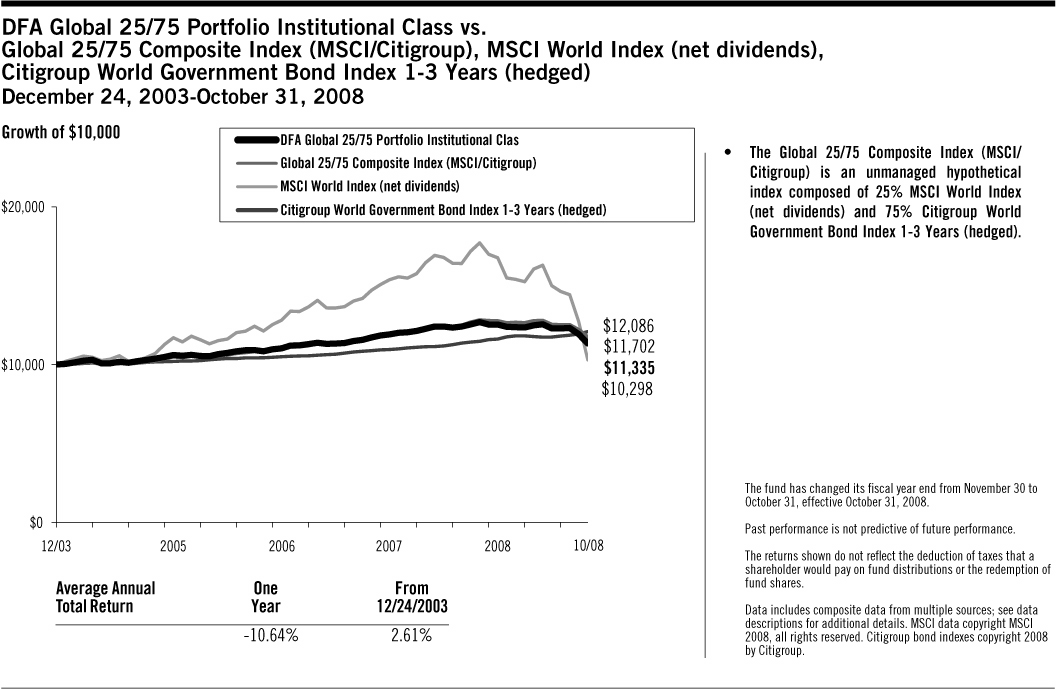
3
MANAGEMENT'S DISCUSSION AND ANALYSIS
On September 16, 2008, at a regular meeting of the Board of Directors/Trustees (the "Board") of the funds covered by this report, the Board voted to change the fiscal and tax year ends of the funds from November 30 to October 31. Therefore, the following discussion generally covers the 11-month period ended October 31, 2008.
DFA Global Equity Portfolio Class I
The DFA Global Equity Portfolio Class I seeks long-term capital appreciation by investing in a combination of mutual funds managed by Dimensional Fund Advisors. As of the date of this report, domestic funds include the U.S. Core Equity 1 Portfolio, the U.S. Core Equity 2 Portfolio, and DFA Real Estate Securities Portfolio; and international funds include the International Core Equity Portfolio, the Emerging Markets Core Equity Portfolio, the Asia Pacific Small Company Series, the Continental Small Company Series, the Japanese Small Company Series, the United Kingdom Small Company Series, the Emerging Markets Series, and the Emerging Markets Small Cap Series (collectively, the "Underlying Funds"). As of October 31, 2008, the Portfolio held, indirectly through its fund holdings, approximately 12,180 equity securities in 40 countries.
The investment strategy employs a disciplined, quantitative approach, emphasizing broad diversification and consistent exposure in each Underlying Fund to stocks with desired asset class characteristics. As a result of the Portfolio's diversified investment approach, performance was determined principally by broad structural trends in global equity markets rather than the behavior of a limited group of stocks in a particular industry or country.
For the 11 months ended October 31, 2008, total returns were –38.50% for the DFA Global Equity Portfolio Class I and –39.37% for the MSCI World Index (net dividends). Relative to the Index, the better relative performance of the Portfolio was primarily due to the Underlying Funds' greater allocation to U.S. stocks, which outperformed the Index. U.S. stocks accounted for approximately 60% of the Underlying Funds, compared to 50% of the Index. During the 11 months ended October 31, 2008, the Portfolio was, on average, exposed through the Underlying Funds to approximately 60% US equities, 33% international developed market equities and 7% emerging markets equities, and its approximate exposure to small and value stocks was 36% and 42%, respectively.
DFA Global Equity Portfolio Class R2
The DFA Global Equity Portfolio Class R2 seeks long-term capital appreciation by investing in a combination of mutual funds managed by Dimensional Fund Advisors. As of the date of this report, domestic funds include the U.S. Core Equity 1 Portfolio, the U.S. Core Equity 2 Portfolio, and the DFA Real Estate Securities Portfolio; and international funds include the International Core Equity Portfolio, the Emerging Markets Core Equity Portfolio, the Asia Pacific Small Company Series, the Continental Small Company Series, the Japanese Small Company Series, the United Kingdom Small Company Series, the Emerging Markets Series, and the Emerging Markets Small Cap Series (collectively, the "Underlying Funds"). As of October 31, 2008, the Portfolio held, indirectly through its fund holdings, approximately 12,180 equity securities in 40 countries.
The investment strategy employs a disciplined, quantitative approach, emphasizing broad diversification and consistent exposure in each Underlying Fund to stocks with desired asset class characteristics. As a result of the Portfolio's diversified investment approach, performance was determined principally by broad structural trends in global equity markets rather than the behavior of a limited group of stocks in a particular industry or country.
For the 11 months ended October 31, 2008, total returns were –38.72% for the DFA Global Equity Portfolio Class R2 and –39.37% for the MSCI World Index (net dividends). Relative to the Index, the better relative performance of the Portfolio was primarily due to the Underlying Funds' greater allocation to U.S. stocks, which outperformed the Index. U.S. stocks accounted for approximately 60% of the Underlying Funds compared to 50% of the Index. During the 11 months ended October 31, 2008, the Portfolio was exposed through the Underlying Funds to approximately 60% US equities, 33% international developed market equities and 7% emerging markets equities, and its approximate exposure to small and value stocks was 36% and 42%, respectively.
DFA Global 60/40 Portfolio Class I
The DFA Global 60/40 Portfolio Class I seeks capital appreciation and current income by investing in a combination of mutual funds managed by Dimensional Fund Advisors. As of the date of this report, domestic funds include
4
the U.S. Core Equity 1 Portfolio, the U.S. Core Equity 2 Portfolio, the U.S. Large Cap Value Series, and DFA Real Estate Securities Portfolio; international funds include the International Core Equity Portfolio, the Emerging Markets Core Equity Portfolio, the Large Cap International Portfolio, the Continental Small Company Series, the Japanese Small Company Series, and the United Kingdom Small Company Series; and fixed income funds include the DFA Two-Year Global Fixed Income Series, the DFA Five-Year Global Fixed Income Portfolio, and the DFA Selectively Hedged Global Fixed Income Portfolio (collectively, the "Underlying Funds"). As of October 31, 2008, the Portfolio held, indirectly through its fund holdings, approximately 12,350 equity securities in 40 countries and 230 fixed income securities in 10 countries.
The investment strategy employs a disciplined, quantitative approach, emphasizing broad diversification and consistent exposure in each Underlying Fund to equity or fixed income securities with desired asset class characteristics. As a result of the Portfolio's diversified investment approach, performance was determined principally by broad structural trends in global equity and fixed income markets rather than the behavior of a limited group of securities in a particular industry, or country, or asset class.
For the 11 months ended October 31, 2008, total returns were –25.47% for the DFA Global 60/40 Portfolio Class I and –23.85% for a hypothetical composite index composed of 60% MSCI World Index (net dividends) and 40% Citigroup World Government Bond Index 1-3 Years (hedged). Relative to this hypothetical 60/40 Index, the underperformance of the Portfolio was primarily due to greater exposure to corporate bonds in the fixed income portion of the Underlying Funds, which underperformed their more heavily government-debt weighted index benchmarks. The shorter duration of the fixed income portion of the Underlying Funds compared to their benchmarks also contributed to the underperformance. During the 11 months ended October 31, 2008, the Portfolio was exposed through the Underlying Funds to approximately 37% US equities, 19% international developed market equities, 4% emerging markets equities, and 40% global bonds.
DFA Global 60/40 Portfolio Class R2
The DFA Global 60/40 Portfolio Class R2 seeks capital appreciation and current income by investing in a combination of mutual funds managed by Dimensional Fund Advisors. As of the date of this report, domestic funds include the U.S. Core Equity 1 Portfolio, the U.S. Core Equity 2 Portfolio, the U.S. Large Cap Value Series, and DFA Real Estate Securities Portfolio; international funds include the International Core Equity Portfolio, the Emerging Markets Core Equity Portfolio, the Large Cap International Portfolio, the Continental Small Company Series, the Japanese Small Company Series, and the United Kingdom Small Company Series; and fixed income funds include the DFA Two-Year Global Fixed Income Series, the DFA Five-Year Global Fixed Income Portfolio, and the DFA Selectively Hedged Global Fixed Income Portfolio (collectively, the "Underlying Funds"). As of October 31, 2008, the Portfolio held, indirectly through its fund holdings, approximat ely 12,350 equity securities in 40 countries and 230 fixed income securities in 10 countries.
The investment strategy employs a disciplined, quantitative approach, emphasizing broad diversification and consistent exposure in each Underlying Fund to equity or fixed income securities with desired asset class characteristics. As a result of the Portfolio's diversified investment approach, performance was determined principally by broad structural trends in global equity and fixed income markets rather than the behavior of a limited group of securities in a particular industry, country, or asset class.
For the 11 months ended October 31, 2008, total returns were –25.63% for the DFA Global 60/40 Portfolio Class R2 and –23.85% for a hypothetical index composed of 60% MSCI World Index (net dividends) and 40% Citigroup World Government Bond Index 1-3 Years (hedged). Relative to this hypothetical 60/40 Index, the underperformance of the Portfolio was primarily due to greater exposure to corporate bonds in the fixed income portion of the Underlying Funds, which underperformed their more heavily government-debt weighted index benchmarks. The shorter duration of the fixed income portion of the Underlying Funds compared to their benchmarks also contributed to the underperformance. During the 11 months ended October 31, 2008, the Portfolio was exposed through the Underlying Funds to approximately 37% US equities, 19% international developed market equities, 4% emerging markets equities, and 40% global bonds.
5
DFA Global 25/75 Portfolio Class I
The DFA Global 25/75 Portfolio Class I seeks total return consistent with current income and preservation of capital with some capital appreciation by investing in a combination of mutual funds managed by Dimensional Fund Advisors. As of the date of this report, domestic funds include the U.S. Core Equity 1 Portfolio and the U.S. Core Equity 2 Portfolio; international funds include the International Core Equity Portfolio and the Emerging Markets Core Equity Portfolio; and fixed income funds include the DFA Two-Year Global Fixed Income Series and the DFA Five-Year Global Fixed Income Portfolio (collectively, the "Underlying Funds"). As of October 31, 2008, the Portfolio held, indirectly through its fund holdings, approximately 11,020 equity securities in 40 countries and 140 fixed income securities in five countries.
The investment strategy employs a disciplined, quantitative approach, emphasizing broad diversification and consistent exposure in each Underlying Fund to equity or fixed income securities with desired asset class characteristics. As a result of the Portfolio's diversified investment approach, performance was determined principally by broad structural trends in global equity and fixed income markets rather than the behavior of a limited group of securities in a particular industry, country, or asset class.
For the 11 months ended October 31, 2008, total returns were –9.55% for the DFA Global 25/75 Portfolio Class I and –8.14% for a hypothetical index composed of 25% MSCI World Index (net dividends) and 75% Citigroup World Government Bond Index 1-3 Years (hedged). Relative to this hypothetical 25/75 Index, the underperformance of the Portfolio was primarily due to greater exposure to corporate bonds in the fixed income portion of the Underlying Funds, which underperformed their more heavily government-debt weighted index benchmarks. The shorter duration of the fixed income portion of the Underlying Funds compared to their benchmarks also contributed to the underperformance. During the 11 months ended October 31, 2008, the Portfolio was exposed through the Underlying Funds to approximately 75% global bonds, 16% US equities, 8% international developed market equities, and 1% emerging markets equities.
DFA Global 25/75 Portfolio Class R2
The DFA Global 25/75 Portfolio Class R2 seeks total return consistent with current income and preservation of capital with some capital appreciation by investing in a combination of mutual funds managed by Dimensional Fund Advisors. As of the date of this report, domestic funds include the U.S. Core Equity 1 Portfolio and the U.S. Core Equity 2 Portfolio; international funds include the International Core Equity Portfolio and the Emerging Markets Core Equity Portfolio; and fixed income funds include the DFA Two-Year Global Fixed Income Series and the DFA Five-Year Global Fixed Income Portfolio (collectively, the "Underlying Funds"). As of October 31, 2008, the Portfolio held, indirectly through its fund holdings, approximately 11,020 equity securities in 40 countries and 140 fixed income securities i n five countries.
The investment strategy employs a disciplined, quantitative approach, emphasizing broad diversification and consistent exposure in each Underlying Fund to equity or fixed income securities with desired asset class characteristics. As a result of the Portfolio's diversified investment approach, performance was determined principally by broad structural trends in global equity and fixed income markets rather than the behavior of a limited group of securities in a particular industry, country, or asset class.
For the 11 months ended October 31, 2008, total returns were –9.72% for the DFA Global 25/75 Portfolio Class R2 and –8.14% for a hypothetical index composed of 25% MSCI World Index (net dividends) and 75% Citigroup World Government Bond Index 1-3 Years (hedged). Relative to this hypothetical 25/75 Index, the underperformance of the Portfolio was primarily due to greater exposure to corporate bonds in the fixed income portion of the Underlying Funds, which underperformed their more heavily government-debt weighted index benchmarks. The shorter duration of the fixed income portion of the Underlying Funds compared to their benchmarks also contributed to the underperformance. During the 11 months ended October 31, 2008, the Portfolio was exposed through the Underlying Funds to approximately 75% global bonds, 16% US equities, 8% international developed market equities, and 1% emerging markets equities.
6
DIMENSIONAL INVESTMENT GROUP INC.
DISCLOSURE OF FUND EXPENSES
(Unaudited)
The following Expense Tables are shown so that you can understand the impact of fees on your investment. All mutual funds have operating expenses. As a shareholder of the fund, you incur ongoing costs, which include costs for portfolio management, administrative services, and shareholder reports, among others. Operating expenses, legal and audit services, which are deducted from a fund's gross income, directly reduce the investment return of the fund. A fund's expenses are expressed as a percentage of its average net assets. This figure is known as the expense ratio. The following examples are intended to help you understand the ongoing costs, in dollars, of investing in the fund and to compare these costs with those of other mutual funds. The examples are based on an investment of $1,000 made at the beginning of the period shown and held for the entire period.
The Expense Tables below illustrate your fund's costs in two ways.
Actual Fund Return
This section helps you to estimate the actual expenses after fee waivers that you paid over the period. The "Ending Account Value" shown is derived from the fund's actual return and "Expenses Paid During Period" reflect the dollar amount that would have been paid by an investor who started with $1,000 in the fund. You may use the information here, together with the amount you invested, to estimate the expenses that you paid over the period.
To do so, simply divide your account value by $1,000 (for example, a $7,500 account value divided by $1,000 = 7.5), then multiply the result by the number given for your fund under the heading "Expenses Paid During Period."
Hypothetical Example for Comparison Purposes
This section is intended to help you compare your fund's costs with those of other mutual funds. The hypothetical "Ending Account Value" and "Expenses Paid During Period" are derived from the fund's actual expense ratio and an assumed 5% annual return before expenses. In this case, because the return used is not the fund's actual return, the results do not apply to your investment. The example is useful in making comparisons because the SEC requires all mutual funds to calculate expenses based on a 5% annual return. You can assess your fund's cost by comparing this hypothetical example with the hypothetical examples that appear in shareholder reports of other funds.
Please note that the expenses shown in the tables are meant to highlight and help you compare ongoing costs only and do not reflect any transactional costs, if applicable. The "Annualized Expense Ratio" represents the actual expenses for the six-month period indicated.
Six Months Ended October 31, 2008
EXPENSE TABLES
| Global Equity Portfolio** | | Beginning
Account
Value
05/01/08 | | Ending
Account
Value
10/31/08 | | Annualized
Expense
Ratio* | | Expenses
Paid
During
Period* | |
| Actual Fund Return | |
| Class R2 Shares | | $ | 1,000.00 | | | $ | 646.90 | | | | 0.62 | % | | $ | 2.57 | | |
| Institutional Class Shares | | $ | 1,000.00 | | | $ | 647.70 | | | | 0.34 | % | | $ | 1.41 | | |
| Hypothetical 5% Annual Return | |
| Class R2 Shares | | $ | 1,000.00 | | | $ | 1,022.02 | | | | 0.62 | % | | $ | 3.15 | | |
| Institutional Class Shares | | $ | 1,000.00 | | | $ | 1,023.43 | | | | 0.34 | % | | $ | 1.73 | | |
7
| Global 60/40 Portfolio** | | Beginning
Account
Value
05/01/08 | | Ending
Account
Value
10/31/08 | | Annualized
Expense
Ratio* | | Expenses
Paid
During
Period* | |
| Actual Fund Return | |
| Class R2 Shares | | $ | 1,000.00 | | | $ | 763.90 | | | | 0.63 | % | | $ | 2.79 | | |
| Institutional Class Shares | | $ | 1,000.00 | | | $ | 764.50 | | | | 0.33 | % | | $ | 1.46 | | |
| Hypothetical 5% Annual Return | |
| Class R2 Shares | | $ | 1,000.00 | | | $ | 1,021.97 | | | | 0.63 | % | | $ | 3.20 | | |
| Institutional Class Shares | | $ | 1,000.00 | | | $ | 1,023.48 | | | | 0.33 | % | | $ | 1.68 | | |
| Global 25/75 Portfolio** | |
| Actual Fund Return | |
| Class R2 Shares | | $ | 1,000.00 | | | $ | 907.00 | | | | 0.67 | % | | $ | 3.21 | | |
| Institutional Class Shares | | $ | 1,000.00 | | | $ | 907.80 | | | | 0.31 | % | | $ | 1.49 | | |
| Hypothetical 5% Annual Return | |
| Class R2 Shares | | $ | 1,000.00 | | | $ | 1,021.77 | | | | 0.67 | % | | $ | 3.40 | | |
| Institutional Class Shares | | $ | 1,000.00 | | | $ | 1,023.58 | | | | 0.31 | % | | $ | 1.58 | | |
* Expenses are equal to the fund's annualized expense ratio for the six-month period, multiplied by the average account value over the period, multiplied by the number of days in the most recent six-month period (184), then divided by the number of days in the year (366) to reflect the six-month period.
** The Portfolio is a Fund of Funds. The expenses shown reflect the direct expenses of the Fund of Funds and the indirect payment of the Fund of Funds' portion of the expenses of its Master Funds.
8
DIMENSIONAL INVESTMENT GROUP INC.
DISCLOSURE OF PORTFOLIO HOLDINGS
(Unaudited)
The SEC requires that all Funds file a complete Schedule of Investments with the SEC for their first and third fiscal quarters on Form N-Q. For Dimensional Investment Group Inc., this would be for the fiscal quarters ending January 31 and July 31. The Form N-Q filing must be made within 60 days of the end of the quarter. Dimensional Investment Group Inc. filed its most recent Form N-Q with the SEC on October 30, 2008. It is available upon request, without charge, by calling collect: (310) 395-8005 or by mailing a request to Dimensional Fund Advisors LP, 1299 Ocean Avenue, Santa Monica, California 90401, or by visiting the SEC's website at http://www.sec.gov, or they may be reviewed and copied at the SEC's Public Reference Room in Washington, D.C. (call 1-800-732-0330 for information on the operation of the Public Reference Room).
PORTFOLIO HOLDINGS
The SEC requires that all Funds present their categories of portfolio holdings in a table, chart or graph format in their annual and semi-annual shareholder reports, whether or not a Schedule of Investments is utilized. The following table, which presents portfolio holdings as a percent of total investments before short-term investments and collateral for loaned securities, is provided in compliance with such requirement.
| | | Affiliated Investment Companies | |
| Global Equity Portfolio | | | 100.0 | % | |
| Global 60/40 Portfolio | | | 100.0 | % | |
| Global 25/75 Portfolio | | | 100.0 | % | |
9
DIMENSIONAL INVESTMENT GROUP INC.
GLOBAL EQUITY PORTFOLIO
SCHEDULE OF INVESTMENTS
October 31, 2008
| | | Shares | | Value† | |
| AFFILIATED INVESTMENT COMPANIES — (99.6%) | |
Investment in U.S. Core Equity 2 Portfolio
of DFA Investment Dimensions Group Inc. | | | 48,046,714 | | | $ | 371,401,099 | | |
Investment in International Core Equity Portfolio
of DFA Investment Dimensions Group Inc. | | | 41,141,163 | | | | 306,913,076 | | |
Investment in U.S. Core Equity 1 Portfolio
of DFA Investment Dimensions Group Inc. | | | 25,429,868 | | | | 198,607,269 | | |
Investment in Emerging Markets Core Equity Portfolio
of DFA Investment Dimensions Group Inc. | | | 6,359,754 | | | | 62,834,370 | | |
Investment in DFA Real Estate Securities Portfolio
of DFA Investment Dimensions Group Inc. | | | 1,042,351 | | | | 16,844,392 | | |
Investment in The Continental Small Company Series
of DFA Investment Trust Company | | | | | | | 3,220,928 | | |
Investment in The Japanese Small Company Series
of DFA Investment Trust Company | | | | | | | 2,507,023 | | |
Investment in The Emerging Markets Series
of DFA Investment Trust Company | | | . | | | | 1,837,906 | | |
Investment in The United Kingdom Small Company Series
of DFA Investment Trust Company | | | | | | | 1,272,048 | | |
Investment in The Asia Pacific Small Company Series
of DFA Investment Trust Company | | | | | | | 891,907 | | |
Investment in The Emerging Markets Small Cap Series
of DFA Investment Trust Company | | | | | | | 848,760 | | |
TOTAL INVESTMENTS IN AFFILIATED INVESTMENT
COMPANIES (Cost $1,371,117,726) | | | | | | | 967,178,778 | | |
| TEMPORARY CASH INVESTMENTS — (0.4%) | |
BlackRock Liquidity Funds Tempcash
Portfolio Institutional Shares | | | 258 | | | | 258 | | |
| | | Face
Amount | | | |
| | | (000) | | | |
Repurchase Agreement, PNC Capital Markets, Inc. 0.94%,
11/03/08 (Collateralized by $5,590,000 FNMA 6.50%, 08/01/36, valued
at $4,169,237) to be repurchased at $4,106,322 | | $ | 4,106 | | | | 4,106,000 | | |
| TOTAL TEMPORARY CASH INVESTMENTS (Cost $4,106,258) | | | | | | | 4,106,258 | | |
| TOTAL INVESTMENTS — (100.0%) (Cost $1,375,223,984) | | | | | | $ | 971,285,036 | | |
See accompanying Notes to Financial Statements.
10
DIMENSIONAL INVESTMENT GROUP INC.
GLOBAL 60/40 PORTFOLIO
SCHEDULE OF INVESTMENTS
October 31, 2008
| | | Shares | | Value† | |
| AFFILIATED INVESTMENT COMPANIES — (99.8%) | |
Investment in U.S. Core Equity 2 Portfolio
of DFA Investment Dimensions Group Inc. | | | 18,458,842 | | | $ | 142,686,849 | | |
Investment in International Core Equity Portfolio
of DFA Investment Dimensions Group Inc. | | | 14,981,138 | | | | 111,759,289 | | |
Investment in DFA Five-Year Global Fixed Income Portfolio
of DFA Investment Dimensions Group Inc. | | | 8,423,207 | | | | 89,959,847 | | |
Investment in DFA Selectively Hedged Global Fixed Income Portfolio
of DFA Investment Dimensions Group Inc. | | | 9,985,626 | | | | 88,971,928 | | |
Investment in U.S. Core Equity 1 Portfolio
of DFA Investment Dimensions Group Inc. | | | 8,895,552 | | | | 69,474,261 | | |
Investment in The DFA Two-Year Global Fixed Income Series
of DFA Investment Trust Company | | | 5,906,083 | | | | 60,602,598 | | |
Investment in Emerging Markets Core Equity Portfolio
of DFA Investment Dimensions Group Inc. | | | 1,631,061 | | | | 16,114,883 | | |
Investment in DFA Real Estate Securities Portfolio
of DFA Investment Dimensions Group Inc. | | | 348,797 | | | | 5,636,559 | | |
Investment in Large Cap International Portfolio
of DFA Investment Dimensions Group Inc. | | | 124,830 | | | | 1,848,732 | | |
Investment in The Emerging Markets Series
of DFA Investment Trust Company | | | | | | | 1,187,868 | | |
Investment in The Continental Small Company Series
of DFA Investment Trust Company | | | | | | | 960,409 | | |
Investment in The U.S. Large Cap Value Series
of DFA Investment Trust Company | | | 53,608 | | | | 726,924 | | |
Investment in The Japanese Small Company Series
of DFA Investment Trust Company | | | | | | | 673,487 | | |
Investment in The Emerging Markets Small Cap Series
of DFA Investment Trust Company | | | | | | | 497,602 | | |
| Investment in Dimensional Emerging Markets Value Fund Inc. | | | 13,947 | | | | 366,109 | | |
Investment in The United Kingdom Small Company Series
of DFA Investment Trust Company | | | | | | | 337,536 | | |
Investment in The Asia Pacific Small Company Series
of DFA Investment Trust Company | | | | | | | 195,449 | | |
TOTAL INVESTMENTS IN AFFILIATED INVESTMENT
COMPANIES (Cost $747,796,927) | | | | | | | 592,000,330 | | |
| TEMPORARY CASH INVESTMENTS — (0.2%) | |
BlackRock Liquidity Funds Tempcash
Portfolio Institutional Shares | | | 836 | | | | 836 | | |
11
GLOBAL 60/40 PORTFOLIO
CONTINUED
| | | Face
Amount | | | |
| | | (000) | | Value† | |
Repurchase Agreement, PNC Capital Markets, Inc. 0.94%,
11/03/08 (Collateralized by $1,190,000 FNMA 5.058%(r), 01/01/36,
valued at $979,781) to be repurchased at $962,075 | | $ | 962 | | | $ | 962,000 | | |
| TOTAL TEMPORARY CASH INVESTMENTS (Cost $962,836) | | | | | 962,836 | | |
| TOTAL INVESTMENTS — (100.0%) (Cost $748,759,763) | | | | $ | 592,963,166 | | |
See accompanying Notes to Financial Statements.
12
DIMENSIONAL INVESTMENT GROUP INC.
GLOBAL 25/75 PORTFOLIO
SCHEDULE OF INVESTMENTS
October 31, 2008
| | | Shares | | Value† | |
| AFFILIATED INVESTMENT COMPANIES — (100.0%) | |
Investment in The DFA Two-Year Global Fixed Income Series
of DFA Investment Trust Company | | | 4,667,925 | | | $ | 48,266,345 | | |
Investment in DFA Five-Year Global Fixed Income Portfolio
of DFA Investment Dimensions Group Inc. | | | 4,508,597 | | | | 48,151,816 | | |
Investment in U.S. Core Equity 2 Portfolio
of DFA Investment Dimensions Group Inc. | | | 1,779,237 | | | | 13,753,502 | | |
Investment in International Core Equity Portfolio
of DFA Investment Dimensions Group Inc. | | | 1,364,077 | | | | 10,176,014 | | |
Investment in U.S. Core Equity 1 Portfolio
of DFA Investment Dimensions Group Inc. | | | 611,282 | | | | 4,774,112 | | |
Investment in Emerging Markets Core Equity Portfolio
of DFA Investment Dimensions Group Inc. | | | 178,958 | | | | 1,768,105 | | |
Investment in DFA Real Estate Securities Portfolio
of DFA Investment Dimensions Group Inc. | | | 31,333 | | | | 506,341 | | |
TOTAL INVESTMENTS IN AFFILIATED INVESTMENT
COMPANIES (Cost $138,591,920) | | | | | | | 127,396,235 | | |
| TEMPORARY CASH INVESTMENTS — (0.0%) | |
BlackRock Liquidity Funds Tempcash
Portfolio Institutional Shares | | | 347 | | | | 347 | | |
| | | Face
Amount | | | |
| | | (000) | | | |
Repurchase Agreement, PNC Capital Markets, Inc. 0.94%,
11/03/08 (Collateralized by $85,000 FNMA 6.50%, 08/01/36, valued
at $63,396) to be repurchased at $61,005 | | $ | 61 | | | | 61,000 | | |
| TOTAL TEMPORARY CASH INVESTMENTS (Cost $61,347) | | | | | | | 61,347 | | |
| TOTAL INVESTMENTS — (100.0%) (Cost $138,653,267) | | | | | | $ | 127,457,582 | | |
See accompanying Notes to Financial Statements.
13
DIMENSIONAL INVESTMENT GROUP INC.
STATEMENTS OF ASSETS AND LIABILITIES
OCTOBER 31, 2008
(Amounts in thousands, except share and per share amounts)
| | | Global
Equity
Portfolio | | Global
60/40
Portfolio | | Global
25/75
Portfolio | |
| ASSETS: | |
| Investments in Affiliated Investment Companies at Value | | $ | 967,179 | | | $ | 592,000 | | | $ | 127,396 | | |
| Temporary Cash Investments at Value & Cost | | | 4,106 | | | | 963 | | | | 61 | | |
| Receivables: | |
| Affiliated Investment Companies | | | — | | | | 29,000 | | | | — | | |
| Interest | | | 6 | | | | 1 | | | | — | | |
| Fund Shares Sold | | | 19,176 | | | | 677 | | | | 57 | | |
| Prepaid Expenses and Other Assets | | | 142 | | | | 30 | | | | 20 | | |
| Total Assets | | | 990,609 | | | | 622,671 | | | | 127,534 | | |
| LIABILITIES: | |
| Payables: | |
| Affiliated Investment Companies | | | 3,606 | | | | — | | | | — | | |
| Fund Shares Redeemed | | | 1,164 | | | | 29,981 | | | | — | | |
| Due to Advisor | | | 14 | | | | 21 | | | | 5 | | |
| Accrued Expenses and Other Liabilities | | | 105 | | | | 64 | | | | 18 | | |
| Total Liabilities | | | 4,889 | | | | 30,066 | | | | 23 | | |
| NET ASSETS | | $ | 985,720 | | | $ | 592,605 | | | $ | 127,511 | | |
NET ASSET VALUE, OFFERING AND REDEMPTION
PRICE PER SHARE: | | | | | |
Class R2 Shares — based on net assets of $6,819; $5,081;
and $1,342, and shares outstanding of 743,751; 532,133;
and 133,679, respectively | | $ | 9.17 | | | $ | 9.55 | | | $ | 10.04 | | |
| NUMBER OF SHARES AUTHORIZED | | | 100,000,000 | | | | 100,000,000 | | | | 100,000,000 | | |
Institutional Class Shares — based on net assets of $978,901;
$587,524; and $126,169, and shares outstanding of 107,146,959;
61,626,405; and 12,603,547, respectively | | $ | 9.14 | | | $ | 9.53 | | | $ | 10.01 | | |
| NUMBER OF SHARES AUTHORIZED | | | 200,000,000 | | | | 150,000,000 | | | | 100,000,000 | | |
| Investments in Affiliated Investment Companies at Cost | | $ | 1,371,118 | | | $ | 747,797 | | | $ | 138,592 | | |
| NET ASSETS CONSIST OF: | |
| Paid-In Capital | | $ | 1,397,888 | | | $ | 748,300 | | | $ | 139,708 | | |
Undistributed Net Investment Income (Distributions in Excess of
Net Investment Income) | | | 3,563 | | | | 1,351 | | | | 354 | | |
| Accumulated Net Realized Gain (Loss) | | | (11,729 | ) | | | 1,817 | | | | 16 | | |
| Deferred Thailand Capital Gains Tax | | | (64 | ) | | | (20 | ) | | | (1 | ) | |
| Net Unrealized Foreign Exchange Gain (Loss) | | | 1 | | | | — | | | | — | | |
| Net Unrealized Appreciation (Depreciation) | | | (403,939 | ) | | | (158,843 | ) | | | (12,566 | ) | |
| NET ASSETS | | $ | 985,720 | | | $ | 592,605 | | | $ | 127,511 | | |
See accompanying Notes to Financial Statements.
14
DIMENSIONAL INVESTMENT GROUP INC.
STATEMENTS OF OPERATIONS
(Amounts in thousands)
| | | Global
Equity
Portfolio | | Global
60/40
Portfolio | | Global
25/75
Portfolio | |
| | | Period Dec. 1,
2007 to
Oct. 31, 2008 | | Year Ended
Nov. 30,
2007 | | Period Dec. 1,
2007 to
Oct. 31, 2008 | | Year Ended
Nov. 30,
2007 | | Period Dec. 1,
2007 to
Oct. 31, 2008 | | Year Ended
Nov. 30,
2007 | |
| Investment Income | |
Net Investment Income Received from
Affiliated Investment Companies: | | | | | |
| Income Distributions | | $ | 25,116 | | | $ | 19,108 | | | $ | 17,223 | | | $ | 12,663 | | | $ | 4,509 | | | $ | 2,718 | | |
*Dividends (Net of Foreign Taxes Withheld
of $51, $46, $17, $13, $0 and $0, respectively) | | | 636 | | | | 797 | | | | 181 | | | | 194 | | | | — | | | | — | | |
| *Interest | | | 5 | | | | 75 | | | | 1 | | | | 43 | | | | — | | | | 13 | | |
| *Income from Securities Lending | | | 73 | | | | 77 | | | | 21 | | | | 20 | | | | — | | | | — | | |
*Expenses Allocated from Affiliated
Investment Companies | | | (32 | ) | | | (47 | ) | | | (11 | ) | | | (13 | ) | | | — | | | | — | | |
Total Investment Income Received
from Affiliated Investment Companies | | | 25,798 | | | | 20,010 | | | | 17,415 | | | | 12,907 | | | | 4,509 | | | | 2,731 | | |
| Fund Investment Income | |
| Interest | | | 57 | | | | 14 | | | | 27 | | | | 3 | | | | 7 | | | | — | | |
| Fund Expenses | |
| Administrative Services Fees | | | 3,346 | | | | 3,395 | | | | 1,735 | | | | 1,627 | | | | 289 | | | | 243 | | |
| Accounting & Transfer Agent Fees | | | 29 | | | | 28 | | | | 23 | | | | 22 | | | | 15 | | | | 15 | | |
| Shareholder Servicing Fees - Class R2 Shares | | | 22 | | | | 88 | | | | 10 | | | | 21 | | | | 3 | | | | 6 | | |
| Filing Fees | | | 94 | | | | 66 | | | | 66 | | | | 51 | | | | 35 | | | | 28 | | |
| Shareholders' Reports | | | 119 | | | | 149 | | | | 59 | | | | 73 | | | | 10 | | | | 13 | | |
| Directors'/Trustees' Fees & Expenses | | | — | | | | 6 | | | | — | | | | 3 | | | | — | | | | — | | |
| Professional Fees | | | 40 | | | | 33 | | | | 28 | | | | 21 | | | | 11 | | | | 8 | | |
| Other | | | 16 | | | | 8 | | | | 17 | | | | 13 | | | | 7 | | | | 3 | | |
| Total Expenses | | | 3,666 | | | | 3,773 | | | | 1,938 | | | | 1,831 | | | | 370 | | | | 316 | | |
Fees Waived, Expenses Reimbursed
and/or Previously Waived Fees
Recovered by Advisor (Note C) | | | (3,064 | ) | | | (2,847 | ) | | | (1,459 | ) | | | (1,280 | ) | | | (228 | ) | | | (179 | ) | |
| Net Expenses | | | 602 | | | | 926 | | | | 479 | | | | 551 | | | | 142 | | | | 137 | | |
| Net Investment Income (Loss) | | | 25,253 | | | | 19,098 | | | | 16,963 | | | | 12,359 | | | | 4,374 | | | | 2,594 | | |
| Realized and Unrealized Gain (Loss) | |
Capital Gain Distributions Received from
Affiliated Investment Companies | | | 10,065 | | | | 10,480 | | | | 3,366 | | | | 3,323 | | | | 153 | | | | 100 | | |
| Net Realized Gain (Loss) on: | |
**Investment Securities Sold/Affiliated
Investment Companies Shares Sold | | | (20,041 | ) | | | 16,678 | | | | (3,064 | ) | | | 4,806 | | | | (1,212 | ) | | | 818 | | |
| *Futures | | | (229 | ) | | | 50 | | | | (67 | ) | | | 18 | | | | — | | | | 1 | | |
| *Foreign Currency Transactions | | | (11 | ) | | | 3 | | | | (3 | ) | | | 1 | | | | — | | | | — | | |
| Change in Unrealized Appreciation (Depreciation) of: | |
**Investment Securities/Affiliated Investment
Companies Shares and Foreign Currency | | | (573,824 | ) | | | 24,134 | | | | (230,704 | ) | | | 16,892 | | | | (18,996 | ) | | | 3,242 | | |
| *Futures | | | (1 | ) | | | (6 | ) | | | 22 | | | | (2 | ) | | | 1 | | | | — | | |
| * Change in Deferred Thailand Capital Gains Tax | | | 4 | | | | (2 | ) | | | 3 | | | | (1 | ) | | | — | | | | — | | |
| Net Realized and Unrealized Gain (Loss) | | | (584,037) | | | | 51,337 | | | | (230,447 | ) | | | 25,037 | | | | (20,054 | ) | | | 4,161 | | |
Net Increase (Decrease) in Net Assets
Resulting from Operations | | $ | (558,784 | ) | | $ | 70,435 | | | $ | (213,484 | ) | | $ | 37,396 | | | $ | (15,680 | ) | | $ | 6,755 | | |
* Allocated from each Portfolio's respective Master Funds (Affiliated Investment Companies).
** A portion has been allocated from each Portfolio's respective Master Funds (Affiliated Investment Companies).
See accompanying Notes to Financial Statements.
15
DIMENSIONAL INVESTMENT GROUP INC.
STATEMENTS OF CHANGES IN NET ASSETS
(Amounts in thousands)
| | | Global
Equity
Portfolio | | Global
60/40
Portfolio | | Global
25/75
Portfolio | |
| | | Period
Dec. 1,
2007 to
Oct. 31,
2008 | |
Year
Ended
Nov. 30,
2007 | |
Year
Ended
Nov. 30,
2006 | | Period
Dec. 1,
2007 to
Oct. 31,
2008 | |
Year
Ended
Nov. 30,
2007 | |
Year
Ended
Nov. 30,
2006 | | Period
Dec. 1,
2007 to
Oct. 31,
2008 | |
Year
Ended
Nov. 30,
2007 | |
Year
Ended
Nov. 30,
2006 | |
| Increase (Decrease) in Net Assets | |
| Operations: | |
| Net Investment Income (Loss) | | $ | 25,253 | | | $ | 19,098 | | | $ | 11,739 | | | $ | 16,963 | | | $ | 12,359 | | | $ | 6,760 | | | $ | 4,374 | | | $ | 2,594 | | | $ | 1,200 | | |
Capital Gain Distributions
Received from Affiliated
Investment Companies | | | 10,065 | | | | 10,480 | | | | 6,730 | | | | 3,366 | | | | 3,323 | | | | 2,036 | | | | 153 | | | | 100 | | | | 147 | | |
| Net Realized Gain (Loss) on: | |
**Investment Securities
Sold/Affiliated Investment
Companies Shares Sold | | | (20,041 | ) | | | 16,678 | | | | 2,867 | | | | (3,064 | ) | | | 4,806 | | | | 1,271 | | | | (1,212 | ) | | | 818 | | | | 552 | | |
| *Futures | | | (229 | ) | | | 50 | | | | 54 | | | | (67 | ) | | | 18 | | | | 19 | | | | — | | | | 1 | | | | 2 | | |
| *Foreign Currency Transactions | | | (11 | ) | | | 3 | | | | (3 | ) | | | (3 | ) | | | 1 | | | | (1 | ) | | | — | | | | — | | | | — | | |
Change in Unrealized Appreciation
(Depreciation) of: | |
**Investment Securities/Affiliated
Investment Companies Shares
and Foreign Currency | | | (573,824 | ) | | | 24,134 | | | | 106,080 | | | | (230,704 | ) | | | 16,892 | | | | 45,806 | | | | (18,996 | ) | | | 3,242 | | | | 4,208 | | |
*Translation of Foreign Currency
Denominated Amounts | | | — | | | | — | | | | 2 | | | | — | | | | — | | | | — | | | | — | | | | — | | | | — | | |
| *Futures | | | (1 | ) | | | (6 | ) | | | (108 | ) | | | 22 | | | | (2 | ) | | | (35 | ) | | | 1 | | | | — | | | | (2 | ) | |
*Change in Deferred Thailand
Capital Gains Tax | | | 4 | | | | (2 | ) | | | (7 | ) | | | 3 | | | | (1 | ) | | | (2 | ) | | | — | | | | — | | | | — | | |
Net Increase (Decrease) in
Net Assets Resulting
from Operations | | | (558,784 | ) | | | 70,435 | | | | 127,354 | | | | (213,484 | ) | | | 37,396 | | | | 55,854 | | | | (15,680 | ) | | | 6,755 | | | | 6,107 | | |
| Distributions From: | |
| Net Investment Income: | |
| Class R2 Shares | | | (150 | ) | | | (408 | ) | | | (301 | ) | | | (81 | ) | | | (143 | ) | | | (45 | ) | | | (27 | ) | | | (43 | ) | | | (5 | ) | |
| Institutional Class Shares | | | (23,670 | ) | | | (16,955 | ) | | | (9,646 | ) | | | (14,711 | ) | | | (12,496 | ) | | | (5,913 | ) | | | (4,129 | ) | | | (2,617 | ) | | | (1,198 | ) | |
Total Distributions From Net
Investment Income | | | (23,820 | ) | | | (17,363 | ) | | | (9,947 | ) | | | (14,792 | ) | | | (12,639 | ) | | | (5,958 | ) | | | (4,156 | ) | | | (2,660 | ) | | | (1,203 | ) | |
| Net Realized Gains: | |
| Class R2 Shares | | | (566 | ) | | | (371 | ) | | | (549 | ) | | | (76 | ) | | | (54 | ) | | | (48 | ) | | | (11 | ) | | | (21 | ) | | | (1 | ) | |
| Institutional Class Shares | | | (24,909 | ) | | | (9,793 | ) | | | (16,961 | ) | | | (7,495 | ) | | | (3,711 | ) | | | (6,319 | ) | | | (962 | ) | | | (800 | ) | | | (629 | ) | |
Total Distributions From Net
Realized Gains | | | (25,475 | ) | | | (10,164 | ) | | | (17,510 | ) | | | (7,571 | ) | | | (3,765 | ) | | | (6,367 | ) | | | (973 | ) | | | (821 | ) | | | (630 | ) | |
Total Distributions to
Shareholders | | | (49,295 | ) | | | (27,527 | ) | | | (27,457 | ) | | | (22,363 | ) | | | (16,404 | ) | | | (12,325 | ) | | | (5,129 | ) | | | (3,481 | ) | | | (1,833 | ) | |
| Capital Share Transactions: | |
| Shares Issued | | | 654,523 | | | | 539,395 | | | | 378,045 | | | | 266,717 | | | | 355,251 | | | | 305,399 | | | | 63,549 | | | | 55,915 | | | | 63,895 | | |
Shares Issued in Lieu of
Cash Distributions | | | 48,601 | | | | 27,119 | | | | 27,347 | | | | 21,391 | | | | 15,327 | | | | 12,077 | | | | 5,084 | | | | 3,448 | | | | 1,821 | | |
| Shares Redeemed | | | (355,668 | ) | | | (243,370 | ) | | | (126,391 | ) | | | (228,380 | ) | | | (168,594 | ) | | | (94,383 | ) | | | (57,916 | ) | | | (24,929 | ) | | | (22,840 | ) | |
Net Increase (Decrease) From
Capital Share Transactions | | | 347,456 | | | | 323,144 | | | | 279,001 | | | | 59,728 | | | | 201,984 | | | | 223,093 | | | | 10,717 | | | | 34,434 | | | | 42,876 | | |
Total Increase (Decrease)
in Net Assets | | | (260,623 | ) | | | 366,052 | | | | 378,898 | | | | (176,119 | ) | | | 222,976 | | | | 266,622 | | | | (10,092 | ) | | | 37,708 | | | | 47,150 | | |
| Net Assets | |
| Beginning of Period | | | 1,246,343 | | | | 880,291 | | | | 501,393 | | | | 768,724 | | | | 545,748 | | | | 279,126 | | | | 137,603 | | | | 99,895 | | | | 52,745 | | |
| End of Period | | $ | 985,720 | | | $ | 1,246,343 | | | $ | 880,291 | | | $ | 592,605 | | | $ | 768,724 | | | $ | 545,748 | | | $ | 127,511 | | | $ | 137,603 | | | $ | 99,895 | | |
Undistributed Net Investment Income
(Distributions in Excess of
Net Investment Income) | | $ | 3,563 | | | $ | 3,345 | | | $ | 2,589 | | | $ | 1,351 | | | $ | 934 | | | $ | 2,741 | | | $ | 354 | | | $ | 195 | | | $ | 218 | | |
* Allocated from each Portfolio's respective Master Funds (Affiliated Investment Companies).
** A portion has been allocated from each Portfolio's respective Master Funds (Affiliated Investment Companies).
See accompanying Notes to Financial Statements.
16
DIMENSIONAL INVESTMENT GROUP INC.
FINANCIAL HIGHLIGHTS
(for a share outstanding throughout each period)
Class R2 Shares
| | | Global Equity Portfolio | | Global 60/40 Portfolio | |
| | | Period
Dec. 1,
2007 to
Oct. 31,
2008 | |
Year
Ended
Nov. 30,
2007 | | Year
Ended
Nov. 30,
2006 | | Year
Ended
Nov. 30,
2005 | | Period
Dec. 24,
2003(a) to
Nov. 30,
2004 | | Period
Dec. 1,
2007 to
Oct. 31,
2008 | | Year
Ended
Nov. 30,
2007 | | Year
Ended
Nov. 30,
2006 | | Year
Ended
Nov. 30,
2005 | | Period
Dec. 24,
2003(a) to
Nov. 30,
2004 | |
| Net Asset Value, Beginning of Period | | $ | 15.49 | | | $ | 14.76 | | | $ | 12.90 | | | $ | 11.54 | | | $ | 10.00 | | | $ | 13.16 | | | $ | 12.65 | | | $ | 11.58 | | | $ | 10.83 | | | $ | 10.00 | | |
| Income from Investment Operations | |
| Net Investment Income | | | 0.24 | (A) | | | 0.22 | (A) | | | 0.19 | (A) | | | 0.19 | (A) | | | 0.07 | | | | 0.30 | (A) | | | 0.22 | (A) | | | 0.11 | (A) | | | 0.19 | (A) | | | 0.08 | | |
Net Gains (Losses) on Securities
(Realized and Unrealized) | | | (6.06 | ) | | | 0.86 | | | | 2.29 | | | | 1.33 | | | | 1.54 | | | | (3.60 | ) | | | 0.60 | | | | 1.40 | | | | 0.73 | | | | 0.84 | | |
| Total from Investrment Operations | | | (5.82 | ) | | | 1.08 | | | | 2.48 | | | | 1.52 | | | | 1.61 | | | | (3.30 | ) | | | 0.82 | | | | 1.51 | | | | 0.92 | | | | 0.92 | | |
| Less Distributions | |
| Net Investment Income | | | (0.18 | ) | | | (0.18 | ) | | | (0.18 | ) | | | (0.14 | ) | | | (0.07 | ) | | | (0.18 | ) | | | (0.22 | ) | | | (0.18 | ) | | | (0.16 | ) | | | (0.09 | ) | |
| Net Realized Gains | | | (0.32 | ) | | | (0.17 | ) | | | (0.44 | ) | | | (0.02 | ) | | | — | | | | (0.13 | ) | | | (0.09 | ) | | | (0.26 | ) | | | (0.01 | ) | | | — | | |
| Total Distributions | | | (0.50 | ) | | | (0.35 | ) | | | (0.62 | ) | | | (0.16 | ) | | | (0.07 | ) | | | (0.31 | ) | | | (0.31 | ) | | | (0.44 | ) | | | (0.17 | ) | | | (0.09 | ) | |
| Net Asset Value, End of Period | | $ | 9.17 | | | $ | 15.49 | | | $ | 14.76 | | | $ | 12.90 | | | $ | 11.54 | | | $ | 9.55 | | | $ | 13.16 | | | $ | 12.65 | | | $ | 11.58 | | | $ | 10.83 | | |
| Total Return | | | (38.72 | )%(C) | | | 7.42 | % | | | 20.04 | % | | | 13.25 | % | | | 16.18 | %(C) | | | (25.63 | )%(C) | | | 6.50 | % | | | 13.49 | % | | | 8.57 | % | | | 9.29 | %(C) | |
| Net Assets, End of Period (thousands) | | $ | 6,819 | | | $ | 27,904 | | | $ | 32,717 | | | $ | 16,092 | | | $ | 14,684 | | | $ | 5,081 | | | $ | 7,631 | | | $ | 7,379 | | | $ | 1,857 | | | $ | 1,912 | | |
| Ratio of Expenses to Average Net Assets (D) | | | 0.60 | %(B) | | | 0.58 | % | | | 0.62 | % | | | 0.71 | % | | | 0.90 | %(B)(E) | | | 0.59 | %(B) | | | 0.57 | % | | | 0.65 | % | | | 0.70 | % | | | 0.95 | %(B)(E) | |
Ratio of Expenses to Average Net Assets
(Excluding Waivers and Assumption of
Expenses and/or Recovery of Previously
Waived Fees) (D) | | | 0.87 | %(B) | | | 0.84 | % | | | 0.85 | % | | | 0.80 | % | | | 0.94 | %(B)(E) | | | 0.80 | %(B) | | | 0.76 | % | | | 0.77 | % | | | 0.80 | % | | | 1.28 | %(B)(E) | |
Ratio of Net Investment Income to Average
Net Assets | | | 1.99 | %(B) | | | 1.38 | % | | | 1.38 | % | | | 1.32 | % | | | 0.82 | %(B)(E) | | | 2.78 | %(B) | | | 1.67 | % | | | 0.89 | % | | | 1.73 | % | | | 0.94 | %(B)(E) | |
See page 1 for the Definitions of Abbreviations and Footnotes.
See accompanying Notes to Financial Statements.
17
DIMENSIONAL INVESTMENT GROUP INC.
FINANCIAL HIGHLIGHTS
(for a share outstanding throughout each period)
Class R2 Shares
| | | Global 25/75 Portfolio | |
| | | Period
Dec. 1,
2007 to
Oct. 31,
2008 | | Year
Ended
Nov. 30,
2007 | | Year
Ended
Nov. 30,
2006 | | Year
Ended
Nov. 30,
2005 | | Period
Dec. 24,
2003(a) to
Nov. 30,
2004 | |
| Net Asset Value, Beginning of Period | | $ | 11.42 | | | $ | 11.11 | | | $ | 10.62 | | | $ | 10.33 | | | $ | 10.00 | | |
| Income from Investment Operations | |
| Net Investment Income | | | 0.30 | (A) | | | 0.19 | (A) | | | 0.03 | (A) | | | 0.20 | (A) | | | 0.07 | | |
| Net Gains (Losses) on Securities (Realized and Unrealized) | | | (1.39 | ) | | | 0.41 | | | | 0.77 | | | | 0.25 | | | | 0.37 | | |
| Total from Investrment Operations | | | (1.09 | ) | | | 0.60 | | | | 0.80 | | | | 0.45 | | | | 0.44 | | |
| Less Distributions | |
| Net Investment Income | | | (0.21 | ) | | | (0.20 | ) | | | (0.20 | ) | | | (0.16 | ) | | | (0.11 | ) | |
| Net Realized Gains | | | (0.08 | ) | | | (0.09 | ) | | | (0.11 | ) | | | — | | | | — | | |
| Total Distributions | | | (0.29 | ) | | | (0.29 | ) | | | (0.31 | ) | | | (0.16 | ) | | | (0.11 | ) | |
| Net Asset Value, End of Period | | $ | 10.04 | | | $ | 11.42 | | | $ | 11.11 | | | $ | 10.62 | | | $ | 10.33 | | |
| Total Return | | | (9.72 | )%(C) | | | 5.47 | % | | | 7.75 | % | | | 4.47 | % | | | 4.44 | %(C) | |
| Net Assets, End of Period (thousands) | | $ | 1,342 | | | $ | 1,564 | | | $ | 2,701 | | | $ | 46 | | | $ | 65 | | |
| Ratio of Expenses to Average Net Assets (D) | | | 0.62 | %(B) | | | 0.62 | % | | | 0.62 | % | | | 0.79 | % | | | 0.95 | %(B)(E) | |
Ratio of Expenses to Average Net Assets (Excluding Waivers and Assumption of
Expenses and/or Recovery of Previously Waived Fees) (D) | | | 0.78 | %(B) | | | 0.71 | % | | | 0.74 | % | | | 0.95 | % | | | 6.00 | %(B)(E) | |
| Ratio of Net Investment Income to Average Net Assets | | | 3.00 | %(B) | | | 1.66 | % | | | 0.28 | % | | | 2.00 | % | | | 1.03 | %(B)(E) | |
See page 1 for the Definitions of Abbreviations and Footnotes.
See accompanying Notes to Financial Statements.
18
DIMENSIONAL INVESTMENT GROUP INC.
FINANCIAL HIGHLIGHTS
(for a share outstanding throughout each period)
Institutional Class Shares
| | | Global Equity Portfolio | | Global 60/40 Portfolio | |
| | | Period
Dec. 1,
2007 to
Oct. 31,
2008 | | Year
Ended
Nov. 30,
2007 | | Year
Ended
Nov. 30,
2006 | | Year
Ended
Nov. 30,
2005 | | Period
Dec. 24,
2003(a) to
Nov. 30,
2004 | | Period
Dec. 1,
2007 to
Oct. 31,
2008 | | Year
Ended
Nov. 30,
2007 | | Year
Ended
Nov. 30,
2006 | | Year
Ended
Nov. 30,
2005 | | Period
Dec. 24,
2003(a) to
Nov. 30,
2004 | |
| Net Asset Value, Beginning of Period | | $ | 15.48 | | | $ | 14.78 | | | $ | 12.92 | | | $ | 11.56 | | | $ | 10.00 | | | $ | 13.17 | | | $ | 12.67 | | | $ | 11.60 | | | $ | 10.83 | | | $ | 10.00 | | |
| Income from Investment Operations | |
| Net Investment Income | | | 0.27 | (A) | | | 0.27 | (A) | | | 0.23 | (A) | | | 0.25 | (A) | | | 0.09 | | | | 0.27 | (A) | | | 0.25 | (A) | | | 0.19 | (A) | | | 0.22 | (A) | | | 0.11 | | |
Net Gains (Losses) on Securities
(Realized and Unrealized) | | | (6.02 | ) | | | 0.85 | | | | 2.28 | | | | 1.29 | | | | 1.55 | | | | (3.54 | ) | | | 0.60 | | | | 1.35 | | | | 0.72 | | | | 0.83 | | |
| Total from Investrment Operations | | | (5.75 | ) | | | 1.12 | | | | 2.51 | | | | 1.54 | | | | 1.64 | | | | (3.27 | ) | | | 0.85 | | | | 1.54 | | | | 0.94 | | | | 0.94 | | |
| Less Distributions | |
| Net Investment Income | | | (0.27 | ) | | | (0.25 | ) | | | (0.21 | ) | | | (0.16 | ) | | | (0.08 | ) | | | (0.24 | ) | | | (0.26 | ) | | | (0.21 | ) | | | (0.16 | ) | | | (0.11 | ) | |
| Net Realized Gains | | | (0.32 | ) | | | (0.17 | ) | | | (0.44 | ) | | | (0.02 | ) | | | — | | | | (0.13 | ) | | | (0.09 | ) | | | (0.26 | ) | | | (0.01 | ) | | | — | | |
| Total Distributions | | | (0.59 | ) | | | (0.42 | ) | | | (0.65 | ) | | | (0.18 | ) | | | (0.08 | ) | | | (0.37 | ) | | | (0.35 | ) | | | (0.47 | ) | | | (0.17 | ) | | | (0.11 | ) | |
| Net Asset Value, End of Period | | $ | 9.14 | | | $ | 15.48 | | | $ | 14.78 | | | $ | 12.92 | | | $ | 11.56 | | | $ | 9.53 | | | $ | 13.17 | | | $ | 12.67 | | | $ | 11.60 | | | $ | 10.83 | | |
| Total Return | | | (38.50 | )%(C) | | | 7.67 | % | | | 20.33 | % | | | 13.47 | % | | | 16.46 | %(C) | | | (25.47 | )%(C) | | | 6.79 | % | | | 13.78 | % | | | 8.80 | % | | | 9.41 | %(C) | |
| Net Assets, End of Period (thousands) | | $ | 978,901 | | | $ | 1,218,439 | | | $ | 847,574 | | | $ | 485,301 | | | $ | 179,079 | | | $ | 587,524 | | | $ | 761,093 | | | $ | 538,369 | | | $ | 277,269 | | | $ | 102,341 | | |
| Ratio of Expenses to Average Net Assets (D) | | | 0.34 | %(B) | | | 0.33 | % | | | 0.37 | % | | | 0.46 | % | | | 0.67 | %(B)(E) | | | 0.32 | %(B) | | | 0.31 | % | | | 0.35 | % | | | 0.45 | % | | | 0.65 | %(B)(E) | |
Ratio of Expenses to Average Net Assets
(Excluding Waivers and Assumption of
Expenses and/or Recovery of Previously
Waived Fees) (D) | | | 0.61 | %(B) | | | 0.59 | % | | | 0.60 | % | | | 0.56 | % | | | 0.71 | %(B)(E) | | | 0.53 | %(B) | | | 0.51 | % | | | 0.52 | % | | | 0.55 | % | | | 0.83 | %(B)(E) | |
Ratio of Net Investment Income to Average
Net Assets | | | 2.26 | %(B) | | | 1.70 | % | | | 1.72 | % | | | 1.50 | % | | | 1.08 | %(B)(E) | | | 2.44 | %(B) | | | 1.90 | % | | | 1.56 | % | | | 1.99 | % | | | 1.18 | %(B)(E) | |
See page 1 for the Definitions of Abbreviations and Footnotes.
See accompanying Notes to Financial Statements.
19
DIMENSIONAL INVESTMENT GROUP INC.
FINANCIAL HIGHLIGHTS
(for a share outstanding throughout each period)
Institutional Class Shares
| | | Global 25/75 Portfolio | |
| | | Period
Dec. 1,
2007 to
Oct. 31,
2008 | | Year
Ended
Nov. 30,
2007 | | Year
Ended
Nov. 30,
2006 | | Year
Ended
Nov. 30,
2005 | | Period
Dec. 24,
2003(a) to
Nov. 30,
2004 | |
| Net Asset Value, Beginning of Period | | $ | 11.46 | | | $ | 11.15 | | | $ | 10.65 | | | $ | 10.34 | | | $ | 10.00 | | |
| Income from Investment Operations | |
| Net Investment Income | | | 0.31 | (A) | | | 0.24 | (A) | | | 0.22 | (A) | | | 0.24 | (A) | | | 0.11 | | |
| Net Gains (Losses) on Securities (Realized and Unrealized) | | | (1.37 | ) | | | 0.40 | | | | 0.60 | | | | 0.24 | | | | 0.36 | | |
| Total from Investrment Operations | | | (1.06 | ) | | | 0.64 | | | | 0.82 | | | | 0.48 | | | | 0.47 | | |
| Less Distributions | |
| Net Investment Income | | | (0.31 | ) | | | (0.24 | ) | | | (0.21 | ) | | | (0.17 | ) | | | (0.13 | ) | |
| Net Realized Gains | | | (0.08 | ) | | | (0.09 | ) | | | (0.11 | ) | | | — | | | | — | | |
| Total Distributions | | | (0.39 | ) | | | (0.33 | ) | | | (0.32 | ) | | | (0.17 | ) | | | (0.13 | ) | |
| Net Asset Value, End of Period | | $ | 10.01 | | | $ | 11.46 | | | $ | 11.15 | | | $ | 10.65 | | | $ | 10.34 | | |
| Total Return | | | (9.55 | )%(C) | | | 5.85 | % | | | 7.97 | % | | | 4.71 | % | | | 4.73 | %(C) | |
| Net Assets, End of Period (thousands) | | $ | 126,169 | | | $ | 136,039 | | | $ | 97,194 | | | $ | 52,699 | | | $ | 31,208 | | |
| Ratio of Expenses to Average Net Assets (D) | | | 0.30 | %(B) | | | 0.31 | % | | | 0.37 | % | | | 0.47 | % | | | 0.99 | %(B)(E) | |
Ratio of Expenses to Average Net Assets (Excluding Waivers and Assumption of
Expenses and/or Recovery of Previously Waived Fees) (D) | | | 0.46 | %(B) | | | 0.46 | % | | | 0.49 | % | | | 0.71 | % | | | 1.32 | %(B)(E) | |
| Ratio of Net Investment Income to Average Net Assets | | | 3.03 | %(B) | | | 2.15 | % | | | 1.59 | % | | | 2.33 | % | | | 0.95 | %(B)(E) | |
See page 1 for the Definitions of Abbreviations and Footnotes.
See accompanying Notes to Financial Statements.
20
DIMENSIONAL INVESTMENT GROUP INC.
NOTES TO FINANCIAL STATEMENTS
A. Organization:
Dimensional Investment Group Inc. (the "Fund") is an open-end management investment company registered under the Investment Company Act of 1940, whose shares are offered to institutional investors, retirement plans and clients of registered investment advisors. The Fund currently offers fifteen portfolios, of which Global Equity Portfolio, Global 60/40 Portfolio and Global 25/75 Portfolio (the "Global Funds") are presented in this report.
The Global Funds achieve their investment objectives by primarily investing in other portfolios within The DFA Investment Trust Company ("ITC"), DFA Investment Dimensions Group Inc. ("IDG") and Dimensional Emerging Markets Value Fund Inc. ("DEM") (collectively, the "Master Funds").
At October 31, 2008, Class R1 shares had not commenced operations. Class R1 shares of the Global Funds have 25,000,000 authorized shares.
At a regular meeting of the Board of Directors/Trustees (the "Board") on September 16, 2008, the Board voted to change the fiscal and tax year ends of the Global Funds from November 30 to October 31.
| | | Global Funds (Percentage of Ownership at October 31, 2008) | |
| Master Funds | | Global Equity
Portfolio | | Global 60/40
Portfolio | | Global 25/75
Portfolio | |
| The U.S. Large Cap Value Series (ITC) | | | N/A | | | | — | | | | N/A | | |
| The Japanese Small Company Series (ITC) | | | — | | | | — | | | | N/A | | |
| The Asia Pacific Small Company Series (ITC) | | | — | | | | — | | | | N/A | | |
| The United Kingdom Small Company Series (ITC) | | | — | | | | — | | | | N/A | | |
| The Continental Small Company Series (ITC) | | | — | | | | — | | | | N/A | | |
| The Emerging Markets Series (ITC) | | | — | | | | — | | | | N/A | | |
| The Emerging Markets Small Cap Series (ITC) | | | — | | | | — | | | | N/A | | |
| The DFA Two-Year Global Fixed Income Series (ITC) | | | N/A | | | | 2 | % | | | 1 | % | |
| U.S. Core Equity 1 Portfolio (IDG) | | | 15 | % | | | 5 | % | | | — | | |
| U.S. Core Equity 2 Portfolio (IDG) | | | 15 | % | | | 6 | % | | | 1 | % | |
| DFA Real Estate Securities Portfolio (IDG) | | | 1 | % | | | — | | | | — | | |
| Large Cap International Portfolio (IDG) | | | N/A | | | | — | | | | N/A | | |
| International Core Equity Portfolio (IDG) | | | 15 | % | | | 6 | % | | | 1 | % | |
| Emerging Markets Core Equity Portfolio (IDG) | | | 5 | % | | | 1 | % | | | — | | |
| DFA Five-Year Global Fixed Income Portfolio (IDG) | | | N/A | | | | 3 | % | | | 2 | % | |
| DFA Selectively Hedged Global Fixed Income Portfolio (IDG) | | | N/A | | | | 45 | % | | | N/A | | |
| Dimensional Emerging Markets Value Fund Inc. (DEM) | | | N/A | | | | — | | | | N/A | | |
N/A – Global Fund does not have any ownership in Master Fund.
Amounts designated as — are less than 1%.
21
B. Significant Accounting Policies:
The following significant accounting policies are in conformity with accounting principles generally accepted in the United States of America. Such policies are consistently followed by the Fund in preparation of its financial statements. The preparation of financial statements in accordance with accounting principles generally accepted in the United States of America requires management to make estimates and assumptions that affect the reported amounts of assets and liabilities and disclosure of contingent assets and liabilities at the date of the financial statements and the reported amounts of increases and decreases in net assets from operations during the reporting period. Actual results could differ from those estimates and those differences could be material.
1. Security Valuation: The U.S. Large Company Series, The Japanese Small Company Series, The Asia Pacific Small Company Series, The United Kingdom Small Company Series, The Continental Small Company Series, The Emerging Markets Series and The Emerging Markets Small Cap Series (the "Partnerships") are treated as partnerships for federal income tax purposes. The Global Funds' investments in the Partnerships reflect their proportionate interest in the net assets of those corresponding Partnerships. The shares of the remaining Master Funds held by the Global Funds are valued at their respective daily net asset values, as these Master Funds are treated as regulated investment companies for federal income tax purposes.
Adoption of Statement of Financial Accounting Standards No. 157 "Fair Value Measurements" ("FAS 157")
In September 2006, the Financial Accounting Standards Board issued FAS 157 effective for fiscal years beginning after November 15, 2007. This standard clarifies the definition of fair value for financial reporting, establishes a framework for measuring fair value and requires additional disclosures about the use of fair value measurements. The Funds have adopted FAS 157 as of December 1, 2007. The three levels of the fair value hierarchy under FAS 157 are described below:
• Level 1 – quoted prices in active markets for identical securities
• Level 2 – other significant observable inputs (including quoted prices for similar securities, interest rates, prepayment speeds, credit risk, etc.)
• Level 3 – significant unobservable inputs (including the Global Funds' own assumptions in determining the fair value of investments)
The inputs or methodology used for valuing securities are not necessarily an indication of the risk associated with investing in those securities. A summary of the inputs used to value the Global Funds' net assets as of October 31, 2008 is listed below (in thousands).
| | | Valuation Inputs | |
| | | Investments in
Securities
(Market Value) | |
| | | Level 1 | | Level 2 | | Level 3 | | Total | |
| Global Equity Portfolio | | $ | 967,179 | | | $ | 4,106 | | | | — | | | $ | 971,285 | | |
| Global 60/40 Portfolio | | | 592,001 | | | | 962 | | | | — | | | | 592,963 | | |
| Global 25/75 Portfolio | | | 127,397 | | | | 61 | | | | — | | | | 127,458 | | |
2. Deferred Compensation Plan: Each eligible Director of the Fund may elect participation in the Deferred Compensation Plan (the "Plan"). Under the Plan, effective January 1, 2002, such Directors may defer payment of all or a portion of their total fees earned as a Director. These deferred amounts may be treated as though such amounts had been invested in shares of the following funds: U.S. Large Cap Value Portfolio; U.S. Core Equity 1 Portfolio; U.S. Core Equity 2 Portfolio; U.S. Vector Equity Portfolio; U.S. Micro Cap Portfolio; DFA International Value Portfolio; International Core Equity Portfolio; Emerging Markets Portfolio; Emerging Markets Core Equity Portfolio; and/or DFA Two-Year Global Fixed Income Portfolio. Contributions made under the Plan and the change in unrealized a ppreciation (depreciation) and income are included in Other Expenses for the period ended October 31, 2008 and are included in Directors'/Trustees' Expenses for the year ended November 30, 2007.
Each Director has the option to receive their distribution of proceeds in one of the following methods upon one year's notice: lump sum; annual installments over a period of agreed upon years; or semi-annual installments over a period of agreed upon years. As of October 31, 2008, none of the Directors have requested distribution of proceeds.
3. Other: Security transactions are accounted for as of the trade date. Costs used in determining realized gains and losses on the sale of affiliated investment company shares are on the basis of identified cost. Dividend
22
income and distributions to shareholders are recorded on the ex-dividend date. Distributions received from the investment in affiliated investment companies that represent a return of capital or capital gain are recorded as a reduction of cost of investments or as a realized gain, respectively. The Global Funds estimate the character of distributions received that may be considered return of capital distributions. Interest income is recorded on the accrual basis. Expenses directly attributable to a Global Fund are directly charged. Common expenses of the Group are allocated using methods approved by the Board of Directors/Trustees, generally based on average net assets.
Class R2 Shares and Institutional Class Shares have equal rights to assets and earnings of its Global Fund. Income, gains and losses, and common expenses of each Global Fund are allocated to each class of shares based on its relative net assets. Each class will bear its own class-specific expenses, if any.
The Global Funds each recognize their pro-rata share of net investment income and realized and unrealized gains/losses on a daily basis, from their respective Partnerships.
C. Investment Advisor:
Dimensional Fund Advisors LP ("Dimensional" or the "Advisor") provides investment advisory services to the Master Funds. The Advisor also provides administrative services to the Global Funds, including supervision of services provided by others, providing information to shareholders and the Board of Directors/Trustees, and other administrative services. For the period December 1, 2007 to October 31, 2008, the Global Equity Portfolio, Global 60/40 Portfolio and Global 25/75 Portfolio's administrative services fees were accrued daily and paid monthly to the Advisor based on an effective annual rate of 0.30%, 0.25%, 0.20%, respectively, of average daily net assets. The Global Funds do not pay separate management fees to the Advisor.
Pursuant to a Fee Waiver and Expense Assumption Agreement, the Advisor has contractually agreed to waive its administrative services fee to the extent necessary to limit the proportionate share of the total combined administrative services fees paid by each of the Global Funds and investment advisory services fees paid by the Master Funds to the Advisor. The Fee Waiver and Expense Assumption Agreement will remain in effect until April 1, 2009, and shall continue to remain in effect from year to year thereafter unless terminated by the Fund or the Advisor. For the period December 1, 2007 to October 31, 2008, the Global Funds had the following expense limits based on a percentage of average net assets on an annualized basis.
| | | Expense
Limits | |
| Global Equity Portfolio | | | 0.27 | % | |
| Global 60/40 Portfolio | | | 0.25 | % | |
| Global 25/75 Portfolio | | | 0.22 | % | |
The Advisor has also contractually agreed to assume the direct operating expenses of the Institutional Class Shares of each Global Fund (excluding administrative services fees paid to the Advisor), to the extent necessary to limit the total expense ratios (including the expenses that the Institutional Class Shares of each such Global Fund bears as a shareholder of the Master Funds, but excluding expenses from investment in other investment companies) of the Institutional Class Shares. For the period December 1, 2007 to October 31, 2008, the Institutional Class Shares had the following expense limits based on a percentage of average net assets on an annualized basis.
| | | Expense
Limits | |
| Global Equity Portfolio | | | 0.44 | % | |
| Global 60/40 Portfolio | | | 0.41 | % | |
| Global 25/75 Portfolio | | | 0.37 | % | |
The Fee Waiver and Expense Assumption Agreement will remain in effect until April 1, 2009, and shall continue to remain in effect from year to year thereafter unless terminated by the Fund or the Advisor.
For the Class R2 Shares, the Advisor has contractually agreed to assume the direct operating expenses of the Class R2 Shares of each Global Fund (excluding administrative services fees paid to the Advisor) to the extent necessary to limit the total expense ratios (including the expenses that the Class R2 Shares of each such Global Fund bears as a shareholder of the Master Funds and including Shareholder Servicing Fees, but excluding expenses from investment in other investment companies) of the Class R2 Shares. For the period December 1, 2007 to October 31, 2008, the Class R2 Shares had the following expense limits based on a percentage of average net assets on an annualized basis.
23
| | | Expense
Limits | |
| Global Equity Portfolio | | | 0.69 | % | |
| Global 60/40 Portfolio | | | 0.66 | % | |
| Global 25/75 Portfolio | | | 0.62 | % | |
The Fee Waiver and Expense Assumption Agreement will remain in effect until April 1, 2009, and shall continue to remain in effect from year to year thereafter unless terminated by the Fund or the Advisor.
At any time that the rate of the fees and annualized expenses of a Global Fund are less than the rates listed above for a Global Fund on an annualized basis, the Advisor retains the right to recover any fees previously waived and/or expenses previously assumed to the extent that such recovery will not cause the Global Fund's Institutional Class and Class R2 Shares' fees or expenses to exceed the fee or expense limitations listed above. Previously waived fees subject to future recovery by the Advisor over periods not exceeding October 31, 2011 are reflected below (amounts in thousands). The Global Funds are not obligated to reimburse the Advisor for fees previously waived or expenses previously assumed by the Advisor more than thirty-six months before the date of recovery.
| | | Previously
Waived
Fees/Expenses
Assumed
Subject to
Future
Recovery | |
| Global Equity Portfolio | |
| Class R2 Shares | | $ | 179 | | |
| Institutional Class Shares | | | 7,361 | | |
| Global 60/40 Portfolio | |
| Class R2 Shares | | | 39 | | |
| Institutional Class Shares | | | 3,540 | | |
| Global 25/75 Portfolio | |
| Class R2 Shares | | | 10 | | |
| Institutional Class Shares | | | 545 | | |
Fees Paid to Officers and Directors/Trustees:
Certain Officers and Directors/Trustees of the Advisor are also Officers and Directors/Trustees of the Fund; however, such Officers and Directors/Trustees (with the exception of the Chief Compliance Officer ("CCO")) receive no compensation from the Fund. For the period December 1, 2007 to October 31, 2008, the total related amounts paid by the Fund to the CCO were $25 (in thousands). The total related amounts paid by each of the Global Funds are included in Other Expenses on the Statement of Operations.
D. Deferred Compensation:
At October 31, 2008, the total liability for deferred compensation to Directors/Trustees is included in Accrued Expenses and Other Liabilities on the Statement of Assets and Liabilities as follows (amounts in thousands):
| Global Equity Portfolio | | $ | 18 | | |
| Global 60/40 Portfolio | | | 11 | | |
| Global 25/75 Portfolio | | | 2 | | |
E. Federal Income Taxes:
Each Global Fund has qualified and intends to continue to qualify as a regulated investment company under Subchapter M of the Internal Revenue Code for federal income tax purposes and to distribute substantially all of its taxable income and net capital gains to its shareholders. Accordingly, no provision has been made for federal income taxes.
Distributions from net investment income and net realized capital gains are determined in accordance with U.S. federal income tax regulations, which may differ from those amounts determined under accounting principles generally accepted in the United States of America. These book/tax differences are either temporary or permanent in
24
nature. To the extent these differences are permanent, they are charged or credited to paid-in capital, undistributed net investment income or accumulated net realized gains, as appropriate, in the period that the differences arise. Accordingly, the following permanent differences as of October 31, 2008, primarily attributable to reclassification of distributions and the utilization of accumulated earnings and profits distributed to shareholders on redemptions of shares as part of the dividends paid deduction for income tax purposes, were reclassified to the following accounts. These reclassifications had no effect on net assets or net asset value per share (amounts in thousands):
| | | Increase
(Decrease)
Paid-In Capital | | Increase
(Decrease)
Undistributed
Net Investment
Income | | Increase
(Decrease)
Accumulated
Net Realized
Gains/(Losses) | |
| Global Equity Portfolio | | $ | 1,155 | | | $ | (1,215 | ) | | $ | 60 | | |
| Global 60/40 Portfolio | | | 2,352 | | | | (1,754 | ) | | | (598 | ) | |
| Global 25/75 Portfolio | | | — | | | | (59 | ) | | | 59 | | |
The tax character of dividends and distributions declared and paid during the years ended November 30, 2006 and November 30, 2007 and the period December 1, 2007 to October 31, 2008 were as follows (amounts in thousands):
| | | Net Investment
Income and
Short-Term
Capital Gains | | Long-Term
Capital Gains | | Total | |
| | Global Equity Portfolio
2006 | | | $ | 11,320 | | | $ | 16,822 | | | $ | 28,142 | | |
| | 2007 | | | | 20,438 | | | | 9,279 | | | | 29,717 | | |
| | 2008 | | | | 26,394 | | | | 24,056 | | | | 50,450 | | |
| | Global 60/40 Portfolio
2006 | | | | 6,429 | | | | 6,175 | | | | 12,604 | | |
| | 2007 | | | | 14,075 | | | | 3,393 | | | | 17,468 | | |
| | 2008 | | | | 17,159 | | | | 7,556 | | | | 24,715 | | |
| | Global 25/75 Portfolio
2006 | | | | 1,273 | | | | 636 | | | | 1,909 | | |
| | 2007 | | | | 2,739 | | | | 742 | | | | 3,481 | | |
| | 2008 | | | | 4,258 | | | | 871 | | | | 5,129 | | |
At October 31, 2008, the following net investment income and short-term capital gains and long-term capital gains distributions designated for federal income tax purposes are due to the utilization of accumulated earnings and profits distributed to shareholders upon redemption of shares (amounts in thousands):
| | | Net Investment
Income and
Short-Term
Capital Gains | | Long-Term
Capital Gains | | Total | |
| Global Equity Portfolio | | $ | 1,155 | | | | — | | | $ | 1,155 | | |
| Global 60/40 Portfolio | | | 1,740 | | | $ | 612 | | | | 2,352 | | |
25
At October 31, 2008, the components of distributable earnings/(accumulated losses) were as follows (amounts in thousands):
| | | Undistributed
Net Investment
Income and
Short-Term
Capital Gains | | Undistributed
Long-Term
Capital Gains | | Capital
Loss
Carryforward | | Total Net
Distributable
Earnings/
(Accumulated
Losses) | |
| Global Equity Portfolio | | $ | 3,630 | | | | — | | | $ | (11,249 | ) | | $ | (7,619 | ) | |
| Global 60/40 Portfolio | | | 1,377 | | | $ | 2,234 | | | | — | | | | 3,611 | | |
| Global 25/75 Portfolio | | | 394 | | | | 1,249 | | | | — | | | | 1,643 | | |
For federal income tax purposes, the Fund measures its capital loss carryforwards annually at October 31, its fiscal year end. Capital loss carryforwards may be carried forward and applied against future capital gains. As of October 31, 2008, the Global Equity Portfolio had capital loss carryforwards available in the amount of $11,249 (in thousands) to offset future realized capital gains through October 31, 2016.
Some of the investments held by the Master Funds are in securities considered to be "passive foreign investment companies" for which any unrealized appreciation (depreciation) (mark to market) and/or realized gains are required to be included in distributable net investment income for federal income tax purposes. At October 31, 2008, the Global Funds received the following cumulative unrealized appreciation (depreciation) (mark to market) to be included in distributable net investment income for federal tax purposes. For the period December 1, 2007 to October 31, 2008, as listed below, there were realized gains on the sale of passive foreign investment companies received to be reclassified from accumulated net realized gains to accumulated net investment income for federal tax purposes. Amounts are in thousands.
| | | Mark to Market | | Realized Gains | |
| Global Equity Portfolio | | $ | 49 | | | $ | 10 | | |
| Global 60/40 Portfolio | | | 14 | | | | 3 | | |
| Global 25/75 Portfolio | | | — | | | | — | | |
At October 31, 2008, the total cost and aggregate gross unrealized appreciation and (depreciation) of securities for federal income tax purposes were different from amounts reported for financial reporting purposes (amounts in thousands):
| | | Federal
Tax Cost | | Unrealized
Appreciation | | Unrealized
(Depreciation) | | Net
Unrealized
Appreciation
(Depreciation) | |
| Global Equity Portfolio | | $ | 1,375,830 | | | $ | 20,087 | | | $ | (424,555 | ) | | $ | (404,468 | ) | |
| Global 60/40 Portfolio | | | 743,946 | | | | 9,922 | | | | (169,196 | ) | | | (159,274 | ) | |
| Global 25/75 Portfolio | | | 141,692 | | | | 1,946 | | | | (15,180 | ) | | | (13,234 | ) | |
In June 2006, the Financial Accounting Standards Board (FASB) issued FASB Interpretation 48 ("FIN 48"), "Accounting for Uncertainty in Income Taxes." This standard defines the threshold for recognizing the benefits of tax-return positions in the financial statements as "more-likely-than-not" to be sustained by the taxing authority and requires measurement of a tax position meeting the more-likely-than-not criterion, based on the largest benefit that is more than 50 percent likely to be realized. Management has analyzed the Global Funds' tax positions to be taken on the federal income tax returns for all open tax years (tax years ended November 30, 2005 through the period ended October 31, 2008), for purposes of implementing FIN 48, and has concluded that no provision for income tax is required in the Global Funds' financial statements.
26
F. Capital Share Transactions:
The capital share transactions by class were as follows (amounts in thousands):
| | | Period Dec. 1, 2007
to
Oct. 31, 2008 | | Year
Ended
Nov. 30, 2007 | |
| | | Amount | | Shares | | Amount | | Shares | |
| Global Equity Portfolio | |
| Class R2 Shares | |
| Shares Issued | | $ | 3,702 | | | | 324 | | | $ | 15,839 | | | | 1,014 | | |
| Shares Issued in Lieu of Cash Distributions | | | 716 | | | | 49 | | | | 779 | | | | 52 | | |
| Shares Redeemed | | | (20,911 | ) | | | (1,431 | ) | | | (23,027 | ) | | | (1,481 | ) | |
| Net Increase (Decrease)—Class R2 Shares | | $ | (16,493 | ) | | | (1,058 | ) | | $ | (6,409 | ) | | | (415 | ) | |
| Institutional Class Shares | |
| Shares Issued | | $ | 650,821 | | | | 52,874 | | | $ | 523,556 | | | | 33,704 | | |
| Shares Issued in Lieu of Cash Distributions | | | 47,885 | | | | 3,401 | | | | 26,340 | | | | 1,743 | | |
| Shares Redeemed | | | (334,757 | ) | | | (27,816 | ) | | | (220,343 | ) | | | (14,087 | ) | |
| Net Increase (Decrease)—Institutional Class Shares | | $ | 363,949 | | | | 28,459 | | | $ | 329,553 | | | | 21,360 | | |
| Global 60/40 Portfolio | |
| Class R2 Shares | |
| Shares Issued | | $ | 2,885 | | | | 283 | | | $ | 4,290 | | | | 330 | | |
| Shares Issued in Lieu of Cash Distributions | | | 156 | | | | 12 | | | | 197 | | | | 15 | | |
| Shares Redeemed | | | (4,313 | ) | | | (343 | ) | | | (4,564 | ) | | | (349 | ) | |
| Net Increase (Decrease)—Class R2 Shares | | $ | (1,272 | ) | | | (48 | ) | | $ | (77 | ) | | | (4 | ) | |
| Institutional Class Shares | |
| Shares Issued | | $ | 263,832 | | | | 21,933 | | | $ | 350,961 | | | | 26,609 | | |
| Shares Issued in Lieu of Cash Distributions | | | 21,235 | | | | 1,711 | | | | 15,130 | | | | 1,178 | | |
| Shares Redeemed | | | (224,067 | ) | | | (19,795 | ) | | | (164,030 | ) | | | (12,504 | ) | |
| Net Increase (Decrease)—Institutional Class Shares | | $ | 61,000 | | | | 3,849 | | | $ | 202,061 | | | | 15,283 | | |
| Global 25/75 Portfolio | |
| Class R2 Shares | |
| Shares Issued | | $ | 739 | | | | 70 | | | $ | 1,494 | | | | 132 | | |
| Shares Issued in Lieu of Cash Distributions | | | 38 | | | | 4 | | | | 64 | | | | 6 | | |
| Shares Redeemed | | | (836 | ) | | | (77 | ) | | | (2,762 | ) | | | (244 | ) | |
| Net Increase (Decrease)—Class R2 Shares | | $ | (59 | ) | | | (3 | ) | | $ | (1,204 | ) | | | (106 | ) | |
| Institutional Class Shares | |
| Shares Issued | | $ | 62,810 | | | | 5,710 | | | $ | 54,421 | | | | 4,802 | | |
| Shares Issued in Lieu of Cash Distributions | | | 5,046 | | | | 458 | | | | 3,384 | | | | 302 | | |
| Shares Redeemed | | | (57,080 | ) | | | (5,437 | ) | | | (22,167 | ) | | | (1,950 | ) | |
| Net Increase (Decrease)—Institutional Class Shares | | $ | 10,776 | | | | 731 | | | $ | 35,638 | | | | 3,154 | | |
G. Financial Instruments:
In accordance with the Fund's investment objectives and policies, the Fund may invest in certain financial instruments that have off-balance sheet risk in excess of the amounts recognized in the financial statements and concentrations of credit and market risk. The instrument and its significant corresponding risks are described below:
27
Repurchase Agreements: The Global Funds may purchase money market instruments subject to the counterparty's agreement to repurchase them at an agreed upon date and price. The counterparty will be required on a daily basis to maintain the value of the collateral subject to the agreement at not less than the repurchase price, including accrued interest. The agreements are conditioned upon the collateral being deposited under the Federal Reserve book-entry system with the Fund's custodian or a third party sub-custodian. In the event of default or bankruptcy by the other party to the agreement, retention of the collateral may be subject to legal proceedings. All open repurchase agreements were entered into on October 31, 2008.
H. Line of Credit:
The Fund, together with other Dimensional-advised portfolios, has entered into a $250 million unsecured discretionary line of credit effective June 30, 2003 with an affiliate of its domestic custodian bank. Each portfolio is permitted to borrow, subject to its investment limitations, up to a maximum of $250 million, as long as total borrowings under the line of credit do not exceed $250 million in the aggregate. Borrowings under the line of credit are charged interest at the then current Federal Funds Rate plus 1%. Each portfolio is individually, and not jointly, liable for its particular advances under the line of credit. There is no commitment fee on the unused portion of the line of credit. The agreement for the discretionary line of credit may be terminated by either party at any time. The line of credit is scheduled to expire on June 23, 2009.
For the period December 1, 2007 to October 31, 2008, borrowings by the Global Funds under this line of credit were as follows (amounts in thousands, except percentages and days):
| | | Weighted
Average
Interest Rate | | Weighted
Average
Loan Balance | | Number of
Days
Outstanding | | Interest
Expense
Incurred | | Maximum Amount
Borrowed During
the Period | |
| Global Equity Portfolio | | | 3.62 | % | | $ | 1,732 | | | | 38 | | | $ | 7 | | | $ | 19,650 | | |
| Global 60/40 Portfolio | | | 3.83 | % | | | 1,184 | | | | 57 | | | | 7 | | | | 7,432 | | |
| Global 25/75 Portfolio | | | 4.07 | % | | | 535 | | | | 57 | | | | 3 | | | | 15,573 | | |
There were no outstanding borrowings by the Global Funds under this line of credit at October 31, 2008.
The Fund, together with other Dimensional-advised portfolios, has also entered into an additional $500 million unsecured line of credit effective January 15, 2008 with its international custodian bank. Each portfolio is permitted to borrow, subject to its investment limitations, up to a maximum of $500 million, as long as total borrowings under the line of credit do not exceed $500 million in the aggregate. Each portfolio is individually, and not jointly, liable for its particular advances under the line of credit. Borrowings under the line of credit are charged interest at rates agreed to by the parties at the time of borrowing. There is no commitment fee on the unused portion of the line of credit. The agreement for the line of credit expires on January 15, 2009. There were no borrowings by the Global Funds under this line of credit during the period ended October 31, 2008.
I. Shareholder Servicing Fees:
The Class R2 Shares pay a shareholder servicing fee in the amount of 0.25% of their annual average net assets to compensate service agents that provide shareholder servicing, record keeping, account maintenance and other services to investors in the Global Funds' Class R2 Shares.
J. Indemnitees; Contractual Obligations:
Under the Fund's organizational documents, its officers and directors are indemnified against certain liabilities arising out of the performance of their duties to the Fund.
In the normal course of business, the Fund enters into contracts that contain a variety of representations and warranties which provide general indemnification. The Fund's maximum exposure under these arrangements is unknown as this would involve future claims that may be made against the Fund and/or its affiliates that have not yet occurred. However, based on experience, the Fund expects the risk of loss to be remote.
K. Recently Issued Accounting Standards and Interpretation:
In March 2008, Statement of Financial Accounting Standards No. 161, Disclosures about Derivative Instruments and Hedging Activities ("FAS 161"), was issued and is effective for fiscal years beginning after November 15, 2008.
28
FAS 161 defines new disclosures of derivative instruments and hedging activities. Management is currently evaluating the implications of FAS 161. At this time, its impact on the Global Fund's financial statements has not been determined.
L. Other:
At October 31, 2008, the following number of shareholders held the following approximate percentages of outstanding shares of the Global Funds. One or more of the shareholders may be omnibus accounts, which typically hold shares for the benefit of several other underlying investors.
| | | Number of
Shareholders | | Approximate
Percentage
of Outstanding
shares | |
| Global Equity Portfolio—Class R2 Shares | | | 3 | | | | 98 | % | |
| Global Equity Portfolio—Institutional Class Shares | | | 3 | | | | 86 | % | |
| Global 60/40 Portfolio—Class R2 Shares | | | 4 | | | | 95 | % | |
| Global 60/40 Portfolio—Institutional Class Shares | | | 3 | | | | 72 | % | |
| Global 25/75 Portfolio—Class R2 Shares | | | 3 | | | | 96 | % | |
| Global 25/75 Portfolio—Institutional Class Shares | | | 3 | | | | 82 | % | |
M. Subsequent Event Note:
On November 1, 2008, The DFA Two-Year Global Fixed Income Series, a master fund in a RIC/RIC master feeder structure with RIC feeders, underlying fund of fund investors (Two Year Global Fixed Income Series) and direct client investor, has made a "Check-the-box" election for federal income tax purposes pursuant to Treasury Regulation § 301.7701-3, to change its federal entity classifications from a corporation taxable as a regulated investment company to a partnership. As a result of this election, for tax purposes, the master fund is deemed to have distributed all of its assets and liabilities to its shareholders in liquidation of the master fund. Since the master fund has a shareholder owning 80% or more of the fund's shares, and also has shareholders owning less than 80%, the fund's respective transaction creates a non-taxable transaction, pursuant to Internal Revenue Code §332 for those owning more than 80%, and a taxable transa ction, pursuant to Internal Revenue Code §331, for those shareholders owning less than 80%. Immediately after the deemed liquidation, the shareholders contributed all of the distributed assets and liabilities to newly formed partnerships. The final tax year end of the Master Fund was October 31, 2008.
For Federal income tax purposes, pursuant to Code §336(a), the master fund recognizes gain or loss relative to the investment of the less than 80% shareholders as if the master's investment securities were sold to those shareholders and, pursuant to Code §331, each of those shareholders recognizes gain or loss as if it liquidated its investment in the master. Pursuant to Code§ 334(a), each of these shareholders will take a fair market value basis in the securities deemed received by them and a new holding period for those securities commences on the deemed liquidation date. In regards to the shareholders owning 80% or more of the master fund, pursuant to Internal Revenue Code § 332 (a), the shareholder will not recognize any gain or loss on the deemed liquidation. However, pursuant to IRC §332(c), a portion of the deemed distribution, which otherwise would have been tax-free as discussed above, since it is utilized b y the master fund to satisfy its dividends paid deduction for the tax year, must be recognized and treated as a dividend by the 80% or greater shareholder. Pursuant to IRC §§ 334(b)(1) and 1223, the 80% or greater shareholder's basis and holding period in the securities received in liquidation is the same as it was in the possession of the master. However, any security distributed in satisfaction of the master's final dividend would have a basis equal to their fair market value and would be deemed acquired on the liquidation date.
The master fund had book/tax differences upon its deemed liquidation. The following summary of permanent differences occurred as of the respective effective "Check the Box" election date.
| | | Increase
(Decrease)
Paid-In
Capital | | Unrealized
Appreciation
(Depreciation)
Investment
Securities | | Increase
(Decrease)
Undistributed
Net Investment
Income | | Increase
(Decrease)
Accumulated
Net Realized
Gains (Losses) | |
| The DFA Two-Year Global Fixed Income Series | | $ | 21,245,521 | | | $ | (39,613,298 | ) | | $ | (6,979,642 | ) | | $ | 25,347,419 | | |
29
Each Portfolio impacted by the "Check the Box" election also has permanent book/tax differences resulting from the transaction. Listed below are the permanent differences impacting each respective Portfolio. For financial statement purposes, this adjustment did not result in any changes to each respective fund's net assets or net asset value per share.
| | | Increase
(Decrease)
Paid-In
Capital | | Unrealized
Appreciation
(Depreciation)
Investment
Securities | | Increase
(Decrease)
Undistributed
Net Investment
Income | | Increase
(Decrease)
Accumulated
Net Realized
Gains (Losses) | |
| Global 60/40 Portfolio | | $ | — | | | $ | (3,046,638 | ) | | $ | — | | | $ | 3,046,638 | | |
| Global 25/75 Portfolio | | | — | | | | (1,370,411 | ) | | | — | | | | 1,370,411 | | |
The Global 60/40 Portfolio and the Global 25/75 Portfolio, each representing a less than 80% owner of the Two Year Global Fixed Income Series, recognized $3,046,638 and $1,370,411 of net capital gain respectively for their tax year ended October 31, 2008, pursuant to IRC §331.
For financial reporting purposes, this transaction had no impact on the net assets of the respective funds.
30
REPORT OF INDEPENDENT REGISTERED PUBLIC ACCOUNTING FIRM
To the Shareholders of the Portfolios, as defined, and
Board of Directors of Dimensional Investment Group Inc.:
In our opinion, the accompanying statements of assets and liabilities, including the schedules of investments, and the related statements of operations and of changes in net assets and the financial highlights present fairly, in all material respects, the financial position of Global Equity Portfolio, Global 60/40 Portfolio and Global 25/75 Portfolio (three of the portfolios constituting Dimensional Investment Group Inc., hereafter referred to as the "Portfolios") at October 31, 2008, the results of each of their operations, the changes in each of their net assets and the financial highlights for the periods indicated, in conformity with accounting principles generally accepted in the United States of America. These financial statements and financial highlights (hereafter referred to as "financial statements") are the responsibility of the Portfolios' management; our responsibility is to express an opinion on these financial statements based on our audits. We conducted our audits of these financial statements in accordance with the Standards of the Public Company Accounting Oversight Board (United States). Those standards require that we plan and perform the audit to obtain reasonable assurance about whether the financial statements are free of material misstatement. An audit includes examining, on a test basis, evidence supporting the amounts and disclosures in the financial statements, assessing the accounting principles used and significant estimates made by management, and evaluating the overall financial statement presentation. We believe that our audits, which included confirmation of securities at October 31, 2008 by correspondence with the transfer agent of the investee funds, provide a reasonable basis for our opinion.
PricewaterhouseCoopers LLP
Philadelphia, Pennsylvania
December 22, 2008
31
FUND MANAGEMENT
Trustees/Directors
Each Board of Trustees/Directors of The DFA Investment Trust Company Inc. ("DFAITC"), DFA Investment Dimensions Group Inc. ("DFAIDG"), Dimensional Investment Group Inc. ("DIG") and Dimensional Emerging Markets Value Fund Inc. ("DEM") (each, the "Fund" and collectively, the "Funds") is responsible for establishing the Funds' policies and for overseeing the management of the Funds. The Trustees/Directors of the Funds, including all of the disinterested Directors, have adopted written procedures to monitor potential conflicts of interest that might develop between portfolios of the Funds (the "Feeder Portfolios") that invest in certain series of DFAITC or DEM (the "Master Funds").
Each Board has two standing committees, an Audit Committee and a Portfolio Performance and Service Review Committee (the "Performance Committee"). The Audit Committee is comprised of George M. Constantinides, Roger G. Ibbotson and Abbie J. Smith. Each member of the Audit Committee is a disinterested Director. The Audit Committee oversees the Fund's accounting and financial reporting policies and practices, the Fund's internal controls, the Fund's financial statements and the independent audits thereof and performs other oversight functions as requested by the Board. The Audit Committee recommends the appointment of each Fund's independent registered certified public accounting firm and also acts as a liaison between the Fund's independent registered certified public accounting firm and the full Board. There were three Audit Committee meetings held during the fiscal year ended October 31, 2008.
Each Board's Performance Committee is comprised of Messrs. Constantinides and Ibbotson, Ms. Smith, John P. Gould, Myron S. Scholes and Robert C. Merton. Each member of the Fund's Performance Committee is a disinterested Director. The Performance Committee regularly reviews and monitors the investment performance of the Fund's series and reviews the performance of the Fund's service providers. There were five Performance Committee meetings held during the fiscal year ended October 31, 2008.
Certain biographical information for each disinterested Trustee/Director and each interested Trustee/Director of the Funds is set forth in the tables below, including a description of each Trustee/Director's experience as a Trustee/Director of the Funds and as a director or trustee of other funds, as well as other recent professional experience.
The statements of additional information (together, "SAI") of the Funds include additional information about each Trustee/Director. You may obtain copies of the SAI and prospectus of each Fund advised by Dimensional Fund Advisors LP by calling collect (310) 395-8005 or by mailing a request to Dimensional Fund Advisors LP, 1299 Ocean Avenue, Santa Monica, California 90401. Prospectuses are also available at www.dimensional.com.
Name, Position
with the Fund,
Address and Age | | Term of Office1 and
Length of Service | | Portfolios within the
DFA Fund Complex2
Overseen | | Principal Occupation(s) During Past 5 Years and
Other Directorships of Public Companies Held | |
| | | Disinterested Trustees/Directors | |
|
George M. Constantinides
Director of DFAIDG, DIG and DEM.
Trustee of DFAITC.
The University of Chicago Booth School of Business
5807 S. Woodlawn Avenue Chicago, IL 60637
Age: 61 | | DFAITC - since 1993
DFAIDG - since 1983
DIG - since 1993
DEM - since 1993 | | 96 portfolios in 4 investment companies | | Leo Melamed Professor of Finance, The University of Chicago Booth School of Business. | |
|
32
Name, Position
with the Fund,
Address and Age | | Term of Office1 and
Length of Service | | Portfolios within the
DFA Fund Complex2
Overseen | | Principal Occupation(s) During Past 5 Years and
Other Directorships of Public Companies Held | |
John P. Gould
Director of DFAIDG, DIG and DEM.
Trustee of DFAITC.
The University of Chicago Booth School of Business
5807 S. Woodlawn Avenue
Chicago, IL 60637
Age: 69 | | DFAITC - since 1993
DFAIDG - since 1986
DIG - since 1993
DEM - since 1993 | | 96 portfolios in 4 investment companies | | Steven G. Rothmeier Distinguished Service Professor of Economics, The University of Chicago Booth School of Business (since 1965). Member of the Boards of Milwaukee Mutual Insurance Company (since 1997) and UNext.com (1999-2006). Member Competitive Markets Advisory Committee, Chicago Mercantile Exchange (futures trading exchange) (since 2004). Formerly, Senior Vice-President, Lexecon Inc. (economics, law, strategy and finance consulting) (1994-2004). Formerly, President, Cardean University (division of UNext.com) (1999-2001). Trustee, Harbor Fund (registered investment company) (14 Portfolios) (since 1994). | |
|
Roger G. Ibbotson
Director of DFAIDG, DIG and DEM.
Trustee of DFAITC.
Yale School of Management
P.O. Box 208200
New Haven, CT 06520-8200
Age: 65 | | DFAITC - since 1993
DFAIDG - since 1981
DIG - since 1993
DEM - since 1993 | | 96 portfolios in 4 investment companies | | Professor in Practice of Finance, Yale School of Management (since 1984). Director, BIRR Portfolio Analysis, Inc. (software products) (since 1990). Chairman, CIO and Partner, Zebra Capital Management, LLC (hedge fund manager) (since 2001).
Consultant to Morningstar, Inc. (since 2006). Formerly, Chairman, Ibbotson Associates, Inc., Chicago, IL (software data publishing and consulting) (1977-2006). | |
|
Robert C. Merton
Director of DFAIDG, DIG and DEM.
Trustee of DFAITC.
Harvard Business School
353 Baker Library
Soldiers Field
Boston, MA 02163
Age: 64 | | DFAITC - since 2003
DFAIDG - since 2003
DIG - since 2003
DEM - since 2003 | | 96 portfolios in 4 investment companies | | John and Natty McArthur University Professor, Graduate School of Business Administration, Harvard University (since 1998). George Fisher Baker Professor of Business Administration, Graduate School of Business Administration, Harvard University (1988-1998), Co-founder, Chief Science Officer and Director, Trinsum Group, a successor to Integrated Finance Limited (since 2002). Director, MF Risk, Inc. (risk management software) (since 2001). Director, Peninsula Banking Group (bank) (since 2003). Director, Community First Financial Group (bank holding company) (since 2003). Advisory Board Member, Alpha Simplex Group (hedge fund) (since 2001). Member Competitive Markets Advisory Council, Chicago Mercantile Exchange (futures trading exchange) (since 2004). Formerly, Advisory Board Member, NuServe (insurance software) (2001-2003). Director, Vical Incorporated (biopharmaceutical product development) (since 2002). | |
|
Myron S. Scholes
Director of DFAIDG, DIG and DEM.
Trustee of DFAITC.
Platinum Grove Asset Management, L.P.
Reckson Executive Park
1100 King Street
Building 4
Rye Brook, NY 10573
Age: 67 | | DFAITC - since 1993
DFAIDG - since 1981
DIG - since 1993
DEM - since 1993 | | 96 portfolios in 4 investment companies | | Frank E. Buck Professor Emeritus of Finance, Stanford University (since 1981). Chairman, Platinum Grove Asset Management, L.P. (hedge fund) (formerly, Oak Hill Platinum Partners) (since 1999). Formerly, Managing Partner, Oak Hill Capital Management (private equity firm) (until 2004). Chairman, Oak Hill Platinum Partners (hedge fund) (since 2004). Director, Chicago Mercantile Exchange (since 2001). Director, American Century Fund Complex (registered investment companies) (37 Portfolios) (since 1981); and Director, Chicago Mercantile Exchange Holdings Inc. (since 2000). | |
|
Abbie J. Smith
Director of DFAIDG, DIG and DEM.
Trustee of DFAITC.
The University of Chicago Booth School of Business
5807 S. Woodlawn Avenue
Chicago, IL 60637
Age: 55 | | DFAITC - since 2000
DFAIDG - since 2000
DIG - since 2000
DEM - since 2000 | | 96 portfolios in 4 investment companies | | Boris and Irene Stern Professor of Accounting, The University of Chicago Booth School of Business (since 1980), Formerly, Marvin Bower Fellow, Harvard Business School (9/01 to 8/02). Director, HNI Corporation (formerly known as HON Industries Inc.) (office furniture) (since 2000) and Director, Ryder System Inc. (transportation, logistics and supply-chain management) (since 2003). | |
|
33
Name, Position
with the Fund,
Address and Age | | Term of Office1 and
Length of Service | | Portfolios within the
DFA Fund Complex2
Overseen | | Principal Occupation(s) During Past 5 Years and
Other Directorships of Public Companies Held | |
| | | Interested Trustees/Directors* | |
|
David G. Booth
Chairman, Director, Chief Executive Officer and President of DFAIDG, DIG and DEM. Chairman, Trustee, Chief Executive Officer, Chief Investment Officer and President of DFAITC.
1299 Ocean Avenue
Santa Monica, CA 90401
Age: 61 | | DFAITC - since 1993
DFAIDG - since 1981
DIG - since 1992
DEM - since 1993 | | 96 portfolios in 4 investment companies | | Chairman, Director/Trustee, President, Chief Executive Officer and formerly Chief Investment Officer of the following companies: Dimensional Holdings Inc., Dimensional Fund Advisors LP, DFA Securities Inc., Dimensional Fund Advisors Canada Inc., DFAIDG, DIG, DEM and DFAITC. Director of Dimensional Fund Advisors Ltd, and formerly Chief Investment Officer. Director, President and formerly Chief Investment Officer of DFA Australia Ltd. Director of Dimensional Funds PLC and Dimensional Fund II PLC. Director, Chief Executive Officer and formerly Chief Investment Officer of Dimensional Fund Advisors Canada Inc. (All Chief Investment Officer positions held starting 1/03 through 3/07 except for Dimensional Fund Advisors Canada Inc., which was from 6/03 through 3/07, and Dimensional Holdings Inc., which was from 10/06 through 3/07.)
Limited Partner, Oak Hill Partners, Director, T he University of Chicago Booth School of Business. Formerly, Director, SA Funds (registered investment company). Formerly Director, Assante Corporation (investment management) (until 2002). | |
|
Rex A. Sinquefield
The Show Me Institute
7777 Bonhomme Ave.,
Suite 2150 St. Louis, MO 63105
Age: 64 | | DFAITC - since 1993
DFAIDG - since 1981
DIG - since 1992
DEM - since 1993 | | 96 portfolios in 4 investment companies | | Director/Trustee (and prior to 2006 Chairman, and prior to 2003, Chief Investment Officer) of Dimensional Fund Advisors LP, DFA Securities Inc., DFAIDG, DIG, DEM and DFAITC. Director of Dimensional Holdings Inc. Prior to 2006, Director of Dimensional Fund Advisors Ltd, Director (and prior to 1/1/2003, Chief Investment Officer) of DFA Australia Ltd. Director of Dimensional Funds PLC and Dimensional Fund Advisors Canada Inc.
Trustee, St. Louis University (since 2003). Life Trustee and Member of Investment Committee, DePaul University. Director, The German St. Vincent Orphan Home. Member of Investment Committee, Archdiocese of St. Louis. Trustee and Member of Investment Committee, St. Louis Art Institute (since 2005). President and Director, The Show Me Institute (since 2006). Trustee, St. Louis Symphony Orchestra (since 2005). Trustee, Missouri Botanical Garden (since 2005 ). | |
|
1 Each Trustee/Director holds office for an indefinite term until his or her successor is elected and qualified.
2 Each Trustee/Director is a director or trustee of each of the four registered investment companies within the DFA Fund Complex, which includes the Funds.
* Interested Directors are described as such because they are deemed to be "interested persons," as that term is defined under the Investment Company Act of 1940, as amended, due to their positions with Dimensional Fund Advisors LP.
34
Officers
The name, age, information regarding positions with the Funds and the principal occupation for each officer of the Funds are set forth below. Each officer listed below holds the same office (except as otherwise noted) in the following entities: Dimensional Fund Advisors LP (prior to November 3, 2006, Dimensional Fund Advisors Inc.) ("Dimensional"), DFA Securities Inc., DFAIDG, DIG, DFAITC and DEM (collectively, the "DFA Entities"). The address of each officer is: Dimensional Fund Advisors LP, 1299 Ocean Avenue, Santa Monica, California 90401, unless otherwise indicated.
Name, Position with the Fund
and Age | | Term of Office1
and Length of
Service | | Principal Occupation(s) During Past 5 Years | |
| | | Officers | |
|
April A. Aandal
Vice President
Age: 35 | | Since 2008 | | Vice President of all the DFA Entities. | |
|
Darryl D. Avery
Vice President
Age: 42 | | Since 2005 | | Vice President of all the DFA Entities. From June 2002 to January 2005, institutional client service representative of Dimensional. | |
|
Arthur H. Barlow
Vice President
Age: 52 | | Since 1993 | | Vice President of all the DFA Entities. Formerly, Vice President of DFA Australia Limited and Dimensional Fund Advisors Ltd. | |
|
Scott A. Bosworth
Vice President
Age: 39 | | Since 2007 | | Vice President of all the DFA Entities. Regional Director of Dimensional (since November 1997). | |
|
Valerie A. Brown
Vice President and Assistant Secretary
Age: 41 | | Since 2001 | | Vice President and Assistant Secretary of all the DFA Entities, DFA Australia Limited, Dimensional Fund Advisors Ltd., and since June 2003, Dimensional Fund Advisors Canada Inc. | |
|
David P. Butler
Vice President
Age: 44 | | Since 2007 | | Vice President of all the DFA Entities. Director of US Financial Services of Dimensional (since January 2005). Formerly, Regional Director of Dimensional Fund Advisors LP (January 1995 to January 2005). | |
|
Patrick Carter
Vice President
Age: 46 | | Since 2007 | | Vice President of all the DFA Entities. Regional Director of Dimensional (since March 2006). Formerly, Director of Merrill Lynch Retirement Group (December 1998 to March 2006). | |
|
Stephen A. Clark
Vice President
Age: 36 | | Since 2004 | | Vice President of all the DFA Entities, April 2001 to April 2004, Portfolio Manager of Dimensional. | |
|
Robert P. Cornell
Vice President
Age: 59 | | Since 2007 | | Vice President of all the DFA Entities. Regional Director of Financial Services Group of Dimensional (since August 1993). | |
|
Christopher S. Crossan
Vice President and Chief Compliance Officer
Age: 42 | | Since 2004 | | Vice President and Chief Compliance Officer of all the DFA Entities. Formerly, Senior Compliance Officer, INVESCO Institutional, Inc. and its affiliates (August 2000 to January 2004). | |
|
James L. Davis
Vice President
Age: 51 | | Since 1999 | | Vice President of all the DFA Entities. Formerly, Vice President of DFA Australia Limited and Dimensional Fund Advisors Ltd. | |
|
Robert T. Deere
Vice President
Age: 51 | | Since 1994 | | Vice President of all the DFA Entities and DFA Australia Limited. | |
|
Robert W. Dintzner
Vice President
Age: 38 | | Since 2001 | | Vice President of all the DFA Entities. Prior to April 2001, marketing supervisor and marketing coordinator for Dimensional. | |
|
35
Name, Position with the Fund
and Age | | Term of Office1
and Length of
Service | | Principal Occupation(s) During Past 5 Years | |
Kenneth Elmgren
Vice President
Age: 54 | | Since 2007 | | Vice President of all the DFA Entities. Formerly, Managing Principal of Beverly Capital (May 2004 to September 2006); Principal of Wydown Capital (September 2001 to May 2004). | |
|
Richard A. Eustice
Vice President and Assistant Secretary
Age: 43 | | Since 1998 | | Vice President and Assistant Secretary of all the DFA Entities and DFA Australia Limited. Formerly, Vice President of Dimensional Fund Advisors Ltd. | |
|
Eugene F. Fama, Jr.
Vice President
Age: 47 | | Since 1993 | | Vice President of all the DFA Entities. Formerly, Vice President of DFA Australia Limited and Dimensional Fund Advisors Ltd. | |
|
Gretchen A. Flicker
Vice President
Age: 37 | | Since 2004 | | Vice President of all the DFA Entities. Prior to April 2004, institutional client service representative of Dimensional. | |
|
Jed S. Fogdall
Vice President
Age: 34 | | Since 2008 | | Vice President of all the DFA Entities. Portfolio Manager for Dimensional (since September 2004). Prior to September 2004, Staff Engineer at the Boeing Company (1997-2004); Graduate Student at the University of California, Los Angeles (2002-2003). | |
|
Glenn S. Freed
Vice President
Age: 46 | | Since 2001 | | Vice President of all the DFA Entities. | |
|
Mark R. Gochnour
Vice President
Age: 41 | | Since 2007 | | Vice President of all the DFA Entities. Regional Director of Dimensional. | |
|
Henry F. Gray
Vice President
Age: 41 | | Since 2000 | | Vice President of all the DFA Entities. Prior to July 2000, Portfolio Manager of Dimensional. Formerly, Vice President of DFA Australia Limited. | |
|
John T. Gray
Vice President
Age: 34 | | Since 2007 | | Vice President of all the DFA Entities. Formerly, Regional Director of Dimensional (January 2005 to February 2007). | |
|
Darla Hastings
Vice President
Age: 53 | | Since 2007 | | Vice President of all the DFA Entities. Chief Marketing Officer of Dimensional. Formerly, Senior Vice President, Customer Experience for Benchmark Assisted Living (May 2005 to April 2006); Executive Vice President and Chief Marketing Officer of State Street Corporation (September 2001 to October 2005). | |
|
Joel H. Hefner
Vice President
Age: 40 | | Since 2007 | | Vice President of all the DFA Entities. Regional Director of Dimensional (since June 1998). | |
|
Julie Henderson
Vice President and Fund Controller
Age: 34 | | Since 2005 | | Vice President and Fund Controller of all the DFA Entities. Formerly, Senior Manager at PricewaterhouseCoopers LLP (July 1996 to April 2005). | |
|
Kevin Hight
Vice President
Age: 40 | | Since 2005 | | Vice President of all the DFA Entities. Formerly, Regional Director of Dimensional (since March 2003 to March 2005). | |
|
Christine W. Ho
Vice President
Age: 40 | | Since 2004 | | Vice President of all the DFA Entities. Prior to April 2004, Assistant Controller of Dimensional. | |
|
Jeff J. Jeon
Vice President
Age: 34 | | Since 2004 | | Vice President of all the DFA Entities. Prior to April 2004, Counsel of Dimensional. | |
|
Patrick M. Keating
Vice President
Age: 53 | | Since 2003 | | Vice President of all the DFA Entities and Chief Operating Officer of Dimensional. Director, Vice President and Chief Privacy Officer of Dimensional Fund Advisors Canada Inc. Director of DFA Australia Limited. | |
|
36
Name, Position with the Fund
and Age | | Term of Office1
and Length of
Service | | Principal Occupation(s) During Past 5 Years | |
Joseph F. Kolerich
Vice President
Age: 36 | | Since 2004 | | Vice President of all the DFA Entities. From April 2001 to April 2004, Portfolio Manager for Dimensional. | |
|
Michael F. Lane
Vice President
Age: 41 | | Since 2004 | | Vice President of all the DFA Entities. Formerly, Vice President of Advisor Services at TIAA-CREF (July 2001 to September 2004). | |
|
Kristina M. LaRusso
Vice President
Age: 33 | | Since 2006 | | Vice President of all DFA Entities. Formerly, Operations Supervisor of Dimensional (March 2003 to December 2006). | |
|
Inmoo Lee
Vice President
Age: 42 | | Since 2007 | | Vice President of all the DFA Entities. Associate Professor Department of Finance and Accounting, Business School, National University of Singapore (July 2004 to present); Associate Professor, College of Business Administration, Korea University (September 2001 to May 2006). | |
|
Juliet Lee
Vice President
Age: 37 | | Since 2005 | | Vice President of all the DFA Entities. Human Resources Manager of Dimensional (since January 2004). Formerly, Assistant Vice President for Metropolitan West Asset Management LLC (February 2001 to December 2003). | |
|
Aaron M. Marcus
Vice President & Head of Global Human Resources
Age: 38 | | Since 2008 | | Vice President and Head of Global Human Resources of Dimensional. Formerly, Global Head of Recruiting and Vice President of Goldman Sachs & Co. (June 2006 to January 2008); Global Co-Head of HR of the Equities & FICC Division, and Vice President of Goldman Sachs & Co. (May 2005 to May 2006); Head of Americas Campus Recruiting and Vice President of Goldman Sachs & Co. (April 2003 to May 2005). | |
|
David R. Martin
Vice President, Chief Financial Officer and Treasurer
Age: 51 | | Since 2007 | | Vice President, Chief Financial Officer and Treasurer of all the DFA Entities. Director, Vice President, Chief Financial Officer and Treasurer of Dimensional Fund Advisors Ltd. and DFA Australia Limited. Chief Financial Officer, Treasurer, and Vice President of Dimensional Fund Advisors Canada Inc. Director of Dimensional Funds PLC and Dimensional Funds II PLC. Formerly, Executive Vice President and Chief Financial Officer of Janus Capital Group Inc. (June 2005 to March 2007); Senior Vice President of Finance at Charles Schwab & Co., Inc. (March 1999 to May 2005). | |
|
Catherine L. Newell
Vice President and Secretary
Age: 44 | | Vice President since 1997 and Secretary since 2000 | | Vice President and Secretary of all the DFA Entities. Director, Vice President and Assistant Secretary of DFA Australia Limited (since February 2002, April 1997 and May 2002, respectively). Vice President and Secretary of Dimensional Fund Advisors Canada Inc. (since June 2003). Director, Dimensional Funds PLC and Dimensional Funds II PLC (since January 2002). Formerly, Assistant Secretary of all DFA Entities and Dimensional Fund Advisors Ltd. | |
|
Gerard K. O'Reilly
Vice President
Age: 31 | | Since 2007 | | Vice President of all the DFA Entities. Formerly, Research Associate of Dimensional Fund Advisors LP (2004 to 2006); Research Assistant in PhD program, Aeronautics Department California Institute of Technology (1998 to 2004). | |
|
Carmen Palafox
Vice President
Age: 34 | | Since 2006 | | Vice President of all the DFA Entities. Operations Manager of Dimensional Fund Advisors LP (since May 1996). | |
|
Sonya Park
Vice President
Age: 36 | | Since 2005 | | Vice President of all the DFA Entities. From February 2002 to January 2005, institutional client service representative of Dimensional. | |
|
David A. Plecha
Vice President
Age: 47 | | Since 1993 | | Vice President of all the DFA Entities, DFA Australia Limited and Dimensional Fund Advisors Ltd.. | |
|
Ted Randall
Vice President
Age: 35 | | Since 2008 | | Vice President of all the DFA Entities. Formerly, Research Associate of Dimensional (2006-2008). Systems Developer of Dimensional (2001-2006). | |
|
37
Name, Position with the Fund
and Age | | Term of Office1
and Length of
Service | | Principal Occupation(s) During Past 5 Years | |
Eduardo A. Repetto
Vice President and Chief Investment Officer
Age: 41 | | Since 2002 | | Chief Investment Officer (beginning March 2007) and Vice President of all the DFA Entities, DFA Australia Limited and Dimensional Fund Advisors Canada Inc. Formerly, Research Associate for Dimensional (June 2000 to April 2002). | |
|
L. Jacobo Rodriguez
Vice President
Age: 37 | | Since 2005 | | Vice President of all the DFA Entities. From August 2004 to July 2005, institutional client service representative of Dimensional. Formerly, Financial Services Analyst, Cato Institute (September 2001 to June 2004); Book Review Editor, Cato Journal, Cato Institute (May 1996 to June 2004). | |
|
David E. Schneider
Vice President
Age: 62 | | Since 2001 | | Vice President of all the DFA Entities. Currently, Director of Institutional Services. | |
|
Ted R. Simpson
Vice President
Age: 40 | | Since 2007 | | Vice President of all the DFA Entities. Regional Director of Dimensional (since December 2002). | |
|
Bryce D. Skaff
Vice President
Age: 33 | | Since 2007 | | Vice President of all the DFA Entities. Formerly, Regional Director of Dimensional (December 1999 to January 2007). | |
|
Grady M. Smith
Vice President
Age: 51 | | Since 2004 | | Vice President of all the DFA Entities. Prior to April 2004, Portfolio Manager of Dimensional. | |
|
Carl G. Snyder
Vice President
Age: 45 | | Since 2000 | | Vice President of all the DFA Entities. Formerly, Vice President of DFA Australia Limited. | |
|
Lawrence R. Spieth
Vice President
Age: 60 | | Since 2004 | | Vice President of all the DFA Entities. Prior to April 2004, Regional Director of Dimensional. | |
|
Bradley G. Steiman
Vice President
Age: 35 | | Since 2004 | | Vice President of all the DFA Entities and Director and Vice President of Dimensional Fund Advisors Canada Inc. | |
|
Karen E. Umland
Vice President
Age: 42 | | Since 1997 | | Vice President of all the DFA Entities, DFA Australia Limited, Dimensional Fund Advisors Ltd., and since June 2003, Dimensional Fund Advisors Canada Inc. | |
|
Carol W. Wardlaw
Vice President
Age: 49 | | Since 2004 | | Vice President of all the DFA Entities. Prior to April 2004, Regional Director of Dimensional. | |
|
Weston J. Wellington
Vice President
Age: 57 | | Since 1997 | | Vice President of all the DFA Entities. Formerly, Vice President of DFA Australia Limited. | |
|
Daniel M. Wheeler
Vice President
Age: 63 | | Since 2001 | | Vice President of all the DFA Entities. Prior to 2001 and currently, Director of Financial Advisors Services of Dimensional. Director of Dimensional Fund Advisors Ltd. (since October 2003) and President of Dimensional Fund Advisors Canada Inc. (since June 2003). | |
|
Ryan Wiley
Vice President
Age: 32 | | Since 2007 | | Vice President of all the DFA Entities. Senior Trader of Dimensional. Formerly, Portfolio Manager (2006 to 2007); Trader (2001 to 2006). | |
|
Paul E. Wise
Vice President
Age: 53 | | Since 2005 | | Vice President of all the DFA Entities. Chief Technology Officer for Dimensional (since 2004). Formerly, Principal of Turnbuckle Management Group (January 2002 to August 2004). | |
|
1 Each officer holds office for an indefinite term at the pleasure of the Boards of Trustee/Directors and until his or her successor is elected and qualified.
38
VOTING PROXIES ON FUND PORTFOLIO SECURITIES
A description of the policies and procedures that the Master Funds use in voting proxies relating to securities held in the portfolios is available without charge, upon request, by calling collect: (310) 395-8005. Information regarding how the Advisor votes these proxies is available from the EDGAR database on the SEC's website at http://www.sec.gov and from the Advisor's website at http://www.dimensional.com and reflects the twelve-month period beginning July 1st and ending June 30th.
39
NOTICE TO SHAREHOLDERS
(Unaudited)
For shareholders that do not have an October 31, 2008 tax year end, this notice is for informational purposes only. For shareholders with an October 31, 2008 tax year end, please consult your tax advisor as to the pertinence of this notice. For the period December 1, 2007 to October 31, 2008, each Global Fund is designating the following items with regard to distributions paid during the period.
| Dimensional Investment Group Inc. | | Net
Investment
Income
Distributions | | Short-Term
Capital Gain
Distributions | | Long-Term
Capital Gain
Distributions | | Total
Distributions | | Qualifying
For Corporate
Dividends
Received
Deduction(1) | | Qualifying
Dividend
Income(2) | | U.S.
Government
Interest(3) | | Foreign
Tax
Credit(4) | | Qualifying
Interest
Income(5) | | Qualifying
Short-Term
Capital Gain(6) | |
| Global Equity Portfolio | |
| Class R2 Shares | | | 52 | % | | | 1 | % | | | 47 | % | | | 100 | % | | | — | | | | 11 | % | | | — | | | | 1 | % | | | 1 | % | | | 1 | % | |
| Institutional Class Shares | | | 52 | % | | | 1 | % | | | 47 | % | | | 100 | % | | | — | | | | 11 | % | | | — | | | | 1 | % | | | 1 | % | | | 1 | % | |
| Global 60/40 Portfolio | |
| Class R2 Shares | | | 69 | % | | | 1 | % | | | 30 | % | | | 100 | % | | | 23 | % | | | 40 | % | | | — | | | | 1 | % | | | 2 | % | | | 2 | % | |
| Institutional Class Shares | | | 69 | % | | | 1 | % | | | 30 | % | | | 100 | % | | | 23 | % | | | 40 | % | | | — | | | | 1 | % | | | 2 | % | | | 2 | % | |
| Global 25/75 Portfolio | |
| Class R2 Shares | | | 82 | % | | | 1 | % | | | 17 | % | | | 100 | % | | | — | | | | 12 | % | | | — | | | | — | | | | 2 | % | | | 1 | % | |
| Institutional Class Shares | | | 82 | % | | | 1 | % | | | 17 | % | | | 100 | % | | | — | | | | 12 | % | | | — | | | | — | | | | 2 | % | | | 1 | % | |
(1) Qualifying dividends represent dividends which qualify for the corporate dividends received deduction and is reflected as a percentage of ordinary income distributions (the total of net investment income and short-term capital gain distributions).
(2) The percentage in this column represents the amount of "Qualifying Dividend Income" as created by the Jobs and Growth Tax Relief Reconciliation Act of 2003 and is reflected as a percentage of ordinary income distributions (the total of net investment income and short-term capital gain distributions). It is the intention of each of the aforementioned funds to designate the maximum amount permitted by law.
(3) "U.S. Government Interest" represents the amount of interest that was derived from direct U.S. Government obligations and distributed during the fiscal year. This amount is reflected as a percentage of total ordinary income distributions (the total of net investment income and short-term capital gain distributions). Generally, interest from direct U.S. Government obligations is exempt from state income tax. However, for residents of California, Connecticut and New York, the statutory threshold requirements were not satisfied to permit exemption of these amounts from state income.
(4) Foreign Tax Credit represent dividends which qualify for the foreign tax credit pass through and is reflected as a percentage of investment company taxable income (the total of net investment income and short-term capital gain distributions).
(5) The percentage in this column represents the amount of "Qualifying Interest Income" as created by The American Jobs Creation Act of 2004. The information is reflected as a percentage of ordinary income distributions (the total of net investment income and short-term capital gain distributions).
(6) The percentage in this column represents the amount of "Qualifying Short-Term Capital Gain" as created by The American Jobs Creation Act of 2004.The information is reflected as a percentage of ordinary income distributions (the total of net investment income and short-term capital gain distributions).
40

DFA103108-012A
DIMENSIONAL INVESTMENT GROUP INC.
U.S. Large Cap Value Portfolio II
Annual Report
Period Ended October 31, 2008
Dimensional Fund Advisors
6300 Bee Cave Road, Building One
Austin, TX 78746
December 2008
Dear Fellow Shareholder,
This has been a challenging year for investors. After drifting lower throughout the spring and summer, stock markets around the world plummeted in mid September on news that the ongoing credit crisis was driving some leading financial services companies toward failure. As the effects of this distress rippled through the financial world, investors became increasingly anxious and stock prices continued to decline sharply. In the month of October, the S&P 500 Index fell 16.8% or 196 points—its worst-ever monthly point decline.
Markets like this test investors' resolve. It is difficult to stick with a long-term investment plan when one sees the dramatic effects of high market volatility on a portfolio's value. Very few people are having a positive investment experience right now. But investors who have based their approach on a sensible risk/return framework tend to be in better shape than those who have not.
The recent market turbulence illustrates the reason why Dimensional believes that markets are efficient. History has shown time and again that prices cannot be predicted in public equity markets. This "random walk" makes diversification very important. Although the broad diversification in our portfolios didn't prevent negative performance this year, we believe it helped our shareholders avoid the extreme losses experienced by investors who concentrated their holdings in individual companies, industry sectors, or markets.
The unpredictability of stock prices also makes it important for investors to take a hard look at their own portfolios and determine how much risk and what types of risk they should take. Investors who hold asset mixes that accurately reflect their tolerance for risk are better able to withstand down markets.
Nobody knows when the capital markets will recover, but over time we can expect them to again offer a premium to investors who are willing to invest in relatively risky assets such as stocks. My view is that investors who have already paid for risk should stay invested and earn the return that can be expected when markets turn around. If markets continue to be so volatile, it's also important to understand that pulling money out of stocks, even for short periods of time, can result in significant missed opportunities.
All of us at Dimensional take our job as the steward of your assets very seriously and hope to have the opportunity to serve you for many years to come.
Sincerely,
David G. Booth
Chairman and Chief Executive Officer
[THIS PAGE INTENTIONALLY LEFT BLANK]
ANNUAL REPORT
Table of Contents
| Letter to Shareholders | | Page | |
| Definitions of Abbreviations and Footnotes | | | 1 | | |
|
| Dimensional Investment Group Inc. — U.S. Large Cap Value Portfolio II | |
|
| Performance Chart | | | 2 | | |
|
| Management's Discussion and Analysis | | | 3 | | |
|
| Disclosure of Fund Expenses | | | 5 | | |
|
| Disclosure of Portfolio Holdings | | | 6 | | |
|
| Statement of Assets and Liabilities | | | 7 | | |
|
| Statements of Operations | | | 8 | | |
|
| Statements of Changes in Net Assets | | | 9 | | |
|
| Financial Highlights | | | 10 | | |
|
| Notes to Financial Statements | | | 11 | | |
|
| Report of Independent Registered Public Accounting Firm | | | 15 | | |
|
| The DFA Investment Trust Company — The U.S. Large Cap Value Series | |
|
| Performance Chart | | | 16 | | |
|
| Disclosure of Fund Expenses | | | 17 | | |
|
| Disclosure of Portfolio Holdings | | | 18 | | |
|
| Summary Schedule of Portfolio Holdings | | | 19 | | |
|
| Statement of Assets and Liabilities | | | 22 | | |
|
| Statements of Operations | | | 23 | | |
|
| Statements of Changes in Net Assets | | | 24 | | |
|
| Financial Highlights | | | 25 | | |
|
| Notes to Financial Statements | | | 26 | | |
|
| Report of Independent Registered Public Accounting Firm | | | 32 | | |
|
| Fund Management | | | 33 | | |
|
| Voting Proxies on Fund Portfolio Securities | | | 40 | | |
|
| Notice to Shareholders | | | 41 | | |
|
This report is submitted for the information of the Fund's shareholders. It is not authorized for distribution to prospective investors unless preceded or accompanied by an effective prospectus.
i
[THIS PAGE INTENTIONALLY LEFT BLANK]
DIMENSIONAL INVESTMENT GROUP INC.
THE DFA INVESTMENT TRUST COMPANY
DEFINITIONS OF ABBREVIATIONS AND FOOTNOTES
Statement of Assets and Liabilities/Summary Schedule of Portfolio Holdings
Investment Abbreviations
FNMA Federal National Mortgage Association
STRIP Separate Trading of Registered Interest and Principal Securities
Investment Footnotes
† See Note B to Financial Statements.
** Calculated as a percentage of total net assets. Percentages shown parenthetically next to the category headings have been calculated as a percentage of total investments. "Other Securities" are those securities that are not among the top 50 holdings of the Fund or do not represent more than 1.0% of the net assets of the Fund. Some of the individual securities within this category may include Total or Partial Securities on Loan and/or Non-Income Producing Securities.
* Non-Income Producing Securities.
# Total or Partial Securities on Loan.
@ Security purchased with cash proceeds from Securities on Loan.
(y) The rate shown is the effective yield.
§ Affiliated Fund.
Financial Highlights
(A) Computed using average shares outstanding.
(B) Annualized
(C) Non-Annualized
(D) Represents the combined ratios for the respective portfolio and its respective pro-rata share of its Master Fund Series.
All Statements and Schedules
— Amounts designated as — are either zero or rounded to zero.
SEC Securities and Exchange Commission
1
DIMENSIONAL INVESTMENT GROUP INC.
PERFORMANCE CHART
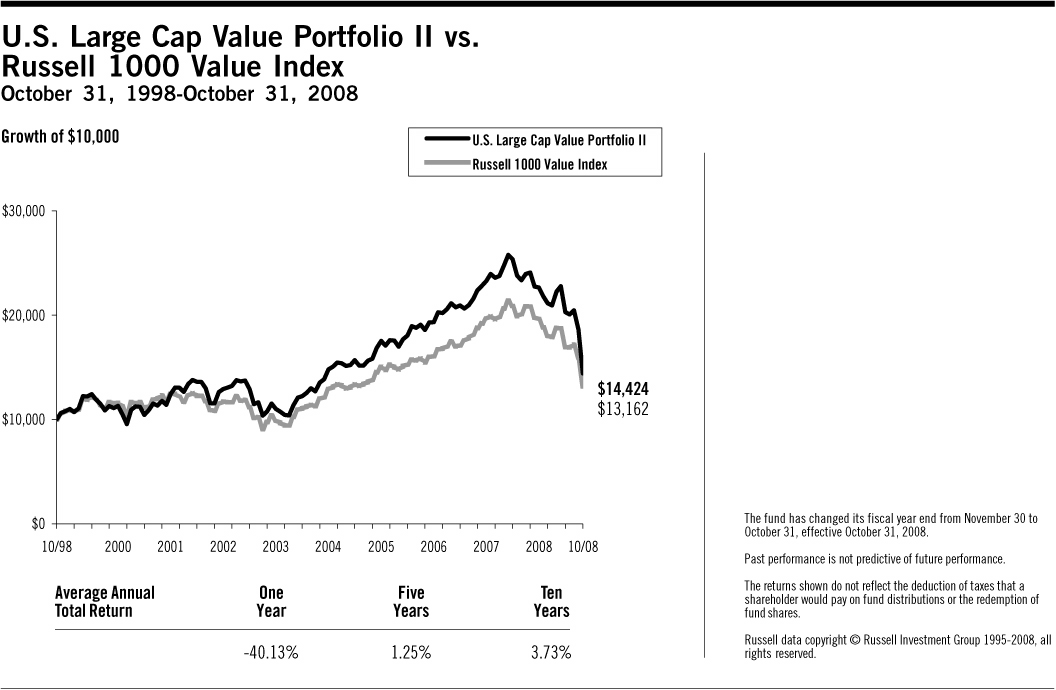
2
DIMENSIONAL INVESTMENT GROUP INC.
MANAGEMENT'S DISCUSSION AND ANALYSIS
On September 16, 2008, at a regular meeting of the Board of Directors/Trustees (the "Board") of the funds covered by this report, the Board voted to change the fiscal and tax year ends of the funds from November 30 to October 31. Therefore, the following discussion generally covers the 11-month period ended October 31, 2008.
U.S. Equity Market Review 11 Months Ended October 31, 2008
U.S. equity markets experienced high levels of volatility during the 11-month fiscal year ended October 31, 2008. The behavior of equity markets has been driven in large part by the contraction of lending in credit markets. In addition to heightened volatility, the cross-sectional dispersion of stock returns in equity markets has increased relative to previous levels, and returns even within each asset class have differed greatly. Dimensional Fund Advisors believes that a security's risk characteristics determine its expected return. Among the most important factors explaining differences in the behavior of diversified equity portfolios are company size and company value/growth characteristics of the portfolio holdings. Size is measured by market capitalization, and "value" classification is a function of stock price relative to one or more fundamental characteristics. Compared to other stocks, value stocks often have lower market value rela tive to their earnings, dividends, and book value.
For the 11 months ended October 31, 2008, small company stocks slightly outperformed large companies, and mid cap companies underperformed both small and large cap companies. The performance of the Russell Microcap Index® was –33.59%, the Russell 2000 Index® was –29.07%, CRSP 6-10 Index was –32.90%, and MSCI USA Small Cap 1750 Index was –32.21%. Large cap value stocks, as measured by the Russell 1000 Value Index®, slightly outperformed large cap growth stocks, as measured by the Russell 1000 Growth Index®. The value premium was larger among small cap stocks.
Total Return for 11 Months Ended October 31, 2008
| Russell 2000 Index® (small cap companies) | | | –29.07 | % | |
| Russell Midcap Index® (mid cap companies) | | | –37.70 | % | |
| Russell 1000 Index® (large cap companies) | | | –33.99 | % | |
| Russell 3000 Value Index® | | | –32.90 | % | |
| Russell 3000 Growth Index® | | | –34.45 | % | |
When the large, mid, and small cap market segments are further divided by value and growth characteristics, the distinction in performance within sectors was equally significant.
Total Return for 11 Months Ended October 31, 2008
| Russell 1000 Value Index® (large cap value companies) | | | –33.55 | % | |
| Russell 1000 Growth Index® (large cap growth companies) | | | –34.54 | % | |
| Russell Midcap Value Index® (mid cap value companies) | | | –35.42 | % | |
| Russell Midcap Growth Index® (mid cap growth companies) | | | –40.01 | % | |
| Russell 2500 Value Index® (small/mid cap value companies) | | | –29.10 | % | |
| Russell 2500 Growth Index® (small/mid cap growth companies) | | | –37.30 | % | |
| Russell 2000 Value Index® (small cap value companies) | | | –24.91 | % | |
| Russell 2000 Growth Index® (small cap growth companies) | | | –33.26 | % | |
Source: Russell data copyright © Russell Investment Group 1995-2008, all rights reserved.
Differences in returns for the various Dimensional U.S. equity funds over the 11 months ended October 31, 2008 were attributable primarily to differences in value/growth and size characteristics as well as the exclusion of REIT securities from most Dimensional portfolios, except for the DFA Real Estate Securities Portfolio and portfolios investing in the U.S. Large Company Series. Moreover, the portfolio construction approach used by Dimensional Fund Advisors generally resulted in portfolios with greater emphasis on value or small company characteristics relative to widely used index benchmarks.
3
Master-Feeder Structure
The portfolio described below, called a "Feeder Fund," does not buy individual securities directly; instead, the portfolio invests in a corresponding fund called a "Master Fund." The Master Fund, in turn, purchases stocks, bonds, and/or other securities.
U.S. Large Cap Value Portfolio II
The U.S. Large Cap Value Portfolio II seeks to capture the returns of U.S. large company value stocks by purchasing shares of a Master Fund that invests in such stocks. The investment strategy employs a disciplined, quantitative approach, emphasizing broad diversification and consistent exposure to large cap value stocks, but does not attempt to track closely a specific equity index. The Master Fund held approximately 200 stocks as of October 31, 2008, and was mostly invested in equities throughout the year: average cash levels for the 11 months ended October 31, 2008 were in general less than 1% of the Master Fund's assets.
As a result of the Master Fund's diversified investment approach, performance was determined principally by broad structural trends in the U.S. equity market, rather than by the behavior of a limited number of stocks. For the 11 months ended October 31, 2008, large cap value stocks generally outperformed large cap growth stocks. Total returns were –33.31% for the S&P 500 Index®, –33.55% for the Russell 1000 Value Index®, and –36.60% for the Portfolio. Relative to the Russell 1000 Value Index®, underperformance of the Portfolio was primarily due to the Master Fund's lower-exposure to stocks with neutral value/growth characteristics as measured by book-to-market ("BtM") ratio, and weighting and composition differences of consumer discretionary and consumer staples stocks due to structural differences in the eligible universe of the Master Fund as compared to the Index. Less value- oriented stocks in the middle BtM quartiles, which represented approximately 11% of the Master Fund compared to approximately 47% of the Index, outperformed value stocks in the highest BtM quartile by more than 15 percentage points. Stocks held by the Master Fund in the consumer discretionary sector, which represented approximately 16% of the Master Fund compared to approximately 8% of the Index, underperformed the Index by about 13 percentage points. Stocks held by the Master Fund in the consumer staples sector, which represented approximately 5% of the Master Fund compared to 9% of the Index, underperformed similar stocks held by the Index by approximately 20 percentage points.
4
DIMENSIONAL INVESTMENT GROUP INC.
U.S. LARGE CAP VALUE PORTFOLIO II
DISCLOSURE OF FUND EXPENSES
(Unaudited)
The following Expense Table is shown so that you can understand the impact of fees on your investment. All mutual funds have operating expenses. As a shareholder of the fund, you incur ongoing costs, which include costs for portfolio management, administrative services, and shareholder reports, among others. Operating expenses, legal and audit services, which are deducted from a fund's gross income, directly reduce the investment return of the fund. A fund's expenses are expressed as a percentage of its average net assets. This figure is known as the expense ratio. The following examples are intended to help you understand the ongoing costs, in dollars, of investing in the fund and to compare these costs with those of other mutual funds. The examples are based on an investment of $1,000 made at the beginning of the period shown and held for the entire period.
The Expense Table below illustrates your fund's costs in two ways.
Actual Fund Return
This section helps you to estimate the actual expenses after fee waivers that you paid over the period. The "Ending Account Value" shown is derived from the fund's actual return and "Expenses Paid During Period" reflect the dollar amount that would have been paid by an investor who started with $1,000 in the fund. You may use the information here, together with the amount you invested, to estimate the expenses that you paid over the period.
To do so, simply divide your account value by $1,000 (for example, a $7,500 account value divided by $1,000 = 7.5), then multiply the result by the number given for your fund under the heading "Expenses Paid During Period."
Hypothetical Example for Comparison Purposes
This section is intended to help you compare your fund's costs with those of other mutual funds. The hypothetical "Ending Account Value" and "Expenses Paid During Period" are derived from the fund's actual expense ratio and an assumed 5% annual return before expenses. In this case, because the return used is not the fund's actual return, the results do not apply to your investment. The example is useful in making comparisons because the SEC requires all mutual funds to calculate expenses based on a 5% annual return. You can assess your fund's cost by comparing this hypothetical example with the hypothetical examples that appear in shareholder reports of other funds.
Please note that the expenses shown in the table are meant to highlight and help you compare ongoing costs only and do not reflect any transactional costs, if applicable. The "Annualized Expense Ratio" represents the actual expenses for the six-month period indicated.
Six Months Ended October 31, 2008
EXPENSE TABLE
| | | Beginning
Account
Value
05/01/08 | | Ending
Account
Value
10/31/08 | | Annualized
Expense
Ratio* | | Expenses
Paid
During
Period* | |
| Actual Fund Return | | $ | 1,000.00 | | | $ | 648.10 | | | | 0.17 | % | | $ | 0.70 | | |
| Hypothetical 5% Annual Return | | $ | 1,000.00 | | | $ | 1,024.28 | | | | 0.17 | % | | $ | 0.87 | | |
* Expenses are equal to the fund's annualized expense ratio for the six-month period, multiplied by the average account value over the period, multiplied by the number of days in the most recent six-month period (184), then divided by the number of days in the year (366) to reflect the six-month period. The Portfolio is a Feeder Fund. The expenses shown reflect the direct expenses of the Feeder Fund and the indirect payment of the Feeder Fund's portion of the expenses of its Master Fund.
5
DIMENSIONAL INVESTMENT GROUP INC.
U.S. LARGE CAP VALUE PORTFOLIO II
DISCLOSURE OF PORTFOLIO HOLDINGS
(Unaudited)
The SEC requires that all Funds file a complete Schedule of Investments with the SEC for their first and third fiscal quarters on Form N-Q. For Dimensional Investment Group Inc., this would be for the fiscal quarters ending January 31 and July 31. The Form N-Q filing must be made within 60 days of the end of the quarter. Dimensional Investment Group Inc. filed its most recent Form N-Q with the SEC on October 30, 2008. It is available upon request, without charge, by calling collect: (310) 395-8005 or by mailing a request to Dimensional Fund Advisors LP, 1299 Ocean Avenue, Santa Monica, California 90401, or by visiting the SEC's website at http://www.sec.gov, or they may be reviewed and copied at the SEC's Public Reference Room in Washington, D.C. (call 1-800-732-0330 for information on the operation of the Public Reference Room).
PORTFOLIO HOLDINGS
The SEC requires that all Funds present their categories of portfolio holdings in a table, chart or graph format in their annual and semi-annual shareholder reports, whether or not a Schedule of Investments is utilized. The following table, which presents portfolio holdings as a percent of total investments before short-term investments and collateral for loaned securities, is provided in compliance with such requirement.
The categories of industry classification for the Affiliated Investment Company are represented in the Disclosure of Portfolio Holdings, which are included elsewhere within the report. Refer to the Summary Schedule of Portfolio Holdings for the underlying Master Fund's holdings which reflect the investments by category.
| Affiliated Investment Company | | | 100.0 | % | |
6
DIMENSIONAL INVESTMENT GROUP INC.
U.S. LARGE CAP VALUE PORTFOLIO II
STATEMENT OF ASSETS AND LIABILITIES
OCTOBER 31, 2008
(Amounts in thousands, except share and per share amounts)
| ASSETS: | |
Investment in The U.S. Large Cap Value Series of The DFA Investment Trust Company
(Affiliated Investment Company) (6,990,534 Shares) at Value† | | $ | 94,792 | | |
| Receivable for Affiliated Investment Company Shares Sold | | | 103 | | |
| Prepaid Expenses and Other Assets | | | 9 | | |
| Total Assets | | | 94,904 | | |
| LIABILITIES: | |
| Payables: | |
| Fund Shares Redeemed | | | 103 | | |
| Due to Advisor | | | 1 | | |
| Accrued Expenses and Other Liabilities | | | 31 | | |
| Total Liabilities | | | 135 | | |
| NET ASSETS | | $ | 94,769 | | |
| SHARES OUTSTANDING, $0.01 PAR VALUE (1) | | | 7,028,450 | | |
| NET ASSET VALUE, OFFERING AND REDEMPTION PRICE PER SHARE | | $ | 13.48 | | |
| Investment in Affiliated Investment Company at Cost | | $ | 136,499 | | |
| NET ASSETS CONSIST OF: | |
| Paid-In Capital | | $ | 96,136 | | |
| Undistributed Net Investment Income (Distributions in Excess of Net Investment Income) | | | 535 | | |
| Accumulated Net Realized Gain (Loss) | | | 39,805 | | |
| Net Unrealized Appreciation (Depreciation) | | | (41,707 | ) | |
| NET ASSETS | | $ | 94,769 | | |
| (1) NUMBER OF SHARES AUTHORIZED | | | 200,000,000 | | |
See accompanying Notes to Financial Statements.
7
DIMENSIONAL INVESTMENT GROUP INC.
U.S. LARGE CAP VALUE PORTFOLIO II
STATEMENTS OF OPERATIONS
(Amounts in thousands)
| | | Period
Dec. 1, 2007
to
Oct. 31, 2008 | | Year
Ended
Nov. 30, 2007 | |
| Investment Income | |
| Income Distributions Received from Affiliated Investment Company | | $ | 3,011 | | | $ | 7,459 | | |
| Expenses | |
| Administrative Services Fees | | | 20 | | | | 54 | | |
| Accounting & Transfer Agent Fees | | | 14 | | | | 19 | | |
| Filing Fees | | | 17 | | | | 20 | | |
| Shareholders' Reports | | | 39 | | | | 45 | | |
| Directors'/Trustees' Fees & Expenses | | | (6 | ) | | | 5 | | |
| Professional Fees | | | 8 | | | | 14 | | |
| Other | | | 4 | | | | 1 | | |
| Total Expenses | | | 96 | | | | 158 | | |
| Net Investment Income (Loss) | | | 2,915 | | | | 7,301 | | |
| Realized and Unrealized Gain (Loss) | |
| Capital Gain Distributions Received from Affiliated Investment Company | | | — | | | | 26,666 | | |
| Net Realized Gain (Loss) on Affiliated Investment Company Shares Sold | | | 48,423 | | | | (2,391 | ) | |
Change in Unrealized Appreciation (Depreciation) of
Affiliated Investment Company Shares | | | (130,048 | ) | | | (33,987 | ) | |
| Net Realized and Unrealized Gain (Loss) | | | (81,625 | ) | | | (9,712 | ) | |
| Net Increase (Decrease) in Net Assets Resulting from Operations | | $ | (78,710 | ) | | $ | (2,411 | ) | |
See accompanying Notes to Financial Statements.
8
DIMENSIONAL INVESTMENT GROUP INC.
U.S. LARGE CAP VALUE PORTFOLIO II
STATEMENTS OF CHANGES IN NET ASSETS
(Amounts in thousands)
| | | Period
Dec. 1, 2007
to
Oct. 31,
2008 | | Year
Ended
Nov. 30,
2007 | | Year
Ended
Nov. 30,
2006 | |
| Increase (Decrease) in Net Assets | |
| Operations: | |
| Net Investment Income (Loss) | | $ | 2,915 | | | $ | 7,301 | | | $ | 7,179 | | |
Capital Gain Distributions Received from Affiliated
Investment Company | | | — | | | | 26,666 | | | | 12,133 | | |
| Net Realized Gain (Loss) on: | |
| Affiliated Investment Company Shares Sold | | | 48,423 | | | | (2,391 | ) | | | (472 | ) | |
Change in Unrealized Appreciation (Depreciation) of Affiliated
Investment Company Shares | | | (130,048 | ) | | | (33,987 | ) | | | 50,597 | | |
Net Increase (Decrease) in Net Assets Resulting
from Operations | | | (78,710 | ) | | | (2,411 | ) | | | 69,437 | | |
| Distributions From: | |
| Net Investment Income | | | (4,450 | ) | | | (7,401 | ) | | | (6,402 | ) | |
| Net Short-Term Gains | | | — | | | | (784 | ) | | | (858 | ) | |
| Net Long-Term Gains | | | (24,080 | ) | | | (10,356 | ) | | | — | | |
| Total Distributions | | | (28,530 | ) | | | (18,541 | ) | | | (7,260 | ) | |
| Capital Share Transactions (1): | |
| Shares Issued | | | 11,812 | | | | 74,150 | | | | 114,342 | | |
| Shares Issued in Lieu of Cash Distributions | | | 28,530 | | | | 18,541 | | | | 7,260 | | |
| Shares Redeemed | | | (308,347 | ) | | | (94,641 | ) | | | (36,034 | ) | |
| Net Increase (Decrease) from Capital Share Transactions | | | (268,005 | ) | | | (1,950 | ) | | | 85,568 | | |
| Total Increase (Decrease) in Net Assets | | | (375,245 | ) | | | (22,902 | ) | | | 147,745 | | |
| Net Assets | |
| Beginning of Period | | | 470,014 | | | | 492,916 | | | | 345,171 | | |
| End of Period | | $ | 94,769 | | | $ | 470,014 | | | $ | 492,916 | | |
| (1) Shares Issued and Redeemed: | |
| Shares Issued | | | 628 | | | | 3,044 | | | | 5,235 | | |
| Shares Issued in Lieu of Cash Distributions | | | 1,358 | | | | 782 | | | | 346 | | |
| Shares Redeemed | | | (15,513 | ) | | | (3,984 | ) | | | (1,677 | ) | |
| | | | (13,527 | ) | | | (158 | ) | | | 3,904 | | |
Undistributed Net Income (Distributions in Excess of Net
Investment Income) | | $ | 535 | | | $ | 2,018 | | | $ | 2,118 | | |
See accompanying Notes to Financial Statements.
9
DIMENSIONAL INVESTMENT GROUP INC.
U.S. LARGE CAP VALUE PORTFOLIO II
FINANCIAL HIGHLIGHTS
(for a share outstanding throughout each period)
| | | Period
Dec. 1
2007 to
Oct. 31,
2008 | | Year
Ended
Nov. 30,
2007 | | Year
Ended
Nov. 30,
2006 | | Year
Ended
Nov. 30,
2005 | | Year
Ended
Nov. 30,
2004 | | Year
Ended
Nov. 30,
2003 | |
Net Asset Value, Beginning of
Period | | $ | 22.87 | | | $ | 23.80 | | | $ | 20.53 | | | $ | 18.13 | | | $ | 15.19 | | | $ | 12.82 | | |
| Income from Investment Operations | |
| Net Investment Income (Loss) | | | 0.27 | (A) | | | 0.33 | (A) | | | 0.38 | (A) | | | 0.30 | | | | 0.16 | | | | 0.18 | | |
Net Gains (Losses) (Realized
and Unrealized) | | | (8.10 | ) | | | (0.39 | ) | | | 3.29 | | | | 2.32 | | | | 3.09 | | | | 2.38 | | |
| Total from Investment Operations | | | (7.83 | ) | | | (0.06 | ) | | | 3.67 | | | | 2.62 | | | | 3.25 | | | | 2.56 | | |
| Less Distributions | |
| Net Investment Income | | | (0.37 | ) | | | (0.34 | ) | | | (0.35 | ) | | | (0.22 | ) | | | (0.31 | ) | | | (0.19 | ) | |
| Net Realized Gains | | | (1.19 | ) | | | (0.53 | ) | | | (0.05 | ) | | | — | | | | — | | | | — | | |
| Total Distributions | | | (1.56 | ) | | | (0.87 | ) | | | (0.40 | ) | | | (0.22 | ) | | | (0.31 | ) | | | (0.19 | ) | |
| Net Asset Value, End of Period | | $ | 13.48 | | | $ | 22.87 | | | $ | 23.80 | | | $ | 20.53 | | | $ | 18.13 | | | $ | 15.19 | | |
| Total Return | | | (36.60 | )%(C) | | | (0.34 | )% | | | 18.16 | % | | | 14.57 | % | | | 21.66 | % | | | 20.26 | % | |
Net Assets, End of Period
(thousands) | | $ | 94,769 | | | $ | 470,014 | | | $ | 492,916 | | | $ | 345,171 | | | $ | 195,975 | | | $ | 103,421 | | |
Ratio of Expenses to Average
Net Assets (D) | | | 0.16 | %(B) | | | 0.14 | % | | | 0.16 | % | | | 0.18 | % | | | 0.21 | % | | | 0.22 | % | |
Ratio of Net Investment Income to
Average Net Assets | | | 1.44 | %(B) | | | 1.36 | % | | | 1.74 | % | | | 1.60 | % | | | 0.98 | % | | | 1.56 | % | |
See page 1 for the Definitions of Abbreviations and Footnotes.
See accompanying Notes to Financial Statements.
10
DIMENSIONAL INVESTMENT GROUP INC.
U.S. LARGE CAP VALUE PORTFOLIO II
NOTES TO FINANCIAL STATEMENTS
A. Organization:
Dimensional Investment Group Inc. (the "Fund") is an open-end management investment company registered under the Investment Company Act of 1940, whose shares are offered to institutional investors, retirement plans and clients of registered investment advisors. The Fund consists of fifteen portfolios, of which U.S. Large Cap Value Portfolio II (the "Portfolio") is presented in this report.
The Portfolio primarily invests its assets in The U.S. Large Cap Value Series (the "Series"), a corresponding series of The DFA Investment Trust Company. At October 31, 2008, the Portfolio owned 2% of the outstanding shares of the Series. The financial statements of the Series are included elsewhere in this report and should be read in conjunction with the financial statements of the Portfolio.
At a regular meeting of the Board of Directors/Trustees (the "Board") on September 16, 2008, the Board voted to change the fiscal and tax year ends of the Portfolio from November 30 to October 31.
B. Significant Accounting Policies:
The following significant accounting policies are in conformity with accounting principles generally accepted in the United States of America. Such policies are consistently followed by the Fund in preparation of its financial statements. The preparation of financial statements in accordance with accounting principles generally accepted in the United States of America requires management to make estimates and assumptions that affect the reported amounts of assets and liabilities and disclosure of contingent assets and liabilities at the date of the financial statements and the reported amounts of increases and decreases in net assets from operations during the reporting period. Actual results could differ from those estimates and those differences could be material.
1. Security Valuation: The shares of the Series held by the Portfolio are valued at their respective daily net asset value.
Adoption of Statement of Financial Accounting Standards No. 157 "Fair Value Measurements" ("FAS 157")
In September 2006, the Financial Accounting Standards Board issued FAS 157 effective for fiscal years beginning after November 15, 2007. This standard clarifies the definition of fair value for financial reporting, establishes a framework for measuring fair value and requires additional disclosures about the use of fair value measurements. The Funds have adopted FAS 157 as of December 1, 2007. The three levels of the fair value hierarchy under FAS 157 are described below:
• Level 1 – quoted prices in active markets for identical securities
• Level 2 – other significant observable inputs (including quoted prices for similar securities, interest rates, prepayment speeds, credit risk, etc.)
• Level 3 – significant unobservable inputs (including the Portfolio's own assumptions in determining the fair value of investments)
The inputs or methodology used for valuing securities are not necessarily an indication of the risk associated with investing in those securities. A summary of the inputs used to value the Portfolio's net assets as of October 31, 2008 is listed below (in thousands).
| | | Valuation Inputs | |
| | | Investments in
Securities
(Market Value) | |
| | | Level 1 | | Level 2 | | Level 3 | | Total | |
| U.S. Large Cap Value Portfolio II | | $ | 94,792 | | | | — | | | | — | | | $ | 94,792 | | |
11
2. Deferred Compensation Plan: Each eligible Director of the Fund may elect participation in the Deferred Compensation Plan (the "Plan"). Under the Plan, effective January 1, 2002, such Directors may defer payment of all or a portion of their total fees earned as a Director. These deferred amounts may be treated as though such amounts had been invested in shares of the following funds: U.S. Large Cap Value Portfolio; U.S. Core Equity 1 Portfolio; U.S. Core Equity 2 Portfolio; U.S. Vector Equity Portfolio; U.S. Micro Cap Portfolio; DFA International Value Portfolio; International Core Equity Portfolio; Emerging Markets Portfolio; Emerging Markets Core Equity Portfolio; and/or DFA Two-Year Global Fixed Income Portfolio. Contributions made under the Plan and the change in unrealized a ppreciation (depreciation) and income, are included in Directors'/Trustees' Fees & Expenses. At October 31, 2008, the total liability for deferred compensation to Directors is included in Accrued Expense and Other Liabilities in the amount of $3 (in thousands).
Each Director has the option to receive their distribution of proceeds in one of the following methods upon one year's notice: lump sum; annual installments over a period of agreed upon years; or semi-annual installments over a period of agreed upon years. As of October 31, 2008, none of the Directors have requested distribution of proceeds.
3. Other: Security transactions are accounted for as of the trade date. Costs used in determining realized gains and losses on the sale of affiliated investment company shares are on the basis of identified cost. Dividend income and distributions to shareholders are recorded on the ex-dividend date. Distributions received from the investment in affiliated investment company that represent a return of capital or capital gain are recorded as a reduction of cost of investments or as a realized gain, respectively. Expenses directly attributable to the Portfolio are directly charged. Common expenses of the Fund are allocated using methods approved by the Board of Directors/Trustees, generally based on average net assets.
C. Investment Advisor:
Dimensional Fund Advisors LP ("Dimensional" or the "Advisor") provides administrative services to the Portfolio, including supervision of services provided by others, providing information to the shareholders and to the Board of Directors/Trustees, and other administrative services. The Advisor provides investment advisory services to the Series. For the period December 1, 2007 to October 31, 2008, the Portfolio's administrative services fees were accrued daily and paid monthly to the Advisor based on an effective annual rate of 0.01% of average daily net assets.
Fees Paid to Officers and Directors/Trustees:
Certain Officers and Directors/Trustees of the Advisor are also Officers and Directors/Trustees of the Fund; however, such Officers and Directors/Trustees (with the exception of the Chief Compliance Officer ("CCO")) receive no compensation from the Fund. For the period December 1, 2007 to October 31, 2008, the total related amounts paid by the Fund to the CCO were $25 (in thousands). The total related amounts paid by the Portfolio are included in Other Expenses on the Statement of Operations.
D. Federal Income Taxes:
The Portfolio has qualified and intends to continue to qualify as a regulated investment company under Subchapter M of the Internal Revenue Code for federal income tax purposes and to distribute substantially all of its taxable income and net capital gains to shareholders. Accordingly, no provision has been made for federal income taxes.
Distributions from net investment income and net realized capital gains are determined in accordance with U.S. federal income tax regulations, which may differ from those amounts determined under accounting principles generally accepted in the United States of America. These book/tax differences are either temporary or permanent in nature. To the extent these differences are permanent, they are charged or credited to paid-in capital, undistributed net investment income or accumulated net realized gains, as appropriate, in the period that the differences
12
arise. Accordingly, the following permanent differences as of October 31, 2008, were classified to the following accounts. The reclassifications had no effect on net assets or net asset value per share (amounts in thousands):
Increase
(Decrease)
Undistributed
Net Investment
Income | | Increase
(Decrease)
Accumulated
Net Realized
Gains | |
| $ | 52 | | | $ | (52 | ) | |
The tax character of dividends and distributions declared and paid during the years ended November 30, 2006, November 30, 2007 and the the period December 1, 2007 to October 31, 2008 were as follows (amounts in thousands):
| | | Net
Investment
Income and
Short-Term
Capital Gains | | Long-Term
Gains | | Total | |
| | 2006 | | | $ | 7,260 | | | | — | | | $ | 7,260 | | |
| | 2007 | | | | 8,185 | | | $ | 10,356 | | | | 18,541 | | |
| | 2008 | | | | 4,399 | | | | 24,131 | | | | 28,530 | | |
At October 31, 2008, the components of distributable earnings/(accumulated losses) were as follows (amounts in thousands):
Undistributed
Net Investment
Income and
Short-Term
Capital Gains | | Undistributed
Long-Term
Capital Gains | | Total Net
Distributable
Earnings/
(Accumulated
Losses) | |
| $ | 538 | | | $ | 40,896 | | | $ | 41,434 | | |
For federal income tax purposes, the Fund measures its capital loss carryforwards annually at October 31, its fiscal year end. Capital loss carryforwards may be carried forward and applied against future capital gains. As of October 31, 2008, the Portfolio had no capital loss carryforwards available to offset future realized gains.
At October 31, 2008, the total cost and aggregate gross unrealized appreciation and (depreciation) of securities for federal income tax purposes were different from amounts reported for financial reporting purposes (amounts in thousands):
Federal
Tax Cost | | Unrealized
Appreciation | | Unrealized
(Depreciation) | | Net
Unrealized
Appreciation
(Depreciation) | |
| $ | 137,589 | | | | — | | | $ | (42,797 | ) | | $ | (42,797 | ) | |
In June 2006, the Financial Accounting Standards Board (FASB) issued FASB Interpretation 48 ("FIN 48"), "Accounting for Uncertainty in Income Taxes." This standard defines the threshold for recognizing the benefits of tax-return positions in the financial statements as "more-likely-than-not" to be sustained by the taxing authority and requires measurement of a tax position meeting the more-likely-than-not criterion, based on the largest benefit that is more than 50 percent likely to be realized. Management has analyzed the Portfolio's tax positions to be taken on the federal income tax returns for all open tax years (tax years ended November 30, 2005 through the period ended October 31, 2008), for purposes of implementing FIN 48, and has concluded that no provision for income tax is required in the Portfolio's financial statements.
E. Line of Credit:
The Fund, together with other Dimensional-advised portfolios, has entered into a $250 million unsecured discretionary line of credit effective June 30, 2003 with an affiliate of its domestic custodian bank. Each portfolio is permitted to borrow, subject to its investment limitations, up to a maximum of $250 million, as long as total borrowings
13
under the line of credit do not exceed $250 million in the aggregate. Borrowings under the line of credit are charged interest at the then current Federal Funds Rate plus 1%. Each portfolio is individually, and not jointly, liable for its particular advances under the line of credit. There is no commitment fee on the unused portion of the line of credit. The agreement for the discretionary line of credit may be terminated by either party at any time. The line of credit is scheduled to expire on June 23, 2009. There were no borrowings by the Portfolio under this line of credit during the period ended October 31, 2008.
The Fund, together with other Dimensional-advised portfolios, has also entered into an additional $500 million unsecured line of credit effective January 15, 2008 with its international custodian bank. Each portfolio is permitted to borrow, subject to its investment limitations, up to a maximum of $500 million, as long as total borrowings under the line of credit do not exceed $500 million in the aggregate. Each portfolio is individually, and not jointly, liable for its particular advances under the line of credit. Borrowings under the line of credit are charged interest at rates agreed to by the parties at the time of borrowing. There is no commitment fee on the unused portion of the line of credit. The agreement for the line of credit expires on January 15, 2009. There were no borrowings by the Portfolio under this line of credit during the period ended October 31, 2008.
F. Indemnitees; Contractual Obligations:
Under the Fund's organizational documents, its officers and directors are indemnified against certain liabilities arising out of the performance of the duties to the Fund.
In the normal course of business, the Fund enters into contracts that contain a variety of representations and warranties which provide general indemnification. The Fund's maximum exposure under these arrangements is unknown as this would involve future claims that may be made against the Fund and/or its affiliates that have not yet occurred. However, based on experience, the Fund expects the risk of loss to be remote.
G. Recently Issued Accounting Standards and Interpretation:
In March 2008, Statement of Financial Accounting Standards No. 161, Disclosures about Derivative Instruments and Hedging Activities ("FAS 161"), was issued and is effective for fiscal years beginning after November 15, 2008. FAS 161 defines new disclosures of derivative instruments and hedging activities. Management is currently evaluating the implications of FAS 161. At this time, its impact on the Portfolio's financial statements has not been determined.
H. Other:
At October 31, 2008, two shareholders held 100% of the outstanding shares of the Portfolio.
14
REPORT OF INDEPENDENT REGISTERED PUBLIC ACCOUNTING FIRM
To the Shareholders of U.S. Large Cap Value Portfolio II and
Board of Directors of Dimensional Investment Group Inc.:
In our opinion, the accompanying statement of assets and liabilities, and the related statements of operations and of changes in net assets and the financial highlights present fairly, in all material respects, the financial position of U.S. Large Cap Value Portfolio II (one of the portfolios constituting Dimensional Investment Group Inc., hereafter referred to as the "Portfolio") at October 31, 2008, the results of its operations, the changes in its net assets and the financial highlights for each of the periods indicated, in conformity with accounting principles generally accepted in the United States of America. These financial statements and financial highlights (hereafter referred to as "financial statements") are the responsibility of the Portfolio's management; our responsibility is to express an opinion on these financial statements based on our audits. We conducted our audits of these financial statements in accordance with the stan dards of the Public Company Accounting Oversight Board (United States). Those standards require that we plan and perform the audit to obtain reasonable assurance about whether the financial statements are free of material misstatement. An audit includes examining, on a test basis, evidence supporting the amounts and disclosures in the financial statements, assessing the accounting principles used and significant estimates made by management, and evaluating the overall financial statement presentation. We believe that our audits, which included confirmation of securities at October 31, 2008 by correspondence with the transfer agent of the investee fund, provide a reasonable basis for our opinion.
PricewaterhouseCoopers LLP
Philadelphia, Pennsylvania
December 22, 2008
15
THE DFA INVESTMENT TRUST COMPANY
PERFORMANCE CHART

16
THE DFA INVESTMENT TRUST COMPANY
THE U.S. LARGE CAP VALUE SERIES
DISCLOSURE OF FUND EXPENSES
(Unaudited)
The following Expense Table is shown so that you can understand the impact of fees on your investment. All mutual funds have operating expenses. As a shareholder of the fund, you incur ongoing costs, which include costs for portfolio management, administrative services, and shareholder reports, among others. Operating expenses, legal and audit services, which are deducted from a fund's gross income, directly reduce the investment return of the fund. A fund's expenses are expressed as a percentage of its average net assets. This figure is known as the expense ratio. The following examples are intended to help you understand the ongoing costs, in dollars, of investing in the fund and to compare these costs with those of other mutual funds. The examples are based on an investment of $1,000 made at the beginning of the period shown and held for the entire period.
The Expense Table below illustrates your fund's costs in two ways.
Actual Fund Return
This section helps you to estimate the actual expenses after fee waivers that you paid over the period. The "Ending Account Value" shown is derived from the fund's actual return and "Expenses Paid During Period" reflect the dollar amount that would have been paid by an investor who started with $1,000 in the fund. You may use the information here, together with the amount you invested, to estimate the expenses that you paid over the period.
To do so, simply divide your account value by $1,000 (for example, a $7,500 account value divided by $1,000 = 7.5), then multiply the result by the number given for your fund under the heading "Expenses Paid During Period."
Hypothetical Example for Comparison Purposes
This section is intended to help you compare your fund's costs with those of other mutual funds. The hypothetical "Ending Account Value" and "Expenses Paid During Period" are derived from the fund's actual expense ratio and an assumed 5% annual return before expenses. In this case, because the return used is not the fund's actual return, the results do not apply to your investment. The example is useful in making comparisons because the SEC requires all mutual funds to calculate expenses based on a 5% annual return. You can assess your fund's cost by comparing this hypothetical example with the hypothetical examples that appear in shareholder reports of other funds.
Please note that the expenses shown in the table are meant to highlight and help you compare ongoing costs only and do not reflect any transactional costs, if applicable. The "Annualized Expense Ratio" represents the actual expenses for the six-month period indicated.
Six Months Ended October 31, 2008
EXPENSE TABLE
| | | Beginning
Account
Value
05/01/08 | | Ending
Account
Value
10/31/08 | | Annualized
Expense
Ratio* | | Expenses
Paid
During
Period* | |
| Actual Fund Return | | $ | 1,000.00 | | | $ | 648.60 | | | | 0.11 | % | | $ | 0.46 | | |
| Hypothetical 5% Annual Return | | $ | 1,000.00 | | | $ | 1,024.58 | | | | 0.11 | % | | $ | 0.56 | | |
* Expenses are equal to the fund's annualized expense ratio for the six-month period, multiplied by the average account value over the period, multiplied by the number of days in the most recent six-month period (184), then divided by the number of days in the year (366) to reflect the six-month period.
17
THE DFA INVESTMENT TRUST COMPANY
THE U.S. LARGE CAP VALUE SERIES
DISCLOSURE OF PORTFOLIO HOLDINGS
(Unaudited)
The SEC requires that all Funds file a complete Schedule of Investments with the SEC for their first and third fiscal quarters on Form N-Q. For The DFA Investment Trust Company, this would be for the fiscal quarters ending January 31 and July 31. The Form N-Q filing must be made within 60 days of the end of the quarter. The DFA Investment Trust Company filed its most recent Form N-Q with the SEC on October 30, 2008. It is available upon request, without charge, by calling collect: (310) 395-8005 or by mailing a request to Dimensional Fund Advisors LP, 1299 Ocean Avenue, Santa Monica, California 90401, or by visiting the SEC's website at http://www.sec.gov, or they may be reviewed and copied at the SEC's Public Reference Room in Washington, D.C. (call 1-800-732-0330 for information on the operation of the Public Reference Room).
SEC regulations permit a fund to include in its reports to shareholders a "Summary Schedule of Portfolio Holdings" in lieu of a full Schedule of Investments. The Summary Schedule of Portfolio Holdings reports the fund's 50 largest holdings in unaffiliated issuers and any investments that exceed one percent of the fund's net assets at the end of the reporting period. The amendments also require that the Summary Schedule of Portfolio Holdings identify each category of investments that are held.
The fund is required to file a complete Schedule of Investments with the SEC on Form N-CSR within ten days after mailing the annual and semi-annual reports to shareholders. It will be available upon request, without charge, by calling collect: (310) 395-8005 or by mailing a request to Dimensional Fund Advisors LP, 1299 Ocean Avenue, Santa Monica, California 90401, or by visiting the SEC's website at http://www.sec.gov, or they may be reviewed and copied at the SEC's Public Reference Room in Washington, D.C. (call 1-800-732-0330 for information on the operation of the Public Reference Room).
PORTFOLIO HOLDINGS
The SEC requires that all Funds present their categories of portfolio holdings in a table, chart or graph format in their annual and semi-annual shareholder reports, whether or not a Schedule of Investments is utilized. The following table, which presents portfolio holdings as a percent of total investments before short-term investments and collateral for loaned securities, is provided in compliance with such requirement. The categories shown below represent broad industry sectors. Each industry sector consists of one or more specific industry classifications.
Consumer
Discretionary | | Consumer
Staples | | Energy | | Financials | | Health
Care | | Industrials | | Information
Technology | | Materials | | Telecommunication
Services | | Utilities | | Total | |
| | 12.6 | % | | | 5.5 | % | | | 15.1 | % | | | 30.8 | % | | | 1.8 | % | | | 17.4 | % | | | 4.6 | % | | | 3.4 | % | | | 8.7 | % | | | 0.1 | % | | | 100.0 | % | |
18
THE U.S. LARGE CAP VALUE SERIES
SUMMARY SCHEDULE OF PORTFOLIO HOLDINGS
October 31, 2008
| | | Shares | | Value† | | Percentage
of Net Assets** | |
| COMMON STOCKS — (88.7%) | |
| Consumer Discretionary — (11.6%) | |
| CBS Corp. Class B | | | 5,590,306 | | | $ | 54,281,871 | | | | 0.8 | % | |
| Comcast Corp. Class A | | | 12,216,542 | | | | 192,532,702 | | | | 2.9 | % | |
| # Comcast Corp. Special Class A Non-Voting | | | 3,110,315 | | | | 47,961,057 | | | | 0.7 | % | |
| * Liberty Media Corp. - Entertainment Class A | | | 3,864,672 | | | | 62,221,219 | | | | 0.9 | % | |
| # Time Warner, Inc. | | | 18,369,180 | | | | 185,345,026 | | | | 2.7 | % | |
| # Tyco Electronics, Ltd. | | | 1,537,111 | | | | 29,881,438 | | | | 0.4 | % | |
| Other Securities | | | | | | | 292,496,695 | | | | 4.4 | % | |
| Total Consumer Discretionary | | | | | | | 864,720,008 | | | | 12.8 | % | |
| Consumer Staples — (4.9%) | |
| Archer-Daniels-Midland Co. | | | 1,219,060 | | | | 25,271,114 | | | | 0.4 | % | |
| # Coca-Cola Enterprises, Inc. | | | 3,519,272 | | | | 35,368,684 | | | | 0.5 | % | |
| Kraft Foods, Inc. | | | 5,533,321 | | | | 161,240,974 | | | | 2.4 | % | |
| Molson Coors Brewing Co. | | | 755,890 | | | | 28,240,050 | | | | 0.4 | % | |
| Other Securities | | | | | | | 116,481,392 | | | | 1.7 | % | |
| Total Consumer Staples | | | | | | | 366,602,214 | | | | 5.4 | % | |
| Energy — (13.4%) | |
| # Anadarko Petroleum Corp. | | | 3,422,156 | | | | 120,802,107 | | | | 1.8 | % | |
| # Apache Corp. | | | 2,051,191 | | | | 168,874,555 | | | | 2.5 | % | |
| # Chesapeake Energy Corp. | | | 2,496,221 | | | | 54,841,975 | | | | 0.8 | % | |
| # ConocoPhillips | | | 4,659,773 | | | | 242,401,391 | | | | 3.6 | % | |
| # Devon Energy Corp. | | | 1,962,942 | | | | 158,723,490 | | | | 2.4 | % | |
| Marathon Oil Corp. | | | 2,640,550 | | | | 76,840,005 | | | | 1.1 | % | |
| Other Securities | | | | | | | 177,364,431 | | | | 2.6 | % | |
| Total Energy | | | | | | | 999,847,954 | | | | 14.8 | % | |
| Financials — (27.3%) | |
| Allstate Corp. | | | 2,540,615 | | | | 67,046,830 | | | | 1.0 | % | |
| # Bank of America Corp. | | | 7,236,574 | | | | 174,907,994 | | | | 2.6 | % | |
| # Capital One Financial Corp. | | | 1,668,884 | | | | 65,286,742 | | | | 1.0 | % | |
| # Chubb Corp. | | | 1,620,173 | | | | 83,957,365 | | | | 1.2 | % | |
| # Cincinnati Financial Corp. | | | 1,305,789 | | | | 33,937,456 | | | | 0.5 | % | |
| CNA Financial Corp. | | | 1,896,282 | | | | 29,506,148 | | | | 0.4 | % | |
| JPMorgan Chase & Co. | | | 7,213,911 | | | | 297,573,829 | | | | 4.4 | % | |
| Loews Corp. | | | 3,808,002 | | | | 126,463,746 | | | | 1.9 | % | |
| # M&T Bank Corp. | | | 440,052 | | | | 35,688,217 | | | | 0.5 | % | |
| # Merrill Lynch & Co., Inc. | | | 1,408,640 | | | | 26,186,618 | | | | 0.4 | % | |
| # MetLife, Inc. | | | 5,000,810 | | | | 166,126,908 | | | | 2.5 | % | |
| # Morgan Stanley | | | 2,999,997 | | | | 52,409,948 | | | | 0.8 | % | |
| # New York Community Bancorp, Inc. | | | 2,223,800 | | | | 34,824,708 | | | | 0.5 | % | |
| # Prudential Financial, Inc. | | | 1,829,600 | | | | 54,888,000 | | | | 0.8 | % | |
| # SunTrust Banks, Inc. | | | 945,360 | | | | 37,946,750 | | | | 0.6 | % | |
| The Travelers Companies, Inc. | | | 5,075,909 | | | | 215,979,928 | | | | 3.2 | % | |
| Unum Group | | | 2,404,389 | | | | 37,869,127 | | | | 0.6 | % | |
| Other Securities | | | | | | | 492,099,070 | | | | 7.3 | % | |
| Total Financials | | | | | | | 2,032,699,384 | | | | 30.2 | % | |
| Health Care — (1.6%) | |
| *# WellPoint, Inc. | | | 1,694,537 | | | | 65,866,653 | | | | 1.0 | % | |
| Other Securities | | | | | | | 52,007,419 | | | | 0.8 | % | |
| Total Health Care | | | | | | | 117,874,072 | | | | 1.8 | % | |
19
THE U.S. LARGE CAP VALUE SERIES
CONTINUED
| | | Shares | | Value† | | Percentage
of Net Assets** | |
| Industrials — (15.4%) | |
| *# Allied Waste Industries, Inc. | | | 2,682,276 | | | $ | 27,949,316 | | | | 0.4 | % | |
| # Burlington Northern Santa Fe Corp. | | | 2,178,273 | | | | 193,996,993 | | | | 2.9 | % | |
| # CSX Corp. | | | 3,309,804 | | | | 151,324,239 | | | | 2.2 | % | |
| FedEx Corp. | | | 432,063 | | | | 28,243,958 | | | | 0.4 | % | |
| # Norfolk Southern Corp. | | | 3,154,102 | | | | 189,056,874 | | | | 2.8 | % | |
| # Northrop Grumman Corp. | | | 2,590,384 | | | | 121,463,106 | | | | 1.8 | % | |
| # Southwest Airlines Co. | | | 5,076,220 | | | | 59,797,872 | | | | 0.9 | % | |
| Union Pacific Corp. | | | 4,066,600 | | | | 271,526,882 | | | | 4.0 | % | |
| Other Securities | | | | | | | 105,722,697 | | | | 1.7 | % | |
| Total Industrials | | | | | | | 1,149,081,937 | | | | 17.1 | % | |
| Information Technology — (3.7%) | |
| *# Computer Sciences Corp. | | | 1,361,543 | | | | 41,064,137 | | | | 0.6 | % | |
| *# Symantec Corp. | | | 2,636,076 | | | | 33,161,836 | | | | 0.5 | % | |
| Xerox Corp. | | | 3,605,491 | | | | 28,916,038 | | | | 0.4 | % | |
| Other Securities | | | | | | | 170,627,649 | | | | 2.6 | % | |
| Total Information Technology | | | | | | | 273,769,660 | | | | 4.1 | % | |
| Materials — (3.0%) | |
| # Dow Chemical Co. | | | 2,427,760 | | | | 64,748,359 | | | | 1.0 | % | |
| # International Paper Co. | | | 1,643,445 | | | | 28,300,123 | | | | 0.4 | % | |
| # Weyerhaeuser Co. | | | 1,415,829 | | | | 54,112,984 | | | | 0.8 | % | |
| Other Securities | | | | | | | 78,273,714 | | | | 1.1 | % | |
| Total Materials | | | | | | | 225,435,180 | | | | 3.3 | % | |
| Telecommunication Services — (7.7%) | |
| # AT&T, Inc. | | | 9,749,000 | | | | 260,980,730 | | | | 3.9 | % | |
| # Verizon Communications, Inc. | | | 8,542,208 | | | | 253,447,311 | | | | 3.7 | % | |
| Other Securities | | | | | | | 58,656,568 | | | | 0.9 | % | |
| Total Telecommunication Services | | | | | | | 573,084,609 | | | | 8.5 | % | |
| Utilities — (0.1%) | |
| Total Utilities | | | | | | | 4,787,743 | | | | 0.1 | % | |
| TOTAL COMMON STOCKS | | | | | | | 6,607,902,761 | | | | 98.1 | % | |
| | | Face
Amount | | | | | |
| | | (000) | | | | | |
| TEMPORARY CASH INVESTMENTS — (1.9%) | |
Repurchase Agreement, PNC Capital Markets, Inc. 0.94%, 11/03/08
(Collateralized by $130,825,000 FNMA 5.50%, 05/01/37 & 6.00%, 05/01/38,
valued at $146,641,902) to be repurchased at $144,481,317 | | $ | 144,470 | | | | 144,470,000 | | | | 2.1 | % | |
20
THE U.S. LARGE CAP VALUE SERIES
CONTINUED
| | | Shares | | Value† | | Percentage
of Net Assets** | |
| SECURITIES LENDING COLLATERAL — (9.4%) | |
| §@ DFA Short Term Investment Fund LP | | | 641,002,721 | | | $ | 641,002,721 | | | | 9.5 | % | |
| @ PNC Demand Deposit Account 0.22% | | | 10,000,000 | | | | 10,000,000 | | | | 0.2 | % | |
| | | Face
Amount | | | | | |
| | | (000) | | | | | |
@ Repurchase Agreement, Deutsche Bank Securitites 0.24%, 11/03/08
(Collateralized by $65,652,304 FNMA, rates ranging from 5.500% to 7.000%,
maturities ranging from 07/01/33 to 09/01/38 & U.S. Treasury STRIP 0.599%(y),
02/15/09, valued at $49,188,211) to be repurchased at $48,070,107 | | $ | 48,069 | | | | 48,069,158 | | | | 0.7 | % | |
| TOTAL SECURITIES LENDING COLLATERAL | | | | | | | 699,071,879 | | | | 10.4 | % | |
TOTAL INVESTMENTS — (100.0%)
(Cost $9,331,596,076) | | | | | | $ | 7,451,444,640 | | | | 110.6 | % | |
See accompanying Notes to Financial Statements.
21
THE DFA INVESTMENT TRUST COMPANY
THE U.S. LARGE CAP VALUE SERIES
STATEMENT OF ASSETS AND LIABILITIES
OCTOBER 31, 2008
(Amounts in thousands, except share and per share amounts)
| ASSETS: | |
| Investments at Value (including $690,374 of securities on loan) | | $ | 6,607,903 | | |
| Temporary Cash Investments at Value & Cost | | | 144,470 | | |
| Collateral Received from Securities on Loan at Value & Cost | | | 699,072 | | |
| Receivables: | |
| Investment Securities Sold | | | 10,617 | | |
| Dividends and Interest | | | 12,718 | | |
| Securities Lending Income | | | 1,430 | | |
| Fund Shares Sold | | | 4,995 | | |
| Fund Margin Variation | | | 29 | | |
| Prepaid Expenses and Other Assets | | | 7 | | |
| Total Assets | | | 7,481,241 | | |
| LIABILITIES: | |
| Payables: | |
| Upon Return of Securities Loaned | | | 699,072 | | |
| Investment Securities Purchased | | | 41,685 | | |
| Fund Shares Redeemed | | | 136 | | |
| Due to Advisor | | | 570 | | |
| Accrued Expenses and Other Liabilities | | | 415 | | |
| Total Liabilities | | | 741,878 | | |
| NET ASSETS | | $ | 6,739,363 | | |
| SHARES OUTSTANDING, $0.01 PAR VALUE (1) | | | 497,037,187 | | |
| NET ASSET VALUE, OFFERING AND REDEMPTION PRICE PER SHARE | | $ | 13.56 | | |
| Investments at Cost | | $ | 8,488,055 | | |
| NET ASSETS CONSIST OF: | |
| Paid-In Capital | | $ | 9,162,464 | | |
| Undistributed Net Income (Distributions in Excess of Net Investment Income) | | | (68 | ) | |
| Accumulated Net Realized Gain (Loss) | | | (542,910 | ) | |
| Net Unrealized Appreciation (Depreciation) | | | (1,880,123 | ) | |
| NET ASSETS | | $ | 6,739,363 | | |
| (1) NUMBER OF SHARES AUTHORIZED | | | Unlimited | | |
See accompanying Notes to Financial Statements.
22
THE DFA INVESTMENT TRUST COMPANY
THE U.S. LARGE CAP VALUE SERIES
STATEMENTS OF OPERATIONS
(Amounts in thousands)
| | | Period
Dec. 1,
2007 to
Oct. 31,
2008 | | Year
Ended
Nov. 30,
2007 | |
| Investment Income | |
| Dividends | | $ | 166,659 | | | $ | 152,304 | | |
| Interest | | | 1,529 | | | | 4,285 | | |
| Income from Securities Lending | | | 7,486 | | | | 2,119 | | |
| Total Investment Income | | | 175,674 | | | | 158,708 | | |
| Expenses | |
| Investment Advisory Services Fees | | | 8,436 | | | | 10,188 | | |
| Accounting & Transfer Agent Fees | | | 847 | | | | 1,011 | | |
| Custodian Fees | | | 90 | | | | 108 | | |
| Shareholders' Reports | | | 82 | | | | 103 | | |
| Directors'/Trustees' Fees & Expenses | | | — | | | | 94 | | |
| Professional Fees | | | 166 | | | | 157 | | |
| Other | | | 37 | | | | 56 | | |
| Total Expenses | | | 9,658 | | | | 11,717 | | |
| Net Investment Income (Loss) | | | 166,016 | | | | 146,991 | | |
| Realized and Unrealized Gain (Loss) | |
| Net Realized Gain (Loss) on: | |
| Investment Securities Sold | | | (422,637 | ) | | | (118,412 | ) | |
| Futures | | | (1,861 | ) | | | — | | |
| In-Kind Redemptions | | | 52,271 | * | | | — | | |
Change in Unrealized Appreciation (Depreciation) of:
Investment Securities | | | (3,601,292 | ) | | | (150,559 | ) | |
| Futures | | | 29 | | | | — | | |
| Net Realized and Unrealized Gain (Loss) | | | (3,973,490 | ) | | | (268,971 | ) | |
| Net Increase (Decrease) in Net Assets Resulting from Operations | | $ | (3,807,474 | ) | | $ | (121,980 | ) | |
* See Note J in the Notes to Financial Statements.
See accompanying Notes to Financial Statements.
23
THE DFA INVESTMENT TRUST COMPANY
THE U.S. LARGE CAP VALUE SERIES
STATEMENTS OF CHANGES IN NET ASSETS
(Amounts in thousands)
| | | Period
Dec. 1,
2007 to
Oct. 31,
2008 | | Year
Ended
Nov. 30,
2007 | | Year
Ended
Nov. 30,
2006 | |
| Increase (Decrease) in Net Assets | |
| Operations: | |
| Net Investment Income (Loss) | | $ | 166,016 | | | $ | 146,991 | | | $ | 119,373 | | |
| Net Realized Gain (Loss) on: | |
| Investment Securities Sold | | | (422,637 | ) | | | (118,412 | ) | | | 477,934 | | |
| Futures | | | (1,861 | ) | | | — | | | | — | | |
| In-Kind Redemptions | | | 52,271 | * | | | — | | | | — | | |
Change in Unrealized Appreciation (Depreciation) of:
Investment Securities | | | (3,601,292 | ) | | | (150,559 | ) | | | 631,814 | | |
| Futures | | | 29 | | | | — | | | | — | | |
Net Increase (Decrease) in Net Assets Resulting
from Operations | | | (3,807,474 | ) | | | (121,980 | ) | | | 1,229,121 | | |
| Distributions From: | |
| Net Investment Income | | | (168,022 | ) | | | (146,268 | ) | | | (127,544 | ) | |
| Net Short-Term Gains | | | — | | | | (14,058 | ) | | | (14,160 | ) | |
| Net Long-Term Gains | | | — | | | | (463,917 | ) | | | (186,026 | ) | |
| Total Distributions | | | (168,022 | ) | | | (624,243 | ) | | | (327,730 | ) | |
| Capital Share Transactions (1): | |
| Shares Issued | | | 1,370,762 | | | | 1,783,358 | | | | 1,997,675 | | |
| Shares Issued in Lieu of Cash Distributions | | | 165,455 | | | | 600,794 | | | | 317,835 | | |
| Shares Redeemed | | | (980,680 | )* | | | (344,913 | ) | | | (182,182 | ) | |
| Net Increase (Decrease) from Capital Share Transactions | | | 555,537 | | | | 2,039,239 | | | | 2,133,328 | | |
| Total Increase (Decrease) in Net Assets | | | (3,419,959 | ) | | | 1,293,016 | | | | 3,034,719 | | |
| Net Assets | |
| Beginning of Period | | | 10,159,322 | | | | 8,866,306 | | | | 5,831,587 | | |
| End of Period | | $ | 6,739,363 | | | $ | 10,159,322 | | | $ | 8,866,306 | | |
| (1) Shares Issued and Redeemed: | |
| Shares Issued | | | 74,071 | | | | 75,958 | | | | 92,566 | | |
| Shares Issued in Lieu of Cash Distributions | | | 9,754 | | | | 26,704 | | | | 15,344 | | |
| Shares Redeemed | | | (52,609 | ) | | | (15,046 | ) | | | (8,564 | ) | |
| | | | 31,216 | | | | 87,616 | | | | 99,346 | | |
Undistributed Net Income (Distributions in Excess of Net
Investment Income) | | $ | (68 | ) | | $ | 1,938 | | | $ | 1,485 | | |
* See Note J in the Notes to Financial Statements.
See accompanying Notes to Financial Statements.
24
THE DFA INVESTMENT TRUST COMPANY
THE U.S. LARGE CAP VALUE SERIES
FINANCIAL HIGHLIGHTS
(for a share outstanding throughout each period)
| | | Period
Dec. 1,
2007
to
Oct. 31,
2008 | | Year
Ended
Nov. 30,
2007 | | Year
Ended
Nov. 30,
2006 | | Year
Ended
Nov. 30,
2005 | | Year
Ended
Nov. 30,
2004 | | Year
Ended
Nov. 30,
2003 | |
Net Asset Value, Beginning of
Period | | $ | 21.81 | | | $ | 23.44 | | | $ | 20.91 | | | $ | 18.55 | | | $ | 15.41 | | | $ | 13.01 | | |
| Income from Investment Operations | |
Net Investment
Income (Loss) | | | 0.35 | (A) | | | 0.34 | (A) | | | 0.36 | (A) | | | 0.29 | | | | 0.23 | | | | 0.21 | | |
Net Gains (Losses) on
Securities (Realized and
Unrealized) | | | (8.25 | ) | | | (0.38 | ) | | | 3.27 | | | | 2.41 | | | | 3.09 | | | | 2.41 | | |
Total from Investment
Operations | | | (7.90 | ) | | | (0.04 | ) | | | 3.63 | | | | 2.70 | | | | 3.32 | | | | 2.62 | | |
| Less Distributions | |
| Net Investment Income | | | (0.35 | ) | | | (0.33 | ) | | | (0.38 | ) | | | (0.32 | ) | | | (0.18 | ) | | | (0.22 | ) | |
| Net Realized Gains | | | — | | | | (1.26 | ) | | | (0.72 | ) | | | (0.02 | ) | | | — | | | | — | | |
| Total Distributions | | | (0.35 | ) | | | (1.59 | ) | | | (1.10 | ) | | | (0.34 | ) | | | (0.18 | ) | | | (0.22 | ) | |
Net Asset Value, End of
Period | | $ | 13.56 | | | $ | 21.81 | | | $ | 23.44 | | | $ | 20.91 | | | $ | 18.55 | | | $ | 15.41 | | |
| Total Return | | | (36.53 | )%(C) | | | (0.32 | )% | | | 18.16 | % | | | 14.66 | % | | | 21.68 | % | | | 20.34 | % | |
Net Assets, End of Period
(thousands) | | $ | 6,739,363 | | | $ | 10,159,322 | | | $ | 8,866,306 | | | $ | 5,831,587 | | | $ | 3,919,913 | | | $ | 2,510,662 | | |
Ratio of Expenses to Average
Net Assets | | | 0.11 | %(B) | | | 0.11 | % | | | 0.12 | % | | | 0.14 | % | | | 0.15 | % | | | 0.15 | % | |
Ratio of Net Investment Income
to Average Net Assets | | | 1.97 | %(B) | | | 1.44 | % | | | 1.68 | % | | | 1.56 | % | | | 1.41 | % | | | 1.62 | % | |
| Portfolio Turnover Rate | | | 19 | %(C) | | | 9 | % | | | 13 | % | | | 9 | % | | | 7 | % | | | 7 | % | |
See page 1 for the Definitions of Abbreviations and Footnotes.
See accompanying Notes to Financial Statements.
25
THE DFA INVESTMENT TRUST COMPANY
THE U.S. LARGE CAP VALUE SERIES
NOTES TO FINANCIAL STATEMENTS
A. Organization:
The DFA Investment Trust Company (the "Trust") is an open-end management investment company registered under the Investment Company Act of 1940. The Trust consists of eighteen series, of which The U.S. Large Cap Value Series (the "Series") is presented in this report.
At a regular meeting of the Board of Directors/Trustees (the "Board") on September 16, 2008, the Board voted to change the fiscal and tax year ends of the Series from November 30 to October 31.
B. Significant Accounting Policies:
The following significant accounting policies are in conformity with accounting principles generally accepted in the United States of America. Such policies are consistently followed by the Trust in preparation of its financial statements. The preparation of financial statements in accordance with accounting principles generally accepted in the United States of America requires management to make estimates and assumptions that affect the reported amounts of assets and liabilities and disclosure of contingent assets and liabilities at the date of the financial statements and the reported amounts of increases and decreases in net assets from operations during the reporting period. Actual results could differ from those estimates and those differences could be material.
1. Security Valuation: Securities held by the Series (including over-the-counter securities) are valued at the last quoted sale price of the day. Securities held by the Series that are listed on Nasdaq are valued at the Nasdaq Official Closing Price ("NOCP"). If there is no last reported sale price or NOCP for the day, the Series values the securities at the mean of the most recent quoted bid and asked prices. Price information on listed securities is taken from the exchange where the security is primarily traded. Generally, securities issued by open-end investment companies are valued using their respective net asset values or public offering prices, as appropriate, for purchase orders placed at the close of the New York Stock Exchange (NYSE).
Securities for which no market quotations are readily available (including restricted securities), or for which market quotations have become unreliable, are valued in good faith at fair value in accordance with procedures adopted by the Board of Directors/Trustees. Fair value pricing may also be used if events that have a significant effect on the value of an investment (as determined in the discretion of the Investment Committee of the Advisor) occur before the net asset value is calculated. When fair value pricing is used, the prices of securities used by the Series may differ from the quoted or published prices for the same securities on their primary markets or exchanges.
Futures contracts held by the Series are valued using the settlement price established each day on the exchange on which they are traded.
Adoption of Statement of Financial Accounting Standards No. 157 "Fair Value Measurements" ("FAS 157")
In September 2006, the Financial Accounting Standards Board issued FAS 157 effective for fiscal years beginning after November 15, 2007. This standard clarifies the definition of fair value for financial reporting, establishes a framework for measuring fair value and requires additional disclosures about the use of fair value measurements. The Funds have adopted FAS 157 as of December 1, 2007. The three levels of the fair value hierarchy under FAS 157 are described below:
• Level 1 – quoted prices in active markets for identical securities
• Level 2 – other significant observable inputs (including quoted prices for similar securities, interest rates, prepayment speeds, credit risk, etc.)
• Level 3 – significant unobservable inputs (including the Series' own assumptions in determining the fair value of investments)
26
The inputs or methodology used for valuing securities are not necessarily an indication of the risk associated with investing in those securities. A summary of the inputs used to value the Series' net assets as of October 31, 2008 is listed below (in thousands).
| | | Valuation Inputs | |
| | | Investments in
Securities
(Market Value) | | Other Financial
Instruments
(Unrealized
Appreciation/
Depreciation)* | |
| | | Level 1 | | Level 2 | | Level 3 | | Total | | Level 1 | | Level 2 | | Level 3 | | Total | |
| The U.S. Large Cap Value Series | | $ | 6,607,903 | | | $ | 843,542 | | | | — | | | $ | 7,451,445 | | | $ | 29 | | | | — | | | | — | | | $ | 29 | | |
* Other financial instruments are derivative instruments not reflected in the Schedule of Investments, such as futures, forwards and swaps which are valued at the unrealized appreciation/depreciation on the investment.
2. Deferred Compensation Plan: Each eligible Trustee of the Trust may elect participation in the Deferred Compensation Plan (the "Plan"). Under the Plan, effective January 1, 2002, such Trustees may defer payment of all or a portion of their total fees earned as a Trustee. These deferred amounts may be treated as though such amounts had been invested in shares of the following funds: U.S. Large Cap Value Portfolio; U.S. Core Equity 1 Portfolio; U.S. Core Equity 2 Portfolio; U.S. Vector Equity Portfolio; U.S. Micro Cap Portfolio; DFA International Value Portfolio; International Core Equity Portfolio; Emerging Markets Portfolio; Emerging Markets Core Equity Portfolio; and/or DFA Two-Year Global Fixed Income Portfolio. Contributions made under the Plan and the change in unrealized app reciation (depreciation) and income, are included in Other Expenses on October 31, 2008 and are included in Directors'/Trustees' Fees & Expenses on November 30, 2007. At October 31, 2008, the total liability for deferred compensation to Trustees is included in Accrued Expenses and Other Liabilities in the amount of $134 (in thousands).
Each Trustee has the option to receive their distribution of proceeds in one of the following methods upon one year's notice: lump sum; annual installments over a period of agreed upon years; or semi-annual installments over a period of agreed upon years. As of October 31, 2008, none of the Trustees have requested distribution of proceeds.
3. Other: Security transactions are accounted for as of the trade date. Costs used in determining realized gains and losses on the sale of investment securities are on the basis of identified cost. Dividend income and distributions to shareholders are recorded on the ex-dividend date. Distributions received on securities that represent a return of capital or capital gain are recorded as a reduction of cost of investments or as a realized gain, respectively. The Series estimates the character of distributions received that may be considered return of capital distributions or capital gain distributions. Interest income is recorded on an accrual basis. Discount and premium on securities purchased are amortized over the lives of the respective securities, utilizing the effective i nterest method. Expenses directly attributable to a Series are directly charged. Common expenses of the Trust are allocated using methods approved by the Board of Directors/Trustees, generally based on average net assets.
C. Investment Advisor:
Dimensional Fund Advisors LP ("Dimensional" or the "Advisor") provides investment advisory services to the Series. For the period December 1, 2007 to October 31, 2008, the Series' investment advisory services fees were accrued daily and paid monthly to the Advisor based on an effective annual rate of 0.10% of average daily net assets.
Fees Paid to Officers and Directors/Trustees:
Certain Officers and Directors/Trustees of the Advisor are also Officers and Directors/Trustees of the Trust; however, such Officers and Directors/Trustees (with the exception of the Chief Compliance Officer ("CCO")) receive no compensation from the Trust. For the period December 1, 2007 to October 31, 2008, the total related amounts paid by the Trust to the CCO were $134 (in thousands). The total related amounts paid by the Series are included in Other Expenses on the Statement of Operations.
27
D. Purchases and Sales of Securities:
For the period December 1, 2007 to October 31, 2008, the Series made the following purchases and sales of investment securities, other than short-term securities and U.S. government securities (amounts in thousands):
| Purchases | | $ | 2,227,129 | | |
| Sales | | | 1,690,939 | | |
There were no purchases or sales of long-term U.S. government securities.
E. Federal Income Taxes:
The Series has qualified and intends to continue to qualify as a regulated investment company under Subchapter M of the Internal Revenue Code for federal income tax purposes and to distribute substantially all of its taxable income and net capital gains to shareholders. Accordingly, no provision has been made for federal income taxes.
Distributions from net investment income and net realized capital gains are determined in accordance with U.S. federal income tax regulations, which may differ from those amounts determined under accounting principles generally accepted in the United States of America. These book/tax differences are either temporary or permanent in nature. To the extent these differences are permanent, they are charged or credited to paid-in capital, undistributed net investment income or accumulated net realized gains, as appropriate, in the period that the differences arise. Accordingly, the following permanent differences as of October 31, 2008, primarily attributable to In-Kind redemptions were classified to the following accounts. These reclassifications had no effect on net assets or net asset value per share (amounts in thousands):
Increase
(Decrease)
Paid-in
Capital
Income | | Increase
(Decrease)
Accumulated
Net Realized
Gains/(Losses) | |
| $ | 52,271 | | | $ | (52,271 | ) | |
The tax character of dividends and distributions declared and paid during the years ended November 30, 2006, November 30, 2007 and the period December 1, 2007 to October 31, 2008 were as follows (amounts in thousands):
| | | Net
Investment
Income and
Short-Term
Capital Gains | | Long-Term
Capital Gains | | Total | |
| | 2006 | | | $ | 141,704 | | | $ | 186,026 | | | $ | 327,730 | | |
| | 2007 | | | | 160,367 | | | | 463,876 | | | | 624,243 | | |
| | 2008 | | | | 168,022 | | | | — | | | | 168,022 | | |
At October 31, 2008, the components of distributable earnings/(accumulated losses) were as follows (amounts in thousands):
Undistributed
Net Investment
Income and
Short-Term
Capital Gains | |
Capital Loss
Carryforward | | Total Net
Distributable
Earnings/
(Accumulated
(Losses) | |
| $ | 66 | | | $ | (542,039 | ) | | $ | (541,973 | ) | |
28
For federal income tax purposes, the Trust measures its capital loss carryforwards annually at October 31, its fiscal year end. Capital loss carryforwards may be carried forward and applied against future capital gains. As of October 31, 2008, the Series had a capital loss carryforward available to offset future realized capital gains through the indicated expiration date (amount in thousands).
| | | Expires on October 31, | |
| | | 2015 | | 2016 | | Total | |
| | | $ | 118,411 | | | $ | 423,628 | | | $ | 542,039 | | |
At October 31, 2008, the total cost and aggregate gross unrealized appreciation and (depreciation) of securities for federal income tax purposes were different from amounts reported for financial reporting purposes (amounts in thousands):
Federal
Tax Cost | |
Unrealized
Appreciation | |
Unrealized
(Depreciation) | | Net
Unrealized
Appreciation
(Depreciation) | |
| $ | 9,332,438 | | | $ | 582,282 | | | $ | (2,463,275 | ) | | $ | (1,880,993 | ) | |
In June 2006, the Financial Accounting Standards Board (FASB) issued FASB Interpretation 48 ("FIN 48"), "Accounting for Uncertainty in Income Taxes." This standard defines the threshold for recognizing the benefits of tax-return positions in the financial statements as "more-likely-than-not" to be sustained by the taxing authority and requires measurement of a tax position meeting the more-likely-than-not criterion, based on the largest benefit that is more than 50 percent likely to be realized. Management has analyzed the Series' tax positions to be taken on the federal income tax returns for all open tax years (tax years ended November 30, 2005 through the period ended October 31, 2008), for purposes of implementing FIN 48, and has concluded that no provision for income tax is required in the Series' financial statements.
F. Financial Instruments:
In accordance with the Series' investment objectives and policies, the Series may invest in certain financial instruments that have off-balance sheet risk in excess of the amounts recognized in the financial statements and concentrations of credit and market risk. These instruments and their significant corresponding risks are described below:
1. Repurchase Agreements: The Series may purchase money market instruments subject to the counterparty's agreement to repurchase them at an agreed upon date and price. The counterparty will be required on a daily basis to maintain the value of the collateral subject to the agreement at not less than the repurchase price (including accrued interest). The agreements are conditioned upon the collateral being deposited under the Federal Reserve book-entry system with the Trust's custodian or a third party sub-custodian. In the event of default or bankruptcy by the other party to the agreement, retention of the collateral may be subject to legal proceedings. All open repurchase agreements were entered into on October 31, 2008.
2. Futures Contracts: During the period October 31, 2008, the Series entered into futures contracts in accordance with its investment objectives. Upon entering into a futures contract, the Series deposits cash or pledges U.S. Government securities to a broker, equal to the minimum "initial margin" requirements of the exchange on which the contract is traded. Subsequent payments are received from or paid to the broker each day, based on the daily fluctuation in the market value of the contract. These receipts or payments are known as "variation margin" and are recorded daily by the Series as unrealized gains or losses until the contracts are closed. When the contracts are closed, the Series records a realized gain or loss equal to the difference between the value of the contrac t at the time it was opened and the value at the time it was closed.
At October 31, 2008, the Series had outstanding 235 long futures contracts of the S&P 500 Index®, all of which expire on December 19, 2008. The value of such contracts on October 31, 2008 was $56,829 (in thousands), which resulted in an unrealized gain of $29 (in thousands). Approximately $5,816 (in thousands) of cash has been segregated as collateral for the open futures contracts and has been accounted for as cash on the Statement of Assets and Liabilities.
29
Risks may arise upon entering into futures contracts from potential imperfect price correlations between the futures contracts and the underlying securities, from the possibility of an illiquid secondary market for these instruments and from the possibility that the Series could lose more than the initial margin requirements.
G. Line of Credit:
The Trust, together with other Dimensional-advised portfolios, has entered into a $250 million unsecured discretionary line of credit effective June 30, 2003 with an affiliate of its domestic custodian bank. Each portfolio is permitted to borrow, subject to its investment limitations, up to a maximum of $250 million, as long as total borrowings under the line of credit do not exceed $250 million in the aggregate. Borrowings under the line are charged interest at the then current Federal Funds Rate plus 1%. Each portfolio is individually, and not jointly, liable for its particular advances under the line of credit. There is no commitment fee on the unused portion of the line of credit. The agreement for the line of credit may be terminated by either party at any time. The line of credit is scheduled to expire on June 23, 2009.
For the period ended October 31, 2008, borrowings by the Series under this line of credit were as follows (amounts in thousands, except percentages and days):
Weighted
Average
Interest Rate | | Weighted
Average
Loan Balance | | Number of
Days
Outstanding | | Interest
Expense
Incurred | | Maximum Amount
Borrowed During
the Period | |
| | 4.03 | % | | $ | 5,774 | | | | 4 | | | $ | 3 | | | $ | 5,880 | | |
There were no outstanding borrowings by the Series under this line of credit at October 31, 2008.
The Trust, together with other Dimensional-advised portfolios, has also entered into an additional $500 million unsecured line of credit effective January 15, 2008 with its international custodian bank. Each portfolio is permitted to borrow, subject to its investment limitations, up to a maximum of $500 million, as long as total borrowings under the line of credit do not exceed $500 million in the aggregate. Each portfolio is individually, and not jointly, liable for its particular advances under the line of credit. Borrowings under the line of credit are charged interest at rates agreed to by the parties at the time of borrowing. There is no commitment fee on the unused portion of the line of credit. The agreement for the line of credit expires on January 15, 2009. There were no borrowings by the Series under this line of credit during the period ended October 31, 2008.
H. Securities Lending:
As of October 31, 2008, the Series had securities on loan to brokers/dealers, for which the Series held cash collateral. The Series invests the cash collateral, as described below, and records a liability for the return of the collateral, during the period the securities are on loan. Loans of securities are expected at all times to be secured by collateral equal to at least (i) 100% of the current market value of the loaned securities with respect to securities of the U.S. government or its agencies, (ii) 102% of the current market value of the loaned securities with respect to U.S. securities, and (iii) 105% of the current market value of the loaned securities with respect to foreign securities. However, daily market fluctuations could cause the Series' collateral to be lower or higher than the expected thresholds. If this were to occur, the collateral would be adjusted the next business day to ensure adequate collateralization. In the even t of default or bankruptcy by the other party to the agreement, realization and/or retention of the collateral may be subject to legal proceedings. If the borrower fails to return loaned securities, and cash collateral being maintained by the borrower is insufficient to cover the value of loaned securities and provided such collateral insufficiency is not the result of investment losses, the lending agent has agreed to pay the amount of the shortfall to the Series or, at the option of the lending agent, to replace the securities.
Subject to the Series' investment policy, the cash collateral received by the Series from securities on loan is invested in securities of the U.S. government or its agencies, repurchase agreements collateralized by securities of the U.S. government or its agencies or shares of the DFA Short Term Investment Fund LP. Agencies include both agency debentures and agency mortgage backed securities. In addition, the Series will be able to terminate the loan at any time and will receive reasonable interest on the loan, as well as amounts equal to any dividends, interest or other
30
distributions on the loaned securities. However, dividend income received from loaned securities may not be eligible to be taxed at qualified dividend income rates.
I. Indemnitees; Contractual Obligations:
Under the Trust's organizational documents, its officers and trustees are indemnified against certain liabilities arising out of the performance of their duties to the Trust.
In the normal course of business, the Trust enters into contracts that contain a variety of representations and warranties which provide general indemnification. The Trust's maximum exposure under these arrangements is unknown as this would involve future claims that may be made against the Trust and/or its affiliates that have not yet occurred. However, based on experience, the Trust expects the risk of loss to be remote.
J. In-Kind Redemptions:
In accordance with guidelines described in the Series' prospectus, the Series may distribute portfolio securities rather than cash as payment for a redemption of fund shares (In-Kind redemption). For financial reporting purposes, the Series recognizes a gain on In-Kind redemptions to the extent the value of the distributed securities on the date of redemption exceeds the cost of those securities. Gains and losses realized on In-Kind redemptions are not recognized for tax purposes and are reclassified from undistributed realized gain (loss) to paid-in capital. During the period December 1, 2007 to October 31, 2008, the Series realized $52,271 (in thousands) of net gain.
K. Recently Issued Accounting Standards and Interpretation:
In March 2008, Statement of Financial Accounting Standards No. 161, Disclosures about Derivative Instruments and Hedging Activities ("FAS 161"), was issued and is effective for fiscal years beginning after November 15, 2008. FAS 161 defines new disclosures of derivative instruments and hedging activities. Management is currently evaluating the implications of FAS 161. At this time, its impact on the Series' financial statements has not been determined.
31
REPORT OF INDEPENDENT REGISTERED PUBLIC ACCOUNTING FIRM
To the Shareholders of The U.S. Large Cap Value Series and
Board of Trustees of The DFA Investment Trust Company:
In our opinion, the accompanying statements of assets and liabilities, including the summary schedules of portfolio holdings, and the related statements of operations and of changes in net assets and the financial highlights presents fairly, in all material respects, the financial position of The U.S. Large Cap Value Series (one of the portfolios constituting The DFA Investment Trust Company, hereafter referred to as the "Series") at October 31, 2008, the results of its operations, the changes in its net assets and the financial highlights for each of the periods indicated, in conformity with accounting principles generally accepted in the United States of America. These financial statements and financial highlights (hereafter referred to as "financial statements") are the responsibility of the Series' management; our responsibility is to express an opinion on these financial statements based on our audits. We conducted our audits of these f inancial statements in accordance with the standards of the Public Company Accounting Oversight Board (United States). Those standards require that we plan and perform the audit to obtain reasonable assurance about whether the financial statements are free of material misstatement. An audit includes examining, on a test basis, evidence supporting the amounts and disclosures in the financial statements, assessing the accounting principles used and significant estimates made by management, and evaluating the overall financial statement presentation. We believe that our audits, which included confirmation of securities at October 31, 2008 by correspondence with the custodian and broker, provide a reasonable basis for our opinion.
PricewaterhouseCoopers LLP
Philadelphia, Pennsylvania
December 22, 2008
32
FUND MANAGEMENT
Trustees/Directors
Each Board of Trustees/Directors of The DFA Investment Trust Company Inc. ("DFAITC"), DFA Investment Dimensions Group Inc. ("DFAIDG"), Dimensional Investment Group Inc. ("DIG") and Dimensional Emerging Markets Value Fund Inc. ("DEM") (each, the "Fund" and collectively, the "Funds") is responsible for establishing the Funds' policies and for overseeing the management of the Funds. The Trustees/Directors of the Funds, including all of the disinterested Directors, have adopted written procedures to monitor potential conflicts of interest that might develop between portfolios of the Funds (the "Feeder Portfolios") that invest in certain series of DFAITC or DEM (the "Master Funds").
Each Board has two standing committees, an Audit Committee and a Portfolio Performance and Service Review Committee (the "Performance Committee"). The Audit Committee is comprised of George M. Constantinides, Roger G. Ibbotson and Abbie J. Smith. Each member of the Audit Committee is a disinterested Director. The Audit Committee oversees the Fund's accounting and financial reporting policies and practices, the Fund's internal controls, the Fund's financial statements and the independent audits thereof and performs other oversight functions as requested by the Board. The Audit Committee recommends the appointment of each Fund's independent registered certified public accounting firm and also acts as a liaison between the Fund's independent registered certified public accounting firm and the full Board. There were three Audit Committee meetings held during the fiscal year ended October 31, 2008.
Each Board's Performance Committee is comprised of Messrs. Constantinides and Ibbotson, Ms. Smith, John P. Gould, Myron S. Scholes and Robert C. Merton. Each member of the Fund's Performance Committee is a disinterested Director. The Performance Committee regularly reviews and monitors the investment performance of the Fund's series and reviews the performance of the Fund's service providers. There were five Performance Committee meetings held during the fiscal year ended October 31, 2008.
Certain biographical information for each disinterested Trustee/Director and each interested Trustee/Director of the Funds is set forth in the tables below, including a description of each Trustee/Director's experience as a Trustee/Director of the Funds and as a director or trustee of other funds, as well as other recent professional experience.
The statements of additional information (together, "SAI") of the Funds include additional information about each Trustee/Director. You may obtain copies of the SAI and prospectus of each Fund advised by Dimensional Fund Advisors LP by calling collect (310) 395-8005 or by mailing a request to Dimensional Fund Advisors LP, 1299 Ocean Avenue, Santa Monica, California 90401. Prospectuses are also available at www.dimensional.com.
Name, Position
with the Fund,
Address and Age | | Term of Office1 and
Length of Service | | Portfolios within the
DFA Fund Complex2
Overseen | | Principal Occupation(s) During Past 5 Years and
Other Directorships of Public Companies Held | |
| | | Disinterested Trustees/Directors | |
|
George M. Constantinides
Director of DFAIDG, DIG and DEM.
Trustee of DFAITC.
The University of Chicago Booth School of Business
5807 S. Woodlawn Avenue Chicago, IL 60637
Age: 61 | | DFAITC - since 1993
DFAIDG - since 1983
DIG - since 1993
DEM - since 1993 | | 96 portfolios in 4 investment companies | | Leo Melamed Professor of Finance, The University of Chicago Booth School of Business. | |
|
33
Name, Position
with the Fund,
Address and Age | | Term of Office1 and
Length of Service | | Portfolios within the
DFA Fund Complex2
Overseen | | Principal Occupation(s) During Past 5 Years and
Other Directorships of Public Companies Held | |
John P. Gould
Director of DFAIDG, DIG and DEM.
Trustee of DFAITC.
The University of Chicago Booth School of Business
5807 S. Woodlawn Avenue
Chicago, IL 60637
Age: 69 | | DFAITC - since 1993
DFAIDG - since 1986
DIG - since 1993
DEM - since 1993 | | 96 portfolios in 4 investment companies | | Steven G. Rothmeier Distinguished Service Professor of Economics, The University of Chicago Booth School of Business (since 1965). Member of the Boards of Milwaukee Mutual Insurance Company (since 1997) and UNext.com (1999-2006). Member Competitive Markets Advisory Committee, Chicago Mercantile Exchange (futures trading exchange) (since 2004). Formerly, Senior Vice-President, Lexecon Inc. (economics, law, strategy and finance consulting) (1994-2004). Formerly, President, Cardean University (division of UNext.com) (1999-2001). Trustee, Harbor Fund (registered investment company) (14 Portfolios) (since 1994). | |
|
Roger G. Ibbotson
Director of DFAIDG, DIG and DEM.
Trustee of DFAITC.
Yale School of Management
P.O. Box 208200
New Haven, CT 06520-8200
Age: 65 | | DFAITC - since 1993
DFAIDG - since 1981
DIG - since 1993
DEM - since 1993 | | 96 portfolios in 4 investment companies | | Professor in Practice of Finance, Yale School of Management (since 1984). Director, BIRR Portfolio Analysis, Inc. (software products) (since 1990). Chairman, CIO and Partner, Zebra Capital Management, LLC (hedge fund manager) (since 2001).
Consultant to Morningstar, Inc. (since 2006). Formerly, Chairman, Ibbotson Associates, Inc., Chicago, IL (software data publishing and consulting) (1977-2006). | |
|
Robert C. Merton
Director of DFAIDG, DIG and DEM.
Trustee of DFAITC.
Harvard Business School
353 Baker Library
Soldiers Field
Boston, MA 02163
Age: 64 | | DFAITC - since 2003
DFAIDG - since 2003
DIG - since 2003
DEM - since 2003 | | 96 portfolios in 4 investment companies | | John and Natty McArthur University Professor, Graduate School of Business Administration, Harvard University (since 1998). George Fisher Baker Professor of Business Administration, Graduate School of Business Administration, Harvard University (1988-1998), Co-founder, Chief Science Officer and Director, Trinsum Group, a successor to Integrated Finance Limited (since 2002). Director, MF Risk, Inc. (risk management software) (since 2001). Director, Peninsula Banking Group (bank) (since 2003). Director, Community First Financial Group (bank holding company) (since 2003). Advisory Board Member, Alpha Simplex Group (hedge fund) (since 2001). Member Competitive Markets Advisory Council, Chicago Mercantile Exchange (futures trading exchange) (since 2004). Formerly, Advisory Board Member, NuServe (insurance software) (2001-2003). Director, Vical Incorporated (biopharmaceutical product development) (since 2002). | |
|
Myron S. Scholes
Director of DFAIDG, DIG and DEM.
Trustee of DFAITC.
Platinum Grove Asset Management, L.P.
Reckson Executive Park
1100 King Street
Building 4
Rye Brook, NY 10573
Age: 67 | | DFAITC - since 1993
DFAIDG - since 1981
DIG - since 1993
DEM - since 1993 | | 96 portfolios in 4 investment companies | | Frank E. Buck Professor Emeritus of Finance, Stanford University (since 1981). Chairman, Platinum Grove Asset Management, L.P. (hedge fund) (formerly, Oak Hill Platinum Partners) (since 1999). Formerly, Managing Partner, Oak Hill Capital Management (private equity firm) (until 2004). Chairman, Oak Hill Platinum Partners (hedge fund) (since 2004). Director, Chicago Mercantile Exchange (since 2001). Director, American Century Fund Complex (registered investment companies) (37 Portfolios) (since 1981); and Director, Chicago Mercantile Exchange Holdings Inc. (since 2000). | |
|
Abbie J. Smith
Director of DFAIDG, DIG and DEM.
Trustee of DFAITC.
The University of Chicago Booth School of Business
5807 S. Woodlawn Avenue
Chicago, IL 60637
Age: 55 | | DFAITC - since 2000
DFAIDG - since 2000
DIG - since 2000
DEM - since 2000 | | 96 portfolios in 4 investment companies | | Boris and Irene Stern Professor of Accounting, The University of Chicago Booth School of Business (since 1980), Formerly, Marvin Bower Fellow, Harvard Business School (9/01 to 8/02). Director, HNI Corporation (formerly known as HON Industries Inc.) (office furniture) (since 2000) and Director, Ryder System Inc. (transportation, logistics and supply-chain management) (since 2003). | |
|
34
Name, Position
with the Fund,
Address and Age | | Term of Office1 and
Length of Service | | Portfolios within the
DFA Fund Complex2
Overseen | | Principal Occupation(s) During Past 5 Years and
Other Directorships of Public Companies Held | |
| | | Interested Trustees/Directors* | |
|
David G. Booth
Chairman, Director, Chief Executive Officer and President of DFAIDG, DIG and DEM. Chairman, Trustee, Chief Executive Officer, Chief Investment Officer and President of DFAITC.
1299 Ocean Avenue
Santa Monica, CA 90401
Age: 61 | | DFAITC - since 1993
DFAIDG - since 1981
DIG - since 1992
DEM - since 1993 | | 96 portfolios in 4 investment companies | | Chairman, Director/Trustee, President, Chief Executive Officer and formerly Chief Investment Officer of the following companies: Dimensional Holdings Inc., Dimensional Fund Advisors LP, DFA Securities Inc., Dimensional Fund Advisors Canada Inc., DFAIDG, DIG, DEM and DFAITC. Director of Dimensional Fund Advisors Ltd, and formerly Chief Investment Officer. Director, President and formerly Chief Investment Officer of DFA Australia Ltd. Director of Dimensional Funds PLC and Dimensional Fund II PLC. Director, Chief Executive Officer and formerly Chief Investment Officer of Dimensional Fund Advisors Canada Inc. (All Chief Investment Officer positions held starting 1/03 through 3/07 except for Dimensional Fund Advisors Canada Inc., which was from 6/03 through 3/07, and Dimensional Holdings Inc., which was from 10/06 through 3/07.)
Limited Partner, Oak Hill Partners, Director, T he University of Chicago Booth School of Business. Formerly, Director, SA Funds (registered investment company). Formerly Director, Assante Corporation (investment management) (until 2002). | |
|
Rex A. Sinquefield
The Show Me Institute
7777 Bonhomme Ave.,
Suite 2150 St. Louis, MO 63105
Age: 64 | | DFAITC - since 1993
DFAIDG - since 1981
DIG - since 1992
DEM - since 1993 | | 96 portfolios in 4 investment companies | | Director/Trustee (and prior to 2006 Chairman, and prior to 2003, Chief Investment Officer) of Dimensional Fund Advisors LP, DFA Securities Inc., DFAIDG, DIG, DEM and DFAITC. Director of Dimensional Holdings Inc. Prior to 2006, Director of Dimensional Fund Advisors Ltd, Director (and prior to 1/1/2003, Chief Investment Officer) of DFA Australia Ltd. Director of Dimensional Funds PLC and Dimensional Fund Advisors Canada Inc.
Trustee, St. Louis University (since 2003). Life Trustee and Member of Investment Committee, DePaul University. Director, The German St. Vincent Orphan Home. Member of Investment Committee, Archdiocese of St. Louis. Trustee and Member of Investment Committee, St. Louis Art Institute (since 2005). President and Director, The Show Me Institute (since 2006). Trustee, St. Louis Symphony Orchestra (since 2005). Trustee, Missouri Botanical Garden (since 2005 ). | |
|
1 Each Trustee/Director holds office for an indefinite term until his or her successor is elected and qualified.
2 Each Trustee/Director is a director or trustee of each of the four registered investment companies within the DFA Fund Complex, which includes the Funds.
* Interested Directors are described as such because they are deemed to be "interested persons," as that term is defined under the Investment Company Act of 1940, as amended, due to their positions with Dimensional Fund Advisors LP.
35
Officers
The name, age, information regarding positions with the Funds and the principal occupation for each officer of the Funds are set forth below. Each officer listed below holds the same office (except as otherwise noted) in the following entities: Dimensional Fund Advisors LP (prior to November 3, 2006, Dimensional Fund Advisors Inc.) ("Dimensional"), DFA Securities Inc., DFAIDG, DIG, DFAITC and DEM (collectively, the "DFA Entities"). The address of each officer is: Dimensional Fund Advisors LP, 1299 Ocean Avenue, Santa Monica, California 90401, unless otherwise indicated.
Name, Position with the Fund
and Age | | Term of Office1
and Length of
Service | | Principal Occupation(s) During Past 5 Years | |
| | | Officers | |
|
April A. Aandal
Vice President
Age: 35 | | Since 2008 | | Vice President of all the DFA Entities. | |
|
Darryl D. Avery
Vice President
Age: 42 | | Since 2005 | | Vice President of all the DFA Entities. From June 2002 to January 2005, institutional client service representative of Dimensional. | |
|
Arthur H. Barlow
Vice President
Age: 52 | | Since 1993 | | Vice President of all the DFA Entities. Formerly, Vice President of DFA Australia Limited and Dimensional Fund Advisors Ltd. | |
|
Scott A. Bosworth
Vice President
Age: 39 | | Since 2007 | | Vice President of all the DFA Entities. Regional Director of Dimensional (since November 1997). | |
|
Valerie A. Brown
Vice President and Assistant Secretary
Age: 41 | | Since 2001 | | Vice President and Assistant Secretary of all the DFA Entities, DFA Australia Limited, Dimensional Fund Advisors Ltd., and since June 2003, Dimensional Fund Advisors Canada Inc. | |
|
David P. Butler
Vice President
Age: 44 | | Since 2007 | | Vice President of all the DFA Entities. Director of US Financial Services of Dimensional (since January 2005). Formerly, Regional Director of Dimensional Fund Advisors LP (January 1995 to January 2005). | |
|
Patrick Carter
Vice President
Age: 46 | | Since 2007 | | Vice President of all the DFA Entities. Regional Director of Dimensional (since March 2006). Formerly, Director of Merrill Lynch Retirement Group (December 1998 to March 2006). | |
|
Stephen A. Clark
Vice President
Age: 36 | | Since 2004 | | Vice President of all the DFA Entities, April 2001 to April 2004, Portfolio Manager of Dimensional. | |
|
Robert P. Cornell
Vice President
Age: 59 | | Since 2007 | | Vice President of all the DFA Entities. Regional Director of Financial Services Group of Dimensional (since August 1993). | |
|
Christopher S. Crossan
Vice President and Chief Compliance Officer
Age: 42 | | Since 2004 | | Vice President and Chief Compliance Officer of all the DFA Entities. Formerly, Senior Compliance Officer, INVESCO Institutional, Inc. and its affiliates (August 2000 to January 2004). | |
|
James L. Davis
Vice President
Age: 51 | | Since 1999 | | Vice President of all the DFA Entities. Formerly, Vice President of DFA Australia Limited and Dimensional Fund Advisors Ltd. | |
|
Robert T. Deere
Vice President
Age: 51 | | Since 1994 | | Vice President of all the DFA Entities and DFA Australia Limited. | |
|
Robert W. Dintzner
Vice President
Age: 38 | | Since 2001 | | Vice President of all the DFA Entities. Prior to April 2001, marketing supervisor and marketing coordinator for Dimensional. | |
|
36
Name, Position with the Fund
and Age | | Term of Office1
and Length of
Service | | Principal Occupation(s) During Past 5 Years | |
Kenneth Elmgren
Vice President
Age: 54 | | Since 2007 | | Vice President of all the DFA Entities. Formerly, Managing Principal of Beverly Capital (May 2004 to September 2006); Principal of Wydown Capital (September 2001 to May 2004). | |
|
Richard A. Eustice
Vice President and Assistant Secretary
Age: 43 | | Since 1998 | | Vice President and Assistant Secretary of all the DFA Entities and DFA Australia Limited. Formerly, Vice President of Dimensional Fund Advisors Ltd. | |
|
Eugene F. Fama, Jr.
Vice President
Age: 47 | | Since 1993 | | Vice President of all the DFA Entities. Formerly, Vice President of DFA Australia Limited and Dimensional Fund Advisors Ltd. | |
|
Gretchen A. Flicker
Vice President
Age: 37 | | Since 2004 | | Vice President of all the DFA Entities. Prior to April 2004, institutional client service representative of Dimensional. | |
|
Jed S. Fogdall
Vice President
Age: 34 | | Since 2008 | | Vice President of all the DFA Entities. Portfolio Manager for Dimensional (since September 2004). Prior to September 2004, Staff Engineer at the Boeing Company (1997-2004); Graduate Student at the University of California, Los Angeles (2002-2003). | |
|
Glenn S. Freed
Vice President
Age: 46 | | Since 2001 | | Vice President of all the DFA Entities. | |
|
Mark R. Gochnour
Vice President
Age: 41 | | Since 2007 | | Vice President of all the DFA Entities. Regional Director of Dimensional. | |
|
Henry F. Gray
Vice President
Age: 41 | | Since 2000 | | Vice President of all the DFA Entities. Prior to July 2000, Portfolio Manager of Dimensional. Formerly, Vice President of DFA Australia Limited. | |
|
John T. Gray
Vice President
Age: 34 | | Since 2007 | | Vice President of all the DFA Entities. Formerly, Regional Director of Dimensional (January 2005 to February 2007). | |
|
Darla Hastings
Vice President
Age: 53 | | Since 2007 | | Vice President of all the DFA Entities. Chief Marketing Officer of Dimensional. Formerly, Senior Vice President, Customer Experience for Benchmark Assisted Living (May 2005 to April 2006); Executive Vice President and Chief Marketing Officer of State Street Corporation (September 2001 to October 2005). | |
|
Joel H. Hefner
Vice President
Age: 40 | | Since 2007 | | Vice President of all the DFA Entities. Regional Director of Dimensional (since June 1998). | |
|
Julie Henderson
Vice President and Fund Controller
Age: 34 | | Since 2005 | | Vice President and Fund Controller of all the DFA Entities. Formerly, Senior Manager at PricewaterhouseCoopers LLP (July 1996 to April 2005). | |
|
Kevin Hight
Vice President
Age: 40 | | Since 2005 | | Vice President of all the DFA Entities. Formerly, Regional Director of Dimensional (since March 2003 to March 2005). | |
|
Christine W. Ho
Vice President
Age: 40 | | Since 2004 | | Vice President of all the DFA Entities. Prior to April 2004, Assistant Controller of Dimensional. | |
|
Jeff J. Jeon
Vice President
Age: 34 | | Since 2004 | | Vice President of all the DFA Entities. Prior to April 2004, Counsel of Dimensional. | |
|
Patrick M. Keating
Vice President
Age: 53 | | Since 2003 | | Vice President of all the DFA Entities and Chief Operating Officer of Dimensional. Director, Vice President and Chief Privacy Officer of Dimensional Fund Advisors Canada Inc. Director of DFA Australia Limited. | |
|
37
Name, Position with the Fund
and Age | | Term of Office1
and Length of
Service | | Principal Occupation(s) During Past 5 Years | |
Joseph F. Kolerich
Vice President
Age: 36 | | Since 2004 | | Vice President of all the DFA Entities. From April 2001 to April 2004, Portfolio Manager for Dimensional. | |
|
Michael F. Lane
Vice President
Age: 41 | | Since 2004 | | Vice President of all the DFA Entities. Formerly, Vice President of Advisor Services at TIAA-CREF (July 2001 to September 2004). | |
|
Kristina M. LaRusso
Vice President
Age: 33 | | Since 2006 | | Vice President of all DFA Entities. Formerly, Operations Supervisor of Dimensional (March 2003 to December 2006). | |
|
Inmoo Lee
Vice President
Age: 42 | | Since 2007 | | Vice President of all the DFA Entities. Associate Professor Department of Finance and Accounting, Business School, National University of Singapore (July 2004 to present); Associate Professor, College of Business Administration, Korea University (September 2001 to May 2006). | |
|
Juliet Lee
Vice President
Age: 37 | | Since 2005 | | Vice President of all the DFA Entities. Human Resources Manager of Dimensional (since January 2004). Formerly, Assistant Vice President for Metropolitan West Asset Management LLC (February 2001 to December 2003). | |
|
Aaron M. Marcus
Vice President & Head of Global Human Resources
Age: 38 | | Since 2008 | | Vice President and Head of Global Human Resources of Dimensional. Formerly, Global Head of Recruiting and Vice President of Goldman Sachs & Co. (June 2006 to January 2008); Global Co-Head of HR of the Equities & FICC Division, and Vice President of Goldman Sachs & Co. (May 2005 to May 2006); Head of Americas Campus Recruiting and Vice President of Goldman Sachs & Co. (April 2003 to May 2005). | |
|
David R. Martin
Vice President, Chief Financial Officer and Treasurer
Age: 51 | | Since 2007 | | Vice President, Chief Financial Officer and Treasurer of all the DFA Entities. Director, Vice President, Chief Financial Officer and Treasurer of Dimensional Fund Advisors Ltd. and DFA Australia Limited. Chief Financial Officer, Treasurer, and Vice President of Dimensional Fund Advisors Canada Inc. Director of Dimensional Funds PLC and Dimensional Funds II PLC. Formerly, Executive Vice President and Chief Financial Officer of Janus Capital Group Inc. (June 2005 to March 2007); Senior Vice President of Finance at Charles Schwab & Co., Inc. (March 1999 to May 2005). | |
|
Catherine L. Newell
Vice President and Secretary
Age: 44 | | Vice President since 1997 and Secretary since 2000 | | Vice President and Secretary of all the DFA Entities. Director, Vice President and Assistant Secretary of DFA Australia Limited (since February 2002, April 1997 and May 2002, respectively). Vice President and Secretary of Dimensional Fund Advisors Canada Inc. (since June 2003). Director, Dimensional Funds PLC and Dimensional Funds II PLC (since January 2002). Formerly, Assistant Secretary of all DFA Entities and Dimensional Fund Advisors Ltd. | |
|
Gerard K. O'Reilly
Vice President
Age: 31 | | Since 2007 | | Vice President of all the DFA Entities. Formerly, Research Associate of Dimensional Fund Advisors LP (2004 to 2006); Research Assistant in PhD program, Aeronautics Department California Institute of Technology (1998 to 2004). | |
|
Carmen Palafox
Vice President
Age: 34 | | Since 2006 | | Vice President of all the DFA Entities. Operations Manager of Dimensional Fund Advisors LP (since May 1996). | |
|
Sonya Park
Vice President
Age: 36 | | Since 2005 | | Vice President of all the DFA Entities. From February 2002 to January 2005, institutional client service representative of Dimensional. | |
|
David A. Plecha
Vice President
Age: 47 | | Since 1993 | | Vice President of all the DFA Entities, DFA Australia Limited and Dimensional Fund Advisors Ltd.. | |
|
Ted Randall
Vice President
Age: 35 | | Since 2008 | | Vice President of all the DFA Entities. Formerly, Research Associate of Dimensional (2006-2008). Systems Developer of Dimensional (2001-2006). | |
|
38
Name, Position with the Fund
and Age | | Term of Office1
and Length of
Service | | Principal Occupation(s) During Past 5 Years | |
Eduardo A. Repetto
Vice President and Chief Investment Officer
Age: 41 | | Since 2002 | | Chief Investment Officer (beginning March 2007) and Vice President of all the DFA Entities, DFA Australia Limited and Dimensional Fund Advisors Canada Inc. Formerly, Research Associate for Dimensional (June 2000 to April 2002). | |
|
L. Jacobo Rodriguez
Vice President
Age: 37 | | Since 2005 | | Vice President of all the DFA Entities. From August 2004 to July 2005, institutional client service representative of Dimensional. Formerly, Financial Services Analyst, Cato Institute (September 2001 to June 2004); Book Review Editor, Cato Journal, Cato Institute (May 1996 to June 2004). | |
|
David E. Schneider
Vice President
Age: 62 | | Since 2001 | | Vice President of all the DFA Entities. Currently, Director of Institutional Services. | |
|
Ted R. Simpson
Vice President
Age: 40 | | Since 2007 | | Vice President of all the DFA Entities. Regional Director of Dimensional (since December 2002). | |
|
Bryce D. Skaff
Vice President
Age: 33 | | Since 2007 | | Vice President of all the DFA Entities. Formerly, Regional Director of Dimensional (December 1999 to January 2007). | |
|
Grady M. Smith
Vice President
Age: 51 | | Since 2004 | | Vice President of all the DFA Entities. Prior to April 2004, Portfolio Manager of Dimensional. | |
|
Carl G. Snyder
Vice President
Age: 45 | | Since 2000 | | Vice President of all the DFA Entities. Formerly, Vice President of DFA Australia Limited. | |
|
Lawrence R. Spieth
Vice President
Age: 60 | | Since 2004 | | Vice President of all the DFA Entities. Prior to April 2004, Regional Director of Dimensional. | |
|
Bradley G. Steiman
Vice President
Age: 35 | | Since 2004 | | Vice President of all the DFA Entities and Director and Vice President of Dimensional Fund Advisors Canada Inc. | |
|
Karen E. Umland
Vice President
Age: 42 | | Since 1997 | | Vice President of all the DFA Entities, DFA Australia Limited, Dimensional Fund Advisors Ltd., and since June 2003, Dimensional Fund Advisors Canada Inc. | |
|
Carol W. Wardlaw
Vice President
Age: 49 | | Since 2004 | | Vice President of all the DFA Entities. Prior to April 2004, Regional Director of Dimensional. | |
|
Weston J. Wellington
Vice President
Age: 57 | | Since 1997 | | Vice President of all the DFA Entities. Formerly, Vice President of DFA Australia Limited. | |
|
Daniel M. Wheeler
Vice President
Age: 63 | | Since 2001 | | Vice President of all the DFA Entities. Prior to 2001 and currently, Director of Financial Advisors Services of Dimensional. Director of Dimensional Fund Advisors Ltd. (since October 2003) and President of Dimensional Fund Advisors Canada Inc. (since June 2003). | |
|
Ryan Wiley
Vice President
Age: 32 | | Since 2007 | | Vice President of all the DFA Entities. Senior Trader of Dimensional. Formerly, Portfolio Manager (2006 to 2007); Trader (2001 to 2006). | |
|
Paul E. Wise
Vice President
Age: 53 | | Since 2005 | | Vice President of all the DFA Entities. Chief Technology Officer for Dimensional (since 2004). Formerly, Principal of Turnbuckle Management Group (January 2002 to August 2004). | |
|
1 Each officer holds office for an indefinite term at the pleasure of the Boards of Trustee/Directors and until his or her successor is elected and qualified.
39
VOTING PROXIES ON FUND PORTFOLIO SECURITIES
A description of the policies and procedures that the Trust uses in voting proxies relating to securities held in the portfolio is available without charge, upon request, by calling collect: (310) 395-8005. Information regarding how the Advisor votes these proxies is available from the EDGAR database on the SEC's website at http://www.sec.gov and from the Advisor's website at http://www.dimensional.com and reflects the twelve-month period beginning July 1st and ending June 30th.
40
NOTICE TO SHAREHOLDERS
(Unaudited)
For shareholders that do not have an October 31, 2008 tax year end, this notice is for informational purposes only. For shareholders with an October 31, 2008 tax year end, please consult your tax advisor as to the pertinence of this notice. For the period December 1, 2007 to October 31, 2008, each Fund is designating the following items with regard to distributions paid during the period.
| Dimensional Investment Group Inc. | | Net
Investment
Income
Distributions | | Short-Term
Capital Gain
Distributions | | Long-Term
Capital Gain
Distributions | | Total
Distributions | | Qualifying
For Corporate
Dividends
Received
Deduction(1) | | Qualifying
Dividend
Income(2) | | Qualifying
Interest
Income(3) | | Qualifying
Short-Term
Capital Gain(4) | |
| U.S. Large Cap Value Portfolio II | | | 15 | % | | | — | | | | 85 | % | | | 100 | % | | | 89 | % | | | 85 | % | | | 1 | % | | | — | | |
| The DFA Investment Trust Company | | | | | | | | | | | | | | | | | |
| The U.S. Large Cap Value Series | | | 100 | % | | | — | | | | — | | | | 100 | % | | | 85 | % | | | 83 | % | | | 1 | % | | | — | | |
(1) Qualifying dividends represent dividends which qualify for the corporate dividends received deduction and is reflected as a percentage of ordinary income distributions (the total of short-term capital gain and net investment income distributions).
(2) The percentage in this column represents the amount of "Qualifying Dividend Income" as created by the Jobs and Growth Tax Relief Reconciliation Act of 2003 and is reflected as a percentage of ordinary income distributions (the total of short-term capital gain and net investment income distributions). It is the intention of each of the aforementioned funds to designate the maximum amount permitted by law.
(3) The percentage in this column represents the amount of "Qualifying Interest Income" as created by The American Jobs Creation Act of 2004. The information is reflected as a percentage of ordinary income distributions (the total of short-term capital gain and net investment income distributions).
(4) The percentage in this column represents the amount of "Qualifying Short-Term Capital Gain" as created by The American Jobs Creation Act of 2004. The information is reflected as a percentage of ordinary income distributions (the total of short-term capital gain and net investment income distributions).
41
[THIS PAGE INTENTIONALLY LEFT BLANK]
[THIS PAGE INTENTIONALLY LEFT BLANK]
[THIS PAGE INTENTIONALLY LEFT BLANK]

DFA103108-009A
DIMENSIONAL INVESTMENT GROUP INC.
U.S. Large Cap Value Portfolio III
Annual Report
Period Ended October 31, 2008
Dimensional Fund Advisors
6300 Bee Cave Road, Building One
Austin, TX 78746
December 2008
Dear Fellow Shareholder,
This has been a challenging year for investors. After drifting lower throughout the spring and summer, stock markets around the world plummeted in mid September on news that the ongoing credit crisis was driving some leading financial services companies toward failure. As the effects of this distress rippled through the financial world, investors became increasingly anxious and stock prices continued to decline sharply. In the month of October, the S&P 500 Index fell 16.8% or 196 points—its worst-ever monthly point decline.
Markets like this test investors' resolve. It is difficult to stick with a long-term investment plan when one sees the dramatic effects of high market volatility on a portfolio's value. Very few people are having a positive investment experience right now. But investors who have based their approach on a sensible risk/return framework tend to be in better shape than those who have not.
The recent market turbulence illustrates the reason why Dimensional believes that markets are efficient. History has shown time and again that prices cannot be predicted in public equity markets. This "random walk" makes diversification very important. Although the broad diversification in our portfolios didn't prevent negative performance this year, we believe it helped our shareholders avoid the extreme losses experienced by investors who concentrated their holdings in individual companies, industry sectors, or markets.
The unpredictability of stock prices also makes it important for investors to take a hard look at their own portfolios and determine how much risk and what types of risk they should take. Investors who hold asset mixes that accurately reflect their tolerance for risk are better able to withstand down markets.
Nobody knows when the capital markets will recover, but over time we can expect them to again offer a premium to investors who are willing to invest in relatively risky assets such as stocks. My view is that investors who have already paid for risk should stay invested and earn the return that can be expected when markets turn around. If markets continue to be so volatile, it's also important to understand that pulling money out of stocks, even for short periods of time, can result in significant missed opportunities.
All of us at Dimensional take our job as the steward of your assets very seriously and hope to have the opportunity to serve you for many years to come.
Sincerely,
David G. Booth
Chairman and Chief Executive Officer
[THIS PAGE INTENTIONALLY LEFT BLANK]
ANNUAL REPORT
Table of Contents
| Letter to Shareholders | | Page | |
| Definitions of Abbreviations and Footnotes | | | 1 | | |
|
| Dimensional Investment Group Inc. — U.S. Large Cap Value Portfolio III | |
|
| Performance Chart | | | 2 | | |
|
| Management's Discussion and Analysis | | | 3 | | |
|
| Disclosure of Fund Expenses | | | 5 | | |
|
| Disclosure of Portfolio Holdings | | | 6 | | |
|
| Statement of Assets and Liabilities | | | 7 | | |
|
| Statements of Operations | | | 8 | | |
|
| Statements of Changes in Net Assets | | | 9 | | |
|
| Financial Highlights | | | 10 | | |
|
| Notes to Financial Statements | | | 11 | | |
|
| Report of Independent Registered Public Accounting Firm | | | 15 | | |
|
| The DFA Investment Trust Company — The U.S. Large Cap Value Series | |
|
| Performance Chart | | | 16 | | |
|
| Disclosure of Fund Expenses | | | 17 | | |
|
| Disclosure of Portfolio Holdings | | | 18 | | |
|
| Summary Schedule of Portfolio Holdings | | | 19 | | |
|
| Statement of Assets and Liabilities | | | 22 | | |
|
| Statements of Operations | | | 23 | | |
|
| Statements of Changes in Net Assets | | | 24 | | |
|
| Financial Highlights | | | 25 | | |
|
| Notes to Financial Statements | | | 26 | | |
|
| Report of Independent Registered Public Accounting Firm | | | 32 | | |
|
| Fund Management | | | 33 | | |
|
| Voting Proxies on Fund Portfolio Securities | | | 40 | | |
|
| Notice to Shareholders | | | 41 | | |
|
This report is submitted for the information of the Fund's shareholders. It is not authorized for distribution to prospective investors unless preceded or accompanied by an effective prospectus.
i
[THIS PAGE INTENTIONALLY LEFT BLANK]
DIMENSIONAL INVESTMENT GROUP INC.
THE DFA INVESTMENT TRUST COMPANY
DEFINITIONS OF ABBREVIATIONS AND FOOTNOTES
Statement of Assets and Liabilities/Summary Schedule of Portfolio Holdings
Investment Abbreviations
FNMA Federal National Mortgage Association
STRIP Separate Trading of Registered Interest and Principal Securities
Investment Footnotes
† See Note B to Financial Statements.
** Calculated as a percentage of total net assets. Percentages shown parenthetically next to the category headings have been calculated as a percentage of total investments. "Other Securities" are those securities that are not among the top 50 holdings of the Fund or do not represent more than 1.0% of the net assets of the Fund. Some of the individual securities within this category may include Total or Partial Securities on Loan and/or Non-Income Producing Securities.
* Non-Income Producing Securities.
# Total or Partial Securities on Loan.
@ Security purchased with cash proceeds from Securities on Loan.
(y) The rate shown is the effective yield.
§ Affiliated Fund.
Financial Highlights
(A) Computed using average shares outstanding.
(B) Annualized
(C) Non-Annualized
(D) Represents the combined ratios for the respective portfolio and its respective pro-rata share of its Master Fund Series.
All Statements and Schedules
— Amounts designated as — are either zero or rounded to zero.
REIT Real Estate Investment Trust
SEC Securities and Exchange Commission
1
DIMENSIONAL INVESTMENT GROUP INC.
PERFORMANCE CHART
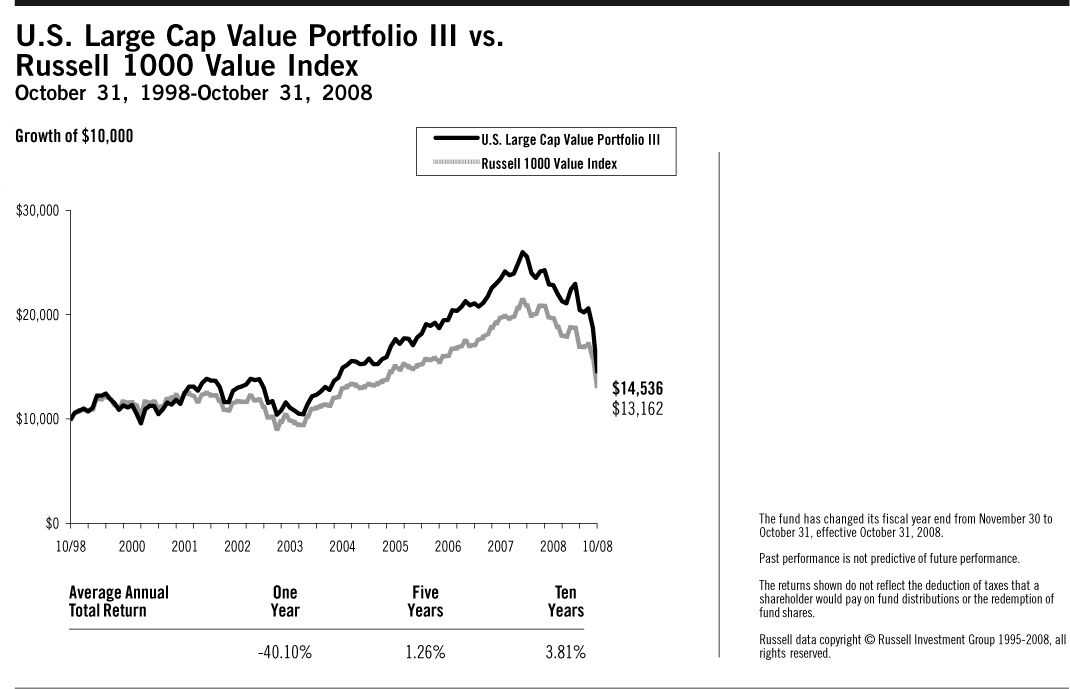
2
MANAGEMENT'S DISCUSSION AND ANALYSIS
On September 16, 2008, at a regular meeting of the Board of Directors/Trustees (the "Board") of the funds covered by this report, the Board voted to change the fiscal and tax year ends of the funds from November 30 to October 31. Therefore, the following discussion generally covers the 11-month period ended October 31, 2008.
U.S. Equity Market Review 11 Months Ended October 31, 2008
U.S. equity markets experienced high levels of volatility during the 11-month fiscal year ended October 31, 2008. The behavior of equity markets has been driven in large part by the contraction of lending in credit markets. In addition to heightened volatility, the cross-sectional dispersion of stock returns in equity markets has increased relative to previous levels, and returns even within each asset class have differed greatly. Dimensional Fund Advisors believes that a security's risk characteristics determine its expected return. Among the most important factors explaining differences in the behavior of diversified equity portfolios are company size and company value/growth characteristics of the portfolio holdings. Size is measured by market capitalization, and "value" classification is a function of stock price relative to one or more fundamental characteristics. Compared to other stocks, value stocks often have lower market value rela tive to their earnings, dividends, and book value.
For the 11 months ended October 31, 2008, small company stocks slightly outperformed large companies, and mid cap companies underperformed both small and large cap companies. The performance of the Russell Microcap Index® was –33.59%, the Russell 2000 Index® was –29.07%, CRSP 6-10 Index was –32.90%, and MSCI USA Small Cap 1750 Index was –32.21%. Large cap value stocks, as measured by the Russell 1000 Value Index®, slightly outperformed large cap growth stocks, as measured by the Russell 1000 Growth Index®. The value premium was larger among small cap stocks.
Total Return for 11 Months Ended October 31, 2008
| Russell 2000 Index® (small cap companies) | | | –29.07 | % | |
| Russell Midcap Index® (mid cap companies) | | | –37.70 | % | |
| Russell 1000 Index® (large cap companies) | | | –33.99 | % | |
| Russell 3000 Value Index® | | | –32.90 | % | |
| Russell 3000 Growth Index® | | | –34.45 | % | |
When the large, mid, and small cap market segments are further divided by value and growth characteristics, the distinction in performance within sectors was equally significant.
Total Return for 11 Months Ended October 31, 2008
| Russell 1000 Value Index® (large cap value companies) | | | –33.55 | % | |
| Russell 1000 Growth Index® (large cap growth companies) | | | –34.54 | % | |
| Russell Midcap Value Index® (mid cap value companies) | | | –35.42 | % | |
| Russell Midcap Growth Index® (mid cap growth companies) | | | –40.01 | % | |
| Russell 2500 Value Index® (small/mid cap value companies) | | | –29.10 | % | |
| Russell 2500 Growth Index® (small/mid cap growth companies) | | | –37.30 | % | |
| Russell 2000 Value Index® (small cap value companies) | | | –24.91 | % | |
| Russell 2000 Growth Index® (small cap growth companies) | | | –33.26 | % | |
Source: Russell data copyright © Russell Investment Group 1995-2008, all rights reserved.
Differences in returns for the various Dimensional U.S. equity funds over the 11 months ended October 31, 2008 were attributable primarily to differences in value/growth and size characteristics as well as the exclusion of REIT securities from most Dimensional portfolios, except for the DFA Real Estate Securities Portfolio and portfolios investing in the U.S. Large Company Series. Moreover, the portfolio construction approach used by Dimensional Fund Advisors generally resulted in portfolios with greater emphasis on value or small company characteristics relative to widely used index benchmarks.
3
Master-Feeder Structure
The portfolio described below, called a "Feeder Fund," does not buy individual securities directly; instead, the portfolio invests in a corresponding fund called a "Master Fund." The Master Fund, in turn, purchases stocks, bonds, and/or other securities.
U.S. Large Cap Value Portfolio III
The U.S. Large Cap Value Portfolio III seeks to capture the returns of U.S. large company value stocks by purchasing shares of a Master Fund that invests in such stocks. The investment strategy employs a disciplined, quantitative approach, emphasizing broad diversification and consistent exposure to large cap value stocks, but does not attempt to track closely a specific equity index. The Master Fund held approximately 200 stocks as of October 31, 2008, and was mostly invested in equities throughout the year: average cash levels for the 11 months ended October 31, 2008 were in general less than 1% of the Master Fund's assets.
As a result of the Master Fund's diversified investment approach, performance was determined principally by broad structural trends in the U.S. equity market, rather than by the behavior of a limited number of stocks. For the 11 months ended October 31, 2008, large cap value stocks generally outperformed large cap growth stocks. Total returns were –33.31% for the S&P 500 Index®, –33.55% for the Russell 1000 Value Index®, and –36.55% for the Portfolio. Relative to the Russell 1000 Value Index®, underperformance of the Portfolio was primarily due to the Master Fund's lower-exposure to stocks with neutral value/growth characteristics as measured by book-to-market ("BtM") ratio, and weighting and composition differences of consumer discretionary and consumer staples stocks due to structural differences in the eligible universe of the Master Fund as compared to the Index. Less value- oriented stocks in the middle BtM quartiles, which represented approximately 11% of the Master Fund compared to approximately 47% of the Index, outperformed value stocks in the highest BtM quartile by more than 15 percentage points. Stocks held by the Master Fund in the consumer discretionary sector, which represented approximately 16% of the Master Fund compared to approximately 8% of the Index, underperformed the Index by about 13 percentage points. Stocks held by the Master Fund in the consumer staples sector, which represented approximately 5% of the Master Fund compared to 9% of the Index, underperformed similar stocks held by the Index by approximately 20 percentage points.
4
DIMENSIONAL INVESTMENT GROUP INC.
U.S. LARGE CAP VALUE PORTFOLIO III
DISCLOSURE OF FUND EXPENSES
(Unaudited)
The following Expense Table is shown so that you can understand the impact of fees on your investment. All mutual funds have operating expenses. As a shareholder of the fund, you incur ongoing costs, which include costs for portfolio management, administrative services, and shareholder reports, among others. Operating expenses, legal and audit services, which are deducted from a fund's gross income, directly reduce the investment return of the fund. A fund's expenses are expressed as a percentage of its average net assets. This figure is known as the expense ratio. The following examples are intended to help you understand the ongoing costs, in dollars, of investing in the fund and to compare these costs with those of other mutual funds. The examples are based on an investment of $1,000 made at the beginning of the period shown and held for the entire period.
The Expense Table below illustrates your fund's costs in two ways.
Actual Fund Return
This section helps you to estimate the actual expenses after fee waivers that you paid over the period. The "Ending Account Value" shown is derived from the fund's actual return and "Expenses Paid During Period" reflect the dollar amount that would have been paid by an investor who started with $1,000 in the fund. You may use the information here, together with the amount you invested, to estimate the expenses that you paid over the period.
To do so, simply divide your account value by $1,000 (for example, a $7,500 account value divided by $1,000 = 7.5), then multiply the result by the number given for your fund under the heading "Expenses Paid During Period."
Hypothetical Example for Comparison Purposes
This section is intended to help you compare your fund's costs with those of other mutual funds. The hypothetical "Ending Account Value" and "Expenses Paid During Period" are derived from the fund's actual expense ratio and an assumed 5% annual return before expenses. In this case, because the return used is not the fund's actual return, the results do not apply to your investment. The example is useful in making comparisons because the SEC requires all mutual funds to calculate expenses based on a 5% annual return. You can assess your fund's cost by comparing this hypothetical example with the hypothetical examples that appear in shareholder reports of other funds.
Please note that the expenses shown in the table are meant to highlight and help you compare ongoing costs only and do not reflect any transactional costs, if applicable. The "Annualized Expense Ratio" represents the actual expenses for the six-month period indicated.
Six Months Ended October 31, 2008
EXPENSE TABLE
| | | Beginning
Account
Value
05/01/08 | | Ending
Account
Value
10/31/08 | | Annualized
Expense
Ratio* | | Expenses
Paid
During
Period* | |
| Actual Fund Return | | $ | 1,000.00 | | | $ | 648.40 | | | | 0.14 | % | | $ | 0.58 | | |
| Hypothetical 5% Annual Return | | $ | 1,000.00 | | | $ | 1,024.43 | | | | 0.14 | % | | $ | 0.71 | | |
* Expenses are equal to the fund's annualized expense ratio for the six-month period, multiplied by the average account value over the period, multiplied by the number of days in the most recent six-month period (184), then divided by the number of days in the year (366) to reflect the six-month period. The Portfolio is a Feeder Fund. The expenses shown reflect the direct expenses of the Feeder Fund and the indirect payment of the Feeder Fund's portion of the expenses of its Master Fund.
5
DIMENSIONAL INVESTMENT GROUP INC.
U.S. LARGE CAP VALUE PORTFOLIO III
DISCLOSURE OF PORTFOLIO HOLDINGS
(Unaudited)
The SEC requires that all Funds file a complete Schedule of Investments with the SEC for their first and third fiscal quarters on Form N-Q. For Dimensional Investment Group Inc., this would be for the fiscal quarters ending January 31 and July 31. The Form N-Q filing must be made within 60 days of the end of the quarter. Dimensional Investment Group Inc. filed its most recent Form N-Q with the SEC on October 30, 2008. It is available upon request, without charge, by calling collect: (310) 395-8005 or by mailing a request to Dimensional Fund Advisors LP, 1299 Ocean Avenue, Santa Monica, California 90401, or by visiting the SEC's website at http://www.sec.gov, or they may be reviewed and copied at the SEC's Public Reference Room in Washington, D.C. (call 1-800-732-0330 for information on the operation of the Public Reference Room).
PORTFOLIO HOLDINGS
The SEC requires that all Funds present their categories of portfolio holdings in a table, chart or graph format in their annual and semi-annual shareholder reports, whether or not a Schedule of Investments is utilized. The following table, which presents portfolio holdings as a percent of total investments before short-term investments and collateral for loaned securities, is provided in compliance with such requirement.
The categories of industry classification for the Affiliated Investment Company are represented in the Disclosure of Portfolio Holdings, which are included elsewhere within the report. Refer to the Summary Schedule of Portfolio Holdings for the underlying Master Fund's holdings which reflect the investments by category.
| Affiliated Investment Company | | | 100.0 | % | |
6
DIMENSIONAL INVESTMENT GROUP INC.
U.S. LARGE CAP VALUE PORTFOLIO III
STATEMENT OF ASSETS AND LIABILITIES
OCTOBER 31, 2008
(Amounts in thousands, except share and per share amounts)
| ASSETS: | |
Investment in The U.S. Large Cap Value Series of The DFA Investment Trust Company
(Affiliated Investment Company) (90,518,096 Shares) at Value† | | $ | 1,227,425 | | |
| Receivables: | |
| Fund Shares Sold | | | 3,786 | | |
| Prepaid Expenses and Other Assets | | | 28 | | |
| Total Assets | | | 1,231,239 | | |
| LIABILITIES: | |
| Payables: | |
| Affiliated Investment Company Shares Purchased | | | 2,712 | | |
| Fund Shares Redeemed | | | 1,074 | | |
| Due to Advisor | | | 10 | | |
| Accrued Expenses and Other Liabilities | | | 112 | | |
| Total Liabilities | | | 3,908 | | |
| NET ASSETS | | $ | 1,227,331 | | |
| SHARES OUTSTANDING, $0.01 PAR VALUE (1) | | | 110,047,778 | | |
| NET ASSET VALUE, OFFERING AND REDEMPTION PRICE PER SHARE | | $ | 11.15 | | |
| Investment in Affiliated Investment Company at Cost | | $ | 1,523,698 | | |
| NET ASSETS CONSIST OF: | |
| Paid-In Capital | | $ | 1,548,133 | | |
| Undistributed Net Investment Income (Distributions in Excess of Net Investment Income) | | | 6,093 | | |
| Accumulated Net Realized Gain (Loss) | | | (30,622 | ) | |
| Net Unrealized Appreciation (Depreciation) | | | (296,273 | ) | |
| NET ASSETS | | $ | 1,227,331 | | |
| (1) NUMBER OF SHARES AUTHORIZED | | | 200,000,000 | | |
See accompanying Notes to Financial Statements.
7
DIMENSIONAL INVESTMENT GROUP INC.
U.S. LARGE CAP VALUE PORTFOLIO III
STATEMENTS OF OPERATIONS
(Amounts in thousands)
| | | Period
Dec. 1, 2007
to
Oct. 31, 2008 | | Year
Ended
Nov. 30,
2007 | |
| Investment Income | |
| Income Distributions Received from Affiliated Investment Company | | $ | 30,044 | | | $ | 24,713 | | |
| Expenses | |
| Administrative Services Fees | | | 150 | | | | 172 | | |
| Accounting & Transfer Agent Fees | | | 33 | | | | 35 | | |
| Filing Fees | | | 69 | | | | 62 | | |
| Shareholders' Reports | | | 84 | | | | 79 | | |
| Directors'/Trustees' Fees & Expenses | | | — | | | | 12 | | |
| Professional Fees | | | 43 | | | | 41 | | |
| Other | | | 10 | | | | 4 | | |
| Total Expenses | | | 389 | | | | 405 | | |
| Net Investment Income (Loss) | | | 29,655 | | | | 24,308 | | |
| Realized and Unrealized Gain (Loss) | |
| Capital Gain Distributions Received from Affiliated Investment Company | | | — | | | | 83,262 | | |
| Net Realized Gain (Loss) on Affiliated Investment Company Shares Sold | | | (18,481 | ) | | | (929 | ) | |
Change in Unrealized Appreciation (Depreciation) of Affiliated
Investment Company Shares | | | (678,634 | ) | | | (122,011 | ) | |
| Net Realized and Unrealized Gain (Loss) | | | (697,115 | ) | | | (39,678 | ) | |
| Net Increase (Decrease) in Net Assets Resulting from Operations | | $ | (667,460 | ) | | $ | (15,370 | ) | |
See accompanying Notes to Financial Statements.
8
DIMENSIONAL INVESTMENT GROUP INC.
U.S. LARGE CAP VALUE PORTFOLIO III
STATEMENTS OF CHANGES IN NET ASSETS
(Amounts in thousands)
| | | Period
Dec. 1, 2007
to
Oct. 31,
2008 | | Year
Ended
Nov. 30,
2007 | | Year
Ended
Nov. 30,
2006 | |
| Increase (Decrease) in Net Assets | |
| Operations: | |
| Net Investment Income (Loss) | | $ | 29,655 | | | $ | 24,308 | | | $ | 23,043 | | |
Capital Gain Distributions Received from Affiliated Investment
Company | | | — | | | | 83,262 | | | | 38,894 | | |
Net Realized Gain (Loss) on Affiliated Investment Company
Shares Sold | | | (18,481 | ) | | | (929 | ) | | | (343 | ) | |
Change in Unrealized Appreciation (Depreciation) of Affiliated
Investment Company Shares | | | (678,634 | ) | | | (122,011 | ) | | | 162,996 | | |
Net Increase (Decrease) in Net Assets
Resulting from Operations | | | (667,460 | ) | | | (15,370 | ) | | | 224,590 | | |
| Distributions From: | |
| Net Investment Income | | | (29,233 | ) | | | (23,042 | ) | | | (20,907 | ) | |
| Net Short-Term Gains | | | (463 | ) | | | (2,528 | ) | | | (2,751 | ) | |
| Net Long-Term Gains | | | (77,610 | ) | | | (35,469 | ) | | | (802 | ) | |
| Total Distributions | | | (107,306 | ) | | | (61,039 | ) | | | (24,460 | ) | |
| Capital Share Transactions (1): | |
| Shares Issued | | | 573,859 | | | | 386,999 | | | | 316,260 | | |
| Shares Issued in Lieu of Cash Distributions | | | 106,838 | | | | 61,039 | | | | 24,460 | | |
| Shares Redeemed | | | (409,826 | ) | | | (188,907 | ) | | | (114,928 | ) | |
| Net Increase (Decrease) from Capital Share Transactions | | | 270,871 | | | | 259,131 | | | | 225,792 | | |
| Total Increase (Decrease) in Net Assets | | | (503,895 | ) | | | 182,722 | | | | 425,922 | | |
| Net Assets | |
| Beginning of Period | | | 1,731,226 | | | | 1,548,504 | | | | 1,122,582 | | |
| End of Period | | $ | 1,227,331 | | | $ | 1,731,226 | | | $ | 1,548,504 | | |
| (1) Shares Issued and Redeemed: | |
| Shares Issued | | | 37,800 | | | | 19,491 | | | | 17,724 | | |
| Shares Issued in Lieu of Cash Distributions | | | 6,224 | | | | 3,141 | | | | 1,421 | | |
| Shares Redeemed | | | (26,294 | ) | | | (9,517 | ) | | | (6,419 | ) | |
| | | | 17,730 | | | | 13,115 | | | | 12,726 | | |
Undistributed Net Investment Income (Distributions in
Excess of Net Investment Income) | | $ | 6,093 | | | $ | 6,580 | | | $ | 6,053 | | |
See accompanying Notes to Financial Statements.
9
DIMENSIONAL INVESTMENT GROUP INC.
U.S. LARGE CAP VALUE PORTFOLIO III
FINANCIAL HIGHLIGHTS
(for a share outstanding throughout each period)
| | | Period
Dec. 1, 2007
to
Oct. 31,
2008 | | Year
Ended
Nov. 30,
2007 | | Year
Ended
Nov. 30,
2006 | | Year
Ended
Nov. 30,
2005 | | Year
Ended
Nov. 30,
2004 | | Year
Ended
Nov. 30,
2003 | |
| Net Asset Value, Beginning of Period | | $ | 18.75 | | | $ | 19.55 | | | $ | 16.89 | | | $ | 14.91 | | | $ | 12.50 | | | $ | 10.55 | | |
| Income from Investment Operations | |
| Net Investment Income (Loss) | | | 0.29 | (A) | | | 0.28 | (A) | | | 0.31 | (A) | | | 0.25 | | | | 0.14 | | | | 0.16 | | |
Net Gains (Losses)
(Realized and Unrealized) | | | (6.76 | ) | | | (0.33 | ) | | | 2.69 | | | | 1.91 | | | | 2.54 | | | | 1.94 | | |
| Total from Investment Operations | | | (6.47 | ) | | | (0.05 | ) | | | 3.00 | | | | 2.16 | | | | 2.68 | | | | 2.10 | | |
| Less Distributions | |
| Net Investment Income | | | (0.29 | ) | | | (0.27 | ) | | | (0.29 | ) | | | (0.18 | ) | | | (0.27 | ) | | | (0.15 | ) | |
| Net Realized Gains | | | (0.84 | ) | | | (0.48 | ) | | | (0.05 | ) | | | — | | | | — | | | | — | | |
| Total Distributions | | | (1.13 | ) | | | (0.75 | ) | | | (0.34 | ) | | | (0.18 | ) | | | (0.27 | ) | | | (0.15 | ) | |
| Net Asset Value, End of Period | | $ | 11.15 | | | $ | 18.75 | | | $ | 19.55 | | | $ | 16.89 | | | $ | 14.91 | | | $ | 12.50 | | |
| Total Return | | | (36.55 | )%(C) | | | (0.35 | )% | | | 18.10 | % | | | 14.62 | % | | | 21.72 | % | | | 20.23 | % | |
| Net Assets, End of Period (thousands) | | $ | 1,227,331 | | | $ | 1,731,226 | | | $ | 1,548,504 | | | $ | 1,122,582 | | | $ | 821,194 | | | $ | 545,795 | | |
Ratio of Expenses to Average
Net Assets (D) | | | 0.14 | %(B) | | | 0.14 | % | | | 0.14 | % | | | 0.17 | % | | | 0.19 | % | | | 0.18 | % | |
Ratio of Net Investment Income to
Average Net Assets | | | 1.98 | %(B) | | | 1.41 | % | | | 1.75 | % | | | 1.60 | % | | | 1.02 | % | | | 1.58 | % | |
See page 1 for the Definitions of Abbreviations and Footnotes.
See accompanying Notes to Financial Statements.
10
DIMENSIONAL INVESTMENT GROUP INC.
U.S. LARGE CAP VALUE PORTFOLIO III
NOTES TO FINANCIAL STATEMENTS
A. Organization:
Dimensional Investment Group Inc. (the "Fund") is an open-end management investment company registered under the Investment Company Act of 1940, whose shares are offered to institutional investors, retirement plans and clients of registered investment advisors. The Fund consists of fifteen portfolios, of which U.S. Large Cap Value Portfolio III (the "Portfolio") is presented in this report.
The Portfolio primarily invests its assets in The U.S. Large Cap Value Series (the "Series"), a corresponding series of The DFA Investment Trust Company. At October 31, 2008, the Portfolio owned 18% of the outstanding shares of the Series. The financial statements of the Series are included elsewhere in this report and should be read in conjunction with the financial statements of the Portfolio.
At a regular meeting of the Board of Directors/Trustees (the "Board") on September 16, 2008, the Board voted to change the fiscal and tax year ends of the Portfolio from November 30 to October 31.
B. Significant Accounting Policies:
The following significant accounting policies are in conformity with accounting principles generally accepted in the United States of America. Such policies are consistently followed by the Fund in preparation of its financial statements. The preparation of financial statements in accordance with accounting principles generally accepted in the United States of America requires management to make estimates and assumptions that affect the reported amounts of assets and liabilities and disclosure of contingent assets and liabilities at the date of the financial statements and the reported amounts of increases and decreases in net assets from operations during the reporting period. Actual results could differ from those estimates and those differences could be material.
1. Security Valuation: The shares of the Series held by the Portfolio are valued at their respective daily net asset value.
Adoption of Statement of Financial Accounting Standards No. 157 "Fair Value Measurements" ("FAS 157")
In September 2006, the Financial Accounting Standards Board issued FAS 157 effective for fiscal years beginning after November 15, 2007. This standard clarifies the definition of fair value for financial reporting, establishes a framework for measuring fair value and requires additional disclosures about the use of fair value measurements. The Funds have adopted FAS 157 as of December 1, 2007. The three levels of the fair value hierarchy under FAS 157 are described below:
• Level 1 – quoted prices in active markets for identical securities
• Level 2 – other significant observable inputs (including quoted prices for similar securities, interest rates, prepayment speeds, credit risk, etc.)
• Level 3 – significant unobservable inputs (including the Portfolio's own assumptions in determining the fair value of investments)
The inputs or methodology used for valuing securities are not necessarily an indication of the risk associated with investing in those securities. A summary of the inputs used to value the Portfolio's net assets as of October 31, 2008 is listed below (in thousands).
| | | Valuation Inputs | |
| | | Investments in
Securities
(Market Value) | |
| | | Level 1 | | Level 2 | | Level 3 | | Total | |
| U.S. Large Cap Value Portfolio III | | $ | 1,227,425 | | | | — | | | | — | | | $ | 1,227,425 | | |
11
2. Deferred Compensation Plan: Each eligible Director of the Fund may elect participation in the Deferred Compensation Plan (the "Plan"). Under the Plan, effective January 1, 2002, such Directors may defer payment of all or a portion of their total fees earned as a Director. These deferred amounts may be treated as though such amounts had been invested in shares of the following funds: U.S. Large Cap Value Portfolio; U.S. Core Equity 1 Portfolio; U.S. Core Equity 2 Portfolio; U.S. Vector Equity Portfolio; U.S. Micro Cap Portfolio; DFA International Value Portfolio; International Core Equity Portfolio; Emerging Markets Portfolio; Emerging Markets Core Equity Portfolio; and/or DFA Two-Year Global Fixed Income Portfolio. Contributions made under the Plan and the change in unrealized a ppreciation (depreciation) and income, are included in Other Expenses for the period ended October 31, 2008 and are included in Directors'/Trustees' Fees & Expenses for the year ended November 30, 2007. At October 31, 2008, the total liability for deferred compensation to Directors is included in Accrued Expenses and Other Liabilities in the amount of $24 (in thousands).
Each Director has the option to receive their distribution of proceeds in one of the following methods upon one year's notice: lump sum; annual installments over a period of agreed upon years; or semi-annual installments over a period of agreed upon years. As of October 31, 2008, none of the Directors have requested distribution of proceeds.
3. Other: Security transactions are accounted for as of the trade date. Costs used in determining realized gains and losses on the sale of affiliated investment company shares are on the basis of identified cost. Dividend income and distributions to shareholders are recorded on the ex-dividend date. Distributions received from investment in affiliated investment company that represent a return of capital or capital gain are recorded as a reduction of cost of investments or as a realized gain, respectively. Expenses directly attributable to the Portfolio are directly charged. Common expenses of the Fund are allocated using methods approved by the Board of Directors/Trustees, generally based on average net assets.
C. Investment Advisor:
Dimensional Fund Advisors LP ("Dimensional" or the "Advisor") provides administrative services to the Portfolio, including supervision of services provided by others, providing information to the shareholders and to the Board of Directors/Trustees, and other administrative services. The Advisor provides investment advisory services to the Series. For the period December 1, 2007 to October 31, 2008, the Portfolio's administrative services fees were accrued daily and paid monthly to the Advisor based on an effective annual rate of 0.01% of average daily net assets.
Fees Paid to Officers and Directors/Trustees:
Certain Officers and Directors/Trustees of the Advisor are also Officers and Directors/Trustees of the Fund; however, such Officers and Directors/Trustees (with the exception of the Chief Compliance Officer ("CCO")) receive no compensation from the Fund. For the period December 1, 2007 to October 31, 2008, the total related amounts paid by the Fund to the CCO were $25 (in thousands). The total related amounts paid by the Portfolio are included in Other Expenses on the Statement of Operations.
D. Federal Income Taxes:
The Portfolio has qualified and intends to continue to qualify as a regulated investment company under Subchapter M of the Internal Revenue Code for federal income tax purposes and to distribute substantially all of its taxable income and net capital gains to shareholders. Accordingly, no provision has been made for federal income taxes.
Distributions from net investment income and net realized capital gains are determined in accordance with U.S. federal income tax regulations, which may differ from those amounts determined under accounting principles generally accepted in the United States of America. These book/tax differences are either temporary or permanent in nature. To the extent these differences are permanent, they are charged or credited to paid-in capital, undistributed net investment income or accumulated net realized gains, as appropriate, in the period that the differences arise. Accordingly, the following permanent differences as of October 31, 2008, primarily attributable to the utilization of accumulated earnings and profits distributed to shareholders on redemptions of shares as part of the dividends paid deduction for income tax
12
purposes were reclassified to the following accounts. These reclassifications had no effect on net assets or net asset value per share. (amounts in thousands):
Increase
(Decrease)
Paid-In Capital | | Increase
(Decrease)
Undistributed
Net Investment
Income | | Increase
(Decrease)
Accumulated
Net Realized
Gains/(Losses) | |
| $ | 912 | | | $ | (909 | ) | | $ | (3 | ) | |
The tax character of dividends and distributions declared and paid during the years ended November 30, 2006, November 30, 2007 and the period December 1, 2007 to October 31, 2008 were as follows (amounts in thousands):
| | | Net Investment
Income and
Short-Term
Capital Gains | | Long-Term
Capital Gains | | Total | |
| | 2006 | | | $ | 24,206 | | | $ | 1,558 | | | $ | 25,764 | | |
| | 2007 | | | | 26,436 | | | | 38,031 | | | | 64,467 | | |
| | 2008 | | | | 29,705 | | | | 77,601 | | | | 107,306 | | |
At October 31, 2008, the following net investment income and short-term capital gain and long-term capital gain distributions designated for federal income tax purposes are due to the utilization of accumulated earnings and profits distributed to shareholders upon redemption of shares (amounts in thousands):
Net Investment
Income
and Short-Term
Capital Gains | | Long-Term
Capital Gains | | Total | |
| $ | 912 | | | | — | | | $ | 912 | | |
At October 31, 2008, the components of distributable earnings/(accumulated losses) were as follows (amounts in thousands):
Undistributed
Net Investment
Income and
Short-Term
Capital Gains | | Undistributed
Long-Term
Capital Gains | | Total Net
Distributable
Earnings/
(Accumulated
Losses) | |
| $ | 6,453 | | | | — | | | $ | 6,453 | | |
For federal income tax purposes, the Fund measures its capital loss carryforwards annually at October 31, its fiscal year end. Capital loss carryforwards may be carried forward and applied against future capital gains. As of October 31, 2008, the Portfolio had no capital loss carryforwards available to offset future realized capital gains.
At October 31, 2008, the total cost and aggregate gross unrealized appreciation and (depreciation) of securities for federal income tax purposes were different from amounts reported for financial reporting purposes (amounts in thousands):
Federal
Tax Cost | | Unrealized
Appreciation | | Unrealized
(Depreciation) | | Net
Unrealized
Appreciation
(Depreciation) | |
| $ | 1,554,657 | | | | — | | | $ | (327,232 | ) | | $ | (327,232 | ) | |
In June 2006, the Financial Accounting Standards Board (FASB) issued FASB Interpretation 48 ("FIN 48"), "Accounting for Uncertainty in Income Taxes." This standard defines the threshold for recognizing the benefits of tax-return positions in the financial statements as "more-likely-than-not" to be sustained by the taxing authority and requires measurement of a tax position meeting the more-likely-than-not criterion, based on the largest benefit that is more than 50 percent likely to be realized. Management has analyzed the Portfolio's tax positions to be taken on the federal income tax returns for all open tax years (tax years ended November 30, 2005 through the period ended October 31, 2008), for purposes of implementing FIN 48, and has concluded that no provision for income tax is required in the Portfolio's financial statements.
13
E. Line of Credit:
The Fund, together with other Dimensional-advised portfolios, has entered into a $250 million unsecured discretionary line of credit effective June 30, 2003 with an affiliate of its domestic custodian bank. Each portfolio is permitted to borrow, subject to its investment limitations, up to a maximum of $250 million, as long as total borrowings under the line of credit do not exceed $250 million in the aggregate. Borrowings under the line of credit are charged interest at the then current Federal Funds Rate plus 1%. Each portfolio is individually, and not jointly, liable for its particular advances under the line of credit. There is no commitment fee on the unused portion of the line of credit. The agreement for the discretionary line of credit may be terminated by either party at any time. The line of credit is scheduled to expire on June 23, 2009. There were no borrowings by the Portfolio under this line of credit during the period ended Oc tober 31, 2008.
The Fund, together with other Dimensional-advised portfolios, has also entered into an additional $500 million unsecured line of credit effective January 15, 2008 with its international custodian bank. Each portfolio is permitted to borrow, subject to its investment limitations, up to a maximum of $500 million, as long as total borrowings under the line of credit do not exceed $500 million in the aggregate. Each portfolio is individually, and not jointly, liable for its particular advances under the line of credit. Borrowings under the line of credit are charged interest at rates agreed to by the parties at the time of borrowing. There is no commitment fee on the unused portion of the line of credit. The agreement of the line of credit expires on January 15, 2009. There were no borrowings by the Portfolio under this line of credit during the period ended October 31, 2008.
F. Indemnitees; Contractual Obligations:
Under the Fund's organizational documents, its officers and directors are indemnified against certain liabilities arising out of the performance of their duties to the Fund.
In the normal course of business, the Fund enters into contracts that contain a variety of representations and warranties which provide general indemnification. The Fund's maximum exposure under these arrangements is unknown as this would involve future claims that may be made against the Fund and/or its affiliates that have not yet occurred. However, based on experience, the Fund expects the risk of loss to be remote.
G. Recently Issued Accounting Standards and Interpretation:
In March 2008, Statement of Financial Accounting Standards No. 161, Disclosures about Derivative Instruments and Hedging Activities ("FAS 161"), was issued and is effective for fiscal years beginning after November 15, 2008. FAS 161 defines new disclosures of derivative instruments and hedging activities. Management is currently evaluating the implications of FAS 161. At this time, its impact on the Portfolio's financial statements has not been determined.
H. Other:
At October 31, 2008, two shareholders held approximately 81% of the outstanding shares of the Portfolio. One or more of the shareholders is an omnibus account, which typically hold shares for the benefit of several other underlying investors.
14
REPORT OF INDEPENDENT REGISTERED PUBLIC ACCOUNTING FIRM
To the Shareholders of U.S. Large Cap Value Portfolio III and
Board of Directors of Dimensional Investment Group Inc.:
In our opinion, the accompanying statement of assets and liabilities, and the related statements of operations and of changes in net assets and the financial highlights present fairly, in all material respects, the financial position of U.S. Large Cap Value Portfolio III (one of the portfolios constituting Dimensional Investment Group Inc., hereafter referred to as the "Portfolio") at October 31, 2008, the results of its operations, the changes in its net assets and the financial highlights for each of the periods indicated, in conformity with accounting principles generally accepted in the United States of America. These financial statements and financial highlights (hereafter referred to as "financial statements") are the responsibility of the Portfolio's management; our responsibility is to express an opinion on these financial statements based on our audits. We conducted our audits of these financial statements in accordance with the sta ndards of the Public Company Accounting Oversight Board (United States). Those standards require that we plan and perform the audit to obtain reasonable assurance about whether the financial statements are free of material misstatement. An audit includes examining, on a test basis, evidence supporting the amounts and disclosures in the financial statements, assessing the accounting principles used and significant estimates made by management, and evaluating the overall financial statement presentation. We believe that our audits, which included confirmation of securities at October 31, 2008 by correspondence with the transfer agent of the investee fund, provide a reasonable basis for our opinion.
PricewaterhouseCoopers LLP
Philadelphia, Pennsylvania
December 22, 2008
15
THE DFA INVESTMENT TRUST COMPANY
PERFORMANCE CHART
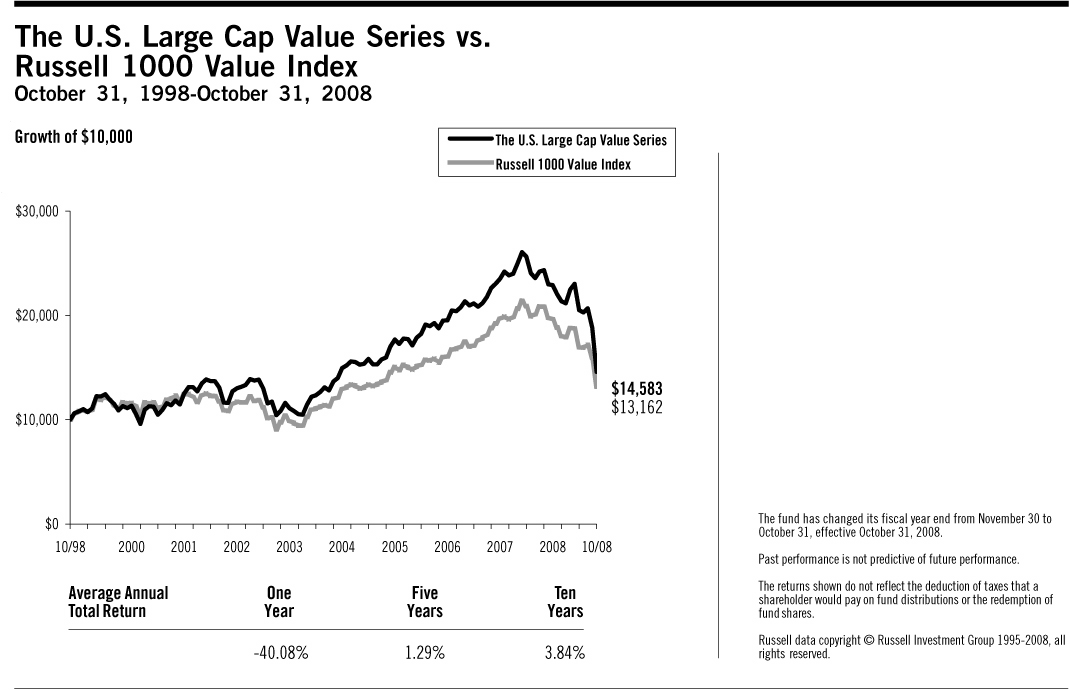
16
THE DFA INVESTMENT TRUST COMPANY
THE U.S. LARGE CAP VALUE SERIES
DISCLOSURE OF FUND EXPENSES
(Unaudited)
The following Expense Table is shown so that you can understand the impact of fees on your investment. All mutual funds have operating expenses. As a shareholder of the fund, you incur ongoing costs, which include costs for portfolio management, administrative services, and shareholder reports, among others. Operating expenses, legal and audit services, which are deducted from a fund's gross income, directly reduce the investment return of the fund. A fund's expenses are expressed as a percentage of its average net assets. This figure is known as the expense ratio. The following examples are intended to help you understand the ongoing costs, in dollars, of investing in the fund and to compare these costs with those of other mutual funds. The examples are based on an investment of $1,000 made at the beginning of the period shown and held for the entire period.
The Expense Table below illustrates your fund's costs in two ways.
Actual Fund Return
This section helps you to estimate the actual expenses after fee waivers that you paid over the period. The "Ending Account Value" shown is derived from the fund's actual return and "Expenses Paid During Period" reflect the dollar amount that would have been paid by an investor who started with $1,000 in the fund. You may use the information here, together with the amount you invested, to estimate the expenses that you paid over the period.
To do so, simply divide your account value by $1,000 (for example, a $7,500 account value divided by $1,000 = 7.5), then multiply the result by the number given for your fund under the heading "Expenses Paid During Period."
Hypothetical Example for Comparison Purposes
This section is intended to help you compare your fund's costs with those of other mutual funds. The hypothetical "Ending Account Value" and "Expenses Paid During Period" are derived from the fund's actual expense ratio and an assumed 5% annual return before expenses. In this case, because the return used is not the fund's actual return, the results do not apply to your investment. The example is useful in making comparisons because the SEC requires all mutual funds to calculate expenses based on a 5% annual return. You can assess your fund's cost by comparing this hypothetical example with the hypothetical examples that appear in shareholder reports of other funds.
Please note that the expenses shown in the table are meant to highlight and help you compare ongoing costs only and do not reflect any transactional costs, if applicable. The "Annualized Expense Ratio" represents the actual expenses for the six-month period indicated.
Six Months Ended October 31, 2008
EXPENSE TABLE
| | | Beginning
Account
Value
05/01/08 | | Ending
Account
Value
10/31/08 | | Annualized
Expense
Ratio* | | Expenses
Paid
During
Period* | |
| Actual Fund Return | | $ | 1,000.00 | | | $ | 648.60 | | | | 0.11 | % | | $ | 0.46 | | |
| Hypothetical 5% Annual Return | | $ | 1,000.00 | | | $ | 1,024.58 | | | | 0.11 | % | | $ | 0.56 | | |
* Expenses are equal to the fund's annualized expense ratio for the six-month period, multiplied by the average account value over the period, multiplied by the number of days in the most recent six-month period (184), then divided by the number of days in the year (366) to reflect the six-month period.
17
THE DFA INVESTMENT TRUST COMPANY
THE U.S. LARGE CAP VALUE SERIES
DISCLOSURE OF PORTFOLIO HOLDINGS
(Unaudited)
The SEC requires that all Funds file a complete Schedule of Investments with the SEC for their first and third fiscal quarters on Form N-Q. For The DFA Investment Trust Company, this would be for the fiscal quarters ending January 31 and July 31. The Form N-Q filing must be made within 60 days of the end of the quarter. The DFA Investment Trust Company filed its most recent Form N-Q with the SEC on October 30, 2008. It is available upon request, without charge, by calling collect: (310) 395-8005 or by mailing a request to Dimensional Fund Advisors LP, 1299 Ocean Avenue, Santa Monica, California 90401, or by visiting the SEC's website at http://www.sec.gov, or they may be reviewed and copied at the SEC's Public Reference Room in Washington, D.C. (call 1-800-732-0330 for information on the operation of the Public Reference Room).
SEC regulations permit a fund to include in its reports to shareholders a "Summary Schedule of Portfolio Holdings" in lieu of a full Schedule of Investments. The Summary Schedule of Portfolio Holdings reports the fund's 50 largest holdings in unaffiliated issuers and any investments that exceed one percent of the fund's net assets at the end of the reporting period. The amendments also require that the Summary Schedule of Portfolio Holdings identify each category of investments that are held.
The fund is required to file a complete Schedule of Investments with the SEC on Form N-CSR within ten days after mailing the annual and semi-annual reports to shareholders. It will be available upon request, without charge, by calling collect: (310) 395-8005 or by mailing a request to Dimensional Fund Advisors LP, 1299 Ocean Avenue, Santa Monica, California 90401, or by visiting the SEC's website at http://www.sec.gov, or they may be reviewed and copied at the SEC's Public Reference Room in Washington, D.C. (call 1-800-732-0330 for information on the operation of the Public Reference Room).
PORTFOLIO HOLDINGS
The SEC requires that all Funds present their categories of portfolio holdings in a table, chart or graph format in their annual and semi-annual shareholder reports, whether or not a Schedule of Investments is utilized. The following table, which presents portfolio holdings as a percent of total investments before short-term investments and collateral for loaned securities, is provided in compliance with such requirement. The categories shown below represent broad industry sectors. Each industry sector consists of one or more specific industry classifications.
Consumer
Discretionary | | Consumer
Staples | | Energy | | Financials | | Health
Care | | Industrials | | Information
Technology | | Materials | | Telecommunication
Services | | Utilities | | Total | |
| | 12.6 | % | | | 5.5 | % | | | 15.1 | % | | | 30.8 | % | | | 1.8 | % | | | 17.4 | % | | | 4.6 | % | | | 3.4 | % | | | 8.7 | % | | | 0.1 | % | | | 100.0 | % | |
18
THE U.S. LARGE CAP VALUE SERIES
SUMMARY SCHEDULE OF PORTFOLIO HOLDINGS
October 31, 2008
| | | Shares | | Value† | | Percentage
of Net Assets** | |
| COMMON STOCKS — (88.7%) | |
| Consumer Discretionary — (11.6%) | |
| CBS Corp. Class B | | | 5,590,306 | | | $ | 54,281,871 | | | | 0.8 | % | |
| Comcast Corp. Class A | | | 12,216,542 | | | | 192,532,702 | | | | 2.9 | % | |
| # Comcast Corp. Special Class A Non-Voting | | | 3,110,315 | | | | 47,961,057 | | | | 0.7 | % | |
| * Liberty Media Corp. - Entertainment Class A | | | 3,864,672 | | | | 62,221,219 | | | | 0.9 | % | |
| # Time Warner, Inc. | | | 18,369,180 | | | | 185,345,026 | | | | 2.7 | % | |
| # Tyco Electronics, Ltd. | | | 1,537,111 | | | | 29,881,438 | | | | 0.4 | % | |
| Other Securities | | | | | | | 292,496,695 | | | | 4.4 | % | |
| Total Consumer Discretionary | | | | | | | 864,720,008 | | | | 12.8 | % | |
| Consumer Staples — (4.9%) | |
| Archer-Daniels-Midland Co. | | | 1,219,060 | | | | 25,271,114 | | | | 0.4 | % | |
| # Coca-Cola Enterprises, Inc. | | | 3,519,272 | | | | 35,368,684 | | | | 0.5 | % | |
| Kraft Foods, Inc. | | | 5,533,321 | | | | 161,240,974 | | | | 2.4 | % | |
| Molson Coors Brewing Co. | | | 755,890 | | | | 28,240,050 | | | | 0.4 | % | |
| Other Securities | | | | | | | 116,481,392 | | | | 1.7 | % | |
| Total Consumer Staples | | | | | | | 366,602,214 | | | | 5.4 | % | |
| Energy — (13.4%) | |
| # Anadarko Petroleum Corp. | | | 3,422,156 | | | | 120,802,107 | | | | 1.8 | % | |
| # Apache Corp. | | | 2,051,191 | | | | 168,874,555 | | | | 2.5 | % | |
| # Chesapeake Energy Corp. | | | 2,496,221 | | | | 54,841,975 | | | | 0.8 | % | |
| # ConocoPhillips | | | 4,659,773 | | | | 242,401,391 | | | | 3.6 | % | |
| # Devon Energy Corp. | | | 1,962,942 | | | | 158,723,490 | | | | 2.4 | % | |
| Marathon Oil Corp. | | | 2,640,550 | | | | 76,840,005 | | | | 1.1 | % | |
| Other Securities | | | | | | | 177,364,431 | | | | 2.6 | % | |
| Total Energy | | | | | | | 999,847,954 | | | | 14.8 | % | |
| Financials — (27.3%) | |
| Allstate Corp. | | | 2,540,615 | | | | 67,046,830 | | | | 1.0 | % | |
| # Bank of America Corp. | | | 7,236,574 | | | | 174,907,994 | | | | 2.6 | % | |
| # Capital One Financial Corp. | | | 1,668,884 | | | | 65,286,742 | | | | 1.0 | % | |
| # Chubb Corp. | | | 1,620,173 | | | | 83,957,365 | | | | 1.2 | % | |
| # Cincinnati Financial Corp. | | | 1,305,789 | | | | 33,937,456 | | | | 0.5 | % | |
| CNA Financial Corp. | | | 1,896,282 | | | | 29,506,148 | | | | 0.4 | % | |
| JPMorgan Chase & Co. | | | 7,213,911 | | | | 297,573,829 | | | | 4.4 | % | |
| Loews Corp. | | | 3,808,002 | | | | 126,463,746 | | | | 1.9 | % | |
| # M&T Bank Corp. | | | 440,052 | | | | 35,688,217 | | | | 0.5 | % | |
| # Merrill Lynch & Co., Inc. | | | 1,408,640 | | | | 26,186,618 | | | | 0.4 | % | |
| # MetLife, Inc. | | | 5,000,810 | | | | 166,126,908 | | | | 2.5 | % | |
| # Morgan Stanley | | | 2,999,997 | | | | 52,409,948 | | | | 0.8 | % | |
| # New York Community Bancorp, Inc. | | | 2,223,800 | | | | 34,824,708 | | | | 0.5 | % | |
| # Prudential Financial, Inc. | | | 1,829,600 | | | | 54,888,000 | | | | 0.8 | % | |
| # SunTrust Banks, Inc. | | | 945,360 | | | | 37,946,750 | | | | 0.6 | % | |
| The Travelers Companies, Inc. | | | 5,075,909 | | | | 215,979,928 | | | | 3.2 | % | |
| Unum Group | | | 2,404,389 | | | | 37,869,127 | | | | 0.6 | % | |
| Other Securities | | | | | | | 492,099,070 | | | | 7.3 | % | |
| Total Financials | | | | | | | 2,032,699,384 | | | | 30.2 | % | |
| Health Care — (1.6%) | |
| *# WellPoint, Inc. | | | 1,694,537 | | | | 65,866,653 | | | | 1.0 | % | |
| Other Securities | | | | | | | 52,007,419 | | | | 0.8 | % | |
| Total Health Care | | | | | | | 117,874,072 | | | | 1.8 | % | |
19
THE U.S. LARGE CAP VALUE SERIES
CONTINUED
| | | Shares | | Value† | | Percentage
of Net Assets** | |
| Industrials — (15.4%) | |
| *# Allied Waste Industries, Inc. | | | 2,682,276 | | | $ | 27,949,316 | | | | 0.4 | % | |
| # Burlington Northern Santa Fe Corp. | | | 2,178,273 | | | | 193,996,993 | | | | 2.9 | % | |
| # CSX Corp. | | | 3,309,804 | | | | 151,324,239 | | | | 2.2 | % | |
| FedEx Corp. | | | 432,063 | | | | 28,243,958 | | | | 0.4 | % | |
| # Norfolk Southern Corp. | | | 3,154,102 | | | | 189,056,874 | | | | 2.8 | % | |
| # Northrop Grumman Corp. | | | 2,590,384 | | | | 121,463,106 | | | | 1.8 | % | |
| # Southwest Airlines Co. | | | 5,076,220 | | | | 59,797,872 | | | | 0.9 | % | |
| Union Pacific Corp. | | | 4,066,600 | | | | 271,526,882 | | | | 4.0 | % | |
| Other Securities | | | | | | | 105,722,697 | | | | 1.7 | % | |
| Total Industrials | | | | | | | 1,149,081,937 | | | | 17.1 | % | |
| Information Technology — (3.7%) | |
| *# Computer Sciences Corp. | | | 1,361,543 | | | | 41,064,137 | | | | 0.6 | % | |
| *# Symantec Corp. | | | 2,636,076 | | | | 33,161,836 | | | | 0.5 | % | |
| Xerox Corp. | | | 3,605,491 | | | | 28,916,038 | | | | 0.4 | % | |
| Other Securities | | | | | | | 170,627,649 | | | | 2.6 | % | |
| Total Information Technology | | | | | | | 273,769,660 | | | | 4.1 | % | |
| Materials — (3.0%) | |
| # Dow Chemical Co. | | | 2,427,760 | | | | 64,748,359 | | | | 1.0 | % | |
| # International Paper Co. | | | 1,643,445 | | | | 28,300,123 | | | | 0.4 | % | |
| # Weyerhaeuser Co. | | | 1,415,829 | | | | 54,112,984 | | | | 0.8 | % | |
| Other Securities | | | | | | | 78,273,714 | | | | 1.1 | % | |
| Total Materials | | | | | | | 225,435,180 | | | | 3.3 | % | |
| Telecommunication Services — (7.7%) | |
| # AT&T, Inc. | | | 9,749,000 | | | | 260,980,730 | | | | 3.9 | % | |
| # Verizon Communications, Inc. | | | 8,542,208 | | | | 253,447,311 | | | | 3.7 | % | |
| Other Securities | | | | | | | 58,656,568 | | | | 0.9 | % | |
| Total Telecommunication Services | | | | | | | 573,084,609 | | | | 8.5 | % | |
| Utilities — (0.1%) | |
| Total Utilities | | | | | | | 4,787,743 | | | | 0.1 | % | |
| TOTAL COMMON STOCKS | | | | | | | 6,607,902,761 | | | | 98.1 | % | |
| | | Face
Amount | | | | | |
| | | (000) | | | | | |
| TEMPORARY CASH INVESTMENTS — (1.9%) | |
Repurchase Agreement, PNC Capital Markets, Inc. 0.94%, 11/03/08
(Collateralized by $130,825,000 FNMA 5.50%, 05/01/37 & 6.00%, 05/01/38,
valued at $146,641,902) to be repurchased at $144,481,317 | | $ | 144,470 | | | | 144,470,000 | | | | 2.1 | % | |
20
THE U.S. LARGE CAP VALUE SERIES
CONTINUED
| | | Shares | | Value† | | Percentage
of Net Assets** | |
| SECURITIES LENDING COLLATERAL — (9.4%) | |
| §@ DFA Short Term Investment Fund LP | | | 641,002,721 | | | $ | 641,002,721 | | | | 9.5 | % | |
| @ PNC Demand Deposit Account 0.22% | | | 10,000,000 | | | | 10,000,000 | | | | 0.2 | % | |
| | | Face
Amount | | | | | |
| | | (000) | | | | | |
@ Repurchase Agreement, Deutsche Bank Securitites 0.24%, 11/03/08
(Collateralized by $65,652,304 FNMA, rates ranging from 5.500% to 7.000%,
maturities ranging from 07/01/33 to 09/01/38 & U.S. Treasury STRIP 0.599%(y),
02/15/09, valued at $49,188,211) to be repurchased at $48,070,107 | | $ | 48,069 | | | | 48,069,158 | | | | 0.7 | % | |
| TOTAL SECURITIES LENDING COLLATERAL | | | | | | | 699,071,879 | | | | 10.4 | % | |
TOTAL INVESTMENTS — (100.0%)
(Cost $9,331,596,076) | | | | | | $ | 7,451,444,640 | | | | 110.6 | % | |
See accompanying Notes to Financial Statements.
21
THE DFA INVESTMENT TRUST COMPANY
THE U.S. LARGE CAP VALUE SERIES
STATEMENT OF ASSETS AND LIABILITIES
OCTOBER 31, 2008
(Amounts in thousands, except share and per share amounts)
| ASSETS: | |
| Investments at Value (including $690,374 of securities on loan) | | $ | 6,607,903 | | |
| Temporary Cash Investments at Value & Cost | | | 144,470 | | |
| Collateral Received from Securities on Loan at Value & Cost | | | 699,072 | | |
| Receivables: | |
| Investment Securities Sold | | | 10,617 | | |
| Dividends and Interest | | | 12,718 | | |
| Securities Lending Income | | | 1,430 | | |
| Fund Shares Sold | | | 4,995 | | |
| Fund Margin Variation | | | 29 | | |
| Prepaid Expenses and Other Assets | | | 7 | | |
| Total Assets | | | 7,481,241 | | |
| LIABILITIES: | |
| Payables: | |
| Upon Return of Securities Loaned | | | 699,072 | | |
| Investment Securities Purchased | | | 41,685 | | |
| Fund Shares Redeemed | | | 136 | | |
| Due to Advisor | | | 570 | | |
| Accrued Expenses and Other Liabilities | | | 415 | | |
| Total Liabilities | | | 741,878 | | |
| NET ASSETS | | $ | 6,739,363 | | |
| SHARES OUTSTANDING, $0.01 PAR VALUE (1) | | | 497,037,187 | | |
| NET ASSET VALUE, OFFERING AND REDEMPTION PRICE PER SHARE | | $ | 13.56 | | |
| Investments at Cost | | $ | 8,488,055 | | |
| NET ASSETS CONSIST OF: | |
| Paid-In Capital | | $ | 9,162,464 | | |
| Undistributed Net Income (Distributions in Excess of Net Investment Income) | | | (68 | ) | |
| Accumulated Net Realized Gain (Loss) | | | (542,910 | ) | |
| Net Unrealized Appreciation (Depreciation) | | | (1,880,123 | ) | |
| NET ASSETS | | $ | 6,739,363 | | |
| (1) NUMBER OF SHARES AUTHORIZED | | | Unlimited | | |
See accompanying Notes to Financial Statements.
22
THE DFA INVESTMENT TRUST COMPANY
THE U.S. LARGE CAP VALUE SERIES
STATEMENTS OF OPERATIONS
(Amounts in thousands)
| | | Period
Dec. 1,
2007 to
Oct. 31,
2008 | | Year
Ended
Nov. 30,
2007 | |
| Investment Income | |
| Dividends | | $ | 166,659 | | | $ | 152,304 | | |
| Interest | | | 1,529 | | | | 4,285 | | |
| Income from Securities Lending | | | 7,486 | | | | 2,119 | | |
| Total Investment Income | | | 175,674 | | | | 158,708 | | |
| Expenses | |
| Investment Advisory Services Fees | | | 8,436 | | | | 10,188 | | |
| Accounting & Transfer Agent Fees | | | 847 | | | | 1,011 | | |
| Custodian Fees | | | 90 | | | | 108 | | |
| Shareholders' Reports | | | 82 | | | | 103 | | |
| Directors'/Trustees' Fees & Expenses | | | — | | | | 94 | | |
| Professional Fees | | | 166 | | | | 157 | | |
| Other | | | 37 | | | | 56 | | |
| Total Expenses | | | 9,658 | | | | 11,717 | | |
| Net Investment Income (Loss) | | | 166,016 | | | | 146,991 | | |
| Realized and Unrealized Gain (Loss) | |
| Net Realized Gain (Loss) on: | |
| Investment Securities Sold | | | (422,637 | ) | | | (118,412 | ) | |
| Futures | | | (1,861 | ) | | | — | | |
| In-Kind Redemptions | | | 52,271 | * | | | — | | |
Change in Unrealized Appreciation (Depreciation) of:
Investment Securities | | | (3,601,292 | ) | | | (150,559 | ) | |
| Futures | | | 29 | | | | — | | |
| Net Realized and Unrealized Gain (Loss) | | | (3,973,490 | ) | | | (268,971 | ) | |
| Net Increase (Decrease) in Net Assets Resulting from Operations | | $ | (3,807,474 | ) | | $ | (121,980 | ) | |
* See Note J in the Notes to Financial Statements.
See accompanying Notes to Financial Statements.
23
THE DFA INVESTMENT TRUST COMPANY
THE U.S. LARGE CAP VALUE SERIES
STATEMENTS OF CHANGES IN NET ASSETS
(Amounts in thousands)
| | | Period
Dec. 1,
2007 to
Oct. 31,
2008 | | Year
Ended
Nov. 30,
2007 | | Year
Ended
Nov. 30,
2006 | |
| Increase (Decrease) in Net Assets | |
| Operations: | |
| Net Investment Income (Loss) | | $ | 166,016 | | | $ | 146,991 | | | $ | 119,373 | | |
| Net Realized Gain (Loss) on: | |
| Investment Securities Sold | | | (422,637 | ) | | | (118,412 | ) | | | 477,934 | | |
| Futures | | | (1,861 | ) | | | — | | | | — | | |
| In-Kind Redemptions | | | 52,271 | * | | | — | | | | — | | |
Change in Unrealized Appreciation (Depreciation) of:
Investment Securities | | | (3,601,292 | ) | | | (150,559 | ) | | | 631,814 | | |
| Futures | | | 29 | | | | — | | | | — | | |
Net Increase (Decrease) in Net Assets Resulting
from Operations | | | (3,807,474 | ) | | | (121,980 | ) | | | 1,229,121 | | |
| Distributions From: | |
| Net Investment Income | | | (168,022 | ) | | | (146,268 | ) | | | (127,544 | ) | |
| Net Short-Term Gains | | | — | | | | (14,058 | ) | | | (14,160 | ) | |
| Net Long-Term Gains | | | — | | | | (463,917 | ) | | | (186,026 | ) | |
| Total Distributions | | | (168,022 | ) | | | (624,243 | ) | | | (327,730 | ) | |
| Capital Share Transactions (1): | |
| Shares Issued | | | 1,370,762 | | | | 1,783,358 | | | | 1,997,675 | | |
| Shares Issued in Lieu of Cash Distributions | | | 165,455 | | | | 600,794 | | | | 317,835 | | |
| Shares Redeemed | | | (980,680 | )* | | | (344,913 | ) | | | (182,182 | ) | |
| Net Increase (Decrease) from Capital Share Transactions | | | 555,537 | | | | 2,039,239 | | | | 2,133,328 | | |
| Total Increase (Decrease) in Net Assets | | | (3,419,959 | ) | | | 1,293,016 | | | | 3,034,719 | | |
| Net Assets | |
| Beginning of Period | | | 10,159,322 | | | | 8,866,306 | | | | 5,831,587 | | |
| End of Period | | $ | 6,739,363 | | | $ | 10,159,322 | | | $ | 8,866,306 | | |
| (1) Shares Issued and Redeemed: | |
| Shares Issued | | | 74,071 | | | | 75,958 | | | | 92,566 | | |
| Shares Issued in Lieu of Cash Distributions | | | 9,754 | | | | 26,704 | | | | 15,344 | | |
| Shares Redeemed | | | (52,609 | ) | | | (15,046 | ) | | | (8,564 | ) | |
| | | | 31,216 | | | | 87,616 | | | | 99,346 | | |
Undistributed Net Income (Distributions in Excess of Net
Investment Income) | | $ | (68 | ) | | $ | 1,938 | | | $ | 1,485 | | |
* See Note J in the Notes to Financial Statements.
See accompanying Notes to Financial Statements.
24
THE DFA INVESTMENT TRUST COMPANY
THE U.S. LARGE CAP VALUE SERIES
FINANCIAL HIGHLIGHTS
(for a share outstanding throughout each period)
| | | Period
Dec. 1,
2007
to
Oct. 31,
2008 | | Year
Ended
Nov. 30,
2007 | | Year
Ended
Nov. 30,
2006 | | Year
Ended
Nov. 30,
2005 | | Year
Ended
Nov. 30,
2004 | | Year
Ended
Nov. 30,
2003 | |
Net Asset Value, Beginning of
Period | | $ | 21.81 | | | $ | 23.44 | | | $ | 20.91 | | | $ | 18.55 | | | $ | 15.41 | | | $ | 13.01 | | |
| Income from Investment Operations | |
Net Investment
Income (Loss) | | | 0.35 | (A) | | | 0.34 | (A) | | | 0.36 | (A) | | | 0.29 | | | | 0.23 | | | | 0.21 | | |
Net Gains (Losses) on
Securities (Realized and
Unrealized) | | | (8.25 | ) | | | (0.38 | ) | | | 3.27 | | | | 2.41 | | | | 3.09 | | | | 2.41 | | |
Total from Investment
Operations | | | (7.90 | ) | | | (0.04 | ) | | | 3.63 | | | | 2.70 | | | | 3.32 | | | | 2.62 | | |
| Less Distributions | |
| Net Investment Income | | | (0.35 | ) | | | (0.33 | ) | | | (0.38 | ) | | | (0.32 | ) | | | (0.18 | ) | | | (0.22 | ) | |
| Net Realized Gains | | | — | | | | (1.26 | ) | | | (0.72 | ) | | | (0.02 | ) | | | — | | | | — | | |
| Total Distributions | | | (0.35 | ) | | | (1.59 | ) | | | (1.10 | ) | | | (0.34 | ) | | | (0.18 | ) | | | (0.22 | ) | |
Net Asset Value, End of
Period | | $ | 13.56 | | | $ | 21.81 | | | $ | 23.44 | | | $ | 20.91 | | | $ | 18.55 | | | $ | 15.41 | | |
| Total Return | | | (36.53 | )%(C) | | | (0.32 | )% | | | 18.16 | % | | | 14.66 | % | | | 21.68 | % | | | 20.34 | % | |
Net Assets, End of Period
(thousands) | | $ | 6,739,363 | | | $ | 10,159,322 | | | $ | 8,866,306 | | | $ | 5,831,587 | | | $ | 3,919,913 | | | $ | 2,510,662 | | |
Ratio of Expenses to Average
Net Assets | | | 0.11 | %(B) | | | 0.11 | % | | | 0.12 | % | | | 0.14 | % | | | 0.15 | % | | | 0.15 | % | |
Ratio of Net Investment Income
to Average Net Assets | | | 1.97 | %(B) | | | 1.44 | % | | | 1.68 | % | | | 1.56 | % | | | 1.41 | % | | | 1.62 | % | |
| Portfolio Turnover Rate | | | 19 | %(C) | | | 9 | % | | | 13 | % | | | 9 | % | | | 7 | % | | | 7 | % | |
See page 1 for the Definitions of Abbreviations and Footnotes.
See accompanying Notes to Financial Statements.
25
THE DFA INVESTMENT TRUST COMPANY
THE U.S. LARGE CAP VALUE SERIES
NOTES TO FINANCIAL STATEMENTS
A. Organization:
The DFA Investment Trust Company (the "Trust") is an open-end management investment company registered under the Investment Company Act of 1940. The Trust consists of eighteen series, of which The U.S. Large Cap Value Series (the "Series") is presented in this report.
At a regular meeting of the Board of Directors/Trustees (the "Board") on September 16, 2008, the Board voted to change the fiscal and tax year ends of the Series from November 30 to October 31.
B. Significant Accounting Policies:
The following significant accounting policies are in conformity with accounting principles generally accepted in the United States of America. Such policies are consistently followed by the Trust in preparation of its financial statements. The preparation of financial statements in accordance with accounting principles generally accepted in the United States of America requires management to make estimates and assumptions that affect the reported amounts of assets and liabilities and disclosure of contingent assets and liabilities at the date of the financial statements and the reported amounts of increases and decreases in net assets from operations during the reporting period. Actual results could differ from those estimates and those differences could be material.
1. Security Valuation: Securities held by the Series (including over-the-counter securities) are valued at the last quoted sale price of the day. Securities held by the Series that are listed on Nasdaq are valued at the Nasdaq Official Closing Price ("NOCP"). If there is no last reported sale price or NOCP for the day, the Series values the securities at the mean of the most recent quoted bid and asked prices. Price information on listed securities is taken from the exchange where the security is primarily traded. Generally, securities issued by open-end investment companies are valued using their respective net asset values or public offering prices, as appropriate, for purchase orders placed at the close of the New York Stock Exchange (NYSE).
Securities for which no market quotations are readily available (including restricted securities), or for which market quotations have become unreliable, are valued in good faith at fair value in accordance with procedures adopted by the Board of Directors/Trustees. Fair value pricing may also be used if events that have a significant effect on the value of an investment (as determined in the discretion of the Investment Committee of the Advisor) occur before the net asset value is calculated. When fair value pricing is used, the prices of securities used by the Series may differ from the quoted or published prices for the same securities on their primary markets or exchanges.
Futures contracts held by the Series are valued using the settlement price established each day on the exchange on which they are traded.
Adoption of Statement of Financial Accounting Standards No. 157 "Fair Value Measurements" ("FAS 157")
In September 2006, the Financial Accounting Standards Board issued FAS 157 effective for fiscal years beginning after November 15, 2007. This standard clarifies the definition of fair value for financial reporting, establishes a framework for measuring fair value and requires additional disclosures about the use of fair value measurements. The Funds have adopted FAS 157 as of December 1, 2007. The three levels of the fair value hierarchy under FAS 157 are described below:
• Level 1 – quoted prices in active markets for identical securities
• Level 2 – other significant observable inputs (including quoted prices for similar securities, interest rates, prepayment speeds, credit risk, etc.)
• Level 3 – significant unobservable inputs (including the Series' own assumptions in determining the fair value of investments)
26
The inputs or methodology used for valuing securities are not necessarily an indication of the risk associated with investing in those securities. A summary of the inputs used to value the Series' net assets as of October 31, 2008 is listed below (in thousands).
| | | Valuation Inputs | |
| | | Investments in
Securities
(Market Value) | | Other Financial
Instruments
(Unrealized
Appreciation/
Depreciation)* | |
| | | Level 1 | | Level 2 | | Level 3 | | Total | | Level 1 | | Level 2 | | Level 3 | | Total | |
| The U.S. Large Cap Value Series | | $ | 6,607,903 | | | $ | 843,542 | | | | — | | | $ | 7,451,445 | | | $ | 29 | | | | — | | | | — | | | $ | 29 | | |
* Other financial instruments are derivative instruments not reflected in the Schedule of Investments, such as futures, forwards and swaps which are valued at the unrealized appreciation/depreciation on the investment.
2. Deferred Compensation Plan: Each eligible Trustee of the Trust may elect participation in the Deferred Compensation Plan (the "Plan"). Under the Plan, effective January 1, 2002, such Trustees may defer payment of all or a portion of their total fees earned as a Trustee. These deferred amounts may be treated as though such amounts had been invested in shares of the following funds: U.S. Large Cap Value Portfolio; U.S. Core Equity 1 Portfolio; U.S. Core Equity 2 Portfolio; U.S. Vector Equity Portfolio; U.S. Micro Cap Portfolio; DFA International Value Portfolio; International Core Equity Portfolio; Emerging Markets Portfolio; Emerging Markets Core Equity Portfolio; and/or DFA Two-Year Global Fixed Income Portfolio. Contributions made under the Plan and the change in unrealized app reciation (depreciation) and income, are included in Other Expenses on October 31, 2008 and are included in Directors'/Trustees' Fees & Expenses on November 30, 2007. At October 31, 2008, the total liability for deferred compensation to Trustees is included in Accrued Expenses and Other Liabilities in the amount of $134 (in thousands).
Each Trustee has the option to receive their distribution of proceeds in one of the following methods upon one year's notice: lump sum; annual installments over a period of agreed upon years; or semi-annual installments over a period of agreed upon years. As of October 31, 2008, none of the Trustees have requested distribution of proceeds.
3. Other: Security transactions are accounted for as of the trade date. Costs used in determining realized gains and losses on the sale of investment securities are on the basis of identified cost. Dividend income and distributions to shareholders are recorded on the ex-dividend date. Distributions received on securities that represent a return of capital or capital gain are recorded as a reduction of cost of investments or as a realized gain, respectively. The Series estimates the character of distributions received that may be considered return of capital distributions or capital gain distributions. Interest income is recorded on an accrual basis. Discount and premium on securities purchased are amortized over the lives of the respective securities, utilizing the effective i nterest method. Expenses directly attributable to a Series are directly charged. Common expenses of the Trust are allocated using methods approved by the Board of Directors/Trustees, generally based on average net assets.
C. Investment Advisor:
Dimensional Fund Advisors LP ("Dimensional" or the "Advisor") provides investment advisory services to the Series. For the period December 1, 2007 to October 31, 2008, the Series' investment advisory services fees were accrued daily and paid monthly to the Advisor based on an effective annual rate of 0.10% of average daily net assets.
Fees Paid to Officers and Directors/Trustees:
Certain Officers and Directors/Trustees of the Advisor are also Officers and Directors/Trustees of the Trust; however, such Officers and Directors/Trustees (with the exception of the Chief Compliance Officer ("CCO")) receive no compensation from the Trust. For the period December 1, 2007 to October 31, 2008, the total related amounts paid by the Trust to the CCO were $134 (in thousands). The total related amounts paid by the Series are included in Other Expenses on the Statement of Operations.
27
D. Purchases and Sales of Securities:
For the period December 1, 2007 to October 31, 2008, the Series made the following purchases and sales of investment securities, other than short-term securities and U.S. government securities (amounts in thousands):
| Purchases | | $ | 2,227,129 | | |
| Sales | | | 1,690,939 | | |
There were no purchases or sales of long-term U.S. government securities.
E. Federal Income Taxes:
The Series has qualified and intends to continue to qualify as a regulated investment company under Subchapter M of the Internal Revenue Code for federal income tax purposes and to distribute substantially all of its taxable income and net capital gains to shareholders. Accordingly, no provision has been made for federal income taxes.
Distributions from net investment income and net realized capital gains are determined in accordance with U.S. federal income tax regulations, which may differ from those amounts determined under accounting principles generally accepted in the United States of America. These book/tax differences are either temporary or permanent in nature. To the extent these differences are permanent, they are charged or credited to paid-in capital, undistributed net investment income or accumulated net realized gains, as appropriate, in the period that the differences arise. Accordingly, the following permanent differences as of October 31, 2008, primarily attributable to In-Kind redemptions were classified to the following accounts. These reclassifications had no effect on net assets or net asset value per share (amounts in thousands):
Increase
(Decrease)
Paid-in
Capital | | Increase
(Decrease)
Accumulated
Net Realized
Gains/(Losses) | |
| $ | 52,271 | | | $ | (52,271 | ) | |
The tax character of dividends and distributions declared and paid during the years ended November 30, 2006, November 30, 2007 and the period December 1, 2007 to October 31, 2008 were as follows (amounts in thousands):
| | | Net
Investment
Income and
Short-Term
Capital Gains | | Long-Term
Capital Gains | | Total | |
| | 2006 | | | $ | 141,704 | | | $ | 186,026 | | | $ | 327,730 | | |
| | 2007 | | | | 160,367 | | | | 463,876 | | | | 624,243 | | |
| | 2008 | | | | 168,022 | | | | — | | | | 168,022 | | |
At October 31, 2008, the components of distributable earnings/(accumulated losses) were as follows (amounts in thousands):
Undistributed
Net Investment
Income and
Short-Term
Capital Gains | |
Capital Loss
Carryforward | | Total Net
Distributable
Earnings/
(Accumulated
(Losses) | |
| $ | 66 | | | $ | (542,039 | ) | | $ | (541,973 | ) | |
28
For federal income tax purposes, the Trust measures its capital loss carryforwards annually at October 31, its fiscal year end. Capital loss carryforwards may be carried forward and applied against future capital gains. As of October 31, 2008, the Series had a capital loss carryforward available to offset future realized capital gains through the indicated expiration date (amount in thousands).
| | Expires on October 31, | |
| | | 2015 | | 2016 | | Total | |
| | $ | 118,411 | | | $ | 423,628 | | | $ | 542,039 | | |
At October 31, 2008, the total cost and aggregate gross unrealized appreciation and (depreciation) of securities for federal income tax purposes were different from amounts reported for financial reporting purposes (amounts in thousands):
Federal
Tax Cost | |
Unrealized
Appreciation | |
Unrealized
(Depreciation) | | Net
Unrealized
Appreciation
(Depreciation) | |
| $ | 9,332,438 | | | $ | 582,282 | | | $ | (2,463,275 | ) | | $ | (1,880,993 | ) | |
In June 2006, the Financial Accounting Standards Board (FASB) issued FASB Interpretation 48 ("FIN 48"), "Accounting for Uncertainty in Income Taxes." This standard defines the threshold for recognizing the benefits of tax-return positions in the financial statements as "more-likely-than-not" to be sustained by the taxing authority and requires measurement of a tax position meeting the more-likely-than-not criterion, based on the largest benefit that is more than 50 percent likely to be realized. Management has analyzed the Series' tax positions to be taken on the federal income tax returns for all open tax years (tax years ended November 30, 2005 through the period ended October 31, 2008), for purposes of implementing FIN 48, and has concluded that no provision for income tax is required in the Series' financial statements.
F. Financial Instruments:
In accordance with the Series' investment objectives and policies, the Series may invest in certain financial instruments that have off-balance sheet risk in excess of the amounts recognized in the financial statements and concentrations of credit and market risk. These instruments and their significant corresponding risks are described below:
1. Repurchase Agreements: The Series may purchase money market instruments subject to the counterparty's agreement to repurchase them at an agreed upon date and price. The counterparty will be required on a daily basis to maintain the value of the collateral subject to the agreement at not less than the repurchase price (including accrued interest). The agreements are conditioned upon the collateral being deposited under the Federal Reserve book-entry system with the Trust's custodian or a third party sub-custodian. In the event of default or bankruptcy by the other party to the agreement, retention of the collateral may be subject to legal proceedings. All open repurchase agreements were entered into on October 31, 2008.
2. Futures Contracts: During the period October 31, 2008, the Series entered into futures contracts in accordance with its investment objectives. Upon entering into a futures contract, the Series deposits cash or pledges U.S. Government securities to a broker, equal to the minimum "initial margin" requirements of the exchange on which the contract is traded. Subsequent payments are received from or paid to the broker each day, based on the daily fluctuation in the market value of the contract. These receipts or payments are known as "variation margin" and are recorded daily by the Series as unrealized gains or losses until the contracts are closed. When the contracts are closed, the Series records a realized gain or loss equal to the difference between the value of the contrac t at the time it was opened and the value at the time it was closed.
At October 31, 2008, the Series had outstanding 235 long futures contracts of the S&P 500 Index®, all of which expire on December 19, 2008. The value of such contracts on October 31, 2008 was $56,829 (in thousands), which resulted in an unrealized gain of $29 (in thousands). Approximately $5,816 (in thousands) of cash has been segregated as collateral for the open futures contracts and has been accounted for as cash on the Statement of Assets and Liabilities.
29
Risks may arise upon entering into futures contracts from potential imperfect price correlations between the futures contracts and the underlying securities, from the possibility of an illiquid secondary market for these instruments and from the possibility that the Series could lose more than the initial margin requirements.
G. Line of Credit:
The Trust, together with other Dimensional-advised portfolios, has entered into a $250 million unsecured discretionary line of credit effective June 30, 2003 with an affiliate of its domestic custodian bank. Each portfolio is permitted to borrow, subject to its investment limitations, up to a maximum of $250 million, as long as total borrowings under the line of credit do not exceed $250 million in the aggregate. Borrowings under the line are charged interest at the then current Federal Funds Rate plus 1%. Each portfolio is individually, and not jointly, liable for its particular advances under the line of credit. There is no commitment fee on the unused portion of the line of credit. The agreement for the line of credit may be terminated by either party at any time. The line of credit is scheduled to expire on June 23, 2009.
For the period ended October 31, 2008, borrowings by the Series under this line of credit were as follows (amounts in thousands, except percentages and days):
Weighted
Average
Interest Rate | | Weighted
Average
Loan Balance | | Number of
Days
Outstanding | | Interest
Expense
Incurred | | Maximum Amount
Borrowed During
the Period | |
| | 4.03 | % | | $ | 5,774 | | | | 4 | | | $ | 3 | | | $ | 5,880 | | |
There were no outstanding borrowings by the Series under this line of credit at October 31, 2008.
The Trust, together with other Dimensional-advised portfolios, has also entered into an additional $500 million unsecured line of credit effective January 15, 2008 with its international custodian bank. Each portfolio is permitted to borrow, subject to its investment limitations, up to a maximum of $500 million, as long as total borrowings under the line of credit do not exceed $500 million in the aggregate. Each portfolio is individually, and not jointly, liable for its particular advances under the line of credit. Borrowings under the line of credit are charged interest at rates agreed to by the parties at the time of borrowing. There is no commitment fee on the unused portion of the line of credit. The agreement for the line of credit expires on January 15, 2009. There were no borrowings by the Series under this line of credit during the period ended October 31, 2008.
H. Securities Lending:
As of October 31, 2008, the Series had securities on loan to brokers/dealers, for which the Series held cash collateral. The Series invests the cash collateral, as described below, and records a liability for the return of the collateral, during the period the securities are on loan. Loans of securities are expected at all times to be secured by collateral equal to at least (i) 100% of the current market value of the loaned securities with respect to securities of the U.S. government or its agencies, (ii) 102% of the current market value of the loaned securities with respect to U.S. securities, and (iii) 105% of the current market value of the loaned securities with respect to foreign securities. However, daily market fluctuations could cause the Series' collateral to be lower or higher than the expected thresholds. If this were to occur, the collateral would be adjusted the next business day to ensure adequate collateralization. In the even t of default or bankruptcy by the other party to the agreement, realization and/or retention of the collateral may be subject to legal proceedings. If the borrower fails to return loaned securities, and cash collateral being maintained by the borrower is insufficient to cover the value of loaned securities and provided such collateral insufficiency is not the result of investment losses, the lending agent has agreed to pay the amount of the shortfall to the Series or, at the option of the lending agent, to replace the securities.
Subject to the Series' investment policy, the cash collateral received by the Series from securities on loan is invested in securities of the U.S. government or its agencies, repurchase agreements collateralized by securities of the U.S. government or its agencies or shares of the DFA Short Term Investment Fund LP. Agencies include both agency debentures and agency mortgage backed securities. In addition, the Series will be able to terminate the loan at any time and will receive reasonable interest on the loan, as well as amounts equal to any dividends, interest or
30
other distributions on the loaned securities. However, dividend income received from loaned securities may not be eligible to be taxed at qualified dividend income rates.
I. Indemnitees; Contractual Obligations:
Under the Trust's organizational documents, its officers and trustees are indemnified against certain liabilities arising out of the performance of their duties to the Trust.
In the normal course of business, the Trust enters into contracts that contain a variety of representations and warranties which provide general indemnification. The Trust's maximum exposure under these arrangements is unknown as this would involve future claims that may be made against the Trust and/or its affiliates that have not yet occurred. However, based on experience, the Trust expects the risk of loss to be remote.
J. In-Kind Redemptions:
In accordance with guidelines described in the Series' prospectus, the Series may distribute portfolio securities rather than cash as payment for a redemption of fund shares (In-Kind redemption). For financial reporting purposes, the Series recognizes a gain on In-Kind redemptions to the extent the value of the distributed securities on the date of redemption exceeds the cost of those securities. Gains and losses realized on In-Kind redemptions are not recognized for tax purposes and are reclassified from undistributed realized gain (loss) to paid-in capital. During the period December 1, 2007 to October 31, 2008, the Series realized $52,271 (in thousands) of net gain.
K. Recently Issued Accounting Standards and Interpretation:
In March 2008, Statement of Financial Accounting Standards No. 161, Disclosures about Derivative Instruments and Hedging Activities ("FAS 161"), was issued and is effective for fiscal years beginning after November 15, 2008. FAS 161 defines new disclosures of derivative instruments and hedging activities. Management is currently evaluating the implications of FAS 161. At this time, its impact on the Series' financial statements has not been determined.
31
REPORT OF INDEPENDENT REGISTERED PUBLIC ACCOUNTING FIRM
To the Shareholders of The U.S. Large Cap Value Series and
Board of Trustees of The DFA Investment Trust Company:
In our opinion, the accompanying statements of assets and liabilities, including the summary schedules of portfolio holdings, and the related statements of operations and of changes in net assets and the financial highlights presents fairly, in all material respects, the financial position of The U.S. Large Cap Value Series (one of the portfolios constituting The DFA Investment Trust Company, hereafter referred to as the "Series") at October 31, 2008, the results of its operations, the changes in its net assets and the financial highlights for each of the periods indicated, in conformity with accounting principles generally accepted in the United States of America. These financial statements and financial highlights (hereafter referred to as "financial statements") are the responsibility of the Series' management; our responsibility is to express an opinion on these financial statements based on our audits. We conducted our audits of these f inancial statements in accordance with the standards of the Public Company Accounting Oversight Board (United States). Those standards require that we plan and perform the audit to obtain reasonable assurance about whether the financial statements are free of material misstatement. An audit includes examining, on a test basis, evidence supporting the amounts and disclosures in the financial statements, assessing the accounting principles used and significant estimates made by management, and evaluating the overall financial statement presentation. We believe that our audits, which included confirmation of securities at October 31, 2008 by correspondence with the custodian and broker, provide a reasonable basis for our opinion.
PricewaterhouseCoopers LLP
Philadelphia, Pennsylvania
December 22, 2008
32
FUND MANAGEMENT
Trustees/Directors
Each Board of Trustees/Directors of The DFA Investment Trust Company Inc. ("DFAITC"), DFA Investment Dimensions Group Inc. ("DFAIDG"), Dimensional Investment Group Inc. ("DIG") and Dimensional Emerging Markets Value Fund Inc. ("DEM") (each, the "Fund" and collectively, the "Funds") is responsible for establishing the Funds' policies and for overseeing the management of the Funds. The Trustees/Directors of the Funds, including all of the disinterested Directors, have adopted written procedures to monitor potential conflicts of interest that might develop between portfolios of the Funds (the "Feeder Portfolios") that invest in certain series of DFAITC or DEM (the "Master Funds").
Each Board has two standing committees, an Audit Committee and a Portfolio Performance and Service Review Committee (the "Performance Committee"). The Audit Committee is comprised of George M. Constantinides, Roger G. Ibbotson and Abbie J. Smith. Each member of the Audit Committee is a disinterested Director. The Audit Committee oversees the Fund's accounting and financial reporting policies and practices, the Fund's internal controls, the Fund's financial statements and the independent audits thereof and performs other oversight functions as requested by the Board. The Audit Committee recommends the appointment of each Fund's independent registered certified public accounting firm and also acts as a liaison between the Fund's independent registered certified public accounting firm and the full Board. There were three Audit Committee meetings held during the fiscal year ended October 31, 2008.
Each Board's Performance Committee is comprised of Messrs. Constantinides and Ibbotson, Ms. Smith, John P. Gould, Myron S. Scholes and Robert C. Merton. Each member of the Fund's Performance Committee is a disinterested Director. The Performance Committee regularly reviews and monitors the investment performance of the Fund's series and reviews the performance of the Fund's service providers. There were five Performance Committee meetings held during the fiscal year ended October 31, 2008.
Certain biographical information for each disinterested Trustee/Director and each interested Trustee/Director of the Funds is set forth in the tables below, including a description of each Trustee/Director's experience as a Trustee/Director of the Funds and as a director or trustee of other funds, as well as other recent professional experience.
The statements of additional information (together, "SAI") of the Funds include additional information about each Trustee/Director. You may obtain copies of the SAI and prospectus of each Fund advised by Dimensional Fund Advisors LP by calling collect (310) 395-8005 or by mailing a request to Dimensional Fund Advisors LP, 1299 Ocean Avenue, Santa Monica, California 90401. Prospectuses are also available at www.dimensional.com.
Name, Position
with the Fund,
Address and Age | | Term of Office1 and
Length of Service | | Portfolios within the
DFA Fund Complex2
Overseen | | Principal Occupation(s) During Past 5 Years and
Other Directorships of Public Companies Held | |
| | | Disinterested Trustees/Directors | |
|
George M. Constantinides
Director of DFAIDG, DIG and DEM.
Trustee of DFAITC.
The University of Chicago Booth School of Business
5807 S. Woodlawn Avenue Chicago, IL 60637
Age: 61 | | DFAITC - since 1993
DFAIDG - since 1983
DIG - since 1993
DEM - since 1993 | | 96 portfolios in 4 investment companies | | Leo Melamed Professor of Finance, The University of Chicago Booth School of Business. | |
|
33
Name, Position
with the Fund,
Address and Age | | Term of Office1 and
Length of Service | | Portfolios within the
DFA Fund Complex2
Overseen | | Principal Occupation(s) During Past 5 Years and
Other Directorships of Public Companies Held | |
John P. Gould
Director of DFAIDG, DIG and DEM.
Trustee of DFAITC.
The University of Chicago Booth School of Business
5807 S. Woodlawn Avenue
Chicago, IL 60637
Age: 69 | | DFAITC - since 1993
DFAIDG - since 1986
DIG - since 1993
DEM - since 1993 | | 96 portfolios in 4 investment companies | | Steven G. Rothmeier Distinguished Service Professor of Economics, The University of Chicago Booth School of Business (since 1965). Member of the Boards of Milwaukee Mutual Insurance Company (since 1997) and UNext.com (1999-2006). Member Competitive Markets Advisory Committee, Chicago Mercantile Exchange (futures trading exchange) (since 2004). Formerly, Senior Vice-President, Lexecon Inc. (economics, law, strategy and finance consulting) (1994-2004). Formerly, President, Cardean University (division of UNext.com) (1999-2001). Trustee, Harbor Fund (registered investment company) (14 Portfolios) (since 1994). | |
|
Roger G. Ibbotson
Director of DFAIDG, DIG and DEM.
Trustee of DFAITC.
Yale School of Management
P.O. Box 208200
New Haven, CT 06520-8200
Age: 65 | | DFAITC - since 1993
DFAIDG - since 1981
DIG - since 1993
DEM - since 1993 | | 96 portfolios in 4 investment companies | | Professor in Practice of Finance, Yale School of Management (since 1984). Director, BIRR Portfolio Analysis, Inc. (software products) (since 1990). Chairman, CIO and Partner, Zebra Capital Management, LLC (hedge fund manager) (since 2001).
Consultant to Morningstar, Inc. (since 2006). Formerly, Chairman, Ibbotson Associates, Inc., Chicago, IL (software data publishing and consulting) (1977-2006). | |
|
Robert C. Merton
Director of DFAIDG, DIG and DEM.
Trustee of DFAITC.
Harvard Business School
353 Baker Library
Soldiers Field
Boston, MA 02163
Age: 64 | | DFAITC - since 2003
DFAIDG - since 2003
DIG - since 2003
DEM - since 2003 | | 96 portfolios in 4 investment companies | | John and Natty McArthur University Professor, Graduate School of Business Administration, Harvard University (since 1998). George Fisher Baker Professor of Business Administration, Graduate School of Business Administration, Harvard University (1988-1998), Co-founder, Chief Science Officer and Director, Trinsum Group, a successor to Integrated Finance Limited (since 2002). Director, MF Risk, Inc. (risk management software) (since 2001). Director, Peninsula Banking Group (bank) (since 2003). Director, Community First Financial Group (bank holding company) (since 2003). Advisory Board Member, Alpha Simplex Group (hedge fund) (since 2001). Member Competitive Markets Advisory Council, Chicago Mercantile Exchange (futures trading exchange) (since 2004). Formerly, Advisory Board Member, NuServe (insurance software) (2001-2003). Director, Vical Incorporated (biopharmaceutical product development) (since 2002). | |
|
Myron S. Scholes
Director of DFAIDG, DIG and DEM.
Trustee of DFAITC.
Platinum Grove Asset Management, L.P.
Reckson Executive Park
1100 King Street
Building 4
Rye Brook, NY 10573
Age: 67 | | DFAITC - since 1993
DFAIDG - since 1981
DIG - since 1993
DEM - since 1993 | | 96 portfolios in 4 investment companies | | Frank E. Buck Professor Emeritus of Finance, Stanford University (since 1981). Chairman, Platinum Grove Asset Management, L.P. (hedge fund) (formerly, Oak Hill Platinum Partners) (since 1999). Formerly, Managing Partner, Oak Hill Capital Management (private equity firm) (until 2004). Chairman, Oak Hill Platinum Partners (hedge fund) (since 2004). Director, Chicago Mercantile Exchange (since 2001). Director, American Century Fund Complex (registered investment companies) (37 Portfolios) (since 1981); and Director, Chicago Mercantile Exchange Holdings Inc. (since 2000). | |
|
Abbie J. Smith
Director of DFAIDG, DIG and DEM.
Trustee of DFAITC.
The University of Chicago Booth School of Business
5807 S. Woodlawn Avenue
Chicago, IL 60637
Age: 55 | | DFAITC - since 2000
DFAIDG - since 2000
DIG - since 2000
DEM - since 2000 | | 96 portfolios in 4 investment companies | | Boris and Irene Stern Professor of Accounting, The University of Chicago Booth School of Business (since 1980), Formerly, Marvin Bower Fellow, Harvard Business School (9/01 to 8/02). Director, HNI Corporation (formerly known as HON Industries Inc.) (office furniture) (since 2000) and Director, Ryder System Inc. (transportation, logistics and supply-chain management) (since 2003). | |
|
34
Name, Position
with the Fund,
Address and Age | | Term of Office1 and
Length of Service | | Portfolios within the
DFA Fund Complex2
Overseen | | Principal Occupation(s) During Past 5 Years and
Other Directorships of Public Companies Held | |
| | | Interested Trustees/Directors* | |
|
David G. Booth
Chairman, Director, Chief Executive Officer and President of DFAIDG, DIG and DEM. Chairman, Trustee, Chief Executive Officer, Chief Investment Officer and President of DFAITC.
1299 Ocean Avenue
Santa Monica, CA 90401
Age: 61 | | DFAITC - since 1993
DFAIDG - since 1981
DIG - since 1992
DEM - since 1993 | | 96 portfolios in 4 investment companies | | Chairman, Director/Trustee, President, Chief Executive Officer and formerly Chief Investment Officer of the following companies: Dimensional Holdings Inc., Dimensional Fund Advisors LP, DFA Securities Inc., Dimensional Fund Advisors Canada Inc., DFAIDG, DIG, DEM and DFAITC. Director of Dimensional Fund Advisors Ltd, and formerly Chief Investment Officer. Director, President and formerly Chief Investment Officer of DFA Australia Ltd. Director of Dimensional Funds PLC and Dimensional Fund II PLC. Director, Chief Executive Officer and formerly Chief Investment Officer of Dimensional Fund Advisors Canada Inc. (All Chief Investment Officer positions held starting 1/03 through 3/07 except for Dimensional Fund Advisors Canada Inc., which was from 6/03 through 3/07, and Dimensional Holdings Inc., which was from 10/06 through 3/07.)
Limited Partner, Oak Hill Partners, Director, T he University of Chicago Booth School of Business. Formerly, Director, SA Funds (registered investment company). Formerly Director, Assante Corporation (investment management) (until 2002). | |
|
Rex A. Sinquefield
The Show Me Institute
7777 Bonhomme Ave.,
Suite 2150 St. Louis, MO 63105
Age: 64 | | DFAITC - since 1993
DFAIDG - since 1981
DIG - since 1992
DEM - since 1993 | | 96 portfolios in 4 investment companies | | Director/Trustee (and prior to 2006 Chairman, and prior to 2003, Chief Investment Officer) of Dimensional Fund Advisors LP, DFA Securities Inc., DFAIDG, DIG, DEM and DFAITC. Director of Dimensional Holdings Inc. Prior to 2006, Director of Dimensional Fund Advisors Ltd, Director (and prior to 1/1/2003, Chief Investment Officer) of DFA Australia Ltd. Director of Dimensional Funds PLC and Dimensional Fund Advisors Canada Inc.
Trustee, St. Louis University (since 2003). Life Trustee and Member of Investment Committee, DePaul University. Director, The German St. Vincent Orphan Home. Member of Investment Committee, Archdiocese of St. Louis. Trustee and Member of Investment Committee, St. Louis Art Institute (since 2005). President and Director, The Show Me Institute (since 2006). Trustee, St. Louis Symphony Orchestra (since 2005). Trustee, Missouri Botanical Garden (since 2005 ). | |
|
1 Each Trustee/Director holds office for an indefinite term until his or her successor is elected and qualified.
2 Each Trustee/Director is a director or trustee of each of the four registered investment companies within the DFA Fund Complex, which includes the Funds.
* Interested Directors are described as such because they are deemed to be "interested persons," as that term is defined under the Investment Company Act of 1940, as amended, due to their positions with Dimensional Fund Advisors LP.
35
Officers
The name, age, information regarding positions with the Funds and the principal occupation for each officer of the Funds are set forth below. Each officer listed below holds the same office (except as otherwise noted) in the following entities: Dimensional Fund Advisors LP (prior to November 3, 2006, Dimensional Fund Advisors Inc.) ("Dimensional"), DFA Securities Inc., DFAIDG, DIG, DFAITC and DEM (collectively, the "DFA Entities"). The address of each officer is: Dimensional Fund Advisors LP, 1299 Ocean Avenue, Santa Monica, California 90401, unless otherwise indicated.
Name, Position with the Fund
and Age | | Term of Office1
and Length of
Service | | Principal Occupation(s) During Past 5 Years | |
| | | Officers | |
|
April A. Aandal
Vice President
Age: 35 | | Since 2008 | | Vice President of all the DFA Entities. | |
|
Darryl D. Avery
Vice President
Age: 42 | | Since 2005 | | Vice President of all the DFA Entities. From June 2002 to January 2005, institutional client service representative of Dimensional. | |
|
Arthur H. Barlow
Vice President
Age: 52 | | Since 1993 | | Vice President of all the DFA Entities. Formerly, Vice President of DFA Australia Limited and Dimensional Fund Advisors Ltd. | |
|
Scott A. Bosworth
Vice President
Age: 39 | | Since 2007 | | Vice President of all the DFA Entities. Regional Director of Dimensional (since November 1997). | |
|
Valerie A. Brown
Vice President and Assistant Secretary
Age: 41 | | Since 2001 | | Vice President and Assistant Secretary of all the DFA Entities, DFA Australia Limited, Dimensional Fund Advisors Ltd., and since June 2003, Dimensional Fund Advisors Canada Inc. | |
|
David P. Butler
Vice President
Age: 44 | | Since 2007 | | Vice President of all the DFA Entities. Director of US Financial Services of Dimensional (since January 2005). Formerly, Regional Director of Dimensional Fund Advisors LP (January 1995 to January 2005). | |
|
Patrick Carter
Vice President
Age: 46 | | Since 2007 | | Vice President of all the DFA Entities. Regional Director of Dimensional (since March 2006). Formerly, Director of Merrill Lynch Retirement Group (December 1998 to March 2006). | |
|
Stephen A. Clark
Vice President
Age: 36 | | Since 2004 | | Vice President of all the DFA Entities, April 2001 to April 2004, Portfolio Manager of Dimensional. | |
|
Robert P. Cornell
Vice President
Age: 59 | | Since 2007 | | Vice President of all the DFA Entities. Regional Director of Financial Services Group of Dimensional (since August 1993). | |
|
Christopher S. Crossan
Vice President and Chief Compliance Officer
Age: 42 | | Since 2004 | | Vice President and Chief Compliance Officer of all the DFA Entities. Formerly, Senior Compliance Officer, INVESCO Institutional, Inc. and its affiliates (August 2000 to January 2004). | |
|
James L. Davis
Vice President
Age: 51 | | Since 1999 | | Vice President of all the DFA Entities. Formerly, Vice President of DFA Australia Limited and Dimensional Fund Advisors Ltd. | |
|
Robert T. Deere
Vice President
Age: 51 | | Since 1994 | | Vice President of all the DFA Entities and DFA Australia Limited. | |
|
Robert W. Dintzner
Vice President
Age: 38 | | Since 2001 | | Vice President of all the DFA Entities. Prior to April 2001, marketing supervisor and marketing coordinator for Dimensional. | |
|
36
Name, Position with the Fund
and Age | | Term of Office1
and Length of
Service | | Principal Occupation(s) During Past 5 Years | |
Kenneth Elmgren
Vice President
Age: 54 | | Since 2007 | | Vice President of all the DFA Entities. Formerly, Managing Principal of Beverly Capital (May 2004 to September 2006); Principal of Wydown Capital (September 2001 to May 2004). | |
|
Richard A. Eustice
Vice President and Assistant Secretary
Age: 43 | | Since 1998 | | Vice President and Assistant Secretary of all the DFA Entities and DFA Australia Limited. Formerly, Vice President of Dimensional Fund Advisors Ltd. | |
|
Eugene F. Fama, Jr.
Vice President
Age: 47 | | Since 1993 | | Vice President of all the DFA Entities. Formerly, Vice President of DFA Australia Limited and Dimensional Fund Advisors Ltd. | |
|
Gretchen A. Flicker
Vice President
Age: 37 | | Since 2004 | | Vice President of all the DFA Entities. Prior to April 2004, institutional client service representative of Dimensional. | |
|
Jed S. Fogdall
Vice President
Age: 34 | | Since 2008 | | Vice President of all the DFA Entities. Portfolio Manager for Dimensional (since September 2004). Prior to September 2004, Staff Engineer at the Boeing Company (1997-2004); Graduate Student at the University of California, Los Angeles (2002-2003). | |
|
Glenn S. Freed
Vice President
Age: 46 | | Since 2001 | | Vice President of all the DFA Entities. | |
|
Mark R. Gochnour
Vice President
Age: 41 | | Since 2007 | | Vice President of all the DFA Entities. Regional Director of Dimensional. | |
|
Henry F. Gray
Vice President
Age: 41 | | Since 2000 | | Vice President of all the DFA Entities. Prior to July 2000, Portfolio Manager of Dimensional. Formerly, Vice President of DFA Australia Limited. | |
|
John T. Gray
Vice President
Age: 34 | | Since 2007 | | Vice President of all the DFA Entities. Formerly, Regional Director of Dimensional (January 2005 to February 2007). | |
|
Darla Hastings
Vice President
Age: 53 | | Since 2007 | | Vice President of all the DFA Entities. Chief Marketing Officer of Dimensional. Formerly, Senior Vice President, Customer Experience for Benchmark Assisted Living (May 2005 to April 2006); Executive Vice President and Chief Marketing Officer of State Street Corporation (September 2001 to October 2005). | |
|
Joel H. Hefner
Vice President
Age: 40 | | Since 2007 | | Vice President of all the DFA Entities. Regional Director of Dimensional (since June 1998). | |
|
Julie Henderson
Vice President and Fund Controller
Age: 34 | | Since 2005 | | Vice President and Fund Controller of all the DFA Entities. Formerly, Senior Manager at PricewaterhouseCoopers LLP (July 1996 to April 2005). | |
|
Kevin Hight
Vice President
Age: 40 | | Since 2005 | | Vice President of all the DFA Entities. Formerly, Regional Director of Dimensional (since March 2003 to March 2005). | |
|
Christine W. Ho
Vice President
Age: 40 | | Since 2004 | | Vice President of all the DFA Entities. Prior to April 2004, Assistant Controller of Dimensional. | |
|
Jeff J. Jeon
Vice President
Age: 34 | | Since 2004 | | Vice President of all the DFA Entities. Prior to April 2004, Counsel of Dimensional. | |
|
Patrick M. Keating
Vice President
Age: 53 | | Since 2003 | | Vice President of all the DFA Entities and Chief Operating Officer of Dimensional. Director, Vice President and Chief Privacy Officer of Dimensional Fund Advisors Canada Inc. Director of DFA Australia Limited. | |
|
37
Name, Position with the Fund
and Age | | Term of Office1
and Length of
Service | | Principal Occupation(s) During Past 5 Years | |
Joseph F. Kolerich
Vice President
Age: 36 | | Since 2004 | | Vice President of all the DFA Entities. From April 2001 to April 2004, Portfolio Manager for Dimensional. | |
|
Michael F. Lane
Vice President
Age: 41 | | Since 2004 | | Vice President of all the DFA Entities. Formerly, Vice President of Advisor Services at TIAA-CREF (July 2001 to September 2004). | |
|
Kristina M. LaRusso
Vice President
Age: 33 | | Since 2006 | | Vice President of all DFA Entities. Formerly, Operations Supervisor of Dimensional (March 2003 to December 2006). | |
|
Inmoo Lee
Vice President
Age: 42 | | Since 2007 | | Vice President of all the DFA Entities. Associate Professor Department of Finance and Accounting, Business School, National University of Singapore (July 2004 to present); Associate Professor, College of Business Administration, Korea University (September 2001 to May 2006). | |
|
Juliet Lee
Vice President
Age: 37 | | Since 2005 | | Vice President of all the DFA Entities. Human Resources Manager of Dimensional (since January 2004). Formerly, Assistant Vice President for Metropolitan West Asset Management LLC (February 2001 to December 2003). | |
|
Aaron M. Marcus
Vice President & Head of Global Human Resources
Age: 38 | | Since 2008 | | Vice President and Head of Global Human Resources of Dimensional. Formerly, Global Head of Recruiting and Vice President of Goldman Sachs & Co. (June 2006 to January 2008); Global Co-Head of HR of the Equities & FICC Division, and Vice President of Goldman Sachs & Co. (May 2005 to May 2006); Head of Americas Campus Recruiting and Vice President of Goldman Sachs & Co. (April 2003 to May 2005). | |
|
David R. Martin
Vice President, Chief Financial Officer and Treasurer
Age: 51 | | Since 2007 | | Vice President, Chief Financial Officer and Treasurer of all the DFA Entities. Director, Vice President, Chief Financial Officer and Treasurer of Dimensional Fund Advisors Ltd. and DFA Australia Limited. Chief Financial Officer, Treasurer, and Vice President of Dimensional Fund Advisors Canada Inc. Director of Dimensional Funds PLC and Dimensional Funds II PLC. Formerly, Executive Vice President and Chief Financial Officer of Janus Capital Group Inc. (June 2005 to March 2007); Senior Vice President of Finance at Charles Schwab & Co., Inc. (March 1999 to May 2005). | |
|
Catherine L. Newell
Vice President and Secretary
Age: 44 | | Vice President since 1997 and Secretary since 2000 | | Vice President and Secretary of all the DFA Entities. Director, Vice President and Assistant Secretary of DFA Australia Limited (since February 2002, April 1997 and May 2002, respectively). Vice President and Secretary of Dimensional Fund Advisors Canada Inc. (since June 2003). Director, Dimensional Funds PLC and Dimensional Funds II PLC (since January 2002). Formerly, Assistant Secretary of all DFA Entities and Dimensional Fund Advisors Ltd. | |
|
Gerard K. O'Reilly
Vice President
Age: 31 | | Since 2007 | | Vice President of all the DFA Entities. Formerly, Research Associate of Dimensional Fund Advisors LP (2004 to 2006); Research Assistant in PhD program, Aeronautics Department California Institute of Technology (1998 to 2004). | |
|
Carmen Palafox
Vice President
Age: 34 | | Since 2006 | | Vice President of all the DFA Entities. Operations Manager of Dimensional Fund Advisors LP (since May 1996). | |
|
Sonya Park
Vice President
Age: 36 | | Since 2005 | | Vice President of all the DFA Entities. From February 2002 to January 2005, institutional client service representative of Dimensional. | |
|
David A. Plecha
Vice President
Age: 47 | | Since 1993 | | Vice President of all the DFA Entities, DFA Australia Limited and Dimensional Fund Advisors Ltd.. | |
|
Ted Randall
Vice President
Age: 35 | | Since 2008 | | Vice President of all the DFA Entities. Formerly, Research Associate of Dimensional (2006-2008). Systems Developer of Dimensional (2001-2006). | |
|
38
Name, Position with the Fund
and Age | | Term of Office1
and Length of
Service | | Principal Occupation(s) During Past 5 Years | |
Eduardo A. Repetto
Vice President and Chief Investment Officer
Age: 41 | | Since 2002 | | Chief Investment Officer (beginning March 2007) and Vice President of all the DFA Entities, DFA Australia Limited and Dimensional Fund Advisors Canada Inc. Formerly, Research Associate for Dimensional (June 2000 to April 2002). | |
|
L. Jacobo Rodriguez
Vice President
Age: 37 | | Since 2005 | | Vice President of all the DFA Entities. From August 2004 to July 2005, institutional client service representative of Dimensional. Formerly, Financial Services Analyst, Cato Institute (September 2001 to June 2004); Book Review Editor, Cato Journal, Cato Institute (May 1996 to June 2004). | |
|
David E. Schneider
Vice President
Age: 62 | | Since 2001 | | Vice President of all the DFA Entities. Currently, Director of Institutional Services. | |
|
Ted R. Simpson
Vice President
Age: 40 | | Since 2007 | | Vice President of all the DFA Entities. Regional Director of Dimensional (since December 2002). | |
|
Bryce D. Skaff
Vice President
Age: 33 | | Since 2007 | | Vice President of all the DFA Entities. Formerly, Regional Director of Dimensional (December 1999 to January 2007). | |
|
Grady M. Smith
Vice President
Age: 51 | | Since 2004 | | Vice President of all the DFA Entities. Prior to April 2004, Portfolio Manager of Dimensional. | |
|
Carl G. Snyder
Vice President
Age: 45 | | Since 2000 | | Vice President of all the DFA Entities. Formerly, Vice President of DFA Australia Limited. | |
|
Lawrence R. Spieth
Vice President
Age: 60 | | Since 2004 | | Vice President of all the DFA Entities. Prior to April 2004, Regional Director of Dimensional. | |
|
Bradley G. Steiman
Vice President
Age: 35 | | Since 2004 | | Vice President of all the DFA Entities and Director and Vice President of Dimensional Fund Advisors Canada Inc. | |
|
Karen E. Umland
Vice President
Age: 42 | | Since 1997 | | Vice President of all the DFA Entities, DFA Australia Limited, Dimensional Fund Advisors Ltd., and since June 2003, Dimensional Fund Advisors Canada Inc. | |
|
Carol W. Wardlaw
Vice President
Age: 49 | | Since 2004 | | Vice President of all the DFA Entities. Prior to April 2004, Regional Director of Dimensional. | |
|
Weston J. Wellington
Vice President
Age: 57 | | Since 1997 | | Vice President of all the DFA Entities. Formerly, Vice President of DFA Australia Limited. | |
|
Daniel M. Wheeler
Vice President
Age: 63 | | Since 2001 | | Vice President of all the DFA Entities. Prior to 2001 and currently, Director of Financial Advisors Services of Dimensional. Director of Dimensional Fund Advisors Ltd. (since October 2003) and President of Dimensional Fund Advisors Canada Inc. (since June 2003). | |
|
Ryan Wiley
Vice President
Age: 32 | | Since 2007 | | Vice President of all the DFA Entities. Senior Trader of Dimensional. Formerly, Portfolio Manager (2006 to 2007); Trader (2001 to 2006). | |
|
Paul E. Wise
Vice President
Age: 53 | | Since 2005 | | Vice President of all the DFA Entities. Chief Technology Officer for Dimensional (since 2004). Formerly, Principal of Turnbuckle Management Group (January 2002 to August 2004). | |
|
1 Each officer holds office for an indefinite term at the pleasure of the Boards of Trustee/Directors and until his or her successor is elected and qualified.
39
VOTING PROXIES ON FUND PORTFOLIO SECURITIES
A description of the policies and procedures that the Trust uses in voting proxies relating to securities held in the portfolio is available without charge, upon request, by calling collect: (310) 395-8005. Information regarding how the Advisor votes these proxies is available from the EDGAR database on the SEC's website at http://www.sec.gov and from the Advisor's website at http://www.dimensional.com and reflects the twelve-month period beginning July 1st and ending June 30th.
40
NOTICE TO SHAREHOLDERS
(Unaudited)
For shareholders that do not have an October 31, 2008 tax year end, this notice is for informational purposes only. For shareholders with an October 31, 2008 tax year end, please consult your tax advisor as to the pertinence of this notice. For the period December 1, 2007 to October 31, 2008, each Fund is designating the following items with regard to distributions paid during the period.
| Dimensional Investment Group Inc. | | Net
Investment
Income
Distributions | | Short-Term
Capital Gain
Distributions | | Long-Term
Capital Gain
Distributions | | Total
Distributions | | Qualifying
For Corporate
Dividends
Received
Deduction(1) | | Qualifying
Dividend
Income(2) | | Qualifying
Interest
Income(3) | | Qualifying
Short-Term
Capital Gain(4) | |
| U.S. Large Cap Value Portfolio III | | | 27 | % | | | 1 | % | | | 72 | % | | | 100 | % | | | 85 | % | | | 83 | % | | | 2 | % | | | 2 | % | |
| The DFA Investment Trust Company | | | | | | | | | | | | | | | | | |
| The U.S. Large Cap Value Series | | | 100 | % | | | — | | | | — | | | | 100 | % | | | 85 | % | | | 84 | % | | | 1 | % | | | — | | |
(1) Qualifying dividends represent dividends which qualify for the corporate dividends received deduction and is reflected as a percentage of ordinary income distributions (the total of short-term capital gain and net investment income distributions).
(2) The percentage in this column represents the amount of "Qualifying Dividend Income" as created by the Jobs and Growth Tax Relief Reconciliation Act of 2003 and is reflected as a percentage of ordinary income distributions (the total of short-term capital gain and net investment income distributions). It is the intention of each of the aforementioned funds to designate the maximum amount permitted by law.
(3) The percentage in this column represents the amount of "Qualifying Interest Income" as created by The American Jobs Creation Act of 2004. The information is reflected as a percentage of ordinary income distributions (the total of short-term capital gain and net investment income distributions).
(4) The percentage in this column represents the amount of "Qualifying Short-Term Capital Gain" as created by The American Jobs Creation Act of 2004. The information is reflected as a percentage of ordinary income distributions (the total of short-term capital gain and net investment income distributions).
41
[THIS PAGE INTENTIONALLY LEFT BLANK]
[THIS PAGE INTENTIONALLY LEFT BLANK]
[THIS PAGE INTENTIONALLY LEFT BLANK]

DFA103108-010A
DIMENSIONAL INVESTMENT GROUP INC.
Emerging Markets Portfolio II
Annual Report
Period Ended October 31, 2008
Dimensional Fund Advisors
6300 Bee Cave Road, Building One
Austin, TX 78746
December 2008
Dear Fellow Shareholder,
This has been a challenging year for investors. After drifting lower throughout the spring and summer, stock markets around the world plummeted in mid September on news that the ongoing credit crisis was driving some leading financial services companies toward failure. As the effects of this distress rippled through the financial world, investors became increasingly anxious and stock prices continued to decline sharply. In the month of October, the S&P 500 Index fell 16.8% or 196 points—its worst-ever monthly point decline.
Markets like this test investors' resolve. It is difficult to stick with a long-term investment plan when one sees the dramatic effects of high market volatility on a portfolio's value. Very few people are having a positive investment experience right now. But investors who have based their approach on a sensible risk/return framework tend to be in better shape than those who have not.
The recent market turbulence illustrates the reason why Dimensional believes that markets are efficient. History has shown time and again that prices cannot be predicted in public equity markets. This "random walk" makes diversification very important. Although the broad diversification in our portfolios didn't prevent negative performance this year, we believe it helped our shareholders avoid the extreme losses experienced by investors who concentrated their holdings in individual companies, industry sectors, or markets.
The unpredictability of stock prices also makes it important for investors to take a hard look at their own portfolios and determine how much risk and what types of risk they should take. Investors who hold asset mixes that accurately reflect their tolerance for risk are better able to withstand down markets.
Nobody knows when the capital markets will recover, but over time we can expect them to again offer a premium to investors who are willing to invest in relatively risky assets such as stocks. My view is that investors who have already paid for risk should stay invested and earn the return that can be expected when markets turn around. If markets continue to be so volatile, it's also important to understand that pulling money out of stocks, even for short periods of time, can result in significant missed opportunities.
All of us at Dimensional take our job as the steward of your assets very seriously and hope to have the opportunity to serve you for many years to come.
Sincerely,
David G. Booth
Chairman and Chief Executive Officer
[THIS PAGE INTENTIONALLY LEFT BLANK]
ANNUAL REPORT
Table of Contents
| Letter to Shareholders | | Page | |
| Definitions of Abbreviations and Footnotes | | | 1 | | |
|
| Dimensional Investment Group Inc. — Emerging Markets Portfolio II | |
|
| Performance Chart | | | 2 | | |
|
| Management's Discussion and Analysis | | | 3 | | |
|
| Disclosure of Fund Expenses | | | 5 | | |
|
| Disclosure of Portfolio Holdings | | | 6 | | |
|
| Statement of Assets and Liabilities | | | 7 | | |
|
| Statements of Operations | | | 8 | | |
|
| Statements of Changes in Net Assets | | | 9 | | |
|
| Financial Highlights | | | 10 | | |
|
| Notes to Financial Statements | | | 11 | | |
|
| Report of Independent Registered Public Accounting Firm | | | 15 | | |
|
| The DFA Investment Trust Company — The Emerging Markets Series | |
|
| Performance Chart | | | 16 | | |
|
| Disclosure of Fund Expenses | | | 17 | | |
|
| Disclosure of Portfolio Holdings | | | 18 | | |
|
| Summary Schedule of Portfolio Holdings | | | 19 | | |
|
| Statement of Assets and Liabilities | | | 22 | | |
|
| Statements of Operations | | | 23 | | |
|
| Statements of Changes in Net Assets | | | 24 | | |
|
| Financial Highlights | | | 25 | | |
|
| Notes to Financial Statements | | | 26 | | |
|
| Report of Independent Registered Public Accounting Firm | | | 32 | | |
|
| Fund Management | | | 33 | | |
|
| Voting Proxies on Fund Portfolio Securities | | | 40 | | |
|
| Notice to Shareholders | | | 41 | | |
|
This report is submitted for the information of the Fund's shareholders. It is not authorized for distribution to prospective investors unless preceded or accompanied by an effective prospectus.
i
[THIS PAGE INTENTIONALLY LEFT BLANK]
DIMENSIONAL INVESTMENT GROUP INC.
THE DFA INVESTMENT TRUST COMPANY
DEFINITIONS OF ABBREVIATIONS AND FOOTNOTES
Statement of Assets and Liabilities/Summary Schedule of Portfolio Holdings
Investment Abbreviations
ADR American Depositary Receipt
FHLMC Federal Home Loan Mortgage Corporation
FNMA Federal National Mortgage Association
Investment Footnotes
† See Note B to Financial Statements.
†† Securities have generally been fair valued. See Note B to Financial Statements.
** Calculated as a percentage of total net assets. Percentages shown parenthetically next to the category headings have been calculated as a percentage of total investments. "Other Securities" are those securities that are not among the top 50 holdings of the Fund or do not represent more than 1.0% of the net assets of the Fund. Some of the individual securities within this category may be Non-Income Producing Securities.
* Non-Income Producing Securities.
# Total or Partial Securities on Loan.
@ Security purchased with cash proceeds from Securities on Loan.
(r) The adjustable rate shown is effective as of October 31, 2008.
§ Affiliated Fund.
Financial Highlights
(A) Computed using average shares outstanding.
(B) Annualized
(C) Non-Annualized
(D) Represents the combined ratios for the respective portfolio and its respective pro-rata share of its Master Fund Series.
All Statements and Schedules
— Amounts designated as — are either zero or rounded to zero.
SEC Securities and Exchange Commission
1
DIMENSIONAL INVESTMENT GROUP INC.
PERFORMANCE CHART
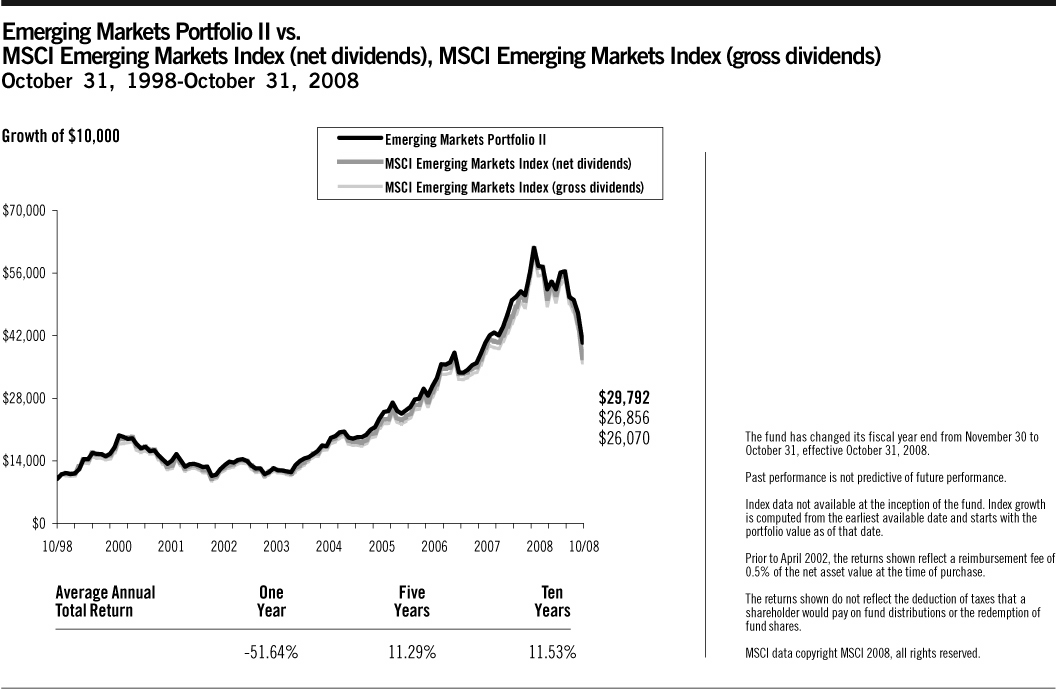
2
DIMENSIONAL INVESTMENT GROUP INC.
MANAGEMENT'S DISCUSSION AND ANALYSIS
On September 16, 2008, at a regular meeting of the Board of Directors/Trustees (the "Board") of the funds covered by this report, the Board voted to change the fiscal and tax year ends of the funds from November 30 to October 31. Therefore, the following discussion generally covers the 11-month period ended October 31, 2008.
International Equity Market Review 11 Months Ended October 31, 2008
International equity markets, affected by credit and liquidity problems similar to those experienced in the U.S., experienced high levels of volatility and broadly negative returns for the period under review. Due to the strengthening of the U.S. dollar vs. most developed countries' currencies (with the exception of the Japanese Yen and the Hong Kong dollar), the performance numbers when expressed in U.S. dollars were lower than when expressed in local currencies for all of the largest country constituents of the MSCI World ex USA Index, with the exception of Japan and Hong Kong. Overall, currency exchange rate changes reduced the returns expressed in U.S. dollars: total return for the MSCI World ex USA Index (net dividends) was –37.82% in local currency and –44.37% in U.S. dollars.
Total Returns for 11 Months Ended October 31, 2008
| Ten Largest Foreign Developed Markets by Market Cap (BB) | | Local
Currency
Return | | U.S. Dollar
Return | |
| Japan ($2,111) | | | –43.55 | % | | | –36.33 | % | |
| United Kingdom ($1,758) | | | –29.61 | % | | | –44.68 | % | |
| France ($872) | | | –36.80 | % | | | –45.40 | % | |
| Canada ($786) | | | ���25.69 | % | | | –38.91 | % | |
| Germany ($705) | | | –37.97 | % | | | –46.42 | % | |
| Switzerland ($704) | | | –30.05 | % | | | –32.39 | % | |
| Australia ($513) | | | –35.10 | % | | | –51.58 | % | |
| Spain ($331) | | | –40.19 | % | | | –48.33 | % | |
| Italy ($301) | | | –43.34 | % | | | –51.06 | % | |
| Netherlands ($206) | | | –41.65 | % | | | –49.59 | % | |
Country market capitalizations (in parentheses) are in USD billions. Source: Returns are of MSCI indices net of foreign withholding taxes on dividends. Country market capitalizations are based on country carve-outs of the MSCI All-Country World Investable Market Index. MSCI data copyright MSCI 2008, all rights reserved.
Small company stocks were the poorest-performing asset classes in international markets, while large company growth stocks had the best relative results.
Total Returns for 11 Months Ended October 31, 2008
| | | U.S. Dollar
Return | |
| MSCI World ex USA Small Cap Index | | | –50.30 | % | |
| MSCI World ex USA Value Index | | | –45.31 | % | |
| MSCI World ex USA Index | | | –44.37 | % | |
| MSCI World ex USA Growth Index | | | –43.47 | % | |
Source: MSCI indices are net of foreign withholding taxes on dividends, copyright MSCI 2008, all rights reserved.
Losses in emerging markets were worse, on average, than in developed country markets, although results varied widely among individual countries. For the 11 months under review, total returns in U.S. dollars were –53.02% for the MSCI Emerging Markets Index (net dividends) and –44.37% for the MSCI World ex USA Index (net dividends).
3
Total Returns for 11 Months Ended October 31, 2008
| Country | | U.S. Dollar
Return | |
| Argentina | | | –55.00 | % | |
| Brazil | | | –51.21 | % | |
| Chile | | | –36.59 | % | |
| China | | | –59.33 | % | |
| Czech Republic | | | –40.25 | % | |
| Hungary | | | –58.65 | % | |
| India | | | –61.19 | % | |
| Indonesia | | | –59.87 | % | |
| Israel | | | –23.01 | % | |
| Malaysia | | | –40.52 | % | |
| Mexico | | | –44.05 | % | |
| Philippines | | | –49.76 | % | |
| Poland | | | –51.90 | % | |
| South Africa | | | –47.38 | % | |
| South Korea | | | –55.75 | % | |
| Taiwan | | | –43.57 | % | |
| Thailand | | | –51.81 | % | |
| Turkey | | | –59.24 | % | |
Source: Returns are of MSCI indices net of foreign withholding taxes on dividends, copyright MSCI 2008, all rights reserved.
Master-Feeder Structure
The portfolio described below, called a "Feeder Fund," does not buy individual securities directly; instead, the portfolio invests in a corresponding fund called a "Master Fund." The Master Fund, in turn, purchases stocks, bonds, and/or other securities.
Emerging Markets Portfolio II
The Emerging Markets Portfolio II seeks to capture the returns of large company stocks in selected emerging markets by purchasing shares of a Master Fund investing in such stocks. The investment strategy employs a disciplined, quantitative approach, emphasizing broad diversification and consistent exposure to large company emerging markets stocks, but does not attempt to track closely a specific equity index. As of October 31, 2008, the Master Fund held approximately 520 stocks in 17 emerging countries, and the average cash levels for the 11 months ended October 31, 2008 were in general less than 1% of the Master Fund's assets.
As a result of the Master Fund's diversified approach, performance was determined principally by broad structural trends in emerging country stock markets, rather than the behavior of a limited number of stocks. For the 11 months ended October 31, 2008, total returns were –52.88% for the MSCI Emerging Markets Index (gross dividends), –53.02% for the MSCI Emerging Markets Index (net dividends), and –48.27% for the Portfolio. The Index net of foreign withholding taxes on dividends does not have ten years of performance. The Portfolio intends to include the Index gross of foreign withholding taxes on dividends for performance comparison purposes until the net-dividends Index has at least ten years of data to report.
Relative to the MSCI Emerging Markets Index (net dividends), the better performance of the Portfolio was primarily due to the Master Fund's lower allocation to China and Russia, which underperformed the overall Index; and a greater allocation to Mexico and Israel, which outperformed the Index. On average, Chinese stocks represented approximately 7% of the Master Fund for the period under review compared to 15% in the Index. The Master Fund does not purchase Russian stocks, which represented approximately 10% of the Index. Israeli stocks represented approximately 4% of the Master Fund, compared to 2% of the Index; while Mexican stocks represented approximately 9% of the Master Fund, compared to 5% of the Index.
4
DIMENSIONAL INVESTMENT GROUP INC.
EMERGING MARKETS PORTFOLIO II
DISCLOSURE OF FUND EXPENSES
(Unaudited)
The following Expense Table is shown so that you can understand the impact of fees on your investment. All mutual funds have operating expenses. As a shareholder of the fund, you incur ongoing costs, which include costs for portfolio management, administrative services, and shareholder reports, among others. Operating expenses, legal and audit services, which are deducted from a fund's gross income, directly reduce the investment return of the fund. A fund's expenses are expressed as a percentage of its average net assets. This figure is known as the expense ratio. The following examples are intended to help you understand the ongoing costs, in dollars, of investing in the fund and to compare these costs with those of other mutual funds. The examples are based on an investment of $1,000 made at the beginning of the period shown and held for the entire period.
The Expense Table below illustrates your fund's costs in two ways.
Actual Fund Return
This section helps you to estimate the actual expenses after fee waivers that you paid over the period. The "Ending Account Value" shown is derived from the fund's actual return and "Expenses Paid During Period" reflect the dollar amount that would have been paid by an investor who started with $1,000 in the fund. You may use the information here, together with the amount you invested, to estimate the expenses that you paid over the period.
To do so, simply divide your account value by $1,000 (for example, a $7,500 account value divided by $1,000 = 7.5), then multiply the result by the number given for your fund under the heading "Expenses Paid During Period."
Hypothetical Example for Comparison Purposes
This section is intended to help you compare your fund's costs with those of other mutual funds. The hypothetical "Ending Account Value" and "Expenses Paid During Period" are derived from the fund's actual expense ratio and an assumed 5% annual return before expenses. In this case, because the return used is not the fund's actual return, the results do not apply to your investment. The example is useful in making comparisons because the SEC requires all mutual funds to calculate expenses based on a 5% annual return. You can assess your fund's cost by comparing this hypothetical example with the hypothetical examples that appear in shareholder reports of other funds.
Please note that the expenses shown in the table are meant to highlight and help you compare ongoing costs only and do not reflect any transactional costs, if applicable. The "Annualized Expense Ratio" represents the actual expenses for the six-month period indicated.
Six Months Ended October 31, 2008
EXPENSE TABLE
| | | Beginning
Account
Value
05/01/08 | | Ending
Account
Value
10/31/08 | | Annualized
Expense
Ratio* | | Expenses
Paid
During
Period* | |
| Actual Fund Return | | $ | 1,000.00 | | | $ | 531.20 | | | | 0.34 | % | | $ | 1.31 | | |
| Hypothetical 5% Annual Return | | $ | 1,000.00 | | | $ | 1,023.43 | | | | 0.34 | % | | $ | 1.73 | | |
* Expenses are equal to the fund's annualized expense ratio for the six-month period, multiplied by the average account value over the period, multiplied by the number of days in the most recent six-month period (184), then divided by the number of days in the year (366) to reflect the six-month period. The Portfolio is a Feeder Fund. The expenses shown reflect the direct expenses of the Feeder Fund and the indirect payment of the Feeder Fund's portion of the expenses of its Master Fund.
5
DIMENSIONAL INVESTMENT GROUP INC.
EMERGING MARKETS PORTFOLIO II
DISCLOSURE OF PORTFOLIO HOLDINGS
(Unaudited)
The SEC requires that all Funds file a complete Schedule of Investments with the SEC for their first and third fiscal quarters on Form N-Q. For Dimensional Investment Group Inc., this would be for the fiscal quarters ending January 31 and July 31. The Form N-Q filing must be made within 60 days of the end of the quarter. Dimensional Investment Group Inc. filed its most recent Form N-Q with the SEC on October 30, 2008. It is available upon request, without charge, by calling collect: (310) 395-8005 or by mailing a request to Dimensional Fund Advisors LP, 1299 Ocean Avenue, Santa Monica, California 90401, or by visiting the SEC's website at http://www.sec.gov, or they may be reviewed and copied at the SEC's Public Reference Room in Washington, D.C. (call 1-800-732-0330 for information on the operation of the Public Reference Room).
PORTFOLIO HOLDINGS
The SEC requires that all Funds present their categories of portfolio holdings in a table, chart or graph format in their annual and semi-annual shareholder reports, whether or not a Schedule of Investments is utilized. The following table, which presents portfolio holdings as a percent of total investments before short-term investments and collateral for loaned securities, is provided in compliance with such requirement.
The categories of industry classification for the Affiliated Investment Company are represented in the Disclosure of Portfolio Holdings, which are included elsewhere within the report. Refer to the Summary Schedule of Portfolio Holdings for the underlying Master Fund's holdings which reflect the investments by country.
| Affiliated Investment Company | | | 100.0 | % | |
6
DIMENSIONAL INVESTMENT GROUP INC.
EMERGING MARKETS PORTFOLIO II
STATEMENT OF ASSETS AND LIABILITIES
OCTOBER 31, 2008
(Amounts in thousands, except share and per share amounts)
| ASSETS: | |
Investment in The Emerging Markets Series of The DFA Investment Trust Company
(Affiliated Investment Company) at Value† | | $ | 112,635 | | |
| Receivable for Fund Shares Sold | | | 333 | | |
| Prepaid Expenses and Other Assets | | | 8 | | |
| Total Assets | | | 112,976 | | |
| LIABILITIES: | |
| Payables: | |
| Affiliated Investment Company | | | 333 | | |
| Due to Advisor | | | 16 | | |
| Accrued Expenses and Other Liabilities | | | 35 | | |
| Total Liabilities | | | 384 | | |
| NET ASSETS | | $ | 112,592 | | |
| SHARES OUTSTANDING, $0.01 PAR VALUE (1) | | | 7,388,537 | | |
| NET ASSET VALUE, OFFERING AND REDEMPTION PRICE PER SHARE | | $ | 15.24 | | |
| Investment in Affiliated Investment Company at Cost | | $ | 85,305 | | |
| NET ASSETS CONSIST OF: | |
| Paid-In Capital | | $ | 166,338 | | |
| Undistributed Net Investment Income (Distributions in Excess of Net Investment Income) | | | 5,645 | | |
| Accumulated Net Realized Gain (Loss) | | | (86,808 | ) | |
| Deferred Thailand Capital Gains Tax | | | 97 | | |
| Net Unrealized Foreign Exchange Gain (Loss) | | | (10 | ) | |
| Net Unrealized Appreciation (Depreciation) | | | 27,330 | | |
| NET ASSETS | | $ | 112,592 | | |
| (1) NUMBER OF SHARES AUTHORIZED | | | 200,000,000 | | |
See accompanying Notes to Financial Statements.
7
DIMENSIONAL INVESTMENT GROUP INC.
EMERGING MARKETS PORTFOLIO II
STATEMENTS OF OPERATIONS
(Amounts in thousands)
| | | Period
Dec. 1, 2007
to
Oct. 31, 2008 | | Year
Ended
Nov. 30,
2007 | |
| Investment Income | |
| Dividends (Net of Foreign Taxes Withheld of $731 and $260, respectively) | | $ | 6,762 | | | $ | 3,244 | | |
| Interest | | | 18 | | | | 24 | | |
| Income from Securities Lending | | | 330 | | | | 156 | | |
| Expenses Allocated from Affiliated Investment Company | | | (410 | ) | | | (257 | ) | |
| Total Investment Income | | | 6,700 | | | | 3,167 | | |
| Expenses | |
| Administrative Services Fees | | | 335 | | | | 236 | | |
| Accounting & Transfer Agent Fees | | | 15 | | | | 14 | | |
| Filing Fees | | | 4 | | | | 62 | | |
| Shareholders' Reports | | | 14 | | | | 15 | | |
| Directors'/Trustees' Fees & Expenses | | | — | | | | 2 | | |
| Professional Fees | | | 10 | | | | 4 | | |
| Other | | | 4 | | | | 2 | | |
| Total Expenses | | | 382 | | | | 335 | | |
Fees Waived, Expenses Reimbursed, and/or Previously Waived Fees
Recovered by Advisor (Note C) | | | — | | | | (66 | ) | |
| Net Expenses | | | 382 | | | | 269 | | |
| Net Investment Income (Loss) | | | 6,318 | | | | 2,898 | | |
| Realized and Unrealized Gain (Loss) | |
| Net Realized Gain (Loss) on: | |
| Investment Securities Sold | | | (86,714 | ) | | | 3,885 | | |
| Futures | | | (12 | ) | | | — | | |
| Foreign Currency Transactions | | | (214 | ) | | | 5 | | |
| Change in Unrealized Appreciation (Depreciation) of: | |
| Investment Securities and Foreign Currency | | | (45,036 | ) | | | 47,846 | | |
| Futures | | | 2 | | | | — | | |
| Translation of Foreign Currency Denominated Amounts | | | (10 | ) | | | (1 | ) | |
| Change in Deferred Thailand Capital Gains Tax | | | 190 | | | | (57 | ) | |
| Net Realized and Unrealized Gain (Loss) | | | (131,794 | ) | | | 51,678 | | |
| Net Increase (Decrease) in Net Assets Resulting from Operations | | $ | (125,476 | ) | | $ | 54,576 | | |
Investment Income and Realized and Unrealized Gain (Loss) were allocated from the Portfolio's Master Fund (Affiliated Investment Company).
See accompanying Notes to Financial Statements.
8
DIMENSIONAL INVESTMENT GROUP INC.
EMERGING MARKETS PORTFOLIO II
STATEMENTS OF CHANGES IN NET ASSETS
(Amounts in thousands)
| | | Period
Dec. 1, 2007
to
Oct. 31, 2008 | | Year
Ended
Nov. 30,
2007 | | Year
Ended
Nov. 30,
2006 | |
| Increase (Decrease) in Net Assets | |
| Operations: | |
| Net Investment Income (Loss) | | $ | 6,318 | | | $ | 2,898 | | | $ | 1,136 | | |
| Net Realized Gain (Loss) on: | |
| Investment Securities Sold | | | (86,714 | ) | | | 3,885 | | | | 526 | | |
| Futures | | | (12 | ) | | | — | | | | — | | |
| Foreign Currency Transactions | | | (214 | ) | | | 5 | | | | (15 | ) | |
| Change in Unrealized Appreciation (Depreciation) of: | |
| Investment Securities and Foreign Currency | | | (45,036 | ) | | | 47,846 | | | | 11,201 | | |
| Futures | | | 2 | | | | — | | | | — | | |
| Translation of Foreign Currency Denominated Amounts | | | (10 | ) | | | (1 | ) | | | — | | |
| Change in Deferred Thailand Capital Gains Tax | | | 190 | | | | (57 | ) | | | 19 | | |
Net Increase (Decrease) in Net Assets
Resulting from Operations | | | (125,476 | ) | | | 54,576 | | | | 12,867 | | |
| Distributions From: | |
| Net Investment Income | | | (3,152 | ) | | | (1,289 | ) | | | (975 | ) | |
| Net Long-Term Gains | | | (2,284 | ) | | | — | | | | — | | |
| Total Distributions | | | (5,436 | ) | | | (1,289 | ) | | | (975 | ) | |
| Capital Share Transactions (1): | |
| Shares Issued | | | 30,359 | | | | 240,044 | | | | 22,833 | | |
| Shares Issued in Lieu of Cash Distributions | | | 5,436 | | | | 1,289 | | | | 975 | | |
| Shares Redeemed | | | (102,918 | ) | | | (46,626 | ) | | | (7,007 | ) | |
| Net Increase (Decrease) from Capital Share Transactions | | | (67,123 | ) | | | 194,707 | | | | 16,801 | | |
| Total Increase (Decrease) in Net Assets | | | (198,035 | ) | | | 247,994 | | | | 28,693 | | |
| Net Assets | |
| Beginning of Period | | | 310,627 | | | | 62,633 | | | | 33,940 | | |
| End of Period | | $ | 112,592 | | | $ | 310,627 | | | $ | 62,633 | | |
| (1) Shares Issued and Redeemed: | |
| Shares Issued | | | 1,149 | | | | 9,033 | | | | 1,204 | | |
| Shares Issued in Lieu of Cash Distributions | | | 192 | | | | 59 | | | | 58 | | |
| Shares Redeemed | | | (4,304 | ) | | | (1,655 | ) | | | (370 | ) | |
| | | | (2,963 | ) | | | 7,437 | | | | 892 | | |
Undistributed Net Investment Income (Distributions in
Excess of Net Investment Income) | | $ | 5,645 | | | $ | 2,703 | | | $ | 1,049 | | |
See accompanying Notes to Financial Statements.
9
DIMENSIONAL INVESTMENT GROUP INC.
EMERGING MARKETS PORTFOLIO II
FINANCIAL HIGHLIGHTS
(for a share outstanding throughout each period)
| | | Period
Dec. 1, 2007
to
Oct. 31, 2008 | | Year
Ended
Nov. 30,
2007 | | Year
Ended
Nov. 30,
2006 | | Year
Ended
Nov. 30,
2005 | | Year
Ended
Nov. 30,
2004 | | Year
Ended
Nov. 30,
2003 | |
| Net Asset Value, Beginning of Period | | $ | 30.01 | | | $ | 21.50 | | | $ | 16.79 | | | $ | 13.03 | | | $ | 9.78 | | | $ | 7.11 | | |
| Income from Investment Operations | |
| Net Investment Income (Loss) | | | 0.68 | (A) | | | 0.53 | (A) | | | 0.45 | (A) | | | 0.53 | (A) | | | 0.24 | | | | 0.16 | | |
Net Gains (Losses) on Securities
(Realized and Unrealized) | | | (14.92 | ) | | | 8.42 | | | | 4.74 | | | | 3.47 | | | | 3.18 | | | | 2.63 | | |
| Total from Investment Operations | | | (14.24 | ) | | | 8.95 | | | | 5.19 | | | | 4.00 | | | | 3.42 | | | | 2.79 | | |
| Less Distributions | |
| Net Investment Income | | | (0.31 | ) | | | (0.44 | ) | | | (0.48 | ) | | | (0.24 | ) | | | (0.17 | ) | | | (0.12 | ) | |
| Net Realized Gains | | | (0.22 | ) | | | — | | | | — | | | | — | | | | — | | | | — | | |
| Total Distributions | | | (0.53 | ) | | | (0.44 | ) | | | (0.48 | ) | | | (0.24 | ) | | | (0.17 | ) | | | (0.12 | ) | |
| Net Asset Value, End of Period | | $ | 15.24 | | | $ | 30.01 | | | $ | 21.50 | | | $ | 16.79 | | | $ | 13.03 | | | $ | 9.78 | | |
| Total Return | | | (48.27 | )%(C) | | | 42.40 | % | | | 31.67 | % | | | 31.22 | % | | | 35.39 | % | | | 39.88 | % | |
| Net Assets, End of Period (thousands) | | $ | 112,592 | | | $ | 310,627 | | | $ | 62,633 | | | $ | 33,940 | | | $ | 22,778 | | | $ | 13,272 | | |
| Ratio of Expenses to Average Net Assets (D) | | | 0.35 | %(B) | | | 0.39 | % | | | 0.35 | % | | | 0.41 | % | | | 0.53 | % | | | 0.58 | % | |
Ratio of Expenses to Average Net Assets
(Excluding Waivers and Assumption of
Expenses and/or Recovery of Previously
Waived Fees) (D) | | | 0.35 | %(B) | | | 0.43 | % | | | 0.74 | % | | | 0.81 | % | | | 0.93 | % | | | 0.98 | % | |
Ratio of Net Investment Income to Average
Net Assets | | | 2.82 | %(B) | | | 2.13 | % | | | 2.38 | % | | | 3.60 | % | | | 2.43 | % | | | 2.09 | % | |
See page 1 for the Definitions of Abbreviations and Footnotes.
See accompanying Notes to Financial Statements.
10
DIMENSIONAL INVESTMENT GROUP INC.
EMERGING MARKETS PORTFOLIO II
NOTES TO FINANCIAL STATEMENTS
A. Organization:
Dimensional Investment Group Inc. (the "Fund") is an open-end management investment company registered under the Investment Company Act of 1940, whose shares are generally offered to institutional investors, retirement plans and clients of registered investment advisors. The Fund consists of fifteen portfolios, of which the Emerging Markets Portfolio II (the "Portfolio") is presented in this report.
The Portfolio primarily invests its assets in The Emerging Markets Series (the "Series"), a series of The DFA Investment Trust Company. At October 31, 2008, the Portfolio owned 7% of the Series. The financial statements of the Series are included elsewhere in this report and should be read in conjunction with the financial statements of the Portfolio.
At a regular meeting of the Board of Directors/Trustees (the "Board") on September 16, 2008, the Board voted to change the fiscal and tax year ends of the Portfolio from November 30 to October 31.
B. Significant Accounting Policies:
The following significant accounting policies are in conformity with accounting principles generally accepted in the United States of America. Such policies are consistently followed by the Fund in preparation of its financial statements. The preparation of financial statements in accordance with accounting principles generally accepted in the United States of America requires management to make estimates and assumptions that affect the reported amounts of assets and liabilities and disclosure of contingent assets and liabilities at the date of the financial statements and the reported amounts of increases and decreases in net assets from operations during the reporting period. Actual results could differ from those estimates and those differences could be material.
1. Security Valuation: The Portfolio's investment reflects its proportionate interest in the net assets of the Series.
Adoption of Statement of Financial Accounting Standards No. 157 "Fair Value Measurements" ("FAS 157")
In September 2006, the Financial Accounting Standards Board issued FAS 157 effective for fiscal years beginning after November 15, 2007. This standard clarifies the definition of fair value for financial reporting, establishes a framework for measuring fair value and requires additional disclosures about the use of fair value measurements. The Funds have adopted FAS 157 as of December 1, 2007. The three levels of the fair value hierarchy under FAS 157 are described below:
• Level 1 – quoted prices in active markets for identical securities
• Level 2 – other significant observable inputs (including quoted prices for similar securities, interest rates, prepayment speeds, credit risk, etc.)
• Level 3 – significant unobservable inputs (including the Portfolio's own assumptions in determining the fair value of investments)
The inputs or methodology used for valuing securities are not necessarily an indication of the risk associated with investing in those securities. A summary of the inputs used to value the Portfolio's net assets as of October 31, 2008 is listed below (in thousands).
| | | Valuation Inputs | |
| | | Investments in
Securities
(Market Value) | |
| | | Level 1 | | Level 2 | | Level 3 | | Total | |
| Emerging Markets Portfolio II | | $ | 112,635 | | | | — | | | | — | | | $ | 112,635 | | |
11
2. Deferred Compensation Plan: Each eligible Director of the Fund may elect participation in the Deferred Compensation Plan (the "Plan"). Under the Plan, effective January 1, 2002, such Directors may defer payment of all or a portion of their total fees earned as a Director. These deferred amounts may be treated as though such amounts had been invested in shares of the following funds: U.S. Large Cap Value Portfolio; U.S. Core Equity 1 Portfolio; U.S. Core Equity 2 Portfolio; U.S. Vector Equity Portfolio; U.S. Micro Cap Portfolio; DFA International Value Portfolio; International Core Equity Portfolio; Emerging Markets Portfolio; Emerging Markets Core Equity Portfolio; and/or DFA Two-Year Global Fixed Income Portfolio. Contributions made under the Plan and the change in unrealized a ppreciation (depreciation) and income, are included in Other Expenses for the period ended October 31, 2008 and are included in Directors'/Trustees' Fees & Expenses for the year ended November 30, 2007. At October 31, 2008, the total liability for deferred compensation to Directors is included in Accrued Expenses and Other Liabilities on the Statement of Assets and Liabilities in the amount of $4 (in thousands).
Each Director has the option to receive their distribution of proceeds in one of the following methods upon one year's notice: lump sum; annual installments over a period of agreed upon years; or semi-annual installments over a period of agreed upon years. As of October 31, 2008, none of the Directors have requested distribution of proceeds.
3. Other: Security transactions are accounted for as of the trade date. Costs used in determining realized gains and losses on the sale of affiliated investment companies are on the basis of identified cost. Dividend income and distributions to shareholders are recorded on the ex-dividend date. Distributions received on securities that represent a return of capital or capital gain are recorded as a reduction of cost of investments or as a realized gain, respectively. The Portfolio estimates the character of distributions received that may be considered return of capital distributions. Expenses directly attributable to the Portfolio are directly charged. Common expenses of the Fund are allocated using methods approved by the Board of Directors/Trustees, generally based on avera ge net assets.
The Emerging Markets Portfolio II recognizes its pro-rata share of net investment income and realized and unrealized gains (losses) of investment securities and foreign currency, on a daily basis, from the Series, which is treated as a partnership for federal income tax purposes.
C. Investment Advisor:
Dimensional Fund Advisors LP ("Dimensional" or the "Advisor") provides administrative services to the Portfolio, including supervision of services provided by others, providing information to the shareholders and to the Board of Directors/Trustees, and other administrative services. The Advisor provides investment advisory services to the Series. The Portfolio's administrative services fees were accrued daily and paid monthly to the Advisor based on an effective annual rate of 0.15% of average daily net assets.
Fees Paid to Officers and Directors/Trustees:
Certain Officers and Directors/Trustees of the Advisor are also Officers and Directors/Trustees of the Fund; however, such Officers and Directors/Trustees (with the exception of the Chief Compliance Officer ("CCO")) receive no compensation from the Fund. For the period December 1, 2007 to October 31, 2008, the total related amounts paid by the Fund to the CCO were $25 (in thousands). The total related amount paid by the Portfolio is included in Other Expenses on the Statement of Operations.
D. Federal Income Taxes:
The Portfolio has qualified and intends to continue to qualify as a regulated investment company under Subchapter M of the Internal Revenue Code for federal income tax purposes and to distribute substantially all of its taxable income and net capital gains to its shareholders. Accordingly, no provision has been made for federal income taxes.
Distributions from net investment income and net realized capital gains are determined in accordance with U.S. federal income tax regulations, which may differ from those amounts determined under accounting principles generally accepted in the United States of America. These book/tax differences are either temporary or permanent in nature. To the extent these differences are permanent, they are charged or credited to paid-in capital, undistributed net investment income or accumulated net realized gains, as appropriate, in the period that the differences arise. Accordingly, the following permanent differences as of October 31, 2008, primarily attributable to realized net foreign currency gains/losses
12
were classified to the following accounts. These reclassifications had no effect on net assets or net asset value per share (amounts in thousands):
Increase (Decrease)
Undistributed
Net Investment
Income | | Increase (Decrease)
Accumulated
Net Realized
Gains/(Losses) | |
| $ | (224 | ) | | $ | 224 | | |
The tax character of dividends and distributions declared and paid during and the years ended November 30, 2006, November 30, 2007 and the period December 1, 2007 to October 31, 2008 were as follows (amounts in thousands):
| | | Net Investment
Income and
Short-Term
Capital Gains | | Long-Term
Capital Gains | | Total | |
| | 2006 | | | $ | 975 | | | | — | | | $ | 975 | | |
| | 2007 | | | | 1,289 | | | | — | | | | 1,289 | | |
| | 2008 | | | | 3,162 | | | $ | 2,274 | | | | 5,436 | | |
At October 31, 2008, the components of distributable earnings/(accumulated losses) were as follows (amounts in thousands):
Undistributed
Net Investment
Income and
Short-Term
Capital Gains | | Undistributed
Long-Term
Capital Gains | | Capital
Loss
Carryforward | | Total Net
Distributable Earnings/
(Accumulated Losses) | |
| $ | 5,649 | | | | — | | | $ | (86,922 | ) | | $ | (81,273 | ) | |
For federal income tax purposes, the Fund measures its capital loss carryforwards annually at October 31, its fiscal year end. Capital loss carryforwards may be carried forward and applied against future capital gains. At October 31, 2008, the Portfolio had capital loss carryforwards of $86,922 (in thousands) available to offset future realized capital gains through October 31, 2016.
Some of the Master Fund's investments are in securities considered to be "passive foreign investment companies" for which any unrealized appreciation (depreciation) (mark to market) and/or realized gains are allocated to the Portfolio and are required to be included in distributable net investment income for tax purposes. At October 31, 2008, the Portfolio had no cumulative unrealized appreciation (depreciation) (mark to market) to be included in distributable net investment income for federal tax purposes. For the period December 1, 2007 to October 31, 2008, there were no realized gains on the sale of passive foreign investment companies to be reclassified from accumulated net realized gains to accumulated net investment income for federal tax purposes.
At October 31, 2008, the total cost and aggregate gross unrealized appreciation and (depreciation) of securities for federal income tax purposes were different from amounts reported for financial reporting purposes (amounts in thousands):
Federal
Tax Cost | | Unrealized
Appreciation | | Unrealized
(Depreciation) | | Net
Unrealized
Appreciation
(Depreciation) | |
| $ | 85,189 | | | $ | (31,733 | ) | | $ | 59,179 | | | $ | 27,446 | | |
In June 2006, the Financial Accounting Standards Board (FASB) issued FASB Interpretation 48 ("FIN 48"), "Accounting for Uncertainty in Income Taxes." This standard defines the threshold for recognizing the benefits of tax-return positions in the financial statements as "more-likely-than-not" to be sustained by the taxing authority and requires measurement of a tax position meeting the more-likely-than-not criterion, based on the largest benefit that is more than 50 percent likely to be realized. Management has analyzed the Portfolio's tax positions to be taken on the federal income tax returns for all open tax years (tax years ended November 30, 2005 through the period ended October 31, 2008), for purposes of implementing FIN 48, and has concluded that no provision for income tax is required in the Portfolio's financial statements.
13
E. Line of Credit:
The Fund, together with other Dimensional-advised portfolios, has entered into a $250 million unsecured discretionary line of credit effective June 30, 2003 with an affiliate of its domestic custodian bank. Each portfolio is permitted to borrow, subject to its investment limitations, up to a maximum of $250 million, as long as total borrowings under the line of credit do not exceed $250 million in the aggregate. Borrowings under the line of credit are charged interest at the then current Federal Funds Rate plus 1%. Each portfolio is individually, and not jointly, liable for its particular advances under the line of credit. There is no commitment fee on the unused portion of the line of credit. The agreement for the discretionary line of credit may be terminated by either party at any time. The line of credit is scheduled to expire on June 23, 2009. There were no borrowings by the Portfolio under this line of credit during the period ended Oc tober 31, 2008.
The Fund, together with other Dimensional-advised portfolios, has also entered into an additional $500 million unsecured line of credit effective January 15, 2008 with its international custodian bank. Each portfolio is permitted to borrow, subject to its investment limitations, up to a maximum of $500 million, as long as total borrowings under the line of credit do not exceed $500 million in the aggregate. Each portfolio is individually, and not jointly, liable for its particular advances under the line of credit. Borrowings under the line of credit are charged interest at rates agreed to by the parties at the time of borrowing. There is no commitment fee on the unused portion of the line of credit. The agreement of the line of credit expires on January 15, 2009. There were no borrowings by the Portfolio under this line of credit during the period ended October 31, 2008.
F. Indemnitees; Contractual Obligations:
Under the Fund's organizational documents, its officers and directors are indemnified against certain liabilities arising out of the performance of their duties to the Fund.
In the normal course of business, the Fund enters into contracts that contain a variety of representations and warranties which provide general indemnification. The Fund's maximum exposure under these arrangements is unknown as this would involve future claims that may be made against the Fund and/or its affiliates that have not yet occurred. However, based on experience, the Fund expects the risk of loss to be remote.
G. Recently Issued Accounting Standards and Interpretation:
In March 2008, Statement of Financial Accounting Standards No. 161, Disclosures about Derivative Instruments and Hedging Activities ("FAS 161"), was issued and is effective for fiscal years beginning after November 15, 2008. FAS 161 defines new disclosures of derivative instruments and hedging activities. Management is currently evaluating the implications of FAS 161. At this time, its impact on the Portfolio's financial statements has not been determined.
H. Other:
At October 31, 2008, two shareholders held 100% of the outstanding shares of the Portfolio.
14
REPORT OF INDEPENDENT REGISTERED PUBLIC ACCOUNTING FIRM
To the Shareholders of Emerging Markets Portfolio II and
Board of Directors of Dimensional Investment Group Inc.:
In our opinion, the accompanying statement of assets and liabilities, and the related statements of operations and of changes in net assets and the financial highlights present fairly, in all material respects, the financial position of Emerging Markets Portfolio II (one of the portfolios constituting Dimensional Investment Group Inc., hereafter referred to as the "Portfolio") at October 31, 2008, the results of its operations, the changes in its net assets and the financial highlights for each of the periods indicated, in conformity with accounting principles generally accepted in the United States of America. These financial statements and financial highlights (hereafter referred to as "financial statements") are the responsibility of the Portfolio's management; our responsibility is to express an opinion on these financial statements based on our audits. We conducted our audits of these financial statements in accordance with the standard s of the Public Company Accounting Oversight Board (United States). Those standards require that we plan and perform the audit to obtain reasonable assurance about whether the financial statements are free of material misstatement. An audit includes examining, on a test basis, evidence supporting the amounts and disclosures in the financial statements, assessing the accounting principles used and significant estimates made by management, and evaluating the overall financial statement presentation. We believe that our audits, which included confirmation of securities at October 31, 2008 by correspondence with the transfer agent of the investee fund, provide a reasonable basis for our opinion.
PricewaterhouseCoopers LLP
Philadelphia, Pennsylvania
December 22, 2008
15
THE DFA INVESTMENT TRUST COMPANY
PERFORMANCE CHART

16
THE DFA INVESTMENT TRUST COMPANY
THE EMERGING MARKETS SERIES
DISCLOSURE OF FUND EXPENSES
(Unaudited)
The following Expense Table is shown so that you can understand the impact of fees on your investment. All mutual funds have operating expenses. As a shareholder of the fund, you incur ongoing costs, which include costs for portfolio management, administrative services, and shareholder reports, among others. Operating expenses, legal and audit services, which are deducted from a fund's gross income, directly reduce the investment return of the fund. A fund's expenses are expressed as a percentage of its average net assets. This figure is known as the expense ratio. The following examples are intended to help you understand the ongoing costs, in dollars, of investing in the fund and to compare these costs with those of other mutual funds. The examples are based on an investment of $1,000 made at the beginning of the period shown and held for the entire period.
The Expense Table below illustrates your fund's costs in two ways.
Actual Fund Return
This section helps you to estimate the actual expenses after fee waivers that you paid over the period. The "Ending Account Value" shown is derived from the fund's actual return and "Expenses Paid During Period" reflect the dollar amount that would have been paid by an investor who started with $1,000 in the fund. You may use the information here, together with the amount you invested, to estimate the expenses that you paid over the period.
To do so, simply divide your account value by $1,000 (for example, a $7,500 account value divided by $1,000 = 7.5), then multiply the result by the number given for your fund under the heading "Expenses Paid During Period."
Hypothetical Example for Comparison Purposes
This section is intended to help you compare your fund's costs with those of other mutual funds. The hypothetical "Ending Account Value" and "Expenses Paid During Period" are derived from the fund's actual expense ratio and an assumed 5% annual return before expenses. In this case, because the return used is not the fund's actual return, the results do not apply to your investment. The example is useful in making comparisons because the SEC requires all mutual funds to calculate expenses based on a 5% annual return. You can assess your fund's cost by comparing this hypothetical example with the hypothetical examples that appear in shareholder reports of other funds.
Please note that the expenses shown in the table are meant to highlight and help you compare ongoing costs only and do not reflect any transactional costs, if applicable. The "Annualized Expense Ratio" represents the actual expenses for the six-month period indicated.
Six Months Ended October 31, 2008
EXPENSE TABLE
| | | Beginning
Account
Value
05/01/08 | | Ending
Account
Value
10/31/08 | | Annualized
Expense
Ratio* | | Expenses
Paid
During
Period* | |
| Actual Fund Return | | $ | 1,000.00 | | | $ | 531.80 | | | | 0.18 | % | | $ | 0.69 | | |
| Hypothetical 5% Annual Return | | $ | 1,000.00 | | | $ | 1,024.23 | | | | 0.18 | % | | $ | 0.92 | | |
* Expenses are equal to the fund's annualized expense ratio for the six-month period, multiplied by the average account value over the period, multiplied by the number of days in the most recent six-month period (184), then divided by the number of days in the year (366) to reflect the six-month period.
17
THE DFA INVESTMENT TRUST COMPANY
THE EMERGING MARKETS SERIES
DISCLOSURE OF PORTFOLIO HOLDINGS
(Unaudited)
The SEC requires that all Funds file a complete Schedule of Investments with the SEC for their first and third fiscal quarters on Form N-Q. For The DFA Investment Trust Company, this would be for the fiscal quarters ending January 31 and July 31. The Form N-Q filing must be made within 60 days of the end of the quarter. The DFA Investment Trust Company filed its most recent Form N-Q with the SEC on October 30, 2008. It is available upon request, without charge, by calling collect: (310) 395-8005 or by mailing a request to Dimensional Fund Advisors LP, 1299 Ocean Avenue, Santa Monica, California 90401, or by visiting the SEC's website at http://www.sec.gov, or they may be reviewed and copied at the SEC's Public Reference Room in Washington, D.C. (call 1-800-732-0330 for information on the operation of the Public Reference Room).
SEC regulations permit a fund to include in its reports to shareholders a "Summary Schedule of Portfolio Holdings" in lieu of a full Schedule of Investments. The Summary Schedule of Portfolio Holdings reports the fund's 50 largest holdings in unaffiliated issuers and any investments that exceed one percent of the fund's net assets at the end of the reporting period. The amendments also require that the Summary Schedule of Portfolio Holdings identify each category of investments that are held.
The fund is required to file a complete Schedule of Investments with the SEC on Form N-CSR within ten days after mailing the annual and semi-annual reports to shareholders. It will be available upon request, without charge, by calling collect: (310) 395-8005 or by mailing a request to Dimensional Fund Advisors LP, 1299 Ocean Avenue, Santa Monica, California 90401, or by visiting the SEC's website at http://www.sec.gov, or they may be reviewed and copied at the SEC's Public Reference Room in Washington, D.C. (call 1-800-732-0330 for information on the operation of the Public Reference Room).
PORTFOLIO HOLDINGS
The SEC requires that all Funds present their categories of portfolio holdings in a table, chart or graph format in their annual and semi-annual shareholder reports, whether or not a Schedule of Investments is utilized. The following table, which presents portfolio holdings as a percent of total investments before short-term investments and collateral for loaned securities, is provided in compliance with such requirement. The categories shown below represent broad industry sectors. Each industry sector consists of one or more specific industry classifications.
Consumer
Discretionary | | Consumer
Staples | | Energy | | Financials | | Health
Care | | Industrials | | Information
Technology | | Materials | | Telecommunication
Services | | Utilities | | Other | | Total | |
| | 6.8 | % | | | 9.9 | % | | | 11.1 | % | | | 16.8 | % | | | 4.8 | % | | | 8.1 | % | | | 11.8 | % | | | 14.2 | % | | | 11.4 | % | | | 4.9 | % | | | 0.2 | % | | | 100.0 | % | |
18
THE EMERGING MARKETS SERIES
SUMMARY SCHEDULE OF PORTFOLIO HOLDINGS
October 31, 2008
| | | Shares | | Value†† | | Percentage
of Net Assets** | |
| ARGENTINA — (0.3%) | |
| COMMON STOCKS — (0.3%) | |
| Other Securities | | | | | | $ | 5,584,351 | | | | 0.3 | % | |
| BRAZIL — (16.0%) | |
| COMMON STOCKS — (6.5%) | |
| Perdigao SA ADR | | | 457,126 | | | | 13,370,936 | | | | 0.8 | % | |
| Petroleo Brasilerio SA ADR (71654V101) | | | 1,934,642 | | | | 42,697,549 | | | | 2.7 | % | |
| Petroleo Brasilerio SA ADR (71654V408) | | | 1,223,746 | | | | 32,906,530 | | | | 2.0 | % | |
| Other Securities | | | | | | | 23,939,591 | | | | 1.5 | % | |
| TOTAL COMMON STOCKS | | | | | | | 112,914,606 | | | | 7.0 | % | |
| PREFERRED STOCKS — (9.5%) | |
| Banci Itau Holding Financeira SA | | | 1,507,125 | | | | 16,278,202 | | | | 1.0 | % | |
| Banco Bradesco SA | | | 1,636,841 | | | | 18,774,751 | | | | 1.2 | % | |
| Companhia Vale do Rio Doce Series A | | | 2,173,591 | | | | 25,212,251 | | | | 1.6 | % | |
| Gerdau SA Sponsored ADR | | | 2,037,600 | | | | 13,061,016 | | | | 0.8 | % | |
| # Sadia SA ADR | | | 1,234,266 | | | | 7,479,652 | | | | 0.5 | % | |
| # Votorantim Celulose e Papel SA Sponsored ADR | | | 1,181,000 | | | | 11,916,290 | | | | 0.7 | % | |
| Other Securities | | | | | | | 72,895,252 | | | | 4.4 | % | |
| TOTAL PREFERRED STOCKS | | | | | | | 165,617,414 | | | | 10.2 | % | |
| TOTAL — BRAZIL | | | | | | | 278,532,020 | | | | 17.2 | % | |
| CHILE — (3.2%) | |
| COMMON STOCKS — (3.2%) | |
| # Empresa Nacional de Electricidad SA Sponsored ADR | | | 262,585 | | | | 9,768,162 | | | | 0.6 | % | |
| Enersis SA Sponsored ADR | | | 1,398,003 | | | | 20,131,243 | | | | 1.3 | % | |
| # Sociedad Quimica y Minera de Chile SA Sponsored ADR | | | 349,195 | | | | 7,996,566 | | | | 0.5 | % | |
| Other Securities | | | | | | | 17,647,476 | | | | 1.0 | % | |
| TOTAL — CHILE | | | | | | | 55,543,447 | | | | 3.4 | % | |
| CHINA — (4.8%) | |
| COMMON STOCKS — (4.8%) | |
| # Bank of China, Ltd. | | | 60,844,000 | | | | 17,765,768 | | | | 1.1 | % | |
| China Resources Enterprise, Ltd. | | | 7,139,000 | | | | 14,213,048 | | | | 0.9 | % | |
| Citic Pacific, Ltd. | | | 17,336,000 | | | | 14,098,717 | | | | 0.9 | % | |
| # Industrial and Commercial Bank of China (Asia), Ltd. | | | 30,590,000 | | | | 14,393,223 | | | | 0.9 | % | |
| Other Securities | | | | | | | 22,976,599 | | | | 1.3 | % | |
| TOTAL — CHINA | | | | | | | 83,447,355 | | | | 5.1 | % | |
| CZECH REPUBLIC — (1.9%) | |
| COMMON STOCKS — (1.9%) | |
| CEZ A.S. | | | 323,973 | | | | 14,169,330 | | | | 0.9 | % | |
| Telefonica 02 Czech Republic A.S. | | | 704,007 | | | | 15,044,164 | | | | 0.9 | % | |
| Other Securities | | | | | | | 4,619,080 | | | | 0.3 | % | |
| TOTAL — CZECH REPUBLIC | | | | | | | 33,832,574 | | | | 2.1 | % | |
| HUNGARY — (2.3%) | |
| COMMON STOCKS — (2.3%) | |
| *# OTP Bank NYRT | | | 719,020 | | | | 11,908,444 | | | | 0.7 | % | |
| # Richter Gedeon NYRT | | | 115,808 | | | | 16,000,427 | | | | 1.0 | % | |
| Other Securities | | | | | | | 12,648,235 | | | | 0.8 | % | |
| TOTAL — HUNGARY | | | | | | | 40,557,106 | | | | 2.5 | % | |
19
THE EMERGING MARKETS SERIES
CONTINUED
| | | Shares | | Value†† | | Percentage
of Net Assets** | |
| INDIA — (9.4%) | |
| COMMON STOCKS — (9.4%) | |
| HDFC Bank, Ltd. | | | 386,733 | | | $ | 8,227,909 | | | | 0.5 | % | |
| Hindustan Unilever, Ltd. | | | 1,921,894 | | | | 8,736,163 | | | | 0.5 | % | |
| Infosys Technologies, Ltd. | | | 657,429 | | | | 19,010,875 | | | | 1.2 | % | |
| Infosys Technologies, Ltd. Sponsored ADR | | | 250,600 | | | | 7,347,592 | | | | 0.5 | % | |
| Reliance Industries, Ltd. | | | 1,030,847 | | | | 29,122,041 | | | | 1.8 | % | |
| Other Securities | | | | | | | 89,772,216 | | | | 5.5 | % | |
| TOTAL COMMON STOCKS | | | | | | | 162,216,796 | | | | 10.0 | % | |
| PREFERRED STOCKS — (0.0%) | |
| Other Securities | | | | | | | 347,069 | | | | 0.0 | % | |
| TOTAL — INDIA | | | | | | | 162,563,865 | | | | 10.0 | % | |
| INDONESIA — (2.1%) | |
| COMMON STOCKS — (2.1%) | |
| PT Astra International Tbk | | | 15,468,561 | | | | 12,876,057 | | | | 0.8 | % | |
| PT Telekomunikasi Indonesia Tbk | | | 15,037,640 | | | | 7,523,134 | | | | 0.5 | % | |
| Other Securities | | | | | | | 16,756,269 | | | | 1.0 | % | |
| TOTAL — INDONESIA | | | | | | | 37,155,460 | | | | 2.3 | % | |
| ISRAEL — (5.3%) | |
| COMMON STOCKS — (5.3%) | |
| Bank Hapoalim B.M. | | | 6,655,731 | | | | 15,071,355 | | | | 0.9 | % | |
| Bank Leumi Le-Israel | | | 5,633,015 | | | | 14,777,977 | | | | 0.9 | % | |
| Israel Chemicals, Ltd. | | | 837,943 | | | | 8,451,396 | | | | 0.5 | % | |
| Teva Pharmaceutical Industries, Ltd. Sponsored ADR | | | 869,167 | | | | 37,269,881 | | | | 2.3 | % | |
| Other Securities | | | | | | | 16,808,772 | | | | 1.1 | % | |
| TOTAL — ISRAEL | | | | | | | 92,379,381 | | | | 5.7 | % | |
| MALAYSIA — (4.0%) | |
| COMMON STOCKS — (4.0%) | |
| Other Securities | | | | | | | 69,964,680 | | | | 4.3 | % | |
| MEXICO — (8.6%) | |
| COMMON STOCKS — (8.6%) | |
| Alfa S.A.B. de C.V. Series A | | | 3,812,637 | | | | 7,822,313 | | | | 0.5 | % | |
| # America Movil S.A.B. de C.V. Series L | | | 19,036,559 | | | | 29,485,030 | | | | 1.8 | % | |
| Grupo Mexico S.A.B. de C.V. Series B | | | 21,157,195 | | | | 16,590,332 | | | | 1.0 | % | |
| # Telefonos de Mexico S.A.B. de C.V. | | | 10,416,800 | | | | 9,309,749 | | | | 0.6 | % | |
| # Wal-Mart de Mexico S.A.B. de C.V. Series V | | | 4,692,980 | | | | 12,582,694 | | | | 0.8 | % | |
| Other Securities | | | | | | | 73,148,266 | | | | 4.5 | % | |
| TOTAL — MEXICO | | | | | | | 148,938,384 | | | | 9.2 | % | |
| PHILIPPINES — (0.7%) | |
| COMMON STOCKS — (0.7%) | |
| Other Securities | | | | | | | 11,676,420 | | | | 0.7 | % | |
| POLAND — (1.4%) | |
| COMMON STOCKS — (1.4%) | |
| Bank Pekao SA | | | 163,030 | | | | 7,414,805 | | | | 0.5 | % | |
| Telekomunikacja Polska SA | | | 1,112,400 | | | | 8,405,484 | | | | 0.5 | % | |
| Other Securities | | | | | | | 8,202,531 | | | | 0.5 | % | |
| TOTAL — POLAND | | | | | | | 24,022,820 | | | | 1.5 | % | |
| SINGAPORE — (0.0%) | |
| COMMON STOCKS — (0.0%) | |
| Other Securities | | | | | | | 138,173 | | | | 0.0 | % | |
20
THE EMERGING MARKETS SERIES
CONTINUED
| | | Shares | | Value†† | | Percentage
of Net Assets** | |
| SOUTH AFRICA — (7.1%) | |
| COMMON STOCKS — (7.1%) | |
| MTN Group, Ltd. | | | 1,745,306 | | | $ | 19,598,239 | | | | 1.2 | % | |
| Sasol, Ltd. Sponsored ADR | | | 1,363,425 | | | | 39,443,885 | | | | 2.4 | % | |
| Other Securities | | | | | | | 63,499,905 | | | | 3.9 | % | |
| TOTAL — SOUTH AFRICA | | | | | | | 122,542,029 | | | | 7.5 | % | |
| SOUTH KOREA — (10.2%) | |
| COMMON STOCKS — (10.2%) | |
| # POSCO | | | 46,060 | | | | 12,686,282 | | | | 0.8 | % | |
| Samsung Electronics Co., Ltd. | | | 97,139 | | | | 40,954,158 | | | | 2.5 | % | |
| Samsung Electronics Co., Ltd. ADR | | | 52,988 | | | | 10,979,734 | | | | 0.7 | % | |
| SK Telecom Co., Ltd. | | | 56,085 | | | | 8,901,750 | | | | 0.5 | % | |
| Other Securities | | | | | | | 103,339,470 | | | | 6.4 | % | |
| TOTAL — SOUTH KOREA | | | | | | | 176,861,394 | | | | 10.9 | % | |
| TAIWAN — (7.6%) | |
| COMMON STOCKS — (7.6%) | |
| Formosa Chemicals & Fiber Co., Ltd. | | | 4,610,141 | | | | 7,452,770 | | | | 0.5 | % | |
| Formosa Plastics Corp. | | | 4,721,167 | | | | 7,967,558 | | | | 0.5 | % | |
| Hon Hai Precision Industry Co., Ltd. | | | 3,761,458 | | | | 9,079,012 | | | | 0.6 | % | |
| Nan Ya Plastic Corp. | | | 6,878,218 | | | | 9,532,403 | | | | 0.6 | % | |
| Taiwan Semiconductor Manufacturing Co., Ltd. | | | 22,275,436 | | | | 32,412,010 | | | | 2.0 | % | |
| Other Securities | | | | | | | 65,276,976 | | | | 3.9 | % | |
| TOTAL — TAIWAN | | | | | | | 131,720,729 | | | | 8.1 | % | |
| THAILAND — (1.1%) | |
| COMMON STOCKS — (1.1%) | |
| Other Securities | | | | | | | 18,868,229 | | | | 1.2 | % | |
| TURKEY — (2.3%) | |
| COMMON STOCKS — (2.3%) | |
| * Koc Holding A.S. Series B | | | 3,943,304 | | | | 7,357,239 | | | | 0.5 | % | |
| Other Securities | | | | | | | 33,128,805 | | | | 2.0 | % | |
| TOTAL — TURKEY | | | | | | | 40,486,044 | | | | 2.5 | % | |
| | | | | Value† | | | |
| SECURITIES LENDING COLLATERAL — (11.7%) | |
| §@ DFA Short Term Investment Fund LP | | | 191,178,954 | | | | 191,178,954 | | | | 11.7 | % | |
| | | Face
Amount | | | | | |
| | | (000) | | | | | |
@ Repurchase Agreement, Deutsche Bank Securities 0.25%, 11/03/08
(Collateralized by $25,549,645 FHLMC, rates ranging from 5.296%(r) to 6.000%,
maturities ranging from 12/01/26 to 03/01/33 & FNMA 5.520%(r), 05/01/17,
valued at $12,757,896) to be repurchased at $12,508,001 | | $ | 12,508 | | | | 12,507,740 | | | | 0.8 | % | |
| TOTAL SECURITIES LENDING COLLATERAL | | | | | | | 203,686,694 | | | | 12.5 | % | |
TOTAL INVESTMENTS — (100.0%)
(Cost $1,345,667,600) | | | | | | $ | 1,738,501,155 | | | | 107.0 | % | |
See accompanying Notes to Financial Statements.
21
THE DFA INVESTMENT TRUST COMPANY
THE EMERGING MARKETS SERIES
STATEMENT OF ASSETS AND LIABILITIES
OCTOBER 31, 2008
(Amounts in thousands)
| ASSETS: | |
| Investments at Value (including $180,629 of securities on loan) | | $ | 1,534,814 | | |
| Collateral Received from Securities on Loan at Value & Cost | | | 203,687 | | |
| Foreign Currencies at Value | | | 13,010 | | |
| Cash | | | 643 | | |
| Receivables: | |
| Investment Securities Sold | | | 165,128 | | |
| Dividends, Interest and Tax Reclaims | | | 2,223 | | |
| Securities Lending Income | | | 383 | | |
| Fund Shares Sold | | | 1,445 | | |
| Fund Margin Variation | | | 32 | | |
| Prepaid Expenses and Other Assets | | | 3 | | |
| Total Assets | | | 1,921,368 | | |
| LIABILITIES: | |
| Payables: | |
| Upon Return of Securities Loaned | | | 203,687 | | |
| Investment Securities Purchased | | | 90,830 | | |
| Due to Advisor | | | 144 | | |
| Loan Payable | | | 1,079 | | |
| Deferred Thailand Capital Gains Tax | | | 788 | | |
| Accrued Expenses and Other Liabilities | | | 316 | | |
| Total Liabilities | | | 296,844 | | |
| NET ASSETS | | $ | 1,624,524 | | |
| Investments at Cost | | $ | 1,141,981 | | |
| Foreign Currencies at Cost | | $ | 12,929 | | |
See accompanying Notes to Financial Statements.
22
THE DFA INVESTMENT TRUST COMPANY
THE EMERGING MARKETS SERIES
STATEMENTS OF OPERATIONS
(Amounts in thousands)
| | | Period
Dec. 1, 2007
to
Oct. 31, 2008 | | Year
Ended
Nov. 30,
2007 | |
| Investment Income | |
| Dividends (Net of Foreign Taxes Withheld of $8,965 and $7,660, respectively) | | $ | 83,157 | | | $ | 78,304 | | |
| Interest | | | 218 | | | | 517 | | |
| Income from Securities Lending | | | 4,081 | | | | 3,188 | | |
| Total Investment Income | | | 87,456 | | | | 82,009 | | |
| Expenses | |
| Investment Advisory Services Fees | | | 2,744 | | | | 3,029 | | |
| Accounting & Transfer Agent Fees | | | 292 | | | | 318 | | |
| Custodian Fees | | | 1,784 | | | | 2,142 | | |
| Shareholders' Reports | | | 30 | | | | 28 | | |
| Directors'/Trustees' Fees & Expenses | | | — | | | | 25 | | |
| Professional Fees | | | 94 | | | | 55 | | |
| Other | | | 76 | | | | 65 | | |
| Total Expenses | | | 5,020 | | | | 5,662 | | |
| Net Investment Income (Loss) | | | 82,436 | | | | 76,347 | | |
| Realized and Unrealized Gain (Loss) | |
| Net Realized Gain (Loss) on: | |
| Investment Securities Sold | | | (59,927 | ) | | | 143,019 | | |
| Futures | | | (361 | ) | | | — | | |
| Foreign Currency Transactions | | | (1,036 | ) | | | (111 | ) | |
| Change in Unrealized Appreciation (Depreciation) of: | |
| Investment Securities and Foreign Currency | | | (1,612,126 | ) | | | 859,017 | | |
| Futures | | | 32 | | | | — | | |
| Translation of Foreign Currency Denominated Amounts | | | (139 | ) | | | (27 | ) | |
| Change in Deferred Thailand Capital Gains Tax | | | 2,797 | | | | (884 | ) | |
| Net Realized and Unrealized Gain (Loss) | | | (1,670,760 | ) | | | 1,001,014 | | |
| Net Increase (Decrease) in Net Assets Resulting from Operations | | $ | (1,588,324 | ) | | $ | 1,077,361 | | |
See accompanying Notes to Financial Statements.
23
THE DFA INVESTMENT TRUST COMPANY
THE EMERGING MARKETS SERIES
STATEMENTS OF CHANGES IN NET ASSETS
(Amounts in thousands)
| | | Period
Dec. 1, 2007
to
Oct. 31, 2008 | | Year
Ended
Nov. 30,
2007 | | Year
Ended
Nov. 30,
2006 | |
| Increase (Decrease) in Net Assets | |
| Operations: | |
| Net Investment Income (Loss) | | $ | 82,436 | | | $ | 76,347 | | | $ | 54,451 | | |
| Net Realized Gain (Loss) on: | |
| Investment Securities Sold | | | (59,927 | ) | | | 143,019 | | | | 28,277 | | |
| Futures | | | (361 | ) | | | — | | | | — | | |
| Foreign Currency Transactions | | | (1,036 | ) | | | (111 | ) | | | (585 | ) | |
| Change in Unrealized Appreciation (Depreciation) of: | |
| Investment Securities and Foreign Currency | | | (1,612,126 | ) | | | 859,017 | | | | 484,776 | | |
| Futures | | | 32 | | | | — | | | | — | | |
| Translation of Foreign Currency Denominated Amounts | | | (139 | ) | | | (27 | ) | | | (23 | ) | |
| Change in Deferred Thailand Capital Gains Tax | | | 2,797 | | | | (884 | ) | | | 902 | | |
Net Increase (Decrease) in Net Assets
Resulting from Operations | | | (1,588,324 | ) | | | 1,077,361 | | | | 567,798 | | |
| Transactions in Interest: | |
| Contributions | | | 197,789 | | | | 481,891 | | | | 455,977 | | |
| Withdrawals | | | (692,731 | ) | | | (266,433 | ) | | | (461,369 | ) | |
| Net Increase from Transactions in Interest | | | (494,942 | ) | | | 215,458 | | | | (5,392 | ) | |
| Total Increase (Decrease) in Net Assets | | | (2,083,266 | ) | | | 1,292,819 | | | | 562,406 | | |
| Net Assets | |
| Beginning of Period | | | 3,707,790 | | | | 2,414,971 | | | | 1,852,565 | | |
| End of Period | | $ | 1,624,524 | | | $ | 3,707,790 | | | $ | 2,414,971 | | |
See accompanying Notes to Financial Statements.
24
THE DFA INVESTMENT TRUST COMPANY
THE EMERGING MARKETS SERIES
FINANCIAL HIGHLIGHTS
| | | Period
Dec. 1, 2007
to Oct. 31,
2008 | | Year
Ended
Nov. 30,
2007 | | Year
Ended
Nov. 30,
2006 | | Year
Ended
Nov. 30,
2005 | | Year
Ended
Nov. 30,
2004 | | Year
Ended
Nov. 30,
2003 | |
| Total Return | | | (48.15 | )%(C) | | | 42.62 | % | | | 31.87 | % | | | 31.23 | % | | | 35.47 | % | | | 39.67 | % | |
Net Assets, End of Period
(thousands) | | $ | 1,624,524 | | | $ | 3,707,790 | | | $ | 2,414,971 | | | $ | 1,852,565 | | | $ | 1,160,262 | | | $ | 607,561 | | |
Ratio of Expenses to
Average Net Assets | | | 0.18 | %(B) | | | 0.19 | % | | | 0.20 | % | | | 0.27 | % | | | 0.31 | % | | | 0.34 | % | |
Ratio of Net Investment Income
to Average Net Assets | | | 3.00 | %(B) | | | 2.52 | % | | | 2.54 | % | | | 3.70 | % | | | 2.63 | % | | | 2.23 | % | |
| Portfolio Turnover Rate | | | 19 | %(C) | | | 7 | % | | | 11 | % | | | 9 | % | | | 2 | % | | | 1 | % | |
See page 1 for the Definitions of Abbreviations and Footnotes.
See accompanying Notes to Financial Statements.
25
THE DFA INVESTMENT TRUST COMPANY
THE EMERGING MARKETS SERIES
NOTES TO FINANCIAL STATEMENTS
A. Organization:
The DFA Investment Trust Company (the "Trust") is an open-end management investment company registered under the Investment Company Act of 1940. The Trust consists of eighteen series, of which The Emerging Markets Series (the "Series") is presented in this report.
At a regular meeting of the Board of Directors/Trustees (the "Board") on September 16, 2008, the Board voted to change the fiscal and tax year ends of the Series from November 30 to October 31.
B. Significant Accounting Policies:
The following significant accounting policies are in conformity with accounting principles generally accepted in the United States of America. Such policies are consistently followed by the Trust in preparation of its financial statements. The preparation of financial statements in accordance with accounting principles generally accepted in the United States of America requires management to make estimates and assumptions that affect the reported amounts of assets and liabilities and disclosure of contingent assets and liabilities at the date of the financial statements and the reported amounts of increases and decreases in net assets from operations during the reporting period. Actual results could differ from those estimates and those differences could be material.
1. Security Valuation: Securities held by the Series (including over-the-counter securities) are valued at the last quoted sale price of the day. Securities held by the Series that are listed on Nasdaq are valued at the Nasdaq Official Closing Price ("NOCP"). If there is no last reported sale price or NOCP for the day, the Series values the securities at the mean of the most recent quoted bid and asked prices. Price information on listed securities is taken from the exchange where the security is primarily traded. Unlisted securities for which market quotations are readily available are valued at the mean of the most recent quoted bid and asked prices. Generally, securities issued by open-end investment companies are valued using their respective net asset values or public offering prices, as appropriate, for purchase orders placed at the close of the New York Stock Exchange (NYSE).
Securities for which no market quotations are readily available (including restricted securities), or for which market quotations have become unreliable, are valued in good faith at fair value in accordance with procedures adopted by the Board of Directors/Trustees. Fair value pricing may also be used if events that have a significant effect on the value of an investment (as determined in the discretion of the Investment Committee of the Advisor) occur before the net asset value is calculated. When fair value pricing is used, the prices of securities used by the Series may differ from the quoted or published prices for the same securities on their primary markets or exchanges.
The Series will also fair value price in the circumstances described below. Generally, trading in foreign securities markets is completed each day at various times prior to the close of the NYSE. For example, trading in the Japanese securities markets is completed each day at the close of Tokyo Stock Exchange (normally 11:00 p.m. PT), which is fourteen hours prior to the close of the NYSE (normally 1:00 p.m. PT) and the time that the net asset value of the Series is computed. Due to the time differences between the closings of the relevant foreign securities exchanges and the time the Series prices its shares at the close of the NYSE, the Series will fair value its foreign investments when it is determined that the market quotations for the foreign investments are either unreliable or not readily available. The fair value prices will attempt to reflect the impact of the U.S. financial markets' perceptions and trading activities on the Series ' foreign investments since the last closing prices of the foreign investments were calculated on their primary foreign securities markets or exchanges. For these purposes, the Board of Directors/Trustees of the Series has determined that movements in relevant indices or other appropriate market indicators, after the close of the Tokyo Stock Exchange or the London Stock Exchange, demonstrate that market quotations may be unreliable. Fair valuation of portfolio securities may occur on a daily basis. The fair value pricing by the Series utilizes data furnished by an independent pricing service (and that data draws upon, among other information, the market values of foreign investments). The fair value prices of portfolio securities generally will be used when it is determined that the use of such prices will have a
26
material impact on the net asset value of the Series. When the Series uses fair value pricing, the values assigned to the Series' foreign investments may not be the quoted or published prices of the investments on their primary markets or exchanges.
Futures contracts held by the Series are valued using the settlement price established each day on the exchange on which they are traded.
Adoption of Statement of Financial Accounting Standards No. 157 "Fair Value Measurements" ("FAS 157")
In September 2006, the Financial Accounting Standards Board issued FAS 157 effective for fiscal years beginning after November 15, 2007. This standard clarifies the definition of fair value for financial reporting, establishes a framework for measuring fair value and requires additional disclosures about the use of fair value measurements. The Funds have adopted FAS 157 as of December 1, 2007. The three levels of the fair value hierarchy under FAS 157 are described below:
• Level 1 – quoted prices in active markets for identical securities
• Level 2 – other significant observable inputs (including quoted prices for similar securities, interest rates, prepayment speeds, credit risk, etc.)
• Level 3 – significant unobservable inputs (including the Series' own assumptions in determining the fair value of investments)
The inputs or methodology used for valuing securities are not necessarily an indication of the risk associated with investing in those securities. A summary of the inputs used to value the Series' net assets as of October 31, 2008 is listed below (in thousands).
| | | Valuation Inputs | |
| | | Investments in
Securities
(Market Value) | | Other Financial
Instruments
(Unrealized
Appreciation/
Depreciation)* | |
| | | Level 1 | | Level 2 | | Level 3 | | Total | | Level 1 | | Level 2 | | Level 3 | | Total | |
| The Emerging Markets Series | | $ | 610,934 | | | $ | 1,127,567 | | | | — | | | $ | 1,738,501 | | | $ | 32 | | | | — | | | | — | | | $ | 32 | | |
* Other financial instruments are derivative instruments not reflected in the Schedule of Investments, such as futures, forwards and swaps which are valued at the unrealized appreciation/depreciation on the investment.
2. Foreign Currency Translation: Securities and other assets and liabilities of the Series whose values are initially expressed in foreign currencies are translated to U.S. dollars using the mean between the most recently quoted bid and asked prices for the U.S. dollar as quoted by generally recognized reliable sources. Dividend and interest income and certain expenses are translated to U.S. dollars at the rate of exchange on their respective accrual dates. Receivables and payables denominated in foreign currencies are marked to market daily based on daily exchange rates and exchange gains or losses are realized upon ultimate receipt or disbursement.
The Series does not isolate the effect of fluctuations in foreign exchange rates from the effect of fluctuations in the market prices of securities held whether realized or unrealized.
Realized gains or losses on foreign currency transactions represent net foreign exchange gains or losses from the disposition of foreign currencies, currency gains or losses realized between the trade and settlement dates on securities transactions, and the difference between amounts of interest, dividends and foreign withholding taxes recorded on the books of the Series and the U.S. dollar equivalent amounts actually received or paid.
3. Deferred Compensation Plan: Each eligible Trustee of the Trust may elect participation in the Deferred Compensation Plan (the "Plan"). Under the Plan, effective January 1, 2002, such Trustees may defer payment of all or a portion of their total fees earned as a Trustee. These deferred amounts may be treated as though such amounts had been invested in shares of the following funds: U.S. Large Cap Value Portfolio; U.S. Core Equity 1 Portfolio; U.S. Core Equity 2 Portfolio; U.S. Vector Equity Portfolio; U.S. Micro Cap Portfolio; DFA International Value Portfolio; International
27
Core Equity Portfolio; Emerging Markets Portfolio; Emerging Markets Core Equity Portfolio; and/or DFA Two-Year Global Fixed Income Portfolio. Contributions made under the Plan and the change in unrealized appreciation (depreciation) and income, are included in Other Expenses for the period ended October 31, 2008 and are included in Directors'/Trustees' Fees & Expenses for the year ended November 30, 2007. At October 31, 2008, the total liability for deferred compensation to Trustees is included in Accrued Expenses and Other Liabilities on the Statement of Assets and Liabilities in the amount of $44 (in thousands).
Each Trustee has the option to receive their distribution of proceeds in one of the following methods upon one year's notice: lump sum; annual installments over a period of agreed upon years; or semi-annual installments over a period of agreed upon years. As of October 31, 2008, none of the Trustees have requested distribution of proceeds.
4. Other: Security transactions are accounted for as of the trade date. Costs used in determining realized gains and losses on the sale of investment securities are on the basis of identified cost. Dividend income and distributions to shareholders are recorded on the ex-dividend date. Distributions received on securities that represent a return of capital or capital gain are recorded as a reduction of cost of investments or as a realized gain, respectively. The Series estimates the character of distributions received that may be considered return of capital distributions or capital gain distributions. Interest income is recorded on the accrual basis. Discount and premium on securities purchased are amortized over the lives of the respective securities utilizing the effective i nterest method. Expenses directly attributable to the Series are directly charged. Common expenses of the Trust are allocated using methods approved by the Board of Directors/Trustees, generally based on average net assets.
The Series may be subject to taxes imposed by countries in which they invest, with respect to their investments in issuers existing or operating in such countries. Such taxes are generally based on income earned or repatriated and capital gains realized on the sale of such investments. The Series accrues such taxes when the related income or capital gains are earned or throughout the holding period. Some countries require governmental approval for the repatriation of investment income, capital or the proceeds of sales earned by foreign investors. In addition, if there is a deterioration in a country's balance of payments or for other reasons, a country may impose temporary restrictions on foreign capital remittances abroad.
The Series' investments in Thailand are subject to a 15% governmental capital gains tax. Such taxes are due upon sale of individual securities. The Series accrues for taxes on the capital gains throughout the holding period based on the unrealized gain of the underlying securities. The Series is also subject to a 10% governmental capital gains tax on short-term capital gains for investments in India. Such taxes are due upon sale of individual securities. The taxes for the capital gains are accrued when the capital gains are earned.
C. Investment Advisor:
Dimensional Fund Advisors LP ("Dimensional" or the "Advisor") provides investment advisory services to the Series. For the period December 1, 2007 to October 31, 2008, the Series' investment advisory services fees were accrued daily and paid monthly to the Advisor based on an effective annual rate of 0.10% of average daily net assets.
Fees Paid to Officers and Directors/Trustees:
Certain Officers and Directors/Trustees of the Advisor are also Officers and Directors/Trustees of the Trust; however, such Officers and Directors/Trustees (with the exception of the Chief Compliance Officer ("CCO")) receive no compensation from the Trust. For the period December 1, 2007 to October 31, 2008, the total related amounts paid by the Trust to the CCO were $106 (in thousands). The total related amount paid by the Series is included in Other Expenses on the Statement of Operations.
D. Purchases and Sales of Securities:
For the period ended October 31, 2008 to the Series made the following purchases and sales of investment securities, other than short-term securities and U.S. government securities (amounts in thousands):
| Purchases | | $ | 564,288 | | |
| Sales | | | 1,065,835 | | |
There were no purchases or sales of long-term U.S. government securities.
28
E. Federal Income Tax:
No provision for federal income taxes is required since the Series is treated as a partnership for federal income tax purposes. Any net investment income and realized and unrealized gains and losses have been deemed to have been "passed through" to its partners.
Some of the Series' investments are in securities considered to be "passive foreign investment companies" for which any unrealized appreciation (depreciation) (mark to market) and/or realized gains are required to be included in distributable net investment income for tax purposes. At October 31, 2008, the Series had cumulative unrealized appreciation (depreciation) (mark to market) of $108 (in thousands) to be included in distributable net investment income for federal tax purposes. For the period December 1, 2007 to October 31, 2008, realized gains on the sale of passive foreign investment companies totaling $0 (in thousands) have been reclassified from accumulated net realized gains to accumulated net investment income for federal tax purposes.
At October 31, 2008, the total cost and aggregate gross unrealized appreciation and (depreciation) of securities for federal income tax purposes were different from amounts reported for financial reporting purposes (amounts in thousands):
Federal
Tax Cost | | Unrealized
Appreciation | | Unrealized
(Depreciation) | | Net
Unrealized
Appreciation
(Depreciation) | |
| $ | 1,346,314 | | | $ | 480,062 | | | $ | (87,875 | ) | | $ | 392,187 | | |
In June 2006, the Financial Accounting Standards Board (FASB) issued FASB Interpretation 48 ("FIN 48"), "Accounting for Uncertainty in Income Taxes." This standard defines the threshold for recognizing the benefits of tax-return positions in the financial statements as "more-likely-than-not" to be sustained by the taxing authority and requires measurement of a tax position meeting the more-likely-than-not criterion, based on the largest benefit that is more than 50 percent likely to be realized. Management has analyzed the Series' tax positions to be taken on the federal income tax returns for all open tax years (tax years ended November 30, 2005 through the period ended October 31, 2008), for purposes of implementing FIN 48, and has concluded that no provision for income tax is required in the Series' financial statements.
F. Financial Instruments:
In accordance with the Series' investment objectives and policies, the Series may invest in certain financial instruments that have off-balance sheet risk in excess of the amounts recognized in the financial statements and concentrations of credit and market risk. These instruments and their significant corresponding risks are described below:
1. Repurchase Agreements: The Series may purchase money market instruments subject to the counterparty's agreement to repurchase them at an agreed upon date and price. The counterparty will be required on a daily basis to maintain the value of the collateral subject to the agreement at not less than the repurchase price (including accrued interest). The agreements are conditioned upon the collateral being deposited under the Federal Reserve book-entry system or with the Trust's custodian or a third party sub-custodian. In the event of default or bankruptcy by the other party to the agreement, retention of the collateral may be subject to legal proceedings. All open repurchase agreements were entered into on October 31, 2008.
2. Foreign Market Risks: Investments in foreign markets may involve certain considerations and risks not typically associated with investments in the United States of America, including the possibility of future political and economic developments and the level of foreign government supervision and regulation of foreign securities markets. These markets are generally smaller, less liquid and more volatile than the major securities markets in the United States of America. Consequently, acquisition and disposition of securities by the Series may be inhibited.
3. Futures Contracts: During the period December 1, 2007 to October 31, 2008, the Series entered into futures contracts in accordance with its investment objectives. Upon entering into a futures contract, the Series deposits cash or pledges U.S. Government securities to a broker, equal to the minimum "initial margin" requirements of the exchange on which the contract is traded. Subsequent payments are received from or paid to the broker each day, based on the daily fluctuation in the market value of the contract. These receipts or payments are known as
29
"variation margin" and are recorded daily by the Series as unrealized gains or losses until the contracts are closed. When the contracts are closed, the Series records a realized gain or loss equal to the difference between the value of the contract at the time it was opened and the value at the time it was closed.
At October 31, 2008, the Series had outstanding 266 long futures contracts of the S&P 500 Index®, all of which expire on December 19, 2008. The value of such contracts on October 31, 2008 was $64,325 (in thousands), which resulted in an unrealized gain of $32 (in thousands). Approximately $6,584 (in thousands) of cash has been segregated as collateral for the open futures contracts and has been accounted for as cash on the Statement of Assets and Liabilities.
Risks may arise upon entering into futures contracts from potential imperfect price correlations between the futures contracts and the underlying securities, from the possibility of an illiquid secondary market for these instruments and from the possibility that the Series could lose more than the initial margin requirements.
G. Line of Credit:
The Trust, together with other Dimensional-advised portfolios, has entered into a $250 million unsecured discretionary line of credit effective June 30, 2003 with an affiliate of its domestic custodian bank. Each portfolio is permitted to borrow, subject to its investment limitations, up to a maximum of $250 million, as long as total borrowings under the line of credit do not exceed $250 million in the aggregate. Borrowings under the line of credit are charged interest at the then current Federal Funds Rate plus 1%. Each portfolio is individually, and not jointly, liable for its particular advances under the line of credit. There is no commitment fee on the unused portion of the line of credit. The agreement for the discretionary line of credit may be terminated by either party at any time. The line of credit is scheduled to expire on June 23, 2009. There were no borrowings by the Series under this line of credit during the period December 1 , 2007 to October 31, 2008.
The Trust, together with other Dimensional-advised portfolios, has also entered into an additional $500 million unsecured line of credit effective January 15, 2008 with its international custodian bank. Each portfolio is permitted to borrow, subject to its investment limitations, up to a maximum of $500 million, as long as total borrowings under the line of credit do not exceed $500 million in the aggregate. Each portfolio is individually, and not jointly, liable for its particular advances under the line of credit. Borrowings under the line of credit are charged interest at rates agreed to by the parties at the time of borrowing. There is no commitment fee on the unused portion of the line of credit. The agreement of the line of credit expires on January 15, 2009.
For the period December 1, 2007 to October 31, 2008, borrowings by the Series under this line of credit were as follows (amounts in thousands, except percentage and days):
Weighted
Average
Interest Rate | | Weighted
Average
Loan Balance | | Number of
Days
Outstanding | | Interest
Expense
Incurred | | Maximum Amount
Borrowed During
the Period | |
| | 3.52 | % | | $ | 6,846 | | | | 56 | | | $ | 37 | | | $ | 18,238 | | |
At October 31, 2008 the Series had a loan outstanding in the amount of $1,079 (in thousands).
H. Securities Lending:
As of October 31, 2008, the Series had securities on loan to brokers/dealers, for which the Series held cash collateral. The Series invests the cash collateral, as described below, and records a liability for the return of the collateral, during the period the securities are on loan. Loans of securities are expected at all times to be secured by collateral equal to at least (i) 100% of the current market value of the loaned securities with respect to securities of the U.S. government or its agencies, (ii) 102% of the current market value of the loaned securities with respect to U.S. securities, and (iii) 105% of the current market value of the loaned securities with respect to foreign securities. However, daily market fluctuations could cause the Series' collateral to be lower or higher than the expected thresholds. If this were to occur, the collateral would be adjusted the next business day to ensure adequate collateralization. In the even t of default or bankruptcy by the other party to the agreement, realization and/or retention of the collateral may be subject to legal proceedings. If the borrower fails to return loaned securities, and cash collateral being maintained by the borrower is insufficient to cover the value of loaned securities and provided such collateral insufficiency is not
30
the result of investment losses, the lending agent has agreed to pay the amount of the shortfall to the Fund or, at the option of the lending agent, to replace the securities.
Subject to the Series' investment policy, the cash collateral received by the Series from securities on loan is invested in securities of the U.S. government or its agencies, repurchase agreements collateralized by securities of the U.S. government or its agencies or shares of the DFA Short Term Investment Fund LP. Agencies include both agency debentures and agency mortgage backed securities. In addition, the Series will be able to terminate the loan at any time and will receive reasonable interest on the loan, as well as amounts equal to any dividends, interest or other distributions on the loaned securities. However, dividend income received from loaned securities may not be eligible to be taxed at qualified dividend income rates.
I. Indemnitees; Contractual Obligations:
Under the Fund's organizational documents, its officers and directors are indemnified against certain liabilities arising out of the performance of their duties to the Fund.
In the normal course of business, the Fund enters into contracts that contain a variety of representations and warranties which provide general indemnification. The Fund's maximum exposure under these arrangements is unknown as this would involve future claims that may be made against the Fund and/or its affiliates that have not yet occurred. However, based on experience, the Fund expects the risk of loss to be remote.
J. Recently Issued Accounting Standards and Interpretation:
In March 2008, Statement of Financial Accounting Standards No. 161, Disclosures about Derivative Instruments and Hedging Activities ("FAS 161"), was issued and is effective for fiscal years beginning after November 15, 2008. FAS 161 defines new disclosures of derivative instruments and hedging activities. Management is currently evaluating the implications of FAS 161. At this time, its impact on the Portfolios' financial statements has not been determined.
31
REPORT OF INDEPENDENT REGISTERED PUBLIC ACCOUNTING FIRM
To the Shareholders of The Emerging Markets Series and
Board of Trustees of The DFA Investment Trust Company:
In our opinion, the accompanying statement of assets and liabilities, including the summary schedule of portfolio holdings, and the related statements of operations and of changes in net assets and the financial highlights present fairly, in all material respects, the financial position of The Emerging Markets Series (one of the portfolios constituting The DFA Investment Trust Company, hereafter referred to as the "Series") at October 31, 2008, the results of its operations, the changes in its net assets and the financial highlights for each of the periods indicated, in conformity with accounting principles generally accepted in the United States of America. These financial statements and financial highlights (hereafter referred to as "financial statements") are the responsibility of the Series' management; our responsibility is to express an opinion on these financial statements based on our audits. We conducted our audits of these financia l statements in accordance with the standards of the Public Company Accounting Oversight Board (United States). Those standards require that we plan and perform the audit to obtain reasonable assurance about whether the financial statements are free of material misstatement. An audit includes examining, on a test basis, evidence supporting the amounts and disclosures in the financial statements, assessing the accounting principles used and significant estimates made by management, and evaluating the overall financial statement presentation. We believe that our audits, which included confirmation of securities at October 31, 2008 by correspondence with the custodian and brokers, provide a reasonable basis for our opinion.
PricewaterhouseCoopers LLP
Philadelphia, Pennsylvania
December 22, 2008
32
FUND MANAGEMENT
Trustees/Directors
Each Board of Trustees/Directors of The DFA Investment Trust Company Inc. ("DFAITC"), DFA Investment Dimensions Group Inc. ("DFAIDG"), Dimensional Investment Group Inc. ("DIG") and Dimensional Emerging Markets Value Fund Inc. ("DEM") (each, the "Fund" and collectively, the "Funds") is responsible for establishing the Funds' policies and for overseeing the management of the Funds. The Trustees/Directors of the Funds, including all of the disinterested Directors, have adopted written procedures to monitor potential conflicts of interest that might develop between portfolios of the Funds (the "Feeder Portfolios") that invest in certain series of DFAITC or DEM (the "Master Funds").
Each Board has two standing committees, an Audit Committee and a Portfolio Performance and Service Review Committee (the "Performance Committee"). The Audit Committee is comprised of George M. Constantinides, Roger G. Ibbotson and Abbie J. Smith. Each member of the Audit Committee is a disinterested Director. The Audit Committee oversees the Fund's accounting and financial reporting policies and practices, the Fund's internal controls, the Fund's financial statements and the independent audits thereof and performs other oversight functions as requested by the Board. The Audit Committee recommends the appointment of each Fund's independent registered certified public accounting firm and also acts as a liaison between the Fund's independent registered certified public accounting firm and the full Board. There were three Audit Committee meetings held during the fiscal year ended October 31, 2008.
Each Board's Performance Committee is comprised of Messrs. Constantinides and Ibbotson, Ms. Smith, John P. Gould, Myron S. Scholes and Robert C. Merton. Each member of the Fund's Performance Committee is a disinterested Director. The Performance Committee regularly reviews and monitors the investment performance of the Fund's series and reviews the performance of the Fund's service providers. There were five Performance Committee meetings held during the fiscal year ended October 31, 2008.
Certain biographical information for each disinterested Trustee/Director and each interested Trustee/Director of the Funds is set forth in the tables below, including a description of each Trustee/Director's experience as a Trustee/Director of the Funds and as a director or trustee of other funds, as well as other recent professional experience.
The statements of additional information (together, "SAI") of the Funds include additional information about each Trustee/Director. You may obtain copies of the SAI and prospectus of each Fund advised by Dimensional Fund Advisors LP by calling collect (310) 395-8005 or by mailing a request to Dimensional Fund Advisors LP, 1299 Ocean Avenue, Santa Monica, California 90401. Prospectuses are also available at www.dimensional.com.
Name, Position
with the Fund,
Address and Age | | Term of Office1 and
Length of Service | | Portfolios within the
DFA Fund Complex2
Overseen | | Principal Occupation(s) During Past 5 Years and
Other Directorships of Public Companies Held | |
| | | Disinterested Trustees/Directors | |
|
George M. Constantinides
Director of DFAIDG, DIG and DEM.
Trustee of DFAITC.
The University of Chicago Booth School of Business
5807 S. Woodlawn Avenue Chicago, IL 60637
Age: 61 | | DFAITC - since 1993
DFAIDG - since 1983
DIG - since 1993
DEM - since 1993 | | 96 portfolios in 4 investment companies | | Leo Melamed Professor of Finance, The University of Chicago Booth School of Business. | |
|
33
Name, Position
with the Fund,
Address and Age | | Term of Office1 and
Length of Service | | Portfolios within the
DFA Fund Complex2
Overseen | | Principal Occupation(s) During Past 5 Years and
Other Directorships of Public Companies Held | |
John P. Gould
Director of DFAIDG, DIG and DEM.
Trustee of DFAITC.
The University of Chicago Booth School of Business
5807 S. Woodlawn Avenue
Chicago, IL 60637
Age: 69 | | DFAITC - since 1993
DFAIDG - since 1986
DIG - since 1993
DEM - since 1993 | | 96 portfolios in 4 investment companies | | Steven G. Rothmeier Distinguished Service Professor of Economics, The University of Chicago Booth School of Business (since 1965). Member of the Boards of Milwaukee Mutual Insurance Company (since 1997) and UNext.com (1999-2006). Member Competitive Markets Advisory Committee, Chicago Mercantile Exchange (futures trading exchange) (since 2004). Formerly, Senior Vice-President, Lexecon Inc. (economics, law, strategy and finance consulting) (1994-2004). Formerly, President, Cardean University (division of UNext.com) (1999-2001). Trustee, Harbor Fund (registered investment company) (14 Portfolios) (since 1994). | |
|
Roger G. Ibbotson
Director of DFAIDG, DIG and DEM.
Trustee of DFAITC.
Yale School of Management
P.O. Box 208200
New Haven, CT 06520-8200
Age: 65 | | DFAITC - since 1993
DFAIDG - since 1981
DIG - since 1993
DEM - since 1993 | | 96 portfolios in 4 investment companies | | Professor in Practice of Finance, Yale School of Management (since 1984). Director, BIRR Portfolio Analysis, Inc. (software products) (since 1990). Chairman, CIO and Partner, Zebra Capital Management, LLC (hedge fund manager) (since 2001).
Consultant to Morningstar, Inc. (since 2006). Formerly, Chairman, Ibbotson Associates, Inc., Chicago, IL (software data publishing and consulting) (1977-2006). | |
|
Robert C. Merton
Director of DFAIDG, DIG and DEM.
Trustee of DFAITC.
Harvard Business School
353 Baker Library
Soldiers Field
Boston, MA 02163
Age: 64 | | DFAITC - since 2003
DFAIDG - since 2003
DIG - since 2003
DEM - since 2003 | | 96 portfolios in 4 investment companies | | John and Natty McArthur University Professor, Graduate School of Business Administration, Harvard University (since 1998). George Fisher Baker Professor of Business Administration, Graduate School of Business Administration, Harvard University (1988-1998), Co-founder, Chief Science Officer and Director, Trinsum Group, a successor to Integrated Finance Limited (since 2002). Director, MF Risk, Inc. (risk management software) (since 2001). Director, Peninsula Banking Group (bank) (since 2003). Director, Community First Financial Group (bank holding company) (since 2003). Advisory Board Member, Alpha Simplex Group (hedge fund) (since 2001). Member Competitive Markets Advisory Council, Chicago Mercantile Exchange (futures trading exchange) (since 2004). Formerly, Advisory Board Member, NuServe (insurance software) (2001-2003). Director, Vical Incorporated (biopharmaceutical product development) (since 2002). | |
|
Myron S. Scholes
Director of DFAIDG, DIG and DEM.
Trustee of DFAITC.
Platinum Grove Asset Management, L.P.
Reckson Executive Park
1100 King Street
Building 4
Rye Brook, NY 10573
Age: 67 | | DFAITC - since 1993
DFAIDG - since 1981
DIG - since 1993
DEM - since 1993 | | 96 portfolios in 4 investment companies | | Frank E. Buck Professor Emeritus of Finance, Stanford University (since 1981). Chairman, Platinum Grove Asset Management, L.P. (hedge fund) (formerly, Oak Hill Platinum Partners) (since 1999). Formerly, Managing Partner, Oak Hill Capital Management (private equity firm) (until 2004). Chairman, Oak Hill Platinum Partners (hedge fund) (since 2004). Director, Chicago Mercantile Exchange (since 2001). Director, American Century Fund Complex (registered investment companies) (37 Portfolios) (since 1981); and Director, Chicago Mercantile Exchange Holdings Inc. (since 2000). | |
|
Abbie J. Smith
Director of DFAIDG, DIG and DEM.
Trustee of DFAITC.
The University of Chicago Booth School of Business
5807 S. Woodlawn Avenue
Chicago, IL 60637
Age: 55 | | DFAITC - since 2000
DFAIDG - since 2000
DIG - since 2000
DEM - since 2000 | | 96 portfolios in 4 investment companies | | Boris and Irene Stern Professor of Accounting, The University of Chicago Booth School of Business (since 1980), Formerly, Marvin Bower Fellow, Harvard Business School (9/01 to 8/02). Director, HNI Corporation (formerly known as HON Industries Inc.) (office furniture) (since 2000) and Director, Ryder System Inc. (transportation, logistics and supply-chain management) (since 2003). | |
|
34
Name, Position
with the Fund,
Address and Age | | Term of Office1 and
Length of Service | | Portfolios within the
DFA Fund Complex2
Overseen | �� | Principal Occupation(s) During Past 5 Years and
Other Directorships of Public Companies Held | |
| | | Interested Trustees/Directors* | |
|
David G. Booth
Chairman, Director, Chief Executive Officer and President of DFAIDG, DIG and DEM. Chairman, Trustee, Chief Executive Officer, Chief Investment Officer and President of DFAITC.
1299 Ocean Avenue
Santa Monica, CA 90401
Age: 61 | | DFAITC - since 1993
DFAIDG - since 1981
DIG - since 1992
DEM - since 1993 | | 96 portfolios in 4 investment companies | | Chairman, Director/Trustee, President, Chief Executive Officer and formerly Chief Investment Officer of the following companies: Dimensional Holdings Inc., Dimensional Fund Advisors LP, DFA Securities Inc., Dimensional Fund Advisors Canada Inc., DFAIDG, DIG, DEM and DFAITC. Director of Dimensional Fund Advisors Ltd, and formerly Chief Investment Officer. Director, President and formerly Chief Investment Officer of DFA Australia Ltd. Director of Dimensional Funds PLC and Dimensional Fund II PLC. Director, Chief Executive Officer and formerly Chief Investment Officer of Dimensional Fund Advisors Canada Inc. (All Chief Investment Officer positions held starting 1/03 through 3/07 except for Dimensional Fund Advisors Canada Inc., which was from 6/03 through 3/07, and Dimensional Holdings Inc., which was from 10/06 through 3/07.)
Limited Partner, Oak Hill Partners, Director, T he University of Chicago Booth School of Business. Formerly, Director, SA Funds (registered investment company). Formerly Director, Assante Corporation (investment management) (until 2002). | |
|
Rex A. Sinquefield
The Show Me Institute
7777 Bonhomme Ave.,
Suite 2150 St. Louis, MO 63105
Age: 64 | | DFAITC - since 1993
DFAIDG - since 1981
DIG - since 1992
DEM - since 1993 | | 96 portfolios in 4 investment companies | | Director/Trustee (and prior to 2006 Chairman, and prior to 2003, Chief Investment Officer) of Dimensional Fund Advisors LP, DFA Securities Inc., DFAIDG, DIG, DEM and DFAITC. Director of Dimensional Holdings Inc. Prior to 2006, Director of Dimensional Fund Advisors Ltd, Director (and prior to 1/1/2003, Chief Investment Officer) of DFA Australia Ltd. Director of Dimensional Funds PLC and Dimensional Fund Advisors Canada Inc.
Trustee, St. Louis University (since 2003). Life Trustee and Member of Investment Committee, DePaul University. Director, The German St. Vincent Orphan Home. Member of Investment Committee, Archdiocese of St. Louis. Trustee and Member of Investment Committee, St. Louis Art Institute (since 2005). President and Director, The Show Me Institute (since 2006). Trustee, St. Louis Symphony Orchestra (since 2005). Trustee, Missouri Botanical Garden (since 2005 ). | |
|
1 Each Trustee/Director holds office for an indefinite term until his or her successor is elected and qualified.
2 Each Trustee/Director is a director or trustee of each of the four registered investment companies within the DFA Fund Complex, which includes the Funds.
* Interested Directors are described as such because they are deemed to be "interested persons," as that term is defined under the Investment Company Act of 1940, as amended, due to their positions with Dimensional Fund Advisors LP.
35
Officers
The name, age, information regarding positions with the Funds and the principal occupation for each officer of the Funds are set forth below. Each officer listed below holds the same office (except as otherwise noted) in the following entities: Dimensional Fund Advisors LP (prior to November 3, 2006, Dimensional Fund Advisors Inc.) ("Dimensional"), DFA Securities Inc., DFAIDG, DIG, DFAITC and DEM (collectively, the "DFA Entities"). The address of each officer is: Dimensional Fund Advisors LP, 1299 Ocean Avenue, Santa Monica, California 90401, unless otherwise indicated.
Name, Position with the Fund
and Age | | Term of Office1
and Length of
Service | | Principal Occupation(s) During Past 5 Years | |
| | | Officers | |
|
April A. Aandal
Vice President
Age: 35 | | Since 2008 | | Vice President of all the DFA Entities. | |
|
Darryl D. Avery
Vice President
Age: 42 | | Since 2005 | | Vice President of all the DFA Entities. From June 2002 to January 2005, institutional client service representative of Dimensional. | |
|
Arthur H. Barlow
Vice President
Age: 52 | | Since 1993 | | Vice President of all the DFA Entities. Formerly, Vice President of DFA Australia Limited and Dimensional Fund Advisors Ltd. | |
|
Scott A. Bosworth
Vice President
Age: 39 | | Since 2007 | | Vice President of all the DFA Entities. Regional Director of Dimensional (since November 1997). | |
|
Valerie A. Brown
Vice President and Assistant Secretary
Age: 41 | | Since 2001 | | Vice President and Assistant Secretary of all the DFA Entities, DFA Australia Limited, Dimensional Fund Advisors Ltd., and since June 2003, Dimensional Fund Advisors Canada Inc. | |
|
David P. Butler
Vice President
Age: 44 | | Since 2007 | | Vice President of all the DFA Entities. Director of US Financial Services of Dimensional (since January 2005). Formerly, Regional Director of Dimensional Fund Advisors LP (January 1995 to January 2005). | |
|
Patrick Carter
Vice President
Age: 46 | | Since 2007 | | Vice President of all the DFA Entities. Regional Director of Dimensional (since March 2006). Formerly, Director of Merrill Lynch Retirement Group (December 1998 to March 2006). | |
|
Stephen A. Clark
Vice President
Age: 36 | | Since 2004 | | Vice President of all the DFA Entities, April 2001 to April 2004, Portfolio Manager of Dimensional. | |
|
Robert P. Cornell
Vice President
Age: 59 | | Since 2007 | | Vice President of all the DFA Entities. Regional Director of Financial Services Group of Dimensional (since August 1993). | |
|
Christopher S. Crossan
Vice President and Chief Compliance Officer
Age: 42 | | Since 2004 | | Vice President and Chief Compliance Officer of all the DFA Entities. Formerly, Senior Compliance Officer, INVESCO Institutional, Inc. and its affiliates (August 2000 to January 2004). | |
|
James L. Davis
Vice President
Age: 51 | | Since 1999 | | Vice President of all the DFA Entities. Formerly, Vice President of DFA Australia Limited and Dimensional Fund Advisors Ltd. | |
|
Robert T. Deere
Vice President
Age: 51 | | Since 1994 | | Vice President of all the DFA Entities and DFA Australia Limited. | |
|
Robert W. Dintzner
Vice President
Age: 38 | | Since 2001 | | Vice President of all the DFA Entities. Prior to April 2001, marketing supervisor and marketing coordinator for Dimensional. | |
|
36
Name, Position with the Fund
and Age | | Term of Office1
and Length of
Service | | Principal Occupation(s) During Past 5 Years | |
Kenneth Elmgren
Vice President
Age: 54 | | Since 2007 | | Vice President of all the DFA Entities. Formerly, Managing Principal of Beverly Capital (May 2004 to September 2006); Principal of Wydown Capital (September 2001 to May 2004). | |
|
Richard A. Eustice
Vice President and Assistant Secretary
Age: 43 | | Since 1998 | | Vice President and Assistant Secretary of all the DFA Entities and DFA Australia Limited. Formerly, Vice President of Dimensional Fund Advisors Ltd. | |
|
Eugene F. Fama, Jr.
Vice President
Age: 47 | | Since 1993 | | Vice President of all the DFA Entities. Formerly, Vice President of DFA Australia Limited and Dimensional Fund Advisors Ltd. | |
|
Gretchen A. Flicker
Vice President
Age: 37 | | Since 2004 | | Vice President of all the DFA Entities. Prior to April 2004, institutional client service representative of Dimensional. | |
|
Jed S. Fogdall
Vice President
Age: 34 | | Since 2008 | | Vice President of all the DFA Entities. Portfolio Manager for Dimensional (since September 2004). Prior to September 2004, Staff Engineer at the Boeing Company (1997-2004); Graduate Student at the University of California, Los Angeles (2002-2003). | |
|
Glenn S. Freed
Vice President
Age: 46 | | Since 2001 | | Vice President of all the DFA Entities. | |
|
Mark R. Gochnour
Vice President
Age: 41 | | Since 2007 | | Vice President of all the DFA Entities. Regional Director of Dimensional. | |
|
Henry F. Gray
Vice President
Age: 41 | | Since 2000 | | Vice President of all the DFA Entities. Prior to July 2000, Portfolio Manager of Dimensional. Formerly, Vice President of DFA Australia Limited. | |
|
John T. Gray
Vice President
Age: 34 | | Since 2007 | | Vice President of all the DFA Entities. Formerly, Regional Director of Dimensional (January 2005 to February 2007). | |
|
Darla Hastings
Vice President
Age: 53 | | Since 2007 | | Vice President of all the DFA Entities. Chief Marketing Officer of Dimensional. Formerly, Senior Vice President, Customer Experience for Benchmark Assisted Living (May 2005 to April 2006); Executive Vice President and Chief Marketing Officer of State Street Corporation (September 2001 to October 2005). | |
|
Joel H. Hefner
Vice President
Age: 40 | | Since 2007 | | Vice President of all the DFA Entities. Regional Director of Dimensional (since June 1998). | |
|
Julie Henderson
Vice President and Fund Controller
Age: 34 | | Since 2005 | | Vice President and Fund Controller of all the DFA Entities. Formerly, Senior Manager at PricewaterhouseCoopers LLP (July 1996 to April 2005). | |
|
Kevin Hight
Vice President
Age: 40 | | Since 2005 | | Vice President of all the DFA Entities. Formerly, Regional Director of Dimensional (since March 2003 to March 2005). | |
|
Christine W. Ho
Vice President
Age: 40 | | Since 2004 | | Vice President of all the DFA Entities. Prior to April 2004, Assistant Controller of Dimensional. | |
|
Jeff J. Jeon
Vice President
Age: 34 | | Since 2004 | | Vice President of all the DFA Entities. Prior to April 2004, Counsel of Dimensional. | |
|
Patrick M. Keating
Vice President
Age: 53 | | Since 2003 | | Vice President of all the DFA Entities and Chief Operating Officer of Dimensional. Director, Vice President and Chief Privacy Officer of Dimensional Fund Advisors Canada Inc. Director of DFA Australia Limited. | |
|
37
Name, Position with the Fund
and Age | | Term of Office1
and Length of
Service | | Principal Occupation(s) During Past 5 Years | |
Joseph F. Kolerich
Vice President
Age: 36 | | Since 2004 | | Vice President of all the DFA Entities. From April 2001 to April 2004, Portfolio Manager for Dimensional. | |
|
Michael F. Lane
Vice President
Age: 41 | | Since 2004 | | Vice President of all the DFA Entities. Formerly, Vice President of Advisor Services at TIAA-CREF (July 2001 to September 2004). | |
|
Kristina M. LaRusso
Vice President
Age: 33 | | Since 2006 | | Vice President of all DFA Entities. Formerly, Operations Supervisor of Dimensional (March 2003 to December 2006). | |
|
Inmoo Lee
Vice President
Age: 42 | | Since 2007 | | Vice President of all the DFA Entities. Associate Professor Department of Finance and Accounting, Business School, National University of Singapore (July 2004 to present); Associate Professor, College of Business Administration, Korea University (September 2001 to May 2006). | |
|
Juliet Lee
Vice President
Age: 37 | | Since 2005 | | Vice President of all the DFA Entities. Human Resources Manager of Dimensional (since January 2004). Formerly, Assistant Vice President for Metropolitan West Asset Management LLC (February 2001 to December 2003). | |
|
Aaron M. Marcus
Vice President & Head of Global Human Resources
Age: 38 | | Since 2008 | | Vice President and Head of Global Human Resources of Dimensional. Formerly, Global Head of Recruiting and Vice President of Goldman Sachs & Co. (June 2006 to January 2008); Global Co-Head of HR of the Equities & FICC Division, and Vice President of Goldman Sachs & Co. (May 2005 to May 2006); Head of Americas Campus Recruiting and Vice President of Goldman Sachs & Co. (April 2003 to May 2005). | |
|
David R. Martin
Vice President, Chief Financial Officer and Treasurer
Age: 51 | | Since 2007 | | Vice President, Chief Financial Officer and Treasurer of all the DFA Entities. Director, Vice President, Chief Financial Officer and Treasurer of Dimensional Fund Advisors Ltd. and DFA Australia Limited. Chief Financial Officer, Treasurer, and Vice President of Dimensional Fund Advisors Canada Inc. Director of Dimensional Funds PLC and Dimensional Funds II PLC. Formerly, Executive Vice President and Chief Financial Officer of Janus Capital Group Inc. (June 2005 to March 2007); Senior Vice President of Finance at Charles Schwab & Co., Inc. (March 1999 to May 2005). | |
|
Catherine L. Newell
Vice President and Secretary
Age: 44 | | Vice President since 1997 and Secretary since 2000 | | Vice President and Secretary of all the DFA Entities. Director, Vice President and Assistant Secretary of DFA Australia Limited (since February 2002, April 1997 and May 2002, respectively). Vice President and Secretary of Dimensional Fund Advisors Canada Inc. (since June 2003). Director, Dimensional Funds PLC and Dimensional Funds II PLC (since January 2002). Formerly, Assistant Secretary of all DFA Entities and Dimensional Fund Advisors Ltd. | |
|
Gerard K. O'Reilly
Vice President
Age: 31 | | Since 2007 | | Vice President of all the DFA Entities. Formerly, Research Associate of Dimensional Fund Advisors LP (2004 to 2006); Research Assistant in PhD program, Aeronautics Department California Institute of Technology (1998 to 2004). | |
|
Carmen Palafox
Vice President
Age: 34 | | Since 2006 | | Vice President of all the DFA Entities. Operations Manager of Dimensional Fund Advisors LP (since May 1996). | |
|
Sonya Park
Vice President
Age: 36 | | Since 2005 | | Vice President of all the DFA Entities. From February 2002 to January 2005, institutional client service representative of Dimensional. | |
|
David A. Plecha
Vice President
Age: 47 | | Since 1993 | | Vice President of all the DFA Entities, DFA Australia Limited and Dimensional Fund Advisors Ltd.. | |
|
Ted Randall
Vice President
Age: 35 | | Since 2008 | | Vice President of all the DFA Entities. Formerly, Research Associate of Dimensional (2006-2008). Systems Developer of Dimensional (2001-2006). | |
|
38
Name, Position with the Fund
and Age | | Term of Office1
and Length of
Service | | Principal Occupation(s) During Past 5 Years | |
Eduardo A. Repetto
Vice President and Chief Investment Officer
Age: 41 | | Since 2002 | | Chief Investment Officer (beginning March 2007) and Vice President of all the DFA Entities, DFA Australia Limited and Dimensional Fund Advisors Canada Inc. Formerly, Research Associate for Dimensional (June 2000 to April 2002). | |
|
L. Jacobo Rodriguez
Vice President
Age: 37 | | Since 2005 | | Vice President of all the DFA Entities. From August 2004 to July 2005, institutional client service representative of Dimensional. Formerly, Financial Services Analyst, Cato Institute (September 2001 to June 2004); Book Review Editor, Cato Journal, Cato Institute (May 1996 to June 2004). | |
|
David E. Schneider
Vice President
Age: 62 | | Since 2001 | | Vice President of all the DFA Entities. Currently, Director of Institutional Services. | |
|
Ted R. Simpson
Vice President
Age: 40 | | Since 2007 | | Vice President of all the DFA Entities. Regional Director of Dimensional (since December 2002). | |
|
Bryce D. Skaff
Vice President
Age: 33 | | Since 2007 | | Vice President of all the DFA Entities. Formerly, Regional Director of Dimensional (December 1999 to January 2007). | |
|
Grady M. Smith
Vice President
Age: 51 | | Since 2004 | | Vice President of all the DFA Entities. Prior to April 2004, Portfolio Manager of Dimensional. | |
|
Carl G. Snyder
Vice President
Age: 45 | | Since 2000 | | Vice President of all the DFA Entities. Formerly, Vice President of DFA Australia Limited. | |
|
Lawrence R. Spieth
Vice President
Age: 60 | | Since 2004 | | Vice President of all the DFA Entities. Prior to April 2004, Regional Director of Dimensional. | |
|
Bradley G. Steiman
Vice President
Age: 35 | | Since 2004 | | Vice President of all the DFA Entities and Director and Vice President of Dimensional Fund Advisors Canada Inc. | |
|
Karen E. Umland
Vice President
Age: 42 | | Since 1997 | | Vice President of all the DFA Entities, DFA Australia Limited, Dimensional Fund Advisors Ltd., and since June 2003, Dimensional Fund Advisors Canada Inc. | |
|
Carol W. Wardlaw
Vice President
Age: 49 | | Since 2004 | | Vice President of all the DFA Entities. Prior to April 2004, Regional Director of Dimensional. | |
|
Weston J. Wellington
Vice President
Age: 57 | | Since 1997 | | Vice President of all the DFA Entities. Formerly, Vice President of DFA Australia Limited. | |
|
Daniel M. Wheeler
Vice President
Age: 63 | | Since 2001 | | Vice President of all the DFA Entities. Prior to 2001 and currently, Director of Financial Advisors Services of Dimensional. Director of Dimensional Fund Advisors Ltd. (since October 2003) and President of Dimensional Fund Advisors Canada Inc. (since June 2003). | |
|
Ryan Wiley
Vice President
Age: 32 | | Since 2007 | | Vice President of all the DFA Entities. Senior Trader of Dimensional. Formerly, Portfolio Manager (2006 to 2007); Trader (2001 to 2006). | |
|
Paul E. Wise
Vice President
Age: 53 | | Since 2005 | | Vice President of all the DFA Entities. Chief Technology Officer for Dimensional (since 2004). Formerly, Principal of Turnbuckle Management Group (January 2002 to August 2004). | |
|
1 Each officer holds office for an indefinite term at the pleasure of the Boards of Trustee/Directors and until his or her successor is elected and qualified.
39
VOTING PROXIES ON FUND PORTFOLIO SECURITIES
A description of the policies and procedures that the Trust uses in voting proxies relating to securities held in the portfolio is available without charge, upon request, by calling collect: (310) 395-8005. Information regarding how the Advisor votes these proxies is available from the EDGAR database on the SEC's website at http://www.sec.gov and from the Advisor's website at http://www.dimensional.com and reflects the twelve-month period beginning July 1st and ending June 30th.
40
NOTICE TO SHAREHOLDERS
(Unaudited)
For shareholders that do not have an October 31, 2008 tax year end, this notice is for informational purposes only. For shareholders with an October 31, 2008 tax year end, please consult your tax advisor as to the pertinence of this notice. For the period December 1, 2007 to October 31, 2008, each portfolio is designating the following items with regard to distributions paid during the period.
| Dimensional Investment Group Inc. | | Net
Investment
Income
Distributions | | Long-Term
Capital Gain
Distributions | | Total
Distributions | | Qualifying
For Corporate
Dividends
Received
Deduction(1) | | Qualifying
Dividend
Income(2) | | Foreign
Tax
Credit(3) | | Qualifying
Interest
Income(4) | |
| Emerging Markets Portfolio II | | | 58 | % | | | 42 | % | | | 100 | % | | | 1 | % | | | 65 | % | | | 24 | % | | | 13 | % | |
(1) Qualifying dividends represent dividends which qualify for the corporate dividends received deduction and is reflected as a percentage of ordinary income distributions (the total of short-term capital gain and net investment income distributions).
(2) The percentage in this column represents the amount of "Qualifying Dividend Income" as created by the Jobs and Growth Tax Relief Reconciliation Act of 2003 and is reflected as a percentage of ordinary income distributions (the total of short-term capital gain and net investment income distributions). It is the intention of each of the aforementioned funds to designate the maximum amount permitted by law.
(3) Foreign Tax Credit represent dividends which qualify for the foreign tax credit pass through and is reflected as a percentage of investment company taxable income (the total of short-term capital gain and net investment income distributions).
(4) The percentage in this column represents the amount of "Qualifying Interest Income" as created by The American Jobs Creation Act of 2004. The information is reflected as a percentage of ordinary income distributions (the total of short-term capital gain and net investment income distributions).
41
[THIS PAGE INTENTIONALLY LEFT BLANK]
[THIS PAGE INTENTIONALLY LEFT BLANK]
[THIS PAGE INTENTIONALLY LEFT BLANK]

DFA0103108-011A
DIMENSIONAL INVESTMENT GROUP INC.
Tax-Managed U.S. Marketwide Value Portfolio II
Annual Report
Period Ended October 31, 2008
Dimensional Fund Advisors
6300 Bee Cave Road, Building One
Austin, TX 78746
December 2008
Dear Fellow Shareholder,
This has been a challenging year for investors. After drifting lower throughout the spring and summer, stock markets around the world plummeted in mid September on news that the ongoing credit crisis was driving some leading financial services companies toward failure. As the effects of this distress rippled through the financial world, investors became increasingly anxious and stock prices continued to decline sharply. In the month of October, the S&P 500 Index fell 16.8% or 196 points—its worst-ever monthly point decline.
Markets like this test investors' resolve. It is difficult to stick with a long-term investment plan when one sees the dramatic effects of high market volatility on a portfolio's value. Very few people are having a positive investment experience right now. But investors who have based their approach on a sensible risk/return framework tend to be in better shape than those who have not.
The recent market turbulence illustrates the reason why Dimensional believes that markets are efficient. History has shown time and again that prices cannot be predicted in public equity markets. This "random walk" makes diversification very important. Although the broad diversification in our portfolios didn't prevent negative performance this year, we believe it helped our shareholders avoid the extreme losses experienced by investors who concentrated their holdings in individual companies, industry sectors, or markets.
The unpredictability of stock prices also makes it important for investors to take a hard look at their own portfolios and determine how much risk and what types of risk they should take. Investors who hold asset mixes that accurately reflect their tolerance for risk are better able to withstand down markets.
Nobody knows when the capital markets will recover, but over time we can expect them to again offer a premium to investors who are willing to invest in relatively risky assets such as stocks. My view is that investors who have already paid for risk should stay invested and earn the return that can be expected when markets turn around. If markets continue to be so volatile, it's also important to understand that pulling money out of stocks, even for short periods of time, can result in significant missed opportunities.
All of us at Dimensional take our job as the steward of your assets very seriously and hope to have the opportunity to serve you for many years to come.
Sincerely,
David G. Booth
Chairman and Chief Executive Officer
[THIS PAGE INTENTIONALLY LEFT BLANK]
ANNUAL REPORT
Table of Contents
| Letter to Shareholders | | Page | |
| Definitions of Abbreviations and Footnotes | | | 1 | | |
|
| Dimensional Investment Group Inc. — Tax-Managed Marketwide Value Portfolio II | |
|
| Performance Chart | | | 2 | | |
|
| Management's Discussion and Analysis | | | 3 | | |
|
| Disclosure of Fund Expenses | | | 5 | | |
|
| Disclosure of Portfolio Holdings | | | 6 | | |
|
| Statement of Assets and Liabilities | | | 7 | | |
|
| Statements of Operations | | | 8 | | |
|
| Statements of Changes in Net Assets | | | 9 | | |
|
| Financial Highlights | | | 10 | | |
|
| Notes to Financial Statements | | | 11 | | |
|
| Report of Independent Registered Public Accounting Firm | | | 15 | | |
|
| The DFA Investment Trust Company — The Tax-Managed U.S. Marketwide Value Series | |
|
| Performance Chart | | | 16 | | |
|
| Disclosure of Fund Expenses | | | 17 | | |
|
| Disclosure of Portfolio Holdings | | | 18 | | |
|
| Summary Schedule of Portfolio Holdings | | | 19 | | |
|
| Statement of Assets and Liabilities | | | 22 | | |
|
| Statements of Operations | | | 23 | | |
|
| Statements of Changes in Net Assets | | | 24 | | |
|
| Financial Highlights | | | 25 | | |
|
| Notes to Financial Statements | | | 26 | | |
|
| Report of Independent Registered Public Accounting Firm | | | 31 | | |
|
| Fund Management | | | 32 | | |
|
| Voting Proxies on Fund Portfolio Securities | | | 39 | | |
|
| Notice to Shareholders | | | 40 | | |
|
This report is submitted for the information of the Fund's shareholders. It is not authorized for distribution to prospective investors unless preceded or accompanied by an effective prospectus.
i
[THIS PAGE INTENTIONALLY LEFT BLANK]
DIMENSIONAL INVESTMENT GROUP INC.
THE DFA INVESTMENT TRUST COMPANY
DEFINITIONS OF ABBREVIATIONS AND FOOTNOTES
Statement of Assets and Liabilities/Summary Schedule of Portfolio Holdings
Investment Abbreviations
FHLMC Federal Home Loan Mortgage Corporation
FNMA Federal National Mortgage Association
STRIP Separate Trading of Registered Interest and Principal Securities
Investment Footnotes
† See Note B to Financial Statements.
** Calculated as a percentage of total net assets. Percentages shown parenthetically next to the category headings have been calculated as a percentage of total investments. "Other Securities" are those securities that are not among the top 50 holdings of the Fund or do not represent more than 1.0% of the net assets of the Fund. Some of the individual securities within this category may include Total or Partial Securities on Loan and/or Non-Income Producing Securities.
* Non-Income Producing Securities.
# Total or Partial Securities on Loan.
@ Security purchased with cash proceeds from Securities on Loan.
(r) The adjustable rate shown is effective as of October 31, 2008.
(y) The rate shown is the effective yield.
§ Affiliated Fund.
Financial Highlights
(A) Computed using average shares outstanding.
(B) Annualized
(C) Non-Annualized
(D) Represents the combined ratios for the respective portfolio and its respective pro-rata share of its Master Fund Series.
All Statements and Schedules
— Amounts designated as — are either zero or rounded to zero.
REIT Real Estate Investment Trust
SEC Securities and Exchange Commission
1
DIMENSIONAL INVESTMENT GROUP INC.
PERFORMANCE CHART

2
MANAGEMENT'S DISCUSSION AND ANALYSIS
On September 16, 2008, at a regular meeting of the Board of Directors/Trustees (the "Board") of the funds covered by this report, the Board voted to change the fiscal and tax year ends of the funds from November 30 to October 31. Therefore, the following discussion generally covers the 11-month period ended October 31, 2008.
U.S. Equity Market Review 11 Months Ended October 31, 2008
U.S. equity markets experienced high levels of volatility during the 11-month fiscal year ended October 31, 2008. The behavior of equity markets has been driven in large part by the contraction of lending in credit markets. In addition to heightened volatility, the cross-sectional dispersion of stock returns in equity markets has increased relative to previous levels, and returns even within each asset class have differed greatly. Dimensional Fund Advisors believes that a security's risk characteristics determine its expected return. Among the most important factors explaining differences in the behavior of diversified equity portfolios are company size and company value/growth characteristics of the portfolio holdings. Size is measured by market capitalization, and "value" classification is a function of stock price relative to one or more fundamental characteristics. Compared to other stocks, value stocks often have lower market value rela tive to their earnings, dividends, and book value.
For the 11 months ended October 31, 2008, small company stocks slightly outperformed large companies, and mid cap companies underperformed both small and large cap companies. The performance of the Russell Microcap Index® was –33.59%, the Russell 2000 Index® was –29.07%, CRSP 6-10 Index was –32.90%, and MSCI USA Small Cap 1750 Index was –32.21%. Large cap value stocks, as measured by the Russell 1000 Value Index®, slightly outperformed large cap growth stocks, as measured by the Russell 1000 Growth Index®. The value premium was larger among small cap stocks.
Total Return for 11 Months Ended October 31, 2008
| Russell 2000 Index® (small cap companies) | | | –29.07 | % | |
| Russell Midcap Index® (mid cap companies) | | | –37.70 | % | |
| Russell 1000 Index® (large cap companies) | | | –33.99 | % | |
| Russell 3000 Value Index® | | | –32.90 | % | |
| Russell 3000 Growth Index® | | | –34.45 | % | |
When the large, mid, and small cap market segments are further divided by value and growth characteristics, the distinction in performance within sectors was equally significant.
Total Return for 11 Months Ended October 31, 2008
| Russell 1000 Value Index® (large cap value companies) | | | –33.55 | % | |
| Russell 1000 Growth Index® (large cap growth companies) | | | –34.54 | % | |
| Russell Midcap Value Index® (mid cap value companies) | | | –35.42 | % | |
| Russell Midcap Growth Index® (mid cap growth companies) | | | –40.01 | % | |
| Russell 2500 Value Index® (small/mid cap value companies) | | | –29.10 | % | |
| Russell 2500 Growth Index® (small/mid cap growth companies) | | | –37.30 | % | |
| Russell 2000 Value Index® (small cap value companies) | | | –24.91 | % | |
| Russell 2000 Growth Index® (small cap growth companies) | | | –33.26 | % | |
Source: Russell data copyright © Russell Investment Group 1995-2008, all rights reserved.
Differences in returns for the various Dimensional U.S. equity funds over the 11 months ended October 31, 2008 were attributable primarily to differences in value/growth and size characteristics as well as the exclusion of REIT securities from most Dimensional portfolios, except for the DFA Real Estate Securities Portfolio and portfolios investing in the U.S. Large Company Series. Moreover, the portfolio construction approach used by Dimensional Fund Advisors generally resulted in portfolios with greater emphasis on value or small company characteristics relative to widely used index benchmarks.
3
Master-Feeder Structure
The portfolio described below, called a "Feeder Fund," does not buy individual securities directly; instead, the portfolio invests in a corresponding fund called a "Master Fund." The Master Fund, in turn, purchases stocks, bonds, and/or other securities.
Tax Managed U.S. Marketwide Value Portfolio II
The Tax-Managed U.S. Marketwide Value Portfolio II seeks to capture the returns of U.S. value stocks by purchasing shares of a Master Fund that invests in such stocks. The Master Fund also seeks to maximize the after-tax value of a shareholder's investment. The investment strategy employs a disciplined, quantitative approach, emphasizing broad diversification and consistent exposure to U.S. value stocks, but does not attempt to track closely a specific equity index. As of October 31, 2008, the Master Fund held approximately 1,410 stocks and essentially was fully invested in equities throughout the year: average cash levels for the 11 months ended October 31, 2008 were in general less than 1% of the Master Fund's assets.
As a result of the Master Fund's diversified investment approach, performance principally was determined by broad structural trends in the U.S. equity market, rather than the behavior of a limited number of stocks. For the 11 months ended October 31, 2008, total returns were –33.31% for the S&P 500 Index®, –32.90% for the Russell 3000 Value Index® and –37.46% for the Portfolio. Relative to the Russell 3000 Value Index®, underperformance of the Portfolio was primarily due to the Master Fund's lower exposure to stocks with neutral value/growth price characteristics as measured by book-to-market ("BtM") ratio. Less value-oriented stocks in the lowest three BtM quartiles, which accounted for approximately 20% of the Master Fund compared to 53% of the Index, outperformed the Value Index by more than 6 percentage points. Large cap stocks held by the Master Fund underperformed similarl y sized stocks held by the Index by approximately 6 percentage points.
4
DIMENSIONAL INVESTMENT GROUP INC.
TAX-MANAGED U.S. MARKETWIDE VALUE PORTFOLIO II
DISCLOSURE OF FUND EXPENSES
(Unaudited)
The following Expense Table is shown so that you can understand the impact of fees on your investment. All mutual funds have operating expenses. As a shareholder of the fund, you incur ongoing costs, which include costs for portfolio management, administrative services, and shareholder reports, among others. Operating expenses, legal and audit services, which are deducted from a fund's gross income, directly reduce the investment return of the fund. A fund's expenses are expressed as a percentage of its average net assets. This figure is known as the expense ratio. The following examples are intended to help you understand the ongoing costs, in dollars, of investing in the fund and to compare these costs with those of other mutual funds. The examples are based on an investment of $1,000 made at the beginning of the period shown and held for the entire period.
The Expense Table below illustrates your fund's costs in two ways.
Actual Fund Return
This section helps you to estimate the actual expenses after fee waivers that you paid over the period. The "Ending Account Value" shown is derived from the fund's actual return and "Expenses Paid During Period" reflect the dollar amount that would have been paid by an investor who started with $1,000 in the fund. You may use the information here, together with the amount you invested, to estimate the expenses that you paid over the period.
To do so, simply divide your account value by $1,000 (for example, a $7,500 account value divided by $1,000 = 7.5), then multiply the result by the number given for your fund under the heading "Expenses Paid During Period."
Hypothetical Example for Comparison Purposes
This section is intended to help you compare your fund's costs with those of other mutual funds. The hypothetical "Ending Account Value" and "Expenses Paid During Period" are derived from the fund's actual expense ratio and an assumed 5% annual return before expenses. In this case, because the return used is not the fund's actual return, the results do not apply to your investment. The example is useful in making comparisons because the SEC requires all mutual funds to calculate expenses based on a 5% annual return. You can assess your fund's cost by comparing this hypothetical example with the hypothetical examples that appear in shareholder reports of other funds.
Please note that the expenses shown in the table are meant to highlight and help you compare ongoing costs only and do not reflect any transactional costs, if applicable. The "Annualized Expense Ratio" represents the actual expenses for the six-month period indicated.
Six Months Ended October 31, 2008
EXPENSE TABLE
| | | Beginning
Account
Value
05/01/08 | | Ending
Account
Value
10/31/08 | | Annualized
Expense
Ratio* | | Expenses
Paid
During
Period* | |
| Actual Fund Return | | $ | 1,000.00 | | | $ | 654.00 | | | | 0.23 | % | | $ | 0.96 | | |
| Hypothetical 5% Annual Return | | $ | 1,000.00 | | | $ | 1,023.98 | | | | 0.23 | % | | $ | 1.17 | | |
* Expenses are equal to the fund's annualized expense ratio for the six-month period, multiplied by the average account value over the period, multiplied by the number of days in the most recent six-month period (184), then divided by the number of days in the year (366) to reflect the six-month period. The Portfolio is a Feeder Fund. The expenses shown reflect the direct expenses of the Feeder Fund and the indirect payment of the Feeder Fund's portion of the expenses of its Master Fund.
5
DIMENSIONAL INVESTMENT GROUP INC.
TAX-MANAGED U.S. MARKETWIDE VALUE PORTFOLIO II
DISCLOSURE OF PORTFOLIO HOLDINGS
(Unaudited)
The SEC requires that all Funds file a complete Schedule of Investments with the SEC for their first and third fiscal quarters on Form N-Q. For Dimensional Investment Group Inc., this would be for the fiscal quarters ending January 31 and July 31. The Form N-Q filing must be made within 60 days of the end of the quarter. Dimensional Investment Group Inc. filed its most recent Form N-Q with the SEC on October 30, 2008. It is available upon request, without charge, by calling collect: (310) 395-8005 or by mailing a request to Dimensional Fund Advisors LP, 1299 Ocean Avenue, Santa Monica, California 90401, or by visiting the SEC's website at http://www.sec.gov, or they may be reviewed and copied at the SEC's Public Reference Room in Washington, D.C. (call 1-800-732-0330 for information on the operation of the Public Reference Room).
PORTFOLIO HOLDINGS
The SEC requires that all Funds present their categories of portfolio holdings in a table, chart or graph format in their annual and semi-annual shareholder reports, whether or not a Schedule of Investments is utilized. The following table, which presents portfolio holdings as a percent of total investments before short-term investments and collateral for loaned securities, is provided in compliance with such requirement.
The categories of industry classification for the Affiliated Investment Company are represented in the Disclosure of Portfolio Holdings, which are included elsewhere within the report. Refer to the Summary Schedule of Portfolio Holdings for the underlying Master Fund's holdings which reflect the investments by category.
| Affiliated Investment Company | | | 100.0 | % | |
6
DIMENSIONAL INVESTMENT GROUP INC.
TAX-MANAGED U.S. MARKETWIDE VALUE PORTFOLIO II
STATEMENT OF ASSETS AND LIABILITIES
OCTOBER 31, 2008
(Amounts in thousands, except share and per share amounts)
| ASSETS: | |
Investment in The Tax-Managed U.S. Marketwide Value Series of The DFA Investment Trust
Company (Affiliated Investment Company) at Value† | | $ | 613,732 | | |
| Receivables: | |
| Affiliated Investment Company | | | 2,724 | | |
| Fund Shares Sold | | | 708 | | |
| Prepaid Expenses and Other Assets | | | 25 | | |
| Total Assets | | | 617,189 | | |
| LIABILITIES: | |
| Payables: | |
| Fund Shares Redeemed | | | 3,432 | | |
| Accrued Expenses and Other Liabilities | | | 67 | | |
| Total Liabilities | | | 3,499 | | |
| NET ASSETS | | $ | 613,690 | | |
| SHARES OUTSTANDING, $0.01 PAR VALUE (1) | | | 60,180,172 | | |
| NET ASSET VALUE, OFFERING AND REDEMPTION PRICE PER SHARE | | $ | 10.20 | | |
| Investment in Affiliated Investment Company at Cost | | $ | 742,432 | | |
| NET ASSETS CONSIST OF: | |
| Paid-In Capital | | $ | 774,627 | | |
| Undistributed Net Investment Income (Distributions in Excess of Net Investment Income) | | | 3,645 | | |
| Accumulated Net Realized Gain (Loss) | | | (35,882 | ) | |
| Net Unrealized Appreciation (Depreciation) | | | (128,700 | ) | |
| NET ASSETS | | $ | 613,690 | | |
| (1) NUMBER OF SHARES AUTHORIZED | | | 200,000,000 | | |
See accompanying Notes to Financial Statements.
7
DIMENSIONAL INVESTMENT GROUP INC.
TAX-MANAGED U.S. MARKETWIDE VALUE PORTFOLIO II
STATEMENTS OF OPERATIONS
FOR THE PERIOD ENDED OCTOBER 31, 2008
(Amounts in thousands)
| | | Period
Dec. 1, 2007
to
Oct. 31, 2008 | | Year
Ended
Nov. 30,
2007 | |
| Investment Income | |
| Dividends | | $ | 18,416 | | | $ | 20,076 | | |
| Interest | | | 193 | | | | 354 | | |
| Income from Securities Lending | | | 1,346 | | | | 400 | | |
| Expenses Allocated from Affiliated Investment Company | | | (1,874 | ) | | | (2,462 | ) | |
| Total Investment Income | | | 18,081 | | | | 18,368 | | |
| Expenses | |
| Accounting & Transfer Agent Fees | | | 24 | | | | 28 | | |
| Filing Fees | | | 44 | | | | 47 | | |
| Shareholders' Reports | | | 36 | | | | 51 | | |
| Directors'/Trustees' Fees & Expenses | | | — | | | | 9 | | |
| Professional Fees | | | 27 | | | | 26 | | |
| Other | | | 4 | | | | 3 | | |
| Total Expenses | | | 135 | | | | 164 | | |
| Net Investment Income (Loss) | | | 17,946 | | | | 18,204 | | |
| Realized and Unrealized Gain (Loss) | |
| Net Realized Gain (Loss) on: | |
| Investment Securities Sold | | | (34,948 | ) | | | 58,675 | | |
| Futures | | | (793 | ) | | | — | | |
| Change in Unrealized Appreciation (Depreciation) of: | |
| Investment Securities | | | (378,517 | ) | | | (76,760 | ) | |
| Futures | | | 4 | | | | — | | |
| Net Realized and Unrealized Gain (Loss) | | | (414,254 | ) | | | (18,085 | ) | |
| Net Increase (Decrease) in Net Assets Resulting from Operations | | $ | (396,308 | ) | | $ | 119 | | |
Investment Income and Realized and Unrealized Gain (Loss) were allocated from the Portfolio's Master Fund (Affiliated Investment Company).
See accompanying Notes to Financial Statements.
8
DIMENSIONAL INVESTMENT GROUP INC.
TAX-MANAGED U.S. MARKETWIDE VALUE PORTFOLIO II
STATEMENTS OF CHANGES IN NET ASSETS
(Amounts in thousands)
| | | Period
Dec. 1, 2007
to
Oct. 31, 2008 | | Year
Ended
Nov. 30,
2007 | | Year
Ended
Nov. 30,
2006 | |
| Increase (Decrease) in Net Assets | |
| Operations: | |
| Net Investment Income (Loss) | | $ | 17,946 | | | $ | 18,204 | | | $ | 13,873 | | |
| Net Realized Gain (Loss) on: | |
| Investment Securities Sold | | | (34,948 | ) | | | 58,675 | | | | 22,986 | | |
| Futures | | | (793 | ) | | | — | | | | — | | |
| Change in Unrealized Appreciation (Depreciation) of: | |
| Investment Securities | | | (378,517 | ) | | | (76,760 | ) | | | 104,800 | | |
| Futures | | | 4 | | | | — | | | | — | | |
Net Increase (Decrease) in Net Assets Resulting from
Operations | | | (396,308 | ) | | | 119 | | | | 141,659 | | |
| Distributions From: | |
| Net Investment Income | | | (19,059 | ) | | | (17,542 | ) | | | (12,670 | ) | |
| Net Long-Term Gains | | | (43,810 | ) | | | — | | | | — | | |
| Total Distributions | | | (62,869 | ) | | | (17,542 | ) | | | (12,670 | ) | |
| Capital Share Transactions (1): | |
| Shares Issued | | | 370,753 | | | | 209,281 | | | | 214,031 | | |
| Shares Issued in Lieu of Cash Distributions | | | 62,846 | | | | 17,537 | | | | 12,668 | | |
| Shares Redeemed | | | (470,998 | ) | | | (114,505 | ) | | | (62,055 | ) | |
| Net Increase (Decrease) from Capital Share Transactions | | | (37,399 | ) | | | 112,313 | | | | 164,644 | | |
| Total Increase (Decrease) in Net Assets | | | (496,576 | ) | | | 94,890 | | | | 293,633 | | |
| Net Assets | |
| Beginning of Period | | | 1,110,266 | | | | 1,015,376 | | | | 721,743 | | |
| End of Period | | $ | 613,690 | | | $ | 1,110,266 | | | $ | 1,015,376 | | |
| (1) Shares Issued and Redeemed: | |
| Shares Issued | | | 26,390 | | | | 11,360 | | | | 13,255 | | |
| Shares Issued in Lieu of Cash Distributions | | | 3,963 | | | | 966 | | | | 811 | | |
| Shares Redeemed | | | (33,945 | ) | | | (6,345 | ) | | | (3,846 | ) | |
| | | | (3,592 | ) | | | 5,981 | | | | 10,220 | | |
Undistributed Net Investment Income (Distributions in Excess
of Net Investment Income) | | $ | 3,645 | | | $ | 4,811 | | | $ | 4,619 | | |
See accompanying Notes to Financial Statements.
9
DIMENSIONAL INVESTMENT GROUP INC.
TAX-MANAGED U.S. MARKETWIDE VALUE PORTFOLIO II
FINANCIAL HIGHLIGHTS
(for a share outstanding throughout each period)
| | | Period
Dec. 1, 2007
to
Oct. 31, 2008 | | Year
Ended
Nov. 30,
2007 | | Year
Ended
Nov. 30,
2006 | | Year
Ended
Nov. 30,
2005 | | Year
Ended
Nov. 30,
2004 | | Year
Ended
Nov. 30,
2003 | |
Net Asset Value, Beginning
of Period | | $ | 17.41 | | | $ | 17.57 | | | $ | 15.17 | | | $ | 13.20 | | | $ | 11.08 | | | $ | 9.06 | | |
| Income from Investment Operations | |
Net Investment
Income (Loss) | | | 0.28 | (A) | | | 0.29 | (A) | | | 0.26 | (A) | | | 0.20 | | | | 0.13 | | | | 0.05 | | |
Net Gains (Losses) on
Securities (Realized
and Unrealized) | | | (6.42 | ) | | | (0.16 | ) | | | 2.39 | | | | 1.94 | | | | 2.12 | | | | 2.01 | | |
Total from Investment
Operations | | | (6.14 | ) | | | 0.13 | | | | 2.65 | | | | 2.14 | | | | 2.25 | | | | 2.06 | | |
| Less Distributions | |
| Net Investment Income | | | (0.31 | ) | | | (0.29 | ) | | | (0.25 | ) | | | (0.17 | ) | | | (0.13 | ) | | | (0.04 | ) | |
| Net Realized Gains | | | (0.76 | ) | | | — | | | | — | | | | — | | | | — | | | | — | | |
| Total Distributions | | | (1.07 | ) | | | (0.29 | ) | | | (0.25 | ) | | | (0.17 | ) | | | (0.13 | ) | | | (0.04 | ) | |
Net Asset Value,
End of Period | | $ | 10.20 | | | $ | 17.41 | | | $ | 17.57 | | | $ | 15.17 | | | $ | 13.20 | | | $ | 11.08 | | |
| Total Return | | | (37.46 | )%(C) | | | 0.67 | % | | | 17.67 | % | | | 16.36 | % | | | 20.41 | % | | | 22.91 | % | |
Net Assets, End of Period
(thousands) | | $ | 613,690 | | | $ | 1,110,266 | | | $ | 1,015,376 | | | $ | 721,743 | | | $ | 505,147 | | | $ | 328,258 | | |
Ratio of Expenses to Average
Net Assets (D) | | | 0.23 | %(B) | | | 0.23 | % | | | 0.24 | % | | | 0.26 | % | | | 0.28 | % | | | 0.30 | % | |
Ratio of Net Investment Income
to Average Net Assets | | | 2.07 | %(B) | | | 1.59 | % | | | 1.61 | % | | | 1.49 | % | | | 1.11 | % | | | 0.57 | % | |
See page 1 for the Definitions of Abbreviations and Footnotes.
See accompanying Notes to Financial Statements.
10
DIMENSIONAL INVESTMENT GROUP INC.
TAX-MANAGED U.S. MARKETWIDE VALUE PORTFOLIO II
NOTES TO FINANCIAL STATEMENTS
A. Organization:
Dimensional Investment Group Inc. (the "Fund") is an open-end management investment company registered under the Investment Company Act of 1940, whose shares are generally offered to institutional investors, retirement plans and clients of registered investment advisors. The Fund consists of fifteen portfolios, of which Tax-Managed U.S. Marketwide Value Portfolio II (the "Portfolio") is presented in this report.
The Portfolio primarily invests its assets in The Tax-Managed U.S. Marketwide Value Series (the "Series"), a corresponding series of The DFA Investment Trust Company. At October 31, 2008, the Portfolio owned 28% of the Series. The financial statements of the Series are included elsewhere in this report and should be read in conjunction with the financial statements of the Portfolio.
At a regular meeting of the Board of Directors/Trustees (the "Board") on September 16, 2008, the Board voted to change the fiscal and tax year ends of the Portfolio from November 30 to October 31.
B. Significant Accounting Policies:
The following significant accounting policies are in conformity with accounting principles generally accepted in the United States of America. Such policies are consistently followed by the Fund in preparation of its financial statements. The preparation of financial statements in accordance with accounting principles generally accepted in the United States of America requires management to make estimates and assumptions that affect the reported amounts of assets and liabilities and disclosure of contingent assets and liabilities at the date of the financial statements and the reported amounts of increases and decreases in net assets from operations during the reporting period. Actual results could differ from those estimates and those differences could be material.
1. Security Valuation: The Portfolio's investment reflects its proportionate interest in the net assets of the Series.
Adoption of Statement of Financial Accounting Standards No. 157 "Fair Value Measurements" ("FAS 157")
In September 2006, the Financial Accounting Standards Board issued FAS 157 effective for fiscal years beginning after November 15, 2007. This standard clarifies the definition of fair value for financial reporting, establishes a framework for measuring fair value and requires additional disclosures about the use of fair value measurements. The Funds have adopted FAS 157 as of December 1, 2007. The three levels of the fair value hierarchy under FAS 157 are described below:
• Level 1 – quoted prices in active markets for identical securities
• Level 2 – other significant observable inputs (including quoted prices for similar securities, interest rates, prepayment speeds, credit risk, etc.)
• Level 3 – significant unobservable inputs (including the Portfolio's own assumptions in determining the fair value of investments)
The inputs or methodology used for valuing securities are not necessarily an indication of the risk associated with investing in those securities. A summary of the inputs used to value the Portfolio's net assets as of October 31, 2008 is listed below (in thousands).
| | | Valuation Inputs | |
| | | Investments in
Securities
(Market Value) | |
| | | Level 1 | | Level 2 | | Level 3 | | Total | |
| Tax-Managed Marketwide Value Portfolio II | | $ | 613,732 | | | | — | | | | — | | | $ | 613,732 | | |
11
2. Deferred Compensation Plan: Each eligible Director of the Fund may elect participation in the Deferred Compensation Plan (the "Plan"). Under the Plan, effective January 1, 2002, such Directors may defer payment of all or a portion of their total fees earned as a Director. These deferred amounts may be treated as though such amounts had been invested in shares of the following funds: U.S. Large Cap Value Portfolio; U.S. Core Equity 1 Portfolio; U.S. Core Equity 2 Portfolio; U.S. Vector Equity Portfolio; U.S. Micro Cap Portfolio; DFA International Value Portfolio; International Core Equity Portfolio; Emerging Markets Portfolio; Emerging Markets Core Equity Portfolio; and/or DFA Two-Year Global Fixed Income Portfolio. Contributions made under the Plan and the change in unrealized a ppreciation (depreciation) and income, are included in Other Expenses for the period ended October 31, 2008 and are included in Directors'/Trustees' Fees & Expenses for the year ended November 30, 2007. At October 31, 2008, the total liability for deferred compensation to Directors is included in Accrued Expenses and Other Liabilities in the amount of $14 (in thousands).
Each Director has the option to receive their distribution of proceeds in one of the following methods upon one year's notice: lump sum; annual installments over a period of agreed upon years; or semi-annual installments over a period of agreed upon years. As of October 31, 2008, none of the Directors have requested distribution of proceeds.
3. Other: The Portfolio recognizes its pro-rata share, on a daily basis, of net investment income and realized and unrealized gains and losses of investment securities from the Series, which is treated as a partnership for federal income tax purposes. Dividend income and distributions to shareholders are recorded on the ex-dividend date. Distributions received on securities that represent a return of capital or capital gain are recorded as a reduction of cost of investments or as a realized gain, respectively. The Portfolio estimates the character of distributions received that may be considered return of capital distributions. Expenses directly attributable to the Portfolio are directly charged. Common expenses of the Fund are allocated using methods approved by the Board of Direc tors/Trustees, generally based on average net assets.
C. Investment Advisor:
Dimensional Fund Advisors LP ("Dimensional" or the "Advisor") provides administrative services to the Portfolio, including supervision of services provided by others, providing information to the shareholders and to the Board of Directors/Trustees, and other administrative services. The Portfolio is not charged a fee for these services. The Advisor provides investment advisory services to the Series.
Fees Paid to Officers and Directors/Trustees:
Certain Officers and Directors/Trustees of the Advisor are also Officers and Directors/Trustees of the Fund; however, such Officers and Directors/Trustees (with the exception of the Chief Compliance Officer ("CCO")) receive no compensation from the Fund. For the period December 1, 2007 to October 31, 2008, the total related amounts paid by the Fund to the CCO were $25 (in thousands). The total related amounts paid by the Portfolio are included in Other Expenses on the Statement of Operations.
D. Federal Income Taxes:
The Portfolio has qualified and intends to continue to qualify as a regulated investment company under Subchapter M of the Internal Revenue Code for federal income tax purposes and to distribute substantially all of its taxable income and net capital gains to its shareholders. Accordingly, no provision has been made for federal income taxes.
Distributions from net investment income and net realized capital gains are determined in accordance with U.S. federal income tax regulations, which may differ from those amounts determined under accounting principles generally accepted in the United States of America. These book/tax differences are either temporary or permanent in nature. To the extent these differences are permanent, they are charged or credited to paid-in capital, undistributed net investment income or accumulated net realized gains, as appropriate, in the period that the differences arise. Accordingly, the following permanent differences as of October 31, 2008, primarily attributable to reclassification of
12
distributions were classified to the following accounts. These reclassifications had no effect on net assets or net asset value per share (amounts in thousands):
Increase
(Decrease)
Paid-In Capital | | Increase (Decrease)
Undistributed
Net Investment
Income | | Increase (Decrease)
Accumulated
Net Realized
Gains/(Losses) | |
| | — | | | $ | (53 | ) | | $ | 53 | | |
The tax character of dividends and distributions declared and paid during the years ended November 30, 2006, November 30, 2007 and the period December 1, 2007 to October 31, 2008 were as follows (amounts in thousands):
| | | Net Investment
Income and
Short-Term
Capital Gains | | Long-Term
Capital Gain | | Total | |
| | 2006 | | | $ | 12,670 | | | | — | | | $ | 12,670 | | |
| | 2007 | | | | 18,012 | | | $ | 1,514 | | | | 19,526 | | |
| | 2008 | | | | 19,112 | | | | 43,757 | | | | 62,869 | | |
At October 31, 2008, the components of distributable earnings/(accumulated losses) were as follows (amounts in thousands):
Undistributed
Net Investment
Income and
Short-Term
Capital Gains | | Undistributed
Long-Term
Capital Gains | | Capital
Loss
Carryforward | | Total Net
Distributable
Earnings/
(Accumulated
Losses) | |
| $ | 3,659 | | | | — | | | $ | (36,000 | ) | | $ | (32,341 | ) | |
For federal income tax purposes, the Fund measures its capital loss carryforwards annually at October 31, its fiscal year end. Capital loss carryforwards may be carried forward and applied against future capital gains. At October 31, 2008, the Portfolio had capital loss carryforwards of $36,000 (in thousands) available to offset future realized capital gains through October 31, 2016.
At October 31, 2008, the total cost and aggregate gross unrealized appreciation and (depreciation) of securities for federal income tax purposes were different from amounts reported for financial reporting purposes (amounts in thousands):
Federal
Tax Cost | | Unrealized
Appreciation | | Unrealized
(Depreciation) | | Net
Unrealized
Appreciation
(Depreciation) | |
| $ | 742,310 | | | $ | 70,131 | | | $ | (198,709 | ) | | $ | (128,578 | ) | |
In June 2006, the Financial Accounting Standards Board (FASB) issued FASB Interpretation 48 ("FIN 48"), "Accounting for Uncertainty in Income Taxes." This standard defines the threshold for recognizing the benefits of tax-return positions in the financial statements as "more-likely-than-not" to be sustained by the taxing authority and requires measurement of a tax position meeting the more-likely-than-not criterion, based on the largest benefit that is more than 50 percent likely to be realized. Management has analyzed the Portfolio's tax positions to be taken on the federal income tax returns for all open tax years (tax years ended November 30, 2005 through the period ended October 31, 2008), for purposes of implementing FIN 48, and has concluded that no provision for income tax is required in the P ortfolio's financial statements.
13
E. Line of Credit:
The Fund, together with other Dimensional-advised portfolios, has entered into a $250 million unsecured discretionary line of credit effective June 30, 2003 with an affiliate of its domestic custodian bank. Each portfolio is permitted to borrow, subject to its investment limitations, up to a maximum of $250 million, as long as total borrowings under the line of credit do not exceed $250 million in the aggregate. Borrowings under the line of credit are charged interest at the then current Federal Funds Rate plus 1%. Each portfolio is individually, and not jointly, liable for its particular advances under the line of credit. There is no commitment fee on the unused portion of the line of credit. The agreement for the discretionary line of credit may be terminated by either party at any time. The line of credit is scheduled to expire on June 23, 2009. There were no borrowings by the Portfolio under this line of credit during the period ended Oc tober 31, 2008.
The Fund, together with other Dimensional-advised portfolios, has also entered into an additional $500 million unsecured line of credit effective January 15, 2008 with its international custodian bank. Each portfolio is permitted to borrow, subject to its investment limitations, up to a maximum of $500 million, as long as total borrowings under the line of credit do not exceed $500 million in the aggregate. Each portfolio is individually, and not jointly, liable for its particular advances under the line of credit. Borrowings under the line of credit are charged interest at rates agreed to by the parties at the time of borrowing. There is no commitment fee on the unused portion of the line of credit. The agreement of the line of credit expires on January 15, 2009. There were no borrowings by the Portfolio under this line of credit during the period ended October 31, 2008.
F. Indemnitees; Contractual Obligations:
Under the Fund's organizational documents, its officers and directors are indemnified against certain liabilities arising out of the performance of their duties to the Fund.
In the normal course of business, the Fund enters into contracts that contain a variety of representations and warranties which provide general indemnification. The Fund's maximum exposure under these arrangements is unknown as this would involve future claims that may be made against the Fund and/or its affiliates that have not yet occurred. However, based on experience, the Fund expects the risk of loss to be remote.
G. Recently Issued Accounting Standards and Interpretation:
In March 2008, Statement of Financial Accounting Standards No. 161, Disclosures about Derivative Instruments and Hedging Activities ("FAS 161"), was issued and is effective for fiscal years beginning after November 15, 2008. FAS 161 defines new disclosures of derivative instruments and hedging activities. Management is currently evaluating the implications of FAS 161. At this time, its impact on the Portfolio's financial statements has not been determined.
H. Other:
At October 31, 2008, two shareholders held approximately 92% of the outstanding shares of the Portfolio. One or more of the shareholders is an omnibus account, which typically hold shares for the benefit of several other underlying investors.
14
REPORT OF INDEPENDENT REGISTERED PUBLIC ACCOUNTING FIRM
To the Shareholders of Tax-Managed U.S. Marketwide Value Portfolio II and
Board of Directors of Dimensional Investment Group Inc.:
In our opinion, the accompanying statement of assets and liabilities, and the related statements of operations and of changes in net assets and the financial highlights present fairly, in all material respects, the financial position of Tax-Managed U.S. Marketwide Value Portfolio II (one of the portfolios constituting Dimensional Investment Group Inc., hereafter referred to as the "Portfolio") at October 31, 2008, the results of its operations, the changes in its net assets and the financial highlights for each of the periods indicated, in conformity with accounting principles generally accepted in the United States of America. These financial statements and financial highlights (hereafter referred to as "financial statements") are the responsibility of the Portfolio's management; our responsibility is to express an opinion on these financial statements based on our audits. We conducted our audits of these financial statements in accordance with the standards of the Public Company Accounting Oversight Board (United States). Those standards require that we plan and perform the audit to obtain reasonable assurance about whether the financial statements are free of material misstatement. An audit includes examining, on a test basis, evidence supporting the amounts and disclosures in the financial statements, assessing the accounting principles used and significant estimates made by management, and evaluating the overall financial statement presentation. We believe that our audits, which included confirmation of securities at October 31, 2008 by correspondence with the transfer agent of the investee fund, provide a reasonable basis for our opinion.
PricewaterhouseCoopers LLP
Philadelphia, Pennsylvania
December 22, 2008
15
THE DFA INVESTMENT TRUST COMPANY
PERFORMANCE CHART
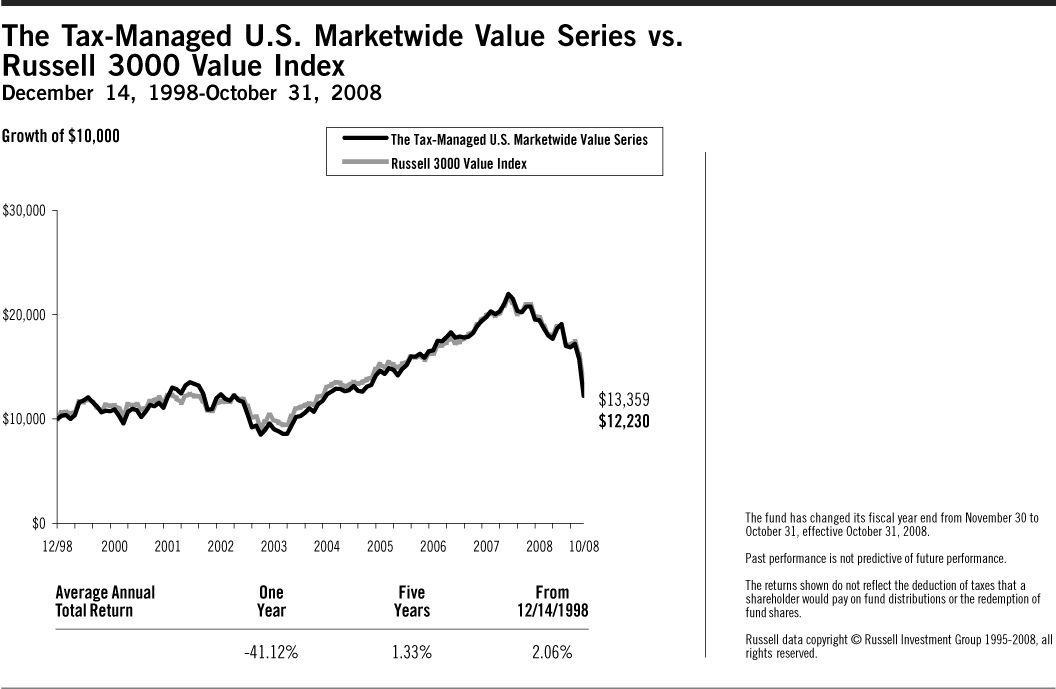
16
THE DFA INVESTMENT TRUST COMPANY
THE TAX-MANAGED U.S. MARKETWIDE VALUE SERIES
DISCLOSURE OF FUND EXPENSES
(Unaudited)
The following Expense Table is shown so that you can understand the impact of fees on your investment. All mutual funds have operating expenses. As a shareholder of the fund, you incur ongoing costs, which include costs for portfolio management, administrative services, and shareholder reports, among others. Operating expenses, legal and audit services, which are deducted from a fund's gross income, directly reduce the investment return of the fund. A fund's expenses are expressed as a percentage of its average net assets. This figure is known as the expense ratio. The following examples are intended to help you understand the ongoing costs, in dollars, of investing in the fund and to compare these costs with those of other mutual funds. The examples are based on an investment of $1,000 made at the beginning of the period shown and held for the entire period.
The Expense Table below illustrates your fund's costs in two ways.
Actual Fund Return
This section helps you to estimate the actual expenses after fee waivers that you paid over the period. The "Ending Account Value" shown is derived from the fund's actual return and "Expenses Paid During Period" reflect the dollar amount that would have been paid by an investor who started with $1,000 in the fund. You may use the information here, together with the amount you invested, to estimate the expenses that you paid over the period.
To do so, simply divide your account value by $1,000 (for example, a $7,500 account value divided by $1,000 = 7.5), then multiply the result by the number given for your fund under the heading "Expenses Paid During Period."
Hypothetical Example for Comparison Purposes
This section is intended to help you compare your fund's costs with those of other mutual funds. The hypothetical "Ending Account Value" and "Expenses Paid During Period" are derived from the fund's actual expense ratio and an assumed 5% annual return before expenses. In this case, because the return used is not the fund's actual return, the results do not apply to your investment. The example is useful in making comparisons because the SEC requires all mutual funds to calculate expenses based on a 5% annual return. You can assess your fund's cost by comparing this hypothetical example with the hypothetical examples that appear in shareholder reports of other funds.
Please note that the expenses shown in the table are meant to highlight and help you compare ongoing costs only and do not reflect any transactional costs, if applicable. The "Annualized Expense Ratio" represents the actual expenses for the six-month period indicated.
Six Months Ended October 31, 2008
EXPENSE TABLE
| | | Beginning
Account
Value
05/01/08 | | Ending
Account
Value
10/31/08 | | Annualized
Expense
Ratio* | | Expenses
Paid
During
Period* | |
| Actual Fund Return | | $ | 1,000.00 | | | $ | 654.40 | | | | 0.22 | % | | $ | 0.91 | | |
| Hypothetical 5% Annual Return | | $ | 1,000.00 | | | $ | 1,024.03 | | | | 0.22 | % | | $ | 1.12 | | |
* Expenses are equal to the fund's annualized expense ratio for the six-month period, multiplied by the average account value over the period, multiplied by the number of days in the most recent six-month period (184), then divided by the number of days in the year (366) to reflect the six-month period.
17
THE DFA INVESTMENT TRUST COMPANY
THE TAX-MANAGED U.S. MARKETWIDE VALUE SERIES
DISCLOSURE OF PORTFOLIO HOLDINGS
(Unaudited)
The SEC requires that all Funds file a complete Schedule of Investments with the SEC for their first and third fiscal quarters on Form N-Q. For The DFA Investment Trust Company, this would be for the fiscal quarters ending January 31 and July 31. The Form N-Q filing must be made within 60 days of the end of the quarter. The DFA Investment Trust Company filed its most recent Form N-Q with the SEC on October 30, 2008. It is available upon request, without charge, by calling collect: (310) 395-8005 or by mailing a request to Dimensional Fund Advisors LP, 1299 Ocean Avenue, Santa Monica, California 90401, or by visiting the SEC's website at http://www.sec.gov, or they may be reviewed and copied at the SEC's Public Reference Room in Washington, D.C. (call 1-800-732-0330 for information on the operation of the Public Reference Room).
SEC regulations permit a fund to include in its reports to shareholders a "Summary Schedule of Portfolio Holdings" in lieu of a full Schedule of Investments. The Summary Schedule of Portfolio Holdings reports the fund's 50 largest holdings in unaffiliated issuers and any investments that exceed one percent of the fund's net assets at the end of the reporting period. The amendments also require that the Summary Schedule of Portfolio Holdings identify each category of investments that are held.
The fund is required to file a complete Schedule of Investments with the SEC on Form N-CSR within ten days after mailing the annual and semi-annual reports to shareholders. It will be available upon request, without charge, by calling collect: (310) 395-8005 or by mailing a request to Dimensional Fund Advisors LP, 1299 Ocean Avenue, Santa Monica, California 90401, or by visiting the SEC's website at http://www.sec.gov, or they may be reviewed and copied at the SEC's Public Reference Room in Washington, D.C. (call 1-800-732-0330 for information on the operation of the Public Reference Room).
PORTFOLIO HOLDINGS
The SEC requires that all Funds present their categories of portfolio holdings in a table, chart or graph format in their annual and semi-annual shareholder reports, whether or not a Schedule of Investments is utilized. The following table, which presents portfolio holdings as a percent of total investments before short-term investments and collateral for loaned securities, is provided in compliance with such requirement. The categories shown below represent broad industry sectors. Each industry sector consists of one or more specific industry classifications.
Consumer
Discretionary | | Consumer
Staples | | Energy | | Financials | | Health
Care | | Industrials | | Information
Technology | | Materials | | Telecommunication
Services | | Utilities | | Total | |
| | 13.4 | % | | | 5.8 | % | | | 16.0 | % | | | 33.4 | % | | | 2.6 | % | | | 12.2 | % | | | 6.1 | % | | | 2.7 | % | | | 7.7 | % | | | 0.1 | % | | | 100.0 | % | |
18
THE TAX-MANAGED U.S. MARKETWIDE VALUE SERIES
SUMMARY SCHEDULE OF PORTFOLIO HOLDINGS
October 31, 2008
| | | Shares | | Value† | | Percentage
of Net Assets** | |
| COMMON STOCKS — (84.9%) | |
| Consumer Discretionary — (11.8%) | |
| Comcast Corp. Class A | | | 3,570,978 | | | $ | 56,278,613 | | | | 2.6 | % | |
| Comcast Corp. Special Class A Non-Voting | | | 1,432,185 | | | | 22,084,293 | | | | 1.0 | % | |
| *# Ford Motor Co. | | | 3,834,761 | | | | 8,398,127 | | | | 0.4 | % | |
| * Liberty Media Corp. - Entertainment Class A | | | 668,364 | | | | 10,760,660 | | | | 0.5 | % | |
| Time Warner, Inc. | | | 5,159,956 | | | | 52,063,956 | | | | 2.4 | % | |
| Tyco Electronics, Ltd. | | | 600,698 | | | | 11,677,569 | | | | 0.5 | % | |
| Other Securities | | | | | | | 134,359,663 | | | | 6.1 | % | |
| Total Consumer Discretionary | | | | | | | 295,622,881 | | | | 13.5 | % | |
| Consumer Staples — (5.0%) | |
| Archer-Daniels-Midland Co. | | | 457,265 | | | | 9,479,103 | | | | 0.4 | % | |
| # CVS Caremark Corp. | | | 726,214 | | | | 22,258,459 | | | | 1.0 | % | |
| Kraft Foods, Inc. | | | 1,178,778 | | | | 34,349,591 | | | | 1.6 | % | |
| Molson Coors Brewing Co. | | | 246,248 | | | | 9,199,825 | | | | 0.4 | % | |
| Other Securities | | | | | | | 50,348,462 | | | | 2.3 | % | |
| Total Consumer Staples | | | | | | | 125,635,440 | | | | 5.7 | % | |
| Energy — (13.5%) | |
| Anadarko Petroleum Corp. | | | 845,068 | | | | 29,830,900 | | | | 1.4 | % | |
| Apache Corp. | | | 403,946 | | | | 33,256,874 | | | | 1.5 | % | |
| Chesapeake Energy Corp. | | | 618,000 | | | | 13,577,460 | | | | 0.6 | % | |
| ConocoPhillips | | | 1,671,850 | | | | 86,969,637 | | | | 4.0 | % | |
| Devon Energy Corp. | | | 498,108 | | | | 40,277,013 | | | | 1.8 | % | |
| # Hess Corp. | | | 198,137 | | | | 11,929,829 | | | | 0.6 | % | |
| Marathon Oil Corp. | | | 845,923 | | | | 24,616,359 | | | | 1.1 | % | |
| Noble Energy, Inc. | | | 177,500 | | | | 9,198,050 | | | | 0.4 | % | |
| Valero Energy Corp. | | | 738,360 | | | | 15,195,449 | | | | 0.7 | % | |
| Other Securities | | | | | | | 73,801,716 | | | | 3.4 | % | |
| Total Energy | | | | | | | 338,653,287 | | | | 15.5 | % | |
| Financials — (28.3%) | |
| Allstate Corp. | | | 739,900 | | | | 19,525,961 | | | | 0.9 | % | |
| Bank of America Corp. | | | 2,475,676 | | | | 59,837,089 | | | | 2.7 | % | |
| # Capital One Financial Corp. | | | 617,854 | | | | 24,170,448 | | | | 1.1 | % | |
| Chubb Corp. | | | 390,477 | | | | 20,234,518 | | | | 0.9 | % | |
| Discover Financial Services | | | 719,953 | | | | 8,819,424 | | | | 0.4 | % | |
| # Fifth Third Bancorp | | | 1,011,926 | | | | 10,979,397 | | | | 0.5 | % | |
| Hudson City Bancorp, Inc. | | | 672,553 | | | | 12,650,722 | | | | 0.6 | % | |
| JPMorgan Chase & Co. | | | 2,667,818 | | | | 110,047,492 | | | | 5.0 | % | |
| Loews Corp. | | | 759,497 | | | | 25,222,895 | | | | 1.2 | % | |
| # M&T Bank Corp. | | | 103,167 | | | | 8,366,844 | | | | 0.4 | % | |
| MetLife, Inc. | | | 1,059,505 | | | | 35,196,756 | | | | 1.6 | % | |
| Morgan Stanley | | | 567,849 | | | | 9,920,322 | | | | 0.5 | % | |
| Prudential Financial, Inc. | | | 463,538 | | | | 13,906,140 | | | | 0.6 | % | |
| # SunTrust Banks, Inc. | | | 383,603 | | | | 15,397,824 | | | | 0.7 | % | |
| The Travelers Companies, Inc. | | | 932,958 | | | | 39,697,363 | | | | 1.8 | % | |
| Unum Group | | | 545,000 | | | | 8,583,750 | | | | 0.4 | % | |
| Other Securities | | | | | | | 286,175,383 | | | | 13.1 | % | |
| Total Financials | | | | | | | 708,732,328 | | | | 32.4 | % | |
| Health Care — (2.3%) | |
| * WellPoint, Inc. | | | 424,020 | | | | 16,481,657 | | | | 0.8 | % | |
| Other Securities | | | | | | | 40,968,859 | | | | 1.8 | % | |
| Total Health Care | | | | | | | 57,450,516 | | | | 2.6 | % | |
19
THE TAX-MANAGED U.S. MARKETWIDE VALUE SERIES
CONTINUED
| | | Shares | | Value† | | Percentage
of Net Assets** | |
| Industrials — (10.2%) | |
| Burlington Northern Santa Fe Corp. | | | 398,500 | | | $ | 35,490,410 | | | | 1.6 | % | |
| CSX Corp. | | | 607,620 | | | | 27,780,386 | | | | 1.3 | % | |
| Norfolk Southern Corp. | | | 661,000 | | | | 39,620,340 | | | | 1.8 | % | |
| Northrop Grumman Corp. | | | 435,224 | | | | 20,407,653 | | | | 0.9 | % | |
| Southwest Airlines Co. | | | 1,077,730 | | | | 12,695,659 | | | | 0.6 | % | |
| Union Pacific Corp. | | | 483,593 | | | | 32,289,505 | | | | 1.5 | % | |
| Other Securities | | | | | | | 85,606,824 | | | | 3.9 | % | |
| Total Industrials | | | | | | | 253,890,777 | | | | 11.6 | % | |
| Information Technology — (4.8%) | |
| # Hewlett-Packard Co. | | | 237,000 | | | | 9,072,360 | | | | 0.4 | % | |
| * Symantec Corp. | | | 780,999 | | | | 9,824,967 | | | | 0.4 | % | |
| Xerox Corp. | | | 1,179,032 | | | | 9,455,837 | | | | 0.4 | % | |
| Other Securities | | | | | | | 91,040,431 | | | | 4.2 | % | |
| Total Information Technology | | | | | | | 119,393,595 | | | | 5.4 | % | |
| Materials — (2.4%) | |
| International Paper Co. | | | 490,762 | | | | 8,450,922 | | | | 0.4 | % | |
| Weyerhaeuser Co. | | | 311,975 | | | | 11,923,685 | | | | 0.6 | % | |
| Other Securities | | | | | | | 38,831,263 | | | | 1.7 | % | |
| Total Materials | | | | | | | 59,205,870 | | | | 2.7 | % | |
| Other — (0.0%) | |
| Total Other | | | | | | | 1,710 | | | | 0.0 | % | |
| Telecommunication Services — (6.5%) | |
| AT&T, Inc. | | | 3,496,990 | | | | 93,614,422 | | | | 4.3 | % | |
| Sprint Nextel Corp. | | | 3,528,077 | | | | 11,042,881 | | | | 0.5 | % | |
| Verizon Communications, Inc. | | | 1,643,676 | | | | 48,767,867 | | | | 2.2 | % | |
| Other Securities | | | | | | | 10,213,254 | | | | 0.5 | % | |
| Total Telecommunication Services | | | | | | | 163,638,424 | | | | 7.5 | % | |
| Utilities — (0.1%) | |
| Total Utilities | | | | | | | 2,430,938 | | | | 0.1 | % | |
| TOTAL COMMON STOCKS | | | | | | | 2,124,655,766 | | | | 97.0 | % | |
| RIGHTS/WARRANTS — (0.0%) | |
| TOTAL RIGHTS/WARRANTS | | | | | | | 17 | | | | 0.0 | % | |
| TEMPORARY CASH INVESTMENTS — (2.0%) | |
| BlackRock Liquidity Funds Tempcash Portfolio-Institutional Shares | | | 38,403,563 | | | | 38,403,563 | | | | 1.8 | % | |
| | | Face
Amount | | | | | |
| | | (000) | | | | | |
Repurchase Agreement, PNC Capital Markets, Inc. 0.94%, 11/03/08
(Collateralized by $14,345,000 FHLMC 6.275%(r), 09/01/36,
valued at $10,738,962) to be repurchased at $10,577,829 | | $ | 10,577 | | | | 10,577,000 | | | | 0.5 | % | |
| TOTAL TEMPORARY CASH INVESTMENTS | | | | | | | 48,980,563 | | | | 2.3 | % | |
20
THE TAX-MANAGED U.S. MARKETWIDE VALUE SERIES
CONTINUED
| | | Shares | | Value† | | Percentage
of Net Assets** | |
| SECURITIES LENDING COLLATERAL — (13.1%) | |
| §@ DFA Short Term Investment Fund LP | | | 301,849,543 | | | $ | 301,849,543 | | | | 13.8 | % | |
| | | Face
Amount | | | | | |
| | | (000) | | | | | |
@ Repurchase Agreement, Deutsche Bank Securities 0.24%, 11/03/08
(Collateralized by $30,992,549 FNMA, rates ranging from 5.000% to
7.000%, maturities from 11/01/33 to 08/01/38 & U.S. Treasury STRIP 1.573%(y),
05/15/12, valued at $28,175,867) to be repurchased at $27,427,287 | | $ | 27,427 | | | | 27,426,740 | | | | 1.2 | % | |
| TOTAL SECURITIES LENDING COLLATERAL | | | | | 329,276,283 | | | | 15.0 | % | |
TOTAL INVESTMENTS — (100.0%)
(Cost $2,977,897,731) | | | | $ | 2,502,912,629 | | | | 114.3 | % | |
See accompanying Notes to Financial Statements.
21
THE DFA INVESTMENT TRUST COMPANY
THE TAX-MANAGED U.S. MARKETWIDE VALUE SERIES
STATEMENT OF ASSETS AND LIABILITIES
OCTOBER 31, 2008
(Amounts in thousands)
| ASSETS: | |
| Investments at Value (including $321,044 of securities on loan) | | $ | 2,124,656 | | |
| Temporary Cash Investments at Value & Cost | | | 48,981 | | |
| Collateral Received from Securities on Loan at Value & Cost | | | 329,276 | | |
| Receivables: | |
| Investment Securities Sold | | | 1,435 | | |
| Dividends and Interest | | | 4,286 | | |
| Fund Shares Sold | | | 13,792 | | |
| Securities Lending Income | | | 803 | | |
| Fund Margin Variation | | | 16 | | |
| Prepaid Expenses and Other Assets | | | 3 | | |
| Total Assets | | | 2,523,248 | | |
| LIABILITIES: | |
| Payables: | |
| Upon Return of Securities Loaned | | | 329,276 | | |
| Fund Shares Redeemed | | | 2,724 | | |
| Due to Advisor | | | 384 | | |
| Accrued Expenses and Other Liabilities | | | 140 | | |
| Total Liabilities | | | 332,524 | | |
| NET ASSETS | | $ | 2,190,724 | | |
| Investments at Cost | | $ | 2,599,641 | | |
See accompanying Notes to Financial Statements.
22
THE DFA INVESTMENT TRUST COMPANY
THE TAX-MANAGED U.S. MARKETWIDE VALUE SERIES
STATEMENTS OF OPERATIONS
(Amounts in thousands)
| | | Period
Dec. 1, 2007
to
Oct. 31, 2008 | | Year
Ended
Nov. 30,
2007 | |
| Investment Income | |
| Dividends | | $ | 64,864 | | | $ | 69,825 | | |
| Interest | | | 683 | | | | 1,231 | | |
| Income from Securities Lending | | | 4,753 | | | | 1,392 | | |
| Total Investment Income | | | 70,300 | | | | 72,448 | | |
| Expenses | |
| Investment Advisory Services Fees | | | 6,098 | | | | 7,949 | | |
| Accounting & Transfer Agent Fees | | | 318 | | | | 407 | | |
| Custodian Fees | | | 62 | | | | 69 | | |
| Shareholders' Reports | | | 21 | | | | 19 | | |
| Directors'/Trustees' Fees & Expenses | | | — | | | | 32 | | |
| Professional Fees | | | 61 | | | | 61 | | |
| Other | | | 36 | | | | 27 | | |
| Total Expenses | | | 6,596 | | | | 8,564 | | |
| Net Investment Income (Loss) | | | 63,704 | | | | 63,884 | | |
| Realized and Unrealized Gain (Loss) | |
| Net Realized Gain (Loss) on: | |
| Investment Securities Sold | | | (152,733 | ) | | | 197,904 | | |
| Futures | | | (2,752 | ) | | | — | | |
| Change in Unrealized Appreciation (Depreciation) of: | |
| Investment Securities | | | (1,321,745 | ) | | | (257,139 | ) | |
| Futures | | | 16 | | | | — | | |
| Net Realized and Unrealized Gain (Loss) | | | (1,477,214 | ) | | | (59,235 | ) | |
| Net Increase (Decrease) in Net Assets Resulting from Operations | | $ | (1,413,510 | ) | | $ | 4,649 | | |
See accompanying Notes to Financial Statements.
23
THE DFA INVESTMENT TRUST COMPANY
THE TAX-MANAGED U.S. MARKETWIDE VALUE SERIES
STATEMENTS OF CHANGES IN NET ASSETS
(Amounts in thousands)
| | | Period
Dec. 1, 2007
to
Oct. 31, 2008 | | Year
Ended
Nov. 30,
2007 | | Year
Ended
Nov. 30,
2006 | |
| Increase (Decrease) in Net Assets | |
| Operations: | |
| Net Investment Income (Loss) | | $ | 63,704 | | | $ | 63,884 | | | $ | 48,576 | | |
| Net Realized Gain (Loss) on: | |
| Investment Securities Sold | | | (152,733 | ) | | | 197,904 | | | | 76,342 | | |
| Futures | | | (2,752 | ) | | | — | | | | — | | |
| Change in Unrealized Appreciation (Depreciation) of: | |
| Investment Securities | | | (1,321,745 | ) | | | (257,139 | ) | | | 364,679 | | |
| Futures | | | 16 | | | | — | | | | — | | |
Net Increase (Decrease) in Net Assets Resulting
from Operations | | | (1,413,510 | ) | | | 4,649 | | | | 489,597 | | |
| Transactions in Interest: | |
| Contributions | | | 457,034 | | | | 478,784 | | | | 604,686 | | |
| Withdrawals | | | (711,380 | ) | | | (146,412 | ) | | | (49,111 | ) | |
| Net Increase (Decrease) from Transactions in Interest | | | (254,346 | ) | | | 332,372 | | | | 555,575 | | |
| Total Increase (Decrease) in Net Assets | | | (1,667,856 | ) | | | 337,021 | | | | 1,045,172 | | |
| Net Assets | |
| Beginning of Period | | | 3,858,580 | | | | 3,521,559 | | | | 2,476,387 | | |
| End of Period | | $ | 2,190,724 | | | $ | 3,858,580 | | | $ | 3,521,559 | | |
See accompanying Notes to Financial Statements.
24
THE DFA INVESTMENT TRUST COMPANY
THE TAX-MANAGED U.S. MARKETWIDE VALUE SERIES
FINANCIAL HIGHLIGHTS
| | | Period
Dec. 1, 2007
to
Oct. 31, 2008 | | Year
Ended
Nov. 30,
2007 | | Year
Ended
Nov. 30,
2006 | | Year
Ended
Nov. 30,
2005 | | Year
Ended
Nov. 30,
2004 | | Year
Ended
Nov. 30,
2003 | |
| Total Return | | | (37.44 | )%(C) | | | 0.67 | % | | | 17.70 | % | | | 16.44 | % | | | 20.49 | % | | | 22.88 | % | |
Net Assets, End of Period
(thousands) | | $ | 2,190,724 | | | $ | 3,858,580 | | | $ | 3,521,559 | | | $ | 2,476,387 | | | $ | 1,702,613 | | | $ | 1,085,233 | | |
Ratio of Expenses to
Average Net Assets | | | 0.22 | %(B) | | | 0.22 | % | | | 0.22 | % | | | 0.24 | % | | | 0.25 | % | | | 0.25 | % | |
Ratio of Net Investment
Income to Average
Net Assets | | | 2.09 | %(B) | | | 1.61 | % | | | 1.63 | % | | | 1.52 | % | | | 1.14 | % | | | 0.61 | % | |
| Portfolio Turnover Rate | | | 40 | %(C) | | | 21 | % | | | 21 | % | | | 12 | % | | | 5 | % | | | 6 | % | |
See page 1 for the Definitions of Abbreviations and Footnotes.
See accompanying Notes to Financial Statements.
25
THE DFA INVESTMENT TRUST COMPANY
THE TAX-MANAGED U.S. MARKETWIDE VALUE SERIES
NOTES TO FINANCIAL STATEMENTS
A. Organization:
The DFA Investment Trust Company (the "Trust") is an open-end management investment company registered under the Investment Company Act of 1940. The Trust consists of eighteen series, of which The Tax-Managed U.S. Marketwide Value Series (the "Series") is presented in this report.
At a regular meeting of the Board of Directors/Trustees (the "Board") on September 16, 2008, the Board voted to change the fiscal and tax year ends of the Series from November 30 to October 31.
B. Significant Accounting Policies:
The following significant accounting policies are in conformity with accounting principles generally accepted in the United States of America. Such policies are consistently followed by the Trust in preparation of its financial statements. The preparation of financial statements in accordance with accounting principles generally accepted in the United States of America requires management to make estimates and assumptions that affect the reported amounts of assets and liabilities and disclosure of contingent assets and liabilities at the date of the financial statements and the reported amounts of increases and decreases in net assets from operations during the reporting period. Actual results could differ from those estimates and those differences could be material.
1. Security Valuation: Securities held by the Series (including over-the-counter securities) are valued at the last quoted sale price of the day. Securities held by the Series that are listed on Nasdaq are valued at the Nasdaq Official Closing Price ("NOCP"). If there is no last reported sale price or NOCP for the day, the Series values the securities at the mean of the most recent quoted bid and asked prices. Price information on listed securities is taken from the exchange where the security is primarily traded. Generally, securities issued by open-end investment companies are valued using their respective net asset values or public offering prices, as appropriate, for purchase orders placed at the close of the New York Stock Exchange (NYSE).
Securities for which no market quotations are readily available (including restricted securities), or for which market quotations have become unreliable, are valued in good faith at fair value in accordance with procedures adopted by the Board of Directors/Trustees. Fair value pricing may also be used if events that have a significant effect on the value of an investment (as determined in the discretion of the Investment Committee of the Advisor) occur before the net asset value is calculated. When fair value pricing is used, the prices of securities used by the Series may differ from the quoted or published prices for the same securities on their primary markets or exchanges.
Futures contracts held by the Series are valued using the settlement price established each day on the exchange on which they are traded.
Adoption of Statement of Financial Accounting Standards No. 157 "Fair Value Measurements" ("FAS 157")
In September 2006, the Financial Accounting Standards Board issued FAS 157 effective for fiscal years beginning after November 15, 2007. This standard clarifies the definition of fair value for financial reporting, establishes a framework for measuring fair value and requires additional disclosures about the use of fair value measurements. The Funds have adopted FAS 157 as of December 1, 2007. The three levels of the fair value hierarchy under FAS 157 are described below:
• Level 1 – quoted prices in active markets for identical securities
• Level 2 – other significant observable inputs (including quoted prices for similar securities, interest rates, prepayment speeds, credit risk, etc.)
• Level 3 – significant unobservable inputs (including the Series' own assumptions in determining the fair value of investments)
26
The inputs or methodology used for valuing securities are not necessarily an indication of the risk associated with investing in those securities. A summary of the inputs used to value the Series' net assets as of October 31, 2008 is listed below (in thousands).
| | | Valuation Inputs | |
| | | Investments in
Securities
(Market Value) | | Other Financial
Instruments
(Unrealized
Appreciation/
Depreciation)* | |
| | | Level 1 | | Level 2 | | Level 3 | | Total | | Level 1 | | Level 2 | | Level 3 | | Total | |
The Tax-Managed U.S. Marketwide
Value Series | | $ | 2,163,005 | | | $ | 339,908 | | | | — | | | $ | 2,502,913 | | | $ | 16 | | | | — | | | | — | | | $ | 16 | | |
* Other financial instruments are derivative instruments not reflected in the Schedule of Investments, such as futures, forwards and swaps which are valued at the unrealized appreciation/depreciation on the investment.
2. Deferred Compensation Plan: Each eligible Trustee of the Trust may elect participation in the Deferred Compensation Plan (the "Plan"). Under the Plan, effective January 1, 2002, such Trustees may defer payment of all or a portion of their total fees earned as a Trustee. These deferred amounts may be treated as though such amounts had been invested in shares of the following funds: U.S. Large Cap Value Portfolio; U.S. Core Equity 1 Portfolio; U.S. Core Equity 2 Portfolio; U.S. Vector Equity Portfolio; U.S. Micro Cap Portfolio; DFA International Value Portfolio; International Core Equity Portfolio; Emerging Markets Portfolio; Emerging Markets Core Equity Portfolio; and/or DFA Two-Year Global Fixed Income Portfolio. Contributions made under the Plan and the change in unrealize d appreciation (depreciation) and income, are included in Other Expenses for the period ended October 31, 2008 and are included in Directors'/Trustees' Fees & Expenses for the year ended November 30, 2007. At October 31, 2008, the total liability for deferred compensation to Trustees is included in Accrued Expenses and Other Liabilities in the amount of $49 (in thousands).
Each Trustee has the option to receive their distribution of proceeds in one of the following methods upon one year's notice: lump sum; annual installments over a period of agreed upon years; or semi-annual installments over a period of agreed upon years. As of October 31, 2008, none of the Trustees have requested distribution of proceeds.
3. Other: Security transactions are accounted for as of the trade date. Costs used in determining realized gains and losses on the sale of investment securities are on the basis of identified cost sold. Dividend income and distributions to shareholders are recorded on the ex-dividend date. Distributions received on securities that represent a return of capital or capital gain are recorded as a reduction of cost of investments or as a realized gain, respectively. The Series estimates the character of distributions received that may be considered return of capital distributions. Interest income is recorded on the accrual basis. Discount and premium on securities purchased are amortized over the lives of the respective securities utilizing the effective interest method. Expenses direc tly attributable to a Series are directly charged. Common expenses of the Trust are allocated using methods approved by the Board of Directors/Trustees, generally based on average net assets.
C. Investment Advisor:
Dimensional Fund Advisors LP ("Dimensional" or the "Advisor") provides investment advisory services to the Series. For the period ended October 31, 2008, the Series' investment advisory services fees were accrued daily and paid monthly to the Advisor based on an effective annual rate of 0.20% of average daily net assets.
Fees Paid to Officers and Directors/Trustees:
Certain Officers and Directors/Trustees of the Advisor are also Officers and Directors/Trustees of the Trust; however, such Officers and Directors/Trustees (with the exception of the Chief Compliance Officer ("CCO")) receive no compensation from the Trust. For the six months ended October 31, 2008, the total related amounts paid by the Trust to the CCO were $106 (in thousands). The total related amounts paid by the Series are included in Other Expenses on the Statement of Operations.
27
D. Purchases and Sales of Securities:
For the period ended October 31, 2008, the Series made the following purchases and sales of investment securities, other than short-term securities and U.S. government securities (amounts in thousands):
| Purchases | | $ | 1,315,564 | | |
| Sales | | | 1,500,370 | | |
There were no purchases or sales of long-term U.S. government securities.
E. Federal Income Tax:
No provision for federal income taxes is required since the Series is treated as a partnership for federal income tax purposes. Any net investment income and net realized and unrealized gains and losses have been deemed to have been "passed through" to its partners.
At October 31, 2008, the total cost and aggregate gross unrealized appreciation and (depreciation) of securities for federal income tax purposes were different from amounts reported for financial reporting purposes (amounts in thousands):
Federal
Tax Cost | | Unrealized
Appreciation | | Unrealized
(Depreciation) | | Net
Unrealized
Appreciation
(Depreciation) | |
| $ | 2,979,112 | | | $ | 243,751 | | | $ | (719,950 | ) | | $ | (476,199 | ) | |
In June 2006, the Financial Accounting Standards Board (FASB) issued FASB Interpretation 48 ("FIN 48"), "Accounting for Uncertainty in Income Taxes." This standard defines the threshold for recognizing the benefits of tax-return positions in the financial statements as "more-likely-than-not" to be sustained by the taxing authority and requires measurement of a tax position meeting the more-likely-than-not criterion, based on the largest benefit that is more than 50 percent likely to be realized. Management has analyzed the Series' tax positions to be taken on the federal income tax returns for all open tax years (tax years ended November 30, 2005 through the period ended October 31, 2008), for purposes of implementing FIN 48, and has concluded that no provision for income tax is required in the Series' financial statements.
F. Financial Instruments:
In accordance with the Series investment objective and policies, the Series may invest in certain financial instruments that have off-balance sheet risk in excess of the amounts recognized in the financial statements and concentrations of credit and market risk. These instruments and their significant corresponding risks are described below:
1. Repurchase Agreements: The Series may purchase money market instruments subject to the counterparty's agreement to repurchase them at an agreed upon date and price. The counterparty will be required on a daily basis to maintain the value of the collateral subject to the agreement at not less than the repurchase price (including accrued interest). The agreements are conditioned upon the collateral being deposited under the Federal Reserve book-entry system or with the Trust's custodian or a third party sub-custodian. In the event of default or bankruptcy by the other party to the agreement, retention of the collateral may be subject to legal proceedings. All open repurchase agreements were entered into on October 31, 2008.
2. Futures Contracts: During the period ended October 31, 2008, the Series entered into futures contracts in accordance with its investment objectives. Upon entering into a futures contract, the Series deposits cash or pledges U.S. Government securities to a broker, equal to the minimum "initial margin" requirements of the exchange on which the contract is traded. Subsequent payments are received from or paid to the broker each day, based on the daily fluctuation in the market value of the contract. These receipts or payments are known as "variation margin" and are recorded daily by the Series as unrealized gains or losses until the contracts are closed. When the contracts
28
are closed, the Series records a realized gain or loss equal to the difference between the value of the contract at the time it was opened and the value at the time it was closed.
At October 31, 2008, the Series had outstanding 130 long futures contracts of the S&P 500 Index®, all of which expire on December 19, 2008. The value of such contracts on October 31, 2008 was $31,437 (in thousands), which resulted in an unrealized gain of $16 (in thousands). Approximately $3,218 (in thousands) of cash has been segregated as collateral for the open futures contracts and has been accounted for as cash on the Statement of Assets and Liabilities.
Risks may arise upon entering into futures contracts from potential imperfect price correlations between the futures contracts and the underlying securities, from the possibility of an illiquid secondary market for these instruments and from the possibility that the Series could lose more than the initial margin requirements.
G. Line of Credit:
The Trust, together with other Dimensional-advised portfolios, has entered into a $250 million unsecured discretionary line of credit effective June 30, 2003 with an affiliate of its domestic custodian bank. Each portfolio is permitted to borrow, subject to its investment limitations, up to a maximum of $250 million, as long as total borrowings under the line of credit do not exceed $250 million in the aggregate. Borrowings under the line of credit are charged interest at the then current Federal Funds Rate plus 1%. Each portfolio is individually, and not jointly, liable for its particular advances under the line of credit. There is no commitment fee on the unused portion of the line of credit. The agreement for the discretionary line of credit may be terminated by either party at any time. The line of credit is scheduled to expire on June 23, 2009.
For the period ended October 31, 2008, borrowings by the Series under this line of credit were as follows (amounts in thousands, except percentages and days):
Weighted
Average
Interest Rate | | Weighted
Average
Loan Balance | | Number of
Days
Outstanding | | Interest
Expense
Incurred | | Maximum Amount
Borrowed During
the Period | |
| | 3.42 | % | | $ | 11,534 | | | | 26 | | | $ | 29 | | | $ | 36,949 | | |
There were no outstanding borrowings by the Series under this line of credit at October 31, 2008.
The Trust, together with other Dimensional-advised portfolios, has also entered into an additional $500 million unsecured line of credit effective January 15, 2008 with its international custodian bank. Each portfolio is permitted to borrow, subject to its investment limitations, up to a maximum of $500 million, as long as total borrowings under the line of credit do not exceed $500 million in the aggregate. Each portfolio is individually, and not jointly, liable for its particular advances under the line of credit. Borrowings under the line of credit are charged interest at rates agreed to by the parties at the time of borrowing. There is no commitment fee on the unused portion of the line of credit. The agreement of the line of credit expires on January 15, 2009. There were no borrowings by the Series under this line of credit during the period ended October 31, 2008.
H. Securities Lending:
As of October 31, 2008, the Series had securities on loan to brokers/dealers, for which the Series held cash collateral. The Series invests the cash collateral, as described below, and records a liability for the return of the collateral, during the period the securities are on loan. Loans of securities are expected at all times to be secured by collateral equal to at least (i) 100% of the current market value of the loaned securities with respect to securities of the U.S. government or its agencies, (ii) 102% of the current market value of the loaned securities with respect to U.S. securities, and (iii) 105% of the current market value of the loaned securities with respect to foreign securities. However, daily market fluctuations could cause the Series' collateral to be lower or higher than the expected thresholds. If this were to occur, the collateral would be adjusted the next business day to ensure adequate collateralization. In the even t of default or bankruptcy by the other party to the agreement, realization and/or retention of the collateral may be subject to legal proceedings. If the borrower fails to return loaned securities, and cash collateral being maintained by the borrower is insufficient to cover the value of loaned securities and provided
29
such collateral insufficiency is not the result of investment losses, the lending agent has agreed to pay the amount of the shortfall to the Series or, at the option of the lending agent, to replace the securities.
Subject to the Series' investment policy, the cash collateral received by the Series from securities on loan is invested in securities of the U.S. government or its agencies, repurchase agreements collateralized by securities of the U.S. government or its agencies or shares of the DFA Short Term Investment Fund LP. Agencies include both agency debentures and agency mortgage backed securities. In addition, the Series will be able to terminate the loan at any time and will receive reasonable interest on the loan, as well as amounts equal to any dividends, interest or other distributions on the loaned securities. However, dividend income received from loaned securities may not be eligible to be taxed at qualified dividend income rates.
I. Indemnitees; Contractual Obligations:
Under the Trust's organizational documents, its officers and trustees are indemnified against certain liabilities arising out of the performance of their duties to the Trust.
In the normal course of business, the Trust enters into contracts that contain a variety of representations and warranties which provide general indemnification. The Trust's maximum exposure under these arrangements is unknown as this would involve future claims that may be made against the Trust and/or its affiliates that have not yet occurred. However, based on experience, the Trust expects the risk of loss to be remote.
J. Recently Issued Accounting Standards and Interpretation:
In March 2008, Statement of Financial Accounting Standards No. 161, Disclosures about Derivative Instruments and Hedging Activities ("FAS 161"), was issued and is effective for fiscal years beginning after November 15, 2008. FAS 161 defines new disclosures of derivative instruments and hedging activities. Management is currently evaluating the implications of FAS 161. At this time, its impact on the Series' financial statements has not been determined.
30
REPORT OF INDEPENDENT REGISTERED PUBLIC ACCOUNTING FIRM
To the Shareholders of The Tax-Managed U.S. Marketwide Value Series and
Board of Trustees of The DFA Investment Trust Company:
In our opinion, the accompanying statements of assets and liabilities, including the summary schedules of portfolio holdings, and the related statements of operations and of changes in net assets and the financial highlights presents fairly, in all material respects, the financial position of The Tax-Managed U.S. Marketwide Value Series (one of the portfolios constituting The DFA Investment Trust Company, hereafter referred to as the "Series") at October 31, 2008, the results of its operations, the changes in its net assets and the financial highlights for each of the periods indicated, in conformity with accounting principles generally accepted in the United States of America. These financial statements and financial highlights (hereafter referred to as "financial statements") are the responsibility of the Series' management; our responsibility is to express an opinion on these financial statements based on our audits. We conducted our audi ts of these financial statements in accordance with the standards of the Public Company Accounting Oversight Board (United States). Those standards require that we plan and perform the audit to obtain reasonable assurance about whether the financial statements are free of material misstatement. An audit includes examining, on a test basis, evidence supporting the amounts and disclosures in the financial statements, assessing the accounting principles used and significant estimates made by management, and evaluating the overall financial statement presentation. We believe that our audits, which included confirmation of securities at October 31, 2008 by correspondence with the custodian and brokers, provide a reasonable basis for our opinion.
PricewaterhouseCoopers LLP
Philadelphia, Pennsylvania
December 22, 2008
31
FUND MANAGEMENT
Trustees/Directors
Each Board of Trustees/Directors of The DFA Investment Trust Company Inc. ("DFAITC"), DFA Investment Dimensions Group Inc. ("DFAIDG"), Dimensional Investment Group Inc. ("DIG") and Dimensional Emerging Markets Value Fund Inc. ("DEM") (each, the "Fund" and collectively, the "Funds") is responsible for establishing the Funds' policies and for overseeing the management of the Funds. The Trustees/Directors of the Funds, including all of the disinterested Directors, have adopted written procedures to monitor potential conflicts of interest that might develop between portfolios of the Funds (the "Feeder Portfolios") that invest in certain series of DFAITC or DEM (the "Master Funds").
Each Board has two standing committees, an Audit Committee and a Portfolio Performance and Service Review Committee (the "Performance Committee"). The Audit Committee is comprised of George M. Constantinides, Roger G. Ibbotson and Abbie J. Smith. Each member of the Audit Committee is a disinterested Director. The Audit Committee oversees the Fund's accounting and financial reporting policies and practices, the Fund's internal controls, the Fund's financial statements and the independent audits thereof and performs other oversight functions as requested by the Board. The Audit Committee recommends the appointment of each Fund's independent registered certified public accounting firm and also acts as a liaison between the Fund's independent registered certified public accounting firm and the full Board. There were three Audit Committee meetings held during the fiscal year ended October 31, 2008.
Each Board's Performance Committee is comprised of Messrs. Constantinides and Ibbotson, Ms. Smith, John P. Gould, Myron S. Scholes and Robert C. Merton. Each member of the Fund's Performance Committee is a disinterested Director. The Performance Committee regularly reviews and monitors the investment performance of the Fund's series and reviews the performance of the Fund's service providers. There were five Performance Committee meetings held during the fiscal year ended October 31, 2008.
Certain biographical information for each disinterested Trustee/Director and each interested Trustee/Director of the Funds is set forth in the tables below, including a description of each Trustee/Director's experience as a Trustee/Director of the Funds and as a director or trustee of other funds, as well as other recent professional experience.
The statements of additional information (together, "SAI") of the Funds include additional information about each Trustee/Director. You may obtain copies of the SAI and prospectus of each Fund advised by Dimensional Fund Advisors LP by calling collect (310) 395-8005 or by mailing a request to Dimensional Fund Advisors LP, 1299 Ocean Avenue, Santa Monica, California 90401. Prospectuses are also available at www.dimensional.com.
Name, Position
with the Fund,
Address and Age | | Term of Office1 and
Length of Service | | Portfolios within the
DFA Fund Complex2
Overseen | | Principal Occupation(s) During Past 5 Years and
Other Directorships of Public Companies Held | |
| | | Disinterested Trustees/Directors | |
|
George M. Constantinides
Director of DFAIDG, DIG and DEM.
Trustee of DFAITC.
The University of Chicago Booth School of Business
5807 S. Woodlawn Avenue Chicago, IL 60637
Age: 61 | | DFAITC - since 1993
DFAIDG - since 1983
DIG - since 1993
DEM - since 1993 | | 96 portfolios in 4 investment companies | | Leo Melamed Professor of Finance, The University of Chicago Booth School of Business. | |
|
32
Name, Position
with the Fund,
Address and Age | | Term of Office1 and
Length of Service | | Portfolios within the
DFA Fund Complex2
Overseen | | Principal Occupation(s) During Past 5 Years and
Other Directorships of Public Companies Held | |
John P. Gould
Director of DFAIDG, DIG and DEM.
Trustee of DFAITC.
The University of Chicago Booth School of Business
5807 S. Woodlawn Avenue
Chicago, IL 60637
Age: 69 | | DFAITC - since 1993
DFAIDG - since 1986
DIG - since 1993
DEM - since 1993 | | 96 portfolios in 4 investment companies | | Steven G. Rothmeier Distinguished Service Professor of Economics, The University of Chicago Booth School of Business (since 1965). Member of the Boards of Milwaukee Mutual Insurance Company (since 1997) and UNext.com (1999-2006). Member Competitive Markets Advisory Committee, Chicago Mercantile Exchange (futures trading exchange) (since 2004). Formerly, Senior Vice-President, Lexecon Inc. (economics, law, strategy and finance consulting) (1994-2004). Formerly, President, Cardean University (division of UNext.com) (1999-2001). Trustee, Harbor Fund (registered investment company) (14 Portfolios) (since 1994). | |
|
Roger G. Ibbotson
Director of DFAIDG, DIG and DEM.
Trustee of DFAITC.
Yale School of Management
P.O. Box 208200
New Haven, CT 06520-8200
Age: 65 | | DFAITC - since 1993
DFAIDG - since 1981
DIG - since 1993
DEM - since 1993 | | 96 portfolios in 4 investment companies | | Professor in Practice of Finance, Yale School of Management (since 1984). Director, BIRR Portfolio Analysis, Inc. (software products) (since 1990). Chairman, CIO and Partner, Zebra Capital Management, LLC (hedge fund manager) (since 2001).
Consultant to Morningstar, Inc. (since 2006). Formerly, Chairman, Ibbotson Associates, Inc., Chicago, IL (software data publishing and consulting) (1977-2006). | |
|
Robert C. Merton
Director of DFAIDG, DIG and DEM.
Trustee of DFAITC.
Harvard Business School
353 Baker Library
Soldiers Field
Boston, MA 02163
Age: 64 | | DFAITC - since 2003
DFAIDG - since 2003
DIG - since 2003
DEM - since 2003 | | 96 portfolios in 4 investment companies | | John and Natty McArthur University Professor, Graduate School of Business Administration, Harvard University (since 1998). George Fisher Baker Professor of Business Administration, Graduate School of Business Administration, Harvard University (1988-1998), Co-founder, Chief Science Officer and Director, Trinsum Group, a successor to Integrated Finance Limited (since 2002). Director, MF Risk, Inc. (risk management software) (since 2001). Director, Peninsula Banking Group (bank) (since 2003). Director, Community First Financial Group (bank holding company) (since 2003). Advisory Board Member, Alpha Simplex Group (hedge fund) (since 2001). Member Competitive Markets Advisory Council, Chicago Mercantile Exchange (futures trading exchange) (since 2004). Formerly, Advisory Board Member, NuServe (insurance software) (2001-2003). Director, Vical Incorporated (biopharmaceutical product development) (since 2002). | |
|
Myron S. Scholes
Director of DFAIDG, DIG and DEM.
Trustee of DFAITC.
Platinum Grove Asset Management, L.P.
Reckson Executive Park
1100 King Street
Building 4
Rye Brook, NY 10573
Age: 67 | | DFAITC - since 1993
DFAIDG - since 1981
DIG - since 1993
DEM - since 1993 | | 96 portfolios in 4 investment companies | | Frank E. Buck Professor Emeritus of Finance, Stanford University (since 1981). Chairman, Platinum Grove Asset Management, L.P. (hedge fund) (formerly, Oak Hill Platinum Partners) (since 1999). Formerly, Managing Partner, Oak Hill Capital Management (private equity firm) (until 2004). Chairman, Oak Hill Platinum Partners (hedge fund) (since 2004). Director, Chicago Mercantile Exchange (since 2001). Director, American Century Fund Complex (registered investment companies) (37 Portfolios) (since 1981); and Director, Chicago Mercantile Exchange Holdings Inc. (since 2000). | |
|
Abbie J. Smith
Director of DFAIDG, DIG and DEM.
Trustee of DFAITC.
The University of Chicago Booth School of Business
5807 S. Woodlawn Avenue
Chicago, IL 60637
Age: 55 | | DFAITC - since 2000
DFAIDG - since 2000
DIG - since 2000
DEM - since 2000 | | 96 portfolios in 4 investment companies | | Boris and Irene Stern Professor of Accounting, The University of Chicago Booth School of Business (since 1980), Formerly, Marvin Bower Fellow, Harvard Business School (9/01 to 8/02). Director, HNI Corporation (formerly known as HON Industries Inc.) (office furniture) (since 2000) and Director, Ryder System Inc. (transportation, logistics and supply-chain management) (since 2003). | |
|
33
Name, Position
with the Fund,
Address and Age | | Term of Office1 and
Length of Service | | Portfolios within the
DFA Fund Complex2
Overseen | | Principal Occupation(s) During Past 5 Years and
Other Directorships of Public Companies Held | |
| | | Interested Trustees/Directors* | |
|
David G. Booth
Chairman, Director, Chief Executive Officer and President of DFAIDG, DIG and DEM. Chairman, Trustee, Chief Executive Officer, Chief Investment Officer and President of DFAITC.
1299 Ocean Avenue
Santa Monica, CA 90401
Age: 61 | | DFAITC - since 1993
DFAIDG - since 1981
DIG - since 1992
DEM - since 1993 | | 96 portfolios in 4 investment companies | | Chairman, Director/Trustee, President, Chief Executive Officer and formerly Chief Investment Officer of the following companies: Dimensional Holdings Inc., Dimensional Fund Advisors LP, DFA Securities Inc., Dimensional Fund Advisors Canada Inc., DFAIDG, DIG, DEM and DFAITC. Director of Dimensional Fund Advisors Ltd, and formerly Chief Investment Officer. Director, President and formerly Chief Investment Officer of DFA Australia Ltd. Director of Dimensional Funds PLC and Dimensional Fund II PLC. Director, Chief Executive Officer and formerly Chief Investment Officer of Dimensional Fund Advisors Canada Inc. (All Chief Investment Officer positions held starting 1/03 through 3/07 except for Dimensional Fund Advisors Canada Inc., which was from 6/03 through 3/07, and Dimensional Holdings Inc., which was from 10/06 through 3/07.)
Limited Partner, Oak Hill Partners, Director, T he University of Chicago Booth School of Business. Formerly, Director, SA Funds (registered investment company). Formerly Director, Assante Corporation (investment management) (until 2002). | |
|
Rex A. Sinquefield
The Show Me Institute
7777 Bonhomme Ave.,
Suite 2150 St. Louis, MO 63105
Age: 64 | | DFAITC - since 1993
DFAIDG - since 1981
DIG - since 1992
DEM - since 1993 | | 96 portfolios in 4 investment companies | | Director/Trustee (and prior to 2006 Chairman, and prior to 2003, Chief Investment Officer) of Dimensional Fund Advisors LP, DFA Securities Inc., DFAIDG, DIG, DEM and DFAITC. Director of Dimensional Holdings Inc. Prior to 2006, Director of Dimensional Fund Advisors Ltd, Director (and prior to 1/1/2003, Chief Investment Officer) of DFA Australia Ltd. Director of Dimensional Funds PLC and Dimensional Fund Advisors Canada Inc.
Trustee, St. Louis University (since 2003). Life Trustee and Member of Investment Committee, DePaul University. Director, The German St. Vincent Orphan Home. Member of Investment Committee, Archdiocese of St. Louis. Trustee and Member of Investment Committee, St. Louis Art Institute (since 2005). President and Director, The Show Me Institute (since 2006). Trustee, St. Louis Symphony Orchestra (since 2005). Trustee, Missouri Botanical Garden (since 2005 ). | |
|
1 Each Trustee/Director holds office for an indefinite term until his or her successor is elected and qualified.
2 Each Trustee/Director is a director or trustee of each of the four registered investment companies within the DFA Fund Complex, which includes the Funds.
* Interested Directors are described as such because they are deemed to be "interested persons," as that term is defined under the Investment Company Act of 1940, as amended, due to their positions with Dimensional Fund Advisors LP.
34
Officers
The name, age, information regarding positions with the Funds and the principal occupation for each officer of the Funds are set forth below. Each officer listed below holds the same office (except as otherwise noted) in the following entities: Dimensional Fund Advisors LP (prior to November 3, 2006, Dimensional Fund Advisors Inc.) ("Dimensional"), DFA Securities Inc., DFAIDG, DIG, DFAITC and DEM (collectively, the "DFA Entities"). The address of each officer is: Dimensional Fund Advisors LP, 1299 Ocean Avenue, Santa Monica, California 90401, unless otherwise indicated.
Name, Position with the Fund
and Age | | Term of Office1
and Length of
Service | | Principal Occupation(s) During Past 5 Years | |
| | | Officers | |
|
April A. Aandal
Vice President
Age: 35 | | Since 2008 | | Vice President of all the DFA Entities. | |
|
Darryl D. Avery
Vice President
Age: 42 | | Since 2005 | | Vice President of all the DFA Entities. From June 2002 to January 2005, institutional client service representative of Dimensional. | |
|
Arthur H. Barlow
Vice President
Age: 52 | | Since 1993 | | Vice President of all the DFA Entities. Formerly, Vice President of DFA Australia Limited and Dimensional Fund Advisors Ltd. | |
|
Scott A. Bosworth
Vice President
Age: 39 | | Since 2007 | | Vice President of all the DFA Entities. Regional Director of Dimensional (since November 1997). | |
|
Valerie A. Brown
Vice President and Assistant Secretary
Age: 41 | | Since 2001 | | Vice President and Assistant Secretary of all the DFA Entities, DFA Australia Limited, Dimensional Fund Advisors Ltd., and since June 2003, Dimensional Fund Advisors Canada Inc. | |
|
David P. Butler
Vice President
Age: 44 | | Since 2007 | | Vice President of all the DFA Entities. Director of US Financial Services of Dimensional (since January 2005). Formerly, Regional Director of Dimensional Fund Advisors LP (January 1995 to January 2005). | |
|
Patrick Carter
Vice President
Age: 46 | | Since 2007 | | Vice President of all the DFA Entities. Regional Director of Dimensional (since March 2006). Formerly, Director of Merrill Lynch Retirement Group (December 1998 to March 2006). | |
|
Stephen A. Clark
Vice President
Age: 36 | | Since 2004 | | Vice President of all the DFA Entities, April 2001 to April 2004, Portfolio Manager of Dimensional. | |
|
Robert P. Cornell
Vice President
Age: 59 | | Since 2007 | | Vice President of all the DFA Entities. Regional Director of Financial Services Group of Dimensional (since August 1993). | |
|
Christopher S. Crossan
Vice President and Chief Compliance Officer
Age: 42 | | Since 2004 | | Vice President and Chief Compliance Officer of all the DFA Entities. Formerly, Senior Compliance Officer, INVESCO Institutional, Inc. and its affiliates (August 2000 to January 2004). | |
|
James L. Davis
Vice President
Age: 51 | | Since 1999 | | Vice President of all the DFA Entities. Formerly, Vice President of DFA Australia Limited and Dimensional Fund Advisors Ltd. | |
|
Robert T. Deere
Vice President
Age: 51 | | Since 1994 | | Vice President of all the DFA Entities and DFA Australia Limited. | |
|
Robert W. Dintzner
Vice President
Age: 38 | | Since 2001 | | Vice President of all the DFA Entities. Prior to April 2001, marketing supervisor and marketing coordinator for Dimensional. | |
|
35
Name, Position with the Fund
and Age | | Term of Office1
and Length of
Service | | Principal Occupation(s) During Past 5 Years | |
Kenneth Elmgren
Vice President
Age: 54 | | Since 2007 | | Vice President of all the DFA Entities. Formerly, Managing Principal of Beverly Capital (May 2004 to September 2006); Principal of Wydown Capital (September 2001 to May 2004). | |
|
Richard A. Eustice
Vice President and Assistant Secretary
Age: 43 | | Since 1998 | | Vice President and Assistant Secretary of all the DFA Entities and DFA Australia Limited. Formerly, Vice President of Dimensional Fund Advisors Ltd. | |
|
Eugene F. Fama, Jr.
Vice President
Age: 47 | | Since 1993 | | Vice President of all the DFA Entities. Formerly, Vice President of DFA Australia Limited and Dimensional Fund Advisors Ltd. | |
|
Gretchen A. Flicker
Vice President
Age: 37 | | Since 2004 | | Vice President of all the DFA Entities. Prior to April 2004, institutional client service representative of Dimensional. | |
|
Jed S. Fogdall
Vice President
Age: 34 | | Since 2008 | | Vice President of all the DFA Entities. Portfolio Manager for Dimensional (since September 2004). Prior to September 2004, Staff Engineer at the Boeing Company (1997-2004); Graduate Student at the University of California, Los Angeles (2002-2003). | |
|
Glenn S. Freed
Vice President
Age: 46 | | Since 2001 | | Vice President of all the DFA Entities. | |
|
Mark R. Gochnour
Vice President
Age: 41 | | Since 2007 | | Vice President of all the DFA Entities. Regional Director of Dimensional. | |
|
Henry F. Gray
Vice President
Age: 41 | | Since 2000 | | Vice President of all the DFA Entities. Prior to July 2000, Portfolio Manager of Dimensional. Formerly, Vice President of DFA Australia Limited. | |
|
John T. Gray
Vice President
Age: 34 | | Since 2007 | | Vice President of all the DFA Entities. Formerly, Regional Director of Dimensional (January 2005 to February 2007). | |
|
Darla Hastings
Vice President
Age: 53 | | Since 2007 | | Vice President of all the DFA Entities. Chief Marketing Officer of Dimensional. Formerly, Senior Vice President, Customer Experience for Benchmark Assisted Living (May 2005 to April 2006); Executive Vice President and Chief Marketing Officer of State Street Corporation (September 2001 to October 2005). | |
|
Joel H. Hefner
Vice President
Age: 40 | | Since 2007 | | Vice President of all the DFA Entities. Regional Director of Dimensional (since June 1998). | |
|
Julie Henderson
Vice President and Fund Controller
Age: 34 | | Since 2005 | | Vice President and Fund Controller of all the DFA Entities. Formerly, Senior Manager at PricewaterhouseCoopers LLP (July 1996 to April 2005). | |
|
Kevin Hight
Vice President
Age: 40 | | Since 2005 | | Vice President of all the DFA Entities. Formerly, Regional Director of Dimensional (since March 2003 to March 2005). | |
|
Christine W. Ho
Vice President
Age: 40 | | Since 2004 | | Vice President of all the DFA Entities. Prior to April 2004, Assistant Controller of Dimensional. | |
|
Jeff J. Jeon
Vice President
Age: 34 | | Since 2004 | | Vice President of all the DFA Entities. Prior to April 2004, Counsel of Dimensional. | |
|
Patrick M. Keating
Vice President
Age: 53 | | Since 2003 | | Vice President of all the DFA Entities and Chief Operating Officer of Dimensional. Director, Vice President and Chief Privacy Officer of Dimensional Fund Advisors Canada Inc. Director of DFA Australia Limited. | |
|
36
Name, Position with the Fund
and Age | | Term of Office1
and Length of
Service | | Principal Occupation(s) During Past 5 Years | |
Joseph F. Kolerich
Vice President
Age: 36 | | Since 2004 | | Vice President of all the DFA Entities. From April 2001 to April 2004, Portfolio Manager for Dimensional. | |
|
Michael F. Lane
Vice President
Age: 41 | | Since 2004 | | Vice President of all the DFA Entities. Formerly, Vice President of Advisor Services at TIAA-CREF (July 2001 to September 2004). | |
|
Kristina M. LaRusso
Vice President
Age: 33 | | Since 2006 | | Vice President of all DFA Entities. Formerly, Operations Supervisor of Dimensional (March 2003 to December 2006). | |
|
Inmoo Lee
Vice President
Age: 42 | | Since 2007 | | Vice President of all the DFA Entities. Associate Professor Department of Finance and Accounting, Business School, National University of Singapore (July 2004 to present); Associate Professor, College of Business Administration, Korea University (September 2001 to May 2006). | |
|
Juliet Lee
Vice President
Age: 37 | | Since 2005 | | Vice President of all the DFA Entities. Human Resources Manager of Dimensional (since January 2004). Formerly, Assistant Vice President for Metropolitan West Asset Management LLC (February 2001 to December 2003). | |
|
Aaron M. Marcus
Vice President & Head of Global Human Resources
Age: 38 | | Since 2008 | | Vice President and Head of Global Human Resources of Dimensional. Formerly, Global Head of Recruiting and Vice President of Goldman Sachs & Co. (June 2006 to January 2008); Global Co-Head of HR of the Equities & FICC Division, and Vice President of Goldman Sachs & Co. (May 2005 to May 2006); Head of Americas Campus Recruiting and Vice President of Goldman Sachs & Co. (April 2003 to May 2005). | |
|
David R. Martin
Vice President, Chief Financial Officer and Treasurer
Age: 51 | | Since 2007 | | Vice President, Chief Financial Officer and Treasurer of all the DFA Entities. Director, Vice President, Chief Financial Officer and Treasurer of Dimensional Fund Advisors Ltd. and DFA Australia Limited. Chief Financial Officer, Treasurer, and Vice President of Dimensional Fund Advisors Canada Inc. Director of Dimensional Funds PLC and Dimensional Funds II PLC. Formerly, Executive Vice President and Chief Financial Officer of Janus Capital Group Inc. (June 2005 to March 2007); Senior Vice President of Finance at Charles Schwab & Co., Inc. (March 1999 to May 2005). | |
|
Catherine L. Newell
Vice President and Secretary
Age: 44 | | Vice President since 1997 and Secretary since 2000 | | Vice President and Secretary of all the DFA Entities. Director, Vice President and Assistant Secretary of DFA Australia Limited (since February 2002, April 1997 and May 2002, respectively). Vice President and Secretary of Dimensional Fund Advisors Canada Inc. (since June 2003). Director, Dimensional Funds PLC and Dimensional Funds II PLC (since January 2002). Formerly, Assistant Secretary of all DFA Entities and Dimensional Fund Advisors Ltd. | |
|
Gerard K. O'Reilly
Vice President
Age: 31 | | Since 2007 | | Vice President of all the DFA Entities. Formerly, Research Associate of Dimensional Fund Advisors LP (2004 to 2006); Research Assistant in PhD program, Aeronautics Department California Institute of Technology (1998 to 2004). | |
|
Carmen Palafox
Vice President
Age: 34 | | Since 2006 | | Vice President of all the DFA Entities. Operations Manager of Dimensional Fund Advisors LP (since May 1996). | |
|
Sonya Park
Vice President
Age: 36 | | Since 2005 | | Vice President of all the DFA Entities. From February 2002 to January 2005, institutional client service representative of Dimensional. | |
|
David A. Plecha
Vice President
Age: 47 | | Since 1993 | | Vice President of all the DFA Entities, DFA Australia Limited and Dimensional Fund Advisors Ltd.. | |
|
Ted Randall
Vice President
Age: 35 | | Since 2008 | | Vice President of all the DFA Entities. Formerly, Research Associate of Dimensional (2006-2008). Systems Developer of Dimensional (2001-2006). | |
|
37
Name, Position with the Fund
and Age | | Term of Office1
and Length of
Service | | Principal Occupation(s) During Past 5 Years | |
Eduardo A. Repetto
Vice President and Chief Investment Officer
Age: 41 | | Since 2002 | | Chief Investment Officer (beginning March 2007) and Vice President of all the DFA Entities, DFA Australia Limited and Dimensional Fund Advisors Canada Inc. Formerly, Research Associate for Dimensional (June 2000 to April 2002). | |
|
L. Jacobo Rodriguez
Vice President
Age: 37 | | Since 2005 | | Vice President of all the DFA Entities. From August 2004 to July 2005, institutional client service representative of Dimensional. Formerly, Financial Services Analyst, Cato Institute (September 2001 to June 2004); Book Review Editor, Cato Journal, Cato Institute (May 1996 to June 2004). | |
|
David E. Schneider
Vice President
Age: 62 | | Since 2001 | | Vice President of all the DFA Entities. Currently, Director of Institutional Services. | |
|
Ted R. Simpson
Vice President
Age: 40 | | Since 2007 | | Vice President of all the DFA Entities. Regional Director of Dimensional (since December 2002). | |
|
Bryce D. Skaff
Vice President
Age: 33 | | Since 2007 | | Vice President of all the DFA Entities. Formerly, Regional Director of Dimensional (December 1999 to January 2007). | |
|
Grady M. Smith
Vice President
Age: 51 | | Since 2004 | | Vice President of all the DFA Entities. Prior to April 2004, Portfolio Manager of Dimensional. | |
|
Carl G. Snyder
Vice President
Age: 45 | | Since 2000 | | Vice President of all the DFA Entities. Formerly, Vice President of DFA Australia Limited. | |
|
Lawrence R. Spieth
Vice President
Age: 60 | | Since 2004 | | Vice President of all the DFA Entities. Prior to April 2004, Regional Director of Dimensional. | |
|
Bradley G. Steiman
Vice President
Age: 35 | | Since 2004 | | Vice President of all the DFA Entities and Director and Vice President of Dimensional Fund Advisors Canada Inc. | |
|
Karen E. Umland
Vice President
Age: 42 | | Since 1997 | | Vice President of all the DFA Entities, DFA Australia Limited, Dimensional Fund Advisors Ltd., and since June 2003, Dimensional Fund Advisors Canada Inc. | |
|
Carol W. Wardlaw
Vice President
Age: 49 | | Since 2004 | | Vice President of all the DFA Entities. Prior to April 2004, Regional Director of Dimensional. | |
|
Weston J. Wellington
Vice President
Age: 57 | | Since 1997 | | Vice President of all the DFA Entities. Formerly, Vice President of DFA Australia Limited. | |
|
Daniel M. Wheeler
Vice President
Age: 63 | | Since 2001 | | Vice President of all the DFA Entities. Prior to 2001 and currently, Director of Financial Advisors Services of Dimensional. Director of Dimensional Fund Advisors Ltd. (since October 2003) and President of Dimensional Fund Advisors Canada Inc. (since June 2003). | |
|
Ryan Wiley
Vice President
Age: 32 | | Since 2007 | | Vice President of all the DFA Entities. Senior Trader of Dimensional. Formerly, Portfolio Manager (2006 to 2007); Trader (2001 to 2006). | |
|
Paul E. Wise
Vice President
Age: 53 | | Since 2005 | | Vice President of all the DFA Entities. Chief Technology Officer for Dimensional (since 2004). Formerly, Principal of Turnbuckle Management Group (January 2002 to August 2004). | |
|
1 Each officer holds office for an indefinite term at the pleasure of the Boards of Trustee/Directors and until his or her successor is elected and qualified.
38
VOTING PROXIES ON FUND PORTFOLIO SECURITIES
A description of the policies and procedures that the Trust uses in voting proxies relating to securities held in the portfolio is available without charge, upon request, by calling collect: (310) 395-8005. Information regarding how the Advisor votes these proxies is available from the EDGAR database on the SEC's website at http://www.sec.gov and from the Advisor's website at http://www.dimensional.com and reflects the twelve-month period beginning July 1st and ending June 30th.
39
NOTICE TO SHAREHOLDERS
(Unaudited)
For shareholders that do not have an October 31, 2008 tax year end, this notice is for informational purposes only. For shareholders with an October 31, 2008 tax year end, please consult your tax advisor as to the pertinence of this notice. For the period December 1, 2006 to October 31, 2008, the portfolio is designating the following items with regard to distributions paid during the period.
| Dimensional Investment Group Inc. | | Net
Investment
Income
Distributions | | Long-Term
Capital Gain
Distributions | | Total
Distributions | | Qualifying
For Corporate
Dividends
Received
Deduction(1) | | Qualifying
Dividend
Income(2) | | Qualifying
Interest
Income(3) | | Qualifying
Short-Term
Capital
Gain(4) | |
Tax-Managed U.S. Marketwide Value
Portfolio II | | | 30 | % | | | 70 | % | | | 100 | % | | | 92 | % | | | 81 | % | | | 2 | % | | | — | | |
(1) Qualifying dividends represent dividends which qualify for the corporate dividends received deduction and is reflected as a percentage of ordinary income distributions (the total of short-term capital gain and net investment income distributions).
(2) The percentage in this column represents the amount of "Qualifying Dividend Income" as created by the Jobs and Growth Tax Relief Reconciliation Act of 2003 and is reflected as a percentage of ordinary income distributions (the total of short term capital gain and net investment income distributions). It is the intention of each of the aforementioned funds to designate the maximum amount permitted by law.
(3) The percentage in this column represents the amount of "Qualifying Interest Income" as created by The American Jobs Creation Act of 2004. The information is reflected as a percentage of ordinary income distributions (the total of short-term capital gain and net investment income distributions).
(4) The percentage in this column represents the amount of "Qualifying Short-Term Capital Gain" as created by The American Jobs Creation Act of 2004. The information is reflected as a percentage of ordinary income distributions (the total of short-term capital gain and net investment income distributions).
40

DFA103108-008A
DIMENSIONAL INVESTMENT GROUP INC.
DFA International Value Portfolio II
Annual Report
Period Ended October 31, 2008
Dimensional Fund Advisors
6300 Bee Cave Road, Building One
Austin, TX 78746
December 2008
Dear Fellow Shareholder,
This has been a challenging year for investors. After drifting lower throughout the spring and summer, stock markets around the world plummeted in mid September on news that the ongoing credit crisis was driving some leading financial services companies toward failure. As the effects of this distress rippled through the financial world, investors became increasingly anxious and stock prices continued to decline sharply. In the month of October, the S&P 500 Index fell 16.8% or 196 points—its worst-ever monthly point decline.
Markets like this test investors' resolve. It is difficult to stick with a long-term investment plan when one sees the dramatic effects of high market volatility on a portfolio's value. Very few people are having a positive investment experience right now. But investors who have based their approach on a sensible risk/return framework tend to be in better shape than those who have not.
The recent market turbulence illustrates the reason why Dimensional believes that markets are efficient. History has shown time and again that prices cannot be predicted in public equity markets. This "random walk" makes diversification very important. Although the broad diversification in our portfolios didn't prevent negative performance this year, we believe it helped our shareholders avoid the extreme losses experienced by investors who concentrated their holdings in individual companies, industry sectors, or markets.
The unpredictability of stock prices also makes it important for investors to take a hard look at their own portfolios and determine how much risk and what types of risk they should take. Investors who hold asset mixes that accurately reflect their tolerance for risk are better able to withstand down markets.
Nobody knows when the capital markets will recover, but over time we can expect them to again offer a premium to investors who are willing to invest in relatively risky assets such as stocks. My view is that investors who have already paid for risk should stay invested and earn the return that can be expected when markets turn around. If markets continue to be so volatile, it's also important to understand that pulling money out of stocks, even for short periods of time, can result in significant missed opportunities.
All of us at Dimensional take our job as the steward of your assets very seriously and hope to have the opportunity to serve you for many years to come.
Sincerely,
David G. Booth
Chairman and Chief Executive Officer
[THIS PAGE INTENTIONALLY LEFT BLANK]
ANNUAL REPORT
Table of Contents
| Letter to Shareholder | | Page | |
| Definitions of Abbreviations and Footnotes | | | 1 | | |
|
| Dimensional Investment Group Inc. — DFA International Value Portfolio II | |
|
| Performance Chart | | | 2 | | |
|
| Management's Discussion and Analysis | | | 3 | | |
|
| Disclosure of Fund Expenses | | | 5 | | |
|
| Disclosure of Portfolio Holdings | | | 6 | | |
|
| Statement of Assets and Liabilities | | | 7 | | |
|
| Statements of Operations | | | 8 | | |
|
| Statements of Changes in Net Assets | | | 9 | | |
|
| Financial Highlights | | | 10 | | |
|
| Notes to Financial Statements | | | 11 | | |
|
| Report of Independent Registered Public Accounting Firm | | | 16 | | |
|
| The DFA Investment Trust Company — The DFA International Value Series | |
|
| Performance Chart | | | 17 | | |
|
| Disclosure of Fund Expenses | | | 18 | | |
|
| Disclosure of Portfolio Holdings | | | 19 | | |
|
| Summary Schedule of Portfolio Holdings | | | 20 | | |
|
| Statement of Assets and Liabilities | | | 23 | | |
|
| Statements of Operations | | | 24 | | |
|
| Statements of Changes in Net Assets | | | 25 | | |
|
| Financial Highlights | | | 26 | | |
|
| Notes to Financial Statements | | | 27 | | |
|
| Report of Independent Registered Public Accounting Firm | | | 34 | | |
|
| Fund Management | | | 35 | | |
|
| Voting Proxies on Fund Portfolio Securities | | | 42 | | |
|
| Notice to Shareholders | | | 43 | | |
|
| This report is submitted for the information of the Fund's shareholders. It is not authorized for distribution to prospective investors unless preceded or accompanied by an effective prospectus. | |
|
i
[THIS PAGE INTENTIONALLY LEFT BLANK]
DIMENSIONAL INVESTMENT GROUP INC.
THE DFA INVESTMENT TRUST COMPANY
DEFINITIONS OF ABBREVIATIONS AND FOOTNOTES
Statement of Assets and Liabilities/Summary Schedule of Portfolio Holdings
Investment Abbreviations
ADR American Depositary Receipt
FHLMC Federal Home Loan Mortgage Corporation
Investment Footnotes
† See Note B to Financial Statements.
†† Securities have generally been fair valued. See Note B to Financial Statements.
** Calculated as a percentage of total net assets. Percentages shown parenthetically next to the category headings have been calculated as a percentage of total investments. "Other Securities" are those securities that are not among the top 50 holdings of the Fund or do not represent more than 1.0% of the net assets of the Fund. Some of the individual securities within this category may include Total or Partial Securities on Loan and/or Non-Income Producing Securities.
* Non-Income Producing Securities.
# Total or Partial Securities on Loan.
@ Security purchased with cash proceeds from Securities on Loan.
§ Affiliated Fund.
Financial Highlights
(A) Computed using average shares outstanding.
(B) Annualized
(C) Non-Annualized
(D) Represents the combined ratios for the respective portfolio and its respective pro-rata share of its Master Fund Series.
All Statements and Schedules
— Amounts designated as — are either zero or rounded to zero.
SEC Securities and Exchange Commission
1
DIMENSIONAL INVESTMENT GROUP INC.
PERFORMANCE CHART

2
DIMENSIONAL INVESTMENT GROUP INC.
MANAGEMENT'S DISCUSSION AND ANALYSIS
On September 16, 2008, at a regular meeting of the Board of Directors/Trustees (the "Board") of the funds covered by this report, the Board voted to change the fiscal and tax year ends of the funds from November 30 to October 31. Therefore, the following discussion generally covers the 11-month period ended October 31, 2008.
International Equity Market Review 11 Months Ended October 31, 2008
International equity markets, affected by credit and liquidity problems similar to those experienced in the U.S., experienced high levels of volatility and broadly negative returns for the period under review. Due to the strengthening of the U.S. dollar vs. most developed countries' currencies (with the exception of the Japanese Yen and the Hong Kong dollar), the performance numbers when expressed in U.S. dollars were lower than when expressed in local currencies for all of the largest country constituents of the MSCI World ex USA Index, with the exception of Japan and Hong Kong. Overall, currency exchange rate changes reduced the returns expressed in U.S. dollars: total return for the MSCI World ex USA Index (net dividends) was –37.82% in local currency and –44.37% in U.S. dollars.
Total Returns for 11 Months Ended October 31, 2008
| Ten Largest Foreign Developed Markets by Market Cap (BB) | | Local
Currency
Return | | U.S. Dollar
Return | |
| Japan ($2,111) | | | –43.55 | % | | | –36.33 | % | |
| United Kingdom ($1,758) | | | –29.61 | % | | | –44.68 | % | |
| France ($872) | | | –36.80 | % | | | –45.40 | % | |
| Canada ($786) | | | –25.69 | % | | | –38.91 | % | |
| Germany ($705) | | | –37.97 | % | | | –46.42 | % | |
| Switzerland ($704) | | | –30.05 | % | | | –32.39 | % | |
| Australia ($513) | | | –35.10 | % | | | –51.58 | % | |
| Spain ($331) | | | –40.19 | % | | | –48.33 | % | |
| Italy ($301) | | | –43.34 | % | | | –51.06 | % | |
| Netherlands ($206) | | | –41.65 | % | | | –49.59 | % | |
Country market capitalizations (in parentheses) are in USD billions. Source: Returns are of MSCI indices net of foreign withholding taxes on dividends. Country market capitalizations are based on country carve-outs of the MSCI All-Country World Investable Market Index. MSCI data copyright MSCI 2008, all rights reserved.
Small company stocks were the poorest-performing asset classes in international markets, while large company growth stocks had the best relative results.
Total Returns for 11 Months Ended October 31, 2008
| | | U.S. Dollar
Return | |
| MSCI World ex USA Small Cap Index | | | –50.30 | % | |
| MSCI World ex USA Value Index | | | –45.31 | % | |
| MSCI World ex USA Index | | | –44.37 | % | |
| MSCI World ex USA Growth Index | | | –43.47 | % | |
Source: MSCI indices are net of foreign withholding taxes on dividends, copyright MSCI 2008, all rights reserved.
Master-Feeder Structure
The portfolio described below, called a "Feeder Fund," does not buy individual securities directly; instead, the portfolio invests in a corresponding fund called a "Master Fund." The Master Fund, in turn, purchases stocks, bonds, and/or other securities.
International Equity Portfolio Performance Overview
DFA International Value Portfolio II
The DFA International Value Portfolio II seeks to capture the returns of international large company value stocks by purchasing shares of a Master Fund that invests in such stocks. The investment strategy employs a disciplined, quantitative approach, emphasizing broad diversification and consistent exposure to large cap value stocks, but does
3
not attempt to track closely a specific equity index. As of October 31, 2008, the Master Fund held approximately 530 stocks in 22 developed countries, and essentially was fully invested in equities throughout the year: average cash levels for the 11 months ended October 31, 2008 were in general less than 1% of the Master Fund's assets.
As a result of the Master Fund's diversified investment approach, performance principally was determined by broad structural trends in global equity markets, rather than the behavior of a limited number of stocks. For the 11 months ended October 31, 2008, growth stocks generally outperformed value stocks in international markets. Total returns were –44.81% for the MSCI EAFE Index (net dividends), –44.37% for the MSCI World ex US Index (net dividends), and –47.93% for the Portfolio. Relative to the MSCI World ex US Index (net dividends), the underperformance of the Portfolio was primarily due to the Master Fund's greater allocation to value stocks in general and financial stocks in particular, both of which underperformed the Index. Value stocks, which accounted for approximately 69% of the Master Fund compared to 28% of the Index, underperformed the Index by approximately 4 percentage points. Financials, which accounted for 44 % of the Master Fund compared to 25% of the Index, underperformed the Index by approximately 8 percentage points. A lower allocation to health care stocks, which accounted for less than 1% of the Master Fund compared to 6% of the Index and outperformed the Index by approximately 22 percentage points, also contributed to the underperformance.
4
DIMENSIONAL INVESTMENT GROUP INC.
DFA INTERNATIONAL VALUE PORTFOLIO II
DISCLOSURE OF FUND EXPENSES
(Unaudited)
The following Expense Table is shown so that you can understand the impact of fees on your investment. All mutual funds have operating expenses. As a shareholder of the fund, you incur ongoing costs, which include costs for portfolio management, administrative services, and shareholder reports, among others. Operating expenses, legal and audit services, which are deducted from a fund's gross income, directly reduce the investment return of the fund. A fund's expenses are expressed as a percentage of its average net assets. This figure is known as the expense ratio. The following examples are intended to help you understand the ongoing costs, in dollars, of investing in the fund and to compare these costs with those of other mutual funds. The examples are based on an investment of $1,000 made at the beginning of the period shown and held for the entire period.
The Expense Table below illustrates your fund's costs in two ways.
Actual Fund Return
This section helps you to estimate the actual expenses after fee waivers that you paid over the period. The "Ending Account Value" shown is derived from the fund's actual return and "Expenses Paid During Period" reflect the dollar amount that would have been paid by an investor who started with $1,000 in the fund. You may use the information here, together with the amount you invested, to estimate the expenses that you paid over the period.
To do so, simply divide your account value by $1,000 (for example, a $7,500 account value divided by $1,000 = 7.5), then multiply the result by the number given for your fund under the heading "Expenses Paid During Period."
Hypothetical Example for Comparison Purposes
This section is intended to help you compare your fund's costs with those of other mutual funds. The hypothetical "Ending Account Value" and "Expenses Paid During Period" are derived from the fund's actual expense ratio and an assumed 5% annual return before expenses. In this case, because the return used is not the fund's actual return, the results do not apply to your investment. The example is useful in making comparisons because the SEC requires all mutual funds to calculate expenses based on a 5% annual return. You can assess your fund's cost by comparing this hypothetical example with the hypothetical examples that appear in shareholder reports of other funds.
Please note that the expenses shown in the table are meant to highlight and help you compare ongoing costs only and do not reflect any transactional costs, if applicable. The "Annualized Expense Ratio" represents the actual expenses for the six-month period indicated.
Six Months Ended October 31, 2008
EXPENSE TABLE
| | | Beginning
Account
Value
05/01/08 | | Ending
Account
Value
10/31/08 | | Annualized
Expense
Ratio* | | Expenses
Paid
During
Period* | |
| Actual Fund Return | | $ | 1,000.00 | | | $ | 555.10 | | | | 0.28 | % | | $ | 1.09 | | |
| Hypothetical 5% Annual Return | | $ | 1,000.00 | | | $ | 1,023.73 | | | | 0.28 | % | | $ | 1.42 | | |
* Expenses are equal to the fund's annualized expense ratio for the six-month period, multiplied by the average account value over the period, multiplied by the number of days in the most recent six-month period (184), then divided by the number of days in the year (366) to reflect the six-month period. The Portfolio is a Feeder Fund. The expenses shown reflect the direct expenses of the Feeder Fund and the indirect payment of the Feeder Fund's portion of the expenses of its Master Fund.
5
DIMENSIONAL INVESTMENT GROUP INC.
DFA INTERNATIONAL VALUE PORTFOLIO II
DISCLOSURE OF PORTFOLIO HOLDINGS
(Unaudited)
The SEC requires that all Funds file a complete Schedule of Investments with the SEC for their first and third fiscal quarters on Form N-Q. For Dimensional Investment Group Inc., this would be for the fiscal quarters ending January 31 and July 31. The Form N-Q filing must be made within 60 days of the end of the quarter. Dimensional Investment Group Inc. filed its most recent Form N-Q with the SEC on October 30, 2008. It is available upon request, without charge, by calling collect: (310) 395-8005 or by mailing a request to Dimensional Fund Advisors LP, 1299 Ocean Avenue, Santa Monica, California 90401, or by visiting the SEC's website at http://www.sec.gov, or they may be reviewed and copied at the SEC's Public Reference Room in Washington, D.C. (call 1-800-732-0330 for information on the operation of the Public Reference Room).
PORTFOLIO HOLDINGS
The SEC requires that all Funds present their categories of portfolio holdings in a table, chart or graph format in their annual and semi-annual shareholder reports, whether or not a Schedule of Investments is utilized. The following table, which presents portfolio holdings as a percent of total investments before short-term investments and collateral for loaned securities, is provided in compliance with such requirement.
The categories of industry classification for the Affiliated Investment Company are represented in the Disclosure of Portfolio Holdings, which are included elsewhere within the report. Refer to the Summary Schedule of Portfolio Holdings for the underlying Master Fund's holdings which reflect the investments by country.
| Affiliated Investment Company | | | 100.0 | % | |
6
DIMENSIONAL INVESTMENT GROUP INC.
DFA INTERNATIONAL VALUE PORTFOLIO II
STATEMENT OF ASSETS AND LIABILITIES
OCTOBER 31, 2008
(Amounts in thousands, except share and per share amounts)
| ASSETS: | |
Investment in The DFA International Value Series of The DFA Investment Trust Company
(Affiliated Investment Company) (9,924,891 Shares) at Value† | | $ | 113,243 | | |
| Receivables: | |
| Affiliated Investment Company Shares Sold | | | 144 | | |
| Prepaid Expenses and Other Assets | | | 10 | | |
| Total Assets | | | 113,397 | | |
| LIABILITIES: | |
| Payables: | |
| Fund Shares Redeemed | | | 144 | | |
| Due to Advisor | | | 1 | | |
| Accrued Expenses and Other Liabilities | | | 36 | | |
| Total Liabilities | | | 181 | | |
| NET ASSETS | | $ | 113,216 | | |
| SHARES OUTSTANDING, $0.01 PAR VALUE (1) | | | 9,773,808 | | |
| NET ASSET VALUE, OFFERING AND REDEMPTION PRICE PER SHARE | | $ | 11.58 | | |
| Investment in Affiliated Investment Company at Cost | | $ | 163,103 | | |
| NET ASSETS CONSIST OF: | |
| Paid-In Capital | | $ | 49,266 | | |
| Undistributed Net Investment Income (Distributions in Excess of Net Investment Income) | | | 365 | | |
| Accumulated Net Realized Gain (Loss) | | | 63,585 | | |
| NET ASSETS | | $ | 113,216 | | |
| (1) NUMBER OF SHARES AUTHORIZED | | | 200,000,000 | | |
See accompanying Notes to Financial Statements.
7
DIMENSIONAL INVESTMENT GROUP INC.
DFA INTERNATIONAL VALUE PORTFOLIO II
STATEMENTS OF OPERATIONS
(Amounts in thousands)
| | | Period
Dec. 1, 2007
to
Oct. 31, 2008 | | Year
Ended
Nov. 30,
2007 | |
| Investment Income | |
| Income Distributions Received from Affiliated Investment Company | | $ | 8,781 | | | $ | 22,591 | | |
| Expenses | |
| Administrative Services Fees | | | 30 | | | | 74 | | |
| Accounting & Transfer Agent Fees | | | 16 | | | | 22 | | |
| Filing Fees | | | 18 | | | | 23 | | |
| Shareholders' Reports | | | 42 | | | | 44 | | |
| Directors'/Trustees' Fees & Expenses | | | (8 | ) | | | 5 | | |
| Professional Fees | | | 11 | | | | 18 | | |
| Other | | | 5 | | | | 1 | | |
| Total Expenses | | | 114 | | | | 187 | | |
| Net Investment Income (Loss) | | | 8,667 | | | | 22,404 | | |
| Realized and Unrealized Gain (Loss) | |
| Capital Gain Distributions Received from Affiliated Investment Company | | | 50,083 | | | | 16,900 | | |
| Net Realized Gain (Loss) on Affiliated Investment Company Shares Sold | | | 82,444 | | | | (2,997 | ) | |
Change in Unrealized Appreciation (Depreciation) of Affiliated Investment
Company Shares | | | (311,807 | ) | | | 73,136 | | |
| Net Realized and Unrealized Gain (Loss) | | | (179,280 | ) | | | 87,039 | | |
| Net Increase (Decrease) in Net Assets Resulting from Operations | | $ | (170,613 | ) | | $ | 109,443 | | |
See accompanying Notes to Financial Statements.
8
DIMENSIONAL INVESTMENT GROUP INC.
DFA INTERNATIONAL VALUE PORTFOLIO II
STATEMENTS OF CHANGES IN NET ASSETS
(Amounts in thousands)
| | | Period
Dec. 1, 2007
to
Oct. 31, 2008 | | Year
Ended
Nov. 30,
2007 | | Year
Ended
Nov. 30,
2006 | |
| Increase (Decrease) in Net Assets | |
| Operations: | |
| Net Investment Income (Loss) | | $ | 8,667 | | | $ | 22,404 | | | $ | 16,780 | | |
Capital Gain Distributions Received from Affiliated Investment
Company | | | 50,083 | | | | 16,900 | | | | 9,872 | | |
Net Realized Gain (Loss) on Affiliated Investment Company
Shares Sold | | | 82,444 | | | | (2,997 | ) | | | (3,001 | ) | |
Change in Unrealized Appreciation (Depreciation) of Affiliated
Investment Company Shares | | | (311,807 | ) | | | 73,136 | | | | 117,975 | | |
Net Increase (Decrease) in Net Assets Resulting
from Operations | | | (170,613 | ) | | | 109,443 | | | | 141,626 | | |
| Distributions From: | |
| Net Investment Income | | | (12,482 | ) | | | (20,432 | ) | | | (16,422 | ) | |
| Net Short-Term Gains | | | (1,773 | ) | | | (1,258 | ) | | | (908 | ) | |
| Net Long-Term Gains | | | (14,297 | ) | | | (8,778 | ) | | | (7,264 | ) | |
| Total Distributions | | | (28,552 | ) | | | (30,468 | ) | | | (24,594 | ) | |
| Capital Share Transactions (1): | |
| Shares Issued | | | 18,325 | | | | 157,119 | | | | 201,915 | | |
| Shares Issued in Lieu of Cash Distributions | | | 28,552 | | | | 30,468 | | | | 24,594 | | |
| Shares Redeemed | | | (497,259 | ) | | | (125,013 | ) | | | (62,794 | ) | |
| Net Increase (Decrease) from Capital Share Transactions | | | (450,382 | ) | | | 62,574 | | | | 163,715 | | |
| Total Increase (Decrease) in Net Assets | | | (649,547 | ) | | | 141,549 | | | | 280,747 | | |
| Net Assets | |
| Beginning of Period | | | 762,763 | | | | 621,214 | | | | 340,467 | | |
| End of Period | | $ | 113,216 | | | $ | 762,763 | | | $ | 621,214 | | |
| (1) Shares Issued and Redeemed: | |
| Shares Issued | | | 948 | | | | 6,917 | | | | 10,794 | | |
| Shares Issued in Lieu of Cash Distributions | | | 1,356 | | | | 1,362 | | | | 1,405 | | |
| Shares Redeemed | | | (24,678 | ) | | | (5,535 | ) | | | (3,424 | ) | |
| | | | (22,374 | ) | | | 2,744 | | | | 8,775 | | |
Undistributed Net Investment Income (Distributions in
Excess of Net Investment Income) | | $ | 365 | | | $ | 3,680 | | | $ | 1,708 | | |
See accompanying Notes to Financial Statements.
9
DIMENSIONAL INVESTMENT GROUP INC.
DFA INTERNATIONAL VALUE PORTFOLIO II
FINANCIAL HIGHLIGHTS
(for a share outstanding throughout each period)
| | | Period
Dec. 1, 2007
to
Oct. 31, 2008 | | Year
Ended
Nov. 30,
2007 | | Year
Ended
Nov. 30,
2006 | | Year
Ended
Nov. 30,
2005 | | Year
Ended
Nov. 30,
2004 | | Year
Ended
Nov. 30,
2003 | |
Net Asset Value,
Beginning of Period | | $ | 23.73 | | | $ | 21.13 | | | $ | 16.50 | | | $ | 14.69 | | | $ | 11.54 | | | $ | 8.69 | | |
| Income from Investment Operations | |
| Net Investment Income (Loss) | | | 0.54 | (A) | | | 0.70 | (A) | | | 0.65 | (A) | | | 0.48 | | | | 0.25 | | | | 0.18 | | |
Net Gains (Losses) (Realized
and Unrealized) | | | (11.35 | ) | | | 2.88 | | | | 5.01 | | | | 1.76 | | | | 3.37 | | | | 2.87 | | |
Total from Investment
Operations | | | (10.81 | ) | | | 3.58 | | | | 5.66 | | | | 2.24 | | | | 3.62 | | | | 3.05 | | |
| Less Distributions | |
| Net Investment Income | | | (0.84 | ) | | | (0.64 | ) | | | (0.64 | ) | | | (0.41 | ) | | | (0.44 | ) | | | (0.20 | ) | |
| Net Realized Gains | | | (0.50 | ) | | | (0.34 | ) | | | (0.39 | ) | | | (0.02 | ) | | | (0.03 | ) | | | — | | |
| Total Distributions | | | (1.34 | ) | | | (0.98 | ) | | | (1.03 | ) | | | (0.43 | ) | | | (0.47 | ) | | | (0.20 | ) | |
| Net Asset Value, End of Period | | $ | 11.58 | | | $ | 23.73 | | | $ | 21.13 | | | $ | 16.50 | | | $ | 14.69 | | | $ | 11.54 | | |
| Total Return | | | (47.93 | )%(C) | | | 17.29 | % | | | 35.74 | % | | | 15.50 | % | | | 32.11 | % | | | 35.98 | % | |
Net Assets,
| |
| End of Period (thousands) | | $ | 113,216 | | | $ | 762,763 | | | $ | 621,214 | | | $ | 340,467 | | | $ | 189,176 | | | $ | 69,220 | | |
Ratio of Expenses to Average
Net Assets (D) | | | 0.26 | %(B) | | | 0.25 | % | | | 0.27 | % | | | 0.31 | % | | | 0.37 | % | | | 0.40 | % | |
Ratio of Net Investment Income
to Average Net Assets | | | 2.84 | %(B) | | | 3.02 | % | | | 3.41 | % | | | 3.06 | % | | | 1.98 | % | | | 2.41 | % | |
See page 1 for the Definitions of Abbreviations and Footnotes.
See accompanying Notes to Financial Statements.
10
DIMENSIONAL INVESTMENT GROUP INC.
DFA INTERNATIONAL VALUE PORTFOLIO II
NOTES TO FINANCIAL STATEMENTS
A. Organization:
Dimensional Investment Group Inc. (the "Fund") is an open-end management investment company registered under the Investment Company Act of 1940, whose shares are offered to institutional investors, retirement plans and clients of registered investment advisors. The Fund consists of fifteen portfolios, of which the DFA International Value Portfolio II (the "Portfolio") is presented in this report.
The Portfolio primarily invests its assets in The DFA International Value Series (the "Series"), a corresponding series of The DFA Investment Trust Company. At October 31, 2008, the Portfolio owned 2% of the outstanding shares of the Series. The financial statements of the Series are included elsewhere in this report and should be read in conjunction with the financial statements of the Portfolio.
At a regular meeting of the Board of Directors/Trustees (the "Board") on September 16, 2008, the Board voted to change the fiscal and tax year ends of the Portfolio from November 30 to October 31.
B. Significant Accounting Policies:
The following significant accounting policies are in conformity with accounting principles generally accepted in the United States of America. Such policies are consistently followed by the Fund in preparation of its financial statements. The preparation of financial statements in accordance with accounting principles generally accepted in the United States of America requires management to make estimates and assumptions that affect the reported amounts of assets and liabilities and disclosure of contingent assets and liabilities at the date of the financial statements and the reported amounts of increases and decreases in net assets from operations during the reporting period. Actual results could differ from those estimates and those differences could be material.
1. Security Valuation: The shares of the Series held by the Portfolio are valued at their respective daily net asset value.
Adoption of Statement of Financial Accounting Standards No. 157 "Fair Value Measurements" ("FAS 157")
In September 2006, the Financial Accounting Standards Board issued FAS 157 effective for fiscal years beginning after November 15, 2007. This standard clarifies the definition of fair value for financial reporting, establishes a framework for measuring fair value and requires additional disclosures about the use of fair value measurements. The Fund has adopted FAS 157 as of December 1, 2007. The three levels of the fair value hierarchy under FAS 157 are described below:
• Level 1 – quoted prices in active markets for identical securities
• Level 2 – other significant observable inputs (including quoted prices for similar securities, interest rates, prepayment speeds, credit risk, etc.)
• Level 3 – significant unobservable inputs (including the Portfolio's own assumptions in determining the fair value of investments)
The inputs or methodology used for valuing securities are not necessarily an indication of the risk associated with investing in those securities. A summary of the inputs used to value the Portfolio's net assets as of October 31, 2008 is listed below (in thousands).
| | | Valuation Inputs | |
| | | Investments in
Securities
(Market Value) | |
| | | Level 1 | | Level 2 | | Level 3 | | Total | |
| DFA International Value Portfolio II | | $ | 113,243 | | | | — | | | | — | | | $ | 113,243 | | |
11
2. Deferred Compensation Plan: Each eligible Director of the Fund may elect participation in the Deferred Compensation Plan (the "Plan"). Under the Plan, effective January 1, 2002, such Directors may defer payment of all or a portion of their total fees earned as a Director. These deferred amounts may be treated as though such amounts had been invested in shares of the following funds: U.S. Large Cap Value Portfolio; U.S. Core Equity 1 Portfolio; U.S. Core Equity 2 Portfolio; U.S. Vector Equity Portfolio; U.S. Micro Cap Portfolio; DFA International Value Portfolio; International Core Equity Portfolio; Emerging Markets Portfolio; Emerging Markets Core Equity Portfolio; and/or DFA Two-Year Global Fixed Income Portfolio. Contributions made under the Plan and the change in unrealized a ppreciation (depreciation) and income are included in Directors'/Trustees' Fees & Expenses. At October 31, 2008, the total liability for deferred compensation to Directors is included in Accrued Expenses and Other Liabilities in the amount of $5 (in thousands).
Each Director has the option to receive their distribution of proceeds in one of the following methods upon one year's notice: lump sum; annual installments over a period of agreed upon years; or semi-annual installments over a period of agreed upon years. As of October 31, 2008, none of the Directors have requested distribution of proceeds.
3. Other: Security transactions are accounted for as of the trade date. Costs used in determining realized gains and losses on the sale of affiliated investment company shares are on the basis of identified cost. Dividend income and distributions to shareholders are recorded on the ex-dividend date. Distributions received from investment in affiliated investment company that represent a return of capital or capital gain are recorded as a reduction of cost of investments or as a realized gain, respectively. Expenses directly attributable to the Portfolio are directly charged. Common expenses of the Fund are allocated using methods approved by the Board of Directors/Trustees, generally based on average net assets.
C. Investment Advisor:
Dimensional Fund Advisors LP ("Dimensional" or the "Advisor") provides administrative services to the Portfolio, including supervision of services provided by others, providing information to the shareholders and to the Board of Directors/Trustees, and other administrative services. The Advisor provides investment advisory services to the Series. For the period ended October 31, 2008, the Portfolio's administrative services fees were accrued daily and paid monthly to the Advisor based on an effective annual rate of 0.01% of average daily net assets.
Fees Paid to Officers and Directors/Trustees:
Certain Officers and Directors/Trustees of the Advisor are also Officers and Directors/Trustees of the Fund; however, such Officers and Directors/Trustees (with the exception of the Chief Compliance Officer ("CCO")) receive no compensation from the Fund. For the period December 1, 2007 to October 31, 2008, the total related amounts paid by the Fund to the CCO were $25 (in thousands). The total related amounts paid by the Portfolio are included in Other Expenses on the Statement of Operations.
D. Federal Income Taxes:
The Portfolio has qualified and intends to continue to qualify as a regulated investment company under Subchapter M of the Internal Revenue Code for federal income tax purposes and to distribute substantially all of its taxable income and net capital gains to its shareholders. Accordingly, no provision has been made for federal income taxes.
Distributions from net investment income and net realized capital gains are determined in accordance with U.S. federal income tax regulations, which may differ from those amounts determined under accounting principles generally accepted in the United States of America. These book/tax differences are either temporary or permanent in nature. To the extent these differences are permanent, they are charged or credited to paid-in capital, undistributed net investment income, accumulated net realized gains or unrealized appreciation, as appropriate, in the period that the differences arise. Accordingly, the following permanent differences as of October 31, 2008, primarily attributable
12
to a reclassification of distributions were classified to the following accounts. These reclassifications had no effect on net assets or net asset value per share (amounts in thousands):
Increase
(Decrease)
Undistributed
Net Investment
Income | | Increase
(Decrease)
Accumulated
Net Realized
Gains (Losses) | |
| $ | 500 | | | $ | (500 | ) | |
The tax character of dividends and distributions declared and paid during the years November 30, 2006, November 30, 2007 and the period December 1, 2007 to October 31, 2008 were as follows (amounts in thousands):
| | | Net Investment
Income and
Short-Term
Capital Gains | | Long-Term
Capital Gains | | Total | |
| | 2006 | | | $ | 17,330 | | | $ | 7,264 | | | $ | 24,594 | | |
| | 2007 | | | | 21,690 | | | | 8,778 | | | | 30,468 | | |
| | 2008 | | | | 13,755 | | | | 14,797 | | | | 25,552 | | |
At October 31, 2008, the components of distributable earnings (accumulated losses) were as follows (amounts in thousands):
Undistributed
Net Investment
Income and
Short-Term
Capital Gains | | Undistributed
Long-Term
Capital Gains | | Total Net
Distributable
Earnings
(Accumulated
Losses) | |
| $ | 370 | | | $ | 63,585 | | | $ | 63,955 | | |
For federal income tax purposes, the Fund measures its capital loss carryforwards annually at October 31, its fiscal year end. Capital loss carryforwards may be carried forward and applied against future capital gains. As of October 31, 2008, the Portfolio had no capital loss carryforwards available to offset future realized capital gains.
At October 31, 2008, the total cost and aggregate gross unrealized appreciation and (depreciation) of securities for federal income tax purposes were not materially different from amounts reported for financial reporting purposes (amounts in thousands):
Federal
Tax Cost | | Unrealized
Appreciation | | Unrealized
(Depreciation) | | Net
Unrealized
Appreciation
(Depreciation) | |
| $ | 113,197 | | | | — | | | | — | | | | — | | |
In June 2006, the Financial Accounting Standards Board (FASB) issued FASB Interpretation 48 ("FIN 48"), "Accounting for Uncertainty in Income Taxes." This standard defines the threshold for recognizing the benefits of tax-return positions in the financial statements as "more-likely-than-not" to be sustained by the taxing authority and requires measurement of a tax position meeting the more-likely-than-not criterion, based on the largest benefit that is more than 50 percent likely to be realized. Management has analyzed the Portfolio's tax positions to be taken on the federal income tax returns for all open tax years (tax years ended November 30, 2005 through the period ended October 31, 2008), for purposes of implementing FIN 48, and has concluded that no provision for income tax is required in the Portfolio's financial statements.
E. Line of Credit:
The Fund, together with other Dimensional-advised portfolios, has entered into a $250 million unsecured discretionary line of credit effective June 30, 2003 with an affiliate of its domestic custodian bank. Each portfolio is permitted to borrow, subject to its investment limitations, up to a maximum of $250 million, as long as total borrowings under the line of credit do not exceed $250 million in the aggregate. Borrowings under the line of credit are charged
13
interest at the then current Federal Funds Rate plus 1%. Each portfolio is individually, and not jointly, liable for its particular advances under the line of credit. There is no commitment fee on the unused portion of the line of credit. The agreement for the discretionary line of credit may be terminated by either party at any time. The line of credit is scheduled to expire on June 23, 2009. There were no borrowings by the Portfolio under this line of credit during the period ended October 31, 2008.
The Fund, together with other Dimensional-advised portfolios, has also entered into an additional $500 million unsecured line of credit effective January 15, 2008 with its international custodian bank. Each portfolio is permitted to borrow, subject to its investment limitations, up to a maximum of $500 million, as long as total borrowings under the line of credit do not exceed $500 million in the aggregate. Borrowings under the line of credit are charged interest at rates agreed to by the parties at the time of borrowing. Each portfolio is individually, and not jointly, liable for its particular advances under the line of credit. There is no commitment fee on the unused portion of the line of credit. The agreement of the line of credit expires on January 15, 2009. There were no borrowings by the Portfolio under this line of credit during the period ended October 31, 2008.
F. Indemnities; Contractual Obligations:
Under the Fund's organizational documents, its officers and directors are indemnified against certain liabilities arising out of the performance of their duties to the Fund.
In the normal course of business, the Fund enters into contracts that contain a variety of representations and warranties which provide general indemnification. The Fund's maximum exposure under these arrangements is unknown as this would involve future claims that may be made against the Fund and/or its affiliates that have not yet occurred. However, based on experience, the Fund expects the risk of loss to be remote.
G. Recently Issued Accounting Standards and Interpretation:
In March 2008, Statement of Financial Accounting Standards No. 161, Disclosures about Derivative Instruments and Hedging Activities ("FAS 161"), was issued and is effective for fiscal years beginning after November 15, 2008. FAS 161 defines new disclosures of derivative instruments and hedging activities. Management is currently evaluating the implications of FAS 161. At this time, its impact on the Portfolio's financial statements has not been determined.
H. Other:
At October 31, 2008, two shareholders held 100% of the outstanding shares of the Portfolio.
I. Subsequent Event Note:
On November 1, 2008, The DFA International Value Series, a master fund in a RIC/RIC master feeder structure with five RIC feeders and two direct client investors, made a "Check-the-box" election for federal income tax purposes pursuant to Treasury Regulation § 301.7701-3, to change its federal entity classification from a corporation taxable as a regulated investment company to a partnership. As a result of this election, the master fund is deemed to have distributed all of its assets and liabilities, in a taxable transaction, to its shareholders in liquidation of the master fund. Immediately thereafter, the shareholders contributed all of the distributed assets and liabilities to a newly formed partnership. The final tax year end of The DFA International Value Series was October 31, 2008. For Federal income tax purposes, pursuant to Code §336(a), the master fund recognizes gain or loss as if the master's investment securities were sold to its shareholders and, pursuant to Code §331, each of the Portfolios recognizes gain or loss as if it liquidated its investment in the master. For tax purposes, pursuant to Code § 334(a), each of the Portfolio's will take a fair market value basis in the securities deemed received by them and a new holding period for those securities commences on the deemed liquidation date.
14
The master fund had book/tax differences upon its deemed liquidation. The following summary of permanent differences occurred as of the respective effective "Check the Box" election date.
Increase
(Decrease)
Paid-in
Capital | | Unrealized
Appreciation
(Depreciation)
Investment
Securities | | Increase
(Decrease)
Undistributed
Net Investment
Income | | Increase
(Decrease)
Accumulated
Net Realized
Gains(Losses) | |
| $ | (2,187,614,395 | ) | | $ | 2,319,051,847 | | | $ | (602,214 | ) | | $ | (130,835,238 | ) | |
As a result of the transaction, The DFA International Value Series recognized a ($2,309,440,866) and ($718,733) capital and currency loss respectively for tax year ended October 31, 2008. Additionally, the fund has written off $2,178,493,687 of expired capital loss carryover as a permanent book/tax reporting difference decreasing paid in capital.
Each Portfolio impacted by the "Check the Box" election also has a permanent book/tax difference resulting from the transaction. Listed below is the permanent difference impacting each respective Portfolio. For financial statement purposes, this adjustment did not result in any changes to each respective fund's net assets or net asset value per share.
| | | Unrealized
Appreciation
(Depreciation)
Investment
Securities | | Increase
(Decrease)
Accumulated
Net Realized
Gains(Losses) | |
| DFA International Value Portfolio | | $ | 1,598,039,236 | | | $ | (1,598,039,236 | ) | |
| DFA International Value Portfolio II | | | 49,859,737 | | | | (49,859,737 | ) | |
| DFA International Value Portfolio III | | | 155,866,882 | | | | (155,866,882 | ) | |
| DFA International Value Portfolio IV | | | 82,052,198 | | | | (82,052,198 | ) | |
| LWAS/DFA International High Book To Market Portfolio | | | (19,800,535 | ) | | | 19,800,535 | | |
For financial reporting purposes, this transaction had no impact on the net assets of the respective funds.
15
REPORT OF INDEPENDENT REGISTERED PUBLIC ACCOUNTING FIRM
To the Shareholders of DFA International Value Portfolio II and
Board of Directors of Dimensional Investment Group Inc.:
In our opinion, the accompanying statement of assets and liabilities, and the related statements of operations and of changes in net assets and the financial highlights present fairly, in all material respects, the financial position of DFA International Value Portfolio II (one of the portfolios constituting Dimensional Investment Group Inc., hereafter referred to as the "Portfolio") at October 31, 2008, the results of its operations, the changes in its net assets and the financial highlights for each of the periods indicated, in conformity with accounting principles generally accepted in the United States of America. These financial statements and financial highlights (hereafter referred to as "financial statements") are the responsibility of the Portfolio's management; our responsibility is to express an opinion on these financial statements based on our audits. We conducted our audits of these financial statements in accordance with the s tandards of the Public Company Accounting Oversight Board (United States). Those standards require that we plan and perform the audit to obtain reasonable assurance about whether the financial statements are free of material misstatement. An audit includes examining, on a test basis, evidence supporting the amounts and disclosures in the financial statements, assessing the accounting principles used and significant estimates made by management, and evaluating the overall financial statement presentation. We believe that our audits, which included confirmation of securities at October 31, 2008 by correspondence with the transfer agent of the investee fund, provide a reasonable basis for our opinion.
PricewaterhouseCoopers LLP
Philadelphia, Pennsylvania
December 22, 2008
16
DIMENSIONAL INVESTMENT GROUP INC.
PERFORMANCE CHART

17
THE DFA INVESTMENT TRUST COMPANY
THE DFA INTERNATIONAL VALUE SERIES
DISCLOSURE OF FUND EXPENSES
(Unaudited)
The following Expense Table is shown so that you can understand the impact of fees on your investment. All mutual funds have operating expenses. As a shareholder of the fund, you incur ongoing costs, which include costs for portfolio management, administrative services, and shareholder reports, among others. Operating expenses, legal and audit services, which are deducted from a fund's gross income, directly reduce the investment return of the fund. A fund's expenses are expressed as a percentage of its average net assets. This figure is known as the expense ratio. The following examples are intended to help you understand the ongoing costs, in dollars, of investing in the fund and to compare these costs with those of other mutual funds. The examples are based on an investment of $1,000 made at the beginning of the period shown and held for the entire period.
The Expense Table below illustrates your fund's costs in two ways.
Actual fund return
This section helps you to estimate the actual expenses after fee waivers that you paid over the period. The "Ending Account Value" shown is derived from the fund's actual return and "Expenses Paid During Period" reflect the dollar amount that would have been paid by an investor who started with $1,000 in the fund. You may use the information here, together with the amount you invested, to estimate the expenses that you paid over the period.
To do so, simply divide your account value by $1,000 (for example, a $7,500 account value divided by $1,000 = 7.5), then multiply the result by the number given for your fund under the heading "Expenses Paid During Period."
Hypothetical example for comparison purposes
This section is intended to help you compare your fund's costs with those of other mutual funds. The hypothetical "Ending Account Value" and "Expenses Paid During Period" are derived from the fund's actual expense ratio and an assumed 5% annual return before expenses. In this case, because the return used is not the fund's actual return, the results do not apply to your investment. The example is useful in making comparisons because the SEC requires all mutual funds to calculate expenses based on a 5% annual return. You can assess your fund's cost by comparing this hypothetical example with the hypothetical examples that appear in shareholder reports of other funds.
Please note that the expenses shown in the table are meant to highlight and help you compare ongoing costs only and do not reflect any transactional costs, if applicable. The "Annualized Expense Ratio" represents the actual expenses for the six-month period indicated.
Six Months Ended October 31, 2008
EXPENSE TABLE
| | | Beginning
Account
Value
05/01/08 | | Ending
Account
Value
10/31/08 | | Annualized
Expense
Ratio* | | Expenses
Paid
During
Period* | |
| Actual Fund Return | | $ | 1,000.00 | | | $ | 555.50 | | | | 0.23 | % | | $ | 0.90 | | |
| Hypothetical 5% Annual Return | | $ | 1,000.00 | | | $ | 1,023.98 | | | | 0.23 | % | | $ | 1.17 | | |
* Expenses are equal to the fund's annualized expense ratio for the six-month period, multiplied by the average account value over the period, multiplied by the number of days in the most recent six-month period (184), then divided by the number of days in the year (366) to reflect the six-month period.
18
THE DFA INVESTMENT TRUST COMPANY
THE DFA INTERNATIONAL VALUE SERIES
DISCLOSURE OF PORTFOLIO HOLDINGS
(Unaudited)
The SEC requires that all Funds file a complete Schedule of Investments with the SEC for their first and third fiscal quarters on Form N-Q. For The DFA Investment Trust Company, this would be for the fiscal quarters ending January 31 and July 31. The Form N-Q filing must be made within 60 days of the end of the quarter. The DFA Investment Trust Company filed its most recent Form N-Q with the SEC on October 30, 2008. It is available upon request, without charge, by calling collect: (310) 395-8005 or by mailing a request to Dimensional Fund Advisors LP, 1299 Ocean Avenue, Santa Monica, California 90401, or by visiting the SEC's website at http://www.sec.gov, or they may be reviewed and copied at the SEC's Public Reference Room in Washington, D.C. (call 1-800-732-0330 for information on the operation of the Public Reference Room).
SEC regulations permit a fund to include in its reports to shareholders a "Summary Schedule of Portfolio Holdings" in lieu of a full Schedule of Investments. The Summary Schedule of Portfolio Holdings reports the fund's 50 largest holdings in unaffiliated issuers and any investments that exceed one percent of the fund's net assets at the end of the reporting period. The amendments also require that the Summary Schedule of Portfolio Holdings identify each category of investments that are held.
The fund is required to file a complete Schedule of Investments with the SEC on Form N-CSR within ten days after mailing the annual and semi-annual reports to shareholders. It will be available upon request, without charge, by calling collect: (310) 395-8005 or by mailing a request to Dimensional Fund Advisors LP, 1299 Ocean Avenue, Santa Monica, California 90401, or by visiting the SEC's website at http://www.sec.gov, or they may be reviewed and copied at the SEC's Public Reference Room in Washington, D.C. (call 1-800-732-0330 for information on the operation of the Public Reference Room).
PORTFOLIO HOLDINGS
The SEC requires that all Funds present their categories of portfolio holdings in a table, chart or graph format in their annual and semi-annual shareholder reports, whether or not a Schedule of Investments is utilized. The following table, which presents portfolio holdings as a percent of total investments before short-term investments and collateral for loaned securities, is provided in compliance with such requirement. The categories shown below represent broad industry sectors. Each industry sector consists of one or more specific industry classifications.
Consumer
Discretionary | | Consumer
Staples | | Energy | | Financials | | Health
Care | | Industrials | | Information
Technology | | Materials | | Telecommunication
Services | | Utilities | | Total | |
| | 12.2 | % | | | 5.1 | % | | | 5.5 | % | | | 41.4 | % | | | 0.5 | % | | | 10.0 | % | | | 3.6 | % | | | 9.3 | % | | | 9.0 | % | | | 3.4 | % | | | 100.0 | % | |
19
THE DFA INTERNATIONAL VALUE SERIES
SUMMARY SCHEDULE OF PORTFOLIO HOLDINGS
October 31, 2008
| | | Shares | | Value†† | | Percentage
of Net Assets** | |
| AUSTRALIA — (4.7%) | |
| COMMON STOCKS — (4.7%) | |
| Australia & New Zealand Banking Group, Ltd. | | | 3,302,749 | | | $ | 38,716,458 | | | | 0.8 | % | |
| Commonwealth Bank of Australia | | | 2,119,091 | | | | 57,926,994 | | | | 1.2 | % | |
| # National Australia Bank, Ltd. | | | 3,087,538 | | | | 50,098,709 | | | | 1.1 | % | |
| Other Securities | | | | | | | 107,641,792 | | | | 2.3 | % | |
| TOTAL — AUSTRALIA | | | | | | | 254,383,953 | | | | 5.4 | % | |
| AUSTRIA — (0.5%) | |
| COMMON STOCKS — (0.5%) | |
| Other Securities | | | | | | | 28,305,261 | | | | 0.6 | % | |
| BELGIUM — (0.5%) | |
| COMMON STOCKS — (0.5%) | |
| Other Securities | | | | | | | 29,328,450 | | | | 0.6 | % | |
| RIGHTS/WARRANTS — (0.0%) | |
| Other Securities | | | | | | | 256 | | | | 0.0 | % | |
| TOTAL — BELGIUM | | | | | | | 29,328,706 | | | | 0.6 | % | |
| CANADA — (5.9%) | |
| COMMON STOCKS — (5.9%) | |
| # Barrick Gold Corp. | | | 1,226,832 | | | | 28,052,344 | | | | 0.6 | % | |
| # EnCana Corp. | | | 560,598 | | | | 28,478,732 | | | | 0.6 | % | |
| Petro-Canada | | | 1,205,300 | | | | 30,140,000 | | | | 0.6 | % | |
| Sun Life Financial, Inc. | | | 1,262,400 | | | | 29,693,056 | | | | 0.6 | % | |
| Other Securities | | | | | | | 200,692,451 | | | | 4.4 | % | |
| TOTAL — CANADA | | | | | | | 317,056,583 | | | | 6.8 | % | |
| DENMARK — (0.9%) | |
| COMMON STOCKS — (0.9%) | |
| Other Securities | | | | | | | 46,987,354 | | | | 1.0 | % | |
| FINLAND — (1.0%) | |
| COMMON STOCKS — (1.0%) | |
| Other Securities | | | | | | | 52,418,538 | | | | 1.1 | % | |
| FRANCE — (8.5%) | |
| COMMON STOCKS — (8.5%) | |
| # AXA SA | | | 2,818,397 | | | | 53,842,817 | | | | 1.2 | % | |
| # BNP Paribas SA | | | 1,558,158 | | | | 112,501,123 | | | | 2.4 | % | |
| # Compagnie de Saint-Gobain | | | 580,915 | | | | 22,415,677 | | | | 0.5 | % | |
| Vivendi SA | | | 2,482,257 | | | | 64,884,026 | | | | 1.4 | % | |
| Other Securities | | | | | | | 208,936,536 | | | | 4.3 | % | |
| TOTAL — FRANCE | | | | | | | 462,580,179 | | | | 9.8 | % | |
| GERMANY — (8.8%) | |
| COMMON STOCKS — (8.8%) | |
| Allianz SE | | | 442,712 | | | | 33,313,833 | | | | 0.7 | % | |
| # Daimler AG | | | 1,684,003 | | | | 57,854,323 | | | | 1.2 | % | |
| # Deutsche Bank AG | | | 774,190 | | | | 28,921,349 | | | | 0.6 | % | |
| # Deutsche Telekom AG | | | 2,621,866 | | | | 38,930,629 | | | | 0.8 | % | |
| Deutsche Telekom AG Sponsored ADR | | | 2,705,150 | | | | 40,171,477 | | | | 0.9 | % | |
| E.ON AG | | | 1,781,013 | | | | 68,160,893 | | | | 1.5 | % | |
| # E.ON AG Sponsored ADR | | | 1,091,708 | | | | 41,484,904 | | | | 0.9 | % | |
20
THE DFA INTERNATIONAL VALUE SERIES
CONTINUED
| | | Shares | | Value†† | | Percentage
of Net Assets** | |
| Munchener Rueckversicherungs-Gesellschaft AG | | | 388,934 | | | $ | 50,491,309 | | | | 1.1 | % | |
| Other Securities | | | | | | | 114,673,630 | | | | 2.4 | % | |
| TOTAL — GERMANY | | | | | | | 474,002,347 | | | | 10.1 | % | |
| GREECE — (0.3%) | |
| COMMON STOCKS — (0.3%) | |
| Other Securities | | | | | | | 14,142,756 | | | | 0.3 | % | |
| HONG KONG — (2.5%) | |
| COMMON STOCKS — (2.5%) | |
| # Cheung Kong Holdings, Ltd. | | | 3,224,000 | | | | 30,955,317 | | | | 0.7 | % | |
| Hutchison Whampoa, Ltd. | | | 5,472,000 | | | | 29,569,976 | | | | 0.6 | % | |
| Sun Hung Kai Properties, Ltd. | | | 2,528,000 | | | | 22,148,070 | | | | 0.5 | % | |
| Other Securities | | | | | | | 54,353,926 | | | | 1.1 | % | |
| TOTAL — HONG KONG | | | | | | | 137,027,289 | | | | 2.9 | % | |
| IRELAND — (0.3%) | |
| COMMON STOCKS — (0.3%) | |
| Other Securities | | | | | | | 16,882,601 | | | | 0.4 | % | |
| ITALY — (1.9%) | |
| COMMON STOCKS — (1.9%) | |
| UniCredito Italiano SpA | | | 10,088,794 | | | | 24,697,595 | | | | 0.5 | % | |
| Other Securities | | | | | | | 78,187,153 | | | | 1.7 | % | |
| TOTAL — ITALY | | | | | | | 102,884,748 | | | | 2.2 | % | |
| JAPAN — (13.3%) | |
| COMMON STOCKS — (13.3%) | |
| FUJIFILM Holdings Corp. | | | 1,077,300 | | | | 24,799,840 | | | | 0.5 | % | |
| Hitachi, Ltd. | | | 6,574,000 | | | | 30,865,283 | | | | 0.7 | % | |
| Tokio Marine Holdings, Inc. | | | 1,457,311 | | | | 44,952,061 | | | | 1.0 | % | |
| Other Securities | | | | | | | 621,977,287 | | | | 13.2 | % | |
| TOTAL — JAPAN | | | | | | | 722,594,471 | | | | 15.4 | % | |
| NETHERLANDS — (3.5%) | |
| COMMON STOCKS — (3.5%) | |
| # ArcelorMittal | | | 1,877,993 | | | | 48,755,658 | | | | 1.0 | % | |
| ING Groep NV | | | 3,093,625 | | | | 29,019,312 | | | | 0.6 | % | |
| Koninklijke Philips Electronics NV | | | 3,192,970 | | | | 59,005,541 | | | | 1.3 | % | |
| Other Securities | | | | | | | 50,984,660 | | | | 1.1 | % | |
| TOTAL — NETHERLANDS | | | | | | | 187,765,171 | | | | 4.0 | % | |
| NEW ZEALAND — (0.1%) | |
| COMMON STOCKS — (0.1%) | |
| Other Securities | | | | | | | 7,460,246 | | | | 0.2 | % | |
| NORWAY — (0.8%) | |
| COMMON STOCKS — (0.8%) | |
| Other Securities | | | | | | | 42,910,368 | | | | 0.9 | % | |
| PORTUGAL — (0.1%) | |
| COMMON STOCKS — (0.1%) | |
| Other Securities | | | | | | | 6,541,713 | | | | 0.1 | % | |
| SINGAPORE — (1.1%) | |
| COMMON STOCKS — (1.1%) | |
| Other Securities | | | | | | | 57,732,771 | | | | 1.2 | % | |
| SPAIN — (4.2%) | |
| COMMON STOCKS — (4.2%) | |
| # Banco Santander Central Hispano SA | | | 7,025,356 | | | | 75,980,397 | | | | 1.6 | % | |
| # Banco Santander SA Sponsored ADR | | | 3,044,700 | | | | 32,700,078 | | | | 0.7 | % | |
| Repsol YPF SA | | | 1,204,043 | | | | 22,895,968 | | | | 0.5 | % | |
21
THE DFA INTERNATIONAL VALUE SERIES
CONTINUED
| | | Shares | | Value†† | | Percentage
of Net Assets** | |
| Repsol YPF SA Sponsored ADR | | | 1,285,700 | | | $ | 24,582,584 | | | | 0.5 | % | |
| Other Securities | | | | | | | 68,834,633 | | | | 1.5 | % | |
| TOTAL — SPAIN | | | | | | | 224,993,660 | | | | 4.8 | % | |
| SWEDEN — (2.4%) | |
| COMMON STOCKS — (2.4%) | |
| # Nordea Bank AB | | | 4,247,718 | | | | 34,046,034 | | | | 0.7 | % | |
| Other Securities | | | | | | | 94,071,267 | | | | 2.0 | % | |
| TOTAL — SWEDEN | | | | | | | 128,117,301 | | | | 2.7 | % | |
| SWITZERLAND — (5.9%) | |
| COMMON STOCKS — (5.9%) | |
| * Compagnie Financiere Richemont SA Series A | | | 1,125,900 | | | | 23,669,433 | | | | 0.5 | % | |
| Credit Suisse Group AG | | | 1,755,349 | | | | 65,639,295 | | | | 1.4 | % | |
| # Credit Suisse Group AG Sponsored ADR | | | 591,859 | | | | 22,135,527 | | | | 0.5 | % | |
| Holcim, Ltd. | | | 435,033 | | | | 24,709,544 | | | | 0.5 | % | |
| Swiss Re | | | 725,996 | | | | 30,276,699 | | | | 0.6 | % | |
| Zurich Financial SVCS AG | | | 300,246 | | | | 60,913,201 | | | | 1.3 | % | |
| Other Securities | | | | | | | 92,813,720 | | | | 2.0 | % | |
| TOTAL — SWITZERLAND | | | | | | | 320,157,419 | | | | 6.8 | % | |
| UNITED KINGDOM — (17.2%) | |
| COMMON STOCKS — (17.2%) | |
| Anglo American P.L.C. | | | 1,329,421 | | | | 33,356,819 | | | | 0.7 | % | |
| Aviva P.L.C. | | | 6,571,996 | | | | 39,201,982 | | | | 0.8 | % | |
| # Barclays P.L.C. Sponsored ADR | | | 2,197,790 | | | | 23,670,198 | | | | 0.5 | % | |
| # HSBC Holdings P.L.C. Sponsored ADR | | | 2,176,243 | | | | 128,398,337 | | | | 2.7 | % | |
| Kingfisher P.L.C. | | | 12,172,495 | | | | 22,467,306 | | | | 0.5 | % | |
| Royal Dutch Shell P.L.C. ADR | | | 1,294,780 | | | | 71,588,386 | | | | 1.5 | % | |
| RSA Insurance Group P.L.C. | | | 12,939,111 | | | | 28,774,426 | | | | 0.6 | % | |
| Vodafone Group P.L.C. | | | 56,881,367 | | | | 109,423,488 | | | | 2.3 | % | |
| Vodafone Group P.L.C. Sponsored ADR | | | 6,370,018 | | | | 122,750,247 | | | | 2.6 | % | |
| William Morrison Supermarkets P.L.C. | | | 6,906,878 | | | | 29,409,035 | | | | 0.6 | % | |
| Other Securities | | | | | | | 324,025,564 | | | | 7.1 | % | |
| TOTAL — UNITED KINGDOM | | | | | | | 933,065,788 | | | | 19.9 | % | |
| | | Face
Amount | | Value† | | | |
| | | (000) | | | | | |
| TEMPORARY CASH INVESTMENTS — (1.6%) | |
Repurchase Agreement, PNC Capital Markets, Inc. 0.94%,
11/03/08 (Collateralized by $92,080,000 FHLMC 4.50%,
05/01/23, valued at $87,591,100) to be repurchased at $86,299,760 | | $ | 86,293 | | | | 86,293,000 | | | | 1.8 | % | |
| | | Shares | | | | | |
| SECURITIES LENDING COLLATERAL — (14.0%) | |
| §@ DFA Short Term Investment Fund LP | | | 757,347,231 | | | | 757,347,231 | | | | 16.1 | % | |
| | | Face
Amount | | | | | |
| | | (000) | | | | | |
@ Repurchase Agreement, Deutsche Bank Securities 0.25%,
11/03/08 (Collateralized by $3,471,793 FHLMC 7.000%,
08/01/37, valued at $2,958,290) to be repurchased at $2,900,344 | | $ | 2,900 | | | | 2,900,284 | | | | 0.1 | % | |
| TOTAL SECURITIES LENDING COLLATERAL | | | | | | | 760,247,515 | | | | 16.2 | % | |
TOTAL INVESTMENTS — (100.0%)
(Cost $7,723,320,604) | | | | | | $ | 5,413,879,738 | | | | 115.2 | % | |
See accompanying Notes to Financial Statements.
22
THE DFA INVESTMENT TRUST COMPANY
THE DFA INTERNATIONAL VALUE SERIES
STATEMENT OF ASSETS AND LIABILITIES
OCTOBER 31, 2008
(Amounts in thousands, except share and per share amounts)
| ASSETS: | |
| Investments at Value (including $717,470 of securities on loan) | | $ | 4,567,339 | | |
| Temporary Cash Investments at Value & Cost | | | 86,293 | | |
| Collateral Received from Securities on Loan at Value & Cost | | | 760,248 | | |
| Foreign Currencies at Value | | | 14,156 | | |
| Cash | | | 15 | | |
| Receivables: | |
| Investment Securities Sold | | | 38,170 | | |
| Dividends, Interest and Tax Reclaims | | | 15,310 | | |
| Securities Lending Income | | | 1,186 | | |
| Fund Shares Sold | | | 10,712 | | |
| Fund Margin Variation | | | 19 | | |
| Prepaid Expenses and Other Assets | | | 7 | | |
| Total Assets | | | 5,493,455 | | |
| LIABILITIES: | |
| Payables: | |
| Upon Return of Securities Loaned | | | 760,248 | | |
| Investment Securities Purchased | | | 31,085 | | |
| Fund Shares Redeemed | | | 510 | | |
| Due to Advisor | | | 853 | | |
| Accrued Expenses and Other Liabilities | | | 422 | | |
| Total Liabilities | | | 793,118 | | |
| NET ASSETS | | $ | 4,700,337 | | |
| SHARES OUTSTANDING, $0.01 PAR VALUE (1) | | | 412,114,828 | | |
| NET ASSET VALUE, OFFERING AND REDEMPTION PRICE PER SHARE | | $ | 11.41 | | |
| Investments at Cost | | $ | 6,876,780 | | |
| Foreign Currencies at Cost | | $ | 14,875 | | |
| NET ASSETS CONSIST OF: | |
| Paid-In Capital | | $ | 4,700,337 | | |
| NET ASSETS | | $ | 4,700,337 | | |
| (1) NUMBER OF SHARES AUTHORIZED | | | Unlimited | | |
See accompanying Notes to Financial Statements.
23
THE DFA INVESTMENT TRUST COMPANY
THE DFA INTERNATIONAL VALUE SERIES
STATEMENTS OF OPERATIONS
(Amounts in thousands)
| | | Period
Dec. 1, 2007
to
Oct. 31, 2008 | | Year
Ended
Nov. 30,
2007 | |
| Investment Income | |
| Dividends (Net of Foreign Taxes Withheld of $28,938 and $23,649, respectively) | | $ | 300,627 | | | $ | 278,708 | | |
| Interest | | | 1,071 | | | | 2,113 | | |
| Income from Securities Lending | | | 19,332 | | | | 14,342 | | |
| Total Investment Income | | | 321,030 | | | | 295,163 | | |
| Expenses | |
| Investment Advisory Services Fees | | | 14,643 | | | | 18,039 | | |
| Accounting & Transfer Agent Fees | | | 739 | | | | 900 | | |
| Custodian Fees | | | 914 | | | | 1,185 | | |
| Shareholders' Reports | | | 78 | | | | 84 | | |
| Directors'/Trustees' Fees & Expenses | | | — | | | | 97 | | |
| Professional Fees | | | 171 | | | | 139 | | |
| Other | | | 98 | | | | 106 | | |
| Total Expenses | | | 16,643 | | | | 20,550 | | |
| Net Investment Income (Loss) | | | 304,387 | | | | 274,613 | | |
| Realized and Unrealized Gain (Loss) | |
| Net Realized Gain (Loss) on: | |
| Investment Securities Sold | | | 137,811 | | | | 654,522 | | |
| Futures | | | (1,153 | ) | | | — | | |
| Foreign Currency Transactions | | | (4,593 | ) | | | 2,498 | | |
| In-Kind Redemptions | | | 103,024 | * | | | — | | |
| Change in Unrealized Appreciation (Depreciation) of: | |
| Investment Securities and Foreign Currency | | | (5,026,911 | ) | | | 403,307 | | |
| Futures | | | 19 | | | | — | | |
| Translation of Foreign Currency Denominated Amounts | | | (76 | ) | | | (180 | ) | |
| Net Realized and Unrealized Gain (Loss) | | | (4,791,879 | ) | | | 1,060,147 | | |
| Net Increase (Decrease) in Net Assets Resulting from Operations | | $ | (4,487,492 | ) | | $ | 1,334,760 | | |
* See Note J in the Notes to Financial Statements.
See accompanying Notes to Financial Statements.
24
THE DFA INVESTMENT TRUST COMPANY
THE DFA INTERNATIONAL VALUE SERIES
STATEMENTS OF CHANGES IN NET ASSETS
(Amounts in thousands)
| | | Period
Dec. 1, 2007
to
Oct. 31, 2008 | | Year
Ended
Nov. 30,
2007 | | Year
Ended
Nov. 30,
2006 | |
| Increase (Decrease) in Net Assets | |
| Operations: | |
| Net Investment Income (Loss) | | $ | 304,387 | | | $ | 274,613 | | | $ | 193,174 | | |
| Net Realized Gain (Loss) on: | |
| Investment Securities Sold | | | 137,811 | | | | 654,522 | | | | 201,700 | | |
| Futures | | | (1,153 | ) | | | — | | | | — | | |
| Foreign Currency Transactions | | | (4,593 | ) | | | 2,498 | | | | 378 | | |
| In-Kind Redemptions | | | 103,024 | * | | | — | | | | — | | |
| Change in Unrealized Appreciation (Depreciation) of: | |
| Investment Securities and Foreign Currency | | | (5,026,911 | ) | | | 403,307 | | | | 1,351,708 | | |
| Futures | | | 19 | | | | — | | | | — | | |
| Translation of Foreign Currency Denominated Amounts | | | (76 | ) | | | (180 | ) | | | 486 | | |
Net Increase (Decrease) in Net Assets Resulting
from Operations | | | (4,487,492 | ) | | | 1,334,760 | | | | 1,747,446 | | |
| Distributions From: | |
| Net Investment Income | | | (293,386 | ) | | | (278,093 | ) | | | (202,210 | ) | |
| Net Short-Term Gains | | | (22,542 | ) | | | (14,957 | ) | | | (11,375 | ) | |
| Net Long-Term Gains | | | (614,160 | ) | | | (185,943 | ) | | | (115,307 | ) | |
| Total Distributions | | | (930,088 | ) | | | (478,993 | ) | | | (328,892 | ) | |
| Capital Share Transactions (1): | |
| Shares Issued | | | 927,878 | | | | 1,731,698 | | | | 1,589,921 | | |
| Shares Issued in Lieu of Cash Distributions | | | 916,898 | | | | 465,562 | | | | 307,948 | | |
| Shares Redeemed | | | (1,365,580 | )* | | | (871,558 | ) | | | (226,869 | ) | |
| Net Increase (Decrease) from Capital Share Transactions | | | 479,196 | | | | 1,325,702 | | | | 1,671,000 | | |
| Total Increase (Decrease) in Net Assets | | | (4,938,384 | ) | | | 2,181,469 | | | | 3,089,554 | | |
| Net Assets | |
| Beginning of Period | | | 9,638,721 | | | | 7,457,252 | | | | 4,367,698 | | |
| End of Period | | $ | 4,700,337 | | | $ | 9,638,721 | | | $ | 7,457,252 | | |
| (1) Shares Issued and Redeemed: | |
| Shares Issued | | | 50,328 | | | | 72,431 | | | | 80,546 | | |
| Shares Issued in Lieu of Cash Distributions | | | 45,073 | | | | 20,227 | | | | 16,678 | | |
| Shares Redeemed | | | (77,527 | ) | | | (36,444 | ) | | | (11,688 | ) | |
| | | | 17,874 | | | | 56,214 | | | | 85,536 | | |
Undistributed Net Investment Income (Distributions in
Excess of Net Investment Income) | | $ | — | | | $ | 9,727 | | | $ | (7,523 | ) | |
* See Note J in the Notes to Financial Statements.
See accompanying Notes to Financial Statements.
25
THE DFA INVESTMENT TRUST COMPANY
THE DFA INTERNATIONAL VALUE SERIES
FINANCIAL HIGHLIGHTS
(for a share outstanding throughout each period)
| | | Period
Dec. 1, 2007
to
Oct. 31, 2008 | | Year
Ended
Nov. 30,
2007 | | Year
Ended
Nov. 30,
2006 | | Year
Ended
Nov. 30,
2005 | | Year
Ended
Nov. 30,
2004 | | Year
Ended
Nov. 30,
2003 | |
Net Asset Value,
Beginning of Period | | $ | 24.45 | | | $ | 22.06 | | | $ | 17.30 | | | $ | 16.04 | | | $ | 12.40 | | | $ | 9.33 | | |
Income from Investment
Operations | | | | | |
| Net Investment Income (Loss) | | | 0.73 | (A) | | | 0.73 | (A) | | | 0.65 | (A) | | | 0.43 | | | | 0.33 | | | | 0.27 | | |
Net Gains (Losses) on
Securities (Realized and
Unrealized) | | | (11.45 | ) | | | 2.98 | | | | 5.27 | | | | 1.95 | | | | 3.61 | | | | 3.06 | | |
Total from Investment
Operations | | | (10.72 | ) | | | 3.71 | | | | 5.92 | | | | 2.38 | | | | 3.94 | | | | 3.33 | | |
| Less Distributions | |
| Net Investment Income | | | (0.71 | ) | | | (0.73 | ) | | | (0.67 | ) | | | (0.52 | ) | | | (0.30 | ) | | | (0.25 | ) | |
| Net Realized Gains | | | (1.61 | ) | | | (0.59 | ) | | | (0.49 | ) | | | (0.60 | ) | | | — | | | | (0.01 | ) | |
| Total Distributions | | | (2.32 | ) | | | (1.32 | ) | | | (1.16 | ) | | | (1.12 | ) | | | (0.30 | ) | | | (0.26 | ) | |
Net Asset Value,
End of Period | | $ | 11.41 | | | $ | 24.45 | | | $ | 22.06 | | | $ | 17.30 | | | $ | 16.04 | | | $ | 12.40 | | |
| Total Return | | | (47.87 | )%(C) | | | 17.32 | % | | | 35.73 | % | | | 15.61 | % | | | 32.15 | % | | | 36.24 | % | |
Net Assets,
| |
| End of Period (thousands) | | $ | 4,700,337 | | | $ | 9,638,721 | | | $ | 7,457,252 | | | $ | 4,367,698 | | | $ | 2,804,043 | | | $ | 1,604,778 | | |
Ratio of Expenses to Average
Net Assets | | | 0.23 | %(B) | | | 0.23 | % | | | 0.23 | % | | | 0.27 | % | | | 0.28 | % | | | 0.30 | % | |
Ratio of Net Investment Income
to Average Net Assets | | | 4.15 | %(B) | | | 3.04 | % | | | 3.29 | % | | | 2.71 | % | | | 2.35 | % | | | 2.61 | % | |
| Portfolio Turnover Rate | | | 16 | %(C) | | | 16 | % | | | 8 | % | | | 10 | % | | | 15 | % | | | 14 | % | |
See page 1 for the Definitions of Abbreviations and Footnotes.
See accompanying Notes to Financial Statements.
26
THE DFA INVESTMENT TRUST COMPANY
THE DFA INTERNATIONAL VALUE SERIES
NOTES TO FINANCIAL STATEMENTS
A. Organization:
The DFA Investment Trust Company (the "Trust") is an open-end management investment company registered under the Investment Company Act of 1940. The Trust consists of eighteen investment portfolios, of which The DFA International Value Series (the "Series") is presented in this report.
At a regular meeting of the Board of Directors/Trustees (the "Board") on September 16, 2008, the Board voted to change the fiscal and tax year ends of the Series from November 30 to October 31.
B. Significant Accounting Policies:
The following significant accounting policies are in conformity with accounting principles generally accepted in the United States of America. Such policies are consistently followed by the Trust in preparation of its financial statements. The preparation of financial statements in accordance with accounting principles generally accepted in the United States of America requires management to make estimates and assumptions that affect the reported amounts of assets and liabilities and disclosure of contingent assets and liabilities at the date of the financial statements and the reported amounts of increases and decreases in net assets from operations during the reporting period. Actual results could differ from those estimates and those differences could be material.
1. Security Valuation: Securities held by the Series (including over-the-counter securities) are valued at the last quoted sale price of the day. Securities held by the Series that are listed on Nasdaq are valued at the Nasdaq Official Closing Price ("NOCP"). If there is no last reported sale price or NOCP for the day, the Series values the securities at the mean of the most recent quoted bid and asked prices. Price information on listed securities is taken from the exchange where the security is primarily traded. Generally, securities issued by open-end investment companies are valued using their respective net asset values or public offering prices, as appropriate, for purchase orders placed at the close of the New York Stock Exchange (NYSE).
Securities for which no market quotations are readily available (including restricted securities), or for which market quotations have become unreliable, are valued in good faith at fair value in accordance with procedures adopted by the Board of Directors/Trustees. Fair value pricing may also be used if events that have a significant effect on the value of an investment (as determined in the discretion of the Investment Committee of the Advisor) occur before the net asset value is calculated. When fair value pricing is used, the prices of securities used by the Series may differ from the quoted or published prices for the same securities on their primary markets or exchanges.
The Series will also fair value price in the circumstances described below. Generally, trading in foreign securities markets is completed each day at various times prior to the close of the NYSE. For example, trading in the Japanese securities markets is completed each day at the close of Tokyo Stock Exchange (normally 11:00 p.m. PT), which is fourteen hours prior to the close of the NYSE (normally 1:00 p.m. PT) and the time that the net asset value of the Series is computed. Due to the time differences between the closings of the relevant foreign securities exchanges and the time the Series prices its shares at the close of the NYSE, the Series will fair value its foreign investments when it is determined that the market quotations for the foreign investments are either unreliable or not readily available. The fair value prices will attempt to reflect the impact of the U.S. financial markets' perceptions and trading activities on the Series ' foreign investments since the last closing prices of the foreign investments were calculated on their primary foreign securities markets or exchanges. For these purposes, the Board of Directors/Trustees of the Series has determined that movements in relevant indices or other appropriate market indicators, after the close of the Tokyo Stock Exchange or the London Stock Exchange, demonstrate that market quotations may be unreliable. Fair valuation of portfolio securities may occur on a daily basis. The fair value pricing by the Series utilizes data furnished by an independent pricing service (and that data draws upon, among other information, the market values of foreign investments). The fair value prices of portfolio securities generally will be used when it is determined that the use of such prices will have a material impact on the net asset value of the Series. When the Series uses fair value
27
pricing, the values assigned to the Series' foreign investments may not be the quoted or published prices of the investments on their primary markets or exchanges.
Futures contracts held by the Series are valued using the settlement price established each day on the exchange on which they are traded.
Adoption of Statement of Financial Accounting Standards No. 157 "Fair Value Measurements" ("FAS 157")
In September 2006, the Financial Accounting Standards Board issued FAS 157 effective for fiscal years beginning after November 15, 2007. This standard clarifies the definition of fair value for financial reporting, establishes a framework for measuring fair value and requires additional disclosures about the use of fair value measurements. The Funds have adopted FAS 157 as of December 1, 2007. The three levels of the fair value hierarchy under FAS 157 are described below:
• Level 1 – quoted prices in active markets for identical securities
• Level 2 – other significant observable inputs (including quoted prices for similar securities, interest rates, prepayment speeds, credit risk, etc.)
• Level 3 – significant unobservable inputs (including the Series' own assumptions in determining the fair value of investments)
The inputs or methodology used for valuing securities are not necessarily an indication of the risk associated with investing in those securities. A summary of the inputs used to value the Series' net assets as of October 31, 2008 is listed below (in thousands).
| | | Valuation Inputs | |
| | | Investments in
Securities
(Market Value) | | Other Financial
Instruments (Unrealized
Appreciation/Depreciation)* | |
| | | Level 1 | | Level 2 | | Level 3 | | Total | | Level 1 | | Level 2 | | Level 3 | | Total | |
| The DFA International Value Series | | $ | 1,004,378 | | | $ | 4,409,502 | | | | — | | | $ | 5,413,880 | | | $ | 19 | | | | — | | | | — | | | $ | 19 | | |
2. Foreign Currency Translation: Securities and other assets and liabilities of the Series whose values are initially expressed in foreign currencies are translated to U.S. dollars using the mean between the most recently quoted bid and asked prices for the U.S. dollar as quoted by generally recognized reliable sources. Dividend and interest income and certain expenses are translated to U.S. dollars at the rate of exchange on their respective accrual dates. Receivables and payables denominated in foreign currencies are marked to market daily based on daily exchange rates. Exchange gains or losses are realized upon ultimate receipt or disbursement.
The Series does not isolate the effect of fluctuations in foreign exchange rates from the effect of fluctuations in the market prices of securities held whether realized or unrealized.
Realized gains or losses on foreign currency transactions represent net foreign exchange gains or losses from the disposition of foreign currencies, currency gains or losses realized between the trade and settlement dates on securities transactions, and the difference between amounts of interest, dividends and foreign withholding taxes recorded on the books of the Series and the U.S. dollar equivalent amounts actually received or paid.
3. Deferred Compensation Plan: Each eligible Trustee of the Trust may elect participation in the Deferred Compensation Plan (the "Plan"). Under the Plan, effective January 1, 2002, such Trustees may defer payment of all or a portion of their total fees earned as a Trustee. These deferred amounts may be treated as though such amounts had been invested in shares of the following funds: U.S. Large Cap Value Portfolio; U.S. Core Equity 1 Portfolio; U.S. Core Equity 2 Portfolio; U.S. Vector Equity Portfolio; U.S. Micro Cap Portfolio; DFA International Value Portfolio; International Core Equity Portfolio; Emerging Markets Portfolio; Emerging Markets Core Equity Portfolio; and/or DFA Two-Year Global Fixed Income Portfolio. Contributions made under the Plan and the change in unrealized app reciation (depreciation) and income are included in Other Expenses for the period ended October 31, 2008 and are included in Directors'/Trustees' Fees & Expenses for the year ended November 30, 2007. At October 31, 2008, the total liability for deferred compensation to Trustees is included in Accrued Expenses and Other Liabilities in the amount of $117 (in thousands).
28
Each Trustee has the option to receive their distribution of proceeds in one of the following methods upon one year's notice: lump sum; annual installments over a period of agreed upon years; or semi-annual installments over a period of agreed upon years. As of October 31, 2008, none of the Trustees have requested distribution of proceeds.
4. Other: Security transactions are accounted for as of the trade date. Costs used in determining realized gains and losses on the sale of investment securities are on the basis of identified cost. Dividend income and distributions to shareholders are recorded on the ex-dividend date. Distributions received on securities that represent a return of capital or capital gains are recorded as a reduction of cost of investments or as a realized gain, respectively. The Series estimates the character of distributions received that may be considered return of capital distributions or capital gain distributions. Interest income is recorded on the accrual basis. Discount and premium on securities purchased are amortized over the lives of the respective securities utilizing the effective inter est method. Expenses directly attributable to a Series are directly charged. Common expenses of the Trust are allocated using methods approved by the Board of Directors/Trustees, generally based on average net assets.
The Series may be subject to taxes imposed by countries in which it invests, with respect to its investments in issuers exiting or operating in such countries. Such taxes are generally based on income earned or repatriated and capital gains realized on the sale of such investments. The Series accrues such taxes when the related income or capital gains are earned or throughout the holding period. Some countries require governmental approval for the repatriation of investment income, capital or the proceeds of sales earned by foreign investors. In addition, if there is a deterioration in a country's balance of payments or for other reasons, a country may impose temporary restrictions on foreign capital remittances abroad.
C. Investment Advisor:
Dimensional Fund Advisors LP ("Dimensional" or the "Advisor") provides investment advisory services to the Series. For the period December 1, 2007 to October 31, 2008, the Series' investment advisory services fees were accrued daily and paid monthly to the Advisor based on an effective annual rate of 0.20% of average daily net assets.
Fees Paid to Officers and Directors/Trustees:
Certain Officers and Directors/Trustees of the Advisor are also Officers and Directors/Trustees of the Trust; however, such Officers and Directors/Trustees (with the exception of the Chief Compliance Officer ("CCO")) receive no compensation from the Trust. For the period December 1, 2007 to October 31, 2008, the total related amounts paid by the Trust to the CCO were $106 (in thousands). The total related amounts paid by the Series are included in Other Expenses on the Statement of Operations.
D. Purchases and Sales of Securities:
For the period December 1, 2007 to October 31, 2008, the Series made the following purchases and sales of investment securities, other than short-term securities and U.S. government securities (amounts in thousands):
| Purchases | | $ | 1,266,540 | | |
| Sales | | | 1,523,257 | | |
There were no purchases or sales of long-term U.S. government securities.
E. Federal Income Taxes:
The Series has qualified and intends to continue to qualify as a regulated investment company under Subchapter M of the Internal Revenue Code for federal income tax purposes and to distribute substantially all of its taxable income and net capital gains to its shareholders. Accordingly, no provision has been made for federal income taxes.
Distributions from net investment income and net realized capital gains are determined in accordance with U.S. federal income tax regulations, which may differ from those amounts determined under accounting principles generally accepted in the United States of America. These book/tax differences are either temporary or permanent
29
in nature. To the extent these differences are permanent, they are charged or credited to paid-in capital, undistributed net investment income or accumulated net realized gains, as appropriate, in the period that the differences arise. Accordingly, the following permanent differences as of October 31, 2008, primarily attributable to realized net foreign currency gains/losses and net realized gains on securities considered to be passive foreign investment companies, were reclassified to the following accounts. These reclassifications had no effect on net assets or net asset value per share (amounts in thousands):
Increase
(Decrease)
Paid-in Capital | | Increase
(Decrease)
Undistributed
Net Investment Income | | Increase
(Decrease)
Accumulated
Net Realized
Gains/(Losses) | |
| $ | 123,628 | | | $ | (20,126 | ) | | $ | (103,502 | ) | |
The tax character of dividends and distributions declared and paid during the years November 30, 2006, November 30, 2007 and the period December 1, 2007 to October 31, 2008 (amounts in thousands):
| | | Net Investment
Income
and Short-Term
Capital Gains | | Long-Term
Capital Gains | | Total | |
| | 2006 | | | $ | 213,585 | | | $ | 115,307 | | | $ | 328,892 | | |
| | 2007 | | | | 293,050 | | | | 185,943 | | | | 478,993 | | |
| | 2008 | | | | 336,790 | | | | 613,845 | | | | 950,635 | | |
In June 2006, the Financial Accounting Standards Board (FASB) issued FASB Interpretation 48 ("FIN 48"), "Accounting for Uncertainty in Income Taxes." This standard defines the threshold for recognizing the benefits of tax-return positions in the financial statements as "more-likely-than-not" to be sustained by the taxing authority and requires measurement of a tax position meeting the more-likely-than-not criterion, based on the largest benefit that is more than 50 percent likely to be realized. Management has analyzed the Series' tax positions to be taken on the federal income tax returns for all open tax years (tax years ended November 30, 2004-2007) and for the period ended October 31, 2008, for purposes of implementing FIN 48, and has concluded that no provision for income tax is required in the Series' financial statements.
F. Financial Instruments:
In accordance with the Series' investment objectives and policies, the Series may invest in certain financial instruments that have off-balance sheet risk in excess of the amounts recognized in the financial statements and concentrations of credit and market risk. These instruments and their significant corresponding risks are described below:
1. Repurchase Agreements: The Series may purchase money market instruments subject to the counterparty's agreement to repurchase them at an agreed upon date and price. The counterparty will be required on a daily basis to maintain the value of the collateral subject to the agreement at not less than the repurchase price (including accrued interest). The agreements are conditioned upon the collateral being deposited under the Federal Reserve book-entry system with the Trust's custodian or a third party sub-custodian. In the event of default or bankruptcy by the other party to the agreement, retention of the collateral may be subject to legal proceedings. All open repurchase agreements were entered into on October 31, 2008.
2. Foreign Market Risks: Investments in foreign markets may involve certain considerations and risks not typically associated with investments in the United States of America, including the possibility of future political and economic developments and the level of foreign government supervision and regulation of foreign securities markets. These markets are generally smaller, less liquid and more volatile than the major securities markets in the United States of America. Consequently, acquisition and disposition of securities by the Series may be inhibited.
3. Futures Contracts: During the period December 1, 2007 to October 31, 2008, the Series entered into futures contracts in accordance with its investment objectives. Upon entering into a futures contract, the Series deposits cash or pledges U.S. Government securities to a broker, equal to the minimum "initial margin" requirements of the exchange on which the contract is traded. Subsequent payments are received from or paid to the broker each day, based on the daily fluctuation in the market value of the contract. These receipts or payments are known as "variation margin" and
30
are recorded daily by the Series as unrealized gains or losses until the contracts are closed. When the contracts are closed, the Series records a realized gain or loss equal to the difference between the value of the contract at the time it was opened and the value at the time it was closed.
At October 31, 2008, the Series had outstanding 156 long futures contracts of the S&P 500 Index®, all of which expire on December 19, 2008. The value of such contracts on October 31, 2008 was $37,725 (in thousands), which resulted in an unrealized gain of $19 (in thousands). Approximately $3,861 (in thousands) of cash has been segregated as collateral for the open futures contracts and has been accounted for as cash on the Statement of Assets and Liabilities.
Risks may arise upon entering into futures contracts from potential imperfect price correlations between the futures contracts and the underlying securities, from the possibility of an illiquid secondary market for these instruments and from the possibility that the Series could lose more than the initial margin requirements.
G. Line of Credit:
The Trust, together with other Dimensional-advised portfolios, has entered into a $250 million unsecured discretionary line of credit effective June 30, 2003 with an affiliate of its domestic custodian bank. Each portfolio is permitted to borrow, subject to its investment limitations, up to a maximum of $250 million, as long as total borrowings under the line of credit do not exceed $250 million in the aggregate. Borrowings under the line of credit are charged interest at the then current Federal Funds Rate plus 1%. Each portfolio is individually, and not jointly, liable for its particular advances under the line of credit. There is no commitment fee on the unused portion of the line of credit. The agreement for the discretionary line of credit may be terminated by either party at any time. The line of credit is scheduled to expire on June 23, 2009. There were no borrowings by the Series under this line of credit during the period ended Octo ber 31, 2008.
The Trust, together with other Dimensional-advised portfolios, has also entered into an additional $500 million unsecured line of credit effective January 15, 2008 with its international custodian bank. Each portfolio is permitted to borrow, subject to its investment limitations, up to a maximum of $500 million, as long as total borrowings under the line of credit do not exceed $500 million in the aggregate. Borrowings under the line of credit are charged interest at rates agreed to by the parties at the time of borrowing. Each portfolio is individually, and not jointly, liable for its particular advances under the line of credit. There is no commitment fee on the unused portion of the line of credit. The agreement for the line of credit expires on January 15, 2009.
For the period December 1, 2007 to October 31, 2008, borrowings by the Series under this line of credit were as follows (amounts in thousands, except percentages and days):
Weighted
Average
Interest Rate | | Weighted
Average
Loan Balance | | Number of
Days
Outstanding | | Interest
Expense
Incurred | | Maximum Amount
Borrowed During
the Period | |
| | 3.68 | % | | $ | 8,004 | | | | 31 | | | $ | 25 | | | $ | 27,822 | | |
There were no outstanding borrowings by the Series under this line of credit at October 31, 2008.
H. Securities Lending:
As of October 31, 2008, the Series had securities on loan to brokers/dealers, for which the Series held cash collateral. The Series invests the cash collateral, as described below, and records a liability for the return of the collateral, during the period the securities are on loan. Loans of securities are expected at all times to be secured by collateral equal to at least (i) 100% of the current market value of the loaned securities with respect to securities of the U.S. government or its agencies, (ii) 102% of the current market value of the loaned securities with respect to U.S. securities, and (iii) 105% of the current market value of the loaned securities with respect to foreign securities. However, daily market fluctuations could cause the Series' collateral to be lower or higher than the expected thresholds. If this were to occur, the collateral would be adjusted the next business day to ensure adequate collateralization. In the even t of default or bankruptcy by the other party to the agreement, realization and/or retention of the collateral may be subject to legal proceedings. If the borrower fails to return loaned securities, and cash collateral being maintained by the borrower is insufficient to cover the value of loaned securities and provided such collateral insufficiency is not the result of investment losses, the lending agent has agreed to pay the amount of the shortfall to the Series or, at the option of the lending agent, to replace the securities.
31
Subject to the Series' investment policy, the cash collateral received by the Series from securities on loan is invested in securities of the U.S. government or its agencies, repurchase agreements collateralized by securities of the U.S. government or its agencies or shares of the DFA Short-Term Investment Fund LP. Agencies include both agency debentures and agency mortgage backed securities. In addition, the Series will be able to terminate the loan at any time and will receive reasonable interest on the loan, as well as amounts equal to any dividends, interest or other distributions on the loaned securities. However, dividend income received from loaned securities may not be eligible to be taxed at qualified dividend income rates.
I. Indemnities; Contractual Obligations:
Under the Trust's organizational documents, its officers and directors are indemnified against certain liabilities arising out of the performance of their duties to the Trust.
In the normal course of business, the Trust enters into contracts that contain a variety of representations and warranties which provide general indemnification. The Trust's maximum exposure under these arrangements is unknown as this would involve future claims that may be made against the Trust and/or its affiliates that have not yet occurred. However, based on experience, the Trust expects the risk of loss to be remote.
J. In-Kind Redemptions:
In accordance with guidelines described in the Series' prospectus, the Series may distribute portfolio securities rather than cash as payment for a redemption of fund shares (In-Kind redemption). For financial reporting purposes, the Series recognizes a gain on In-Kind redemptions to the extent the value of the distributed securities on the date of redemption exceeds the cost of those securities. Gains and losses realized on In-Kind redemptions are not recognized for tax purposes and are reclassified from undistributed realized gain (loss) to paid-in capital. During the period December 1, 2007 to October 31, 2008, the Series realized $103,024 (in thousands) of net gain.
K. Recently Issued Accounting Standards and Interpretation:
In March 2008, Statement of Financial Accounting Standards No. 161, Disclosures about Derivative Instruments and Hedging Activities ("FAS 161"), was issued and is effective for fiscal years beginning after November 15, 2008. FAS 161 defines new disclosures of derivative instruments and hedging activities. Management is currently evaluating the implications of FAS 161. At this time, its impact on the Series' financial statements has not been determined.
L. Subsequent Event Note:
On November 1, 2008, The DFA International Value Series, a master fund in a RIC/RIC master feeder structure with five RIC feeders and two direct client investors, made a "Check-the-box" election for federal income tax purposes pursuant to Treasury Regulation § 301.7701-3, to change its federal entity classification from a corporation taxable as a regulated investment company to a partnership. As a result of this election, the master fund is deemed to have distributed all of its assets and liabilities, in a taxable transaction, to its shareholders in liquidation of the master fund. Immediately thereafter, the shareholders contributed all of the distributed assets and liabilities to a newly formed partnership. The final tax year end of The DFA International Value Series was October 31, 2008. For Federal income tax purposes, pursuant to Code §336(a), the master fund recognizes gain or loss as if the master's investment securities were sold to its shareholders and, pursuant to Code §336, each of the Portfolios recognizes gain or loss as if it liquidated its investment in the master. For tax purposes, pursuant to Code § 331(a), each of the Portfolio's will take a fair market value basis in the securities deemed received by them and a new holding period for those securities commences on the deemed liquidation date.
The master fund had book/tax differences upon its deemed liquidation. The following summary of permanent differences occurred as of the respective effective "Check the Box" election date.
Increase
(Decrease)
Paid-in
Capital | | Unrealized
Appreciation
(Depreciation)
Investment
Securities | | Increase
(Decrease)
Undistributed
Net Investment
Income | | Increase
(Decrease)
Accumulated
Net Realized
Gains(Losses) | |
| $ | (2,187,614,395 | ) | | $ | 2,319,051,847 | | | $ | (602,214 | ) | | $ | (130,835,238 | ) | |
32
As a result of the transaction, The DFA International Value Series recognized a ($2,309,440,866) and ($718,733) capital and currency loss respectively for tax year ended October 31, 2008. Additionally, the fund has written off $2,178,493,687 of expired capital loss carryover as a permanent book/tax reporting difference decreasing paid in capital.
Each Portfolio impacted by the "Check the Box" election also has a permanent book/tax difference resulting from the transaction. Listed below is the permanent difference impacting each respective Portfolio. For financial statement purposes, this adjustment did not result in any changes to each respective fund's net assets or net asset value per share.
| | | Unrealized
Appreciation
(Depreciation)
Investment
Securities | | Increase
(Decrease)
Accumulated
Net Realized
Gains(Losses) | |
| DFA International Value Portfolio | | $ | 1,598,039,236 | | | $ | (1,598,039,236 | ) | |
| DFA International Value Portfolio II | | | 49,859,737 | | | | (49,859,737 | ) | |
| DFA International Value Portfolio III | | | 155,866,882 | | | | (155,866,882 | ) | |
| DFA International Value Portfolio IV | | | 82,052,198 | | | | (82,052,198 | ) | |
| LWAS/DFA International High Book To Market Portfolio | | | (19,800,535 | ) | | | 19,800,535 | | |
For financial reporting purposes, this transaction had no impact on the net assets of the respective funds.
33
REPORT OF INDEPENDENT REGISTERED PUBLIC ACCOUNTING FIRM
To the Shareholders of The DFA International Value Series and
Board of Trustees of The DFA Investment Trust Company:
In our opinion, the accompanying statements of assets and liabilities, including the summary schedules of portfolio holdings, and the related statements of operations and of changes in net assets and the financial highlights presents fairly, in all material respects, the financial position of The DFA International Value Series (one of the portfolios constituting The DFA Investment Trust Company, hereafter referred to as the "Series") at October 31, 2008, the results of its operations, the changes in its net assets and the financial highlights for each of the periods indicated, in conformity with accounting principles generally accepted in the United States of America. These financial statements and financial highlights (hereafter referred to as "financial statements") are the responsibility of the Series' management; our responsibility is to express an opinion on these financial statements based on our audits. We conducted our audits of thes e financial statements in accordance with the standards of the Public Company Accounting Oversight Board (United States). Those standards require that we plan and perform the audit to obtain reasonable assurance about whether the financial statements are free of material misstatement. An audit includes examining, on a test basis, evidence supporting the amounts and disclosures in the financial statements, assessing the accounting principles used and significant estimates made by management, and evaluating the overall financial statement presentation. We believe that our audits, which included confirmation of securities at October 31, 2008 by correspondence with the custodian and brokers, provide a reasonable basis for our opinion.
PricewaterhouseCoopers LLP
Philadelphia, Pennsylvania
December 22, 2008
34
FUND MANAGEMENT
Trustees/Directors
Each Board of Trustees/Directors of The DFA Investment Trust Company Inc. ("DFAITC"), DFA Investment Dimensions Group Inc. ("DFAIDG"), Dimensional Investment Group Inc. ("DIG") and Dimensional Emerging Markets Value Fund Inc. ("DEM") (each, the "Fund" and collectively, the "Funds") is responsible for establishing the Funds' policies and for overseeing the management of the Funds. The Trustees/Directors of the Funds, including all of the disinterested Directors, have adopted written procedures to monitor potential conflicts of interest that might develop between portfolios of the Funds (the "Feeder Portfolios") that invest in certain series of DFAITC or DEM (the "Master Funds").
Each Board has two standing committees, an Audit Committee and a Portfolio Performance and Service Review Committee (the "Performance Committee"). The Audit Committee is comprised of George M. Constantinides, Roger G. Ibbotson and Abbie J. Smith. Each member of the Audit Committee is a disinterested Director. The Audit Committee oversees the Fund's accounting and financial reporting policies and practices, the Fund's internal controls, the Fund's financial statements and the independent audits thereof and performs other oversight functions as requested by the Board. The Audit Committee recommends the appointment of each Fund's independent registered certified public accounting firm and also acts as a liaison between the Fund's independent registered certified public accounting firm and the full Board. There were three Audit Committee meetings held during the fiscal year ended October 31, 2008.
Each Board's Performance Committee is comprised of Messrs. Constantinides and Ibbotson, Ms. Smith, John P. Gould, Myron S. Scholes and Robert C. Merton. Each member of the Fund's Performance Committee is a disinterested Director. The Performance Committee regularly reviews and monitors the investment performance of the Fund's series and reviews the performance of the Fund's service providers. There were five Performance Committee meetings held during the fiscal year ended October 31, 2008.
Certain biographical information for each disinterested Trustee/Director and each interested Trustee/Director of the Funds is set forth in the tables below, including a description of each Trustee/Director's experience as a Trustee/Director of the Funds and as a director or trustee of other funds, as well as other recent professional experience.
The statements of additional information (together, "SAI") of the Funds include additional information about each Trustee/Director. You may obtain copies of the SAI and prospectus of each Fund advised by Dimensional Fund Advisors LP by calling collect (310) 395-8005 or by mailing a request to Dimensional Fund Advisors LP, 1299 Ocean Avenue, Santa Monica, California 90401. Prospectuses are also available at www.dimensional.com.
Name, Position
with the Fund,
Address and Age | | Term of Office1 and
Length of Service | | Portfolios within the
DFA Fund Complex2
Overseen | | Principal Occupation(s) During Past 5 Years and
Other Directorships of Public Companies Held | |
| | | Disinterested Trustees/Directors | |
|
George M. Constantinides
Director of DFAIDG, DIG and DEM.
Trustee of DFAITC.
The University of Chicago Booth School of Business
5807 S. Woodlawn Avenue Chicago, IL 60637
Age: 61 | | DFAITC - since 1993
DFAIDG - since 1983
DIG - since 1993
DEM - since 1993 | | 96 portfolios in 4 investment companies | | Leo Melamed Professor of Finance, The University of Chicago Booth School of Business. | |
|
35
Name, Position
with the Fund,
Address and Age | | Term of Office1 and
Length of Service | | Portfolios within the
DFA Fund Complex2
Overseen | | Principal Occupation(s) During Past 5 Years and
Other Directorships of Public Companies Held | |
John P. Gould
Director of DFAIDG, DIG and DEM.
Trustee of DFAITC.
The University of Chicago Booth School of Business
5807 S. Woodlawn Avenue
Chicago, IL 60637
Age: 69 | | DFAITC - since 1993
DFAIDG - since 1986
DIG - since 1993
DEM - since 1993 | | 96 portfolios in 4 investment companies | | Steven G. Rothmeier Distinguished Service Professor of Economics, The University of Chicago Booth School of Business (since 1965). Member of the Boards of Milwaukee Mutual Insurance Company (since 1997) and UNext.com (1999-2006). Member Competitive Markets Advisory Committee, Chicago Mercantile Exchange (futures trading exchange) (since 2004). Formerly, Senior Vice-President, Lexecon Inc. (economics, law, strategy and finance consulting) (1994-2004). Formerly, President, Cardean University (division of UNext.com) (1999-2001). Trustee, Harbor Fund (registered investment company) (14 Portfolios) (since 1994). | |
|
Roger G. Ibbotson
Director of DFAIDG, DIG and DEM.
Trustee of DFAITC.
Yale School of Management
P.O. Box 208200
New Haven, CT 06520-8200
Age: 65 | | DFAITC - since 1993
DFAIDG - since 1981
DIG - since 1993
DEM - since 1993 | | 96 portfolios in 4 investment companies | | Professor in Practice of Finance, Yale School of Management (since 1984). Director, BIRR Portfolio Analysis, Inc. (software products) (since 1990). Chairman, CIO and Partner, Zebra Capital Management, LLC (hedge fund manager) (since 2001).
Consultant to Morningstar, Inc. (since 2006). Formerly, Chairman, Ibbotson Associates, Inc., Chicago, IL (software data publishing and consulting) (1977-2006). | |
|
Robert C. Merton
Director of DFAIDG, DIG and DEM.
Trustee of DFAITC.
Harvard Business School
353 Baker Library
Soldiers Field
Boston, MA 02163
Age: 64 | | DFAITC - since 2003
DFAIDG - since 2003
DIG - since 2003
DEM - since 2003 | | 96 portfolios in 4 investment companies | | John and Natty McArthur University Professor, Graduate School of Business Administration, Harvard University (since 1998). George Fisher Baker Professor of Business Administration, Graduate School of Business Administration, Harvard University (1988-1998), Co-founder, Chief Science Officer and Director, Trinsum Group, a successor to Integrated Finance Limited (since 2002). Director, MF Risk, Inc. (risk management software) (since 2001). Director, Peninsula Banking Group (bank) (since 2003). Director, Community First Financial Group (bank holding company) (since 2003). Advisory Board Member, Alpha Simplex Group (hedge fund) (since 2001). Member Competitive Markets Advisory Council, Chicago Mercantile Exchange (futures trading exchange) (since 2004). Formerly, Advisory Board Member, NuServe (insurance software) (2001-2003). Director, Vical Incorporated (biopharmaceutical product development) (since 2002). | |
|
Myron S. Scholes
Director of DFAIDG, DIG and DEM.
Trustee of DFAITC.
Platinum Grove Asset Management, L.P.
Reckson Executive Park
1100 King Street
Building 4
Rye Brook, NY 10573
Age: 67 | | DFAITC - since 1993
DFAIDG - since 1981
DIG - since 1993
DEM - since 1993 | | 96 portfolios in 4 investment companies | | Frank E. Buck Professor Emeritus of Finance, Stanford University (since 1981). Chairman, Platinum Grove Asset Management, L.P. (hedge fund) (formerly, Oak Hill Platinum Partners) (since 1999). Formerly, Managing Partner, Oak Hill Capital Management (private equity firm) (until 2004). Chairman, Oak Hill Platinum Partners (hedge fund) (since 2004). Director, Chicago Mercantile Exchange (since 2001). Director, American Century Fund Complex (registered investment companies) (37 Portfolios) (since 1981); and Director, Chicago Mercantile Exchange Holdings Inc. (since 2000). | |
|
Abbie J. Smith
Director of DFAIDG, DIG and DEM.
Trustee of DFAITC.
The University of Chicago Booth School of Business
5807 S. Woodlawn Avenue
Chicago, IL 60637
Age: 55 | | DFAITC - since 2000
DFAIDG - since 2000
DIG - since 2000
DEM - since 2000 | | 96 portfolios in 4 investment companies | | Boris and Irene Stern Professor of Accounting, The University of Chicago Booth School of Business (since 1980), Formerly, Marvin Bower Fellow, Harvard Business School (9/01 to 8/02). Director, HNI Corporation (formerly known as HON Industries Inc.) (office furniture) (since 2000) and Director, Ryder System Inc. (transportation, logistics and supply-chain management) (since 2003). | |
|
36
Name, Position
with the Fund,
Address and Age | | Term of Office1 and
Length of Service | | Portfolios within the
DFA Fund Complex2
Overseen | | Principal Occupation(s) During Past 5 Years and
Other Directorships of Public Companies Held | |
| | | Interested Trustees/Directors* | |
|
David G. Booth
Chairman, Director, Chief Executive Officer and President of DFAIDG, DIG and DEM. Chairman, Trustee, Chief Executive Officer, Chief Investment Officer and President of DFAITC.
1299 Ocean Avenue
Santa Monica, CA 90401
Age: 61 | | DFAITC - since 1993
DFAIDG - since 1981
DIG - since 1992
DEM - since 1993 | | 96 portfolios in 4 investment companies | | Chairman, Director/Trustee, President, Chief Executive Officer and formerly Chief Investment Officer of the following companies: Dimensional Holdings Inc., Dimensional Fund Advisors LP, DFA Securities Inc., Dimensional Fund Advisors Canada Inc., DFAIDG, DIG, DEM and DFAITC. Director of Dimensional Fund Advisors Ltd, and formerly Chief Investment Officer. Director, President and formerly Chief Investment Officer of DFA Australia Ltd. Director of Dimensional Funds PLC and Dimensional Fund II PLC. Director, Chief Executive Officer and formerly Chief Investment Officer of Dimensional Fund Advisors Canada Inc. (All Chief Investment Officer positions held starting 1/03 through 3/07 except for Dimensional Fund Advisors Canada Inc., which was from 6/03 through 3/07, and Dimensional Holdings Inc., which was from 10/06 through 3/07.)
Limited Partner, Oak Hill Partners, Director, T he University of Chicago Booth School of Business. Formerly, Director, SA Funds (registered investment company). Formerly Director, Assante Corporation (investment management) (until 2002). | |
|
Rex A. Sinquefield
The Show Me Institute
7777 Bonhomme Ave.,
Suite 2150 St. Louis, MO 63105
Age: 64 | | DFAITC - since 1993
DFAIDG - since 1981
DIG - since 1992
DEM - since 1993 | | 96 portfolios in 4 investment companies | | Director/Trustee (and prior to 2006 Chairman, and prior to 2003, Chief Investment Officer) of Dimensional Fund Advisors LP, DFA Securities Inc., DFAIDG, DIG, DEM and DFAITC. Director of Dimensional Holdings Inc. Prior to 2006, Director of Dimensional Fund Advisors Ltd, Director (and prior to 1/1/2003, Chief Investment Officer) of DFA Australia Ltd. Director of Dimensional Funds PLC and Dimensional Fund Advisors Canada Inc.
Trustee, St. Louis University (since 2003). Life Trustee and Member of Investment Committee, DePaul University. Director, The German St. Vincent Orphan Home. Member of Investment Committee, Archdiocese of St. Louis. Trustee and Member of Investment Committee, St. Louis Art Institute (since 2005). President and Director, The Show Me Institute (since 2006). Trustee, St. Louis Symphony Orchestra (since 2005). Trustee, Missouri Botanical Garden (since 2005 ). | |
|
1 Each Trustee/Director holds office for an indefinite term until his or her successor is elected and qualified.
2 Each Trustee/Director is a director or trustee of each of the four registered investment companies within the DFA Fund Complex, which includes the Funds.
* Interested Directors are described as such because they are deemed to be "interested persons," as that term is defined under the Investment Company Act of 1940, as amended, due to their positions with Dimensional Fund Advisors LP.
37
Officers
The name, age, information regarding positions with the Funds and the principal occupation for each officer of the Funds are set forth below. Each officer listed below holds the same office (except as otherwise noted) in the following entities: Dimensional Fund Advisors LP (prior to November 3, 2006, Dimensional Fund Advisors Inc.) ("Dimensional"), DFA Securities Inc., DFAIDG, DIG, DFAITC and DEM (collectively, the "DFA Entities"). The address of each officer is: Dimensional Fund Advisors LP, 1299 Ocean Avenue, Santa Monica, California 90401, unless otherwise indicated.
Name, Position with the Fund
and Age | | Term of Office1
and Length of
Service | | Principal Occupation(s) During Past 5 Years | |
| | | Officers | |
|
April A. Aandal
Vice President
Age: 35 | | Since 2008 | | Vice President of all the DFA Entities. | |
|
Darryl D. Avery
Vice President
Age: 42 | | Since 2005 | | Vice President of all the DFA Entities. From June 2002 to January 2005, institutional client service representative of Dimensional. | |
|
Arthur H. Barlow
Vice President
Age: 52 | | Since 1993 | | Vice President of all the DFA Entities. Formerly, Vice President of DFA Australia Limited and Dimensional Fund Advisors Ltd. | |
|
Scott A. Bosworth
Vice President
Age: 39 | | Since 2007 | | Vice President of all the DFA Entities. Regional Director of Dimensional (since November 1997). | |
|
Valerie A. Brown
Vice President and Assistant Secretary
Age: 41 | | Since 2001 | | Vice President and Assistant Secretary of all the DFA Entities, DFA Australia Limited, Dimensional Fund Advisors Ltd., and since June 2003, Dimensional Fund Advisors Canada Inc. | |
|
David P. Butler
Vice President
Age: 44 | | Since 2007 | | Vice President of all the DFA Entities. Director of US Financial Services of Dimensional (since January 2005). Formerly, Regional Director of Dimensional Fund Advisors LP (January 1995 to January 2005). | |
|
Patrick Carter
Vice President
Age: 46 | | Since 2007 | | Vice President of all the DFA Entities. Regional Director of Dimensional (since March 2006). Formerly, Director of Merrill Lynch Retirement Group (December 1998 to March 2006). | |
|
Stephen A. Clark
Vice President
Age: 36 | | Since 2004 | | Vice President of all the DFA Entities, April 2001 to April 2004, Portfolio Manager of Dimensional. | |
|
Robert P. Cornell
Vice President
Age: 59 | | Since 2007 | | Vice President of all the DFA Entities. Regional Director of Financial Services Group of Dimensional (since August 1993). | |
|
Christopher S. Crossan
Vice President and Chief Compliance Officer
Age: 42 | | Since 2004 | | Vice President and Chief Compliance Officer of all the DFA Entities. Formerly, Senior Compliance Officer, INVESCO Institutional, Inc. and its affiliates (August 2000 to January 2004). | |
|
James L. Davis
Vice President
Age: 51 | | Since 1999 | | Vice President of all the DFA Entities. Formerly, Vice President of DFA Australia Limited and Dimensional Fund Advisors Ltd. | |
|
Robert T. Deere
Vice President
Age: 51 | | Since 1994 | | Vice President of all the DFA Entities and DFA Australia Limited. | |
|
Robert W. Dintzner
Vice President
Age: 38 | | Since 2001 | | Vice President of all the DFA Entities. Prior to April 2001, marketing supervisor and marketing coordinator for Dimensional. | |
|
38
Name, Position with the Fund
and Age | | Term of Office1
and Length of
Service | | Principal Occupation(s) During Past 5 Years | |
Kenneth Elmgren
Vice President
Age: 54 | | Since 2007 | | Vice President of all the DFA Entities. Formerly, Managing Principal of Beverly Capital (May 2004 to September 2006); Principal of Wydown Capital (September 2001 to May 2004). | |
|
Richard A. Eustice
Vice President and Assistant Secretary
Age: 43 | | Since 1998 | | Vice President and Assistant Secretary of all the DFA Entities and DFA Australia Limited. Formerly, Vice President of Dimensional Fund Advisors Ltd. | |
|
Eugene F. Fama, Jr.
Vice President
Age: 47 | | Since 1993 | | Vice President of all the DFA Entities. Formerly, Vice President of DFA Australia Limited and Dimensional Fund Advisors Ltd. | |
|
Gretchen A. Flicker
Vice President
Age: 37 | | Since 2004 | | Vice President of all the DFA Entities. Prior to April 2004, institutional client service representative of Dimensional. | |
|
Jed S. Fogdall
Vice President
Age: 34 | | Since 2008 | | Vice President of all the DFA Entities. Portfolio Manager for Dimensional (since September 2004). Prior to September 2004, Staff Engineer at the Boeing Company (1997-2004); Graduate Student at the University of California, Los Angeles (2002-2003). | |
|
Glenn S. Freed
Vice President
Age: 46 | | Since 2001 | | Vice President of all the DFA Entities. | |
|
Mark R. Gochnour
Vice President
Age: 41 | | Since 2007 | | Vice President of all the DFA Entities. Regional Director of Dimensional. | |
|
Henry F. Gray
Vice President
Age: 41 | | Since 2000 | | Vice President of all the DFA Entities. Prior to July 2000, Portfolio Manager of Dimensional. Formerly, Vice President of DFA Australia Limited. | |
|
John T. Gray
Vice President
Age: 34 | | Since 2007 | | Vice President of all the DFA Entities. Formerly, Regional Director of Dimensional (January 2005 to February 2007). | |
|
Darla Hastings
Vice President
Age: 53 | | Since 2007 | | Vice President of all the DFA Entities. Chief Marketing Officer of Dimensional. Formerly, Senior Vice President, Customer Experience for Benchmark Assisted Living (May 2005 to April 2006); Executive Vice President and Chief Marketing Officer of State Street Corporation (September 2001 to October 2005). | |
|
Joel H. Hefner
Vice President
Age: 40 | | Since 2007 | | Vice President of all the DFA Entities. Regional Director of Dimensional (since June 1998). | |
|
Julie Henderson
Vice President and Fund Controller
Age: 34 | | Since 2005 | | Vice President and Fund Controller of all the DFA Entities. Formerly, Senior Manager at PricewaterhouseCoopers LLP (July 1996 to April 2005). | |
|
Kevin Hight
Vice President
Age: 40 | | Since 2005 | | Vice President of all the DFA Entities. Formerly, Regional Director of Dimensional (since March 2003 to March 2005). | |
|
Christine W. Ho
Vice President
Age: 40 | | Since 2004 | | Vice President of all the DFA Entities. Prior to April 2004, Assistant Controller of Dimensional. | |
|
Jeff J. Jeon
Vice President
Age: 34 | | Since 2004 | | Vice President of all the DFA Entities. Prior to April 2004, Counsel of Dimensional. | |
|
Patrick M. Keating
Vice President
Age: 53 | | Since 2003 | | Vice President of all the DFA Entities and Chief Operating Officer of Dimensional. Director, Vice President and Chief Privacy Officer of Dimensional Fund Advisors Canada Inc. Director of DFA Australia Limited. | |
|
39
Name, Position with the Fund
and Age | | Term of Office1
and Length of
Service | | Principal Occupation(s) During Past 5 Years | |
Joseph F. Kolerich
Vice President
Age: 36 | | Since 2004 | | Vice President of all the DFA Entities. From April 2001 to April 2004, Portfolio Manager for Dimensional. | |
|
Michael F. Lane
Vice President
Age: 41 | | Since 2004 | | Vice President of all the DFA Entities. Formerly, Vice President of Advisor Services at TIAA-CREF (July 2001 to September 2004). | |
|
Kristina M. LaRusso
Vice President
Age: 33 | | Since 2006 | | Vice President of all DFA Entities. Formerly, Operations Supervisor of Dimensional (March 2003 to December 2006). | |
|
Inmoo Lee
Vice President
Age: 42 | | Since 2007 | | Vice President of all the DFA Entities. Associate Professor Department of Finance and Accounting, Business School, National University of Singapore (July 2004 to present); Associate Professor, College of Business Administration, Korea University (September 2001 to May 2006). | |
|
Juliet Lee
Vice President
Age: 37 | | Since 2005 | | Vice President of all the DFA Entities. Human Resources Manager of Dimensional (since January 2004). Formerly, Assistant Vice President for Metropolitan West Asset Management LLC (February 2001 to December 2003). | |
|
Aaron M. Marcus
Vice President & Head of Global Human Resources
Age: 38 | | Since 2008 | | Vice President and Head of Global Human Resources of Dimensional. Formerly, Global Head of Recruiting and Vice President of Goldman Sachs & Co. (June 2006 to January 2008); Global Co-Head of HR of the Equities & FICC Division, and Vice President of Goldman Sachs & Co. (May 2005 to May 2006); Head of Americas Campus Recruiting and Vice President of Goldman Sachs & Co. (April 2003 to May 2005). | |
|
David R. Martin
Vice President, Chief Financial Officer and Treasurer
Age: 51 | | Since 2007 | | Vice President, Chief Financial Officer and Treasurer of all the DFA Entities. Director, Vice President, Chief Financial Officer and Treasurer of Dimensional Fund Advisors Ltd. and DFA Australia Limited. Chief Financial Officer, Treasurer, and Vice President of Dimensional Fund Advisors Canada Inc. Director of Dimensional Funds PLC and Dimensional Funds II PLC. Formerly, Executive Vice President and Chief Financial Officer of Janus Capital Group Inc. (June 2005 to March 2007); Senior Vice President of Finance at Charles Schwab & Co., Inc. (March 1999 to May 2005). | |
|
Catherine L. Newell
Vice President and Secretary
Age: 44 | | Vice President since 1997 and Secretary since 2000 | | Vice President and Secretary of all the DFA Entities. Director, Vice President and Assistant Secretary of DFA Australia Limited (since February 2002, April 1997 and May 2002, respectively). Vice President and Secretary of Dimensional Fund Advisors Canada Inc. (since June 2003). Director, Dimensional Funds PLC and Dimensional Funds II PLC (since January 2002). Formerly, Assistant Secretary of all DFA Entities and Dimensional Fund Advisors Ltd. | |
|
Gerard K. O'Reilly
Vice President
Age: 31 | | Since 2007 | | Vice President of all the DFA Entities. Formerly, Research Associate of Dimensional Fund Advisors LP (2004 to 2006); Research Assistant in PhD program, Aeronautics Department California Institute of Technology (1998 to 2004). | |
|
Carmen Palafox
Vice President
Age: 34 | | Since 2006 | | Vice President of all the DFA Entities. Operations Manager of Dimensional Fund Advisors LP (since May 1996). | |
|
Sonya Park
Vice President
Age: 36 | | Since 2005 | | Vice President of all the DFA Entities. From February 2002 to January 2005, institutional client service representative of Dimensional. | |
|
David A. Plecha
Vice President
Age: 47 | | Since 1993 | | Vice President of all the DFA Entities, DFA Australia Limited and Dimensional Fund Advisors Ltd.. | |
|
Ted Randall
Vice President
Age: 35 | | Since 2008 | | Vice President of all the DFA Entities. Formerly, Research Associate of Dimensional (2006-2008). Systems Developer of Dimensional (2001-2006). | |
|
40
Name, Position with the Fund
and Age | | Term of Office1
and Length of
Service | | Principal Occupation(s) During Past 5 Years | |
Eduardo A. Repetto
Vice President and Chief Investment Officer
Age: 41 | | Since 2002 | | Chief Investment Officer (beginning March 2007) and Vice President of all the DFA Entities, DFA Australia Limited and Dimensional Fund Advisors Canada Inc. Formerly, Research Associate for Dimensional (June 2000 to April 2002). | |
|
L. Jacobo Rodriguez
Vice President
Age: 37 | | Since 2005 | | Vice President of all the DFA Entities. From August 2004 to July 2005, institutional client service representative of Dimensional. Formerly, Financial Services Analyst, Cato Institute (September 2001 to June 2004); Book Review Editor, Cato Journal, Cato Institute (May 1996 to June 2004). | |
|
David E. Schneider
Vice President
Age: 62 | | Since 2001 | | Vice President of all the DFA Entities. Currently, Director of Institutional Services. | |
|
Ted R. Simpson
Vice President
Age: 40 | | Since 2007 | | Vice President of all the DFA Entities. Regional Director of Dimensional (since December 2002). | |
|
Bryce D. Skaff
Vice President
Age: 33 | | Since 2007 | | Vice President of all the DFA Entities. Formerly, Regional Director of Dimensional (December 1999 to January 2007). | |
|
Grady M. Smith
Vice President
Age: 51 | | Since 2004 | | Vice President of all the DFA Entities. Prior to April 2004, Portfolio Manager of Dimensional. | |
|
Carl G. Snyder
Vice President
Age: 45 | | Since 2000 | | Vice President of all the DFA Entities. Formerly, Vice President of DFA Australia Limited. | |
|
Lawrence R. Spieth
Vice President
Age: 60 | | Since 2004 | | Vice President of all the DFA Entities. Prior to April 2004, Regional Director of Dimensional. | |
|
Bradley G. Steiman
Vice President
Age: 35 | | Since 2004 | | Vice President of all the DFA Entities and Director and Vice President of Dimensional Fund Advisors Canada Inc. | |
|
Karen E. Umland
Vice President
Age: 42 | | Since 1997 | | Vice President of all the DFA Entities, DFA Australia Limited, Dimensional Fund Advisors Ltd., and since June 2003, Dimensional Fund Advisors Canada Inc. | |
|
Carol W. Wardlaw
Vice President
Age: 49 | | Since 2004 | | Vice President of all the DFA Entities. Prior to April 2004, Regional Director of Dimensional. | |
|
Weston J. Wellington
Vice President
Age: 57 | | Since 1997 | | Vice President of all the DFA Entities. Formerly, Vice President of DFA Australia Limited. | |
|
Daniel M. Wheeler
Vice President
Age: 63 | | Since 2001 | | Vice President of all the DFA Entities. Prior to 2001 and currently, Director of Financial Advisors Services of Dimensional. Director of Dimensional Fund Advisors Ltd. (since October 2003) and President of Dimensional Fund Advisors Canada Inc. (since June 2003). | |
|
Ryan Wiley
Vice President
Age: 32 | | Since 2007 | | Vice President of all the DFA Entities. Senior Trader of Dimensional. Formerly, Portfolio Manager (2006 to 2007); Trader (2001 to 2006). | |
|
Paul E. Wise
Vice President
Age: 53 | | Since 2005 | | Vice President of all the DFA Entities. Chief Technology Officer for Dimensional (since 2004). Formerly, Principal of Turnbuckle Management Group (January 2002 to August 2004). | |
|
1 Each officer holds office for an indefinite term at the pleasure of the Boards of Trustee/Directors and until his or her successor is elected and qualified.
41
VOTING PROXIES ON FUND PORTFOLIO SECURITIES
A description of the policies and procedures that the Trust uses in voting proxies relating to securities held in the portfolio is available without charge, upon request, by calling collect: (310) 395-8005. Information regarding how the Advisor votes these proxies is available from the EDGAR database on the SEC's website at http://www.sec.gov and from the Advisor's website at http://www.dimensional.com and reflects the twelve-month period beginning July 1st and ending June 30th.
42
NOTICE TO SHAREHOLDERS
(Unaudited)
For shareholders that do not have an October 31, 2008 tax year end, this notice is for informational purposes only. For shareholders with an October 31, 2008 tax year end, please consult your tax advisor as to the pertinence of this notice. For the period December 1, 2007 to October 31, 2008, the portfolio is designating the following items with regard to distributions paid during the period.
Dimensional
Investment Group Inc. | | Net
Investment
Income
Distributions | | Short-Term
Capital Gain
Distributions | | Long-Term
Capital Gain
Distributions | | Total
Distributions | | Qualifying For
Corporate
Dividends
Received
Deduction(1) | | Qualifying
Dividend
Income(2) | | Foreign
Tax
Credit(3) | | Qualifying
Interest
Income(4) | | Qualifying
Short-Term
Capital Gain(5) | |
DFA International
Value Portfolio II | | | 48 | % | | | — | | | | 52 | % | | | 100 | % | | | — | | | | 58 | % | | | — | | | | 1 | % | | | — | | |
| The DFA Investment Trust Company | |
The DFA
International
Value Series | | | 33 | % | | | 2 | % | | | 65 | % | | | 100 | % | | | 6 | % | | | 58 | % | | | — | | | | — | | | | 7 | % | |
(1) Qualifying dividends represent dividends which qualify for the corporate dividends received deduction and is reflected as a percentage of ordinary income distributions (the total of short-term capital gain and net investment income distributions).
(2) The percentage in this column represents the amount of "Qualifying Dividend Income" as created by the Jobs and Growth Tax Relief Reconciliation Act of 2003 and is reflected as a percentage of ordinary income distributions (the total of short-term capital gain and net investment income distributions). It is the intention of each of the aforementioned funds to designate the maximum amount permitted by law.
(3) Foreign Tax Credit represent dividends which qualify for the foreign tax credit pass through and is reflected as a percentage of investment company taxable income (the total of short-term capital gain and net investment income distributions).
(4) The percentage in this column represents the amount of "Qualifying Interest Income" as created by The American Jobs Creation Act of 2004. The information is reflected as a percentage of ordinary income distributions (the total of short-term capital gain and net investment income distributions).
(5) The percentage in this column represents the amount of "Qualifying Short-Term Capital Gain" as created by The American Jobs Creation Act of 2004. The information is reflected as a percentage of ordinary income distributions (the total of short-term capital gain and net investment income distributions).
43
[THIS PAGE INTENTIONALLY LEFT BLANK]

DFA103108-014A
DIMENSIONAL INVESTMENT GROUP INC.
DFA International Value Portfolio III
Annual Report
Period Ended October 31, 2008
Dimensional Fund Advisors
6300 Bee Cave Road, Building One
Austin, TX 78746
December 2008
Dear Fellow Shareholder,
This has been a challenging year for investors. After drifting lower throughout the spring and summer, stock markets around the world plummeted in mid September on news that the ongoing credit crisis was driving some leading financial services companies toward failure. As the effects of this distress rippled through the financial world, investors became increasingly anxious and stock prices continued to decline sharply. In the month of October, the S&P 500 Index fell 16.8% or 196 points—its worst-ever monthly point decline.
Markets like this test investors' resolve. It is difficult to stick with a long-term investment plan when one sees the dramatic effects of high market volatility on a portfolio's value. Very few people are having a positive investment experience right now. But investors who have based their approach on a sensible risk/return framework tend to be in better shape than those who have not.
The recent market turbulence illustrates the reason why Dimensional believes that markets are efficient. History has shown time and again that prices cannot be predicted in public equity markets. This "random walk" makes diversification very important. Although the broad diversification in our portfolios didn't prevent negative performance this year, we believe it helped our shareholders avoid the extreme losses experienced by investors who concentrated their holdings in individual companies, industry sectors, or markets.
The unpredictability of stock prices also makes it important for investors to take a hard look at their own portfolios and determine how much risk and what types of risk they should take. Investors who hold asset mixes that accurately reflect their tolerance for risk are better able to withstand down markets.
Nobody knows when the capital markets will recover, but over time we can expect them to again offer a premium to investors who are willing to invest in relatively risky assets such as stocks. My view is that investors who have already paid for risk should stay invested and earn the return that can be expected when markets turn around. If markets continue to be so volatile, it's also important to understand that pulling money out of stocks, even for short periods of time, can result in significant missed opportunities.
All of us at Dimensional take our job as the steward of your assets very seriously and hope to have the opportunity to serve you for many years to come.
Sincerely,
David G. Booth
Chairman and Chief Executive Officer
[THIS PAGE INTENTIONALLY LEFT BLANK]
ANNUAL REPORT
Table of Contents
| Letter to Shareholder | | Page | |
| Definitions of Abbreviations and Footnotes | | | 1 | | |
| Dimensional Investment Group Inc. — DFA International Value Portfolio III | |
|
| Performance Chart | | | 2 | | |
| Management's Discussion and Analysis | | | 3 | | |
| Disclosure of Fund Expenses | | | 5 | | |
| Disclosure of Portfolio Holdings | | | 6 | | |
| Statement of Assets and Liabilities | | | 7 | | |
| Statements of Operations | | | 8 | | |
| Statements of Changes in Net Assets | | | 9 | | |
| Financial Highlights | | | 10 | | |
| Notes to Financial Statements | | | 11 | | |
| Report of Independent Registered Public Accounting Firm | | | 16 | | |
| The DFA Investment Trust Company — The DFA International Value Series | |
|
| Performance Chart | | | 17 | | |
| Disclosure of Fund Expenses | | | 18 | | |
| Disclosure of Portfolio Holdings | | | 19 | | |
| Summary Schedule of Portfolio Holdings | | | 20 | | |
| Statement of Assets and Liabilities | | | 23 | | |
| Statements of Operations | | | 24 | | |
| Statements of Changes in Net Assets | | | 25 | | |
| Financial Highlights | | | 26 | | |
| Notes to Financial Statements | | | 27 | | |
| Report of Independent Registered Public Accounting Firm | | | 34 | | |
| Fund Management | | | 35 | | |
|
| Voting Proxies on Fund Portfolio Securities | | | 42 | | |
|
| Notice to Shareholders | | | 43 | | |
|
This report is submitted for the information of the Fund's shareholders. It is not authorized for distribution to prospective investors unless preceded or accompanied by an effective prospectus.
i
[THIS PAGE INTENTIONALLY LEFT BLANK]
DIMENSIONAL INVESTMENT GROUP INC.
THE DFA INVESTMENT TRUST COMPANY
DEFINITIONS OF ABBREVIATIONS AND FOOTNOTES
Statement of Assets and Liabilities/Summary Schedule of Portfolio Holdings
Investment Abbreviations
ADR American Depositary Receipt
FHLMC Federal Home Loan Mortgage Corporation
Investment Footnotes
† See Note B to Financial Statements.
†† Securities have generally been fair valued. See Note B to Financial Statements.
** Calculated as a percentage of total net assets. Percentages shown parenthetically next to the category headings have been calculated as a percentage of total investments. "Other Securities" are those securities that are not among the top 50 holdings of the Fund or do not represent more than 1.0% of the net assets of the Fund. Some of the individual securities within this category may include Total or Partial Securities on Loan and/or Non-Income Producing Securities.
* Non-Income Producing Securities.
# Total or Partial Securities on Loan.
@ Security purchased with cash proceeds from Securities on Loan.
§ Affiliated Fund.
Financial Highlights
(A) Computed using average shares outstanding.
(B) Annualized
(C) Non-Annualized
(D) Represents the combined ratios for the respective portfolio and its respective pro-rata share of its Master Fund Series.
All Statements and Schedules
— Amounts designated as — are either zero or rounded to zero.
SEC Securities and Exchange Commission
1
DIMENSIONAL INVESTMENT GROUP INC.
PERFORMANCE CHART
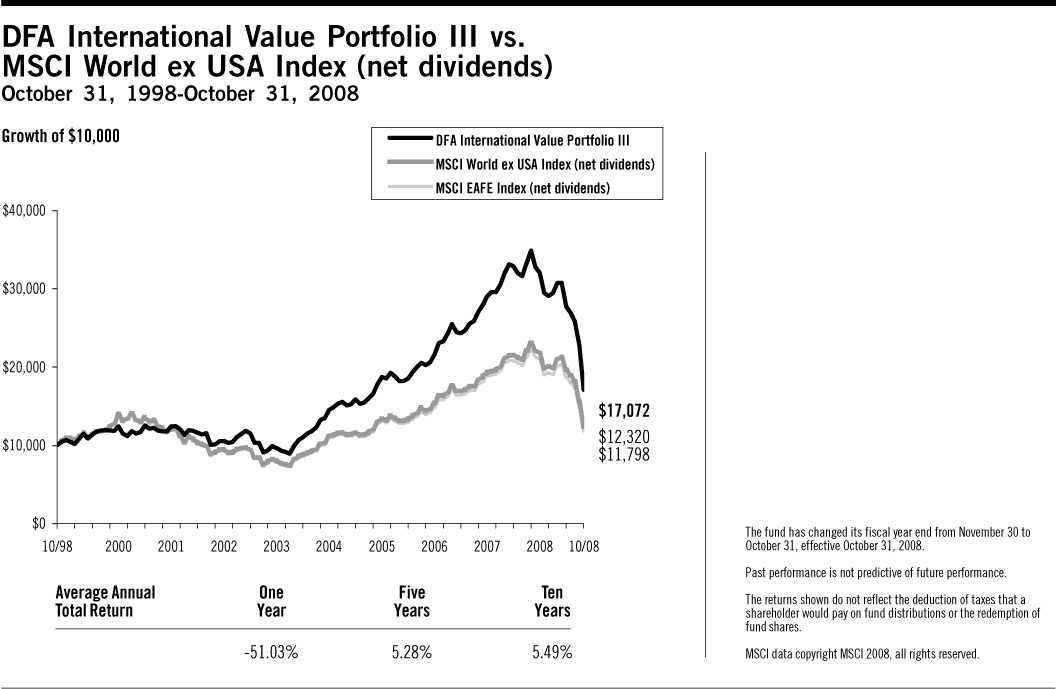
2
DIMENSIONAL INVESTMENT GROUP INC.
MANAGEMENT'S DISCUSSION AND ANALYSIS
On September 16, 2008, at a regular meeting of the Board of Directors/Trustees (the "Board") of the funds covered by this report, the Board voted to change the fiscal and tax year ends of the funds from November 30 to October 31. Therefore, the following discussion generally covers the 11-month period ended October 31, 2008.
International Equity Market Review 11 Months Ended October 31, 2008
International equity markets, affected by credit and liquidity problems similar to those experienced in the U.S., experienced high levels of volatility and broadly negative returns for the period under review. Due to the strengthening of the U.S. dollar vs. most developed countries' currencies (with the exception of the Japanese Yen and the Hong Kong dollar), the performance numbers when expressed in U.S. dollars were lower than when expressed in local currencies for all of the largest country constituents of the MSCI World ex USA Index, with the exception of Japan and Hong Kong. Overall, currency exchange rate changes reduced the returns expressed in U.S. dollars: total return for the MSCI World ex USA Index (net dividends) was –37.82% in local currency and –44.37% in U.S. dollars.
Total Returns for 11 Months Ended October 31, 2008
| Ten Largest Foreign Developed Markets by Market Cap (BB) | | Local
Currency
Return | | U.S. Dollar
Return | |
| Japan ($2,111) | | | –43.55 | % | | | –36.33 | % | |
| United Kingdom ($1,758) | | | –29.61 | % | | | –44.68 | % | |
| France ($872) | | | –36.80 | % | | | –45.40 | % | |
| Canada ($786) | | | –25.69 | % | | | –38.91 | % | |
| Germany ($705) | | | –37.97 | % | | | –46.42 | % | |
| Switzerland ($704) | | | –30.05 | % | | | –32.39 | % | |
| Australia ($513) | | | –35.10 | % | | | –51.58 | % | |
| Spain ($331) | | | –40.19 | % | | | –48.33 | % | |
| Italy ($301) | | | –43.34 | % | | | –51.06 | % | |
| Netherlands ($206) | | | –41.65 | % | | | –49.59 | % | |
Country market capitalizations (in parentheses) are in USD billions. Source: Returns are of MSCI indices net of foreign withholding taxes on dividends. Country market capitalizations are based on country carve-outs of the MSCI All-Country World Investable Market Index. MSCI data copyright MSCI 2008, all rights reserved.
Small company stocks were the poorest-performing asset classes in international markets, while large company growth stocks had the best relative results.
Total Returns for 11 Months Ended October 31, 2008
| | | U.S. Dollar
Return | |
| MSCI World ex USA Small Cap Index | | | –50.30 | % | |
| MSCI World ex USA Value Index | | | –45.31 | % | |
| MSCI World ex USA Index | | | –44.37 | % | |
| MSCI World ex USA Growth Index | | | –43.47 | % | |
Source: MSCI indices are net of foreign withholding taxes on dividends, copyright MSCI 2008, all rights reserved.
3
Master-Feeder Structure
The portfolio described below, called a "Feeder Fund," does not buy individual securities directly; instead, the portfolio invests in a corresponding fund called a "Master Fund." The Master Fund, in turn, purchases stocks, bonds, and/or other securities.
International Equity Portfolio Performance Overview
DFA International Value Portfolio III
The DFA International Value Portfolio III seeks to capture the returns of international large company value stocks by purchasing shares of a Master Fund that invests in such stocks. The investment strategy employs a disciplined, quantitative approach, emphasizing broad diversification and consistent exposure to large cap value stocks, but does not attempt to track closely a specific equity index. As of October 31, 2008, the Master Fund held approximately 530 stocks in 22 developed countries, and essentially was fully invested in equities throughout the year: average cash levels for the 11 months ended October 31, 2008 were in general less than 1% of the Master Fund's assets.
As a result of the Master Fund's diversified investment approach, performance principally was determined by broad structural trends in global equity markets, rather than the behavior of a limited number of stocks. For the 11 months ended October 31, 2008, growth stocks generally outperformed value stocks in international markets. Total returns were –44.81% for the MSCI EAFE Index (net dividends), –44.37% for the MSCI World ex US Index (net dividends), and –47.87% for the Portfolio. Relative to the MSCI World ex US Index (net dividends), the underperformance of the Portfolio was primarily due to the Master Fund's greater allocation to value stocks in general and financial stocks in particular, both of which underperformed the Index. Value stocks, which accounted for approximately 69% of the Master Fund compared to 28% of the Index, underperformed the Index by approximately 4 percentage points. Financials, which accounted for 44 % of the Master Fund compared to 25% of the Index, underperformed the Index by approximately 8 percentage points. A lower allocation to health care stocks, which accounted for less than 1% of the Master Fund compared to 6% of the Index and outperformed the Index by approximately 22 percentage points, also contributed to the underperformance.
4
DIMENSIONAL INVESTMENT GROUP INC.
DFA INTERNATIONAL VALUE PORTFOLIO III
DISCLOSURE OF FUND EXPENSES
(Unaudited)
The following Expense Table is shown so that you can understand the impact of fees on your investment. All mutual funds have operating expenses. As a shareholder of the fund, you incur ongoing costs, which include costs for portfolio management, administrative services, and shareholder reports, among others. Operating expenses, legal and audit services, which are deducted from a fund's gross income, directly reduce the investment return of the fund. A fund's expenses are expressed as a percentage of its average net assets. This figure is known as the expense ratio. The following examples are intended to help you understand the ongoing costs, in dollars, of investing in the fund and to compare these costs with those of other mutual funds. The examples are based on an investment of $1,000 made at the beginning of the period shown and held for the entire period.
The Expense Table below illustrates your fund's costs in two ways.
Actual Fund Return
This section helps you to estimate the actual expenses after fee waivers that you paid over the period. The "Ending Account Value" shown is derived from the fund's actual return and "Expenses Paid During Period" reflect the dollar amount that would have been paid by an investor who started with $1,000 in the fund. You may use the information here, together with the amount you invested, to estimate the expenses that you paid over the period.
To do so, simply divide your account value by $1,000 (for example, a $7,500 account value divided by $1,000 = 7.5), then multiply the result by the number given for your fund under the heading "Expenses Paid During Period."
Hypothetical Example for Comparison Purposes
This section is intended to help you compare your fund's costs with those of other mutual funds. The hypothetical "Ending Account Value" and "Expenses Paid During Period" are derived from the fund's actual expense ratio and an assumed 5% annual return before expenses. In this case, because the return used is not the fund's actual return, the results do not apply to your investment. The example is useful in making comparisons because the SEC requires all mutual funds to calculate expenses based on a 5% annual return. You can assess your fund's cost by comparing this hypothetical example with the hypothetical examples that appear in shareholder reports of other funds.
Please note that the expenses shown in the table are meant to highlight and help you compare ongoing costs only and do not reflect any transactional costs, if applicable. The "Annualized Expense Ratio" represents the actual expenses for the six-month period indicated.
Six Months Ended October 31, 2008
EXPENSE TABLE
| | | Beginning
Account
Value
05/01/08 | | Ending
Account
Value
10/31/08 | | Annualized
Expense
Ratio* | | Expenses
Paid
During
Period* | |
| Actual Fund Return | | $ | 1,000.00 | | | $ | 555.60 | | | | 0.26 | % | | $ | 1.02 | | |
| Hypothetical 5% Annual Return | | $ | 1,000.00 | | | $ | 1,023.83 | | | | 0.26 | % | | $ | 1.32 | | |
* Expenses are equal to the fund's annualized expense ratio for the six-month period, multiplied by the average account value over the period, multiplied by the number of days in the most recent six-month period (184), then divided by the number of days in the year (366) to reflect the six-month period. The Portfolio is a Feeder Fund. The expenses shown reflect the direct expenses of the Feeder Fund and the indirect payment of the Feeder Fund's portion of the expenses of its Master Fund.
5
DIMENSIONAL INVESTMENT GROUP INC.
DFA INTERNATIONAL VALUE PORTFOLIO III
DISCLOSURE OF PORTFOLIO HOLDINGS
(Unaudited)
The SEC requires that all Funds file a complete Schedule of Investments with the SEC for their first and third fiscal quarters on Form N-Q. For Dimensional Investment Group Inc., this would be for the fiscal quarters ending January 31 and July 31. The Form N-Q filing must be made within 60 days of the end of the quarter. Dimensional Investment Group Inc. filed its most recent Form N-Q with the SEC on October 30, 2008. It is available upon request, without charge, by calling collect: (310) 395-8005 or by mailing a request to Dimensional Fund Advisors LP, 1299 Ocean Avenue, Santa Monica, California 90401, or by visiting the SEC's website at http://www.sec.gov, or they may be reviewed and copied at the SEC's Public Reference Room in Washington, D.C. (call 1-800-732-0330 for information on the operation of the Public Reference Room).
PORTFOLIO HOLDINGS
The SEC requires that all Funds present their categories of portfolio holdings in a table, chart or graph format in their annual and semi-annual shareholder reports, whether or not a Schedule of Investments is utilized. The following table, which presents portfolio holdings as a percent of total investments before short-term investments and collateral for loaned securities, is provided in compliance with such requirement.
The categories of industry classification for the Affiliated Investment Company are represented in the Disclosure of Portfolio Holdings, which are included elsewhere within the report. Refer to the Summary Schedule of Portfolio Holdings for the underlying Master Fund's holdings which reflect the investments by country.
| Affiliated Investment Company | | | 100.0 | % | |
6
DIMENSIONAL INVESTMENT GROUP INC.
DFA INTERNATIONAL VALUE PORTFOLIO III
STATEMENT OF ASSETS AND LIABILITIES
OCTOBER 31, 2008
(Amounts in thousands, except share and per share amounts)
| ASSETS: | |
Investment in The DFA International Value Series of The DFA Investment Trust Company
(Affiliated Investment Company) (63,639,994 Shares) at Value† | | $ | 726,132 | | |
| Receivables: | |
| Fund Shares Sold | | | 2,913 | | |
| Prepaid Expenses and Other Assets | | | 26 | | |
| Total Assets | | | 729,071 | | |
| LIABILITIES: | |
| Payables: | |
| Affiliated Investment Company Shares Purchased | | | 2,236 | | |
| Fund Shares Redeemed | | | 678 | | |
| Due to Advisor | | | 6 | | |
| Accrued Expenses and Other Liabilities | | | 90 | | |
| Total Liabilities | | | 3,010 | | |
| NET ASSETS | | $ | 726,061 | | |
| SHARES OUTSTANDING, $0.01 PAR VALUE (1) | | | 61,868,723 | | |
| NET ASSET VALUE, OFFERING AND REDEMPTION PRICE PER SHARE | | $ | 11.74 | | |
| Investment in Affiliated Investment Company at Cost | | $ | 881,999 | | |
| NET ASSETS CONSIST OF: | |
| Paid-In Capital | | $ | 824,587 | | |
| Undistributed Net Investment Income (Distributions in Excess of Net Investment Income) | | | 2,317 | | |
| Accumulated Net Realized Gain (Loss) | | | (100,843 | ) | |
| NET ASSETS | | $ | 726,061 | | |
| (1) NUMBER OF SHARES AUTHORIZED | | | 200,000,000 | | |
See accompanying Notes to Financial Statements.
7
DIMENSIONAL INVESTMENT GROUP INC.
DFA INTERNATIONAL VALUE PORTFOLIO III
STATEMENTS OF OPERATIONS
(Amounts in thousands)
| | | Period
Dec. 1, 2007
to
Oct. 31, 2008 | | Year
Ended
Nov. 30,
2007 | |
| Investment Income | |
| Income Distributions Received from Affiliated Investment Company | | $ | 38,955 | | | $ | 34,552 | | |
| Expenses | |
| Administrative Services Fees | | | 96 | | | | 113 | | |
| Accounting & Transfer Agent Fees | | | 25 | | | | 28 | | |
| Filing Fees | | | 54 | | | | 42 | | |
| Shareholders' Reports | | | 81 | | | | 82 | | |
| Directors'/Trustees' Fees & Expenses | | | — | | | | 9 | | |
| Professional Fees | | | 29 | | | | 26 | | |
| Other | | | 5 | | | | 5 | | |
| Total Expenses | | | 290 | | | | 305 | | |
| Net Investment Income (Loss) | | | 38,665 | | | | 34,247 | | |
| Realized and Unrealized Gain (Loss) | |
| Capital Gain Distributions Received from Affiliated Investment Company | | | 78,527 | | | | 26,825 | | |
| Net Realized Gain (Loss) on Affiliated Investment Company Shares Sold | | | (9,952 | ) | | | 159 | | |
Change in Unrealized Appreciation (Depreciation) of Affiliated
Investment Company Shares | | | (714,241 | ) | | | 113,019 | | |
| Net Realized and Unrealized Gain (Loss) | | | (645,666 | ) | | | 140,003 | | |
| Net Increase (Decrease) in Net Assets Resulting from Operations | | $ | (607,001 | ) | | $ | 174,250 | | |
See accompanying Notes to Financial Statements.
8
DIMENSIONAL INVESTMENT GROUP INC.
DFA INTERNATIONAL VALUE PORTFOLIO III
STATEMENTS OF CHANGES IN NET ASSETS
(Amounts in thousands)
| | | Period
Dec. 1, 2007
to
Oct. 31, 2008 | | Year
Ended
Nov. 30,
2007 | | Year
Ended
Nov. 30,
2006 | |
| Increase (Decrease) in Net Assets | |
| Operations: | |
| Net Investment Income (Loss) | | $ | 38,665 | | | $ | 34,247 | | | $ | 28,677 | | |
Capital Gain Distributions Received from Affiliated Investment
Company | | | 78,527 | | | | 26,825 | | | | 19,813 | | |
Net Realized Gain (Loss) on Affiliated Investment Company
Shares Sold | | | (9,952 | ) | | | 159 | | | | (20 | ) | |
Change in Unrealized Appreciation (Depreciation) of Affiliated
Investment Company Shares | | | (714,241 | ) | | | 113,019 | | | | 208,571 | | |
Net Increase (Decrease) in Net Assets
Resulting from Operations | | | (607,001 | ) | | | 174,250 | | | | 257,041 | | |
| Distributions From: | |
| Net Investment Income | | | (41,959 | ) | | | (30,502 | ) | | | (28,668 | ) | |
| Net Short-Term Gains | | | (3,276 | ) | | | (2,370 | ) | | | (1,779 | ) | |
| Net Long-Term Gains | | | (24,865 | ) | | | (17,585 | ) | | | (19,713 | ) | |
| Total Distributions | | | (70,100 | ) | | | (50,457 | ) | | | (50,160 | ) | |
| Capital Share Transactions (1): | |
| Shares Issued | | | 395,584 | | | | 215,069 | | | | 172,619 | | |
| Shares Issued in Lieu of Cash Distributions | | | 69,191 | | | | 50,456 | | | | 50,160 | | |
| Shares Redeemed | | | (251,899 | ) | | | (198,925 | ) | | | (126,721 | ) | |
| Net Increase (Decrease) from Capital Share Transactions | | | 212,876 | | | | 66,600 | | | | 96,058 | | |
| Total Increase (Decrease) in Net Assets | | | (464,225 | ) | | | 190,393 | | | | 302,939 | | |
| Net Assets | |
| Beginning of Period | | | 1,190,286 | | | | 999,893 | | | | 696,954 | | |
| End of Period | | $ | 726,061 | | | $ | 1,190,286 | | | $ | 999,893 | | |
| (1) Shares Issued and Redeemed: | |
| Shares Issued | | | 22,558 | | | | 9,221 | | | | 9,117 | | |
| Shares Issued in Lieu of Cash Distributions | | | 3,339 | | | | 2,237 | | | | 2,843 | | |
| Shares Redeemed | | | (13,566 | ) | | | (8,503 | ) | | | (6,641 | ) | |
| | | | 12,331 | | | | 2,955 | | | | 5,319 | | |
Undistributed Net Investment Income (Distributions in
Excess of Net Investment Income) | | $ | 2,317 | | | $ | 5,669 | | | $ | 1,907 | | |
See accompanying Notes to Financial Statements.
9
DIMENSIONAL INVESTMENT GROUP INC.
DFA INTERNATIONAL VALUE PORTFOLIO III
FINANCIAL HIGHLIGHTS
(for a share outstanding throughout each period)
| | | Period
Dec. 1, 2007
to
Oct. 31, 2008 | | Year
Ended
Nov. 30,
2007 | | Year
Ended
Nov. 30,
2006 | | Year
Ended
Nov. 30,
2005 | | Year
Ended
Nov. 30,
2004 | | Year
Ended
Nov. 30,
2003 | |
Net Asset Value, Beginning of
Period | | $ | 24.03 | | | $ | 21.46 | | | $ | 16.89 | | | $ | 15.03 | | | $ | 11.83 | | | $ | 8.92 | | |
| Income from Investment Operations | |
| Net Investment Income (Loss) | | | 0.72 | (A) | | | 0.71 | (A) | | | 0.64 | (A) | | | 0.49 | | | | 0.27 | | | | 0.22 | | |
Net Gains (Losses) (Realized
and Unrealized) | | | (11.64 | ) | | | 2.92 | | | | 5.10 | | | | 1.80 | | | | 3.43 | | | | 2.91 | | |
Total from Investment
Operations | | | (10.92 | ) | | | 3.63 | | | | 5.74 | | | | 2.29 | | | | 3.70 | | | | 3.13 | | |
| Less Distributions | |
| Net Investment Income | | | (0.80 | ) | | | (0.63 | ) | | | (0.65 | ) | | | (0.42 | ) | | | (0.49 | ) | | | (0.20 | ) | |
| Net Realized Gains | | | (0.57 | ) | | | (0.43 | ) | | | (0.52 | ) | | | (0.01 | ) | | | (0.01 | ) | | | (0.02 | ) | |
| Total Distributions | | | (1.37 | ) | | | (1.06 | ) | | | (1.17 | ) | | | (0.43 | ) | | | (0.50 | ) | | | (0.22 | ) | |
| Net Asset Value, End of Period | | $ | 11.74 | | | $ | 24.03 | | | $ | 21.46 | | | $ | 16.89 | | | $ | 15.03 | | | $ | 11.83 | | |
| Total Return | | | (47.87 | )%(C) | | | 17.32 | % | | | 35.67 | % | | | 15.59 | % | | | 32.11 | % | | | 36.09 | % | |
Net Assets, End of Period
(thousands) | | $ | 726,061 | | | $ | 1,190,286 | | | $ | 999,893 | | | $ | 696,954 | | | $ | 532,647 | | | $ | 356,509 | | |
Ratio of Expenses to Average
Net Assets (D) | | | 0.26 | %(B) | | | 0.25 | % | | | 0.26 | % | | | 0.30 | % | | | 0.33 | % | | | 0.35 | % | |
Ratio of Net Investment Income
to Average Net Assets | | | 4.03 | %(B) | | | 3.02 | % | | | 3.37 | % | | | 3.08 | % | | | 2.07 | % | | | 2.46 | % | |
See page 1 for the Definitions of Abbreviations and Footnotes.
See accompanying Notes to Financial Statements.
10
DIMENSIONAL INVESTMENT GROUP INC.
DFA INTERNATIONAL VALUE PORTFOLIO III
NOTES TO FINANCIAL STATEMENTS
A. Organization:
Dimensional Investment Group Inc. (the "Fund") is an open-end management investment company registered under the Investment Company Act of 1940, whose shares are offered to institutional investors, retirement plans and clients of registered investment advisors. The Fund consists of fifteen portfolios, of which the DFA International Value Portfolio III (the "Portfolio") is presented in this report.
The Portfolio primarily invests its assets in The DFA International Value Series (the "Series"), a corresponding series of The DFA Investment Trust Company. At October 31, 2008, the Portfolio owned 15% of the outstanding shares of the Series. The financial statements of the Series are included elsewhere in this report and should be read in conjunction with the financial statements of the Portfolio.
At a regular meeting of the Board of Directors/Trustees (the "Board") on September 16, 2008, the Board voted to change the fiscal and tax year ends of the Portfolio from November 30 to October 31.
B. Significant Accounting Policies:
The following significant accounting policies are in conformity with accounting principles generally accepted in the United States of America. Such policies are consistently followed by the Fund in preparation of its financial statements. The preparation of financial statements in accordance with accounting principles generally accepted in the United States of America requires management to make estimates and assumptions that affect the reported amounts of assets and liabilities and disclosure of contingent assets and liabilities at the date of the financial statements and the reported amounts of increases and decreases in net assets from operations during the reporting period. Actual results could differ from those estimates and those differences could be material.
1. Security Valuation: The shares of the Series held by the Portfolio are valued at their respective daily net asset value.
Adoption of Statement of Financial Accounting Standards No. 157 "Fair Value Measurements" ("FAS 157")
In September 2006, the Financial Accounting Standards Board issued FAS 157 effective for fiscal years beginning after November 15, 2007. This standard clarifies the definition of fair value for financial reporting, establishes a framework for measuring fair value and requires additional disclosures about the use of fair value measurements. The Fund has adopted FAS 157 as of December 1, 2007. The three levels of the fair value hierarchy under FAS 157 are described below:
• Level 1 – quoted prices in active markets for identical securities
• Level 2 – other significant observable inputs (including quoted prices for similar securities, interest rates, prepayment speeds, credit risk, etc.)
• Level 3 – significant unobservable inputs (including the Portfolio's own assumptions in determining the fair value of investments)
The inputs or methodology used for valuing securities are not necessarily an indication of the risk associated with investing in those securities. A summary of the inputs used to value the Portfolio's net assets as of October 31, 2008 is listed below (in thousands).
| | | Valuation Inputs | |
| | | Investments in
Securities
(Market Value) | |
| | | Level 1 | | Level 2 | | Level 3 | | Total | |
| DFA International Value Portfolio III | | $ | 726,132 | | | | — | | | | — | | | $ | 726,132 | | |
11
2. Deferred Compensation Plan: Each eligible Director of the Fund may elect participation in the Deferred Compensation Plan (the "Plan"). Under the Plan, effective January 1, 2002, such Directors may defer payment of all or a portion of their total fees earned as a Director. These deferred amounts may be treated as though such amounts had been invested in shares of the following funds: U.S. Large Cap Value Portfolio; U.S. Core Equity 1 Portfolio; U.S. Core Equity 2 Portfolio; U.S. Vector Equity Portfolio; U.S. Micro Cap Portfolio; DFA International Value Portfolio; International Core Equity Portfolio; Emerging Markets Portfolio; Emerging Ma rkets Core Equity Portfolio; and/or DFA Two-Year Global Fixed Income Portfolio. Contributions made under the Plan and the change in unrealized appreciation (depreciation) and income are included in Other Expenses for the period ended October 31, 2008 and are included in Directors'/Trustees' Fees & Expenses for the year ended November 30, 2007. At October 31, 2008, the total liability for deferred compensation to Directors is included in Accrued Expenses and Other Liabilities in the amount of $15 (in thousands).
Each Director has the option to receive their distribution of proceeds in one of the following methods upon one year's notice: lump sum; annual installments over a period of agreed upon years; or semi-annual installments over a period of agreed upon years. As of October 31, 2008, none of the Directors have requested distribution of proceeds.
3. Other: Security transactions are accounted for as of the trade date. Costs used in determining realized gains and losses on the sale of affiliated investment company shares are on the basis of identified cost. Dividend income and distributions to shareholders are recorded on the ex-dividend date. Distributions received from investment in affiliated investment company that represent a return of capital or capital gain are recorded as a reduction of cost of investments or as a realized gain, respectively. Expenses directly attributable to the Portfolio are directly charged. Common expenses of the Fund are allocated using methods approved by the Board of Directors/Trustees, generally based on average net assets.
C. Investment Advisor:
Dimensional Fund Advisors LP ("Dimensional" or the "Advisor") provides administrative services to the Portfolio, including supervision of services provided by others, providing information to the shareholders and to the Board of Directors/Trustees, and other administrative services. The Advisor provides investment advisory services to the Series. For the period December 1, 2007 to October 31, 2008, the Portfolio's administrative services fees were accrued daily and paid monthly to the Advisor based on an effective annual rate of 0.01% of average daily net assets.
Fees Paid to Officers and Directors/Trustees:
Certain Officers and Directors/Trustees of the Advisor are also Officers and Directors/Trustees of the Fund; however, such Officers and Directors/Trustees (with the exception of the Chief Compliance Officer ("CCO")) receive no compensation from the Fund. For the period December 1, 2007 to October 31, 2008, the total related amounts paid by the Fund to the CCO were $25 (in thousands). The total related amounts paid by the Portfolio are included in Other Expenses on the Statement of Operations.
D. Federal Income Taxes:
The Portfolio has qualified and intends to continue to qualify as a regulated investment company under Subchapter M of the Internal Revenue Code for federal income tax purposes and to distribute substantially all of its taxable income and net capital gains to its shareholders. Accordingly, no provision has been made for federal income taxes.
Distributions from net investment income and net realized capital gains are determined in accordance with U.S. federal income tax regulations, which may differ from those amounts determined under accounting principles generally accepted in the United States of America. These book/tax differences are either temporary or permanent in nature. To the extent these differences are permanent, they are charged or credited to paid-in capital, undistributed net investment income, accumulated net realized gains or unrealized appreciation (depreciation), as appropriate, in the period that the differences arise. Accordingly, the following permanent differences as of October 31, 2008, primarily
12
attributable to a reclassification of distributions were classified to the following accounts. These reclassifications had no effect on net assets or net value per share (amounts in thousands):
| | | Increase
(Decrease)
Undistributed
Net Investment Income | | Increase
(Decrease)
Accumulated
Net Realized
Gains (Losses) | |
| | $ | (58 | ) | | $ | 58 | | |
The tax character of dividends and distributions declared and paid during the years ended November 30, 2006, November 30, 2007 and the period December 1, 2007 to October 31, 2008 were as follows (amounts in thousands):
| | | Net Investment
Income and
Short-Term
Capital Gains | | Long-Term
Capital Gains | | Total | |
| | 2006 | | | $ | 31,266 | | | $ | 20,190 | | | $ | 51,456 | | |
| | 2007 | | | | 32,872 | | | | 17,585 | | | | 50,457 | | |
| | 2008 | | | | 45,275 | | | | 24,825 | | | | 70,100 | | |
At October 31, 2008, the components of distributable earnings (accumulated losses) were as follows (amounts in thousands):
Undistributed
Net Investment
Income and
Short-Term
Capital Gains | | Undistributed
Long-Term
Capital Gains | | Capital Loss
Carryforward | | Total Net
Distributable
Earnings
(Accumulated
Losses) | |
| $ | 2,332 | | | | — | | | $ | (100,843 | ) | | $ | (98,511 | ) | |
For federal income tax purposes, the Fund measures its capital loss carryforwards annually at October 31, its fiscal year end. Capital loss carryforwards may be carried forward and applied against future capital gains. As of October 31, 2008, the Portfolio had capital loss carryforwards available in the amount of $100,843 (in thousands) to offset future realized capital gains expiring in 2016.
At October 31, 2008, the total cost and aggregate gross unrealized appreciation and (depreciation) of securities for federal income tax purposes were not materially different from amounts reported for financial reporting purposes (amounts in thousands):
Federal
Tax Cost | | Unrealized
Appreciation | | Unrealized
(Depreciation) | | Net
Unrealized
Appreciation
(Depreciation) | |
| $ | 725,840 | | | | — | | | | — | | | | — | | |
In June 2006, the Financial Accounting Standards Board (FASB) issued FASB Interpretation 48 ("FIN 48"), "Accounting for Uncertainty in Income Taxes". This standard defines the threshold for recognizing the benefits of tax-return positions in the financial statements as "more-likely-than-not" to be sustained by the taxing authority and requires measurement of a tax position meeting the more-likely-than-not criterion, based on the largest benefit that is more than 50 percent likely to be realized. Management has analyzed the Portfolio's tax positions to be taken on the federal income tax returns for all open tax years (tax years ended November 30, 2004-2005 through the period ended October 31, 2008), for purposes of implementing FIN 48, and has concluded that no provision for income tax is required in the Portfolio's financial statements.
E. Line of Credit:
The Fund, together with other Dimensional-advised portfolios, has entered into a $250 million unsecured discretionary line of credit effective June 30, 2003 with an affiliate of its domestic custodian bank. Each portfolio is permitted to borrow, subject to its investment limitations, up to a maximum of $250 million, as long as total borrowings under the line of credit do not exceed $250 million in the aggregate. Borrowings under the line of credit
13
are charged interest at the then current Federal Funds Rate plus 1%. Each portfolio is individually, and not jointly, liable for its particular advances under the line of credit. There is no commitment fee on the unused portion of the line of credit. The agreement for the discretionary line of credit may be terminated by either party at any time. The line of credit is scheduled to expire on June 23, 2009. There were no borrowings by the Portfolio under this line of credit during the period ended October 31, 2008.
The Fund, together with other Dimensional-advised portfolios, has also entered into an additional $500 million unsecured line of credit effective January 15, 2008 with its international custodian bank. Each portfolio is permitted to borrow, subject to its investment limitations, up to a maximum of $500 million, as long as total borrowings under the line of credit do not exceed $500 million in the aggregate. Borrowings under the line of credit are charged interest at rates agreed to by the parties at the time of borrowing. Each portfolio is individually, and not jointly, liable for its particular advances under the line of credit. There is no commitment fee on the unused portion of the line of credit. The agreement for the line of credit expires on January 15, 2009. There were no borrowings by the Portfolio under this line of credit during the period ended October 31, 2008.
F. Indemnitees; Contractual Obligations:
Under the Fund's organizational documents, its officers and directors are indemnified against certain liabilities arising out of the performance of their duties to the Fund.
In the normal course of business, the Fund enters into contracts that contain a variety of representations and warranties which provide general indemnification. The Fund's maximum exposure under these arrangements is unknown as this would involve future claims that may be made against the Fund and/or its affiliates that have not yet occurred. However, based on experience, the Fund expects the risk of loss to be remote.
G. Recently Issued Accounting Standards and Interpretation:
In March 2008, Statement of Financial Accounting Standards No. 161, Disclosures about Derivative Instruments and Hedging Activities ("FAS 161"), was issued and is effective for fiscal years beginning after November 15, 2008. FAS 161 defines new disclosures of derivative instruments and hedging activities. Management is currently evaluating the implications of FAS 161. At this time, its impact on the Portfolio's financial statements has not been determined.
H. Other:
At October 31, 2008, two shareholders held 79% of the outstanding shares of the Portfolio. One or more of the shareholders is an omnibus account, which typically holds shares for the benefit of several other underlying investors.
I. Subsequent Event Note:
On November 1, 2008, The DFA International Value Series, a master fund in a RIC/RIC master feeder structure with five RIC feeders and two direct client investors, made a "Check-the-box" election for federal income tax purposes pursuant to Treasury Regulation § 301.7701-3, to change its federal entity classification from a corporation taxable as a regulated investment company to a partnership. As a result of this election, the master fund is deemed to have distributed all of its assets and liabilities, in a taxable transaction, to its shareholders in liquidation of the master fund. Immediately thereafter, the shareholders contributed all of the distributed assets and liabilities to a newly formed partnership. The final tax year end of The DFA International Value Series was October 31, 2008. For Federal income tax purposes, pursuant to Code §336(a), the master fund recognizes gain or loss as if the master's investment securities were sold to its shareholders and, pursuant to Code §331, each of the Portfolios recognizes gain or loss as if it liquidated its investment in the master. For tax purposes, pursuant to Code § 334(a), each of the Portfolio's will take a fair market value basis in the securities deemed received by them and a new holding period for those securities commences on the deemed liquidation date.
14
The master fund had book/tax differences upon its deemed liquidation. The following summary of permanent differences occurred as of the respective effective "Check the Box" election date.
Increase
(Decrease)
Paid-in Capital | | Unrealized
Appreciation
(Depreciation)
Investment
Securities | | Increase
(Decrease)
Undistributed
Net Investment
Income | | Increase
(Decrease)
Accumulated
Net Realized
Gains(Losses) | |
| $ | (2,187,614,395 | ) | | $ | 2,319,051,847 | | | $ | (602,214 | ) | | $ | (130,835,238 | ) | |
As a result of the transaction, The DFA International Value Series recognized a ($2,309,440,866) and ($718,733) capital and currency loss respectively for tax year ended October 31, 2008. Additionally, the fund has written off $2,178,493,687 of expired capital loss carryover as a permanent book/tax reporting difference decreasing paid in capital.
Each Portfolio impacted by the "Check the Box" election also has a permanent book/tax difference resulting from the transaction. Listed below is the permanent difference impacting each respective Portfolio. For financial statement purposes, this adjustment did not result in any changes to each respective fund's net assets or net asset value per share.
| | | Unrealized
Appreciation
(Depreciation)
Investment
Securities | | Increase
(Decrease)
Accumulated
Net Realized
Gains(Losses) | |
| DFA International Value Portfolio | | $ | 1,598,039,236 | | | $ | (1,598,039,236 | ) | |
| DFA International Value Portfolio II | | | 49,859,737 | | | | (49,859,737 | ) | |
| DFA International Value Portfolio III | | | 155,866,882 | | | | (155,866,882 | ) | |
| DFA International Value Portfolio IV | | | 82,052,198 | | | | (82,052,198 | ) | |
| LWAS/DFA International High Book To Market Portfolio | | | (19,800,535 | ) | | | 19,800,535 | | |
For financial reporting purposes, this transaction had no impact on the net assets of the respective funds.
15
REPORT OF INDEPENDENT REGISTERED PUBLIC ACCOUNTING FIRM
To the Shareholders of DFA International Value Portfolio III and
Board of Directors of Dimensional Investment Group Inc.:
In our opinion, the accompanying statement of assets and liabilities, and the related statements of operations and of changes in net assets and the financial highlights present fairly, in all material respects, the financial position of DFA International Value Portfolio III (one of the portfolios constituting Dimensional Investment Group Inc., hereafter referred to as the "Portfolio") at October 31, 2008, the results of its operations, the changes in its net assets and the financial highlights for each of the periods indicated, in conformity with accounting principles generally accepted in the United States of America. These financial statements and financial highlights (hereafter referred to as "financial statements") are the responsibility of the Portfolio's management; our responsibility is to express an opinion on these financial statements based on our audits. We conducted our audits of these financial statements in accordance with the standards of the Public Company Accounting Oversight Board (United States). Those standards require that we plan and perform the audit to obtain reasonable assurance about whether the financial statements are free of material misstatement. An audit includes examining, on a test basis, evidence supporting the amounts and disclosures in the financial statements, assessing the accounting principles used and significant estimates made by management, and evaluating the overall financial statement presentation. We believe that our audits, which included confirmation of securities at October 31, 2008 by correspondence with the transfer agent of the investee fund, provide a reasonable basis for our opinion.
PricewaterhouseCoopers LLP
Philadelphia, Pennsylvania
December 22, 2008
16
DIMENSIONAL INVESTMENT GROUP INC.
PERFORMANCE CHART
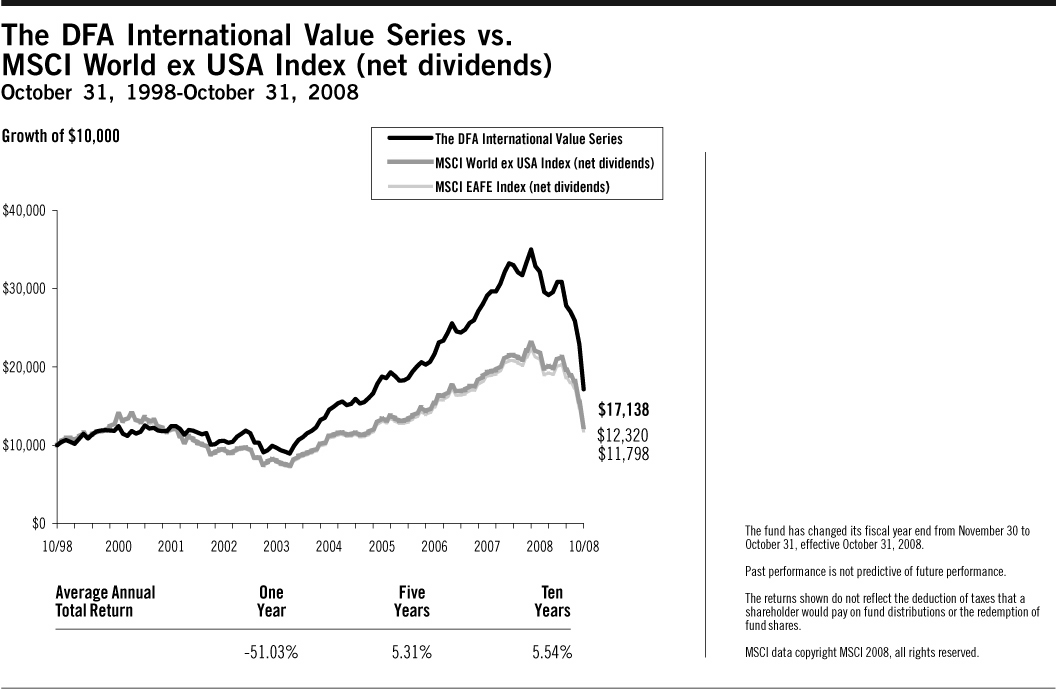
17
THE DFA INVESTMENT TRUST COMPANY
THE DFA INTERNATIONAL VALUE SERIES
DISCLOSURE OF FUND EXPENSES
(Unaudited)
The following Expense Table is shown so that you can understand the impact of fees on your investment. All mutual funds have operating expenses. As a shareholder of the fund, you incur ongoing costs, which include costs for portfolio management, administrative services, and shareholder reports, among others. Operating expenses, legal and audit services, which are deducted from a fund's gross income, directly reduce the investment return of the fund. A fund's expenses are expressed as a percentage of its average net assets. This figure is known as the expense ratio. The following examples are intended to help you understand the ongoing costs, in dollars, of investing in the fund and to compare these costs with those of other mutual funds. The examples are based on an investment of $1,000 made at the beginning of the period shown and held for the entire period.
The Expense Table below illustrates your fund's costs in two ways.
Actual fund return
This section helps you to estimate the actual expenses after fee waivers that you paid over the period. The "Ending Account Value" shown is derived from the fund's actual return and "Expenses Paid During Period" reflect the dollar amount that would have been paid by an investor who started with $1,000 in the fund. You may use the information here, together with the amount you invested, to estimate the expenses that you paid over the period.
To do so, simply divide your account value by $1,000 (for example, a $7,500 account value divided by $1,000 = 7.5), then multiply the result by the number given for your fund under the heading "Expenses Paid During Period."
Hypothetical example for comparison purposes
This section is intended to help you compare your fund's costs with those of other mutual funds. The hypothetical "Ending Account Value" and "Expenses Paid During Period" are derived from the fund's actual expense ratio and an assumed 5% annual return before expenses. In this case, because the return used is not the fund's actual return, the results do not apply to your investment. The example is useful in making comparisons because the SEC requires all mutual funds to calculate expenses based on a 5% annual return. You can assess your fund's cost by comparing this hypothetical example with the hypothetical examples that appear in shareholder reports of other funds.
Please note that the expenses shown in the table are meant to highlight and help you compare ongoing costs only and do not reflect any transactional costs, if applicable. The "Annualized Expense Ratio" represents the actual expenses for the six-month period indicated.
Six Months Ended October 31, 2008
EXPENSE TABLE
| | | Beginning
Account
Value
05/01/08 | | Ending
Account
Value
10/31/08 | | Annualized
Expense
Ratio* | | Expenses
Paid
During
Period* | |
| Actual Fund Return | | $ | 1,000.00 | | | $ | 555.50 | | | | 0.23 | % | | $ | 0.90 | | |
| Hypothetical 5% Annual Return | | $ | 1,000.00 | | | $ | 1,023.98 | | | | 0.23 | % | | $ | 1.17 | | |
* Expenses are equal to the fund's annualized expense ratio for the six-month period, multiplied by the average account value over the period, multiplied by the number of days in the most recent six-month period (184), then divided by the number of days in the year (366) to reflect the six-month period.
18
THE DFA INVESTMENT TRUST COMPANY
THE DFA INTERNATIONAL VALUE SERIES
DISCLOSURE OF PORTFOLIO HOLDINGS
(Unaudited)
The SEC requires that all Funds file a complete Schedule of Investments with the SEC for their first and third fiscal quarters on Form N-Q. For The DFA Investment Trust Company, this would be for the fiscal quarters ending January 31 and July 31. The Form N-Q filing must be made within 60 days of the end of the quarter. The DFA Investment Trust Company filed its most recent Form N-Q with the SEC on October 30, 2008. It is available upon request, without charge, by calling collect: (310) 395-8005 or by mailing a request to Dimensional Fund Advisors LP, 1299 Ocean Avenue, Santa Monica, California 90401, or by visiting the SEC's website at http://www.sec.gov, or they may be reviewed and copied at the SEC's Public Reference Room in Washington, D.C. (call 1-800-732-0330 for information on the operation of the Public Reference Room).
SEC regulations permit a fund to include in its reports to shareholders a "Summary Schedule of Portfolio Holdings" in lieu of a full Schedule of Investments. The Summary Schedule of Portfolio Holdings reports the fund's 50 largest holdings in unaffiliated issuers and any investments that exceed one percent of the fund's net assets at the end of the reporting period. The amendments also require that the Summary Schedule of Portfolio Holdings identify each category of investments that are held.
The fund is required to file a complete Schedule of Investments with the SEC on Form N-CSR within ten days after mailing the annual and semi-annual reports to shareholders. It will be available upon request, without charge, by calling collect: (310) 395-8005 or by mailing a request to Dimensional Fund Advisors LP, 1299 Ocean Avenue, Santa Monica, California 90401, or by visiting the SEC's website at http://www.sec.gov, or they may be reviewed and copied at the SEC's Public Reference Room in Washington, D.C. (call 1-800-732-0330 for information on the operation of the Public Reference Room).
PORTFOLIO HOLDINGS
The SEC requires that all Funds present their categories of portfolio holdings in a table, chart or graph format in their annual and semi-annual shareholder reports, whether or not a Schedule of Investments is utilized. The following table, which presents portfolio holdings as a percent of total investments before short-term investments and collateral for loaned securities, is provided in compliance with such requirement. The categories shown below represent broad industry sectors. Each industry sector consists of one or more specific industry classifications.
Consumer
Discretionary | | Consumer
Staples | | Energy | | Financials | | Health
Care | | Industrials | | Information
Technology | | Materials | | Telecommunication
Services | | Utilities | | Total | |
| | 12.2 | % | | | 5.1 | % | | | 5.5 | % | | | 41.4 | % | | | 0.5 | % | | | 10.0 | % | | | 3.6 | % | | | 9.3 | % | | | 9.0 | % | | | 3.4 | % | | | 100.0 | % | |
19
THE DFA INTERNATIONAL VALUE SERIES
SUMMARY SCHEDULE OF PORTFOLIO HOLDINGS
October 31, 2008
| | | Shares | | Value†† | | Percentage
of Net Assets** | |
| AUSTRALIA — (4.7%) | |
| COMMON STOCKS — (4.7%) | |
| Australia & New Zealand Banking Group, Ltd. | | | 3,302,749 | | | $ | 38,716,458 | | | | 0.8 | % | |
| Commonwealth Bank of Australia | | | 2,119,091 | | | | 57,926,994 | | | | 1.2 | % | |
| # National Australia Bank, Ltd. | | | 3,087,538 | | | | 50,098,709 | | | | 1.1 | % | |
| Other Securities | | | | | | | 107,641,792 | | | | 2.3 | % | |
| TOTAL — AUSTRALIA | | | | | | | 254,383,953 | | | | 5.4 | % | |
| AUSTRIA — (0.5%) | |
| COMMON STOCKS — (0.5%) | |
| Other Securities | | | | | | | 28,305,261 | | | | 0.6 | % | |
| BELGIUM — (0.5%) | |
| COMMON STOCKS — (0.5%) | |
| Other Securities | | | | | | | 29,328,450 | | | | 0.6 | % | |
| RIGHTS/WARRANTS — (0.0%) | |
| Other Securities | | | | | | | 256 | | | | 0.0 | % | |
| TOTAL — BELGIUM | | | | | | | 29,328,706 | | | | 0.6 | % | |
| CANADA — (5.9%) | |
| COMMON STOCKS — (5.9%) | |
| # Barrick Gold Corp. | | | 1,226,832 | | | | 28,052,344 | | | | 0.6 | % | |
| # EnCana Corp. | | | 560,598 | | | | 28,478,732 | | | | 0.6 | % | |
| Petro-Canada | | | 1,205,300 | | | | 30,140,000 | | | | 0.6 | % | |
| Sun Life Financial, Inc. | | | 1,262,400 | | | | 29,693,056 | | | | 0.6 | % | |
| Other Securities | | | | | | | 200,692,451 | | | | 4.4 | % | |
| TOTAL — CANADA | | | | | | | 317,056,583 | | | | 6.8 | % | |
| DENMARK — (0.9%) | |
| COMMON STOCKS — (0.9%) | |
| Other Securities | | | | | | | 46,987,354 | | | | 1.0 | % | |
| FINLAND — (1.0%) | |
| COMMON STOCKS — (1.0%) | |
| Other Securities | | | | | | | 52,418,538 | | | | 1.1 | % | |
| FRANCE — (8.5%) | |
| COMMON STOCKS — (8.5%) | |
| # AXA SA | | | 2,818,397 | | | | 53,842,817 | | | | 1.2 | % | |
| # BNP Paribas SA | | | 1,558,158 | | | | 112,501,123 | | | | 2.4 | % | |
| # Compagnie de Saint-Gobain | | | 580,915 | | | | 22,415,677 | | | | 0.5 | % | |
| Vivendi SA | | | 2,482,257 | | | | 64,884,026 | | | | 1.4 | % | |
| Other Securities | | | | | | | 208,936,536 | | | | 4.3 | % | |
| TOTAL — FRANCE | | | | | | | 462,580,179 | | | | 9.8 | % | |
| GERMANY — (8.8%) | |
| COMMON STOCKS — (8.8%) | |
| Allianz SE | | | 442,712 | | | | 33,313,833 | | | | 0.7 | % | |
| # Daimler AG | | | 1,684,003 | | | | 57,854,323 | | | | 1.2 | % | |
| # Deutsche Bank AG | | | 774,190 | | | | 28,921,349 | | | | 0.6 | % | |
| # Deutsche Telekom AG | | | 2,621,866 | | | | 38,930,629 | | | | 0.8 | % | |
| Deutsche Telekom AG Sponsored ADR | | | 2,705,150 | | | | 40,171,477 | | | | 0.9 | % | |
| E.ON AG | | | 1,781,013 | | | | 68,160,893 | | | | 1.5 | % | |
| # E.ON AG Sponsored ADR | | | 1,091,708 | | | | 41,484,904 | | | | 0.9 | % | |
20
THE DFA INTERNATIONAL VALUE SERIES
CONTINUED
| | | Shares | | Value†† | | Percentage
of Net Assets** | |
| Munchener Rueckversicherungs-Gesellschaft AG | | | 388,934 | | | $ | 50,491,309 | | | | 1.1 | % | |
| Other Securities | | | | | | | 114,673,630 | | | | 2.4 | % | |
| TOTAL — GERMANY | | | | | | | 474,002,347 | | | | 10.1 | % | |
| GREECE — (0.3%) | |
| COMMON STOCKS — (0.3%) | |
| Other Securities | | | | | | | 14,142,756 | | | | 0.3 | % | |
| HONG KONG — (2.5%) | |
| COMMON STOCKS — (2.5%) | |
| # Cheung Kong Holdings, Ltd. | | | 3,224,000 | | | | 30,955,317 | | | | 0.7 | % | |
| Hutchison Whampoa, Ltd. | | | 5,472,000 | | | | 29,569,976 | | | | 0.6 | % | |
| Sun Hung Kai Properties, Ltd. | | | 2,528,000 | | | | 22,148,070 | | | | 0.5 | % | |
| Other Securities | | | | | | | 54,353,926 | | | | 1.1 | % | |
| TOTAL — HONG KONG | | | | | | | 137,027,289 | | | | 2.9 | % | |
| IRELAND — (0.3%) | |
| COMMON STOCKS — (0.3%) | |
| Other Securities | | | | | | | 16,882,601 | | | | 0.4 | % | |
| ITALY — (1.9%) | |
| COMMON STOCKS — (1.9%) | |
| UniCredito Italiano SpA | | | 10,088,794 | | | | 24,697,595 | | | | 0.5 | % | |
| Other Securities | | | | | | | 78,187,153 | | | | 1.7 | % | |
| TOTAL — ITALY | | | | | | | 102,884,748 | | | | 2.2 | % | |
| JAPAN — (13.3%) | |
| COMMON STOCKS — (13.3%) | |
| FUJIFILM Holdings Corp. | | | 1,077,300 | | | | 24,799,840 | | | | 0.5 | % | |
| Hitachi, Ltd. | | | 6,574,000 | | | | 30,865,283 | | | | 0.7 | % | |
| Tokio Marine Holdings, Inc. | | | 1,457,311 | | | | 44,952,061 | | | | 1.0 | % | |
| Other Securities | | | | | | | 621,977,287 | | | | 13.2 | % | |
| TOTAL — JAPAN | | | | | | | 722,594,471 | | | | 15.4 | % | |
| NETHERLANDS — (3.5%) | |
| COMMON STOCKS — (3.5%) | |
| # ArcelorMittal | | | 1,877,993 | | | | 48,755,658 | | | | 1.0 | % | |
| ING Groep NV | | | 3,093,625 | | | | 29,019,312 | | | | 0.6 | % | |
| Koninklijke Philips Electronics NV | | | 3,192,970 | | | | 59,005,541 | | | | 1.3 | % | |
| Other Securities | | | | | | | 50,984,660 | | | | 1.1 | % | |
| TOTAL — NETHERLANDS | | | | | | | 187,765,171 | | | | 4.0 | % | |
| NEW ZEALAND — (0.1%) | |
| COMMON STOCKS — (0.1%) | |
| Other Securities | | | | | | | 7,460,246 | | | | 0.2 | % | |
| NORWAY — (0.8%) | |
| COMMON STOCKS — (0.8%) | |
| Other Securities | | | | | | | 42,910,368 | | | | 0.9 | % | |
| PORTUGAL — (0.1%) | |
| COMMON STOCKS — (0.1%) | |
| Other Securities | | | | | | | 6,541,713 | | | | 0.1 | % | |
| SINGAPORE — (1.1%) | |
| COMMON STOCKS — (1.1%) | |
| Other Securities | | | | | | | 57,732,771 | | | | 1.2 | % | |
| SPAIN — (4.2%) | |
| COMMON STOCKS — (4.2%) | |
| # Banco Santander Central Hispano SA | | | 7,025,356 | | | | 75,980,397 | | | | 1.6 | % | |
| # Banco Santander SA Sponsored ADR | | | 3,044,700 | | | | 32,700,078 | | | | 0.7 | % | |
| Repsol YPF SA | | | 1,204,043 | | | | 22,895,968 | | | | 0.5 | % | |
21
THE DFA INTERNATIONAL VALUE SERIES
CONTINUED
| | | Shares | | Value†† | | Percentage
of Net Assets** | |
| Repsol YPF SA Sponsored ADR | | | 1,285,700 | | | $ | 24,582,584 | | | | 0.5 | % | |
| Other Securities | | | | | | | 68,834,633 | | | | 1.5 | % | |
| TOTAL — SPAIN | | | | | | | 224,993,660 | | | | 4.8 | % | |
| SWEDEN — (2.4%) | |
| COMMON STOCKS — (2.4%) | |
| # Nordea Bank AB | | | 4,247,718 | | | | 34,046,034 | | | | 0.7 | % | |
| Other Securities | | | | | | | 94,071,267 | | | | 2.0 | % | |
| TOTAL — SWEDEN | | | | | | | 128,117,301 | | | | 2.7 | % | |
| SWITZERLAND — (5.9%) | |
| COMMON STOCKS — (5.9%) | |
| * Compagnie Financiere Richemont SA Series A | | | 1,125,900 | | | | 23,669,433 | | | | 0.5 | % | |
| Credit Suisse Group AG | | | 1,755,349 | | | | 65,639,295 | | | | 1.4 | % | |
| # Credit Suisse Group AG Sponsored ADR | | | 591,859 | | | | 22,135,527 | | | | 0.5 | % | |
| Holcim, Ltd. | | | 435,033 | | | | 24,709,544 | | | | 0.5 | % | |
| Swiss Re | | | 725,996 | | | | 30,276,699 | | | | 0.6 | % | |
| Zurich Financial SVCS AG | | | 300,246 | | | | 60,913,201 | | | | 1.3 | % | |
| Other Securities | | | | | | | 92,813,720 | | | | 2.0 | % | |
| TOTAL — SWITZERLAND | | | | | | | 320,157,419 | | | | 6.8 | % | |
| UNITED KINGDOM — (17.2%) | |
| COMMON STOCKS — (17.2%) | |
| Anglo American P.L.C. | | | 1,329,421 | | | | 33,356,819 | | | | 0.7 | % | |
| Aviva P.L.C. | | | 6,571,996 | | | | 39,201,982 | | | | 0.8 | % | |
| # Barclays P.L.C. Sponsored ADR | | | 2,197,790 | | | | 23,670,198 | | | | 0.5 | % | |
| # HSBC Holdings P.L.C. Sponsored ADR | | | 2,176,243 | | | | 128,398,337 | | | | 2.7 | % | |
| Kingfisher P.L.C. | | | 12,172,495 | | | | 22,467,306 | �� | | | 0.5 | % | |
| Royal Dutch Shell P.L.C. ADR | | | 1,294,780 | | | | 71,588,386 | | | | 1.5 | % | |
| RSA Insurance Group P.L.C. | | | 12,939,111 | | | | 28,774,426 | | | | 0.6 | % | |
| Vodafone Group P.L.C. | | | 56,881,367 | | | | 109,423,488 | | | | 2.3 | % | |
| Vodafone Group P.L.C. Sponsored ADR | | | 6,370,018 | | | | 122,750,247 | | | | 2.6 | % | |
| William Morrison Supermarkets P.L.C. | | | 6,906,878 | | | | 29,409,035 | | | | 0.6 | % | |
| Other Securities | | | | | | | 324,025,564 | | | | 7.1 | % | |
| TOTAL — UNITED KINGDOM | | | | | | | 933,065,788 | | | | 19.9 | % | |
| | | Face
Amount | | Value† | | | |
| | | (000) | | | | | |
| TEMPORARY CASH INVESTMENTS — (1.6%) | |
Repurchase Agreement, PNC Capital Markets, Inc. 0.94%,
11/03/08 (Collateralized by $92,080,000 FHLMC 4.50%,
05/01/23, valued at $87,591,100) to be repurchased at $86,299,760 | | $ | 86,293 | | | | 86,293,000 | | | | 1.8 | % | |
| | | Shares | | | | | |
| SECURITIES LENDING COLLATERAL — (14.0%) | |
| §@ DFA Short Term Investment Fund LP | | | 757,347,231 | | | | 757,347,231 | | | | 16.1 | % | |
| | | Face
Amount | | | | | |
| | | (000) | | | | | |
@ Repurchase Agreement, Deutsche Bank Securities 0.25%,
11/03/08 (Collateralized by $3,471,793 FHLMC 7.000%,
08/01/37, valued at $2,958,290) to be repurchased at $2,900,344 | | $ | 2,900 | | | | 2,900,284 | | | | 0.1 | % | |
| TOTAL SECURITIES LENDING COLLATERAL | | | | | | | 760,247,515 | | | | 16.2 | % | |
TOTAL INVESTMENTS — (100.0%)
(Cost $7,723,320,604) | | | | | | $ | 5,413,879,738 | | | | 115.2 | % | |
See accompanying Notes to Financial Statements.
22
THE DFA INVESTMENT TRUST COMPANY
THE DFA INTERNATIONAL VALUE SERIES
STATEMENT OF ASSETS AND LIABILITIES
OCTOBER 31, 2008
(Amounts in thousands, except share and per share amounts)
| ASSETS: | |
| Investments at Value (including $717,470 of securities on loan) | | $ | 4,567,339 | | |
| Temporary Cash Investments at Value & Cost | | | 86,293 | | |
| Collateral Received from Securities on Loan at Value & Cost | | | 760,248 | | |
| Foreign Currencies at Value | | | 14,156 | | |
| Cash | | | 15 | | |
| Receivables: | |
| Investment Securities Sold | | | 38,170 | | |
| Dividends, Interest and Tax Reclaims | | | 15,310 | | |
| Securities Lending Income | | | 1,186 | | |
| Fund Shares Sold | | | 10,712 | | |
| Fund Margin Variation | | | 19 | | |
| Prepaid Expenses and Other Assets | | | 7 | | |
| Total Assets | | | 5,493,455 | | |
| LIABILITIES: | |
| Payables: | |
| Upon Return of Securities Loaned | | | 760,248 | | |
| Investment Securities Purchased | | | 31,085 | | |
| Fund Shares Redeemed | | | 510 | | |
| Due to Advisor | | | 853 | | |
| Accrued Expenses and Other Liabilities | | | 422 | | |
| Total Liabilities | | | 793,118 | | |
| NET ASSETS | | $ | 4,700,337 | | |
| SHARES OUTSTANDING, $0.01 PAR VALUE (1) | | | 412,114,828 | | |
| NET ASSET VALUE, OFFERING AND REDEMPTION PRICE PER SHARE | | $ | 11.41 | | |
| Investments at Cost | | $ | 6,876,780 | | |
| Foreign Currencies at Cost | | $ | 14,875 | | |
| NET ASSETS CONSIST OF: | |
| Paid-In Capital | | $ | 4,700,337 | | |
| NET ASSETS | | $ | 4,700,337 | | |
| (1) NUMBER OF SHARES AUTHORIZED | | | Unlimited | | |
See accompanying Notes to Financial Statements.
23
THE DFA INVESTMENT TRUST COMPANY
THE DFA INTERNATIONAL VALUE SERIES
STATEMENTS OF OPERATIONS
(Amounts in thousands)
| | | Period
Dec. 1, 2007
to
Oct. 31, 2008 | | Year
Ended
Nov. 30,
2007 | |
| Investment Income | |
| Dividends (Net of Foreign Taxes Withheld of $28,938 and $23,649, respectively) | | $ | 300,627 | | | $ | 278,708 | | |
| Interest | | | 1,071 | | | | 2,113 | | |
| Income from Securities Lending | | | 19,332 | | | | 14,342 | | |
| Total Investment Income | | | 321,030 | | | | 295,163 | | |
| Expenses | |
| Investment Advisory Services Fees | | | 14,643 | | | | 18,039 | | |
| Accounting & Transfer Agent Fees | | | 739 | | | | 900 | | |
| Custodian Fees | | | 914 | | | | 1,185 | | |
| Shareholders' Reports | | | 78 | | | | 84 | | |
| Directors'/Trustees' Fees & Expenses | | | — | | | | 97 | | |
| Professional Fees | | | 171 | | | | 139 | | |
| Other | | | 98 | | | | 106 | | |
| Total Expenses | | | 16,643 | | | | 20,550 | | |
| Net Investment Income (Loss) | | | 304,387 | | | | 274,613 | | |
| Realized and Unrealized Gain (Loss) | |
| Net Realized Gain (Loss) on: | |
| Investment Securities Sold | | | 137,811 | | | | 654,522 | | |
| Futures | | | (1,153 | ) | | | — | | |
| Foreign Currency Transactions | | | (4,593 | ) | | | 2,498 | | |
| In-Kind Redemptions | | | 103,024 | * | | | — | | |
| Change in Unrealized Appreciation (Depreciation) of: | |
| Investment Securities and Foreign Currency | | | (5,026,911 | ) | | | 403,307 | | |
| Futures | | | 19 | | | | — | | |
| Translation of Foreign Currency Denominated Amounts | | | (76 | ) | | | (180 | ) | |
| Net Realized and Unrealized Gain (Loss) | | | (4,791,879 | ) | | | 1,060,147 | | |
| Net Increase (Decrease) in Net Assets Resulting from Operations | | $ | (4,487,492 | ) | | $ | 1,334,760 | | |
* See Note J in the Notes to Financial Statements.
See accompanying Notes to Financial Statements.
24
THE DFA INVESTMENT TRUST COMPANY
THE DFA INTERNATIONAL VALUE SERIES
STATEMENTS OF CHANGES IN NET ASSETS
(Amounts in thousands)
| | | Period
Dec. 1, 2007
to
Oct. 31, 2008 | | Year
Ended
Nov. 30,
2007 | | Year
Ended
Nov. 30,
2006 | |
| Increase (Decrease) in Net Assets | |
| Operations: | |
| Net Investment Income (Loss) | | $ | 304,387 | | | $ | 274,613 | | | $ | 193,174 | | |
| Net Realized Gain (Loss) on: | |
| Investment Securities Sold | | | 137,811 | | | | 654,522 | | | | 201,700 | | |
| Futures | | | (1,153 | ) | | | — | | | | — | | |
| Foreign Currency Transactions | | | (4,593 | ) | | | 2,498 | | | | 378 | | |
| In-Kind Redemptions | | | 103,024 | * | | | — | | | | — | | |
| Change in Unrealized Appreciation (Depreciation) of: | |
| Investment Securities and Foreign Currency | | | (5,026,911 | ) | | | 403,307 | | | | 1,351,708 | | |
| Futures | | | 19 | | | | — | | | | — | | |
| Translation of Foreign Currency Denominated Amounts | | | (76 | ) | | | (180 | ) | | | 486 | | |
Net Increase (Decrease) in Net Assets Resulting
from Operations | | | (4,487,492 | ) | | | 1,334,760 | | | | 1,747,446 | | |
| Distributions From: | |
| Net Investment Income | | | (293,386 | ) | | | (278,093 | ) | | | (202,210 | ) | |
| Net Short-Term Gains | | | (22,542 | ) | | | (14,957 | ) | | | (11,375 | ) | |
| Net Long-Term Gains | | | (614,160 | ) | | | (185,943 | ) | | | (115,307 | ) | |
| Total Distributions | | | (930,088 | ) | | | (478,993 | ) | | | (328,892 | ) | |
| Capital Share Transactions (1): | |
| Shares Issued | | | 927,878 | | | | 1,731,698 | | | | 1,589,921 | | |
| Shares Issued in Lieu of Cash Distributions | | | 916,898 | | | | 465,562 | | | | 307,948 | | |
| Shares Redeemed | | | (1,365,580 | )* | | | (871,558 | ) | | | (226,869 | ) | |
| Net Increase (Decrease) from Capital Share Transactions | | | 479,196 | | | | 1,325,702 | | | | 1,671,000 | | |
| Total Increase (Decrease) in Net Assets | | | (4,938,384 | ) | | | 2,181,469 | | | | 3,089,554 | | |
| Net Assets | |
| Beginning of Period | | | 9,638,721 | | | | 7,457,252 | | | | 4,367,698 | | |
| End of Period | | $ | 4,700,337 | | | $ | 9,638,721 | | | $ | 7,457,252 | | |
| (1) Shares Issued and Redeemed: | |
| Shares Issued | | | 50,328 | | | | 72,431 | | | | 80,546 | | |
| Shares Issued in Lieu of Cash Distributions | | | 45,073 | | | | 20,227 | | | | 16,678 | | |
| Shares Redeemed | | | (77,527 | ) | | | (36,444 | ) | | | (11,688 | ) | |
| | | | 17,874 | | | | 56,214 | | | | 85,536 | | |
Undistributed Net Investment Income (Distributions in
Excess of Net Investment Income) | | $ | — | | | $ | 9,727 | | | $ | (7,523 | ) | |
* See Note J in the Notes to Financial Statements.
See accompanying Notes to Financial Statements.
25
THE DFA INVESTMENT TRUST COMPANY
THE DFA INTERNATIONAL VALUE SERIES
FINANCIAL HIGHLIGHTS
(for a share outstanding throughout each period)
| | | Period
Dec. 1, 2007
to
Oct. 31, 2008 | | Year
Ended
Nov. 30,
2007 | | Year
Ended
Nov. 30,
2006 | | Year
Ended
Nov. 30,
2005 | | Year
Ended
Nov. 30,
2004 | | Year
Ended
Nov. 30,
2003 | |
Net Asset Value,
Beginning of Period | | $ | 24.45 | | | $ | 22.06 | | | $ | 17.30 | | | $ | 16.04 | | | $ | 12.40 | | | $ | 9.33 | | |
Income from Investment
Operations | | | | | |
| Net Investment Income (Loss) | | | 0.73 | (A) | | | 0.73 | (A) | | | 0.65 | (A) | | | 0.43 | | | | 0.33 | | | | 0.27 | | |
Net Gains (Losses) on
Securities (Realized and
Unrealized) | | | (11.45 | ) | | | 2.98 | | | | 5.27 | | | | 1.95 | | | | 3.61 | | | | 3.06 | | |
Total from Investment
Operations | | | (10.72 | ) | | | 3.71 | | | | 5.92 | | | | 2.38 | | | | 3.94 | | | | 3.33 | | |
| Less Distributions | |
| Net Investment Income | | | (0.71 | ) | | | (0.73 | ) | | | (0.67 | ) | | | (0.52 | ) | | | (0.30 | ) | | | (0.25 | ) | |
| Net Realized Gains | | | (1.61 | ) | | | (0.59 | ) | | | (0.49 | ) | | | (0.60 | ) | | | — | | | | (0.01 | ) | |
| Total Distributions | | | (2.32 | ) | | | (1.32 | ) | | | (1.16 | ) | | | (1.12 | ) | | | (0.30 | ) | | | (0.26 | ) | |
Net Asset Value,
End of Period | | $ | 11.41 | | | $ | 24.45 | | | $ | 22.06 | | | $ | 17.30 | | | $ | 16.04 | | | $ | 12.40 | | |
| Total Return | | | (47.87 | )%(C) | | | 17.32 | % | | | 35.73 | % | | | 15.61 | % | | | 32.15 | % | | | 36.24 | % | |
Net Assets,
| |
| End of Period (thousands) | | $ | 4,700,337 | | | $ | 9,638,721 | | | $ | 7,457,252 | | | $ | 4,367,698 | | | $ | 2,804,043 | | | $ | 1,604,778 | | |
Ratio of Expenses to Average
Net Assets | | | 0.23 | %(B) | | | 0.23 | % | | | 0.23 | % | | | 0.27 | % | | | 0.28 | % | | | 0.30 | % | |
Ratio of Net Investment Income
to Average Net Assets | | | 4.15 | %(B) | | | 3.04 | % | | | 3.29 | % | | | 2.71 | % | | | 2.35 | % | | | 2.61 | % | |
| Portfolio Turnover Rate | | | 16 | %(C) | | | 16 | % | | | 8 | % | | | 10 | % | | | 15 | % | | | 14 | % | |
See page 1 for the Definitions of Abbreviations and Footnotes.
See accompanying Notes to Financial Statements.
26
THE DFA INVESTMENT TRUST COMPANY
THE DFA INTERNATIONAL VALUE SERIES
NOTES TO FINANCIAL STATEMENTS
A. Organization:
The DFA Investment Trust Company (the "Trust") is an open-end management investment company registered under the Investment Company Act of 1940. The Trust consists of eighteen investment portfolios, of which The DFA International Value Series (the "Series") is presented in this report.
At a regular meeting of the Board of Directors/Trustees (the "Board") on September 16, 2008, the Board voted to change the fiscal and tax year ends of the Series from November 30 to October 31.
B. Significant Accounting Policies:
The following significant accounting policies are in conformity with accounting principles generally accepted in the United States of America. Such policies are consistently followed by the Trust in preparation of its financial statements. The preparation of financial statements in accordance with accounting principles generally accepted in the United States of America requires management to make estimates and assumptions that affect the reported amounts of assets and liabilities and disclosure of contingent assets and liabilities at the date of the financial statements and the reported amounts of increases and decreases in net assets from operations during the reporting period. Actual results could differ from those estimates and those differences could be material.
1. Security Valuation: Securities held by the Series (including over-the-counter securities) are valued at the last quoted sale price of the day. Securities held by the Series that are listed on Nasdaq are valued at the Nasdaq Official Closing Price ("NOCP"). If there is no last reported sale price or NOCP for the day, the Series values the securities at the mean of the most recent quoted bid and asked prices. Price information on listed securities is taken from the exchange where the security is primarily traded. Generally, securities issued by open-end investment companies are valued using their respective net asset values or public offering prices, as appropriate, for purchase orders placed at the close of the New York Stock Exchange (NYSE).
Securities for which no market quotations are readily available (including restricted securities), or for which market quotations have become unreliable, are valued in good faith at fair value in accordance with procedures adopted by the Board of Directors/Trustees. Fair value pricing may also be used if events that have a significant effect on the value of an investment (as determined in the discretion of the Investment Committee of the Advisor) occur before the net asset value is calculated. When fair value pricing is used, the prices of securities used by the Series may differ from the quoted or published prices for the same securities on their primary markets or exchanges.
The Series will also fair value price in the circumstances described below. Generally, trading in foreign securities markets is completed each day at various times prior to the close of the NYSE. For example, trading in the Japanese securities markets is completed each day at the close of Tokyo Stock Exchange (normally 11:00 p.m. PT), which is fourteen hours prior to the close of the NYSE (normally 1:00 p.m. PT) and the time that the net asset value of the Series is computed. Due to the time differences between the closings of the relevant foreign securities exchanges and the time the Series prices its shares at the close of the NYSE, the Series will fair value its foreign investments when it is determined that the market quotations for the foreign investments are either unreliable or not readily available. The fair value prices will attempt to reflect the impact of the U.S. financial markets' perceptions and trading activities on the Series ' foreign investments since the last closing prices of the foreign investments were calculated on their primary foreign securities markets or exchanges. For these purposes, the Board of Directors/Trustees of the Series has determined that movements in relevant indices or other appropriate market indicators, after the close of the Tokyo Stock Exchange or the London Stock Exchange, demonstrate that market quotations may be unreliable. Fair valuation of portfolio securities may occur on a daily basis. The fair value pricing by the Series utilizes data furnished by an independent pricing service (and that data draws upon, among other information, the market values of foreign investments). The fair value prices of portfolio securities generally will be used when it is determined that the use of such prices will have a material impact on the net asset value of the Series. When the Series uses fair value
27
pricing, the values assigned to the Series' foreign investments may not be the quoted or published prices of the investments on their primary markets or exchanges.
Futures contracts held by the Series are valued using the settlement price established each day on the exchange on which they are traded.
Adoption of Statement of Financial Accounting Standards No. 157 "Fair Value Measurements" ("FAS 157")
In September 2006, the Financial Accounting Standards Board issued FAS 157 effective for fiscal years beginning after November 15, 2007. This standard clarifies the definition of fair value for financial reporting, establishes a framework for measuring fair value and requires additional disclosures about the use of fair value measurements. The Funds have adopted FAS 157 as of December 1, 2007. The three levels of the fair value hierarchy under FAS 157 are described below:
• Level 1 – quoted prices in active markets for identical securities
• Level 2 – other significant observable inputs (including quoted prices for similar securities, interest rates, prepayment speeds, credit risk, etc.)
• Level 3 – significant unobservable inputs (including the Series' own assumptions in determining the fair value of investments)
The inputs or methodology used for valuing securities are not necessarily an indication of the risk associated with investing in those securities. A summary of the inputs used to value the Series' net assets as of October 31, 2008 is listed below (in thousands).
| | | Valuation Inputs | |
| | | Investments in
Securities
(Market Value) | | Other Financial
Instruments
(Unrealized
Appreciation/
Depreciation)* | |
| | | Level 1 | | Level 2 | | Level 3 | | Total | | Level 1 | | Level 2 | | Level 3 | | Total | |
| The DFA International Value Series | | $ | 1,004,378 | | | $ | 4,409,502 | | | | — | | | $ | 5,413,880 | | | $ | 19 | | | | — | | | | — | | | $ | 19 | | |
2. Foreign Currency Translation: Securities and other assets and liabilities of the Series whose values are initially expressed in foreign currencies are translated to U.S. dollars using the mean between the most recently quoted bid and asked prices for the U.S. dollar as quoted by generally recognized reliable sources. Dividend and interest income and certain expenses are translated to U.S. dollars at the rate of exchange on their respective accrual dates. Receivables and payables denominated in foreign currencies are marked to market daily based on daily exchange rates. Exchange gains or losses are realized upon ultimate receipt or disbursement.
The Series does not isolate the effect of fluctuations in foreign exchange rates from the effect of fluctuations in the market prices of securities held whether realized or unrealized.
Realized gains or losses on foreign currency transactions represent net foreign exchange gains or losses from the disposition of foreign currencies, currency gains or losses realized between the trade and settlement dates on securities transactions, and the difference between amounts of interest, dividends and foreign withholding taxes recorded on the books of the Series and the U.S. dollar equivalent amounts actually received or paid.
3. Deferred Compensation Plan: Each eligible Trustee of the Trust may elect participation in the Deferred Compensation Plan (the "Plan"). Under the Plan, effective January 1, 2002, such Trustees may defer payment of all or a portion of their total fees earned as a Trustee. These deferred amounts may be treated as though such amounts had been invested in shares of the following funds: U.S. Large Cap Value Portfolio; U.S. Core Equity 1 Portfolio; U.S. Core Equity 2 Portfolio; U.S. Vector Equity Portfolio; U.S. Micro Cap Portfolio; DFA International Value Portfolio; International Core Equity Portfolio; Emerging Markets Portfolio; Emerging Markets Core Equity Portfolio; and/or DFA Two-Year Global Fixed Income Portfolio. Contributions made under the Plan and the change in unrealized app reciation (depreciation) and income are included in Other Expenses for the period ended October 31, 2008 and are included in Directors'/Trustees' Fees & Expenses for the year ended November 30, 2007. At October 31, 2008,
28
the total liability for deferred compensation to Trustees is included in Accrued Expenses and Other Liabilities in the amount of $117 (in thousands).
Each Trustee has the option to receive their distribution of proceeds in one of the following methods upon one year's notice: lump sum; annual installments over a period of agreed upon years; or semi-annual installments over a period of agreed upon years. As of October 31, 2008, none of the Trustees have requested distribution of proceeds.
4. Other: Security transactions are accounted for as of the trade date. Costs used in determining realized gains and losses on the sale of investment securities are on the basis of identified cost. Dividend income and distributions to shareholders are recorded on the ex-dividend date. Distributions received on securities that represent a return of capital or capital gains are recorded as a reduction of cost of investments or as a realized gain, respectively. The Series estimates the character of distributions received that may be considered return of capital distributions or capital gain distributions. Interest income is recorded on the accrual basis. Discount and premium on securities purchased are amortized over the lives of the respective securities utilizing the effective inter est method. Expenses directly attributable to a Series are directly charged. Common expenses of the Trust are allocated using methods approved by the Board of Directors/Trustees, generally based on average net assets.
The Series may be subject to taxes imposed by countries in which it invests, with respect to its investments in issuers exiting or operating in such countries. Such taxes are generally based on income earned or repatriated and capital gains realized on the sale of such investments. The Series accrues such taxes when the related income or capital gains are earned or throughout the holding period. Some countries require governmental approval for the repatriation of investment income, capital or the proceeds of sales earned by foreign investors. In addition, if there is a deterioration in a country's balance of payments or for other reasons, a country may impose temporary restrictions on foreign capital remittances abroad.
C. Investment Advisor:
Dimensional Fund Advisors LP ("Dimensional" or the "Advisor") provides investment advisory services to the Series. For the period December 1, 2007 to October 31, 2008, the Series' investment advisory services fees were accrued daily and paid monthly to the Advisor based on an effective annual rate of 0.20% of average daily net assets.
Fees Paid to Officers and Directors/Trustees:
Certain Officers and Directors/Trustees of the Advisor are also Officers and Directors/Trustees of the Trust; however, such Officers and Directors/Trustees (with the exception of the Chief Compliance Officer ("CCO")) receive no compensation from the Trust. For the period December 1, 2007 to October 31, 2008, the total related amounts paid by the Trust to the CCO were $117 (in thousands). The total related amounts paid by the Series are included in Other Expenses on the Statement of Operations.
D. Purchases and Sales of Securities:
For the period December 1, 2007 to October 31, 2008, the Series made the following purchases and sales of investment securities, other than short-term securities and U.S. government securities (amounts in thousands):
| Purchases | | $ | 1,266,540 | | |
| Sales | | | 1,523,257 | | |
There were no purchases or sales of long-term U.S. government securities.
E. Federal Income Taxes:
The Series has qualified and intends to continue to qualify as a regulated investment company under Subchapter M of the Internal Revenue Code for federal income tax purposes and to distribute substantially all of its taxable income and net capital gains to its shareholders. Accordingly, no provision has been made for federal income taxes.
29
Distributions from net investment income and net realized capital gains are determined in accordance with U.S. federal income tax regulations, which may differ from those amounts determined under accounting principles generally accepted in the United States of America. These book/tax differences are either temporary or permanent in nature. To the extent these differences are permanent, they are charged or credited to paid-in capital, undistributed net investment income or accumulated net realized gains, as appropriate, in the period that the differences arise. Accordingly, the following permanent differences as of October 31, 2008, primarily attributable to realized net foreign currency gains/losses and net realized gains on securities considered to be passive foreign investment companies, were reclassified to the following accounts. These reclassifications had no effect on net assets or net asset value per share (amounts in thousands):
Increase
(Decrease)
Paid-in Capital | | Increase
(Decrease)
Undistributed
Net Investment Income | | Increase
(Decrease)
Accumulated
Net Realized
Gains/(Losses) | |
| $ | 123,628 | | | $ | (20,126 | ) | | $ | (103,502 | ) | |
The tax character of dividends and distributions declared and paid during the years November 30, 2006, November 30, 2007 and the period December 1, 2007 to October 31, 2008 (amounts in thousands):
| | | Net Investment
Income
and Short-Term
Capital Gains | | Long-Term
Capital Gains | | Total | |
| | 2006 | | | $ | 213,585 | | | $ | 115,307 | | | $ | 328,892 | | |
| | 2007 | | | | 293,050 | | | | 185,943 | | | | 478,993 | | |
| | 2008 | | | | 336,790 | | | | 613,845 | | | | 950,635 | | |
In June 2006, the Financial Accounting Standards Board (FASB) issued FASB Interpretation 48 ("FIN 48"), "Accounting for Uncertainty in Income Taxes." This standard defines the threshold for recognizing the benefits of tax-return positions in the financial statements as "more-likely-than-not" to be sustained by the taxing authority and requires measurement of a tax position meeting the more-likely-than-not criterion, based on the largest benefit that is more than 50 percent likely to be realized. Management has analyzed the Series' tax positions to be taken on the federal income tax returns for all open tax years (tax years ended November 30, 2005 through the period ended October 31, 2008) and for the period ended October 31, 2008, for purposes of implementing FIN 48, and has concluded that no provision for income tax is required in the Series' financial statements.
F. Financial Instruments:
In accordance with the Series' investment objectives and policies, the Series may invest in certain financial instruments that have off-balance sheet risk in excess of the amounts recognized in the financial statements and concentrations of credit and market risk. These instruments and their significant corresponding risks are described below:
1. Repurchase Agreements: The Series may purchase money market instruments subject to the counterparty's agreement to repurchase them at an agreed upon date and price. The counterparty will be required on a daily basis to maintain the value of the collateral subject to the agreement at not less than the repurchase price (including accrued interest). The agreements are conditioned upon the collateral being deposited under the Federal Reserve book-entry system with the Trust's custodian or a third party sub-custodian. In the event of default or bankruptcy by the other party to the agreement, retention of the collateral may be subject to legal proceedings. All open repurchase agreements were entered into on October 31, 2008.
2. Foreign Market Risks: Investments in foreign markets may involve certain considerations and risks not typically associated with investments in the United States of America, including the possibility of future political and economic developments and the level of foreign government supervision and regulation of foreign securities markets. These markets are generally smaller, less liquid and more volatile than the major securities markets in the United States of America. Consequently, acquisition and disposition of securities by the Series may be inhibited.
3. Futures Contracts: During the period December 1, 2007 to October 31, 2008, the Series entered into futures contracts in accordance with its investment objectives. Upon entering into a futures contract, the Series deposits cash or pledges U.S. Government securities to a broker, equal to the minimum "initial margin" requirements of the exchange
30
on which the contract is traded. Subsequent payments are received from or paid to the broker each day, based on the daily fluctuation in the market value of the contract. These receipts or payments are known as "variation margin" and are recorded daily by the Series as unrealized gains or losses until the contracts are closed. When the contracts are closed, the Series records a realized gain or loss equal to the difference between the value of the contract at the time it was opened and the value at the time it was closed.
At October 31, 2008, the Series had outstanding 156 long futures contracts of the S&P 500 Index®, all of which expire on December 19, 2008. The value of such contracts on October 31, 2008 was $37,725 (in thousands), which resulted in an unrealized gain of $19 (in thousands). Approximately $3,861 (in thousands) of cash has been segregated as collateral for the open futures contracts and has been accounted for as cash on the Statement of Assets and Liabilities.
Risks may arise upon entering into futures contracts from potential imperfect price correlations between the futures contracts and the underlying securities, from the possibility of an illiquid secondary market for these instruments and from the possibility that the Series could lose more than the initial margin requirements.
G. Line of Credit:
The Trust, together with other Dimensional-advised portfolios, has entered into a $250 million unsecured discretionary line of credit effective June 30, 2003 with an affiliate of its domestic custodian bank. Each portfolio is permitted to borrow, subject to its investment limitations, up to a maximum of $250 million, as long as total borrowings under the line of credit do not exceed $250 million in the aggregate. Borrowings under the line of credit are charged interest at the then current Federal Funds Rate plus 1%. Each portfolio is individually, and not jointly, liable for its particular advances under the line of credit. There is no commitment fee on the unused portion of the line of credit. The agreement for the discretionary line of credit may be terminated by either party at any time. The line of credit is scheduled to expire on June 23, 2009. There were no borrowings by the Series under this line of credit during the period ended Octo ber 31, 2008.
The Trust, together with other Dimensional-advised portfolios, has also entered into an additional $500 million unsecured line of credit effective January 15, 2008 with its international custodian bank. Each portfolio is permitted to borrow, subject to its investment limitations, up to a maximum of $500 million, as long as total borrowings under the line of credit do not exceed $500 million in the aggregate. Borrowings under the line of credit are charged interest at rates agreed to by the parties at the time of borrowing. Each portfolio is individually, and not jointly, liable for its particular advances under the line of credit. There is no commitment fee on the unused portion of the line of credit. The agreement for the line of credit expires on January 15, 2009.
For the period December 1, 2007 to October 31, 2008, borrowings by the Series under this line of credit were as follows (amounts in thousands, except percentages and days):
Weighted
Average
Interest Rate | | Weighted
Average
Loan Balance | | Number of
Days
Outstanding | | Interest
Expense
Incurred | | Maximum Amount
Borrowed During
the Period | |
| | 3.68 | % | | $ | 8,004 | | | | 31 | | | $ | 25 | | | $ | 27,822 | | |
There were no outstanding borrowings by the Series under this line of credit at October 31, 2008.
H. Securities Lending:
As of October 31, 2008, the Series had securities on loan to brokers/dealers, for which the Series held cash collateral. The Series invests the cash collateral, as described below, and records a liability for the return of the collateral, during the period the securities are on loan. Loans of securities are expected at all times to be secured by collateral equal to at least (i) 100% of the current market value of the loaned securities with respect to securities of the U.S. government or its agencies, (ii) 102% of the current market value of the loaned securities with respect to U.S. securities, and (iii) 105% of the current market value of the loaned securities with respect to foreign securities. However, daily market fluctuations could cause the Series' collateral to be lower or higher than the expected thresholds. If this were to occur, the collateral would be adjusted the next business day to ensure adequate collateralization. In the even t of default or bankruptcy by the other party to the agreement, realization and/or retention of the collateral may be subject to legal proceedings. If the borrower fails to return loaned securities, and cash collateral being maintained by the borrower is insufficient to cover the value of loaned securities and provided such collateral insufficiency is not the result
31
of investment losses, the lending agent has agreed to pay the amount of the shortfall to the Series or, at the option of the lending agent, to replace the securities.
Subject to the Series' investment policy, the cash collateral received by the Series from securities on loan is invested in securities of the U.S. government or its agencies, repurchase agreements collateralized by securities of the U.S. government or its agencies or shares of the DFA Short-Term Investment Fund LP. Agencies include both agency debentures and agency mortgage backed securities. In addition, the Series will be able to terminate the loan at any time and will receive reasonable interest on the loan, as well as amounts equal to any dividends, interest or other distributions on the loaned securities. However, dividend income received from loaned securities may not be eligible to be taxed at qualified dividend income rates.
I. Indemnities; Contractual Obligations:
Under the Trust's organizational documents, its officers and directors are indemnified against certain liabilities arising out of the performance of their duties to the Trust.
In the normal course of business, the Trust enters into contracts that contain a variety of representations and warranties which provide general indemnification. The Trust's maximum exposure under these arrangements is unknown as this would involve future claims that may be made against the Trust and/or its affiliates that have not yet occurred. However, based on experience, the Trust expects the risk of loss to be remote.
J. In-Kind Redemptions:
In accordance with guidelines described in the Series' prospectus, the Series may distribute portfolio securities rather than cash as payment for a redemption of fund shares (In-Kind redemption). For financial reporting purposes, the Series recognizes a gain on In-Kind redemptions to the extent the value of the distributed securities on the date of redemption exceeds the cost of those securities. Gains and losses realized on In-Kind redemptions are not recognized for tax purposes and are reclassified from undistributed realized gain (loss) to paid-in capital. During the period December 1, 2007 to October 31, 2008, the Series realized $103,024 (in thousands) of net gain.
K. Recently Issued Accounting Standards and Interpretation:
In March 2008, Statement of Financial Accounting Standards No. 161, Disclosures about Derivative Instruments and Hedging Activities ("FAS 161"), was issued and is effective for fiscal years beginning after November 15, 2008. FAS 161 defines new disclosures of derivative instruments and hedging activities. Management is currently evaluating the implications of FAS 161. At this time, its impact on the Series' financial statements has not been determined.
L. Subsequent Event Note:
On November 1, 2008, The DFA International Value Series, a master fund in a RIC/RIC master feeder structure with five RIC feeders and two direct client investors, made a "Check-the-box" election for federal income tax purposes pursuant to Treasury Regulation § 301.7701-3, to change its federal entity classification from a corporation taxable as a regulated investment company to a partnership. As a result of this election, the master fund is deemed to have distributed all of its assets and liabilities, in a taxable transaction, to its shareholders in liquidation of the master fund. Immediately thereafter, the shareholders contributed all of the distributed assets and liabilities to a newly formed partnership. The final tax year end of The DFA International Value Series was October 31, 2008. For Federal income tax purposes, pursuant to Code §336(a), the master fund recognizes gain or loss as if the master's investment securities were sold to its shareholders and, pursuant to Code §331, each of the Portfolios recognizes gain or loss as if it liquidated its investment in the master. For tax purposes, pursuant to Code § 334(a), each of the Portfolio's will take a fair market value basis in the securities deemed received by them and a new holding period for those securities commences on the deemed liquidation date.
32
The master fund had book/tax differences upon its deemed liquidation. The following summary of permanent differences occurred as of the respective effective "Check the Box" election date.
Increase
(Decrease)
Paid-in Capital | | Unrealized
Appreciation
(Depreciation)
Investment
Securities | | Increase
(Decrease)
Undistributed
Net Investment
Income | | Increase
(Decrease)
Accumulated
Net Realized
Gains(Losses) | |
| $ | (2,187,614,395 | ) | | $ | 2,319,051,847 | | | $ | (602,214 | ) | | $ | (130,835,238 | ) | |
As a result of the transaction, The DFA International Value Series recognized a ($2,309,440,866) and ($718,733) capital and currency loss respectively for tax year ended October 31, 2008. Additionally, the fund has written off $2,178,493,687 of expired capital loss carryover as a permanent book/tax reporting difference decreasing paid in capital.
Each Portfolio impacted by the "Check the Box" election also has a permanent book/tax difference resulting from the transaction. Listed below is the permanent difference impacting each respective Portfolio. For financial statement purposes, this adjustment did not result in any changes to each respective fund's net assets or net asset value per share.
| | | Unrealized
Appreciation
(Depreciation)
Investment
Securities | | Increase
(Decrease)
Accumulated
Net Realized
Gains(Losses) | |
| DFA International Value Portfolio | | $ | 1,598,039,236 | | | $ | (1,598,039,236 | ) | |
| DFA International Value Portfolio II | | | 49,859,737 | | | | (49,859,737 | ) | |
| DFA International Value Portfolio III | | | 155,866,882 | | | | (155,866,882 | ) | |
| DFA International Value Portfolio IV | | | 82,052,198 | | | | (82,052,198 | ) | |
| LWAS/DFA International High Book To Market Portfolio | | | (19,800,535 | ) | | | 19,800,535 | | |
For financial reporting purposes, this transaction had no impact on the net assets of the respective funds.
33
REPORT OF INDEPENDENT REGISTERED PUBLIC ACCOUNTING FIRM
To the Shareholders of The DFA International Value Series and
Board of Trustees of The DFA Investment Trust Company:
In our opinion, the accompanying statements of assets and liabilities, including the summary schedules of portfolio holdings, and the related statements of operations and of changes in net assets and the financial highlights presents fairly, in all material respects, the financial position of The DFA International Value Series (one of the portfolios constituting The DFA Investment Trust Company, hereafter referred to as the "Series") at October 31, 2008, the results of its operations, the changes in its net assets and the financial highlights for each of the periods indicated, in conformity with accounting principles generally accepted in the United States of America. These financial statements and financial highlights (hereafter referred to as "financial statements") are the responsibility of the Series' management; our responsibility is to express an opinion on these financial statements based on our audits. We conducted our audits of thes e financial statements in accordance with the standards of the Public Company Accounting Oversight Board (United States). Those standards require that we plan and perform the audit to obtain reasonable assurance about whether the financial statements are free of material misstatement. An audit includes examining, on a test basis, evidence supporting the amounts and disclosures in the financial statements, assessing the accounting principles used and significant estimates made by management, and evaluating the overall financial statement presentation. We believe that our audits, which included confirmation of securities at October 31, 2008 by correspondence with the custodian and brokers, provide a reasonable basis for our opinion.
PricewaterhouseCoopers LLP
Philadelphia, Pennsylvania
December 22, 2008
34
FUND MANAGEMENT
Trustees/Directors
Each Board of Trustees/Directors of The DFA Investment Trust Company Inc. ("DFAITC"), DFA Investment Dimensions Group Inc. ("DFAIDG"), Dimensional Investment Group Inc. ("DIG") and Dimensional Emerging Markets Value Fund Inc. ("DEM") (each, the "Fund" and collectively, the "Funds") is responsible for establishing the Funds' policies and for overseeing the management of the Funds. The Trustees/Directors of the Funds, including all of the disinterested Directors, have adopted written procedures to monitor potential conflicts of interest that might develop between portfolios of the Funds (the "Feeder Portfolios") that invest in certain series of DFAITC or DEM (the "Master Funds").
Each Board has two standing committees, an Audit Committee and a Portfolio Performance and Service Review Committee (the "Performance Committee"). The Audit Committee is comprised of George M. Constantinides, Roger G. Ibbotson and Abbie J. Smith. Each member of the Audit Committee is a disinterested Director. The Audit Committee oversees the Fund's accounting and financial reporting policies and practices, the Fund's internal controls, the Fund's financial statements and the independent audits thereof and performs other oversight functions as requested by the Board. The Audit Committee recommends the appointment of each Fund's independent registered certified public accounting firm and also acts as a liaison between the Fund's independent registered certified public accounting firm and the full Board. There were three Audit Committee meetings held during the fiscal year ended October 31, 2008.
Each Board's Performance Committee is comprised of Messrs. Constantinides and Ibbotson, Ms. Smith, John P. Gould, Myron S. Scholes and Robert C. Merton. Each member of the Fund's Performance Committee is a disinterested Director. The Performance Committee regularly reviews and monitors the investment performance of the Fund's series and reviews the performance of the Fund's service providers. There were five Performance Committee meetings held during the fiscal year ended October 31, 2008.
Certain biographical information for each disinterested Trustee/Director and each interested Trustee/Director of the Funds is set forth in the tables below, including a description of each Trustee/Director's experience as a Trustee/Director of the Funds and as a director or trustee of other funds, as well as other recent professional experience.
The statements of additional information (together, "SAI") of the Funds include additional information about each Trustee/Director. You may obtain copies of the SAI and prospectus of each Fund advised by Dimensional Fund Advisors LP by calling collect (310) 395-8005 or by mailing a request to Dimensional Fund Advisors LP, 1299 Ocean Avenue, Santa Monica, California 90401. Prospectuses are also available at www.dimensional.com.
Name, Position
with the Fund,
Address and Age | | Term of Office1 and
Length of Service | | Portfolios within the
DFA Fund Complex2
Overseen | | Principal Occupation(s) During Past 5 Years and
Other Directorships of Public Companies Held | |
| | | Disinterested Trustees/Directors | |
|
George M. Constantinides
Director of DFAIDG, DIG and DEM.
Trustee of DFAITC.
The University of Chicago Booth School of Business
5807 S. Woodlawn Avenue Chicago, IL 60637
Age: 61 | | DFAITC - since 1993
DFAIDG - since 1983
DIG - since 1993
DEM - since 1993 | | 96 portfolios in 4 investment companies | | Leo Melamed Professor of Finance, The University of Chicago Booth School of Business. | |
|
35
Name, Position
with the Fund,
Address and Age | | Term of Office1 and
Length of Service | | Portfolios within the
DFA Fund Complex2
Overseen | | Principal Occupation(s) During Past 5 Years and
Other Directorships of Public Companies Held | |
John P. Gould
Director of DFAIDG, DIG and DEM.
Trustee of DFAITC.
The University of Chicago Booth School of Business
5807 S. Woodlawn Avenue
Chicago, IL 60637
Age: 69 | | DFAITC - since 1993
DFAIDG - since 1986
DIG - since 1993
DEM - since 1993 | | 96 portfolios in 4 investment companies | | Steven G. Rothmeier Distinguished Service Professor of Economics, The University of Chicago Booth School of Business (since 1965). Member of the Boards of Milwaukee Mutual Insurance Company (since 1997) and UNext.com (1999-2006). Member Competitive Markets Advisory Committee, Chicago Mercantile Exchange (futures trading exchange) (since 2004). Formerly, Senior Vice-President, Lexecon Inc. (economics, law, strategy and finance consulting) (1994-2004). Formerly, President, Cardean University (division of UNext.com) (1999-2001). Trustee, Harbor Fund (registered investment company) (14 Portfolios) (since 1994). | |
|
Roger G. Ibbotson
Director of DFAIDG, DIG and DEM.
Trustee of DFAITC.
Yale School of Management
P.O. Box 208200
New Haven, CT 06520-8200
Age: 65 | | DFAITC - since 1993
DFAIDG - since 1981
DIG - since 1993
DEM - since 1993 | | 96 portfolios in 4 investment companies | | Professor in Practice of Finance, Yale School of Management (since 1984). Director, BIRR Portfolio Analysis, Inc. (software products) (since 1990). Chairman, CIO and Partner, Zebra Capital Management, LLC (hedge fund manager) (since 2001).
Consultant to Morningstar, Inc. (since 2006). Formerly, Chairman, Ibbotson Associates, Inc., Chicago, IL (software data publishing and consulting) (1977-2006). | |
|
Robert C. Merton
Director of DFAIDG, DIG and DEM.
Trustee of DFAITC.
Harvard Business School
353 Baker Library
Soldiers Field
Boston, MA 02163
Age: 64 | | DFAITC - since 2003
DFAIDG - since 2003
DIG - since 2003
DEM - since 2003 | | 96 portfolios in 4 investment companies | | John and Natty McArthur University Professor, Graduate School of Business Administration, Harvard University (since 1998). George Fisher Baker Professor of Business Administration, Graduate School of Business Administration, Harvard University (1988-1998), Co-founder, Chief Science Officer and Director, Trinsum Group, a successor to Integrated Finance Limited (since 2002). Director, MF Risk, Inc. (risk management software) (since 2001). Director, Peninsula Banking Group (bank) (since 2003). Director, Community First Financial Group (bank holding company) (since 2003). Advisory Board Member, Alpha Simplex Group (hedge fund) (since 2001). Member Competitive Markets Advisory Council, Chicago Mercantile Exchange (futures trading exchange) (since 2004). Formerly, Advisory Board Member, NuServe (insurance software) (2001-2003). Director, Vical Incorporated (biopharmaceutical product development) (since 2002). | |
|
Myron S. Scholes
Director of DFAIDG, DIG and DEM.
Trustee of DFAITC.
Platinum Grove Asset Management, L.P.
Reckson Executive Park
1100 King Street
Building 4
Rye Brook, NY 10573
Age: 67 | | DFAITC - since 1993
DFAIDG - since 1981
DIG - since 1993
DEM - since 1993 | | 96 portfolios in 4 investment companies | | Frank E. Buck Professor Emeritus of Finance, Stanford University (since 1981). Chairman, Platinum Grove Asset Management, L.P. (hedge fund) (formerly, Oak Hill Platinum Partners) (since 1999). Formerly, Managing Partner, Oak Hill Capital Management (private equity firm) (until 2004). Chairman, Oak Hill Platinum Partners (hedge fund) (since 2004). Director, Chicago Mercantile Exchange (since 2001). Director, American Century Fund Complex (registered investment companies) (37 Portfolios) (since 1981); and Director, Chicago Mercantile Exchange Holdings Inc. (since 2000). | |
|
Abbie J. Smith
Director of DFAIDG, DIG and DEM.
Trustee of DFAITC.
The University of Chicago Booth School of Business
5807 S. Woodlawn Avenue
Chicago, IL 60637
Age: 55 | | DFAITC - since 2000
DFAIDG - since 2000
DIG - since 2000
DEM - since 2000 | | 96 portfolios in 4 investment companies | | Boris and Irene Stern Professor of Accounting, The University of Chicago Booth School of Business (since 1980), Formerly, Marvin Bower Fellow, Harvard Business School (9/01 to 8/02). Director, HNI Corporation (formerly known as HON Industries Inc.) (office furniture) (since 2000) and Director, Ryder System Inc. (transportation, logistics and supply-chain management) (since 2003). | |
|
36
Name, Position
with the Fund,
Address and Age | | Term of Office1 and
Length of Service | | Portfolios within the
DFA Fund Complex2
Overseen | | Principal Occupation(s) During Past 5 Years and
Other Directorships of Public Companies Held | |
| | | Interested Trustees/Directors* | |
|
David G. Booth
Chairman, Director, Chief Executive Officer and President of DFAIDG, DIG and DEM. Chairman, Trustee, Chief Executive Officer, Chief Investment Officer and President of DFAITC.
1299 Ocean Avenue
Santa Monica, CA 90401
Age: 61 | | DFAITC - since 1993
DFAIDG - since 1981
DIG - since 1992
DEM - since 1993 | | 96 portfolios in 4 investment companies | | Chairman, Director/Trustee, President, Chief Executive Officer and formerly Chief Investment Officer of the following companies: Dimensional Holdings Inc., Dimensional Fund Advisors LP, DFA Securities Inc., Dimensional Fund Advisors Canada Inc., DFAIDG, DIG, DEM and DFAITC. Director of Dimensional Fund Advisors Ltd, and formerly Chief Investment Officer. Director, President and formerly Chief Investment Officer of DFA Australia Ltd. Director of Dimensional Funds PLC and Dimensional Fund II PLC. Director, Chief Executive Officer and formerly Chief Investment Officer of Dimensional Fund Advisors Canada Inc. (All Chief Investment Officer positions held starting 1/03 through 3/07 except for Dimensional Fund Advisors Canada Inc., which was from 6/03 through 3/07, and Dimensional Holdings Inc., which was from 10/06 through 3/07.)
Limited Partner, Oak Hill Partners, Director, T he University of Chicago Booth School of Business. Formerly, Director, SA Funds (registered investment company). Formerly Director, Assante Corporation (investment management) (until 2002). | |
|
Rex A. Sinquefield
The Show Me Institute
7777 Bonhomme Ave.,
Suite 2150 St. Louis, MO 63105
Age: 64 | | DFAITC - since 1993
DFAIDG - since 1981
DIG - since 1992
DEM - since 1993 | | 96 portfolios in 4 investment companies | | Director/Trustee (and prior to 2006 Chairman, and prior to 2003, Chief Investment Officer) of Dimensional Fund Advisors LP, DFA Securities Inc., DFAIDG, DIG, DEM and DFAITC. Director of Dimensional Holdings Inc. Prior to 2006, Director of Dimensional Fund Advisors Ltd, Director (and prior to 1/1/2003, Chief Investment Officer) of DFA Australia Ltd. Director of Dimensional Funds PLC and Dimensional Fund Advisors Canada Inc.
Trustee, St. Louis University (since 2003). Life Trustee and Member of Investment Committee, DePaul University. Director, The German St. Vincent Orphan Home. Member of Investment Committee, Archdiocese of St. Louis. Trustee and Member of Investment Committee, St. Louis Art Institute (since 2005). President and Director, The Show Me Institute (since 2006). Trustee, St. Louis Symphony Orchestra (since 2005). Trustee, Missouri Botanical Garden (since 2005 ). | |
|
1 Each Trustee/Director holds office for an indefinite term until his or her successor is elected and qualified.
2 Each Trustee/Director is a director or trustee of each of the four registered investment companies within the DFA Fund Complex, which includes the Funds.
* Interested Directors are described as such because they are deemed to be "interested persons," as that term is defined under the Investment Company Act of 1940, as amended, due to their positions with Dimensional Fund Advisors LP.
37
Officers
The name, age, information regarding positions with the Funds and the principal occupation for each officer of the Funds are set forth below. Each officer listed below holds the same office (except as otherwise noted) in the following entities: Dimensional Fund Advisors LP (prior to November 3, 2006, Dimensional Fund Advisors Inc.) ("Dimensional"), DFA Securities Inc., DFAIDG, DIG, DFAITC and DEM (collectively, the "DFA Entities"). The address of each officer is: Dimensional Fund Advisors LP, 1299 Ocean Avenue, Santa Monica, California 90401, unless otherwise indicated.
Name, Position with the Fund
and Age | | Term of Office1
and Length of
Service | | Principal Occupation(s) During Past 5 Years | |
| | | Officers | |
|
April A. Aandal
Vice President
Age: 35 | | Since 2008 | | Vice President of all the DFA Entities. | |
|
Darryl D. Avery
Vice President
Age: 42 | | Since 2005 | | Vice President of all the DFA Entities. From June 2002 to January 2005, institutional client service representative of Dimensional. | |
|
Arthur H. Barlow
Vice President
Age: 52 | | Since 1993 | | Vice President of all the DFA Entities. Formerly, Vice President of DFA Australia Limited and Dimensional Fund Advisors Ltd. | |
|
Scott A. Bosworth
Vice President
Age: 39 | | Since 2007 | | Vice President of all the DFA Entities. Regional Director of Dimensional (since November 1997). | |
|
Valerie A. Brown
Vice President and Assistant Secretary
Age: 41 | | Since 2001 | | Vice President and Assistant Secretary of all the DFA Entities, DFA Australia Limited, Dimensional Fund Advisors Ltd., and since June 2003, Dimensional Fund Advisors Canada Inc. | |
|
David P. Butler
Vice President
Age: 44 | | Since 2007 | | Vice President of all the DFA Entities. Director of US Financial Services of Dimensional (since January 2005). Formerly, Regional Director of Dimensional Fund Advisors LP (January 1995 to January 2005). | |
|
Patrick Carter
Vice President
Age: 46 | | Since 2007 | | Vice President of all the DFA Entities. Regional Director of Dimensional (since March 2006). Formerly, Director of Merrill Lynch Retirement Group (December 1998 to March 2006). | |
|
Stephen A. Clark
Vice President
Age: 36 | | Since 2004 | | Vice President of all the DFA Entities, April 2001 to April 2004, Portfolio Manager of Dimensional. | |
|
Robert P. Cornell
Vice President
Age: 59 | | Since 2007 | | Vice President of all the DFA Entities. Regional Director of Financial Services Group of Dimensional (since August 1993). | |
|
Christopher S. Crossan
Vice President and Chief Compliance Officer
Age: 42 | | Since 2004 | | Vice President and Chief Compliance Officer of all the DFA Entities. Formerly, Senior Compliance Officer, INVESCO Institutional, Inc. and its affiliates (August 2000 to January 2004). | |
|
James L. Davis
Vice President
Age: 51 | | Since 1999 | | Vice President of all the DFA Entities. Formerly, Vice President of DFA Australia Limited and Dimensional Fund Advisors Ltd. | |
|
Robert T. Deere
Vice President
Age: 51 | | Since 1994 | | Vice President of all the DFA Entities and DFA Australia Limited. | |
|
Robert W. Dintzner
Vice President
Age: 38 | | Since 2001 | | Vice President of all the DFA Entities. Prior to April 2001, marketing supervisor and marketing coordinator for Dimensional. | |
|
38
Name, Position with the Fund
and Age | | Term of Office1
and Length of
Service | | Principal Occupation(s) During Past 5 Years | |
Kenneth Elmgren
Vice President
Age: 54 | | Since 2007 | | Vice President of all the DFA Entities. Formerly, Managing Principal of Beverly Capital (May 2004 to September 2006); Principal of Wydown Capital (September 2001 to May 2004). | |
|
Richard A. Eustice
Vice President and Assistant Secretary
Age: 43 | | Since 1998 | | Vice President and Assistant Secretary of all the DFA Entities and DFA Australia Limited. Formerly, Vice President of Dimensional Fund Advisors Ltd. | |
|
Eugene F. Fama, Jr.
Vice President
Age: 47 | | Since 1993 | | Vice President of all the DFA Entities. Formerly, Vice President of DFA Australia Limited and Dimensional Fund Advisors Ltd. | |
|
Gretchen A. Flicker
Vice President
Age: 37 | | Since 2004 | | Vice President of all the DFA Entities. Prior to April 2004, institutional client service representative of Dimensional. | |
|
Jed S. Fogdall
Vice President
Age: 34 | | Since 2008 | | Vice President of all the DFA Entities. Portfolio Manager for Dimensional (since September 2004). Prior to September 2004, Staff Engineer at the Boeing Company (1997-2004); Graduate Student at the University of California, Los Angeles (2002-2003). | |
|
Glenn S. Freed
Vice President
Age: 46 | | Since 2001 | | Vice President of all the DFA Entities. | |
|
Mark R. Gochnour
Vice President
Age: 41 | | Since 2007 | | Vice President of all the DFA Entities. Regional Director of Dimensional. | |
|
Henry F. Gray
Vice President
Age: 41 | | Since 2000 | | Vice President of all the DFA Entities. Prior to July 2000, Portfolio Manager of Dimensional. Formerly, Vice President of DFA Australia Limited. | |
|
John T. Gray
Vice President
Age: 34 | | Since 2007 | | Vice President of all the DFA Entities. Formerly, Regional Director of Dimensional (January 2005 to February 2007). | |
|
Darla Hastings
Vice President
Age: 53 | | Since 2007 | | Vice President of all the DFA Entities. Chief Marketing Officer of Dimensional. Formerly, Senior Vice President, Customer Experience for Benchmark Assisted Living (May 2005 to April 2006); Executive Vice President and Chief Marketing Officer of State Street Corporation (September 2001 to October 2005). | |
|
Joel H. Hefner
Vice President
Age: 40 | | Since 2007 | | Vice President of all the DFA Entities. Regional Director of Dimensional (since June 1998). | |
|
Julie Henderson
Vice President and Fund Controller
Age: 34 | | Since 2005 | | Vice President and Fund Controller of all the DFA Entities. Formerly, Senior Manager at PricewaterhouseCoopers LLP (July 1996 to April 2005). | |
|
Kevin Hight
Vice President
Age: 40 | | Since 2005 | | Vice President of all the DFA Entities. Formerly, Regional Director of Dimensional (since March 2003 to March 2005). | |
|
Christine W. Ho
Vice President
Age: 40 | | Since 2004 | | Vice President of all the DFA Entities. Prior to April 2004, Assistant Controller of Dimensional. | |
|
Jeff J. Jeon
Vice President
Age: 34 | | Since 2004 | | Vice President of all the DFA Entities. Prior to April 2004, Counsel of Dimensional. | |
|
Patrick M. Keating
Vice President
Age: 53 | | Since 2003 | | Vice President of all the DFA Entities and Chief Operating Officer of Dimensional. Director, Vice President and Chief Privacy Officer of Dimensional Fund Advisors Canada Inc. Director of DFA Australia Limited. | |
|
39
Name, Position with the Fund
and Age | | Term of Office1
and Length of
Service | | Principal Occupation(s) During Past 5 Years | |
Joseph F. Kolerich
Vice President
Age: 36 | | Since 2004 | | Vice President of all the DFA Entities. From April 2001 to April 2004, Portfolio Manager for Dimensional. | |
|
Michael F. Lane
Vice President
Age: 41 | | Since 2004 | | Vice President of all the DFA Entities. Formerly, Vice President of Advisor Services at TIAA-CREF (July 2001 to September 2004). | |
|
Kristina M. LaRusso
Vice President
Age: 33 | | Since 2006 | | Vice President of all DFA Entities. Formerly, Operations Supervisor of Dimensional (March 2003 to December 2006). | |
|
Inmoo Lee
Vice President
Age: 42 | | Since 2007 | | Vice President of all the DFA Entities. Associate Professor Department of Finance and Accounting, Business School, National University of Singapore (July 2004 to present); Associate Professor, College of Business Administration, Korea University (September 2001 to May 2006). | |
|
Juliet Lee
Vice President
Age: 37 | | Since 2005 | | Vice President of all the DFA Entities. Human Resources Manager of Dimensional (since January 2004). Formerly, Assistant Vice President for Metropolitan West Asset Management LLC (February 2001 to December 2003). | |
|
Aaron M. Marcus
Vice President & Head of Global Human Resources
Age: 38 | | Since 2008 | | Vice President and Head of Global Human Resources of Dimensional. Formerly, Global Head of Recruiting and Vice President of Goldman Sachs & Co. (June 2006 to January 2008); Global Co-Head of HR of the Equities & FICC Division, and Vice President of Goldman Sachs & Co. (May 2005 to May 2006); Head of Americas Campus Recruiting and Vice President of Goldman Sachs & Co. (April 2003 to May 2005). | |
|
David R. Martin
Vice President, Chief Financial Officer and Treasurer
Age: 51 | | Since 2007 | | Vice President, Chief Financial Officer and Treasurer of all the DFA Entities. Director, Vice President, Chief Financial Officer and Treasurer of Dimensional Fund Advisors Ltd. and DFA Australia Limited. Chief Financial Officer, Treasurer, and Vice President of Dimensional Fund Advisors Canada Inc. Director of Dimensional Funds PLC and Dimensional Funds II PLC. Formerly, Executive Vice President and Chief Financial Officer of Janus Capital Group Inc. (June 2005 to March 2007); Senior Vice President of Finance at Charles Schwab & Co., Inc. (March 1999 to May 2005). | |
|
Catherine L. Newell
Vice President and Secretary
Age: 44 | | Vice President since 1997 and Secretary since 2000 | | Vice President and Secretary of all the DFA Entities. Director, Vice President and Assistant Secretary of DFA Australia Limited (since February 2002, April 1997 and May 2002, respectively). Vice President and Secretary of Dimensional Fund Advisors Canada Inc. (since June 2003). Director, Dimensional Funds PLC and Dimensional Funds II PLC (since January 2002). Formerly, Assistant Secretary of all DFA Entities and Dimensional Fund Advisors Ltd. | |
|
Gerard K. O'Reilly
Vice President
Age: 31 | | Since 2007 | | Vice President of all the DFA Entities. Formerly, Research Associate of Dimensional Fund Advisors LP (2004 to 2006); Research Assistant in PhD program, Aeronautics Department California Institute of Technology (1998 to 2004). | |
|
Carmen Palafox
Vice President
Age: 34 | | Since 2006 | | Vice President of all the DFA Entities. Operations Manager of Dimensional Fund Advisors LP (since May 1996). | |
|
Sonya Park
Vice President
Age: 36 | | Since 2005 | | Vice President of all the DFA Entities. From February 2002 to January 2005, institutional client service representative of Dimensional. | |
|
David A. Plecha
Vice President
Age: 47 | | Since 1993 | | Vice President of all the DFA Entities, DFA Australia Limited and Dimensional Fund Advisors Ltd.. | |
|
Ted Randall
Vice President
Age: 35 | | Since 2008 | | Vice President of all the DFA Entities. Formerly, Research Associate of Dimensional (2006-2008). Systems Developer of Dimensional (2001-2006). | |
|
40
Name, Position with the Fund
and Age | | Term of Office1
and Length of
Service | | Principal Occupation(s) During Past 5 Years | |
Eduardo A. Repetto
Vice President and Chief Investment Officer
Age: 41 | | Since 2002 | | Chief Investment Officer (beginning March 2007) and Vice President of all the DFA Entities, DFA Australia Limited and Dimensional Fund Advisors Canada Inc. Formerly, Research Associate for Dimensional (June 2000 to April 2002). | |
|
L. Jacobo Rodriguez
Vice President
Age: 37 | | Since 2005 | | Vice President of all the DFA Entities. From August 2004 to July 2005, institutional client service representative of Dimensional. Formerly, Financial Services Analyst, Cato Institute (September 2001 to June 2004); Book Review Editor, Cato Journal, Cato Institute (May 1996 to June 2004). | |
|
David E. Schneider
Vice President
Age: 62 | | Since 2001 | | Vice President of all the DFA Entities. Currently, Director of Institutional Services. | |
|
Ted R. Simpson
Vice President
Age: 40 | | Since 2007 | | Vice President of all the DFA Entities. Regional Director of Dimensional (since December 2002). | |
|
Bryce D. Skaff
Vice President
Age: 33 | | Since 2007 | | Vice President of all the DFA Entities. Formerly, Regional Director of Dimensional (December 1999 to January 2007). | |
|
Grady M. Smith
Vice President
Age: 51 | | Since 2004 | | Vice President of all the DFA Entities. Prior to April 2004, Portfolio Manager of Dimensional. | |
|
Carl G. Snyder
Vice President
Age: 45 | | Since 2000 | | Vice President of all the DFA Entities. Formerly, Vice President of DFA Australia Limited. | |
|
Lawrence R. Spieth
Vice President
Age: 60 | | Since 2004 | | Vice President of all the DFA Entities. Prior to April 2004, Regional Director of Dimensional. | |
|
Bradley G. Steiman
Vice President
Age: 35 | | Since 2004 | | Vice President of all the DFA Entities and Director and Vice President of Dimensional Fund Advisors Canada Inc. | |
|
Karen E. Umland
Vice President
Age: 42 | | Since 1997 | | Vice President of all the DFA Entities, DFA Australia Limited, Dimensional Fund Advisors Ltd., and since June 2003, Dimensional Fund Advisors Canada Inc. | |
|
Carol W. Wardlaw
Vice President
Age: 49 | | Since 2004 | | Vice President of all the DFA Entities. Prior to April 2004, Regional Director of Dimensional. | |
|
Weston J. Wellington
Vice President
Age: 57 | | Since 1997 | | Vice President of all the DFA Entities. Formerly, Vice President of DFA Australia Limited. | |
|
Daniel M. Wheeler
Vice President
Age: 63 | | Since 2001 | | Vice President of all the DFA Entities. Prior to 2001 and currently, Director of Financial Advisors Services of Dimensional. Director of Dimensional Fund Advisors Ltd. (since October 2003) and President of Dimensional Fund Advisors Canada Inc. (since June 2003). | |
|
Ryan Wiley
Vice President
Age: 32 | | Since 2007 | | Vice President of all the DFA Entities. Senior Trader of Dimensional. Formerly, Portfolio Manager (2006 to 2007); Trader (2001 to 2006). | |
|
Paul E. Wise
Vice President
Age: 53 | | Since 2005 | | Vice President of all the DFA Entities. Chief Technology Officer for Dimensional (since 2004). Formerly, Principal of Turnbuckle Management Group (January 2002 to August 2004). | |
|
1 Each officer holds office for an indefinite term at the pleasure of the Boards of Trustee/Directors and until his or her successor is elected and qualified.
41
VOTING PROXIES ON FUND PORTFOLIO SECURITIES
A description of the policies and procedures that the Trust uses in voting proxies relating to securities held in the portfolio is available without charge, upon request, by calling collect: (310) 395-8005. Information regarding how the Advisor votes these proxies is available from the EDGAR database on the SEC's website at http://www.sec.gov and from the Advisor's website at http://www.dimensional.com and reflects the twelve-month period beginning July 1st and ending June 30th.
42
NOTICE TO SHAREHOLDERS
(Unaudited)
For shareholders that do not have an October 31, 2008 tax year end, this notice is for informational purposes only. For shareholders with an October 31, 2008 tax year end, please consult your tax advisor as to the pertinence of this notice. For the period December 1, 2007 to October 31, 2008, the portfolio is designating the following items with regard to distributions paid during the period.
Dimensionl Investment
Group Inc. | | Net
Investment
Income
Distributions | | Short-Term
Capital Gain
Distributions | | Long-Term
Capital Gain
Distributions | | Total
Distributions | | Qualifying
For Corporate
Dividends
Received
Deductions(1) | | Qualifying
Dividend
Income(2) | | Foreign
Tax
Credit(3) | | Qualifying
Interest
Income(4) | | Qualifying
Short-Term
Capital Gain(5) | |
DFA International
Value Portfolio III | | | 64 | % | | | 1 | % | | | 35 | % | | | 100 | % | | | — | | | | 58 | % | | | — | | | | 1 | % | | | 1 | % | |
The DFA Investment
Trust Company | |
The DFA International
Value Series | | | 33 | % | | | 2 | % | | | 65 | % | | | 100 | % | | | 6 | % | | | 58 | % | | | — | | | | — | | | | 7 | % | |
(1) Qualifying dividends represent dividends which qualify for the corporate dividends received deduction and is reflected as a percentage of ordinary income distributions (the total of short-term capital gain and net investment income and distributions).
(2) The percentage in this column represents the amount of "Qualifying Dividend Income" as created by the Jobs and Growth Tax Relief Reconciliation Act of 2003 and is reflected as a percentage of ordinary income distributions (the total of short-term capital gain and net investment income distributions). It is the intention of each of the aforementioned funds to designate the maximum amount permitted by law.
(3) Foreign Tax Credit represent dividends which qualify for the foreign tax credit pass through and is reflected as a percentage of investment company taxable income (the total of short-term capital gain and net investment income distributions).
(4) The percentage in this column represents the amount of "Qualifying Interest Income" as created by The American Jobs Creation Act of 2004. The information is reflected as a percentage of ordinary income distributions (the total of short-term capital gain and net investment income distributions).
(5) The percentage in this column represents the amount of "Qualifying Short-Term Capital Gain" as created by The American Jobs Creation Act of 2004. The information is reflected as a percentage of ordinary income distributions (the total of short-term capital gain and net investment income distributions).
43
[THIS PAGE INTENTIONALLY LEFT BLANK]

DFA103108-015A
DIMENSIONAL INVESTMENT GROUP INC.
DFA International Value Portfolio IV
Annual Report
Period Ended October 31, 2008
Dimensional Fund Advisors
6300 Bee Cave Road, Building One
Austin, TX 78746
December 2008
Dear Fellow Shareholder,
This has been a challenging year for investors. After drifting lower throughout the spring and summer, stock markets around the world plummeted in mid September on news that the ongoing credit crisis was driving some leading financial services companies toward failure. As the effects of this distress rippled through the financial world, investors became increasingly anxious and stock prices continued to decline sharply. In the month of October, the S&P 500 Index fell 16.8% or 196 points—its worst-ever monthly point decline.
Markets like this test investors' resolve. It is difficult to stick with a long-term investment plan when one sees the dramatic effects of high market volatility on a portfolio's value. Very few people are having a positive investment experience right now. But investors who have based their approach on a sensible risk/return framework tend to be in better shape than those who have not.
The recent market turbulence illustrates the reason why Dimensional believes that markets are efficient. History has shown time and again that prices cannot be predicted in public equity markets. This "random walk" makes diversification very important. Although the broad diversification in our portfolios didn't prevent negative performance this year, we believe it helped our shareholders avoid the extreme losses experienced by investors who concentrated their holdings in individual companies, industry sectors, or markets.
The unpredictability of stock prices also makes it important for investors to take a hard look at their own portfolios and determine how much risk and what types of risk they should take. Investors who hold asset mixes that accurately reflect their tolerance for risk are better able to withstand down markets.
Nobody knows when the capital markets will recover, but over time we can expect them to again offer a premium to investors who are willing to invest in relatively risky assets such as stocks. My view is that investors who have already paid for risk should stay invested and earn the return that can be expected when markets turn around. If markets continue to be so volatile, it's also important to understand that pulling money out of stocks, even for short periods of time, can result in significant missed opportunities.
All of us at Dimensional take our job as the steward of your assets very seriously and hope to have the opportunity to serve you for many years to come.
Sincerely,
David G. Booth
Chairman and Chief Executive Officer
[THIS PAGE INTENTIONALLY LEFT BLANK]
ANNUAL REPORT
Table of Contents
| Letter to Shareholders | | Page | |
| Definitions of Abbreviations and Footnotes | | | 1 | | |
|
| Dimensional Investment Group Inc. — DFA International Value Portfolio IV | |
|
| Performance Chart | | | 2 | | |
|
| Management's Discussion and Analysis | | | 3 | | |
|
| Disclosure of Fund Expenses | | | 5 | | |
|
| Disclosure of Portfolio Holdings | | | 6 | | |
|
| Statement of Assets and Liabilities | | | 7 | | |
|
| Statements of Operations | | | 8 | | |
|
| Statements of Changes in Net Assets | | | 9 | | |
|
| Financial Highlights | | | 10 | | |
|
| Notes to Financial Statements | | | 11 | | |
|
| Report of Independent Registered Public Accounting Firm | | | 16 | | |
|
| The DFA Investment Trust Company — The DFA International Value Series | |
|
| Performance Chart | | | 17 | | |
|
| Disclosure of Fund Expenses | | | 18 | | |
|
| Disclosure of Portfolio Holdings | | | 19 | | |
|
| Summary Schedule of Portfolio Holdings | | | 20 | | |
|
| Statement of Assets and Liabilities | | | 23 | | |
|
| Statements of Operations | | | 24 | | |
|
| Statements of Changes in Net Assets | | | 25 | | |
|
| Financial Highlights | | | 26 | | |
|
| Notes to Financial Statements | | | 27 | | |
|
| Report of Independent Registered Public Accounting Firm | | | 34 | | |
|
| Fund Management | | | 35 | | |
|
| Voting Proxies on Fund Portfolio Securities | | | 42 | | |
|
| Notice to Shareholders | | | 43 | | |
|
This report is submitted for the information of the Fund's shareholders. It is not authorized for distribution to prospective investors unless preceded or accompanied by an effective prospectus.
i
[THIS PAGE INTENTIONALLY LEFT BLANK]
DIMENSIONAL INVESTMENT GROUP INC.
THE DFA INVESTMENT TRUST COMPANY
DEFINITIONS OF ABBREVIATIONS AND FOOTNOTES
Statement of Assets and Liabilities/Summary Schedule of Portfolio Holdings
Investment Abbreviations
ADR American Depositary Receipt
FHLMC Federal Home Loan Mortgage Corporation
Investment Footnotes
† See Note B to Financial Statements.
†† Securities have generally been fair valued. See Note B to Financial Statements.
** Calculated as a percentage of total net assets. Percentages shown parenthetically next to the category headings have been calculated as a percentage of total investments. "Other Securities" are those securities that are not among the top 50 holdings of the Fund or do not represent more than 1.0% of the net assets of the Fund. Some of the individual securities within this category may include Total or Partial Securities on Loan and/or Non-Income Producing Securities.
* Non-Income Producing Securities.
# Total or Partial Securities on Loan.
@ Security purchased with cash proceeds from Securities on Loan.
§ Affiliated Fund.
Financial Highlights
(A) Computed using average shares outstanding.
(B) Annualized
(C) Non-Annualized
(D) Represents the combined ratios for the respective portfolio and its respective pro-rata share of its Master Fund Series.
All Statements and Schedules
— Amounts designated as — are either zero or rounded to zero.
SEC Securities and Exchange Commission
1
DIMENSIONAL INVESTMENT GROUP INC.
PERFORMANCE CHART

2
DIMENSIONAL INVESTMENT GROUP INC.
MANAGEMENT'S DISCUSSION AND ANALYSIS
On September 16, 2008, at a regular meeting of the Board of Directors/Trustees (the "Board") of the funds covered by this report, the Board voted to change the fiscal and tax year ends of the funds from November 30 to October 31. Therefore, the following discussion generally covers the 11-month period ended October 31, 2008.
International Equity Market Review 11 Months Ended October 31, 2008
International equity markets, affected by credit and liquidity problems similar to those experienced in the U.S., experienced high levels of volatility and broadly negative returns for the period under review. Due to the strengthening of the U.S. dollar vs. most developed countries' currencies (with the exception of the Japanese Yen and the Hong Kong dollar), the performance numbers when expressed in U.S. dollars were lower than when expressed in local currencies for all of the largest country constituents of the MSCI World ex USA Index, with the exception of Japan and Hong Kong. Overall, currency exchange rate changes reduced the returns expressed in U.S. dollars: total return for the MSCI World ex USA Index (net dividends) was –37.82% in local currency and –44.37% in U.S. dollars.
Total Returns for 11 Months Ended October 31, 2008
| Ten Largest Foreign Developed Markets by Market Cap (BB) | | Local
Currency
Return | | U.S. Dollar
Return | |
| Japan ($2,111) | | | –43.55 | % | | | –36.33 | % | |
| United Kingdom ($1,758) | | | –29.61 | % | | | –44.68 | % | |
| France ($872) | | | –36.80 | % | | | –45.40 | % | |
| Canada ($786) | | | –25.69 | % | | | –38.91 | % | |
| Germany ($705) | | | –37.97 | % | | | –46.42 | % | |
| Switzerland ($704) | | | –30.05 | % | | | –32.39 | % | |
| Australia ($513) | | | –35.10 | % | | | –51.58 | % | |
| Spain ($331) | | | –40.19 | % | | | –48.33 | % | |
| Italy ($301) | | | –43.34 | % | | | –51.06 | % | |
| Netherlands ($206) | | | –41.65 | % | | | –49.59 | % | |
Country market capitalizations (in parentheses) are in USD billions. Source: Returns are of MSCI indices net of foreign withholding taxes on dividends. Country market capitalizations are based on country carve-outs of the MSCI All-Country World Investable Market Index. MSCI data copyright MSCI 2008, all rights reserved.
Small company stocks were the poorest-performing asset classes in international markets, while large company growth stocks had the best relative results.
Total Returns for 11 Months Ended October 31, 2008
| | | U.S. Dollar
Return | |
| MSCI World ex USA Small Cap Index | | | –50.30 | % | |
| MSCI World ex USA Value Index | | | –45.31 | % | |
| MSCI World ex USA Index | | | –44.37 | % | |
| MSCI World ex USA Growth Index | | | –43.47 | % | |
Source: MSCI indices are net of foreign withholding taxes on dividends, copyright MSCI 2008, all rights reserved.
Master-Feeder Structure
The portfolio described below, called a "Feeder Fund", does not buy individual securities directly; instead, the portfolio invests in a corresponding fund called a "Master Fund". The Master Fund, in turn, purchases stocks, bonds, and/or other securities.
3
International Equity Portfolio Performance Overview
DFA International Value Portfolio IV
The DFA International Value Portfolio IV seeks to capture the returns of international large company value stocks by purchasing shares of a Master Fund that invests in such stocks. The investment strategy employs a disciplined, quantitative approach, emphasizing broad diversification and consistent exposure to large cap value stocks, but does not attempt to track closely a specific equity index. As of October 31, 2008, the Master Fund held approximately 530 stocks in 22 developed countries, and essentially was fully invested in equities throughout the year: average cash levels for the 11 months ended October 31, 2008 were in general less than 1% of the Master Fund's assets.
As a result of the Master Fund's diversified investment approach, performance principally was determined by broad structural trends in global equity markets, rather than the behavior of a limited number of stocks. For the 11 months ended October 31, 2008, growth stocks generally outperformed value stocks in international markets. Total returns were –44.81% for the MSCI EAFE Index (net dividends), –44.37% for the MSCI World ex US Index (net dividends), and –47.88% for the Portfolio. Relative to the MSCI World ex US Index (net dividends), the underperformance of the Portfolio was primarily due to the Master Fund's greater allocation to value stocks in general and financial stocks in particular, both of which underperformed the Index. Value stocks, which accounted for approximately 69% of the Master Fund compared to 28% of the Index, underperformed the Index by approximately 4 percentage points. Financials, which accounted for 44% of the Master Fund compared to 25% of the Index, underperformed the Index by approximately 8 percentage points. A lower allocation to health care stocks, which accounted for less than 1% of the Master Fund compared to 6% of the Index and outperformed the Index by approximately 22 percentage points, also contributed to the underperformance.
4
DIMENSIONAL INVESTMENT GROUP INC.
DFA INTERNATIONAL VALUE PORTFOLIO IV
DISCLOSURE OF FUND EXPENSES
(Unaudited)
The following Expense Table is shown so that you can understand the impact of fees on your investment. All mutual funds have operating expenses. As a shareholder of the fund, you incur ongoing costs, which include costs for portfolio management, administrative services, and shareholder reports, among others. Operating expenses, legal and audit services, which are deducted from a fund's gross income, directly reduce the investment return of the fund. A fund's expenses are expressed as a percentage of its average net assets. This figure is known as the expense ratio. The following examples are intended to help you understand the ongoing costs, in dollars, of investing in the fund and to compare these costs with those of other mutual funds. The examples are based on an investment of $1,000 made at the beginning of the period shown and held for the entire period.
The Expense Table below illustrates your fund's costs in two ways.
Actual Fund Return
This section helps you to estimate the actual expenses after fee waivers that you paid over the period. The "Ending Account Value" shown is derived from the fund's actual return and "Expenses Paid During Period" reflect the dollar amount that would have been paid by an investor who started with $1,000 in the fund. You may use the information here, together with the amount you invested, to estimate the expenses that you paid over the period.
To do so, simply divide your account value by $1,000 (for example, a $7,500 account value divided by $1,000 = 7.5), then multiply the result by the number given for your fund under the heading "Expenses Paid During Period."
Hypothetical Example for Comparison Purposes
This section is intended to help you compare your fund's costs with those of other mutual funds. The hypothetical "Ending Account Value" and "Expenses Paid During Period" are derived from the fund's actual expense ratio and an assumed 5% annual return before expenses. In this case, because the return used is not the fund's actual return, the results do not apply to your investment. The example is useful in making comparisons because the SEC requires all mutual funds to calculate expenses based on a 5% annual return. You can assess your fund's cost by comparing this hypothetical example with the hypothetical examples that appear in shareholder reports of other funds.
Please note that the expenses shown in the table are meant to highlight and help you compare ongoing costs only and do not reflect any transactional costs, if applicable. The "Annualized Expense Ratio" represents the actual expenses for the six-month period indicated.
Six Months Ended October 31, 2008
EXPENSE TABLE
| | | Beginning
Account
Value
05/01/08 | | Ending
Account
Value
10/31/08 | | Annualized
Expense
Ratio* | | Expenses
Paid
During
Period* | |
| Actual Fund Return $1,000.00 | | $ | | | 555.50 | | | 0.26% | | $ | 1.02 | | |
| Hypothetical 5% Annual Return $1,000.00 | | $ | | | 1,023.83 | | | 0.26% | | $ | 1.32 | | |
* Expenses are equal to the fund's annualized expense ratio for the six-month period, multiplied by the average account value over the period, multiplied by the number of days in the most recent six-month period (184), then divided by the number of days in the year (366) to reflect the six-month period. The Portfolio is a Feeder Fund. The expenses shown reflect the direct expenses of the Feeder Fund and the indirect payment of the Feeder Fund's portion of the expenses of its Master Fund.
5
DIMENSIONAL INVESTMENT GROUP INC.
DFA INTERNATIONAL VALUE PORTFOLIO IV
DISCLOSURE OF PORTFOLIO HOLDINGS
(Unaudited)
The SEC requires that all Funds file a complete Schedule of Investments with the SEC for their first and third fiscal quarters on Form N-Q. For Dimensional Investment Group Inc., this would be for the fiscal quarters ending January 31 and July 31. The Form N-Q filing must be made within 60 days of the end of the quarter. Dimensional Investment Group Inc. filed its most recent Form N-Q with the SEC on October 30, 2008. It is available upon request, without charge, by calling collect: (310) 395-8005 or by mailing a request to Dimensional Fund Advisors LP, 1299 Ocean Avenue, Santa Monica, California 90401, or by visiting the SEC's website at http://www.sec.gov, or they may be reviewed and copied at the SEC's Public Reference Room in Washington, D.C. (call 1-800-732-0330 for information on the operation of the Public Reference Room).
PORTFOLIO HOLDINGS
The SEC requires that all Funds present their categories of portfolio holdings in a table, chart or graph format in their annual and semi-annual shareholder reports, whether or not a Schedule of Investments is utilized. The following table, which presents portfolio holdings as a percent of total investments before short-term investments and collateral for loaned securities, is provided in compliance with such requirement
The categories of industry classification for the Affiliated Investment Company are represented in the Disclosure of Portfolio Holdings, which are included elsewhere within the report. Refer to the Summary Schedule of Portfolio Holdings for the underlying Master Fund's holdings which reflect the investments by country.
| Affiliated Investment Company | | | 100.0 | % | |
6
DIMENSIONAL INVESTMENT GROUP INC.
DFA INTERNATIONAL VALUE PORTFOLIO IV
STATEMENT OF ASSETS AND LIABILITIES
OCTOBER 31, 2008
(Amounts in thousands, except share and per share amounts)
| ASSETS: | |
Investment in The DFA International Value Series of The DFA Investment Trust Company
(Affiliated Investment Company) (26,630,977 Shares) at Value† | | $ | 303,860 | | |
| Receivable for Fund Shares Sold | | | 772 | | |
| Prepaid Expenses and Other Assets | | | 9 | | |
| Total Assets | | | 304,641 | | |
| LIABILITIES: | |
| Payables: | |
| Affiliated Investment Company Shares Purchased | | | 772 | | |
| Due to Advisor | | | 7 | | |
| Accrued Expenses and Other Liabilities | | | 40 | | |
| Total Liabilities | | | 819 | | |
| NET ASSETS | | $ | 303,822 | | |
| SHARES OUTSTANDING, $0.01 PAR VALUE (1) | | | 29,053,405 | | |
| NET ASSET VALUE, OFFERING AND REDEMPTION PRICE PER SHARE | | $ | 10.46 | | |
| Investment in Affiliated Investment Company at Cost | | $ | 385,912 | | |
| NET ASSETS CONSIST OF: | |
| Paid-In Capital | | $ | 384,559 | | |
| Undistributed Net Investment Income (Distributions in Excess of Net Investment Income) | | | 19,867 | | |
| Accumulated Net Realized Gain (Loss) | | | (100,604 | ) | |
| NET ASSETS | | $ | 303,822 | | |
| (1) NUMBER OF SHARES AUTHORIZED | | | 200,000,000 | | |
See accompanying Notes to Financial Statements.
7
DIMENSIONAL INVESTMENT GROUP INC.
DFA INTERNATIONAL VALUE PORTFOLIO IV
STATEMENTS OF OPERATIONS
(Amounts in thousands)
| | | Period
Dec. 1, 2007
to
Oct. 31, 2008 | | Year
Ended
Nov. 30,
2007 | |
| Investment Income | |
| Income Distributions Received from Affiliated Investment Company | | $ | 20,881 | | | $ | 22,107 | | |
| Expenses | |
| Administrative Services Fees | | | 73 | | | | 80 | | |
| Accounting & Transfer Agent Fees | | | 19 | | | | 21 | | |
| Filing Fees | | | 19 | | | | 24 | | |
| Shareholders' Reports | | | 20 | | | | 22 | | |
| Directors'/Trustees' Fees & Expenses | | | — | | | | 4 | | |
| Professional Fees | | | 18 | | | | 17 | | |
| Other | | | 1 | | | | — | | |
| Total Expenses | | | 150 | | | | 168 | | |
| Net Investment Income (Loss) | | | 20,731 | | | | 21,939 | | |
| Realized and Unrealized Gain (Loss) | |
| Capital Gain Distributions Received from Affiliated Investment Company | | | 47,885 | | | | 15,399 | | |
| Net Realized Gain (Loss) on Affiliated Investment Company Shares Sold | | | (29,440 | ) | | | (1,925 | ) | |
Change in Unrealized Appreciation (Depreciation) of Affiliated Investment
Company Shares | | | (349,427 | ) | | | 68,316 | | |
| Net Realized and Unrealized Gain (Loss) | | | (330,982 | ) | | | 81,790 | | |
| Net Increase (Decrease) in Net Assets Resulting from Operations | | $ | (310,251 | ) | | $ | 103,729 | | |
See accompanying Notes to Financial Statements.
8
DIMENSIONAL INVESTMENT GROUP INC.
DFA INTERNATIONAL VALUE PORTFOLIO IV
STATEMENTS OF CHANGES IN NET ASSETS
(Amounts in thousands)
| | | Period
Dec. 1, 2007
to
Oct. 31, 2008 | | Year
Ended
Nov. 30,
2007 | | Year
Ended
Nov. 30,
2006 | |
| Increase (Decrease) in Net Assets | |
| Operations: | |
| Net Investment Income (Loss) | | $ | 20,731 | | | $ | 21,939 | | | $ | 14,668 | | |
Capital Gain Distributions Received from Affiliated Investment
Company | | | 47,885 | | | | 15,399 | | | | 8,723 | | |
Net Realized Gain (Loss) on Affiliated Investment Company
Shares Sold | | | (29,440 | ) | | | (1,925 | ) | | | (1,989 | ) | |
Change in Unrealized Appreciation (Depreciation) of Affiliated
Investment Company Shares | | | (349,427 | ) | | | 68,316 | | | | 103,656 | | |
| Net Increase (Decrease) in Net Assets Resulting from Operations | | | (310,251 | ) | | | 103,729 | | | | 125,058 | | |
| Distributions From: | |
| Net Investment Income | | | (21,806 | ) | | | (14,495 | ) | | | (7,638 | ) | |
| Net Short-Term Gains | | | (1,695 | ) | | | (1,177 | ) | | | (805 | ) | |
| Net Long-Term Gains | | | (14,217 | ) | | | (7,928 | ) | | | (7,663 | ) | |
| Total Distributions | | | (37,718 | ) | | | (23,600 | ) | | | (16,106 | ) | |
| Capital Share Transactions (1): | |
| Shares Issued | | | 34,072 | | | | 166,017 | | | | 158,759 | | |
| Shares Issued in Lieu of Cash Distributions | | | 37,718 | | | | 23,600 | | | | 16,106 | | |
| Shares Redeemed | | | (149,620 | ) | | | (105,380 | ) | | | (23,163 | ) | |
| Net Increase (Decrease) from Capital Share Transactions | | | (77,830 | ) | | | 84,237 | | | | 151,702 | | |
| Total Increase (Decrease) in Net Assets | | | (425,799 | ) | | | 164,366 | | | | 260,654 | | |
| Net Assets | |
| Beginning of Period | | | 729,621 | | | | 565,255 | | | | 304,601 | | |
| End of Period | | $ | 303,822 | | | $ | 729,621 | | | $ | 565,255 | | |
| (1) Shares Issued and Redeemed: | |
| Shares Issued | | | 1,932 | | | | 8,266 | | | | 9,506 | | |
| Shares Issued in Lieu of Cash Distributions | | | 1,981 | | | | 1,270 | | | | 1,111 | | |
| Shares Redeemed | | | (9,233 | ) | | | (5,148 | ) | | | (1,456 | ) | |
| | | | (5,320 | ) | | | 4,388 | | | | 9,161 | | |
Undistributed Net Investment Income (Distributions in Excess
of Net Investment Income) | | $ | 19,867 | | | $ | 20,554 | | | $ | 13,125 | | |
See accompanying Notes to Financial Statements.
9
DIMENSIONAL INVESTMENT GROUP INC.
DFA INTERNATIONAL VALUE PORTFOLIO IV
FINANCIAL HIGHLIGHTS
(for a share outstanding throughout each period)
| | | Period
Dec. 1, 2007
to
Oct. 31, 2008 | | Year
Ended
Nov. 30,
2007 | | Year
Ended
Nov. 30,
2006 | | Year
Ended
Nov. 30,
2005 | | Year
Ended
Nov. 30,
2004 | | Year
Ended
Nov. 30,
2003 | |
Net Asset Value, Beginning of
Period | | $ | 21.23 | | | $ | 18.85 | | | $ | 14.63 | | | $ | 12.94 | | | $ | 10.19 | | | $ | 7.49 | | |
| Income from Investment Operations | |
| Net Investment Income (Loss) | | | 0.62 | (A) | | | 0.63 | (A) | | | 0.57 | (A) | | | 0.40 | | | | 0.20 | | | | 0.18 | | |
Net Gains (Losses) (Realized
and Unrealized) | | | (10.29 | ) | | | 2.53 | | | | 4.41 | | | | 1.58 | | | | 2.95 | | | | 2.52 | | |
Total from Investment
Operations | | | (9.67 | ) | | | 3.16 | | | | 4.98 | | | | 1.98 | | | | 3.15 | | | | 2.70 | | |
| Less Distributions | |
| Net Investment Income | | | (0.64 | ) | | | (0.48 | ) | | | (0.36 | ) | | | (0.27 | ) | | | (0.22 | ) | | | — | | |
| Net Realized Gains | | | (0.46 | ) | | | (0.30 | ) | | | (0.40 | ) | | | (0.02 | ) | | | (0.18 | ) | | | — | | |
| Total Distributions | | | (1.10 | ) | | | (0.78 | ) | | | (0.76 | ) | | | (0.29 | ) | | | (0.40 | ) | | | — | | |
| Net Asset Value, End of Period | | $ | 10.46 | | | $ | 21.23 | | | $ | 18.85 | | | $ | 14.63 | | | $ | 12.94 | | | $ | 10.19 | | |
| Total Return | | | (47.88 | )%(C) | | | 17.32 | % | | | 35.65 | % | | | 15.58 | % | | | 31.99 | % | | | 36.05 | % | |
Net Assets, End of Period
| |
| (thousands) | | $ | 303,822 | | | $ | 729,621 | | | $ | 565,255 | | | $ | 304,601 | | | $ | 203,569 | | | $ | 120,092 | | |
Ratio of Expenses to Average
Net Assets (D) | | | 0.26 | %(B) | | | 0.25 | % | | | 0.27 | % | | | 0.32 | % | | | 0.37 | % | | | 0.43 | % | |
Ratio of Net Investment Income to
Average Net Assets | | | 3.93 | %(B) | | | 3.07 | % | | | 3.42 | % | | | 3.03 | % | | | 2.00 | % | | | 2.28 | % | |
See Page 1 for the Definitions of Abbreviations and Footnotes.
See accompanying Notes to Financial Statements.
10
DIMENSIONAL INVESTMENT GROUP INC.
DFA INTERNATIONAL VALUE PORTFOLIO IV
NOTES TO FINANCIAL STATEMENTS
A. Organization:
Dimensional Investment Group Inc. (the "Fund") is an open-end management investment company registered under the Investment Company Act of 1940, whose shares are offered to institutional investors, retirement plans and clients of registered investment advisors. The Fund consists of fifteen portfolios, of which the DFA International Value Portfolio IV (the "Portfolio") is presented in this report.
The Portfolio primarily invests its assets in The DFA International Value Series (the "Series"), a corresponding series of The DFA Investment Trust Company. At October 31, 2008, the Portfolio owned 7% of the outstanding shares of the Series. The financial statements of the Series are included elsewhere in this report and should be read in conjunction with the financial statements of the Portfolio.
At a regular meeting of the Board of Directors/Trustees (the "Board") on September 16, 2008, the Board voted to change the fiscal and tax year ends of the Portfolio from November 30 to October 31.
B. Significant Accounting Policies:
The following significant accounting policies are in conformity with accounting principles generally accepted in the United States of America. Such policies are consistently followed by the Fund in preparation of its financial statements. The preparation of financial statements in accordance with accounting principles generally accepted in the United States of America requires management to make estimates and assumptions that affect the reported amounts of assets and liabilities and disclosure of contingent assets and liabilities at the date of the financial statements and the reported amounts of increases and decreases in net assets from operations during the reporting period. Actual results could differ from those estimates and those differences could be material.
1. Security Valuation: The shares of the Series held by the Portfolio are valued at their respective daily net asset value.
Adoption of Statement of Financial Accounting Standards No. 157 "Fair Value Measurements" ("FAS 157")
In September 2006, the Financial Accounting Standards Board issued FAS 157 effective for fiscal years beginning after November 15, 2007. This standard clarifies the definition of fair value for financial reporting, establishes a framework for measuring fair value and requires additional disclosures about the use of fair value measurements. The Fund has adopted FAS 157 as of December 1, 2007. The three levels of the fair value hierarchy under FAS 157 are described below:
• Level 1 – quoted prices in active markets for identical securities
• Level 2 – other significant observable inputs (including quoted prices for similar securities, interest rates, prepayment speeds, credit risk, etc.)
• Level 3 – significant unobservable inputs (including the Portfolio's own assumptions in determining the fair value of investments)
The inputs or methodology used for valuing securities are not necessarily an indication of the risk associated with investing in those securities. A summary of the inputs used to value the Portfolio's net assets as of October 31, 2008 is listed below (in thousands).
| | | Valuation Inputs | |
| | | Investments in
Securities
(Market Value) | |
| | | Level 1 | | Level 2 | | Level 3 | | Total | |
| DFA International Value Portfolio IV | | $ | 303,860 | | | | — | | | | — | | | $ | 303,860 | | |
11
2. Deferred Compensation Plan: Each eligible Director of the Fund may elect participation in the Deferred Compensation Plan (the "Plan"). Under the Plan, effective January 1, 2002, such Directors may defer payment of all or a portion of their total fees earned as a Director. These deferred amounts may be treated as though such amounts had been invested in shares of the following funds: U.S. Large Cap Value Portfolio; U.S. Core Equity 1 Portfolio; U.S. Core Equity 2 Portfolio; U.S. Vector Equity Portfolio; U.S. Micro Cap Portfolio; DFA International Value Portfolio; International Core Equity Portfolio; Emerging Markets Portfolio; Emerging Markets Core Equity Portfolio; and/or DFA Two-Year Global Fixed Income Portfolio. Contributions made under the Plan and the change in unrealized a ppreciation (depreciation) and income, are included in Other Expenses for the period ended October 31, 2008 and are included in Directors'/Trustees' Fees & Expenses for the year ended November 30, 2007. At October 31, 2008, the total liability for deferred compensation to Directors is included in Accrued Expenses and Other Liabilities in the amount of $8 (in thousands).
Each Director has the option to receive their distribution of proceeds in one of the following methods upon one year's notice: lump sum; annual installments over a period of agreed upon years; or semi-annual installments over a period of agreed upon years. As of October 31, 2008, none of the Directors have requested distribution of proceeds.
3. Other: Security transactions are accounted for as of the trade date. Costs used in determining realized gains and losses on the sale of affiliated investment company shares are on the basis of identified cost. Dividend income and distributions to shareholders are recorded on the ex-dividend date. Distributions received from the investment in affiliated investment company that represent a return of capital gain are recorded as a reduction of cost of investments or as a realized gain, respectively. Expenses directly attributable to the Portfolio are directly charged. Common expenses of the Fund are allocated using methods approved by the Board of Directors/Trustees, generally based on average net assets.
C. Investment Advisor:
Dimensional Fund Advisors LP ("Dimensional" or the "Advisor") provides administrative services to the Portfolio, including supervision of services provided by others, providing information to the shareholders and to the Board of Directors/Trustees, and other administrative services. The Advisor provides investment advisory services to the Series. For the period December 1, 2007 to October 31, 2008, the Portfolio's administrative services fees were accrued daily and paid monthly to the Advisor based on an effective annual rate of 0.20% of the first $40 million of average daily net assets and no fees on assets exceeding $40 million.
Fees Paid to Officers and Directors/Trustees:
Certain Officers and Directors/Trustees of the Advisor are also Officers and Directors/Trustees of the Fund; however, such Officers and Directors/Trustees (with the exception of the Chief Compliance Officer ("CCO")) receive no compensation from the Fund. For the period December 1, 2007 to October 31, 2008, the total related amounts paid by the Fund to the CCO were $25 (in thousands). The total related amounts paid by the Portfolio are included in Other Expenses on the Statement of Operations.
D. Federal Income Taxes:
The Portfolio has qualified and intends to continue to qualify as a regulated investment company under Subchapter M of the Internal Revenue Code for federal income tax purposes and to distribute substantially all of its taxable income and net capital gains to its shareholders. Accordingly, no provision has been made for federal income taxes.
Distributions from net investment income and net realized capital gains are determined in accordance with U.S. federal income tax regulations, which may differ from those amounts determined under accounting principles generally accepted in the United States of America. These book/tax differences are either temporary or permanent in nature. To the extent these differences are permanent, they are charged or credited to paid-in capital, undistributed net investment income, accumulated net realized gains or unrealized appreciation, as appropriate, in the period that the differences arise. Accordingly, the following permanent differences as of October 31, 2008, primarily attributable
12
to a reclassification of distributions were reclassified to the following accounts. These reclassifications had no effect on net assets or net asset value per share (amounts in thousands):
Increase
(Decrease)
Undistributed
Net Investment
Income | | Increase
(Decrease)
Accumulated
Net Realized
Gains (Losses) | |
| $ | 388 | | | $ | (388 | ) | |
The tax character of dividends and distributions declared and paid during the years ended November 30, 2006, November 30, 2007 and the period December 1, 2007 to October 31, 2008 were as follows (amounts in thousands):
| | | Net
Investment
Income and
Short-Term
Capital Gains | | Long-Term
Capital Gains | | Total | |
| | 2006 | | | $ | 8,443 | | | $ | 7,663 | | | $ | 16,106 | | |
| | 2007 | | | | 15,672 | | | | 7,928 | | | | 23,600 | | |
| | 2008 | | | | 23,113 | | | | 14,605 | | | | 37,718 | | |
At October 31, 2008, the components of distributable earnings (accumulated losses) were as follows (amounts in thousands):
Undistributed
Net Investment
Income and
Short-Term
Capital Gains | | Undistributed
Long-Term
Capital Gains | | Capital Loss
Carryforward | | Total Net
Distributable
Earnings/
(Accumulated
Losses) | |
| $ | 19,876 | | | | — | | | $ | (100,605 | ) | | $ | (80,729 | ) | |
For federal income tax purposes, the Fund measures its capital loss carryforwards annually at October 31, its fiscal year end. Capital loss carryforwards may be carried forward and applied against future capital gains. As of October 31, 2008, the Portfolio had capital loss carryforwards available in the amount of $100,605 (in thousands) to offset future realized capital gains expiring on 2016.
At October 31, 2008, the total cost and aggregate gross unrealized appreciation and (depreciation) of securities for federal income tax purposes were not materially different from amounts reported for financial reporting purposes (amounts in thousands):
Federal
Tax Cost | | Unrealized
Appreciation | | Unrealized
(Depreciation) | | Net
Unrealized
Appreciation
(Depreciation) | |
| $ | 303,737 | | | | — | | | | — | | | | — | | |
In June 2006, the Financial Accounting Standards Board (FASB) issued FASB Interpretation 48 ("FIN 48"), "Accounting for Uncertainty in Income Taxes." This standard defines the threshold for recognizing the benefits of tax-return positions in the financial statements as "more-likely-than-not" to be sustained by the taxing authority and requires measurement of a tax position meeting the more-likely-than-not criterion, based on the largest benefit that is more than 50 percent likely to be realized. Management has analyzed the Portfolio's tax positions to be taken on the federal income tax returns for all open tax years (tax years ended November 30, 2005 through the period ended October 31, 2008), for purposes of implementing FIN 48, and has concluded that no provision for income tax is required in the Portfolio's financial statements.
E. Line of Credit:
The Fund, together with other Dimensional-advised portfolios, has entered into a $250 million unsecured discretionary line of credit effective June 30, 2003 with an affiliate of its domestic custodian bank. Each portfolio is permitted to borrow, subject to its investment limitations, up to a maximum of $250 million, as long as total borrowings
13
under the line of credit do not exceed $250 million in the aggregate. Borrowings under the line of credit are charged interest at the then current Federal Funds Rate plus 1%. Each portfolio is individually, and not jointly, liable for its particular advances under the line of credit. There is no commitment fee on the unused portion of the line of credit. The agreement for the discretionary line of credit may be terminated by either party at any time. The line of credit is scheduled to expire on June 23, 2009. There were no borrowings by the Portfolio under this line of credit during the period ended October 31, 2008.
The Fund, together with other Dimensional-advised portfolios, has also entered into an additional $500 million unsecured line of credit effective January 15, 2008 with its international custodian bank. Each portfolio is permitted to borrow, subject to its investment limitations, up to a maximum of $500 million, as long as total borrowings under the line of credit do not exceed $500 million in the aggregate. Borrowings under the line of credit are charged interest at rates agreed to by the parties at the time of borrowing. Each portfolio is individually, and not jointly, liable for its particular advances under the line of credit. There is no commitment fee on the unused portion of the line of credit. The agreement of the line of credit expires on January 15, 2009. There were no borrowings by the Portfolio under this line of credit during the period ended October 31, 2008.
F. Indemnitees; Contractual Obligations:
Under the Fund's organizational documents, its officers and directors are indemnified against certain liabilities arising out of the performance of their duties to the Fund.
In the normal course of business, the Fund enters into contracts that contain a variety of representations and warranties which provide general indemnification. The Fund's maximum exposure under these arrangements is unknown as this would involve future claims that may be made against the Fund and/or its affiliates that have not yet occurred. However, based on experience, the Fund expects the risk of loss to be remote.
G. Recently Issued Accounting Standards and Interpretation:
In March 2008, Statement of Financial Accounting Standards No. 161, Disclosures about Derivative Instruments and Hedging Activities ("FAS 161"), was issued and is effective for fiscal years beginning after November 15, 2008. FAS 161 defines new disclosures of derivative instruments and hedging activities. Management is currently evaluating the implications of FAS 161. At this time, its impact on the Portfolio's financial statements has not been determined.
H. Other:
At October 31, 2008, one shareholder held 100% of the outstanding shares of the Portfolio.
I. Subsequent Event Note:
On November 1, 2008, The DFA International Value Series, a master fund in a RIC/RIC master feeder structure with five RIC feeders and two direct client investors, made a "Check-the-box" election for federal income tax purposes pursuant to Treasury Regulation § 301.7701-3, to change its federal entity classification from a corporation taxable as a regulated investment company to a partnership. As a result of this election, the master fund is deemed to have distributed all of its assets and liabilities, in a taxable transaction, to its shareholders in liquidation of the master fund. Immediately thereafter, the shareholders contributed all of the distributed assets and liabilities to a newly formed partnership. The final tax year end of The DFA International Value Series was October 31, 2008. For Federal income tax purposes, pursuant to Code §336(a), the master fund recognizes gain or loss as if the master's investment securities were sold to its shareholders and, pursuant to Code §331, each of the Portfolios recognizes gain or loss as if it liquidated its investment in the master. For tax purposes, pursuant to Code § 334(a), each of the Portfolio's will take a fair market value basis in the securities deemed received by them and a new holding period for those securities commences on the deemed liquidation date.
14
The master fund had book/tax differences upon its deemed liquidation. The following summary of permanent differences occurred as of the respective effective "Check the Box" election date.
Increase
(Decrease)
Paid-in Capital | | Unrealized
Appreciation
(Depreciation)
Investment
Securities | | Increase
(Decrease)
Undistributed
Net Investment
Income | | Increase
(Decrease)
Accumulated
Net Realized
Gains(Losses) | |
| $ | (2,187,614,395 | ) | | $ | 2,319,051,847 | | | $ | (602,214 | ) | | $ | (130,835,238 | ) | |
As a result of the transaction, The DFA International Value Series recognized a ($2,309,440,866) and ($718,733) capital and currency loss respectively for tax year ended October 31, 2008. Additionally, the fund has written off $2,178,493,687 of expired capital loss carryover as a permanent book/tax reporting difference decreasing paid in capital.
Each Portfolio impacted by the "Check the Box" election also has a permanent book/tax difference resulting from the transaction. Listed below is the permanent difference impacting each respective Portfolio. For financial statement purposes, this adjustment did not result in any changes to each respective fund's net assets or net asset value per share.
| | | Unrealized
Appreciation
(Depreciation)
Investment
Securities | | Increase
(Decrease)
Accumulated
Net Realized
Gains(Losses) | |
| DFA International Value Portfolio | | $ | 1,598,039,236 | | | $ | (1,598,039,236 | ) | |
| DFA International Value Portfolio II | | | 49,859,737 | | | | (49,859,737 | ) | |
| DFA International Value Portfolio III | | | 155,866,882 | | | | (155,866,882 | ) | |
| DFA International Value Portfolio IV | | | 82,052,198 | | | | (82,052,198 | ) | |
| LWAS/DFA International High Book To Market Portfolio | | | (19,800,535 | ) | | | 19,800,535 | | |
For financial reporting purposes, this transaction had no impact on the net assets of the respective funds.
15
REPORT OF INDEPENDENT REGISTERED PUBLIC ACCOUNTING FIRM
To the Shareholders of DFA International Value Portfolio IV and
Board of Directors of Dimensional Investment Group Inc.:
In our opinion, the accompanying statement of assets and liabilities, and the related statements of operations and of changes in net assets and the financial highlights present fairly, in all material respects, the financial position of DFA International Value Portfolio IV (one of the portfolios constituting Dimensional Investment Group Inc., hereafter referred to as the "Portfolio") at October 31, 2008, the results of its operations, the changes in its net assets and the financial highlights for each of the periods indicated, in conformity with accounting principles generally accepted in the United States of America. These financial statements and financial highlights (hereafter referred to as "financial statements") are the responsibility of the Portfolio's management; our responsibility is to express an opinion on these financial statements based on our audits. We conducted our audits of these financial statements in accordance with the s tandards of the Public Company Accounting Oversight Board (United States). Those standards require that we plan and perform the audit to obtain reasonable assurance about whether the financial statements are free of material misstatement. An audit includes examining, on a test basis, evidence supporting the amounts and disclosures in the financial statements, assessing the accounting principles used and significant estimates made by management, and evaluating the overall financial statement presentation. We believe that our audits, which included confirmation of securities at October 31, 2008 by correspondence with the transfer agent of the investee fund, provide a reasonable basis for our opinion.
PricewaterhouseCoopers LLP
Philadelphia, Pennsylvania
December 22, 2008
16
DIMENSIONAL INVESTMENT GROUP INC.
PERFORMANCE CHART

17
THE DFA INVESTMENT TRUST COMPANY
THE DFA INTERNATIONAL VALUE SERIES
DISCLOSURE OF FUND EXPENSES
(Unaudited)
The following Expense Table is shown so that you can understand the impact of fees on your investment. All mutual funds have operating expenses. As a shareholder of the fund, you incur ongoing costs, which include costs for portfolio management, administrative services, and shareholder reports, among others. Operating expenses, legal and audit services, which are deducted from a fund's gross income, directly reduce the investment return of the fund. A fund's expenses are expressed as a percentage of its average net assets. This figure is known as the expense ratio. The following examples are intended to help you understand the ongoing costs, in dollars, of investing in the fund and to compare these costs with those of other mutual funds. The examples are based on an investment of $1,000 made at the beginning of the period shown and held for the entire period.
The Expense Table below illustrates your fund's costs in two ways.
Actual fund return
This section helps you to estimate the actual expenses after fee waivers that you paid over the period. The "Ending Account Value" shown is derived from the fund's actual return and "Expenses Paid During Period" reflect the dollar amount that would have been paid by an investor who started with $1,000 in the fund. You may use the information here, together with the amount you invested, to estimate the expenses that you paid over the period.
To do so, simply divide your account value by $1,000 (for example, a $7,500 account value divided by $1,000 = 7.5), then multiply the result by the number given for your fund under the heading "Expenses Paid During Period."
Hypothetical example for comparison purposes
This section is intended to help you compare your fund's costs with those of other mutual funds. The hypothetical "Ending Account Value" and "Expenses Paid During Period" are derived from the fund's actual expense ratio and an assumed 5% annual return before expenses. In this case, because the return used is not the fund's actual return, the results do not apply to your investment. The example is useful in making comparisons because the SEC requires all mutual funds to calculate expenses based on a 5% annual return. You can assess your fund's cost by comparing this hypothetical example with the hypothetical examples that appear in shareholder reports of other funds.
Please note that the expenses shown in the table are meant to highlight and help you compare ongoing costs only and do not reflect any transactional costs, if applicable. The "Annualized Expense Ratio" represents the actual expenses for the six-month period indicated.
Six Months Ended October 31, 2008
EXPENSE TABLE
| | | Beginning
Account
Value
05/01/08 | | Ending
Account
Value
10/31/08 | | Annualized
Expense
Ratio* | | Expenses
Paid
During
Period* | |
| Actual Fund Return | | $ | 1,000.00 | | | $ | 555.50 | | | | 0.23 | % | | $ | 0.90 | | |
| Hypothetical 5% Annual Return | | $ | 1,000.00 | | | $ | 1,023.98 | | | | 0.23 | % | | $ | 1.17 | | |
* Expenses are equal to the fund's annualized expense ratio for the six-month period, multiplied by the average account value over the period, multiplied by the number of days in the most recent six-month period (184), then divided by the number of days in the year (366) to reflect the six-month period.
18
THE DFA INVESTMENT TRUST COMPANY
THE DFA INTERNATIONAL VALUE SERIES
DISCLOSURE OF PORTFOLIO HOLDINGS
(Unaudited)
The SEC requires that all Funds file a complete Schedule of Investments with the SEC for their first and third fiscal quarters on Form N-Q. For The DFA Investment Trust Company, this would be for the fiscal quarters ending January 31 and July 31. The Form N-Q filing must be made within 60 days of the end of the quarter. The DFA Investment Trust Company filed its most recent Form N-Q with the SEC on October 30, 2008. It is available upon request, without charge, by calling collect: (310) 395-8005 or by mailing a request to Dimensional Fund Advisors LP, 1299 Ocean Avenue, Santa Monica, California 90401, or by visiting the SEC's website at http://www.sec.gov, or they may be reviewed and copied at the SEC's Public Reference Room in Washington, D.C. (call 1-800-732-0330 for information on the operation of the Public Reference Room).
SEC regulations permit a fund to include in its reports to shareholders a "Summary Schedule of Portfolio Holdings" in lieu of a full Schedule of Investments. The Summary Schedule of Portfolio Holdings reports the fund's 50 largest holdings in unaffiliated issuers and any investments that exceed one percent of the fund's net assets at the end of the reporting period. The amendments also require that the Summary Schedule of Portfolio Holdings identify each category of investments that are held.
The fund is required to file a complete Schedule of Investments with the SEC on Form N-CSR within ten days after mailing the annual and semi-annual reports to shareholders. It will be available upon request, without charge, by calling collect: (310) 395-8005 or by mailing a request to Dimensional Fund Advisors LP, 1299 Ocean Avenue, Santa Monica, California 90401, or by visiting the SEC's website at http://www.sec.gov, or they may be reviewed and copied at the SEC's Public Reference Room in Washington, D.C. (call 1-800-732-0330 for information on the operation of the Public Reference Room).
PORTFOLIO HOLDINGS
The SEC requires that all Funds present their categories of portfolio holdings in a table, chart or graph format in their annual and semi-annual shareholder reports, whether or not a Schedule of Investments is utilized. The following table, which presents portfolio holdings as a percent of total investments before short-term investments and collateral for loaned securities, is provided in compliance with such requirement. The categories shown below represent broad industry sectors. Each industry sector consists of one or more specific industry classifications.
Consumer
Discretionary | | Consumer
Staples | | Energy | | Financials | | Health
Care | | Industrials | | Information
Technology | | Materials | | Telecommunication
Services | | Utilities | | Total | |
| | 12.2 | % | | | 5.1 | % | | | 5.5 | % | | | 41.4 | % | | | 0.5 | % | | | 10.0 | % | | | 3.6 | % | | | 9.3 | % | | | 9.0 | % | | | 3.4 | % | | | 100.0 | % | |
19
THE DFA INTERNATIONAL VALUE SERIES
SUMMARY SCHEDULE OF PORTFOLIO HOLDINGS
October 31, 2008
| | | Shares | | Value†† | | Percentage
of Net Assets** | |
| AUSTRALIA — (4.7%) | |
| COMMON STOCKS — (4.7%) | |
| Australia & New Zealand Banking Group, Ltd. | | | 3,302,749 | | | $ | 38,716,458 | | | | 0.8 | % | |
| Commonwealth Bank of Australia | | | 2,119,091 | | | | 57,926,994 | | | | 1.2 | % | |
| # National Australia Bank, Ltd. | | | 3,087,538 | | | | 50,098,709 | | | | 1.1 | % | |
| Other Securities | | | | | | | 107,641,792 | | | | 2.3 | % | |
| TOTAL — AUSTRALIA | | | | | | | 254,383,953 | | | | 5.4 | % | |
| AUSTRIA — (0.5%) | |
| COMMON STOCKS — (0.5%) | |
| Other Securities | | | | | | | 28,305,261 | | | | 0.6 | % | |
| BELGIUM — (0.5%) | |
| COMMON STOCKS — (0.5%) | |
| Other Securities | | | | | | | 29,328,450 | | | | 0.6 | % | |
| RIGHTS/WARRANTS — (0.0%) | |
| Other Securities | | | | | | | 256 | | | | 0.0 | % | |
| TOTAL — BELGIUM | | | | | | | 29,328,706 | | | | 0.6 | % | |
| CANADA — (5.9%) | |
| COMMON STOCKS — (5.9%) | |
| # Barrick Gold Corp. | | | 1,226,832 | | | | 28,052,344 | | | | 0.6 | % | |
| # EnCana Corp. | | | 560,598 | | | | 28,478,732 | | | | 0.6 | % | |
| Petro-Canada | | | 1,205,300 | | | | 30,140,000 | | | | 0.6 | % | |
| Sun Life Financial, Inc. | | | 1,262,400 | | | | 29,693,056 | | | | 0.6 | % | |
| Other Securities | | | | | | | 200,692,451 | | | | 4.4 | % | |
| TOTAL — CANADA | | | | | | | 317,056,583 | | | | 6.8 | % | |
| DENMARK — (0.9%) | |
| COMMON STOCKS — (0.9%) | |
| Other Securities | | | | | | | 46,987,354 | | | | 1.0 | % | |
| FINLAND — (1.0%) | |
| COMMON STOCKS — (1.0%) | |
| Other Securities | | | | | | | 52,418,538 | | | | 1.1 | % | |
| FRANCE — (8.5%) | |
| COMMON STOCKS — (8.5%) | |
| # AXA SA | | | 2,818,397 | | | | 53,842,817 | | | | 1.2 | % | |
| # BNP Paribas SA | | | 1,558,158 | | | | 112,501,123 | | | | 2.4 | % | |
| # Compagnie de Saint-Gobain | | | 580,915 | | | | 22,415,677 | | | | 0.5 | % | |
| Vivendi SA | | | 2,482,257 | | | | 64,884,026 | | | | 1.4 | % | |
| Other Securities | | | | | | | 208,936,536 | | | | 4.3 | % | |
| TOTAL — FRANCE | | | | | | | 462,580,179 | | | | 9.8 | % | |
| GERMANY — (8.8%) | |
| COMMON STOCKS — (8.8%) | |
| Allianz SE | | | 442,712 | | | | 33,313,833 | | | | 0.7 | % | |
| # Daimler AG | | | 1,684,003 | | | | 57,854,323 | | | | 1.2 | % | |
| # Deutsche Bank AG | | | 774,190 | | | | 28,921,349 | | | | 0.6 | % | |
| # Deutsche Telekom AG | | | 2,621,866 | | | | 38,930,629 | | | | 0.8 | % | |
| Deutsche Telekom AG Sponsored ADR | | | 2,705,150 | | | | 40,171,477 | | | | 0.9 | % | |
| E.ON AG | | | 1,781,013 | | | | 68,160,893 | | | | 1.5 | % | |
| # E.ON AG Sponsored ADR | | | 1,091,708 | | | | 41,484,904 | | | | 0.9 | % | |
20
THE DFA INTERNATIONAL VALUE SERIES
CONTINUED
| | | Shares | | Value†† | | Percentage
of Net Assets** | |
| Munchener Rueckversicherungs-Gesellschaft AG | | | 388,934 | | | $ | 50,491,309 | | | | 1.1 | % | |
| Other Securities | | | | | | | 114,673,630 | | | | 2.4 | % | |
| TOTAL — GERMANY | | | | | | | 474,002,347 | | | | 10.1 | % | |
| GREECE — (0.3%) | |
| COMMON STOCKS — (0.3%) | |
| Other Securities | | | | | | | 14,142,756 | | | | 0.3 | % | |
| HONG KONG — (2.5%) | |
| COMMON STOCKS — (2.5%) | |
| # Cheung Kong Holdings, Ltd. | | | 3,224,000 | | | | 30,955,317 | | | | 0.7 | % | |
| Hutchison Whampoa, Ltd. | | | 5,472,000 | | | | 29,569,976 | | | | 0.6 | % | |
| Sun Hung Kai Properties, Ltd. | | | 2,528,000 | | | | 22,148,070 | | | | 0.5 | % | |
| Other Securities | | | | | | | 54,353,926 | | | | 1.1 | % | |
| TOTAL — HONG KONG | | | | | | | 137,027,289 | | | | 2.9 | % | |
| IRELAND — (0.3%) | |
| COMMON STOCKS — (0.3%) | |
| Other Securities | | | | | | | 16,882,601 | | | | 0.4 | % | |
| ITALY — (1.9%) | |
| COMMON STOCKS — (1.9%) | |
| UniCredito Italiano SpA | | | 10,088,794 | | | | 24,697,595 | | | | 0.5 | % | |
| Other Securities | | | | | | | 78,187,153 | | | | 1.7 | % | |
| TOTAL — ITALY | | | | | | | 102,884,748 | | | | 2.2 | % | |
| JAPAN — (13.3%) | |
| COMMON STOCKS — (13.3%) | |
| FUJIFILM Holdings Corp. | | | 1,077,300 | | | | 24,799,840 | | | | 0.5 | % | |
| Hitachi, Ltd. | | | 6,574,000 | | | | 30,865,283 | | | | 0.7 | % | |
| Tokio Marine Holdings, Inc. | | | 1,457,311 | | | | 44,952,061 | | | | 1.0 | % | |
| Other Securities | | | | | | | 621,977,287 | | | | 13.2 | % | |
| TOTAL — JAPAN | | | | | | | 722,594,471 | | | | 15.4 | % | |
| NETHERLANDS — (3.5%) | |
| COMMON STOCKS — (3.5%) | |
| # ArcelorMittal | | | 1,877,993 | | | | 48,755,658 | | | | 1.0 | % | |
| ING Groep NV | | | 3,093,625 | | | | 29,019,312 | | | | 0.6 | % | |
| Koninklijke Philips Electronics NV | | | 3,192,970 | | | | 59,005,541 | | | | 1.3 | % | |
| Other Securities | | | | | | | 50,984,660 | | | | 1.1 | % | |
| TOTAL — NETHERLANDS | | | | | | | 187,765,171 | | | | 4.0 | % | |
| NEW ZEALAND — (0.1%) | |
| COMMON STOCKS — (0.1%) | |
| Other Securities | | | | | | | 7,460,246 | | | | 0.2 | % | |
| NORWAY — (0.8%) | |
| COMMON STOCKS — (0.8%) | |
| Other Securities | | | | | | | 42,910,368 | | | | 0.9 | % | |
| PORTUGAL — (0.1%) | |
| COMMON STOCKS — (0.1%) | |
| Other Securities | | | | | | | 6,541,713 | | | | 0.1 | % | |
| SINGAPORE — (1.1%) | |
| COMMON STOCKS — (1.1%) | |
| Other Securities | | | | | | | 57,732,771 | | | | 1.2 | % | |
| SPAIN — (4.2%) | |
| COMMON STOCKS — (4.2%) | |
| # Banco Santander Central Hispano SA | | | 7,025,356 | | | | 75,980,397 | | | | 1.6 | % | |
| # Banco Santander SA Sponsored ADR | | | 3,044,700 | | | | 32,700,078 | | | | 0.7 | % | |
| Repsol YPF SA | | | 1,204,043 | | | | 22,895,968 | | | | 0.5 | % | |
21
THE DFA INTERNATIONAL VALUE SERIES
CONTINUED
| | | Shares | | Value†† | | Percentage
of Net Assets** | |
| Repsol YPF SA Sponsored ADR | | | 1,285,700 | | | $ | 24,582,584 | | | | 0.5 | % | |
| Other Securities | | | | | | | 68,834,633 | | | | 1.5 | % | |
| TOTAL — SPAIN | | | | | | | 224,993,660 | | | | 4.8 | % | |
| SWEDEN — (2.4%) | |
| COMMON STOCKS — (2.4%) | |
| # Nordea Bank AB | | | 4,247,718 | | | | 34,046,034 | | | | 0.7 | % | |
| Other Securities | | | | | | | 94,071,267 | | | | 2.0 | % | |
| TOTAL — SWEDEN | | | | | | | 128,117,301 | | | | 2.7 | % | |
| SWITZERLAND — (5.9%) | |
| COMMON STOCKS — (5.9%) | |
| * Compagnie Financiere Richemont SA Series A | | | 1,125,900 | | | | 23,669,433 | | | | 0.5 | % | |
| Credit Suisse Group AG | | | 1,755,349 | | | | 65,639,295 | | | | 1.4 | % | |
| # Credit Suisse Group AG Sponsored ADR | | | 591,859 | | | | 22,135,527 | | | | 0.5 | % | |
| Holcim, Ltd. | | | 435,033 | | | | 24,709,544 | | | | 0.5 | % | |
| Swiss Re | | | 725,996 | | | | 30,276,699 | | | | 0.6 | % | |
| Zurich Financial SVCS AG | | | 300,246 | | | | 60,913,201 | | | | 1.3 | % | |
| Other Securities | | | | | | | 92,813,720 | | | | 2.0 | % | |
| TOTAL — SWITZERLAND | | | | | | | 320,157,419 | | | | 6.8 | % | |
| UNITED KINGDOM — (17.2%) | |
| COMMON STOCKS — (17.2%) | |
| Anglo American P.L.C. | | | 1,329,421 | | | | 33,356,819 | | | | 0.7 | % | |
| Aviva P.L.C. | | | 6,571,996 | | | | 39,201,982 | | | | 0.8 | % | |
| # Barclays P.L.C. Sponsored ADR | | | 2,197,790 | | | | 23,670,198 | | | | 0.5 | % | |
| # HSBC Holdings P.L.C. Sponsored ADR | | | 2,176,243 | | | | 128,398,337 | | | | 2.7 | % | |
| Kingfisher P.L.C. | | | 12,172,495 | | | | 22,467,306 | | | | 0.5 | % | |
| Royal Dutch Shell P.L.C. ADR | | | 1,294,780 | | | | 71,588,386 | | | | 1.5 | % | |
| RSA Insurance Group P.L.C. | | | 12,939,111 | | | | 28,774,426 | | | | 0.6 | % | |
| Vodafone Group P.L.C. | | | 56,881,367 | | | | 109,423,488 | | | | 2.3 | % | |
| Vodafone Group P.L.C. Sponsored ADR | | | 6,370,018 | | | | 122,750,247 | | | | 2.6 | % | |
| William Morrison Supermarkets P.L.C. | | | 6,906,878 | | | | 29,409,035 | | | | 0.6 | % | |
| Other Securities | | | | | | | 324,025,564 | | | | 7.1 | % | |
| TOTAL — UNITED KINGDOM | | | | | | | 933,065,788 | | | | 19.9 | % | |
| | | Face
Amount | | Value† | | | |
| | | (000) | | | | | |
| TEMPORARY CASH INVESTMENTS — (1.6%) | |
Repurchase Agreement, PNC Capital Markets, Inc. 0.94%,
11/03/08 (Collateralized by $92,080,000 FHLMC 4.50%,
05/01/23, valued at $87,591,100) to be repurchased at $86,299,760 | | $ | 86,293 | | | | 86,293,000 | | | | 1.8 | % | |
| | | Shares | | | | | |
| SECURITIES LENDING COLLATERAL — (14.0%) | |
| §@ DFA Short Term Investment Fund LP | | | 757,347,231 | | | | 757,347,231 | | | | 16.1 | % | |
| | | Face
Amount | |
| |
| |
| | | (000) | | | | | |
@ Repurchase Agreement, Deutsche Bank Securities 0.25%,
11/03/08 (Collateralized by $3,471,793 FHLMC 7.000%,
08/01/37, valued at $2,958,290) to be repurchased at $2,900,344 | | $ | 2,900 | | | | 2,900,284 | | | | 0.1 | % | |
| TOTAL SECURITIES LENDING COLLATERAL | | | | | | | 760,247,515 | | | | 16.2 | % | |
TOTAL INVESTMENTS — (100.0%)
(Cost $7,723,320,604) | | | | | | $ | 5,413,879,738 | | | | 115.2 | % | |
See accompanying Notes to Financial Statements.
22
THE DFA INVESTMENT TRUST COMPANY
THE DFA INTERNATIONAL VALUE SERIES
STATEMENT OF ASSETS AND LIABILITIES
OCTOBER 31, 2008
(Amounts in thousands, except share and per share amounts)
| ASSETS: | |
| Investments at Value (including $717,470 of securities on loan) | | $ | 4,567,339 | | |
| Temporary Cash Investments at Value & Cost | | | 86,293 | | |
| Collateral Received from Securities on Loan at Value & Cost | | | 760,248 | | |
| Foreign Currencies at Value | | | 14,156 | | |
| Cash | | | 15 | | |
| Receivables: | |
| Investment Securities Sold | | | 38,170 | | |
| Dividends, Interest and Tax Reclaims | | | 15,310 | | |
| Securities Lending Income | | | 1,186 | | |
| Fund Shares Sold | | | 10,712 | | |
| Fund Margin Variation | | | 19 | | |
| Prepaid Expenses and Other Assets | | | 7 | | |
| Total Assets | | | 5,493,455 | | |
| LIABILITIES: | |
| Payables: | |
| Upon Return of Securities Loaned | | | 760,248 | | |
| Investment Securities Purchased | | | 31,085 | | |
| Fund Shares Redeemed | | | 510 | | |
| Due to Advisor | | | 853 | | |
| Accrued Expenses and Other Liabilities | | | 422 | | |
| Total Liabilities | | | 793,118 | | |
| NET ASSETS | | $ | 4,700,337 | | |
| SHARES OUTSTANDING, $0.01 PAR VALUE (1) | | | 412,114,828 | | |
| NET ASSET VALUE, OFFERING AND REDEMPTION PRICE PER SHARE | | $ | 11.41 | | |
| Investments at Cost | | $ | 6,876,780 | | |
| Foreign Currencies at Cost | | $ | 53,045 | | |
| NET ASSETS CONSIST OF: | |
| Paid-In Capital | | $ | 4,700,337 | | |
| NET ASSETS | | $ | 4,700,337 | | |
| (1) NUMBER OF SHARES AUTHORIZED | | | Unlimited | | |
See accompanying Notes to Financial Statements.
23
THE DFA INVESTMENT TRUST COMPANY
THE DFA INTERNATIONAL VALUE SERIES
STATEMENTS OF OPERATIONS
(Amounts in thousands)
| | | Period
Dec. 1, 2007
to
Oct. 31, 2008 | | Year
Ended
Nov. 30,
2007 | |
| Investment Income | |
| Dividends (Net of Foreign Taxes Withheld of $28,938 and $23,649, respectively) | | $ | 300,627 | | | $ | 278,708 | | |
| Interest | | | 1,071 | | | | 2,113 | | |
| Income from Securities Lending | | | 19,332 | | | | 14,342 | | |
| Total Investment Income | | | 321,030 | | | | 295,163 | | |
| Expenses | |
| Investment Advisory Services Fees | | | 14,643 | | | | 18,039 | | |
| Accounting & Transfer Agent Fees | | | 739 | | | | 900 | | |
| Custodian Fees | | | 914 | | | | 1,185 | | |
| Shareholders' Reports | | | 78 | | | | 84 | | |
| Directors'/Trustees' Fees & Expenses | | | — | | | | 97 | | |
| Professional Fees | | | 171 | | | | 139 | | |
| Other | | | 98 | | | | 106 | | |
| Total Expenses | | | 16,643 | | | | 20,550 | | |
| Net Investment Income (Loss) | | | 304,387 | | | | 274,613 | | |
| Realized and Unrealized Gain (Loss) | |
| Net Realized Gain (Loss) on: | |
| Investment Securities Sold | | | 137,811 | | | | 654,522 | | |
| Futures | | | (1,153 | ) | | | — | | |
| Foreign Currency Transactions | | | (4,593 | ) | | | 2,498 | | |
| In-Kind Redemptions | | | 103,024 | * | | | — | | |
| Change in Unrealized Appreciation (Depreciation) of: | |
| Investment Securities and Foreign Currency | | | (5,026,911 | ) | | | 403,307 | | |
| Futures | | | 19 | | | | — | | |
| Translation of Foreign Currency Denominated Amounts | | | (76 | ) | | | (180 | ) | |
| Net Realized and Unrealized Gain (Loss) | | | (4,791,879 | ) | | | 1,060,147 | | |
| Net Increase (Decrease) in Net Assets Resulting from Operations | | $ | (4,487,492 | ) | | $ | 1,334,760 | | |
* See Note J in the Notes to Financial Statements.
See accompanying Notes to Financial Statements.
24
THE DFA INVESTMENT TRUST COMPANY
THE DFA INTERNATIONAL VALUE SERIES
STATEMENTS OF CHANGES IN NET ASSETS
(Amounts in thousands)
| | | Period
Dec. 1, 2007
to
Oct. 31, 2008 | | Year
Ended
Nov. 30,
2007 | | Year
Ended
Nov. 30,
2006 | |
| Increase (Decrease) in Net Assets | |
| Operations: | |
| Net Investment Income (Loss) | | $ | 304,387 | | | $ | 274,613 | | | $ | 193,174 | | |
| Net Realized Gain (Loss) on: | |
| Investment Securities Sold | | | 137,811 | | | | 654,522 | | | | 201,700 | | |
| Futures | | | (1,153 | ) | | | — | | | | — | | |
| Foreign Currency Transactions | | | (4,593 | ) | | | 2,498 | | | | 378 | | |
| In-Kind Redemptions | | | 103,024 | * | | | — | | | | — | | |
| Change in Unrealized Appreciation (Depreciation) of: | |
| Investment Securities and Foreign Currency | | | (5,026,911 | ) | | | 403,307 | | | | 1,351,708 | | |
| Futures | | | 19 | | | | — | | | | — | | |
| Translation of Foreign Currency Denominated Amounts | | | (76 | ) | | | (180 | ) | | | 486 | | |
Net Increase (Decrease) in Net Assets Resulting
from Operations | | | (4,487,492 | ) | | | 1,334,760 | | | | 1,747,446 | | |
| Distributions From: | |
| Net Investment Income | | | (293,386 | ) | | | (278,093 | ) | | | (202,210 | ) | |
| Net Short-Term Gains | | | (22,542 | ) | | | (14,957 | ) | | | (11,375 | ) | |
| Net Long-Term Gains | | | (614,160 | ) | | | (185,943 | ) | | | (115,307 | ) | |
| Total Distributions | | | (930,088 | ) | | | (478,993 | ) | | | (328,892 | ) | |
| Capital Share Transactions (1): | |
| Shares Issued | | | 927,878 | | | | 1,731,698 | | | | 1,589,921 | | |
| Shares Issued in Lieu of Cash Distributions | | | 916,898 | | | | 465,562 | | | | 307,948 | | |
| Shares Redeemed | | | (1,365,580 | )* | | | (871,558 | ) | | | (226,869 | ) | |
| Net Increase (Decrease) from Capital Share Transactions | | | 479,196 | | | | 1,325,702 | | | | 1,671,000 | | |
| Total Increase (Decrease) in Net Assets | | | (4,938,384 | ) | | | 2,181,469 | | | | 3,089,554 | | |
| Net Assets | |
| Beginning of Period | | | 9,638,721 | | | | 7,457,252 | | | | 4,367,698 | | |
| End of Period | | $ | 4,700,337 | | | $ | 9,638,721 | | | $ | 7,457,252 | | |
| (1) Shares Issued and Redeemed: | |
| Shares Issued | | | 50,328 | | | | 72,431 | | | | 80,546 | | |
| Shares Issued in Lieu of Cash Distributions | | | 45,073 | | | | 20,227 | | | | 16,678 | | |
| Shares Redeemed | | | (77,527 | ) | | | (36,444 | ) | | | (11,688 | ) | |
| | | | 17,874 | | | | 56,214 | | | | 85,536 | | |
Undistributed Net Investment Income (Distributions in
Excess of Net Investment Income) | | $ | — | | | $ | 9,727 | | | $ | (7,523 | ) | |
* See Note J in the Notes to Financial Statements.
See accompanying Notes to Financial Statements.
25
THE DFA INVESTMENT TRUST COMPANY
THE DFA INTERNATIONAL VALUE SERIES
FINANCIAL HIGHLIGHTS
(for a share outstanding throughout each period)
| | | Period
Dec. 1, 2007
to
Oct. 31, 2008 | | Year
Ended
Nov. 30,
2007 | | Year
Ended
Nov. 30,
2006 | | Year
Ended
Nov. 30,
2005 | | Year
Ended
Nov. 30,
2004 | | Year
Ended
Nov. 30,
2003 | |
Net Asset Value,
Beginning of Period | | $ | 24.45 | | | $ | 22.06 | | | $ | 17.30 | | | $ | 16.04 | | | $ | 12.40 | | | $ | 9.33 | | |
Income from Investment
Operations | | | | | |
| Net Investment Income (Loss) | | | 0.73 | (A) | | | 0.73 | (A) | | | 0.65 | (A) | | | 0.43 | | | | 0.33 | | | | 0.27 | | |
Net Gains (Losses) on
Securities (Realized and
Unrealized) | | | (11.45 | ) | | | 2.98 | | | | 5.27 | | | | 1.95 | | | | 3.61 | | | | 3.06 | | |
Total from Investment
Operations | | | (10.72 | ) | | | 3.71 | | | | 5.92 | | | | 2.38 | | | | 3.94 | | | | 3.33 | | |
| Less Distributions | |
| Net Investment Income | | | (0.71 | ) | | | (0.73 | ) | | | (0.67 | ) | | | (0.52 | ) | | | (0.30 | ) | | | (0.25 | ) | |
| Net Realized Gains | | | (1.61 | ) | | | (0.59 | ) | | | (0.49 | ) | | | (0.60 | ) | | | — | | | | (0.01 | ) | |
| Total Distributions | | | (2.32 | ) | | | (1.32 | ) | | | (1.16 | ) | | | (1.12 | ) | | | (0.30 | ) | | | (0.26 | ) | |
Net Asset Value,
End of Period | | $ | 11.41 | | | $ | 24.45 | | | $ | 22.06 | | | $ | 17.30 | | | $ | 16.04 | | | $ | 12.40 | | |
| Total Return | | | (47.87 | )%(C) | | | 17.32 | % | | | 35.73 | % | | | 15.61 | % | | | 32.15 | % | | | 36.24 | % | |
Net Assets,
| |
| End of Period (thousands) | | $ | 4,700,337 | | | $ | 9,638,721 | | | $ | 7,457,252 | | | $ | 4,367,698 | | | $ | 2,804,043 | | | $ | 1,604,778 | | |
Ratio of Expenses to Average
Net Assets | | | 0.23 | %(B) | | | 0.23 | % | | | 0.23 | % | | | 0.27 | % | | | 0.28 | % | | | 0.30 | % | |
Ratio of Net Investment Income
to Average Net Assets | | | 4.15 | %(B) | | | 3.04 | % | | | 3.29 | % | | | 2.71 | % | | | 2.35 | % | | | 2.61 | % | |
| Portfolio Turnover Rate | | | 16 | %(C) | | | 16 | % | | | 8 | % | | | 10 | % | | | 15 | % | | | 14 | % | |
See page 1 for the Definitions of Abbreviations and Footnotes.
See accompanying Notes to Financial Statements.
26
THE DFA INVESTMENT TRUST COMPANY
THE DFA INTERNATIONAL VALUE SERIES
NOTES TO FINANCIAL STATEMENTS
A. Organization:
The DFA Investment Trust Company (the "Trust") is an open-end management investment company registered under the Investment Company Act of 1940. The Trust consists of eighteen investment portfolios, of which The DFA International Value Series (the "Series") is presented in this report.
At a regular meeting of the Board of Directors/Trustees (the "Board") on September 16, 2008, the Board voted to change the fiscal and tax year ends of the Series from November 30 to October 31.
B. Significant Accounting Policies:
The following significant accounting policies are in conformity with accounting principles generally accepted in the United States of America. Such policies are consistently followed by the Trust in preparation of its financial statements. The preparation of financial statements in accordance with accounting principles generally accepted in the United States of America requires management to make estimates and assumptions that affect the reported amounts of assets and liabilities and disclosure of contingent assets and liabilities at the date of the financial statements and the reported amounts of increases and decreases in net assets from operations during the reporting period. Actual results could differ from those estimates and those differences could be material.
1. Security Valuation: Securities held by the Series (including over-the-counter securities) are valued at the last quoted sale price of the day. Securities held by the Series that are listed on Nasdaq are valued at the Nasdaq Official Closing Price ("NOCP"). If there is no last reported sale price or NOCP for the day, the Series values the securities at the mean of the most recent quoted bid and asked prices. Price information on listed securities is taken from the exchange where the security is primarily traded. Generally, securities issued by open-end investment companies are valued using their respective net asset values or public offering prices, as appropriate, for purchase orders placed at the close of the New York Stock Exchange (NYSE).
Securities for which no market quotations are readily available (including restricted securities), or for which market quotations have become unreliable, are valued in good faith at fair value in accordance with procedures adopted by the Board of Directors/Trustees. Fair value pricing may also be used if events that have a significant effect on the value of an investment (as determined in the discretion of the Investment Committee of the Advisor) occur before the net asset value is calculated. When fair value pricing is used, the prices of securities used by the Series may differ from the quoted or published prices for the same securities on their primary markets or exchanges.
The Series will also fair value price in the circumstances described below. Generally, trading in foreign securities markets is completed each day at various times prior to the close of the NYSE. For example, trading in the Japanese securities markets is completed each day at the close of Tokyo Stock Exchange (normally 11:00 p.m. PT), which is fourteen hours prior to the close of the NYSE (normally 1:00 p.m. PT) and the time that the net asset value of the Series is computed. Due to the time differences between the closings of the relevant foreign securities exchanges and the time the Series prices its shares at the close of the NYSE, the Series will fair value its foreign investments when it is determined that the market quotations for the foreign investments are either unreliable or not readily available. The fair value prices will attempt to reflect the impact of the U.S. financial markets' perceptions and trading activities on the Series ' foreign investments since the last closing prices of the foreign investments were calculated on their primary foreign securities markets or exchanges. For these purposes, the Board of Directors/Trustees of the Series has determined that movements in relevant indices or other appropriate market indicators, after the close of the Tokyo Stock Exchange or the London Stock Exchange, demonstrate that market quotations may be unreliable. Fair valuation of portfolio securities may occur on a daily basis. The fair value pricing by the Series utilizes data furnished by an independent pricing service (and that data draws upon, among other information, the market values of foreign investments). The fair value prices of portfolio securities generally will be used when it is determined that the use of such prices will have a material impact on the net asset value of the Series. When the Series uses fair value
27
pricing, the values assigned to the Series' foreign investments may not be the quoted or published prices of the investments on their primary markets or exchanges.
Futures contracts held by the Series are valued using the settlement price established each day on the exchange on which they are traded.
Adoption of Statement of Financial Accounting Standards No. 157 "Fair Value Measurements" ("FAS 157")
In September 2006, the Financial Accounting Standards Board issued FAS 157 effective for fiscal years beginning after November 15, 2007. This standard clarifies the definition of fair value for financial reporting, establishes a framework for measuring fair value and requires additional disclosures about the use of fair value measurements. The Funds have adopted FAS 157 as of December 1, 2007. The three levels of the fair value hierarchy under FAS 157 are described below:
• Level 1 – quoted prices in active markets for identical securities
• Level 2 – other significant observable inputs (including quoted prices for similar securities, interest rates, prepayment speeds, credit risk, etc.)
• Level 3 – significant unobservable inputs (including the Series' own assumptions in determining the fair value of investments)
The inputs or methodology used for valuing securities are not necessarily an indication of the risk associated with investing in those securities. A summary of the inputs used to value the Series' net assets as of October 31, 2008 is listed below (in thousands).
| | | Valuation Inputs | |
| | | Investments in
Securities
(Market Value) | | Other Financial
Instruments (Unrealized
Appreciation/Depreciation)* | |
| | | Level 1 | | Level 2 | | Level 3 | | Total | | Level 1 | | Level 2 | | Level 3 | | Total | |
| The DFA International Value Series | | $ | 1,004,378 | | | $ | 4,409,502 | | | | — | | | $ | 5,413,880 | | | $ | 19 | | | | — | | | | — | | | $ | 19 | | |
2. Foreign Currency Translation: Securities and other assets and liabilities of the Series whose values are initially expressed in foreign currencies are translated to U.S. dollars using the mean between the most recently quoted bid and asked prices for the U.S. dollar as quoted by generally recognized reliable sources. Dividend and interest income and certain expenses are translated to U.S. dollars at the rate of exchange on their respective accrual dates. Receivables and payables denominated in foreign currencies are marked to market daily based on daily exchange rates. Exchange gains or losses are realized upon ultimate receipt or disbursement.
The Series does not isolate the effect of fluctuations in foreign exchange rates from the effect of fluctuations in the market prices of securities held whether realized or unrealized.
Realized gains or losses on foreign currency transactions represent net foreign exchange gains or losses from the disposition of foreign currencies, currency gains or losses realized between the trade and settlement dates on securities transactions, and the difference between amounts of interest, dividends and foreign withholding taxes recorded on the books of the Series and the U.S. dollar equivalent amounts actually received or paid.
3. Deferred Compensation Plan: Each eligible Trustee of the Trust may elect participation in the Deferred Compensation Plan (the "Plan"). Under the Plan, effective January 1, 2002, such Trustees may defer payment of all or a portion of their total fees earned as a Trustee. These deferred amounts may be treated as though such amounts had been invested in shares of the following funds: U.S. Large Cap Value Portfolio; U.S. Core Equity 1 Portfolio; U.S. Core Equity 2 Portfolio; U.S. Vector Equity Portfolio; U.S. Micro Cap Portfolio; DFA International Value Portfolio; International Core Equity Portfolio; Emerging Markets Portfolio; Emerging Markets Core Equity Portfolio; and/or DFA Two-Year Global Fixed Income Portfolio. Contributions made under the Plan and the change in unrealized app reciation (depreciation) and income are included in Other Expenses for the period ended October 31, 2008 and are included in Directors'/Trustees' Fees & Expenses for the year ended November 30, 2007. At October 31, 2008, the total liability for deferred compensation to Trustees is included in Accrued Expenses and Other Liabilities in the amount of $117 (in thousands).
28
Each Trustee has the option to receive their distribution of proceeds in one of the following methods upon one year's notice: lump sum; annual installments over a period of agreed upon years; or semi-annual installments over a period of agreed upon years. As of October 31, 2008, none of the Trustees have requested distribution of proceeds.
4. Other: Security transactions are accounted for as of the trade date. Costs used in determining realized gains and losses on the sale of investment securities are on the basis of identified cost. Dividend income and distributions to shareholders are recorded on the ex-dividend date. Distributions received on securities that represent a return of capital or capital gains are recorded as a reduction of cost of investments or as a realized gain, respectively. The Series estimates the character of distributions received that may be considered return of capital distributions or capital gain distributions. Interest income is recorded on the accrual basis. Discount and premium on securities purchased are amortized over the lives of the respective securities utilizing the effective inter est method. Expenses directly attributable to a Series are directly charged. Common expenses of the Trust are allocated using methods approved by the Board of Directors/Trustees, generally based on average net assets.
The Series may be subject to taxes imposed by countries in which it invests, with respect to its investments in issuers exiting or operating in such countries. Such taxes are generally based on income earned or repatriated and capital gains realized on the sale of such investments. The Series accrues such taxes when the related income or capital gains are earned or throughout the holding period. Some countries require governmental approval for the repatriation of investment income, capital or the proceeds of sales earned by foreign investors. In addition, if there is a deterioration in a country's balance of payments or for other reasons, a country may impose temporary restrictions on foreign capital remittances abroad.
C. Investment Advisor:
Dimensional Fund Advisors LP ("Dimensional" or the "Advisor") provides investment advisory services to the Series. For the period December 1, 2007 to October 31, 2008, the Series' investment advisory services fees were accrued daily and paid monthly to the Advisor based on an effective annual rate of 0.20% of average daily net assets.
Fees Paid to Officers and Directors/Trustees:
Certain Officers and Directors/Trustees of the Advisor are also Officers and Directors/Trustees of the Trust; however, such Officers and Directors/Trustees (with the exception of the Chief Compliance Officer ("CCO")) receive no compensation from the Trust. For the period December 1, 2007 to October 31, 2008, the total related amounts paid by the Trust to the CCO were $117 (in thousands). The total related amounts paid by the Series are included in Other Expenses on the Statement of Operations.
D. Purchases and Sales of Securities:
For the period December 1, 2007 to October 31, 2008, the Series made the following purchases and sales of investment securities, other than short-term securities and U.S. government securities (amounts in thousands):
| Purchases | | $ | 1,266,540 | | |
| Sales | | | 1,523,257 | | |
There were no purchases or sales of long-term U.S. government securities.
E. Federal Income Taxes:
The Series has qualified and intends to continue to qualify as a regulated investment company under Subchapter M of the Internal Revenue Code for federal income tax purposes and to distribute substantially all of its taxable income and net capital gains to its shareholders. Accordingly, no provision has been made for federal income taxes.
Distributions from net investment income and net realized capital gains are determined in accordance with U.S. federal income tax regulations, which may differ from those amounts determined under accounting principles generally accepted in the United States of America. These book/tax differences are either temporary or permanent in
29
nature. To the extent these differences are permanent, they are charged or credited to paid-in capital, or undistributed net investment income or accumulated net realized gains, as appropriate, in the period that the differences arise. Accordingly, the following permanent differences as of October 31, 2008, primarily attributable to realized net foreign currency gains/losses and net realized gains on securities considered to be passive foreign investment companies, were reclassified to the following accounts. These reclassifications had no effect on net assets or net asset value per share (amounts in thousands):
Increase
(Decrease)
Paid-in Capital | | Increase
(Decrease)
Undistributed
Net Investment
Income | | Increase
(Decrease)
Accumulated
Net Realized
Gains/(Losses) | |
| $ | 123,628 | | | $ | (20,126 | ) | | $ | (103,502 | ) | |
The tax character of dividends and distributions declared and paid during the years November 30, 2006, November 30, 2007, and the period December 1, 2007 to October 31, 2008 (amount in thousands):
| | | Net Investment
Income
and Short-Term
Capital Gains | |
Long-Term
Capital Gains | |
Total | |
| 2006 | | $ | 213,585 | | | $ | 115,307 | | | $ | 328,892 | | |
| 2007 | | | 293,050 | | | | 185,943 | | | | 478,993 | | |
| 2008 | | | 336,790 | | | | 613,845 | | | | 950,635 | | |
In June 2006, the Financial Accounting Standards Board (FASB) issued FASB Interpretation 48 ("FIN 48"), "Accounting for Uncertainty in Income Taxes." This standard defines the threshold for recognizing the benefits of tax-return positions in the financial statements as "more-likely-than-not" to be sustained by the taxing authority and requires measurement of a tax position meeting the more-likely-than-not criterion, based on the largest benefit that is more than 50 percent likely to be realized. Management has analyzed the Series' tax positions to be taken on the federal income tax returns for all open tax years (tax years ended November 30, 2005 through the period ended October 31, 2008) and for the period ended October 31, 2008, for purposes of implementing FIN 48, and has concluded that no provision for income tax is required in the Series' financial statements.
F. Financial Instruments:
In accordance with the Series' investment objectives and policies, the Series may invest in certain financial instruments that have off-balance sheet risk in excess of the amounts recognized in the financial statements and concentrations of credit and market risk. These instruments and their significant corresponding risks are described below:
1. Repurchase Agreements: The Series may purchase money market instruments subject to the counterparty's agreement to repurchase them at an agreed upon date and price. The counterparty will be required on a daily basis to maintain the value of the collateral subject to the agreement at not less than the repurchase price (including accrued interest). The agreements are conditioned upon the collateral being deposited under the Federal Reserve book-entry system with the Trust's custodian or a third party sub-custodian. In the event of default or bankruptcy by the other party to the agreement, retention of the collateral may be subject to legal proceedings. All open repurchase agreements were entered into on October 31, 2008.
2. Foreign Market Risks: Investments in foreign markets may involve certain considerations and risks not typically associated with investments in the United States of America, including the possibility of future political and economic developments and the level of foreign government supervision and regulation of foreign securities markets. These markets are generally smaller, less liquid and more volatile than the major securities markets in the United States of America. Consequently, acquisition and disposition of securities by the Series may be inhibited.
3. Futures Contracts: During the period December 1, 2007 to October 31, 2008, the Series entered into futures contracts in accordance with its investment objectives. Upon entering into a futures contract, the Series deposits cash or pledges U.S. Government securities to a broker, equal to the minimum "initial margin" requirements of the exchange on which the contract is traded. Subsequent payments are received from or paid to the broker each day, based on the
30
daily fluctuation in the market value of the contract. These receipts or payments are known as "variation margin" and are recorded daily by the Series as unrealized gains or losses until the contracts are closed. When the contracts are closed, the Series records a realized gain or loss equal to the difference between the value of the contract at the time it was opened and the value at the time it was closed.
At October 31, 2008, the Series had outstanding 156 long futures contracts of the S&P 500 Index®, all of which expire on December 19, 2008. The value of such contracts on October 31, 2008 was $37,725 (in thousands), which resulted in an unrealized gain of $19 (in thousands). Approximately $3,861 (in thousands) of cash has been segregated as collateral for the open futures contracts and has been accounted for as cash on the Statement of Assets and Liabilities.
Risks may arise upon entering into futures contracts from potential imperfect price correlations between the futures contracts and the underlying securities, from the possibility of an illiquid secondary market for these instruments and from the possibility that the Series could lose more than the initial margin requirements.
G. Line of Credit:
The Trust, together with other Dimensional-advised portfolios, has entered into a $250 million unsecured discretionary line of credit effective June 30, 2003 with an affiliate of its domestic custodian bank. Each portfolio is permitted to borrow, subject to its investment limitations, up to a maximum of $250 million, as long as total borrowings under the line of credit do not exceed $250 million in the aggregate. Borrowings under the line of credit are charged interest at the then current Federal Funds Rate plus 1%. Each portfolio is individually, and not jointly, liable for its particular advances under the line of credit. There is no commitment fee on the unused portion of the line of credit. The agreement for the discretionary line of credit may be terminated by either party at any time. The line of credit is scheduled to expire on June 23, 2009. There were no borrowings by the Series under this line of credit during the period ended Octo ber 31, 2008.
The Trust, together with other Dimensional-advised portfolios, has also entered into an additional $500 million unsecured line of credit effective January 15, 2008 with its international custodian bank. Each portfolio is permitted to borrow, subject to its investment limitations, up to a maximum of $500 million, as long as total borrowings under the line of credit do not exceed $500 million in the aggregate. Borrowings under the line of credit are charged interest at rates agreed to by the parties at the time of borrowing. Each portfolio is individually, and not jointly, liable for its particular advances under the line of credit. There is no commitment fee on the unused portion of the line of credit. The agreement for the line of credit expires on January 15, 2009.
For the period December 1, 2007 to October 31, 2008, borrowings by the Series under this line of credit were as follows (amounts in thousands, except percentages and days):
Weighted
Average
Interest Rate | | Weighted
Average
Loan Balance | | Number of
Days
Outstanding | | Interest
Expense
Incurred | | Maximum Amount
Borrowed During
the Period | |
| | 3.68 | % | | $ | 8,004 | | | | 31 | | | $ | 25 | | | $ | 27,822 | | |
There were no outstanding borrowings by the Series under this line of credit at October 31, 2008.
H. Securities Lending:
As of October 31, 2008, the Series had securities on loan to brokers/dealers, for which the Series held cash collateral. The Series invests the cash collateral, as described below, and records a liability for the return of the collateral, during the period the securities are on loan. Loans of securities are expected at all times to be secured by collateral equal to at least (i) 100% of the current market value of the loaned securities with respect to securities of the U.S. government or its agencies, (ii) 102% of the current market value of the loaned securities with respect to U.S. securities, and (iii) 105% of the current market value of the loaned securities with respect to foreign securities. However, daily market fluctuations could cause the Series' collateral to be lower or higher than the expected thresholds. If this were to occur, the collateral would be adjusted the next business day to ensure adequate collateralization. In the even t of default or bankruptcy by the other party to the agreement, realization and/or retention of the collateral may be subject to legal proceedings. If the borrower fails to return loaned securities, and cash collateral being maintained by the borrower is insufficient to cover the value of loaned securities and provided such collateral insufficiency is not the result of investment losses, the lending agent has agreed to pay the amount of the shortfall to the Series or, at the option of the lending agent, to replace the securities.
31
Subject to the Series' investment policy, the cash collateral received by the Series from securities on loan is invested in securities of the U.S. government or its agencies, repurchase agreements collateralized by securities of the U.S. government or its agencies or shares of the DFA Short-Term Investment Fund LP. Agencies include both agency debentures and agency mortgage backed securities. In addition, the Series will be able to terminate the loan at any time and will receive reasonable interest on the loan, as well as amounts equal to any dividends, interest or other distributions on the loaned securities. However, dividend income received from loaned securities may not be eligible to be taxed at qualified dividend income rates.
I. Indemnities; Contractual Obligations:
Under the Trust's organizational documents, its officers and directors are indemnified against certain liabilities arising out of the performance of their duties to the Trust.
In the normal course of business, the Trust enters into contracts that contain a variety of representations and warranties which provide general indemnification. The Trust's maximum exposure under these arrangements is unknown as this would involve future claims that may be made against the Trust and/or its affiliates that have not yet occurred. However, based on experience, the Trust expects the risk of loss to be remote.
J. In-Kind Redemptions:
In accordance with guidelines described in the Series' prospectus, the Series may distribute portfolio securities rather than cash as payment for a redemption of fund shares (In-Kind redemption). For financial reporting purposes, the Series recognizes a gain on In-Kind redemptions to the extent the value of the distributed securities on the date of redemption exceeds the cost of those securities. Gains and losses realized on In-Kind redemptions are not recognized for tax purposes and are reclassified from undistributed realized gain (loss) to paid-in capital. During the period December 1, 2007 to October 31, 2008, the Series realized $103,024 (in thousands) of net gain.
K. Recently Issued Accounting Standards and Interpretation:
In March 2008, Statement of Financial Accounting Standards No. 161, Disclosures about Derivative Instruments and Hedging Activities ("FAS 161"), was issued and is effective for fiscal years beginning after November 15, 2008. FAS 161 defines new disclosures of derivative instruments and hedging activities. Management is currently evaluating the implications of FAS 161. At this time, its impact on the Series' financial statements has not been determined.
L. Subsequent Event Note:
On November 1, 2008, The DFA International Value Series, a master fund in a RIC/RIC master feeder structure with five RIC feeders and two direct client investors, made a "Check-the-box" election for federal income tax purposes pursuant to Treasury Regulation § 301.7701-3, to change its federal entity classification from a corporation taxable as a regulated investment company to a partnership. As a result of this election, the master fund is deemed to have distributed all of its assets and liabilities, in a taxable transaction, to its shareholders in liquidation of the master fund. Immediately thereafter, the shareholders contributed all of the distributed assets and liabilities to a newly formed partnership. The final tax year end of The DFA International Value Series was October 31, 2008. For Federal income tax purposes, pursuant to Code §336(a), the master fund recognizes gain or loss as if the master's investment securities were sold to its shareholders and, pursuant to Code §331, each of the Portfolios recognizes gain or loss as if it liquidated its investment in the master. For tax purposes, pursuant to Code § 334(a), each of the Portfolio's will take a fair market value basis in the securities deemed received by them and a new holding period for those securities commences on the deemed liquidation date.
The master fund had book/tax differences upon its deemed liquidation. The following summary of permanent differences occurred as of the respective effective "Check the Box" election date.
Increase
(Decrease)
Paid-in Capital | | Unrealized
Appreciation
(Depreciation)
Investment
Securities | | Increase
(Decrease)
Undistributed
Net Investment
Income | | Increase
(Decrease)
Accumulated
Net Realized
Gains(Losses) | |
| $ | (2,187,614,395 | ) | | $ | 2,319,051,847 | | | $ | (602,214 | ) | | $ | (130,835,238 | ) | |
32
As a result of the transaction, The DFA International Value Series recognized a ($2,309,440,866) and ($718,733) capital and currency loss respectively for tax year ended October 31, 2008. Additionally, the fund has written off $2,178,493,687 of expired capital loss carryover as a permanent book/tax reporting difference decreasing paid in capital.
Each Portfolio impacted by the "Check the Box" election also has a permanent book/tax difference resulting from the transaction. Listed below is the permanent difference impacting each respective Portfolio. For financial statement purposes, this adjustment did not result in any changes to each respective fund's net assets or net asset value per share.
| | | Unrealized
Appreciation
(Depreciation)
Investment
Securities | | Increase
(Decrease)
Accumulated
Net Realized
Gains(Losses) | |
| DFA International Value Portfolio | | $ | 1,598,039,236 | | | $ | (1,598,039,236 | ) | |
| DFA International Value Portfolio II | | | 49,859,737 | | | | (49,859,737 | ) | |
| DFA International Value Portfolio III | | | 155,866,882 | | | | (155,866,882 | ) | |
| DFA International Value Portfolio IV | | | 82,052,198 | | | | (82,052,198 | ) | |
| LWAS/DFA International High Book To Market Portfolio | | | (19,800,535 | ) | | | 19,800,535 | | |
For financial reporting purposes, this transaction had no impact on the net assets of the respective funds.
33
REPORT OF INDEPENDENT REGISTERED PUBLIC ACCOUNTING FIRM
To the Shareholders of The DFA International Value Series and
Board of Trustees of The DFA Investment Trust Company:
In our opinion, the accompanying statements of assets and liabilities, including the summary schedules of portfolio holdings, and the related statements of operations and of changes in net assets and the financial highlights presents fairly, in all material respects, the financial position of The DFA International Value Series (one of the portfolios constituting The DFA Investment Trust Company, hereafter referred to as the "Series") at October 31, 2008, the results of its operations, the changes in its net assets and the financial highlights for each of the periods indicated, in conformity with accounting principles generally accepted in the United States of America. These financial statements and financial highlights (hereafter referred to as "financial statements") are the responsibility of the Series' management; our responsibility is to express an opinion on these financial statements based on our audits. We conducted our audits of thes e financial statements in accordance with the standards of the Public Company Accounting Oversight Board (United States). Those standards require that we plan and perform the audit to obtain reasonable assurance about whether the financial statements are free of material misstatement. An audit includes examining, on a test basis, evidence supporting the amounts and disclosures in the financial statements, assessing the accounting principles used and significant estimates made by management, and evaluating the overall financial statement presentation. We believe that our audits, which included confirmation of securities at October 31, 2008 by correspondence with the custodian and brokers, provide a reasonable basis for our opinion.
PricewaterhouseCoopers LLP
Philadelphia, Pennsylvania
December 22, 2008
34
FUND MANAGEMENT
Trustees/Directors
Each Board of Trustees/Directors of The DFA Investment Trust Company Inc. ("DFAITC"), DFA Investment Dimensions Group Inc. ("DFAIDG"), Dimensional Investment Group Inc. ("DIG") and Dimensional Emerging Markets Value Fund Inc. ("DEM") (each, the "Fund" and collectively, the "Funds") is responsible for establishing the Funds' policies and for overseeing the management of the Funds. The Trustees/Directors of the Funds, including all of the disinterested Directors, have adopted written procedures to monitor potential conflicts of interest that might develop between portfolios of the Funds (the "Feeder Portfolios") that invest in certain series of DFAITC or DEM (the "Master Funds").
Each Board has two standing committees, an Audit Committee and a Portfolio Performance and Service Review Committee (the "Performance Committee"). The Audit Committee is comprised of George M. Constantinides, Roger G. Ibbotson and Abbie J. Smith. Each member of the Audit Committee is a disinterested Director. The Audit Committee oversees the Fund's accounting and financial reporting policies and practices, the Fund's internal controls, the Fund's financial statements and the independent audits thereof and performs other oversight functions as requested by the Board. The Audit Committee recommends the appointment of each Fund's independent registered certified public accounting firm and also acts as a liaison between the Fund's independent registered certified public accounting firm and the full Board. There were three Audit Committee meetings held during the fiscal year ended October 31, 2008.
Each Board's Performance Committee is comprised of Messrs. Constantinides and Ibbotson, Ms. Smith, John P. Gould, Myron S. Scholes and Robert C. Merton. Each member of the Fund's Performance Committee is a disinterested Director. The Performance Committee regularly reviews and monitors the investment performance of the Fund's series and reviews the performance of the Fund's service providers. There were five Performance Committee meetings held during the fiscal year ended October 31, 2008.
Certain biographical information for each disinterested Trustee/Director and each interested Trustee/Director of the Funds is set forth in the tables below, including a description of each Trustee/Director's experience as a Trustee/Director of the Funds and as a director or trustee of other funds, as well as other recent professional experience.
The statements of additional information (together, "SAI") of the Funds include additional information about each Trustee/Director. You may obtain copies of the SAI and prospectus of each Fund advised by Dimensional Fund Advisors LP by calling collect (310) 395-8005 or by mailing a request to Dimensional Fund Advisors LP, 1299 Ocean Avenue, Santa Monica, California 90401. Prospectuses are also available at www.dimensional.com.
Name, Position
with the Fund,
Address and Age | | Term of Office1 and
Length of Service | | Portfolios within the
DFA Fund Complex2
Overseen | | Principal Occupation(s) During Past 5 Years and
Other Directorships of Public Companies Held | |
| | | Disinterested Trustees/Directors | |
|
George M. Constantinides
Director of DFAIDG, DIG and DEM.
Trustee of DFAITC.
The University of Chicago Booth School of Business
5807 S. Woodlawn Avenue Chicago, IL 60637
Age: 61 | | DFAITC - since 1993
DFAIDG - since 1983
DIG - since 1993
DEM - since 1993 | | 96 portfolios in 4 investment companies | | Leo Melamed Professor of Finance, The University of Chicago Booth School of Business. | |
|
35
Name, Position
with the Fund,
Address and Age | | Term of Office1 and
Length of Service | | Portfolios within the
DFA Fund Complex2
Overseen | | Principal Occupation(s) During Past 5 Years and
Other Directorships of Public Companies Held | |
John P. Gould
Director of DFAIDG, DIG and DEM.
Trustee of DFAITC.
The University of Chicago Booth School of Business
5807 S. Woodlawn Avenue
Chicago, IL 60637
Age: 69 | | DFAITC - since 1993
DFAIDG - since 1986
DIG - since 1993
DEM - since 1993 | | 96 portfolios in 4 investment companies | | Steven G. Rothmeier Distinguished Service Professor of Economics, The University of Chicago Booth School of Business (since 1965). Member of the Boards of Milwaukee Mutual Insurance Company (since 1997) and UNext.com (1999-2006). Member Competitive Markets Advisory Committee, Chicago Mercantile Exchange (futures trading exchange) (since 2004). Formerly, Senior Vice-President, Lexecon Inc. (economics, law, strategy and finance consulting) (1994-2004). Formerly, President, Cardean University (division of UNext.com) (1999-2001). Trustee, Harbor Fund (registered investment company) (14 Portfolios) (since 1994). | |
|
Roger G. Ibbotson
Director of DFAIDG, DIG and DEM.
Trustee of DFAITC.
Yale School of Management
P.O. Box 208200
New Haven, CT 06520-8200
Age: 65 | | DFAITC - since 1993
DFAIDG - since 1981
DIG - since 1993
DEM - since 1993 | | 96 portfolios in 4 investment companies | | Professor in Practice of Finance, Yale School of Management (since 1984). Director, BIRR Portfolio Analysis, Inc. (software products) (since 1990). Chairman, CIO and Partner, Zebra Capital Management, LLC (hedge fund manager) (since 2001).
Consultant to Morningstar, Inc. (since 2006). Formerly, Chairman, Ibbotson Associates, Inc., Chicago, IL (software data publishing and consulting) (1977-2006). | |
|
Robert C. Merton
Director of DFAIDG, DIG and DEM.
Trustee of DFAITC.
Harvard Business School
353 Baker Library
Soldiers Field
Boston, MA 02163
Age: 64 | | DFAITC - since 2003
DFAIDG - since 2003
DIG - since 2003
DEM - since 2003 | | 96 portfolios in 4 investment companies | | John and Natty McArthur University Professor, Graduate School of Business Administration, Harvard University (since 1998). George Fisher Baker Professor of Business Administration, Graduate School of Business Administration, Harvard University (1988-1998), Co-founder, Chief Science Officer and Director, Trinsum Group, a successor to Integrated Finance Limited (since 2002). Director, MF Risk, Inc. (risk management software) (since 2001). Director, Peninsula Banking Group (bank) (since 2003). Director, Community First Financial Group (bank holding company) (since 2003). Advisory Board Member, Alpha Simplex Group (hedge fund) (since 2001). Member Competitive Markets Advisory Council, Chicago Mercantile Exchange (futures trading exchange) (since 2004). Formerly, Advisory Board Member, NuServe (insurance software) (2001-2003). Director, Vical Incorporated (biopharmaceutical product development) (since 2002). | |
|
Myron S. Scholes
Director of DFAIDG, DIG and DEM.
Trustee of DFAITC.
Platinum Grove Asset Management, L.P.
Reckson Executive Park
1100 King Street
Building 4
Rye Brook, NY 10573
Age: 67 | | DFAITC - since 1993
DFAIDG - since 1981
DIG - since 1993
DEM - since 1993 | | 96 portfolios in 4 investment companies | | Frank E. Buck Professor Emeritus of Finance, Stanford University (since 1981). Chairman, Platinum Grove Asset Management, L.P. (hedge fund) (formerly, Oak Hill Platinum Partners) (since 1999). Formerly, Managing Partner, Oak Hill Capital Management (private equity firm) (until 2004). Chairman, Oak Hill Platinum Partners (hedge fund) (since 2004). Director, Chicago Mercantile Exchange (since 2001). Director, American Century Fund Complex (registered investment companies) (37 Portfolios) (since 1981); and Director, Chicago Mercantile Exchange Holdings Inc. (since 2000). | |
|
Abbie J. Smith
Director of DFAIDG, DIG and DEM.
Trustee of DFAITC.
The University of Chicago Booth School of Business
5807 S. Woodlawn Avenue
Chicago, IL 60637
Age: 55 | | DFAITC - since 2000
DFAIDG - since 2000
DIG - since 2000
DEM - since 2000 | | 96 portfolios in 4 investment companies | | Boris and Irene Stern Professor of Accounting, The University of Chicago Booth School of Business (since 1980), Formerly, Marvin Bower Fellow, Harvard Business School (9/01 to 8/02). Director, HNI Corporation (formerly known as HON Industries Inc.) (office furniture) (since 2000) and Director, Ryder System Inc. (transportation, logistics and supply-chain management) (since 2003). | |
|
36
Name, Position
with the Fund,
Address and Age | | Term of Office1 and
Length of Service | | Portfolios within the
DFA Fund Complex2
Overseen | | Principal Occupation(s) During Past 5 Years and
Other Directorships of Public Companies Held | |
| | | Interested Trustees/Directors* | |
|
David G. Booth
Chairman, Director, Chief Executive Officer and President of DFAIDG, DIG and DEM. Chairman, Trustee, Chief Executive Officer, Chief Investment Officer and President of DFAITC.
1299 Ocean Avenue
Santa Monica, CA 90401
Age: 61 | | DFAITC - since 1993
DFAIDG - since 1981
DIG - since 1992
DEM - since 1993 | | 96 portfolios in 4 investment companies | | Chairman, Director/Trustee, President, Chief Executive Officer and formerly Chief Investment Officer of the following companies: Dimensional Holdings Inc., Dimensional Fund Advisors LP, DFA Securities Inc., Dimensional Fund Advisors Canada Inc., DFAIDG, DIG, DEM and DFAITC. Director of Dimensional Fund Advisors Ltd, and formerly Chief Investment Officer. Director, President and formerly Chief Investment Officer of DFA Australia Ltd. Director of Dimensional Funds PLC and Dimensional Fund II PLC. Director, Chief Executive Officer and formerly Chief Investment Officer of Dimensional Fund Advisors Canada Inc. (All Chief Investment Officer positions held starting 1/03 through 3/07 except for Dimensional Fund Advisors Canada Inc., which was from 6/03 through 3/07, and Dimensional Holdings Inc., which was from 10/06 through 3/07.)
Limited Partner, Oak Hill Partners, Director, T he University of Chicago Booth School of Business. Formerly, Director, SA Funds (registered investment company). Formerly Director, Assante Corporation (investment management) (until 2002). | |
|
Rex A. Sinquefield
The Show Me Institute
7777 Bonhomme Ave.,
Suite 2150 St. Louis, MO 63105
Age: 64 | | DFAITC - since 1993
DFAIDG - since 1981
DIG - since 1992
DEM - since 1993 | | 96 portfolios in 4 investment companies | | Director/Trustee (and prior to 2006 Chairman, and prior to 2003, Chief Investment Officer) of Dimensional Fund Advisors LP, DFA Securities Inc., DFAIDG, DIG, DEM and DFAITC. Director of Dimensional Holdings Inc. Prior to 2006, Director of Dimensional Fund Advisors Ltd, Director (and prior to 1/1/2003, Chief Investment Officer) of DFA Australia Ltd. Director of Dimensional Funds PLC and Dimensional Fund Advisors Canada Inc.
Trustee, St. Louis University (since 2003). Life Trustee and Member of Investment Committee, DePaul University. Director, The German St. Vincent Orphan Home. Member of Investment Committee, Archdiocese of St. Louis. Trustee and Member of Investment Committee, St. Louis Art Institute (since 2005). President and Director, The Show Me Institute (since 2006). Trustee, St. Louis Symphony Orchestra (since 2005). Trustee, Missouri Botanical Garden (since 2005 ). | |
|
1 Each Trustee/Director holds office for an indefinite term until his or her successor is elected and qualified.
2 Each Trustee/Director is a director or trustee of each of the four registered investment companies within the DFA Fund Complex, which includes the Funds.
* Interested Directors are described as such because they are deemed to be "interested persons," as that term is defined under the Investment Company Act of 1940, as amended, due to their positions with Dimensional Fund Advisors LP.
37
Officers
The name, age, information regarding positions with the Funds and the principal occupation for each officer of the Funds are set forth below. Each officer listed below holds the same office (except as otherwise noted) in the following entities: Dimensional Fund Advisors LP (prior to November 3, 2006, Dimensional Fund Advisors Inc.) ("Dimensional"), DFA Securities Inc., DFAIDG, DIG, DFAITC and DEM (collectively, the "DFA Entities"). The address of each officer is: Dimensional Fund Advisors LP, 1299 Ocean Avenue, Santa Monica, California 90401, unless otherwise indicated.
Name, Position with the Fund
and Age | | Term of Office1
and Length of
Service | | Principal Occupation(s) During Past 5 Years | |
| | | Officers | |
|
April A. Aandal
Vice President
Age: 35 | | Since 2008 | | Vice President of all the DFA Entities. | |
|
Darryl D. Avery
Vice President
Age: 42 | | Since 2005 | | Vice President of all the DFA Entities. From June 2002 to January 2005, institutional client service representative of Dimensional. | |
|
Arthur H. Barlow
Vice President
Age: 52 | | Since 1993 | | Vice President of all the DFA Entities. Formerly, Vice President of DFA Australia Limited and Dimensional Fund Advisors Ltd. | |
|
Scott A. Bosworth
Vice President
Age: 39 | | Since 2007 | | Vice President of all the DFA Entities. Regional Director of Dimensional (since November 1997). | |
|
Valerie A. Brown
Vice President and Assistant Secretary
Age: 41 | | Since 2001 | | Vice President and Assistant Secretary of all the DFA Entities, DFA Australia Limited, Dimensional Fund Advisors Ltd., and since June 2003, Dimensional Fund Advisors Canada Inc. | |
|
David P. Butler
Vice President
Age: 44 | | Since 2007 | | Vice President of all the DFA Entities. Director of US Financial Services of Dimensional (since January 2005). Formerly, Regional Director of Dimensional Fund Advisors LP (January 1995 to January 2005). | |
|
Patrick Carter
Vice President
Age: 46 | | Since 2007 | | Vice President of all the DFA Entities. Regional Director of Dimensional (since March 2006). Formerly, Director of Merrill Lynch Retirement Group (December 1998 to March 2006). | |
|
Stephen A. Clark
Vice President
Age: 36 | | Since 2004 | | Vice President of all the DFA Entities, April 2001 to April 2004, Portfolio Manager of Dimensional. | |
|
Robert P. Cornell
Vice President
Age: 59 | | Since 2007 | | Vice President of all the DFA Entities. Regional Director of Financial Services Group of Dimensional (since August 1993). | |
|
Christopher S. Crossan
Vice President and Chief Compliance Officer
Age: 42 | | Since 2004 | | Vice President and Chief Compliance Officer of all the DFA Entities. Formerly, Senior Compliance Officer, INVESCO Institutional, Inc. and its affiliates (August 2000 to January 2004). | |
|
James L. Davis
Vice President
Age: 51 | | Since 1999 | | Vice President of all the DFA Entities. Formerly, Vice President of DFA Australia Limited and Dimensional Fund Advisors Ltd. | |
|
Robert T. Deere
Vice President
Age: 51 | | Since 1994 | | Vice President of all the DFA Entities and DFA Australia Limited. | |
|
Robert W. Dintzner
Vice President
Age: 38 | | Since 2001 | | Vice President of all the DFA Entities. Prior to April 2001, marketing supervisor and marketing coordinator for Dimensional. | |
|
38
Name, Position with the Fund
and Age | | Term of Office1
and Length of
Service | | Principal Occupation(s) During Past 5 Years | |
Kenneth Elmgren
Vice President
Age: 54 | | Since 2007 | | Vice President of all the DFA Entities. Formerly, Managing Principal of Beverly Capital (May 2004 to September 2006); Principal of Wydown Capital (September 2001 to May 2004). | |
|
Richard A. Eustice
Vice President and Assistant Secretary
Age: 43 | | Since 1998 | | Vice President and Assistant Secretary of all the DFA Entities and DFA Australia Limited. Formerly, Vice President of Dimensional Fund Advisors Ltd. | |
|
Eugene F. Fama, Jr.
Vice President
Age: 47 | | Since 1993 | | Vice President of all the DFA Entities. Formerly, Vice President of DFA Australia Limited and Dimensional Fund Advisors Ltd. | |
|
Gretchen A. Flicker
Vice President
Age: 37 | | Since 2004 | | Vice President of all the DFA Entities. Prior to April 2004, institutional client service representative of Dimensional. | |
|
Jed S. Fogdall
Vice President
Age: 34 | | Since 2008 | | Vice President of all the DFA Entities. Portfolio Manager for Dimensional (since September 2004). Prior to September 2004, Staff Engineer at the Boeing Company (1997-2004); Graduate Student at the University of California, Los Angeles (2002-2003). | |
|
Glenn S. Freed
Vice President
Age: 46 | | Since 2001 | | Vice President of all the DFA Entities. | |
|
Mark R. Gochnour
Vice President
Age: 41 | | Since 2007 | | Vice President of all the DFA Entities. Regional Director of Dimensional. | |
|
Henry F. Gray
Vice President
Age: 41 | | Since 2000 | | Vice President of all the DFA Entities. Prior to July 2000, Portfolio Manager of Dimensional. Formerly, Vice President of DFA Australia Limited. | |
|
John T. Gray
Vice President
Age: 34 | | Since 2007 | | Vice President of all the DFA Entities. Formerly, Regional Director of Dimensional (January 2005 to February 2007). | |
|
Darla Hastings
Vice President
Age: 53 | | Since 2007 | | Vice President of all the DFA Entities. Chief Marketing Officer of Dimensional. Formerly, Senior Vice President, Customer Experience for Benchmark Assisted Living (May 2005 to April 2006); Executive Vice President and Chief Marketing Officer of State Street Corporation (September 2001 to October 2005). | |
|
Joel H. Hefner
Vice President
Age: 40 | | Since 2007 | | Vice President of all the DFA Entities. Regional Director of Dimensional (since June 1998). | |
|
Julie Henderson
Vice President and Fund Controller
Age: 34 | | Since 2005 | | Vice President and Fund Controller of all the DFA Entities. Formerly, Senior Manager at PricewaterhouseCoopers LLP (July 1996 to April 2005). | |
|
Kevin Hight
Vice President
Age: 40 | | Since 2005 | | Vice President of all the DFA Entities. Formerly, Regional Director of Dimensional (since March 2003 to March 2005). | |
|
Christine W. Ho
Vice President
Age: 40 | | Since 2004 | | Vice President of all the DFA Entities. Prior to April 2004, Assistant Controller of Dimensional. | |
|
Jeff J. Jeon
Vice President
Age: 34 | | Since 2004 | | Vice President of all the DFA Entities. Prior to April 2004, Counsel of Dimensional. | |
|
Patrick M. Keating
Vice President
Age: 53 | | Since 2003 | | Vice President of all the DFA Entities and Chief Operating Officer of Dimensional. Director, Vice President and Chief Privacy Officer of Dimensional Fund Advisors Canada Inc. Director of DFA Australia Limited. | |
|
39
Name, Position with the Fund
and Age | | Term of Office1
and Length of
Service | | Principal Occupation(s) During Past 5 Years | |
Joseph F. Kolerich
Vice President
Age: 36 | | Since 2004 | | Vice President of all the DFA Entities. From April 2001 to April 2004, Portfolio Manager for Dimensional. | |
|
Michael F. Lane
Vice President
Age: 41 | | Since 2004 | | Vice President of all the DFA Entities. Formerly, Vice President of Advisor Services at TIAA-CREF (July 2001 to September 2004). | |
|
Kristina M. LaRusso
Vice President
Age: 33 | | Since 2006 | | Vice President of all DFA Entities. Formerly, Operations Supervisor of Dimensional (March 2003 to December 2006). | |
|
Inmoo Lee
Vice President
Age: 42 | | Since 2007 | | Vice President of all the DFA Entities. Associate Professor Department of Finance and Accounting, Business School, National University of Singapore (July 2004 to present); Associate Professor, College of Business Administration, Korea University (September 2001 to May 2006). | |
|
Juliet Lee
Vice President
Age: 37 | | Since 2005 | | Vice President of all the DFA Entities. Human Resources Manager of Dimensional (since January 2004). Formerly, Assistant Vice President for Metropolitan West Asset Management LLC (February 2001 to December 2003). | |
|
Aaron M. Marcus
Vice President & Head of Global Human Resources
Age: 38 | | Since 2008 | | Vice President and Head of Global Human Resources of Dimensional. Formerly, Global Head of Recruiting and Vice President of Goldman Sachs & Co. (June 2006 to January 2008); Global Co-Head of HR of the Equities & FICC Division, and Vice President of Goldman Sachs & Co. (May 2005 to May 2006); Head of Americas Campus Recruiting and Vice President of Goldman Sachs & Co. (April 2003 to May 2005). | |
|
David R. Martin
Vice President, Chief Financial Officer and Treasurer
Age: 51 | | Since 2007 | | Vice President, Chief Financial Officer and Treasurer of all the DFA Entities. Director, Vice President, Chief Financial Officer and Treasurer of Dimensional Fund Advisors Ltd. and DFA Australia Limited. Chief Financial Officer, Treasurer, and Vice President of Dimensional Fund Advisors Canada Inc. Director of Dimensional Funds PLC and Dimensional Funds II PLC. Formerly, Executive Vice President and Chief Financial Officer of Janus Capital Group Inc. (June 2005 to March 2007); Senior Vice President of Finance at Charles Schwab & Co., Inc. (March 1999 to May 2005). | |
|
Catherine L. Newell
Vice President and Secretary
Age: 44 | | Vice President since 1997 and Secretary since 2000 | | Vice President and Secretary of all the DFA Entities. Director, Vice President and Assistant Secretary of DFA Australia Limited (since February 2002, April 1997 and May 2002, respectively). Vice President and Secretary of Dimensional Fund Advisors Canada Inc. (since June 2003). Director, Dimensional Funds PLC and Dimensional Funds II PLC (since January 2002). Formerly, Assistant Secretary of all DFA Entities and Dimensional Fund Advisors Ltd. | |
|
Gerard K. O'Reilly
Vice President
Age: 31 | | Since 2007 | | Vice President of all the DFA Entities. Formerly, Research Associate of Dimensional Fund Advisors LP (2004 to 2006); Research Assistant in PhD program, Aeronautics Department California Institute of Technology (1998 to 2004). | |
|
Carmen Palafox
Vice President
Age: 34 | | Since 2006 | | Vice President of all the DFA Entities. Operations Manager of Dimensional Fund Advisors LP (since May 1996). | |
|
Sonya Park
Vice President
Age: 36 | | Since 2005 | | Vice President of all the DFA Entities. From February 2002 to January 2005, institutional client service representative of Dimensional. | |
|
David A. Plecha
Vice President
Age: 47 | | Since 1993 | | Vice President of all the DFA Entities, DFA Australia Limited and Dimensional Fund Advisors Ltd.. | |
|
Ted Randall
Vice President
Age: 35 | | Since 2008 | | Vice President of all the DFA Entities. Formerly, Research Associate of Dimensional (2006-2008). Systems Developer of Dimensional (2001-2006). | |
|
40
Name, Position with the Fund
and Age | | Term of Office1
and Length of
Service | | Principal Occupation(s) During Past 5 Years | |
Eduardo A. Repetto
Vice President and Chief Investment Officer
Age: 41 | | Since 2002 | | Chief Investment Officer (beginning March 2007) and Vice President of all the DFA Entities, DFA Australia Limited and Dimensional Fund Advisors Canada Inc. Formerly, Research Associate for Dimensional (June 2000 to April 2002). | |
|
L. Jacobo Rodriguez
Vice President
Age: 37 | | Since 2005 | | Vice President of all the DFA Entities. From August 2004 to July 2005, institutional client service representative of Dimensional. Formerly, Financial Services Analyst, Cato Institute (September 2001 to June 2004); Book Review Editor, Cato Journal, Cato Institute (May 1996 to June 2004). | |
|
David E. Schneider
Vice President
Age: 62 | | Since 2001 | | Vice President of all the DFA Entities. Currently, Director of Institutional Services. | |
|
Ted R. Simpson
Vice President
Age: 40 | | Since 2007 | | Vice President of all the DFA Entities. Regional Director of Dimensional (since December 2002). | |
|
Bryce D. Skaff
Vice President
Age: 33 | | Since 2007 | | Vice President of all the DFA Entities. Formerly, Regional Director of Dimensional (December 1999 to January 2007). | |
|
Grady M. Smith
Vice President
Age: 51 | | Since 2004 | | Vice President of all the DFA Entities. Prior to April 2004, Portfolio Manager of Dimensional. | |
|
Carl G. Snyder
Vice President
Age: 45 | | Since 2000 | | Vice President of all the DFA Entities. Formerly, Vice President of DFA Australia Limited. | |
|
Lawrence R. Spieth
Vice President
Age: 60 | | Since 2004 | | Vice President of all the DFA Entities. Prior to April 2004, Regional Director of Dimensional. | |
|
Bradley G. Steiman
Vice President
Age: 35 | | Since 2004 | | Vice President of all the DFA Entities and Director and Vice President of Dimensional Fund Advisors Canada Inc. | |
|
Karen E. Umland
Vice President
Age: 42 | | Since 1997 | | Vice President of all the DFA Entities, DFA Australia Limited, Dimensional Fund Advisors Ltd., and since June 2003, Dimensional Fund Advisors Canada Inc. | |
|
Carol W. Wardlaw
Vice President
Age: 49 | | Since 2004 | | Vice President of all the DFA Entities. Prior to April 2004, Regional Director of Dimensional. | |
|
Weston J. Wellington
Vice President
Age: 57 | | Since 1997 | | Vice President of all the DFA Entities. Formerly, Vice President of DFA Australia Limited. | |
|
Daniel M. Wheeler
Vice President
Age: 63 | | Since 2001 | | Vice President of all the DFA Entities. Prior to 2001 and currently, Director of Financial Advisors Services of Dimensional. Director of Dimensional Fund Advisors Ltd. (since October 2003) and President of Dimensional Fund Advisors Canada Inc. (since June 2003). | |
|
Ryan Wiley
Vice President
Age: 32 | | Since 2007 | | Vice President of all the DFA Entities. Senior Trader of Dimensional. Formerly, Portfolio Manager (2006 to 2007); Trader (2001 to 2006). | |
|
Paul E. Wise
Vice President
Age: 53 | | Since 2005 | | Vice President of all the DFA Entities. Chief Technology Officer for Dimensional (since 2004). Formerly, Principal of Turnbuckle Management Group (January 2002 to August 2004). | |
|
1 Each officer holds office for an indefinite term at the pleasure of the Boards of Trustee/Directors and until his or her successor is elected and qualified.
41
VOTING PROXIES ON FUND PORTFOLIO SECURITIES
A description of the policies and procedures that the Trust uses in voting proxies relating to securities held in the portfolio is available without charge, upon request, by calling collect: (310) 395-8005. Information regarding how the Advisor votes these proxies is available from the EDGAR database on the SEC's website at http://www.sec.gov and from the Advisor's website at http://www.dimensional.com and reflects the twelve-month period beginning July 1st and ending June 30th.
42
NOTICE TO SHAREHOLDERS
(Unaudited)
For shareholders that do not have an October 31, 2008 tax year end, this notice is for informational purposes only. For shareholders with an October 31, 2008 tax year end, please consult your tax advisor as to the pertinence of this notice. For the period December 1, 2007 to October 31, 2008, the portfolio is designating the following items with regard to distributions paid during the period.
Dimensional
Investment
Group Inc. | | Net
Investment
Income
Distributions | | Short-Term
Capital Gain
Distributions | | Long-Term
Capital Gain
Distributions | | Total
Distributions | | Qualifying
For
Corporate
Dividends
Recieved
Deduction(1) | | Qualifying
Dividend
Income(2) | | Foreign
Tax
Credit(3) | | Qualifying
Interest
Income(4) | | Qualifying
Short-Term
Capital Gain(5) | |
DFA International Value
Portfolio IV | | | 61 | % | | | — | | | | 39 | % | | | 100 | % | | | 1 | % | | | 56 | % | | | — | | | | 1 | % | | | — | | |
| The DFA Investment Trust Company | |
The DFA International
Value Series | | | 33 | % | | | 2 | % | | | 65 | % | | | 100 | % | | | 6 | % | | | 58 | % | | | — | | | | — | | | | 7 | % | |
(1) Qualifying dividends represent dividends which qualify for the corporate dividends received deduction and is reflected as a percentage of ordinary income distributions (the total of short-term capital gain and net investment income distributions).
(2) The percentage in this column represents the amount of "Qualifying Dividend Income" as created by the Jobs and Growth Tax Relief Reconciliation Act of 2003 and is reflected as a percentage of ordinary income distributions (the total of short-term capital gain and net investment income distributions). It is the intention of each of the aforementioned funds to designate the maximum amount permitted by law.
(3) Foreign Tax Credit represent dividends which qualify for the foreign tax credit pass through and is reflected as a percentage of investment company taxable income (the total of short-term capital gain and net investment income distributions).
(4) The percentage in this column represents the amount of "Qualifying Interest Income" as created by The American Jobs Creation Act of 2004. The information is reflected as a percentage of ordinary income distributions (the total of short-term capital gain and net investment income distributions).
(5) The percentage in this column represents the amount of "Qualifying Short-Term Capital Gain" as created by The American Jobs Creation Act of 2004. The information is reflected as a percentage of ordinary income distributions (the total of short-term capital gain and net investment income distributions).
43
[THIS PAGE INTENTIONALLY LEFT BLANK]

DFA103108-016A
ITEM 2. CODE OF ETHICS.
The Registrant has adopted, as of the end of the period covered by this Form N-CSR (the “Report”), a code of ethics that applies to the Registrant’s principal executive officer and principal financial officer (the “Code of Business Ethics”). The Registrant has not made any substantive amendments to the Code of Business Ethics during the period covered by this Report. The Registrant also has not granted any waiver from any provisions of the Code of Business Ethics during the period covered by this Report. A copy of the Code of Business Ethics is filed as an exhibit to this Report.
ITEM 3. AUDIT COMMITTEE FINANCIAL EXPERT.
The Registrant’s Board of Directors has determined that Abbie J. Smith possesses the technical attributes to qualify as an “audit committee financial expert” serving on the Registrant’s Audit Committee and has designated Ms. Smith as the “audit committee financial expert.” Ms. Smith earned a Ph.D. in Accounting, and has taught Accounting at the graduate level since 1980. Ms. Smith’s education and career have provided her with an understanding of generally accepted accounting principles and financial statements; the ability to assess the general application of such principles in connection with the accounting for estimates, accruals and reserves; and experience preparing, analyzing and evaluating financial statements that present a breadth and level of complexity of issues that can reasonably be expected to be raised by the Registrant’s financial statements. In addition, Ms. Smith has served on the boards of directors and audit committees of entities other than the Registrant. Ms. Smith is independent under the standards set forth in Item 3 of Form N-CSR.
ITEM 4. PRINCIPAL ACCOUNTANT FEES AND SERVICES.
(a) Audit Fees
Fiscal Year Ended October 31, 2008: $82,264
Fiscal Year Ended November 30, 2007: $78,067
(b) Audit-Related Fees
Fees for Registrant Fiscal Year Ended October 31, 2008: $18,227
Fiscal Year Ended November 30, 2007: $18,227
For fiscal years ended October 31, 2008 and November 30, 2007, Audited-Related Fees included fees for services related to limited procedures performed in connection with the production of the Registrant’s semi-annual financial statements.
Audit-Related Fees required to be approved pursuant to paragraph (c)(7)(ii) of Rule 2-01 of Regulation S-X
Fiscal Year Ended October 31, 2008: $165,000
Fiscal Year Ended November 30, 2007: $130,000
For the fiscal years ended October 31, 2008 and November 30, 2007, Audit-Related Fees required to be approved pursuant to paragraph (c)(7)(ii) of Rule 2-01 of Regulation S-X included fees for services rendered in connection with the issuance of a Type II SAS 70 over controls at the Registrant’s investment adviser.
(c) Tax Fees
Fees for Registrant Fiscal Year Ended October 31, 2008: $58,544
Fiscal Year Ended November 30, 2007: $35,571
In the fiscal years ended October 31, 2008 and November 30, 2007, Tax Fees included services in connection with the Registrant’s excise tax calculations and review of the Registrant’s applicable tax returns.
There were no Tax Fees required to be approved pursuant to paragraph (c)(7)(ii) of Rule 2-01 of Regulation S-X during the fiscal years indicated above.
(d) All Other Fees
Fees for Registrant Fiscal Year Ended October 31, 2008: $0
Fiscal Year Ended November 30, 2007: $0
There were no “All Other Fees” required to be approved pursuant to paragraph (c)(7)(ii) of Rule 2-01 of Regulation S-X during the fiscal years indicated above.
(e)(1) Audit Committee’s Pre-Approval Policies and Procedures
Pre-Approval Policies and Procedures
as adopted by the
Audit Committees
of
DFA Investment Dimensions Group Inc.
Dimensional Emerging Markets Value Fund Inc.
Dimensional Investment Group Inc.
The DFA Investment Trust Company
(together, the “Funds”)
The Sarbanes-Oxley Act of 2002 (the “Act”) and the rules (the “Rules”) adopted by the U.S. Securities and Exchange Commission (the “SEC”) require that the Funds’ Audit Committees (together, the “Committee”) pre-approve all audit services and non-audit services provided to the Funds by their independent registered public accounting firm (the “Auditor”). The Act and the Rules also require that the Committee pre-approve all non-audit services provided by the Auditor to Dimensional Fund Advisors, Inc. (“Dimensional”), the Funds’ investment advisor, and to affiliates of Dimensional that provide ongoing services to the Funds (with Dimensional, together the “Service Affiliates”) if the services directly impact the Funds’ operations and financial reporting.
The following policies and procedures govern the ways in which the Committee will pre-approve audit and various types of non-audit services that the Auditor provides to the Funds and to Service Affiliates. These policies and procedures do not apply in the case of audit services that the Auditor provides to Service Affiliates, nor do they apply to services that an audit firm other than the Auditor provides to such entities.
These policies and procedures comply with the requirements for pre-approval, but also provide a mechanism by which management of the Funds may request and secure pre-approval of audit and non-audit services in an orderly manner with minimal disruption to normal business operations. Pre-approval of non-audit services may be achieved through a combination of the procedures described in Sections C and D below.
A. General
1. The Committee must pre-approve all audit services and non-audit services that the Auditor provides to the Funds.
2. The Committee must pre-approve any engagement of the Auditor to provide non-audit services to any Service Affiliate during the period of the Auditor’s engagement to provide audit services to the Funds, if the non-audit services to the Service Affiliate directly impact the Funds’ operations and financial reporting.
B. Pre-Approval of Audit Services to the Funds
1. The Committee shall approve the engagement of an independent registered public accounting firm to certify the Funds’ financial statements for each fiscal year (the “Engagement”). The approval of the Engagement shall not be delegated to a Designated Member (as that term is defined in Section D below). In approving the Engagement, the Committee shall obtain, review and consider sufficient information concerning the proposed Auditor to enable the Committee to make a reasonable evaluation of the Auditor’s qualifications and independence. The Committee also shall consider the Auditor’s proposed fees for the Engagement, in light of the scope and nature of the audit services that the Funds will receive.
2. The Committee shall report to the Boards of Directors/Trustees of the Funds (together, the “Board”) regarding its approval of the Engagement and of the proposed fees for the Engagement, and the basis for such approval.
3. Unless otherwise in accordance with applicable law, the Engagement, in any event, shall require that the Auditor be selected by the vote, cast in person, of a majority of the members of the Board who are not “interested persons” of the Funds (as that term is defined in Section 2(a)(19) of the Investment Company Act of 1940, as amended) (the “Independent Directors”).
C. Pre-Approval of Non-Audit Services to the Funds and to Service Affiliates—by Types of Services
1. The Committee may pre-approve types of non-audit services to the Funds and their Service Affiliates pursuant to this Section C.
2. Annually, at such time as the Committee considers the Engagement of the Auditor, management of the Funds, in consultation with the Auditor, shall provide to the Committee, for its consideration and action, the following: (a) a list of those types of non-audit services, if any, that the Funds may request from the Auditor during the fiscal year; and (b) a list of those types of non-audit services directly impacting the Funds’ operations and financial reporting that Service Affiliates may request from the Auditor during the fiscal year.
3. The lists submitted to the Committee shall describe the types of non-audit services in reasonable detail and shall include an estimated budget (or budgeted range) of fees, where possible, and such other information as the Committee may request.
4. The Committee’s pre-approval of the types of non-audit services submitted pursuant to this Section C shall constitute authorization for management of the Funds to utilize the Auditor for the types of non-audit services so pre-approved, if needed or desired during the fiscal year.
5. A list of the types of non-audit services pre-approved by the Committee pursuant to this Section C will be distributed to management of the Service Affiliates and the appropriate partners of the Auditor. Periodically, the Auditor will discuss with the Committee those non-audit services that have been or are being provided pursuant to this Section C.
D. Pre-Approval of Non-Audit Services to the Funds and to Service Affiliates—Project-by-Project Basis
1. The Committee also may pre-approve non-audit services on a project-by-project basis pursuant to this Section D.
2. Management of the Funds, in consultation with the Auditor, may submit either to the Committee or to the Designated Member, as provided in this Section D, for their consideration and action, a pre-approval request identifying one or more non-audit service projects. The request so submitted shall describe the project(s) in reasonable detail and shall include an estimated budget (or budgeted range) of fees and such other information as the Committee or the Designated Member, as appropriate, shall request.
3. The Committee, from time to time, shall designate one or more of its members who are Independent Directors (each a “Designated Member”) to consider, on the Committee’s behalf, any non-audit services, whether to the Funds or to any Service Affiliate, that have not been pre-approved by the Committee. The Designated Member also shall review, on the Committee’s behalf, any proposed material change in the nature or extent of any non-audit services previously approved. The Funds’ management, in consultation with the Auditor, shall explain why such non-audit services or material change in non-audit services are necessary and appropriate and the anticipated costs thereof.
4. The Designated Member will review the requested non-audit services or proposed material change in such services and will either:
(a) pre-approve, pre-approve subject to conditions, or disapprove any such requested services, or any proposed material change in services, whether to the Funds or to a Service Affiliate; or
(b) refer such matter to the Committee for its consideration and action.
In considering any requested non-audit services or proposed material change in such services, the Designated Member’s authority shall be limited to approving non-audit services or proposed material changes that do not exceed $10,000 in value.
5. The Designated Member’s pre-approval (or pre-approval subject to conditions) of the requested non-audit services or proposed material change in services pursuant to this Section D shall constitute authorization for the management of the Funds or the Service Affiliate, as the case may be, to utilize the Auditor for the non-audit services so pre-approved. Any action by the Designated Member in approving a requested non-audit service shall be presented for ratification by the Committee not later than at its next scheduled meeting. If the Designated Member does not approve the Auditor providing the requested non-audit service, the matter may be presented to the full Committee for its consideration and action.
E. Amendment; Annual Review
1. The Committee may amend these procedures from time to time.
2. These procedures shall be reviewed annually by the Committee.
F. Recordkeeping
1. The Funds shall maintain a written record of all decisions made by the Committee or by a Designated Member pursuant to these procedures, together with appropriate supporting materials.
2. In connection with the approval of any non-audit service pursuant to the de minimis exception provided in the Rules, a record shall be made indicating that each of the conditions for this exception, as set forth in the Rules, has been satisfied.
3. A copy of these Procedures (and of any amendments to these Procedures) shall be maintained and preserved permanently in an easily accessible place. The written records referred to in paragraphs 1 and 2 of this Section F shall be maintained and preserved for six years from the end of the fiscal year in which the actions recorded were taken, for at least the first two years in an easily accessible location.
(e)(2) The fees disclosed in Items 4(b), 4(c) or 4(d) were approved by the Registrant’s Audit Committee but not pursuant to paragraph (c)(7)(i)(C) of Rule 2-01 of Regulation S-X.
(f) The percentage of hours expended on the principal accountant’s engagement to audit the Registrant’s financial statements for the fiscal year ended October 31,
2008 that were attributed to work performed by persons other than the principal accountant’s full time, permanent employees was not greater than 50%.
(g) Aggregate Non-Audit Fees
Fiscal Year Ended October 31, 2008: $692,520
Fiscal Year Ended November 30, 2007: $417,130
(h) The Registrant’s Audit Committee has considered whether the provision of non-audit services that were rendered to the Registrant’s investment adviser, and any entity controlling, controlled by, or under common control with the investment adviser that provides ongoing services to the Registrant, that were not pre-approved pursuant to paragraph (c)(7)(ii) of Rule 2-01 of Regulation S-X is compatible with maintaining the principal accountant’s independence.
ITEM 5. AUDIT COMMITTEE OF LISTED REGISTRANTS.
This item is not applicable to the Registrant because it is not a listed issuer.
ITEM 6. INVESTMENTS.
Please see schedules of investments contained in the reports to stockholders included under Item 1 of this Report except as discussed below. Provided below is a complete schedule of investments for each master fund in which a series of the Registrant invests that provided a summary schedule of portfolio holdings in a report to stockholders included under Item 1 in lieu of a complete schedule of investments. The schedules of investments for the following series are provided below:
Name of Entity for which Schedule of
Investments is Provided | | Relationship to Series of the Registrant | |
The U.S. Large Company Series | | Master fund for U.S. Large Company Institutional Index Portfolio | |
| | | |
The U.S. Large Cap Value Series | | Master fund for U.S. Large Cap Value Portfolio II, U.S. Large Cap Value Portfolio III and LWAS/DFA U.S. High Book to Market Portfolio | |
| | | |
The DFA International Value Series | | Master fund for DFA International Value Portfolio, DFA International Value Portfolio II, DFA International Value Portfolio III and DFA International Value Portfolio IV | |
| | | |
The Emerging Markets Series | | Master fund for Emerging Markets Portfolio II | |
| | | |
The Tax-Managed U.S. Marketwide Value Series | | Master fund for Tax-Managed U.S. Marketwide Value Portfolio II | |
DIMENSIONAL INVESTMENT GROUP INC.
THE DFA INVESTMENT TRUST COMPANY
DEFINITIONS OF ABBREVIATIONS AND FOOTNOTES
Schedule of Investments
Investment Abbreviations
| ADR | American Depositary Receipt |
| FHLMC | Federal Home Loan Mortgage Corporation |
| FNMA | Federal National Mortgage Association |
| NVDR | Non-Voting Depositary Receipt |
| PLC | Public Liability Company |
| STRIP | Separate Trading of Registered Interest and Principal of Securities |
Investment Footnotes
| † | See Note B to Financial Statements. |
| †† | Securities have been fair valued. See Note B to Financial Statements |
| * | Non-Income Producing Securities. |
| # | Total or Partial Securities on Loan. |
| @ | Security purchased with cash proceeds from Securities on Loan. |
| l | Security is being fair valued as of October 31, 2008. |
| (r) | The adjustable rate shown is effective as of October 31, 2008. |
| § | Affiliated Fund. |
| – | Amounts designated as - are either zero or rounded to zero |
THE U.S. LARGE COMPANY SERIES
SCHEDULE OF INVESTMENTS
October 31, 2008
| | Shares | | Value † | |
| | | | | |
COMMON STOCKS — (80.9%) | | | | | |
Consumer Discretionary — (6.8%) | | | | | |
# | | Abercrombie & Fitch Co. | | 33,088 | | $958,228 | |
# * | | Amazon.com, Inc. | | 121,440 | | 6,951,226 | |
# * | | Apollo Group, Inc. Class A | | 40,374 | | 2,806,397 | |
# * | | AutoNation, Inc. | | 40,967 | | 281,443 | |
# * | | Autozone, Inc. | | 15,881 | | 2,021,492 | |
# * | | Bed Bath and Beyond, Inc. | | 98,999 | | 2,551,204 | |
# | | Best Buy Co., Inc. | | 128,413 | | 3,442,753 | |
# * | | Big Lots, Inc. | | 31,183 | | 761,801 | |
# | | Black & Decker Corp. | | 22,798 | | 1,154,035 | |
# | | Carnival Corp. | | 166,114 | | 4,219,296 | |
| | CBS Corp. Class B | | 258,483 | | 2,509,870 | |
# | | Centex Corp. | | 46,978 | | 575,480 | |
# * | | Coach, Inc. | | 128,073 | | 2,638,304 | |
| | Comcast Corp. Class A | | 1,109,388 | | 17,483,955 | |
# | | D.R. Horton, Inc. | | 104,716 | | 772,804 | |
# | | Darden Restaurants, Inc. | | 53,393 | | 1,183,723 | |
| | Disney (Walt) Co. | | 713,351 | | 18,475,791 | |
# * | | Dr Pepper Snapple Group, Inc. | | 96,445 | | 2,208,590 | |
# | | Eastman Kodak Co. | | 109,561 | | 1,005,770 | |
* | | Expedia, Inc. | | 79,551 | | 756,530 | |
# | | Family Dollar Stores, Inc. | | 53,107 | | 1,429,109 | |
# * | | Ford Motor Co. | | 859,687 | | 1,882,715 | |
| | Fortune Brands, Inc. | | 56,994 | | 2,173,751 | |
# * | | GameStop Corp. Class A | | 62,102 | | 1,700,974 | |
# | | Gannett Co., Inc. | | 86,721 | | 953,931 | |
# | | Gap, Inc. | | 178,501 | | 2,309,803 | |
# | | General Motors Corp. | | 215,235 | | 1,244,058 | |
# | | Genuine Parts Co. | | 61,512 | | 2,420,497 | |
* | | Goodyear Tire & Rubber Co. | | 91,673 | | 817,723 | |
# | | H&R Block, Inc. | | 124,728 | | 2,459,636 | |
# | | Harley-Davidson, Inc. | | 89,462 | | 2,190,030 | |
# | | Harman International Industries, Inc. | | 22,251 | | 408,751 | |
# | | Hasbro, Inc. | | 47,732 | | 1,387,569 | |
# | | Home Depot, Inc. | | 645,698 | | 15,232,016 | |
# | | International Game Technology | | 117,699 | | 1,647,786 | |
# * | | Interpublic Group of Companies, Inc. | | 181,138 | | 940,106 | |
| | J.C. Penney Co., Inc. | | 84,427 | | 2,019,494 | |
# | | Johnson Controls, Inc. | | 225,731 | | 4,002,211 | |
| | Jones Apparel Group, Inc. | | 31,717 | | 352,376 | |
# | | KB HOME | | 28,614 | | 477,568 | |
# * | | Kohl’s Corp. | | 115,782 | | 4,067,422 | |
# | | Leggett & Platt, Inc. | | 61,108 | | 1,060,835 | |
# | | Lennar Corp. Class A | | 53,737 | | 415,924 | |
1
# | | Limited Brands, Inc. | | 108,492 | | 1,299,734 | |
| | Liz Claiborne, Inc. | | 36,030 | | 293,644 | |
# | | Lowe’s Companies, Inc. | | 557,201 | | 12,091,262 | |
| | Macy’s, Inc. | | 159,877 | | 1,964,888 | |
| | Marriott International, Inc. Class A | | 112,342 | | 2,344,578 | |
| | Mattel, Inc. | | 137,059 | | 2,028,346 | |
# | | McDonald’s Corp. | | 427,563 | | 24,768,725 | |
| | McGraw-Hill Companies, Inc. | | 120,740 | | 3,240,662 | |
# | | Meredith Corp. | | 13,761 | | 266,551 | |
# | | Newell Rubbermaid, Inc. | | 105,343 | | 1,448,466 | |
# | | News Corp. Class A | | 872,843 | | 9,287,050 | |
# | | NIKE, Inc. Class B | | 149,150 | | 8,473,685 | |
# | | Nordstrom, Inc. | | 60,628 | | 1,096,761 | |
* | | Office Depot, Inc. | | 104,541 | | 376,348 | |
# | | Omnicom Group, Inc. | | 121,196 | | 3,580,130 | |
# | | Polo Ralph Lauren Corp. | | 21,613 | | 1,019,485 | |
# | | Pulte Homes, Inc. | | 81,223 | | 904,824 | |
# | | RadioShack Corp. | | 49,853 | | 631,139 | |
| | Scripps Networks Interactive | | 34,167 | | 970,343 | |
# * | | Sears Holdings Corp. | | 21,626 | | 1,248,685 | |
# | | Sherwin-Williams Co. | | 37,509 | | 2,134,637 | |
# | | Snap-On, Inc. | | 21,835 | | 806,803 | |
# | | Staples, Inc. | | 270,312 | | 5,252,162 | |
* | | Starbucks Corp. | | 277,748 | | 3,646,831 | |
# | | Starwood Hotels & Resorts Worldwide, Inc. | | 70,981 | | 1,599,912 | |
# | | Target Corp. | | 286,894 | | 11,336,147 | |
# * | | The DIRECTV Group, Inc. | | 219,446 | | 4,803,673 | |
# | | The New York Times Co. Class A | | 44,275 | | 442,750 | |
# | | The Stanley Works | | 29,873 | | 978,042 | |
# | | The TJX Companies, Inc. | | 159,445 | | 4,266,748 | |
# | | Tiffany & Co. | | 47,143 | | 1,294,075 | |
| | Time Warner, Inc. | | 1,362,065 | | 13,743,236 | |
| | Tyco Electronics, Ltd. | | 179,556 | | 3,490,569 | |
# | | V.F. Corp. | | 33,122 | | 1,825,022 | |
* | | Viacom, Inc. Class B | | 236,050 | | 4,772,931 | |
# | | Washington Post Co. | | 2,278 | | 972,250 | |
# | | Whirlpool Corp. | | 28,299 | | 1,320,148 | |
| | Wyndham Worldwide Corp. | | 67,467 | | 552,555 | |
# | | Yum! Brands, Inc. | | 178,193 | | 5,169,379 | |
Total Consumer Discretionary | | | | 270,096,153 | |
| | | | | |
Consumer Staples — (10.4%) | | | | | |
| | Altria Group, Inc. | | 783,038 | | 15,026,499 | |
# | | Anheuser-Busch Companies, Inc. | | 273,354 | | 16,956,149 | |
| | Archer-Daniels-Midland Co. | | 244,928 | | 5,077,357 | |
| | Avon Products, Inc. | | 161,834 | | 4,018,338 | |
| | Brown-Forman Corp. Class B | | 37,281 | | 1,692,569 | |
# | | Campbell Soup Co. | | 80,505 | | 3,055,165 | |
# | | Clorox Co. | | 52,496 | | 3,192,282 | |
# | | Coca-Cola Co. | | 755,726 | | 33,297,288 | |
| | Coca-Cola Enterprises, Inc. | | 120,546 | | 1,211,487 | |
| | Colgate-Palmolive Co. | | 192,261 | | 12,066,300 | |
# | | ConAgra, Inc. | | 172,219 | | 3,000,055 | |
* | | Constellation Brands, Inc. Class A | | 73,688 | | 924,048 | |
| | Costco Wholesale Corp. | | 165,286 | | 9,422,955 | |
2
# | | CVS Caremark Corp. | | 545,607 | | 16,722,855 | |
# * | | Dean Foods Co. | | 57,918 | | 1,266,087 | |
# | | Estee Lauder Companies, Inc. | | 43,650 | | 1,573,146 | |
# | | General Mills, Inc. | | 127,812 | | 8,657,985 | |
# | | Heinz (H.J.) Co. | | 118,729 | | 5,202,705 | |
# | | Kellogg Co. | | 95,196 | | 4,799,782 | |
# | | Kimberly-Clark Corp. | | 157,850 | | 9,674,626 | |
| | Kraft Foods, Inc. | | 577,134 | | 16,817,685 | |
| | Lorillard, Inc. | | 66,121 | | 4,290,911 | |
| | McCormick & Co., Inc. | | 49,024 | | 1,650,148 | |
| | Molson Coors Brewing Co. | | 57,267 | | 2,139,495 | |
# | | Pepsi Bottling Group, Inc. | | 51,920 | | 1,200,390 | |
| | PepsiCo, Inc. | | 595,156 | | 33,929,844 | |
| | Philip Morris International, Inc. | | 783,600 | | 34,063,092 | |
| | Procter & Gamble Co. | | 1,153,540 | | 74,449,472 | |
| | Reynolds American, Inc. | | 64,626 | | 3,164,089 | |
# | | Safeway, Inc. | | 165,524 | | 3,520,695 | |
| | Sara Lee Corp. | | 268,542 | | 3,002,300 | |
| | SUPERVALU, Inc. | | 80,747 | | 1,149,837 | |
# | | Sysco Corp. | | 228,857 | | 5,996,053 | |
| | The Hershey Co. | | 63,003 | | 2,346,232 | |
# | | The Kroger Co. | | 248,974 | | 6,836,826 | |
| | Tyson Foods, Inc. Class A | | 114,064 | | 996,919 | |
| | UST, Inc. | | 56,092 | | 3,791,258 | |
# | | Walgreen Co. | | 376,319 | | 9,581,082 | |
# | | Wal-Mart Stores, Inc. | | 852,470 | | 47,576,351 | |
# | | Whole Foods Market, Inc. | | 53,331 | | 563,336 | |
Total Consumer Staples | | | | 413,903,693 | |
| | | | | |
Energy — (10.6%) | | | | | |
| | Anadarko Petroleum Corp. | | 178,097 | | 6,286,824 | |
| | Apache Corp. | | 127,146 | | 10,467,930 | |
# | | Baker Hughes, Inc. | | 117,179 | | 4,035,432 | |
# | | BJ Services Co. | | 111,826 | | 1,436,964 | |
# | | Cabot Oil & Gas Corp. | | 39,290 | | 1,102,870 | |
# * | | Cameron International Corp. | | 82,755 | | 2,007,636 | |
| | Chesapeake Energy Corp. | | 198,160 | | 4,353,575 | |
# | | Chevron Corp. | | 781,038 | | 58,265,435 | |
| | ConocoPhillips | | 577,777 | | 30,055,960 | |
| | CONSOL Energy, Inc. | | 69,641 | | 2,186,031 | |
| | Devon Energy Corp. | | 167,957 | | 13,581,003 | |
# | | El Paso Corp. | | 266,572 | | 2,585,748 | |
# | | ENSCO International, Inc. | | 54,480 | | 2,070,785 | |
# | | EOG Resources, Inc. | | 94,585 | | 7,653,818 | |
| | Exxon Mobil Corp. | | 1,974,580 | | 146,355,870 | |
# | | Halliburton Co. | | 333,357 | | 6,597,135 | |
| | Hess Corp. | | 107,602 | | 6,478,716 | |
| | Marathon Oil Corp. | | 268,226 | | 7,805,377 | |
# | | Massey Energy Co. | | 32,149 | | 742,320 | |
# | | Murphy Oil Corp. | | 72,396 | | 3,666,133 | |
# * | | Nabors Industries, Ltd. | | 106,504 | | 1,531,528 | |
# * | | National-Oilwell, Inc. | | 158,673 | | 4,742,736 | |
# | | Noble Corp. | | 102,313 | | 3,247,283 | |
| | Noble Energy, Inc. | | 65,653 | | 3,402,138 | |
| | Occidental Petroleum Corp. | | 310,624 | | 17,252,057 | |
3
# | | Peabody Energy Corp. | | 103,383 | | 3,567,747 | |
| | Pioneer Natural Resources Co. | | 45,489 | | 1,265,959 | |
# | | Range Resources Corp. | | 58,964 | | 2,489,460 | |
# | | Rowan Companies, Inc. | | 42,960 | | 779,294 | |
# | | Schlumberger, Ltd. | | 456,045 | | 23,554,724 | |
# | | Smith International, Inc. | | 82,113 | | 2,831,256 | |
# * | | Southwestern Energy Co. | | 130,466 | | 4,647,199 | |
# | | Spectra Energy Corp. | | 233,739 | | 4,518,175 | |
# | | Sunoco, Inc. | | 44,426 | | 1,354,993 | |
# | | Tesoro Petroleum Corp. | | 52,422 | | 506,921 | |
# | | The Williams Companies, Inc. | | 219,076 | | 4,594,024 | |
# * | | Transocean, Inc. | | 121,283 | | 9,985,229 | |
| | Valero Energy Corp. | | 198,887 | | 4,093,094 | |
# * | | Weatherford International, Ltd. | | 258,759 | | 4,303,927 | |
| | XTO Energy, Inc. | | 208,833 | | 7,507,546 | |
Total Energy | | | | 423,910,852 | |
| | | | | |
Financials — (11.3%) | | | | | |
# | | AFLAC, Inc. | | 181,039 | | 8,016,407 | |
| | Allstate Corp. | | 205,866 | | 5,432,804 | |
# | | American Capital, Ltd. | | 78,696 | | 1,105,679 | |
# | | American Express Co. | | 440,756 | | 12,120,790 | |
# | | American International Group, Inc. | | 1,022,201 | | 1,952,404 | |
| | Ameriprise Financial, Inc. | | 82,471 | | 1,781,374 | |
| | AON Corp. | | 105,560 | | 4,465,188 | |
| | Assurant, Inc. | | 45,085 | | 1,148,766 | |
| | Bank of America Corp. | | 1,906,573 | | 46,081,869 | |
| | Bank of New York Mellon Corp. | | 435,696 | | 14,203,690 | |
# | | BB&T Corp. | | 208,897 | | 7,488,957 | |
# | | Capital One Financial Corp. | | 142,841 | | 5,587,940 | |
# * | | CB Richard Ellis Group, Inc. | | 65,388 | | 458,370 | |
| | Chubb Corp. | | 137,071 | | 7,103,019 | |
| | Cincinnati Financial Corp. | | 61,731 | | 1,604,389 | |
# | | CIT Group, Inc. | | 108,483 | | 449,120 | |
# | | Citigroup, Inc. | | 2,070,150 | | 28,257,547 | |
# | | CME Group, Inc. | | 25,507 | | 7,196,800 | |
| | Comerica, Inc. | | 57,196 | | 1,578,038 | |
| | Discover Financial Services | | 182,230 | | 2,232,317 | |
# * | | E*TRADE Financial Corp. | | 204,234 | | 371,706 | |
| | Federated Investors, Inc. | | 33,407 | | 808,449 | |
# | | Fifth Third Bancorp | | 219,556 | | 2,382,183 | |
# | | First Horizon National Corp. | | 76,696 | | 913,458 | |
# | | Franklin Resources, Inc. | | 57,887 | | 3,936,316 | |
| | Genworth Financial, Inc. | | 164,637 | | 796,843 | |
| | Hartford Financial Services Group, Inc. | | 114,541 | | 1,182,063 | |
| | Hudson City Bancorp, Inc. | | 197,562 | | 3,716,141 | |
# | | Huntington Bancshares, Inc. | | 139,197 | | 1,315,412 | |
* | | IntercontinentalExchange, Inc. | | 28,657 | | 2,451,893 | |
| | Invesco, Ltd. ADR | | 147,032 | | 2,192,247 | |
| | Janus Capital Group, Inc. | | 60,754 | | 713,252 | |
| | JPMorgan Chase & Co. | | 1,400,511 | | 57,771,079 | |
| | KeyCorp | | 188,051 | | 2,299,864 | |
| | Legg Mason, Inc. | | 53,885 | | 1,195,708 | |
# | | Leucadia National Corp. | | 67,273 | | 1,805,607 | |
| | Lincoln National Corp. | | 97,637 | | 1,683,262 | |
4
| | Loews Corp. | | 137,658 | | 4,571,622 | |
# | | M&T Bank Corp. | | 29,327 | | 2,378,420 | |
| | Marsh & McLennan Companies, Inc. | | 194,986 | | 5,716,990 | |
# | | Marshall & Ilsley Corp. | | 98,629 | | 1,778,281 | |
# | | Mastercard, Inc. | | 27,500 | | 4,065,050 | |
# | | MBIA, Inc. | | 74,325 | | 730,615 | |
| | Merrill Lynch & Co., Inc. | | 582,209 | | 10,823,265 | |
| | MetLife, Inc. | | 289,577 | | 9,619,748 | |
| | Moody’s Corp. | | 75,043 | | 1,921,101 | |
| | Morgan Stanley | | 421,608 | | 7,365,492 | |
# | | National City Corp. | | 795,671 | | 2,148,312 | |
| | Northern Trust Corp. | | 84,034 | | 4,731,955 | |
| | NYSE Euronext, Inc. | | 101,123 | | 3,051,892 | |
# | | PNC Financial Services Group, Inc. | | 131,726 | | 8,782,172 | |
| | Principal Financial Group, Inc. | | 98,522 | | 1,870,933 | |
# | | Progressive Corp. | | 256,820 | | 3,664,821 | |
| | Prudential Financial, Inc. | | 162,330 | | 4,869,900 | |
# | | Regions Financial Corp. | | 264,138 | | 2,929,290 | |
# | | Schwab (Charles) Corp. | | 354,652 | | 6,780,946 | |
# * | | SLM Corp. | | 177,650 | | 1,895,525 | |
# * | | Sovereign Bancorp, Inc. | | 206,600 | | 599,140 | |
# | | State Street Corp. | | 164,135 | | 7,115,252 | |
| | SunTrust Banks, Inc. | | 134,460 | | 5,397,224 | |
# | | T. Rowe Price Group, Inc. | | 98,365 | | 3,889,352 | |
| | The Goldman Sachs Group, Inc. | | 165,164 | | 15,277,670 | |
# * | | The NASDAQ OMX Group, Inc. | | 51,685 | | 1,677,695 | |
| | The Travelers Companies, Inc. | | 224,601 | | 9,556,773 | |
| | Torchmark Corp. | | 33,162 | | 1,385,177 | |
# | | U.S. Bancorp | | 662,268 | | 19,742,209 | |
| | Unum Group | | 131,345 | | 2,068,684 | |
# | | Wachovia Corp. | | 820,722 | | 5,260,828 | |
# | | Wells Fargo & Co. | | 1,257,952 | | 42,833,266 | |
# | | XL Capital, Ltd. | | 118,636 | | 1,150,769 | |
# | | Zions Bancorporation | | 43,595 | | 1,661,405 | |
Total Financials | | | | 451,112,725 | |
| | | | | |
Health Care — (11.2%) | | | | | |
| | Abbott Laboratories | | 586,042 | | 32,320,216 | |
| | Aetna, Inc. | | 179,286 | | 4,458,843 | |
# | | Allergan, Inc. | | 116,905 | | 4,637,621 | |
# | | AmerisourceBergen Corp. | | 60,241 | | 1,883,736 | |
* | | Amgen, Inc. | | 402,228 | | 24,089,435 | |
| | Applied Biosystems, Inc. | | 65,377 | | 2,015,573 | |
# | | Bard (C.R.), Inc. | | 37,765 | | 3,332,761 | |
# * | | Barr Laboratories, Inc. | | 41,373 | | 2,658,629 | |
# | | Baxter International, Inc. | | 238,614 | | 14,433,761 | |
# | | Becton Dickinson & Co. | | 92,596 | | 6,426,162 | |
# * | | Biogen Idec, Inc. | | 110,344 | | 4,695,137 | |
# * | | Boston Scientific Corp. | | 570,491 | | 5,151,534 | |
# | | Bristol-Myers Squibb Co. | | 752,581 | | 15,465,540 | |
# | | Cardinal Health, Inc. | | 136,537 | | 5,215,713 | |
# * | | Celgene Corp. | | 172,931 | | 11,112,546 | |
# | | Cigna Corp. | | 104,491 | | 1,703,203 | |
# * | | Coventry Health Care, Inc. | | 56,309 | | 731,570 | |
# | | Covidien, Ltd. | | 190,769 | | 8,449,159 | |
5
* | | DaVita, Inc. | | 39,689 | | 2,252,351 | |
| | Eli Lilly & Co. | | 380,361 | | 12,863,809 | |
# * | | Express Scripts, Inc. | | 93,759 | | 5,682,733 | |
# * | | Forest Laboratories, Inc. | | 115,899 | | 2,652,889 | |
# * | | Genzyme Corp. | | 102,132 | | 7,443,380 | |
# * | | Gilead Sciences, Inc. | | 349,719 | | 16,034,616 | |
# * | | Hospira, Inc. | | 60,617 | | 1,686,365 | |
* | | Humana, Inc. | | 64,206 | | 1,871,982 | |
| | IMS Health, Inc. | | 69,140 | | 991,468 | |
# * | | Intuitive Surgical, Inc. | | 14,764 | | 2,551,072 | |
# | | Johnson & Johnson | | 1,062,370 | | 65,165,776 | |
* | | King Pharmaceuticals, Inc. | | 93,706 | | 823,676 | |
# * | | Laboratory Corp. of America Holdings | | 42,274 | | 2,599,428 | |
| | McKesson Corp. | | 104,891 | | 3,858,940 | |
# * | | Medco Health Solutions, Inc. | | 192,248 | | 7,295,812 | |
# | | Medtronic, Inc. | | 428,938 | | 17,299,070 | |
# | | Merck & Co., Inc. | | 814,494 | | 25,208,589 | |
# * | | Millipore Corp. | | 20,980 | | 1,088,652 | |
# * | | Mylan, Inc. | | 115,756 | | 992,029 | |
# * | | Patterson Companies, Inc. | | 34,625 | | 877,051 | |
# | | PerkinElmer, Inc. | | 45,432 | | 815,050 | |
| | Pfizer, Inc. | | 2,562,692 | | 45,385,275 | |
| | Quest Diagnostics, Inc. | | 60,087 | | 2,812,072 | |
| | Schering-Plough Corp. | | 617,993 | | 8,954,719 | |
* | | St. Jude Medical, Inc. | | 129,937 | | 4,941,504 | |
# | | Stryker Corp. | | 94,048 | | 5,027,806 | |
* | | Tenet Healthcare Corp. | | 157,700 | | 690,726 | |
* | | Thermo Fisher Scientific, Inc. | | 159,294 | | 6,467,336 | |
# | | UnitedHealth Group, Inc. | | 462,907 | | 10,984,783 | |
# * | | Varian Medical Systems, Inc. | | 47,462 | | 2,159,996 | |
# * | | Waters Corp. | | 37,630 | | 1,648,194 | |
* | | Watson Pharmaceuticals, Inc. | | 39,713 | | 1,039,289 | |
* | | WellPoint, Inc. | | 194,391 | | 7,555,978 | |
# | | Wyeth | | 506,924 | | 16,312,814 | |
# * | | Zimmer Holdings, Inc. | | 85,625 | | 3,915,674 | |
Total Health Care | | | | 446,732,043 | |
| | | | | |
Industrials — (8.9%) | | | | | |
# | | 3M Co. | | 265,731 | | 17,086,503 | |
* | | Allied Waste Industries, Inc. | | 128,829 | | 1,342,398 | |
# | | Avery Dennison Corp. | | 40,483 | | 1,417,715 | |
# | | B.F. Goodrich Co. | | 47,560 | | 1,738,794 | |
# | | Boeing Co. | | 281,415 | | 14,709,562 | |
| | Burlington Northern Santa Fe Corp. | | 107,363 | | 9,561,749 | |
| | C.H. Robinson Worldwide, Inc. | | 64,633 | | 3,346,697 | |
# | | Caterpillar, Inc. | | 231,412 | | 8,832,996 | |
| | Cintas Corp. | | 50,248 | | 1,190,878 | |
# | | Cooper Industries, Ltd. | | 66,146 | | 2,047,219 | |
| | CSX Corp. | | 154,971 | | 7,085,274 | |
# | | Cummins, Inc. | | 77,059 | | 1,991,975 | |
# | | Danaher Corp. | | 96,999 | | 5,746,221 | |
| | Deere & Co. | | 162,332 | | 6,259,522 | |
# | | Dover Corp. | | 71,412 | | 2,268,759 | |
# | | Eaton Corp. | | 63,183 | | 2,817,962 | |
# | | Emerson Electric Co. | | 294,986 | | 9,654,892 | |
6
| | Equifax, Inc. | | 48,755 | | 1,271,530 | |
# | | Expeditors International of Washington, Inc. | | 80,996 | | 2,644,519 | |
# | | Fastenal Co. | | 49,125 | | 1,977,772 | |
# | | FedEx Corp. | | 118,302 | | 7,733,402 | |
# | | Flowserve Corp. | | 21,813 | | 1,241,596 | |
# | | Fluor Corp. | | 68,049 | | 2,717,197 | |
| | General Dynamics Corp. | | 151,024 | | 9,109,768 | |
# | | General Electric Co. | | 3,990,157 | | 77,847,963 | |
| | Honeywell International, Inc. | | 283,008 | | 8,617,594 | |
# | | Illinois Tool Works, Inc. | | 152,033 | | 5,076,382 | |
# | | Ingersoll-Rand Co., Ltd. Class A | | 121,092 | | 2,234,147 | |
# | | ITT Industries, Inc. | | 69,092 | | 3,074,594 | |
# * | | Jacobs Engineering Group, Inc. | | 46,538 | | 1,695,379 | |
| | L-3 Communications Holdings, Inc. | | 46,160 | | 3,746,807 | |
# | | Lockheed Martin Corp. | | 126,570 | | 10,764,778 | |
| | Masco Corp. | | 136,859 | | 1,389,119 | |
* | | Monster Worldwide, Inc. | | 47,132 | | 671,160 | |
| | Norfolk Southern Corp. | | 142,637 | | 8,549,662 | |
| | Northrop Grumman Corp. | | 128,317 | | 6,016,784 | |
# | | Paccar, Inc. | | 138,131 | | 4,038,950 | |
| | Pall Corp. | | 45,572 | | 1,203,557 | |
# | | Parker Hannifin Corp. | | 63,726 | | 2,470,657 | |
| | Pitney Bowes, Inc. | | 78,992 | | 1,957,422 | |
# | | Precision Castparts Corp. | | 52,976 | | 3,433,375 | |
| | R. R. Donnelley & Sons Co. | | 79,834 | | 1,322,849 | |
| | Raytheon Co. | | 158,491 | | 8,100,475 | |
# | | Robert Half International, Inc. | | 59,272 | | 1,118,463 | |
| | Rockwell Automation, Inc. | | 55,348 | | 1,531,479 | |
| | Rockwell Collins, Inc. | | 60,603 | | 2,256,250 | |
| | Ryder System, Inc. | | 21,461 | | 850,285 | |
| | Southwest Airlines Co. | | 279,015 | | 3,238,770 | |
# * | | Terex Corp. | | 36,952 | | 616,729 | |
# | | Textron, Inc. | | 94,485 | | 1,672,385 | |
# | | The Manitowoc Co., Inc. | | 49,526 | | 487,336 | |
| | Tyco International, Ltd. | | 180,510 | | 4,495,365 | |
| | Union Pacific Corp. | | 193,568 | | 12,924,535 | |
# | | United Parcel Service, Inc. | | 383,268 | | 20,228,885 | |
| | United Technologies Corp. | | 366,615 | | 20,149,160 | |
# | | W.W. Grainger, Inc. | | 24,634 | | 1,935,493 | |
# | | Waste Management, Inc. | | 186,457 | | 5,823,052 | |
Total Industrials | | | | 353,334,741 | |
| | | | | |
Information Technology — (12.5%) | | | | | |
# * | | Adobe Systems, Inc. | | 201,660 | | 5,372,222 | |
# * | | Advanced Micro Devices, Inc. | | 230,833 | | 807,916 | |
# * | | Affiliated Computer Services, Inc. Class A | | 36,977 | | 1,516,057 | |
# * | | Agilent Technologies, Inc. | | 135,924 | | 3,016,154 | |
# * | | Akamai Technologies, Inc. | | 64,293 | | 924,533 | |
# | | Altera Corp. | | 114,359 | | 1,984,129 | |
| | Amphenol Corp. | | 67,214 | | 1,925,681 | |
| | Analog Devices, Inc. | | 110,417 | | 2,358,507 | |
# * | | Apple, Inc. | | 336,779 | | 36,234,053 | |
# | | Applied Materials, Inc. | | 510,052 | | 6,584,771 | |
# * | | Autodesk, Inc. | | 85,519 | | 1,822,410 | |
# | | Automatic Data Processing, Inc. | | 193,452 | | 6,761,147 | |
7
# * | | BMC Software, Inc. | | 72,242 | | 1,865,288 | |
# * | | Broadcom Corp. | | 167,786 | | 2,865,785 | |
| | CA, Inc. | | 149,736 | | 2,626,586 | |
# * | | Ciena Corp. | | 34,335 | | 329,959 | |
# * | | Cisco Sytems, Inc. | | 2,245,688 | | 39,905,876 | |
# * | | Citrix Systems, Inc. | | 69,334 | | 1,786,737 | |
# * | | Cognizant Technology Solutions Corp. | | 110,865 | | 2,128,608 | |
* | | Computer Sciences Corp. | | 57,534 | | 1,735,225 | |
* | | Compuware Corp. | | 96,902 | | 618,235 | |
* | | Convergys Corp. | | 46,313 | | 356,147 | |
# | | Corning, Inc. | | 599,869 | | 6,496,581 | |
# * | | Dell, Inc. | | 662,604 | | 8,050,639 | |
# * | | eBay, Inc. | | 415,320 | | 6,341,936 | |
# * | | Electronic Arts, Inc. | | 121,205 | | 2,720,638 | |
# * | | EMC Corp. | | 787,143 | | 9,272,545 | |
| | Fidelity National Information Services, Inc. | | 72,124 | | 1,073,925 | |
# * | | Fiserv, Inc. | | 62,361 | | 2,080,363 | |
# * | | Google, Inc. | | 90,851 | | 32,182,844 | |
# | | Harris Corp. | | 51,016 | | 1,834,025 | |
# | | Hewlett-Packard Co. | | 931,064 | | 35,641,130 | |
# | | Intel Corp. | | 2,137,289 | | 34,196,624 | |
# | | International Business Machines Corp. | | 515,063 | | 47,885,407 | |
# * | | Intuit, Inc. | | 122,036 | | 3,058,222 | |
| | Jabil Circuit, Inc. | | 79,847 | | 671,513 | |
* | | JDS Uniphase Corp. | | 81,499 | | 444,985 | |
# * | | Juniper Networks, Inc. | | 206,635 | | 3,872,340 | |
# | | KLA-Tencor Corp. | | 65,853 | | 1,531,082 | |
* | | Lexmark International, Inc. | | 33,445 | | 863,884 | |
# | | Linear Technology Corp. | | 84,216 | | 1,910,019 | |
# * | | LSI Corp. | | 244,682 | | 942,026 | |
# * | | MEMC Electronic Materials, Inc. | | 85,878 | | 1,578,438 | |
# | | Microchip Technology, Inc. | | 69,998 | | 1,724,051 | |
* | | Micron Technology, Inc. | | 289,321 | | 1,362,702 | |
# | | Microsoft Corp. | | 2,985,078 | | 66,656,792 | |
# | | Molex, Inc. | | 54,235 | | 781,526 | |
| | Motorola, Inc. | | 861,220 | | 4,624,751 | |
# | | National Semiconductor Corp. | | 74,119 | | 976,147 | |
# * | | NetApp, Inc. | | 124,463 | | 1,683,984 | |
# * | | Novell, Inc. | | 131,253 | | 611,639 | |
# * | | Novellus Systems, Inc. | | 37,693 | | 586,765 | |
# * | | Nvidia Corp. | | 211,593 | | 1,853,555 | |
* | | Oracle Corp. | | 1,489,655 | | 27,245,790 | |
# | | Paychex, Inc. | | 121,976 | | 3,481,195 | |
# * | | QLogic Corp. | | 49,870 | | 599,437 | |
| | QUALCOMM, Inc. | | 623,836 | | 23,867,965 | |
# * | | Salesforce.com, Inc. | | 39,560 | | 1,224,778 | |
# * | | Sandisk Corp. | | 85,541 | | 760,459 | |
* | | Sun Microsystems, Inc. | | 286,246 | | 1,316,732 | |
* | | Symantec Corp. | | 318,996 | | 4,012,970 | |
* | | Tellabs, Inc. | | 151,142 | | 640,842 | |
* | | Teradata Corp. | | 67,859 | | 1,044,350 | |
* | | Teradyne, Inc. | | 64,195 | | 327,395 | |
# | | Texas Instruments, Inc. | | 498,350 | | 9,747,726 | |
| | Total System Services, Inc. | | 75,150 | | 1,032,561 | |
# * | | Unisys Corp. | | 136,693 | | 207,773 | |
8
# * | | VeriSign, Inc. | | 73,451 | | 1,534,159 | |
| | Western Union Co. | | 277,191 | | 4,229,935 | |
| | Xerox Corp. | | 331,592 | | 2,659,368 | |
| | Xilinx, Inc. | | 105,095 | | 1,935,850 | |
# * | | Yahoo!, Inc. | | 526,829 | | 6,753,948 | |
Total Information Technology | | | | 499,660,337 | |
| | | | | |
Materials — (2.5%) | | | | | |
| | Air Products & Chemicals, Inc. | | 80,533 | | 4,681,383 | |
| | AK Steel Holding Corp. | | 42,656 | | 585,085 | |
| | Alcoa, Inc. | | 309,224 | | 3,559,168 | |
# | | Allegheny Technologies, Inc. | | 38,126 | | 1,011,864 | |
| | Ashland, Inc. | | 21,557 | | 486,973 | |
# | | Ball Corp. | | 36,756 | | 1,257,055 | |
| | Bemis Co., Inc. | | 37,885 | | 941,063 | |
# | | CF Industries Holdings, Inc. | | 21,476 | | 1,378,544 | |
| | Dow Chemical Co. | | 351,640 | | 9,378,239 | |
| | du Pont (E.I.) de Nemours & Co. | | 342,971 | | 10,975,072 | |
# | | Eastman Chemical Co. | | 29,041 | | 1,172,966 | |
# | | Ecolab, Inc. | | 66,741 | | 2,486,770 | |
# | | Freeport-McMoRan Copper & Gold, Inc. Class B | | 145,967 | | 4,247,640 | |
# | | Hercules, Inc. | | 42,848 | | 720,275 | |
# | | International Flavors & Fragrances, Inc. | | 29,866 | | 952,128 | |
| | International Paper Co. | | 162,541 | | 2,798,956 | |
| | MeadWestavco Corp. | | 64,936 | | 911,052 | |
# | | Monsanto Co. | | 209,091 | | 18,604,917 | |
# | | Newmont Mining Corp. | | 173,612 | | 4,572,940 | |
| | Nucor Corp. | | 120,351 | | 4,875,419 | |
# * | | Pactiv Corp. | | 49,770 | | 1,172,581 | |
# | | PPG Industries, Inc. | | 62,393 | | 3,093,445 | |
# | | Praxair, Inc. | | 119,746 | | 7,801,452 | |
# | | Rohm & Haas Co. | | 47,082 | | 3,312,219 | |
# | | Sealed Air Corp. | | 60,099 | | 1,016,875 | |
# | | Sigma-Aldrich Corp. | | 47,888 | | 2,068,876 | |
# | | Titanium Metals Corp. | | 32,351 | | 301,188 | |
# | | United States Steel Corp. | | 44,664 | | 1,647,208 | |
# | | Vulcan Materials Co. | | 41,755 | | 2,266,461 | |
| | Weyerhaeuser Co. | | 80,322 | | 3,069,907 | |
Total Materials | | | | 101,347,721 | |
| | | | | |
Real Estate Investment Trusts — (0.9%) | | | | | |
| | Apartment Investment & Management Co. Class A | | 32,549 | | 476,192 | |
| | AvalonBay Communities, Inc. | | 29,289 | | 2,080,105 | |
| | Boston Properties, Inc. | | 45,547 | | 3,228,371 | |
| | Developers Diversified Realty Corp. | | 45,723 | | 602,172 | |
| | Equity Residential | | 102,997 | | 3,597,685 | |
| | General Growth Properties, Inc. | | 86,506 | | 358,135 | |
| | HCP, Inc. | | 95,665 | | 2,863,253 | |
| | Host Marriott Corp. | | 197,484 | | 2,041,985 | |
| | Kimco Realty Corp. | | 86,327 | | 1,949,264 | |
# | | Plum Creek Timber Co., Inc. | | 65,056 | | 2,425,288 | |
| | ProLogis | | 99,783 | | 1,396,962 | |
| | Public Storage | | 47,608 | | 3,880,052 | |
| | Simon Property Group, Inc. | | 85,553 | | 5,734,618 | |
# | | Vornado Realty Trust | | 52,067 | | 3,673,327 | |
Total Real Estate Investment Trusts | | | | 34,307,409 | |
9
Telecommunication Services — (2.7%) | | | | | |
# * | | American Tower Corp. | | 149,763 | | 4,838,843 | |
| | AT&T, Inc. | | 2,240,314 | | 59,973,206 | |
| | CenturyTel, Inc. | | 38,910 | | 977,030 | |
# | | Embarq Corp. | | 54,176 | | 1,625,280 | |
| | Frontier Communications Corp. | | 120,115 | | 914,075 | |
# | | Qwest Communications International, Inc. | | 564,284 | | 1,613,852 | |
| | Sprint Nextel Corp. | | 1,085,065 | | 3,396,253 | |
| | Verizon Communications, Inc. | | 1,082,609 | | 32,121,009 | |
| | Windstream Corp. | | 167,124 | | 1,255,101 | |
Total Telecommunication Services | | | | 106,714,649 | |
| | | | | |
Utilities — (3.1%) | | | | | |
# * | | AES Corp. | | 255,755 | | 2,038,367 | |
# | | Allegheny Energy, Inc. | | 64,195 | | 1,907,259 | |
# | | Ameren Corp. | | 79,913 | | 2,593,177 | |
# | | American Electric Power Co., Inc. | | 152,924 | | 4,989,910 | |
# | | CenterPoint Energy, Inc. | | 129,949 | | 1,497,012 | |
| | CMS Energy Corp. | | 85,644 | | 877,851 | |
# | | Consolidated Edison, Inc. | | 103,857 | | 4,499,085 | |
| | Constellation Energy Group | | 67,795 | | 1,641,317 | |
# | | Dominion Resources, Inc. | | 220,472 | | 7,998,724 | |
| | DTE Energy Co. | | 62,003 | | 2,188,706 | |
# | | Duke Energy Corp. | | 480,869 | | 7,876,634 | |
# * | | Dynegy, Inc. | | 192,191 | | 699,575 | |
| | Edison International | | 123,862 | | 4,408,249 | |
| | Entergy Corp. | | 72,830 | | 5,684,382 | |
# | | Exelon Corp. | | 249,894 | | 13,554,251 | |
# | | FirstEnergy Corp. | | 115,887 | | 6,044,666 | |
| | FPL Group, Inc. | | 155,293 | | 7,336,041 | |
| | Integrys Energy Group, Inc. | | 29,053 | | 1,382,923 | |
| | Nicor, Inc. | | 17,164 | | 793,148 | |
# | | NiSource, Inc. | | 104,252 | | 1,351,106 | |
| | Pepco Holdings, Inc. | | 76,701 | | 1,583,876 | |
| | PG&E Corp. | | 136,310 | | 4,998,488 | |
# | | Pinnacle West Capital Corp. | | 38,295 | | 1,212,037 | |
| | PPL Corp. | | 142,368 | | 4,672,518 | |
| | Progress Energy, Inc. | | 99,598 | | 3,921,173 | |
| | Public Service Enterprise Group, Inc. | | 193,306 | | 5,441,564 | |
# | | Questar Corp. | | 65,914 | | 2,271,396 | |
| | Sempra Energy | | 93,664 | | 3,989,150 | |
# | | Southern Co. | | 292,798 | | 10,054,683 | |
| | TECO Energy, Inc. | | 80,875 | | 933,298 | |
| | Xcel Energy, Inc. | | 169,555 | | 2,953,648 | |
Total Utilities | | | | 121,394,214 | |
| | | | | |
TOTAL COMMON STOCKS | | | | 3,222,514,537 | |
10
| | Face | | | |
| | | | Amount | | | |
| | (000) | | | |
TEMPORARY CASH INVESTMENTS — (0.9%) | | | | | |
| | Repurchase Agreement, PNC Capital Markets, Inc. 0.94%, 11/03/08 (Collateralized by $36,525,000 FNMA 5.00%, 06/01/23, valued at $34,569,468) to be repurchased at $34,058,668 | | $34,056 | | 34,056,000 | |
| | | | | |
| | Shares | | | |
SECURITIES LENDING COLLATERAL — (18.2%) | | | | | |
§ @ | | DFA Short Term Investment Fund LP | | 665,250,501 | | 665,250,501 | |
@ | | PNC Demand Deposit Account 0.22% | | 10,000,000 | | 10,000,000 | |
| | Face | | | |
| | | | Amount | | | |
| | (000) | | | |
@ | | Repurchase Agreement, Deutsche Bank Securitites 0.24%, 11/03/08 (Collateralized by $66,764,882 FNMA, rates ranging from 5.000% to 7.000%, maturities ranging from 05/01/18 to 12/01/37 & U.S. Treasury STRIP, rates ranging from 0.569%(y) to 1.359%(y), maturities ranging from 11/30/08 to 11/30/09, valued at $51,835,339) to be repurchased at $50,489,596 | | $50,489 | | 50,488,600 | |
| | | | | | | |
TOTAL SECURITIES LENDING COLLATERAL | | | | 725,739,101 | |
| | | | | |
TOTAL INVESTMENTS - (100.0%)
(Cost $4,182,606,777) | | | | $3,982,309,638 | |
See accompanying Notes to Financial Statements.
11
THE U.S. LARGE CAP VALUE SERIES
SCHEDULE OF INVESTMENTS
October 31, 2008
| | Shares | | Value † | |
| | | | | |
COMMON STOCKS — (88.7%) | | | | | |
Consumer Discretionary — (11.6%) | | | | | |
* | | Ascent Media Corp. (043632108) | | 50,869 | | $1,286,477 | |
* # | | AutoNation, Inc. | | 1,417,058 | | 9,735,188 | |
# | | Carnival Corp. | | 456,598 | | 11,597,589 | |
| | CBS Corp. Class B | | 5,590,306 | | 54,281,871 | |
| | Comcast Corp. Class A | | 12,216,542 | | 192,532,702 | |
# | | Comcast Corp. Special Class A Non-Voting | | 3,110,315 | | 47,961,057 | |
* # | | Discovery Communications, Inc. (25470F104) | | 499,995 | | 6,819,932 | |
* | | Discovery Communications, Inc. (25470F302) | | 499,995 | | 6,659,933 | |
| | Disney (Walt) Co. | | 453,134 | | 11,736,171 | |
| | Eastman Kodak Co. | | 250,000 | | 2,295,000 | |
* | | Expedia, Inc. | | 1,137,251 | | 10,815,257 | |
# | | Foot Locker, Inc. | | 763,948 | | 11,168,920 | |
# | | Fortune Brands, Inc. | | 575,610 | | 21,953,765 | |
# | | Gannett Co., Inc. | | 915,685 | | 10,072,535 | |
* # | | Goodyear Tire & Rubber Co. | | 547,002 | | 4,879,258 | |
# | | Hearst-Argyle Television, Inc. | | 311,300 | | 4,663,274 | |
# | | J.C. Penney Co., Inc. | | 757,550 | | 18,120,596 | |
# | | Leggett & Platt, Inc. | | 434,300 | | 7,539,448 | |
* # | | Liberty Global, Inc. Class A | | 304,305 | | 5,017,989 | |
* # | | Liberty Global, Inc. Series C | | 333,205 | | 5,384,593 | |
* | | Liberty Media Corp. - Entertainment Class A | | 3,864,672 | | 62,221,219 | |
* | | Liberty Media Holding Corp. Capital Class A | | 242,602 | | 1,652,120 | |
* | | Liberty Media Holding Corp. Interactive Class A | | 4,162,762 | | 20,314,279 | |
# | | Macy’s, Inc. | | 1,710,230 | | 21,018,727 | |
| | MDC Holdings, Inc. | | 153,327 | | 5,156,387 | |
* # | | Mohawk Industries, Inc. | | 397,617 | | 19,236,710 | |
# | | News Corp. Class A | | 268,376 | | 2,855,521 | |
# | | Royal Caribbean Cruises, Ltd. | | 544,275 | | 7,380,369 | |
* # | | Sears Holdings Corp. | | 410,635 | | 23,710,065 | |
# | | Service Corp. International | | 518,100 | | 3,574,890 | |
* | | Ticketmaster | | 73,729 | | 713,697 | |
# | | Time Warner, Inc. | | 18,369,180 | | 185,345,026 | |
* # | | Toll Brothers, Inc. | | 904,000 | | 20,900,480 | |
* # | | TRW Automotive Holdings Corp. | | 201,285 | | 1,272,121 | |
# | | Tyco Electronics, Ltd. | | 1,537,111 | | 29,881,438 | |
# | | Whirlpool Corp. | | 183,115 | | 8,542,315 | |
| | Wyndham Worldwide Corp. | | 784,260 | | 6,423,089 | |
Total Consumer Discretionary | | | | 864,720,008 | |
| | | | | |
Consumer Staples — (4.9%) | | | | | |
| | Archer-Daniels-Midland Co. | | 1,219,060 | | 25,271,114 | |
# | | Coca-Cola Enterprises, Inc. | | 3,519,272 | | 35,368,684 | |
* # | | Constellation Brands, Inc. Class A | | 831,737 | | 10,429,982 | |
| | Corn Products International, Inc. | | 475,400 | | 11,561,728 | |
1
# | | CVS Caremark Corp. | | 498,811 | | 15,288,557 | |
| | Del Monte Foods Co. | | 59 | | 372 | |
# | | J.M. Smucker Co. | | 397,802 | | 17,726,057 | |
| | Kraft Foods, Inc. | | 5,533,321 | | 161,240,974 | |
| | Molson Coors Brewing Co. | | 755,890 | | 28,240,050 | |
| | PepsiAmericas, Inc. | | 521,775 | | 9,877,201 | |
# | | Safeway, Inc. | | 207,654 | | 4,416,801 | |
* # | | Smithfield Foods, Inc. | | 786,000 | | 8,268,720 | |
# | | SUPERVALU, Inc. | | 1,510,542 | | 21,510,118 | |
| | Tyson Foods, Inc. Class A | | 1,991,059 | | 17,401,856 | |
Total Consumer Staples | | | | 366,602,214 | |
| | | | | |
Energy — (13.4%) | | | | | |
# | | Anadarko Petroleum Corp. | | 3,422,156 | | 120,802,107 | |
# | | Apache Corp. | | 2,051,191 | | 168,874,555 | |
# | | Chesapeake Energy Corp. | | 2,496,221 | | 54,841,975 | |
# | | Cimarex Energy Co. | | 409,247 | | 16,558,134 | |
# | | ConocoPhillips | | 4,659,773 | | 242,401,391 | |
# | | Devon Energy Corp. | | 1,962,942 | | 158,723,490 | |
* # | | Forest Oil Corp. | | 467,500 | | 13,655,675 | |
| | Marathon Oil Corp. | | 2,640,550 | | 76,840,005 | |
* # | | Mariner Energy, Inc. | | 356,180 | | 5,125,430 | |
* # | | Newfield Exploration Co. | | 662,965 | | 15,234,936 | |
# | | Noble Energy, Inc. | | 419,300 | | 21,728,126 | |
| | Overseas Shipholding Group, Inc. | | 281,700 | | 10,586,286 | |
# | | Patterson-UTI Energy, Inc. | | 269,500 | | 3,576,265 | |
# | | Pioneer Natural Resources Co. | | 773,098 | | 21,515,317 | |
* # | | Pride International, Inc. | | 644,204 | | 12,104,593 | |
# | | Rowan Companies, Inc. | | 456,566 | | 8,282,107 | |
# | | Tidewater, Inc. | | 423,900 | | 18,486,279 | |
* # | | Unit Corp. | | 145,000 | | 5,443,300 | |
| | Valero Energy Corp. | | 1,218,075 | | 25,067,983 | |
Total Energy | | | | 999,847,954 | |
| | | | | |
Financials — (27.3%) | | | | | |
* # | | Allegheny Corp. | | 36,122 | | 10,186,404 | |
| | Allstate Corp. | | 2,540,615 | | 67,046,830 | |
# | | American Capital, Ltd. | | 464,547 | | 6,526,885 | |
| | American Financial Group, Inc. | | 868,200 | | 19,734,186 | |
| | American National Insurance Co. | | 70,452 | | 4,810,463 | |
# | | Associated Banc-Corp. | | 238,410 | | 5,259,325 | |
| | Assurant, Inc. | | 218,809 | | 5,575,253 | |
# | | Bank of America Corp. | | 7,236,574 | | 174,907,994 | |
# | | Bank of New York Mellon Corp. | | 530,645 | | 17,299,027 | |
# | | Capital One Financial Corp. | | 1,668,884 | | 65,286,742 | |
# | | Chubb Corp. | | 1,620,173 | | 83,957,365 | |
# | | Cincinnati Financial Corp. | | 1,305,789 | | 33,937,456 | |
# | | CIT Group, Inc. | | 244,220 | | 1,011,071 | |
# | | Citigroup, Inc. | | 1,838,237 | | 25,091,935 | |
| | CME Group, Inc. | | 10,977 | | 3,097,161 | |
| | CNA Financial Corp. | | 1,896,282 | | 29,506,148 | |
# | | Comerica, Inc. | | 328,400 | | 9,060,556 | |
# | | Discover Financial Services | | 1,973,030 | | 24,169,617 | |
# | | Fidelity National Financial, Inc. | | 935,959 | | 8,432,991 | |
# | | Fifth Third Bancorp | | 508,474 | | 5,516,943 | |
2
# | | First American Corp. | | 710,500 | | 14,501,305 | |
# | | Fulton Financial Corp. | | 8,369 | | 87,874 | |
# | | Genworth Financial, Inc. | | 1,076,023 | | 5,207,951 | |
| | Hanover Insurance Group, Inc. | | 382,166 | | 15,000,015 | |
# | | Hartford Financial Services Group, Inc. | | 1,274,698 | | 13,154,883 | |
# | | HCC Insurance Holdings, Inc. | | 355,689 | | 7,846,499 | |
# | | Janus Capital Group, Inc. | | 693,391 | | 8,140,410 | |
| | JPMorgan Chase & Co. | | 7,213,911 | | 297,573,829 | |
# | | KeyCorp | | 912,700 | | 11,162,321 | |
# | | Legg Mason, Inc. | | 289,947 | | 6,433,924 | |
# | | Leucadia National Corp. | | 93,873 | | 2,519,551 | |
# | | Lincoln National Corp. | | 1,308,073 | | 22,551,179 | |
| | Loews Corp. | | 3,808,002 | | 126,463,746 | |
# | | M&T Bank Corp. | | 440,052 | | 35,688,217 | |
# | | Marsh & McLennan Companies, Inc. | | 316,800 | | 9,288,576 | |
# | | Marshall & Ilsley Corp. | | 585,900 | | 10,563,777 | |
# | | Mercury General Corp. | | 156,425 | | 8,035,552 | |
# | | Merrill Lynch & Co., Inc. | | 1,408,640 | | 26,186,618 | |
# | | MetLife, Inc. | | 5,000,810 | | 166,126,908 | |
# | | Morgan Stanley | | 2,999,997 | | 52,409,948 | |
# | | National City Corp. | | 1,929,294 | | 5,209,094 | |
# | | Nationwide Financial Services, Inc. | | 386,402 | | 18,280,679 | |
# | | New York Community Bancorp, Inc. | | 2,223,800 | | 34,824,708 | |
# | | Odyssey Re Holdings Corp. | | 345,255 | | 13,616,857 | |
| | Old Republic International Corp. | | 1,751,854 | | 16,134,575 | |
# | | Principal Financial Group, Inc. | | 1,166,479 | | 22,151,436 | |
# | | Protective Life Corp. | | 537,900 | | 4,491,465 | |
# | | Prudential Financial, Inc. | | 1,829,600 | | 54,888,000 | |
* # | | Reinsurance Group of America, Inc. Class A | | 470,900 | | 17,583,406 | |
* # | | Reinsurance Group of America, Inc. Class B | | 621,575 | | 23,023,138 | |
* # | | Sovereign Bancorp, Inc. | | 2,171,448 | | 6,297,199 | |
# | | StanCorp Financial Group, Inc. | | 219,100 | | 7,466,928 | |
# | | SunTrust Banks, Inc. | | 945,360 | | 37,946,750 | |
# | | Synovus Financial Corp. | | 732,800 | | 7,569,824 | |
| | The Goldman Sachs Group, Inc. | | 245,800 | | 22,736,500 | |
| | The Travelers Companies, Inc. | | 5,075,909 | | 215,979,928 | |
# | | Torchmark Corp. | | 171,900 | | 7,180,263 | |
| | Transatlantic Holdings, Inc. | | 173,907 | | 7,451,915 | |
# | | Unitrin, Inc. | | 750 | | 15,750 | |
| | Unum Group | | 2,404,389 | | 37,869,127 | |
# | | W. R. Berkley Corp. | | 667,640 | | 17,538,903 | |
| | Wesco Financial Corp. | | 18,700 | | 6,170,813 | |
# | | Zions Bancorporation | | 233,920 | | 8,914,691 | |
Total Financials | | | | 2,032,699,384 | |
| | | | | |
Health Care — (1.6%) | | | | | |
* # | | Community Health Systems, Inc. | | 210,554 | | 4,316,357 | |
* | | King Pharmaceuticals, Inc. | | 1,215,010 | | 10,679,938 | |
# | | Omnicare, Inc. | | 582,523 | | 16,060,159 | |
# | | PerkinElmer, Inc. | | 64,800 | | 1,162,512 | |
* # | | Tenet Healthcare Corp. | | 542,820 | | 2,377,552 | |
* # | | Watson Pharmaceuticals, Inc. | | 665,300 | | 17,410,901 | |
* # | | WellPoint, Inc. | | 1,694,537 | | 65,866,653 | |
Total Health Care | | | | 117,874,072 | |
3
Industrials — (15.4%) | | | | | |
| | Alexander & Baldwin, Inc. | | 121,315 | | 3,869,949 | |
* # | | Allied Waste Industries, Inc. | | 2,682,276 | | 27,949,316 | |
# | | Burlington Northern Santa Fe Corp. | | 2,178,273 | | 193,996,993 | |
# | | CSX Corp. | | 3,309,804 | | 151,324,239 | |
| | FedEx Corp. | | 432,063 | | 28,243,958 | |
# | | IKON Office Solutions, Inc. | | 41,430 | | 713,839 | |
* # | | Kansas City Southern | | 206,873 | | 6,386,170 | |
# | | Kennametal, Inc. | | 106,185 | | 2,253,246 | |
# | | Masco Corp. | | 1,188,679 | | 12,065,092 | |
# | | Norfolk Southern Corp. | | 3,154,102 | | 189,056,874 | |
# | | Northrop Grumman Corp. | | 2,590,384 | | 121,463,106 | |
| | Parker Hannifin Corp. | | 50,000 | | 1,938,500 | |
# | | Pentair, Inc. | | 161,320 | | 4,458,885 | |
# | | R. R. Donnelley & Sons Co. | | 738,598 | | 12,238,569 | |
# | | Raytheon Co. | | 463,707 | | 23,700,065 | |
# | | Ryder System, Inc. | | 458,700 | | 18,173,694 | |
# | | Southwest Airlines Co. | | 5,076,220 | | 59,797,872 | |
| | Timken Co. | | 471,069 | | 7,480,576 | |
# | | Trinity Industries, Inc. | | 319,685 | | 5,396,283 | |
| | Union Pacific Corp. | | 4,066,600 | | 271,526,882 | |
* | | URS Corp. | | 220,435 | | 6,478,585 | |
* # | | YRC Worldwide, Inc. | | 124,289 | | 569,244 | |
Total Industrials | | | | 1,149,081,937 | |
| | | | | |
Information Technology — (3.7%) | | | | | |
* # | | Arrow Electronics, Inc. | | 448,400 | | 7,824,580 | |
* # | | Avnet, Inc. | | 1,056,200 | | 17,680,788 | |
* # | | Computer Sciences Corp. | | 1,361,543 | | 41,064,137 | |
* | | Compuware Corp. | | 365,063 | | 2,329,102 | |
* # | | Convergys Corp. | | 101,416 | | 779,889 | |
| | Fidelity National Information Services, Inc. | | 935,123 | | 14,111,006 | |
* | | IAC/InterActiveCorp | | 1,030,725 | | 17,274,951 | |
* # | | Ingram Micro, Inc. | | 1,316,268 | | 17,545,852 | |
* # | | Integrated Device Technology, Inc. | | 577,354 | | 3,671,971 | |
* # | | International Rectifier Corp. | | 8,528 | | 131,672 | |
# | | Intersil Corp. | | 1,030,698 | | 14,110,256 | |
| | Jabil Circuit, Inc. | | 809,885 | | 6,811,133 | |
* | | JDS Uniphase Corp. | | 600,062 | | 3,276,339 | |
# | | Lender Processing Services, Inc. | | 197,831 | | 4,563,961 | |
* # | | Micron Technology, Inc. | | 3,840,357 | | 18,088,081 | |
| | Motorola, Inc. | | 3,549,464 | | 19,060,622 | |
* # | | Novellus Systems, Inc. | | 160,292 | | 2,532,614 | |
* # | | Sandisk Corp. | | 136,000 | | 1,209,040 | |
* # | | Sun Microsystems, Inc. | | 519,425 | | 2,389,355 | |
* # | | Symantec Corp. | | 2,636,076 | | 33,161,836 | |
* # | | Tech Data Corp. | | 332,603 | | 7,134,334 | |
* # | | Tellabs, Inc. | | 1,931,218 | | 8,188,364 | |
* # | | Vishay Intertechnology, Inc. | | 444,023 | | 1,913,739 | |
| | Xerox Corp. | | 3,605,491 | | 28,916,038 | |
Total Information Technology | | | | 273,769,660 | |
| | | | | |
Materials — (3.0%) | | | | | |
# | | Alcoa, Inc. | | 1,172,708 | | 13,497,869 | |
| | Ashland, Inc. | | 523,511 | | 11,826,113 | |
4
| | Bemis Co., Inc. | | 227,000 | | 5,638,680 | |
# | | Cytec Industries, Inc. | | 219,525 | | 6,216,948 | |
* # | | Domtar Corp. | | 3,086,136 | | 7,653,617 | |
# | | Dow Chemical Co. | | 2,427,760 | | 64,748,359 | |
# | | International Paper Co. | | 1,643,445 | | 28,300,123 | |
# | | Lubrizol Corp. | | 222,800 | | 8,372,824 | |
| | MeadWestavco Corp. | | 1,369,631 | | 19,215,923 | |
# | | Reliance Steel & Aluminum Co. | | 114,900 | | 2,877,096 | |
* | | Rockwood Holdings, Inc. | | 132,630 | | 1,637,981 | |
| | Tronox, Inc. Class B | | 66,034 | | 9,245 | |
# | | Valhi, Inc. | | 89,555 | | 1,282,428 | |
| | Valspar Corp. | | 2,200 | | 44,990 | |
# | | Weyerhaeuser Co. | | 1,415,829 | | 54,112,984 | |
Total Materials | | | | 225,435,180 | |
| | | | | |
Telecommunication Services — (7.7%) | | | | | |
# | | AT&T, Inc. | | 9,749,000 | | 260,980,730 | |
# | | CenturyTel, Inc. | | 504,003 | | 12,655,515 | |
| | Sprint Nextel Corp. | | 6,449,998 | | 20,188,494 | |
| | Telephone & Data Systems, Inc. | | 406,797 | | 10,922,499 | |
| | Telephone & Data Systems, Inc. Special Shares | | 174,000 | | 4,767,600 | |
* | | United States Cellular Corp. | | 264,225 | | 10,122,460 | |
# | | Verizon Communications, Inc. | | 8,542,208 | | 253,447,311 | |
Total Telecommunication Services | | | | 573,084,609 | |
| | | | | |
Utilities — (0.1%) | | | | | |
* | | Reliant Energy, Inc. | | 911,951 | | 4,787,743 | |
| | | | | |
TOTAL COMMON STOCKS | | | | 6,607,902,761 | |
| | | | | |
| | Face | | | |
| | | | Amount | | | |
| | (000) | | | |
TEMPORARY CASH INVESTMENTS — (1.9%) | | | | | |
| | Repurchase Agreement, PNC Capital Markets, Inc. 0.94%, 11/03/08 (Collateralized by $130,825,000 FNMA 5.50%, 05/01/37 & 6.00%, 05/01/38, valued at $146,641,902) to be repurchased at $144,481,317 | | $144,470 | | 144,470,000 | |
| | | | | |
| | Shares | | | |
SECURITIES LENDING COLLATERAL — (9.4%) | | | | | |
§ @ | | DFA Short Term Investment Fund LP | | 641,002,721 | | 641,002,721 | |
@ | | PNC Demand Deposit Account 0.22% | | 10,000,000 | | 10,000,000 | |
| | | | | |
| | Face | | | |
| | | | Amount | | | |
| | (000) | | | |
@ | | Repurchase Agreement, Deutsche Bank Securitites 0.24%, 11/03/08 (Collateralized by $65,652,304 FNMA, rates ranging from 5.500% to 7.000%, maturities ranging from 07/01/33 to 09/01/38 & U.S. Treasury STRIP 0.599%(y), 02/15/09, valued at $49,188,211) to be repurchased at $48,070,107 | | $48,069 | | 48,069,158 | |
| | | | | |
TOTAL SECURITIES LENDING COLLATERAL | | | | 699,071,879 | |
| | | | | |
TOTAL INVESTMENTS - (100.0%)
(Cost $9,331,596,076) | | | | $7,451,444,640 | |
See accompanying Notes to Financial Statements.
5
THE DFA INTERNATIONAL VALUE SERIES
SCHEDULE OF INVESTMENTS
October 31, 2008
| | | | Shares | | Value †† | |
| | | | | |
AUSTRALIA — (4.7%) | | | | | |
COMMON STOCKS — (4.7%) | | | | | |
| | Amcor, Ltd. | | 1,413,233 | | $5,455,636 | |
| | Amcor, Ltd. Sponsored ADR | | 77,103 | | 1,191,241 | |
# | | APN News & Media, Ltd. | | 526,344 | | 854,799 | |
| | Australia & New Zealand Banking Group, Ltd. | | 3,302,749 | | 38,716,458 | |
| | AXA Asia Pacific Holdings, Ltd. | | 1,686,544 | | 4,975,425 | |
| | Bendigo Bank, Ltd. | | 198,194 | | 1,748,416 | |
| | BlueScope Steel, Ltd. | | 1,761,980 | | 5,182,288 | |
# | | Boral, Ltd. | | 1,165,887 | | 3,509,071 | |
# | | Caltex Australia, Ltd. | | 265,507 | | 1,672,240 | |
| | Commonwealth Bank of Australia | | 2,119,091 | | 57,926,994 | |
| | Crown, Ltd. | | 171,766 | | 768,725 | |
| | CSR, Ltd. | | 1,601,348 | | 2,327,596 | |
| | Downer EDI, Ltd. | | 522,335 | | 1,696,318 | |
# | | Fairfax Media, Ltd. | | 2,026,771 | | 2,598,350 | |
| | Foster’s Group, Ltd. | | 4,257,295 | | 16,274,745 | |
| | Goodman Fielder, Ltd. | | 2,290,858 | | 2,542,304 | |
| | Harvey Norman Holdings, Ltd. | | 113,157 | | 195,318 | |
| | Insurance Australia Group, Ltd. | | 2,728,706 | | 6,912,152 | |
| | Lend Lease Corp., Ltd. | | 666,410 | | 3,083,644 | |
# | | Macquarie Group, Ltd. | | 71,639 | | 1,421,251 | |
| | Metcash, Ltd. | | 400,000 | | 1,079,613 | |
# | | National Australia Bank, Ltd. | | 3,087,538 | | 50,098,709 | |
| | Onesteel, Ltd. | | 1,520,970 | | 3,494,299 | |
| | Origin Energy, Ltd. | | 1,895,569 | | 19,879,356 | |
| | OZ Minerals, Ltd. | | 1,644,020 | | 1,032,798 | |
| | Publishing and Broadcasting, Ltd. | | 31,694 | | 43,370 | |
| | Qantas Airways, Ltd. | | 2,144,492 | | 3,483,217 | |
| | QBE Insurance Group, Ltd. | | 41,746 | | 712,228 | |
# | | Seven Network, Ltd. | | 195,723 | | 821,369 | |
| | Sims Group, Ltd. | | 2 | | 19 | |
| | Suncorp-Metway, Ltd. | | 1,364,610 | | 7,345,940 | |
| | TABCORP Holdings, Ltd. | | 1,277,891 | | 5,858,644 | |
# | | Toll Holdings, Ltd. | | 206,171 | | 823,052 | |
| | Washington H. Soul Pattinson & Co., Ltd. | | 113,801 | | 658,368 | |
| | | | | |
TOTAL — AUSTRALIA | | | | 254,383,953 | |
| | | | | |
AUSTRIA — (0.5%) | | | | | |
COMMON STOCKS — (0.5%) | | | | | |
# | | Erste Group Bank AG | | 262,796 | | 7,006,143 | |
| | OMV AG | | 443,854 | | 14,207,734 | |
| | Voestalpine AG | | 180,281 | | 4,399,658 | |
1
# | | Wienerberger AG | | 162,140 | | 2,691,726 | |
| | | | | |
TOTAL — AUSTRIA | | | | 28,305,261 | |
| | | | | |
BELGIUM — (0.5%) | | | | | |
COMMON STOCKS — (0.5%) | | | | | |
| | Delhaize Group | | 201,237 | | 11,317,280 | |
# | | Delhaize Group Sponsored ADR | | 52,900 | | 2,983,560 | |
# | | Dexia SA | | 1,490,720 | | 7,928,871 | |
| | UCB SA | | 278,888 | | 7,098,739 | |
TOTAL COMMON STOCKS | | | | 29,328,450 | |
| | | | | |
RIGHTS/WARRANTS — (0.0%) | | | | | |
* | | Umicore | | 10,045 | | 256 | |
| | | | | |
TOTAL — BELGIUM | | | | 29,328,706 | |
| | | | | |
CANADA — (5.9%) | | | | | |
COMMON STOCKS — (5.9%) | | | | | |
| | Astral Media, Inc. Class A | | 40,138 | | 928,106 | |
# | | Bank of Montreal | | 364,600 | | 13,013,434 | |
# | | Barrick Gold Corp. | | 1,226,832 | | 28,052,344 | |
| | BCE, Inc. | | 572,125 | | 16,627,843 | |
| | Canadian Pacific Railway, Ltd. | | 329,797 | | 14,926,098 | |
# | | Canadian Tire Corp. Class A | | 166,647 | | 6,332,392 | |
| | Canadian Utilities, Ltd. Class A | | 1,600 | | 56,285 | |
* | | CGI Group, Inc. | | 572,389 | | 4,568,474 | |
# * | | Domtar Corp. | | 315,000 | | 781,424 | |
| | E-L Financial Corp., Ltd. | | 600 | | 194,143 | |
| | Empire Co., Ltd. Class A | | 65,500 | | 2,499,793 | |
# | | EnCana Corp. | | 560,598 | | 28,478,732 | |
# | | Fairfax Financial Holdings, Inc. | | 46,500 | | 12,769,850 | |
| | George Weston, Ltd. | | 107,600 | | 5,491,144 | |
| | Gerdau Ameristeel Corp. | | 403,761 | | 2,160,672 | |
| | Goldcorp, Inc. | | 730,500 | | 13,660,889 | |
| | Industrial Alliance Insurance & Financial Services, Inc. | | 140,300 | | 2,910,064 | |
| | ING Canada, Inc. | | 128,700 | | 3,503,399 | |
| | Jean Coutu Group PJC, Inc. Class A | | 307,800 | | 1,861,663 | |
| | Loblaw Companies, Ltd. | | 184,013 | | 4,480,861 | |
# * | | Lundin Mining Corp. | | 411,100 | | 613,939 | |
| | Magna International, Inc. Class A | | 243,268 | | 8,162,082 | |
| | Manitoba Telecom Services, Inc. | | 40,500 | | 1,431,092 | |
# | | Manulife Financial Corp. | | 771,400 | | 15,436,960 | |
* | | MDS, Inc. | | 316,264 | | 3,303,546 | |
| | Methanex Corp. | | 23,300 | | 264,645 | |
# | | Metro, Inc. Class A | | 137,300 | | 3,457,276 | |
| | National Bank of Canada | | 254,700 | | 9,553,627 | |
# | | Onex Corp. | | 168,200 | | 2,909,624 | |
# * | | OPTI Canada, Inc. | | 24,400 | | 64,983 | |
| | Petro-Canada | | 1,205,300 | | 30,140,000 | |
| | Power Corp. of Canada, Ltd. | | 456,696 | | 9,927,350 | |
2
# | | Quebecor, Inc. Class B | | 70,700 | | 1,153,795 | |
# * | | Saskatchewan Wheat Pool, Inc. | | 381,473 | | 2,421,197 | |
| | Sherritt International Corp. | | 590,000 | | 1,811,167 | |
* | | Sino-Forest Corp. | | 55,300 | | 517,534 | |
| | Sun Life Financial, Inc. | | 1,262,400 | | 29,693,056 | |
| | Teck Cominco Class B | | 614,800 | | 6,120,966 | |
# | | The Thomson Corp. | | 404,700 | | 9,529,068 | |
| | TransCanada Corp. | | 412,302 | | 12,458,341 | |
# | | Yamana Gold, Inc. | | 1,003,800 | | 4,788,725 | |
| | | | | |
TOTAL — CANADA | | | | 317,056,583 | |
| | | | | |
DENMARK — (0.9%) | | | | | |
COMMON STOCKS — (0.9%) | | | | | |
# | | A P Moller - Maersk A.S. | | 3,132 | | 18,024,667 | |
* | | Alm. Brand A.S. | | 11,571 | | 156,831 | |
# | | Carlsberg A.S. Series B | | 133,750 | | 5,265,543 | |
# | | Dampskibsselsk Torm A.S. | | 29,600 | | 478,822 | |
# | | Dampskibsselskabet Torm A.S. ADR | | 15,086 | | 248,014 | |
# | | Danisco A.S. | | 107,780 | | 4,669,508 | |
# | | Danske Bank A.S. | | 965,053 | | 14,285,980 | |
# * | | Jyske Bank A.S. | | 93,150 | | 2,751,375 | |
| | Sydbank A.S. | | 71,200 | | 1,106,614 | |
| | | | | |
TOTAL — DENMARK | | | | 46,987,354 | |
| | | | | |
FINLAND — (1.0%) | | | | | |
COMMON STOCKS — (1.0%) | | | | | |
| | Fortum Oyj | | 390,135 | | 9,587,983 | |
# | | Kesko Oyj | | 152,447 | | 3,568,514 | |
| | Outokumpu Oyj Series A | | 333,313 | | 3,454,132 | |
| | Pohjola Bank P.L.C. | | 117,000 | | 1,574,185 | |
| | Sampo Oyj | | 491,593 | | 9,851,386 | |
| | Stora Enso Oyj Series R | | 991,740 | | 9,222,615 | |
| | Stora Enso Oyj Sponsored ADR | | 91,500 | | 825,330 | |
| | UPM-Kymmene Oyj | | 944,769 | | 13,359,342 | |
| | UPM-Kymmene Oyj Sponsored ADR | | 69,300 | | 975,051 | |
| | | | | |
TOTAL — FINLAND | | | | 52,418,538 | |
| | | | | |
FRANCE — (8.5%) | | | | | |
COMMON STOCKS — (8.5%) | | | | | |
# | | Air France-KLM | | 250,260 | | 3,605,673 | |
| | Atos Origin SA | | 30,931 | | 718,263 | |
# | | AXA SA | | 2,818,397 | | 53,842,817 | |
| | AXA SA Sponsored ADR | | 90,300 | | 1,689,513 | |
# | | BNP Paribas SA | | 1,558,158 | | 112,501,123 | |
| | Capgemini SA | | 259,094 | | 8,347,945 | |
| | Casino Guichard Perrachon SA | | 90,782 | | 6,345,930 | |
# | | Ciments Francais SA | | 26,702 | | 1,938,738 | |
| | CNP Assurances | | 72,302 | | 5,825,949 | |
# | | Compagnie de Saint-Gobain | | 580,915 | | 22,415,677 | |
| | Compagnie Generale des Establissements Michelin Series B | | 211,913 | | 10,907,391 | |
3
| | Credit Agricole SA | | 1,444,499 | | 20,897,598 | |
| | Esso Ste Anonyme Francaise | | 2,114 | | 243,131 | |
| | Euler Hermes SA | | 10,758 | | 529,962 | |
# | | European Aeronautic Defence & Space Co. | | 676,746 | | 11,256,159 | |
# | | France Telecom SA | | 829,338 | | 20,912,252 | |
| | France Telecom SA Sponsored ADR | | 123,605 | | 3,129,679 | |
# | | Lafarge SA | | 319,678 | | 21,133,151 | |
| | Lagardere S.C.A. | | 238,722 | | 9,491,600 | |
| | Nexans SA | | 23,976 | | 1,367,590 | |
| | Peugeot SA | | 325,797 | | 8,693,852 | |
| | PPR SA | | 156,369 | | 9,965,473 | |
| | Remy Cointreau SA | | 41 | | 1,706 | |
# | | Renault SA | | 383,543 | | 11,754,754 | |
# | | Rexel SA | | 123,451 | | 1,203,765 | |
# | | Safran SA | | 312,438 | | 3,965,327 | |
| | Schneider Electric SA | | 288,328 | | 17,281,707 | |
| | SCOR SE (4797364) | | 6 | | 16 | |
| | SCOR SE (B1LB9P6) | | 193,766 | | 3,174,591 | |
| | Societe Generale Paris | | 356,270 | | 19,418,514 | |
| | STMicroelectronics NV | | 624,832 | | 5,136,307 | |
| | Vivendi SA | | 2,482,257 | | 64,884,026 | |
| | | | | |
TOTAL — FRANCE | | | | 462,580,179 | |
| | | | | |
GERMANY — (8.8%) | | | | | |
COMMON STOCKS — (8.8%) | | | | | |
| | Allianz SE | | 442,712 | | 33,313,833 | |
| | Allianz SE Sponsored ADR | | 2,772,640 | | 21,016,611 | |
# | | AMB Generali Holding AG | | 33,484 | | 3,661,890 | |
| | Bayerische Motoren Werke AG | | 709,047 | | 17,980,438 | |
| | Bilfinger Berger AG | | 21,332 | | 965,059 | |
# | | Celesio AG | | 131,969 | | 3,874,496 | |
# | | Commerzbank AG | | 1,089,462 | | 11,719,253 | |
# | | Daimler AG | | 1,684,003 | | 57,854,323 | |
# | | Daimler AG Sponsored ADR | | 163,964 | | 5,656,758 | |
# | | Deutsche Bank AG | | 774,190 | | 28,921,349 | |
# | | Deutsche Bank AG ADR | | 128,363 | | 4,875,227 | |
# | | Deutsche Lufthansa AG | | 395,567 | | 5,478,653 | |
| | Deutsche Postbank AG | | 14,003 | | 284,458 | |
# | | Deutsche Telekom AG | | 2,621,866 | | 38,930,629 | |
| | Deutsche Telekom AG Sponsored ADR | | 2,705,150 | | 40,171,477 | |
| | E.ON AG | | 1,781,013 | | 68,160,893 | |
# | | E.ON AG Sponsored ADR | | 1,091,708 | | 41,484,904 | |
# | | Fraport AG | | 41,329 | | 1,323,747 | |
| | Hannover Rueckversicherung AG | | 110,141 | | 2,732,165 | |
# | | Heidelberger Zement AG | | 28,931 | | 2,073,604 | |
| | Hochtief AG | | 8,774 | | 272,050 | |
* | | Infineon Technologies AG | | 1,208,286 | | 3,779,850 | |
* | | Infineon Technologies AG ADR | | 98,600 | | 308,618 | |
# | | Lanxess AG | | 44,897 | | 679,504 | |
# | | Linde AG | | 133,956 | | 11,267,653 | |
| | Munchener Rueckversicherungs-Gesellschaft AG | | 388,934 | | 50,491,309 | |
4
| | Salzgitter AG | | 47,551 | | 3,127,045 | |
| | SCA Hygiene Products AG | | 3,195 | | 1,219,540 | |
# | | Suedzucker AG | | 102,666 | | 1,141,358 | |
| | ThyssenKrupp AG | | 393,850 | | 7,380,232 | |
# | | TUI AG | | 320,226 | | 3,855,421 | |
| | | | | |
TOTAL — GERMANY | | | | 474,002,347 | |
| | | | | |
GREECE — (0.3%) | | | | | |
COMMON STOCKS — (0.3%) | | | | | |
| | Agricultural Bank of Greece S.A. | | 285,278 | | 677,394 | |
| | Alpha Bank A.E. | | 214,210 | | 3,127,453 | |
| | EFG Eurobank Ergasias S.A. | | 60,000 | | 652,180 | |
| | Hellenic Petroleum S.A. | | 580,801 | | 4,811,644 | |
# | | National Bank of Greece S.A. ADR | | 619,230 | | 2,706,035 | |
| | Piraeus Bank S.A. | | 170,906 | | 2,168,050 | |
| | | | | |
TOTAL — GREECE | | | | 14,142,756 | |
| | | | | |
HONG KONG — (2.5%) | | | | | |
COMMON STOCKS — (2.5%) | | | | | |
| | C C Land Holdings, Ltd. | | 790,000 | | 143,493 | |
# | | Cathay Pacific Airways, Ltd. | | 2,703,000 | | 3,298,495 | |
# | | Cheung Kong Holdings, Ltd. | | 3,224,000 | | 30,955,317 | |
* | | CITIC International Financial Holdings, Ltd. | | 1,425,000 | | 900,962 | |
| | Dah Sing Banking Group, Ltd. | | 306,964 | | 171,111 | |
# | | Dah Sing Financial Holdings, Ltd. | | 194,400 | | 471,596 | |
# * | | Galaxy Entertainment Group, Ltd. | | 1,318,000 | | 97,327 | |
| | Great Eagle Holdings, Ltd. | | 521,233 | | 598,381 | |
# | | Hang Lung Group, Ltd. | | 2,202,000 | | 7,085,981 | |
| | Henderson Land Development Co., Ltd. | | 1,855,000 | | 6,708,408 | |
# | | Hong Kong and Shanghai Hotels, Ltd. | | 1,147,022 | | 1,083,403 | |
| | Hopewell Holdings, Ltd. | | 1,413,000 | | 4,393,135 | |
| | Hutchison Whampoa, Ltd. | | 5,472,000 | | 29,569,976 | |
| | Hysan Development Co., Ltd. | | 1,441,191 | | 2,259,876 | |
| | Kingboard Chemical Holdings, Ltd. | | 1,145,500 | | 2,286,656 | |
# | | MTR Corp., Ltd. | | 2,813,040 | | 6,233,506 | |
# | | New World China Land, Ltd. | | 1,963,600 | | 336,276 | |
| | New World Development Co., Ltd. | | 3,947,065 | | 3,285,671 | |
| | Sino Land Co., Ltd. | | 2,559,315 | | 2,250,100 | |
| | Sun Hung Kai Properties, Ltd. | | 2,528,000 | | 22,148,070 | |
| | Wharf Holdings, Ltd. | | 3,509,740 | | 7,002,705 | |
# | | Wheelock and Co., Ltd. | | 3,482,000 | | 5,216,211 | |
| | Wheelock Properties, Ltd. | | 1,565,000 | | 530,633 | |
| | | | | |
TOTAL — HONG KONG | | | | 137,027,289 | |
| | | | | |
IRELAND — (0.3%) | | | | | |
COMMON STOCKS — (0.3%) | | | | | |
| | Allied Irish Banks P.L.C. (0019783) | | 932,956 | | 5,000,022 | |
| | Allied Irish Banks P.L.C. (4020684) | | 286,577 | | 1,526,495 | |
# | | Allied Irish Banks P.L.C. Sponsored ADR | | 391,037 | | 4,047,233 | |
| | Bank of Ireland P.L.C. | | 1,247,876 | | 3,691,940 | |
5
| | Bank of Ireland P.L.C. Sponsored ADR | | 8,000 | | 97,120 | |
| | Irish Life & Permanent P.L.C. | | 719,172 | | 2,519,791 | |
| | | | | |
TOTAL — IRELAND | | | | 16,882,601 | |
| | | | | |
ITALY — (1.9%) | | | | | |
COMMON STOCKS — (1.9%) | | | | | |
# | | Banca Monte Dei Paschi di Siena SpA | | 2,415,790 | | 4,690,180 | |
# | | Banca Popolare di Milano Scarl | | 982,340 | | 5,749,175 | |
| | Banco Popolare Scarl | | 227,880 | | 2,842,793 | |
| | Fondiaria - Sai SpA | | 167,605 | | 3,148,760 | |
| | Intesa Sanpaolo SpA | | 2,827,315 | | 10,347,673 | |
# | | Italcementi SpA | | 273,413 | | 3,186,689 | |
| | Italmobiliare SpA | | 25,663 | | 1,054,096 | |
| | Pirelli & Co. SpA | | 6,030,909 | | 2,126,375 | |
| | Telecom Italia SpA | | 4,286,450 | | 4,924,131 | |
# | | Telecom Italia SpA Sponsored ADR | | 1,853,000 | | 21,124,200 | |
| | UniCredito Italiano SpA | | 10,088,794 | | 24,697,595 | |
| | Unione di Banche Italiane ScpA | | 934,145 | | 15,759,144 | |
| | Unipol Gruppo Finanziario SpA | | 1,822,774 | | 3,233,937 | |
| | | | | |
TOTAL — ITALY | | | | 102,884,748 | |
| | | | | |
JAPAN — (13.3%) | | | | | |
COMMON STOCKS — (13.3%) | | | | | |
# | | AEON Co., Ltd. | | 320,300 | | 3,071,379 | |
| | Aioi Insurance Co., Ltd. | | 1,178,735 | | 4,840,116 | |
# | | Aisin Seiki Co., Ltd. | | 186,700 | | 3,303,750 | |
| | Ajinomoto Co., Inc. | | 1,130,000 | | 9,756,863 | |
| | Alps Electric Co., Ltd. | | 263,100 | | 1,447,368 | |
| | Amada Co., Ltd. | | 631,000 | | 2,897,735 | |
| | Aoyama Trading Co., Ltd. | | 105,500 | | 1,233,469 | |
# | | Asatsu-Dk, Inc. | | 32,500 | | 719,402 | |
# | | Bridgestone Corp. | | 954,300 | | 16,684,018 | |
| | Calsonic Kansei Corp. | | 190,000 | | 329,137 | |
| | Canon Marketing Japan, Inc. | | 124,900 | | 2,089,472 | |
| | Chudenko Corp. | | 41,100 | | 616,816 | |
| | Chuo Mitsui Trust Holdings, Inc. | | 637,000 | | 2,513,214 | |
| | Citizen Holdings Co., Ltd. | | 377,500 | | 2,088,743 | |
| | Coca-Cola West Japan Co., Ltd. | | 65,907 | | 1,321,828 | |
| | Comsys Holdings Corp. | | 149,000 | | 1,065,142 | |
| | Cosmo Oil Co., Ltd. | | 980,000 | | 2,084,724 | |
# | | CSK Holdings Corp. | | 100,600 | | 840,823 | |
| | Dai Nippon Printing Co., Ltd. | | 1,093,000 | | 12,913,952 | |
# | | Dai Nippon Sumitomo Pharma Co., Ltd. | | 321,000 | | 2,536,156 | |
| | Daicel Chemical Industries, Ltd. | | 485,000 | | 1,748,716 | |
| | Dainippon Ink & Chemicals, Inc. | | 596,000 | | 963,352 | |
| | Daiwa House Industry Co., Ltd. | | 916,000 | | 8,143,166 | |
| | Denso Corp. | | 7,500 | | 146,179 | |
# | | Dentsu, Inc. | | 527 | | 864,721 | |
# | | Ebara Corp. | | 253,000 | | 504,329 | |
# * | | Elpida Memory, Inc. | | 112,900 | | 601,904 | |
6
| | Fuji Electric Holdings Co., Ltd. | | 781,780 | | 1,140,650 | |
| | Fuji Heavy Industries, Ltd. | | 988,000 | | 3,475,459 | |
| | FUJIFILM Holdings Corp. | | 1,077,300 | | 24,799,840 | |
| | Fujikura, Ltd. | | 609,000 | | 1,745,356 | |
| | Fukuoka Financial Group, Inc. | | 1,329,000 | | 4,395,550 | |
# | | Futaba Industrial Co., Ltd. | | 85,600 | | 533,079 | |
| | Glory, Ltd. | | 75,400 | | 1,080,565 | |
| | Gunze, Ltd. | | 248,000 | | 818,613 | |
# | | H2O Retailing Corp. | | 198,000 | | 1,221,898 | |
# | | Hakuhodo Dy Holdings, Inc. | | 12,670 | | 576,929 | |
| | Hankyu Hanshin Holdings, Inc. | | 1,180,000 | | 5,566,543 | |
| | Heiwa Corp. | | 81,500 | | 559,298 | |
| | Hino Motors, Ltd. | | 217,000 | | 501,476 | |
# | | Hitachi Cable, Ltd. | | 364,000 | | 766,674 | |
| | Hitachi Transport System, Ltd. | | 111,000 | | 1,484,392 | |
| | Hitachi, Ltd. | | 6,574,000 | | 30,865,283 | |
# | | Hitachi, Ltd. Sponsored ADR | | 140,900 | | 6,627,936 | |
# | | House Foods Corp. | | 117,000 | | 1,901,791 | |
# | | Idemitsu Kosan Co., Ltd. | | 25,800 | | 1,504,218 | |
| | INPEX Corp. | | 1 | | 1,393 | |
| | JS Group Corp. | | 548,300 | | 7,099,955 | |
# | | Juroku Bank, Ltd. | | 400,000 | | 1,475,329 | |
| | Kajima Corp. | | 1,395,000 | | 4,034,951 | |
| | Kamigumi Co., Ltd. | | 488,000 | | 3,882,322 | |
# | | Kandenko Co., Ltd. | | 129,000 | | 677,847 | |
| | Kaneka Corp. | | 560,000 | | 2,613,265 | |
# | | Kansai Paint Co., Ltd. | | 111,000 | | 619,506 | |
| | Kinden Corp. | | 240,000 | | 2,003,934 | |
| | Kissei Pharmaceutical Co., Ltd. | | 30,000 | | 684,138 | |
| | Komori Corp. | | 101,100 | | 1,155,886 | |
| | Kuraray Co., Ltd. | | 107,000 | | 818,840 | |
| | Kyocera Corp. | | 327,900 | | 19,260,319 | |
| | Kyocera Corp. Sponsored ADR | | 13,600 | | 819,264 | |
# | | Mabuchi Motor Co., Ltd. | | 36,300 | | 1,435,828 | |
# | | Marui Group Co., Ltd. | | 498,500 | | 3,047,238 | |
| | Mazda Motor Corp. | | 96,000 | | 212,910 | |
# | | Meiji Dairies Corp. | | 88,000 | | 401,365 | |
# | | Meiji Seika Kaisha, Ltd. | | 408,000 | | 1,668,368 | |
| | Mitsubishi Gas Chemical Co., Inc. | | 95,000 | | 349,572 | |
# | | Mitsubishi Heavy Industries, Ltd. | | 6,023,000 | | 19,311,903 | |
| | Mitsubishi Logistics Corp. | | 146,000 | | 1,328,322 | |
# | | Mitsubishi Rayon Co., Ltd. | | 1,012,000 | | 2,172,518 | |
| | Mitsubishi UFJ Financial Group, Inc. ADR | | 857,000 | | 5,373,390 | |
# | | Mitsui Chemicals, Inc. | | 1,244,800 | | 4,346,203 | |
# | | Mitsui Mining and Smelting Co., Ltd. | | 915,000 | | 1,673,436 | |
| | Mitsui Sumitomo Insurance Group Holdings, Inc. | | 753,600 | | 20,941,334 | |
| | Musashino Bank, Ltd. | | 37,500 | | 1,129,622 | |
| | Nagase & Co., Ltd. | | 196,000 | | 1,679,535 | |
| | NEC Corp. | | 4,396,101 | | 13,033,403 | |
# | | NGK Spark Plug Co., Ltd. | | 254,000 | | 2,394,380 | |
| | Nippon Express Co., Ltd. | | 1,363,000 | | 5,501,407 | |
| | Nippon Kayaku Co., Ltd. | | 128,000 | | 586,173 | |
7
| | Nippon Meat Packers, Inc. | | 220,536 | | 3,024,881 | |
| | Nippon Mining Holdings, Inc. | | 1,731,500 | | 5,300,733 | |
| | Nippon Mitsubishi Oil Corp. | | 2,732,050 | | 11,214,424 | |
| | Nippon Paper Group, Inc. | | 1,563 | | 4,177,343 | |
# | | Nippon Sheet Glass Co., Ltd. | | 1,009,000 | | 3,299,830 | |
| | Nippon Shokubai Co., Ltd. | | 231,000 | | 1,338,666 | |
| | Nippon Suisan Kaisha, Ltd. | | 254,000 | | 633,797 | |
| | Nippon Television Network Corp. | | 9,400 | | 906,914 | |
| | Nipponkoa Insurance Co., Ltd. | | 848,000 | | 5,082,550 | |
# | | Nipro Corp. | | 42,000 | | 643,896 | |
| | Nishi-Nippon Bank, Ltd. | | 1,123,000 | | 2,446,504 | |
| | Nissan Motor Co., Ltd. | | 3,567,800 | | 17,719,112 | |
| | Nissay Dowa General Insurance Co., Ltd. | | 383,000 | | 1,703,703 | |
| | Nisshin Seifun Group, Inc. | | 64,000 | | 693,855 | |
| | Nisshin Steel Co., Ltd. | | 1,226,000 | | 1,641,832 | |
# | | Nisshinbo Industries, Inc. | | 305,000 | | 1,772,768 | |
# | | NOK Corp. | | 112,600 | | 1,072,064 | |
| | Obayashi Corp. | | 945,000 | | 4,623,656 | |
# | | Oji Paper Co., Ltd. | | 1,756,000 | | 6,704,486 | |
| | Onward Holdings Co., Ltd. | | 251,000 | | 1,835,830 | |
| | Panasonic Corp. | | 763,135 | | 12,289,325 | |
| | Panasonic Electric Works Co., Ltd. | | 616,000 | | 5,376,324 | |
# | | Pioneer Electronic Corp. | | 272,600 | | 808,635 | |
| | Q.P. Corp. | | 135,900 | | 1,562,656 | |
# | | Rengo Co., Ltd. | | 254,000 | | 1,295,203 | |
| | Ricoh Co., Ltd. | | 779,000 | | 8,383,612 | |
| | Rohm Co., Ltd. | | 171,800 | | 8,278,302 | |
| | Sanwa Holdings Corp. | | 238,000 | | 789,582 | |
| | Sapporo Hokuyo Holdings, Inc. | | 428 | | 1,845,867 | |
# | | Sega Sammy Holdings, Inc. | | 373,300 | | 2,822,079 | |
# | | Seiko Epson Corp. | | 249,600 | | 3,748,627 | |
| | Seino Holdings Co., Ltd. | | 295,000 | | 1,427,504 | |
| | Sekisui Chemical Co., Ltd. | | 689,000 | | 4,025,599 | |
| | Sekisui House, Ltd. | | 1,131,000 | | 11,341,152 | |
# | | Shiga Bank, Ltd. | | 301,000 | | 1,868,908 | |
| | Shimachu Co., Ltd. | | 70,700 | | 1,612,472 | |
| | Shimizu Corp. | | 1,099,000 | | 5,392,733 | |
| | Shinko Securities Co., Ltd. | | 819,000 | | 2,030,922 | |
| | Shinsei Bank, Ltd. | | 394,000 | | 604,360 | |
| | Shizuoka Bank, Ltd. | | 943,000 | | 8,328,342 | |
# | | Showa Shell Sekiyu K.K. | | 36,200 | | 295,728 | |
# | | Sohgo Security Services Co., Ltd. | | 101,300 | | 947,263 | |
| | Sojitz Corp. | | 1,875,200 | | 3,133,572 | |
| | Sompo Japan Insurance, Inc. | | 1,881,000 | | 13,184,221 | |
| | Sony Corp. | | 652,500 | | 15,464,479 | |
| | Sony Corp. Sponsored ADR | | 862,281 | | 20,039,410 | |
| | Sumco Corp. | | 158,300 | | 1,714,235 | |
| | Sumitomo Bakelite Co., Ltd. | | 347,000 | | 1,265,845 | |
| | Sumitomo Corp. | | 1,638,700 | | 14,417,351 | |
| | Sumitomo Electric Industries, Ltd. | | 1,097,400 | | 8,885,150 | |
| | Sumitomo Forestry Co., Ltd. | | 158,000 | | 1,036,701 | |
# | | Sumitomo Rubber Industries, Ltd. | | 256,500 | | 2,262,732 | |
8
| | Sumitomo Trust & Banking Co., Ltd. | | 2,774,000 | | 12,846,613 | |
| | Suzuken Co., Ltd. | | 25,000 | | 534,164 | |
| | Taiheiyo Cement Corp. | | 1,638,800 | | 1,907,497 | |
| | Taisei Corp. | | 1,740,000 | | 4,010,024 | |
| | Taisho Pharmaceutical Co., Ltd. | | 166,000 | | 2,989,954 | |
# | | Taiyo Yuden Co., Ltd. | | 184,000 | | 882,053 | |
# | | Takashimaya Co., Ltd. | | 299,000 | | 2,304,402 | |
| | TDK Corp. | | 151,000 | | 5,102,183 | |
| | Teijin, Ltd. | | 1,827,000 | | 4,751,403 | |
| | The 77 Bank, Ltd. | | 494,000 | | 2,327,452 | |
| | The Awa Bank, Ltd. | | 246,600 | | 1,533,352 | |
# | | The Bank of Iwate, Ltd. | | 19,600 | | 1,218,179 | |
| | The Bank of Kyoto, Ltd. | | 353,400 | | 3,717,326 | |
| | The Bank of Nagoya, Ltd. | | 213,000 | | 1,282,206 | |
| | The Chiba Bank, Ltd. | | 823,000 | | 4,067,792 | |
| | The Chugoku Bank, Ltd. | | 240,800 | | 3,312,710 | |
| | The Daishi Bank, Ltd. | | 427,000 | | 1,662,698 | |
| | The Fuji Fire & Marine Insurance Co., Ltd. | | 297,000 | | 593,288 | |
| | The Gunma Bank, Ltd. | | 529,000 | | 2,701,155 | |
# | | The Hachijuni Bank, Ltd. | | 675,000 | | 3,312,140 | |
| | The Higo Bank, Ltd. | | 278,000 | | 1,538,742 | |
| | The Hiroshima Bank, Ltd. | | 719,000 | | 2,671,811 | |
| | The Hokkoku Bank, Ltd. | | 394,000 | | 1,483,244 | |
| | The Hyakugo Bank, Ltd. | | 303,000 | | 1,701,851 | |
| | The Hyakujishi Bank, Ltd. | | 329,000 | | 1,642,231 | |
| | The Iyo Bank, Ltd. | | 340,000 | | 3,667,934 | |
# | | The Joyo Bank, Ltd. | | 1,509,000 | | 7,099,108 | |
| | The Kagoshima Bank, Ltd. | | 273,000 | | 1,730,771 | |
| | The Keiyo Bank, Ltd. | | 317,000 | | 1,421,148 | |
# | | The Nanto Bank, Ltd. | | 317,000 | | 1,489,583 | |
| | The Ogaki Kyoritsu Bank, Ltd. | | 334,000 | | 1,659,851 | |
| | The San-in Godo Bank, Ltd. | | 241,000 | | 1,725,158 | |
# | | Toda Corp. | | 385,000 | | 1,390,692 | |
| | Tokai Tokyo Securities Co., Ltd. | | 155,000 | | 424,599 | |
| | Tokio Marine Holdings, Inc. | | 1,457,311 | | 44,952,061 | |
| | Tokuyama Corp. | | 252,000 | | 1,276,170 | |
| | Tokyo Steel Manufacturing Co., Ltd. | | 186,800 | | 1,442,876 | |
# | | Toppan Forms Co., Ltd. | | 48,500 | | 450,506 | |
| | Toppan Printing Co., Ltd. | | 1,154,000 | | 8,485,278 | |
| | Toshiba TEC Corp. | | 181,000 | | 558,872 | |
| | Toyo Ink Manufacturing Co., Ltd. | | 213,000 | | 564,592 | |
| | Toyo Seikan Kaisha, Ltd. | | 334,800 | | 4,130,621 | |
# | | Toyobo Co., Ltd. | | 743,000 | | 1,053,758 | |
| | Toyota Auto Body Co., Ltd. | | 105,100 | | 1,684,959 | |
| | TV Asahi Corp. | | 755 | | 953,331 | |
| | UNY Co., Ltd. | | 309,000 | | 2,408,170 | |
# | | Wacoal Corp. | | 135,000 | | 1,462,521 | |
| | Yamaguchi Financial Group, Inc. | | 313,000 | | 2,993,825 | |
# | | Yamaha Corp. | | 285,400 | | 2,765,805 | |
| | Yamaha Motor Co., Ltd. | | 255,300 | | 2,822,584 | |
| | Yamanashi Chuo Bank, Ltd. | | 241,000 | | 1,370,714 | |
| | Yamazaki Baking Co., Ltd. | | 22,000 | | 292,312 | |
9
| | Yokogawa Electric Corp. | | 274,000 | | 1,268,818 | |
| | Yokohama Rubber Co., Ltd. | | 410,000 | | 2,011,769 | |
| | | | | |
TOTAL — JAPAN | | | | 722,594,471 | |
| | | | | |
MALAYSIA — (0.0%) | | | | | |
COMMON STOCKS — (0.0%) | | | | | |
* | | Rekapacific Berhad | | 691,000 | | — | |
| | | | | |
NETHERLANDS — (3.5%) | | | | | |
COMMON STOCKS — (3.5%) | | | | | |
| | Aegon NV (5927375) | | 3,202,429 | | 13,306,633 | |
* | | Aegon NV (B3CH8P0) | | 234,015 | | — | |
# | | ArcelorMittal | | 1,877,993 | | 48,755,658 | |
# | | Heineken Holding NV | | 74,614 | | 2,265,169 | |
| | ING Groep NV | | 3,093,625 | | 29,019,312 | |
| | ING Groep NV Sponsored ADR | | 538,200 | | 5,010,642 | |
# | | Koninklijke Ahold NV | | 1,318,845 | | 14,158,302 | |
# | | Koninklijke DSM NV | | 386,232 | | 10,755,948 | |
| | Koninklijke Philips Electronics NV | | 3,192,970 | | 59,005,541 | |
| | Koninklijke Philips Electronics NV ADR | | 133,700 | | 2,473,450 | |
* | | Reinet Investments SCA | | 154,136 | | 1,587,350 | |
| | SNS Reaal | | 194,551 | | 1,427,166 | |
| | | | | |
TOTAL — NETHERLANDS | | | | 187,765,171 | |
| | | | | |
NEW ZEALAND — (0.1%) | | | | | |
COMMON STOCKS — (0.1%) | | | | | |
# | | Contact Energy, Ltd. | | 1,263,902 | | 5,358,576 | |
# | | Fletcher Building, Ltd. | | 618,947 | | 2,101,670 | |
| | | | | |
TOTAL — NEW ZEALAND | | | | 7,460,246 | |
| | | | | |
NORWAY — (0.8%) | | | | | |
COMMON STOCKS — (0.8%) | | | | | |
| | Bonheur ASA | | 300 | | 5,757 | |
| | DnB NOR ASA Series A | | 2,507,294 | | 14,530,611 | |
# * | | Marine Harvest | | 5,652,000 | | 912,942 | |
| | Norsk Hydro ASA | | 1,764,614 | | 7,373,068 | |
| | Norsk Hydro ASA Sponsored ADR | | 59,900 | | 248,585 | |
| | Orkla ASA | | 2,700,350 | | 17,976,811 | |
| | Storebrand ASA | | 713,900 | | 1,692,181 | |
| | Wilh. Wilhelmsen ASA | | 11,850 | | 170,413 | |
| | | | | |
TOTAL — NORWAY | | | | 42,910,368 | |
| | | | | |
PORTUGAL — (0.1%) | | | | | |
COMMON STOCKS — (0.1%) | | | | | |
# | | Banco BPI SA | | 275,646 | | 568,076 | |
# | | Banco Comercial Portugues SA | | 2,008,205 | | 2,333,899 | |
10
# | | Banco Espirito Santo SA | | 320,446 | | 3,051,033 | |
# | | Cimpor Cimentos de Portugal SA | | 129,009 | | 588,705 | |
| | | | | |
TOTAL — PORTUGAL | | | | 6,541,713 | |
| | | | | |
SINGAPORE — (1.1%) | | | | | |
COMMON STOCKS — (1.1%) | | | | | |
* | | Chartered Semiconductor Manufacturing, Ltd. | | 906,000 | | 140,682 | |
| | DBS Group Holdings, Ltd. | | 2,776,500 | | 21,194,400 | |
| | Fraser & Neave, Ltd. | | 2,351,450 | | 4,437,036 | |
| | Jardine Cycle & Carriage, Ltd. | | 179,324 | | 1,150,252 | |
# | | Neptune Orient Lines, Ltd. | | 697,000 | | 588,691 | |
| | Overseas Chinese Banking Corp., Ltd. | | 3,086,000 | | 10,433,618 | |
# | | Singapore Airlines, Ltd. | | 1,301,600 | | 9,972,225 | |
# | | Singapore Land, Ltd. | | 603,000 | | 1,369,777 | |
| | United Industrial Corp., Ltd. | | 1,391,000 | | 1,262,279 | |
| | United Overseas Bank, Ltd. | | 528,000 | | 4,773,519 | |
| | UOL Group, Ltd. | | 1,376,600 | | 1,802,007 | |
| | Venture Corp., Ltd. | | 85,000 | | 310,621 | |
# | | Wheelock Properties, Ltd. | | 526,000 | | 297,664 | |
| | | | | |
TOTAL — SINGAPORE | | | | 57,732,771 | |
| | | | | |
SPAIN — (4.2%) | | | | | |
COMMON STOCKS — (4.2%) | | | | | |
| | Acciona SA | | 68,193 | | 6,450,366 | |
# | | Acerinox SA | | 464,577 | | 5,840,211 | |
# | | Banco Bilbao Vizcaya Argentaria SA Sponsored ADR | | 379,800 | | 4,405,680 | |
# | | Banco de Sabadell SA | | 2,431,718 | | 16,586,375 | |
# | | Banco Espanol de Credito SA | | 264,996 | | 3,371,341 | |
# | | Banco Pastor SA | | 320,162 | | 2,661,461 | |
# | | Banco Popular Espanol SA | | 467,750 | | 4,256,830 | |
# | | Banco Santander Central Hispano SA | | 7,025,356 | | 75,980,397 | |
* | | Banco Santander SA | | 149,432 | | 1,641,917 | |
# | | Banco Santander SA Sponsored ADR | | 3,044,700 | | 32,700,078 | |
# | | Bankinter SA | | 210,353 | | 2,269,803 | |
# | | Fomento de Construcciones y Contratas SA | | 46,530 | | 1,850,125 | |
# | | Gas Natural SDG SA | | 212,029 | | 6,525,799 | |
# | | Grupo Catalana Occidente SA | | 125,781 | | 1,978,156 | |
# | | Grupo Ferrovial SA | | 211,889 | | 6,530,193 | |
| | Iberia Lineas Aereas de Espana SA | | 617,500 | | 1,456,795 | |
# | | Mapfre SA | | 732,775 | | 2,332,078 | |
| | Repsol YPF SA | | 1,204,043 | | 22,895,968 | |
| | Repsol YPF SA Sponsored ADR | | 1,285,700 | | 24,582,584 | |
# | | Sacyr Vallehermoso SA | | 68,588 | | 632,545 | |
* | | Sacyr Vallehermoso SA Issue 08 | | 4,899 | | 44,958 | |
| | | | | |
TOTAL — SPAIN | | | | 224,993,660 | |
| | | | | |
SWEDEN — (2.4%) | | | | | |
COMMON STOCKS — (2.4%) | | | | | |
# | | Boliden AB | | 497,200 | | 1,195,907 | |
# | | Electrolux AB Series B | | 460,347 | | 4,238,049 | |
11
| | Holmen AB Series A | | 6,300 | | 185,534 | |
# | | Holmen AB Series B | | 146,100 | | 4,118,077 | |
# | | Nordea Bank AB | | 4,247,718 | | 34,046,034 | |
# | | Skandinaviska Enskilda Banken AB Series A | | 722,000 | | 7,155,501 | |
# | | Skandinaviska Enskilda Banken AB Series C | | 9,800 | | 90,862 | |
| | Skanska AB Series B | | 449,400 | | 3,947,105 | |
| | SSAB Svenskt Stal AB Series A | | 427,300 | | 4,320,451 | |
# | | SSAB Svenskt Stal AB Series B | | 131,700 | | 1,193,966 | |
| | Svenska Cellulosa AB | | 57,000 | | 424,064 | |
| | Svenska Cellulosa AB Series B | | 1,331,900 | | 9,835,281 | |
# | | Svenska Handelsbanken AB Series A | | 740,000 | | 13,598,988 | |
# | | Swedbank AB Series A | | 349,300 | | 2,886,587 | |
| | Tele2 AB Series B | | 476,500 | | 4,066,059 | |
# | | Telefonaktiebolaget LM Erricson Sponsored ADR | | 1,431,356 | | 10,119,687 | |
| | TeliaSonera AB | | 3,790,500 | | 16,676,942 | |
| | Volvo AB Series A | | 898,101 | | 4,641,204 | |
# | | Volvo AB Series B | | 1,028,966 | | 5,377,003 | |
| | | | | |
TOTAL — SWEDEN | | | | 128,117,301 | |
| | | | | |
SWITZERLAND — (5.9%) | | | | | |
COMMON STOCKS — (5.9%) | | | | | |
# | | Adecco SA | | 413,827 | | 14,395,755 | |
| | Baloise-Holding AG | | 200,163 | | 10,701,617 | |
| | Banque Cantonale Vaudoise | | 9,461 | | 2,108,802 | |
* | | Compagnie Financiere Richemont SA Series A | | 1,125,900 | | 23,669,433 | |
| | Credit Suisse Group AG | | 1,755,349 | | 65,639,295 | |
# | | Credit Suisse Group AG Sponsored ADR | | 591,859 | | 22,135,527 | |
# | | Givaudan SA | | 13,556 | | 9,237,258 | |
| | Holcim, Ltd. | | 435,033 | | 24,709,544 | |
| | Julius Baer Holdings, Ltd. AG | | 38,097 | | 1,489,983 | |
| | PSP Swiss Property AG | | 95,780 | | 4,143,944 | |
| | St. Galler Kantonalbank | | 9,132 | | 3,188,845 | |
| | Sulzer AG | | 15,000 | | 885,598 | |
| | Swatch Group AG | | 28,715 | | 4,480,806 | |
| | Swiss Life Holding AG | | 123,557 | | 11,133,243 | |
| | Swiss Re | | 725,996 | | 30,276,699 | |
| | Syngenta AG | | 92,793 | | 17,346,099 | |
* | | UBS AG | | 807,541 | | 13,701,770 | |
| | Zurich Financial SVCS AG | | 300,246 | | 60,913,201 | |
| | | | | |
TOTAL — SWITZERLAND | | | | 320,157,419 | |
| | | | | |
UNITED KINGDOM — (17.2%) | | | | | |
COMMON STOCKS — (17.2%) | | | | | |
| | Anglo American P.L.C. | | 1,329,421 | | 33,356,819 | |
| | Arriva P.L.C. | | 105,930 | | 1,024,812 | |
| | Associated British Foods P.L.C. | | 1,870,707 | | 20,932,235 | |
| | Aviva P.L.C. | | 6,571,996 | | 39,201,982 | |
# | | Barclays P.L.C. Sponsored ADR | | 2,197,790 | | 23,670,198 | |
| | British Airways P.L.C. | | 2,965,957 | | 6,562,735 | |
| | British American Tobacco P.L.C. | | 688,218 | | 18,877,322 | |
12
| | Cable and Wireless P.L.C. | | 3,245,829 | | 6,433,186 | |
| | Cadbury P.L.C. Sponsored ADR | | 56,000 | | 2,070,880 | |
| | Carnival P.L.C. | | 658,867 | | 14,489,470 | |
# | | Carnival P.L.C. ADR | | 218,000 | | 4,948,600 | |
| | Cookson Group P.L.C. | | 529,282 | | 1,713,315 | |
# | | DSG International P.L.C. | | 2,385,971 | | 1,242,119 | |
* | | easyJet P.L.C. | | 687,918 | | 3,431,732 | |
| | Enterprise Inns P.L.C. | | 1,212,242 | | 1,908,987 | |
| | Friends Provident P.L.C. | | 4,238,630 | | 4,860,376 | |
| | GKN P.L.C. | | 2,521,754 | | 4,835,524 | |
| | HBOS P.L.C. | | 197,513 | | 323,413 | |
# | | HSBC Holdings P.L.C. Sponsored ADR | | 2,176,243 | | 128,398,337 | |
| | International Power P.L.C. | | 3,905,403 | | 13,971,573 | |
| | ITV P.L.C. | | 11,111,390 | | 5,366,399 | |
| | Kingfisher P.L.C. | | 12,172,495 | | 22,467,306 | |
| | Ladbrokes P.L.C. | | 1,091,195 | | 2,780,814 | |
| | Legal and General Group P.L.C. | | 14,464,693 | | 16,635,709 | |
| | Meggitt P.L.C. | | 2,354,842 | | 5,158,785 | |
| | Mondi P.L.C. | | 1,101,221 | | 3,996,727 | |
| | Old Mutual P.L.C. | | 7,283,170 | | 5,897,698 | |
| | Pearson P.L.C. | | 820,157 | | 8,169,016 | |
# | | Pearson P.L.C. Sponsored ADR | | 1,817,509 | | 18,393,191 | |
| | Rexam P.L.C. | | 3,248,785 | | 19,576,536 | |
* | | Rolls-Royce Group P.L.C. | | 2,134,501 | | 11,293,445 | |
* | | Rolls-Royce Group P.L.C. Series C | | 1,220,934 | | 1,965 | |
| | Royal Bank of Scotland Group P.L.C. | | 15,142,602 | | 16,679,810 | |
| | Royal Dutch Shell P.L.C. ADR | | 1,294,780 | | 71,588,386 | |
| | RSA Insurance Group P.L.C. | | 12,939,111 | | 28,774,426 | |
| | SABmiller P.L.C. | | 1,174,082 | | 18,648,851 | |
| | Sainsbury (J.) P.L.C. | | 4,805,106 | | 21,950,527 | |
| | Schroders P.L.C. | | 123,678 | | 1,585,508 | |
| | Schroders P.L.C. Non-Voting | | 63,155 | | 672,085 | |
| | Thomas Cook Group P.L.C. | | 1,861,207 | | 5,049,137 | |
# | | Thomson Reuters P.L.C. | | 1,137,914 | | 19,716,377 | |
| | Tomkins P.L.C. Sponsored ADR | | 330,800 | | 2,434,688 | |
| | Vodafone Group P.L.C. | | 56,881,367 | | 109,423,488 | |
| | Vodafone Group P.L.C. Sponsored ADR | | 6,370,018 | | 122,750,247 | |
| | Whitbread P.L.C. | | 898,551 | | 13,023,242 | |
| | William Morrison Supermarkets P.L.C. | | 6,906,878 | | 29,409,035 | |
| | WPP Group P.L.C. | | 1,259,793 | | 7,535,763 | |
| | WPP Group P.L.C. Sponsored ADR | | 24,445 | | 743,372 | |
| | Xstrata P.L.C. | | 648,354 | | 11,089,640 | |
| | | | | |
TOTAL — UNITED KINGDOM | | | | 933,065,788 | |
| | | | | |
| | Face | | | |
| | | | Amount | | Value † | |
| | (000) | | | |
TEMPORARY CASH INVESTMENTS — (1.6%) | | | | | |
| | Repurchase Agreement, PNC Capital Markets, Inc. 0.94%, 11/03/08 (Collateralized by $92,080,000 FHLMC 4.50%, 05/01/23, valued at $87,591,100) to be repurchased at $86,299,760 | | $86,293 | | 86,293,000 | |
13
| | Shares | | | |
SECURITIES LENDING COLLATERAL — (14.0%) | | | | | |
§ @ | | DFA Short Term Investment Fund LP | | 757,347,231 | | 757,347,231 | |
| | | | | | | |
| | Face | | | |
| | | | Amount | | | |
| | (000) | | | |
@ | | Repurchase Agreement, Deutsche Bank Securities 0.25%, 11/03/08 (Collateralized by $3,471,793 FHLMC 7.000%, 08/01/37, valued at $2,958,290) to be repurchased at $2,900,344 | | $2,900 | | 2,900,284 | |
| | | | | |
TOTAL SECURITIES LENDING COLLATERAL | | | | 760,247,515 | |
| | | | | |
TOTAL INVESTMENTS - (100.0%)
(Cost $7,723,320,604) | | | | $5,413,879,738 | |
See accompanying Notes to Financial Statements.
14
THE EMERGING MARKETS SERIES
SCHEDULE OF INVESTMENTS
October 31, 2008
| | | | Shares | | Value †† | |
| | | | | |
ARGENTINA — (0.3%) | | | | | |
COMMON STOCKS — (0.3%) | | | | | |
| | Alto Palermo SA Series A | | 3,418 | | $7,023 | |
| | BBVA Banco Frances SA | | 6,152 | | 5,252 | |
* | | Capex SA Series A | | 108,079 | | 71,310 | |
* | | Celulosa Argentina SA Series B | | 1 | | — | |
* | | Endesa Costanera SA Series B | | 76,100 | | 44,044 | |
* | | Gas Natural Ban SA | | 345,000 | | 148,758 | |
* | | IRSA Inversiones y Representaciones SA | | 1 | | — | |
* | | Juan Minetti SA | | 353,151 | | 94,021 | |
| | Ledesma S.A.A.I. | | 242,632 | | 224,684 | |
* | | MetroGas SA Series B | | 50,000 | | 7,524 | |
* | | Molinos Rio de la Plata SA Series B | | 596,060 | | 1,535,166 | |
| | Siderar S.A.I.C. Series A | | 649,191 | | 3,193,719 | |
| | Solvay Indupa S.A.I.C. | | 375,000 | | 252,850 | |
| | | | | |
TOTAL — ARGENTINA | | | | 5,584,351 | |
| | | | | |
BRAZIL — (16.0%) | | | | | |
COMMON STOCKS — (6.5%) | | | | | |
| | Brasil Telecom Participacoes SA | | 59,520 | | 1,277,489 | |
| | Companhia de Bebidas das Americas | | 85,924 | | 3,168,460 | |
| | Companhia Siderurgica Nacional SA | | 502,476 | | 6,684,218 | |
| | CPFL Energia SA | | 1,935 | | 28,491 | |
# | | Empresa Brasileira de Aeronautica SA ADR | | 330,900 | | 6,922,428 | |
| | Perdigao SA ADR | | 457,126 | | 13,370,936 | |
| | Petroleo Brasilerio SA ADR (71654V101) | | 1,934,642 | | 42,697,549 | |
| | Petroleo Brasilerio SA ADR (71654V408) | | 1,223,746 | | 32,906,530 | |
| | Souza Cruz SA | | 95,874 | | 1,662,583 | |
| | Tele Norte Leste Participacoes SA | | 59,254 | | 929,904 | |
| | Tractebel Energia SA | | 164,900 | | 1,301,542 | |
* | | Vivo Participacoes SA | | 16,035 | | 173,931 | |
| | Vivo Participacoes SA ADR | | 2,500 | | 27,350 | |
| | Weg SA | | 310,566 | | 1,763,195 | |
TOTAL COMMON STOCKS | | | | 112,914,606 | |
| | | | | |
PREFERRED STOCKS — (9.5%) | | | | | |
# | | Aracruz Celulose SA Series B | | 102,635 | | 126,014 | |
| | Banci Itau Holding Financeira SA | | 1,507,125 | | 16,278,202 | |
| | Banco Bradesco SA | | 1,636,841 | | 18,774,751 | |
| | Brasil Telecom Participacoes SA | | 222,326 | | 1,557,770 | |
| | Brasil Telecom Participacoes SA ADR | | 10,165 | | 348,151 | |
| | Brasil Telecom SA | | 234,762 | | 1,397,844 | |
# | | Braskem SA Preferred A Sponsored ADR | | 497,900 | | 4,296,877 | |
1
# | | Companhia Brasileira de Distribuicao Grupo Pao de Acucar Sponsored ADR | | 229,600 | | 6,871,928 | |
| | Companhia de Bebidas das Americas | | 83 | | 3,486 | |
# | | Companhia de Bebidas das Americas Preferred ADR | | 162,700 | | 6,914,750 | |
| | Companhia Energetica de Minas Gerais | | 327,798 | | 4,993,000 | |
| | Companhia Energetica de Minas Gerais SA Sponsored ADR | | 22,240 | | 338,270 | |
| | Companhia Vale do Rio Doce Series A | | 2,173,591 | | 25,212,251 | |
| | Companhia Vale do Rio Doce Series B | | 81,160 | | — | |
| | Companhia Vale do Rio Doce Sponsored ADR | | 324,500 | | 3,799,895 | |
* | | Empresa Nasional de Comercio Redito e Participacoes SA | | 480 | | 5,980 | |
| | Gerdau SA | | 756,268 | | 4,810,234 | |
| | Gerdau SA Sponsored ADR | | 2,037,600 | | 13,061,016 | |
| | Metalurgica Gerdau SA | | 296,550 | | 2,645,886 | |
# | | Net Servicos de Comunicacao SA Preferred ADR | | 982,327 | | 6,424,419 | |
# | | Sadia SA ADR | | 1,234,266 | | 7,479,652 | |
| | Tele Norte Leste Participacoes SA | | 180,034 | | 2,434,801 | |
| | Tele Norte Leste Participacoes SA ADR | | 137,000 | | 1,860,460 | |
| | Telecomunicacoes de Sao Paulo SA | | 247,800 | | 5,490,145 | |
| | Telemar Norte Leste SA | | 63,412 | | 1,545,421 | |
# | | Ultrapar Participacoes SA Sponsored ADR | | 173,754 | | 3,214,449 | |
| | Unibanco-Uniao de Bancos Brasileiros SA | | 40,000 | | 113,178 | |
| | Unibanco-Uniao de Bancos Brasileiros SA ADR | | 46,000 | | 2,901,680 | |
| | Unibanco-Uniao de Bancos Brasileiros Units SA | | 806,260 | | 4,986,792 | |
| | Usinas Siderurgicas de Minas Gerais SA Series A | | 337,962 | | 4,367,845 | |
* | | Vivo Participacoes SA | | 132,854 | | 1,445,977 | |
# | | Votorantim Celulose e Papel SA Sponsored ADR | | 1,181,000 | | 11,916,290 | |
TOTAL PREFERRED STOCKS | | | | 165,617,414 | |
| | | | | |
TOTAL — BRAZIL | | | | 278,532,020 | |
| | | | | |
CHILE — (3.2%) | | | | | |
COMMON STOCKS — (3.2%) | | | | | |
# | | Banco de Chile Series F ADR | | 49,895 | | 1,576,680 | |
| | Banco Santander Chile SA ADR | | 73,998 | | 2,649,129 | |
* | | Colbun SA | | 1,731,270 | | 262,704 | |
| | Compania Cervecerias Unidas SA ADR | | 63,800 | | 1,705,374 | |
| | Compania Telecomunicaciones de Chile SA Sponsored ADR | | 302,304 | | 2,052,644 | |
# | | Distribucion y Servicio D&S SA ADR | | 208,828 | | 3,719,227 | |
| | Embotelladora Andina SA Series A ADR | | 28,300 | | 284,415 | |
| | Embotelladora Andina SA Series B ADR | | 46,400 | | 549,840 | |
# | | Empresa Nacional de Electricidad SA Sponsored ADR | | 262,585 | | 9,768,162 | |
| | Empresas Copec SA | | 20,500 | | 169,602 | |
| | Enersis SA Sponsored ADR | | 1,398,003 | | 20,131,243 | |
# | | Lan Airlines SA Sponsored ADR | | 299,002 | | 3,016,930 | |
| | Masisa SA | | 706,560 | | 53,733 | |
# | | Sociedad Quimica y Minera de Chile SA Sponsored ADR | | 349,195 | | 7,996,566 | |
# | | Vina de Concha y Toro SA Sponsored ADR | | 58,550 | | 1,607,198 | |
| | | | | |
TOTAL — CHILE | | | | 55,543,447 | |
2
CHINA — (4.8%) | | | | | |
COMMON STOCKS — (4.8%) | | | | | |
# | | Bank of China, Ltd. | | 60,844,000 | | 17,765,768 | |
# | | Beijing Capital International Airport Co., Ltd. | | 9,832,000 | | 5,544,166 | |
| | Beijing Enterprises Holdings, Ltd. | | 50,000 | | 197,467 | |
# | | Byd Co., Ltd. | | 272,900 | | 463,829 | |
* | | China High Speed Transmission Equipment Group Co., Ltd. | | 561,000 | | 445,663 | |
| | China Mobile, Ltd. Sponsored ADR | | 54,000 | | 2,370,060 | |
| | China Power International Development, Ltd. | | 1,633,000 | | 300,624 | |
| | China Resources Enterprise, Ltd. | | 7,139,000 | | 14,213,048 | |
| | China Resources Power Holdings Co., Ltd. | | 956,000 | | 1,868,365 | |
| | China Travel International Investment Hong Kong, Ltd. | | 3,830,000 | | 543,203 | |
| | Citic Pacific, Ltd. | | 17,336,000 | | 14,098,717 | |
* | | CITIC Resources Holdings, Ltd. | | 3,666,000 | | 278,841 | |
| | CNOOC, Ltd. | | 45,000 | | 36,949 | |
* | | Country Garden Holdings Co. | | 2,395,000 | | 425,439 | |
| | Dalian Port (PDA) Co., Ltd. | | 1,070,000 | | 243,454 | |
| | FU JI Food & Catering Services | | 289,000 | | 152,986 | |
| | Global Bio-Chem Technology Group Co., Ltd. | | 2,008,000 | | 279,852 | |
| | Harbin Power Equipment Co., Ltd. | | 908,000 | | 504,918 | |
| | HKC (Holdings), Ltd. | | 4,797,213 | | 264,272 | |
| | Hopson Development Holdings, Ltd. | | 818,000 | | 273,328 | |
# | | Huadian Power International Corp. | | 694,000 | | 128,113 | |
# | | Industrial and Commercial Bank of China (Asia), Ltd. | | 30,590,000 | | 14,393,223 | |
| | Jiangsu Express Co., Ltd. | | 628,000 | | 439,258 | |
| | Li Ning Co., Ltd. | | 467,500 | | 578,554 | |
* | | Semiconductor Manufacturing International Corp. ADR | | 275,643 | | 270,130 | |
| | Shenzhen Expressway Co., Ltd. | | 744,000 | | 253,266 | |
| | Shenzhen International Holdings, Ltd. | | 9,752,500 | | 329,187 | |
| | Sinotrans, Ltd. | | 1,852,000 | | 415,858 | |
| | TPV Technology, Ltd. | | 1,848,000 | | 366,902 | |
| | Travelsky Technology, Ltd. | | 740,000 | | 178,052 | |
# | | ZTE Corp. | | 2,575,560 | | 5,823,863 | |
| | | | | |
TOTAL — CHINA | | | | 83,447,355 | |
| | | | | |
CZECH REPUBLIC — (1.9%) | | | | | |
COMMON STOCKS — (1.9%) | | | | | |
| | CEZ A.S. | | 323,973 | | 14,169,330 | |
| | Komercni Banka A.S. | | 15,737 | | 2,396,183 | |
| | Telefonica 02 Czech Republic A.S. | | 704,007 | | 15,044,164 | |
| | Zentiva NV | | 38,106 | | 2,222,897 | |
| | | | | |
TOTAL — CZECH REPUBLIC | | | | 33,832,574 | |
| | | | | |
HUNGARY — (2.3%) | | | | | |
COMMON STOCKS — (2.3%) | | | | | |
| | Egis Gyogyszergyar NYRT | | 69,355 | | 3,430,423 | |
# | | ELMU NYRT | | 185 | | 20,428 | |
| | Magyar Telekom Telecommunications P.L.C. | | 714,375 | | 2,260,280 | |
# | | MOL Hungarian Oil & Gas NYRT | | 108,224 | | 5,855,120 | |
* # | | OTP Bank NYRT | | 719,020 | | 11,908,444 | |
# | | Richter Gedeon NYRT | | 115,808 | | 16,000,427 | |
| | Tiszai Vegyi Kombinat NYRT | | 63,988 | | 1,081,984 | |
| | | | | |
TOTAL — HUNGARY | | | | 40,557,106 | |
3
INDIA — (9.4%) | | | | | |
COMMON STOCKS — (9.4%) | | | | | |
| | Adani Enterprises, Ltd. | | 51,000 | | 397,048 | |
| | Aditya Birla Nuvo, Ltd. | | 5,819 | | 66,189 | |
| | Ambuja Cements, Ltd. | | 1,162,146 | | 1,463,275 | |
| | Apollo Hospitals Enterprise, Ltd. | | 21,437 | | 173,264 | |
| | Asea Brown Boveri India, Ltd. | | 97,291 | | 1,080,496 | |
| | Asian Paints (India), Ltd. | | 75,936 | | 1,488,931 | |
| | Aventis Pharma, Ltd. | | 3,628 | | 53,036 | |
| | Axis Bank, Ltd. | | 349,044 | | 4,040,524 | |
| | Bajaj Auto, Ltd. (6124142) | | 62,764 | | 434,320 | |
| | Bajaj Auto, Ltd. (B2QKXW0) | | 98,754 | | 1,112,019 | |
| | Bajaj Finserv, Ltd. | | 59,835 | | 147,135 | |
* | | Bharti Airtel, Ltd. | | 61,000 | | 817,712 | |
| | Cadila Healthcare, Ltd. | | 43,070 | | 226,147 | |
| | Cipla, Ltd. | | 752,827 | | 2,742,215 | |
| | Colgate-Palmolive (India), Ltd. | | 84,376 | | 654,861 | |
| | Crompton Greaves, Ltd. | | 184,828 | | 583,419 | |
| | Cummins India, Ltd. | | 107,892 | | 456,571 | |
| | Dabur India, Ltd. | | 308,253 | | 511,176 | |
| | Divi’s Laboratories, Ltd. | | 31,510 | | 723,291 | |
| | Dr. Reddy’s Laboratories, Ltd. | | 174,080 | | 1,535,501 | |
| | Dr. Reddy’s Laboratories, Ltd. ADR | | 89,614 | | 758,134 | |
| | EIH, Ltd. | | 165,150 | | 289,653 | |
| | Exide Industries, Ltd. | | 202,666 | | 206,681 | |
| | Gail India, Ltd. | | 57,000 | | 251,263 | |
| | GlaxoSmithKline Pharmaceuticals, Ltd. | | 59,367 | | 1,311,861 | |
| | Glenmark Pharmaceuticals, Ltd. | | 140,860 | | 833,670 | |
| | Godrej Consumer Products, Ltd. | | 109,632 | | 222,640 | |
| | Great Eastern Shipping Co., Ltd. | | 110,304 | | 494,576 | |
| | HCL Technologies, Ltd. | | 311,688 | | 1,114,384 | |
| | HDFC Bank, Ltd. | | 386,733 | | 8,227,909 | |
# | | HDFC Bank, Ltd. ADR | | 47,240 | | 3,098,944 | |
| | Hero Honda Motors, Ltd. Series B | | 219,870 | | 3,380,880 | |
| | Hindustan Unilever, Ltd. | | 1,921,894 | | 8,736,163 | |
| | Indian Hotels Co., Ltd. | | 556,861 | | 528,696 | |
| | Infosys Technologies, Ltd. | | 657,429 | | 19,010,875 | |
| | Infosys Technologies, Ltd. Sponsored ADR | | 250,600 | | 7,347,592 | |
| | Infrastructure Development Finance Co., Ltd. | | 1,931 | | 2,320 | |
| | ITC, Ltd. | | 2,007,345 | | 6,339,447 | |
| | Jammu & Kashmir Bank, Ltd. | | 9,547 | | 74,323 | |
| | Jindal Steel & Power, Ltd. | | 104,510 | | 1,721,111 | |
| | JSW Steel, Ltd. | | 106,526 | | 673,308 | |
| | Jubilant Organosys, Ltd. | | 90,060 | | 305,079 | |
| | Larsen & Toubro, Ltd. | | 433,176 | | 7,206,518 | |
| | Lupin, Ltd. | | 53,780 | | 730,853 | |
| | Mahindra & Mahindra, Ltd. | | 254,183 | | 1,956,792 | |
| | Mangalore Refinery & Petrochemicals, Ltd. | | 846,013 | | 663,527 | |
| | Maruti Suzuki India, Ltd. | | 129,741 | | 1,517,516 | |
* | | Matrix Laboratories, Ltd. | | 63,511 | | 90,839 | |
4
| | Motor Industries Co., Ltd. | | 22,318 | | 1,480,156 | |
| | Nirma, Ltd. | | 66,235 | | 124,242 | |
| | Pantaloon Retail India, Ltd. | | 9,760 | | 40,820 | |
| | Petronet LNG, Ltd. | | 97,953 | | 76,775 | |
| | Piramal Healthcare, Ltd. | | 76,008 | | 349,903 | |
| | Proctor & Gamble Hygiene & Health Care, Ltd. | | 11,227 | | 163,542 | |
| | Ranbaxy Laboratories, Ltd. | | 221,915 | | 774,509 | |
| | Reliance Capital, Ltd. | | 86,097 | | 1,164,296 | |
| | Reliance Communications, Ltd. | | 1,071,955 | | 4,905,008 | |
| | Reliance Energy, Ltd. | | 191,590 | | 1,813,786 | |
| | Reliance Industries, Ltd. | | 1,030,847 | | 29,122,041 | |
* | | Reliance Natural Resources, Ltd. | | 1,099,793 | | 988,284 | |
| | Satyam Computer Services, Ltd. | | 772,898 | | 4,875,528 | |
| | Sesa Goa, Ltd. | | 534,990 | | 886,528 | |
| | Shree Cement, Ltd. | | 2,872 | | 23,062 | |
| | Siemens India, Ltd. | | 153,743 | | 827,065 | |
| | Sterlite Industries (India), Ltd. Series A | | 431,495 | | 2,553,212 | |
* | | Sun Pharma Advanced Research Co., Ltd. | | 105,040 | | 112,245 | |
| | Sun Pharmaceuticals Industries, Ltd. | | 146,188 | | 3,396,720 | |
| | Tata Chemicals, Ltd. | | 106,220 | | 343,942 | |
| | Tata Consultancy Services, Ltd. | | 378,487 | | 4,221,590 | |
| | Tata Power Co., Ltd. | | 144,515 | | 2,057,124 | |
| | Tata Tea, Ltd. | | 8,903 | | 92,900 | |
| | Thermax, Ltd. | | 46,429 | | 307,763 | |
| | Titan Industries, Ltd. | | 7,547 | | 157,841 | |
| | United Phosphorus, Ltd. | | 69,388 | | 151,455 | |
| | United Spirits, Ltd. | | 21,912 | | 404,014 | |
| | Videsh Sanchar Nigam, Ltd. | | 105,825 | | 1,075,026 | |
| | Wipro, Ltd. | | 440,456 | | 2,464,641 | |
| | Zee Entertainment Enterprises, Ltd. | | 402,083 | | 1,270,937 | |
| | Zee News, Ltd. | | 239,188 | | 189,157 | |
TOTAL COMMON STOCKS | | | | 162,216,796 | |
| | | | | |
PREFERRED STOCKS — (0.0%) | | | | | |
| | Tata Steel, Ltd. | | 533,337 | | 347,069 | |
| | | | | |
RIGHTS/WARRANTS — (0.0%) | | | | | |
* | | Dish TV (India), Ltd. Rights 2008 | | 368,092 | | — | |
| | | | | |
TOTAL — INDIA | | | | 162,563,865 | |
| | | | | |
INDONESIA — (2.1%) | | | | | |
COMMON STOCKS — (2.1%) | | | | | |
| | PT Aneka Tambang Tbk | | 2,782,000 | | 261,909 | |
| | PT Astra International Tbk | | 15,468,561 | | 12,876,057 | |
* | | PT Bakrie & Brothers Tbk | | 21,200,000 | | 282,018 | |
| | PT Bank Central Asia Tbk | | 9,860,000 | | 2,389,612 | |
| | PT Bank Danamon Indonesia Tbk | | 1,762,000 | | 417,557 | |
* | | PT Bank Pan Indonesia Tbk | | 12,348,500 | | 585,821 | |
| | PT Berlian Laju Tanker Tbk | | 3,803,000 | | 218,773 | |
5
| | PT Bumi Resources Tbk | | 16,615,000 | | 3,315,378 | |
* | | PT Holcim Indonesia Tbk | | 13,611,000 | | 560,722 | |
| | PT Indocement Tunggal Prakarsa Tbk | | 875,000 | | 286,899 | |
| | PT Indosat Tbk | | 5,352,500 | | 2,567,321 | |
| | PT Kalbe Farma Tbk | | 7,288,500 | | 247,486 | |
| | PT Lippo Karawaci Tbk | | 28,822,750 | | 1,593,080 | |
* | | PT Medco Energi International Tbk | | 2,543,500 | | 498,469 | |
* | | PT Panasia Indosyntec Tbk | | 75,100 | | 2,756 | |
| | PT Semen Gresik Tbk | | 3,194,500 | | 862,973 | |
| | PT Sinar Mas Agro Resources & Technology Tbk | | 1,152,500 | | 153,110 | |
| | PT Telekomunikasi Indonesia Tbk | | 15,037,640 | | 7,523,134 | |
| | PT Unilever Indonesia Tbk | | 3,681,500 | | 2,512,385 | |
| | | | | |
TOTAL — INDONESIA | | | | 37,155,460 | |
| | | | | |
ISRAEL — (5.3%) | | | | | |
COMMON STOCKS — (5.3%) | | | | | |
| | Africa-Israel Investments, Ltd. | | 21,821 | | 324,907 | |
| | Bank Hapoalim B.M. | | 6,655,731 | | 15,071,355 | |
| | Bank Leumi Le-Israel | | 5,633,015 | | 14,777,977 | |
| | Bezeq Israeli Telecommunication Corp., Ltd. | | 2,194,669 | | 3,276,573 | |
| | Clal Industries, Ltd. | | 23,420 | | 62,134 | |
| | Clal Insurance Enterprise Holdings, Ltd. | | 1,996 | | 17,531 | |
| | Delek Group, Ltd. | | 4,584 | | 299,372 | |
| | Discount Investment Corp. | | 43,272 | | 505,444 | |
| | Elbit Systems, Ltd. | | 51,399 | | 2,458,338 | |
* | | First International Bank of Israel, Ltd. (6123804) | | 133,659 | | 150,555 | |
* | | First International Bank of Israel, Ltd. (6123815) | | 36,426 | | 199,379 | |
| | IDB Development Corp., Ltd. Series A | | 10,449 | | 121,725 | |
| | IDB Holding Corp., Ltd. | | 36,578 | | 576,775 | |
| | Israel Chemicals, Ltd. | | 837,943 | | 8,451,396 | |
| | Israel Discount Bank Series A | | 232,575 | | 228,494 | |
| | Koor Industries, Ltd. | | 1 | | 18 | |
| | Makhteshim-Agan Industries, Ltd. | | 545,196 | | 2,064,460 | |
| | Migdal Insurance Holdings, Ltd. | | 495,258 | | 338,023 | |
| | Osem Investment, Ltd. | | 67,801 | | 774,549 | |
| | Partner Communications Co., Ltd. | | 124,006 | | 2,271,401 | |
| | Strauss Group, Ltd. | | 55,697 | | 568,960 | |
| | Teva Pharmaceutical Industries, Ltd. Sponsored ADR | | 869,167 | | 37,269,881 | |
| | United Mizrahi Bank, Ltd. | | 490,955 | | 2,570,134 | |
| | | | | |
TOTAL — ISRAEL | | | | 92,379,381 | |
| | | | | |
MALAYSIA — (4.0%) | | | | | |
COMMON STOCKS — (4.0%) | | | | | |
| | Affin Holdings Berhad | | 312,600 | | 107,457 | |
| | AMMB Holdings Berhad | | 540,359 | | 329,369 | |
| | Asiatic Development Berhad | | 276,600 | | 246,172 | |
| | Batu Kawan Berhad | | 15,000 | | 30,273 | |
| | Berjaya Sports Toto Berhad | | 749,900 | | 930,027 | |
| | Boustead Holdings Berhad | | 113,900 | | 79,688 | |
| | British American Tobacco Berhad | | 239,100 | | 2,768,117 | |
6
| | Bumiputra-Commerce Asset Holdings Berhad | | 3,095,227 | | 5,392,902 | |
| | Digi.Com Berhad | | 495,162 | | 2,576,259 | |
| | EON Capital Berhad | | 175,500 | | 171,580 | |
| | Fraser & Neave Holdings Berhad | | 61,000 | | 142,233 | |
| | Genting Berhad | | 3,086,500 | | 3,981,916 | |
| | Hong Leong Bank Berhad | | 820,150 | | 1,219,120 | |
| | Hong Leong Financial Group Berhad | | 548,429 | | 595,374 | |
| | IJM Corp. Berhad | | 79,000 | | 57,347 | |
| | IOI Corp. Berhad | | 5,147,195 | | 4,080,125 | |
| | IOI Properties Berhad | | 302,600 | | 220,015 | |
| | KLCC Property Holdings Berhad | | 778,600 | | 596,398 | |
| | Kuala Lumpur Kepong Berhad | | 814,200 | | 1,904,922 | |
| | Lafarge Malayan Cement Berhad | | 259,580 | | 209,951 | |
| | Malayan Banking Berhad | | 538,175 | | 819,927 | |
| | Malaysian Airlines System Berhad | | 599,367 | | 482,983 | |
| | Malaysian Pacific Industries Berhad | | 152,900 | | 275,487 | |
| | MISC Berhad | | 2,124,832 | | 4,893,976 | |
| | MMC Corp. Berhad | | 1,503,800 | | 843,812 | |
| | Nestle (Malaysia) Berhad | | 217,200 | | 1,648,248 | |
| | Oriental Holdings Berhad | | 241,300 | | 311,850 | |
| | Parkson Holdings Berhad | | 182,650 | | 173,230 | |
| | Petronas Dagangan Berhad | | 445,100 | | 842,894 | |
| | Petronas Gas Berhad | | 886,800 | | 2,452,339 | |
| | Plus Expressways Berhad | | 2,589,600 | | 1,945,687 | |
| | PPB Group Berhad | | 889,100 | | 1,949,749 | |
| | Public Bank Berhad | | 1,550,201 | | 3,671,016 | |
| | Resorts World Berhad | | 4,928,500 | | 3,479,868 | |
| | RHB Capital Berhad | | 525,900 | | 458,031 | |
| | Sarawak Energy Berhad | | 430,200 | | 255,295 | |
| | Shell Refining Co. Federation of Malaysia Berhad | | 227,000 | | 642,165 | |
| | Sime Darby Berhad | | 3,457,620 | | 6,106,678 | |
| | SP Setia Berhad | | 971,150 | | 769,518 | |
| | Star Publications (Malaysia) Berhad | | 485,600 | | 425,161 | |
| | Telekom Malaysia Berhad | | 1,816,400 | | 1,718,269 | |
| | Tenaga Nasional Berhad | | 2,121,000 | | 3,605,127 | |
* | | TM International Berhad | | 1,937,500 | | 2,479,604 | |
* | | UEM World Berhad | | 560,500 | | 307,794 | |
| | UMW Holdings Berhad | | 729,066 | | 1,127,019 | |
| | YTL Corp. Berhad | | 1,420,966 | | 2,506,354 | |
| | YTL Power International Berhad | | 283,040 | | 133,354 | |
| | | | | |
TOTAL — MALAYSIA | | | | 69,964,680 | |
| | | | | |
MEXICO — (8.6%) | | | | | |
COMMON STOCKS — (8.6%) | | | | | |
| | Alfa S.A.B. de C.V. Series A | | 3,812,637 | | 7,822,313 | |
# | | America Movil S.A.B. de C.V. Series L | | 19,036,559 | | 29,485,030 | |
* # | | Carso Global Telecom S.A.B. de C.V. Telecom Series A1 | | 1,252,271 | | 4,855,318 | |
| | Cementos de Mexico S.A.B de C.V. Series B | | 340,000 | | 253,662 | |
# | | Coca-Cola Femsa S.A.B. de C.V. Series L | | 555,200 | | 1,770,772 | |
| | Consorcio ARA S.A.B. de C.V. | | 1,231,500 | | 483,316 | |
* | | Corporacion GEO S.A.B. de C.V. Series B | | 508,600 | | 704,747 | |
7
* | | Corporacion Interamericana de Entramiento S.A.B. de C.V. Series B | | 28,827 | | 22,403 | |
| | Corporacion Mexicana de Restaurantes S.A.B. de C.V. Series B | | 1,107 | | 602 | |
| | Corporativo Fragua S.A.B. de C.V. Series B | | 21 | | 193 | |
* | | Dine S.A.B. de C.V. | | 116,965 | | 71,720 | |
| | El Puerto de Liverpool S.A.B. de C.V. Series C1 | | 339,100 | | 1,152,953 | |
| | Embotelladora Arca S.A.B. de C.V., Mexico | | 414,103 | | 873,422 | |
* | | Empresas ICA S.A.B. de C.V. | | 50 | | 72 | |
* | | Empresas ICA S.A.B. de C.V. Sponsored ADR | | 94,740 | | 548,545 | |
| | Fomento Economico Mexicano S.A.B. de C.V. Series B & D | | 2,264,400 | | 5,733,371 | |
* | | Gruma S.A.B. de C.V. ADR | | 85,490 | | 222,274 | |
| | Grupo Aeroportuario del Pacifico S.A. de C.V. ADR | | 97,300 | | 1,777,671 | |
# | | Grupo Carso S.A.B. de C.V. Series A-1 | | 1,063,532 | | 2,892,014 | |
# | | Grupo Elektra S.A. de C.V. | | 126,080 | | 3,409,721 | |
# | | Grupo Financiero Banorte S.A.B. de C.V. | | 3,793,009 | | 6,897,720 | |
# | | Grupo Financiero Inbursa S.A.B. de C.V. Series O | | 2,319,364 | | 6,151,925 | |
| | Grupo Gigante S.A.B. de C.V. Series B | | 87,382 | | 84,954 | |
# | | Grupo Industrial Bimbo S.A.B. de C.V. Series A | | 672,500 | | 3,226,223 | |
| | Grupo Industrial Maseca S.A.B. de C.V. Series B | | 229,000 | | 160,171 | |
* | | Grupo Kuo S.A.B. de C.V. Series B | | 68 | | 26 | |
| | Grupo Mexico S.A.B. de C.V. Series B | | 21,157,195 | | 16,590,332 | |
# | | Grupo Modelo S.A.B. de C.V. Series C | | 992,400 | | 3,057,217 | |
* | | Grupo Nutrisa S.A. de C.V. | | 129 | | 135 | |
* | | Grupo Qumma S.A. de C.V. Series B | | 1,591 | | 22 | |
# | | Grupo Televisa S.A. | | 1,829,700 | | 6,410,171 | |
* # | | Impulsora Del Desarrollo Y El Empleo en America Latina S.A. de C.V. | | 3,161,776 | | 2,747,127 | |
| | Industrias Penoles S.A.B. de C.V. | | 208,750 | | 1,857,701 | |
# | | Kimberly Clark de Mexico S.A.B. de C.V. Series A | | 740,600 | | 2,417,346 | |
* # | | Organizacion Soriana S.A.B. de C.V. Series B | | 2,682,800 | | 5,393,747 | |
* | | Promotora y Operadora de Infraestructura S.A. de C.V. | | 2,085 | | 2,998 | |
* | | Savia S.A. de C.V. | | 120,000 | | 7,461 | |
| | Telefonos de Mexico S.A. de C.V. Series A | | 200,000 | | 170,973 | |
# | | Telefonos de Mexico S.A.B. de C.V. | | 10,416,800 | | 9,309,749 | |
| | Telmex Internacional S.A.B. de C.V. (B39SQ41) | | 200,000 | | 100,874 | |
# | | Telmex Internacional S.A.B. de C.V. (B39SR26) | | 10,416,800 | | 5,488,704 | |
| | Telmex Internacional S.A.B. de C.V. ADR | | 30,200 | | 316,798 | |
* | | Urbi, Desarrollos Urbanos, S.A.B. de C.V. | | 2,602,450 | | 3,883,197 | |
# | | Wal-Mart de Mexico S.A.B. de C.V. Series V | | 4,692,980 | | 12,582,694 | |
| | | | | |
TOTAL — MEXICO | | | | 148,938,384 | |
| | | | | |
PHILIPPINES — (0.7%) | | | | | |
COMMON STOCKS — (0.7%) | | | | | |
| | Aboitiz Equity Ventures, Inc. | | 3,075,000 | | 346,856 | |
| | Ayala Corp. Series A | | 313,453 | | 1,508,046 | |
| | Ayala Land, Inc. | | 9,214,518 | | 1,117,920 | |
| | Banco de Oro Unibank, Inc. | | 1,292,908 | | 717,386 | |
| | Bank of the Philippine Islands | | 2,320,456 | | 1,921,217 | |
* | | Filipina Water Bottling Corp. | | 2,006,957 | | — | |
| | Metro Bank & Trust Co. | | 257,100 | | 136,080 | |
| | Philippine Long Distance Telephone Co. | | 100,210 | | 4,099,641 | |
| | Pilipino Telephone Corp. | | 876,000 | | 107,624 | |
8
| | Robinson’s Land Corp. Series B | | 2,165,100 | | 247,845 | |
| | SM Prime Holdings, Inc. | | 7,365,168 | | 1,267,717 | |
| | Universal Robina Corp. | | 1,933,200 | | 206,088 | |
| | | | | |
TOTAL — PHILIPPINES | | | | 11,676,420 | |
| | | | | |
POLAND — (1.4%) | | | | | |
COMMON STOCKS — (1.4%) | | | | | |
| | Bank Millennium SA | | 480,376 | | 683,279 | |
| | Bank Pekao SA | | 163,030 | | 7,414,805 | |
* | | Bank Przemyslowo Handlowy BPH SA | | 2,029 | | 36,359 | |
| | Bank Zackodni WBK SA | | 37,228 | | 1,641,628 | |
| | Browary Zywiec SA | | 13,855 | | 2,471,526 | |
| | Kredyt Bank SA | | 88,259 | | 322,884 | |
* | | Mondi Packaging Paper Swiecie SA | | 26,883 | | 321,839 | |
| | Polski Koncern Naftowy Orlen SA | | 267,237 | | 2,725,016 | |
| | Telekomunikacja Polska SA | | 1,112,400 | | 8,405,484 | |
| | | | | |
TOTAL — POLAND | | | | 24,022,820 | |
| | | | | |
SINGAPORE — (0.0%) | | | | | |
COMMON STOCKS — (0.0%) | | | | | |
* # | | Genting International P.L.C. | | 560,350 | | 138,173 | |
| | | | | |
SOUTH AFRICA — (7.1%) | | | | | |
COMMON STOCKS — (7.1%) | | | | | |
| | ABSA Group, Ltd. | | 389,068 | | 4,070,598 | |
* | | Adcock Ingram Holdings, Ltd. | | 253,166 | | 885,757 | |
| | African Rainbow Minerals, Ltd. | | 424,340 | | 4,341,924 | |
| | Anglo American Platinum Corp., Ltd. | | 122,915 | | 5,078,760 | |
| | ArcelorMittal South Africa, Ltd. | | 394,568 | | 3,729,512 | |
| | Barloworld, Ltd. | | 92,734 | | 541,862 | |
| | Bidvest Group, Ltd. | | 193,516 | | 2,063,893 | |
| | Data Tec, Ltd. | | 205,495 | | 323,063 | |
| | Discovery Holdings, Ltd. | | 419,855 | | 1,031,490 | |
| | Exxaro Resources, Ltd. | | 90,044 | | 594,413 | |
| | FirstRand, Ltd. | | 273,016 | | 396,611 | |
| | Freeworld Coatings, Ltd. | | 117,583 | | 72,066 | |
* | | Harmony Gold Mining Co., Ltd. | | 416,418 | | 3,045,552 | |
* | | Harmony Gold Mining Co., Ltd. Sponsored ADR | | 418,320 | | 3,057,919 | |
| | Impala Platinum Holdings, Ltd. | | 449,160 | | 4,688,199 | |
| | Kumba Iron Ore, Ltd. | | 15,092 | | 198,751 | |
| | Liberty Group, Ltd. | | 224,453 | | 1,413,719 | |
| | Massmart Holdings, Ltd. | | 133,568 | | 1,198,132 | |
* | | Metorex, Ltd. | | 332,485 | | 184,855 | |
| | MTN Group, Ltd. | | 1,745,306 | | 19,598,239 | |
| | Naspers, Ltd. Series N | | 204,973 | | 3,412,448 | |
| | Nedbank Group, Ltd. | | 56,096 | | 544,531 | |
| | Network Healthcare Holdings, Ltd. | | 356,530 | | 250,424 | |
| | Pick’n Pay Stores, Ltd. | | 309,695 | | 978,977 | |
9
| | Pretoria Portland Cement Co., Ltd. | | 873,234 | | 2,688,078 | |
| | PSG Group, Ltd. | | 189,027 | | 251,797 | |
| | Sanlam, Ltd. | | 836,190 | | 1,372,267 | |
| | Sasol, Ltd. Sponsored ADR | | 1,363,425 | | 39,443,885 | |
| | Shoprite Holdings, Ltd. | | 640,645 | | 3,381,623 | |
* | | Simmer & Jack Mines, Ltd. | | 866,328 | | 162,717 | |
| | Standard Bank Group, Ltd. | | 634,566 | | 5,038,637 | |
| | Steinhoff International Holdings, Ltd. | | 745,364 | | 1,086,506 | |
* | | Super Group, Ltd. | | 513,680 | | 155,538 | |
| | Telkom South Africa, Ltd. | | 559,552 | | 6,072,981 | |
| | Tiger Brands, Ltd. | | 81,830 | | 1,186,305 | |
| | | | | |
TOTAL — SOUTH AFRICA | | | | 122,542,029 | |
| | | | | |
SOUTH KOREA — (10.2%) | | | | | |
COMMON STOCKS — (10.2%) | | | | | |
# | | Amorepacific Corp. | | 3,527 | | 1,550,276 | |
# | | Cheil Industrial, Inc. | | 20,690 | | 675,307 | |
| | Daelim Industrial Co., Ltd. | | 9,670 | | 279,181 | |
# | | Daewoo Engineering & Construction Co., Ltd. | | 218,088 | | 1,513,731 | |
| | Daewoo International Corp. | | 45,870 | | 508,570 | |
# | | Daewoo Securities Co., Ltd. | | 103,195 | | 981,448 | |
# | | Daewoo Shipbuilding & Marine Engineering Co., Ltd. | | 142,290 | | 1,340,616 | |
| | Doosan Heavy Industries & Construction Co., Ltd. | | 14,950 | | 658,849 | |
# | | Doosan Infracore Co., Ltd. | | 82,000 | | 698,465 | |
| | GS Engineering & Construction Corp. | | 27,320 | | 1,297,587 | |
# | | GS Holdings Corp. | | 42,945 | | 857,223 | |
# | | Hana Financial Group, Inc. | | 112,261 | | 1,782,838 | |
| | Hankook Tire Manufacturing Co., Ltd. | | 84,420 | | 790,552 | |
* # | | Hite Brewery Co., Ltd. | | 5,979 | | 798,929 | |
| | Hyundai Development Co. | | 33,870 | | 916,541 | |
# | | Hyundai Heavy Industries Co., Ltd. | | 49,890 | | 6,590,960 | |
# | | Hyundai Merchant Marine Co., Ltd. | | 24,600 | | 654,407 | |
| | Hyundai Mobis | | 53,070 | | 3,116,817 | |
# | | Hyundai Motor Co., Ltd. | | 95,919 | | 4,432,307 | |
| | Hyundai Steel Co. | | 58,560 | | 1,699,002 | |
| | Kangwon Land, Inc. | | 150,410 | | 1,539,380 | |
* | | KB Financial Group, Inc. | | 139,085 | | 3,447,632 | |
# | | KCC Corp. | | 7,410 | | 1,445,995 | |
* # | | Kia Motors Corp. | | 225,130 | | 1,896,462 | |
| | Korea Electric Power Corp. | | 295,290 | | 5,867,602 | |
| | Korea Exchange Bank | | 200,200 | | 1,113,613 | |
| | Korea Gas Corp. | | 35,793 | | 1,347,901 | |
| | KT Corp. | | 195,930 | | 4,987,524 | |
* | | KT Freetel, Ltd. | | 47,030 | | 986,204 | |
| | KT&G Corp. | | 103,590 | | 6,648,787 | |
# | | LG Chemical, Ltd. | | 36,776 | | 2,232,591 | |
# | | LG Corp. | | 129,413 | | 5,179,570 | |
# | | LG Electronics, Inc. | | 88,910 | | 6,638,078 | |
# | | LG Household & Healthcare Co., Ltd. | | 5,120 | | 731,426 | |
# | | POSCO | | 46,060 | | 12,686,282 | |
| | S1 Corp. | | 3,130 | | 106,395 | |
10
| | Samsung Corp. | | 77,520 | | 2,483,949 | |
# | | Samsung Electro-Mechanics Co., Ltd. | | 37,767 | | 1,112,311 | |
| | Samsung Electronics Co., Ltd. | | 97,139 | | 40,954,158 | |
| | Samsung Electronics Co., Ltd. ADR | | 52,988 | | 10,979,734 | |
| | Samsung Fire and Marine Insurance, Ltd. | | 27,229 | | 3,606,348 | |
# | | Samsung Heavy Industries Co., Ltd. | | 126,000 | | 1,940,388 | |
* # | | Samsung SDI Co., Ltd. | | 20,352 | | 1,142,731 | |
# | | Samsung Securities Co., Ltd. | | 33,780 | | 1,717,986 | |
| | Shinhan Financial Group Co., Ltd. | | 190,952 | | 4,645,637 | |
# | | Shinsegae Co., Ltd. | | 10,460 | | 3,671,319 | |
| | SK Co., Ltd. | | 21,194 | | 1,421,537 | |
| | SK Energy Co., Ltd. | | 51,889 | | 2,985,135 | |
| | SK Telecom Co., Ltd. | | 56,085 | | 8,901,750 | |
# | | S-Oil Corp. | | 47,310 | | 2,397,010 | |
| | Woongjin Coway Co., Ltd. | | 13,260 | | 272,851 | |
| | Woori Investment & Securities Co., Ltd. | | 67,386 | | 629,502 | |
| | | | | |
TOTAL — SOUTH KOREA | | | | 176,861,394 | |
| | | | | |
TAIWAN — (7.6%) | | | | | |
COMMON STOCKS — (7.6%) | | | | | |
| | Acer, Inc. | | 1,964,494 | | 2,533,893 | |
| | Advanced Semiconductor Engineering, Inc. | | 2,990,899 | | 1,273,561 | |
| | Advantech Co., Ltd. | | 73,244 | | 102,200 | |
| | Asia Cement Corp. | | 2,380,693 | | 1,410,566 | |
| | Asustek Computer, Inc. | | 2,962,281 | | 4,243,037 | |
| | AU Optronics Corp. | | 1,294,052 | | 903,594 | |
| | Catcher Co., Ltd. | | 25,027 | | 63,549 | |
| | Cathay Financial Holdings Co., Ltd. | | 181,761 | | 195,210 | |
| | Chang Hwa Commercial Bank | | 196,000 | | 75,082 | |
| | Cheng Shin Rubber Industry Co., Ltd. | | 980,718 | | 1,093,259 | |
| | Cheng Uei Precision Industry Co., Ltd. | | 35,659 | | 49,172 | |
| | China Steel Corp. | | 8,387,027 | | 6,057,113 | |
| | Compal Electronics, Inc. | | 2,776,927 | | 1,993,108 | |
| | Delta Electronics Industrial Co., Ltd. | | 1,669,830 | | 3,789,574 | |
| | Evergreen Marine Corp., Ltd. | | 481,869 | | 247,606 | |
| | Far East Textile, Ltd. | | 4,207,850 | | 2,442,270 | |
| | First Financial Holding Co., Ltd. | | 5,083,487 | | 2,397,452 | |
| | Formosa Chemicals & Fiber Co., Ltd. | | 4,610,141 | | 7,452,770 | |
| | Formosa Plastics Corp. | | 4,721,167 | | 7,967,558 | |
| | Formosa Taffeta Co., Ltd. | | 484,000 | | 285,242 | |
| | Foxconn Technology Co., Ltd. | | 600,694 | | 1,471,933 | |
| | Fubon Financial Holding Co., Ltd. | | 5,940,052 | | 3,602,837 | |
| | Hon Hai Precision Industry Co., Ltd. | | 3,761,458 | | 9,079,012 | |
| | Hotai Motor Co., Ltd. | | 387,000 | | 557,914 | |
| | HTC Corp. | | 502,095 | | 5,951,542 | |
| | Hua Nan Financial Holding Co., Ltd. | | 5,559,124 | | 2,929,517 | |
| | Inventec Corp. | | 1,575,202 | | 493,679 | |
| | Macronix International Co., Ltd. | | 1,369,335 | | 382,087 | |
| | Media Tek, Inc. | | 734,059 | | 6,573,790 | |
| | Mitac International Corp. | | 209,288 | | 77,460 | |
| | Nan Ya Plastic Corp. | | 6,878,218 | | 9,532,403 | |
11
| | Pou Chen Corp. | | 1,911,754 | | 871,420 | |
| | President Chain Store Corp. | | 776,260 | | 1,802,105 | |
| | Shin Kong Financial Holding Co., Ltd. | | 572,619 | | 151,450 | |
| | Siliconware Precision Industries Co., Ltd. | | 2,347,324 | | 2,422,919 | |
| | Synnex Technology International Corp. | | 770,364 | | 999,957 | |
| | Taiwan Cement Corp. | | 2,415,895 | | 1,240,523 | |
| | Taiwan Cooperative Bank | | 1,452,634 | | 698,058 | |
| | Taiwan Glass Industrial Corp. | | 1,271,068 | | 616,570 | |
| | Taiwan Semiconductor Manufacturing Co., Ltd. | | 22,275,436 | | 32,412,010 | |
| | U-Ming Marine Transport Corp. | | 648,860 | | 757,511 | |
| | Uni-President Enterprises Corp. | | 2,796,991 | | 2,390,865 | |
| | Walsin Lihwa Corp. | | 2,278,539 | | 528,438 | |
| | Wan Hai Lines Co., Ltd. | | 129,209 | | 54,146 | |
| | Wistron Corp. | | 1,081,690 | | 855,393 | |
| | Yang Ming Marine Transport Corp. | | 341,131 | | 94,047 | |
| | Yuanta Financial Holding Co., Ltd. | | 1,526,885 | | 597,327 | |
| | | | | |
TOTAL — TAIWAN | | | | 131,720,729 | |
| | | | | |
THAILAND — (1.1%) | | | | | |
COMMON STOCKS — (1.1%) | | | | | |
| | Advance Info Service PCL (Foreign) | | 1,654,700 | | 3,446,308 | |
# | | Bangkok Dusit Medical Services PCL (Foreign) | | 586,600 | | 334,722 | |
| | Bank of Ayudhya PCL (Foreign) NVDR (6075949) | | 2,521,900 | | 726,710 | |
| | Bank of Ayudhya PCL (Foreign) NVDR (6359933) | | 258,000 | | 74,345 | |
| | Banpu Coal, Ltd. | | 24,100 | | 110,702 | |
| | Banpu PCL (Foreign) | | 99,400 | | 462,260 | |
# | | BEC World PCL (Foreign) | | 1,178,000 | | 557,912 | |
# | | Bumrungrad Hospital PCL (Foreign) | | 297,000 | | 186,419 | |
| | C.P. Seven Eleven PCL (Foreign) | | 2,614,700 | | 574,413 | |
| | Central Pattana PCL (Foreign) | | 888,500 | | 234,483 | |
| | Charoen Pokphand Foods PCL (Foreign) | | 4,487,600 | | 389,224 | |
# | | Delta Electronics (Thailand) PCL (Foreign) | | 922,510 | | 273,726 | |
| | Kasikornbank PCL (Foreign) | | 1,730,300 | | 2,468,331 | |
# | | Krung Thai Bank PCL (Foreign) | | 10,840,270 | | 1,212,378 | |
| | Padaeng Industry PCL (Foreign) NVDR | | 550,900 | | 130,456 | |
# | | PTT Aromatics & Refining PCL (Foreign) | | 1,381,437 | | 392,163 | |
| | PTT Chemical PCL (Foreign) | | 2,577,960 | | 2,537,507 | |
| | PTT Exploration & Production PCL (Foreign) | | 300,000 | | 736,091 | |
# | | Ratchaburi Electricity Generating Holding PCL (Foreign) | | 927,600 | | 820,417 | |
| | Siam Cement PCL (Foreign) (6609906) | | 125,700 | | 376,562 | |
# | | Siam Cement PCL (Foreign) (6806387) | | 183,613 | | 560,530 | |
* | | Siam City Bank PCL (Foreign) | | 833,100 | | 159,252 | |
| | Siam Commercial Bank PCL (Foreign) | | 1,074,766 | | 1,640,513 | |
| | Siam Makro PCL (Foreign) | | 112,500 | | 192,582 | |
# | | Thai Union Frozen Products PCL (Foreign) | | 574,020 | | 270,223 | |
| | | | | |
TOTAL — THAILAND | | | | 18,868,229 | |
12
TURKEY — (2.3%) | | | | | |
COMMON STOCKS — (2.3%) | | | | | |
| | Akbank T.A.S. | | 1,278,133 | | 4,389,996 | |
| | Akcansa Cimento Sanayi ve Ticaret A.S. | | 229,004 | | 382,629 | |
| | Aksigorta A.S. | | 1,510,481 | | 3,114,203 | |
| | Anadolu Efes Biracilik ve Malt Sanayi A.S. | | 414,134 | | 3,506,365 | |
| | Arcelik A.S | | 503,962 | | 715,063 | |
* | | Aygaz A.S. | | 1 | | — | |
* | | Dogan Sirketler Grubu Holding A.S. | | 1,897,319 | | 1,495,972 | |
* | | Dogan Yayin Holding A.S. | | 2 | | 2 | |
| | Enka Insaat ve Sanayi A.S. | | 275,905 | | 1,033,782 | |
| | Eregli Demir ve Celik Fabrikalari Turk A.S. | | 832,026 | | 2,564,775 | |
| | Ford Otomotiv Sanayi A.S. | | 114,792 | | 361,106 | |
* | | Hurriyet Gazetecilik ve Matbaacilik A.S. | | 408,376 | | 220,408 | |
* | | Koc Holding A.S. Series B | | 3,943,304 | | 7,357,239 | |
| | Tofas Turk Otomobil Fabrikasi A.S. | | 1 | | 1 | |
| | Tupras-Turkiye Petrol Rafinerileri A.S. | | 231,906 | | 2,928,406 | |
* | | Turk Ekonomi Bankasi A.S. | | 1 | | — | |
* | | Turk Sise ve Cam Fabrikalari A.S. | | 486,117 | | 395,266 | |
| | Turkcell Iletisim Hizmetleri A.S. | | 257,680 | | 1,293,456 | |
* | | Turkiye Garanti Bankasi A.S. | | 3,050,806 | | 5,124,083 | |
| | Turkiye Is Bankasi A.S. | | 1,372,915 | | 3,903,216 | |
* | | Yapi ve Kredi Bankasi A.S. | | 1,340,636 | | 1,700,076 | |
| | | | | |
TOTAL — TURKEY | | | | 40,486,044 | |
| | | | Value † | |
SECURITIES LENDING COLLATERAL — (11.7%) | | | | | |
§ @ | | DFA Short Term Investment Fund LP | | 191,178,954 | | 191,178,954 | |
| | | | | | | |
| | | | Face | | | |
| | | | Amount | | | |
| | | | (000) | | | |
@ | | Repurchase Agreement, Deutsche Bank Securities 0.25%, 11/03/08 (Collateralized by $25,549,645 FHLMC, rates ranging from 5.296%(r) to 6.000%, maturities ranging from 12/01/26 to 03/01/33 & FNMA 5.520%(r), 05/01/17, valued at $12,757,896) to be repurchasedat $12,508,001 | | $12,508 | | 12,507,740 | |
| | | | | |
TOTAL SECURITIES LENDING COLLATERAL | | | | 203,686,694 | |
| | | | | |
TOTAL INVESTMENTS - (100.0%) (Cost $1,345,667,600) | | | | $1,738,501,155 | |
See accompanying Notes to Financial Statements.
13
THE TAX-MANAGED U.S. MARKETWIDE VALUE SERIES
SCHEDULE OF INVESTMENTS
October 31, 2008
| | Shares | | Value † | |
| | | | | |
COMMON STOCKS — (84.9%) | | | | | |
Consumer Discretionary — (11.8%) | | | | | |
* | | 4Kids Entertainment, Inc. | | 842 | | $4,454 | |
* # | | 99 Cents Only Stores | | 143,220 | | 1,747,284 | |
* | | A.C. Moore Arts & Crafts, Inc. | | 30,471 | | 84,709 | |
# | | Aaron Rents, Inc. | | 26,200 | | 649,498 | |
* | | Acme Communications, Inc. | | 18,512 | | 9,256 | |
| | Aldila, Inc. | | 7,385 | | 31,755 | |
* | | Alloy, Inc. | | 17,245 | | 86,570 | |
# | | American Axle & Manufacturing Holdings, Inc. | | 14,804 | | 53,146 | |
# | | American Greetings Corp. Class A | | 73,700 | | 860,816 | |
* # | | America’s Car-Mart, Inc. | | 25,396 | | 414,717 | |
| | Arctic Cat, Inc. | | 20,244 | | 153,450 | |
# | | ArvinMeritor, Inc. | | 129,930 | | 769,186 | |
| | Asbury Automotive Group, Inc. | | 50,300 | | 163,475 | |
* | | Ascent Media Corp. (043632108) | | 48 | | 1,214 | |
* # l | | Ascent Media Corp. (043632207) | | 393 | | 46,649 | |
* | | Ashworth, Inc. | | 12,200 | | 22,326 | |
* | | Audiovox Corp. Class A | | 23,689 | | 139,528 | |
* # | | AutoNation, Inc. | | 311,900 | | 2,142,753 | |
* # | | Avatar Holdings, Inc. | | 1,900 | | 64,505 | |
* # | | Bakers Footwear Group, Inc. | | 4,000 | | 4,920 | |
* | | Ballantyne of Omaha, Inc. | | 7,332 | | 13,198 | |
# | | Barnes & Noble, Inc. | | 58,445 | | 1,103,442 | |
| | Bassett Furniture Industries, Inc. | | 8,939 | | 39,421 | |
| | Beasley Broadcast Group, Inc. | | 11,000 | | 16,390 | |
| | Beazer Homes USA, Inc. | | 46,461 | | 147,281 | |
| | Belo Corp. Class A | | 142,548 | | 303,627 | |
* | | Benihana, Inc. Class A | | 300 | | 894 | |
* # | | Big Lots, Inc. | | 22,600 | | 552,118 | |
# | | Blockbuster, Inc. Class A | | 218,800 | | 332,576 | |
* # | | Blockbuster, Inc. Class B | | 44,552 | | 38,760 | |
* | | Bluegreen Corp. | | 21,700 | | 105,245 | |
| | Bob Evans Farms, Inc. | | 56,700 | | 1,183,896 | |
# | | Bon-Ton Stores, Inc. | | 14,849 | | 33,262 | |
| | Books-A-Million, Inc. | | 21,400 | | 67,410 | |
# | | Borders Group, Inc. | | 2,900 | | 9,831 | |
# | | Brookfield Homes Corp. | | 39,865 | | 365,163 | |
# | | Brown Shoe Company, Inc. | | 74,175 | | 781,804 | |
| | Brunswick Corp. | | 112,200 | | 389,334 | |
# | | Building Materials Holding Corp. | | 8,100 | | 1,944 | |
* # | | Cabela’s, Inc. | | 120,700 | | 959,565 | |
* | | Cache, Inc. | | 9,000 | | 32,310 | |
* # | | California Coastal Communities, Inc. | | 10,209 | | 12,965 | |
# | | Callaway Golf Co. | | 6,859 | | 71,745 | |
| | Canterbury Park Holding Corp. | | 2,833 | | 19,548 | |
1
| | Carmike Cinemas, Inc. | | 8,200 | | 17,630 | |
# | | Carnival Corp. | | 89 | | 2,261 | |
* | | Carriage Services, Inc. | | 19,056 | | 45,353 | |
* # | | Casual Male Retail Group, Inc. | | 17,267 | | 32,807 | |
* | | Cavalier Homes, Inc. | | 23,813 | | 37,863 | |
* | | Cavco Industries, Inc. | | 9,895 | | 336,727 | |
| | CBS Corp. Class B | | 493,166 | | 4,788,642 | |
* # | | Charming Shoppes, Inc. | | 57,800 | | 63,580 | |
* # | | Chico’s FAS, Inc. | | 7,700 | | 26,180 | |
* | | Chromcraft Revington, Inc. | | 100 | | 45 | |
| | Churchill Downs, Inc. | | 81 | | 3,076 | |
| | Cinemark Holdings, Inc. | | 67,196 | | 557,055 | |
| | Coachmen Industries, Inc. | | 6,900 | | 7,452 | |
| | Coast Distribution System, Inc. | | 400 | | 880 | |
| | Cobra Electronics Corp. | | 1,200 | | 1,932 | |
| | Collectors Universe, Inc. | | 15,716 | | 58,309 | |
# | | Columbia Sportswear Co. | | 19,513 | | 719,444 | |
| | Comcast Corp. Class A | | 3,570,978 | | 56,278,613 | |
| | Comcast Corp. Special Class A Non-Voting | | 1,432,185 | | 22,084,293 | |
* | | Concord Camera Corp. | | 9,362 | | 18,537 | |
* # | | Conn’s, Inc. | | 38,000 | | 514,900 | |
# | | Cooper Tire & Rubber Co. | | 97,000 | | 740,110 | |
* # | | Cox Radio, Inc. | | 61,500 | | 335,175 | |
| | Craftmade International, Inc. | | 3,099 | | 5,919 | |
| | CSS Industries, Inc. | | 18,850 | | 418,470 | |
* | | Culp, Inc. | | 21,913 | | 62,890 | |
* # | | Cumulus Media, Inc. Class A | | 9,982 | | 10,481 | |
* | | Cybex International, Inc. | | 30,133 | | 59,663 | |
* | | Cycle Country Accessories Corp. | | 2,876 | | 2,013 | |
* | | DEI Holdings, Inc. | | 1,368 | | 315 | |
* | | dELiA*s, Inc. | | 17,143 | | 41,486 | |
* | | Delta Apparel, Inc. | | 879 | | 5,362 | |
* | | Design Within Reach, Inc. | | 24,371 | | 48,986 | |
* | | Diedrich Coffee, Inc. | | 9,452 | | 9,925 | |
# | | Dillards, Inc. Class A | | 120,300 | | 641,199 | |
# | �� | DineEquity, Inc. | | 55,683 | | 1,003,964 | |
* | | Discovery Communications, Inc. (25470F104) | | 40,480 | | 552,147 | |
* # | | Discovery Communications, Inc. (25470F203) | | 3,937 | | 53,543 | |
* | | Discovery Communications, Inc. (25470F302) | | 44,417 | | 591,634 | |
* | | Dixie Group, Inc. | | 11,800 | | 48,380 | |
* | | Dorman Products, Inc. | | 12,347 | | 138,904 | |
| | Dover Motorsports, Inc. | | 15,900 | | 34,026 | |
* # | | DSW, Inc. | | 2,000 | | 25,860 | |
* | | Duckwall-ALCO Stores, Inc. | | 700 | | 9,023 | |
| | Educational Development Corp. | | 2,100 | | 8,778 | |
* | | Emerson Radio Corp. | | 16,040 | | 9,303 | |
* | | Entravision Communications Corp. | | 38,700 | | 73,143 | |
# | | Escalade, Inc. | | 600 | | 816 | |
* | | Expedia, Inc. | | 109,511 | | 1,041,450 | |
* | | Famous Dave’s of America, Inc. | | 200 | | 838 | |
| | Finish Line, Inc. Class A | | 110,609 | | 1,058,528 | |
| | Fisher Communications, Inc. | | 8,231 | | 303,724 | |
* | | Flanigan’s Enterprises, Inc. | | 865 | | 3,892 | |
| | Flexsteel Industries, Inc. | | 1,719 | | 13,975 | |
| | Foot Locker, Inc. | | 211,064 | | 3,085,756 | |
2
* # | | Ford Motor Co. | | 3,834,761 | | 8,398,127 | |
| | Fortune Brands, Inc. | | 78,326 | | 2,987,354 | |
* # | | Franklin Covey Co. | | 10,916 | | 55,672 | |
* | | Franklin Electronic Publishers, Inc. | | 15,050 | | 19,189 | |
# | | Fred’s, Inc. | | 60,080 | | 735,980 | |
| | Frisch’s Restaurants, Inc. | | 600 | | 10,260 | |
* | | Fuel Systems Solutions, Inc. | | 1,973 | | 56,132 | |
# | | Furniture Brands International, Inc. | | 71,463 | | 406,624 | |
* | | GameTech International, Inc. | | 16,810 | | 39,672 | |
* # | | Gander Mountain Co. | | 43,992 | | 89,304 | |
# | | Gannett Co., Inc. | | 53,822 | | 592,042 | |
* # | | Gaylord Entertainment Co. | | 28,382 | | 607,659 | |
* # | | G-III Apparel Group, Ltd. | | 24,200 | | 334,202 | |
* | | Goodyear Tire & Rubber Co. | | 152,323 | | 1,358,721 | |
# | | Gray Television, Inc. | | 21,091 | | 10,545 | |
* | | Great Wolf Resorts, Inc. | | 1,800 | | 3,402 | |
# | | Group 1 Automotive, Inc. | | 41,700 | | 419,085 | |
* # | | Harris Interactive, Inc. | | 43,601 | | 50,577 | |
* | | Hartmarx Corp. | | 1,893 | | 1,117 | |
* | | Hastings Entertainment, Inc. | | 1,572 | | 7,121 | |
| | Haverty Furniture Co., Inc. | | 36,299 | | 357,182 | |
* | | Hawk Corp. | | 600 | | 8,670 | |
* | | Hayes Lemmerz International, Inc. | | 8,881 | | 11,812 | |
| | Hearst-Argyle Television, Inc. | | 90,553 | | 1,356,484 | |
* | | Heelys, Inc. | | 22,220 | | 77,992 | |
* # | | Helen of Troy, Ltd. | | 64,389 | | 1,158,358 | |
* | | Hollywood Media Corp. | | 30,308 | | 58,191 | |
* | | Hot Topic, Inc. | | 12,657 | | 82,017 | |
* # | | Hovnanian Enterprises, Inc. Class A | | 97,900 | | 419,991 | |
* | | HSN, Inc. | | 68,956 | | 424,079 | |
* # | | Iconix Brand Group, Inc. | | 9,157 | | 99,720 | |
* | | ILX Resorts, Inc. | | 900 | | 1,116 | |
* | | Interstate Hotels & Resorts, Inc. | | 52,424 | | 51,376 | |
* | | Interval Leisure Group, Inc. | | 68,956 | | 500,621 | |
| | J. Alexander’s Corp. | | 9,296 | | 45,086 | |
| | J.C. Penney Co., Inc. | | 232,990 | | 5,573,121 | |
* # | | JAKKS Pacific, Inc. | | 18,275 | | 408,812 | |
* # | | Jarden Corp. | | 105,350 | | 1,875,230 | |
* # | | Jo-Ann Stores, Inc. | | 47,950 | | 918,722 | |
| | Johnson Outdoors, Inc. | | 12,128 | | 101,390 | |
| | Jones Apparel Group, Inc. | | 42,015 | | 466,787 | |
| | Journal Communications, Inc. Class A | | 17,629 | | 44,072 | |
# | | KB HOME | | 116,206 | | 1,939,478 | |
| | Kenneth Cole Productions, Inc. Class A | | 7,474 | | 99,255 | |
| | Kimball International, Inc. Class B | | 28,687 | | 213,718 | |
# | | K-Swiss, Inc. Class A | | 23,908 | | 361,728 | |
| | LaCrosse Footwear, Inc. | | 495 | | 7,078 | |
* | | Lakeland Industries, Inc. | | 11,757 | | 116,747 | |
* # | | Lakes Entertainment, Inc. | | 8,221 | | 35,350 | |
# | | Landry’s Restaurants, Inc. | | 25,100 | | 315,005 | |
* | | Lazare Kaplan International, Inc. | | 13,180 | | 94,896 | |
# | | La-Z-Boy, Inc. | | 48,700 | | 281,486 | |
* | | LeapFrog Enterprises, Inc. | | 100 | | 675 | |
* | | Lear Corp. | | 47,300 | | 95,073 | |
# | | Lee Enterprises, Inc. | | 27,711 | | 69,277 | |
3
# | | Leggett & Platt, Inc. | | 236,744 | | 4,109,876 | |
* | | Liberty Media Corp. - Entertainment Class A | | 668,364 | | 10,760,660 | |
* | | Liberty Media Corp. - Entertainment Class B | | 16,688 | | 254,492 | |
* | | Liberty Media Holding Corp. Capital Class A | | 217,289 | | 1,479,738 | |
* | | Liberty Media Holding Corp. Capital Class B | | 6,066 | | 45,252 | |
* | | Liberty Media Holding Corp. Interactive Class A | | 883,163 | | 4,309,835 | |
* # | | Liberty Media Holding Corp. Interactive Class B | | 35,506 | | 172,559 | |
# | | Lifetime Brands, Inc. | | 11,058 | | 54,184 | |
* | | LIN TV Corp. | | 28,200 | | 48,222 | |
| | Lithia Motors, Inc. Class A | | 249 | | 1,021 | |
* # | | Live Nation, Inc. | | 130,962 | | 1,473,322 | |
* | | Lodgian, Inc. | | 21,628 | | 110,303 | |
* | | Luby’s, Inc. | | 48,862 | | 236,492 | |
# | | M/I Homes, Inc. | | 30,930 | | 420,957 | |
* | | Mace Security International, Inc. | | 8,131 | | 7,074 | |
| | Macy’s, Inc. | | 372,300 | | 4,575,567 | |
* # | | MarineMax, Inc. | | 1,200 | | 2,784 | |
* | | McCormick & Schmick’s Seafood Restaurants, Inc. | | 14,412 | | 70,475 | |
| | MDC Holdings, Inc. | | 58,234 | | 1,958,409 | |
* | | Meade Instruments Corp. | | 4,151 | | 706 | |
* # | | Meritage Homes Corp. | | 61,660 | | 846,592 | |
| | Modine Manufacturing Co. | | 42,200 | | 312,280 | |
* # | | Mohawk Industries, Inc. | | 98,740 | | 4,777,041 | |
| | Monro Muffler Brake, Inc. | | 1,919 | | 41,316 | |
* | | Morton’s Restaurant Group, Inc. | | 17,295 | | 59,841 | |
* | | Mothers Work, Inc. | | 11,618 | | 102,006 | |
# | | Movado Group, Inc. | | 31,700 | | 482,157 | |
* | | MTR Gaming Group, Inc. | | 35,575 | | 95,341 | |
* # | | Multimedia Games, Inc. | | 34,788 | | 105,060 | |
# | | Nautilus Group, Inc. | | 51,000 | | 124,440 | |
* | | Navarre Corp. | | 79 | | 73 | |
| | New Frontier Media, Inc. | | 22,735 | | 43,651 | |
* # | | New Motion, Inc. | | 7,832 | | 13,941 | |
* | | New York & Co., Inc. | | 33,100 | | 93,342 | |
# | | News Corp. Class A | | 1,550 | | 16,492 | |
* # | | Office Depot, Inc. | | 233,937 | | 842,173 | |
# | | OfficeMax, Inc. | | 51,600 | | 415,380 | |
# | | Orleans Homebuilders, Inc. | | 21,971 | | 67,451 | |
| | O’Charleys, Inc. | | 28,308 | | 212,310 | |
* # | | Outdoor Channel Holdings, Inc. | | 49,315 | | 394,520 | |
| | Oxford Industries, Inc. | | 35,285 | | 475,289 | |
* # | | Palm Harbor Homes, Inc. | | 1,200 | | 10,320 | |
* | | PC Mall, Inc. | | 6,308 | | 28,260 | |
# | | Penske Automotive Group, Inc. | | 161,280 | | 1,320,883 | |
* | | Perry Ellis International, Inc. | | 31,523 | | 308,610 | |
* | | Phoenix Footwear Group, Inc. | | 8,300 | | 3,361 | |
* # | | Pinnacle Entertainment, Inc. | | 9,100 | | 50,960 | |
* # | | Playboy Enterprises, Inc. Class B | | 45,100 | | 111,397 | |
* | | Pomeroy IT Solutions, Inc. | | 10,282 | | 26,733 | |
* | | Proliance International, Inc. | | 4,966 | | 2,980 | |
* | | QEP Co., Inc. | | 5,300 | | 18,921 | |
* # | | Quiksilver, Inc. | | 137,900 | | 357,161 | |
* | | Rainmaker Systems, Inc. | | 15,054 | | 18,817 | |
* # | | RC2 Corp. | | 6,900 | | 87,630 | |
* | | Red Lion Hotels Corp. | | 28,076 | | 77,771 | |
4
* | | Regent Communications, Inc. | | 7,837 | | 2,273 | |
# | | Regis Corp. | | 73,400 | | 907,958 | |
* # | | Rent-A-Center, Inc. | | 40,770 | | 595,242 | |
* | | Retail Ventures, Inc. | | 65,700 | | 135,342 | |
* | | Rex Stores Corp. | | 4,050 | | 35,964 | |
* # | | Rocky Brands, Inc. | | 6,664 | | 27,656 | |
# | | Royal Caribbean Cruises, Ltd. | | 322,500 | | 4,373,100 | |
| | Ruby Tuesday, Inc. | | 8,900 | | 21,449 | |
# | | Russ Berrie & Co., Inc. | | 15,100 | | 40,770 | |
# | | Ryland Group, Inc. | | 16,800 | | 315,672 | |
* | | Saga Communications, Inc. Class A | | 26,080 | | 139,528 | |
| | Salem Communications Corp. | | 16,481 | | 17,305 | |
# | | Sauer-Danfoss, Inc. | | 6,000 | | 61,500 | |
| | Scholastic Corp. | | 38,300 | | 711,231 | |
* # | | Sears Holdings Corp. | | 110,430 | | 6,376,228 | |
| | Service Corp. International | | 207,451 | | 1,431,412 | |
| | Shiloh Industries, Inc. | | 25,710 | | 128,807 | |
* | | Shoe Carnival, Inc. | | 26,682 | | 373,815 | |
| | Sinclair Broadcast Group, Inc. Class A | | 103,923 | | 335,671 | |
* | | Skechers U.S.A., Inc. Class A | | 23,700 | | 321,846 | |
| | Skyline Corp. | | 5,323 | | 115,083 | |
# | | Snap-On, Inc. | | 18,575 | | 686,346 | |
# | | Sonic Automotive, Inc. | | 48,400 | | 248,292 | |
* # | | Source Interlink Companies, Inc. | | 4,817 | | 1,782 | |
* | | Spanish Broadcasting System, Inc. | | 17,195 | | 3,955 | |
# | | Speedway Motorsports, Inc. | | 74,817 | | 1,193,331 | |
* | | Sport Chalet, Inc. Class A | | 15,382 | | 24,150 | |
* | | Sport Chalet, Inc. Class B | | 500 | | 950 | |
# | | Sport Supply Group, Inc. | | 3,633 | | 29,173 | |
# | | Stage Stores, Inc. | | 60,550 | | 466,840 | |
| | Standard Motor Products, Inc. | | 23,500 | | 98,935 | |
# | | Standard Pacific Corp. | | 133,900 | | 381,615 | |
| | Stanley Furniture, Inc. | | 11,599 | | 114,134 | |
* | | Steinway Musical Instruments, Inc. | | 8,617 | | 191,814 | |
# | | Stewart Enterprises, Inc. | | 25,202 | | 130,294 | |
* # | | Stoneridge, Inc. | | 23,350 | | 132,861 | |
| | Strattec Security Corp. | | 5,656 | | 121,378 | |
# | | Superior Industries International, Inc. | | 38,900 | | 556,270 | |
| | Superior Uniform Group, Inc. | | 9,178 | | 91,688 | |
* # | | Syms Corp. | | 6,000 | | 63,000 | |
# | | Systemax, Inc. | | 29,000 | | 410,640 | |
# | | Tandy Brand Accessories, Inc. | | 10,432 | | 25,141 | |
* | | Tandy Leather Factory, Inc. | | 200 | | 460 | |
* | | Tarragon Corp. | | 236 | | 31 | |
| | The Marcus Corp. | | 17,610 | | 247,068 | |
| | The Men’s Wearhouse, Inc. | | 1,500 | | 22,935 | |
# | | The Pep Boys - Manny, Moe & Jack | | 81,600 | | 393,312 | |
* # | | The Steak n Shake Co. | | 600 | | 3,090 | |
* | | Ticketmaster | | 44,432 | | 430,102 | |
| | Time Warner, Inc. | | 5,159,956 | | 52,063,956 | |
* | | Toll Brothers, Inc. | | 257,599 | | 5,955,689 | |
* | | Trans World Entertainment Corp. | | 35,365 | | 84,876 | |
* | | TRW Automotive Holdings Corp. | | 168,375 | | 1,064,130 | |
* | | Tuesday Morning Corp. | | 32,332 | | 72,424 | |
| | Tyco Electronics, Ltd. | | 600,698 | | 11,677,569 | |
5
* # | | Unifi, Inc. | | 172,580 | | 828,384 | |
# | | Unifirst Corp. | | 18,900 | | 616,707 | |
* # | | Valassis Communications, Inc. | | 48,600 | | 215,784 | |
* | | ValueVision Media, Inc. Class A | | 47,100 | | 32,499 | |
| | Virco Manufacturing Corp. | | 12,501 | | 34,253 | |
* # | | Warnaco Group, Inc. | | 24,108 | | 718,659 | |
| | Washington Post Co. | | 14,654 | | 6,254,327 | |
* # | | West Marine, Inc. | | 3,600 | | 22,788 | |
| | Whirlpool Corp. | | 86,201 | | 4,021,277 | |
* | | WPT Enterprises, Inc. | | 3,937 | | 1,496 | |
| | Wyndham Worldwide Corp. | | 244,516 | | 2,002,586 | |
| | Xerium Technologies, Inc. | | 43,860 | | 170,615 | |
* # | | Zale Corp. | | 75,640 | | 1,290,418 | |
Total Consumer Discretionary | | | | 295,622,881 | |
| | | | | |
Consumer Staples — (5.0%) | | | | | |
| | American Italian Pasta Co. | | 651 | | 8,300 | |
| | Archer-Daniels-Midland Co. | | 457,265 | | 9,479,103 | �� |
* | | Bridgford Foods Corp. | | 100 | | 400 | |
* # | | Cagle’s, Inc. Class A | | 600 | | 1,980 | |
# | | Cal-Maine Foods, Inc. | | 27,317 | | 802,847 | |
* # | | Caribou Coffee Co. | | 3,840 | | 6,835 | |
* | | Central Garden & Pet Co. | | 48,200 | | 162,916 | |
* | | Central Garden & Pet Co. Class A | | 110,693 | | 352,004 | |
# | | Chiquita Brands International, Inc. | | 48,500 | | 662,025 | |
| | Coca-Cola Bottling Co. | | 6,321 | | 279,262 | |
| | Coca-Cola Enterprises, Inc. | | 722,040 | | 7,256,502 | |
* # | | Collective Brands, Inc. | | 45,200 | | 578,108 | |
* | | Constellation Brands, Inc. Class A | | 133,054 | | 1,668,497 | |
* # | | Constellation Brands, Inc. Class B | | 12,715 | | 159,446 | |
| | Corn Products International, Inc. | | 93,300 | | 2,269,056 | |
* # | | Craft Brewers Alliance, Inc. | | 11,301 | | 31,530 | |
# | | CVS Caremark Corp. | | 726,214 | | 22,258,459 | |
| | Del Monte Foods Co. | | 359,370 | | 2,267,625 | |
# | | Farmer Brothers Co. | | 34,214 | | 821,136 | |
| | Griffin Land & Nurseries, Inc. Class A | | 1,500 | | 46,005 | |
* # | | Hain Celestial Group, Inc. | | 32,559 | | 756,671 | |
# | | Imperial Sugar Co. | | 8,419 | | 99,681 | |
| | Ingles Market, Inc. Class A | | 2,038 | | 38,029 | |
# | | J.M. Smucker Co. | | 92,382 | | 4,116,542 | |
| | Kraft Foods, Inc. | | 1,178,778 | | 34,349,591 | |
# | | MGP Ingredients, Inc. | | 40,300 | | 61,256 | |
| | Molson Coors Brewing Co. | | 246,248 | | 9,199,825 | |
# | | Molson Coors Brewing Co. Class A | | 1,908 | | 70,596 | |
* | | Monterey Pasta Co. | | 15,479 | | 24,457 | |
# | | Nash-Finch Co. | | 20,900 | | 824,087 | |
| | Oil-Dri Corp. of America | | 3,066 | | 50,742 | |
* | | Omega Protein Corp. | | 35,725 | | 263,650 | |
* | | Orchids Paper Products Co. | | 700 | | 4,865 | |
* # | | Parlux Fragrances, Inc. | | 48,809 | | 157,653 | |
| | PepsiAmericas, Inc. | | 52,095 | | 986,158 | |
# | | Pilgrim’s Pride Corp. | | 98,100 | | 107,910 | |
* # | | Prestige Brands Holdings, Inc. | | 101,900 | | 704,129 | |
# | | Reynolds American, Inc. | | 137,000 | | 6,707,520 | |
# | | Sanderson Farms, Inc. | | 9,200 | | 287,224 | |
6
* # | | Sanfilippo (John B.) & Son, Inc. | | 9,100 | | 65,611 | |
# | | Seaboard Corp. | | 2,041 | | 2,734,940 | |
* | | Seneca Foods Corp. Class B | | 300 | | 5,356 | |
* # | | Smart Balance, Inc. | | 600 | | 4,296 | |
* # | | Smithfield Foods, Inc. | | 226,973 | | 2,387,756 | |
* # | | Spectrum Brands, Inc. | | 67,400 | | 49,202 | |
| | SUPERVALU, Inc. | | 339,545 | | 4,835,121 | |
| | Tasty Baking Co. | | 2,699 | | 11,822 | |
* # | | TreeHouse Foods, Inc. | | 53,970 | | 1,633,132 | |
# | | Tyson Foods, Inc. Class A | | 405,030 | | 3,539,962 | |
| | Weis Markets, Inc. | | 32,063 | | 1,040,124 | |
* | | Winn-Dixie Stores, Inc. | | 92,300 | | 1,386,346 | |
* | | Zapata Corp. | | 3,064 | | 19,150 | |
Total Consumer Staples | | | | 125,635,440 | |
| | | | | |
Energy — (13.5%) | | | | | |
| | Adams Resources & Energy, Inc. | | 6,958 | | 129,419 | |
* | | Allis-Chalmers Energy, Inc. | | 73,600 | | 497,536 | |
| | Anadarko Petroleum Corp. | | 845,068 | | 29,830,900 | |
| | Apache Corp. | | 403,946 | | 33,256,874 | |
* | | Aventine Renewable Energy Holdings, Inc. | | 400 | | 780 | |
| | Barnwell Industries, Inc. | | 5,190 | | 33,216 | |
* # | | Basic Energy Services, Inc. | | 79,746 | | 1,090,925 | |
* | | Bill Barret Corp. | | 1,140 | | 23,256 | |
* | | Brigham Exploration Co. | | 97,094 | | 761,217 | |
* # | | Bristow Group, Inc. | | 38,200 | | 946,214 | |
* | | Bronco Drilling Co., Inc. | | 40,781 | | 314,829 | |
# | | Cabot Oil & Gas Corp. | | 3,300 | | 92,631 | |
* | | Callon Petroleum Co. | | 21,700 | | 223,944 | |
| | Chesapeake Energy Corp. | | 618,000 | | 13,577,460 | |
| | Cimarex Energy Co. | | 127,200 | | 5,146,512 | |
* | | Clayton Williams Energy, Inc. | | 18,190 | | 880,942 | |
* | | Complete Production Services, Inc. | | 95,200 | | 1,179,528 | |
* # | | Comstock Resources, Inc. | | 27,444 | | 1,356,282 | |
| | ConocoPhillips | | 1,671,850 | | 86,969,637 | |
* # | | Delta Petroleum Corp. | | 8,728 | | 82,043 | |
| | Devon Energy Corp. | | 498,108 | | 40,277,013 | |
* # | | Edge Petroleum Corp. | | 14,709 | | 8,678 | |
* | | Encore Acquisition Co. | | 65,400 | | 2,037,210 | |
* # | | Endeavour International Corp. | | 56,417 | | 42,313 | |
* | | Energy Partners, Ltd. | | 8,200 | | 35,424 | |
# | | ENSCO International, Inc. | | 48,547 | | 1,845,271 | |
| | EOG Resources, Inc. | | 20,900 | | 1,691,228 | |
* # | | EXCO Resources, Inc. | | 162,510 | | 1,493,467 | |
* # | | Exterran Holdings, Inc. | | 26,789 | | 600,341 | |
* # | | Forest Oil Corp. | | 112,481 | | 3,285,570 | |
* | | Geokinetics, Inc. | | 12,504 | | 71,273 | |
* # | | Geomet, Inc. | | 65,104 | | 192,057 | |
* # | | Grey Wolf, Inc. | | 245,898 | | 1,578,665 | |
* | | Gulfmark Offshore, Inc. | | 17,147 | | 634,439 | |
* # | | Harvest Natural Resources, Inc. | | 28,700 | | 243,663 | |
* # | | Helix Energy Solutions Group, Inc. | | 3,100 | | 32,736 | |
| | Helmerich & Payne, Inc. | | 64,234 | | 2,203,869 | |
* | | Hercules Offshore, Inc. | | 92,800 | | 676,512 | |
# | | Hess Corp. | | 198,137 | | 11,929,829 | |
7
* | | HKN, Inc. | | 19,023 | | 99,300 | |
* | | Hornbeck Offshore Services, Inc. | | 9,800 | | 233,240 | |
| | Marathon Oil Corp. | | 845,923 | | 24,616,359 | |
* # | | Mariner Energy, Inc. | | 150,441 | | 2,164,846 | |
# | | Massey Energy Co. | | 33,400 | | 771,206 | |
* | | Meridian Resource Corp. | | 154,985 | | 184,432 | |
* | | Natural Gas Services Group | | 15,260 | | 202,195 | |
* | | Newfield Exploration Co. | | 221,665 | | 5,093,862 | |
* # | | Newpark Resources, Inc. | | 130,700 | | 751,525 | |
| | Noble Energy, Inc. | | 177,500 | | 9,198,050 | |
* | | Oil States International, Inc. | | 39,000 | | 902,070 | |
* # | | OMNI Energy Services Corp. | | 17,800 | | 40,050 | |
| | Overseas Shipholding Group, Inc. | | 52,000 | | 1,954,160 | |
* # | | Parker Drilling Co. | | 87,100 | | 445,952 | |
| | Patterson-UTI Energy, Inc. | | 111,625 | | 1,481,264 | |
* | | Petrohawk Energy Corp. | | 182,762 | | 3,463,340 | |
* | | Petroleum Development Corp. | | 16,500 | | 341,715 | |
* | | PHI, Inc. Non-Voting | | 24,417 | | 512,269 | |
* # | | PHI, Inc. Voting | | 200 | | 4,660 | |
* # | | Pioneer Drilling Co. | | 83,080 | | 643,039 | |
| | Pioneer Natural Resources Co. | | 164,693 | | 4,583,406 | |
* # | | Plains Exploration & Production Co. | | 162,830 | | 4,591,806 | |
* | | Pride International, Inc. | | 30,126 | | 566,068 | |
* # | | Quest Resource Corp. | | 14,737 | | 6,263 | |
# | | Rowan Companies, Inc. | | 44,876 | | 814,051 | |
* # | | SEACOR Holdings, Inc. | | 38,153 | | 2,562,737 | |
* # | | Stone Energy Corp. | | 51,287 | | 1,556,048 | |
* | | Swift Energy Corp. | | 48,099 | | 1,543,016 | |
# | | Tesoro Petroleum Corp. | | 54,600 | | 527,982 | |
* # | | Toreador Resources Corp. | | 13,050 | | 96,570 | |
* # | | Trico Marine Services, Inc. | | 41,694 | | 375,246 | |
* | | Union Drilling, Inc. | | 34,327 | | 188,112 | |
* | | Unit Corp. | | 57,000 | | 2,139,780 | |
# | | USEC, Inc. | | 56,800 | | 234,584 | |
| | Valero Energy Corp. | | 738,360 | | 15,195,449 | |
* # | | VeraSun Energy Corp. | | 158,300 | | 80,733 | |
# | | W&T Offshore, Inc. | | 65,800 | | 1,261,386 | |
* | | Whiting Petroleum Corp. | | 70,255 | | 3,652,557 | |
# | | World Fuel Services Corp. | | 14,011 | | 300,256 | |
Total Energy | | | | 338,653,287 | |
| | | | | |
Financials — (28.3%) | | | | | |
| | 1st Source Corp. | | 51,101 | | 1,096,627 | |
| | 21st Century Holding Co. | | 21,667 | | 117,435 | |
| | Abigail Adams National Bancorp, Inc. | | 900 | | 3,600 | |
| | Abington Bancorp, Inc. | | 49,812 | | 515,554 | |
| | Access National Corp. | | 600 | | 3,507 | |
| | Advanta Corp. Class A | | 28,983 | | 68,690 | |
# | | Advanta Corp. Class B | | 63,916 | | 288,900 | |
| | Affirmative Insurance Holdings, Inc. | | 7,456 | | 8,873 | |
* # | | Allegheny Corp. | | 15,148 | | 4,271,736 | |
| | Alliance Bancorp, Inc. of Pennsylvania | | 700 | | 5,600 | |
| | Allstate Corp. | | 739,900 | | 19,525,961 | |
* # | | AmComp, Inc. | | 8,043 | | 97,642 | |
# | | Amcore Financial, Inc. | | 36,434 | | 169,418 | |
8
| | American Bancorp of New Jersey, Inc. | | 22,486 | | 202,374 | |
# | | American Capital, Ltd. | | 319,685 | | 4,491,574 | |
| | American Equity Investment Life Holding Co. | | 88,700 | | 400,924 | |
| | American Financial Group, Inc. | | 206,800 | | 4,700,564 | |
* | | American Independence Corp. | | 866 | | 2,988 | |
| | American National Insurance Co. | | 48,061 | | 3,281,605 | |
| | American Physicians Capital, Inc. | | 4,950 | | 202,504 | |
# | | American West Bancorporation | | 30,946 | | 37,445 | |
* # | | AmeriCredit Corp. | | 151,900 | | 890,134 | |
| | Ameriprise Financial, Inc. | | 136,412 | | 2,946,499 | |
| | Ameris Bancorp | | 36,345 | | 401,249 | |
* | | Amerisafe, Inc. | | 39,216 | | 676,084 | |
* # | | AmeriServe Financial, Inc. | | 33,134 | | 81,510 | |
# | | Anchor Bancorp Wisconsin, Inc. | | 31,539 | | 179,772 | |
* # | | Appalachian Bancshares, Inc. | | 1,797 | | 8,931 | |
# | | Asset Acceptance Capital Corp. | | 12,421 | | 100,734 | |
| | Associated Banc-Corp. | | 21,861 | | 482,254 | |
| | Atlantic Coast Federal Corp. | | 3,455 | | 22,492 | |
# | | Atlantic Southern Financial Group, Inc. | | 1,000 | | 11,000 | |
* # | | B of I Holding, Inc. | | 12,754 | | 58,668 | |
| | Baldwin & Lyons, Inc. Class A | | 300 | | 4,800 | |
| | Baldwin & Lyons, Inc. Class B | | 8,413 | | 153,032 | |
| | Bancorp Rhode Island, Inc. | | 1,300 | | 31,486 | |
# | | BancorpSouth, Inc. | | 35,800 | | 868,866 | |
# | | BancTrust Financial Group, Inc. | | 14,204 | | 176,982 | |
| | Bank Mutual Corp. | | 94,800 | | 1,093,044 | |
| | Bank of America Corp. | | 2,475,676 | | 59,837,089 | |
* # | | Bank of Florida Corp. | | 21,114 | | 128,795 | |
| | Bank of Granite Corp. | | 32,753 | | 126,099 | |
# | | BankAtlantic Bancorp, Inc. | | 2,860 | | 17,646 | |
# | | BankFinancial Corp. | | 46,664 | | 568,834 | |
# | | BankUnited Financial Corp. Class A | | 225 | | 105 | |
| | Banner Corp. | | 666 | | 8,505 | |
| | Bar Harbor Bankshares | | 2,200 | | 59,290 | |
# | | BB&T Corp. | | 165,800 | | 5,943,930 | |
* # | | Beach First National Bancshares, Inc. | | 7,596 | | 39,195 | |
| | Benjamin Franklin Bancorp, Inc. | | 5,074 | | 65,911 | |
| | Berkshire Hills Bancorp, Inc. | | 25,284 | | 658,143 | |
# | | Beverly Hills Bancorp, Inc. | | 26,339 | | 19,227 | |
# | | BlackRock, Inc. | | 10,920 | | 1,434,233 | |
* | | BNCCORP, Inc. | | 494 | | 3,087 | |
| | Brookline Bancorp, Inc. | | 77,125 | | 902,362 | |
# | | Cadence Financial Corp. | | 27,281 | | 204,607 | |
| | Camden National Corp. | | 637 | | 18,632 | |
# | | Capital City Bank Group, Inc. | | 14,054 | | 393,512 | |
# | | Capital Corp. of the West | | 9,068 | | 20,856 | |
# | | Capital One Financial Corp. | | 617,854 | | 24,170,448 | |
| | Capital Southwest Corp. | | 8,539 | | 870,978 | |
# | | CapitalSouth Bancorp | | 100 | | 188 | |
# | | Capitol Bancorp, Ltd. | | 35,999 | | 368,630 | |
| | Cardinal Financial Corp. | | 63,270 | | 394,805 | |
| | Carver Bancorp, Inc. | | 600 | | 4,044 | |
| | Cascade Financial Corp. | | 9,977 | | 69,340 | |
# | | Cathay General Bancorp | | 68,257 | | 1,670,931 | |
| | Center Bancorp, Inc. | | 837 | | 8,537 | |
9
| | Center Financial Corp. | | 40,876 | | 421,023 | |
# | | Centerstate Banks of Florida, Inc. | | 400 | | 7,000 | |
* | | Central Jersey Bancorp | | 7,049 | | 48,215 | |
| | Central Pacific Financial Corp. | | 14,800 | | 230,880 | |
| | Centrue Financial Corp. | | 1,000 | | 10,880 | |
| | Century Bancorp, Inc. Class A | | 1,206 | | 19,899 | |
| | CFS Bancorp, Inc. | | 14,248 | | 115,409 | |
# | | Chemical Financial Corp. | | 34,775 | | 913,539 | |
* | | Chicopee Bancorp, Inc. | | 1,000 | | 12,300 | |
| | Chubb Corp. | | 390,477 | | 20,234,518 | |
| | Cincinnati Financial Corp. | | 230,743 | | 5,997,011 | |
| | Citigroup, Inc. | | 260,500 | | 3,555,825 | |
| | Citizens Community Bancorp, Inc. | | 10,355 | | 61,198 | |
| | Citizens Holding Co. | | 300 | | 5,748 | |
# | | Citizens Republic Bancorp, Inc. | | 6,639 | | 19,585 | |
| | Citizens South Banking Corp. | | 1,842 | | 12,433 | |
# | | City National Corp. | | 73,100 | | 3,913,043 | |
| | CNA Financial Corp. | | 381,500 | | 5,936,140 | |
* # | | CNA Surety Corp. | | 59,978 | | 830,695 | |
| | Codorus Valley Bancorp, Inc. | | 315 | | 3,196 | |
# | | Colony Bankcorp, Inc. | | 300 | | 2,625 | |
# | | Columbia Banking System, Inc. | | 39,247 | | 624,812 | |
| | Comerica, Inc. | | 181,422 | | 5,005,433 | |
| | Commonwealth Bankshares, Inc. | | 1,300 | | 12,935 | |
* # | | Community Bancorp | | 2,900 | | 9,338 | |
# | | Community Bank System, Inc. | | 31,500 | | 785,925 | |
# | | Community Trust Bancorp, Inc. | | 26,863 | | 896,687 | |
# | | Community West Bancshares | | 400 | | 1,500 | |
* # | | CompuCredit Corp. | | 51,918 | | 133,948 | |
* | | Conseco, Inc. | | 246,095 | | 457,737 | |
* | | Consumer Portfolio Services, Inc. | | 19,578 | | 21,144 | |
* # | | Core-Mark Holding Co., Inc. | | 22,071 | | 436,344 | |
# | | Corus Bankshares, Inc. | | 10,197 | | 22,433 | |
* | | Cowen Group, Inc. | | 2,400 | | 16,968 | |
| | Crawford & Co. Class A | | 1,200 | | 9,252 | |
* | | Crescent Financial Corp. | | 18,540 | | 99,189 | |
* | | Dearborn Bancorp, Inc. | | 7,013 | | 21,249 | |
| | Delphi Financial Group, Inc. Class A | | 72,650 | | 1,144,237 | |
| | Discover Financial Services | | 719,953 | | 8,819,424 | |
| | Donegal Group, Inc. Class A | | 40,892 | | 669,811 | |
| | Donegal Group, Inc. Class B | | 300 | | 4,905 | |
* # | | E*TRADE Financial Corp. | | 123,406 | | 224,599 | |
# | | East West Bancorp, Inc. | | 29,363 | | 509,448 | |
| | Eastern Insurance Holdings, Inc. | | 22,090 | | 207,425 | |
| | Eastern Virginia Bankshares, Inc. | | 300 | | 3,147 | |
# | | EMC Insurance Group, Inc. | | 24,800 | | 606,608 | |
* | | Encore Bancshares, Inc. | | 2,700 | | 45,063 | |
* # | | Encore Capital Group, Inc. | | 37,672 | | 352,610 | |
| | Enterprise Bancorp, Inc. | | 600 | | 7,728 | |
# | | Enterprise Financial Services Corp. | | 17,061 | | 316,482 | |
| | ESB Financial Corp. | | 1,000 | | 10,400 | |
# | | ESSA Bancorp, Inc. | | 21,670 | | 300,346 | |
| | Evans Bancorp, Inc. | | 400 | | 6,720 | |
# | | F.N.B. Corp. | | 28,392 | | 371,935 | |
# | | Farmers Capital Bank Corp. | | 1,900 | | 37,582 | |
10
| | FBL Financial Group, Inc. Class A | | 49,686 | | 867,518 | |
# | | Federal Agriculture Mortgage Corp. Class A | | 277 | | 831 | |
# | | Federal Agriculture Mortgage Corp. Class C | | 13,100 | | 75,980 | |
| | Fidelity Bancorp, Inc. | | 400 | | 4,160 | |
| | Fidelity National Financial, Inc. | | 315,427 | | 2,841,997 | |
# | | Fidelity Southern Corp. | | 6,266 | | 21,618 | |
# | | Fifth Third Bancorp | | 1,011,926 | | 10,979,397 | |
# | | Financial Federal Corp. | | 26,141 | | 605,164 | |
# | | Financial Institutions, Inc. | | 5,250 | | 85,102 | |
* # | | First Acceptance Corp. | | 24,600 | | 75,030 | |
| | First American Corp. | | 155,240 | | 3,168,448 | |
# | | First Bancorp | | 12,931 | | 226,292 | |
# | | First Bancorp, Inc. | | 870 | | 15,660 | |
| | First Bancshares, Inc. (318687100) | | 400 | | 6,220 | |
| | First Bancshares, Inc. (318916103) | | 300 | | 4,360 | |
# | | First Busey Corp. | | 62,149 | | 1,158,457 | |
# | | First Business Financial Services, Inc. | | 300 | | 5,094 | |
| | First Citizens BancShares, Inc. | | 18,938 | | 2,895,999 | |
# | | First Commonwealth Financial Corp. | | 104,690 | | 1,157,871 | |
# | | First Community Bancshares, Inc. | | 2,977 | | 93,180 | |
| | First Defiance Financial Corp. | | 10,977 | | 110,319 | |
# | | First Federal Bancshares of Arkansas, Inc. | | 1,300 | | 11,336 | |
| | First Federal of Northern Michigan Bancorp, Inc. | | 1,100 | | 3,025 | |
# | | First Financial Bancorp | | 56,678 | | 762,319 | |
# | | First Financial Corp. | | 27,466 | | 1,161,262 | |
# | | First Financial Holdings, Inc. | | 2,652 | | 57,548 | |
| | First Financial Service Corp. | | 900 | | 16,335 | |
| | First M&F Corp. | | 300 | | 2,853 | |
# | | First Merchants Corp. | | 31,341 | | 689,815 | |
* | | First Mercury Financial Corp. | | 27,414 | | 295,797 | |
# | | First Niagara Financial Group, Inc. | | 191,382 | | 3,018,094 | |
| | First PacTrust Bancorp, Inc. | | 900 | | 9,180 | |
| | First Place Financial Corp. | | 24,803 | | 170,397 | |
* # | | First Regional Bancorp | | 16,621 | | 91,415 | |
| | First Security Group, Inc. | | 10,832 | | 81,132 | |
| | First United Corp. | | 600 | | 10,452 | |
| | Firstbank Corp. | | 210 | | 1,928 | |
* # | | FirstCity Financial Corp. | | 705 | | 2,291 | |
# | | Flagstar Bancorp, Inc. | | 33,000 | | 62,700 | |
# | | Flushing Financial Corp. | | 37,796 | | 587,728 | |
| | FNB United Corp. | | 21,631 | | 139,087 | |
* # | | FPIC Insurance Group, Inc. | | 10,600 | | 474,456 | |
# | | Fulton Financial Corp. | | 165,453 | | 1,737,256 | |
# | | Gateway Financial Holdings, Inc. | | 23,241 | | 126,431 | |
| | Genworth Financial, Inc. | | 705,238 | | 3,413,352 | |
| | German American Bancorp, Inc. | | 16,936 | | 193,070 | |
* | | Golfsmith International Holdings, Inc. | | 531 | | 504 | |
# | | Great Southern Bancorp, Inc. | | 500 | | 5,325 | |
# | | Greene Bancshares, Inc. | | 3,500 | | 69,125 | |
| | GS Financial Corp. | | 400 | | 6,196 | |
* # | | Guaranty Bancorp | | 113,605 | | 483,957 | |
| | Guaranty Federal Bancshares, Inc. | | 1,684 | | 14,415 | |
* # | | Guaranty Financial Group, Inc. | | 3,334 | | 6,768 | |
* | | Hallmark Financial Services, Inc. | | 20,100 | | 130,650 | |
# | | Hancock Holding Co. | | 1,500 | | 66,240 | |
11
# | | Hanmi Financial Corp. | | 6,300 | | 25,200 | |
| | Hanover Insurance Group, Inc. | | 96,080 | | 3,771,140 | |
| | Harleysville Group, Inc. | | 36,500 | | 1,152,670 | |
# | | Harleysville National Corp. | | 66,217 | | 918,430 | |
| | Harrington West Financial Group, Inc. | | 400 | | 1,520 | |
* # | | Harris & Harris Group, Inc. | | 57,901 | | 289,505 | |
| | Hartford Financial Services Group, Inc. | | 358,609 | | 3,700,845 | |
| | HCC Insurance Holdings, Inc. | | 166,823 | | 3,680,115 | |
# | | Heartland Financial USA, Inc. | | 13,489 | | 320,364 | |
| | Heritage Commerce Corp. | | 37,423 | | 484,254 | |
| | Heritage Financial Corp. | | 11,918 | | 145,519 | |
| | HF Financial Corp. | | 400 | | 5,492 | |
* | | Hilltop Holdings, Inc. | | 9,727 | | 91,434 | |
| | Hingham Institution for Savings | | 500 | | 14,450 | |
| | HMN Financial, Inc. | | 4,096 | | 36,864 | |
| | Home Bancshares, Inc. | | 29,170 | | 759,587 | |
| | Home Federal Bancorp, Inc. | | 20,386 | | 236,274 | |
| | HopFed Bancorp, Inc. | | 1,719 | | 18,600 | |
| | Horace Mann Educators Corp. | | 68,828 | | 547,871 | |
| | Horizon Bancorp | | 300 | | 5,190 | |
# | | Horizon Financial Corp. | | 17,341 | | 104,219 | |
| | Hudson City Bancorp, Inc. | | 672,553 | | 12,650,722 | |
# | | Huntington Bancshares, Inc. | | 94,200 | | 890,190 | |
| | IBERIABANK Corp. | | 21,918 | | 1,116,503 | |
| | Imperial Capital Bancorp, Inc. | | 359 | | 1,852 | |
# | | Independence Holding Co. | | 25,070 | | 163,707 | |
# | | Independent Bank Corp. (MA) | | 21,300 | | 612,801 | |
# | | Independent Bank Corp. (MI) | | 42,610 | | 156,379 | |
| | Infinity Property & Casualty Corp. | | 32,000 | | 1,274,240 | |
# | | Integra Bank Corp. | | 37,375 | | 225,371 | |
| | Intervest Bancshares Corp. | | 1,136 | | 6,793 | |
| | Investors Title Co. | | 1,100 | | 41,756 | |
# | | Irwin Financial Corp. | | 380 | | 836 | |
| | JPMorgan Chase & Co. | | 2,667,818 | | 110,047,492 | |
| | Kentucky First Federal Bancorp | | 3,200 | | 30,432 | |
# | | KeyCorp | | 497,441 | | 6,083,703 | |
# | | K-Fed Bancorp | | 107 | | 900 | |
* | | Knight Capital Group, Inc. | | 76,607 | | 1,107,737 | |
* # | | LaBranche & Co., Inc. | | 2,500 | | 15,575 | |
| | Lakeland Bancorp, Inc. | | 43,159 | | 475,612 | |
| | LandAmerica Financial Group, Inc. | | 11,300 | | 111,305 | |
| | Landmark Bancorp, Inc. | | 1,470 | | 30,870 | |
| | Legacy Bancorp, Inc. | | 22,879 | | 298,342 | |
# | | Legg Mason, Inc. | | 145,493 | | 3,228,490 | |
# | | Leucadia National Corp. | | 244,200 | | 6,554,328 | |
| | Lincoln National Corp. | | 464,693 | | 8,011,307 | |
# | | LNB Bancorp, Inc. | | 12,489 | | 86,923 | |
| | Loews Corp. | | 759,497 | | 25,222,895 | |
| | LSB Corp. | | 800 | | 8,440 | |
# | | M&T Bank Corp. | | 103,167 | | 8,366,844 | |
# | | Macatawa Bank Corp. | | 33,567 | | 168,171 | |
# | | MainSource Financial Group, Inc. | | 40,061 | | 715,489 | |
* | | Marlin Business Services, Inc. | | 100 | | 396 | |
| | Marshall & Ilsley Corp. | | 319,280 | | 5,756,618 | |
| | MB Financial, Inc. | | 59,049 | | 1,754,346 | |
12
# | | MBT Financial Corp. | | 21,613 | | 94,881 | |
| | Meadowbrook Insurance Group, Inc. | | 113,375 | | 597,486 | |
| | Medallion Financial Corp. | | 26,860 | | 217,297 | |
# | | Mercantile Bancorp, Inc. | | 400 | | 5,700 | |
| | Mercantile Bank Corp. | | 716 | | 6,938 | |
| | Mercer Insurance Group, Inc. | | 14,397 | | 188,817 | |
* # | | Meridian Interstate Bancorp, Inc. | | 1,700 | | 16,490 | |
| | Merrill Lynch & Co., Inc. | | 108,016 | | 2,008,017 | |
| | Meta Financial Group, Inc. | | 1,601 | | 16,730 | |
| | MetLife, Inc. | | 1,059,505 | | 35,196,756 | |
| | MetroCorp Bancshares, Inc. | | 2,600 | | 28,756 | |
| | MicroFinancial, Inc. | | 4,100 | | 12,300 | |
# | | Midwest Banc Holdings, Inc. | | 50,922 | | 153,275 | |
| | Morgan Stanley | | 567,849 | | 9,920,322 | |
| | MutualFirst Financial, Inc. | | 2,300 | | 20,125 | |
# | | Nara Bancorp, Inc. | | 40,685 | | 447,535 | |
# | | National Penn Bancshares, Inc. | | 139,707 | | 2,366,637 | |
| | National Western Life Insurance Co. Class A | | 900 | | 169,902 | |
# | | Nationwide Financial Services, Inc. | | 76,100 | | 3,600,291 | |
* # | | Navigators Group, Inc. | | 8,200 | | 414,182 | |
| | Nelnet, Inc. Class A | | 36,200 | | 529,606 | |
* # | | New Century Bancorp, Inc. | | 600 | | 3,450 | |
| | New Hampshire Thrift Bancshares, Inc. | | 2,300 | | 21,160 | |
| | New Westfield Financial, Inc. | | 41,439 | | 428,894 | |
| | New York Community Bancorp, Inc. | | 309,198 | | 4,842,041 | |
# | | NewAlliance Bancshares, Inc. | | 185,060 | | 2,553,828 | |
| | NewBridge Bancorp | | 5,501 | | 20,739 | |
* | | Newport Bancorp, Inc. | | 700 | | 8,050 | |
* # | | NewStar Financial, Inc. | | 1,000 | | 5,410 | |
* # | | NexCen Brands, Inc. | | 240 | | 20 | |
* | | Nexity Financial Corp. | | 5,159 | | 7,739 | |
| | Northeast Community Bancorp, Inc. | | 18,337 | | 142,020 | |
| | Northrim Bancorp, Inc. | | 6,315 | | 83,295 | |
# | | NYMAGIC, Inc. | | 13,520 | | 235,924 | |
| | OceanFirst Financial Corp. | | 12,175 | | 201,983 | |
| | Odyssey Re Holdings Corp. | | 126,009 | | 4,969,795 | |
# | | Old National Bancorp | | 65,900 | | 1,248,146 | |
| | Old Republic International Corp. | | 407,212 | | 3,750,423 | |
| | Osage Bancshares, Inc. | | 600 | | 4,770 | |
# | | PAB Bankshares, Inc. | | 306 | | 1,882 | |
# | | Pacific Capital Bancorp | | 75,280 | | 1,478,499 | |
# | | Pacific Continental Corp. | | 4,430 | | 63,128 | |
| | Pacific Mercantile Bancorp | | 15,114 | | 63,479 | |
* | | Pacific Premier Bancorp, Inc. | | 300 | | 1,200 | |
# | | PacWest Bancorp | | 1,100 | | 27,489 | |
| | Pamrapo Bancorp, Inc. | | 2,200 | | 18,656 | |
# | | Park National Corp. | | 19,846 | | 1,443,797 | |
| | Parkvale Financial Corp. | | 500 | | 7,490 | |
| | Patriot National Bancorp | | 400 | | 4,684 | |
* # l | | Pelican Financial, Inc. Escrow Shares | | 300 | | — | |
* # | | Pennsylvania Commerce Bancorp, Inc. | | 3,131 | | 93,147 | |
* # | | Penson Worldwide, Inc. | | 32,500 | | 232,050 | |
| | Peoples Bancorp of North Carolina | | 300 | | 3,030 | |
| | Peoples Bancorp, Inc. | | 21,610 | | 413,832 | |
* | | PICO Holdings, Inc. | | 32,451 | | 812,573 | |
13
* # | | Pinnacle Financial Partners, Inc. | | 38,859 | | 1,137,014 | |
* # | | Piper Jaffray Companies, Inc. | | 3,100 | | 122,295 | |
* | | PMA Capital Corp. Class A | | 38,757 | | 179,057 | |
# | | PMI Group, Inc. | | 20,600 | | 51,294 | |
| | Porter Bancorp, Inc. | | 1,575 | | 29,122 | |
| | Preferred Bank | | 2,500 | | 17,475 | |
| | Premier Financial Bancorp, Inc. | | 900 | | 7,875 | |
# | | Presidential Life Corp. | | 23,958 | | 224,726 | |
| | Princeton National Bancorp, Inc. | | 1,100 | | 26,648 | |
| | Principal Financial Group, Inc. | | 13,157 | | 249,851 | |
* | | ProAssurance Corp. | | 40,933 | | 2,249,268 | |
# | | Prosperity Bancshares, Inc. | | 75,055 | | 2,492,577 | |
| | Protective Life Corp. | | 125,973 | | 1,051,875 | |
| | Provident Financial Holdings, Inc. | | 8,407 | | 48,340 | |
| | Provident Financial Services, Inc. | | 68,965 | | 1,011,027 | |
| | Provident New York Bancorp | | 84,300 | | 1,014,972 | |
| | Prudential Financial, Inc. | | 463,538 | | 13,906,140 | |
# | | Pulaski Financial Corp. | | 9,672 | | 77,376 | |
| | Rainier Pacific Financial Group, Inc. | | 15,619 | | 70,286 | |
# | | Regions Financial Corp. | | 6,101 | | 67,660 | |
* # | | Reinsurance Group of America, Inc. Class A | | 97,140 | | 3,627,208 | |
* | | Reinsurance Group of America, Inc. Class B | | 131,688 | | 4,877,724 | |
# | | Renasant Corp. | | 44,612 | | 935,068 | |
# | | Republic Bancorp, Inc. Class A | | 1,900 | | 43,738 | |
* | | Republic First Bancorp, Inc. | | 7,511 | | 60,088 | |
| | Resource America, Inc. | | 22,388 | | 128,731 | |
* | | Rewards Network, Inc. | | 6,834 | | 25,969 | |
# | | Riverview Bancorp, Inc. | | 14,671 | | 70,127 | |
| | RLI Corp. | | 35,020 | | 2,009,798 | |
# | | Rockville Financial, Inc. | | 14,403 | | 187,383 | |
| | Rome Bancorp, Inc. | | 16,195 | | 163,489 | |
| | Royal Bancshares of Pennsylvania, Inc. Class A | | 900 | | 4,608 | |
# | | Safety Insurance Group, Inc. | | 29,335 | | 1,114,437 | |
| | Sanders Morris Harris Group, Inc. | | 59,090 | | 437,266 | |
# | | Sandy Spring Bancorp, Inc. | | 35,765 | | 767,875 | |
| | SCBT Financial Corp. | | 2,860 | | 96,925 | |
* | | Seabright Insurance Holdings | | 44,350 | | 463,901 | |
# | | Seacoast Banking Corp. of Florida | | 18,176 | | 161,403 | |
# | | Security Bank Corp. | | 21,068 | | 41,715 | |
# | | Selective Insurance Group, Inc. | | 82,800 | | 1,966,500 | |
# | | Shore Bancshares, Inc. | | 1,200 | | 29,136 | |
| | SI Financial Group, Inc. | | 5,417 | | 37,648 | |
# | | Simmons First National Corp. Class A | | 13,221 | | 410,115 | |
# | | Somerset Hills Bancorp | | 4,111 | | 34,944 | |
# | | South Financial Group, Inc. | | 308 | | 1,789 | |
* | | Southcoast Financial Corp. | | 700 | | 3,605 | |
| | Southern Community Financial Corp. | | 30,490 | | 118,301 | |
* # | | Southern First Bancshares, Inc. | | 900 | | 9,153 | |
# | | Southwest Bancorp, Inc. | | 30,600 | | 443,088 | |
* # | | Sovereign Bancorp, Inc. | | 298,408 | | 865,383 | |
* | | Specialty Underwriters’ Alliance, Inc. | | 2,510 | | 8,735 | |
| | State Auto Financial Corp. | | 74,593 | | 1,964,780 | |
| | StellarOne Corp. | | 14,774 | | 251,158 | |
| | Sterling Bancshares, Inc. | | 29,924 | | 238,195 | |
# | | Sterling Financial Corp. | | 6,509 | | 55,261 | |
14
# | | Stewart Information Services Corp. | | 25,500 | | 423,300 | |
* # | | Stratus Properties, Inc. | | 2,802 | | 68,649 | |
* | | Sun American Bancorp | | 560 | | 1,078 | |
* | | Sun Bancorp, Inc. | | 31,881 | | 318,810 | |
# | | SunTrust Banks, Inc. | | 383,603 | | 15,397,824 | |
* # | | Superior Bancorp | | 108 | | 597 | |
# | | Susquehanna Bancshares, Inc. | | 153,978 | | 2,385,119 | |
* # | | Susser Holdings Corp. | | 9,700 | | 151,126 | |
| | SWS Group, Inc. | | 41,145 | | 763,651 | |
# | | Synovus Financial Corp. | | 511,500 | | 5,283,795 | |
| | Taylor Capital Group, Inc. | | 2,735 | | 30,769 | |
| | Teche Holding Co. | | 600 | | 18,000 | |
# | | Temecula Valley Bancorp, Inc. | | 2,718 | | 9,377 | |
* # | | Texas Capital Bancshares, Inc. | | 40,316 | | 719,641 | |
| | TF Financial Corp. | | 600 | | 11,340 | |
* # | | The Bancorp, Inc. | | 9,634 | | 36,031 | |
* # | | The NASDAQ OMX Group, Inc. | | 8,600 | | 279,156 | |
# | | The Phoenix Companies, Inc. | | 88,600 | | 573,242 | |
| | The Travelers Companies, Inc. | | 932,958 | | 39,697,363 | |
| | The Wilber Corp. | | 600 | | 4,656 | |
* # | | Thomas Weisel Partners Group, Inc. | | 7,655 | | 43,021 | |
# | | TIB Financial Corp. | | 1,553 | | 7,004 | |
* # | | Tidelands Bancshares, Inc. | | 400 | | 1,928 | |
# | | Timberland Bancorp, Inc. | | 3,000 | | 17,700 | |
| | Transatlantic Holdings, Inc. | | 91,903 | | 3,938,044 | |
* | | Tree.com, Inc. | | 11,492 | | 31,143 | |
| | TriCo Bancshares | | 2,200 | | 47,388 | |
# | | Trustmark Corp. | | 56,645 | | 1,162,355 | |
# | | UMB Financial Corp. | | 46,740 | | 2,118,724 | |
# | | Umpqua Holdings Corp. | | 70,705 | | 1,203,399 | |
* | | Unico American Corp. | | 1,900 | | 13,395 | |
| | Union Bankshares Corp. | | 28,291 | | 674,175 | |
* # | | United Capital Corp. | | 300 | | 6,675 | |
# | | United Community Banks, Inc. | | 35,446 | | 465,052 | |
# | | United Community Financial Corp. | | 62,591 | | 293,552 | |
| | United Financial Bancorp, Inc. | | 36,681 | | 513,534 | |
# | | United Fire & Casualty Co. | | 47,123 | | 1,091,840 | |
* | | United PanAm Financial Corp. | | 14,353 | | 25,118 | |
| | United Western Bancorp, Inc. | | 18,229 | | 206,899 | |
# | | Unitrin, Inc. | | 104,046 | | 2,184,966 | |
| | Unity Bancorp, Inc. | | 2,925 | | 11,671 | |
* | | Universal American Corp. | | 46,291 | | 409,675 | |
| | Univest Corp. of Pennsylvania | | 17,567 | | 543,523 | |
| | Unum Group | | 545,000 | | 8,583,750 | |
| | W. R. Berkley Corp. | | 206,690 | | 5,429,746 | |
| | Wachovia Corp. | | 412,954 | | 2,647,035 | |
# | | Washington Federal, Inc. | | 15,332 | | 270,150 | |
# | | Webster Financial Corp. | | 51,670 | | 957,962 | |
# | | Wesbanco, Inc. | | 41,466 | | 1,127,046 | |
| | Wesco Financial Corp. | | 12,923 | | 4,264,461 | |
| | West Bancorporation | | 22,100 | | 276,250 | |
# | | West Coast Bancorp | | 3,775 | | 32,918 | |
* # | | Western Alliance Bancorp | | 25,600 | | 379,136 | |
# | | White Mountains Insurance Group, Ltd. | | 18,985 | | 6,540,333 | |
* | | White River Capital, Inc. | | 300 | | 3,758 | |
15
# | | Whitney Holding Corp. | | 111,205 | | 2,112,895 | |
| | Willow Financial Bancorp, Inc. | | 28,055 | | 242,676 | |
# | | Wilshire Bancorp, Inc. | | 17,744 | | 195,716 | |
# | | Wintrust Financial Corp. | | 40,447 | | 1,035,443 | |
* # | | WSB Financial Group, Inc. | | 754 | | 679 | |
| | WSB Holdings, Inc. | | 100 | | 398 | |
# | | Yadkin Valley Financial Corp. | | 14,330 | | 213,374 | |
| | Zenith National Insurance Corp. | | 63,800 | | 2,096,468 | |
# | | Zions Bancorporation | | 161,212 | | 6,143,789 | |
* | | ZipRealty, Inc. | | 13,033 | | 37,665 | |
Total Financials | | | | 708,732,328 | |
| | | | | |
Health Care — (2.3%) | | | | | |
* | | Adolor Corp. | | 6,302 | | 19,851 | |
* # | | Advanced Medical Optics, Inc. | | 35,678 | | 220,133 | |
| | Aetna, Inc. | | 95 | | 2,363 | |
* | | Albany Molecular Research, Inc. | | 34,810 | | 440,347 | |
* | | Allied Healthcare International, Inc. | | 57,915 | | 83,977 | |
* | | Allied Healthcare Products, Inc. | | 1,000 | | 4,275 | |
* | | Allion Healthcare, Inc. | | 27,600 | | 119,508 | |
| | Alpharma, Inc. Class A | | 78,205 | | 2,448,599 | |
* | | American Dental Partners, Inc. | | 21,149 | | 184,631 | |
* | | AMICAS, Inc. | | 99,113 | | 183,359 | |
* | | Anadys Pharmaceuticals, Inc. | | 4,584 | | 10,039 | |
* # | | AngioDynamics, Inc. | | 48,717 | | 613,834 | |
* | | Arqule, Inc. | | 2,100 | | 5,796 | |
* | | Arrhythmia Research Technology, Inc. | | 1,200 | | 3,372 | |
* | | Assisted Living Concepts, Inc. | | 74,765 | | 371,582 | |
* # | | ATS Medical, Inc. | | 8,800 | | 23,320 | |
* # | | Avigen, Inc. | | 4,409 | | 2,645 | |
* | | BioScrip, Inc. | | 65,100 | | 195,300 | |
* # | | Boston Scientific Corp. | | 17 | | 154 | |
# | | Brookdale Senior Living, Inc. | | 112,800 | | 972,336 | |
* # | | Caliper Life Sciences, Inc. | | 33,998 | | 47,597 | |
| | Cambrex Corp. | | 20,000 | | 90,000 | |
* | | Cantel Medical Corp. | | 30,908 | | 296,717 | |
* | | Capital Senior Living Corp. | | 45,075 | | 202,387 | |
* | | Cardiac Science Corp. | | 37,674 | | 351,498 | |
* # | | Celera Corp. | | 66,920 | | 756,865 | |
* # | | Community Health Systems, Inc. | | 151,474 | | 3,105,217 | |
* # | | CONMED Corp. | | 49,672 | | 1,301,406 | |
* | | Continucare Corp. | | 20,028 | | 47,266 | |
# | | Cooper Companies, Inc. | | 77,156 | | 1,271,531 | |
* | | Cross Country Healthcare, Inc. | | 36,400 | | 412,048 | |
* | | Cutera, Inc. | | 5,552 | | 47,248 | |
| | Daxor Corp. | | 1,100 | | 16,830 | |
* # | | Digirad Corp. | | 37,779 | | 31,734 | |
* # | | Dynacq Healthcare, Inc. | | 314 | | 1,083 | |
* # | | ev3, Inc. | | 37,893 | | 245,168 | |
* | | Fresenius Kabi Pharmaceuticals Holding, Inc. | | 34,028 | | 39,132 | |
* # | | Gentiva Health Services, Inc. | | 42,124 | | 1,143,667 | |
* # | | Greatbatch, Inc. | | 47,900 | | 1,041,825 | |
* # | | Hanger Orthopedic Group, Inc. | | 9,000 | | 149,940 | |
* # | | HealthSpring, Inc. | | 86,917 | | 1,435,869 | |
* | | HealthTronics, Inc. | | 59,194 | | 114,836 | |
16
# | | Hill-Rom Holdings, Inc. | | 57,955 | | 1,319,056 | |
* # | | Hi-Tech Pharmacal Co., Inc. | | 12,055 | | 87,881 | |
* # | | Hologic, Inc. | | 44,000 | | 538,560 | |
* | | Home Diagnostics, Inc. | | 16,023 | | 139,560 | |
| | Hooper Holmes, Inc. | | 6,014 | | 3,909 | |
# | | Invacare Corp. | | 49,400 | | 898,586 | |
* # | | Inverness Medical Innovations, Inc. | | 3,400 | | 65,110 | |
* # | | Iridex Corp. | | 4,807 | | 10,960 | |
| | Kewaunee Scientific Corp. | | 1,631 | | 14,761 | |
* # | | Kindred Healthcare, Inc. | | 43,700 | | 633,213 | |
* | | King Pharmaceuticals, Inc. | | 426,520 | | 3,749,111 | |
* | | Langer, Inc. | | 9,342 | | 6,913 | |
* # | | Lannet Co., Inc. | | 8,400 | | 23,940 | |
* # | | Lexicon Pharmaceuticals, Inc. | | 24,800 | | 38,936 | |
* # | | LifePoint Hospitals, Inc. | | 82,208 | | 1,970,526 | |
* | | Magyar Bancorp, Inc. | | 500 | | 4,015 | |
| | Martek Biosciences Corp. | | 4,700 | | 140,201 | |
* | | Maxygen, Inc. | | 267 | | 1,119 | |
* | | MedCath Corp. | | 39,208 | | 604,587 | |
* | | Medical Staffing Network Holdings, Inc. | | 29,839 | | 12,831 | |
* # | | MediciNova, Inc. | | 300 | | 680 | |
* | | Nabi Biopharmaceuticals | | 500 | | 1,960 | |
* | | National Dentex Corp. | | 400 | | 2,116 | |
* | | Novacea, Inc. | | 10,743 | | 14,288 | |
* # | | NovaMed, Inc. | | 38,506 | | 136,311 | |
* | | Nutraceutical International Corp. | | 25,992 | | 237,827 | |
* # | | NxStage Medical, Inc. | | 22,100 | | 89,726 | |
| | Omnicare, Inc. | | 202,170 | | 5,573,827 | |
* # | | Orchid Cellmark, Inc. | | 289 | | 341 | |
* | | Osteotech, Inc. | | 25,510 | | 81,377 | |
* | | Par Pharmaceutical Cos, Inc. | | 46,800 | | 468,000 | |
* | | PDI, Inc. | | 15,476 | | 75,059 | |
* | | Pharmanet Development Group, Inc. | | 8,875 | | 14,200 | |
* | | Prospect Medical Holdings, Inc. | | 14,274 | | 34,258 | |
* | | Regeneration Technologies, Inc. | | 30,452 | | 92,879 | |
* | | RehabCare Group, Inc. | | 27,481 | | 470,750 | |
* # | | Res-Care, Inc. | | 32,560 | | 501,750 | |
* # | | Spectrum Pharmaceuticals, Inc. | | 184 | | 331 | |
* | | SRI/Surgical Express, Inc. | | 1,600 | | 3,680 | |
* | | SunLink Health Systems, Inc. | | 500 | | 1,110 | |
* # | | Symmetry Medical, Inc. | | 1,442 | | 18,631 | |
* | | Synovis Life Technologies, Inc. | | 1,836 | | 32,112 | |
* | | Theragenics Corp. | | 32,183 | | 62,757 | |
* # | | Triple-S Management Corp. | | 8,500 | | 86,785 | |
* # | | ViroPharma, Inc. | | 121,567 | | 1,524,450 | |
* # | | Vital Images, Inc. | | 31,973 | | 417,248 | |
* | | Watson Pharmaceuticals, Inc. | | 102,600 | | 2,685,042 | |
* | | WellPoint, Inc. | | 424,020 | | 16,481,657 | |
| | Young Innovations, Inc. | | 1,312 | | 22,304 | |
Total Health Care | | | | 57,450,516 | |
| | | | | |
Industrials — (10.2%) | | | | | |
* | | A. T. Cross Co. Class A | | 18,431 | | 97,684 | |
| | A.O. Smith Corp. | | 34,400 | | 1,085,320 | |
* | | ACCO Brands Corp. | | 83,346 | | 235,036 | |
17
* # | | Accuride Corp. | | 27,500 | | 8,800 | |
| | Aceto Corp. | | 31,800 | | 265,530 | |
| | Alamo Group, Inc. | | 20,383 | | 256,418 | |
* # | | Alaska Air Group, Inc. | | 78,900 | | 1,948,830 | |
| | Albany International Corp. Class A | | 28,323 | | 412,383 | |
| | Alexander & Baldwin, Inc. | | 67,519 | | 2,153,856 | |
* # | | Allied Defense Group, Inc. | | 17,161 | | 124,417 | |
* | | Allied Waste Industries, Inc. | | 437,356 | | 4,557,250 | |
* # | | Amerco, Inc. | | 31,616 | | 1,430,940 | |
| | American Railcar Industries, Inc. | | 10,700 | | 118,984 | |
# | | American Woodmark Corp. | | 4,852 | | 89,956 | |
| | Ameron International Corp. | | 7,300 | | 343,100 | |
| | Ampco-Pittsburgh Corp. | | 251 | | 5,934 | |
* # | | AMR Corp. | | 2,200 | | 22,462 | |
* # | | AMREP Corp. | | 1,419 | | 42,726 | |
| | Applied Industrial Technologies, Inc. | | 53,325 | | 1,076,632 | |
| | Applied Signal Technologies, Inc. | | 17,902 | | 320,804 | |
* # | | Argon ST, Inc. | | 21,980 | | 458,503 | |
| | Arkansas Best Corp. | | 38,800 | | 1,132,572 | |
* # | | Arotech Corp. | | 20,120 | | 12,877 | |
* | | Avis Budget Group, Inc. | | 53,950 | | 88,478 | |
* # | | Axsys Technologies, Inc. | | 12,900 | | 851,787 | |
* | | Baldwin Technology Co., Inc. Class A | | 17,977 | | 35,594 | |
| | Barrett Business Services, Inc. | | 16,000 | | 176,000 | |
* # | | Beacon Roofing Supply, Inc. | | 72,525 | | 992,142 | |
# | | Belden, Inc. | | 46,850 | | 976,354 | |
# | | BlueLinx Holdings, Inc. | | 56,806 | | 152,808 | |
| | Bowne & Co., Inc. | | 19,714 | | 153,572 | |
# | | Briggs & Stratton Corp. | | 31,661 | | 498,977 | |
* # | | Builders FirstSource, Inc. | | 54,493 | | 207,073 | |
| | Burlington Northern Santa Fe Corp. | | 398,500 | | 35,490,410 | |
# | | C&D Technologies, Inc. | | 36,712 | | 128,492 | |
| | CDI Corp. | | 29,909 | | 388,817 | |
* | | Celadon Group, Inc. | | 39,349 | | 420,641 | |
| | Champion Industries, Inc. | | 5,186 | | 16,388 | |
| | Chicago Rivet & Machine Co. | | 300 | | 4,710 | |
# | | CIRCOR International, Inc. | | 18,850 | | 577,753 | |
* | | Commercial Vehicle Group, Inc. | | 34,696 | | 46,146 | |
# | | CompX International, Inc. | | 700 | | 3,976 | |
* # | | Cornell Companies, Inc. | | 3,700 | | 84,249 | |
* | | Covenant Transport Group Class A | | 4,818 | | 10,070 | |
* | | CPI Aerostructures, Inc. | | 5,826 | | 39,034 | |
| | CSX Corp. | | 607,620 | | 27,780,386 | |
# | | Cubic Corp. | | 24,200 | | 538,450 | |
* # | | Dollar Thrifty Automotive Group, Inc. | | 300 | | 486 | |
| | Ducommun, Inc. | | 19,878 | | 401,337 | |
| | Eastern Co. | | 10,296 | | 120,978 | |
| | Ecology & Environment, Inc. Class A | | 1,000 | | 10,000 | |
# | | Electro Rent Corp. | | 54,304 | | 651,105 | |
# | | Encore Wire Corp. | | 35,480 | | 680,152 | |
* # | | EnerSys Inc. | | 60,439 | | 799,004 | |
| | Ennis, Inc. | | 48,199 | | 567,302 | |
* # | | EnPro Industries, Inc. | | 26,355 | | 585,345 | |
| | Espey Manufacturing & Electronics Corp. | | 3,050 | | 60,085 | |
* # | | Esterline Technologies Corp. | | 51,094 | | 1,841,939 | |
18
* # | | ExpressJet Holdings, Inc. | | 2,460 | | 4,256 | |
# | | Federal Signal Corp. | | 81,490 | | 693,480 | |
* | | First Advantage Corp. | | 14,062 | | 153,698 | |
* # | | Flanders Corp. | | 18,900 | | 117,180 | |
| | Frozen Food Express Industries, Inc. | | 6,500 | | 37,635 | |
# | | G & K Services, Inc. Class A | | 32,639 | | 737,315 | |
* # | | Gardner Denver Machinery, Inc. | | 4,005 | | 102,608 | |
| | GATX Corp. | | 73,797 | | 2,106,904 | |
# | | Greenbrier Companies, Inc. | | 33,734 | | 278,306 | |
* | | Griffon Corp. | | 43,752 | | 369,267 | |
| | Hardinge, Inc. | | 26,515 | | 184,810 | |
* # | | Henry Bros. Electronics, Inc. | | 8,600 | | 52,030 | |
* | | Herley Industries, Inc. | | 5,800 | | 77,140 | |
* | | Hudson Highland Group, Inc. | | 35,619 | | 186,644 | |
* | | Huttig Building Products, Inc. | | 4,100 | | 4,551 | |
* # | | ICF International, Inc. | | 400 | | 7,432 | |
* | | ICT Group, Inc. | | 9,323 | | 49,132 | |
| | IKON Office Solutions, Inc. | | 172,140 | | 2,965,972 | |
# | | Innovative Solutions & Support, Inc. | | 1,200 | | 7,380 | |
* # | | Insituform Technologies, Inc. Class A | | 57,301 | | 769,552 | |
| | Insteel Industries, Inc. | | 2,229 | | 22,870 | |
* # | | Interline Brands, Inc. | | 11,698 | | 124,467 | |
* | | International Shipholding Corp. | | 8,100 | | 199,179 | |
* | | Intersections, Inc. | | 35,048 | | 294,403 | |
* # | | JetBlue Airways Corp. | | 152,100 | | 844,155 | |
* | | Kadant, Inc. | | 5,957 | | 97,933 | |
# | | Kaman Corp. Class A | | 37,597 | | 959,851 | |
* | | Kansas City Southern | | 10,954 | | 338,150 | |
# | | Kelly Services, Inc. Class A | | 53,465 | | 761,342 | |
| | Kennametal, Inc. | | 20,956 | | 444,686 | |
* | | Kforce, Inc. | | 42,221 | | 332,279 | |
* # | | K-Tron International, Inc. | | 70 | | 6,579 | |
| | L.S. Starrett Co. Class A | | 5,000 | | 71,000 | |
| | Lawson Products, Inc. | | 3,859 | | 114,998 | |
* | | LECG Corp. | | 31,316 | | 150,317 | |
* | | LGL Group, Inc. | | 400 | | 1,800 | |
* | | Limco-Piedmont, Inc. | | 300 | | 1,065 | |
| | LSI Industries, Inc. | | 14,163 | | 111,180 | |
* | | Lydall, Inc. | | 7,000 | | 46,550 | |
* # | | M&F Worldwide Corp. | | 29,969 | | 690,785 | |
* | | Mac-Gray Corp. | | 10,800 | | 81,972 | |
* # | | Marten Transport, Ltd. | | 45,793 | | 841,675 | |
| | Masco Corp. | | 124,744 | | 1,266,152 | |
* | | Medialink Worldwide, Inc. | | 5,500 | | 770 | |
* | | Merrimac Industries, Inc. | | 2,600 | | 7,930 | |
* | | Mesa Air Group, Inc. | | 1,000 | | 370 | |
* | | Miller Industries, Inc. | | 22,810 | | 139,141 | |
* | | Misonix, Inc. | | 8,971 | | 18,391 | |
* # | | Mobile Mini, Inc. | | 52,331 | | 879,161 | |
# | | Mueller Industries, Inc. | | 38,242 | | 874,595 | |
# | | Mueller Water Products, Inc. | | 40,933 | | 286,531 | |
| | Mueller Water Products, Inc. Class B | | 130,035 | | 855,630 | |
# | | NACCO Industries, Inc. Class A | | 10,965 | | 675,554 | |
* | | Nashua Corp. | | 400 | | 2,736 | |
| | National Technical Systems, Inc. | | 15,400 | | 65,681 | |
19
* # | | NCI Building Systems, Inc. | | 22,800 | | 424,308 | |
| | Norfolk Southern Corp. | | 661,000 | | 39,620,340 | |
| | Northrop Grumman Corp. | | 435,224 | | 20,407,653 | |
* | | On Assignment, Inc. | | 23,009 | | 149,559 | |
# | | Oshkosh Truck Corp. Class B | | 50,500 | | 386,830 | |
* # | | Owens Corning, Inc. | | 205,722 | | 3,236,007 | |
* | | P.A.M. Transportation Services, Inc. | | 20,990 | | 182,193 | |
* | | Paragon Technologies, Inc. | | 3,771 | | 14,877 | |
* | | Park-Ohio Holdings Corp. | | 3,700 | | 28,083 | |
* | | Patrick Industries, Inc. | | 1,300 | | 2,496 | |
* | | PGT, Inc. | | 7,500 | | 15,525 | |
* # | | PHH Corp. | | 88,157 | | 710,545 | |
* # | | Pinnacle Airlines Corp. | | 3,900 | | 10,647 | |
* # | | Plug Power, Inc. | | 178,671 | | 175,098 | |
| | Portec Rail Products, Inc. | | 11,395 | | 76,688 | |
* # | | Power-One, Inc. | | 7,000 | | 7,770 | |
| | Providence & Worcester Railroad Co. | | 1,000 | | 14,000 | |
# | | Quanex Building Products Corp. | | 2,800 | | 25,648 | |
| | R. R. Donnelley & Sons Co. | | 295,956 | | 4,903,991 | |
| | Raytheon Co. | | 7,274 | | 371,774 | |
* | | RCM Technologies, Inc. | | 19,816 | | 22,590 | |
# | | Regal-Beloit Corp. | | 6,432 | | 209,426 | |
* # | | Republic Airways Holdings, Inc. | | 48,800 | | 729,560 | |
# | | Robbins & Myers, Inc. | | 1,146 | | 23,378 | |
* | | Rush Enterprises, Inc. Class A | | 31,175 | | 292,110 | |
* # | | Rush Enterprises, Inc. Class B | | 18,522 | | 197,630 | |
| | Ryder System, Inc. | | 89,844 | | 3,559,619 | |
* | | Saia, Inc. | | 10,800 | | 114,588 | |
| | Schawk, Inc. | | 32,616 | | 428,248 | |
* # | | School Specialty, Inc. | | 37,902 | | 795,942 | |
| | Servidyne, Inc. | | 7,283 | | 28,258 | |
* | | SIFCO Industries, Inc. | | 600 | | 3,420 | |
# | | SkyWest, Inc. | | 79,932 | | 1,231,752 | |
| | Southwest Airlines Co. | | 1,077,730 | | 12,695,659 | |
* | | Sparton Corp. | | 3,057 | | 6,206 | |
* | | Spherion Corp. | | 20,600 | | 65,508 | |
# | | SPX Corp. | | 54,690 | | 2,118,691 | |
| | Standex International Corp. | | 25,800 | | 665,898 | |
| | Supreme Industries, Inc. | | 1,642 | | 2,381 | |
| | Sypris Solutions, Inc. | | 13,620 | | 12,667 | |
| | Tech/Ops Sevcon, Inc. | | 874 | | 4,195 | |
| | Technology Research Corp. | | 12,921 | | 21,966 | |
| | Tecumseh Products Co. Class A | | 11,200 | | 207,424 | |
* | | Tecumseh Products Co. Class B | | 1,400 | | 23,240 | |
| | Timken Co. | | 116,978 | | 1,857,611 | |
| | Todd Shipyards Corp. | | 9,932 | | 124,150 | |
* | | TRC Companies, Inc. | | 29,646 | | 53,659 | |
| | Tredegar Industries, Inc. | | 50,900 | | 749,248 | |
* # | | Trex Co., Inc. | | 15,119 | | 246,591 | |
| | Trinity Industries, Inc. | | 91,550 | | 1,545,364 | |
# | | Triumph Group, Inc. | | 5,400 | | 236,844 | |
* | | Tufco Technologies, Inc. | | 1,000 | | 3,450 | |
| | Twin Disc, Inc. | | 8,294 | | 64,279 | |
* | | U.S. Home Systems, Inc. | | 4,314 | | 9,146 | |
| | Union Pacific Corp. | | 483,593 | | 32,289,505 | |
20
* # | | United Rentals, Inc. | | 93,585 | | 959,246 | |
# | | Universal Forest Products, Inc. | | 31,400 | | 742,610 | |
* | | URS Corp. | | 91,400 | | 2,686,246 | |
* | | US Airways Group, Inc. | | 4,301 | | 43,612 | |
* | | USA Truck, Inc. | | 13,849 | | 204,550 | |
| | Valpey Fisher Corp. | | 1,464 | | 2,928 | |
# | | Viad Corp. | | 34,729 | | 758,829 | |
* | | Volt Information Sciences, Inc. | | 45,263 | | 346,262 | |
| | Wabash National Corp. | | 59,700 | | 362,976 | |
| | Watts Water Technologies, Inc. | | 60,015 | | 1,586,196 | |
* | | WCA Waste Corp. | | 29,283 | | 95,170 | |
# | | Werner Enterprises, Inc. | | 115,482 | | 2,265,757 | |
* # | | Westaff, Inc. | | 14,426 | | 5,770 | |
* | | Willdan Group, Inc. | | 1,000 | | 2,205 | |
* | | Willis Lease Finance Corp. | | 4,400 | | 56,056 | |
* # | | YRC Worldwide, Inc. | | 59,368 | | 271,905 | |
Total Industrials | | | | 253,890,777 | |
| | | | | |
Information Technology — (4.8%) | | | | | |
* # | | 3Com Corp. | | 270,673 | | 738,937 | |
* # | | Access Integrated Technologies, Inc. | | 14,024 | | 16,689 | |
* | | Actel Corp. | | 33,263 | | 402,150 | |
* # | | ActivIdentity Corp. | | 62,658 | | 125,316 | |
# | | Acxiom Corp. | | 20,804 | | 163,519 | |
* # | | Adaptec, Inc. | | 212,719 | | 682,828 | |
* # | | Advanced Micro Devices, Inc. | | 125,500 | | 439,250 | |
# | | Agilysys, Inc. | | 26,100 | | 104,922 | |
* | | Amtech Systems, Inc. | | 10,600 | | 67,946 | |
* | | Anaren, Inc. | | 11,003 | | 136,987 | |
* # | | Applied Micro Circuits Corp. | | 94,993 | | 485,414 | |
* # | | Arris Group, Inc. | | 109,812 | | 758,801 | |
* | | Arrow Electronics, Inc. | | 200,870 | | 3,505,182 | |
| | Astro-Med, Inc. | | 2,626 | | 18,540 | |
* | | Autobytel, Inc. | | 3,863 | | 3,013 | |
* # | | Avid Technology, Inc. | | 61,723 | | 915,352 | |
* | | Avnet, Inc. | | 228,000 | | 3,816,720 | |
* # | | Avocent Corp. | | 52,800 | | 793,056 | |
| | AVX Corp. | | 298,652 | | 2,693,841 | |
* | | Aware, Inc. | | 21,340 | | 48,015 | |
* | | Axcelis Technologies, Inc. | | 193,369 | | 85,082 | |
* | | AXT, Inc. | | 36,400 | | 57,876 | |
| | Bel Fuse, Inc. Class A | | 4,174 | | 86,903 | |
| | Bel Fuse, Inc. Class B | | 17,950 | | 389,515 | |
* # | | Benchmark Electronics, Inc. | | 91,303 | | 1,094,723 | |
# | | Black Box Corp. | | 29,500 | | 897,095 | |
* # | | Bookham, Inc. | | 5,300 | | 2,862 | |
* # | | Borland Software Corp. | | 25,977 | | 38,966 | |
* | | Brightpoint, Inc. | | 30,900 | | 177,984 | |
* # | | Brooks Automation, Inc. | | 92,404 | | 632,967 | |
* | | CalAmp Corp. | | 46,571 | | 36,325 | |
* | | California Micro Devices Corp. | | 34,646 | | 82,111 | |
* | | CallWave, Inc. | | 37,140 | | 40,483 | |
* | | Captaris, Inc. | | 15,700 | | 74,732 | |
* | | Cascade Microtech, Inc. | | 23,271 | | 74,467 | |
* | | Catapult Communications Corp. | | 30,276 | | 129,279 | |
21
* | | CEVA, Inc. | | 11,574 | | 98,379 | |
* # | | Checkpoint Systems, Inc. | | 28,400 | | 358,124 | |
* | | Ciber, Inc. | | 31,700 | | 171,180 | |
* # | | Cirrus Logic, Inc. | | 51,910 | | 297,963 | |
| | Cohu, Inc. | | 37,208 | | 526,121 | |
* | | Comarco, Inc. | | 5,867 | | 6,659 | |
| | Communications Systems, Inc. | | 6,864 | | 54,912 | |
* | | Computer Sciences Corp. | | 231,053 | | 6,968,558 | |
* | | Concurrent Computer Corp. | | 10,140 | | 37,214 | |
* | | Convergys Corp. | | 197,364 | | 1,517,729 | |
* | | Cray, Inc. | | 30,490 | | 95,739 | |
* | | CSP, Inc. | | 2,514 | | 9,365 | |
# | | CTS Corp. | | 34,200 | | 239,058 | |
* | | CyberOptics Corp. | | 9,134 | | 70,697 | |
| | Dataram Corp. | | 11,134 | | 14,252 | |
* | | DDi Corp. | | 25,458 | | 114,052 | |
* | | Digi International, Inc. | | 27,887 | | 285,563 | |
* | | Ditech Networks, Inc. | | 4,748 | | 3,941 | |
* | | Dot Hill Systems Corp. | | 100,590 | | 119,702 | |
* | | DSP Group, Inc. | | 7,000 | | 44,100 | |
* | | Dynamics Research Corp. | | 17,974 | | 138,400 | |
* | | EDCI Holdings, Inc. | | 4 | | 13 | |
* | | Edgewater Technology, Inc. | | 6,593 | | 14,175 | |
* | | EFJohnson Technologies, Inc. | | 5,104 | | 9,698 | |
* | | Electro Scientific Industries, Inc. | | 34,300 | | 287,091 | |
* | | Electronics for Imaging, Inc. | | 25,800 | | 273,480 | |
* # | | EMCORE Corp. | | 19,200 | | 68,352 | |
* # | | EMS Technologies, Inc. | | 15,237 | | 318,453 | |
* | | Endwave Corp. | | 19,815 | | 65,390 | |
* # | | Entegris, Inc. | | 126,900 | | 341,361 | |
* # | | EPIQ Systems, Inc. | | 32,616 | | 443,251 | |
* | | Euronet Worldwide, Inc. | | 47,991 | | 572,053 | |
* # | | Exar Corp. | | 7,481 | | 49,973 | |
* | | Extreme Networks, Inc. | | 10,300 | | 18,952 | |
* | | Fairchild Semiconductor Corp. Class A | | 144,238 | | 819,272 | |
| | Fidelity National Information Services, Inc. | | 91,600 | | 1,382,244 | |
* | | FormFactor, Inc. | | 18,500 | | 322,270 | |
# | | Frequency Electronics, Inc. | | 17,253 | | 74,360 | |
* | | FSI International, Inc. | | 5,123 | | 2,510 | |
* | | Gerber Scientific, Inc. | | 50,097 | | 239,464 | |
| | Gevity HR, Inc. | | 30,736 | | 104,810 | |
* | | Globecomm Systems, Inc. | | 14,674 | | 115,631 | |
* # | | Glu Mobile, Inc. | | 2,070 | | 1,842 | |
* | | GSI Technology, Inc. | | 16,780 | | 58,730 | |
* | | GTSI Corp. | | 8,203 | | 47,659 | |
* | | Hackett Group, Inc. | | 51,020 | | 152,040 | |
* # | | Harris Stratex Networks, Inc. Class A | | 6,475 | | 42,929 | |
# | | Hewlett-Packard Co. | | 237,000 | | 9,072,360 | |
* | | hi/fn, inc. | | 15,101 | | 40,018 | |
* # | | Hutchinson Technology, Inc. | | 49,671 | | 339,750 | |
* | | Hypercom Corp. | | 67,100 | | 130,845 | |
* | | I.D. Systems, Inc. | | 1,909 | | 10,366 | |
* | | IAC/InterActiveCorp | | 172,391 | | 2,889,273 | |
* | | iBasis, Inc. | | 1,900 | | 4,199 | |
* | | Ikanos Communications, Inc. | | 12,254 | | 18,504 | |
22
# | | Imation Corp. | | 66,691 | | 821,633 | |
* | | InFocus Corp. | | 26,671 | | 23,737 | |
| | InfoSpace, Inc. | | 65,299 | | 559,612 | |
* | | Ingram Micro, Inc. | | 299,279 | | 3,989,389 | |
* # | | Insight Enterprises, Inc. | | 23,200 | | 225,736 | |
# | | Integral Systems, Inc. | | 21,364 | | 524,913 | |
* | | Integrated Device Technology, Inc. | | 220,510 | | 1,402,444 | |
* | | Integrated Silicon Solution, Inc. | | 27,577 | | 49,914 | |
* # | | Intelli-Check, Inc. | | 3,300 | | 7,590 | |
* # | | International Rectifier Corp. | | 32,800 | | 506,432 | |
* # | | Internet Brands, Inc. | | 4,500 | | 29,205 | |
* | | Internet Capital Group, Inc. | | 58,172 | | 332,744 | |
| | Intersil Corp. | | 169,165 | | 2,315,869 | |
* | | Interwoven, Inc. | | 16,300 | | 205,543 | |
* | | Intest Corp. | | 12,266 | | 9,567 | |
* | | Intevac, Inc. | | 34,801 | | 270,752 | |
* | | IntriCon Corp. | | 482 | | 2,531 | |
* # | | iPass, Inc. | | 85,896 | | 163,202 | |
# | | IXYS Corp. | | 63,086 | | 500,903 | |
| | Jabil Circuit, Inc. | | 189,400 | | 1,592,854 | |
* | | JDS Uniphase Corp. | | 137,990 | | 753,425 | |
| | Keithley Instruments, Inc. | | 16,951 | | 72,042 | |
* # | | Kemet Corp. | | 332 | | 196 | |
* | | Key Tronic Corp. | | 17,405 | | 27,500 | |
* | | Keynote Systems, Inc. | | 31,600 | | 309,680 | |
* | | Kopin Corp. | | 32,016 | | 74,277 | |
* | | Kratos Defense & Security Solutions, Inc. | | 113,983 | | 168,695 | |
* # | | L-1 Identity Solutions, Inc. | | 143,173 | | 1,174,019 | |
* | | Lattice Semiconductor Corp. | | 142,278 | | 267,483 | |
* | | Leadis Technolgies, Inc. | | 12,767 | | 8,554 | |
* # | | LeCroy Corp. | | 14,031 | | 69,734 | |
* | | Lionbridge Technologies, Inc. | | 69,200 | | 120,408 | |
* | | Logility, Inc. | | 194 | | 1,028 | |
* | | LookSmart, Ltd. | | 35,780 | | 61,899 | |
* # | | LTX-Credence Corp. | | 90,925 | | 56,374 | |
* | | Management Network Group, Inc. | | 38,306 | | 32,560 | |
* | | Mattson Technology, Inc. | | 6,600 | | 17,292 | |
* # | | Mentor Graphics Corp. | | 52,655 | | 386,488 | |
* | | Mercury Computer Systems, Inc. | | 35,415 | | 254,280 | |
* | | Merix Corp. | | 733 | | 418 | |
# | | Methode Electronics, Inc. | | 79,571 | | 603,944 | |
* | | Micron Technology, Inc. | | 990,716 | | 4,666,272 | |
* | | Microtune, Inc. | | 5,400 | | 13,500 | |
* | | MIPS Technologies, Inc. | | 40,025 | | 111,670 | |
* # | | MKS Instruments, Inc. | | 85,290 | | 1,582,130 | |
* | | ModusLink Global Solutions, Inc. | | 77,660 | | 431,790 | |
* # | | MPS Group, Inc. | | 128,700 | | 1,002,573 | |
* # | | MRV Communications, Inc. | | 10,780 | | 7,976 | |
* | | Multi-Fineline Electronix, Inc. | | 16,900 | | 197,392 | |
* | | Nanometrics, Inc. | | 47,970 | | 59,003 | |
* # | | Network Equipment Technologies, Inc. | | 14,285 | | 38,998 | |
* | | Newport Corp. | | 56,016 | | 402,755 | |
* # | | Novellus Systems, Inc. | | 18,200 | | 287,560 | |
* | | Nu Horizons Electronics Corp. | | 14,932 | | 28,072 | |
* # | | OmniVision Technologies, Inc. | | 38,897 | | 314,677 | |
23
* # | | ON Semiconductor Corp. | | 10,701 | | 54,682 | |
# | | Openwave Systems, Inc. | | 7,095 | | 5,321 | |
* | | Oplink Communications, Inc. | | 20,800 | | 168,896 | |
* # | | OPNET Technologies, Inc. | | 23,600 | | 298,068 | |
* | | Opnext, Inc. | | 38,358 | | 153,432 | |
* | | Optelecom-NKF, Inc. | | 4,329 | | 22,143 | |
* | | Optical Cable Corp. | | 9,195 | | 42,205 | |
* # | | Orbcomm, Inc. | | 11,500 | | 34,500 | |
* | | OSI Systems, Inc. | | 8,630 | | 99,245 | |
* # | | Overland Storage, Inc. | | 3,099 | | 837 | |
* # | | OYO Geospace Corp. | | 1 | | 29 | |
* | | Palm, Inc. | | 3,530 | | 14,085 | |
* | | PAR Technology Corp. | | 22,375 | | 110,756 | |
* # | | PC Connection, Inc. | | 52,813 | | 318,991 | |
| | PC-Tel, Inc. | | 62,853 | | 368,947 | |
* | | PDF Solutions, Inc. | | 193 | | 579 | |
* | | Perceptron, Inc. | | 4,904 | | 20,793 | |
* | | Performance Technologies, Inc. | | 25,851 | | 80,397 | |
* | | Pericom Semiconductor Corp. | | 10,468 | | 81,650 | |
* # | | Perot Systems Corp. | | 95,861 | | 1,379,440 | |
* | | Pervasive Software, Inc. | | 36,268 | | 150,512 | |
* | | Photronics, Inc. | | 43,100 | | 29,739 | |
* | | Physicians Formula Holdings, Inc. | | 7,529 | | 26,577 | |
* | | PlanetOut, Inc. | | 340 | | 544 | |
* | | PLATO Learning, Inc. | | 25,884 | | 44,520 | |
* | | PLX Technology, Inc. | | 14,500 | | 49,880 | |
* # | | Powerwave Technologies, Inc. | | 72,367 | | 68,749 | |
* l | | Price Communications Liquidation Trust | | 47,738 | | 6,520 | |
| | Qualstar Corp. | | 700 | | 1,547 | |
* | | Quantum Corp. | | 4,846 | | 1,405 | |
* # | | RadiSys Corp. | | 42,445 | | 270,375 | |
* | | RealNetworks, Inc. | | 224,844 | | 962,332 | |
* # | | RF Micro Devices, Inc. | | 201,156 | | 400,300 | |
* | | RF Monolithics, Inc. | | 3,187 | | 1,689 | |
| | Richardson Electronics, Ltd. | | 11,619 | | 58,327 | |
* | | Rudolph Technologies, Inc. | | 69,020 | | 231,217 | |
* # | | S1 Corp. | | 53,400 | | 334,818 | |
* | | Safeguard Scientifics, Inc. | | 68,723 | | 54,291 | |
* # | | Sandisk Corp. | | 936 | | 8,321 | |
* | | Sanmina-SCI Corp. | | 131,096 | | 98,322 | |
* | | SCM Microsystems, Inc. | | 18,612 | | 37,038 | |
* | | SeaChange International, Inc. | | 33,539 | | 256,238 | |
* # | | Secure Computing Corp. | | 20,975 | | 118,719 | |
* | | Selectica, Inc. | | 3,953 | | 4,230 | |
* | | Semitool, Inc. | | 4,824 | | 28,510 | |
* | | SI International, Inc. | | 5,570 | | 160,416 | |
* # | | Silicon Image, Inc. | | 52,024 | | 237,750 | |
* # | | Silicon Storage Technology, Inc. | | 197,920 | | 623,448 | |
* # | | Skyworks Solutions, Inc. | | 169,331 | | 1,207,330 | |
* | | Smith Micro Software, Inc. | | 32,001 | | 200,006 | |
* | | Soapstone Networks, Inc. | | 28,005 | | 80,654 | |
* # | | Sonic Solutions, Inc. | | 600 | | 1,224 | |
* | | SonicWALL, Inc. | | 13,803 | | 61,837 | |
* | | Spansion, Inc. | | 5,400 | | 3,348 | |
* | | Spectrum Control, Inc. | | 13,833 | | 86,180 | |
24
* # | | Standard Microsystems Corp. | | 5,090 | | 91,671 | |
| | StarTek, Inc. | | 30,545 | | 101,104 | |
* # | | STEC, Inc. | | 9,696 | | 53,328 | |
* | | SumTotal Systems, Inc. | | 39,973 | | 128,313 | |
* | | Sun Microsystems, Inc. | | 123,975 | | 570,285 | |
* | | SupportSoft, Inc. | | 64,379 | | 160,948 | |
* # | | Sycamore Networks, Inc. | | 517,447 | | 1,728,273 | |
* | | Symantec Corp. | | 780,999 | | 9,824,967 | |
* | | Symmetricom, Inc. | | 95,703 | | 425,878 | |
* # | | SYNNEX Corp. | | 60,100 | | 927,343 | |
* | | Tech Data Corp. | | 93,952 | | 2,015,270 | |
| | Technitrol, Inc. | | 14,000 | | 80,780 | |
* | | Technology Solutions Co. | | 3,555 | | 9,119 | |
* | | TechTeam Global, Inc. | | 13,534 | | 79,174 | |
* | | Tellabs, Inc. | | 279,155 | | 1,183,617 | |
* | | Telular Corp. | | 24,670 | | 37,005 | |
* # | | Teradyne, Inc. | | 355,484 | | 1,812,968 | |
* | | Tessco Technologies, Inc. | | 9,246 | | 101,429 | |
* | | Tier Technologies, Inc. Class B | | 8,900 | | 53,222 | |
* | | Tollgrade Communications, Inc. | | 8,755 | | 38,522 | |
* # | | Track Data Corp. | | 8,633 | | 14,029 | |
* | | Trident Microsystems, Inc. | | 2,123 | | 3,843 | |
* # | | Triquint Semiconductor, Inc. | | 168,914 | | 756,735 | |
| | TSR, Inc. | | 1,300 | | 2,600 | |
* | | TTM Technologies, Inc. | | 31,977 | | 228,955 | |
* | | Ultra Clean Holdings, Inc. | | 3,316 | | 10,014 | |
* | | Ultratech, Inc. | | 41,685 | | 628,610 | |
# | | United Online, Inc. | | 21,062 | | 155,859 | |
* # | | UTStarcom, Inc. | | 200,314 | | 476,747 | |
* | | Vicon Industries, Inc. | | 3,081 | | 14,481 | |
* | | Vignette Corp. | | 35,100 | | 285,012 | |
* # | | Virage Logic Corp. | | 27,855 | | 125,905 | |
* | | Vishay Intertechnology, Inc. | | 227,425 | | 980,202 | |
* | | Web.com Group, Inc. | | 45,583 | | 223,813 | |
* # | | Westell Technologies, Inc. | | 8,831 | | 2,799 | |
* | | White Electronics Designs Corp. | | 27,184 | | 108,464 | |
* | | Wireless Telecom Group, Inc. | | 39,972 | | 23,583 | |
* | | WPCS International, Inc. | | 9,861 | | 29,583 | |
| | Xerox Corp. | | 1,179,032 | | 9,455,837 | |
* | | Zoran Corp. | | 59,212 | | 481,986 | |
* | | Zygo Corp. | | 39,500 | | 339,305 | |
Total Information Technology | | | | 119,393,595 | |
| | | | | |
Materials — (2.4%) | | | | | |
| | A. Schulman, Inc. | | 26,800 | | 479,988 | |
| | A.M. Castle & Co. | | 24,182 | | 294,295 | |
* | | American Pacific Corp. | | 2,873 | | 33,183 | |
| | Ashland, Inc. | | 112,560 | | 2,542,730 | |
| | Bemis Co., Inc. | | 78,113 | | 1,940,327 | |
* # | | Brush Engineered Materials, Inc. | | 9,287 | | 113,951 | |
* | | Buckeye Technologies, Inc. | | 22,600 | | 133,114 | |
* | | Bway Holding Co. | | 1,500 | | 11,220 | |
# | | Cabot Corp. | | 438 | | 11,585 | |
* | | Caraustar Industries, Inc. | | 6,005 | | 2,168 | |
| | Chemtura Corp. | | 420,979 | | 728,294 | |
25
# | | Cliffs Natural Resources, Inc. | | 2,000 | | 53,980 | |
* # | | Coeur d’Alene Mines Corp. | | 911,433 | | 656,232 | |
* | | Continental Materials Corp. | | 100 | | 1,813 | |
* | | Core Molding Technologies, Inc. | | 1,188 | | 3,861 | |
| | Cytec Industries, Inc. | | 64,700 | | 1,832,304 | |
# | | Empire Resources, Inc. | | 8,950 | | 20,585 | |
| | Ferro Corp. | | 49,500 | | 766,260 | |
# | | Freeport-McMoRan Copper & Gold, Inc. Class B | | 110,372 | | 3,211,825 | |
| | Friedman Industries, Inc. | | 10,535 | | 54,255 | |
# | | Georgia Gulf Corp. | | 8,200 | | 18,860 | |
# | | Gibraltar Industries, Inc. | | 61,100 | | 809,575 | |
* # | | Graphic Packaging Holding Co. | | 275,452 | | 509,586 | |
* # | | Headwaters, Inc. | | 84,996 | | 900,958 | |
| | International Paper Co. | | 490,762 | | 8,450,922 | |
# | | Kaiser Aluminum Corp. | | 32,695 | | 1,097,244 | |
# | | Kronos Worldwide, Inc. | | 2,919 | | 37,071 | |
# | | Louisiana-Pacific Corp. | | 155,300 | | 745,440 | |
* | | Material Sciences Corp. | | 24,611 | | 121,332 | |
| | MeadWestavco Corp. | | 264,051 | | 3,704,636 | |
* | | Mod-Pac Corp. | | 1,091 | | 3,218 | |
# | | Myers Industries, Inc. | | 40,050 | | 423,329 | |
| | Neenah Paper, Inc. | | 23,700 | | 214,011 | |
# | | NL Industries, Inc. | | 75,511 | | 1,040,542 | |
| | NN, Inc. | | 22,500 | | 162,225 | |
* | | Northern Technologies International Corp. | | 3,000 | | 31,050 | |
* # | | Northwest Pipe Co. | | 12,085 | | 347,202 | |
| | Olympic Steel, Inc. | | 2,500 | | 57,150 | |
* # | | OM Group, Inc. | | 46,900 | | 1,000,846 | |
| | P.H. Glatfelter Co. | | 46,800 | | 482,508 | |
| | Penford Corp. | | 22,044 | | 283,706 | |
* # | | PolyOne Corp. | | 171,354 | | 813,932 | |
| | Quaker Chemical Corp. | | 2,900 | | 55,477 | |
* | | Ready Mix, Inc. | | 3,839 | | 9,060 | |
| | Reliance Steel & Aluminum Co. | | 50,700 | | 1,269,528 | |
* | | Rock of Ages Corp. | | 1,200 | | 3,600 | |
# | | Rock-Tenn Co. Class A | | 56,380 | | 1,714,516 | |
* | | Rockwood Holdings, Inc. | | 35,100 | | 433,485 | |
* # | | Rosetta Resources, Inc. | | 79,112 | | 834,632 | |
# | | Schnitzer Steel Industries, Inc. Class A | | 30,900 | | 832,137 | |
| | Schweitzer-Maudoit International, Inc. | | 32,213 | | 538,601 | |
* | | Smurfit-Stone Container Corp. | | 372,794 | | 503,272 | |
| | Spartech Corp. | | 2,500 | | 15,900 | |
| | Stepan Co. | | 15,906 | | 569,912 | |
* # | | Stillwater Mining Co. | | 13,259 | | 52,506 | |
# | | Synalloy Corp. | | 4,195 | | 31,463 | |
# | | Temple-Inland, Inc. | | 44,500 | | 263,885 | |
# | | Terra Industries, Inc. | | 1,835 | | 40,352 | |
* | | U.S. Concrete, Inc. | | 87,351 | | 275,156 | |
* # | | U.S. Gold Corp. | | 14,827 | | 10,379 | |
* | | Universal Stainless & Alloy Products, Inc. | | 5,509 | | 101,531 | |
# | | Valspar Corp. | | 144,410 | | 2,953,185 | |
| | Wausau Paper Corp. | | 80,700 | | 747,282 | |
# | | Westlake Chemical Corp. | | 99,100 | | 1,806,593 | |
| | Weyerhaeuser Co. | | 311,975 | | 11,923,685 | |
# | | Worthington Industries, Inc. | | 6,000 | | 72,420 | |
Total Materials | | | | 59,205,870 | |
26
Other — (0.0%) | | | | | |
* # l | | ePresence, Inc. Escrow Shares | | 6,400 | | — | |
* l | | MAIR Holdings, Inc. Escrow Shares | | 1,415 | | 1,656 | |
* l | | Petrocorp, Inc. Escrow Shares | | 900 | | 54 | |
Total Other | | | | 1,710 | |
| | | | | |
Telecommunication Services — (6.5%) | | | | | |
# | | Arbinet-thexchange, Inc. | | 3,200 | | 9,280 | |
| | AT&T, Inc. | | 3,496,990 | | 93,614,422 | |
| | CenturyTel, Inc. | | 207,530 | | 5,211,078 | |
| | D&E Communications, Inc. | | 24,213 | | 169,491 | |
* # | | General Communications, Inc. Class A | | 44,592 | | 342,467 | |
| | IDT Corp. | | 2,259 | | 2,011 | |
# | | IDT Corp. Class B | | 2,200 | | 2,266 | |
* # | | NextWave Wireless, Inc. | | 10,528 | | 2,948 | |
* | | Occam Networks, Inc. | | 26,624 | | 74,813 | |
| | Sprint Nextel Corp. | | 3,528,077 | | 11,042,881 | |
| | SureWest Communications | | 11,866 | | 209,672 | |
| | Telephone & Data Systems, Inc. | | 80,200 | | 2,153,370 | |
| | Telephone & Data Systems, Inc. Special Shares | | 12,407 | | 339,952 | |
* | | United States Cellular Corp. | | 43,453 | | 1,664,684 | |
| | Verizon Communications, Inc. | | 1,643,676 | | 48,767,867 | |
* | | Xeta Corp. | | 18,366 | | 31,222 | |
Total Telecommunication Services | | | | 163,638,424 | |
| | | | | |
Utilities — (0.1%) | | | | | |
* | | Maine & Maritimes Corp. | | 1,600 | | 52,800 | |
* | | Reliant Energy, Inc. | | 444,750 | | 2,334,938 | |
| | Southern Union Co. | | 1 | | — | |
| | Unitil Corp. | | 1,800 | | 43,200 | |
Total Utilities | | | | 2,430,938 | |
| | | | | |
TOTAL COMMON STOCKS | | | | 2,124,655,766 | |
| | | | | |
RIGHTS/WARRANTS — (0.0%) | | | | | |
* | | Lantronix, Inc. Warrants 2008 | | 33 | | 17 | |
| | | | | |
TEMPORARY CASH INVESTMENTS — (2.0%) | | | | | |
| | BlackRock Liquidity Funds Tempcash Portfolio-Institutional Shares | | 38,403,563 | | 38,403,563 | |
| | | | | | | |
| | | | Face | | | |
| | | | Amount | | | |
| | | | (000) | | | |
| | Repurchase Agreement, PNC Capital Markets, Inc. 0.94%, 11/03/08 (Collateralized by $14,345,000 FHLMC 6.275%(r), 09/01/36, valued at $10,738,962) to be repurchased at $10,577,829 | | $10,577 | | 10,577,000 | |
TOTAL TEMPORARY CASH INVESTMENTS | | | | 48,980,563 | |
27
| | Shares | | | |
SECURITIES LENDING COLLATERAL — (13.1%) | | | | | |
§ @ | | DFA Short Term Investment Fund LP | | 301,849,543 | | 301,849,543 | |
| | | | | | | |
| | | | Face | | | |
| | | | Amount | | | |
| | | | (000) | | | |
@ | | Repurchase Agreement, Deutsche Bank Securities 0.24%, 11/03/08 (Collateralized by $30,992,549 FNMA, rates ranging from 5.000% to 7.000%, maturities from 11/01/33 to 08/01/38 & U.S. Treasury STRIP 1.573%(y), 05/15/12, valued at $28,175,867) to be repurchased at $27,427,287 | | $27,427 | | 27,426,740 | |
| | | | | |
TOTAL SECURITIES LENDING COLLATERAL | | | | 329,276,283 | |
| | | | | |
TOTAL INVESTMENTS - (100.0%)
(Cost $2,977,897,731) | | | | $2,502,912,629 | |
See accompanying Notes to Financial Statements.
28
Report of Independent Registered Public Accounting Firm
To the Board of Trustees and Shareholders of
The DFA Investment Trust Company
We have audited, in accordance with the standards of the Public Company Accounting Oversight Board (United States), the financial statements of The U.S. Large Company Series, The U.S. Large Cap Value Series, The U.S. Small Cap Value Series, The U.S. Small Cap Series, The U.S. Micro Cap Series, The DFA International Value Series, The Japanese Small Company Series, The Asia Pacific Small Company Series, The United Kingdom Small Company Series, The Canadian Small Company Series, The Continental Small Company Series, The Emerging Markets Series, The Emerging Markets Small Cap Series, The Tax-Managed U.S. Marketwide Value Series, The Tax-Managed U.S. Equity Series, DFA Two-Year Global Fixed Income Series, Enhanced U.S. Large Company Series and DFA One-Year Fixed Income Series (constituting series within The DFA Investment Trust Company, hereafter referred to as the “Series”) as of October 31, 2008, and for the year then ended and have issued our unqualified report thereon dated December 22, 2008 (which report and financial statements are included in Item 1 of this Certified Shareholder Report on Form N-CSR). Our audit included an audit of the Series’ investment portfolios (the “Portfolios”) as of October 31, 2008 appearing in Item 6 of this Form N-CSR. These Portfolios are the responsibility of the Series’ management. Our responsibility is to express an opinion on these Portfolios based on our audit. In our opinion, the Portfolios referred to above, when read in conjunction with the financial statements of the Series referred to above, present fairly, in all material respects, the information set forth therein.
PricewaterhouseCoopers LLP
Philadelphia, Pennsylvania
December 22, 2008
ITEM 7. DISCLOSURE OF PROXY VOTING POLICIES AND PROCEDURES FOR CLOSED-END MANAGEMENT INVESTMENT COMPANIES.
This item is not applicable to the Registrant, which is an open-end management investment company.
ITEM 8. PORTFOLIO MANAGERS OF CLOSED-END MANAGEMENT INVESTMENT COMPANIES.
This item is not applicable to the Registrant, which is an open-end management investment company.
ITEM 9. PURCHASES OF EQUITY SECURITIES BY CLOSED-END MANAGEMENT INVESTMENT COMPANY AND AFFILIATED PURCHASERS
This item is not applicable to the Registrant, which is an open-end management investment company.
ITEM 10. SUBMISSION OF MATTERS TO A VOTE OF SECURITY HOLDERS.
The Registrant has adopted procedures by which a Qualifying Fund Shareholder (as defined below) may recommend disinterested board of directors candidates to the Registrant’s Nominating Committee. While the Nominating Committee is solely responsible for the selection and recommendation of disinterested board of directors candidates to the board of directors, the Nominating Committee will consider nominees recommended by Qualifying Fund Shareholders if a vacancy occurs among board members. A Qualifying Fund Shareholder is a shareholder, or group of shareholders, that: (i) owns of record, or beneficially through a financial intermediary, 5% or more of the Registrant’s outstanding shares, and (ii) has owned such shares for 12 months or more prior to submitting the recommendation to the Nominating Committee. Such recommendations shall be directed to the Secretary of the Registrant at such address as is set forth in the Registrant’s disclosure documents. The Qualifying Fund Shareholder’s letter should include: (i) the name and address of the Qualifying Fund Shareholder making the recommendation; (ii) the number of shares of each series of shares of the Registrant that are owned of record and beneficially by such Qualifying Fund Shareholder, and the length of time that such shares have been so owned by the Qualifying Fund Shareholder; (iii) a description of all arrangements and understandings between such Qualifying Fund Shareholder and any other person or persons (naming such person or persons) pursuant to which the recommendation is being made; (iv) the name and address of the nominee; and (v) the nominee’s resume or curriculum vitae. The Qualifying Fund Shareholder’s letter must be accompanied by a written consent of the individual to stand for election if nominated for the board and to serve if elected by shareholders. The Nominating Committee also may seek such additional information about the nominee as the Nominating Committee considers appropriate, including information relating to such nominee that is required to be disclosed in solicitations or proxies for the election of board members.
ITEM 11. CONTROLS AND PROCEDURES.
(a) Based on their evaluation of the Registrant’s disclosure controls and procedures as of a date within 90 days of the filing date of this Report, the Registrant’s Principal Executive Officer and Principal Financial Officer believe that the disclosure controls and procedures (as defined in Rule 30a-3(c) under the Investment Company Act of 1940, as amended) are effectively designed to ensure that information required to be disclosed by the Registrant in the Report is recorded, processed, summarized and reported by the filing date, including ensuring that information required to be disclosed in the Report is accumulated and communicated to the Registrant’s officers that are making certifications in the Report, as appropriate, to allow timely decisions regarding required disclosure. The Registrant’s management, including the Principal Executive Officer and the Principal Financial Officer, recognizes that any set of controls and procedures, no matter how well designed and operated, can provide only reasonable assurance of achieving the desired control objectives.
(b) There were no changes in the Registrant’s internal control over financial reporting (as defined in Rule 30a-3(d) under the Investment Company Act of 1940, as amended) that occurred during the second fiscal quarter of the period covered by this Report that have materially affected, or are reasonably likely to materially affect, the Registrant’s internal control over financial reporting.
ITEM 12. EXHIBITS.
(a)(1) Code of Ethics is filed herewith.
(a)(2) Certifications pursuant to Section 302 of the Sarbanes-Oxley Act of 2002 are filed herewith.
(a)(3) This item is not applicable.
(b) Certifications pursuant to Section 906 of the Sarbanes-Oxley Act of 2002 are filed herewith.
SIGNATURES
Pursuant to the requirements of the Securities Exchange Act of 1934 and the Investment Company Act of 1940, the Registrant has duly caused this Report to be signed on its behalf by the undersigned, thereunto duly authorized.
Dimensional Investment Group Inc.
By: | /s/David G. Booth | |
| David G. Booth |
| Chairman, Director, President and |
| Chief Executive Officer |
Date: January 5, 2009
Pursuant to the requirements of the Securities Exchange Act of 1934 and the Investment Company Act of 1940, this Report has been signed below by the following persons on behalf of the Registrant and in the capacities and on the dates indicated.
By: | /s/David G. Booth | |
| David G. Booth |
| Principal Executive Officer |
| Dimensional Investment Group Inc. |
Date: January 5, 2009
By: | /s/David R. Martin | |
| David R. Martin |
| Principal Financial Officer |
| Dimensional Investment Group Inc. |
Date: January 6, 2009