UNITED STATES
SECURITIES AND EXCHANGE COMMISSION
Washington, D.C. 20549
FORM N-CSR
CERTIFIED SHAREHOLDER REPORT OF REGISTERED
MANAGEMENT INVESTMENT COMPANIES
Investment Company Act file number 811-6067
DIMENSIONAL INVESTMENT GROUP INC.
(Exact name of registrant as specified in charter)
6300 Bee Cave Road, Building One, Austin, TX 78746
(Address of principal executive offices) (Zip code)
Catherine L. Newell, Esquire, Vice President and Secretary
Dimensional Investment Group Inc.,
6300 Bee Cave Road, Building One, Austin, TX 78746
(Name and address of agent for service)
Registrant’s telephone number, including area code: 512-306-7400
Date of fiscal year end: October 31
Date of reporting period: October 31, 2009
| ITEM 1. | REPORTS TO STOCKHOLDERS. |

Dimensional Fund Advisors
6300 Bee Cave Road, Building One
Austin, TX 78746
December 2009
Dear Fellow Shareholder,
After sinking to ten-year lows, stock prices around the world rebounded sharply in March 2009 and posted steady gains in the seven months between March and September. March and April were among the best-return months in the life of Dimensional’s equity Funds.
The unexpected turns in the financial markets this year offered some valuable lessons. We were reminded that stock prices are unpredictable. We saw once again the benefits of staying disciplined in the market as it inevitably moves up and down. And I believe these markets showed very clearly why diversification is so important to long-term investment success.
Although diversification can’t prevent losses, it can help investors avoid the extreme outcomes that can result from concentrating investments in individual stocks or market segments. We believe that successful investing is about both increasing wealth and being able to sleep well at night. Investors who understand how markets work and have a realistic understanding of their own tolerance for risk are most likely to have a good overall experience.
More than $10 billion in net long-term assets flowed into Dimensional’s Funds during the first 10 months of 2009, a reflection of the trust our shareholders around the world have placed in us. We are grateful for that trust and want you to know that we take our responsibility as the steward of your investments in Dimensional’s Funds very seriously. We hope to have the opportunity to continue serving your needs for many years to come.
|
| Sincerely, |
|
 |
|
| David G. Booth |
| Chairman and Chief Executive Officer |
[THIS PAGE INTENTIONALLY LEFT BLANK]
ANNUAL REPORT
Table of Contents
This report is submitted for the information of the Fund’s shareholders. It is not authorized for distribution to prospective investors unless preceded or accompanied by an effective prospectus.
i
[THIS PAGE INTENTIONALLY LEFT BLANK]
DIMENSIONAL INVESTMENT GROUP INC.
THE DFA INVESTMENT TRUST COMPANY
DEFINITIONS OF ABBREVIATIONS AND FOOTNOTES
Statement of Assets and Liabilities/Summary Schedule of Portfolio Holdings
Investment Abbreviations
| | | | |
| | FHLMC | | Federal Home Loan Mortgage Corporation |
| | FNMA | | Federal National Mortgage Association |
Investment Footnotes
| | | | |
| | † | | See Note B to Financial Statements. |
| | ** | | Calculated as a percentage of total net assets. Percentages shown parenthetically next to the category headings have been calculated as a percentage of total investments. “Other Securities” are those securities that are not among the top 50 holdings of the Fund or do not represent more than 1.0% of the net assets of the Fund. Some of the individual securities within this category may include Total or Partial Securities on Loan and/or Non-Income Producing Securities. |
| | * | | Non-Income Producing Securities. |
| | # | | Total or Partial Securities on Loan. |
| | @ | | Security purchased with cash proceeds from Securities on Loan. |
| | (r) | | The adjustable rate shown is effective as of October 31, 2009. |
| | (y) | | The rate shown is the effective yield. |
| | § | | Affiliated Fund. |
Financial Highlights
| | | | |
| | (A) | | Computed using average shares outstanding. |
| | (B) | | Annualized |
| | (C) | | Non-Annualized |
| | (D) | | Represents the combined ratios for the respective portfolio and its respective pro-rata share of its Master Fund Series. |
All Statements and Schedules
| | | | |
| | — | | Amounts designated as — are either zero or rounded to zero. |
| | REITs | | Real Estate Investment Trusts |
| | SEC | | Securities and Exchange Commission |
1
DIMENSIONAL INVESTMENT GROUP INC.
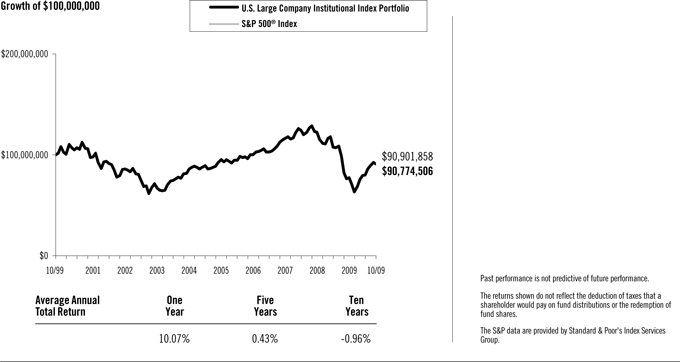
PERFORMANCE CHART
U.S. Large Company Institutional Index Portfolio vs.
S&P 500® Index
October 31, 1999-October 31, 2009
2
DIMENSIONAL INVESTMENT GROUP INC.
MANAGEMENT’S DISCUSSION AND ANALYSIS
| | |
| U.S. Equity Market Review | | 12 Months Ended October 31, 2009 |
The year ending October 31, 2009, was among the most volatile periods in U.S. market history. Broad market returns were positive with stocks represented by the mid cap index outperforming those within both small cap and large cap indexes and stocks represented by the growth index outperforming those represented by the value index. Investors moving out of stocks, beginning in late 2008 and extending into early 2009, contributed to high volatility and negative returns over that period. Markets turned sharply higher in March, and the size and value premiums both turned positive over the eight months ending October 2009. Although the large cap index outperformed the small cap index, and the growth index outperformed the value index, returns within the broader market (Russell 3000® Index) demonstrate that there was a positive small size premium and a positive value premium. This counterintuitive result occurred because the stock markets were characterized by extreme volatility, and the indexes, which are reconstituted annually, were not able to rebalance during the course of the year to maintain their intended asset class exposure. Among the most important factors explaining differences in the behavior of diversified equity portfolios are the company size and company value/growth characteristics of the portfolio’s holdings. Size is measured by market capitalization, and value classification is a function of stock price relative to one or more fundamental characteristics. Compared to other stocks, value stocks often have lower market value relative to their earnings, dividends, and book value.
For the 12 months ended October 31, 2009, the total return of the Russell Microcap® Index was 5.06%, the Russell 2000® Index was 6.46%, the CRSP 6-10 Index was 20.94%, and the MSCI US Small Cap 1750 Index was 14.11%. Large cap growth stocks outperformed large cap value stocks, as measured by the Russell 1000® Growth Index and Russell 1000® Value Index®. Small cap growth stocks outperformed small cap value stocks, by a lesser amount than in large caps, as measured by the Russell 2000® Growth Index and Russell 2000® Value Index.
Total Return for 12 Months Ended October 31, 2009
| | | |
Russell 2000® Index (small cap companies) | | 6.46 | % |
Russell Midcap® Index (mid cap companies) | | 18.74 | % |
Russell 1000® Index (large cap companies) | | 11.19 | % |
Russell 3000® Value Index | | 4.55 | % |
Russell 3000® Growth Index | | 17.04 | % |
Further dividing the large, mid, and small cap market segments by value and growth characteristics shows more detail in the performance differences over the period.
Total Return for 12 Months Ended October 31, 2009
| | | |
Russell 1000® Value Index (large cap value companies) | | 4.78 | % |
Russell 1000® Growth Index (large cap growth companies) | | 17.50 | % |
Russell Midcap® Value Index (mid cap value companies) | | 14.52 | % |
Russell Midcap® Growth Index (mid cap growth companies) | | 22.48 | % |
Russell 2500TM Value Index (small/mid cap value companies) | | 8.56 | % |
Russell 2500TM Growth Index (small/mid cap growth companies) | | 18.20 | % |
Russell 2000® Value Index (small cap value companies) | | 1.95 | % |
Russell 2000® Growth Index (small cap growth companies) | | 11.34 | % |
Source: Russell data copyright © Russell Investment Group 1995-2009, all rights reserved.
Differences in returns for the various Dimensional U.S. equity funds over the 12 months ended October 31, 2009 were attributable primarily to differences in value/growth and size characteristics as well as the exclusion of REIT securities from most Dimensional portfolios, except for the DFA Real Estate Securities Portfolio and portfolios investing in the U.S. Large Company Series. Moreover, the portfolio construction approach used by Dimensional Fund Advisors (the “Advisor”) generally resulted in portfolios with greater emphasis on value or small company characteristics relative to widely used index benchmarks.
3
Master-Feeder Structure
The portfolio described below, called a “Feeder Fund”, does not buy individual securities directly; instead, the portfolio invests in a corresponding fund called a “Master Fund”. The Master Fund, in turn, purchase stocks and/or other securities.
U.S. Large Company Institutional Index Portfolio
The U.S. Large Company Institutional Index Portfolio seeks to approximate the returns of the S&P 500® Index by purchasing shares of a Master Fund that invests in S&P 500® Index stocks in approximately the same proportions as they are represented in the Index. The Portfolio was mostly invested in equities throughout the year: the average non-equitized cash level for the period was less than 1% of the Master Fund’s assets.
For the 12 months ended October 31, 2009, the total return was 10.07% for the Portfolio and 9.80% for the S&P 500® Index. Relative to the Index, outperformance was mostly due to the flexible trading approach employed by the Master Fund to gain exposure to the performance of the Index during periods of index reconstitution.
4
DIMENSIONAL INVESTMENT GROUP INC.
U.S. LARGE COMPANY INSTITUTIONAL INDEX PORTFOLIO
DISCLOSURE OF FUND EXPENSES
(Unaudited)
The following Expense Table is shown so that you can understand the impact of fees on your investment. All mutual funds have operating expenses. As a shareholder of the fund, you incur ongoing costs, which include costs for portfolio management, administrative services, and shareholder reports, among others. Operating expenses, legal and audit services, which are deducted from a fund’s gross income, directly reduce the investment return of the fund. A fund’s expenses are expressed as a percentage of its average net assets. This figure is known as the expense ratio. The following examples are intended to help you understand the ongoing costs, in dollars, of investing in the fund and to compare these costs with those of other mutual funds. The examples are based on an investment of $1,000 made at the beginning of the period shown and held for the entire period.
The Expense Table below illustrates your fund’s costs in two ways.
Actual Fund Return
This section helps you to estimate the actual expenses after fee waivers that you paid over the period. The “Ending Account Value” shown is derived from the fund’s actual return and “Expenses Paid During Period” reflect the dollar amount that would have been paid by an investor who started with $1,000 in the fund. You may use the information here, together with the amount you invested, to estimate the expenses that you paid over the period.
To do so, simply divide your account value by $1,000 (for example, a $7,500 account value divided by $1,000 = 7.5), then multiply the result by the number given for your fund under the heading “Expenses Paid During Period.”
Hypothetical Example for Comparison Purposes
This section is intended to help you compare your fund’s costs with those of other mutual funds. The hypothetical “Ending Account Value” and “Expenses Paid During Period” are derived from the fund’s actual expense ratio and an assumed 5% annual return before expenses. In this case, because the return used is not the fund’s actual return, the results do not apply to your investment. The example is useful in making comparisons because the SEC requires all mutual funds to calculate expenses based on a 5% annual return. You can assess your fund’s costs by comparing this hypothetical example with the hypothetical examples that appear in shareholder reports of other funds.
Please note that the expenses shown in the table are meant to highlight and help you compare ongoing costs only and do not reflect any transactional costs, if applicable. The “Annualized Expense Ratio” represents the actual expenses for the six-month period indicated.
Six Months Ended October 31, 2009
EXPENSE TABLE
| | | | | | | | | | | | |
| | | Beginning
Account
Value
05/01/09 | | Ending
Account
Value
10/31/09 | | Annualized
Expense
Ratio* | | | Expenses
Paid
During
Period* |
Actual Fund Return | | $ | 1,000.00 | | $ | 1,200.20 | | 0.10 | % | | $ | 0.55 |
Hypothetical 5% Annual Return | | $ | 1,000.00 | | $ | 1,024.70 | | 0.10 | % | | $ | 0.51 |
| * | Expenses are equal to the fund’s annualized expense ratio for the six-month period, multiplied by the average account value over the period, multiplied by the number of days in the most recent six-month period (184), then divided by the number of days in the year (365) to reflect the six-month period. The Portfolio is a Feeder Fund. The expenses shown reflect the direct expenses of the Feeder Fund and the indirect payment of the Feeder Fund’s portion of the expenses of its Master Fund. |
5
DIMENSIONAL INVESTMENT GROUP INC.
U.S. LARGE COMPANY INSTITUTIONAL INDEX PORTFOLIO
DISCLOSURE OF PORTFOLIO HOLDINGS
(Unaudited)
The SEC requires that all Funds file a complete Schedule of Investments with the SEC for their first and third fiscal quarters on Form N-Q. For Dimensional Investment Group Inc., this would be for the fiscal quarters ending January 31 and July 31. The Form N-Q filing must be made within 60 days of the end of the quarter. Dimensional Investment Group Inc. filed its most recent Form N-Q with the SEC on September 29, 2009. It is available upon request, without charge, by calling collect: (512) 306-7400 or by mailing a request to Dimensional Fund Advisors LP, 6300 Bee Cave Road, Building One, Austin, Texas 78746, or by visiting the SEC’s website at http://www.sec.gov, or they may be reviewed and copied at the SEC’s Public Reference Room in Washington, D.C. (call 1-800-732-0330 for information on the operation of the Public Reference Room).
PORTFOLIO HOLDINGS
The SEC requires that all Funds present their categories of portfolio holdings in a table, chart or graph format in their annual and semi-annual shareholder reports, whether or not a Schedule of Investments is utilized. The following table, which presents portfolio holdings as a percent of total investments before short-term investments and collateral for loaned securities, is provided in compliance with such requirement.
The categories of industry classification for the Affiliated Investment Company are represented in the Disclosure of Portfolio Holdings, which are included elsewhere within the report. Refer to the Summary Schedule of Portfolio Holdings for the underlying Master Fund’s holdings which reflect the investments by category.
| | | |
Affiliated Investment Company | | 100.0 | % |
6
DIMENSIONAL INVESTMENT GROUP INC.
U.S. LARGE COMPANY INSTITUTIONAL INDEX PORTFOLIO
STATEMENT OF ASSETS AND LIABILITIES
OCTOBER 31, 2009
(Amounts in thousands, except share and per share amounts)
| | | | |
ASSETS: | | | | |
Investment in The U.S. Large Company Series of The DFA Investment Trust Company
(Affiliated Investment Company) at Value† | | $ | 785,743 | |
Investment Securities Sold | | | 91 | |
Receivable for Fund Shares Sold | | | 337 | |
Prepaid Expenses and Other Assets | | | 24 | |
| | | | |
Total Assets | | | 786,195 | |
| | | | |
LIABILITIES: | | | | |
Payables: | | | | |
Fund Shares Redeemed | | | 428 | |
Due to Advisor | | | 25 | |
Accrued Expenses and Other Liabilities | | | 53 | |
| | | | |
Total Liabilities | | | 506 | |
| | | | |
NET ASSETS | | $ | 785,689 | |
| | | | |
SHARES OUTSTANDING, $0.01 PAR VALUE (1) | | | 96,246,158 | |
| | | | |
NET ASSET VALUE, OFFERING AND REDEMPTION PRICE PER SHARE | | $ | 8.16 | |
| | | | |
Investment in Affiliated Investment Company at Cost | | $ | 763,427 | |
| | | | |
NET ASSETS CONSIST OF: | | | | |
Paid-In Capital | | $ | 861,070 | |
Undistributed Net Investment Income (Distributions in Excess of Net Investment Income) | | | 2,126 | |
Accumulated Net Realized Gain (Loss) | | | (99,823 | ) |
Net Unrealized Appreciation (Depreciation) | | | 22,316 | |
| | | | |
NET ASSETS | | $ | 785,689 | |
| | | | |
(1) NUMBER OF SHARES AUTHORIZED | | | 500,000,000 | |
| | | | |
See accompanying Notes to Financial Statements.
7
DIMENSIONAL INVESTMENT GROUP INC.
U.S. LARGE COMPANY INSTITUTIONAL INDEX PORTFOLIO
STATEMENT OF OPERATIONS
FOR THE YEAR ENDED OCTOBER 31, 2009
(Amounts in thousands)
| | | | |
Investment Income | | | | |
Dividends | | $ | 17,067 | |
Interest | | | 29 | |
Income from Securities Lending | | | 830 | |
Expenses Allocated from Affiliated Investment Company | | | (409 | ) |
| | | | |
Total Investment Income | | | 17,517 | |
| | | | |
Expenses | | | | |
Administrative Services Fees | | | 340 | |
Accounting & Transfer Agent Fees | | | 25 | |
Filing Fees | | | 41 | |
Shareholders’ Reports | | | 47 | |
Directors’/Trustees’ Fees & Expenses | | | 13 | |
Audit Fees | | | 3 | |
Legal Fees | | | 27 | |
Other | | | 9 | |
| | | | |
Total Expenses | | | 505 | |
| | | | |
Fees Waived, Expenses Reimbursed, and/or Previously Waived Fees Recovered by Advisor (Note C) | | | (233 | ) |
| | | | |
Net Expenses | | | 272 | |
| | | | |
Net Investment Income (Loss) | | | 17,245 | |
| | | | |
Realized and Unrealized Gain (Loss) | | | | |
Net Realized Gain (Loss) on: | | | | |
Investment Securities Sold | | | (37,974 | ) |
Futures | | | 12,592 | |
Change in Unrealized Appreciation (Depreciation) of: | | | | |
Investment Securities | | | 73,084 | |
Futures | | | 1,948 | |
| | | | |
Net Realized and Unrealized Gain (Loss) | | | 49,650 | |
| | | | |
Net Increase (Decrease) in Net Assets Resulting from Operations | | $ | 66,895 | |
| | | | |
Investment Income and Realized and Unrealized Gain (Loss) were allocated from the Portfolio’s Master Fund (Affiliated Investment Company).
See accompanying Notes to Financial Statements.
8
DIMENSIONAL INVESTMENT GROUP INC.
U.S. LARGE COMPANY INSTITUTIONAL INDEX PORTFOLIO
STATEMENTS OF CHANGES IN NET ASSETS
(Amounts in thousands)
| | | | | | | | | | | | |
| | | Year
Ended
Oct. 31,
2009 | | | Period
Dec. 1, 2007
to
Oct. 31, 2008 | | | Year
Ended
Nov. 30,
2007 | |
Increase (Decrease) in Net Assets | | | | | | | | | | | | |
Operations: | | | | | | | | | | | | |
Net Investment Income (Loss) | | $ | 17,245 | | | $ | 18,019 | | | $ | 18,174 | |
Net Realized Gain (Loss) on: | | | | | | | | | | | | |
Investment Securities Sold | | | (37,974 | ) | | | (22,091 | ) | | | 2,354 | |
Futures | | | 12,592 | | | | (4,079 | ) | | | 441 | |
Change in Unrealized Appreciation (Depreciation) of: | | | | | | | | | | | | |
Investment Securities | | | 73,084 | | | | (342,835 | ) | | | 48,691 | |
Futures | | | 1,948 | | | | 682 | | | | (119 | ) |
| | | | | | | | | | | | |
Net Increase (Decrease) in Net Assets Resulting from Operations | | | 66,895 | | | | (350,304 | ) | | | 69,541 | |
| | | | | | | | | | | | |
Distributions From: | | | | | | | | | | | | |
Net Investment Income | | | (18,243 | ) | | | (19,755 | ) | | | (17,347 | ) |
| | | | | | | | | | | | |
Total Distributions | | | (18,243 | ) | | | (19,755 | ) | | | (17,347 | ) |
| | | | | | | | | | | | |
Capital Share Transactions (1): | | | | | | | | | | | | |
Shares Issued | | | 156,796 | | | | 224,711 | | | | 178,336 | |
Shares Issued in Lieu of Cash Distributions | | | 17,318 | | | | 19,426 | | | | 16,995 | |
Shares Redeemed | | | (166,295 | ) | | | (147,002 | ) | | | (122,788 | ) |
| | | | | | | | | | | | |
Net Increase (Decrease) from Capital Share Transactions | | | 7,819 | | | | 97,135 | | | | 72,543 | |
| | | | | | | | | | | | |
Total Increase (Decrease) in Net Assets | | | 56,471 | | | | (272,924 | ) | | | 124,737 | |
Net Assets | | | | | | | | | | | | |
Beginning of Period | | | 729,218 | | | | 1,002,142 | | | | 877,405 | |
| | | | | | | | | | | | |
End of Period | | $ | 785,689 | | | $ | 729,218 | | | $ | 1,002,142 | |
| | | | | | | | | | | | |
(1) Shares Issued and Redeemed: | | | | | | | | | | | | |
Shares Issued | | | 22,124 | | | | 22,832 | | | | 15,525 | |
Shares Issued in Lieu of Cash Distributions | | | 2,474 | | | | 1,861 | | | | 1,500 | |
Shares Redeemed | | | (24,057 | ) | | | (15,126 | ) | | | (10,622 | ) |
| | | | | | | | | | | | |
Net Increase (Decrease) from Shares Issued and Redeemed | | | 541 | | | | 9,567 | | | | 6,403 | |
| | | | | | | | | | | | |
Undistributed Net Investment Income (Distributions in Excess of Net Investment Income) | | $ | 2,126 | | | $ | 3,125 | | | $ | 4,861 | |
See accompanying Notes to Financial Statements.
9
DIMENSIONAL INVESTMENT GROUP INC.
U.S. LARGE COMPANY INSTITUTIONAL INDEX PORTFOLIO
FINANCIAL HIGHLIGHTS
(for a share outstanding throughout each period)
��
| | | | | | | | | | | | | | | | | | | | | | | | |
| | | Year
Ended
Oct. 31,
2009 | | | Period
Dec. 1, 2007
to Oct. 31, 2008 | | | Year Ended Nov. 30,
2007 | | | Year
Ended
Nov. 30,
2006 | | | Year
Ended
Nov. 30,
2005 | | | Year
Ended
Nov. 30,
2004 | |
| | |
Net Asset Value, Beginning of Period | | $ | 7.62 | | | $ | 11.63 | | | $ | 11.00 | | | $ | 9.82 | | | $ | 9.23 | | | $ | 8.32 | |
| | | | | | | | | | | | | | | | | | | | | | | | |
Income from Investment Operations | | | | | |
Net Investment Income (Loss) | | | 0.18 | (A) | | | 0.20 | (A) | | | 0.22 | (A) | | | 0.19 | (A) | | | 0.17 | | | | 0.17 | |
Net Gains (Losses) on Securities | | | | | | | | | | | | | | | | | | | | | | | | |
(Realized and Unrealized) | | | 0.55 | | | | (3.99 | ) | | | 0.62 | | | | 1.18 | | | | 0.61 | | | | 0.88 | |
| | | | | | | | | | | | | | | | | | | | | | | | |
Total from Investment Operations | | | 0.73 | | | | (3.79 | ) | | | 0.84 | | | | 1.37 | | | | 0.78 | | | | 1.05 | |
| | |
Less Distributions | | | | | | | | | | | | | | | | | | | | | | | | |
Net Investment Income | | | (0.19 | ) | | | (0.22 | ) | | | (0.21 | ) | | | (0.19 | ) | | | (0.19 | ) | | | (0.14 | ) |
| | | | | | | | | | | | | | | | | | | | | | | | |
Total Distributions | | | (0.19 | ) | | | (0.22 | ) | | | (0.21 | ) | | | (0.19 | ) | | | (0.19 | ) | | | (0.14 | ) |
| | |
Net Asset Value, End of Period | | $ | 8.16 | | | $ | 7.62 | | | $ | 11.63 | | | $ | 11.00 | | | $ | 9.82 | | | $ | 9.23 | |
| | |
Total Return | | | 10.07 | % | | | (33.10 | )%(C) | | | 7.71 | % | | | 14.11 | % | | | 8.50 | % | | | 12.66 | % |
| | |
| | | | | | |
Net Assets, End of Period (thousands) | | $ | 785,689 | | | $ | 729,218 | | | $ | 1,002,142 | | | $ | 877,405 | | | $ | 692,595 | | | $ | 534,285 | |
Ratio of Expenses to Average Net Assets (D) | | | 0.10 | % | | | 0.10 | %(B) | | | 0.10 | % | | | 0.10 | % | | | 0.10 | % | | | 0.10 | % |
Ratio of Expenses to Average Net Assets (Excluding Waivers and Assumption of Expenses and/or Recovery of Previously Waived Fees) (D) | | | 0.13 | % | | | 0.11 | %(B) | | | 0.11 | % | | | 0.11 | % | | | 0.14 | % | | | 0.15 | % |
Ratio of Net Investment Income to Average Net Assets | | | 2.53 | % | | | 2.10 | %(B) | | | 1.90 | % | | | 1.90 | % | | | 1.82 | % | | | 1.96 | % |
| | |
See Page 1 for the Definitions of Abbreviations and Footnotes.
See accompanying Notes to Financial Statements.
10
DIMENSIONAL INVESTMENT GROUP INC.
U.S. LARGE COMPANY INSTITUTIONAL INDEX PORTFOLIO
NOTES TO FINANCIAL STATEMENTS
A. Organization:
Dimensional Investment Group Inc. (the “Fund”) is an open-end management investment company registered under the Investment Company Act of 1940, whose shares are offered to institutional investors, retirement plans and clients of registered investment advisors. The Fund consists of fifteen portfolios, of which the U.S. Large Company Institutional lndex Portfolio (the “Portfolio”) is presented in this report.
The Portfolio primarily invests its assets in The U.S. Large Company Series (the “Series”), a corresponding series of The DFA Investment Trust Company. At October 31, 2009, the Portfolio owned 22% of the Series. The financial statements of the Series are included elsewhere in this report and should be read in conjunction with the financial statements of the Portfolio.
At a regular meeting of the Board of Directors/Trustees (the “Board”) on September 16, 2008, the Board voted to change the fiscal and tax year ends of the Portfolio from November 30 to October 31.
B. Significant Accounting Policies:
The following significant accounting policies are in conformity with accounting principles generally accepted in the United States of America. Such policies are consistently followed by the Fund in preparation of its financial statements. The preparation of financial statements in accordance with accounting principles generally accepted in the United States of America requires management to make estimates and assumptions that affect the reported amounts of assets and liabilities and disclosure of contingent assets and liabilities at the date of the financial statements and the reported amounts of increases and decreases in net assets from operations during the reporting period. Actual results could differ from those estimates and those differences could be material.
1. Security Valuation: The Portfolio’s investment reflects its proportionate interest in the net assets of the Series.
The Portfolios utilize a fair value hierarchy which prioritizes the inputs to valuation techniques used to measure fair value into three broad levels described below:
— Level 1 – quoted prices in active markets for identical securities
— Level 2 – other significant observable inputs (including quoted prices for similar securities, interest rates, prepayment speeds, credit risk, etc.)
— Level 3 – significant unobservable inputs (including the Portfolio’s own assumptions in determining the fair value of investments)
The inputs or methodology used for valuing securities are not necessarily an indication of the risk associated with investing in those securities. A summary of these inputs used to value the Portfolio’s net assets as of October 31, 2009 are listed below (in thousands):
| | | | | | | | | | |
| | | Valuation Inputs |
| | | Investments in
Securities
(Market Value) |
| | | Level 1 | | Level 2 | | Level 3 | | Total |
U.S. Large Company Institutional Index Portfolio | | $ | 785,743 | | — | | — | | $ | 785,743 |
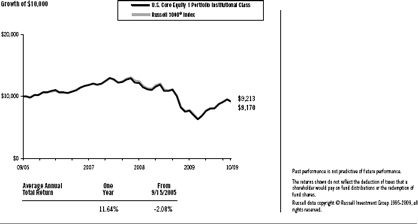
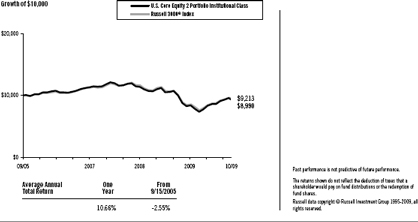
2. Deferred Compensation Plan: Each eligible Director of the Fund may elect participation in the Deferred Compensation Plan (the “Plan”). Under the Plan, effective January 1, 2002, such Directors may defer payment of all or a portion of their total fees earned as a Director. These deferred amounts may be treated as though such amounts had been invested in shares of the following funds: U.S. Large Cap Value Portfolio; U.S. Core Equity 1
11
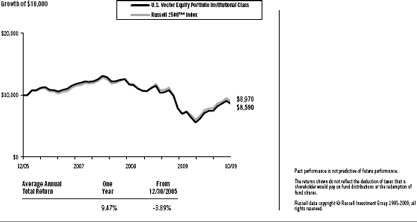
Portfolio; U.S. Core Equity 2 Portfolio; U.S. Vector Equity Portfolio; U.S. Micro Cap Portfolio; DFA International Value Portfolio; International Core Equity Portfolio; Emerging Markets Portfolio; Emerging Markets Core Equity Portfolio; and/or DFA Two-Year Global Fixed Income Portfolio. Contributions made under the Plan and the change in unrealized appreciation (depreciation) and income, are included in Directors’/Trustees’ Fees. At October 31, 2009, the total liability for deferred compensation to Directors is included in Accrued Expenses and Other Liabilities on the Statement of Assets and Liabilities in the amount of $19 (in thousands).
Each Director has the option to receive their distribution of proceeds in one of the following methods upon one year’s notice: lump sum; annual installments over a period of agreed upon years; or semi-annual installments over a period of agreed upon years. As of October 31, 2009, none of the Directors have requested distribution of proceeds.
3. Other: The Portfolio recognizes its pro-rata share, on a daily basis, of net investment income and realized and unrealized gains and losses of investment securities and futures from the Series, which is treated as a partnership for federal income tax purposes. Dividend income and distributions to shareholders are recorded on the ex-dividend date. Distributions received on securities that represent a return of capital or capital gain are recorded as a reduction of cost of investments or as a realized gain, respectively. The Portfolio estimates the character of distributions received that may be considered return of capital distributions. Expenses directly attributable to the Portfolio are directly charged. Common expenses of the Fund are allocated using methods approved by the Board of Directors/Trustees, generally based on average net assets.
C. Investment Advisor:
Dimensional Fund Advisors LP (“Dimensional” or the “Advisor”) provides administrative services to the Portfolio, including supervision of services provided by others, providing information to the shareholders and to the Board of Directors/Trustees, and other administrative services. The Advisor provides investment advisory services to the Series. For the year ended October 31, 2009, the Portfolio’s administrative services fees were accrued daily and paid monthly to the Advisor at an effective annual rate of 0.05% of average daily net assets.
Pursuant to the Fee Waiver and Expense Assumption Agreement for the Portfolio, the Advisor has contractually agreed to waive its administration fee to the extent necessary to reduce the Portfolio’s expenses to the extent that its total direct and indirect expenses (including the expenses the Portfolio bears as a shareholder of the Series) exceed 0.10% of its average daily net assets on an annualized basis. At any time that the total direct and indirect expenses of the Portfolio are less than 0.10% of its average daily net assets on an annualized basis, the Advisor retains the right to recover any fees previously waived to the extent that such recovery will not cause the Portfolio’s total direct and indirect expenses to exceed 0.10% of its average daily net assets on an annualized basis. The Portfolio is not obligated to reimburse the Advisor for fees waived by the Advisor more than thirty-six months before the date of such recovery. The Fee Waiver and Expense Assumption Agreement will remain in effect for a period of one year from March 1, 2009 to March 1, 2010, and shall continue in effect from year to year thereafter unless terminated by the Fund or the Advisor. At October 31, 2009, approximately $418 (in thousands) of previously waived fees are subject to future recovery by the Advisor over various periods not exceeding October 31, 2012.
Fees Paid to Officers and Directors/Trustees:
Certain Officers and Directors/Trustees of the Advisor are also Officers and Directors/Trustees of the Fund; however, such Officers and Directors/Trustees (with the exception of the Chief Compliance Officer (“CCO”)) receive no compensation from the Fund. For the year ended October 31, 2009, the total related amounts paid by the Fund to the CCO were $27 (in thousands). The total related amounts paid by the Portfolio are included in Other Expenses on the Statement of Operations.
D. Federal Income Taxes:
The Portfolio has qualified and intends to continue to qualify as a regulated investment company under Subchapter M of the Internal Revenue Code for federal income tax purposes and to distribute substantially all of its taxable income and net capital gains to its shareholders. Accordingly, no provision has been made for federal income taxes.
Distributions from net investment income and net realized capital gains are determined in accordance with U.S. federal income tax regulations, which may differ from those amounts determined under accounting principles generally
12
accepted in the United States of America. These book/tax differences are either temporary or permanent in nature. To the extent these differences are permanent, they are charged or credited to paid-in capital, undistributed net investment income or accumulated net realized gains, as appropriate, in the period that the differences arise. Accordingly, the following permanent differences as of October 31, 2009, primarily attributable to net realized gains on securities were reclassified to the following accounts. These reclassifications had no effect on net assets or net asset value per share (amount in thousands):
| | | | |
Increase (Decrease) Paid-In-Capital | | Increase (Decrease) Undistributed Net Investment Income | | Increase (Decrease) Accumulated Net Realized Gains |
$(51,204) | | $(1) | | $51,205 |
The tax character of dividends and distributions declared and paid during the year ended November 30, 2007, the period December 1, 2007 to October 31, 2008 and the year ended October 31, 2009 were as follows (amounts in thousands):
| | | | | | |
| | | Net Investment
Income and
Short-Term
Capital Gains | | Long-Term Capital Gains | | Total |
2007 | | $17,347 | | — | | $17,347 |
2008 | | 19,755 | | — | | 19,755 |
2009 | | 18,243 | | — | | 18,243 |
As of October 31, 2009, the components of distributable earnings/(accumulated losses) were as follows (amounts in thousands):
| | | | | | |
Undistributed Net Investment Income and Short-Term Capital Gains | | Undistributed Long-Term Capital Gains | | Capital Loss Carryforwards | | Total Net Distributable Earnings/ (Accumulated Losses) |
$2,146 | | — | | $(50,288) | | $(48,142) |
For federal income tax purposes, the Fund measures its capital loss carryforwards annually at October 31, its fiscal year end. Capital loss carryforwards may be carried forward and applied against future capital gains. As of October 31, 2009, the Portfolio had capital loss carryforward available to offset future realized capital gains through the indicated expiration dates (amounts in thousands):
| | | | | | | | | | | | |
| Expires on October 31, | | |
2010 | | 2011 | | 2013 | | 2014 | | 2016 | | 2017 | | Total |
| $14,821 | | $13,996 | | $1,702 | | $1,944 | | $15,152 | | $2,673 | | $50,288 |
During the period ended October 31,2009, the Portfolio expired $50,824 of capital loss carryforwards.
At October 31, 2009, the total cost and aggregate gross unrealized appreciation and (depreciation) of securities for federal income tax purposes were different from amounts reported for financial reporting purposes (amounts in thousands):
| | | | | | |
Federal Tax Cost | | Unrealized Appreciation | | Unrealized (Depreciation) | | Net Unrealized Appreciation (Depreciation) |
$812,931 | | $104,059 | | $(131,247) | | $(27,188) |
Accounting for Uncertainty in Income Taxes sets forth a minimum threshold for financial statement recognition of the benefit of a tax position taken or expected to be in a tax return. Management has analyzed the Portfolio’s
13
financial tax position and has concluded that no provision for income tax is required in the Portfolio’s financial statements. The Portfolio is not aware of any tax position for which it is reasonably possible that the total amounts of unrecognized tax benefits will significantly change in the next twelve months. The Portfolio’s federal tax returns for the prior three fiscal years remains subject to examination by the Internal Revenue Service.
E. Line of Credit:
The Fund, together with other Dimensional-advised portfolios, has entered into an amended and restated $250 million unsecured discretionary line of credit effective July 8, 2009 with an affiliate of its domestic custodian bank. Each portfolio is permitted to borrow, subject to its investment limitations, up to a maximum of $250 million, as long as total borrowings under the line of credit do not exceed $250 million in the aggregate. Borrowings under the line are charged interest at the then current Federal Funds Rate plus 1%. Each portfolio is individually, and not jointly, liable for its particular advances under the line of credit. There is no commitment fee on the unused portion of the line of credit. The agreement for the discretionary line of credit may be terminated by either party at any time. The line of credit is scheduled to expire on June 22, 2010. There were no borrowings by the Portfolio under this line of credit during the year ended October 31, 2009.
The Fund, together with other Dimensional-advised portfolios, has also entered into an additional $500 million unsecured line of credit effective January 15, 2009 with its international custodian bank. Each portfolio is permitted to borrow, subject to its investment limitations, up to a maximum of $500 million as long as total borrowings under the line of credit do not exceed $500 million in the aggregate. Each portfolio is individually, and not jointly, liable for its particular advances under the line of credit. Borrowings under the line of credit are charged interest at rates agreed to by the parties at the time of borrowing. There is no commitment fee on the unused portion of the line of credit. The agreement of the line of credit expires on January 15, 2010. There were no borrowings by the Portfolio under this line of credit during the year ended October 31, 2009.
F. Indemnitees; Contractual Obligations:
Under the Fund’s organizational documents, its officers and directors are indemnified against certain liabilities arising out of the performance of their duties to the Fund.
In the normal course of business, the Fund enters into contracts that contain a variety of representations and warranties which provide general indemnification. The Fund’s maximum exposure under these arrangements is unknown as this would involve future claims that may be made against the Fund and/or its affiliates that have not yet occurred. However, based on experience, the Fund expects the risk of loss to be remote.
G. Other:
At October 31, 2009, two shareholders held approximately 91% of the outstanding shares of the Portfolio. One or more of the shareholders may be omnibus accounts, which typically hold shares for the benefit of several other underlying investors.
H. Subsequent Event Evaluations:
Management has evaluated the impact of all the subsequent events on the Series through December 23, 2009, the date the financial statements were available for issuance, and has determined that the following subsequent event requires recognition or disclosure in the financial statements.
On December 18, 2009, the Board of Directors of Dimensional Investment Group Inc., on behalf of the U.S. Large Company Institutional Index Portfolio (the “Large Company Institutional Portfolio”), approved an Agreement and Plan of Reorganization (the “Plan of Reorganization”), under which the U.S. Large Company Portfolio (the “Large Company Portfolio”), a portfolio of DFA Investment Dimensions Group Inc., will be reorganized with and into the Large Company Institutional Portfolio. Under the Plan of Reorganization, the Large Company Portfolio will transfer substantially all of its assets to the Large Company Institutional Portfolio in exchange solely for shares of the Large Company Institutional Portfolio (the “Reorganization”), which will be distributed to shareholders of the Large Company Portfolio according to their interests held in the Large Company Portfolio immediately prior to the Reorganization. As soon as practicable thereafter, the Large Company Portfolio will be liquidated and dissolved.
14
REPORT OF INDEPENDENT REGISTERED PUBLIC ACCOUNTING FIRM
To the Shareholders of U.S. Large Company Institutional Index Portfolio and
Board of Directors of Dimensional Investment Group Inc.:
In our opinion, the accompanying statement of assets and liabilities, and the related statements of operations and of changes in net assets and the financial highlights present fairly, in all material respects, the financial position of U.S. Large Company Institutional Index Portfolio (one of the portfolios constituting Dimensional Investment Group Inc., hereafter referred to as the “Portfolio”) at October 31, 2009, the results of its operations for the year then ended, the changes in its net assets and the financial highlights for each of the periods indicated, in conformity with accounting principles generally accepted in the United States of America. These financial statements and financial highlights (hereafter referred to as “financial statements”) are the responsibility of the Portfolio’s management; our responsibility is to express an opinion on these financial statements based on our audits. We conducted our audits of these financial statements in accordance with the standards of the Public Company Accounting Oversight Board (United States). Those standards require that we plan and perform the audit to obtain reasonable assurance about whether the financial statements are free of material misstatement. An audit includes examining, on a test basis, evidence supporting the amounts and disclosures in the financial statements, assessing the accounting principles used and significant estimates made by management, and evaluating the overall financial statement presentation. We believe that our audits, which included confirmation of securities at October 31, 2009 by correspondence with the transfer agent of the investee fund, provide a reasonable basis for our opinion.
PricewaterhouseCoopers LLP
Philadelphia, Pennsylvania
December 23, 2009
15
RESULTS OF THE SHAREHOLDER MEETING
On June 2, 2009, June 5, 2009, and July 8, 2009, Dimensional Investment Group Inc. (“DIG”) held a Special Joint Meeting of Shareholders for the purpose of voting on several proposals affecting DIG and the Portfolio, including, among other items, the election of Directors, the amendment of certain fundamental investment limitations, and the elimination of certain fundamental investment limitations. The shareholders of the Portfolio approved each of the applicable proposals for DIG and the Portfolio presented at the Meeting. Listed below are the voting results from the Meeting. Please note that not all Proposals presented at the Meeting were voted on by the Portfolio. Additionally, the Proposal numbers reflected below correlate to the Proposal numbers presented for vote at the Meeting.
DIG
| | | | | | | | | | | | | | | | | | | | |
| | | | | Shares Voted | | Percent of Outstanding Shares Voted |
| | | | | For | | % | | Against | | % | | Abstain/ WithHold | | % | | For | | Against | | Abstain / WithHold |
| Proposal 1: Election of Directors for DIG* | | | | | | | | | | | | | | | | | | |
| | | | | | | | | | |
1a | | David G. Booth | | 754,612,895 | | 96.26% | | — | | 0.00% | | 29,301,677 | | 3.74% | | 85.87% | | 0.00% | | 3.33% |
1b | | George M. Constantinides | | 753,991,785 | | 96.18% | | — | | 0.00% | | 29,922,787 | | 3.82% | | 85.80% | | 0.00% | | 3.41% |
1c | | John P. Gould | | 753,344,569 | | 96.10% | | — | | 0.00% | | 30,570,003 | | 3.90% | | 85.73% | | 0.00% | | 3.48% |
1d | | Roger G. Ibbotson | | 754,232,365 | | 96.21% | | — | | 0.00% | | 29,682,207 | | 3.79% | | 85.83% | | 0.00% | | 3.38% |
1e | | Robert C. Merton | | 754,598,874 | | 96.26% | | — | | 0.00% | | 29,315,698 | | 3.74% | | 85.87% | | 0.00% | | 3.34% |
1f | | Myron S. Scholes | | 754,057,040 | | 96.19% | | — | | 0.00% | | 29,857,532 | | 3.81% | | 85.81% | | 0.00% | | 3.40% |
1g | | Eduardo A. Repetto | | 753,295,592 | | 96.09% | | — | | 0.00% | | 30,618,979 | | 3.91% | | 85.72% | | 0.00% | | 3.48% |
1h | | Abbie J. Smith | | 754,123,603 | | 96.20% | | — | | 0.00% | | 29,790,969 | | 3.80% | | 85.82% | | 0.00% | | 3.39% |
| | | | | | | | | | | | | | | | | | | | | | |
| | | Shares Voted | | Percent of Outstanding Shares Voted |
| | | For | | % | | Against | | % | | Abstain/ WithHold | | % | | NonVote | | % | | For | | Against | | Abstain / WithHold |
Proposal 2: To approve Articles of Amendment and Restatement for DIG* | | 479,705,048 | | 93.81% | | 7,503,436 | | 1.47% | | 24,156,664 | | 4.72% | | NA | | NA | | 54.59% | | 0.85% | | 2.75% |
| * | Results are for all Portfolios within DIG |
U.S. Large Company Institutional Index Portfolio
| | | | | | | | | | | | | | | | | | | | |
| | | | | Shares Voted | | Percent of Outstanding Shares Voted |
| | | | | For | | % | | Against | | % | | Abstain/ WithHold | | % | | For | | Against | | Abstain / WithHold |
| Proposals: | | | | | | | | | | | | | | | | | | |
| | | | | |
5 | | To approve amendments to certain fundamental investment restrictions | | | | | | | | |
5a | | Borrowing Money | | 51,732,595 | | 96.87% | | 662,055 | | 1.24% | | 1,010,728 | | 1.89% | | 55.52% | | 0.71% | | 1.08% |
5b | | Making Loans | | 51,732,615 | | 96.87% | | 662,036 | | 1.24% | | 1,010,727 | | 1.89% | | 55.52% | | 0.71% | | 1.08% |
5c | | Investments in Real Estate | | 51,761,717 | | 96.92% | | 613,072 | | 1.15% | | 1,030,589 | | 1.93% | | 55.55% | | 0.66% | | 1.11% |
5d | | Investments in Commodities | | 51,789,882 | | 96.98% | | 610,543 | | 1.14% | | 4,004,953 | | 7.50% | | 55.58% | | 0.66% | | 4.30% |
5e | | Diversification of Investments | | 51,905,924 | | 97.19% | | 509,910 | | 0.95% | | 989,544 | | 1.85% | | 55.71% | | 0.55% | | 1.06% |
6 | | To approve the elimination of certain fundamental investment restrictions | | | | | | | | |
6b | | Purchasing Securities on Margin | | 51,634,695 | | 96.68% | | 764,925 | | 1.43% | | 1,005,758 | | 1.88% | | 55.41% | | 0.82% | | 1.08% |
8 | | Approval of Investment Advisory Agreement between Dimensional Fund Advisors LP and the Company | | 51,963,094 | | 97.30% | | 431,757 | | 0.81% | | 1,010,527 | | 1.89% | | 55.77% | | 0.46% | | 1.08% |
16
THE DFA INVESTMENT TRUST COMPANY
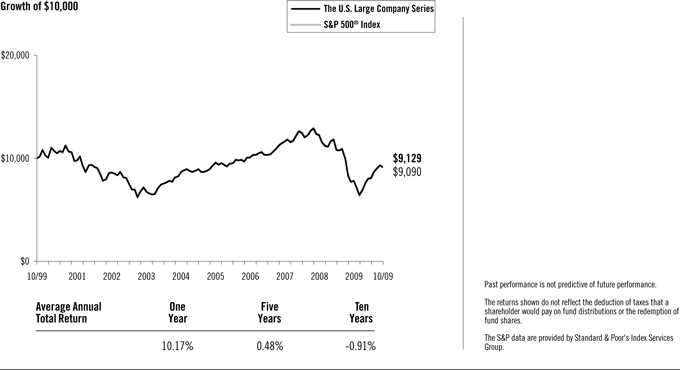
PERFORMANCE CHART
The U.S. Large Company Series vs.
S&P 500® Index
October 31, 1999-October 31, 2009
17
THE DFA INVESTMENT TRUST COMPANY
THE U.S. LARGE COMPANY SERIES
DISCLOSURE OF FUND EXPENSES
(Unaudited)
The following Expense Table is shown so that you can understand the impact of fees on your investment. All mutual funds have operating expenses. As a shareholder of the fund, you incur ongoing costs, which include costs for portfolio management, administrative services, and shareholder reports, among others. Operating expenses, legal and audit services, which are deducted from a fund’s gross income, directly reduce the investment return of the fund. A fund’s expenses are expressed as a percentage of its average net assets. This figure is known as the expense ratio. The following examples are intended to help you understand the ongoing costs, in dollars, of investing in the fund and to compare these costs with those of other mutual funds. The examples are based on an investment of $1,000 made at the beginning of the period shown and held for the entire period.
The Expense Table below illustrates your fund’s costs in two ways.
Actual Fund Return
This section helps you to estimate the actual expenses after fee waivers that you paid over the period. The “Ending Account Value” shown is derived from the fund’s actual return and “Expenses Paid During Period” reflect the dollar amount that would have been paid by an investor who started with $1,000 in the fund. You may use the information here, together with the amount you invested, to estimate the expenses that you paid over the period.
To do so, simply divide your account value by $1,000 (for example, a $7,500 account value divided by $1,000 = 7.5), then multiply the result by the number given for your fund under the heading “Expenses Paid During Period.”
Hypothetical Example for Comparison Purposes
This section is intended to help you compare your fund’s costs with those of other mutual funds. The hypothetical “Ending Account Value” and “Expenses Paid During Period” are derived from the fund’s actual expense ratio and an assumed 5% annual return before expenses. In this case, because the return used is not the fund’s actual return, the results do not apply to your investment. The example is useful in making comparisons because the SEC requires all mutual funds to calculate expenses based on a 5% annual return. You can assess your fund’s costs by comparing this hypothetical example with the hypothetical examples that appear in shareholder reports of other funds.
Please note that the expenses shown in the table are meant to highlight and help you compare ongoing costs only and do not reflect any transactional costs, if applicable. The “Annualized Expense Ratio” represents the actual expenses for the six-month period indicated.
Six Months Ended October 31, 2009
EXPENSE TABLE
| | | | | | | | | | |
| | | Beginning
Account
Value
05/01/09 | | Ending
Account
Value
10/31/09 | | Annualized
Expense
Ratio* | | Expenses
Paid
During
Period* |
Actual Fund Return | | $ | 1,000.00 | | $ | 1,200.50 | | 0.06% | | $0.33 |
Hypothetical 5% Annual Return | | $ | 1,000.00 | | $ | 1,024.90 | | 0.06% | | $0.31 |
| * | Expenses are equal to the fund’s annualized expense ratio for the six-month period, multiplied by the average account value over the period, multiplied by the number of days in the most recent six-month period (184), then divided by the number of days in the year (365) to reflect the six-month period. |
18
THE DFA INVESTMENT TRUST COMPANY
THE U.S. LARGE COMPANY SERIES
DISCLOSURE OF PORTFOLIO HOLDINGS
(Unaudited)
The SEC requires that all Funds file a complete Schedule of Investments with the SEC for their first and third fiscal quarters on Form N-Q. For The DFA Investment Trust Company, this would be for the fiscal quarters ending January 31 and July 31. The Form N-Q filing must be made within 60 days of the end of the quarter. The DFA Investment Trust Company filed its most recent Form N-Q with the SEC on September 29, 2009. It is available upon request, without charge, by calling collect: (512) 306-7400 or by mailing a request to Dimensional Fund Advisors LP, 6300 Bee Cave Road, Building One, Austin, Texas 78746, or by visiting the SEC’s website at http://www.sec.gov, or they may be reviewed and copied at the SEC’s Public Reference Room in Washington, D.C. (call 1-800-732-0330 for information on the operation of the Public Reference Room).
SEC regulations permit a fund to include in its reports to shareholders a “Summary Schedule of Portfolio Holdings” in lieu of a full Schedule of Investments. The Summary Schedule of Portfolio Holdings reports the fund’s 50 largest holdings in unaffiliated issuers and any investments that exceed one percent of the fund’s net assets at the end of the reporting period. The amendments also require that the Summary Schedule of Portfolio Holdings identify each category of investments that are held.
The fund is required to file a complete Schedule of Investments with the SEC on Form N-CSR within ten days after mailing the annual and semi-annual reports to shareholders. It will be available upon request, without charge, by calling collect: (512) 306-7400 or by mailing a request to Dimensional Fund Advisors LP, 6300 Bee Cave Road, Building One, Austin, Texas 78746, or by visiting the SEC’s website at http://www.sec.gov, or they may be reviewed and copied at the SEC’s Public Reference Room in Washington, D.C. (call 1-800-732-0330 for information on the operation of the Public Reference Room).
PORTFOLIO HOLDINGS
The SEC requires that all Funds present their categories of portfolio holdings in a table, chart or graph format in their annual and semi-annual shareholder reports, whether or not a Schedule of Investments is utilized. The following table, which presents portfolio holdings as a percent of total investments before short-term investments and collateral for loaned securities, is provided in compliance with such requirement. The categories shown below represent broad industry sectors. Each industry sector consists of one or more specific industry classifications.
| | |
| The U.S. Large Company Series |
Consumer Discretionary | | 9.2% |
Consumer Staples | | 11.9% |
Energy | | 12.4% |
Financials | | 13.6% |
Health Care | | 12.6% |
Industrials | | 10.0% |
Information Technology | | 19.0% |
Materials | | 3.4% |
Real Estate Investment Trusts | | 1.1% |
Telecommunication Services | | 3.1% |
Utilities | | 3.7% |
| | |
| | 100.0% |
19
THE U.S. LARGE COMPANY SERIES
SUMMARY SCHEDULE OF PORTFOLIO HOLDINGS
October 31, 2009
| | | | | | | |
| | | Shares | | Value† | | Percentage of Net Assets** |
COMMON STOCKS — (92.1%) | | | | | | | |
Consumer Discretionary — (8.5%) | | | | | | | |
*Amazon.com, Inc. | | 126,572 | | $ | 15,038,019 | | 0.4% |
Comcast Corp. Class A | | 1,092,473 | | | 15,840,859 | | 0.4% |
Disney (Walt) Co. | | 707,515 | | | 19,364,686 | | 0.6% |
#Home Depot, Inc. | | 648,891 | | | 16,280,675 | | 0.5% |
McDonald’s Corp. | | 415,454 | | | 24,349,759 | | 0.7% |
Other Securities | | | | | 227,637,040 | | 6.5% |
| | | | | | | |
Total Consumer Discretionary | | | | | 318,511,038 | | 9.1% |
| | | | | | | |
| | | |
Consumer Staples — (11.0%) | | | | | | | |
Coca-Cola Co. | | 882,204 | | | 47,030,295 | | 1.3% |
Colgate-Palmolive Co. | | 189,741 | | | 14,919,335 | | 0.4% |
CVS Caremark Corp. | | 549,409 | | | 19,394,138 | | 0.6% |
Kraft Foods, Inc. | | 561,489 | | | 15,452,177 | | 0.4% |
PepsiCo, Inc. | | 593,045 | | | 35,908,875 | | 1.0% |
Philip Morris International, Inc. | | 736,409 | | | 34,876,330 | | 1.0% |
Procter & Gamble Co. | | 1,111,163 | | | 64,447,454 | | 1.8% |
Wal-Mart Stores, Inc. | | 822,201 | | | 40,846,946 | | 1.2% |
Other Securities | | | | | 141,728,671 | | 4.1% |
| | | | | | | |
Total Consumer Staples | | | | | 414,604,221 | | 11.8% |
| | | | | | | |
| | | |
Energy — (11.4%) | | | | | | | |
Chevron Corp. | | 763,458 | | | 58,435,075 | | 1.7% |
ConocoPhillips | | 564,511 | | | 28,327,162 | | 0.8% |
Exxon Mobil Corp. | | 1,829,468 | | | 131,117,972 | | 3.7% |
Occidental Petroleum Corp. | | 308,646 | | | 23,420,058 | | 0.7% |
Schlumberger, Ltd. | | 455,987 | | | 28,362,391 | | 0.8% |
Other Securities | | | | | 159,417,519 | | 4.5% |
| | | | | | | |
Total Energy | | | | | 429,080,177 | | 12.2% |
| | | | | | | |
| | | |
Financials — (12.5%) | | | | | | | |
American Express Co. | | 452,705 | | | 15,772,242 | | 0.4% |
Bank of America Corp. | | 3,293,490 | | | 48,019,084 | | 1.4% |
Citigroup, Inc. | | 4,964,744 | | | 20,305,803 | | 0.6% |
Goldman Sachs Group, Inc. | | 194,617 | | | 33,117,975 | | 0.9% |
JPMorgan Chase & Co. | | 1,497,052 | | | 62,531,862 | | 1.8% |
Morgan Stanley | | 517,407 | | | 16,619,113 | | 0.5% |
#U.S. Bancorp | | 727,850 | | | 16,900,677 | | 0.5% |
Wells Fargo & Co. | | 1,778,388 | | | 48,941,238 | | 1.4% |
Other Securities | | | | | 209,712,141 | | 6.0% |
| | | | | | | |
Total Financials | | | | | 471,920,135 | | 13.5% |
| | | | | | | |
| | | |
Health Care — (11.7%) | | | | | | | |
Abbott Laboratories | | 588,498 | | | 29,760,344 | | 0.8% |
*Amgen, Inc. | | 386,571 | | | 20,770,460 | | 0.6% |
Bristol-Myers Squibb Co. | | 754,098 | | | 16,439,336 | | 0.5% |
*Gilead Sciences, Inc. | | 344,234 | | | 14,647,157 | | 0.4% |
Johnson & Johnson | | 1,049,083 | | | 61,948,351 | | 1.8% |
Medtronic, Inc. | | 421,338 | | | 15,041,767 | | 0.4% |
#Merck & Co., Inc. | | 802,803 | | | 24,830,697 | | 0.7% |
Pfizer, Inc. | | 3,069,869 | | | 52,279,869 | | 1.5% |
Schering-Plough Corp. | | 622,008 | | | 17,540,626 | | 0.5% |
Other Securities | | | | | 186,020,772 | | 5.3% |
| | | | | | | |
Total Health Care | | | | | 439,279,379 | | 12.5% |
| | | | | | | |
| | | |
Industrials — (9.2%) | | | | | | | |
3M Co. | | 265,836 | | | 19,557,555 | | 0.6% |
20
THE U.S. LARGE COMPANY SERIES
CONTINUED
| | | | | | | | |
| | | Shares | | Value† | | Percentage of Net Assets** |
Industrials — (Continued) | | | | | | | | |
General Electric Co. | | | 4,045,427 | | $ | 57,687,789 | | 1.6% |
United Parcel Service, Inc. | | | 378,570 | | | 20,321,638 | | 0.6% |
United Technologies Corp. | | | 358,323 | | | 22,018,948 | | 0.6% |
Other Securities | | | | | | 228,629,561 | | 6.5% |
| | | | | | | | |
Total Industrials | | | | | | 348,215,491 | | 9.9% |
| | | | | | | | |
| | | |
Information Technology — (17.5%) | | | | | | | | |
*Apple, Inc. | | | 341,019 | | | 64,282,082 | | 1.8% |
*Cisco Sytems, Inc. | | | 2,195,717 | | | 50,172,133 | | 1.4% |
*Google, Inc. | | | 91,589 | | | 49,102,695 | | 1.4% |
Hewlett-Packard Co. | | | 902,618 | | | 42,838,250 | | 1.2% |
Intel Corp. | | | 2,131,047 | | | 40,724,308 | | 1.2% |
International Business Machines Corp. | | | 499,027 | | | 60,187,646 | | 1.7% |
Microsoft Corp. | | | 2,951,141 | | | 81,835,140 | | 2.4% |
Oracle Corp. | | | 1,486,799 | | | 31,371,459 | | 0.9% |
QUALCOMM, Inc. | | | 632,808 | | | 26,204,579 | | 0.8% |
Other Securities | | | | | | 214,771,869 | | 6.1% |
| | | | | | | | |
Total Information Technology | | | | | | 661,490,161 | | 18.9% |
| | | | | | | | |
| | | |
Materials — (3.1%) | | | | | | | | |
Other Securities | | | | | | 117,813,227 | | 3.4% |
| | | | | | | | |
| | | |
Real Estate Investment Trusts — (1.0%) | | | | | | | | |
Other Securities | | | | | | 37,279,130 | | 1.1% |
| | | | | | | | |
| | | |
Telecommunication Services — (2.8%) | | | | | | | | |
AT&T, Inc. | | | 2,246,012 | | | 57,655,128 | | 1.7% |
Verizon Communications, Inc. | | | 1,081,364 | | | 31,997,561 | | 0.9% |
Other Securities | | | | | | 17,544,350 | | 0.5% |
| | | | | | | | |
Total Telecommunication Services | | | | | | 107,197,039 | | 3.1% |
| | | | | | | | |
| | | |
Utilities — (3.4%) | | | | | | | | |
Other Securities | | | | | | 127,970,719 | | 3.6% |
| | | | | | | | |
TOTAL COMMON STOCKS | | | | | | 3,473,360,717 | | 99.1% |
| | | | | | | | |
| | | |
| | | Face Amount | | | | |
| | | (000) | | | | |
TEMPORARY CASH INVESTMENTS — (0.7%) | | | | | | | | |
Repurchase Agreement, PNC Capital Markets, Inc. 0.19%, 11/02/09 (Collateralized by $25,855,000, FNMA 6.50%, 06/25/39 valued at $27,826,444) to be repurchased at $27,414,434 | | $ | 27,414 | | | 27,414,000 | | 0.8% |
| | | | | | | | |
21
THE U.S. LARGE COMPANY SERIES
CONTINUED
| | | | | | | | | |
| | | Shares/
Face
Amount | | Value† | | Percentage
of Net Assets** | |
| | | (000) | | | | | |
SECURITIES LENDING COLLATERAL — (7.2%) | | | | | | | | | |
§@DFA Short Term Investment Fund LP | | | 269,088,352 | | $ | 269,088,352 | | 7.7 | % |
@Repurchase Agreement, Deutsche Bank Securities 0.08%, | | | | | | | | | |
11/02/09 (Collateralized by $2,507,470 FHLMC 5.793%(r), 01/01/37, valued at $1,408,594) to be repurchased at $1,367,576 | | $ | 1,368 | | | 1,367,567 | | 0.0 | % |
| | | | | | | | | |
TOTAL SECURITIES LENDING COLLATERAL | | | | | | 270,455,919 | | 7.7 | % |
| | | | | | | | | |
TOTAL INVESTMENTS — (100.0%) | | | | | | | | | |
(Cost $3,544,033,089) | | | | | $ | 3,771,230,636 | | 107.6 | % |
| | | | | | | | | |
Summary of inputs used to value the Series’ net assets as of October 31, 2009 is as follows (See Security Valuation Note):
| | | | | | | | | | | |
| | | Valuation Inputs |
| |
| | | Investment in Securities (Market Value) |
| | | Level 1 | | Level 2 | | Level 3 | | Total |
Common Stocks | | | | | | | | | | | |
Consumer Discretionary | | $ | 318,511,038 | | $ | — | | — | | $ | 318,511,038 |
Consumer Staples | | | 414,604,221 | | | — | | — | | | 414,604,221 |
Energy | | | 429,080,177 | | | — | | — | | | 429,080,177 |
Financials | | | 471,920,135 | | | — | | — | | | 471,920,135 |
Health Care | | | 439,279,379 | | | — | | — | | | 439,279,379 |
Industrials | | | 348,215,491 | | | — | | — | | | 348,215,491 |
Information Technology | | | 661,490,161 | | | — | | — | | | 661,490,161 |
Materials | | | 117,813,227 | | | — | | — | | | 117,813,227 |
Real Estate Investment Trusts | | | 37,279,130 | | | — | | — | | | 37,279,130 |
Telecommunication Services | | | 107,197,039 | | | — | | — | | | 107,197,039 |
Utilities | | | 127,970,719 | | | — | | — | | | 127,970,719 |
Temporary Cash Investments | | | — | | | 27,414,000 | | — | | | 27,414,000 |
Securities Lending Collateral | | | — | | | 270,455,919 | | — �� | | | 270,455,919 |
Other Financial Instruments** | | | 140,905 | | | — | | — | | | 140,905 |
| | | | | | | | | | | |
TOTAL | | $ | 3,473,501,622 | | $ | 297,869,919 | | — | | $ | 3,771,371,541 |
| | | | | | | | | | | |
| | ** | Other financial instruments are derivative instruments not reflected in the Schedule of Investments, such as futures and forwards which are valued at the unrealized appreciation/depreciation on the investment. |
See accompanying Notes to Financial Statements.
22
THE DFA INVESTMENT TRUST COMPANY
THE U.S. LARGE COMPANY SERIES
STATEMENT OF ASSETS AND LIABILITIES
OCTOBER 31, 2009
(Amounts in thousands)
| | |
ASSETS: | | |
Investments at Value (including $252,538 of securities on loan) | | $3,473,361 |
Temporary Cash Investments at Value & Cost | | 27,414 |
Collateral Received from Securities on Loan at Value & Cost | | 270,456 |
Cash | | 2,839 |
Receivables: | | |
Dividends and Interest | | 4,362 |
Fund Shares Sold | | 71 |
Securities Lending Income | | 62 |
Prepaid Expenses and Other Assets | | 1 |
| | |
Total Assets | | 3,778,566 |
| | |
LIABILITIES: | | |
Payables: | | |
Upon Return of Securities Loaned | | 270,456 |
Investment Securities Purchased | | 1,042 |
Fund Shares Redeemed | | 458 |
Due to Advisor | | 75 |
Futures Margin Variation | | 851 |
Accrued Expenses and Other Liabilities | | 233 |
| | |
Total Liabilities | | 273,115 |
| | |
NET ASSETS | | $3,505,451 |
| | |
Investments at Cost | | $3,246,163 |
| | |
See accompanying Notes to Financial Statements.
23
THE DFA INVESTMENT TRUST COMPANY
THE U.S. LARGE COMPANY SERIES
STATEMENT OF OPERATIONS
FOR THE YEAR ENDED OCTOBER 31, 2009
(Amounts in thousands)
| | | | |
Investment Income | | | | |
Dividends (Net of Foreign Taxes Withheld of $2) | | $ | 76,385 | |
Interest | | | 131 | |
Income from Securities Lending | | | 3,715 | |
| | | | |
Total Investment Income | | | 80,231 | |
| | | | |
Expenses | | | | |
Investment Advisory Services Fees | | | 762 | |
Accounting & Transfer Agent Fees | | | 341 | |
S&P 500® Fees | | | 90 | |
Custodian Fees | | | 47 | |
Shareholders’ Reports | | | 32 | |
Directors’/Trustees’ Fees & Expenses | | | 59 | |
Audit Fees | | | 63 | |
Legal Fees | | | 75 | |
Other | | | 359 | |
| | | | |
Total Expenses | | | 1,828 | |
| | | | |
Net Investment Income (Loss) | | | 78,403 | |
| | | | |
Realized and Unrealized Gain (Loss) | | | | |
Net Realized Gain (Loss) on: | | | | |
Investment Securities Sold | | | (215,329 | ) |
Futures | | | 20,268 | |
Change in Unrealized Appreciation (Depreciation) of: | | | | |
Investment Securities | | | 427,495 | |
Futures | | | (2,236 | ) |
| | | | |
Net Realized and Unrealized Gain (Loss) | | | 230,198 | |
| | | | |
Net Increase (Decrease) in Net Assets Resulting from Operations | | $ | 308,601 | |
| | | | |
See accompanying Notes to Financial Statements.
24
THE DFA INVESTMENT TRUST COMPANY
THE U.S. LARGE COMPANY SERIES
STATEMENTS OF CHANGES IN NET ASSETS
(Amounts in thousands)
| | | | | | | | | | | | |
| | | Year
Ended
Oct. 31,
2009 | | | Period
Dec. 1, 2007
to
Oct. 31, 2008 | | | Year
Ended
Nov. 30,
2007 | |
Increase (Decrease) in Net Assets | | | | | | | | | | | | |
Operations: | | | | | | | | | | | | |
Net Investment Income (Loss) | | $ | 78,403 | | | $ | 84,705 | | | $ | 94,262 | |
Net Realized Gain (Loss) on: | | | | | | | | | | | | |
Investment Securities Sold | | | (215,329 | ) | | | (126,174 | ) | | | 10,206 | |
Futures | | | 20,268 | | | | (22,232 | ) | | | 3,585 | |
In-Kind Redemptions | | | — | | | | 24,362 | * | | | 529,199 | * |
Change in Unrealized Appreciation (Depreciation) of: | | | | | | | | | | | | |
Investment Securities | | | 427,495 | | | | (1,591,847 | ) | | | (217,829 | ) |
Futures | | | (2,236 | ) | | | 1,195 | | | | (216 | ) |
| | | | | | | | | | | | |
Net Increase (Decrease) in Net Assets Resulting from Operations | | | 308,601 | | | | (1,629,991 | ) | | | 419,207 | |
| | | | | | | | | | | | |
Transactions in Interest: | | | | | | | | | | | | |
Contributions | | | 363,357 | | | | 696,520 | | | | 616,294 | |
Withdrawals | | | (440,159 | ) | | | (299,226 | )* | | | (1,482,132 | )* |
| | | | | | | | | | | | |
Net Increase (Decrease) from Transactions in Interest | | | (76,802 | ) | | | 397,294 | | | | (865,838 | ) |
| | | | | | | | | | | | |
Total Increase (Decrease) in Net Assets | | | 231,799 | | | | (1,232,697 | ) | | | (446,631 | ) |
Net Assets | | | | | | | | | | | | |
Beginning of Period | | | 3,273,652 | | | | 4,506,349 | | | | 4,952,980 | |
| | | | | | | | | | | | |
End of Period | | $ | 3,505,451 | | | $ | 3,273,652 | | | $ | 4,506,349 | |
| | | | | | | | | | | | |
| * | See Note J in the Notes to Financial Statements. |
See accompanying Notes to Financial Statements.
25
THE DFA INVESTMENT TRUST COMPANY
THE U.S. LARGE COMPANY SERIES
FINANCIAL HIGHLIGHTS
| | | | | | | | | | | | | | | | | | |
| | | Year
Ended
Oct. 31,
2009 | | | Period
Dec. 1, 2007
to
Oct. 31, 2008 | | | Year
Ended
Nov. 30,
2007 | | | Year
Ended
Nov. 30,
2006 | | | Year
Ended
Nov. 30,
2005 | | | Year
Ended
Nov. 30,
2004 | |
Total Return | | 10.17 | % | | (33.10 | )%(C) | | 7.77 | % | | 14.25 | % | | 8.51 | % | | 12.77 | % |
Net Assets, End of Period (thousands) | | $3,505,451 | | | $3,273,652 | | | $4,506,349 | | | $4,952,980 | | | $4,238,712 | | | $3,493,919 | |
Ratio of Expenses to Average Net Assets | | 0.06 | % | | 0.04 | %(B) | | 0.04 | % | | 0.04 | % | | 0.05 | % | | 0.05 | % |
Ratio of Net Investment Incometo Average Net Assets | | 2.57 | % | | 2.16 | %(B) | | 1.96 | % | | 1.95 | % | | 1.87 | % | | 1.99 | % |
Portfolio Turnover Rate | | 10 | % | | 6 | %(C) | | 13 | %* | | 4 | % | | 6 | % | | 2 | % |
See Page 1 for the Definitions of Abbreviations and Footnotes.
| * | Excluding security sales due to the In-Kind Redemptions, the portfolio turnover rate would have been 5%. See Note J in the Notes to Financial Statements. |
See accompanying Notes to Financial Statements.
26
THE DFA INVESTMENT TRUST COMPANY
THE U.S. LARGE COMPANY SERIES
NOTES TO FINANCIAL STATEMENTS
A. Organization:
The DFA Investment Trust Company (the “Trust”) is an open-end management investment company registered under the Investment Company Act of 1940.The Trust consists of twelve investment portfolios, of which The U.S. Large Company Series (the “Series”) is presented in this report.
At a regular meeting of the Board of Directors/Trustees (the “Board”) on September 16, 2008, the Board voted to change the fiscal and tax year ends of the Series from November 30 to October 31.
B. Significant Accounting Policies:
The following significant accounting policies are in conformity with accounting principles generally accepted in the United States of America. Such policies are consistently followed by the Trust in preparation of its financial statements. The preparation of financial statements in accordance with accounting principles generally accepted in the United States of America requires management to make estimates and assumptions that affect the reported amounts of assets and liabilities and disclosure of contingent assets and liabilities at the date of the financial statements and the reported amounts of increases and decreases in net assets from operations during the reporting period. Actual results could differ from those estimates and those differences could be material.
1. Security Valuation: Securities held by the Series (including over-the-counter securities) are valued at the last quoted sale price of the day. Securities held by the Series that are listed on Nasdaq are valued at the Nasdaq Official Closing Price (“NOCP”). If there is no last reported sale price or NOCP for the day, the Series values the securities at the mean of the most recent quoted bid and asked prices. Price information on listed securities is taken from the exchange where the security is primarily traded. Generally, securities issued by open-end investment companies are valued using their respective net asset values or public offering prices, as appropriate, for purchase orders placed at the close of the New York Stock Exchange (NYSE).
Securities for which no market quotations are readily available (including restricted securities), or for which market quotations have become unreliable, are valued in good faith at fair value in accordance with procedures adopted by the Board of Directors/Trustees. Fair value pricing may also be used if events that have a significant effect on the value of an investment (as determined in the discretion of the Investment Committee of the Advisor) occur before the net asset value is calculated. When fair value pricing is used, the prices of securities used by the Series may differ from the quoted or published prices for the same securities on their primary markets or exchanges.
Futures contracts held by the Series are valued using the settlement price established each day on the exchange on which they are traded.
The Series utilizes a fair value hierarchy which prioritizes the inputs to valuation techniques used to measure fair value into three broad levels described below:
• Level 1 – quoted prices in active markets for identical securities
• Level 2 – other significant observable inputs (including quoted prices for similar securities, interest rates, prepayment speeds, credit risk, etc.)
• Level 3 – significant unobservable inputs (including the Series’ own assumptions in determining the fair value of investments)
A summary of the inputs used to value the Series’ net assets by each major security type, industry and/or country is disclosed at the end of the Summary Schedule of Portfolio Holdings. The inputs or methodology used for valuing securities are not necessarily an indication of the risk associated with investing in those securities.
27
2. Deferred Compensation Plan: Each eligible Trustee of the Trust may elect participation in the Deferred Compensation Plan (the “Plan”). Under the Plan, effective January 1, 2002, such Trustees may defer payment of all or a portion of their total fees earned as a Trustee. These deferred amounts may be treated as though such amounts had been invested in shares of the following funds: U.S. Large Cap Value Portfolio; U.S. Core Equity 1 Portfolio; U.S. Core Equity 2 Portfolio; U.S. Vector Equity Portfolio; U.S. Micro Cap Portfolio; DFA International Value Portfolio; International Core Equity Portfolio; Emerging Markets Portfolio; Emerging Markets Core Equity Portfolio; and/or DFA Two-Year Global Fixed Income Portfolio. Contributions made under the Plan and the change in unrealized appreciation (depreciation) and income are included in Directors’/Trustees’ Fees & Expenses. At October 31, 2009, the total liability for deferred compensation to Trustees is included in Accrued Expenses and Other Liabilities on the Statement of Assets and Liabilities in the amount of $87 (in thousands).
Each Trustee has the option to receive their distribution of proceeds in one of the following methods upon one year’s notice: lump sum; annual installments over a period of agreed upon years; or semi-annual installments over a period of agreed upon years. As of October 31, 2009, none of the Trustees have requested distribution of proceeds.
3. Other: Security transactions are accounted for as of the trade date. Costs used in determining realized gains and losses on the sale of investment securities are on the basis of identified cost. Dividend income and distributions to shareholders are recorded on the ex-dividend date. Distributions received on securities that represent a return of capital or capital gains are recorded as a reduction of cost of investments or as a realized gain, respectively. The Series estimate the character of distributions received that may be considered return of capital distributions. Interest income is recorded on the accrual basis. Discount and premium on securities purchased are amortized over the lives of the respective securities utilizing the effective interest method. Expenses directly attributable to a Series are directly charged. Common expenses of the Trust are allocated using methods approved by the Board of Directors/Trustees, generally based on average net assets.
C. Investment Advisor:
Dimensional Fund Advisors LP (“Dimensional” or the “Advisor”) provides investment advisory services to the Series. For the year ended October 31, 2009, the Series’ investment advisory services fees were accrued daily and paid monthly to the Advisor based on an effective annual rate of 0.025% of average daily net assets.
Fees Paid to Officers and Directors/Trustees:
Certain Officers and Directors/Trustees of the Advisor are also Officers and Directors/Trustees of the Trust; however, such Officers and Directors/Trustees (with the exception of the Chief Compliance Officer (“CCO”)) receive no compensation from the Trust. For the year ended October 31, 2009, the total related amounts paid by the Trust to the CCO were $98 (in thousands). The total related amounts paid by the Series are included in Other Expenses on the Statement of Operations.
D. Purchases and Sales of Securities:
For the year ended October 31, 2009, the Series made the following purchases and sales of investment securities, other than short-term securities and U.S. government securities (amounts in thousands):
| | | |
Purchases | | $ | 324,298 |
Sales | | | 294,824 |
There were no purchases or sales of long-term U.S. government securities.
28
E. Federal Income Taxes:
No provision for federal income taxes is required since the Series is treated as a partnership for federal income tax purposes. Any net investment income and realized and unrealized gains or losses have been deemed to have been “passed down” to its partners.
At October 31, 2009, the total cost and aggregate gross unrealized appreciation and (depreciation) of securities for federal income tax purposes were different from amounts reported for financial reporting purposes (amounts in thousands):
| | | | | | |
Federal
Tax Cost | | Unrealized
Appreciation | | Unrealized
(Depreciation) | | Net
Unrealized
Appreciation
(Depreciation) |
$3,858,145 | | $789,949 | | $(876,863) | | $(86,914) |
Accounting for Uncertainty in Income Taxes sets forth a minimum threshold for financial statement recognition of the benefit of a tax position taken or expected to be in a tax return. Management has analyzed the Series’ tax position and has concluded that no provision for income tax is required in the Portfolio’s financial statements. The Series is not aware of any tax position for which it is reasonably possible that the total amounts of unrecognized tax benefits will significantly change in the next twelve months. The Series’ federal tax returns for the prior three fiscal years remains subject to examination by the Internal Revenue Service.
F. Financial Instruments:
In accordance with the Series’ investment objectives and policies, the Series may invest in certain financial instruments that have off-balance sheet risk in excess of the amounts recognized in the financial statements and concentrations of credit and market risk. These instruments and their significant corresponding risks are described below:
1. Repurchase Agreements: The Series may purchase certain U.S. Government securities subject to the counterparty’s agreement to repurchase them at an agreed upon date and price. The counterparty will be required on a daily basis to maintain the value of the collateral subject to the agreement at not less than the repurchase price (including accrued interest). The agreements are conditioned upon the collateral being deposited under the Federal Reserve book-entry system with the Trust’s custodian or a third party sub-custodian. In the event of default or bankruptcy by the other party to the agreement, retention of the collateral may be subject to legal proceedings. All open repurchase agreements were entered into on October 30, 2009.
Derivative Financial Instruments:
Disclosures on derivative instruments and hedging activities are intended to improve financial reporting for derivative instruments by enabling investors to understand how and why a fund uses derivatives, how derivatives are accounted for and how derivative instruments affect a fund’s results of operations and financial position. Summarized below are the specific types of derivative instruments used by the Series.
2. Futures Contracts: The Series may enter into futures contracts to gain market exposure on uninvested cash pending investment in securities or to maintain liquidity to pay redemptions. Upon entering into a futures contract, the Series deposits cash or pledges U.S. Government securities to a broker, equal to the minimum “initial margin” requirements of the exchange on which the contract is traded. Subsequent payments are received from or paid to the broker each day, based on the daily fluctuation in the market value of the contract. These receipts or payments are known as “variation margin” and are recorded daily by the Series as unrealized gains or losses until the contracts are closed. When the contracts are closed, the Series records a realized gain or loss, which is presented in the Statement of Operations as a net realized gain or loss on futures, equal to the difference between the value of the contract at the time it was opened and the value at the time it was closed.
29
Risks may arise upon entering into futures contracts from potential imperfect price correlations between the futures contracts and the underlying securities, from the possibility of an illiquid secondary market for these instruments and from the possibility that the Series could lose more than the initial margin requirements. The Series entering into stock index futures are subject to equity price risk from those futures contracts. Counterparty credit risk related to exchange-traded futures is minimal because the exchange’s clearinghouse, as counterparty to all exchange-traded futures, guarantees the futures against default.
| | | | | | | | | | | | | |
| | | Description | | Expiration
Date | | Number of
Contracts | | Contract
Value | | Unrealized
Gain (Loss) | | Approximate
Cash
Collateral |
The U.S. Large Company Series | | S&P 500 ® Index | | 12/18/2009 | | 118* | | $ | 30,474 | | $141 | | $2,655 |
* During the year ended October 31, 2009, the Series had limited activity in futures transactions.
Additional disclosure on derivative instruments is required showing a summary by primary risk exposure of the derivatives instruments’ (i) location in the balance sheet and fair value at period end and (ii) the location in the Statement of Operations and the realized and change in unrealized gain or loss over the reporting period. The following is a summary of the Series’ derivative instrument holdings for the year ended October 31, 2009.
The following is a summary of the Series’ location and value of derivative instrument holdings on the Series’ Statements of Assets and Liabilities categorized by primary risk exposure as of October 31, 2009 (amounts in thousands):
| | | | |
| | | | | Asset Derivatives Value |
| | | Location on the Statements
of Assets and
Liabilities | | Equity
Contracts |
| | Payables: Futures | | |
The U.S. Large Company Series | | Margin Variation | | $141* |
| * | Includes cumulative appreciation (depreciation) of futures contracts. Only current day’s margin variation is reported within the Statement of Assets and Liabilities. |
The following is a summary of the location of realized and change in unrealized gains and losses on the Series’ Statement of Operations for the Series’ derivative instrument holdings through the year ended October 31, 2009:
| | |
Derivative Type | | Location of Gain (Loss) on Derivatives Recognized in Income |
Equity contracts | | Net Realized Gain (Loss) on: Futures
Change in Unrealized Appreciation (Depreciation) of: Futures |
The following is a summary of the realized and change in unrealized gains and losses from the Series’ derivative instrument holdings categorized by primary risk exposure through the year ended October 31, 2009 (amounts in thousands):
| | |
| | | Realized Gain (Loss)
on Derivatives
Recognized in Income |
| | | Equity
Contracts |
The U.S. Large Company Series | | $20,268 |
30
| | |
| | | Change in Unrealized
Appreciation (Depreciation) on
Derivatives Recognized in Income |
| | | Equity
Contracts |
The U.S. Large Company Series | | $(2,236) |
G. Line of Credit:
The Trust, together with other Dimensional-advised portfolios, has entered into an amended and restated $250 million unsecured discretionary line of credit effective July 8, 2009 with an affiliate of its domestic custodian bank. Each portfolio is permitted to borrow, subject to its investment limitations, up to a maximum of $250 million, as long as total borrowings under the line of credit do not exceed $250 million in the aggregate. Borrowings under the line of credit are charged interest at the then current Federal Funds Rate plus 1%. Each portfolio is individually, and not jointly, liable for its particular advances under the line of credit. There is no commitment fee on the unused portion of the line of credit. The agreement for the discretionary line of credit may be terminated by either party at any time. The line of credit is scheduled to expire on June 22, 2010.
For the year ended October 31, 2009, borrowings by the Series under this line of credit were as follows (amounts in thousands, except for percentages and days):
| | | | | | | | |
Weighted
Average
Interest Rate | | Weighted
Average
Loan Balance | | Number of
Days
Outstanding | | Interest
Expense
Incurred | | Maximum Amount
Borrowed During
the Period |
2.48% | | $8,245 | | 10 | | $6 | | $14,732 |
There were no outstanding borrowings by the Series under this line of credit as of October 31, 2009
The Trust, together with other Dimensional-advised portfolios, has also entered into an additional $500 million unsecured line of credit effective January 15, 2009 with its international custodian bank. Each portfolio is permitted to borrow, subject to its investment limitations, up to a maximum of $500 million, as long as total borrowings under the line of credit do not exceed $500 million in the aggregate. Each portfolio is individually, and not jointly, liable for its particular advances under the line of credit. Borrowings under the line of credit are charged interest at rates agreed to by the parties at the time of borrowing. There is no commitment fee on the unused portion of the line of credit. The agreement of the line of credit expires on January 15, 2010. There were no borrowings by the Series under this line of credit during the year ended October 31, 2009.
H. Securities Lending:
As of October 31, 2009, the Series had securities on loan to brokers/dealers, for which the Series held cash collateral. The Series invests the cash collateral, as described below, and records a liability for the return of the collateral, during the period the securities are on loan. Loans of securities are expected at all times to be secured by collateral equal to at least (i) 100% of the current market value of the loaned securities with respect to securities of the U.S. government or its agencies, (ii) 102% of the current market value of the loaned securities with respect to U.S. securities, and (iii) 105% of the current market value of the loaned securities with respect to foreign securities. However, daily market fluctuations could cause the Series’ collateral to be lower or higher than the expected thresholds. If this were to occur, the collateral would be adjusted the next business day to ensure adequate collateralization. In the event of default or bankruptcy by the other party to the agreement, realization and/or retention of the collateral may be subject to legal proceedings. If the borrower fails to return loaned securities, and cash collateral being maintained by the borrower is insufficient to cover the value of loaned securities and provided such collateral insufficiency is not the result of investment losses, the lending agent has agreed to pay the amount of the shortfall to the Series or, at the option of the lending agent, to replace the securities.
Subject to the Series’ investment policy, the cash collateral received by the Series from securities on loan is invested in securities of the U.S. government or its agencies, repurchase agreements collateralized by securities of
31
the U.S. government or its agencies or shares of the DFA Short Term Investment Fund LP. Agencies include both agency debentures and agency mortgage backed securities. In addition, each Series will be able to terminate the loan at any time and will receive reasonable interest on the loan, as well as amounts equal to any dividends, interest or other distributions on the loaned securities. However, dividend income received from loaned securities may not be eligible to be taxed at qualified dividend income rates.
I. Indemnitees; Contractual Obligations:
Under the Trust’s organizational documents, its officers and directors are indemnified against certain liabilities arising out of the performance of their duties to the Trust.
In the normal course of business, the Trust enters into contracts that contain a variety of representations and warranties which provide general indemnification. The Trust’s maximum exposure under these arrangements is unknown as this would involve future claims that may be made against the Trust and/or its affiliates that have not yet occurred. However, based on experience, the Trust expects the risk of loss to be remote.
J. In-Kind Redemptions:
In accordance with guidelines described in the Series’ prospectus, the Series may distribute portfolio securities rather than cash as payment for a redemption of fund shares (in-kind redemption). For financial reporting purposes, the Series recognizes a gain on in-kind redemptions to the extent the value of the distributed securities on the date of redemption exceeds the cost of those securities. Gains and losses realized on in-kind redemptions are not recognized for tax purposes and are reclassified from undistributed realized gain (loss) to paid-in capital. During the period December 1, 2007 to October 31, 2008, the Series realized $24,362 (in thousands) of net gain.
During the year ended November 30, 2007, The U.S. Large Company Series distributed securities in lieu of cash for shareholder redemptions. The value of the redemption was $1,099,445 (in thousands) which resulted in a realized gain of $529,199 (in thousands) to the Series.
K. Subsequent Event Evaluations:
Management has evaluated the impact of all the subsequent events on the Series through December 23, 2009, the date the financial statements were available for issuance, and has determined that there are no subsequent events requiring recognition or disclosure in the financial statements.
32
REPORT OF INDEPENDENT REGISTERED PUBLIC ACCOUNTING FIRM
To the Shareholders of The U.S. Large Company Series and
Board of Trustees of The DFA Investment Trust Company:
In our opinion, the accompanying statements of assets and liabilities, including the summary schedules of portfolio holdings, and the related statements of operations and of changes in net assets and the financial highlights presents fairly, in all material respects, the financial position of The U.S. Large Company Series (one of the series constituting The DFA Investment Trust Company, hereafter referred to as the “Series”) at October 31, 2009, the results of its operations for the year then ended, the changes in its net assets and the financial highlights for each of the periods indicated, in conformity with accounting principles generally accepted in the United States of America. These financial statements and financial highlights (hereafter referred to as “financial statements”) are the responsibility of the Series’ management; our responsibility is to express an opinion on these financial statements based on our audits. We conducted our audits of these financial statements in accordance with the standards of the Public Company Accounting Oversight Board (United States). Those standards require that we plan and perform the audit to obtain reasonable assurance about whether the financial statements are free of material misstatement. An audit includes examining, on a test basis, evidence supporting the amounts and disclosures in the financial statements, assessing the accounting principles used and significant estimates made by management, and evaluating the overall financial statement presentation. We believe that our audits, which included confirmation of securities at October 31, 2009 by correspondence with the custodian, brokers and the transfer agent of the investee fund, provide a reasonable basis for our opinion.
PricewaterhouseCoopers LLP
Philadelphia, Pennsylvania
December 23, 2009
33
RESULTS OF THE SHAREHOLDER MEETING
On June 2, 2009 and June 5, 2009, The DFA Investment Trust Company (“DFAITC”) held a Special Joint Meeting of Shareholders for the purpose of voting on several proposals affecting DFAITC and the Series, including, among other items, the election of Trustees, the amendment of certain fundamental investment limitations, and the elimination of certain fundamental investment limitations. The shareholders of the Series approved each of the applicable proposals for DFAITC and the Series presented at the Meeting. Listed below are the voting results from the Meeting. Please note that not all Proposals presented at the Meeting were voted on by the Series. Additionally, the Proposal numbers reflected below correlate to the Proposal numbers presented for vote at the Meeting.
DFAITC
| | | | | | | | | | | | | | | | | | | | |
| | | | | Shares Voted | | Percent of Outstanding Shares Voted |
| | | | | For | | % | | Against | | % | | Abstain/ WithHold | | % | | For | | Against | | Abstain / WithHold |
| Proposal 1: Election of Trustees for DFAITC* | | | | | | | | | | |
| | | | | | | | | | |
1a | | David G. Booth | | 2,166,359,402 | | 96.50% | | — | | 0.00% | | 78,661,259 | | 3.50% | | 95.78% | | 0.00% | | 3.48% |
1b | | George M. Constantinides | | 2,169,219,982 | | 96.62% | | — | | 0.00% | | 75,800,679 | | 3.38% | | 95.90% | | 0.00% | | 3.35% |
1c | | John P. Gould | | 2,168,577,186 | | 96.59% | | — | | 0.00% | | 76,443,476 | | 3.41% | | 95.88% | | 0.00% | | 3.38% |
1d | | Roger G. Ibbotson | | 2,169,778,365 | | 96.65% | | — | | 0.00% | | 75,242,297 | | 3.35% | | 95.93% | | 0.00% | | 3.33% |
1e | | Robert C. Merton | | 2,170,124,638 | | 96.66% | | — | | 0.00% | | 74,896,023 | | 3.34% | | 95.94% | | 0.00% | | 3.31% |
1f | | Myron S. Scholes | | 2,169,439,189 | | 96.63% | | — | | 0.00% | | 75,581,473 | | 3.37% | | 95.91% | | 0.00% | | 3.34% |
1g | | Eduardo A. Repetto | | 2,167,010,793 | | 96.53% | | — | | 0.00% | | 78,009,868 | | 3.47% | | 95.81% | | 0.00% | | 3.45% |
1h | | Abbie J. Smith | | 2,169,626,842 | | 96.64% | | — | | 0.00% | | 75,393,820 | | 3.36% | | 95.92% | | 0.00% | | 3.33% |
| | | | | | | | | | | | | | | | | | | | | | |
| | | Shares Voted | | Percent of Outstanding Shares Voted |
| | | For | | % | | Against | | % | | Abstain/ WithHold | | % | | NonVote | | % | | For | | Against | | Abstain / WithHold |
Proposal 4: To approve Articles of Amendment and Restatement for DFAITC* | | 2,076,877,329 | | 92.43% | | 36,623,148 | | 1.63% | | 133,356,326 | | 5.94% | | NA | | NA | | 91.82% | | 1.62% | | 5.90% |
| * | Results are for all Series within DFAITC |
The U.S. Large Company Series
| | | | | | | | | | | | | | | | | | | | |
| | | | | Shares Voted | | Percent of Outstanding Shares Voted |
| | | | | For | | % | | Against | | % | | Abstain/ WithHold | | % | | For | | Against | | Abstain / WithHold |
| Proposals: | | | | | | | | | | | | | | | | | | |
| | | |
5 | | To approve amendments to certain fundamental investment restrictions | | | | |
5a | | Borrowing Money | | 98,665,686 | | 84.14% | | 3,106,492 | | 2.65% | | 15,494,433 | | 13.21% | | 84.14% | | 2.65% | | 13.21% |
5b | | Making Loans | | 98,733,300 | | 84.20% | | 3,052,305 | | 2.60% | | 15,481,007 | | 13.20% | | 84.20% | | 2.60% | | 13.20% |
5c | | Investments in Real Estate | | 100,125,217 | | 85.38% | | 1,637,239 | | 1.40% | | 15,504,156 | | 13.22% | | 85.38% | | 1.40% | | 13.22% |
5d | | Investments in Commodities | | 98,776,384 | | 84.23% | | 2,997,328 | | 2.56% | | 15,492,899 | | 13.21% | | 84.23% | | 2.56% | | 13.21% |
5e | | Diversification of Investments | | 99,185,648 | | 84.58% | | 2,614,284 | | 2.23% | | 15,466,679 | | 13.19% | | 84.58% | | 2.23% | | 13.19% |
6 | | To approve the elimination of certain fundamental investment restrictions | | | | |
6a | | Pledging, Mortgaging, or | | | | | | | | | | | | | | | | | | |
| | Hypothecating Assets | | 98,359,523 | | 83.88% | | 3,372,501 | | 2.88% | | 15,534,587 | | 13.25% | | 83.88% | | 2.88% | | 13.25% |
6b | | Purchasing Securities on Margin | | 98,444,356 | | 83.95% | | 3,290,886 | | 2.81% | | 15,531,369 | | 13.24% | | 83.95% | | 2.81% | | 13.24% |
6c | | Investing in Restricted or Illiquid | | | | | | | | | | | | | | | | | | |
| | Securities | | 98,296,531 | | 83.82% | | 3,028,611 | | 2.58% | | 15,941,469 | | 13.59% | | 83.82% | | 2.58% | | 13.59% |
6d | | Investing for the Purpose of | | | | | | | | | | | | | | | | | | |
| | Exercising Control | | 98,535,100 | | 84.03% | | 2,726,201 | | 2.32% | | 16,005,309 | | 13.65% | | 84.03% | | 2.32% | | 13.65% |
6e | | Investing in Other Investment | | | | | | | | | | | | | | | | | | |
| | Companies | | 98,532,657 | | 84.02% | | 2,740,349 | | 2.34% | | 15,993,605 | | 13.64% | | 84.02% | | 2.34% | | 13.64% |
6f | | Management Ownership of | | | | | | | | | | | | | | | | | | |
| | Securities of an Issuer | | 98,694,385 | | 84.16% | | 2,533,976 | | 2.16% | | 16,038,250 | | 13.68% | | 84.16% | | 2.16% | | 13.68% |
6g | | Investing in Oil, Gas, or other | | | | | | | | | | | | | | | | | | |
| | Mineral Exploration, Leases or | | | | | | | | | | | | | | | | | | |
| | Development Programs | | 98,853,168 | | 84.30% | | 2,461,685 | | 2.10% | | 15,951,758 | | 13.60% | | 84.30% | | 2.10% | | 13.60% |
6h | | Investing in Securities of | | | | | | | | | | | | | | | | | | |
| | Unseasoned Issuers | | 98,385,119 | | 83.90% | | 2,882,682 | | 2.46% | | 15,998,811 | | 13.64% | | 83.90% | | 2.46% | | 13.64% |
6i | | Investing in Warrants | | 98,619,865 | | 84.10% | | 2,598,182 | | 2.22% | | 16,048,564 | | 13.69% | | 84.10% | | 2.22% | | 13.69% |
6j | | Writing or Acquiring Options | | 98,646,590 | | 84.12% | | 2,632,309 | | 2.24% | | 15,987,712 | | 13.63% | | 84.12% | | 2.24% | | 13.63% |
34
FUND MANAGEMENT
Trustees/Directors
Each Board of Trustees/Directors of The DFA Investment Trust Company Inc. (“DFAITC”), DFA Investment Dimensions Group Inc. (“DFAIDG”), Dimensional Investment Group Inc. (“DIG”) and Dimensional Emerging Markets Value Fund (“DEM”) (each, the “Fund” and collectively, the “Funds”) is responsible for establishing the Funds’ policies and for overseeing the management of the Funds. The Trustees/Directors of the Funds, including all of the disinterested Directors, have adopted written procedures to monitor potential conflicts of interest that might develop between portfolios of the Funds (the “Feeder Portfolios”) that invest in certain series of DFAITC or DEM (the “Master Funds”).
Each Board has two standing committees, an Audit Committee and a Portfolio Performance and Service Review Committee (the “Performance Committee”). The Audit Committee is comprised of George M. Constantinides, Roger G. Ibbotson and Abbie J. Smith. Each member of the Audit Committee is a disinterested Director. The Audit Committee oversees the Fund’s accounting and financial reporting policies and practices, the Fund’s internal controls, the Fund’s financial statements and the independent audits thereof and performs other oversight functions as requested by the Board. The Audit Committee recommends the appointment of each Fund’s independent registered certified public accounting firm and also acts as a liaison between the Fund’s independent registered certified public accounting firm and the full Board. There were two Audit Committee meetings held during the fiscal year ended October 31, 2009.
Each Board’s Performance Committee is comprised of Messrs. Constantinides and Ibbotson, Ms. Smith, John P. Gould, Myron S. Scholes and Robert C. Merton. Each member of the Fund’s Performance Committee is a disinterested Director. The Performance Committee regularly reviews and monitors the investment performance of the Fund’s series and reviews the performance of the Fund’s service providers. There were six Performance Committee meetings held during the fiscal year ended October 31, 2009.
Certain biographical information for each disinterested Trustee/Director and each interested Trustee/Director of the Funds is set forth in the tables below, including a description of each Trustee/Director’s experience as a Trustee/ Director of the Funds and as a director or trustee of other funds, as well as other recent professional experience.
The statements of additional information (together, “SAI”) of the Funds include additional information about each Trustee/Director. You may obtain copies of the SAI and prospectus of each Fund advised by Dimensional Fund Advisors LP by calling collect (512) 306-7400 or by mailing a request to Dimensional Fund Advisors LP, 6300 Bee Cave Road, Building One, Austin, Texas 78746. Prospectuses are also available at www.dimensional.com.
| | | | | | |
Name, Position
with the Fund,
Address and Age | | Term of Office1 and
Length of Service | | Portfolios within the
DFA Fund Complex2
Overseen | | Principal Occupation(s) During Past 5 Years and
Other Directorships of Public Companies Held |
Disinterested Trustees/Directors |
George M. Constantinides Director of DFAIDG, DIG and DEM.
Trustee of DFAITC.
The University of Chicago Booth School of Business 5807 S. Woodlawn
Avenue
Chicago, IL 60637
Age: 62 | | DFAITC - since 1993 DFAIDG - since 1983
DIG - since 1993
DEM - since 1993 | | 87 portfolios in 4 investment companies | | Leo Melamed Professor of Finance, The University of Chicago Booth School of Business. |
John P. Gould
Director of DFAIDG, DIG and DEM.
Trustee of DFAITC.
The University of Chicago
Booth School of Business
5807 S. Woodlawn
Avenue
Chicago, IL 60637
Age: 70 | | DFAITC - - since 1993 DFAIDG - since 1986
DIG - since 1993
DEM - since 1993 | | 87 portfolios in 4 investment companies | | Steven G. Rothmeier Distinguished Service Professor of Economics, The University of Chicago Booth School of Business (since 1965). Member of the Boards of Milwaukee Mutual Insurance Company (since 1997). Member and Chair, Competitive Markets Advisory Committee, Chicago Mercantile Exchange (futures trading exchange) (since 2004). Formerly, Director of UNext, Inc. (1999-2006). Formerly, Senior Vice-President, Lexecon Inc. (economics, law, strategy and finance consulting) (1994-2004). Trustee, Harbor Fund (registered investment company) (27 Portfolios) (since 1994). |
35
| | | | | | |
Name, Position
with the Fund,
Address and Age | | Term of Office1 and
Length of Service | | Portfolios within the
DFA Fund Complex2
Overseen | | Principal Occupation(s) During Past 5 Years and
Other Directorships of Public Companies Held |
Roger G. Ibbotson
Director of DFAIDG, DIG
and DEM.
Trustee of DFAITC.
Yale School of
Management
135 Prospect Street
New Haven, CT
06520-8200
Age: 66 | | DFAITC - - since 1993 DFAIDG - since 1981
DIG - since 1993
DEM - since 1993 | | 87 portfolios in 4 investment companies | | Professor in Practice of Finance, Yale School of Management (since 1984). Director, BIRR Portfolio Analysis, Inc. (software products) (since 1990). Chairman, CIO and Partner, Zebra Capital Management, LLC (hedge fund manager) (since 2001). Formerly, Chairman, Ibbotson Associates, Inc., Chicago, IL (software data publishing and consulting) (1977-2006). |
Robert C. Merton
Director of DFAIDG, DIG
and DEM.
Trustee of DFAITC.
Harvard Business School
353 Baker Library
Soldiers Field
Boston, MA 02163
Age: 65 | | DFAITC - since 2003 DFAIDG - since 2003
DIG - since 2003
DEM - since 2003 | | 87 portfolios in 4 investment companies | | John and Natty McArthur University Professor, Graduate School of Business Administration, Harvard University (since 1998). Director, MF Risk, Inc. (risk management software) (since 2001). Director, Peninsula Banking Group (bank) (since 2003). Director, Community First Financial Group (bank holding company) (since 2003). Member Competitive Markets Advisory Council, Chicago Mercantile Exchange (futures trading exchange) (since 2004). Chairman and Director, Daedalus Software (medical software) (since 2008). Formerly, Advisory Board Member, Alpha Simplex Group (hedge fund) (2001-2007). Formerly, Chief Science Officer and Director, Trinsum Group, a successor to Integrated Finance Limited (2002-2008). Director, Vical Incorporated (biopharmaceutical product development) (since 2002). |
Myron S. Scholes
Director of DFAIDG, DIG
and DEM.
Trustee of DFAITC.
Platinum Grove Asset
Management, L.P.
Reckson Executive Park
1100 King Street
Building 4
Rye Brook, NY 10573
Age: 68 | | DFAITC - - since 1993 DFAIDG - since 1981
DIG - since 1993
DEM - since 1993 | | 87 portfolios in 4 investment companies | | Frank E. Buck Professor Emeritus of Finance, Stanford University (since 1981). Chairman, Platinum Grove Asset Management, L.P. (hedge fund) (formerly, Oak Hill Platinum Partners) (since 1999). Formerly, Managing Partner, Oak Hill Capital Management (private equity firm) (until 2004). Formerly, Director, Chicago Mercantile Exchange (2001-2008). Director, American Century Fund Complex (registered investment companies) (37 Portfolios) (since 1981). |
Abbie J. Smith
Director of DFAIDG, DIG
and DEM.
Trustee of DFAITC.
The University of Chicago
Booth School of Business
5807 S. Woodlawn
Avenue
Chicago, IL 60637
Age: 56 | | DFAITC - since 2000 DFAIDG - since 2000 DIG - since 2000 DEM - since 2000 | | 87 portfolios in 4 investment companies | | Boris and Irene Stern Professor of Accounting, The University of Chicago Booth School of Business (since 1980), and Co-Director Investment Research, Fundamental Investment Advisors (hedge fund) (since 2008). Director, HNI Corporation (formerly known as HON Industries Inc.) (office furniture) (since 2000). Director, Ryder System Inc. (transportation, logistics and supply-chain management) (since 2003). Director/ Trustee, UBS Funds (fund complex) (5 portfolios) (since 2008). |
36
| | | | | | |
Name, Position
with the Fund,
Address and Age | | Term of Office1 and Length of Service | | Portfolios within the
DFA Fund Complex2
Overseen | | Principal Occupation(s) During Past 5 Years
and
Other Directorships of Public Companies
Held |
Interested Trustees/Directors* |
David G. Booth
Chairman, Director, Chief
Executive Officer and
President of DFAIDG, DIG
and DEM. Chairman,
Trustee, Chief Executive
Officer, Chief Investment
Officer and President of
DFAITC.
6300 Bee Cave Road,
Building One
Austin, Texas 78746
Age: 62 | | DFAITC - - since 1993 DFAIDG - since 1981 DIG - since 1992 DEM - since 1993 | | 87 portfolios in 4 investment companies | | Chairman, Director/Trustee, President, Chief Executive Officer and formerly Chief Investment Officer of the following companies: Dimensional Holdings Inc., Dimensional Fund Advisors LP, Dimensional Fund Advisors Canada ULC, DFAIDG, DIG, DEM and DFAITC. President and Chief Executive Officer of DFA Securities LLC. Director of Dimensional Fund Advisors Ltd, and formerly Chief Investment Officer. Director and formerly, President and Chief Investment Officer of DFA Australia Ltd. Formerly, Director of Dimensional Funds PLC and Dimensional Fund II PLC. Chairman, Director and Chief Executive Officer of Dimensional Fund Advisors Canada ULC (All Chief Investment Officer positions held starting 1/03 through 3/07 except Dimensional Holdings Inc., which was from 10/06 through 3/07.) Limited Partner, Oak Hill Partners (since 2001) and VSC Investors, LLC (since 2007). Trustee, The University of Chicago Booth School of Business. Formerly, Director, SA Funds (registered investment company). Formerly Director, Assante Corporation (investment management) (until 2002). |
Eduardo A. Repetto
Director, Chief Investment
Officer and Vice President
of DFAIDG, DIG and
DEM.
Trustee, Chief Investment
Officer and Vice President
of DFAITC
6300 Bee Cave Road,
Building One
Austin, TX 78746
Age: 42 | | DFAITC - since 2009 DFAIDG - since 2009 DIG - since 2009 DEM - since 2009 | | 87 portfolios in 4 investment companies | | Director/Trustee (beginning June 2009), Chief Investment Officer (beginning March 2007) and Vice President of DFAIDG, DIG, DEM and DFAITC. Chief Investment Officer (beginning March 2007) and Vice President of all the DFA Entities, DFA Australia Limited and Dimensional Fund Advisors Canada ULC. |
| | 1 | Each Trustee/Director holds office for an indefinite term until his or her successor is elected and qualified. |
| | 2 | Each Trustee/Director is a director or trustee of each of the four registered investment companies within the DFA Fund Complex, which includes the Funds. |
| | * | Interested Trustees/Directors are described as such because they are deemed to be “interested persons,” as that term is defined under the Investment Company Act of 1940, as amended, due to their positions with Dimensional Fund Advisors LP. |
37
Officers
The name, age, information regarding positions with the Funds and the principal occupation for each officer of the Funds are set forth below. Each officer listed below holds the same office (except as otherwise noted) in the following entities: Dimensional Fund Advisors LP (prior to November 3, 2006, Dimensional Fund Advisors Inc.) (“Dimensional”), DFA Securities Inc., DFAIDG, DIG, DFAITC and DEM (collectively, the “DFA Entities”). The address of each officer is: Dimensional Fund Advisors LP, 6300 Bee Cave Road, Building One, Austin, Texas 78746, unless otherwise indicated.
| | | | |
Name, Position with the Fund
and Age | | Term of Office1
and Length of
Service | | Principal Occupation(s) During Past 5 Years |
Officers |
April A. Aandal
Vice President and Chief Learning Officer
Age: 46 | | Since 2008 | | Vice President of all the DFA Entities. Chief Learning Officer of Dimensional (since September 2008). Formerly, Regional Director of Dimensional (2004-2008); Vice President of Professional Development at Assante Asset Management (June 2002-January 2005). |
Darryl D. Avery
Vice President
Age: 43 | | Since 2005 | | Vice President of all the DFA Entities. From June 2002 to January 2005, institutional client service representative of Dimensional. |
Arthur H. Barlow
Vice President
Age: 53 | | Since 1993 | | Vice President of all the DFA Entities. Formerly, Vice President of DFA Australia Limited and Dimensional Fund Advisors Ltd. |
Scott A. Bosworth
Vice President
Age: 40 | | Since 2007 | | Vice President of all the DFA Entities. Regional Director of Dimensional (since November 1997). |
Valerie A. Brown Vice President and Assistant Secretary
Age: 42 | | Since 2001 | | Vice President and Assistant Secretary of all the DFA Entities, DFA Australia Limited, Dimensional Fund Advisors Ltd., and since June 2003, Dimensional Fund Advisors Canada ULC. |
David P. Butler
Vice President
Age: 45 | | Since 2007 | | Vice President of all the DFA Entities. Director of Global Financial Services of Dimensional (since 2008). Formerly, Regional Director of Dimensional Fund Advisors LP (January 1995 to January 2005). |
Patrick Carter
Vice President
Age: 47 | | Since 2007 | | Vice President of all the DFA Entities. Regional Director of Dimensional (since March 2006). Formerly, Director of Merrill Lynch Retirement Group (December 1998 to March 2006). |
Joseph H. Chi
Vice President
Age: 43 | | Since 2009 | | Vice President of all the DFA Entities. Portfolio Manager for Dimensional Fund Advisors LP (since October 2005). Prior to October 2005, Corporate Counsel at Hewitt Associates (July 2002-August 2005). |
Stephen A. Clark
Vice President
Age: 37 | | Since 2004 | | Vice President of all the DFA Entities. Formerly, Portfolio Manager of Dimensional (April 2001-April 2004). |
Robert P. Cornell
Vice President
Age: 60 | | Since 2007 | | Vice President of all the DFA Entities. Regional Director of Financial Services Group of Dimensional (since August 1993). |
Christopher S. Crossan
Vice President and Chief Compliance Officer
Age: 43 | | Since 2004 | | Vice President and Chief Compliance Officer of all the DFA Entities. |
James L. Davis
Vice President
Age: 52 | | Since 1999 | | Vice President of all the DFA Entities. Formerly, Vice President of DFA Australia Limited and Dimensional Fund Advisors Ltd. |
Robert T. Deere
Vice President
Age: 52 | | Since 1994 | | Vice President of all the DFA Entities and DFA Australia Limited. |
Robert W. Dintzner
Vice President
Age: 39 | | Since 2001 | | Vice President of all the DFA Entities. |
38
| | | | |
Name, Position with the Fund and Age | | Term of Office1 and Length of Service | | Principal Occupation(s) During Past 5 Years |
Kenneth Elmgren Vice President Age: 55 | | Since 2007 | | Vice President of all the DFA Entities. Formerly, Managing Principal of Beverly Capital (May 2004 to September 2006). |
Richard A. Eustice Vice President and Assistant Secretary Age: 44 | | Since 1998 | | Vice President and Assistant Secretary of all the DFA Entities and DFA Australia Limited. Chief Operating Officer of Dimensional Fund Advisors Ltd. (since July 2008). Formerly, Vice President of Dimensional Fund Advisors Ltd. |
Eugene F. Fama, Jr. Vice President Age: 48 | | Since 1993 | | Vice President of all the DFA Entities. Formerly, Vice President of DFA Australia Limited and Dimensional Fund Advisors Ltd. |
Gretchen A. Flicker Vice President Age: 38 | | Since 2004 | | Vice President of all the DFA Entities. Prior to April 2004, institutional client service representative of Dimensional. |
Jed S. Fogdall Vice President Age: 35 | | Since 2008 | | Vice President of all the DFA Entities. Portfolio Manager for Dimensional (since September 2004). Prior to September 2004, Staff Engineer at the Boeing Company (1997-2004). |
Glenn S. Freed Vice President Age: 47 | | Since 2001 | | Vice President of all the DFA Entities. |
Jeremy P. Freeman Vice President Age: 38 | | Since 2009 | | Vice President of all the DFA Entities. Senior Technology Manager for Dimensional Fund Advisors LP (since June 2006). Formerly, Principal at AIM Investments/Amvescap PLC (now Invesco) (June 1998-June 2006). |
Mark R. Gochnour Vice President Age: 42 | | Since 2007 | | Vice President of all the DFA Entities. Regional Director of Dimensional. |
Henry F. Gray Vice President Age: 42 | | Since 2000 | | Vice President of all the DFA Entities. Prior to July 2000, Portfolio Manager of Dimensional. Formerly, Vice President of DFA Australia Limited. |
John T. Gray Vice President Age: 35 | | Since 2007 | | Vice President of all the DFA Entities. Formerly, Regional Director of Dimensional (January 2005 to February 2007). |
Darla Hastings Vice President Age: 54 | | Since 2007 | | Vice President of all the DFA Entities. Chief Marketing Officer of Dimensional. Formerly, Senior Vice President, Customer Experience for Benchmark Assisted Living (May 2005 to April 2006); Executive Vice President and Chief Marketing Officer of State Street Corporation (September 2001 to October 2005). |
Joel H. Hefner Vice President Age: 41 | | Since 2007 | | Vice President of all the DFA Entities. Regional Director of Dimensional (since June 1998). |
Julie Henderson Vice President and Fund Controller Age: 35 | | Since 2005 | | Vice President and Fund Controller of all the DFA Entities. Formerly, Senior Manager at PricewaterhouseCoopers LLP (July 1996 to April 2005). |
Kevin Hight Vice President Age: 41 | | Since 2005 | | Vice President of all the DFA Entities. Formerly, Regional Director of Dimensional (since March 2003 to March 2005). |
Christine W. Ho Vice President Age: 41 | | Since 2004 | | Vice President of all the DFA Entities. Prior to April 2004, Assistant Controller of Dimensional. |
Jeff J. Jeon Vice President Age: 35 | | Since 2004 | | Vice President of all the DFA Entities. Counsel of Dimensional (since September 2001). |
Patrick M. Keating Vice President Age: 54 | | Since 2003 | | Vice President of all the DFA Entities and Chief Operating Officer of Dimensional. Director, Vice President and Chief Privacy Officer of Dimensional Fund Advisors Canada ULC. Director of DFA Australia Limited. |
39
| | | | |
Name, Position with the Fund
and Age | | Term of Office1
and Length of
Service | | Principal Occupation(s) During Past 5 Years |
Joseph F. Kolerich Vice President Age: 37 | | Since 2004 | | Vice President of all the DFA Entities. Portfolio Manager for Dimensional (since April 2001). |
Michael F. Lane Vice President Age: 42 | | Since 2004 | | Vice President of all the DFA Entities. Formerly, Vice President of Advisor Services at TIAA-CREF (July 2001 to September 2004). |
Kristina M. LaRusso Vice President Age: 34 | | Since 2006 | | Vice President of all DFA Entities. Formerly, Operations Supervisor of Dimensional (March 2003 to December 2006). |
Inmoo Lee Vice President Age: 43 | | Since 2007 | | Vice President of all the DFA Entities. Associate Professor Department of Finance and Accounting, Business School, National University of Singapore (July 2004 to present); Associate Professor, College of Business Administration, Korea University (September 2001 to May 2006). |
Juliet Lee Vice President Age: 38 | | Since 2005 | | Vice President of all the DFA Entities. Human Resources Manager of Dimensional (since January 2004). |
Aaron M. Marcus Vice President & Head of Global Human Resources Age: 39 | | Since 2008 | | Vice President and Head of Global Human Resources of Dimensional. Formerly, Global Head of Recruiting and Vice President of Goldman Sachs & Co. (June 2006 to January 2008); Global Co-Head of HR of the Equities & FICC Division, and Vice President of Goldman Sachs & Co. (May 2005 to May 2006); Head of Americas Campus Recruiting and Vice President of Goldman Sachs & Co. (April 2003 to May 2005). |
David R. Martin Vice President, Chief Financial Officer and Treasurer Age: 52 | | Since 2007 | | Vice President, Chief Financial Officer and Treasurer of all the DFA Entities. Director, Vice President, Chief Financial Officer and Treasurer of Dimensional Fund Advisors Ltd. and DFA Australia Limited. Chief Financial Officer, Treasurer, and Vice President of Dimensional Fund Advisors Canada ULC. Director of Dimensional Funds PLC and Dimensional Funds II PLC. Formerly, Executive Vice President and Chief Financial Officer of Janus Capital Group Inc. (June 2005 to March 2007); Senior Vice President of Finance at Charles Schwab & Co., Inc. (March 1999 to May 2005). |
Catherine L. Newell Vice President and Secretary Age: 45 | | Vice President since 1997 and Secretary since 2000 | | Vice President and Secretary of all the DFA Entities. Director, Vice President and Secretary of DFA Australia Limited and Dimensional Fund Advisors Ltd. (since February 2002, April 1997 and May 2002, respectively). Vice President and Secretary of Dimensional Fund Advisors Canada ULC (since June 2003). Director, Dimensional Funds PLC and Dimensional Funds II PLC (since 2002 and 2006, respectively). Formerly, Assistant Secretary of all DFA Entities, DFA Australia Limited and Dimensional Fund Advisors Ltd. |
Christian Newton Vice President Age: 34 | | Since 2009 | | Vice President of all DFA Entities. Web Services Manager for Dimensional Fund Advisors LP (Since January 2008). Formerly Design Manager (2005-2008) and Web Developer (2002-2005) of Dimensional Fund Advisors LP. |
Gerard K. O’Reilly Vice President Age: 32 | | Since 2007 | | Vice President of all the DFA Entities. Formerly, Research Associate of Dimensional Fund Advisors LP (2004 to 2006); Research Assistant in PhD program, Aeronautics Department California Institute of Technology (1998 to 2004). |
Daniel C. Ong Vice President Age: 35 | | Since 2009 | | Vice President of all the DFA Entities. Portfolio Manager for Dimensional Fund Advisors LP (since July 2005). Prior to 2005, Graduate Student at the University of Chicago Booth School of Business (2003-2005). |
Carmen Palafox Vice President Age: 35 | | Since 2006 | | Vice President of all the DFA Entities. Operations Manager of Dimensional Fund Advisors LP (since May 1996). |
Sonya Park Vice President Age: 37 | | Since 2005 | | Vice President of all the DFA Entities. From February 2002 to January 2005, institutional client service representative of Dimensional. |
40
| | | | |
Name, Position with the Fund and Age | | Term of Office1 and Length of Service | | Principal Occupation(s) During Past 5 Years |
David A. Plecha Vice President Age: 48 | | Since 1993 | | Vice President of all the DFA Entities, DFA Australia Limited and Dimensional Fund Advisors Ltd |
Ted Randall Vice President Age: 36 | | Since 2008 | | Vice President of all the DFA Entities. Formerly, Research Associate of Dimensional (2006-2008). Systems Developer of Dimensional (2001-2006). |
L. Jacobo Rodriguez Vice President Age: 38 | | Since 2005 | | Vice President of all the DFA Entities. From August 2004 to July 2005, institutional client service representative of Dimensional. Formerly, Financial Services Analyst, Cato Institute (September 2001 to June 2004); Book Review Editor, Cato Journal, Cato Institute (May 1996 to June 2004). |
David E. Schneider Vice President Age: 63 | | Since 2001 | | Vice President of all the DFA Entities. Currently, Director of Institutional Services. |
Bruce A. Simmons Vice President Age: 44 | | Since 2009 | | Vice President of all the DFA Entities. Investment Operations Manager for Dimensional Fund Advisors LP (since May 2007). Formerly, Vice President Client and Fund Reporting at Mellon Financial (September 2005-May 2007); Vice President Business Development at CUADPRO Marketing (July 2003-September 2005). |
Ted R. Simpson Vice President Age: 41 | | Since 2007 | | Vice President of all the DFA Entities. Regional Director of Dimensional (since December 2002). |
Bryce D. Skaff Vice President Age: 34 | | Since 2007 | | Vice President of all the DFA Entities. Formerly, Regional Director of Dimensional (December 1999 to January 2007). |
Grady M. Smith Vice President Age: 53 | | Since 2004 | | Vice President of all the DFA Entities. Prior to April 2004, Portfolio Manager of Dimensional. |
Carl G. Snyder Vice President Age: 46 | | Since 2000 | | Vice President of all the DFA Entities. Formerly, Vice President of DFA Australia Limited. |
Lawrence R. Spieth Vice President Age: 61 | | Since 2004 | | Vice President of all the DFA Entities. Prior to April 2004, Regional Director of Dimensional. |
Bradley G. Steiman Vice President Age: 36 | | Since 2004 | | Vice President of all the DFA Entities and Director and Vice President of Dimensional Fund Advisors Canada ULC. |
Robert C. Trotter Vice President Age: 51 | | Since 2009 | | Vice President of all the DFA Entities. Senior Manager Technology for Dimensional Fund Advisors LP (since March 2007). Formerly, Director of Technology at AMVESCAP (2002-2007). |
Karen E. Umland Vice President Age: 43 | | Since 1997 | | Vice President of all the DFA Entities, DFA Australia Limited, Dimensional Fund Advisors Ltd., and Dimensional Fund Advisors Canada ULC. |
Sunil Wahal Vice President Age: 42 | | Since 2009 | | Vice President of all the DFA Entities. Formerly, Research Associate for Dimensional Fund Advisors LP (July 2008-January 2009); Consultant to Dimensional Fund Advisors LP (September 2005-July 2008); Jack D. Furst Professor of Finance at Arizona State University, WP Carey School of Business (July 2005-July 2008); Associate Professor of Finance at Goizueta Business School, Emory University (1997-2005). |
Brian J. Walsh Vice President Age: 39 | | Since 2009 | | Vice President of all the DFA Entities. Portfolio Manager for Dimensional Fund Advisors LP (since 2004). Formerly, Trader for Dimensional Fund Advisors LP (1997-2004). |
Carol W. Wardlaw Vice President Age: 51 | | Since 2004 | | Vice President of all the DFA Entities. Prior to April 2004, Regional Director of Dimensional. |
41
| | | | |
Name, Position with the Fund and Age | | Term of Office1
and Length of
Service | | Principal Occupation(s) During Past 5 Years |
Weston J. Wellington Vice President Age: 58 | | Since 1997 | | Vice President of all the DFA Entities. Formerly, Vice President of DFA Australia Limited. |
Daniel M. Wheeler Vice President Age: 64 | | Since 2001 | | Vice President of all the DFA Entities. Prior to 2001 and currently, Director of Financial Advisors Services of Dimensional. Director of Dimensional Fund Advisors Ltd. (since October 2003) and President of Dimensional Fund Advisors Canada ULC (since June 2003). |
Ryan Wiley Vice President Age: 33 | | Since 2007 | | Vice President of all the DFA Entities. Senior Trader of Dimensional. Formerly, Portfolio Manager (2006 to 2007); Trader (2001 to 2006). |
Paul E. Wise Vice President Age: 54 | | Since 2005 | | Vice President of all the DFA Entities. Chief Technology Officer for Dimensional (since 2004). Formerly, Principal of Turnbuckle Management Group (January 2002 to August 2004). |
| | 1 | Each officer holds office for an indefinite term at the pleasure of the Boards of Trustees/Directors and until his or her successor is elected and qualified. |
42
VOTING PROXIES ON FUND PORTFOLIO SECURITIES
A description of the policies and procedures that the Trust uses in voting proxies relating to securities held in the portfolio is available without charge, upon request, by calling collect: (512) 306-7400. Information regarding how the Advisor votes these proxies is available from the EDGAR database on the SEC’s website at http://www.sec.gov and from the Advisor’s website at http://www.dimensional.com and reflects the twelve-month period beginning July 1st and ending June 30th.
43
NOTICE TO SHAREHOLDERS
(Unaudited)
For shareholders that do not have an October 31, 2009 tax year end, this notice is for informational purposes only. For shareholders with an October 31, 2009 tax year end, please consult your tax advisor as to the pertinence of this notice. For the fiscal year November 1, 2008 to October 31, 2009, the Portfolio is designating the following items with regard to distributions paid during the period. All designations are based on financial information available as of the date of this annual report and, accordingly are subject to change. For each item, it is the intention of the Portfolio to designate the maximum amount permitted under the Internal Revenue Code and the regulations thereunder.
| | | | | | | | | | | | |
| Dimensional Investment Group Inc. | | Net
Investment
Income
Distributions | | Total
Distributions | | Qualifying
For Corporate
Dividends Received
Deduction(1) | | Qualifying
Dividend
Income(2) | | Qualifying
Interest
Income(3) | | Qualifying
Short-Term
Capital Gain(4) |
U.S. Large Company Institutional Index Portfolio | | 100% | | 100% | | 100% | | 100% | | 100% | | 100% |
| (1) | Qualifying dividends represent dividends which qualify for the corporate dividends received deduction and is reflected as a percentage of ordinary Income distributions (the total of short-term capital gain and net investment income distributions). |
| (2) | The percentage in this column represents the amount of “Qualifying Dividend Income” as created by the Jobs and Growth Tax Relief Reconciliation Act of 2003 and is reflected as a percentage of ordinary income distributions (the total of short-term capital gain and net investment income distributions). |
| (3) | The percentage in this column represents the amount of “Qualifying Interest Income” as created by The American Jobs Creation Act of 2004. The information is reflected as a percentage of ordinary income distributions (the total of short-term capital gain and net investment income distributions). |
| (4) | The percentage in this column represents the amount of “Qualifying Short-Term Capital Gain” as created by The American Jobs Creation Act of 2004. The information is reflected as a percentage of ordinary income distributions (the total of short-term capital gain and net investment income distributions). |
44


Dimensional Fund Advisors
6300 Bee Cave Road, Building One
Austin, TX 78746
December 2009
Dear Fellow Shareholder,
After sinking to ten-year lows, stock prices around the world rebounded sharply in March 2009 and posted steady gains in the seven months between March and September. March and April were among the best-return months in the life of Dimensional’s equity Funds.
The unexpected turns in the financial markets this year offered some valuable lessons. We were reminded that stock prices are unpredictable. We saw once again the benefits of staying disciplined in the market as it inevitably moves up and down. And I believe these markets showed very clearly why diversification is so important to long-term investment success.
Although diversification can’t prevent losses, it can help investors avoid the extreme outcomes that can result from concentrating investments in individual stocks or market segments. We believe that successful investing is about both increasing wealth and being able to sleep well at night. Investors who understand how markets work and have a realistic understanding of their own tolerance for risk are most likely to have a good overall experience.
More than $10 billion in net long-term assets flowed into Dimensional’s Funds during the first 10 months of 2009, a reflection of the trust our shareholders around the world have placed in us. We are grateful for that trust and want you to know that we take our responsibility as the steward of your investments in Dimensional’s Funds very seriously. We hope to have the opportunity to continue serving your needs for many years to come.
|
Sincerely, |
|
 |
David G. Booth |
Chairman and Chief Executive Officer |
[THIS PAGE INTENTIONALLY LEFT BLANK]
ANNUAL REPORT
Table of Contents
i
Table of Contents
Continued
ii
Table of Contents
Continued
This report is submitted for the information of the Fund’s shareholders. It is not authorized for distribution to prospective investors unless preceded or accompanied by an effective prospectus.
iii
[THIS PAGE INTENTIONALLY LEFT BLANK]
DFA INVESTMENT DIMENSIONS GROUP INC.
DIMENSIONAL INVESTMENT GROUP INC.
THE DFA INVESTMENT TRUST COMPANY
DEFINITIONS OF ABBREVIATIONS AND FOOTNOTES
Schedules of Investments/Summary Schedules of Portfolio Holdings
| | |
| Investment Abbreviations |
ADR | | American Depositary Receipt |
AMBAC | | American Municipal Bond Assurance Corporation |
ETM | | Escrowed to Maturity |
FGIC | | Federal Guaranty Insurance Corporation |
FSA | | Financial Security Assurance |
FHLMC | | Federal Home Loan Mortgage Corporation |
FNMA | | Federal National Mortgage Association |
GO | | General Obligation |
MBIA | | Municipal Bond Insurance Association |
NATL-RE | | Credit rating enhanced by guaranty or insurance from National Public Finance Guarantee Corp. |
P.L.C. | | Public Limited Company |
PSF-GTD | | Public School Fund Guarantee |
RB | | Revenue Bond |
REIT | | Real Estate Investment Trust |
SA | | Special Assessment |
SCSDE | | South Carolina State Department of Education |
SPDR | | Standard & Poor’s Depository Receipts |
TAN | | Tax Anticipation Note |
|
Investment Footnotes |
† | | See Note B to Financial Statements. |
†† | | Securities have generally been fair valued. See Note B to Financial Statements. |
** | | Calculated as a percentage of total net assets. Percentages shown parenthetically next to the category headings have been calculated as a percentage of total investments. “Other Securities” are those securities that are not among the top 50 holdings of the Fund or do not represent more than 1.0% of the net assets of the Fund. Some of the individual securities within this category may include Total or Partial Securities on Loan and/or Non-Income Producing Securities. |
* | | Non-Income Producing Securities. |
# | | Total or Partial Securities on Loan. |
^ | | Denominated in local currency or the Euro, unless otherwise noted. |
@ | | Security purchased with cash proceeds from Securities on Loan. |
(r) | | The adjustable rate shown is effective as of October 31, 2009. |
(y) | | The rate shown is the effective yield. |
(t) | | Face Amount denominated in Australian Dollars. |
(g) | | Face Amount denominated in British Pounds. |
(e) | | Face Amount denominated in Euro. |
(j) | | Face Amount denominated in Japanese Yen. |
(z) | | Face Amount denominated in New Zealand Dollars. |
(n) | | Face Amount denominated in Norwegian Krone. |
(u) | | Face Amount denominated in United States Dollars. |
§ | | Affiliated Fund. |
v | | Security segregated as collateral for the Open Futures Contracts. |
1
DEFINITIONS OF ABBREVIATIONS AND FOOTNOTES
CONTINUED
Financial Highlights
| | (A) | Computed using average shares outstanding. |
| | (D) | Represents the combined ratios for the respective portfolio and its respective pro-rata share of its Master Fund Series. |
| | (E) | Because of commencement of operations and related preliminary transaction costs, these ratios are not necessarily indicative of future ratios. |
| | N/A | Does not apply to this fund. |
All Statements and Schedules
| | — | Amounts designated as — are either zero or rounded to zero. |
| | SEC | Securities and Exchange Commission |
| | REITs | Real Estate Investment Trusts |
| | (a) | Commencement of Operations. |
2
DFA INVESTMENT DIMENSIONS GROUP INC.
PERFORMANCE CHARTS
U.S. Large Company Portfolio Institutional Class vs.
S&P 500® Index
October 31, 1999-October 31, 2009
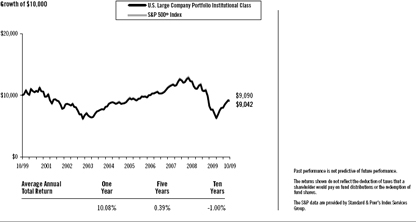
Enhanced U.S. Large Company Portfolio Institutional Class vs.
S&P 500® Index
October 31, 1999-October 31, 2009
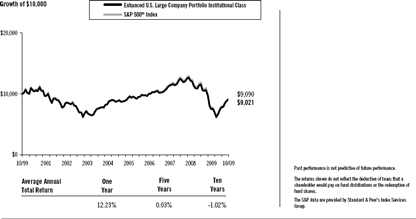
U.S. Large Cap Value Portfolio Institutional Class vs.
Russell 1000® Value Index
October 31, 1999-October 31, 2009
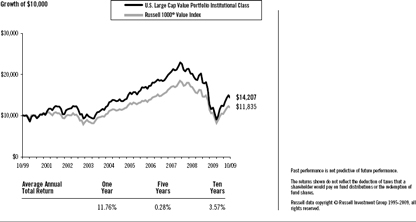
3
DFA INVESTMENT DIMENSIONS GROUP INC.
PERFORMANCE CHARTS
U.S. Targeted Value Portfolio Institutional Class vs.
Russell 2000® Value Index
February 23, 2000-October 31, 2009
U.S. Targeted Value Portfolio Class R1 vs.
Russell 2000® Value Index
January 31, 2008-October 31, 2009
U.S. Targeted Value Portfolio Class R2 vs.
Russell 2000® Value Index
June 30, 2008-October 31, 2009
4
DFA INVESTMENT DIMENSIONS GROUP INC.
PERFORMANCE CHARTS
U.S. Small Cap Value Portfolio Institutional Class vs.
Russell 2000® Value Index
October 31, 1999-October 31, 2009
U.S. Core Equity 1 Portfolio Institutional Class vs.
Russell 3000® Index
September 15, 2005-October 31, 2009
U.S. Core Equity 2 Portfolio Institutional Class vs.
Russell 3000® Index
September 15, 2005-October 31, 2009
5
DFA INVESTMENT DIMENSIONS GROUP INC.
PERFORMANCE CHARTS
U.S. Vector Equity Portfolio Institutional Class vs.
Russell 2500™ Index
December 30, 2005-October 31, 2009
T.A. U.S. Core Equity 2 Portfolio Institutional Class vs.
Russell 3000® Index
October 4, 2007-October 31, 2009
U.S. Small Cap Portfolio Institutional Class vs.
Russell 2000® Index
October 31, 1999-October 31, 2009
6
DFA INVESTMENT DIMENSIONS GROUP INC.
PERFORMANCE CHARTS
U.S. Micro Cap Portfolio Institutional Class vs.
Russell 2000® Index
October 31, 1999-October 31, 2009
DFA Real Estate Securities Portfolio Institutional Class vs.
Dow Jones U.S. Select REIT IndexSM, S&P 500® Index
October 31, 1999-October 31, 2009
Large Cap International Portfolio Institutional Class vs.
MSCI World ex USA Index (net dividends)
October 31, 1999-October 31, 2009
7
DFA INVESTMENT DIMENSIONS GROUP INC.
PERFORMANCE CHARTS
International Core Equity Portfolio Institutional Class vs.
MSCI World ex USA Index (net dividends)
September 15, 2005-October 31, 2009

T.A. World ex U.S. Core Equity Portfolio Institutional Class vs.
MSCI All Country World ex USA Index (net dividends)
March 6, 2008-October 31, 2009
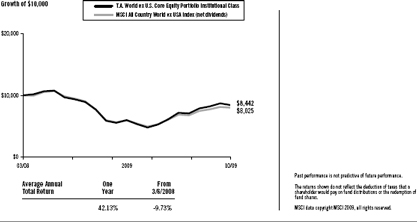
International Small Company Portfolio Institutional Class vs.
MSCI World ex USA Small Cap Index (net dividends)
October 31, 1999-October 31, 2009
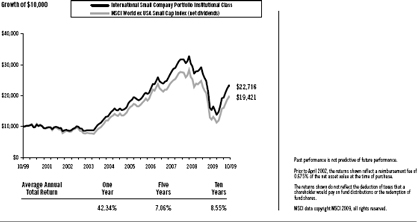
8
DFA INVESTMENT DIMENSIONS GROUP INC.
PERFORMANCE CHARTS
Japanese Small Company Portfolio Institutional Class vs.
MSCI Japan Small Cap Index (net dividends)
October 31, 1999-October 31, 2009
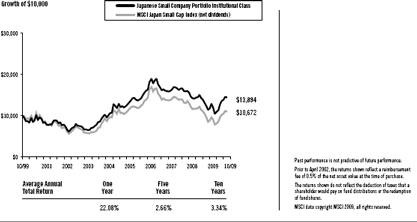
Asia Pacific Small Company Portfolio Institutional Class vs.
MSCI Pacific ex Japan Small Cap Index (net dividends)
October 31, 1999-October 31, 2009
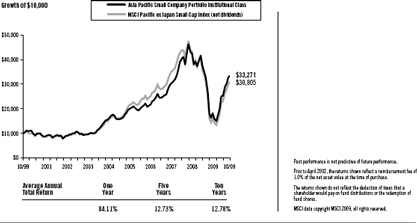
United Kingdom Small Company Portfolio Institutional Class vs.
MSCI UK Small Cap Index (net dividends)
October 31, 1999-October 31, 2009
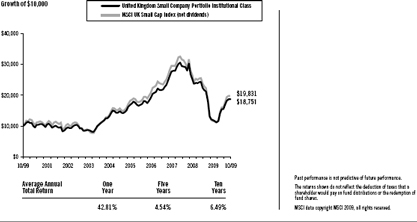
9
DFA INVESTMENT DIMENSIONS GROUP INC.
PERFORMANCE CHARTS
Continental Small Company Portfolio Institutional Class vs.
MSCI Europe ex UK Small Cap Index (net dividends),
October 31, 1999-October 31, 2009
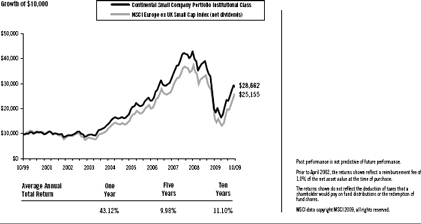
DFA International Real Estate Securities Portfolio Institutional Class vs.
S&P Global ex US REIT Index (net dividends), S&P Global ex US REIT Index (gross dividends)
March 1, 2007-October 31, 2009
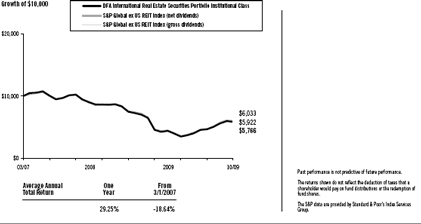
DFA Global Real Estate Securities Portfolio Institutional Class vs.
S&P Global REIT Index (net dividends), S&P Global REIT Index (gross dividends)
June 4, 2008-October 31, 2009
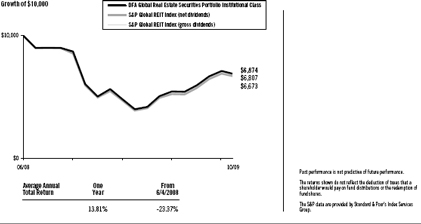
10
DFA INVESTMENT DIMENSIONS GROUP INC.
PERFORMANCE CHARTS
DFA International Small Cap Value Portfolio Institutional Class vs.
MSCI World ex USA Small Cap Index (net dividends)
October 31, 1999-October 31, 2009
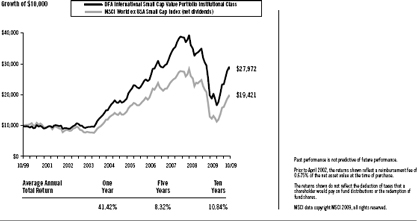
International Vector Equity Portfolio Institutional Class vs.
MSCI World ex USA Index (net dividends)
August 14, 2008-October 31, 2009
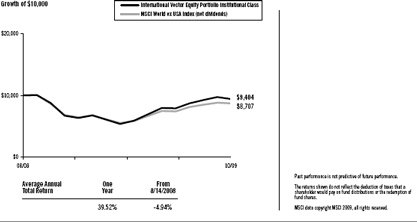
Emerging Markets Portfolio Institutional Class vs.
MSCI Emerging Markets Index (net dividends)
October 31, 1999-October 31, 2009
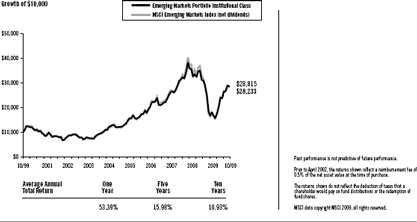
11
DFA INVESTMENT DIMENSIONS GROUP INC.
PERFORMANCE CHARTS
Emerging Markets Small Cap Portfolio Institutional Class vs.
MSCI Emerging Markets Index (net dividends)
October 31, 1999-October 31, 2009
Emerging Markets Core Equity Portfolio Institutional Class vs.
MSCI Emerging Markets Index (net dividends)
April 5, 2005-October 31, 2009
DFA One-Year Fixed Income Portfolio Institutional Class vs.
BofA Merrill Lynch Six-Month US Treasury Bill Index, BofA Merrill Lynch One-Year US Treasury Note Index
October 31, 1999-October 31, 2009
12
DFA INVESTMENT DIMENSIONS GROUP INC.
PERFORMANCE CHARTS
DFA Two-Year Global Fixed Income Portfolio Institutional Class vs.
Citigroup World Government Bond Index 1-3 Years (hedged)
October 31, 1999-October 31, 2009
DFA Selectively Hedged Global Fixed Income Portfolio Institutional Class vs.
Citigroup World Government Bond Index 1-3 Years (unhedged)
January 9, 2008-October 31, 2009
DFA Five-Year Government Portfolio Institutional Class vs.
BofA Merrill Lynch US Treasury/Agency Index 1-5 Years
October 31, 1999-October 31, 2009
13
DFA INVESTMENT DIMENSIONS GROUP INC.
PERFORMANCE CHARTS
DFA Five-Year Global Fixed Income Portfolio Institutional Class vs.
Citigroup World Government Bond Index 1-5 Years (hedged)
October 31, 1999-October 31, 2009
DFA Intermediate Government Fixed Income Portfolio Institutional Class vs.
Barclays Capital US Government Bond Index
October 31, 1999-October 31, 2009
DFA Short-Term Extended Quality Portfolio Institutional Class vs.
BofA Merrill Lynch US Corporate and Government Index 1-5 Years
March 4, 2009-October 31, 2009
14
DFA INVESTMENT DIMENSIONS GROUP INC.
PERFORMANCE CHARTS
DFA Inflation-Protected Securities Portfolio Institutional Class vs.
Barclays Capital US TIPS Index (Series-L)
September 18, 2006-October 31, 2009
DFA Short-Term Municipal Bond Portfolio Institutional Class vs.
Barclays Capital Municipal Bond Index 3 Years
August 20, 2002-October 31, 2009
DFA California Short-Term Municipal Bond Portfolio Institutional Class vs.
BofA Merrill Lynch California Municipal Bond Index 1-3 Years
April 2, 2007-October 31, 2009
15
DFA INVESTMENT DIMENSIONS GROUP INC.
MANAGEMENT’S DISCUSSION AND ANALYSIS
| | |
| U.S. Equity Market Review | | 12 Months Ended October 31, 2009 |
The year ending October 31, 2009, was among the most volatile periods in U.S. market history. Broad market returns were positive with stocks represented by the mid cap index outperforming those within both small cap and large cap indexes and stocks represented by the growth index outperforming those represented by the value index. Investors moving out of stocks, beginning in late 2008 and extending into early 2009, contributed to high volatility and negative returns over that period. Markets turned sharply higher in March, and the size and value premiums both turned positive over the eight months ending October 2009. Although the large cap index outperformed the small cap index, and the growth index outperformed the value index, returns within the broader market (Russell 3000® Index) demonstrate that there was a positive small size premium and a positive value premium. This counterintuitive result occurred because the stock markets were characterized by extreme volatility, and the indexes, which are reconstituted annually, were not able to rebalance during the course of the year to maintain their intended asset class exposure. Among the most important factors explaining differences in the behavior of diversified equity portfolios are the company size and company value/growth characteristics of the portfolio’s holdings. Size is measured by market capitalization, and value classification is a function of stock price relative to one or more fundamental characteristics. Compared to other stocks, value stocks often have lower market value relative to their earnings, dividends, and book value.
For the 12 months ended October 31, 2009, the total return of the Russell Microcap® Index was 5.06%, the Russell 2000® Index was 6.46%, the CRSP 6-10 Index was 20.94%, and the MSCI US Small Cap 1750 Index was 14.11%. Large cap growth stocks outperformed large cap value stocks, as measured by the Russell 1000® Growth Index and Russell 1000® Value Index. Small cap growth stocks outperformed small cap value stocks, by a lesser amount than in large caps, as measured by the Russell 2000® Growth Index and Russell 2000® Value Index.
Total Return for 12 Months Ended October 31, 2009
| | | |
Russell 2000® Index (small cap companies) | | 6.46 | % |
Russell Midcap® Index (mid cap companies) | | 18.74 | % |
Russell 1000® Index (large cap companies) | | 11.19 | % |
Russell 3000® Value Index | | 4.55 | % |
Russell 3000® Growth Index | | 17.04 | % |
Further dividing the large, mid, and small cap market segments by value and growth characteristics shows more detail in the performance differences over the period.
Total Return for 12 Months Ended October 31, 2009
| | | |
Russell 1000® Value Index (large cap value companies) | | 4.78 | % |
Russell 1000® Growth Index (large cap growth companies) | | 17.50 | % |
Russell Midcap® Value Index (mid cap value companies) | | 14.52 | % |
Russell Midcap® Growth Index (mid cap growth companies) | | 22.48 | % |
Russell 2500TM Value Index (small/mid cap value companies) | | 8.56 | % |
Russell 2500TM Growth Index (small/mid cap growth companies) | | 18.20 | % |
Russell 2000® Value Index (small cap value companies) | | 1.95 | % |
Russell 2000® Growth Index (small cap growth companies) | | 11.34 | % |
Source: Russell data copyright © Russell Investment Group 1995-2009, all rights reserved.
Differences in returns for the various Dimensional U.S. equity funds over the 12 months ended October 31, 2009 were attributable primarily to differences in value/growth and size characteristics as well as the exclusion of
16
REIT securities from most Dimensional portfolios, except for the DFA Real Estate Securities Portfolio and portfolios investing in the U.S. Large Company Series. Moreover, the portfolio construction approach used by Dimensional Fund Advisors (the “Advisor”) generally resulted in portfolios with greater emphasis on value or small company characteristics relative to widely used index benchmarks.
Master-Feeder Structure
Certain portfolios described below, called “Feeder Funds,” do not buy individual securities directly; instead, these portfolios invest in corresponding funds called “Master Funds.” Master Funds, in turn, purchase stocks and/or other securities.
Domestic Equity Portfolios’ Performance Overview
U.S. Large Company Portfolio
The U.S. Large Company Portfolio seeks to approximate the returns of the S&P 500® Index by purchasing shares of a Master Fund that invests in S&P 500® Index stocks in approximately the same proportions as they are represented in the Index. The Portfolio was mostly invested in equities throughout the year: the average non-equitized cash level for the period was less than 1% of the Master Fund’s assets.
For the 12 months ended October 31, 2009, the total return was 10.08% for the Portfolio and 9.80% for the S&P 500® Index. Relative to the Index, outperformance was mostly due to the flexible trading approach employed by the Master Fund to gain exposure to the performance of the Index during periods of index reconstitution.
Enhanced U.S. Large Company Portfolio
The Enhanced U.S. Large Company Portfolio seeks to outperform the total return performance of the S&P 500® Index by using an “enhanced cash” strategy. This strategy combines investment in high-grade, short-term fixed income instruments with an overlay of S&P 500® Index futures contracts or swaps. For the 12 months ended October 31, 2009, approximately 97% of the overlay instruments consisted of S&P 500® Index futures contracts. Swaps and ETFs completed the equity exposure for the last month of the fiscal year. The behavior of S&P 500® Index futures contracts and ETFs linked to the S&P 500® Index is determined principally by the performance of the S&P 500® Index.
For the 12 months ended October 31, 2009, the total return was 12.23% for the Portfolio and 9.80% for the S&P 500® Index. Relative to the Index, the Portfolio’s outperformance was primarily due to the fixed income component of the Portfolio exceeding the return embedded in the Portfolio’s S&P 500 futures contracts. The Portfolio’s concentration in government agency and corporate fixed income securities with maturities between one and two years had the most significant contribution to the outperformance.
U.S. Large Cap Value Portfolio
The U.S. Large Cap Value Portfolio seeks to capture the returns of U.S. large company value stocks by purchasing shares of a Master Fund that invests in such stocks. The investment strategy employs a disciplined, quantitative approach, emphasizing broad diversification and consistent exposure to large cap value stocks, but does not attempt to track closely a specific equity index. As of October 31, 2009, the Master Fund held 213 stocks and was mostly invested in equities throughout the year: the average non-equitized cash level for the period was less than 1% of the Master Fund’s assets.
As a result of the Master Fund’s diversified investment approach, performance was determined principally by broad structural trends in the U.S. equity market, rather than the behavior of a limited number of stocks. For the 12 months ended October 31, 2009, total returns were 11.76% for the Portfolio and 4.78% for the Russell 1000® Value Index. The Portfolio benefited from a positive size premium and value premium over the last eight months of the period. Relative to the Index, the Master Fund’s greater exposure to stocks with more pronounced value characteristics and composition differences along the value/growth dimension added approximately 4.2% to the relative performance. Differences in sector weights between the Portfolio and Index also contributed to the outperformance.
17
The Master Fund’s larger allocation than the Index to consumer discretionary stocks, due to its strategy of maintaining consistent large cap value exposure, added approximately 3% to relative performance. The Portfolio also benefited from composition differences among the Master Fund’s basket of financial stocks, which added approximately 3.6% to relative performance.
U.S. Targeted Value Portfolio
The U.S. Targeted Value Portfolio seeks to capture the returns of U.S. small and mid capitalization value stocks. The investment strategy employed by the U.S. Targeted Value Portfolio is a disciplined, quantitative approach, emphasizing broad diversification and consistent exposure to small and mid cap value stocks, but does not attempt to track closely a specific equity index. As of October 31, 2009, the Portfolio held 1,580 stocks, and was mostly invested in equities throughout the year: the average non-equitized cash level for the period was less than 1% of the Portfolio’s assets.
As a result of the Portfolio’s diversified investment approach, performance was determined principally by broad structural trends in the U.S. equity market, rather than the behavior of a limited number of stocks. For the 12 months ended October 31, 2009, total returns were 9.47% for the Institutional Class shares of the Portfolio, 9.36% for the Class R1 shares of the Portfolio and 9.23% for the Class R2 shares of the Portfolio, as compared to 1.95% for the Russell 2000® Value Index. The Portfolio benefited from a positive size premium and value premium over the last eight months of the period. Relative to the Index, the Portfolio’s deeper value tilt contributed to outperformance. The Portfolio’s greater exposure to value stocks (42% of the Portfolio compared to 33% of the Index) added approximately 3.7% to the relative performance. Differences in sector weights between the Portfolio and Index also contributed to performance differences. The Portfolio’s greater exposure to information technology stocks and consumer discretionary stocks, due to its strategy of maintaining consistent small and value exposure, added approximately 1.5% and 1.1% respectively to relative performance.
U.S. Small Cap Value Portfolio
The U.S. Small Cap Value Portfolio seeks to capture the returns of U.S. small company value stocks. The investment strategy employs a disciplined, quantitative approach, emphasizing broad diversification and consistent exposure to small company and value stocks, but does not attempt to track closely a specific equity index. As of October 31, 2009, the Portfolio held 1,634 stocks and was mostly invested in equities throughout the year: the average non-equitized cash level for the period was less than 1% of the Portfolio’s assets.
As a result of the Portfolio’s diversified investment approach, performance was determined principally by broad structural trends in the U.S. equity market, rather than the behavior of a limited number of stocks. For the 12 months ended October 31, 2009, total returns were 9.97% for the Portfolio and 1.95% for the Russell 2000® Value Index. The Portfolio benefited from a positive size premium and value premium over the last eight months of the period. Relative to the Index, the Portfolio’s greater exposure to stocks with more pronounced value characteristics added approximately 4.0% to the relative performance. Higher exposure to, and differences in portfolio composition with respect to, the smallest stocks added approximately 3.8% to the Portfolio’s relative performance.
U.S. Core Equity 1 Portfolio
The U.S. Core Equity 1 Portfolio seeks to capture the returns of the total U.S. market universe, with increased exposure to smaller company stocks and those stocks with value characteristics as measured by book-to-market ratio. The investment strategy employs a disciplined, quantitative approach, emphasizing wide diversification and comprehensive exposure to U.S. stocks, but does not attempt to track closely a specific equity index. As of October 31, 2009, the Portfolio held 3,476 stocks and was mostly invested in equities throughout the year: the average non-equitized cash level for the period was less than 1% of the Portfolio’s assets.
As a result of the Portfolio’s diversified investment approach, performance was determined principally by broad structural trends in the U.S. equity market, rather than the behavior of a limited number of stocks. For the 12 months ended October 31, 2009, total returns were 11.64% for the Portfolio and 10.83% for the Russell 3000® Index. Relative to the Index, the Portfolio benefited from its greater small cap and value allocations and a positive size premium and value premium over the last eight months of the period. The Portfolio’s exposure to value stocks (on
18
average 9% more than the Index) added approximately 1.0% to the relative return. The Portfolio’s greater exposure to small cap stocks also contributed to the outperformance. The Portfolio’s increased exposure to the financials sector, which comes as a result of the Portfolio’s construction methodology which emphasizes value companies, detracted approximately 0.5% from relative return.
U.S. Core Equity 2 Portfolio
The U.S. Core Equity 2 Portfolio seeks to capture the returns of the total U.S. market universe with greater exposure to smaller company stocks and those stocks with value characteristics as measured by book-to-market ratio than the U.S. Core Equity 1 Portfolio. The investment strategy employs a disciplined, quantitative approach, emphasizing wide diversification and comprehensive exposure to U.S. stocks, but does not attempt to track closely a specific equity index. As of October 31, 2009, the Portfolio held 3,575 stocks and was mostly invested in equities throughout the year: the average non-equitized cash level for the period was less than 1% of the Portfolio’s assets.
As a result of the Portfolio’s diversified investment approach, performance was determined principally by broad structural trends in the U.S. equity market, rather than the behavior of a limited number of stocks. For the 12 months ended October 31, 2009, total returns were 10.66% for the Portfolio and 10.83% for the Russell 3000® Index. The Portfolio’s increased exposure to the financials sector, which comes as a result of the Portfolio’s construction methodology which emphasizes value companies, detracted approximately 1.5% from the relative return. Relative to the Index, the Portfolio benefited from its greater small cap and value allocations and a positive size premium and value premium over the last eight months of the period. The Portfolio’s exposure to value stocks (on average 17% more than the Index) added approximately 1.3% to the relative return. The Portfolio’s greater exposure to small cap stocks also had a positive impact.
U.S. Vector Equity Portfolio
The U.S. Vector Equity Portfolio seeks to capture the returns of a broadly diversified basket of U.S. stocks with stronger exposure to smaller company stocks and those stocks with value characteristics as measured by book-to-market ratio than the U.S. Core Equity 2 Portfolio. The investment strategy employs a disciplined, quantitative approach, emphasizing broad diversification, but does not attempt to track closely a specific equity index. As of October 31, 2009, the Portfolio held 3,310 stocks and essentially was mostly invested in equities throughout the year: the average non-equitized cash level for the period was less than 1% of the Portfolio’s assets.
As a result of the Portfolio’s diversified investment approach, performance was determined principally by broad structural trends in the U.S. equity market, rather than the behavior of a limited number of stocks. For the 12 months ended October 31, 2009, total returns were 9.47% for the Portfolio and 13.26% for the Russell 2500TM Index. The Portfolio’s increased exposure to the financials sector, which comes as a result of the Portfolio’s construction methodology which emphasizes value companies, detracted approximately 2.5% from the relative return. Relative to the Index, the Portfolio benefited from its greater small cap and value allocations and a positive size premium and value premium over the last eight months of the period. The Portfolio’s exposure to value stocks (more than twice the weight of the Index on average) added approximately 2.2% to the relative return. The Portfolio’s greater exposure to small cap stocks also had a positive impact.
T.A. U.S. Core Equity 2 Portfolio
The T.A. U.S. Core Equity 2 Portfolio seeks to capture the returns of the total U.S. market universe, with increased exposure to smaller company stocks and those stocks with value characteristics as measured by book-to-market ratio, while minimizing federal income tax implications of investment decisions. The investment strategy employs a disciplined, quantitative approach, emphasizing wide diversification and comprehensive exposure to U.S. stocks, but does not attempt to track closely a specific equity index. As of October 31, 2009, the Portfolio held 3,177 stocks and was mostly invested in equities throughout the year: the average non-equitized cash level for the period was less than 1% of the Portfolio’s assets.
As a result of the Portfolio’s diversified investment approach, performance was determined principally by broad structural trends in the U.S. equity market, rather than the behavior of a limited number of stocks. For the 12 months
19
ended October 31, 2009, total returns were 10.28% for the Portfolio and 10.83% for the Russell 3000® Index. The Portfolio’s tilt toward value companies caused an increased exposure to the financials sector, which was the worst performing sector of the period. This increase in exposure and specific composition detracted approximately 1.0% from the Portfolio’s performance relative to the Index. The Portfolio benefited from a positive size premium and value premium over the last eight months of the period. Relative to the Index, the Portfolio benefited from its greater small cap and value allocations and a positive size premium and value premium over the last eight months of the period. The Portfolio’s exposure to value stocks (on average 18% more than the Index) added approximately 1.0% to the relative return. The Portfolio’s greater exposure to small cap stocks also had a positive impact.
U.S. Small Cap Portfolio
The U.S. Small Cap Portfolio seeks to capture the returns of U.S. small company stocks. The investment strategy employs a disciplined, quantitative approach, emphasizing broad diversification and consistent exposure to small company stocks, but does not attempt to track closely a specific equity index. As of October 31, 2009, the Portfolio held 2,780 stocks and was mostly invested in equities throughout the year: the average non-equitized cash level for the period was less than 1% of the Portfolio’s assets.
As a result of the Portfolio’s diversified investment approach, performance was determined principally by broad structural trends in the U.S. equity market, rather than the behavior of a limited number of stocks. For the 12 months ended October 31, 2009, total returns were 13.08% for the Portfolio and 6.46% for the Russell 2000® Index. The Portfolio benefited from a positive size premium over the last eight months of the period. Relative to the Index, the Portfolio’s outperformance was primarily due to a larger allocation to small cap and micro cap stocks. The Portfolio also benefited from its larger allocation to the consumer discretionary and information technology sectors, due to the Portfolio’s strategy of maintaining consistent size exposure, which added approximately 1.7% and 0.7% respectively to the relative performance.
U.S. Micro Cap Portfolio
The U.S. Micro Cap Portfolio seeks to capture the returns of very small U.S. company stocks. The investment strategy employs a disciplined, quantitative approach, emphasizing broad diversification and consistent exposure to very small company stocks, but does not attempt to track closely a specific equity index. As of October 31, 2009, the Portfolio held 2,452 stocks and was mostly invested in equities throughout the year: the average non-equitized cash level for the period was less than 1% of the Portfolio’s assets.
As a result of the Portfolio’s diversified investment approach, performance was determined principally by broad structural trends in the U.S. equity market, rather than the behavior of a limited number of stocks. For the 12 months ended October 31, 2009, total returns were 6.61% for the Portfolio and 6.46% for the Russell 2000® Index. The Portfolio benefited from a positive size premium over the last eight months of the period. Relative to the Index, the Portfolio’s outperformance was primarily due to a larger allocation to micro cap stocks. On average, more than 50% of the Portfolio was allocated to the tiniest micro cap stocks, compared to 25% for the Index, adding approximately 1.1% to the relative performance.
DFA Real Estate Securities Portfolio
The DFA Real Estate Securities Portfolio is designed to capture the returns of a broadly diversified portfolio of real estate securities (e.g., REITs), but does not attempt to track closely a specific index. As of October 31, 2009, the Portfolio held 105 REITs and was mostly invested in equities throughout the year: the average non-equitized cash level for the period was less than 1% of the Portfolio’s assets.
As a result of the Portfolio’s diversified investment approach, performance was determined principally by broad structural trends in the real estate securities market, rather than the behavior of a limited number of stocks. For the 12 months ended October 31, 2009, total returns were 0.98% for the Portfolio, 9.80% for the S&P 500® Index and -0.26% for the Dow Jones U.S. Select REIT IndexSM. Over the period, the Portfolio’s greater diversification than the Dow Jones U.S. Select REIT IndexSM, including allocations to smaller REITs and net-lease REITs entirely excluded from the Index, contributed to the outperformance. Small REITs generally outperformed the broader
20
Index. Composition differences between the Portfolio and the Index across sectors also had a positive impact on the Portfolio’s relative performance.
As of March 31, 2009, the Dow Jones Wilshire REIT IndexSM has been discontinued, and the Dow Jones U.S. Select REIT IndexSM has been selected to take its place as an appropriate benchmark for the Portfolio. According to the index provider, Dow Jones Indexes, the Dow Jones U.S. Select REIT IndexSM uses the same methodology, composition and historical data back to 1987 as the Portfolio’s previous benchmark.
| | |
| International Equity Market Review | | 12 Months Ended October 31, 2009 |
The one-year period ending October 31, 2009, was characterized by unprecedented volatility in non-US developed markets. Non-US developed markets lost 18.87% from November 2008 through February 2009, as measured by the MSCI World ex USA Index (net dividends). From March through October 2009 these same markets gained 57.56%. In April 2009, the Index had its largest-ever monthly gain (12.90%) since October 1990.
From November 2008 through February 2009, developed markets returns were negative across all asset classes. The US dollar rallied against most currencies, reversing a general trend of depreciation dating back to 2006. From March through October 2009 the market reversed course, with small cap and value stocks strongly outperforming large cap and growth stocks. The US dollar depreciated against most major currencies. The rally drove strong positive returns for the 12-month period, with small cap stocks significantly outperforming large cap stocks and value stocks outperforming growth stocks, as measured by the MSCI indexes.
12 Months Ended October 31, 2009
| | | | |
Ten Largest Foreign Developed Markets by Market Cap (BB) | | Local
Currency
Return | | U.S. Dollar
Return |
Japan ($2,432) | | 6.03% | | 15.20% |
United Kingdom ($2,328) | | 23.19% | | 25.68% |
France ($1,106) | | 10.09% | | 28.10% |
Canada ($1,060) | | 17.46% | | 32.58% |
Australia ($912) | | 21.91% | | 66.97% |
Germany ($843) | | 6.37% | | 23.77% |
Switzerland ($821) | | 5.78% | | 20.63% |
Spain ($488) | | 33.27% | | 55.06% |
Italy ($388) | | 7.57% | | 25.17% |
Netherlands ($277) | | 20.17% | | 39.83% |
Country market capitalizations (in parentheses) are in USD billions. Source: Returns are of MSCI indices net of foreign withholding taxes on dividends. Country market capitalizations are based on country carve-outs of the MSCI All-Country World Investable Market Index. MSCI data copyright MSCI 2009, all rights reserved.
Small company stocks were the best-performing asset class in international markets, while growth stocks had the worst relative results.
12 Months Ended October 31, 2009
| | |
| | | U.S. Dollar
Return |
MSCI World ex USA Small Cap Index | | 50.01% |
MSCI World ex USA Value Index | | 31.71% |
MSCI World ex USA Index | | 27.83% |
MSCI World ex USA Growth Index | | 24.03% |
Source: MSCI indices are net of foreign withholding taxes on dividends, copyright MSCI 2009, all rights reserved.
21
Gains in emerging markets were better, on average, than in developed markets, although results varied widely among the individual emerging markets countries. For the 12 month period, returns in U.S. dollars were 64.13% for the MSCI Emerging Markets Index (net dividends) and 27.83% for the MSCI World ex USA Index (net dividends).
12 Months Ended October 31, 2009
| | |
Country | | U.S. Dollar
Return |
Argentina | | 53.21% |
Brazil | | 91.55% |
Chile | | 61.68% |
China | | 82.16% |
Czech Republic | | 26.83% |
Hungary | | 63.54% |
India | | 77.12% |
Indonesia | | 127.39% |
Israel | | 31.43% |
Malaysia | | 56.99% |
Mexico | | 39.79% |
Philippines | | 50.71% |
Poland | | 23.09% |
South Africa | | 61.69% |
South Korea | | 56.17% |
Taiwan | | 48.86% |
Thailand | | 78.58% |
Turkey | | 68.21% |
Source: Returns are of MSCI indices net of foreign withholding taxes on dividends, copyright MSCI 2009, all rights reserved.
Global REIT Market Review
The publicly-traded REIT market experienced significant volatility during the 1-year period ended October 31, 2009. REITs were particularly impacted by the credit crises that started with Lehman Brothers’ bankruptcy, as financing became increasingly expensive or unavailable, and serious concerns over both the residential and commercial real estate markets rippled through REIT valuations. The S&P Global REIT Index (net dividends) lost 34.55% from October 31, 2008 through February 28, 2009, which was on the heels of its largest ever monthly decline (–30.56%) in October 2008. The Index then returned 71.68% from February 28 through October 31, 2009, after large amounts of government-supplied liquidity helped ease the credit crisis and restored confidence in the markets. During this 8-month period, the Index saw its largest ever monthly return (+20.9%) in April 2009.
12 Months Ended October 31, 2009
| | |
| | | U.S. Dollar
Return |
S&P Global ex U.S. REIT Index (net dividends) | | 30.51% |
S&P Global REIT Index (net dividends) | | 12.36% |
Master-Feeder Structure
Certain portfolios described below, called “Feeder Funds,” do not buy individual securities directly; instead, these portfolios invest in corresponding funds called “Master Funds.” The Master Funds, in turn, purchase stocks and/or other securities.
22
International Equity Portfolios’ Performance Overview
Large Cap International Portfolio
The Large Cap International Portfolio seeks to capture the returns of a broadly diversified basket of international large company stocks. The investment strategy employs a disciplined quantitative approach, emphasizing broad diversification, but does not attempt to track closely a specific equity index. As of October 31, 2009, the Portfolio held 1,212 stocks in 22 developed country markets and was mostly invested in equities throughout the year: the average non-equitized cash level for the period was less than 1% of the Portfolio’s assets.
As a result of the Portfolio’s diversified investment approach, performance was determined principally by broad structural trends in the international equity markets rather than by the behavior of a limited number of stocks. For the 12 months ended October 31, 2009, total returns were 25.20% for the Portfolio and 27.83% for the MSCI World ex USA Index (net dividends). No single stock, industry sector, or geographical region explained a significant amount of the performance difference. Over the period, there was a wider than usual performance difference between the best and worst performing stocks within countries, industry sectors, and asset classes. Consequently, slight differences in weights or in holdings between the Portfolio and the Index had a significant impact on relative performance.
International Core Equity Portfolio
The International Core Equity Portfolio seeks to capture the returns of a broadly diversified basket of international stocks, with increased exposure to smaller company stocks and those with value characteristics as measured by book-to-market ratio. The investment strategy employs a disciplined quantitative approach, emphasizing broad diversification, but does not attempt to track closely a specific equity index. As of October 31, 2009, the Portfolio held 4,785 stocks in 22 developed country markets and was mostly invested in equities throughout the year: the average non-equitized cash level for the period was less than 1% of the Portfolio’s assets.
As a result of the Portfolio’s diversified investment approach, performance was determined principally by broad structural trends in the international equity markets, rather than by the behavior of a limited number of stocks. For the 12 months ended October 31, 2009, total returns were 34.81% for the Portfolio and 27.83% for the MSCI World ex USA Index (net dividends). Relative to the Index, the Portfolio’s outperformance was primarily due to strong tilts towards small cap and value stocks. On average, the deepest value names constituted 44% of the Portfolio as compared to 26% for the Index. Small cap stocks, which accounted for 18% of the Portfolio on average and were excluded from the Index, also added to relative performance. The Portfolio’s larger relative allocation to materials and industrials, the best performing industries over the period, and smaller relative allocation to utilities and healthcare, the worst performing industries over the period, also contributed to the relative outperformance.
T.A. World ex U.S. Core Equity Portfolio
The T.A. World ex U.S. Core Equity Portfolio seeks to capture the returns of a broadly diversified basket of international stocks in developed and emerging markets, with stronger exposure to smaller company stocks and those with value characteristics as measured by book-to-market ratio. The Portfolio intends to consider the effects of the realization of capital gains and taxable dividend income. When selling a security, the Portfolio typically will select the highest cost shares in order to limit the realization of capital gains and, when possible, will refrain from disposing of a security until the long-term holding period for capital gains tax purposes has been satisfied. The purchase of a stock may be delayed to avoid dividend income, and a stock may be sold to realize a capital loss, subject to applicable investment criteria. The investment strategy employs a disciplined quantitative approach, emphasizing broad diversification, but does not attempt to track closely a specific equity index. As of October 31, 2009, the Portfolio held 4,239 stocks in 22 developed country markets and 18 emerging markets countries. The Portfolio was mostly invested in equities throughout the year as the average non-equitized cash level for the period was less than 1% of the Portfolio’s assets.
As a result of the Portfolio’s diversified investment approach, performance was determined principally by broad structural trends in the international equity markets, rather than by the behavior of a limited number of stocks. For the 12 months ended October 31, 2009, total returns were 42.13% for the Portfolio and 34.10% for the MSCI All
23
Country World ex USA Index (net dividends). Relative to the Index, the Portfolio’s outperformance was primarily due to strong tilts towards small cap and value stocks. On average, the deepest value names constituted 43% of the Portfolio as compared to 26% for the Index. Small cap stocks, which accounted for 37% of the Portfolio as compared to 8% for the Index, also added to relative performance. The Portfolio’s larger relative allocation to materials, financials, and industrials, the best performing industries over the period, and smaller relative allocation to utilities and healthcare, the worst performing industries over the period, also contributed to the relative outperformance.
International Small Company Portfolio
The International Small Company Portfolio seeks to capture the returns of international small company stocks by purchasing shares of five Master Funds that invest individually in Canada, the United Kingdom, Continental Europe (excluding the U.K.), Japan, and Asia Pacific. The investment strategy employs a disciplined, quantitative approach, emphasizing broad diversification and consistent exposure to small company stocks, but does not attempt to track closely a specific equity index. As of October 31, 2009, the Master Funds held 4,201 stocks in 22 developed country markets and were mostly invested in equities throughout the year: the combined average non-equitized cash level for the period was less than 1% of the Master Funds’ assets.
As a result of the Master Funds’ diversified investment approach, performance was determined principally by broad structural trends in international equity markets, rather than the behavior of a limited number of stocks. Over the period, international small company stocks outperformed international large company stocks. For the 12 months ended October 31, 2009, total returns were 42.34% for the Portfolio and 50.01% for the MSCI World ex USA Small Cap Index (net dividends). The Master Funds hold a large number of stocks, and no single stock explained a significant amount of the performance difference. Relative to the Index, the Portfolio underperformed primarily due to composition differences in the Continental Europe region, particularly in value stocks. The Portfolio and Index held a number of securities in common, but in different weights, due to the different methods for defining size and the Portfolio’s exclusion rules. Other differences in performance resulted from the process of continually rebalancing the Master Funds toward their targets. Over the period, there was a wider than usual performance difference between the best and worst performing stocks within countries, industry sectors, and asset classes. Consequently, slight differences in weights or in holdings between the Master Fund and the Index had a significant impact on relative performance.
Japanese Small Company Portfolio
The Japanese Small Company Portfolio seeks to capture the returns of Japanese small company stocks by purchasing shares of a Master Fund that invests in such stocks. The investment strategy employs a disciplined, quantitative approach, emphasizing broad diversification and consistent exposure to small company stocks, but does not attempt to track closely a specific equity index. As of October 31, 2009, the Master Fund held 1,313 stocks and was mostly invested in equities throughout the year: the average non-equitized cash level for period was less than 1% of the Master Fund’s assets.
As a result of the Master Fund’s diversified investment approach, performance was determined principally by broad structural trends in the Japanese equity market, rather than the behavior of a limited number of stocks. Over the period, Japanese small company stocks outperformed Japanese large company stocks. For the 12 months ended October 31, 2009, total returns were 22.08% for the Portfolio and 24.60% for the MSCI Japan Small Cap Index (net dividends). The Master Fund holds a large number of stocks, and no single stock explained a significant amount of the performance difference. Relative to the Index, the Portfolio underperformed primarily due to composition differences, a result of the Master Fund’s process of continually rebalancing toward its target. Over the period, there was a wider than usual performance difference between the best and worst performing stocks within countries, industry sectors, and asset classes. Consequently, slight differences in weights or in holdings between the Master Fund and the Index had a significant impact on relative performance.
Asia Pacific Small Company Portfolio
The Asia Pacific Small Company Portfolio seeks to capture the returns of small company stocks in developed Asia Pacific markets, excluding Japan, by purchasing shares of a Master Fund that invests in such stocks. The
24
investments strategy employs a disciplined, quantitative approach, emphasizing broad diversification and consistent exposure to small company stocks, but does not attempt to track closely a specific equity index. As of October 31, 2009, the Master Fund held 963 stocks, and assets were allocated mainly among four countries: Australia, Hong Kong, New Zealand, and Singapore (approximately 59%, 21%, 7%, and 13% respectively). Country allocations are determined by utilizing the approximate weights of individual securities within a universe of Asia Pacific small company stocks constructed by the Advisor. The allocations do not represent a forecast of future performance and are subject to change by the Advisor. The average non-equitized cash level for period was less than 1% of the Master Fund’s assets.
As a result of the Master Fund’s diversified investment approach, performance was determined principally by broad structural trends in Asia Pacific equity markets rather than the behavior of a limited number of stocks. Over the period, Asia Pacific small company stocks outperformed Asia Pacific large company stocks. For the 12 months ended October 31, 2009, total returns were 84.11% for the Portfolio and 90.41% for the MSCI Pacific ex Japan Small Cap Index (net dividends). The Master Fund holds a large number of stocks, and no single stock explained a significant amount of the performance difference. Relative to the Index, the Portfolio underperformed primarily due to composition differences, a result of the Master Fund’s process of continually rebalancing toward its target. Over the period, there was a wider than usual performance difference between the best and worst performing stocks within countries, industry sectors, and asset classes. Consequently, slight differences in weights or in holdings between the Master Fund and the Index had a significant impact on relative performance.
United Kingdom Small Company Portfolio
The United Kingdom Small Company Portfolio seeks to capture the returns of U.K. small company stocks by purchasing shares of a Master Fund that invests in such stocks. The investment strategy employs a disciplined, quantitative approach, emphasizing broad diversification and consistent exposure to small company stocks, but does not attempt to track closely a specific equity index. As of October 31, 2009, the Master Fund held 386 stocks and was mostly invested in equities throughout the year: the average non-equitized cash level for the period was less than 1% of the Master Fund’s assets.
As a result of the Master Fund’s diversified investment approach, performance was determined principally by broad structural trends in the U.K. equity market, rather than the behavior of a limited number of stocks. Over the period, U.K. small company stocks outperformed U.K. large company stocks. For the 12 months ended October 31, 2009, total returns were 42.81% for the Portfolio and 51.09% for the MSCI UK Small Cap Index (net dividends). The Master Fund holds a large number of stocks, and no single stock explained a significant amount of the performance difference. Relative to the Index, the Portfolio underperformed primarily due to composition differences, a result of the Master Fund’s process of continually rebalancing toward its target. Over the period, there was a wider than usual performance difference between the best and worst performing stocks within countries, industry sectors, and asset classes. Consequently, slight differences in weights or in holdings between the Master Fund and the Index had a significant impact on relative performance.
Continental Small Company Portfolio
The Continental Small Company Portfolio seeks to capture the returns of small company stocks in developed markets of Europe, excluding the U.K., by purchasing shares of a Master Fund that invests in such stocks. The investment strategy employs a disciplined, quantitative approach, emphasizing broad diversification and consistent exposure to small company stocks, but does not attempt to track closely a specific equity index. As of October 31, 2009, the Master Fund held 1,234 stocks in 15 developed continental European countries. Country allocations reflect the approximate weights of individual securities within a universe of continental European small company stocks constructed by the Advisor. Country allocations do not represent a forecast of future performance and are subject to change by the Advisor. The average non-equitized cash level for period was less than 1% of the Master Fund’s assets.
As a result of the Master Fund’s diversified investment approach, performance was determined principally by broad structural trends in the continental European equity markets, excluding the U.K., rather than the behavior of
25
a limited number of stocks. Over the period, continental European small company stocks outperformed continental European large company stocks. For the 12 months ended October 31, 2009, total returns were 43.12% for the Portfolio and 57.29% for the MSCI Europe ex UK Small Cap Index (net dividends). The Master Fund holds a large number of stocks, and no single stock explained a significant amount of the performance difference. Relative to the Index, the Portfolio underperformed primarily due to composition differences, a result of the Portolio’s process of continually rebalancing toward its target. Over the period, there was a wider than usual performance difference between the best and worst performing stocks within countries, industry sectors, and asset classes. Consequently, slight differences in weights or in holdings between the Master Fund and the Index had a significant impact on relative performance.
DFA International Real Estate Securities Portfolio
The DFA International Real Estate Securities Portfolio is designed to capture the returns of a broadly diversified portfolio of real estate securities in international markets, but does not attempt to track closely a specific index. As of October 31, 2009, the Portfolio held 172 stocks in 16 developed and emerging countries and was mostly invested in equities throughout the year: the average non-equitized cash level for the period was less than 1% of the Portfolio’s assets.
As a result of the Portfolio’s diversified approach, performance was determined principally by structural trends in international real estate securities markets, rather than the behavior of a limited number of stocks. For the 12 months ended October 31, 2009, total returns were 29.25% for the Portfolio, 31.95% for the S&P Global ex US REIT Index (gross dividends), and 30.51% for the S&P Global ex US REIT Index (net dividends). The Portfolio’s underperformance relative to the Indexes was primarily the result of withholding taxes, expenses, and a difference in the timing of the pricing of securities and foreign exchange rates between the Portfolio and the Indexes. The Portfolio prices foreign exchange rates at the closing of the U.S. markets while the Index uses rates at 4 P.M. London time. Relative to the Index (net dividends), the Portfolio benefited from a smaller allocation to large cap REITs which generally underperformed over the period.
DFA Global Real Estate Securities Portfolio
The DFA Global Real Estate Securities Portfolio, a fund of funds, is designed to capture the returns of a broadly diversified portfolio of real estate securities in U.S. and international markets, but does not attempt to track closely a specific index. As of October 31, 2009, the Portfolio invested in the DFA International Real Estate Securities Portfolio and the DFA Real Estate Securities Portfolio. As of October 31, 2009, the Portfolio had exposure to 277 stocks, through its underlying funds, in 17 developed and emerging markets countries and was mostly invested in equities throughout the year: the average non-equitized cash level for the period was less than 1% of the Portfolio’s assets.
As a result of the diversified approach of the Portfolio’s underlying funds, performance was principally determined by structural trends in global real estate securities markets, rather than the behavior of a limited number of stocks. For the 12 months ended October 31, 2009, total returns were 13.81% for the Portfolio, 14.11% for the S&P Global REIT Index (gross dividends), and 12.36% for the S&P Global REIT Index (net dividends). Relative to the Index (net dividends), the Portfolio’s outperformance was primarily due to a greater allocation to small cap REITs, which outperformed over the period, and a smaller allocation to large cap REITs, which generally underperformed over the period.
DFA International Small Cap Value Portfolio
The DFA International Small Cap Value Portfolio seeks to capture the returns of international small company value stocks. The investment strategy employs a disciplined, quantitative approach, emphasizing broad diversification and consistent exposure to small company value stocks, but does not attempt to track closely a specific equity index. As of October 31, 2009, the Portfolio held 2,127 stocks in 22 developed countries and was mostly invested in equities throughout the year: the average non-equitized cash level for the period was less than 1% of the Portfolio’s assets.
26
As a result of the Portfolio’s diversified investment approach, performance was determined principally by broad structural trends in international equity markets, rather than the behavior of a limited number of stocks. Over the period, international small stocks outperformed international large stocks and international value stocks outperformed international growth stocks. For the 12 months ended October 31, 2009, total returns were 41.42% for the Portfolio and 50.01% for the MSCI World ex USA Small Cap Index (net dividends). The Portfolio holds a large number of stocks, and no single stock explained a significant amount of the performance difference. The Portfolio’s greater allocation than the Index to value stocks had a positive impact on relative performance. However, composition differences in the Portfolio’s stock portfolio relative to the Index had a greater negative impact. The Portfolio and Index held a number of securities in common, but in different weights, due to the different methods for defining size and value and the Portfolio’s exclusion rules. Other differences in performance resulted from the process of continually rebalancing the Portfolio toward its target. Over the period, there was a wider than usual performance difference between the best and worst performing stocks within countries, industry sectors, and asset classes. Consequently, slight differences in weights or in holdings between the Portfolio and the Index had a significant impact on relative performance.
International Vector Equity Portfolio
The International Vector Equity Portfolio seeks to capture the returns of a broadly diversified basket of international stocks, with stronger exposure to smaller company stocks and those with value characteristics, as measured by book-to-market ratio, than the International Core Equity Portfolio. The investment strategy employs a disciplined quantitative approach, emphasizing broad diversification, but does not attempt to track closely a specific equity index. As of October 31, 2009, the Portfolio held 2,989 stocks in 22 developed country markets and was mostly invested in equities throughout the year: the average non-equitized cash level for the period was less than 1% of the Portfolio’s assets.
As a result of the Portfolio’s diversified investment approach, performance was determined principally by broad structural trends in the international equity markets, rather than by the behavior of a limited number of stocks. For the 12 months ended October 31, 2009, total returns were 39.52% for the Portfolio and 27.83% for the MSCI World ex USA Index (net dividends). Relative to the Index, the Portfolio’s outperformance was primarily due to strong tilts towards small cap and value stocks. On average, the deepest value names constituted 53% of the Portfolio as compared to 26% for the Index. Small cap stocks, which accounted for 26% of the Portfolio on average and were excluded from the Index, also added to relative performance. The Portfolio’s larger relative allocation to materials and industrials, the best performing industries over the period, and smaller relative allocation to utilities and healthcare, the worst performing industries over the period, also contributed to the relative outperformance.
Emerging Markets Portfolio
The Emerging Markets Portfolio seeks to capture the returns of large company stocks in selected emerging markets by purchasing shares of a Master Fund investing in such firms. The investment strategy employs a disciplined quantitative approach, emphasizing broad diversification and consistent exposure to large company emerging markets stocks, but does not attempt to track closely a specific equity index. As of October 31, 2009, the Master Fund held 654 stocks in 18 emerging countries and was mostly invested in equities throughout the year: the average non-equitized cash level for the period was less than 1% of the Portfolio’s assets. The Master Fund’s target country weights are capped at a ceiling set by the manager in order to limit single-country risk exposure.
As a result of the Master Fund’s diversified approach, performance was generally determined by structural trends in emerging country stock markets, rather than the behavior of a limited number of stocks. For the 12 months ended October 31, 2009, total returns were 53.39% for the Portfolio and 64.13% for the MSCI Emerging Markets Index (net dividends). The Portfolio’s relative underperformance was primarily due to differences in country weights and in the composition of the Master Fund’s holdings relative to the Index. Over the period, there was a wider than usual performance difference between the best and worst performing stocks within countries, industry sectors, and asset classes. Consequently, slight differences in weights or in holdings between the Master Fund and the Index had a significant impact on relative performance.
27
Emerging Markets Small Cap Portfolio
The Emerging Markets Small Cap Portfolio seeks to capture the returns of small company stocks in selected emerging markets by purchasing shares of a Master Fund investing in such firms. The investment strategy employs a disciplined quantitative approach, emphasizing broad diversification and consistent exposure to emerging markets small company stocks, but does not attempt to track closely a specific equity index. As of October 31, 2009, the Master Fund held 2,152 stocks across 16 emerging countries and was mostly invested in equities throughout the year: the average non-equitized cash level for the period was less than 1% of the Master Fund’s assets. The Master Fund’s target country weights are capped at a ceiling set by the manager in order to limit single-country risk exposure.
As a result of the Master Fund’s diversified approach, performance was generally determined by structural trends in emerging country stock markets, rather than the behavior of a limited number of stocks. For the 12 months ended October 31, 2009, total returns were 91.35% for the Portfolio and 64.13% for the MSCI Emerging Markets Index (net dividends). The Portfolio outperformed primarily because small cap stocks dramatically outperformed large cap stocks during the period. Over the period, there was a wider than usual performance difference between the best and worst performing stocks within countries, industry sectors, and asset classes. Consequently, slight differences in weights or in holdings between the Master Fund and the Index had a significant impact on relative performance.
Emerging Markets Core Equity Portfolio
The Emerging Markets Core Equity Portfolio seeks to capture the returns of the broad universe of emerging markets stocks with increased exposure to smaller company stocks and those stocks with value characteristics as measured by book-to-market ratio. The investment strategy employs a disciplined quantitative approach, emphasizing broad diversification and consistent exposure to emerging market countries, but does not attempt to track closely a specific equity index. As of October 31, 2009, the Portfolio held 2,665 stocks across 18 emerging countries and was mostly invested in equities throughout the year: the average non-equitized cash level for the period was less than 1% of the Portfolio’s assets. The Portfolio’s target country weights were capped at a ceiling set by the manager in order to limit single-country risk exposure.
As a result of the Portfolio’s diversified approach, performance was generally determined by structural trends in emerging country stock markets, rather than the behavior of a limited number of stocks. For the 12 months ended October 31, 2009, total returns were 69.47% for the Portfolio and 64.13% for the MSCI Emerging Markets Index (net dividends). The Portfolio’s outperformance was primarily due to a stronger tilt than the Index toward value and small cap stocks, which outperformed their growth and large cap counterparts. Composition differences in the Portfolio’s holdings relative to the Index also had a positive impact on the relative performance. Over the period, there was a wider than usual performance difference between the best and worst performing stocks within countries, industry sectors, and asset classes. Consequently, slight differences in weights or in holdings between the Portfolio and the Index had a significant impact on relative performance.
| | |
| Fixed Income Market Review | | 12 Months Ended October 31, 2009 |
U.S. and international credit markets experienced high levels of volatility in the fiscal year ended October 31, 2009. Investor appetite for credit risk returned as the year progressed, and credit spreads narrowed significantly. Over the course of the year the U.S. Federal Reserve lowered the target rate for federal funds from 1.00% on October 31, 2008 to between 0% and 0.25% by October 31, 2009, and continued to add liquidity into the financial system through various loan programs and capital injections into financial institutions. Central banks around the world took similar actions to loosen credit markets. The three-month London Interbank Offered Rate (LIBOR), a widely-used benchmark of short-term interest rates, fell 275 basis points during the 12 months ended October 31, 2009, while the yield on ten-year U.S. Treasury notes declined 57 basis points. The yield curve remained upwardly sloped throughout the year.
28
| | | | | | | | | | |
| | | 10/31/09 | | | | 10/31/08 | | | | Change |
Three-Month LIBOR (yield) | | 0.28% | | | | 3.03% | | | | –90.76% |
Ten-Year U.S. Treasury Notes (yield) | | 3.38% | | | | 3.95% | | | | –14.43% |
Source: Bloomberg. “Change” values are calculated prior to rounding.
There is generally an inverse relationship between interest rates and bond prices, such that bond prices fall when interest rates rise. For the fiscal year under review, changes in interest rates and bond prices were more pronounced in some parts of the yield curve than others. For the 12 months ended October 31, 2009, total returns were 0.32% for three-month U.S. Treasury bills, 6.77% for five-year U.S. Treasury notes, and 5.57% for thirty-year U.S. Treasury bonds.
Some of the Advisor’s fixed income strategies are based on a shifting-maturity strategy that identifies the maturity range with the highest risk-adjusted expected return. When the yield curve is flat or inverted, short-term securities are believed to offer the most attractive opportunity on a risk-adjusted basis. When the yield curve is upwardly sloped, maturities are lengthened to achieve higher returns associated with longer maturities. During the period under review, weighted average maturities of most Portfolios lengthened, reflecting upwardly sloped yield curves in the U.S.
Fixed Income Portfolio Performance Overview
DFA One-Year Fixed Income Portfolio
The DFA One-Year Fixed Income Portfolio seeks to maximize risk-adjusted total returns from a universe of high-quality fixed income securities with an average maturity of one year or less. The investment strategy shifts maturities based on changes in the yield curve. Using current prices, the strategy creates a matrix of expected returns from different buy and sell strategies, and identifies the maturity range for the highest risk-adjusted expected returns according to the variable maturity model. Maturities are shifted if expected premiums can be documented. The average maturity of the Portfolio increased to 340 days on October 31, 2009, from 265 days on October 31, 2008.
For the 12 months ended October 31, 2009 the total return was 3.80% for the Portfolio, 1.05% for the BofA Merrill Lynch Six-Month U.S. Treasury Bill Index, and 1.86% for the BofA Merrill Lynch One-Year U.S. Treasury Note Index. During the period, interest rates declined but maintained a positive expected return premium. Relative to the Indexes, the Portfolio benefited from exposure to securities with higher credit risk premium. The Portfolio had exposure to corporate and agency debt, which significantly outperformed Treasury debt during the period of tightening credit spreads. Additionally, the Portfolio benefited from the period of falling interest rates, as it maintained a higher average maturity than the BofA Merrill Lynch Six-Month U.S. Treasury Bill Index and had allocations to 1-2 year maturity securities, which significantly outperformed less-than-1-year maturity securities. The benchmarks had no exposure to securities with maturities of over one year.
DFA Two-Year Global Fixed Income Portfolio
The DFA Two-Year Global Fixed Income Portfolio seeks to maximize risk-adjusted returns from a universe of U.S. and foreign government securities, high-quality corporate securities, and currency-hedged global fixed income instruments maturing in two years or less. Eligible countries include but are not limited to Australia, Canada, Denmark, France, Germany, Japan, the Netherlands, Norway, Sweden, Switzerland, the United Kingdom, and the United States. The investment strategy shifts maturities based on changes in the yield curve. Using current prices, the strategy creates a matrix of expected returns from different buy and sell strategies and identifies the maturity range for the highest risk-adjusted expected returns according to the variable maturity model. Maturities are shifted if expected premiums can be documented. The average maturity of the Portfolio increased to 1.46 years on October 31, 2009, from 0.74 years on October 31, 2008.
29
For the 12 months ended October 31, 2009 the total return was 3.71% for the Portfolio and 3.42% for the Citigroup World Government Bond Index 1-3 Years (hedged). Relative to the Index, outperformance of the Portfolio was primarily due to structural and maturity differences between the Portfolio and Index. A higher exposure to government agency securities, which outperformed sovereign government debt, had a positive impact on the relative performance. The Portfolio had an average duration of 1.42 years on October 31, 2009 compared to 1.89 years for the Index, which limited relative returns in a falling interest rate environment.
DFA Selectively Hedged Global Fixed Income Portfolio
The DFA Selectively Hedged Global Fixed Income Portfolio seeks to maximize risk-adjusted returns from a universe of U.S. and foreign government securities, high-quality corporate securities, and global fixed income instruments maturing in two years or less. It hedges foreign currency exposure on a selective basis to capture the higher interest rates that may be offered in foreign yield curves. Eligible countries include but are not limited to Australia, Canada, Denmark, the EMU countries, Japan, Sweden, Switzerland, the United Kingdom, and the United States. The investment strategy shifts maturities based on changes in the yield curve. Using current prices, the strategy creates a matrix of expected returns from different buy and sell strategies and identifies the maturity range for the highest risk-adjusted expected returns according to the variable maturity model. Maturities are shifted if expected premiums can be documented. The average maturity of the Portfolio increased to 1.31 years on October 31, 2009, from 0.47 years on October 31, 2008.
For the 12 months ended October 31, 2009, total returns were 12.23% for the Portfolio and 12.18% for the Citigroup World Government Bond Index 1-3 Years (unhedged). Relative to the Index, outperformance of the Portfolio was primarily due to differences in currency exposures. In particular, the Portfolio was aided by its unhedged Australian Dollar, New Zealand Dollar and Norwegian Krone holdings.
DFA Five-Year Government Portfolio
The DFA Five-Year Government Portfolio seeks to maximize risk-adjusted total returns from a universe of U.S. government securities maturing in five years or less. The investment strategy shifts maturities based on changes in the yield curve. Using current prices, the strategy creates a matrix of expected returns from different buy and sell strategies, and identifies the maturity range for the highest risk-adjusted expected returns according to the variable maturity model. Maturities are shifted if expected premiums can be documented. The average maturity of the Portfolio decreased to 3.06 years on October 31, 2009 from 3.46 years on October 31, 2008.
For the 12 months ended October 31, 2009, total returns were 7.27% for the Portfolio and 4.56% for the BofA Merrill Lynch US Treasury/Agency Index 1-5 Years. Relative to the Index, outperformance by the Portfolio was primarily due to structural differences. The Portfolio had much higher exposure to agency debt, which significantly outperformed Treasury debt during the period of significantly tightening credit spreads. Interest rates declined during the period, but the yield curve continued to be upwardly-sloped and exhibited positive expected term premium. The Portfolio also benefited from a longer duration than the Index during the period when interest rates declined.
DFA Five-Year Global Fixed Income Portfolio
The DFA Five-Year Global Fixed Income Portfolio seeks to maximize risk-adjusted returns from a universe of U.S. and foreign government securities, high-quality corporate securities, and currency-hedged global fixed income instruments maturing in five years or less. Eligible countries include but are not limited to Australia, Canada, Denmark, France, Germany, Japan, the Netherlands, Norway, Sweden, Switzerland, the United Kingdom, and the United States. The investment strategy shifts maturities based on changes in the yield curve. Using current prices, the strategy creates a matrix of expected returns from different buy and sell strategies and identifies the maturity range for the highest risk-adjusted expected returns according to the variable maturity model. Maturities are shifted if expected premiums can be documented. The average maturity of the Portfolio increased from 2.46 years on October 31, 2008 to 3.52 years on October 31, 2009.
30
For the 12 months ended October 31, 2009 the total return was 7.74% for the Portfolio and 4.26% for the Citigroup World Government Bond Index 1-5 Years (hedged). Relative to the Index, outperformance by the Portfolio was primarily due to structural and maturity differences. A higher exposure to government agency and corporate securities, during a period when credit spreads narrowed relative to sovereign governments, contributed to the outperformance.
DFA Intermediate Government Fixed Income Portfolio
The DFA Intermediate Government Fixed Income Portfolio seeks to provide a market rate of return and current income from investing generally in U.S. Treasury and government agency issues with maturities of between five and fifteen years. The investment strategy maintains a relatively constant average maturity. The average maturity of the Portfolio decreased to 5.83 years on October 31, 2009 from 6.37 years on October 31, 2008.
For the 12 months ended October 31, 2009, total returns were 10.71% for the Portfolio and 7.05% for the Barclays Capital U.S. Government Bond Index. The Portfolio’s outperformance was primarily due to a much higher allocation to agency debt, which significantly outperformed Treasury debt during the period of tightening credit spreads. The Portfolio also benefited from the period of falling interest rates, as it had a higher allocation to securities with maturities greater than ten years.
DFA Short-Term Extended Quality Portfolio
The DFA Short-Term Extended Quality Fixed Income Portfolio seeks to maximize total returns from a universe of U.S. and foreign corporate debt securities with an investment grade credit rating. The Portfolio emphasizes investment grade obligations rated in the lower half of the investment grade spectrum. However, the Portfolio will not emphasize investment grade obligations rated in the lower half of the investment grade spectrum when the Advisor believes the credit risk premium does not warrant the investment. The Portfolio primarily invests in securities that mature within five years from the date of settlement, and seeks to maintain an average portfolio duration of approximately three years or less. The Portfolio hedges foreign currency risks. The average maturity of the Portfolio was 3.12 years on October 31, 2009.
From the Portfolio’s inception on March 4, 2009, through October 31, 2009, total returns were 7.49% for the Portfolio and 5.24% for the BofA Merrill Lynch US Corporate and Government Index 1-5 Years. Relative to the Index, the Portfolio’s outperformance was primarily due to its significant overweight in corporate securities during the period when corporate securities outperformed government securities. The Portfolio’s average duration remained close to 2.8 years over the period as upwardly sloped yield curves exhibited positive expected return premiums.
DFA Inflation-Protected Securities Portfolio
The DFA Inflation-Protected Securities Portfolio seeks to provide inflation protection and current income from investing generally in inflation-protected securities issued by the US government and its agencies and instrumentalities with maturities of between five and twenty years. The investment strategy maintains a relatively constant average maturity. The average maturity of the Portfolio increased to 8.73 years on October 31, 2009, from 8.60 years on October 31, 2008.
For the 12 months ended October 31, 2009, total returns were 17.70% for the Portfolio and 17.15% for the Barclays Capital U.S. TIPS Index. The Portfolio’s outperformance was primarily due to structural differences with the Index. A much lower allocation to short-term securities, which underperformed intermediate and long-term securities during the period of falling interest rates, contributed to the outperformance.
DFA Short-Term Municipal Bond Portfolio
The DFA Short-Term Municipal Bond Portfolio seeks to provide a market rate of return from a universe of high-quality municipal securities providing current income exempt from federal personal income tax. The weighted average maturity of the Portfolio generally will not exceed three years. The average maturity of the Portfolio increased to 2.78 years on October 31, 2009 from 1.53 years on October 31, 2008.
31
For the 12 months ended October 31, 2009, total returns were 4.32% for the Portfolio and 7.34% for the Barclays Capital Municipal Bond Index 3 Years. Municipal interest rates decreased significantly during the period, and the Portfolio’s relative underperformance was primarily due to its shorter duration.
DFA California Short-Term Municipal Bond Portfolio
The DFA California Short-Term Municipal Bond Portfolio seeks to provide a market rate of return from a universe of municipal securities providing current income exempt from federal personal income taxes and California state personal income taxes. The weighted average maturity of the Portfolio generally will not exceed three years. The average maturity increased to 2.78 years on October 31, 2009, from 2.12 years on October 31, 2008.
For the 12 months ended October 31, 2009, total returns were 4.91% for the Portfolio and 5.37% for the BofA Merrill Lynch California Municipal Bond Index 1-3 Years. California municipal interest rates decreased significantly during the period, and the Portfolio’s 25% average allocation to securities with maturities of less than one year contributed to the relative underperformance.
Sources: Citigroup bond indexes copyright 2009 by Citigroup. Barclays Capital data, formerly Lehman Brothers, provided by Barclays Bank PLC. The Merrill Lynch Indices are used with permission; copyright 2009 Merrill Lynch, Pierce, Fenner & Smith Incorporated; all rights reserved.
32
DFA INVESTMENT DIMENSIONS GROUP INC.
DISCLOSURE OF FUND EXPENSES
(Unaudited)
The following Expense Tables are shown so that you can understand the impact of fees on your investment. All mutual funds have operating expenses. As a shareholder of the fund, you incur ongoing costs, which include costs for portfolio management, administrative services, and shareholder reports, among others. Operating expenses, legal and audit services, which are deducted from a fund’s gross income, directly reduce the investment return of the fund. A fund’s expenses are expressed as a percentage of its average net assets. This figure is known as the expense ratio. The following examples are intended to help you understand the ongoing costs, in dollars, of investing in the fund and to compare these costs with those of other mutual funds. The examples are based on an investment of $1,000 made at the beginning of the period shown and held for the entire period.
The Expense Tables below illustrate your fund’s costs in two ways.
Actual Fund Return
This section helps you to estimate the actual expenses after fee waivers that you paid over the period. The “Ending Account Value” shown is derived from the fund’s actual return and “Expenses Paid During Period” reflect the dollar amount that would have been paid by an investor who started with $1,000 in the fund. You may use the information here, together with the amount you invested, to estimate the expenses that you paid over the period.
To do so, simply divide your account value by $1,000 (for example, a $7,500 account value divided by $1,000 = 7.5), then multiply the result by the number given for your fund under the heading “Expenses Paid During Period.”
Hypothetical Example for Comparison Purposes
This section is intended to help you compare your fund’s costs with those of other mutual funds. The hypothetical “Ending Account Value” and “Expenses Paid During Period” are derived from the fund’s actual expense ratio and an assumed 5% annual return before expenses. In this case, because the return used is not the fund’s actual return, the results do not apply to your investment. The example is useful in making comparisons because the SEC requires all mutual funds to calculate expenses based on a 5% annual return. You can assess your fund’s costs by comparing this hypothetical example with the hypothetical examples that appear in shareholder reports of other funds.
Please note that the expenses shown in the tables are meant to highlight and help you compare ongoing costs only and do not reflect any transactional costs, if applicable. The “Annualized Expense Ratio” represents the actual expenses for the six-month period indicated.
Six Months Ended October 31, 2009
EXPENSE TABLES
| | | | | | | | | | | | |
| | | Beginning
Account
Value
05/01/09 | | Ending
Account
Value
10/31/09 | | Annualized
Expense
Ratio* | | | Expenses
Paid
During
Period* |
U.S. Large Company Portfolio** | | | | | | | | | |
Actual Fund Return | | | | | | | | | | | | |
Institutional Class Shares | | $ | 1,000.00 | | $ | 1,200.60 | | 0.15 | % | | $ | 0.83 |
Hypothetical 5% Annual Return | | | | | | | | | | | | |
Institutional Class Shares | | $ | 1,000.00 | | $ | 1,024.45 | | 0.15 | % | | $ | 0.77 |
33
DISCLOSURE OF FUND EXPENSES
CONTINUED
| | | | | | | | |
| | | Beginning
Account
Value
05/01/09 | | Ending
Account
Value
10/31/09 | | Annualized
Expense
Ratio* | | Expenses
Paid
During
Period* |
Enhanced U.S. Large Company Portfolio | | | | | | | | |
Actual Fund Return | | | | | | | | |
Institutional Class Shares | | $1,000.00 | | $1,216.90 | | 0.30% | | $1.68 |
Hypothetical 5% Annual Return | | | | | | | | |
Institutional Class Shares | | $1,000.00 | | $1,023.69 | | 0.30% | | $1.53 |
| | | | |
U.S. Large Cap Value Portfolio** | | | | | | | | |
Actual Fund Return | | | | | | | | |
Institutional Class Shares | | $1,000.00 | | $1,241.40 | | 0.30% | | $1.69 |
Hypothetical 5% Annual Return | | | | | | | | |
Institutional Class Shares | | $1,000.00 | | $1,023.69 | | 0.30% | | $1.53 |
| | | | |
U.S. Targeted Value Portfolio | | | | | | | | |
Actual Fund Return | | | | | | | | |
Class R1 Shares | | $1,000.00 | | $1,189.10 | | 0.52% | | $2.87 |
Class R2 Shares | | $1,000.00 | | $1,189.90 | | 0.68% | | $3.75 |
Institutional Class Shares | | $1,000.00 | | $1,190.70 | | 0.42% | | $2.32 |
Hypothetical 5% Annual Return | | | | | | | | |
Class R1 Shares | | $1,000.00 | | $1,022.58 | | 0.52% | | $2.65 |
Class R2 Shares | | $1,000.00 | | $1,021.78 | | 0.68% | | $3.47 |
Institutional Class Shares | | $1,000.00 | | $1,023.09 | | 0.42% | | $2.14 |
| | | | |
U.S. Small Cap Value Portfolio | | | | | | | | |
Actual Fund Return | | | | | | | | |
Institutional Class Shares | | $1,000.00 | | $1,214.80 | | 0.54% | | $3.01 |
Hypothetical 5% Annual Return | | | | | | | | |
Institutional Class Shares | | $1,000.00 | | $1,022.48 | | 0.54% | | $2.75 |
| | | | |
U.S. Core Equity 1 Portfolio | | | | | | | | |
Actual Fund Return | | | | | | | | |
Institutional Class Shares | | $1,000.00 | | $1,194.80 | | 0.23% | | $1.27 |
Hypothetical 5% Annual Return | | | | | | | | |
Institutional Class Shares | | $1,000.00 | | $1,024.05 | | 0.23% | | $1.17 |
| | | | |
U.S. Core Equity 2 Portfolio | | | | | | | | |
Actual Fund Return | | | | | | | | |
Institutional Class Shares | | $1,000.00 | | $1,192.60 | | 0.25% | | $1.38 |
Hypothetical 5% Annual Return | | | | | | | | |
Institutional Class Shares | | $1,000.00 | | $1,023.95 | | 0.25% | | $1.28 |
| | | | |
U.S. Vector Equity Portfolio | | | | | | | | |
Actual Fund Return | | | | | | | | |
Institutional Class Shares | | $1,000.00 | | $1,196.70 | | 0.36% | | $1.99 |
Hypothetical 5% Annual Return | | | | | | | | |
Institutional Class Shares | | $1,000.00 | | $1,023.39 | | 0.36% | | $1.84 |
34
DISCLOSURE OF FUND EXPENSES
CONTINUED
| | | | | | | | |
| | | Beginning
Account
Value
05/01/09 | | Ending
Account
Value
10/31/09 | | Annualized
Expense
Ratio* | | Expenses
Paid
During
Period* |
T.A. U.S. Core Equity 2 Portfolio | | | | | | | | |
Actual Fund Return | | | | | | | | |
Institutional Class Shares | | $1,000.00 | | $1,188.30 | | 0.29% | | $1.60 |
Hypothetical 5% Annual Return | | | | | | | | |
Institutional Class Shares | | $1,000.00 | | $1,023.74 | | 0.29% | | $1.48 |
| | | | |
U.S. Small Cap Portfolio | | | | | | | | |
Actual Fund Return | | | | | | | | |
Institutional Class Shares | | $1,000.00 | | $1,200.50 | | 0.40% | | $2.22 |
Hypothetical 5% Annual Return | | | | | | | | |
Institutional Class Shares | | $1,000.00 | | $1,023.19 | | 0.40% | | $2.04 |
| | | | |
U.S. Micro Cap Portfolio | | | | | | | | |
Actual Fund Return | | | | | | | | |
Institutional Class Shares | | $1,000.00 | | $1,175.90 | | 0.55% | | $3.02 |
Hypothetical 5% Annual Return | | | | | | | | |
Institutional Class Shares | | $1,000.00 | | $1,022.43 | | 0.55% | | $2.80 |
| | | | |
DFA Real Estate Securities Portfolio | | | | | | | | |
Actual Fund Return | | | | | | | | |
Institutional Class Shares | | $1,000.00 | | $1,270.00 | | 0.37% | | $2.12 |
Hypothetical 5% Annual Return | | | | | | | | |
Institutional Class Shares | | $1,000.00 | | $1,023.34 | | 0.37% | | $1.89 |
| | | | |
Large Cap International Portfolio | | | | | | | | |
Actual Fund Return | | | | | | | | |
Institutional Class Shares | | $1,000.00 | | $1,299.90 | | 0.32% | | $1.86 |
Hypothetical 5% Annual Return | | | | | | | | |
Institutional Class Shares | | $1,000.00 | | $1,023.59 | | 0.32% | | $1.63 |
| | | | |
International Core Equity Portfolio | | | | | | | | |
Actual Fund Return | | | | | | | | |
Institutional Class Shares | | $1,000.00 | | $1,347.00 | | 0.42% | | $2.48 |
Hypothetical 5% Annual Return | | | | | | | | |
Institutional Class Shares | | $1,000.00 | | $1,023.09 | | 0.42% | | $2.14 |
| | | | |
T.A. World ex U.S. Core Equity Portfolio | | | | | | | | |
Actual Fund Return | | | | | | | | |
Institutional Class Shares | | $1,000.00 | | $1,363.10 | | 0.51% | | $3.04 |
Hypothetical 5% Annual Return | | | | | | | | |
Institutional Class Shares | | $1,000.00 | | $1,022.63 | | 0.51% | | $2.60 |
| | | | |
International Small Company Portfolio*** | | | | | | | | |
Actual Fund Return | | | | | | | | |
Institutional Class Shares | | $1,000.00 | | $1,372.40 | | 0.57% | | $3.41 |
Hypothetical 5% Annual Return | | | | | | | | |
Institutional Class Shares | | $1,000.00 | | $1,022.33 | | 0.57% | | $2.91 |
35
DISCLOSURE OF FUND EXPENSES
CONTINUED
| | | | | | | | |
| | | Beginning
Account
Value
05/01/09 | | Ending
Account
Value
10/31/09 | | Annualized
Expense
Ratio* | | Expenses
Paid
During
Period* |
Japanese Small Company Portfolio** | | | | | | | | |
Actual Fund Return | | | | | | | | |
Institutional Class Shares | | $1,000.00 | | $1,226.20 | | 0.57% | | $3.20 |
Hypothetical 5% Annual Return | | | | | | | | |
Institutional Class Shares | | $1,000.00 | | $1,022.33 | | 0.57% | | $2.91 |
| | | | |
Asia Pacific Small Company Portfolio** | | | | | | | | |
Actual Fund Return | | | | | | | | |
Institutional Class Shares | | $1,000.00 | | $1,670.90 | | 0.64% | | $4.31 |
Hypothetical 5% Annual Return | | | | | | | | |
Institutional Class Shares | | $1,000.00 | | $1,021.98 | | 0.64% | | $3.26 |
| | | | |
United Kingdom Small Company Portfolio** | | | | | | | | |
Actual Fund Return | | | | | | | | |
Institutional Class Shares | | $1,000.00 | | $1,334.70 | | 0.62% | | $3.65 |
Hypothetical 5% Annual Return | | | | | | | | |
Institutional Class Shares | | $1,000.00 | | $1,022.08 | | 0.62% | | $3.16 |
| | | | |
Continental Small Company Portfolio** | | | | | | | | |
Actual Fund Return | | | | | | | | |
Institutional Class Shares | | $1,000.00 | | $1,394.00 | | 0.62% | | $3.74 |
Hypothetical 5% Annual Return | | | | | | | | |
Institutional Class Shares | | $1,000.00 | | $1,022.08 | | 0.62% | | $3.16 |
| | | | |
DFA International Real Estate Securities Portfolio | | | | | | | | |
Actual Fund Return | | | | | | | | |
Institutional Class Shares | | $1,000.00 | | $1,459.60 | | 0.43% | | $2.67 |
Hypothetical 5% Annual Return | | | | | | | | |
Institutional Class Shares | | $1,000.00 | | $1,023.04 | | 0.43% | | $2.19 |
| | | | |
DFA Global Real Estate Securities Portfolio*** | | | | | | | | |
Actual Fund Return | | | | | | | | |
Institutional Class Shares | | $1,000.00 | | $1,360.90 | | 0.47% | | $2.80 |
Hypothetical 5% Annual Return | | | | | | | | |
Institutional Class Shares | | $1,000.00 | | $1,022.84 | | 0.47% | | $2.40 |
| | | | |
DFA International Small Cap Value Portfolio | | | | | | | | |
Actual Fund Return | | | | | | | | |
Institutional Class Shares | | $1,000.00 | | $1,360.20 | | 0.71% | | $4.22 |
Hypothetical 5% Annual Return | | | | | | | | |
Institutional Class Shares | | $1,000.00 | | $1,021.63 | | 0.71% | | $3.62 |
| | | | |
International Vector Equity Portfolio | | | | | | | | |
Actual Fund Return | | | | | | | | |
Institutional Class Shares | | $1,000.00 | | $1,359.20 | | 0.60% | | $3.57 |
Hypothetical 5% Annual Return | | | | | | | | |
Institutional Class Shares | | $1,000.00 | | $1,022.18 | | 0.60% | | $3.06 |
36
DISCLOSURE OF FUND EXPENSES
CONTINUED
| | | | | | | | |
| | | Beginning
Account
Value
05/01/09 | | Ending
Account
Value
10/31/09 | | Annualized
Expense
Ratio* | | Expenses
Paid
During
Period* |
Emerging Markets Portfolio** | | | | | | | | |
Actual Fund Return | | | | | | | | |
Institutional Class Shares | | $1,000.00 | | $1,380.80 | | 0.62% | | $3.72 |
Hypothetical 5% Annual Return | | | | | | | | |
Institutional Class Shares | | $1,000.00 | | $1,022.08 | | 0.62% | | $3.16 |
| | | | |
Emerging Markets Small Cap Portfolio** | | | | | | | | |
Actual Fund Return | | | | | | | | |
Institutional Class Shares | | $1,000.00 | | $1,509.00 | | 0.80% | | $5.06 |
Hypothetical 5% Annual Return | | | | | | | | |
Institutional Class Shares | | $1,000.00 | | $1,021.17 | | 0.80% | | $4.08 |
| | | | |
Emerging Markets Core Equity Portfolio | | | | | | | | |
Actual Fund Return | | | | | | | | |
Institutional Class Shares | | $1,000.00 | | $1,422.40 | | 0.67% | | $4.09 |
Hypothetical 5% Annual Return | | | | | | | | |
Institutional Class Shares | | $1,000.00 | | $1,021.83 | | 0.67% | | $3.41 |
| | | | |
DFA One-Year Fixed Income Portfolio**** | | | | | | | | |
Actual Fund Return | | | | | | | | |
Institutional Class Shares | | $1,000.00 | | $1,013.20 | | 0.22% | | $1.12 |
Hypothetical 5% Annual Return | | | | | | | | |
Institutional Class Shares | | $1,000.00 | | $1,024.10 | | 0.22% | | $1.12 |
| | | | |
DFA Two-Year Global Fixed Income Portfolio**** | | | | | | | | |
Actual Fund Return | | | | | | | | |
Institutional Class Shares | | $1,000.00 | | $1,013.30 | | 0.22% | | $1.12 |
Hypothetical 5% Annual Return | | | | | | | | |
Institutional Class Shares | | $1,000.00 | | $1,024.10 | | 0.22% | | $1.12 |
| | | | |
DFA Selectively Hedged Global Fixed Income Portfolio | | | | | | | | |
Actual Fund Return | | | | | | | | |
Institutional Class Shares | | $1,000.00 | | $1,091.70 | | 0.26% | | $1.37 |
Hypothetical 5% Annual Return | | | | | | | | |
Institutional Class Shares | | $1,000.00 | | $1,023.89 | | 0.26% | | $1.33 |
| | | | |
DFA Five-Year Government Portfolio | | | | | | | | |
Actual Fund Return | | | | | | | | |
Institutional Class Shares | | $1,000.00 | | $1,018.90 | | 0.27% | | $1.37 |
Hypothetical 5% Annual Return | | | | | | | | |
Institutional Class Shares | | $1,000.00 | | $1,023.84 | | 0.27% | | $1.38 |
| | | | |
DFA Five-Year Global Fixed Income Portfolio | | | | | | | | |
Actual Fund Return | | | | | | | | |
Institutional Class Shares | | $1,000.00 | | $1,037.70 | | 0.32% | | $1.64 |
Hypothetical 5% Annual Return | | | | | | | | |
Institutional Class Shares | | $1,000.00 | | $1,023.59 | | 0.32% | | $1.63 |
37
DISCLOSURE OF FUND EXPENSES
CONTINUED
| | | | | | | | | | |
| | | Beginning
Account
Value
05/01/09 | | Ending
Account
Value
10/31/09 | | Annualized
Expense
Ratio* | | Expenses
Paid
During
Period* |
DFA Intermediate Government Fixed Income Portfolio | | | | | | | | | | |
Actual Fund Return | | | | | | | | | | |
Institutional Class Shares | | $ | 1,000.00 | | $ | 1,026.90 | | 0.16% | | $0.82 |
Hypothetical 5% Annual Return | | | | | | | | | | |
Institutional Class Shares | | $ | 1,000.00 | | $ | 1,024.40 | | 0.16% | | $0.82 |
| | | | |
DFA Short-Term Extended Quality Portfolio | | | | | | | | | | |
Actual Fund Return | | | | | | | | | | |
Institutional Class Shares | | $ | 1,000.00 | | $ | 1,060.60 | | 0.22% | | $1.14 |
Hypothetical 5% Annual Return | | | | | | | | | | |
Institutional Class Shares | | $ | 1,000.00 | | $ | 1,024.10 | | 0.22% | | $1.12 |
| | | | |
DFA Inflation-Protected Securities Portfolio | | | | | | | | | | |
Actual Fund Return | | | | | | | | | | |
Institutional Class Shares | | $ | 1,000.00 | | $ | 1,066.20 | | 0.17% | | $0.89 |
Hypothetical 5% Annual Return | | | | | | | | | | |
Institutional Class Shares | | $ | 1,000.00 | | $ | 1,024.35 | | 0.17% | | $0.87 |
| | | | |
DFA Short-Term Municipal Bond Portfolio | | | | | | | | | | |
Actual Fund Return | | | | | | | | | | |
Institutional Class Shares | | $ | 1,000.00 | | $ | 1,010.10 | | 0.26% | | $1.32 |
Hypothetical 5% Annual Return | | | | | | | | | | |
Institutional Class Shares | | $ | 1,000.00 | | $ | 1,023.89 | | 0.26% | | $1.33 |
| | | | |
DFA California Short-Term Municipal Bond Portfolio | | | | | | | | | | |
Actual Fund Return | | | | | | | | | | |
Institutional Class Shares | | $ | 1,000.00 | | $ | 1,009.70 | | 0.27% | | $1.37 |
Hypothetical 5% Annual Return | | | | | | | | | | |
Institutional Class Shares | | $ | 1,000.00 | | $ | 1,023.84 | | 0.27% | | $1.38 |
| * | Expenses are equal to the fund’s annualized expense ratio for the six-month period, multiplied by the average account value over the period, multiplied by the number of days in the most recent six-month period (184), then divided by the number of days in the year (365) to reflect the six-month period. |
| ** | The Portfolio is a Feeder Fund. The expenses shown reflect the direct expenses of the Feeder Fund and the indirect payment of the Feeder Fund’s portion of the expenses of its Master Fund (Affiliated Investment Company). |
| *** | The Portfolio is a Fund of Funds. The expenses shown reflect the direct expenses of the Fund of Funds and the indirect payment of the Fund of Funds’ portion of the expenses of its Master Funds (Affiliated Investment Companies). |
| **** | Effective October 23, 2009, the Portfolio invests directly in securities rather than through the Master Fund. The expenses shown reflect the direct expenses of the Portfolio and the indirect payments of the Portfolio’s portion of the expenses, for the period May 1, 2009 through October 22, 2009 of the Master Fund (Affiliated Investment Company). |
38
DFA INVESTMENT DIMENSIONS GROUP INC.
DISCLOSURE OF PORTFOLIO HOLDINGS
(Unaudited)
The SEC requires that all Funds file a complete Schedule of Investments with the SEC for their first and third fiscal quarters on Form N-Q. For DFA Investment Dimensions Group Inc., this would be for the fiscal quarters ending January 31 and July 31. The Form N-Q filing must be made within 60 days of the end of the quarter. DFA Investment Dimensions Group Inc. filed its most recent Form N-Q with the SEC on September 29, 2009. It is available upon request, without charge, by calling collect: (512) 306-7400 or by mailing a request to Dimensional Fund Advisors LP, 6300 Bee Cave Road, Building One, Austin, Texas 78746, or by visiting the SEC’s website at http://www.sec.gov, or they may be reviewed and copied at the SEC’s Public Reference Room in Washington, D.C. (call 1-800-732-0330 for information on the operation of the Public Reference Room).
SEC regulations permit a fund to include in its reports to shareholders a “Summary Schedule of Portfolio Holdings” in lieu of a full Schedule of Investments. The Summary Schedule of Portfolio Holdings reports the fund’s 50 largest holdings in unaffiliated issuers and any investments that exceed one percent of the fund’s net assets at the end of the reporting period. The amendments also require that the Summary Schedule of Portfolio Holdings identify each category of investments that are held.
The fund is required to file a complete Schedule of Investments with the SEC on Form N-CSR within ten days after mailing the annual and semi-annual reports to shareholders. It will be available upon request, without charge, by calling collect: (512) 306-7400 or by mailing a request to Dimensional Fund Advisors LP, 6300 Bee Cave Road, Building One, Austin, Texas 78746, or by visiting the SEC’s website at http://www.sec.gov, or they may be reviewed and copied at the SEC’s Public Reference Room in Washington, D.C. (call 1-800-732-0330 for information on the operation of the Public Reference Room).
PORTFOLIO HOLDINGS
The SEC requires that all Funds present their categories of portfolio holdings in a table, chart or graph format in their annual and semi-annual shareholder reports, whether or not a Schedule of Investments is utilized. The following table, which presents portfolio holdings as a percent of total investments before short-term investments and collateral for loaned securities, is provided in compliance with such requirement. The categories shown below represent broad industry sectors. Each industry sector consists of one or more specific industry classifications.
The categories of industry classification for the Affiliated Investment Companies are represented in the Disclosure of Portfolio Holdings, which are included elsewhere within the report. Refer to the Schedule of Investments/Summary Schedule of Portfolio Holdings for each of the underlying Master Funds’ holdings which reflect the investments by category or country.
FEEDER FUNDS
| | |
| | | Affiliated Investment Companies |
U.S. Large Company Portfolio | | 100.0% |
U.S. Large Cap Value Portfolio | | 100.0% |
International Small Company Portfolio | | 100.0% |
Japanese Small Company Portfolio | | 100.0% |
Asia Pacific Small Company Portfolio | | 100.0% |
United Kingdom Small Company Portfolio | | 100.0% |
Continental Small Company Portfolio | | 100.0% |
DFA Global Real Estate Securities Portfolio | | 100.0% |
Emerging Markets Portfolio | | 100.0% |
Emerging Markets Small Cap Portfolio | | 100.0% |
39
DISCLOSURE OF PORTFOLIO HOLDINGS
CONTINUED
DOMESTIC AND INTERNATIONAL EQUITY PORTFOLIOS
| | |
| U.S. Targeted Value Portfolio |
Consumer Discretionary | | 18.1% |
Consumer Staples | | 3.5% |
Energy | | 8.5% |
Financials | | 22.6% |
Health Care | | 7.3% |
Industrials | | 14.8% |
Information Technology | | 18.2% |
Materials | | 6.2% |
Telecommunication Services | | 0.3% |
Utilities | | 0.5% |
| | |
| | 100.0% |
| | |
| U.S. Small Cap Value Portfolio |
Consumer Discretionary | | 18.3% |
Consumer Staples | | 3.0% |
Energy | | 8.7% |
Financials | | 22.6% |
Health Care | | 6.1% |
Industrials | | 18.2% |
Information Technology | | 16.5% |
Materials | | 6.3% |
Other | | — |
Telecommunication Services | | 0.3% |
Utilities | | — |
| | |
| | 100.0% |
| | |
| U.S. Core Equity 1 Portfolio |
Consumer Discretionary | | 12.7% |
Consumer Staples | | 9.0% |
Energy | | 10.1% |
Financials | | 15.7% |
Health Care | | 11.6% |
Industrials | | 12.1% |
Information Technology | | 17.3% |
Materials | | 4.9% |
Other | | — |
Telecommunication Services | | 2.7% |
Utilities | | 3.9% |
| | |
| | 100.0% |
| | |
| U.S. Core Equity 2 Portfolio |
Consumer Discretionary | | 14.5% |
Consumer Staples | | 7.2% |
Energy | | 10.4% |
Financials | | 19.4% |
Health Care | | 10.1% |
Industrials | | 12.9% |
Information Technology | | 14.6% |
Materials | | 5.2% |
Other | | — |
Telecommunication Services | | 3.1% |
Utilities | | 2.6% |
| | |
| | 100.0% |
| | |
| U.S. Vector Equity Portfolio |
Consumer Discretionary | | 16.3% |
Consumer Staples | | 5.2% |
Energy | | 10.0% |
Financials | | 23.3% |
Health Care | | 8.9% |
Industrials | | 13.0% |
Information Technology | | 14.3% |
Materials | | 5.6% |
Other | | — |
Telecommunication Services | | 1.9% |
Utilities | | 1.5% |
| | |
| | 100.0% |
| | |
| T.A. U.S. Core Equity 2 Portfolio |
Consumer Discretionary | | 14.8% |
Consumer Staples | | 6.8% |
Energy | | 10.3% |
Financials | | 18.5% |
Health Care | | 10.3% |
Industrials | | 13.5% |
Information Technology | | 14.8% |
Materials | | 4.8% |
Telecommunication Services | | 3.4% |
Utilities | | 2.8% |
| | |
| | 100.0% |
| | |
| U.S. Small Cap Portfolio |
Consumer Discretionary | | 18.1% |
Consumer Staples | | 4.2% |
Energy | | 5.6% |
Financials | | 12.8% |
Health Care | | 13.0% |
Industrials | | 17.3% |
Information Technology | | 20.6% |
Materials | | 5.0% |
Other | | — |
Telecommunication Services | | 1.1% |
Utilities | | 2.3% |
| | |
| | 100.0% |
| | |
| U.S. Micro Cap Portfolio |
Consumer Discretionary | | 17.6% |
Consumer Staples | | 4.8% |
Energy | | 3.5% |
Financials | | 14.5% |
Health Care | | 14.5% |
Industrials | | 16.7% |
Information Technology | | 21.3% |
Materials | | 4.2% |
Other | | — |
Telecommunication Services | | 1.2% |
Utilities | | 1.7% |
| | |
| | 100.0% |
| | |
| DFA Real Estate Securities Portfolio |
Real Estate Investment Trusts | | 100.0% |
| | |
| | 100.0% |
| | |
| Large Cap International Portfolio |
Consumer Discretionary | | 9.3% |
Consumer Staples | | 9.5% |
Energy | | 9.9% |
Financials | | 25.7% |
Health Care | | 7.5% |
Industrials | | 10.9% |
Information Technology | | 4.9% |
Materials | | 10.8% |
Other | | — |
Real Estate Investment Trusts | | — |
Telecommunication Services | | 6.0% |
Utilities | | 5.5% |
| | |
| | 100.0% |
| | |
| International Core Equity Portfolio |
Consumer Discretionary | | 13.3% |
Consumer Staples | | 6.8% |
Energy | | 8.4% |
Financials | | 26.8% |
Health Care | | 4.1% |
Industrials | | 16.2% |
Information Technology | | 5.4% |
Materials | | 13.0% |
Other | | 0.1% |
Real Estate Investment Trusts | | — |
Telecommunication Services | | 3.1% |
Utilities | | 2.8% |
| | |
| | 100.0% |
| | |
| T.A. World ex U.S. Core Equity Portfolio |
Consumer Discretionary | | 12.7% |
Consumer Staples | | 6.3% |
Energy | | 7.4% |
Financials | | 27.0% |
Health Care | | 4.0% |
Industrials | | 16.1% |
Information Technology | | 6.5% |
Materials | | 14.3% |
Other | | 0.1% |
Real Estate Investment Trusts | | — |
Telecommunication Services | | 2.8% |
Utilities | | 2.8% |
| | |
| | 100.0% |
DISCLOSURE OF PORTFOLIO HOLDINGS
CONTINUED
| | |
| DFA International Real Estate Securities Portfolio |
Financials | | 5.3% |
Other | | — |
Real Estate Investment Trusts | | 94.7% |
| | |
| | 100.0% |
| | |
| DFA International Small Cap Value Portfolio |
Consumer Discretionary | | 18.4% |
Consumer Staples | | 6.9% |
Energy | | 4.4% |
Financials | | 21.4% |
Health Care | | 1.8% |
Industrials | | 23.3% |
Information Technology | | 5.7% |
Materials | | 17.2% |
Other | | 0.1% |
Real Estate Investment Trusts | | 0.1% |
Telecommunication Services | | 0.3% |
Utilities | | 0.4% |
| | |
| | 100.0% |
| | |
| International Vector Equity Portfolio |
Consumer Discretionary | | 15.2% |
Consumer Staples | | 5.9% |
Energy | | 6.8% |
Financials | | 26.2% |
Health Care | | 3.5% |
Industrials | | 18.0% |
Information Technology | | 6.1% |
Materials | | 15.1% |
Other | | 0.1% |
Real Estate Investment Trusts | | — |
Telecommunication Services | | 1.7% |
Utilities | | 1.4% |
| | |
| | 100.0% |
| | |
| Emerging Markets Core Equity Portfolio |
Consumer Discretionary | | 10.2% |
Consumer Staples | | 6.6% |
Energy | | 9.1% |
Financials | | 23.5% |
Health Care | | 3.7% |
Industrials | | 11.3% |
Information Technology | | 9.9% |
Materials | | 16.2% |
Other | | 0.1% |
Real Estate Investment Trusts | | — |
Telecommunication Services | | 5.9% |
Utilities | | 3.5% |
| | |
| | 100.0% |
FIXED INCOME PORTFOLIOS
| | |
| Enhanced U.S. Large Company Portfolio |
Corporate | | 20.2% |
Government | | 21.0% |
Foreign Corporate | | 19.7% |
Foreign Government | | 34.3% |
Supranational | | 4.8% |
| | |
| | 100.0% |
| | |
| DFA One-Year Fixed Income Portfolio |
Corporate | | 43.2% |
Government | | 39.5% |
Foreign Corporate | | 7.2% |
Foreign Government | | 9.8% |
Supranational | | 0.3% |
| | |
| | 100.0% |
| | |
| DFA Two-Year Global Fixed Income Portfolio |
Corporate | | 13.2% |
Government | | 36.7% |
Foreign Corporate | | 13.4% |
Foreign Government | | 35.1% |
Supranational | | 1.6% |
| | |
| | 100.0% |
| | |
| DFA Selectively Hedged Global Fixed Income Portfolio |
Corporate | | 13.2% |
Government | | 25.9% |
Foreign Corporate | | 20.5% |
Foreign Government | | 30.5% |
Supranational | | 9.9% |
| | |
| | 100.0% |
| | |
| DFA Five-Year Government Portfolio |
Government | | 100.0% |
| | |
| | 100.0% |
| | |
| DFA Five-Year Global Fixed Income Portfolio |
Corporate | | 16.4% |
Government | | 29.9% |
Foreign Corporate | | 18.7% |
Foreign Government | | 22.3% |
Supranational | | 12.7% |
| | |
| | 100.0% |
| | |
| DFA Intermediate Government Fixed Income Portfolio |
Government | | 100.0% |
| | |
| | 100.0% |
| | |
| DFA Short-Term Extended Quality Portfolio |
Corporate | | 59.8% |
Government | | 6.7% |
Foreign Corporate | | 13.8% |
Foreign Government | | 18.3% |
Supranational | | 1.4% |
| | |
| | 100.0% |
| | |
| DFA Inflation-Protected Securities Portfolio |
Government | | 100.0% |
| | |
| | 100.0% |
| | |
| DFA Short-Term Municipal Bond Portfolio |
Muni Insured | | 30.3% |
Muni G.O. Local | | 30.0% |
Muni G.O. State | | 27.6% |
Muni Revenue | | 12.1% |
| | |
| | 100.0% |
| | |
| DFA California Short-Term Municipal Bond Portfolio |
Muni Insured | | 57.6% |
Muni G.O. Local | | 14.4% |
Muni G.O. State | | 15.7% |
Muni Revenue | | 12.3% |
| | |
| | 100.0% |
41
DFA INVESTMENT DIMENSIONS GROUP INC.
SCHEDULE OF INVESTMENTS
October 31, 2009
U.S. LARGE COMPANY PORTFOLIO
| | | |
| | | Value† |
AFFILIATED INVESTMENT COMPANY — (100.0%) | | | |
Investment in The U.S. Large Company Series of The DFA Investment Trust Company | | $ | 2,719,708,191 |
| | | |
| |
TOTAL INVESTMENTS IN AFFILIATED INVESTMENT COMPANY
(Cost $2,707,794,365) | | $ | 2,719,708,191 |
| | | |
Summary of inputs used to value the Portfolio’s net assets as of October 31, 2009 is as follows (See Security Valuation Note):
| | | | | | | | | | |
| | | Valuation Inputs |
| |
| | | Investment in Securities (Market Value) |
| | | Level 1 | | Level 2 | | Level 3 | | Total |
Affiliated Investment Company | | $ | 2,719,708,191 | | — | | — | | $ | 2,719,708,191 |
See accompanying Notes to Financial Statements.
42
ENHANCED U.S. LARGE COMPANY PORTFOLIO
SCHEDULE OF INVESTMENTS
October 31, 2009
| | | | | |
| | | Face
Amount^ | | Value† |
| | | (000) | | |
BONDS — (70.1%) | | | | | |
AUSTRALIA — (4.8%) | | | | | |
Australia & New Zealand Banking Group, Ltd. | | | | | |
(u) 4.875%, 11/08/10 | | 3,258 | | $ | 3,351,439 |
(u) 5.500%, 05/24/11 | | 1,000 | | | 1,052,732 |
Commonwealth Bank of Australia | | | | | |
(u) 4.750%, 01/27/11 | | 434 | | | 447,160 |
(g) 6.000%, 03/18/11 | | 1,000 | | | 1,729,714 |
National Australia Bank, Ltd. | | | | | |
(u) 5.125%, 03/08/10 | | 1,500 | | | 1,520,665 |
| | | | | |
TOTAL AUSTRALIA | | | | | 8,101,710 |
| | | | | |
| | |
AUSTRIA — (3.4%) | | | | | |
ASFINAG | | | | | |
(u) 4.750%, 11/17/10 | | 3,500 | | | 3,639,191 |
Oesterreichische Kontrollbank AG | | | | | |
(u) 2.875%, 03/15/11 | | 1,000 | | | 1,030,422 |
Republic of Austria | | | | | |
(u) 4.375%, 08/30/10 | | 1,000 | | | 1,030,087 |
| | | | | |
TOTAL AUSTRIA | | | | | 5,699,700 |
| | | | | |
| | |
CANADA — (8.1%) | | | | | |
Canada Housing Trust | | | | | |
4.600%, 09/15/11 | | 2,000 | | | 1,956,934 |
Canadian Government Bond | | | | | |
1.250%, 06/01/11 | | 2,500 | | | 2,318,747 |
Ontario, Province of Canada | | | | | |
(u) 3.125%, 09/08/10 | | 3,400 | | | 3,475,361 |
Royal Bank of Canada | | | | | |
(u) 5.650%, 07/20/11 | | 1,500 | | | 1,611,332 |
(e) 5.750%, 07/25/11 | | 2,000 | | | 3,130,774 |
Toronto-Dominion Bank | | | | | |
(g) 6.875%, 06/24/11 | | 650 | | | 1,147,065 |
| | | | | |
TOTAL CANADA | | | | | 13,640,213 |
| | | | | |
| | |
FRANCE — (3.1%) | | | | | |
Agence Francaise de Developpement | | | | | |
(u) 4.125%, 06/24/11 | | 1,500 | | | 1,565,511 |
Caisse D’amortissement de la Dette Sociale | | | | | |
(u) 4.250%, 11/08/10 | | 3,500 | | | 3,615,916 |
| | | | | |
TOTAL FRANCE | | | | | 5,181,427 |
| | | | | |
| | | | | |
| | | Face
Amount^ | | Value† |
| | | (000) | | |
| | | | | |
GERMANY — (7.4%) | | | | | |
Kreditanstalt fuer Wiederaufbau | | | | | |
(u) 4.625%, 01/20/11 | | 3,000 | | $ | 3,132,237 |
(g) 4.375%, 03/07/11 | | 600 | | | 1,024,404 |
Landeskreditbank Baden-Wuerttemberg Foerderbank | | | | | |
(u) 3.250%, 10/29/10 | | 4,000 | | | 4,089,112 |
Landwirtschaftliche Rentenbank | | | | | |
(u) 4.250%, 01/21/11 | | 4,000 | | | 4,156,204 |
| | | | | |
TOTAL GERMANY | | | | | 12,401,957 |
| | | | | |
| | |
JAPAN — (0.6%) | | | | | |
Japan Finance Corp. | | | | | |
(u) 2.000%, 06/24/11 | | 1,000 | | | 1,015,621 |
| | | | | |
| | |
NETHERLANDS — (10.0%) | | | | | |
Bank Nederlandse Gemeenten | | | | | |
(u) 3.375%, 12/15/10 | | 3,000 | | | 3,076,824 |
(u) 3.375%, 01/18/11 | | 800 | | | 822,731 |
Deutsche Bahn Finance | | | | | |
(u) 5.125%, 01/05/11 | | 4,500 | | | 4,678,285 |
Nederlandse Waterschapsbank | | | | | |
(u) 2.875%, 06/16/11 | | 4,000 | | | 4,100,980 |
Rabobank Nederland | | | | | |
(u) 5.000%, 02/15/11 | | 2,200 | | | 2,306,971 |
(g) 5.000%, 04/11/11 | | 1,000 | | | 1,708,046 |
| | | | | |
TOTAL NETHERLANDS | | | | | 16,693,837 |
| | | | | |
| | |
NORWAY — (2.5%) | | | | | |
Kommunalbanken | | | | | |
(u) 3.250%, 06/15/11 | | 4,000 | | | 4,129,264 |
| | | | | |
| | |
SPAIN — (2.7%) | | | | | |
Instituto de Credito Oficial | | | | | |
(u) 4.625%, 10/26/10 | | 3,400 | | | 3,519,112 |
(u) 1.875%, 04/15/11 | | 1,000 | | | 1,013,200 |
| | | | | |
TOTAL SPAIN | | | | | 4,532,312 |
| | | | | |
| | |
SUPRANATIONAL ORGANIZATION OBLIGATIONS — (4.6%) | | | | | |
Council of Europe Development Bank | | | | | |
(u) 6.125%, 01/25/11 | | 2,000 | | | 2,121,490 |
Inter-American Development Bank | | | | | |
(u) 5.000%, 04/05/11 | | 1,500 | | | 1,586,520 |
43
ENHANCED U.S. LARGE COMPANY PORTFOLIO
CONTINUED
| | | | | |
| | | Face
Amount^ | | Value† |
| | | (000) | | |
| | |
SUPRANATIONAL ORGANIZATION OBLIGATIONS — (Continued) | | | | | |
Nordic Investment Bank | | | | | |
(u) 4.875%, 03/15/11 | | 3,840 | | $ | 4,060,401 |
| | | | | |
| | |
TOTAL SUPRANATIONAL ORGANIZATION OBLIGATIONS | | | | | 7,768,411 |
| | | | | |
| | |
SWEDEN — (3.3%) | | | | | |
Kommuninvest I Sverige | | | | | |
(u) 5.375%, 06/15/11 | | 1,000 | | | 1,061,023 |
Svensk Exportkredit AB | | | | | |
(u) 4.000%, 06/15/10 | | 4,332 | | | 4,424,800 |
| | | | | |
TOTAL SWEDEN | | | | | 5,485,823 |
| | | | | |
| | |
UNITED KINGDOM — (5.7%) | | | | | |
BP Capital Markets P.L.C. Floating Rate Note | | | | | |
(r)(u)1.293%, 03/17/11 | | 2,000 | | | 2,027,078 |
Network Rail Infrastructure Finance P.L.C. | | | | | |
(u) 3.000%, 01/24/11 | | 3,115 | | | 3,191,031 |
United Kingdom Gilt | | | | | |
9.000%, 07/12/11 | | 2,300 | | | 4,272,379 |
| | | | | |
TOTAL UNITED KINGDOM | | | | | 9,490,488 |
| | | | | |
| | |
UNITED STATES — (13.9%) | | | | | |
CME Group, Inc. Floating Rate Note | | | | | |
(r) 1.121%, 08/06/10 | | $4,000 | | | 4,019,660 |
General Electric Capital Corp. Floating Rate Note | | | | | |
(r) 0.933%, 02/01/11 | | 4,000 | | | 3,982,756 |
John Deere Capital Corp. Floating Rate Note | | | | | |
(r) 0.837%, 02/26/10 | | 4,000 | | | 4,005,840 |
JPMorgan Chase & Co. Floating Rate Note | | | | | |
(r) 0.781%, 11/19/09 | | 2,000 | | | 2,000,504 |
(r) 1.050%, 06/13/11 | | 1,800 | | | 1,812,994 |
Procter & Gamble International Funding Floating Rate Note | | | | | |
(r) 0.478%, 05/07/10 | | 400 | | | 399,620 |
Toyota Motor Credit Corp. Floating Rate Note | | | | | |
(r) 0.345%, 06/16/10 | | 1,000 | | | 1,000,631 |
(r) 0.384%, 10/04/11 | | 2,000 | | | 1,996,186 |
| | | | | | |
| | | Face
Amount | | Value† |
| | | (000) | | |
| | |
UNITED STATES — (Continued) | | | | | | |
Wells Fargo Bank & Co. | | | | | | |
4.625%, 08/09/10 | | $ | 4,000 | | $ | 4,121,152 |
| | | | | | |
TOTAL UNITED STATES | | | | | | 23,339,343 |
| | | | | | |
TOTAL BONDS | | | | | | 117,480,106 |
| | | | | | |
| | |
AGENCY OBLIGATIONS — (18.0%) | | | | | | |
Federal Farm Credit Bank | | | | | | |
1.125%, 10/03/11 | | | 2,000 | | | 1,998,506 |
Federal Home Loan Bank | | | | | | |
1.625%, 03/16/11 | | | 1,000 | | | 1,013,162 |
1.375%, 05/16/11 | | | 1,500 | | | 1,514,568 |
3.750%, 09/09/11 | | | 2,000 | | | 2,105,046 |
v 3.625%, 09/16/11 | | | 4,200 | | | 4,414,070 |
Federal Home Loan Bank Discount Note | | | | | | |
(y) 0.077%, 12/11/09 | | | 15,000 | | | 14,999,028 |
Federal Home Loan Mortgage Corporation | | | | | | |
6.000%, 06/15/11 | | | 1,000 | | | 1,083,118 |
Federal National Mortgage Association | | | | | | |
3.375%, 05/19/11 | | | 3,000 | | | 3,122,145 |
| | | | | | |
TOTAL AGENCY OBLIGATIONS | | | | | | 30,249,643 |
| | | | | | |
| | |
COMMERCIAL PAPER — (8.4%) | | | | | | |
Bank of America Corp. | | | | | | |
0.100%, 11/02/09 | | | 2,500 | | | 2,499,986 |
Caisse Cent Desjardins Du Quebec | | | | | | |
0.310%, 11/19/09 | | | 2,000 | | | 1,999,728 |
Ireland | | | | | | |
0.400%, 11/20/09 | | | 2,000 | | | 1,999,711 |
PACCAR Financial Corp. | | | | | | |
0.200%, 12/17/09 | | | 2,000 | | | 1,999,408 |
Procter & Gamble International Funding | | | | | | |
0.220%, 11/02/09 | | | 2,000 | | | 1,999,971 |
Queensland Treasury Corp. | | | | | | |
0.190%, 12/15/09 | | | 2,000 | | | 1,999,438 |
Total Capital | | | | | | |
0.170%, 12/30/09 | | | 1,500 | | | 1,499,570 |
| | | | | | |
TOTAL COMMERCIAL PAPER | | | | | | 13,997,812 |
| | | | | | |
| | |
| | | Shares | | |
EXCHANGE-TRADED FUND — (2.7%) | | | | | | |
UNITED STATES — (2.7%) | | | | | | |
SPDR Trust Series I | | | 44,100 | | | 4,566,996 |
| | | | | | |
44
ENHANCED U.S. LARGE COMPANY PORTFOLIO
CONTINUED
| | | | | |
| | | Shares | | Value† |
| | |
TEMPORARY CASH INVESTMENTS — (0.8%) | | | | | |
BlackRock Liquidity Funds Tempcash Portfolio - Institutional Shares | | 1,327,514 | | $ | 1,327,514 |
| | | | | |
| | | |
| | | Value† |
| |
TOTAL INVESTMENTS — (100.0%)
(Cost $165,748,889) | | $ | 167,622,071 |
| | | |
Summary of inputs used to value the Portfolio’s net assets as of October 31, 2009 is as follows (See Security Valuation Note):
| | | | | | | | | | | |
| | | Valuation Inputs |
| |
| | | Investment in Securities (Market Value) |
| | | Level 1 | | Level 2 | | Level 3 | | Total |
Bonds | | $ | — | | $ | 117,480,106 | | — | | $ | 117,480,106 |
Agency Obligations | | | — | | | 30,249,643 | | — | | | 30,249,643 |
Commercial Paper | | | — | | | 13,997,812 | | — | | | 13,997,812 |
Exchange-Traded Fund | | | 4,566,996 | | | — | | — | | | 4,566,996 |
Temporary Cash Investments | | | 1,327,514 | | | — | | — | | | 1,327,514 |
Other Financial Instruments** | | | 1,705,113 | | | 38,625 | | — | | | 1,743,738 |
| | | | | | | | | | | |
| | | | |
TOTAL | | $ | 7,599,623 | | $ | 161,766,186 | | — | | $ | 169,365,809 |
| | | | | | | | | | | |
| | ** | Other financial instruments are derivative instruments not reflected in the Schedule of Investments, such as futures and forwards which are valued at the unrealized appreciation/depreciation on the investment. |
See accompanying Notes to Financial Statements.
45
DFA INVESTMENT DIMENSIONS GROUP INC.
SCHEDULE OF INVESTMENTS
October 31, 2009
U.S. LARGE CAP VALUE PORTFOLIO
| | | |
| | | Value† |
AFFILIATED INVESTMENT COMPANY — (100.0%) | | | |
Investment in The U.S. Large Cap Value Series of The DFA Investment Trust Company | | $ | 5,864,670,633 |
| | | |
| |
TOTAL INVESTMENTS IN AFFILIATED INVESTMENT COMPANY
(Cost $4,959,195,121) | | $ | 5,864,670,633 |
| | | |
Summary of inputs used to value the Portfolio’s net assets as of October 31, 2009 is as follows (See Security Valuation Note):
| | | | | | | | | | |
| | | Valuation Inputs |
| |
| | | Investment in Securities (Market Value) |
| | | Level 1 | | Level 2 | | Level 3 | | Total |
Affiliated Investment Company | | $ | 5,864,670,633 | | — | | — | | $ | 5,864,670,633 |
See accompanying Notes to Financial Statements.
46
U.S. TARGETED VALUE PORTFOLIO
SUMMARY SCHEDULE OF PORTFOLIO HOLDINGS
October 31, 2009
| | | | | | | |
| | | Shares | | Value† | | Percentage
of Net Assets** |
COMMON STOCKS — (83.3%) | | | | | | | |
Consumer Discretionary — (15.1%) | | | | | | | |
#*AutoNation, Inc. | | 285,685 | | $ | 4,925,209 | | 0.3% |
Cinemark Holdings, Inc. | | 382,492 | | | 4,433,082 | | 0.3% |
#*Collective Brands, Inc. | | 278,432 | | | 5,164,914 | | 0.4% |
#Jarden Corp. | | 239,973 | | | 6,572,860 | | 0.5% |
#*Mohawk Industries, Inc. | | 102,954 | | | 4,409,520 | | 0.3% |
#*Penske Automotive Group, Inc. | | 322,318 | | | 5,047,500 | | 0.3% |
Phillips-Van Heusen Corp. | | 104,053 | | | 4,177,728 | | 0.3% |
#*Royal Caribbean Cruises, Ltd. | | 278,627 | | | 5,636,624 | | 0.4% |
#*Toll Brothers, Inc. | | 269,219 | | | 4,662,873 | | 0.3% |
#Whirlpool Corp. | | 110,030 | | | 7,877,048 | | 0.5% |
#Wyndham Worldwide Corp. | | 271,939 | | | 4,636,560 | | 0.3% |
Other Securities | | | | | 211,275,934 | | 14.2% |
| | | | | | | |
Total Consumer Discretionary | | | | | 268,819,852 | | 18.1% |
| | | | | | | |
| | | |
Consumer Staples — (2.9%) | | | | | | | |
*Constellation Brands, Inc. Class A | | 282,958 | | | 4,476,396 | | 0.3% |
Del Monte Foods Co. | | 386,240 | | | 4,171,392 | | 0.3% |
#PepsiAmericas, Inc. | | 160,714 | | | 4,699,277 | | 0.3% |
Other Securities | | | | | 38,325,835 | | 2.6% |
| | | | | | | |
Total Consumer Staples | | | | | 51,672,900 | | 3.5% |
| | | | | | | |
| | | |
Energy — (7.1%) | | | | | | | |
#Cimarex Energy Co. | | 126,477 | | | 4,952,839 | | 0.3% |
#Pioneer Natural Resources Co. | | 149,975 | | | 6,165,472 | | 0.4% |
*Plains Exploration & Production Co. | | 155,941 | | | 4,132,436 | | 0.3% |
*Whiting Petroleum Corp. | | 72,600 | | | 4,094,640 | | 0.3% |
Other Securities | | | | | 106,147,722 | | 7.2% |
| | | | | | | |
Total Energy | | | | | 125,493,109 | | 8.5% |
| | | | | | | |
| | | |
Financials — (18.9%) | | | | | | | |
American Financial Group, Inc. | | 221,530 | | | 5,449,638 | | 0.3% |
#*AmeriCredit Corp. | | 308,822 | | | 5,450,708 | | 0.4% |
First American Corp. | | 179,565 | | | 5,456,980 | | 0.4% |
*First Horizon National Corp. | | 346,956 | | | 4,104,489 | | 0.3% |
Genworth Financial, Inc. | | 545,763 | | | 5,796,003 | | 0.4% |
Hanover Insurance Group, Inc. | | 99,669 | | | 4,192,078 | | 0.3% |
HCC Insurance Holdings, Inc. | | 177,467 | | | 4,683,354 | | 0.3% |
Huntington Bancshares, Inc. | | 1,168,996 | | | 4,453,875 | | 0.3% |
#Old Republic International Corp. | | 431,692 | | | 4,610,471 | | 0.3% |
Reinsurance Group of America, Inc. | | 119,151 | | | 5,492,861 | | 0.4% |
Transatlantic Holdings, Inc. | | 115,613 | | | 5,838,456 | | 0.4% |
White Mountains Insurance Group, Ltd. | | 15,966 | | | 4,952,174 | | 0.3% |
Other Securities | | | | | 274,940,649 | | 18.5% |
| | | | | | | |
Total Financials | | | | | 335,421,736 | | 22.6% |
| | | | | | | |
| | | |
Health Care — (6.1%) | | | | | | | |
#*Community Health Systems, Inc. | | 178,748 | | | 5,591,237 | | 0.4% |
#*Inverness Medical Innovations, Inc. | | 131,000 | | | 4,979,310 | | 0.3% |
*King Pharmaceuticals, Inc. | | 479,100 | | | 4,853,283 | | 0.3% |
Other Securities | | | | | 92,153,883 | | 6.2% |
| | | | | | | |
Total Health Care | | | | | 107,577,713 | | 7.2% |
| | | | | | | |
| | | |
Industrials — (12.3%) | | | | | | | |
Applied Industrial Technologies, Inc. | | 202,120 | | | 4,088,888 | | 0.3% |
Masco Corp. | | 483,152 | | | 5,677,036 | | 0.4% |
#Ryder System, Inc. | | 101,652 | | | 4,121,989 | | 0.3% |
47
U.S. TARGETED VALUE PORTFOLIO
CONTINUED
| | | | | | | |
| | | Shares | | Value† | | Percentage
of Net Assets** |
Industrials — (Continued) | | | | | | | |
Other Securities | | | | $ | 205,535,777 | | 13.8% |
| | | | | | | |
Total Industrials | | | | | 219,423,690 | | 14.8% |
| | | | | | | |
| | | |
Information Technology — (15.2%) | | | | | | | |
*3Com Corp. | | 1,419,866 | | | 7,298,111 | | 0.5% |
*Arrow Electronics, Inc. | | 227,021 | | | 5,752,712 | | 0.4% |
*Avnet, Inc. | | 196,527 | | | 4,869,939 | | 0.3% |
*Benchmark Electronics, Inc. | | 298,403 | | | 5,013,170 | | 0.3% |
#*Cypress Semiconductor Corp. | | 579,563 | | | 4,885,716 | | 0.3% |
*Euronet Worldwide, Inc. | | 170,179 | | | 4,024,733 | | 0.3% |
Fidelity National Information Services, Inc. | | 259,600 | | | 5,648,896 | | 0.4% |
*IAC/InterActiveCorp. | | 221,621 | | | 4,197,502 | | 0.3% |
*Ingram Micro, Inc. | | 317,283 | | | 5,600,045 | | 0.4% |
Jabil Circuit, Inc. | | 387,509 | | | 5,184,870 | | 0.3% |
#*Rovi Corp. | | 191,465 | | | 5,274,861 | | 0.4% |
*Tech Data Corp. | | 220,978 | | | 8,492,185 | | 0.6% |
Other Securities | | | | | 203,236,729 | | 13.7% |
| | | | | | | |
Total Information Technology | | | | | 269,479,469 | | 18.2% |
| | | | | | | |
| | | |
Materials — (5.1%) | | | | | | | |
Cabot Corp. | | 204,579 | | | 4,486,417 | | 0.3% |
#MeadWestavco Corp. | | 313,877 | | | 7,165,812 | | 0.5% |
Other Securities | | | | | 79,535,488 | | 5.3% |
| | | | | | | |
Total Materials | | | | | 91,187,717 | | 6.1% |
| | | | | | | |
| | | |
Telecommunication Services — (0.2%) | | | | | | | |
Other Securities | | | | | 4,169,050 | | 0.3% |
| | | | | | | |
| | | |
Utilities — (0.4%) | | | | | | | |
Other Securities | | | | | 7,562,210 | | 0.5% |
| | | | | | | |
TOTAL COMMON STOCKS | | | | | 1,480,807,446 | | 99.8% |
| | | | | | | |
RIGHTS/WARRANTS — (0.0%) | | | | | | | |
Other Securities | | | | | 969 | | 0.0% |
| | | | | | | |
| | | |
TEMPORARY CASH INVESTMENTS — (0.9%) | | | | | | | |
BlackRock Liquidity Funds Tempcash Portfolio - Institutional Shares | | 15,296,895 | | | 15,296,895 | | 1.0% |
| | | | | | | |
| | | |
| | | Shares/ Face Amount | | | | |
| | | (000) | | | | |
SECURITIES LENDING COLLATERAL — (15.8%) | | | | | | | |
§@DFA Short Term Investment Fund LP | | 278,907,219 | | | 278,907,219 | | 18.8% |
@Repurchase Agreement, Deutsche Bank Securities 0.08%, 11/02/09 (Collateralized by $2,598,967 FHLMC 5.793%(r), 01/01/37, valued at $1,459,993) to be repurchased at $1,417,478 | | $1,417 | | | 1,417,469 | | 0.1% |
| | | | | | | |
| | | |
TOTAL SECURITIES LENDING COLLATERAL | | | | | 280,324,688 | | 18.9% |
| | | | | | | |
| | | |
TOTAL INVESTMENTS — (100.0%)
(Cost $1,874,838,984) | | | | $ | 1,776,429,998 | | 119.7% |
| | | | | | | |
48
U.S. TARGETED VALUE PORTFOLIO
CONTINUED
Summary of inputs used to value the Portfolio’s net assets as of October 31, 2009 is as follows (See Security Valuation Note):
| | | | | | | | | | | |
| | | Valuation Inputs |
| |
| | | Investment in Securities (Market Value) |
| | | Level 1 | | Level 2 | | Level 3 | | Total |
Common Stocks | | | | | | | | | | | |
Consumer Discretionary | | $ | 268,812,122 | | $ | 7,730 | | — | | $ | 268,819,852 |
Consumer Staples | | | 51,672,900 | | | — | | — | | | 51,672,900 |
Energy | | | 125,493,109 | | | — | | — | | | 125,493,109 |
Financials | | | 335,421,736 | | | — | | — | | | 335,421,736 |
Health Care | | | 107,577,713 | | | — | | — | | | 107,577,713 |
Industrials | | | 219,423,690 | | | — | | — | | | 219,423,690 |
Information Technology | | | 269,476,519 | | | 2,950 | | — | | | 269,479,469 |
Materials | | | 91,187,717 | | | — | | — | | | 91,187,717 |
Telecommunication Services | | | 4,169,050 | | | — | | — | | | 4,169,050 |
Utilities | | | 7,562,210 | | | — | | — | | | 7,562,210 |
Rights/Warrants | | | 969 | | | — | | — | | | 969 |
Temporary Cash Investments | | | 15,296,895 | | | — | | — | | | 15,296,895 |
Securities Lending Collateral | | | — | | | 280,324,688 | | — | | | 280,324,688 |
| | | | | | | | | | | |
| | | | |
TOTAL | | $ | 1,496,094,630 | | $ | 280,335,368 | | — | | $ | 1,776,429,998 |
| | | | | | | | | | | |
See accompanying Notes to Financial Statements.
49
U.S. SMALL CAP VALUE PORTFOLIO
SUMMARY SCHEDULE OF PORTFOLIO HOLDINGS
October 31, 2009
| | | | | | | |
| | | Shares | | Value† | | Percentage
of Net Assets** |
COMMON STOCKS — (86.3%) | | | | | | | |
Consumer Discretionary — (15.8%) | | | | | | | |
#American Greetings Corp. Class A | | 1,904,200 | | $ | 38,731,428 | | 0.7% |
Bob Evans Farms, Inc. | | 984,921 | | | 25,873,875 | | 0.4% |
Foot Locker, Inc. | | 2,143,946 | | | 22,468,554 | | 0.4% |
Jarden Corp. | | 1,909,448 | | | 52,299,781 | | 0.9% |
Jones Apparel Group, Inc. | | 1,788,255 | | | 31,991,882 | | 0.6% |
#*Penske Automotive Group, Inc. | | 2,028,957 | | | 31,773,467 | | 0.6% |
#Scholastic Corp. | | 1,711,917 | | | 42,575,376 | | 0.7% |
Other Securities | | | | | 793,297,778 | | 14.0% |
| | | | | | | |
Total Consumer Discretionary | | | | | 1,039,012,141 | | 18.3% |
| | | | | | | |
| | | |
Consumer Staples — (2.6%) | | | | | | | |
#*Hain Celestial Group, Inc. | | 1,303,172 | | | 22,857,637 | | 0.4% |
#Universal Corp. | | 653,753 | | | 27,189,587 | | 0.5% |
Other Securities | | | | | 119,553,794 | | 2.1% |
| | | | | | | |
Total Consumer Staples | | | | | 169,601,018 | | 3.0% |
| | | | | | | |
| | | |
Energy — (7.5%) | | | | | | | |
*Bristow Group, Inc. | | 929,038 | | | 27,081,458 | | 0.5% |
#*Helix Energy Solutions Group, Inc. | | 1,727,104 | | | 23,713,138 | | 0.4% |
#Overseas Shipholding Group, Inc. | | 736,187 | | | 28,895,340 | | 0.5% |
#*SEACOR Holdings, Inc. | | 312,838 | | | 25,424,344 | | 0.5% |
Other Securities | | | | | 385,596,115 | | 6.8% |
| | | | | | | |
Total Energy | | | | | 490,710,395 | | 8.7% |
| | | | | | | |
| | | |
Financials — (19.5%) | | | | | | | |
#*AmeriCredit Corp. | | 2,109,220 | | | 37,227,733 | | 0.7% |
*Argo Group International Holdings, Ltd. | | 919,019 | | | 31,209,885 | | 0.5% |
Delphi Financial Group, Inc. Class A | | 1,232,969 | | | 26,755,427 | | 0.5% |
Infinity Property & Casualty Corp. | | 579,946 | | | 22,426,512 | | 0.4% |
*Navigators Group, Inc. | | 458,215 | | | 24,317,470 | | 0.4% |
#NewAlliance Bancshares, Inc. | | 3,348,207 | | | 37,098,134 | | 0.6% |
#*PHH Corp. | | 1,619,647 | | | 26,173,496 | | 0.5% |
#Prosperity Bancshares, Inc. | | 777,550 | | | 27,828,514 | | 0.5% |
Provident Financial Services, Inc. | | 2,524,606 | | | 27,139,514 | | 0.5% |
Selective Insurance Group, Inc. | | 1,931,259 | | | 29,586,888 | | 0.5% |
Unitrin, Inc. | | 1,168,143 | | | 22,895,603 | | 0.4% |
Washington Federal, Inc. | | 1,442,759 | | | 24,743,317 | | 0.4% |
#Wintrust Financial Corp. | | 865,512 | | | 24,416,094 | | 0.4% |
Other Securities | | | | | 916,613,580 | | 16.2% |
| | | | | | | |
Total Financials | | | �� | | 1,278,432,167 | | 22.5% |
| | | | | | | |
| | | |
Health Care — (5.2%) | | | | | | | |
*Kindred Healthcare, Inc. | | 1,556,280 | | | 22,877,316 | | 0.4% |
#*LifePoint Hospitals, Inc. | | 1,732,785 | | | 49,089,799 | | 0.9% |
Other Securities | | | | | 271,704,113 | | 4.8% |
| | | | | | | |
Total Health Care | | | | | 343,671,228 | | 6.1% |
| | | | | | | |
| | | |
Industrials — (15.8%) | | | | | | | |
#Alexander & Baldwin, Inc. | | 1,094,786 | | | 31,562,680 | | 0.6% |
#Applied Industrial Technologies, Inc. | | 1,273,350 | | | 25,759,871 | | 0.4% |
#Briggs & Stratton Corp. | | 1,918,846 | | | 35,882,420 | | 0.6% |
*EnerSys, Inc. | | 1,239,788 | | | 27,399,315 | | 0.5% |
*Esterline Technologies Corp. | | 1,043,023 | | | 43,921,699 | | 0.8% |
#GATX Corp. | | 1,374,465 | | | 37,357,959 | | 0.7% |
*MPS Group, Inc. | | 2,729,886 | | | 36,908,059 | | 0.6% |
*Oshkosh Truck Corp. Class B | | 1,447,301 | | | 45,242,629 | | 0.8% |
50
U.S. SMALL CAP VALUE PORTFOLIO
CONTINUED
| | | | | | | |
| | | Shares | | Value† | | Percentage
of Net Assets** |
Industrials — (Continued) | | | | | | | |
Seaboard Corp. | | 18,999 | | $ | 25,667,649 | | 0.4% |
SkyWest, Inc. | | 1,621,728 | | | 22,655,540 | | 0.4% |
#Trinity Industries, Inc. | | 1,569,201 | | | 26,488,113 | | 0.5% |
Watts Water Technologies, Inc. | | 882,816 | | | 24,939,552 | | 0.4% |
Other Securities | | | | | 650,146,702 | | 11.5% |
| | | | | | | |
Total Industrials | | | | | 1,033,932,188 | | 18.2% |
| | | | | | | |
| | | |
Information Technology — (14.2%) | | | | | | | |
*Benchmark Electronics, Inc. | | 2,841,081 | | | 47,730,161 | | 0.8% |
#*Coherent, Inc. | | 952,417 | | | 23,934,239 | | 0.4% |
*Integrated Device Technology, Inc. | | 3,811,553 | | | 22,411,932 | | 0.4% |
*MKS Instruments, Inc. | | 1,978,214 | | | 30,939,267 | | 0.6% |
#*Skyworks Solutions, Inc. | | 3,593,575 | | | 37,480,987 | | 0.7% |
#*SYNNEX Corp. | | 978,845 | | | 25,185,682 | | 0.4% |
*Tech Data Corp. | | 1,314,127 | | | 50,501,901 | | 0.9% |
Other Securities | | | | | 696,324,463 | | 12.3% |
| | | | | | | |
Total Information Technology | | | | | 934,508,632 | | 16.5% |
| | | | | | | |
| | | |
Materials — (5.4%) | | | | | | | |
#*Coeur d’Alene Mines Corp. | | 1,229,731 | | | 24,692,998 | | 0.5% |
#*OM Group, Inc. | | 836,126 | | | 22,592,125 | | 0.4% |
#Westlake Chemical Corp. | | 1,707,624 | | | 41,478,187 | | 0.7% |
Other Securities | | | | | 266,133,234 | | 4.7% |
| | | | | | | |
Total Materials | | | | | 354,896,544 | | 6.3% |
| | | | | | | |
| | | |
Other — (0.0%) | | | | | | | |
Other Securities | | | | | 14,709 | | 0.0% |
| | | | | | | |
| | | |
Telecommunication Services — (0.3%) | | | | | | | |
Other Securities | | | | | 19,487,174 | | 0.3% |
| | | | | | | |
| | | |
Utilities — (0.0%) | | | | | | | |
Other Securities | | | | | 1,886,349 | | 0.0% |
| | | | | | | |
TOTAL COMMON STOCKS | | | | | 5,666,152,545 | | 99.9% |
| | | | | | | |
RIGHTS/WARRANTS — (0.0%) | | | | | | | |
Other Securities | | | | | 8,086 | | 0.0% |
| | | | | | | |
| | | |
| | | Shares/ Face Amount | | | | |
| | | (000) | | | | |
SECURITIES LENDING COLLATERAL — (13.7%) | | | | | | | |
§@DFA Short Term Investment Fund LP | | 891,912,224 | | | 891,912,224 | | 15.7% |
@Repurchase Agreement, Deutsche Bank Securities 0.08%, 11/02/09 (Collateralized by $12,306,408 FHLMC 5.945%(r), 07/01/37, valued at $9,454,190) to be repurchased at $9,178,886 | | $9,179 | | | 9,178,825 | | 0.2% |
| | | | | | | |
| | | |
TOTAL SECURITIES LENDING COLLATERAL | | | | | 901,091,049 | | 15.9% |
| | | | | | | |
| | | |
TOTAL INVESTMENTS — (100.0%)
(Cost $7,346,609,773) | | | | $ | 6,567,251,680 | | 115.8% |
| | | | | | | |
51
U.S. SMALL CAP VALUE PORTFOLIO
CONTINUED
Summary of inputs used to value the Portfolio’s net assets as of October 31, 2009 is as follows (See Security Valuation Note):
| | | | | | | | | | | |
| | | Valuation Inputs |
| |
| | | Investment in Securities (Market Value) |
| | | Level 1 | | Level 2 | | Level 3 | | Total |
Common Stocks | | | | | | | | | | | |
Consumer Discretionary | | $ | 1,038,674,739 | | $ | 337,402 | | — | | $ | 1,039,012,141 |
Consumer Staples | | | 169,601,018 | | | — | | — | | | 169,601,018 |
Energy | | | 490,710,395 | | | — | | — | | | 490,710,395 |
Financials | | | 1,278,432,167 | | | — | | — | | | 1,278,432,167 |
Health Care | | | 343,010,581 | | | 660,647 | | — | | | 343,671,228 |
Industrials | | | 1,033,932,188 | | | — | | — | | | 1,033,932,188 |
Information Technology | | | 934,303,993 | | | 204,639 | | — | | | 934,508,632 |
Materials | | | 354,896,544 | | | — | | — | | | 354,896,544 |
Other | | | — | | | 14,709 | | — | | | 14,709 |
Telecommunication Services | | | 19,487,174 | | | — | | — | | | 19,487,174 |
Utilities | | | 1,886,349 | | | — | | — | | | 1,886,349 |
Rights/Warrants | | | 8,086 | | | — | | — | | | 8,086 |
Securities Lending Collateral | | | — | | | 901,091,049 | | — | | | 901,091,049 |
| | | | | | | | | | | |
| | | | |
TOTAL | | $ | 5,664,943,234 | | $ | 902,308,446 | | — | | $ | 6,567,251,680 |
| | | | | | | | | | | |
See accompanying Notes to Financial Statements.
52
U.S. CORE EQUITY 1 PORTFOLIO
SUMMARY SCHEDULE OF PORTFOLIO HOLDINGS
October 31, 2009
| | | | | | | |
| | | Shares | | Value† | | Percentage
of Net Assets** |
COMMON STOCKS — (87.6%) | | | | | | | |
Consumer Discretionary — (11.1%) | | | | | | | |
*Amazon.com, Inc. | | 49,380 | | $ | 5,866,838 | | 0.3% |
Comcast Corp. Class A | | 347,609 | | | 5,040,331 | | 0.3% |
Disney (Walt) Co. | | 289,025 | | | 7,910,614 | | 0.4% |
#Home Depot, Inc. | | 200,625 | | | 5,033,681 | | 0.2% |
McDonald’s Corp. | | 124,831 | | | 7,316,345 | | 0.4% |
Time Warner, Inc. | | 188,821 | | | 5,687,289 | | 0.3% |
Other Securities | | | | | 215,017,573 | | 10.8% |
| | | | | | | |
Total Consumer Discretionary | | | | | 251,872,671 | | 12.7% |
| | | | | | | |
| | | |
Consumer Staples — (7.9%) | | | | | | | |
Coca-Cola Co. | | 250,108 | | | 13,333,257 | | 0.7% |
CVS Caremark Corp. | | 263,150 | | | 9,289,195 | | 0.5% |
Kraft Foods, Inc. | | 255,784 | | | 7,039,176 | | 0.3% |
#PepsiCo, Inc. | | 171,759 | | | 10,400,007 | | 0.5% |
Philip Morris International, Inc. | | 212,774 | | | 10,076,977 | | 0.5% |
Procter & Gamble Co. | | 341,128 | | | 19,785,424 | | 1.0% |
Wal-Mart Stores, Inc. | | 347,708 | | | 17,274,133 | | 0.9% |
Other Securities | | | | | 90,417,306 | | 4.5% |
| | | | | | | |
Total Consumer Staples | | | | | 177,615,475 | | 8.9% |
| | | | | | | |
| | | |
Energy — (8.9%) | | | | | | | |
Anadarko Petroleum Corp. | | 76,361 | | | 4,652,676 | | 0.2% |
Apache Corp. | | 58,756 | | | 5,530,115 | | 0.3% |
Chevron Corp. | | 276,544 | | | 21,166,678 | | 1.1% |
ConocoPhillips | | 239,732 | | | 12,029,752 | | 0.6% |
Exxon Mobil Corp. | | 442,772 | | | 31,733,469 | | 1.6% |
Occidental Petroleum Corp. | | 64,024 | | | 4,858,141 | | 0.3% |
Schlumberger, Ltd. | | 129,860 | | | 8,077,292 | | 0.4% |
Other Securities | | | | | 112,273,218 | | 5.6% |
| | | | | | | |
Total Energy | | | | | 200,321,341 | | 10.1% |
| | | | | | | |
| | | |
Financials — (13.8%) | | | | | | | |
Bank of America Corp. | | 1,196,477 | | | 17,444,635 | | 0.9% |
Bank of New York Mellon Corp. | | 186,378 | | | 4,968,837 | | 0.3% |
Goldman Sachs Group, Inc. | | 77,173 | | | 13,132,529 | | 0.7% |
JPMorgan Chase & Co. | | 629,826 | | | 26,307,832 | | 1.3% |
Morgan Stanley | | 209,929 | | | 6,742,919 | | 0.3% |
Travelers Cos., Inc. (The) | | 98,865 | | | 4,922,488 | | 0.2% |
U.S. Bancorp | | 210,315 | | | 4,883,514 | | 0.2% |
Wells Fargo & Co. | | 683,030 | | | 18,796,986 | | 0.9% |
Other Securities | | | | | 214,138,947 | | 10.8% |
| | | | | | | |
Total Financials | | | | | 311,338,687 | | 15.6% |
| | | | | | | |
| | | |
Health Care — (10.1%) | | | | | | | |
Abbott Laboratories | | 178,855 | | | 9,044,697 | | 0.5% |
*Amgen, Inc. | | 127,585 | | | 6,855,142 | | 0.3% |
Bristol-Myers Squibb Co. | | 231,655 | | | 5,050,079 | | 0.2% |
Johnson & Johnson | | 304,296 | | | 17,968,679 | | 0.9% |
#Merck & Co., Inc. | | 237,954 | | | 7,359,917 | | 0.4% |
Pfizer, Inc. | | 1,180,571 | | | 20,105,124 | | 1.0% |
Schering-Plough Corp. | | 182,136 | | | 5,136,235 | | 0.3% |
UnitedHealth Group, Inc. | | 183,755 | | | 4,768,442 | | 0.2% |
Other Securities | | | | | 152,555,741 | | 7.7% |
| | | | | | | |
Total Health Care | | | | | 228,844,056 | | 11.5% |
| | | | | | | |
53
U.S. CORE EQUITY 1 PORTFOLIO
CONTINUED
| | | | | | | |
| | | Shares | | Value† | | Percentage
of Net Assets** |
Industrials — (10.6%) | | | | | | | |
3M Co. | | 79,085 | | $ | 5,818,283 | | 0.3% |
General Electric Co. | | 1,278,657 | | | 18,233,649 | | 0.9% |
United Technologies Corp. | | 103,303 | | | 6,347,969 | | 0.3% |
Other Securities | | | | | 209,232,706 | | 10.5% |
| | | | | | | |
Total Industrials | | | | | 239,632,607 | | 12.0% |
| | | | | | | |
| | | |
Information Technology — (15.2%) | | | | | | | |
*Apple, Inc. | | 99,324 | | | 18,722,574 | | 0.9% |
*Cisco Sytems, Inc. | | 713,334 | | | 16,299,682 | | 0.8% |
*Google, Inc. | | 26,997 | | | 14,473,632 | | 0.7% |
Hewlett-Packard Co. | | 277,599 | | | 13,174,849 | | 0.7% |
Intel Corp. | | 614,522 | | | 11,743,515 | | 0.6% |
International Business Machines Corp. | | 135,495 | | | 16,342,052 | | 0.8% |
Microsoft Corp. | | 975,390 | | | 27,047,565 | | 1.4% |
Oracle Corp. | | 551,185 | | | 11,630,004 | | 0.6% |
QUALCOMM, Inc. | | 185,100 | | | 7,664,991 | | 0.4% |
Other Securities | | | | | 205,577,304 | | 10.3% |
| | | | | | | |
Total Information Technology | | | | | 342,676,168 | | 17.2% |
| | | | | | | |
| | | |
Materials — (4.3%) | | | | | | | |
Other Securities | | | | | 97,072,917 | | 4.9% |
| | | | | | | |
| | | |
Other — (0.0%) | | | | | | | |
Other Securities | | | | | — | | 0.0% |
| | | | | | | |
| | | |
Telecommunication Services — (2.4%) | | | | | | | |
AT&T, Inc. | | 926,606 | | | 23,785,976 | | 1.2% |
Verizon Communications, Inc. | | 446,911 | | | 13,224,096 | | 0.7% |
Other Securities | | | | | 16,360,101 | | 0.8% |
| | | | | | | |
Total Telecommunication Services | | | | | 53,370,173 | | 2.7% |
| | | | | | | |
| | | |
Utilities — (3.3%) | | | | | | | |
Other Securities | | | | | 75,909,223 | | 3.8% |
| | | | | | | |
TOTAL COMMON STOCKS | | | | | 1,978,653,318 | | 99.4% |
| | | | | | | |
RIGHTS/WARRANTS — (0.0%) | | | | | | | |
Other Securities | | | | | 601 | | 0.0% |
| | | | | | | |
TEMPORARY CASH INVESTMENTS — (0.3%) | | | | | | | |
BlackRock Liquidity Funds Tempcash Portfolio - Institutional Shares | | 7,604,090 | | | 7,604,090 | | 0.4% |
| | | | | | | |
| | | |
| | | Shares/ Face Amount | | | | |
| | | (000) | | | | |
SECURITIES LENDING COLLATERAL — (12.1%) | | | | | | | |
§@DFA Short Term Investment Fund LP | | 270,634,566 | | | 270,634,566 | | 13.6% |
@Repurchase Agreement, Deutsche Bank Securities 0.08%, 11/02/09 (Collateralized by $2,521,878 FHLMC 5.793%(r), 01/01/37, valued at $1,416,688) to be repurchased at $1,375,434 | | $1,375 | | | 1,375,425 | | 0.1% |
| | | | | | | |
| | | |
TOTAL SECURITIES LENDING COLLATERAL | | | | | 272,009,991 | | 13.7% |
| | | | | | | |
| | | |
TOTAL INVESTMENTS — (100.0%)
(Cost $2,487,093,788) | | | | $ | 2,258,268,000 | | 113.5% |
| | | | | | | |
54
U.S. CORE EQUITY 1 PORTFOLIO
CONTINUED
Summary of inputs used to value the Portfolio’s net assets as of October 31, 2009 is as follows (See Security Valuation Note):
| | | | | | | | | | | |
| | | Valuation Inputs |
| |
| | | Investment in Securities (Market Value) |
| | | Level 1 | | Level 2 | | Level 3 | | Total |
Common Stocks | | | | | | | | | | | |
Consumer Discretionary | | $ | 251,868,671 | | $ | 4,000 | | — | | $ | 251,872,671 |
Consumer Staples | | | 177,615,475 | | | — | | — | | | 177,615,475 |
Energy | | | 200,321,341 | | | — | | — | | | 200,321,341 |
Financials | | | 311,338,687 | | | — | | — | | | 311,338,687 |
Health Care | | | 228,820,192 | | | 23,864 | | — | | | 228,844,056 |
Industrials | | | 239,632,607 | | | — | | — | | | 239,632,607 |
Information Technology | | | 342,675,389 | | | 779 | | — | | | 342,676,168 |
Materials | | | 97,072,917 | | | — | | — | | | 97,072,917 |
Other | | | — | | | — | | — | | | — |
Telecommunication Services | | | 53,370,173 | | | — | | — | | | 53,370,173 |
Utilities | | | 75,909,223 | | | — | | — | | | 75,909,223 |
Rights/Warrants | | | 334 | | | 267 | | — | | | 601 |
Temporary Cash Investments | | | 7,604,090 | | | — | | — | | | 7,604,090 |
Securities Lending Collateral | | | — | | | 272,009,991 | | — | | | 272,009,991 |
| | | | | | | | | | | |
TOTAL | | $ | 1,986,229,099 | | $ | 272,038,901 | | — | | $ | 2,258,268,000 |
| | | | | | | | | | | |
See accompanying Notes to Financial Statements.
55
U.S. CORE EQUITY 2 PORTFOLIO
SUMMARY SCHEDULE OF PORTFOLIO HOLDINGS
October 31, 2009
| | | | | | | |
| | | Shares | | Value† | | Percentage
of Net Assets** |
COMMON STOCKS — (87.6%) | | | | | | | |
Consumer Discretionary — (12.7%) | | | | | | | |
Comcast Corp. Class A | | 803,975 | | $ | 11,657,638 | | 0.3% |
Disney (Walt) Co. | | 762,512 | | | 20,869,953 | | 0.5% |
*Liberty Media Corp. Entertainment Class A | | 324,533 | | | 10,002,107 | | 0.3% |
Lowe’s Cos., Inc. | | 577,087 | | | 11,293,593 | | 0.3% |
News Corp. Class A | | 776,144 | | | 8,941,179 | | 0.2% |
Time Warner, Inc. | | 505,637 | | | 15,229,786 | | 0.4% |
Other Securities | | | | | 471,143,837 | | 12.4% |
| | | | | | | |
Total Consumer Discretionary | | | | | 549,138,093 | | 14.4% |
| | | | | | | |
| | | |
Consumer Staples — (6.3%) | | | | | | | |
Coca-Cola Co. | | 172,459 | | | 9,193,789 | | 0.3% |
CVS Caremark Corp. | | 598,385 | | | 21,122,991 | | 0.6% |
Kraft Foods, Inc. | | 594,231 | | | 16,353,237 | | 0.4% |
Procter & Gamble Co. | | 480,488 | | | 27,868,304 | | 0.7% |
Wal-Mart Stores, Inc. | | 405,500 | | | 20,145,240 | | 0.5% |
Other Securities | | | | | 179,330,811 | | 4.7% |
| | | | | | | |
Total Consumer Staples | | | | | 274,014,372 | | 7.2% |
| | | | | | | |
| | | |
Energy — (9.1%) | | | | | | | |
Anadarko Petroleum Corp. | | 191,338 | | | 11,658,224 | | 0.3% |
Apache Corp. | | 140,063 | | | 13,182,730 | | 0.3% |
Chevron Corp. | | 638,061 | | | 48,837,189 | | 1.3% |
ConocoPhillips | | 584,396 | | | 29,324,991 | | 0.8% |
Devon Energy Corp. | | 160,926 | | | 10,413,521 | | 0.3% |
Exxon Mobil Corp. | | 404,458 | | | 28,987,505 | | 0.8% |
Marathon Oil Corp. | | 294,470 | | | 9,414,206 | | 0.2% |
Occidental Petroleum Corp. | | 157,660 | | | 11,963,241 | | 0.3% |
XTO Energy, Inc. | | 240,650 | | | 10,001,414 | | 0.3% |
Other Securities | | | | | 220,292,233 | | 5.8% |
| | | | | | | |
Total Energy | | | | | 394,075,254 | | 10.4% |
| | | | | | | |
| | | |
Financials — (17.0%) | | | | | | | |
Bank of America Corp. | | 3,267,707 | | | 47,643,168 | | 1.3% |
Bank of New York Mellon Corp. | | 476,180 | | | 12,694,959 | | 0.3% |
Goldman Sachs Group, Inc. | | 174,144 | | | 29,634,084 | | 0.8% |
JPMorgan Chase & Co. | | 1,554,737 | | | 64,941,364 | | 1.7% |
MetLife, Inc. | | 327,880 | | | 11,157,756 | | 0.3% |
Morgan Stanley | | 535,661 | | | 17,205,431 | | 0.5% |
PNC Financial Services Group, Inc. | | 182,154 | | | 8,914,617 | | 0.2% |
Prudential Financial, Inc. | | 185,892 | | | 8,407,895 | | 0.2% |
Travelers Cos., Inc. (The) | | 240,418 | | | 11,970,412 | | 0.3% |
Wells Fargo & Co. | | 1,945,537 | | | 53,541,178 | | 1.4% |
Other Securities | | | | | 469,783,862 | | 12.3% |
| | | | | | | |
Total Financials | | | | | 735,894,726 | | 19.3% |
| | | | | | | |
| | | |
Health Care — (8.8%) | | | | | | | |
Johnson & Johnson | | 294,829 | | | 17,409,652 | | 0.5% |
Pfizer, Inc. | | 2,232,446 | | | 38,018,555 | | 1.0% |
UnitedHealth Group, Inc. | | 468,620 | | | 12,160,689 | | 0.3% |
*WellPoint, Inc. | | 211,328 | | | 9,881,697 | | 0.3% |
Other Securities | | | | | 304,873,393 | | 8.0% |
| | | | | | | |
Total Health Care | | | | | 382,343,986 | | 10.1% |
| | | | | | | |
| | | |
Industrials — (11.3%) | | | | | | | |
Burlington Northern Santa Fe Corp. | | 139,866 | | | 10,534,707 | | 0.3% |
FedEx Corp. | | 127,079 | | | 9,237,373 | | 0.2% |
56
U.S. CORE EQUITY 2 PORTFOLIO
CONTINUED
| | | | | | | | |
| | | Shares | | Value† | | Percentage
of Net Assets** |
Industrials — (Continued) | | | | | | | | |
General Electric Co. | | | 3,116,591 | | $ | 44,442,588 | | 1.2% |
Union Pacific Corp. | | | 206,650 | | | 11,394,681 | | 0.3% |
Other Securities | | | | | | 413,720,137 | | 10.9% |
| | | | | | | | |
Total Industrials | | | | | | 489,329,486 | | 12.9% |
| | | | | | | | |
| | | |
Information Technology — (12.8%) | | | | | | | | |
*Apple, Inc. | | | 70,536 | | | 13,296,036 | | 0.4% |
*Cisco Sytems, Inc. | | | 558,086 | | | 12,752,265 | | 0.3% |
*Google, Inc. | | | 21,180 | | | 11,355,022 | | 0.3% |
Hewlett-Packard Co. | | | 421,467 | | | 20,002,824 | | 0.5% |
Intel Corp. | | | 620,264 | | | 11,853,245 | | 0.3% |
International Business Machines Corp. | | | 91,559 | | | 11,042,931 | | 0.3% |
Microsoft Corp. | | | 709,934 | | | 19,686,470 | | 0.5% |
Oracle Corp. | | | 435,610 | | | 9,191,371 | | 0.2% |
Other Securities | | | | | | 443,187,202 | | 11.7% |
| | | | | | | | |
Total Information Technology | | | | | | 552,367,366 | | 14.5% |
| | | | | | | | |
| | | |
Materials — (4.6%) | | | | | | | | |
Dow Chemical Co. | | | 460,717 | | | 10,817,635 | | 0.3% |
International Paper Co. | | | 388,835 | | | 8,674,909 | | 0.2% |
Other Securities | | | | | | 178,059,818 | | 4.7% |
| | | | | | | | |
Total Materials | | | | | | 197,552,362 | | 5.2% |
| | | | | | | | |
| | | |
Other — (0.0%) | | | | | | | | |
Other Securities | | | | | | 63 | | 0.0% |
| | | | | | | | |
| | | |
Telecommunication Services — (2.8%) | | | | | | | | |
AT&T, Inc. | | | 2,076,121 | | | 53,294,026 | | 1.4% |
Verizon Communications, Inc. | | | 1,065,744 | | | 31,535,365 | | 0.8% |
Other Securities | | | | | | 34,309,434 | | 0.9% |
| | | | | | | | |
Total Telecommunication Services | | | | | | 119,138,825 | | 3.1% |
| | | | | | | | |
| | | |
Utilities — (2.2%) | | | | | | | | |
Other Securities | | | | | | 96,927,672 | | 2.5% |
| | | | | | | | |
TOTAL COMMON STOCKS | | | | | | 3,790,782,205 | | 99.6% |
| | | | | | | | |
RIGHTS/WARRANTS — (0.0%) | | | | | | | | |
Other Securities | | | | | | 2,115 | | 0.0% |
| | | | | | | | |
| | | |
TEMPORARY CASH INVESTMENTS — (0.5%) | | | | | | | | |
BlackRock Liquidity Funds Tempcash Portfolio - Institutional Shares | | | 21,699,929 | | | 21,699,929 | | 0.6% |
| | | | | | | | |
| | | |
| | | Shares/ Face Amount | | | | |
| | | (000) | | | | |
SECURITIES LENDING COLLATERAL — (11.9%) | | | | | | | | |
§@DFA Short Term Investment Fund LP | | | 511,775,326 | | | 511,775,326 | | 13.4% |
@Repurchase Agreement, Deutsche Bank Securities 0.08%, | | | | | | | | |
11/02/09 (Collateralized by $4,768,923 FHLMC 5.793%(r), 01/01/37, valued at $2,678,986) to be repurchased at $2,600,974 | | $ | 2,601 | | | 2,600,957 | | 0.1% |
| | | | | | | | |
TOTAL SECURITIES LENDING COLLATERAL | | | | | | 514,376,283 | | 13.5% |
| | | | | | | | |
57
U.S. CORE EQUITY 2 PORTFOLIO
CONTINUED
| | | | | |
| | | Value† | | Percentage
of Net Assets** |
TOTAL INVESTMENTS — (100.0%)
(Cost $4,987,965,248) | | $ | 4,326,860,532 | | 113.7% |
| | | | | |
Summary of inputs used to value the Portfolio’s net assets as of October 31, 2009 is as follows (See Security Valuation Note):
| | | | | | | | | | | |
| | | Valuation Inputs |
| |
| | | Investment in Securities (Market Value) |
| | | Level 1 | | Level 2 | | Level 3 | | Total |
Common Stocks | | | | | | | | | | | |
Consumer Discretionary | | $ | 549,128,925 | | $ | 9,168 | | — | | $ | 549,138,093 |
Consumer Staples | | | 274,014,372 | | | — | | — | | | 274,014,372 |
Energy | | | 394,075,254 | | | — | | — | | | 394,075,254 |
Financials | | | 735,894,726 | | | — | | — | | | 735,894,726 |
Health Care | | | 382,279,666 | | | 64,320 | | — | | | 382,343,986 |
Industrials | | | 489,329,486 | | | — | | — | | | 489,329,486 |
Information Technology | | | 552,365,768 | | | 1,598 | | — | | | 552,367,366 |
Materials | | | 197,552,362 | | | — | | — | | | 197,552,362 |
Other | | | — | | | 63 | | — | | | 63 |
Telecommunication Services | | | 119,138,825 | | | — | | — | | | 119,138,825 |
Utilities | | | 96,927,672 | | | — | | — | | | 96,927,672 |
Rights/Warrants | | | 951 | | | 1,164 | | — | | | 2,115 |
Temporary Cash Investments | | | 21,699,929 | | | — | | — | | | 21,699,929 |
Securities Lending Collateral | | | — | | | 514,376,283 | | — | | | 514,376,283 |
| | | | | | | | | | | |
TOTAL | | $ | 3,812,407,936 | | $ | 514,452,596 | | — | | $ | 4,326,860,532 |
| | | | | | | | | | | |
See accompanying Notes to Financial Statements.
58
U.S. VECTOR EQUITY PORTFOLIO
SUMMARY SCHEDULE OF PORTFOLIO HOLDINGS
October 31, 2009
| | | | | | | |
| | | Shares | | Value† | | Percentage
of Net Assets** |
COMMON STOCKS — (84.1%) | | | | | | | |
Consumer Discretionary — (13.7%) | | | | | | | |
#*AutoNation, Inc. | | 161,659 | | $ | 2,787,001 | | 0.2% |
Carnival Corp. | | 88,808 | | | 2,586,089 | | 0.2% |
Comcast Corp. Class A | | 298,194 | | | 4,323,813 | | 0.4% |
Disney (Walt) Co. | | 112,792 | | | 3,087,117 | | 0.3% |
Jarden Corp. | | 98,783 | | | 2,705,666 | | 0.2% |
*Liberty Media Corp. Interactive Class A | | 257,857 | | | 2,924,098 | | 0.3% |
#*Sears Holdings Corp. | | 54,760 | | | 3,716,014 | | 0.3% |
Time Warner, Inc. | | 198,927 | | | 5,991,681 | | 0.5% |
Other Securities | | | | | 162,744,900 | | 13.8% |
| | | | | | | |
Total Consumer Discretionary | | | | | 190,866,379 | | 16.2% |
| | | | | | | |
| | | |
Consumer Staples — (4.4%) | | | | | | | |
CVS Caremark Corp. | | 88,513 | | | 3,124,509 | | 0.3% |
J.M. Smucker Co. | | 49,794 | | | 2,625,638 | | 0.2% |
Kraft Foods, Inc. | | 120,422 | | | 3,314,013 | | 0.3% |
Procter & Gamble Co. | | 76,240 | | | 4,421,920 | | 0.4% |
Other Securities | | | | | 47,503,444 | | 4.0% |
| | | | | | | |
Total Consumer Staples | | | | | 60,989,524 | | 5.2% |
| | | | | | | |
| | | |
Energy — (8.4%) | | | | | | | |
Anadarko Petroleum Corp. | | 62,067 | | | 3,781,742 | | 0.3% |
Chevron Corp. | | 79,607 | | | 6,093,120 | | 0.5% |
ConocoPhillips | | 197,546 | | | 9,912,858 | | 0.8% |
Exxon Mobil Corp. | | 66,600 | | | 4,773,222 | | 0.4% |
Marathon Oil Corp. | | 94,908 | | | 3,034,209 | | 0.3% |
XTO Energy, Inc. | | 69,919 | | | 2,905,834 | | 0.3% |
Other Securities | | | | | 86,347,519 | | 7.3% |
| | | | | | | |
Total Energy | | | | | 116,848,504 | | 9.9% |
| | | | | | | |
| | | |
Financials — (19.6%) | | | | | | | |
American Financial Group, Inc. | | 129,237 | | | 3,179,230 | | 0.3% |
Ameriprise Financial, Inc. | | 89,186 | | | 3,092,079 | | 0.3% |
Bank of America Corp. | | 531,294 | | | 7,746,267 | | 0.7% |
#*CNA Financial Corp. | | 123,408 | | | 2,686,592 | | 0.2% |
Discover Financial Services | | 235,869 | | | 3,335,188 | | 0.3% |
First American Corp. | | 86,160 | | | 2,618,402 | | 0.2% |
Goldman Sachs Group, Inc. | | 21,070 | | | 3,585,482 | | 0.3% |
JPMorgan Chase & Co. | | 539,281 | | | 22,525,767 | | 1.9% |
#M&T Bank Corp. | | 55,943 | | | 3,516,018 | | 0.3% |
MetLife, Inc. | | 84,340 | | | 2,870,090 | | 0.2% |
Morgan Stanley | | 84,025 | | | 2,698,883 | | 0.2% |
Reinsurance Group of America, Inc. | | 59,129 | | | 2,725,847 | | 0.2% |
Travelers Cos., Inc. (The) | | 73,100 | | | 3,639,649 | | 0.3% |
Unum Group | | 203,475 | | | 4,059,326 | | 0.3% |
Wells Fargo & Co. | | 161,404 | | | 4,441,838 | | 0.4% |
Other Securities | | | | | 200,054,535 | | 17.0% |
| | | | | | | |
Total Financials | | | | | 272,775,193 | | 23.1% |
| | | | | | | |
| | | |
Health Care — (7.5%) | | | | | | | |
#*Community Health Systems, Inc. | | 104,600 | | | 3,271,888 | | 0.3% |
Pfizer, Inc. | | 326,770 | | | 5,564,893 | | 0.5% |
*WellPoint, Inc. | | 62,400 | | | 2,917,824 | | 0.2% |
Other Securities | | | | | 93,197,030 | | 7.9% |
| | | | | | | |
Total Health Care | | | | | 104,951,635 | | 8.9% |
| | | | | | | |
59
U.S. VECTOR EQUITY PORTFOLIO
CONTINUED
| | | | | | | | |
| | | Shares | | Value† | | Percentage
of Net Assets** |
Industrials — (10.9%) | | | | | | | | |
General Electric Co. | | | 267,064 | | $ | 3,808,333 | | 0.3% |
Ryder System, Inc. | | | 66,622 | | | 2,701,522 | | 0.2% |
Southwest Airlines Co. | | | 307,716 | | | 2,584,814 | | 0.2% |
Other Securities | | | | | | 143,551,380 | | 12.2% |
| | | | | | | | |
Total Industrials | | | | | | 152,646,049 | | 12.9% |
| | | | | | | | |
| | | |
Information Technology — (12.1%) | | | | | | | | |
Fidelity National Information Services, Inc. | | | 121,153 | | | 2,636,289 | | 0.2% |
*IAC/InterActiveCorp | | | 143,788 | | | 2,723,345 | | 0.2% |
*Ingram Micro, Inc. | | | 166,139 | | | 2,932,353 | | 0.3% |
Jabil Circuit, Inc. | | | 223,919 | | | 2,996,036 | | 0.3% |
*Rovi Corp. | | | 110,469 | | | 3,043,421 | | 0.3% |
*Tellabs, Inc. | | | 426,210 | | | 2,565,784 | | 0.2% |
#Xerox Corp. | | | 518,918 | | | 3,902,263 | | 0.3% |
Other Securities | | | | | | 147,333,309 | | 12.5% |
| | | | | | | | |
Total Information Technology | | | | | | 168,132,800 | | 14.3% |
| | | | | | | | |
| | | |
Materials — (4.7%) | | | | | | | | |
International Paper Co. | | | 281,200 | | | 6,273,572 | | 0.5% |
MeadWestavco Corp. | | | 151,161 | | | 3,451,006 | | 0.3% |
Other Securities | | | | | | 55,796,528 | | 4.8% |
| | | | | | | | |
Total Materials | | | | | | 65,521,106 | | 5.6% |
| | | | | | | | |
| | | |
Other — (0.0%) | | | | | | | | |
Other Securities | | | | | | 6 | | 0.0% |
| | | | | | | | |
| | | |
Telecommunication Services — (1.6%) | | | | | | | | |
AT&T, Inc. | | | 332,498 | | | 8,535,224 | | 0.7% |
Verizon Communications, Inc. | | | 159,887 | | | 4,731,056 | | 0.4% |
Other Securities | | | | | | 9,379,784 | | 0.8% |
| | | | | | | | |
Total Telecommunication Services | | | | | | 22,646,064 | | 1.9% |
| | | | | | | | |
| | | |
Utilities — (1.2%) | | | | | | | | |
Other Securities | | | | | | 17,444,083 | | 1.5% |
| | | | | | | | |
TOTAL COMMON STOCKS | | | | | | 1,172,821,343 | | 99.5% |
| | | | | | | | |
RIGHTS/WARRANTS — (0.0%) | | | | | | | | |
Other Securities | | | | | | 1,158 | | 0.0% |
| | | | | | | | |
TEMPORARY CASH INVESTMENTS — (0.7%) | | | | | | | | |
BlackRock Liquidity Funds Tempcash Portfolio - Institutional Shares | | | 10,352,638 | | | 10,352,638 | | 0.9% |
| | | | | | | | |
| | | |
| | | Shares/ Face Amount | | | | |
| | | (000) | | | | |
SECURITIES LENDING COLLATERAL — (15.2%) | | | | | | | | |
§@DFA Short Term Investment Fund LP | | | 210,532,503 | | | 210,532,503 | | 17.9% |
@Repurchase Agreement, Deutsche Bank Securities 0.08%, | | | | | | | | |
11/02/09 (Collateralized by $1,961,824 FHLMC 5.793%(r), 01/01/37, valued at $1,102,073) to be repurchased at $1,069,980 | | $ | 1,070 | | | 1,069,973 | | 0.1% |
| | | | | | | | |
TOTAL SECURITIES LENDING COLLATERAL | | | | | | 211,602,476 | | 18.0% |
| | | | | | | | |
TOTAL INVESTMENTS — (100.0%)
(Cost $1,626,855,214) | | | | | $ | 1,394,777,615 | | 118.4% |
| | | | | | | | |
60
U.S. VECTOR EQUITY PORTFOLIO
CONTINUED
Summary of inputs used to value the Portfolio’s net assets as of October 31, 2009 is as follows (See Security Valuation Note):
| | | | | | | | | | | |
| | | Valuation Inputs |
| |
| | | Investment in Securities (Market Value) |
| | | Level 1 | | Level 2 | | Level 3 | | Total |
Common Stocks | | | | | | | | | | | |
Consumer Discretionary | | $ | 190,856,379 | | $ | 10,000 | | — | | $ | 190,866,379 |
Consumer Staples | | | 60,989,524 | | | — | | — | | | 60,989,524 |
Energy | | | 116,848,504 | | | — | | — | | | 116,848,504 |
Financials | | | 272,775,193 | | | — | | — | | | 272,775,193 |
Health Care | | | 104,930,024 | | | 21,611 | | — | | | 104,951,635 |
Industrials | | | 152,646,049 | | | — | | — | | | 152,646,049 |
Information Technology | | | 168,131,625 | | | 1,175 | | — | | | 168,132,800 |
Materials | | | 65,521,106 | | | — | | — | | | 65,521,106 |
Other | | | — | | | 6 | | — | | | 6 |
Telecommunication Services | | | 22,646,064 | | | — | | — | | | 22,646,064 |
Utilities | | | 17,444,083 | | | — | | — | | | 17,444,083 |
Rights/Warrants | | | 238 | | | 920 | | — | | | 1,158 |
Temporary Cash Investments | | | 10,352,638 | | | — | | — | | | 10,352,638 |
Securities Lending Collateral | | | — | | | 211,602,476 | | — | | | 211,602,476 |
| | | | | | | | | | | |
TOTAL | | $ | 1,183,141,427 | | $ | 211,636,188 | | — | | $ | 1,394,777,615 |
| | | | | | | | | | | |
See accompanying Notes to Financial Statements.
61
T.A. U.S. CORE EQUITY 2 PORTFOLIO
SUMMARY SCHEDULE OF PORTFOLIO HOLDINGS
October 31, 2009
| | | | | | | |
| | | Shares | | Value† | | Percentage
of Net Assets** |
COMMON STOCKS — (87.0%) | | | | | | | |
Consumer Discretionary — (12.9%) | | | | | | | |
Comcast Corp. Class A | | 346,719 | | $ | 5,027,426 | | 0.4% |
Disney (Walt) Co. | | 340,594 | | | 9,322,058 | | 0.6% |
*Liberty Media Corp. Entertainment Class A | | 118,270 | | | 3,645,081 | | 0.3% |
Lowe’s Cos., Inc. | | 167,907 | | | 3,285,940 | | 0.2% |
News Corp. Class A | | 318,443 | | | 3,668,463 | | 0.3% |
Time Warner Cable, Inc. | | 88,298 | | | 3,482,473 | | 0.2% |
Time Warner, Inc. | | 177,057 | | | 5,332,957 | | 0.4% |
Other Securities | | | | | 178,121,726 | | 12.3% |
| | | | | | | |
Total Consumer Discretionary | | | | | 211,886,124 | | 14.7% |
| | | | | | | |
| | | |
Consumer Staples — (5.9%) | | | | | | | |
Archer-Daniels-Midland Co. | | 114,684 | | | 3,454,282 | | 0.2% |
Coca-Cola Co. | | 69,082 | | | 3,682,761 | | 0.3% |
CVS Caremark Corp. | | 246,749 | | | 8,710,240 | | 0.6% |
Kraft Foods, Inc. | | 258,941 | | | 7,126,056 | | 0.5% |
Procter & Gamble Co. | | 126,580 | | | 7,341,640 | | 0.5% |
Other Securities | | | | | 67,570,477 | | 4.7% |
| | | | | | | |
Total Consumer Staples | | | | | 97,885,456 | | 6.8% |
| | | | | | | |
| | | |
Energy — (8.9%) | | | | | | | |
Anadarko Petroleum Corp. | | 71,637 | | | 4,364,842 | | 0.3% |
Apache Corp. | | 56,903 | | | 5,355,710 | | 0.4% |
Chevron Corp. | | 236,822 | | | 18,126,356 | | 1.3% |
ConocoPhillips | | 207,460 | | | 10,410,343 | | 0.7% |
Devon Energy Corp. | | 70,570 | | | 4,566,585 | | 0.3% |
Exxon Mobil Corp. | | 232,529 | | | 16,665,353 | | 1.1% |
Marathon Oil Corp. | | 136,394 | | | 4,360,516 | | 0.3% |
Other Securities | | | | | 83,187,956 | | 5.8% |
| | | | | | | |
Total Energy | | | | | 147,037,661 | | 10.2% |
| | | | | | | |
| | | |
Financials — (16.1%) | | | | | | | |
Bank of America Corp. | | 763,692 | | | 11,134,629 | | 0.8% |
Bank of New York Mellon Corp. | | 183,418 | | | 4,889,924 | | 0.3% |
#BlackRock, Inc. | | 18,115 | | | 3,921,716 | | 0.3% |
CME Group, Inc. | | 12,950 | | | 3,918,799 | | 0.3% |
Goldman Sachs Group, Inc. | | 79,332 | | | 13,499,926 | | 0.9% |
JPMorgan Chase & Co. | | 633,250 | | | 26,450,852 | | 1.8% |
MetLife, Inc. | | 126,449 | | | 4,303,059 | | 0.3% |
Morgan Stanley | | 205,947 | | | 6,615,018 | | 0.5% |
Travelers Cos., Inc. (The) | | 100,570 | | | 5,007,380 | | 0.4% |
Wells Fargo & Co. | | 439,736 | | | 12,101,535 | | 0.8% |
Other Securities | | | | | 173,514,260 | | 12.0% |
| | | | | | | |
Total Financials | | | | | 265,357,098 | | 18.4% |
| | | | | | | |
| | | |
Health Care — (9.0%) | | | | | | | |
Johnson & Johnson | | 92,545 | | | 5,464,782 | | 0.4% |
Pfizer, Inc. | | 810,516 | | | 13,803,087 | | 0.9% |
*Thermo Fisher Scientific, Inc. | | 74,214 | | | 3,339,630 | | 0.2% |
UnitedHealth Group, Inc. | | 200,614 | | | 5,205,933 | | 0.4% |
*WellPoint, Inc. | | 83,721 | | | 3,914,794 | | 0.3% |
Other Securities | | | | | 116,692,475 | | 8.1% |
| | | | | | | |
Total Health Care | | | | | 148,420,701 | | 10.3% |
| | | | | | | |
| | | |
Industrials — (11.8%) | | | | | | | |
Burlington Northern Santa Fe Corp. | | 54,536 | | | 4,107,652 | | 0.3% |
FedEx Corp. | | 55,500 | | | 4,034,295 | | 0.3% |
62
T.A. U.S. CORE EQUITY 2 PORTFOLIO
CONTINUED
| | | | | | | | |
| | | Shares | | Value† | | Percentage
of Net Assets** |
Industrials — (Continued) | | | | | | | | |
General Electric Co. | | | 1,163,033 | | $ | 16,584,851 | | 1.1% |
Union Pacific Corp. | | | 87,049 | | | 4,799,882 | | 0.3% |
Other Securities | | | | | | 164,472,087 | | 11.4% |
| | | | | | | | |
Total Industrials | | | | | | 193,998,767 | | 13.4% |
| | | | | | | | |
| | | |
Information Technology — (12.9%) | | | | | | | | |
*Apple, Inc. | | | 27,332 | | | 5,152,082 | | 0.4% |
*Cisco Sytems, Inc. | | | 153,862 | | | 3,515,747 | | 0.2% |
*Google, Inc. | | | 7,940 | | | 4,256,793 | | 0.3% |
Hewlett-Packard Co. | | | 150,483 | | | 7,141,923 | | 0.5% |
Intel Corp. | | | 314,896 | | | 6,017,663 | | 0.4% |
International Business Machines Corp. | | | 43,923 | | | 5,297,553 | | 0.4% |
Microsoft Corp. | | | 263,082 | | | 7,295,264 | | 0.5% |
Oracle Corp. | | | 166,850 | | | 3,520,535 | | 0.2% |
Other Securities | | | | | | 170,774,371 | | 11.8% |
| | | | | | | | |
Total Information Technology | | | | | | 212,971,931 | | 14.7% |
| | | | | | | | |
| | | |
Materials — (4.2%) | | | | | | | | |
Dow Chemical Co. | | | 170,500 | | | 4,003,340 | | 0.3% |
International Paper Co. | | | 173,200 | | | 3,864,092 | | 0.3% |
Other Securities | | | | | | 61,355,121 | | 4.2% |
| | | | | | | | |
Total Materials | | | | | | 69,222,553 | | 4.8% |
| | | | | | | | |
| | | |
Telecommunication Services — (2.9%) | | | | | | | | |
AT&T, Inc. | | | 887,556 | | | 22,783,563 | | 1.6% |
Verizon Communications, Inc. | | | 417,968 | | | 12,367,673 | | 0.8% |
Other Securities | | | | | | 12,939,327 | | 0.9% |
| | | | | | | | |
Total Telecommunication Services | | | | | | 48,090,563 | | 3.3% |
| | | | | | | | |
| | | |
Utilities — (2.4%) | | | | | | | | |
Other Securities | | | | | | 39,536,347 | | 2.7% |
| | | | | | | | |
TOTAL COMMON STOCKS | | | | | | 1,434,407,201 | | 99.3% |
| | | | | | | | |
RIGHTS/WARRANTS — (0.0%) | | | | | | | | |
Other Securities | | | | | | — | | 0.0% |
| | | | | | | | |
| | | |
TEMPORARY CASH INVESTMENTS — (0.8%) | | | | | | | | |
BlackRock Liquidity Funds Tempcash Portfolio - Institutional Shares | | | 13,452,630 | | | 13,452,630 | | 0.9% |
| | | | | | | | |
| | | |
| | | Shares/ Face Amount | | | | |
| | | (000) | | | | |
SECURITIES LENDING COLLATERAL — (12.2%) | | | | | | | | |
§@DFA Short Term Investment Fund LP | | | 199,507,736 | | | 199,507,736 | | 13.8% |
@Repurchase Agreement, Deutsche Bank Securities 0.08%, | | | | | | | | |
11/02/09 (Collateralized by $1,164,996 FNMA 7.000%, 10/01/38, valued at $1,044,362) to be repurchased at $1,013,950 | | $ | 1,014 | | | 1,013,943 | | 0.1% |
| | | | | | | | |
| | | |
TOTAL SECURITIES LENDING COLLATERAL | | | | | | 200,521,679 | | 13.9% |
| | | | | | | | |
| | | |
TOTAL INVESTMENTS — (100.0%)
(Cost $1,617,549,118) | | | | | $ | 1,648,381,510 | | 114.1% |
| | | | | | | | |
63
T.A. U.S. CORE EQUITY 2 PORTFOLIO
CONTINUED
Summary of inputs used to value the Portfolio’s net assets as of October 31, 2009 is as follows (See Security Valuation Note):
| | | | | | | | | | | |
| | | Valuation Inputs |
| |
| | | Investment in Securities (Market Value) |
| | | Level 1 | | Level 2 | | Level 3 | | Total |
Common Stocks | | | | | | | | | | | |
Consumer Discretionary | | $ | 211,883,636 | | $ | 2,488 | | — | | $ | 211,886,124 |
Consumer Staples | | | 97,885,456 | | | — | | — | | | 97,885,456 |
Energy | | | 147,037,661 | | | — | | — | | | 147,037,661 |
Financials | | | 265,357,098 | | | — | | — | | | 265,357,098 |
Health Care | | | 148,398,711 | | | 21,990 | | — | | | 148,420,701 |
Industrials | | | 193,998,767 | | | — | | — | | | 193,998,767 |
Information Technology | | | 212,971,931 | | | — | | — | | | 212,971,931 |
Materials | | | 69,222,553 | | | — | | — | | | 69,222,553 |
Telecommunication Services | | | 48,090,563 | | | — | | — | | | 48,090,563 |
Utilities | | | 39,536,347 | | | — | | — | | | 39,536,347 |
Rights/Warrants | | | — | | | — | | — | | | — |
Temporary Cash Investments | | | 13,452,630 | | | — | | — | | | 13,452,630 |
Securities Lending Collateral | | | — | | | 200,521,679 | | — | | | 200,521,679 |
| | | | | | | | | | | |
TOTAL | | $ | 1,447,835,353 | | $ | 200,546,157 | | — | | $ | 1,648,381,510 |
| | | | | | | | | | | |
See accompanying Notes to Financial Statements.
64
U.S. SMALL CAP PORTFOLIO
SUMMARY SCHEDULE OF PORTFOLIO HOLDINGS
October 31, 2009
| | | | | | | |
| | | Shares | | Value† | | Percentage
of Net Assets** |
COMMON STOCKS — (84.2%) | | | | | | | |
Consumer Discretionary — (15.2%) | | | | | | | |
#Buckle, Inc. | | 124,650 | | $ | 3,740,746 | | 0.1% |
#Cooper Tire & Rubber Co. | | 483,812 | | | 7,382,971 | | 0.3% |
#*Gymboree Corp. | | 83,700 | | | 3,563,109 | | 0.1% |
*Harman International Industries, Inc. | | 103,046 | | | 3,875,560 | | 0.2% |
*Liberty Media Corp. Capital Class A | | 306,878 | | | 6,349,306 | | 0.3% |
Stage Stores, Inc. | | 454,540 | | | 5,363,572 | | 0.2% |
Tupperware Corp. | | 100,500 | | | 4,524,510 | | 0.2% |
*Warnaco Group, Inc. | | 133,817 | | | 5,423,603 | | 0.2% |
Wolverine World Wide, Inc. | | 146,900 | | | 3,757,702 | | 0.2% |
Other Securities | | | | | 409,239,690 | | 16.2% |
| | | | | | | |
Total Consumer Discretionary | | | | | 453,220,769 | | 18.0% |
| | | | | | | |
| | | |
Consumer Staples — (3.6%) | | | | | | | |
#Casey’s General Stores, Inc. | | 137,677 | | | 4,340,956 | | 0.2% |
*Central Garden & Pet Co. Class A | | 502,714 | | | 4,755,674 | | 0.2% |
Lancaster Colony Corp. | | 86,132 | | | 4,184,293 | | 0.2% |
Nu Skin Enterprises, Inc. Class A | | 180,500 | | | 4,108,180 | | 0.1% |
Other Securities | | | | | 88,819,373 | | 3.5% |
| | | | | | | |
Total Consumer Staples | | | | | 106,208,476 | | 4.2% |
| | | | | | | |
| | | |
Energy — (4.7%) | | | | | | | |
CARBO Ceramics, Inc. | | 66,655 | | | 3,891,985 | | 0.2% |
Other Securities | | | | | 137,267,123 | | 5.4% |
| | | | | | | |
Total Energy | | | | | 141,159,108 | | 5.6% |
| | | | | | | |
| | | |
Financials — (10.8%) | | | | | | | |
#Prosperity Bancshares, Inc. | | 112,211 | | | 4,016,032 | | 0.2% |
#*SVB Financial Group | | 86,286 | | | 3,559,298 | | 0.1% |
#Westamerica Bancorporation | | 79,557 | | | 3,802,825 | | 0.2% |
Other Securities | | | | | 310,538,970 | | 12.3% |
| | | | | | | |
Total Financials | | | | | 321,917,125 | | 12.8% |
| | | | | | | |
| | | |
Health Care — (11.0%) | | | | | | | |
#*Allscripts-Misys Healthcare Solutions, Inc. | | 193,106 | | | 3,765,567 | | 0.2% |
*Catalyst Health Solutions, Inc. | | 114,340 | | | 3,586,846 | | 0.1% |
*Dionex Corp. | | 53,415 | | | 3,625,810 | | 0.1% |
#*NuVasive, Inc. | | 97,252 | | | 3,529,275 | | 0.1% |
#*PSS World Medical, Inc. | | 178,200 | | | 3,603,204 | | 0.1% |
#Quality Systems, Inc. | | 72,918 | | | 4,449,456 | | 0.2% |
*Varian, Inc. | | 76,999 | | | 3,942,349 | | 0.2% |
Other Securities | | | | | 299,868,947 | | 11.9% |
| | | | | | | |
Total Health Care | | | | | 326,371,454 | | 12.9% |
| | | | | | | |
| | | |
Industrials — (14.6%) | | | | | | | |
*EMCOR Group, Inc. | | 176,300 | | | 4,164,206 | | 0.2% |
#Heartland Express, Inc. | | 264,941 | | | 3,603,198 | | 0.1% |
Knight Transportation, Inc. | | 227,179 | | | 3,643,951 | | 0.1% |
*MPS Group, Inc. | | 266,800 | | | 3,607,136 | | 0.1% |
Nordson Corp. | | 92,150 | | | 4,862,756 | | 0.2% |
*Oshkosh Truck Corp. Class B | | 113,829 | | | 3,558,295 | | 0.1% |
#Regal-Beloit Corp. | | 82,104 | | | 3,849,036 | | 0.2% |
*Tetra Tech, Inc. | | 153,296 | | | 3,944,306 | | 0.2% |
*United Stationers, Inc. | | 76,209 | | | 3,592,492 | | 0.1% |
#Werner Enterprises, Inc. | | 203,184 | | | 3,809,700 | | 0.2% |
Other Securities | | | | | 396,316,990 | | 15.7% |
| | | | | | | |
Total Industrials | | | | | 434,952,066 | | 17.2% |
| | | | | | | |
65
U.S. SMALL CAP PORTFOLIO
CONTINUED
| | | | | | | |
| | | Shares | | Value† | | Percentage
of Net Assets** |
Information Technology — (17.3%) | | | | | | | |
#Adtran, Inc. | | 210,232 | | $ | 4,843,745 | | 0.2% |
#*Atheros Communications, Inc. | | 149,696 | | | 3,685,516 | | 0.1% |
#*Concur Technologies, Inc. | | 107,483 | | | 3,830,694 | | 0.1% |
*Euronet Worldwide, Inc. | | 178,724 | | | 4,226,823 | | 0.2% |
*Exar Corp. | | 521,305 | | | 3,597,004 | | 0.1% |
#*Informatica Corp. | | 245,857 | | | 5,219,544 | | 0.2% |
*Quest Software, Inc. | | 296,730 | | | 4,976,162 | | 0.2% |
*RF Micro Devices, Inc. | | 1,149,123 | | | 4,573,510 | | 0.2% |
#*Silicon Laboratories, Inc. | | 92,924 | | | 3,893,516 | | 0.1% |
*Skyworks Solutions, Inc. | | 384,710 | | | 4,012,525 | | 0.2% |
*Starent Networks Corp. | | 141,611 | | | 4,777,955 | | 0.2% |
Syntel, Inc. | | 108,782 | | | 3,897,659 | | 0.2% |
*TIBCO Software, Inc. | | 474,473 | | | 4,151,639 | | 0.2% |
Other Securities | | | | | 461,308,866 | | 18.3% |
| | | | | | | |
Total Information Technology | | | | | 516,995,158 | | 20.5% |
| | | | | | | |
| | | |
Materials — (4.2%) | | | | | | | |
#NewMarket Corp. | | 43,500 | | | 4,067,250 | | 0.1% |
Schweitzer-Maudoit International, Inc. | | 80,768 | | | 4,171,667 | | 0.2% |
Other Securities | | | | | 115,900,513 | | 4.6% |
| | | | | | | |
Total Materials | | | | | 124,139,430 | | 4.9% |
| | | | | | | |
| | | |
Other — (0.0%) | | | | | | | |
Other Securities | | | | | 1,790 | | 0.0% |
| | | | | | | |
| | | |
Telecommunication Services — (0.9%) | | | | | | | |
Other Securities | | | | | 26,637,821 | | 1.1% |
| | | | | | | |
| | | |
Utilities — (1.9%) | | | | | | | |
#Cleco Corp. | | 157,387 | | | 3,895,328 | | 0.1% |
Other Securities | | | | | 52,686,048 | | 2.1% |
| | | | | | | |
Total Utilities | | | | | 56,581,376 | | 2.2% |
| | | | | | | |
TOTAL COMMON STOCKS | | | | | 2,508,184,573 | | 99.4% |
| | | | | | | |
RIGHTS/WARRANTS — (0.0%) | | | | | | | |
Other Securities | | | | | 1,961 | | 0.0% |
| | | | | | | |
| | | |
| | | Face Amount | | | | |
| | | (000) | | | | |
TEMPORARY CASH INVESTMENTS — (0.2%) | | | | | | | |
Repurchase Agreement, PNC Capital Markets, Inc. 0.19%, 11/02/09 (Collateralized by $6,820,000 FNMA 5.00%, 08/25/18, valued at $5,330,182) to be repurchased at $5,249,083 | | $5,249 | | | 5,249,000 | | 0.2% |
| | | | | | | |
| | | |
| | | Shares/ Face Amount | | | | |
| | | (000) | | | | |
SECURITIES LENDING COLLATERAL — (15.6%) | | | | | | | |
§@DFA Short Term Investment Fund LP | | 463,746,494 | | | 463,746,494 | | 18.4% |
@Repurchase Agreement, Deutsche Bank Securities 0.08%, | | | | | | | |
11/02/09 (Collateralized by $4,321,370 FHLMC 5.793%(r), 01/01/37, valued at $2,427,569) to be repurchased at $2,356,879 | | $2,357 | | | 2,356,863 | | 0.1% |
| | | | | | | |
TOTAL SECURITIES LENDING COLLATERAL | | | | | 466,103,357 | | 18.5% |
| | | | | | | |
66
U.S. SMALL CAP PORTFOLIO
CONTINUED
| | | | | |
| | | Value† | | Percentage
of Net Assets** |
TOTAL INVESTMENTS — (100.0%)
(Cost $3,017,501,920) | | $ | 2,979,538,891 | | 118.1% |
| | | | | |
Summary of inputs used to value the Portfolio’s net assets as of October 31, 2009 is as follows (See Security Valuation Note):
| | | | | | | | | | | |
| | | Valuation Inputs |
| |
| | | Investment in Securities (Market Value) |
| | | Level 1 | | Level 2 | | Level 3 | | Total |
| | | | |
Common Stocks | | | | | | | | | | | |
Consumer Discretionary | | $ | 453,196,769 | | $ | 24,000 | | — | | $ | 453,220,769 |
Consumer Staples | | | 106,208,476 | | | — | | — | | | 106,208,476 |
Energy | | | 141,159,108 | | | — | | — | | | 141,159,108 |
Financials | | | 321,917,125 | | | — | | — | | | 321,917,125 |
Health Care | | | 326,239,973 | | | 131,481 | | — | | | 326,371,454 |
Industrials | | | 434,952,066 | | | — | | — | | | 434,952,066 |
Information Technology | | | 516,973,323 | | | 21,835 | | — | | | 516,995,158 |
Materials | | | 124,139,430 | | | — | | — | | | 124,139,430 |
Other | | | — | | | 1,790 | | — | | | 1,790 |
Telecommunication Services | | | 26,637,821 | | | — | | — | | | 26,637,821 |
Utilities | | | 56,581,376 | | | — | | — | | | 56,581,376 |
Rights/Warrants | | | 1,961 | | | — | | — | | | 1,961 |
Temporary Cash Investments | | | — | | | 5,249,000 | | — | | | 5,249,000 |
Securities Lending Collateral | | | — | | | 466,103,357 | | — | | | 466,103,357 |
| | | | | | | | | | | |
TOTAL | | $ | 2,508,007,428 | | $ | 471,531,463 | | — | | $ | 2,979,538,891 |
| | | | | | | | | | | |
See accompanying Notes to Financial Statements.
67
U.S. MICRO CAP PORTFOLIO
SUMMARY SCHEDULE OF PORTFOLIO HOLDINGS
October 31, 2009
| | | | | | | |
| | | Shares | | Value† | | Percentage
of Net Assets** |
COMMON STOCKS — (85.7%) | | | | | | | |
Consumer Discretionary — (15.0%) | | | | | | | |
#*Brunswick Corp. | | 643,908 | | $ | 6,104,248 | | 0.2% |
#*Buffalo Wild Wings, Inc. | | 156,089 | | | 6,401,210 | | 0.2% |
*Jo-Ann Stores, Inc. | | 231,900 | | | 6,173,178 | | 0.2% |
#*Jos. A. Bank Clothiers, Inc. | | 176,578 | | | 7,236,166 | | 0.3% |
Monro Muffler Brake, Inc. | | 187,706 | | | 5,817,009 | | 0.2% |
#*Penske Automotive Group, Inc. | | 835,188 | | | 13,079,044 | | 0.5% |
*Steven Madden, Ltd. | | 180,802 | | | 7,322,481 | | 0.3% |
#*True Religion Apparel, Inc. | | 215,705 | | | 5,558,718 | | 0.2% |
UniFirst Corp. | | 132,382 | | | 5,573,282 | | 0.2% |
*Valassis Communications, Inc. | | 395,647 | | | 7,212,645 | | 0.2% |
Other Securities | | | | | 420,820,301 | | 14.9% |
| | | | | | | |
Total Consumer Discretionary | | | | | 491,298,282 | | 17.4% |
| | | | | | | |
| | | |
Consumer Staples — (4.1%) | | | | | | | |
#Cal-Maine Foods, Inc. | | 207,719 | | | 5,639,571 | | 0.2% |
J & J Snack Foods Corp. | | 181,697 | | | 7,117,071 | | 0.3% |
#Lance, Inc. | | 242,775 | | | 5,855,733 | | 0.2% |
PriceSmart, Inc. | | 296,600 | | | 5,724,380 | | 0.2% |
Other Securities | | | | | 110,564,745 | | 3.9% |
| | | | | | | |
Total Consumer Staples | | | | | 134,901,500 | | 4.8% |
| | | | | | | |
| | | |
Energy — (3.0%) | | | | | | | |
*NATCO Group, Inc. Class A | | 168,512 | | | 7,343,753 | | 0.3% |
*Rosetta Resources, Inc. | | 481,444 | | | 6,513,937 | | 0.2% |
Other Securities | | | | | 84,623,767 | | 3.0% |
| | | | | | | |
Total Energy | | | | | 98,481,457 | | 3.5% |
| | | | | | | |
| | | |
Financials — (12.4%) | | | | | | | |
FBL Financial Group, Inc. Class A | | 293,211 | | | 5,908,202 | | 0.2% |
Infinity Property & Casualty Corp. | | 144,873 | | | 5,602,239 | | 0.2% |
*PICO Holdings, Inc. | | 170,271 | | | 5,778,998 | | 0.2% |
#*Portfolio Recovery Associates, Inc. | | 134,197 | | | 6,191,850 | | 0.2% |
Other Securities | | | | | 383,238,435 | | 13.6% |
| | | | | | | |
Total Financials | | | | | 406,719,724 | | 14.4% |
| | | | | | | |
| | | |
Health Care — (12.5%) | | | | | | | |
*Amsurg Corp. | | 297,081 | | | 6,259,497 | | 0.3% |
*CONMED Corp. | | 266,279 | | | 5,642,452 | | 0.2% |
#Invacare Corp. | | 251,311 | | | 5,636,906 | | 0.2% |
*Par Pharmaceutical Cos., Inc. | | 271,575 | | | 5,694,928 | | 0.2% |
Other Securities | | | | | 383,894,332 | | 13.6% |
| | | | | | | |
Total Health Care | | | | | 407,128,115 | | 14.5% |
| | | | | | | |
| | | |
Industrials — (14.3%) | | | | | | | |
#American Science & Engineering, Inc. | | 88,885 | | | 5,877,076 | | 0.2% |
#Badger Meter, Inc. | | 157,501 | | | 5,870,062 | | 0.2% |
Healthcare Services Group, Inc. | | 353,878 | | | 6,989,090 | | 0.3% |
#Raven Industries, Inc. | | 253,116 | | | 6,251,965 | | 0.2% |
*Sykes Enterprises, Inc. | | 354,492 | | | 8,415,640 | | 0.3% |
Other Securities | | | | | 433,609,242 | | 15.4% |
| | | | | | | |
Total Industrials | | | | | 467,013,075 | | 16.6% |
| | | | | | | |
| | | |
Information Technology — (18.3%) | | | | | | | |
#*Cabot Microelectronics Corp. | | 234,301 | | | 7,492,946 | | 0.3% |
*Forrester Research, Inc. | | 224,649 | | | 5,690,359 | | 0.2% |
*Littlefuse, Inc. | | 204,498 | | | 5,635,965 | | 0.2% |
68
U.S. MICRO CAP PORTFOLIO
CONTINUED
| | | | | | | | |
| | | Shares | | Value† | | Percentage
of Net Assets** |
Information Technology — (Continued) | | | | | | | | |
#*Manhattan Associates, Inc. | | | 243,170 | | $ | 5,580,752 | | 0.2% |
Maximus, Inc. | | | 144,349 | | | 6,677,585 | | 0.2% |
#*Monolithic Power Systems, Inc. | | | 283,490 | | | 5,666,965 | | 0.2% |
#Pegasystems, Inc. | | | 274,711 | | | 7,875,964 | | 0.3% |
#Power Integrations, Inc. | | | 254,493 | | | 7,940,182 | | 0.3% |
#*ScanSource, Inc. | | | 237,698 | | | 6,035,152 | | 0.2% |
#*STEC, Inc. | | | 446,325 | | | 9,515,649 | | 0.3% |
#*TNS, Inc. | | | 214,400 | | | 6,058,944 | | 0.2% |
*Triquint Semiconductor, Inc. | | | 1,347,578 | | | 7,263,445 | | 0.3% |
#*Tyler Technologies, Inc. | | | 367,652 | | | 6,992,741 | | 0.3% |
#*Ultimate Software Group, Inc. | | | 243,491 | | | 6,211,455 | | 0.2% |
United Online, Inc. | | | 732,564 | | | 5,860,512 | | 0.2% |
Other Securities | | | | | | 496,102,824 | | 17.6% |
| | | | | | | | |
Total Information Technology | | | | | | 596,601,440 | | 21.2% |
| | | | | | | | |
| | | |
Materials — (3.6%) | | | | | | | | |
#AMCOL International Corp. | | | 271,602 | | | 7,072,516 | | 0.2% |
Arch Chemicals, Inc. | | | 221,263 | | | 6,126,772 | | 0.2% |
Schweitzer-Maudoit International, Inc. | | | 146,820 | | | 7,583,253 | | 0.3% |
Other Securities | | | | | | 97,697,901 | | 3.5% |
| | | | | | | | |
Total Materials | | | | | | 118,480,442 | | 4.2% |
| | | | | | | | |
| | | |
Other — (0.0%) | | | | | | | | |
Other Securities | | | | | | 10,290 | | 0.0% |
| | | | | | | | |
| | | |
Telecommunication Services — (1.1%) | | | | | | | | |
Other Securities | | | | | | 34,241,370 | | 1.2% |
| | | | | | | | |
| | | |
Utilities — (1.4%) | | | | | | | | |
American States Water Co. | | | 165,279 | | | 5,478,999 | | 0.2% |
Empire District Electric Co. | | | 300,150 | | | 5,420,709 | | 0.2% |
#MGE Energy, Inc. | | | 197,335 | | | 6,910,672 | | 0.2% |
Other Securities | | | | | | 28,565,305 | | 1.0% |
| | | | | | | | |
Total Utilities | | | | | | 46,375,685 | | 1.6% |
| | | | | | | | |
TOTAL COMMON STOCKS | | | | | | 2,801,251,380 | | 99.4% |
| | | | | | | | |
RIGHTS/WARRANTS — (0.0%) | | | | | | | | |
Other Securities | | | | | | 2,209 | | 0.0% |
| | | | | | | | |
| | | |
TEMPORARY CASH INVESTMENTS — (0.3%) | | | | | | | | |
BlackRock Liquidity Funds Tempcash Portfolio - Institutional Shares | | | 9,293,471 | | | 9,293,471 | | 0.3% |
| | | | | | | | |
| | | |
| | | Shares/ Face Amount | | | | |
| | | (000) | | | | |
SECURITIES LENDING COLLATERAL — (14.0%) | | | | | | | | |
§@DFA Short Term Investment Fund LP | | | 456,745,018 | | | 456,745,018 | | 16.2% |
@Repurchase Agreement, Deutsche Bank Securities 0.08%, | | | | | | | | |
11/02/09 (Collateralized by $4,256,128 FHLMC 5.793%(r), 01/01/37, valued at $2,390,919) to be repurchased at $2,321,295 | | $ | 2,321 | | | 2,321,280 | | 0.1% |
| | | | | | | | |
| | | |
TOTAL SECURITIES LENDING COLLATERAL | | | | | | 459,066,298 | | 16.3% |
| | | | | | | | |
TOTAL INVESTMENTS — (100.0%)
(Cost $3,473,226,895) | | | | | $ | 3,269,613,358 | | 116.0% |
| | | | | | | | |
69
U.S. MICRO CAP PORTFOLIO
CONTINUED
Summary of inputs used to value the Portfolio’s net assets as of October 31, 2009 is as follows (See Security Valuation Note):
| | | | | | | | | | | |
| | | Valuation Inputs |
| |
| | | Investment in Securities (Market Value) |
| | | Level 1 | | Level 2 | | Level 3 | | Total |
Common Stocks | | | | | | | | | | | |
Consumer Discretionary | | $ | 491,089,532 | | $ | 208,750 | | — | | $ | 491,298,282 |
Consumer Staples | | | 134,901,500 | | | — | | — | | | 134,901,500 |
Energy | | | 98,481,457 | | | — | | — | | | 98,481,457 |
Financials | | | 406,719,724 | | | — | | — | | | 406,719,724 |
Health Care | | | 406,927,042 | | | 201,073 | | — | | | 407,128,115 |
Industrials | | | 467,013,075 | | | — | | — | | | 467,013,075 |
Information Technology | | | 596,601,440 | | | — | | — | | | 596,601,440 |
Materials | | | 118,480,442 | | | — | | — | | | 118,480,442 |
Other | | | — | | | 10,290 | | — | | | 10,290 |
Telecommunication Services | | | 34,241,370 | | | — | | — | | | 34,241,370 |
Utilities | | | 46,375,685 | | | — | | — | | | 46,375,685 |
Rights/Warrants | | | 2,209 | | | — | | — | | | 2,209 |
Temporary Cash Investments | | | 9,293,471 | | | — | | — | | | 9,293,471 |
Securities Lending Collateral | | | — | | | 459,066,298 | | — | | | 459,066,298 |
| | | | | | | | | | | |
TOTAL | | $ | 2,810,126,947 | | $ | 459,486,411 | | — | | $ | 3,269,613,358 |
| | | | | | | | | | | |
See accompanying Notes to Financial Statements.
70
DFA REAL ESTATE SECURITIES PORTFOLIO
SUMMARY SCHEDULE OF PORTFOLIO HOLDINGS
October 31, 2009
| | | | | | | |
| | | Shares | | Value† | | Percentage
of Net Assets** |
COMMON STOCKS — (73.6%) | | | | | | | |
Real Estate Investment Trusts — (73.6%) | | | | | | | |
#Alexander’s, Inc. | | 55,500 | | $ | 14,703,060 | | 0.7% |
#Alexandria Real Estate Equities, Inc. | | 419,576 | | | 22,728,432 | | 1.1% |
#AMB Property Corp. | | 1,436,481 | | | 31,573,852 | | 1.6% |
American Campus Communites, Inc. | | 508,012 | | | 13,726,484 | | 0.7% |
#Apartment Investment & Management Co. Class A | | 1,251,241 | | | 15,452,826 | | 0.8% |
#AvalonBay Communities, Inc. | | 828,309 | | | 56,971,093 | | 2.8% |
BioMed Realty Trust, Inc. | | 955,828 | | | 12,970,586 | | 0.6% |
#Boston Properties, Inc. | | 1,347,700 | | | 81,899,729 | | 4.1% |
#BRE Properties, Inc. Class A | | 548,615 | | | 14,938,786 | | 0.7% |
#Camden Property Trust | | 635,103 | | | 23,022,484 | | 1.1% |
#Corporate Office Properties Trust | | 570,400 | | | 18,931,576 | | 0.9% |
#Developers Diversified Realty Corp. | | 1,727,951 | | | 14,843,099 | | 0.7% |
#Digital Realty Trust, Inc. | | 798,117 | | | 36,019,020 | | 1.8% |
#Douglas Emmett, Inc. | | 1,309,963 | | | 15,457,563 | | 0.8% |
#Duke Realty Corp. | | 2,172,470 | | | 24,418,563 | | 1.2% |
#Equity Lifestyle Properties, Inc. | | 298,926 | | | 13,885,113 | | 0.7% |
#Equity One, Inc. | | 849,219 | | | 12,670,347 | | 0.6% |
#Equity Residential | | 2,734,906 | | | 78,984,085 | | 3.9% |
#Essex Property Trust, Inc. | | 283,571 | | | 21,318,868 | | 1.1% |
#Federal Realty Investment Trust | | 631,358 | | | 37,269,063 | | 1.8% |
#HCP, Inc. | | 2,837,822 | | | 83,971,153 | | 4.2% |
#Health Care REIT, Inc. | | 1,174,673 | | | 52,120,241 | | 2.6% |
#Healthcare Realty Trust, Inc. | | 635,960 | | | 13,247,047 | | 0.7% |
#Highwood Properties, Inc. | | 695,760 | | | 19,147,315 | | 0.9% |
#Home Properties, Inc. | | 352,370 | | | 13,805,857 | | 0.7% |
#Hospitality Properties Trust | | 1,194,605 | | | 23,067,823 | | 1.1% |
#Host Marriott Corp. | | 5,857,767 | | | 59,222,024 | | 2.9% |
#HRPT Properties Trust | | 2,385,161 | | | 16,767,682 | | 0.8% |
#Kimco Realty Corp. | | 3,650,770 | | | 46,145,733 | | 2.3% |
#Liberty Property Trust | | 1,082,967 | | | 31,806,741 | | 1.6% |
#Macerich Co. (The) | | 864,550 | | | 25,763,590 | | 1.3% |
Mack-Cali Realty Corp. | | 779,841 | | | 24,136,079 | | 1.2% |
#Mid-America Apartment Communities, Inc. | | 302,710 | | | 13,264,752 | | 0.7% |
#National Retail Properties, Inc. | | 857,504 | | | 16,618,428 | | 0.8% |
Nationwide Health Properties, Inc. | | 1,090,924 | | | 35,182,299 | | 1.7% |
#Omega Healthcare Investors, Inc. | �� | 882,824 | | | 13,383,612 | | 0.7% |
#ProLogis | | 4,295,149 | | | 48,664,038 | | 2.4% |
#Public Storage | | 1,703,066 | | | 125,345,658 | | 6.2% |
#Realty Income Corp. | | 1,118,748 | | | 25,932,579 | | 1.3% |
#Regency Centers Corp. | | 788,282 | | | 26,446,861 | | 1.3% |
#Senior Housing Properties Trust | | 1,265,132 | | | 24,391,745 | | 1.2% |
#Simon Property Group, Inc. | | 2,747,056 | | | 186,497,632 | | 9.2% |
#SL Green Realty Corp. | | 761,883 | | | 29,530,585 | | 1.5% |
#Tanger Factory Outlet Centers, Inc. | | 368,951 | | | 14,045,965 | | 0.7% |
#Taubman Centers, Inc. | | 565,761 | | | 17,261,368 | | 0.9% |
#UDR, Inc. | | 1,491,932 | | | 21,453,982 | | 1.1% |
#Ventas, Inc. | | 1,545,828 | | | 62,034,078 | | 3.1% |
#Vornado Realty Trust | | 1,740,706 | | | 103,676,449 | | 5.1% |
#Washington REIT | | 570,272 | | | 15,226,262 | | 0.8% |
#Weingarten Realty Investors | | 1,161,941 | | | 21,495,908 | | 1.1% |
Other Securities | | | | | 232,842,748 | | 11.5% |
| | | | | | | |
| | | |
TOTAL COMMON STOCKS | | | | | 2,004,280,863 | | 99.3% |
| | | | | | | |
| | | |
RIGHTS/WARRANTS — (0.0%) | | | | | | | |
Other Securities | | | | | — | | 0.0% |
| | | | | | | |
71
DFA REAL ESTATE SECURITIES PORTFOLIO
CONTINUED
| | | | | | | | |
| | | Face Amount | | Value† | | Percentage
of Net Assets** |
| | | (000) | | | | |
TEMPORARY CASH INVESTMENTS — (0.7%) | | | | | | | | |
Repurchase Agreement, PNC Capital Markets, Inc. 0.19%, 11/02/09 (Collateralized by $18,765,000 FNMA 6.50%, 06/25/39, valued at $20,195,831) to be repurchased at $19,896,315 | | | $19,896 | | $ | 19,896,000 | | 1.0% |
| | | | | | | | |
| | | |
| | | Shares/ Face Amount | | | | |
| | | (000) | | | | |
SECURITIES LENDING COLLATERAL — (25.7%) | | | | | | | | |
§@DFA Short Term Investment Fund LP | | | 696,103,948 | | | 696,103,948 | | 34.5% |
@Repurchase Agreement, Deutsche Bank Securities 0.08%, | | | | | | | | |
11/02/09 (Collateralized by $4,743,207 FHLMC 5.945%, 07/01/37, valued at $3,643,889) to be repurchased at $3,537,780 | | $ | 3,538 | | | 3,537,756 | | 0.1% |
| | | | | | | | |
TOTAL SECURITIES LENDING COLLATERAL | | | | | | 699,641,704 | | 34.6% |
| | | | | | | | |
| | | |
TOTAL INVESTMENTS — (100.0%)
(Cost $3,104,327,377) | | | | | $ | 2,723,818,567 | | 134.9% |
| | | | | | | | |
Summary of inputs used to value the Portfolio’s net assets as of October 31, 2009 is as follows (See Security Valuation Note):
| | | | | | | | | | | |
| | | Valuation Inputs |
| |
| | | Investment in Securities (Market Value) |
| | | Level 1 | | Level 2 | | Level 3 | | Total |
Common Stocks
Real Estate Investment Trusts | | $ | 2,004,205,423 | | $ | 75,440 | | — | | $ | 2,004,280,863 |
Rights/Warrants | | | — | | | — | | — | | | — |
Temporary Cash Investments | | | — | | | 19,896,000 | | — | | | 19,896,000 |
Securities Lending Collateral | | | — | | | 699,641,704 | | — | | | 699,641,704 |
| | | | | | | | | | | |
TOTAL | | $ | 2,004,205,423 | | $ | 719,613,144 | | — | | $ | 2,723,818,567 |
| | | | | | | | | | | |
See accompanying Notes to Financial Statements.
72
LARGE CAP INTERNATIONAL PORTFOLIO
SUMMARY SCHEDULE OF PORTFOLIO HOLDINGS
October 31, 2009
| | | | | | | |
| | | Shares | | Value†† | | Percentage
of Net Assets** |
COMMON STOCKS — (84.9%) | | | | | | | |
AUSTRALIA — (6.4%) | | | | | | | |
Australia & New Zealand Banking Group, Ltd. | | 313,082 | | $ | 6,385,657 | | 0.5% |
BHP Billiton, Ltd. | | 297,885 | | | 9,769,625 | | 0.7% |
Commonwealth Bank of Australia | | 205,240 | | | 9,484,434 | | 0.7% |
National Australia Bank, Ltd. | | 269,835 | | | 7,129,483 | | 0.5% |
Westpac Banking Corp. | | 303,665 | | | 7,097,436 | | 0.5% |
Other Securities | | | | | 62,682,123 | | 4.6% |
| | | | | | | |
TOTAL AUSTRALIA | | | | | 102,548,758 | | 7.5% |
| | | | | | | |
| | | |
AUSTRIA — (0.3%) | | | | | | | |
Other Securities | | | | | 4,353,395 | | 0.3% |
| | | | | | | |
| | | |
BELGIUM — (0.6%) | | | | | | | |
Other Securities | | | | | 9,594,243 | | 0.7% |
| | | | | | | |
| | | |
CANADA — (7.3%) | | | | | | | |
Bank of Nova Scotia | | 131,127 | | | 5,483,570 | | 0.4% |
EnCana Corp | | 98,862 | | | 5,481,928 | | 0.4% |
#Royal Bank of Canada | | 194,768 | | | 9,863,949 | | 0.7% |
Suncor Energy, Inc. | | 211,107 | | | 7,007,960 | | 0.5% |
#Toronto Dominion Bank | | 115,015 | | | 6,556,190 | | 0.5% |
Other Securities | | | | | 81,866,578 | | 6.0% |
| | | | | | | |
TOTAL CANADA | | | | | 116,260,175 | | 8.5% |
| | | | | | | |
| | | |
DENMARK — (0.8%) | | | | | | | |
Other Securities | | | | | 12,304,930 | | 0.9% |
| | | | | | | |
| | | |
FINLAND — (0.8%) | | | | | | | |
Other Securities | | | | | 12,017,978 | | 0.9% |
| | | | | | | |
| | | |
FRANCE — (7.9%) | | | | | | | |
BNP Paribas SA | | 125,043 | | | 9,420,006 | | 0.7% |
France Telecom SA | | 214,253 | | | 5,308,922 | | 0.4% |
#*GDF Suez | | 152,694 | | | 6,383,743 | | 0.5% |
Sanofi - Aventis SA | | 101,521 | | | 7,441,704 | | 0.5% |
#Total SA | | 177,977 | | | 10,650,191 | | 0.8% |
Other Securities | | | | | 86,909,130 | | 6.4% |
| | | | | | | |
TOTAL FRANCE | | | | | 126,113,696 | | 9.3% |
| | | | | | | |
| | | |
GERMANY — (5.8%) | | | | | | | |
BASF AG | | 108,701 | | | 5,850,644 | | 0.4% |
E.ON AG | | 177,264 | | | 6,772,790 | | 0.5% |
#Siemens AG Sponsored ADR | | 61,550 | | | 5,540,731 | | 0.4% |
Other Securities | | | | | 74,896,903 | | 5.5% |
| | | | | | | |
TOTAL GERMANY | | | | | 93,061,068 | | 6.8% |
| | | | | | | |
| | | |
GREECE — (0.4%) | | | | | | | |
Other Securities | | | | | 7,184,018 | | 0.5% |
| | | | | | | |
| | | |
HONG KONG — (1.8%) | | | | | | | |
Other Securities | | | | | 28,121,806 | | 2.1% |
| | | | | | | |
| | | |
IRELAND — (0.2%) | | | | | | | |
Other Securities | | | | | 3,035,031 | | 0.2% |
| | | | | | | |
| | | |
ITALY — (2.7%) | | | | | | | |
Eni SpA | | 241,210 | | | 5,973,993 | | 0.4% |
*UniCredito SpA | | 1,875,900 | | | 6,284,651 | | 0.5% |
73
LARGE CAP INTERNATIONAL PORTFOLIO
CONTINUED
| | | | | | | |
| | | Shares | | Value†† | | Percentage
of Net Assets** |
ITALY — (Continued) | | | | | | | |
Other Securities | | | | $ | 31,732,183 | | 2.3% |
| | | | | | | |
TOTAL ITALY | | | | | 43,990,827 | | 3.2% |
| | | | | | | |
| | | |
JAPAN — (17.3%) | | | | | | | |
Mitsubishi UFJ Financial Group, Inc. ADR | | 1,013,378 | | | 5,381,037 | | 0.4% |
Toyota Motor Corp. | | 249,300 | | | 9,841,604 | | 0.7% |
Other Securities | | | | | 260,980,547 | | 19.2% |
| | | | | | | |
TOTAL JAPAN | | | | | 276,203,188 | | 20.3% |
| | | | | | | |
| | | |
NETHERLANDS — (2.2%) | | | | | | | |
#Royal Dutch Shell P.L.C. Series A | | 280,159 | | | 8,306,337 | | 0.6% |
Other Securities | | | | | 26,344,081 | | 1.9% |
| | | | | | | |
TOTAL NETHERLANDS | | | | | 34,650,418 | | 2.5% |
| | | | | | | |
| | | |
NEW ZEALAND — (0.1%) | | | | | | | |
Other Securities | | | | | 1,507,930 | | 0.1% |
| | | | | | | |
| | | |
NORWAY — (0.7%) | | | | | | | |
Other Securities | | | | | 11,130,516 | | 0.8% |
| | | | | | | |
| | | |
PORTUGAL — (0.2%) | | | | | | | |
Other Securities | | | | | 3,989,070 | | 0.3% |
| | | | | | | |
| | | |
SINGAPORE — (0.9%) | | | | | | | |
Other Securities | | | | | 14,774,570 | | 1.1% |
| | | | | | | |
| | | |
SPAIN — (3.8%) | | | | | | | |
#Banco Bilbao Vizcaya SA Sponsored ADR | | 367,402 | | | 6,539,756 | | 0.5% |
Banco Santander SA | | 406,785 | | | 6,546,088 | | 0.5% |
Banco Santander SA Sponsored ADR | | 632,567 | | | 10,159,026 | | 0.7% |
Telefonica SA | | 257,024 | | | 7,177,778 | | 0.5% |
#Telefonica SA Sponsored ADR | | 119,800 | | | 10,054,814 | | 0.7% |
Other Securities | | | | | 21,096,802 | | 1.6% |
| | | | | | | |
TOTAL SPAIN | | | | | 61,574,264 | | 4.5% |
| | | | | | | |
| | | |
SWEDEN — (2.0%) | | | | | | | |
Other Securities | | | | | 31,496,226 | | 2.3% |
| | | | | | | |
| | | |
SWITZERLAND — (6.2%) | | | | | | | |
Credit Suisse Group AG | | 113,322 | | | 6,057,874 | | 0.4% |
Nestle SA | | 475,908 | | | 22,130,471 | | 1.6% |
Novartis AG | | 171,916 | | | 8,952,381 | | 0.7% |
Novartis AG ADR | | 120,800 | | | 6,275,560 | | 0.5% |
Roche Holding AG Genusschein | | 86,959 | | | 13,927,609 | | 1.0% |
*UBS AG | | 372,238 | | | 6,206,973 | | 0.5% |
Other Securities | | | | | 35,996,303 | | 2.6% |
| | | | | | | |
TOTAL SWITZERLAND | | | | | 99,547,171 | | 7.3% |
| | | | | | | |
| | | |
UNITED KINGDOM — (16.5%) | | | | | | | |
*Anglo American P.L.C. | | 178,356 | | | 6,453,474 | | 0.5% |
AstraZeneca P.L.C. | | 134,585 | | | 6,041,736 | | 0.4% |
BG Group P.L.C. | | 396,021 | | | 6,816,838 | | 0.5% |
BP P.L.C. | | 1,435,437 | | | 13,450,442 | | 1.0% |
#*BP P.L.C. Sponsored ADR | | 160,400 | | | 9,081,848 | | 0.7% |
British American Tobacco P.L.C. | | 244,717 | | | 7,798,164 | | 0.6% |
GlaxoSmithKline P.L.C. | | 503,498 | | | 10,328,121 | | 0.7% |
HSBC Holdings P.L.C. | | 1,247,046 | | | 13,922,088 | | 1.0% |
HSBC Holdings P.L.C. Sponsored ADR | | 200,759 | | | 11,120,041 | | 0.8% |
Rio Tinto P.L.C. | | 153,950 | | | 6,806,118 | | 0.5% |
Royal Dutch Shell P.L.C. ADR | | 93,987 | | | 5,466,284 | | 0.4% |
74
LARGE CAP INTERNATIONAL PORTFOLIO
CONTINUED
| | | | | | | | |
| | | Shares | | Value†† | | Percentage
of Net Assets** |
UNITED KINGDOM — (Continued) | | | | | | | | |
Royal Dutch Shell P.L.C. Series B | | | 235,872 | | $ | 6,790,173 | | 0.5% |
Standard Chartered P.L.C. | | | 265,170 | | | 6,505,166 | | 0.5% |
Tesco P.L.C. | | | 1,025,017 | | | 6,853,642 | | 0.5% |
Vodafone Group P.L.C. | | | 4,315,608 | | | 9,510,887 | | 0.7% |
Vodafone Group P.L.C. Sponsored ADR | | | 303,700 | | | 6,739,103 | | 0.5% |
Other Securities | | | | | | 130,529,930 | | 9.6% |
| | | | | | | | |
TOTAL UNITED KINGDOM | | | | | | 264,214,055 | | 19.4% |
| | | | | | | | |
TOTAL COMMON STOCKS | | | | | | 1,357,673,333 | | 99.5% |
| | | | | | | | |
PREFERRED STOCKS — (0.0%) | | | | | | | | |
ITALY — (0.0%) | | | | | | | | |
Other Securities | | | | | | 26,635 | | 0.0% |
| | | | | | | | |
| | | |
RIGHTS/WARRANTS — (0.0%) | | | | | | | | |
BELGIUM — (0.0%) | | | | | | | | |
Other Securities | | | | | | 7 | | 0.0% |
| | | | | | | | |
| | | |
HONG KONG — (0.0%) | | | | | | | | |
Other Securities | | | | | | 6,412 | | 0.0% |
| | | | | | | | |
| | | |
ITALY — (0.0%) | | | | | | | | |
Other Securities | | | | | | — | | 0.0% |
| | | | | | | | |
| | | |
JAPAN — (0.0%) | | | | | | | | |
Other Securities | | | | | | — | | 0.0% |
| | | | | | | | |
TOTAL RIGHTS/WARRANTS | | | | | | 6,419 | | 0.0% |
| | | | | | | | |
| | | |
| | | Face Amount | | | | |
| | | (000) | | Value† | | |
TEMPORARY CASH INVESTMENTS — (0.0%) | | | | | | | | |
Repurchase Agreement, PNC Capital Markets, Inc. 0.19%, 11/02/09 (Collateralized by $730,000 FNMA 6.50%, 06/25/39, valued at $785,663) to be repurchased at $772,012 | | $ | 772 | | | 772,000 | | 0.1% |
| | | | | | | | |
| | | |
| | | Shares/ Face Amount | | | | |
| | | (000) | | | | |
SECURITIES LENDING COLLATERAL — (15.1%) | | | | | | | | |
§@DFA Short Term Investment Fund LP | | | 237,395,211 | | | 237,395,211 | | 17.4% |
@Repurchase Agreement, Deutsche Bank Securities 0.07%, 11/02/09 (Collateralized by various corporate obligations, ranging in par value from $4,247,617 to $16,429,280, rates ranging from 5.000% to 7.000%, maturities ranging from 03/01/37 to 10/01/39, valued at $4,251,826) to be repurchased at $4,168,481 | | $ | 4,168 | | | 4,168,457 | | 0.3% |
| | | | | | | | |
TOTAL SECURITIES LENDING COLLATERAL | | | | | | 241,563,668 | | 17.7% |
| | | | | | | | |
TOTAL INVESTMENTS — (100.0%)
(Cost $1,509,613,716) | | | | | $ | 1,600,042,055 | | 117.3% |
| | | | | | | | |
75
LARGE CAP INTERNATIONAL PORTFOLIO
CONTINUED
Summary of inputs used to value the Portfolio’s net assets as of October 31, 2009 is as follows (See Security Valuation Note):
| | | | | | | | | | | |
| | | Valuation Inputs |
| |
| | | Investment in Securities (Market Value) |
| | | Level 1 | | Level 2 | | Level 3 | | Total |
Common Stocks | | | | | | | | | | | |
Australia | | $ | 6,198,344 | | $ | 96,350,414 | | — | | $ | 102,548,758 |
Austria | | | 78,240 | | | 4,275,155 | | — | | | 4,353,395 |
Belgium | | | 359,340 | | | 9,234,903 | | — | | | 9,594,243 |
Canada | | | 116,260,175 | | | — | | — | | | 116,260,175 |
Denmark | | | 1,521,494 | | | 10,783,436 | | — | | | 12,304,930 |
Finland | | | 2,495,194 | | | 9,522,784 | | — | | | 12,017,978 |
France | | | 11,817,363 | | | 114,296,333 | | — | | | 126,113,696 |
Germany | | | 23,137,574 | | | 69,923,494 | | — | | | 93,061,068 |
Greece | | | 891,949 | | | 6,292,069 | | — | | | 7,184,018 |
Hong Kong | | | — | | | 28,121,806 | | — | | | 28,121,806 |
Ireland | | | 1,529,520 | | | 1,505,511 | | — | | | 3,035,031 |
Italy | | | 5,133,789 | | | 38,857,038 | | — | | | 43,990,827 |
Japan | | | 23,900,740 | | | 252,302,448 | | — | | | 276,203,188 |
Netherlands | | | 1,086,918 | | | 33,563,500 | | — | | | 34,650,418 |
New Zealand | | | — | | | 1,507,930 | | — | | | 1,507,930 |
Norway | | | 949,419 | | | 10,181,097 | | — | | | 11,130,516 |
Portugal | | | — | | | 3,989,070 | | — | | | 3,989,070 |
Singapore | | | — | | | 14,774,570 | | — | | | 14,774,570 |
Spain | | | 28,615,596 | | | 32,958,668 | | — | | | 61,574,264 |
Sweden | | | 414,585 | | | 31,081,641 | | — | | | 31,496,226 |
Switzerland | | | 14,774,954 | | | 84,772,217 | | — | | | 99,547,171 |
United Kingdom | | | 66,124,743 | | | 198,089,312 | | — | | | 264,214,055 |
Preferred Stocks | | | | | | | | | | | |
Italy | | | — | | | 26,635 | | — | | | 26,635 |
Rights/Warrants | | | | | | | | | | | |
Belgium | | | 7 | | | — | | — | | | 7 |
Hong Kong | | | — | | | 6,412 | | — | | | 6,412 |
Italy | | | — | | | — | | — | | | — |
Japan | | | — | | | — | | — | | | — |
Temporary Cash Investments | | | — | | | 772,000 | | — | | | 772,000 |
Securities Lending Collateral | | | — | | | 241,563,668 | | — | | | 241,563,668 |
| | | | | | | | | | | |
| | | | |
TOTAL | | $ | 305,289,944 | | $ | 1,294,752,111 | | — | | $ | 1,600,042,055 |
| | | | | | | | | | | |
See accompanying Notes to Financial Statements.
76
INTERNATIONAL CORE EQUITY PORTFOLIO
SUMMARY SCHEDULE OF PORTFOLIO HOLDINGS
October 31, 2009
| | | | | | | |
| | | Shares | | Value†† | | Percentage
of Net Assets** |
COMMON STOCKS — (84.3%) | | | | | | | |
AUSTRALIA — (5.9%) | | | | | | | |
Australia & New Zealand Banking Group, Ltd. | | 642,628 | | $ | 13,107,115 | | 0.4% |
Commonwealth Bank of Australia | | 249,307 | | | 11,520,833 | | 0.3% |
National Australia Bank, Ltd. | | 468,016 | | | 12,365,750 | | 0.3% |
Other Securities | | | | | 222,067,785 | | 6.0% |
| | | | | | | |
TOTAL AUSTRALIA | | | | | 259,061,483 | | 7.0% |
| | | | | | | |
| | | |
AUSTRIA — (0.5%) | | | | | | | |
Other Securities | | | | | 23,127,388 | | 0.6% |
| | | | | | | |
| | | |
BELGIUM — (0.9%) | | | | | | | |
Other Securities | | | | | 40,361,634 | | 1.1% |
| | | | | | | |
| | | |
CANADA — (7.5%) | | | | | | | |
#Bank of Montreal | | 202,373 | | | 9,362,592 | | 0.2% |
EnCana Corp. | | 208,817 | | | 11,578,966 | | 0.3% |
#Manulife Financial Corp. | | 443,273 | | | 8,316,105 | | 0.2% |
#Royal Bank of Canada | | 162,793 | | | 8,244,588 | | 0.2% |
Suncor Energy, Inc. | | 402,417 | | | 13,358,748 | | 0.4% |
Talisman Energy, Inc. | | 499,600 | | | 8,523,281 | | 0.2% |
*Teck Resources, Ltd. Class B | | 337,587 | | | 9,799,554 | | 0.3% |
#Toronto Dominion Bank | | 234,460 | | | 13,364,903 | | 0.4% |
Other Securities | | | | | 242,654,600 | | 6.6% |
| | | | | | | |
TOTAL CANADA | | | | | 325,203,337 | | 8.8% |
| | | | | | | |
| | | |
DENMARK — (0.8%) | | | | | | | |
Other Securities | | | | | 33,362,644 | | 0.9% |
| | | | | | | |
| | | |
FINLAND — (1.3%) | | | | | | | |
Other Securities | | | | | 57,389,630 | | 1.6% |
| | | | | | | |
| | | |
FRANCE — (7.1%) | | | | | | | |
#AXA SA Sponsored ADR | | 450,270 | | | 11,166,696 | | 0.3% |
BNP Paribas SA | | 264,297 | | | 19,910,585 | | 0.5% |
#Compagnie de Saint-Gobain SA | | 199,892 | | | 9,740,682 | | 0.3% |
#*GDF Suez SA | | 332,503 | | | 13,901,095 | | 0.4% |
Sanofi - Aventis SA ADR | | 423,195 | | | 15,624,359 | | 0.4% |
#Schneider Electric SA | | 86,442 | | | 8,988,999 | | 0.2% |
Societe Generale Paris SA | | 172,286 | | | 11,443,202 | | 0.3% |
Total SA Sponsored ADR | | 155,727 | | | 9,354,521 | | 0.3% |
Other Securities | | | | | 211,624,580 | | 5.7% |
| | | | | | | |
TOTAL FRANCE | | | | | 311,754,719 | | 8.4% |
| | | | | | | |
| | | |
GERMANY — (5.0%) | | | | | | | |
Allianz SE Sponsored ADR | | 984,886 | | | 11,178,456 | | 0.3% |
#E.ON AG Sponsored ADR | | 218,470 | | | 8,389,248 | | 0.2% |
Munchener Rueckversicherungs-Gesellschaft AG | | 59,826 | | | 9,465,241 | | 0.2% |
Siemens AG Sponsored ADR | | 125,474 | | | 11,295,169 | | 0.3% |
Other Securities | | | | | 179,767,598 | | 4.9% |
| | | | | | | |
TOTAL GERMANY | | | | | 220,095,712 | | 5.9% |
| | | | | | | |
| | | |
GREECE — (1.0%) | | | | | | | |
Other Securities | | | | | 44,809,050 | | 1.2% |
| | | | | | | |
| | | |
HONG KONG — (1.8%) | | | | | | | |
Other Securities | | | | | 77,593,825 | | 2.1% |
| | | | | | | |
77
INTERNATIONAL CORE EQUITY PORTFOLIO
CONTINUED
| | | | | | | |
| | | Shares | | Value†† | | Percentage
of Net Assets** |
IRELAND — (0.6%) | | | | | | | |
Other Securities | | | | $ | 23,913,871 | | 0.6% |
| | | | | | | |
| | | |
ITALY — (2.6%) | | | | | | | |
#*Intesa Sanpaolo SpA | | 2,143,093 | | | 9,019,162 | | 0.2% |
*UniCredito SpA | | 4,050,516 | | | 13,570,061 | | 0.4% |
Other Securities | | | | | 88,829,673 | | 2.4% |
| | | | | | | |
TOTAL ITALY | | | | | 111,418,896 | | 3.0% |
| | | | | | | |
| | | |
JAPAN — (17.1%) | | | | | | | |
#Honda Motor Co., Ltd. Sponsored ADR | | 409,732 | | | 12,689,400 | | 0.3% |
#Mitsubishi UFJ Financial Group, Inc. ADR | | 1,712,038 | | | 9,090,922 | | 0.3% |
�� Sony Corp. Sponsored ADR | | 290,300 | | | 8,531,917 | | 0.2% |
#Toyota Motor Corp. Sponsored ADR | | 260,669 | | | 20,564,177 | | 0.6% |
Other Securities | | | | | 695,631,016 | | 18.8% |
| | | | | | | |
TOTAL JAPAN | | | | | 746,507,432 | | 20.2% |
| | | | | | | |
| | | |
NETHERLANDS — (2.4%) | | | | | | | |
#*ING Groep NV Sponsored ADR | | 843,215 | | | 10,877,473 | | 0.3% |
Other Securities | | | | | 91,719,715 | | 2.5% |
| | | | | | | |
TOTAL NETHERLANDS | | | | | 102,597,188 | | 2.8% |
| | | | | | | |
| | | |
NEW ZEALAND — (0.2%) | | | | | | | |
Other Securities | | | | | 9,828,546 | | 0.3% |
| | | | | | | |
| | | |
NORWAY — (0.9%) | | | | | | | |
Other Securities | | | | | 40,646,423 | | 1.1% |
| | | | | | | |
| | | |
PORTUGAL — (0.5%) | | | | | | | |
Other Securities | | | | | 20,329,702 | | 0.5% |
| | | | | | | |
| | | |
SINGAPORE — (1.2%) | | | | | | | |
Other Securities | | | | | 51,319,251 | | 1.4% |
| | | | | | | |
| | | |
SPAIN — (2.9%) | | | | | | | |
#Banco Bilbao Vizcaya SA Sponsored ADR | | 858,383 | | | 15,279,217 | | 0.4% |
Banco Santander SA Sponsored ADR | | 2,128,205 | | | 34,178,972 | | 0.9% |
Other Securities | | | | | 75,624,685 | | 2.1% |
| | | | | | | |
TOTAL SPAIN | | | | | 125,082,874 | | 3.4% |
| | | | | | | |
| | | |
SWEDEN — (2.0%) | | | | | | | |
#Nordea Bank AB | | 910,765 | | | 9,775,622 | | 0.3% |
Other Securities | | | | | 77,992,798 | | 2.1% |
| | | | | | | |
TOTAL SWEDEN | | | | | 87,768,420 | | 2.4% |
| | | | | | | |
| | | |
SWITZERLAND — (5.7%) | | | | | | | |
Credit Suisse Group AG Sponsored ADR | | 405,680 | | | 21,622,744 | | 0.6% |
#*Holcim, Ltd. | | 196,366 | | | 12,497,670 | | 0.3% |
Nestle SA | | 546,164 | | | 25,397,485 | | 0.7% |
#Novartis AG ADR | | 446,694 | | | 23,205,753 | | 0.6% |
Roche Holding AG Genusschein | | 82,873 | | | 13,273,183 | | 0.4% |
Zurich Financial Services AG | | 61,540 | | | 14,092,204 | | 0.4% |
Other Securities | | | | | 138,371,293 | | 3.7% |
| | | | | | | |
TOTAL SWITZERLAND | | | | | 248,460,332 | | 6.7% |
| | | | | | | |
| | | |
UNITED KINGDOM — (16.4%) | | | | | | | |
*Anglo American P.L.C. | | 536,326 | | | 19,405,941 | | 0.5% |
Aviva P.L.C. | | 1,407,246 | | | 8,799,750 | | 0.2% |
#*Barclays P.L.C. Sponsored ADR | | 892,663 | | | 18,656,657 | | 0.5% |
#*BP P.L.C. Sponsored ADR | | 717,376 | | | 40,617,829 | | 1.1% |
#HSBC Holdings P.L.C. Sponsored ADR | | 1,132,387 | | | 62,722,916 | | 1.7% |
78
INTERNATIONAL CORE EQUITY PORTFOLIO
CONTINUED
| | | | | | | | |
| | | Shares | | Value†† | | Percentage
of Net Assets** |
UNITED KINGDOM — (Continued) | | | | | | | | |
#Pearson P.L.C. Sponsored ADR | | | 607,283 | | $ | 8,265,122 | | 0.2% |
Royal Dutch Shell P.L.C. ADR | | | 935,795 | | | 54,425,837 | | 1.5% |
SABmiller P.L.C. | | | 376,453 | | | 9,867,463 | | 0.3% |
Standard Chartered P.L.C. | | | 749,103 | | | 18,377,039 | | 0.5% |
Vodafone Group P.L.C. Sponsored ADR | | | 1,571,531 | | | 34,872,273 | | 1.0% |
*Xstrata P.L.C. | | | 782,713 | | | 11,273,856 | | 0.3% |
Other Securities | | | | | | 429,857,805 | | 11.6% |
| | | | | | | | |
TOTAL UNITED KINGDOM | | | | | | 717,142,488 | | 19.4% |
| | | | | | | | |
| | | |
UNITED STATES — (0.0%) | | | | | | | | |
Other Securities | | | | | | 158,075 | | 0.0% |
| | | | | | | | |
TOTAL COMMON STOCKS | | | | | | 3,677,932,920 | | 99.4% |
| | | | | | | | |
PREFERRED STOCKS — (0.0%) | | | | | | | | |
AUSTRALIA — (0.0%) | | | | | | | | |
Other Securities | | | | | | 92,550 | | 0.0% |
| | | | | | | | |
RIGHTS/WARRANTS — (0.0%) | | | | | | | | |
AUSTRALIA — (0.0%) | | | | | | | | |
Other Securities | | | | | | 4,504 | | 0.0% |
| | | | | | | | |
| | | |
BELGIUM — (0.0%) | | | | | | | | |
Other Securities | | | | | | 80 | | 0.0% |
| | | | | | | | |
| | | |
DENMARK — (0.0%) | | | | | | | | |
Other Securities | | | | | | 8,768 | | 0.0% |
| | | | | | | | |
| | | |
FRANCE — (0.0%) | | | | | | | | |
Other Securities | | | | | | 8 | | 0.0% |
| | | | | | | | |
| | | |
GERMANY — (0.0%) | | | | | | | | |
Other Securities | | | | | | 24,017 | | 0.0% |
| | | | | | | | |
| | | |
HONG KONG — (0.0%) | | | | | | | | |
Other Securities | | | | | | 56,110 | | 0.0% |
| | | | | | | | |
| | | |
ITALY — (0.0%) | | | | | | | | |
Other Securities | | | | | | — | | 0.0% |
| | | | | | | | |
| | | |
JAPAN — (0.0%) | | | | | | | | |
Other Securities | | | | | | — | | 0.0% |
| | | | | | | | |
| | | |
SPAIN — (0.0%) | | | | | | | | |
Other Securities | | | | | | 82,382 | | 0.0% |
| | | | | | | | |
| | | |
UNITED KINGDOM — (0.0%) | | | | | | | | |
Other Securities | | | | | | 57,481 | | 0.0% |
| | | | | | | | |
TOTAL RIGHTS/WARRANTS | | | | | | 233,350 | | 0.0% |
| | | | | | | | |
| | | |
| | | Face
Amount | | | | |
| | | (000) | | Value† | | |
TEMPORARY CASH INVESTMENTS — (0.3%) | | | | | | | | |
Repurchase Agreement, PNC Capital Markets, Inc. 0.19%, 11/02/09 (Collateralized by $19,120,000 FNMA 5.058%(r), 01/01/36, valued at $12,807,097) to be repurchased at $12,615,200 | | $ | 12,615 | | | 12,615,000 | | 0.3% |
| | | | | | | | |
79
INTERNATIONAL CORE EQUITY PORTFOLIO
CONTINUED
| | | | | | | | |
| | | Shares/ Face Amount | | Value† | | Percentage
of Net Assets** |
| | | (000) | | | | |
SECURITIES LENDING COLLATERAL — (15.4%) | | | | | | | | |
§@DFA Short Term Investment Fund LP | | | 670,812,556 | | $ | 670,812,556 | | 18.1% |
@Repurchase Agreement, Deutsche Bank Securities 0.07%, 11/02/09 (Collateralized by various corporate obligations, ranging in par value from $4,247,617 to $16,429,280, rates ranging from 5.000% to 7.000%, maturities ranging from 03/01/37 to 10/01/39, valued at $1,919,841) to be repurchased at $1,882,208 | | $ | 1,882 | | | 1,882,197 | | 0.1% |
| | | | | | | | |
TOTAL SECURITIES LENDING COLLATERAL | | | | | | 672,694,753 | | 18.2% |
| | | | | | | | |
TOTAL INVESTMENTS — (100.0%)
(Cost $4,714,596,181) | | | | | $ | 4,363,568,573 | | 117.9% |
| | | | | | | | |
80
INTERNATIONAL CORE EQUITY PORTFOLIO
CONTINUED
Summary of inputs used to value the Portfolio’s net assets as of October 31, 2009 is as follows (See Security Valuation Note):
| | | | | | | | | | | |
| | | Valuation Inputs |
| |
| | | Investment in Securities (Market Value) |
| | | Level 1 | | Level 2 | | Level 3 | | Total |
Common Stocks | | | | | | | | | | | |
Australia | | $ | 14,324,535 | | $ | 244,736,948 | | — | | $ | 259,061,483 |
Austria | | | 136,920 | | | 22,990,468 | | — | | | 23,127,388 |
Belgium | | | 4,443,476 | | | 35,918,158 | | — | | | 40,361,634 |
Canada | | | 325,194,945 | | | 8,392 | | — | | | 325,203,337 |
Denmark | | | 1,655,474 | | | 31,707,170 | | — | | | 33,362,644 |
Finland | | | 4,054,711 | | | 53,334,919 | | — | | | 57,389,630 |
France | | | 58,844,669 | | | 252,910,050 | | — | | | 311,754,719 |
Germany | | | 51,479,020 | | | 168,616,692 | | — | | | 220,095,712 |
Greece | | | 9,703,353 | | | 35,105,697 | | — | | | 44,809,050 |
Hong Kong | | | 367,693 | | | 77,226,132 | | — | | | 77,593,825 |
Ireland | | | 8,090,545 | | | 15,823,326 | | — | | | 23,913,871 |
Italy | | | 11,908,539 | | | 99,510,357 | | — | | | 111,418,896 |
Japan | | | 77,579,498 | | | 668,927,934 | | — | | | 746,507,432 |
Netherlands | | | 23,506,438 | | | 79,090,750 | | — | | | 102,597,188 |
New Zealand | | | 449,228 | | | 9,379,318 | | — | | | 9,828,546 |
Norway | | | 1,899,632 | | | 38,746,791 | | — | | | 40,646,423 |
Portugal | | | 320,178 | | | 20,009,524 | | — | | | 20,329,702 |
Singapore | | | 250,797 | | | 51,068,454 | | — | | | 51,319,251 |
Spain | | | 61,473,102 | | | 63,609,772 | | — | | | 125,082,874 |
Sweden | | | 7,169,735 | | | 80,598,685 | | — | | | 87,768,420 |
Switzerland | | | 62,098,431 | | | 186,361,901 | | — | | | 248,460,332 |
United Kingdom | | | 283,516,061 | | | 433,626,427 | | — | | | 717,142,488 |
United States | | | 158,075 | | | — | | — | | | 158,075 |
Preferred Stocks | | | | | | | | | | | |
Australia | | | — | | | 92,550 | | — | | | 92,550 |
Rights/Warrants | | | | | | | | | | | |
Australia | | | — | | | 4,504 | | — | | | 4,504 |
Belgium | | | 80 | | | — | | — | | | 80 |
Denmark | | | 8,768 | | | — | | — | | | 8,768 |
France | | | 8 | | | — | | — | | | 8 |
Germany | | | — | | | 24,017 | | — | | | 24,017 |
Hong Kong | | | — | | | 56,110 | | — | | | 56,110 |
Italy | | | — | | | — | | — | | | — |
Japan | | | — | | | — | | — | | | — |
Spain | | | — | | | 82,382 | | — | | | 82,382 |
United Kingdom | | | 57,481 | | | — | | — | | | 57,481 |
Temporary Cash Investments | | | — | | | 12,615,000 | | — | | | 12,615,000 |
Securities Lending Collateral | | | — | | | 672,694,753 | | — | | | 672,694,753 |
| | | | | | | | | | | |
| | | | |
TOTAL | | $ | 1,008,691,392 | | $ | 3,354,877,181 | | — | | $ | 4,363,568,573 |
| | | | | | | | | | | |
See accompanying Notes to Financial Statements.
81
T.A. WORLD EX U.S. CORE EQUITY PORTFOLIO
SUMMARY SCHEDULE OF PORTFOLIO HOLDINGS
October 31, 2009
| | | | | | | |
| | | Shares | | Value†† | | Percentage
of Net Assets** |
COMMON STOCKS — (90.9%) | | | | | | | |
AUSTRALIA — (5.2%) | | | | | | | |
Australia & New Zealand Banking Group, Ltd. | | 96,142 | | $ | 1,960,923 | | 0.3% |
Commonwealth Bank of Australia | | 50,642 | | | 2,340,239 | | 0.3% |
National Australia Bank, Ltd. | | 65,156 | | | 1,721,528 | | 0.3% |
Other Securities | | | | | 31,119,926 | | 4.7% |
| | | | | | | |
TOTAL AUSTRALIA | | | | | 37,142,616 | | 5.6% |
| | | | | | | |
| | | |
AUSTRIA — (0.5%) | | | | | | | |
Other Securities | | | | | 3,352,618 | | 0.5% |
| | | | | | | |
| | | |
BELGIUM — (0.8%) | | | | | | | |
Other Securities | | | | | 5,498,868 | | 0.8% |
| | | | | | | |
| | | |
BRAZIL — (1.8%) | | | | | | | |
Cia Vale do Rio Doce | | 52,700 | | | 1,343,323 | | 0.2% |
Other Securities | | | | | 11,352,922 | | 1.7% |
| | | | | | | |
TOTAL BRAZIL | | | | | 12,696,245 | | 1.9% |
| | | | | | | |
| | | |
CANADA — (6.4%) | | | | | | | |
Royal Bank of Canada | | 39,027 | | | 1,976,507 | | 0.3% |
Suncor Energy, Inc. | | 70,464 | | | 2,339,140 | | 0.4% |
*Teck Resources, Ltd. Class B | | 51,800 | | | 1,503,662 | | 0.2% |
Toronto Dominion Bank | | 37,400 | | | 2,131,909 | | 0.3% |
Other Securities | | | | | 38,015,826 | | 5.7% |
| | | | | | | |
TOTAL CANADA | | | | | 45,967,044 | | 6.9% |
| | | | | | | |
| | | |
CHILE — (0.3%) | | | | | | | |
Other Securities | | | | | 2,173,675 | | 0.3% |
| | | | | | | |
| | | |
CHINA — (4.3%) | | | | | | | |
Bank of China, Ltd. | | 2,353,000 | | | 1,353,034 | | 0.2% |
China Construction Bank Corp. | | 1,628,000 | | | 1,403,550 | | 0.2% |
*Industrial & Commercial Bank of China, Ltd. | | 1,714,000 | | | 1,363,684 | | 0.2% |
Other Securities | | | | | 26,921,629 | | 4.0% |
| | | | | | | |
TOTAL CHINA | | | | | 31,041,897 | | 4.6% |
| | | | | | | |
| | | |
CZECH REPUBLIC — (0.1%) | | | | | | | |
Other Securities | | | | | 607,478 | | 0.1% |
| | | | | | | |
| | | |
DENMARK — (0.6%) | | | | | | | |
Other Securities | | | | | 4,631,600 | | 0.7% |
| | | | | | | |
| | | |
FINLAND — (1.1%) | | | | | | | |
Other Securities | | | | | 7,702,907 | | 1.2% |
| | | | | | | |
| | | |
FRANCE — (5.9%) | | | | | | | |
AXA SA Sponsored ADR | | 62,400 | | | 1,547,520 | | 0.2% |
BNP Paribas SA | | 43,518 | | | 3,278,391 | | 0.5% |
#Lafarge SA | | 15,620 | | | 1,267,872 | | 0.2% |
Sanofi - Aventis SA | | 17,594 | | | 1,289,677 | | 0.2% |
Schneider Electric SA | | 14,962 | | | 1,555,880 | | 0.2% |
Societe Generale Paris SA | | 27,595 | | | 1,832,854 | | 0.3% |
Other Securities | | | | | 31,931,445 | | 4.8% |
| | | | | | | |
TOTAL FRANCE | | | | | 42,703,639 | | 6.4% |
| | | | | | | |
| | | |
GERMANY — (4.1%) | | | | | | | |
Allianz SE | | 11,378 | | | 1,303,354 | | 0.2% |
#Deutsche Bank AG | | 20,100 | | | 1,439,763 | | 0.2% |
82
T.A. WORLDEX U.S. CORE EQUITY PORTFOLIO
CONTINUED
| | | | | | | |
| | | Shares | | Value†† | | Percentage
of Net Assets** |
GERMANY — (Continued) | | | | | | | |
E.ON AG | | 52,403 | | $ | 2,002,180 | | 0.3% |
Munchener Rueckversicherungs-Gesellschaft AG | | 8,352 | | | 1,321,394 | | 0.2% |
Other Securities | | | | | 23,413,988 | | 3.5% |
| | | | | | | |
TOTAL GERMANY | | | | | 29,480,679 | | 4.4% |
| | | | | | | |
| | | |
GREECE — (0.9%) | | | | | | | |
Other Securities | | | | | 6,504,671 | | 1.0% |
| | | | | | | |
| | | |
HONG KONG — (1.7%) | | | | | | | |
Other Securities | | | | | 11,943,648 | | 1.8% |
| | | | | | | |
| | | |
HUNGARY — (0.2%) | | | | | | | |
Other Securities | | | | | 1,268,151 | | 0.2% |
| | | | | | | |
| | | |
INDIA — (2.0%) | | | | | | | |
Other Securities | | | | | 14,392,828 | | 2.2% |
| | | | | | | |
| | | |
INDONESIA — (0.4%) | | | | | | | |
Other Securities | | | | | 2,832,953 | | 0.4% |
| | | | | | | |
| | | |
IRELAND — (0.4%) | | | | | | | |
Other Securities | | | | | 2,897,143 | | 0.4% |
| | | | | | | |
| | | |
ISRAEL — (0.5%) | | | | | | | |
Other Securities | | | | | 3,660,827 | | 0.6% |
| | | | | | | |
| | | |
ITALY — (2.2%) | | | | | | | |
*UniCredito SpA | | 486,410 | | | 1,629,574 | | 0.2% |
Other Securities | | | | | 14,033,052 | | 2.1% |
| | | | | | | |
TOTAL ITALY | | | | | 15,662,626 | | 2.3% |
| | | | | | | |
| | | |
JAPAN — (14.2%) | | | | | | | |
Toyota Motor Corp. Sponsored ADR | | 26,776 | | | 2,112,359 | | 0.3% |
Other Securities | | | | | 100,458,222 | | 15.0% |
| | | | | | | |
TOTAL JAPAN | | | | | 102,570,581 | | 15.3% |
| | | | | | | |
| | | |
MALAYSIA — (0.7%) | | | | | | | |
Other Securities | | | | | 4,824,190 | | 0.7% |
| | | | | | | |
| | | |
MEXICO — (0.8%) | | | | | | | |
Other Securities | | | | | 6,009,411 | | 0.9% |
| | | | | | | |
| | | |
NETHERLANDS — (2.0%) | | | | | | | |
#*ING Groep NV Sponsored ADR | | 141,618 | | | 1,826,872 | | 0.3% |
Philips Electronics NV ADR | | 58,800 | | | 1,475,292 | | 0.2% |
Other Securities | | | | | 11,423,625 | | 1.7% |
| | | | | | | |
TOTAL NETHERLANDS | | | | | 14,725,789 | | 2.2% |
| | | | | | | |
| | | |
NEW ZEALAND — (0.2%) | | | | | | | |
Other Securities | | | | | 1,536,665 | | 0.2% |
| | | | | | | |
| | | |
NORWAY — (0.8%) | | | | | | | |
Other Securities | | | | | 5,893,963 | | 0.9% |
| | | | | | | |
| | | |
PHILIPPINES — (0.1%) | | | | | | | |
Other Securities | | | | | 789,804 | | 0.1% |
| | | | | | | |
| | | |
POLAND — (0.3%) | | | | | | | |
Other Securities | | | | | 2,027,176 | | 0.3% |
| | | | | | | |
83
T.A. WORLDEX U.S. CORE EQUITY PORTFOLIO
CONTINUED
| | | | | | | |
| | | Shares | | Value†† | | Percentage
of Net Assets** |
PORTUGAL — (0.4%) | | | | | | | |
Other Securities | | | | $ | 2,941,399 | | 0.4% |
| | | | | | | |
| | | |
RUSSIA — (0.0%) | | | | | | | |
Other Securities | | | | | 40,151 | | 0.0% |
| | | | | | | |
| | | |
SINGAPORE — (0.9%) | | | | | | | |
Other Securities | | | | | 6,821,647 | | 1.0% |
| | | | | | | |
| | | |
SOUTH AFRICA — (1.5%) | | | | | | | |
Other Securities | | | | | 10,630,181 | | 1.6% |
| | | | | | | |
| | | |
SOUTH KOREA — (2.8%) | | | | | | | |
Other Securities | | | | | 20,380,746 | | 3.1% |
| | | | | | | |
| | | |
SPAIN — (2.5%) | | | | | | | |
Banco Bilbao Vizcaya SA Sponsored ADR | | 146,546 | | | 2,608,519 | | 0.4% |
Banco Santander SA | | 198,448 | | | 3,193,476 | | 0.4% |
Banco Santander SA Sponsored ADR | | 157,920 | | | 2,536,195 | | 0.4% |
Other Securities | | | | | 9,886,784 | | 1.5% |
| | | | | | | |
TOTAL SPAIN | | | �� | | 18,224,974 | | 2.7% |
| | | | | | | |
| | | |
SWEDEN — (1.7%) | | | | | | | |
#Nordea Bank AB | | 145,566 | | | 1,562,421 | | 0.2% |
Other Securities | | | | | 10,615,068 | | 1.6% |
| | | | | | | |
TOTAL SWEDEN | | | | | 12,177,489 | | 1.8% |
| | | | | | | |
| | | |
SWITZERLAND — (4.7%) | | | | | | | |
Credit Suisse Group AG | | 43,068 | | | 2,302,294 | | 0.4% |
Credit Suisse Group AG Sponsored ADR | | 28,818 | | | 1,535,999 | | 0.2% |
#*Holcim, Ltd. | | 31,260 | | | 1,989,536 | | 0.3% |
Nestle SA | | 33,903 | | | 1,576,543 | | 0.2% |
Novartis AG ADR | | 69,100 | | | 3,589,745 | | 0.5% |
Roche Holding AG Genusschein | | 9,111 | | | 1,459,245 | | 0.2% |
*UBS AG ADR | | 128,000 | | | 2,123,520 | | 0.3% |
Zurich Financial Services AG | | 10,105 | | | 2,313,970 | | 0.4% |
Other Securities | | | | | 17,317,610 | | 2.6% |
| | | | | | | |
TOTAL SWITZERLAND | | | | | 34,208,462 | | 5.1% |
| | | | | | | |
| | | |
TAIWAN — (2.4%) | | | | | | | |
Other Securities | | | | | 17,643,449 | | 2.6% |
| | | | | | | |
| | | |
THAILAND — (0.3%) | | | | | | | |
Other Securities | | | | | 2,296,967 | | 0.4% |
| | | | | | | |
| | | |
TURKEY — (0.4%) | | | | | | | |
Other Securities | | | | | 2,590,955 | | 0.4% |
| | | | | | | |
| | | |
UNITED KINGDOM — (14.8%) | | | | | | | |
*Anglo American P.L.C. | | 76,082 | | | 2,752,883 | | 0.4% |
Aviva P.L.C. | | 240,528 | | | 1,504,063 | | 0.2% |
*Barclays P.L.C. | | 374,834 | | | 1,964,536 | | 0.3% |
*BP P.L.C. Sponsored ADR | | 96,420 | | | 5,459,300 | | 0.8% |
HSBC Holdings P.L.C. | | 167,327 | | | 1,868,048 | | 0.3% |
HSBC Holdings P.L.C. Sponsored ADR | | 103,820 | | | 5,750,590 | | 0.9% |
Kingfisher P.L.C. | | 390,107 | | | 1,425,888 | | 0.2% |
Royal Dutch Shell P.L.C. ADR | | 108,043 | | | 6,283,781 | | 0.9% |
SABmiller P.L.C. | | 61,179 | | | 1,603,604 | | 0.2% |
Standard Chartered P.L.C. | | 138,929 | | | 3,408,215 | | 0.5% |
Vodafone Group P.L.C. Sponsored ADR | | 196,999 | | | 4,371,408 | | 0.7% |
*Xstrata P.L.C. | | 143,852 | | | 2,071,981 | | 0.3% |
84
T.A. WORLDEX U.S. CORE EQUITY PORTFOLIO
CONTINUED
| | | | | | | | |
| | | Shares | | Value†† | | Percentage
of Net Assets** |
UNITED KINGDOM — (Continued) | | | | | | | | |
Other Securities | | | | | $ | 68,498,903 | | 10.3% |
| | | | | | | | |
TOTAL UNITED KINGDOM | | | | | | 106,963,200 | | 16.0% |
| | | | | | | | |
| | | |
UNITED STATES — (0.0%) | | | | | | | | |
Other Securities | | | | | | 59,244 | | 0.0% |
| | | | | | | | |
TOTAL COMMON STOCKS | | | | | | 655,518,556 | | 98.0% |
| | | | | | | | |
PREFERRED STOCKS — (1.3%) | | | | | | | | |
BRAZIL — (1.3%) | | | | | | | | |
Cia Vale do Rio Doce | | | 66,950 | | | 1,546,545 | | 0.2% |
Other Securities | | | | | | 7,337,728 | | 1.1% |
| | | | | | | | |
TOTAL BRAZIL | | | | | | 8,884,273 | | 1.3% |
| | | | | | | | |
TOTAL PREFERRED STOCKS | | | | | | 8,884,273 | | 1.3% |
| | | | | | | | |
RIGHTS/WARRANTS — (0.0%) | | | | | | | | |
BELGIUM — (0.0%) | | | | | | | | |
Other Securities | | | | | | — | | 0.0% |
| | | | | | | | |
| | | |
BRAZIL — (0.0%) | | | | | | | | |
Other Securities | | | | | | 4,501 | | 0.0% |
| | | | | | | | |
| | | |
DENMARK — (0.0%) | | | | | | | | |
Other Securities | | | | | | 4,510 | | 0.0% |
| | | | | | | | |
| | | |
GERMANY — (0.0%) | | | | | | | | |
Other Securities | | | | | | 3,707 | | 0.0% |
| | | | | | | | |
| | | |
HONG KONG — (0.0%) | | | | | | | | |
Other Securities | | | | | | 8,989 | | 0.0% |
| | | | | | | | |
| | | |
ITALY — (0.0%) | | | | | | | | |
Other Securities | | | | | | — | | 0.0% |
| | | | | | | | |
| | | |
SPAIN — (0.0%) | | | | | | | | |
Other Securities | | | | | | 19,316 | | 0.0% |
| | | | | | | | |
| | | |
TAIWAN — (0.0%) | | | | | | | | |
Other Securities | | | | | | 2,503 | | 0.0% |
| | | | | | | | |
| | | |
UNITED KINGDOM — (0.0%) | | | | | | | | |
Other Securities | | | | | | 10,252 | | 0.0% |
| | | | | | | | |
TOTAL RIGHTS/WARRANTS | | | | | | 53,778 | | 0.0% |
| | | | | | | | |
| | | |
| | | Face Amount | | Value† | | |
| | | (000) | | | | |
TEMPORARY CASH INVESTMENTS — (0.6%) | | | | | | | | |
Repurchase Agreement, PNC Capital Markets, Inc. 0.19%, 11/02/09 (Collateralized by $7,150,000 FHLMC 6.040%(r), 11/01/36, valued at $4,590,056) to be repurchased at $4,521,072 | | $ | 4,521 | | | 4,521,000 | | 0.7% |
| | | | | | | | |
| | | |
| | | Shares/ Face Amount | | | | |
| | | (000) | | | | |
SECURITIES LENDING COLLATERAL — (7.2%) | | | | | | | | |
§@DFA Short Term Investment Fund LP | | | 47,095,489 | | | 47,095,489 | | 7.1% |
85
T.A. WORLDEX U.S. CORE EQUITY PORTFOLIO
CONTINUED
| | | | | | | | |
| | | Shares/
Face Amount | | Value† | | Percentage
of Net Assets** |
| | | (000) | | | | |
@Repurchase Agreement, Deutsche Bank Securities 0.07%11/02/09 (Collateralized by various corporate obligations, ranging in par value from $4,247,617 to $16,429,280, rates ranging from 5.000% to 7.000%, maturities ranging from 03/01/37 to 10/01/39, valued at $4,991,891) to be repurchased at $4,894,040 | | $ | 4,894 | | | 4,894,011 | | 0.7% |
| | | | | | | | |
TOTAL SECURITIES LENDING COLLATERAL | | | | | | 51,989,500 | | 7.8% |
| | | | | | | | |
TOTAL INVESTMENTS — (100.0%)
(Cost $611,968,564) | | | | | $ | 720,967,107 | | 107.8% |
| | | | | | | | |
86
T.A. WORLDEX U.S. CORE EQUITY PORTFOLIO
CONTINUED
Summary of inputs used to value the Portfolio’s net assets as of October 31, 2009 is as follows (See Security Valuation Note):
| | | | | | | | | | | |
| | | Valuation Inputs |
| |
| | | Investment in Securities (Market Value) |
| | | Level 1 | | Level 2 | | Level 3 | | Total |
Common Stocks | | | | | | | | | | | |
Australia | | $ | 1,225,736 | | $ | 35,916,880 | | — | | $ | 37,142,616 |
Austria | | | — | | | 3,352,618 | | — | | | 3,352,618 |
Belgium | | | 911,842 | | | 4,587,026 | | — | | | 5,498,868 |
Brazil | | | 12,696,245 | | | — | | — | | | 12,696,245 |
Canada | | | 45,967,044 | | | — | | — | | | 45,967,044 |
Chile | | | 2,173,675 | | | — | | — | | | 2,173,675 |
China | | | 3,407,086 | | | 27,634,811 | | — | | | 31,041,897 |
Czech Republic | | | — | | | 607,478 | | — | | | 607,478 |
Denmark | | | 211,980 | | | 4,419,620 | | — | | | 4,631,600 |
Finland | | | 361,058 | | | 7,341,849 | | — | | | 7,702,907 |
France | | | 4,886,686 | | | 37,816,953 | | — | | | 42,703,639 |
Germany | | | 5,824,473 | | | 23,656,206 | | — | | | 29,480,679 |
Greece | | | 1,441,545 | | | 5,063,126 | | — | | | 6,504,671 |
Hong Kong | | | 15,483 | | | 11,928,165 | | — | | | 11,943,648 |
Hungary | | | 102,720 | | | 1,165,431 | | — | | | 1,268,151 |
India | | | 874,488 | | | 13,518,340 | | — | | | 14,392,828 |
Indonesia | | | 70,126 | | | 2,762,827 | | — | | | 2,832,953 |
Ireland | | | 565,371 | | | 2,331,772 | | — | | | 2,897,143 |
Israel | | | 1,160,535 | | | 2,500,292 | | — | | | 3,660,827 |
Italy | | | 1,103,915 | | | 14,558,711 | | — | | | 15,662,626 |
Japan | | | 9,057,114 | | | 93,513,467 | | — | | | 102,570,581 |
Malaysia | | | — | | | 4,824,190 | | — | | | 4,824,190 |
Mexico | | | 6,009,411 | | | — | | — | | | 6,009,411 |
Netherlands | | | 5,536,180 | | | 9,189,609 | | — | | | 14,725,789 |
New Zealand | | | 32,256 | | | 1,504,409 | | — | | | 1,536,665 |
Norway | | | 154,418 | | | 5,739,545 | | — | | | 5,893,963 |
Philippines | | | 53,300 | | | 736,504 | | — | | | 789,804 |
Poland | | | — | | | 2,027,176 | | — | | | 2,027,176 |
Portugal | | | 4,386 | | | 2,937,013 | | — | | | 2,941,399 |
Russia | | | — | | | 40,151 | | — | | | 40,151 |
Singapore | | | — | | | 6,821,647 | | — | | | 6,821,647 |
South Africa | | | 1,169,370 | | | 9,460,811 | | — | | | 10,630,181 |
South Korea | | | 2,200,192 | | | 18,180,554 | | — | | | 20,380,746 |
Spain | | | 6,894,180 | | | 11,330,794 | | — | | | 18,224,974 |
Sweden | | | 268,124 | | | 11,909,365 | | — | | | 12,177,489 |
Switzerland | | | 8,892,771 | | | 25,315,691 | | — | | | 34,208,462 |
Taiwan | | | 228,385 | | | 17,415,064 | | — | | | 17,643,449 |
Thailand | | | 2,296,967 | | | — | | — | | | 2,296,967 |
Turkey | | | 52,576 | | | 2,538,379 | | — | | | 2,590,955 |
United Kingdom | | | 28,580,518 | | | 78,382,682 | | — | | | 106,963,200 |
United States | | | 59,244 | | | — | | — | | | 59,244 |
Preferred Stocks | | | | | | | | | | | |
Brazil | | | 8,884,273 | | | — | | — | | | 8,884,273 |
Rights/Warrants | | | | | | | | | | | |
Belgium | | | — | | | — | | — | | | — |
87
T.A. WORLDEX U.S. CORE EQUITY PORTFOLIO
CONTINUED
| | | | | | | | | | | |
| | | Valuation Inputs |
| |
| | | Investment in Securities (Market Value) |
| | | Level 1 | | Level 2 | | Level 3 | | Total |
Brazil | | $ | 4,501 | | | — | | — | | $ | 4,501 |
Denmark | | | 4,510 | | | — | | — | | | 4,510 |
Germany | | | — | | $ | 3,707 | | — | | | 3,707 |
Hong Kong | | | 2,895 | | | 6,094 | | — | | | 8,989 |
Italy | | | — | | | — | | — | | | — |
Spain | | | — | | | 19,316 | | — | | | 19,316 |
Taiwan | | | — | | | 2,503 | | — | | | 2,503 |
United Kingdom | | | 10,252 | | | — | | — | | | 10,252 |
Temporary Cash Investments | | | — | | | 4,521,000 | | — | | | 4,521,000 |
Securities Lending Collateral | | | — | | | 51,989,500 | | — | | | 51,989,500 |
| | | | | | | | | | | |
| | | | |
TOTAL | | $ | 163,395,831 | | $ | 557,571,276 | | — | | $ | 720,967,107 |
| | | | | | | | | | | |
See accompanying Notes to Financial Statements.
88
DFA INVESTMENT DIMENSIONS GROUP INC.
SCHEDULES OF INVESTMENTS
October 31, 2009
INTERNATIONAL SMALL COMPANY PORTFOLIO
| | | |
| | | Value† |
AFFILIATED INVESTMENT COMPANIES — (100.0%) | | | |
Investment in The Continental Small Company Series of
The DFA Investment Trust Company | | $ | 1,519,912,526 |
Investment in The Japanese Small Company Series of
The DFA Investment Trust Company | | | 1,068,920,039 |
Investment in The United Kingdom Small Company Series of
The DFA Investment Trust Company | | | 742,599,754 |
Investment in The Asia Pacific Small Company Series of
The DFA Investment Trust Company | | | 579,094,079 |
Investment in The Canadian Small Company Series of
The DFA Investment Trust Company | | | 365,189,000 |
| | | |
TOTAL INVESTMENTS IN AFFILIATED INVESTMENT COMPANIES
(Cost $4,294,422,039) | | $ | 4,275,715,398 |
| | | |
Summary of inputs used to value the Portfolio’s net assets as of October 31, 2009 is as follows (See Security Valuation Note):
| | | | | | | | | | |
| | | Valuation Inputs |
| |
| | | Investment in Securities (Market Value) |
| | | Level 1 | | Level 2 | | Level 3 | | Total |
Affiliated Investment Companies | | $ | 4,275,715,398 | | — | | — | | $ | 4,275,715,398 |
See accompanying Notes to Financial Statements.
89
DFA INVESTMENT DIMENSIONS GROUP INC.
SCHEDULESOF INVESTMENTS
CONTINUED
JAPANESE SMALL COMPANY PORTFOLIO
| | | |
| | | Value† |
AFFILIATED INVESTMENT COMPANY — (100.0%) | | | |
Investment in The Japanese Small Company Series of
The DFA Investment Trust Company | | $ | 114,114,441 |
| | | |
TOTAL INVESTMENTS IN AFFILIATED INVESTMENT COMPANY
(Cost $200,813,832) | | $ | 114,114,441 |
| | | |
Summary of inputs used to value the Portfolio’s net assets as of October 31, 2009 is as follows (See Security Valuation Note):
| | | | | | | | | | |
| | | Valuation Inputs |
| |
| | | Investment in Securities (Market Value) |
| | | Level 1 | | Level 2 | | Level 3 | | Total |
Affiliated Investment Company | | $ | 114,114,441 | | — | | — | | $ | 114,114,441 |
ASIA PACIFIC SMALL COMPANY PORTFOLIO
| | | |
| | | Value† |
AFFILIATED INVESTMENT COMPANY — (100.0%) | | | |
Investment in The Asia Pacific Small Company Series of
The DFA Investment Trust Company | | $ | 101,906,415 |
| | | |
TOTAL INVESTMENTS IN AFFILIATED INVESTMENT COMPANY
(Cost $94,124,358) | | $ | 101,906,415 |
| | | |
Summary of inputs used to value the Portfolio’s net assets as of October 31, 2009 is as follows (See Security Valuation Note):
| | | | | | | | | | |
| | | Valuation Inputs |
| |
| | | Investment in Securities (Market Value) |
| | | Level 1 | | Level 2 | | Level 3 | | Total |
Affiliated Investment Company | | $ | 101,906,415 | | — | | — | | $ | 101,906,415 |
90
DFA INVESTMENT DIMENSIONS GROUP INC.
SCHEDULES OF INVESTMENTS
October 31, 2009
UNITED KINGDOM SMALL COMPANY PORTFOLIO
| | | |
| | | Value† |
AFFILIATED INVESTMENT COMPANY — (100.0%) | | | |
Investment in The United Kingdom Small Company Series of
The DFA Investment Trust Company | | $ | 27,871,894 |
| | | |
TOTAL INVESTMENTS IN AFFILIATED INVESTMENT COMPANY
(Cost $30,454,263) | | $ | 27,871,894 |
| | | |
Summary of inputs used to value the Portfolio’s net assets as of October 31, 2009 is as follows (See Security Valuation Note):
| | | | | | | | | | |
| | | Valuation Inputs |
| |
| | | Investment in Securities (Market Value) |
| | | Level 1 | | Level 2 | | Level 3 | | Total |
Affiliated Investment Company | | $ | 27,871,894 | | — | | — | | $ | 27,871,894 |
CONTINENTAL SMALL COMPANY PORTFOLIO
| | | |
| | | Value† |
AFFILIATED INVESTMENT COMPANY — (100.0%) | | | |
Investment in The Continental Small Company Series of
The DFA Investment Trust Company | | $ | 110,985,135 |
| | | |
TOTAL INVESTMENTS IN AFFILIATED INVESTMENT COMPANY
(Cost $112,793,150) | | $ | 110,985,135 |
| | | |
Summary of inputs used to value the Portfolio’s net assets as of October 31, 2009 is as follows (See Security Valuation Note):
| | | | | | | | | | |
| | | Valuation Inputs |
| |
| | | Investment in Securities (Market Value) |
| | | Level 1 | | Level 2 | | Level 3 | | Total |
Affiliated Investment Company | | $ | 110,985,135 | | — | | — | | $ | 110,985,135 |
See accompanying Notes to Financial Statements.
91
DFA INTERNATIONAL REAL ESTATE SECURITIES PORTFOLIO
SUMMARY SCHEDULE OF PORTFOLIO HOLDINGS
October 31, 2009
| | | | | | | |
| | | Shares | | Value†† | | Percentage
of Net Assets** |
COMMON STOCKS — (85.0%) | | | | | | | |
AUSTRALIA — (22.2%) | | | | | | | |
CFS Retail Property Trust | | 9,299,087 | | $ | 15,978,498 | | 2.1% |
Commonwealth Property Office Fund | | 8,329,358 | | | 6,533,372 | | 0.9% |
Dexus Property Group | | 21,038,811 | | | 14,864,254 | | 2.0% |
#Goodman Group | | 16,279,701 | | | 8,729,311 | | 1.2% |
GPT Group | | 38,018,670 | | | 19,402,061 | | 2.6% |
ING Office Fund | | 9,301,027 | | | 4,907,378 | | 0.6% |
Macquarie Country Wide Trust | | 6,416,906 | | | 3,550,288 | | 0.5% |
Macquarie Office Trust | | 17,635,306 | | | 4,937,341 | | 0.7% |
Stockland Trust Group | | 10,526,908 | | | 34,969,564 | | 4.7% |
Westfield Group | | 5,691,219 | | | 61,658,889 | | 8.3% |
Other Securities | | | | | 17,694,934 | | 2.4% |
| | | | | | | |
TOTAL AUSTRALIA | | | | | 193,225,890 | | 26.0% |
| | | | | | | |
| | | |
BELGIUM — (1.7%) | | | | | | | |
Befimmo SCA | | 54,310 | | | 5,169,734 | | 0.7% |
#Cofinimmo SA | | 37,088 | | | 5,344,597 | | 0.7% |
Other Securities | | | | | 4,474,108 | | 0.6% |
| | | | | | | |
TOTAL BELGIUM | | | | | 14,988,439 | | 2.0% |
| | | | | | | |
| | | |
CANADA — (4.1%) | | | | | | | |
#Boardwalk REIT | | 110,766 | | | 3,786,548 | | 0.5% |
#Riocan REIT | | 530,784 | | | 8,996,422 | | 1.2% |
Other Securities | | | | | 22,539,091 | | 3.1% |
| | | | | | | |
TOTAL CANADA | | | | | 35,322,061 | | 4.8% |
| | | | | | | |
| | | |
CHINA — (0.1%) | | | | | | | |
Other Securities | | | | | 880,600 | | 0.1% |
| | | | | | | |
| | | |
FRANCE — (14.0%) | | | | | | | |
#Fonciere des Regions SA | | 76,369 | | | 8,417,507 | | 1.1% |
*Gecina SA | | 45,779 | | | 4,870,047 | | 0.7% |
Icade SA | | 87,009 | | | 9,160,308 | | 1.2% |
#Klepierre SA | | 406,887 | | | 16,865,600 | | 2.3% |
#Mercialys SA | | 101,662 | | | 4,097,176 | | 0.6% |
#Societe Immobiliere de Location pour l’Industrie et le Commerce SA | | 60,852 | | | 7,730,059 | | 1.0% |
#Unibail-Rodamco SE | | 295,081 | | | 65,344,360 | | 8.8% |
Other Securities | | | | | 5,071,061 | | 0.7% |
| | | | | | | |
TOTAL FRANCE | | | | | 121,556,118 | | 16.4% |
| | | | | | | |
| | | |
GERMANY — (0.1%) | | | | | | | |
Other Securities | | | | | 918,116 | | 0.1% |
| | | | | | | |
| | | |
GREECE — (0.0%) | | | | | | | |
Other Securities | | | | | 421,005 | | 0.1% |
| | | | | | | |
| | | |
HONG KONG — (3.2%) | | | | | | | |
#Champion REIT | | 10,915,658 | | | 4,594,160 | | 0.6% |
Link REIT (The) | | 9,083,626 | | | 20,618,431 | | 2.8% |
Other Securities | | | | | 2,418,572 | | 0.3% |
| | | | | | | |
TOTAL HONG KONG | | | | | 27,631,163 | | 3.7% |
| | | | | | | |
| | | |
ITALY — (0.1%) | | | | | | | |
Other Securities | | | | | 792,853 | | 0.1% |
| | | | | | | |
| | | |
JAPAN — (13.0%) | | | | | | | |
Frontier Real Estate Investment Corp. | | 595 | | | 4,484,008 | | 0.6% |
92
DFA INTERNATIONAL REAL ESTATE SECURITIES PORTFOLIO
CONTINUED
| | | | | | | |
| | | Shares | | Value†† | | Percentage
of Net Assets** |
| | | |
JAPAN — (Continued) | | | | | | | |
Japan Logistics Fund, Inc. | | 565 | | $ | 4,293,002 | | 0.6% |
Japan Prime Realty Investment Corp. | | 2,682 | | | 5,840,893 | | 0.8% |
Japan Real Estate Investment Corp. | | 1,633 | | | 13,029,902 | | 1.7% |
Japan Retail Fund Investment | | 1,570 | | | 7,381,067 | | 1.0% |
#MORI TRUST Sogo REIT, Inc. | | 494 | | | 3,798,479 | | 0.5% |
Nippon Building Fund, Inc. | | 1,884 | | | 15,443,177 | | 2.1% |
#Nomura Real Estate Office Fund, Inc. | | 1,246 | | | 7,698,702 | | 1.0% |
Orix Jreit, Inc. | | 1,134 | | | 5,194,029 | | 0.7% |
#TOKYU REIT, Inc. | | 697 | | | 3,503,253 | | 0.5% |
United Urban Investment Corp. | | 857 | | | 4,999,093 | | 0.7% |
Other Securities | | | | | 37,013,139 | | 5.0% |
| | | | | | | |
TOTAL JAPAN | | | | | 112,678,744 | | 15.2% |
| | | | | | | |
| | | |
NETHERLANDS — (4.0%) | | | | | | | |
#Corio NV | | 194,995 | | | 13,222,285 | | 1.8% |
Eurocommercial Properties NV | | 98,088 | | | 4,249,401 | | 0.6% |
#VastNed Retail NV | | 61,128 | | | 4,076,447 | | 0.5% |
#Wereldhave NV | | 87,503 | | | 8,542,822 | | 1.1% |
Other Securities | | | | | 4,257,365 | | 0.6% |
| | | | | | | |
TOTAL NETHERLANDS | | | | | 34,348,320 | | 4.6% |
| | | | | | | |
| | | |
NEW ZEALAND — (0.8%) | | | | | | | |
Other Securities | | | | | 7,017,019 | | 1.0% |
| | | | | | | |
| | | |
SINGAPORE — (5.0%) | | | | | | | |
Ascendas REIT | | 5,236,000 | | | 6,805,677 | | 0.9% |
CapitaCommercial Trust | | 9,676,000 | | | 7,274,904 | | 1.0% |
CapitaMall Trust | | 8,698,300 | | | 9,770,603 | | 1.3% |
Suntec REIT | | 6,516,000 | | | 5,542,650 | | 0.8% |
Other Securities | | | | | 14,063,235 | | 1.9% |
| | | | | | | |
TOTAL SINGAPORE | | | | | 43,457,069 | | 5.9% |
| | | | | | | |
| | | |
SOUTH AFRICA — (1.2%) | | | | | | | |
Other Securities | | | | | 10,626,976 | | 1.4% |
| | | | | | | |
| | | |
TAIWAN — (0.4%) | | | | | | | |
Other Securities | | | | | 3,802,919 | | 0.5% |
| | | | | | | |
| | | |
UNITED KINGDOM — (15.1%) | | | | | | | |
British Land Co. P.L.C. | | 3,002,251 | | | 23,249,638 | | 3.1% |
Derwent London P.L.C. | | 487,068 | | | 9,921,298 | | 1.3% |
#Great Portland Estates P.L.C. | | 1,223,426 | | | 4,944,721 | | 0.7% |
Hammerson P.L.C. | | 2,396,955 | | | 15,898,980 | | 2.2% |
Land Securities Group P.L.C. | | 3,104,143 | | | 33,587,116 | | 4.5% |
Liberty International P.L.C. | | 1,794,983 | | | 13,250,009 | | 1.8% |
Segro P.L.C. | | 2,987,900 | | | 17,218,157 | | 2.3% |
Shaftesbury P.L.C. | | 977,674 | | | 6,022,655 | | 0.8% |
Other Securities | | | | | 6,802,638 | | 0.9% |
| | | | | | | |
TOTAL UNITED KINGDOM | | | | | 130,895,212 | | 17.6% |
| | | | | | | |
TOTAL COMMON STOCKS | | | | | 738,562,504 | | 99.5% |
| | | | | | | |
RIGHTS/WARRANTS — (0.0%) | | | | | | | |
SINGAPORE — (0.0%) | | | | | | | |
Other Securities | | | | | 38,850 | | 0.0% |
| | | | | | | |
93
DFA INTERNATIONAL REAL ESTATE SECURITIES PORTFOLIO
CONTINUED
| | | | | | | | |
| | | Face Amount | | Value† | | Percentage
of Net Assets** |
| | | (000) | | | | |
TEMPORARY CASH INVESTMENTS — (0.5%) | | | | | | | | |
Repurchase Agreement, PNC Capital Markets, Inc. 0.19%, 11/02/09 (Collateralized by $3,915,000 FNMA 6.50%, 06/25/39, valued at $4,213,519) to be repurchased at $4,146,066 | | $ | 4,146 | | | 4,146,000 | | 0.6% |
| | | | | | | | |
| | | |
| | | Shares/ Face Amount | | | | |
| | | (000) | | | | |
SECURITIES LENDING COLLATERAL — (14.5%) | | | | | | | | |
§@DFA Short Term Investment Fund LP | | | 125,600,221 | | | 125,600,221 | | 16.9% |
@Repurchase Agreement, Deutsche Bank Securities 0.07%, 11/02/09 (Collateralized by various corporate obligations, ranging in par value from $4,247,617 to $16,429,280, rates ranging from 5.000% to 7.000%, maturities ranging from 03/01/37 to 10/01/39, valued at $108,366) to be repurchased at $106,242 | | $ | 106 | | | 106,241 | | 0.0% |
| | | | | | | | |
TOTAL SECURITIES LENDING COLLATERAL | | | | | | 125,706,462 | | 16.9% |
| | | | | | | | |
TOTAL INVESTMENTS — (100.0%)
(Cost $1,087,597,780) | | | | | $ | 868,453,816 | | 117.0% |
| | | | | | | | |
94
DFA INTERNATIONAL REAL ESTATE SECURITIES PORTFOLIO
CONTINUED
Summary of inputs used to value the Portfolio’s net assets as of October 31, 2009 is as follows (See Security Valuation Note):
| | | | | | | | | | | |
| | | Valuation Inputs |
| |
| | | Investment in Securities (Market Value) |
| | | Level 1 | | Level 2 | | Level 3 | | Total |
Common Stocks | | | | | | | | | | | |
Australia | | | — | | $ | 193,225,890 | | — | | $ | 193,225,890 |
Belgium | | | — | | | 14,988,439 | | — | | | 14,988,439 |
Canada | | $ | 35,322,061 | | | — | | — | | | 35,322,061 |
China | | | — | | | 880,600 | | — | | | 880,600 |
France | | | — | | | 121,556,118 | | — | | | 121,556,118 |
Germany | | | — | | | 918,116 | | — | | | 918,116 |
Greece | | | — | | | 421,005 | | — | | | 421,005 |
Hong Kong | | | — | | | 27,631,163 | | — | | | 27,631,163 |
Italy | | | — | | | 792,853 | | — | | | 792,853 |
Japan | | | — | | | 112,678,744 | | — | | | 112,678,744 |
Netherlands | | | — | | | 34,348,320 | | — | | | 34,348,320 |
New Zealand | | | — | | | 7,017,019 | | — | | | 7,017,019 |
Singapore | | | 33,178 | | | 43,423,891 | | — | | | 43,457,069 |
South Africa | | | 1,963,337 | | | 8,663,639 | | — | | | 10,626,976 |
Taiwan | | | 748,199 | | | 3,054,720 | | — | | | 3,802,919 |
United Kingdom | | | — | | | 130,895,212 | | — | | | 130,895,212 |
Rights/Warrants | | | | | | | | | | | |
Singapore | | | — | | | 38,850 | | — | | | 38,850 |
Temporary Cash Investments | | | — | | | 4,146,000 | | — | | | 4,146,000 |
Securities Lending Collateral | | | — | | | 125,706,462 | | — | | | 125,706,462 |
| | | | | | | | | | | |
| | | | |
TOTAL | | $ | 38,066,775 | | $ | 830,387,041 | | — | | $ | 868,453,816 |
| | | | | | | | | | | |
See accompanying Notes to Financial Statements.
95
DFA INVESTMENT DIMENSIONS GROUP INC.
SCHEDULE OF INVESTMENTS
October 31, 2009
DFA GLOBAL REAL ESTATE SECURITIES PORTFOLIO
| | | | | |
| | | Shares | | Value† |
| | |
AFFILIATED INVESTMENT COMPANIES — (99.7%) | | | | | |
Investment in DFA Real Estate Securities Portfolio of
DFA Investment Dimensions Group Inc. | | 14,759,754 | | $ | 225,676,641 |
Investment in DFA International Real Estate Securities Portfolio
DFA Investment Dimensions Group Inc. | | 39,193,696 | | | 205,374,965 |
| | | | | |
TOTAL INVESTMENTS IN AFFILIATED INVESTMENT COMPANIES
(Cost $398,826,539) | | | | | 431,051,606 |
| | | | | |
TEMPORARY CASH INVESTMENTS — (0.3%) | | | | | |
BlackRock Liquidity Funds Tempcash
Portfolio-Institutional Shares
(Cost $1,475,873) | | 1,475,873 | | | 1,475,873 |
| | | | | |
TOTAL INVESTMENTS - (100.0%) (Cost $400,302,412) | | | | $ | 432,527,479 |
| | | | | |
Summary of inputs used to value the Portfolio’s net assets as of October 31, 2009 is as follows (See Security Valuation Note):
| | | | | | | | | | |
| | | Valuation Inputs |
| |
| | | Investment in Securities (Market Value) |
| | | Level 1 | | Level 2 | | Level 3 | | Total |
Affiliated Investment Companies | | $ | 431,051,606 | | — | | — | | $ | 431,051,606 |
Temporary Cash Investments | | | 1,475,873 | | — | | — | | | 1,475,873 |
| | | | | | | | | | |
TOTAL | | $ | 432,527,479 | | — | | — | | $ | 432,527,479 |
| | | | | | | | | | |
See accompanying Notes to Financial Statements.
96
DFA INTERNATIONAL SMALL CAP VALUE PORTFOLIO
SUMMARY SCHEDULE OF PORTFOLIO HOLDINGS
October 31, 2009
| | | | | | | |
| | | Shares | | Value†† | | Percentage of Net Assets** |
COMMON STOCKS — (91.0%) | | | | | | | |
AUSTRALIA — (6.9%) | | | | | | | |
#Downer EDI, Ltd. | | 3,069,424 | | $ | 23,365,680 | | 0.4% |
*Pacific Brands, Ltd. | | 29,002,108 | | | 33,770,277 | | 0.5% |
Other Securities | | | | | 462,236,503 | | 6.7% |
| | | | | | | |
TOTAL AUSTRALIA | | | | | 519,372,460 | | 7.6% |
| | | | | | | |
| | | |
AUSTRIA — (1.0%) | | | | | | | |
*Wienerberger AG | | 1,587,273 | | | 28,673,473 | | 0.4% |
Other Securities | | | | | 49,351,717 | | 0.7% |
| | | | | | | |
TOTAL AUSTRIA | | | | | 78,025,190 | | 1.1% |
| | | | | | | |
| | | |
BELGIUM — (1.4%) | | | | | | | |
Other Securities | | | | | 106,691,942 | | 1.6% |
| | | | | | | |
| | | |
CANADA — (7.6%) | | | | | | | |
*Celestica, Inc. | | 4,081,842 | | | 33,649,120 | | 0.5% |
#Laurentian Bank of Canada | | 689,000 | | | 25,170,898 | | 0.4% |
*Lundin Mining Corp. | | 6,297,886 | | | 25,318,427 | | 0.4% |
Sherritt International Corp. | | 5,573,711 | | | 35,748,398 | | 0.5% |
#*Viterra, Inc. | | 3,936,739 | | | 37,473,695 | | 0.5% |
Other Securities | | | | | 413,560,283 | | 6.0% |
| | | | | | | |
TOTAL CANADA | | | | | 570,920,821 | | 8.3% |
| | | | | | | |
| | | |
DENMARK — (0.5%) | | | | | | | |
Other Securities | | | | | 37,680,909 | | 0.6% |
| | | | | | | |
| | | |
FINLAND — (2.9%) | | | | | | | |
#Huhtamaki Oyj | | 1,826,851 | | | 24,693,015 | | 0.4% |
#Kemira Oyj | | 1,754,896 | | | 27,826,374 | | 0.4% |
#Outokumpu Oyj Series A | | 2,864,481 | | | 47,366,190 | | 0.7% |
#Pohjola Bank P.L.C. | | 3,363,010 | | | 37,370,684 | | 0.5% |
#Rautaruukki Oyj Series K | | 1,108,900 | | | 22,603,880 | | 0.3% |
Other Securities | | | | | 58,739,847 | | 0.9% |
| | | | | | | |
TOTAL FINLAND | | | | | 218,599,990 | | 3.2% |
| | | | | | | |
| | | |
FRANCE — (6.1%) | | | | | | | |
Arkema SA | | 1,028,400 | | | 39,258,912 | | 0.6% |
*Atos Origin SA | | 752,174 | | | 35,214,237 | | 0.5% |
#Havas SA | | 8,111,619 | | | 30,830,117 | | 0.4% |
#Nexans SA | | 593,945 | | | 41,941,024 | | 0.6% |
*Valeo SA | | 1,402,110 | | | 38,061,454 | | 0.6% |
Other Securities | | | | | 268,325,024 | | 3.9% |
| | | | | | | |
TOTAL FRANCE | | | | | 453,630,768 | | 6.6% |
| | | | | | | |
| | | |
GERMANY — (5.8%) | | | | | | | |
#Aurubis AG | | 1,148,031 | | | 45,536,498 | | 0.7% |
#Bilfinger Berger AG | | 956,696 | | | 61,253,282 | | 0.9% |
#Lanxess AG | | 1,049,103 | | | 32,980,226 | | 0.5% |
#Rheinmetall AG | | 482,624 | | | 26,206,443 | | 0.4% |
Other Securities | | | | | 269,817,799 | | 3.9% |
| | | | | | | |
TOTAL GERMANY | | | | | 435,794,248 | | 6.4% |
| | | | | | | |
| | | |
GREECE — (0.8%) | | | | | | | |
Other Securities | | | | | 58,439,452 | | 0.9% |
| | | | | | | |
| | | |
HONG KONG — (2.2%) | | | | | | | |
Other Securities | | | | | 163,275,519 | | 2.4% |
| | | | | | | |
97
DFA INTERNATIONAL SMALL CAP VALUE PORTFOLIO
CONTINUED
| | | | | | | |
| | | Shares | | Value†† | | Percentage of Net Assets** |
IRELAND — (0.9%) | | | | | | | |
Other Securities | | | | $ | 64,395,941 | | 0.9% |
| | | | | | | |
| | | |
ITALY — (4.5%) | | | | | | | |
Banca Popolare di Milano Scarl | | 10,151,010 | | | 75,527,076 | | 1.1% |
#Fondiaria - SAI SpA | | 1,781,588 | | | 32,470,921 | | 0.5% |
*Pirelli & Co. SpA | | 67,386,003 | | | 37,862,403 | | 0.6% |
Other Securities | | | | | 188,514,113 | | 2.7% |
| | | | | | | |
TOTAL ITALY | | | | | 334,374,513 | | 4.9% |
| | | | | | | |
| | | |
JAPAN — (19.9%) | | | | | | | |
Other Securities | | | | | 1,490,165,879 | | 21.7% |
| | | | | | | |
| | | |
MALAYSIA — (0.0%) | | | | | | | |
Other Securities | | | | | — | | 0.0% |
| | | | | | | |
| | | |
NETHERLANDS — (1.9%) | | | | | | | |
Nutreco Holding NV | | 746,767 | | | 37,693,977 | | 0.5% |
#*USG People NV | | 1,386,176 | | | 24,117,169 | | 0.4% |
Other Securities | | | | | 79,748,369 | | 1.2% |
| | | | | | | |
TOTAL NETHERLANDS | | | | | 141,559,515 | | 2.1% |
| | | | | | | |
| | | |
NEW ZEALAND — (0.3%) | | | | | | | |
Other Securities | | | | | 23,944,763 | | 0.3% |
| | | | | | | |
| | | |
NORWAY — (1.0%) | | | | | | | |
Other Securities | | | | | 78,702,123 | | 1.1% |
| | | | | | | |
| | | |
PORTUGAL — (0.2%) | | | | | | | |
Other Securities | | | | | 13,469,857 | | 0.2% |
| | | | | | | |
| | | |
SINGAPORE — (1.6%) | | | | | | | |
Other Securities | | | | | 118,964,304 | | 1.7% |
| | | | | | | |
| | | |
SPAIN — (1.3%) | | | | | | | |
Ebro Puleva SA | | 1,461,723 | | | 27,835,690 | | 0.4% |
Other Securities | | | | | 71,335,758 | | 1.0% |
| | | | | | | |
TOTAL SPAIN | | | | | 99,171,448 | | 1.4% |
| | | | | | | |
| | | |
SWEDEN — (3.3%) | | | | | | | |
#Boliden AB | | 4,986,751 | | | 60,046,993 | | 0.9% |
#*Trelleborg AB Series B | | 6,681,684 | | | 40,590,079 | | 0.6% |
Other Securities | | | | | 142,855,875 | | 2.1% |
| | | | | | | |
TOTAL SWEDEN | | | | | 243,492,947 | | 3.6% |
| | | | | | | |
| | | |
SWITZERLAND — (4.6%) | | | | | | | |
*Clariant AG | | 4,668,293 | | | 44,630,582 | | 0.6% |
Helvetia Holding AG | | 86,089 | | | 27,449,020 | | 0.4% |
#PSP Swiss Property AG | | 588,827 | | | 33,042,294 | | 0.5% |
Other Securities | | | | | 237,538,217 | | 3.5% |
| | | | | | | |
TOTAL SWITZERLAND | | | | | 342,660,113 | | 5.0% |
| | | | | | | |
| | | |
UNITED KINGDOM — (16.3%) | | | | | | | |
Amlin P.L.C. | | 9,708,370 | | | 56,193,562 | | 0.8% |
Bellway P.L.C. | | 3,481,205 | | | 41,637,233 | | 0.6% |
*Bovis Homes Group P.L.C. | | 4,184,856 | | | 28,182,882 | | 0.4% |
Brit Insurance Holdings P.L.C. | | 11,179,422 | | | 38,072,361 | | 0.6% |
Catlin Group, Ltd. | | 8,508,243 | | | 45,940,078 | | 0.7% |
Close Brothers Group P.L.C. | | 2,135,186 | | | 24,553,339 | | 0.4% |
*Cookson Group P.L.C. | | 3,902,119 | | | 23,284,656 | | 0.3% |
DS Smith P.L.C. | | 12,895,987 | | | 24,629,261 | | 0.4% |
98
DFA INTERNATIONAL SMALL CAP VALUE PORTFOLIO
CONTINUED
| | | | | | | |
| | | Shares | | Value†† | | Percentage of Net Assets** |
UNITED KINGDOM — (Continued) | | | | | | | |
Greene King P.L.C. | | 5,260,781 | | $ | 33,988,997 | | 0.5% |
Hiscox, Ltd. | | 10,648,017 | | | 55,841,012 | | 0.8% |
Meggitt P.L.C. | | 12,962,458 | | | 51,899,258 | | 0.8% |
Millennium & Copthorne Hotels P.L.C. | | 5,019,556 | | | 27,745,529 | | 0.4% |
Mondi P.L.C. | | 7,958,099 | | | 43,926,465 | | 0.6% |
*Persimmon P.L.C. | | 6,879,478 | | | 45,355,560 | | 0.7% |
*Premier Foods P.L.C. | | 40,873,986 | | | 23,964,979 | | 0.3% |
Tomkins P.L.C. | | 13,525,823 | | | 37,106,806 | | 0.5% |
Travis Perkins P.L.C. | | 3,875,156 | | | 47,804,947 | | 0.7% |
Other Securities | | | | | 572,280,454 | | 8.3% |
| | | | | | | |
TOTAL UNITED KINGDOM | | | | | 1,222,407,379 | | 17.8% |
| | | | | | | |
TOTAL COMMON STOCKS | | | | | 6,815,740,081 | | 99.4% |
| | | | | | | |
PREFERRED STOCKS — (0.0%) | | | | | | | |
AUSTRALIA — (0.0%) | | | | | | | |
Other Securities | | | | | 2,217,142 | | 0.0% |
| | | | | | | |
| | | |
FINLAND — (0.0%) | | | | | | | |
Other Securities | | | | | 18,739 | | 0.0% |
| | | | | | | |
TOTAL PREFERRED STOCKS | | | | | 2,235,881 | | 0.0% |
| | | | | | | |
RIGHTS/WARRANTS — (0.2%) | | | | | | | |
| | | |
AUSTRALIA — (0.0%) | | | | | | | |
Other Securities | | | | | 103,581 | | 0.0% |
| | | | | | | |
| | | |
BELGIUM — (0.0%) | | | | | | | |
Other Securities | | | | | 14 | | 0.0% |
| | | | | | | |
| | | |
CANADA — (0.0%) | | | | | | | |
Other Securities | | | | | 24,280 | | 0.0% |
| | | | | | | |
| | | |
FRANCE — (0.0%) | | | | | | | |
Other Securities | | | | | 27,132 | | 0.0% |
| | | | | | | |
| | | |
GERMANY — (0.0%) | | | | | | | |
Other Securities | | | | | 308,692 | | 0.0% |
| | | | | | | |
| | | |
HONG KONG — (0.0%) | | | | | | | |
Other Securities | | | | | 1,197,219 | | 0.0% |
| | | | | | | |
| | | |
ITALY — (0.0%) | | | | | | | |
Other Securities | | | | | 37,152 | | 0.0% |
| | | | | | | |
| | | |
JAPAN — (0.0%) | | | | | | | |
Other Securities | | | | | — | | 0.0% |
| | | | | | | |
| | | |
MALAYSIA — (0.0%) | | | | | | | |
Other Securities | | | | | 3,012 | | 0.0% |
| | | | | | | |
| | | |
NORWAY — (0.0%) | | | | | | | |
Other Securities | | | | | 13,925 | | 0.0% |
| | | | | | | |
| | | |
SPAIN — (0.1%) | | | | | | | |
Other Securities | | | | | 2,182,764 | | 0.1% |
| | | | | | | |
| | | |
UNITED KINGDOM — (0.1%) | | | | | | | |
Other Securities | | | | | 6,923,620 | | 0.1% |
| | | | | | | |
TOTAL RIGHTS/WARRANTS | | | | | 10,821,391 | | 0.2% |
| | | | | | | |
99
DFA INTERNATIONAL SMALL CAP VALUE PORTFOLIO
CONTINUED
| | | | | | | |
| | | Shares/ Face Amount | | Value† | | Percentage of Net Assets** |
| | | (000) | | | | |
| | | |
SECURITIES LENDING COLLATERAL — (8.8%) | | | | | | | |
§@DFA Short Term Investment Fund LP | | 660,084,739 | | $ | 660,084,739 | | 9.6% |
@Repurchase Agreement, Deutsche Bank Securities 0.07%, | | | | | | | |
11/02/09 (Collateralized by various corporate obligations, ranging in par value from $4,247,617 to $16,429,280, rates ranging from 5.000% to 7.000%, maturities ranging from 03/01/37 to 10/01/39, valued at $355,813) to be repurchased at $348,838 | | $349 | | | 348,836 | | 0.0% |
| | | | | | | |
TOTAL SECURITIES LENDING COLLATERAL | | | | | 660,433,575 | | 9.6% |
| | | | | | | |
TOTAL INVESTMENTS — (100.0%)
(Cost $8,133,915,343) | | | | $ | 7,489,230,928 | | 109.2% |
| | | | | | | |
Summary of inputs used to value the Portfolio’s net assets as of October 31, 2009 is as follows (See Security Valuation Note):
| | | | | | | | | | | |
| | | Valuation Inputs |
| |
| | | Investment in Securities (Market Value) |
| | | Level 1 | | Level 2 | | Level 3 | | Total |
Common Stocks | | | | | | | | | | | |
Australia | | $ | 288,015 | | $ | 519,084,445 | | — | | $ | 519,372,460 |
Austria | | | 22,426 | | | 78,002,764 | | — | | | 78,025,190 |
Belgium | | | — | | | 106,691,942 | | — | | | 106,691,942 |
Canada | | | 570,920,821 | | | — | | — | | | 570,920,821 |
Denmark | | | 98,745 | | | 37,582,164 | | — | | | 37,680,909 |
Finland | | | — | | | 218,599,990 | | — | | | 218,599,990 |
France | | | 1,488,725 | | | 452,142,043 | | — | | | 453,630,768 |
Germany | | | — | | | 435,794,248 | | — | | | 435,794,248 |
Greece | | | 96,399 | | | 58,343,053 | | — | | | 58,439,452 |
Hong Kong | | | 258,326 | | | 163,017,193 | | — | | | 163,275,519 |
Ireland | | | 154,426 | | | 64,241,515 | | — | | | 64,395,941 |
Italy | | | — | | | 334,374,513 | | — | | | 334,374,513 |
Japan | | | 541,687 | | | 1,489,624,192 | | — | | | 1,490,165,879 |
Malaysia | | | — | | | — | | — | | | — |
Netherlands | | | — | | | 141,559,515 | | — | | | 141,559,515 |
New Zealand | | | — | | | 23,944,763 | | — | | | 23,944,763 |
Norway | | | — | | | 78,702,123 | | — | | | 78,702,123 |
Portugal | | | — | | | 13,469,857 | | — | | | 13,469,857 |
Singapore | | | 930,728 | | | 118,033,576 | | — | | | 118,964,304 |
Spain | | | — | | | 99,171,448 | | — | | | 99,171,448 |
Sweden | | | — | | | 243,492,947 | | — | | | 243,492,947 |
Switzerland | | | 690,857 | | | 341,969,256 | | — | | | 342,660,113 |
United Kingdom | | | 385,964 | | | 1,222,021,415 | | — | | | 1,222,407,379 |
Preferred Stocks | | | | | | | | | | | |
Australia | | | — | | | 2,217,142 | | — | | | 2,217,142 |
100
DFA INTERNATIONAL SMALL CAP VALUE PORTFOLIO
CONTINUED
| | | | | | | | | | | |
| | | Valuation Inputs |
| |
| | | Investment in Securities (Market Value) |
| | | Level 1 | | Level 2 | | Level 3 | | Total |
Finland | | | — | | $ | 18,739 | | — | | $ | 18,739 |
Rights/Warrants | | | | | | | | | | | |
Australia | | | — | | | 103,581 | | — | | | 103,581 |
Belgium | | $ | 14 | | | — | | — | | | 14 |
Canada | | | 24,280 | | | — | | — | | | 24,280 |
France | | | 27,132 | | | — | | — | | | 27,132 |
Germany | | | — | | | 308,692 | | — | | | 308,692 |
Hong Kong | | | 51,124 | | | 1,146,095 | | — | | | 1,197,219 |
Italy | | | 37,152 | | | — | | — | | | 37,152 |
Japan | | | — | | | — | | — | | | — |
Malaysia | | | — | | | 3,012 | | — | | | 3,012 |
Norway | | | — | | | 13,925 | | — | | | 13,925 |
Spain | | | — | | | 2,182,764 | | — | | | 2,182,764 |
United Kingdom | | | 1,771,371 | | | 5,152,249 | | — | | | 6,923,620 |
Securities Lending Collateral | | | — | | | 660,433,575 | | — | | | 660,433,575 |
| | | | | | | | | | | |
TOTAL | | $ | 577,788,192 | | $ | 6,911,442,736 | | — | | $ | 7,489,230,928 |
| | | | | | | | | | | |
See accompanying Notes to Financial Statements.
101
INTERNATIONAL VECTOR EQUITY PORTFOLIO
SUMMARY SCHEDULE OF PORTFOLIO HOLDINGS
October 31, 2009
| | | | | | | |
| | | Shares | | Value†† | | Percentage of Net Assets** |
COMMON STOCKS — (86.2%) | | | | | | | |
AUSTRALIA — (6.1%) | | | | | | | |
Australia & New Zealand Banking Group, Ltd. | | 29,839 | | $ | 608,600 | | 0.3% |
#Macquarie Group, Ltd. | | 13,345 | | | 584,454 | | 0.2% |
Other Securities | | | | | 17,131,267 | | 6.5% |
| | | | | | | |
TOTAL AUSTRALIA | | | | | 18,324,321 | | 7.0% |
| | | | | | | |
| | | |
AUSTRIA — (0.7%) | | | | | | | |
Voestalpine AG | | 16,154 | | | 552,370 | | 0.2% |
Other Securities | | | | | 1,529,125 | | 0.6% |
| | | | | | | |
TOTAL AUSTRIA | | | | | 2,081,495 | | 0.8% |
| | | | | | | |
| | | |
BELGIUM — (1.0%) | | | | | | | |
Solvay SA | | 5,891 | | | 578,480 | | 0.2% |
Other Securities | | | | | 2,468,869 | | 1.0% |
| | | | | | | |
TOTAL BELGIUM | | | | | 3,047,349 | | 1.2% |
| | | | | | | |
| | | |
CANADA — (8.1%) | | | | | | | |
#Bank of Montreal | | 20,300 | | | 939,160 | | 0.4% |
Sun Life Financial, Inc. | | 19,778 | | | 547,069 | | 0.2% |
Suncor Energy, Inc. | | 29,572 | | | 981,664 | | 0.4% |
Talisman Energy, Inc. | | 45,748 | | | 780,470 | | 0.3% |
*Teck Resources, Ltd. Class B | | 33,100 | | | 960,835 | | 0.4% |
#Toronto Dominion Bank | | 11,000 | | | 627,032 | | 0.2% |
Other Securities | | | | | 19,751,980 | | 7.5% |
| | | | | | | |
TOTAL CANADA | | | | | 24,588,210 | | 9.4% |
| | | | | | | |
| | | |
DENMARK — (1.0%) | | | | | | | |
Other Securities | | | | | 2,897,663 | | 1.1% |
| | | | | | | |
| | | |
FINLAND — (1.7%) | | | | | | | |
UPM-Kymmene Oyj | | 45,985 | | | 551,884 | | 0.2% |
Other Securities | | | | | 4,542,667 | | 1.7% |
| | | | | | | |
TOTAL FINLAND | | | | | 5,094,551 | | 1.9% |
| | | | | | | |
| | | |
FRANCE — (6.2%) | | | | | | | |
BNP Paribas SA | | 13,962 | | | 1,051,815 | | 0.4% |
Compagnie Generale des Establissements Michelin SA Series B | | 8,950 | | | 662,989 | | 0.3% |
#Lafarge SA | | 8,284 | | | 672,410 | | 0.3% |
*Natixis SA | | 99,455 | | | 558,692 | | 0.2% |
Societe Generale Paris SA | | 9,034 | | | 600,036 | | 0.2% |
Other Securities | | | | | 15,242,693 | | 5.8% |
| | | | | | | |
TOTAL FRANCE | | | | | 18,788,635 | | 7.2% |
| | | | | | | |
| | | |
GERMANY — (4.5%) | | | | | | | |
#Deutsche Bank AG | | 20,528 | | | 1,470,421 | | 0.5% |
E.ON AG | | 18,237 | | | 696,788 | | 0.3% |
Other Securities | | | | | 11,465,158 | | 4.4% |
| | | | | | | |
TOTAL GERMANY | | | | | 13,632,367 | | 5.2% |
| | | | | | | |
| | | |
GREECE — (1.5%) | | | | | | | |
*Alpha Bank A.E. | | 33,606 | | | 647,924 | | 0.3% |
*Piraeus Bank S.A. | | 34,245 | | | 590,409 | | 0.2% |
Other Securities | | | | | 3,220,866 | | 1.2% |
| | | | | | | |
TOTAL GREECE | | | | | 4,459,199 | | 1.7% |
| | | | | | | |
102
INTERNATIONAL VECTOR EQUITY PORTFOLIO
CONTINUED
| | | | | | | |
| | | Shares | | Value†† | | Percentage of Net Assets** |
HONG KONG — (1.9%) | | | | | | | |
Other Securities | | | | $ | 5,818,759 | | 2.2% |
| | | | | | | |
| | | |
IRELAND — (0.8%) | | | | | | | |
Other Securities | | | | | 2,323,811 | | 0.9% |
| | | | | | | |
| | | |
ITALY — (2.6%) | | | | | | | |
Other Securities | | | | | 7,735,814 | | 2.9% |
| | | | | | | |
| | | |
JAPAN — (18.9%) | | | | | | | |
Toyota Motor Corp. Sponsored ADR | | 7,600 | | | 599,564 | | 0.2% |
Other Securities | | | | | 56,552,820 | | 21.6% |
| | | | | | | |
TOTAL JAPAN | | | | | 57,152,384 | | 21.8% |
| | | | | | | |
| | | |
NETHERLANDS — (2.5%) | | | | | | | |
Koninklijke DSM NV | | 11,964 | | | 524,191 | | 0.2% |
Philips Electronics NV | | 22,955 | | | 576,648 | | 0.2% |
Other Securities | | | | | 6,514,761 | | 2.5% |
| | | | | | | |
TOTAL NETHERLANDS | | | | | 7,615,600 | | 2.9% |
| | | | | | | |
| | | |
NEW ZEALAND — (0.3%) | | | | | | | |
Other Securities | | | | | 919,440 | | 0.4% |
| | | | | | | |
| | | |
NORWAY — (1.2%) | | | | | | | |
Other Securities | | | | | 3,760,388 | | 1.4% |
| | | | | | | |
| | | |
PORTUGAL — (0.5%) | | | | | | | |
Other Securities | | | | | 1,619,843 | | 0.6% |
| | | | | | | |
| | | |
SINGAPORE — (1.2%) | | | | | | | |
Other Securities | | | | | 3,732,209 | | 1.4% |
| | | | | | | |
| | | |
SPAIN — (2.4%) | | | | | | | |
Banco Bilbao Vizcaya SA Sponsored ADR | | 40,108 | | | 713,922 | | 0.3% |
Banco Santander SA | | 71,865 | | | 1,156,470 | | 0.4% |
Banco Santander SA Sponsored ADR | | 49,420 | | | 793,685 | | 0.3% |
Other Securities | | | | | 4,688,871 | | 1.8% |
| | | | | | | |
TOTAL SPAIN | | | | | 7,352,948 | | 2.8% |
| | | | | | | |
| | | |
SWEDEN — (2.0%) | | | | | | | |
Other Securities | | | | | 6,102,081 | | 2.3% |
| | | | | | | |
| | | |
SWITZERLAND — (5.4%) | | | | | | | |
Credit Suisse Group AG | | 13,655 | | | 729,958 | | 0.3% |
#*Holcim, Ltd. | | 21,970 | | | 1,398,276 | | 0.5% |
Novartis AG ADR | | 11,400 | | | 592,230 | | 0.2% |
#Swatch Group AG | | 2,763 | | | 645,152 | | 0.3% |
Swiss Reinsurance Co., Ltd. AG | | 23,898 | | | 973,141 | | 0.4% |
*UBS AG | | 52,017 | | | 867,370 | | 0.3% |
*UBS AG ADR | | 34,236 | | | 567,975 | | 0.2% |
Zurich Financial Services AG | | 6,240 | | | 1,428,914 | | 0.5% |
Other Securities | | | | | 9,144,399 | | 3.5% |
| | | | | | | |
TOTAL SWITZERLAND | | | | | 16,347,415 | | 6.2% |
| | | | | | | |
| | | |
UNITED KINGDOM — (15.7%) | | | | | | | |
*Anglo American P.L.C. | | 48,414 | | | 1,751,769 | | 0.7% |
Aviva P.L.C. | | 128,562 | | | 803,920 | | 0.3% |
*Barclays P.L.C. | | 105,354 | | | 552,169 | | 0.2% |
*BP P.L.C. Sponsored ADR | | 18,084 | | | 1,023,916 | | 0.4% |
HSBC Holdings P.L.C. Sponsored ADR | | 35,757 | | | 1,980,580 | | 0.8% |
International Power P.L.C. | | 146,938 | | | 610,041 | | 0.2% |
Kingfisher P.L.C. | | 225,944 | | | 825,853 | | 0.3% |
103
INTERNATIONAL VECTOR EQUITY PORTFOLIO
CONTINUED
| | | | | | | |
| | | Shares | | Value†† | | Percentage of Net Assets** |
| | | |
UNITED KINGDOM — (Continued) | | | | | | | |
Legal & General Group P.L.C. | | 575,477 | | $ | 738,420 | | 0.3% |
Old Mutual P.L.C. | | 499,092 | | | 866,235 | | 0.3% |
Prudential P.L.C. | | 68,348 | | | 620,833 | | 0.2% |
Royal Dutch Shell P.L.C. ADR | | 32,048 | | | 1,863,912 | | 0.7% |
RSA Insurance Group P.L.C. | | 322,917 | | | 639,902 | | 0.2% |
Standard Chartered P.L.C. | | 26,514 | | | 650,443 | | 0.3% |
Standard Life P.L.C. | | 213,961 | | | 762,724 | | 0.3% |
Vodafone Group P.L.C. Sponsored ADR | | 56,540 | | | 1,254,623 | | 0.5% |
*Xstrata P.L.C. | | 53,951 | | | 777,087 | | 0.3% |
Other Securities | | | | | 31,609,787 | | 12.0% |
| | | | | | | |
TOTAL UNITED KINGDOM | | | | | 47,332,214 | | 18.0% |
| | | | | | | |
TOTAL COMMON STOCKS | | | | | 260,726,696 | | 99.3% |
| | | | | | | |
RIGHTS/WARRANTS — (0.0%) | | | | | | | |
BELGIUM — (0.0%) | | | | | | | |
Other Securities | | | | | — | | 0.0% |
| | | | | | | |
| | | |
DENMARK — (0.0%) | | | | | | | |
Other Securities | | | | | 568 | | 0.0% |
| | | | | | | |
| | | |
GERMANY — (0.0%) | | | | | | | |
Other Securities | | | | | 3,559 | | 0.0% |
| | | | | | | |
| | | |
HONG KONG — (0.0%) | | | | | | | |
Other Securities | | | | | 5,586 | | 0.0% |
| | | | | | | |
| | | |
ITALY — (0.0%) | | | | | | | |
Other Securities | | | | | — | | 0.0% |
| | | | | | | |
| | | |
NORWAY — (0.0%) | | | | | | | |
Other Securities | | | | | 2,334 | | 0.0% |
| | | | | | | |
| | | |
SPAIN — (0.0%) | | | | | | | |
Other Securities | | | | | 6,021 | | 0.0% |
| | | | | | | |
| | | |
UNITED KINGDOM — (0.0%) | | | | | | | |
Other Securities | | | | | 33,339 | | 0.0% |
| | | | | | | |
TOTAL RIGHTS/WARRANTS | | | | | 51,407 | | 0.0% |
| | | | | | | |
| | | |
| | | Face Amount | | | | |
| | | (000) | | Value† | | |
TEMPORARY CASH INVESTMENTS — (0.4%) | | | | | | | |
Repurchase Agreement, PNC Capital Markets, Inc. 0.19%, | | | | | | | |
11/02/09 (Collateralized by $1,830,000 FHLMC 6.040%(r), 11/01/36, valued at $1,174,798) to be repurchased at $1,155,018 | | $1,155 | | | 1,155,000 | | 0.5% |
| | | | | | | |
| | | |
| | | Shares/ Face Amount | | | | |
| | | (000) | | | | |
SECURITIES LENDING COLLATERAL — (13.4%) | | | | | | | |
§@DFA Short Term Investment Fund LP | | 38,492,317 | | | 38,492,317 | | 14.7% |
104
INTERNATIONAL VECTOR EQUITY PORTFOLIO
CONTINUED
| | | | | | | | |
| | | Shares/ Face Amount | | Value† | | Percentage of Net Assets** |
| | | (000) | | | | |
@Repurchase Agreement, Deutsche Bank Securities 0.07% 11/02/09 | | | | | | | | |
(Collateralized by various corporate obligations, ranging in par value from $4,247,617 to $16,429,280, rates ranging from 5.000% to 7.000%, maturities ranging from 03/01/37 to 10/01/39, valued at $2,012,891) to be repurchased at $1,973,435 | | $ | 1,973 | | | 1,973,423 | | 0.7% |
| | | | | | | | |
TOTAL SECURITIES LENDING COLLATERAL | | | | | | 40,465,740 | | 15.4% |
| | | | | | | | |
TOTAL INVESTMENTS — (100.0%)
(Cost $247,812,128) | | | | | $ | 302,398,843 | | 115.2% |
| | | | | | | | |
Summary of inputs used to value the Portfolio’s net assets as of October 31, 2009 is as follows (See Security Valuation Note):
| | | | | | | | | | | |
| | | Valuation Inputs |
| |
| | | Investment in Securities (Market Value) |
| | | Level 1 | | Level 2 | | Level 3 | | Total |
Common Stocks | | | | | | | | | | | |
Australia | | $ | 411,657 | | $ | 17,912,664 | | — | | $ | 18,324,321 |
Austria | | | — | | | 2,081,495 | | — | | | 2,081,495 |
Belgium | | | 230,520 | | | 2,816,829 | | — | | | 3,047,349 |
Canada | | | 24,588,210 | | | — | | — | | | 24,588,210 |
Denmark | | | 17,522 | | | 2,880,141 | | — | | | 2,897,663 |
Finland | | | — | | | 5,094,551 | | — | | | 5,094,551 |
France | | | 1,046,254 | | | 17,742,381 | | — | | | 18,788,635 |
Germany | | | 2,742,895 | | | 10,889,472 | | — | | | 13,632,367 |
Greece | | | 381,443 | | | 4,077,756 | | — | | | 4,459,199 |
Hong Kong | | | 9,693 | | | 5,809,066 | | — | | | 5,818,759 |
Ireland | | | 495,321 | | | 1,828,490 | | — | | | 2,323,811 |
Italy | | | 473,358 | | | 7,262,456 | | — | | | 7,735,814 |
Japan | | | 2,796,176 | | | 54,356,208 | | — | | | 57,152,384 |
Netherlands | | | 1,819,243 | | | 5,796,357 | | — | | | 7,615,600 |
New Zealand | | | 11,648 | | | 907,792 | | — | | | 919,440 |
Norway | | | — | | | 3,760,388 | | — | | | 3,760,388 |
Portugal | | | — | | | 1,619,843 | | — | | | 1,619,843 |
Singapore | | | — | | | 3,732,209 | | — | | | 3,732,209 |
Spain | | | 1,724,397 | | | 5,628,551 | | — | | | 7,352,948 |
Sweden | | | 62,400 | | | 6,039,681 | | — | | | 6,102,081 |
Switzerland | | | 1,752,841 | | | 14,594,574 | | — | | | 16,347,415 |
United Kingdom | | | 7,015,128 | | | 40,317,086 | | — | | | 47,332,214 |
Rights/Warrants | | | | | | | | | | | |
Belgium | | | — | | | — | | — | | | — |
Denmark | | | 568 | | | — | | — | | | 568 |
Germany | | | — | | | 3,559 | | — | | | 3,559 |
Hong Kong | | | — | | | 5,586 | | — | | | 5,586 |
Italy | | | — | | | — | | — | | | — |
105
INTERNATIONAL VECTOR EQUITY PORTFOLIO
CONTINUED
| | | | | | | | | | | |
| | | Valuation Inputs |
| |
| | | Investment in Securities (Market Value) |
| | | Level 1 | | Level 2 | | Level 3 | | Total |
Norway | | | — | | $ | 2,334 | | — | | $ | 2,334 |
Spain | | | — | | | 6,021 | | — | | | 6,021 |
United Kingdom | | $ | 6,884 | | | 26,455 | | — | | | 33,339 |
Temporary Cash Investments | | | — | | | 1,155,000 | | — | | | 1,155,000 |
Securities Lending Collateral | | | — | | | 40,465,740 | | — | | | 40,465,740 |
| | | | | | | | | | | |
TOTAL | | $ | 45,586,158 | | $ | 256,812,685 | | — | | $ | 302,398,843 |
| | | | | | | | | | | |
See accompanying Notes to Financial Statements.
106
DFA INVESTMENT DIMENSIONS GROUP INC.
SCHEDULES OF INVESTMENTS
October 31, 2009
EMERGING MARKETS PORTFOLIO
| | | |
| | | Value† |
AFFILIATED INVESTMENT COMPANY — (100.0%) | | | |
Investment in The Emerging Markets Series of
The DFA Investment Trust Company | | $ | 1,967,084,229 |
| | | |
TOTAL INVESTMENTS IN AFFILIATED INVESTMENT COMPANY
(Cost $1,011,671,280) | | $ | 1,967,084,229 |
| | | |
Summary of inputs used to value the Portfolio’s net assets as of October 31, 2009 is as follows (See Security Valuation Note):
| | | | | | | | | | |
| | | Valuation Inputs |
| |
| | | Investment in Securities (Market Value) |
| | | Level 1 | | Level 2 | | Level 3 | | Total |
Affiliated Investment Company | | $ | 1,967,084,229 | | — | | — | | $ | 1,967,084,229 |
EMERGING MARKETS SMALL CAP PORTFOLIO
| | | |
| | | Value† |
AFFILIATED INVESTMENT COMPANY — (100.0%) | | | |
Investment in The Emerging Markets Small Cap Series of
The DFA Investment Trust Company | | $ | 1,134,439,234 |
| | | |
TOTAL INVESTMENTS IN AFFILIATED INVESTMENT COMPANY
(Cost $854,969,140) | | $ | 1,134,439,234 |
| | | |
Summary of inputs used to value the Portfolio’s net assets as of October 31, 2009 is as follows (See Security Valuation Note):
| | | | | | | | | | |
| | | Valuation Inputs |
| |
| | | Investment in Securities (Market Value) |
| | | Level 1 | | Level 2 | | Level 3 | | Total |
Affiliated Investment Company | | $ | 1,134,439,234 | | — | | — | | $ | 1,134,439,234 |
See accompanying Notes to Financial Statements.
107
EMERGING MARKETS CORE EQUITY PORTFOLIO
SUMMARY SCHEDULE OF PORTFOLIO HOLDINGS
October 31, 2009
| | | | | | | |
| | | Shares | | Value†† | | Percentage of Net Assets** |
COMMON STOCKS — (84.5%) | | | | | | | |
BRAZIL — (7.4%) | | | | | | | |
BM&F Bovespa SA | | 1,104,321 | | $ | 7,115,147 | | 0.3% |
Cia Vale do Rio Doce | | 708,190 | | | 18,051,763 | | 0.7% |
#Itau Unibanco Holding SA ADR | | 1,648,537 | | | 31,552,998 | | 1.3% |
Petroleo Brasileiro SA ADR (71654V101) | | 637,166 | | | 25,563,100 | | 1.0% |
#Petroleo Brasileiro SA ADR (71654V408) | | 462,510 | | | 21,377,212 | | 0.9% |
Other Securities | | | | | 98,747,396 | | 4.0% |
| | | | | | | |
TOTAL BRAZIL | | | | | 202,407,616 | | 8.2% |
| | | | | | | |
| | | |
CHILE — (1.8%) | | | | | | | |
Other Securities | | | | | 49,299,787 | | 2.0% |
| | | | | | | |
| | | |
CHINA — (11.0%) | | | | | | | |
Bank of China, Ltd. | | 17,448,000 | | | 10,033,035 | | 0.4% |
China Construction Bank Corp. | | 16,648,000 | | | 14,352,768 | | 0.6% |
#China Life Insurance Co., Ltd. ADR | | 159,456 | | | 10,940,276 | | 0.5% |
#China Mobile, Ltd. Sponsored ADR | | 318,041 | | | 14,862,056 | | 0.6% |
#China Petroleum and Chemical Corp. (Sinopec) ADR | | 88,100 | | | 7,432,116 | | 0.3% |
#CNOOC, Ltd. ADR | | 116,476 | | | 17,347,935 | | 0.7% |
#*Industrial & Commercial Bank of China, Ltd. | | 21,941,000 | | | 17,456,588 | | 0.7% |
#PetroChina Co., Ltd. ADR | | 129,733 | | | 15,573,149 | | 0.6% |
Other Securities | | | | | 193,263,616 | | 7.9% |
| | | | | | | |
TOTAL CHINA | | | | | 301,261,539 | | 12.3% |
| | | | | | | |
| | | |
CZECH REPUBLIC — (0.6%) | | | | | | | |
Other Securities | | | | | 16,134,619 | | 0.7% |
| | | | | | | |
| | | |
HUNGARY — (1.1%) | | | | | | | |
*MOL Hungarian Oil & Gas NYRT | | 83,994 | | | 7,017,209 | | 0.3% |
#*OTP Bank NYRT | | 488,536 | | | 13,737,383 | | 0.6% |
Other Securities | | | | | 8,659,120 | | 0.3% |
| | | | | | | |
TOTAL HUNGARY | | | | | 29,413,712 | | 1.2% |
| | | | | | | |
| | | |
INDIA — (10.5%) | | | | | | | |
ICICI Bank, Ltd. Sponsored ADR | | 396,338 | | | 12,464,830 | | 0.5% |
Infosys Technologies, Ltd. | | 225,217 | | | 10,455,397 | | 0.4% |
*Reliance Industries, Ltd. | | 690,546 | | | 27,939,425 | | 1.1% |
Other Securities | | | | | 237,253,820 | | 9.7% |
| | | | | | | |
TOTAL INDIA | | | | | 288,113,472 | | 11.7% |
| | | | | | | |
| | | |
INDONESIA — (2.3%) | | | | | | | |
PT Astra International Tbk | | 2,085,000 | | | 6,708,063 | | 0.3% |
Other Securities | | | | | 57,010,581 | | 2.3% |
| | | | | | | |
TOTAL INDONESIA | | | | | 63,718,644 | | 2.6% |
| | | | | | | |
| | | |
ISRAEL — (3.6%) | | | | | | | |
*Bank Hapoalim B.M. | | 1,946,691 | | | 7,106,879 | | 0.3% |
*Bank Leumi Le-Israel B.M. | | 1,734,653 | | | 6,774,661 | | 0.3% |
Teva Pharmaceutical Industries, Ltd. Sponsored ADR | | 838,566 | | | 42,330,812 | | 1.7% |
Other Securities | | | | | 42,860,323 | | 1.7% |
| | | | | | | |
TOTAL ISRAEL | | | | | 99,072,675 | | 4.0% |
| | | | | | | |
| | | |
MALAYSIA — (3.8%) | | | | | | | |
Other Securities | | | | | 105,292,715 | | 4.3% |
| | | | | | | |
| | | |
MEXICO — (5.0%) | | | | | | | |
America Movil S.A.B. de C.V. Series L ADR | | 359,075 | | | 15,845,980 | | 0.6% |
108
EMERGING MARKETS CORE EQUITY PORTFOLIO
CONTINUED
| | | | | | | |
| | | Shares | | Value†† | | Percentage of Net Assets** |
MEXICO — (Continued) | | | | | | | |
*Cemex S.A.B. de C.V. Sponsored ADR | | 1,165,980 | | $ | 12,102,873 | | 0.5% |
Fomento Economico Mexicano S.A.B. de C.V. Sponsored ADR | | 230,240 | | | 9,971,694 | | 0.4% |
*Grupo Financiero Banorte S.A.B. de C.V. | | 2,596,307 | | | 8,297,957 | | 0.3% |
*Grupo Mexico S.A.B. de C.V. Series B | | 5,000,219 | | | 9,997,598 | | 0.4% |
Grupo Televisa S.A. de C.V. Sponsored ADR | | 356,510 | | | 6,902,034 | | 0.3% |
Other Securities | | | | | 74,768,418 | | 3.1% |
| | | | | | | |
TOTAL MEXICO | | | | | 137,886,554 | | 5.6% |
| | | | | | | |
| | | |
PHILIPPINES — (0.6%) | | | | | | | |
Other Securities | | | | | 15,883,678 | | 0.6% |
| | | | | | | |
| | | |
POLAND — (1.8%) | | | | | | | |
KGHM Polska Miedz SA | | 192,817 | | | 6,490,348 | | 0.2% |
Other Securities | | | | | 43,827,902 | | 1.8% |
| | | | | | | |
TOTAL POLAND | | | | | 50,318,250 | | 2.0% |
| | | | | | | |
| | | |
RUSSIA — (0.9%) | | | | | | | |
*Gazprom OAO Sponsored ADR | | 410,963 | | | 9,855,738 | | 0.4% |
Other Securities | | | | | 13,898,180 | | 0.6% |
| | | | | | | |
TOTAL RUSSIA | | | | | 23,753,918 | | 1.0% |
| | | | | | | |
| | | |
SINGAPORE — (0.0%) | | | | | | | |
Other Securities | | | | | 114,229 | | 0.0% |
| | | | | | | |
| | | |
SOUTH AFRICA — (9.2%) | | | | | | | |
#Gold Fields, Ltd. Sponsored ADR | | 755,800 | | | 9,636,450 | | 0.4% |
Impala Platinum Holdings, Ltd. | | 418,209 | | | 9,088,505 | | 0.4% |
MTN Group, Ltd. | | 1,041,866 | | | 15,512,590 | | 0.6% |
Naspers, Ltd. Series N | | 378,717 | | | 13,663,814 | | 0.5% |
Sanlam, Ltd. | | 3,530,404 | | | 9,688,256 | | 0.4% |
Sasol, Ltd. Sponsored ADR | | 466,600 | | | 17,446,174 | | 0.7% |
Standard Bank Group, Ltd. | | 1,207,837 | | | 15,143,321 | | 0.6% |
Other Securities | | | | | 163,739,983 | | 6.7% |
| | | | | | | |
TOTAL SOUTH AFRICA | | | | | 253,919,093 | | 10.3% |
| | | | | | | |
| | | |
SOUTH KOREA — (10.5%) | | | | | | | |
Hyundai Motor Co., Ltd. | | 92,301 | | | 8,372,115 | | 0.4% |
*KB Financial Group, Inc. ADR | | 206,311 | | | 9,787,394 | | 0.4% |
#POSCO ADR | | 127,995 | | | 13,070,849 | | 0.5% |
Samsung Electronics Co., Ltd. | | 46,112 | | | 27,747,117 | | 1.1% |
Shinhan Financial Group Co., Ltd. ADR | | 97,355 | | | 7,364,906 | | 0.3% |
Other Securities | | | | | 222,288,787 | | 9.1% |
| | | | | | | |
TOTAL SOUTH KOREA | | | | | 288,631,168 | | 11.8% |
| | | | | | | |
| | | |
TAIWAN — (10.3%) | | | | | | | |
Hon Hai Precision Industry Co., Ltd. | | 3,065,530 | | | 12,007,153 | | 0.5% |
Taiwan Semiconductor Manufacturing Co., Ltd. | | 6,259,652 | | | 11,354,999 | | 0.5% |
Other Securities | | | | | 260,512,700 | | 10.6% |
| | | | | | | |
TOTAL TAIWAN | | | | | 283,874,852 | | 11.6% |
| | | | | | | |
| | | |
THAILAND — (1.8%) | | | | | | | |
Other Securities | | | | | 50,759,389 | | 2.1% |
| | | | | | | |
| | | |
TURKEY — (2.3%) | | | | | | | |
Turkiye Garanti Bankasi A.S. | | 1,790,492 | | | 6,502,250 | | 0.3% |
Other Securities | | | | | 56,452,562 | | 2.3% |
| | | | | | | |
TOTAL TURKEY | | | | | 62,954,812 | | 2.6% |
| | | | | | | |
TOTAL COMMON STOCKS | | | | | 2,322,810,722 | | 94.6% |
| | | | | | | |
109
EMERGING MARKETS CORE EQUITY PORTFOLIO
CONTINUED
| | | | | | | |
| | | Shares | | Value†† | | Percentage of Net Assets** |
PREFERRED STOCKS — (4.6%) | | | | | | | |
BRAZIL — (4.6%) | | | | | | | |
#Banco Bradesco SA Sponsored ADR | | 696,802 | | $ | 13,726,999 | | 0.6% |
Cia Vale do Rio Doce | | 738,786 | | | 17,065,957 | | 0.7% |
#Gerdau SA Sponsored ADR | | 678,100 | | | 10,239,310 | | 0.4% |
Metalurgica Gerdau SA | | 394,900 | | | 7,251,939 | | 0.3% |
Usinas Siderurgicas de Minas Gerais SA Series A | | 330,300 | | | 8,625,000 | | 0.3% |
Other Securities | | | | | 68,244,882 | | 2.8% |
| | | | | | | |
TOTAL BRAZIL | | | | | 125,154,087 | | 5.1% |
| | | | | | | |
| | | |
INDIA — (0.0%) | | | | | | | |
Other Securities | | | | | 6,467 | | 0.0% |
| | | | | | | |
TOTAL PREFERRED STOCKS | | | | | 125,160,554 | | 5.1% |
| | | | | | | |
RIGHTS/WARRANTS — (0.0%) | | | | | | | |
BRAZIL — (0.0%) | | | | | | | |
Other Securities | | | | | 36,466 | | 0.0% |
| | | | | | | |
| | | |
CHILE — (0.0%) | | | | | | | |
Other Securities | | | | | 638 | | 0.0% |
| | | | | | | |
| | | |
CHINA — (0.0%) | | | | | | | |
Other Securities | | | | | 12,816 | | 0.0% |
| | | | | | | |
| | | |
MALAYSIA — (0.0%) | | | | | | | |
Other Securities | | | | | 22,681 | | 0.0% |
| | | | | | | |
| | | |
PHILIPPINES — (0.0%) | | | | | | | |
Other Securities | | | | | 33,455 | | 0.0% |
| | | | | | | |
| | | |
SOUTH AFRICA — (0.0%) | | | | | | | |
Other Securities | | | | | 10,914 | | 0.0% |
| | | | | | | |
| | | |
SOUTH KOREA — (0.0%) | | | | | | | |
Other Securities | | | | | 27 | | 0.0% |
| | | | | | | |
| | | |
TAIWAN — (0.0%) | | | | | | | |
Other Securities | | | | | 39,026 | | 0.0% |
| | | | | | | |
| | | |
THAILAND — (0.0%) | | | | | | | |
Other Securities | | | | | 96,005 | | 0.0% |
| | | | | | | |
TOTAL RIGHTS/WARRANTS | | | | | 252,028 | | 0.0% |
| | | | | | | |
| | | |
| | | Face Amount | | | | |
| | | (000) | | Value† | | |
TEMPORARY CASH INVESTMENTS — (0.3%) | | | | | | | |
Repurchase Agreement, PNC Capital Markets, Inc. 0.19%, | | | | | | | |
11/02/09 (Collateralized by $14,795,000 FHLMC 6.040%(r), 11/01/36, valued at $9,497,885) to be repurchased at $9,355,148 | | $9,355 | | | 9,355,000 | | 0.4% |
| | | | | | | |
110
EMERGING MARKETS CORE EQUITY PORTFOLIO
CONTINUED
| | | | | | | | |
| | | Shares/ Face Amount | | Value† | | Percentage of Net Assets** |
| | | (000) | | | | |
| | | |
SECURITIES LENDING COLLATERAL — (10.6%) | | | | | | | | |
§@DFA Short Term Investment Fund LP | | | 288,996,329 | | $ | 288,996,329 | | 11.8% |
@Repurchase Agreement, Deutsche Bank Securities 0.07%, | | | | | | | | |
11/02/09 (Collateralized by various corporate obligations, ranging in par value from $4,247,617 to $16,429,280, rates ranging from 5.000% to 7.000%, maturities ranging from 03/01/37 to 10/01/39, valued at $2,814,708) to be repurchased at $2,759,534 | | $ | 2,760 | | | 2,759,518 | | 0.1% |
| | | | | | | | |
TOTAL SECURITIES LENDING COLLATERAL | | | | | | 291,755,847 | | 11.9% |
| | | | | | | | |
TOTAL INVESTMENTS — (100.0%)
(Cost $2,300,286,128) | | | | | $ | 2,749,334,151 | | 112.0% |
| | | | | | | | |
Summary of inputs used to value the Portfolio’s net assets as of October 31, 2009 is as follows (See Security Valuation Note):
| | | | | | | | | | | |
| | | Valuation Inputs |
| |
| | | Investment in Securities (Market Value) |
| | | Level 1 | | Level 2 | | Level 3 | | Total |
Common Stocks | | | | | | | | | | | |
Brazil | | $ | 202,407,616 | | | — | | — | | $ | 202,407,616 |
Chile | | | 49,299,787 | | | — | | — | | | 49,299,787 |
China | | | 93,691,579 | | $ | 207,569,960 | | — | | | 301,261,539 |
Czech Republic | | | — | | | 16,134,619 | | — | | | 16,134,619 |
Hungary | | | 840,571 | | | 28,573,141 | | — | | | 29,413,712 |
India | | | 16,678,159 | | | 271,435,313 | | — | | | 288,113,472 |
Indonesia | | | 5,180,275 | | | 58,538,369 | | — | | | 63,718,644 |
Israel | | | 46,850,946 | | | 52,221,729 | | — | | | 99,072,675 |
Malaysia | | | 103,683 | | | 105,189,032 | | — | | | 105,292,715 |
Mexico | | | 137,844,921 | | | 41,633 | | — | | | 137,886,554 |
Philippines | | | 2,041,390 | | | 13,842,288 | | — | | | 15,883,678 |
Poland | | | — | | | 50,318,250 | | — | | | 50,318,250 |
Russia | | | 1,112,475 | | | 22,641,443 | | — | | | 23,753,918 |
Singapore | | | — | | | 114,229 | | — | | | 114,229 |
South Africa | | | 36,360,155 | | | 217,558,938 | | — | | | 253,919,093 |
South Korea | | | 37,224,895 | | | 251,406,273 | | — | | | 288,631,168 |
Taiwan | | | 7,621,543 | | | 276,253,309 | | — | | | 283,874,852 |
Thailand | | | 50,753,618 | | | 5,771 | | — | | | 50,759,389 |
Turkey | | | 550,208 | | | 62,404,604 | | — | | | 62,954,812 |
Preferred Stocks | | | | | | | | | | | |
Brazil | | | 125,154,087 | | | — | | — | | | 125,154,087 |
India | | | — | | | 6,467 | | — | | | 6,467 |
Rights/Warrants | | | | | | | | | | | |
Brazil | | | 36,466 | | | — | | — | | | 36,466 |
Chile | | | 638 | | | — | | — | | | 638 |
China | | | 12,816 | | | — | | — | | | 12,816 |
Malaysia | | | 22,681 | | | — | | — | | | 22,681 |
Philippines | | | — | | | 33,455 | | — | | | 33,455 |
111
EMERGING MARKETS CORE EQUITY PORTFOLIO
CONTINUED
| | | | | | | | | | | |
| | | Valuation Inputs |
| |
| | | Investment in Securities (Market Value) |
| | | Level 1 | | Level 2 | | Level 3 | | Total |
South Africa | | $ | 10,914 | | | — | | — | | $ | 10,914 |
South Korea | | | — | | $ | 27 | | — | | | 27 |
Taiwan | | | — | | | 39,026 | | — | | | 39,026 |
Thailand | | | 96,005 | | | — | | — | | | 96,005 |
Temporary Cash Investments | | | — | | | 9,355,000 | | — | | | 9,355,000 |
Securities Lending Collateral | | | — | | | 291,755,847 | | — | | | 291,755,847 |
| | | | | | | | | | | |
TOTAL | | $ | 813,895,428 | | $ | 1,935,438,723 | | — | | $ | 2,749,334,151 |
| | | | | | | | | | | |
See accompanying Notes to Financial Statements.
112
DFA ONE-YEAR FIXED INCOME PORTFOLIO
SCHEDULE OF INVESTMENTS
OCTOBER 31, 2009
| | | | | | | | |
| | | | | Face Amount | | Value† |
| | | | | (000) | | |
AGENCY OBLIGATIONS — (28.4%) |
Federal Farm Credit Bank | | | |
# | | 5.375%, 07/18/11 | | $ | 57,000 | | $ | 61,302,189 |
| | 3.875%, 08/25/11 | | | 40,000 | | | 42,065,120 |
# | | 1.125%, 10/03/11 | | | 30,000 | | | 29,977,590 |
Federal Home Loan Bank | | | | | | |
# | | 1.375%, 05/16/11 | | | 77,000 | | | 77,747,824 |
# | | 2.625%, 05/20/11 | | | 40,000 | | | 41,157,240 |
# | | 3.375%, 06/24/11 | | | 85,000 | | | 88,343,050 |
# | | 3.625%, 07/01/11 | | | 112,000 | | | 117,147,968 |
# | | 1.625%, 07/27/11 | | | 133,200 | | | 134,744,454 |
# | | 5.375%, 08/19/11 | | | 55,000 | | | 59,265,525 |
| | 3.750%, 09/09/11 | | | 90,000 | | | 94,727,070 |
# | | 3.625%, 09/16/11 | | | 121,000 | | | 127,167,249 |
Federal Home Loan Mortgage Corporation | | | | | | |
# | | 5.625%, 03/15/11 | | | 65,000 | | | 69,381,455 |
| | 1.625%, 04/26/11 | | | 80,000 | | | 81,012,880 |
# | | 6.000%, 06/15/11 | | | 79,000 | | | 85,566,322 |
| | 5.250%, 07/18/11 | | | 65,000 | | | 69,901,975 |
Federal National Mortgage Association | | | | | | |
# | | 4.500%, 02/15/11 | | | 63,000 | | | 66,203,172 |
| | 1.750%, 03/23/11 | | | 40,000 | | | 40,576,760 |
| | 1.375%, 04/28/11 | | | 82,000 | | | 82,689,046 |
# | | 6.000%, 05/15/11 | | | 65,000 | | | 70,099,185 |
| | 3.375%, 05/19/11 | | | 20,000 | | | 20,814,300 |
| | | | | | | | |
TOTAL AGENCY OBLIGATIONS | | | | | | 1,459,890,374 |
| | | | | | | | |
|
BONDS — (31.3%) |
Bank of America | | | | | | |
| | 1.700%, 12/23/10 | | | 40,000 | | | 40,446,440 |
Bank of New York Mellon Corp. | | | | | | |
| | 4.950%, 01/14/11 | | | 5,000 | | | 5,199,450 |
Bank of New York Mellon Corp. Floating Rate Note | | | | | | |
(r) | | 0.872%, 02/05/10 | | | 59,000 | | | 59,062,894 |
BP Capital Markets P.L.C. | | | | | | |
| | 1.550%, 08/11/11 | | | 24,000 | | | 24,355,608 |
BP Capital Markets P.L.C. Floating Rate Note | | | | | | |
(r) | | 1.293%, 03/17/11 | | | 29,364 | | | 29,761,559 |
Citigroup, Inc. | | | | | | |
| | 1.500%, 07/12/11 | | | 39,000 | | | 39,361,920 |
| | 1.250%, 09/22/11 | | | 20,000 | | | 20,082,220 |
| | | | | | | | |
| | | | | Face Amount | | Value† |
| | | | | (000) | | |
| | |
CME Group, Inc. Floating Rate Note | | | | | | |
(r) | | 1.121%, 08/06/10 | | $ | 100,000 | | $ | 100,491,500 |
Deutsche Bank AG Floating Rate Note | | | | | | |
(r) | | 0.892%, 06/18/10 | | | 100,000 | | | 99,599,300 |
General Electric Capital Corp. | | | | | | |
| | 5.000%, 12/01/10 | | | 10,000 | | | 10,389,700 |
| | 1.625%, 01/07/11 | | | 60,000 | | | 60,648,780 |
General Electric Capital Corp. Floating Rate Note | | | | | | |
(r) | | 0.330%, 03/12/10 | | | 15,000 | | | 15,000,825 |
(r) | | 0.524%, 05/10/10 | | | 10,200 | | | 10,203,468 |
Goldman Sachs Group, Inc. | | | | | | |
| | 1.700%, 03/15/11 | | | 50,000 | | | 50,722,350 |
| | 1.625%, 07/15/11 | | | 66,000 | | | 66,804,672 |
Japan Finance Corp. | | | | | | |
| | 2.000%, 06/24/11 | | | 78,200 | | | 79,421,562 |
JPMorgan Chase & Co. Floating Rate Note | | | | | | |
(r) | | 0.781%, 11/19/09 | | | 66,510 | | | 66,526,761 |
(r) | | 0.454%, 01/17/11 | | | 10,000 | | | 9,953,260 |
(r) | | 0.550%, 05/16/11 | | | 15,000 | | | 14,884,380 |
(r) | | 1.050%, 06/13/11 | | | 10,490 | | | 10,565,727 |
Kreditanstalt fuer Wiederaufbau | | | | | | |
| | 4.625%, 01/20/11 | | | 58,000 | | | 60,556,582 |
| | 1.875%, 03/15/11 | | | 35,000 | | | 35,542,290 |
| | 3.250%, 10/14/11 | | | 20,000 | | | 20,824,500 |
Landeskreditbank Baden-Wuerttemberg Foerderbank | | | | | | |
| | 4.250%, 09/15/10 | | | 24,400 | | | 25,165,867 |
Manitoba, Province of Canada | | | | | | |
| | 4.450%, 04/12/10 | | | 5,450 | | | 5,546,312 |
Morgan Stanley | | | | | | |
| | 2.900%, 12/01/10 | | | 90,000 | | | 92,098,170 |
# | | 2.000%, 09/22/11 | | | 25,000 | | | 25,489,250 |
Nordea Bank Finland P.L.C. Floating Rate Note | | | | | | |
(r) | | 0.584%, 10/14/11 | | | 50,000 | | | 50,000,000 |
Nordic Investment Bank | | | | | | |
| | 4.875%, 03/15/11 | | | 12,291 | | | 12,996,454 |
Oesterreichische Kontrollbank AG | | | | | | |
| | 4.250%, 10/06/10 | | | 10,000 | | | 10,344,380 |
Oesterreichische Kontrollbank AG | | | | | | |
| | 2.875%, 03/15/11 | | | 82,000 | | | 84,494,604 |
113
DFA ONE-YEAR FIXED INCOME PORTFOLIO
CONTINUED
| | | | | | | | |
| | | | | Face Amount | | Value† |
| | | | | (000) | | |
| | |
Regions Bank | | | | | | |
| | 2.750%, 12/10/10 | | $ | 18,000 | | $ | 18,394,128 |
Royal Bank of Canada | | | | | | |
| | 5.650%, 07/20/11 | | | 23,000 | | | 24,707,083 |
Svensk Exportkredit AB | | | | | | |
| | 4.000%, 06/15/10 | | | 77,000 | | | 78,649,494 |
| | 4.500%, 09/27/10 | | | 13,000 | | | 13,463,437 |
Toyota Motor Credit Corp. Floating Rate Note | | | | | | |
(r) | | 0.384%, 10/04/11 | | | 48,000 | | | 47,908,464 |
Wachovia Corp. Floating Rate Note | | | | | | |
(r) | | 0.857%, 11/24/09 | | | 93,000 | | | 93,027,528 |
Wells Fargo & Co. Floating Rate Note | | | | | | |
(r) | | 0.384%, 01/12/11 | | | 25,000 | | | 24,916,150 |
Westpac Banking Corp. Floating Rate Note | | | | | | |
(r) | | 0.304%, 10/06/10 | | | 75,000 | | | 74,931,525 |
| | | | | | | | |
TOTAL BONDS | | | | | | 1,612,538,594 |
| | | | | | | | |
|
U.S. TREASURY OBLIGATIONS — (1.9%) |
U.S. Treasury Note | | | | | | |
# | | 1.000%, 09/30/11 | | | 96,000 | | | 96,269,952 |
| | | | | | | | |
|
COMMERCIAL PAPER — (20.7%) |
ANZ National (International), Ltd. | | | | | | |
| | 1.605%, 11/06/09 | | | 57,000 | | | 56,998,336 |
| | 0.230%, 11/09/09 | | | 30,000 | | | 29,998,683 |
Australia & New Zealand Banking Group, Ltd. | | | | | | |
| | 0.240%, 11/10/09 | | | 12,000 | | | 11,999,413 |
| | 0.000%, 01/15/10 | | | 21,200 | | | 21,189,434 |
Bank of Nova Scotia | | | | | | |
| | 0.260%, 11/02/09 | | | 75,000 | | | 74,999,250 |
BNP Paribas Finance, Inc. | | | | | | |
| | 0.240%, 12/04/09 | | | 20,000 | | | 19,996,306 |
Caisse Cent Desjardins Du Quebec | | | | | | |
| | 0.300%, 11/19/09 | | | 25,000 | | | 24,997,640 |
| | 0.310%, 11/19/09 | | | 25,000 | | | 24,997,640 |
| | 0.220%, 12/11/09 | | | 10,000 | | | 9,997,783 |
| | 0.230%, 12/29/09 | | | 50,000 | | | 49,982,500 |
CBA Delaware Finance, Inc. | | | | | | |
| | 0.280%, 11/06/09 | | | 50,000 | | | 49,998,835 |
| | 0.230%, 12/02/09 | | | 55,000 | | | 54,993,648 |
| | | | | | | | |
| | | | | Face Amount | | Value† |
| | | | | (000) | | |
| | |
DnB NOR Bank ASA | | | | | | |
| | 0.230%, 12/07/09 | | $ | 15,000 | | $ | 14,996,991 |
| | 0.220%, 12/30/09 | | | 24,000 | | | 23,991,420 |
Eksportfinans ASA | | | | | | |
| | 0.200%, 11/24/09 | | | 11,000 | | | 10,998,633 |
Fortis Funding LLC | | | | | | |
| | 0.230%, 12/22/09 | | | 70,000 | | | 69,976,193 |
| | 0.260%, 01/15/10 | | | 20,000 | | | 19,988,750 |
National Australia Funding Delaware, Inc. | | | | | | |
| | 0.265%, 11/02/09 | | | 55,000 | | | 54,999,219 |
| | 0.240%, 11/17/09 | | | 50,000 | | | 49,995,250 |
Nestle Capital Corp. | | | | | | |
| | 0.180%, 11/24/09 | | | 25,000 | | | 24,997,918 |
Nestle Finance International, Ltd. | | | | | | |
| | 0.210%, 12/04/09 | | | 87,435 | | | 87,423,948 |
NRW.BANK | | | | | | |
| | 0.230%, 11/27/09 | | | 28,000 | | | 27,995,948 |
| | 0.000%, 12/28/09 | | | 59,000 | | | 58,979,793 |
| | 0.285%, 01/06/10 | | | 15,000 | | | 14,993,739 |
Procter & Gamble International Funding | | | | | | |
| | 0.220%, 11/02/09 | | | 27,000 | | | 26,999,730 |
Procter & Gamble International Funding SCA | | | | | | |
| | 0.180%, 12/03/09 | | | 7,650 | | | 7,649,075 |
| | 0.190%, 12/11/09 | | | 5,350 | | | 5,349,101 |
Rabobank USA Financial Corp. | | | | | | |
| | 0.230%, 12/01/09 | | | 15,000 | | | 14,998,347 |
| | 0.230%, 12/10/09 | | | 25,000 | | | 24,995,958 |
Scotiabanc, Inc. | | | | | | |
| | 0.210%, 12/08/09 | | | 17,000 | | | 16,996,501 |
Svenska Handelsbanken AB | | | | | | |
| | 0.225%, 01/27/10 | | | 20,000 | | | 19,987,688 |
Svenska Handelsbanken, Inc. | | | | | | |
| | 0.210%, 01/04/10 | | | 35,000 | | | 34,986,010 |
Total Capital Canada, Ltd. | | | | | | |
| | 0.230%, 11/10/09 | | | 22,300 | | | 22,298,910 |
| | | | | | | | |
TOTAL COMMERCIAL PAPER | | | | | | 1,063,748,590 |
| | | | | | | | |
114
DFA ONE-YEAR FIXED INCOME PORTFOLIO
CONTINUED
| | | | | | |
| | | Face Amount | | Value† |
| | | (000) | | |
| |
TEMPORARY CASH INVESTMENTS — (0.3%) | | | |
Repurchase Agreement, PNC Capital Markets, Inc. 0.19%, 11/02/09 (Collateralized by $23,955,000 FNMA 5.00%, 08/25/18, valued at $18,722,068) to be repurchased at $18,442,292 | | $ | 18,442 | | $ | 18,442,000 |
| | | | | | |
| | | | | |
| | | Shares | | Value† |
|
SECURITIES LENDING COLLATERAL — (17.4%) |
§@ DFA Short Term Investment Fund LP | | 894,976,200 | | $ | 894,976,200 |
| | | | | |
TOTAL INVESTMENTS — (100.0%)
(Cost $5,126,967,083) | | $ | 5,145,865,710 |
| | | | | |
Summary of inputs used to value the Portfolio’s net assets as of October 31, 2009 is as follows (See Security Valuation Note):
| | | | | | | | | | |
| | | Valuation Inputs |
| |
| | | Investment in Securities (Market Value) |
| | | Level 1 | | Level 2 | | Level 3 | | Total |
Agency Obligations | | — | | $ | 1,459,890,374 | | — | | $ | 1,459,890,374 |
Bonds | | — | | | 1,612,538,594 | | — | | | 1,612,538,594 |
U.S. Treasury Obligations | | — | | | 96,269,952 | | — | | | 96,269,952 |
Commercial Paper | | — | | | 1,063,748,590 | | — | | | 1,063,748,590 |
Temporary Cash Investments | | — | | | 18,442,000 | | — | | | 18,442,000 |
Securities Lending Collateral | | — | | | 894,976,200 | | — | | | 894,976,200 |
| | | | | | | | | | |
TOTAL | | — | | $ | 5,145,865,710 | | — | | $ | 5,145,865,710 |
| | | | | | | | | | |
See accompanying Notes to Financial Statements.
115
DFA TWO-YEAR GLOBAL FIXED INCOME PORTFOLIO
SCHEDULE OF INVESTMENTS
OCTOBER 31, 2009
| | | | | | | |
| | | | | Face Amount^ | | Value† |
| | | | | (000) | | |
BONDS — (42.7%) |
AUSTRALIA — (0.5%) |
Australia & New Zealand Banking Group, Ltd. | | | | | |
(u) | | 4.875%, 11/08/10 | | 4,085 | | $ | 4,202,158 |
(g) | | 4.500%, 12/15/10 | | 3,410 | | | 5,755,032 |
Commonwealth Bank of Australia | | | | | |
(e) | | 3.625%, 04/05/11 | | 5,800 | | | 8,725,206 |
Westpac Banking Corp. | | | | | |
(g) | | 4.875%, 04/13/11 | | 5,639 | | | 9,635,502 |
| | | | | | | |
TOTAL AUSTRALIA | | | | | 28,317,898 |
| | | | | | | |
| | |
AUSTRIA — (0.2%) | | | | | |
Erste Group Bank AG | | | | | |
| | 2.250%, 05/13/11 | | 8,400 | | | 12,450,001 |
| | | | | | | |
| | |
CANADA — (7.5%) | | | | | |
Bank of Nova Scotia | | | | | |
| | 4.400%, 05/09/11 | | 21,500 | | | 20,768,795 |
Canada Housing Trust | | | | | |
| | 4.600%, 09/15/11 | | 55,000 | | | 53,815,674 |
Canada Mortgage & Housing Corp. | | | | | |
(u) | | 4.800%, 10/01/10 | | 26,280 | | | 27,304,683 |
Canadian Government Bond | | | | | |
| | 1.250%, 06/01/11 | | 108,500 | | | 100,633,612 |
Ontario, Province of Canada | | | | | |
(u) | | 3.125%, 09/08/10 | | 89,000 | | | 90,972,685 |
Royal Bank of Canada | | | | | |
(g) | | 4.625%, 12/07/10 | | 6,313 | | | 10,668,101 |
| | 4.920%, 07/06/11 | | 8,000 | | | 7,819,971 |
(u) | | 5.650%, 07/20/11 | | 3,500 | | | 3,759,774 |
(e) | | 5.750%, 07/25/11 | | 48,000 | | | 75,138,567 |
| | | | | | | |
TOTAL CANADA | | | | | 390,881,862 |
| | | | | | | |
| | |
FRANCE — (4.1%) | | | | | |
Agence Francaise de Developpement | | | | | |
(u) | | 1.750%, 01/18/11 | | 26,500 | | | 26,730,206 |
(u) | | 4.125%, 06/24/11 | | 45,500 | | | 47,487,167 |
Caisse d’Amortissement de la Dette Sociale | | | | | |
(u) | | 4.000%, 07/15/11 | | 31,720 | | | 33,208,302 |
French Treasury Note | | | | | |
| | 3.500%, 07/12/11 | | 70,000 | | | 106,813,586 |
| | | | | | | |
TOTAL FRANCE | | | | | 214,239,261 |
| | | | | | | |
| | | | | | | |
| | | | | Face Amount^ | | Value† |
| | | | | (000) | | |
|
GERMANY — (7.5%) |
Bundesschatzanweisungen | | | | | |
| | 1.500%, 06/10/11 | | 70,000 | | $ | 103,623,199 |
Deutsche Bank AG Floating Rate Note | | | | | |
(r)(u) | | 0.940%, 02/16/10 | | 40,000 | | | 40,063,880 |
Kreditanstalt fuer Wiederaufbau | | | | | |
(u) | | 4.625%, 01/20/11 | | 53,200 | | | 55,545,003 |
(u) | | 1.875%, 03/15/11 | | 19,755 | | | 20,061,084 |
(u) | | 3.250%, 10/14/11 | | 5,000 | | | 5,206,125 |
Landeskreditbank Baden-Wuerttemberg Foerderbank | | | | | |
(u) | | 4.250%, 09/15/10 | | 25,000 | | | 25,784,700 |
(u) | | 3.250%, 10/29/10 | | 34,000 | | | 34,757,452 |
(u) | | 2.500%, 02/14/11 | | 29,000 | | | 29,537,370 |
(u) | | 4.125%, 07/15/11 | | 18,000 | | | 18,847,728 |
Landwirtschaftliche Rentenbank | | | | | |
(u) | | 4.250%, 01/21/11 | | 25,000 | | | 25,976,275 |
#(u) | | 4.875%, 02/14/11 | | 9,100 | | | 9,582,236 |
(u) | | 3.125%, 06/15/11 | | 18,400 | | | 19,021,313 |
| | | | | | | |
TOTAL GERMANY | | | | | 388,006,365 |
| | | | | | | |
|
JAPAN — (0.6%) |
Japan Finance Corp. | | | | | |
(u) | | 2.000%, 06/24/11 | | 29,600 | | | 30,062,382 |
| | | | | | | |
|
NETHERLANDS — (7.1%) |
Bank Nederlandse Gemeenten | | | | | |
(u) | | 3.375%, 12/15/10 | | 8,648 | | | 8,869,458 |
(u) | | 3.375%, 01/18/11 | | 15,000 | | | 15,426,210 |
(g) | | 4.500%, 08/16/11 | | 18,000 | | | 30,886,335 |
(u) | | 5.125%, 10/20/11 | | 28,600 | | | 30,493,835 |
Deutsche Bahn Finance | | | | | |
(u) | | 5.125%, 01/05/11 | | 48,385 | | | 50,301,965 |
Nederlandse Waterschapsbank | | | | | |
(u) | | 2.875%, 06/16/11 | | 107,000 | | | 109,701,215 |
Netherlands Government Bond | | | | | |
| | 5.000%, 07/15/11 | | 70,000 | | | 109,449,751 |
Rabobank Nederland | | | | | |
(u) | | 5.000%, 02/15/11 | | 6,884 | | | 7,218,721 |
(g) | | 5.000%, 04/11/11 | | 4,870 | | | 8,318,183 |
| | | | | | | |
TOTAL NETHERLANDS | | | | | 370,665,673 |
| | | | | | | |
116
DFA TWO-YEAR GLOBAL FIXED INCOME PORTFOLIO
CONTINUED
| | | | | | | |
| | | | | Face Amount^ | | Value† |
| | | |
| | | | | (000) | | |
|
NORWAY — (2.0%) |
Kommunalbanken |
(u) | | 3.250%, 06/15/11 | | 101,832 | | $ | 105,122,803 |
| | | | | | | |
|
SPAIN — (0.6%) |
Instituto de Credito Oficial |
(u) | | 4.625%, 10/26/10 | | 26,300 | | | 27,221,368 |
(u) | | 3.000%, 03/15/11 | | 5,000 | | | 5,127,410 |
| | | | | | | |
TOTAL SPAIN | | | | | 32,348,778 |
| | | | | | | |
| | |
SUPRANATIONAL ORGANIZATION OBLIGATIONS — (1.2%) | | | | | |
Council of Europe Development Bank | | | | | |
(u) | | 6.125%, 01/25/11 | | 21,208 | | | 22,496,280 |
(u) | | 3.375%, 09/15/11 | | 6,000 | | | 6,238,812 |
European Investment Bank |
(g) | | 5.375%, 03/07/11 | | 5,860 | | | 10,144,846 |
(u) | | 3.250%, 10/14/11 | | 22,000 | | | 22,941,644 |
| | | | | | | |
TOTAL SUPRANATIONAL ORGANIZATION OBLIGATIONS | | | | | 61,821,582 |
| | | | | | | |
|
SWEDEN — (1.1%) |
Kommuninvest I Sverige |
(u) | | 5.375%, 06/15/11 | | 23,000 | | | 24,403,529 |
Svensk Exportkredit AB |
(u) | | 4.000%, 06/15/10 | | 5,767 | | | 5,890,541 |
Sweden Government International Bond | | | | | |
(u) | | 4.500%, 02/07/11 | | 25,000 | | | 26,204,825 |
| | | | | | | |
TOTAL SWEDEN | | | | | 56,498,895 |
| | | | | | | |
|
UNITED KINGDOM — (3.8%) |
BP Capital Markets P.L.C. |
(u) | | 4.750%, 11/10/10 | | 5,814 | | | 6,027,839 |
(u) | | 3.625%, 05/27/11 | | 3,160 | | | 3,282,169 |
#(u) | | 1.550%, 08/11/11 | | 21,000 | | | 21,311,157 |
Lloyds TSB Bank P.L.C. |
(u) | | 2.300%, 04/01/11 | | 40,000 | | | 40,651,840 |
Network Rail Infrastructure Finance P.L.C. | | | | | |
(u) | | 3.000%, 01/24/11 | | 21,200 | | | 21,717,450 |
United Kingdom Gilt |
| | 9.000%, 07/12/11 | | 56,000 | | | 104,023,136 |
| | | | | | | |
TOTAL UNITED KINGDOM | | | | | 197,013,591 |
| | | | | | | |
| | | | | | | | |
| | | | | Face Amount | | Value† |
| | | |
| | | | | (000) | | |
| | |
UNITED STATES — (6.5%) | | | | | | |
Bank of America |
# | | 1.700%, 12/23/10 | | $ | 80,000 | | $ | 80,892,880 |
Bank of America Corp. |
| | 4.500%, 08/01/10 | | | 5,092 | | | 5,215,461 |
Citigroup, Inc. |
| | 1.500%, 07/12/11 | | | 65,000 | | | 65,603,200 |
| | 1.375%, 08/10/11 | | | 20,000 | | | 20,134,220 |
| | 1.250%, 09/22/11 | | | 15,000 | | | 15,061,665 |
General Electric Capital Corp. |
| | 1.625%, 01/07/11 | | | 40,000 | | | 40,432,520 |
Goldman Sachs Group, Inc. |
| | 1.625%, 07/15/11 | | | 24,000 | | | 24,292,608 |
Morgan Stanley |
| | 2.000%, 09/22/11 | | | 86,200 | | | 87,886,934 |
| | | | | | | | |
TOTAL UNITED STATES | | | | | | 339,519,488 |
| | | | | | | | |
TOTAL BONDS | | | | | | 2,226,948,579 |
| | | | | | | | |
AGENCY OBLIGATIONS — (25.3%) |
Federal Farm Credit Bank | | | | | | |
# | | 5.375%, 07/18/11 | | | 10,800 | | | 11,615,152 |
# | | 3.875%, 08/25/11 | | | 20,000 | | | 21,032,560 |
# | | 1.125%, 10/03/11 | | | 70,500 | | | 70,447,336 |
# | | 3.500%, 10/03/11 | | | 20,000 | | | 20,938,620 |
Federal Home Loan Bank |
# | | 4.375%, 10/22/10 | | | 60,000 | | | 62,213,460 |
# | | 1.625%, 01/21/11 | | | 100,000 | | | 101,318,200 |
# | | 1.375%, 05/16/11 | | | 88,200 | | | 89,056,598 |
# | | 2.625%, 05/20/11 | | | 80,000 | | | 82,314,480 |
# | | 3.375%, 06/24/11 | | | 65,000 | | | 67,556,450 |
# | | 3.625%, 07/01/11 | | | 110,600 | | | 115,683,618 |
# | | 1.625%, 07/27/11 | | | 95,000 | | | 96,101,525 |
# | | 3.750%, 09/09/11 | | | 126,800 | | | 133,459,916 |
# | | 3.625%, 09/16/11 | | | 70,000 | | | 73,567,830 |
Federal Home Loan Mortgage Corporation | | | | | | |
# | | 4.750%, 01/18/11 | | | 20,000 | | | 20,996,680 |
# | | 1.625%, 04/26/11 | | | 60,000 | | | 60,759,660 |
# | | 6.000%, 06/15/11 | | | 79,000 | | | 85,566,322 |
# | | 5.250%, 07/18/11 | | | 13,500 | | | 14,518,102 |
117
DFA TWO-YEAR GLOBAL FIXED INCOME PORTFOLIO
CONTINUED
| | | | | | | | |
| | | | | Face Amount | | Value† |
| | | |
| | | | | (000) | | |
| | |
Federal National Mortgage Association | | | | | | |
# | | 4.500%, 02/15/11 | | $ | 13,500 | | $ | 14,186,394 |
# | | 1.375%, 04/28/11 | | | 20,000 | | | 20,168,060 |
# | | 6.000%, 05/15/11 | | | 69,000 | | | 74,412,981 |
# | | 3.375%, 05/19/11 | | | 80,000 | | | 83,257,200 |
| | | | | | | | |
TOTAL AGENCY OBLIGATIONS | | | | | | 1,319,171,144 |
| | | | | | | | |
U.S. TREASURY OBLIGATIONS — (1.3%) | | | | | | |
U.S. Treasury Note |
# | | 1.000%, 09/30/11 | | | 65,000 | | | 65,182,780 |
| | | | | | | | |
| | |
CERTIFICATES OF DEPOSIT INTEREST BEARING — (1.5%) | | | | | | |
Nordea Bank Finland |
| | 1.650%, 01/28/10 | | | 40,000 | | | 40,136,552 |
Toronto Dominion Bank |
| | 1.650%, 01/28/10 | | | 40,000 | | | 40,155,852 |
| | | | | | | | |
TOTAL CERTIFICATES OF DEPOSIT INTEREST BEARING | | | | | | 80,292,404 |
| | | | | | | | |
| | |
COMMERCIAL PAPER — (1.5%) | | | | | | |
Westpac Banking Corp. |
| | 1.370%, 01/15/10 | | | 80,000 | | | 79,962,352 |
| | | | | | | | |
| | |
TEMPORARY CASH INVESTMENTS — (0.9%) | | | | | | |
| | Repurchase Agreement, PNC Capital Markets, Inc. 0.19%, 11/02/09 (Collateralized by $42,415,000 FNMA 6.50%, 06/25/39, valued at $44,641,788) to be repurchased at $43,978,696 | | $ | 43,978 | | | 43,978,000 |
| | | | | | | | |
| | | | | | | |
| | | Shares | | Value† |
| |
SECURITIES LENDING COLLATERAL — (26.8%) | | | |
§@ | | DFA Short Term Investment Fund LP | | 1,395,043,125 | | $ | 1,395,043,125 |
| | | | | | | |
| |
TOTAL INVESTMENTS — (100.0%)
(Cost $5,172,581,817) | | $ | 5,210,578,384 |
| | | | | | | |
118
DFA TWO-YEAR GLOBAL FIXED INCOME PORTFOLIO
CONTINUED
Summary of inputs used to value the Portfolio’s net assets as of October 31, 2009 is as follows (See Security Valuation Note):
| | | | | | | | | | |
| | | Valuation Inputs |
| |
| | | Investment in Securities (Market Value) |
| | | Level 1 | | Level 2 | | Level 3 | | Total |
| | | | |
Bonds | | | | | | | | | | |
Australia | | — | | $ | 28,317,898 | | — | | $ | 28,317,898 |
Austria | | — | | | 12,450,001 | | — | | | 12,450,001 |
Canada | | — | | | 390,881,862 | | — | | | 390,881,862 |
France | | — | | | 214,239,261 | | — | | | 214,239,261 |
Germany | | — | | | 388,006,365 | | — | | | 388,006,365 |
Japan | | — | | | 30,062,382 | | — | | | 30,062,382 |
Netherlands | | — | | | 370,665,673 | | — | | | 370,665,673 |
Norway | | — | | | 105,122,803 | | — | | | 105,122,803 |
Spain | | — | | | 32,348,778 | | — | | | 32,348,778 |
Supranational Organization Obligations | | — | | | 61,821,582 | | — | | | 61,821,582 |
Sweden | | — | | | 56,498,895 | | — | | | 56,498,895 |
United Kingdom | | — | | | 197,013,591 | | — | | | 197,013,591 |
United States | | — | | | 339,519,488 | | — | | | 339,519,488 |
Agency Obligations | | | | | | | | | | |
United States | | — | | | 1,319,171,144 | | — | | | 1,319,171,144 |
U.S. Treasury Obligations | | | | | | | | | | |
United States | | — | | | 65,182,780 | | — | | | 65,182,780 |
Certificates of Deposit Interest Bearing | | | | | | | | | | |
United States | | — | | | 80,292,404 | | — | | | 80,292,404 |
Commercial Paper | | | | | | | | | | |
United States | | — | | | 79,962,352 | | — | | | 79,962,352 |
Temporary Cash Investments | | — | | | 43,978,000 | | — | | | 43,978,000 |
Securities Lending Collateral | | — | | | 1,395,043,125 | | — | | | 1,395,043,125 |
Other Financial Instruments** | | — | | | 6,880,002 | | — | | | 6,880,002 |
| | | | | | | | | | |
TOTAL | | — | | $ | 5,217,458,386 | | — | | $ | 5,217,458,386 |
| | | | | | | | | | |
| | ** | Other financial instruments are derivative instruments not reflected in the Schedule of Investments, such as futures and forwards which are valued at the unrealized appreciation/depreciation on the investment. |
See accompanying Notes to Financial Statements.
119
DFA SELECTIVELY HEDGED GLOBAL FIXED INCOME PORTFOLIO
SCHEDULE OF INVESTMENTS
October 31, 2009
| | | | | | | |
| | | | | Face
Amount^ | | Value† |
| | | |
| | | | | (000) | | |
BONDS — (72.1%) |
AUSTRALIA — (4.0%) |
Australia & New Zealand Banking Group, Ltd. | | | | | |
| | 6.500%, 02/02/10 | | 1,279 | | $ | 1,157,274 |
| | 5.750%, 02/22/10 | | 2,576 | | | 2,325,465 |
(u) | | 5.500%, 05/24/11 | | 1,311 | | | 1,380,132 |
Commonwealth Bank of Australia |
| | 7.250%, 09/17/10 | | 5,000 | | | 4,583,367 |
Westpac Banking Corp. Floating Rate Note | | | | | |
(e)(r) | | 0.812%, 12/22/09 | | 1,750 | | | 2,574,316 |
| | | | | | | |
TOTAL AUSTRALIA | | | | | 12,020,554 |
| | | | | | | |
| | |
AUSTRIA — (2.4%) | | | | | |
ASFINAG |
(u) | | 4.750%, 11/17/10 | | 3,500 | | | 3,639,192 |
Oesterreichische Kontrollbank AG | | | | | |
(u) | | 2.875%, 03/15/11 | | 3,500 | | | 3,606,477 |
| | | | | | | |
TOTAL AUSTRIA | | | | | 7,245,669 |
| | | | | | | |
|
CANADA — (8.9%) |
Bank of Nova Scotia |
(g) | | 4.625%, 01/25/11 | | 1,700 | | | 2,872,242 |
| | 4.400%, 05/09/11 | | 3,500 | | | 3,380,967 |
Canada Housing Trust |
| | 4.600%, 09/15/11 | | 7,000 | | | 6,849,268 |
Canadian Government Bond |
| | 1.250%, 06/01/11 | | 6,900 | | | 6,399,741 |
Ontario, Province of Canada |
(u) | | 3.125%, 09/08/10 | | 5,000 | | | 5,110,825 |
(z) | | 6.375%, 10/12/10 | | 1,800 | | | 1,320,846 |
Royal Bank of Canada |
(u) | | 5.650%, 07/20/11 | | 1,000 | | | 1,074,221 |
| | | | | | | |
TOTAL CANADA | | | | | 27,008,110 |
| | | | | | | |
|
DENMARK — (0.2%) |
Denmark, Kingdom of |
| | 6.000%, 11/15/09 | | 2,600 | | | 514,904 |
| | | | | | | |
|
FINLAND — (0.2%) |
Municipality Finance P.L.C. |
(t) | | 6.705%, 08/25/10 | | 800 | | | 726,865 |
| | | | | | | |
| | | | | | | |
| | | | | Face
Amount^ | | Value† |
| | | |
| | | | | (000) | | |
|
FRANCE — (5.8%) |
Agence Francaise de Developpement | | | | | |
(u) | | 1.750%, 01/18/11 | | 3,500 | | $ | 3,530,405 |
BNP Paribas Finance, Inc. Floating Rate Note | | | | | |
(r) | | 1.243%, 04/14/10 | | 3,850 | | | 5,676,074 |
Caisse d’Amortissement de la Dette Sociale | | | | | |
(u) | | 4.000%, 07/15/11 | | 8,000 | | | 8,375,360 |
| | | | | | | |
TOTAL FRANCE | | | | | 17,581,839 |
| | | | | | | |
|
GERMANY — (6.6%) |
Kreditanstalt fuer Wiederaufbau |
(z) | | 8.000%, 01/14/11 | | 4,302 | | | 3,226,988 |
(n) | | 5.250%, 05/16/11 | | 27,000 | | | 4,910,573 |
Landeskreditbank Baden-Wuerttemberg Foerderbank | | | | | |
(n) | | 3.500%, 04/15/10 | | 2,930 | | | 511,651 |
(u) | | 3.250%, 10/29/10 | | 4,500 | | | 4,600,251 |
(u) | | 4.125%, 07/15/11 | | 3,000 | | | 3,141,288 |
Landwirtschaftliche Rentenbank |
(u) | | 4.250%, 01/21/11 | | 2,000 | | | 2,078,102 |
(t) | | 6.500%, 05/04/11 | | 1,000 | | | 916,349 |
Norddeutsche Landesbank Girozentrale AG | | | | | |
(z) | | 6.500%, 11/11/09 | | 1,053 | | | 755,826 |
| | | | | | | |
TOTAL GERMANY | | | | | 20,141,028 |
| | | | | | | |
|
IRELAND — (1.9%) |
General Electric Capital Corp. Floating Rate Note | | | | | |
(g)(r) | | 1.276%, 02/01/10 | | 3,600 | | | 5,895,720 |
| | | | | | | |
|
JAPAN — (1.4%) |
Japan Finance Corp. |
(u) | | 2.000%, 06/24/11 | | 4,200 | | | 4,265,608 |
| | | | | | | |
|
NETHERLANDS — (6.5%) |
Bank Nederlandse Gemeenten |
(t) | | 5.000%, 07/16/10 | | 3,800 | | | 3,424,833 |
(u) | | 5.125%, 10/20/11 | | 1,400 | | | 1,492,705 |
Deutsche Bahn Finance |
(u) | | 5.125%, 01/05/11 | | 5,000 | | | 5,198,095 |
Nederlandse Waterschapsbank |
(u) | | 2.875%, 06/16/11 | | 4,000 | | | 4,100,980 |
120
DFA SELECTIVELY HEDGED GLOBAL FIXED INCOME PORTFOLIO
CONTINUED
| | | | | | | |
| | | Face
Amount^ | | Value† |
| | |
| | | (000) | | |
|
NETHERLANDS — (Continued) |
Nederlandse Waterschapsbank NV | | | | | |
(z) | | 8.250%, 01/21/10 | | 2,299 | | $ | 1,664,488 |
(t) | | 7.375%, 02/18/11 | | 2,000 | | | 1,851,512 |
Toyota Motor Finance |
(t) | | 6.630%, 05/25/10 | | 2,100 | | | 1,892,028 |
| | | | | | | |
TOTAL NETHERLANDS | | | | | 19,624,641 |
| | | | | | | |
|
NORWAY — (2.5%) |
Kommunalbanken |
| | 5.250%, 11/10/10 | | 4,000 | | | 719,226 |
(t) | | 4.000%, 11/15/10 | | 1,300 | | | 1,156,675 |
| | 3.500%, 03/01/11 | | 9,290 | | | 1,645,451 |
(u) | | 3.250%, 06/15/11 | | 4,000 | | | 4,129,264 |
| | | | | | | |
TOTAL NORWAY | | | | | 7,650,616 |
| | | | | | | |
|
SPAIN — (2.1%) |
Instituto de Credito Oficial |
(u) | | 4.625%, 10/26/10 | | 4,500 | | | 4,657,649 |
(u) | | 1.875%, 04/15/11 | | 1,700 | | | 1,722,440 |
| | | | | | | |
TOTAL SPAIN | | | | | 6,380,089 |
| | | | | | | |
| | |
SUPRANATIONAL ORGANIZATION OBLIGATIONS — (9.7%) | | | | | |
Council of Europe Development Bank | | | | | |
(u) | | 6.125%, 01/25/11 | | 1,800 | | | 1,909,341 |
(u) | | 3.375%, 09/15/11 | | 4,000 | | | 4,159,208 |
Eurofima |
(z) | | 6.500%, 10/21/10 | | 5,500 | | | 4,038,086 |
European Investment Bank |
(z) | | 7.250%, 02/08/10 | | 1,000 | | | 724,450 |
(n) | | 6.000%, 08/06/10 | | 7,500 | | | 1,344,066 |
(z) | | 6.250%, 09/30/10 | | 3,252 | | | 2,381,961 |
(z) | | 7.750%, 10/26/10 | | 3,674 | | | 2,737,684 |
Inter-American Development Bank |
(z) | | 7.410%, 01/29/10 | | 1,300 | | | 941,446 |
(z) | | 6.125%, 07/19/11 | | 3,800 | | | 2,800,426 |
International Bank for Reconstruction & Development | | | | | |
(t) | | 0.500%, 03/12/10 | | 2,059 | | | 1,828,995 |
(t) | | 5.520%, 04/18/11 | | 1,796 | | | 1,616,615 |
(t) | | 5.520%, 04/18/11 | | 1,000 | | | 900,120 |
(t) | | 5.760%, 04/26/11 | | 1,200 | | | 1,086,085 |
| | | | | | | | |
| | | Face
Amount^ | | Value† |
| | |
| | | (000) | | |
| | |
SUPRANATIONAL ORGANIZATION OBLIGATIONS — (Continued) | | | | | | |
Nordic Investment Bank |
(n) | | 4.625%, 07/30/10 | | | 16,000 | | $ | 2,830,652 |
| | | | | | | | |
TOTAL SUPRANATIONAL ORGANIZATION OBLIGATIONS | | | | | | 29,299,135 |
| | | | | | | | |
|
SWEDEN — (2.5%) |
City of Stockholm |
| | 3.375%, 03/08/10 | | | 10,000 | | | 1,415,398 |
Kommuninvest I Sverige |
(u) | | 5.375%, 06/15/11 | | | 4,000 | | | 4,244,092 |
Svensk Exportkredit AB |
(u) | | 4.875%, 09/29/11 | | | 1,000 | | | 1,065,380 |
Swedish Export Credit |
(t) | | 5.800%, 09/13/10 | | | 1,000 | | | 902,397 |
| | | | | | | | |
TOTAL SWEDEN | | | | | | 7,627,267 |
| | | | | | | | |
|
UNITED KINGDOM — (4.6%) |
BP Capital Markets P.L.C. |
(t) | | 8.000%, 03/11/11 | | | 4,728 | | | 4,393,785 |
Lloyds TSB Bank P.L.C. |
(u) | | 2.300%, 04/01/11 | | | 5,500 | | | 5,589,628 |
Network Rail Infrastructure Finance P.L.C. | | | | | | |
(u) | | 3.000%, 01/24/11 | | | 3,800 | | | 3,892,750 |
| | | | | | | | |
TOTAL UNITED KINGDOM | | | | | | 13,876,163 |
| | | | | | | | |
|
UNITED STATES — (12.8%) |
Bank of America Corp. |
| | 4.500%, 08/01/10 | | $ | 1,472 | | | 1,507,690 |
Citigroup, Inc. |
| | 1.500%, 07/12/11 | | | 7,300 | | | 7,367,744 |
General Electric Capital Corp. |
(z) | | 6.625%, 02/04/10 | | | 1,000 | | | 721,750 |
(z) | | 9.000%, 01/04/11 | | | 1,100 | | | 820,338 |
Goldman Sachs Group, Inc. |
| | 1.700%, 03/15/11 | | | 5,300 | | | 5,376,569 |
| | 1.625%, 07/15/11 | | | 2,000 | | | 2,024,384 |
Morgan Stanley |
| | 2.900%, 12/01/10 | | | 2,000 | | | 2,046,626 |
| | 2.000%, 09/22/11 | | | 5,000 | | | 5,097,850 |
Nestle Holdings, Inc. |
(n) | | 4.750%, 02/12/10 | | | 6,000 | | | 1,054,174 |
(z) | | 8.250%, 03/31/10 | | | 2,000 | | | 1,459,381 |
(n) | | 5.000%, 01/31/11 | | | 29,500 | | | 5,291,700 |
121
DFA SELECTIVELY HEDGED GLOBAL FIXED INCOME PORTFOLIO
CONTINUED
| | | | | | | | |
| | | Face
Amount | | Value† |
| | |
| | | (000) | | |
| | |
UNITED STATES — (Continued) | | | | | | |
Regions Bank |
| | 2.750%, 12/10/10 | | $ | 1,000 | | $ | 1,021,896 |
Toyota Motor Credit Corp. |
(n) | | 4.625%, 01/22/10 | | | 4,200 | | | 735,842 |
(z) | | 7.660%, 04/26/10 | | | 2,800 | | | 2,037,166 |
(z) | | 8.500%, 12/21/10 | | | 1,300 | | | 972,643 |
(z) | | 7.375%, 01/18/11 | | | 1,800 | | | 1,333,569 |
| | | | | | | | |
TOTAL UNITED STATES | | | | | | 38,869,322 |
| | | | | | | | |
TOTAL BONDS | | | | | | 218,727,530 |
| | | | | | | | |
AGENCY OBLIGATIONS — (24.8%) |
Federal Farm Credit Bank |
| | 2.625%, 04/21/11 | | | 1,300 | | | 1,335,632 |
| | 5.375%, 07/18/11 | | | 4,500 | | | 4,839,646 |
| | 3.875%, 08/25/11 | | | 7,000 | | | 7,361,396 |
| | 1.125%, 10/03/11 | | | 3,000 | | | 2,997,759 |
Federal Home Loan Bank |
| | 1.625%, 01/21/11 | | | 5,000 | | | 5,065,910 |
| | 1.375%, 05/16/11 | | | 4,000 | | | 4,038,848 |
| | 3.375%, 06/24/11 | | | 1,000 | | | 1,039,330 |
| | 1.625%, 07/27/11 | | | 8,500 | | | 8,598,558 |
| | 3.750%, 09/09/11 | | | 11,600 | | | 12,209,267 |
| | 3.625%, 09/16/11 | | | 9,800 | | | 10,299,496 |
Federal Home Loan Mortgage Corporation | | | | | | |
| | 4.750%, 01/18/11 | | | 1,700 | | | 1,784,718 |
| | 1.625%, 04/26/11 | | | 2,500 | | | 2,531,652 |
| | 6.000%, 06/15/11 | | | 4,500 | | | 4,874,031 |
| | 5.250%, 07/18/11 | | | 4,500 | | | 4,839,368 |
Federal National Mortgage Association | | | | | | |
| | 6.000%, 05/15/11 | | | 2,000 | | | 2,156,898 |
| | 3.375%, 05/19/11 | | | 1,000 | | | 1,040,715 |
| | | | | | | | |
TOTAL AGENCY OBLIGATIONS | | | | | | 75,013,224 |
| | | | | | | | |
| | |
U.S. TREASURY OBLIGATIONS — (0.7%) | | | | | | |
U.S. Treasury Note |
| | 1.000%, 09/30/11 | | | 2,200 | | | 2,206,186 |
| | | | | | | | |
| | | | | | | | |
| | | | | Face
Amount | | Value† |
| | | |
| | | | | (000) | | |
|
TEMPORARY CASH INVESTMENTS — (2.4%) |
| | Repurchase Agreement, PNC Capital Markets, Inc. 0.19%, 11/02/09 (Collateralized by $6,940,000 FNMA 6.50%, 06/25/39, valued at $7,469,175) to be repurchased at $7,357,116. | | $ | 7,357 | | $ | 7,357,000 |
| | | | | | | | |
TOTAL INVESTMENTS — (100.0%)
(Cost $299,330,879) | | $ | 303,303,940 |
| | | | | | | | |
122
DFA SELECTIVELY HEDGED GLOBAL FIXED INCOME PORTFOLIO
CONTINUED
Summary of inputs used to value the Portfolio’s net assets as of October 31, 2009 is as follows (See Security Valuation Note):
| | | | | | | | | | |
| | | Valuation Inputs |
| |
| | | Investment in Securities (Market Value) |
| | | Level 1 | | Level 2 | | Level 3 | | Total |
Bonds | | | | | | | | | | |
Australia | | — | | $ | 12,020,554 | | — | | $ | 12,020,554 |
Austria | | — | | | 7,245,669 | | — | | | 7,245,669 |
Canada | | — | | | 27,008,110 | | — | | | 27,008,110 |
Denmark | | — | | | 514,904 | | — | | | 514,904 |
Finland | | — | | | 726,865 | | — | | | 726,865 |
France | | — | | | 17,581,839 | | — | | | 17,581,839 |
Germany | | — | | | 20,141,028 | | — | | | 20,141,028 |
Ireland | | — | | | 5,895,720 | | — | | | 5,895,720 |
Japan | | — | | | 4,265,608 | | — | | | 4,265,608 |
Netherlands | | — | | | 19,624,641 | | — | | | 19,624,641 |
Norway | | — | | | 7,650,616 | | — | | | 7,650,616 |
Spain | | — | | | 6,380,089 | | — | | | 6,380,089 |
Supranational Organization Obligations | | — | | | 29,299,135 | | — | | | 29,299,135 |
Sweden | | — | | | 7,627,267 | | — | | | 7,627,267 |
United Kingdom | | — | | | 13,876,163 | | — | | | 13,876,163 |
United States | | — | | | 38,869,322 | | — | | | 38,869,322 |
Agency Obligations | | | | | | | | | | |
United States | | — | | | 75,013,224 | | — | | | 75,013,224 |
U.S. Treasury Obligations | | | | | | | | | | |
United States | | — | | | 2,206,186 | | — | | | 2,206,186 |
Temporary Cash Investments | | — | | | 7,357,000 | | — | | | 7,357,000 |
Other Financial Instruments** | | — | | | 255,714 | | — | | | 255,714 |
| | | | | | | | | | |
TOTAL | | — | | $ | 303,559,654 | | — | | $ | 303,559,654 |
| | | | | | | | | | |
| | ** | Other financial instruments are derivative instruments not reflected in the Schedule of Investments, such as futures and forwards which are valued at the unrealized appreciation/depreciation on the investment. |
See accompanying Notes to Financial Statements.
123
DFA FIVE-YEAR GOVERNMENT PORTFOLIO
SCHEDULE OF INVESTMENTS
October 31, 2009
| | | | | | |
| | | Face
Amount | | Value† |
| | |
| | | (000) | | |
| | |
AGENCY OBLIGATIONS — (77.8%) | | | | | | |
Federal Farm Credit Bank | | | | | | |
2.625%, 04/17/14 | | $ | 31,500 | | $ | 31,653,878 |
3.000%, 09/22/14 | | | 9,000 | | | 9,193,536 |
Federal Home Loan Bank | | | | | | |
1.625%, 01/21/11 | | | 10,000 | | | 10,131,820 |
4.625%, 02/18/11 | | | 21,500 | | | 22,606,669 |
1.375%, 05/16/11 | | | 4,000 | | | 4,038,848 |
2.625%, 05/20/11 | | | 50,200 | | | 51,652,336 |
3.375%, 06/24/11 | | | 6,300 | | | 6,547,779 |
5.375%, 08/19/11 | | | 50,000 | | | 53,877,750 |
3.750%, 09/09/11 | | | 40,000 | | | 42,100,920 |
3.625%, 09/16/11 | | | 50,000 | | | 52,548,450 |
4.875%, 11/18/11 | | | 50,000 | | | 53,892,450 |
5.750%, 05/15/12 | | | 150,000 | | | 166,461,600 |
4.625%, 10/10/12 | | | 100,000 | | | 108,867,700 |
5.250%, 06/18/14 | | | 65,000 | | | 73,109,985 |
5.500%, 08/13/14 | | | 67,500 | | | 76,731,435 |
Tennessee Valley Authority | | | | | | |
5.625%, 01/18/11 | | | 10,930 | | | 11,597,954 |
| | | | | | |
TOTAL AGENCY OBLIGATIONS | | | | | | 775,013,110 |
| | | | | | |
| | |
U.S. TREASURY OBLIGATIONS — (21.4%) | | | | | | |
U.S. Treasury Notes | | | | | | |
2.750%, 10/31/13 | | | 50,000 | | | 51,621,100 |
2.000%, 11/30/13 | | | 112,000 | | | 112,323,792 |
1.750%, 01/31/14 | | | 50,000 | | | 49,457,050 |
| | | | | | |
TOTAL U.S. TREASURY OBLIGATIONS | | | | | | 213,401,942 |
| | | | | | |
TEMPORARY CASH INVESTMENTS — (0.8%) | | | | | | |
Repurchase Agreement, PNC Capital Markets, Inc. 0.19%, 11/02/09 (Collateralized by $7,650,000 FNMA 6.50%, 06/25/39, valued at $8,233,313) to be repurchased at $8,107,128 | | | 8,107 | | | 8,107,000 |
| | | | | | |
TOTAL INVESTMENTS — (100.0%)
(Cost $968,224,925) | | | | | $ | 996,522,052 |
| | | | | | |
124
DFA FIVE-YEAR GOVERNMENT PORTFOLIO
CONTINUED
Summary of inputs used to value the Portfolio’s net assets as of October 31, 2009 is as follows (See Security Valuation Note):
| | | | | | | | | | |
| | | Valuation Inputs |
| |
| | | Investment in Securities (Market Value) |
| | | Level 1 | | Level 2 | | Level 3 | | Total |
Agency Obligations | | — | | $ | 775,013,110 | | — | | $ | 775,013,110 |
U.S. Treasury Obligations | | — | | | 213,401,942 | | — | | | 213,401,942 |
Temporary Cash Investments | | — | | | 8,107,000 | | — | | | 8,107,000 |
| | | | | | | | | | |
TOTAL | | — | | $ | 996,522,052 | | — | | $ | 996,522,052 |
| | | | | | | | | | |
See accompanying Notes to Financial Statements.
125
DFA FIVE-YEAR GLOBAL FIXED INCOME PORTFOLIO
SCHEDULE OF INVESTMENTS
October 31, 2009
| | | | | | | |
| | | Face Amount^ | | Value† |
| | |
| | | (000) | | |
|
BONDS — (53.6%) |
AUSTRALIA — (2.0%) |
National Australia Bank, Ltd. |
(u) | | 5.350%, 06/12/13 | | 10,364 | | $ | 11,102,518 |
SunCorp-Metway, Ltd. |
(g) | | 4.000%, 01/16/14 | | 43,555 | | | 73,461,203 |
| | | | | | | |
TOTAL AUSTRALIA | | | | | 84,563,721 |
| | | | | | | |
|
AUSTRIA — (2.3%) |
Oesterreichischen Kontrollbank AG | | | | | |
(u) | | 3.625%, 06/17/13 | | 2,867 | | | 2,993,435 |
PfandBriefstelle der Oesterreichischen Landes-Hypothekenbanken | | | | | |
(j) | | 1.600%, 02/15/11 | | 8,246,000 | | | 91,282,299 |
| | | | | | | |
TOTAL AUSTRIA | | | | | 94,275,734 |
| | | | | | | |
|
BELGIUM — (2.2%) |
Belgium Government International Bond | | | | | |
(u) | | 4.250%, 09/03/13 | | 78,000 | | | 83,219,292 |
(u) | | 2.875%, 09/15/14 | | 8,000 | | | 8,019,208 |
| | | | | | | |
TOTAL BELGIUM | | | | | 91,238,500 |
| | | | | | | |
|
CANADA — (2.2%) |
Ontario, Province of |
(u) | | 4.375%, 02/15/13 | | 55,000 | | | 58,246,485 |
(u) | | 4.100%, 06/16/14 | | 31,000 | | | 32,775,866 |
| | | | | | | |
TOTAL CANADA | | | | | 91,022,351 |
| | | | | | | |
|
FRANCE — (2.5%) |
Caisse d’Amortissement de la Dette Sociale | | | | | |
(u) | | 3.500%, 07/01/14 | | 88,833 | | | 91,991,013 |
Total Capital SA |
(g) | | 4.625%, 03/07/12 | | 2,014 | | | 3,473,486 |
(u) | | 5.000%, 05/22/12 | | 9,900 | | | 10,651,687 |
| | | | | | | |
TOTAL FRANCE | | | | | 106,116,186 |
| | | | | | | |
|
GERMANY — (5.1%) |
Bayerische Landesbank |
(j) | | 1.000%, 09/20/10 | | 2,950,000 | | | 32,786,965 |
Kreditanstalt fuer Wiederaufbau |
(g) | | 4.875%, 01/15/13 | | 5,000 | | | 8,793,992 |
(u) | | 4.000%, 10/15/13 | | 10,200 | | | 10,834,756 |
(g) | | 3.250%, 02/24/14 | | 10,000 | | | 16,539,567 |
| | | | | | | |
| | | Face
Amount^ | | Value† |
| | |
| | | (000) | | |
|
GERMANY — (Continued) |
(u) | | 3.500%, 03/10/14 | | 51,800 | | $ | 54,032,321 |
Landeskreditbank Baden-Wuerttemberg Foerderbank | | | | | |
(u) | | 4.875%, 01/13/12 | | 9,000 | | | 9,613,782 |
Landwirtschaftliche Rentenbank | | | | | |
(u) | | 4.125%, 07/15/13 | | 9,000 | | | 9,592,236 |
(u) | | 4.875%, 01/10/14 | | 64,200 | | | 69,836,632 |
| | | | | | | |
TOTAL GERMANY | | | | | 212,030,251 |
| | | | | | | |
|
NETHERLANDS — (3.4%) |
Bank Nederlandse Gemeenten |
(g) | | 5.750%, 03/07/12 | | 6,500 | | | 11,483,930 |
(g) | | 4.750%, 04/22/13 | | 13,577 | | | 23,531,631 |
(u) | | 5.000%, 05/16/14 | | 19,200 | | | 20,787,475 |
Rabobank Nederland |
(j) | | 0.800%, 02/03/11 | | 7,292,000 | | | 80,990,089 |
#(u) | | 4.200%, 05/13/14 | | 3,000 | | | 3,128,124 |
| | | | | | | |
TOTAL NETHERLANDS | | | | | 139,921,249 |
| | | | | | | |
|
NORWAY — (2.0%) |
Eksportfinans |
(j) | | 1.800%, 06/21/10 | | 5,998,000 | | | 66,979,099 |
Kommunalbanken |
(g) | | 4.875%, 12/10/12 | | 8,965 | | | 15,627,199 |
| | | | | | | |
TOTAL NORWAY | | | | | 82,606,298 |
| | | | | | | |
|
SPAIN — (1.0%) |
Instituto de Credito Oficial |
(g) | | 4.500%, 03/07/13 | | 15,640 | | | 26,876,221 |
(u) | | 3.250%, 05/14/13 | | 15,600 | | | 16,005,085 |
| | | | | | | |
TOTAL SPAIN | | | | | 42,881,306 |
| | | | | | | |
| | |
SUPRANATIONAL ORGANIZATION OBLIGATIONS — (9.7%) | | | | | |
African Development Bank |
(u) | | 3.000%, 05/27/14 | | 90,100 | | | 91,644,494 |
Asian Development Bank |
(u) | | 2.750%, 05/21/14 | | 20,500 | | | 20,746,184 |
Council of Europe Development Bank | | | | | |
(g) | | 4.625%, 03/07/12 | | 12,800 | | | 22,231,679 |
(u) | | 4.500%, 06/30/14 | | 14,400 | | | 15,455,261 |
(u) | | 4.500%, 06/30/14 | | 50,000 | | | 53,664,100 |
126
DFA FIVE-YEAR GLOBAL FIXED INCOME PORTFOLIO
CONTINUED
| | | | | | | | |
| | | | | Face
Amount^ | | Value† |
| | | |
| | | | | (000) | | |
| | |
SUPRANATIONAL ORGANIZATION OBLIGATIONS — (Continued) | | | | | | |
Eurofima | | | | | | |
(u) | | 4.250%, 09/05/13 | | | 40,100 | | $ | 42,676,746 |
(u) | | 4.250%, 02/04/14 | | | 42,860 | | | 45,478,446 |
European Investment Bank | | | | | | |
(u) | | 3.000%, 04/08/14 | | | 10,500 | | | 10,732,386 |
(g) | | 6.250%, 04/15/14 | | | 12,500 | | | 23,153,225 |
#(u) | | 3.125%, 06/04/14 | | | 50,000 | | | 51,259,500 |
Inter-American Development Bank | | | | | | |
(u) | | 3.000%, 04/22/14 | | | 13,463 | | | 13,728,867 |
Nordic Investment Bank | | | | | | |
(u) | | 2.625%, 10/06/14 | | | 10,000 | | | 9,999,000 |
| | | | | | | | |
TOTAL SUPRANATIONAL ORGANIZATION OBLIGATIONS | | | | | | 400,769,888 |
| | | | | | | | |
| | |
SWEDEN — (0.9%) | | | | | | |
Svensk Exportkredit AB | | | | | | |
(u) | | 3.250%, 09/16/14 | | | 35,810 | | | 36,213,364 |
| | | | | | | | |
| | |
UNITED KINGDOM — (7.7%) | | | | | | |
Barclays Bank P.L.C. | | | | | | |
(u) | | 5.200%, 07/10/14 | | | 35,800 | | | 38,174,363 |
BP Capital Markets P.L.C. | | | | | | |
(u) | | 5.250%, 11/07/13 | | | 77,000 | | | 84,981,204 |
Lloyds TSB Bank P.L.C. | | | | | | |
| | 2.750%, 03/16/12 | | | 27,400 | | | 45,572,136 |
Network Rail Infrastructure Finance P.L.C. | | | | | | |
| | 4.875%, 03/07/12 | | | 18,888 | | | 32,841,426 |
(u) | | 3.500%, 06/17/13 | | | 24,000 | | | 24,980,472 |
United Kingdom Gilt | | | | | | |
| | 5.250%, 06/07/12 | | | 47,000 | | | 83,802,250 |
| | 5.000%, 09/07/14 | | | 4,000 | | | 7,235,571 |
| | | | | | | | |
TOTAL UNITED KINGDOM | | | | | | 317,587,422 |
| | | | | | | | |
| | |
UNITED STATES — (12.6%) | | | | | | |
3M Co. | | | | | | |
| | 4.375%, 08/15/13 | | $ | 19,600 | | | 21,183,190 |
Bank of America Corp. | | | | | | |
| | 4.900%, 05/01/13 | | | 54,265 | | | 56,502,292 |
Bank of New York Mellon Corp. | | | | | | |
| | 4.500%, 04/01/13 | | | 10,000 | | | 10,605,800 |
| | 4.300%, 05/15/14 | | | 65,000 | | | 68,504,020 |
General Electric Capital Corp. | | | | | | |
(j) | | 1.450%, 11/10/11 | | | 5,140,000 | | | 56,652,833 |
| | | | | | | | |
| | | | | Face
Amount | | Value† |
| | | | | (000) | | |
| | |
UNITED STATES — (Continued) | | | | | | |
| | 4.800%, 05/01/13 | | $ | 34,800 | | $ | 36,576,296 |
JPMorgan Chase & Co. | | | | | | |
| | 4.750%, 05/01/13 | | | 15,000 | | | 15,898,575 |
Mellon Funding Corp. | | | | | | |
| | 5.200%, 05/15/14 | | | 11,760 | | | 12,787,448 |
Merck & Co., Inc. | | | | | | |
| | 4.375%, 02/15/13 | | | 30,506 | | | 31,875,811 |
Microsoft Corp. | | | | | | |
| | 2.950%, 06/01/14 | | | 22,300 | | | 22,624,666 |
Toyota Motor Credit Corp. | | | | | | |
(j) | | 1.300%, 03/16/12 | | | 5,550,000 | | | 62,103,091 |
Wal-Mart Stores, Inc. | | | | | | |
| | 4.250%, 04/15/13 | | | 18,500 | | | 19,731,212 |
| | 7.250%, 06/01/13 | | | 47,800 | | | 55,812,523 |
| | 3.200%, 05/15/14 | | | 5,000 | | | 5,123,635 |
Wells Fargo Bank & Co. | | | | | | |
| | 5.250%, 10/23/12 | | | 42,700 | | | 45,679,649 |
| | | | | | | | |
TOTAL UNITED STATES | | | | | | 521,661,041 |
| | | | | | | | |
TOTAL BONDS | | | | | | 2,220,887,311 |
| | | | | | | | |
| | |
AGENCY OBLIGATIONS — (22.9%) | | | | | | |
Federal Farm Credit Bank | | | | | | |
# | | 4.250%, 07/08/13 | | | 50,000 | | | 53,960,200 |
# | | 2.625%, 04/17/14 | | | 50,000 | | | 50,244,250 |
# | | 3.000%, 09/22/14 | | | 45,000 | | | 45,967,680 |
Federal Home Loan Bank | | | | | | |
# | | 5.750%, 05/15/12 | | | 50,000 | | | 55,487,200 |
# | | 3.625%, 05/29/13 | | | 37,500 | | | 39,713,625 |
# | | 5.500%, 08/13/14 | | | 112,000 | | | 127,317,344 |
Federal Home Loan Mortgage Corporation | | | | | | |
# | | 4.750%, 03/05/12 | | | 100,000 | | | 108,275,400 |
# | | 3.000%, 07/28/14 | | | 112,000 | | | 114,528,736 |
Federal National Mortgage Association | | | | | | |
# | | 5.000%, 02/16/12 | | | 50,000 | | | 54,198,250 |
# | | 6.125%, 03/15/12 | | | 50,000 | | | 55,667,450 |
# | | 4.875%, 05/18/12 | | | 100,000 | | | 108,707,500 |
# | | 3.000%, 09/16/14 | | | 118,000 | | | 120,358,466 |
# | | 4.625%, 10/15/14 | | | 15,000 | | | 16,403,190 |
| | | | | | | | |
TOTAL AGENCY OBLIGATIONS | | | | | | 950,829,291 |
| | | | | | | | |
127
DFA FIVE-YEAR GLOBAL FIXED INCOME PORTFOLIO
CONTINUED
| | | | | |
| | | Face
Amount | | Value† |
| | | (000) | | |
TEMPORARY CASH INVESTMENTS — (0.7%) | | | | | |
Repurchase Agreement, PNC Capital Markets, Inc. 0.19%, 11/02/09 (Collateralized by $34,615,000 FHLMC 4.50%, 05/01/23, valued at $29,372,432) to be repurchased at $28,937,458 | | $ | 28,937 | | 28,937,000 |
| | | | | |
| | | | | | | |
| | | | | Shares | | Value† |
SECURITIES LENDING COLLATERAL — (22.8%) | | | |
§@ | | DFA Short Term Investment Fund LP | | 943,857,350 | | $ | 943,857,350 |
| | | | | | | |
TOTAL INVESTMENTS — (100.0%)
(Cost $3,961,944,892) | | $ | 4,144,510,952 |
| | | | | | | |
Summary of inputs used to value the Portfolio’s net assets as of October 31, 2009 is as follows (See Security Valuation Note):
| | | | | | | | | | | | |
| | | Valuation Inputs | |
| |
| | | Investment in Securities (Market Value) | |
| | | Level 1 | | Level 2 | | | Level 3 | | Total | |
Bonds | | | | | | | | | | | | |
Australia | | — | | $ | 84,563,721 | | | — | | $ | 84,563,721 | |
Austria | | — | | | 94,275,734 | | | — | | | 94,275,734 | |
Belgium | | — | | | 91,238,500 | | | — | | | 91,238,500 | |
Canada | | — | | | 91,022,351 | | | — | | | 91,022,351 | |
France | | — | | | 106,116,186 | | | — | | | 106,116,186 | |
Germany | | — | | | 212,030,251 | | | — | | | 212,030,251 | |
Netherlands | | — | | | 139,921,249 | | | — | | | 139,921,249 | |
Norway | | — | | | 82,606,298 | | | — | | | 82,606,298 | |
Spain | | — | | | 42,881,306 | | | — | | | 42,881,306 | |
Supranational Organization Obligations | | — | | | 400,769,888 | | | — | | | 400,769,888 | |
Sweden | | — | | | 36,213,364 | | | — | | | 36,213,364 | |
United Kingdom | | — | | | 317,587,422 | | | — | | | 317,587,422 | |
United States | | — | | | 521,661,041 | | | — | | | 521,661,041 | |
Agency Obligations | | | | | | | | | | | | |
United States | | — | | | 950,829,291 | | | — | | | 950,829,291 | |
Temporary Cash Investments | | — | | | 28,937,000 | | | — | | | 28,937,000 | |
Securities Lending Collateral | | — | | | 943,857,350 | | | — | | | 943,857,350 | |
Other Financial Instruments** | | — | | | (5,596,063 | ) | | — | | | (5,596,063 | ) |
| | | | | | | | | | | | |
TOTAL | | — | | $ | 4,138,914,889 | | | — | | $ | 4,138,914,889 | |
| | | | | | | | | | | | |
| | ** | Other financial instruments are derivative instruments not reflected in the Schedule of Investments, such as futures and forwards which are valued at the unrealized appreciation/depreciation on the investment. |
See accompanying Notes to Financial Statements.
128
DFA INTERMEDIATE GOVERNMENT FIXED INCOME PORTFOLIO
SCHEDULE OF INVESTMENTS
October 31, 2009
| | | | | | |
| | | Face
Amount | | Value† |
| | |
| | | (000) | | |
AGENCY OBLIGATIONS — (66.0%) |
Federal Farm Credit Bank | | | | | | |
4.800%, 05/24/11 | | $ | 3,300 | | $ | 3,503,999 |
6.300%, 06/06/11 | | | 2,800 | | | 3,041,920 |
4.250%, 07/11/11 | | | 13,600 | | | 14,362,062 |
4.350%, 11/02/11 | | | 8,000 | | | 8,507,328 |
4.200%, 11/07/11 | | | 6,650 | | | 7,053,675 |
4.300%, 11/23/11 | | | 5,500 | | | 5,849,228 |
6.260%, 12/02/11 | | | 2,000 | | | 2,208,306 |
4.950%, 12/22/11 | | | 9,000 | | | 9,707,220 |
5.230%, 02/14/12 | | | 12,000 | | | 13,055,964 |
4.500%, 03/14/12 | | | 8,500 | | | 9,120,934 |
4.625%, 03/16/12 | | | 7,000 | | | 7,532,343 |
5.000%, 06/01/12 | | | 4,295 | | | 4,677,075 |
4.480%, 08/24/12 | | | 12,000 | | | 12,949,968 |
6.280%, 11/26/12 | | | 3,000 | | | 3,407,448 |
4.400%, 01/03/13 | | | 11,000 | | | 11,890,395 |
4.150%, 05/15/13 | | | 10,000 | | | 10,754,950 |
5.580%, 07/03/13 | | | 23,000 | | | 25,898,046 |
3.880%, 07/08/13 | | | 7,000 | | | 7,460,362 |
4.920%, 08/26/13 | | | 4,125 | | | 4,552,985 |
4.710%, 10/18/13 | | | 7,000 | | | 7,676,088 |
4.900%, 01/16/14 | | | 5,700 | | | 6,241,768 |
5.300%, 02/18/14 | | | 12,000 | | | 13,439,520 |
5.250%, 06/05/14 | | | 14,400 | | | 16,096,694 |
4.375%, 06/30/14 | | | 3,915 | | | 4,225,961 |
3.000%, 09/22/14 | | | 7,000 | | | 7,150,528 |
8.160%, 09/30/14 | | | 3,615 | | | 4,516,635 |
4.700%, 12/10/14 | | | 4,000 | | | 4,359,968 |
4.550%, 02/03/15 | | | 4,500 | | | 4,868,874 |
4.375%, 02/17/15 | | | 14,300 | | | 15,346,760 |
6.030%, 03/21/16 | | | 4,700 | | | 5,428,495 |
5.050%, 03/08/17 | | | 10,000 | | | 10,782,700 |
5.625%, 08/18/17 | | | 4,000 | | | 4,506,620 |
5.100%, 09/03/19 | | | 9,000 | | | 9,630,018 |
5.320%, 09/03/19 | | | 21,300 | | | 22,845,720 |
5.150%, 11/15/19 | | | 11,200 | | | 12,005,347 |
4.670%, 05/07/20 | | | 5,600 | | | 5,782,963 |
5.350%, 08/07/20 | | | 6,700 | | | 7,306,169 |
5.250%, 03/02/21 | | | 6,100 | | | 6,433,786 |
5.220%, 02/22/22 | | | 5,000 | | | 5,224,285 |
5.210%, 12/19/22 | | | 21,200 | | | 22,736,449 |
Federal Home Loan Bank | | | | | | |
7.200%, 06/14/11 | | | 3,000 | | | 3,308,493 |
5.750%, 08/15/11 | | | 12,000 | | | 13,009,992 |
5.000%, 10/13/11 | | | 25,000 | | | 26,959,850 |
5.625%, 11/15/11 | | | 5,000 | | | 5,465,830 |
5.625%, 02/15/12 | | | 6,100 | | | 6,711,464 |
| | | | | | |
| | | Face
Amount | | Value† |
| | |
| | | (000) | | |
5.750%, 05/15/12 | | $ | 8,300 | | $ | 9,210,875 |
4.625%, 08/15/12 | | | 15,175 | | | 16,465,877 |
4.500%, 11/15/12 | | | 18,000 | | | 19,517,292 |
5.126%, 02/28/13 | | | 5,615 | | | 6,217,810 |
3.875%, 06/14/13 | | | 12,600 | | | 13,451,445 |
5.375%, 06/14/13 | | | 52,400 | | | 58,556,738 |
4.500%, 09/16/13 | | | 11,000 | | | 11,993,883 |
6.395%, 06/03/14 | | | 5,200 | | | 6,104,748 |
5.250%, 06/18/14 | | | 50,300 | | | 56,575,881 |
6.700%, 06/25/14 | | | 12,500 | | | 14,853,625 |
5.500%, 08/13/14 | | | 35,500 | | | 40,355,051 |
4.500%, 11/14/14 | | | 4,000 | | | 4,364,456 |
4.875%, 03/11/16 | | | 13,600 | | | 14,799,996 |
5.375%, 05/18/16 | | | 6,000 | | | 6,766,230 |
5.375%, 09/09/16 | | | 6,000 | | | 6,609,708 |
4.875%, 05/17/17 | | | 10,500 | | | 11,437,009 |
5.000%, 11/17/17 | | | 31,000 | | | 33,890,285 |
4.625%, 09/11/20 | | | 11,200 | | | 11,527,006 |
5.000%, 03/12/21 | | | 5,200 | | | 5,503,623 |
5.000%, 12/10/21 | | | 39,500 | | | 43,175,198 |
5.750%, 06/10/22 | | | 19,500 | | | 22,003,040 |
4.750%, 03/10/23 | | | 22,200 | | | 22,767,232 |
Tennessee Valley Authority | | | | | | |
6.790%, 05/23/12 | | | 37,600 | | | 42,481,946 |
6.000%, 03/15/13 | | | 28,100 | | | 31,679,547 |
4.750%, 08/01/13 | | | 12,500 | | | 13,586,850 |
4.375%, 06/15/15 | | | 6,500 | | | 6,979,635 |
6.250%, 12/15/17 | | | 10,000 | | | 11,626,650 |
4.500%, 04/01/18 | | | 10,000 | | | 10,388,480 |
| | | | | | |
TOTAL AGENCY OBLIGATIONS | | | 970,485,301 |
| | | | | | |
|
U.S. TREASURY OBLIGATIONS — (33.0%) |
U.S. Treasury Bonds | | | | | | |
11.250%, 02/15/15 | | | 19,000 | | | 27,319,929 |
10.625%, 08/15/15 | | | 11,000 | | | 15,752,341 |
9.875%, 11/15/15 | | | 11,600 | | | 16,272,619 |
9.250%, 02/15/16 | | | 9,000 | | | 12,386,952 |
7.250%, 05/15/16 | | | 6,000 | | | 7,565,628 |
7.500%, 11/15/16 | | | 17,800 | | | 22,882,737 |
9.000%, 11/15/18 | | | 12,200 | | | 17,584,202 |
8.125%, 08/15/19 | | | 3,800 | | | 5,278,436 |
8.750%, 08/15/20 | | | 12,700 | | | 18,522,163 |
8.125%, 05/15/21 | | | 27,100 | | | 38,299,915 |
7.250%, 08/15/22 | | | 21,000 | | | 28,169,526 |
6.250%, 08/15/23 | | | 21,000 | | | 26,043,276 |
129
DFA INTERMEDIATE GOVERNMENT FIXED INCOME PORTFOLIO
CONTINUED
| | | | | | |
| | | Face
Amount | | Value† |
| | |
| | | (000) | | |
| | |
U.S. Treasury Notes | | | | | | |
4.875%, 02/15/12 | | $ | 51,800 | �� | $ | 56,239,415 |
4.375%, 08/15/12 | | | 54,700 | | | 59,349,500 |
4.000%, 11/15/12 | | | 9,700 | | | 10,451,750 |
3.875%, 02/15/13 | | | 27,600 | | | 29,620,403 |
3.625%, 05/15/13 | | | 7,700 | | | 8,210,726 |
4.250%, 08/15/13 | | | 30,100 | | | 32,801,957 |
4.000%, 02/15/14 | | | 10,500 | | | 11,358,868 |
4.250%, 08/15/14 | | | 15,500 | | | 16,939,810 |
4.250%, 11/15/14 | | | 7,500 | | | 8,189,062 |
4.875%, 08/15/16 | | | 8,200 | | | 9,207,706 |
3.000%, 09/30/16 | | | 7,000 | | | 7,018,592 |
| | | | | | |
TOTAL U.S. TREASURY OBLIGATIONS | | | | | | 485,465,513 |
| | | | | | |
| | | | | | |
| | | Face
Amount | | Value† |
| | |
| | | (000) | | |
|
TEMPORARY CASH INVESTMENTS — (1.0%) |
Repurchase Agreement, PNC Capital Markets, Inc. 0.19%, 11/02/09 (Collateralized by $13,455,000 FNMA 6.50%, 06/25/39, valued at $14,161,388) to be repurchased at $13,952,221 | | $ | 13,952 | | $ | 13,952,000 |
| | | | | | |
TOTAL INVESTMENTS — (100.0%)
(Cost $1,366,863,221) | | $ | 1,469,902,814 |
| | | | | | |
Summary of inputs used to value the Portfolio’s net assets as of October 31, 2009 is as follows (See Security Valuation Note):
| | | | | | | | | | |
| | | Valuation Inputs |
| |
| | | Investment in Securities (Market Value) |
| | | Level 1 | | Level 2 | | Level 3 | | Total |
Agency Obligations | | — | | $ | 970,485,301 | | — | | $ | 970,485,301 |
U.S. Treasury Obligations | | — | | | 485,465,513 | | — | | | 485,465,513 |
Temporary Cash Investments | | — | | | 13,952,000 | | — | | | 13,952,000 |
| | | | | | | | | | |
TOTAL | | — | | $ | 1,469,902,814 | | — | | $ | 1,469,902,814 |
| | | | | | | | | | |
See accompanying Notes to Financial Statements.
130
DFA SHORT-TERM EXTENDED QUALITY PORTFOLIO
SCHEDULE OF INVESTMENTS
October 31, 2009
| | | | | | |
| | | Face
Amount | | Value† |
| | |
| | | (000) | | |
AGENCY OBLIGATIONS — (6.7%) | | | | | | |
Federal Farm Credit Bank | | | | | | |
2.625%, 04/17/14 | | $ | 5,000 | | $ | 5,024,425 |
Federal Home Loan Bank | | | | | | |
1.625%, 03/16/11 | | | 6,600 | | | 6,686,869 |
Federal Home Loan Mortgage Corporation | | | | | | |
3.250%, 02/25/11 | | | 6,500 | | | 6,709,196 |
Federal National Mortgage Association | | | | | | |
1.750%, 03/23/11 | | | 6,600 | | | 6,695,165 |
| | | | | | |
TOTAL AGENCY OBLIGATIONS | | | | | | 25,115,655 |
| | | | | | |
| | |
BONDS — (91.8%) | | | | | | |
Abbott Laboratories | | | | | | |
5.600%, 05/15/11 | | | 600 | | | 640,937 |
Aetna, Inc. | | | | | | |
5.750%, 06/15/11 | | | 1,600 | | | 1,684,789 |
African Development Bank | | | | | | |
1.875%, 01/23/12 | | | 1,000 | | | 1,010,670 |
3.000%, 05/27/14 | | | 4,000 | | | 4,068,568 |
Agence Francaise de Developpement | | | | | | |
2.250%, 05/22/12 | | | 2,000 | | | 2,019,670 |
Alcoa, Inc. | | | | | | |
6.000%, 01/15/12 | | | 1,000 | | | 1,055,160 |
5.375%, 01/15/13 | | | 470 | | | 488,245 |
Allied Waste North America, Inc. | | | | | | |
6.375%, 04/15/11 | | | 1,100 | | | 1,161,310 |
Allstate Corp. | | | | | | |
7.500%, 06/15/13 | | | 1,100 | | | 1,242,909 |
Allstate Corp.(The) | | | | | | |
6.200%, 05/16/14 | | | 500 | | | 552,204 |
Altria Group, Inc. | | | | | | |
7.750%, 02/06/14 | | | 1,600 | | | 1,825,781 |
American Express Credit Corp. | | | | | | |
5.875%, 05/02/13 | | | 1,000 | | | 1,073,205 |
7.300%, 08/20/13 | | | 1,800 | | | 2,021,533 |
Anadarko Petroleum Corp. | | | | | | |
5.000%, 10/01/12 | | | 600 | | | 624,235 |
7.625%, 03/15/14 | | | 500 | | | 572,099 |
Analog Devices, Inc. | | | | | | |
5.000%, 07/01/14 | | | 1,500 | | | 1,576,764 |
Anheuser-Busch Cos., Inc. | | | | | | |
6.000%, 04/15/11 | | | 300 | | | 315,638 |
Apache Corp. | | | | | | |
6.000%, 09/15/13 | | | 1,100 | | | 1,224,926 |
| | | | | | |
| | | Face
Amount | | Value† |
| | |
| | | (000) | | |
Appalachian Power Co. | | | | | | |
5.650%, 08/15/12 | | $ | 600 | | $ | 645,243 |
Archer-Daniels-Midland Co. | | | | | | |
7.125%, 03/01/13 | | | 800 | | | 905,614 |
Arizona Public Service Co. | | | | | | |
6.500%, 03/01/12 | | | 600 | | | 649,463 |
AT&T, Inc. | | | | | | |
6.700%, 11/15/13 | | | 1,700 | | | 1,930,945 |
Atmos Energy Corp. | | | | | | |
7.375%, 05/15/11 | | | 800 | | | 860,066 |
Australia & New Zealand Banking Group, Ltd. | | | | | | |
5.125%, 11/14/11 | | | 2,400 | | | 2,544,415 |
Austria Government International Bond | | | | | | |
5.500%, 02/22/12 | | | 3,020 | | | 3,253,050 |
AutoZone, Inc. | | | | | | |
5.875%, 10/15/12 | | | 760 | | | 814,688 |
Avon Products, Inc. | | | | | | |
5.125%, 01/15/11 | | | 1,100 | | | 1,137,497 |
Baker Hughes, Inc. | | | | | | |
6.500%, 11/15/13 | | | 1,870 | | | 2,125,083 |
Bank of America Corp. | | | | | | |
5.375%, 09/11/12 | | | 3,100 | | | 3,297,123 |
Bank of New York Mellon Corp. | | | | | | |
4.950%, 11/01/12 | | | 2,500 | | | 2,708,400 |
4.300%, 05/15/14 | | | 2,000 | | | 2,107,816 |
Barclays Bank P.L.C. | | | | | | |
5.450%, 09/12/12 | | | 2,700 | | | 2,922,278 |
Baxter International, Inc. | | | | | | |
4.000%, 03/01/14 | | | 1,600 | | | 1,668,357 |
BB&T Corp. | | | | | | |
3.850%, 07/27/12 | | | 500 | | | 516,863 |
5.700%, 04/30/14 | | | 1,000 | | | 1,082,044 |
Bear Stearns Cos. LLC | | | | | | |
5.500%, 08/15/11 | | | 1,600 | | | 1,677,987 |
Belgium Government International Bond | | | | | | |
4.250%, 09/03/13 | | | 1,000 | | | 1,066,914 |
BHP Billiton Finance, Ltd. | | | | | | |
5.125%, 03/29/12 | | | 600 | | | 646,150 |
5.500%, 04/01/14 | | | 1,000 | | | 1,098,500 |
Black & Decker Corp. | | | | | | |
7.125%, 06/01/11 | | | 1,430 | | | 1,534,719 |
Black Hills Corp. | | | | | | |
6.500%, 05/15/13 | | | 1,500 | | | 1,582,430 |
131
DFA SHORT-TERM EXTENDED QUALITY PORTFOLIO
CONTINUED
| | | | | | |
| | | Face
Amount | | Value† |
| | |
| | | (000) | | |
Block Financial LLC | | | | | | |
5.125%, 10/30/14 | | $ | 1,000 | | $ | 1,013,823 |
Boeing Capital Corp. | | | | | | |
7.375%, 09/27/10 | | | 600 | | | 635,887 |
Boeing Co. | | | | | | |
5.000%, 03/15/14 | | | 1,000 | | | 1,087,604 |
BP Capital Markets P.L.C. | | | | | | |
3.125%, 03/10/12 | | | 3,500 | | | 3,618,797 |
3.750%, 06/17/13 | | | 2,500 | | | 2,608,375 |
5.250%, 11/07/13 | | | 1,000 | | | 1,103,652 |
Bristol-Myers Squibb Co. | | | | | | |
5.250%, 08/15/13 | | | 600 | | | 653,552 |
Brown-Forman Corp. | | | | | | |
5.000%, 02/01/14 | | | 1,510 | | | 1,611,372 |
Burlington Northern Santa Fe Corp. | | | | | | |
5.900%, 07/01/12 | | | 1,100 | | | 1,201,078 |
Caisse d’Amortissement de la Dette Sociale | | | | | | |
4.125%, 12/09/11 | | | 1,400 | | | 1,479,729 |
3.500%, 07/01/14 | | | 3,800 | | | 3,935,090 |
Campbell Soup Co. | | | | | | |
4.875%, 10/01/13 | | | 2,050 | | | 2,227,618 |
Canadian National Railway Co. | | | | | | |
4.400%, 03/15/13 | | | 600 | | | 634,774 |
Capital One Financial Corp. | | | | | | |
7.375%, 05/23/14 | | | 1,500 | | | 1,702,476 |
Caterpillar Financial Services Corp. | | | | | | |
6.200%, 09/30/13 | | | 1,576 | | | 1,756,194 |
CenterPoint Energy Resources Corp. | | | | | | |
7.875%, 04/01/13 | | | 600 | | | 676,644 |
CIGNA Corp. | | | | | | |
6.375%, 10/15/11 | | | 1,000 | | | 1,064,962 |
Cisco Systems, Inc. | | | | | | |
5.250%, 02/22/11 | | | 1,100 | | | 1,159,805 |
Citigroup, Inc. | | | | | | |
6.000%, 02/21/12 | | | 1,100 | | | 1,169,891 |
6.500%, 08/19/13 | | | 2,000 | | | 2,143,896 |
CNA Financial Corp. | | | | | | |
6.000%, 08/15/11 | | | 1,000 | | | 1,022,197 |
Coca-Cola Co. | | | | | | |
3.625%, 03/15/14 | | | 1,500 | | | 1,563,638 |
Coca-Cola Enterprises, Inc. | | | | | | |
7.375%, 03/03/14 | | | 1,600 | | | 1,879,354 |
Comcast Cable Communications Holdings, Inc. | | | | | | |
8.375%, 03/15/13 | | | 600 | | | 697,429 |
| | | | | | |
| | | Face
Amount | | Value† |
| | |
| | | (000) | | |
Comcast Corp. | | | | | | |
5.300%, 01/15/14 | | $ | 1,000 | | $ | 1,066,464 |
Commonwealth Bank of Australia | | | | | | |
4.750%, 01/27/11 | | | 1,800 | | | 1,854,580 |
2.500%, 12/10/12 | | | 1,400 | | | 1,429,613 |
ConAgra Foods, Inc. | | | | | | |
6.750%, 09/15/11 | | | 800 | | | 872,277 |
ConocoPhillips | | | | | | |
4.750%, 02/01/14 | | | 1,600 | | | 1,717,934 |
Consolidated Edison Co. of New York, Inc. | | | | | | |
3.850%, 06/15/13 | | | 600 | | | 617,557 |
Credit Suisse | | | | | | |
5.000%, 05/15/13 | | | 1,100 | | | 1,174,172 |
Credit Suisse USA, Inc. | | | | | | |
5.125%, 01/15/14 | | | 500 | | | 534,456 |
CSX Corp. | | | | | | |
6.750%, 03/15/11 | | | 600 | | | 638,354 |
5.500%, 08/01/13 | | | 500 | | | 536,301 |
CVS Caremark Corp. | | | | | | |
5.750%, 08/15/11 | | | 600 | | | 645,410 |
4.875%, 09/15/14 | | | 1,000 | | | 1,064,188 |
Dell, Inc. | | | | | | |
4.700%, 04/15/13 | | | 600 | | | 638,446 |
5.625%, 04/15/14 | | | 500 | | | 552,281 |
Detroit Edison Co. | | | | | | |
6.400%, 10/01/13 | | | 600 | | | 666,750 |
Deutsche Bank AG | | | | | | |
4.875%, 05/20/13 | | | 1,100 | | | 1,174,936 |
3.875%, 08/18/14 | | | 500 | | | 509,377 |
Deutsche Telekom International Finance | | | | | | |
5.250%, 07/22/13 | | | 1,500 | | | 1,604,754 |
Devon Energy Corp. | | | | | | |
5.625%, 01/15/14 | | | 1,100 | | | 1,194,474 |
Diageo Capital P.L.C. | | | | | | |
5.200%, 01/30/13 | | | 600 | | | 643,370 |
7.375%, 01/15/14 | | | 1,500 | | | 1,747,209 |
Dominion Resources, Inc. | | | | | | |
5.000%, 03/15/13 | | | 600 | | | 633,395 |
Dover Corp. | | | | | | |
6.500%, 02/15/11 | | | 1,100 | | | 1,173,220 |
Dow Chemical Co. | | | | | | |
6.000%, 10/01/12 | | | 1,500 | | | 1,602,982 |
DTE Energy Co. | | | | | | |
7.625%, 05/15/14 | | | 1,000 | | | 1,103,565 |
Duke Energy Corp. | | | | | | |
3.950%, 09/15/14 | | | 570 | | | 580,364 |
132
DFA SHORT-TERM EXTENDED QUALITY PORTFOLIO
CONTINUED
| | | | | | |
| | | Face
Amount | | Value† |
| | |
| | | (000) | | |
Duke Energy Ohio, Inc. | | | | | | |
5.700%, 09/15/12 | | $ | 450 | | $ | 492,682 |
E.I. Du Pont de Nemours & Co. | | | | | | |
4.750%, 11/15/12 | | | 1,000 | | | 1,071,249 |
5.875%, 01/15/14 | | | 600 | | | 667,774 |
Eaton Corp. | | | | | | |
5.950%, 03/20/14 | | | 600 | | | 659,415 |
Eksportfinans | | | | | | |
5.000%, 02/14/12 | | | 1,900 | | | 2,037,203 |
Eli Lilly & Co. | | | | | | |
3.550%, 03/06/12 | | | 600 | | | 628,208 |
4.200%, 03/06/14 | | | 1,000 | | | 1,061,272 |
Emerson Electric Co. | | | | | | |
5.625%, 11/15/13 | | | 480 | | | 531,532 |
Enbridge Energy Partners LP | | | | | | |
4.750%, 06/01/13 | | | 800 | | | 816,064 |
EnCana Holdings Finance Corp. | | | | | | |
5.800%, 05/01/14 | | | 1,500 | | | 1,635,798 |
Enterprise Products Operating LLC | | | | | | |
7.625%, 02/15/12 | | | 1,500 | | | 1,658,698 |
9.750%, 01/31/14 | | | 600 | | | 723,859 |
Export Development Canada | | | | | | |
2.375%, 03/19/12 | | | 1,000 | | | 1,024,320 |
Express Scripts, Inc. | | | | | | |
5.250%, 06/15/12 | | | 1,500 | | | 1,597,902 |
FirstEnergy Corp. | | | | | | |
6.450%, 11/15/11 | | | 49 | | | 52,959 |
Fortune Brands, Inc. | | | | | | |
4.875%, 12/01/13 | | | 600 | | | 604,052 |
FPL Group Capital, Inc. | | | | | | |
5.625%, 09/01/11 | | | 800 | | | 859,908 |
General Dynamics Corp. | | | | | | |
5.250%, 02/01/14 | | | 1,100 | | | 1,202,883 |
General Electric Capital Corp. | | | | | | |
5.875%, 02/15/12 | | | 600 | | | 646,933 |
4.800%, 05/01/13 | | | 1,000 | | | 1,051,043 |
General Mills, Inc. | | | | | | |
6.000%, 02/15/12 | | | 600 | | | 652,931 |
GlaxoSmithKline Capital, Inc. | | | | | | |
4.850%, 05/15/13 | | | 2,100 | | | 2,264,690 |
Goldman Sachs Group, Inc. | | | | | | |
4.750%, 07/15/13 | | | 1,600 | | | 1,680,534 |
6.000%, 05/01/14 | | | 1,200 | | | 1,319,238 |
Halliburton Co. | | | | | | |
5.500%, 10/15/10 | | | 600 | | | 626,059 |
Hess Corp. | | | | | | |
7.000%, 02/15/14 | | | 1,100 | | | 1,238,230 |
| | | | | | |
| | | Face
Amount | | Value† |
| | |
| | | (000) | | |
Hewlett-Packard Co. | | | | | | |
6.125%, 03/01/14 | | $ | 2,100 | | $ | 2,362,410 |
Home Depot, Inc. | | | | | | |
5.200%, 03/01/11 | | | 1,100 | | | 1,149,118 |
Honeywell International, Inc. | | | | | | |
3.875%, 02/15/14 | | | 2,100 | | | 2,191,266 |
Husky Energy, Inc. | | | | | | |
5.900%, 06/15/14 | | | 1,500 | | | 1,629,513 |
Hydro-Quebec | | | | | | |
6.300%, 05/11/11 | | | 800 | | | 864,398 |
ICI Wilmington, Inc. | | | | | | |
5.625%, 12/01/13 | | | 1,000 | | | 1,030,538 |
Instituto de Credito Oficial | | | | | | |
5.375%, 07/02/12 | | | 8,500 | | | 9,266,981 |
International Business Machines Corp. | | | | | | |
6.500%, 10/15/13 | | | 1,500 | | | 1,716,016 |
John Deere Capital Corp. | | | | | | |
7.000%, 03/15/12 | | | 1,600 | | | 1,789,021 |
Johnson Controls, Inc. | | | | | | |
4.875%, 09/15/13 | | | 1,000 | | | 1,022,991 |
JPMorgan Chase & Co. | | | | | | |
5.375%, 10/01/12 | | | 800 | | | 873,936 |
4.650%, 06/01/14 | | | 500 | | | 527,435 |
Kansas City Power & Light Co. | | | | | | |
6.500%, 11/15/11 | | | 800 | | | 862,947 |
Kellogg Co. | | | | | | |
6.600%, 04/01/11 | | | 600 | | | 645,326 |
Kerr-McGee Corp. | | | | | | |
6.875%, 09/15/11 | | | 400 | | | 432,974 |
Kinder Morgan Energy Partners LP | | | | | | |
7.125%, 03/15/12 | | | 500 | | | 545,425 |
5.850%, 09/15/12 | | | 600 | | | 646,635 |
Kohl’s Corp. | | | | | | |
7.375%, 10/15/11 | | | 600 | | | 659,155 |
Kommunalbanken AS | | | | | | |
5.125%, 05/30/12 | | | 1,500 | | | 1,613,691 |
Kommuninvest I Sverige | | | | | | |
5.375%, 07/03/12 | | | 5,600 | | | 6,107,080 |
Koninklijke Philips Electronics NV | | | | | | |
7.250%, 08/15/13 | | | 1,500 | | | 1,711,214 |
Kraft Foods, Inc. | | | | | | |
6.250%, 06/01/12 | | | 2,100 | | | 2,280,453 |
Kreditanstalt fuer Wiederaufbau | | | | | | |
3.250%, 10/14/11 | | | 1,900 | | | 1,970,710 |
4.750%, 05/15/14 | | | 1,000 | | | 1,085,473 |
Kroger Co. | | | | | | |
6.800%, 04/01/11 | | | 600 | | | 639,222 |
133
DFA SHORT-TERM EXTENDED QUALITY PORTFOLIO
CONTINUED
| | | | | | |
| | | Face
Amount | | Value† |
| | |
| | | (000) | | |
| | |
Lafarge SA | | | | | | |
6.150%, 07/15/11 | | $ | 800 | | $ | 837,002 |
Landeskreditbank Baden-Wuerttemberg Foerderbank | | | | | | |
4.875%, 01/13/12 | | | 1,000 | | | 1,068,198 |
2.000%, 10/01/12 | | | 6,800 | | | 6,792,649 |
Landwirtschaftliche Rentenbank | | | | | | |
1.875%, 09/24/12 | | | 4,000 | | | 4,012,872 |
4.125%, 07/15/13 | | | 1,800 | | | 1,918,447 |
Lowe’s Cos., Inc. | | | | | | |
8.250%, 06/01/10 | | | 600 | | | 626,616 |
Marathon Oil Corp. | | | | | | |
6.125%, 03/15/12 | | | 500 | | | 540,570 |
6.500%, 02/15/14 | | | 1,100 | | | 1,223,583 |
Marriott International, Inc. | | | | | | |
4.625%, 06/15/12 | | | 1,100 | | | 1,109,438 |
Marsh & McLennan Cos., Inc. | | | | | | |
6.250%, 03/15/12 | | | 600 | | | 620,038 |
McDonald’s Corp. | | | | | | |
4.300%, 03/01/13 | | | 600 | | | 637,049 |
McKesson Corp. | | | | | | |
6.500%, 02/15/14 | | | 1,600 | | | 1,759,778 |
Medtronic, Inc. | | | | | | |
4.500%, 03/15/14 | | | 1,100 | | | 1,176,748 |
MetLife, Inc. | | | | | | |
5.375%, 12/15/12 | | | 600 | | | 645,661 |
Molson Coors Capital Finance | | | | | | |
4.850%, 09/22/10 | | | 1,275 | | | 1,318,370 |
Monsanto Co. | | | | | | |
7.375%, 08/15/12 | | | 700 | | | 803,729 |
Morgan Stanley | | | | | | |
5.250%, 11/02/12 | | | 2,000 | | | 2,132,846 |
5.300%, 03/01/13 | | | 1,100 | | | 1,163,552 |
National Rural Utilities Cooperative Finance Corp. | | | | | | |
7.250%, 03/01/12 | | | 1,600 | | | 1,777,846 |
Network Rail Infrastructure Finance P.L.C. | | | | | | |
2.000%, 01/17/12 | | | 2,600 | | | 2,630,053 |
Newell Rubbermaid, Inc. | | | | | | |
4.000%, 05/01/10 | | | 170 | | | 171,679 |
Nisource Finance Corp. | | | | | | |
6.150%, 03/01/13 | | | 1,000 | | | 1,055,831 |
Nordstrom, Inc. | | | | | | |
6.750%, 06/01/14 | | | 1,000 | | | 1,114,334 |
Norfolk Southern Corp. | | | | | | |
8.625%, 05/15/10 | | | 600 | | | 625,347 |
| | | | | | |
| | | Face
Amount | | Value† |
| | |
| | | (000) | | |
| | |
Northern States Power Co. | | | | | | |
8.000%, 08/28/12 | | $ | 800 | | $ | 928,318 |
Northern Trust Corp. | | | | | | |
5.500%, 08/15/13 | | | 2,000 | | | 2,198,796 |
Northrop Grumman Corp. | | | | | | |
3.700%, 08/01/14 | | | 1,500 | | | 1,523,952 |
Northrop Grumman Systems Corp. | | | | | | |
7.125%, 02/15/11 | | | 800 | | | 855,221 |
Occidental Petroleum Corp. | | | | | | |
7.000%, 11/01/13 | | | 1,600 | | | 1,855,416 |
Oesterreichischen Kontrollbank AG | | | | | | |
3.125%, 10/14/11 | | | 1,900 | | | 1,953,947 |
4.750%, 11/08/11 | | | 1,800 | | | 1,916,167 |
4.750%, 10/16/12 | | | 3,800 | | | 4,108,096 |
ONEOK Partners LP | | | | | | |
5.900%, 04/01/12 | | | 600 | | | 631,399 |
Ontario Electricity Financial Corp. | | | | | | |
7.450%, 03/31/13 | | | 1,000 | | | 1,138,169 |
Ontario, Province of | | | | | | |
4.100%, 06/16/14 | | | 7,900 | | | 8,352,559 |
Oracle Corp. | | | | | | |
4.950%, 04/15/13 | | | 1,100 | | | 1,191,159 |
3.750%, 07/08/14 | | | 1,000 | | | 1,039,569 |
PACCAR, Inc. | | | | | | |
6.875%, 02/15/14 | | | 1,500 | | | 1,712,982 |
Pacific Gas & Electric Co. | | | | | | |
4.800%, 03/01/14 | | | 600 | | | 638,737 |
Packaging Corp. of America | | | | | | |
5.750%, 08/01/13 | | | 800 | | | 829,146 |
Panhandle Eastern Pipeline Co. | | | | | | |
6.050%, 08/15/13 | | | 600 | | | 639,702 |
Pepco Holdings, Inc. | | | | | | |
6.450%, 08/15/12 | | | 1,100 | | | 1,181,869 |
PepsiAmericas, Inc. | | | | | | |
4.375%, 02/15/14 | | | 1,100 | | | 1,154,022 |
PepsiCo, Inc. | | | | | | |
3.750%, 03/01/14 | | | 1,500 | | | 1,562,596 |
Philip Morris International, Inc. | | | | | | |
4.875%, 05/16/13 | | | 1,100 | | | 1,170,235 |
Pitney Bowes, Inc. | | | | | | |
4.625%, 10/01/12 | | | 800 | | | 858,202 |
Plains All American Pipeline LP | | | | | | |
4.250%, 09/01/12 | | | 1,500 | | | 1,541,307 |
PNC Funding Corp. | | | | | | |
5.125%, 12/14/10 | | | 600 | | | 619,838 |
5.400%, 06/10/14 | | | 500 | | | 541,213 |
134
DFA SHORT-TERM EXTENDED QUALITY PORTFOLIO
CONTINUED
| | | | | | |
| | | Face
Amount | | Value† |
| | |
| | | (000) | | |
| | |
Potash Corp. of Saskatchewan, Inc. | | | | | | |
7.750%, 05/31/11 | | $ | 600 | | $ | 657,143 |
PPL Energy Supply LLC | | | | | | |
6.300%, 07/15/13 | | | 600 | | | 648,255 |
Praxair, Inc. | | | | | | |
6.375%, 04/01/12 | | | 1,200 | | | 1,326,646 |
Principal Financial Group, Inc. | | | | | | |
7.875%, 05/15/14 | | | 760 | | | 852,313 |
Progress Energy, Inc. | | | | | | |
7.100%, 03/01/11 | | | 600 | | | 636,931 |
Prudential Financial, Inc. | | | | | | |
5.100%, 09/20/14 | | | 1,500 | | | 1,545,344 |
PSEG Power LLC | | | | | | |
5.000%, 04/01/14 | | | 1,000 | | | 1,048,707 |
Rabobank Nederland | | | | | | |
4.200%, 05/13/14 | | | 6,000 | | | 6,256,248 |
Reynolds American, Inc. | | | | | | |
6.500%, 07/15/10 | | | 600 | | | 616,129 |
7.250%, 06/01/13 | | | 1,000 | | | 1,090,254 |
Royal Bank of Canada | | | | | | |
5.650%, 07/20/11 | | | 2,200 | | | 2,363,286 |
Ryder System, Inc. | | | | | | |
5.000%, 06/15/12 | | | 900 | | | 924,113 |
6.000%, 03/01/13 | | | 600 | | | 632,474 |
Safeway, Inc. | | | | | | |
4.950%, 08/16/10 | | | 600 | | | 618,641 |
5.800%, 08/15/12 | | | 500 | | | 546,807 |
5.625%, 08/15/14 | | | 1,000 | | | 1,088,434 |
Sara Lee Corp. | | | | | | |
6.250%, 09/15/11 | | | 1,100 | | | 1,187,447 |
Smith International, Inc. | | | | | | |
8.625%, 03/15/14 | | | 1,000 | | | 1,147,199 |
Southern California Edison Co. | | | | | | |
5.750%, 03/15/14 | | | 800 | | | 891,441 |
Southern Co. | | | | | | |
5.300%, 01/15/12 | | | 1,600 | | | 1,716,120 |
Southwest Airlines Co. | | | | | | |
5.250%, 10/01/14 | | | 2,000 | | | 2,015,372 |
Spectra Energy Capital LLC | | | | | | |
5.668%, 08/15/14 | | | 1,500 | | | 1,596,045 |
St. Jude Medical, Inc. | | | | | | |
3.750%, 07/15/14 | | | 2,000 | | | 2,037,064 |
State Street Corp. | | | | | | |
4.300%, 05/30/14 | | | 1,500 | | | 1,576,804 |
SunTrust Banks, Inc. | | | | | | |
5.250%, 11/05/12 | | | 1,100 | | | 1,150,902 |
Svensk Exportkredit AB | | | | | | |
4.875%, 09/29/11 | | | 1,000 | | | 1,065,380 |
| | | | | | |
| | | Face
Amount | | Value† |
| | |
| | | (000) | | |
| | |
Tampa Electric Co. | | | | | | |
6.375%, 08/15/12 | | $ | 600 | | $ | 649,262 |
Target Corp. | | | | | | |
6.350%, 01/15/11 | | | 600 | | | 635,190 |
5.875%, 03/01/12 | | | 1,000 | | | 1,089,372 |
Time Warner Cable, Inc. | | | | | | |
5.400%, 07/02/12 | | | 800 | | | 854,436 |
6.200%, 07/01/13 | | | 800 | | | 876,430 |
Total Capital SA | | | | | | |
5.000%, 05/22/12 | | | 2,900 | | | 3,120,191 |
Toyota Motor Credit Corp. | | | | | | |
4.250%, 06/27/11 | | | 2,500 | | | 2,591,455 |
TransCanada Pipelines, Ltd. | | | | | | |
4.000%, 06/15/13 | | | 800 | | | 815,925 |
Transocean, Inc. | | | | | | |
5.250%, 03/15/13 | | | 595 | | | 632,821 |
Unilever Capital Corp. | | | | | | |
3.650%, 02/15/14 | | | 1,650 | | | 1,712,306 |
Union Pacific Corp. | | | | | | |
6.650%, 01/15/11 | | | 1,100 | | | 1,160,965 |
United Technologies Corp. | | | | | | |
6.100%, 05/15/12 | | | 1,600 | | | 1,765,568 |
UnitedHealth Group, Inc. | | | | | | |
5.250%, 03/15/11 | | | 1,100 | | | 1,148,226 |
Valero Energy Corp. | | | | | | |
6.875%, 04/15/12 | | | 1,600 | | | 1,743,286 |
Veolia Environnement | | | | | | |
5.250%, 06/03/13 | | | 800 | | | 851,553 |
Verizon Communications, Inc. | | | | | | |
4.350%, 02/15/13 | | | 600 | | | 632,038 |
5.250%, 04/15/13 | | | 1,500 | | | 1,628,220 |
Wal-Mart Stores, Inc. | | | | | | |
5.000%, 04/05/12 | | | 3,300 | | | 3,564,591 |
7.250%, 06/01/13 | | | 1,000 | | | 1,167,626 |
3.200%, 05/15/14 | | | 3,000 | | | 3,074,181 |
Walt Disney Co. | | | | | | |
4.700%, 12/01/12 | | | 500 | | | 539,968 |
4.500%, 12/15/13 | | | 1,100 | | | 1,179,237 |
Waste Management, Inc. | | | | | | |
6.375%, 11/15/12 | | | 655 | | | 717,535 |
5.000%, 03/15/14 | | | 258 | | | 268,855 |
Weatherford International, Ltd. | | | | | | |
4.950%, 10/15/13 | | | 1,045 | | | 1,097,081 |
Wellpoint Health Networks, Inc. | | | | | | |
6.375%, 01/15/12 | | | 600 | | | 645,484 |
Wells Fargo Bank & Co. | | | | | | |
5.250%, 10/23/12 | | | 2,600 | | | 2,781,431 |
Western Union Co. | | | | | | |
6.500%, 02/26/14 | | | 600 | | | 678,592 |
135
DFA SHORT-TERM EXTENDED QUALITY PORTFOLIO
CONTINUED
| | | | | | |
| | | Face
Amount | | Value† |
| | |
| | | (000) | | |
| | |
WR Berkley Corp. | | | | | | |
5.875%, 02/15/13 | | $ | 1,000 | | $ | 994,514 |
XTO Energy, Inc. | | | | | | |
5.900%, 08/01/12 | | | 1,500 | | | 1,618,857 |
5.750%, 12/15/13 | | | 600 | | | 652,721 |
Yum! Brands, Inc. | | | | | | |
8.875%, 04/15/11 | | | 820 | | | 893,512 |
| | | | | | |
TOTAL BONDS | | | | | | 345,909,699 |
| | | | | | |
| | | | | | |
| | | Face
Amount | | Value† |
| | |
| | | (000) | | |
| | |
TEMPORARY CASH INVESTMENTS — (1.5%) | | | | | | |
Repurchase Agreement, PNC Capital Markets, Inc. 0.19%, 11/02/09 (Collateralized by $10,215,000 FNMA 4.381%(r), 10/01/35, valued at $5,723,998) to be repurchased at $5,637,089 | | $ | 5,637 | | $ | 5,637,000 |
| | | | | | |
TOTAL INVESTMENTS — (100.0%)
(Cost $365,573,230) | | | | | $ | 376,662,354 |
| | | | | | |
Summary of inputs used to value the Portfolio’s net assets as of October 31, 2009 is as follows (See Security Valuation Note):
| | | | | | | | | | |
| | | Valuation Inputs |
| |
| | | Investment in Securities (Market Value) |
| | | Level 1 | | Level 2 | | Level 3 | | Total |
Agency Obligations | | — | | $ | 25,115,655 | | — | | $ | 25,115,655 |
Bonds | | — | | | 345,909,699 | | — | | | 345,909,699 |
Temporary Cash Investments | | — | | | 5,637,000 | | — | | | 5,637,000 |
| | | | | | | | | | |
TOTAL | | — | | $ | 376,662,354 | | — | | $ | 376,662,354 |
| | | | | | | | | | |
See accompanying Notes to Financial Statements.
136
DFA INFLATION-PROTECTED SECURITIES PORTFOLIO
SCHEDULE OF INVESTMENTS
October 31, 2009
| | | | | | |
| | | Face
Amount | | Value† |
| | |
| | | (000) | | |
U.S. TREASURY OBLIGATIONS — (99.3%) | | | | | | |
U.S. Treasury Inflation Notes | | | | | | |
1.875%, 07/15/13 | | $ | 10,700 | | $ | 13,161,612 |
2.000%, 01/15/14 | | | 44,800 | | | 54,927,184 |
2.000%, 07/15/14 | | | 49,700 | | | 60,015,702 |
1.625%, 01/15/15 | | | 53,100 | | | 62,052,025 |
1.875%, 07/15/15 | | | 55,300 | | | 64,320,694 |
2.000%, 01/15/16 | | | 50,550 | | | 57,813,690 |
2.500%, 07/15/16 | | | 48,500 | | | 56,316,925 |
2.375%, 01/15/17 | | | 49,900 | | | 57,582,741 |
2.625%, 07/15/17 | | | 42,100 | | | 48,236,964 |
1.625%, 01/15/18 | | | 38,700 | | | 40,836,576 |
1.375%, 07/15/18 | | | 32,300 | | | 32,468,489 |
2.125%, 01/15/19 | | | 31,900 | | | 34,130,585 |
1.875%, 07/15/19 | | | 20,400 | | | 21,539,670 |
2.375%, 01/15/25 | | | 27,500 | | | 33,463,688 |
2.000%, 01/15/26 | | | 22,400 | | | 24,572,204 |
2.375%, 01/15/27 | | | 18,300 | | | 20,709,036 |
1.750%, 01/15/28 | | | 22,200 | | | 22,014,229 |
3.625%, 04/15/28 | | | 11,200 | | | 18,529,037 |
2.500%, 01/15/29 | | | 11,300 | | | 12,222,364 |
3.875%, 04/15/29 | | | 16,400 | | | 27,746,673 |
| | | | | | |
TOTAL U.S. TREASURY OBLIGATIONS | | | | | | 762,660,088 |
| | | | | | |
TEMPORARY CASH INVESTMENTS — (0.7%) | | | | | | |
Repurchase Agreement, PNC Capital Markets, Inc. 0.19%, 11/02/09 (Collateralized by $5,005,000 FNMA 6.50%, 06/25/39, valued at $5,267,763) to be repurchased at $5,189,082 | | | 5,189 | | | 5,189,000 |
| | | | | | |
TOTAL INVESTMENTS — (100.0%)
(Cost $737,599,192) | | | | | $ | 767,849,088 |
| | | | | | |
Summary of inputs used to value the Portfolio’s net assets as of October 31, 2009 is as follows (See Security Valuation Note):
| | | | | | | | | | |
| | | Valuation Inputs |
| |
| | | Investment in Securities (Market Value) |
| | | Level 1 | | Level 2 | | Level 3 | | Total |
U.S. Treasury Obligations | | — | | $ | 762,660,088 | | — | | $ | 762,660,088 |
Temporary Cash Investments | | — | | | 5,189,000 | | — | | | 5,189,000 |
| | | | | | | | | | |
TOTAL | | — | | $ | 767,849,088 | | — | | $ | 767,849,088 |
| | | | | | | | | | |
See accompanying Notes to Financial Statements.
137
DFA SHORT-TERM MUNICIPAL BOND PORTFOLIO
SCHEDULE OF INVESTMENTS
October 31, 2009
| | | | | | |
| | | Face
Amount | | Value† |
| | |
| | | (000) | | |
MUNICIPAL BONDS — (97.3%) | | | | | | |
ARIZONA — (3.8%) | | | | | | |
Arizona State Transportation Board (RB) | | | | | | |
5.000%, 07/01/13 | | $ | 8,000 | | $ | 8,974,720 |
City of Phoenix (GO) Series A | | | | | | |
5.000%, 07/01/14 | | | 7,975 | | | 8,999,788 |
Maricopa County Unified School District (GO) | | | | | | |
7.400%, 07/01/10 | | | 3,485 | | | 3,646,878 |
Maricopa County Unified School District (GO) (FSA) | | | | | | |
5.000%, 07/01/13 | | | 6,800 | | | 7,595,056 |
Salt River Project Agricultural Improvement & Power District (RB) Series A | | | | | | |
5.000%, 01/01/14 | | | 7,000 | | | 7,801,150 |
Scottsdale Municipal Property Corp. (RB) | | | | | | |
5.000%, 07/01/13 | | | 3,070 | | | 3,409,327 |
Town of Gilbert (GO) | | | | | | |
5.000%, 07/01/14 | | | 3,600 | | | 4,069,440 |
| | | | | | |
TOTAL ARIZONA | | | | | | 44,496,359 |
| | | | | | |
| | |
CALIFORNIA — (2.6%) | | | | | | |
California State (GO) | | | | | | |
5.250%, 11/01/09 | | | 7,695 | | | 7,695,000 |
California State Department of Water Resources Power Supply (RB) (ETM) Series A | | | | | | |
5.125%, 05/01/12 | | | 1,900 | | | 2,110,938 |
California State Economic Recovery (GO) Series A | | | | | | |
5.000%, 01/01/11 | | | 9,100 | | | 9,509,409 |
California State Economic Recovery (GO) Series A (MBIA) | | | | | | |
5.000%, 07/01/12 | | | 8,400 | | | 9,092,244 |
Los Angeles Unified School District (GO) Series E (AMBAC) | | | | | | |
5.750%, 07/01/12 | | | 2,000 | | | 2,222,880 |
| | | | | | |
TOTAL CALIFORNIA | | | | | | 30,630,471 |
| | | | | | |
| | |
COLORADO — (0.8%) | | | | | | |
Arapahoe County School District (GO) (FSA) | | | | | | |
5.000%, 12/15/10 | | | 9,000 | | | 9,448,200 |
| | | | | | |
| | | | | | |
| | | Face
Amount | | Value† |
| | |
| | | (000) | | |
| | |
CONNECTICUT — (2.8%) | | | | | | |
Connecticut State (GO) | | | | | | |
5.000%, 03/15/12 | | $ | 5,000 | | $ | 5,461,100 |
Connecticut State (GO) Series A | | | | | | |
5.000%, 03/01/13 | | | 3,855 | | | 4,296,282 |
5.000%, 04/15/13 | | | 4,000 | | | 4,471,480 |
Connecticut State (GO) Series B | | | | | | |
5.000%, 12/01/13 | | | 5,000 | | | 5,674,350 |
Connecticut State (GO) Series C | | | | | | |
5.000%, 12/15/09 | | | 4,000 | | | 4,021,360 |
Connecticut State (GO) Series E | | | | | | |
5.500%, 11/15/12 | | | 3,300 | | | 3,724,215 |
Connecticut State Health & Educational Facility Authority (GO) Series B (MBIA) | | | | | | |
5.000%, 12/01/12 | | | 4,000 | | | 4,460,080 |
| | | | | | |
TOTAL CONNECTICUT | | | | | | 32,108,867 |
| | | | | | |
| | |
DELAWARE — (2.2%) | | | | | | |
Delaware State (GO) | | | | | | |
5.000%, 08/01/12 | | | 11,370 | | | 12,580,450 |
Delaware State (GO) Series B | | | | | | |
5.000%, 02/01/11 | | | 7,470 | | | 7,873,007 |
5.000%, 02/01/12 | | | 5,000 | | | 5,451,500 |
| | | | | | |
TOTAL DELAWARE | | | | | | 25,904,957 |
| | | | | | |
| | |
FLORIDA — (4.7%) | | | | | | |
Broward County (GO) | | | | | | |
5.000%, 01/01/14 | | | 5,000 | | | 5,642,450 |
City of Gainesville (RB) Series C | | | | | | |
5.000%, 10/01/10 | | | 2,265 | | | 2,358,092 |
Florida State Board of Education (GO) Series 2006C | | | | | | |
5.000%, 06/01/12 | | | 2,935 | | | 3,190,374 |
Florida State Board of Education (GO) Series B | | | | | | |
5.250%, 06/01/13 | | | 3,700 | | | 4,133,196 |
Florida State Board of Education (GO) Series D | | | | | | |
5.000%, 06/01/13 | | | 13,085 | | | 14,504,330 |
Florida State Board of Education (GO) Series H | | | | | | |
5.250%, 06/01/12 | | | 4,650 | | | 5,083,845 |
138
DFA SHORT-TERM MUNICIPAL BOND PORTFOLIO
CONTINUED
| | | | | | |
| | | Face
Amount | | Value† |
| | |
| | | (000) | | |
| | |
FLORIDA — (Continued) | | | | | | |
Florida State Department of Environmental Protection Preservation (RB) Series A (MBIA) | | | | | | |
5.000%, 07/01/11 | | $ | 5,330 | | $ | 5,629,813 |
5.000%, 07/01/11 | | | 5,130 | | | 5,418,563 |
Florida State Department of Environmental Protection Preservation (RB) Series B (MBIA) | | | | | | |
5.000%, 07/01/11 | | | 5,800 | | | 6,145,912 |
Johns River Power Park System (RB) Series 21 | | | | | | |
5.000%, 10/01/11 | | | 2,325 | | | 2,494,376 |
| | | | | | |
TOTAL FLORIDA | | | | | | 54,600,951 |
| | | | | | |
| | |
GEORGIA — (6.2%) | | | | | | |
De Kalb County School District (GO) | | | | | | |
5.000%, 02/01/12 | | | 21,330 | | | 23,201,494 |
Georgia State (GO) Series C | | | | | | |
5.500%, 07/01/12 | | | 8,400 | | | 9,379,608 |
Georgia State (GO) Series D | | | | | | |
5.800%, 11/01/09 | | | 2,010 | | | 2,010,000 |
5.000%, 08/01/12 | | | 7,100 | | | 7,855,866 |
Georgia State (GO) Series G | | | | | | |
5.000%, 10/01/12 | | | 8,000 | | | 8,897,840 |
Henry County School District (GO) Series A | | | | | | |
5.000%, 04/01/13 | | | 14,000 | | | 15,636,880 |
Private Colleges & Universities Authority (RB) Series A | | | | | | |
4.750%, 09/01/12 | | | 4,450 | | | 4,883,519 |
| | | | | | |
TOTAL GEORGIA | | | | | | 71,865,207 |
| | | | | | |
| | |
HAWAII — (2.0%) | | | | | | |
City & County of Honolulu (GO) (ETM) Series A (MBIA) | | | | | | |
5.000%, 03/01/10 | | | 1,255 | | | 1,274,139 |
City & County of Honolulu (GO) Series A (MBIA) | | | | | | |
5.000%, 03/01/10 | | | 745 | | | 756,339 |
City & County of Honolulu (GO) Series C (MBIA) | | | | | | |
5.000%, 07/01/12 | | | 5,000 | | | 5,484,500 |
| | | | | | |
| | | Face
Amount | | Value† |
| | |
| | | (000) | | |
| | |
HAWAII — (Continued) | | | | | | |
Hawaii State (GO) Series CY (FSA) | | | | | | |
5.750%, 02/01/13 | | $ | 4,750 | | $ | 5,392,770 |
Hawaii State (GO) Series DE | | | | | | |
5.000%, 10/01/12 | | | 3,340 | | | 3,699,618 |
Hawaii State (GO) Series DG (AMBAC) | | | | | | |
5.000%, 07/01/13 | | | 6,000 | | | 6,719,700 |
| | | | | | |
TOTAL HAWAII | | | | | | 23,327,066 |
| | | | | | |
| | |
ILLINOIS — (1.9%) | | | | | | |
Chicago Park District (GO) Series A (FGIC) | | | | | | |
5.250%, 01/01/13 | | | 4,935 | | | 5,523,153 |
City of Chicago (GO) Series A (FSA) | | | | | | |
5.000%, 01/01/13 | | | 8,150 | | | 8,957,584 |
Cook County (GO) Series D (AMBAC) | | | | | | |
5.250%, 11/15/12 | | | 2,000 | | | 2,210,720 |
Illinois State (GO) First Series (MBIA) | | | | | | |
5.125%, 10/01/11 | | | 5,300 | | | 5,677,678 |
| | | | | | |
TOTAL ILLINOIS | | | | | | 22,369,135 |
| | | | | | |
| | |
KANSAS — (0.5%) | | | | | | |
Johnson County Unified School District (GO) Series A (MBIA) | | | | | | |
5.000%, 10/01/11 | | | 5,770 | | | 6,220,002 |
| | | | | | |
| | |
KENTUCKY — (1.3%) | | | | | | |
Kentucky Asset Liability Commission (RB) First Series (MBIA) | | | | | | |
5.000%, 09/01/11 | | | 14,300 | | | 15,221,492 |
| | | | | | |
| | |
MARYLAND — (3.6%) | | | | | | |
Baltimore County (GO) | | | | | | |
5.000%, 02/01/12 | | | 1,700 | | | 1,851,929 |
5.000%, 02/01/14 | | | 4,750 | | | 5,370,018 |
Maryland State (GO) | | | | | | |
5.250%, 02/15/12 | | | 5,000 | | | 5,489,800 |
5.500%, 08/01/13 | | | 6,000 | | | 6,888,840 |
Maryland State (GO) Series B | | | | | | |
5.000%, 02/15/13 | | | 14,000 | | | 15,653,260 |
139
DFA SHORT-TERM MUNICIPAL BOND PORTFOLIO
CONTINUED
| | | | | | |
| | | Face
Amount | | Value† |
| | |
| | | (000) | | |
| | |
MARYLAND — (Continued) | | | | | | |
Montgomery County (GO) Series A | | | | | | |
5.000%, 08/01/12 | | $ | 5,990 | | $ | 6,629,432 |
| | | | | | |
TOTAL MARYLAND | | | | | | 41,883,279 |
| | | | | | |
| | |
MASSACHUSETTS — (2.6%) | | | | | | |
City of Boston (GO) Series A | | | | | | |
5.000%, 04/01/14 | | | 4,650 | | | 5,267,288 |
Commonwealth of Massachusetts (GO) Series D | | | | | | |
5.500%, 11/01/13 | | | 7,550 | | | 8,646,411 |
Commonwealth of Massachusetts (GO) Series D (NATL-RE) | | | | | | |
5.500%, 11/01/12 | | | 910 | | | 1,022,358 |
Commonwealth of Massachusetts (RB) Series A | | | | | | |
5.500%, 12/15/13 | | | 9,450 | | | 10,846,426 |
University of Massachusetts Building Authority (RB) Series 1 | | | | | | |
5.250%, 11/01/13 | | | 3,490 | | | 3,996,678 |
| | | | | | |
TOTAL MASSACHUSETTS | | | | | | 29,779,161 |
| | | | | | |
| | |
MICHIGAN — (3.4%) | | | | | | |
Kent County (GO) Series A | | | | | | |
5.000%, 11/01/09 | | | 7,235 | | | 7,235,000 |
Michigan Municipal Bond Authority (RB) | | | | | | |
5.000%, 10/01/13 | | | 3,240 | | | 3,643,898 |
5.500%, 10/01/13 | | | 15,085 | | | 17,249,547 |
Michigan State (GO) | | | | | | |
5.500%, 12/01/13 | | | 10,000 | | | 11,167,600 |
| | | | | | |
TOTAL MICHIGAN | | | | | | 39,296,045 |
| | | | | | |
| | |
MINNESOTA — (3.1%) | | | | | | |
City of Minneapolis (GO) | | | | | | |
5.000%, 12/01/10 | | | 6,840 | | | 7,173,382 |
City of Minneapolis (GO) Series A | | | | | | |
3.000%, 12/01/12 | | | 5,200 | | | 5,496,296 |
Minnesota Public Facilities Authority (RB) Series B | | | | | | |
5.000%, 03/01/14 | | | 5,800 | | | 6,573,952 |
Minnesota State (GO) | | | | | | |
5.000%, 06/01/11 | | | 7,050 | | | 7,523,972 |
5.250%, 11/01/12 | | | 8,000 | | | 8,969,360 |
| | | | | | |
TOTAL MINNESOTA | | | | | | 35,736,962 |
| | | | | | |
| | | | | | |
| | | Face
Amount | | Value† |
| | |
| | | (000) | | |
| | |
MISSISSIPPI — (0.3%) | | | | | | |
Mississippi State (GO) Series A | | | | | | |
5.375%, 12/01/12 | | $ | 3,350 | | $ | 3,761,246 |
| | | | | | |
| | |
MISSOURI — (0.3%) | | | | | | |
Missouri State (GO) Series A | | | | | | |
5.000%, 10/01/13 | | | 2,600 | | | 2,948,374 |
| | | | | | |
| | |
NEVADA — (3.9%) | | | | | | |
Clark County (GO) (AMBAC) | | | | | | |
5.000%, 11/01/11 | | | 5,010 | | | 5,379,437 |
Clark County School District (GO) Series A (AMBAC) | | | | | | |
4.500%, 06/15/11 | | | 11,000 | | | 11,580,140 |
Nevada State (GO) | | | | | | |
5.000%, 06/01/13 | | | 12,990 | | | 14,318,487 |
5.000%, 12/01/13 | | | 1,400 | | | 1,559,488 |
Nevada State (GO) Series A | | | | | | |
5.000%, 02/01/10 | | | 10,045 | | | 10,158,709 |
5.000%, 02/01/12 | | | 2,000 | | | 2,157,380 |
| | | | | | |
TOTAL NEVADA | | | | | | 45,153,641 |
| | | | | | |
| | |
NEW JERSEY — (2.8%) | | | | | | |
Monmouth County (GO) | | | | | | |
4.250%, 09/15/12 | | | 5,115 | | | 5,574,020 |
New Jersey State (GO) | | | | | | |
5.000%, 04/01/13 | | | 3,900 | | | 4,340,817 |
New Jersey State (GO) (ETM) | | | | | | |
5.250%, 08/01/12 | | | 8,400 | | | 9,338,784 |
New Jersey Transportation Trust Fund Authority (RB) Series B (FGIC) | | | | | | |
5.250%, 12/15/09 | | | 6,130 | | | 6,163,776 |
New Jersey Transportation Trust Fund Authority (RB) Series B (FSA) | | | | | | |
5.500%, 12/15/11 | | | 6,035 | | | 6,547,190 |
| | | | | | |
TOTAL NEW JERSEY | | | | | | 31,964,587 |
| | | | | | |
| | |
NEW MEXICO — (2.0%) | | | | | | |
New Mexico State (GO) | | | | | | |
5.000%, 03/01/12 | | | 10,260 | | | 11,188,325 |
New Mexico State Severance Tax (RB) (MBIA) | | | | | | |
5.000%, 07/01/10 | | | 11,385 | | | 11,734,292 |
| | | | | | |
TOTAL NEW MEXICO | | | | | | 22,922,617 |
| | | | | | |
140
DFA SHORT-TERM MUNICIPAL BOND PORTFOLIO
CONTINUED
| | | | | | |
| | | Face
Amount | | Value† |
| | |
| | | (000) | | |
| | |
NEW YORK — (4.2%) | | | | | | |
Nassau County Interim Finance Authority (RB) Series A (AMBAC) | | | | | | |
5.000%, 11/15/09 | | $ | 3,415 | | $ | 3,419,952 |
New York City (GO) Series C | | | | | | |
5.000%, 08/01/10 | | | 5,000 | | | 5,164,800 |
New York City (GO) Series G | | | | | | |
5.000%, 08/01/10 | | | 5,040 | | | 5,206,118 |
New York City (GO) Series H | | | | | | |
5.000%, 08/01/12 | | | 3,000 | | | 3,265,710 |
New York City (GO) Series J-1 | | | | | | |
5.000%, 08/01/10 | | | 11,180 | | | 11,548,493 |
New York State (GO) Series A | | | | | | |
3.500%, 03/15/12 | | | 1,755 | | | 1,852,578 |
New York State Dormitory Authority (RB) | | | | | | |
5.000%, 07/01/13 | | | 4,590 | | | 5,150,990 |
New York State Dormitory Authority (RB) Series C | | | | | | |
5.000%, 03/15/14 | | | 7,500 | | | 8,349,225 |
New York State Tollway Authority (RB) (MBIA) | | | | | | |
5.000%, 01/01/10 | | | 5,000 | | | 5,035,750 |
| | | | | | |
TOTAL NEW YORK | | | | | | 48,993,616 |
| | | | | | |
| | |
NORTH CAROLINA — (4.5%) | | | | | | |
Guilford County (GO) Series C | | | | | | |
5.000%, 10/01/12 | | | 8,040 | | | 8,942,329 |
Mecklenburg County | | | | | | |
5.000%, 02/01/14 | | | 5,680 | | | 6,441,290 |
North Carolina State (GO) Series A | | | | | | |
5.000%, 03/01/11 | | | 13,000 | | | 13,757,250 |
5.000%, 06/01/11 | | | 10,000 | | | 10,675,600 |
5.500%, 03/01/14 | | | 3,000 | | | 3,462,510 |
Wake County (GO) | | | | | | |
4.500%, 03/01/13 | | | 7,800 | | | 8,596,146 |
| | | | | | |
TOTAL NORTH CAROLINA | | | | | | 51,875,125 |
| | | | | | |
| | |
OHIO — (4.5%) | | | | | | |
Cincinnati City School District (GO) (FSA) | | | | | | |
5.000%, 12/01/13 | | | 11,730 | | | 13,351,907 |
City of Columbus (GO) Series 2 | | | | | | |
5.000%, 07/01/13 | | | 3,000 | | | 3,370,080 |
5.000%, 07/01/14 | | | 4,605 | | | 5,229,622 |
| | | | | | |
| | | Face
Amount | | Value† |
| | |
| | | (000) | | |
| | |
OHIO — (Continued) | | | | | | |
City of Columbus (GO) Series A | | | | | | |
5.000%, 06/15/12 | | $ | 3,875 | | $ | 4,265,406 |
Ohio State (GO) | | | | | | |
5.500%, 11/01/12 | | | 8,615 | | | 9,651,729 |
5.000%, 05/01/14 | | | 5,000 | | | 5,607,000 |
Ohio State (GO) Series E | | | | | | |
5.000%, 09/15/11 | | | 10,470 | | | 11,239,336 |
| | | | | | |
TOTAL OHIO | | | | | | 52,715,080 |
| | | | | | |
| | |
OKLAHOMA — (0.6%) | | | | | | |
Oklahoma Turnpike Authority (RB) Series A | | | | | | |
5.000%, 01/01/10 | | | 7,160 | | | 7,213,772 |
| | | | | | |
| | |
PENNSYLVANIA — (2.6%) | | | | | | |
Commonwealth of Pennsylvania (GO) First Series | | | | | | |
5.000%, 08/01/11 | | | 13,000 | | | 13,935,220 |
Commonwealth of Pennsylvania (GO) First Series (MBIA) | | | | | | |
5.000%, 01/01/10 | | | 3,500 | | | 3,525,935 |
5.250%, 02/01/13 | | | 5,755 | | | 6,444,967 |
Commonwealth of Pennsylvania (GO) First Series A | | | | | | |
5.000%, 11/01/10 | | | 3,000 | | | 3,136,140 |
Commonwealth of Pennsylvania, (GO) Third Series | | | | | | |
5.000%, 09/01/12 | | | 2,800 | | | 3,096,268 |
| | | | | | |
TOTAL PENNSYLVANIA | | | | | | 30,138,530 |
| | | | | | |
| | |
RHODE ISLAND — (0.9%) | | | | | | |
Rhode Island State & Providence Plantations (GO) Series B | | | | | | |
5.000%, 08/01/12 | | | 5,200 | | | 5,713,500 |
5.000%, 08/01/13 | | | 4,700 | | | 5,254,412 |
| | | | | | |
TOTAL RHODE ISLAND | | | | | | 10,967,912 |
| | | | | | |
| | |
SOUTH CAROLINA — (0.4%) | | | | | | |
Beaufort County School District (GO) Series B (SCSDE) | | | | | | |
5.000%, 03/01/14 | | | 2,795 | | | 3,155,527 |
Richland County School District No. 2 (GO) Series B (FGIC) | | | | | | |
5.000%, 02/01/10 | | | 1,500 | | | 1,517,010 |
| | | | | | |
TOTAL SOUTH CAROLINA | | | | | | 4,672,537 |
| | | | | | |
141
DFA SHORT-TERM MUNICIPAL BOND PORTFOLIO
CONTINUED
| | | | | | |
| | | Face
Amount | | Value† |
| | |
| | | (000) | | |
| | |
TENNESSEE — (2.7%) | | | | | | |
Hamilton County (GO) | | | | | | |
5.000%, 03/01/11 | | $ | 5,700 | | $ | 6,021,081 |
5.000%, 03/01/12 | | | 5,095 | | | 5,554,722 |
Knox County (GO) | | | | | | |
5.500%, 04/01/14 | | | 6,300 | | | 7,254,639 |
Shelby County (GO) | | | | | | |
5.000%, 04/01/14 | | | 8,345 | | | 9,403,730 |
Tennessee State (GO) Series A | | | | | | |
5.000%, 05/01/14 | | | 3,000 | | | 3,402,720 |
| | | | | | |
TOTAL TENNESSEE | | | | | | 31,636,892 |
| | | | | | |
| | |
TEXAS — (13.2%) | | | | | | |
Arlington Independent School District (GO) | | | | | | |
5.000%, 02/15/14 | | | 5,885 | | | 6,636,632 |
Austin Independent School District (GO) (PSF-GTD) | | | | | | |
5.000%, 08/01/14 | | | 6,895 | | | 7,839,477 |
City of Dallas (GO) | | | | | | |
4.750%, 02/15/10 | | | 11,675 | | | 11,820,587 |
5.000%, 02/15/14 | | | 8,770 | | | 9,843,974 |
5.000%, 02/15/14 | | | 4,585 | | | 5,146,479 |
City of Dallas (RB) (AMBAC) | | | | | | |
5.000%, 10/01/12 | | | 13,985 | | | 15,456,921 |
5.000%, 10/01/13 | | | 7,605 | | | 8,553,039 |
City of San Antonio (RB) (NATL-RE FGIC) | | | | | | |
5.000%, 05/15/12 | | | 7,000 | | | 7,651,840 |
City of San Antonio (RB) Series A | | | | | | |
5.500%, 02/01/11 | | | 2,000 | | | 2,117,160 |
Dallas Area Rapid Transit (RB) (FGIC) | | | | | | |
5.000%, 12/01/12 | | | 10,475 | | | 11,706,755 |
Fort Worth Independent School District (GO) | | | | | | |
5.000%, 02/15/13 | | | 8,025 | | | 8,923,399 |
Katy Independent School District (GO) Series A | | | | | | |
5.000%, 02/15/12 | | | 7,465 | | | 8,145,360 |
North Texas Municipal Water District (RB) | | | | | | |
5.000%, 09/01/14 | | | 605 | | | 685,386 |
San Marcos Consolidated Independent School District (GO) (PSF-GTD) | | | | | | |
5.250%, 08/01/14 | | | 3,195 | | | 3,685,880 |
5.500%, 08/01/14 | | | 4,200 | | | 4,892,748 |
| | | | | | |
| | | Face
Amount | | Value† |
| | |
| | | (000) | | |
| | |
TEXAS — (Continued) | | | | | | |
Texas A&M University (RB) Series B | | | | | | |
5.000%, 05/15/12 | | $ | 3,975 | | $ | 4,351,432 |
Texas Public Finance Authority (GO) Series A | | | | | | |
5.000%, 10/01/12 | | | 1,500 | | | 1,662,420 |
Texas State (GO) | | | | | | |
5.000%, 10/01/12 | | | 3,000 | | | 3,324,840 |
Texas State Transportation Commission (RB) | | | | | | |
4.000%, 04/01/13 | | | 1,500 | | | 1,621,005 |
5.000%, 04/01/14 | | | 5,870 | | | 6,617,368 |
Travis County (GO) | | | | | | |
5.000%, 03/01/12 | | | 3,375 | | | 3,672,202 |
University of Texas (RB) Series A | | | | | | |
5.000%, 08/15/12 | | | 3,500 | | | 3,864,595 |
5.000%, 07/01/14 | | | 5,250 | | | 5,987,258 |
University of Texas (RB) Series B | | | | | | |
5.250%, 08/15/12 | | | 2,730 | | | 3,033,003 |
5.250%, 08/15/13 | | | 3,850 | | | 4,367,979 |
University of Texas (RB) Series D | | | | | | |
5.000%, 08/15/12 | | | 1,815 | | | 2,004,069 |
| | | | | | |
TOTAL TEXAS | | | | | | 153,611,808 |
| | | | | | |
| | |
UTAH — (2.0%) | | | | | | |
Salt Lake County (GO) | | | | | | |
5.000%, 06/15/12 | | | 10,060 | | | 11,081,794 |
Utah State (GO) Series A | | | | | | |
5.000%, 07/01/12 | | | 6,440 | | | 7,099,714 |
Utah State (GO) Series B | | | | | | |
4.000%, 07/01/13 | | | 4,700 | | | 5,121,919 |
| | | | | | |
TOTAL UTAH | | | | | | 23,303,427 |
| | | | | | |
| | |
VIRGINIA — (4.8%) | | | | | | |
Fairfax County (GO) Series A | | | | | | |
5.000%, 04/01/13 | | | 9,975 | | | 11,180,180 |
5.000%, 04/01/14 | | | 9,375 | | | 10,649,250 |
Loudoun County (GO) Series B | | | | | | |
4.000%, 11/01/12 | | | 1,000 | | | 1,087,890 |
5.000%, 12/01/13 | | | 5,285 | | | 6,024,741 |
Virginia Commonwealth Transportation Board (RB) | | | | | | |
5.000%, 10/01/11 | | | 1,940 | | | 2,092,057 |
5.000%, 09/27/12 | | | 4,040 | | | 4,477,007 |
142
DFA SHORT-TERM MUNICIPAL BOND PORTFOLIO
CONTINUED
| | | | | | |
| | | Face Amount | | Value† |
| | |
| | | (000) | | |
| | |
VIRGINIA — (Continued) | | | | | | |
Virginia State Public School Authority (RB) Series B | | | | | | |
5.000%, 08/01/11 | | $ | 9,595 | | $ | 10,285,264 |
5.000%, 08/01/13 | | | 5,505 | | | 6,188,446 |
West Virginia State (GO) (NATL-RE FGIC) | | | | | | |
5.000%, 06/01/12 | | | 3,300 | | | 3,614,358 |
| | | | | | |
TOTAL VIRGINIA | | | | | | 55,599,193 |
| | | | | | |
| | |
WASHINGTON — (3.6%) | | | | | | |
City of Seattle (GO) | | | | | | |
5.000%, 05/01/14 | | | 8,300 | | | 9,345,551 |
City of Seattle (RB) (FSA) | | | | | | |
5.000%, 08/01/12 | | | 1,500 | | | 1,643,445 |
Grant County Public Utility District No. 2 Priest Rapids (RB) Series H (FSA) | | | | | | |
5.000%, 01/01/10 | | | 2,000 | | | 2,014,760 |
Snohomish County Public Utility (RB) Series B | | | | | | |
5.250%, 12/01/10 | | | 11,000 | | | 11,559,460 |
Washington State (GO) Series C | | | | | | |
5.000%, 02/01/14 | | | 6,895 | | | 7,711,092 |
Washington State (GO) (FSA) | | | | | | |
5.000%, 07/01/14 | | | 5,145 | | | 5,798,827 |
Washington State (GO) Series D | | | | | | |
5.000%, 01/01/14 | | | 3,330 | | | 3,722,374 |
| | | | | | |
TOTAL WASHINGTON | | | | | | 41,795,509 |
| | | | | | |
| | | | | | |
| | | Face Amount | | Value† |
| | |
| | | (000) | | |
| | |
WISCONSIN — (2.5%) | | | | | | |
Wisconsin State (GO) Series 1 (MBIA) | | | | | | |
5.500%, 05/01/11 | | $ | 16,000 | | $ | 17,107,840 |
Wisconsin State (GO) Series A | | | | | | |
5.000%, 05/01/12 | | | 6,760 | | | 7,386,990 |
Wisconsin State (RB) Series B (AMBAC) | | | | | | |
5.000%, 07/01/12 | | | 3,775 | | | 4,136,645 |
| | | | | | |
TOTAL WISCONSIN | | | | | | 28,631,475 |
| | | | | | |
TOTAL MUNICIPAL BONDS | | | | | | 1,130,793,495 |
| | | | | | |
| | |
| | | Shares | | |
TEMPORARY CASH INVESTMENTS — (2.7%) | | | |
BlackRock Liquidity Funds MuniFund - Institutional Shares | | | 31,145,864 | | | 31,145,864 |
| | | | | | |
TOTAL INVESTMENTS — (100.0%)
(Cost $1,144,068,690) | | $ | 1,161,939,359 |
| | | | | | |
Summary of inputs used to value the Portfolio’s net assets as of October 31, 2009 is as follows (See Security Valuation Note):
| | | | | | | | | | | |
| | | Valuation Inputs |
| |
| | | Investment in Securities (Market Value) |
| | | Level 1 | | Level 2 | | Level 3 | | Total |
Municipal Bonds | | | — | | $ | 1,130,793,495 | | — | | $ | 1,130,793,495 |
Temporary Cash Investments | | $ | 31,145,864 | | | — | | — | | | 31,145,864 |
| | | | | | | | | | | |
TOTAL | | $ | 31,145,864 | | $ | 1,130,793,495 | | — | | $ | 1,161,939,359 |
| | | | | | | | | | | |
See accompanying Notes to Financial Statements.
143
DFA CALIFORNIA SHORT-TERM MUNICIPAL BOND PORTFOLIO
SCHEDULE OF INVESTMENTS
October 31, 2009
| | | | | | |
| | | Face
Amount | | Value† |
| | |
| | | (000) | | |
| | |
MUNICIPAL BONDS — (98.0%) | | | | | | |
CALIFORNIA — (98.0%) | | | | | | |
Anaheim Union High School District (GO) (FSA) | | | | | | |
5.000%, 08/01/14 | | $ | 800 | | $ | 884,728 |
Anaheim Union High School District (GO) Series A (FSA) | | | | | | |
5.000%, 08/01/12 | | | 1,275 | | | 1,412,572 |
Bay Area Toll Authority (RB) (FGIC) | | | | | | |
5.125%, 04/01/11 | | | 1,535 | | | 1,632,258 |
Bay Area Toll Authority (RB) Series F | | | | | | |
5.000%, 04/01/13 | | | 775 | | | 853,910 |
Berryessa Union School District (GO) Series B (FSA) | | | | | | |
5.375%, 08/01/11 | | | 1,205 | | | 1,317,571 |
California Educational Facilities Authority (RB) Series A | | | | | | |
5.000%, 04/01/13 | | | 2,250 | | | 2,526,637 |
California Educational Facilities Authority (RB) Series P | | | | | | |
5.250%, 12/01/13 | | | 925 | | | 1,059,634 |
California Educational Facilities Authority (RB) Series T-4 | | | | | | |
5.000%, 03/15/14 | | | 3,390 | | | 3,818,937 |
California Infrastructure & Economic Development Bank (RB) (FSA) | | | | | | |
5.250%, 07/01/13 | | | 2,000 | | | 2,276,700 |
California Infrastructure & Economic Development Bank (RB) Series A (AMBAC) | | | | | | |
5.000%, 10/01/10 | | | 3,180 | | | 3,296,165 |
California State (GO) | | | | | | |
5.000%, 02/01/10 | | | 1,500 | | | 1,512,390 |
5.000%, 03/01/10 | | | 3,000 | | | 3,033,330 |
5.250%, 09/01/10 | | | 550 | | | 566,098 |
5.000%, 10/01/10 | | | 2,000 | | | 2,059,580 |
4.000%, 02/01/11 | | | 1,000 | | | 1,029,620 |
5.250%, 03/01/11 | | | 800 | | | 838,328 |
5.000%, 04/01/11 | | | 3,000 | | | 3,142,290 |
5.000%, 06/01/11 | | | 500 | | | 526,490 |
5.000%, 10/01/11 | | | 2,215 | | | 2,355,520 |
5.000%, 04/01/12 | | | 1,500 | | | 1,604,160 |
5.000%, 02/01/14 | | | 770 | | | 831,508 |
5.000%, 03/01/14 | | | 800 | | | 865,088 |
5.000%, 03/01/14 | | | 2,850 | | | 3,081,876 |
| | | | | | |
| | | Face
Amount | | Value† |
| | |
| | | (000) | | |
| | |
CALIFORNIA — (Continued) | | | | | | |
5.000%, 04/01/14 | | $ | 1,000 | | $ | 1,082,410 |
5.000%, 04/01/14 | | | 555 | | | 600,738 |
5.000%, 05/01/14 | | | 700 | | | 758,723 |
5.000%, 08/01/14 | | | 1,480 | | | 1,609,855 |
California State (GO) Series A | | | | | | |
5.250%, 07/01/14 | | | 425 | | | 473,900 |
California State Department of Transportation (RB) Series A (MBIA) | | | | | | |
5.000%, 02/01/11 | | | 1,125 | | | 1,178,944 |
California State Department of Water Resources (RB) | | | | | | |
5.500%, 12/01/13 | | | 1,075 | | | 1,235,153 |
California State Department of Water Resources (RB) Series A | | | | | | |
5.500%, 05/01/10 | | | 500 | | | 512,210 |
5.250%, 05/01/12 | | | 2,000 | | | 2,177,100 |
California State Department of Water Resources (RB) Series A (FSA) | | | | | | |
5.250%, 05/01/11 | | | 1,450 | | | 1,534,114 |
California State Department of Water Resources Power Supply (RB) (ETM) Series A | | | | | | |
5.125%, 05/01/12 | | | 1,850 | | | 2,055,387 |
California State Department of Water Resources Power Supply (RB) Series A (MBIA) | | | | | | |
5.000%, 05/01/11 | | | 1,000 | | | 1,054,330 |
California State Economic Recovery (GO) Series A | | | | | | |
5.000%, 01/01/10 | | | 985 | | | 991,599 |
5.000%, 01/01/11 | | | 3,500 | | | 3,657,465 |
3.500%, 07/01/11 | | | 1,075 | | | 1,110,787 |
5.000%, 07/01/11 | | | 1,000 | | | 1,057,770 |
California State Economic Recovery (GO) Series A (MBIA) | | | | | | |
5.000%, 07/01/11 | | | 800 | | | 846,216 |
5.000%, 07/01/12 | | | 2,475 | | | 2,678,965 |
5.250%, 07/01/13 | | | 3,810 | | | 4,216,184 |
California State University (RB) Series A | | | | | | |
3.000%, 11/01/12 | | | 500 | | | 520,220 |
4.000%, 11/01/12 | | | 545 | | | 583,722 |
4.000%, 11/01/12 | | | 1,000 | | | 1,071,050 |
144
DFA CALIFORNIA SHORT-TERM MUNICIPAL BOND PORTFOLIO
CONTINUED
| | | | | | |
| | | Face
Amount | | Value† |
| | |
| | | (000) | | |
| | |
CALIFORNIA — (Continued) | | | | | | |
Chabot-Las Positas Community College District (GO) (AMBAC) | | | | | | |
5.000%, 08/01/11 | | $ | 1,010 | | $ | 1,080,478 |
Charter Oak Unified School District (GO) Series B (FSA) | | | | | | |
5.000%, 07/01/13 | | | 2,805 | | | 3,168,135 |
Chino Basin Regional Financing Authority (RB) | | | | | | |
5.900%, 08/01/11 | | | 810 | | | 875,262 |
City & County of San Francisco (GO) Series A (AMBAC) | | | | | | |
5.000%, 06/15/12 | | | 1,600 | | | 1,744,720 |
City & County of San Francisco (GO) Series R-1 (FGIC) | | | | | | |
5.000%, 06/15/12 | | | 3,855 | | | 4,219,298 |
City of Folsom (GO) | | | | | | |
4.000%, 08/01/14 | | | 1,285 | | | 1,387,967 |
City of Los Angeles (GO) (MBIA) | | | | | | |
4.000%, 09/01/10 | | | 1,000 | | | 1,028,690 |
City of Los Angeles (GO) Series A | | | | | | |
2.500%, 09/01/13 | | | 2,500 | | | 2,559,700 |
City of Los Angeles (GO) Series A (MBIA) | | | | | | |
5.000%, 09/01/12 | | | 1,165 | | | 1,280,405 |
City of Los Angeles (RB) Series A | | | | | | |
4.000%, 06/01/12 | | | 815 | | | 854,446 |
5.000%, 06/01/13 | | | 1,300 | | | 1,412,788 |
5.000%, 06/01/14 | | | 2,000 | | | 2,255,440 |
City of Los Angeles (RB) Series C (NATL-RE) | | | | | | |
5.375%, 06/01/13 | | | 600 | | | 676,158 |
East Bay Regional Park District (GO) | | | | | | |
4.000%, 09/01/13 | | | 1,375 | | | 1,496,949 |
El Camino Community College District (GO) Series A (MBIA) | | | | | | |
5.000%, 08/01/13 | | | 2,915 | | | 3,300,742 |
5.000%, 08/01/13 | | | 3,060 | | | 3,464,930 |
El Camino Community College District (GO) Series A (NATL-RE) | | | | | | |
5.000%, 08/01/13 | | | 600 | | | 679,398 |
El Monte Union High School District (GO) Series A (FSA) | | | | | | |
5.000%, 06/01/13 | | | 2,185 | | | 2,457,513 |
Escondido Union School District (GO) Series A | | | | | | |
5.000%, 08/01/12 | | | 3,045 | | | 3,369,171 |
| | | | | | |
| | | Face
Amount | | Value† |
| | |
| | | (000) | | |
| | |
CALIFORNIA — (Continued) | | | | | | |
Foothill-De Anza Community College District (GO) Series B | | | | | | |
5.250%, 08/01/13 | | $ | 2,000 | | $ | 2,278,900 |
5.250%, 08/01/13 | | | 3,675 | | | 4,187,479 |
Fremont Union High School District (GO) (MBIA) | | | | | | |
4.000%, 09/01/11 | | | 750 | | | 789,045 |
Fresno (RB) Series A-1 (AMBAC) | | | | | | |
6.250%, 09/01/10 | | | 300 | | | 312,318 |
Hacienda La Puente Unified School District (GO) Series B | | | | | | |
5.000%, 08/01/13 | | | 4,340 | | | 4,914,312 |
Industry Public Facilities Authority (TAN) (MBIA) | | | | | | |
4.500%, 05/01/10 | | | 700 | | | 712,859 |
Long Beach Bond Finance Authority (TAN) (AMBAC) | | | | | | |
5.375%, 08/01/12 | | | 1,585 | | | 1,762,916 |
Long Beach Unified School District (GO) | | | | | | |
4.000%, 08/01/12 | | | 500 | | | 538,205 |
Long Beach Unified School District (GO) Series A | | | | | | |
5.000%, 08/01/13 | | | 2,000 | | | 2,245,960 |
Los Angeles Community College District (GO) Series A (FSA) | | | | | | |
5.250%, 08/01/14 | | | 4,000 | | | 4,573,480 |
Los Angeles Community College District (GO) Series F-1 | | | | | | |
3.250%, 08/01/14 | | | 850 | | | 887,621 |
Los Angeles Convention & Exhibit Center Authority (RB) Series A | | | | | | |
6.125%, 08/15/11 | | | 1,500 | | | 1,596,480 |
Los Angeles County Capital Asset Leasing Corp. (RB) Series A (AMBAC) | | | | | | |
4.000%, 12/01/09 | | | 520 | | | 521,342 |
Los Angeles County Metropolitan Transportation Authority (RB) (ETM) Series A (FSA) | | | | | | |
5.000%, 07/01/11 | | | 2,500 | | | 2,708,150 |
Los Angeles County Metropolitan Transportation Authority (RB) Series A | | | | | | |
4.000%, 07/01/11 | | | 750 | | | 784,875 |
145
DFA CALIFORNIA SHORT-TERM MUNICIPAL BOND PORTFOLIO
CONTINUED
| | | | | | |
| | | Face
Amount | | Value† |
| | |
| | | (000) | | |
| | |
CALIFORNIA — (Continued) | | | | | | |
Los Angeles County Metropolitan Transportation Authority (RB) Series C (AMBAC) | | | | | | |
6.000%, 07/01/11 | | $ | 580 | | $ | 626,464 |
Los Angeles County Public Works Financing Authority (RB) Series A (MBIA) | | | | | | |
5.000%, 12/01/09 | | | 1,300 | | | 1,303,081 |
Los Angeles County Sanitation Districts Financing Authority (RB) Series A (FSA) | | | | | | |
5.000%, 10/01/12 | | | 5,000 | | | 5,517,200 |
Los Angeles Department of Water & Power (RB) Series A-1 (MBIA) | | | | | | |
5.000%, 07/01/11 | | | 460 | | | 490,102 |
Los Angeles Municipal Improvement Corp (RB) Series A (NATL-RE) | | | | | | |
5.250%, 06/01/12 | | | 1,050 | | | 1,137,696 |
Los Angeles Unified School District (GO) | | | | | | |
5.500%, 07/01/11 | | | 800 | | | 858,912 |
Los Angeles Unified School District (GO) (AMBAC) | | | | | | |
5.000%, 07/01/11 | | | 175 | | | 186,452 |
Los Angeles Unified School District (GO) (MBIA) | | | | | | |
5.500%, 07/01/12 | | | 800 | | | 883,952 |
Los Angeles Unified School District (GO) Series A (FGIC) | | | | | | |
6.000%, 07/01/11 | | | 1,000 | | | 1,081,840 |
Los Angeles Unified School District (GO) Series A (MBIA) | | | | | | |
5.250%, 07/01/12 | | | 3,600 | | | 3,954,420 |
Los Angeles Unified School District (GO) Series B | | | | | | |
4.000%, 07/01/13 | | | 500 | | | 535,095 |
Los Angeles Wastewater System (RB) Series A | | | | | | |
4.000%, 06/01/12 | | | 1,000 | | | 1,069,200 |
Metropolitan Water District of Southern California (GO) Series B | | | | | | |
4.000%, 03/01/11 | | | 500 | | | 520,500 |
| | | | | | |
| | | Face
Amount | | Value† |
| | |
| | | (000) | | |
| | |
CALIFORNIA — (Continued) | | | | | | |
Metropolitan Water District of Southern California (RB) Series B | | | | | | |
3.750%, 07/01/11 | | $ | 3,000 | | $ | 3,142,440 |
Mountain View-Whisman School District (GO) Series D (MBIA) | | | | | | |
5.000%, 06/01/12 | | | 1,480 | | | 1,644,532 |
Norwalk Redevelopment Agency (TAN) Series A (MBIA) | | | | | | |
4.000%, 10/01/10 | | | 670 | | | 686,891 |
Orange County (RB) Series A (MBIA) | | | | | | |
5.000%, 06/01/12 | | | 730 | | | 794,101 |
Oxnard School District (GO) (FSA) | | | | | | |
5.000%, 08/01/12 | | | 610 | | | 670,061 |
Pasadena Unified School District (GO) (FSA) | | | | | | |
5.000%, 11/01/12 | | | 2,000 | | | 2,206,520 |
Piedmont Unified School District (GO) | | | | | | |
2.000%, 08/01/13 | | | 725 | | | 731,532 |
2.000%, 08/01/14 | | | 340 | | | 339,079 |
Sacramento Regional County Sanitation District (RB) (NATL-RE) | | | | | | |
5.000%, 08/01/14 | | | 750 | | | 832,612 |
San Diego County Water Authority (NATL-RE FGIC) Series A | | | | | | |
5.250%, 05/01/13 | | | 795 | | | 880,304 |
San Diego Public Facilities Financing Authority (RB) Series A | | | | | | |
2.750%, 05/15/11 | | | 1,150 | | | 1,172,367 |
2.750%, 05/15/12 | | | 1,655 | | | 1,693,297 |
San Diego Public Facilities Financing Authority (RB) Series B | | | | | | |
5.000%, 05/15/14 | | | 1,000 | | | 1,099,250 |
San Diego Unified School District (GO) Series F (FSA) | | | | | | |
5.000%, 07/01/14 | | | 1,555 | | | 1,774,861 |
San Francisco Bay Area Transit Financing Authority (RB) | | | | | | |
6.750%, 07/01/11 | | | 795 | | | 869,428 |
San Francisco City & County Public Utilities Commission (RB) Series A (FSA) | | | | | | |
5.000%, 11/01/12 | | | 4,810 | | | 5,291,818 |
146
DFA CALIFORNIA SHORT-TERM MUNICIPAL BOND PORTFOLIO
CONTINUED
| | | | | | |
| | | Face Amount | | Value† |
| | | (000) | | |
| | |
CALIFORNIA — (Continued) | | | | | | |
San Jose Unified School District (GO) (FGIC) | | | | | | |
5.000%, 08/01/11 | | $ | 1,300 | | $ | 1,386,034 |
5.000%, 08/01/12 | | | 5,000 | | | 5,464,000 |
San Leandro Unified School District (GO) Series A (FSA) | | | | | | |
6.000%, 08/01/10 | | | 615 | | | 640,522 |
San Mateo County Community College District (GO) Series A | | | | | | |
4.500%, 09/01/13 | | | 2,000 | | | 2,214,320 |
Santa Clara County Financing Authority (RB) (AMBAC) | | | | | | |
7.750%, 11/15/09 | | | 1,200 | | | 1,202,700 |
Santa Clara Unified School District (GO) | | | | | | |
4.000%, 07/01/13 | | | 915 | | | 965,956 |
Sonoma County (RB) Series A (FGIC) | | | | | | |
4.000%, 09/01/12 | | | 1,950 | | | 2,098,922 |
Southern California Public Power Authority (RB) Series A (AMBAC) | | | | | | |
5.000%, 07/01/13 | | | 1,545 | | | 1,742,065 |
Southern Kern Unified School District (GO) | | | | | | |
4.000%, 12/01/09 | | | 2,800 | | | 2,806,160 |
Southwestern Community College District (GO) Series B | | | | | | |
5.250%, 08/01/12 | | | 750 | | | 822,915 |
| | | | | | |
| | | Face Amount | | Value† |
| | | (000) | | |
|
CALIFORNIA — (Continued) |
Torrance Unified School District (GO) | | | | | | |
4.000%, 08/01/13 | | $ | 830 | | $ | 887,984 |
University of California (RB) Series A (AMBAC) | | | | | | |
5.000%, 05/15/11 | | | 1,140 | | | 1,210,520 |
University of California (RB) Series E (MBIA) | | | | | | |
5.000%, 05/15/13 | | | 1,560 | | | 1,730,009 |
University of California (RB) Series J (MBIA) | | | | | | |
5.000%, 05/15/12 | | | 450 | | | 490,018 |
University of California (RB) Series K (MBIA) | | | | | | |
5.000%, 05/15/12 | | | 500 | | | 544,465 |
| | | | | | |
TOTAL MUNICIPAL BONDS | | | | | | 203,858,961 |
| | | | | | |
| | |
| | | Shares | | |
|
TEMPORARY CASH INVESTMENTS — (2.0%) |
BlackRock Liquidity Funds California Money Fund - Institutional Shares | | | 4,098,274 | | | 4,098,274 |
| | | | | | |
| |
TOTAL INVESTMENTS — (100.0%)
(Cost $204,397,696) | | $ | 207,957,235 |
| | | | | | |
Summary of inputs used to value the Portfolio’s net assets as of October 31, 2009 is as follows (See Security Valuation Note):
| | | | | | | | | | | |
| | | Valuation Inputs |
| |
| | | Investment in Securities (Market Value) |
| | | Level 1 | | Level 2 | | Level 3 | | Total |
Municipal Bonds | | | — | | $ | 203,858,961 | | — | | $ | 203,858,961 |
Temporary Cash Investments | | $ | 4,098,274 | | | — | | — | | | 4,098,274 |
| | | | | | | | | | | |
TOTAL | | $ | 4,098,274 | | $ | 203,858,961 | | — | | $ | 207,957,235 |
| | | | | | | | | | | |
See accompanying Notes to Financial Statements.
147
DFA INVESTMENT DIMENSIONS GROUP INC.
STATEMENTS OF ASSETS AND LIABILITIES
OCTOBER 31, 2009
(Amounts in thousands, except share and per share amounts)
| | | | | | | | | | | | | | | | |
| | | U.S.
Large
Company
Portfolio | | | Enhanced
U.S. Large
Company
Portfolio | | | U.S.
Large Cap
Value
Portfolio | | | U.S.
Targeted
Value Portfolio | |
ASSETS: | | | | | | | | | | | | | | | | |
Investments in Affiliated Investment Companies at Value | | $ | 2,719,708 | | | | — | | | $ | 5,864,671 | | | | — | |
Investments at Value (including $0, $0, $0 and $254,637 of securities on loan, respectively) | | | — | | | $ | 166,294 | | | | — | | | $ | 1,480,808 | |
Temporary Cash Investments at Value & Cost | | | — | | | | 1,328 | | | | — | | | | 15,297 | |
Collateral Received from Securities on Loan at Value & Cost | | | — | | | | — | | | | — | | | | 280,325 | |
Foreign Currencies at Value | | | — | | | | 2 | | | | — | | | | — | |
Receivables: | | | | | | | | | | | | | | | | |
Investment Securities/Affiliated Investment Companies Sold | | | 367 | | | | 1,803 | | | | 1,788 | | | | 39 | |
Dividends and Interest | | | — | | | | 2,134 | | | | — | | | | 414 | |
Securities Lending Income | | | — | | | | — | | | | — | | | | 113 | |
Fund Shares Sold | | | 1,641 | | | | 22 | | | | 3,418 | | | | 2,403 | |
Unrealized Gain on Forward Currency Contracts | | | — | | | | 84 | | | | — | | | | — | |
Prepaid Expenses and Other Assets | | | 21 | | | | 19 | | | | 75 | | | | 37 | |
| | | | | | | | | | | | | | | | |
Total Assets | | | 2,721,737 | | | | 171,686 | | | | 5,869,952 | | | | 1,779,436 | |
| | | | | | | | | | | | | | | | |
LIABILITIES: | | | | | | | | | | | | | | | | |
Payables: | | | | | | | | | | | | | | | | |
Upon Return of Securities Loaned | | | — | | | | — | | | | — | | | | 280,325 | |
Investment Securities/Affiliated Investment Companies Purchased | | | 70 | | | | 1,816 | | | | 6 | | | | 14,119 | |
Fund Shares Redeemed | | | 1,938 | | | | 113 | | | | 5,200 | | | | 640 | |
Due to Advisor | | | 162 | | | | 28 | | | | 772 | | | | 460 | |
Forward Currency Contracts | | | — | | | | 1 | | | | — | | | | — | |
Futures Margin Variation | | | — | | | | 4,433 | | | | — | | | | — | |
Unrealized Loss on Forward Currency Contracts | | | — | | | | 45 | | | | — | | | | — | |
Accrued Expenses and Other Liabilities | | | 149 | | | | 19 | | | | 322 | | | | 132 | |
| | | | | | | | | | | | | | | | |
Total Liabilities | | | 2,319 | | | | 6,455 | | | | 6,300 | | | | 295,676 | |
| | | | | | | | | | | | | | | | |
NET ASSETS | | $ | 2,719,418 | | | $ | 165,231 | | | $ | 5,863,652 | | | $ | 1,483,760 | |
| | | | | | | | | | | | | | | | |
NET ASSET VALUE, OFFERING AND REDEMPTION PRICE PER SHARE: | | | | | | | | | | | | | | | | |
Class R1 Shares — based on net assets of $0; $0; $0 and $31,393 and shares outstanding of 0; 0; 0 and 3,932,911, respectively | | | N/A | | | | N/A | | | | N/A | | | $ | 7.98 | |
| | | | | | | | | | | | | | | | |
NUMBER OF SHARES AUTHORIZED | | | 100,000,000 | * | | | 100,000,000 | * | | | 100,000,000 | * | | | 100,000,000 | |
| | | | | | | | | | | | | | | | |
Class R2 Shares — based on net assets of $0; $0; $0 and $2,930 and shares outstanding of 0; 0; 0 and 348,148, respectively | | | N/A | | | | N/A | | | | N/A | | | $ | 8.42 | |
| | | | | | | | | | | | | | | | |
NUMBER OF SHARES AUTHORIZED | | | 100,000,000 | * | | | 100,000,000 | * | | | 100,000,000 | * | | | 100,000,000 | |
| | | | | | | | | | | | | | | | |
Institutional Class Shares — based on net assets of $2,719,418; $165,231; $5,863,652 and $1,449,437 and shares outstanding of 88,883,846; 25,491,421; 370,896,893 and 123,882,701, respectively | | $ | 30.60 | | | $ | 6.48 | | | $ | 15.81 | | | $ | 11.70 | |
| | | | | | | | | | | | | | | | |
NUMBER OF SHARES AUTHORIZED | | | 500,000,000 | | | | 300,000,000 | | | | 2,000,000,000 | | | | 700,000,000 | |
| | | | | | | | | | | | | | | | |
Investments in Affiliated Investment Companies at Cost | | $ | 2,707,794 | | | $ | — | | | $ | 4,959,195 | | | $ | — | |
| | | | | | | | | | | | | | | | |
Investments at Cost | | $ | — | | | $ | 164,421 | | | $ | — | | | $ | 1,579,217 | |
| | | | | | | | | | | | | | | | |
Foreign Currencies at Cost | | $ | — | | | $ | 2 | | | $ | — | | | $ | — | |
| | | | | | | | | | | | | | | | |
NET ASSETS CONSIST OF: | | | | | | | | | | | | | | | | |
Paid-In Capital | | $ | 3,083,525 | | | $ | 270,995 | | | $ | 7,386,030 | | | $ | 1,664,507 | |
Undistributed Net Investment Income (Distributions in Excess of Net Investment Income) | | | 7,113 | | | | 285 | | | | 13,540 | | | | 1,308 | |
Accumulated Net Realized Gain (Loss) | | | (383,134 | ) | | | (109,666 | ) | | | (2,441,394 | ) | | | (83,646 | ) |
Net Unrealized Foreign Exchange Gain (Loss) | | | — | | | | 39 | | | | — | | | | — | |
Net Unrealized Appreciation (Depreciation) | | | 11,914 | | | | 3,578 | | | | 905,476 | | | | (98,409 | ) |
| | | | | | | | | | | | | | | | |
NET ASSETS | | $ | 2,719,418 | | | $ | 165,231 | | | $ | 5,863,652 | | | $ | 1,483,760 | |
| | | | | | | | | | | | | | | | |
| * | Share class has not yet commenced operations. See Organization note in Notes to Financial Statements. |
See accompanying Notes to Financial Statements.
148
DFA INVESTMENT DIMENSIONS GROUP INC.
STATEMENTS OF ASSETS AND LIABILITIES
OCTOBER 31, 2009
(Amounts in thousands, except share and per share amounts)
| | | | | | | | | | | | | | | | |
| | | U.S.
Small Cap
Value
Portfolio | | | U.S.
Core
Equity 1
Portfolio | | | U.S.
Core
Equity 2
Portfolio | | | U.S.
Vector
Equity
Portfolio | |
ASSETS: | | | | | | | | | | | | | | | | |
Investments at Value (including $805,217, $252,234, $475,044 and $194,392 of securities on loan, respectively) | | $ | 5,666,160 | | | $ | 1,978,654 | | | $ | 3,790,784 | | | $ | 1,172,822 | |
Temporary Cash Investments at Value & Cost | | | — | | | | 7,604 | | | | 21,700 | | | | 10,353 | |
Collateral Received from Securities on Loan at Value & Cost | | | 901,091 | | | | 272,010 | | | | 514,376 | | | | 211,602 | |
Receivables: | | | | | | | | | | | | | | | | |
Investment Securities Sold | | | 11,613 | | | | 187 | | | | 482 | | | | 157 | |
Dividends and Interest | | | 1,762 | | | | 1,891 | | | | 3,381 | | | | 761 | |
Securities Lending Income | | | 503 | | | | 128 | | | | 296 | | | | 151 | |
Fund Shares Sold | | | 2,578 | | | | 2,570 | | | | 3,354 | | | | 1,717 | |
Prepaid Expenses and Other Assets | | | 36 | | | | 59 | | | | 117 | | | | 38 | |
| | | | | | | | | | | | | | | | |
Total Assets | | | 6,583,743 | | | | 2,263,103 | | | | 4,334,490 | | | | 1,397,601 | |
| | | | | | | | | | | | | | | | |
LIABILITIES: | | | | | | | | | | | | | | | | |
Payables: | | | | | | | | | | | | | | | | |
Upon Return of Securities Loaned | | | 901,091 | | | | 272,010 | | | | 514,376 | | | | 211,602 | |
Investment Securities Purchased | | | 231 | | | | — | | | | 13,346 | | | | 6,909 | |
Fund Shares Redeemed | | | 3,650 | | | | 1,086 | | | | 1,516 | | | | 573 | |
Due to Advisor | | | 2,572 | | | | 293 | | | | 663 | | | | 311 | |
Loan Payable | | | 6,072 | | | | — | | | | — | | | | — | |
Accrued Expenses and Other Liabilities | | | 468 | | | | 131 | | | | 264 | | | | 92 | |
| | | | | | | | | | | | | | | | |
Total Liabilities | | | 914,084 | | | | 273,520 | | | | 530,165 | | | | 219,487 | |
| | | | | | | | | | | | | | | | |
NET ASSETS | | $ | 5,669,659 | | | $ | 1,989,583 | | | $ | 3,804,325 | | | $ | 1,178,114 | |
| | | | | | | | | | | | | | | | |
NET ASSET VALUE, OFFERING AND REDEMPTION PRICE PER SHARE: | | | | | | | | | | | | | | | | |
Institutional Class Shares — based on net assets of $5,669,659; $1,989,583; $3,804,325 and $1,178,114 and shares outstanding of 320,480,765; 232,927,015; 453,514,041 and 146,773,590, respectively | | $ | 17.69 | | | $ | 8.54 | | | $ | 8.39 | | | $ | 8.03 | |
| | | | | | | | | | | | | | | | |
NUMBER OF SHARES AUTHORIZED | | | 1,700,000,000 | | | | 1,500,000,000 | | | | 2,300,000,000 | | | | 1,000,000,000 | |
| | | | | | | | | | | | | | | | |
Investments at Cost | | $ | 6,445,519 | | | $ | 2,207,480 | | | $ | 4,451,889 | | | $ | 1,404,900 | |
| | | | | | | | | | | | | | | | |
NET ASSETS CONSIST OF: | | | | | | | | | | | | | | | | |
Paid-In Capital | | $ | 7,033,726 | | | $ | 2,300,603 | | | $ | 4,561,822 | | | $ | 1,503,595 | |
Undistributed Net Investment Income (Distributions in Excess of Net Investment Income) | | | 2,918 | | | | 373 | | | | 698 | | | | 1,895 | |
Accumulated Net Realized Gain (Loss) | | | (587,626 | ) | | | (82,567 | ) | | | (97,090 | ) | | | (95,298 | ) |
Net Unrealized Appreciation (Depreciation) | | | (779,359 | ) | | | (228,826 | ) | | | (661,105 | ) | | | (232,078 | ) |
| | | | | | | | | | | | | | | | |
NET ASSETS | | $ | 5,669,659 | | | $ | 1,989,583 | | | $ | 3,804,325 | | | $ | 1,178,114 | |
| | | | | | | | | | | | | | | | |
See accompanying Notes to Financial Statements.
149
DFA INVESTMENT DIMENSIONS GROUP INC.
STATEMENTS OF ASSETS AND LIABILITIES
OCTOBER 31, 2009
(Amounts in thousands, except share and per share amounts)
| | | | | | | | | | | | | | | | |
| | | T.A. U.S.
Core
Equity 2
Portfolio | | | U.S.
Small
Cap
Portfolio | | | U.S.
Micro
Cap
Portfolio | | | DFA
Real Estate
Securities
Portfolio | |
ASSETS: | | | | | | | | | | | | | | | | |
Investments at Value (including $185,052, $424,249, $414,662 and $657,820 of securities on loan, respectively) | | $ | 1,434,407 | | | $ | 2,508,187 | | | $ | 2,801,254 | | | $ | 2,004,281 | |
Temporary Cash Investments at Value & Cost | | | 13,453 | | | | 5,249 | | | | 9,293 | | | | 19,896 | |
Collateral Received from Securities on Loan at Value & Cost | | | 200,522 | | | | 466,103 | | | | 459,066 | | | | 699,642 | |
Cash | | | — | | | | 817 | | | | — | | | | — | |
Receivables: | | | | | | | | | | | | | | | | |
Investment Securities Sold | | | 245 | | | | 7,518 | | | | 8,032 | | | | — | |
Dividends and Interest | | | 1,314 | | | | 799 | | | | 1,044 | | | | 2,002 | |
Securities Lending Income | | | 131 | | | | 439 | | | | 448 | | | | 138 | |
Fund Shares Sold | | | 3,590 | | | | 2,376 | | | | 5,459 | | | | 1,407 | |
Prepaid Expenses and Other Assets | | | 75 | | | | 28 | | | | 18 | | | | 33 | |
| | | | | | | | | | | | | | | | |
Total Assets | | | 1,653,737 | | | | 2,991,516 | | | | 3,284,614 | | | | 2,727,399 | |
| | | | | | | | | | | | | | | | |
LIABILITIES: | | | | | | | | | | | | | | | | |
Payables: | | | | | | | | | | | | | | | | |
Upon Return of Securities Loaned | | | 200,522 | | | | 466,103 | | | | 459,066 | | | | 699,642 | |
Investment Securities Purchased | | | 7,318 | | | | 50 | | | | 4,270 | | | | 7,269 | |
Fund Shares Redeemed | | | 623 | | | | 2,360 | | | | 1,397 | | | | 1,227 | |
Due to Advisor | | | 276 | | | | 795 | | | | 1,265 | | | | 515 | |
Accrued Expenses and Other Liabilities | | | 112 | | | | 207 | | | | 251 | | | | 187 | |
| | | | | | | | | | | | | | | | |
Total Liabilities | | | 208,851 | | | | 469,515 | | | | 466,249 | | | | 708,840 | |
| | | | | | | | | | | | | | | | |
NET ASSETS | | $ | 1,444,886 | | | $ | 2,522,001 | | | $ | 2,818,365 | | | $ | 2,018,559 | |
| | | | | | | | | | | | | | | | |
NET ASSET VALUE, OFFERING AND REDEMPTION PRICE PER SHARE: | | | | | | | | | | | | | | | | |
Institutional Class Shares — based on net assets of $1,444,886; $2,522,001; $2,818,365 and $2,018,559 and shares outstanding of 211,424,756; 169,387,953; 294,459,077 and 132,015,997, respectively | | $ | 6.83 | | | $ | 14.89 | | | $ | 9.57 | | | $ | 15.29 | |
| | | | | | | | | | | | | | | | |
NUMBER OF SHARES AUTHORIZED | | | 1,000,000,000 | | | | 1,000,000,000 | | | | 1,500,000,000 | | | | 700,000,000 | |
| | | | | | | | | | | | | | | | |
Investments at Cost | | $ | 1,403,575 | | | $ | 2,546,150 | | | $ | 3,004,867 | | | $ | 2,384,790 | |
| | | | | | | | | | | | | | | | |
NET ASSETS CONSIST OF: | | | | | | | | | | | | | | | | |
Paid-In Capital | | $ | 1,460,862 | | | $ | 2,976,209 | | | $ | 3,539,037 | | | $ | 2,582,474 | |
Undistributed Net Investment Income (Distributions in Excess of Net Investment Income) | | | 3,080 | | | | 3,780 | | | | 3,100 | | | | 8,197 | |
Accumulated Net Realized Gain (Loss) | | | (49,888 | ) | | | (420,025 | ) | | | (520,159 | ) | | | (191,603 | ) |
Net Unrealized Appreciation (Depreciation) | | | 30,832 | | | | (37,963 | ) | | | (203,613 | ) | | | (380,509 | ) |
| | | | | | | | | | | | | | | | |
NET ASSETS | | $ | 1,444,886 | | | $ | 2,522,001 | | | $ | 2,818,365 | | | $ | 2,018,559 | |
| | | | | | | | | | | | | | | | |
See accompanying Notes to Financial Statements.
150
DFA INVESTMENT DIMENSIONS GROUP INC.
STATEMENTS OF ASSETS AND LIABILITIES
OCTOBER 31, 2009
(Amounts in thousands, except share and per share amounts)
| | | | | | | | | | | | | | | | |
| | | Large
Cap
International
Portfolio | | | International
Core
Equity
Portfolio | | | T.A. World
ex U.S. Core
Equity
Portfolio | | | International
Small
Company
Portfolio | |
ASSETS: | | | | | | | | | | | | | | | | |
Investments in Affiliated Investment Companies at Value | | | — | | | | — | | | | — | | | $ | 4,275,715 | |
Investments at Value (including $228,732, $638,659, $48,751 and $0 of securities on loan, respectively) | | $ | 1,357,706 | | | $ | 3,678,259 | | | $ | 664,457 | | | | — | |
Temporary Cash Investments at Value & Cost | | | 772 | | | | 12,615 | | | | 4,521 | | | | — | |
Collateral Received from Securities on Loan at Value & Cost | | | 241,564 | | | | 672,695 | | | | 51,990 | | | | — | |
Foreign Currencies at Value | | | 4,670 | | | | 4,897 | | | | 637 | | | | — | |
Cash | | | 15 | | | | 15 | | | | 16 | | | | — | |
Receivables: | | | | | | | | | | | | | | | | |
Investment Securities/Affiliated Investment Companies Sold | | | — | | | | 94 | | | | — | | | | — | |
Dividends, Interest and Tax Reclaims | | | 3,097 | | | | 7,308 | | | | 1,242 | | | | — | |
Securities Lending Income | | | 94 | | | | 369 | | | | 28 | | | | — | |
Fund Shares Sold | | | 644 | | | | 2,762 | | | | 1,167 | | | | 1,809 | |
Prepaid Expenses and Other Assets | | | 20 | | | | 97 | | | | 13 | | | | 25 | |
| | | | | | | | | | | | | | | | |
Total Assets | | | 1,608,582 | | | | 4,379,111 | | | | 724,071 | | | | 4,277,549 | |
| | | | | | | | | | | | | | | | |
LIABILITIES: | | | | | | | | | | | | | | | | |
Payables: | | | | | | | | | | | | | | | | |
Upon Return of Securities Loaned | | | 241,564 | | | | 672,695 | | | | 51,990 | | | | — | |
Investment Securities/Affiliated Investment Companies Purchased | | | 816 | | | | 3,402 | | | | 2,511 | | | | — | |
Fund Shares Redeemed | | | 1,415 | | | | 1,553 | | | | 434 | | | | 4,028 | |
Due to Advisor | | | 294 | | | | 1,117 | | | | 230 | | | | 1,459 | |
Loan Payable | | | — | | | | — | | | | — | | | | 1,970 | |
Unrealized Loss on Foreign Currency Contracts | | | — | | | | — | | | | 13 | | | | — | |
Deferred Thailand Capital Gains Tax | | | — | | | | — | | | | 101 | | | | — | |
Accrued Expenses and Other Liabilities | | | 142 | | | | 502 | | | | 64 | | | | 228 | |
| | | | | | | | | | | | | | | | |
Total Liabilities | | | 244,231 | | | | 679,269 | | | | 55,343 | | | | 7,685 | |
| | | | | | | | | | | | | | | | |
NET ASSETS | | $ | 1,364,351 | | | $ | 3,699,842 | | | $ | 668,728 | | | $ | 4,269,864 | |
| | | | | | | | | | | | | | | | |
NET ASSET VALUE, OFFERING AND REDEMPTION PRICE PER SHARE: | | | | | | | | | | | | | | | | |
Institutional Class Shares — based on net assets of $1,364,351; $3,699,842; $668,728 and $4,269,864 and shares outstanding of 75,697,978; 378,082,644; 82,247,205 and 305,149,395, respectively | | $ | 18.02 | | | $ | 9.79 | | | $ | 8.13 | | | $ | 13.99 | |
| | | | | | | | | | | | | | | | |
NUMBER OF SHARES AUTHORIZED | | | 500,000,000 | | | | 2,000,000,000 | | | | 500,000,000 | | | | 1,500,000,000 | |
| | | | | | | | | | | | | | | | |
Investments in Affiliated Investment Companies at Cost | | $ | — | | | $ | — | | | $ | — | | | $ | 4,294,421 | |
| | | | | | | | | | | | | | | | |
Investments at Cost | | $ | 1,267,278 | | | $ | 4,029,287 | | | $ | 555,458 | | | $ | — | |
| | | | | | | | | | | | | | | | |
Foreign Currencies at Cost | | $ | 4,632 | | | $ | 4,955 | | | $ | 636 | | | $ | — | |
| | | | | | | | | | | | | | | | |
NET ASSETS CONSIST OF: | | | | | | | | | | | | | | | | |
Paid-In Capital | | $ | 1,438,873 | | | $ | 4,147,095 | | | $ | 569,997 | | | $ | 4,510,524 | |
Undistributed Net Investment Income (Distributions in Excess of Net Investment Income) | | | 5,593 | | | | 2,148 | | | | 1,772 | | | | 13,949 | |
Accumulated Net Realized Gain (Loss) | | | (170,622 | ) | | | (98,357 | ) | | | (11,965 | ) | | | (236,142 | ) |
Deferred Thailand Capital Gains Tax | | | — | | | | — | | | | (101 | ) | | | — | |
Net Unrealized Foreign Exchange Gain (Loss) | | | 41 | | | | 42 | | | | 25 | | | | 239 | |
Net Unrealized Appreciation (Depreciation) | | | 90,466 | | | | (351,086 | ) | | | 109,000 | | | | (18,706 | ) |
| | | | | | | | | | | | | | | | |
NET ASSETS | | $ | 1,364,351 | | | $ | 3,699,842 | | | $ | 668,728 | | | $ | 4,269,864 | |
| | | | | | | | | | | | | | | | |
See accompanying Notes to Financial Statements.
151
DFA INVESTMENT DIMENSIONS GROUP INC.
STATEMENTS OF ASSETS AND LIABILITIES
OCTOBER 31, 2009
(Amounts in thousands, except share and per share amounts)
| | | | | | | | | | | | | | | | |
| | | Japanese
Small
Company
Portfolio | | | Asia
Pacific
Small
Company
Portfolio | | | United
Kingdom
Small
Company
Portfolio | | | Continental
Small
Company
Portfolio | |
ASSETS: | | | | | | | | | | | | | | | | |
Investments in Affiliated Investment Companies at Value | | $ | 114,115 | | | $ | 101,906 | | | $ | 27,872 | | | $ | 110,985 | |
Receivables: | | | | | | | | | | | | | | | | |
Fund Shares Sold | | | 39 | | | | 60 | | | | — | | | | 2 | |
Prepaid Expenses and Other Assets | | | 6 | | | | 541 | | | | 8 | | | | 8 | |
| | | | | | | | | | | | | | | | |
Total Assets | | | 114,160 | | | | 102,507 | | | | 27,880 | | | | 110,995 | |
| | | | | | | | | | | | | | | | |
LIABILITIES: | | | | | | | | | | | | | | | | |
Payables: | | | | | | | | | | | | | | | | |
Affiliated Investment Companies Purchased | | | 5 | | | | — | | | | — | | | | 2 | |
Fund Shares Redeemed | | | 35 | | | | 590 | | | | — | | | | — | |
Due to Advisor | | | 39 | | | | 45 | | | | 10 | | | | 47 | |
Accrued Expenses and Other Liabilities | | | 23 | | | | 19 | | | | 7 | | | | 20 | |
| | | | | | | | | | | | | | | | |
Total Liabilities | | | 102 | | | | 654 | | | | 17 | | | | 69 | |
| | | | | | | | | | | | | | | | |
NET ASSETS | | $ | 114,058 | | | $ | 101,853 | | | $ | 27,863 | | | $ | 110,926 | |
| | | | | | | | | | | | | | | | |
NET ASSET VALUE, OFFERING AND REDEMPTION PRICE PER SHARE: | | | | | | | | | | | | | | | | |
Institutional Class Shares — based on net assets of $114,058; $101,853; $27,863 and $110,926 and shares outstanding of 7,965,887; 4,946,123; 1,405,185 and 7,384,856, respectively | | $ | 14.32 | | | $ | 20.59 | | | $ | 19.83 | | | $ | 15.02 | |
| | | | | | | | | | | | | | | | |
NUMBER OF SHARES AUTHORIZED | | | 100,000,000 | | | | 100,000,000 | | | | 100,000,000 | | | | 100,000,000 | |
| | | | | | | | | | | | | | | | |
Investments in Affiliated Investment Companies at Cost | | $ | 200,814 | | | $ | 94,124 | | | $ | 30,454 | | | $ | 112,793 | |
| | | | | | | | | | | | | | | | |
NET ASSETS CONSIST OF: | | | | | | | | | | | | | | | | |
Paid-In Capital | | $ | 281,358 | | | $ | 133,100 | | | $ | 33,451 | | | $ | 136,984 | |
Undistributed Net Investment Income (Distributions in Excess of Net Investment Income) | | | 665 | | | | 246 | | | | 171 | | | | (12 | ) |
Accumulated Net Realized Gain (Loss) | | | (81,282 | ) | | | (39,285 | ) | | | (3,182 | ) | | | (24,284 | ) |
Net Unrealized Foreign Exchange Gain (Loss) | | | 16 | | | | 10 | | | | 5 | | | | 46 | |
Net Unrealized Appreciation (Depreciation) | | | (86,699 | ) | | | 7,782 | | | | (2,582 | ) | | | (1,808 | ) |
| | | | | | | | | | | | | | | | |
NET ASSETS | | $ | 114,058 | | | $ | 101,853 | | | $ | 27,863 | | | $ | 110,926 | |
| | | | | | | | | | | | | | | | |
See accompanying Notes to Financial Statements.
152
DFA INVESTMENT DIMENSIONS GROUP INC.
STATEMENTS OF ASSETS AND LIABILITIES
OCTOBER 31, 2009
(Amounts in thousands, except share and per share amounts)
| | | | | | | | | | | | | | | | |
| | | DFA
International
Real Estate
Securities
Portfolio | | | DFA
Global
Real Estate
Securities
Portfolio | | | DFA
International
Small Cap
Value
Portfolio | | | International
Vector
Equity
Portfolio | |
ASSETS: | | | | | | | | | | | | | | | | |
Investments in Affiliated Investment Companies at Value | | | — | | | $ | 431,052 | | | | — | | | | — | |
Investments at Value (including $115,028, $0, $608,093 and $37,782 of securities on loan, respectively) | | $ | 738,601 | | | | — | | | $ | 6,828,797 | | | $ | 260,778 | |
Temporary Cash Investments at Value & Cost | | | 4,146 | | | | 1,476 | | | | — | | | | 1,155 | |
Collateral Received from Securities on Loan at Value & Cost | | | 125,706 | | | | — | | | | 660,434 | | | | 40,466 | |
Foreign Currencies at Value | | | 2,412 | | | | — | | | | 15,132 | | | | 393 | |
Cash | | | 15 | | | | — | | | | — | | | | 16 | |
Receivables: | | | | | | | | | | | | | | | | |
Investment Securities/Affiliated Investment Companies Sold | | | — | | | | — | | | | 30,421 | | | | — | |
Dividends, Interest and Tax Reclaims | | | 2,843 | | | | — | | | | 14,992 | | | | 505 | |
Securities Lending Income | | | 84 | | | | — | | | | 796 | | | | 29 | |
Fund Shares Sold | | | 1,443 | | | | 1,216 | | | | 3,242 | | | | 433 | |
Unrealized Gain on Foreign Currency Contracts | | | — | | | | — | | | | 11 | | | | — | |
Prepaid Expenses and Other Assets | | | 23 | | | | 11 | | | | 44 | | | | 11 | |
| | | | | | | | | | | | | | | | |
Total Assets | | | 875,273 | | | | 433,755 | | | | 7,553,869 | | | | 303,786 | |
| | | | | | | | | | | | | | | | |
LIABILITIES: | | | | | | | | | | | | | | | | |
Payables: | | | | | | | | | | | | | | | | |
Upon Return of Securities Loaned | | | 125,706 | | | | — | | | | 660,434 | | | | 40,466 | |
Investment Securities/Affiliated Investment Companies Purchased | | | 6,642 | | | | 851 | | | | 5,189 | | | | 608 | |
Fund Shares Redeemed | | | 278 | | | | 364 | | | | 17,039 | | | | 28 | |
Due to Advisor | | | 220 | | | | 12 | | | | 3,900 | | | | 114 | |
Loan Payable | | | — | | | | — | | | | 6,784 | | | | — | |
Unrealized Loss on Foreign Currency Contracts | | | 12 | | | | — | | | | — | | | | — | |
Accrued Expenses and Other Liabilities | | | 86 | | | | 26 | | | | 566 | | | | 26 | |
| | | | | | | | | | | | | | | | |
Total Liabilities | | | 132,944 | | | | 1,253 | | | | 693,912 | | | | 41,242 | |
| | | | | | | | | | | | | | | | |
NET ASSETS | | $ | 742,329 | | | $ | 432,502 | | | $ | 6,859,957 | | | $ | 262,544 | |
| | | | | | | | | | | | | | | | |
NET ASSET VALUE, OFFERING AND REDEMPTION PRICE PER SHARE: | | | | | | | | | | | | | | | | |
Institutional Cass Shares — based on net assets of $742,329; $432,502; $6,859,957 and $262,544 and shares outstanding of 141,680,837; 64,034,248; 459,928,367 and 28,473,641, respectively | | $ | 5.24 | | | $ | 6.75 | | | $ | 14.92 | | | $ | 9.22 | |
| | | | | | | | | | | | | | | | |
NUMBER OF SHARES AUTHORIZED | | | 700,000,000 | | | | 500,000,000 | | | | 2,300,000,000 | | | | 500,000,000 | |
| | | | | | | | | | | | | | | | |
Investments in Affiliated Investment Companies at Cost | | $ | — | | | $ | 398,827 | | | $ | — | | | $ | — | |
| | | | | | | | | | | | | | | | |
Investments at Cost | | $ | 957,745 | | | $ | — | | | $ | 7,473,482 | | | $ | 206,191 | |
| | | | | | | | | | | | | | | | |
Foreign Currencies at Cost | | $ | 2,416 | | | $ | — | | | $ | 15,313 | | | $ | 397 | |
| | | | | | | | | | | | | | | | |
NET ASSETS CONSIST OF: | | | | | | | | | | | | | | | | |
Paid-In Capital | | $ | 987,291 | | | $ | 402,565 | | | $ | 7,526,604 | | | $ | 211,061 | |
Undistributed Net Investment Income (Distributions in Excess of Net Investment Income) | | | 24,078 | | | | 4,918 | | | | 11,837 | | | | 715 | |
Accumulated Net Realized Gain (Loss) | | | (49,991 | ) | | | (7,206 | ) | | | (33,616 | ) | | | (3,819 | ) |
Net Unrealized Foreign Exchange Gain (Loss) | | | 99 | | | | — | | | | (2 | ) | | | 4 | |
Net Unrealized Appreciation (Depreciation) | | | (219,148 | ) | | | 32,225 | | | | (644,866 | ) | | | 54,583 | |
| | | | | | | | | | | | | | | | |
NET ASSETS | | $ | 742,329 | | | $ | 432,502 | | | $ | 6,859,957 | | | $ | 262,544 | |
| | | | | | | | | | | | | | | | |
See accompanying Notes to Financial Statements.
153
DFA INVESTMENT DIMENSIONS GROUP INC.
STATEMENTS OF ASSETS AND LIABILITIES
OCTOBER 31, 2009
(Amounts in thousands, except share and per share amounts)
| | | | | | | | | | | | | | | | |
| | | Emerging
Markets
Portfolio | | | Emerging
Markets
Small Cap
Portfolio | | | Emerging
Markets
Core Equity
Portfolio | | | DFA
One-Year
Fixed Income
Portfolio | |
ASSETS: | | | | | | | | | | | | | | | | |
Investments in Affiliated Investment Companies at Value | | $ | 1,967,084 | | | $ | 1,134,439 | | | | — | | | | — | |
Investments at Value (including $0, $0, $268,990 and $878,404 of securities on loan, respectively) | | | — | | | | — | | | $ | 2,448,223 | | | $ | 4,232,448 | |
Temporary Cash Investments at Value & Cost | | | — | | | | — | | | | 9,355 | | | | 18,442 | |
Collateral Received from Securities on Loan at Value & Cost | | | — | | | | — | | | | 291,756 | | | | 894,976 | |
Foreign Currencies at Value | | | — | | | | — | | | | 2,773 | | | | — | |
Cash | | | — | | | | — | | | | 20 | | | | 1 | |
Receivables: | | | | | | | | | | | | | | | | |
Investment Securities/Affiliated Investment Companies Sold | | | — | | | | 570 | | | | 131 | | | | 30,611 | |
Dividends, Interest and Tax Reclaims | | | — | | | | — | | | | 2,785 | | | | 20,258 | |
Securities Lending Income | | | — | | | | — | | | | 287 | | | | 92 | |
Fund Shares Sold | | | 1,632 | | | | 2,107 | | | | 3,735 | | | | 4,025 | |
Prepaid Expenses and Other Assets | | | 83 | | | | 20 | | | | 51 | | | | 68 | |
| | | | | | | | | | | | | | | | |
Total Assets | | | 1,968,799 | | | | 1,137,136 | | | | 2,759,116 | | | | 5,200,921 | |
| | �� | | | | | | | | | | | | | | |
LIABILITIES: | | | | | | | | | | | | | | | | |
Payables: | | | | | | | | | | | | | | | | |
Upon Return of Securities Loaned | | | — | | | | — | | | | 291,756 | | | | 894,976 | |
Investment Securities/Affiliated Investment Companies Purchased | | | 5 | | | | — | | | | 7,266 | | | | 31,674 | |
Fund Shares Redeemed | | | 1,693 | | | | 2,677 | | | | 1,685 | | | | 3,676 | |
Due to Advisor | | | 687 | | | | 440 | | | | 1,172 | | | | 529 | |
Deferred Thailand Capital Gains Tax | | | — | | | | — | | | | 1,833 | | | | — | |
Accrued Expenses and Other Liabilities | | | 126 | | | | 61 | | | | 369 | | | | 451 | |
| | | | | | | | | | | | | | | | |
Total Liabilities | | | 2,511 | | | | 3,178 | | | | 304,081 | | | | 931,306 | |
| | | | | | | | | | | | | | | | |
NET ASSETS | | $ | 1,966,288 | | | $ | 1,133,958 | | | $ | 2,455,035 | | | $ | 4,269,615 | |
| | | | | | | | | | | | | | | | |
NET ASSET VALUE, OFFERING AND REDEMPTION PRICE PER SHARE: | | | | | | | | | | | | | | | | |
Institutional Class Shares — based on net assets of $1,966,288; $1,133,958; $2,455,035 and $4,269,615 and shares outstanding of 77,941,731; 64,989,784; 148,925,100 and 413,344,376, respectively | | $ | 25.23 | | | $ | 17.45 | | | $ | 16.49 | | | $ | 10.33 | |
| | | | | | | | | | | | | | | | |
NUMBER OF SHARES AUTHORIZED | | | 500,000,000 | | | | 500,000,000 | | | | 1,000,000,000 | | | | 2,000,000,000 | |
| | | | | | | | | | | | | | | | |
Investments in Affiliated Investment Companies at Cost | | $ | 1,011,671 | | | $ | 854,969 | | | $ | — | | | $ | — | |
| | | | | | | | | | | | | | | | |
Investments at Cost | | $ | — | | | $ | — | | | $ | 1,999,175 | | | $ | 4,213,549 | |
| | | | | | | | | | | | | | | | |
Foreign Currencies at Cost | | $ | — | | | $ | — | | | $ | 2,802 | | | $ | — | |
| | | | | | | | | | | | | | | | |
NET ASSETS CONSIST OF: | | | | | | | | | | | | | | | | |
Paid-In Capital | | $ | 977,560 | | | $ | 890,751 | | | $ | 2,091,817 | | | $ | 4,248,039 | |
Undistributed Net Investment Income (Distributions in Excess of Net Investment Income) | | | 3,281 | | | | 2,323 | | | | 6,664 | | | | 3,329 | |
Accumulated Net Realized Gain (Loss) | | | 32,042 | | | | (38,091 | ) | | | (90,709 | ) | | | (652 | ) |
Deferred Thailand Capital Gains Tax | | | (2,072 | ) | | | (570 | ) | | | (1,832 | ) | | | — | |
Net Unrealized Foreign Exchange Gain (Loss) | | | 64 | | | | 75 | | | | 76 | | | | — | |
Net Unrealized Appreciation (Depreciation) | | | 955,413 | | | | 279,470 | | | | 449,019 | | | | 18,899 | |
| | | | | | | | | | | | | | | | |
NET ASSETS | | $ | 1,966,288 | | | $ | 1,133,958 | | | $ | 2,455,035 | | | $ | 4,269,615 | |
| | | | | | | | | | | | | | | | |
See accompanying Notes to Financial Statements.
154
DFA INVESTMENT DIMENSIONS GROUP INC.
STATEMENTS OF ASSETS AND LIABILITIES
OCTOBER 31, 2009
(Amounts in thousands, except share and per share amounts)
| | | | | | | | | | | | | | |
| | | DFA
Two-Year
Global
Fixed Income
Portfolio | | DFA
Selectively
Hedged Global
Fixed Income
Portfolio | | | DFA
Five-Year
Government
Portfolio | | DFA
Five-Year
Global
Fixed Income
Portfolio | |
ASSETS: | | | | | | | | | | | | | | |
Investments at Value (including $1,393,220, $0, $0 and $942,168 of securities on loan, respectively) | | $ | 3,771,558 | | $ | 295,947 | | | $ | 988,415 | | $ | 3,171,717 | |
Temporary Cash Investments at Value & Cost | | | 43,978 | | | 7,357 | | | | 8,107 | | | 28,937 | |
Collateral Received from Securities on Loan at Value & Cost | | | 1,395,043 | | | — | | | | — | | | 943,857 | |
Foreign Currencies at Value | | | 4 | | | 318 | | | | — | | | 31 | |
Cash | | | 16 | | | 15 | | | | — | | | 15 | |
Receivables: | | | | | | | | | | | | | | |
Interest | | | 38,547 | | | 4,094 | | | | 11,429 | | | 43,757 | |
Securities Lending Income | | | 120 | | | — | | | | — | | | 94 | |
Fund Shares Sold | | | 3,971 | | | 264 | | | | 1,179 | | | 2,772 | |
Unrealized Gain on Forward Currency Contracts | | | 7,608 | | | 221 | | | | — | | | 1,098 | |
Prepaid Expenses and Other Assets | | | 53 | | | 21 | | | | 21 | | | 36 | |
| | | | | | | | | | | | | | |
Total Assets | | | 5,260,898 | | | 308,237 | | | | 1,009,151 | | | 4,192,314 | |
| | | | | | | | | | | | | | |
LIABILITIES: | | | | | | | | | | | | | | |
Payables: | | | | | | | | | | | | | | |
Upon Return of Securities Loaned | | | 1,395,043 | | | — | | | | — | | | 943,857 | |
Investment Securities Purchased | | | 16,145 | | | 4,730 | | | | — | | | 15,361 | |
Fund Shares Redeemed | | | 2,053 | | | 10 | | | | 665 | | | 1,907 | |
Due to Advisor | | | 473 | | | 37 | | | | 166 | | | 661 | |
Forward Currency Contracts | | | — | | | — | | | | — | | | 2,755 | |
Unrealized Loss on Forward Currency Contracts | | | 728 | | | — | | | | — | | | 6,734 | |
Accrued Expenses and Other Liabilities | | | 427 | | | 20 | | | | 83 | | | 252 | |
| | | | | | | | | | | | | | |
Total Liabilities | | | 1,414,869 | | | 4,797 | | | | 914 | | | 971,527 | |
| | | | | | | | | | | | | | |
NET ASSETS | | $ | 3,846,029 | | $ | 303,440 | | | $ | 1,008,237 | | $ | 3,220,787 | |
| | | | | | | | | | | | | | |
NET ASSET VALUE, OFFERING AND REDEMPTION PRICE PER SHARE: | | | | | | | | | | | | | | |
Institutional Class Shares — based on net assets of $3,846,029; $303,440; $1,008,237 and $3,220,787 and shares outstanding of 374,426,564; 30,329,215; 92,315,819 and 285,848,266, respectively | | $ | 10.27 | | $ | 10.00 | | | $ | 10.92 | | $ | 11.27 | |
| | | | | | | | | | | | | | |
NUMBER OF SHARES AUTHORIZED | | | 2,000,000,000 | | | 300,000,000 | | | | 500,000,000 | | | 1,500,000,000 | |
| | | | | | | | | | | | | | |
Investments at Cost | | $ | 3,733,561 | | $ | 291,974 | | | $ | 960,118 | | $ | 2,989,151 | |
| | | | | | | | | | | | | | |
Foreign Currencies at Cost | | $ | 4 | | $ | 328 | | | $ | — | | $ | 25 | |
| | | | | | | | | | | | | | |
NET ASSETS CONSIST OF: | | | | | | | | | | | | | | |
Paid-In Capital | | $ | 3,761,961 | | $ | 299,175 | | | $ | 968,280 | | $ | 2,997,967 | |
Undistributed Net Investment Income (Distributions in Excess of Net Investment Income) | | | 35,357 | | | (262 | ) | | | 4,029 | | | 51,072 | |
Accumulated Net Realized Gain (Loss) | | | 3,896 | | | 230 | | | | 7,631 | | | (5,372 | ) |
Net Unrealized Foreign Exchange Gain (Loss) | | | 6,818 | | | 334 | | | | — | | | (5,452 | ) |
Net Unrealized Appreciation (Depreciation) | | | 37,997 | | | 3,963 | | | | 28,297 | | | 182,572 | |
| | | | | | | | | | | | | | |
NET ASSETS | | $ | 3,846,029 | | $ | 303,440 | | | $ | 1,008,237 | | $ | 3,220,787 | |
| | | | | | | | | | | | | | |
See accompanying Notes to Financial Statements.
155
DFA INVESTMENT DIMENSIONS GROUP INC.
STATEMENTS OF ASSETS AND LIABILITIES
OCTOBER 31, 2009
(Amounts in thousands, except share and per share amounts)
| | | | | | | | | | | | | | | | | |
| | | DFA
Intermediate
Government
Fixed Income
Portfolio | | DFA
Short-Term
Extended
Quality
Portfolio | | DFA
Inflation-
Protected
Securities
Portfolio | | | DFA
Short-Term
Municipal Bond
Portfolio | | | DFA
California
Short-Term
Municipal Bond
Portfolio |
ASSETS: | | | | | | | | | | | | | | | | | |
Investments at Value | | $ | 1,455,951 | | $ | 371,025 | | $ | 762,660 | | | $ | 1,130,793 | | | $ | 203,859 |
Temporary Cash Investments at Value & Cost | | | 13,952 | | | 5,637 | | | 5,189 | | | | 31,146 | | | | 4,098 |
Cash | | | — | | | 1,249 | | | 1 | | | | — | | | | — |
Receivables: | | | | | | | | | | | | | | | | | |
Interest | | | 20,658 | | | 4,739 | | | 4,182 | | | | 14,817 | | | | 2,717 |
Fund Shares Sold | | | 1,383 | | | 760 | | | 2,441 | | | | 773 | | | | 216 |
Prepaid Expenses and Other Assets | | | 21 | | | 5 | | | 29 | | | | 29 | | | | 8 |
Deferred Offering Costs | | | — | | | 13 | | | — | | | | — | | | | — |
| | | | | | | | | | | | | | | | | |
Total Assets | | | 1,491,965 | | | 383,428 | | | 774,502 | | | | 1,177,558 | | | | 210,898 |
| | | | | | | | | | | | | | | | | |
LIABILITIES: | | | | | | | | | | | | | | | | | |
Payables: | | | | | | | | | | | | | | | | | |
Investment Securities Purchased | | | 7,073 | | | 4,583 | | | — | | | | 8,637 | | | | — |
Fund Shares Redeemed | | | 506 | | | 303 | | | 268 | | | | 389 | | | | 74 |
Due to Advisor | | | 122 | | | 31 | | | 62 | | | | 194 | | | | 35 |
Accrued Expenses and Other Liabilities | | | 109 | | | 36 | | | 62 | | | | 79 | | | | 15 |
| | | | | | | | | | | | | | | | | |
Total Liabilities | | | 7,810 | | | 4,953 | | | 392 | | | | 9,299 | | | | 124 |
| | | | | | | | | | | | | | | | | |
NET ASSETS | | $ | 1,484,155 | | $ | 378,475 | | $ | 774,110 | | | $ | 1,168,259 | | | $ | 210,774 |
| | | | | | | | | | | | | | | | | |
NET ASSET VALUE, OFFERING AND REDEMPTION PRICE PER SHARE: | | | | | | | | | | | | | | | | | |
Institutional Class Shares — based on net assets of $1,484,155; $378,475; $774,110; $1,168,259 and $210,774 and shares outstanding of 120,610,863; 35,845,121; 70,674,107; 114,050,473 and 20,544,763, respectively | | $ | 12.31 | | $ | 10.56 | | $ | 10.95 | | | $ | 10.24 | | | $ | 10.26 |
| | | | | | | | | | | | | | | | | |
NUMBER OF SHARES AUTHORIZED | | | 700,000,000 | | | 500,000,000 | | | 500,000,000 | | | | 500,000,000 | | | | 300,000,000 |
| | | | | | | | | | | | | | | | | |
Investments at Cost | | $ | 1,352,911 | | $ | 359,936 | | $ | 732,410 | | | $ | 1,112,922 | | | $ | 200,300 |
| | | | | | | | | | | | | | | | | |
NET ASSETS CONSIST OF: | | | | | | | | | | | | | | | | | |
Paid-In Capital | | $ | 1,365,244 | | $ | 366,048 | | $ | 738,273 | | | $ | 1,148,598 | | | $ | 206,861 |
Undistributed Net Investment Income (Distributions in Excess of Net Investment Income) | | | 9,734 | | | 1,051 | | | 6,361 | | | | 1,807 | | | | 354 |
Accumulated Net Realized Gain (Loss) | | | 6,137 | | | 287 | | | (774 | ) | | | (17 | ) | | | — |
Net Unrealized Appreciation (Depreciation) | | | 103,040 | | | 11,089 | | | 30,250 | | | | 17,871 | | | | 3,559 |
| | | | | | | | | | | | | | | | | |
NET ASSETS | | $ | 1,484,155 | | $ | 378,475 | | $ | 774,110 | | | $ | 1,168,259 | | | $ | 210,774 |
| | | | | | | | | | | | | | | | | |
See accompanying Notes to Financial Statements.
156
DFA INVESTMENT DIMENSIONS GROUP INC.
STATEMENTS OF OPERATIONS
FOR THE YEAR ENDED OCTOBER 31, 2009
(Amounts in thousands)
| | | | | | | | | | | | | | | | |
| | | U.S. Large
Company
Portfolio* | | | Enhanced
U.S. Large
Company
Portfolio | | | U.S.
Large Cap
Value
Portfolio* | | | U.S.
Targeted
Value
Portfolio | |
Investment Income | | | | | | | | | | | | | | | | |
Dividends | | $ | 59,319 | | | $ | 70 | | | $ | 117,909 | | | $ | 15,053 | |
Interest | | | 102 | | | | 1,745 | | | | 134 | | | | 174 | |
Income from Securities Lending | | | 2,885 | | | | — | | | | 10,208 | | | | 2,833 | |
Expenses Allocated from Affiliated Investment Company | | | (1,420 | ) | | | — | | | | (6,547 | ) | | | — | |
| | | | | | | | | | | | | | | | |
Total Investment Income | | | 60,886 | | | | 1,815 | | | | 121,704 | | | | 18,060 | |
| | | | | | | | | | | | | | | | |
Expenses | | | | | | | | | | | | | | | | |
Investment Advisory Services Fees | | | — | | | | 52 | | | | — | | | | 1,129 | |
Administrative Services Fees | | | 2,248 | | | | 237 | | | | 7,521 | | | | 2,823 | |
Accounting & Transfer Agent Fees | | | 58 | | | | 32 | | | | 108 | | | | 161 | |
S&P 500® Fees | | | — | | | | 3 | | | | — | | | | — | |
Shareholder Servicing Fees — | | | | | | | | | | | | | | | | |
Class R1 Shares | | | — | | | | — | | | | — | | | | 26 | |
Class R2 Shares | | | — | | | | — | | | | — | | | | 5 | |
Custodian Fees | | | — | | | | 5 | | | | — | | | | 49 | |
Filing Fees | | | 90 | | | | 32 | | | | 148 | | | | 149 | |
Shareholders’ Reports | | | 114 | | | | 18 | | | | 250 | | | | 94 | |
Directors’/Trustees’ Fees & Expenses | | | 47 | | | | — | | | | 97 | | | | 31 | |
Professional Fees | | | 32 | | | | 7 | | | | 76 | | | | 61 | |
Other | | | 29 | | | | 20 | | | | 64 | | | | 132 | |
| | | | | | | | | | | | | | | | |
Total Expenses | | | 2,618 | | | | 406 | | | | 8,264 | | | | 4,660 | |
Fees Waived, Expenses Reimbursed, and/or Previously Waived Fees Recovered by Advisor (Note C) | | | (485 | ) | | | — | | | | — | | | | — | |
| | | | | | | | | | | | | | | | |
Net Expenses | | | 2,133 | | | | 406 | | | | 8,264 | | | | 4,660 | |
| | | | | | | | | | | | | | | | |
Net Investment Income (Loss) | | | 58,753 | | | | 1,409 | | | | 113,440 | | | | 13,400 | |
| | | | | | | | | | | | | | | | |
Realized and Unrealized Gain (Loss) | | | | | | | | | | | | | | | | |
Net Realized Gain (Loss) on: | | | | | | | | | | | | | | | | |
Investment Securities Sold | | | (177,354 | ) | | | (24,217 | ) | | | (2,244,299 | ) | | | (80,571 | ) |
Futures | | | 7,676 | | | | 25,750 | | | | — | | | | (823 | ) |
Foreign Currency Transactions | | | — | | | | (1,379 | ) | | | — | | | | — | |
Change in Unrealized Appreciation (Depreciation) of: | | | | | | | | | | | | | | | | |
Investment Securities | | | 354,409 | | | | 2,720 | | | | 2,728,048 | | | | 244,441 | |
Futures | | | (4,182 | ) | | | 1,705 | | | | — | | | | (3 | ) |
Translation of Foreign Currency Denominated Amounts | | | — | | | | 39 | | | | — | | | | — | |
| | | | | | | | | | | | | | | | |
Net Realized and Unrealized Gain (Loss) | | | 180,549 | | | | 4,618 | | | | 483,749 | | | | 163,044 | |
| | | | | | | | | | | | | | | | |
Net Increase (Decrease) in Net Assets Resulting from Operations | | $ | 239,302 | | | $ | 6,027 | | | $ | 597,189 | | | $ | 176,444 | |
| | | | | | | | | | | | | | | | |
| * | Investment Income and Realized and Unrealized Gain (Loss) were allocated from each Portfolio’s Master Fund (Affiliated Investment Companies). |
See accompanying Notes to Financial Statements.
157
DFA INVESTMENT DIMENSIONS GROUP INC.
STATEMENTS OF OPERATIONS
FOR THE YEAR ENDED OCTOBER 31, 2009
(Amounts in thousands)
| | | | | | | | | | | | | | | | |
| | | U.S.
Small Cap
Value
Portfolio | | | U.S.
Core
Equity 1
Portfolio | | | U.S.
Core
Equity 2
Portfolio | | | U.S.
Vector
Equity
Portfolio | |
Investment Income | | | | | | | | | | | | | | | | |
Dividends | | $ | 35,309 | | | $ | 32,271 | | | $ | 56,277 | | | $ | 15,402 | |
Interest | | | 31 | | | | 125 | | | | 229 | | | | 70 | |
Income from Securities Lending | | | 4,728 | | | | 2,723 | | | | 5,784 | | | | 2,521 | |
| | | | | | | | | | | | | | | | |
Total Investment Income | | | 40,068 | | | | 35,119 | | | | 62,290 | | | | 17,993 | |
| | | | | | | | | | | | | | | | |
Expenses | | | | | | | | | | | | | | | | |
Investment Advisory Services Fees | | | 6,898 | | | | 2,668 | | | | 5,833 | | | | 2,766 | |
Administrative Services Fees | | | 14,851 | | | | — | | | | — | | | | — | |
Accounting & Transfer Agent Fees | | | 472 | | | | 212 | | | | 377 | | | | 133 | |
Custodian Fees | | | 85 | | | | 48 | | | | 72 | | | | 41 | |
Filing Fees | | | 72 | | | | 120 | | | | 194 | | | | 97 | |
Shareholders’ Reports | | | 352 | | | | 45 | | | | 102 | | | | 50 | |
Directors’/Trustees’ Fees & Expenses | | | — | | | | 40 | | | | 69 | | | | 21 | |
Professional Fees | | | 226 | | | | 67 | | | | 122 | | | | 38 | |
Other | | | 553 | | | | 190 | | | | 341 | | | | 114 | |
| | | | | | | | | | | | | | | | |
Total Expenses | | | 23,509 | | | | 3,390 | | | | 7,110 | | | | 3,260 | |
| | | | | | | | | | | | | | | | |
Net Investment Income (Loss) | | | 16,559 | | | | 31,729 | | | | 55,180 | | | | 14,733 | |
| | | | | | | | | | | | | | | | |
Realized and Unrealized Gain (Loss) | | | | | | | | | | | | | | | | |
Net Realized Gain (Loss) on: | | | | | | | | | | | | | | | | |
Investment Securities Sold | | | (373,304 | ) | | | (60,672 | ) | | | (38,804 | ) | | | (80,019 | ) |
Futures | | | 570 | | | | 683 | | | | 3,212 | | | | 407 | |
Change in Unrealized Appreciation (Depreciation) of: | | | | | | | | | | | | | | | | |
Investment Securities | | | 602,920 | | | | 253,827 | | | | 375,912 | | | | 173,818 | |
Futures | | | — | | | | (2 | ) | | | (1 | ) | | | — | |
| | | | | | | | | | | | | | | | |
Net Realized and Unrealized Gain (Loss) | | | 230,186 | | | | 193,836 | | | | 340,319 | | | | 94,206 | |
| | | | | | | | | | | | | | | | |
Net Increase (Decrease) in Net Assets Resulting from Operations | | $ | 246,745 | | | $ | 225,565 | | | $ | 395,499 | | | $ | 108,939 | |
| | | | | | | | | | | | | | | | |
See accompanying Notes to Financial Statements.
158
DFA INVESTMENT DIMENSIONS GROUP INC.
STATEMENTS OF OPERATIONS
FOR THE YEAR ENDED OCTOBER 31, 2009
(Amounts in thousands)
| | | | | | | | | | | | | | | | |
| | | T.A. U.S.
Core
Equity 2
Portfolio | | | U.S.
Small
Cap
Portfolio | | | U.S.
Micro
Cap
Portfolio | | | DFA
Real Estate
Securities
Portfolio | |
Investment Income | | | | | | | | | | | | | | | | |
Dividends | | $ | 20,994 | | | $ | 15,145 | | | $ | 19,025 | | | $ | 71,430 | |
Interest | | | 174 | | | | 16 | | | | 15 | | | | 51 | |
Income from Securities Lending | | | 1,782 | | | | 3,676 | | | | 4,341 | | | | 3,792 | |
| | | | | | | | | | | | | | | | |
Total Investment Income | | | 22,950 | | | | 18,837 | | | | 23,381 | | | | 75,273 | |
| | | | | | | | | | | | | | | | |
Expenses | | | | | | | | | | | | | | | | |
Investment Advisory Services Fees | | | 2,406 | | | | 447 | | | | 1,753 | | | | 4,606 | |
Administrative Services Fees | | | — | | | | 6,693 | | | | 10,155 | | | | — | |
Accounting & Transfer Agent Fees | | | 152 | | | | 212 | | | | 251 | | | | 211 | |
Custodian Fees | | | 50 | | | | 58 | | | | 47 | | | | 20 | |
Filing Fees | | | 201 | | | | 132 | | | | 68 | | | | 97 | |
Shareholders’ Reports | | | 29 | | | | 146 | | | | 198 | | | | 147 | |
Directors’/Trustees’ Fees & Expenses | | | 35 | | | | — | | | | — | | | | 24 | |
Professional Fees | | | 45 | | | | 91 | | | | 113 | | | | 69 | |
Other | | | 129 | | | | 240 | | | | 287 | | | | 369 | |
| | | | | | | | | | | | | | | | |
Total Expenses | | | 3,047 | | | | 8,019 | | | | 12,872 | | | | 5,543 | |
| | | | | | | | | | | | | | | | |
Net Investment Income (Loss) | | | 19,903 | | | | 10,818 | | | | 10,509 | | | | 69,730 | |
| | | | | | | | | | | | | | | | |
Realized and Unrealized Gain (Loss) | | | | | | | | | | | | | | | | |
Capital Gain Distributions Received from Investment Securities | | | — | | | | — | | | | — | | | | 16,169 | |
Net Realized Gain (Loss) on: | | | | | | | | | | | | | | | | |
Investment Securities Sold | | | (41,654 | ) | | | (68,079 | ) | | | (190,350 | ) | | | (106,626 | ) |
Futures | | | (854 | ) | | | — | | | | — | | | | (1,065 | ) |
Change in Unrealized Appreciation (Depreciation) of: | | | | | | | | | | | | | | | | |
Investment Securities | | | 211,836 | | | | 284,014 | | | | 168,490 | | | | 92,786 | |
Futures | | | (1 | ) | | | — | | | | — | | | | (10 | ) |
| | | | | | | | | | | | | | | | |
Net Realized and Unrealized Gain (Loss) | | | 169,327 | | | | 215,935 | | | | (21,860 | ) | | | 1,254 | |
| | | | | | | | | | | | | | | | |
Net Increase (Decrease) in Net Assets Resulting from Operations | | $ | 189,230 | | | $ | 226,753 | | | $ | (11,351 | ) | | $ | 70,984 | |
| | | | | | | | | | | | | | | | |
See accompanying Notes to Financial Statements.
159
DFA INVESTMENT DIMENSIONS GROUP INC.
STATEMENTS OF OPERATIONS
FOR THE YEAR ENDED OCTOBER 31, 2009
(Amounts in thousands)
| | | | | | | | | | | | | | | | |
| | | Large Cap
International
Portfolio | | | International
Core Equity
Portfolio | | | T.A. World
ex U.S.
Core Equity
Portfolio | | | International
Small
Company
Portfolio* | |
Investment Income | | | | | | | | | | | | | | | | |
Net Investment Income Received from Affiliated Investment Companies: | | | | | | | | | | | | | | | | |
Dividends (Net of Foreign Taxes Withheld of $0, $0, $0 and $6,806, respectively) | | | — | | | | — | | | | — | | | $ | 89,418 | |
Interest | | | — | | | | — | | | | — | | | | 106 | |
Income from Securities Lending | | | — | | | | — | | | | — | | | | 13,207 | |
Expenses Allocated from Affiliated Investment Company | | | — | | | | — | | | | — | | | | (5,258 | ) |
| | | | | | | | | | | | | | | | |
Total Net Investment Income Received from Affiliated Investment Companies | | | — | | | | — | | | | — | | | | 97,473 | |
| | | | | | | | | | | | | | | | |
Fund Investment Income | | | | | | | | | | | | | | | | |
Dividends (Net of Foreign Taxes Withheld of $3,405, $7,233, $1,206, and $0, respectively) | | $ | 37,283 | | | $ | 81,517 | | | $ | 13,481 | | | | — | |
Interest | | | 26 | | | | 112 | | | | 27 | | | | 21 | |
Income from Securities Lending | | | 2,539 | | | | 7,668 | | | | 488 | | | | — | |
| | | | | | | | | | | | | | | | |
Total Fund Investment Income | | | 39,848 | | | | 89,297 | | | | 13,996 | | | | 21 | |
| | | | | | | | | | | | | | | | |
Fund Expenses | | | | | | | | | | | | | | | | |
Investment Advisory Services Fees | | | 2,880 | | | | 9,575 | | | | 1,911 | | | | — | |
Administrative Services Fees | | | — | | | | — | | | | — | | | | 13,452 | |
Accounting & Transfer Agent Fees | | | 169 | | | | 359 | | | | 83 | | | | 77 | |
Custodian Fees | | | 202 | | | | 589 | | | | 248 | | | | — | |
Filing Fees | | | 88 | | | | 187 | | | | 63 | | | | 107 | |
Shareholders’ Reports | | | 106 | | | | 118 | | | | 14 | | | | 189 | |
Directors’/Trustees’ Fees & Expenses | | | 17 | | | | 68 | | | | 16 | | | | 59 | |
Professional Fees | | | 53 | | | | 118 | | | | 35 | | | | 36 | |
Organizational & Offering Costs | | | — | | | | — | | | | 17 | | | | — | |
Other | | | 161 | | | | 342 | | | | 64 | | | | 34 | |
| | | | | | | | | | | | | | | | |
Total Expenses | | | 3,676 | | | | 11,356 | | | | 2,451 | | | | 13,954 | |
Fees Waived, Expenses Reimbursed, and/or Previously Waived Fees Recovered by Advisor (Note C) | | | — | | | | — | | | | 135 | | | | — | |
| | | | | | | | | | | | | | | | |
Net Expenses | | | 3,676 | | | | 11,356 | | | | 2,586 | | | | 13,954 | |
| | | | | | | | | | | | | | | | |
Net Investment Income (Loss) | | | 36,172 | | | | 77,941 | | | | 11,410 | | | | 83,540 | |
| | | | | | | | | | | | | | | | |
Realized and Unrealized Gain (Loss) | | | | | | | | | | | | | | | | |
Net Realized Gain (Loss) on: | | | | | | | | | | | | | | | | |
Investment Securities Sold | | | (150,602 | ) | | | (83,575 | ) | | | (8,990 | ) | | | (110,040 | ) |
Futures | | | 919 | | | | (2,556 | ) | | | (660 | ) | | | 592 | |
Foreign Currency Transactions | | | 951 | | | | 1,319 | | | | 97 | | | | 1,180 | |
Change in Unrealized Appreciation (Depreciation) of: | | | | | | | | | | | | | | | | |
Investment Securities and Foreign Currency | | | 374,243 | | | | 928,934 | | | | 196,743 | | | | 1,280,471 | |
Futures | | | — | | | | (15 | ) | | | (1 | ) | | | 1 | |
Translation of Foreign Currency Denominated Amounts | | | (64 | ) | | | (108 | ) | | | (31 | ) | | | (297 | ) |
Change in Deferred Thailand Capital Gains Tax | | | — | | | | — | | | | (101 | ) | | | — | |
| | | | | | | | | | | | | | | | |
Net Realized and Unrealized Gain (Loss) | | | 225,447 | | | | 843,999 | | | | 187,057 | | | | 1,171,907 | |
| | | | | | | | | | | | | | | | |
Net Increase (Decrease) in Net Assets Resulting from Operations | | $ | 261,619 | | | $ | 921,940 | | | $ | 198,467 | | | $ | 1,255,447 | |
| | | | | | | | | | | | | | | | |
| * | Investment Income and Realized and Unrealized Gain (Loss) were allocated from each Portfolio’s Master Fund (Affiliated Investment Companies). |
See accompanying Notes to Financial Statements.
160
DFA INVESTMENT DIMENSIONS GROUP INC.
STATEMENTS OF OPERATIONS
FOR THE YEAR ENDED OCTOBER 31, 2009
(Amounts in thousands)
| | | | | | | | | | | | | | | | |
| | | Japanese
Small
Company
Portfolio* | | | Asia Pacific
Small
Company
Portfolio* | | | United
Kingdom
Small
Company
Portfolio* | | | Continental
Small
Company
Portfolio* | |
Investment Income | | | | | | | | | | | | | | | | |
Dividends (Net of Foreign Taxes Withheld of $142, $58, $0 and $358, respectively) | | $ | 1,899 | | | $ | 2,693 | | | $ | 989 | | | $ | 2,349 | |
Interest | | | 2 | | | | 2 | | | | 1 | | | | 5 | |
Income from Securities Lending | | | 640 | | | | 299 | | | | 17 | | | | 380 | |
Expenses Allocated from Affiliated Investment Companies | | | (169 | ) | | | (132 | ) | | | (34 | ) | | | (142 | ) |
| | | | | | | | | | | | | | | | |
Total Net Investment Income Received from Affiliated Investment Companies | | | 2,372 | | | | 2,862 | | | | 973 | | | | 2,592 | |
| | | | | | | | | | | | | | | | |
Expenses | | | | | | | | | | | | | | | | |
Administrative Services Fees | | | 446 | | | | 286 | | | | 95 | | | | 362 | |
Accounting & Transfer Agent Fees | | | 15 | | | | 15 | | | | 13 | | | | 15 | |
Filing Fees | | | 18 | | | | 20 | �� | | | 15 | | | | 22 | |
Shareholders’ Reports | | | 6 | | | | 6 | | | | 3 | | | | 7 | |
Directors’/Trustees’ Fees & Expenses | | | 2 | | | | 1 | | | | — | | | | 1 | |
Professional Fees | | | 2 | | | | 3 | | | | 2 | | | | 2 | |
Other | | | 4 | | | | 2 | | | | 4 | | | | 4 | |
| | | | | | | | | | | | | | | | |
Total Expenses | | | 493 | | | | 333 | | | | 132 | | | | 413 | |
Fees Waived, Expenses Reimbursed, and/or Previously Waived Fees Recovered by Advisor (Note C) | | | — | | | | 4 | | | | (20 | ) | | | 11 | |
| | | | | | | | | | | | | | | | |
Net Expenses | | | 493 | | | | 337 | | | | 112 | | | | 424 | |
| | | | | | | | | | | | | | | | |
Net Investment Income (Loss) | | | 1,879 | | | | 2,525 | | | | 861 | | | | 2,168 | |
| | | | | | | | | | | | | | | | |
Realized and Unrealized Gain (Loss) | | | | | | | | | | | | | | | | |
Net Realized Gain (Loss) on: | | | | | | | | | | | | | | | | |
Investment Securities Sold | | | (14,110 | ) | | | (8,877 | ) | | | (2,247 | ) | | | (7,421 | ) |
Futures | | | 43 | | | | (89 | ) | | | 26 | | | | (137 | ) |
Foreign Currency Transactions | | | 250 | | | | 23 | | | | (10 | ) | | | (49 | ) |
Change in Unrealized Appreciation (Depreciation) of: | | | | | | | | | | | | | | | | |
Investment Securities | | | 37,328 | | | | 52,469 | | | | 9,569 | | | | 37,449 | |
Futures | | | — | | | | — | | | | — | | | | (1 | ) |
Translation of Foreign Currency Denominated Amounts | | | (61 | ) | | | 29 | | | | (6 | ) | | | 24 | |
| | | | | | | | | | | | | | | | |
Net Realized and Unrealized Gain (Loss) | | | 23,450 | | | | 43,555 | | | | 7,332 | | | | 29,865 | |
| | | | | | | | | | | | | | | | |
Net Increase (Decrease) in Net Assets Resulting from Operations | | $ | 25,329 | | | $ | 46,080 | | | $ | 8,193 | | | $ | 32,033 | |
| | | | | | | | | | | | | | | | |
| * | Investment Income and Realized and Unrealized Gain (Loss) were allocated from each Portfolio’s respective Master Fund (Affiliated Investment Companies). |
See accompanying Notes to Financial Statements.
161
DFA INVESTMENT DIMENSIONS GROUP INC.
STATEMENTS OF OPERATIONS
FOR THE YEAR ENDED OCTOBER 31, 2009
(Amounts in thousands)
| | | | | | | | | | | | | | | | |
| | | DFA
International
Real Estate
Securities
Portfolio | | | DFA Global
Real Estate
Securities
Portfolio* | | | DFA
International
Small Cap
Value
Portfolio | | | International
Vector
Equity
Portfolio | |
Investment Income | | | | | | | | | | | | | | | | |
Income Distributions Received from Affiliated Investment Companies | | | — | | | $ | 7,670 | | | | — | | | | — | |
Dividends (Net of Foreign Taxes Withheld of $3,542, $0, $10,608 and $431, respectively) | | $ | 32,209 | | | | — | | | $ | 142,769 | | | $ | 4,841 | |
Interest | | | 5 | | | | 10 | | | | 231 | | | | 12 | |
Income from Securities Lending | | | 2,060 | | | | — | | | | 14,358 | | | | 412 | |
| | | | | | | | | | | | | | | | |
Total Investment Income | | | 34,274 | | | | 7,680 | | | | 157,358 | | | | 5,265 | |
| | | | | | | | | | | | | | | | |
Expenses | | | | | | | | | | | | | | | | |
Investment Advisory Services Fees | | | 1,753 | | | | — | | | | 35,181 | | | | 811 | |
Administrative Services Fees | | | — | | | | 769 | | | | — | | | | — | |
Accounting & Transfer Agent Fees | | | 87 | | | | 16 | | | | 693 | | | | 47 | |
Custodian Fees | | | 108 | | | | — | | | | 1,096 | | | | 107 | |
Filing Fees | | | 66 | | | | 31 | | | | 121 | | | | 16 | |
Shareholders’ Reports | | | 63 | | | | 15 | | | | 275 | | | | 16 | |
Directors’/Trustees’ Fees & Expenses | | | 12 | | | | 7 | | | | 99 | | | | 6 | |
Professional Fees | | | 20 | | | | 7 | | | | 254 | | | | 7 | |
Organizational & Offering Costs | | | — | | | | 33 | | | | — | | | | 35 | |
Other | | | 64 | | | | 4 | | | | 730 | | | | 22 | |
| | | | | | | | | | | | | | | | |
Total Expenses | | | 2,173 | | | | 882 | | | | 38,449 | | | | 1,067 | |
Fees Waived, Expenses Reimbursed, and/or Previously Waived Fees Recovered by Advisor (Note C) | | | — | | | | (706 | ) | | | — | | | | 17 | |
| | | | | | | | | | | | | | | | |
Net Expenses | | | 2,173 | | | | 176 | | | | 38,449 | | | | 1,084 | |
| | | | | | | | | | | | | | | | |
Net Investment Income (Loss) | | | 32,101 | | | | 7,504 | | | | 118,909 | | | | 4,181 | |
| | | | | | | | | | | | | | | | |
Realized and Unrealized Gain (Loss) | | | | | | | | | | | | | | | | |
Net Realized Gain (Loss) on: | | | | | | | | | | | | | | | | |
Investment Securities Sold | | | (36,531 | ) | | | (6,921 | ) | | | (20,925 | ) | | | (3,551 | ) |
Futures | | | 234 | | | | — | | | | (9,031 | ) | | | (232 | ) |
Foreign Currency Transactions | | | 185 | | | | — | | | | (2,189 | ) | | | (23 | ) |
Change in Unrealized Appreciation (Depreciation) of: | | | | | | | | | | | | | | | | |
Investment Securities and Foreign Currency | | | 170,229 | | | | 66,893 | | | | 1,907,503 | | | | 71,485 | |
Futures | | | — | | | | — | | | | (28 | ) | | | (1 | ) |
Translation of Foreign Currency Denominated Amounts | | | 209 | | | | — | | | | (469 | ) | | | (11 | ) |
| | | | | | | | | | | | | | | | |
Net Realized and Unrealized Gain (Loss) | | | 134,326 | | | | 59,972 | | | | 1,874,861 | | | | 67,667 | |
| | | | | | | | | | | | | | | | |
Net Increase (Decrease) in Net Assets Resulting from Operations | | $ | 166,427 | | | $ | 67,476 | | | $ | 1,993,770 | | | $ | 71,848 | |
| | | | | | | | | | | | | | | | |
| * | Investment Income and Realized and Unrealized Gain (Loss) were allocated from each Portfolio’s Master Fund (Affiliated Investment Companies). |
See accompanying Notes to Financial Statements.
162
DFA INVESTMENT DIMENSIONS GROUP INC.
STATEMENTS OF OPERATIONS
FOR THE YEAR ENDED OCTOBER 31, 2009
(Amounts in thousands)
| | | | | | | | | | | | | | | | |
| | | Emerging
Markets
Portfolio* | | | Emerging
Markets
Small Cap
Portfolio* | | | Emerging
Markets
Core Equity
Portfolio | | | DFA One-Year
Fixed Income
Portfolio* | |
Investment Income | | | | | | | | | | | | | | | | |
Dividends (Net of Foreign Taxes Withheld of $4,615, $1,814, $4,585 and $0, respectively) | | $ | 40,471 | | | $ | 19,964 | | | $ | 43,855 | | | | — | |
Interest | | | 67 | | | | 21 | | | | 48 | | | $ | 50,479 | |
Income from Securities Lending | | | 3,108 | | | | 2,129 | | | | 4,061 | | | | — | |
Expenses Allocated from Affiliated Investment Companies | | | (3,138 | ) | | | (2,578 | ) | | | — | | | | (1,302 | ) |
| | | | | | | | | | | | | | | | |
Total Investment Income | | | 40,508 | | | | 19,536 | | | | 47,964 | | | | 49,177 | |
| | | | | | | | | | | | | | | | |
Expenses | | | | | | | | | | | | | | | | |
Investment Advisory Services Fees | | | — | | | | — | | | | 9,732 | | | | 46 | |
Administrative Services Fees | | | 6,299 | | | | 3,484 | | | | — | | | | 3,448 | |
Accounting & Transfer Agent Fees | | | 44 | | | | 28 | | | | 241 | | | | 86 | |
Custodian Fees | | | — | | | | — | | | | 1,315 | | | | 1 | |
Filing Fees | | | 63 | | | | 58 | | | | 152 | | | | 183 | |
Shareholders’ Reports | | | 117 | | | | 48 | | | | 114 | | | | 152 | |
Directors’/Trustees’ Fees & Expenses | | | 21 | | | | 12 | | | | 41 | | | | 94 | |
Professional Fees | | | 17 | | | | 8 | | | | 103 | | | | 72 | |
Other | | | 25 | | | | 13 | | | | 226 | | | | 78 | |
| | | | | | | | | | | | | | | | |
Total Expenses | | | 6,586 | | | | 3,651 | | | | 11,924 | | | | 4,160 | |
| | | | | | | | | | | | | | | | |
Net Investment Income (Loss) | | | 33,922 | | | | 15,885 | | | | 36,040 | | | | 45,017 | |
| | | | | | | | | | | | | | | | |
Realized and Unrealized Gain (Loss) | | | | | | | | | | | | | | | | |
Net Realized Gain (Loss) on: | | | | | | | | | | | | | | | | |
Investment Securities Sold | | | 37,268 | | | | (15,114 | ) | | | (25,567 | ) | | | 6,804 | |
Futures | | | (2,712 | ) | | | (630 | ) | | | (873 | ) | | | — | |
Foreign Currency Transactions | | | (28 | ) | | | (178 | ) | | | (297 | ) | | | — | |
In-Kind Redemptions | | | 17,805 | ** | | | — | | | | — | | | | — | |
Change in Unrealized Appreciation (Depreciation) of: | | | | | | | | | | | | | | | | |
Investment Securities and Foreign Currency | | | 592,684 | | | | 522,143 | | | | 981,322 | | | | 30,261 | |
Futures | | | (30 | ) | | | (9 | ) | | | (4 | ) | | | — | |
Translation of Foreign Currency Denominated Amounts | | | 196 | | | | 168 | | | | 33 | | | | — | |
Change in Deferred Thailand Capital Gains Tax | | | (1,264 | ) | | | (785 | ) | | | (1,800 | ) | | | — | |
| | | | | | | | | | | | | | | | |
Net Realized and Unrealized Gain (Loss) | | | 643,919 | | | | 505,595 | | | | 952,814 | | | | 37,065 | |
| | | | | | | | | | | | | | | | |
Net Increase (Decrease) in Net Assets Resulting from Operations | | $ | 677,841 | | | $ | 521,480 | | | $ | 988,854 | | | $ | 82,082 | |
| | | | | | | | | | | | | | | | |
| * | For the period November 1, 2008 to June 4, 2009 Investment Income and Realized and Unrealized Gain (Loss) were allocated from each Portfolio’s respective Master Fund (Affiliated Investment Companies). |
| ** | See Note M in the Notes to Financial Statements. |
See accompanying Notes to Financial Statements.
163
DFA INVESTMENT DIMENSIONS GROUP INC.
STATEMENTS OF OPERATIONS
FOR THE YEAR ENDED OCTOBER 31, 2009
(Amounts in thousands)
| | | | | | | | | | | | | | | |
| | | DFA
Two-Year
Global
Fixed Income
Portfolio* | | | DFA
Selectively
Hedged Global
Fixed Income
Portfolio | | | DFA
Five-Year
Government
Portfolio | | DFA
Five-Year
Global
Fixed Income
Portfolio | |
Investment Income | | | | | | | | | | | | | | | |
Interest | | $ | 66,491 | | | $ | 6,472 | | | $ | 27,157 | | $ | 84,414 | |
Income from Securities Lending | | | 39 | | | | — | | | | — | | | 160 | |
Expenses Allocated from Affiliated Investment Company | | | (2,534 | ) | | | — | | | | — | | | — | |
| | | | | | | | | | | | | | | |
Total Investment Income | | | 63,996 | | | | 6,472 | | | | 27,157 | | | 84,574 | |
| | | | | | | | | | | | | | | |
Expenses | | | | | | | | | | | | | | | |
Investment Advisory Services Fees | | | 41 | | | | 318 | | | | 2,022 | | | 7,617 | |
Administrative Services Fees | | | 3,169 | | | | — | | | | — | | | — | |
Accounting & Transfer Agent Fees | | | 80 | | | | 51 | | | | 147 | | | 406 | |
Custodian Fees | | | 13 | | | | 18 | | | | 11 | | | 184 | |
Filing Fees | | | 122 | | | | 61 | | | | 66 | | | 144 | |
Shareholders’ Reports | | | 156 | | | | 6 | | | | 56 | | | 158 | |
Directors’/Trustees’ Fees & Expenses | | | 86 | | | | 6 | | | | 24 | | | 73 | |
Professional Fees | | | 68 | | | | 12 | | | | 47 | | | 143 | |
Organizational & Offering Costs | | | — | | | | 7 | | | | — | | | — | |
Other | | | 78 | | | | 27 | | | | 144 | | | 400 | |
| | | | | | | | | | | | | | | |
Total Expenses | | | 3,813 | | | | 506 | | | | 2,517 | | | 9,125 | |
| | | | | | | | | | | | | | | |
Net Investment Income (Loss) | | | 60,183 | | | | 5,966 | | | | 24,640 | | | 75,449 | |
| | | | | | | | | | | | | | | |
Realized and Unrealized Gain (Loss) | | | | | | | | | | | | | | | |
Net Realized Gain (Loss) on: | | | | | | | | | | | | | | | |
Investment Securities Sold | | | 25,365 | | | | 384 | | | | 27,247 | | | 19,184 | |
Foreign Currency Transactions | | | 25,954 | | | | (15,821 | ) | | | — | | | 49,631 | |
Change in Unrealized Appreciation (Depreciation) of: | | | | | | | | | | | | | | | |
Investment Securities and Foreign Currency | | | (6,521 | ) | | | 32,803 | | | | 22,977 | | | 87,483 | |
Translation of Foreign Currency Denominated Amounts | | | 6,818 | | | | 806 | | | | — | | | (3,992 | ) |
| | | | | | | | | | | | | | | |
Net Realized and Unrealized Gain (Loss) | | | 51,616 | | | | 18,172 | | | | 50,224 | | | 152,306 | |
| | | | | | | | | | | | | | | |
Net Increase (Decrease) in Net Assets Resulting from Operations | | $ | 111,799 | | | $ | 24,138 | | | $ | 74,864 | | $ | 227,755 | |
| | | | | | | | | | | | | | | |
| * | For the period November 1, 2008 to October 16, 2009 Investment Income and Realized and Unrealized Gain (Loss) were allocated from each Portfolio’s respective Master Fund (Affiliated Investment Companies). |
See accompanying Notes to Financial Statements.
164
DFA INVESTMENT DIMENSIONS GROUP INC.
STATEMENTS OF OPERATIONS
FOR THE YEAR ENDED OCTOBER 31, 2009
(Amounts in thousands)
| | | | | | | | | | | | | | | | | |
| | | DFA
Intermediate
Government
Fixed Income
Portfolio | | DFA
Short-Term
Extended
Quality
Portfolio(a) | | | DFA
Inflation-
Protected
Securities
Portfolio | | | DFA
Short-Term
Municipal
Bond
Portfolio | | DFA
California
Short-Term
Municipal
Bond Portfolio |
Investment Income | | | | | | | | | | | | | | | | | |
Interest | | $ | 57,708 | | $ | 5,679 | | | $ | 7,287 | | | $ | 23,118 | | $ | 4,669 |
| | | | | | | | | | | | | | | | | |
Total Investment Income | | | 57,708 | | | 5,679 | | | | 7,287 | | | | 23,118 | | | 4,669 |
| | | | | | | | | | | | | | | | | |
Expenses | | | | | | | | | | | | | | | | | |
Investment Advisory Services Fees | | | 1,333 | | | 300 | | | | 536 | | | | 2,064 | | | 385 |
Accounting & Transfer Agent Fees | | | 186 | | | 34 | | | | 86 | | | | 148 | | | 44 |
Custodian Fees | | | 15 | | | 7 | | | | 7 | | | | 11 | | | 3 |
Filing Fees | | | 114 | | | 21 | | | | 79 | | | | 70 | | | 17 |
Shareholders’ Reports | | | 63 | | | 3 | | | | 28 | | | | 36 | | | 5 |
Directors’/Trustees’ Fees & Expenses | | | 34 | | | 7 | | | | 15 | | | | 27 | | | 5 |
Professional Fees | | | 61 | | | 6 | | | | 23 | | | | 46 | | | 10 |
Organizational & Offering Costs | | | — | | | 27 | | | | — | | | | — | | | — |
Other | | | 167 | | | 15 | | | | 68 | | | | 137 | | | 28 |
| | | | | | | | | | | | | | | | | |
Total Expenses | | | 1,973 | | | 420 | | | | 842 | | | | 2,539 | | | 497 |
Fees Waived, Expenses Reimbursed, and/or Previously Waived Fees Recovered by Advisor (Note C) | | | — | | | (87 | ) | | | — | | | | — | | | — |
| | | | | | | | | | | | | | | | | |
Net Expenses | | | 1,973 | | | 333 | | | | 842 | | | | 2,539 | | | 497 |
| | | | | | | | | | | | | | | | | |
Net Investment Income (Loss) | | | 55,735 | | | 5,346 | | | | 6,445 | | | | 20,579 | | | 4,172 |
| | | | | | | | | | | | | | | | | |
Realized and Unrealized Gain (Loss) | | | | | | | | | | | | | | | | | |
Net Realized Gain (Loss) on Investment Securities Sold | | | 6,168 | | | 287 | | | | (774 | ) | | | — | | | 23 |
Change in Unrealized Appreciation (Depreciation) of Investment Securities | | | 71,964 | | | 11,089 | | | | 77,881 | | | | 22,482 | | | 4,608 |
| | | | | | | | | | | | | | | | | |
Net Realized and Unrealized Gain (Loss) | | | 78,132 | | | 11,376 | | | | 77,107 | | | | 22,482 | | | 4,631 |
| | | | | | | | | | | | | | | | | |
Net Increase (Decrease) in Net Assets Resulting from Operations | | $ | 133,867 | | $ | 16,722 | | | $ | 83,552 | | | $ | 43,061 | | $ | 8,803 |
| | | | | | | | | | | | | | | | | |
| (a) | The Portfolio commenced operations on March 4, 2009. |
See accompanying Notes to Financial Statements.
165
DFA INVESTMENT DIMENSIONS GROUP INC.
STATEMENTS OF CHANGES IN NET ASSETS
(Amounts in thousands)
| | | | | | | | | | | | | | | | | | | | | | | | | | | | |
| | | U.S. Large
Company
Portfolio | | | | | | | Enhanced
U.S. Large Company
Portfolio | |
| | | Year
Ended
Oct. 31,
2009 | | | Period
Dec. 1,
2007 to
Oct. 31,
2008 | | | Year
Ended
Nov. 30,
2007 | | | | | | | Year
Ended
Oct. 31,
2009 | | | Period
Dec. 1,
2007 to
Oct. 31,
2008 | | | Year
Ended
Nov. 30,
2007 | |
Increase (Decrease) in Net Assets | | | | | | | | | | | | | | | | | | | | | | | | | | | | |
Operations: | | | | | | | | | | | | | | | | | | | | | | | | | | | | |
Net Investment Income (Loss) | | $ | 58,753 | | | $ | 61,569 | | | $ | 59,476 | | | | | | | $ | 1,409 | | | $ | 12,018 | | | $ | 9,767 | |
Capital Gain Distributions Received from Affiliated Investment Company | | | — | | | | — | | | | — | | | | | | | | — | | | | 8,681 | | | | 26,075 | |
Net Realized Gain (Loss) on: | | | | | | | | | | | | | | | | | | | | | | | | | | | | |
Investment Securities Sold/Affiliated Investment Company Shares Sold | | | (177,354 | ) | | | (104,970 | ) | | | 3,775 | | | | | | | | (24,217 | ) | | | (11,592 | ) | | | 3,051 | |
Futures | | | 7,676 | | | | (17,555 | ) | | | 714 | | | | | | | | 25,750 | | | | — | | | | — | |
Foreign Currency Transactions | | | — | | | | — | | | | — | | | | | | | | (1,379 | ) | | | — | | | | — | |
Change in Unrealized Appreciation (Depreciation) of: | | | | | | | | | | | | | | | | | | | | | | | | | | | | |
Investment Securities/Affiliated Investment Company Shares | | | 354,409 | | | | (1,194,131 | ) | | | 164,399 | | | | | | | | 2,720 | | | | (116,750 | ) | | | (13,649 | ) |
Futures | | | (4,182 | ) | | | 521 | | | | (288 | ) | | | | | | | 1,705 | | | | — | | | | — | |
Translation of Foreign Currency Denominated Amounts | | | — | | | | — | | | | — | | | | | | | | 39 | | | | — | | | | — | |
| | | | | | | | | | | | | | | | | | | | | | | | | | | | |
Net Increase (Decrease) in Net Assets Resulting from Operations | | | 239,302 | | | | (1,254,566 | ) | | | 228,076 | | | | | | | | 6,027 | | | | (107,643 | ) | | | 25,244 | |
| | | | | | | | | | | | | | | | | | | | | | | | | | | | |
Distributions From: | | | | | | | | | | | | | | | | | | | | | | | | | | | | |
Net Investment Income: | | | | | | | | | | | | | | | | | | | | | | | | | | | | |
Institutional Class Shares | | | (62,498 | ) | | | (67,060 | ) | | | (55,847 | ) | | | | | | | (17,802 | ) | | | (10,906 | ) | | | (11,397 | ) |
Net Short-Term Gains: | | | | | | | | | | | | | | | | | | | | | | | | | | | | |
Institutional Class Shares | | | — | | | | — | | | | — | | | | | | | | (1,762 | ) | | | (4,842 | ) | | | (11,623 | ) |
Net Long-Term Gains: | | | | | | | | | | | | | | | | | | | | | | | | | | | | |
Institutional Class Shares | | | — | | | | — | | | | — | | | | | | | | — | | | | (17,601 | ) | | | (1,991 | ) |
| | | | | | | | | | | | | | | | | | | | | | | | | | | | |
Total Distributions | | | (62,498 | ) | | | (67,060 | ) | | | (55,847 | ) | | | | | | | (19,564 | ) | | | (33,349 | ) | | | (25,011 | ) |
| | | | | | | | | | | | | | | | | | | | | | | | | | | | |
Capital Share Transactions (1): | | | | | | | | | | | | | | | | | | | | | | | | | | | | |
Shares Issued | | | 812,573 | | | | 1,128,680 | | | | 906,212 | | | | | | | | 58,709 | * | | | 75,527 | | | | 93,808 | |
Shares Issued in Lieu of Cash Distributions | | | 49,324 | | | | 59,339 | | | | 51,856 | | | | | | | | 18,404 | | | | 32,429 | | | | 24,050 | |
Shares Redeemed | | | (863,321 | ) | | | (738,188 | ) | | | (583,275 | ) | | | | | | | (98,676 | ) | | | (103,683 | ) | | | (128,257 | ) |
| | | | | | | | | | | | | | | | | | | | | | | | | | | | |
Net Increase (Decrease) from Capital Share Transactions | | | (1,424 | ) | | | 449,831 | | | | 374,793 | | | | | | | | (21,563 | ) | | | 4,273 | | | | (10,399 | ) |
| | | | | | | | | | | | | | | | | | | | | | | | | | | | |
Total Increase (Decrease) in Net Assets | | | 175,380 | | | | (871,795 | ) | | | 547,022 | | | | | | | | (35,100 | ) | | | (136,719 | ) | | | (10,166 | ) |
Net Assets | | | | | | | | | | | | | | | | | | | | | | | | | | | | |
Beginning of Period | | | 2,544,038 | | | | 3,415,833 | | | | 2,868,811 | | | | | | | | 200,331 | | | | 337,050 | | | | 347,216 | |
| | | | | | | | | | | | | | | | | | | | | | | | | | | | |
End of Period | | $ | 2,719,418 | | | $ | 2,544,038 | | | $ | 3,415,833 | | | | | | | $ | 165,231 | | | $ | 200,331 | | | $ | 337,050 | |
| | | | | | | | | | | | | | | | | | | | | | | | | | | | |
(1) Shares Issued and Redeemed: | | | | | | | | | | | | | | | | | | | | | | | | | | | | |
Shares Issued | | | 31,260 | | | | 29,917 | | | | 21,005 | | | | | | | | 9,053 | | | | 9,136 | | | | 8,538 | |
Shares Issued in Lieu of Cash Distributions | | | 1,881 | | | | 1,514 | | | | 1,222 | | | | | | | | 3,392 | | | | 3,364 | | | | 2,263 | |
Shares Redeemed | | | (33,310 | ) | | | (20,702 | ) | | | (13,462 | ) | | | | | | | (17,904 | ) | | | (12,436 | ) | | | (11,632 | ) |
| | | | | | | | | | | | | | | | | | | | | | | | | | | | |
Net Increase (Decrease) from Shares Issued and Redeemed | | | (169 | ) | | | 10,729 | | | | 8,765 | | | | | | | | (5,459 | ) | | | 64 | | | | (831 | ) |
| | | | | | | | | | | | | | | | | | | | | | | | | | | | |
Undistributed Net Investment Income (Distributions in Excess of Net Investment Income) | | $ | 7,113 | | | $ | 10,863 | | | $ | 16,354 | | | | | | | $ | 285 | | | $ | 15,378 | | | $ | 4 | |
| * | Includes $7,414 in capital contributions related to the liquidation of The Enhanced U.S. Large Company Series. See Organization note within the Notes to Financial Statements. |
See accompanying Notes to Financial Statements.
166
DFA INVESTMENT DIMENSIONS GROUP INC.
STATEMENTS OF CHANGES IN NET ASSETS
(Amounts in thousands)
| | | | | | | | | | | | | | | | | | | | | | | | | | | | |
| | | U.S. Large
Cap Value
Portfolio | | | | | | | U.S. Targeted
Value Portfolio | |
| | | Year
Ended
Oct. 31,
2009 | | | Period
Dec. 1,
2007 to
Oct. 31,
2008 | | | Year
Ended
Nov. 30,
2007 | | | | | | | Year
Ended
Oct. 31,
2009 | | | Period
Dec. 1,
2007 to
Oct. 31,
2008 | | | Year
Ended
Nov. 30,
2007 | |
Increase (Decrease) in Net Assets | | | | | | | | | | | | | | | | | | | | | | | | | | | | |
Operations: | | | | | | | | | | | | | | | | | | | | | | | | | | | | |
Net Investment Income (Loss) | | $ | 113,440 | | | $ | 119,241 | | | $ | 95,990 | | | | | | | $ | 13,400 | | | $ | 10,389 | | | $ | 3,886 | |
Capital Gain Distributions Received from Affiliated Investment Company | | | — | | | | — | | | | — | | | | | | | | — | | | | — | | | | 26,668 | |
Net Realized Gain (Loss) on: | | | | | | | | | | | | | | | | | | | | | | | | | | | | |
Investment Securities Sold | | | (2,244,299 | ) | | | — | † | | | 346,023 | † | | | | | | | (80,571 | ) | | | (2,137 | ) | | | (2,825 | ) |
Futures | | | — | | | | — | | | | — | | | | | | | | (823 | ) | | | — | | | | — | |
Change in Unrealized Appreciation (Depreciation) of: | | | | | | | | | | | | | | | | | | | | | | | | | | | | |
Investment Securities | | | 2,728,048 | | | | (3,044,875 | )† | | | (554,415 | )† | | | | | | | 244,441 | | | | (319,766 | ) | | | (75,837 | ) |
Futures | | | — | | | | — | | | | — | | | | | | | | (3 | ) | | | 3 | | | | — | |
| | | | | | | | | | | | | | | | | | | | | | | | | | | | |
Net Increase (Decrease) in Net Assets Resulting from Operations | | | 597,189 | | | | (2,925,634 | ) | | | (112,402 | ) | | | | | | | 176,444 | | | | (311,511 | ) | | | (48,108 | ) |
| | | | | | | | | | | | | | | | | | | | | | | | | | | | |
Distributions From: | | | | | | | | | | | | | | | | | | | | | | | | | | | | |
Net Investment Income: | | | | | | | | | | | | | | | | | | | | | | | | | | | | |
Class R1 Shares | | | — | | | | — | | | | — | | | | | | | | (424 | ) | | | (351 | ) | | | — | |
Class R2 Shares | | | — | | | | — | | | | — | | | | | | | | (27 | ) | | | (10 | ) | | | — | |
Institutional Class Shares | | | (123,996 | ) | | | (113,742 | ) | | | (88,197 | ) | | | | | | | (13,728 | ) | | | (7,766 | ) | | | (3,642 | ) |
Net Short-Term Gains: | | | | | | | | | | | | | | | | | | | | | | | | | | | | |
Institutional Class Shares | | | (6,242 | ) | | | (304 | ) | | | (10,685 | ) | | | | | | | — | | | | — | | | | (5,313 | ) |
Net Long-Term Gains: | | | | | | | | | | | | | | | | | | | | | | | | | | | | |
Institutional Class Shares | | | — | | | | (315,650 | ) | | | (127,166 | ) | | | | | | | — | | | | (14,019 | ) | | | (11,902 | ) |
| | | | | | | | | | | | | | | | | | | | | | | | | | | | |
Total Distributions | | | (130,238 | ) | | | (429,696 | ) | | | (226,048 | ) | | | | | | | (14,179 | ) | | | (22,146 | ) | | | (20,857 | ) |
| | | | | | | | | | | | | | | | | | | | | | | | | | | | |
Capital Share Transactions (1): | | | | | | | | | | | | | | | | | | | | | | | | | | | | |
Shares Issued | | | 1,807,041 | | | | 2,629,415 | | | | 2,547,717 | | | | | | | | 850,582 | | | | 975,465 | | | | 500,717 | * |
Shares Issued in Lieu of Cash Distributions | | | 117,409 | | | | 398,086 | | | | 203,411 | | | | | | | | 13,641 | | | | 21,294 | | | | 18,152 | |
Shares Redeemed | | | (1,858,197 | ) | | | (1,877,275 | ) | | | (1,287,212 | ) | | | | | | | (425,490 | ) | | | (335,145 | ) | | | (110,437 | ) |
| | | | | | | | | | | | | | | | | | | | | | | | | | | | |
Net Increase (Decrease) from Capital Share Transactions | | | 66,253 | | | | 1,150,226 | | | | 1,463,916 | | | | | | | | 438,733 | | | | 661,614 | | | | 408,432 | |
| | | | | | | | | | | | | | | | | | | | | | | | | | | | |
Total Increase (Decrease) in Net Assets | | | 533,204 | | | | (2,205,104 | ) | | | 1,125,466 | | | | | | | | 600,998 | | | | 327,957 | | | | 339,467 | |
Net Assets | | | | | | | | | | | | | | | | | | | | | | | | | | | | |
Beginning of Period | | | 5,330,448 | | | | 7,535,552 | | | | 6,410,086 | | | | | | | | 882,762 | | | | 554,805 | | | | 215,338 | |
| | | | | | | | | | | | | | | | | | | | | | | | | | | | |
End of Period | | $ | 5,863,652 | | | $ | 5,330,448 | | | $ | 7,535,552 | | | | | | | $ | 1,483,760 | | | $ | 882,762 | | | $ | 554,805 | |
| | | | | | | | | | | | | | | | | | | | | | | | | | | | |
(1) Shares Issued and Redeemed: | | | | | | | | | | | | | | | | | | | | | | | | | | | | |
Shares Issued | | | 140,615 | | | | 131,947 | | | | 97,946 | | | | | | | | 88,462 | | | | 71,448 | | | | 28,579 | |
Shares Issued in Lieu of Cash Distributions | | | 10,018 | | | | 17,729 | | | | 8,025 | | | | | | | | 1,442 | | | | 1,447 | | | | 1,060 | |
Shares Redeemed | | | (145,245 | ) | | | (92,441 | ) | | | (50,063 | ) | | | | | | | (44,353 | ) | | | (25,199 | ) | | | (6,247 | ) |
| | | | | | | | | | | | | | | | | | | | | | | | | | | | |
Net Increase (Decrease) from Shares Issued and Redeemed | | | 5,388 | | | | 57,235 | | | | 55,908 | | | | | | | | 45,551 | | | | 47,696 | | | | 23,392 | |
| | | | | | | | | | | | | | | | | | | | | | | | | | | | |
Undistributed Net Investment Income (Distributions in Excess of Net Investment Income) | | $ | 13,540 | | | $ | 25,004 | | | $ | 23,690 | | | | | | | $ | 1,308 | | | $ | 2,098 | | | $ | 794 | |
| * | Includes $6,246 in capital contributions related to the liquidation of The U.S. Targeted Value Series. See Organization note within the Notes to Financial Statements. |
| † | See Note A in the Notes to Financial Statements. |
See accompanying Notes to Financial Statements.
167
DFA INVESTMENT DIMENSIONS GROUP INC.
STATEMENTS OF CHANGES IN NET ASSETS
(Amounts in thousands)
| | | | | | | | | | | | | | | | | | | | | | | | | | | | |
| | | U.S. Small
Cap Value Portfolio | | | | | | | U.S. Core
Equity 1 Portfolio | |
| | | Year
Ended
Oct. 31,
2009 | | | Period
Dec. 1,
2007 to
Oct. 31,
2008 | | | Year
Ended
Nov. 30,
2007 | | | | | | | Year
Ended
Oct. 31,
2009 | | | Period
Dec. 1,
2007 to
Oct. 31,
2008 | | | Year
Ended
Nov. 30,
2007 | |
Increase (Decrease) in Net Assets | | | | | | | | | | | | | | | | | | | | | | | | | | | | |
Operations: | | | | | | | | | | | | | | | | | | | | | | | | | | | | |
Net Investment Income (Loss) | | $ | 16,559 | | | $ | 60,650 | | | $ | 92,097 | | | | | | | $ | 31,729 | | | $ | 22,840 | | | $ | 14,928 | |
Capital Gain Distributions Received from Affiliated Investment Company | | | — | | | | 1,046,424 | | | | 875,446 | | | | | | | | — | | | | — | | | | — | |
Net Realized Gain (Loss) on: | | | | | | | | | | | | | | | | | | | | | | | | | | | | |
Investment Securities Sold/Affiliated Investment Company Shares Sold | | | (373,304 | ) | | | (209,110 | ) | | | (37,370 | ) | | | | | | | (60,672 | ) | | | (19,218 | ) | | | (3,304 | ) |
Futures | | | 570 | | | | — | | | | — | | | | | | | | 683 | | | | — | | | | — | |
Change in Unrealized Appreciation (Depreciation) of: | | | | | | | | | | | | | | | | | | | | | | | | | | | | |
Investment Securities/Affiliated Investment Company Shares | | | 602,920 | | | | (3,538,529 | ) | | | (1,754,043 | ) | | | | | | | 253,827 | | | | (553,125 | ) | | | 15,592 | |
Futures | | | — | | | | — | | | | — | | | | | | | | (2 | ) | | | 2 | | | | — | |
| | | | | | | | | | | | | | | | | | | | | | | | | | | | |
Net Increase (Decrease) in Net Assets Resulting from Operations | | | 246,745 | | | | (2,640,565 | ) | | | (823,870 | ) | | | | | | | 225,565 | | | | (549,501 | ) | | | 27,216 | |
| | | | | | | | | | | | | | | | | | | | | | | | | | | | |
Distributions From: | | | | | | | | | | | | | | | | | | | | | | | | | | | | |
Net Investment Income: | | | | | | | | | | | | | | | | | | | | | | | | | | | | |
Institutional Class Shares | | | (69,882 | ) | | | (74,354 | ) | | | (85,546 | ) | | | | | | | (31,598 | ) | | | (22,927 | ) | | | (14,899 | ) |
Net Short-Term Gains: | | | | | | | | | | | | | | | | | | | | | | | | | | | | |
Institutional Class Shares | | | — | | | | — | | | | (72,477 | ) | | | | | | | — | | | | — | | | | (578 | ) |
Net Long-Term Gains: | | | | | | | | | | | | | | | | | | | | | | | | | | | | |
Institutional Class Shares | | | — | | | | (746,639 | )�� | | | (592,599 | ) | | | | | | | — | | | | — | | | | (1,040 | ) |
| | | | | | | | | | | | | | | | | | | | | | | | | | | | |
Total Distributions | | | (69,882 | ) | | | (820,993 | ) | | | (750,622 | ) | | | | | | | (31,598 | ) | | | (22,927 | ) | | | (16,517 | ) |
| | | | | | | | | | | | | | | | | | | | | | | | | | | | |
Capital Share Transactions (1): | | | | | | | | | | | | | | | | | | | | | | | | | | | | |
Shares Issued | | | 1,293,768 | * | | | 1,857,448 | | | | 2,756,160 | | | | | | | | 1,158,480 | | | | 1,087,323 | | | | 609,131 | |
Shares Issued in Lieu of Cash Distributions | | | 67,125 | | | | 798,952 | | | | 722,554 | | | | | | | | 30,660 | | | | 21,544 | | | | 16,079 | |
Shares Redeemed | | | (1,372,042 | ) | | | (2,493,743 | ) | | | (1,839,654 | ) | | | | | | | (714,086 | ) | | | (425,908 | ) | | | (78,148 | ) |
| | | | | | | | | | | | | | | | | | | | | | | | | | | | |
Net Increase (Decrease) from Capital Share Transactions | | | (11,149 | ) | | | 162,657 | | | | 1,639,060 | | | | | | | | 475,054 | | | | 682,959 | | | | 547,062 | |
| | | | | | | | | | | | | | | | | | | | | | | | | | | | |
Total Increase (Decrease) in Net Assets | | | 165,714 | | | | (3,298,901 | ) | | | 64,568 | | | | | | | | 669,021 | | | | 110,531 | | | | 557,761 | |
Net Assets | | | | | | | | | | | | | | | | | | | | | | | | | | | | |
Beginning of Period | | | 5,503,945 | | | | 8,802,846 | | | | 8,738,278 | | | | | | | | 1,320,562 | | | | 1,210,031 | | | | 652,270 | |
| | | | | | | | | | | | | | | | | | | | | | | | | | | | |
End of Period | | $ | 5,669,659 | | | $ | 5,503,945 | | | $ | 8,802,846 | | | | | | | $ | 1,989,583 | | | $ | 1,320,562 | | | $ | 1,210,031 | |
| | | | | | | | | | | | | | | | | | | | | | | | | | | | |
(1) Shares Issued and Redeemed: | | | | | | | | | | | | | | | | | | | | | | | | | | | | |
Shares Issued | | | 72,979 | | | | 84,519 | | | | 93,005 | | | | | | | | 160,998 | | | | 107,874 | | | | 50,720 | |
Shares Issued in Lieu of Cash Distributions | | | 4,580 | | | | 34,137 | | | | 24,691 | | | | | | | | 4,155 | | | | 2,264 | | | | 1,371 | |
Shares Redeemed | | | (94,264 | ) | | | (113,726 | ) | | | (62,068 | ) | | | | | | | (101,230 | ) | | | (43,396 | ) | | | (6,544 | ) |
| | | | | | | | | | | | | | | | | | | | | | | | | | | | |
Net Increase (Decrease) from Shares Issued and Redeemed | | | (16,705 | ) | | | 4,930 | | | | 55,628 | | | | | | | | 63,923 | | | | 66,742 | | | | 45,547 | |
| | | | | | | | | | | | | | | | | | | | | | | | | | | | |
Undistributed Net Investment Income (Distributions in Excess of Net Investment Income) | | $ | 2,918 | | | $ | 31,701 | | | $ | 8,847 | | | | | | | $ | 373 | | | $ | 257 | | | $ | 344 | |
| * | Includes $28,400 in capital contributions related to the liquidation of The U.S. Small Cap Value Series. See Organization note within the Notes to Financial Statements. |
See accompanying Notes to Financial Statements.
168
DFA INVESTMENT DIMENSIONS GROUP INC.
STATEMENTS OF CHANGES IN NET ASSETS
(Amounts in thousands)
| | | | | | | | | | | | | | | | | | | | | | | | | | | | |
| | | U.S. Core
Equity 2 Portfolio | | | | | | | U.S. Vector
Equity Portfolio | |
| | | Year
Ended
Oct. 31,
2009 | | | Period
Dec. 1,
2007 to
Oct. 31,
2008 | | | Year
Ended
Nov. 30,
2007 | | | | | | | Year
Ended
Oct. 31,
2009 | | | Period
Dec. 1,
2007 to
Oct. 31,
2008 | | | Year
Ended
Nov. 30,
2007 | |
Increase (Decrease) in Net Assets | | | | | | | | | | | | | | | | | | | | | | | | | | | | |
Operations: | | | | | | | | | | | | | | | | | | | | | | | | | | | | |
Net Investment Income (Loss) | | $ | 55,180 | | | $ | 47,930 | | | $ | 34,532 | | | | | | | $ | 14,733 | | | $ | 15,482 | | | $ | 9,503 | |
Net Realized Gain (Loss) on: | | | | | | | | | | | | | | | | | | | | | | | | | | | | |
Investment Securities Sold | | | (38,804 | ) | | | (45,734 | ) | | | (15,734 | ) | | | | | | | (80,019 | ) | | | (13,893 | ) | | | (1,810 | ) |
Futures | | | 3,212 | | | | — | | | | — | | | | | | | | 407 | | | | — | | | | — | |
Change in Unrealized Appreciation (Depreciation) of: | | | | | | | | | | | | | | | | | | | | | | | | | | | | |
Investment Securities | | | 375,912 | | | | (1,104,305 | ) | | | (32,306 | ) | | | | | | | 173,818 | | | | (400,041 | ) | | | (41,111 | ) |
Futures | | | (1 | ) | | | 1 | | | | — | | | | | | | | — | | | | — | | | | — | |
| | | | | | | | | | | | | | | | | | | | | | | | | | | | |
Net Increase (Decrease) in Net Assets Resulting from Operations | | | 395,499 | | | | (1,102,108 | ) | | | (13,508 | ) | | | | | | | 108,939 | | | | (398,452 | ) | | | (33,418 | ) |
| | | | | | | | | | | | | | | | | | | | | | | | | | | | |
Distributions From: | | | | | | | | | | | | | | | | | | | | | | | | | | | | |
Net Investment Income: | | | | | | | | | | | | | | | | | | | | | | | | | | | | |
Institutional Class Shares | | | (55,009 | ) | | | (48,004 | ) | | | (34,490 | ) | | | | | | | (16,454 | ) | | | (14,964 | ) | | | (7,650 | ) |
Net Short-Term Gains: | | | | | | | | | | | | | | | | | | | | | | | | | | | | |
Institutional Class Shares | | | — | | | | — | | | | (1,625 | ) | | | | | | | — | | | | — | | | | (6,329 | ) |
Net Long-Term Gains: | | | | | | | | | | | | | | | | | | | | | | | | | | | | |
Institutional Class Shares | | | — | | | | — | | | | (1,516 | ) | | | | | | | — | | | | — | | | | — | |
| | | | | | | | | | | | | | | | | | | | | | | | | | | | |
Total Distributions | | | (55,009 | ) | | | (48,004 | ) | | | (37,631 | ) | | | | | | | (16,454 | ) | | | (14,964 | ) | | | (13,979 | ) |
| | | | | | | | | | | | | | | | | | | | | | | | | | | | |
Capital Share Transactions (1): | | | | | | | | | | | | | | | | | | | | | | | | | | | | |
Shares Issued | | | 1,847,067 | | | | 1,647,226 | | | | 2,019,061 | | | | | | | | 508,175 | | | | 599,481 | | | | 689,895 | |
Shares Issued in Lieu of Cash Distributions | | | 54,122 | | | | 47,199 | | | | 37,027 | | | | | | | | 16,189 | | | | 14,671 | | | | 13,800 | |
Shares Redeemed | | | (938,382 | ) | | | (982,705 | ) | | | (281,839 | ) | | | | | | | (289,358 | ) | | | (309,855 | ) | | | (99,868 | ) |
| | | | | | | | | | | | | | | | | | | | | | | | | | | | |
Net Increase (Decrease) from Capital Share Transactions | | | 962,807 | | | | 711,720 | | | | 1,774,249 | | | | | | | | 235,006 | | | | 304,297 | | | | 603,827 | |
| | | | | | | | | | | | | | | | | | | | | | | | | | | | |
Total Increase (Decrease) in Net Assets | | | 1,303,297 | | | | (438,392 | ) | | | 1,723,110 | | | | | | | | 327,491 | | | | (109,119 | ) | | | 556,430 | |
Net Assets | | | | | | | | | | | | | | | | | | | | | | | | | | | | |
Beginning of Period | | | 2,501,028 | | | | 2,939,420 | | | | 1,216,310 | | | | | | | | 850,623 | | | | 959,742 | | | | 403,312 | |
| | | | | | | | | | | | | | | | | | | | | | | | | | | | |
End of Period | | $ | 3,804,325 | | | $ | 2,501,028 | | | $ | 2,939,420 | | | | | | | $ | 1,178,114 | | | $ | 850,623 | | | $ | 959,742 | |
| | | | | | | | | | | | | | | | | | | | | | | | | | | | |
(1) Shares Issued and Redeemed: | | | | | | | | | | | | | | | | | | | | | | | | | | | | |
Shares Issued | | | 258,455 | | | | 166,628 | | | | 165,360 | | | | | | | | 74,700 | | | | 59,904 | | | | 57,308 | |
Shares Issued in Lieu of Cash Distributions | | | 7,485 | | | | 5,013 | | | | 3,137 | | | | | | | | 2,427 | | | | 1,411 | | | | 1,170 | |
Shares Redeemed | | | (135,979 | ) | | | (97,859 | ) | | | (23,138 | ) | | | | | | | (44,108 | ) | | | (31,898 | ) | | | (8,342 | ) |
| | | | | | | | | | | | | | | | | | | | | | | | | | | | |
Net Increase (Decrease) from Shares Issued and Redeemed | | | 129,961 | | | | 73,782 | | | | 145,359 | | | | | | | | 33,019 | | | | 29,417 | | | | 50,136 | |
| | | | | | | | | | | | | | | | | | | | | | | | | | | | |
Undistributed Net Investment Income (Distributions in Excess of Net Investment Income) | | $ | 698 | | | $ | 399 | | | $ | 473 | | | | | | | $ | 1,895 | | | $ | 3,637 | | | $ | 3,119 | |
See accompanying Notes to Financial Statements.
169
DFA INVESTMENT DIMENSIONS GROUP INC.
STATEMENTS OF CHANGES IN NET ASSETS
(Amounts in thousands)
| | | | | | | | | | | | | | | | | | | | | | | | | | | | |
| | | T.A. U.S.
Core Equity 2
Portfolio | | | | | | | U.S. Small
Cap Portfolio | |
| | | Year
Ended
Oct. 31,
2009 | | | Period
Dec. 1,
2007 to
Oct. 31,
2008 | | | Period
Oct. 4,
2007(a) to
Nov. 30
2007 | | | | | | | Year
Ended
Oct. 31,
2009 | | | Period
Dec. 1,
2007 to
Oct. 31,
2008 | | | Year
Ended
Nov. 30,
2007 | |
Increase (Decrease) in Net Assets | | | | | | | | | | | | | | | | | | | | | | | | | | | | |
Operations: | | | | | | | | | | | | | | | | | | | | | | | | | | | | |
Net Investment Income (Loss) | | $ | 19,903 | | | $ | 6,271 | | | $ | 167 | | | | | | | $ | 10,818 | | | $ | 21,360 | | | $ | 33,291 | |
Capital Gain Distributions Received from Affiliated Investment Company | | | — | | | | — | | | | — | | | | | | | | — | | | | 243,531 | | | | 216,208 | |
Net Realized Gain (Loss) on: | | | | | | | | | | | | | | | | | | | | | | | | | | | | |
Investment Securities Sold/Affiliated Investment Company Shares Sold | | | (41,654 | ) | | | (7,078 | ) | | | (310 | ) | | | | | | | (68,079 | ) | | | (116,947 | ) | | | 2,061 | |
Futures | | | (854 | ) | | | — | | | | — | | | | | | | | — | | | | — | | | | — | |
Change in Unrealized Appreciation (Depreciation) of: | | | | | | | | | | | | | | | | | | | | | | | | | | | | |
Investment Securities/Affiliated Investment Company Shares | | | 211,836 | | | | (179,572 | ) | | | (1,432 | ) | | | | | | | 284,014 | | | | (1,073,797 | ) | | | (321,609 | ) |
Futures | | | (1 | ) | | | 1 | | | | — | | | | | | | | — | | | | — | | | | — | |
| | | | | | | | | | | | | | | | | | | | | | | | | | | | |
Net Increase (Decrease) in Net Assets Resulting from Operations | | | 189,230 | | | | (180,378 | ) | | | (1,575 | ) | | | | | | | 226,753 | | | | (925,853 | ) | | | (70,049 | ) |
| | | | | | | | | | | | | | | | | | | | | | | | | | | | |
Distributions From: | | | | | | | | | | | | | | | | | | | | | | | | | | | | |
Net Investment Income: | | | | | | | | | | | | | | | | | | | | | | | | | | | | |
Institutional Class Shares | | | (18,642 | ) | | | (4,648 | ) | | | — | | | | | | | | (26,412 | ) | | | (26,222 | ) | | | (32,047 | ) |
Net Short-Term Gains: | | | | | | | | | | | | | | | | | | | | | | | | | | | | |
Institutional Class Shares | | | — | | | | — | | | | — | | | | | | | | — | | | | (8,922 | ) | | | (34,803 | ) |
Net Long-Term Gains: | | | | | | | | | | | | | | | | | | | | | | | | | | | | |
Institutional Class Shares | | | — | | | | — | | | | — | | | | | | | | — | | | | (173,725 | ) | | | (134,723 | ) |
| | | | | | | | | | | | | | | | | | | | | | | | | | | | |
Total Distributions | | | (18,642 | ) | | | (4,648 | ) | | | — | | | | | | | | (26,412 | ) | | | (208,869 | ) | | | (201,573 | ) |
| | | | | | | | | | | | | | | | | | | | | | | | | | | | |
Capital Share Transactions (1): | | | | | | | | | | | | | | | | | | | | | | | | | | | | |
Shares Issued | | | 1,195,628 | | | | 995,838 | | | | 120,639 | | | | | | | | 877,915 | * | | | 937,947 | | | | 727,472 | |
Shares Issued in Lieu of Cash Distributions | | | 18,449 | | | | 4,587 | | | | — | | | | | | | | 24,690 | | | | 204,052 | | | | 197,467 | |
Shares Redeemed | | | (524,944 | ) | | | (336,741 | ) | | | (12,557 | ) | | | | | | | (647,794 | ) | | | (1,225,521 | ) | | | (665,423 | ) |
| | | | | | | | | | | | | | | | | | | | | | | | �� | | | | |
Net Increase (Decrease) from Capital Share Transactions | | | 689,133 | | | | 663,684 | | | | 108,082 | | | | | | | | 254,811 | | | | (83,522 | ) | | | 259,516 | |
| | | | | | | | | | | | | | | | | | | | | | | | | | | | |
Total Increase (Decrease) in Net Assets | | | 859,721 | | | | 478,658 | | | | 106,507 | | | | | | | | 455,152 | | | | (1,218,244 | ) | | | (12,106 | ) |
Net Assets | | | | | | | | | | | | | | | | | | | | | | | | | | | | |
Beginning of Period | | | 585,165 | | | | 106,507 | | | | — | | | | | | | | 2,066,849 | | | | 3,285,093 | | | | 3,297,199 | |
| | | | | | | | | | | | | | | | | | | | | | | | | | | | |
End of Period | | $ | 1,444,886 | | | $ | 585,165 | | | $ | 106,507 | | | | | | | $ | 2,522,001 | | | $ | 2,066,849 | | | $ | 3,285,093 | |
| | | | | | | | | | | | | | | | | | | | | | | | | | | | |
(1) Shares Issued and Redeemed: | | | | | | | | | | | | | | | | | | | | | | | | | | | | |
Shares Issued | | | 209,711 | | | | 125,252 | | | | 12,664 | | | | | | | | 67,035 | | | | 54,875 | | | | 33,265 | |
Shares Issued in Lieu of Cash Distributions | | | 3,194 | | | | 543 | | | | — | | | | | | | | 2,058 | | | | 10,771 | | | | 9,289 | |
Shares Redeemed | | | (94,288 | ) | | | (44,316 | ) | | | (1,335 | ) | | | | | | | (54,475 | ) | | | (70,022 | ) | | | (30,180 | ) |
| | | | | | | | | | | | | | | | | | | | | | | | | | | | |
Net Increase (Decrease) from Shares Issued and Redeemed | | | 118,617 | | | | 81,479 | | | | 11,329 | | | | | | | | 14,618 | | | | (4,376 | ) | | | 12,374 | |
| | | | | | | | | | | | | | | | | | | | | | | | | | | | |
Undistributed Net Investment Income (Distributions in Excess of Net Investment Income) | | $ | 3,080 | | | $ | 1,827 | | | $ | 173 | | | | | | | $ | 3,780 | | | $ | 7,754 | | | $ | 3,498 | |
See page 1 & 2 for the Definitions of Abbreviations and Footnotes.
| * | Includes $8,355 in capital contributions related to the liquidation of The U.S. Small Cap Series. See Organization note within the Notes to Financial Statements. |
See accompanying Notes to Financial Statements.
170
DFA INVESTMENT DIMENSIONS GROUP INC.
STATEMENTS OF CHANGES IN NET ASSETS
(Amounts in thousands)
| | | | | | | | | | | | | | | | | | | | | | | | | | | | |
| | | U.S. Micro
Cap Portfolio | | | | | | | DFA Real Estate
Securities
Portfolio | |
| | | Year
Ended
Oct. 31,
2009 | | | Period
Dec. 1,
2007 to
Oct. 31,
2008 | | | Year
Ended
Nov. 30,
2007 | | | | | | | Year
Ended
Oct. 31,
2009 | | | Period
Dec. 1,
2007 to
Oct. 31,
2008 | | | Year
Ended
Nov. 30,
2007 | |
Increase (Decrease) in Net Assets | | | | | | | | | | | | | | | | | | | | | | | | | | | | |
Operations: | | | | | | | | | | | | | | | | | | | | | | | | | | | | |
Net Investment Income (Loss) | | $ | 10,509 | | | $ | 33,434 | | | $ | 45,400 | | | | | | | $ | 69,730 | | | $ | 68,746 | | | $ | 57,485 | |
Capital Gain Distributions Received from: | | | | | | | | | | | | | | | | | | | | | | | | | | | | |
Affiliated Investment Company | | | — | | | | 379,091 | | | | 436,439 | | | | | | | | — | | | | — | | | | — | |
Investment Securities | | | — | | | | — | | | | — | | | | | | | | 16,169 | | | | 42,861 | | | | 41,558 | |
Net Realized Gain (Loss) on: | | | | | | | | | | | | | | | | | | | | | | | | | | | | |
Investment Securities Sold/Affiliated Investment Company Shares Sold | | | (190,350 | ) | | | (130,372 | ) | | | (3,367 | ) | | | | | | | (106,626 | ) | | | (142,397 | ) | | | 181,105 | |
Futures | | | — | | | | — | | | | — | | | | | | | | (1,065 | ) | | | (1,472 | ) | | | — | |
Change in Unrealized Appreciation (Depreciation) of: | | | | | | | | | | | | | | | | | | | | | | | | | | | | |
Investment Securities/Affiliated Investment Company Shares | | | 168,490 | | | | (1,674,701 | ) | | | (655,320 | ) | | | | | | | 92,786 | | | | (893,193 | ) | | | (762,357 | ) |
Futures | | | — | | | | — | | | | — | | | | | | | | (10 | ) | | | 10 | | | | — | |
| | | | | | | | | | | | | | | | | | | | | | | | | | | | |
Net Increase (Decrease) in Net Assets Resulting from Operations | | | (11,351 | ) | | | (1,392,548 | ) | | | (176,848 | ) | | | | | | | 70,984 | | | | (925,445 | ) | | | (482,209 | ) |
| | | | | | | | | | | | | | | | | | | | | | | | | | | | |
Distributions From: | | | | | | | | | | | | | | | | | | | | | | | | | | | | |
Net Investment Income: | | | | | | | | | | | | | | | | | | | | | | | | | | | | |
Institutional Class Shares | | | (57,816 | ) | | | (42,596 | ) | | | (40,532 | ) | | | | | | | (95,934 | ) | | | (31,389 | ) | | | (62,692 | ) |
Net Short-Term Gains: | | | | | | | | | | | | | | | | | | | | | | | | | | | | |
Institutional Class Shares | | | — | | | | (40,254 | ) | | | (62,657 | ) | | | | | | | — | | | | (3,305 | ) | | | (2,939 | ) |
Net Long-Term Gains: | | | | | | | | | | | | | | | | | | | | | | | | | | | | |
Institutional Class Shares | | | — | | | | (350,779 | ) | | | (324,224 | ) | | | | | | | — | | | | (200,903 | ) | | | (70,533 | ) |
| | | | | | | | | | | | | | | | | | | | | | | | | | | | |
Total Distributions | | | (57,816 | ) | | | (433,629 | ) | | | (427,413 | ) | | | | | | | (95,934 | ) | | | (235,597 | ) | | | (136,164 | ) |
| | | | | | | | | | | | | | | | | | | | | | | | | | | | |
Capital Share Transactions (1): | | | | | | | | | | | | | | | | | | | | | | | | | | | | |
Shares Issued | | | 588,720 | * | | | 799,061 | | | | 1,088,866 | | | | | | | | 760,871 | | | | 946,371 | | | | 1,093,839 | |
Shares Issued in Lieu of Cash Distributions | | | 56,003 | | | | 425,522 | | | | 415,408 | | | | | | | | 93,552 | | | | 232,037 | | | | 133,705 | |
Shares Redeemed | | | (681,416 | ) | | | (1,174,552 | ) | | | (1,023,645 | ) | | | | | | | (557,875 | ) | | | (941,862 | ) | | | (774,740 | ) |
| | | | | | | | | | | | | | | | | | | | | | | | | | | | |
Net Increase (Decrease) from Capital Share Transactions | | | (36,693 | ) | | | 50,031 | | | | 480,629 | | | | | | | | 296,548 | | | | 236,546 | | | | 452,804 | |
| | | | | | | | | | | | | | | | | | | | | | | | | | | | |
Total Increase (Decrease) in Net Assets | | | (105,860 | ) | | | (1,776,146 | ) | | | (123,632 | ) | | | | | | | 271,598 | | | | (924,496 | ) | | | (165,569 | ) |
Net Assets | | | | | | | | | | | | | | | | | | | | | | | | | | | | |
Beginning of Period | | | 2,924,225 | | | | 4,700,371 | | | | 4,824,003 | | | | | | | | 1,746,961 | | | | 2,671,457 | | | | 2,837,026 | |
| | | | | | | | | | | | | | | | | | | | | | | | | | | | |
End of Period | | $ | 2,818,365 | | | $ | 2,924,225 | | | $ | 4,700,371 | | | | | | | $ | 2,018,559 | | | $ | 1,746,961 | | | $ | 2,671,457 | |
| | | | | | | | | | | | | | | | | | | | | | | | | | | | |
(1) Shares Issued and Redeemed: | | | | | | | | | | | | | | | | | | | | | | | | | | | | |
Shares Issued | | | 53,716 | | | | 65,963 | | | | 68,282 | | | | | | | | 61,585 | | | | 41,914 | | | | 34,996 | |
Shares Issued in Lieu of Cash Distributions | | | 6,981 | | | | 32,229 | | | | 26,806 | | | | | | | | 7,388 | | | | 9,889 | | | | 4,257 | |
Shares Redeemed | | | (84,421 | ) | | | (97,545 | ) | | | (64,141 | ) | | | | | | | (45,050 | ) | | | (41,934 | ) | | | (24,958 | ) |
| | | | | | | | | | | | | | | | | | | | | | | | | | | | |
Net Increase (Decrease) from Shares Issued and Redeemed | | | (23,724 | ) | | | 647 | | | | 30,947 | | | | | | | | 23,923 | | | | 9,869 | | | | 14,295 | |
| | | | | | | | | | | | | | | | | | | | | | | | | | | | |
Undistributed Net Investment Income (Distributions in Excess of Net Investment Income) | | $ | 3,100 | | | $ | 36,069 | | | $ | 6,812 | | | | | | | $ | 8,197 | | | $ | 34,213 | | | $ | 161 | |
| * | Includes $11,529 in capital contributions related to the liquidation of The U.S. Micro Cap Series. See Organization note within the Notes to Financial Statements. |
See accompanying Notes to Financial Statements.
171
DFA INVESTMENT DIMENSIONS GROUP INC.
STATEMENTS OF CHANGES IN NET ASSETS
(Amounts in thousands)
| | | | | | | | | | | | | | | | | | | | | | | | | | | | |
| | | Large Cap
International
Portfolio | | | | | | | International
Core Equity
Portfolio | |
| | | Year
Ended
Oct. 31,
2009 | | | Period
Dec. 1,
2007 to
Oct. 31,
2008 | | | Year
Ended
Nov. 30,
2007 | | | | | | | Year
Ended
Oct. 31,
2009 | | | Period
Dec. 1,
2007 to
Oct. 31,
2008 | | | Year
Ended
Nov. 30,
2007 | |
Increase (Decrease) in Net Assets | | | | | | | | | | | | | | | | | | | | | | | | | | | | |
Operations: | | | | | | | | | | | | | | | | | | | | | | | | | | | | |
Net Investment Income (Loss) | | $ | 36,172 | | | $ | 56,577 | | | $ | 51,732 | | | | | | | $ | 77,941 | | | $ | 76,838 | | | $ | 39,035 | |
Net Realized Gain (Loss) on: | | | | | | | | | | | | | | | | | | | | | | | | | | | | |
Investment Securities Sold | | | (150,602 | ) | | | (19,013 | ) | | | 37,442 | | | | | | | | (83,575 | ) | | | (11,335 | ) | | | 24,982 | |
Futures | | | 919 | | | | — | | | | — | | | | | | | | (2,556 | ) | | | — | | | | — | |
Foreign Currency Transactions | | | 951 | | | | (1,346 | ) | | | 174 | | | | | | | | 1,319 | | | | (911 | ) | | | 105 | |
In-Kind Redemptions | | | — | | | | 14,987 | * | | | — | | | | | | | | — | | | | 7,590 | * | | | — | |
Change in Unrealized Appreciation (Depreciation) of: | | | | | | | | | | | | | | | | | | | | | | | | | | | | |
Investment Securities and Foreign Currency | | | 374,243 | | | | (1,012,012 | ) | | | 231,080 | | | | | | | | 928,934 | | | | (1,484,029 | ) | | | 105,889 | |
Futures | | | — | | | | — | | | | — | | | | | | | | (15 | ) | | | 15 | | | | — | |
Translation of Foreign Currency Denominated Amounts | | | (64 | ) | | | 65 | | | | (44 | ) | | | | | | | (108 | ) | | | 73 | | | | 59 | |
| | | | | | | | | | | | | | | | | | | | | | | | | | | | |
Net Increase (Decrease) in Net Assets Resulting from Operations | | | 261,619 | | | | (960,742 | ) | | | 320,384 | | | | | | | | 921,940 | | | | (1,411,759 | ) | | | 170,070 | |
| | | | | | | | | | | | | | | | | | | | | | | | | | | | |
Distributions From: | | | | | | | | | | | | | | | | | | | | | | | | | | | | |
Net Investment Income: | | | | | | | | | | | | | | | | | | | | | | | | | | | | |
Institutional Class Shares | | | (32,286 | ) | | | (53,392 | ) | | | (51,063 | ) | | | | | | | (77,469 | ) | | | (76,637 | ) | | | (38,518 | ) |
Net Short-Term Gains: | | | | | | | | | | | | | | | | | | | | | | | | | | | | |
Institutional Class Shares | | | — | | | | — | | | | — | | | | | | | | — | | | | (7,592 | ) | | | (2,252 | ) |
Net Long-Term Gains: | | | | | | | | | | | | | | | | | | | | | | | | | | | | |
Institutional Class Shares | | | — | | | | (28,968 | ) | | | — | | | | | | | | — | | | | (17,164 | ) | | | (205 | ) |
| | | | | | | | | | | | | | | | | | | | | | | | | | | | |
Total Distributions | | | (32,286 | ) | | | (82,360 | ) | | | (51,063 | ) | | | | | | | (77,469 | ) | | | (101,393 | ) | | | (40,975 | ) |
| | | | | | | | | | | | | | | | | | | | | | | | | | | | |
Capital Share Transactions (1): | | | | | | | | | | | | | | | | | | | | | | | | | | | | |
Shares Issued | | | 380,682 | | | | 534,434 | | | | 529,554 | | | | | | | | 1,709,907 | | | | 1,729,052 | | | | 1,460,555 | |
Shares Issued in Lieu of Cash Distributions | | | 31,081 | | | | 78,686 | | | | 47,880 | | | | | | | | 75,441 | | | | 97,113 | | | | 39,306 | |
Shares Redeemed | | | (483,605 | ) | | | (587,338 | )* | | | (295,814 | ) | | | | | | | (911,026 | ) | | | (674,151 | )* | | | (137,846 | ) |
| | | | | | | | | | | | | | | | | | | | | | | | | | | | |
Net Increase (Decrease) from Capital Share Transactions | | | (71,842 | ) | | | 25,782 | | | | 281,620 | | | | | | | | 874,322 | | | | 1,152,014 | | | | 1,362,015 | |
| | | | | | | | | | | | | | | | | | | | | | | | | | | | |
Total Increase (Decrease) in Net Assets | | | 157,491 | | | | (1,017,320 | ) | | | 550,941 | | | | | | | | 1,718,793 | | | | (361,138 | ) | | | 1,491,110 | |
Net Assets | | | | | | | | | | | | | | | | | | | | | | | | | | | | |
Beginning of Period | | | 1,206,860 | | | | 2,224,180 | | | | 1,673,239 | | | | | | | | 1,981,049 | | | | 2,342,187 | | | | 851,077 | |
| | | | | | | | | | | | | | | | | | | | | | | | | | | | |
End of Period | | $ | 1,364,351 | | | $ | 1,206,860 | | | $ | 2,224,180 | | | | | | | $ | 3,699,842 | | | $ | 1,981,049 | | | $ | 2,342,187 | |
| | | | | | | | | | | | | | | | | | | | | | | | | | | | |
(1) Shares Issued and Redeemed: | | | | | | | | | | | | | | | | | | | | | | | | | | | | |
Shares Issued | | | 26,226 | | | | 24,768 | | | | 20,502 | | | | | | | | 227,407 | | | | 156,232 | | | | 103,681 | |
Shares Issued in Lieu of Cash Distributions | | | 2,085 | | | | 3,394 | | | | 1,862 | | | | | | | | 9,039 | | | | 8,456 | | | | 2,819 | |
Shares Redeemed | | | (34,086 | ) | | | (28,525 | ) | | | (11,428 | ) | | | | | | | (123,941 | ) | | | (62,282 | ) | | | (9,741 | ) |
| | | | | | | | | | | | | | | | | | | | | | | | | | | | |
Net Increase (Decrease) from Shares Issued and Redeemed | | | (5,775 | ) | | | (363 | ) | | | 10,936 | | | | | | | | 112,505 | | | | 102,406 | | | | 96,759 | |
| | | | | | | | | | | | | | | | | | | | | | | | | | | | |
Undistributed Net Investment Income (Distributions in Excess of Net Investment Income) | | $ | 5,593 | | | $ | 449 | | | $ | (1,254 | ) | | | | | | $ | 2,148 | | | $ | (485 | ) | | $ | 1,609 | |
| * | See Note M in the Notes to Financial Statements. |
See accompanying Notes to Financial Statements.
172
DFA INVESTMENT DIMENSIONS GROUP INC.
STATEMENTS OF CHANGES IN NET ASSETS
(Amounts in thousands)
| | | | | | | | | | | | | | | | | | | | | | | | |
| | | T.A. World
ex U.S.
Core Equity
Portfolio | | | | | | | International
Small Company
Portfolio | |
| | | Year
Ended
Oct. 31,
2009 | | | Period
Mar. 6,
2008(a) to
Oct. 31,
2008 | | | | | | | Year
Ended
Oct. 31,
2009 | | | Period
Dec. 1,
2007 to
Oct. 31,
2008 | | | Year
Ended
Nov. 30,
2007 | |
Increase (Decrease) in Net Assets | | | | | | | | | | | | | | | | | | | | | | | | |
Operations: | | | | | | | | | | | | | | | | | | | | | | | | |
Net Investment Income (Loss) | | $ | 11,410 | | | $ | 2,171 | | | | | | | $ | 83,540 | | | $ | 131,960 | | | $ | 108,657 | |
Net Realized Gain (Loss) on: | | | | | | | | | | | | | | | | | | | | | | | | |
Investment Securities Sold | | | (8,990 | ) | | | (2,290 | ) | | | | | | | (110,040 | ) | | | (120,455 | ) | | | 331,045 | |
Futures | | | (660 | ) | | | — | | | | | | | | 592 | | | | (569 | ) | | | — | |
Foreign Currency Transactions | | | 97 | | | | 6 | | | | | | | | 1,180 | | | | (3,640 | ) | | | 1,035 | |
Change in Unrealized Appreciation (Depreciation) of: | | | | | | | | | | | | | | | | | | | | | | | | |
Investment Securities and Foreign Currency | | | 196,743 | | | | (87,743 | ) | | | | | | | 1,280,471 | | | | (2,759,513 | ) | | | 162,772 | |
Futures | | | (1 | ) | | | 1 | | | | | | | | 1 | | | | (1 | ) | | | — | |
Translation of Foreign Currency Denominated Amounts | | | (31 | ) | | | 56 | | | | | | | | (297 | ) | | | 188 | | | | 160 | |
Change in Deferred Thailand Capital Gains Tax | | | (101 | ) | | | — | | | | | | | | — | | | | — | | | | — | |
| | | | | | | | | | | | | | | | | | | | | | | | |
Net Increase (Decrease) in Net Assets Resulting from Operations | | | 198,467 | | | | (87,799 | ) | | | | | | | 1,255,447 | | | | (2,752,030 | ) | | | 603,669 | |
| | | | | | | | | | | | | | | | | | | | | | | | |
Distributions From: | | | | | | | | | | | | | | | | | | | | | | | | |
Net Investment Income: | | | | | | | | | | | | | | | | | | | | | | | | |
Institutional Class Shares | | | (10,761 | ) | | | (1,192 | ) | | | | | | | (81,118 | ) | | | (132,809 | ) | | | (114,210 | ) |
Net Short-Term Gains: | | | | | | | | | | | | | | | | | | | | | | | | |
Institutional Class Shares | | | — | | | | — | | | | | | | | — | | | | (36,135 | ) | | | (28,033 | ) |
Net Long-Term Gains: | | | | | | | | | | | | | | | | | | | | | | | | |
Institutional Class Shares | | | — | | | | — | | | | | | | | — | | | | (278,291 | ) | | | (129,328 | ) |
| | | | | | | | | | | | | | | | | | | | | | | | |
Total Distributions | | | (10,761 | ) | | | (1,192 | ) | | | | | | | (81,118 | ) | | | (447,235 | ) | | | (271,571 | ) |
| | | | | | | | | | | | | | | | | | | | | | | | |
Capital Share Transactions (1): | | | | | | | | | | | | | | | | | | | | | | | | |
Shares Issued | | | 495,969 | | | | 408,243 | | | | | | | | 890,444 | | | | 1,327,412 | | | | 1,085,538 | |
Shares Issued in Lieu of Cash Distributions | | | 10,580 | | | | 1,155 | | | | | | | | 77,147 | | | | 430,141 | | | | 258,985 | |
Shares Redeemed | | | (253,845 | ) | | | (92,089 | ) | | | | | | | (956,429 | ) | | | (1,071,124 | ) | | | (625,483 | ) |
| | | | | | | | | | | | | | | | | | | | | | | | |
Net Increase (Decrease) from Capital Share Transactions | | | 252,704 | | | | 317,309 | | | | | | | | 11,162 | | | | 686,429 | | | | 719,040 | |
| | | | | | | | | | | | | | | | | | | | | | | | |
Total Increase (Decrease) in Net Assets | | | 440,410 | | | | 228,318 | | | | | | | | 1,185,491 | | | | (2,512,836 | ) | | | 1,051,138 | |
Net Assets | | | | | | | | | | | | | | | | | | | | | | | | |
Beginning of Period | | | 228,318 | | | | — | | | | | | | | 3,084,373 | | | | 5,597,209 | | | | 4,546,071 | |
| | | | | | | | | | | | | | | | | | | | | | | | |
End of Period | | $ | 668,728 | | | $ | 228,318 | | | | | | | $ | 4,269,864 | | | $ | 3,084,373 | | | $ | 5,597,209 | |
| | | | | | | | | | | | | | | | | | | | | | | | |
(1) Shares Issued and Redeemed: | | | | | | | | | | | | | | | | | | | | | | | | |
Shares Issued | | | 85,214 | | | | 51,464 | | | | | | | | 81,822 | | | | 83,183 | | | | 52,082 | |
Shares Issued in Lieu of Cash Distributions | | | 1,589 | | | | 124 | | | | | | | | 6,961 | | | | 24,110 | | | | 13,230 | |
Shares Redeemed | | | (43,612 | ) | | | (12,532 | ) | | | | | | | (89,990 | ) | | | (70,097 | ) | | | (30,074 | ) |
| | | | | | | | | | | | | | | | | | | | | | | | |
Net Increase (Decrease) from Shares Issued and Redeemed | | | 43,191 | | | | 39,056 | | | | | | | | (1,207 | ) | | | 37,196 | | | | 35,238 | |
| | | | | | | | | | | | | | | | | | | | | | | | |
Undistributed Net Investment Income (Distributions in Excess of Net Investment Income) | | $ | 1,772 | | | $ | 1,014 | | | | | | | $ | 13,949 | | | $ | 8,898 | | | $ | 6,151 | |
See page 1 & 2 for the Definitions of Abbreviations and Footnotes.
See accompanying Notes to Financial Statements.
173
DFA INVESTMENT DIMENSIONS GROUP INC.
STATEMENTS OF CHANGES IN NET ASSETS
(Amounts in thousands)
| | | | | | | | | | | | | | | | | | | | | | | | | | |
| | | Japanese
Small Company
Portfolio | | | | | Asia Pacific
Small Company
Portfolio | |
| | | Year
Ended
Oct. 31,
2009 | | | Period
Dec. 1,
2007 to
Oct. 31,
2008 | | | Year
Ended
Nov. 30,
2007 | | | | | Year
Ended
Oct. 31,
2009 | | | Period
Dec. 1,
2007 to
Oct. 31,
2008 | | | Year
Ended
Nov. 30,
2007 | |
Increase (Decrease) in Net Assets | | | | | | | | | | | | | | | | | | | | | | | | | | |
Operations: | | | | | | | | | | | | | | | | | | | | | | | | | | |
Net Investment Income (Loss) | | $ | 1,879 | | | $ | 3,548 | | | $ | 3,072 | | | | | $ | 2,525 | | | $ | 4,300 | | | $ | 3,553 | |
Net Realized Gain (Loss) on: | | | | | | | | | | | | | | | | | | | | | | | | | | |
Investment Securities Sold | | | (14,110 | ) | | | (22,824 | ) | | | (7,840 | ) | | | | | (8,877 | ) | | | (21,574 | ) | | | 4,912 | |
Futures | | | 43 | | | | (10 | ) | | | — | | | | | | (89 | ) | | | (34 | ) | | | — | |
Foreign Currency Transactions | | | 250 | | | | (46 | ) | | | (35 | ) | | | | | 23 | | | | (193 | ) | | | 93 | |
Change in Unrealized Appreciation (Depreciation) of: | | | | | | | | | | | | | | | | | | | | | | | | | | |
Investment Securities and Foreign Currency | | | 37,328 | | | | (35,124 | ) | | | 365 | | | | | | 52,469 | | | | (69,553 | ) | | | 32,175 | |
Translation of Foreign Currency Denominated Amounts | | | (61 | ) | | | 60 | | | | 19 | | | | | | 29 | | | | (15 | ) | | | (2 | ) |
| | | | | | | | | | | | | | | | | | | | | | | | | | |
Net Increase (Decrease) in Net Assets Resulting from Operations | | | 25,329 | | | | (54,396 | ) | | | (4,419 | ) | | | | | 46,080 | | | | (87,069 | ) | | | 40,731 | |
| | | | | | | | | | | | | | | | | | | | | | | | | | |
Distributions From: | | | | | | | | | | | | | | | | | | | | | | | | | | |
Net Investment Income: | | | | | | | | | | | | | | | | | | | | | | | | | | |
Institutional Class Shares | | | (2,426 | ) | | | (3,574 | ) | | | (2,759 | ) | | | | | (2,724 | ) | | | (4,433 | ) | | | (3,089 | ) |
| | | | | | | | | | | | | | | | | | | | | | | | | | |
Total Distributions | | | (2,426 | ) | | | (3,574 | ) | | | (2,759 | ) | | | | | (2,724 | ) | | | (4,433 | ) | | | (3,089 | ) |
| | | | | | | | | | | | | | | | | | | | | | | | | | |
Capital Share Transactions (1): | | | | | | | | | | | | | | | | | | | | | | | | | | |
Shares Issued | | | 18,298 | | | | 32,726 | | | | 102,980 | | | | | | 18,265 | | | | 51,749 | | | | 58,296 | |
Shares Issued in Lieu of Cash Distributions | | | 2,219 | | | | 3,367 | | | | 2,746 | | | | | | 2,398 | | | | 4,090 | | | | 3,008 | |
Shares Redeemed | | | (62,735 | ) | | | (43,830 | ) | | | (68,425 | ) | | | | | (26,210 | ) | | | (46,600 | ) | | | (24,176 | ) |
| | | | | | | | | | | | | | | | | | | | | | | | | | |
Net Increase (Decrease) from Capital Share Transactions | | | (42,218 | ) | | | (7,737 | ) | | | 37,301 | | | | | | (5,547 | ) | | | 9,239 | | | | 37,128 | |
| | | | | | | | | | | | | | | | | | | | | | | | | | |
Total Increase (Decrease) in Net Assets | | | (19,315 | ) | | | (65,707 | ) | | | 30,123 | | | | | | 37,809 | | | | (82,263 | ) | | | 74,770 | |
Net Assets | | | | | | | | | | | | | | | | | | | | | | | | | | |
Beginning of Period | | | 133,373 | | | | 199,080 | | | | 168,957 | | | | | | 64,044 | | | | 146,307 | | | | 71,537 | |
| | | | | | | | | | | | | | | | | | | | | | | | | | |
End of Period | | $ | 114,058 | | | $ | 133,373 | | | $ | 199,080 | | | | | $ | 101,853 | | | $ | 64,044 | | | $ | 146,307 | |
| | | | | | | | | | | | | | | | | | | | | | | | | | |
(1) Shares Issued and Redeemed: | | | | | | | | | | | | | | | | | | | | | | | | | | |
Shares Issued | | | 1,589 | | | | 2,312 | | | | 5,861 | | | | | | 1,318 | | | | 2,384 | | | | 2,409 | |
Shares Issued in Lieu of Cash Distributions | | | 174 | | | | 220 | | | | 157 | | | | | | 196 | | | | 168 | | | | 131 | |
Shares Redeemed | | | (4,937 | ) | | | (3,276 | ) | | | (3,939 | ) | | | | | (2,055 | ) | | | (2,157 | ) | | | (979 | ) |
| | | | | | | | | | | | | | | | | | | | | | | | | | |
Net Increase (Decrease) from Shares Issued and Redeemed | | | (3,174 | ) | | | (744 | ) | | | 2,079 | | | | | | (541 | ) | | | 395 | | | | 1,561 | |
| | | | | | | | | | | | | | | | | | | | | | | | | | |
Undistributed Net Investment Income (Distributions in Excess of Net Investment Income) | | $ | 665 | | | $ | 964 | | | $ | 894 | | | | | $ | 246 | | | $ | 412 | | | $ | 621 | |
See accompanying Notes to Financial Statements.
174
DFA INVESTMENT DIMENSIONS GROUP INC.
STATEMENTS OF CHANGES IN NET ASSETS
(Amounts in thousands)
| | | | | | | | | | | | | | | | | | | | | | | | | | |
| | | United Kingdom
Small Company
Portfolio | | | | | Continental
Small Company
Portfolio | |
| | | Year
Ended
Oct. 31,
2009 | | | Period
Dec. 1,
2007 to
Oct. 31,
2008 | | | Year
Ended
Nov. 30,
2007 | | | | | Year
Ended
Oct. 31,
2009 | | | Period
Dec. 1,
2007 to
Oct. 31,
2008 | | | Year
Ended
Nov. 30,
2007 | |
Increase (Decrease) in Net Assets | | | | | | | | | | | | | | | | | | | | | | | | | | |
Operations: | | | | | | | | | | | | | | | | | | | | | | | | | | |
Net Investment Income (Loss) | | $ | 861 | | | $ | 1,182 | | | $ | 899 | | | | | $ | 2,168 | | | $ | 4,234 | | | $ | 2,554 | |
Net Realized Gain (Loss) on: | | | | | | | | | | | | | | | | | | | | | | | | | | |
Investment Securities Sold | | | (2,247 | ) | | | (771 | ) | | | 1,545 | | | | | | (7,421 | ) | | | (16,519 | ) | | | 7,620 | |
Futures | | | 26 | | | | — | | | | — | | | | | | (137 | ) | | | (16 | ) | | | — | |
Foreign Currency Transactions | | | (10 | ) | | | (77 | ) | | | 13 | | | | | | (49 | ) | | | (16 | ) | | | 39 | |
Change in Unrealized Appreciation (Depreciation) of: | | | | | | | | | | | | | | | | | | | | | | | | | | |
Investment Securities and Foreign Currency | | | 9,569 | | | | (24,744 | ) | | | (2,123 | ) | | | | | 37,449 | | | | (81,292 | ) | | | 4,064 | |
Futures | | | — | | | | — | | | | — | | | | | | (1 | ) | | | 1 | | | | — | |
Translation of Foreign Currency Denominated Amounts | | | (6 | ) | | | 11 | | | | — | | | | | | 24 | | | | (30 | ) | | | 10 | |
| | | | | | | | | | | | | | | | | | | | | | | | | | |
Net Increase (Decrease) in Net Assets Resulting from Operations | | | 8,193 | | | | (24,399 | ) | | | 334 | | | | | | 32,033 | | | | (93,638 | ) | | | 14,287 | |
| | | | | | | | | | | | | | | | | | | | | | | | | | |
Distributions From: | | | | | | | | | | | | | | | | | | | | | | | | | | |
Net Investment Income: | | | | | | | | | | | | | | | | | | | | | | | | | | |
Institutional Class Shares | | | (658 | ) | | | (1,104 | ) | | | (1,097 | ) | | | | | (2,087 | ) | | | (3,979 | ) | | | (2,638 | ) |
Return of Capital | | | — | | | | (19 | ) | | | — | | | | | | — | | | | (97 | ) | | | — | |
Net Short-Term Gains: | | | | | | | | | | | | | | | | | | | | | | | | | | |
Institutional Class Shares | | | — | | | | (123 | ) | | | (217 | ) | | | | | — | | | | (347 | ) | | | (549 | ) |
Net Long-Term Gains: | | | | | | | | | | | | | | | | | | | | | | | | | | |
Institutional Class Shares | | | — | | | | (1,311 | ) | | | (1,092 | ) | | | | | — | | | | (6,764 | ) | | | (1,842 | ) |
| | | | | | | | | | | | | | | | | | | | | | | | | | |
Total Distributions | | | (658 | ) | | | (2,557 | ) | | | (2,406 | ) | | | | | (2,087 | ) | | | (11,187 | ) | | | (5,029 | ) |
| | | | | | | | | | | | | | | | | | | | | | | | | | |
Capital Share Transactions (1): | | | | | | | | | | | | | | | | | | | | | | | | | | |
Shares Issued | | | 4,137 | | | | 25,474 | | | | 11,009 | | | | | | 14,850 | | | | 72,836 | | | | 94,168 | |
Shares Issued in Lieu of Cash Distributions | | | 556 | | | | 2,517 | | | | 2,404 | | | | | | 1,874 | | | | 10,871 | | | | 4,921 | |
Shares Redeemed | | | (10,248 | ) | | | (12,291 | ) | | | (6,010 | ) | | | | | (29,732 | ) | | | (55,803 | ) | | | (27,699 | ) |
| | | | | | | | | | | | | | | | | | | | | | | | | | |
Net Increase (Decrease) from Capital Share Transactions | | | (5,555 | ) | | | 15,700 | | | | 7,403 | | | | | | (13,008 | ) | | | 27,904 | | | | 71,390 | |
| | | | | | | | | | | | | | | | | | | | | | | | | | |
Total Increase (Decrease) in Net Assets | | | 1,980 | | | | (11,256 | ) | | | 5,331 | | | | | | 16,938 | | | | (76,921 | ) | | | 80,648 | |
Net Assets | | | | | | | | | | | | | | | | | | | | | | | | | | |
Beginning of Period | | | 25,883 | | | | 37,139 | | | | 31,808 | | | | | | 93,988 | | | | 170,909 | | | | 90,261 | |
| | | | | | | | | | | | | | | | | | | | | | | | | | |
End of Period | | $ | 27,863 | | | $ | 25,883 | | | $ | 37,139 | | | | | $ | 110,926 | | | $ | 93,988 | | | $ | 170,909 | |
| | | | | | | | | | | | | | | | | | | | | | | | | | |
(1) Shares Issued and Redeemed: | | | | | | | | | | | | | | | | | | | | | | | | | | |
Shares Issued | | | 288 | | | | 1,087 | | | | 327 | | | | | | 1,344 | | | | 3,830 | | | | 4,007 | |
Shares Issued in Lieu of Cash Distributions | | | 36 | | | | 96 | | | | 74 | | | | | | 148 | | | | 539 | | | | 227 | |
Shares Redeemed | | | (733 | ) | | | (556 | ) | | | (179 | ) | | | | | (2,868 | ) | | | (3,056 | ) | | | (1,195 | ) |
| | | | | | | | | | | | | | | | | | | | | | | | | | |
Net Increase (Decrease) from Shares Issued and Redeemed | | | (409 | ) | | | 627 | | | | 222 | | | | | | (1,376 | ) | | | 1,313 | | | | 3,039 | |
| | | | | | | | | | | | | | | | | | | | | | | | | | |
Undistributed Net Investment Income (Distributions in Excess of Net Investment Income) | | $ | 171 | | | $ | (41 | ) | | $ | (171 | ) | | | | $ | (12 | ) | | $ | (43 | ) | | $ | (198 | ) |
See accompanying Notes to Financial Statements.
175
DFA INVESTMENT DIMENSIONS GROUP INC.
STATEMENTS OF CHANGES IN NET ASSETS
(Amounts in thousands)
| | | | | | | | | | | | | | | | | | | | | | |
| | | DFA International
Real Estate Securities
Portfolio | | | | | DFA Global
Real Estate Securities
Portfolio | |
| | | Year
Ended
Oct. 31,
2009 | | | Period
Dec. 1,
2007 to
Oct. 31,
2008 | | | Year
Ended
Nov. 30,
2007 | | | | | Year
Ended
Oct. 31,
2009 | | | Period
June 4,
2008(a) to
Oct. 31,
2008 | |
Increase (Decrease) in Net Assets | | | | | | | | | | | | | | | | | | | | | | |
Operations: | | | | | | | | | | | | | | | | | | | | | | |
Net Investment Income (Loss) | | $ | 32,101 | | | $ | 22,511 | | | $ | 4,578 | | | | | $ | 7,504 | | | $ | (10 | ) |
Net Realized Gain (Loss) on: | | | | | | | | | | | | | | | | | | | | | | |
Investment Securities Sold | | | (36,531 | ) | | | (13,579 | ) | | | (3 | ) | | | | | (6,921 | ) | | | (280 | ) |
Futures | | | 234 | | | | — | | | | — | | | | | | — | | | | — | |
Foreign Currency Transactions | | | 185 | | | | (521 | ) | | | 9 | | | | | | — | | | | — | |
Change in Unrealized Appreciation (Depreciation) of: | | | | | | | | | | | | | | | | | | | | | | |
Investment Securities and Foreign Currency | | | 170,229 | | | | (363,676 | ) | | | (25,701 | ) | | | | | 66,893 | | | | (34,668 | ) |
Translation of Foreign Currency Denominated Amounts | | | 209 | | | | (124 | ) | | | 14 | | | | | | — | | | | — | |
| | | | | | | | | | | | | | | | | | | | | | |
Net Increase (Decrease) in Net Assets Resulting from Operations | | | 166,427 | | | | (355,389 | ) | | | (21,103 | ) | | | | | 67,476 | | | | (34,958 | ) |
| | | | | | | | | | | | | | | | | | | | | | |
Distributions From: | | | | | | | | | | | | | | | | | | | | | | |
Net Investment Income: | | | | | | | | | | | | | | | | | | | | | | |
Institutional Class Shares | | | (11,227 | ) | | | (19,783 | ) | | | (2,361 | ) | | | | | (2,346 | ) | | | — | |
Net Short-Term Gains: | | | | | | | | | | | | | | | | | | | | | | |
Institutional Class Shares | | | — | | | | — | | | | — | | | | | | (24 | ) | | | — | |
| | | | | | | | | | | | | | | | | | | | | | |
Total Distributions | | | (11,227 | ) | | | (19,783 | ) | | | (2,361 | ) | | | | | (2,370 | ) | | | — | |
| | | | | | | | | | | | | | | | | | | | | | |
Capital Share Transactions (1): | | | | | | | | | | | | | | | | | | | | | | |
Shares Issued | | | 331,853 | | | | 580,235 | | | | 375,453 | | | | | | 345,457 | | | | 144,246 | |
Shares Issued in Lieu of Cash Distributions | | | 11,113 | | | | 19,359 | | | | 2,263 | | | | | | 2,351 | | | | — | |
Shares Redeemed | | | (150,317 | ) | | | (166,782 | ) | | | (17,412 | ) | | | | | (71,084 | ) | | | (18,616 | ) |
| | | | | | | | | | | | | | | | | | | | | | |
Net Increase (Decrease) from Capital Share Transactions | | | 192,649 | | | | 432,812 | | | | 360,304 | | | | | | 276,724 | | | | 125,630 | |
| | | | | | | | | | | | | | | | | | | | | | |
Total Increase (Decrease) in Net Assets | | | 347,849 | | | | 57,640 | | | | 336,840 | | | | | | 341,830 | | | | 90,672 | |
Net Assets | | | | | | | | | | | | | | | | | | | | | | |
Beginning of Period | | | 394,480 | | | | 336,840 | | | | — | | | | | | 90,672 | | | | — | |
| | | | | | | | | | | | | | | | | | | | | | |
End of Period | | $ | 742,329 | | | $ | 394,480 | | | $ | 336,840 | | | | | $ | 432,502 | | | $ | 90,672 | |
| | | | | | | | | | | | | | | | | | | | | | |
(1) Shares Issued and Redeemed: | | | | | | | | | | | | | | | | | | | | | | |
Shares Issued | | | 82,981 | | | | 81,466 | | | | 37,594 | | | | | | 62,358 | | | | 17,468 | |
Shares Issued in Lieu of Cash Distributions | | | 3,104 | | | | 2,444 | | | | 239 | | | | | | 445 | | | | — | |
Shares Redeemed | | | (38,756 | ) | | | (25,570 | ) | | | (1,821 | ) | | | | | (13,777 | ) | | | (2,460 | ) |
| | | | | | | | | | | | | | | | | | | | | | |
Net Increase (Decrease) from Shares Issued and Redeemed | | | 47,329 | | | | 58,340 | | | | 36,012 | | | | | | 49,026 | | | | 15,008 | |
| | | | | | | | | | | | | | | | | | | | | | |
Undistributed Net Investment Income (Distributions in Excess of Net Investment Income) | | $ | 24,078 | | | $ | 4,089 | | | $ | 1,877 | | | | | $ | 4,918 | | | $ | 6 | |
See page 1 & 2 for the Definitions of Abbreviations and Footnotes.
See accompanying Notes to Financial Statements.
176
DFA INVESTMENT DIMENSIONS GROUP INC.
STATEMENTS OF CHANGES IN NET ASSETS
(Amounts in thousands)
| | | | | | | | | | | | | | | | | | | | | | |
| | | DFA International
Small Cap Value
Portfolio | | | | | International
Vector Equity
Portfolio | |
| | | Year
Ended
Oct. 31,
2009 | | | Period
Dec. 1,
2007 to
Oct. 31,
2008 | | | Year
Ended
Nov. 30,
2007 | | | | | Year
Ended
Oct. 31,
2009 | | | Period
Aug. 14,
2008(a) to
Oct. 31,
2008 | |
Increase (Decrease) in Net Assets | | | | | | | | | | | | | | | | | | | | | | |
Operations: | | | | | | | | | | | | | | | | | | | | | | |
Net Investment Income (Loss) | | $ | 118,909 | | | $ | 222,701 | | | $ | 162,639 | | | | | $ | 4,181 | | | $ | 246 | |
Net Realized Gain (Loss) on: | | | | | | | | | | | | | | | | | | | | | | |
Investment Securities Sold | | | (20,925 | ) | | | 28,945 | | | | 682,920 | | | | | | (3,551 | ) | | | (27 | ) |
Futures | | | (9,031 | ) | | | (1,804 | ) | | | — | | | | | | (232 | ) | | | — | |
Foreign Currency Transactions | | | (2,189 | ) | | | (3,478 | ) | | | 3,452 | | | | | | (23 | ) | | | (19 | ) |
Change in Unrealized Appreciation (Depreciation) of: | | | | | | | | | | | | | | | | | | | | | | |
Investment Securities and Foreign Currency | | | 1,907,503 | | | | (4,209,886 | ) | | | (197,398 | ) | | | | | 71,485 | | | | (16,902 | ) |
Futures | | | (28 | ) | | | 28 | | | | — | | | | | | (1 | ) | | | 1 | |
Translation of Foreign Currency Denominated Amounts | | | (469 | ) | | | 112 | | | | 46 | | | | | | (11 | ) | | | 15 | |
| | | | | | | | | | | | | | | | | | | | | | |
Net Increase (Decrease) in Net Assets Resulting from Operations | | | 1,993,770 | | | | (3,963,382 | ) | | | 651,659 | | | | | | 71,848 | | | | (16,686 | ) |
| | | | | | | | | | | | | | | | | | | | | | |
Distributions From: | | | | | | | | | | | | | | | | | | | | | | |
Net Investment Income: | | | | | | | | | | | | | | | | | | | | | | |
Institutional Class Shares | | | (105,935 | ) | | | (245,481 | ) | | | (179,161 | ) | | | | | (3,671 | ) | | | — | |
Net Short-Term Gains: | | | | | | | | | | | | | | | | | | | | | | |
Institutional Class Shares | | | — | | | | (65,513 | ) | | | (22,039 | ) | | | | | — | | | | — | |
Net Long-Term Gains: | | | | | | | | | | | | | | | | | | | | | | |
Institutional Class Shares | | | (25,433 | ) | | | (533,622 | ) | | | (365,355 | ) | | | | | — | | | | — | |
| | | | | | | | | | | | | | | | | | | | | | |
Total Distributions | | | (131,368 | ) | | | (844,616 | ) | | | (566,555 | ) | | | | | (3,671 | ) | | | — | |
| | | | | | | | | | | | | | | | | | | | | | |
Capital Share Transactions (1): | | | | | | | | | | | | | | | | | | | | | | |
Shares Issued | | | 1,516,998 | | | | 2,492,365 | | | | 2,243,987 | | | | | | 203,871 | | | | 88,814 | |
Shares Issued in Lieu of Cash Distributions | | | 123,396 | | | | 812,456 | | | | 539,597 | | | | | | 3,533 | | | | — | �� |
Shares Redeemed | | | (1,442,587 | ) | | | (1,877,934 | ) | | | (1,420,896 | ) | | | | | (79,811 | ) | | | (5,354 | ) |
| | | | | | | | | | | | | | | | | | | | | | |
Net Increase (Decrease) from Capital Share Transactions | | | 197,807 | | | | 1,426,887 | | | | 1,362,688 | | | | | | 127,593 | | | | 83,460 | |
| | | | | | | | | | | | | | | | | | | | | | |
Total Increase (Decrease) in Net Assets | | | 2,060,209 | | | | (3,381,111 | ) | | | 1,447,792 | | | | | | 195,770 | | | | 66,774 | |
Net Assets | | | | | | | | | | | | | | | | | | | | | | |
Beginning of Period | | | 4,799,748 | | | | 8,180,859 | | | | 6,733,067 | | | | | | 66,774 | | | | — | |
| | | | | | | | | | | | | | | | | | | | | | |
End of Period | | $ | 6,859,957 | | | $ | 4,799,748 | | | $ | 8,180,859 | | | | | $ | 262,544 | | | $ | 66,774 | |
| | | | | | | | | | | | | | | | | | | | | | |
(1) Shares Issued and Redeemed: | | | | | | | | | | | | | | | | | | | | | | |
Shares Issued | | | 132,410 | | | | 143,771 | | | | 98,177 | | | | | | 30,203 | | | | 10,648 | |
Shares Issued in Lieu of Cash Distributions | | | 10,640 | | | | 43,511 | | | | 25,571 | | | | | | 455 | | | | — | |
Shares Redeemed | | | (126,703 | ) | | | (114,727 | ) | | | (62,812 | ) | | | | | (12,091 | ) | | | (741 | ) |
| | | | | | | | | | | | | | | | | | | | | | |
Net Increase (Decrease) from Shares Issued and Redeemed | | | 16,347 | | | | 72,555 | | | | 60,936 | | | | | | 18,567 | | | | 9,907 | |
| | | | | | | | | | | | | | | | | | | | | | |
Undistributed Net Investment Income (Distributions in Excess of Net Investment Income) | | $ | 11,837 | | | $ | 681 | | | $ | 33,083 | | | | | $ | 715 | | | $ | 232 | |
See page 1 & 2 for the Definitions of Abbreviations and Footnotes.
See accompanying Notes to Financial Statements.
177
DFA INVESTMENT DIMENSIONS GROUP INC.
STATEMENTS OF CHANGES IN NET ASSETS
(Amounts in thousands)
| | | | | | | | | | | | | | | | | | | | | | | | | | |
| | | Emerging Markets
Portfolio | | | | | Emerging Markets
Small Cap
Portfolio | |
| | | Year
Ended
Oct. 31,
2009 | | | Period
Dec. 1,
2007 to
Oct. 31,
2008 | | | Year
Ended
Nov. 30,
2007 | | | | | Year
Ended
Oct. 31,
2009 | | | Period
Dec. 1,
2007 to
Oct. 31,
2008 | | | Year
Ended
Nov. 30,
2007 | |
Increase (Decrease) in Net Assets | | | | | | | | | | | | | | | | | | | | | | | | | | |
Operations: | | | | | | | | | | | | | | | | | | | | | | | | | | |
Net Investment Income (Loss) | | $ | 33,922 | | | $ | 65,186 | | | $ | 61,164 | | | | | $ | 15,885 | | | $ | 27,317 | | | $ | 17,268 | |
Net Realized Gain (Loss) on: | | | | | | | | | | | | | | | | | | | | | | | | | | |
Investment Securities Sold | | | 37,268 | | | | 25,666 | | | | 138,572 | | | | | | (15,114 | ) | | | (21,877 | ) | | | 98,170 | |
Futures | | | (2,712 | ) | | | (348 | ) | | | — | | | | | | (630 | ) | | | (404 | ) | | | — | |
Foreign Currency Transactions | | | (28 | ) | | | (820 | ) | | | (116 | ) | | | | | (178 | ) | | | (1,270 | ) | | | (319 | ) |
In-Kind Redemptions | | | 17,805 | * | | | — | | | | — | | | | | | — | | | | — | | | | — | |
Change in Unrealized Appreciation (Depreciation) of: | | | | | | | | | | | | | | | | | | | | | | | | | | |
Investment Securities and Foreign Currency | | | 592,684 | | | | (1,562,393 | ) | | | 809,069 | | | | | | 522,143 | | | | (754,950 | ) | | | 268,054 | |
Futures | | | (30 | ) | | | 30 | | | | — | | | | | | (9 | ) | | | 9 | | | | — | |
Translation of Foreign Currency Denominated Amounts | | | 196 | | | | (130 | ) | | | (26 | ) | | | | | 168 | | | | (175 | ) | | | 74 | |
Change in Deferred Thailand Capital Gains Tax | | | (1,264 | ) | | | 2,600 | | | | (825 | ) | | | | | (785 | ) | | | 1,394 | | | | (451 | ) |
| | | | | | | | | | | | | | | | | | | | | | | | | | |
Net Increase (Decrease) in Net Assets Resulting from Operations | | | 677,841 | | | | (1,470,209 | ) | | | 1,007,838 | | | | | | 521,480 | | | | (749,956 | ) | | | 382,796 | |
| | | | | | | | | | | | | | | | | | | | | | | | | | |
Distributions From: | | | | | | | | | | | | | | | | | | | | | | | | | | |
Net Investment Income: | | | | | | | | | | | | | | | | | | | | | | | | | | |
Institutional Class Shares | | | (33,127 | ) | | | (63,916 | ) | | | (50,360 | ) | | | | | (16,832 | ) | | | (24,950 | ) | | | (13,632 | ) |
Net Short-Term Gains: | | | | | | | | | | | | | | | | | | | | | | | | | | |
Institutional Class Shares | | | — | | | | (855 | ) | | | — | | | | | | — | | | | (7,087 | ) | | | (5,938 | ) |
Net Long-Term Gains: | | | | | | | | | | | | | | | | | | | | | | | | | | |
Institutional Class Shares | | | (20,948 | ) | | | (126,608 | ) | | | (14,375 | ) | | | | | — | | | | (83,694 | ) | | | (46,706 | ) |
| | | | | | | | | | | | | | | | | | | | | | | | | | |
Total Distributions | | | (54,075 | ) | | | (191,379 | ) | | | (64,735 | ) | | | | | (16,832 | ) | | | (115,731 | ) | | | (66,276 | ) |
| | | | | | | | | | | | | | | | | | | | | | | | | | |
Capital Share Transactions (1): | | | | | | | | | | | | | | | | | | | | | | | | | | |
Shares Issued | | | 448,802 | | | | 564,637 | | | | 654,824 | | | | | | 278,046 | | | | 293,300 | | | | 507,036 | |
Shares Issued in Lieu of Cash Distributions | | | 48,701 | | | | 160,500 | | | | 52,208 | | | | | | 15,192 | | | | 95,251 | | | | 60,107 | |
Shares Redeemed | | | (663,241 | )* | | | (943,731 | ) | | | (606,683 | ) | | | | | (211,257 | ) | | | (433,687 | ) | | | (264,459 | ) |
| | | | | | | | | | | | | | | | | | | | | | | | | | |
Net Increase (Decrease) from Capital Share Transactions | | | (165,738 | ) | | | (218,594 | ) | | | 100,349 | | | | | | 81,981 | | | | (45,136 | ) | | | 302,684 | |
| | | | | | | | | | | | | | | | | | | | | | | | | | |
Total Increase (Decrease) in Net Assets | | | 458,028 | | | | (1,880,182 | ) | | | 1,043,452 | | | | | | 586,629 | | | | (910,823 | ) | | | 619,204 | |
Net Assets | | | | | | | | | | | | | | | | | | | | | | | | | | |
Beginning of Period | | | 1,508,260 | | | | 3,388,442 | | | | 2,344,990 | | | | | | 547,329 | | | | 1,458,152 | | | | 838,948 | |
| | | | | | | | | | | | | | | | | | | | | | | | | | |
End of Period | | $ | 1,966,288 | | | $ | 1,508,260 | | | $ | 3,388,442 | | | | | $ | 1,133,958 | | | $ | 547,329 | | | $ | 1,458,152 | |
| | | | | | | | | | | | | | | | | | | | | | | | | | |
(1) Shares Issued and Redeemed: | | | | | | | | | | | | | | | | | | | | | | | | | | |
Shares Issued | | | 23,617 | | | | 20,801 | | | | 21,863 | | | | | | 23,468 | | | | 17,412 | | | | 23,711 | |
Shares Issued in Lieu of Cash Distributions | | | 2,705 | | | | 5,181 | | | | 1,846 | | | | | | 1,244 | | | | 4,649 | | | | 3,382 | |
Shares Redeemed | | | (36,851 | ) | | | (33,697 | ) | | | (19,853 | ) | | | | | (18,390 | ) | | | (24,805 | ) | | | (12,406 | ) |
| | | | | | | | | | | | | | | | | | | | | | | | | | |
Net Increase (Decrease) from Shares Issued and Redeemed | | | (10,529 | ) | | | (7,715 | ) | | | 3,856 | | | | | | 6,322 | | | | (2,744 | ) | | | 14,687 | |
| | | | | | | | | | | | | | | | | | | | | | | | | | |
Undistributed Net Investment Income (Distributions in Excess of Net Investment Income) | | $ | 3,281 | | | $ | 5,826 | | | $ | 10,896 | | | | | $ | 2,323 | | | $ | 3,451 | | | $ | 2,393 | |
| | * | See Note M in the Notes to Financial Statements. |
See accompanying Notes to Financial Statements.
178
DFA INVESTMENT DIMENSIONS GROUP INC.
STATEMENTS OF CHANGES IN NET ASSETS
(Amounts in thousands)
| | | | | | | | | | | | | | | | | | | | | | | | | | |
| | | Emerging Markets
Core Equity
Portfolio | | | | | DFA One-Year
Fixed Income
Portfolio | |
| | | Year
Ended
Oct. 31,
2009 | | | Period
Dec. 1,
2007 to
Oct. 31,
2008 | | | Year
Ended
Nov. 30,
2007 | | | | | Year
Ended
Oct. 31,
2009 | | | Period
Dec. 1,
2007 to
Oct. 31,
2008 | | | Year
Ended
Nov. 30,
2007 | |
Increase (Decrease) in Net Assets | | | | | | | | | | | | | | | | | | | | | | | | | | |
Operations: | | | | | | | | | | | | | | | | | | | | | | | | | | |
Net Investment Income (Loss) | | $ | 36,040 | | | $ | 42,186 $ | | | | 24,655 | | | | | $ | 45,017 | | | $ | 102,695 | | | $ | 149,623 | |
Net Realized Gain (Loss) on: | | | | | | | | | | | | | | | | | | | | | | | | | | |
Investment Securities Sold | | | (25,567 | ) | | | (64,050 | ) | | | 7,602 | | | | | | 6,804 | | | | — | | | | — | |
Futures | | | (873 | ) | | | — | | | | — | | | | | | — | | | | — | | | | — | |
Foreign Currency Transactions | | | (297 | ) | | | (1,282 | ) | | | (348 | ) | | | | | — | | | | — | | | | — | |
In-Kind Redemptions | | | — | | | | 1,902 | * | | | — | | | | | | — | | | | — | | | | — | |
Change in Unrealized Appreciation (Depreciation) of: | | | | | | | | | | | | | | | | | | | | | | | | | | |
Investment Securities and Foreign Currency | | | 981,322 | | | | (1,113,650 | ) | | | 426,503 | | | | | | 30,261 | | | | (14,362 | )† | | | 2,923 | † |
Futures | | | (4 | ) | | | 4 | | | | — | | | | | | — | | | | — | | | | — | |
Translation of Foreign Currency Denominated Amounts | | | 33 | | | | 30 | | | | (1 | ) | | | | | — | | | | — | | | | — | |
Change in Deferred Thailand Capital Gains Tax | | | (1,800 | ) | | | 1,150 | | | | (772 | ) | | | | | — | | | | — | | | | — | |
| | | | | | | | | | | | | | | | | | | | | | | | | | |
Net Increase (Decrease) in Net Assets Resulting from Operations | | | 988,854 | | | | (1,133,710 | ) | | | 457,639 | | | | | | 82,082 | | | | 88,333 | | | | 152,546 | |
| | | | | | | | | | | | | | | | | | | | | | | | | | |
Distributions From: | | | | | | | | | | | | | | | | | | | | | | | | | | |
Net Investment Income: | | | | | | | | | | | | | | | | | | | | | | | | | | |
Institutional Class Shares | | | (29,028 | ) | | | (40,942 | ) | | | (23,343 | ) | | | | | (72,237 | ) | | | (102,391 | ) | | | (149,471 | ) |
Return of Capital | | | — | | | | (204 | ) | | | — | | | | | | — | | | | — | | | | — | |
Net Short-Term Gains: | | | | | | | | | | | | | | | | | | | | | | | | | | |
Institutional Class Shares | | | — | | | | (1,827 | ) | | | (1,657 | ) | | | | | — | | | | — | | | | — | |
Net Long-Term Gains: | | | | | | | | | | | | | | | | | | | | | | | | | | |
Institutional Class Shares | | | — | | | | (5,265 | ) | | | (1,602 | ) | | | | | — | | | | — | | | | — | |
| | | | | | | | | | | | | | | | | | | | | | | | | | |
Total Distributions | | | (29,028 | ) | | | (48,238 | ) | | | (26,602 | ) | | | | | (72,237 | ) | | | (102,391 | ) | | | (149,471 | ) |
| | | | | | | | | | | | | | | | | | | | | | | | | | |
Capital Share Transactions (1): | | | | | | | | | | | | | | | | | | | | | | | | | | |
Shares Issued | | | 935,028 | | | | 940,532 | | | | 857,837 | | | | | | 2,452,200 | ** | | | 1,593,555 | | | | 2,045,675 | |
Shares Issued in Lieu of Cash Distributions | | | 27,561 | | | | 47,045 | | | | 25,903 | | | | | | 70,060 | | | | 100,257 | | | | 146,025 | |
Shares Redeemed | | | (622,906 | ) | | | (479,569 | )* | | | (307,447 | ) | | | | | (1,456,910 | ) | | | (1,714,911 | ) | | | (1,383,749 | ) |
| | | | | | | | | | | | | | | | | | | | | | | | | | |
Net Increase (Decrease) from Capital Share Transactions | | | 339,683 | | | | 508,008 | | | | 576,293 | | | | | | 1,065,350 | | | | (21,099 | ) | | | 807,951 | |
| | | | | | | | | | | | | | | | | | | | | | | | | | |
Total Increase (Decrease) in Net Assets | | | 1,299,509 | | | | (673,940 | ) | | | 1,007,330 | | | | | | 1,075,195 | | | | (35,157 | ) | | | 811,026 | |
Net Assets | | | | | | | | | | | | | | | | | | | | | | | | | | |
Beginning of Period | | | 1,155,526 | | | | 1,829,466 | | | | 822,136 | | | | | | 3,194,420 | | | | 3,229,577 | | | | 2,418,551 | |
| | | | | | | | | | | | | | | | | | | | | | | | | | |
End of Period | | $ | 2,455,035 | | | $ | 1,155,526 | | | $ | 1,829,466 | | | | | $ | 4,269,615 | | | $ | 3,194,420 | | | $ | 3,229,577 | |
| | | | | | | | | | | | | | | | | | | | | | | | | | |
(1) Shares Issued and Redeemed: | | | | | | | | | | | | | | | | | | | | | | | | | | |
Shares Issued | | | 84,048 | | | | 59,236 | | | | 46,855 | | | | | | 234,250 | | | | 156,545 | | | | 200,504 | |
Shares Issued in Lieu of Cash Distributions | | | 2,073 | | | | 3,094 | | | | 1,454 | | | | | | 6,837 | | | | 9,865 | | | | 14,346 | |
Shares Redeemed | | | (54,153 | ) | | | (31,680 | ) | | | (16,331 | ) | | | | | (141,838 | ) | | | (168,625 | ) | | | (135,669 | ) |
| | | | | | | | | | | | | | | | | | | | | | | | | | |
Net Increase (Decrease) from Shares Issued and Redeemed | | | 31,968 | | | | 30,650 | | | | 31,978 | | | | | | 99,249 | | | | (2,215 | ) | | | 79,181 | |
| | | | | | | | | | | | | | | | | | | | | | | | | | |
Undistributed Net Investment Income (Distributions in Excess of Net Investment Income) | | $ | 6,664 | | | $ | (45 | ) $ | | | (11 | ) | | | | $ | 3,329 | | | $ | 9,703 | | | $ | 545 | |
| * | See Note M in the Notes to Financial Statements. |
| ** | Includes $42,141 in capital contributions related to the liquidation of The DFA One-Year Fixed Income Series. See Organization note within the Notes to Financial Statements. |
| † | See Note A in the Notes to Financial Statements. |
See accompanying Notes to Financial Statements.
179
DFA INVESTMENT DIMENSIONS GROUP INC.
STATEMENTS OF CHANGES IN NET ASSETS
(Amounts in thousands)
| | | | | | | | | | | | | | | | | | | | | | |
| | | DFA Two-Year
Global Fixed Income
Portfolio | | | | | DFA Selectively
Hedged Global Fixed
Income Portfolio | |
| | | Year
Ended
Oct. 31,
2009 | | | Period
Dec. 1,
2007 to
Oct. 31,
2008 | | | Year
Ended
Nov. 30,
2007 | | | | | Year
Ended
Oct. 31,
2009 | | | Period
Jan. 9,
2008(a) to
Oct. 31,
2008 | |
Increase (Decrease) in Net Assets | | | | | | | | | | | | | | | | | | | | | | |
Operations: | | | | | | | | | | | | | | | | | | | | | | |
Net Investment Income (Loss) | | $ | 60,183 | | | $ | 120,570 | | | $ | 71,628 | | | | | $ | 5,966 | | | $ | 5,310 | |
Net Realized Gain (Loss) on: | | | | | | | | | | | | | | | | | | | | | | |
Investment Securities Sold | | | 25,365 | | | | — | | | | — | | | | | | 384 | | | | 84 | |
Foreign Currency Transactions | | | 25,954 | | | | — | | | | — | | | | | | (15,821 | ) | | | (7,531 | ) |
Change in Unrealized Appreciation (Depreciation) of: | | | | | | | | | | | | | | | | | | | | | | |
Investment Securities and Foreign Currency | | | (6,521 | ) | | | (29,349 | )† | | | 64,546 | † | | | | | 32,803 | | | | (28,840 | ) |
Translation of Foreign Currency Denominated Amounts | | | 6,818 | | | | — | | | | — | | | | | | 806 | | | | (472 | ) |
| | | | | | | | | | | | | | | | | | | | | | |
Net Increase (Decrease) in Net Assets Resulting from Operations | | | 111,799 | | | | 91,221 | | | | 136,174 | | | | | | 24,138 | | | | (31,449 | ) |
| | | | | | | | | | | | | | | | | | | | | | |
Distributions From: | | | | | | | | | | | | | | | | | | | | | | |
Net Investment Income: | | | | | | | | | | | | | | | | | | | | | | |
Institutional Class Shares | | | (137,717 | ) | | | (99,225 | ) | | | (78,938 | ) | | | | | — | | | | — | |
Return of Capital | | | — | | | | — | | | | — | | | | | | — | | | | (68 | ) |
Net Short-Term Gains: | | | | | | | | | | | | | | | | | | | | | | |
Institutional Class Shares | | | — | | | | (300 | ) | | | — | | | | | | — | | | | — | |
Net Long-Term Gains: | | | | | | | | | | | | | | | | | | | | | | |
Institutional Class Shares | | | — | | | | (299 | ) | | | — | | | | | | — | | | | — | |
| | | | | | | | | | | | | | | | | | | | | | |
Total Distributions | | | (137,717 | ) | | | (99,824 | ) | | | (78,938 | ) | | | | | — | | | | (68 | ) |
| | | | | | | | | | | | | | | | | | | | | | |
Capital Share Transactions (1): | | | | | | | | | | | | | | | | | | | | | | |
Shares Issued | | | 1,712,693 | * | | | 860,433 | | | | 1,087,521 | | | | | | 137,279 | | | | 300,770 | |
Shares Issued in Lieu of Cash Distributions | | | 135,759 | | | | 98,963 | | | | 78,258 | | | | | | — | | | | 68 | |
Shares Redeemed | | | (1,101,490 | ) | | | (923,706 | ) | | | (548,739 | ) | | | | | (56,142 | ) | | | (71,156 | ) |
| | | | | | | | | | | | | | | | | | | | | | |
Net Increase (Decrease) from Capital Share Transactions | | | 746,962 | | | | 35,690 | | | | 617,040 | | | | | | 81,137 | | | | 229,682 | |
| | | | | | | | | | | | | | | | | | | | | | |
Total Increase (Decrease) in Net Assets | | | 721,044 | | | | 27,087 | | | | 674,276 | | | | | | 105,275 | | | | 198,165 | |
Net Assets | | | | | | | | | | | | | | | | | | | | | | |
Beginning of Period | | | 3,124,985 | | | | 3,097,898 | | | | 2,423,622 | | | | | | 198,165 | | | | — | |
| | | | | | | | | | | | | | | | | | | | | | |
End of Period | | $ | 3,846,029 | | | $ | 3,124,985 | | | $ | 3,097,898 | | | | | $ | 303,440 | | | $ | 198,165 | |
| | | | | | | | | | | | | | | | | | | | | | |
(1) Shares Issued and Redeemed: | | | | | | | | | | | | | | | | | | | | | | |
Shares Issued | | | 166,814 | | | | 83,111 | | | | 105,633 | | | | | | 14,290 | | | | 29,751 | |
Shares Issued in Lieu of Cash Distributions | | | 13,402 | | | | 9,614 | | | | 7,641 | | | | | | — | | | | 7 | |
Shares Redeemed | | | (107,449 | ) | | | (89,218 | ) | | | (53,359 | ) | | | | | (6,214 | ) | | | (7,505 | ) |
| | | | | | | | | | | | | | | | | | | | | | |
Net Increase (Decrease) from Shares Issued and Redeemed | | | 72,767 | | | | 3,507 | | | | 59,915 | | | | | | 8,076 | | | | 22,253 | |
| | | | | | | | | | | | | | | | | | | | | | |
Undistributed Net Investment Income (Distributions in Excess of Net Investment Income) | | $ | 35,357 | | | $ | 78,106 | | | $ | 206 | | | | | $ | (262 | ) | | $ | 4 | |
See page 1 & 2 for the Definitions of Abbreviations and Footnotes.
| * | Includes $3,286 in capital contributions related to the liquidation of The DFA Two-Year Global Fixed Income Series. See Organization note within the Notes to Financial Statements. |
| † | See Note A in the Notes to Financial Statements. |
See accompanying Notes to Financial Statements.
180
DFA INVESTMENT DIMENSIONS GROUP INC.
STATEMENTS OF CHANGES IN NET ASSETS
(Amounts in thousands)
| | | | | | | | | | | | | | | | | | | | | | | | | | |
| | | DFA Five-Year
Government
Portfolio | | | | | DFA
Five-Year
Global Fixed Income
Portfolio | |
| | | Year
Ended
Oct. 31,
2009 | | | Period
Dec. 1,
2007 to
Oct. 31,
2008 | | | Year
Ended
Nov. 30,
2007 | | | | | Year
Ended
Oct. 31,
2009 | | | Period
Dec. 1,
2007 to
Oct. 31,
2008 | | | Year
Ended
Nov. 30,
2007 | |
Increase (Decrease) in Net Assets | | | | | | | | | | | | | | | | | | | | | | | | | | |
Operations: | | | | | | | | | | | | | | | | | | | | | | | | | | |
Net Investment Income (Loss) | | $ | 24,640 | | | $ | 30,580 | | | $ | 51,637 | | | | | $ | 75,449 | | | $ | 83,061 | | | $ | 87,390 | |
Net Realized Gain (Loss) on: | | | | | | | | | | | | | | | | | | | | | | | | | | |
Investment Securities Sold | | | 27,247 | | | | 2,704 | | | | — | | | | | | 19,184 | | | | (7,737 | ) | | | (13,531 | ) |
Foreign Currency Transactions | | | — | | | | — | | | | — | | | | | | 49,631 | | | | (17,965 | ) | | | (29,264 | ) |
Change in Unrealized Appreciation (Depreciation) of: | | | | | | | | | | | | | | | | | | | | | | | | | | |
Investment Securities and Foreign Currency | | | 22,977 | | | | 4,964 | | | | 645 | | | | | | 87,483 | | | | 8,004 | | | | 31,164 | |
Translation of Foreign Currency Denominated Amounts | | | — | | | | — | | | | — | | | | | | (3,992 | ) | | | (14,921 | ) | | | 67,297 | |
| | | | | | | | | | | | | | | | | | | | | | | | | | |
Net Increase (Decrease) in Net Assets Resulting from Operations | | | 74,864 | | | | 38,248 | | | | 52,282 | | | | | | 227,755 | | | | 50,442 | | | | 143,056 | |
| | | | | | | | | | | | | | | | | | | | | | | | | | |
Distributions From: | | | | | | | | | | | | | | | | | | | | | | | | | | |
Net Investment Income: | | | | | | | | | | | | | | | | | | | | | | | | | | |
Institutional Class Shares | | | (25,750 | ) | | | (38,626 | ) | | | (49,378 | ) | | | | | (61,945 | ) | | | (96,473 | ) | | | (60,967 | ) |
Return of Capital | | | — | | | | — | | | | — | | | | | | — | | | | (5,349 | ) | | | — | |
| | | | | | | | | | | | | | | | | | | | | | | | | | |
Total Distributions | | | (25,750 | ) | | | (38,626 | ) | | | (49,378 | ) | | | | | (61,945 | ) | | | (101,822 | ) | | | (60,967 | ) |
| | | | | | | | | | | | | | | | | | | | | | | | | | |
Capital Share Transactions (1): | | | | | | | | | | | | | | | | | | | | | | | | | | |
Shares Issued | | | 312,955 | | | | 358,924 | | | | 467,057 | | | | | | 1,025,996 | | | | 1,006,419 | | | | 1,355,752 | |
Shares Issued in Lieu of Cash Distributions | | | 24,243 | | | | 37,437 | | | | 48,237 | | | | | | 57,682 | | | | 96,878 | | | | 58,427 | |
Shares Redeemed | | | (493,112 | ) | | | (497,555 | ) | | | (233,710 | ) | | | | | (1,347,958 | ) | | | (1,217,579 | ) | | | (399,133 | ) |
| | | | | | | | | | | | | | | | | | | | | | | | | | |
Net Increase (Decrease) from Capital Share Transactions | | | (155,914 | ) | | | (101,194 | ) | | | 281,584 | | | | | | (264,280 | ) | | | (114,282 | ) | | | 1,015,046 | |
| | | | | | | | | | | | | | | | | | | | | | | | | | |
Total Increase (Decrease) in Net Assets | | | (106,800 | ) | | | (101,572 | ) | | | 284,488 | | | | | | (98,470 | ) | | | (165,662 | ) | | | 1,097,135 | |
Net Assets | | | | | | | | | | | | | | | | | | | | | | | | | | |
Beginning of Period | | | 1,115,037 | | | | 1,216,609 | | | | 932,121 | | | | | | 3,319,257 | | | | 3,484,919 | | | | 2,387,784 | |
| | | | | | | | | | | | | | | | | | | | | | | | | | |
End of Period | | $ | 1,008,237 | | | $ | 1,115,037 | | | $ | 1,216,609 | | | | | $ | 3,220,787 | | | $ | 3,319,257 | | | $ | 3,484,919 | |
| | | | | | | | | | | | | | | | | | | | | | | | | | |
(1) Shares Issued and Redeemed: | | | | | | | | | | | | | | | | | | | | | | | | | | |
Shares Issued | | | 28,916 | | | | 34,739 | | | | 44,986 | | | | | | 92,928 | | | | 93,497 | | | | 126,584 | |
Shares Issued in Lieu of Cash Distributions | | | 2,254 | | | | 3,640 | | | | 4,674 | | | | | | 5,258 | | | | 9,019 | | | | 5,452 | |
Shares Redeemed | | | (45,608 | ) | | | (48,135 | ) | | | (22,517 | ) | | | | | (122,986 | ) | | | (113,277 | ) | | | (37,300 | ) |
| | | | | | | | | | | | | | | | | | | | | | | | | | |
Net Increase (Decrease) from Shares Issued and Redeemed | | | (14,438 | ) | | | (9,756 | ) | | | 27,143 | | | | | | (24,800 | ) | | | (10,761 | ) | | | 94,736 | |
| | | | | | | | | | | | | | | | | | | | | | | | | | |
Undistributed Net Investment Income (Distributions in Excess of Net Investment Income) | | $ | 4,029 | | | $ | 5,139 | | | $ | 13,185 | | | | | $ | 51,072 | | | $ | 1,377 | | | $ | 35,427 | |
See accompanying Notes to Financial Statements.
181
DFA INVESTMENT DIMENSIONS GROUP INC.
STATEMENTS OF CHANGES IN NET ASSETS
(Amounts in thousands)
| | | | | | | | | | | | | | | | | | | | | | | | | | | | | | | | |
| | | DFA
Intermediate Government
Fixed Income
Portfolio | | | | | DFA
Short-Term
Extended
Quality
Portfolio | | | | | DFA
Inflation-Protected
Securities
Portfolio | |
| | | Year
Ended
Oct. 31,
2009 | | | Period
Dec. 1,
2007 to
Oct. 31,
2008 | | | Year
Ended
Nov. 30,
2007 | | | | | Period
March 4,
2009(a) to
Oct. 31,
2009 | | | | | Year
Ended
Oct. 31,
2009 | | | Period
Dec. 1,
2007 to
Oct. 31,
2008 | | | Year
Ended
Nov. 30,
2007 | |
Increase (Decrease) in Net Assets | | | | | | | | | | | | | | | | | | | | | | | | | | | | | | | | |
Operations: | | | | | | | | | | | | | | | | | | | | | | | | | | | | | | | | |
Net Investment Income (Loss) | | $ | 55,735 | | | $ | 55,814 | | | $ | 51,217 | | | | | $ | 5,346 | | | | | $ | 6,445 | | | $ | 22,209 | | | $ | 4,228 | |
Net Realized Gain (Loss) on Investment Securities Sold | | | 6,168 | | | | 6,370 | | | | 99 | | | | | | 287 | | | | | | (774 | ) | | | 416 | | | | — | |
Change in Unrealized Appreciation (Depreciation) of Investment Securities | | | 71,964 | | | | (24,474 | ) | | | 43,651 | | | | | | 11,089 | | | | | | 77,881 | | | | (60,021 | ) | | | 11,920 | |
| | | | | | | | | | | | | | | | | | | | | | | | | | | | | | | | |
Net Increase (Decrease) in Net Assets Resulting from Operations | | | 133,867 | | | | 37,710 | | | | 94,967 | | | | | | 16,722 | | | | | | 83,552 | | | | (37,396 | ) | | | 16,148 | |
| | | | | | | | | | | | | | | | | | | | | | | | | | | | | | | | |
Distributions From: | | | | | | | | | | | | | | | | | | | | | | | | | | | | | | | | |
Net Investment Income: | | | | | | | | | | | | | | | | | | | | | | | | | | | | | | | | |
Institutional Class Shares | | | (56,385 | ) | | | (59,933 | ) | | | (46,222 | ) | | | | | (4,322 | ) | | | | | (3,971 | ) | | | (19,588 | ) | | | (2,996 | ) |
Net Short-Term Gains: | | | | | | | | | | | | | | | | | | | | | | | | | | | | | | | | |
Institutional Class Shares | | | — | | | | — | | | | — | | | | | | — | | | | | | (80 | ) | | | — | | | | — | |
Net Long-Term Gains: | | | | | | | | | | | | | | | | | | | | | | | | | | | | | | | | |
Institutional Class Shares | | | (6,325 | ) | | | (112 | ) | | | (310 | ) | | | | | — | | | | | | (401 | ) | | | — | | | | — | |
| | | | | | | | | | | | | | | | | | | | | | | | | | | | | | | | |
Total Distributions | | | (62,710 | ) | | | (60,045 | ) | | | (46,532 | ) | | | | | (4,322 | ) | | | | | (4,452 | ) | | | (19,588 | ) | | | (2,996 | ) |
| | | | | | | | | | | | | | | | | | | | | | | | | | | | | | | | |
Capital Share Transactions (1): | | | | | | | | | | | | | | | | | | | | | | | | | | | | | | | | |
Shares Issued | | | 524,999 | | | | 443,281 | | | | 484,902 | | | | | | 377,923 | | | | | | 478,535 | | | | 273,593 | | | | 197,991 | |
Shares Issued in Lieu of Cash Distributions | | | 58,792 | | | | 56,181 | | | | 42,284 | | | | | | 4,280 | | | | | | 4,435 | | | | 19,520 | | | | 2,996 | |
Shares Redeemed | | | (419,307 | ) | | | (543,466 | ) | | | (132,160 | ) | | | | | (16,128 | ) | | | | | (159,707 | ) | | | (104,785 | ) | | | (8,035 | ) |
| | | | | | | | | | | | | | | | | | | | | | | | | | | | | | | | |
Net Increase (Decrease) from Capital Share Transactions | | | 164,484 | | | | (44,004 | ) | | | 395,026 | | | | | | 366,075 | | | | | | 323,263 | | | | 188,328 | | | | 192,952 | |
| | | | | | | | | | | | | | | | | | | | | | | | | | | | | | | | |
Total Increase (Decrease) in Net Assets | | | 235,641 | | | | (66,339 | ) | | | 443,461 | | | | | | 378,475 | | | | | | 402,363 | | | | 131,344 | | | | 206,104 | |
Net Assets | | | | | | | | | | | | | | | | | | | | | | | | | | | | | | | | |
Beginning of Period | | | 1,248,514 | | | | 1,314,853 | | | | 871,392 | | | | | | — | | | | | | 371,747 | | | | 240,403 | | | | 34,299 | |
| | | | | | | | | | | | | | | | | | | | | | | | | | | | | | | | |
End of Period | | $ | 1,484,155 | | | $ | 1,248,514 | | | $ | 1,314,853 | | | | | $ | 378,475 | | | | | $ | 774,110 | | | $ | 371,747 | | | $ | 240,403 | |
| | | | | | | | | | | | | | | | | | | | | | | | | | | | | | | | |
(1) Shares Issued and Redeemed: | | | | | | | | | | | | | | | | | | | | | | | | | | | | | | | | |
Shares Issued | | | 42,884 | | | | 37,222 | | | | 42,833 | | | | | | 36,989 | | | | | | 46,497 | | | | 25,237 | | | | 19,382 | |
Shares Issued in Lieu of Cash Distributions | | | 4,837 | | | | 4,761 | | | | 3,751 | | | | | | 414 | | | | | | 459 | | | | 1,803 | | | | 298 | |
Shares Redeemed | | | (34,207 | ) | | | (45,743 | ) | | | (11,629 | ) | | | | | (1,558 | ) | | | | | (15,790 | ) | | | (9,793 | ) | | | (786 | ) |
| | | | | | | | | | | | | | | | | | | | | | | | | | | | | | | | |
Net Increase (Decrease) from Shares Issued and Redeemed | | | 13,514 | | | | (3,760 | ) | | | 34,955 | | | | | | 35,845 | | | | | | 31,166 | | | | 17,247 | | | | 18,894 | |
| | | | | | | | | | | | | | | | | | | | | | | | | | | | | | | | |
Undistributed Net Investment Income (Distributions in Excess of Net Investment Income) | | $ | 9,734 | | | $ | 10,384 | | | $ | 14,503 | | | | | $ | 1,051 | | | | | $ | 6,361 | | | $ | 3,952 | | | $ | 1,299 | |
See page 1 & 2 for the Definitions of Abbreviations and Footnotes.
See accompanying Notes to Financial Statements.
182
DFA INVESTMENT DIMENSIONS GROUP INC.
STATEMENTS OF CHANGES IN NET ASSETS
(Amounts in thousands)
| | | | | | | | | | | | | | | | | | | | | | | | | | |
| | | DFA
Short-Term
Municipal Bond
Portfolio | | | | | DFA
California
Short-Term
Municipal Bond
Portfolio | |
| | | Year
Ended
Oct. 31,
2009 | | | Period
Dec. 1,
2007 to
Oct. 31,
2008 | | | Year
Ended
Nov. 30,
2007 | | | | | Year
Ended
Oct. 31,
2009 | | | Period
Dec. 1,
2007 to
Oct. 31,
2008 | | | Period
April 2,
2007(a) to
Nov. 30,
2007 | |
Increase (Decrease) in Net Assets | | | | | | | | | | | | | | | | | | | | | | | | | | |
Operations: | | | | | | | | | | | | | | | | | | | | | | | | | | |
Net Investment Income (Loss) | | $ | 20,579 | | | $ | 18,477 | | | $ | 25,609 | | | | | $ | 4,172 | | | $ | 3,606 | | | $ | 1,493 | |
Net Realized Gain (Loss) on Investment Securities Sold | | | — | | | | — | | | | — | | | | | | 23 | | | | (19 | ) | | | (4 | ) |
Change in Unrealized Appreciation (Depreciation) of Investment Securities | | | 22,482 | | | | (3,435 | ) | | | 2,926 | | | | | | 4,608 | | | | (1,259 | ) | | | 210 | |
| | | | | | | | | | | | | | | | | | | | | | | | | | |
Net Increase (Decrease) in Net Assets Resulting from Operations | | | 43,061 | | | | 15,042 | | | | 28,535 | | | | | | 8,803 | | | | 2,328 | | | | 1,699 | |
| | | | | | | | | | | | | | | | | | | | | | | | | | |
Distributions From: | | | | | | | | | | | | | | | | | | | | | | | | | | |
Net Investment Income: | | | | | | | | | | | | | | | | | | | | | | | | | | |
Institutional Class Shares | | | (20,942 | ) | | | (18,834 | ) | | | (24,969 | ) | | | | | (4,257 | ) | | | (3,577 | ) | | | (1,116 | ) |
| | | | | | | | | | | | | | | | | | | | | | | | | | |
Total Distributions | | | (20,942 | ) | | | (18,834 | ) | | | (24,969 | ) | | | | | (4,257 | ) | | | (3,577 | ) | | | (1,116 | ) |
| | | | | | | | | | | | | | | | | | | | | | | | | | |
Capital Share Transactions (1): | | | | | | | | | | | | | | | | | | | | | | | | | | |
Shares Issued | | | 617,393 | | | | 411,057 | | | | 452,239 | | | | | | 124,576 | | | | 152,527 | | | | 143,647 | |
Shares Issued in Lieu of Cash Distributions | | | 20,381 | | | | 18,360 | | | | 24,353 | | | | | | 4,153 | | | | 3,453 | | | | 1,060 | |
Shares Redeemed | | | (483,552 | ) | | | (382,133 | ) | | | (229,674 | ) | | | | | (103,416 | ) | | | (102,799 | ) | | | (16,307 | ) |
| | | | | | | | | | | | | | | | | | | | | | | | | | |
Net Increase (Decrease) from Capital Share Transactions | | | 154,222 | | | | 47,284 | | | | 246,918 | | | | | | 25,313 | | | | 53,181 | | | | 128,400 | |
| | | | | | | | | | | | | | | | | | | | | | | | | | |
Total Increase (Decrease) in Net Assets | | | 176,341 | | | | 43,492 | | | | 250,484 | | | | | | 29,859 | | | | 51,932 | | | | 128,983 | |
Net Assets | | | | | | | | | | | | | | | | | | | | | | | | | | |
Beginning of Period | | | 991,918 | | | | 948,426 | | | | 697,942 | | | | | | 180,915 | | | | 128,983 | | | | — | |
| | | | | | | | | | | | | | | | | | | | | | | | | | |
End of Period | | $ | 1,168,259 | | | $ | 991,918 | | | $ | 948,426 | | | | | $ | 210,774 | | | $ | 180,915 | | | $ | 128,983 | |
| | | | | | | | | | | | | | | | | | | | | | | | | | |
(1) Shares Issued and Redeemed: | | | | | | | | | | | | | | | | | | | | | | | | | | |
Shares Issued | | | 60,500 | | | | 40,917 | | | | 45,158 | | | | | | 12,194 | | | | 15,158 | | | | 14,330 | |
Shares Issued in Lieu of Cash Distributions | | | 2,002 | | | | 1,829 | | | | 2,434 | | | | | | 407 | | | | 344 | | | | 106 | |
Shares Redeemed | | | (47,480 | ) | | | (38,066 | ) | | | (22,928 | ) | | | | | (10,148 | ) | | | (10,222 | ) | | | (1,624 | ) |
| | | | | | | | | | | | | | | | | | | | | | | | | | |
Net Increase (Decrease) from Shares Issued and Redeemed | | | 15,022 | | | | 4,680 | | | | 24,664 | | | | | | 2,453 | | | | 5,280 | | | | 12,812 | |
| | | | | | | | | | | | | | | | | | | | | | | | | | |
Undistributed Net Investment Income (Distributions in Excess of Net Investment Income) | | $ | 1,807 | | | $ | 2,170 | | | $ | 2,527 | | | | | $ | 354 | | | $ | 439 | | | $ | 399 | |
See page 1 & 2 for the Definitions of Abbreviations and Footnotes.
See accompanying Notes to Financial Statements.
183
DFA INVESTMENT DIMENSIONS GROUP INC.
FINANCIAL HIGHLIGHTS
(for a share outstanding throughout each period)
| | | | | | | | | | | | | | | | | | | | | | | | | | |
| | | U.S. Large Company Portfolio | | | |
| | | Year Ended Oct. 31, 2009 | | | Period Dec. 1, 2007 to Oct. 31, 2008 | | | Year Ended Nov. 30,
2007 | | | Year Ended Nov. 30,
2006 | | | Year Ended Nov. 30,
2005 | | | Year Ended Nov. 30,
2004 | | | |
|
| | | | | | | |
Net Asset Value, Beginning of Period | | $ | 28.57 | | | $ | 43.61 | | | $ | 41.24 | | | $ | 36.79 | | | $ | 34.59 | | | $ | 31.16 | | | |
| | | | | | | | | | | | | | | | | | | | | | | | | | |
Income From Investment Operations | | | | | | | | | | | | | | | | | | | | | | | | | | |
Net Investment Income (Loss) | | | 0.67 | (A) | | | 0.72 | (A) | | | 0.80 | (A) | | | 0.71 | (A) | | | 0.60 | | | | 0.61 | | | |
Net Gains (Losses) on Securities (Realized and Unrealized) | | | 2.08 | | | | (14.96 | ) | | | 2.33 | | | | 4.41 | | | | 2.28 | | | | 3.31 | | | |
| | | | | | | | | | | | | | | | | | | | | | | | | | |
Total From Investment Operations | | | 2.75 | | | | (14.24 | ) | | | 3.13 | | | | 5.12 | | | | 2.88 | | | | 3.92 | | | |
| |
Less Distributions | | | | | | | | | | | | | | | | | | | | | | | | | | |
Net Investment Income | | | (0.72 | ) | | | (0.80 | ) | | | (0.76 | ) | | | (0.67 | ) | | | (0.68 | ) | | | (0.49 | ) | | |
Net Realized Gains | | | — | | | | — | | | | — | | | | — | | | | — | | | | — | | | |
| | | | | | | | | | | | | | | | | | | | | | | | | | |
Total Distributions | | | (0.72 | ) | | | (0.80 | ) | | | (0.76 | ) | | | (0.67 | ) | | | (0.68 | ) | | | (0.49 | ) | | |
| |
Net Asset Value, End of Period | | $ | 30.60 | | | $ | 28.57 | | | $ | 43.61 | | | $ | 41.24 | | | $ | 36.79 | | | $ | 34.59 | | | |
| |
Total Return | | | 10.08 | % | | | (33.14 | )%(C) | | | 7.66 | % | | | 14.12 | % | | | 8.41 | % | | | 12.68 | % | | |
| |
Net Assets, End of Period (thousands) | | $ | 2,719,418 | | | $ | 2,544,038 | | | $ | 3,415,833 | | | $ | 2,868,811 | | | $ | 2,088,128 | | | $ | 1,440,869 | | | |
Ratio of Expenses to Average Net Assets | | | 0.15 | %(D) | | | 0.15 | %(B)(D) | | | 0.15 | %(D) | | | 0.15 | %(D) | | | 0.15 | %(D) | | | 0.15 | %(D) | | |
Ratio of Expenses to Average Net Assets (Excluding Waivers and Assumption of Expenses and/or Recovery of Previously Waived Fees) | | | 0.17 | %(D) | | | 0.15 | %(B)(D) | | | 0.15 | %(D) | | | 0.19 | %(D) | | | 0.30 | %(D) | | | 0.30 | %(D) | | |
Ratio of Net Investment Income to Average Net Assets | | | 2.48 | % | | | 2.05 | %(B) | | | 1.85 | % | | | 1.85 | % | | | 1.78 | % | | | 1.92 | % | | |
Portfolio Turnover Rate | | | N/A | | | | N/A | | | | N/A | | | | N/A | | | | N/A | | | | N/A | | | |
| |
| | | | | | | | | | | | | | | | | | | | | | | | |
| | | Enhanced U.S. Large Company Portfolio | |
| | | Year
Ended
Oct. 31,
2009 | | | Period
Dec. 1,
2007 to
Oct. 31,
2008 | | | Year
Ended
Nov. 30,
2007 | | | Year
Ended
Nov. 30,
2006 | | | Year
Ended
Nov. 30,
2005 | | | Year
Ended
Nov. 30,
2004 | |
| | |
| | | | | | |
Net Asset Value, Beginning of Period | | $ | 6.47 | | | $ | 10.91 | | | $ | 10.95 | | | $ | 9.82 | | | $ | 9.35 | | | $ | 8.42 | |
| | | | | | | | | | | | | | | | | | | | | | | | |
Income From Investment Operations | | | | | | | | | | | | | | | | | | | | | | | | |
Net Investment Income (Loss) | | | 0.05 | (A) | | | 0.39 | (A) | | | 0.30 | (A) | | | 0.12 | (A) | | | 0.29 | | | | 0.09 | |
Net Gains (Losses) on Securities (Realized and Unrealized) | | | 0.61 | | | | (3.74 | ) | | | 0.45 | | | | 1.19 | | | | 0.37 | | | | 0.94 | |
| | | | | | | | | | | | | | | | | | | | | | | | |
Total From Investment Operations | | | 0.66 | | | | (3.35 | ) | | | 0.75 | | | | 1.31 | | | | 0.66 | | | | 1.03 | |
| | |
Less Distributions | | | | | | | | | | | | | | | | | | | | | | | | |
Net Investment Income | | | (0.59 | ) | | | (0.36 | ) | | | (0.36 | ) | | | (0.18 | ) | | | (0.19 | ) | | | (0.10 | ) |
Net Realized Gains | | | (0.06 | ) | | | (0.73 | ) | | | (0.43 | ) | | | — | | | | — | | | | — | |
| | | | | | | | | | | | | | | | | | | | | | | | |
Total Distributions | | | (0.65 | ) | | | (1.09 | ) | | | (0.79 | ) | | | (0.18 | ) | | | (0.19 | ) | | | (0.10 | ) |
| | |
Net Asset Value, End of Period | | $ | 6.48 | | | $ | 6.47 | | | $ | 10.91 | | | $ | 10.95 | | | $ | 9.82 | | | $ | 9.35 | |
| | |
Total Return | | | 12.23 | % | | | (33.89 | )%(C) | | | 7.13 | % | | | 13.52 | % | | | 7.08 | % | | | 12.28 | % |
| | |
Net Assets, End of Period (thousands) | | $ | 165,231 | | | $ | 200,331 | | | $ | 337,050 | | | $ | 347,216 | | | $ | 313,543 | | | $ | 221,744 | |
Ratio of Expenses to Average Net Assets | | | 0.29 | %** | | | 0.25 | %(B)(D) | | | 0.25 | %(D) | | | 0.26 | %(D) | | | 0.34 | %(D) | | | 0.37 | %(D) |
Ratio of Expenses to Average Net Assets (Excluding Waivers and Assumption of Expenses and/or Recovery of Previously Waived Fees) | | | 0.29 | %** | | | 0.25 | %(B)(D) | | | 0.25 | %(D) | | | 0.26 | %(D) | | | 0.34 | %(D) | | | 0.37 | %(D) |
Ratio of Net Investment Income to Average Net Assets | | | 0.86 | % | | | 4.74 | %(B) | | | 2.67 | % | | | 1.19 | % | | | 3.11 | % | | | 0.95 | % |
Portfolio Turnover Rate | | | 46 | %* | | | N/A | | | | N/A | | | | N/A | | | | N/A | | | | N/A | |
| | |
| * | For the period February 28, 2009 through October 31, 2009. Effective February 28, 2009, the Enhanced U.S. Large Company Portfolio invests directly in securities rather than through the Series. |
| ** | Represents the combined ratios for the respective portfolio and for the period November 1, 2008 through February 27, 2009, its respective pro-rata share of its Master Fund Series. |
See page 1 & 2 for the Definitions of Abbreviations and Footnotes.
See accompanying Notes to Financial Statements.
184
DFA INVESTMENT DIMENSIONS GROUP INC.
FINANCIAL HIGHLIGHTS
(for a share outstanding throughout each period)
| | | | | | | | | | | | | | | | | | | | | | | | |
| | | U.S. Large Cap Value Portfolio | |
| | | Year Ended
Oct. 31, 2009 | | | Period Dec. 1 2007 to Oct. 31, 2008 | | | Year Ended Nov. 30,
2007 | | | Year Ended
Nov. 30,
2006 | | | Year Ended Nov. 30,
2005 | | | Year Ended Nov. 30,
2004 | |
Net Asset Value, Beginning of Period | | $ | 14.58 | | | $ | 24.44 | | | $ | 25.40 | | | $ | 21.93 | | | $ | 19.37 | | | $ | 16.14 | |
| | | | | | | | | | | | | | | | | | | | | | | | |
Income From Investment Operations | | | | | | | | | | | | | | | | | | | | | | | | |
Net Investment Income (Loss) | | | 0.31 | (A) | | | 0.36 | (A) | | | 0.33 | (A) | | | 0.38 | (A) | | | 0.30 | | | | 0.16 | |
Net Gains (Losses) on Securities (Realized and Unrealized) | | | 1.28 | | | | (8.83 | ) | | | (0.43 | ) | | | 3.50 | | | | 2.49 | | | | 3.28 | |
| | | | | | | | | | | | | | | | | | | | | | | | |
Total From Investment Operations | | | 1.59 | | | | (8.47 | ) | | | (0.10 | ) | | | 3.88 | | | | 2.79 | | | | 3.44 | |
Less Distributions | | | | | | | | | | | | | | | | | | | | | | | | |
Net Investment Income | | | (0.34 | ) | | | (0.35 | ) | | | (0.32 | ) | | | (0.35 | ) | | | (0.23 | ) | | | (0.21 | ) |
Net Realized Gains | | | (0.02 | ) | | | (1.04 | ) | | | (0.54 | ) | | | (0.06 | ) | | | — | | | | — | |
| | | | | | | | | | | | | | | | | | | | | | | | |
Total Distributions | | | (0.36 | ) | | | (1.39 | ) | | | (0.86 | ) | | | (0.41 | ) | | | (0.23 | ) | | | (0.21 | ) |
Net Asset Value, End of Period | | $ | 15.81 | | | $ | 14.58 | | | $ | 24.44 | | | $ | 25.40 | | | $ | 21.93 | | | $ | 19.37 | |
| | | | | | | | | | | | | | | | | | | | | | | | | |
Total Return | | | 11.76 | % | | | (36.63 | )%(C) | | | (0.49 | )% | | | 17.97 | % | | | 14.49 | % | | | 21.48 | % |
Net Assets, End of Period (thousands) | | $ | 5,863,652 | | | $ | 5,330,448 | | | $ | 7,535,552 | | | $ | 6,410,086 | | | $ | 4,046,083 | | | $ | 2,630,361 | |
Ratio of Expenses to Average Net Assets (D) | | | 0.30 | % | | | 0.28 | %(B) | | | 0.27 | % | | | 0.28 | % | | | 0.30 | % | | | 0.32 | % |
Ratio of Net Investment Income to Average Net Assets | | | 2.26 | % | | | 1.86 | %(B) | | | 1.28 | % | | | 1.64 | % | | | 1.48 | % | | | 0.89 | % |
See page 1 & 2 for the Definitions of Abbreviations and Footnotes.
See accompanying Notes to Financial Statements.
185
DFA INVESTMENT DIMENSIONS GROUP INC.
FINANCIAL HIGHLIGHTS
(for a share outstanding throughout each period)
| | | | | | | | | | | | | | | | | | | | | | | | | | | | | | | | | | | | | | | | | | | | | | | | | | |
| | | U.S. Targeted Value Portfolio-
Institutional Class Shares | | | | | | | | | U.S.
Targeted
Value
Portfolio-
Class R1
Shares | | | | | | | U.S.
Targeted
Value
Portfolio-
Class R2
Shares | |
| | | Year Ended Oct. 31, 2009 | | | Period
Dec. 1,
2007 to
Oct. 31,
2008 | | | Year
Ended
Nov. 30,
2007 | | | Year
Ended
Nov. 30,
2006 | | | Year
Ended
Nov. 30,
2005 | | | Year
Ended
Nov. 30,
2004 | | | | | | | | | Year
Ended
Oct. 31,
2009 | | | Period
Jan. 31,
2008(a)
to Oct. 31,
2008 | | | | | | | Year
Ended
Oct. 31,
2009 | | | Period
June 30,
2008(a)
to Oct. 31,
2008 | |
| | |
Net Asset Value, Beginning of Period | | $ | 10.84 | | | $ | 15.89 | | | $ | 18.69 | | | $ | 17.33 | | | $ | 17.09 | | | $ | 15.14 | | | | | | | | | $ | 7.43 | | | $ | 10.00 | | | | | | | $ | 7.83 | | | $ | 10.00 | |
| | | | | | | | | | | | | | | | | | | | | | | | | | | | | | | | | | | | | | | | | | | | | | | | | | |
Income From Investment Operations | | | | | | | | | | | | | | | | | | | | | | | | | | | | | | | | | | | | | | | | | | | | | | | | | | |
Net Investment Income (Loss) | | | 0.12 | (A) | | | 0.18 | (A) | | | 0.20 | (A) | | | 0.21 | (A) | | | 0.32 | | | | 0.86 | | | | | | | | | | 0.08 | (A) | | | 0.09 | (A) | | | | | | | 0.07 | (A) | | | 0.04 | (A) |
Net Gains (Losses) on Securities (Realized and Unrealized) | | | 0.88 | | | | (4.68 | ) | | | (1.32 | ) | | | 2.84 | | | | 1.59 | | | | 2.88 | | | | | | | | | | 0.59 | | | | (2.56 | ) | | | | | | | 0.63 | | | | (2.17 | ) |
| | | | | | | | | | | | | | | | | | | | | | | | | | | | | | | | | | | | | | | | | | | | | | | | | | |
Total From Investment Operations | | | 1.00 | | | | (4.50 | ) | | | (1.12 | ) | | | 3.05 | | | | 1.91 | | | | 3.74 | | | | | | | | | | 0.67 | | | | (2.47 | ) | | | | | | | 0.70 | | | | (2.13 | ) |
| | |
Less Distributions | | | | | | | | | | | | | | | | | | | | | | | | | | | | | | | | | | | | | | | | | | | | | | | | | | |
Net Investment Income | | | (0.14 | ) | | | (0.15 | ) | | | (0.20 | ) | | | (0.25 | ) | | | (0.23 | ) | | | (0.90 | ) | | | | | | | | | (0.12 | ) | | | (0.10 | ) | | | | | | | (0.11 | ) | | | (0.04 | ) |
Net Realized Gains | | | — | | | | (0.40 | ) | | | (1.48 | ) | | | (1.44 | ) | | | (1.44 | ) | | | (0.89 | ) | | | | | | | | | — | | | | — | | | | | | | | — | | | | — | |
| | | | | | | | | | | | | | | | | | | | | | | | | | | | | | | | | | | | | | | | | | | | | | | | | | |
Total Distributions | | | (0.14 | ) | | | (0.55 | ) | | | (1.68 | ) | | | (1.69 | ) | | | (1.67 | ) | | | (1.79 | ) | | | | | | | | | (0.12 | ) | | | (0.10 | ) | | | | | | | (0.11 | ) | | | (0.04 | ) |
| | |
Net Asset Value, End of Period | | $ | 11.70 | | | $ | 10.84 | | | $ | 15.89 | | | $ | 18.69 | | | $ | 17.33 | | | $ | 17.09 | | | | | | | | | $ | 7.98 | | | $ | 7.43 | | | | | | | $ | 8.42 | | | $ | 7.83 | |
| | |
Total Return | | | 9.47 | % | | | (29.27 | )%(C) | | | (6.59 | )% | | | 19.48 | % | | | 12.17 | % | | | 27.36 | % | | | | | | | | | 9.36 | % | | | (24.96 | )%(C) | | | | | | | 9.23 | % | | | (21.40 | )%(C) |
| | |
Net Assets, End of Period (thousands) | | $ | 1,449,437 | | | $ | 855,448 | | | $ | 554,805 | | | $ | 215,338 | | | $ | 172,595 | | | $ | 159,325 | | | | | | | | | $ | 31,393 | | | $ | 25,599 | | | | | | | $ | 2,930 | | | $ | 1,715 | |
Ratio of Expenses to Average Net Assets | | | 0.41 | % | | | 0.40 | %(B) | | | 0.41 | %(D)** | | | 0.46 | %(D) | | | 0.47 | %(D) | | | 0.50 | %(D) | | | | | | | | | 0.52 | % | | | 0.50 | %(B)(E) | | | | | | | 0.67 | % | | | 0.66 | %(B)(E) |
Ratio of Expenses to Average Net Assets (Excluding Waivers and Assumption of Expenses and/or Recovery of Previously Waived Fees) | | | 0.41 | % | | | 0.40 | %(B) | | | 0.41 | %(D)** | | | 0.46 | %(D) | | | 0.47 | %(D) | | | 0.48 | %(D) | | | | | | | | | 0.52 | % | | | 0.50 | %(B)(E) | | | | | | | 0.67 | % | | | 0.66 | %(B)(E) |
Ratio of Net Investment Income to Average Net Assets | | | 1.19 | % | | | 1.39 | %(B) | | | 1.12 | % | | | 1.19 | % | | | 1.91 | % | | | 0.27 | % | | | | | | | | | 1.12 | % | | | 1.24 | %(B)(E) | | | | | | | 0.91 | % | | | 1.35 | %(B)(E) |
Portfolio Turnover Rate | | | 17 | % | | | 20 | %(C) | | | 9 | %(C)* | | | N/A | | | | N/A | | | | N/A | | | | | | | | | | 17 | % | | | 20 | %(C) | | | | | | | 17 | % | | | 20 | %(C) |
| | |
| * For | the period March 30, 2007 through November 30, 2007. Effective March 30, 2007, the U.S. Targeted Value Portfolio invests directly in securities rather than through the Series. |
| ** | Represents the combined ratios for the respective portfolio and for the period December 1, 2006 through March 29, 2007, its respective pro-rata share of its Master Fund Series. |
See page 1 & 2 for the Definitions of Abbreviations and Footnotes.
See accompanying Notes to Financial Statements.
186
DFA INVESTMENT DIMENSIONS GROUP INC.
FINANCIAL HIGHLIGHTS
(for a share outstanding throughout each period)
| | | | | | | | | | | | | | | | | | | | | | | | | | |
| | | U.S. Small Cap Value Portfolio |
| | | Year Ended Oct. 31, 2009 | | | Period Dec. 1, 2007 to Oct. 31, 2008 | | | Year Ended Nov. 30,
2007 | | | Year Ended Nov. 30,
2006 | | | Year Ended Nov. 30,
2005 | | | Year Ended Nov. 30,
2004 | | | |
| |
| | | | | | | |
Net Asset Value, Beginning of Period | | $ | 16.32 | | | $ | 26.49 | | | $ | 31.59 | | | $ | 28.74 | | | $ | 27.71 | | | $ | 23.26 | | | |
| | | | | | | | | | | | | | | | | | | | | | | | | | |
Income From Investment Operations | | | | | | | | | | | | | | | | | | | | | | | | | | |
Net Investment Income (Loss) | | | 0.04 | (A) | | | 0.18 | (A) | | | 0.30 | (A) | | | 0.28 | (A) | | | 0.29 | | | | 0.30 | | | |
Net Gains (Losses) on Securities (Realized and Unrealized) | | | 1.54 | | | | (7.86 | ) | | | (2.72 | ) | | | 5.06 | | | | 2.66 | | | | 5.73 | | | |
| | | | | | | | | | | | | | | | | | | | | | | | | | |
Total From Investment Operations | | | 1.58 | | | | (7.68 | ) | | | (2.42 | ) | | | 5.34 | | | | 2.95 | | | | 6.03 | | | |
| |
Less Distributions | | | | | | | | | | | | | | | | | | | | | | | | | | |
Net Investment Income | | | (0.21 | ) | | | (0.22 | ) | | | (0.28 | ) | | | (0.23 | ) | | | (0.26 | ) | | | (0.38 | ) | | |
Net Realized Gains | | | — | | | | (2.27 | ) | | | (2.40 | ) | | | (2.26 | ) | | | (1.66 | ) | | | (1.20 | ) | | |
| | | | | | | | | | | | | | | | | | | | | | | | | | |
Total Distributions | | | (0.21 | ) | | | (2.49 | ) | | | (2.68 | ) | | | (2.49 | ) | | | (1.92 | ) | | | (1.58 | ) | | |
| |
Net Asset Value, End of Period | | $ | 17.69 | | | $ | 16.32 | | | $ | 26.49 | | | $ | 31.59 | | | $ | 28.74 | | | $ | 27.71 | | | |
| |
Total Return | | | 9.97 | % | | | (31.80 | )%(C) | | | (8.41 | )% | | | 20.29 | % | | | 11.32 | % | | | 27.46 | % | | |
| |
Net Assets, End of Period (thousands) | | $ | 5,669,659 | | | $ | 5,503,945 | | | $ | 8,802,846 | | | $ | 8,738,278 | | | $ | 6,924,234 | | | $ | 5,795,166 | | | |
Ratio of Expenses to Average Net Assets | | | 0.54 | %** | | | 0.52 | %(B)(D) | | | 0.52 | %(D) | | | 0.53 | %(D) | | | 0.55 | %(D) | | | 0.56 | %(D) | | |
Ratio of Net Investment Income to Average Net Assets | | | 0.27 | % | | | 0.86 | %(B) | | | 0.98 | % | | | 0.94 | % | | | 1.04 | % | | | 0.04 | % | | |
Portfolio Turnover Rate | | | 21 | %* | | | N/A | | | | N/A | | | | N/A | | | | N/A | | | | N/A | | | |
| |
| * For | the period February 28, 2009 through October 31, 2009. Effective February 28, 2009, the U.S. Small Cap Value Portfolio invests directly in securities rather than through the Series. |
| ** | Represents the combined ratios for the respective portfolio and for the period November 1, 2008 through February 27, 2009, its respective pro-rata share of its Master Fund Series. |
See page 1 & 2 for the Definitions of Abbreviations and Footnotes.
See accompanying Notes to Financial Statements.
187
DFA INVESTMENT DIMENSIONS GROUP INC.
FINANCIAL HIGHLIGHTS
(for a share outstanding throughout each period)
| | | | | | | | | | | | | | | | | | | | | | | | | | | | | | | | | | | | | | | | | | | | |
| | | U.S. Core Equity 1 Portfolio | | | | | | | U.S. Core Equity 2 Portfolio | |
| | | Year
Ended
Oct. 31,
2009 | | | Period
Dec. 1,
2007 to
Oct. 31,
2008 | | | Year
Ended
Nov. 30,
2007 | | | Year
Ended
Nov. 30,
2006 | | | Period
Sept. 15,
2005(a)
to
Nov. 30,
2005 | | | | | | | Year
Ended
Oct. 31,
2009 | | | Period
Dec. 1,
2007 to
Oct. 31,
2008 | | | Year
Ended
Nov. 30,
2007 | | | Year
Ended
Nov. 30,
2006 | | | Period
Sept. 15,
2005(a)
to
Nov. 30,
2005 | |
Net Asset Value, Beginning of Period | | $ | 7.81 | | | $ | 11.83 | | | $ | 11.50 | | | $ | 10.22 | | | $ | 10.00 | | | | | | | $ | 7.73 | | | $ | 11.77 | | | $ | 11.65 | | | $ | 10.24 | | | $ | 10.00 | |
| | | | | | | | | | | | | | | | | | | | | | | | | | | | | | | | | | | | | | | | | | | | |
Income From Investment Operations | | | | | | | | | | | | | | | | | | | | | | | | | | | | | | | | | | | | | | | | | | | | |
Net Investment Income (Loss) | | | 0.15 | (A) | | | 0.17 | (A) | | | 0.19 | (A) | | | 0.17 | (A) | | | 0.03 | | | | | | | | 0.14 | (A) | | | 0.17 | (A) | | | 0.19 | (A) | | | 0.17 | (A) | | | 0.03 | |
Net Gains (Losses) on Securities (Realized and Unrealized) | | | 0.73 | | | | (4.03 | ) | | | 0.35 | | | | 1.28 | | | | 0.19 | | | | | | | | 0.66 | | | | (4.04 | ) | | | 0.13 | | | | 1.40 | | | | 0.21 | |
| | | | | | | | | | | | | | | | | | | | | | | | | | | | | | | | | | | | | | | | | | | | |
Total From Investment Operations | | | 0.88 | | | | (3.86 | ) | | | 0.54 | | | | 1.45 | | | | 0.22 | | | | | | | | 0.80 | | | | (3.87 | ) | | | 0.32 | | | | 1.57 | | | | 0.24 | |
Less Distributions | | | | | | | | | | | | | | | | | | | | | | | | | | | | | | | | | | | | | | | | | | | | |
Net Investment Income | | | (0.15 | ) | | | (0.16 | ) | | | (0.18 | ) | | | (0.17 | ) | | | — | | | | | | | | (0.14 | ) | | | (0.17 | ) | | | (0.17 | ) | | | (0.16 | ) | | | — | |
Net Realized Gains | | | — | | | | — | | | | (0.03 | ) | | | — | | | | — | | | | | | | | — | | | | — | | | | (0.03 | ) | | | — | | | | — | |
| | | | | | | | | | | | | | | | | | | | | | | | | | | | | | | | | | | | | | | | | | | | |
Total Distributions | | | (0.15 | ) | | | (0.16 | ) | | | (0.21 | ) | | | (0.17 | ) | | | — | | | | | | | | (0.14 | ) | | | (0.17 | ) | | | (0.20 | ) | | | (0.16 | ) | | | — | |
Net Asset Value, End of Period | | $ | 8.54 | | | $ | 7.81 | | | $ | 11.83 | | | $ | 11.50 | | | $ | 10.22 | | | | | | | $ | 8.39 | | | $ | 7.73 | | | $ | 11.77 | | | $ | 11.65 | | | $ | 10.24 | |
| | | | | | | | | | | | | | | | | | | | | | | | | | | | | | | | | | | | | | | | | | | | | |
Total Return | | | 11.64 | % | | | (32.85 | )%(C) | | | 4.68 | % | | | 14.35 | % | | | 2.20 | %(C) | | | | | | | 10.66 | % | | | (33.16 | )%(C) | | | 2.78 | % | | | 15.50 | % | | | 2.40 | %(C) |
Net Assets, End of Period (thousands) | | $ | 1,989,583 | | | $ | 1,320,562 | | | $ | 1,210,031 | | | $ | 652,270 | | | $ | 123,591 | | | | | | | $ | 3,804,325 | | | $ | 2,501,028 | | | $ | 2,939,420 | | | $ | 1,216,310 | | | $ | 182,078 | |
Ratio of Expenses to Average Net Assets | | | 0.22 | % | | | 0.20 | %(B) | | | 0.20 | % | | | 0.23 | % | | | 0.23 | %(B)(E) | | | | | | | 0.24 | % | | | 0.23 | %(B) | | | 0.23 | % | | | 0.26 | % | | | 0.26 | %(B)(E) |
Ratio of Expenses to Average Net Assets (Excluding Waivers and Assumption of Expenses and/or Recovery of Previously Waived Fees) | | | 0.22 | % | | | 0.20 | %(B) | | | 0.20 | % | | | 0.23 | % | | | 0.37 | %(B)(E) | | | | | | | 0.24 | % | | | 0.23 | %(B) | | | 0.23 | % | | | 0.26 | % | | | 0.38 | %(B)(E) |
Ratio of Net Investment Income to Average Net Assets | | | 2.02 | % | | | 1.78 | %(B) | | | 1.53 | % | | | 1.52 | % | | | 1.85 | %(B)(E) | | | | | | | 1.89 | % | | | 1.77 | %(B) | | | 1.55 | % | | | 1.55 | % | | | 1.92 | %(B)(E) |
Portfolio Turnover Rate | | | 7 | % | | | 5 | %(C) | | | 10 | % | | | 6 | % | | | 0 | %(C) | | | | | | | 4 | % | | | 8 | %(C) | | | 7 | % | | | 5 | % | | | 0 | %(C) |
See page 1 & 2 for the Definitions of Abbreviations and Footnotes.
See accompanying Notes to Financial Statements.
188
DFA INVESTMENT DIMENSIONS GROUP INC.
FINANCIAL HIGHLIGHTS
(for a share outstanding throughout each period)
| | | | | | | | | | | | | | | | | | | | | | | | | | | | | | | | |
| | | U.S. Vector Equity Portfolio | | | | | | | T.A. U.S. Core Equity 2 Portfolio | |
| | | Year
Ended
Oct. 31,
2009 | | | Period
Dec. 1,
2007 to
Oct. 31,
2008 | | | Year
Ended
Nov. 30,
2007 | | | Period
Dec. 30,
2005(a) to
Nov. 30,
2006 | | | | | | | Year
Ended
Oct. 31,
2009 | | | Period
Dec. 1,
2007 to
Oct. 31,
2008 | | | Period
Oct. 4,
2007(a) to
Nov. 30,
2007 | |
Net Asset Value, Beginning of Period | | $ | 7.48 | | | $ | 11.38 | | | $ | 11.79 | | | $ | 10.00 | | | | | | | $ | 6.31 | | | $ | 9.40 | | | $ | 10.00 | |
| | | | | | | | | | | | | | | | | | | | | | | | | | | | | | | | |
Income From Investment Operations | | | | | | | | | | | | | | | | | | | | | | | | | | | | | | | | |
Net Investment Income (Loss) | | | 0.11 | (A) | | | 0.15 | (A) | | | 0.16 | (A) | | | 0.13 | (A) | | | | | | | 0.11 | (A) | | | 0.13 | (A) | | | 0.02 | (A) |
Net Gains (Losses) on Securities (Realized and Unrealized) | | | 0.57 | | | | (3.89 | ) | | | (0.25 | ) | | | 1.73 | | | | | | | | 0.52 | | | | (3.12 | ) | | | (0.62 | ) |
| | | | | | | | | | | | | | | | | | | | | | | | | | | | | | | | |
Total From Investment Operations | | | 0.68 | | | | (3.74 | ) | | | (0.09 | ) | | | 1.86 | | | | | | | | 0.63 | | | | (2.99 | ) | | | (0.60 | ) |
Less Distributions | | | | | | | | | | | | | | | | | | | | | | | | | | | | | | | | |
Net Investment Income | | | (0.13 | ) | | | (0.16 | ) | | | (0.14 | ) | | | (0.07 | ) | | | | | | | (0.11 | ) | | | (0.10 | ) | | | — | |
Net Realized Gains | | | — | | | | — | | | | (0.18 | ) | | | — | | | | | | | | — | | | | — | | | | — | |
| | | | | | | | | | | | | | | | | | | | | | | | | | | | | | | | |
Total Distributions | | | (0.13 | ) | | | (0.16 | ) | | | (0.32 | ) | | | (0.07 | ) | | | | | | | (0.11 | ) | | | (0.10 | ) | | | — | |
Net Asset Value, End of Period | | $ | 8.03 | | | $ | 7.48 | | | $ | 11.38 | | | $ | 11.79 | | | | | | | $ | 6.83 | | | $ | 6.31 | | | $ | 9.40 | |
| | | | | | | | | | | | | | | | | | | | | | | | | | | | | | | | | |
Total Return | | | 9.47 | % | | | (33.29 | )%(C) | | | (0.87 | )% | | | 18.65 | %(C) | | | | | | | 10.28 | % | | | (32.16 | )%(C) | | | (6.00 | )%(C) |
Net Assets, End of Period (thousands) | | $ | 1,178,114 | | | $ | 850,623 | | | $ | 959,742 | | | $ | 403,312 | | | | | | | $ | 1,444,886 | | | $ | 585,165 | | | $ | 106,507 | |
Ratio of Expenses to Average Net Assets | | | 0.35 | % | | | 0.34 | %(B) | | | 0.34 | % | | | 0.36 | %(B)(E) | | | | | | | 0.28 | % | | | 0.29 | %(B) | | | 0.30 | %(B)(E) |
Ratio of Expenses to Average Net Assets (Excluding Waivers and Assumption of Expenses and/or Recovery of Previously Waived Fees) | | | 0.35 | % | | | 0.34 | %(B) | | | 0.33 | % | | | 0.39 | %(B)(E) | | | | | | | 0.28 | % | | | 0.29 | %(B) | | | 0.60 | %(B)(E) |
Ratio of Net Investment Income to Average Net Assets | | | 1.60 | % | | | 1.66 | %(B) | | | 1.29 | % | | | 1.24 | %(B)(E) | | | | | | | 1.82 | % | | | 1.75 | %(B) | | | 2.09 | %(B)(E) |
Portfolio Turnover Rate | | | 11 | % | | | 11 | %(C) | | | 14 | % | | | 24 | %(C) | | | | | | | 5 | % | | | 9 | %(C) | | | 0 | %(C) |
See page 1 & 2 for the Definitions of Abbreviations and Footnotes.
See accompanying Notes to Financial Statements.
189
DFA INVESTMENT DIMENSIONS GROUP INC.
FINANCIAL HIGHLIGHTS
(for a share outstanding throughout each period)
| | | | | | | | | | | | | | | | | | | | | | | | | | |
| | | U.S. Small Cap Portfolio | | | |
| | | Year Ended Oct. 31, 2009 | | | Period Dec. 1, 2007 to Oct. 31, 2008 | | | Year
Ended
Nov. 30,
2007 | | | Year Ended Nov. 30, 2006 | | | Year Ended Nov. 30, 2005 | | | Year Ended Nov. 30, 2004 | | | |
| |
Net Asset Value, Beginning of Period | | $ | 13.35 | | | $ | 20.64 | | | $ | 22.46 | | | $ | 20.75 | | | $ | 19.13 | | | $ | 16.52 | | | |
| | | | | | | | | | | | | | | | | | | | | | | | | | |
Income From Investment Operations | | | | | | | | | | | | | | | | | | | | | | | | | | |
Net Investment Income (Loss) | | | 0.06 | (A) | | | 0.14 | (A) | | | 0.21 | (A) | | | 0.17 | (A) | | | 0.15 | | | | 0.05 | | | |
Net Gains (Losses) on Securities (Realized and Unrealized) | | | 1.65 | | | | (6.08 | ) | | | (0.66 | ) | | | 2.84 | | | | 1.75 | | | | 2.67 | | | |
| | | | | | | | | | | | | | | | | | | | | | | | | | |
Total From Investment Operations | | | 1.71 | | | | (5.94 | ) | | | (0.45 | ) | | | 3.01 | | | | 1.90 | | | | 2.72 | | | |
| |
Less Distributions | | | | | | | | | | | | | | | | | | | | | | | | | | |
Net Investment Income | | | (0.17 | ) | | | (0.17 | ) | | | (0.21 | ) | | | (0.13 | ) | | | (0.13 | ) | | | (0.10 | ) | | |
Net Realized Gains | | | — | | | | (1.18 | ) | | | (1.16 | ) | | | (1.17 | ) | | | (0.15 | ) | | | — | | | |
Tax Return of Capital | | | — | | | | — | | | | — | | | | — | | | | — | | | | (0.01 | ) | | |
| | | | | | | | | | | | | | | | | | | | | | | | | | |
Total Distributions | | | (0.17 | ) | | | (1.35 | ) | | | (1.37 | ) | | | (1.30 | ) | | | (0.28 | ) | | | (0.11 | ) | | |
| |
Net Asset Value, End of Period | | $ | 14.89 | | | $ | 13.35 | | | $ | 20.64 | | | $ | 22.46 | | | $ | 20.75 | | | $ | 19.13 | | | |
| |
| |
Total Return | | | 13.08 | % | | | (30.67 | )%(C) | | | (2.17 | )% | | | 15.49 | % | | | 10.04 | % | | | 16.59 | % | | |
| |
Net Assets, End of Period (thousands) | | $ | 2,522,001 | | | $ | 2,066,849 | | | $ | 3,285,093 | | | $ | 3,297,199 | | | $ | 2,641,670 | | | $ | 2,137,970 | | | |
Ratio of Expenses to Average Net Assets | | | 0.40 | %** | | | 0.38 | %(B)(D) | | | 0.38 | %(D) | | | 0.38 | %(D) | | | 0.40 | %(D) | | | 0.41 | %(D) | | |
Ratio of Net Investment Income to Average Net Assets | | | 0.50 | % | | | 0.86 | %(B) | | | 0.95 | % | | | 0.82 | % | | | 0.78 | % | | | 0.22 | % | | |
Portfolio Turnover Rate | | | 17 | %* | | | N/A | | | | N/A | | | | N/A | | | | N/A | | | | N/A | | | |
| |
| | |
| | | U.S. Micro Cap Portfolio | | | |
| | | Year Ended Oct. 31, 2009 | | | Period Dec. 1, 2007 to Oct. 31, 2008 | | | Year Ended Nov. 30, 2007 | | | Year Ended Nov. 30, 2006 | | | Year Ended Nov. 30, 2005 | | | Year Ended Nov. 30, 2004 | | | |
| | | | |
Net Asset Value, Beginning of Period | | $ | 9.19 | | | $ | 14.80 | | | $ | 16.83 | | | $ | 15.91 | | | $ | 15.06 | | | $ | 13.34 | | | |
| | | | | | | | | | | | | | | | | | | | | | | | | | |
Income From Investment Operations | | | | | | | | | | | | | | | | | | | | | | | | | | |
Net Investment Income (Loss) | | | 0.03 | (A) | | | 0.10 | (A) | | | 0.14 | (A) | | | 0.10 | (A) | | | 0.07 | | | | 0.19 | | | |
Net Gains (Losses) on Securities (Realized and Unrealized) | | | 0.54 | | | | (4.32 | ) | | | (0.69 | ) | | | 2.04 | | | | 1.43 | | | | 1.93 | | | |
| | | | | | | | | | | | | | | | | | | | | | | | | | |
Total From Investment Operations | | | 0.57 | | | | (4.22 | ) | | | (0.55 | ) | | | 2.14 | | | | 1.50 | | | | 2.12 | | | |
| | | | |
Less Distributions | | | | | | | | | | | | | | | | | | | | | | | | | | |
Net Investment Income | | | (0.19 | ) | | | (0.13 | ) | | | (0.13 | ) | | | (0.08 | ) | | | (0.06 | ) | | | (0.22 | ) | | |
Net Realized Gains | | | — | | | | (1.26 | ) | | | (1.35 | ) | | | (1.14 | ) | | | (0.59 | ) | | | (0.18 | ) | | |
Tax Return of Capital | | | — | | | | — | | | | — | | | | — | | | | — | | | | — | | | |
| | | | | | | | | | | | | | | | | | | | | | | | | | |
Total Distributions | | | (0.19 | ) | | | (1.39 | ) | | | (1.48 | ) | | | (1.22 | ) | | | (0.65 | ) | | | (0.40 | ) | | |
| | | | |
Net Asset Value, End of Period | | $ | 9.57 | | | $ | 9.19 | | | $ | 14.80 | | | $ | 16.83 | | | $ | 15.91 | | | $ | 15.06 | | | |
| | | | |
Total Return | | | 6.61 | % | | | (31.33 | )%(C) | | | (3.63 | )% | | | 14.52 | % | | | 10.33 | % | | | 16.34 | % | | |
| | | | |
Net Assets, End of Period (thousands) | | $ | 2,818,365 | | | $ | 2,924,225 | | | $ | 4,700,371 | | | $ | 4,824,003 | | | $ | 3,949,511 | | | $ | 3,214,520 | | | |
Ratio of Expenses to Average Net Assets | | | 0.54 | %** | | | 0.53 | %(B)(D) | | | 0.52 | %(D) | | | 0.53 | %(D) | | | 0.55 | %(D) | | | 0.56 | %(D) | | |
Ratio of Net Investment Income to Average Net Assets | | | 0.38 | % | | | 0.91 | %(B) | | | 0.89 | % | | | 0.64 | % | | | 0.48 | % | | | 0.06 | % | | |
Portfolio Turnover Rate | | | 12 | %* | | | N/A | | | | N/A | | | | N/A | | | | N/A | | | | N/A | | | |
| | | | |
| * | For the period February 28, 2009 through October 31, 2009. Effective February 28, 2009, the Portfolios invest directly in securities rather than through the Series. |
| ** | Represents the combined ratios for the respective portfolio and for the period November 1, 2008 through February 27, 2009, its respective pro-rata share of its Master Fund Series. |
See page 1 & 2 for the Definitions of Abbreviations and Footnotes.
See accompanying Notes to Financial Statements.
190
DFA INVESTMENT DIMENSIONS GROUP INC.
FINANCIAL HIGHLIGHTS
(for a share outstanding throughout each period)
| | | | | | | | | | | | | | | | | | | | | | | | | | |
| | | DFA Real Estate Securities Portfolio | | | |
| | | Year Ended Oct. 31, 2009 | | | Period Dec. 1, 2007 to Oct. 31, 2008 | | | Year Ended Nov. 30, 2007 | | | Year Ended Nov. 30, 2006 | | | Year Ended Nov. 30, 2005 | | | Year Ended Nov. 30, 2004 | | | |
| |
Net Asset Value, Beginning of Period | | $ | 16.16 | | | $ | 27.20 | | | $ | 33.80 | | | $ | 25.75 | | | $ | 23.02 | | | $ | 18.80 | | | |
| | | | | | | | | | | | | | | | | | | | | | | | | | |
Income From Investment Operations | | | | | | | | | | | | | | | | | | | | | | | | | | |
Net Investment Income (Loss) | | | 0.58 | (A) | | | 0.64 | (A) | | | 0.62 | (A) | | | 0.64 | (A) | | | 0.82 | | | | 0.62 | | | |
Net Gains (Losses) on Securities (Realized and Unrealized) | | | (0.62 | ) | | | (9.28 | ) | | | (5.64 | ) | | | 8.84 | | | | 3.33 | | | | 4.47 | | | |
| | | | | | | | | | | | | | | | | | | | | | | | | | |
Total From Investment Operations | | | (0.04 | ) | | | (8.64 | ) | | | (5.02 | ) | | | 9.48 | | | | 4.15 | | | | 5.09 | | | |
| |
Less Distributions | | | | | | | | | | | | | | | | | | | | | | | | | | |
Net Investment Income | | | (0.83 | ) | | | (0.30 | ) | | | (0.70 | ) | | | (1.02 | ) | | | (0.86 | ) | | | (0.71 | ) | | |
Net Realized Gains | | | — | | | | (2.10 | ) | | | (0.88 | ) | | | (0.41 | ) | | | (0.56 | ) | | | (0.16 | ) | | |
| | | | | | | | | | | | | | | | | | | | | | | | | | |
Total Distributions | | | (0.83 | ) | | | (2.40 | ) | | | (1.58 | ) | | | (1.43 | ) | | | (1.42 | ) | | | (0.87 | ) | | |
| | | | |
Net Asset Value, End of Period | | $ | 15.29 | | | $ | 16.16 | | | $ | 27.20 | | | $ | 33.80 | | | $ | 25.75 | | | $ | 23.02 | | | |
| |
| |
Total Return | | | 0.98 | % | | | (34.46 | )%(C) | | | (15.45 | )% | | | 38.23 | % | | | 18.81 | % | | | 29.44 | % | | |
| | | | |
Net Assets, End of Period (thousands) | | $ | 2,018,559 | | | $ | 1,746,961 | | | $ | 2,671,457 | | | $ | 2,837,026 | | | $ | 1,836,650 | | | $ | 1,308,898 | | | |
Ratio of Expenses to Average Net Assets | | | 0.36 | % | | | 0.33 | %(B) | | | 0.33 | % | | | 0.33 | % | | | 0.37 | % | | | 0.39 | % | | |
Ratio of Net Investment Income to Average Net Assets | | | 4.54 | % | | | 3.01 | %(B) | | | 1.99 | % | | | 2.25 | % | | | 3.11 | % | | | 3.61 | % | | |
Portfolio Turnover Rate | | | 2 | % | | | 13 | %(C) | | | 17 | % | | | 10 | % | | | 3 | % | | | 6 | % | | |
| |
| | |
| | | Large Cap International Portfolio | | | |
| | | Year Ended Oct. 31, 2009 | | | Period Dec. 1, 2007 to Oct. 31, 2008 | | | Year Ended Nov. 30, 2007 | | | Year Ended Nov. 30, 2006 | | | Year Ended Nov. 30, 2005 | | | Year Ended Nov. 30, 2004 | | | |
| | | | |
Net Asset Value, Beginning of Period | | $ | 14.81 | | | $ | 27.18 | | | $ | 23.60 | | | $ | 19.00 | | | $ | 17.31 | | | $ | 14.65 | | | |
| | | | | | | | | | | | | | | | | | | | | | | | | | |
Income From Investment Operations | | | | | | | | | | | | | | | | | | | | | | | | | | |
Net Investment Income (Loss) | | | 0.48 | (A) | | | 0.68 | (A) | | | 0.68 | (A) | | | 0.55 | (A) | | | 0.44 | | | | 0.31 | | | |
Net Gains (Losses) on Securities (Realized and Unrealized) | | | 3.16 | | | | (12.06 | ) | | | 3.57 | | | | 4.68 | | | | 1.72 | | | | 2.86 | | | |
| | | | | | | | | | | | | | | | | | | | | | | | | | |
Total From Investment Operations | | | 3.64 | | | | (11.38 | ) | | | 4.25 | | | | 5.23 | | | | 2.16 | | | | 3.17 | | | |
| | | | |
Less Distributions | | | | | | | | | | | | | | | | | | | | | | | | | | |
Net Investment Income | | | (0.43 | ) | | | (0.64 | ) | | | (0.67 | ) | | | (0.63 | ) | | | (0.47 | ) | | | (0.51 | ) | | |
Net Realized Gains | | | — | | | | (0.35 | ) | | | — | | | | — | | | | — | | | | — | | | |
| | | | | | | | | | | | | | | | | | | | | | | | | | |
Total Distributions | | | (0.43 | ) | | | (0.99 | ) | | | (0.67 | ) | | | (0.63 | ) | | | (0.47 | ) | | | (0.51 | ) | | |
| | | | |
Net Asset Value, End of Period | | $ | 18.02 | | | $ | 14.81 | | | $ | 27.18 | | | $ | 23.60 | | | $ | 19.00 | | | $ | 17.31 | | | |
| | | | |
| | | | |
Total Return | | | 25.20 | % | | | (43.14 | )%(C) | | | 18.18 | % | | | 28.00 | % | | | 12.73 | % | | | 22.09 | % | | |
| | | | |
Net Assets, End of Period (thousands) | | $ | 1,364,351 | | | $ | 1,206,860 | | | $ | 2,224,180 | | | $ | 1,673,239 | | | $ | 1,125,455 | | | $ | 844,883 | | | |
Ratio of Expenses to Average Net Assets | | | 0.32 | % | | | 0.29 | %(B) | | | 0.29 | % | | | 0.29 | % | | | 0.37 | % | | | 0.41 | % | | |
Ratio of Net Investment Income to Average Net Assets | | | 3.14 | % | | | 3.18 | %(B) | | | 2.62 | % | | | 2.56 | % | | | 2.41 | % | | | 2.07 | % | | |
Portfolio Turnover Rate | | | 12 | % | | | 12 | %(C) | | | 5 | % | | | 4 | % | | | 4 | % | | | 1 | % | | |
| | | | |
See page 1 & 2 for the Definitions of Abbreviations and Footnotes.
See accompanying Notes to Financial Statements.
191
DFA INVESTMENT DIMENSIONS GROUP INC.
FINANCIAL HIGHLIGHTS
(for a share outstanding throughout each period)
| | | | | | | | | | | | | | | | | | | | | | | | | | | | | | | | |
| | | International Core Equity Portfolio | | | | | | | T.A World
ex U.S. Core
Equity
Portfolio | |
| | | Year Ended Oct. 31, 2009 | | | Period Dec. 1, 2007 to Oct. 31, 2008 | | | Year Ended Nov. 30,
2007 | | | Year
Ended
Nov. 30,
2006 | | | Period
Sept. 15,
2005(a) to Nov. 30,
2005 | | | | | | | Year
Ended
Oct. 31,
2009 | | | Period
March 6,
2008(a) to Oct. 31,
2008 | |
Net Asset Value, Beginning of Period | | $ | 7.46 | | | $ | 14.35 | | | $ | 12.82 | | | $ | 10.07 | | | $ | 10.00 | | | | | | | $ | 5.85 | | | $ | 10.00 | |
| | | | | | | | | | | | | | | | | | | | | | | | | | | | | | | | |
Income From Investment Operations | | | | | | | | | | | | | | | | | | | | | | | | | | | | | | | | |
Net Investment Income (Loss) | | | 0.23 | (A) | | | 0.37 | (A) | | | 0.35 | (A) | | | 0.28 | (A) | | | 0.04 | (A) | | | | | | | 0.16 | (A) | | | 0.15 | (A) |
Net Gains (Losses) on Securities (Realized and Unrealized) | | | 2.32 | | | | (6.76 | ) | | | 1.54 | | | | 2.71 | | | | 0.03 | | | | | | | | 2.27 | | | | (4.15 | ) |
| | | | | | | | | | | | | | | | | | | | | | | | | | | | | | | | |
Total From Investment Operations | | | 2.55 | | | | (6.39 | ) | | | 1.89 | | | | 2.99 | | | | 0.07 | | | | | | | | 2.43 | | | | (4.00 | ) |
Less Distributions | | | | | | | | | | | | | | | | | | | | | | | | | | | | | | | | |
Net Investment Income | | | (0.22 | ) | | | (0.35 | ) | | | (0.32 | ) | | | (0.24 | ) | | | — | | | | | | | | (0.15 | ) | | | (0.15 | ) |
Net Realized Gains | | | — | | | | (0.15 | ) | | | (0.04 | ) | | | — | | | | — | | | | | | | | — | | | | — | |
| | | | | | | | | | | | | | | | | | | | | | | | | | | | | | | | |
Total Distributions | | | (0.22 | ) | | | (0.50 | ) | | | (0.36 | ) | | | (0.24 | ) | | | — | | | | | | | | (0.15 | ) | | | (0.15 | ) |
Net Asset Value, End of Period | | $ | 9.79 | | | $ | 7.46 | | | $ | 14.35 | | | $ | 12.82 | | | $ | 10.07 | | | | | | | $ | 8.13 | | | $ | 5.85 | |
| | | | | | | | | | | | | | | | | | | | | | | | | | | | | | | | | |
Total Return | | | 34.81 | % | | | (45.76 | )%(C) | | | 14.83 | % | | | 30.06 | % | | | 0.70 | %(C) | | | | | | | 42.13 | % | | | (40.61 | )%(C) |
Net Assets, End of Period (thousands) | | $ | 3,699,842 | | | $ | 1,981,049 | | | $ | 2,342,187 | | | $ | 851,077 | | | $ | 121,249 | | | | | | | $ | 668,728 | | | $ | 228,318 | |
Ratio of Expenses to Average Net Assets | | | 0.41 | % | | | 0.41 | %(B) | | | 0.41 | % | | | 0.48 | % | | | 0.49 | %(B)(E) | | | | | | | 0.54 | % | | | 0.60 | %(B)(E) |
Ratio of Expenses to Average Net Assets (Excluding Waivers and Assumption of Expenses and/or Recovery of Previously Waived Fees) | | | 0.41 | % | | | 0.41 | %(B) | | | 0.41 | % | | | 0.46 | % | | | 0.90 | %(B)(E) | | | | | | | 0.51 | % | | | 0.85 | %(B)(E) |
Ratio of Net Investment Income to Average Net Assets | | | 2.84 | % | | | 3.39 | %(B) | | | 2.49 | % | | | 2.35 | % | | | 1.89 | %(B)(E) | | | | | | | 2.38 | % | | | 3.27 | %(B)(E) |
Portfolio Turnover Rate | | | 5 | % | | | 4 | %(C) | | | 4 | % | | | 2 | % | | | 0 | %(C) | | | | | | | 5 | % | | | 2 | %(C) |
See page 1 & 2 for the Definitions of Abbreviations and Footnotes.
See accompanying Notes to Financial Statements.
192
DFA INVESTMENT DIMENSIONS GROUP INC.
FINANCIAL HIGHLIGHTS
(for a share outstanding throughout each period)
| | | | | | | | | | | | | | | | | | | | | | | | | | | | | | | | | | | | | | | | | | | | | | | | | | |
| | | International Small Company Portfolio | | | | | Japanese Small Company Portfolio | |
| | | Year Ended Oct. 31, 2009 | | | Period Dec. 1, 2007 to Oct. 31, 2008 | | | Year Ended Nov. 30, 2007 | | | Year Ended Nov. 30,
2006 | | | Year Ended Nov. 30, 2005 | | | Year Ended Nov. 30,
2004 | | | | | Year
Ended
Oct. 31,
2009 | | | Period
Dec. 1,
2007 to
Oct. 31,
2008 | | | Year
Ended
Nov. 30,
2007 | | | Year
Ended
Nov. 30,
2006 | | | Year
Ended
Nov. 30,
2005 | | | Year
Ended
Nov. 30,
2004 | |
Net Asset Value, Beginning of Period | | $ | 10.07 | | | $ | 20.80 | | | $ | 19.43 | | | $ | 16.19 | | | $ | 14.12 | | | $ | 11.00 | | | | | $ | 11.97 | | | $ | 16.75 | | | $ | 17.23 | | | $ | 17.97 | | | $ | 13.99 | | | $ | 10.80 | |
| | | | | | | | | | | | | | | | | | | | | | | | | | | | | | | | | | | | | | | | | | | | | | | | | | |
Income From Investment Operations | | | | | | | | | | | | | | | | | | | | | | | | | | | | | | | | | | | | | | | | | | | | | | | | | | |
Net Investment Income (Loss) | | | 0.28 | (A) | | | 0.44 | (A) | | | 0.43 | (A) | | | 0.36 | (A) | | | 0.31 | (A) | | | 0.22 | | | | | | 0.22 | (A) | | | 0.29 | (A) | | | 0.27 | (A) | | | 0.22 | (A) | | | 0.16 | (A) | | | 0.22 | |
Net Gains (Losses) on Securities (Realized and Unrealized) | | | 3.91 | | | | (9.55 | ) | | | 2.07 | | | | 4.02 | | | | 2.38 | | | | 3.24 | | | | | | 2.39 | | | | (4.78 | ) | | | (0.52 | ) | | | (0.73 | ) | | | 4.00 | | | | 3.16 | |
| | | | | | | | | | | | | | | | | | | | | | | | | | | | | | | | | | | | | | | | | | | | | | | | | | |
Total From Investment Operations | | | 4.19 | | | | (9.11 | ) | | | 2.50 | | | | 4.38 | | | | 2.69 | | | | 3.46 | | | | | | 2.61 | | | | (4.49 | ) | | | (0.25 | ) | | | (0.51 | ) | | | 4.16 | | | | 3.38 | |
Less Distributions | | | | | | | | | | | | | | | | | | | | | | | | | | | | | | | | | | | | | | | | | | | | | | | | | | |
Net Investment Income | | | (0.27 | ) | | | (0.45 | ) | | | (0.46 | ) | | | (0.36 | ) | | | (0.29 | ) | | | (0.34 | ) | | | | | (0.26 | ) | | | (0.29 | ) | | | (0.23 | ) | | | (0.23 | ) | | | (0.18 | ) | | | (0.19 | ) |
Net Realized Gains | | | — | | | | (1.17 | ) | | | (0.67 | ) | | | (0.78 | ) | | | (0.33 | ) | | | — | | | | | | — | | | | — | | | | — | | | | — | | | | — | | | | — | |
| | | | | | | | | | | | | | | | | | | | | | | | | | | | | | | | | | | | | | | | | | | | | | | | | | |
Total Distributions | | | (0.27 | ) | | | (1.62 | ) | | | (1.13 | ) | | | (1.14 | ) | | | (0.62 | ) | | | (0.34 | ) | | | | | (0.26 | ) | | | (0.29 | ) | | | (0.23 | ) | | | (0.23 | ) | | | (0.18 | ) | | | (0.19 | ) |
Net Asset Value, End of Period | | $ | 13.99 | | | $ | 10.07 | | | $ | 20.80 | | | $ | 19.43 | | | $ | 16.19 | | | $ | 14.12 | | | | | $ | 14.32 | | | $ | 11.97 | | | $ | 16.75 | | | $ | 17.23 | | | $ | 17.97 | | �� | $ | 13.99 | |
| | | | | | | | | | | | | | | | | | | | | | | | | | | | | | | | | | | | | | | | | | | | | | | | | | | |
Total Return | | | 42.34 | % | | | (47.13 | )%(C) | | | 13.29 | % | | | 28.51 | % | | | 19.74 | % | | | 32.10 | % | | | | | 22.08 | % | | | (27.16 | )%(C) | | | (1.51 | )% | | | (2.94 | )% | | | 30.13 | % | | | 31.79 | % |
Net Assets, End of Period (thousands) | | $ | 4,269,864 | | | $ | 3,084,373 | | | $ | 5,597,209 | | | $ | 4,546,071 | | | $ | 2,725,231 | | | $ | 1,658,184 | | | | | $ | 114,058 | | | $ | 133,373 | | | $ | 199,080 | | | $ | 168,957 | | | $ | 169,995 | | | $ | 65,879 | |
Ratio of Expenses to Average Net Assets (D) | | | 0.57 | % | | | 0.55 | %(B) | | | 0.55 | % | | | 0.56 | % | | | 0.64 | % | | | 0.69 | % | | | | | 0.59 | % | | | 0.58 | %(B) | | | 0.56 | % | | | 0.61 | % | | | 0.68 | % | | | 0.73 | % |
Ratio of Expenses to Average Net Assets (Excluding Waivers and Assumption of Expenses and/or Recovery of Previously Waived Fees) (D) | | | 0.57 | % | | | 0.55 | %(B) | | | 0.55 | % | | | 0.56 | % | | | 0.64 | % | | | 0.69 | % | | | | | 0.59 | % | | | 0.58 | %(B) | | | 0.56 | % | | | 0.58 | % | | | 0.68 | % | | | 0.79 | % |
Ratio of Net Investment Income to Average Net Assets | | | 2.48 | % | | | 2.90 | %(B) | | | 2.03 | % | | | 2.04 | % | | | 2.05 | % | | | 1.82 | % | | | | | 1.68 | % | | | 2.18 | %(B) | | | 1.51 | % | | | 1.19 | % | | | 1.03 | % | | | 1.01 | % |
See page 1 & 2 for the Definitions of Abbreviations and Footnotes.
See accompanying Notes to Financial Statements.
193
DFA INVESTMENT DIMENSIONS GROUP INC.
FINANCIAL HIGHLIGHTS
(for a share outstanding throughout each period)
| | | | | | | | | | | | | | | | | | | | | | | | | | | | | | | | | | | | | | | | | | | | | | | | | | |
| | | Asia Pacific Small Company Portfolio | | | | | United Kingdom Small Company Portfolio | |
| | | Year
Ended
Oct. 31,
2009 | | | Period
Dec. 1, 2007 to
Oct. 31,
2008 | | | Year
Ended
Nov. 30,
2007 | | | Year
Ended
Nov. 30,
2006 | | | Year
Ended
Nov. 30,
2005 | | | Year
Ended
Nov. 30,
2004 | | | | | Year
Ended
Oct. 31,
2009 | | | Period
Dec. 1,
2007 to
Oct. 31,
2008 | | | Year
Ended
Nov. 30,
2007 | | | Year
Ended
Nov. 30,
2006 | | | Year
Ended
Nov. 30,
2005 | | | Year
Ended
Nov. 30,
2004 | |
Net Asset Value, Beginning of Period | | $ | 11.67 | | | $ | 28.73 | | | $ | 20.26 | | | $ | 15.28 | | | $ | 14.54 | | | $ | 12.10 | | | | | $ | 14.27 | | | $ | 31.29 | | | $ | 32.97 | | | $ | 24.65 | | | $ | 23.47 | | | $ | 19.26 | |
| | | | | | | | | | | | | | | | | | | | | | | | | | | | | | | | | | | | | | | | | | | | | | | | | | |
Income From Investment Operations | | | | | | | | | | | | | | | | | | | | | | | | | | | | | | | | | | | | | | | | | | | | | | | | | | |
Net Investment Income (Loss) | | | 0.50 | (A) | | | 0.83 | (A) | | | 0.79 | (A) | | | 0.64 | (A) | | | 0.70 | | | | 0.50 | | | | | | 0.55 | (A) | | | 0.77 | (A) | | | 0.78 | (A) | | | 0.61 | (A) | | | 0.64 | (A) | | | 0.48 | |
Net Gains (Losses) on Securities (Realized and Unrealized) | | | 8.95 | | | | (17.04 | ) | | | 8.43 | | | | 4.92 | | | | 0.54 | | | | 2.58 | | | | | | 5.44 | | | | (15.84 | ) | | | (0.08 | ) | | | 9.61 | | | | 2.15 | | | | 4.87 | |
| | | | | | | | | | | | | | | | | | | | | | | | | | | | | | | | | | | | | | | | | | | | | | | | | | |
Total From Investment Operations | | | 9.45 | | | | (16.21 | ) | | | 9.22 | | | | 5.56 | | | | 1.24 | | | | 3.08 | | | | | | 5.99 | | | | (15.07 | ) | | | 0.70 | | | | 10.22 | | | | 2.79 | | | | 5.35 | |
Less Distributions | | | | | | | | | | | | | | | | | | | | | | | | | | | | | | | | | | | | | | | | | | | | | | | | | | |
Net Investment Income | | | (0.53 | ) | | | (0.85 | ) | | | (0.75 | ) | | | (0.58 | ) | | | (0.50 | ) | | | (0.64 | ) | | | | | (0.43 | ) | | | (0.72 | ) | | | (1.03 | ) | | | (0.68 | ) | | | (0.59 | ) | | | (1.14 | ) |
Net Realized Gains | | | — | | | | — | | | | — | | | | — | | | | — | | | | — | | | | | | — | | | | (1.22 | ) | | | (1.35 | ) | | | (1.22 | ) | | | (1.02 | ) | | | — | |
Return of Capital | | | — | | | | — | | | | — | | | | — | | | | — | | | | — | | | | | | — | | | | (0.01 | ) | | | — | | | | — | | | | — | | | | — | |
| | | | | | | | | | | | | | | | | | | | | | | | | | | | | | | | | | | | | | | | | | | | | | | | | | |
Total Distributions | | | (0.53 | ) | | | (0.85 | ) | | | (0.75 | ) | | | (0.58 | ) | | | (0.50 | ) | | | (0.64 | ) | | | | | (0.43 | ) | | | (1.95 | ) | | | (2.38 | ) | | | (1.90 | ) | | | (1.61 | ) | | | (1.14 | ) |
Net Asset Value, End of Period | | $ | 20.59 | | | $ | 11.67 | | | $ | 28.73 | | | $ | 20.26 | | | $ | 15.28 | | | $ | 14.54 | | | | | $ | 19.83 | | | $ | 14.27 | | | $ | 31.29 | | | $ | 32.97 | | | $ | 24.65 | | | $ | 23.47 | |
| | | | | | | | | | | | | | | | | | | | | | | | | | | | | | | | | | | | | | | | | | | | | | | | | | | |
Total Return | | | 84.11 | % | | | (57.94 | )%(C) | | | 46.55 | % | | | 37.52 | % | | | 8.81 | % | | | 26.73 | % | | | | | 42.81 | % | | | (50.97 | )%(C) | | | 1.94 | % | | | 44.15 | % | | | 12.35 | % | | | 29.05 | % |
Net Assets, End of Period (thousands) | | $ | 101,853 | | | $ | 64,044 | | | $ | 146,307 | | | $ | 71,537 | | | $ | 38,927 | | | $ | 26,735 | | | | | $ | 27,863 | | | $ | 25,883 | | | $ | 37,139 | | | $ | 31,808 | | | $ | 20,578 | | | $ | 15,816 | |
Ratio of Expenses to Average Net Assets(D) | | | 0.65 | % | | | 0.62 | %(B) | | | 0.62 | % | | | 0.64 | % | | | 0.74 | % | | | 0.80 | % | | | | | 0.61 | % | | | 0.59 | %(B) | | | 0.59 | % | | | 0.60 | % | | | 0.70 | % | | | 0.74 | % |
Ratio of Expenses to Average Net Assets (Excluding Waivers and Assumption of Expenses and/or Recovery of Previously Waived Expenses)(D) | | | 0.65 | % | | | 0.61 | %(B) | | | 0.59 | % | | | 0.64 | % | | | 0.86 | % | | | 0.96 | % | | | | | 0.70 | % | | | 0.65 | %(B) | | | 0.62 | % | | | 0.67 | % | | | 0.89 | % | | | 1.04 | % |
Ratio of Net Investment Income to Average Net Assets | | | 3.53 | % | | | 3.85 | %(B) | | | 3.13 | % | | | 3.68 | % | | | 3.89 | % | | | 3.29 | % | | | | | 3.62 | % | | | 3.41 | %(B) | | | 2.28 | % | | | 2.20 | % | | | 2.70 | % | | | 2.21 | % |
See page 1 & 2 for the Definitions of Abbreviations and Footnotes.
See accompanying Notes to Financial Statements.
194
DFA INVESTMENT DIMENSIONS GROUP INC.
FINANCIAL HIGHLIGHTS
(for a share outstanding throughout each period)
| | | | | | | | | | | | | | | | | | | | | | | | | | | | | | | | | | | | |
| | | Continental Small Company Portfolio | | | DFA International Real Estate
Securities Portfolio | |
| | | Year Ended Oct. 31, 2009 | | | Period Dec. 1, 2007 to Oct. 31, 2008 | | | Year Ended Nov. 30, 2007 | | | Year Ended Nov. 30, 2006 | | | Year Ended Nov. 30, 2005 | | | Year Ended Nov. 30, 2004 | | | Year Ended Oct. 31, 2009 | | | Period Dec. 1, 2007 to Oct. 31, 2008 | | | Period March 1, 2007(a) to Nov. 30, 2007 | |
Net Asset Value, Beginning of Period | | $ | 10.73 | | | $ | 22.95 | | | $ | 20.47 | | | $ | 15.78 | | | $ | 14.12 | | | $ | 12.60 | | | $ | 4.18 | | | $ | 9.35 | | | $ | 10.00 | |
| | | | | | | | | | | | | | | | | | | | | | | | | | | | | | | | | | | | |
Income From Investment Operations | | | | | | | | | | | | | | | | | | | | | | | | | | | | | | | | | | | | |
Net Investment Income (Loss) | | | 0.28 | (A) | | | 0.52 | (A) | | | 0.40 | (A) | | | 0.31 | (A) | | | 0.21 | | | | 0.17 | | | | 0.26 | (A) | | | 0.34 | (A) | | | 0.23 | (A) |
Net Gains (Losses) on Securities (Realized and Unrealized) | | | 4.29 | | | | (11.32 | ) | | | 3.00 | | | | 6.28 | | | | 2.28 | | | | 3.64 | | | | 0.91 | | | | (5.08 | ) | | | (0.76) | |
| | | | | | | | | | | | | | | | | | | | | | | | | | | | | | | | | | | | |
Total From Investment Operations | | | 4.57 | | | | (10.80 | ) | | | 3.40 | | | | 6.59 | | | | 2.49 | | | | 3.81 | | | | 1.17 | | | | (4.74 | ) | | | (0.53) | |
| | |
Less Distributions | | | | | | | | | | | | | | | | | | | | | | | | | | | | | | | | | | | | |
Net Investment Income | | | (0.28 | ) | | | (0.45 | ) | | | (0.38 | ) | | | (0.34 | ) | | | (0.30 | ) | | | (0.50 | ) | | | (0.11 | ) | | | (0.43 | ) | | | (0.12) | |
Net Realized Gains | | | — | | | | (0.96 | ) | | | (0.54 | ) | | | (1.56 | ) | | | (0.53 | ) | | | (1.79 | ) | | | — | | | | — | | | | — | |
Return of Capital | | | — | | | | (0.01 | ) | | | — | | | | — | | | | — | | | | — | | | | — | | | | — | | | | — | |
| | | | | | | | | | | | | | | | | | | | | | | | | | | | | | | | | | | | |
Total Distributions | | | (0.28 | ) | | | (1.42 | ) | | | (0.92 | ) | | | (1.90 | ) | | | (0.83 | ) | | | (2.29 | ) | | | (0.11 | ) | | | (0.43 | ) | | | (0.12 | ) |
| | |
Net Asset Value, End of Period | | $ | 15.02 | | | $ | 10.73 | | | $ | 22.95 | | | $ | 20.47 | | | $ | 15.78 | | | $ | 14.12 | | | $ | 5.24 | | | $ | 4.18 | | | $ | 9.35 | |
| | |
Total Return | | | 43.12 | % | | | (49.89 | )%(C) | | | 16.99 | % | | | 46.33 | % | | | 18.42 | % | | | 35.91 | % | | | 29.25 | % | | | (52.85 | )%(C) | | | (5.38) | %(C) |
| | |
Net Assets, End of Period (thousands) | | $ | 110,926 | | | $ | 93,988 | | | $ | 170,909 | | | $ | 90,261 | | | $ | 52,061 | | | $ | 33,839 | | | $ | 742,329 | | | $ | 394,480 | | | $ | 336,840 | |
Ratio of Expenses to Average Net Assets | | | 0.62 | %(D) | | | 0.59 | %(B)(D) | | | 0.61 | %(D) | | | 0.62 | %(D) | | | 0.71 | %(D) | | | 0.73 | %(D) | | | 0.43 | % | | | 0.44 | %(B) | | | 0.48 | %(B)(E) |
Ratio of Expenses to Average Net Assets (Excluding Waivers and Assumption of Expenses and/or Recovery of Previously Waived Fees) | | | 0.61 | %(D) | | | 0.59 | %(B)(D) | | | 0.57 | %(D) | | | 0.61 | %(D) | | | 0.78 | %(D) | | | 0.87 | %(D) | | | 0.43 | % | | | 0.44 | %(B) | | | 0.48 | %(B)(E) |
Ratio of Net Investment Income (Loss) to Average Net Assets | | | 2.39 | % | | | 3.04 | %(B) | | | 1.70 | % | | | 1.78 | % | | | 1.77 | % | | | 1.56 | % | | | 6.40 | % | | | 5.20 | %(B) | | | 3.50 | %(B)(E) |
Portfolio Turnover Rate | | | N/A | | | | N/A | | | | N/A | | | | N/A | | | | N/A | | | | N/A | | | | 5 | % | | | 1 | %(C) | | | 2 | %(C) |
| | |
See page 1 & 2 for the Definitions of Abbreviations and Footnotes.
See accompanying Notes to Financial Statements.
195
DFA INVESTMENT DIMENSIONS GROUP INC.
FINANCIAL HIGHLIGHTS
(for a share outstanding throughout each period)
| | | | | | | | | | | | | | | | | | | | | | | | | | | | | | | | |
| | | DFA Global Real
Estate Securities
Portfolio | | | DFA International Small Cap Value Portfolio | |
| | | Year Ended Oct. 31,
2009 | | | Period June 4, 2008(a) to Oct. 31, 2008 | | | Year Ended Oct. 31, 2009 | | | Period Dec. 1, 2007 to Oct. 31, 2008 | | | Year Ended Nov. 30, 2007 | | | Year Ended Nov. 30, 2006 | | | Year Ended Nov. 30, 2005 | | | Year Ended Nov. 30, 2004 | |
Net Asset Value, Beginning of Period | | $ | 6.04 | | | $ | 10.00 | | | $ | 10.82 | | | $ | 22.05 | | | $ | 21.71 | | | $ | 17.57 | | | $ | 15.16 | | | $ | 11.52 | |
| | | | | | | | | | | | | | | | | | | | | | | | | | | | | | | | |
Income From Investment Operations | | | | | | | | | | | | | | | | | | | | | | | | | | | | | | | | |
Net Investment Income (Loss) | | | 0.19 | (A) | | | — | (A) | | | 0.26 | (A) | | | 0.52 | (A) | | | 0.46 | (A) | | | 0.36 | (A) | | | 0.40 | (A) | | | 0.23 | |
Net Gains (Losses) on Securities (Realized and Unrealized) | | | 0.62 | | | | (3.96 | ) | | | 4.14 | | | | (9.60 | ) | | | 1.66 | | | | 4.95 | | | | 2.77 | | | | 3.85 | |
| | | | | | | | | | | | | | | | | | | | | | | | | | | | | | | | |
Total From Investment Operations | | | 0.81 | | | | (3.96 | ) | | | 4.40 | | | | (9.08 | ) | | | 2.12 | | | | 5.31 | | | | 3.17 | | | | 4.08 | |
| | |
Less Distributions | | | | | | | | | | | | | | | | | | | | | | | | | | | | | | | | |
Net Investment Income | | | (0.10 | ) | | | — | | | | (0.24 | ) | | | (0.58 | ) | | | (0.53 | ) | | | (0.38 | ) | | | (0.36 | ) | | | (0.35 | ) |
Net Realized Gains | | | — | | | | — | | | | (0.06 | ) | | | (1.57 | ) | | | (1.25 | ) | | | (0.79 | ) | | | (0.40 | ) | | | (0.09 | ) |
| | | | | | | | | | | | | | | | | | | | | | | | | | | | | | | | |
Total Distributions | | | (0.10 | ) | | | — | | | | (0.30 | ) | | | (2.15 | ) | | | (1.78 | ) | | | (1.17 | ) | | | (0.76 | ) | | | (0.44 | ) |
| | |
Net Asset Value, End of Period | | $ | 6.75 | | | $ | 6.04 | | | $ | 14.92 | | | $ | 10.82 | | | $ | 22.05 | | | $ | 21.71 | | | $ | 17.57 | | | $ | 15.16 | |
| | |
Total Return | | | 13.81 | % | | | (39.60 | )%(C) | | | 41.42 | % | | | (45.17 | )%(C) | | | 10.25 | % | | | 31.73 | % | | | 21.75 | % | | | 36.34 | % |
| | |
Net Assets, End of Period (thousands) | | $ | 432,502 | | | $ | 90,672 | | | $ | 6,859,957 | | | $ | 4,799,748 | | | $ | 8,180,859 | | | $ | 6,733,067 | | | $ | 4,128,428 | | | $ | 2,215,523 | |
Ratio of Expenses to Average Net Assets | | | 0.47 | %(D) | | | 0.54 | %(B)(D)(E) | | | 0.71 | % | | | 0.69 | %(B) | | | 0.69 | % | | | 0.70 | % | | | 0.75 | % | | | 0.78 | % |
Ratio of Expenses to Average Net Assets (Excluding Waivers and Assumption of Expenses and/or Recovery of Previously Waived Fees) | | | 0.79 | %(D) | | | 0.86 | %(B)(D)(E) | | | 0.71 | % | | | 0.69 | %(B) | | | 0.69 | % | | | 0.70 | % | | | 0.75 | % | | | 0.78 | % |
Ratio of Net Investment Income to Average Net Assets | | | 3.40 | % | | | (0.04 | )%(B)(E) | | | 2.19 | % | | | 3.22 | %(B) | | | 2.03 | % | | | 1.85 | % | | | 2.44 | % | | | 1.63 | % |
Portfolio Turnover Rate | | | N/A | | | | N/A | | | | 22 | % | | | 16 | %(C) | | | 18 | % | | | 14 | % | | | 13 | % | | | 10 | % |
| | |
See page 1 & 2 for the Definitions of Abbreviations and Footnotes.
See accompanying Notes to Financial Statements.
196
DFA INVESTMENT DIMENSIONS GROUP INC.
FINANCIAL HIGHLIGHTS
(for a share outstanding throughout each period)
| | | | | | | | | | | | | | | | | | | | | | | | | | | | | | | | |
| | | International
Vector Equity
Portfolio | | | Emerging Markets Portfolio | |
| | | Year Ended Oct. 31, 2009 | | | Period August 14, 2008(a) to Oct. 31, 2008 | | | Year Ended Oct. 31, 2009 | | | Period Dec. 1, 2007 to Oct. 31, 2008 | | | Year Ended Nov. 30, 2007 | | | Year Ended Nov. 30, 2006 | | | Year Ended Nov. 30, 2005 | | | Year Ended Nov. 30, 2004 | |
Net Asset Value, Beginning of Period | | $ | 6.74 | | | $ | 10.00 | | | $ | 17.05 | | | $ | 35.23 | | | $ | 25.40 | | | $ | 19.89 | | | $ | 15.61 | | | $ | 11.87 | |
| | | | | | | | | | | | | | | | | | | | | | | | | | | | | | | | |
Income From Investment Operations | | | | | | | | | | | | | | | | | | | | | | | | | | | | | | | | |
Net Investment Income (Loss) | | | 0.17 | (A) | | | 0.06 | (A) | | | 0.42 | (A) | | | 0.70 | (A) | | | 0.64 | (A) | | | 0.48 | (A) | | | 0.58 | (A) | | | 0.27 | |
Net Gains (Losses) on Securities (Realized and Unrealized) | | | 2.46 | | | | (3.32 | ) | | | 8.42 | | | | (16.85 | ) | | | 9.88 | | | | 5.61 | | | | 4.13 | | | | 3.80 | |
| | | | | | | | | | | | | | | | | | | | | | | | | | | | | | | | |
Total From Investment Operations | | | 2.63 | | | | (3.26 | ) | | | 8.84 | | | | (16.15 | ) | | | 10.52 | | | | 6.09 | | | | 4.71 | | | | 4.07 | |
| | |
Less Distributions | | | | | | | | | | | | | | | | | | | | | | | | | | | | | | | | |
Net Investment Income | | | (0.15 | ) | | | — | | | | (0.41 | ) | | | (0.69 | ) | | | (0.53 | ) | | | (0.58 | ) | | | (0.43 | ) | | | (0.33 | ) |
Net Realized Gains | | | — | | | | — | | | | (0.25 | ) | | | (1.34 | ) | | | (0.16 | ) | | | — | | | | — | | | | — | |
| | | | | | | | | | | | | | | | | | | | | | | | | | | | | | | | |
Total Distributions | | | (0.15 | ) | | | — | | | | (0.66 | ) | | | (2.03 | ) | | | (0.69 | ) | | | (0.58 | ) | | | (0.43 | ) | | | (0.33 | ) |
| | |
Net Asset Value, End of Period | | $ | 9.22 | | | $ | 6.74 | | | $ | 25.23 | | | $ | 17.05 | | | $ | 35.23 | | | $ | 25.40 | | | $ | 19.89 | | | $ | 15.61 | |
| | |
Total Return | | | 39.52 | % | | | (32.60 | )%(C) | | | 53.39 | % | | | (48.37 | )%(C) | | | 42.08 | % | | | 31.31 | % | | | 30.65 | % | | | 34.95 | % |
| | |
Net Assets, End of Period (thousands) | | $ | 262,544 | | | $ | 66,774 | | | $ | 1,966,288 | | | $ | 1,508,260 | | | $ | 3,388,442 | | | $ | 2,344,990 | | | $ | 1,805,186 | | | $ | 1,131,778 | |
Ratio of Expenses to Average Net Assets | | | 0.60 | % | | | 0.60 | %(B)(E) | | | 0.62 | %(D) | | | 0.60 | %(B)(D) | | | 0.60 | %(D) | | | 0.61 | %(D) | | | 0.69 | %(D) | | | 0.74 | %(D) |
Ratio of Expenses to Average Net Assets (Excluding Waivers and Assumption of Expenses and/or Recovery of Previously Waived Fees) | | | 0.59 | % | | | 1.15 | %(B)(E) | | | 0.62 | %(D) | | | 0.60 | %(B)(D) | | | 0.60 | %(D) | | | 0.61 | %(D) | | | 0.69 | %(D) | | | 0.74 | %(D) |
Ratio of Net Investment Income to Average Net Assets. | | | 2.31 | % | | | 3.01 | %(B)(E) | | | 2.15 | % | | | 2.59 | %(B) | | | 2.12 | % | | | 2.13 | % | | | 3.28 | % | | | 2.20 | % |
Portfolio Turnover Rate | | | 8 | % | | | 0 | %(C) | | | N/A | | | | N/A | | | | N/A | | | | N/A | | | | N/A | | | | N/A | |
| | |
See page 1 & 2 for the Definitions of Abbreviations and Footnotes.
See accompanying Notes to Financial Statements.
197
DFA INVESTMENT DIMENSIONS GROUP INC.
FINANCIAL HIGHLIGHTS
(for a share outstanding throughout each period)
| | | | | | | | | | | | | | | | | | | | | | | | |
| | | Emerging Markets Small Cap Portfolio | |
| | | Year Ended Oct. 31, 2009 | | | Period Dec. 1, 2007 to Oct. 31, 2008 | | | Year Ended Nov. 30, 2007 | | | Year Ended Nov. 30, 2006 | | | Year Ended Nov. 30, 2005 | | | Year Ended Nov. 30, 2004 | |
Net Asset Value, Beginning of Period | | $ | 9.33 | | | $ | 23.74 | | | $ | 17.96 | | | $ | 13.37 | | | $ | 11.44 | | | $ | 8.74 | |
| | | | | | | | | | | | | | | | | | | | | | | | |
Income From Investment Operations | | | | | | | | | | | | | | | | | | | | | | | | |
Net Investment Income (Loss) | | | 0.26 | (A) | | | 0.44 | (A) | | | 0.31 | (A) | | | 0.30 | (A) | | | 0.27 | (A) | | | 0.11 | |
Net Gains (Losses) on Securities (Realized and Unrealized) | | | 8.14 | | | | (12.95 | ) | | | 6.86 | | | | 4.86 | | | | 2.37 | | | | 2.85 | |
| | | | | | | | | | | | | | | | | | | | | | | | |
Total From Investment Operations | | | 8.40 | | | | (12.51 | ) | | | 7.17 | | | | 5.16 | | | | 2.64 | | | | 2.96 | |
| | |
Less Distributions | | | | | | | | | | | | | | | | | | | | | | | | |
Net Investment Income | | | (0.28 | ) | | | (0.41 | ) | | | (0.26 | ) | | | (0.26 | ) | | | (0.22 | ) | | | (0.19 | ) |
Net Realized Gains | | | — | | | | (1.49 | ) | | | (1.13 | ) | | | (0.31 | ) | | | (0.49 | ) | | | (0.07 | ) |
| | | | | | | | | | | | | | | | | | | | | | | | |
Total Distributions | | | (0.28 | ) | | | (1.90 | ) | | | (1.39 | ) | | | (0.57 | ) | | | (0.71 | ) | | | (0.26 | ) |
| | |
Net Asset Value, End of Period | | $ | 17.45 | | | $ | 9.33 | | | $ | 23.74 | | | $ | 17.96 | | | $ | 13.37 | | | $ | 11.44 | |
| | |
Total Return | | | 91.35 | % | | | (57.00 | )%(C) | | | 42.58 | % | | | 39.95 | % | | | 24.27 | % | | | 34.55 | % |
| | |
Net Assets, End of Period (thousands) | | $ | 1,133,958 | | | $ | 547,329 | | | $ | 1,458,152 | | | $ | 838,948 | | | $ | 482,378 | | | $ | 190,028 | |
Ratio of Expenses to Average Net Assets | | | 0.80 | %(D) | | | 0.77 | %(B)(D) | | | 0.78 | %(D) | | | 0.81 | %(D) | | | 0.97 | %(D) | | | 1.04 | %(D) |
Ratio of Expenses to Average Net Assets (Excluding Waivers and Assumption of Expenses and/or Recovery of Previously Waived Fees) | | | 0.80 | %(D) | | | 0.77 | %(B)(D) | | | 0.78 | %(D) | | | 0.81 | %(D) | | | 0.97 | %(D) | | | 1.04 | %(D) |
Ratio of Net Investment Income to Average Net Assets | | | 2.05 | % | | | 2.61 | %(B) | | | 1.48 | % | | | 1.92 | % | | | 2.21 | % | | | 1.41 | % |
Portfolio Turnover Rate | | | N/A | | | | N/A | | | | N/A | | | | N/A | | | | N/A | | | | N/A | |
| | |
| | |
| | | | | | Emerging Markets Core Equity Portfolio | |
| | | | | | Year Ended Oct. 31, 2009 | | | Period Dec. 1, 2007 to Oct. 31, 2008 | | | Year Ended Nov. 30, 2007 | | | Year Ended Nov. 30, 2006 | | | Period April 5, 2005(a) to Nov. 30, 2005 | |
Net Asset Value, Beginning of Period | | | | | | $ | 9.88 | | | $ | 21.20 | | | $ | 15.13 | | | $ | 11.54 | | | $ | 10.00 | |
| | | | | | | | | | | | | | | | | | | | | | | | |
Income From Investment Operations | | | | | | | | | | | | | | | | | | | | | | | | |
Net Investment Income (Loss) | | | | | | | 0.25 | (A) | | | 0.43 | (A) | | | 0.35 | (A) | | | 0.27 | (A) | | | 0.10 | |
Net Gains (Losses) on Securities (Realized and Unrealized) | | | | | | | 6.56 | | | | (11.27 | ) | | | 6.10 | | | | 3.54 | | | | 1.51 | |
| | | | | | | | | | | | | | | | | | | | | | | | |
Total From Investment Operations | | | | | | | 6.81 | | | | (10.84 | ) | | | 6.45 | | | | 3.81 | | | | 1.61 | |
| | |
Less Distributions | | | | | | | | | | | | | | | | | | | | | | | | |
Net Investment Income | | | | | | | (0.20 | ) | | | (0.40 | ) | | | (0.32 | ) | | | (0.22 | ) | | | (0.07 | ) |
Net Realized Gains | | | | | | | — | | | | (0.08 | ) | | | (0.06 | ) | | | — | | | | — | |
| | | | | | | | | | | | | | | | | | | | | | | | |
Total Distributions | | | | | | | (0.20 | ) | | | (0.48 | ) | | | (0.38 | ) | | | (0.22 | ) | | | (0.07 | ) |
| | |
Net Asset Value, End of Period | | | | | | $ | 16.49 | | | $ | 9.88 | | | $ | 21.20 | | | $ | 15.13 | | | $ | 11.54 | |
| | |
Total Return | | | | | | | 69.47 | % | | | (51.93 | )%(C) | | | 43.20 | % | | | 33.39 | % | | | 16.12 | %(C) |
| | |
Net Assets, End of Period (thousands) | | | | | | $ | 2,455,035 | | | $ | 1,155,526 | | | $ | 1,829,466 | | | $ | 822,136 | | | $ | 218,563 | |
Ratio of Expenses to Average Net Assets | | | | | | | 0.67 | % | | | 0.65 | %(B) | | | 0.65 | % | | | 0.74 | % | | | 1.00 | %(B)(E) |
Ratio of Expenses to Average Net Assets (Excluding Waivers and Assumption of Expenses and/or Recovery of Previously Waived Fees) | | | | | | | 0.67 | % | | | 0.65 | %(B) | | | 0.65 | % | | | 0.72 | % | | | 1.09 | %(B)(E) |
Ratio of Net Investment Income to Average Net Assets | | | | | | | 2.03 | % | | | 2.62 | %(B) | | | 1.87 | % | | | 2.02 | % | | | 1.79 | %(B)(E) |
Portfolio Turnover Rate | | | | | | | 6 | % | | | 3 | %(C) | | | 2 | % | | | 6 | % | | | 2 | %(C) |
| | |
See page 1 & 2 for the Definitions of Abbreviations and Footnotes.
See accompanying Notes to Financial Statements.
198
DFA INVESTMENT DIMENSIONS GROUP INC.
FINANCIAL HIGHLIGHTS
(for a share outstanding throughout each period)
| | | | | | | | | | | | | | | | | | | | | | | | |
| | | DFA One-Year Fixed Income Portfolio | |
| | | Year Ended Oct. 31, 2009 | | | Period Dec. 1, 2007 to Oct. 31 2008 | | | Year Ended Nov. 30, 2007 | | | Year Ended Nov. 30, 2006 | | | Year Ended Nov. 30, 2005 | | | Year Ended Nov. 30, 2004 | |
| | |
Net Asset Value, Beginning of Period | | $ | 10.17 | | | $ | 10.21 | | | $ | 10.20 | | | $ | 10.14 | | | $ | 10.20 | | | $ | 10.30 | |
| | | | | | | | | | | | | | | | | | | | | | | | |
Income From Investment Operations | | | | | | | | | | | | | | | | | | | | | | | | |
Net Investment Income (Loss) | | | 0.13 | (A) | | | 0.31 | (A) | | | 0.51 | (A) | | | 0.40 | (A) | | | 0.28 | | | | 0.25 | |
Net Gains (Losses) on Securities (Realized and Unrealized) | | | 0.25 | | | | (0.04 | ) | | | 0.01 | | | | 0.06 | | | | (0.05 | ) | | | (0.10 | ) |
| | | | | | | | | | | | | | | | | | | | | | | | |
Total From Investment Operations | | | 0.38 | | | | 0.27 | | | | 0.52 | | | | 0.46 | | | | 0.23 | | | | 0.15 | |
| | |
Less Distributions | | | | | | | | | | | | | | | | | | | | | | | | |
Net Investment Income | | | (0.22 | ) | | | (0.31 | ) | | | (0.51 | ) | | | (0.40 | ) | | | (0.29 | ) | | | (0.25 | ) |
Net Realized Gains | | | — | | | | — | | | | — | | | | — | | | | — | | | | — | |
| | | | | | | | | | | | | | | | | | | | | | | | |
Total Distributions | | | (0.22 | ) | | | (0.31 | ) | | | (0.51 | ) | | | (0.40 | ) | | | (0.29 | ) | | | (0.25 | ) |
| | |
Net Asset Value, End of Period | | $ | 10.33 | | | $ | 10.17 | | | $ | 10.21 | | | $ | 10.20 | | | $ | 10.14 | | | $ | 10.20 | |
| | |
Total Return | | | 3.80 | % | | | 2.68 | %(C) | | | 5.20 | % | | | 4.58 | % | | | 2.24 | % | | | 1.08 | % |
| | |
Net Assets, End of Period (thousands) | | $ | 4,269,615 | | | $ | 3,194,420 | | | $ | 3,229,577 | | | $ | 2,418,551 | | | $ | 1,953,884 | | | $ | 1,738,574 | |
Ratio of Expenses to Average Net Assets | | | 0.20 | %** | | | 0.18 | %(B)(D) | | | 0.18 | %(D) | | | 0.18 | %(D) | | | 0.19 | %(D) | | | 0.20 | %(D) |
Ratio of Net Investment Income to Average Net Assets | | | 1.26 | % | | | 3.30 | %(B) | | | 4.96 | % | | | 3.89 | % | | | 2.78 | % | | | 1.40 | % |
Portfolio Turnover Rate | | | 2 | %* | | | N/A | | | | N/A | | | | N/A | | | | N/A | | | | N/A | |
| | |
| |
| | | DFA Two-Year Global Fixed Income Portfolio | |
| | | Year Ended Oct. 31, 2009 | | | Period Dec. 1, 2007 to Oct. 31, 2008 | | | Year Ended Nov. 30, 2007 | | | Year Ended Nov. 30, 2006 | | | Year Ended Nov. 30, 2005 | | | Year Ended Nov. 30, 2004 | |
| | |
Net Asset Value, Beginning of Period | | $ | 10.36 | | | $ | 10.39 | | | $ | 10.17 | | | $ | 9.88 | | | $ | 9.92 | | | $ | 10.08 | |
| | | | | | | | | | | | | | | | | | | | | | | | |
Income From Investment Operations | | | | | | | | | | | | | | | | | | | | | | | | |
Net Investment Income (Loss) | | | 0.19 | (A) | | | 0.39 | (A) | | | 0.27 | (A) | | | 0.07 | (A) | | | 0.31 | | | | 0.25 | |
Net Gains (Losses) on Securities (Realized and Unrealized) | | | 0.18 | | | | (0.09 | ) | | | 0.24 | | | | 0.36 | | | | (0.14 | ) | | | (0.14 | ) |
| | | | | | | | | | | | | | | | | | | | | | | | |
Total From Investment Operations | | | 0.37 | | | | 0.30 | | | | 0.51 | | | | 0.43 | | | | 0.17 | | | | 0.11 | |
| | |
Less Distributions | | | | | | | | | | | | | | | | | | | | | | | | |
Net Investment Income | | | (0.46 | ) | | | (0.33 | ) | | | (0.29 | ) | | | (0.14 | ) | | | (0.21 | ) | | | (0.27 | ) |
Net Realized Gains | | | — | | | | — | | | | — | | | | — | | | | — | | | | — | |
| | | | | | | | | | | | | | | | | | | | | | | | |
Total Distributions | | | (0.46 | ) | | | (0.33 | ) | | | (0.29 | ) | | | (0.14 | ) | | | (0.21 | ) | | | (0.27 | ) |
| | |
Net Asset Value, End of Period | | $ | 10.27 | | | $ | 10.36 | | | $ | 10.39 | | | $ | 10.17 | | | $ | 9.88 | | | $ | 9.92 | |
| | |
Total Return | | | 3.71 | % | | | 2.93 | %(C) | | | 5.06 | % | | | 4.41 | % | | | 1.77 | % | | | 1.08 | % |
| | |
Net Assets, End of Period (thousands) | | $ | 3,846,029 | | | $ | 3,124,985 | | | $ | 3,097,898 | | | $ | 2,423,622 | | | $ | 1,992,869 | | | $ | 1,674,972 | |
Ratio of Expenses to Average Net Assets | | | 0.20 | %** | | | 0.18 | %(B)(D) | | | 0.18 | %(D) | | | 0.19 | %(D) | | | 0.21 | %(D) | | | 0.23 | %(D) |
Ratio of Net Investment Income to Average Net Assets | | | 1.89 | % | | | 4.12 | %(B) | | | 2.59 | % | | | 0.72 | % | | | 3.25 | % | | | 1.35 | % |
Portfolio Turnover Rate | | | 1 | %* | | | N/A | | | | N/A | | | | N/A | | | | N/A | | | | N/A | |
| | |
| * | For the period October 23, 2009 through October 31, 2009. Effective October 23, 2009, the Portfolios directly invest in securities rather than through the Series. |
| ** | Represents the combined ratios for the respective portfolios and for the period November 1, 2008 through October 22, 2009, its respective pro-rata shares of its Master Fund Series. |
See page 1 & 2 for the Definitions of Abbreviations and Footnotes.
See accompanying Notes to Financial Statements.
199
DFA INVESTMENT DIMENSIONS GROUP INC.
FINANCIAL HIGHLIGHTS
(for a share outstanding throughout each period)
| | | | | | | | | | | | | | | | | | | | | | | | | | | | | | | | |
| | | DFA Selectively
Hedged Global
Fixed Income
Portfolio | | | DFA Five-Year Government Portfolio | |
| | | Year Ended Oct. 31, 2009 | | | Period Jan. 9, 2008(a) to Oct. 31, 2008 | | | Year Ended Oct. 31, 2009 | | | Period Dec. 1, 2007 to Oct. 31, 2008 | | | Year Ended Nov. 30, 2007 | | | Year Ended Nov. 30, 2006 | | | Year Ended Nov. 30, 2005 | | | Year Ended Nov. 30, 2004 | |
Net Asset Value, Beginning of Period | | $ | 8.91 | | | $ | 10.00 | | | $ | 10.44 | | | $ | 10.44 | | | $ | 10.43 | | | $ | 10.41 | | | $ | 10.64 | | | $ | 11.11 | |
| | | | | | | | | | | | | | | | | | | | | | | | | | | | | | | | |
Income From Investment Operations | | | | | | | | | | | | | | | | | | | | | | | | | | | | | | | | |
Net Investment Income (Loss) | | | 0.26 | (A) | | | 0.33 | (A) | | | 0.26 | (A) | | | 0.26 | (A) | | | 0.50 | (A) | | | 0.46 | (A) | | | 0.35 | | | | 0.33 | |
Net Gains (Losses) on Securities (Realized and Unrealized) | | | 0.83 | | | | (1.39 | ) | | | 0.49 | | | | 0.07 | | | | 0.01 | | | | (0.02 | ) | | | (0.24 | ) | | | (0.01 | ) |
| | | | | | | | | | | | | | | | | | | | | | | | | | | | | | | | |
Total From Investment Operations | | | 1.09 | | | | (1.06 | ) | | | 0.75 | | | | 0.33 | | | | 0.51 | | | | 0.44 | | | | 0.11 | | | | 0.32 | |
| | |
Less Distributions | | | | | | | | | | | | | | | | | | | | | | | | | | | | | | | | |
Net Investment Income | | | — | | | | — | | | | (0.27 | ) | | | (0.33 | ) | | | (0.50 | ) | | | (0.42 | ) | | | (0.34 | ) | | | (0.41 | ) |
Net Realized Gains | | | — | | | | — | | | | — | | | | — | | | | — | | | | — | | | | — | | | | (0.38 | ) |
Return of Capital | | | — | | | | (0.03 | ) | | | — | | | | — | | | | — | | | | — | | | | — | | | | — | |
| | | | | | | | | | | | | | | | | | | | | | | | | | | | | | | | |
Total Distributions | | | — | | | | (0.03 | ) | | | (0.27 | ) | | | (0.33 | ) | | | (0.50 | ) | | | (0.42 | ) | | | (0.34 | ) | | | (0.79 | ) |
| | |
Net Asset Value, End of Period | | $ | 10.00 | | | $ | 8.91 | | | $ | 10.92 | | | $ | 10.44 | | | $ | 10.44 | | | $ | 10.43 | | | $ | 10.41 | | | $ | 10.64 | |
| | |
Total Return | | | 12.23 | % | | | (10.67 | )%(C) | | | 7.27 | % | | | 3.25 | %(C) | | | 4.98 | % | | | 4.36 | % | | | 1.02 | % | | | 3.02 | % |
| | |
Net Assets, End of Period (thousands) | | $ | 303,440 | | | $ | 198,165 | | | $ | 1,008,237 | | | $ | 1,115,037 | | | $ | 1,216,609 | | | $ | 932,121 | | | $ | 748,847 | | | $ | 542,634 | |
Ratio of Expenses to Average Net Assets | | | 0.24 | % | | | 0.24 | %(B)(E) | | | 0.25 | % | | | 0.23 | %(B) | | | 0.23 | % | | | 0.23 | % | | | 0.25 | % | | | 0.27 | % |
Ratio of Net Investment Income to Average Net Assets | | | 2.81 | % | | | 4.32 | %(B)(E) | | | 2.44 | % | | | 2.77 | %(B) | | | 4.81 | % | | | 4.45 | % | | | 3.47 | % | | | 3.21 | % |
Portfolio Turnover Rate | | | 28 | % | | | 21 | %(C) | | | 72 | % | | | 79 | %(C) | | | 0 | % | | | 86 | % | | | 36 | % | | | 45 | % |
| | |
See page 1 & 2 for the Definitions of Abbreviations and Footnotes.
See accompanying Notes to Financial Statements.
200
DFA INVESTMENT DIMENSIONS GROUP INC.
FINANCIAL HIGHLIGHTS
(for a share outstanding throughout each period)
| | | | | | | | | | | | | | | | | | | | | | | | |
| | | DFA Five-Year Global Fixed Income Portfolio | |
| | | Year Ended Oct. 31, 2009 | | | Period Dec. 1, 2007 to Oct. 31, 2008 | | | Year Ended Nov. 30, 2007 | | | Year Ended Nov. 30, 2006 | | | Year Ended Nov. 30, 2005 | | | Year Ended Nov. 30, 2004 | |
Net Asset Value, Beginning of Period | | $ | 10.68 | | | $ | 10.84 | | | $ | 10.53 | | | $ | 10.48 | | | $ | 10.50 | | | $ | 10.92 | |
| | | | | | | | | | | | | | | | | | | | | | | | |
Income From Investment Operations | | | | | | | | | | | | | | | | | | | | | | | | |
Net Investment Income (Loss) | | | 0.27 | (A) | | | 0.25 | (A) | | | 0.32 | (A) | | | 0.28 | (A) | | | 0.34 | (A) | | | 0.26 | |
Net Gains (Losses) on Securities (Realized and Unrealized) | | | 0.55 | | | | (0.10 | ) | | | 0.20 | | | | 0.12 | | | | (0.11 | ) | | | 0.06 | |
| | | | | | | | | | | | | | | | | | | | | | | | |
Total From Investment Operations | | | 0.82 | | | | 0.15 | | | | 0.52 | | | | 0.40 | | | | 0.23 | | | | 0.32 | |
| | |
Less Distributions | | | | | | | | | | | | | | | | | | | | | | | | |
Net Investment Income | | | (0.23 | ) | | | (0.30 | ) | | | (0.21 | ) | | | (0.33 | ) | | | (0.25 | ) | | | (0.32 | ) |
Net Realized Gains | | | — | | | | — | | | | — | | | | — | | | | — | | | | (0.42 | ) |
Return of Capital | | | — | | | | (0.01 | ) | | | — | | | | (0.02 | ) | | | — | | | | — | |
| | | | | | | | | | | | | | | | | | | | | | | | |
Total Distributions | | | (0.23 | ) | | | (0.31 | ) | | | (0.21 | ) | | | (0.35 | ) | | | (0.25 | ) | | | (0.74 | ) |
| | |
Net Asset Value, End of Period | | $ | 11.27 | | | $ | 10.68 | | | $ | 10.84 | | | $ | 10.53 | | | $ | 10.48 | | | $ | 10.50 | |
| | |
Total Return | | | 7.74 | % | | | 1.40 | %(C) | | | 5.00 | % | | | 3.89 | % | | | 2.15 | % | | | 3.04 | % |
| | |
Net Assets, End of Period (thousands) | | $ | 3,220,787 | | | $ | 3,319,257 | | | $ | 3,484,919 | | | $ | 2,387,784 | | | $ | 1,699,793 | | | $ | 1,205,578 | |
Ratio of Expenses to Average Net Assets | | | 0.30 | % | | | 0.28 | %(B) | | | 0.28 | % | | | 0.29 | % | | | 0.33 | % | | | 0.34 | % |
Ratio of Net Investment Income to Average Net Assets | | | 2.48 | % | | | 2.53 | %(B) | | | 3.01 | % | | | 2.72 | % | | | 3.22 | % | | | 3.12 | % |
Portfolio Turnover Rate | | | 70 | % | | | 55 | %(C) | | | 108 | % | | | 92 | % | | | 69 | % | | | 90 | % |
| | |
| |
| | | DFA Intermediate Government Fixed Income Portfolio | |
| | | Year Ended Oct. 31, 2009 | | | Period Dec. 1, 2007 to Oct. 31, 2008 | | | Year Ended Nov. 30, 2007 | | | Year Ended Nov. 30, 2006 | | | Year Ended Nov. 30, 2005 | | | Year Ended Nov. 30, 2004 | |
Net Asset Value, Beginning of Period | | $ | 11.66 | | | $ | 11.86 | | | $ | 11.48 | | | $ | 11.45 | | | $ | 11.79 | | | $ | 12.14 | |
| | | | | | | | | | | | | | | | | | | | | | | | |
Income From Investment Operations | | | | | | | | | | | | | | | | | | | | | | | | |
Net Investment Income (Loss) | | | 0.51 | (A) | | | 0.49 | (A) | | | 0.54 | (A) | | | 0.53 | (A) | | | 0.52 | | | | 0.55 | |
Net Gains (Losses) on Securities (Realized and Unrealized) | | | 0.72 | | | | (0.17 | ) | | | 0.35 | | | | 0.05 | | | | (0.29 | ) | | | (0.05 | ) |
| | | | | | | | | | | | | | | | | | | | | | | | |
Total From Investment Operations | | | 1.23 | | | | 0.32 | | | | 0.89 | | | | 0.58 | | | | 0.23 | | | | 0.50 | |
| | |
Less Distributions | | | | | | | | | | | | | | | | | | | | | | | | |
Net Investment Income | | | (0.52 | ) | | | (0.52 | ) | | | (0.51 | ) | | | (0.49 | ) | | | (0.53 | ) | | | (0.56 | ) |
Net Realized Gains | | | (0.06 | ) | | | — | | | | — | | | | (0.06 | ) | | | (0.04 | ) | | | (0.29 | ) |
Return of Capital | | | — | | | | — | | | | — | | | | — | | | | — | | | | — | |
| | | | | | | | | | | | | | | | | | | | | | | | |
Total Distributions | | | (0.58 | ) | | | (0.52 | ) | | | (0.51 | ) | | | (0.55 | ) | | | (0.57 | ) | | | (0.85 | ) |
| | |
Net Asset Value, End of Period | | $ | 12.31 | | | $ | 11.66 | | | $ | 11.86 | | | $ | 11.48 | | | $ | 11.45 | | | $ | 11.79 | |
| | |
Total Return | | | 10.71 | % | | | 2.73 | %(C) | | | 8.06 | % | | | 5.31 | % | | | 1.87 | % | | | 4.21 | % |
| | |
Net Assets, End of Period (thousands) | | $ | 1,484,155 | | | $ | 1,248,514 | | | $ | 1,314,853 | | | $ | 871,392 | | | $ | 463,538 | | | $ | 373,108 | |
Ratio of Expenses to Average Net Assets | | | 0.15 | % | | | 0.13 | %(B) | | | 0.13 | % | | | 0.14 | % | | | 0.15 | % | | | 0.17 | % |
Ratio of Net Investment Income to Average Net Assets | | | 4.18 | % | | | 4.44 | %(B) | | | 4.72 | % | | | 4.72 | % | | | 4.61 | % | | | 4.72 | % |
Portfolio Turnover Rate | | | 8 | % | | | 14 | %(C) | | | 0 | % | | | 3 | % | | | 16 | % | | | 6 | % |
| | |
See page 1 & 2 for the Definitions of Abbreviations and Footnotes.
See accompanying Notes to Financial Statements.
201
DFA INVESTMENT DIMENSIONS GROUP INC.
FINANCIAL HIGHLIGHTS
(for a share outstanding throughout each period)
| | | | | | | | | | | | | | | | | | | | |
| | | DFA Short-Term Extended
Quality Portfolio | | | DFA Inflation-Protected
Securities Portfolio | |
| | | Period March 4, 2009(a) to Oct. 31, 2009 | | | Year Ended Oct. 31, 2009 | | | Period Dec. 1, 2007 to Oct. 31, 2008 | | | Year Ended Nov. 30, 2007 | | | Period Sept. 18, 2006(a) to Nov. 30, 2006 | |
| | |
Net Asset Value, Beginning of Period | | $ | 10.00 | | | $ | 9.41 | | | $ | 10.80 | | | $ | 10.19 | | | $ | 10.00 | |
| | | | | | | | | | | | | | | | | | | | |
Income From Investment Operations | | | | | | | | | | | | | | | | | | | | |
Net Investment Income (Loss) | | | 0.24 | (A) | | | 0.12 | (A) | | | 0.70 | (A) | | | 0.45 | (A) | | | 0.02 | (A) |
Net Gains (Losses) on Securities (Realized and Unrealized) | | | 0.50 | | | | 1.53 | | | | (1.48 | ) | | | 0.50 | | | | 0.17 | |
| | | | | | | | | | | | | | | | | | | | |
Total From Investment Operations | | | 0.74 | | | | 1.65 | | | | (0.78 | ) | | | 0.95 | | | | 0.19 | |
| | |
Less Distributions | | | | | | | | | | | | | | | | | | | | |
Net Investment Income | | | (0.18 | ) | | | (0.10 | ) | | | (0.61 | ) | | | (0.34 | ) | | | — | |
Net Realized Gains | | | — | | | | (0.01 | ) | | | — | | | | — | | | | — | |
| | | | | | | | | | | | | | | | | | | | |
Total Distributions | | | (0.18 | ) | | | (0.11 | ) | | | (0.61 | ) | | | (0.34 | ) | | | — | |
| | |
Net Asset Value, End of Period | | $ | 10.56 | | | $ | 10.95 | | | $ | 9.41 | | | $ | 10.80 | | | $ | 10.19 | |
| | |
Total Return | | | 7.49 | %(C) | | | 17.70 | % | | | (7.90 | )%(C) | | | 9.59 | % | | | 1.90 | %(C) |
| | |
Net Assets, End of Period (thousands) | | $ | 378,475 | | | $ | 774,110 | | | $ | 371,747 | | | $ | 240,403 | | | $ | 34,299 | |
Ratio of Expenses to Average Net Assets | | | 0.22 | %(B)(E) | | | 0.16 | % | | | 0.15 | %(B) | | | 0.20 | % | | | 0.20 | %(B)(E) |
Ratio of Expenses to Average Net Assets (Excluding Waivers and Assumption of Expenses and/or Recovery of Previously Waived Fees) | | | 0.28 | %(B)(E) | | | 0.16 | % | | | 0.14 | %(B) | | | 0.21 | % | | | 0.60 | %(B)(E) |
Ratio of Net Investment Income to Average Net Assets | | | 3.54 | %(B)(E) | | | 1.20 | % | | | 7.01 | %(B) | | | 4.58 | % | | | 0.94 | %(B)(E) |
Portfolio Turnover Rate | | | 2 | %(C) | | | 6 | % | | | 3 | %(C) | | | 0 | % | | | 0 | %(C) |
| | |
See page 1 & 2 for the Definitions of Abbreviations and Footnotes.
See accompanying Notes to Financial Statements.
202
DFA INVESTMENT DIMENSIONS GROUP INC.
FINANCIAL HIGHLIGHTS
(for a share outstanding throughout each period)
| | | | | | | | | | | | | | | | | | | | | | | | | | | | | | | | | | | | | | |
| | | DFA Short-Term Municipal Bond Portfolio | | | | | DFA California Short-Term
Municipal Bond Portfolio | |
| | | Year Ended Oct. 31, 2009 | | | Period Dec. 1, 2007 to Oct. 31, 2008 | | | Year Ended Nov. 30, 2007 | | | Year Ended Nov. 30, 2006 | | | Year Ended Nov. 30, 2005 | | | Year Ended Nov. 30, 2004 | | | | | Year Ended Oct. 31, 2009 | | | Period Dec. 1, 2007 to Oct. 31, 2008 | | | Period April 2, 2007(a) to Nov. 30, 2007 | |
| | |
Net Asset Value, Beginning of Period | | $ | 10.02 | | | $ | 10.05 | | | $ | 10.02 | | | $ | 9.99 | | | $ | 10.09 | | | $ | 10.13 | | | | | $ | 10.00 | | | $ | 10.07 | | | $ | 10.00 | |
| | | | | | | | | | | | | | | | | | | | | | | | | | | | | | | | | | | | | | |
Income From Investment Operations | | | | | | | | | | | | | | | | | | | | | | | | | | | | | | | | | | | | | | |
Net Investment Income (Loss) | | | 0.20 | (A) | | | 0.19 | (A) | | | 0.31 | (A) | | | 0.28 | (A) | | | 0.22 | | | | 0.17 | | | | | | 0.22 | (A) | | | 0.21 | (A) | | | 0.20 | (A) |
Net Gains (Losses) on Securities (Realized and Unrealized) | | | 0.23 | | | | (0.03 | ) | | | 0.02 | | | | 0.02 | | | | (0.11 | ) | | | (0.04 | ) | | | | | 0.27 | | | | (0.06 | ) | | | 0.02 | |
| | | | | | | | | | | | | | | | | | | | | | | | | | | | | | | | | | | | | | |
Total From Investment Operations | | | 0.43 | | | | 0.16 | | | | 0.33 | | | | 0.30 | | | | 0.11 | | | | 0.13 | | | | | | 0.49 | | | | 0.15 | | | | 0.22 | |
| | |
Less Distributions | | | | | | | | | | | | | | | | | | | | | | | | | | | | | | | | | | | | | | |
Net Investment Income | | | (0.21 | ) | | | (0.19 | ) | | | (0.30 | ) | | | (0.27 | ) | | | (0.21 | ) | | | (0.17 | ) | | | | | (0.23 | ) | | | (0.22 | ) | | | (0.15 | ) |
| | | | | | | | | | | | | | | | | | | | | | | | | | | | | | | | | | | | | | |
Total Distributions | | | (0.21 | ) | | | (0.19 | ) | | | (0.30 | ) | | | (0.27 | ) | | | (0.21 | ) | | | (0.17 | ) | | | | | (0.23 | ) | | | (0.22 | ) | | | (0.15 | ) |
| | |
Net Asset Value, End of Period | | $ | 10.24 | | | $ | 10.02 | | | $ | 10.05 | | | $ | 10.02 | | | $ | 9.99 | | | $ | 10.09 | | | | | $ | 10.26 | | | $ | 10.00 | | | $ | 10.07 | |
| | |
Total Return | | | 4.32 | % | | | 1.63 | %(C) | | | 3.38 | % | | | 3.01 | % | | | 1.11 | % | | | 1.27 | % | | | | | 4.91 | % | | | 1.45 | %(C) | | | 2.23 | %(C) |
| | |
Net Assets, End of Period (thousands) | | $ | 1,168,259 | | | $ | 991,918 | | | $ | 948,426 | | | $ | 697,942 | | | $ | 511,543 | | | $ | 381,709 | | | | | $ | 210,774 | | | $ | 180,915 | | | $ | 128,983 | |
Ratio of Expenses to Average Net Assets | | | 0.25 | % | | | 0.23 | %(B) | | | 0.23 | % | | | 0.26 | % | | | 0.30 | % | | | 0.30 | % | | | | | 0.26 | % | | | 0.27 | %(B) | | | 0.30 | %(B)(E) |
Ratio of Expenses to Average Net Assets (Excluding Waivers and Assumption of Expenses and/or Recovery of Previously Waived Fees) | | | 0.25 | % | | | 0.23 | %(B) | | | 0.23 | % | | | 0.24 | % | | | 0.29 | % | | | 0.33 | % | | | | | 0.26 | % | | | 0.26 | %(B) | | | 0.33 | %(B)(E) |
Ratio of Net Investment Income to Average Net Assets | | | 1.99 | % | | | 2.04 | %(B) | | | 3.07 | % | | | 2.77 | % | | | 2.22 | % | | | 1.73 | % | | | | | 2.17 | % | | | 2.27 | %(B) | | | 3.22 | %(B)(E) |
Portfolio Turnover Rate | | | 0 | % | | | 1 | %(C) | | | 0 | % | | | 0 | % | | | 2 | % | | | 6 | % | | | | | 4 | % | | | 17 | %(C) | | | 7 | %(C) |
| | |
See page 1 & 2 for the Definitions of Abbreviations and Footnotes.
See accompanying Notes to Financial Statements.
203
DFA INVESTMENT DIMENSIONS GROUP INC.
NOTES TO FINANCIAL STATEMENTS
A. Organization:
DFA Investment Dimensions Group Inc. (the “Fund”) is an open-end management investment company registered under the Investment Company Act of 1940, whose shares are generally offered to institutional investors, retirement plans and clients of registered investment advisors. The Fund consists of fifty-seven operational portfolios, of which thirty-seven (the “Portfolios”) are included in this report and the remaining twenty are presented in separate reports.
Of the Portfolios, ten invest in one or more series of The DFA Investment Trust Company, and the DFA Global Real Estate Securities Portfolio invests in two portfolios of the DFA Investment Dimensions Group Inc.
| | | | |
Feeder Funds | | Master Funds | | Percentage Ownership at 10/31/09 |
U.S. Large Company Portfolio | | The U.S. Large Company Series | | 78% |
U.S. Large Cap Value Portfolio | | The U.S. Large Cap Value Series | | 78% |
Japanese Small Company Portfolio | | The Japanese Small Company Series | | 10% |
Asia Pacific Small Company Portfolio | | The Asia Pacific Small Company Series | | 15% |
United Kingdom Small Company Portfolio | | The United Kingdom Small Company Series | | 4% |
Continental Small Company Portfolio | | The Continental Small Company Series | | 7% |
Emerging Markets Portfolio | | The Emerging Markets Series | | 93% |
Emerging Markets Small Cap Portfolio | | The Emerging Markets Small Cap Series | | 97% |
| | |
Fund of Funds | | | | |
International Small Company Portfolio | | The Japanese Small Company Series | | 90% |
| | The Asia Pacific Small Company Series | | 85% |
| | The United Kingdom Small Company Series | | 96% |
| | The Continental Small Company Series | | 93% |
| | The Canadian Small Company Series | | 100% |
DFA Global Real Estate Securities Portfolio | | DFA Real Estate Securities Portfolio | | 11% |
| | DFA International Real Estate Securities Portfolio | | 28% |
Each feeder fund and fund of funds (collectively, “Feeder Funds) invests primarily in a corresponding master fund(s) (”Master Fund“) as indicated. The DFA Global Real Estate Securities Portfolio also invests in short-term temporary cash investments.
The financial statements of the Master Funds are included elsewhere in this report and should be read in conjunction with the financial statements of the Feeder Funds.
Prior to March 30, 2007, the U.S.Targeted Value Portfolio invested substantially all of its assets in shares of The U.S. Targeted Value Series. At the close of business on March 29, 2007, the U.S. Targeted Value Portfolio received its pro-rata share of cash and securities from The U.S. Targeted Value Series in a complete liquidation of its interest in the Series. Effective March 30, 2007, the U.S. Targeted Value Portfolio invests directly in securities rather than through the Series and maintains the same investment objective.
Prior to October 23, 2009, the DFA One-Year Fixed Income Portfolio and DFA Two-Year Global Fixed Income Portfolio invested substantially all of their assets in respective shares of The DFA One-Year Fixed Income Series and The DFA Two-Year Global Fixed Income Series. At the close of business on October 23, 2009, the Portfolios received their pro-rata share of cash and securities from the respective Series in a complete liquidation of their
204
interest in the Series. Effective October 23, 2009, the Portfolios invest directly in securities rather than through the Series and maintain the same investment objectives.
Effective February 28, 2009, the Enhanced U.S. Large Company Portfolio, U.S. Small Cap Value Portfolio, U.S. Small Cap Portfolio and U.S. Micro Cap Portfolio invest directly in securities rather than through a Master Fund. See Federal Income Taxes note for more information regarding these transactions.
Effective December 31, 2008, The U.S. Large Cap Value Series, a master fund in a RIC/RIC master-feeder structure, elected with the consent of its respective Holder(s) to change its U.S. federal income tax classification from that of an association taxable as a corporation to a partnership pursuant to Treasury Regulation §301.7701-3. The change in capital structure and retroactive reclassification of the statement of changes in net assets and financial highlights for the respective funds is a result of the treatment of a partnership for book purposes. The Series/Portfolio will maintain its books and records and present its financial statements in accordance with generally accepted accounting principles for investment partnerships.
On January 31, 2008, Class R1 Shares and on June 30, 2008, Class R2 Shares of U.S. Targeted Value Portfolio commenced operations. The Class R1 Shares and Class R2 Shares of each Portfolio of the Fund (the U.S. Small Cap Value Portfolio, T.A. U.S. Core Equity 2 Portfolio, U.S. Micro Cap Portfolio, T.A. World ex U.S. Core Equity Portfolio, Japanese Small Company Portfolio, Asia Pacific Small Company Portfolio, United Kingdom Small Company Portfolio, Continental Small Company Portfolio, DFA Global Real Estate Securities Portfolio, DFA International Small Cap Value Portfolio, International Vector Equity Portfolio, Emerging Markets Small Cap Portfolio, DFA Selectively Hedged Global Fixed Income Portfolio, DFA Short-Term Extended Quality Portfolio, DFA Short-Term Municipal Bond Portfolio and DFA California Short-Term Municipal Bond Portfolio) contained in this report, had not commenced operations as of October 31, 2009. Class R1 and Class R2 Shares of each Portfolio have 100,000,000 authorized shares.
At a regular meeting of the Board of Directors/Trustees (the “Board”) on September 16, 2008, the Board voted to change the fiscal and tax year ends of the Portfolios from November 30 to October 31.
B. Significant Accounting Policies:
The following significant accounting policies are in conformity with accounting principles generally accepted in the United States of America. Such policies are consistently followed by the Fund in preparation of its financial statements. The preparation of financial statements in accordance with accounting principles generally accepted in the United States of America requires management to make estimates and assumptions that affect the reported amounts of assets and liabilities and disclosure of contingent assets and liabilities at the date of the financial statements and the reported amounts of increases and decreases in net assets from operations during the reporting period. Actual results could differ from those estimates and those differences could be material.
1. Security Valuation: Securities held by U.S. Targeted Value Portfolio, U.S. Small Cap Value Portfolio, U.S. Core Equity 1 Portfolio, U.S. Core Equity 2 Portfolio, U.S. Vector Equity Portfolio, T.A. U.S. Core Equity 2 Portfolio, U.S. Small Cap Portfolio, U.S. Micro Cap Portfolio and DFA Real Estate Securities Portfolio (the “Domestic Equity Portfolios”) and Large Cap International Portfolio, International Core Equity Portfolio, T.A. World ex U.S. Core Equity Portfolio, DFA International Real Estate Securities Portfolio, DFA International Small Cap Value Portfolio, International Vector Equity Portfolio and Emerging Markets Core Equity Portfolio (the “International Equity Portfolios”), including over-the-counter securities, are valued at the last quoted sale price of the day. Securities held by the Domestic Equity Portfolios and the International Equity Portfolios that are listed on Nasdaq are valued at the Nasdaq Official Closing Price (“NOCP”). If there is no last reported sale price or NOCP for the day, the Domestic Equity Portfolios and International Equity Portfolios value the securities at the mean of the most recent quoted bid and asked prices. Price information on listed securities is taken from the exchange where the security is primarily traded. Generally, securities issued by open-end investment companies are valued using their respective net asset values or public offering prices, as appropriate, for purchase orders placed at the close of the New York Stock Exchange (NYSE).
Securities for which no market quotations are readily available (including restricted securities), or for which market quotations have become unreliable, are valued in good faith at fair value in accordance with procedures
205
adopted by the Board of Directors/Trustees. Fair value pricing may also be used if events that have a significant effect on the value of an investment (as determined in the discretion of the Investment Committee of the Advisor) occur before the net asset value is calculated. When fair value pricing is used, the prices of securities used by the Domestic Equity Portfolios and International Equity Portfolios may differ from the quoted or published prices for the same securities on their primary markets or exchanges.
The International Equity Portfolios will also apply a fair value price in the circumstances described below. Generally, trading in foreign securities markets is completed each day at various times prior to the close of the NYSE. For example, trading in the Japanese securities markets is completed each day at the close of the Tokyo Stock Exchange (normally, 11:00 p.m. PT), which is fourteen hours prior to the close of the NYSE (normally, 1:00 p.m. PT) and the time that the net asset values of the International Equity Portfolios are computed. Due to the time differences between the closings of the relevant foreign securities exchanges and the time the International Equity Portfolios price their shares at the close of the NYSE, the International Equity Portfolios will fair value their foreign investments when it is determined that the market quotations for the foreign investments are either unreliable or not readily available. The fair value prices will attempt to reflect the impact of the U.S. financial markets’ perceptions and trading activities on the International Equity Portfolios’ foreign investments since the last closing prices of the foreign investments were calculated on their primary foreign securities markets or exchanges. For these purposes, the Board of Directors/Trustees of the Fund have determined that movements in relevant indices or other appropriate market indicators, after the close of the Tokyo Stock Exchange or the London Stock Exchange, demonstrate that market quotations may be unreliable. Fair valuation of portfolio securities may occur on a daily basis. The fair value pricing by the International Equity Portfolios utilizes data furnished by an independent pricing service (and that data draws upon, among other information, the market values of foreign investments). When an International Equity Portfolio uses fair value pricing, the values assigned to the International Equity Portfolio’s foreign investments may not be the quoted or published prices of the investments on their primary markets or exchanges.
Securities held by Enhanced U.S. Large Company Portfolio, DFA One-Year Fixed Income Portfolio, DFA Two-Year Global Fixed Income Portfolio, DFA Selectively Hedged Global Fixed Income Portfolio, DFA Five-Year Government Portfolio, DFA Five-Year Global Fixed Income Portfolio, DFA Intermediate Government Fixed Income Portfolio, DFA Short-Term Extended Quality Portfolio, DFA Inflation-Protected Securities Portfolio, DFA Short-Term Extended Quality Portfolio, DFA Short-Term Municipal Bond Portfolio and DFA California Short-Term Municipal Bond Portfolio (the “Fixed Income Portfolios”), are valued on the basis of prices provided by one or more pricing services or other reasonably reliable sources including broker/dealers that typically handle the purchase and sale of such securities. Securities which are traded over-the-counter and on a stock exchange generally will be valued according to the broadest and most representative market, and it is expected that for bonds and other fixed income securities, this ordinarily will be the over-the-counter market. Securities for which quotations are not readily available (including restricted securities), or for which market quotations have become unreliable, are valued in good faith at fair value in accordance with procedures adopted by the Board of Directors/Trustees.
Master Fund shares held by the International Small Company Portfolio and the DFA Global Real Estate Securities Portfolio are valued at their respective daily net asset value. The Feeder Funds’ investments reflect proportionate interest in the net assets of their corresponding Master Fund.
The Portfolios utilize a fair value hierarchy which prioritizes the inputs to valuation techniques used to measure fair value into three broad levels described below:
— Level 1 – quoted prices in active markets for identical securities
— Level 2 – other significant observable inputs (including quoted prices for similar securities, interest rates, prepayment speeds, credit risk, etc.)
— Level 3 – significant unobservable inputs (including the Portfolios’ own assumptions in determining the fair value of investments)
206
A summary of inputs used to value the Portfolios’ net assets by each major security type, industry and/or country is disclosed at the end of the Summary Schedule of Portfolio Holdings/Schedule of Investments. The inputs or methodology used for valuing securities are not necessarily an indication of the risk associated with investing in those securities.
2. Foreign Currency Translation: Securities and other assets and liabilities of the Enhanced U.S. Large Company Portfolio, the International Equity Portfolios, the DFA Two-Year Global Fixed Income Portfolio, the DFA Selectively Hedged Global Fixed Income Portfolio, and the DFA Five-Year Global Fixed Income Portfolio whose values are initially expressed in foreign currencies are translated to U.S. dollars using the mean between the most recently quoted bid and asked prices for the U.S. dollar as quoted by generally recognized reliable sources. Dividend and interest income and certain expenses are translated to U.S. dollars at the rate of exchange on their respective accrual dates. Receivables and payables denominated in foreign currencies are marked to market daily based on daily exchange rates and exchange gains or losses are realized upon ultimate receipt or disbursement. Enhanced U.S. Large Company Portfolio, DFA Two-Year Global Fixed Income Portfolio, DFA Selectively Hedged Global Fixed Income Portfolio and DFA Five-Year Global Fixed Income Portfolio also enter into forward foreign currency contracts solely for the purpose of hedging against fluctuations in currency exchange rates. These contracts are marked to market daily based on daily forward exchange rates. The DFA Selectively Hedged Global Fixed Income Portfolio may hedge the currency exposure of its foreign securities or leave some or all of the currency exposure unhedged.
The International Equity Portfolios do not isolate the effect of fluctuation in foreign exchange rates from the effect of fluctuations in the market prices of securities whether realized or unrealized. However, the Enhanced U.S. Large Company Portfolio, DFA Two-Year Global Fixed Income Portfolio, DFA Selectively Hedged Global Fixed Income Portfolio, and the DFA Five-Year Global Fixed Income Portfolio do isolate the effect of fluctuations in foreign currency rates when determining the realized gain or loss upon the sale or maturity of foreign currency denominated debt obligations pursuant to U.S. Federal income tax regulations; such amounts are categorized as foreign exchange gain or loss for both financial reporting and income tax reporting purposes.
Realized gains or losses on foreign currency transactions represent net foreign exchange gains or losses from the disposition of foreign currencies, currency gains or losses realized between the trade and settlement dates on securities transactions, and the difference between amounts of interest, dividends and foreign withholding taxes recorded on the books of the International Equity Portfolios, the Enhanced U.S. Large Company Portfolio, the DFA Two-Year Global Fixed Income Portfolio, the DFA Selectively Hedged Global Fixed Income Portfolio, and the DFA Five-Year Global Fixed Income Portfolio and the U.S. dollar equivalent amounts actually received or paid.
3. Deferred Compensation Plan: Each eligible Director of the Fund may elect participation in the Deferred Compensation Plan (the “Plan”). Under the Plan, effective January 1, 2002, such Directors may defer payment of all or a portion of their total fees earned as a Director. These deferred amounts may be treated as though such amounts had been invested in shares of the following funds: U.S. Large Cap Value Portfolio; U.S. Core Equity 1 Portfolio; U.S. Core Equity 2 Portfolio; U.S. Vector Equity Portfolio; U.S. Micro Cap Portfolio; DFA International Value Portfolio; International Core Equity Portfolio; Emerging Markets Portfolio; Emerging Markets Core Equity Portfolio; and/or DFA Two-Year Global Fixed Income Portfolio. Contributions made under the Plan and the change in unrealized appreciation (depreciation) and income are included in Directors’/Trustees’ Fees & Expenses or Other Expenses.
Each Director has the option to receive their distribution of proceeds in one of the following methods upon one year’s notice: lump sum; annual installments over a period of agreed upon years; or semi-annual installments over a period of agreed upon years. As of October 31, 2009, none of the Directors have requested distribution of proceeds.
4. Other: Security transactions are accounted for as of the trade date. Costs used in determining realized gains and losses on the sale of investment securities/affiliated investment companies are on the basis of identified cost. Dividend income and distributions to shareholders are recorded on the ex-dividend date. Distributions received on securities that represent a return of capital or capital gain are recorded as a reduction of cost of investments or as a realized gain, respectively. The Portfolios estimate the character of distributions received that may be considered return of capital distributions. Interest income is recorded on an accrual basis. Discount and premium on debt securities purchased are amortized over the lives of the respective securities utilizing the effective interest method.
207
Expenses directly attributable to a Portfolio are directly charged. Common expenses of the Fund or Portfolios are allocated using methods approved by the Board of Directors/Trustees, generally based on average net assets.
Class R1 Shares, Class R2 Shares and Institutional Class Shares have equal rights to assets and earnings of the Portfolio. Income, gains and losses, and common expenses of the Portfolio are allocated to each class of shares based on its relative net assets. Each class will bear its own class-specific expenses, if any.
The U.S. Large Company Portfolio, U.S. Large Cap Value Portfolio, International Small Company Portfolio, Japanese Small Company Portfolio, Asia Pacific Small Company Portfolio, United Kingdom Small Company Portfolio, Continental Small Company Portfolio, Emerging Markets Portfolio, and Emerging Markets Small Cap Portfolio each recognize their pro-rata share of net investment income and realized and unrealized gains/losses on a daily basis, from their respective Master Funds, which are treated as partnerships for federal income tax purposes.
Prior to June 4, 2009 and October 16, 2009, the DFA One-Year Fixed Income Portfolio and DFA Two-Year Global Fixed Income Portfolio, respectively, recognized their pro-rata share of net investment income and realized and unrealized gains/losses on a daily basis from their respective investments in the DFA One-Year Fixed Income Series and DFA Two-Year Global Fixed Income Series which were treated as partnerships in accordance with both U.S. federal income tax regulations and accounting principles generally accepted in the United States of America. Effective June 4, 2009 and October 16, 2009, The DFA One-Year Fixed Income Series’ and The DFA Two-Year Global Fixed Income Series’, respectively, partnership status ceased and each became a corporate master fund in a RIC/RIC master-feeder structure. The Portfolios became the feeders of these Funds. On October 23, 2009, both the DFA One-Year Fixed Income Portfolio and DFA Two-Year Global Fixed Income Portfolio liquidated their investment in The DFA One-Year Fixed Income Series and The DFA Two-Year Global Fixed Income Series, respectively. Effective October 24, 2009, the DFA One-Year Fixed Income Portfolio and DFA Two-Year Global Fixed Income Portfolio invest directly in securities rather than through the Series and maintain the same investment objective. See Federal Income Taxes note for more information regarding these transactions.
The Portfolios may be subject to taxes imposed by countries in which they invest, with respect to their investments in issuers existing or operating in such countries. Such taxes are generally based on income earned or repatriated and capital gains realized on the sale of such investments. The Portfolios accrue such taxes when the related income or capital gains are earned or throughout the holding period. Some countries require governmental approval for the repatriation of investment income, capital or the proceeds of sales earned by foreign investors. In addition, if there is a deterioration in a country’s balance of payments or for other reasons, a country may impose temporary restrictions on foreign capital remittances abroad.
The Emerging Markets Core Equity Portfolio’s investments in Thailand and the investments in Thailand held by the Master Funds of Emerging Markets Portfolio and Emerging Markets Small Cap Portfolio are subject to a 15% governmental capital gains tax. Such taxes are due upon sale of individual securities. The Emerging Markets Core Equity Portfolio and the Master Funds of Emerging Markets Portfolio and Emerging Markets Small Cap Portfolio accrues for taxes on the capital gains throughout the holding period based on the unrealized gain of the underlying securities. These funds are also subject to a 15% governmental capital gains tax on short-term capital gains for investments in India. Such taxes are due upon sale of individual securities. The taxes for the capital gains are accrued when the capital gains are earned.
C. Investment Advisor and Administrator:
Dimensional Fund Advisors LP (“Dimensional” or the “Advisor”) provides investment advisory services to all Portfolios except the Feeder Funds. The Advisor provides administrative services to the Feeder Funds, including supervision of services provided by others, providing information to shareholders and the Board of Directors/Trustees, and other administrative services.
For the year ended , October 31, 2009, the Portfolios’ investment advisory services fees were accrued daily and paid monthly to the Advisor based on the following effective annual rates of average daily net assets:
| | | |
Enhanced U.S. Large Company Portfolio* | | 0.05 | % |
208
| | | |
U.S. Targeted Value Portfolio | | 0.10 | % |
U.S. Small Cap Value Portfolio* | | 0.20 | % |
U.S. Core Equity 1 Portfolio | | 0.17 | % |
U.S. Core Equity 2 Portfolio | | 0.20 | % |
U.S. Vector Equity Portfolio | | 0.30 | % |
T.A. U.S. Core Equity 2 Portfolio | | 0.22 | % |
U.S. Small Cap Portfolio* | | 0.03 | % |
U.S. Micro Cap Portfolio* | | 0.10 | % |
DFA Real Estate Securities Portfolio | | 0.30 | % |
Large Cap International Portfolio | | 0.25 | % |
International Core Equity Portfolio | | 0.35 | % |
T.A. World ex U.S. Core Equity Portfolio | | 0.40 | % |
DFA International Real Estate Securities Portfolio | | 0.35 | % |
DFA Global Real Estate Securities Portfolio | | 0.35 | % |
DFA International Small Cap Value Portfolio | | 0.65 | % |
International Vector Equity Portfolio | | 0.45 | % |
Emerging Markets Core Equity Portfolio | | 0.55 | % |
DFA One-Year Fixed Income Portfolio** | | 0.05 | % |
DFA Two-Year Global Fixed Income Portfolio** | | 0.05 | % |
DFA Selectively Hedged Global Fixed Income Portfolio | | 0.15 | % |
DFA Five-Year Government Portfolio | | 0.20 | % |
DFA Five-Year Global Fixed Income Portfolio | | 0.25 | % |
DFA Intermediate Government Fixed Income Portfolio | | 0.10 | % |
DFA Short-Term Extended Quality Portfolio | | 0.20 | % |
DFA Inflation-Protected Securities Portfolio | | 0.10 | % |
DFA Short-Term Municipal Bond Portfolio | | 0.20 | % |
For the year ended October 31, 2009, the Feeder Funds’ and the Enhanced U.S. Large Company Portfolio, U.S. Targeted Value Portfolio, U.S. Small Cap Value Portfolio, U.S. Small Cap Portfolio, U.S. Micro Cap Portfolio, DFA One-Year Fixed Income Portfolio and DFA Two-Year Global Fixed Income Portfolio administrative services fees were accrued daily and paid monthly to the Advisor based on the following effective annual rates of average daily net assets:
| | | |
U.S. Large Company Portfolio | | 0.095 | % |
Enhanced U.S. Large Company Portfolio* | | 0.15 | % |
U.S. Large Cap Value Portfolio | | 0.15 | % |
U.S. Targeted Value Portfolio | | 0.25 | % |
U.S. Small Cap Value Portfolio* | | 0.30 | % |
U.S. Small Cap Portfolio* | | 0.32 | % |
U.S. Micro Cap Portfolio* | | 0.40 | % |
International Small Company Portfolio | | 0.40 | % |
Japanese Small Company Portfolio | | 0.40 | % |
Asia Pacific Small Company Portfolio | | 0.40 | % |
United Kingdom Small Company Portfolio | | 0.40 | % |
Continental Small Company Portfolio | | 0.40 | % |
Emerging Markets Portfolio | | 0.40 | % |
Emerging Markets Small Cap Portfolio | | 0.45 | % |
DFA One-Year Fixed Income Portfolio** | | 0.10 | % |
DFA Two-Year Global Fixed Income Portfolio** | | 0.10 | % |
209
* Effective February 28, 2009, the Portfolio no longer invests substantially all of its assets in its respective Series. Instead, the Portfolio’s assets are managed directly in accordance with the Portfolio’s investment objective and strategies, pursuant to an investment management agreement between the Fund, on behalf of the Portfolio, and Dimensional, which previously was the manager of the Series’ assets. The investment advisory fee paid by the Portfolio is identical to the advisory fee that was charged to the Series.
** Effective October 23, 2009, the Portfolio no longer invests substantially all of its assets in its respective Series. Instead, the Portfolio’s assets are managed directly in accordance with the Portfolio’s investment objective and strategies, pursuant to an investment management agreement between the Fund, on behalf of the Portfolio, and Dimensional, which previously was the manager of the Series’ assets. The investment advisory fee paid by the Portfolio is identical to the advisory fee that was charged to the Series.
Pursuant to a Fee Waiver and Expense Assumption Agreement, the Advisor has contractually agreed to waive certain fees, including administration/advisory fees, and in certain instances, assume certain expenses of the Portfolios, as described in the notes below. The Fee Waiver and Expense Assumption Agreement for the Portfolios below will remain in effect through March 1, 2010, and shall continue in effect from year to year thereafter unless terminated by the Fund or the Advisor. For the year ended October 31, 2009, the Portfolios had expense limits based on a percentage of average net assets on an annualized basis, and the Advisor recovered previously waived fees and/or expenses assumed as listed below (amounts in thousands). Previously waived fees subject to future recovery by the Advisor are also reflected below (amounts in thousands). The Portfolios are not obligated to reimburse the Advisor for fees previously waived or expenses previously assumed by the Advisor more than thirty-six months before the date of recovery.
| | | | | | |
Institutional Class Shares | | Expense
Limits | | Recovery
of Previously
Waived Fees/
Expenses Assumed | | Previously
Waived Fees/
Expenses Assumed
Subject to Future
Recovery |
U.S. Large Company Portfolio (1) | | 0.15% | | — | | $617 |
U.S. Targeted Value Portfolio (1) | | 0.50% | | — | | — |
U.S. Core Equity 1 Portfolio (2) | | 0.23% | | — | | — |
U.S. Core Equity 2 Portfolio (2) | | 0.26% | | — | | — |
U.S. Vector Equity Portfolio (2) | | 0.36% | | — | | — |
T.A. U.S. Core Equity 2 Portfolio (2) | | 0.30% | | — | | — |
International Core Equity Portfolio (2) | | 0.49% | | — | | — |
T.A. World ex U.S. Core Equity Portfolio (3) | | 0.60% | | $135 | | — |
International Small Company Portfolio (4) | | 0.45% | | — | | — |
Japanese Small Company Portfolio (4) | | 0.47% | | — | | — |
Asia Pacific Small Company Portfolio (4) | | 0.47% | | 4 | | 25 |
United Kingdom Small Company Portfolio (4) | | 0.47% | | — | | 52 |
Continental Small Company Portfolio (4) | | 0.47% | | 11 | | — |
DFA International Real Estate Securities Portfolio (5) | | 0.65% | | — | | — |
DFA Global Real Estate Securities Portfolio (6) | | 0.55% | | — | | 794 |
International Vector Equity Portfolio (5) | | 0.60% | | 17 | | 28 |
Emerging Markets Core Equity Portfolio (5) | | 0.85% | | — | | — |
DFA Selectively Hedged Global Fixed Income Portfolio (5) | | 0.25% | | — | | — |
DFA Short-Term Extended Quality Portfolio (2) | | 0.22% | | — | | 87 |
DFA Inflation-Protected Securities Portfolio (5) | | 0.20% | | — | | — |
DFA Short-Term Municipal Bond Portfolio (7) | | 0.30% | | — | | — |
DFA California Short-Term Municipal Bond Portfolio (5) | | 0.30% | | — | | — |
| | | |
Class R1 Shares | | | | | | |
U.S. Targeted Value Portfolio (8) | | 0.62% | | — | | — |
210
| | | | | | |
Institutional Class Shares | | Expense
Limits | | Recovery
of Previously
Waived Fees/
Expenses Assumed | | Previously
Waived Fees/
Expenses Assumed
Subject to Future
Recovery |
| | | |
Class R2 Shares | | | | | | |
U.S. Targeted Value Portfolio (9) | | 0.77% | | — | | — |
(1) The Advisor has contractually agreed to waive its administration fee and to assume each Portfolio’s direct and indirect expenses (including, for U.S. Large Company Portfolio, the expenses the Portfolio bears as a shareholder of its Master Fund) to the extent necessary to limit the expenses of each Portfolio to the rates listed above as a percentage of average net assets on an annualized basis. At any time that the annualized expenses of a Portfolio are less than the rate listed above for such Portfolio, the Advisor retains the right to recover any fees previously waived and/or expenses previously assumed to the extent that such recovery will not cause the Portfolio’s annualized expenses to exceed the applicable percentage of average net assets on an annualized basis, as listed above.
(2) The Advisor has contractually agreed to waive all or a portion of its advisory fee and assume each Portfolio’s ordinary operating expenses (excluding the expenses a Portfolio incurs indirectly through investment in other investment companies) (“Portfolio Expenses”) to the extent necessary to limit the Portfolio Expenses of each Portfolio to the rates listed above as a percentage of average net assets on an annualized basis. At any time that the annualized Portfolio Expenses of a Portfolio are less than the rates listed above for such Portfolio, the Advisor retains the right to recover any fees previously waived and/or expenses previously assumed to the extent that such recovery will not cause the Portfolio’s annualized Portfolio Expenses to exceed the applicable percentage of average net assets on an annualized basis, as listed above.
(3) The Advisor has contractually agreed to waive all or a portion of the Portfolio’s advisory fee to the extent necessary to limit the total advisory fees paid by the Portfolio to the Advisor directly or indirectly (the proportionate share of the advisory fees paid by the Portfolio through its investment in other funds managed by the Advisor) to 0.40% of the Portfolio’s average net assets on an annualized basis. The Advisor has also contractually agreed to waive all or a portion of its advisory fee and to assume the expenses of the Portfolio (including the expenses that the Portfolio bears as a shareholder of other funds managed by the Advisor but excluding the expenses that the Portfolio incurs indirectly through its investment in unaffiliated investment companies) (“Portfolio Expenses”) to the extent necessary to limit the Portfolio Expenses of the Portfolio to the rate listed above as a percentage of average net assets on an annualized basis. At any time that the annualized expenses of the Portfolio are less than the rate listed above for the Portfolio, the Advisor retains the right to recover any fees previously waived and/or expenses previously assumed to the extent that such recovery will not cause the Portfolio’s annualized expenses to exceed the applicable percentage of average net assets on an annualized basis, as listed above.
(4) The Advisor has contractually agreed to waive its administration fee and to assume each Portfolio’s other direct expenses (for International Small Company, not including expenses incurred through its investment in other investment companies) to the extent necessary to limit the direct expenses of each Portfolio to the rates listed above as a percentage of average net assets on an annualized basis. The Fee Waiver and Expense Assumption Agreement does not include the indirect expenses each Portfolio bears as a shareholder of its Master Funds. At any time that the direct expenses of a Portfolio are less than the rates listed above as a percentage of average net assets on an annualized basis, the Advisor retains the right to recover any fees previously waived and/or expenses previously assumed to the extent that such recovery will not cause the Portfolio’s direct expenses to exceed the applicable percentage of average net assets on an annualized basis, as listed above.
(5) The Advisor has contractually agreed to waive all or a portion of its advisory fee and to assume each Portfolio’s ordinary operating expenses (excluding the expenses a Portfolio incurs indirectly through investment in other investment companies) (“Portfolio Expenses”) to the extent necessary to limit the Portfolio Expenses of each Portfolio to the rates listed above as a percentage of average net assets on an annualized basis. At any time that the annualized Portfolio Expenses of a Portfolio are less than the rate listed above as a percentage of average net assets on an annualized basis, the Advisor retains the right to recover any fees previously waived and/or expenses
211
previously assumed to the extent that such recovery will not cause the Portfolio’s annualized Portfolio Expenses to exceed the applicable percentage of average net assets on an annualized basis, as listed above.
(6) The Advisor has contractually agreed to waive all or a portion of its administration fee and to assume the expenses of the Portfolio (including the expenses that the Portfolio bears as a shareholder of other investment companies managed by the Advisor but excluding the expenses that the Portfolio incurs indirectly through its investment in unaffiliated investment companies) (“Portfolio Expenses”) to the extent necessary to limit the Portfolio Expenses of the Portfolio to the rate listed above as a percentage of average net assets on an annualized basis. At any time that the annualized Portfolio Expenses of the Portfolio are less than the rate listed above as a percentage of average net assets on an annualized basis, the Advisor retains the right to recover any fees previously waived and/or expenses previously assumed to the extent that such recovery will not cause the Portfolio’s annualized Portfolio Expenses to exceed the applicable percentage of average net assets on an annualized basis, as listed above. The Advisor has voluntarily agreed to waive all or a portion of its administration fee to the extent necessary to limit the total administration fees paid by the Portfolio to the Advisor directly and indirectly (the proportionate share of the administration fees paid by the Portfolio through its investment in other funds managed by the Advisor) to 0.35% of the Portfolio’s average net assets on an annualized basis.
(7) The Advisor has contractually agreed to waive all or a portion of its advisory fee to the extent necessary to reduce the Portfolio’s ordinary operating expenses (not including expenses incurred through its investment in other investment companies) (“Portfolio Expenses”) up to the amount of its total advisory fee when its Portfolio Expenses exceed the rate listed above as a percentage of average net assets on an annualized basis. At any time that the annualized Portfolio Expenses of the Portfolio are less than the rate listed above as a percentage of average net assets on an annualized basis, the Advisor retains the right to recover any fees previously waived to the extent that such recovery will not cause the Portfolio’s annualized Portfolio Expenses to exceed the applicable percentage of average net assets on an annualized basis, as listed above.
(8) The Advisor has contractually agreed to waive its administration fee and to assume the Portfolio’s direct and indirect expenses (excluding the expenses the Portfolio incurs indirectly through investment in other investment companies) (“Portfolio Expenses”) to the extent necessary to limit the Portfolio Expenses of the Class R1 Shares to the rate listed above as a percentage of average net assets on an annualized basis. At any time that the Class R1 Shares’ annualized expenses are less than the rate listed above as a percentage of average net assets on an annualized basis, the Advisor retains the right to recover any fees previously waived and/or expenses previously assumed to the extent that such recovery will not cause the Portfolio’s annualized expenses to exceed the applicable percentage of average net assets on an annualized basis, as listed above.
(9) The Advisor has contractually agreed to waive its administration fee and to assume the Portfolio’s direct and indirect expenses (excluding the expenses the Portfolio incurs indirectly through investment in other investment companies) (“Portfolio Expenses”) to the extent necessary to limit the Portfolio Expenses of the Class R2 Shares to the rate listed above as a percentage of average net assets on an annualized basis. At any time that the Class R2 Shares’ annualized expenses are less than the rate listed above as a percentage of average net assets on an annualized basis, the Advisor retains the right to recover any fees previously waived and/or expenses previously assumed to the extent that such recovery will not cause the Portfolio’s annualized expenses to exceed the applicable percentage of average net assets on an annualized basis, as listed above.
Fees Paid to Officers and Directors/Trustees:
Certain Officers and Directors/Trustees of the Advisor are also Officers and Directors/Trustees of the Fund; however, such Officers and Directors/Trustees (with the exception of the Chief Compliance Officer (“CCO”)) receive no compensation from the Fund. For the year ended October 31, 2009, the total related amounts paid by the Fund to the CCO were $197 (in thousands). The total related amounts paid by each of the Portfolios are included in Other Expenses on the Statement of Operations.
212
D. Deferred Compensation:
At October 31, 2009, the total liability for deferred compensation to Directors/Trustees is included in Accrued Expenses and Other Liabilities on the Statement of Assets and Liabilities as follows (amounts in thousands):
| | |
U.S. Large Company Portfolio | | $ 67 |
Enhanced U.S. Large Company Portfolio | | 5 |
U.S. Large Cap Value Portfolio | | 143 |
U.S. Targeted Value Portfolio | | 32 |
U.S. Small Cap Value Portfolio | | 141 |
U.S. Core Equity 1 Portfolio | | 45 |
U.S. Core Equity 2 Portfolio | | 83 |
U.S. Vector Equity Portfolio | | 26 |
T.A. U.S. Core Equity 2 Portfolio | | 31 |
U.S. Small Cap Portfolio | | 60 |
U.S. Micro Cap Portfolio | | 72 |
DFA Real Estate Securities Portfolio | | 44 |
Large Cap International Portfolio | | 33 |
International Core Equity Portfolio | | 78 |
T.A. World ex U.S. Core Equity Portfolio | | 14 |
International Small Company Portfolio | | 96 |
Japanese Small Company Portfolio | | 3 |
Asia Pacific Small Company Portfolio | | 2 |
United Kingdom Small Company Portfolio | | 1 |
Continental Small Company Portfolio | | 3 |
DFA International Real Estate Securities Portfolio | | 14 |
DFA Global Real Estate Securities Portfolio | | 6 |
DFA International Small Cap Value Portfolio | | 154 |
International Vector Equity Portfolio | | 5 |
Emerging Markets Portfolio | | 45 |
Emerging Markets Small Cap Portfolio | | 22 |
Emerging Markets Core Equity Portfolio | | 51 |
DFA One-Year Fixed Income Portfolio | | 196 |
DFA Two-Year Global Fixed Income Portfolio | | 182 |
DFA Selectively Hedged Global Fixed Income Portfolio | | 6 |
DFA Five-Year Government Portfolio | | 29 |
DFA Five-Year Global Fixed Income Portfolio | | 87 |
DFA Intermediate Government Fixed Income Portfolio | | 38 |
DFA Short-Term Extended Quality Portfolio | | 6 |
DFA Inflation-Protected Securities Portfolio | | 15 |
DFA Short-Term Municipal Bond Portfolio | | 29 |
DFA California Short-Term Municipal Bond Portfolio | | 5 |
213
E. Purchases and Sales of Securities:
For the year ended October 31, 2009, the Portfolios made the following purchases and sales of investment securities, other than short-term securities (amounts in thousands):
| | | | | | | | |
| | | U.S. Government
Securities | | Other Investment
Securities |
| | | Purchases | | Sales | | Purchases | | Sales |
Enhanced U.S. Large Company Portfolio* | | $ 17,221 | | $ 27,607 | | $ 83,078 | | $ 27,487 |
U.S. Targeted Value Portfolio | | — | | — | | 651,247 | | 191,035 |
U.S. Small Cap Value Portfolio* | | — | | — | | 1,103,537 | | 1,218,825 |
U.S. Core Equity 1 Portfolio | | — | | — | | 586,197 | | 112,979 |
U.S. Core Equity 2 Portfolio | | — | | — | | 1,096,280 | | 112,471 |
U.S. Vector Equity Portfolio | | — | | — | | 336,346 | | 98,773 |
T.A. U.S. Core Equity 2 Portfolio | | — | | — | | 752,211 | | 56,631 |
U.S. Small Cap Portfolio* | | — | | — | | 499,660 | | 383,415 |
U.S. Micro Cap Portfolio* | | — | | — | | 330,753 | | 408,096 |
DFA Real Estate Securities Portfolio | | — | | — | | 348,104 | | 34,556 |
Large Cap International Portfolio | | — | | — | | 139,779 | | 187,901 |
International Core Equity Portfolio | | — | | — | | 1,054,265 | | 123,079 |
T.A. World ex U.S. Core Equity Portfolio | | — | | — | | 280,810 | | 24,082 |
DFA International Real Estate Securities Portfolio | | — | | — | | 260,673 | | 23,908 |
DFA International Small Cap Value Portfolio | | — | | — | | 1,540,691 | | 1,178,091 |
International Vector Equity Portfolio | | — | | — | | 143,899 | | 13,463 |
Emerging Markets Core Equity Portfolio | | — | | — | | 468,871 | | 108,517 |
DFA One-Year Fixed Income Portfolio** | | 47,152 | | 21,008 | | 30,615 | | 30,326 |
DFA Two-Year Global Fixed Income Portfolio** | | 24,906 | | 22,829 | | 60,081 | | 20,035 |
DFA Selectively Hedged Global Fixed Income Portfolio | | 62,928 | | 17,676 | | 265,145 | | 35,804 |
DFA Five-Year Government Portfolio | | 720,934 | | 842,124 | | — | | — |
DFA Five-Year Global Fixed Income Portfolio | | 586,954 | | 972,316 | | 1,525,274 | | 1,181,228 |
DFA Intermediate Government Fixed Income Portfolio | | 264,518 | | 102,492 | | — | | — |
DFA Short-Term Extended Quality Portfolio | | 19,968 | | — | | 345,149 | | 4,257 |
DFA Inflation-Protected Securities Portfolio | | 353,068 | | 31,714 | | — | | — |
DFA Short-Term Municipal Bond Portfolio | | — | | — | | 658,802 | | — |
DFA California Short-Term Municipal Bond Portfolio | | — | | — | | 116,165 | | 7,876 |
| * | For the period February 28, 2009 through October 31, 2009, during which the Portfolio invested directly in securities. |
| ** | For the period October 23, 2009 through October 31, 2009, during which the Portfolio invested directly in securities. |
F. Federal Income Taxes:
Each Portfolio has qualified and intends to continue to qualify as a regulated investment company under Subchapter M of the Internal Revenue Code for federal income tax purposes and to distribute substantially all of its taxable income and net capital gains to its shareholders. Accordingly, no provision has been made for federal income taxes.
Distributions from net investment income and net realized capital gains are determined in accordance with U.S. federal income tax regulations, which may differ from those amounts determined under accounting principles generally accepted in the United States of America. These book/tax differences are either temporary or permanent in nature. To the extent these differences are permanent, they are charged or credited to paid-in capital, undistributed net investment income or accumulated net realized gains, as appropriate, in the period that the differences arise. Accordingly, the following permanent differences as of October 31, 2009, primarily attributable to net realized gains on securities
214
considered to be “passive foreign investment companies”, non-deductible offering costs, foreign bond bifurcation, the utilization of accumulated earnings and profits distributed to shareholders on redemptions of shares as part of the dividends paid deduction for income tax purposes and distribution redesignations, were reclassified to the following accounts. These reclassifications had no effect on net assets or net asset value per share (amounts in thousands):
| | | | | | |
| | | Increase
(Decrease)
Paid-In Capital | | Increase
(Decrease)
Undistributed
Net Investment
Income | | Increase
(Decrease)
Accumulated
Net Realized
Gains (Losses) |
U.S. Large Company Portfolio | | $ (1,323) | | $ (5) | | $ 1,328 |
Enhanced U.S. Large Company Portfolio | | (58,767) | | 1,300 | | 57,467 |
U.S. Large Cap Value Portfolio | | (61) | | (908) | | 969 |
U.S. Targeted Value Portfolio | | (43) | | (11) | | 54 |
U.S. Small Cap Value Portfolio | | (200,882) | | 24,540 | | 176,342 |
U.S. Core Equity 1 Portfolio | | — | | (15) | | 15 |
U.S. Core Equity 2 Portfolio | | (178) | | 128 | | 50 |
U.S. Vector Equity Portfolio | | — | | (21) | | 21 |
T.A. U.S. Core Equity 2 Portfolio | | — | | (8) | | 8 |
U.S. Small Cap Portfolio | | (47,334) | | 11,620 | | 35,714 |
U.S. Micro Cap Portfolio | | (147,324) | | 14,338 | | 132,986 |
DFA Real Estate Securities Portfolio | | (199) | | 188 | | 11 |
Large Cap International Portfolio | | — | | 1,258 | | (1,258) |
International Core Equity Portfolio | | — | | 2,161 | | (2,161) |
T.A. World ex U.S. Core Equity Portfolio | | 13 | | 109 | | (122) |
International Small Company Portfolio | | (8,890) | | 2,627 | | 6,263 |
Japanese Small Company Portfolio | | (3,671) | | 248 | | 3,423 |
Asia Pacific Small Company Portfolio | | (271) | | 33 | | 238 |
United Kingdom Small Company Portfolio | | (88) | | 9 | | 79 |
Continental Small Company Portfolio | | (272) | | (50) | | 322 |
DFA International Real Estate Securities Portfolio | | 1,139 | | (885) | | (254) |
DFA Global Real Estate Securities Portfolio | | 227 | | (246) | | 19 |
DFA International Small Cap Value Portfolio | | 2,536 | | (1,818) | | (718) |
International Vector Equity Portfolio | | 13 | | (27) | | 14 |
Emerging Markets Portfolio | | 24,336 | | (3,340) | | (20,996) |
Emerging Markets Small Cap Portfolio | | — | | (181) | | 181 |
Emerging Markets Core Equity Portfolio | | — | | (303) | | 303 |
DFA One-Year Fixed Income Portfolio | | (43,319) | | 20,846 | | 22,473 |
DFA Two-Year Global Fixed Income Portfolio | | (10,273) | | 34,785 | | (24,512) |
DFA Selectively Hedged Global Fixed Income Portfolio | | (9,435) | | (6,232) | | 15,667 |
DFA Five-Year Global Fixed Income Portfolio | | — | | 36,191 | | (36,191) |
DFA Short-Term Extended Quality Portfolio | | (27) | | 27 | | — |
DFA Inflation-Protected Securities Portfolio | | — | | (65) | | 65 |
The tax character of dividends and distributions declared and paid during the year ended November 30, 2007, the period December 1, 2007 to October 31, 2008 and the year ended October 31, 2009 were as follows (amounts in thousands):
215
| | | | | | |
| | | Net Investment
Income
and Short-Term
Capital Gains | | Long-Term
Capital Gains | | Total |
U.S. Large Company Portfolio | | | | | | |
2007 | | $ 55,847 | | — | | $ 55,847 |
2008 | | 67,060 | | — | | 67,060 |
2009 | | 62,498 | | — | | 62,498 |
| | | |
Enhanced U.S. Large Company Portfolio | | | | | | |
2007 | | 23,020 | | $ 1,991 | | 25,011 |
2008 | | 15,756 | | 17,593 | | 33,349 |
2009 | | 19,564 | | — | | 19,564 |
| | | |
U.S. Large Cap Value Portfolio | | | | | | |
2007 | | 105,066 | | 146,660 | | 251,726 |
2008 | | 118,438 | | 315,456 | | 433,894 |
2009 | | 130,238 | | — | | 130,238 |
| | | |
U.S. Targeted Value Portfolio | | | | | | |
2007 | | 9,597 | | 12,911 | | 22,508 |
2008 | | 9,084 | | 14,001 | | 23,085 |
2009 | | 14,179 | | — | | 14,179 |
| | | |
U.S. Small Cap Value Portfolio | | | | | | |
2007 | | 168,338 | | 643,084 | �� | 811,422 |
2008 | | 73,038 | | 747,955 | | 820,993 |
2009 | | 69,882 | | — | | 69,882 |
| | | |
U.S. Core Equity 1 Portfolio | | | | | | |
2007 | | 15,517 | | 1,000 | | 16,517 |
2008 | | 22,927 | | — | | 22,927 |
2009 | | 31,598 | | — | | 31,598 |
| | | |
U.S. Core Equity 2 Portfolio | | | | | | |
2007 | | 36,180 | | 1,451 | | 37,631 |
2008 | | 48,004 | | — | | 48,004 |
2009 | | 55,009 | | — | | 55,009 |
| | | |
U.S. Vector Equity Portfolio | | | | | | |
2007 | | 13,979 | | — | | 13,979 |
2008 | | 14,964 | | — | | 14,964 |
2009 | | 16,454 | | — | | 16,454 |
| | | |
T.A. U.S. Core Equity 2 Portfolio | | | | | | |
2007 | | — | | — | | — |
2008 | | 4,648 | | — | | 4,648 |
2009 | | 18,642 | | — | | 18,642 |
216
| | | | | | |
| | | Net Investment
Income
and Short-Term
Capital Gains | | Long-Term
Capital Gains | | Total |
U.S. Small Cap Portfolio | | | | | | |
2007 | | $ 70,394 | | $144,164 | | $214,558 |
2008 | | 35,218 | | 173,651 | | 208,869 |
2009 | | 26,412 | | — | | 26,412 |
| | | |
U.S. Micro Cap Portfolio | | | | | | |
2007 | | 109,408 | | 344,357 | | 453,765 |
2008 | | 82,937 | | 350,692 | | 433,629 |
2009 | | 57,816 | | — | | 57,816 |
| | | |
DFA Real Estate Securities Portfolio | | | | | | |
2007 | | 65,631 | | 77,963 | | 143,594 |
2008 | | 34,694 | | 200,903 | | 235,597 |
2009 | | 95,934 | | — | | 95,934 |
| | | |
Large Cap International Portfolio | | | | | | |
2007 | | 52,781 | | 909 | | 53,690 |
2008 | | 54,328 | | 28,913 | | 83,241 |
2009 | | 32,286 | | — | | 32,286 |
| | | |
International Core Equity Portfolio | | | | | | |
2007 | | 40,770 | | 205 | | 40,975 |
2008 | | 85,639 | | 17,053 | | 102,692 |
2009 | | 77,469 | | — | | 77,469 |
| | | |
T.A. World ex U.S. Core Equity Portfolio | | | | | | |
2008 | | 1,192 | | — | | 1,192 |
2009 | | 10,761 | | — | | 10,761 |
| | | |
International Small Company Portfolio | | | | | | |
2007 | | 147,606 | | 139,397 | | 287,003 |
2008 | | 167,345 | | 279,890 | | 447,235 |
2009 | | 81,118 | | — | | 81,118 |
| | | |
Japanese Small Company Portfolio | | | | | | |
2007 | | 2,759 | | — | | 2,759 |
2008 | | 3,574 | | — | | 3,574 |
2009 | | 2,426 | | — | | 2,426 |
| | | |
Asia Pacific Small Company Portfolio | | | | | | |
2007 | | 3,089 | | — | | 3,089 |
2008 | | 4,433 | | — | | 4,433 |
2009 | | 2,724 | | — | | 2,724 |
217
| | | | | | | | |
| | | Net Investment
Income
and Short-Term
Capital Gains | | Long-Term
Capital Gains | | Return of
Capital | | Total |
United Kingdom Small Company Portfolio | | | | | | | | |
2007 | | $ 1,360 | | $ 1,153 | | — | | $ 2,513 |
2008 | | 1,227 | | 1,311 | | $ 19 | | 2,557 |
2009 | | 658 | | — | | — | | 658 |
| | | | |
Continental Small Company Portfolio | | | | | | | | |
2007 | | 3,386 | | 2,271 | | — | | 5,657 |
2008 | | 4,326 | | 6,764 | | 97 | | 11,187 |
2009 | | 2,087 | | — | | — | | 2,087 |
| | | | |
DFA International Real Estate Securities Portfolio | | | | | | | | |
2007 | | 2,768 | | — | | — | | 2,768 |
2008 | | 19,791 | | — | | — | | 19,791 |
2009 | | 11,227 | | — | | — | | 11,227 |
| | | | |
DFA Global Real Estate Securities Portfolio | | | | | | | | |
2008 | | — | | — | | — | | — |
2009 | | 2,370 | | — | | — | | 2,370 |
| | | | |
DFA International Small Cap Value Portfolio | | | | | | | | |
2007 | | 218,066 | | 401,394 | | — | | 619,460 |
2008 | | 318,023 | | 534,468 | | — | | 852,491 |
2009 | | 108,717 | | 25,188 | | — | | 133,905 |
| | | | |
International Vector Equity Portfolio | | | | | | | | |
2008 | | — | | — | | — | | — |
2009 | | 3,671 | | — | | — | | 3,671 |
| | | | |
Emerging Markets Portfolio | | | | | | | | |
2007 | | 54,872 | | 23,352 | | — | | 78,224 |
2008 | | 70,205 | | 128,306 | | — | | 198,511 |
2009 | | 36,673 | | 23,932 | | — | | 60,605 |
| | | | |
Emerging Markets Small Cap Portfolio | | | | | | | | |
2007 | | 21,595 | | 53,499 | | — | | 75,094 |
2008 | | 32,090 | | 83,686 | | — | | 115,776 |
2009 | | 16,832 | | — | | — | | 16,832 |
| | | | |
Emerging Markets Core Equity Portfolio | | | | | | | | |
2007 | | 26,413 | | 1,966 | | — | | 28,379 |
2008 | | 42,769 | | 5,265 | | 204 | | 48,238 |
2009 | | 29,028 | | — | | — | | 29,028 |
| | | | |
DFA One-Year Fixed Income Portfolio | | | | | | | | |
2007 | | 149,471 | | — | | — | | 149,471 |
2008 | | 102,391 | | — | | — | | 102,391 |
2009 | | 72,237 | | — | | — | | 72,237 |
218
| | | | | | | | |
| | | Net Investment
Income
and Short-Term
Capital Gains | | Long-Term
Capital Gains | | Return of
Capital | | Total |
DFA Two-Year Global Fixed Income Portfolio | | | | | | | | |
2007 | | $ 78,938 | | — | | — | | $ 78,938 |
2008 | | 99,528 | | $ 296 | | — | | 99,824 |
2009 | | 137,717 | | — | | — | | 137,717 |
| | | | |
DFA Selectively Hedged Global Fixed Income Portfolio | | | | | | | | |
2008 | | — | | — | | $ 68 | | 68 |
2009 | | — | | — | | — | | — |
| | | | |
DFA Five-Year Government Portfolio | | | | | | | | |
2007 | | 49,378 | | — | | — | | 49,378 |
2008 | | 38,626 | | — | | — | | 38,626 |
2009 | | 25,750 | | — | | — | | 25,750 |
| | | | |
DFA Five-Year Global Fixed Income Portfolio | | | | | | | | |
2007 | | 60,967 | | — | | — | | 60,967 |
2008 | | 96,473 | | — | | 5,349 | | 101,822 |
2009 | | 61,945 | | — | | — | | 61,945 |
| | | | |
DFA Intermediate Government Fixed Income Portfolio | | | | | | | | |
2007 | | 46,222 | | 310 | | — | | 46,532 |
2008 | | 59,933 | | 112 | | — | | 60,045 |
2009 | | 56,385 | | 6,325 | | — | | 62,710 |
| | | | |
DFA Short-Term Extended Quality Portfolio | | | | | | | | |
2009 | | 4,322 | | — | | — | | 4,322 |
| | | | |
DFA Inflation-Protected Securities Portfolio | | | | | | | | |
2007 | | 2,996 | | — | | — | | 2,996 |
2008 | | 19,588 | | — | | — | | 19,588 |
2009 | | 4,088 | | 364 | | — | | 4,452 |
| | | | |
DFA Short-Term Municipal Bond Portfolio | | | | | | | | |
2007 | | 24,969 | | — | | — | | 24,969 |
2008 | | 18,834 | | — | | — | | 18,834 |
2009 | | 20,942 | | — | | — | | 20,942 |
| | | | |
DFA California Short-Term Municipal Bond Portfolio | | | | | | | | |
2007 | | 1,116 | | — | | — | | 1,116 |
2008 | | 3,577 | | — | | — | | 3,577 |
2009 | | 4,256 | | — | | — | | 4,256 |
At October 31, 2009, the following net investment income and short-term capital gains and long-term capital gains distributions designated for federal income tax purposes are due to the utilization of accumulated earnings and profits distributed to shareholders upon redemption of shares (amounts in thousands):
219
| | | | | | |
| | | Net Investment
Income
and Short-Term
Capital Gains | | Long-Term
Capital Gains | | Total |
T.A. World ex U.S. Core Equity Portfolio | | $ 30 | | — | | $ 30 |
DFA International Real Estate Securities Portfolio | | 1,139 | | — | | 1,139 |
DFA Global Real Estate Securities Portfolio | | 319 | | — | | 319 |
DFA International Small Cap Value Portfolio | | 2,537 | | — | | 2,537 |
International Vector Equity Portfolio | | 29 | | — | | 29 |
Emerging Markets Portfolio | | 3,546 | | $2,984 | | 6,530 |
At October 31, 2009, the components of distributable earnings (accumulated losses) were as follows (amounts in thousands):
| | | | | | | | | | |
| | | Undistributed
Net Investment
Income and
Short-Term
Capital Gains | | Undistributed
Long-Term
Capital Gains | | Capital
Loss
Carryforward | | | Total Net
Distributable
Earnings
(Accumulated
Losses) | |
U.S. Large Company Portfolio | | $ 7,182 | | — | | $(213,037 | ) | | $(205,855 | ) |
Enhanced U.S. Large Company Portfolio | | 328 | | — | | (107,961 | ) | | (107,633 | ) |
U.S. Large Cap Value Portfolio | | 13,684 | | — | | (2,441,394 | ) | | (2,427,710 | ) |
U.S. Targeted Value Portfolio | | 1,248 | | — | | (82,714 | ) | | (81,466 | ) |
U.S. Small Cap Value Portfolio | | 2,747 | | — | | (574,282 | ) | | (571,535 | ) |
U.S. Core Equity 1 Portfolio | | 419 | | — | | (82,131 | ) | | (81,712 | ) |
U.S. Core Equity 2 Portfolio | | 777 | | — | | (94,753 | ) | | (93,976 | ) |
U.S. Vector Equity Portfolio | | 1,903 | | — | | (94,679 | ) | | (92,776 | ) |
T.A. U.S. Core Equity 2 Portfolio | | 3,092 | | — | | (49,818 | ) | | (46,726 | ) |
U.S. Small Cap Portfolio | | 3,710 | | — | | (380,659 | ) | | (376,949 | ) |
U.S. Micro Cap Portfolio | | 2,984 | | — | | (515,046 | ) | | (512,062 | ) |
DFA Real Estate Securities Portfolio | | 8,242 | | — | | (138,089 | ) | | (129,847 | ) |
Large Cap International Portfolio | | 7,702 | | — | | (154,396 | ) | | (146,694 | ) |
International Core Equity Portfolio | | 3,803 | | — | | (98,253 | ) | | (94,450 | ) |
T.A. World ex U.S. Core Equity Portfolio | | 1,785 | | — | | (9,680 | ) | | (7,895 | ) |
International Small Company Portfolio | | 22,490 | | — | | (227,832 | ) | | (205,342 | ) |
Japanese Small Company Portfolio | | 787 | | — | | (78,684 | ) | | (77,897 | ) |
Asia Pacific Small Company Portfolio | | 932 | | — | | (38,642 | ) | | (37,710 | ) |
United Kingdom Small Company Portfolio | | 192 | | — | | (3,008 | ) | | (2,816 | ) |
Continental Small Company Portfolio | | 402 | | — | | (24,183 | ) | | (23,781 | ) |
DFA International Real Estate Securities Portfolio | | 71,386 | | — | | (48,084 | ) | | 23,302 | |
DFA Global Real Estate Securities Portfolio | | 4,924 | | — | | — | | | 4,924 | |
DFA International Small Cap Value Portfolio | | 32,551 | | — | | (32,601 | ) | | (50 | ) |
International Vector Equity Portfolio | | 720 | | — | | (3,383 | ) | | (2,663 | ) |
Emerging Markets Portfolio | | 5,734 | | $29,774 | | — | | | 35,508 | |
Emerging Markets Small Cap Portfolio | | 2,699 | | — | | (37,102 | ) | | (34,403 | ) |
Emerging Markets Core Equity Portfolio | | 6,737 | | — | | (89,395 | ) | | (82,658 | ) |
DFA One-Year Fixed Income Portfolio | | 3,526 | | — | | (651 | ) | | 2,875 | |
DFA Two-Year Global Fixed Income Portfolio | | 42,421 | | 3,896 | | — | | | 46,317 | |
DFA Selectively Hedged Global Fixed Income Portfolio | | — | | 230 | | — | | | 230 | |
DFA Five-Year Government Portfolio | | 11,738 | | — | | — | | | 11,738 | |
220
| | | | | | | | | | | | | |
| | | Undistributed
Net Investment
Income and
Short-Term
Capital Gains | | Undistributed
Long-Term
Capital Gains | | Capital
Loss
Carryforward | | | Total Net
Distributable
Earnings
(Accumulated
Losses) |
DFA Five-Year Global Fixed Income Portfolio | | $ | 45,563 | | | — | | $ | (5,372 | ) | | $ | 40,191 |
DFA Intermediate Government Fixed Income Portfolio | | | 10,456 | | $ | 5,453 | | | — | | | | 15,909 |
DFA Short-Term Extended Quality Portfolio | | | 1,345 | | | — | | | — | | | | 1,345 |
DFA Inflation-Protected Securities Portfolio | | | 6,370 | | | — | | | (774 | ) | | | 5,596 |
DFA Short-Term Municipal Bond Portfolio | | | 1,836 | | | — | | | (17 | ) | | | 1,819 |
DFA California Short-Term Municipal Bond Portfolio | | | 359 | | | — | | | — | | | | 359 |
For federal income tax purposes, the Fund measures its capital loss carryforwards annually at October 31, its fiscal year end. Capital loss carryforwards may be carried forward and applied against future capital gains. As of October 31, 2009, the following Portfolios had capital loss carryforwards available to offset future realized capital gains through the indicated expiration dates (amounts in thousands):
| | | | | | | | | | | | | | | | | | | | | | | | | | | |
| | | 2010 | | 2011 | | 2012 | | 2013 | | 2014 | | 2015 | | 2016 | | 2017 | | Total |
U.S. Large Company Portfolio | | | — | | $ | 27,798 | | | — | | $ | 5,485 | | $ | 8,867 | | | — | | $ | 86,015 | | $ | 84,872 | | $ | 213,037 |
Enhanced U.S. Large Company Portfolio | | | — | | | — | | | — | | | — | | | — | | | — | | | 107,961 | | | — | | | 107,961 |
U.S. Large Cap Value Portfolio | | | — | | | — | | | — | | | — | | | — | | | — | | | — | | | 2,441,394 | | | 2,441,394 |
U.S. Targeted Value Portfolio | | | — | | | — | | | — | | | — | | | — | | | — | | | 998 | | | 81,716 | | | 82,714 |
U.S. Small Cap Value Portfolio | | | — | | | — | | | — | | | — | | | — | | | — | | | 371,018 | | | 203,264 | | | 574,282 |
U.S. Core Equity 1 Portfolio | | | — | | | — | | | — | | | — | | | — | | $ | 3,266 | | | 18,644 | | | 60,221 | | | 82,131 |
U.S. Core Equity 2 Portfolio | | | — | | | — | | | — | | | — | | | — | | | 15,562 | | | 42,181 | | | 37,010 | | | 94,753 |
U.S. Vector Equity Portfolio | | | — | | | — | | | — | | | — | | | — | | | 1,759 | | | 12,704 | | | 80,216 | | | 94,679 |
T.A. U.S. Core Equity 2 Portfolio | | | — | | | — | | | — | | | — | | | — | | | 310 | | | 6,972 | | | 42,536 | | | 49,818 |
U.S. Small Cap Portfolio | | | — | | | — | | | — | | | — | | | — | | | — | | | 380,119 | | | 540 | | | 380,659 |
U.S. Micro Cap Portfolio | | | — | | | — | | | — | | | — | | | — | | | — | | | 453,532 | | | 61,514 | | | 515,046 |
DFA Real Estate Securities Portfolio | | | — | | | — | | | — | | | — | | | — | | | — | | | 81,911 | | | 56,178 | | | 138,089 |
Large Cap International Portfolio | | | — | | | — | | | — | | | — | | | — | | | — | | | 19,004 | | | 135,392 | | | 154,396 |
International Core Equity Portfolio | | | — | | | — | | | — | | | — | | | — | | | — | | | 10,739 | | | 87,514 | | | 98,253 |
T.A. World ex U.S. Core Equity Portfolio | | | — | | | — | | | — | | | — | | | — | | | — | | | 2,250 | | | 7,430 | | | 9,680 |
International Small Company Portfolio | | | — | | | — | | | — | | | — | | | — | | | — | | | 133,454 | | | 94,378 | | | 227,832 |
Japanese Small Company Portfolio | | $ | 4,453 | | | 19,912 | | $ | 3,801 | | | 3,055 | | | 2,451 | | | 8,003 | | | 23,057 | | | 13,952 | | | 78,684 |
Asia Pacific Small Company Portfolio | | | — | | | 5,837 | | | 1,150 | | | 907 | | | 864 | | | — | | | 21,680 | | | 8,204 | | | 38,642 |
United Kingdom Small Company Portfolio | | | — | | | — | | | — | | | — | | | — | | | — | | | 1,020 | | | 1,988 | | | 3,008 |
Continental Small Company Portfolio | | | — | | | — | | | — | | | — | | | — | | | — | | | 16,959 | | | 7,224 | | | 24,183 |
DFA International Real Estate Securities Portfolio | | | — | | | — | | | — | | | — | | | — | | | 46 | | | 13,446 | | | 34,592 | | | 48,084 |
DFA International Small Cap Value Portfolio | | | — | | | — | | | — | | | — | | | — | | | — | | | — | | | 32,601 | | | 32,601 |
International Vector Equity Portfolio | | | — | | | — | | | — | | | — | | | — | | | — | | | 27 | | | 3,356 | | | 3,383 |
Emerging Markets Small Cap Portfolio | | | — | | | — | | | — | | | — | | | — | | | — | | | 21,881 | | | 15,221 | | | 37,102 |
Emerging Markets Core Equity Portfolio | | | — | | | — | | | — | | | — | | | — | | | — | | | 62,950 | | | 26,445 | | | 89,395 |
DFA One-Year Fixed Income Portfolio | | | — | | | — | | | — | | | — | | | — | | | — | | | 651 | | | — | | | 651 |
DFA Five-Year Global Fixed Income Portfolio | | | — | | | — | | | — | | | — | | | 309 | | | — | | | 5,063 | | | — | | | 5,372 |
DFA Inflation Protected Securities Portfolio | | | — | | | — | | | — | | | — | | | — | | | — | | | — | | | 774 | | | 774 |
DFA Short-Term Municipal Bond Portfolio | | | — | | | — | | | 17 | | | — | | | — | | | — | | | — | | | — | | | 17 |
During the year ended October 31, 2009, the following Portfolios utilized capital loss carryforwards to offset realized capital gains for federal income tax purposes (amounts in thousands):
| | | |
Enhanced U.S. Large Company Portfolio | | $ | 8,177 |
DFA One-Year Fixed Income Portfolio | | | 29,277 |
DFA Two-Year Global Fixed Income Portfolio | | | 22,911 |
DFA Five-Year Government Portfolio | | | 19,566 |
DFA Five-Year Global Fixed Income Portfolio | | | 32,624 |
DFA California Short-Term Municipal Bond Portfolio | | | 23 |
221
For the year ended October 31, 2009, the Japanese Small Company Portfolio had capital loss carryforward expirations of $3,508 (in thousands).
Some of the Portfolios’ investments and investments held by the Master Funds are in securities considered to be “passive foreign investment companies” for which any unrealized appreciation (depreciation) (mark to market) and/or realized gains are required to be included in distributable net investment income for federal income tax purposes. At October 31, 2009, the following Portfolios had cumulative unrealized appreciation (depreciation) (mark to market) to be included in distributable net investment income for federal tax purposes. For the Year Ended October 31, 2009, realized gains on the sale of passive foreign investment companies have been reclassified from accumulated net realized gains to accumulated net investment income for federal tax purposes. Amounts listed below are in thousands.
| | | | | | |
| | | Mark to Market | | Realized Gains |
Large Cap International Portfolio | | $ | 1,808 | | | — |
International Core Equity Portfolio | | | 638 | | $ | 838 |
T.A. World ex U.S. Core Equity Portfolio | | | — | | | 25 |
International Small Company Portfolio | | | 8,444 | | | 574 |
Japanese Small Company Portfolio | | | 117 | | | — |
Asia Pacific Small Company Portfolio | | | 684 | | | — |
United Kingdom Small Company Portfolio | | | 20 | | | 9 |
Continental Small Company Portfolio | | | 403 | | | — |
DFA International Real Estate Securities Portfolio | | | 47,294 | | | 56 |
DFA International Small Cap Value Portfolio | | | 20,585 | | | 2,797 |
Emerging Markets Small Cap Portfolio | | | 354 | | | — |
Emerging Markets Core Equity Portfolio | | | 4 | | | — |
At October 31, 2009, the total cost and aggregate gross unrealized appreciation and (depreciation) of securities for federal income tax purposes were different from amounts reported for financial reporting purposes (amounts in thousands):
| | | | | | | | | | | | | | |
| | | Federal
Tax Cost | | Unrealized
Appreciation | | Unrealized
(Depreciation) | | | Net
Unrealized
Appreciation
(Depreciation) | |
U.S. Large Company Portfolio | | $ | 2,877,782 | | $ | 352,056 | | $ | (510,130 | ) | | $ | (158,074 | ) |
Enhanced U.S. Large Company Portfolio | | | 165,749 | | | 1,894 | | | (21 | ) | | | 1,873 | |
U.S. Large Cap Value Portfolio | | | 4,959,196 | | | 1,012,620 | | | (107,145 | ) | | | 905,475 | |
U.S. Targeted Value Portfolio | | | 1,875,678 | | | 182,315 | | | (281,563 | ) | | | (99,248 | ) |
U.S. Small Cap Value Portfolio | | | 7,359,688 | | | 856,341 | | | (1,648,779 | ) | | | (792,438 | ) |
U.S. Core Equity 1 Portfolio | | | 2,487,529 | | | 139,350 | | | (368,611 | ) | | | (229,261 | ) |
U.S. Core Equity 2 Portfolio | | | 4,990,297 | | | 260,228 | | | (923,665 | ) | | | (663,437 | ) |
U.S. Vector Equity Portfolio | | | 1,627,456 | | | 92,281 | | | (324,960 | ) | | | (232,679 | ) |
T.A. U.S. Core Equity 2 Portfolio | | | 1,617,600 | | | 164,083 | | | (133,301 | ) | | | 30,782 | |
U.S. Small Cap Portfolio | | | 3,056,739 | | | 463,996 | | | (541,196 | ) | | | (77,200 | ) |
U.S. Micro Cap Portfolio | | | 3,478,151 | | | 656,832 | | | (865,370 | ) | | | (208,538 | ) |
DFA Real Estate Securities Portfolio | | | 3,157,842 | | | 143,598 | | | (577,621 | ) | | | (434,023 | ) |
Large Cap International Portfolio | | | 1,527,916 | | | 270,759 | | | (198,633 | ) | | | 72,126 | |
International Core Equity Portfolio | | | 4,716,225 | | | 295,954 | | | (648,610 | ) | | | (352,656 | ) |
T.A. World ex U.S. Core Equity Portfolio | | | 614,254 | | | 134,993 | | | (28,279 | ) | | | 106,714 | |
International Small Company Portfolio | | | 4,311,177 | | | 727,413 | | | (762,875 | ) | | | (35,462 | ) |
Japanese Small Company Portfolio | | | 203,529 | | | 52,585 | | | (141,999 | ) | | | (89,414 | ) |
Asia Pacific Small Company Portfolio | | $ | 95,452 | | $ | 61,222 | | $ | (54,768 | ) | | $ | 6,454 | |
222
| | | | | | | | | | |
| | | Federal
Tax Cost | | Unrealized
Appreciation | | Unrealized
(Depreciation) | | | Net
Unrealized
Appreciation
(Depreciation) | |
United Kingdom Small Company Portfolio | | 30,650 | | 20,946 | | (23,724 | ) | | (2,778 | ) |
Continental Small Company Portfolio | | 113,305 | | 64,204 | | (66,524 | ) | | (2,320 | ) |
DFA International Real Estate Securities Portfolio | | 1,136,799 | | 11,976 | | (280,322 | ) | | (268,346 | ) |
DFA Global Real Estate Securities Portfolio | | 407,508 | | 32,225 | | (7,205 | ) | | 25,020 | |
DFA International Small Cap Value Portfolio | | 8,155,491 | | 1,022,184 | | (1,688,444 | ) | | (666,260 | ) |
International Vector Equity Portfolio | | 248,248 | | 60,999 | | (6,848 | ) | | 54,151 | |
Emerging Markets Portfolio | | 1,011,811 | | 1,037,753 | | (82,480 | ) | | 955,273 | |
Emerging Markets Small Cap Portfolio | | 856,324 | | 358,008 | | (79,893 | ) | | 278,115 | |
Emerging Markets Core Equity Portfolio | | 2,301,604 | | 614,169 | | (166,439 | ) | | 447,730 | |
DFA One-Year Fixed Income Portfolio | | 5,126,966 | | 19,644 | | (744 | ) | | 18,900 | |
DFA Two-Year Global Fixed Income Portfolio | | 5,172,582 | | 38,592 | | (595 | ) | | 37,997 | |
DFA Selectively Hedged Global Fixed Income Portfolio | | 299,331 | | 4,281 | | (308 | ) | | 3,973 | |
DFA Five-Year Government Portfolio | | 968,275 | | 31,245 | | (2,998 | ) | | 28,247 | |
DFA Five-Year Global Fixed Income Portfolio | | 3,961,945 | | 170,703 | | 11,863 | | | 182,566 | |
DFA Intermediate Government Fixed Income Portfolio | | 1,366,863 | | 103,431 | | (391 | ) | | 103,040 | |
DFA Short-Term Extended Quality Portfolio | | 365,573 | | 11,120 | | (31 | ) | | 11,089 | |
DFA Inflation-Protected Securities Portfolio | | 737,599 | | 30,004 | | 246 | | | 30,250 | |
DFA Short-Term Municipal Bond Portfolio | | 1,144,069 | | 19,233 | | (1,363 | ) | | 17,870 | |
DFA California Short-Term Municipal Bond Portfolio | | 204,398 | | 4,000 | | (441 | ) | | 3,559 | |
Accounting for Uncertainty in Income Taxes sets forth a minimum threshold for financial statement recognition of the benefit of a tax position taken or expected to be taken in a tax return. Management has analyzed each Portfolio’s tax positions and has concluded that no provision for income tax is required in any Portfolios’ financial statements. No Portfolio is aware of any tax positions for which it is reasonably possible that the total amounts of unrecognized tax benefits will significantly change in the next twelve months. Each of the Portfolios’ federal tax returns for the prior three fiscal years remains subject to examination by the Internal Revenue Service.
On October 22, 2008, The U.S. Micro Cap Series and The U.S. Small Cap Value Series and on October 25, 2008 The U.S. Small Cap Series, each a master fund in a RIC/RIC master-feeder structure, each with a RIC feeder (“the Portfolios”), having 100% investment in their respective master fund, have each made a “Check-the-box” election for federal income tax purposes pursuant to Treasury Regulation § 301.7701-3, to change their federal entity classifications from a corporation taxable as a regulated investment company to a disregarded entity. As a result of this election for tax purposes, each master fund is deemed to have liquidated and distributed all of its assets and liabilities to its owners, the respective portfolios (the RIC feeders), with the respective portfolios deemed the surviving entities. The final tax year end of the Master Funds was October 21, 2008 for The U.S. Micro Cap Series and The U.S. Small Cap Value Series and October 24, 2008 for The U.S. Small Cap Series. For Federal income tax purposes, pursuant to Code §337(a), each of the master funds recognizes no gain or loss and, pursuant to Code §332(a), each of the Portfolios recognizes no gain or loss on the deemed liquidation. However, pursuant to IRC §332 (c), each of the aforementioned Portfolios has recognized the master fund’s deemed dividend, which was distributed as part of the deemed liquidating distribution, as taxable income. Pursuant to IRC Code §334(b)(1) and §1223, each of the Portfolios will maintain each respective master fund’s holding period and tax basis in the assets deemed transferred to the respective Portfolio.
223
Effective December 31, 2008, The U.S. Large Cap Value Series, a master fund in a RIC/RIC master-feeder structure with four RIC feeders and other direct client investor(s), made a “Check-the-box” election for federal income tax purposes pursuant to Treasury Regulation §301.7701-3, to change its federal entity classification from a corporation taxable as a regulated investment company to a partnership. As a result of this election, the master fund is deemed to have distributed all of its assets and liabilities, in a taxable transaction, to its shareholders in liquidation of the master fund. Immediately thereafter, the shareholders contributed all of the distributed assets and liabilities to a newly formed partnership. The final tax year end of The U.S. Large Cap Value Series was December 30, 2008. For Federal income tax purposes, pursuant to IRC Code §336(a), the master fund recognized a loss as if the master’s investment securities were sold to its shareholders and, pursuant to IRC Code §331, each of the Portfolios recognized a gain as if it liquidated its investment in the master. For tax purposes, pursuant to IRC Code §334(a), each of the Portfolios took a fair market value basis in the securities deemed received by them and a new holding period for those securities commenced on the deemed liquidation date.
The master fund had book/tax differences upon its deemed liquidation. The following summary of permanent differences occurred as of the respective effective “Check the Box” election date.
| | | | | | |
Increase (Decrease) Paid-In Capital | | Unrealized
Appreciation
(Depreciation)
Investment
Securities | | Increase
(Decrease)
Undistributed
Net Investment
Income | | Increase
(Decrease)
Accumulated
Net Realized
Gains (Losses) |
$(3,038,312,278) | | $2,303,664,484 | | $(698,899) | | $735,346,693 |
As a result of the transaction, The U.S. Large Cap Value Series recognized a ($2,303,664,484) capital loss for tax year ended December 30, 2008. Additionally, the fund has written off $3,039,011,176 of expired capital loss carryover as a permanent book/tax reporting difference decreasing paid in capital.
Each Portfolio impacted by the ”Check the Box“ election also has a permanent book/tax difference resulting from the transaction. Listed below is the permanent difference impacting each respective Portfolio. For financial statement purposes, this adjustment did not result in any changes to each respective fund’s net assets or net asset value per share.
| | | | | | | |
| | | Increase
(Decrease)
Undistributed
Net Investment
Income | | | Increase
(Decrease)
Accumulated
Net Realized
Gains (Losses) |
DFA U.S. Large Cap Value Portfolio | | $ | (606,345 | ) | | $ | 606,345 |
DFA U.S. Large Cap Value Portfolio II | | | (10,872 | ) | | | 10,872 |
DFA U.S. Large Cap Value Portfolio III | | | (139,353 | ) | | | 139,353 |
LWAS/DFA U.S. High Book To Market Portfolio | | | (7,793 | ) | | | 7,793 |
For financial reporting purposes, this transaction had no impact on the net assets of the respective funds.
On November 1, 2008, The Enhanced U.S. Large Company Series, a master fund in a RIC/RIC master-feeder structure and The Enhanced U.S. Large Company Portfolio (“the Portfolio”), having 100% investment in its respective master fund, made a “Check-the-box” election for federal income tax purposes pursuant to Treasury Regulation §301.7701-3, to change the Series’ federal entity classification from a corporation taxable as a regulated investment company to a disregarded entity. As a result of this election for tax purposes, the master fund is deemed to have liquidated and distributed all of its assets and liabilities to its owner, the Portfolio, with the Portfolio deemed the surviving entity. The final tax year end of the Master Fund was October 31, 2008. For Federal income tax purposes, pursuant to Code §337(a), the Master Fund did not recognize any gain or loss and, pursuant to Code §332(a), the Portfolio did not recognize any gain or loss on the deemed liquidation. However, pursuant to IRC §332(c), the Portfolio has recognized the Master Fund’s deemed dividend, which was distributed as part of the deemed liquidating distribution, as taxable income. Pursuant to IRC Code §334(b)(1) and §1223, the Portfolio will maintain its respective master fund’s holding period and tax basis in the assets deemed transferred to the respective Portfolio.
224
On November 1, 2008, The DFA One-Year Fixed Income Series and The DFA Two-Year Global Fixed Income Series, each a master fund in a RIC/RIC master-feeder structure with RIC feeders, underlying fund of fund investors (Two-Year Global Fixed Income Series) and other direct client investor(s), have each made a “Check-the-box” election for federal income tax purposes pursuant to Treasury Regulation §301.7701-3, to change their federal entity classifications from a corporation taxable as a regulated investment company to a partnership. As a result of this election, for tax purposes, the Master Funds are deemed to have distributed all of their assets and liabilities to their shareholders in liquidation of the Master Fund. Since each Master Fund has a shareholder owning 80% or more of the fund’s shares and also has shareholders owning less than 80%, each fund’s respective transaction creates a non-taxable transaction, pursuant to Internal Revenue Code §332 for those owning more than 80%, and a taxable transaction, pursuant to Internal Revenue Code §331, for those shareholders owning less than 80%. Immediately after the deemed liquidation, the shareholders contributed all of the distributed assets and liabilities to newly formed partnerships. The final tax year end of the Master Funds was October 31, 2008.
For federal income tax purposes, pursuant to IRC §332(a), the DFA One-Year Fixed Income Portfolio and the DFA Two-Year Global Fixed Income Portfolio, having a more than 80% investment in its respective master fund, will not recognize any gain or loss on the deemed liquidation. However, pursuant to IRC §332(c), a portion of the deemed distribution, which otherwise would have been tax-free as discussed above, since it is utilized by the Master Fund to satisfy its dividends paid deduction for the tax year, must be recognized and treated as a dividend by the 80% or greater shareholder. Pursuant to IRC §334(b)(1) and §1223, the 80% or greater shareholder’s basis and holding period in the securities received in liquidation is the same as it was in the possession of the Master Fund. However, any security distributed in satisfaction of the Master Fund’s final dividend would have a basis equal to its fair market value and would be deemed acquired on the liquidation date.
For financial reporting purposes, this transaction had no impact on the net assets of the respective funds.
G. Capital Share Transactions:
The capital share transactions by class were as follows (amounts in thousands):
| | | | | | | | | | | | | | | | | | |
| | | Year
Ended
Oct. 31, 2009 | | | Period
Dec. 1, 2007
to
Oct. 31, 2008 | | | Year
Ended
Nov. 30, 2007 |
| | | Amount | | | Shares | | | Amount | | | Shares | | | Amount | | Shares |
| | | | | | |
U.S. Targeted Value Portfolio | | | | | | | | | | | | | | | | | | |
Class R1 Shares* | | | | | | | | | | | | | | | | | | |
Shares Issued | | $ | 7,979 | | | 1,266 | | | $ | 41,494 | | | 4,172 | | | N/A | | N/A |
Shares Issued in Lieu of Cash Distributions | | | 423 | | | 64 | | | | 351 | | | 36 | | | N/A | | N/A |
Shares Redeemed | | | (5,207 | ) | | (844 | ) | | | (7,142 | ) | | (761 | ) | | N/A | | N/A |
| | | | | | | | | | | | | | | | | | |
Net Increase (Decrease) — Class R1 Shares | | $ | 3,195 | | | 486 | | | $ | 34,703 | | | 3,447 | | | N/A | | N/A |
| | | | | | | | | | | | | | | | | | |
Class R2 Shares** | | | | | | | | | | | | | | | | | | |
Shares Issued | | $ | 1,638 | | | 210 | | | $ | 3,032 | | | 306 | | | N/A | | N/A |
Shares Issued in Lieu of Cash Distributions | | | 27 | | | 4 | | | | 10 | | | 1 | | | N/A | | N/A |
Shares Redeemed | | | (626 | ) | | (85 | ) | | | (799 | ) | | (88 | ) | | N/A | | N/A |
| | | | | | | | | | | | | | | | | | |
Net Increase (Decrease) — Class R2 Shares | | $ | 1,039 | | | 129 | | | $ | 2,243 | | | 219 | | | N/A | | N/A |
| | | | | | | | | | | | | | | | | | |
225
| | | | | | | | | | | | | | | | | | | | | |
| | | Year
Ended
Oct. 31, 2009 | | | Period
Dec. 1, 2007
to
Oct. 31, 2008 | | | Year
Ended
Nov. 30, 2007 | |
| | | Amount | | | Shares | | | Amount | | | Shares | | | Amount | | | Shares | |
| | | | | | |
U.S. Targeted Value Portfolio | | | | | | | | | | | | | | | | | | | | | |
Institutional Class Shares | | | | | | | | | | | | | | | | | | | | | |
Shares Issued | | $ | 840,965 | | | 86,986 | | | $ | 930,939 | | | 66,970 | | | $ | 500,717 | | | 28,579 | |
Shares Issued in Lieu of Cash Distributions | | | 13,191 | | | 1,374 | | | | 20,933 | | | 1,410 | | | | 18,152 | | | 1,060 | |
Shares Redeemed | | | (419,657 | ) | | (43,424 | ) | | | (327,204 | ) | | (24,350 | ) | | | (110,437 | ) | | (6,247 | ) |
| | | | | | | | | | | | | | | | | | | | | |
Net Increase | | | | | | | | | | | | | | | | | | | | | |
(Decrease) — Institutional Class Shares | | $ | 434,499 | | | 44,936 | | | $ | 624,668 | | | 44,030 | | | $ | 408,432 | | | 23,392 | |
| | | | | | | | | | | | | | | | | | | | | |
| * | Class R1 Shares commenced operations on January 31, 2008. |
| ** | Class R2 Shares commenced operations on June 30, 2008. |
H. Financial Instruments:
In accordance with the Portfolios’ investment objectives and policies, the Portfolios may invest, either directly or indirectly through their investment in a corresponding Master Fund, in certain financial instruments that have off-balance sheet risk in excess of the amounts recognized in the financial statements and concentrations of credit and market risk. These instruments and their significant corresponding risks are described below:
1. Repurchase Agreements: The Portfolios may purchase certain U.S. Government securities subject to the counterparty’s agreement to repurchase them at an agreed upon date and price. The counterparty will be required on a daily basis to maintain the value of the collateral subject to the agreement at not less than the repurchase price (including accrued interest). The agreements are conditioned upon the collateral being deposited under the Federal Reserve book-entry system with the Fund’s custodian or a third party sub-custodian. In the event of default or bankruptcy by the other party to the agreement, retention of the collateral may be subject to legal proceedings. All open repurchase agreements were entered into on October 30, 2009.
2. Treasury Inflation-Protected Securities (TIPS): The DFA Inflation-Protected Securities Portfolio may purchase TIPS which are securities issued by the U.S. Treasury. Because the interest and/or principal payments on an inflation-protected security are adjusted periodically for changes in inflation, the income distributed by the Portfolio may be irregular. In addition, the current market value of inflation-protected securities is not guaranteed and will fluctuate.
3. Foreign Market Risks: Investments in foreign markets may involve certain considerations and risks not typically associated with investments in U.S. companies, including the possibility of future political and economic developments and the level of foreign governmental supervision and regulation of foreign securities markets. These markets are generally smaller, less liquid and more volatile than the major securities markets in the United States of America. Consequently, acquisition and disposition of international securities held by the Portfolios may be inhibited.
Derivative Financial Instruments:
Disclosures on derivative instruments and hedging activities are intended to improve financial reporting for derivative instruments by enabling investors to understand how and why a Portfolio uses derivatives, how derivatives are accounted for and how derivative instruments affect a Portfolio’s results of operations and financial position. Summarized below are the specific types of derivative instruments used by the Portfolios.
4. Forward Currency Contracts: The Enhanced U.S. Large Company Portfolio, DFA Two-Year Global Fixed Income Portfolio, DFA Selectively Hedged Global Fixed Income Portfolio, DFA Five-Year Global Fixed Income Portfolio
226
and DFA Short-Term Extended Quality Portfolio may enter into forward foreign currency contracts only to hedge against adverse changes in the relationship of the U.S. dollar to foreign currencies (foreign exchange rate risk). The decision to hedge a Portfolio’s currency exposure with respect to a foreign market will be based primarily on the Portfolio’s existing exposure to a given foreign currency. Each contract is valued daily and the change in value is recorded by the Portfolios as an unrealized gain or loss, which is presented in the Statements of Operations as the change in unrealized appreciation or depreciation of translation of foreign currency denominated amounts. When the contract is closed or offset with the same counterparty, the Portfolio records a realized gain or loss equal to the change in the value of the contract when it was opened and the value at the time it was closed or offset. This is presented in the Statements of Operations as a net realized gain or loss on foreign currency transactions. At October 31, 2009, the Portfolios had entered into the following contracts and the net unrealized foreign exchange gain/(loss) is reflected in the accompanying financial statements (amounts in thousands):
Enhanced U.S. Large Company Portfolio*
| | | | | | | | | | | |
Settlement Date | | Currency Amount | | Currency Sold | | Contract Amount | | Value at
October 31, 2009 | | Unrealized Foreign Exchange Gain (Loss) | |
11/18/09 | | 4,648 | | Canadian Dollar | | $ 4,364 | | $ 4,296 | | $ 68 | |
11/18/09 | | 2,162 | | Euro | | 3,198 | | 3,182 | | 16 | |
11/18/09 | | 6,200 | | Pound Sterling | | 10,129 | | 10,174 | | (45 | ) |
| | | | | | | | | | | |
| | | | | | $17,691 | | $17,652 | | $ 39 | |
| | | | | | | | | | | |
| | | | | | | | | | | |
|
| DFA Two-Year Global Fixed Income Portfolio* | |
| | | | | |
Settlement Date | | Currency Amount | | Currency Sold | | Contract Amount | | Value at
October 31, 2009 | | Unrealized Foreign Exchange Gain (Loss) | |
11/06/09 | | 142,065 | | Euro | | $212,339 | | $209,067 | | $3,272 | |
11/18/09 | | 198,938 | | Canadian Dollar | | 187,075 | | 183,855 | | 3,220 | |
11/18/09 | | 144,042 | | Euro | | 213,086 | | 211,970 | | 1,116 | |
11/18/09 | | 112,239 | | Pound Sterling | | 183,461 | | 184,189 | | (728 | ) |
| | | | | | | | | | | |
| | | | | | $795,961 | | $789,081 | | $6,880 | |
| | | | | | | | | | | |
| | | | | | | | | | |
|
| DFA Selectively Hedged Global Fixed Income Portfolio* |
| | | | | |
Settlement Date | | Currency Amount | | Currency Sold | | Contract Amount | | Value at
October 31, 2009 | | Unrealized Foreign Exchange Gain (Loss) |
11/18/09 | | 18,062 | | Canadian Dollar | | $16,948 | | $16,692 | | $256 |
| | | | | | | | | | |
| | | | | | | | | | | |
|
| DFA Five-Year Global Fixed Income Portfolio* | |
| | | | | |
Settlement Date | | Currency Amount | | Currency Sold | | Contract Amount | | Value at
October 31, 2009 | | Unrealized Foreign Exchange Gain (Loss) | |
11/09/09 | | 17,858,616 | | Japanese Yen | | $196,481 | | $198,406 | | $(1,925 | ) |
11/13/09 | | 17,553,714 | | Japanese Yen | | 191,063 | | 195,023 | | (3,960 | ) |
11/13/09 | | 119,009 | | Pound Sterling | | 194,496 | | 195,305 | | (809 | ) |
11/13/09 | | 4,438 | | Pound Sterling | | 7,323 | | 7,284 | | 39 | |
11/23/09 | | 123,425 | | Pound Sterling | | 203,599 | | 202,540 | | 1,059 | |
| | | | | | | | | | | |
| | | | | | $792,962 | | $798,558 | | $(5,596 | ) |
| | | | | | | | | | | |
227
*During the year ended October 31, 2009, the Portfolios had limited activity in these transactions.
Risks may arise upon entering into these contracts from the potential inability of counterparties to meet the terms of their contracts and from unanticipated movements in the value of foreign currency relative to the U.S. dollar.
5. Futures Contracts: Certain Portfolios may enter into futures contracts to gain market exposure on uninvested cash pending investment in securities or to maintain liquidity to pay redemptions. Additionally, the Enhanced U.S. Large Company Portfolio uses stock index futures to hedge against changes in equity securities’ prices in the normal course of pursuing its investment objectives. Upon entering into a futures contract, the Portfolio deposits cash or pledges U.S. Government securities to a broker, equal to the minimum “initial margin” requirements of the exchange on which the contract is traded. Subsequent payments are received from or paid to the broker each day, based on the daily fluctuation in the market value of the contract. These receipts or payments are known as “variation margin” and are recorded daily by the Portfolio as unrealized gains or losses until the contracts are closed. When the contracts are closed, the Portfolio records a realized gain or loss, which is presented in the Statement of Operations as a net realized gain or loss on futures, equal to the difference between the value of the contract at the time it was opened and the value at the time it was closed.
Risks may arise upon entering into futures contracts from potential imperfect price correlations between the futures contracts and the underlying securities, from the possibility of an illiquid secondary market for these instruments and from the possibility that the Portfolio could lose more than the initial margin requirements. The Portfolios entering into stock index futures are subject to equity price risk from those futures contracts. Counterparty credit risk related to exchange-traded futures is minimal because the exchange’s clearinghouse, as counterparty to all exchange-traded futures, guarantees the futures against default.
At October 31, 2009, the following Portfolio had outstanding futures contracts (dollar amounts in thousands):
| | | | | | | | | | |
| | | Description | | Expiration
Date | | Number of
Contracts | | Contract
Value | | Unrealized
Gain (Loss) |
Enhanced U.S. Large Company Portfolio | | S&P 500 Index® | | 12/18/2009 | | 620* | | $160,115 | | $1,705 |
Enhanced Securities have been segregated as collateral for open futures contracts.
*Outstanding contracts on futures at year end October 31, 2009 are indicative of the volume of activity during the year.
Additional disclosure on derivative instruments is required showing a summary by primary risk exposure of the derivatives instruments’ (i) location in the balance sheet and fair value at period end and (ii) the location in the Statements of Operations and the realized and change in unrealized gain or loss over the reporting period. The following is a summary of the Portfolios’ derivative instrument holdings for the year ended October 31, 2009.
The following is a summary of the location of derivatives on the Portfolios’ Statements of Assets and Liabilities as of October 31, 2009:
| | | | | | | | |
| | | | | Location on the Statements of Assets and Liabilities |
Derivative Type | | | | Asset Derivatives | | | | Liability Derivatives |
| Foreign exchange contracts | | | | Unrealized Gain on Forward Currency Contracts | | | | Unrealized Loss on Forward Currency Contracts |
| | | | |
Equity contracts | | | | | | | | Payables: Futures Margin Variation |
228
The following is a summary of the Portfolios’ derivative instrument holdings categorized by primary risk exposure as of October 31, 2009 (amounts in thousands):
| | | | | | |
| | | | | Asset Derivatives Value |
| | | Total Value
at
October 31, 2009 | | Foreign
Exchange
Contracts | | Equity
Contracts |
Enhanced U.S. Large Company Portfolio | | $1,789 | | $ 84 | | $1,705* |
DFA Two-Year Global Fixed Income Portfolio | | 7,608 | | 7,608 | | — |
DFA Selectively Hedged Global Fixed Income Portfolio | | 256 | | 256 | | — |
DFA Five-Year Global Fixed Income Portfolio | | 1,098 | | 1,098 | | — |
| | |
| | | | | Liability Derivatives Value |
| | | Total Value
at
October 31, 2009 | | Foreign
Exchange
Contracts | | Equity
Contracts |
Enhanced U.S. Large Company Portfolio | | $ 45 | | $ 45 | | — |
DFA Two-Year Global Fixed Income Portfolio | | 728 | | 728 | | — |
DFA Five-Year Global Fixed Income Portfolio | | 6,694 | | 6,694 | | — |
| * | Includes cumulative appreciation (depreciation) of futures contracts. Only current day’s margin variation is reported within the Statement of Assets and Liabilities. |
The following is a summary of the location on the Portfolios’ Statements of Operations of realized and change in unrealized gains and losses from the Portfolio’s derivative instrument holdings through the year ended October 31, 2009 (amounts in thousands):
| | | | |
Derivative Type | | | | Location of Gain (Loss) on Derivatives Recognized in Income |
Foreign exchange contracts | | | | Net Realized Gain (Loss) on: Foreign Currency Transactions Change in Unrealized Appreciation (Depreciation) of: Translation of Foreign Currency Denominated Amounts |
| | |
Equity contracts | | | | Net Realized Gain (Loss) on: Futures Change in Unrealized Appreciation (Depreciation) of: Futures |
The following is a summary of the realized and change in unrealized gains and losses from the Portfolios’ derivative instrument holdings categorized by primary risk exposure through the year ended October 31, 2009 (amounts in thousands):
| | | | | | | | | |
| | | Realized Gain (Loss)
on Derivatives
Recognized in Income | |
| | | Total | | | Foreign
Exchange
Contracts | | | Equity
Contracts | |
Enhanced U.S. Large Company Portfolio | | $25,521 | | | $(229 | ) | | $25,750 | |
U.S. Targeted Value Portfolio* | | (823 | ) | | — | | | (823 | ) |
U.S. Small Cap Value Portfolio* | | 570 | | | — | | | 570 | |
U.S. Core Equity 1 Portfolio* | | 683 | | | — | | | 683 | |
U.S. Core Equity 2 Portfolio* | | 3,212 | | | — | | | 3,212 | |
U.S. Vector Equity Portfolio* | | 407 | | | — | | | 407 | |
T.A. U.S. Core Equity 2 Portfolio* | | (854 | ) | | — | | | (854 | ) |
DFA Real Estate Securities Portfolio* | | (1,065 | ) | | — | | | (1,065 | ) |
Large Cap International Portfolio* | | 919 | | | — | | | 919 | |
229
| | | | | | | | | |
| | | Realized Gain (Loss)
on Derivatives
Recognized in Income | |
| | | Total | | | Foreign
Exchange
Contracts | | | Equity
Contracts | |
International Core Equity Portfolio* | | $ (2,556 | ) | | — | | | $(2,556 | ) |
T.A. World ex U.S. Core Equity Portfolio* | | (660 | ) | | — | | | (660 | ) |
DFA International Real Estate Securities Portfolio* | | 234 | | | — | | | 234 | |
DFA International Small Cap Value Portfolio* | | (9,031 | ) | | — | | | (9,031 | ) |
International Vector Equity Portfolio* | | (232 | ) | | — | | | (232 | ) |
Emerging Markets Core Equity Portfolio* | | (873 | ) | | — | | | (873 | ) |
DFA Two-Year Global Fixed Income Portfolio | | (3,286 | ) | | $ (3,286 | ) | | — | |
DFA Selectively Hedged Global Fixed Income Portfolio | | (37 | ) | | (37 | ) | | — | |
DFA Five-Year Global Fixed Income Portfolio | | (63,248 | ) | | (63,248 | ) | | — | |
| |
| | | Change in Unrealized
Appreciation (Depreciation) on
Derivatives Recognized in Income | |
| | | Total | | | Foreign
Exchange
Contracts | | | Equity
Contracts | |
Enhanced U.S. Large Company Portfolio | | $ 1,744 | | | $ 39 | | | $1,705 | |
U.S. Targeted Value Portfolio* | | (3 | ) | | — | | | (3 | ) |
U.S. Core Equity 1 Portfolio* | | (2 | ) | | — | | | (2 | ) |
U.S. Core Equity 2 Portfolio* | | (1 | ) | | — | | | (1 | ) |
T.A. U.S. Core Equity 2 Portfolio* | | (1 | ) | | — | | | (1 | ) |
DFA Real Estate Securities Portfolio* | | (10 | ) | | — | | | (10 | ) |
International Core Equity Portfolio* | | (15 | ) | | — | | | (15 | ) |
T.A. World ex U.S. Core Equity Portfolio* | | (1 | ) | | — | | | (1 | ) |
DFA International Small Cap Value Portfolio* | | (28 | ) | | — | | | (28 | ) |
International Vector Equity Portfolio* | | (1 | ) | | — | | | (1 | ) |
Emerging Markets Core Equity Portfolio* | | (4 | ) | | — | | | (4 | ) |
DFA Two-Year Global Fixed Income Portfolio | | 6,880 | | | 6,880 | | | — | |
DFA Selectively Hedged Global Fixed Income Portfolio | | 262 | | | 262 | | | — | |
DFA Five-Year Global Fixed Income Portfolio | | (4,167 | ) | | (4,167 | ) | | — | |
| * | As of October 31, 2009, there were no futures contracts outstanding. During the year ended October 31, 2009, the Portfolios had limited activity in these transactions. |
I. Line of Credit:
The Fund, together with other Dimensional-advised portfolios, has entered into an amended and restated $250 million unsecured discretionary line of credit effective July 8, 2009 with an affiliate of its domestic custodian bank. Each portfolio is permitted to borrow, subject to its investment limitations, up to a maximum of $250 million, as long as total borrowings under the line of credit do not exceed $250 million in the aggregate. Borrowings under the line of credit are charged interest at the then current Federal Funds Rate plus 1%. Each portfolio is individually, and not jointly, liable for its particular advances under the line of credit. There is no commitment fee on the unused portion of the line of credit. The agreement for the discretionary line of credit may be terminated by either party at any time. The line of credit is scheduled to expire on June 22, 2010.
230
For the year ended October 31, 2009, borrowings by the Portfolios under this line of credit were as follows (amounts in thousands, except percentages and days):
| | | | | | | | | | |
| | | Weighted
Average
Interest Rate | | Weighted
Average
Loan Balance | | Number of
Days
Outstanding | | Interest
Expense
Incurred | | Maximum Amount
Borrowed During
the Period |
U.S. Targeted Value Portfolio | | 1.95% | | $1,732 | | 1 | | — | | $ 1,732 |
U.S. Small Cap Value Portfolio | | 1.99% | | 9,824 | | 18 | | $10 | | 24,299 |
U.S. Core Equity 1 Portfolio | | 1.99% | | 2,842 | | 20 | | 3 | | 12,148 |
U.S. Vector Equity Portfolio | | 2.25% | | 4,672 | | 20 | | 6 | | 14,819 |
T.A. U.S. Core Equity 2 Portfolio | | 2.05% | | 3,160 | | 17 | | 3 | | 12,832 |
U.S. Small Cap Portfolio | | 2.06% | | 7,934 | | 20 | | 9 | | 27,804 |
U.S. Micro Cap Portfolio | | 1.87% | | 4,049 | | 21 | | 4 | | 22,530 |
DFA Real Estate Securities Portfolio | | 1.90% | | 3,088 | | 20 | | 3 | | 6,865 |
DFA Global Real Estate Securities Portfolio | | 1.99% | | 110 | | 14 | | — | | 263 |
At October 31, 2009, U.S. Small Cap Value Portfolio had a loan outstanding in the amount of $6,072 (in thousands).
The Fund, together with other Dimensional-advised portfolios, has also entered into an additional $500 million unsecured line of credit effective January 15, 2009 with its international custodian bank. Each portfolio is permitted to borrow, subject to its investment limitations, up to a maximum of $500 million, as long as total borrowings under the line of credit do not exceed $500 million in the aggregate. Each portfolio is individually, and not jointly, liable for its particular advances under the line of credit. Borrowings under the line of credit are charged interest at rates agreed to by the parties at the time of borrowing. There is no commitment fee on the unused portion of the line of credit. The agreement for the line of credit expires on January 15, 2010.
For the year ended October 31, 2009, borrowings by the Portfolios under this line of credit were as follows (amounts in thousands, except percentages and days):
| | | | | | | | | | |
| | | Weighted
Average
Interest Rate | | Weighted
Average
Loan Balance | | Number of
Days
Outstanding | | Interest
Expense
Incurred | | Maximum Amount
Borrowed During
the Period |
Large Cap International Portfolio | | 0.95% | | $3,702 | | 39 | | $ 4 | | $14,855 |
International Core Equity Portfolio | | 0.96% | | 7,333 | | 27 | | 5 | | 19,021 |
T.A. World ex U.S. Core Equity Portfolio | | 0.89% | | 3,108 | | 30 | | 2 | | 8,114 |
International Small Company Portfolio | | 0.92% | | 3,301 | | 45 | | 4 | | 9,459 |
DFA International Real Estate Securities Portfolio | | 0.94% | | 855 | | 17 | | — | | 2,591 |
DFA International Small Cap Value Portfolio | | 0.93% | | 6,909 | | 53 | | 9 | | 22,578 |
International Vector Equity Portfolio | | 0.95% | | 971 | | 30 | | 1 | | 2,875 |
Emerging Markets Core Equity Portfolio | | 0.94% | | 3,107 | | 56 | | 5 | | 12,568 |
At October 31, 2009, International Small Company Portfolio and DFA International Small Cap Value Portfolio had loans outstanding in the amounts of $1,970 and $6,784 (in thousands), respectively.
J. Securities Lending:
As of October 31, 2009, some of the Portfolios had securities on loan to brokers/dealers, for which each Portfolio held cash collateral. Each Portfolio invests the cash collateral, as described below, and records a liability for the return of the collateral, during the period the securities are on loan. Loans of securities are expected at all times to be secured by collateral equal to at least (i) 100% of the current market value of the loaned securities with respect to securities of the U.S. government or its agencies, (ii) 102% of the current market value of the loaned securities with respect to U.S. securities, and (iii) 105% of the current market value of the loaned securities with respect to foreign securities. However, daily market fluctuations could cause the Portfolios’ collateral to be lower or higher than
231
the expected thresholds. If this were to occur, the collateral would be adjusted the next business day to ensure adequate collateralization. In the event of default or bankruptcy by the other party to the agreement, realization and/or retention of the collateral may be subject to legal proceedings. If the borrower fails to return loaned securities, and cash collateral being maintained by the borrower is insufficient to cover the value of loaned securities and provided such collateral insufficiency is not the result of investment losses, the lending agent has agreed to pay the amount of the shortfall to the Portfolio or, at the option of the lending agent, to replace the securities.
Subject to each Portfolios’ investment policy, the cash collateral received by the Portfolio from securities on loan is invested in securities of the U.S. government or its agencies, repurchase agreements collateralized by securities of the U.S. government or its agencies or shares of the DFA Short Term Investment Fund LP. Agencies include both agency debentures and agency mortgage backed securities. In addition, each Portfolio will be able to terminate the loan at any time and will receive reasonable interest on the loan, as well as amounts equal to any dividends, interest or other distributions on the loaned securities. However, dividend income received from loaned securities may not be eligible to be taxed at qualified dividend income rates.
K. Shareholder Servicing Fees:
The Class R1 Shares pay a shareholder servicing fee in the amount of 0.10% and Class R2 Shares pay a shareholder servicing fee in the amount of 0.25% of their annual average net assets to compensate service agents that provide shareholder servicing, record keeping, account maintenance and other services to investors in the U.S. Targeted Value Portfolio Class R1 and Class R2 Shares.
L. Indemnitees; Contractual Obligations:
Under the Fund’s organizational documents, its officers and directors are indemnified against certain liabilities arising out of the performance of their duties to the Fund.
In the normal course of business, the Fund enters into contracts that contain a variety of representations and warranties which provide general indemnification. The Fund’s maximum exposure under these arrangements is unknown as this would involve future claims that may be made against the Fund and/or its affiliates that have not yet occurred. However, based on experience, the Fund expects the risk of loss to be remote.
M. In-Kind Redemptions:
In accordance with guidelines described in the Portfolios’ prospectus, the fund may distribute portfolio securities rather than cash as payment for a redemption of fund shares (in-kind redemption). For financial reporting purposes, the fund recognizes a gain on in-kind redemptions to the extent the value of the distributed securities on the date of redemption exceeds the cost of those securities. Gains and losses realized on in-kind redemptions are not recognized for tax purposes and are reclassified from undistributed realized gain (loss) to paid-in capital.
During the year ended October 31, 2009, the Emerging Markets Portfolio realized net gains of in-kind redemptions in the amount of $17,805 (amount in thousands).
During the period ended October 31, 2008, the following Portfolios realized net gains of in-kind redemptions (amounts in thousands):
| | | |
Large Cap International Portfolio | | $ | 14,987 |
International Core Equity Portfolio | | | 7,590 |
Emerging Markets Core Equity Portfolio | | | 1,902 |
N. Other:
At October 31, 2009, the following number of shareholders held the following approximate percentages of outstanding shares of the Portfolios. One or more of the shareholders may be omnibus accounts, which typically hold shares for the benefit of several other underlying investors.
232
| | | | |
| | | Number of
Shareholders | | Approximate
Percentage
of Outstanding
Shares |
U.S. Large Company Portfolio — Institutional Class Shares | | 2 | | 59% |
Enhanced U.S. Large Company Portfolio — Institutional Class Shares | | 3 | | 81% |
U.S. Large Cap Value Portfolio — Institutional Class Shares | | 3 | | 75% |
U.S. Targeted Value Portfolio — Class R1 Shares | | 1 | | 97% |
U.S. Targeted Value Portfolio — Class R2 Shares | | 1 | | 89% |
U.S. Targeted Value Portfolio — Institutional Class Shares | | 2 | | 59% |
U.S. Small Cap Value Portfolio — Institutional Class Shares | | 2 | | 52% |
U.S. Core Equity 1 Portfolio — Institutional Class Shares | | 3 | | 62% |
U.S. Core Equity 2 Portfolio — Institutional Class Shares | | 3 | | 67% |
U.S. Vector Equity Portfolio — Institutional Class Shares | | 4 | | 89% |
T.A. U.S. Core Equity 2 Portfolio — Institutional Class Shares | | 3 | | 93% |
U.S. Small Cap Portfolio — Institutional Class Shares | | 3 | | 53% |
U.S. Micro Cap Portfolio — Institutional Class Shares | | 2 | | 55% |
DFA Real Estate Securities Portfolio — Institutional Class Shares | | 3 | | 72% |
Large Cap International Portfolio — Institutional Class Shares | | 2 | | 76% |
International Core Equity Portfolio — Institutional Class Shares | | 3 | | 69% |
T.A. World ex U.S. Core Equity Portfolio — Institutional Class Shares | | 3 | | 92% |
International Small Company Portfolio — Institutional Class Shares | | 2 | | 51% |
Japanese Small Company Portfolio — Institutional Class Shares | | 3 | | 68% |
Asia Pacific Small Company Portfolio — Institutional Class Shares | | 2 | | 68% |
United Kingdom Small Company Portfolio — Institutional Class Shares | | 2 | | 86% |
Continental Small Company Portfolio — Institutional Class Shares | | 2 | | 63% |
DFA International Real Estate Securities Portfolio — Institutional Class Shares . | | 3 | | 82% |
DFA Global Real Estate Securities Portfolio — Institutional Class Shares | | 2 | | 87% |
DFA International Small Cap Value Portfolio — Institutional Class Shares | | 2 | | 49% |
International Vector Equity Portfolio — Institutional Class Shares | | 3 | | 92% |
Emerging Markets Portfolio — Institutional Class Shares | | 2 | | 56% |
Emerging Markets Small Cap Portfolio — Institutional Class Shares | | 1 | | 34% |
Emerging Markets Core Equity Portfolio — Institutional Class Shares | | 3 | | 79% |
DFA One-Year Fixed Income Portfolio — Institutional Class Shares | | 2 | | 60% |
DFA Two-Year Global Fixed Income Portfolio — Institutional Class Shares | | 3 | | 81% |
DFA Selectively Hedged Global Fixed Income Portfolio — Institutional Class Shares | | 4 | | 96% |
DFA Five-Year Government Portfolio — Institutional Class Shares | | 3 | | 77% |
DFA Five-Year Global Fixed Income Portfolio — Institutional Class Shares | | 3 | | 74% |
DFA Intermediate Government Fixed Income Portfolio — Institutional Class Shares | | 2 | | 75% |
DFA Short-Term Extended Quality Portfolio — Institutional Class Shares | | 4 | | 86% |
DFA Inflation-Protected Securities Portfolio — Institutional Class Shares | | 3 | | 81% |
DFA Short-Term Municipal Bond Portfolio — Institutional Class Shares | | 3 | | 82% |
DFA California Short-Term Municipal Bond Portfolio — Institutional Class Shares | | 3 | | 96% |
233
O. Subsequent Event Evaluations:
Management has evaluated the impact of all subsequent events on the Fund through December 23, 2009, the date the financial statements were available for issuance, and has determined that the following subsequent event requires recognition or disclosure in the financial statements.
On December 18, 2009, the Board of Directors of DFA Investment Dimensions Group Inc., on behalf of the U.S. Large Company Portfolio (the “Large Company Portfolio”), approved an Agreement and Plan of Reorganization (the “Plan of Reorganization”), under which the Large Company Portfolio will be reorganized with and into the U.S. Large Company Institutional Index Portfolio (the “Large Company Institutional Portfolio”), a portfolio of Dimensional Investment Group Inc. Under the Plan of Reorganization, the Large Company Portfolio will transfer substantially all of its assets to the Large Company Institutional Portfolio in exchange solely for shares of the Large Company Institutional Portfolio (the “Reorganization”), which will be distributed to shareholders of the Large Company Portfolio according to their interests held in the Large Company Portfolio immediately prior to the Reorganization. As soon as practicable thereafter, the Large Company Portfolio will be liquidated and dissolved.
234
REPORT OF INDEPENDENT REGISTERED PUBLIC ACCOUNTING FIRM
To the Shareholders of the Portfolios, as defined, and
Board of Directors of DFA Investment Dimensions Group Inc.:
In our opinion, the accompanying statements of assets and liabilities, including the schedules of investments/ summary schedules of portfolio holdings, and the related statements of operations and of changes in net assets and the financial highlights present fairly, in all material respects, the financial position of U.S. Large Company Portfolio, Enhanced U.S. Large Company Portfolio, U.S. Large Cap Value Portfolio, U.S. Targeted Value Portfolio, U.S. Small Cap Value Portfolio, U.S. Core Equity 1 Portfolio, U.S. Core Equity 2 Portfolio, U.S. Vector Equity Portfolio, T.A. U.S. Core Equity 2 Portfolio, U.S. Small Cap Portfolio, U.S. Micro Cap Portfolio, DFA Real Estate Securities Portfolio, Large Cap International Portfolio, International Core Equity Portfolio, T.A. World ex U.S. Core Equity Portfolio, International Small Company Portfolio, Japanese Small Company Portfolio, Asia Pacific Small Company Portfolio, United Kingdom Small Company Portfolio, Continental Small Company Portfolio, DFA International Real Estate Securities Portfolio, DFA Global Real Estate Securities Portfolio, DFA International Small Cap Value Portfolio, International Vector Equity Portfolio, Emerging Markets Portfolio, Emerging Markets Small Cap Portfolio, Emerging Markets Core Equity Portfolio, DFA One-Year Fixed Income Portfolio, DFA Two-Year Global Fixed Income Portfolio, DFA Selectively Hedged Global Fixed Income Portfolio, DFA Five-Year Government Portfolio, DFA Five-Year Global Fixed Income Portfolio, DFA Intermediate Government Fixed Income Portfolio, DFA Short-Term Extended Quality Portfolio, DFA Inflation-Protected Securities Portfolio, DFA Short-Term Municipal Bond Portfolio and DFA California Short-Term Municipal Bond Portfolio (constituting portfolios within DFA Investment Dimensions Group Inc., hereafter referred to as the “Portfolios”) at October 31, 2009, the results of each of their operations, the changes in each of their net assets and the financial highlights for each of the periods indicated, in conformity with accounting principles generally accepted in the United States of America. These financial statements and financial highlights (hereafter referred to as “financial statements”) are the responsibility of the Portfolios’ management; our responsibility is to express an opinion on these financial statements based on our audits. We conducted our audits of these financial statements in accordance with the standards of the Public Company Accounting Oversight Board (United States). Those standards require that we plan and perform the audit to obtain reasonable assurance about whether the financial statements are free of material misstatement. An audit includes examining, on a test basis, evidence supporting the amounts and disclosures in the financial statements, assessing the accounting principles used and significant estimates made by management, and evaluating the overall financial statement presentation. We believe that our audits, which included confirmation of securities at October 31, 2009 by correspondence with the custodians, brokers, and the transfer agents of the investee funds, provide a reasonable basis for our opinion.
PricewaterhouseCoopers LLP
Philadelphia, Pennsylvania
December 23, 2009
235
RESULTS OF THE SHAREHOLDER MEETING
On June 2, 2009 and July 8, 2009, DFA Investment Dimensions Group Inc. (“DFAIDG”) held a Special Joint Meeting of Shareholders for the purpose of voting on several proposals affecting DFAIDG and the Portfolios, including, among other items, the election of Directors, the amendment of certain fundamental investment limitations, and the elimination of certain fundamental investment limitations. The shareholders of the Portfolios approved each of the applicable proposals for DFAIDG and the Portfolios presented at the Meeting. Listed below are the voting results from the Meeting. Please note that not all Proposals presented at the Meeting were voted on by each Portfolio. Additionally, the Proposal numbers reflected below correlate to the Proposal numbers presented for vote at the Meeting.
DFAIDG
| | | | | | | | | | | | | | | | | | | | | | | | |
| | | | | Shares Voted | | Percent of Outstanding Shares Voted |
| | | | | For | | % | | Against | | % | | Abstain/WithHold | | % | | NonVote | | % | | For | | Against | | Abstain / WithHold |
Proposal 1: Election of Directors for DFAIDG* | | | | |
1a | | David G. Booth | | 5,100,343,281 | | 93.94% | | — | | 0.00% | | 328,971,623 | | 6.06% | | | | | | 81.55% | | 0.00% | | 5.26% |
| 1b | | George M. Constantinides | | 5,105,280,301 | | 94.03% | | — | | 0.00% | | 324,034,602 | | 5.97% | | | | | | 81.63% | | 0.00% | | 5.18% |
| 1c | | John P. Gould | | 5,100,584,112 | | 93.95% | | — | | 0.00% | | 328,730,791 | | 6.05% | | | | | | 81.55% | | 0.00% | | 5.26% |
| 1d | | Roger G. Ibbotson | | 5,105,426,112 | | 94.03% | | — | | 0.00% | | 323,888,792 | | 5.97% | | | | | | 81.63% | | 0.00% | | 5.18% |
| 1e | | Robert C. Merton | | 5,107,268,900 | | 94.07% | | — | | 0.00% | | 322,046,003 | | 5.93% | | | | | | 81.66% | | 0.00% | | 5.15% |
| 1f | | Myron S. Scholes | | 5,104,997,961 | | 94.03% | | — | | 0.00% | | 324,316,942 | | 5.97% | | | | | | 81.62% | | 0.00% | | 5.19% |
| 1g | | Eduardo A. Repetto | | 5,094,783,848 | | 93.84% | | — | | 0.00% | | 334,531,055 | | 6.16% | | | | | | 81.46% | | 0.00% | | 5.35% |
| 1h | | Abbie J. Smith | | 5,100,861,923 | | 93.95% | | — | | 0.00% | | 328,452,981 | | 6.05% | | | | | | 81.55% | | 0.00% | | 5.25% |
| | | | | | | | | | | | | | | | | | |
| | | Shares Voted | | Percent of Outstanding Shares Voted |
| | | For | | % | | Against | | % | | Abstain/WithHold | | % | | For | | Against | | Abstain / WithHold |
Proposal 2: To approve Articles of Amendment and Restatement for DFAIDG* | | 3,385,698,613 | | 93.83% | | 43,557,844 | | 1.21% | | 179,189,489 | | 4.97% | | 54.13% | | 0.70% | | 4.97% |
| * | Results are for all Portfolios within DFAIDG |
U.S. Large Company Portfolio
| | | | | | | | | | | | | | | | | | | | |
| | | | | Shares Voted | | Percent of Outstanding Shares Voted |
| | | | | For | | % | | Against | | % | | Abstain/WithHold | | % | | For | | Against | | Abstain / WithHold |
Proposals: | | | | | | | | | | | | | | | | | | |
5 | | To approve amendments to certain fundamental investment restrictions |
5a | | Borrowing Money | | 40,430,126 | | 80.58% | | 1,516,358 | | 3.02% | | 8,224,375 | | 16.39% | | 47.41% | | 1.78% | | 9.64% |
5b | | Making Loans | | 40,467,481 | | 80.66% | | 1,486,422 | | 2.96% | | 8,216,956 | | 16.38% | | 47.46% | | 1.74% | | 9.64% |
5c | | Investments in Real Estate | | 41,229,199 | | 82.18% | | 716,953 | | 1.43% | | 8,224,707 | | 16.39% | | 48.35% | | 0.84% | | 9.65% |
5d | | Investments in Commodities | | 40,474,610 | | 80.67% | | 1,471,256 | | 2.93% | | 8,224,993 | | 16.39% | | 47.46% | | 1.73% | | 9.65% |
5e | | Diversification of Investments | | 40,673,446 | | 81.07% | | 1,282,998 | | 2.56% | | 8,214,415 | | 16.37% | | 47.70% | | 1.50% | | 9.63% |
6 | | To approve the elimination of certain fundamental investment restrictions |
6a | | Pledging, Mortgaging, or Hypothecating Assets | | 40,286,840 | | 80.30% | | 1,636,196 | | 3.26% | | 8,247,823 | | 16.44% | | 47.24% | | 1.92% | | 9.67% |
6b | | Purchasing Securities on Margin | | 40,249,338 | | 80.22% | | 1,678,831 | | 3.35% | | 8,242,690 | | 16.43% | | 47.20% | | 1.97% | | 9.67% |
6c | | Investing in Restricted or Illiquid Securities | | 40,254,755 | | 80.24% | | 1,673,457 | | 3.34% | | 8,242,647 | | 16.43% | | 47.21% | | 1.96% | | 9.67% |
6d | | Investing for the Purpose of Exercising Control | | 40,412,651 | | 80.55% | | 1,506,361 | | 3.00% | | 8,251,847 | | 16.45% | | 47.39% | | 1.77% | | 9.68% |
6e | | Investing in Other Investment Companies | | 40,411,300 | | 80.55% | | 1,514,178 | | 3.02% | | 8,245,381 | | 16.43% | | 47.39% | | 1.78% | | 9.67% |
6f | | Management Ownership of Securities of an Issuer | | 40,509,353 | | 80.74% | | 1,400,147 | | 2.79% | | 8,261,359 | | 16.47% | | 47.51% | | 1.64% | | 9.69% |
6g | | Investing in Oil, Gas, or other Mineral Exploration, Leases or Development Programs | | 40,571,084 | | 80.87% | | 1,360,203 | | 2.71% | | 8,239,572 | | 16.42% | | 47.58% | | 1.60% | | 9.66% |
6h | | Investing in Securities of Unseasoned Issuers | | 40,332,047 | | 80.39% | | 1,592,824 | | 3.17% | | 8,245,988 | | 16.44% | | 47.30% | | 1.87% | | 9.67% |
6i | | Investing in Warrants | | 40,461,757 | | 80.65% | | 1,435,624 | | 2.86% | | 8,273,478 | | 16.49% | | 47.45% | | 1.68% | | 9.70% |
6j | | Writing or Acquiring Options | | 40,450,447 | | 80.63% | | 1,454,481 | | 2.90% | | 8,265,931 | | 16.48% | | 47.44% | | 1.71% | | 9.69% |
8 | | Approval of Investment Advisory Agreement between Dimensional Fund Advisors LP and the Company | | 41,387,142 | | 82.49% | | 542,566 | | 1.08% | | 8,241,151 | | 16.43% | | 48.53% | | 0.64% | | 9.66% |
236
Enhanced U.S. Large Company Portfolio
| | | | | | | | | | | | | | | | | | | | | | | | |
| | | | | Shares Voted | | Percent of Outstanding Shares Voted |
| | | | | For | | % | | Against | | % | | Abstain/WithHold | | % | | NonVote | | % | | For | | Against | | Abstain / WithHold |
Proposals: | | | | |
5 | | To approve amendments to certain fundamental investment restrictions | | | | |
5a | | Borrowing Money | | 15,387,271 | | 56.14% | | 40,860 | | 0.15% | | 394,026 | | 1.44% | | 11,586,812 | | 42.27% | | 56.13% | | 0.15% | | 1.44% |
5b | | Making Loans | | 15,381,417 | | 56.12% | | 50,690 | | 0.18% | | 390,050 | | 1.42% | | 11,586,812 | | 42.27% | | 56.11% | | 0.18% | | 1.42% |
5c | | Investments in Real Estate | | 15,387,025 | | 56.14% | | 44,866 | | 0.16% | | 390,266 | | 1.42% | | 11,586,812 | | 42.27% | | 56.13% | | 0.16% | | 1.42% |
5d | | Investments in Commodities | | 15,365,625 | | 56.06% | | 66,266 | | 0.24% | | 390,266 | | 1.42% | | 11,586,812 | | 42.27% | | 56.05% | | 0.24% | | 1.42% |
5e | | Diversification of Investments | | 15,392,316 | | 56.16% | | 39,575 | | 0.14% | | 390,266 | | 1.42% | | 11,586,812 | | 42.27% | | 56.15% | | 0.14% | | 1.42% |
6 | | To approve the elimination of certain fundamental investment restrictions | | | | |
6a | | Pledging, Mortgaging, or Hypothecating Assets | | 15,381,129 | | 56.12% | | 45,153 | | 0.16% | | 395,875 | | 1.44% | | 11,586,812 | | 42.27% | | 56.11% | | 0.16% | | 1.44% |
6b | | Purchasing Securities on Margin | | 15,384,140 | | 56.13% | | 42,142 | | 0.15% | | 395,875 | | 1.44% | | 11,586,812 | | 42.27% | | 56.12% | | 0.15% | | 1.44% |
6d | | Investing for the Purpose of Exercising Control | | 15,381,129 | | 56.12% | | 45,153 | | 0.16% | | 395,875 | | 1.44% | | 11,586,812 | | 42.27% | | 56.11% | | 0.16% | | 1.44% |
6e | | Investing in Other Investment Companies | | 15,372,610 | | 56.09% | | 42,874 | | 0.16% | | 406,673 | | 1.48% | | 11,586,812 | | 42.27% | | 56.08% | | 0.16% | | 1.48% |
6f | | Management Ownership of Securities of an Issuer | | 15,373,342 | | 56.09% | | 42,142 | | 0.15% | | 406,673 | | 1.48% | | 11,586,812 | | 42.27% | | 56.08% | | 0.15% | | 1.48% |
6h | | Investing in Securities of Unseasoned Issuers | | 15,370,330 | | 56.08% | | 50,977 | | 0.19% | | 400,850 | | 1.46% | | 11,586,812 | | 42.27% | | 56.07% | | 0.19% | | 1.46% |
6i | | Investing in Warrants | | 15,375,621 | | 56.10% | | 45,686 | | 0.17% | | 400,850 | | 1.46% | | 11,586,812 | | 42.27% | | 56.09% | | 0.17% | | 1.46% |
U.S. Large Cap Value Portfolio
| | | | | | | | | | | | | | | | | | | | |
| | | | | Shares Voted | | Percent of Outstanding Shares Voted |
| | | | | For | | % | | Against | | % | | Abstain/WithHold | | % | | For | | Against | | Abstain / WithHold |
Proposals: | | | | | | | | | | | | | | | | | | |
5 | | To approve amendments to certain fundamental investment restrictions |
5a | | Borrowing Money | | 172,893,840 | | 88.81% | | 7,186,773 | | 3.69% | | 14,599,592 | | 7.50% | | 46.64% | | 1.94% | | 3.94% |
5b | | Making Loans | | 172,791,986 | | 88.76% | | 7,254,169 | | 3.73% | | 14,634,050 | | 7.52% | | 46.61% | | 1.96% | | 3.95% |
5c | | Investments in Real Estate | | 175,160,321 | | 89.97% | | 4,984,199 | | 2.56% | | 14,535,685 | | 7.47% | | 47.25% | | 1.34% | | 3.92% |
5d | | Investments in Commodities | | 173,112,100 | | 88.92% | | 7,020,863 | | 3.61% | | 14,547,242 | | 7.47% | | 46.70% | | 1.89% | | 3.92% |
5e | | Diversification of Investments | | 174,205,973 | | 89.48% | | 6,003,329 | | 3.08% | | 14,470,903 | | 7.43% | | 46.99% | | 1.62% | | 3.90% |
6 | | To approve the elimination of certain fundamental investment restrictions |
6a | | Pledging, Mortgaging, or Hypothecating Assets | | 171,633,445 | | 88.16% | | 8,205,849 | | 4.22% | | 14,840,911 | | 7.62% | | 46.30% | | 2.21% | | 4.00% |
6b | | Purchasing Securities on Margin | | 171,417,311 | | 88.05% | | 8,446,023 | | 4.34% | | 14,816,871 | | 7.61% | | 46.24% | | 2.28% | | 4.00% |
6c | | Investing in Restricted or Illiquid Securities | | 171,472,444 | | 88.08% | | 8,394,752 | | 4.31% | | 14,813,009 | | 7.61% | | 46.25% | | 2.26% | | 4.00% |
6d | | Investing for the Purpose of Exercising Control | | 172,419,927 | | 88.57% | | 7,483,007 | | 3.84% | | 14,777,271 | | 7.59% | | 46.51% | | 2.02% | | 3.99% |
6e | | Investing in Other Investment Companies | | 172,365,026 | | 88.54% | | 7,593,625 | | 3.90% | | 14,721,554 | | 7.56% | | 46.50% | | 2.05% | | 3.97% |
6f | | Management Ownership of Securities of an Issuer | | 172,683,982 | | 88.70% | | 7,182,843 | | 3.69% | | 14,813,380 | | 7.61% | | 46.58% | | 1.94% | | 4.00% |
6g | | Investing in Oil, Gas, or other Mineral Exploration, Leases or Development Programs | | 173,364,846 | | 89.05% | | 6,724,869 | | 3.45% | | 14,590,490 | | 7.49% | | 46.77% | | 1.81% | | 3.94% |
6h | | Investing in Securities of Unseasoned Issuers | | 171,698,443 | | 88.20% | | 8,063,113 | | 4.14% | | 14,918,649 | | 7.66% | | 46.32% | | 2.18% | | 4.02% |
6i | | Investing in Warrants | | 172,471,724 | | 88.59% | | 7,221,658 | | 3.71% | | 14,986,823 | | 7.70% | | 46.52% | | 1.95% | | 4.04% |
6j | | Writing or Acquiring Options | | 172,546,830 | | 88.63% | | 7,283,118 | | 3.74% | | 14,850,257 | | 7.63% | | 46.54% | | 1.96% | | 4.01% |
8 | | Approval of Investment Advisory Agreement between Dimensional Fund Advisors LP and the Company | | 175,966,526 | | 90.39% | | 3,924,543 | | 2.02% | | 14,789,136 | | 7.60% | | 47.47% | | 1.06% | | 3.99% |
U.S. Targeted Value Portfolio
| | | | | | | | | | | | | | | | | | | | |
| | | | | Shares Voted | | Percent of Outstanding Shares Voted |
| | | | | For | | % | | Against | | % | | Abstain/WithHold | | % | | For | | Against | | Abstain / WithHold |
Proposals: | | | | | | | | | | | | | | | | | | |
5 | | To approve amendments to certain fundamental investment restrictions |
5a | | Borrowing Money | | 53,117,513 | | 85.60% | | 2,133,467 | | 3.44% | | 6,803,169 | | 10.96% | | 47.78% | | 1.92% | | 6.12% |
5b | | Making Loans | | 53,052,457 | | 85.49% | | 2,177,756 | | 3.51% | | 6,823,936 | | 11.00% | | 47.72% | | 1.96% | | 6.14% |
5c | | Investments in Real Estate | | 53,653,525 | | 86.46% | | 1,628,785 | | 2.62% | | 6,771,840 | | 10.91% | | 48.26% | | 1.47% | | 6.09% |
5d | | Investments in Commodities | | 52,832,185 | | 85.14% | | 2,453,403 | | 3.95% | | 6,768,562 | | 10.91% | | 47.52% | | 2.21% | | 6.09% |
5e | | Diversification of Investments | | 53,540,956 | | 86.28% | | 1,762,547 | | 2.84% | | 6,750,646 | | 10.88% | | 48.16% | | 1.59% | | 6.07% |
237
| | | | | | | | | | | | | | | | | | | | |
| | | | | Shares Voted | | Percent of Outstanding Shares Voted |
| | | | | For | | % | | Against | | % | | Abstain/WithHold | | % | | For | | Against | | Abstain / WithHold |
Proposals: | | | | | | | | | | | | | | | | | | |
6 | | To approve the elimination of certain fundamental investment restrictions |
6b | | Purchasing Securities on Margin | | 52,457,864 | | 84.54% | | 2,842,428 | | 4.58% | | 6,753,858 | | 10.88% | | 47.18% | | 2.56% | | 6.07% |
6e | | Investing in Other Investment Companies | | 53,069,209 | | 85.52% | | 2,199,274 | | 3.54% | | 6,785,666 | | 10.94% | | 47.73% | | 1.98% | | 6.10% |
U.S. Small Cap Value Portfolio
| | | | | | | | | | | | | | | | | | | | |
| | | | | Shares Voted | | Percent of Outstanding Shares Voted |
| | | | | For | | % | | Against | | % | | Abstain/WithHold | | % | | For | | Against | | Abstain / WithHold |
Proposals: | | | | | | | | | | | | | | | | | | |
5 | | To approve amendments to certain fundamental investment restrictions |
5a | | Borrowing Money | | 173,119,722 | | 92.72% | | 7,695,223 | | 4.12% | | 5,896,085 | | 3.16% | | 52.84% | | 2.35% | | 1.80% |
5b | | Making Loans | | 172,804,656 | | 92.55% | | 7,706,222 | | 4.13% | | 6,200,153 | | 3.32% | | 52.74% | | 2.35% | | 1.89% |
5c | | Investments in Real Estate | | 174,223,319 | | 93.31% | | 6,289,826 | | 3.37% | | 6,197,885 | | 3.32% | | 53.18% | | 1.92% | | 1.89% |
5d | | Investments in Commodities | | 173,534,303 | | 92.94% | | 7,026,376 | | 3.76% | | 6,150,351 | | 3.29% | | 52.97% | | 2.14% | | 1.88% |
5e | | Diversification of Investments | | 174,656,837 | | 93.54% | | 5,903,682 | | 3.16% | | 6,150,511 | | 3.29% | | 53.31% | | 1.80% | | 1.88% |
6 | | To approve the elimination of certain fundamental investment restrictions |
6a | | Pledging, Mortgaging, or Hypothecating Assets | | 171,661,614 | | 91.94% | | 8,760,032 | | 4.69% | | 6,289,384 | | 3.37% | | 52.39% | | 2.67% | | 1.92% |
6b | | Purchasing Securities on Margin | | 171,441,491 | | 91.82% | | 9,025,749 | | 4.83% | | 6,243,791 | | 3.34% | | 52.33% | | 2.75% | | 1.91% |
6c | | Investing in Restricted or Illiquid Securities | | 172,683,093 | | 92.49% | | 7,799,254 | | 4.18% | | 6,228,683 | | 3.34% | | 52.71% | | 2.38% | | 1.90% |
6d | | Investing for the Purpose of Exercising Control | | 172,786,379 | | 92.54% | | 7,641,558 | | 4.09% | | 6,283,093 | | 3.37% | | 52.74% | | 2.33% | | 1.92% |
6e | | Investing in Other Investment Companies | | 172,761,077 | | 92.53% | | 7,687,308 | | 4.12% | | 6,262,646 | | 3.35% | | 52.73% | | 2.35% | | 1.91% |
6f | | Management Ownership of Securities of an Issuer | | 172,799,765 | | 92.55% | | 7,635,419 | | 4.09% | | 6,275,846 | | 3.36% | | 52.74% | | 2.33% | | 1.92% |
6g | | Investing in Oil, Gas, or other Mineral Exploration, Leases or Development Programs | | 173,667,640 | | 93.01% | | 6,844,588 | | 3.67% | | 6,198,802 | | 3.32% | | 53.01% | | 2.09% | | 1.89% |
6h | | Investing in Securities of Unseasoned Issuers | | 173,452,804 | | 92.90% | | 7,025,400 | | 3.76% | | 6,232,826 | | 3.34% | | 52.94% | | 2.14% | | 1.90% |
6i | | Investing in Warrants | | 174,070,813 | | 93.23% | | 6,367,229 | | 3.41% | | 6,272,988 | | 3.36% | | 53.13% | | 1.94% | | 1.91% |
6j | | Writing or Acquiring Options | | 172,730,578 | | 92.51% | | 7,736,815 | | 4.14% | | 6,243,638 | | 3.34% | | 52.72% | | 2.36% | | 1.91% |
U.S. Core Equity 1 Portfolio
| | | | | | | | | | | | | | | | | | | | | | | | | | |
| | | | | Shares Voted | | Percent of Outstanding Shares Voted |
| | | For | | % | | Against | | % | | Abstain/WithHold | | % | | NonVote | | % | | For | | Against | | Abstain / WithHold | | Non-Vote |
Proposals: | | | | | | | | | | | | | | | | | | | | | | | | |
5 | | To approve amendments to certain fundamental investment restrictions |
5a | | Borrowing Money | | 104,483,941 | | 52.11% | | 1,098,003 | | 0.55% | | 1,009,578 | | 0.50% | | 93,932,769 | | 46.84% | | 51.39% | | 0.54% | | 0.50% | | NA |
5b | | Making Loans | | 104,358,224 | | 52.04% | | 1,139,060 | | 0.57% | | 1,094,238 | | 0.55% | | 93,932,769 | | 46.84% | | 51.33% | | 0.56% | | 0.54% | | NA |
5c | | Investments in Real Estate | | 104,566,166 | | 52.15% | | 982,878 | | 0.49% | | 1,042,478 | | 0.52% | | 93,932,769 | | 46.84% | | 51.43% | | 0.48% | | 0.51% | | NA |
5d | | Investments in Commodities | | 104,404,880 | | 52.07% | | 1,088,620 | | 0.54% | | 1,098,022 | | 0.55% | | 93,932,769 | | 46.84% | | 51.35% | | 0.54% | | 0.54% | | NA |
5e | | Diversification of Investments | | 104,679,991 | | 52.20% | | 932,378 | | 0.46% | | 979,153 | | 0.49% | | 93,932,769 | | 46.84% | | 51.49% | | 0.46% | | 0.48% | | NA |
U.S. Core Equity 2 Portfolio
| | | | | | | | | | | | | | | | | | | | | | | | | | |
| | | | | Shares Voted | | Percent of Outstanding Shares Voted |
| | | For | | % | | Against | | % | | Abstain/WithHold | | % | | NonVote | | % | | For | | Against | | Abstain / WithHold | | Non-Vote |
Proposals: | | | | | | | | | | | | | | | | | | | | | | | | |
5 | | To approve amendments to certain fundamental investment restrictions |
5a | | Borrowing Money | | 213,171,499 | | 62.76% | | 1,782,444 | | 0.52% | | 2,933,581 | | 0.86% | | 121,790,485 | | 35.85% | | 55.36% | | 0.46% | | 0.76% | | NA |
5b | | Making Loans | | 212,884,025 | | 62.67% | | 1,771,008 | | 0.52% | | 3,232,491 | | 0.95% | | 121,790,485 | | 35.85% | | 55.28% | | 0.46% | | 0.84% | | NA |
5c | | Investments in Real Estate | | 213,332,926 | | 62.80% | | 1,646,861 | | 0.48% | | 2,907,737 | | 0.86% | | 121,790,485 | | 35.85% | | 55.40% | | 0.43% | | 0.76% | | NA |
5d | | Investments in Commodities | | 213,163,570 | | 62.75% | | 1,876,742 | | 0.55% | | 2,847,212 | | 0.84% | | 121,790,485 | | 35.85% | | 55.35% | | 0.49% | | 0.74% | | NA |
5e | | Diversification of Investments | | 213,641,376 | | 62.90% | | 1,393,944 | | 0.41% | | 2,852,204 | | 0.84% | | 121,790,485 | | 35.85% | | 55.48% | | 0.36% | | 0.74% | | NA |
238
U.S. Vector Equity Portfolio
| | | | | | | | | | | | | | | | | | | | |
| | | | | Shares Voted | | Percent of Outstanding Shares Voted |
| | | | | For | | % | | Against | | % | | Abstain/WithHold | | % | | For | | Against | | Abstain / WithHold |
Proposals: | | | | | | | | | | | | | | | | | | |
5 | | To approve amendments to certain fundamental investment restrictions |
5a | | Borrowing Money | | 64,539,853 | | 94.75% | | 1,390,999 | | 2.04% | | 2,184,255 | | 3.21% | | 51.32% | | 1.11% | | 1.74% |
5b | | Making Loans | | 64,564,833 | | 94.79% | | 1,389,158 | | 2.04% | | 2,161,116 | | 3.17% | | 51.34% | | 1.10% | | 1.72% |
5c | | Investments in Real Estate | | 64,620,224 | | 94.87% | | 1,344,830 | | 1.97% | | 2,150,053 | | 3.16% | | 51.39% | | 1.07% | | 1.71% |
5d | | Investments in Commodities | | 64,507,548 | | 94.70% | | 1,443,149 | | 2.12% | | 2,164,410 | | 3.18% | | 51.30% | | 1.15% | | 1.72% |
5e | | Diversification of Investments | | 64,723,933 | | 95.02% | | 1,275,843 | | 1.87% | | 2,115,331 | | 3.11% | | 51.47% | | 1.01% | | 1.68% |
T.A. U.S. Core Equity 2 Portfolio
| | | | | | | | | | | | | | | | | | | | |
| | | | | Shares Voted | | Percent of Outstanding Shares Voted |
| | | | | For | | % | | Against | | % | | Abstain/WithHold | | % | | For | | Against | | Abstain / WithHold |
Proposals: | | | | | | | | | | | | | | | | | | |
5 | | To approve amendments to certain fundamental investment restrictions |
5a | | Borrowing Money | | 92,018,708 | | 91.72% | | 2,273,749 | | 2.27% | | 6,033,779 | | 6.01% | | 50.98% | | 1.26% | | 3.34% |
5b | | Making Loans | | 92,000,616 | | 91.70% | | 2,303,383 | | 2.30% | | 6,022,237 | | 6.00% | | 50.97% | | 1.28% | | 3.34% |
5c | | Investments in Real Estate | | 92,151,224 | | 91.85% | | 2,192,495 | | 2.19% | | 5,982,517 | | 5.96% | | 51.06% | | 1.21% | | 3.31% |
5d | | Investments in Commodities | | 92,398,250 | | 92.10% | | 1,909,189 | | 1.90% | | 6,018,797 | | 6.00% | | 51.19% | | 1.06% | | 3.33% |
5e | | Diversification of Investments | | 92,414,737 | | 92.11% | | 1,994,656 | | 1.99% | | 5,916,843 | | 5.90% | | 51.20% | | 1.11% | | 3.28% |
U.S. Small Cap Portfolio
| | | | | | | | | | | | | | | | | | | | | | | | | | |
| | | | | Shares Voted | | Percent of Outstanding Shares Voted |
| | | For | | % | | Against | | % | | Abstain/WithHold | | % | | NonVote | | % | | For | | Against | | Abstain / WithHold | | Non-Vote |
Proposals: | | | | | | | | | | | | | | | | | | | | | | | | |
5 | | To approve amendments to certain fundamental investment restrictions |
5a | | Borrowing Money | | 82,575,641 | | 57.01% | | 6,234,882 | | 4.30% | | 663,803 | | 0.46% | | 55,371,235 | | 38.23% | | 52.22% | | 3.94% | | 0.42% | | NA |
5b | | Making Loans | | 82,405,615 | | 56.89% | | 6,269,283 | | 4.33% | | 799,428 | | 0.55% | | 55,371,235 | | 38.23% | | 52.11% | | 3.96% | | 0.51% | | NA |
5c | | Investments in Real Estate | | 83,174,614 | | 57.42% | | 5,640,775 | | 3.89% | | 658,937 | | 0.45% | | 55,371,235 | | 38.23% | | 52.60% | | 3.57% | | 0.42% | | NA |
5d | | Investments in Commodities | | 82,541,203 | | 56.99% | | 6,276,843 | | 4.33% | | 656,280 | | 0.45% | | 55,371,235 | | 38.23% | | 52.20% | | 3.97% | | 0.41% | | NA |
5e | | Diversification of Investments | | 82,695,020 | | 57.09% | | 6,131,184 | | 4.23% | | 648,122 | | 0.45% | | 55,371,235 | | 38.23% | | 52.29% | | 3.88% | | 0.41% | | NA |
6 | | To approve the elimination of certain fundamental investment restrictions |
6a | | Pledging, Mortgaging, or Hypothecating Assets | | 82,406,144 | | 56.89% | | 6,379,410 | | 4.40% | | 688,772 | | 0.48% | | 55,371,235 | | 38.23% | | 52.11% | | 4.03% | | 0.44% | | NA |
6b | | Purchasing Securities on Margin | | 82,364,690 | | 56.86% | | 6,425,765 | | 4.44% | | 683,871 | | 0.47% | | 55,371,235 | | 38.23% | | 52.08% | | 4.06% | | 0.43% | | NA |
6c | | Investing in Restricted or Illiquid Securities | | 82,382,951 | | 56.88% | | 6,408,942 | | 4.42% | | 682,433 | | 0.47% | | 55,371,235 | | 38.23% | | 52.10% | | 4.05% | | 0.43% | | NA |
6d | | Investing for the Purpose of Exercising Control | | 82,193,695 | | 56.75% | | 6,595,405 | | 4.55% | | 685,226 | | 0.47% | | 55,371,235 | | 38.23% | | 51.98% | | 4.17% | | 0.43% | | NA |
6e | | Investing in Other Investment Companies | | 82,354,250 | | 56.86% | | 6,444,117 | | 4.45% | | 675,959 | | 0.47% | | 55,371,235 | | 38.23% | | 52.08% | | 4.07% | | 0.43% | | NA |
6f | | Management Ownership of Securities of an Issuer | | 82,495,363 | | 56.95% | | 6,289,478 | | 4.34% | | 689,485 | | 0.48% | | 55,371,235 | | 38.23% | | 52.17% | | 3.98% | | 0.44% | | NA |
6g | | Investing in Oil, Gas, or other Mineral Exploration, Leases or Development Programs | | 82,572,008 | | 57.01% | | 6,254,150 | | 4.32% | | 648,168 | | 0.45% | | 55,371,235 | | 38.23% | | 52.21% | | 3.95% | | 0.41% | | NA |
6h | | Investing in Securities of Unseasoned Issuers | | 82,229,235 | | 56.77% | | 6,552,410 | | 4.52% | | 692,681 | | 0.48% | | 55,371,235 | | 38.23% | | 52.00% | | 4.14% | | 0.44% | | NA |
6i | | Investing in Warrants | | 82,525,143 | | 56.97% | | 6,265,011 | | 4.33% | | 684,172 | | 0.47% | | 55,371,235 | | 38.23% | | 52.18% | | 3.96% | | 0.43% | | NA |
6j | | Writing or Acquiring Options | | 82,296,649 | | 56.82% | | 6,498,926 | | 4.49% | | 678,751 | | 0.47% | | 55,371,235 | | 38.23% | | 52.04% | | 4.11% | | 0.43% | | NA |
U.S. Micro Cap Portfolio
| | | | | | | | | | | | | | | | | | | | | | | | | | |
| | | | | Shares Voted | | | Percent of Outstanding Shares Voted | |
| | | | | For | | % | | | Against | | % | | | Abstain/WithHold | | % | | | For | | | Against | | | Abstain / WithHold | |
Proposals: | | | | | | | | | | | | | | | | | | | | | | | | |
5 | | To approve amendments to certain fundamental investment restrictions | |
5a | | Borrowing Money | | 164,980,200 | | 96.27 | % | | 3,066,686 | | 1.79 | % | | 3,319,399 | | 1.94 | % | | 54.77 | % | | 1.02 | % | | 1.10 | % |
5b | | Making Loans | | 164,907,178 | | 96.23 | % | | 3,097,794 | | 1.81 | % | | 3,361,313 | | 1.96 | % | | 54.74 | % | | 1.03 | % | | 1.12 | % |
5c | | Investments in Real Estate | | 165,176,839 | | 96.39 | % | | 2,886,113 | | 1.68 | % | | 3,303,333 | | 1.93 | % | | 54.83 | % | | 0.96 | % | | 1.10 | % |
5d | | Investments in Commodities | | 163,886,571 | | 95.64 | % | | 4,195,928 | | 2.45 | % | | 3,283,786 | | 1.92 | % | | 54.40 | % | | 1.39 | % | | 1.09 | % |
5e | | Diversification of Investments | | 165,476,898 | | 96.56 | % | | 2,620,926 | | 1.53 | % | | 3,268,461 | | 1.91 | % | | 54.93 | % | | 0.87 | % | | 1.09 | % |
6 | | To approve the elimination of certain fundamental investment restrictions | |
6a | | Pledging, Mortgaging, or Hypothecating Assets | | 163,544,790 | | 95.44 | % | | 4,428,988 | | 2.58 | % | | 3,392,506 | | 1.98 | % | | 54.29 | % | | 1.47 | % | | 1.13 | % |
239
| | | | | | | | | | | | | | | | | | | | |
| | | Shares Voted | | Percent of Outstanding Shares Voted |
| | | For | | % | | Against | | % | | Abstain/WithHold | | % | | For | | Against | | Abstain / WithHold |
Proposals: | | | | | | | | | | | | | | | | | | |
| | | | | | | | | | |
| 6b | | Purchasing Securities on Margin | | 163,473,742 | | 95.39% | | 4,520,335 | | 2.64% | | 3,372,208 | | 1.97% | | 54.27% | | 1.50% | | 1.12% |
| 6c | | Investing in Restricted or Illiquid Securities | | 163,626,099 | | 95.48% | | 4,371,813 | | 2.55% | | 3,368,374 | | 1.97% | | 54.32% | | 1.45% | | 1.12% |
| 6e | | Investing in Other Investment Companies | | 164,860,510 | | 96.20% | | 3,170,962 | | 1.85% | | 3,334,813 | | 1.95% | | 54.73% | | 1.05% | | 1.11% |
| 6f | | Management Ownership of Securities of an Issuer | | 165,048,646 | | 96.31% | | 2,969,253 | | 1.73% | | 3,348,387 | | 1.95% | | 54.79% | | 0.99% | | 1.11% |
| 6g | | Investing in Oil, Gas, or other Mineral Exploration, Leases or Development Programs | | 164,132,773 | | 95.78% | | 3,920,347 | | 2.29% | | 3,313,165 | | 1.93% | | 54.49% | | 1.30% | | 1.10% |
| 6i | | Investing in Warrants | | 165,149,647 | | 96.37% | | 2,844,275 | | 1.66% | | 3,372,363 | | 1.97% | | 54.82% | | 0.94% | | 1.12% |
| 6j | | Writing or Acquiring Options | | 165,066,228 | | 96.32% | | 2,958,519 | | 1.73% | | 3,341,538 | | 1.95% | | 54.80% | | 0.98% | | 1.11% |
|
| DFA Real Estate Securities Portfolio |
| | |
| | | Shares Voted | | Percent of Outstanding Shares Voted |
| | | For | | % | | Against | | % | | Abstain/WithHold | | % | | For | | Against | | Abstain / WithHold |
Proposals: | | | | | | | | | | | | | | | | | | |
| |
| 5 | | To approve amendments to certain fundamental investment restrictions |
| 5a | | Borrowing Money | | 61,754,553 | | 93.39% | | 1,889,527 | | 2.86% | | 2,480,208 | | 3.75% | | 52.56% | | 1.61% | | 2.11% |
| 5b | | Making Loans | | 61,717,979 | | 93.34% | | 1,938,943 | | 2.93% | | 2,467,366 | | 3.73% | | 52.53% | | 1.65% | | 2.10% |
| 5c | | Investments in Real Estate | | 62,160,227 | | 94.01% | | 1,481,985 | | 2.24% | | 2,482,076 | | 3.75% | | 52.91% | | 1.26% | | 2.11% |
| 5d | | Investments in Commodities | | 61,395,815 | | 92.85% | | 2,252,630 | | 3.41% | | 2,475,843 | | 3.74% | | 52.26% | | 1.92% | | 2.11% |
| 5e | | Diversification of Investments | | 62,144,270 | | 93.98% | | 1,529,527 | | 2.31% | | 2,450,491 | | 3.71% | | 52.90% | | 1.30% | | 2.09% |
| 6 | | To approve the elimination of certain fundamental investment restrictions |
| 6a | | Pledging, Mortgaging, or Hypothecating Assets | | 61,103,483 | | 92.41% | | 2,522,483 | | 3.81% | | 2,498,322 | | 3.78% | | 52.01% | | 2.15% | | 2.13% |
| 6b | | Purchasing Securities on Margin | | 61,040,406 | | 92.31% | | 2,607,638 | | 3.94% | | 2,476,244 | | 3.74% | | 51.96% | | 2.22% | | 2.11% |
| 6c | | Investing in Restricted or Illiquid Securities | | 61,152,163 | | 92.48% | | 2,491,475 | | 3.77% | | 2,480,650 | | 3.75% | | 52.05% | | 2.12% | | 2.11% |
| 6d | | Investing for the Purpose of Exercising Control | | 61,741,715 | | 93.37% | | 1,893,125 | | 2.86% | | 2,489,448 | | 3.76% | | 52.55% | | 1.61% | | 2.12% |
| 6e | | Investing in Other Investment Companies | | 61,680,175 | | 93.28% | | 1,962,785 | | 2.97% | | 2,481,328 | | 3.75% | | 52.50% | | 1.67% | | 2.11% |
| 6f | | Management Ownership of Securities of an Issuer | | 61,837,326 | | 93.52% | | 1,792,836 | | 2.71% | | 2,494,126 | | 3.77% | | 52.64% | | 1.53% | | 2.12% |
| 6g | | Investing in Oil, Gas, or other Mineral Exploration, Leases or Development Programs | | 61,567,170 | | 93.11% | | 2,111,244 | | 3.19% | | 2,445,874 | | 3.70% | | 52.41% | | 1.80% | | 2.08% |
| 6i | | Investing in Warrants | | 61,810,828 | | 93.48% | | 1,814,347 | | 2.74% | | 2,499,113 | | 3.78% | | 52.61% | | 1.54% | | 2.13% |
| 6j | | Writing or Acquiring Options | | 61,781,880 | | 93.43% | | 1,850,982 | | 2.80% | | 2,491,426 | | 3.77% | | 52.59% | | 1.58% | | 2.12% |
|
| Large Cap International Portfolio |
| | |
| | | Shares Voted | | Percent of Outstanding Shares Voted |
| | | For | | % | | Against | | % | | Abstain/WithHold | | % | | For | | Against | | Abstain / WithHold |
Proposals: | | | | | | | | | | | | | | | | | | |
| |
5 | | To approve amendments to certain fundamental investment restrictions |
| 5a | | Borrowing Money | | 37,997,717 | | 94.68% | | 873,247 | | 2.18% | | 1,263,266 | | 3.15% | | 50.99% | | 1.17% | | 1.70% |
| 5b | | Making Loans | | 37,952,326 | | 94.56% | | 930,997 | | 2.32% | | 1,250,907 | | 3.12% | | 50.93% | | 1.25% | | 1.68% |
| 5c | | Investments in Real Estate | | 37,421,132 | | 93.24% | | 1,513,828 | | 3.77% | | 1,199,271 | | 2.99% | | 50.22% | | 2.03% | | 1.61% |
| 5d | | Investments in Commodities | | 37,427,437 | | 93.26% | | 1,517,390 | | 3.78% | | 1,189,404 | | 2.96% | | 50.22% | | 2.04% | | 1.60% |
| 5e | | Diversification of Investments | | 38,181,915 | | 95.14% | | 774,663 | | 1.93% | | 1,177,653 | | 2.93% | | 51.24% | | 1.04% | | 1.58% |
| 6 | | To approve the elimination of certain fundamental investment restrictions |
| 6a | | Pledging, Mortgaging, or Hypothecating Assets | | 37,089,479 | | 92.41% | | 1,807,123 | | 4.50% | | 1,237,628 | | 3.08% | | 49.77% | | 2.42% | | 1.66% |
| 6b | | Purchasing Securities on Margin | | 37,110,845 | | 92.47% | | 1,790,428 | | 4.46% | | 1,232,957 | | 3.07% | | 49.80% | | 2.40% | | 1.65% |
| 6c | | Investing in Restricted or Illiquid Securities | | 37,035,863 | | 92.28% | | 1,861,009 | | 4.64% | | 1,237,358 | | 3.08% | | 49.70% | | 2.50% | | 1.66% |
| 6d | | Investing for the Purpose of Exercising Control | | 37,986,250 | | 94.65% | | 913,502 | | 2.28% | | 1,234,478 | | 3.08% | | 50.97% | | 1.23% | | 1.66% |
| 6e | | Investing in Other Investment Companies | | 37,922,294 | | 94.49% | | 982,986 | | 2.45% | | 1,228,950 | | 3.06% | | 50.89% | | 1.32% | | 1.65% |
| 6f | | Management Ownership of Securities of an Issuer | | 37,951,172 | | 94.56% | | 964,995 | | 2.40% | | 1,218,063 | | 3.03% | | 50.93% | | 1.29% | | 1.63% |
| 6g | | Investing in Oil, Gas, or other Mineral Exploration, Leases or Development Programs | | 37,396,426 | | 93.18% | | 1,493,613 | | 3.72% | | 1,244,191 | | 3.10% | | 50.18% | | 2.00% | | 1.67% |
240
| | | | | | | | | | | | | | | | | | | | |
| | | Shares Voted | | Percent of Outstanding Shares Voted |
| | | For | | % | | Against | | % | | Abstain/WithHold | | % | | For | | Against | | Abstain / WithHold |
Proposals: | | | | | | | | | | | | | | | | | | |
| | | | | | | | | | |
| 6h | | Investing in Securities of Unseasoned Issuers | | 37,762,857 | | 94.09% | | 1,085,971 | | 2.71% | | 1,285,402 | | 3.20% | | 50.67% | | 1.46% | | 1.72% |
| 6i | | Investing in Warrants | | 37,928,700 | | 94.50% | | 918,894 | | 2.29% | | 1,286,636 | | 3.21% | | 50.90% | | 1.23% | | 1.73% |
| 6j | | Writing or Acquiring Options | | 37,941,166 | | 94.54% | | 903,732 | | 2.25% | | 1,289,332 | | 3.21% | | 50.91% | | 1.21% | | 1.73% |
| 7a | | Proposed Sub-Advisory Agreement among Dimensional Fund Advisors LP, DFA Australia Limited, and the Company | | 38,233,655 | | 95.26% | | 584,902 | | 1.46% | | 1,315,673 | | 3.28% | | 51.31% | | 0.78% | | 1.77% |
| 7b | | Proposed Sub-Advisory Agreement among Dimensional Fund Advisors LP, Dimensional Fund Advisors Ltd., and the Company | | 38,232,780 | | 95.26% | | 584,735 | | 1.46% | | 1,316,715 | | 3.28% | | 51.30% | | 0.78% | | 1.77% |
International Core Equity Portfolio
| | | | | | | | | | | | | | | | | | | | | | | | |
| | | | | Shares Voted | | Percent of Outstanding Shares Voted |
| | | | | For | | % | | Against | | % | | Abstain/WithHold | | % | | NonVote | | % | | For | | Against | | Abstain / WithHold |
Proposals: | | | | | | | | | | | | | | | | | | | | | | |
| | | |
| 5 | | To approve amendments to certain fundamental investment restrictions | | | | |
| 5a | | Borrowing Money | | 177,373,455 | | 56.74% | | 4,154,996 | | 1.33% | | 4,660,259 | | 1.49% | | 126,424,297 | | 40.44% | | 53.06% | | 1.24% | | 1.39% |
| 5b | | Making Loans | | 176,924,084 | | 56.60% | | 4,414,472 | | 1.41% | | 4,850,153 | | 1.55% | | 126,424,297 | | 40.44% | | 52.92% | | 1.32% | | 1.45% |
| 5c | | Investments in Real Estate | | 177,497,921 | | 56.78% | | 4,005,870 | | 1.28% | | 4,684,919 | | 1.50% | | 126,424,297 | | 40.44% | | 53.10% | | 1.20% | | 1.40% |
| 5d | | Investments in Commodities | | 177,390,060 | | 56.74% | | 4,174,411 | | 1.34% | | 4,624,239 | | 1.48% | | 126,424,297 | | 40.44% | | 53.06% | | 1.25% | | 1.38% |
| 5e | | Diversification of Investments | | 177,693,681 | | 56.84% | | 3,871,733 | | 1.24% | | 4,623,296 | | 1.48% | | 126,424,297 | | 40.44% | | 53.16% | | 1.16% | | 1.38% |
T.A. World ex U.S. Core Equity Portfolio
| | | | | | | | | | | | | | | | | | | | |
| | | | | Shares Voted | | Percent of Outstanding Shares Voted |
| | | | | For | | % | | Against | | % | | Abstain/WithHold | | % | | For | | Against | | Abstain / WithHold |
Proposals: | | | | | | | | | | | | | | | | | | |
| |
5 | | To approve amendments to certain fundamental investment restrictions |
| 5a | | Borrowing Money | | 39,055,490 | | 91.06% | | 1,840,767 | | 4.29% | | 1,994,796 | | 4.65% | | 53.00% | | 2.50% | | 2.71% |
| 5b | | Making Loans | | 39,042,172 | | 91.03% | | 1,854,086 | | 4.32% | | 1,994,795 | | 4.65% | | 52.98% | | 2.52% | | 2.71% |
| 5c | | Investments in Real Estate | | 39,039,635 | | 91.02% | | 1,848,576 | | 4.31% | | 2,002,842 | | 4.67% | | 52.98% | | 2.51% | | 2.72% |
| 5d | | Investments in Commodities | | 39,107,803 | | 91.18% | | 1,808,202 | | 4.22% | | 1,975,048 | | 4.60% | | 53.07% | | 2.45% | | 2.68% |
| 5e | | Diversification of Investments | | 39,122,349 | | 91.21% | | 1,812,695 | | 4.23% | | 1,956,009 | | 4.56% | | 53.09% | | 2.46% | | 2.65% |
International Small Company Portfolio
| | | | | | | | | | | | | | | | | | | | |
| | | | | Shares Voted | | Percent of Outstanding Shares Voted |
| | | For | | % | | Against | | % | | Abstain/WithHold | | % | | For | | Against | | Abstain / WithHold |
Proposals: | | | | | | | | | | | | | | | | | | |
| |
| 5 | | To approve amendments to certain fundamental investment restrictions |
| 5a | | Borrowing Money | | 146,761,050 | | 82.53% | | 5,759,650 | | 3.24% | | 25,304,179 | | 14.23% | | 49.23% | | 1.93% | | 8.49% |
| 5b | | Making Loans | | 146,487,502 | | 82.38% | | 5,764,592 | | 3.24% | | 25,572,786 | | 14.38% | | 49.13% | | 1.93% | | 8.58% |
| 5c | | Investments in Real Estate | | 136,816,309 | | 76.94% | | 15,717,711 | | 8.84% | | 25,290,860 | | 14.22% | | 45.89% | | 5.27% | | 8.48% |
| 5d | | Investments in Commodities | | 146,666,615 | | 82.48% | | 5,882,289 | | 3.31% | | 25,275,976 | | 14.21% | | 49.19% | | 1.97% | | 8.48% |
| 5e | | Diversification of Investments | | 147,253,567 | | 82.81% | | 5,304,294 | | 2.98% | | 25,267,019 | | 14.21% | | 49.39% | | 1.78% | | 8.48% |
| 6 | | To approve the elimination of certain fundamental investment restrictions |
| 6a | | Pledging, Mortgaging, or Hypothecating Assets | | 146,450,914 | | 82.36% | | 6,115,754 | | 3.44% | | 25,258,212 | | 14.20% | | 49.12% | | 2.05% | | 8.47% |
| 6b | | Purchasing Securities on Margin | | 146,093,000 | | 82.16% | | 6,478,434 | | 3.64% | | 25,253,445 | | 14.20% | | 49.00% | | 2.17% | | 8.47% |
| 6d | | Investing for the Purpose of Exercising Control | | 146,487,649 | | 82.38% | | 6,046,180 | | 3.40% | | 25,291,052 | | 14.22% | | 49.13% | | 2.03% | | 8.48% |
| 6e | | Investing in Other Investment Companies | | 150,205,417 | | 84.47% | | 2,351,498 | | 1.32% | | 25,267,965 | | 14.21% | | 50.38% | | 0.79% | | 8.48% |
| 6f | | Management Ownership of Securities of an Issuer | | 147,009,760 | | 82.67% | | 5,540,873 | | 3.12% | | 25,274,247 | | 14.21% | | 49.31% | | 1.86% | | 8.48% |
| 6g | | Investing in Oil, Gas, or other Mineral Exploration, Leases or Development Programs | | 132,479,321 | | 74.50% | | 20,087,264 | | 11.30% | | 25,258,295 | | 14.20% | | 44.44% | | 6.74% | | 8.47% |
| 6h | | Investing in Securities of Unseasoned Issuers | | 137,270,123 | | 77.19% | | 15,257,960 | | 8.58% | | 25,296,797 | | 14.23% | | 46.04% | | 5.12% | | 8.49% |
| 6i | | Investing in Warrants | | 148,246,012 | | 83.37% | | 4,311,609 | | 2.42% | | 25,267,259 | | 14.21% | | 49.72% | | 1.45% | | 8.48% |
| 6j | | Writing or Acquiring Options | | 133,979,497 | | 75.34% | | 18,558,642 | | 10.44% | | 25,286,741 | | 14.22% | | 44.94% | | 6.22% | | 8.48% |
241
Japanese Small Company Portfolio
| | | | | | | | | | | | | | | | | | | | | | | | |
| | | Shares Voted | | Percent of Outstanding Shares Voted |
| | | For | | % | | Against | | % | | Abstain/WithHold | | % | | NonVote | | % | | For | | Against | | Abstain / WithHold |
Proposals: | | | | | | | | | | | | | | | | | | | | | | |
| |
| 5 | | To approve amendments to certain fundamental investment restrictions |
| 5a | | Borrowing Money | | 6,133,943 | | 80.60% | | 10,327 | | 0.14% | | 2,027 | | 0.03% | | 1,464,448 | | 19.24% | | 74.07% | | 0.12% | | 0.02% |
| 5b | | Making Loans | | 6,133,943 | | 80.60% | | 10,327 | | 0.14% | | 2,027 | | 0.03% | | 1,464,448 | | 19.24% | | 74.07% | | 0.12% | | 0.02% |
| 5c | | Investments in Real Estate | | 6,133,943 | | 80.60% | | 10,327 | | 0.14% | | 2,027 | | 0.03% | | 1,464,448 | | 19.24% | | 74.07% | | 0.12% | | 0.02% |
| 5d | | Investments in Commodities | | 6,135,575 | | 80.62% | | 8,694 | | 0.11% | | 2,028 | | 0.03% | | 1,464,448 | | 19.24% | | 74.09% | | 0.10% | | 0.02% |
| 5e | | Diversification of Investments | | 6,135,575 | | 80.62% | | 8,694 | | 0.11% | | 2,028 | | 0.03% | | 1,464,448 | | 19.24% | | 74.09% | | 0.10% | | 0.02% |
| 6 | | To approve the elimination of certain fundamental investment restrictions |
| 6a | | Pledging, Mortgaging, or Hypothecating Assets | | 6,133,943 | | 80.60% | | 10,327 | | 0.14% | | 2,027 | | 0.03% | | 1,464,448 | | 19.24% | | 74.07% | | 0.12% | | 0.02% |
| 6b | | Purchasing Securities on Margin | | 6,134,672 | | 80.61% | | 9,597 | | 0.13% | | 2,028 | | 0.03% | | 1,464,448 | | 19.24% | | 74.08% | | 0.12% | | 0.02% |
| 6c | | Investing in Restricted or Illiquid Securities | | 6,133,943 | | 80.60% | | 10,327 | | 0.14% | | 2,027 | | 0.03% | | 1,464,448 | | 19.24% | | 74.07% | | 0.12% | | 0.02% |
| 6d | | Investing for the Purpose of Exercising Control | | 6,004,971 | | 78.90% | | 139,298 | | 1.83% | | 2,027 | | 0.03% | | 1,464,448 | | 19.24% | | 72.51% | | 1.68% | | 0.02% |
| 6e | | Investing in Other Investment Companies | | 6,136,305 | | 80.63% | | 7,965 | | 0.10% | | 2,027 | | 0.03% | | 1,464,448 | | 19.24% | | 74.10% | | 0.10% | | 0.02% |
| 6f | | Management Ownership of Securities of an Issuer | | 6,134,672 | | 80.61% | | 9,597 | | 0.13% | | 2,028 | | 0.03% | | 1,464,448 | | 19.24% | | 74.08% | | 0.12% | | 0.02% |
| 6g | | Investing in Oil, Gas, or other Mineral Exploration, Leases or Development Programs | | 6,133,943 | | 80.60% | | 10,327 | | 0.14% | | 2,027 | | 0.03% | | 1,464,448 | | 19.24% | | 74.07% | | 0.12% | | 0.02% |
| 6h | | Investing in Securities of Unseasoned Issuers | | 6,005,700 | | 78.91% | | 138,569 | | 1.82% | | 2,028 | | 0.03% | | 1,464,448 | | 19.24% | | 72.52% | | 1.67% | | 0.02% |
| 6i | | Investing in Warrants | | 6,133,943 | | 80.60% | | 10,327 | | 0.14% | | 2,027 | | 0.03% | | 1,464,448 | | 19.24% | | 74.07% | | 0.12% | | 0.02% |
| 6j | | Writing or Acquiring Options | | 6,004,971 | | 78.90% | | 139,298 | | 1.83% | | 2,028 | | 0.03% | | 1,464,448 | | 19.24% | | 72.51% | | 1.68% | | 0.02% |
| 8 | | Approval of Investment Advisory Agreement between Dimensional Fund Advisors LP and the Company | | 6,136,900 | | 80.63% | | 7,370 | | 0.10% | | 2,027 | | 0.03% | | 1,464,448 | | 19.24% | | 74.10% | | 0.09% | | 0.02% |
|
| Asia Pacific Small Company Portfolio |
| | |
| | | Shares Voted | | Percent of Outstanding Shares Voted |
| | | For | | % | | Against | | % | | Abstain/WithHold | | % | | NonVote | | % | | For | | Against | | Abstain / WithHold |
Proposals: | | | | | | | | | | | | | | | | | | | | | | |
| |
| 5 | | To approve amendments to certain fundamental investment restrictions |
| 5a | | Borrowing Money | | 3,125,999 | | 65.79% | | 87,920 | | 1.85% | | 13,068 | | 0.28% | | 1,524,711 | | 32.09% | | 62.92% | | 1.77% | | 0.26% |
| 5b | | Making Loans | | 3,125,999 | | 65.79% | | 87,920 | | 1.85% | | 13,068 | | 0.28% | | 1,524,711 | | 32.09% | | 62.92% | | 1.77% | | 0.26% |
| 5c | | Investments in Real Estate | | 3,125,999 | | 65.79% | | 87,920 | | 1.85% | | 13,068 | | 0.28% | | 1,524,711 | | 32.09% | | 62.92% | | 1.77% | | 0.26% |
| 5d | | Investments in Commodities | | 3,127,867 | | 65.83% | | 86,052 | | 1.81% | | 13,068 | | 0.28% | | 1,524,711 | | 32.09% | | 62.96% | | 1.73% | | 0.26% |
| 5e | | Diversification of Investments | | 3,127,867 | | 65.83% | | 86,052 | | 1.81% | | 13,068 | | 0.28% | | 1,524,711 | | 32.09% | | 62.96% | | 1.73% | | 0.26% |
| 6 | | To approve the elimination of certain fundamental investment restrictions |
| 6a | | Pledging, Mortgaging, or Hypothecating Assets | | 3,124,333 | | 65.75% | | 88,471 | | 1.86% | | 14,183 | | 0.30% | | 1,524,711 | | 32.09% | | 62.89% | | 1.78% | | 0.29% |
| 6b | | Purchasing Securities on Margin | | 3,125,189 | | 65.77% | | 87,615 | | 1.84% | | 14,183 | | 0.30% | | 1,524,711 | | 32.09% | | 62.91% | | 1.76% | | 0.29% |
| 6c | | Investing in Restricted or Illiquid Securities | | 3,123,874 | | 65.74% | | 88,930 | | 1.87% | | 14,183 | | 0.30% | | 1,524,711 | | 32.09% | | 62.88% | | 1.79% | | 0.29% |
| 6d | | Investing for the Purpose of Exercising Control | | 3,020,946 | | 63.58% | | 191,858 | | 4.04% | | 14,183 | | 0.30% | | 1,524,711 | | 32.09% | | 60.81% | | 3.86% | | 0.29% |
| 6e | | Investing in Other Investment Companies | | 3,123,780 | | 65.74% | | 89,023 | | 1.87% | | 14,184 | | 0.30% | | 1,524,711 | | 32.09% | | 62.88% | | 1.79% | | 0.29% |
| 6f | | Management Ownership of Securities of an Issuer | | 3,124,333 | | 65.75% | | 88,471 | | 1.86% | | 14,183 | | 0.30% | | 1,524,711 | | 32.09% | | 62.89% | | 1.78% | | 0.29% |
| 6g | | Investing in Oil, Gas, or other Mineral Exploration, Leases or Development Programs | | 3,125,742 | | 65.78% | | 87,062 | | 1.83% | | 14,183 | | 0.30% | | 1,524,711 | | 32.09% | | 62.92% | | 1.75% | | 0.29% |
| 6h | | Investing in Securities of Unseasoned Issuers | | 3,019,079 | | 63.54% | | 193,725 | | 4.08% | | 14,183 | | 0.30% | | 1,524,711 | | 32.09% | | 60.77% | | 3.90% | | 0.29% |
| 6i | | Investing in Warrants | | 3,123,818 | | 65.74% | | 89,023 | | 1.87% | | 14,146 | | 0.30% | | 1,524,711 | | 32.09% | | 62.88% | | 1.79% | | 0.28% |
| 6j | | Writing or Acquiring Options | | 3,018,526 | | 63.53% | | 194,278 | | 4.09% | | 14,183 | | 0.30% | | 1,524,711 | | 32.09% | | 60.76% | | 3.91% | | 0.29% |
242
| | | | | | | | | | | | | | | | | | | | | | | | |
| | | | | Shares Voted | | Percent of Outstanding Shares Voted |
| | | | | For | | % | | Against | | % | | Abstain/WithHold | | % | | NonVote | | % | | For | | Against | | Abstain / WithHold |
Proposals: | | | | | | | | | | | | | | | | | | | | | | |
| | | | | | | | | | | | |
8 | | Approval of Investment Advisory Agreement between Dimensional Fund Advisors LP and the Company | | 3,128,063 | | 65.83% | | 85,856 | | 1.81% | | 13,068 | | 0.28% | | 1,524,711 | | 32.09% | | 62.96% | | 1.73% | | 0.26% |
|
| United Kingdom Small Company Portfolio |
| | | |
| | | | | Shares Voted | | Percent of Outstanding Shares Voted |
| | | | | For | | % | | Against | | % | | Abstain/WithHold | | % | | NonVote | | % | | For | | Against | | Abstain / WithHold |
Proposals: | | | | | | | | | | | | | | | | | | | | | | |
| | | |
5 | | To approve amendments to certain fundamental investment restrictions | | | | |
| 5a | | Borrowing Money | | 1,281,767 | | 83.93% | | 1,704 | | 0.11% | | 1,940 | | 0.13% | | 241,804 | | 15.83% | | 81.64% | | 0.11% | | 0.12% |
| 5b | | Making Loans | | 1,281,767 | | 83.93% | | 1,704 | | 0.11% | | 1,940 | | 0.13% | | 241,804 | | 15.83% | | 81.64% | | 0.11% | | 0.12% |
| 5c | | Investments in Real Estate | | 1,281,767 | | 83.93% | | 1,704 | | 0.11% | | 1,940 | | 0.13% | | 241,804 | | 15.83% | | 81.64% | | 0.11% | | 0.12% |
| 5d | | Investments in Commodities | | 1,281,767 | | 83.93% | | 1,704 | | 0.11% | | 1,940 | | 0.13% | | 241,804 | | 15.83% | | 81.64% | | 0.11% | | 0.12% |
| 5e | | Diversification of Investments | | 1,281,767 | | 83.93% | | 1,704 | | 0.11% | | 1,940 | | 0.13% | | 241,804 | | 15.83% | | 81.64% | | 0.11% | | 0.12% |
6 | | To approve the elimination of certain fundamental investment restrictions |
| 6a | | Pledging, Mortgaging, or Hypothecating Assets | | 1,281,767 | | 83.93% | | 1,704 | | 0.11% | | 1,940 | | 0.13% | | 241,804 | | 15.83% | | 81.64% | | 0.11% | | 0.12% |
| 6b | | Purchasing Securities on Margin | | 1,281,533 | | 83.91% | | 1,937 | | 0.13% | | 1,941 | | 0.13% | | 241,804 | | 15.83% | | 81.63% | | 0.12% | | 0.12% |
| 6c | | Investing in Restricted or Illiquid Securities | | 1,281,767 | | 83.93% | | 1,704 | | 0.11% | | 1,940 | | 0.13% | | 241,804 | | 15.83% | | 81.64% | | 0.11% | | 0.12% |
| 6d | | Investing for the Purpose of Exercising Control | | 1,226,898 | | 80.34% | | 56,572 | | 3.70% | | 1,941 | | 0.13% | | 241,804 | | 15.83% | | 78.15% | | 3.60% | | 0.12% |
| 6e | | Investing in Other Investment Companies | | 1,281,767 | | 83.93% | | 1,704 | | 0.11% | | 1,940 | | 0.13% | | 241,804 | | 15.83% | | 81.64% | | 0.11% | | 0.12% |
| 6f | | Management Ownership of Securities of an Issuer | | 1,281,767 | | 83.93% | | 1,704 | | 0.11% | | 1,940 | | 0.13% | | 241,804 | | 15.83% | | 81.64% | | 0.11% | | 0.12% |
| 6g | | Investing in Oil, Gas, or other Mineral Exploration, Leases or Development Programs | | 1,281,767 | | 83.93% | | 1,704 | | 0.11% | | 1,940 | | 0.13% | | 241,804 | | 15.83% | | 81.64% | | 0.11% | | 0.12% |
| 6h | | Investing in Securities of Unseasoned Issuers | | 1,226,898 | | 80.34% | | 56,572 | | 3.70% | | 1,941 | | 0.13% | | 241,804 | | 15.83% | | 78.15% | | 3.60% | | 0.12% |
| 6i | | Investing in Warrants | | 1,281,533 | | 83.91% | | 1,937 | | 0.13% | | 1,941 | | 0.13% | | 241,804 | | 15.83% | | 81.63% | | 0.12% | | 0.12% |
| 6j | | Writing or Acquiring Options | | 1,226,665 | | 80.32% | | 56,805 | | 3.72% | | 1,941 | | 0.13% | | 241,804 | | 15.83% | | 78.13% | | 3.62% | | 0.12% |
8 | | Approval of Investment Advisory Agreement between Dimensional Fund Advisors LP and the Company | | 1,281,840 | | 83.93% | | 1,630 | | 0.11% | | 1,941 | | 0.13% | | 241,804 | | 15.83% | | 81.65% | | 0.10% | | 0.12% |
|
| Continental Small Company Portfolio |
| | | |
| | | | | Shares Voted | | Percent of Outstanding Shares Voted |
| | | | | For | | % | | Against | | % | | Abstain/WithHold | | % | | NonVote | | % | | For | | Against | | Abstain / WithHold |
Proposals: | | | | | | | | | | | | | | | | | | | | | | |
| |
| 5 | | To approve amendments to certain fundamental investment restrictions |
| 5a | | Borrowing Money | | 5,570,603 | | 77.24% | | 24,245 | | 0.34% | | 22,517 | | 0.31% | | 1,595,160 | | 22.12% | | 74.40% | | 0.32% | | 0.30% |
| 5b | | Making Loans | | 5,428,383 | | 75.26% | | 166,465 | | 2.31% | | 22,517 | | 0.31% | | 1,595,160 | | 22.12% | | 72.50% | | 2.22% | | 0.30% |
| 5c | | Investments in Real Estate | | 5,570,603 | | 77.24% | | 24,245 | | 0.34% | | 22,517 | | 0.31% | | 1,595,160 | | 22.12% | | 74.40% | | 0.32% | | 0.30% |
| 5d | | Investments in Commodities | | 5,572,946 | | 77.27% | | 24,245 | | 0.34% | | 20,174 | | 0.28% | | 1,595,160 | | 22.12% | | 74.43% | | 0.32% | | 0.27% |
| 5e | | Diversification of Investments | | 5,570,603 | | 77.24% | | 24,245 | | 0.34% | | 22,517 | | 0.31% | | 1,595,160 | | 22.12% | | 74.40% | | 0.32% | | 0.30% |
| 6 | | To approve the elimination of certain fundamental investment restrictions |
| 6a | | Pledging, Mortgaging, or Hypothecating Assets | | 5,569,884 | | 77.23% | | 24,964 | | 0.35% | | 22,517 | | 0.31% | | 1,595,160 | | 22.12% | | 74.39% | | 0.33% | | 0.30% |
| 6b | | Purchasing Securities on Margin | | 5,569,884 | | 77.23% | | 24,964 | | 0.35% | | 22,517 | | 0.31% | | 1,595,160 | | 22.12% | | 74.39% | | 0.33% | | 0.30% |
| 6c | | Investing in Restricted or Illiquid Securities | | 5,413,476 | | 75.06% | | 181,373 | | 2.51% | | 22,516 | | 0.31% | | 1,595,160 | | 22.12% | | 72.30% | | 2.42% | | 0.30% |
| 6d | | Investing for the Purpose of Exercising Control | | 5,476,922 | | 75.94% | | 117,926 | | 1.64% | | 22,517 | | 0.31% | | 1,595,160 | | 22.12% | | 73.15% | | 1.58% | | 0.30% |
| 6e | | Investing in Other Investment Companies | | 5,414,106 | | 75.07% | | 180,742 | | 2.51% | | 22,517 | | 0.31% | | 1,595,160 | | 22.12% | | 72.31% | | 2.41% | | 0.30% |
| 6f | | Management Ownership of Securities of an Issuer | | 5,427,664 | | 75.25% | | 167,184 | | 2.32% | | 22,517 | | 0.31% | | 1,595,160 | | 22.12% | | 72.49% | | 2.23% | | 0.30% |
| 6g | | Investing in Oil, Gas, or other Mineral Exploration, Leases or Development Programs | | 5,569,884 | | 77.23% | | 24,964 | | 0.35% | | 22,517 | | 0.31% | | 1,595,160 | | 22.12% | | 74.39% | | 0.33% | | 0.30% |
243
| | | | | | | | | | | | | | | | | | | | | | | | |
| | | | | Shares Voted | | Percent of Outstanding Shares Voted |
| | | | | For | | % | | Against | | % | | Abstain/WithHold | | % | | NonVote | | % | | For | | Against | | Abstain / WithHold |
Proposals: | | | | | | | | | | | | | | | | | | | | | | |
| | | | | | | | | | | | |
| 6h | | Investing in Securities of Unseasoned Issuers | | 5,463,995 | | 75.76% | | 130,853 | | 1.81% | | 22,517 | | 0.31% | | 1,595,160 | | 22.12% | | 72.98% | | 1.75% | | 0.30% |
| 6i | | Investing in Warrants | | 5,569,884 | | 77.23% | | 24,964 | | 0.35% | | 22,517 | | 0.31% | | 1,595,160 | | 22.12% | | 74.39% | | 0.33% | | 0.30% |
| 6j | | Writing or Acquiring Options | | 5,476,922 | | 75.94% | | 117,926 | | 1.64% | | 22,517 | | 0.31% | | 1,595,160 | | 22.12% | | 73.15% | | 1.58% | | 0.30% |
| 8 | | Approval of Investment Advisory Agreement between Dimensional Fund Advisors LP and the Company | | 5,428,490 | | 75.26% | | 166,358 | | 2.31% | | 22,517 | | 0.31% | | 1,595,160 | | 22.12% | | 72.50% | | 2.22% | | 0.30% |
|
| DFA International Real Estate Securities Portfolio |
| | | |
| | | | | Shares Voted | | Percent of Outstanding Shares Voted |
| | | | | For | | % | | Against | | % | | Abstain/WithHold | | % | | NonVote | | % | | For | | Against | | Abstain / WithHold |
Proposals: | | | | | | | | | | | | | | | | | | | | | | |
| | | |
| 5 | | To approve amendments to certain fundamental investment restrictions | | | | |
| 5a | | Borrowing Money | | 60,208,121 | | 57.02% | | 847,657 | | 0.80% | | 924,740 | | 0.88% | | 43,608,759 | | 41.30% | | 51.93% | | 0.73% | | 0.80% |
| 5b | | Making Loans | | 60,111,915 | | 56.93% | | 856,731 | | 0.81% | | 1,011,872 | | 0.96% | | 43,608,759 | | 41.30% | | 51.85% | | 0.74% | | 0.87% |
| 5c | | Investments in Real Estate | | 60,225,576 | | 57.04% | | 837,514 | | 0.79% | | 917,428 | | 0.87% | | 43,608,759 | | 41.30% | | 51.95% | | 0.72% | | 0.79% |
| 5d | | Investments in Commodities | | 60,227,589 | | 57.04% | | 836,068 | | 0.79% | | 916,861 | | 0.87% | | 43,608,759 | | 41.30% | | 51.95% | | 0.72% | | 0.79% |
| 5e | | Diversification of Investments | | 60,072,714 | | 56.89% | | 991,378 | | 0.94% | | 916,426 | | 0.87% | | 43,608,759 | | 41.30% | | 51.81% | | 0.86% | | 0.79% |
DFA Global Real Estate Securities Portfolio
| | | | | | | | | | | | | | | | | | | | |
| | | Shares Voted | | Percent of Outstanding Shares Voted |
| | | For | | % | | Against | | % | | Abstain/WithHold | | % | | For | | Against | | Abstain / WithHold |
Proposals: | | | | | | | | | | | | | | | | | | |
| |
5 | | To approve amendments to certain fundamental investment restrictions |
| 5a | | Borrowing Money | | 16,862,648 | | 76.95% | | 525,109 | | 2.40% | | 4,524,924 | | 20.65% | | 47.50% | | 1.48% | | 12.75% |
| 5b | | Making Loans | | 16,870,688 | | 76.99% | | 525,109 | | 2.40% | | 4,516,884 | | 20.61% | | 47.53% | | 1.48% | | 12.72% |
| 5c | | Investments in Real Estate | | 16,877,330 | | 77.02% | | 512,787 | | 2.34% | | 4,522,564 | | 20.64% | | 47.54% | | 1.44% | | 12.74% |
| 5d | | Investments in Commodities | | 16,862,467 | | 76.95% | | 556,044 | | 2.54% | | 4,494,170 | | 20.51% | | 47.50% | | 1.57% | | 12.66% |
| 5e | | Diversification of Investments | | 16,885,025 | | 77.06% | | 510,772 | | 2.33% | | 4,516,884 | | 20.61% | | 47.57% | | 1.44% | | 12.72% |
|
| DFA International Small Cap Value Portfolio |
| | |
| | | Shares Voted | | Percent of Outstanding Shares Voted |
| | | For | | % | | Against | | % | | Abstain/WithHold | | % | | For | | Against | | Abstain / WithHold |
Proposals: | | | | | | | | | | | | | | | | | | |
| |
5 | | To approve amendments to certain fundamental investment restrictions |
| 5a | | Borrowing Money | | 241,024,647 | | 90.81% | | 16,685,673 | | 6.29% | | 7,720,246 | | 2.91% | | 54.48% | | 3.77% | | 1.74% |
| 5b | | Making Loans | | 246,529,473 | | 92.88% | | 10,966,978 | | 4.13% | | 7,934,116 | | 2.99% | | 55.72% | | 2.48% | | 1.79% |
| 5c | | Investments in Real Estate | | 243,318,088 | | 91.67% | | 14,402,198 | | 5.43% | | 7,710,280 | | 2.90% | | 55.00% | | 3.26% | | 1.74% |
| 5d | | Investments in Commodities | | 246,941,521 | | 93.03% | | 10,784,598 | | 4.06% | | 7,704,447 | | 2.90% | | 55.81% | | 2.44% | | 1.74% |
| 5e | | Diversification of Investments | | 247,689,322 | | 93.32% | | 10,372,791 | | 3.91% | | 7,368,453 | | 2.78% | | 55.98% | | 2.34% | | 1.67% |
6 | | To approve the elimination of certain fundamental investment restrictions |
| 6a | | Pledging, Mortgaging, or Hypothecating Assets | | 240,479,220 | | 90.60% | | 17,424,322 | | 6.56% | | 7,527,025 | | 2.84% | | 54.35% | | 3.94% | | 1.70% |
| 6b | | Purchasing Securities on Margin | | 231,448,174 | | 87.20% | | 26,471,659 | | 9.97% | | 7,510,734 | | 2.83% | | 52.31% | | 5.98% | | 1.70% |
| 6c | | Investing in Restricted or Illiquid Securities | | 246,099,078 | | 92.72% | | 11,923,494 | | 4.49% | | 7,407,995 | | 2.79% | | 55.62% | | 2.70% | | 1.67% |
| 6d | | Investing for the Purpose of Exercising Control | | 247,063,679 | | 93.08% | | 10,955,999 | | 4.13% | | 7,410,888 | | 2.79% | | 55.84% | | 2.48% | | 1.68% |
| 6e | | Investing in Other Investment Companies | | 246,884,157 | | 93.01% | | 11,150,453 | | 4.20% | | 7,395,957 | | 2.79% | | 55.80% | | 2.52% | | 1.67% |
| 6f | | Management Ownership of Securities of an Issuer | | 246,927,220 | | 93.03% | | 10,962,683 | | 4.13% | | 7,540,664 | | 2.84% | | 55.81% | | 2.48% | | 1.70% |
| 6g | | Investing in Oil, Gas, or other Mineral Exploration, Leases or Development Programs | | 247,330,663 | | 93.18% | | 10,697,732 | | 4.03% | | 7,402,171 | | 2.79% | | 55.90% | | 2.42% | | 1.67% |
| 6h | | Investing in Securities of Unseasoned Issuers | | 247,045,502 | | 93.07% | | 10,940,101 | | 4.12% | | 7,444,963 | | 2.80% | | 55.84% | | 2.47% | | 1.68% |
| 6i | | Investing in Warrants | | 247,420,726 | | 93.21% | | 10,575,200 | | 3.98% | | 7,434,640 | | 2.80% | | 55.92% | | 2.39% | | 1.68% |
| 6j | | Writing or Acquiring Options | | 236,706,345 | | 89.18% | | 21,199,007 | | 7.99% | | 7,525,215 | | 2.84% | | 53.50% | | 4.79% | | 1.70% |
244
| | | | | | | | | | | | | | | | | | | | |
| | | Shares Voted | | Percent of Outstanding Shares Voted |
| | | For | | % | | Against | | % | | Abstain/WithHold | | % | | For | | Against | | Abstain / WithHold |
Proposals: | | | | | | | | | | | | | | | | | | |
| | | | | | | | | | |
| 7a | | Proposed Sub-Advisory Agreement among Dimensional Fund Advisors LP, DFA Australia Limited, and the Company | | 256,232,261 | | 96.53% | | 1,564,025 | | 0.59% | | 7,634,280 | | 2.88% | | 57.91% | | 0.35% | | 1.73% |
| 7b | | Proposed Sub-Advisory Agreement among Dimensional Fund Advisors LP, Dimensional Fund Advisors Ltd., and the Company | | 256,223,264 | | 96.53% | | 1,572,911 | | 0.59% | | 7,634,391 | | 2.88% | | 57.91% | | 0.36% | | 1.73% |
International Vector Equity Portfolio
| | | | | | | | | | | | | | | | | | | | | | | | |
| | | | | Shares Voted | | Percent of Outstanding Shares Voted |
| | | | | For | | % | | Against | | % | | Abstain/WithHold | | % | | NonVote | | % | | For | | Against | | Abstain / WithHold |
Proposals: | | | | | | | | | | | | | | | | | | | | | | |
| | | |
| 5 | | To approve amendments to certain fundamental investment restrictions | | | | |
| 5a | | Borrowing Money | | 12,634,182 | | 53.44% | | 339,533 | | 1.44% | | 95,624 | | 0.40% | | 10,572,971 | | 44.72% | | 53.01% | | 1.42% | | 0.40% |
| 5b | | Making Loans | | 12,635,088 | | 53.44% | | 338,627 | | 1.43% | | 95,624 | | 0.40% | | 10,572,971 | | 44.72% | | 53.01% | | 1.42% | | 0.40% |
| 5c | | Investments in Real Estate | | 12,639,741 | | 53.46% | | 333,973 | | 1.41% | | 95,624 | | 0.40% | | 10,572,971 | | 44.72% | | 53.03% | | 1.40% | | 0.40% |
| 5d | | Investments in Commodities | | 12,636,624 | | 53.45% | | 337,090 | | 1.43% | | 95,624 | | 0.40% | | 10,572,971 | | 44.72% | | 53.02% | | 1.41% | | 0.40% |
| 5e | | Diversification of Investments | | 12,649,164 | | 53.50% | | 315,724 | | 1.34% | | 104,451 | | 0.44% | | 10,572,971 | | 44.72% | | 53.07% | | 1.32% | | 0.44% |
Emerging Markets Portfolio
| | | | | | | | | | | | | | | | | | | | |
| | | Shares Voted | | Percent of Outstanding Shares Voted |
| | | For | | % | | Against | | % | | Abstain/WithHold | | % | | For | | Against | | Abstain / WithHold |
Proposals: | | | | | | | | | | | | | | | | | | |
| |
5 | | To approve amendments to certain fundamental investment restrictions |
| 5a | | Borrowing Money | | 37,169,348 | | 93.78% | | 1,245,444 | | 3.14% | | 1,221,412 | | 3.08% | | 47.22% | | 1.58% | | 1.55% |
| 5b | | Making Loans | | 37,216,081 | �� | 93.89% | | 1,177,804 | | 2.97% | | 1,242,319 | | 3.13% | | 47.28% | | 1.50% | | 1.58% |
| 5c | | Investments in Real Estate | | 37,416,071 | | 94.40% | | 1,013,151 | | 2.56% | | 1,206,982 | | 3.05% | | 47.53% | | 1.29% | | 1.53% |
| 5d | | Investments in Commodities | | 37,201,487 | | 93.86% | | 1,224,791 | | 3.09% | | 1,209,926 | | 3.05% | | 47.26% | | 1.56% | | 1.54% |
| 5e | | Diversification of Investments | | 37,578,860 | | 94.81% | | 850,957 | | 2.15% | | 1,206,387 | | 3.04% | | 47.74% | | 1.08% | | 1.53% |
6 | | To approve the elimination of certain fundamental investment restrictions |
| 6a | | Pledging, Mortgaging, or Hypothecating Assets | | 36,955,077 | | 93.24% | | 1,405,465 | | 3.55% | | 1,275,662 | | 3.22% | | 46.95% | | 1.79% | | 1.62% |
| 6b | | Purchasing Securities on Margin | | 36,960,851 | | 93.25% | | 1,412,821 | | 3.56% | | 1,262,532 | | 3.19% | | 46.95% | | 1.79% | | 1.60% |
| 6c | | Investing in Restricted or Illiquid Securities | | 36,949,469 | | 93.22% | | 1,413,050 | | 3.57% | | 1,273,685 | | 3.21% | | 46.94% | | 1.80% | | 1.62% |
| 6d | | Investing for the Purpose of Exercising Control | | 37,109,742 | | 93.63% | | 1,268,403 | | 3.20% | | 1,258,059 | | 3.17% | | 47.14% | | 1.61% | | 1.60% |
| 6e | | Investing in Other Investment Companies | | 37,246,632 | | 93.97% | | 1,130,044 | | 2.85% | | 1,259,528 | | 3.18% | | 47.32% | | 1.44% | | 1.60% |
| 6f | | Management Ownership of Securities of an Issuer | | 37,303,599 | | 94.11% | | 1,062,837 | | 2.68% | | 1,269,768 | | 3.20% | | 47.39% | | 1.35% | | 1.61% |
| 6g | | Investing in Oil, Gas, or other Mineral Exploration, Leases or Development Programs | | 34,987,306 | | 88.27% | | 3,417,693 | | 8.62% | | 1,231,206 | | 3.11% | | 44.45% | | 4.34% | | 1.56% |
| 6h | | Investing in Securities of Unseasoned Issuers | | 37,137,132 | | 93.69% | | 1,223,800 | | 3.09% | | 1,275,272 | | 3.22% | | 47.18% | | 1.55% | | 1.62% |
| 6i | | Investing in Warrants | | 37,332,785 | | 94.19% | | 1,044,802 | | 2.64% | | 1,258,617 | | 3.18% | | 47.43% | | 1.33% | | 1.60% |
| 6j | | Writing or Acquiring Options | | 37,208,618 | | 93.88% | | 1,176,807 | | 2.97% | | 1,250,779 | | 3.16% | | 47.27% | | 1.49% | | 1.59% |
| 8 | | Approval of Investment Advisory Agreement between Dimensional Fund Advisors LP and the Company | | 37,650,756 | | 94.99% | | 719,321 | | 1.81% | | 1,266,127 | | 3.19% | | 47.83% | | 0.91% | | 1.61% |
|
| Emerging Markets Small Cap Portfolio |
| | |
| | | Shares Voted | | Percent of Outstanding Shares Voted |
| | | For | | % | | Against | | % | | Abstain/WithHold | | % | | For | | Against | | Abstain / WithHold |
Proposals: | | | | | | | | | | | | | | | | | | |
| |
5 | | To approve amendments to certain fundamental investment restrictions |
| 5a | | Borrowing Money | | 34,906,600 | | 96.69% | | 636,885 | | 1.76% | | 558,129 | | 1.55% | | 57.34% | | 1.05% | | 0.92% |
| 5b | | Making Loans | | 34,860,289 | | 96.56% | | 648,269 | | 1.80% | | 593,056 | | 1.64% | | 57.27% | | 1.06% | | 0.97% |
| 5c | | Investments in Real Estate | | 34,900,964 | | 96.67% | | 641,082 | | 1.78% | | 559,568 | | 1.55% | | 57.34% | | 1.05% | | 0.92% |
| 5d | | Investments in Commodities | | 34,808,353 | | 96.42% | | 738,763 | | 2.05% | | 554,498 | | 1.54% | | 57.18% | | 1.21% | | 0.91% |
245
| | | | | | | | | | | | | | | | | | | | |
| | | Shares Voted | | Percent of Outstanding Shares Voted |
| | | For | | % | | Against | | % | | Abstain/WithHold | | % | | For | | Against | | Abstain / WithHold |
Proposals: | | | | | | | | | | | | | | | | | | |
| | | | | | | | | | |
| 5e | | Diversification of Investments | | 35,011,893 | | 96.98% | | 536,458 | | 1.49% | | 553,263 | | 1.53% | | 57.52% | | 0.88% | | 0.91% |
6 | | To approve the elimination of certain fundamental investment restrictions |
| 6a | | Pledging, Mortgaging, or Hypothecating Assets | | 34,721,947 | | 96.18% | | 819,310 | | 2.27% | | 560,357 | | 1.55% | | 57.04% | | 1.35% | | 0.92% |
| 6b | | Purchasing Securities on Margin | | 34,707,419 | | 96.14% | | 839,880 | | 2.33% | | 554,315 | | 1.54% | | 57.02% | | 1.38% | | 0.91% |
| 6d | | Investing for the Purpose of Exercising Control | | 34,904,556 | | 96.68% | | 640,251 | | 1.77% | | 556,807 | | 1.54% | | 57.34% | | 1.05% | | 0.91% |
| 6e | | Investing in Other Investment Companies | | 34,889,974 | | 96.64% | | 657,584 | | 1.82% | | 554,056 | | 1.53% | | 57.32% | | 1.08% | | 0.91% |
| 6f | | Management Ownership of Securities of an Issuer | | 34,978,653 | | 96.89% | | 564,851 | | 1.56% | | 558,110 | | 1.55% | | 57.46% | | 0.93% | | 0.92% |
| 6g | | Investing in Oil, Gas, or other Mineral Exploration, Leases or Development Programs | | 34,877,263 | | 96.61% | | 665,189 | | 1.84% | | 559,162 | | 1.55% | | 57.30% | | 1.09% | | 0.92% |
| 6h | | Investing in Securities of Unseasoned Issuers | | 34,951,721 | | 96.81% | | 593,562 | | 1.64% | | 556,331 | | 1.54% | | 57.42% | | 0.98% | | 0.91% |
| 6i | | Investing in Warrants | | 34,929,577 | | 96.75% | | 610,801 | | 1.69% | | 561,236 | | 1.55% | | 57.38% | | 1.00% | | 0.92% |
| 6j | | Writing or Acquiring Options | | 34,985,838 | | 96.91% | | 555,585 | | 1.54% | | 560,191 | | 1.55% | | 57.47% | | 0.91% | | 0.92% |
8 | | Approval of Investment Advisory Agreement between Dimensional Fund Advisors LP and the Company | | 35,075,885 | | 97.16% | | 462,218 | | 1.28% | | 563,511 | | 1.56% | | 57.62% | | 0.76% | | 0.93% |
|
| Emerging Markets Core Equity Portfolio |
| | |
| | | Shares Voted | | Percent of Outstanding Shares Voted |
| | | For | | % | | Against | | % | | Abstain/WithHold | | % | | For | | Against | | Abstain / WithHold |
Proposals: | | | | | | | | | | | | | | | | | | |
| |
5 | | To approve amendments to certain fundamental investment restrictions |
| 5a | | Borrowing Money | | 76,691,134 | | 94.65% | | 1,233,644 | | 1.52% | | 3,102,222 | | 3.83% | | 54.29% | | 0.87% | | 2.20% |
| 5b | | Making Loans | | 76,467,186 | | 94.37% | | 1,229,941 | | 1.52% | | 3,329,873 | | 4.11% | | 54.13% | | 0.87% | | 2.36% |
| 5c | | Investments in Real Estate | | 76,841,272 | | 94.83% | | 1,091,087 | | 1.35% | | 3,094,641 | | 3.82% | | 54.40% | | 0.77% | | 2.19% |
| 5d | | Investments in Commodities | | 76,729,334 | | 94.70% | | 1,195,718 | | 1.48% | | 3,101,948 | | 3.83% | | 54.32% | | 0.85% | | 2.20% |
| 5e | | Diversification of Investments | | 76,941,496 | | 94.96% | | 989,883 | | 1.22% | | 3,095,621 | | 3.82% | | 54.47% | | 0.70% | | 2.19% |
7a | | Proposed Sub-Advisory Agreement among Dimensional Fund Advisors LP, DFA Australia Limited, and the Company | | 76,964,499 | | 94.99% | | 897,886 | | 1.11% | | 3,164,615 | | 3.91% | | 54.48% | | 0.64% | | 2.24% |
7b | | Proposed Sub-Advisory Agreement among Dimensional Fund Advisors LP, Dimensional Fund Advisors Ltd., and the Company | | 76,970,688 | | 94.99% | | 888,008 | | 1.10% | | 3,168,304 | | 3.91% | | 54.49% | | 0.63% | | 2.24% |
|
| DFA One-Year Fixed Income Portfolio |
| | |
| | | Shares Voted | | Percent of Outstanding Shares Voted |
| | | For | | % | | Against | | % | | Abstain/WithHold | | % | | For | | Against | | Abstain / WithHold |
Proposals: | | | | | | | | | | | | | | | | | | |
| |
5 | | To approve amendments to certain fundamental investment restrictions |
| 5a | | Borrowing Money | | 153,377,768 | | 91.51% | | 6,144,346 | | 3.67% | | 8,089,183 | | 4.83% | | 48.46% | | 1.94% | | 2.56% |
| 5b | | Making Loans | | 152,748,450 | | 91.13% | | 6,592,602 | | 3.93% | | 8,270,245 | | 4.93% | | 48.26% | | 2.08% | | 2.61% |
| 5c | | Investments in Real Estate | | 154,207,507 | | 92.00% | | 5,311,570 | | 3.17% | | 8,092,220 | | 4.83% | | 48.72% | | 1.68% | | 2.56% |
| 5d | | Investments in Commodities | | 152,064,206 | | 90.72% | | 7,572,711 | | 4.52% | | 7,974,380 | | 4.76% | | 48.04% | | 2.39% | | 2.52% |
| 5e | | Diversification of Investments | | 154,698,156 | | 92.30% | | 5,086,651 | | 3.03% | | 7,826,490 | | 4.67% | | 48.87% | | 1.61% | | 2.47% |
6 | | To approve the elimination of certain fundamental investment restrictions |
| 6a | | Pledging, Mortgaging, or Hypothecating Assets | | 150,707,343 | | 89.91% | | 8,650,102 | | 5.16% | | 8,253,852 | | 4.92% | | 47.61% | | 2.73% | | 2.61% |
| 6b | | Purchasing Securities on Margin | | 150,472,257 | | 89.77% | | 8,973,993 | | 5.35% | | 8,165,047 | | 4.87% | | 47.54% | | 2.84% | | 2.58% |
| 6c | | Investing in Restricted or Illiquid Securities | | 150,768,260 | | 89.95% | | 8,621,479 | | 5.14% | | 8,221,558 | | 4.91% | | 47.63% | | 2.72% | | 2.60% |
| 6d | | Investing for the Purpose of Exercising Control | | 152,161,542 | | 90.78% | | 7,368,734 | | 4.40% | | 8,081,021 | | 4.82% | | 48.07% | | 2.33% | | 2.55% |
| 6e | | Investing in Other Investment Companies | | 151,990,281 | | 90.68% | | 7,538,347 | | 4.50% | | 8,082,669 | | 4.82% | | 48.02% | | 2.38% | | 2.55% |
| 6f | | Management Ownership of Securities of an Issuer | | 151,924,487 | | 90.64% | | 7,181,676 | | 4.28% | | 8,505,134 | | 5.07% | | 48.00% | | 2.27% | | 2.69% |
246
| | | | | | | | | | | | | | | | | | | | |
| | | Shares Voted | | Percent of Outstanding Shares Voted |
| | | For | | % | | Against | | % | | Abstain/WithHold | | % | | For | | Against | | Abstain / WithHold |
Proposals: | | | | | | | | | | | | | | | | | | |
| | | | | | | | | | |
| 6g | | Investing in Oil, Gas, or other Mineral Exploration, Leases or Development Programs | | 153,645,763 | | 91.67% | | 6,091,872 | | 3.63% | | 7,873,662 | | 4.70% | | 48.54% | | 1.92% | | 2.49% |
| 6h | | Investing in Securities of Unseasoned Issuers | | 150,891,239 | | 90.02% | | 8,513,610 | | 5.08% | | 8,206,448 | | 4.90% | | 47.67% | | 2.69% | | 2.59% |
| 6i | | Investing in Warrants | | 151,466,137 | | 90.37% | | 7,900,018 | | 4.71% | | 8,245,142 | | 4.92% | | 47.85% | | 2.50% | | 2.60% |
| 6j | | Writing or Acquiring Options | | 151,858,071 | | 90.60% | | 7,499,862 | | 4.47% | | 8,253,364 | | 4.92% | | 47.98% | | 2.37% | | 2.61% |
8 | | Approval of Investment Advisory Agreement between Dimensional Fund Advisors LP and the Company | | 154,827,452 | | 92.37% | | 4,814,053 | | 2.87% | | 7,969,792 | | 4.75% | | 48.91% | | 1.52% | | 2.52% |
|
| DFA Two-Year Global Fixed Income Portfolio |
| | |
| | | Shares Voted | | Percent of Outstanding Shares Voted |
| | | For | | % | | Against | | % | | Abstain/WithHold | | % | | For | | Against | | Abstain / WithHold |
Proposals: | | | | | | | | | | | | | | | | | | |
| |
5 | | To approve amendments to certain fundamental investment restrictions |
| 5a | | Borrowing Money | | 139,368,344 | | 91.55% | | 5,265,257 | | 3.46% | | 7,599,709 | | 4.99% | | 48.10% | | 1.82% | | 2.62% |
| 5b | | Making Loans | | 138,424,532 | | 90.93% | | 6,081,866 | | 4.00% | | 7,726,912 | | 5.08% | | 47.77% | | 2.10% | | 2.67% |
| 5c | | Investments in Real Estate | | 139,514,480 | | 91.65% | | 5,058,809 | | 3.32% | | 7,660,021 | | 5.03% | | 48.15% | | 1.75% | | 2.64% |
| 5d | | Investments in Commodities | | 139,272,598 | | 91.49% | | 5,366,927 | | 3.53% | | 7,593,785 | | 4.99% | | 48.07% | | 1.85% | | 2.62% |
| 5e | | Diversification of Investments | | 139,699,396 | | 91.77% | | 5,027,412 | | 3.30% | | 7,506,502 | | 4.93% | | 48.21% | | 1.74% | | 2.59% |
6 | | To approve the elimination of certain fundamental investment restrictions |
| 6a | | Pledging, Mortgaging, or Hypothecating Assets | | 137,994,426 | | 90.65% | | 6,376,548 | | 4.19% | | 7,862,336 | | 5.16% | | 47.63% | | 2.20% | | 2.71% |
| 6b | | Purchasing Securities on Margin | | 137,625,225 | | 90.40% | | 6,934,367 | | 4.56% | | 7,673,718 | | 5.04% | | 47.50% | | 2.39% | | 2.65% |
| 6d | | Investing for the Purpose of Exercising Control | | 138,357,280 | | 90.89% | | 6,162,929 | | 4.05% | | 7,713,101 | | 5.07% | | 47.75% | | 2.13% | | 2.66% |
| 6e | | Investing in Other Investment Companies | | 138,122,567 | | 90.73% | | 6,431,516 | | 4.22% | | 7,679,227 | | 5.04% | | 47.67% | | 2.22% | | 2.65% |
| 6f | | Management Ownership of Securities of an Issuer | | 138,594,487 | | 91.04% | | 5,812,947 | | 3.82% | | 7,825,876 | | 5.14% | | 47.83% | | 2.01% | | 2.70% |
| 6g | | Investing in Oil, Gas, or other Mineral Exploration, Leases or Development Programs | | 139,120,718 | | 91.39% | | 5,428,157 | | 3.57% | | 7,684,435 | | 5.05% | | 48.01% | | 1.87% | | 2.65% |
| 6h | | Investing in Securities of Unseasoned Issuers | | 138,057,537 | | 90.69% | | 6,530,145 | | 4.29% | | 7,645,628 | | 5.02% | | 47.65% | | 2.25% | | 2.64% |
| 6i | | Investing in Warrants | | 138,431,219 | | 90.93% | | 5,957,354 | | 3.91% | | 7,844,737 | | 5.15% | | 47.78% | | 2.06% | | 2.71% |
| 6j | | Writing or Acquiring Options | | 138,371,663 | | 90.89% | | 6,052,179 | | 3.98% | | 7,809,468 | | 5.13% | | 47.76% | | 2.09% | | 2.70% |
8 | | Approval of Investment Advisory Agreement between Dimensional Fund Advisors LP and the Company | | 140,431,098 | | 92.25% | | 3,991,763 | | 2.62% | | 7,810,449 | | 5.13% | | 48.47% | | 1.38% | | 2.70% |
DFA Selectively Hedged Global Fixed Income Portfolio
| | | | | | | | | | | | | | | | | | | | | | | | |
| | | Shares Voted | | Percent of Outstanding Shares Voted |
| | | For | | % | | Against | | % | | Abstain/WithHold | | % | | NonVote | | % | | For | | Against | | Abstain / WithHold |
Proposals: | | | | | | | | | | | | | | | | | | | | | | |
| | | |
| 5 | | To approve amendments to certain fundamental investment restrictions | | | | |
| 5a | | Borrowing Money | | 14,004,711 | | 71.19% | | 69,771 | | 0.35% | | 142,380 | | 0.72% | | 5,454,109 | | 27.73% | | 69.44% | | 0.35% | | 0.71% |
| 5b | | Making Loans | | 14,004,711 | | 71.19% | | 69,771 | | 0.35% | | 142,380 | | 0.72% | | 5,454,109 | | 27.73% | | 69.44% | | 0.35% | | 0.71% |
| 5c | | Investments in Real Estate | | 14,005,443 | | 71.20% | | 69,039 | | 0.35% | | 142,380 | | 0.72% | | 5,454,109 | | 27.73% | | 69.44% | | 0.34% | | 0.71% |
| 5d | | Investments in Commodities | | 14,001,626 | | 71.18% | | 72,856 | | 0.37% | | 142,380 | | 0.72% | | 5,454,109 | | 27.73% | | 69.42% | | 0.36% | | 0.71% |
| 5e | | Diversification of Investments | | 14,004,711 | | 71.19% | | 69,771 | | 0.35% | | 142,380 | | 0.72% | | 5,454,109 | | 27.73% | | 69.44% | | 0.35% | | 0.71% |
DFA Five-Year Government Portfolio
| | | | | | | | | | | | | | | | | | | | |
| | | Shares Voted | | Percent of Outstanding Shares Voted |
| | | For | | % | | Against | | % | | Abstain/WithHold | | % | | For | | Against | | Abstain / WithHold |
Proposals: | | | | | | | | | | | | | | | | | | |
| |
| 5 | | To approve amendments to certain fundamental investment restrictions |
| 5a | | Borrowing Money | | 46,558,553 | | 92.40% | | 1,353,231 | | 2.69% | | 2,475,682 | | 4.91% | | 50.03% | | 1.45% | | 2.66% |
| 5b | | Making Loans | | 46,562,156 | | 92.41% | | 1,273,283 | | 2.53% | | 2,552,027 | | 5.06% | | 50.04% | | 1.37% | | 2.74% |
| 5c | | Investments in Real Estate | | 46,677,621 | | 92.64% | | 1,175,541 | | 2.33% | | 2,534,304 | | 5.03% | | 50.16% | | 1.26% | | 2.72% |
| 5d | | Investments in Commodities | | 46,451,042 | | 92.19% | | 1,439,885 | | 2.86% | | 2,496,539 | | 4.95% | | 49.92% | | 1.55% | | 2.68% |
247
| | | | | | | | | | | | | | | | | | | | |
| | | Shares Voted | | Percent of Outstanding Shares Voted |
| | | For | | % | | Against | | % | | Abstain/WithHold | | % | | For | | Against | | Abstain / WithHold |
Proposals: | | | | | | | | | | | | | | | | | | |
| | | | | | | | | | |
| 5e | | Diversification of Investments | | 46,842,089 | | 92.96% | | 994,424 | | 1.97% | | 2,550,953 | | 5.06% | | 50.34% | | 1.07% | | 2.74% |
6 | | To approve the elimination of certain fundamental investment restrictions |
| 6a | | Pledging, Mortgaging, or Hypothecating Assets | | 46,327,059 | | 91.94% | | 1,424,209 | | 2.83% | | 2,636,198 | | 5.23% | | 49.78% | | 1.53% | | 2.83% |
| 6b | | Purchasing Securities on Margin | | 46,149,375 | | 91.59% | | 1,677,783 | | 3.33% | | 2,560,308 | | 5.08% | | 49.59% | | 1.80% | | 2.75% |
| 6c | | Investing in Restricted or Illiquid Securities | | 46,275,781 | | 91.84% | | 1,556,039 | | 3.09% | | 2,555,646 | | 5.07% | | 49.73% | | 1.67% | | 2.75% |
| 6d | | Investing for the Purpose of Exercising Control | | 46,556,994 | | 92.40% | | 1,189,269 | | 2.36% | | 2,641,203 | | 5.24% | | 50.03% | | 1.28% | | 2.84% |
| 6e | | Investing in Other Investment Companies | | 46,370,043 | | 92.03% | | 1,480,358 | | 2.94% | | 2,537,065 | | 5.04% | | 49.83% | | 1.59% | | 2.73% |
| 6f | | Management Ownership of Securities of an Issuer | | 46,582,785 | | 92.45% | | 1,119,663 | | 2.22% | | 2,685,018 | | 5.33% | | 50.06% | | 1.20% | | 2.89% |
| 6g | | Investing in Oil, Gas, or other Mineral Exploration, Leases or Development Programs | | 46,631,031 | | 92.54% | | 1,203,255 | | 2.39% | | 2,553,180 | | 5.07% | | 50.11% | | 1.29% | | 2.74% |
| 6h | | Investing in Securities of Unseasoned Issuers | | 46,336,492 | | 91.96% | | 1,383,463 | | 2.75% | | 2,667,511 | | 5.29% | | 49.79% | | 1.49% | | 2.87% |
| 6i | | Investing in Warrants | | 46,483,170 | | 92.25% | | 1,247,053 | | 2.47% | | 2,657,243 | | 5.27% | | 49.95% | | 1.34% | | 2.86% |
| 6j | | Writing or Acquiring Options | | 46,458,268 | | 92.20% | | 1,324,131 | | 2.63% | | 2,605,067 | | 5.17% | | 49.92% | | 1.42% | | 2.80% |
|
| DFA Five-Year Global Fixed Income Portfolio |
| | |
| | | Shares Voted | | Percent of Outstanding Shares Voted |
| | | For | | % | | Against | | % | | Abstain/WithHold | | % | | For | | Against | | Abstain / WithHold |
Proposals: | | | | | | | | | | | | | | | | | | |
| |
5 | | To approve amendments to certain fundamental investment restrictions |
| 5a | | Borrowing Money | | 134,955,377 | | 91.87% | | 4,431,120 | | 3.02% | | 7,511,430 | | 5.11% | | 50.02% | | 1.64% | | 2.78% |
| 5b | | Making Loans | | 135,102,367 | | 91.97% | | 4,353,195 | | 2.96% | | 7,442,365 | | 5.07% | | 50.08% | | 1.61% | | 2.76% |
| 5c | | Investments in Real Estate | | 134,638,282 | | 91.65% | | 4,797,569 | | 3.27% | | 7,462,076 | | 5.08% | | 49.91% | | 1.78% | | 2.77% |
| 5d | | Investments in Commodities | | 133,701,933 | | 91.02% | | 5,712,099 | | 3.89% | | 7,483,895 | | 5.09% | | 49.56% | | 2.12% | | 2.77% |
| 5e | | Diversification of Investments | | 135,608,777 | | 92.31% | | 3,898,510 | | 2.65% | | 7,390,640 | | 5.03% | | 50.27% | | 1.45% | | 2.74% |
6 | | To approve the elimination of certain fundamental investment restrictions |
| 6a | | Pledging, Mortgaging, or Hypothecating Assets | | 131,739,647 | | 89.68% | | 7,131,409 | | 4.85% | | 8,026,871 | | 5.46% | | 48.83% | | 2.64% | | 2.98% |
| 6b | | Purchasing Securities on Margin | | 131,816,552 | | 89.73% | | 7,196,541 | | 4.90% | | 7,884,834 | | 5.37% | | 48.86% | | 2.67% | | 2.92% |
| 6c | | Investing in Restricted or Illiquid Securities | | 131,862,431 | | 89.76% | | 7,113,623 | | 4.84% | | 7,921,873 | | 5.39% | | 48.88% | | 2.64% | | 2.94% |
| 6d | | Investing for the Purpose of Exercising Control | | 133,826,154 | | 91.10% | | 5,166,047 | | 3.52% | | 7,905,726 | | 5.38% | | 49.61% | | 1.91% | | 2.93% |
| 6e | | Investing in Other Investment Companies | | 133,405,684 | | 90.82% | | 5,645,906 | | 3.84% | | 7,846,337 | | 5.34% | | 49.45% | | 2.09% | | 2.91% |
| 6f | | Management Ownership of Securities of an Issuer | | 133,890,906 | | 91.15% | | 5,135,516 | | 3.50% | | 7,871,505 | | 5.36% | | 49.63% | | 1.90% | | 2.92% |
| 6g | | Investing in Oil, Gas, or other Mineral Exploration, Leases or Development Programs | | 132,957,234 | | 90.51% | | 6,236,723 | | 4.25% | | 7,703,970 | | 5.24% | | 49.28% | | 2.31% | | 2.86% |
| 6h | | Investing in Securities of Unseasoned Issuers | | 133,013,383 | | 90.55% | | 5,913,651 | | 4.03% | | 7,970,893 | | 5.43% | | 49.30% | | 2.19% | | 2.95% |
| 6i | | Investing in Warrants | | 133,424,158 | | 90.83% | | 5,484,620 | | 3.73% | | 7,989,149 | | 5.44% | | 49.46% | | 2.03% | | 2.96% |
| 6j | | Writing or Acquiring Options | | 133,569,451 | | 90.93% | | 5,394,696 | | 3.67% | | 7,933,780 | | 5.40% | | 49.51% | | 2.00% | | 2.94% |
|
| DFA Intermediate Government Fixed Income Portfolio |
| | |
| | | Shares Voted | | Percent of Outstanding Shares Voted |
| | | For | | % | | Against | | % | | Abstain/WithHold | | % | | For | | Against | | Abstain / WithHold |
Proposals: | | | | | | | | | | | | | | | | | | |
| |
5 | | To approve amendments to certain fundamental investment restrictions |
| 5a | | Borrowing Money | | 54,112,609 | | 94.93% | | 1,332,170 | | 2.34% | | 1,560,712 | | 2.74% | | 52.04% | | 1.28% | | 1.50% |
| 5b | | Making Loans | | 54,115,618 | | 94.93% | | 1,332,103 | | 2.34% | | 1,557,770 | | 2.73% | | 52.04% | | 1.28% | | 1.50% |
| 5c | | Investments in Real Estate | | 54,203,775 | | 95.09% | | 1,268,740 | | 2.23% | | 1,532,976 | | 2.69% | | 52.12% | | 1.22% | | 1.47% |
| 5d | | Investments in Commodities | | 54,116,557 | | 94.93% | | 1,216,191 | | 2.13% | | 1,672,743 | | 2.93% | | 52.04% | | 1.17% | | 1.61% |
| 5e | | Diversification of Investments | | 54,424,099 | | 95.47% | | 1,063,379 | | 1.87% | | 1,518,013 | | 2.66% | | 52.34% | | 1.02% | | 1.46% |
6 | | To approve the elimination of certain fundamental investment restrictions |
| 6a | | Pledging, Mortgaging, or Hypothecating Assets | | 53,888,561 | | 94.53% | | 1,358,039 | | 2.38% | | 1,758,891 | | 3.09% | | 51.82% | | 1.31% | | 1.69% |
| 6b | | Purchasing Securities on Margin | | 53,837,539 | | 94.44% | | 1,460,949 | | 2.56% | | 1,707,003 | | 2.99% | | 51.77% | | 1.40% | | 1.64% |
248
| | | | | | | | | | | | | | | | | | | | |
| | |
| | | Shares Voted | | Percent of Outstanding Shares Voted |
| | | For | | % | | Against | | % | | Abstain/WithHold | | % | | For | | Against | | Abstain / WithHold |
Proposals: | | | | | | | | | | | | | | | | | | |
| | | | | | | | | | |
| 6c | | Investing in Restricted or Illiquid Securities | | 53,834,633 | | 94.44% | | 1,461,291 | | 2.56% | | 1,709,567 | | 3.00% | | 51.77% | | 1.41% | | 1.64% |
| 6d | | Investing for the Purpose of Exercising Control | | 54,012,976 | | 94.75% | | 1,269,332 | | 2.23% | | 1,723,183 | | 3.02% | | 51.94% | | 1.22% | | 1.66% |
| 6e | | Investing in Other Investment Companies | | 53,976,867 | | 94.69% | | 1,318,326 | | 2.31% | | 1,710,298 | | 3.00% | | 51.91% | | 1.27% | | 1.64% |
| 6f | | Management Ownership of Securities of an Issuer | | 53,649,613 | | 94.11% | | 1,257,167 | | 2.21% | | 2,098,711 | | 3.68% | | 51.59% | | 1.21% | | 2.02% |
| 6g | | Investing in Oil, Gas, or other Mineral Exploration, Leases or Development Programs | | 54,233,916 | | 95.14% | | 1,071,047 | | 1.88% | | 1,700,528 | | 2.98% | | 52.15% | | 1.03% | | 1.64% |
| 6h | | Investing in Securities of Unseasoned Issuers | | 53,872,308 | | 94.50% | | 1,409,329 | | 2.47% | | 1,723,854 | | 3.02% | | 51.81% | | 1.36% | | 1.66% |
| 6i | | Investing in Warrants | | 53,958,445 | | 94.65% | | 1,256,814 | | 2.20% | | 1,790,232 | | 3.14% | | 51.89% | | 1.21% | | 1.72% |
| 6j | | Writing or Acquiring Options | | 53,954,255 | | 94.65% | | 1,331,376 | | 2.34% | | 1,719,860 | | 3.02% | | 51.88% | | 1.28% | | 1.65% |
|
| DFA Inflation-Protected Securities Portfolio |
| | |
| | | Shares Voted | | Percent of Outstanding Shares Voted |
| | | For | | % | | Against | | % | | Abstain/WithHold | | % | | For | | Against | | Abstain / WithHold |
Proposals: | | | | | | | | | | | | | | | | | | |
| |
5 | | To approve amendments to certain fundamental investment restrictions |
| 5a | | Borrowing Money | | 22,200,756 | | 88.45% | | 549,282 | | 2.19% | | 2,349,633 | | 9.36% | | 47.34% | | 1.17% | | 5.01% |
| 5b | | Making Loans | | 22,158,222 | | 88.28% | | 616,217 | | 2.46% | | 2,325,232 | | 9.26% | | 47.25% | | 1.31% | | 4.96% |
| 5c | | Investments in Real Estate | | 22,208,512 | | 88.48% | | 555,632 | | 2.21% | | 2,335,527 | | 9.31% | | 47.35% | | 1.18% | | 4.98% |
| 5d | | Investments in Commodities | | 22,054,691 | | 87.87% | | 717,727 | | 2.86% | | 2,327,253 | | 9.27% | | 47.03% | | 1.53% | | 4.96% |
| 5e | | Diversification of Investments | | 22,330,643 | | 88.97% | | 436,065 | | 1.74% | | 2,332,963 | | 9.29% | | 47.61% | | 0.93% | | 4.97% |
|
| DFA Short-Term Municipal Bond Portfolio |
| | |
| | | Shares Voted | | Percent of Outstanding Shares Voted |
| | | For | | % | | Against | | % | | Abstain/WithHold | | % | | For | | Against | | Abstain / WithHold |
Proposals: | | | | | | | | | | | | | | | | | | |
| |
| 5 | | To approve amendments to certain fundamental investment restrictions |
| 5a | | Borrowing Money | | 47,846,807 | | 90.90% | | 1,786,880 | | 3.39% | | 3,004,747 | | 5.71% | | 49.85% | | 1.86% | | 3.13% |
| 5b | | Making Loans | | 47,551,098 | | 90.34% | | 2,148,747 | | 4.08% | | 2,938,589 | | 5.58% | | 49.54% | | 2.24% | | 3.06% |
| 5c | | Investments in Real Estate | | 47,659,646 | | 90.54% | | 2,033,544 | | 3.86% | | 2,945,243 | | 5.60% | | 49.66% | | 2.12% | | 3.07% |
| 5d | | Investments in Commodities | | 47,877,083 | | 90.95% | | 1,865,943 | | 3.54% | | 2,895,408 | | 5.50% | | 49.88% | | 1.94% | | 3.02% |
| 5e | | Diversification of Investments | | 48,432,918 | | 92.01% | | 1,307,493 | | 2.48% | | 2,898,023 | | 5.51% | | 50.46% | | 1.36% | | 3.02% |
6 | | To approve the elimination of certain fundamental investment restrictions |
| 6b | | Purchasing Securities on Margin | | 47,283,554 | | 89.83% | | 2,333,055 | | 4.43% | | 3,021,825 | | 5.74% | | 49.26% | | 2.43% | | 3.15% |
| 6c | | Investing in Restricted or Illiquid Securities | | 47,328,591 | | 89.91% | | 2,240,528 | | 4.26% | | 3,069,315 | | 5.83% | | 49.31% | | 2.33% | | 3.20% |
| 6e | | Investing in Other Investment Companies | | 47,695,950 | | 90.61% | | 1,985,833 | | 3.77% | | 2,956,651 | | 5.62% | | 49.69% | | 2.07% | | 3.08% |
|
| DFA California Short-Term Municipal Bond Portfolio |
| | |
| | | Shares Voted | | Percent of Outstanding Shares Voted |
| | | For | | % | | Against | | % | | Abstain/WithHold | | % | | For | | Against | | Abstain / WithHold |
Proposals: | | | | | | | | | | | | | | | | | | |
| |
5 | | To approve amendments to certain fundamental investment restrictions |
| 5a | | Borrowing Money | | 9,590,777 | | 93.26% | | 364,898 | | 3.55% | | 328,092 | | 3.19% | | 50.94% | | 1.94% | | 1.74% |
| 5b | | Making Loans | | 9,608,945 | | 93.44% | | 350,863 | | 3.41% | | 323,958 | | 3.15% | | 51.03% | | 1.86% | | 1.72% |
| 5c | | Investments in Real Estate | | 9,582,414 | | 93.18% | | 377,674 | | 3.67% | | 323,679 | | 3.15% | | 50.89% | | 2.01% | | 1.72% |
| 5d | | Investments in Commodities | | 9,756,933 | | 94.88% | | 233,103 | | 2.27% | | 293,730 | | 2.86% | | 51.82% | | 1.24% | | 1.56% |
249
DIMENSIONAL INVESTMENT GROUP INC.
PERFORMANCE CHARTS
DFA International Value Portfolio Institutional Class vs.
MSCI World ex USA Index (net dividends)
October 31, 1999-October 31, 2009
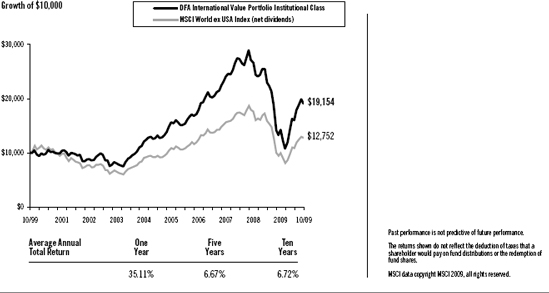
DFA International Value Portfolio Class R2 vs.
MSCI World ex USA Index (net dividends)
April 30, 2008-October 31, 2009
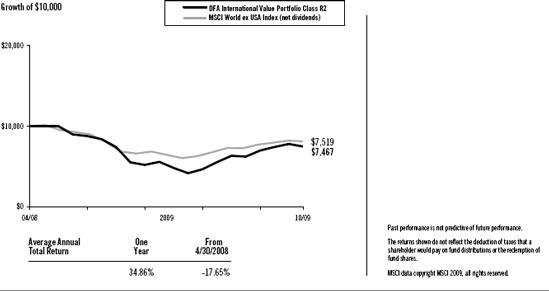
250
DIMENSIONAL INVESTMENT GROUP INC.
MANAGEMENT’S DISCUSSION AND ANALYSIS
| | |
| International Equity Market Review | | 12 Months Ended October 31, 2009 |
The one-year period ending October 31, 2009, was characterized by unprecedented volatility in non-US developed markets. Non-US developed markets lost 18.87% from November 2008 through February 2009, as measured by the MSCI World ex USA Index (net dividends). From March through October 2009 these same markets gained 57.56%. In April 2009, the Index had its largest-ever monthly gain (12.90%) since October 1990.
From November 2008 through February 2009, developed markets returns were negative across all asset classes. The US dollar rallied against most currencies, reversing a general trend of depreciation dating back to 2006. From March through October 2009 the market reversed course, with small cap and value stocks strongly outperforming large cap and growth stocks. The US dollar depreciated against most major currencies. The rally drove strong positive returns for the 12-month period, with small cap stocks significantly outperforming large cap stocks and value stocks outperforming growth stocks, as measured by the MSCI indexes.
12 Months Ended October 31, 2009
| | | | |
Ten Largest Foreign Developed Markets by Market Cap (BB) | | Local
Currency
Return | | U.S. Dollar
Return |
Japan ($2,432) | | 6.03% | | 15.20% |
United Kingdom ($2,328) | | 23.19% | | 25.68% |
France ($1,106) | | 10.09% | | 28.10% |
Canada ($1,060) | | 17.46% | | 32.58% |
Australia ($912) | | 21.91% | | 66.97% |
Germany ($843) | | 6.37% | | 23.77% |
Switzerland ($821) | | 5.78% | | 20.63% |
Spain ($488) | | 33.27% | | 55.06% |
Italy ($388) | | 7.57% | | 25.17% |
Netherlands ($277) | | 20.17% | | 39.83% |
Country market capitalizations (in parentheses) are in USD billions. Source: Returns are of MSCI indices net of foreign withholding taxes on dividends. Country market capitalizations are based on country carve-outs of the MSCI All-Country World Investable Market Index. MSCI data copyright MSCI 2009, all rights reserved.
Small company stocks were the best-performing asset class in international markets, while growth stocks had the worst relative results.
12 Months Ended October 31, 2009
| | |
| | | U.S. Dollar
Return |
MSCI World ex USA Small Cap Index | | 50.01% |
MSCI World ex USA Value Index | | 31.71% |
MSCI World ex USA Index | | 27.83% |
MSCI World ex USA Growth Index | | 24.03% |
Source: MSCI indices are net of foreign withholding taxes on dividends, copyright MSCI 2009, all rights reserved.
Gains in emerging markets were better, on average, than in developed markets, although results varied widely among the individual emerging markets countries. For the 12 month period, returns in U.S. dollars were 64.13% for the MSCI Emerging Markets Index (net dividends) and 27.83% for the MSCI World ex USA Index (net dividends).
251
12 Months Ended October 31, 2009
| | |
Country | | U.S. Dollar
Return |
Argentina | | 53.21% |
Brazil | | 91.55% |
Chile | | 61.68% |
China | | 82.16% |
Czech Republic | | 26.83% |
Hungary | | 63.54% |
India | | 77.12% |
Indonesia | | 127.39% |
Israel | | 31.43% |
Malaysia | | 56.99% |
Mexico | | 39.79% |
Philippines | | 50.71% |
Poland | | 23.09% |
South Africa | | 61.69% |
South Korea | | 56.17% |
Taiwan | | 48.86% |
Thailand | | 78.58% |
Turkey | | 68.21% |
Source: Returns are of MSCI indices net of foreign withholding taxes on dividends, copyright MSCI 2009, all rights reserved.
Master-Feeder Structure
The Portfolio described below, called a “Feeder Fund”, does not buy individual securities directly; instead, the Portfolio invests in a corresponding fund called a “Master Fund“. The Master Fund, in turn, purchases stocks and/or other securities.
International Equity Portfolio Performance Overview
DFA International Value Portfolio
The DFA International Value Portfolio seeks to capture the returns of international large company value stocks by purchasing shares of a Master Fund that invests in such stocks. The investment strategy employs a disciplined, quantitative approach, emphasizing broad diversification and consistent exposure to large cap value stocks, but does not attempt to track closely a specific equity index. As of October 31, 2009, the Master Fund held 465 stocks in 22 developed countries and was mostly invested in equities throughout the year: the average non-equitized cash level for the period was less than 1% of the Master Fund’s assets.
As a result of the Master Fund’s diversified investment approach, performance was determined principally by broad structural trends in global equity markets rather than the behavior of a limited number of stocks. For the 12 months ended October 31, 2009, value stocks outperformed growth stocks in international developed markets. Total returns were 35.11% for the Institutional Class Shares of the Portfolio, 34.86% for the Class R2 Shares of the Portfolio and 27.83% for the MSCI World ex USA Index (net dividends). The Master Fund’s greater allocation than the Index to value stocks (66% on average vs. 26% in the Index) added approximately 6.7% to the relative performance.
252
DIMENSIONAL INVESTMENT GROUP INC.
DFA INTERNATIONAL VALUE PORTFOLIO
DISCLOSURE OF FUND EXPENSES
(Unaudited)
The following Expense Table is shown so that you can understand the impact of fees on your investment. All mutual funds have operating expenses. As a shareholder of the fund, you incur ongoing costs, which include costs for portfolio management, administrative services, and shareholder reports, among others. Operating expenses, legal and audit services, which are deducted from a fund’s gross income, directly reduce the investment return of the fund. A fund’s expenses are expressed as a percentage of its average net assets. This figure is known as the expense ratio. The following examples are intended to help you understand the ongoing costs, in dollars, of investing in the fund and to compare these costs with those of other mutual funds. The examples are based on an investment of $1,000 made at the beginning of the period shown and held for the entire period.
The Expense Table below illustrates your fund’s costs in two ways.
Actual Fund Return
This section helps you to estimate the actual expenses after fee waivers that you paid over the period. The “Ending Account Value” shown is derived from the fund’s actual return and “Expenses Paid During Period” reflect the dollar amount that would have been paid by an investor who started with $1,000 in the fund. You may use the information here, together with the amount you invested, to estimate the expenses that you paid over the period.
To do so, simply divide your account value by $1,000 (for example, a $7,500 account value divided by $1,000 = 7.5), then multiply the result by the number given for your fund under the heading “Expenses Paid During Period.”
Hypothetical Example for Comparison Purposes
This section is intended to help you compare your fund’s costs with those of other mutual funds. The hypothetical “Ending Account Value” and “Expenses Paid During Period” are derived from the fund’s actual expense ratio and an assumed 5% annual return before expenses. In this case, because the return used is not the fund’s actual return, the results do not apply to your investment. The example is useful in making comparisons because the SEC requires all mutual funds to calculate expenses based on a 5% annual return. You can assess your fund’s costs by comparing this hypothetical example with the hypothetical examples that appear in shareholder reports of other funds.
Please note that the expenses shown in the table are meant to highlight and help you compare ongoing costs only and do not reflect any transactional costs, if applicable. The “Annualized Expense Ratio” represents the actual expenses for the six-month period indicated.
| | | | | | | | |
| | | Six Months Ended October 31, 2009 |
EXPENSE TABLE | | | | | | | | |
| | | Beginning
Account
Value
05/01/09 | | Ending
Account
Value
10/31/09 | | Annualized
Expense
Ratio* | | Expenses
Paid
During
Period* |
Actual Fund Return | | | | | | | | |
Class R2 Shares | | $1,000.00 | | $1,348.00 | | 0.74% | | $4.38 |
Institutional Class Shares | | $1,000.00 | | $1,349.40 | | 0.46% | | $2.72 |
Hypothetical 5% Annual Return | | | | | | | | |
Class R2 Shares | | $1,000.00 | | $1,021.48 | | 0.74% | | $3.77 |
Institutional Class Shares | | $1,000.00 | | $1,022.89 | | 0.46% | | $2.35 |
| * | Expenses are equal to the fund’s annualized expense ratio for the six-month period, multiplied by the average account value over the period, multiplied by the number of days in the most recent six-month period (184), then divided by the number of days in the year (365) to reflect the six-month period. The Portfolio is a Feeder Fund. The expenses shown reflect the direct expenses of the Feeder Fund and the indirect payment of the Feeder Fund’s portion of the expenses of its Master Fund (Affiliated Investment Company). |
253
DIMENSIONAL INVESTMENT GROUP INC.
DFA INTERNATIONAL VALUE PORTFOLIO
DISCLOSURE OF PORTFOLIO HOLDINGS
(Unaudited)
The SEC requires that all Funds file a complete Schedule of Investments with the SEC for their first and third fiscal quarters on Form N-Q. For Dimensional Investment Group Inc., this would be for the fiscal quarters ending January 31 and July 31. The Form N-Q filing must be made within 60 days of the end of the quarter. Dimensional Investment Group Inc. filed its most recent Form N-Q with the SEC on September 29, 2009. It is available upon request, without charge, by calling collect: (512) 306-7400 or by mailing a request to Dimensional Fund Advisors LP, 6300 Bee Cave Road, Building One, Austin, Texas 78746, or by visiting the SEC’s website at http://www.sec.gov, or they may be reviewed and copied at the SEC’s Public Reference Room in Washington, D.C. (call 1-800-732-0330 for information on the operation of the Public Reference Room).
PORTFOLIO HOLDINGS
The SEC requires that all Funds present their categories of portfolio holdings in a table, chart or graph format in their annual and semi-annual shareholder reports, whether or not a Schedule of Investments is utilized. The following table, which presents portfolio holdings as a percent of total investments before short-term investments and collateral for loaned securities, is provided in compliance with such requirement.
The categories of industry classification for the Affiliated Investment Company is represented in the Disclosure of Portfolio Holdings, which is included elsewhere within the report. Refer to the Summary Schedule of Portfolio Holdings for the underlying Master Fund’s holdings which reflects the investments by country.
| | |
Affiliated Investment Company | | 100.0% |
254
DIMENSIONAL INVESTMENT GROUP INC.
DFA INTERNATIONAL VALUE PORTFOLIO
STATEMENT OF ASSETS AND LIABILITIES
OCTOBER 31, 2009
(Amounts in thousands, except share and per share amounts)
| | | | |
ASSETS: | | | | |
Investments in The DFA International Value Series of The DFA Investment Trust Company (Affiliated Investment Company) at Value† | | $ | 4,442,243 | |
Receivables: | | | | |
Investment Securities Sold | | | 3,206 | |
Fund Shares Sold | | | 6,504 | |
Prepaid Expenses and Other Assets | | | 60 | |
| | | | |
Total Assets | | | 4,452,013 | |
| | | | |
LIABILITIES: | | | | |
Payables: | | | | |
Affiliated Investment Company Shares Sold | | | 85 | |
Fund Shares Redeemed | | | 9,624 | |
Due to Advisor | | | 777 | |
Accrued Expenses and Other Liabilities | | | 238 | |
| | | | |
Total Liabilities | | | 10,724 | |
| | | | |
NET ASSETS | | $ | 4,441,289 | |
| | | | |
NET ASSET VALUE, OFFERING AND REDEMPTION PRICE PER SHARE: | | | | |
Class R2 Shares — based on net assets of $3,443 and shares outstanding of 528,722 | | $ | 6.51 | |
| | | | |
NUMBER OF SHARES AUTHORIZED | | | 100,000,000 | |
| | | | |
Institutional Class Shares — based on net assets of $4,437,846 and shares outstanding of 269,611,153 | | $ | 16.46 | |
| | | | |
NUMBER OF SHARES AUTHORIZED | | | 1,500,000,000 | |
| | | | |
Investment in Affiliated Investment Company at Cost | | $ | 3,454,200 | |
| | | | |
NET ASSETS CONSIST OF: | | | | |
Paid-In Capital | | $ | 4,788,452 | |
Undistributed Net Investment Income (Distributions in Excess of Net Investment Income) | | | 12,961 | |
Accumulated Net Realized Gain (Loss) | | | (1,348,339 | ) |
Net Unrealized Foreign Exchange Gain (Loss) | | | 172 | |
Net Unrealized Appreciation (Depreciation) | | | 988,043 | |
| | | | |
NET ASSETS | | $ | 4,441,289 | |
| | | | |
See accompanying Notes to Financial Statements.
255
DIMENSIONAL INVESTMENT GROUP INC.
DFA INTERNATIONAL VALUE PORTFOLIO
STATEMENT OF OPERATIONS
FOR THE YEAR ENDED OCTOBER 31, 2009
(Amounts in thousands)
| | | | |
Investment Income | | | | |
Dividends (Net of Foreign Taxes Withheld of $10,174) | | $ | 113,412 | |
Interest | | | 140 | |
Income from Securities Lending | | | 9,229 | |
Expenses Allocated from Affiliated Investment Company | | | (8,633 | ) |
| | | | |
Total Investment Income | | | 114,148 | |
| | | | |
Expenses | | | | |
Administrative Services Fees | | | 7,097 | |
Accounting & Transfer Agent Fees | | | 82 | |
Shareholder Servicing Fees — Class R2 Shares | | | 8 | |
Filing Fees | | | 117 | |
Shareholders’ Reports | | | 169 | |
Directors’/Trustees’ Fees & Expenses | | | 58 | |
Professional Fees | | | 57 | |
Other | | | 49 | |
| | | | |
Total Expenses | | | 7,637 | |
| | | | |
Net Investment Income (Loss) | | | 106,511 | |
| | | | |
Realized and Unrealized Gain (Loss) | | | | |
Net Realized Gain (Loss) on: | | | | |
Investment Securities Sold | | | 45,432 | |
Futures | | | (824 | ) |
Foreign Currency Transactions | | | 2,711 | |
Change in Unrealized Appreciation (Depreciation) of: | | | | |
Investment Securities | | | 988,043 | |
Translation of Foreign Currency Denominated Amounts | | | 172 | |
| | | | |
Net Realized and Unrealized Gain (Loss) | | | 1,035,534 | |
| | | | |
Net Increase (Decrease) in Net Assets Resulting from Operations | | $ | 1,142,045 | |
| | | | |
Investment Income and Realized and Unrealized Gain (Loss) were allocated from the Portfolio’s Master Fund (Affiliated Investment Company).
See accompanying Notes to Financial Statements.
256
DIMENSIONAL INVESTMENT GROUP INC.
DFA INTERNATIONAL VALUE PORTFOLIO
STATEMENTS OF CHANGES IN NET ASSETS
(Amounts in thousands)
| | | | | | | | | | | | |
| | | Year
Ended
Oct. 31,
2009 | | | Period
Dec. 1,
2007 to
Oct. 31,
2008 | | | Year
Ended
Nov. 30,
2007 | |
Increase (Decrease) in Net Assets | | | | | | | | | | | | |
Operations: | | | | | | | | | | | | |
Net Investment Income (Loss) | | $ | 106,511 | | | $ | 193,222 | | | $ | 160,985 | |
Net Realized Gain (Loss) on: | | | | | | | | | | | | |
Investment Securities Sold | | | 45,432 | | | | 414,722 | † | | | 120,165 | † |
Futures | | | (824 | ) | | | — | | | | — | |
Foreign Currency Transactions | | | 2,711 | | | | — | | | | — | |
Change in Unrealized Appreciation (Depreciation) of: | | | | | | | | | | | | |
Investment Securities | | | 988,043 | | | | (3,685,039 | )† | | | 517,981 | † |
Translation of Foreign Currency Denominated Amounts | | | 172 | | | | — | | | | — | |
| | | | | | | | | | | | |
Net Increase (Decrease) in Net Assets Resulting from Operations | | | 1,142,045 | | | | (3,077,095 | ) | | | 799,131 | |
| | | | | | | | | | | | |
Distributions From: | | | | | | | | | | | | |
Net Investment Income: | | | | | | | | | | | | |
Class R2 Shares | | | (208 | ) | | | (218 | ) | | | — | |
Institutional Class Shares | | | (105,492 | ) | | | (203,735 | ) | | | (140,110 | ) |
Net Short-Term Gains: | | | | | | | | | | | | |
Institutional Class Shares | | | — | | | | (14,929 | ) | | | (9,341 | ) |
Net Long-Term Gains: | | | | | | | | | | | | |
Institutional Class Shares | | | — | | | | (106,397 | ) | | | (65,358 | ) |
| | | | | | | | | | | | |
Total Distributions | | | (105,700 | ) | | | (325,279 | ) | | | (214,809 | ) |
| | | | | | | | | | | | |
Capital Share Transactions: | | | | | | | | | | | | |
Shares Issued | | | 1,077,621 | | | | 1,701,392 | | | | 2,157,333 | |
Shares Issued in Lieu of Cash Distributions | | | 98,218 | | | | 301,997 | | | | 192,509 | |
Shares Redeemed | | | (1,124,340 | ) | | | (1,509,639 | ) | | | (1,128,154 | ) |
| | | | | | | | | | | | |
Net Increase (Decrease) from Capital Share Transactions | | | 51,499 | | | | 493,750 | | | | 1,221,688 | |
| | | | | | | | | | | | |
Total Increase (Decrease) in Net Assets | | | 1,087,844 | | | | (2,908,624 | ) | | | 1,806,010 | |
Net Assets | | | | | | | | | | | | |
Beginning of Period | | | 3,353,445 | | | | 6,262,069 | | | | 4,456,059 | |
| | | | | | | | | | | | |
End of Period | | $ | 4,441,289 | | | $ | 3,353,445 | | | $ | 6,262,069 | |
| | | | | | | | | | | | |
Undistributed Net Investment Income (Distributions in Excess of Net Investment Income) | | $ | 12,961 | | | $ | 9,456 | | | $ | 20,513 | |
| † | See Note A in the Notes to Financial Statements. |
See accompanying Notes to Financial Statements.
257
DIMENSIONAL INVESTMENT GROUP INC.
DFA INTERNATIONAL VALUE PORTFOLIO
FINANCIAL HIGHLIGHTS
(for a share outstanding throughout each period)
Class R2 Shares
| | | | | | | | |
| | | Year
Ended
Oct. 31,
2009 | | | Period April 30,
2008(a) to Oct. 31, 2008 | |
| | |
Net Asset Value, Beginning of Period | | $ | 5.16 | | | $ | 10.00 | |
| | | | | | | | |
Income from Investment Operations | | | | | | | | |
Net Investment Income (Loss) | | | 0.16 | (A) | | | 0.25 | (A) |
Net Gains (Losses) on Securities (Realized and Unrealized) | | | 1.56 | | | | (4.46 | ) |
| | | | | | | | |
Total from Investment Operations | | | 1.72 | | | | (4.21 | ) |
| | |
Less Distributions | | | | | | | | |
Net Investment Income | | | (0.37 | ) | | | (0.63 | ) |
Net Realized Gains | | | — | | | | — | |
| | | | | | | | |
Total Distributions | | | (0.37 | ) | | | (0.63 | ) |
| | |
Net Asset Value, End of Period | | $ | 6.51 | | | $ | 5.16 | |
| | |
Total Return | | | 34.86 | % | | | (44.63)%( | C) |
| | |
Net Assets, End of Period (thousands) | | $ | 3,443 | | | $ | 3,372 | |
Ratio of Expenses to Average Net Assets (D) | | | 0.74 | % | | | 0.73%(B | )(E) |
Ratio of Net Investment Income to Average Net Assets | | | 2.96 | % | | | 7.47%(B | )(E) |
| | |
See page 1 & 2 for the Definitions of Abbreviations and Footnotes.
See accompanying Notes to Financial Statements.
258
DIMENSIONAL INVESTMENT GROUP INC.
DFA INTERNATIONAL VALUE PORTFOLIO
FINANCIAL HIGHLIGHTS
(for a share outstanding throughout each period)
Institutional Class Shares
| | | | | | | | | | | | | | | | | | | | | | | | |
| | | Year Ended Oct. 31, 2009 | | | Period Dec. 1, 2007 to Oct. 31, 2008 | | | Year Ended Nov. 30,
2007 | | | Year Ended Nov. 30, 2006 | | | Year Ended Nov. 30, 2005 | | | Year Ended Nov. 30, 2004 | |
| | |
Net Asset Value, Beginning of Period | | $ | 12.54 | | | $ | 25.51 | | | $ | 22.71 | | | $ | 17.67 | | | $ | 15.73 | | | $ | 12.20 | |
| | | | | | | | | | | | | | | | | | | | | | | | |
Income from Investment | | | | | | | | | | | | | | | | | | | | | | | | |
Operations | | | | | | | | | | | | | | | | | | | | | | | | |
Net Investment Income (Loss) | | | 0.40 | (A) | | | 0.74 | (A) | | | 0.72 | (A) | | | 0.66 | (A) | | | 0.48 | | | | 0.26 | |
Net Gains (Losses) on Securities (Realized and Unrealized) | | | 3.92 | | | | (12.44 | ) | | | 3.09 | | | | 5.37 | | | | 1.89 | | | | 3.58 | |
| | | | | | | | | | | | | | | | | | | | | | | | |
Total from Investment Operations | | | 4.32 | | | | (11.70 | ) | | | 3.81 | | | | 6.03 | | | | 2.37 | | | | 3.84 | |
| | |
Less Distributions | | | | | | | | | | | | | | | | | | | | | | | | |
Net Investment Income | | | (0.40 | ) | | | (0.78 | ) | | | (0.63 | ) | | | (0.65 | ) | | | (0.42 | ) | | | (0.31 | ) |
Net Realized Gains | | | — | | | | (0.49 | ) | | | (0.38 | ) | | | (0.34 | ) | | | (0.01 | ) | | | — | |
| | | | | | | | | | | | | | | | | | | | | | | | |
Total Distributions | | | (0.40 | ) | | | (1.27 | ) | | | (1.01 | ) | | | (0.99 | ) | | | (0.43 | ) | | | (0.31 | ) |
| | |
Net Asset Value, End of Period | | $ | 16.46 | | | $ | 12.54 | | | $ | 25.51 | | | $ | 22.71 | | | $ | 17.67 | | | $ | 15.73 | |
| | |
Total Return | | | 35.11 | % | | | (47.96 | )%(C) | | | 17.09 | % | | | 35.39 | % | | | 15.40 | % | | | 31.86 | % |
| | |
Net Assets, End of Period (thousands) | | $ | 4,437,846 | | | $ | 3,350,073 | | | $ | 6,262,069 | | | $ | 4,456,059 | | | $ | 2,518,457 | | | $ | 1,431,989 | |
Ratio of Expenses to Average Net Assets (D) | | | 0.46 | % | | | 0.44 | %(B) | | | 0.44 | % | | | 0.44 | % | | | 0.48 | % | | | 0.51 | % |
Ratio of Net Investment Income to Average Net Assets | | | 3.00 | % | | | 3.86 | %(B) | | | 2.89 | % | | | 3.25 | % | | | 2.86 | % | | | 1.87 | % |
| | |
See page 1 & 2 for the Definitions of Abbreviations and Footnotes.
See accompanying Notes to Financial Statements.
259
DIMENSIONAL INVESTMENT GROUP INC.
DFA INTERNATIONAL VALUE PORTFOLIO
NOTES TO FINANCIAL STATEMENTS
A. Organization:
Dimensional Investment Group Inc. (the “Fund”) is an open-end management investment company registered under the Investment Company Act of 1940, whose shares are generally offered to institutional investors, retirement plans and clients of registered investment advisors. The Fund consists of fifteen portfolios, of which the DFA International Value Portfolio (the “Portfolio”) is presented in this section of the report.
The Portfolio primarily invests its assets in The DFA International Value Series (the “Series”), a corresponding series of The DFA Investment Trust Company. At October 31, 2009, the Portfolio owned 72% of the Series. The financial statements of the Series are included elsewhere in this report and should be read in conjunction with the financial statements of the Portfolio.
Class R2 shares commenced operations on April 30, 2008. As of October 31, 2009, Class R1 shares has 100,000,000 authorized shares and has not commenced operations.
On November 1, 2008, The DFAInternational Value Series, a master fund in a RIC/RIC master-feeder structure, elected with the consent of its respective Holder(s) to change its U.S. federal income tax classification from that of an association taxable as a corporation to a partnership pursuant to Treasury Regulation § 301.7701-3. The change in capital structure and retroactive reclassification of the statement of changes in net assets and financial highlights for the respective funds is a result of the treatment of a partnership for book purposes. The Series/Portfolio will maintain its books and records and present its financial statements in accordance with generally accepted accounting principles for investment partnerships.
At a regular meeting of the Board of Directors/Trustees (the “Board”) on September 16, 2008, the Board voted to change the fiscal and tax year ends of the Portfolio from November 30 to October 31.
B. Significant Accounting Policies:
The following significant accounting policies are in conformity with accounting principles generally accepted in the United States of America. Such policies are consistently followed by the Fund in preparation of its financial statements. The preparation of financial statements in accordance with accounting principles generally accepted in the United States of America requires management to make estimates and assumptions that affect the reported amounts of assets and liabilities and disclosure of contingent assets and liabilities at the date of the financial statements and the reported amounts of increases and decreases in net assets from operations during the reporting period. Actual results could differ from those estimates and those differences could be material.
1. Security Valuation: The Portfolio’s investment reflects its proportionate interest in the net assets of the Series.
The Portfolio utilizes a fair value heirarchy which prioritizes the inputs to valuation techniques used to measure fair value into three broad levels described below:
— Level 1 – quoted prices in active markets for identical securities
— Level 2 – other significant observable inputs (including quoted prices for similar securities, interest rates, prepayment speeds, credit risk, etc.)
— Level 3 – significant unobservable inputs (including the Portfolio’s own assumptions in determining the fair value of investments)
260
The inputs or methodology used for valuing securities are not necessarily an indication of the risk associated with investing in those securities. A summary of the inputs used to value the Portfolio’s net assets as of October 31, 2009 is listed below (in thousands):
| | | | | | | | | | |
| | | Valuation Inputs |
| | | Investments in
Securities
(Market Value) |
| | | Level 1 | | Level 2 | | Level 3 | | Total |
DFA International Value Portfolio | | $ | 4,442,243 | | — | | — | | $ | 4,442,243 |
2. Deferred Compensation Plan: Each eligible Director of the Fund may elect participation in the Deferred Compensation Plan (the “Plan”). Under the Plan, effective January 1, 2002, such Directors may defer payment of all or a portion of their total fees earned as a Director. These deferred amounts may be treated as though such amounts had been invested in shares of the following funds: U.S. Large Cap Value Portfolio; U.S. Core Equity 1 Portfolio; U.S. Core Equity 2 Portfolio; U.S. Vector Equity Portfolio; U.S. Micro Cap Portfolio; DFA International Value Portfolio; International Core Equity Portfolio; Emerging Markets Portfolio; Emerging Markets Core Equity Portfolio; and/or DFA Two-Year Global Fixed Income Portfolio. Contributions made under the Plan and the change in unrealized appreciation (depreciation) and income, are included in Directors’/Trustees’ Fees & Expenses. At October 31, 2009, the total liability for deferred compensation to Directors is included in Accrued Expenses and Other Liabilities on the Statement of Assets and Liabilities in the amount of $101 (in thousands).
Each Director has the option to receive their distribution of proceeds in one of the following methods upon one year’s notice: lump sum; annual installments over a period of agreed upon years; or semi-annual installments over a period of agreed upon years. As of October 31, 2009, none of the Directors have requested distribution of proceeds.
3. Other: The Portfolio recognizes its pro-rata share, on a daily basis, of net investment income and realized and unrealized gains and losses of investment securities from the Series, which is treated as a partnership for federal income tax purposes. Dividend income and distributions to shareholders are recorded on the ex-dividend date. Distributions received on securities that represent a return of capital or capital gain are recorded as a reduction of cost of investments or as a realized gain, respectively. The Portfolio estimates the character of distributions received that may be considered return of capital distributions. Expenses directly attributable to the Portfolio are directly charged. Common expenses of the Fund are allocated using methods approved by the Board of Directors/Trustees, generally based on average net assets.
Class R2 Shares and Institutional Class Shares have equal rights to assets and earnings of the Portfolio. Income, gains and losses, and common expenses of the Portfolio are allocated to each class of shares based on its relative net assets. Each class will bear its own class-specific expenses, if any.
C. Investment Advisor:
Dimensional Fund Advisors LP (“Dimensional” or the “Advisor”) provides administrative services to the Portfolio, including supervision of services provided by others, providing information to the shareholders and to the Board of Directors/Trustees, and other administrative services. The Advisor provides investment advisory services to the Series. For the year ended October 31, 2009, the Portfolio’s administrative services fees were accrued daily and paid monthly to the Advisor based on an effective annual rate of 0.20% of average daily net assets.
Pursuant to the Expense Assumption Agreement for the Class R2 shares of the DFA International Value Portfolio, the Advisor has contractually agreed to assume the Portfolio’s direct expenses (excluding management fees and custodian fees) to the extent necessary to limit the expenses of the Class R2 shares of the Portfolio to 0.79% of its average net assets on an annualized basis. At any time that the annualized expenses of the Class R2 shares of the Portfolio are less than 0.79% of its average net assets on an annualized basis, the Advisor retains the right to recover any fees previously waived and/or expenses previously assumed to the extent that such recovery will not cause the annualized expenses to exceed 0.79% of its average net assets on an annualized basis. The Portfolio is
261
not obligated to reimburse the advisor for fees previously waived or expenses previously assumed by the Advisor more than thirty-six months before the date of such reimbursement.
The Expense Assumption Agreement will remain in effect until March 1, 2010 and shall continue to remain in effect for year to year thereafter unless terminated by the Fund or the Advisor. At October 31, 2009, there were no fees subject to future recovery by the Advisor.
Fees Paid to Officers and Directors/Trustees:
Certain Officers and Directors/Trustees of the Advisor are also Officers and Directors/Trustees of the Fund; however, such Officers and Directors/Trustees (with the exception of the Chief Compliance Officer (“CCO”)) receive no compensation from the Fund. For the year ended October 31, 2009, the total related amounts paid by the Fund to the CCO were $27 (in thousands). The total related amounts paid by the Portfolio are included in Other Expenses on the Statement of Operations.
D. Federal Income Taxes:
The Portfolio has qualified and intends to continue to qualify as a regulated investment company under Subchapter M of the Internal Revenue Code for federal income tax purposes and to distribute substantially all of its taxable income and net capital gains to its shareholders. Accordingly, no provision has been made for federal income taxes.
Distributions from net investment income and from net realized capital gains are determined in accordance with U.S. federal income tax regulations, which may differ from those amounts determined under accounting principles generally accepted in the United States of America. These book/tax differences are either temporary or permanent in nature. To the extent these differences are permanent, they are charged or credited to paid-in capital, undistributed net investment income, accumulated net realized gains or unrealized appreciation, as appropriate, in the period that the differences arise. Accordingly, the following permanent differences as of October 31, 2009, primarily attributable to a reclassification of distributions, were reclassified to the following accounts. These reclassifications had no effect on net assets or net asset value per share (amounts in thousands):
| | |
Increase
(Decrease)
Undistributed
Net Investment
Income | | Increase
(Decrease)
Accumulated
Net Realized
Gains (Losses) |
| $2,694 | | $(2,694) |
The tax character of dividends and distributions declared and paid during the year ended November 30, 2007, the period December 1, 2007 to October 31, 2008 and the year ended October 31, 2009 were as follows (amounts in thousands):
| | | | | | |
| | | Net Investment
Income and
Short-Term
Capital Gains | | Long-Term
Capital Gains | | Total |
2007 | | $156,076 | | $ 69,683 | | $225,759 |
2008 | | 218,970 | | 106,309 | | 325,279 |
2009 | | 105,700 | | — | | 105,700 |
262
At October 31, 2009, the components of distributable earnings (accumulated losses) were as follows (amounts in thousands):
| | | | | | | | | | |
Undistributed
Net Investment
Income and
Short-Term
Capital Gains | | Undistributed
Long-Term
Capital Gains | | Capital Loss
Carryforward | | | Total Net
Distributable
Earnings
(Accumulated
Losses) | |
| $13,063 | | — | | $ | (1,348,208 | ) | | $ | (1,335,145 | ) |
For federal income tax purposes, the Fund measures its capital loss carryforwards annually at October 31, its fiscal year end. Capital loss carryforwards may be carried forward and applied against future capital gains. As of October 31, 2009, the Portfolio had capital loss carryforwards in the amount of $1,348,208 to offset future realized capital gains expiring in 2016.
For the year ended October 31, 2009, the Portfolio had utilized capital loss carryforwards to offset realized capital gains for federal income tax purposes of $44,756 (amount in thousands).
At October 31, 2009, the total cost and aggregate gross unrealized appreciation and (depreciation) of securities for federal income tax purposes were different from amounts reported for financial reporting purposes (amounts in thousands):
| | | | | | | | |
Federal
Tax Cost | | Unrealized
Appreciation | | Unrealized
(Depreciation) | | Net
Unrealized
Appreciation
(Depreciation) |
| $ | 3,454,309 | | $ | 1,035,783 | | $(47,849) | | $987,934 |
Accounting for Uncertainty in Income Taxes sets forth a minimum threshold for financial statement recognition of the benefit of a tax position taken or expected to be taken in a tax return. Management has analyzed the Portfolio’s tax positions and has concluded that no provision for income tax is required in the Portfolio’s financial statements. The Portfolio is not aware of any tax positions for which it is reasonably possible that the total amounts of unrecognized tax benefits will significantly change in the next twelve months. The Portfolio’s federal tax returns for the prior three fiscal years remains subject to examination by the Internal Revenue Service.
On November 1, 2008, The DFA International Value Series, a master fund in a RIC/RIC master-feeder structure with five RIC feeders and other direct client investor(s), made a “Check-the-box” election for federal income tax purposes pursuant to Treasury Regulation §301.7701-3, to change its federal entity classification from a corporation taxable as a regulated investment company to a partnership. As a result of this election, the master fund is deemed to have distributed all of its assets and liabilities, in a taxable transaction, to its shareholders in liquidation of the master fund. Immediately thereafter, the shareholders contributed all of the distributed assets and liabilities to a newly formed partnership. The final tax year end of The DFA International Value Series was October 31, 2008. For Federal income tax purposes, pursuant to Internal Revenue Code §336(a), the master fund recognizes gain or loss as if the master’s investment securities were sold to its shareholders and, pursuant to IRC Code §331, each of the Portfolios recognizes gain or loss as if it liquidated its investment in the master. As a result of the transaction, The DFA International Value Series recognized a ($2,309,440,866) and ($718,733) capital and currency loss respectively for tax year ended October 31, 2008. For tax purposes, pursuant to IRC Code §334(a), each of the Portfolios will take a fair market value basis in the securities deemed received by them and a new holding period for those securities commences on the deemed liquidation date.
263
E. Capital Share Transactions:
The capital share transactions by class were as follows (amounts in thousands):
| | | | | | | | | | | | | | | | | | | | | |
| | | Year
Ended
Oct. 31, 2009 | | | Period
Dec. 1, 2007
to
Oct. 31, 2008 | | | Year
Ended
Nov. 30, 2007 | |
| | | Amount | | | Shares | | | Amount | | | Shares | | | Amount | | | Shares | |
Class R2 Shares* | | | | | | | | | | | | | | | | | | | | | |
Shares Issued | | $ | 1,393 | | | 263 | | | $ | 5,585 | | | 703 | | | | N/A | | | N/A | |
Shares Issued in Lieu of Cash Distributions | | | 207 | | | 38 | | | | 218 | | | 25 | | | | N/A | | | N/A | |
Shares Redeemed | | | (2,329 | ) | | (425 | ) | | | (624 | ) | | (75 | ) | | | N/A | | | N/A | |
| | | | | | | | | | | | | | | | | | | | | |
Net Increase (Decrease) — Class R2 Shares | | $ | (729 | ) | | (124 | ) | | $ | 5,179 | | | 653 | | | | N/A | | | N/A | |
| | | | | | | | | | | | | | | | | | | | | |
Institutional Class Shares | | | | | | | | | | | | | | | | | | | | | |
Shares Issued | | $ | 1,076,228 | | | 84,945 | | | $ | 1,695,807 | | | 84,544 | | | $ | 2,157,333 | | | 86,715 | |
Shares Issued in Lieu of Cash Distributions | | | 98,011 | | | 7,185 | | | | 301,779 | | | 13,697 | | | | 192,509 | | | 7,988 | |
Shares Redeemed | | | (1,122,011 | ) | | (89,725 | ) | | | (1,509,015 | ) | | (76,488 | ) | | | (1,128,154 | ) | | (45,424 | ) |
| | | | | | | | | | | | | | | | | | | | | |
Net Increase (Decrease) — Institutional Class Shares | | $ | 52,228 | | | 2,405 | | | $ | 488,571 | | | 21,753 | | | $ | 1,221,688 | | | 49,279 | |
| | | | | | | | | | | | | | | | | | | | | |
| * | Class R2 Shares commenced operations on April 30, 2008. |
F. Line of Credit:
The Fund, together with other Dimensional-advised portfolios, has entered into an amended and restated $250 million unsecured discretionary line of credit effective July 8, 2009 with an affiliate of its domestic custodian bank. Each portfolio is permitted to borrow, subject to its investment limitations, up to a maximum of $250 million, as long as total borrowings under the line of credit do not exceed $250 million in the aggregate. Borrowings under the line of credit are charged interest at the current overnight Federal Funds Rate plus 1%. Each portfolio is individually, and not jointly, liable for its particular advances under the line of credit. There is no commitment fee on the unused portion of the line of credit. The agreement for the discretionary line of credit may be terminated by either party at any time. The line of credit is scheduled to expire on June 22, 2010. There were no borrowings by the Portfolio under this line of credit during the year ended October 31, 2009.
The Fund, together with other Dimensional-advised portfolios, has also entered into an additional $500 million unsecured line of credit effective January 15, 2009 with its international custodian bank. Each portfolio is permitted to borrow, subject to its investment limitations, up to a maximum of $500 million, as long as total borrowings under the line of credit do not exceed $500 million in the aggregate. Each portfolio is individually, and not jointly, liable for its particular advances under the line of credit. Borrowings under the line of credit are charged interest at rates agreed to by the parties at the time of borrowing. There is no commitment fee on the unused portion of the line of credit. The agreement of the line of credit expires on January 15, 2010. There were no borrowings by the Portfolio under this line of credit during the year ended October 31, 2009.
G. Shareholder Servicing Fees:
The Class R2 Shares pay a shareholder servicing fee in the amount of 0.25% of their annual average net assets to compensate service agents that provide shareholder servicing, record keeping, account maintenance and other services to investors in the DFA International Value Portfolio Class R2 Shares.
264
H. Indemnitees; Contractual Obligations:
Under the Fund’s organizational documents, its officers and directors are indemnified against certain liabilities arising out of the performance of their duties to the Fund.
In the normal course of business, the Fund enters into contracts that contain a variety of representations and warranties which provide general indemnification. The Fund’s maximum exposure under these arrangements is unknown as this would involve future claims that may be made against the Fund and/or its affiliates that have not yet occurred. However, based on experience, the Fund expects the risk of loss to be remote.
I. Other:
At October 31, 2009, two shareholders held approximately 89% of the outstanding shares of Class R2 shares of the Portfolio and two shareholders held approximately 46% of the outstanding shares of the Institutional Class shares of the Portfolio. One or more of the shareholders is an omnibus account, which typically holds shares for the benefit of several other underlying investors.
J. Subsequent Event Evaluations:
Management has evaluated the impact of all subsequent events on the Portfolio through December 23, 2009, the date the financial statements were available for issuance, and has determined that there are no subsequent events requiring recognition or disclosure in the financial statements.
265
REPORT OF INDEPENDENT REGISTERED PUBLIC ACCOUNTING FIRM
To the Shareholders of DFA International Value Portfolio and
Board of Directors of Dimensional Investment Group Inc.:
In our opinion, the accompanying statement of assets and liabilities, and the related statements of operations and of changes in net assets and the financial highlights present fairly, in all material respects, the financial position of DFA International Value Portfolio (one of the portfolios constituting Dimensional Investment Group Inc., hereafter referred to as the “Portfolio”) at October 31, 2009, the results of its operations for the year then ended, the changes in its net assets and the financial highlights for each of the periods indicated, in conformity with accounting principles generally accepted in the United States of America. These financial statements and financial highlights (hereafter referred to as “financial statements”) are the responsibility of the Portfolio’s management; our responsibility is to express an opinion on these financial statements based on our audits. We conducted our audits of these financial statements in accordance with the standards of the Public Company Accounting Oversight Board (United States). Those standards require that we plan and perform the audit to obtain reasonable assurance about whether the financial statements are free of material misstatement. An audit includes examining, on a test basis, evidence supporting the amounts and disclosures in the financial statements, assessing the accounting principles used and significant estimates made by management, and evaluating the overall financial statement presentation. We believe that our audits, which included confirmation of securities at October 31, 2009 by correspondence with the transfer agent of the investee fund, provide a reasonable basis for our opinion.
PricewaterhouseCoopers LLP
Philadelphia, Pennsylvania
December 23, 2009
266
RESULTS OF THE SHAREHOLDER MEETING
On June 2, 2009, June 5, 2009, and July 8, 2009, Dimensional Investment Group Inc. (“DIG”) held a Special Joint Meeting of Shareholders for the purpose of voting on several proposals affecting DIG and the Portfolio, including, among other items, the election of Directors, the amendment of certain fundamental investment limitations, and the elimination of certain fundamental investment limitations. The shareholders of the Portfolio approved each of the applicable proposals for DIG and the Portfolio presented at the Meeting. Listed below are the voting results from the Meeting. Please note that not all Proposals presented at the Meeting were voted on by the Portfolio. Additionally, the Proposal numbers reflected below correlate to the Proposal numbers presented for vote at the Meeting.
DIG
| | | | | | | | | | | | | | | | | | | | |
| | | Shares Voted | | Percent of Outstanding Shares Voted |
| | | For | | % | | Against | | % | | Abstain/WithHold | | % | | For | | Against | | Abstain / WithHold |
Proposal 1: Election of Directors for DIG* |
| | | | | | | | | | |
| 1a | | David G. Booth | | 754,612,895 | | 96.26% | | — | | 0.00% | | 29,301,677 | | 3.74% | | 85.87% | | 0.00% | | 3.33% |
| 1b | | George M. Constantinides | | 753,991,785 | | 96.18% | | — | | 0.00% | | 29,922,787 | | 3.82% | | 85.80% | | 0.00% | | 3.41% |
| 1c | | John P. Gould | | 753,344,569 | | 96.10% | | — | | 0.00% | | 30,570,003 | | 3.90% | | 85.73% | | 0.00% | | 3.48% |
| 1d | | Roger G. Ibbotson | | 754,232,365 | | 96.21% | | — | | 0.00% | | 29,682,207 | | 3.79% | | 85.83% | | 0.00% | | 3.38% |
| 1e | | Robert C. Merton | | 754,598,874 | | 96.26% | | — | | 0.00% | | 29,315,698 | | 3.74% | | 85.87% | | 0.00% | | 3.34% |
| 1f | | Myron S. Scholes | | 754,057,040 | | 96.19% | | — | | 0.00% | | 29,857,532 | | 3.81% | | 85.81% | | 0.00% | | 3.40% |
| 1g | | Eduardo A. Repetto | | 753,295,592 | | 96.09% | | — | | 0.00% | | 30,618,979 | | 3.91% | | 85.72% | | 0.00% | | 3.48% |
| 1h | | Abbie J. Smith | | 754,123,603 | | 96.20% | | — | | 0.00% | | 29,790,969 | | 3.80% | | 85.82% | | 0.00% | | 3.39% |
| | | | | | | | | | | | | | | | | | | | | | |
| | | Shares Voted | | Percent of Outstanding Shares Voted |
| | | For | | % | | Against | | % | | Abstain/WithHold | | % | | NonVote | | % | | For | | Against | | Abstain / WithHold |
Proposal 2: To approve Articles of Amendment and Restatement for DIG* | | 479,705,048 | | 93.81% | | 7,503,436 | | 1.47% | | 24,156,664 | | 4.72% | | NA | | NA | | 54.59% | | 0.85% | | 2.75% |
| * | Results are for all Portfolios within DIG |
DFA International Value Portfolio
| | | | | | | | | | | | | | | | | | | | | | | | | | |
| | | Shares Voted | | Percent of Outstanding Shares Voted |
| | | For | | % | | Against | | % | | Abstain/WithHold | | % | | NonVote | | % | | For | | Against | | Abstain / WithHold | | Non-Vote |
Proposals: | | | | | | | | | | | | | | | | | | | | | | | | |
| |
5 | | To approve amendments to certain fundamental investment restrictions |
| 5a | | Borrowing Money | | 127,614,315 | | 85.58% | | 14,496,066 | | 9.72% | | 7,013,040 | | 4.70% | | NA | | NA | | 48.32% | | 5.49% | | 2.66% | | NA |
| 5b | | Making Loans | | 127,641,188 | | 85.59% | | 14,331,582 | | 9.61% | | 7,150,651 | | 4.80% | | NA | | NA | | 48.33% | | 5.43% | | 2.71% | | NA |
| 5c | | Investments in Real Estate | | 129,571,288 | | 86.89% | | 12,561,171 | | 8.42% | | 6,990,962 | | 4.69% | | NA | | NA | | 49.06% | | 4.76% | | 2.65% | | NA |
| 5d | | Investments in Commodities | | 127,850,565 | | 85.73% | | 14,282,207 | | 9.58% | | 6,990,649 | | 4.69% | | NA | | NA | | 48.41% | | 5.41% | | 2.65% | | NA |
| 5e | | Diversification of Investments | | 128,058,001 | | 85.87% | | 13,639,129 | | 9.15% | | 7,426,291 | | 4.98% | | NA | | NA | | 48.49% | | 5.16% | | 2.81% | | NA |
6 | | To approve the elimination of certain fundamental investment restrictions |
| 6a | | Pledging, Mortgaging, or Hypothecating Assets | | 126,781,111 | | 85.02% | | 15,180,463 | | 10.18% | | 7,161,847 | | 4.80% | | NA | | NA | | 48.00% | | 5.75% | | 2.71% | | NA |
| 6b | | Purchasing Securities on Margin | | 126,743,961 | | 84.99% | | 15,230,781 | | 10.21% | | 7,148,679 | | 4.79% | | NA | | NA | | 47.99% | | 5.77% | | 2.71% | | NA |
| 6c | | Investing in Restricted or Illiquid Securities | | 126,892,075 | | 85.09% | | 15,147,599 | | 10.16% | | 7,083,747 | | 4.75% | | NA | | NA | | 48.05% | | 5.74% | | 2.68% | | NA |
| 6d | | Investing for the Purpose of Exercising Control | | 127,557,569 | | 85.54% | | 14,485,326 | | 9.71% | | 7,080,526 | | 4.75% | | NA | | NA | | 48.30% | | 5.48% | | 2.68% | | NA |
| 6e | | Investing in Other Investment Companies | | 127,306,100 | | 85.37% | | 14,765,431 | | 9.90% | | 7,051,890 | | 4.73% | | NA | | NA | | 48.20% | | 5.59% | | 2.67% | | NA |
| 6f | | Management Ownership of Securities of an Issuer | | 127,523,344 | | 85.52% | | 13,985,818 | | 9.38% | | 7,614,259 | | 5.11% | | NA | | NA | | 48.29% | | 5.30% | | 2.88% | | NA |
| 6g | | Investing in Oil, Gas, or other Mineral Exploration, Leases or Development Programs | | 128,355,439 | | 86.07% | | 13,751,004 | | 9.22% | | 7,016,978 | | 4.71% | | NA | | NA | | 48.60% | | 5.21% | | 2.66% | | NA |
| 6h | | Investing in Securities of Unseasoned Issuers | | 127,429,787 | | 85.45% | | 14,603,028 | | 9.79% | | 7,090,605 | | 4.75% | | NA | | NA | | 48.25% | | 5.53% | | 2.68% | | NA |
| 6i | | Investing in Warrants | | 127,537,439 | | 85.52% | | 13,993,622 | | 9.38% | | 7,592,359 | | 5.09% | | NA | | NA | | 48.29% | | 5.30% | | 2.87% | | NA |
| 6j | | Writing or Acquiring Options | | 127,281,114 | | 85.35% | | 14,227,906 | | 9.54% | | 7,614,401 | | 5.11% | | NA | | NA | | 48.19% | | 5.39% | | 2.88% | | NA |
8 | | Approval of Investment Advisory Agreement between Dimensional Fund Advisors LP and the Company | | 129,446,599 | | 86.81% | | 8,913,716 | | 5.98% | | 10,763,106 | | 7.22% | | NA | | NA | | 49.01% | | 3.38% | | 4.08% | | NA |
267
THE DFA INVESTMENT TRUST COMPANY
PERFORMANCE CHARTS
The U.S. Large Company Series vs.
S&P 500® Index
October 31, 1999-October 31, 2009
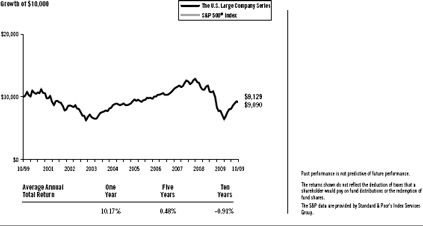
The U.S. Large Cap Value Series vs.
Russell 1000® Value Index
October 31, 1999-October 31, 2009
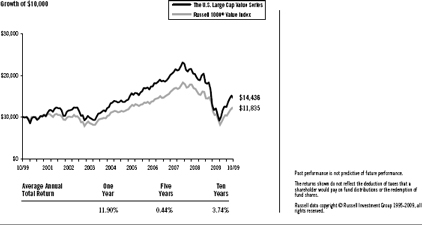
The DFA International Value Series vs.
MSCI World ex USA Index (net dividends)
October 31, 1999-October 31, 2009
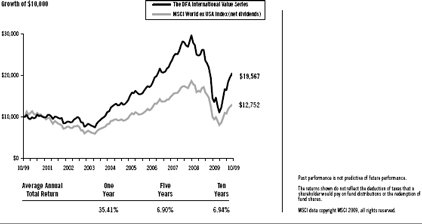
268
THE DFA INVESTMENT TRUST COMPANY
PERFORMANCE CHARTS
The Japanese Small Company Series vs.
MSCI Japan Small Cap Index (net dividends)
October 31, 1999-October 31, 2009
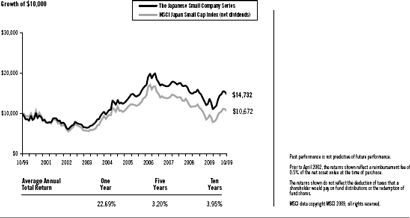
The Asia Pacific Small Company Series vs.
MSCI Pacific ex Japan Small Cap Index (net dividends)
October 31, 1999-October 31, 2009
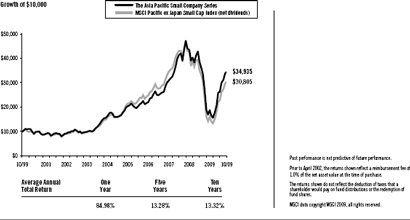
The United Kingdom Small Company Series vs.
MSCI UK Small Cap Index (net dividends)
October 31, 1999-October 31, 2009
269
THE DFA INVESTMENT TRUST COMPANY
PERFORMANCE CHARTS
The Continental Small Company Series vs.
MSCI Europe ex UK Small Cap Index (net dividends)
October 31, 1999-October 31, 2009
The Canadian Small Company Series vs.
MSCI Canada Small Cap Index (net dividends)
April 2, 2007-October 31, 2009
270
THE DFA INVESTMENT TRUST COMPANY
PERFORMANCE CHARTS
The Emerging Markets Series vs.
MSCI Emerging Markets Index (net dividends)
October 31, 1999-October 31, 2009
The Emerging Markets Small Cap Series vs.
MSCI Emerging Markets Index (net dividends)
October 31, 1999-October 31, 2009
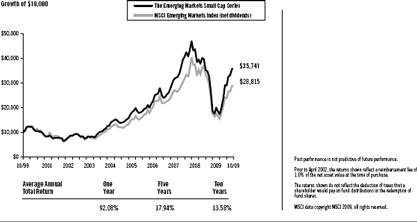
271
THE DFA INVESTMENT TRUST COMPANY
MANAGEMENT’S DISCUSSION AND ANALYSIS
| | |
| U.S. Equity Market Review | | 12 Months Ended October 31, 2009 |
The year ending October 31, 2009, was among the most volatile periods in U.S. market history. Broad market returns were positive with stocks represented by the mid cap index outperforming those within both small cap and large cap indexes and stocks represented by the growth index outperforming those represented by the value index. Investors moving out of stocks, beginning in late 2008 and extending into early 2009, contributed to high volatility and negative returns over that period. Markets turned higher sharply in March, and the size and value premiums both turned positive over the eight months ending October 2009. Although the large cap index outperformed the small cap index, and the growth index outperformed the value index, returns within the broader market (Russell 3000® Index) demonstrate that there was a positive small size premium and a positive value premium. This counterintuitive result occurred because the stock markets were characterized by extreme volatility, and the indexes, which are reconstituted annually, were not able to rebalance during the course of the year to maintain their intended asset class exposure. Among the most important factors explaining differences in the behavior of diversified equity portfolios are the company size and company value/growth characteristics of the portfolio’s holdings. Size is measured by market capitalization, and value classification is a function of stock price relative to one or more fundamental characteristics. Compared to other stocks, value stocks often have lower market value relative to their earnings, dividends, and book value.
For the 12 months ended October 31, 2009, the total return of the Russell Microcap® Index was 5.06%, the Russell 2000® Index was 6.46%, the CRSP 6-10 Index was 20.94%, and the MSCI US Small Cap 1750 Index was 14.11%. Large cap growth stocks outperformed large cap value stocks, as measured by the Russell 1000® Growth Index and Russell 1000® Value Index. Small cap growth stocks outperformed small cap value stocks, by a lesser amount than in large caps, as measured by the Russell 2000® Growth Index and Russell 2000® Value Index.
Total Return for 12 Months Ended October 31, 2009
| | |
Russell 2000® Index (small cap companies) | | 6.46% |
Russell Midcap® Index (mid cap companies) | | 18.74% |
Russell 1000® Index (large cap companies) | | 11.19% |
Russell 3000® Value Index | | 4.55% |
Russell 3000® Growth Index | | 17.04% |
Further dividing the large, mid, and small cap market segments by value and growth characteristics shows more detail in the performance differences over the period.
Total Return for 12 Months Ended October 31, 2009
| | |
Russell 1000® Value Index (large cap value companies) | | 4.78% |
Russell 1000® Growth Index (large cap growth companies) | | 17.50% |
Russell Midcap® Value Index (mid cap value companies) | | 14.52% |
Russell Midcap® Growth Index (mid cap growth companies) | | 22.48% |
Russell 2500TM Value Index (small/mid cap value companies) | | 8.56% |
Russell 2500TM Growth Index (small/mid cap growth companies) | | 18.20% |
Russell 2000® Value Index (small cap value companies) | | 1.95% |
Russell 2000® Growth Index (small cap growth companies) | | 11.34% |
Source: Russell data copyright © Russell Investment Group 1995-2009, all rights reserved.
Differences in returns for the various Dimensional U.S. equity funds over the 12 months ended October 31, 2009 were attributable primarily to differences in value/growth and size characteristics as well as the exclusion of
272
REIT securities from most Dimensional portfolios, except for the DFA Real Estate Securities Portfolio and portfolios investing in the U.S. Large Company Series. Moreover, the portfolio construction approach used by Dimensional Fund Advisors (the “Advisor”) generally resulted in portfolios with greater emphasis on value or small company characteristics relative to widely used index benchmarks.
Domestic Equity Series’ Performance Overview
The U.S. Large Company Series
The U.S. Large Company Series seeks to approximate the returns of the S&P 500® Index by purchasing shares in S&P 500® Index stocks in approximately the same proportions as they are represented in the Index. The Series was mostly invested in equities throughout the year: the average non-equitized cash level for the period was less than 1% of the Series’ assets.
For the 12 months ended October 31, 2009, the total return was 10.17% for the Series and 9.80% for the S&P 500® Index Relative to the Index, outperformance was mostly due to the flexible trading approach employed by the Series to gain exposure to the performance of the Index during periods of index reconstitution.
The U.S. Large Cap Value Series
The U.S. Large Cap Value Series seeks to capture the returns of U.S. large company value stocks. The investment strategy employs a disciplined, quantitative approach, emphasizing broad diversification and consistent exposure to large cap value stocks, but does not attempt to track closely a specific equity index. As of October 31, 2009, the Series held 213 stocks and was mostly invested in equities throughout the year: the average non-equitized cash level for the period was less than 1% of the Series’ assets.
As a result of the Series’ diversified investment approach, performance was determined principally by broad structural trends in the U.S. equity market, rather than the behavior of a limited number of stocks. For the 12 months ended October 31, 2009, total returns were 11.90% for the Series and 4.78% for the Russell 1000® Value Index. The Series benefited from a positive size premium and value premium over the last eight months of the period. Relative to the Index, the Series’ greater exposure to stocks with more pronounced value characteristics and composition differences along the value/growth dimension added approximately 4.2% to the relative performance. Differences in sector weights between the Series and Index also contributed to the outperformance. The Series’ larger allocation than the Index to consumer discretionary stocks, due to its strategy of maintaining consistent large cap value exposure, added approximately 3% to relative performance. The Series also benefited from composition differences among the Series’ basket of financial stocks, which added approximately 3.6% to relative performance.
| | |
| International Equity Market Review | | 12 Months Ended October 31, 2009 |
The one-year period ending October 31, 2009, was characterized by unprecedented volatility in non-US developed markets. Non-US developed markets lost 18.87% from November 2008 through February 2009, as measured by the MSCI World ex USA Index (net dividends). From March through October 2009 these same markets gained 57.56%. In April 2009, the Index had its largest-ever monthly gain (12.90%) since October 1990.
From November 2008 through February 2009, developed markets returns were negative across all asset classes. The US dollar rallied against most currencies, reversing a general trend of depreciation dating back to 2006. From March through October 2009 the market reversed course, with small cap and value stocks strongly outperforming large cap and growth stocks. The US dollar depreciated against most major currencies. The rally drove strong positive returns for the 12-month period, with small cap stocks significantly outperforming large cap stocks and value stocks outperforming growth stocks, as measured by the MSCI indexes.
273
12 Months Ended October 31, 2009
| | | | |
Ten Largest Foreign Developed Markets by Market Cap (BB) | | Local
Currency
Return | | U.S. Dollar
Return |
Japan ($2,432) | | 6.03% | | 15.20% |
United Kingdom ($2,328) | | 23.19% | | 25.68% |
France ($1,106) | | 10.09% | | 28.10% |
Canada ($1,060) | | 17.46% | | 32.58% |
Australia ($912) | | 21.91% | | 66.97% |
Germany ($843) | | 6.37% | | 23.77% |
Switzerland ($821) | | 5.78% | | 20.63% |
Spain ($488) | | 33.27% | | 55.06% |
Italy ($388) | | 7.57% | | 25.17% |
Netherlands ($277) | | 20.17% | | 39.83% |
Country market capitalizations (in parentheses) are in USD billions. Source: Returns are of MSCI indices net of foreign withholding taxes on dividends. Country market capitalizations are based on country carve-outs of the MSCI All-Country World Investable Market Index. MSCI data copyright MSCI 2009, all rights reserved.
Small company stocks were the best-performing asset class in international markets, while growth stocks had the worst relative results.
12 Months Ended October 31, 2009
| | |
| | | U.S. Dollar
Return |
MSCI World ex USA Small Cap Index | | 50.01% |
MSCI World ex USA Value Index | | 31.71% |
MSCI World ex USA Index | | 27.83% |
MSCI World ex USA Growth Index | | 24.03% |
Source: MSCI indices are net of foreign withholding taxes on dividends, copyright MSCI 2009, all rights reserved.
Gains in emerging markets were better, on average, than in developed markets, although results varied widely among the individual emerging markets countries. For the 12 month period, returns in U.S. dollars were 64.13% for the MSCI Emerging Markets Index (net dividends) and 27.83% for the MSCI World ex USA Index (net dividends).
12 Months Ended October 31, 2009
| | |
Country | | U.S. Dollar
Return |
Argentina | | 53.21% |
Brazil | | 91.55% |
Chile | | 61.68% |
China | | 82.16% |
Czech Republic | | 26.83% |
Hungary | | 63.54% |
India | | 77.12% |
Indonesia | | 127.39% |
Israel | | 31.43% |
Malaysia | | 56.99% |
Mexico | | 39.79% |
274
12 Months Ended October 31, 2009
| | |
Country | | U.S. Dollar
Return |
Philippines | | 50.71% |
Poland | | 23.09% |
South Africa | | 61.69% |
South Korea | | 56.17% |
Taiwan | | 48.86% |
Thailand | | 78.58% |
Turkey | | 68.21% |
Source: Returns are of MSCI indices net of foreign withholding taxes on dividends, copyright MSCI 2008, all rights reserved.
International Equity Series’ Performance Overview
The DFA International Value Series
The DFA International Value Series seeks to capture the returns of international large company value stocks by purchasing shares in such stocks. The investment strategy employs a disciplined, quantitative approach, emphasizing broad diversification and consistent exposure to large cap value stocks, but does not attempt to track closely a specific equity index. As of October 31, 2009, the Series held 465 stocks in 22 developed countries and was mostly invested in equities throughout the year: the average non-equitized cash level for the period was less than 1% of the Series’ assets.
As a result of the Series’ diversified investment approach, performance principally was determined by broad structural trends in global equity markets, rather than the behavior of a limited number of stocks. For the 12 months ended October 31, 2009, value stocks outperformed growth stocks in international developed markets. Total returns were 35.41% for the Series and 27.83% for the MSCI World ex USA Index (net dividends). The Series’ greater allocation than the Index to value stocks (66% on average vs. 26% in the Index) added approximately 6.7% to the relative performance.
The Japanese Small Company Series
The Japanese Small Company Series seeks to capture the returns of Japanese small company stocks. The investment strategy employs a disciplined, quantitative approach, emphasizing broad diversification and consistent exposure to small company stocks, but does not attempt to track closely a specific equity index. As of October 31, 2009, the Series held 1,313 stocks and was mostly invested in equities throughout the year: the average non-equitized cash level for period was less than 1% of the Series’ assets.
As a result of the Series’ diversified investment approach, performance was determined principally by broad structural trends in the Japanese equity market, rather than the behavior of a limited number of stocks. Over the period, Japanese small company stocks outperformed Japanese large company stocks. For the 12 months ended October 31, 2009, total returns were 22.69% for the Series and 24.60% for the MSCI Japan Small Cap Index (net dividends). The Series holds a large number of stocks, and no single stock explained a significant amount of the performance difference. Relative to the Index, the Series underperformed primarily due to composition differences, a result of the Series’ process of continually rebalancing toward its target. Over the period, there was a wider than usual performance difference between the best and worst performing stocks within countries, industry sectors and asset classes. Consequently, slight differences in weights or in holdings between the Series and the Index had a significant impact on relative performance.
275
The Asia Pacific Small Company Series
The Asia Pacific Small Company Series seeks to capture the returns of small company stocks in developed Asia Pacific markets, excluding Japan, by purchasing shares of a Master Fund that invests in such stocks. The investments strategy employs a disciplined, quantitative approach, emphasizing broad diversification and consistent exposure to small company stocks, but does not attempt to track closely a specific equity index. As of October 31, 2009, the Series held 963 stocks, and assets were allocated mainly among four countries: Australia, Hong Kong, New Zealand, and Singapore (approximately 59%, 21%, 7%, and 13% respectively). Country allocations are determined by utilizing the approximate weights of individual securities within a universe of Asia Pacific small company stocks constructed by the Advisor. The allocations do not represent a forecast of future performance and are subject to change by the Advisor. The average non-equitized cash level for period was less than 1% of the Series’ assets.
As a result of the Series’ diversified investment approach, performance was determined principally by broad structural trends in Asia Pacific equity markets rather than the behavior of a limited number of stocks. Over the period, Asia Pacific small company stocks outperformed Asia Pacific large company stocks. For the 12 months ended October 31, 2009, total returns were 84.98% for the Series and 90.41% for the MSCI Pacific ex Japan Small Cap Index (net dividends). The Series holds a large number of stocks, and no single stock explained a significant amount of the performance difference. Relative to the Index, the Series underperformed primarily due to composition differences, a result of the Series’ process of continually rebalancing toward its target. Over the period, there was a wider than usual performance difference between the best and worst performing stocks within countries, industry sectors and asset classes. Consequently, slight differences in weights or in holdings between the Series and the Index had a significant impact on relative performance.
The United Kingdom Small Company Series
The United Kingdom Small Company Series seeks to capture the returns of U.K. small company stocks. The investment strategy employs a disciplined, quantitative approach, emphasizing broad diversification and consistent exposure to small company stocks, but does not attempt to track closely a specific equity index. As of October 31, 2009, the Series held 386 stocks and was mostly invested in equities throughout the year: the average non-equitized cash level for the period was less than 1% of the Series’ assets.
As a result of the Series’ diversified investment approach, performance was determined principally by broad structural trends in the U.K. equity market, rather than the behavior of a limited number of stocks. Over the period, U.K. small company stocks outperformed U.K. large company stocks. For the 12 months ended October 31, 2009, total returns were 43.51% for the Series and 51.09% for the MSCI UK Small Cap Index (net dividends). The Series holds a large number of stocks, and no single stock explained a significant amount of the performance difference. Relative to the Index, the Series underperformed primarily due to composition differences, a result of the Series’ process of continually rebalancing toward its target. Over the period, there was a wider than usual performance difference between the best and worst performing stocks within countries, industry sectors and asset classes. Consequently, slight differences in weights or in holdings between the Series and the Index had a significant impact on relative performance.
The Continental Small Company Series
The Continental Small Company Series seeks to capture the returns of small company stocks in developed markets of Europe, excluding the U.K., by purchasing shares in such stocks. The investment strategy employs a disciplined, quantitative approach, emphasizing broad diversification and consistent exposure to small company stocks, but does not attempt to track closely a specific equity index. As of October 31, 2009, the Series held 1,234 stocks in 15 developed continental European countries. Country allocations reflect the approximate weights of individual securities within a universe of continental European small company stocks constructed by the Advisor. Country allocations do not represent a forecast of future performance and are subject to change by the Advisor. The average non-equitized cash level for period was less than 1% of the Series’ assets.
276
As a result of the Series’ diversified investment approach, performance was determined principally by broad structural trends in the continental European equity markets, excluding the U.K., rather than the behavior of a limited number of stocks. Over the period, continental European small company stocks outperformed continental European large company stocks. For the 12 months ended October 31, 2009, total returns were 43.78% for the Series and 57.29% for the MSCI Europe ex UK Small Cap Index (net dividends). The Series holds a large number of stocks, and no single stock explained a significant amount of the performance difference. Relative to the Index, the Series underperformed primarily due to composition differences, a result of the Series’ process of continually rebalancing toward its target. Over the period, there was a wider than usual performance difference between the best and worst performing stocks within countries, industry sectors and asset classes. Consequently, slight differences in weights or in holdings between the Series and the Index had a significant impact on relative performance.
The Canadian Small Company Series
The Canadian Small Company Series seeks to capture the returns of Canadian small company stocks. The investment strategy employs a disciplined, quantitative approach, emphasizing broad diversification and consistent exposure to small company stocks, but does not attempt to track closely a specific equity index. As of October 31, 2009, the Series held 306 stocks and was mostly invested in equities throughout the year: the average non-equitized cash level for the period was less than 1% of the Series’ assets.
As a result of the Series’ diversified investment approach, performance was determined principally by broad structural trends in the Canadian equity market, rather than the behavior of a limited number of stocks. Over the period, Canadian small company stocks outperformed Canadian large company stocks. For the 12 months ended October 31, 2009, total returns were 61.67% for the Series and 63.84% for the MSCI Canada Small Cap Index (net dividends). The Series holds a large number of stocks, and no single stock explained a significant amount of the performance difference. Relative to the Index, the Portfolio underperformed primarily due to composition differences, a result of the Series’ process of continually rebalancing toward its target. Over the period, there was a wider than usual performance difference between the best and worst performing stocks within countries, industry sectors and asset classes. Consequently, slight differences in weights or in holdings between the Series and the Index had a significant impact on relative performance.
The Emerging Markets Series
The Emerging Markets Series seeks to capture the returns of large company stocks in selected emerging markets. The investment strategy employs a disciplined quantitative approach, emphasizing broad diversification and consistent exposure to large company emerging markets stocks, but does not attempt to track closely a specific equity index. As of October 31, 2009, the Series held 654 stocks in 18 emerging countries and was mostly invested in equities throughout the year: the average non-equitized cash level for the period was less than 1% of the Series’ assets. The Series’ target country weights are capped at a ceiling set by the manager in order to limit single-country risk exposure.
As a result of the Series’ diversified approach, performance was generally determined by structural trends in emerging country stock markets, rather than the behavior of a limited number of stocks. For the 12 months ended October 31, 2009, total returns were 53.99% for the Series and 64.13% for the MSCI Emerging Markets Index (net dividends). The Series’ relative underperformance was primarily due to differences in country weights and in the composition of the Series’ holdings relative to the Index. Over the period, there was a wider than usual performance difference between the best and worst performing stocks within countries, industry sectors and asset classes. Consequently, slight differences in weights or in holdings between the Series and the Index had a significant impact on relative performance.
The Emerging Markets Small Cap Series
The Emerging Markets Small Cap Series seeks to capture the returns of small company stocks in selected emerging markets. The investment strategy employs a disciplined quantitative approach, emphasizing broad diversification and consistent exposure to emerging markets small company stocks, but does not attempt to track closely a specific equity index. As of October 31, 2009, the Series held 2,152 stocks in 16 emerging countries and
277
was mostly invested in equities throughout the year: the average non-equitized cash level for the period was less than 1% of the Series’ assets. The Series’ target country weights are capped at a ceiling set by the manager in order to limit single-country risk exposure.
As a result of the Series’ diversified approach, performance was principally determined by structural trends in emerging country stock markets, rather than the behavior of a limited number of stocks. For the 12 months ended October 31, 2009, total returns were 92.08% for the Series and 64.13% for the MSCI Emerging Markets Index (net dividends). The Series’ outperformance was primarily because small cap stocks dramatically outperformed large cap stocks during the period. Also, over the period, there was a wider than usual performance difference between the best and worst performing stocks within countries, industry sectors, and asset classes. Consequently, slight differences in weights or in holdings between the Series and the Index had a significant impact on relative performance.
278
THE DFA INVESTMENT TRUST COMPANY
DISCLOSURE OF FUND EXPENSES
(Unaudited)
The following Expense Tables are shown so that you can understand the impact of fees on your investment. All mutual funds have operating expenses. As a shareholder of the fund, you incur ongoing costs, which include costs for portfolio management, administrative services, and shareholder reports, among others. Operating expenses, legal and audit services, which are deducted from a fund’s gross income, directly reduce the investment return of the fund. A fund’s expenses are expressed as a percentage of its average net assets. This figure is known as the expense ratio. The following examples are intended to help you understand the ongoing costs, in dollars, of investing in the fund and to compare these costs with those of other mutual funds. The examples are based on an investment of $1,000 made at the beginning of the period shown and held for the entire period.
The Expense Tables below illustrate your fund’s costs in two ways.
Actual Fund Return
This section helps you to estimate the actual expenses after fee waivers that you paid over the period. The “Ending Account Value” shown is derived from the fund’s actual return and “Expenses Paid During Period” reflect the dollar amount that would have been paid by an investor who started with $1,000 in the fund. You may use the information here, together with the amount you invested, to estimate the expenses that you paid over the period.
To do so, simply divide your account value by $1,000 (for example, a $7,500 account value divided by $1,000 = 7.5), then multiply the result by the number given for your fund under the heading “Expenses Paid During Period.”
Hypothetical Example for Comparison Purposes
This section is intended to help you compare your fund’s costs with those of other mutual funds. The hypothetical “Ending Account Value” and “Expenses Paid During Period” are derived from the fund’s actual expense ratio and an assumed 5% annual return before expenses. In this case, because the return used is not the fund’s actual return, the results do not apply to your investment. The example is useful in making comparisons because the SEC requires all mutual funds to calculate expenses based on a 5% annual return. You can assess your fund’s costs by comparing this hypothetical example with the hypothetical examples that appear in shareholder reports of other funds.
Please note that the expenses shown in the tables are meant to highlight and help you compare ongoing costs only and do not reflect any transactional costs, if applicable. The “Annualized Expense Ratio” represents the actual expenses for the six-month period indicated.
Six Months Ended October 31, 2009
EXPENSE TABLES
| | | | | | | | |
| | | Beginning
Account
Value
05/01/09 | | Ending
Account
Value
10/31/09 | | Annualized
Expense
Ratio* | | Expenses
Paid
During
Period* |
| | | | |
The U.S. Large Company Series | | | | | | | | |
Actual Fund Return | | $1,000.00 | | $1,200.50 | | 0.06% | | $0.33 |
Hypothetical 5% Annual Return | | $1,000.00 | | $1,024.90 | | 0.06% | | $0.31 |
| | | | |
The U.S. Large Cap Value Series | | | | | | | | |
Actual Fund Return | | $1,000.00 | | $1,242.20 | | 0.14% | | $0.79 |
Hypothetical 5% Annual Return | | $1,000.00 | | $1,024.50 | | 0.14% | | $0.71 |
279
DISCLOSURE OF FUND EXPENSES
CONTINUED
| | | | | | | | |
| | | Beginning
Account
Value
05/01/09 | | Ending
Account
Value
10/31/09 | | Annualized
Expense
Ratio* | | Expenses
Paid
During
Period* |
| | | | |
The DFA International Value Series | | | | | | | | |
Actual Fund Return | | $1,000.00 | | $1,350.50 | | 0.25% | | $1.48 |
Hypothetical 5% Annual Return | | $1,000.00 | | $1,023.95 | | 0.25% | | $1.28 |
| | | | |
The Japanese Small Company Series | | | | | | | | |
Actual Fund Return | | $1,000.00 | | $1,228.70 | | 0.16% | | $0.90 |
Hypothetical 5% Annual Return | | $1,000.00 | | $1,024.40 | | 0.16% | | $0.82 |
| | | | |
The Asia Pacific Small Company Series | | | | | | | | |
Actual Fund Return | | $1,000.00 | | $1,674.70 | | 0.17% | | $1.15 |
Hypothetical 5% Annual Return | | $1,000.00 | | $1,024.35 | | 0.17% | | $0.87 |
| | | | |
The United Kingdom Small Company Series | | | | | | | | |
Actual Fund Return | | $1,000.00 | | $1,337.60 | | 0.14% | | $0.82 |
Hypothetical 5% Annual Return | | $1,000.00 | | $1,024.50 | | 0.14% | | $0.71 |
| | | | |
The Continental Small Company Series | | | | | | | | |
Actual Fund Return | | $1,000.00 | | $1,396.50 | | 0.16% | | $0.97 |
Hypothetical 5% Annual Return | | $1,000.00 | | $1,024.40 | | 0.16% | | $0.82 |
| | | | |
The Canadian Small Company Series | | | | | | | | |
Actual Fund Return | | $1,000.00 | | $1,464.20 | | 0.16% | | $0.99 |
Hypothetical 5% Annual Return | | $1,000.00 | | $1,024.40 | | 0.16% | | $0.82 |
| | | | |
The Emerging Markets Series | | | | | | | | |
Actual Fund Return | | $1,000.00 | | $1,383.70 | | 0.21% | | $1.26 |
Hypothetical 5% Annual Return | | $1,000.00 | | $1,024.15 | | 0.21% | | $1.07 |
| | | | |
The Emerging Markets Small Cap Series | | | | | | | | |
Actual Fund Return | | $1,000.00 | | $1,509.50 | | 0.34% | | $2.15 |
Hypothetical 5% Annual Return | | $1,000.00 | | $1,023.49 | | 0.34% | | $1.73 |
| * | Expenses are equal to the fund’s annualized expense ratio for the six-month period, multiplied by the average account value over the period, multiplied by the number of days in the most recent six-month period (184), then divided by the number of days in the year (365) to reflect the six-month period. |
280
DFA INVESTMENT TRUST COMPANY
DISCLOSURE OF PORTFOLIO HOLDINGS
(Unaudited)
The SEC requires that all Funds file a complete Schedule of Investments with the SEC for their first and third fiscal quarters on Form N-Q. For The DFA Investment Trust Company, this would be for the fiscal quarters ending January 31 and July 31. The Form N-Q filing must be made within 60 days of the end of the quarter. The DFA Investment Trust Company filed its most recent Form N-Q with the SEC on September 29, 2009. It is available upon request, without charge, by calling collect: (512) 306-7400 or by mailing a request to Dimensional Fund Advisors LP, 6300 Bee Cave Road, Building One, Austin, Texas 78746, or by visiting the SEC’s website at http://www.sec.gov, or they may be reviewed and copied at the SEC’s Public Reference Room in Washington, D.C. (call 1-800-732-0330 for information on the operation of the Public Reference Room).
SEC regulations permit a fund to include in its reports to shareholders a “Summary Schedule of Portfolio Holdings” in lieu of a full Schedule of Investments. The Summary Schedule of Portfolio Holdings reports the fund’s 50 largest holdings in unaffiliated issuers and any investments that exceed one percent of the fund’s net assets at the end of the reporting period. The amendments also require that the Summary Schedule of Portfolio Holdings identify each category of investments that are held.
The fund is required to file a complete Schedule of Investments with the SEC on Form N-CSR within ten days after mailing the annual and semi-annual reports to shareholders. It will be available upon request, without charge, by calling collect: (512) 306-7400 or by mailing a request to Dimensional Fund Advisors LP, 6300 Bee Cave Road, Building One, Austin, Texas 78746, or by visiting the SEC’s website at http://www.sec.gov, or they may be reviewed and copied at the SEC’s Public Reference Room in Washington, D.C. (call 1-800-732-0330 for information on the operation of the Public Reference Room).
PORTFOLIO HOLDINGS
The SEC requires that all Funds present their categories of portfolio holdings in a table, chart or graph format in their annual and semi-annual shareholder reports, whether or not a Schedule of Investments is utilized. The following table, which presents portfolio holdings as a percent of total investments before short-term investments and collateral for loaned securities, is provided in compliance with such requirement. The categories shown below represent broad industry sectors. Each industry sector consists of one or more specific industry classifications.
DOMESTIC AND INTERNATIONAL EQUITY PORTFOLIOS
| | |
| The U.S. Large Company Series |
Consumer Discretionary | | 9.2% |
Consumer Staples | | 11.9% |
Energy | | 12.4% |
Financials | | 13.6% |
Health Care | | 12.6% |
Industrials | | 10.0% |
Information Technology | | 19.0% |
Materials | | 3.4% |
Real Estate Investment Trusts | | 1.1% |
Telecommunication Services | | 3.1% |
Utilities | | 3.7% |
| | |
| | 100.0% |
| | |
| The U.S. Large Cap Value Series |
Consumer Discretionary | | 16.7% |
Consumer Staples | | 6.4% |
Energy | | 13.9% |
Financials | | 31.3% |
Health Care | | 5.5% |
Industrials | | 14.7% |
Information Technology | | 3.6% |
Materials | | 3.8% |
Telecommunication Services | | 3.6% |
Utilities | | 0.5% |
| | |
| | 100.0% |
| | |
| The DFA International Value Series |
Consumer Discretionary | | 13.2% |
Consumer Staples | | 4.9% |
Energy | | 6.0% |
Financials | | 42.8% |
Health Care | | 0.4% |
Industrials | | 10.3% |
Information Technology | | 3.1% |
Materials | | 11.2% |
Other | | — |
Telecommunication Services | | 6.9% |
Utilities | | 1.2% |
| | |
| | 100.0% |
281
DISCLOSURE OF PORTFOLIO HOLDINGS
CONTINUED
| | |
| The Japanese Small Company Series |
Consumer Discretionary | | 21.1% |
Consumer Staples | | 10.4% |
Energy | | 1.4% |
Financials | | 10.4% |
Health Care | | 4.0% |
Industrials | | 27.4% |
Information Technology | | 11.5% |
Materials | | 12.9% |
Other | | — |
Telecommunication Services | | 0.1% |
Utilities | | 0.8% |
| | |
| | 100.0% |
| | |
| The Asia Pacific Small Company Series |
Consumer Discretionary | | 23.1% |
Consumer Staples | | 4.1% |
Energy | | 6.8% |
Financials | | 13.0% |
Health Care | | 6.6% |
Industrials | | 23.4% |
Information Technology | | 5.0% |
Materials | | 12.3% |
Other | | 0.1% |
Real Estate Investment Trusts | | 0.2% |
Telecommunication Services | | 1.8% |
Utilities | | 3.6% |
| | |
| | 100.0% |
| | |
| The United Kingdom Small Company Series |
Consumer Discretionary | | 21.0% |
Consumer Staples | | 4.3% |
Energy | | 5.3% |
Financials | | 14.2% |
Health Care | | 3.6% |
Industrials | | 33.0% |
Information Technology | | 13.0% |
Materials | | 4.4% |
Other | | — |
Telecommunication Services | | 0.7% |
Utilities | | 0.5% |
| | |
| | 100.0% |
| | |
| The Continental Small Company Series |
Consumer Discretionary | | 14.2% |
Consumer Staples | | 7.0% |
Energy | | 5.4% |
Financials | | 17.3% |
Health Care | | 8.3% |
Industrials | | 25.8% |
Information Technology | | 8.6% |
Materials | | 9.6% |
Other | | — |
Telecommunication Services | | 1.0% |
Utilities | | 2.8% |
| | |
| | 100.0% |
| | |
| The Canadian Small Company Series |
Consumer Discretionary | | 13.6% |
Consumer Staples | | 2.8% |
Energy | | 20.6% |
Financials | | 7.8% |
Health Care | | 4.9% |
Industrials | | 7.9% |
Information Technology | | 6.4% |
Materials | | 35.2% |
Telecommunication Services | | 0.4% |
Utilities | | 0.4% |
| | |
| | 100.0% |
| | |
| | |
| The Emerging Markets Series |
Consumer Discretionary | | 6.3% |
Consumer Staples | | 8.5% |
Energy | | 12.9% |
Financials | | 20.7% |
Health Care | | 3.4% |
Industrials | | 6.5% |
Information Technology | | 13.7% |
Materials | | 13.5% |
Other | | — |
Telecommunication Services | | 10.7% |
Utilities | | 3.8% |
| | |
| | 100.0% |
| | |
| The Emerging Markets Small Cap Series |
Consumer Discretionary | | 19.3% |
Consumer Staples | | 10.9% |
Energy | | 1.3% |
Financials | | 15.0% |
Health Care | | 4.8% |
Industrials | | 17.6% |
Information Technology | | 9.3% |
Materials | | 15.9% |
Other | | 0.2% |
Real Estate Investment Trusts | | — |
Telecommunication Services | | 1.3% |
Utilities | | 4.4% |
| | |
| | 100.0% |
282
THE U.S. LARGE COMPANY SERIES
SUMMARY SCHEDULE OF PORTFOLIO HOLDINGS
October 31, 2009
| | | | | | | |
| | | Shares | | Value† | | Percentage
of Net Assets** |
COMMON STOCKS — (92.1%) | | | | | | | |
Consumer Discretionary — (8.5%) | | | | | | | |
*Amazon.com, Inc. | | 126,572 | | $ | 15,038,019 | | 0.4% |
Comcast Corp. Class A | | 1,092,473 | | | 15,840,859 | | 0.4% |
Disney (Walt) Co. | | 707,515 | | | 19,364,686 | | 0.6% |
#Home Depot, Inc. | | 648,891 | | | 16,280,675 | | 0.5% |
McDonald’s Corp. | | 415,454 | | | 24,349,759 | | 0.7% |
Other Securities | | | | | 227,637,040 | | 6.5% |
| | | | | | | |
Total Consumer Discretionary | | | | | 318,511,038 | | 9.1% |
| | | | | | | |
| | | |
Consumer Staples — (11.0%) | | | | | | | |
Coca-Cola Co. | | 882,204 | | | 47,030,295 | | 1.3% |
Colgate-Palmolive Co. | | 189,741 | | | 14,919,335 | | 0.4% |
CVS Caremark Corp. | | 549,409 | | | 19,394,138 | | 0.6% |
Kraft Foods, Inc. | | 561,489 | | | 15,452,177 | | 0.4% |
PepsiCo, Inc. | | 593,045 | | | 35,908,875 | | 1.0% |
Philip Morris International, Inc. | | 736,409 | | | 34,876,330 | | 1.0% |
Procter & Gamble Co. | | 1,111,163 | | | 64,447,454 | | 1.8% |
Wal-Mart Stores, Inc. | | 822,201 | | | 40,846,946 | | 1.2% |
Other Securities | | | | | 141,728,671 | | 4.1% |
| | | | | | | |
Total Consumer Staples | | | | | 414,604,221 | | 11.8% |
| | | | | | | |
| | | |
Energy — (11.4%) | | | | | | | |
Chevron Corp. | | 763,458 | | | 58,435,075 | | 1.7% |
ConocoPhillips | | 564,511 | | | 28,327,162 | | 0.8% |
Exxon Mobil Corp. | | 1,829,468 | | | 131,117,972 | | 3.7% |
Occidental Petroleum Corp. | | 308,646 | | | 23,420,058 | | 0.7% |
Schlumberger, Ltd. | | 455,987 | | | 28,362,391 | | 0.8% |
Other Securities | | | | | 159,417,519 | | 4.5% |
| | | | | | | |
Total Energy | | | | | 429,080,177 | | 12.2% |
| | | | | | | |
| | | |
Financials — (12.5%) | | | | | | | |
American Express Co. | | 452,705 | | | 15,772,242 | | 0.4% |
Bank of America Corp. | | 3,293,490 | | | 48,019,084 | | 1.4% |
Citigroup, Inc. | | 4,964,744 | | | 20,305,803 | | 0.6% |
Goldman Sachs Group, Inc. | | 194,617 | | | 33,117,975 | | 0.9% |
JPMorgan Chase & Co. | | 1,497,052 | | | 62,531,862 | | 1.8% |
Morgan Stanley | | 517,407 | | | 16,619,113 | | 0.5% |
#U.S. Bancorp | | 727,850 | | | 16,900,677 | | 0.5% |
Wells Fargo & Co. | | 1,778,388 | | | 48,941,238 | | 1.4% |
Other Securities | | | | | 209,712,141 | | 6.0% |
| | | | | | | |
Total Financials | | | | | 471,920,135 | | 13.5% |
| | | | | | | |
| | | |
Health Care — (11.7%) | | | | | | | |
Abbott Laboratories | | 588,498 | | | 29,760,344 | | 0.8% |
*Amgen, Inc. | | 386,571 | | | 20,770,460 | | 0.6% |
Bristol-Myers Squibb Co. | | 754,098 | | | 16,439,336 | | 0.5% |
*Gilead Sciences, Inc. | | 344,234 | | | 14,647,157 | | 0.4% |
Johnson & Johnson | | 1,049,083 | | | 61,948,351 | | 1.8% |
Medtronic, Inc. | | 421,338 | | | 15,041,767 | | 0.4% |
#Merck & Co., Inc. | | 802,803 | | | 24,830,697 | | 0.7% |
Pfizer, Inc. | | 3,069,869 | | | 52,279,869 | | 1.5% |
Schering-Plough Corp. | | 622,008 | | | 17,540,626 | | 0.5% |
Other Securities | | | | | 186,020,772 | | 5.3% |
| | | | | | | |
Total Health Care | | | | | 439,279,379 | | 12.5% |
| | | | | | | |
| | | |
Industrials — (9.2%) | | | | | | | |
3M Co. | | 265,836 | | | 19,557,555 | | 0.6% |
283
THE U.S. LARGE COMPANY SERIES
CONTINUED
| | | | | | |
| | | Shares | | Value† | | Percentage
of Net Assets** |
Industrials — (Continued) | | | | | | |
General Electric Co. | | 4,045,427 | | $ 57,687,789 | | 1.6% |
United Parcel Service, Inc. | | 378,570 | | 20,321,638 | | 0.6% |
United Technologies Corp. | | 358,323 | | 22,018,948 | | 0.6% |
Other Securities | | | | 228,629,561 | | 6.5% |
| | | | | | |
Total Industrials | | | | 348,215,491 | | 9.9% |
| | | | | | |
| | | |
Information Technology — (17.5%) | | | | | | |
*Apple, Inc. | | 341,019 | | 64,282,082 | | 1.8% |
*Cisco Sytems, Inc. | | 2,195,717 | | 50,172,133 | | 1.4% |
*Google, Inc. | | 91,589 | | 49,102,695 | | 1.4% |
Hewlett-Packard Co. | | 902,618 | | 42,838,250 | | 1.2% |
Intel Corp. | | 2,131,047 | | 40,724,308 | | 1.2% |
International Business Machines Corp. | | 499,027 | | 60,187,646 | | 1.7% |
Microsoft Corp. | | 2,951,141 | | 81,835,140 | | 2.4% |
Oracle Corp. | | 1,486,799 | | 31,371,459 | | 0.9% |
QUALCOMM, Inc. | | 632,808 | | 26,204,579 | | 0.8% |
Other Securities | | | | 214,771,869 | | 6.1% |
| | | | | | |
Total Information Technology | | | | 661,490,161 | | 18.9% |
| | | | | | |
| | | |
Materials — (3.1%) | | | | | | |
Other Securities | | | | 117,813,227 | | 3.4% |
| | | | | | |
| | | |
Real Estate Investment Trusts — (1.0%) | | | | | | |
Other Securities | | | | 37,279,130 | | 1.1% |
| | | | | | |
| | | |
Telecommunication Services — (2.8%) | | | | | | |
AT&T, Inc. | | 2,246,012 | | 57,655,128 | | 1.7% |
Verizon Communications, Inc. | | 1,081,364 | | 31,997,561 | | 0.9% |
Other Securities | | | | 17,544,350 | | 0.5% |
| | | | | | |
Total Telecommunication Services | | | | 107,197,039 | | 3.1% |
| | | | | | |
| | | |
Utilities — (3.4%) | | | | | | |
Other Securities | | | | 127,970,719 | | 3.6% |
| | | | | | |
TOTAL COMMON STOCKS | | | | 3,473,360,717 | | 99.1% |
| | | | | | |
| | | |
| | | Face
Amount | | | | |
| | | (000) | | | | |
TEMPORARY CASH INVESTMENTS — (0.7%) | | | | | | |
Repurchase Agreement, PNC Capital Markets, Inc. 0.19%, 11/02/09 (Collateralized by $25,855,000, FNMA 6.50%, 06/25/39 valued at $27,826,444) to be repurchased at $27,414,434 | | $27,414 | | 27,414,000 | | 0.8% |
| | | | | | |
284
THE U.S. LARGE COMPANY SERIES
CONTINUED
| | | | | | |
| | | Shares/ Face Amount | | Value† | | Percentage
of Net Assets** |
| | | (000) | | | | |
SECURITIES LENDING COLLATERAL — (7.2%) | | | | | | |
§@DFA Short Term Investment Fund LP | | 269,088,352 | | $ 269,088,352 | | 7.7% |
@Repurchase Agreement, Deutsche Bank Securities 0.08%, 11/02/09 (Collateralized by $2,507,470 FHLMC 5.793%(r), 01/01/37, valued at $1,408,594) to be repurchased at $1,367,576 | | $1,368 | | 1,367,567 | | 0.0% |
| | | | | | |
| | | |
TOTAL SECURITIES LENDING COLLATERAL | | | | 270,455,919 | | 7.7% |
| | | | | | |
| | | |
TOTAL INVESTMENTS — (100.0%)
(Cost $3,544,033,089) | | | | $3,771,230,636 | | 107.6% |
| | | | | | |
Summary of inputs used to value the Series’ net assets as of October 31, 2009 is as follows (See Security Valuation Note):
| | | | | | | | | | | |
| | | Valuation Inputs |
| | | Investment in Securities (Market Value) |
| | | Level 1 | | Level 2 | | Level 3 | | Total |
Common Stocks | | | | | | | | | | | |
Consumer Discretionary | | $ | 318,511,038 | | | — | | — | | $ | 318,511,038 |
Consumer Staples | | | 414,604,221 | | | — | | — | | | 414,604,221 |
Energy | | | 429,080,177 | | | — | | — | | | 429,080,177 |
Financials | | | 471,920,135 | | | — | | — | | | 471,920,135 |
Health Care | | | 439,279,379 | | | — | | — | | | 439,279,379 |
Industrials | | | 348,215,491 | | | — | | — | | | 348,215,491 |
Information Technology | | | 661,490,161 | | | — | | — | | | 661,490,161 |
Materials | | | 117,813,227 | | | — | | — | | | 117,813,227 |
Real Estate Investment Trusts | | | 37,279,130 | | | — | | — | | | 37,279,130 |
Telecommunication Services | | | 107,197,039 | | | — | | — | | | 107,197,039 |
Utilities | | | 127,970,719 | | | — | | — | | | 127,970,719 |
Temporary Cash Investments | | | — | | $ | 27,414,000 | | — | | | 27,414,000 |
Securities Lending Collateral | | | — | | | 270,455,919 | | — | | | 270,455,919 |
Other Financial Instruments** | | | 140,905 | | | — | | — | | | 140,905 |
| | | | | | | | | | | |
| | | | |
TOTAL | | $ | 3,473,501,622 | | $ | 297,869,919 | | — | | $ | 3,771,371,541 |
| | | | | | | | | | | |
| | ** | Other financial instruments are derivative instruments not reflected in the Schedule of Investments, such as futures and forwards which are valued at the unrealized appreciation/depreciation on the investment. |
See accompanying Notes to Financial Statements.
285
THE U.S. LARGE CAP VALUE SERIES
SUMMARY SCHEDULE OF PORTFOLIO HOLDINGS
October 31, 2009
| | | | | | | |
| | | Shares | | Value† | | Percentage
of Net Assets** |
COMMON STOCKS — (93.1%) | | | | | | | |
Consumer Discretionary — (15.5%) | | | | | | | |
Carnival Corp. | | 2,624,598 | | $ | 76,428,294 | | 1.0% |
CBS Corp. Class B | | 3,870,469 | | | 45,555,420 | | 0.6% |
Comcast Corp. Class A | | 11,512,642 | | | 166,933,309 | | 2.2% |
Comcast Corp. Special Class A | | 3,396,043 | | | 47,612,523 | | 0.6% |
#Disney (Walt) Co. | | 4,577,802 | | | 125,294,441 | | 1.7% |
*Liberty Media Corp. Entertainment Class A | | 2,954,309 | | | 91,051,803 | | 1.2% |
*Liberty Media Corp. Interactive Class A | | 3,585,265 | | | 40,656,905 | | 0.6% |
News Corp. Class A | | 5,810,104 | | | 66,932,398 | | 0.9% |
Time Warner Cable, Inc. | | 1,980,956 | | | 78,128,905 | | 1.0% |
Time Warner, Inc. | | 6,114,193 | | | 184,159,493 | | 2.5% |
Other Securities | | | | | 325,704,783 | | 4.3% |
| | | | | | | |
Total Consumer Discretionary | | | | | 1,248,458,274 | | 16.6% |
| | | | | | | |
| | | |
Consumer Staples — (5.9%) | | | | | | | |
Archer-Daniels-Midland Co. | | 1,723,060 | | | 51,898,567 | | 0.7% |
CVS Caremark Corp. | | 4,840,631 | | | 170,874,274 | | 2.3% |
Kraft Foods, Inc. | | 2,137,904 | | | 58,835,118 | | 0.8% |
Other Securities | | | | | 193,282,891 | | 2.5% |
| | | | | | | |
Total Consumer Staples | | | | | 474,890,850 | | 6.3% |
| | | | | | | |
| | | |
Energy — (13.0%) | | | | | | | |
Anadarko Petroleum Corp. | | 2,760,568 | | | 168,201,408 | | 2.2% |
#Chesapeake Energy Corp. | | 2,647,458 | | | 64,862,721 | | 0.9% |
ConocoPhillips | | 5,213,766 | | | 261,626,778 | | 3.5% |
Marathon Oil Corp. | | 3,280,335 | | | 104,872,310 | | 1.4% |
*National-Oilwell, Inc. | | 1,160,300 | | | 47,560,697 | | 0.6% |
XTO Energy, Inc. | | 2,156,495 | | | 89,623,932 | | 1.2% |
Other Securities | | | | | 306,390,542 | | 4.1% |
| | | | | | | |
Total Energy | | | | | 1,043,138,388 | | 13.9% |
| | | | | | | |
| | | |
Financials — (29.1%) | | | | | | | |
Allstate Corp. | | 2,596,315 | | | 76,773,035 | | 1.0% |
Bank of America Corp. | | 16,675,426 | | | 243,127,711 | | 3.2% |
Bank of New York Mellon Corp. | | 1,972,678 | | | 52,591,595 | | 0.7% |
#Capital One Financial Corp. | | 1,815,684 | | | 66,454,034 | | 0.9% |
Chubb Corp. | | 1,669,873 | | | 81,022,238 | | 1.1% |
Citigroup, Inc. | | 19,573,191 | | | 80,054,351 | | 1.1% |
CME Group, Inc. | | 203,881 | | | 61,696,429 | | 0.8% |
JPMorgan Chase & Co. | | 7,983,370 | | | 333,465,365 | | 4.4% |
#Loews Corp. | | 2,592,160 | | | 85,800,496 | | 1.1% |
MetLife, Inc. | | 4,663,914 | | | 158,712,993 | | 2.1% |
#Morgan Stanley | | 3,619,297 | | | 116,251,820 | | 1.5% |
PNC Financial Services Group, Inc. | | 1,190,568 | | | 58,266,398 | | 0.8% |
Prudential Financial, Inc. | | 1,918,000 | | | 86,751,140 | | 1.2% |
Travelers Cos., Inc. (The) | | 3,328,076 | | | 165,704,904 | | 2.2% |
Unum Group | | 1,898,589 | | | 37,876,851 | | 0.5% |
Other Securities | | | | | 634,916,189 | | 8.5% |
| | | | | | | |
Total Financials | | | | | 2,339,465,549 | | 31.1% |
| | | | | | | |
| | | |
Health Care — (5.1%) | | | | | | | |
*Thermo Fisher Scientific, Inc. | | 1,056,245 | | | 47,531,025 | | 0.7% |
UnitedHealth Group, Inc. | | 2,406,388 | | | 62,445,769 | | 0.8% |
*WellPoint, Inc. | | 2,580,122 | | | 120,646,505 | | 1.6% |
Other Securities | | | | | 181,920,544 | | 2.4% |
| | | | | | | |
Total Health Care | | | | | 412,543,843 | | 5.5% |
| | | | | | | |
286
THE U.S. LARGE CAP VALUE SERIES
CONTINUED
| | | | | | |
| | | Shares | | Value† | | Percentage
of Net Assets** |
Industrials — (13.7%) | | | | | | |
Burlington Northern Santa Fe Corp. | | 1,930,415 | | $ 145,398,858 | | 1.9% |
#CSX Corp. | | 2,287,204 | | 96,474,265 | | 1.3% |
#FedEx Corp. | | 599,693 | | 43,591,684 | | 0.6% |
General Electric Co. | | 18,139,800 | | 258,673,548 | | 3.4% |
Norfolk Southern Corp. | | 2,186,220 | | 101,921,576 | | 1.4% |
#Northrop Grumman Corp. | | 1,926,678 | | 96,584,368 | | 1.3% |
Union Pacific Corp. | | 2,835,808 | | 156,366,453 | | 2.1% |
Other Securities | | | | 203,214,199 | | 2.7% |
| | | | | | |
Total Industrials | | | | 1,102,224,951 | | 14.7% |
| | | | | | |
| | | |
Information Technology — (3.3%) | | | | | | |
*Computer Sciences Corp. | | 946,932 | | 48,018,922 | | 0.7% |
Other Securities | | | | 219,566,373 | | 2.9% |
| | | | | | |
Total Information Technology | | | | 267,585,295 | | 3.6% |
| | | | | | |
| | | |
Materials — (3.6%) | | | | | | |
#Alcoa, Inc. | | 4,317,440 | | 53,622,605 | | 0.7% |
#Dow Chemical Co. | | 3,993,594 | | 93,769,587 | | 1.3% |
#International Paper Co. | | 1,909,245 | | 42,595,256 | | 0.6% |
#Weyerhaeuser Co. | | 1,105,551 | | 40,175,723 | | 0.5% |
Other Securities | | | | 54,072,078 | | 0.7% |
| | | | | | |
Total Materials | | | | 284,235,249 | | 3.8% |
| | | | | | |
| | | |
Telecommunication Services — (3.4%) | | | | | | |
#AT&T, Inc. | | 8,438,300 | | 216,611,161 | | 2.9% |
Other Securities | | | | 52,619,682 | | 0.7% |
| | | | | | |
Total Telecommunication Services | | | | 269,230,843 | | 3.6% |
| | | | | | |
| | | |
Utilities — (0.5%) | | | | | | |
Other Securities | | | | 39,398,283 | | 0.5% |
| | | | | | |
TOTAL COMMON STOCKS | | | | 7,481,171,525 | | 99.6% |
| | | | | | |
| | | |
| | | Face Amount | | | | |
| | | (000) | | | | |
TEMPORARY CASH INVESTMENTS — (0.5%) | | | | | | |
Repurchase Agreement, PNC Capital Markets, Inc. 0.19%, 11/02/09 (Collateralized by $39,850,000 FNMA 6.50%, 6/25/39, valued at $42,888,563) to be repurchased at $42,250,669 | | $42,250 | | 42,250,000 | | 0.6% |
| | | | | | |
| | | |
| | | Shares/ Face Amount | | | | |
| | | (000) | | | | |
SECURITIES LENDING COLLATERAL — (6.4%) | | | | | | |
§@DFA Short Term Investment Fund LP | | 512,733,772 | | 512,733,772 | | 6.8% |
@Repurchase Agreement, Deutsche Bank Securities 0.08%, 11/02/09 (Collateralized by $3,853,074 FHLMC 5.793%(r), 01/01/37 & 5.945%(r), 07/01/37, valued at $2,684,003) to be repurchased at $2,605,845 | | $2,606 | | 2,605,828 | | 0.1% |
| | | | | | |
TOTAL SECURITIES LENDING COLLATERAL | | | | 515,339,600 | | 6.9% |
| | | | | | |
TOTAL INVESTMENTS — (100.0%)
(Cost $6,877,390,667) | | | | $8,038,761,125 | | 107.1% |
| | | | | | |
287
THE U.S. LARGE CAP VALUE SERIES
CONTINUED
Summary of inputs used to value the Series’ net assets as of October 31, 2009 is as follows (See Security Valuation Note):
| | | | | | | | | | | |
| | | Valuation Inputs |
| | | Investment in Securities (Market Value) |
| | | Level 1 | | Level 2 | | Level 3 | | Total |
Common Stocks | | | | | | | | | | | |
Consumer Discretionary | | $ | 1,248,458,274 | | | — | | — | | $ | 1,248,458,274 |
Consumer Staples | | | 474,890,850 | | | — | | — | | | 474,890,850 |
Energy | | | 1,043,138,388 | | | — | | — | | | 1,043,138,388 |
Financials | | | 2,339,465,549 | | | — | | — | | | 2,339,465,549 |
Health Care | | | 412,543,843 | | | — | | — | | | 412,543,843 |
Industrials | | | 1,102,224,951 | | | — | | — | | | 1,102,224,951 |
Information Technology | | | 267,585,295 | | | — | | — | | | 267,585,295 |
Materials | | | 284,235,249 | | | — | | — | | | 284,235,249 |
Telecommunication Services | | | 269,230,843 | | | — | | — | | | 269,230,843 |
Utilities | | | 39,398,283 | | | — | | — | | | 39,398,283 |
Temporary Cash Investments | | | — | | $ | 42,250,000 | | — | | | 42,250,000 |
Securities Lending Collateral | | | — | | | 515,339,600 | | — | | | 515,339,600 |
| | | | | | | | | | | |
TOTAL | | $ | 7,481,171,525 | | $ | 557,589,600 | | — | | $ | 8,038,761,125 |
| | | | | | | | | | | |
See accompanying Notes to Financial Statements.
288
THE DFA INTERNATIONAL VALUE SERIES
SUMMARY SCHEDULE OF PORTFOLIO HOLDINGS
October 31, 2009
| | | | | | | |
| | | Shares | | Value†† | | Percentage
of Net Assets** |
COMMON STOCKS — (85.2%) | | | | | | | |
AUSTRALIA — (4.5%) | | | | | | | |
Australia & New Zealand Banking Group, Ltd. | | 3,343,351 | | $ | 68,191,374 | | 1.1% |
National Australia Bank, Ltd. | | 2,465,437 | | | 65,140,887 | | 1.0% |
Wesfarmers, Ltd. | | 1,898,047 | | | 47,362,464 | | 0.8% |
Other Securities | | | | | 141,329,082 | | 2.3% |
| | | | | | | |
TOTAL AUSTRALIA | | | | | 322,023,807 | | 5.2% |
| | | | | | | |
| | | |
AUSTRIA — (0.5%) | | | | | | | |
Other Securities | | | | | 34,182,743 | | 0.6% |
| | | | | | | |
| | | |
BELGIUM — (0.5%) | | | | | | | |
Other Securities | | | | | 38,019,953 | | 0.6% |
| | | | | | | |
| | | |
CANADA — (7.6%) | | | | | | | |
EnCana Corp. | | 671,498 | | | 37,234,767 | | 0.6% |
#Manulife Financial Corp. | | 2,074,478 | | | 38,918,630 | | 0.6% |
*Teck Resources, Ltd. Class B | | 1,418,230 | | | 41,168,712 | | 0.7% |
#Thomson Reuters Corp. | | 1,832,184 | | | 58,281,755 | | 0.9% |
#Toronto Dominion Bank | | 944,998 | | | 53,867,637 | | 0.9% |
Other Securities | | | | | 318,836,929 | | 5.2% |
| | | | | | | |
TOTAL CANADA | | | | | 548,308,430 | | 8.9% |
| | | | | | | |
| | | |
DENMARK — (1.1%) | | | | | | | |
Other Securities | | | | | 77,023,723 | | 1.2% |
| | | | | | | |
| | | |
FINLAND — (0.6%) | | | | | | | |
Other Securities | | | | | 40,451,320 | | 0.7% |
| | | | | | | |
| | | |
FRANCE — (8.3%) | | | | | | | |
#AXA SA | | 2,818,397 | | | 70,093,978 | | 1.1% |
BNP Paribas SA | | 913,891 | | | 68,847,185 | | 1.1% |
#Compagnie de Saint-Gobain SA | | 846,142 | | | 41,232,265 | | 0.7% |
#Lafarge SA | | 467,217 | | | 37,923,901 | | 0.6% |
#Societe Generale Paris SA | | 913,312 | | | 60,662,002 | | 1.0% |
Vivendi SA | | 2,686,677 | | | 74,534,678 | | 1.2% |
Other Securities | | | | | 244,803,391 | | 4.0% |
| | | | | | | |
TOTAL FRANCE | | | | | 598,097,400 | | 9.7% |
| | | | | | | |
| | | |
GERMANY — (7.4%) | | | | | | | |
Allianz SE | | 442,712 | | | 50,712,808 | | 0.8% |
#Bayerische Motoren Werke AG | | 915,762 | | | 44,797,554 | | 0.7% |
#Daimler AG | | 1,684,003 | | | 81,364,327 | | 1.3% |
#Deutsche Bank AG | | 774,190 | | | 56,245,973 | | 0.9% |
#Deutsche Telekom AG | | 2,621,866 | | | 35,693,819 | | 0.6% |
Deutsche Telekom AG Sponsored ADR | | 2,809,150 | | | 38,035,891 | | 0.6% |
Munchener Rueckversicherungs-Gesellschaft AG | | 388,934 | | | 61,534,351 | | 1.0% |
Other Securities | | | | | 167,080,419 | | 2.7% |
| | | | | | | |
TOTAL GERMANY | | | | | 535,465,142 | | 8.6% |
| | | | | | | |
| | | |
GREECE — (0.3%) | | | | | | | |
Other Securities | | | | | 19,019,902 | | 0.3% |
| | | | | | | |
| | | |
HONG KONG — (2.7%) | | | | | | | |
Cheung Kong Holdings, Ltd. | | 3,224,000 | | | 41,120,708 | | 0.7% |
Hutchison Whampoa, Ltd. | | 5,568,000 | | | 39,081,157 | | 0.6% |
Other Securities | | | | | 117,731,620 | | 1.9% |
| | | | | | | |
TOTAL HONG KONG | | | | | 197,933,485 | | 3.2% |
| | | | | | | |
289
THE DFA INTERNATIONAL VALUE SERIES
CONTINUED
| | | | | | | |
| | | Shares | | Value†† | | Percentage
of Net Assets** |
IRELAND — (0.0%) | | | | | | | |
Other Securities | | | | $ | 57,893 | | 0.0% |
| | | | | | | |
ITALY — (2.9%) | | | | | | | |
#*Intesa Sanpaolo SpA | | 11,201,860 | | | 47,142,793 | | 0.8% |
*UniCredito SpA | | 19,413,366 | | | 65,038,767 | | 1.0% |
Other Securities | | | | | 98,411,874 | | 1.6% |
| | | | | | | |
TOTAL ITALY | | | | | 210,593,434 | | 3.4% |
| | | | | | | |
| | | |
JAPAN — (11.7%) | | | | | | | |
FUJIFILM Holdings Corp. | | 1,257,700 | | | 35,755,504 | | 0.6% |
*Nissan Motor Co., Ltd. | | 4,991,500 | | | 36,119,215 | | 0.6% |
Sony Corp. Sponsored ADR | | 1,725,386 | | | 50,709,095 | | 0.8% |
Other Securities | | | | | 726,760,636 | | 11.7% |
| | | | | | | |
TOTAL JAPAN | | | | | 849,344,450 | | 13.7% |
| | | | | | | |
| | | |
MALAYSIA — (0.0%) | | | | | | | |
Other Securities | | | | | — | | 0.0% |
| | | | | | | |
| | | |
NETHERLANDS — (3.7%) | | | | | | | |
#ArcelorMittal NV | | 2,446,831 | | | 82,806,981 | | 1.3% |
*ING Groep NV | | 3,093,625 | | | 40,259,293 | | 0.7% |
Philips Electronics NV | | 3,072,622 | | | 77,186,781 | | 1.2% |
Other Securities | | | | | 69,089,143 | | 1.1% |
| | | | | | | |
TOTAL NETHERLANDS | | | | | 269,342,198 | | 4.3% |
| | | | | | | |
| | | |
NEW ZEALAND — (0.1%) | | | | | | | |
Other Securities | | | | | 8,185,686 | | 0.1% |
| | | | | | | |
| | | |
NORWAY — (1.0%) | | | | | | | |
Other Securities | | | | | 75,691,447 | | 1.2% |
| | | | | | | |
| | | |
PORTUGAL — (0.2%) | | | | | | | |
Other Securities | | | | | 13,072,321 | | 0.2% |
| | | | | | | |
| | | |
SINGAPORE — (1.6%) | | | | | | | |
DBS Group Holdings, Ltd. | | 4,164,750 | | | 38,138,997 | | 0.6% |
Other Securities | | | | | 78,569,480 | | 1.3% |
| | | | | | | |
TOTAL SINGAPORE | | | | | 116,708,477 | | 1.9% |
| | | | | | | |
| | | |
SPAIN — (4.7%) | | | | | | | |
Banco Santander SA | | 5,654,108 | | | 90,987,342 | | 1.5% |
Banco Santander SA Sponsored ADR | | 5,549,048 | | | 89,117,711 | | 1.4% |
#Repsol YPF SA Sponsored ADR | | 1,332,613 | | | 35,447,506 | | 0.6% |
Other Securities | | | | | 120,997,642 | | 1.9% |
| | | | | | | |
TOTAL SPAIN | | | | | 336,550,201 | | 5.4% |
| | | | | | | |
| | | |
SWEDEN — (2.9%) | | | | | | | |
#Nordea Bank AB | | 6,583,962 | | | 70,668,421 | | 1.2% |
Other Securities | | | | | 138,442,067 | | 2.2% |
| | | | | | | |
TOTAL SWEDEN | | | | | 209,110,488 | | 3.4% |
| | | | | | | |
| | | |
SWITZERLAND — (6.3%) | | | | | | | |
Credit Suisse Group AG | | 1,755,349 | | | 93,836,004 | | 1.5% |
#Credit Suisse Group AG Sponsored ADR | | 840,377 | | | 44,792,094 | | 0.7% |
#*Holcim, Ltd. | | 650,248 | | | 41,384,888 | | 0.7% |
*UBS AG | | 3,481,616 | | | 58,055,052 | | 1.0% |
Zurich Financial Services AG | | 322,012 | | | 73,738,360 | | 1.2% |
Other Securities | | | | | 144,088,911 | | 2.3% |
| | | | | | | |
TOTAL SWITZERLAND | | | | | 455,895,309 | | 7.4% |
| | | | | | | |
290
THE DFA INTERNATIONAL VALUE SERIES
CONTINUED
| | | | | | | |
| | | Shares | | Value†† | | Percentage of Net Assets** |
UNITED KINGDOM — (16.6%) | | | | | | | |
*Anglo American P.L.C. | | 1,329,421 | | $ | 48,102,581 | | 0.8% |
Aviva P.L.C. | | 7,396,866 | | | 46,253,871 | | 0.7% |
#*Barclays P.L.C. Sponsored ADR | | 2,451,654 | | | 51,239,569 | | 0.8% |
#HSBC Holdings P.L.C. Sponsored ADR | | 3,278,400 | | | 181,590,576 | | 2.9% |
Kingfisher P.L.C. | | 9,743,172 | | | 35,612,473 | | 0.6% |
#Royal Dutch Shell P.L.C. ADR | | 2,252,783 | | | 131,021,859 | | 2.1% |
Vodafone Group P.L.C. | | 34,976,333 | | | 77,082,062 | | 1.2% |
#Vodafone Group P.L.C. Sponsored ADR | | 7,395,974 | | | 164,116,663 | | 2.7% |
*Xstrata P.L.C. | | 3,245,577 | | | 46,747,872 | | 0.8% |
Other Securities | | | | | 419,126,814 | | 6.8% |
| | | | | | | |
TOTAL UNITED KINGDOM | | | | | 1,200,894,340 | | 19.4% |
| | | | | | | |
TOTAL COMMON STOCKS | | | | | 6,155,972,149 | | 99.4% |
| | | | | | | |
RIGHTS/WARRANTS — (0.0%) | | | | | | | |
GERMANY — (0.0%) | | | | | | | |
Other Securities | | | | | 41,059 | | 0.0% |
| | | | | | | |
| | | |
ITALY — (0.0%) | | | | | | | |
Other Securities | | | | | 76,976 | | 0.0% |
| | | | | | | |
TOTAL RIGHTS/WARRANTS | | | | | 118,035 | | 0.0% |
| | | | | | | |
| | | |
| | | Face Amount | | | | |
| | | (000) | | Value† | | |
TEMPORARY CASH INVESTMENTS — (0.2%) | | | | | | | |
Repurchase Agreement, PNC Capital Markets, Inc. 0.19%, 11/02/09 (Collateralized by $13,010,000 FNMA 6.50%, 06/25/39, valued at $14,002,013) to be repurchased at $13,790,218 | | $13,790 | | | 13,790,000 | | 0.2% |
| | | | | | | |
| | | |
| | | Shares/ Face Amount | | | | |
| | | (000) | | | | |
SECURITIES LENDING COLLATERAL — (14.6%) | | | | | | | |
§@DFA Short Term Investment Fund LP | | 1,055,086,714 | | | 1,055,086,714 | | 17.1% |
@Repurchase Agreement, Deutsche Bank Securities 0.07%, 11/02/09 (Collateralized by various corporate obligations, ranging in par value from $4,247,617 to $16,429,280, rates ranging from 5.000% to 7.000%, maturities ranging from 03/01/37 to 10/01/39, valued at $1,212,860) to be repurchased at $1,189,085 | | $1,189 | | | 1,189,078 | | 0.0% |
| | | | | | | |
TOTAL SECURITIES LENDING COLLATERAL | | | | | 1,056,275,792 | | 17.1% |
| | | | | | | |
TOTAL INVESTMENTS — (100.0%)
(Cost $5,830,288,347) | | | | $ | 7,226,155,976 | | 116.7% |
| | | | | | | |
291
THE DFA INTERNATIONAL VALUE SERIES
CONTINUED
Summary of inputs used to value the Series’ net assets as of October 31, 2009 is as follows (See Security Valuation Note):
| | | | | | | | | | | |
| | | Valuation Inputs |
| |
| | | Investment in Securities (Market Value) |
| | | Level 1 | | Level 2 | | Level 3 | | Total |
Common Stocks | | | | | | | | | | | |
Australia | | $ | 2,073,789 | | $ | 319,950,018 | | — | | $ | 322,023,807 |
Austria | | | — | | | 34,182,743 | | — | | | 34,182,743 |
Belgium | | | 3,586,620 | | | 34,433,333 | | — | | | 38,019,953 |
Canada | | | 548,308,430 | | | — | | — | | | 548,308,430 |
Denmark | | | — | | | 77,023,723 | | — | | | 77,023,723 |
Finland | | | 1,516,659 | | | 38,934,661 | | — | | | 40,451,320 |
France | | | 3,494,320 | | | 594,603,080 | | — | | | 598,097,400 |
Germany | | | 98,912,195 | | | 436,552,947 | | — | | | 535,465,142 |
Greece | | | 4,501,802 | | | 14,518,100 | | — | | | 19,019,902 |
Hong Kong | | | — | | | 197,933,485 | | — | | | 197,933,485 |
Ireland | | | 57,893 | | | — | | — | | | 57,893 |
Italy | | | 29,729,570 | | | 180,863,864 | | — | | | 210,593,434 |
Japan | | | 56,497,996 | | | 792,846,454 | | — | | | 849,344,450 |
Malaysia | | | — | | | — | | — | | | — |
Netherlands | | | 10,297,313 | | | 259,044,885 | | — | | | 269,342,198 |
New Zealand | | | — | | | 8,185,686 | | — | | | 8,185,686 |
Norway | | | 401,330 | | | 75,290,117 | | — | | | 75,691,447 |
Portugal | | | — | | | 13,072,321 | | — | | | 13,072,321 |
Singapore | | | — | | | 116,708,477 | | — | | | 116,708,477 |
Spain | | | 131,434,682 | | | 205,115,519 | | — | | | 336,550,201 |
Sweden | | | 7,351,053 | | | 201,759,435 | | — | | | 209,110,488 |
Switzerland | | | 46,226,255 | | | 409,669,054 | | — | | | 455,895,309 |
United Kingdom | | | 564,527,406 | | | 636,366,934 | | — | | | 1,200,894,340 |
Rights/Warrants | | | | | | | | | | | |
Germany | | | — | | | 41,059 | | — | | | 41,059 |
Italy | | | 76,976 | | | — | | — | | | 76,976 |
Temporary Cash Investments | | | — | | | 13,790,000 | | — | | | 13,790,000 |
Securities Lending Collateral | | | — | | | 1,056,275,792 | | — | | | 1,056,275,792 |
| | | | | | | | | | | |
TOTAL | | $ | 1,508,994,289 | | $ | 5,717,161,687 | | — | | $ | 7,226,155,976 |
| | | | | | | | | | | |
See accompanying Notes to Financial Statements.
292
THE JAPANESE SMALL COMPANY SERIES
SUMMARY SCHEDULE OF PORTFOLIO HOLDINGS
October 31, 2009
| | | | | | | |
| | | Shares | | Value†† | | Percentage of Net Assets** |
COMMON STOCKS — (87.1%) | | | | | | | |
Consumer Discretionary — (18.4%) | | | | | | | |
#K’s Holdings Corp. | | 130,772 | | $ | 4,237,998 | | 0.4% |
Nissan Shatai Co., Ltd. | | 407,023 | | | 3,430,896 | | 0.3% |
PanaHome Corp. | | 440,200 | | | 2,756,561 | | 0.2% |
#Saizeriya Co., Ltd. | | 168,800 | | | 3,256,721 | | 0.3% |
Shochiku Co., Ltd. | | 416,400 | | | 3,658,864 | | 0.3% |
#Tomy Co., Ltd. | | 313,193 | | | 2,764,145 | | 0.2% |
Other Securities | | | | | 227,372,576 | | 19.2% |
| | | | | | | |
Total Consumer Discretionary | | | | | 247,477,761 | | 20.9% |
| | | | | | | |
| | | |
Consumer Staples — (9.1%) | | | | | | | |
Fancl Corp. | | 170,300 | | | 3,039,176 | | 0.3% |
Itoham Foods, Inc. | | 693,800 | | | 2,742,506 | | 0.2% |
Life Corp. | | 183,900 | | | 3,224,609 | | 0.3% |
*Megmilk Snow Brand Co., Ltd. | | 180,000 | | | 3,549,408 | | 0.3% |
Morinaga Milk Industry Co., Ltd. | | 852,000 | | | 3,975,218 | | 0.3% |
Nippon Flour Mills Co., Ltd. | | 604,000 | | | 3,069,254 | | 0.3% |
#Nisshin Oillio Group, Ltd. (The) | | 548,000 | | | 2,887,732 | | 0.2% |
Other Securities | | | | | 99,240,254 | | 8.4% |
| | | | | | | |
Total Consumer Staples | | | | | 121,728,157 | | 10.3% |
| | | | | | | |
| | | |
Energy — (1.2%) | | | | | | | |
Other Securities | | | | | 16,608,436 | | 1.4% |
| | | | | | | |
| | | |
Financials — (9.1%) | | | | | | | |
Aichi Bank, Ltd. (The) | | 34,100 | | | 2,859,215 | | 0.2% |
#Bank of Iwate, Ltd. (The) | | 57,400 | | | 3,400,866 | | 0.3% |
Century Tokyo Leasing Corp. | | 308,990 | | | 3,451,730 | | 0.3% |
#Fukui Bank, Ltd. (The) | | 841,000 | | | 2,791,181 | | 0.2% |
Okasan Securities Group, Inc. | | 594,000 | | | 2,807,164 | | 0.2% |
#*Senshu Ikeda Holdings, Inc. | | 1,258,000 | | | 4,304,438 | | 0.4% |
Tokai Tokyo Financial Holdings, Inc. | | 898,000 | | | 2,910,323 | | 0.3% |
Yamagata Bank, Ltd. | | 584,500 | | | 2,803,136 | | 0.2% |
Other Securities | | | | | 96,639,604 | | 8.2% |
| | | | | | | |
Total Financials | | | | | 121,967,657 | | 10.3% |
| | | | | | | |
| | | |
Health Care — (3.5%) | | | | | | | |
Hogy Medical Co., Ltd. | | 50,300 | | | 2,703,731 | | 0.2% |
Kaken Pharmaceutical Co., Ltd. | | 348,000 | | | 3,148,930 | | 0.3% |
Kyorin Co., Ltd. | | 177,000 | | | 2,830,803 | | 0.3% |
Nippon Shinyaku Co., Ltd. | | 237,000 | | | 3,278,069 | | 0.3% |
Nipro Corp. | | 180,100 | | | 3,888,012 | | 0.3% |
Other Securities | | | | | 31,071,410 | | 2.6% |
| | | | | | | |
Total Health Care | | | | | 46,920,955 | | 4.0% |
| | | | | | | |
| | | |
Industrials — (23.9%) | | | | | | | |
#Daiseki Co., Ltd. | | 147,263 | | | 2,893,882 | | 0.3% |
*Ebara Corp. | | 825,000 | | | 3,624,591 | | 0.3% |
#*Iseki & Co., Ltd. | | 759,000 | | | 2,841,757 | | 0.2% |
Kyowa Exeo Corp. | | 306,000 | | | 2,802,620 | | 0.2% |
#Meidensha Corp. | | 764,050 | | | 3,828,337 | | 0.3% |
Miura Co., Ltd. | | 132,100 | | | 3,689,039 | | 0.3% |
Nippon Konpo Unyu Soko Co., Ltd. | | 247,000 | | | 2,682,995 | | 0.2% |
Takara Standard Co., Ltd. | | 515,000 | | | 2,970,448 | | 0.3% |
#Toshiba Plant Kensetsu Co., Ltd. | | 219,450 | | | 2,872,309 | | 0.2% |
Other Securities | | | | | 292,927,396 | | 24.8% |
| | | | | | | |
Total Industrials | | | | | 321,133,374 | | 27.1% |
| | | | | | | |
293
THE JAPANESE SMALL COMPANY SERIES
CONTINUED
| | | | | | | |
| | | Shares | | Value†† | | Percentage of Net Assets** |
Information Technology — (10.0%) | | | | | | | |
#*Dainippon Screen Manufacturing Co., Ltd. | | 652,000 | | $ | 2,771,193 | | 0.2% |
eAccess, Ltd. | | 4,312 | | | 3,024,281 | | 0.3% |
Hosiden Corp. | | 243,000 | | | 2,942,705 | | 0.3% |
IT Holdings Corp. | | 262,001 | | | 3,228,913 | | 0.3% |
Ryosan Co., Ltd. | | 122,000 | | | 2,913,094 | | 0.2% |
Other Securities | | | | | 119,972,304 | | 10.1% |
| | | | | | | |
Total Information Technology | | | | | 134,852,490 | | 11.4% |
| | | | | | | |
| | | |
Materials — (11.2%) | | | | | | | |
Adeka Corp. | | 341,200 | | | 3,127,162 | | 0.2% |
#FP Corp. | | 63,900 | | | 3,165,602 | | 0.3% |
Hokuetsu Kishu Paper Co., Ltd. | | 601,199 | | | 3,109,276 | | 0.2% |
Kureha Corp. | | 627,500 | | | 3,384,770 | | 0.3% |
Nifco, Inc. | | 162,700 | | | 3,329,607 | | 0.3% |
Nihon Parkerizing Co., Ltd. | | 230,000 | | | 2,726,796 | | 0.2% |
#Nippon Paint Co., Ltd. | | 727,200 | | | 4,364,964 | | 0.4% |
#NOF Corp. | | 701,000 | | | 3,179,395 | | 0.3% |
Toagosei Co., Ltd. | | 897,000 | | | 3,137,826 | | 0.3% |
Other Securities | | | | | 121,727,189 | | 10.3% |
| | | | | | | |
Total Materials | | | | | 151,252,587 | | 12.8% |
| | | | | | | |
| | | |
Telecommunication Services — (0.0%) | | | | | | | |
Other Securities | | | | | 596,409 | | 0.1% |
| | | | | | | |
| | | |
Utilities — (0.7%) | | | | | | | |
#Saibu Gas Co., Ltd. | | 1,291,000 | | | 3,693,034 | | 0.3% |
Other Securities | | | | | 5,914,064 | | 0.5% |
| | | | | | | |
Total Utilities | | | | | 9,607,098 | | 0.8% |
| | | | | | | |
TOTAL COMMON STOCKS | | | | | 1,172,144,924 | | 99.1% |
| | | | | | | |
RIGHTS/WARRANTS — (0.0%) | | | | | | | |
Other Securities | | | | | — | | 0.0% |
| | | | | | | |
| | | |
| | | Face Amount | | | | |
| | | (000) | | Value† | | |
TEMPORARY CASH INVESTMENTS — (0.0%) | | | | | | | |
Repurchase Agreement, PNC Capital Markets, Inc. 0.19%, 11/02/09 (Collateralized by $115,000 FNMA 6.50%, 06/25/39, valued at $123,769) to be repurchased at $118,002 | | $118 | | | 118,000 | | 0.0% |
| | | | | | | |
| | | |
| | | Shares/ Face Amount | | | | |
| | | (000) | | | | |
SECURITIES LENDING COLLATERAL — (12.9%) | | | | | | | |
§@DFA Short Term Investment Fund LP | | 172,297,110 | | | 172,297,110 | | 14.6% |
@Repurchase Agreement, Deutsche Bank Securities 0.07%, 11/02/09 (Collateralized by various corporate obligations, ranging in par value from $4,247,617 to $16,429,280, rates ranging from 5.000% to 7.000%, maturities ranging from 03/01/37 to 10/01/39, valued at $752,982) to be repurchased at $738,222 | | $738 | | | 738,218 | | 0.0% |
| | | | | | | |
TOTAL SECURITIES LENDING COLLATERAL | | | | | 173,035,328 | | 14.6% |
| | | | | | | |
294
THE JAPANESE SMALL COMPANY SERIES
CONTINUED
| | | | | |
| | | Value† | | Percentage of Net Assets** |
TOTAL INVESTMENTS — (100.0%)
(Cost $1,560,342,919) | | $ | 1,345,298,252 | | 113.7% |
| | | | | |
Summary of inputs used to value the Series’ net assets as of October 31, 2009 is as follows (See Security Valuation Note):
| | | | | | | | | | | |
| | | Valuation Inputs |
| |
| | | Investment in Securities (Market Value) |
| | | Level 1 | | Level 2 | | Level 3 | | Total |
Common Stocks | | | | | | | | | | | |
Consumer Discretionary | | | — | | $ | 247,477,761 | | — | | $ | 247,477,761 |
Consumer Staples | | $ | 3,549,408 | | | 118,178,749 | | — | | | 121,728,157 |
Energy | | | — | | | 16,608,436 | | — | | | 16,608,436 |
Financials | | | 4,304,438 | | | 117,663,219 | | — | | | 121,967,657 |
Health Care | | | — | | | 46,920,955 | | — | | | 46,920,955 |
Industrials | | | 176,637 | | | 320,956,737 | | — | | | 321,133,374 |
Information Technology | | | — | | | 134,852,490 | | — | | | 134,852,490 |
Materials | | | — | | | 151,252,587 | | — | | | 151,252,587 |
Telecommunication Services | | | — | | | 596,409 | | — | | | 596,409 |
Utilities | | | — | | | 9,607,098 | | — | | | 9,607,098 |
Temporary Cash Investments | | | — | | | 118,000 | | — | | | 118,000 |
Securities Lending Collateral | | | — | | | 173,035,328 | | — | | | 173,035,328 |
| | | | | | | | | | | |
TOTAL | | $ | 8,030,483 | | $ | 1,337,267,769 | | — | | $ | 1,345,298,252 |
| | | | | | | | | | | |
See accompanying Notes to Financial Statements.
295
THE ASIA PACIFIC SMALL COMPANY SERIES
SUMMARY SCHEDULE OF PORTFOLIO HOLDINGS
October 31, 2009
| | | | | | | |
| | | Shares | | Value†† | | Percentage of Net Assets** |
COMMON STOCKS — (82.9%) | | | | | | | |
AUSTRALIA — (48.9%) | | | | | | | |
#Adelaide Brighton, Ltd. | | 1,480,311 | | $ | 3,724,318 | | 0.5% |
#*Andean Resources, Ltd. | | 1,464,837 | | | 2,876,891 | | 0.4% |
#APA Group, Ltd. | | 1,044,302 | | | 2,954,348 | | 0.4% |
*Austar United Communications, Ltd. | | 3,107,163 | | | 3,602,715 | | 0.5% |
Australian Infrastructure Fund | | 2,805,723 | | | 4,426,075 | | 0.7% |
#Australian Pharmaceutical Industries, Ltd. (6002840) | | 5,079,394 | | | 3,377,108 | | 0.5% |
*Australian Pharmaceutical Industries, Ltd. (60028RR) | | 4,331,586 | | | 2,904,802 | | 0.4% |
Australian Worldwide Exploration, Ltd. | | 1,482,305 | | | 3,397,856 | | 0.5% |
#AWB, Ltd. | | 3,807,619 | | | 4,157,632 | | 0.6% |
#Bradken, Ltd. | | 582,247 | | | 3,202,182 | | 0.5% |
#Campbell Brothers, Ltd. | | 240,269 | | | 6,196,971 | | 0.9% |
*Centamin Egypt, Ltd. | | 2,112,300 | | | 4,331,276 | | 0.6% |
#Centennial Coal Co., Ltd. | | 1,196,500 | | | 3,341,606 | | 0.5% |
Challenger Financial Services Group, Ltd. | | 1,750,037 | | | 5,754,880 | | 0.8% |
#ConnectEast Group, Ltd. | | 8,607,304 | | | 3,049,683 | | 0.5% |
#Crane Group, Ltd. | | 345,440 | | | 2,783,584 | | 0.4% |
#David Jones, Ltd. | | 1,296,067 | | | 6,140,136 | | 0.9% |
#Downer EDI, Ltd. | | 908,261 | | | 6,914,045 | | 1.0% |
#DUET Group, Ltd. | | 2,903,270 | | | 4,392,324 | | 0.6% |
#Flight Centre, Ltd. | | 192,954 | | | 2,910,033 | | 0.4% |
#*Graincorp, Ltd. Series A | | 461,398 | | | 2,868,614 | | 0.4% |
#Healthscope, Ltd. | | 857,741 | | | 3,640,247 | | 0.5% |
Invocare, Ltd. | | 637,257 | | | 3,346,428 | | 0.5% |
#IOOF Holdings, Ltd. | | 950,183 | | | 4,451,477 | | 0.7% |
#JB Hi-Fi, Ltd. | | 281,420 | | | 5,175,392 | | 0.8% |
#*Karoon Gas Australia, Ltd. | | 628,673 | | | 4,257,692 | | 0.6% |
Monadelphous Group, Ltd. | | 302,955 | | | 3,598,672 | | 0.5% |
#*Mount Gibson Iron, Ltd. | | 3,114,599 | | | 3,290,085 | | 0.5% |
Navitas, Ltd. | | 1,205,167 | | | 4,012,073 | | 0.6% |
*Pacific Brands, Ltd. | | 4,412,120 | | | 5,137,506 | | 0.8% |
#*PanAust, Ltd. | | 8,757,197 | | | 3,578,848 | | 0.5% |
#Perpetual Trustees Australia, Ltd. | | 95,745 | | | 3,190,548 | | 0.5% |
#Reece Australia, Ltd. | | 238,457 | | | 5,244,014 | | 0.8% |
#*Riversdale Mining, Ltd. | | 692,356 | | | 3,279,236 | | 0.5% |
#Seek, Ltd. | | 666,916 | | | 3,584,917 | | 0.5% |
Sigma Pharmaceuticals, Ltd. | | 4,862,235 | | | 4,070,078 | | 0.6% |
#Spark Infrastructure Group, Ltd. | | 2,596,492 | | | 2,815,225 | | 0.4% |
Super Cheap Auto Group, Ltd. | | 718,503 | | | 3,377,562 | | 0.5% |
*Tap Oil, Ltd. | | 3,987,713 | | | 3,732,072 | | 0.6% |
#Ten Network Holdings, Ltd. | | 2,056,782 | | | 2,807,921 | | 0.4% |
Tower Australia Group, Ltd. | | 1,159,243 | | | 3,055,999 | | 0.5% |
Transfield Services, Ltd. | | 753,413 | | | 2,840,717 | | 0.4% |
#West Australian Newspapers Holdings, Ltd. | | 709,322 | | | 4,717,984 | | 0.7% |
#Wotif.com Holdings, Ltd. | | 538,244 | | | 2,893,564 | | 0.4% |
Other Securities | | | | | 229,192,872 | | 33.7% |
| | | | | | | |
TOTAL AUSTRALIA | | | | | 398,598,208 | | 58.5% |
| | | | | | | |
| | | |
HONG KONG — (17.2%) | | | | | | | |
Daphne International Holdings, Ltd. | | 4,086,000 | | | 3,088,086 | | 0.5% |
Lee & Man Paper Manufacturing, Ltd. | | 1,504,400 | | | 2,974,469 | | 0.4% |
Pacific Basin Shipping, Ltd. | | 3,924,000 | | | 2,888,627 | | 0.4% |
Other Securities | | | | | 131,448,120 | | 19.3% |
| | | | | | | |
TOTAL HONG KONG | | | | | 140,399,302 | | 20.6% |
| | | | | | | |
| | | |
MALAYSIA — (0.0%) | | | | | | | |
Other Securities | | | | | 3,780 | | 0.0% |
| | | | | | | |
296
THE ASIA PACIFIC SMALL COMPANY SERIES
CONTINUED
| | | | | | | |
| | | Shares | | Value†† | | Percentage of Net Assets** |
NEW ZEALAND — (5.7%) | | | | | | | |
#Fisher & Paykel Healthcare Corp., Ltd. | | 2,418,756 | | $ | 5,359,380 | | 0.8% |
Sky City Entertainment Group, Ltd. | | 2,535,089 | | | 6,262,217 | | 0.9% |
Other Securities | | | | | 35,214,606 | | 5.2% |
| | | | | | | |
TOTAL NEW ZEALAND | | | | | 46,836,203 | | 6.9% |
| | | | | | | |
| | | |
SINGAPORE — (11.1%) | | | | | | | |
Venture Corp., Ltd. | | 504,000 | | | 3,215,158 | | 0.5% |
Other Securities | | | | | 87,252,814 | | 12.8% |
| | | | | | | |
TOTAL SINGAPORE | | | | | 90,467,972 | | 13.3% |
| | | | | | | |
TOTAL COMMON STOCKS | | | | | 676,305,465 | | 99.3% |
| | | | | | | |
PREFERRED STOCKS — (0.1%) | | | | | | | |
AUSTRALIA — (0.1%) | | | | | | | |
Other Securities | | | | | 518,901 | | 0.1% |
| | | | | | | |
RIGHTS/WARRANTS — (0.0%) | | | | | | | |
AUSTRALIA — (0.0%) | | | | | | | |
Other Securities | | | | | 38,010 | | 0.0% |
| | | | | | | |
| | | |
HONG KONG — (0.0%) | | | | | | | |
Other Securities | | | | | 311,564 | | 0.0% |
| | | | | | | |
| | | |
SINGAPORE — (0.0%) | | | | | | | |
Other Securities | | | | | 16,019 | | 0.0% |
| | | | | | | |
TOTAL RIGHTS/WARRANTS | | | | | 365,593 | | 0.0% |
| | | | | | | |
| | | |
| | | Face Amount | | | | |
| | | (000) | | Value† | | |
TEMPORARY CASH INVESTMENTS — (0.1%) | | | | | | | |
Repurchase Agreement, PNC Capital Markets, Inc. 0.19%, 11/02/09 (Collateralized by $465,000 FNMA 6.50%, 06/25/39, valued at $500,456) to be repurchased at $490,008 | | $490 | | | 490,000 | | 0.1% |
| | | | | | | |
| | | |
| | | Shares/ Face Amount | | | | |
| | | (000) | | | | |
SECURITIES LENDING COLLATERAL — (16.9%) | | | | | | | |
§@DFA Short Term Investment Fund LP | | 133,343,064 | | | 133,343,064 | | 19.6% |
@Repurchase Agreement, Deutsche Bank Securities 0.07%, 11/02/09 (Collateralized by various corporate obligations, ranging in par value from $4,247,617 to $16,429,280, rates ranging from 5.000% to 7.000%, maturities ranging from 03/01/37 to 10/01/39, valued at $4,861,165) to be repurchased at $4,765,876 | | $4,766 | | | 4,765,848 | | 0.7% |
| | | | | | | |
TOTAL SECURITIES LENDING COLLATERAL | | | | | 138,108,912 | | 20.3% |
| | | | | | | |
TOTAL INVESTMENTS — (100.0%)
(Cost $748,104,019) | | | | $ | 815,788,871 | | 119.8% |
| | | | | | | |
297
THE ASIA PACIFIC SMALL COMPANY SERIES
CONTINUED
Summary of inputs used to value the Series’ net assets as of October 31, 2009 is as follows (See Security Valuation Note):
| | | | | | | | | | | |
| | | Valuation Inputs |
| |
| | | Investment in Securities (Market Value) |
| | | Level 1 | | Level 2 | | Level 3 | | Total |
Common Stocks | | | | | | | | | | | |
Australia | | $ | 4,134,169 | | $ | 394,464,039 | | — | | $ | 398,598,208 |
Hong Kong | | | 364,876 | | | 140,034,426 | | — | | | 140,399,302 |
Malaysia | | | — | | | 3,780 | | — | | | 3,780 |
New Zealand | | | — | | | 46,836,203 | | — | | | 46,836,203 |
Singapore | | | 2,266,376 | | | 88,201,596 | | — | | | 90,467,972 |
Preferred Stocks | | | | | | | | | | | |
Australia | | | — | | | 518,901 | | — | | | 518,901 |
Rights/Warrants | | | | | | | | | | | |
Australia | | | 1,380 | | | 36,630 | | — | | | 38,010 |
Hong Kong | | | 29,621 | | | 281,943 | | — | | | 311,564 |
Singapore | | | 16,019 | | | — | | — | | | 16,019 |
Temporary Cash Investments | | | — | | | 490,000 | | — | | | 490,000 |
Securities Lending Collateral | | | — | | | 138,108,912 | | — | | | 138,108,912 |
| | | | | | | | | | | |
TOTAL | | $ | 6,812,441 | | $ | 808,976,430 | | — | | $ | 815,788,871 |
| | | | | | | | | | | |
See accompanying Notes to Financial Statements.
298
THE UNITED KINGDOM SMALL COMPANY SERIES
SUMMARY SCHEDULE OF PORTFOLIO HOLDINGS
October 31, 2009
| | | | | | | |
| | | Shares | | Value†† | | Percentage of Net Assets** |
COMMON STOCKS — (96.4%) | | | | | | | |
Consumer Discretionary — (20.2%) | | | | | | | |
Aegis Group P.L.C. | | 3,279,567 | | $ | 5,895,612 | | 0.8% |
Bellway P.L.C. | | 420,170 | | | 5,025,477 | | 0.7% |
*DSG International P.L.C. | | 10,089,373 | | | 5,051,941 | | 0.7% |
Halfords Group P.L.C. | | 837,680 | | | 5,371,161 | | 0.7% |
Informa P.L.C. | | 1,440,320 | | | 6,909,243 | | 0.9% |
United Business Media P.L.C. | | 864,643 | | | 6,542,539 | | 0.8% |
WH Smith P.LC. | | 588,205 | | | 4,851,076 | | 0.6% |
Other Securities | | | | | 120,525,991 | | 15.6% |
| | | | | | | |
Total Consumer Discretionary | | | | | 160,173,040 | | 20.8% |
| | | | | | | |
| | | |
Consumer Staples — (4.2%) | | | | | | | |
PZ Cussons P.L.C. | | 1,348,567 | | | 5,515,893 | | 0.7% |
Other Securities | | | | | 27,693,553 | | 3.6% |
| | | | | | | |
Total Consumer Staples | | | | | 33,209,446 | | 4.3% |
| | | | | | | |
| | | |
Energy — (5.2%) | | | | | | | |
*Dana Petroleum P.L.C. | | 333,328 | | | 6,973,969 | | 0.9% |
*Premier Oil P.L.C. | | 335,099 | | | 6,460,840 | | 0.8% |
*Soco International P.L.C. | | 258,739 | | | 5,459,305 | | 0.7% |
Other Securities | | | | | 21,961,724 | | 2.9% |
| | | | | | | |
Total Energy | | | | | 40,855,838 | | 5.3% |
| | | | | | | |
| | | |
Financials — (13.8%) | | | | | | | |
Aberdeen Asset Management P.L.C. | | 2,558,118 | | | 5,538,248 | | 0.7% |
Amlin P.L.C. | | 1,027,564 | | | 5,947,701 | | 0.8% |
Catlin Group, Ltd. | | 977,375 | | | 5,277,316 | | 0.7% |
Close Brothers Group P.L.C. | | 481,680 | | | 5,539,027 | | 0.7% |
#Henderson Group P.L.C. | | 2,936,019 | | | 6,189,595 | | 0.8% |
Hiscox, Ltd. | | 1,535,730 | | | 8,053,774 | | 1.1% |
IG Group Holdings P.L.C. | | 1,241,907 | | | 6,140,967 | | 0.8% |
Jardine Lloyd Thompson Group P.L.C. | | 663,478 | | | 4,936,106 | | 0.6% |
#Provident Financial P.L.C. | | 485,695 | | | 7,409,228 | | 1.0% |
Other Securities | | | | | 54,027,848 | | 7.0% |
| | | | | | | |
Total Financials | | | | | 109,059,810 | | 14.2% |
| | | | | | | |
| | | |
Health Care — (3.4%) | | | | | | | |
SSL International P.L.C. | | 753,239 | | | 7,822,386 | | 1.0% |
Other Securities | | | | | 19,383,617 | | 2.5% |
| | | | | | | |
Total Health Care | | | | | 27,206,003 | | 3.5% |
| | | | | | | |
| | | |
Industrials — (31.8%) | | | | | | | |
Aggreko P.L.C. | | 611,546 | | | 7,601,086 | | 1.0% |
Babcock International Group P.L.C. | | 853,247 | | | 8,470,820 | | 1.1% |
Carillion P.L.C. | | 1,523,518 | | | 7,339,374 | | 1.0% |
Charter International P.L.C. | | 614,873 | | | 6,992,444 | | 0.9% |
Chemring Group P.L.C. | | 128,869 | | | 5,527,463 | | 0.7% |
De la Rue P.L.C. | | 387,017 | | | 5,796,504 | | 0.7% |
Hays P.L.C. | | 5,101,389 | | | 8,172,104 | | 1.1% |
#Homeserve P.L.C. | | 227,284 | | | 6,015,087 | | 0.8% |
IMI P.L.C. | | 1,191,221 | | | 8,401,977 | | 1.1% |
Intertek Group P.L.C. | | 539,854 | | | 11,091,513 | | 1.4% |
Meggitt P.L.C. | | 1,630,199 | | | 6,527,012 | | 0.8% |
Michael Page International P.L.C. | | 1,235,568 | | | 6,511,423 | | 0.8% |
Qinetiq P.L.C. | | 2,172,472 | | | 5,838,845 | | 0.8% |
Regus P.L.C. | | 3,220,926 | | | 5,379,876 | | 0.7% |
Spirax-Sarco Engineering P.L.C. | | 301,608 | | | 5,381,748 | | 0.7% |
299
THE UNITED KINGDOM SMALL COMPANY SERIES
CONTINUED
| | | | | | | |
| | | Shares | | Value†† | | Percentage of Net Assets** |
Industrials — (Continued) | | | | | | | |
Tomkins P.L.C. | | 3,282,427 | | $ | 9,005,026 | | 1.2% |
Travis Perkins P.L.C. | | 482,448 | | | 5,951,606 | | 0.8% |
Ultra Electronics Holdings P.L.C. | | 267,145 | | | 5,766,343 | | 0.7% |
VT Group P.L.C. | | 677,021 | | | 6,026,593 | | 0.8% |
Weir Group P.L.C. (The) | | 479,090 | | | 5,490,425 | | 0.7% |
Other Securities | | | | | 115,352,022 | | 15.0% |
| | | | | | | |
Total Industrials | | | | | 252,639,291 | | 32.8% |
| | | | | | | |
| | | |
Information Technology — (12.5%) | | | | | | | |
ARM Holdings P.L.C. | | 4,777,637 | | | 11,606,124 | | 1.5% |
Dimension Data Holdings P.L.C. | | 5,615,130 | | | 6,524,511 | | 0.8% |
Halma P.L.C. | | 1,486,473 | | | 5,547,008 | | 0.7% |
Logica P.L.C. | | 3,037,910 | | | 5,759,339 | | 0.8% |
*Misys P.L.C. | | 1,982,492 | | | 6,711,250 | | 0.9% |
Rotork P.L.C. | | 350,626 | | | 6,524,289 | | 0.8% |
Spectris P.L.C. | | 490,382 | | | 5,442,149 | | 0.7% |
Other Securities | | | | | 51,368,435 | | 6.7% |
| | | | | | | |
Total Information Technology | | | | | 99,483,105 | | 12.9% |
| | | | | | | |
| | | |
Materials — (4.2%) | | | | | | | |
Croda International P.L.C. | | 484,717 | | | 5,935,810 | | 0.7% |
Mondi P.L.C. | | 943,611 | | | 5,208,467 | | 0.7% |
Other Securities | | | | | 22,152,270 | | 2.9% |
| | | | | | | |
Total Materials | | | | | 33,296,547 | | 4.3% |
| | | | | | | |
| | | |
Other — (0.0%) | | | | | | | |
Other Securities | | | | | 295,816 | | 0.0% |
| | | | | | | |
| | | |
Telecommunication Services — (0.7%) | | | | | | | |
Other Securities | | | | | 5,415,067 | | 0.7% |
| | | | | | | |
| | | |
Utilities — (0.4%) | | | | | | | |
Other Securities | | | | | 3,451,570 | | 0.5% |
| | | | | | | |
TOTAL COMMON STOCKS | | | | | 765,085,533 | | 99.3% |
| | | | | | | |
RIGHTS/WARRANTS — (0.1%) | | | | | | | |
Other Securities | | | | | 1,093,389 | | 0.1% |
| | | | | | | |
TOTAL RIGHTS/WARRANTS | | | | | 1,093,389 | | 0.1% |
| | | | | | | |
| | | |
| | | Face Amount | | | | |
| | | (000) | | Value† | | |
TEMPORARY CASH INVESTMENTS — (0.3%) | | | | | | | |
Repurchase Agreement, PNC Capital Markets, Inc. 0.19%, 11/02/09 (Collateralized by $2,070,000 FNMA 6.50%, 06/25/39,valued at $2,227,838) to be repurchased at $2,191,035 | | $2,191 | | | 2,191,000 | | 0.3% |
| | | | | | | |
| | | |
| | | Shares/ Face Amount | | | | |
| | | (000) | | | | |
SECURITIES LENDING COLLATERAL — (3.2%) | | | | | | | |
§@DFA Short Term Investment Fund LP | | 24,472,278 | | | 24,472,278 | | 3.2% |
300
THE UNITED KINGDOM SMALL COMPANY SERIES
CONTINUED
| | | | | | | |
| | | Shares/ Face Amount | | Value† | | Percentage of Net Assets** |
| | | (000) | | | | |
@Repurchase Agreement, Deutsche Bank Securities 0.07%, 11/02/09 (Collateralized by various corporate obligations, ranging in par value from $4,247,617 to $16,429,280, rates ranging from 5.000% to 7.000%, maturities ranging from 03/01/37 to 10/01/39, valued at $527,028) to be repurchased at $516,697 | | $517 | | | 516,694 | | 0.1% |
| | | | | | | |
TOTAL SECURITIES LENDING COLLATERAL | | | | | 24,988,972 | | 3.3% |
| | | | | | | |
TOTAL INVESTMENTS — (100.0%)
(Cost $851,007,486) | | | | $ | 793,358,894 | | 103.0% |
| | | | | | | |
Summary of inputs used to value the Series’ net assets as of October 31, 2009 is as follows (See Security Valuation Note):
| | | | | | | | | | | |
| | | Valuation Inputs |
| | | Investment in Securities (Market Value) |
| | | Level 1 | | Level 2 | | Level 3 | | Total |
Common Stocks | | | | | | | | | | | |
Consumer Discretionary | | | — | | $ | 160,173,040 | | — | | $ | 160,173,040 |
Consumer Staples | | | — | | | 33,209,446 | | — | | | 33,209,446 |
Energy | | | — | | | 40,855,838 | | — | | | 40,855,838 |
Financials | | $ | 626 | | | 109,059,184 | | — | | | 109,059,810 |
Health Care | | | — | | | 27,206,003 | | — | | | 27,206,003 |
Industrials | | | 35,451 | | | 252,603,840 | | — | | | 252,639,291 |
Information Technology | | | — | | | 99,483,105 | | — | | | 99,483,105 |
Materials | | | — | | | 33,296,547 | | — | | | 33,296,547 |
Other | | | — | | | 295,816 | | — | | | 295,816 |
Telecommunication Services | | | — | | | 5,415,067 | | — | | | 5,415,067 |
Utilities | | | — | | | 3,451,570 | | — | | | 3,451,570 |
Rights/Warrants | | | 415,536 | | | 677,853 | | — | | | 1,093,389 |
Temporary Cash Investments | | | — | | | 2,191,000 | | — | | | 2,191,000 |
Securities Lending Collateral | | | — | | | 24,988,972 | | — | | | 24,988,972 |
| | | | | | | | | | | |
TOTAL | | $ | 451,613 | | $ | 792,907,281 | | — | | $ | 793,358,894 |
| | | | | | | | | | | |
See accompanying Notes to Financial Statements.
301
THE CONTINENTAL SMALL COMPANY SERIES
SUMMARY SCHEDULE OF PORTFOLIO HOLDINGS
October 31, 2009
| | | | | | | |
| | | Shares | | Value†† | | Percentage
of Net Assets** |
COMMON STOCKS — (88.5%) | | | | | | | |
AUSTRIA — (2.9%) | | | | | | | |
Andritz AG | | 116,739 | | $ | 6,428,780 | | 0.4% |
Other Securities | | | | | 46,101,446 | | 2.8% |
| | | | | | | |
TOTAL AUSTRIA | | | | | 52,530,226 | | 3.2% |
| | | | | | | |
| | | |
BELGIUM — (3.8%) | | | | | | | |
Ackermans & van Haaren NV | | 81,854 | | | 5,925,427 | | 0.4% |
Bekaert SA | | 56,746 | | | 7,297,993 | | 0.5% |
Other Securities | | | | | 56,164,707 | | 3.4% |
| | | | | | | |
TOTAL BELGIUM | | | | | 69,388,127 | | 4.3% |
| | | | | | | |
| | | |
DENMARK — (2.3%) | | | | | | | |
Other Securities | | | | | 42,483,853 | | 2.6% |
| | | | | | | |
| | | |
FINLAND — (7.0%) | | | | | | | |
Elisa Oyj | | 276,614 | | | 5,356,961 | | 0.3% |
KCI Konecranes Oyj | | 234,271 | | | 6,252,168 | | 0.4% |
#*Metso Corp. Oyj | | 206,460 | | | 5,765,320 | | 0.4% |
*M-Real Oyj Series B | | 3,798,185 | | | 5,517,413 | | 0.3% |
#Nokian Renkaat Oyj | | 325,926 | | | 6,954,619 | | 0.4% |
Tieto Oyj | | 277,638 | | | 5,544,956 | | 0.3% |
Other Securities | | | | | 92,587,386 | | 5.7% |
| | | | | | | |
TOTAL FINLAND | | | | | 127,978,823 | | 7.8% |
| | | | | | | |
| | | |
FRANCE — (12.3%) | | | | | | | |
Arkema SA | | 199,362 | | | 7,610,594 | | 0.5% |
*Atos Origin SA | | 143,571 | | | 6,721,508 | | 0.4% |
#Bourbon SA | | 162,224 | | | 6,746,721 | | 0.4% |
Establissements Maurel et Prom SA | | 305,061 | | | 6,132,788 | | 0.4% |
*Gemalto NV | | 149,247 | | | 6,272,472 | | 0.4% |
#Neopost SA | | 61,086 | | | 5,345,872 | | 0.3% |
Nexans SA | | 92,377 | | | 6,523,139 | | 0.4% |
Societe BIC SA | | 84,787 | | | 5,884,544 | | 0.3% |
#*Valeo SA | | 232,962 | | | 6,323,949 | | 0.4% |
Other Securities | | | | | 167,942,426 | | 10.3% |
| | | | | | | |
TOTAL FRANCE | | | | | 225,504,013 | | 13.8% |
| | | | | | | |
| | | |
GERMANY — (13.4%) | | | | | | | |
*Aareal Bank AG | | 561,290 | | | 12,138,286 | | 0.7% |
Aixtron AG | | 259,027 | | | 7,740,951 | | 0.5% |
Aurubis AG | | 146,836 | | | 5,824,231 | | 0.4% |
Bilfinger Berger AG | | 162,980 | | | 10,434,934 | | 0.6% |
DVB Bank SE | | 173,470 | | | 6,413,252 | | 0.4% |
Lanxess AG | | 218,704 | | | 6,875,309 | | 0.4% |
MTU Aero Engines Holding AG | | 163,223 | | | 7,393,072 | | 0.4% |
Rheinmetall AG | | 107,359 | | | 5,829,585 | | 0.4% |
Rhoen-Klinikum AG | | 379,608 | | | 9,172,173 | | 0.6% |
#*SGL Carbon SE | | 217,830 | | | 8,239,684 | | 0.5% |
Software AG | | 70,053 | | | 6,245,235 | | 0.4% |
Wincor Nixdorf AG | | 112,151 | | | 6,558,995 | | 0.4% |
Other Securities | | | | | 151,967,940 | | 9.3% |
| | | | | | | |
TOTAL GERMANY | | | | | 244,833,647 | | 15.0% |
| | | | | | | |
| | | |
GREECE — (3.5%) | | | | | | | |
Bank of Greece S.A. | | 73,229 | | | 5,536,868 | | 0.4% |
Other Securities | | | | | 58,866,685 | | 3.6% |
| | | | | | | |
TOTAL GREECE | | | | | 64,403,553 | | 4.0% |
| | | | | | | |
302
THE CONTINENTAL SMALL COMPANY SERIES
CONTINUED
| | | | | | | |
| | | Shares | | Value†† | | Percentage
of Net Assets** |
IRELAND — (2.6%) | | | | | | | |
DCC P.L.C | | 308,989 | | $ | 8,138,971 | | 0.5% |
*Dragon Oil P.L.C. | | 1,347,570 | | | 9,171,834 | | 0.6% |
Paddy Power P.L.C. | | 180,573 | | | 5,778,573 | | 0.3% |
Other Securities | | | | | 25,358,738 | | 1.6% |
| | | | | | | |
TOTAL IRELAND | | | | | 48,448,116 | | 3.0% |
| | | | | | | |
| | | |
ITALY — (7.9%) | | | | | | | |
Banca Popolare di Milano Scarl | | 1,012,836 | | | 7,535,855 | | 0.4% |
Other Securities | | | | | 138,031,663 | | 8.5% |
| | | | | | | |
TOTAL ITALY | | | | | 145,567,518 | | 8.9% |
| | | | | | | |
| | | |
NETHERLANDS — (5.4%) | | | | | | | |
Imtech NV | | 248,834 | | | 6,325,202 | | 0.4% |
Nutreco Holding NV | | 139,331 | | | 7,032,903 | | 0.4% |
Other Securities | | | | | 85,739,447 | | 5.3% |
| | | | | | | |
TOTAL NETHERLANDS | | | | | 99,097,552 | | 6.1% |
| | | | | | | |
| | | |
NORWAY — (3.8%) | | | | | | | |
Tandberg ASA Series A | | 208,204 | | | 5,570,172 | | 0.3% |
*TGS Nopec Geophysical Co. ASA | | 404,241 | | | 6,130,506 | | 0.4% |
Other Securities | | | | | 58,632,730 | | 3.6% |
| | | | | | | |
TOTAL NORWAY | | | | | 70,333,408 | | 4.3% |
| | | | | | | |
| | | |
PORTUGAL — (1.4%) | | | | | | | |
Other Securities | | | | | 26,035,355 | | 1.6% |
| | | | | | | |
| | | |
SPAIN — (4.9%) | | | | | | | |
Ebro Puleva SA | | 312,280 | | | 5,946,769 | | 0.3% |
Other Securities | | | | | 84,329,623 | | 5.2% |
| | | | | | | |
TOTAL SPAIN | | | | | 90,276,392 | | 5.5% |
| | | | | | | |
| | | |
SWEDEN — (5.7%) | | | | | | | |
Boliden AB | | 497,124 | | | 5,986,022 | | 0.4% |
#Elekta AB Series B | | 302,500 | | | 5,701,787 | | 0.3% |
Other Securities | | | | | 92,630,985 | | 5.7% |
| | | | | | | |
TOTAL SWEDEN | | | | | 104,318,794 | | 6.4% |
| | | | | | | |
| | | |
SWITZERLAND — (11.6%) | | | | | | | |
*Aryzta AG | | 265,691 | | | 10,429,578 | | 0.6% |
*Bank Sarasin & Cie AG Series B | | 172,644 | | | 6,874,386 | | 0.4% |
*Clariant AG | | 756,817 | | | 7,235,446 | | 0.5% |
#PSP Swiss Property AG | | 141,111 | | | 7,918,508 | | 0.5% |
Romande Energie Holding SA | | 2,714 | | | 5,386,990 | | 0.3% |
Sika AG | | 4,203 | | | 5,698,044 | | 0.4% |
Swiss Prime Site AG | | 163,073 | | | 8,976,492 | | 0.6% |
#Valiant Holding AG | | 33,293 | | | 6,559,434 | | 0.4% |
Other Securities | | | | | 153,867,567 | | 9.4% |
| | | | | | | |
TOTAL SWITZERLAND | | | | | 212,946,445 | | 13.1% |
| | | | | | | |
TOTAL COMMON STOCKS | | | | | 1,624,145,822 | | 99.6% |
| | | | | | | |
PREFERRED STOCKS — (0.1%) | | | | | | | |
SWITZERLAND — (0.1%) | | | | | | | |
Other Securities | | | | | 1,565,574 | | 0.1% |
| | | | | | | |
RIGHTS/WARRANTS — (0.0%) | | | | | | | |
BELGIUM — (0.0%) | | | | | | | |
Other Securities | | | | | 1,373 | | 0.0% |
| | | | | | | |
303
THE CONTINENTAL SMALL COMPANY SERIES
CONTINUED
| | | | | | | | |
| | | Shares | | Value†† | | Percentage
of Net Assets** |
DENMARK — (0.0%) | | | | | | | | |
Other Securities | | | | | $ | 82,324 | | 0.0% |
| | | | | | | | |
| | | |
FINLAND — (0.0%) | | | | | | | | |
Other Securities | | | | | | 232,888 | | 0.0% |
| | | | | | | | |
| | | |
FRANCE — (0.0%) | | | | | | | | |
Other Securities | | | | | | 1,083 | | 0.0% |
| | | | | | | | |
| | | |
GERMANY — (0.0%) | | | | | | | | |
Other Securities | | | | | | 37,491 | | 0.0% |
| | | | | | | | |
| | | |
ITALY — (0.0%) | | | | | | | | |
Other Securities | | | | | | 8,898 | | 0.0% |
| | | | | | | | |
| | | |
NORWAY — (0.0%) | | | | | | | | |
Other Securities | | | | | | 6,649 | | 0.0% |
| | | | | | | | |
| | | |
SPAIN — (0.0%) | | | | | | | | |
Other Securities | | | | | | 426,564 | | 0.0% |
| | | | | | | | |
TOTAL RIGHTS/WARRANTS | | | | | | 797,270 | | 0.0% |
| | | | | | | | |
| | | |
| | | Face Amount | | Value† | | |
| | | (000) | | | | |
TEMPORARY CASH INVESTMENTS — (0.2%) | | | | | | | | |
Repurchase Agreement, PNC Capital Markets, Inc. 0.19%, 11/02/09 (Collateralized by $2,725,000 FNMA 6.50%, 06/25/39, valued at $2,932,781) to be repurchased at $2,888,046 | | $ | 2,888 | | | 2,888,000 | | 0.2% |
| | | | | | | | |
| | | |
| | | Shares/
Face Amount | | | | |
| | | (000) | | | | |
SECURITIES LENDING COLLATERAL — (11.2%) | | | | | | | | |
§@DFA Short Term Investment Fund LP | | | 200,182,842 | | | 200,182,842 | | 12.3% |
@Repurchase Agreement, Deutsche Bank Securities 0.07%, 11/02/09 (Collateralized by various corporate obligations, ranging in par value from $4,247,617 to $16,429,280, rates ranging from 5.000% to 7.000%, maturities ranging from 03/01/37 to 10/01/39, valued at $4,949,334) to be repurchased at $4,852,316 | | $ | 4,852 | | | 4,852,288 | | 0.3% |
| | | | | | | | |
TOTAL SECURITIES LENDING COLLATERAL | | | | | | 205,035,130 | | 12.6% |
| | | | | | | | |
| | | |
TOTAL INVESTMENTS — (100.0%)
(Cost $1,667,112,137) | | | | | $ | 1,834,431,796 | | 112.5% |
| | | | | | | | |
304
THE CONTINENTAL SMALL COMPANY SERIES
CONTINUED
Summary of inputs used to value the Series’ net assets as of October 31, 2009 is as follows (See Security Valuation Note):
| | | | | | | | | | | |
| | | Valuation Inputs |
| |
| | | Investment in Securities (Market Value) |
| | | Level 1 | | Level 2 | | Level 3 | | Total |
Common Stocks | | | | | | | | | | | |
Austria | | $ | 127,622 | | $ | 52,402,604 | | — | | $ | 52,530,226 |
Belgium | | | 618,245 | | | 68,769,882 | | — | | | 69,388,127 |
Denmark | | | 71,185 | | | 42,412,668 | | — | | | 42,483,853 |
Finland | | | — | | | 127,978,823 | | — | | | 127,978,823 |
France | | | 304,773 | | | 225,199,240 | | — | | | 225,504,013 |
Germany | | | 620,371 | | | 244,213,276 | | — | | | 244,833,647 |
Greece | | | 62,295 | | | 64,341,258 | | — | | | 64,403,553 |
Ireland | | | 184,669 | | | 48,263,447 | | — | | | 48,448,116 |
Italy | | | — | | | 145,567,518 | | — | | | 145,567,518 |
Netherlands | | | 903,918 | | | 98,193,634 | | — | | | 99,097,552 |
Norway | | | 28,118 | | | 70,305,290 | | — | | | 70,333,408 |
Portugal | | | 325,570 | | | 25,709,785 | | — | | | 26,035,355 |
Spain | | | — | | | 90,276,392 | | — | | | 90,276,392 |
Sweden | | | — | | | 104,318,794 | | — | | | 104,318,794 |
Switzerland | | | 2,599,415 | | | 210,347,030 | | — | | | 212,946,445 |
Preferred Stocks | | | | | | | | | | | |
Switzerland | | | 1,565,574 | | | — | | — | | | 1,565,574 |
Rights/Warrants | | | | | | | | | | | |
Belgium | | | 1,373 | | | — | | — | | | 1,373 |
Denmark | | | 82,324 | | | — | | — | | | 82,324 |
Finland | | | — | | | 232,888 | | — | | | 232,888 |
France | | | 1,066 | | | 17 | | — | | | 1,083 |
Germany | | | — | | | 37,491 | | — | | | 37,491 |
Italy | | | 8,898 | | | — | | — | | | 8,898 |
Norway | | | — | | | 6,649 | | — | | | 6,649 |
Spain | | | — | | | 426,564 | | — | | | 426,564 |
Temporary Cash Investments | | | — | | | 2,888,000 | | — | | | 2,888,000 |
Securities Lending Collateral | | | — | | | 205,035,130 | | — | | | 205,035,130 |
| | | | | | | | | | | |
TOTAL | | $ | 7,505,416 | | $ | 1,826,926,380 | | — | | $ | 1,834,431,796 |
| | | | | | | | | | | |
See accompanying Notes to Financial Statements.
305
THE CANADIAN SMALL COMPANY SERIES
SUMMARY SCHEDULE OF PORTFOLIO HOLDINGS
October 31, 2009
| | | | | | | |
| | | Shares | | Value†† | | Percentage
of Net Assets** |
COMMON STOCKS — (84.0%) | | | | | | | |
Consumer Discretionary — (11.4%) | | | | | | | |
Astral Media, Inc. Class A | | 186,347 | | $ | 5,517,821 | | 1.5% |
Corus Entertainment, Inc. Class B | | 278,300 | | | 4,575,534 | | 1.2% |
Dorel Industries, Inc. Class B | | 107,500 | | | 2,884,086 | | 0.8% |
*Gildan Activewear, Inc. | | 246,010 | | | 4,333,395 | | 1.2% |
Groupe Aeroplan, Inc. | | 283,650 | | | 2,427,428 | | 0.7% |
Linamar Corp. | | 179,780 | | | 2,508,829 | | 0.7% |
Quebecor, Inc. Class B | | 159,493 | | | 3,258,990 | | 0.9% |
Reitmans Canada, Ltd. | | 193,400 | | | 2,920,527 | | 0.8% |
*RONA, Inc. | | 426,885 | | | 5,842,768 | | 1.6% |
Other Securities | | | | | 15,002,844 | �� | 4.1% |
| | | | | | | |
Total Consumer Discretionary | | | | | 49,272,222 | | 13.5% |
| | | | | | | |
| | | |
Consumer Staples — (2.3%) | | | | | | | |
*Cott Corp. | | 512,400 | | | 4,053,550 | | 1.1% |
#Maple Leaf Foods, Inc. | | 254,000 | | | 2,631,431 | | 0.7% |
Other Securities | | | | | 3,374,521 | | 1.0% |
| | | | | | | |
Total Consumer Staples | | | | | 10,059,502 | | 2.8% |
| | | | | | | |
| | | |
Energy — (17.3%) | | | | | | | |
#*Bankers Petroleum, Ltd. | | 685,432 | | | 3,002,586 | | 0.8% |
*Nuvista Energy, Ltd. | | 274,221 | | | 2,911,880 | | 0.8% |
#*PetroBakken Energy, Ltd. | | 185,863 | | | 5,362,638 | | 1.5% |
#Progress Energy Resources Corp. | | 333,082 | | | 4,260,297 | | 1.2% |
ShawCor, Ltd. | | 209,500 | | | 5,452,169 | | 1.5% |
Trican Well Service, Ltd. | | 391,971 | | | 4,586,066 | | 1.2% |
Trinidad Drilling, Ltd. | | 389,000 | | | 2,541,685 | | 0.7% |
#*Uranium One, Inc. | | 1,819,900 | | | 5,163,433 | | 1.4% |
Other Securities | | | | | 41,607,072 | | 11.4% |
| | | | | | | |
Total Energy | | | | | 74,887,826 | | 20.5% |
| | | | | | | |
| | | |
Financials — (6.5%) | | | | | | | |
AGF Management, Ltd. Class B | | 348,279 | | | 5,188,538 | | 1.4% |
Canadian Western Bank | | 226,200 | | | 4,469,439 | | 1.2% |
Home Capital Group, Inc. | | 113,700 | | | 3,835,359 | | 1.1% |
Laurentian Bank of Canada | | 92,400 | | | 3,375,604 | | 0.9% |
Other Securities | | | | | 11,355,113 | | 3.1% |
| | | | | | | |
Total Financials | | | | | 28,224,053 | | 7.7% |
| | | | | | | |
| | | |
Health Care — (4.2%) | | | | | | | |
#Biovail Corp. | | 304,150 | | | 4,103,868 | | 1.1% |
*MDS, Inc. | | 464,108 | | | 3,671,517 | | 1.0% |
*SXC Health Solutions Corp. | | 84,161 | | | 3,864,849 | | 1.1% |
Other Securities | | | | | 6,324,915 | | 1.7% |
| | | | | | | |
Total Health Care | | | | | 17,965,149 | | 4.9% |
| | | | | | | |
| | | |
Industrials — (6.7%) | | | | | | | |
#Russel Metals, Inc. | | 229,900 | | | 3,359,104 | | 0.9% |
*Stantec, Inc. | | 156,600 | | | 3,784,566 | | 1.0% |
#Toromont Industries, Ltd. | | 214,900 | | | 4,917,447 | | 1.4% |
Transcontinental, Inc. Class A | | 256,564 | | | 3,080,048 | | 0.8% |
Other Securities | | | | | 13,687,961 | | 3.8% |
| | | | | | | |
Total Industrials | | | | | 28,829,126 | | 7.9% |
| | | | | | | |
| | | |
Information Technology — (5.4%) | | | | | | | |
*Celestica, Inc. | | 797,607 | | | 6,575,162 | | 1.8% |
#*MacDonald Dettweiler & Associates, Ltd. | | 129,900 | | | 4,429,842 | | 1.2% |
306
THE CANADIAN SMALL COMPANY SERIES
CONTINUED
| | | | | | | | |
| | | Shares | | Value†† | | Percentage
of Net Assets** |
Information Technology — (Continued) | | | | | | | | |
Other Securities | | | | | $ | 12,304,418 | | 3.4% |
| | | | | | | | |
Total Information Technology | | | | | | 23,309,422 | | 6.4% |
| | | | | | | | |
| | | |
Materials — (29.5%) | | | | | | | | |
*Alamos Gold, Inc. | | | 347,100 | | | 2,771,539 | | 0.8% |
*Aurizon Mines, Ltd. | | | 561,000 | | | 2,410,841 | | 0.7% |
#*Equinox Minerals, Ltd. | | | 1,678,290 | | | 5,645,742 | | 1.5% |
#*Euro Goldfields, Ltd. | | | 521,060 | | | 2,937,448 | | 0.8% |
#*Golden Star Resources, Ltd. | | | 855,400 | | | 2,664,108 | | 0.7% |
*HudBay Minerals, Inc. | | | 477,851 | | | 6,187,045 | | 1.7% |
*Lundin Mining Corp. | | | 1,147,100 | | | 4,611,511 | | 1.3% |
Methanex Corp. | | | 359,200 | | | 6,194,420 | | 1.7% |
#*New Gold, Inc. | | | 725,960 | | | 2,629,974 | | 0.7% |
*Northgate Minerals Corp. | | | 937,300 | | | 2,399,446 | | 0.6% |
#*Osisko Mining Corp. | | | 522,931 | | | 3,527,930 | | 1.0% |
*Pan Amer Silver Corp. | | | 213,700 | | | 4,520,672 | | 1.2% |
#*Quadra Mining, Ltd. | | | 253,150 | | | 3,528,027 | | 1.0% |
Sherritt International Corp. | | | 641,601 | | | 4,115,069 | | 1.1% |
*Silver Standard Resources, Inc. | | | 229,462 | | | 4,300,623 | | 1.2% |
#Silvercorp Metals, Inc. | | | 482,000 | | | 2,490,070 | | 0.7% |
#*Thompson Creek Metals Co., Inc. | | | 474,700 | | | 4,795,038 | | 1.3% |
#West Fraser Timber Co., Ltd. | | | 123,716 | | | 2,984,139 | | 0.8% |
Other Securities | | | | | | 59,011,979 | | 16.2% |
| | | | | | | | |
Total Materials | | | | | | 127,725,621 | | 35.0% |
| | | | | | | | |
| | | |
Telecommunication Services — (0.3%) | | | | | | | | |
Other Securities | | | | | | 1,271,891 | | 0.3% |
| | | | | | | | |
| | | |
Utilities — (0.4%) | | | | | | | | |
Other Securities | | | | | | 1,602,945 | | 0.4% |
| | | | | | | | |
TOTAL COMMON STOCKS | | | | | | 363,147,757 | | 99.4% |
| | | | | | | | |
| | | |
| | | Face Amount | | Value† | | |
| | | (000) | | | | |
TEMPORARY CASH INVESTMENTS — (0.2%) | | | | | | | | |
Repurchase Agreement, PNC Capital Markets, Inc. 0.19%, 11/02/09 (Collateralized by $1,075,000 FHLMC 4.50%, 05/01/23, valued at $912,187) to be repurchased at $896,014 | | $ | 896 | | | 896,000 | | 0.3% |
| | | | | | | | |
| | | |
| | | Shares/ Face Amount | | | | |
| | | (000) | | | | |
SECURITIES LENDING COLLATERAL — (15.8%) | | | | | | | | |
§@DFA Short Term Investment Fund LP | | | 62,142,299 | | | 62,142,299 | | 17.0% |
@Repurchase Agreement, Deutsche Bank Securities 0.05%, 11/02/09 (Collateralized by $5,049,431 U.S. Treasury Note 0.875%, 01/31/11, valued at $5,028,666) to be repurchased at $4,979,736 | | $ | 4,980 | | | 4,979,715 | | 1.4% |
307
THE CANADIAN SMALL COMPANY SERIES
CONTINUED
| | | | | | | | | |
| | | Shares/
Face
Amount | | Value† | | Percentage
of Net Assets** | |
| | | (000) | | | | | |
@Repurchase Agreement, Deutsche Bank Securities 0.07%, 11/02/09 (Collateralized by various corporate obligations, ranging in par value from $4,247,617 to $16,429,280, rates ranging from 5.000% to 7.000%, maturities ranging from 03/01/37 to 10/01/39, valued at $1,434,975) to be repurchased at $1,406,846 | | $ | 1,407 | | | 1,406,838 | | 0.4 | % |
| | | | | | | | | |
TOTAL SECURITIES LENDING COLLATERAL | | | | | | 68,528,852 | | 18.8 | % |
| | | | | | | | | |
TOTAL INVESTMENTS — (100.0%)
(Cost $558,452,607) | | | | | $ | 432,572,609 | | 118.5 | % |
| | | | | | | | | |
Summary of inputs used to value the Series’ net assets as of October 31, 2009 is as follows (See Security Valuation Note):
| | | | | | | | | | | |
| | | Valuation Inputs |
| |
| | | Investment in Securities (Market Value) |
| | | Level 1 | | Level 2 | | Level 3 | | Total |
Common Stocks | | | | | | | | | | | |
Consumer Discretionary | | $ | 49,272,222 | | | — | | — | | $ | 49,272,222 |
Consumer Staples | | | 10,059,502 | | | — | | — | | | 10,059,502 |
Energy | | | 74,887,826 | | | — | | — | | | 74,887,826 |
Financials | | | 28,224,053 | | | — | | — | | | 28,224,053 |
Health Care | | | 17,965,149 | | | — | | — | | | 17,965,149 |
Industrials | | | 28,829,126 | | | — | | — | | | 28,829,126 |
Information Technology | | | 23,308,884 | | $ | 538 | | — | | | 23,309,422 |
Materials | | | 127,724,533 | | | 1,088 | | — | | | 127,725,621 |
Telecommunication Services | | | 1,271,891 | | | — | | — | | | 1,271,891 |
Utilities | | | 1,602,945 | | | — | | — | | | 1,602,945 |
Temporary Cash Investments | | | — | | | 896,000 | | — | | | 896,000 |
Securities Lending Collateral | | | — | | | 68,528,852 | | — | | | 68,528,852 |
| | | | | | | | | | | |
TOTAL | | $ | 363,146,131 | | $ | 69,426,478 | | — | | $ | 432,572,609 |
| | | | | | | | | | | |
See accompanying Notes to Financial Statements.
308
THE EMERGING MARKETS SERIES
SUMMARY SCHEDULE OF PORTFOLIO HOLDINGS
October 31, 2009
| | | | | | | |
| | | Shares | | Value†† | | Percentage
of Net Assets** |
COMMON STOCKS — (82.9%) | | | | | | | |
ARGENTINA — (0.1%) | | | | | | | |
Other Securities | | | | $ | 1,818,247 | | 0.1% |
| | | | | | | |
| | | |
BRAZIL — (5.8%) | | | | | | | |
Companhia Siderurgica Nacional SA | | 367,276 | | | 12,132,034 | | 0.6% |
Petroleo Brasilerio SA ADR (71654V101) | | 1,256,219 | | | 50,399,506 | | 2.4% |
Petroleo Brasilerio SA ADR (71654V408) | | 914,546 | | | 42,270,316 | | 2.0% |
Other Securities | | | | | 30,983,709 | | 1.4% |
| | | | | | | |
TOTAL BRAZIL | | | | | 135,785,565 | | 6.4% |
| | | | | | | |
| | | |
CHILE — (1.7%) | | | | | | | |
Empresa Nacional de Electricidad SA Sponsored ADR | | 207,763 | | | 9,534,244 | | 0.4% |
Other Securities | | | | | 29,219,969 | | 1.4% |
| | | | | | | |
TOTAL CHILE | | | | | 38,754,213 | | 1.8% |
| | | | | | | |
| | | |
CHINA — (9.4%) | | | | | | | |
Bank of China, Ltd. | | 56,691,000 | | | 32,598,740 | | 1.6% |
#China Life Insurance Co., Ltd. ADR | | 250,705 | | | 17,200,870 | | 0.8% |
China Mobile, Ltd. Sponsored ADR | | 696,697 | | | 32,556,651 | | 1.5% |
#CNOOC, Ltd. ADR | | 67,956 | | | 10,121,367 | | 0.5% |
*Industrial & Commercial Bank of China, Ltd. | | 34,093,000 | | | 27,124,901 | | 1.3% |
#PetroChina Co., Ltd. ADR | | 115,210 | | | 13,829,808 | | 0.7% |
Tencent Holdings, Ltd. | | 700,600 | | | 12,199,255 | | 0.6% |
Other Securities | | | | | 74,618,243 | | 3.5% |
| | | | | | | |
TOTAL CHINA | | | | | 220,249,835 | | 10.5% |
| | | | | | | |
| | | |
CZECH REPUBLIC — (1.0%) | | | | | | | |
CEZ A.S. | | 301,862 | | | 14,864,947 | | 0.7% |
Other Securities | | | | | 8,518,048 | | 0.4% |
| | | | | | | |
TOTAL CZECH REPUBLIC | | | | | 23,382,995 | | 1.1% |
| | | | | | | |
| | | |
HUNGARY — (1.5%) | | | | | | | |
#*OTP Bank NYRT | | 618,710 | | | 17,397,809 | | 0.8% |
Other Securities | | | | | 17,906,431 | | 0.9% |
| | | | | | | |
TOTAL HUNGARY | | | | | 35,304,240 | | 1.7% |
| | | | | | | |
| | | |
INDIA — (11.2%) | | | | | | | |
HDFC Bank, Ltd. | | 386,733 | | | 13,175,290 | | 0.6% |
Hindustan Unilever, Ltd. | | 1,633,609 | | | 9,748,048 | | 0.5% |
Infosys Technologies, Ltd. | | 657,429 | | | 30,520,259 | | 1.4% |
Infosys Technologies, Ltd. Sponsored ADR | | 233,496 | | | 10,740,816 | | 0.5% |
ITC, Ltd. | | 2,007,345 | | | 10,823,298 | | 0.5% |
Larsen & Toubro, Ltd. | | 371,281 | | | 12,248,925 | | 0.6% |
*Reliance Industries, Ltd. | | 1,030,847 | | | 41,707,940 | | 2.0% |
Tata Consultancy Services, Ltd. | | 756,974 | | | 10,030,279 | | 0.5% |
Other Securities | | | | | 122,736,201 | | 5.8% |
| | | | | | | |
TOTAL INDIA | | | | | 261,731,056 | | 12.4% |
| | | | | | | |
| | | |
INDONESIA — (2.2%) | | | | | | | |
PT Astra International Tbk | | 4,017,561 | | | 12,925,685 | | 0.6% |
PT Telekomunikasi Indonesia Tbk | | 14,011,140 | | | 12,065,191 | | 0.6% |
Other Securities | | | | | 25,780,160 | | 1.2% |
| | | | | | | |
TOTAL INDONESIA | | | | | 50,771,036 | | 2.4% |
| | | | | | | |
| | | |
ISRAEL — (3.6%) | | | | | | | |
Israel Chemicals, Ltd. | | 780,753 | | | 9,119,540 | | 0.5% |
Teva Pharmaceutical Industries, Ltd. Sponsored ADR | | 888,925 | | | 44,872,934 | | 2.1% |
309
THE EMERGING MARKETS SERIES
CONTINUED
| | | | | | | |
| | | Shares | | Value†† | | Percentage
of Net Assets** |
ISRAEL — (Continued) | | | | | | | |
Other Securities | | | | $ | 29,303,182 | | 1.4% |
| | | | | | | |
TOTAL ISRAEL | | | | | 83,295,656 | | 4.0% |
| | | | | | | |
| | | |
MALAYSIA — (4.4%) | | | | | | | |
CIMB Group Holdings Berhad | | 3,095,227 | | | 11,229,284 | | 0.5% |
Other Securities | | | | | 92,150,262 | | 4.4% |
| | | | | | | |
TOTAL MALAYSIA | | | | | 103,379,546 | | 4.9% |
| | | | | | | |
| | | |
MEXICO — (6.8%) | | | | | | | |
#America Movil S.A.B. de C.V. Series L | | 17,737,259 | | | 39,145,222 | | 1.8% |
#Fomento Economico Mexicano S.A.B. de C.V. Series B & D | | 2,109,900 | | | 9,132,314 | | 0.4% |
#*Grupo Mexico S.A.B. de C.V. Series B | | 9,098,785 | | | 18,192,402 | | 0.9% |
#Wal-Mart de Mexico S.A.B. de C.V. Series V | | 4,372,680 | | | 15,250,358 | | 0.7% |
Other Securities | | | | | 77,158,719 | | 3.7% |
| | | | | | | |
TOTAL MEXICO | | | | | 158,879,015 | | 7.5% |
| | | | | | | |
| | | |
PHILIPPINES — (0.6%) | | | | | | | |
Other Securities | | | | | 13,288,391 | | 0.6% |
| | | | | | | |
| | | |
POLAND — (1.3%) | | | | | | | |
Other Securities | | | | | 30,821,592 | | 1.5% |
| | | | | | | |
| | | |
RUSSIA — (0.6%) | | | | | | | |
Other Securities | | | | | 13,599,374 | | 0.7% |
| | | | | | | |
| | | |
SINGAPORE — (0.0%) | | | | | | | |
Other Securities | | | | | 513,710 | | 0.0% |
| | | | | | | |
| | | |
SOUTH AFRICA — (8.2%) | | | | | | | |
*Anglo American Platinum Corp., Ltd. | | 114,526 | | | 9,954,766 | | 0.5% |
Impala Platinum Holdings, Ltd. | | 478,692 | | | 10,402,919 | | 0.5% |
MTN Group, Ltd. | | 1,659,950 | | | 24,715,390 | | 1.2% |
Naspers, Ltd. Series N | | 324,237 | | | 11,698,218 | | 0.5% |
#Sasol, Ltd. Sponsored ADR | | 1,270,370 | | | 47,499,134 | | 2.2% |
#Standard Bank Group, Ltd. | | 843,110 | | | 10,570,537 | | 0.5% |
Other Securities | | | | | 77,167,798 | | 3.7% |
| | | | | | | |
TOTAL SOUTH AFRICA | | | | | 192,008,762 | | 9.1% |
| | | | | | | |
| | | |
SOUTH KOREA — (11.5%) | | | | | | | |
POSCO | | 46,060 | | | 19,088,540 | | 0.9% |
#Samsung Electronics Co., Ltd. | | 97,139 | | | 58,451,752 | | 2.8% |
*Samsung Electronics Co., Ltd. GDR | | 49,372 | | | 14,972,842 | | 0.7% |
Other Securities | | | | | 174,979,885 | | 8.3% |
| | | | | | | |
TOTAL SOUTH KOREA | | | | | 267,493,019 | | 12.7% |
| | | | | | | |
| | | |
TAIWAN — (9.6%) | | | | | | | |
Formosa Plastics Corp. | | 5,051,649 | | | 9,689,505 | | 0.5% |
Hon Hai Precision Industry Co., Ltd. | | 4,590,177 | | | 17,978,933 | | 0.9% |
Media Tek, Inc. | | 735,527 | | | 10,294,431 | | 0.5% |
Nan Ya Plastic Corp. | | 7,084,565 | | | 11,269,977 | | 0.5% |
Taiwan Semiconductor Manufacturing Co., Ltd. | | 22,386,808 | | | 40,609,637 | | 1.9% |
Other Securities | | | | | 133,066,226 | | 6.3% |
| | | | | | | |
TOTAL TAIWAN | | | | | 222,908,709 | | 10.6% |
| | | | | | | |
| | | |
THAILAND — (1.4%) | | | | | | | |
Other Securities | | | | | 32,436,355 | | 1.5% |
| | | | | | | |
| | | |
TURKEY — (2.0%) | | | | | | | |
Turkiye Garanti Bankasi A.S. | | 2,842,585 | | | 10,322,968 | | 0.5% |
310
THE EMERGING MARKETS SERIES
CONTINUED
| | | | | | | |
| | | Shares | | Value†† | | Percentage
of Net Assets** |
TURKEY — (Continued) | | | | | | | |
Other Securities | | | | $ | 36,814,452 | | 1.7% |
| | | | | | | |
TOTAL TURKEY | | | | | 47,137,420 | | 2.2% |
| | | | | | | |
TOTAL COMMON STOCKS | | | | | 1,933,558,736 | | 91.7% |
| | | | | | | |
PREFERRED STOCKS — (7.1%) | | | | | | | |
BRAZIL — (7.1%) | | | | | | | |
Banco Bradesco SA | | 1,309,200 | | | 25,610,259 | | 1.2% |
#Companhia de Bebidas das Americas Preferred ADR | | 151,600 | | | 13,656,128 | | 0.7% |
Gerdau SA | | 756,268 | | | 11,398,113 | | 0.5% |
Itau Unibanco Holding SA | | 1,765,755 | | | 33,589,042 | | 1.6% |
Vale SA Series A | | 1,412,691 | | | 31,796,775 | | 1.5% |
Other Securities | | | | | 49,632,382 | | 2.4% |
| | | | | | | |
TOTAL BRAZIL | | | | | 165,682,699 | | 7.9% |
| | | | | | | |
TOTAL PREFERRED STOCKS | | | | | 165,682,699 | | 7.9% |
| | | | | | | |
RIGHTS/WARRANTS — (0.0%) | | | | | | | |
SOUTH AFRICA — (0.0%) | | | | | | | |
Other Securities | | | | | 40,450 | | 0.0% |
| | | | | | | |
| | | |
TAIWAN — (0.0%) | | | | | | | |
Other Securities | | | | | 8,490 | | 0.0% |
| | | | | | | |
TOTAL RIGHTS/WARRANTS | | | | | 48,940 | | 0.0% |
| | | | | | | |
| | | |
| | | Face Amount | | | | |
| | | (000) | | Value† | | |
TEMPORARY CASH INVESTMENTS — (0.0%) | | | | | | | |
Repurchase Agreement, PNC Capital Markets, Inc. 0.19%, 11/02/09 (Collateralized by $310,000 FNMA 6.50%, 06/25/39, valued at $326,275) to be repurchased at $317,005 | | $317 | | | 317,000 | | 0.0% |
| | | | | | | |
| | | |
| | | Shares/ Face Amount | | | | |
| | | (000) | | | | |
SECURITIES LENDING COLLATERAL — (10.0%) | | | | | | | |
§@DFA Short Term Investment Fund LP | | 226,669,881 | | | 226,669,881 | | 10.7% |
@Repurchase Agreement, Deutsche Bank Securities 0.07%, 11/02/09 (Collateralized by various corporate obligations, ranging in par value from $4,247,617 to $16,429,280, rates ranging from 5.000% to 7.000%, maturities ranging from 03/01/37 to 10/01/39, valued at $6,420,547) to be repurchased at $6,294,691 | | $6,295 | | | 6,294,654 | | 0.3% |
| | | | | | | |
TOTAL SECURITIES LENDING COLLATERAL | | | | | 232,964,535 | | 11.0% |
| | | | | | | |
TOTAL INVESTMENTS — (100.0%)
(Cost $1,297,590,646) | | | | $ | 2,332,571,910 | | 110.6% |
| | | | | | | |
311
THE EMERGING MARKETS SERIES
CONTINUED
Summary of inputs used to value the Series’ net assets as of October 31, 2009 is as follows (See Security Valuation Note):
| | | | | | | | | | | |
| | | Valuation Inputs |
| |
| | | Investment in Securities (Market Value) |
| | | Level 1 | | Level 2 | | Level 3 | | Total |
Common Stocks | | | | | | | | | | | |
Argentina | | $ | 1,818,247 | | | — | | — | | $ | 1,818,247 |
Brazil | | | 135,785,565 | | | — | | — | | | 135,785,565 |
Chile | | | 38,754,213 | | | — | | — | | | 38,754,213 |
China | | | 81,011,010 | | $ | 139,238,825 | | — | | | 220,249,835 |
Czech Republic | | | — | | | 23,382,995 | | — | | | 23,382,995 |
Hungary | | | — | | | 35,304,240 | | — | | | 35,304,240 |
India | | | 16,626,590 | | | 245,104,466 | | — | | | 261,731,056 |
Indonesia | | | — | | | 50,771,036 | | — | | | 50,771,036 |
Israel | | | 44,872,934 | | | 38,422,722 | | — | | | 83,295,656 |
Malaysia | | | — | | | 103,379,546 | | — | | | 103,379,546 |
Mexico | | | 158,715,803 | | | 163,212 | | — | | | 158,879,015 |
Philippines | | | — | | | 13,288,391 | | — | | | 13,288,391 |
Poland | | | — | | | 30,821,592 | | — | | | 30,821,592 |
Russia | | | 206,569 | | | 13,392,805 | | — | | | 13,599,374 |
Singapore | | | — | | | 513,710 | | — | | | 513,710 |
South Africa | | | 64,231,071 | | | 127,777,691 | | — | | | 192,008,762 |
South Korea | | | 2,797,395 | | | 264,695,624 | | — | | | 267,493,019 |
Taiwan | | | 3,072,894 | | | 219,835,815 | | — | | | 222,908,709 |
Thailand | | | 32,436,355 | | | — | | — | | | 32,436,355 |
Turkey | | | — | | | 47,137,420 | | — | | | 47,137,420 |
Preferred Stocks | | | | | | | | | | | |
Brazil | | | 165,682,699 | | | — | | — | | | 165,682,699 |
Rights/Warrants | | | | | | | | | | | |
South Africa | | | 40,450 | | | — | | — | | | 40,450 |
Taiwan | | | — | | | 8,490 | | — | | | 8,490 |
Temporary Cash Investments | | | — | | | 317,000 | | — | | | 317,000 |
Securities Lending Collateral | | | — | | | 232,964,535 | | — | | | 232,964,535 |
| | | | | | | | | | | |
TOTAL | | $ | 746,051,795 | | $ | 1,586,520,115 | | — | | $ | 2,332,571,910 |
| | | | | | | | | | | |
See accompanying Notes to Financial Statements.
312
THE EMERGING MARKETS SMALL CAP SERIES
SUMMARY SCHEDULE OF PORTFOLIO HOLDINGS
October 31, 2009
| | | | | | | |
| | | Shares | | Value†† | | Percentage
of Net Assets** |
COMMON STOCKS — (87.8%) | | | | | | | |
ARGENTINA — (0.0%) | | | | | | | |
Other Securities | | | | $ | — | | 0.0% |
| | | | | | | |
| | | |
BRAZIL — (7.3%) | | | | | | | |
B2W Cia Global Do Varejo | | 123,200 | | | 3,570,954 | | 0.3% |
*BRF - Brasil Foods SA ADR | | 112,544 | | | 5,443,753 | | 0.5% |
Cyrela Brazil Realty SA | | 326,200 | | | 4,138,607 | | 0.4% |
*Duratex SA | | 624,462 | | | 4,324,725 | | 0.4% |
*Global Village Telecom Holding SA | | 178,300 | | | 5,116,408 | | 0.4% |
Lojas Renner SA | | 273,700 | | | 4,847,548 | | 0.4% |
*Magnesita Refratarios SA | | 441,455 | | | 3,232,726 | | 0.3% |
Other Securities | | | | | 60,956,792 | | 5.2% |
| | | | | | | |
TOTAL BRAZIL | | | | | 91,631,513 | | 7.9% |
| | | | | | | |
| | | |
CHILE — (2.1%) | | | | | | | |
Other Securities | | | | | 26,049,604 | | 2.2% |
| | | | | | | |
| | | |
CHINA — (11.8%) | | | | | | | |
#*Brilliance China Automotive Holdings, Ltd. | | 18,522,000 | | | 3,404,681 | | 0.3% |
#*Byd Co., Ltd. | | 482,000 | | | 4,418,950 | | 0.4% |
China Travel International Investment Hong Kong, Ltd. | | 21,347,000 | | | 4,357,667 | | 0.4% |
China Yurun Food Group, Ltd. | | 2,622,000 | | | 5,375,559 | | 0.5% |
Hopson Development Holdings, Ltd. | | 3,914,000 | | | 6,810,095 | | 0.6% |
#*Hunan Non-Ferrous Metal Corp., Ltd. | | 14,290,000 | | | 4,362,982 | | 0.4% |
#*Semiconductor Manufacturing International Corp. | | 167,851,000 | | | 8,306,535 | | 0.7% |
Shenzhen International Holdings, Ltd. | | 71,794,300 | | | 5,020,114 | | 0.4% |
Shenzhen Investment, Ltd. | | 14,500,000 | | | 5,729,496 | | 0.5% |
#Skyworth Digital Holdings, Ltd. | | 14,661,400 | | | 8,252,870 | | 0.7% |
TPV Technology, Ltd. | | 14,518,000 | | | 9,396,713 | | 0.8% |
Xinao Gas Holdings, Ltd. | | 2,178,000 | | | 4,667,339 | | 0.4% |
Other Securities | | | | | 78,871,412 | | 6.7% |
| | | | | | | |
TOTAL CHINA | | | | | 148,974,413 | | 12.8% |
| | | | | | | |
| | | |
HUNGARY — (0.3%) | | | | | | | |
Other Securities | | | | | 3,747,270 | | 0.3% |
| | | | | | | |
| | | |
INDIA — (11.2%) | | | | | | | |
Other Securities | | | | | 141,238,191 | | 12.1% |
| | | | | | | |
| | | |
INDONESIA — (2.9%) | | | | | | | |
Other Securities | | | | | 36,214,944 | | 3.1% |
| | | | | | | |
| | | |
ISRAEL — (2.9%) | | | | | | | |
*Clal Insurance Enterprise Holdings, Ltd. | | 257,136 | | | 5,443,527 | | 0.5% |
*Harel Insurance Investments & Finances, Ltd. | | 96,806 | | | 4,582,314 | | 0.4% |
Other Securities | | | | | 27,039,061 | | 2.3% |
| | | | | | | |
TOTAL ISRAEL | | | | | 37,064,902 | | 3.2% |
| | | | | | | |
| | | |
MALAYSIA — (5.3%) | | | | | | | |
Other Securities | | | | | 66,950,408 | | 5.7% |
| | | | | | | |
| | | |
MEXICO — (5.3%) | | | | | | | |
*Corporacion GEO S.A.B. de C.V. Series B | | 1,330,000 | | | 3,500,331 | | 0.3% |
#*Desarrolladora Homex S.A.B. de C.V. | | 576,300 | | | 3,428,448 | | 0.3% |
Embotelladora Arca S.A.B. de C.V. | | 1,909,100 | | | 4,800,312 | | 0.4% |
*Empresas ICA S.A.B. de C.V. | | 1,463,608 | | | 3,210,155 | | 0.3% |
#*Empresas ICA S.A.B. de C.V. Sponsored ADR | | 681,589 | | | 5,943,456 | | 0.5% |
Grupo Continental S.A.B. de C.V. | | 3,323,559 | | | 7,777,940 | | 0.6% |
*Industrias CH S.A.B. de C.V. Series B | | 1,854,348 | | | 5,645,729 | | 0.5% |
313
THE EMERGING MARKETS SMALL CAP SERIES
CONTINUED
| | | | | | | |
| | | Shares | | Value†† | | Percentage
of Net Assets** |
MEXICO — (Continued) | | | | | | | |
#TV Azteca S.A.B. de C.V. Series A | | 6,581,300 | | $ | 3,394,388 | | 0.3% |
Other Securities | | | | | 29,031,756 | | 2.5% |
| | | | | | | |
TOTAL MEXICO | | | | | 66,732,515 | | 5.7% |
| | | | | | | |
| | | |
PHILIPPINES — (1.4%) | | | | | | | |
Other Securities | | | | | 17,814,064 | | 1.5% |
| | | | | | | |
| | | |
POLAND — (2.5%) | | | | | | | |
Other Securities | | | | | 30,873,987 | | 2.6% |
| | | | | | | |
| | | |
SOUTH AFRICA — (9.2%) | | | | | | | |
Aveng, Ltd. | | 981,591 | | | 5,205,828 | | 0.4% |
Barloworld, Ltd. | | 579,959 | | | 3,615,988 | | 0.3% |
Dimension Data Holdings P.L.C. | | 3,458,471 | | | 4,021,101 | | 0.3% |
Foschini, Ltd. | | 521,461 | | | 4,117,902 | | 0.4% |
#Grindrod, Ltd. | | 1,607,864 | | | 3,688,055 | | 0.3% |
Imperial Holdings, Ltd. | | 467,965 | | | 4,816,593 | | 0.4% |
JD Group, Ltd. | | 1,161,251 | | | 6,410,898 | | 0.6% |
Mr. Price Group, Ltd. | | 928,134 | | | 4,276,741 | | 0.4% |
Reunert, Ltd. | | 594,843 | | | 4,189,937 | | 0.4% |
Spar Group, Ltd. (The) | | 559,850 | | | 4,893,172 | | 0.4% |
Tongaat-Hulett, Ltd. | | 625,434 | | | 8,045,394 | | 0.7% |
Woolworths Holdings, Ltd. | | 2,268,438 | | | 5,072,025 | | 0.4% |
Other Securities | | | | | 58,194,480 | | 5.0% |
| | | | | | | |
TOTAL SOUTH AFRICA | | | | | 116,548,114 | | 10.0% |
| | | | | | | |
| | | |
SOUTH KOREA — (10.1%) | | | | | | | |
Daegu Bank Co., Ltd. | | 261,800 | | | 3,473,548 | | 0.3% |
#*NCsoft Corp. | | 29,254 | | | 3,128,582 | | 0.3% |
Other Securities | | | | | 120,778,808 | | 10.3% |
| | | | | | | |
TOTAL SOUTH KOREA | | | | | 127,380,938 | | 10.9% |
| | | | | | | |
| | | |
TAIWAN — (10.6%) | | | | | | | |
Other Securities | | | | | 134,178,175 | | 11.5% |
| | | | | | | |
| | | |
THAILAND — (2.3%) | | | | | | | |
Other Securities | | | | | 29,202,227 | | 2.5% |
| | | | | | | |
| | | |
TURKEY — (2.6%) | | | | | | | |
Other Securities | | | | | 32,724,404 | | 2.8% |
| | | | | | | |
TOTAL COMMON STOCKS | | | | | 1,107,325,669 | | 94.8% |
| | | | | | | |
PREFERRED STOCKS — (4.6%) | | | | | | | |
BRAZIL — (4.6%) | | | | | | | |
*Braskem SA Preferred A Sponsored ADR | | 301,000 | | | 3,949,120 | | 0.3% |
Eletropaulo Metropolita SA Preferred A | | 184,200 | | | 3,485,119 | | 0.3% |
Klabin SA | | 1,412,700 | | | 3,368,154 | | 0.3% |
Lojas Americanas SA | | 488,403 | | | 3,185,599 | | 0.3% |
*Net Servicos de Comunicacao SA | | 400,902 | | | 4,940,726 | | 0.4% |
*Suzano Papel e Celullose SA | | 390,634 | | | 3,394,986 | | 0.3% |
Ultrapar Participacoes SA | | 208,040 | | | 9,111,198 | | 0.8% |
Other Securities | | | | | 26,457,903 | | 2.3% |
| | | | | | | |
TOTAL BRAZIL | | | | | 57,892,805 | | 5.0% |
| | | | | | | |
| | | |
INDIA — (0.0%) | | | | | | | |
Other Securities | | | | | 41,324 | | 0.0% |
| | | | | | | |
| | | |
MALAYSIA — (0.0%) | | | | | | | |
Other Securities | | | | | 20,742 | | 0.0% |
| | | | | | | |
TOTAL PREFERRED STOCKS | | | | | 57,954,871 | | 5.0% |
| | | | | | | |
314
THE EMERGING MARKETS SMALL CAP SERIES
CONTINUED
| | | | | | | |
| | | Shares | | Value†† | | Percentage
of Net Assets** |
RIGHTS/WARRANTS — (0.0%) | | | | | | | |
BRAZIL — (0.0%) | | | | | | | |
Other Securities | | | | $ | 33,992 | | 0.0% |
| | | | | | | |
| | | |
CHILE — (0.0%) | | | | | | | |
Other Securities | | | | | 24,024 | | 0.0% |
| | | | | | | |
| | | |
CHINA — (0.0%) | | | | | | | |
Other Securities | | | | | 4,329 | | 0.0% |
| | | | | | | |
| | | |
MALAYSIA — (0.0%) | | | | | | | |
Other Securities | | | | | 232 | | 0.0% |
| | | | | | | |
| | | |
PHILIPPINES — (0.0%) | | | | | | | |
Other Securities | | | | | 50,992 | | 0.0% |
| | | | | | | |
| | | |
SOUTH AFRICA — (0.0%) | | | | | | | |
Other Securities | | | | | 262,200 | | 0.0% |
| | | | | | | |
| | | |
SOUTH KOREA — (0.0%) | | | | | | | |
Other Securities | | | | | 67 | | 0.0% |
| | | | | | | |
| | | |
TAIWAN — (0.0%) | | | | | | | |
Other Securities | | | | | 10,085 | | 0.0% |
| | | | | | | |
| | | |
THAILAND — (0.0%) | | | | | | | |
Other Securities | | | | | 171,980 | | 0.0% |
| | | | | | | |
TOTAL RIGHTS/WARRANTS | | | | | 557,901 | | 0.0% |
| | | | | | | |
| | | |
| | | Face | | | | |
| | | Amount | | | | |
| | | (000) | | Value† | | |
TEMPORARY CASH INVESTMENTS — (0.1%) | | | | | | | |
Repurchase Agreement, PNC Capital Markets, Inc. 0.19%, 11/02/09 (Collateralized by $2,270,000 FHLMC 6.040%(r), 11/01/36, valued at $1,457,263) to be repurchased at $1,433,023 | | $1,433 | | | 1,433,000 | | 0.1% |
| | | | | | | |
| | | |
| | | Shares/
Face Amount | | | | |
| | | (000) | | | | |
SECURITIES LENDING COLLATERAL — (7.5%) | | | | | | | |
§@DFA Short Term Investment Fund LP | | 93,074,091 | | | 93,074,091 | | 8.0% |
@Repurchase Agreement, Deutsche Bank Securities 0.07%, 11/02/09 (Collateralized by various corporate obligations, ranging in par value from $4,247,617 to $16,429,280, rates ranging from 5.000% to 7.000%, maturities ranging from 03/01/37 to 10/01/39, valued at $1,345,493) to be repurchased at $1,319,119 | | $1,319 | | | 1,319,111 | | 0.1% |
| | | | | | | |
TOTAL SECURITIES LENDING COLLATERAL | | | | | 94,393,202 | | 8.1% |
| | | | | | | |
TOTAL INVESTMENTS — (100.0%)
(Cost $968,312,341) | | | | $ | 1,261,664,643 | | 108.0% |
| | | | | | | |
315
THE EMERGING MARKETS SMALL CAP SERIES
CONTINUED
Summary of inputs used to value the Series’ net assets as of October 31, 2009 is as follows (See Security Valuation Note):
| | | | | | | | | | | |
| | | Valuation Inputs |
| |
| | | Investment in Securities (Market Value) |
| | | Level 1 | | Level 2 | | Level 3 | | Total |
Common Stocks | | | | | | | | | | | |
Argentina | | | — | | | — | | — | | | — |
Brazil | | $ | 91,631,513 | | | — | | — | | $ | 91,631,513 |
Chile | | | 26,049,604 | | | — | | — | | | 26,049,604 |
China | | | — | | $ | 148,974,413 | | — | | | 148,974,413 |
Hungary | | | — | | | 3,747,270 | | — | | | 3,747,270 |
India | | | 62,079 | | | 141,176,112 | | — | | | 141,238,191 |
Indonesia | | | 521,444 | | | 35,693,500 | | — | | | 36,214,944 |
Israel | | | 264,352 | | | 36,800,550 | | — | | | 37,064,902 |
Malaysia | | | 117,274 | | | 66,833,134 | | — | | | 66,950,408 |
Mexico | | | 66,238,177 | | | 494,338 | | — | | | 66,732,515 |
Philippines | | | 409,393 | | | 17,404,671 | | — | | | 17,814,064 |
Poland | | | — | | | 30,873,987 | | — | | | 30,873,987 |
South Africa | | | 49,374 | | | 116,498,740 | | — | | | 116,548,114 |
South Korea | | | 398,960 | | | 126,981,978 | | — | | | 127,380,938 |
Taiwan | | | 2,836 | | | 134,175,339 | | — | | | 134,178,175 |
Thailand | | | 29,110,102 | | | 92,125 | | — | | | 29,202,227 |
Turkey | | | — | | | 32,724,404 | | — | | | 32,724,404 |
Preferred Stocks | | | | | | | | | | | |
Brazil | | | 57,858,189 | | | 34,616 | | — | | | 57,892,805 |
India | | | — | | | 41,324 | | — | | | 41,324 |
Malaysia | | | 20,742 | | | — | | — | | | 20,742 |
Rights/Warrants | | | | | | | | | | | |
Brazil | | | 33,992 | | | — | | — | | | 33,992 |
Chile | | | 24,024 | | | — | | — | | | 24,024 |
China | | | 4,329 | | | — | | — | | | 4,329 |
Malaysia | | | 40 | | | 192 | | — | | | 232 |
Philippines | | | — | | | 50,992 | | — | | | 50,992 |
South Africa | | | 262,200 | | | — | | — | | | 262,200 |
South Korea | | | — | | | 67 | | — | | | 67 |
Taiwan | | | — | | | 10,085 | | — | | | 10,085 |
Thailand | | | 171,980 | | | — | | — | | | 171,980 |
Temporary Cash Investments | | | — | | | 1,433,000 | | — | | | 1,433,000 |
Securities Lending Collateral | | | — | | | 94,393,202 | | — | | | 94,393,202 |
| | | | | | | | | | | |
TOTAL | | $ | 273,230,604 | | $ | 988,434,039 | | — | | $ | 1,261,664,643 |
| | | | | | | | | | | |
See accompanying Notes to Financial Statements.
316
THE DFA INVESTMENT TRUST COMPANY
STATEMENTS OF ASSETS AND LIABILITIES
OCTOBER 31, 2009
(Amounts in thousands)
| | | | | | | | | | | | |
| | | The U.S. | | The U.S. | | The DFA | | The Japanese |
| | | Large | | Large Cap | | International | | Small |
| | | Company | | Value | | Value | | Company |
| | | Series | | Series | | Series | | Series |
ASSETS: | | | | | | | | | | | | |
Investments at Value (including $252,538, $470,665, $1,004,314 and $160,740 of securities on loan, respectively) | | $ | 3,473,361 | | $ | 7,481,171 | | $ | 6,156,090 | | $ | 1,172,145 |
Temporary Cash Investments at Value & Cost | | | 27,414 | | | 42,250 | | | 13,790 | | | 118 |
Collateral Received from Securities on Loan at Value & Cost | | | 270,456 | | | 515,340 | | | 1,056,276 | | | 173,035 |
Foreign Currencies at Value | | | — | | | — | | | 19,131 | | | 114 |
Cash | | | 2,839 | | | 1 | | | 16 | | | 16 |
Receivables: | | | | | | | | | | | | |
Investment Securities Sold | | | — | | | 1,660 | | | 10,656 | | | 4,019 |
Dividends, Interest and Tax Reclaims | | | 4,362 | | | 7,943 | | | 10,784 | | | 6,521 |
Securities Lending Income | | | 62 | | | 700 | | | 444 | | | 279 |
Fund Shares Sold | | | 71 | | | 365 | | | 724 | | | 5 |
Unrealized Gain on Foreign Currency Contracts | | | — | | | — | | | 19 | | | — |
Prepaid Expenses and Other Assets | | | 1 | | | — | | | — | | | — |
| | | | | | | | | | | | |
Total Assets | | | 3,778,566 | | | 8,049,430 | | | 7,267,930 | | | 1,356,252 |
| | | | | | | | | | | | |
LIABILITIES: | | | | | | | | | | | | |
Payables: | | | | | | | | | | | | |
Upon Return of Securities Loaned | | | 270,456 | | | 515,340 | | | 1,056,276 | | | 173,035 |
Investment Securities Purchased | | | 1,042 | | | 22,419 | | | 14,723 | | | — |
Fund Shares Redeemed | | | 458 | | | 2,242 | | | 3,518 | | | — |
Due to Advisor | | | 75 | | | 659 | | | 1,084 | | | 99 |
Futures Margin Variation | | | 851 | | | — | | | — | | | — |
Accrued Expenses and Other Liabilities | | | 233 | | | 370 | | | 365 | | | 82 |
| | | | | | | | | | | | |
Total Liabilities | | | 273,115 | | | 541,030 | | | 1,075,966 | | | 173,216 |
| | | | | | | | | | | | |
NET ASSETS | | $ | 3,505,451 | | $ | 7,508,400 | | $ | 6,191,964 | | $ | 1,183,036 |
| | | | | | | | | | | | |
Investments at Cost | | $ | 3,246,163 | | $ | 6,319,801 | | $ | 4,760,222 | | $ | 1,387,190 |
| | | | | | | | | | | | |
Foreign Currencies at Cost | | $ | — | | $ | — | | $ | 19,163 | | $ | 113 |
| | | | | | | | | | | | |
See accompanying Notes to Financial Statements.
317
THE DFA INVESTMENT TRUST COMPANY
STATEMENTS OF ASSETS AND LIABILITIES
OCTOBER 31, 2009
(Amounts in thousands)
| | | | | | | | | | | | | |
| | | The | | The United | | The | | | The |
| | | Asia Pacific | | Kingdom | | Continental | | | Canadian |
| | | Small | | Small | | Small | | | Small |
| | | Company | | Company | | Company | | | Company |
| | | Series | | Series | | Series | | | Series |
ASSETS: | | | | | | | | | | | | | |
Investments at Value (including $123,079, $23,377, $189,629 and $64,936 of securities on loan, respectively) | | $ | 677,190 | | $ | 766,179 | | $ | 1,626,509 | | | $ | 363,148 |
Temporary Cash Investments at Value & Cost | | | 490 | | | 2,191 | | | 2,888 | | | | 896 |
Collateral Received from Securities on Loan at Value & Cost | | | 138,109 | | | 24,989 | | | 205,035 | | | | 68,529 |
Foreign Currencies at Value | | | 3,065 | | | 3,035 | | | 60 | | | | 2,668 |
Cash | | | 15 | | | 15 | | | 16 | | | | 15 |
Receivables: | | | | | | | | | | | | | |
Investment Securities Sold | | | 4,364 | | | 1,326 | | | 1,220 | | | | — |
Dividends, Interest and Tax Reclaims | | | 898 | | | 1,791 | | | 1,590 | | | | 116 |
Securities Lending Income | | | 176 | | | 17 | | | 199 | | | | 73 |
Fund Shares Sold | | | — | | | — | | | 2 | | | | — |
| | | | | | | | | | | | | |
Total Assets | | | 824,307 | | | 799,543 | | | 1,837,519 | | | | 435,445 |
| | | | | | | | | | | | | |
LIABILITIES: | | | | | | | | | | | | | |
Payables: | | | | | | | | | | | | | |
Upon Return of Securities Loaned | | | 138,109 | | | 24,989 | | | 205,035 | | | | 68,529 |
Investment Securities Purchased | | | 4,568 | | | 3,978 | | | 1,339 | | | | 1,682 |
Fund Shares Redeemed | | | 530 | | | — | | | — | | | | — |
Due to Advisor | | | 58 | | | 65 | | | 141 | | | | 31 |
Unrealized Loss on Foreign Currency Contracts | | | — | | | — | | | 6 | | | | — |
Accrued Expenses and Other Liabilities | | | 45 | | | 39 | | | 106 | | | | 22 |
| | | | | | | | | | | | | |
Total Liabilities | | | 143,310 | | | 29,071 | | | 206,627 | | | | 70,264 |
| | | | | | | | | | | | | |
NET ASSETS | | $ | 680,997 | | $ | 770,472 | | $ | 1,630,892 | | | $ | 365,181 |
| | | | | | | | | | | | | |
Investments at Cost | | $ | 609,505 | | $ | 823,827 | | $ | 1,459,189 | | | $ | 489,028 |
| | | | | | | | | | | | | |
Foreign Currencies at Cost | | $ | 3,072 | | $ | 3,020 | | $ | (142 | ) | | $ | 2,722 |
| | | | | | | | | | | | | |
See accompanying Notes to Financial Statements.
318
THE DFA INVESTMENT TRUST COMPANY
STATEMENTS OF ASSETS AND LIABILITIES
OCTOBER 31, 2009
(Amounts in thousands)
| | | | | | |
| | | The | | The Emerging |
| | | Emerging | | Markets |
| | | Markets | | Small Cap |
| | | Series | | Series |
ASSETS: | | | | | | |
Investments at Value (including $213,269 and $82,334 of securities on loan, respectively) | | $ | 2,099,290 | | $ | 1,165,839 |
Temporary Cash Investments at Value & Cost | | | 317 | | | 1,433 |
Collateral Received from Securities on Loan at Value & Cost | | | 232,965 | | | 94,393 |
Foreign Currencies at Value | | | 1,950 | | | 701 |
Cash | | | 21 | | | 81 |
Receivables: | | | | | | |
Investment Securities Sold | | | 6,815 | | | 1,164 |
Dividends, Interest and Tax Reclaims | | | 3,192 | | | 1,017 |
Securities Lending Income | | | 185 | | | 175 |
Fund Shares Sold | | | 188 | | | 1,018 |
Unrealized Gain on Foreign Currency Contracts | | | 6 | | | — |
| | | | | | |
Total Assets | | | 2,344,929 | | | 1,265,821 |
| | | | | | |
LIABILITIES: | | | | | | |
Payables: | | | | | | |
Upon Return of Securities Loaned | | | 232,965 | | | 94,393 |
Investment Securities Purchased | | | — | | | 553 |
Fund Shares Redeemed | | | 67 | | | 1,588 |
Due to Advisor | | | 184 | | | 201 |
Deferred Thailand Capital Gains Tax | | | 2,154 | | | 951 |
Accrued Expenses and Other Liabilities | | | 243 | | | 162 |
| | | | | | |
Total Liabilities | | | 235,613 | | | 97,848 |
| | | | | | |
NET ASSETS | | $ | 2,109,316 | | $ | 1,167,973 |
| | | | | | |
Investments at Cost | | $ | 1,064,309 | | $ | 872,486 |
| | | | | | |
Foreign Currencies at Cost | | $ | 1,958 | | $ | 701 |
| | | | | | |
See accompanying Notes to Financial Statements.
319
THE DFA INVESTMENT TRUST COMPANY
STATEMENTS OF OPERATIONS
FOR THE YEAR ENDED OCTOBER 31, 2009
(AMOUNTS IN THOUSANDS)
| | | | | | | | | | | | | | | | |
| | | The U.S. | | | The U.S. | | | The DFA | | | The Japanese | |
| | | Large | | | Large | | | International | | | Small | |
| | | Company | | | Cap Value | | | Value | | | Company | |
| | | Series | | | Series | | | Series | | | Series | |
Investment Income | | | | | | | | | | | | | | | | |
Dividends (Net of Foreign Taxes Withheld of $2, $20, $14,384 and $1,431, respectively) | | $ | 76,385 | | | $ | 150,233 | | | $ | 160,091 | | | $ | 19,179 | |
Interest | | | 131 | | | | 170 | | | | 197 | | | | 16 | |
Income from Securities Lending | | | 3,715 | | | | 13,048 | | | | 13,032 | | | | 6,156 | |
| | | | | | | | | | | | | | | | |
Total Investment Income | | | 80,231 | | | | 163,451 | | | | 173,320 | | | | 25,351 | |
| | | | | | | | | | | | | | | | |
Expenses | | | | | | | | | | | | | | | | |
Investment Advisory Services Fees | | | 762 | | | | 6,414 | | | | 9,991 | | | | 1,101 | |
Accounting & Transfer Agent Fees | | | 341 | | | | 695 | | | | 549 | | | | 141 | |
S&P 500® Fees | | | 90 | | | | — | | | | — | | | | — | |
Custodian Fees | | | 47 | | | | 73 | | | | 688 | | | | 190 | |
Shareholders’ Reports | | | 32 | | | | 66 | | | | 49 | | | | 12 | |
Directors’/Trustees’ Fees & Expenses | | | 59 | | | | 120 | | | | 78 | | | | 25 | |
Audit Fees | | | 63 | | | | 137 | | | | 111 | | | | 23 | |
Legal Fees | | | 75 | | | | 164 | | | | 110 | | | | 25 | |
Other | | | 359 | | | | 702 | | | | 574 | | | | 149 | |
| | | | | | | | | | | | | | | | |
Total Expenses | | | 1,828 | | | | 8,371 | | | | 12,150 | | | | 1,666 | |
| | | | | | | | | | | | | | | | |
Net Investment Income (Loss) | | | 78,403 | | | | 155,080 | | | | 161,170 | | | | 23,685 | |
| | | | | | | | | | | | | | | | |
Realized and Unrealized Gain (Loss) | | | | | | | | | | | | | | | | |
Net Realized Gain (Loss) on: | | | | | | | | | | | | | | | | |
Investment Securities Sold | | | (215,329 | ) | | | (122,113 | ) | | | 63,984 | | | | (27,421 | ) |
Futures | | | 20,268 | | | | 7,204 | | | | (1,125 | ) | | | 1,131 | |
Foreign Currency Transactions | | | — | | | | — | | | | 3,828 | | | | 2,027 | |
Change in Unrealized Appreciation (Depreciation) of: | | | | | | | | | | | | | | | | |
Investment Securities and Foreign Currency | | | 427,495 | | | | 1,161,370 | | | | 1,395,836 | | | | 227,157 | |
Futures | | | (2,236 | ) | | | (29 | ) | | | — | | | | — | |
Translation of Foreign Currency Denominated Amounts | | | — | | | | — | | | | 240 | | | | (641 | ) |
| | | | | | | | | | | | | | | | |
Net Realized and Unrealized Gain (Loss) | | | 230,198 | | | | 1,046,432 | | | | 1,462,763 | | | | 202,253 | |
| | | | | | | | | | | | | | | | |
Net Increase (Decrease) in Net Assets Resulting from Operations | | $ | 308,601 | | | $ | 1,201,512 | | | $ | 1,623,933 | | | $ | 225,938 | |
| | | | | | | | | | | | | | | | |
See accompanying Notes to Financial Statements.
320
THE DFA INVESTMENT TRUST COMPANY
STATEMENTS OF OPERATIONS
FOR THE YEAR ENDED OCTOBER 31, 2009
(AMOUNTS IN THOUSANDS)
| | | | | | | | | | | | | | | | |
| | | The Asia
Pacific
Small
Company
Series | | | The United
Kingdom
Small
Company
Series | | | The
Continental
Small
Company
Series | | | The Canadian
Small
Company
Series | |
Investment Income | | | | | | | | | | | | | | | | |
Dividends (Net of Foreign Taxes Withheld of $392, $2, $5,010 and $528, respectively) | | $ | 18,390 | | | $ | 23,954 | | | $ | 32,817 | | | $ | 3,021 | |
Interest | | | 17 | | | | 13 | | | | 66 | | | | 5 | |
Income from Securities Lending | | | 2,043 | | | | 395 | | | | 5,130 | | | | 821 | |
| | | | | | | | | | | | | | | | |
Total Investment Income | | | 20,450 | | | | 24,362 | | | | 38,013 | | | | 3,847 | |
| | | | | | | | | | | | | | | | |
Expenses | | | | | | | | | | | | | | | | |
Investment Advisory Services Fees | | | 488 | | | | 585 | | | | 1,230 | | | | 251 | |
Accounting & Transfer Agent Fees | | | 76 | | | | 86 | | | | 154 | | | | 51 | |
Custodian Fees | | | 245 | | | | 50 | | | | 310 | | | | 65 | |
Shareholders’ Reports | | | 4 | | | | 6 | | | | 12 | | | | 3 | |
Directors’/Trustees’ Fees & Expenses | | | 5 | | | | 8 | | | | 18 | | | | 4 | |
Professional Fees | | | 19 | | | | 22 | | | | 48 | | | | 10 | |
Other | | | 66 | | | | 72 | | | | 150 | | | | 31 | |
| | | | | | | | | | | | | | | | |
Total Expenses | | | 903 | | | | 829 | | | | 1,922 | | | | 415 | |
| | | | | | | | | | | | | | | | |
Net Investment Income (Loss) | | | 19,547 | | | | 23,533 | | | | 36,091 | | | | 3,432 | |
| | | | | | | | | | | | | | | | |
Realized and Unrealized Gain (Loss) | | | | | | | | | | | | | | | | |
Net Realized Gain (Loss) on: | | | | | | | | | | | | | | | | |
Investment Securities Sold | | | (32,245 | ) | | | (34,448 | ) | | | (13,321 | ) | | | (38,817 | ) |
Futures | | | (432 | ) | | | 534 | | | | (476 | ) | | | (322 | ) |
Foreign Currency Transactions | | | 146 | | | | (50 | ) | | | (549 | ) | | | (182 | ) |
Change in Unrealized Appreciation (Depreciation) of: | | | | | | | | | | | | | | | | |
Investment Securities and Foreign Currency | | | 330,580 | | | | 234,459 | | | | 468,759 | | | | 159,928 | |
Futures | | | (3 | ) | | | (1 | ) | | | (9 | ) | | | — | |
Translation of Foreign Currency Denominated Amounts | | | 209 | | | | (199 | ) | | | 305 | | | | 19 | |
| | | | | | | | | | | | | | | | |
Net Realized and Unrealized Gain (Loss) | | | 298,255 | | | | 200,295 | | | | 454,709 | | | | 120,626 | |
| | | | | | | | | | | | | | | | |
Net Increase (Decrease) in Net Assets Resulting from Operations | | $ | 317,802 | | | $ | 223,828 | | | $ | 490,800 | | | $ | 124,058 | |
| | | | | | | | | | | | | | | | |
See accompanying Notes to Financial Statements.
321
THE DFA INVESTMENT TRUST COMPANY
STATEMENTS OF OPERATIONS
FOR THE YEAR ENDED OCTOBER 31, 2009
(AMOUNTS IN THOUSANDS)
| | | | | | | | |
| | | The
Emerging
Markets
Series | | | The
Emerging
Markets
Small Cap
Series | |
Investment Income | | | | | | | | |
Dividends (Net of Foreign Taxes Withheld of $4,972 and $1,870, respectively) | | $ | 43,658 | | | $ | 20,584 | |
Interest | | | 73 | | | | 22 | |
Income from Securities Lending | | | 3,350 | | | | 2,196 | |
| | | | | | | | |
Total Investment Income | | | 47,081 | | | | 22,802 | |
| | | | | | | | |
Expenses | | | | | | | | |
Investment Advisory Services Fees | | | 1,697 | | | | 1,597 | |
Accounting & Transfer Agent Fees | | | 203 | | | | 108 | |
Custodian Fees | | | 1,105 | | | | 747 | |
Shareholders’ Reports | | | 17 | | | | 7 | |
Directors’/Trustees’ Fees & Expenses | | | 22 | | | | 12 | |
Professional Fees | | | 127 | | | | 83 | |
Other | | | 210 | | | | 104 | |
| | | | | | | | |
Total Expenses | | | 3,381 | | | | 2,658 | |
| | | | | | | | |
Net Investment Income (Loss) | | | 43,700 | | | | 20,144 | |
| | | | | | | | |
Realized and Unrealized Gain (Loss) | | | | | | | | |
Net Realized Gain (Loss) on: | | | | | | | | |
Investment Securities Sold | | | 40,421 | | | | (13,070 | ) |
Futures | | | (2,920 | ) | | | (181 | ) |
Foreign Currency Transactions | | | (24 | ) | | | (182 | ) |
In-Kind Redemptions | | | 17,805 | * | | | — | |
Change in Unrealized Appreciation (Depreciation) of: | | | | | | | | |
Investment Securities and Foreign Currency | | | 642,058 | | | | 535,144 | |
Futures | | | (32 | ) | | | (10 | ) |
Translation of Foreign Currency Denominated Amounts | | | 210 | | | | 185 | |
Change in Deferred Thailand Capital Gains Tax | | | (1,366 | ) | | | (786 | ) |
| | | | | | | | |
Net Realized and Unrealized Gain (Loss) | | | 696,152 | | | | 521,100 | |
| | | | | | | | |
Net Increase (Decrease) in Net Assets Resulting from Operations | | $ | 739,852 | | | $ | 541,244 | |
| | | | | | | | |
| * | See Note K in the Notes to Financial Statements. |
See accompanying Notes to Financial Statements.
322
THE DFA INVESTMENT TRUST COMPANY
STATEMENTS OF CHANGES IN NET ASSETS
(Amounts in thousands)
| | | | | | | | | | | | | | | | | | | | | | | | | | | | |
| | | The U.S.
Large Company
Series | | | | | | | The U.S.
Large Cap Value
Series | |
| | | Year
Ended
Oct. 31,
2009 | | | Period
Dec. 1,
2007 to
Oct. 31,
2008 | | | Year
Ended
Nov. 30,
2007 | | | | | | | Year
Ended
Oct. 31,
2009 | | | Period
Dec. 1,
2007 to
Oct. 31,
2008 | | | Year
Ended
Nov. 30,
2007 | |
Increase (Decrease) in Net Assets | | | | | | | | | | | | | | | | | | | | | | | | | | | | |
Operations: | | | | | | | | | | | | | | | | | | | | | | | | | | | | |
Net Investment Income (Loss) | | $ | 78,403 | | | $ | 84,705 $ | | | | 94,262 | | | | | | | $ | 155,080 | | | $ | 166,016 | | | $ | 146,991 | |
Net Realized Gain (Loss) on: | | | | | | | | | | | | | | | | | | | | | | | | | | | | |
Investment Securities Sold | | | (215,329 | ) | | | (126,174 | ) | | | 10,206 | | | | | | | | (122,113 | ) | | | (422,637 | ) | | | (118,412 | ) |
Futures | | | 20,268 | | | | (22,232 | ) | | | 3,585 | | | | | | | | 7,204 | | | | (1,861 | ) | | | — | |
In-Kind Redemptions | | | — | | | | 24,362 | * | | | 529,199 | * | | | | | | | — | | | | 52,271 | * | | | — | |
Change in Unrealized Appreciation (Depreciation) of: | | | | | | | | | | | | | | | | | | | | | | | | | | | | |
Investment Securities and Foreign Currency | | | 427,495 | | | | (1,591,847 | ) | | | (217,829 | ) | | | | | | | 1,161,370 | | | | (3,601,292 | ) | | | (150,559 | ) |
Futures | | | (2,236 | ) | | | 1,195 | | | | (216 | ) | | | | | | | (29 | ) | | | 29 | | | | — | |
| | | | | | | | | | | | | | | | | | | | | | | | | | | | |
Net Increase (Decrease) in Net Assets Resulting from Operations | | | 308,601 | | | | (1,629,991 | ) | | | 419,207 | | | | | | | | 1,201,512 | | | | (3,807,474 | ) | | | (121,980 | ) |
| | | | | | | | | | | | | | | | | | | | | | | | | | | | |
Transactions in Interest: | | | | | | | | | | | | | | | | | | | | | | | | | | | | |
Contributions | | | 363,357 | | | | 696,520 | | | | 616,294 | | | | | | | | 734,173 | | | | 1,370,762 | † | | | 1,783,358 | † |
Withdrawals | | | (440,159 | ) | | | (299,226 | )* | | | (1,482,132 | )* | | | | | | | (1,166,648 | ) | | | (983,247 | )*† | | | (368,362 | )† |
| | | | | | | | | | | | | | | | | | | | | | | | | | | | |
Net Increase (Decrease) from Transactions in Interest | | | (76,802 | ) | | | 397,294 | | | | (865,838 | ) | | | | | | | (432,475 | ) | | | 387,515 | | | | 1,414,996 | |
| | | | | | | | | | | | | | | | | | | | | | | | | | | | |
Total Increase (Decrease) in Net Assets | | | 231,799 | | | | (1,232,697 | ) | | | (446,631 | ) | | | | | | | 769,037 | | | | (3,419,959 | ) | | | 1,293,016 | |
Net Assets | | | | | | | | | | | | | | | | | | | | | | | | | | | | |
Beginning of Period | | | 3,273,652 | | | | 4,506,349 | | | | 4,952,980 | | | | | | | | 6,739,363 | | | | 10,159,322 | | | | 8,866,306 | |
| | | | | | | | | | | | | | | | | | | | | | | | | | | | |
End of Period | | $ | 3,505,451 | | | $ | 3,273,652 | | | $ | 4,506,349 | | | | | | | $ | 7,508,400 | | | $ | 6,739,363 | | | $ | 10,159,322 | |
| | | | | | | | | | | | | | | | | | | | | | | | | | | | |
| * | See Note K in the Notes to Financial Statements. |
| † | See Note A in the Notes to Financial Statements. |
See accompanying Notes to Financial Statements.
323
THE DFA INVESTMENT TRUST COMPANY
STATEMENTS OF CHANGES IN NET ASSETS
(Amounts in thousands)
| | | | | | | | | | | | | | | | | | | | | | | | | | | | |
| | | The DFA
International Value
Series | | | | | | | The Japanese
Small Company
Series | |
| | | Year
Ended
Oct. 31,
2009 | | | Period
Dec. 1,
2007 to
Oct. 31,
2008 | | | Year
Ended
Nov. 30,
2007 | | | | | | | Year
Ended
Oct. 31,
2009 | | | Period
Dec. 1,
2007 to
Oct. 31,
2008 | | | Year
Ended
Nov. 30,
2007 | |
Increase (Decrease) in Net Assets | | | | | | | | | | | | | | | | | | | | | | | | | | | | |
Operations: | | | | | | | | | | | | | | | | | | | | | | | | | | | | |
Net Investment Income (Loss) | | $ | 161,170 | | | $ | 304,387 | | | $ | 274,613 | | | | | | | $ | 23,685 | | | $ | 32,246 | | | $ | 29,640 | |
Net Realized Gain (Loss) on: | | | | | | | | | | | | | | | | | | | | | | | | | | | | |
Investment Securities Sold | | | 63,984 | | | | 137,811 | | | | 654,522 | | | | | | | | (27,421 | ) | | | (68,518 | ) | | | 51,317 | |
Futures | | | (1,125 | ) | | | (1,153 | ) | | | — | | | | | | | | 1,131 | | | | (16 | ) | | | — | |
Foreign Currency Transactions | | | 3,828 | | | | (4,593 | ) | | | 2,498 | | | | | | | | 2,027 | | | | (321 | ) | | | (227 | ) |
In-Kind Redemptions | | | — | | | | 103,024 | * | | | — | | | | | | | | — | | | | 1,625 | * | | | — | |
Change in Unrealized Appreciation (Depreciation) of: | | | | | | | | | | | | | | | | | | | | | | | | | | | | |
Investment Securities and Foreign Currency | | | 1,395,836 | | | | (5,026,911 | ) | | | 403,307 | | | | | | | | 227,157 | | | | (374,750 | ) | | | (103,081 | ) |
Futures | | | — | | | | 19 | | | | — | | | | | | | | — | | | | — | | | | — | |
Translation of Foreign Currency Denominated Amounts | | | 240 | | | | (76 | ) | | | (180 | ) | | | | | | | (641 | ) | | | 495 | | | | 144 | |
| | | | | | | | | | | | | | | | | | | | | | | | | | | | |
Net Increase (Decrease) in Net Assets Resulting from Operations | | | 1,623,933 | | | | (4,487,492 | ) | | | 1,334,760 | | | | | | | | 225,938 | | | | (409,239 | ) | | | (22,207 | ) |
| | | | | | | | | | | | | | | | | | | | | | | | | | | | |
Transactions in Interest: | | | | | | | | | | | | | | | | | | | | | | | | | | | | |
Contributions | | | 449,410 | | | | 927,878 | † | | | 1,731,698 | † | | | | | | | 37,597 | | | | 64,727 | | | | 227,009 | |
Withdrawals | | | (581,716 | ) | | | (1,378,770 | )*† | | | (884,989 | )† | | | | | | | (143,463 | ) | | | (97,345 | )* | | | (85,703 | ) |
| | | | | | | | | | | | | | | | | | | | | | | | | | | | |
Net Increase (Decrease) from Transactions in Interest | | | (132,306 | ) | | | (450,892 | ) | | | 846,709 | | | | | | | | (105,866 | ) | | | (32,618 | ) | | | 141,306 | |
| | | | | | | | | | | | | | | | | | | | | | | | | | | | |
Total Increase (Decrease) in Net Assets | | | 1,491,627 | | | | (4,938,384 | ) | | | 2,181,469 | | | | | | | | 120,072 | | | | (441,857 | ) | | | 119,099 | |
Net Assets | | | | | | | | | | | | | | | | | | | | | | | | | | | | |
Beginning of Period | | | 4,700,337 | | | | 9,638,721 | | | | 7,457,252 | | | | | | | | 1,062,964 | | | | 1,504,821 | | | | 1,385,722 | |
| | | | | | | | | | | | | | | | | | | | | | | | | | | | |
End of Period | | $ | 6,191,964 | | | $ | 4,700,337 | | | $ | 9,638,721 | | | | | | | $ | 1,183,036 | | | $ | 1,062,964 | | | $ | 1,504,821 | |
| | | | | | | | | | | | | | | | | | | | | | | | | | | | |
| * | See Note K in the Notes to Financial Statements. |
| † | See Note A in the Notes to Financial Statements. |
See accompanying Notes to Financial Statements.
324
THE DFA INVESTMENT TRUST COMPANY
STATEMENTS OF CHANGES IN NET ASSETS
(Amounts in thousands)
| | | | | | | | | | | | | | | | | | | | | | | | | | | | |
| | | The Asia Pacific
Small Company
Series | | | | | | | The United Kingdom
Small Company
Series | |
| | | Year
Ended
Oct. 31,
2009 | | | Period
Dec. 1,
2007 to
Oct. 31,
2008 | | | Year
Ended
Nov. 30,
2007 | | | | | | | Year
Ended
Oct. 31,
2009 | | | Period
Dec. 1,
2007 to
Oct. 31,
2008 | | | Year
Ended
Nov. 30,
2007 | |
Increase (Decrease) in Net Assets | | | | | | | | | | | | | | | | | | | | | | | | | | | | |
Operations: | | | | | | | | | | | | | | | | | | | | | | | | | | | | |
Net Investment Income (Loss) | | $ | 19,547 | | | $ | 37,740 | | | $ | 36,380 | | | | | | | $ | 23,533 | | | $ | 34,127 | | | $ | 33,556 | |
Net Realized Gain (Loss) on: | | | | | | | | | | | | | | | | | | | | | | | | | | | | |
Investment Securities Sold | | | (32,245 | ) | | | (38,746 | ) | | | 111,215 | | | | | | | | (34,448 | ) | | | 10,543 | | | | 42,995 | |
Futures | | | (432 | ) | | | (283 | ) | | | — | | | | | | | | 534 | | | | — | | | | — | |
Foreign Currency Transactions | | | 146 | | | | (1,429 | ) | | | 874 | | | | | | | | (50 | ) | | | (1,788 | ) | | | 397 | |
In-Kind Redemptions | | | — | | | | 4,018 | * | | | — | | | | | | | | — | | | | 6,873 | * | | | — | |
Change in Unrealized Appreciation (Depreciation) of: | | | | | | | | | | | | | | | | | | | | | | | | | | | | |
Investment Securities and Foreign Currency | | | 330,580 | | | | (649,251 | ) | | | 232,165 | | | | | | | | 234,459 | | | | (643,213 | ) | | | (51,516 | ) |
Futures | | | (3 | ) | | | 3 | | | | — | | | | | | | | (1 | ) | | | 1 | | | | — | |
Translation of Foreign Currency Denominated Amounts | | | 209 | | | | (121 | ) | | | (25 | ) | | | | | | | (199 | ) | | | 222 | | | | (10 | ) |
| | | | | | | | | | | | | | | | | | | | | | | | | | | | |
Net Increase (Decrease) in Net Assets Resulting from Operations | | | 317,802 | | | | (648,069 | ) | | | 380,609 | | | | | | | | 223,828 | | | | (593,235 | ) | | | 25,422 | |
| | | | | | | | | | | | | | | | | | | | | | | | | | | | |
Transactions in Interest: | | | | | | | | | | | | | | | | | | | | | | | | | | | | |
Contributions | | | 21,607 | | | | 50,371 | | | | 123,444 | | | | | | | | 26,861 | | | | 52,563 | | | | 36,898 | |
Withdrawals | | | (99,649 | ) | | | (166,219 | )* | | | (48,526 | ) | | | | | | | (35,607 | ) | | | (62,518 | )* | | | (21,566 | ) |
| | | | | | | | | | | | | | | | | | | | | | | | | | | | |
Net Increase (Decrease) from Transactions in Interest | | | (78,042 | ) | | | (115,848 | ) | | | 74,918 | | | | | | | | (8,746 | ) | | | (9,955 | ) | | | 15,332 | |
| | | | | | | | | | | | | | | | | | | | | | | | | | | | |
Total Increase (Decrease) in Net Assets | | | 239,760 | | | | (763,917 | ) | | | 455,527 | | | | | | | | 215,082 | | | | (603,190 | ) | | | 40,754 | |
Net Assets | | | | | | | | | | | | | | | | | | | | | | | | | | | | |
Beginning of Period | | | 441,237 | | | | 1,205,154 | | | | 749,627 | | | | | | | | 555,390 | | | | 1,158,580 | | | | 1,117,826 | |
| | | | | | | | | | | | | | | | | | | | | | | | | | | | |
End of Period | | $ | 680,997 | | | $ | 441,237 | | | $ | 1,205,154 | | | | | | | $ | 770,472 | | | $ | 555,390 | | | $ | 1,158,580 | |
| | | | | | | | | | | | | | | | | | | | | | | | | | | | |
| * | See Note K in the Notes to Financial Statements. |
See accompanying Notes to Financial Statements.
325
THE DFA INVESTMENT TRUST COMPANY
STATEMENTS OF CHANGES IN NET ASSETS
(Amounts in thousands)
| | | | | | | | | | | | | | | | | | | | | | | | | | | | |
| | | The Continental
Small Company
Series | | | | | | | The Canadian
Small Company
Series | |
| | | Year
Ended
Oct. 31,
2009 | | | Period
Dec. 1,
2007 to
Oct. 31,
2008 | | | Year
Ended
Nov. 30,
2007 | | | | | | | Year
Ended
Oct. 31,
2009 | | | Period
Dec. 1,
2007 to
Oct. 31,
2008 | | | Period
April 2,
2007(a) to
Nov. 30,
2007 | |
Increase (Decrease) in Net Assets | | | | | | | | | | | | | | | | | | | | | | | | | | | | |
Operations: | | | | | | | | | | | | | | | | | | | | | | | | | | | | |
Net Investment Income (Loss) | | $ | 36,091 | | | $ | 63,045 | | | $ | 48,296 | | | | | | | $ | 3,432 | | | $ | 3,212 | | | $ | 383 | |
Net Realized Gain (Loss) on: | | | | | | | | | | | | | | | | | | | | | | | | | | | | |
Investment Securities Sold | | | (13,321 | ) | | | (48,434 | ) | | | 151,648 | | | | | | | | (38,817 | ) | | | (20,515 | ) | | | 1,663 | |
Futures | | | (476 | ) | | | (358 | ) | | | — | | | | | | | | (322 | ) | | | — | | | | — | |
Foreign Currency Transactions | | | (549 | ) | | | (76 | ) | | | 559 | | | | | | | | (182 | ) | | | (433 | ) | | | (413 | ) |
In-Kind Redemptions | | | — | | | | 16,564 | * | | | — | | | | | | | | — | | | | (2,616 | )* | | | — | |
Change in Unrealized Appreciation (Depreciation) of: | | | | | | | | | | | | | | | | | | | | | | | | | | | | |
Investment Securities and Foreign Currency | | | 468,759 | | | | (1,158,591 | ) | | | 126,217 | | | | | | | | 159,928 | | | | (279,292 | ) | | | (6,570 | ) |
Futures | | | (9 | ) | | | 9 | | | | — | | | | | | | | — | | | | — | | | | — | |
Translation of Foreign Currency Denominated Amounts | | | 305 | | | | (386 | ) | | | 83 | | | | | | | | 19 | | | | (6 | ) | | | (2 | ) |
| | | | | | | | | | | | | | | | | | | | | | | | | | | | |
Net Increase (Decrease) in Net Assets Resulting from Operations | | | 490,800 | | | | (1,128,227 | ) | | | 326,803 | | | | | | | | 124,058 | | | | (299,650 | ) | | | (4,939 | ) |
| | | | | | | | | | | | | | | | | | | | | | | | | | | | |
Transactions in Interest: | | | | | | | | | | | | | | | | | | | | | | | | | | | | |
Contributions | | | 118,904 | | | | 131,960 | | | | 103,548 | | | | | | | | 37,000 | | | | 341,843 | | | | 222,468 | |
Withdrawals | | | (90,397 | ) | | | (148,270 | )* | | | (49,423 | ) | | | | | | | (28,750 | ) | | | (22,849 | )* | | | (4,000 | ) |
| | | | | | | | | | | | | | | | | | | | | | | | | | | | |
Net Increase (Decrease) from Transactions in Interest | | | 28,507 | | | | (16,310 | ) | | | 54,125 | | | | | | | | 8,250 | | | | 318,994 | | | | 218,468 | |
| | | | | | | | | | | | | | | | | | | | | | | | | | | | |
Total Increase (Decrease) in Net Assets | | | 519,307 | | | | (1,144,537 | ) | | | 380,928 | | | | | | | | 132,308 | | | | 19,344 | | | | 213,529 | |
Net Assets | | | | | | | | | | | | | | | | | | | | | | | | | | | | |
Beginning of Period | | | 1,111,585 | | | | 2,256,122 | | | | 1,875,194 | | | | | | | | 232,873 | | | | 213,529 | | | | — | |
| | | | | | | | | | | | | | | | | | | | | | | | | | | | |
End of Period | | $ | 1,630,892 | | | $ | 1,111,585 | | | $ | 2,256,122 | | | | | | | $ | 365,181 | | | $ | 232,873 | | | $ | 213,529 | |
| | | | | | | | | | | | | | | | | | | | | | | | | | | | |
See page 1 & 2 for the Definitions of Abbreviations and Footnotes.
| * | See Note K in the Notes to Financial Statements. |
See accompanying Notes to Financial Statements.
326
THE DFA INVESTMENT TRUST COMPANY
STATEMENTS OF CHANGES IN NET ASSETS
(Amounts in thousands)
| | | | | | | | | | | | | | | | | | | | | | | | | | | | |
| | | The Emerging
Markets Series | | | | | | | The Emerging
Markets Small Cap
Series | |
| | | Year
Ended
Oct. 31,
2009 | | | Period
Dec. 1,
2007 to
Oct. 31,
2008 | | | Year
Ended
Nov. 30,
2007 | | | | | | | Year
Ended
Oct. 31,
2009 | | | Period
Dec. 1,
2007 to
Oct. 31,
2008 | | | Year
Ended
Nov. 30,
2007 | |
Increase (Decrease) in Net Assets | | | | | | | | | | | | | | | | | | | | | | | | | | | | |
Operations: | | | | | | | | | | | | | | | | | | | | | | | | | | | | |
Net Investment Income (Loss) | | $ | 43,700 | | | $ | 82,436 | | | $ | 76,347 | | | | | | | $ | 20,144 | | | $ | 33,406 | | | $ | 23,921 | |
Net Realized Gain (Loss) on: | | | | | | | | | | | | | | | | | | | | | | | | | | | | |
Investment Securities Sold | | | 40,421 | | | | (59,927 | ) | | | 143,019 | | | | | | | | (13,070 | ) | | | (9,181 | ) | | | 107,316 | |
Futures | | | (2,920 | ) | | | (361 | ) | | | — | | | | | | | | (181 | ) | | | (439 | ) | | | — | |
Foreign Currency Transactions | | | (24 | ) | | | (1,036 | ) | | | (111 | ) | | | | | | | (182 | ) | | | (1,324 | ) | | | (336 | ) |
In-Kind Redemptions | | | 17,805 | * | | | — | | | | — | | | | | | | | — | | | | — | | | | — | |
Change in Unrealized Appreciation (Depreciation) of: | | | | | | | | | | | | | | | | | | | | | | | | | | | | |
Investment Securities and Foreign Currency | | | 642,058 | | | | (1,612,126 | ) | | | 859,017 | | | | | | | | 535,144 | | | | (796,299 | ) | | | 279,364 | |
Futures | | | (32 | ) | | | 32 | | | | — | | | | | | | | (10 | ) | | | 10 | | | | — | |
Translation of Foreign Currency Denominated Amounts | | | 210 | | | | (139 | ) | | | (27 | ) | | | | | | | 185 | | | | (182 | ) | | | 76 | |
Change in Deferred Thailand Capital Gains Tax | | | (1,366 | ) | | | 2,797 | | | | (884 | ) | | | | | | | (786 | ) | | | 1,377 | | | | (450 | ) |
| | | | | | | | | | | | | | | | | | | | | | | | | | | | |
Net Increase (Decrease) in Net Assets Resulting from Operations | | | 739,852 | | | | (1,588,324 | ) | | | 1,077,361 | | | | | | | | 541,244 | | | | (772,632 | ) | | | 409,891 | |
| | | | | | | | | | | | | | | | | | | | | | | | | | | | |
Transactions in Interest: | | | | | | | | | | | | | | | | | | | | | | | | | | | | |
Contributions | | | 162,102 | | | | 197,789 | | | | 481,891 | | | | | | | | 168,060 | | | | 137,703 | | | | 360,040 | |
Withdrawals | | | (417,162 | )* | | | (692,731 | ) | | | (266,433 | ) | | | | | | | (107,710 | ) | | | (324,263 | ) | | | (147,889 | ) |
| | | | | | | | | | | | | | | | | | | | | | | | | | | | |
Net Increase (Decrease) from Transactions in Interest | | | (255,060 | ) | | | (494,942 | ) | | | 215,458 | | | | | | | | 60,350 | | | | (186,560 | ) | | | 212,151 | |
| | | | | | | | | | | | | | | | | | | | | | | | | | | | |
Total Increase (Decrease) in Net Assets | | | 484,792 | | | | (2,083,266 | ) | | | 1,292,819 | | | | | | | | 601,594 | | | | (959,192 | ) | | | 622,042 | |
Net Assets | | | | | | | | | | | | | | | | | | | | | | | | | | | | |
Beginning of Period | | | 1,624,524 | | | | 3,707,790 | | | | 2,414,971 | | | | | | | | 566,379 | | | | 1,525,571 | | | | 903,529 | |
| | | | | | | | | | | | | | | | | | | | | | | | | | | | |
End of Period | | $ | 2,109,316 | | | $ | 1,624,524 | | | $ | 3,707,790 | | | | | | | $ | 1,167,973 | | | $ | 566,379 | | | $ | 1,525,571 | |
| | | | | | | | | | | | | | | | | | | | | | | | | | | | |
| * | See Note K in the Notes to Financial Statements. |
See accompanying Notes to Financial Statements.
327
THE DFA INVESTMENT TRUST COMPANY
FINANCIAL HIGHLIGHTS
| | | | | | | | | | | | | | | | | | | | | | | | |
| | | The U.S. Large Company Series | |
| | | | |
| | | Year Ended Oct. 31, 2009 | | | Period Dec. 1, 2007 to Oct. 31, 2008 | | | Year Ended Nov. 30, 2007 | | | Year Ended Nov. 30, 2006 | | | Year Ended Nov. 30, 2005 | | | Year Ended Nov. 30, 2004 | |
| | |
Total Return | | | 10.17 | % | | | (33.10 | )%(C) | | | 7.77 | % | | | 14.25 | % | | | 8.51 | % | | | 12.77 | % |
| | |
Net Assets, End of Period (thousands) | | $ | 3,505,451 | | | $ | 3,273,652 | | | | $4,506,349 | | | $ | 4,952,980 | | | $ | 4,238,712 | | | $ | 3,493,919 | |
Ratio of Expenses to Average Net Assets | | | 0.06 | % | | | 0.04 | %(B) | | | 0.04 | % | | | 0.04 | % | | | 0.05 | % | | | 0.05 | % |
Ratio of Net Investment Income to Average Net Assets | | | 2.57 | % | | | 2.16 | %(B) | | | 1.96 | % | | | 1.95 | % | | | 1.87 | % | | | 1.99 | % |
Portfolio Turnover Rate | | | 10 | % | | | 6 | %(C) | | | 13 | %* | | | 4 | % | | | 6 | % | | | 2 | % |
| | |
| |
| | | The U.S. Large Cap Value Series† | |
| | | | |
| | | Year Ended Oct. 31, 2009 | | | Period Dec. 1, 2007 to Oct. 31, 2008 | | | Year Ended Nov. 30, 2007 | | | Year Ended Nov. 30, 2006 | | | Year Ended Nov. 30, 2005 | | | Year Ended Nov. 30, 2004 | |
| | |
| | | | | | |
Total Return | | | 11.90 | % | | | (36.53 | )%(C) | | | (0.32 | )% | | | 18.16 | % | | | 14.66 | % | | | 21.68 | % |
| | |
Net Assets, End of Period (thousands) | | $ | 7,508,400 | | | $ | 6,739,363 | | | $ | 10,159,322 | | | $ | 8,866,306 | | | $ | 5,831,587 | | | $ | 3,919,913 | |
Ratio of Expenses to Average Net Assets | | | 0.13 | % | | | 0.11 | %(B) | | | 0.11 | % | | | 0.12 | % | | | 0.14 | % | | | 0.15 | % |
Ratio of Net Investment Income to Average Net Assets | | | 2.42 | % | | | 1.97 | %(B) | | | 1.44 | % | | | 1.68 | % | | | 1.56 | % | | | 1.41 | % |
Portfolio Turnover Rate | | | 29 | % | | | 19 | %(C) | | | 9 | % | | | 13 | % | | | 9 | % | | | 7 | % |
| | |
See page 1 & 2 for the Definitions of Abbreviations and Footnotes.
* Excluding security sales due to the In-Kind Redemptions the portfolio turnover rate would have been 5%. See Note K in the Notes to Financial Statements.
† See Note A in the Notes to Financial Statements.
See accompanying Notes to Financial Statements.
328
THE DFA INVESTMENT TRUST COMPANY
FINANCIAL HIGHLIGHTS
| | | | | | | | | | | | | | | | | | | | | | | | |
| | | The DFA International Value Series† | |
| | | | |
| | | Year Ended Oct. 31, 2009 | | | Period Dec. 1, 2007 to Oct. 31, 2008 | | | Year Ended Nov. 30, 2007 | | | Year Ended Nov. 30, 2006 | | | Year Ended Nov. 30, 2005 | | | Year Ended Nov. 30, 2004 | |
| | |
Total Return | | | 35.41 | % | | | (47.87 | )%(C) | | | 17.32 | % | | | 35.73 | % | | | 15.61 | % | | | 32.15 | % |
| | |
Net Assets, End of Period (thousands) | | $ | 6,191,964 | | | $ | 4,700,337 | | | $ | 9,638,721 | | | $ | 7,457,252 | | | $ | 4,367,698 | | | $ | 2,804,043 | |
Ratio of Expenses to Average Net Assets | | | 0.24 | % | | | 0.23 | %(B) | | | 0.23 | % | | | 0.23 | % | | | 0.27 | % | | | 0.28 | % |
Ratio of Net Investment Income to Average Net Assets | | | 3.22 | % | | | 4.15 | %(B) | | | 3.04 | % | | | 3.29 | % | | | 2.71 | % | | | 2.35 | % |
Portfolio Turnover Rate | | | 18 | % | | | 16 | %(C) | | | 16 | % | | | 8 | % | | | 10 | % | | | 15 | % |
| | |
| |
| | | The Japanese Small Company Series | |
| | | | |
| | | Year Ended Oct. 31, 2009 | | | Period Dec. 1, 2007 to Oct. 31, 2008 | | | Year Ended Nov. 30, 2007 | | | Year Ended Nov. 30, 2006 | | | Year Ended Nov. 30, 2005 | | | Year Ended Nov. 30, 2004 | |
| | |
Total Return | | | 22.69 | % | | | (26.87 | )%(C) | | | (1.16 | )% | | | (2.28 | )% | | | 31.03 | % | | | 32.73 | % |
| | |
Net Assets, End of Period (thousands) | | $ | 1,183,036 | | | $ | 1,062,964 | | | $ | 1,504,821 | | | $ | 1,385,722 | | | $ | 1,151,429 | | | | $605,132 | |
Ratio of Expenses to Average Net Assets | | | 0.15 | % | | | 0.13 | %(B) | | | 0.13 | % | | | 0.14 | % | | | 0.22 | % | | | 0.27 | % |
Ratio of Net Investment Income to Average Net Assets | | | 2.15 | % | | | 2.64 | %(B) | | | 1.94 | % | | | 1.68 | % | | | 1.51 | % | | | 1.45 | % |
Portfolio Turnover Rate | | | 7 | % | | | 10 | %(C) | | | 9 | % | | | 9 | % | | | 6 | % | | | 5 | % |
| | |
See page 1 & 2 for the Definitions of Abbreviations and Footnotes.
† See Note A in the Notes to Financial Statements.
See accompanying Notes to Financial Statements.
329
THE DFA INVESTMENT TRUST COMPANY
FINANCIAL HIGHLIGHTS
| | | | | | | | | | | | | | | | | | | | | | | | |
| | | The Asia Pacific Small Company Series | |
| | | | |
| | | Year Ended Oct. 31, 2009 | | | Period
Dec. 1, 2007 to Oct. 31, 2008 | | | Year Ended Nov. 30, 2007 | | | Year Ended Nov. 30, 2006 | | | Year Ended Nov. 30, 2005 | | | Year Ended Nov. 30, 2004 | |
| | |
Total Return | | | 84.98 | % | | | (57.75 | )%(C) | | | 47.23 | % | | | 38.26 | % | | | 9.30 | % | | | 27.40 | % |
| | |
Net Assets, End of Period (thousands) | | $ | 680,997 | | | $ | 441,237 | | | $ | 1,205,154 | | | | $749,627 | | | $ | 395,923 | | | $ | 282,999 | |
Ratio of Expenses to Average Net Assets | | | 0.18 | % | | | 0.15 | %(B) | | | 0.15 | % | | | 0.17 | % | | | 0.27 | % | | | 0.32 | % |
Ratio of Net Investment Income to Average Net Assets | | | 4.00 | % | | | 4.33 | %(B) | | | 3.58 | % | | | 4.19 | % | | | 4.33 | % | | | 3.82 | % |
Portfolio Turnover Rate | | | 23 | % | | | 20 | %(C) | | | 25 | % | | | 14 | % | | | 10 | % | | | 11 | % |
| | |
| |
| | | The United Kingdom Small Company Series | |
| | | | |
| | | Year Ended Oct. 31,
2009 | | | Period Dec. 1, 2007 to Oct. 31, 2008 | | | Year Ended Nov. 30, 2007 | | | Year Ended Nov. 30, 2006 | | | Year Ended Nov. 30, 2005 | | | Year Ended Nov. 30, 2004 | |
| | |
Total Return | | | 43.51 | % | | | (50.77 | )%(C) | | | 2.42 | % | | | 44.80 | % | | | 12.88 | % | | | 29.68 | % |
| | |
Net Assets, End of Period (thousands) | | $ | 770,472 | | | $ | 555,390 | | | $ | 1,158,580 | | | $ | 1,117,826 | | | $ | 643,038 | | | $ | 377,763 | |
Ratio of Expenses to Average Net Assets | | | 0.14 | % | | | 0.12 | %(B) | | | 0.12 | % | | | 0.13 | % | | | 0.22 | % | | | 0.27 | % |
Ratio of Net Investment Income to Average Net Assets | | | 4.02 | % | | | 3.79 | %(B) | | | 2.72 | % | | | 2.70 | % | | | 3.19 | % | | | 2.70 | % |
Portfolio Turnover Rate | | | 10 | % | | | 25 | %(C) | | | 12 | % | | | 8 | % | | | 12 | % | | | 7 | % |
| | |
See page 1 & 2 for the Definitions of Abbreviations and Footnotes.
See accompanying Notes to Financial Statements.
330
THE DFA INVESTMENT TRUST COMPANY
FINANCIAL HIGHLIGHTS
| | | | | | | | | | | | | | | | | | | | | | | |
| | | The Continental Small Company Series | |
| | | | |
| | | Year Ended Oct. 31, 2009 | | | Period Dec. 1, 2007 to Oct. 31, 2008 | | | Year Ended Nov. 30, 2007 | | | Year Ended Nov. 30, 2006 | | | Year Ended Nov. 30, 2005 | | | Year Ended Nov. 30, 2004 | |
| | |
Total Return | | | 43.78 | % | | | (49.66 | )%(C) | | | 17.49 | % | | | 47.10 | % | | | 18.97 | % | | 36.57 | % |
| | |
Net Assets, End of Period (thousands) | | $ | 1,630,892 | | | $ | 1,111,585 | | | $ | 2,256,122 | | | $ | 1,875,194 | | | $ | 981,938 | | | $654,644 | |
Ratio of Expenses to Average Net Assets | | | 0.16 | % | | | 0.14 | %(B) | | | 0.14 | % | | | 0.15 | % | | | 0.24 | % | | 0.26 | % |
Ratio of Net Investment Income to Average Net Assets | | | 2.93 | % | | | 3.49 | %(B) | | | 2.16 | % | | | 2.27 | % | | | 2.16 | % | | 2.09 | % |
Portfolio Turnover Rate | | | 7 | % | | | 18 | %(C) | | | 12 | % | | | 7 | % | | | 18 | % | | 9 | % |
| | |
| | | | | | | | | | |
| | | The Canadian Small Company Series | |
| | | | |
| | | Year
Ended
Oct. 31,
2009 | | | Period
Dec. 1,
2007 to
Oct. 31,
2008 | | | Period
April 2, 2007(a)
to
Nov. 30, 2007 | |
| | |
Total Return | | | 61.67 | % | | (56.44 | )%(C) | | 10.20 | %(C) |
| | |
Net Assets, End of Period (thousands) | | $ | 365,181 | | | $232,873 | | | $213,529 | |
Ratio of Expenses to Average Net Assets | | | 0.17 | % | | 0.18 | %(B) | | 0.26 | %(B)(E) |
Ratio of Net Investment Income to Average Net Assets | | | 1.37 | % | | 0.97 | %(B) | | 0.47 | %(B)(E) |
Portfolio Turnover Rate | | | 23 | % | | 21 | %(C) | | 6 | %(C) |
| | |
See page 1 & 2 for the Definitions of Abbreviations and Footnotes.
See accompanying Notes to Financial Statements.
331
THE DFA INVESTMENT TRUST COMPANY
FINANCIAL HIGHLIGHTS
| | | | | | | | | | | | | | | | | | | | | | | | |
| | | The Emerging Markets Series | |
| | | | |
| | | Year Ended Oct. 31, 2009 | | | Period Dec. 1, 2007 to Oct. 31, 2008 | | | Year Ended Nov. 30,
2007 | | | Year Ended Nov. 30,
2006 | | | Year Ended Nov. 30,
2005 | | | Year Ended Nov. 30,
2004 | |
| | |
Total Return | | | 53.99 | % | | | (48.15 | )%(C) | | | 42.62 | % | | | 31.87 | % | | | 31.23 | % | | | 35.47 | % |
| | |
Net Assets, End of Period (thousands) | | $ | 2,109,316 | | | $ | 1,624,524 | | | $ | 3,707,790 | | | $ | 2,414,971 | | | $ | 1,852,565 | | | $ | 1,160,262 | |
Ratio of Expenses to Average Net Assets | | | 0.20 | % | | | 0.18 | %(B) | | | 0.19 | % | | | 0.20 | % | | | 0.27 | % | | | 0.31 | % |
Ratio of Net Investment Income to Average Net Assets | | | 2.57 | % | | | 3.00 | %(B) | | | 2.52 | % | | | 2.54 | % | | | 3.70 | % | | | 2.63 | % |
Portfolio Turnover Rate | | | 14 | % | | | 19 | %(C) | | | 7 | % | | | 11 | % | | | 9 | % | | | 2 | % |
| | |
| |
| | | The Emerging Markets Small Cap Series | |
| | | | |
| | | Year Ended Oct. 31, 2009 | | | Period Dec. 1,
2007 to Oct. 31,
2008 | | | Year Ended Nov. 30,
2007 | | | Year Ended Nov. 30,
2006 | | | Year Ended Nov. 30, 2005 | | | Year Ended Nov. 30, 2004 | |
| | |
Total Return | | | 92.08 | % | | | (56.84 | )%(C) | | | 43.32 | % | | | 40.55 | % | | | 24.85 | % | | | 35.22 | % |
| | |
Net Assets, End of Period (thousands) | | $ | 1,167,973 | | | | $566,379 | | | $ | 1,525,571 | | | | $903,529 | | | | $545,271 | | | | $237,865 | |
Ratio of Expenses to Average Net Assets | | | 0.33 | % | | | 0.30 | %(B) | | | 0.31 | % | | | 0.34 | % | | | 0.49 | % | | | 0.52 | % |
Ratio of Net Investment Income to Average Net Assets | | | 2.52 | % | | | 3.07 | %(B) | | | 1.94 | % | | | 2.39 | % | | | 2.70 | % | | | 1.93 | % |
Portfolio Turnover Rate | | | 13 | % | | | 19 | %(C) | | | 16 | % | | | 18 | % | | | 8 | % | | | 11 | % |
| | |
See page 1 & 2 for the Definitions of Abbreviations and Footnotes.
See accompanying Notes to Financial Statements.
332
THE DFA INVESTMENT TRUST COMPANY
NOTES TO FINANCIAL STATEMENTS
A. Organization:
The DFA Investment Trust Company (the “Trust”) is an open-end management investment company registered under the Investment Company Act of 1940. The Trust consists of twelve investment portfolios, of which ten are included in this section of the report (collectively, the “Series”), and two are presented in separate reports.
| | |
Domestic Equity Portfolios | | International Equity Portfolios |
The U.S. Large Company Series | | The DFA International Value Series |
The U.S. Large Cap Value Series | | The Japanese Small Company Series |
| | The Asia Pacific Small Company Series |
| | The United Kingdom Small Company Series |
| | The Continental Small Company Series |
| | The Canadian Small Company Series |
| | The Emerging Markets Series |
| | The Emerging Markets Small Cap Series |
Effective December 31, 2008 and November 1, 2008, The U.S. Large Cap Value Series and The DFA International Value Series, respectively, each a master fund in a RIC/RIC master-feeder structure, elected with the consent of their respective Holder(s) to change their U.S. federal income tax classification from that of an association taxable as a corporation to a partnership pursuant to Treasury Regulation § 301.7701-3. The change in capital structure and retroactive reclassification of the statement of changes in net assets and financial highlights for the respective funds is a result of the treatment of a partnership for book purposes. Each Series/Portfolio will maintain its books and records and present its financial statements in accordance with generally accepted accounting principles for investment partnerships.
At a regular meeting of the Board of Directors/Trustees (the “Board”) on September 16, 2008, the Board voted to change the fiscal and tax year ends of the Series from November 30 to October 31.
B. Significant Accounting Policies:
The following significant accounting policies are in conformity with accounting principles generally accepted in the United States of America. Such policies are consistently followed by the Trust in preparation of its financial statements. The preparation of financial statements in accordance with accounting principles generally accepted in the United States of America requires management to make estimates and assumptions that affect the reported amounts of assets and liabilities and disclosure of contingent assets and liabilities at the date of the financial statements and the reported amounts of increases and decreases in net assets from operations during the reporting period. Actual results could differ from those estimates and those differences could be material.
1. Security Valuation: Securities held by the Domestic Equity Portfolios and the International Equity Portfolios, including over-the-counter securities, are valued at the last quoted sale price of the day. Securities held by the Domestic Equity Portfolios and the International Equity Portfolios that are listed on Nasdaq are valued at the Nasdaq Official Closing Price (“NOCP”). If there is no last reported sale price or NOCP for the day, the Domestic Equity Portfolios and International Equity Portfolios value the securities at the mean of the most recent quoted bid and asked prices. Price information on listed securities is taken from the exchange where the security is primarily traded. Generally, securities issued by open-end investment companies are valued using their respective net asset values or public offering prices, as appropriate, for purchase orders placed at the close of the New York Stock Exchange (NYSE).
333
Securities for which no market quotations are readily available (including restricted securities), or for which market quotations have become unreliable, are valued in good faith at fair value in accordance with procedures adopted by the Board of Directors/Trustees. Fair value pricing may also be used if events that have a significant effect on the value of an investment (as determined in the discretion of the Investment Committee of the Advisor) occur before the net asset value is calculated. When fair value pricing is used, the prices of securities used by the Domestic Equity Portfolios and International Equity Portfolios may differ from the quoted or published prices for the same securities on their primary markets or exchanges.
The International Equity Portfolios will also apply a fair value price in the circumstances described below. Generally, trading in foreign securities markets is completed each day at various times prior to the close of the NYSE. For example, trading in the Japanese securities markets is completed each day at the close of the Tokyo Stock Exchange (normally, 11:00 p.m. PT), which is fourteen hours prior to the close of the NYSE (normally, 1:00 p.m. PT) and the time that the net asset values of the International Equity Portfolios are computed. Due to the time differences between the closings of the relevant foreign securities exchanges and the time the International Equity Portfolios price their shares at the close of the NYSE, the International Equity Portfolios will fair value their foreign investments when it is determined that the market quotations for the foreign investments are either unreliable or not readily available. The fair value prices will attempt to reflect the impact of the U.S. financial markets’ perceptions and trading activities on the International Equity Portfolios’ foreign investments since the last closing prices of the foreign investments were calculated on their primary foreign securities markets or exchanges. For these purposes, the Board of Directors/Trustees of the Trust have determined that movements in relevant indices or other appropriate market indicators, after the close of the Tokyo Stock Exchange or the London Stock Exchange, demonstrate that market quotations may be unreliable. Fair valuation of portfolio securities may occur on a daily basis. The fair value pricing by the International Equity Portfolios utilizes data furnished by an independent pricing service (and that data draws upon, among other information, the market values of foreign investments). When an International Equity Portfolio uses fair value pricing, the values assigned to the International Equity Portfolio’s foreign investments may not be the quoted or published prices of the investments on their primary markets or exchanges.
Futures contracts held by the Series are valued using the settlement price established each day on the exchange on which they are traded.
The Series utilizes a fair value hierarchy which prioritizes the inputs to valuation techniques used to measure fair value into three broad levels described below:
• Level 1 – quoted prices in active markets for identical securities
• Level 2 – other significant observable inputs (including quoted prices for similar securities, interest rates, prepayment speeds, credit risk, etc.)
• Level 3 – significant unobservable inputs (including the Series’ own assumptions in determining the fair value of investments)
A summary of the inputs used to value the Series’ net assets by each major security type, industry and/or country is disclosed at the end of the Summary Schedule of Portfolio Holdings/Schedule of Investments. The inputs or methodology used for valuing securities are not necessarily an indication of the risk associated with investing in those securities.
2. Foreign Currency Translation: Securities and other assets and liabilities of the International Equity Portfolios, whose values are initially expressed in foreign currencies, are translated to U.S. dollars using the mean between the most recently quoted bid and asked prices for the U.S. dollar as quoted by generally recognized reliable sources. Dividend and interest income and certain expenses are translated to U.S. dollars at the rate of exchange on their respective accrual dates. Receivables and payables denominated in foreign currencies are marked to market daily based on daily exchange rates and exchange gains or losses are realized upon ultimate receipt or disbursement.
The International Equity Portfolios do not isolate the effect of fluctuations in foreign exchange rates from the effect of fluctuations in the market prices of securities held whether realized or unrealized.
334
Realized gains or losses on foreign currency transactions represent net foreign exchange gains or losses from the disposition of foreign currencies, currency gains or losses realized between the trade and settlement dates on securities transactions, and the difference between amounts of interest, dividends and foreign withholding taxes recorded on the books of the International Equity Portfolios and the U.S. dollar equivalent amounts actually received or paid.
3. Deferred Compensation Plan: Each eligible Trustee of the Trust may elect participation in the Deferred Compensation Plan (the “Plan”). Under the Plan, effective January 1, 2002, such Trustees may defer payment of all or a portion of their total fees earned as a Trustee. These deferred amounts may be treated as though such amounts had been invested in shares of the following funds: U.S. Large Cap Value Portfolio; U.S. Core Equity 1 Portfolio; U.S. Core Equity 2 Portfolio; U.S. Vector Equity Portfolio; U.S. Micro Cap Portfolio; DFA International Value Portfolio; International Core Equity Portfolio; Emerging Markets Portfolio; Emerging Markets Core Equity Portfolio; and/or DFA Two-Year Global Fixed Income Portfolio. Contributions made under the Plan and the change in unrealized appreciation (depreciation) and income, are included in Directors’/Trustees’ Fees & Expenses.
Each Trustee has the option to receive their distribution of proceeds in one of the following methods upon one year’s notice: lump sum; annual installments over a period of agreed upon years; or semi-annual installments over a period of agreed upon years. As of October 31, 2009, none of the Trustees have requested distribution of proceeds.
4. Other: Security transactions are accounted for as of the trade date. Costs used in determining realized gains and losses on the sale of investment securities are on the basis of identified cost. Dividend income and distributions to shareholders are recorded on the ex-dividend date. Distributions received on securities that represent a return of capital or capital gain are recorded as a reduction of cost of investments or as a realized gain, respectively. The Series estimate the character of distributions received that may be considered return of capital distributions. Interest income is recorded on an accrual basis. Discount and premium on securities purchased are amortized over the lives of the respective securities, utilizing the effective interest method. Expenses directly attributable to a Series are directly charged. Common expenses of the Trust or Series are allocated using methods approved by the Board of Directors/Trustees, generally based on average net assets.
The International Portfolios may be subject to taxes imposed by countries in which they invest, with respect to their investments in issuers existing or operating in such countries. Such taxes are generally based on income earned or repatriated and capital gains realized on the sale of such investments. The Series accrue such taxes when the related income or capital gains are earned or throughout the holding period. Some countries require governmental approval for the repatriation of investment income, capital or the proceeds of sales earned by foreign investors. In addition, if there is a deterioration in a country’s balance of payments or for other reasons, a country may impose temporary restrictions on foreign capital remittances abroad.
The Emerging Markets Series and The Emerging Markets Small Cap Series investments in Thailand are subject to a 15% governmental capital gains tax. Such taxes are due upon sale of individual securities. The Emerging Markets Series and The Emerging Markets Small Cap Series accrue for taxes on the capital gains throughout the holding period based on the unrealized gain of the underlying securities. These Series are also subject to a 15% governmental capital gains tax on short-term capital gains for investments in India. Such taxes are due upon sale of individual securities. The taxes for the capital gains are accrued when the capital gains are earned.
C. Investment Advisor:
Dimensional Fund Advisors LP (“Dimensional” or the “Advisor”) provides investment advisory services to the Trust. For year ended October 31, 2009, the Series’ investment advisory services fees were accrued daily and paid monthly to the Advisor based on the following effective annual rates of average daily net assets:
| | | |
The U.S. Large Company Series | | 0.025 | % |
The U.S. Large Cap Value Series | | 0.10 | % |
The DFA International Value Series | | 0.20 | % |
The Japanese Small Company Series | | 0.10 | % |
335
| | | |
The Asia Pacific Small Company Series | | 0.10 | % |
The United Kingdom Small Company Series | | 0.10 | % |
The Continental Small Company Series | | 0.10 | % |
The Canadian Small Company Series | | 0.10 | % |
The Emerging Markets Series | | 0.10 | % |
The Emerging Markets Small Cap Series | | 0.20 | % |
Fees Paid to Officers and Directors/Trustees:
Certain Officers and Directors/Trustees of the Advisor are also Officers and Directors/Trustees of the Trust; however, such Officers and Directors/Trustees (with the exception of the Chief Compliance Officer (“CCO”)) receive no compensation from the Trust. For the year ended October 31, 2009, the total related amounts paid by the Trust to the CCO were $98 (in thousands). The total related amounts paid by each of the Series are included in Other Expenses on the Statement of Operations.
D. Deferred Compensation:
At October 31, 2009, the total liability for deferred compensation to Directors/Trustees is included in Accrued Expenses and Other Liabilities on the Statement of Assets and Liabilities as follows (amounts in thousands):
| | | |
The U.S. Large Company Series | | $ | 87 |
The U.S. Large Cap Value Series | | | 183 |
The DFA International Value Series | | | 143 |
The Japanese Small Company Series | | | 31 |
The Asia Pacific Small Company Series | | | 14 |
The United Kingdom Small Company Series | | | 17 |
The Continental Small Company Series | | | 35 |
The Canadian Small Company Series | | | 7 |
The Emerging Markets Series | | | 48 |
The Emerging Markets Small Cap Series | | | 23 |
E. Purchases and Sales of Securities:
For the year ended October 31, 2009, the Series made the following purchases and sales of investment securities, other than short-term securities and U.S. government securities (amounts in thousands):
| | | | | | |
| | | Purchases | | Sales |
The U.S. Large Company Series | | $ | 324,298 | | $ | 294,824 |
The U.S. Large Cap Value Series | | | 1,964,487 | | | 1,887,094 |
The DFA International Value Series | | | 1,071,984 | | | 935,775 |
The Japanese Small Company Series | | | 76,298 | | | 144,852 |
The Asia Pacific Small Company Series | | | 111,607 | | | 164,466 |
The United Kingdom Small Company Series | | | 101,735 | | | 57,562 |
The Continental Small Company Series | | | 199,144 | | | 90,144 |
The Canadian Small Company Series | | | 65,303 | | | 57,297 |
The Emerging Markets Series | | | 230,547 | | | 367,789 |
The Emerging Markets Small Cap Series | | | 206,567 | | | 105,446 |
336
F. Federal Income Taxes:
No provision for federal income taxes is required since the Series are treated as partnerships for Federal income tax purposes. Any net investment income and realized and unrealized gains and losses have been deemed to have been “passed down” to their respective partners.
Some of the Series’ investments are in securities considered to be “passive foreign investment companies” for which any unrealized appreciation (depreciation) (mark to market) and/or realized gains are required to be included in distributable net investment income for federal income tax purposes. At October 31, 2009, the following Series had cumulative unrealized appreciation (depreciation) (mark to market) to be included in distributable net investment income for federal tax purposes. For the year ended October 31, 2009, realized gains on the sale of passive foreign investment companies have been reclassified from accumulated net realized gains to accumulated net investment income for federal tax purposes. Amounts listed below are in thousands.
| | | | |
| | | Mark to Market | | Realized Gains |
The Japanese Small Company Series | | $ 801 | | — |
The Asia Pacific Small Company Series | | 241 | | $385 |
The United Kingdom Small Company Series | | 2,879 | | 256 |
The Continental Small Company Series | | 6,098 | | — |
The Emerging Markets Small Cap Series | | 476 | | — |
At October 31, 2009, the total cost and aggregate gross unrealized appreciation and (depreciation) of securities for federal income tax purposes were different from amounts reported for financial reporting purposes (amounts in thousands):
| | | | | | | | | | | | | |
| | | Federal Tax
Cost | | Unrealized
Appreciation | | Unrealized
(Depreciation) | | | Net
Unrealized
Appreciation
(Depreciation) | |
The U.S. Large Company Series | | $ | 3,858,145 | | $ | 789,949 | | $(876,863 | ) | | $ | (86,914 | ) |
The U.S. Large Cap Value Series | | | 6,877,391 | | | 1,296,505 | | (135,135 | ) | | | 1,161,370 | |
The DFA International Value Series | | | 5,830,471 | | | 1,458,762 | | (63,077 | ) | | | 1,395,685 | |
The Japanese Small Company Series | | | 1,561,973 | | | 122,281 | | (338,956 | ) | | | (216,675 | ) |
The Asia Pacific Small Company Series | | | 752,488 | | | 164,965 | | (101,664 | ) | | | 63,301 | |
The United Kingdom Small Company Series | | | 856,216 | | | 134,083 | | (196,940 | ) | | | (62,857 | ) |
The Continental Small Company Series | | | 1,674,575 | | | 418,155 | | (258,298 | ) | | | 159,857 | |
The Canadian Small Company Series | | | 558,453 | | | 22,376 | | (148,256 | ) | | | (125,880 | ) |
The Emerging Markets Series | | | 1,299,053 | | | 1,057,665 | | (24,146 | ) | | | 1,033,519 | |
The Emerging Markets Small Cap Series | | | 969,640 | | | 402,071 | | (110,046 | ) | | | 292,025 | |
Accounting for Uncertainty in Income Taxes sets forth a minimum threshold for financial statement recognition of the benefit of a tax position taken or expected to be taken in a tax return. Management has analyzed each Series’ tax positions and has concluded that no provision for income tax is required in any Series’ financial statements. No Series is aware of any tax positions for which it is reasonably possible that the total amounts of unrecognized tax benefits will significantly change in the next twelve months. Each of the Series’ federal tax returns for the prior three fiscal years remains subject to examination by the Internal Revenue Service.
On November 1, 2008, The DFA International Value Series, a master fund in a RIC/RIC master-feeder structure with five RIC feeders and other direct client investor(s), made a “Check-the-box” election for federal income tax purposes pursuant to Treasury Regulation §301.7701-3, to change its federal entity classification from a corporation taxable as a regulated investment company to a partnership. As a result of this election, the master fund is deemed to have distributed all of its assets and liabilities, in a taxable transaction, to its shareholders in liquidation of the master fund. Immediately thereafter, the shareholders contributed all of the distributed assets and liabilities to a newly formed partnership. The final tax year end of The DFA International Value Series was October 31, 2008. For
337
Federal income tax purposes, pursuant to Internal Revenue Code §336(a), the master fund recognizes gain or loss as if the master’s investment securities were sold to its shareholders and, pursuant to IRC Code §331, each of the Portfolios recognizes gain or loss as if it liquidated its investment in the master. As a result of the transaction, The DFA International Value Series recognized a ($2,309,440,866) and ($718,733) capital and currency loss respectively for tax year ended October 31, 2008. For tax purposes, pursuant to IRC Code §334(a), each of the Portfolios will take a fair market value basis in the securities deemed received by them and a new holding period for those securities commences on the deemed liquidation date.
Effective December 31, 2008, The U.S. Large Cap Value Series, a master fund in a RIC/RIC master-feeder structure with four RIC feeders and other direct client investor(s), made a “Check-the-box” election for federal income tax purposes pursuant to Treasury Regulation §301.7701-3, to change its federal entity classification from a corporation taxable as a regulated investment company to a partnership. As a result of this election, the master fund is deemed to have distributed all of its assets and liabilities, in a taxable transaction, to its shareholders in liquidation of the master fund. Immediately thereafter, the shareholders contributed all of the distributed assets and liabilities to a newly formed partnership. The final tax year end of The U.S. Large Cap Value Series was December 30, 2008. For Federal income tax purposes, pursuant to IRC Code §336(a), the master fund recognized a loss as if the master’s investment securities were sold to its shareholders and, pursuant to IRC Code §331, each of the Portfolios recognized a gain as if it liquidated its investment in the master. For tax purposes, pursuant to IRC Code §334(a), each of the Portfolios took a fair market value basis in the securities deemed received by them and a new holding period for those securities commenced on the deemed liquidation date.
The master fund had book/tax differences upon its deemed liquidation. The following summary of permanent differences occurred as of the respective effective “Check the Box” election date.
| | | | | | | |
Increase
(Decrease)
Paid-In
Capital | | | Unrealized
Appreciation
(Depreciation)
Investment
Securities | | Increase
(Decrease)
Undistributed
Net Investment
Income | | Increase
(Decrease)
Accumulated
Net Realized
Gains (Losses) |
| $(3,038,312,278 | ) | | $2,303,664,484 | | $(698,899) | | $735,346,693 |
As a result of the transaction, The U.S. Large Cap Value Series recognized a ($2,303,664,484) capital loss for tax year ended December 30, 2008. Additionally, the fund has written off $3,039,011,176 of expired capital loss carryover as a permanent book/tax reporting difference decreasing paid in capital.
G. Financial Instruments:
In accordance with the Series’ investment objectives and policies, the Series may invest in certain financial instruments that have off-balance sheet risk in excess of the amounts recognized in the financial statements and concentrations of credit and market risk. These instruments and their significant corresponding risks are described below:
1. Repurchase Agreements: The Series may purchase certain U.S. Government securities subject to the counterparty’s agreement to repurchase them at an agreed upon date and price. The counterparty will be required on a daily basis to maintain the value of the collateral subject to the agreement at not less than the repurchase price (including accrued interest). The agreements are conditioned upon the collateral being deposited under the Federal Reserve book-entry system with the Trust’s custodian or a third party sub-custodian. In the event of default or bankruptcy by the other party to the agreement, retention of the collateral may be subject to legal proceedings. All open repurchase agreements were entered into on October 30, 2009.
2. Foreign Markets Risks: Investments in foreign markets may involve certain consideration and risks not typically associated with investments in the United States of America, including the possibility of future political and economic developments and the level of foreign government supervision and regulation of foreign securities markets. These markets are generally smaller, less liquid and more volatile than the major securities markets in the United States of America. Consequently, acquisition and disposition of securities by the Master Funds may be inhibited.
338
Derivative Financial Instruments:
Disclosures on derivative instruments and hedging activities are intended to improve financial reporting for derivative instruments by enabling investors to understand how and why a fund uses derivatives, how derivatives are accounted for and how derivative instruments affect a fund’s results of operations and financial position. Summarized below are the specific types of derivative instruments used by the Series.
3. Futures Contracts: The Series may enter into futures contracts to gain market exposure on uninvested cash pending investment in securities or to maintain liquidity to pay redemptions. Upon entering into a futures contract, the Series deposits cash or pledges U.S. Government securities to a broker, equal to the minimum “initial margin” requirements of the exchange on which the contract is traded. Subsequent payments are received from or paid to the broker each day, based on the daily fluctuation in the market value of the contract. These receipts or payments are known as “variation margin” and are recorded daily by the Series as unrealized gains or losses until the contracts are closed. When the contracts are closed, the Series record a realized gain or loss, which is presented in the Statements of Operations as a net realized gain or loss on futures, equal to the difference between the value of the contract at the time it was opened and the value at the time it was closed.
Risks may arise upon entering into futures contracts from potential imperfect price correlations between the futures contracts and the underlying securities, from the possibility of an illiquid secondary market for these instruments and from the possibility that the Series could lose more than the initial margin requirements. The Series entering into stock index futures are subject to equity price risk from those futures contracts. Counterparty credit risk related to exchange-traded futures is minimal because the exchange’s clearinghouse, as counterparty to all exchange-traded futures, guarantees the futures against default.
At October 31, 2009, the following Series had the following outstanding futures contracts (dollar amounts in thousands):
| | | | | | | | | | | | | |
| | | Description | | Expiration
Date | | Number of
Contracts | | Contract
Value | | Unrealized
Gain (Loss) | | Approximate
Cash
Collateral |
The U.S. Large Company Series | | S&P 500 ®Index | | 12/18/2009 | | 118* | | $ | 30,474 | | $141 | | $2,655 |
*During the year ended October 31, 2009, the Series had limited activity in futures transactions.
Additional disclosure on derivative instruments is required showing a summary by primary risk exposure of the derivatives instruments’ (i) location in the balance sheet and fair value at period end and (ii) the location in the Statements of Operations and the realized and change in unrealized gain or loss over the reporting period. The following is a summary of the Series’ derivative instrument holdings for the year ended October 31, 2009.
The following is a summary of the Series’ location and value of derivative instrument holdings on the Series’ Statements of Assets and Liabilities categorized by primary risk exposure as of October 31, 2009 (amounts in thousands):
| | | | |
| | | | | Asset Derivatives Value |
| | | Location on the Statements
of Assets and Liabilities | | Equity
Contracts |
The U.S. Large Company Series | | Payables: Futures Margin Variation | | $141* |
| * | Includes cumulative appreciation (depreciation) of futures contracts. Only current day’s margin variation is reported within the Statement of Assets and Liabilities. |
The following is a summary of the location on the Series’ Statements of Operations of realized and change in unrealized gains and losses from the Series’ derivative instrument holdings through the year ended October 31, 2009 (amounts in thousands):
339
| | |
Derivative Type | | Location of Gain (Loss) on Derivatives Recognized in Income |
Equity contracts | | Net Realized Gain (Loss) on: Futures Change in Unrealized Appreciation (Depreciation) of: Futures |
The following is a summary of the location of realized and change in unrealized gains and losses on the Series’ Statements of Operations for the Series’ derivative instrument holdings categorized by primary risk exposure through the year ended October 31, 2009 (amounts in thousands):
| | |
| | | Realized Gain (Loss)
on Derivatives
Recognized in Income |
| |
| | | Equity
Contracts |
The U.S. Large Company Series | | $20,268 |
The U.S. Large Cap Value Series* | | 7,204 |
The DFA International Value Series* | | (1,125) |
The Japanese Small Company Series* | | 1,131 |
The Asia Pacific Small Company Series* | | (432) |
The United Kingdom Small Company Series* | | (534) |
The Continental Small Company Series* | | (476) |
The Canadian Small Company Series* | | (322) |
The Emerging Markets Series* | | (2,920) |
The Emerging Markets Small Cap Series* | | (181) |
| |
| | | Change in Unrealized
Appreciation (Depreciation) on
Derivatives Recognized in Income |
| |
| | | Equity
Contracts |
The U.S. Large Company Series | | $(2,236) |
The U.S. Large Cap Value Series* | | (29) |
The Asia Pacific Small Company Series* | | (3) |
The United Kingdom Small Company Series* | | (1) |
The Continental Small Company Series* | | (9) |
The Emerging Markets Series* | | (32) |
The Emerging Markets Small Cap Series* | | (10) |
| * | As of October 31, 2009, there were no futures contracts outstanding. During the year ended October 31, 2009, the Series had limited activity in these transactions. |
H. Line of Credit:
The Trust, together with other Dimensional-advised portfolios, has entered into an amended and restated $250 million unsecured discretionary line of credit effective July 8, 2009 with an affiliate of its domestic custodian bank. Each portfolio is permitted to borrow, subject to its investment limitations, up to a maximum of $250 million, as long as total borrowings under the line of credit do not exceed $250 million in the aggregate. Borrowings under the line of credit are charged interest at the then current Federal Funds Rate plus 1%. Each portfolio is individually, and not jointly, liable for its particular advances under the line of credit. There is no commitment fee on the unused portion of the line of credit. The agreement for the discretionary line of credit may be terminated by either party at any time. The line of credit is scheduled to expire on June 22, 2010.
340
For the year ended October 31, 2009, borrowings by the Series under this line of credit were as follows (amounts in thousands, except percentages and days):
| | | | | | | | | | |
| | | Weighted
Average
Interest Rate | | Weighted
Average
Loan Balance | | Number of
Days
Outstanding | | Interest
Expense
Incurred | | Maximum Amount
Borrowed During
the Period |
The U.S. Large Company Series | | 2.48% | | $ 8,245 | | 10 | | $6 | | $14,732 |
The U.S. Large Cap Value Series | | 1.90% | | 11,126 | | 5 | | 3 | | 31,000 |
There were no outstanding borrowings by the Series under this line of credit as of October 31, 2009.
The Trust, together with other Dimensional-advised portfolios, has also entered into an additional $500 million unsecured line of credit effective January 15, 2009 with its international custodian bank. Each portfolio is permitted to borrow, subject to its investment limitations, up to a maximum of $500 million, as long as total borrowings under the line of credit do not exceed $500 million in the aggregate. Each portfolio is individually, and not jointly, liable for its particular advances under the line of credit. Borrowings under the line of credit are charged interest at rates agreed to by the parties at the time of borrowing. There is no commitment fee on the unused portion of the line of credit. The agreement for the line of credit expires on January 15, 2010.
For the year ended October 31, 2009, borrowings by the Series under this line of credit were as follows (amounts in thousands, except percentages and days):
| | | | | | | | | | |
| | | Weighted
Average
Interest Rate | | Weighted
Average
Loan Balance | | Number of
Days
Outstanding | | Interest
Expense
Incurred | | Maximum Amount
Borrowed During
the Period |
The DFA International Value Series | | 0.95% | | $8,517 | | 11 | | $ 2 | | $18,062 |
The Japanese Small Company Series | | 0.94% | | 1,248 | | 13 | | — | | 10,042 |
The Asia Pacific Small Company Series | | 0.92% | | 601 | | 32 | | — | | 2,864 |
The United Kingdom Small Company Series | | 0.93% | | 940 | | 10 | | — | | 2,977 |
The Continental Small Company Series | | 0.95% | | 695 | | 13 | | — | | 1,624 |
The Emerging Markets Series | | 0.91% | | 3,365 | | 87 | | 7 | | 13,587 |
The Emerging Markets Small Cap Series | | 0.92% | | 1,891 | | 30 | | 1 | | 6,555 |
There were no outstanding borrowings by the Series under this line of credit as of October 31, 2009.
I. Securities Lending:
As of October 31, 2009, some of the Series had securities on loan to brokers/dealers, for which each Series held cash collateral. Each Series invests the cash collateral, as described below, and records a liability for the return of the collateral, during the period the securities are on loan. Loans of securities are expected at all times to be secured by collateral equal to at least (i) 100% of the current market value of the loaned securities with respect to securities of the U.S. government or its agencies, (ii) 102% of the current market value of the loaned securities with respect to U.S. securities, and (iii) 105% of the current market value of the loaned securities with respect to foreign securities. However, daily market fluctuations could cause the Series’ collateral to be lower or higher than the expected thresholds. If this were to occur, the collateral would be adjusted the next business day to ensure adequate collateralization. In the event of default or bankruptcy by the other party to the agreement, realization and/or retention of the collateral may be subject to legal proceedings. If the borrower fails to return loaned securities, and cash collateral being maintained by the borrower is insufficient to cover the value of loaned securities and provided such collateral insufficiency is not the result of investment losses, the lending agent has agreed to pay the amount of the shortfall to the Series or, at the option of the lending agent, to replace the securities.
Subject to each Series’ investment policy, the cash collateral received by the Series from securities on loan is invested in securities of the U.S. government or its agencies, repurchase agreements collateralized by securities of the U.S. government or its agencies or shares of the DFA Short Term Investment Fund LP. Agencies include both agency debentures and agency mortgage backed securities. In addition, each Series will be able to terminate the
341
loan at any time and will receive reasonable interest on the loan, as well as amounts equal to any dividends, interest or other distributions on the loaned securities. However, dividend income received from loaned securities may not be eligible to be taxed at qualified dividend income rates.
J. Indemnitees; Contractual Obligations:
Under the Trust’s organizational documents, its officers and directors are indemnified against certain liabilities arising out of the performance of their duties to the Trust.
In the normal course of business, the Trust enters into contracts that contain a variety of representations and warranties which provide general indemnification. The Trust’s maximum exposure under these arrangements is unknown as this would involve future claims that may be made against the Trust and/or its affiliates that have not yet occurred. However, based on experience, the Trust expects the risk of loss to be remote.
K. In-Kind Redemptions:
In accordance with guidelines described in the Series’ prospectus, the fund may distribute portfolio securities rather than cash as payment for a redemption of fund shares (in-kind redemption). For financial reporting purposes, the fund recognizes a gain on in-kind redemptions to the extent the value of the distributed securities on the date of redemption exceeds the cost of those securities. Gains and losses realized on in-kind redemptions are not recognized for tax purposes and are reclassified from undistributed realized gain (loss) to paid-in capital.
During the year ended October 31, 2009, The Emerging Markets Series realized net gains of $17,805 (in thousands) of in-kind redemptions.
During the period December 1, 2007 to October 31, 2008, the following Series realized net gains (losses) of in-kind redemptions (amounts in thousands):
| | | |
The U.S. Large Company Series | | $ | 24,362 |
The U.S. Large Cap Value Series | | | 52,271 |
The DFA International Value Series | | | 103,024 |
The Japanese Small Company Series | | | 1,625 |
The Asia Pacific Small Company Series | | | 4,018 |
The United Kingdom Small Company Series | | | 6,873 |
The Continental Small Company Series | | | 16,564 |
The Canadian Small Company Series | | | (2,616) |
During the year ended November 30, 2007, The U.S. Large Company Series distributed securities in lieu of cash for shareholder redemptions. The value of the redemption was $1,099,445 (in thousands) which resulted in a realized gain of $529,199 (in thousands) to the Series.
L. Subsequent Event Evaluations:
Management has evaluated the impact of all subsequent events on the Series through December 23, 2009, the date the financial statements were available for issuance, and has determined that there are no subsequent events requiring recognition or disclosure in the financial statements.
342
REPORT OF INDEPENDENT REGISTERED PUBLIC ACCOUNTING FIRM
To the Shareholders of the Series, as defined, and
Board of Trustees of The DFA Investment Trust Company.:
In our opinion, the accompanying statements of assets and liabilities, including the summary schedules of portfolio holdings, and the related statements of operations and of changes in net assets and the financial highlights present fairly, in all material respects, the financial position of The U.S. Large Company Series, The U.S. Large Cap Value Series, The DFA International Value Series, The Japanese Small Company Series, The Asia Pacific Small Company Series, The United Kingdom Small Company Series, The Continental Small Company Series, The Canadian Small Company Series, The Emerging Markets Series and The Emerging Markets Small Cap Series (constituting portfolios within The DFA Investment Trust Company, hereafter referred to as the “Series”) at October 31, 2009, the results of each of their operations for the year then ended, the changes in each of their net assets and the financial highlights for each of the periods indicated, in conformity with accounting principles generally accepted in the United States of America. These financial statements and financial highlights (hereafter referred to as “financial statements”) are the responsibility of the Series’ management; our responsibility is to express an opinion on these financial statements based on our audits. We conducted our audits of these financial statements in accordance with the standards of the Public Company Accounting Oversight Board (United States). Those standards require that we plan and perform the audit to obtain reasonable assurance about whether the financial statements are free of material misstatement. An audit includes examining, on a test basis, evidence supporting the amounts and disclosures in the financial statements, assessing the accounting principles used and significant estimates made by management, and evaluating the overall financial statement presentation. We believe that our audits, which included confirmation of securities at October 31, 2009 by correspondence with the custodians, brokers, and the transfer agent of the investee fund, provide a reasonable basis for our opinion.
PricewaterhouseCoopers LLP
Philadelphia, Pennsylvania
December 23, 2009
343
RESULTS OF THE SHAREHOLDER MEETING
On June 2, 2009 and June 5, 2009, The DFA Investment Trust Company (“DFAITC”) held a Special Joint Meeting of Shareholders for the purpose of voting on several proposals affecting DFAITC and the Series, including, among other items, the election of Trustees, the amendment of certain fundamental investment limitations, and the elimination of certain fundamental investment limitations. The shareholders of the Series approved each of the applicable proposals for DFAITC and the Series presented at the Meeting. Listed below are the voting results from the Meeting. Please note that not all Proposals presented at the Meeting were voted on by each Series. Additionally, the Proposal numbers reflected below correlate to the Proposal numbers presented for vote at the Meeting.
DFAITC
| | | | | | | | | | | | | | | | | | | | |
| | | | | Shares Voted | | Percent of Outstanding Shares Voted |
| | | | | For | | % | | Against | | % | | Abstain/WithHold | | % | | For | | Against | | Abstain / WithHold |
Proposal 1: Election of Trustees for DFAITC* |
1a | | David G. Booth | | 2,166,359,402 | | 96.50% | | — | | 0.00% | | 78,661,259 | | 3.50% | | 95.78% | | 0.00% | | 3.48% |
1b | | George M. Constantinides | | 2,169,219,982 | | 96.62% | | — | | 0.00% | | 75,800,679 | | 3.38% | | 95.90% | | 0.00% | | 3.35% |
1c | | John P. Gould | | 2,168,577,186 | | 96.59% | | — | | 0.00% | | 76,443,476 | | 3.41% | | 95.88% | | 0.00% | | 3.38% |
1d | | Roger G. Ibbotson | | 2,169,778,365 | | 96.65% | | — | | 0.00% | | 75,242,297 | | 3.35% | | 95.93% | | 0.00% | | 3.33% |
1e | | Robert C. Merton | | 2,170,124,638 | | 96.66% | | — | | 0.00% | | 74,896,023 | | 3.34% | | 95.94% | | 0.00% | | 3.31% |
1f | | Myron S. Scholes | | 2,169,439,189 | | 96.63% | | — | | 0.00% | | 75,581,473 | | 3.37% | | 95.91% | | 0.00% | | 3.34% |
1g | | Eduardo A. Repetto | | 2,167,010,793 | | 96.53% | | — | | 0.00% | | 78,009,868 | | 3.47% | | 95.81% | | 0.00% | | 3.45% |
1h | | Abbie J. Smith | | 2,169,626,842 | | 96.64% | | — | | 0.00% | | 75,393,820 | | 3.36% | | 95.92% | | 0.00% | | 3.33% |
| | | | | | | | | | | | | | | | | | | | | | |
| | | Shares Voted | | Percent of Outstanding Shares Voted |
| | | For | | % | | Against | | % | | Abstain/WithHold | | % | | NonVote | | % | | For | | Against | | Abstain / WithHold |
| Proposal 4: Approval of an Amended and Restated Agreement and Declaration of Trust for DFAITC* | | 2,076,877,329 | | 92.43% | | 36,623,148 | | 1.63% | | 133,356,326 | | 5.94% | | NA | | NA | | 91.82% | | 1.62% | | 5.90% |
* Results are for all Series within DFAITC
The U.S. Large Company Series
| | | | | | | | | | | | | | | | | | | | |
| | | | | Shares Voted | | Percent of Outstanding Shares Voted |
| | | | | For | | % | | Against | | % | | Abstain/WithHold | | % | | For | | Against | | Abstain / WithHold |
Proposals: | | | | | | | | | | | | | | | | | | |
5 | | To approve amendments to certain fundamental investment restrictions |
5a | | Borrowing Money | | 98,665,686 | | 84.14% | | 3,106,492 | | 2.65% | | 15,494,433 | | 13.21% | | 84.14% | | 2.65% | | 13.21% |
5b | | Making Loans | | 98,733,300 | | 84.20% | | 3,052,305 | | 2.60% | | 15,481,007 | | 13.20% | | 84.20% | | 2.60% | | 13.20% |
5c | | Investments in Real Estate | | 100,125,217 | | 85.38% | | 1,637,239 | | 1.40% | | 15,504,156 | | 13.22% | | 85.38% | | 1.40% | | 13.22% |
5d | | Investments in Commodities | | 98,776,384 | | 84.23% | | 2,997,328 | | 2.56% | | 15,492,899 | | 13.21% | | 84.23% | | 2.56% | | 13.21% |
5e | | Diversification of Investments | | 99,185,648 | | 84.58% | | 2,614,284 | | 2.23% | | 15,466,679 | | 13.19% | | 84.58% | | 2.23% | | 13.19% |
6 | | To approve the elimination of certain fundamental investment restrictions |
6a | | Pledging, Mortgaging, or Hypothecating Assets | | 98,359,523 | | 83.88% | | 3,372,501 | | 2.88% | | 15,534,587 | | 13.25% | | 83.88% | | 2.88% | | 13.25% |
6b | | Purchasing Securities on Margin | | 98,444,356 | | 83.95% | | 3,290,886 | | 2.81% | | 15,531,369 | | 13.24% | | 83.95% | | 2.81% | | 13.24% |
6c | | Investing in Restricted or Illiquid Securities | | 98,296,531 | | 83.82% | | 3,028,611 | | 2.58% | | 15,941,469 | | 13.59% | | 83.82% | | 2.58% | | 13.59% |
6d | | Investing for the Purpose of Exercising Control | | 98,535,100 | | 84.03% | | 2,726,201 | | 2.32% | | 16,005,309 | | 13.65% | | 84.03% | | 2.32% | | 13.65% |
6e | | Investing in Other Investment Companies | | 98,532,657 | | 84.02% | | 2,740,349 | | 2.34% | | 15,993,605 | | 13.64% | | 84.02% | | 2.34% | | 13.64% |
6f | | Management Ownership of Securities of an Issuer | | 98,694,385 | | 84.16% | | 2,533,976 | | 2.16% | | 16,038,250 | | 13.68% | | 84.16% | | 2.16% | | 13.68% |
6g | | Investing in Oil, Gas, or other Mineral Exploration, Leases or Development Programs | | 98,853,168 | | 84.30% | | 2,461,685 | | 2.10% | | 15,951,758 | | 13.60% | | 84.30% | | 2.10% | | 13.60% |
6h | | Investing in Securities of Unseasoned Issuers | | 98,385,119 | | 83.90% | | 2,882,682 | | 2.46% | | 15,998,811 | | 13.64% | | 83.90% | | 2.46% | | 13.64% |
6i | | Investing in Warrants | | 98,619,865 | | 84.10% | | 2,598,182 | | 2.22% | | 16,048,564 | | 13.69% | | 84.10% | | 2.22% | | 13.69% |
6j | | Writing or Acquiring Options | | 98,646,590 | | 84.12% | | 2,632,309 | | 2.24% | | 15,987,712 | | 13.63% | | 84.12% | | 2.24% | | 13.63% |
344
The U.S. Large Cap Value Series
| | | | | | | | | | | | | | | | | | | | |
| | | | | Shares Voted | | Percent of Outstanding Shares Voted |
| | | | | For | | % | | Against | | % | | Abstain/WithHold | | % | | For | | Against | | Abstain / WithHold |
Proposals: | | | | | | | | | | | | | | | | | | |
5 | | To approve amendments to certain fundamental investment restrictions |
5a | | Borrowing Money | | 450,089,477 | | 90.34% | | 13,835,372 | | 2.78% | | 34,296,468 | | 6.88% | | 90.12% | | 2.77% | | 6.87% |
5b | | Making Loans | | 446,508,610 | | 89.62% | | 17,323,887 | | 3.48% | | 34,388,819 | | 6.90% | | 89.41% | | 3.47% | | 6.89% |
5c | | Investments in Real Estate | | 449,117,076 | | 90.14% | | 14,867,126 | | 2.98% | | 34,237,115 | | 6.87% | | 89.93% | | 2.98% | | 6.86% |
5d | | Investments in Commodities | | 445,240,298 | | 89.37% | | 18,945,498 | | 3.80% | | 34,035,520 | | 6.83% | | 89.15% | | 3.79% | | 6.82% |
5e | | Diversification of Investments | | 450,429,968 | | 90.41% | | 13,968,473 | | 2.80% | | 33,822,876 | | 6.79% | | 90.19% | | 2.80% | | 6.77% |
6 | | To approve the elimination of certain fundamental investment restrictions |
6a | | Pledging, Mortgaging, or Hypothecating Assets | | 442,477,364 | | 88.81% | | 21,095,580 | | 4.23% | | 34,648,372 | | 6.95% | | 88.60% | | 4.22% | | 6.94% |
6b | | Purchasing Securities on Margin | | 442,025,675 | | 88.72% | | 21,654,237 | | 4.35% | | 34,541,405 | | 6.93% | | 88.51% | | 4.34% | | 6.92% |
6c | | Investing in Restricted or Illiquid Securities | | 441,905,416 | | 88.70% | | 21,661,567 | | 4.35% | | 34,654,334 | | 6.96% | | 88.48% | | 4.34% | | 6.94% |
6d | | Investing for the Purpose of Exercising Control | | 446,950,234 | | 89.71% | | 16,844,128 | | 3.38% | | 34,426,955 | | 6.91% | | 89.49% | | 3.37% | | 6.89% |
6e | | Investing in Other Investment Companies | | 446,376,678 | | 89.59% | | 17,480,520 | | 3.51% | | 34,364,119 | | 6.90% | | 89.38% | | 3.50% | | 6.88% |
6f | | Management Ownership of Securities of an Issuer | | 446,904,545 | | 89.70% | | 16,712,196 | | 3.35% | | 34,604,577 | | 6.95% | | 89.49% | | 3.35% | | 6.93% |
6g | | Investing in Oil, Gas, or other Mineral Exploration, Leases or Development Programs | | 445,817,286 | | 89.48% | | 18,271,331 | | 3.67% | | 34,132,700 | | 6.85% | | 89.27% | | 3.66% | | 6.83% |
6h | | Investing in Securities of Unseasoned Issuers | | 445,230,922 | | 89.36% | | 18,304,705 | | 3.67% | | 34,685,690 | | 6.96% | | 89.15% | | 3.67% | | 6.95% |
6i | | Investing in Warrants | | 446,950,388 | | 89.71% | | 16,531,063 | | 3.32% | | 34,739,866 | | 6.97% | | 89.49% | | 3.31% | | 6.96% |
6j | | Writing or Acquiring Options | | 446,696,672 | | 89.66% | | 16,985,456 | | 3.41% | | 34,539,189 | | 6.93% | | 89.44% | | 3.40% | | 6.92% |
|
The DFA International Value Series |
| | | | | Shares Voted | | Percent of Outstanding Shares Voted |
| | | | | For | | % | | Against | | % | | Abstain/WithHold | | % | | For | | Against | | Abstain / WithHold |
Proposals: | | | | | | | | | | | | | | | | | | |
5 | | To approve amendments to certain fundamental investment restrictions |
5a | | Borrowing Money | | 349,117,663 | | 88.20% | | 30,044,848 | | 7.59% | | 16,661,166 | | 4.21% | | 86.14% | | 7.41% | | 4.11% |
5b | | Making Loans | | 348,947,065 | | 88.16% | | 29,971,477 | | 7.57% | | 16,905,135 | | 4.27% | | 86.10% | | 7.40% | | 4.17% |
5c | | Investments in Real Estate | | 351,165,048 | | 88.72% | | 28,070,820 | | 7.09% | | 16,587,809 | | 4.19% | | 86.65% | | 6.93% | | 4.09% |
5d | | Investments in Commodities | | 347,839,401 | | 87.88% | | 31,372,412 | | 7.93% | | 16,611,864 | | 4.20% | | 85.82% | | 7.74% | | 4.10% |
5e | | Diversification of Investments | | 351,038,355 | | 88.69% | | 28,302,302 | | 7.15% | | 16,483,020 | | 4.16% | | 86.61% | | 6.98% | | 4.07% |
6 | | To approve the elimination of certain fundamental investment restrictions |
6a | | Pledging, Mortgaging, or Hypothecating Assets | | 346,783,275 | | 87.61% | | 32,195,687 | | 8.13% | | 16,844,715 | | 4.26% | | 85.56% | | 7.94% | | 4.16% |
6b | | Purchasing Securities on Margin | | 346,279,680 | | 87.48% | | 32,728,442 | | 8.27% | | 16,815,555 | | 4.25% | | 85.44% | | 8.08% | | 4.15% |
6c | | Investing in Restricted or Illiquid Securities | | 346,650,940 | | 87.58% | | 32,506,501 | | 8.21% | | 16,666,236 | | 4.21% | | 85.53% | | 8.02% | | 4.11% |
6d | | Investing for the Purpose of Exercising Control | | 349,242,494 | | 88.23% | | 29,958,913 | | 7.57% | | 16,621,270 | | 4.20% | | 86.17% | | 7.39% | | 4.10% |
6e | | Investing in Other Investment Companies | | 349,373,590 | | 88.26% | | 29,787,506 | | 7.53% | | 16,662,582 | | 4.21% | | 86.20% | | 7.35% | | 4.11% |
6f | | Management Ownership of Securities of an Issuer | | 349,991,995 | | 88.42% | | 28,988,874 | | 7.32% | | 16,842,809 | | 4.26% | | 86.36% | | 7.15% | | 4.16% |
6g | | Investing in Oil, Gas, or other Mineral Exploration, Leases or Development Programs | | 348,999,679 | | 88.17% | | 30,314,009 | | 7.66% | | 16,509,990 | | 4.17% | | 86.11% | | 7.48% | | 4.07% |
6h | | Investing in Securities of Unseasoned Issuers | | 349,376,398 | | 88.27% | | 29,792,320 | | 7.53% | | 16,653,959 | | 4.21% | | 86.20% | | 7.35% | | 4.11% |
6i | | Investing in Warrants | | 349,983,930 | | 88.42% | | 29,092,914 | | 7.35% | | 16,745,833 | | 4.23% | | 86.35% | | 7.18% | | 4.13% |
6j | | Writing or Acquiring Options | | 349,310,900 | | 88.25% | | 29,764,139 | | 7.52% | | 16,747,638 | | 4.23% | | 86.19% | | 7.34% | | 4.13% |
7a | | Proposed Sub-Advisory Agreement among Dimensional Fund Advisors LP, DFA Australia Limited, and the Company | | 355,560,358 | | 89.83% | | 17,051,279 | | 4.31% | | 23,212,041 | | 5.86% | | 87.73% | | 4.21% | | 5.73% |
7b | | Proposed Sub-Advisory Agreement among Dimensional Fund Advisors LP, Dimensional Fund Advisors Ltd., and the Company | | 355,594,969 | | 89.84% | | 16,996,602 | | 4.29% | | 23,232,105 | | 5.87% | | 87.74% | | 4.19% | | 5.73% |
345
The Japanese Small Company Series
| | | | | | | | | | | | | | | | | | | | |
| | | | | Shares Voted | | Percent of Outstanding Shares Voted |
| | | | | For | | % | | Against | | % | | Abstain/WithHold | | % | | For | | Against | | Abstain / WithHold |
Proposals: | | | | | | | | | | | | | | | | | | |
5 | | To approve amendments to certain fundamental investment restrictions |
5a | | Borrowing Money | | 146,642,769 | | 99.96% | | 44,210 | | 0.03% | | 19,310 | | 0.01% | | 99.96% | | 0.03% | | 0.01% |
5b | | Making Loans | | 146,642,769 | | 99.96% | | 44,210 | | 0.03% | | 19,310 | | 0.01% | | 99.96% | | 0.03% | | 0.01% |
5c | | Investments in Real Estate | | 146,642,769 | | 99.96% | | 44,210 | | 0.03% | | 19,310 | | 0.01% | | 99.96% | | 0.03% | | 0.01% |
5d | | Investments in Commodities | | 146,646,464 | | 99.96% | | 40,512 | | 0.03% | | 19,313 | | 0.01% | | 99.96% | | 0.03% | | 0.01% |
5e | | Diversification of Investments | | 146,646,464 | | 99.96% | | 40,512 | | 0.03% | | 19,313 | | 0.01% | | 99.96% | | 0.03% | | 0.01% |
6 | | To approve the elimination of certain fundamental investment restrictions |
6a | | Pledging, Mortgaging, or Hypothecating Assets | | 146,642,769 | | 99.96% | | 44,210 | | 0.03% | | 19,310 | | 0.01% | | 99.96% | | 0.03% | | 0.01% |
6b | | Purchasing Securities on Margin | | 146,644,420 | | 99.96% | | 42,557 | | 0.03% | | 19,313 | | 0.01% | | 99.96% | | 0.03% | | 0.01% |
6c | | Investing in Restricted or Illiquid Securities | | 146,642,296 | | 99.96% | | 44,683 | | 0.03% | | 19,310 | | 0.01% | | 99.96% | | 0.03% | | 0.01% |
6d | | Investing for the Purpose of Exercising Control | | 146,350,730 | | 99.76% | | 336,246 | | 0.23% | | 19,313 | | 0.01% | | 99.76% | | 0.23% | | 0.01% |
6e | | Investing in Other Investment Companies | | 146,644,420 | | 99.96% | | 42,557 | | 0.03% | | 19,313 | | 0.01% | | 99.96% | | 0.03% | | 0.01% |
6f | | Management Ownership of Securities of an Issuer | | 146,644,420 | | 99.96% | | 42,557 | | 0.03% | | 19,313 | | 0.01% | | 99.96% | | 0.03% | | 0.01% |
6g | | Investing in Oil, Gas, or other Mineral Exploration, Leases or Development Programs | | 146,660,306 | | 99.97% | | 26,673 | | 0.02% | | 19,310 | | 0.01% | | 99.97% | | 0.02% | | 0.01% |
6h | | Investing in Securities of Unseasoned Issuers | | 146,370,392 | | 99.77% | | 316,585 | | 0.22% | | 19,313 | | 0.01% | | 99.77% | | 0.22% | | 0.01% |
6i | | Investing in Warrants | | 146,660,780 | | 99.97% | | 26,199 | | 0.02% | | 19,310 | | 0.01% | | 99.97% | | 0.02% | | 0.01% |
6j | | Writing or Acquiring Options | | 146,368,741 | | 99.77% | | 318,236 | | 0.22% | | 19,313 | | 0.01% | | 99.77% | | 0.22% | | 0.01% |
|
The Asia Pacific Small Company Series |
| | | | | Shares Voted | | Percent of Outstanding Shares Voted |
| | | | | For | | % | | Against | | % | | Abstain/WithHold | | % | | For | | Against | | Abstain / WithHold |
| Proposals: | | | | | | | | | | | | | | | | | | |
5 | | To approve amendments to certain fundamental investment restrictions |
5a | | Borrowing Money | | 27,034,666 | | 99.48% | | 101,817 | | 0.37% | | 39,663 | | 0.15% | | 99.48% | | 0.37% | | 0.15% |
5b | | Making Loans | | 27,031,355 | | 99.47% | | 101,817 | | 0.37% | | 42,973 | | 0.16% | | 99.47% | | 0.37% | | 0.16% |
5c | | Investments in Real Estate | | 27,032,309 | | 99.47% | | 100,863 | | 0.37% | | 42,973 | | 0.16% | | 99.47% | | 0.37% | | 0.16% |
5d | | Investments in Commodities | | 27,031,355 | | 99.47% | | 101,817 | | 0.37% | | 42,973 | | 0.16% | | 99.47% | | 0.37% | | 0.16% |
5e | | Diversification of Investments | | 27,031,355 | | 99.47% | | 101,817 | | 0.37% | | 42,973 | | 0.16% | | 99.47% | | 0.37% | | 0.16% |
6 | | To approve the elimination of certain fundamental investment restrictions |
6a | | Pledging, Mortgaging, or Hypothecating Assets | | 27,030,130 | | 99.46% | | 101,817 | | 0.37% | | 44,198 | | 0.16% | | 99.46% | | 0.37% | | 0.16% |
6b | | Purchasing Securities on Margin | | 27,029,461 | | 99.46% | | 102,444 | | 0.38% | | 44,240 | | 0.16% | | 99.46% | | 0.38% | | 0.16% |
6c | | Investing in Restricted or Illiquid Securities | | 27,030,088 | | 99.46% | | 101,817 | | 0.37% | | 44,240 | | 0.16% | | 99.46% | | 0.37% | | 0.16% |
6d | | Investing for the Purpose of Exercising Control | | 26,910,498 | | 99.02% | | 221,407 | | 0.81% | | 44,240 | | 0.16% | | 99.02% | | 0.81% | | 0.16% |
6e | | Investing in Other Investment Companies | | 27,029,461 | | 99.46% | | 102,444 | | 0.38% | | 44,240 | | 0.16% | | 99.46% | | 0.38% | | 0.16% |
6f | | Management Ownership of Securities of an Issuer | | 27,030,088 | | 99.46% | | 101,817 | | 0.37% | | 44,240 | | 0.16% | | 99.46% | | 0.37% | | 0.16% |
6g | | Investing in Oil, Gas, or other Mineral Exploration, Leases or Development Programs | | 27,030,130 | | 99.46% | | 101,817 | | 0.37% | | 44,198 | | 0.16% | | 99.46% | | 0.37% | | 0.16% |
6h | | Investing in Securities of Unseasoned Issuers | | 26,910,498 | | 99.02% | | 221,407 | | 0.81% | | 44,240 | | 0.16% | | 99.02% | | 0.81% | | 0.16% |
6i | | Investing in Warrants | | 27,029,461 | | 99.46% | | 102,444 | | 0.38% | | 44,240 | | 0.16% | | 99.46% | | 0.38% | | 0.16% |
6j | | Writing or Acquiring Options | | 26,909,871 | | 99.02% | | 222,034 | | 0.82% | | 44,240 | | 0.16% | | 99.02% | | 0.82% | | 0.16% |
|
The United Kingdom Small Company Series |
| | | | | Shares Voted | | Percent of Outstanding Shares Voted |
| | | | | For | | % | | Against | | % | | Abstain/WithHold | | % | | For | | Against | | Abstain / WithHold |
| Proposals: | | | | | | | | | | | | | | | | | | |
5 | | To approve amendments to certain fundamental investment restrictions |
5a | | Borrowing Money | | 27,789,656 | | 99.98% | | 2,228 | | 0.01% | | 3,028 | | 0.01% | | 99.98% | | 0.01% | | 0.01% |
5b | | Making Loans | | 27,789,656 | | 99.98% | | 2,228 | | 0.01% | | 3,028 | | 0.01% | | 99.98% | | 0.01% | | 0.01% |
5c | | Investments in Real Estate | | 27,789,656 | | 99.98% | | 2,228 | | 0.01% | | 3,028 | | 0.01% | | 99.98% | | 0.01% | | 0.01% |
346
| | | | | | | | | | | | | | | | | | | | |
| | | | | Shares Voted | | Percent of Outstanding Shares Voted |
| | | | | For | | % | | Against | | % | | Abstain/WithHold | | % | | For | | Against | | Abstain / WithHold |
Proposals: | | | | | | | | | | | | | | | | | | |
5d | | Investments in Commodities | | 27,789,656 | | 99.98% | | 2,228 | | 0.01% | | 3,028 | | 0.01% | | 99.98% | | 0.01% | | 0.01% |
5e | | Diversification of Investments | | 27,789,656 | | 99.98% | | 2,228 | | 0.01% | | 3,028 | | 0.01% | | 99.98% | | 0.01% | | 0.01% |
6 | | To approve the elimination of certain fundamental investment restrictions |
6a | | Pledging, Mortgaging, or Hypothecating Assets | | 27,789,656 | | 99.98% | | 2,228 | | 0.01% | | 3,028 | | 0.01% | | 99.98% | | 0.01% | | 0.01% |
6b | | Purchasing Securities on Margin | | 27,789,450 | | 99.98% | | 2,434 | | 0.01% | | 3,028 | | 0.01% | | 99.98% | | 0.01% | | 0.01% |
6c | | Investing in Restricted or Illiquid Securities | | 27,789,656 | | 99.98% | | 2,228 | | 0.01% | | 3,028 | | 0.01% | | 99.98% | | 0.01% | | 0.01% |
6d | | Investing for the Purpose of Exercising Control | | 27,741,238 | | 99.81% | | 50,646 | | 0.18% | | 3,028 | | 0.01% | | 99.81% | | 0.18% | | 0.01% |
6e | | Investing in Other Investment Companies | | 27,789,656 | | 99.98% | | 2,228 | | 0.01% | | 3,028 | | 0.01% | | 99.98% | | 0.01% | | 0.01% |
6f | | Management Ownership of Securities of an Issuer | | 27,789,656 | | 99.98% | | 2,228 | | 0.01% | | 3,028 | | 0.01% | | 99.98% | | 0.01% | | 0.01% |
6g | | Investing in Oil, Gas, or other Mineral Exploration, Leases or Development Programs | | 27,789,656 | | 99.98% | | 2,228 | | 0.01% | | 3,028 | | 0.01% | | 99.98% | | 0.01% | | 0.01% |
6h | | Investing in Securities of Unseasoned Issuers | | 27,741,238 | | 99.81% | | 50,646 | | 0.18% | | 3,028 | | 0.01% | | 99.81% | | 0.18% | | 0.01% |
6i | | Investing in Warrants | | 27,789,450 | | 99.98% | | 2,434 | | 0.01% | | 3,028 | | 0.01% | | 99.98% | | 0.01% | | 0.01% |
6j | | Writing or Acquiring Options | | 27,741,032 | | 99.81% | | 50,853 | | 0.18% | | 3,028 | | 0.01% | | 99.81% | | 0.18% | | 0.01% |
The Continental Small Company Series |
| | | | | Shares Voted | | Percent of Outstanding Shares Voted |
| | | | | For | | % | | Against | | % | | Abstain/WithHold | | % | | For | | Against | | Abstain / WithHold |
Proposals: | | | | | | | | | | | | | | | | | | |
5 | | To approve amendments to certain fundamental investment restrictions |
5a | | Borrowing Money | | 38,121,496 | | 99.90% | | 19,389 | | 0.05% | | 17,169 | | 0.04% | | 99.90% | | 0.05% | | 0.04% |
5b | | Making Loans | | 38,121,654 | | 99.90% | | 19,230 | | 0.05% | | 17,169 | | 0.04% | | 99.90% | | 0.05% | | 0.04% |
5c | | Investments in Real Estate | | 38,121,826 | | 99.91% | | 19,059 | | 0.05% | | 17,169 | | 0.04% | | 99.91% | | 0.05% | | 0.04% |
5d | | Investments in Commodities | | 38,121,654 | | 99.90% | | 19,230 | | 0.05% | | 17,169 | | 0.04% | | 99.90% | | 0.05% | | 0.04% |
5e | | Diversification of Investments | | 38,128,283 | | 99.92% | | 12,602 | | 0.03% | | 17,169 | | 0.04% | | 99.92% | | 0.03% | | 0.04% |
6 | | To approve the elimination of certain fundamental investment restrictions |
6a | | Pledging, Mortgaging, or Hypothecating Assets | | 38,121,654 | | 99.90% | | 19,230 | | 0.05% | | 17,169 | | 0.04% | | 99.90% | | 0.05% | | 0.04% |
6b | | Purchasing Securities on Margin | | 38,121,496 | | 99.90% | | 19,389 | | 0.05% | | 17,169 | | 0.04% | | 99.90% | | 0.05% | | 0.04% |
6c | | Investing in Restricted or Illiquid Securities | | 38,121,348 | | 99.90% | | 19,536 | | 0.05% | | 17,169 | | 0.04% | | 99.90% | | 0.05% | | 0.04% |
6d | | Investing for the Purpose of Exercising Control | | 38,076,201 | | 99.79% | | 64,684 | | 0.17% | | 17,169 | | 0.04% | | 99.79% | | 0.17% | | 0.04% |
6e | | Investing in Other Investment Companies | | 38,121,187 | | 99.90% | | 19,697 | | 0.05% | | 17,169 | | 0.04% | | 99.90% | | 0.05% | | 0.04% |
6f | | Management Ownership of Securities of an Issuer | | 38,121,346 | | 99.90% | | 19,539 | | 0.05% | | 17,169 | | 0.04% | | 99.90% | | 0.05% | | 0.04% |
6g | | Investing in Oil, Gas, or other Mineral Exploration, Leases or Development Programs | | 38,121,826 | | 99.91% | | 19,059 | | 0.05% | | 17,169 | | 0.04% | | 99.91% | | 0.05% | | 0.04% |
6h | | Investing in Securities of Unseasoned Issuers | | 38,076,201 | | 99.79% | | 64,684 | | 0.17% | | 17,169 | | 0.04% | | 99.79% | | 0.17% | | 0.04% |
6i | | Investing in Warrants | | 38,120,643 | | 99.90% | | 20,241 | | 0.05% | | 17,169 | | 0.04% | | 99.90% | | 0.05% | | 0.04% |
6j | | Writing or Acquiring Options | | 38,076,042 | | 99.79% | | 64,842 | | 0.17% | | 17,169 | | 0.04% | | 99.79% | | 0.17% | | 0.04% |
The Canadian Small Company Series |
| | | | | Shares Voted | | Percent of Outstanding Shares Voted |
| | | | | For | | % | | Against | | % | | Abstain/WithHold | | % | | For | | Against | | Abstain / WithHold |
Proposals: | | | | | | | | | | | | | | | | | | |
5 | | To approve amendments to certain fundamental investment restrictions |
5a | | Borrowing Money | | 43,055,683 | | 100.00% | | — | | 0.00% | | — | | 0.00% | | 100.00% | | 0.00% | | 0.00% |
5b | | Making Loans | | 43,055,683 | | 100.00% | | — | | 0.00% | | — | | 0.00% | | 100.00% | | 0.00% | | 0.00% |
5c | | Investments in Real Estate | | 43,055,683 | | 100.00% | | — | | 0.00% | | — | | 0.00% | | 100.00% | | 0.00% | | 0.00% |
5d | | Investments in Commodities | | 43,055,683 | | 100.00% | | — | | 0.00% | | — | | 0.00% | | 100.00% | | 0.00% | | 0.00% |
5e | | Diversification of Investments | | 43,055,683 | | 100.00% | | — | | 0.00% | | — | | 0.00% | | 100.00% | | 0.00% | | 0.00% |
The Emerging Markets Series
347
| | | | | | | | | | | | | | | | | | | | |
| | | | | Shares Voted | | Percent of Outstanding Shares Voted |
| | | | | For | | % | | Against | | % | | Abstain/WithHold | | % | | For | | Against | | Abstain / WithHold |
Proposals: | | | | | | | | | | | | | | | | | | |
5 | | To approve amendments to certain fundamental investment restrictions |
5a | | Borrowing Money | | 52,121,556 | | 93.84% | | 1,664,956 | | 3.00% | | 1,757,089 | | 3.16% | | 87.03% | | 2.78% | | 2.93% |
5b | | Making Loans | | 52,099,490 | | 93.80% | | 1,648,888 | | 2.97% | | 1,795,223 | | 3.23% | | 86.99% | | 2.75% | | 3.00% |
5c | | Investments in Real Estate | | 52,397,882 | | 94.34% | | 1,398,009 | | 2.52% | | 1,747,709 | | 3.15% | | 87.49% | | 2.33% | | 2.92% |
5d | | Investments in Commodities | | 52,040,226 | | 93.69% | | 1,748,233 | | 3.15% | | 1,755,143 | | 3.16% | | 86.89% | | 2.92% | | 2.93% |
5e | | Diversification of Investments | | 52,611,281 | | 94.72% | | 1,181,063 | | 2.13% | | 1,751,257 | | 3.15% | | 87.85% | | 1.97% | | 2.92% |
6 | | To approve the elimination of certain fundamental investment restrictions |
6a | | Pledging, Mortgaging, or Hypothecating Assets | | 51,861,192 | | 93.37% | | 1,894,995 | | 3.41% | | 1,787,414 | | 3.22% | | 86.60% | | 3.16% | | 2.98% |
6b | | Purchasing Securities on Margin | | 51,912,008 | | 93.46% | | 1,862,926 | | 3.35% | | 1,768,666 | | 3.18% | | 86.68% | | 3.11% | | 2.95% |
6c | | Investing in Restricted or Illiquid Securities | | 51,782,840 | | 93.23% | | 1,972,942 | | 3.55% | | 1,787,818 | | 3.22% | | 86.47% | | 3.29% | | 2.99% |
6d | | Investing for the Purpose of Exercising Control | | 52,148,416 | | 93.89% | | 1,633,661 | | 2.94% | | 1,761,524 | | 3.17% | | 87.08% | | 2.73% | | 2.94% |
6e | | Investing in Other Investment Companies | | 52,226,140 | | 94.03% | | 1,552,404 | | 2.79% | | 1,765,057 | | 3.18% | | 87.21% | | 2.59% | | 2.95% |
6f | | Management Ownership of Securities of an Issuer | | 52,340,283 | | 94.23% | | 1,414,052 | | 2.55% | | 1,789,266 | | 3.22% | | 87.40% | | 2.36% | | 2.99% |
6g | | Investing in Oil, Gas, or other Mineral Exploration, Leases or Development Programs | | 49,027,368 | | 88.27% | | 4,764,525 | | 8.58% | | 1,751,708 | | 3.15% | | 81.86% | | 7.96% | | 2.92% |
6h | | Investing in Securities of Unseasoned Issuers | | 52,200,460 | | 93.98% | | 1,550,569 | | 2.79% | | 1,792,572 | | 3.23% | | 87.16% | | 2.59% | | 2.99% |
6i | | Investing in Warrants | | 52,426,418 | | 94.39% | | 1,350,164 | | 2.43% | | 1,767,018 | | 3.18% | | 87.54% | | 2.25% | | 2.95% |
6j | | Writing or Acquiring Options | | 52,093,118 | | 93.79% | | 1,682,479 | | 3.03% | | 1,768,004 | | 3.18% | | 86.98% | | 2.81% | | 2.95% |
7a | | Proposed Sub-Advisory Agreement among Dimensional Fund Advisors LP, DFA Australia Limited, and the Company | | 52,843,359 | | 95.14% | | 879,647 | | 1.58% | | 1,820,595 | | 3.28% | | 88.24% | | 1.47% | | 3.04% |
7b | | Proposed Sub-Advisory Agreement among Dimensional Fund Advisors LP, Dimensional Fund Advisors Ltd., and the Company | | 52,852,461 | | 95.15% | | 862,958 | | 1.55% | | 1,828,182 | | 3.29% | | 88.25% | | 1.44% | | 3.05% |
The Emerging Markets Small Cap Series |
| | | | | Shares Voted | | Percent of Outstanding Shares Voted |
| | | | | For | | % | | Against | | % | | Abstain/WithHold | | % | | For | | Against | | Abstain / WithHold |
Proposals: | | | | | | | | | | | | | | | | | | |
5 | | To approve amendments to certain fundamental investment restrictions |
5a | | Borrowing Money | | 28,003,797 | | 96.84% | | 486,844 | | 1.68% | | 426,138 | | 1.47% | | 96.84% | | 1.68% | | 1.47% |
5b | | Making Loans | | 27,099,770 | | 93.72% | | 1,364,563 | | 4.72% | | 452,447 | | 1.56% | | 93.72% | | 4.72% | | 1.56% |
5c | | Investments in Real Estate | | 27,992,430 | | 96.80% | | 499,696 | | 1.73% | | 424,654 | | 1.47% | | 96.80% | | 1.73% | | 1.47% |
5d | | Investments in Commodities | | 27,913,853 | | 96.53% | | 577,490 | | 2.00% | | 425,436 | | 1.47% | | 96.53% | | 2.00% | | 1.47% |
5e | | Diversification of Investments | | 28,035,370 | | 96.95% | | 422,105 | | 1.46% | | 459,304 | | 1.59% | | 96.95% | | 1.46% | | 1.59% |
6 | | To approve the elimination of certain fundamental investment restrictions |
6a | | Pledging, Mortgaging, or Hypothecating Assets | | 26,983,015 | | 93.31% | | 1,471,880 | | 5.09% | | 461,884 | | 1.60% | | 93.31% | | 5.09% | | 1.60% |
6b | | Purchasing Securities on Margin | | 27,848,848 | | 96.31% | | 604,830 | | 2.09% | | 463,101 | | 1.60% | | 96.31% | | 2.09% | | 1.60% |
6d | | Investing for the Purpose of Exercising Control | | 27,959,095 | | 96.69% | | 492,373 | | 1.70% | | 465,311 | | 1.61% | | 96.69% | | 1.70% | | 1.61% |
6e | | Investing in Other Investment Companies | | 27,939,843 | | 96.62% | | 515,813 | | 1.78% | | 461,123 | | 1.59% | | 96.62% | | 1.78% | | 1.59% |
6f | | Management Ownership of Securities of an Issuer | | 28,014,739 | | 96.88% | | 431,977 | | 1.49% | | 470,062 | | 1.63% | | 96.88% | | 1.49% | | 1.63% |
6g | | Investing in Oil, Gas, or other Mineral Exploration, Leases or Development Programs | | 27,936,946 | | 96.61% | | 518,946 | | 1.79% | | 460,887 | | 1.59% | | 96.61% | | 1.79% | | 1.59% |
6h | | Investing in Securities of Unseasoned Issuers | | 27,999,589 | | 96.83% | | 447,127 | | 1.55% | | 470,063 | | 1.63% | | 96.83% | | 1.55% | | 1.63% |
6i | | Investing in Warrants | | 28,022,853 | | 96.91% | | 428,573 | | 1.48% | | 465,354 | | 1.61% | | 96.91% | | 1.48% | | 1.61% |
6j | | Writing or Acquiring Options | | 28,028,907 | | 96.93% | | 425,938 | | 1.47% | | 461,934 | | 1.60% | | 96.93% | | 1.47% | | 1.60% |
7a | | Proposed Sub-Advisory Agreement among Dimensional Fund Advisors LP, DFA Australia Limited, and the Company | | 28,096,987 | | 97.16% | | 355,522 | | 1.23% | | 464,270 | | 1.61% | | 97.16% | | 1.23% | | 1.61% |
348
| | | | | | | | | | | | | | | | | | | | |
| | | | | Shares Voted | | Percent of Outstanding Shares Voted |
| | | | | For | | % | | Against | | % | | Abstain/WithHold | | % | | For | | Against | | Abstain / WithHold |
Proposals: | | | | | | | | | | | | | | | | | | |
7b | | Proposed Sub-Advisory Agreement among Dimensional Fund Advisors LP, Dimensional Fund Advisors Ltd., and the Company | | 28,096,987 | | 97.16% | | 355,522 | | 1.23% | | 464,270 | | 1.61% | | 97.16% | | 1.23% | | 1.61% |
349
FUND MANAGEMENT
Trustees/Directors
Each Board of Trustees/Directors of The DFA Investment Trust Company Inc. (“DFAITC”), DFA Investment Dimensions Group Inc. (“DFAIDG”), Dimensional Investment Group Inc. (“DIG”) and Dimensional Emerging Markets Value Fund (“DEM”) (each, the “Fund” and collectively, the “Funds”) is responsible for establishing the Funds’ policies and for overseeing the management of the Funds. The Trustees/Directors of the Funds, including all of the disinterested Directors, have adopted written procedures to monitor potential conflicts of interest that might develop between portfolios of the Funds (the “Feeder Portfolios”) that invest in certain series of DFAITC or DEM (the “Master Funds”).
Each Board has two standing committees, an Audit Committee and a Portfolio Performance and Service Review Committee (the “Performance Committee”). The Audit Committee is comprised of George M. Constantinides, Roger G. Ibbotson and Abbie J. Smith. Each member of the Audit Committee is a disinterested Director. The Audit Committee oversees the Fund’s accounting and financial reporting policies and practices, the Fund’s internal controls, the Fund’s financial statements and the independent audits thereof and performs other oversight functions as requested by the Board. The Audit Committee recommends the appointment of each Fund’s independent registered certified public accounting firm and also acts as a liaison between the Fund’s independent registered certified public accounting firm and the full Board. There were two Audit Committee meetings held during the fiscal year ended October 31, 2009.
Each Board’s Performance Committee is comprised of Messrs. Constantinides and Ibbotson, Ms. Smith, John P. Gould, Myron S. Scholes and Robert C. Merton. Each member of the Fund’s Performance Committee is a disinterested Director. The Performance Committee regularly reviews and monitors the investment performance of the Fund’s series and reviews the performance of the Fund’s service providers. There were six Performance Committee meetings held during the fiscal year ended October 31, 2009.
Certain biographical information for each disinterested Trustee/Director and each interested Trustee/Director of the Funds is set forth in the tables below, including a description of each Trustee/Director’s experience as a Trustee/ Director of the Funds and as a director or trustee of other funds, as well as other recent professional experience.
The statements of additional information (together, “SAI”) of the Funds include additional information about each Trustee/Director. You may obtain copies of the SAI and prospectus of each Fund advised by Dimensional Fund Advisors LP by calling collect (512) 306-7400 or by mailing a request to Dimensional Fund Advisors LP, 6300 Bee Cave Road, Building One, Austin, Texas 78746. Prospectuses are also available at www.dimensional.com.
| | | | | | |
Name, Position with the Fund, Address and Age | | Term of Office1 and Length of Service | | Portfolios within the DFA Fund Complex2
Overseen | | Principal Occupation(s) During Past 5 Years and Other Directorships of Public Companies Held |
Disinterested Trustees/Directors |
George M. Constantinides Director of DFAIDG, DIG and DEM. Trustee of DFAITC. The University of Chicago Booth School of Business 5807 S. Woodlawn Avenue Chicago, IL 60637 Age: 62 | | DFAITC - since 1993 DFAIDG - since 1983 DIG - since 1993 DEM - since 1993 | | 87 portfolios in 4 investment companies | | Leo Melamed Professor of Finance, The University of Chicago Booth School of Business. |
John P. Gould Director of DFAIDG, DIG and DEM. Trustee of DFAITC. The University of Chicago Booth School of Business 5807 S. Woodlawn Avenue Chicago, IL 60637 Age: 70 | | DFAITC - since 1993 DFAIDG - since 1986 DIG - since 1993 DEM - since 1993 | | 87 portfolios in 4 investment companies | | Steven G. Rothmeier Distinguished Service Professor of Economics, The University of Chicago Booth School of Business (since 1965). Member of the Boards of Milwaukee Mutual Insurance Company (since 1997). Member and Chair, Competitive Markets Advisory Committee, Chicago Mercantile Exchange (futures trading exchange) (since 2004). Formerly, Director of UNext, Inc. (1999-2006). Formerly, Senior Vice-President, Lexecon Inc. (economics, law, strategy and finance consulting) (1994-2004). Trustee, Harbor Fund (registered investment company) (27 Portfolios) (since 1994). |
350
| | | | | | |
Name, Position with the Fund, Address and Age | | Term of Office1 and Length of Service | | Portfolios within the DFA Fund Complex2 Overseen | | Principal Occupation(s) During Past 5 Years and
Other Directorships of Public Companies Held |
Roger G. Ibbotson Director of DFAIDG, DIG and DEM. Trustee of DFAITC. Yale School of Management 135 Prospect Street New Haven, CT 06520-8200 Age: 66 | | DFAITC - since 1993 DFAIDG - since 1981 DIG - since 1993 DEM - since 1993 | | 87 portfolios in 4 investment companies | | Professor in Practice of Finance, Yale School of Management (since 1984). Director, BIRR Portfolio Analysis, Inc. (software products) (since 1990). Chairman, CIO and Partner, Zebra Capital Management, LLC (hedge fund manager) (since 2001). Formerly, Chairman, Ibbotson Associates, Inc., Chicago, IL (software data publishing and consulting) (1977-2006). |
Robert C. Merton Director of DFAIDG, DIG and DEM. Trustee of DFAITC. Harvard Business School 353 Baker Library Soldiers Field Boston, MA 02163 Age: 65 | | DFAITC - since 2003 DFAIDG - since 2003 DIG - since 2003 DEM - since 2003 | | 87 portfolios in 4 investment companies | | John and Natty McArthur University Professor, Graduate School of Business Administration, Harvard University (since 1998). Director, MF Risk, Inc. (risk management software) (since 2001). Director, Peninsula Banking Group (bank) (since 2003). Director, Community First Financial Group (bank holding company) (since 2003). Member Competitive Markets Advisory Council, Chicago Mercantile Exchange (futures trading exchange) (since 2004). Chairman and Director, Daedalus Software (medical software) (since 2008). Formerly, Advisory Board Member, Alpha Simplex Group (hedge fund) (2001-2007). Formerly, Chief Science Officer and Director, Trinsum Group, a successor to Integrated Finance Limited (2002-2008). Director, Vical Incorporated (biopharmaceutical product development) (since 2002). |
Myron S. Scholes Director of DFAIDG, DIG and DEM. Trustee of DFAITC. Platinum Grove Asset Management, L.P. Reckson Executive Park 1100 King Street Building 4 Rye Brook, NY 10573 Age: 68 | | DFAITC - since 1993 DFAIDG - since 1981 DIG - since 1993 DEM - since 1993 | | 87 portfolios in 4 investment companies | | Frank E. Buck Professor Emeritus of Finance, Stanford University (since 1981). Chairman, Platinum Grove Asset Management, L.P. (hedge fund) (formerly, Oak Hill Platinum Partners) (since 1999). Formerly, Managing Partner, Oak Hill Capital Management (private equity firm) (until 2004). Formerly, Director, Chicago Mercantile Exchange (2001-2008). Director, American Century Fund Complex (registered investment companies) (37 Portfolios) (since 1981). |
Abbie J. Smith Director of DFAIDG, DIG and DEM. Trustee of DFAITC. The University of Chicago Booth School of Business 5807 S. Woodlawn Avenue Chicago, IL 60637 Age: 56 | | DFAITC - since 2000 DFAIDG - since 2000 DIG - since 2000 DEM - since 2000 | | 87 portfolios in 4 investment companies | | Boris and Irene Stern Professor of Accounting, The University of Chicago Booth School of Business (since 1980), and Co-Director Investment Research, Fundamental Investment Advisors (hedge fund) (since 2008). Director, HNI Corporation (formerly known as HON Industries Inc.) (office furniture) (since 2000). Director, Ryder System Inc. (transportation, logistics and supply-chain management) (since 2003). Director/ Trustee, UBS Funds (fund complex) (5 portfolios) (since 2008). |
351
| | | | | | |
Name, Position with the Fund, Address and Age | | Term of Office1 and Length of Service | | Portfolios within the DFA Fund Complex2 Overseen | | Principal Occupation(s) During Past 5 Years and
Other Directorships of Public Companies Held |
Interested Trustees/Directors* |
David G. Booth Chairman, Director, Chief Executive Officer and President of DFAIDG, DIG and DEM. Chairman, Trustee, Chief Executive Officer, Chief Investment Officer and President of DFAITC. 6300 Bee Cave Road, Building One Austin, Texas 78746 Age: 62 | | DFAITC - since 1993 DFAIDG - since 1981 DIG - since 1992 DEM - since 1993 | | 87 portfolios in 4 investment companies | | Chairman, Director/Trustee, President, Chief Executive Officer and formerly Chief Investment Officer of the following companies: Dimensional Holdings Inc., Dimensional Fund Advisors LP, Dimensional Fund Advisors Canada ULC, DFAIDG, DIG, DEM and DFAITC. President and Chief Executive Officer of DFA Securities LLC. Director of Dimensional Fund Advisors Ltd, and formerly Chief Investment Officer. Director and formerly, President and Chief Investment Officer of DFA Australia Ltd. Formerly, Director of Dimensional Funds PLC and Dimensional Fund II PLC. Chairman, Director and Chief Executive Officer of Dimensional Fund Advisors Canada ULC (All Chief Investment Officer positions held starting 1/03 through 3/07 except Dimensional Holdings Inc., which was from 10/06 through 3/07.) Limited Partner, Oak Hill Partners (since 2001) and VSC Investors, LLC (since 2007). Trustee, The University of Chicago Booth School of Business. Formerly, Director, SA Funds (registered investment company). Formerly Director, Assante Corporation (investment management) (until 2002). |
Eduardo A. Repetto Director, Chief Investment Officer and Vice President of DFAIDG, DIG and DEM. Trustee, Chief Investment Officer and Vice President of DFAITC 6300 Bee Cave Road, Building One Austin, TX 78746 Age: 42 | | DFAITC - since 2009 DFAIDG - since 2009 DIG - since 2009 DEM - since 2009 | | 87 portfolios in 4 investment companies | | Director/Trustee (beginning June 2009), Chief Investment Officer (beginning March 2007) and Vice President of DFAIDG, DIG, DEM and DFAITC. Chief Investment Officer (beginning March 2007) and Vice President of all the DFA Entities, DFA Australia Limited and Dimensional Fund Advisors Canada ULC. |
| 1 | Each Trustee/Director holds office for an indefinite term until his or her successor is elected and qualified. |
| 2 | Each Trustee/Director is a director or trustee of each of the four registered investment companies within the DFA Fund Complex, which includes the Funds. |
| * | Interested Trustees/Directors are described as such because they are deemed to be “interested persons,” as that term is defined under the Investment Company Act of 1940, as amended, due to their positions with Dimensional Fund Advisors LP. |
352
Officers
The name, age, information regarding positions with the Funds and the principal occupation for each officer of the Funds are set forth below. Each officer listed below holds the same office (except as otherwise noted) in the following entities: Dimensional Fund Advisors LP (prior to November 3, 2006, Dimensional Fund Advisors Inc.) (“Dimensional”), DFA Securities Inc., DFAIDG, DIG, DFAITC and DEM (collectively, the “DFA Entities”). The address of each officer is: Dimensional Fund Advisors LP, 6300 Bee Cave Road, Building One, Austin, Texas 78746, unless otherwise indicated.
| | | | |
Name, Position with the Fund and Age | | Term of Office1 and Length of Service | | Principal Occupation(s) During Past 5 Years |
Officers |
April A. Aandal Vice President and Chief Learning Officer Age: 46 | | Since 2008 | | Vice President of all the DFA Entities. Chief Learning Officer of Dimensional (since September 2008). Formerly, Regional Director of Dimensional (2004-2008); Vice President of Professional Development at Assante Asset Management (June 2002-January 2005). |
Darryl D. Avery Vice President Age: 43 | | Since 2005 | | Vice President of all the DFA Entities. From June 2002 to January 2005, institutional client service representative of Dimensional. |
Arthur H. Barlow Vice President Age: 53 | | Since 1993 | | Vice President of all the DFA Entities. Formerly, Vice President of DFA Australia Limited and Dimensional Fund Advisors Ltd. |
Scott A. Bosworth Vice President Age: 40 | | Since 2007 | | Vice President of all the DFA Entities. Regional Director of Dimensional (since November 1997). |
Valerie A. Brown Vice President and Assistant Secretary Age: 42 | | Since 2001 | | Vice President and Assistant Secretary of all the DFA Entities, DFA Australia Limited, Dimensional Fund Advisors Ltd., and since June 2003, Dimensional Fund Advisors Canada ULC. |
David P. Butler Vice President Age: 45 | | Since 2007 | | Vice President of all the DFA Entities. Director of Global Financial Services of Dimensional (since 2008). Formerly, Regional Director of Dimensional Fund Advisors LP (January 1995 to January 2005). |
Patrick Carter Vice President Age: 47 | | Since 2007 | | Vice President of all the DFA Entities. Regional Director of Dimensional (since March 2006). Formerly, Director of Merrill Lynch Retirement Group (December 1998 to March 2006). |
Joseph H. Chi Vice President Age: 43 | | Since 2009 | | Vice President of all the DFA Entities. Portfolio Manager for Dimensional Fund Advisors LP (since October 2005). Prior to October 2005, Corporate Counsel at Hewitt Associates (July 2002-August 2005). |
Stephen A. Clark Vice President Age: 37 | | Since 2004 | | Vice President of all the DFA Entities. Formerly, Portfolio Manager of Dimensional (April 2001-April 2004). |
Robert P. Cornell Vice President Age: 60 | | Since 2007 | | Vice President of all the DFA Entities. Regional Director of Financial Services Group of Dimensional (since August 1993). |
Christopher S. Crossan Vice President and Chief Compliance Officer Age: 43 | | Since 2004 | | Vice President and Chief Compliance Officer of all the DFA Entities. |
James L. Davis Vice President Age: 52 | | Since 1999 | | Vice President of all the DFA Entities. Formerly, Vice President of DFA Australia Limited and Dimensional Fund Advisors Ltd. |
Robert T. Deere Vice President Age: 52 | | Since 1994 | | Vice President of all the DFA Entities and DFA Australia Limited. |
Robert W. Dintzner Vice President Age: 39 | | Since 2001 | | Vice President of all the DFA Entities. |
353
| | | | |
Name, Position with the Fund and Age | | Term of Office1 and Length of Service | | Principal Occupation(s) During Past 5 Years |
Kenneth Elmgren Vice President Age: 55 | | Since 2007 | | Vice President of all the DFA Entities. Formerly, Managing Principal of Beverly Capital (May 2004 to September 2006). |
Richard A. Eustice Vice President and Assistant Secretary Age: 44 | | Since 1998 | | Vice President and Assistant Secretary of all the DFA Entities and DFA Australia Limited. Chief Operating Officer of Dimensional Fund Advisors Ltd. (since July 2008). Formerly, Vice President of Dimensional Fund Advisors Ltd. |
Eugene F. Fama, Jr. Vice President Age: 48 | | Since 1993 | | Vice President of all the DFA Entities. Formerly, Vice President of DFA Australia Limited and Dimensional Fund Advisors Ltd. |
Gretchen A. Flicker Vice President Age: 38 | | Since 2004 | | Vice President of all the DFA Entities. Prior to April 2004, institutional client service representative of Dimensional. |
Jed S. Fogdall Vice President Age: 35 | | Since 2008 | | Vice President of all the DFA Entities. Portfolio Manager for Dimensional (since September 2004). Prior to September 2004, Staff Engineer at the Boeing Company (1997-2004). |
Glenn S. Freed Vice President Age: 47 | | Since 2001 | | Vice President of all the DFA Entities. |
Jeremy P. Freeman Vice President Age: 38 | | Since 2009 | | Vice President of all the DFA Entities. Senior Technology Manager for Dimensional Fund Advisors LP (since June 2006). Formerly, Principal at AIM Investments/Amvescap PLC (now Invesco) (June 1998-June 2006). |
Mark R. Gochnour Vice President Age: 42 | | Since 2007 | | Vice President of all the DFA Entities. Regional Director of Dimensional. |
Henry F. Gray Vice President Age: 42 | | Since 2000 | | Vice President of all the DFA Entities. Prior to July 2000, Portfolio Manager of Dimensional. Formerly, Vice President of DFA Australia Limited. |
John T. Gray Vice President Age: 35 | | Since 2007 | | Vice President of all the DFA Entities. Formerly, Regional Director of Dimensional (January 2005 to February 2007). |
Darla Hastings Vice President Age: 54 | | Since 2007 | | Vice President of all the DFA Entities. Chief Marketing Officer of Dimensional. Formerly, Senior Vice President, Customer Experience for Benchmark Assisted Living (May 2005 to April 2006); Executive Vice President and Chief Marketing Officer of State Street Corporation (September 2001 to October 2005). |
Joel H. Hefner Vice President Age: 41 | | Since 2007 | | Vice President of all the DFA Entities. Regional Director of Dimensional (since June 1998). |
Julie Henderson Vice President and Fund Controller Age: 35 | | Since 2005 | | Vice President and Fund Controller of all the DFA Entities. Formerly, Senior Manager at PricewaterhouseCoopers LLP (July 1996 to April 2005). |
Kevin Hight Vice President Age: 41 | | Since 2005 | | Vice President of all the DFA Entities. Formerly, Regional Director of Dimensional (since March 2003 to March 2005). |
Christine W. Ho Vice President Age: 41 | | Since 2004 | | Vice President of all the DFA Entities. Prior to April 2004, Assistant Controller of Dimensional. |
Jeff J. Jeon Vice President Age: 35 | | Since 2004 | | Vice President of all the DFA Entities. Counsel of Dimensional (since September 2001). |
Patrick M. Keating Vice President Age: 54 | | Since 2003 | | Vice President of all the DFA Entities and Chief Operating Officer of Dimensional. Director, Vice President and Chief Privacy Officer of Dimensional Fund Advisors Canada ULC. Director of DFA Australia Limited. |
354
| | | | |
Name, Position with the Fund and Age | | Term of Office1 and Length of Service | | Principal Occupation(s) During Past 5 Years |
Joseph F. Kolerich Vice President Age: 37 | | Since 2004 | | Vice President of all the DFA Entities. Portfolio Manager for Dimensional (since April 2001). |
Michael F. Lane Vice President Age: 42 | | Since 2004 | | Vice President of all the DFA Entities. Formerly, Vice President of Advisor Services at TIAA-CREF (July 2001 to September 2004). |
Kristina M. LaRusso Vice President Age: 34 | | Since 2006 | | Vice President of all DFA Entities. Formerly, Operations Supervisor of Dimensional (March 2003 to December 2006). |
Inmoo Lee Vice President Age: 43 | | Since 2007 | | Vice President of all the DFA Entities. Associate Professor Department of Finance and Accounting, Business School, National University of Singapore (July 2004 to present); Associate Professor, College of Business Administration, Korea University (September 2001 to May 2006). |
Juliet Lee Vice President Age: 38 | | Since 2005 | | Vice President of all the DFA Entities. Human Resources Manager of Dimensional (since January 2004). |
Aaron M. Marcus Vice President & Head of Global Human Resources Age: 39 | | Since 2008 | | Vice President and Head of Global Human Resources of Dimensional. Formerly, Global Head of Recruiting and Vice President of Goldman Sachs & Co. (June 2006 to January 2008); Global Co-Head of HR of the Equities & FICC Division, and Vice President of Goldman Sachs & Co. (May 2005 to May 2006); Head of Americas Campus Recruiting and Vice President of Goldman Sachs & Co. (April 2003 to May 2005). |
David R. Martin Vice President, Chief Financial Officer and Treasurer Age: 52 | | Since 2007 | | Vice President, Chief Financial Officer and Treasurer of all the DFA Entities. Director, Vice President, Chief Financial Officer and Treasurer of Dimensional Fund Advisors Ltd. and DFA Australia Limited. Chief Financial Officer, Treasurer, and Vice President of Dimensional Fund Advisors Canada ULC. Director of Dimensional Funds PLC and Dimensional Funds II PLC. Formerly, Executive Vice President and Chief Financial Officer of Janus Capital Group Inc. (June 2005 to March 2007); Senior Vice President of Finance at Charles Schwab & Co., Inc. (March 1999 to May 2005). |
Catherine L. Newell Vice President and Secretary Age: 45 | | Vice President since 1997 and Secretary since 2000 | | Vice President and Secretary of all the DFA Entities. Director, Vice President and Secretary of DFA Australia Limited and Dimensional Fund Advisors Ltd. (since February 2002, April 1997 and May 2002, respectively). Vice President and Secretary of Dimensional Fund Advisors Canada ULC (since June 2003). Director, Dimensional Funds PLC and Dimensional Funds II PLC (since 2002 and 2006, respectively). Formerly, Assistant Secretary of all DFA Entities, DFA Australia Limited and Dimensional Fund Advisors Ltd. |
Christian Newton Vice President Age: 34 | | Since 2009 | | Vice President of all DFA Entities. Web Services Manager for Dimensional Fund Advisors LP (Since January 2008). Formerly Design Manager (2005-2008) and Web Developer (2002-2005) of Dimensional Fund Advisors LP. |
Gerard K. O’Reilly Vice President Age: 32 | | Since 2007 | | Vice President of all the DFA Entities. Formerly, Research Associate of Dimensional Fund Advisors LP (2004 to 2006); Research Assistant in PhD program, Aeronautics Department California Institute of Technology (1998 to 2004). |
Daniel C. Ong Vice President Age: 35 | | Since 2009 | | Vice President of all the DFA Entities. Portfolio Manager for Dimensional Fund Advisors LP (since July 2005). Prior to 2005, Graduate Student at the University of Chicago Booth School of Business (2003-2005). |
Carmen Palafox Vice President Age: 35 | | Since 2006 | | Vice President of all the DFA Entities. Operations Manager of Dimensional Fund Advisors LP (since May 1996). |
Sonya Park Vice President Age: 37 | | Since 2005 | | Vice President of all the DFA Entities. From February 2002 to January 2005, institutional client service representative of Dimensional. |
355
| | | | |
Name, Position with the Fund and Age | | Term of Office1 and Length of Service | | Principal Occupation(s) During Past 5 Years |
David A. Plecha Vice President Age: 48 | | Since 1993 | | Vice President of all the DFA Entities, DFA Australia Limited and Dimensional Fund Advisors Ltd. |
Ted Randall Vice President Age: 36 | | Since 2008 | | Vice President of all the DFA Entities. Formerly, Research Associate of Dimensional (2006-2008). Systems Developer of Dimensional (2001-2006). |
L. Jacobo Rodriguez Vice President Age: 38 | | Since 2005 | | Vice President of all the DFA Entities. From August 2004 to July 2005, institutional client service representative of Dimensional. Formerly, Financial Services Analyst, Cato Institute (September 2001 to June 2004); Book Review Editor, Cato Journal, Cato Institute (May 1996 to June 2004). |
David E. Schneider Vice President Age: 63 | | Since 2001 | | Vice President of all the DFA Entities. Currently, Director of Institutional Services. |
Bruce A. Simmons Vice President Age: 44 | | Since 2009 | | Vice President of all the DFA Entities. Investment Operations Manager for Dimensional Fund Advisors LP (since May 2007). Formerly, Vice President Client and Fund Reporting at Mellon Financial (September 2005-May 2007); Vice President Business Development at CUADPRO Marketing (July 2003-September 2005). |
Ted R. Simpson Vice President Age: 41 | | Since 2007 | | Vice President of all the DFA Entities. Regional Director of Dimensional (since December 2002). |
Bryce D. Skaff Vice President Age: 34 | | Since 2007 | | Vice President of all the DFA Entities. Formerly, Regional Director of Dimensional (December 1999 to January 2007). |
Grady M. Smith Vice President Age: 53 | | Since 2004 | | Vice President of all the DFA Entities. Prior to April 2004, Portfolio Manager of Dimensional. |
Carl G. Snyder Vice President Age: 46 | | Since 2000 | | Vice President of all the DFA Entities. Formerly, Vice President of DFA Australia Limited. |
Lawrence R. Spieth Vice President Age: 61 | | Since 2004 | | Vice President of all the DFA Entities. Prior to April 2004, Regional Director of Dimensional. |
Bradley G. Steiman Vice President Age: 36 | | Since 2004 | | Vice President of all the DFA Entities and Director and Vice President of Dimensional Fund Advisors Canada ULC. |
Robert C. Trotter Vice President Age: 51 | | Since 2009 | | Vice President of all the DFA Entities. Senior Manager Technology for Dimensional Fund Advisors LP (since March 2007). Formerly, Director of Technology at AMVESCAP (2002-2007). |
Karen E. Umland Vice President Age: 43 | | Since 1997 | | Vice President of all the DFA Entities, DFA Australia Limited, Dimensional Fund Advisors Ltd., and Dimensional Fund Advisors Canada ULC. |
Sunil Wahal Vice President Age: 42 | | Since 2009 | | Vice President of all the DFA Entities. Formerly, Research Associate for Dimensional Fund Advisors LP (July 2008-January 2009); Consultant to Dimensional Fund Advisors LP (September 2005-July 2008); Jack D. Furst Professor of Finance at Arizona State University, WP Carey School of Business (July 2005-July 2008); Associate Professor of Finance at Goizueta Business School, Emory University (1997-2005). |
Brian J. Walsh Vice President Age: 39 | | Since 2009 | | Vice President of all the DFA Entities. Portfolio Manager for Dimensional Fund Advisors LP (since 2004). Formerly, Trader for Dimensional Fund Advisors LP (1997-2004). |
Carol W. Wardlaw Vice President Age: 51 | | Since 2004 | | Vice President of all the DFA Entities. Prior to April 2004, Regional Director of Dimensional. |
356
| | | | |
Name, Position with the Fund and Age | | Term of Office1 and Length of Service | | Principal Occupation(s) During Past 5 Years |
Weston J. Wellington Vice President Age: 58 | | Since 1997 | | Vice President of all the DFA Entities. Formerly, Vice President of DFA Australia Limited. |
Daniel M. Wheeler Vice President Age: 64 | | Since 2001 | | Vice President of all the DFA Entities. Prior to 2001 and currently, Director of Financial Advisors Services of Dimensional. Director of Dimensional Fund Advisors Ltd. (since October 2003) and President of Dimensional Fund Advisors Canada ULC (since June 2003). |
Ryan Wiley Vice President Age: 33 | | Since 2007 | | Vice President of all the DFA Entities. Senior Trader of Dimensional. Formerly, Portfolio Manager (2006 to 2007); Trader (2001 to 2006). |
Paul E. Wise Vice President Age: 54 | | Since 2005 | | Vice President of all the DFA Entities. Chief Technology Officer for Dimensional (since 2004). Formerly, Principal of Turnbuckle Management Group (January 2002 to August 2004). |
| 1 | Each officer holds office for an indefinite term at the pleasure of the Boards of Trustees/Directors and until his or her successor is elected and qualified. |
357
VOTING PROXIES ON FUND PORTFOLIO SECURITIES
A description of the policies and procedures that the Fund and the Trust use in voting proxies relating to securities held in the portfolios is available without charge, upon request, by calling collect: (512) 306-7400. Information regarding how the Advisor votes these proxies is available from the EDGAR database on the SEC’s website at http://www.sec.gov and from the Advisor’s website at http://www.dimensional.com and reflects the twelve-month period beginning July 1st and ending June 30th.
358
NOTICE TO SHAREHOLDERS
(Unaudited)
For shareholders that do not have an October 31, 2009 tax year end, this notice is for informational purposes only. For shareholders with an October 31, 2009 tax year end, please consult your tax advisor as to the pertinence of this notice. For the fiscal year November 1, 2008 to October 31, 2009, each Portfolio is designating the following items with regard to distributions paid during the fiscal year. All designations are based on financial information available as of the date of this annual report and, accordingly are subject to change. For each item, it is the intention of the Portfolio to designate the maximum amount permitted under the Internal Revenue Code and the regulations thereunder.
| | | | | | | | | | | | | | | | | | | | | | | | | | |
DFA Investment
Dimensions
Group Inc. | | Net
Investment
Income
Distributions | | Short-Term
Capital Gain
Distributions | | Long-Term
Capital Gain
Distributions | | Return
of
Capital | | Tax-Exempt
Interest | | Total
Distributions | | Qualifying
For
Corporate
Dividends
Received
Deduction(1) | | Qualifying
Dividend
Income(2) | | U.S.
Government
Interest(3) | | Foreign
Tax
Credit(4) | | Foreign
Source
Income(5) | | Qualifying
Interest
Income(6) | | Qualifying
Short-Term
Capital
Gain(7) |
U.S. Large Company Portfolio | | 100% | | — | | — | | — | | — | | 100% | | 100% | | 100% | | — | | — | | — | | 100% | | 100% |
Enhanced U.S. Large Company Portfolio | | 91% | | 9% | | — | | — | | — | | 100% | | — | | — | | 1% | | — | | — | | 100% | | 100% |
U.S. Large Cap Value Portfolio | | 95% | | 5% | | — | | — | | — | | 100% | | 100% | | 100% | | — | | — | | — | | 100% | | 100% |
U.S. Targeted Value Portfolio | | 100% | | — | | — | | — | | — | | 100% | | 100% | | 100% | | — | | — | | — | | 100% | | 100% |
U.S. Small Cap Value Portfolio | | 100% | | — | | — | | — | | — | | 100% | | 100% | | 100% | | — | | — | | — | | 100% | | 100% |
U.S. Core Equity 1 Portfolio | | 100% | | — | | — | | — | | — | | 100% | | 100% | | 100% | | — | | — | | — | | 100% | | 100% |
U.S. Core Equity 2 Portfolio | | 100% | | — | | — | | — | | — | | 100% | | 100% | | 100% | | — | | — | | — | | 100% | | 100% |
U.S. Vector Equity Portfolio | | 100% | | — | | — | | — | | — | | 100% | | 100% | | 100% | | — | | — | | — | | 100% | | 100% |
T.A. U.S. Core Equity 2 Portfolio | | 100% | | — | | — | | — | | — | | 100% | | 100% | | 100% | | — | | — | | — | | 100% | | 100% |
U.S. Small Cap Portfolio | | 100% | | — | | — | | — | | — | | 100% | | 100% | | 100% | | — | | — | | — | | 100% | | 100% |
U.S. Micro Cap Portfolio | | 100% | | — | | — | | — | | — | | 100% | | 100% | | 100% | | — | | — | | — | | 100% | | 100% |
DFA Real Estate Securities Portfolio | | 100% | | — | | — | | — | | — | | 100% | | 100% | | 100% | | — | | — | | — | | 100% | | 100% |
Large Cap International Portfolio | | 100% | | — | | — | | — | | — | | 100% | | 100% | | 100% | | — | | 8% | | 124% | | 100% | | 100% |
International Core Equity Portfolio | | 100% | | — | | — | | — | | — | | 100% | | 100% | | 100% | | 1% | | 7% | | 113% | | 100% | | 100% |
T.A. World ex U.S. Core Equity Portfolio | | 100% | | — | | — | | — | | — | | 100% | | 100% | | 100% | | — | | 8% | | 137% | | 100% | | 100% |
International Small Company Portfolio | | 100% | | — | | — | | — | | — | | 100% | | 100% | | 100% | | — | | 7% | | 119% | | 100% | | 100% |
Japanese Small Company Portfolio | | 100% | | — | | — | | — | | — | | 100% | | 100% | | 100% | | — | | 6% | | 85% | | 100% | | 100% |
Asia Pacific Small Company Portfolio | | 100% | | — | | — | | — | | — | | 100% | | 100% | | 100% | | — | | 2% | | 101% | | 100% | | 100% |
United Kingdom Small Company Portfolio | | 100% | | — | | — | | — | | — | | 100% | | 100% | | 100% | | — | | — | | — | | 100% | | 100% |
Continental Small Company Portfolio | | 100% | | — | | — | | — | | — | | 100% | | 100% | | 100% | | — | | 12% | | 124% | | 100% | | 100% |
DFA International Real Estate Securities Portfolio | | 100% | | — | | — | | — | | — | | 100% | | 100% | | 100% | | — | | 15% | | 290% | | 100% | | 100% |
DFA Global Real Estate Securities Portfolio | | 100% | | — | | — | | — | | — | | 100% | | 100% | | 100% | | — | | — | | — | | 100% | | 100% |
DFA International Small Cap Value Portfolio | | 81% | | — | | 19% | | — | | — | | 100% | | 100% | | 100% | | — | | 8% | | 142% | | 100% | | 100% |
International Vector Equity Portfolio | | 100% | | — | | — | | — | | — | | 100% | | 100% | | 100% | | — | | 9% | | 140% | | 100% | | 100% |
Emerging Markets Portfolio | | 59% | | 1% | | 40% | | — | | — | | 100% | | 100% | | 100% | | — | | 8% | | 123% | | 100% | | 100% |
Emerging Markets Small Cap Portfolio | | 100% | | — | | — | | — | | — | | 100% | | 100% | | 100% | | — | | 10% | | 130% | | 100% | | 100% |
Emerging Markets Core Equity Portfolio | | 100% | | — | | — | | — | | — | | 100% | | 100% | | 100% | | — | | 9% | | 167% | | 100% | | 100% |
DFA One-Year Fixed Income Portfolio | | 100% | | — | | — | | — | | — | | 100% | | — | | — | | 1% | | — | | — | | 100% | | 100% |
DFA Two-Year Global Fixed Income Portfolio | | 100% | | — | | — | | — | | — | | 100% | | — | | — | | 2% | | — | | — | | 100% | | 100% |
DFA Selectively Hedged Global Fixed Income Portfolio | | — | | — | | — | | — | | — | | — | | — | | — | | — | | — | | — | | — | | — |
DFA Five-Year Government Portfolio | | 100% | | — | | — | | — | | — | | 100% | | — | | — | | 100% | | — | | — | | 100% | | 100% |
DFA Five-Year Global Fixed Income Portfolio | | 100% | | — | | — | | — | | — | | 100% | | — | | — | | 23% | | — | | — | | 100% | | 100% |
DFA Intermediate Government Fixed Income Portfolio | | 89% | | — | | 11% | | — | | — | | 100% | | — | | — | | 100% | | — | | — | | 100% | | 100% |
DFA Short-Term Extended Quality Portfolio | | 100% | | — | | — | | — | | — | | 100% | | — | | — | | — | | — | | — | | 100% | | 100% |
DFA Inflation-Protected Securities Portfolio | | 90% | | 1% | | 9% | | — | | — | | 100% | | — | | — | | 34% | | — | | — | | 100% | | 100% |
DFA Short-Term Municipal Bond Portfolio | | — | | — | | — | | — | | 100% | | 100% | | — | | — | | — | | — | | — | | 100% | | 100% |
DFA California Short-Term Municipal Bond Portfolio | | — | | — | | — | | — | | 100% | | 100% | | — | | — | | — | | — | | — | | 100% | | 100% |
Dimensional Investment Group Inc. | | | | | | | | | | | | | | | | | | | | | | | | | | |
DFA International Value Portfolio | | 100% | | — | | — | | — | | — | | 100% | | 100% | | 100% | | — | | 7% | | 114% | | 100% | | 100% |
| (1) | Qualifying dividends represent dividends which qualify for the corporate dividends received deduction and is reflected as a percentage of ordinary Income distributions (the total of short-term capital gain and net investment income distributions). |
| (2) | The percentage in this column represents the amount of “Qualifying Dividend Income” as created by the Jobs and Growth Tax Relief Reconciliation Act of 2003 and is reflected as a percentage of ordinary income distributions (the total of short-term capital gain and net investment income distributions). Please note that these percentages are designated only, refer to your 1099 for actual qualified dividend income. |
| (3) | “U.S. Government Interest” represents the amount of interest that was derived from direct U.S. Government obligations and distributed during the fiscal year. This amount is reflected as a percentage of total ordinary income distributions (the total of short-term capital gain and net investment income distributions). Generally, interest from direct U.S. Government obligations is exempt from state income tax. However, for residents of California, Connecticut and New York, the statutory threshold requirements were satisfied for DFA Five-Year Government Portfolio, DFA Intermediate Government Fixed Income Portfolio, and DFA Inflation-Protected Securities Portfolio to permit exemption of these amounts from state income for these funds. |
| (4) | “Foreign Tax Credit” represents dividends which qualify for the foreign tax credit pass through and is reflected as a percentage of investment company taxable income (the total of short-term capital gain and net investment income distributions). |
| (5) | “Foreign Source Income” represents the portion of dividends derived from foreign sources, and is reflected as a percentage of ordinary income (i.e., the sum of short-term capital gain and net investment income) distributions made during the period. |
| (6) | The percentage in this column represents the amount of “Qualifying Interest Income” as created by The American Jobs Creation Act of 2004. The information is reflected as a percentage ordinary income distributions (the total of short-term capital gain and net investment income distributions). |
| (7) | The percentage in this column represents the amount of “Qualifying Short-Term Capital Gain” as created by The American Jobs Creation Act of 2004. The information is reflected as a percentage of ordinary income distributions (the total of short-term capital gain and net investment income distributions). |
359


Dimensional Fund Advisors
6300 Bee Cave Road, Building One
Austin, TX 78746
December 2009
Dear Fellow Shareholder,
After sinking to ten-year lows, stock prices around the world rebounded sharply in March 2009 and posted steady gains in the seven months between March and September. March and April were among the best-return months in the life of Dimensional’s equity Funds.
The unexpected turns in the financial markets this year offered some valuable lessons. We were reminded that stock prices are unpredictable. We saw once again the benefits of staying disciplined in the market as it inevitably moves up and down. And I believe these markets showed very clearly why diversification is so important to long-term investment success.
Although diversification can’t prevent losses, it can help investors avoid the extreme outcomes that can result from concentrating investments in individual stocks or market segments. We believe that successful investing is about both increasing wealth and being able to sleep well at night. Investors who understand how markets work and have a realistic understanding of their own tolerance for risk are most likely to have a good overall experience.
More than $10 billion in net long-term assets flowed into Dimensional’s Funds during the first 10 months of 2009, a reflection of the trust our shareholders around the world have placed in us. We are grateful for that trust and want you to know that we take our responsibility as the steward of your investments in Dimensional’s Funds very seriously. We hope to have the opportunity to continue serving your needs for many years to come.
|
Sincerely, |
|
 |
|
David G. Booth |
Chairman and Chief Executive Officer |
[THIS PAGE INTENTIONALLY LEFT BLANK]
ANNUAL REPORT
Table of Contents
This report is submitted for the information of the Fund’s shareholders. It is not authorized for distribution to prospective investors unless preceded or accompanied by an effective prospectus.
i
[THIS PAGE INTENTIONALLY LEFT BLANK]
DIMENSIONAL INVESTMENT GROUP INC.
DFA INVESTMENT DIMENSIONS GROUP INC.
THE DFA INVESTMENT TRUST COMPANY
DEFINITIONS OF ABBREVIATIONS AND FOOTNOTES
Statements of Assets and Liabilities/Schedules of Investments/Summary Schedules of Portfolio Holdings
| | |
Investment Abbreviations |
ADR | | American Depositary Receipt |
FHLMC | | Federal Home Loan Mortgage Corporation |
FNMA | | Federal National Mortgage Association |
P.L.C. | | Public Limited Company |
|
Investment Footnotes |
† | | See Note B to Financial Statements. |
†† | | Securities have generally been fair valued. See Note B to Financial Statements. |
** | | Calculated as a percentage of total net assets. Percentages shown parenthetically next to the category headings have been calculated as a percentage of total investments. “Other Securities” are those securities that are not among the top 50 holdings of the Fund or do not represent more than 1.0% of the net assets of the Fund. Some of the individual securities within this category may include Total or Partial Securities on Loan and/or Non-Income Producing Securities. |
* | | Non-Income Producing Securities. |
# | | Total or Partial Securities on Loan. |
@ | | Security purchased with cash proceeds from Securities on Loan. |
(r) | | The adjustable rate shown is effective as of October 31, 2009. |
§ | | Affiliated Fund. |
|
| Financial Highlights |
(A) | | Computed using average shares outstanding. |
(B) | | Annualized |
(C) | | Non-Annualized |
(D) | | Represents the combined ratios for the respective portfolio and its respective pro-rata share of its Master Fund Series. |
|
| All Statements and Schedules |
— | | Amounts designated as — are either zero or rounded to zero. |
SEC | | Securities and Exchange Commission |
1
DIMENSIONAL INVESTMENT GROUP INC.
PERFORMANCE CHARTS
LWAS/DFA U.S. High Book to Market Portfolio vs.
Russell 1000® Value Index
October 31, 1999-October 31, 2009
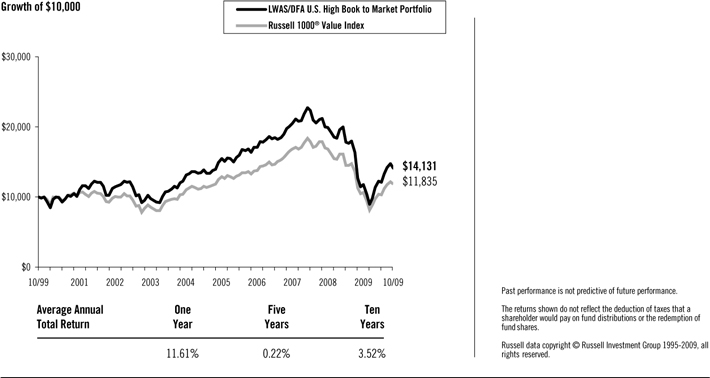
LWAS/DFA Two-Year Fixed Income Portfolio vs.
BofA Merrill Lynch US Corporate and Government Index 1-3 Years
October 31, 1999-October 31, 2009
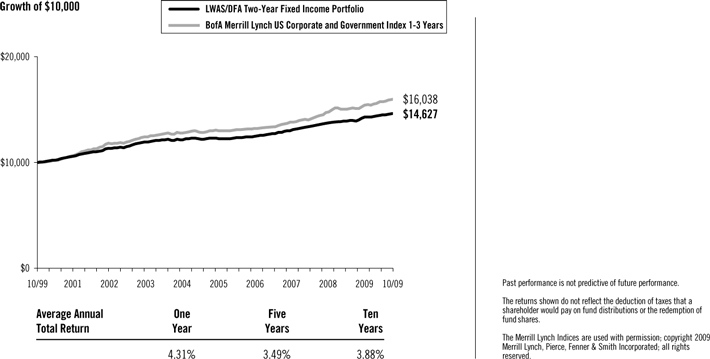
LWAS/DFA Two-Year Government Portfolio vs.
BofA Merrill Lynch US Government Bond Index 1-3 Years
October 31, 1999-October 31, 2009
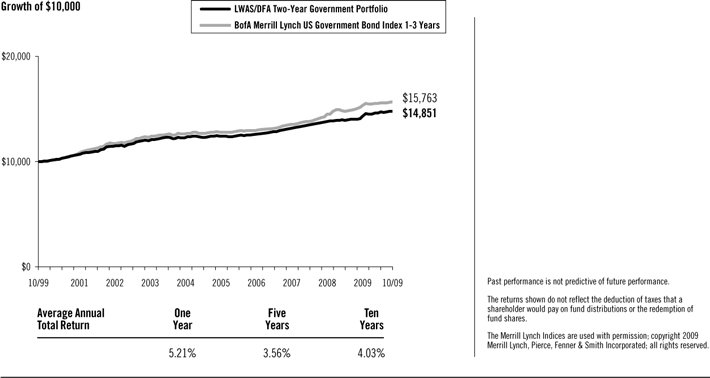
2
DIMENSIONAL INVESTMENT GROUP INC.
MANAGEMENT’S DISCUSSION AND ANALYSIS
| | |
| U.S. Equity Market Review | | 12 Months Ended October 31, 2009 |
The year ending October 31, 2009, was among the most volatile periods in U.S. market history. Broad market returns were positive with stocks represented by the mid cap index outperforming those within both small cap and large cap indexes and stocks represented by the growth index outperforming those represented by the value index. Investors moving out of stocks, beginning in late 2008 and extending into early 2009, contributed to high volatility and negative returns over that period. Markets turned sharply higher in March, and the size and value premiums both turned positive over the eight months ending October 2009. Although the large cap index outperformed the small cap index, and the growth index outperformed the value index, returns within the broader market (Russell 3000® Index) demonstrate that there was a positive small size premium and a positive value premium. This counterintuitive result occurred because the stock markets were characterized by extreme volatility, and the indexes, which are reconstituted annually, were not able to rebalance during the course of the year to maintain their intended asset class exposure. Among the most important factors explaining differences in the behavior of diversified equity portfolios are the company size and company value/growth characteristics of the portfolio’s holdings. Size is measured by market capitalization, and value classification is a function of stock price relative to one or more fundamental characteristics. Compared to other stocks, value stocks often have lower market value relative to their earnings, dividends, and book value.
For the 12 months ended October 31, 2009, the total return of the Russell Microcap® Index was 5.06%, the Russell 2000® Index was 6.46%, the CRSP 6-10 Index was 20.94%, and the MSCI US Small Cap 1750 Index was 14.11%. Large cap growth stocks outperformed large cap value stocks, as measured by the Russell 1000® Growth Index and Russell 1000® Value Index. Small cap growth stocks outperformed small cap value stocks, by a lesser amount than in large caps, as measured by the Russell 2000® Growth Index and Russell 2000® Value Index.
| | | |
| Total Return for 12 Months Ended October 31, 2009 | |
| |
Russell 2000® Index (small cap companies) | | 6.46 | % |
Russell Midcap® Index (mid cap companies) | | 18.74 | % |
Russell 1000® Index (large cap companies) | | 11.19 | % |
Russell 3000® Value Index | | 4.55 | % |
Russell 3000® Growth Index | | 17.04 | % |
Further dividing the large, mid, and small cap market segments by value and growth characteristics shows more detail in the performance differences over the period.
| | | |
| Total Return for 12 Months Ended October 31, 2009 | |
| |
Russell 1000® Value Index (large cap value companies) | | 4.78 | % |
Russell 1000® Growth Index (large cap growth companies) | | 17.50 | % |
Russell Midcap® Value Index (mid cap value companies) | | 14.52 | % |
Russell Midcap® Growth Index (mid cap growth companies) | | 22.48 | % |
Russell 2500TM Value Index (small/mid cap value companies) | | 8.56 | % |
Russell 2500TM Growth Index (small/mid cap growth companies) | | 18.20 | % |
Russell 2000® Value Index (small cap value companies) | | 1.95 | % |
Russell 2000® Growth Index(small cap growth companies) | | 11.34 | % |
Source: Russell data copyright © Russell Investment Group 1995-2009, all rights reserved.
Differences in returns for the various Dimensional U.S. equity funds over the 12 months ended October 31, 2009 were attributable primarily to differences in value/growth and size characteristics as well as the exclusion of
3
REIT securities from most Dimensional portfolios, except for the DFA Real Estate Securities Portfolio and portfolios investing in the U.S. Large Company Series. Moreover, the portfolio construction approach used by Dimensional Fund Advisors (the “Advisor”) generally resulted in portfolios with greater emphasis on value or small company characteristics relative to widely used index benchmarks.
Master-Feeder Structure
The portfolio described below, called a “Feeder Fund”, does not buy individual securities directly; instead, the portfolio invests in a corresponding fund called a “Master Fund”. The Master Fund, in turn, purchases stocks and/or other securities.
Domestic Equity Portfolio Performance Overview
LWAS/DFA U.S. High Book to Market Portfolio
The LWAS/DFA U.S. High Book to Market Portfolio seeks to capture the returns of U.S. large company value stocks by purchasing shares of a Master Fund that invests in such stocks. The investment strategy employs a disciplined, quantitative approach, emphasizing broad diversification and consistent exposure to large cap value stocks, but does not attempt to track closely a specific equity index. As of October 31, 2009, the Master Fund about 213 stocks and was mostly invested in equities throughout the year: the average non-equitized cash level for the period was less than 1% of the Master Fund’s assets.
As a result of the Master Fund’s diversified investment approach, performance was determined principally by broad structural trends in the U.S. equity market, rather than the behavior of a limited number of stocks. For the 12 months ended October 31, 2009, total returns were 11.61% for the Portfolio and 4.78% for the Russell 1000® Value Index. The Portfolio benefited from a positive size premium and value premium over the last eight months of the period. Relative to the Index, the Master Fund’s greater exposure to stocks with more pronounced value characteristics and composition differences along the value/growth dimension added approximately 4.2% to the relative performance. Differences in sector weights between the Portfolio and Index also contributed to the outperformance. The Master Fund’s larger allocation than the Index to consumer discretionary stocks, due to its strategy of maintaining consistent large cap value exposure, added approximately 3% to relative performance. The Portfolio also benefited from composition differences among the Master Fund’s basket of financial stocks, which added approximately 3.6% to relative performance.
| | |
| Fixed Income Market Review | | 12 Months Ended October 31, 2009 |
U.S. and international credit markets experienced high levels of volatility in the fiscal year ended October 31, 2009. Investor appetite for credit risk returned as the year progressed, and credit spreads narrowed significantly. Over the course of the year the U.S. Federal Reserve lowered the target rate for federal funds from 1.00% on October 31, 2008 to between 0% and 0.25% by October 31, 2009, and continued to add liquidity into the financial system through various loan programs and capital injections into financial institutions. Central banks around the world took similar actions to loosen credit markets. The three-month London Interbank Offered Rate (LIBOR), a widely-used benchmark of short-term interest rates, fell 275 basis points during the 12 months ended October 31, 2009, while the yield on ten-year U.S. Treasury notes declined 57 basis points. The yield curve remained upwardly sloped throughout the year.
| | | | | | |
| | | 10/31/09 | | 10/31/08 | | Change |
Three-Month LIBOR (yield) | | 0.28% | | 3.03% | | -90.76% |
Ten-Year U.S. Treasury Notes (yield) | | 3.38% | | 3.95% | | -14.43% |
Source: Bloomberg. “Change” values are calculated prior to rounding.
There is generally an inverse relationship between interest rates and bond prices, such that bond prices fall when interest rates rise. For the fiscal year under review, changes in interest rates and bond prices were more pronounced in some parts of the yield curve than others. For the 12 months ended October 31, 2009, total returns
4
were 0.32% for three-month U.S. Treasury bills, 6.77% for five-year U.S. Treasury notes, and 5.57% for thirty-year U.S. Treasury bonds.
Fixed Income Portfolio Performance Overview
LWAS/DFA Two-Year Fixed Income Portfolio
The LWAS/DFA Two-Year Fixed Income Portfolio seeks to maximize risk-adjusted total returns from a universe of high-quality fixed income securities maturing in two years or less. The investment strategy shifts maturities based on changes in the yield curve. Using current prices, the strategy creates a matrix of expected returns from different buy and sell strategies, and identifies the maturity range for the highest risk-adjusted expected returns. Maturities are shifted if expected premiums can be documented. Average maturity of the Portfolio increased to 1.47 years on October 31, 2009, from 0.89 years on October 31, 2008.
For the 12 months ended October 31, 2009, total returns were 4.31% for the LWAS/DFA Two-Year Fixed Income Portfolio and 6.35% for the BofA Merrill Lynch U.S. Corporate and Government Index 1-3 Years. Structural differences between the Portfolio and Index were the primary reason for the Portfolio’s relative underperformance. A majority of the Portfolio’s holdings were invested in bonds rated AA or better while the Index had a relatively large allocation to securities rated A or lower. Over the period, lower-rated securities benefited from tightening credit spreads and outperformed higher-rated securities.
LWAS/DFA Two-Year Government Portfolio
The LWAS/DFA Two-Year Government Portfolio seeks to maximize risk-adjusted total returns from a universe of U.S. government securities maturing in two years or less. The investment strategy shifts maturities based on changes in the yield curve. Using current prices, the strategy creates a matrix of expected returns from different buy and sell strategies, and identifies the maturity range for the highest risk-adjusted expected returns. Maturities are shifted if expected premiums can be documented. Average maturity of the Portfolio increased to 1.47 years on October 31, 2009, from 1.42 years on October 31, 2008.
For the 12 months ended October 31, 2009, total returns were 5.21% for the LWAS/DFA Two-Year Government Portfolio and 3.73% for the BofA Merrill Lynch U.S. Government Bond Index 1-3 Years. Structural differences between the Portfolio and Index were the primary reason for the Portfolio’s relative outperformance. Over the period, all of the Portfolio’s holdings were government agency debt which significantly outperformed Treasury debt during the period of tightening credit spreads.
5
DIMENSIONAL INVESTMENT GROUP INC.
DISCLOSURE OF FUND EXPENSES
(Unaudited)
The following Expense Tables are shown so that you can understand the impact of fees on your investment. All mutual funds have operating expenses. As a shareholder of the fund, you incur ongoing costs, which include costs for portfolio management, administrative services, and shareholder reports, among others. Operating expenses, legal and audit services, which are deducted from a fund’s gross income, directly reduce the investment return of the fund. A fund’s expenses are expressed as a percentage of its average net assets. This figure is known as the expense ratio. The following examples are intended to help you understand the ongoing costs, in dollars, of investing in the fund and to compare these costs with those of other mutual funds. The examples are based on an investment of $1,000 made at the beginning of the period shown and held for the entire period.
The Expense Tables below illustrate your fund’s costs in two ways.
Actual Fund Return
This section helps you to estimate the actual expenses after fee waivers that you paid over the period. The “Ending Account Value” shown is derived from the fund’s actual return and “Expenses Paid During Period” reflect the dollar amount that would have been paid by an investor who started with $1,000 in the fund. You may use the information here, together with the amount you invested, to estimate the expenses that you paid over the period.
To do so, simply divide your account value by $1,000 (for example, a $7,500 account value divided by $1,000 = 7.5), then multiply the result by the number given for your fund under the heading “Expenses Paid During Period.”
Hypothetical Example for Comparison Purposes
This section is intended to help you compare your fund’s costs with those of other mutual funds. The hypothetical “Ending Account Value” and “Expenses Paid During Period” are derived from the fund’s actual expense ratio and an assumed 5% annual return before expenses. In this case, because the return used is not the fund’s actual return, the results do not apply to your investment. The example is useful in making comparisons because the SEC requires all mutual funds to calculate expenses based on a 5% annual return. You can assess your fund’s costs by comparing this hypothetical example with the hypothetical examples that appear in shareholder reports of other funds.
Please note that the expenses shown in the tables are meant to highlight and help you compare ongoing costs only and do not reflect any transactional costs, if applicable. The “Annualized Expense Ratio” represents the actual expenses for the six-month period indicated.
| | |
| EXPENSE TABLES | | Six Months Ended October 31, 2009 |
| | | | | | | | |
| | | Beginning
Account
Value
05/01/09 | | Ending
Account
Value
10/31/09 | | Annualized
Expense
Ratio* | | Expenses
Paid
During
Period* |
LWAS/DFA U.S. High Book to Market Portfolio** | | | | | | | | |
Actual Fund Return | | $1,000.00 | | $1,241.10 | | 0.37% | | $2.09 |
Hypothetical 5% Annual Return | | $1,000.00 | | $1,023.34 | | 0.37% | | $1.89 |
| | | | |
LWAS/DFA Two-Year Fixed Income Portfolio | | | | | | | | |
Actual Fund Return | | $1,000.00 | | $1,015.00 | | 0.35% | | $1.78 |
Hypothetical 5% Annual Return | | $1,000.00 | | $1,023.44 | | 0.35% | | $1.79 |
| | | | |
LWAS/DFA Two-Year Government Portfolio | | | | | | | | |
Actual Fund Return | | $1,000.00 | | $1,012.00 | | 0.33% | | $1.67 |
Hypothetical 5% Annual Return | | $1,000.00 | | $1,023.54 | | 0.33% | | $1.68 |
| * | Expenses are equal to the fund’s annualized expense ratio for the six-month period, multiplied by the average account value over the period, multiplied by the number of days in the most recent six-month period (184), then divided by the number of days in the year (365) to reflect the six-month period. |
| ** | The Portfolio is a Feeder Fund. The expenses shown reflect the direct expenses of the Feeder Fund and the indirect payment of the Feeder Fund’s portion of the expenses of its Master Fund. |
6
DIMENSIONAL INVESTMENT GROUP INC.
DISCLOSURE OF PORTFOLIO HOLDINGS
(Unaudited)
The SEC requires that all Funds file a complete Schedule of Investments with the SEC for their first and third fiscal quarters on Form N-Q. For Dimensional Investment Group Inc., this would be for the fiscal quarters ending January 31 and July 31. The Form N-Q filing must be made within 60 days of the end of the quarter. Dimensional Investment Group Inc. filed its most recent Form N-Q with the SEC on September 29, 2009. It is available upon request, without charge, by calling collect: (512) 306-7400 or by mailing a request to Dimensional Fund Advisors LP, 6300 Bee Cave Road, Building One, Austin, Texas 78746, or by visiting the SEC’s website at http://www.sec.gov, or they may be reviewed and copied at the SEC’s Public Reference Room in Washington, D.C. (call 1-800-732-0330 for information on the operation of the Public Reference Room).
PORTFOLIO HOLDINGS
The SEC requires that all Funds present their categories of portfolio holdings in a table, chart or graph format in their annual and semi-annual shareholder reports, whether or not a Schedule of Investments is utilized. The following tables, which presents portfolio holdings as a percent of total investments before short-term investments and collateral for loaned securities, are provided in compliance with such requirement. The categories shown below represent broad industry sectors. Each industry sector consists of one or more specific industry classifications.
The categories of industry classification for the Affiliated Investment Company are represented in the Disclosure of Portfolio Holdings, which are included elsewhere within the report. Refer to the Summary Schedule of Portfolio Holdings for the underlying Master Fund’s holdings which reflect the investments by category.
FEEDER FUND
| | |
| | | Affiliated
Investment
Company |
LWAS/DFA U.S. High Book to Market Portfolio | | 100.0% |
FIXED INCOME PORTFOLIOS
| | |
| LWAS/DFA Two-Year Fixed Income Portfolio |
Corporate | | 11.2% |
Government | | 73.2% |
Foreign Corporate | | 2.8% |
Foreign Government | | 12.1% |
Supranational | | 0.7% |
| | |
Total | | 100.0% |
| | |
| LWAS/DFA Two-Year Government Portfolio |
Government | | 100.0% |
| | |
Total | | 100.0% |
7
LWAS/DFA TWO-YEAR FIXED INCOME PORTFOLIO
SCHEDULE OF INVESTMENTS
October 31, 2009
| | | | | | |
| | | Face
Amount | | Value† |
| | | (000) | | |
AGENCY OBLIGATIONS — (68.6%) | | | | | | |
Federal Farm Credit Bank | | | | | | |
3.750%, 12/06/10 | | $ | 1,400 | | $ | 1,448,306 |
5.375%, 07/18/11 | | | 2,200 | | | 2,366,049 |
3.875%, 08/25/11 | | | 2,300 | | | 2,418,744 |
1.125%, 10/03/11 | | | 2,000 | | | 1,998,506 |
Federal Home Loan Bank | | | | | | |
4.375%, 10/22/10 | | | 400 | | | 414,756 |
1.625%, 01/21/11 | | | 4,200 | | | 4,255,364 |
1.375%, 05/16/11 | | | 2,900 | | | 2,928,165 |
2.625%, 05/20/11 | | | 5,500 | | | 5,659,121 |
3.375%, 06/24/11 | | | 4,500 | | | 4,676,985 |
3.625%, 07/01/11 | | | 2,800 | | | 2,928,699 |
1.625%, 07/27/11 | | | 5,100 | | | 5,159,134 |
3.750%, 09/09/11 | | | 3,400 | | | 3,578,578 |
3.625%, 09/16/11 | | | 1,800 | | | 1,891,744 |
Federal Home Loan Mortgage Corporation | | | | | | |
4.750%, 01/18/11 | | | 2,100 | | | 2,204,651 |
3.250%, 02/25/11 | | | 2,200 | | | 2,270,805 |
6.000%, 06/15/11 | | | 1,000 | | | 1,083,118 |
Federal National Mortgage Association | | | | | | |
1.750%, 03/23/11 | | | 500 | | | 507,210 |
1.375%, 04/28/11 | | | 2,200 | | | 2,218,487 |
6.000%, 05/15/11 | | | 3,500 | | | 3,774,572 |
3.375%, 05/19/11 | | | 900 | | | 936,644 |
| | | | | | |
TOTAL AGENCY OBLIGATIONS | | | | | | 52,719,638 |
| | | | | | |
| | |
BONDS — (26.7%) | | | | | | |
Canada Mortgage & Housing Corp. | | | | | | |
4.800%, 10/01/10 | | | 500 | | | 519,496 |
Citigroup, Inc. | | | | | | |
1.250%, 09/22/11 | | | 400 | | | 401,644 |
General Electric Capital Corp. | | | | | | |
7.375%, 01/19/10 | | | 2,100 | | | 2,130,771 |
Goldman Sachs Group, Inc. | | | | | | |
1.700%, 03/15/11 | | | 2,000 | | | 2,028,894 |
Japan Finance Corp. | | | | | | |
2.000%, 06/24/11 | | | 2,000 | | | 2,031,242 |
Kreditanstalt fuer Wiederaufbau | | | | | | |
4.625%, 01/20/11 | | | 1,800 | | | 1,879,342 |
Landwirtschaftliche Rentenbank | | | | | | |
4.875%, 02/14/11 | | | 400 | | | 421,197 |
Morgan Stanley | | | | | | |
2.900%, 12/01/10 | | | 2,000 | | | 2,046,626 |
| | | | | | |
| | | Face
Amount | | Value† |
| | | (000) | | |
Nordic Investment Bank | | | | | | |
4.875%, 03/15/11 | | $ | 500 | | $ | 528,698 |
Oesterreichische Kontrollbank AG | | | | | | |
4.250%, 10/06/10 | | | 2,000 | | | 2,068,876 |
Ontario, Province of Canada | | | | | | |
3.125%, 09/08/10 | | | 400 | | | 408,866 |
Royal Bank of Canada | | | | | | |
5.650%, 07/20/11 | | | 2,000 | | | 2,148,442 |
State Street Bank & Trust Co. | | | | | | |
1.850%, 03/15/11 | | | 1,900 | | | 1,927,670 |
Svensk Exportkredit AB | | | | | | |
4.000%, 06/15/10 | | | 400 | | | 408,569 |
4.500%, 09/27/10 | | | 1,500 | | | 1,553,474 |
| | | | | | |
TOTAL BONDS | | | | | | 20,503,807 |
| | | | | | |
| | |
U.S. TREASURY OBLIGATIONS — (4.1%) | | | | | | |
U.S. Treasury Note | | | | | | |
1.000%, 09/30/11 | | | 3,100 | | | 3,108,717 |
| | | | | | |
TEMPORARY CASH INVESTMENTS — (0.6%) | | | | | | |
Repurchase Agreement, PNC Capital Markets, Inc. 0.19%, 11/02/09 (Collateralized by $640,000 FNMA 5.00%, 08/25/18, valued at $500,193) to be repurchased at $492,008 | | | 492 | | | 492,000 |
| | | | | | |
TOTAL INVESTMENTS — (100.0%)
(Cost $76,279,263) | | | | | $ | 76,824,162 |
| | | | | | |
8
LWAS/DFA TWO-YEAR FIXED INCOME PORTFOLIO
CONTINUED
Summary of inputs used to value the Portfolio’s net assets as of October 31, 2009 is as follows (See Security Valuation Note):
| | | | | | | | | | |
| | | Valuation Inputs |
| |
| | | Investment in Securities (Market Value) |
| | | Level 1 | | Level 2 | | Level 3 | | Total |
Agency Obligations | | — | | $ | 52,719,638 | | — | | $ | 52,719,638 |
Bonds | | — | | | 20,503,807 | | — | | | 20,503,807 |
U.S. Treasury Obligations | | — | | | 3,108,717 | | — | | | 3,108,717 |
Temporary Cash Investments | | — | | | 492,000 | | — | | | 492,000 |
| | | | | | | | | | |
TOTAL | | — | | $ | 76,824,162 | | — | | $ | 76,824,162 |
| | | | | | | | | | |
See accompanying Notes to Financial Statements.
9
LWAS/DFA TWO-YEAR GOVERNMENT PORTFOLIO
SCHEDULE OF INVESTMENTS
October 31, 2009
| | | | | | |
| | | Face
Amount | | Value† |
| | | (000) | | |
AGENCY OBLIGATIONS — (97.2%) | | | | | | |
Federal Farm Credit Bank | | | | | | |
1.600%, 01/12/11 | | $ | 17,000 | | $ | 17,200,957 |
2.625%, 04/21/11 | | | 2,400 | | | 2,465,782 |
5.375%, 07/18/11 | | | 9,300 | | | 10,001,936 |
3.875%, 08/25/11 | | | 3,100 | | | 3,260,047 |
1.125%, 10/03/11 | | | 1,700 | | | 1,698,730 |
3.500%, 10/03/11 | | | 1,000 | | | 1,046,931 |
Federal Home Loan Bank | | | | | | |
3.625%, 12/17/10 | | | 31,100 | | | 32,166,388 |
1.625%, 01/21/11 | | | 5,000 | | | 5,065,910 |
4.625%, 02/18/11 | | | 2,500 | | | 2,628,683 |
1.625%, 03/16/11 | | | 2,500 | | | 2,532,905 |
1.375%, 05/16/11 | | | 5,700 | | | 5,755,358 |
2.625%, 05/20/11 | | | 6,400 | | | 6,585,158 |
3.375%, 06/24/11 | | | 9,800 | | | 10,185,434 |
3.625%, 07/01/11 | | | 9,100 | | | 9,518,272 |
1.625%, 07/27/11 | | | 7,900 | | | 7,991,600 |
5.375%, 08/19/11 | | | 2,000 | | | 2,155,110 |
3.750%, 09/09/11 | | | 10,500 | | | 11,051,492 |
| | | | | | |
TOTAL AGENCY OBLIGATIONS | | | | | | 131,310,693 |
| | | | | | |
U.S. TREASURY OBLIGATIONS — (2.2%) | | | | | | |
U.S. Treasury Note | | | | | | |
1.000%, 09/30/11 | | | 3,000 | | | 3,008,436 |
| | | | | | |
TEMPORARY CASH INVESTMENTS — (0.6%) | | | | | | |
Repurchase Agreement, PNC Capital Markets, Inc. 0.19%, 11/02/09 (Collateralized by $930,000 FHLMC 4.50%, 05/01/23, valued at $789,148) to be repurchased at $776,012 | | | 776 | | | 776,000 |
| | | | | | |
TOTAL INVESTMENTS — (100.0%)
(Cost $134,115,168) | | | | | $ | 135,095,129 |
| | | | | | |
Summary of inputs used to value the Portfolio’s net assets as of October 31, 2009 is as follows (See Security Valuation Note):
| | | | | | | | | | |
| | | Valuation Inputs |
| |
| | | Investment in Securities (Market Value) |
| | | Level 1 | | Level 2 | | Level 3 | | Total |
Agency Obligations | | — | | $ | 131,310,693 | | — | | $ | 131,310,693 |
U.S. Treasury Obligations | | — | | | 3,008,436 | | — | | | 3,008,436 |
Temporary Cash Investments | | — | | | 776,000 | | — | | | 776,000 |
| | | | | | | | | | |
TOTAL | | — | | $ | 135,095,129 | | — | | $ | 135,095,129 |
| | | | | | | | | | |
See accompanying Notes to Financial Statements.
10
DIMENSIONAL INVESTMENT GROUP INC.
LWAS/DFA U.S. HIGH BOOK TO MARKET PORTFOLIO
STATEMENT OF ASSETS AND LIABILITIES
OCTOBER 31, 2009
(Amounts in thousands, except share and per share amounts)
| | | | |
ASSETS: | | | | |
Investment in The U.S. Large Cap Value Series of The DFA Investment Trust Company (Affiliated Investment Company) at Value† | | $ | 65,935 | |
Investment Securities Sold | | | 86 | |
Receivables: | | | | |
Fund Shares Sold | | | 5 | |
Prepaid Expenses and Other Assets | | | 9 | |
| | | | |
Total Assets | | | 66,035 | |
| | | | |
LIABILITIES: | | | | |
Payables: | | | | |
Fund Shares Redeemed | | | 91 | |
Due to Advisor | | | 1 | |
Accrued Expenses and Other Liabilities | | | 16 | |
| | | | |
Total Liabilities | | | 108 | |
| | | | |
NET ASSETS | | $ | 65,927 | |
| | | | |
SHARES OUTSTANDING, $0.01 PAR VALUE (1) | | | 6,724,191 | |
| | | | |
NET ASSET VALUE, OFFERING AND REDEMPTION PRICE PER SHARE | | $ | 9.80 | |
| | | | |
Investment in Affiliated Investment Company at Cost | | $ | 55,499 | |
| | | | |
NET ASSETS CONSIST OF: | | | | |
Paid-In Capital | | $ | 71,625 | |
Undistributed Net Investment Income (Distributions in Excess of Net Investment Income) | | | 155 | |
Accumulated Net Realized Gain (Loss) | | | (16,289 | ) |
Net Unrealized Appreciation (Depreciation) | | | 10,436 | |
| | | | |
NET ASSETS | | $ | 65,927 | |
| | | | |
(1) NUMBER OF SHARES AUTHORIZED | | | 300,000,000 | |
| | | | |
See accompanying Notes to Financial Statements.
11
DIMENSIONAL INVESTMENT GROUP INC.
STATEMENTS OF ASSETS AND LIABILITIES
OCTOBER 31, 2009
(Amounts in thousands, except share and per share amounts)
| | | | | | | |
| | | LWAS/DFA
Two-Year
Fixed Income
Portfolio | | | LWAS/DFA
Two-Year
Government
Portfolio |
ASSETS: | | | | | | | |
Investments at Value | | $ | 76,332 | | | $ | 134,319 |
Temporary Cash Investments at Value & Cost | | | 492 | | | | 776 |
Cash | | | 1 | | | | 1 |
Receivables: | | | | | | | |
Interest | | | 669 | | | | 1,192 |
Fund Shares Sold | | | 69 | | | | 264 |
Prepaid Expenses and Other Assets | | | 8 | | | | 8 |
| | | | | | | |
Total Assets | | | 77,571 | | | | 136,560 |
| | | | | | | |
LIABILITIES: | | | | | | | |
Payables: | | | | | | | |
Fund Shares Redeemed | | | 148 | | | | 10 |
Due to Advisor | | | 10 | | | | 17 |
Accrued Expenses and Other Liabilities | | | 15 | | | | 25 |
| | | | | | | |
Total Liabilities | | | 173 | | | | 52 |
| | | | | | | |
NET ASSETS | | $ | 77,398 | | | $ | 136,508 |
| | | | | | | |
SHARES OUTSTANDING, $0.01 PAR VALUE (1) | | | 7,718,308 | | | | 13,519,225 |
| | | | | | | |
NET ASSET VALUE, OFFERING AND REDEMPTION PRICE PER SHARE | | $ | 10.03 | | | $ | 10.10 |
| | | | | | | |
Investments at Cost | | $ | 75,787 | | | $ | 133,339 |
| | | | | | | |
NET ASSETS CONSIST OF: | | | | | | | |
Paid-In Capital | | $ | 77,038 | | | $ | 133,277 |
Undistributed Net Investment Income (Distributions in Excess of Net Investment Income) | | | 135 | | | | 234 |
Accumulated Net Realized Gain (Loss) | | | (320 | ) | | | 2,017 |
Net Unrealized Appreciation (Depreciation) | | | 545 | | | | 980 |
| | | | | | | |
NET ASSETS | | $ | 77,398 | | | $ | 136,508 |
| | | | | | | |
(1) NUMBER OF SHARES AUTHORIZED | | | 300,000,000 | | | | 300,000,000 |
| | | | | | | |
See accompanying Notes to Financial Statements.
12
DIMENSIONAL INVESTMENT GROUP INC.
STATEMENTS OF OPERATIONS
FOR THE YEAR ENDED OCTOBER 31, 2009
(Amounts in thousands)
| | | | | | | | | | | | | | | | | | | | | | | | | | | | | | | | | | | | | |
| | | LWAS/DFA
U.S. High
Book to Market
Portfolio* | | LWAS/DFA
Two-Year
Fixed Income
Portfolio | | LWAS/DFA
Two-Year
Government
Portfolio |
Investment Income | | | | | | | | | | | | | | | | | | | | | | | | | | | | | | | | | | | | | |
Dividends | | | | | | | | | | $ 1,403 | | | | | | | | | | | — | | | | | | | | | | | | — | | | | |
Interest | | | | | | | | | | 2 | | | | | | | | | | | $1,677 | | | | | | | | | | | | $2,669 | | | | |
Income from Securities Lending | | | | | | | | | | 121 | | | | | | | | | | | — | | | | | | | | | | | | — | | | | |
Expenses Allocated from Affiliated Investment Company | | | | | | | | | | (77 | ) | | | | | | | | | | — | | | | | | | | | | | | — | | | | |
| | | | | | | | | | | | | | | | | | | | | | | | | | | | | | | | | | | | | |
Total Investment Income | | | | | | | | | | 1,449 | | | | | | | | | | | 1,677 | | | | | | | | | | | | 2,669 | | | | |
| | | | | | | | | | | | | | | | | | | | | | | | | | | | | | | | | | | | | |
Expenses | | | | | | | | | | | | | | | | | | | | | | | | | | | | | | | | | | | | | |
Investment Advisory Services Fees | | | | | | | | | | — | | | | | | | | | | | 112 | | | | | | | | | | | | 193 | | | | |
Administrative Services Fees | | | | | | | | | | 6 | | | | | | | | | | | — | | | | | | | | | | | | — | | | | |
Accounting & Transfer Agent Fees | | | | | | | | | | 14 | | | | | | | | | | | 30 | | | | | | | | | | | | 37 | | | | |
Shareholder Servicing Fees | | | | | | | | | | 89 | | | | | | | | | | | 59 | | | | | | | | | | | | 103 | | | | |
Filing Fees | | | | | | | | | | 23 | | | | | | | | | | | 16 | | | | | | | | | | | | 17 | | | | |
Shareholders’ Reports | | | | | | | | | | 11 | | | | | | | | | | | 13 | | | | | | | | | | | | 21 | | | | |
Directors’/Trustees’ Fees & Expenses | | | | | | | | | | 1 | | | | | | | | | | | 2 | | | | | | | | | | | | 3 | | | | |
Custodian Fees | | | | | | | | | | — | | | | | | | | | | | 2 | | | | | | | | | | | | 2 | | | | |
Professional Fees | | | | | | | | | | 2 | | | | | | | | | | | 4 | | | | | | | | | | | | 8 | | | | |
Other | | | | | | | | | | 1 | | | | | | | | | | | 13 | | | | | | | | | | | | 19 | | | | |
| | | | | | | | | | | | | | | | | | | | | | | | | | | | | | | | | | | | | |
Total Expenses | | | | | | | | | | 147 | | | | | | | | | | | 251 | | | | | | | | | | | | 403 | | | | |
| | | | | | | | | | | | | | | | | | | | | | | | | | | | | | | | | | | | | |
Net Investment Income (Loss) | | | | | | | | | | 1,302 | | | | | | | | | | | 1,426 | | | | | | | | | | | | 2,266 | | | | |
| | | | | | | | | | | | | | | | | | | | | | | | | | | | | | | | | | | | | |
Realized and Unrealized Gain (Loss) | | | | | | | | | | | | | | | | | | | | | | | | | | | | | | | | | | | | | |
Net Realized Gain (Loss) on Investment Securities Sold | | | | | | | | | | (3,229 | ) | | | | | | | | | | 823 | | | | | | | | | | | | 2,856 | | | | |
Change in Unrealized Appreciation (Depreciation) of Investment Securities | | | | | | | | | | 8,041 | | | | | | | | | | | 967 | | | | | | | | | | | | 1,507 | | | | |
| | | | | | | | | | | | | | | | | | | | | | | | | | | | | | | | | | | | | |
Net Realized and Unrealized Gain (Loss) | | | | | | | | | | 4,812 | | | | | | | | | | | 1,790 | | | | | | | | | | | | 4,363 | | | | |
| | | | | | | | | | | | | | | | | | | | | | | | | | | | | | | | | | | | | |
Net Increase (Decrease) in Net Assets Resulting from Operations | | | | | | | | | | $ 6,114 | | | | | | | | | | | $3,216 | | | | | | | | | | | | $6,629 | | | | |
| | | | | | | | | | | | | | | | | | | | | | | | | | | | | | | | | | | | | |
| * | Investment Income and Realized and Unrealized Gain (Loss) were allocated from the Portfolio’s Master Fund (Affiliated Investment Company). |
See accompanying Notes to Financial Statements.
13
DIMENSIONAL INVESTMENT GROUP INC.
STATEMENTS OF CHANGES IN NET ASSETS
(Amounts in thousands)
| | | | | | | | | | | | | | | | | | | | | | | | | | | | | | | | | | | | |
| | | LWAS/DFA
U.S. High
Book to Market
Portfolio | | | LWAS/DFA
Two-Year
Fixed Income
Portfolio | | | LWAS/DFA
Two-Year
Government
Portfolio | |
| | | Year
Ended
Oct. 31,
2009 | | | Period
Dec. 1,
2007 to
Oct. 31,
2008 | | | Year
Ended
Nov. 30,
2007 | | | Year
Ended
Oct. 31,
2009 | | | Period
Dec. 1,
2007 to
Oct. 31,
2008 | | | Year
Ended
Nov. 30,
2007 | | | Year
Ended
Oct. 31,
2009 | | | Period
Dec. 1,
2007 to
Oct. 31,
2008 | | | Year
Ended
Nov. 30,
2007 | |
Increase (Decrease) in Net Assets | | | | | | | | | | | | | | | | | | | | | | | | | | | | | | | | | | | | |
Operations: | | | | | | | | | | | | | | | | | | | | | | | | | | | | | | | | | | | | |
Net Investment Income (Loss) | | $ | 1,302 | | | $ | 1,631 | | | $ | 1,551 | | | $ | 1,426 | | | $ | 2,567 | | | $ | 4,543 | | | $ | 2,266 | | | $ | 3,089 | | | $ | 4,053 | |
Net Realized Gain (Loss) on Investment Securities Sold | | | (3,229 | ) | | | — | † | | | 6,681 | † | | | 823 | | | | (14 | ) | | | (2 | ) | | | 2,856 | | | | (22 | ) | | | (1 | ) |
Change in Unrealized Appreciation (Depreciation) of Investment Securities | | | 8,041 | | | | (42,930 | )† | | | (8,701 | )† | | | 967 | | | | (360 | ) | | | (24 | ) | | | 1,507 | | | | (560 | ) | | | 97 | |
| | | | | | | | | | | | | | | | | | | | | | | | | | | | | | | | | | | | |
Net Increase (Decrease) in Net Assets Resulting from Operations | | | 6,114 | | | | (41,299 | ) | | | (469 | ) | | | 3,216 | | | | 2,193 | | | | 4,517 | | | | 6,629 | | | | 2,507 | | | | 4,149 | |
| | | | | | | | | | | | | | | | | | | | | | | | | | | | | | | | | | | | |
Distributions From: | | | | | | | | | | | | | | | | | | | | | | | | | | | | | | | | | | | | |
Net Investment Income | | | (1,505 | ) | | | (1,652 | ) | | | (1,533 | ) | | | (1,709 | ) | | | (3,304 | ) | | | (4,369 | ) | | | (2,630 | ) | | | (3,616 | ) | | | (3,767 | ) |
Net Short-Term Gains | | | — | | | | (16 | ) | | | (506 | ) | | | — | | | | — | | | | — | | | | — | | | | — | | | | — | |
Net Long-Term Gains | | | — | | | | (6,421 | ) | | | (3,294 | ) | | | — | | | | — | | | | — | | | | — | | | | — | | | | — | |
| | | | | | | | | | | | | | | | | | | | | | | | | | | | | | | | | | | | |
Total Distributions | | | (1,505 | ) | | | (8,089 | ) | | | (5,333 | ) | | | (1,709 | ) | | | (3,304 | ) | | | (4,369 | ) | | | (2,630 | ) | | | (3,616 | ) | | | (3,767 | ) |
| | | | | | | | | | | | | | | | | | | | | | | | | | | | | | | | | | | | |
Capital Share Transactions (1): | | | | | | | | | | | | | | | | | | | | | | | | | | | | | | | | | | | | |
Shares Issued | | | 9,566 | | | | 12,180 | | | | 11,690 | | | | 23,629 | | | | 9,071 | | | | 18,206 | | | | 59,636 | | | | 51,236 | | | | 50,978 | |
Shares Issued in Lieu of Cash Distributions | | | 1,340 | | | | 6,808 | | | | 4,529 | | | | 1,518 | | | | 2,785 | | | | 3,631 | | | | 1,747 | | | | 2,696 | | | | 3,311 | |
Shares Redeemed | | | (18,050 | ) | | | (20,971 | ) | | | (15,567 | ) | | | (33,321 | ) | | | (23,122 | ) | | | (11,625 | ) | | | (62,659 | ) | | | (29,376 | ) | | | (17,281 | ) |
| | | | | | | | | | | | | | | | | | | | | | | | | | | | | | | | | | | | |
Net Increase (Decrease) from Capital Share Transactions | | | (7,144 | ) | | | (1,983 | ) | | | 652 | | | | (8,174 | ) | | | (11,266 | ) | | | 10,212 | | | | (1,276 | ) | | | 24,556 | | | | 37,008 | |
| | | | | | | | | | | | | | | | | | | | | | | | | | | | | | | | | | | | |
Total Increase (Decrease) in Net Assets | | | (2,535 | ) | | | (51,371 | ) | | | (5,150 | ) | | | (6,667 | ) | | | (12,377 | ) | | | 10,360 | | | | 2,723 | | | | 23,447 | | | | 37,390 | |
Net Assets | | | | | | | | | | | | | | | | | | | | | | | | | | | | | | | | | | | | |
Beginning of Period | | | 68,462 | | | | 119,833 | | | | 124,983 | | | | 84,065 | | | | 96,442 | | | | 86,082 | | | | 133,785 | | | | 110,338 | | | | 72,948 | |
| | | | | | | | | | | | | | | | | | | | | | | | | | | | | | | | | | | | |
End of Period | | $ | 65,927 | | | $ | 68,462 | | | $ | 119,833 | | | $ | 77,398 | | | $ | 84,065 | | | $ | 96,442 | | | $ | 136,508 | | | $ | 133,785 | | | $ | 110,338 | |
| | | | | | | | | | | | | | | | | | | | | | | | | | | | | | | | | | | | |
(1) Shares Issued and Redeemed: | | | | | | | | | | | | | | | | | | | | | | | | | | | | | | | | | | | | |
Shares Issued | | | 1,238 | | | | 1,117 | | | | 714 | | | | 2,370 | | | | 920 | | | | 1,837 | | | | 5,944 | | | | 5,221 | | | | 5,179 | |
Shares Issued in Lieu of Cash Distributions | | | 186 | | | | 487 | | | | 285 | | | | 154 | | | | 283 | | | | 369 | | | | 175 | | | | 276 | | | | 339 | |
Shares Redeemed | | | (2,271 | ) | | | (1,841 | ) | | | (955 | ) | | | (3,351 | ) | | | (2,346 | ) | | | (1,175 | ) | | | (6,256 | ) | | | (2,993 | ) | | | (1,758 | ) |
| | | | | | | | | | | | | | | | | | | | | | | | | | | | | | | | | | | | |
Net Increase (Decrease) from Shares Issued and Redeemed | | | (847 | ) | | | (237 | ) | | | 44 | | | | (827 | ) | | | (1,143 | ) | | | 1,031 | | | | (137 | ) | | | 2,504 | | | | 3,760 | |
| | | | | | | | | | | | | | | | | | | | | | | | | | | | | | | | | | | | |
Undistributed Net Investment Income (Distributions in Excess of Net Investment Income) | | $ | 155 | | | $ | 366 | | | $ | 395 | | | $ | 135 | | | $ | 418 | | | $ | 1,155 | | | $ | 234 | | | $ | 598 | | | $ | 1,125 | |
| † | See Note A in the Notes to Financial Statements. |
See accompanying Notes to Financial Statements.
14
DIMENSIONAL INVESTMENT GROUP INC.
LWAS/DFA U.S. HIGH BOOK TO MARKET PORTFOLIO
FINANCIAL HIGHLIGHTS
(for a share outstanding throughout each period)
| | | | | | | | | | | | | | | | | | | | | | | | |
| | | Year
Ended
Oct. 31,
2009 | | | Period
Dec. 1,
2007 to
Oct. 31,
2008 | | | Year Ended Nov. 30, 2007 | | | Year Ended Nov. 30,
2006 | | | Year Ended Nov. 30,
2005 | | | Year
Ended
Nov. 30,
2004 | |
| | |
Net Asset Value, Beginning of Period | | $ | 9.04 | | | $ | 15.35 | | | $ | 16.10 | | | $ | 13.91 | | | $ | 12.28 | | | $ | 10.23 | |
| | | | | | | | | | | | | | | | | | | | | | | | |
Income from Investment Operations | | | | | | | | | | | | | | | | | | | | | | | | |
Net Investment Income (Loss) | | | 0.18 | (A) | | | 0.21 | (A) | | | 0.20 | (A) | | | 0.23 | (A) | | | 0.19 | | | | 0.10 | |
Net Gains (Losses) on Securities (Realized and Unrealized) | | | 0.79 | | | | (5.48 | ) | | | (0.26 | ) | | | 2.23 | | | | 1.57 | | | | 2.08 | |
| | | | | | | | | | | | | | | | | | | | | | | | |
Total from Investment Operations | | | 0.97 | | | | (5.27 | ) | | | (0.06 | ) | | | 2.46 | | | | 1.76 | | | | 2.18 | |
| | |
Less Distributions | | | | | | | | | | | | | | | | | | | | | | | | |
Net Investment Income | | | (0.21 | ) | | | (0.21 | ) | | | (0.20 | ) | | | (0.22 | ) | | | (0.13 | ) | | | (0.13 | ) |
Net Realized Gains | | | — | | | | (0.83 | ) | | | (0.49 | ) | | | (0.05 | ) | | | — | | | | — | |
| | | | | | | | | | | | | | | | | | | | | | | | |
Total Distributions | | | (0.21 | ) | | | (1.04 | ) | | | (0.69 | ) | | | (0.27 | ) | | | (0.13 | ) | | | (0.13 | ) |
| | |
Net Assets Value, End of Period | | $ | 9.80 | | | $ | 9.04 | | | $ | 15.35 | | | $ | 16.10 | | | $ | 13.91 | | | $ | 12.28 | |
| | |
Total Return | | | 11.61 | % | | | (36.69 | )%(C) | | | (0.51 | )% | | | 17.90 | % | | | 14.44 | % | | | 21.45 | % |
| | |
| | | | | | |
Net Assets, End of Period (thousands) | | $ | 65,927 | | | $ | 68,462 | | | $ | 119,833 | | | $ | 124,983 | | | $ | 103,311 | | | $ | 92,494 | |
Ratio of Expenses to Average Net Assets (D) | | | 0.38 | % | | | 0.33 | %(B) | | | 0.32 | % | | | 0.32 | % | | | 0.34 | % | | | 0.35 | % |
Ratio of Net Investment Income to Average Net Assets | | | 2.20 | % | | | 1.72 | %(B) | | | 1.20 | % | | | 1.54 | % | | | 1.43 | % | | | 0.87 | % |
| | |
See page 1 for the Definitions of Abbreviations and Footnotes.
See accompanying Notes to Financial Statements.
15
DIMENSIONAL INVESTMENT GROUP INC.
FINANCIAL HIGHLIGHTS
(for a share outstanding throughout each period)
| | | | | | | | | | | | | | | | | | | | | | | | | | | | | | | | | | | | | | | | | | | | | | | | |
| | | LWAS/DFA Two-Year Fixed Income Portfolio | | | LWAS/DFA Two-Year Government Portfolio | |
| | | Year Ended Oct. 31, 2009 | | | Period Dec. 1, 2007 to Oct. 31, 2008 | | | Year Ended Nov. 30, 2007 | | | Year Ended Nov. 30, 2006 | | | Year Ended Nov. 30, 2005 | | | Year Ended Nov. 30, 2004 | | | Year Ended Oct. 31, 2009 | | | Period Dec. 1, 2007 to Oct. 31, 2008 | | | Year Ended Nov. 30, 2007 | | | Year Ended Nov. 30, 2006 | | | Year Ended Nov. 30, 2005 | | | Year Ended Nov. 30, 2004 | |
| | |
Net Asset Value, Beginning of Period | | $ | 9.84 | | | $ | 9.95 | | | $ | 9.94 | | | $ | 9.82 | | | $ | 9.90 | | | $ | 10.17 | | | $ | 9.80 | | | $ | 9.89 | | | $ | 9.87 | | | $ | 9.75 | | | $ | 9.83 | | | $ | 10.13 | |
| | | | | | | | | | | | | | | | | | | | | | | | | | | | | | | | | | | | | | | | | | | | | | | | |
Income from Investment Operations | | | | | | | | | | | | | | | | | | | | | | | | | | | | | | | | | | | | | | | | | | | | | | | | |
Net Investment Income (Loss) | | | 0.19 | (A) | | | 0.28 | (A) | | | 0.49 | (A) | | | 0.35 | (A) | | | 0.27 | | | | 0.16 | | | | 0.18 | (A) | | | 0.24 | (A) | | | 0.46 | (A) | | | 0.34 | (A) | | | 0.26 | | | | 0.17 | |
Net Gains (Losses) on Securities (Realized and Unrealized) | | | 0.23 | | | | (0.04 | ) | | | — | | | | 0.08 | | | | (0.11 | ) | | | (0.08 | ) | | | 0.33 | | | | (0.03 | ) | | | 0.01 | | | | 0.08 | | | | (0.10 | ) | | | (0.06 | ) |
| | | | | | | | | | | | | | | | | | | | | | | | | | | | | | | | | | | | | | | | | | | | | | | | |
Total from Investment Operations | | | 0.42 | | | | 0.24 | | | | 0.49 | | | | 0.43 | | | | 0.16 | | | | 0.08 | | | | 0.51 | | | | 0.21 | | | | 0.47 | | | | 0.42 | | | | 0.16 | | | | 0.11 | |
| | |
Less Distributions | | | | | | | | | | | | | | | | | | | | | | | | | | | | | | | | | | | | | | | | | | | | | | | | |
Net Investment Income | | | (0.23 | ) | | | (0.35 | ) | | | (0.48 | ) | | | (0.31 | ) | | | (0.24 | ) | | | (0.14 | ) | | | (0.21 | ) | | | (0.30 | ) | | | (0.45 | ) | | | (0.30 | ) | | | (0.24 | ) | | | (0.15 | ) |
Net Realized Gains | | | — | | | | — | | | | — | | | | — | | | | — | | | | (0.21 | ) | | | — | | | | — | | | | — | | | | — | | | | — | | | | (0.26 | ) |
| | | | | | | | | | | | | | | | | | | | | | | | | | | | | | | | | | | | | | | | | | | | | | | | |
Total Distributions | | | (0.23 | ) | | | (0.35 | ) | | | (0.48 | ) | | | (0.31 | ) | | | (0.24 | ) | | | (0.35 | ) | | | (0.21 | ) | | | (0.30 | ) | | | (0.45 | ) | | | (0.30 | ) | | | (0.24 | ) | | | (0.41 | ) |
| | |
Net Asset Value, End of Period | | $ | 10.03 | | | $ | 9.84 | | | $ | 9.95 | | | $ | 9.94 | | | $ | 9.82 | | | $ | 9.90 | | | $ | 10.10 | | | $ | 9.80 | | | $ | 9.89 | | | $ | 9.87 | | | $ | 9.75 | | | $ | 9.83 | |
| | |
Total Return | | | 4.31 | % | | | 2.46 | %(C) | | | 5.03 | % | | | 4.47 | % | | | 1.65 | % | | | 0.85 | % | | | 5.21 | % | | | 2.13 | %(C) | | | 4.85 | % | | | 4.42 | % | | | 1.67 | % | | | 1.10 | % |
| | |
Net Assets, End of Period (thousands) | | $ | 77,398 | | | $ | 84,065 | | | $ | 96,442 | | | $ | 86,082 | | | $ | 80,199 | | | $ | 80,584 | | | $ | 136,508 | | | $ | 133,785 | | | $ | 110,338 | | | $ | 72,948 | | | $ | 68,708 | | | $ | 69,853 | |
Ratio of Expenses to Average Net Assets | | | 0.34 | % | | | 0.31 | %(B) | | | 0.31 | % | | | 0.31 | % | | | 0.36 | % | | | 0.38 | % | | | 0.31 | % | | | 0.30 | %(B) | | | 0.31 | % | | | 0.32 | % | | | 0.37 | % | | | 0.36 | % |
Ratio of Net Investment Income to Average Net Assets | | | 1.92 | % | | | 3.04 | %(B) | | | 4.94 | % | | | 3.57 | % | | | 2.72 | % | | | 1.65 | % | | | 1.76 | % | | | 2.69 | %(B) | | | 4.66 | % | | | 3.45 | % | | | 2.67 | % | | | 1.63 | % |
Portfolio Turnover Rate | | | 77 | % | | | 20 | %(C) | | | 22 | % | | | 15 | % | | | 48 | % | | | 152 | % | | | 112 | % | | | 7 | %(C) | | | 0 | % | | | 29 | % | | | 44 | % | | | 142 | % |
| | |
See page 1 for the Definitions of Abbreviations and Footnotes.
See accompanying Notes to Financial Statements.
16
DIMENSIONAL INVESTMENT GROUP INC.
NOTES TO FINANCIAL STATEMENTS
A. Organization:
Dimensional Investment Group Inc. (the “Fund”) is an open-end management investment company registered under the Investment Company Act of 1940, whose shares are generally offered to institutional investors, retirement plans and clients of registered investment advisors. The Fund consists of fifteen portfolios, of which three (the “Portfolios”) are presented in this report.
The LWAS/DFA U.S. High Book to Market Portfolio (“Feeder Fund”) primarily invests its assets in The U.S. Large Cap Value Series (the “Series”), a corresponding Series of The DFA Investment Trust Company. At October 31, 2009, the Portfolio owned 1% of the Series.
Effective December 31, 2008, The U.S. Large Cap Value Series, a master fund in a RIC/RIC master-feeder structure, elected with the consent of its respective Holder(s) to change its U.S. federal income tax classification from that of an association taxable as a corporation to a partnership pursuant to Treasury Regulation § 301.7701-3. The change in capital structure and retroactive reclassification of the statement of changes in net assets and financial highlights for the fund is a result of the treatment of a partnership for book purposes. The Series/Portfolio will maintain its books and records and present its financial statements in accordance with generally accepted accounting principles for investment partnerships.
At a regular meeting of the Board of Directors/Trustees (the “Board”) on September 16, 2008, the Board voted to change the fiscal and tax year ends of the Portfolios from November 30 to October 31.
B. Significant Accounting Policies:
The following significant accounting policies are in conformity with accounting principles generally accepted in the United States of America. Such policies are consistently followed by the Fund in preparation of its financial statements. The preparation of financial statements in accordance with accounting principles generally accepted in the United States of America requires management to make estimates and assumptions that affect the reported amounts of assets and liabilities and disclosure of contingent assets and liabilities at the date of the financial statements and the reported amounts of increases and decreases in net assets from operations during the reporting period. Actual results could differ from those estimates and those differences could be material.
1. Security Valuation: The LWAS/DFA U.S. High Book to Market Portfolio’s investment reflects its proportionate interest in the net assets of The U.S. Large Cap Value Series. Securities held by the LWAS/DFA Two-Year Fixed Income Portfolio and the LWAS/DFA Two-Year Government Portfolio are valued on the basis of prices provided by one or more pricing services or other reasonably reliable sources including broker/dealers that typically handle the purchase and sale of such securities. Securities which are traded over-the counter and on a stock exchange generally will be valued according to the broadest and most representative market, and it is expected that for bonds and other fixed income securities, this ordinarily will be the over-the-counter market. Securities for which quotations are not readily available (including restricted securities), or for which market quotations have become unreliable, are valued in good faith at fair value in accordance with procedures adopted by the Board of Directors/Trustees. Fair value pricing may also be used if events that have a significant effect on the value of an investment (as determined in the discretion of the Investment Committee of the Advisor) occur before the net asset value is calculated. When fair value pricing is used, the prices of securities used by the Portfolios may differ from the quoted or published prices for the same securities on their primary markets or exchanges.
The Portfolios utilize a fair value hierarchy which prioritizes the inputs to valuation techniques used to measure fair value into three broad levels described below:
— Level 1 – quoted prices in active markets for identical securities
— Level 2 – other significant observable inputs (including quoted prices for similar securities, interest rates, prepayment speeds, credit risk, etc.)
17
— Level 3 – significant unobservable inputs (including the Portfolios’ own assumptions in determining the fair value of investments)
A summary of the inputs used to value the Portfolios’ net assets by each major security type, industry and/or country is disclosed at the end of the Schedule of Investments for the LWAS/DFA Two-Year Fixed Income Portfolio and LWAS/DFA Two-Year Government Portfolio. The inputs or methodology used for valuing securities are not necessarily an indication of the risk associated with investing in those securities. A summary of the inputs used to value LWAS/DFA U.S. High Book to Market Portfolio’s net assets as of October 31, 2009 is listed below (in thousands).
| | | | | | | | | | |
| | | Valuation Inputs |
| |
| | | Investments in
Securities
(Market Value) |
| | | Level 1 | | Level 2 | | Level 3 | | Total |
LWAS/DFA U.S. High Book to Market Portfolio | | $ | 65,935 | | — | | — | | $ | 65,935 |
2. Deferred Compensation Plan: Each eligible Director of the Fund may elect participation in the Deferred Compensation Plan (the “Plan”). Under the Plan, effective January 1, 2002, such Directors may defer payment of all or a portion of their total fees earned as a Director. These deferred amounts may be treated as though such amounts had been invested in shares of the following funds: U.S. Large Cap Value Portfolio; U.S. Core Equity 1 Portfolio; U.S. Core Equity 2 Portfolio; U.S. Vector Equity Portfolio; U.S. Micro Cap Portfolio; DFA International Value Portfolio; International Core Equity Portfolio; Emerging Markets Portfolio; Emerging Markets Core Equity Portfolio; and/or DFA Two- Year Global Fixed Income Portfolio. Contributions made under the Plan and the change in unrealized appreciation (depreciation) and income, are included in Directors’/Trustees’ Fees & Expenses for the year ended October 31, 2009.
Each Director has the option to receive their distribution of proceeds in one of the following methods upon one year’s notice: lump sum; annual installments over a period of agreed upon years; or semi-annual installments over a period of agreed upon years. As of October 31, 2009, none of the Directors have requested distribution of proceeds.
3. Other: The LWAS/DFA U.S. High Book to Market Portfolio recognizes its pro-rata share, on a daily basis, of net investment income and realized and unrealized gains and losses of investment securities from The U.S. Large Cap Value Series, which is treated as a partnership for federal income tax purposes. Security transactions are accounted for as of the trade date. Costs used in determining realized gains and losses on the sale of investment securities are on the basis of identified cost. Dividend income and distributions to shareholders are recorded on the ex-dividend date. Interest income is recorded on the accrual basis. Discount and premium on debt securities purchased are amortized over the lives of the respective securities utilizing the effective interest method. Expenses directly attributable to the Portfolios are directly charged. Common expenses of the Fund are allocated using methods approved by the Board of Directors/Trustees, generally based on average net assets.
C. Investment Advisor:
Dimensional Fund Advisors LP (“Dimensional” or the “Advisor”) provides administrative services to one of the Portfolios, including supervision of services provided by others, providing information to the shareholders and to the Board of Directors/Trustees, and other administrative services. The Advisor provides investment advisory services to two of the Portfolios. For the year ended October 31, 2009, the Portfolios’ administrative services fees or investment advisory services fees were accrued daily and paid monthly to the Advisor based on the following effective annual rates of average daily net assets:
| | | | |
| | | Administrative
Services Fees | | Advisory
Services Fees |
LWAS/DFA U.S. High Book to Market Portfolio | | 0.01% | | — |
LWAS/DFA Two-Year Fixed Income Portfolio | | — | | 0.15% |
LWAS/DFA Two-Year Government Portfolio | | — | | 0.15% |
18
In addition, pursuant to a Client Service Agreement with LWI Financial Inc. (“LWIF”), the Portfolios pay fees to LWIF at the following effective annual rates of their average daily net assets:
| | |
| | | Shareholder
Servicing Fees |
LWAS/DFA U.S. High Book to Market Portfolio | | 0.15% |
LWAS/DFA Two-Year Fixed Income Portfolio | | 0.08% |
LWAS/DFA Two-Year Government Portfolio | | 0.08% |
Fees Paid to Officers and Directors/Trustees:
Certain Officers and Directors/Trustees of the Advisor are also Officers and Directors/Trustees of the Fund; however, such Officers and Directors/Trustees (with the exception of the Chief Compliance Officer (“CCO”)) receive no compensation from the Fund. For the year ended October 31, 2009, the total related amounts paid by the Fund to the CCO were $27 (in thousands). The total related amounts paid by each of the Portfolios are included in Other Expenses on the Statement of Operations.
D. Deferred Compensation:
At October 31, 2009, the total liability for deferred compensation to Directors/Trustees is included in Accrued Expenses and Other Liabilities on the Statement of Assets and Liabilities as follows (amounts in thousands):
| | | |
LWAS/DFA U.S. High Book to Market Portfolio | | $ | 2 |
LWAS/DFA Two-Year Fixed Income Portfolio | | | 2 |
LWAS/DFA Two-Year Government Portfolio | | | 4 |
E. Purchases and Sales of Securities:
For the year ended October 31, 2009, the Portfolios made the following purchases and sales of investment securities, other than short-term securities (amounts in thousands):
| | | | | | | | | | | | |
| | | U.S. Government
Securities | | Other Investment
Securities |
| | | Purchases | | Sales | | Purchases | | Sales |
LWAS/DFA Two-Year Fixed Income Portfolio | | $ | 57,877 | | $ | 38,941 | | $ | 18,303 | | $ | 11,007 |
LWAS/DFA Two-Year Government Portfolio | | | 144,660 | | | 141,734 | | | — | | | — |
F. Federal Income Taxes:
Each Portfolio has qualified and intends to continue to qualify as a regulated investment company under Subchapter M of the Internal Revenue Code for federal income tax purposes and to distribute substantially all of its taxable income and net capital gains to its shareholders. Accordingly, no provision has been made for federal income taxes.
Distributions from net investment income and net realized capital gains are determined in accordance with U.S. federal income tax regulations, which may differ from those amounts determined under accounting principles generally accepted in the United States of America. These book/tax differences are either temporary or permanent in nature. To the extent these differences are permanent, they are charged or credited to paid-in capital, undistributed net investment income or accumulated net realized gains, as appropriate, in the period that the differences arise. Accordingly, the following permanent differences as of October 31, 2009, primarily attributable to the recharacterizations of partnership income from net investment income to capital gain and were reclassified to the following accounts. These reclassifications had no effect on net asset value per share (amounts in thousands):
19
| | | | |
| | | Increase
(Decrease)
Undistributed
Net Investment
Income | | Increase
(Decrease)
Accumulated
Net Realized
Gains (Losses) |
LWAS/DFA U.S. High Book to Market Portfolio | | $(8) | | $8 |
The tax character of dividends and distributions declared and paid during the year ended November 30, 2007, the period December 1, 2007 to October 31, 2008 and the year ended October 31, 2009 were as follows (amounts in thousands):
| | | | | | |
| | | Net Investment
Income
and Short-Term
Capital Gains | | Long-Term
Capital Gains | | Total |
LWAS/DFA U.S. High Book to Market Portfolio | | | | | | |
2007 | | $2,104 | | $3,541 | | $5,645 |
2008 | | 1,668 | | 6,420 | | 8,088 |
2009 | | 1,505 | | — | | 1,505 |
LWAS/DFA Two-Year Fixed Income Portfolio | | | | | | |
2007 | | 4,369 | | — | | 4,369 |
2008 | | 3,304 | | — | | 3,304 |
2009 | | 1,709 | | — | | 1,709 |
LWAS/DFA Two-Year Government Portfolio | | | | | | |
2007 | | 3,767 | | — | | 3,767 |
2008 | | 3,616 | | — | | 3,616 |
2009 | | 2,630 | | — | | 2,630 |
At October 31, 2009, the components of distributable earnings/(accumulated losses) were as follows (amounts in thousands):
| | | | | | | | | | | | |
| | | Undistributed
Net
Investment
Income and
Short-Term
Capital Gains | | Undistributed
Long-Term
Capital Gains | | Capital
Loss
Carryforward | | Total Net
Distributable
Earnings
Accumulated
(Losses) |
LWAS/DFA U.S. High Book to Market Portfolio | | $ | 156 | | | — | | $ | (16,289) | | $ | (16,133) |
LWAS/DFA Two-Year Fixed Income Portfolio | | | 137 | | | — | | | (320) | | | (183) |
LWAS/DFA Two-Year Government Portfolio | | | 1,192 | | $ | 1,068 | | | — | | | 2,260 |
For federal income tax purposes, the Fund measures its capital loss carryforwards annually at October 31, its fiscal year end. Capital loss carryforwards may be carried forward and applied against future capital gains. As of October 31, 2009, the following Portfolios had capital loss carryforwards available to offset future realized capital gains through the indicated expiration dates (amounts in thousands):
| | | | | | | | | | | | | | | | | | |
| | | Expires on October 31, | | |
| | | 2013 | | 2014 | | 2015 | | 2016 | | 2017 | | Total |
LWAS/DFA U.S. High Book to Market Portfolio | | | — | | | — | | | — | | $ | 1,337 | | $ | 14,952 | | $ | 16,289 |
LWAS/DFA Two-Year Fixed Income Portfolio | | $ | 102 | | $ | 202 | | $ | 2 | | | 14 | | | — | | | 320 |
20
During the year ended October 31, 2009, the following Portfolios utilized capital loss carryforwards to offset realized capital gains for federal income tax purposes (amounts in thousands):
| | | |
LWAS/DFA Two-Year Fixed Income Portfolio | | $ | 822 |
LWAS/DFA Two-Year Government Portfolio | | | 833 |
At October 31, 2009, the total cost and aggregate gross unrealized appreciation and (depreciation) of securities for federal income tax purposes were different from amounts reported for financial reporting purposes (amounts in thousands):
| | | | | | | | | |
| | | Federal
Tax Cost | | Unrealized
Appreciation | | Unrealized
(Depreciation) | | Net
Unrealized
Appreciation
(Depreciation) |
LWAS/DFA U.S. High Book to Market Portfolio | | $ | 55,499 | | $11,901 | | $(1,465) | | $10,436 |
LWAS/DFA Two-Year Fixed Income Portfolio | | | 76,279 | | 501 | | 44 | | 545 |
LWAS/DFA Two-Year Government Portfolio | | | 134,121 | | 982 | | (8) | | 974 |
Accounting for Uncertainty in Income Taxes sets forth a minimum threshold for financial statement recognition of the benefit of a tax position taken or expected to be taken on a tax return. Management has analyzed each Portfolios’ tax positions and has concluded that no provision for income tax is required in any Portfolios’ financial statements. No Portfolio is aware of any tax positions for which it is reasonably possible that the total amounts of unrecognized tax benefits will significantly change in the next twelve months. Each of Portfolios’ federal tax returns for the prior three fiscal years remain subject to examination by the Internal Revenue Service.
Effective December 31, 2008, The U.S. Large Cap Value Series, a master fund in a RIC/RIC master-feeder structure with four RIC feeders and other direct client investor(s), made a “Check-the-box” election for federal income tax purposes pursuant to Treasury Regulation §301.7701-3, to change its federal entity classification from a corporation taxable as a regulated investment company to a partnership. As a result of this election, the master fund is deemed to have distributed all of its assets and liabilities, in a taxable transaction, to its shareholders in liquidation of the master fund. Immediately thereafter, the shareholders contributed all of the distributed assets and liabilities to a newly formed partnership. The final tax year end of The U.S. Large Cap Value Series was December 30, 2008. For Federal income tax purposes, pursuant to IRC Code §336(a), the master fund recognized a loss as if the master’s investment securities were sold to its shareholders and, pursuant to IRC Code §331, each of the Portfolios recognized a gain as if it liquidated its investment in the master. For tax purposes, pursuant to IRC Code §334(a), each of the Portfolios took a fair market value basis in the securities deemed received by them and a new holding period for those securities commenced on the deemed liquidation date.
The master fund had book/tax differences upon its deemed liquidation. The following summary of permanent differences occurred as of the respective effective “Check the Box” election date.
| | | | | | | |
Increase
(Decrease)
Paid-In
Capital | | | Unrealized
Appreciation
(Depreciation)
Investment
Securities | | Increase
(Decrease)
Undistributed
Net Investment
Income | | Increase
(Decrease)
Accumulated
Net Realized
Gains (Losses) |
$(3,038,312,278 | ) | | $2,303,664,484 | | $(698,899) | | $735,346,693 |
As a result of the transaction, The U.S. Large Cap Value Series recognized a ($2,303,664,484) capital loss for tax year ended December 30, 2008. Additionally, the fund has written off $3,039,011,176 of expired capital loss carryover as a permanent book/tax reporting difference decreasing paid in capital.
Each Portfolio impacted by the “Check the Box” election also has a permanent book/tax difference resulting from the transaction. Listed below is the permanent difference impacting each respective Portfolio. For financial statement purposes, this adjustment did not result in any changes to each respective fund’s net assets or net asset value per share.
21
| | | | | | |
| | | Increase
(Decrease)
Undistributed
Net Investment
Income | | Increase
(Decrease)
Accumulated Net
Realized
Gains (Losses) |
DFA U.S. Large Cap Value Portfolio | | $ | (606,345) | | $ | 606,345 |
DFA U.S. Large Cap Value Portfolio II | | | (10,872) | | | 10,872 |
DFA U.S. Large Cap Value Portfolio III | | | (139,353) | | | 139,353 |
LWAS/DFA U.S. High Book To Market Portfolio | | | (7,793) | | | 7,793 |
For financial reporting purposes, this transaction had no impact on the net assets of the respective funds.
G. Financial Instruments:
In accordance with the Portfolios’ investment objectives and policies, the Portfolios may invest in certain financial instruments that have off-balance sheet risk in excess of the amounts recognized in the Financial Statements and concentrations of credit and market risk. The instruments and its significant corresponding risks are described below:
1. Repurchase Agreements: The LWAS/DFA Two-Year Fixed Income Portfolio and the LWAS/DFA Two-Year Government Portfolio may purchase certain U.S. Government securities subject to the counterparty’s agreement to repurchase them at an agreed upon date and price. The counterparty will be required on a daily basis to maintain the value of the collateral subject to the agreement at not less than the repurchase price (including accrued interest). The agreements are conditioned upon the collateral being deposited under the Federal Reserve book-entry system or with the Fund’s custodian or a third party sub-custodian. In the event of default or bankruptcy by the other party to the agreement, retention of the collateral may be subject to legal proceedings. All open repurchase agreements were entered into on October 30, 2009.
H. Line of Credit:
The Fund, together with other Dimensional-advised portfolios, has entered into an amended and restated $250 million unsecured discretionary line of credit effective July 8, 2009 with an affiliate of its domestic custodian bank. Each portfolio is permitted to borrow, subject to its investment limitations, up to a maximum of $250 million, as long as total borrowings under the line of credit do not exceed $250 million in the aggregate. Borrowings under the line of credit are charged interest at the then current Federal Funds Rate plus 1%. Each portfolio is individually, and not jointly, liable for its particular advances under the line of credit. There is no commitment fee on the unused portion of the line of credit. The agreement for the discretionary line of credit may be terminated by either party at any time. The line of credit is scheduled to expire on June 22, 2010. There were no borrowings by the Portfolios under this line of credit during the year ended October 31, 2009.
The Fund, together with other Dimensional-advised portfolios, has also entered into an additional $500 million unsecured line of credit effective January 15, 2009 with its international custodian bank. Each portfolio is permitted to borrow, subject to its investment limitations, up to a maximum of $500 million, as long as total borrowings under the line of credit do not exceed $500 million in the aggregate. Each portfolio is individually, and not jointly, liable for its particular advances under the line of credit. Borrowings under the line of credit are charged interest at rates agreed to by the parties at the time of borrowing. There is no commitment fee on the unused portion of the line of credit. The agreement for the line of credit expires on January 15, 2010. There were no borrowings by the Portfolios under this line of credit during the year ended October 31, 2009.
I. Indemnitees; Contractual Obligations:
Under the Fund’s organizational documents, its officers and directors are indemnified against certain liabilities arising out of the performance of their duties to the Fund.
In the normal course of business, the Fund enters into contracts that contain a variety of representations and warranties which provide general indemnification. The Fund’s maximum exposure under these arrangements is
22
unknown as this would involve future claims that may be made against the Fund and/or its affiliates that have not yet occurred. However, based on experience, the Fund expects the risk of loss to be remote.
J. Other:
At October 31, 2009, the following number of shareholders held the following approximate percentages of outstanding shares of the Portfolios. One or more of the shareholders is an omnibus account, which typically hold shares for the benefit of several other underlying investors.
| | | | |
| | | Number of
Shareholders | | Approximate
Percentage
of Outstanding
Shares |
LWAS/DFA U.S. High Book to Market Portfolio | | 2 | | 96% |
LWAS/DFA Two-Year Fixed Income Portfolio | | 3 | | 100% |
LWAS/DFA Two-Year Government Portfolio | | 2 | | 96% |
K. Subsequent Event Evaluations:
Management has evaluated the impact of all subsequent events on the Portfolios through December 23, 2009, the date the financial statements were available for issuance, and has determined that there are no subsequent events requiring recognition or disclosure in the financial statements.
23
REPORT OF INDEPENDENT REGISTERED PUBLIC ACCOUNTING FIRM
To the Shareholders of the Portfolios, as defined, and
Board of Directors of Dimensional Investment Group Inc.:
In our opinion, the accompanying statement of assets and liabilities of LWAS/DFA U.S. High Book to Market Portfolio, and the statements of assets and liabilities, including the schedules of investments, of LWAS/DFA Two-Year Fixed Income Portfolio and LWAS/DFA Two-Year Government Portfolio, and the related statements of operations and of changes in net assets and the financial highlights present fairly, in all material respects, the financial position of LWAS/DFA U.S. High Book to Market Portfolio, LWAS/DFA Two-Year Fixed Income Portfolio and LWAS/DFA Two-Year Government Portfolio, (constituting portfolios within Dimensional Investment Group Inc., hereafter referred to as the “Portfolios”) at October 31, 2009, the results of each of their operations for the year then ended, the changes in each of their net assets and the financial highlights for each of the periods indicated, in conformity with accounting principles generally accepted in the United States of America. These financial statements and financial highlights (hereafter referred to as “financial statements”) are the responsibility of the Portfolios’ management; our responsibility is to express an opinion on these financial statements based on our audits. We conducted our audits of these financial statements in accordance with the standards of the Public Company Accounting Oversight Board (United States). Those standards require that we plan and perform the audit to obtain reasonable assurance about whether the financial statements are free of material misstatement. An audit includes examining, on a test basis, evidence supporting the amounts and disclosures in the financial statements, assessing the accounting principles used and significant estimates made by management, and evaluating the overall financial statement presentation. We believe that our audits, which included confirmation of securities at October 31, 2009 by correspondence with the custodian, and by correspondence with the transfer agents of the investee funds, provide a reasonable basis for our opinion.
PricewaterhouseCoopers LLP
Philadelphia, Pennsylvania
December 23, 2009
24
RESULTS OF THE SHAREHOLDER MEETING
On June 2, 2009, June 5, 2009, and July 8, 2009, Dimensional Investment Group Inc. (“DIG”) held a Special Joint Meeting of Shareholders for the purpose of voting on several proposals affecting DIG and the Portfolios including, among other items, the election of Directors, the amendment of certain fundamental investment limitations, and the elimination of certain fundamental investment limitations. The shareholders of the Portfolios approved each of the applicable proposals for DIG and the Portfolios presented at the Meeting. Listed below are the voting results from the Meeting. Please note that not all Proposals presented at the Meeting were voted on by each Portfolio. Additionally, the Proposal numbers reflected below correlate to the Proposal numbers presented for vote at the Meeting.
DIG
| | | | | | | | | | | | | | | | | | | | |
| | | | | Shares Voted | | Percent of Outstanding Shares Voted |
| | | | | For | | % | | Against | | % | | Abstain/WithHold | | % | | For | | Against | | Abstain / WithHold |
Proposal 1: Election of Directors for DIG* | | | | | | | | | | | | | | | | | | |
1a | | David G. Booth | | 754,612,895 | | 96.26% | | — | | 0.00% | | 29,301,677 | | 3.74% | | 85.87% | | 0.00% | | 3.33% |
1b | | George M. Constantinides | | 753,991,785 | | 96.18% | | — | | 0.00% | | 29,922,787 | | 3.82% | | 85.80% | | 0.00% | | 3.41% |
1c | | John P. Gould | | 753,344,569 | | 96.10% | | — | | 0.00% | | 30,570,003 | | 3.90% | | 85.73% | | 0.00% | | 3.48% |
1d | | Roger G. Ibbotson | | 754,232,365 | | 96.21% | | — | | 0.00% | | 29,682,207 | | 3.79% | | 85.83% | | 0.00% | | 3.38% |
1e | | Robert C. Merton | | 754,598,874 | | 96.26% | | — | | 0.00% | | 29,315,698 | | 3.74% | | 85.87% | | 0.00% | | 3.34% |
1f | | Myron S. Scholes | | 754,057,040 | | 96.19% | | — | | 0.00% | | 29,857,532 | | 3.81% | | 85.81% | | 0.00% | | 3.40% |
1g | | Eduardo A. Repetto | | 753,295,592 | | 96.09% | | — | | 0.00% | | 30,618,979 | | 3.91% | | 85.72% | | 0.00% | | 3.48% |
1h | | Abbie J. Smith | | 754,123,603 | | 96.20% | | — | | 0.00% | | 29,790,969 | | 3.80% | | 85.82% | | 0.00% | | 3.39% |
| | | | | | | | | | | | | | | | | | | | | | |
| | | Shares Voted | | Percent of Outstanding Shares Voted |
| | | For | | % | | Against | | % | | Abstain/WithHold | | % | | NonVote | | % | | For | | Against | | Abstain / WithHold |
Proposal 2: To approve Articles of Amendment and Restatement for DIG* | | 479,705,048 | | 93.81% | | 7,503,436 | | 1.47% | | 24,156,664 | | 4.72% | | NA | | NA | | 54.59% | | 0.85% | | 2.75% |
* Results are for all Portfolios within DIG
LWAS/DFA U.S. High Book to Market Portfolio
| | | | | | | | | | | | | | | | | | | | | | | | | | |
| | | | | Shares Voted | | Percent of Outstanding Shares Voted |
| | | | | For | | % | | Against | | % | | Abstain/WithHold | | % | | NonVote | | % | | For | | Against | | Abstain / WithHold | | Non-Vote |
Proposals: | | | | | | | | | | | | | | | | | | | | | | | | |
5 | | To approve amendments to certain fundamental investment restrictions |
5a | | Borrowing Money | | 3,426,211 | | 87.46% | | 186,847 | | 4.77% | | 304,250 | | 7.77% | | NA | | NA | | 48.21% | | 2.63% | | 4.28% | | NA |
5b | | Making Loans | | 3,424,905 | | 87.43% | | 192,169 | | 4.91% | | 300,234 | | 7.66% | | NA | | NA | | 48.19% | | 2.70% | | 4.22% | | NA |
5c | | Investments in Real Estate | | 3,456,737 | | 88.24% | | 160,338 | | 4.09% | | 300,233 | | 7.66% | | NA | | NA | | 48.64% | | 2.26% | | 4.22% | | NA |
5d | | Investments in Commodities | | 3,448,485 | | 88.03% | | 168,590 | | 4.30% | | 300,233 | | 7.66% | | NA | | NA | | 48.53% | | 2.37% | | 4.22% | | NA |
5e | | Diversification of Investments | | 3,483,330 | | 88.92% | | 133,744 | | 3.41% | | 300,234 | | 7.66% | | NA | | NA | | 49.02% | | 1.88% | | 4.22% | | NA |
6 | | To approve the elimination of certain fundamental investment restrictions |
6a | | Pledging, Mortgaging, or Hypothecating Assets | | 3,414,784 | | 87.17% | | 202,635 | | 5.17% | | 299,889 | | 7.66% | | NA | | NA | | 48.05% | | 2.85% | | 4.22% | | NA |
6b | | Purchasing Securities on Margin | | 3,397,232 | | 86.72% | | 224,205 | | 5.72% | | 295,871 | | 7.55% | | NA | | NA | | 47.80% | | 3.15% | | 4.16% | | NA |
6c | | Investing in Restricted or Illiquid Securities | | 3,394,100 | | 86.64% | | 223,449 | | 5.70% | | 299,759 | | 7.65% | | NA | | NA | | 47.76% | | 3.14% | | 4.22% | | NA |
6d | | Investing for the Purpose of Exercising Control | | 3,475,596 | | 88.72% | | 145,840 | | 3.72% | | 295,872 | | 7.55% | | NA | | NA | | 48.91% | | 2.05% | | 4.16% | | NA |
6e | | Investing in Other Investment Companies | | 3,442,495 | | 87.88% | | 178,941 | | 4.57% | | 295,872 | | 7.55% | | NA | | NA | | 48.44% | | 2.52% | | 4.16% | | NA |
6f | | Management Ownership of Securities of an Issuer | | 3,440,053 | | 87.82% | | 181,384 | | 4.63% | | 295,871 | | 7.55% | | NA | | NA | | 48.41% | | 2.55% | | 4.16% | | NA |
6g | | Investing in Oil, Gas, or other Mineral Exploration, Leases or Development Programs | | 3,453,467 | | 88.16% | | 167,970 | | 4.29% | | 295,871 | | 7.55% | | NA | | NA | | 48.60% | | 2.36% | | 4.16% | | NA |
6h | | Investing in Securities of Unseasoned Issuers | | 3,395,770 | | 86.69% | | 221,780 | | 5.66% | | 299,758 | | 7.65% | | NA | | NA | | 47.78% | | 3.12% | | 4.22% | | NA |
6i | | Investing in Warrants | | 3,422,649 | | 87.37% | | 198,788 | | 5.07% | | 295,871 | | 7.55% | | NA | | NA | | 48.16% | | 2.80% | | 4.16% | | NA |
6j | | Writing or Acquiring Options | | 3,418,765 | | 87.27% | | 202,672 | | 5.17% | | 295,871 | | 7.55% | | NA | | NA | | 48.11% | | 2.85% | | 4.16% | | NA |
8 | | Approval of Investment Advisory Agreement between Dimensional Fund Advisors LP and the Company | | 3,492,808 | | 89.16% | | 117,805 | | 3.01% | | 306,695 | | 7.83% | | NA | | NA | | 49.15% | | 1.66% | | 4.32% | | NA |
25
LWAS/DFA Two-Year Fixed Income Portfolio
| | | | | | | | | | | | | | | | | | | | |
| | | | | Shares Voted | | Percent of Outstanding Shares Voted |
| | | | | For | | % | | Against | | % | | Abstain/WithHold | | % | | For | | Against | | Abstain / WithHold |
Proposals: | | | | | | | | | | | | | | | | | | |
5 | | To approve amendments to certain fundamental investment restrictions |
5a | | Borrowing Money | | 3,710,454 | | 87.68% | | — | | 0.00% | | 521,241 | | 12.32% | | 50.24% | | 0.00% | | 7.06% |
5b | | Making Loans | | 3,657,332 | | 86.43% | | — | | 0.00% | | 574,363 | | 13.57% | | 49.52% | | 0.00% | | 7.78% |
5c | | Investments in Real Estate | | 3,707,589 | | 87.61% | | — | | 0.00% | | 524,106 | | 12.39% | | 50.20% | | 0.00% | | 7.10% |
5d | | Investments in Commodities | | 3,715,761 | | 87.81% | | — | | 0.00% | | 515,934 | | 12.19% | | 50.32% | | 0.00% | | 6.99% |
5e | | Diversification of Investments | | 3,736,816 | | 88.31% | | — | | 0.00% | | 494,879 | | 11.69% | | 50.60% | | 0.00% | | 6.70% |
6 | | To approve the elimination of certain fundamental investment restrictions |
6a | | Pledging, Mortgaging, or Hypothecating Assets | | 3,647,642 | | 86.20% | | — | | 0.00% | | 584,053 | | 13.80% | | 49.39% | | 0.00% | | 7.91% |
6b | | Purchasing Securities on Margin | | 3,631,680 | | 85.82% | | — | | 0.00% | | 600,015 | | 14.18% | | 49.18% | | 0.00% | | 8.12% |
6c | | Investing in Restricted or Illiquid Securities | | 3,632,272 | | 85.83% | | — | | 0.00% | | 599,423 | | 14.17% | | 49.18% | | 0.00% | | 8.12% |
6d | | Investing for the Purpose of Exercising Control | | 3,720,365 | | 87.92% | | — | | 0.00% | | 511,330 | | 12.08% | | 50.38% | | 0.00% | | 6.92% |
6e | | Investing in Other Investment Companies | | 3,710,404 | | 87.68% | | — | | 0.00% | | 521,291 | | 12.32% | | 50.24% | | 0.00% | | 7.06% |
6f | | Management Ownership of Securities of an Issuer | | 3,722,986 | | 87.98% | | — | | 0.00% | | 508,709 | | 12.02% | | 50.41% | | 0.00% | | 6.89% |
6g | | Investing in Oil, Gas, or other Mineral Exploration, Leases or Development Programs | | 3,730,656 | | 88.16% | | — | | 0.00% | | 501,039 | | 11.84% | | 50.52% | | 0.00% | | 6.78% |
6h | | Investing in Securities of Unseasoned Issuers | | 3,680,639 | | 86.98% | | — | | 0.00% | | 551,056 | | 13.02% | | 49.84% | | 0.00% | | 7.46% |
6i | | Investing in Warrants | | 3,705,232 | | 87.56% | | — | | 0.00% | | 526,463 | | 12.44% | | 50.17% | | 0.00% | | 7.13% |
6j | | Writing or Acquiring Options | | 3,713,436 | | 87.75% | | — | | 0.00% | | 518,259 | | 12.25% | | 50.28% | | 0.00% | | 7.02% |
LWAS/DFA Two-Year Government Portfolio |
| | | | | Shares Voted | | Percent of Outstanding Shares Voted |
| | | | | For | | % | | Against | | % | | Abstain/WithHold | | % | | For | | Against | | Abstain / WithHold |
Proposals: |
5 | | To approve amendments to certain fundamental investment restrictions |
5a | | Borrowing Money | | 6,012,061 | | 90.26% | | 505,785 | | 7.59% | | 142,614 | | 2.14% | | 48.57% | | 4.09% | | 1.15% |
5b | | Making Loans | | 6,026,920 | | 90.49% | | 496,036 | | 7.45% | | 137,504 | | 2.06% | | 48.69% | | 4.01% | | 1.11% |
5c | | Investments in Real Estate | | 6,029,505 | | 90.53% | | 493,451 | | 7.41% | | 137,504 | | 2.06% | | 48.71% | | 3.99% | | 1.11% |
5d | | Investments in Commodities | | 6,026,460 | | 90.48% | | 491,387 | | 7.38% | | 142,613 | | 2.14% | | 48.68% | | 3.97% | | 1.15% |
5e | | Diversification of Investments | | 6,423,456 | | 96.44% | | 88,960 | | 1.34% | | 148,044 | | 2.22% | | 51.89% | | 0.72% | | 1.20% |
6 | | To approve the elimination of certain fundamental investment restrictions |
6a | | Pledging, Mortgaging, or Hypothecating Assets | | 5,962,505 | | 89.52% | | 549,706 | | 8.25% | | 148,249 | | 2.23% | | 48.17% | | 4.44% | | 1.20% |
6b | | Purchasing Securities on Margin | | 5,968,825 | | 89.62% | | 542,528 | | 8.15% | | 149,107 | | 2.24% | | 48.22% | | 4.38% | | 1.20% |
6c | | Investing in Restricted or Illiquid Securities | | 5,969,143 | | 89.62% | | 547,320 | | 8.22% | | 143,997 | | 2.16% | | 48.22% | | 4.42% | | 1.16% |
6d | | Investing for the Purpose of Exercising Control | | 6,017,754 | | 90.35% | | 489,347 | | 7.35% | | 153,359 | | 2.30% | | 48.61% | | 3.95% | | 1.24% |
6e | | Investing in Other Investment Companies | | 5,979,453 | | 89.78% | | 537,010 | | 8.06% | | 143,997 | | 2.16% | | 48.30% | | 4.34% | | 1.16% |
6f | | Management Ownership of Securities of an Issuer | | 5,992,179 | | 89.97% | | 524,284 | | 7.87% | | 143,997 | | 2.16% | | 48.41% | | 4.24% | | 1.16% |
6g | | Investing in Oil, Gas, or other Mineral Exploration, Leases or Development Programs | | 5,991,652 | | 89.96% | | 524,810 | | 7.88% | | 143,998 | | 2.16% | | 48.40% | | 4.24% | | 1.16% |
6h | | Investing in Securities of Unseasoned Issuers | | 5,967,144 | | 89.59% | | 544,208 | | 8.17% | | 149,108 | | 2.24% | | 48.21% | | 4.40% | | 1.20% |
6i | | Investing in Warrants | | 5,976,059 | | 89.72% | | 535,294 | | 8.04% | | 149,107 | | 2.24% | | 48.28% | | 4.32% | | 1.20% |
6j | | Writing or Acquiring Options | | 5,973,077 | | 89.68% | | 538,276 | | 8.08% | | 149,107 | | 2.24% | | 48.25% | | 4.35% | | 1.20% |
26
DFA INVESTMENT DIMENSIONS GROUP INC.
PERFORMANCE CHART
LWAS/DFA International High Book to Market Portfolio vs.
MSCI World ex USA Index (net dividends)
October 31, 1999-October 31, 2009
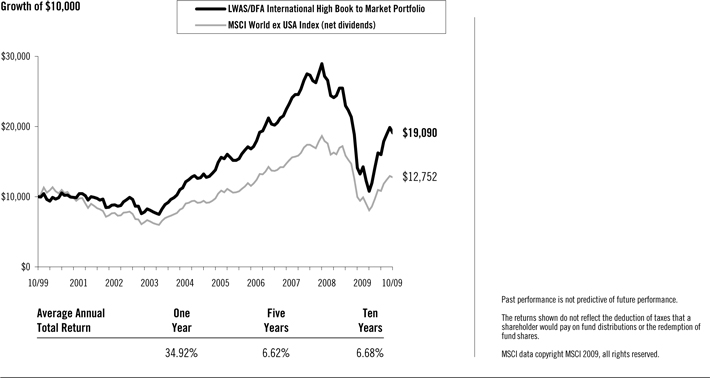
27
DFA INVESTMENT DIMENSIONS GROUP INC.
MANAGEMENT’S DISCUSSION AND ANALYSIS
| | |
| International Equity Market Review | | 12 Months Ended October 31, 2009 |
The one-year period ending October 31, 2009, was characterized by unprecedented volatility in non-US developed markets. Non-US developed markets lost 18.87% from November 2008 through February 2009, as measured by the MSCI World ex USA Index (net dividends). From March through October 2009 these same markets gained 57.56%. In April 2009, the Index had its largest-ever monthly gain (12.90%) since October 1990.
From November 2008 through February 2009, developed markets returns were negative across all asset classes. The US dollar rallied against most currencies, reversing a general trend of depreciation dating back to 2006. From March through October 2009 the market reversed course, with small cap and value stocks strongly outperforming large cap and growth stocks. The US dollar depreciated against most major currencies. The rally drove strong positive returns for the 12-month period, with small cap stocks significantly outperforming large cap stocks and value stocks outperforming growth stocks, as measured by the MSCI indexes.
12 Months Ended October 31, 2009
| | | | |
Ten Largest Foreign Developed Markets by Market Cap (BB) | | Local
Currency
Return | | U.S. Dollar
Return |
Japan ($2,432) | | 6.03% | | 15.20% |
United Kingdom ($2,328) | | 23.19% | | 25.68% |
France ($1,106) | | 10.09% | | 28.10% |
Canada ($1,060) | | 17.46% | | 32.58% |
Australia ($912) | | 21.91% | | 66.97% |
Germany ($843) | | 6.37% | | 23.77% |
Switzerland ($821) | | 5.78% | | 20.63% |
Spain ($488) | | 33.27% | | 55.06% |
Italy ($388) | | 7.57% | | 25.17% |
Netherlands ($277) | | 20.17% | | 39.83% |
Country market capitalizations (in parentheses) are in USD billions. Source: Returns are of MSCI indices net of foreign withholding taxes on dividends. Country market capitalizations are based on country carve-outs of the MSCI All-Country World Investable Market Index. MSCI data copyright MSCI 2009, all rights reserved.
Small company stocks were the best-performing asset class in international markets, while growth stocks had the worst relative results.
| | |
12 Months Ended October 31, 2009 | | U.S. Dollar
Return |
MSCI World ex USA Small Cap Index | | 50.01% |
MSCI World ex USA Value Index | | 31.71% |
MSCI World ex USA Index | | 27.83% |
MSCI World ex USA Growth Index | | 24.03% |
Source: MSCI indices are net of foreign withholding taxes on dividends, copyright MSCI 2009, all rights reserved.
Master-Feeder Structure
The Portfolio described below, called a “Feeder Fund”, does not buy individual securities directly; instead, the Portfolio invests in a corresponding fund called a “Master Fund”. The Master Fund, in turn, purchases stocks and/or other securities.
28
International Equity Portfolio Performance Overview
LWAS/DFA International High Book to Market Portfolio
The LWAS/DFA International High Book to Market Portfolio seeks to capture the returns of international large company value stocks by purchasing shares of a Master Fund that invests in such stocks. The investment strategy employs a disciplined, quantitative approach, emphasizing broad diversification and consistent exposure to large cap value stocks, but does not attempt to track closely a specific equity index. As of October 31, 2009, the Master Fund held 465 stocks in 22 developed countries and was mostly invested in equities throughout the year: the average non-equitized cash level for the period was less than 1% of the Master Fund’s assets.
As a result of the Master Fund’s diversified investment approach, performance was determined principally by broad structural trends in global equity markets rather than the behavior of a limited number of stocks. For the 12 months ended October 31, 2009, value stocks outperformed growth stocks in international developed markets. Total returns were 34.92% for the Portfolio and 27.83% for the MSCI World ex USA Index (net dividends). The Master Fund’s greater allocation than the Index to value stocks (66% on average vs. 26% in the Index) added approximately 6.7% to the relative performance.
29
DFA INVESTMENT DIMENSIONS GROUP INC.
LWAS/DFA INTERNATIONAL HIGH BOOK TO MARKET PORTFOLIO
DISCLOSURE OF FUND EXPENSES
(Unaudited)
The following Expense Table is shown so that you can understand the impact of fees on your investment. All mutual funds have operating expenses. As a shareholder of the fund, you incur ongoing costs, which include costs for portfolio management, administrative services, and shareholder reports, among others. Operating expenses, legal and audit services, which are deducted from a fund’s gross income, directly reduce the investment return of the fund. A fund’s expenses are expressed as a percentage of its average net assets. This figure is known as the expense ratio. The following examples are intended to help you understand the ongoing costs, in dollars, of investing in the fund and to compare these costs with those of other mutual funds. The examples are based on an investment of $1,000 made at the beginning of the period shown and held for the entire period.
The Expense Table below illustrate your fund’s costs in two ways.
Actual Fund Return
This section helps you to estimate the actual expenses after fee waivers that you paid over the period. The “Ending Account Value” shown is derived from the fund’s actual return and “Expenses Paid During Period” reflect the dollar amount that would have been paid by an investor who started with $1,000 in the fund. You may use the information here, together with the amount you invested, to estimate the expenses that you paid over the period.
To do so, simply divide your account value by $1,000 (for example, a $7,500 account value divided by $1,000 = 7.5), then multiply the result by the number given for your fund under the heading “Expenses Paid During Period.”
Hypothetical Example for Comparison Purposes
This section is intended to help you compare your fund’s costs with those of other mutual funds. The hypothetical “Ending Account Value” and “Expenses Paid During Period” are derived from the fund’s actual expense ratio and an assumed 5% annual return before expenses. In this case, because the return used is not the fund’s actual return, the results do not apply to your investment. The example is useful in making comparisons because the SEC requires all mutual funds to calculate expenses based on a 5% annual return. You can assess your fund’s costs by comparing this hypothetical example with the hypothetical examples that appear in shareholder reports of other funds.
Please note that the expenses shown in the table are meant to highlight and help you compare ongoing costs only and do not reflect any transactional costs, if applicable. The “Annualized Expense Ratio” represents the actual expenses for the six-month period indicated.
| | | | | | | | |
| | | | Six Months Ended October 31, 2009 |
| EXPENSE TABLE | | | | | | | | |
| | | | |
| | | Beginning
Account
Value
05/01/09 | | Ending Account
Value
10/31/09 | | Annualized
Expense
Ratio* | | Expenses
Paid
During
Period* |
Actual Fund Return | | $1,000.00 | | $1,348.70 | | 0.51% | | $3.02 |
Hypothetical 5% Annual Return | | $1,000.00 | | $1,022.63 | | 0.51% | | $2.60 |
| * | Expenses are equal to the fund’s annualized expense ratio for the six-month period, multiplied by the average account value over the period, multiplied by the number of days in the most recent six-month period (184), then divided by the number of days in the year (365) to reflect the six-month period. The Portfolio is a Feeder Fund. The expenses shown reflect the direct expenses of the Feeder Fund and the indirect payment of the Feeder Fund’s portion of the expenses of its Master Fund. |
30
DFA INVESTMENT DIMENSIONS GROUP INC.
LWAS/DFA INTERNATIONAL HIGH BOOK TO MARKET PORTFOLIO
DISCLOSURE OF PORTFOLIO HOLDINGS
(Unaudited)
The SEC requires that all Funds file a complete Schedule of Investments with the SEC for their first and third fiscal quarters on Form N-Q. For DFA Investment Dimensions Group Inc., this would be for the fiscal quarters ending January 31 and July 31. The Form N-Q filing must be made within 60 days of the end of the quarter. DFA Investment Dimensions Group Inc. filed its most recent Form N-Q with the SEC on September 29, 2009. It is available upon request, without charge, by calling collect: (512) 306-7400 or by mailing a request to Dimensional Fund Advisors LP, 6300 Bee Cave Road, Building One, Austin, Texas 78746, or by visiting the SEC’s website at http://www.sec.gov, or they may be reviewed and copied at the SEC’s Public Reference Room in Washington, D.C. (call 1-800-732-0330 for information on the operation of the Public Reference Room).
PORTFOLIO HOLDINGS
The SEC requires that all Funds present their categories of portfolio holdings in a table, chart or graph format in their annual and semi-annual shareholder reports, whether or not a Schedule of Investments is utilized. The following table, which presents portfolio holdings as a percent of total investments before short-term investments and collateral for loaned securities, is provided in compliance with such requirement.
The categories of industry classification for the Affiliated Investment Company are represented in the Disclosure of Portfolio Holdings, which are included elsewhere within the report. Refer to the Summary Schedule of Portfolio Holdings for the underlying Master Fund’s holdings which reflect the investments by country.
| | |
Affiliated Investment Company | | 100.0% |
31
DFA INVESTMENT DIMENSIONS GROUP INC.
LWAS/DFA INTERNATIONAL HIGH BOOK TO MARKET PORTFOLIO
STATEMENT OF ASSETS AND LIABILITIES
OCTOBER 31, 2009
(Amounts in thousands, except share and per share amounts)
| | | |
ASSETS: | | | |
Investment in The DFA International Value Series of The DFA Investment Trust Company (Affiliated Investment Company) at Value† | | $ | 85,519 |
Receivables: | | | |
Investment Securities Sold | | | 59 |
Prepaid Expenses and Other Assets | | | 10 |
| | | |
Total Assets | | | 85,588 |
| | | |
LIABILITIES: | | | |
Payables: | | | |
Fund Shares Redeemed | | | 59 |
Due to Advisor | | | 1 |
Accrued Expenses and Other Liabilities | | | 24 |
| | | |
Total Liabilities | | | 84 |
| | | |
NET ASSETS | | $ | 85,504 |
| | | |
SHARES OUTSTANDING, $0.01 PAR VALUE (1) | | | 8,853,630 |
| | | |
NET ASSET VALUE, OFFERING AND REDEMPTION PRICE PER SHARE | | $ | 9.66 |
| | | |
Investment in Affiliated Investment Company at Cost | | $ | 65,883 |
| | | |
NET ASSETS CONSIST OF: | | | |
Paid-In Capital | | $ | 65,110 |
Undistributed Net Investment Income (Distributions in Excess of Net Investment Income) | | | 252 |
Accumulated Net Realized Gain (Loss) | | | 503 |
Net Unrealized Foreign Exchange Gain (Loss) | | | 3 |
Net Unrealized Appreciation (Depreciation) | | | 19,636 |
| | | |
NET ASSETS | | $ | 85,504 |
| | | |
(1) NUMBER OF SHARES AUTHORIZED | | | 200,000,000 |
| | | |
See accompanying Notes to Financial Statements.
32
DFA INVESTMENT DIMENSIONS GROUP INC.
LWAS/DFA INTERNATIONAL HIGH BOOK TO MARKET PORTFOLIO
STATEMENT OF OPERATIONS
FOR THE YEAR ENDED OCTOBER 31, 2009
(Amounts in thousands)
| | | | |
Investment Income | | | | |
Dividends (Net of Foreign Taxes Withheld of $214) | | $ | 2,408 | |
Interest | | | 3 | |
Income from Securities Lending | | | 196 | |
Expenses Allocated from Affiliated Investment Company | | | (180 | ) |
| | | | |
Total Investment Income | | | 2,427 | |
| | | | |
Expenses | | | | |
Administrative Services Fees | | | 7 | |
Accounting & Transfer Agent Fees | | | 14 | |
Shareholder Servicing Fees | | | 141 | |
Filing Fees | | | 24 | |
Shareholders’ Reports | | | 15 | |
Directors’/Trustees’ Fees & Expenses | | | 1 | |
Professional Fees | | | 2 | |
Other | | | 2 | |
| | | | |
Total Expenses | | | 206 | |
| | | | |
Net Investment Income (Loss) | | | 2,221 | |
| | | | |
Realized and Unrealized Gain (Loss) | | | | |
Net Realized Gain (Loss) on: | | | | |
Investment Securities Sold | | | 504 | |
Futures | | | (2 | ) |
Foreign Currency Transactions | | | 54 | |
Change in Unrealized Appreciation (Depreciation) of: | | | | |
Investment Securities and Foreign Currency | | | 19,636 | |
Translation of Foreign Currency Denominated Amounts | | | 3 | |
| | | | |
Net Realized and Unrealized Gain (Loss) | | | 20,195 | |
| | | | |
Net Increase (Decrease) in Net Assets Resulting from Operations | | $ | 22,416 | |
| | | | |
Investment Income and Realized and Unrealized Gain (Loss) were allocated from the Portfolio’s Master Fund (Affiliated Investment Company).
See accompanying Notes to Financial Statements.
33
DFA INVESTMENT DIMENSIONS GROUP INC.
LWAS/DFA INTERNATIONAL HIGH BOOK TO MARKET PORTFOLIO
STATEMENTS OF CHANGES IN NET ASSETS
(Amounts in thousands)
| | | | | | | | | | | | |
| | | Year
Ended
Oct. 31,
2009 | | | Period
Dec. 1,
2007 to
Oct. 31,
2008 | | | Year
Ended
Nov. 30,
2007 | |
Increase (Decrease) in Net Assets | | | | | | | | | | | | |
Operations: | | | | | | | | | | | | |
Net Investment Income (Loss) | | $ | 2,221 | | | $ | 5,051 | | | $ | 5,215 | |
Net Realized Gain (Loss) on: | | | | | | | | | | | | |
Investment Securities Sold | | | 504 | | | | 12,068 | † | | | 4,751 | † |
Futures | | | (2 | ) | | | — | | | | — | |
Foreign Currency Transactions | | | 54 | | | | — | | | | — | |
Change in Unrealized Appreciation (Depreciation) of: | | | | | | | | | | | | |
Investment Securities and Foreign Currency | | | 19,636 | | | | (99,015 | )† | | | 19,463 | † |
Translation of Foreign Currency Denominated Amounts | | | 3 | | | | — | | | | — | |
| | | | | | | | | | | | |
Net Increase (Decrease) in Net Assets Resulting from Operations | | | 22,416 | | | | (81,896 | ) | | | 29,429 | |
| | | | | | | | | | | | |
Distributions From: | | | | | | | | | | | | |
Net Investment Income | | | (2,264 | ) | | | (5,330 | ) | | | (4,570 | ) |
Net Short-Term Gains | | | — | | | | (1,075 | ) | | | (1,512 | ) |
Net Long-Term Gains | | | (26,436 | ) | | | (10,361 | ) | | | (3,475 | ) |
| | | | | | | | | | | | |
Total Distributions | | | (28,700 | ) | | | (16,766 | ) | | | (9,557 | ) |
| | | | | | | | | | | | |
Capital Share Transactions (1): | | | | | | | | | | | | |
Shares Issued | | | 17,247 | | | | 13,918 | | | | 12,669 | |
Shares Issued in Lieu of Cash Distributions | | | 25,369 | | | | 14,298 | | | | 8,135 | |
Shares Redeemed | | | (35,147 | ) | | | (30,474 | ) | | | (35,421 | ) |
| | | | | | | | | | | | |
Net Increase (Decrease) from Capital Share Transactions | | | 7,469 | | | | (2,258 | ) | | | (14,617 | ) |
| | | | | | | | | | | | |
Total Increase (Decrease) in Net Assets | | | 1,185 | | | | (100,920 | ) | | | 5,255 | |
Net Assets | | | | | | | | | | | | |
Beginning of Period | | | 84,319 | | | | 185,239 | | | | 179,984 | |
| | | | | | | | | | | | |
End of Period | | $ | 85,504 | | | $ | 84,319 | | | $ | 185,239 | |
| | | | | | | | | | | | |
(1) Shares Issued and Redeemed: | | | | | | | | | | | | |
Shares Issued | | | 2,238 | | | | 875 | | | | 540 | |
Shares Issued in Lieu of Cash Distributions | | | 3,560 | | | | 690 | | | | 359 | |
Shares Redeemed | | | (4,341 | ) | | | (1,785 | ) | | | (1,504 | ) |
| | | | | | | | | | | | |
Net Increase (Decrease) from Shares Issued and Redeemed | | | 1,457 | | | | (220 | ) | | | (605 | ) |
| | | | | | | | | | | | |
Undistributed Net Investment Income (Distributions in Excess of Net Investment Income) | | $ | 252 | | | $ | 244 | | | $ | 522 | |
| † | See Note A in the Notes to Financial Statements. |
See accompanying Notes to Financial Statements.
34
DFA INVESTMENT DIMENSIONS GROUP INC.
LWAS/DFA INTERNATIONAL HIGH BOOK TO MARKET PORTFOLIO
FINANCIAL HIGHLIGHTS
(for a share outstanding throughout each period)
| | | | | | | | | | | | | | | | | | | | | | | | |
| | | Year
Ended
Oct. 31,
2009 | | | Period
Dec. 1,
2007 to
Oct. 31,
2008 | | | Year Ended Nov. 30,
2007 | | | Year Ended Nov. 30,
2006 | | | Year Ended Nov. 30,
2005 | | | Year Ended Nov. 30,
2004 | |
| | |
Net Asset Value, Beginning of Period | | $ | 11.40 | | | $ | 24.32 | | | $ | 21.89 | | | $ | 17.49 | | | $ | 15.93 | | | $ | 12.55 | |
| | | | | | | | | | | | | | | | | | | | | | | | |
Income from Investment Operations | | | | | | | | | | | | | | | | | | | | | | | | |
Net Investment Income (Loss) | | | 0.25 | (A) | | | 0.66 | (A) | | | 0.65 | (A) | | | 0.61 | (A) | | | 0.48 | | | | 0.27 | |
Net Gains (Losses) on Securities (Realized and Unrealized) | | | 2.14 | | | | (11.36 | ) | | | 2.98 | | | | 5.23 | | | | 1.87 | | | | 3.63 | |
| | | | | | | | | | | | | | | | | | | | | | | | |
Total from Investment Operations | | | 2.39 | | | | (10.70 | ) | | | 3.63 | | | | 5.84 | | | | 2.35 | | | | 3.90 | |
| | |
Less Distributions | | | | | | | | | | | | | | | | | | | | | | | | |
Net Investment Income | | | (0.27 | ) | | | (0.70 | ) | | | (0.58 | ) | | | (0.63 | ) | | | (0.43 | ) | | | (0.51 | ) |
Net Realized Gains | | | (3.86 | ) | | | (1.52 | ) | | | (0.62 | ) | | | (0.81 | ) | | | (0.36 | ) | | | (0.01 | ) |
| | | | | | | | | | | | | | | | | | | | | | | | |
Total Distributions | | | (4.13 | ) | | | (2.22 | ) | | | (1.20 | ) | | | (1.44 | ) | | | (0.79 | ) | | | (0.52 | ) |
| | |
Net Asset Value, End of Period | | $ | 9.66 | | | $ | 11.40 | | | $ | 24.32 | | | $ | 21.89 | | | $ | 17.49 | | | $ | 15.93 | |
| | |
Total Return | | | 34.92 | % | | | (47.99 | )%(C) | | | 17.05 | % | | | 35.40 | % | | | 15.32 | % | | | 31.89 | % |
| | |
| | | | | | |
Net Assets, End of Period (thousands) | | $ | 85,504 | | | $ | 84,319 | | | $ | 185,239 | | | $ | 179,984 | | | $ | 138,782 | | | $ | 130,397 | |
Ratio of Expenses to Average Net Assets (D) | | | 0.52 | % | | | 0.47 | %(B) | | | 0.46 | % | | | 0.47 | % | | | 0.50 | % | | | 0.52 | % |
Ratio of Net Investment Income to Average Net Assets | | | 2.99 | % | | | 3.74 | %(B) | | | 2.76 | % | | | 3.14 | % | | | 2.88 | % | | | 1.88 | % |
| | |
See page 1 for the Definitions of Abbreviations and Footnotes.
See accompanying Notes to Financial Statements.
35
DFA INVESTMENT DIMENSIONS GROUP INC.
LWAS/DFA INTERNATIONAL HIGH BOOK TO MARKET PORTFOLIO
NOTES TO FINANCIAL STATEMENTS
A. Organization:
DFA Investment Dimensions Group Inc. (the “Fund”) is an open-end management investment company registered under the Investment Company Act of 1940, whose shares are offered to institutional investors, retirement plans and clients of registered investment advisors. The Fund consists of fifty-seven operational portfolios, of which the LWAS/DFA International High Book to Market Portfolio (“the Portfolio”) is presented in this report.
The Portfolio primarily invests its assets in The DFA International Value Series (the “Series”), a corresponding series of The DFA Investment Trust Company. At October 31, 2009, the Portfolio owned 1% of the Series.
On November 1, 2008 The DFA International Value Series, a master fund in a RIC/RIC master-feeder structure, elected with the consent of its respective Holder(s) to change its U.S. federal income tax classification from that of an association taxable as a corporation to a partnership pursuant to Treasury Regulation § 301.7701-3. The change in capital structure and retroactive reclassification of the statement of changes in net assets and financial highlights for the respective funds is a result of the treatment of a partnership for book purposes. The Series/Portfolio will maintain its books and records and present its financial statements in accordance with generally accepted accounting principles for investment partnerships.
At a regular meeting of the Board of Directors/Trustees (the “Board”) on September 16, 2008, the Board voted to change the fiscal and tax year ends of the Portfolio from November 30 to October 31.
B. Significant Accounting Policies:
The following significant accounting policies are in conformity with accounting principles generally accepted in the United States of America. Such policies are consistently followed by the Fund in preparation of its financial statements. The preparation of financial statements in accordance with accounting principles generally accepted in the United States of America requires management to make estimates and assumptions that affect the reported amounts of assets and liabilities and disclosure of contingent assets and liabilities at the date of the financial statements and the reported amounts of increases and decreases in net assets from operations during the reporting period. Actual results could differ from those estimates and those differences could be material.
1. Security Valuation: The Portfolio’s investment reflects its proportionate interest in the net assets of the Series.
The Portfolio utilizes a fair value hierarchy which prioritizes the inputs to valuation techniques used to measure fair value into three broad levels described below:
— Level 1 – quoted prices in active markets for identical securities
— Level 2 – other significant observable inputs (including quoted prices for similar securities, interest rates, prepayment speeds, credit risk, etc.)
— Level 3 – significant unobservable inputs (including the Portfolio’s own assumptions in determining the fair value of investments)
The inputs or methodology used for valuing securities are not necessarily an indication of the risk associated with investing in those securities. A summary of the inputs used to value the Portfolio’s net assets as of October 31, 2009 is listed below (in thousands).
36
| | | | | | | | |
| | | Valuation Inputs |
| |
| | | Investments in
Securities
(Market Value) |
| | | Level 1 | | Level 2 | | Level 3 | | Total |
LWAS/DFA International High Book to Market Portfolio | | $85,519 | | — | | — | | $85,519 |
2. Deferred Compensation Plan: Each eligible Director of the Fund may elect participation in the Deferred Compensation Plan (the “Plan”). Under the Plan, effective January 1, 2002, such Directors may defer payment of all or a portion of their total fees earned as a Director. These deferred amounts may be treated as though such amounts had been invested in shares of the following funds: U.S. Large Cap Value Portfolio; U.S. Core Equity 1 Portfolio; U.S. Core Equity 2 Portfolio; U.S. Vector Equity Portfolio; U.S. Micro Cap Portfolio; DFA International Value Portfolio; International Core Equity Portfolio; Emerging Markets Portfolio; Emerging Markets Core Equity Portfolio; and/or DFA Two-Year Global Fixed Income Portfolio. Contributions made under the Plan and the change in unrealized appreciation (depreciation) and income, are included in Directors’/Trustees’ Fees & Expenses for the year ended October 31, 2009. At October 31, 2009, the total liability for deferred compensation to Directors is included in Accrued Expenses and Other Liabilities on the Statement of Assets and Liabilities in the amount of $2 (in thousands).
Each Director has the option to receive their distribution of proceeds in one of the following methods upon one year’s notice: lump sum; annual installments over a period of agreed upon years; or semi-annual installments over a period of agreed upon years. As of October 31, 2009, none of the Directors have requested distribution of proceeds.
3. Other: The Portfolio recognizes its pro-rata share, on a daily basis, of net investment income and realized and unrealized gains and losses of investment securities and foreign currency from The DFA International Value Series, which is treated as a partnership for federal income tax purposes. Distributions received on securities that represent a return of capital are recorded as a reduction of cost of investments or as a realized gain, respectively. Expenses directly attributable to the Portfolio are directly charged. Common expenses of the Fund are allocated using methods approved by the Board of Directors/Trustees, generally based on average net assets.
C. Investment Advisor:
Dimensional Fund Advisors LP (“Dimensional” or the “Advisor”) provides administrative services to the Portfolio, including supervision of services provided by others, providing information to the shareholders and to the Board of Directors/Trustees, and other administrative services. The Advisor provides investment advisory services to the Series. For the year ended October 31, 2009, the Portfolio’s administrative services fees were accrued daily and paid monthly to the Advisor based on an effective annual rate of 0.01% of average daily net assets.
In addition, pursuant to a Client Service Agreement with LWI Financial Inc. (“LWIF”), the Portfolio pays a Shareholder Servicing fee to LWIF at the effective annual rate of 0.19% of its average daily net assets.
Fees Paid to Officers and Directors/Trustees:
Certain Officers and Directors/Trustees of the Advisor are also Officers and Directors/Trustees of the Fund; however, such Officers and Directors/Trustees (with the exception of the Chief Compliance Officer (“CCO”)) receive no compensation from the Fund. For the year ended October 31, 2009, the total related amounts paid by the Fund to the CCO were $197 (in thousands). The total related amount paid by the Portfolio is included in Other Expenses on the Statement of Operations.
D. Federal Income Taxes:
The Portfolio has qualified and intends to continue to qualify as a regulated investment company under Subchapter M of the Internal Revenue Code for federal income tax purposes and to distribute substantially all of its taxable income and net capital gains to its shareholders.
37
Distributions from net investment income and net realized capital gains are determined in accordance with U.S. federal income tax regulations, which may differ from those amounts determined under accounting principles generally accepted in the United States of America. These book/tax differences are either temporary or permanent in nature. To the extent these differences are permanent they are charged, or credited to paid-in capital, undistributed net investment income or accumulated net realized gains, as appropriate, in the period that the differences arise. Accordingly, the following permanent differences as of October 31, 2009, primarily attributable to the reclassification of foreign currency gains to net investment income for income tax purposes were reclassified to the following accounts. These reclassifications had no effect on net asset value per share (amounts in thousands):
| | | | |
| | | Increase
(Decrease)
Undistributed
Net Investment
Income | | Increase
(Decrease)
Accumulated
Net Realized
Gains (Losses) |
LWAS/DFA International High Book to Market Portfolio | | $51 | | $(51) |
The tax character of dividends and distributions declared and paid during the year ended November 30, 2007, the period December 1, 2007 to October 31, 2008 and the year ended October 31, 2009 were as follows (amounts in thousands):
| | | | | | |
| | | Net Investment
Income
and Short-Term
Capital Gains | | Long-Term
Capital Gain | | Total |
2007 | | $6,376 | | $ 3,987 | | $10,363 |
2008 | | 6,405 | | 10,361 | | 16,766 |
2009 | | 2,267 | | 26,433 | | 28,700 |
At October 31, 2009, the components of distributable earnings/(accumulated losses) were as follows (amounts in thousands):
| | | | |
Undistributed
Net
Investment
Income and
Short-Term
Capital Gains | | Undistributed
Long-Term
Capital Gains | | Total Net
Distributable
Earnings
(Accumulated
Losses) |
| $760 | | — | | $760 |
For federal income tax purposes, the Fund measures its capital loss carryforwards annually at October 31, its fiscal year end. Capital loss carryforwards may be carried forward and applied against future capital gains. As of October 31, 2009, the Portfolio had no capital loss carryforwards available to offset future realized capital gains.
At October 31, 2009, the total cost and aggregate gross unrealized appreciation and (depreciation) of securities for federal income tax purposes were different from amounts reported for financial reporting purposes (amounts in thousands):
| | | | | | |
Federal
Tax Cost | | Unrealized
Appreciation | | Unrealized
(Depreciation) | | Net
Unrealized
Appreciation
(Depreciation) |
| $65,885 | | $21,969 | | $(2,335) | | $19,634 |
Accounting for Uncertainty in Income Taxes sets forth a minimum threshold for financial statement recognition of the benefit of a tax position taken or expected to be taken on a tax return. Management has analyzed each Portfolios’ tax positions and has concluded that no provision for income tax is required in any Portfolios’ financial statements. No Portfolio is aware of any tax positions for which it is reasonably possible that the total amounts of
38
unrecognized tax benefits will significantly change in the next twelve months. Each of the Portfolios’ federal tax returns for the prior three fiscal years remain subject to examination by the Internal Revenue Service.
On November 1, 2008, The DFA International Value Series, a master fund in a RIC/RIC master feeder structure with five RIC feeders and other direct client investor(s), made a “Check-the-box” election for federal income tax purposes pursuant to Treasury Regulation §301.7701-3, to change its federal entity classification from a corporation taxable as a regulated investment company to a partnership. As a result of this election, the master fund is deemed to have distributed all of its assets and liabilities, in a taxable transaction, to its shareholders in liquidation of the master fund. Immediately thereafter, the shareholders contributed all of the distributed assets and liabilities to a newly formed partnership. The final tax year end of The DFA International Value Series was October 31, 2008. For Federal income tax purposes, pursuant to Internal Revenue Code §336(a), the master fund recognizes gain or loss as if the master’s investment securities were sold to its shareholders and, pursuant to IRC Code §331, each of the Portfolios recognizes gain or loss as if it liquidated its investment in the master. As a result of the transaction, The DFA International Value Series recognized a ($2,309,440,866) and ($718,733) capital and currency loss respectively for tax year ended October 31, 2008. For tax purposes, pursuant to IRC Code §334(a), each of the Portfolios will take a fair market value basis in the securities deemed received by them and a new holding period for those securities commences on the deemed liquidation date.
E. Line of Credit:
The Fund, together with other Dimensional-advised portfolios, has entered into an amended and restated $250 million unsecured discretionary line of credit effective July 8, 2009 with an affiliate of its domestic custodian bank. Each portfolio is permitted to borrow, subject to its investment limitations, up to a maximum of $250 million, as long as total borrowings under the line of credit do not exceed $250 million in the aggregate. Borrowings under the line of credit are charged interest at the current Federal Funds Rate plus 1%. Each portfolio is individually, and not jointly, liable for its particular advances under the line of credit. There is no commitment fee on the unused portion of the line of credit. The agreement for the discretionary line of credit may be terminated by either party at any time. The line of credit is scheduled to expire on June 22, 2010. There were no borrowings by the Portfolio under this line of credit during the year ended October 31, 2009.
The Fund, together with other Dimensional-advised portfolios, has also entered into an additional $500 million unsecured line of credit effective January 15, 2009 with its international custodian bank. Each portfolio is permitted to borrow, subject to its investment limitations, up to a maximum of $500 million, as long as total borrowings under the line of credit do not exceed $500 million in the aggregate. Each portfolio is individually, and not jointly, liable for its particular advances under the line of credit. Borrowings under the line of credit are charged interest at rates agreed to by the parties at the time of borrowing. There is no commitment fee on the unused portion of the line of credit. The agreement for the line of credit expires on January 15, 2010. There were no borrowings by the Portfolio under this line of credit during the year ended October 31, 2009.
F. Indemnitees; Contractual Obligations:
Under the Fund’s organizational documents, its officers and directors are indemnified against certain liabilities arising out of the performance of their duties to the Fund.
In the normal course of business, the Fund enters into contracts that contain a variety of representations and warranties which provide general indemnification. The Fund’s maximum exposure under these arrangements is unknown as this would involve future claims that may be made against the Fund and/or its affiliates that have not yet occurred. However, based on experience, the Fund expects the risk of loss to be remote.
G. Other:
At October 31, 2009, two shareholders held approximately 95% of the outstanding shares of the Portfolio. One or more of the shareholders is an omnibus account, which typically hold shares for the benefit of several other underlying investors.
39
H. Subsequent Event Evaluations:
Management has evaluated the impact of all subsequent events on the Portfolio through December 23, 2009, the date the financial statements were available for issuance, and has determined that there are no subsequent events requiring recognition or disclosure in the financial statements.
40
REPORT OF INDEPENDENT REGISTERED PUBLIC ACCOUNTING FIRM
To the Shareholders of LWAS/DFA International High Book to Market Portfolio and
Board of Directors of DFA Investment Dimensions Group Inc.:
In our opinion, the accompanying statement of assets and liabilities, and the related statements of operations and of changes in net assets and the financial highlights present fairly, in all material respects, the financial position of LWAS/DFA International High Book to Market Portfolio (one of the portfolios constituting DFA Investment Dimensions Group Inc., hereafter referred to as the “Portfolio”) at October 31, 2009, the results of its operations for the year then ended, the changes in its net assets and the financial highlights for each of the periods indicated, in conformity with accounting principles generally accepted in the United States of America. These financial statements and financial highlights (hereafter referred to as “financial statements”) are the responsibility of the Portfolio’s management; our responsibility is to express an opinion on these financial statements based on our audits. We conducted our audits of these financial statements in accordance with the standards of the Public Company Accounting Oversight Board (United States). Those standards require that we plan and perform the audit to obtain reasonable assurance about whether the financial statements are free of material misstatement. An audit includes examining, on a test basis, evidence supporting the amounts and disclosures in the financial statements, assessing the accounting principles used and significant estimates made by management, and evaluating the overall financial statement presentation. We believe that our audits, which included confirmation of securities at October 31, 2009 by correspondence with the transfer agent of the investee fund, provide a reasonable basis for our opinion.
PricewaterhouseCoopers LLP
Philadelphia, Pennsylvania
December 23, 2009
41
RESULTS OF THE SHAREHOLDER MEETING
On June 2, 2009 and July 8, 2009, DFA Investment Dimensions Group Inc. (“DFAIDG”) held a Special Joint Meeting of Shareholders for the purpose of voting on several proposals affecting DFAIDG and the Portfolio, including, among other items, the election of Directors, the amendment of certain fundamental investment limitations, and the elimination of certain fundamental investment limitations. The shareholders of the Portfolio approved each of the applicable proposals for DIG and the Portfolio presented at the Meeting. Listed below are the voting results from the Meeting. Please note that not all Proposals presented at the Meeting were voted on by the Portfolio. Additionally, the Proposal numbers reflected below correlate to the Proposal numbers presented for vote at the Meeting.
DFAIDG
| | | | | | | | | | | | | | | | | | | | | | | | |
| | | | | Shares Voted | | Percent of Outstanding Shares Voted |
| | | | | For | | % | | Against | | % | | Abstain/WithHold | | % | | NonVote | | % | | For | | Against | | Abstain / WithHold |
Proposal 1: Election of Directors for DFAIDG* | | | | | | | | | | | | | | | | | | |
| | | | | | | | | | | | |
| 1a | | David G. Booth | | 5,100,343,281 | | 93.94% | | — | | 0.00% | | 328,971,623 | | 6.06% | | | | | | 81.55% | | 0.00% | | 5.26% |
| 1b | | George M. Constantinides | | 5,105,280,301 | | 94.03% | | — | | 0.00% | | 324,034,602 | | 5.97% | | | | | | 81.63% | | 0.00% | | 5.18% |
| 1c | | John P. Gould | | 5,100,584,112 | | 93.95% | | — | | 0.00% | | 328,730,791 | | 6.05% | | | | | | 81.55% | | 0.00% | | 5.26% |
| 1d | | Roger G. Ibbotson | | 5,105,426,112 | | 94.03% | | — | | 0.00% | | 323,888,792 | | 5.97% | | | | | | 81.63% | | 0.00% | | 5.18% |
| 1e | | Robert C. Merton | | 5,107,268,900 | | 94.07% | | — | | 0.00% | | 322,046,003 | | 5.93% | | | | | | 81.66% | | 0.00% | | 5.15% |
| 1f | | Myron S. Scholes | | 5,104,997,961 | | 94.03% | | — | | 0.00% | | 324,316,942 | | 5.97% | | | | | | 81.62% | | 0.00% | | 5.19% |
| 1g | | Eduardo A. Repetto | | 5,094,783,848 | | 93.84% | | — | | 0.00% | | 334,531,055 | | 6.16% | | | | | | 81.46% | | 0.00% | | 5.35% |
| 1h | | Abbie J. Smith | | 5,100,861,923 | | 93.95% | | — | | 0.00% | | 328,452,981 | | 6.05% | | | | | | 81.55% | | 0.00% | | 5.25% |
| | | | | | | | | | | | | | | | | | | | |
| | | | | Shares Voted | | Percent of Outstanding Shares Voted |
| | | | | For | | % | | Against | | % | | Abstain/WithHold | | % | | For | | Against | | Abstain / WithHold |
Proposal 2: To approve Articles of Amendment and Restatement for DFAIDG* | | 3,385,698,613 | | 93.83% | | 43,557,844 | | 1.21% | | 179,189,489 | | 4.97% | | 54.13% | | 0.70% | | 4.97% |
* Results are for all Portfolios within DFAIDG
LWAS/DFA International High Book to Market Portfolio
| | | | | | | | | | | | | | | | | | | | |
| | | | | Shares Voted | | Percent of Outstanding Shares Voted |
| | | | | For | | % | | Against | | % | | Abstain/WithHold | | % | | For | | Against | | Abstain / WithHold |
Proposals: | | | | | | | | | | | | | | | | | | |
| | | | | | |
| 5 | | To approve amendments to certain fundamental investment restrictions | | | | | | | | | | |
| 5a | | Borrowing Money | | 4,598,257 | | 89.07% | | 227,896 | | 4.41% | | 336,255 | | 6.51% | | 48.50% | | 2.40% | | 3.55% |
| 5b | | Making Loans | | 4,586,811 | | 88.85% | | 246,873 | | 4.78% | | 328,724 | | 6.37% | | 48.37% | | 2.60% | | 3.47% |
| 5c | | Investments in Real Estate | | 4,621,475 | | 89.52% | | 207,644 | | 4.02% | | 333,289 | | 6.46% | | 48.74% | | 2.19% | | 3.52% |
| 5d | | Investments in Commodities | | 4,629,069 | | 89.67% | | 200,050 | | 3.88% | | 333,289 | | 6.46% | | 48.82% | | 2.11% | | 3.52% |
| 5e | | Diversification of Investments | | 4,631,742 | | 89.72% | | 201,943 | | 3.91% | | 328,723 | | 6.37% | | 48.85% | | 2.13% | | 3.47% |
| 6 | | To approve the elimination of certain fundamental investment restrictions | | | | | | | | | | |
| 6a | | Pledging, Mortgaging, or Hypothecating Assets | | 4,561,822 | | 88.37% | | 272,740 | | 5.28% | | 327,846 | | 6.35% | | 48.11% | | 2.88% | | 3.46% |
| 6b | | Purchasing Securities on Margin | | 4,538,483 | | 87.91% | | 290,875 | | 5.63% | | 333,050 | | 6.45% | | 47.87% | | 3.07% | | 3.51% |
| 6c | | Investing in Restricted or Illiquid Securities | | 4,557,342 | | 88.28% | | 276,581 | | 5.36% | | 328,485 | | 6.36% | | 48.06% | | 2.92% | | 3.46% |
| 6d | | Investing for the Purpose of Exercising Control | | 4,613,185 | | 89.36% | | 228,908 | | 4.43% | | 320,315 | | 6.20% | | 48.65% | | 2.41% | | 3.38% |
| 6e | | Investing in Other Investment Companies | | 4,603,023 | | 89.16% | | 233,021 | | 4.51% | | 326,364 | | 6.32% | | 48.55% | | 2.46% | | 3.44% |
| 6f | | Management Ownership of Securities of an Issuer | | 4,621,084 | | 89.51% | | 219,525 | | 4.25% | | 321,799 | | 6.23% | | 48.74% | | 2.32% | | 3.39% |
| 6g | | Investing in Oil, Gas, or other Mineral Exploration, Leases or Development Programs | | 4,637,348 | | 89.83% | | 203,261 | | 3.94% | | 321,799 | | 6.23% | | 48.91% | | 2.14% | | 3.39% |
| 6h | | Investing in Securities of Unseasoned Issuers | | 4,529,091 | | 87.73% | | 302,107 | | 5.85% | | 331,210 | | 6.42% | | 47.77% | | 3.19% | | 3.49% |
| 6i | | Investing in Warrants | | 4,585,616 | | 88.83% | | 248,662 | | 4.82% | | 328,130 | | 6.36% | | 48.36% | | 2.62% | | 3.46% |
| 6j | | Writing or Acquiring Options | | 4,586,803 | | 88.85% | | 247,476 | | 4.79% | | 328,129 | | 6.36% | | 48.37% | | 2.61% | | 3.46% |
| 8 | | Approval of Investment Advisory Agreement between Dimensional Fund Advisors LP and the Company | | 4,662,591 | | 90.32% | | 168,676 | | 3.27% | | 331,141 | | 6.41% | | 49.17% | | 1.78% | | 3.49% |
42
THE DFA INVESTMENT TRUST COMPANY
PERFORMANCE CHARTS
The U.S. Large Cap Value Series vs.
Russell 1000® Value Index
October 31, 1999-October 31, 2009
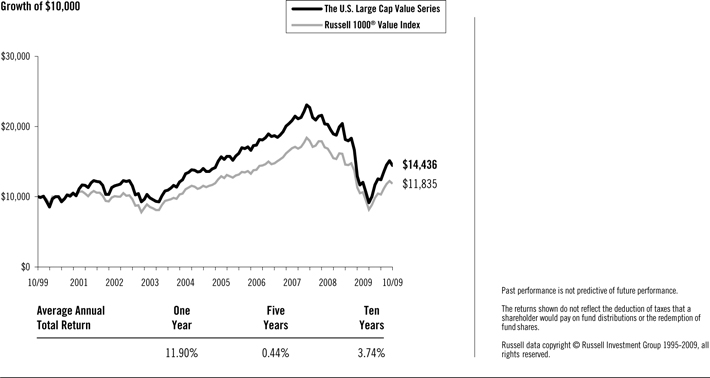
The DFA International Value Series vs.
MSCI World ex USA Index (net dividends)
October 31, 1999-October 31, 2009
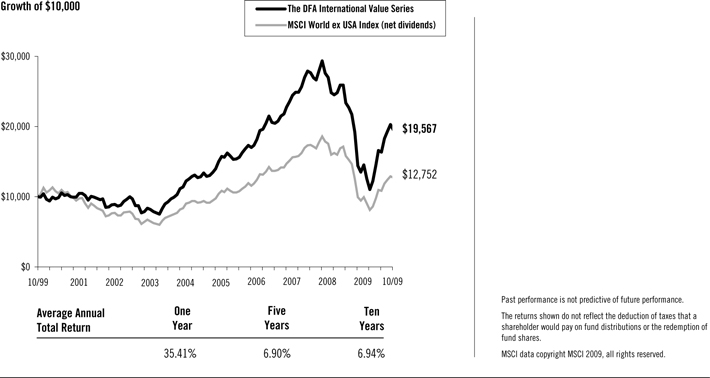
43
THE DFA INVESTMENT TRUST COMPANY
MANAGEMENT’S DISCUSSION AND ANALYSIS
The U.S. Large Cap Value Series
The U.S. Large Cap Value Series seeks to capture the returns of U.S. large company value stocks. The investment strategy employs a disciplined, quantitative approach, emphasizing broad diversification and consistent exposure to large cap value stocks, but does not attempt to track closely a specific equity index. As of October 31, 2009, the Series held 213 stocks and was mostly invested in equities throughout the year: the average non-equitized cash level for the period was less than 1% of the Series’ assets.
As a result of the Series’ diversified investment approach, performance was determined principally by broad structural trends in the U.S. equity market, rather than the behavior of a limited number of stocks. For the 12 months ended October 31, 2009, total returns were 11.90% for the Series and 4.78% for the Russell 1000® Value Index. The Series benefited from a positive size premium and value premium over the last eight months of the period. Relative to the Index, the Series’ greater exposure to value stocks and composition differences along the value/growth dimension added approximately 4.2% to the relative performance. Differences in sector weights between the Series and Index also contributed to the outperformance. The Master Fund’s larger allocation than the Index to consumer discretionary stocks, due to its strategy of maintaining consistent large cap value exposure, added approximately 3% to relative performance. The Series also benefited from composition differences among the Series’ basket of financial stocks, which added approximately 3.6% to relative performance.
The DFA International Value Series
The International Value Series seeks to capture the returns of international large company value stocks by purchasing shares in such stocks. The investment strategy employs a disciplined, quantitative approach, emphasizing broad diversification and consistent exposure to large cap value stocks, but does not attempt to track closely a specific equity index. As of October 31, 2009, the Series held 465 stocks in 22 developed countries and was mostly invested in equities throughout the year: the average non-equitized cash level for the period was less than 1% of the Series’ assets.
As a result of the Series’ diversified investment approach, performance principally was determined by broad structural trends in global equity markets, rather than the behavior of a limited number of stocks. For the 12 months ended October 31, 2008, value stocks outperformed growth stocks in international developed markets. Total returns were 35.41% for the Series and 27.83% for the MSCI World ex USA Index (net dividends). The Series’ greater allocation than the Index to value stocks (66% on average vs. 26% in the Index) added approximately 10.4% to the relative performance. The Series and Index held a number of securities in common, but in different weights, due to the different methods for defining size and value and the Series’ exclusion rules. These differences in allocation, and differences in the composition between the Series’ holdings and the Index, also contributed to the Series’ outperformance.
44
THE DFA INVESTMENT TRUST COMPANY
DISCLOSURE OF FUND EXPENSES
(Unaudited)
The following Expense Tables are shown so that you can understand the impact of fees on your investment. All mutual funds have operating expenses. As a shareholder of the fund, you incur ongoing costs, which include costs for portfolio management, administrative services, and shareholder reports, among others. Operating expenses, legal and audit services, which are deducted from a fund’s gross income, directly reduce the investment return of the fund. A fund’s expenses are expressed as a percentage of its average net assets. This figure is known as the expense ratio. The following examples are intended to help you understand the ongoing costs, in dollars, of investing in the fund and to compare these costs with those of other mutual funds. The examples are based on an investment of $1,000 made at the beginning of the period shown and held for the entire period.
The Expense Tables below illustrate your fund’s costs in two ways.
Actual Fund Return
This section helps you to estimate the actual expenses after fee waivers that you paid over the period. The “Ending Account Value” shown is derived from the fund’s actual return and “Expenses Paid During Period” reflect the dollar amount that would have been paid by an investor who started with $1,000 in the fund. You may use the information here, together with the amount you invested, to estimate the expenses that you paid over the period.
To do so, simply divide your account value by $1,000 (for example, a $7,500 account value divided by $1,000 = 7.5), then multiply the result by the number given for your fund under the heading “Expenses Paid During Period.”
Hypothetical Example for Comparison Purposes
This section is intended to help you compare your fund’s costs with those of other mutual funds. The hypothetical “Ending Account Value” and “Expenses Paid During Period” are derived from the fund’s actual expense ratio and an assumed 5% annual return before expenses. In this case, because the return used is not the fund’s actual return, the results do not apply to your investment. The example is useful in making comparisons because the SEC requires all mutual funds to calculate expenses based on a 5% annual return. You can assess your fund’s costs by comparing this hypothetical example with the hypothetical examples that appear in shareholder reports of other funds.
Please note that the expenses shown in the tables are meant to highlight and help you compare ongoing costs only and do not reflect any transactional costs, if applicable. The “Annualized Expense Ratio” represents the actual expenses for the six-month period indicated.
Six Months Ended October 31, 2009
EXPENSE TABLES
| | | | | | | | |
| | | Beginning
Account
Value
05/01/09 | | Ending
Account
Value
10/31/09 | | Annualized
Expense
Ratio* | | Expenses
Paid
During
Period* |
The U.S. Large Cap Value Series | | | | | | | | |
Actual Fund Return | | $1,000.00 | | $1,242.20 | | 0.14% | | $0.79 |
Hypothetical 5% Annual Return | | $1,000.00 | | $1,024.50 | | 0.14% | | $0.71 |
| | | | |
The DFA International Value Series | | | | | | | | |
Actual Fund Return | | $1,000.00 | | $1,350.50 | | 0.25% | | $1.48 |
Hypothetical 5% Annual Return | | $1,000.00 | | $1,023.95 | | 0.25% | | $1.28 |
| * | Expenses are equal to the fund’s annualized expense ratio for the six-month period, multiplied by the average account value over the period, multiplied by the number of days in the most recent six-month period (184), then divided by the number of days in the year (365) to reflect the six-month period. |
45
THE DFA INVESTMENT TRUST COMPANY
DISCLOSURE OF PORTFOLIO HOLDINGS
(Unaudited)
The SEC requires that all Funds file a complete Schedule of Investments with the SEC for their first and third fiscal quarters on Form N-Q. For The DFA Investment Trust Company, this would be for the fiscal quarters ending January 31 and July 31. The Form N-Q filing must be made within 60 days of the end of the quarter. The DFA Investment Trust Company filed its most recent Form N-Q with the SEC on September 29, 2009. It is available upon request, without charge, by calling collect: (512) 306-7400 or by mailing a request to Dimensional Fund Advisors LP, 6300 Bee Cave Road, Building One, Austin, Texas 78746, or by visiting the SEC’s website at http://www.sec.gov, or they may be reviewed and copied at the SEC’s Public Reference Room in Washington, D.C. (call 1-800-732-0330 for information on the operation of the Public Reference Room).
SEC regulations permit a fund to include in its reports to shareholders a “Summary Schedule of Portfolio Holdings” in lieu of a full Schedule of Investments. The Summary Schedule of Portfolio Holdings reports the fund’s 50 largest holdings in unaffiliated issuers and any investments that exceed one percent of the fund’s net assets at the end of the reporting period. The amendments also require that the Summary Schedule of Portfolio Holdings identify each category of investments that are held.
The fund is required to file a complete Schedule of Investments with the SEC on Form N-CSR within ten days after mailing the annual and semi-annual reports to shareholders. It will be available upon request, without charge, by calling collect: (512) 306-7400 or by mailing a request to Dimensional Fund Advisors LP, 6300 Bee Cave Road, Building One, Austin, Texas 78746, or by visiting the SEC’s website at http://www.sec.gov, or they may be reviewed and copied at the SEC’s Public Reference Room in Washington, D.C. (call 1-800-732-0330 for information on the operation of the Public Reference Room).
PORTFOLIO HOLDINGS
The SEC requires that all Funds present their categories of portfolio holdings in a table, chart or graph format in their annual and semi-annual shareholder reports, whether or not a Schedule of Investments is utilized. The following table, which presents portfolio holdings as a percent of total investments before short-term investments and collateral for loaned securities, is provided in compliance with such requirement. The categories shown below represent broad industry sectors. Each industry sector consists of one or more specific industry classifications.
DOMESTIC AND INTERNATIONAL EQUITY PORTFOLIOS
The U.S. Large Cap Value Series
| | |
Consumer Discretionary | | 16.7% |
Consumer Staples | | 6.4% |
Energy | | 13.9% |
Financials | | 31.3% |
Health Care | | 5.5% |
Industrials | | 14.7% |
Information Technology | | 3.6% |
Materials | | 3.8% |
Telecommunication Services | | 3.6% |
Utilities | | 0.5% |
| | |
| | 100.0% |
The DFA International Value Series
| | |
Consumer Discretionary | | 13.2% |
Consumer Staples | | 4.9% |
Energy | | 6.0% |
Financials | | 42.8% |
Health Care | | 0.4% |
Industrials | | 10.3% |
Information Technology | | 3.1% |
Materials | | 11.2% |
Other | | — |
Telecommunication Services | | 6.9% |
Utilities | | 1.2% |
| | |
| | 100.0% |
46
THE U.S. LARGE CAP VALUE SERIES
SUMMARY SCHEDULE OF PORTFOLIO HOLDINGS
October 31, 2009
| | | | | | | |
| | | Shares | | Value† | | Percentage
of Net Assets** |
COMMON STOCKS — (93.1%) | | | | | | | |
Consumer Discretionary — (15.5%) | | | | | | | |
Carnival Corp. | | 2,624,598 | | $ | 76,428,294 | | 1.0% |
CBS Corp. Class B | | 3,870,469 | | | 45,555,420 | | 0.6% |
Comcast Corp. Class A | | 11,512,642 | | | 166,933,309 | | 2.2% |
Comcast Corp. Special Class A | | 3,396,043 | | | 47,612,523 | | 0.6% |
#Disney (Walt) Co. | | 4,577,802 | | | 125,294,441 | | 1.7% |
*Liberty Media Corp. Entertainment Class A | | 2,954,309 | | | 91,051,803 | | 1.2% |
*Liberty Media Corp. Interactive Class A | | 3,585,265 | | | 40,656,905 | | 0.6% |
News Corp. Class A | | 5,810,104 | | | 66,932,398 | | 0.9% |
Time Warner Cable, Inc. | | 1,980,956 | | | 78,128,905 | | 1.0% |
Time Warner, Inc. | | 6,114,193 | | | 184,159,493 | | 2.5% |
Other Securities | | | | | 325,704,783 | | 4.3% |
| | | | | | | |
Total Consumer Discretionary | | | | | 1,248,458,274 | | 16.6% |
| | | | | | | |
| | | |
Consumer Staples — (5.9%) | | | | | | | |
Archer-Daniels-Midland Co. | | 1,723,060 | | | 51,898,567 | | 0.7% |
CVS Caremark Corp. | | 4,840,631 | | | 170,874,274 | | 2.3% |
Kraft Foods, Inc. | | 2,137,904 | | | 58,835,118 | | 0.8% |
Other Securities | | | | | 193,282,891 | | 2.5% |
| | | | | | | |
Total Consumer Staples | | | | | 474,890,850 | | 6.3% |
| | | | | | | |
| | | |
Energy — (13.0%) | | | | | | | |
Anadarko Petroleum Corp. | | 2,760,568 | | | 168,201,408 | | 2.2% |
#Chesapeake Energy Corp. | | 2,647,458 | | | 64,862,721 | | 0.9% |
ConocoPhillips | | 5,213,766 | | | 261,626,778 | | 3.5% |
Marathon Oil Corp. | | 3,280,335 | | | 104,872,310 | | 1.4% |
*National-Oilwell, Inc. | | 1,160,300 | | | 47,560,697 | | 0.6% |
XTO Energy, Inc. | | 2,156,495 | | | 89,623,932 | | 1.2% |
Other Securities | | | | | 306,390,542 | | 4.1% |
| | | | | | | |
Total Energy | | | | | 1,043,138,388 | | 13.9% |
| | | | | | | |
| | | |
Financials — (29.1%) | | | | | | | |
Allstate Corp. | | 2,596,315 | | | 76,773,035 | | 1.0% |
Bank of America Corp. | | 16,675,426 | | | 243,127,711 | | 3.2% |
Bank of New York Mellon Corp. | | 1,972,678 | | | 52,591,595 | | 0.7% |
#Capital One Financial Corp. | | 1,815,684 | | | 66,454,034 | | 0.9% |
Chubb Corp. | | 1,669,873 | | | 81,022,238 | | 1.1% |
Citigroup, Inc. | | 19,573,191 | | | 80,054,351 | | 1.1% |
CME Group, Inc. | | 203,881 | | | 61,696,429 | | 0.8% |
JPMorgan Chase & Co. | | 7,983,370 | | | 333,465,365 | | 4.4% |
#Loews Corp. | | 2,592,160 | | | 85,800,496 | | 1.1% |
MetLife, Inc. | | 4,663,914 | | | 158,712,993 | | 2.1% |
#Morgan Stanley | | 3,619,297 | | | 116,251,820 | | 1.5% |
PNC Financial Services Group, Inc. | | 1,190,568 | | | 58,266,398 | | 0.8% |
Prudential Financial, Inc. | | 1,918,000 | | | 86,751,140 | | 1.2% |
Travelers Cos., Inc. (The) | | 3,328,076 | | | 165,704,904 | | 2.2% |
Unum Group | | 1,898,589 | | | 37,876,851 | | 0.5% |
Other Securities | | | | | 634,916,189 | | 8.5% |
| | | | | | | |
Total Financials | | | | | 2,339,465,549 | | 31.1% |
| | | | | | | |
| | | |
Health Care — (5.1%) | | | | | | | |
*Thermo Fisher Scientific, Inc. | | 1,056,245 | | | 47,531,025 | | 0.7% |
UnitedHealth Group, Inc. | | 2,406,388 | | | 62,445,769 | | 0.8% |
*WellPoint, Inc. | | 2,580,122 | | | 120,646,505 | | 1.6% |
Other Securities | | | | | 181,920,544 | | 2.4% |
| | | | | | | |
Total Health Care | | | | | 412,543,843 | | 5.5% |
| | | | | | | |
47
THE U.S. LARGE CAP VALUE SERIES
CONTINUED
| | | | | | |
| | | Shares | | Value† | | Percentage
of Net Assets** |
Industrials — (13.7%) | | | | | | |
Burlington Northern Santa Fe Corp. | | 1,930,415 | | $145,398,858 | | 1.9% |
#CSX Corp. | | 2,287,204 | | 96,474,265 | | 1.3% |
#FedEx Corp. | | 599,693 | | 43,591,684 | | 0.6% |
General Electric Co. | | 18,139,800 | | 258,673,548 | | 3.4% |
Norfolk Southern Corp. | | 2,186,220 | | 101,921,576 | | 1.4% |
#Northrop Grumman Corp. | | 1,926,678 | | 96,584,368 | | 1.3% |
Union Pacific Corp. | | 2,835,808 | | 156,366,453 | | 2.1% |
Other Securities | | | | 203,214,199 | | 2.7% |
| | | | | | |
Total Industrials | | | | 1,102,224,951 | | 14.7% |
| | | | | | |
| | | |
Information Technology — (3.3%) | | | | | | |
*Computer Sciences Corp. | | 946,932 | | 48,018,922 | | 0.7% |
Other Securities | | | | 219,566,373 | | 2.9% |
| | | | | | |
Total Information Technology | | | | 267,585,295 | | 3.6% |
| | | | | | |
| | | |
Materials — (3.6%) | | | | | | |
#Alcoa, Inc. | | 4,317,440 | | 53,622,605 | | 0.7% |
#Dow Chemical Co. | | 3,993,594 | | 93,769,587 | | 1.3% |
#International Paper Co. | | 1,909,245 | | 42,595,256 | | 0.6% |
#Weyerhaeuser Co. | | 1,105,551 | | 40,175,723 | | 0.5% |
Other Securities | | | | 54,072,078 | | 0.7% |
| | | | | | |
Total Materials | | | | 284,235,249 | | 3.8% |
| | | | | | |
| | | |
Telecommunication Services — (3.4%) | | | | | | |
#AT&T, Inc. | | 8,438,300 | | 216,611,161 | | 2.9% |
Other Securities | | | | 52,619,682 | | 0.7% |
| | | | | | |
Total Telecommunication Services | | | | 269,230,843 | | 3.6% |
| | | | | | |
| | | |
Utilities — (0.5%) | | | | | | |
Other Securities | | | | 39,398,283 | | 0.5% |
| | | | | | |
TOTAL COMMON STOCKS | | | | 7,481,171,525 | | 99.6% |
| | | | | | |
| | | |
| | | Face Amount | | | | |
| | | (000) | | | | |
TEMPORARY CASH INVESTMENTS — (0.5%) | | | | | | |
Repurchase Agreement, PNC Capital Markets, Inc. 0.19%,
11/02/09 (Collateralized by $39,850,000 FNMA 6.50%, 6/25/39,
valued at $42,888,563) to be repurchased at $42,250,669 | | $42,250 | | 42,250,000 | | 0.6% |
| | | | | | |
| | | |
| | | Shares/ Face Amount | | | | |
| | | (000) | | | | |
SECURITIES LENDING COLLATERAL — (6.4%) | | | | | | |
§@DFA Short Term Investment Fund LP | | 512,733,772 | | 512,733,772 | | 6.8% |
@Repurchase Agreement, Deutsche Bank Securities 0.08%,
11/02/09 (Collateralized by $3,853,074 FHLMC 5.793%(r),
01/01/37 & 5.945%(r), 07/01/37, valued at $2,684,003) to be
repurchased at $2,605,845 | | $2,606 | | 2,605,828 | | 0.1% |
| | | | | | |
| | | |
TOTAL SECURITIES LENDING COLLATERAL | | | | 515,339,600 | | 6.9% |
| | | | | | |
| | | |
TOTAL INVESTMENTS — (100.0%)
(Cost $6,877,390,667) | | | | $8,038,761,125 | | 107.1% |
| | | | | | |
48
THE U.S. LARGE CAP VALUE SERIES
CONTINUED
Summary of inputs used to value the Series’ net assets as of October 31, 2009 is as follows (See Security Valuation Note):
| | | | | | | | | | | |
| | | Valuation Inputs |
| |
| | | Investment in Securities (Market Value) |
| | | Level 1 | | Level 2 | | Level 3 | | Total |
Common Stocks | | | | | | | | | | | |
Consumer Discretionary | | $ | 1,248,458,274 | | | — | | — | | $ | 1,248,458,274 |
Consumer Staples | | | 474,890,850 | | | — | | — | | | 474,890,850 |
Energy | | | 1,043,138,388 | | | — | | — | | | 1,043,138,388 |
Financials | | | 2,339,465,549 | | | — | | — | | | 2,339,465,549 |
Health Care | | | 412,543,843 | | | — | | — | | | 412,543,843 |
Industrials | | | 1,102,224,951 | | | — | | — | | | 1,102,224,951 |
Information Technology | | | 267,585,295 | | | — | | — | | | 267,585,295 |
Materials | | | 284,235,249 | | | — | | — | | | 284,235,249 |
Telecommunication Services | | | 269,230,843 | | | — | | — | | | 269,230,843 |
Utilities | | | 39,398,283 | | | — | | — | | | 39,398,283 |
Temporary Cash Investments | | | — | | $ | 42,250,000 | | — | | | 42,250,000 |
Securities Lending Collateral | | | — | | | 515,339,600 | | — | | | 515,339,600 |
| | | | | | | | | | | |
| | | | |
TOTAL | | $ | 7,481,171,525 | | $ | 557,589,600 | | — | | $ | 8,038,761,125 |
| | | | | | | | | | | |
See accompanying Notes to Financial Statements.
49
THE DFA INTERNATIONAL VALUE SERIES
SUMMARY SCHEDULE OF PORTFOLIO HOLDINGS
October 31, 2009
| | | | | | | |
| | | Shares | | Value†† | | Percentage
of Net Assets** |
COMMON STOCKS — (85.2%) | | | | | | | |
AUSTRALIA — (4.5%) | | | | | | | |
Australia & New Zealand Banking Group, Ltd. | | 3,343,351 | | $ | 68,191,374 | | 1.1% |
National Australia Bank, Ltd. | | 2,465,437 | | | 65,140,887 | | 1.0% |
Wesfarmers, Ltd. | | 1,898,047 | | | 47,362,464 | | 0.8% |
Other Securities | | | | | 141,329,082 | | 2.3% |
| | | | | | | |
TOTAL AUSTRALIA | | | | | 322,023,807 | | 5.2% |
| | | | | | | |
| | | |
AUSTRIA — (0.5%) | | | | | | | |
Other Securities | | | | | 34,182,743 | | 0.6% |
| | | | | | | |
| | | |
BELGIUM — (0.5%) | | | | | | | |
Other Securities | | | | | 38,019,953 | | 0.6% |
| | | | | | | |
| | | |
CANADA — (7.6%) | | | | | | | |
EnCana Corp. | | 671,498 | | | 37,234,767 | | 0.6% |
#Manulife Financial Corp. | | 2,074,478 | | | 38,918,630 | | 0.6% |
*Teck Resources, Ltd. Class B | | 1,418,230 | | | 41,168,712 | | 0.7% |
#Thomson Reuters Corp. | | 1,832,184 | | | 58,281,755 | | 0.9% |
#Toronto Dominion Bank | | 944,998 | | | 53,867,637 | | 0.9% |
Other Securities | | | | | 318,836,929 | | 5.2% |
| | | | | | | |
TOTAL CANADA | | | | | 548,308,430 | | 8.9% |
| | | | | | | |
| | | |
DENMARK — (1.1%) | | | | | | | |
Other Securities | | | | | 77,023,723 | | 1.2% |
| | | | | | | |
| | | |
FINLAND — (0.6%) | | | | | | | |
Other Securities | | | | | 40,451,320 | | 0.7% |
| | | | | | | |
| | | |
FRANCE — (8.3%) | | | | | | | |
#AXA SA | | 2,818,397 | | | 70,093,978 | | 1.1% |
BNP Paribas SA | | 913,891 | | | 68,847,185 | | 1.1% |
#Compagnie de Saint-Gobain SA | | 846,142 | | | 41,232,265 | | 0.7% |
#Lafarge SA | | 467,217 | | | 37,923,901 | | 0.6% |
#Societe Generale Paris SA | | 913,312 | | | 60,662,002 | | 1.0% |
Vivendi SA | | 2,686,677 | | | 74,534,678 | | 1.2% |
Other Securities | | | | | 244,803,391 | | 4.0% |
| | | | | | | |
TOTAL FRANCE | | | | | 598,097,400 | | 9.7% |
| | | | | | | |
| | | |
GERMANY — (7.4%) | | | | | | | |
Allianz SE | | 442,712 | | | 50,712,808 | | 0.8% |
#Bayerische Motoren Werke AG | | 915,762 | | | 44,797,554 | | 0.7% |
#Daimler AG | | 1,684,003 | | | 81,364,327 | | 1.3% |
#Deutsche Bank AG | | 774,190 | | | 56,245,973 | | 0.9% |
#Deutsche Telekom AG | | 2,621,866 | | | 35,693,819 | | 0.6% |
Deutsche Telekom AG Sponsored ADR | | 2,809,150 | | | 38,035,891 | | 0.6% |
Munchener Rueckversicherungs-Gesellschaft AG | | 388,934 | | | 61,534,351 | | 1.0% |
Other Securities | | | | | 167,080,419 | | 2.7% |
| | | | | | | |
TOTAL GERMANY | | | | | 535,465,142 | | 8.6% |
| | | | | | | |
| | | |
GREECE — (0.3%) | | | | | | | |
Other Securities | | | | | 19,019,902 | | 0.3% |
| | | | | | | |
| | | |
HONG KONG — (2.7%) | | | | | | | |
Cheung Kong Holdings, Ltd. | | 3,224,000 | | | 41,120,708 | | 0.7% |
Hutchison Whampoa, Ltd. | | 5,568,000 | | | 39,081,157 | | 0.6% |
Other Securities | | | | | 117,731,620 | | 1.9% |
| | | | | | | |
TOTAL HONG KONG | | | | | 197,933,485 | | 3.2% |
| | | | | | | |
50
THE DFA INTERNATIONAL VALUE SERIES
CONTINUED
| | | | | | | |
| | | Shares | | Value†† | | Percentage
of Net Assets** |
IRELAND — (0.0%) | | | | | | | |
Other Securities | | | | $ | 57,893 | | 0.0% |
| | | | | | | |
| | | |
ITALY — (2.9%) | | | | | | | |
#*Intesa Sanpaolo SpA | | 11,201,860 | | | 47,142,793 | | 0.8% |
*UniCredito SpA | | 19,413,366 | | | 65,038,767 | | 1.0% |
Other Securities | | | | | 98,411,874 | | 1.6% |
| | | | | | | |
TOTAL ITALY | | | | | 210,593,434 | | 3.4% |
| | | | | | | |
| | | |
JAPAN — (11.7%) | | | | | | | |
FUJIFILM Holdings Corp. | | 1,257,700 | | | 35,755,504 | | 0.6% |
*Nissan Motor Co., Ltd. | | 4,991,500 | | | 36,119,215 | | 0.6% |
Sony Corp. Sponsored ADR | | 1,725,386 | | | 50,709,095 | | 0.8% |
Other Securities | | | | | 726,760,636 | | 11.7% |
| | | | | | | |
TOTAL JAPAN | | | | | 849,344,450 | | 13.7% |
| | | | | | | |
| | | |
MALAYSIA — (0.0%) | | | | | | | |
Other Securities | | | | | — | | 0.0% |
| | | | | | | |
| | | |
NETHERLANDS — (3.7%) | | | | | | | |
#ArcelorMittal NV | | 2,446,831 | | | 82,806,981 | | 1.3% |
*ING Groep NV | | 3,093,625 | | | 40,259,293 | | 0.7% |
Philips Electronics NV | | 3,072,622 | | | 77,186,781 | | 1.2% |
Other Securities | | | | | 69,089,143 | | 1.1% |
| | | | | | | |
TOTAL NETHERLANDS | | | | | 269,342,198 | | 4.3% |
| | | | | | | |
| | | |
NEW ZEALAND — (0.1%) | | | | | | | |
Other Securities | | | | | 8,185,686 | | 0.1% |
| | | | | | | |
| | | |
NORWAY — (1.0%) | | | | | | | |
Other Securities | | | | | 75,691,447 | | 1.2% |
| | | | | | | |
| | | |
PORTUGAL — (0.2%) | | | | | | | |
Other Securities | | | | | 13,072,321 | | 0.2% |
| | | | | | | |
| | | |
SINGAPORE — (1.6%) | | | | | | | |
DBS Group Holdings, Ltd. | | 4,164,750 | | | 38,138,997 | | 0.6% |
Other Securities | | | | | 78,569,480 | | 1.3% |
| | | | | | | |
TOTAL SINGAPORE | | | | | 116,708,477 | | 1.9% |
| | | | | | | |
| | | |
SPAIN — (4.7%) | | | | | | | |
Banco Santander SA | | 5,654,108 | | | 90,987,342 | | 1.5% |
Banco Santander SA Sponsored ADR | | 5,549,048 | | | 89,117,711 | | 1.4% |
#Repsol YPF SA Sponsored ADR | | 1,332,613 | | | 35,447,506 | | 0.6% |
Other Securities | | | | | 120,997,642 | | 1.9% |
| | | | | | | |
TOTAL SPAIN | | | | | 336,550,201 | | 5.4% |
| | | | | | | |
| | | |
SWEDEN — (2.9%) | | | | | | | |
#Nordea Bank AB | | 6,583,962 | | | 70,668,421 | | 1.2% |
Other Securities | | | | | 138,442,067 | | 2.2% |
| | | | | | | |
TOTAL SWEDEN | | | | | 209,110,488 | | 3.4% |
| | | | | | | |
| | | |
SWITZERLAND — (6.3%) | | | | | | | |
Credit Suisse Group AG | | 1,755,349 | | | 93,836,004 | | 1.5% |
#Credit Suisse Group AG Sponsored ADR | | 840,377 | | | 44,792,094 | | 0.7% |
#*Holcim, Ltd. | | 650,248 | | | 41,384,888 | | 0.7% |
*UBS AG | | 3,481,616 | | | 58,055,052 | | 1.0% |
Zurich Financial Services AG | | 322,012 | | | 73,738,360 | | 1.2% |
Other Securities | | | | | 144,088,911 | | 2.3% |
| | | | | | | |
TOTAL SWITZERLAND | | | | | 455,895,309 | | 7.4% |
| | | | | | | |
51
THE DFA INTERNATIONAL VALUE SERIES
CONTINUED
| | | | | | |
| | | |
| | | Shares | | Value†† | | Percentage
of Net Assets** |
UNITED KINGDOM — (16.6%) | | | | | | |
*Anglo American P.L.C. | | 1,329,421 | | $48,102,581 | | 0.8% |
Aviva P.L.C. | | 7,396,866 | | 46,253,871 | | 0.7% |
#*Barclays P.L.C. Sponsored ADR | | 2,451,654 | | 51,239,569 | | 0.8% |
#HSBC Holdings P.L.C. Sponsored ADR | | 3,278,400 | | 181,590,576 | | 2.9% |
Kingfisher P.L.C. | | 9,743,172 | | 35,612,473 | | 0.6% |
#Royal Dutch Shell P.L.C. ADR | | 2,252,783 | | 131,021,859 | | 2.1% |
Vodafone Group P.L.C. | | 34,976,333 | | 77,082,062 | | 1.2% |
#Vodafone Group P.L.C. Sponsored ADR | | 7,395,974 | | 164,116,663 | | 2.7% |
*Xstrata P.L.C. | | 3,245,577 | | 46,747,872 | | 0.8% |
Other Securities | | | | 419,126,814 | | 6.8% |
| | | | | | |
TOTAL UNITED KINGDOM | | | | 1,200,894,340 | | 19.4% |
| | | | | | |
TOTAL COMMON STOCKS | | | | 6,155,972,149 | | 99.4% |
| | | | | | |
RIGHTS/WARRANTS — (0.0%) | | | | | | |
GERMANY — (0.0%) | | | | | | |
Other Securities | | | | 41,059 | | 0.0% |
| | | | | | |
| | | |
ITALY — (0.0%) | | | | | | |
Other Securities | | | | 76,976 | | 0.0% |
| | | | | | |
TOTAL RIGHTS/WARRANTS | | | | 118,035 | | 0.0% |
| | | | | | |
| | | |
| | | Shares/ Face Amount | | | | |
| | | (000) | | Value† | | |
TEMPORARY CASH INVESTMENTS — (0.2%) | | | | | | |
Repurchase Agreement, PNC Capital Markets, Inc. 0.19%,
11/02/09 (Collateralized by $13,010,000 FNMA 6.50%,
06/25/39, valued at $14,002,013) to be repurchased at
$13,790,218 | | $13,790 | | 13,790,000 | | 0.2% |
| | | | | | |
| | | |
| | | Shares/ Face Amount | | | | |
| | | (000) | | | | |
SECURITIES LENDING COLLATERAL — (14.6%) | | | | | | |
§@DFA Short Term Investment Fund LP | | 1,055,086,714 | | 1,055,086,714 | | 17.1% |
@Repurchase Agreement, Deutsche Bank Securities 0.07%,
11/02/09 (Collateralized by various corporate obligations,
ranging in par value from $4,247,617 to $16,429,280, rates
ranging from 5.000% to 7.000%, maturities ranging from
03/01/37 to 10/01/39, valued at $1,212,860) to be repurchased
at $1,189,085 | | $1,189 | | 1,189,078 | | 0.0% |
| | | | | | |
TOTAL SECURITIES LENDING COLLATERAL | | | | 1,056,275,792 | | 17.1% |
| | | | | | |
TOTAL INVESTMENTS — (100.0%)
(Cost $5,830,288,347) | | | | $7,226,155,976 | | 116.7% |
| | | | | | |
52
THE DFA INTERNATIONAL VALUE SERIES
CONTINUED
Summary of inputs used to value the Series’ net assets as of October 31, 2009 is as follows (See Security Valuation Note):
| | | | | | | | | | | |
| | | Valuation Inputs |
| |
| | | Investment in Securities (Market Value) |
| | | Level 1 | | Level 2 | | Level 3 | | Total |
Common Stocks | | | | | | | | | | | |
Australia | | $ | 2,073,789 | | $ | 319,950,018 | | — | | $ | 322,023,807 |
Austria | | | — | | | 34,182,743 | | — | | | 34,182,743 |
Belgium | | | 3,586,620 | | | 34,433,333 | | — | | | 38,019,953 |
Canada | | | 548,308,430 | | | — | | — | | | 548,308,430 |
Denmark | | | — | | | 77,023,723 | | — | | | 77,023,723 |
Finland | | | 1,516,659 | | | 38,934,661 | | — | | | 40,451,320 |
France | | | 3,494,320 | | | 594,603,080 | | — | | | 598,097,400 |
Germany | | | 98,912,195 | | | 436,552,947 | | — | | | 535,465,142 |
Greece | | | 4,501,802 | | | 14,518,100 | | — | | | 19,019,902 |
Hong Kong | | | — | | | 197,933,485 | | — | | | 197,933,485 |
Ireland | | | 57,893 | | | — | | — | | | 57,893 |
Italy | | | 29,729,570 | | | 180,863,864 | | — | | | 210,593,434 |
Japan | | | 56,497,996 | | | 792,846,454 | | — | | | 849,344,450 |
Malaysia | | | — | | | — | | — | | | — |
Netherlands | | | 10,297,313 | | | 259,044,885 | | — | | | 269,342,198 |
New Zealand | | | — | | | 8,185,686 | | — | | | 8,185,686 |
Norway | | | 401,330 | | | 75,290,117 | | — | | | 75,691,447 |
Portugal | | | — | | | 13,072,321 | | — | | | 13,072,321 |
Singapore | | | — | | | 116,708,477 | | — | | | 116,708,477 |
Spain | | | 131,434,682 | | | 205,115,519 | | — | | | 336,550,201 |
Sweden | | | 7,351,053 | | | 201,759,435 | | — | | | 209,110,488 |
Switzerland | | | 46,226,255 | | | 409,669,054 | | — | | | 455,895,309 |
United Kingdom | | | 564,527,406 | | | 636,366,934 | | — | | | 1,200,894,340 |
Rights/Warrants | | | | | | | | | | | |
Germany | | | — | | | 41,059 | | — | | | 41,059 |
Italy | | | 76,976 | | | — | | — | | | 76,976 |
Temporary Cash Investments | | | — | | | 13,790,000 | | — | | | 13,790,000 |
Securities Lending Collateral | | | — | | | 1,056,275,792 | | — | | | 1,056,275,792 |
| | | | | | | | | | | |
| | | | |
TOTAL | | $ | 1,508,994,289 | | $ | 5,717,161,687 | | — | | $ | 7,226,155,976 |
| | | | | | | | | | | |
See accompanying Notes to Financial Statements.
53
THE DFA INVESTMENT TRUST COMPANY
STATEMENTS OF ASSETS AND LIABILITIES
OCTOBER 31, 2009
(Amounts in thousands)
| | | | |
| | | The U.S. Large
Cap Value
Series | | The DFA
International
Value
Series |
ASSETS: | | | | |
Investments at Value (including $470,665 and $1,004,314 of securities on loan, respectively) | | $7,481,171 | | $6,156,090 |
Temporary Cash Investments at Value & Cost | | 42,250 | | 13,790 |
Collateral Received from Securities on Loan at Value & Cost | | 515,340 | | 1,056,276 |
Foreign Currencies at Value | | — | | 19,131 |
Cash | | 1 | | 16 |
Receivables: | | | | |
Investment Securities Sold | | 1,660 | | 10,656 |
Dividends, Interest and Tax Reclaims | | 7,943 | | 10,784 |
Securities Lending Income | | 700 | | 444 |
Fund Shares Sold | | 365 | | 724 |
Unrealized Gain on Foreign Currency Contracts | | — | | 19 |
| | | | |
Total Assets | | 8,049,430 | | 7,267,930 |
| | | | |
LIABILITIES: | | | | |
Payables: | | | | |
Upon Return of Securities Loaned | | 515,340 | | 1,056,276 |
Investment Securities Purchased | | 22,419 | | 14,723 |
Fund Shares Redeemed | | 2,242 | | 3,518 |
Due to Advisor | | 659 | | 1,084 |
Accrued Expenses and Other Liabilities | | 370 | | 365 |
| | | | |
Total Liabilities | | 541,030 | | 1,075,966 |
| | | | |
NET ASSETS | | $7,508,400 | | $6,191,964 |
| | | | |
Investments at Cost | | $6,319,801 | | $4,760,222 |
| | | | |
Foreign Currencies at Cost | | $ — | | $ 19,163 |
| | | | |
See accompanying Notes to Financial Statements.
54
THE DFA INVESTMENT TRUST COMPANY
STATEMENTS OF OPERATIONS
FOR THE YEAR ENDED OCTOBER 31, 2009
(Amounts in thousands)
| | | | | | | | |
| | | The U.S.
Large
Cap Value
Series | | | The DFA
International
Value
Series | |
Investment Income | | | | | | | | |
Dividends (Net of Foreign Taxes Withheld of $20 and $14,384 respectively) | | $ | 150,233 | | | $ | 160,091 | |
Interest | | | 170 | | | | 197 | |
Income from Securities Lending | | | 13,048 | | | | 13,032 | |
| | | | | | | | |
Total Investment Income | | | 163,451 | | | | 173,320 | |
| | | | | | | | |
Expenses | | | | | | | | |
Investment Advisory Services Fees | | | 6,414 | | | | 9,991 | |
Accounting & Transfer Agent Fees | | | 695 | | | | 549 | |
Custodian Fees | | | 73 | | | | 688 | |
Shareholders’ Reports | | | 66 | | | | 49 | |
Directors’/Trustees’ Fees & Expenses | | | 120 | | | | 78 | |
Professional Fees | | | 301 | | | | 221 | |
Other | | | 702 | | | | 574 | |
| | | | | | | | |
Total Expenses | | | 8,371 | | | | 12,150 | |
| | | | | | | | |
Net Investment Income (Loss) | | | 155,080 | | | | 161,170 | |
| | | | | | | | |
| | |
Realized and Unrealized Gain (Loss) | | | | | | | | |
Net Realized Gain (Loss) on: | | | | | | | | |
Investment Securities Sold | | | (122,113 | ) | | | 63,984 | |
Futures | | | 7,204 | | | | (1,125 | ) |
Foreign Currency Transactions | | | — | | | | 3,828 | |
Change in Unrealized Appreciation (Depreciation) of: | | | | | | | | |
Investment Securities and Foreign Currency | | | 1,161,370 | | | | 1,395,836 | |
Futures | | | (29 | ) | | | — | |
Translation of Foreign Currency Denominated Amounts | | | — | | | | 240 | |
| | | | | | | | |
Net Realized and Unrealized Gain (Loss) | | | 1,046,432 | | | | 1,462,763 | |
| | | | | | | | |
Net Increase (Decrease) in Net Assets Resulting from Operations | | $ | 1,201,512 | | | $ | 1,623,933 | |
| | | | | | | | |
See accompanying Notes to Financial Statements.
55
THE DFA INVESTMENT TRUST COMPANY
STATEMENTS OF CHANGES IN NET ASSETS
(Amounts in thousands)
| | | | | | | | | | | | | | | | | | | | | | | | |
| | | The U.S. Large Cap Value
Series | | | The DFA International Value
Series | |
| | | Year
Ended
Oct. 31,
2009 | | | Period
Dec. 1,
2007 to
Oct. 31,
2008 | | | Year
Ended
Nov. 30,
2007 | | | Year
Ended
Oct. 31,
2009 | | | Period
Dec. 1,
2007 to
Oct. 31,
2008 | | | Year
Ended
Nov. 30,
2007 | |
Increase (Decrease) in Net Assets | | | | | | | | | | | | | | | | | | | | | | | | |
Operations: | | | | | | | | | | | | | | | | | | | | | | | | |
Net Investment Income (Loss) | | $ | 155,080 | | | $ | 166,016 | | | $ | 146,991 | | | $ | 161,170 | | | $ | 304,387 | | | $ | 274,613 | |
Net Realized Gain (Loss) on: | | | | | | | | | | | | | | | | | | | | | | | | |
Investment Securities Sold | | | (122,113 | ) | | | (422,637 | ) | | | (118,412 | ) | | | 63,984 | | | | 137,811 | | | | 654,522 | |
Futures | | | 7,204 | | | | (1,861 | ) | | | — | | | | (1,125 | ) | | | (1,153 | ) | | | — | |
Foreign Currency Transactions | | | — | | | | — | | | | — | | | | 3,828 | | | | (4,593 | ) | | | 2,498 | |
In-Kind Redemptions | | | — | | | | 52,271 | * | | | — | | | | — | | | | 103,024 | * | | | — | |
Change in Unrealized Appreciation (Depreciation) of: | | | | | | | | | | | | | | | | | | | | | | | | |
Investment Securities and Foreign Currency | | | 1,161,370 | | | | (3,601,292 | ) | | | (150,559 | ) | | | 1,395,836 | | | | (5,026,911 | ) | | | 403,307 | |
Futures | | | (29 | ) | | | 29 | | | | — | | | | — | | | | 19 | | | | — | |
Translation of Foreign Currency Denominated Amounts | | | — | | | | — | | | | — | | | | 240 | | | | (76 | ) | | | (180 | ) |
| | | | | | | | | | | | | | | | | | | | | | | | |
Net Increase (Decrease) in Net Assets Resulting from Operations | | | 1,201,512 | | | | (3,807,474 | ) | | | (121,980 | ) | | | 1,623,933 | | | | (4,487,492 | ) | | | 1,334,760 | |
| | | | | | | | | | | | | | | | | | | | | | | | |
| | | | | | |
Transactions in Interest: | | | | | | | | | | | | | | | | | | | | | | | | |
Contributions | | | 734,173 | | | | 1,370,762 | † | | | 1,783,358 | † | | | 449,410 | | | | 927,878 | † | | | 1,731,698 | † |
Withdrawals | | | (1,166,648 | ) | | | (983,247 | )*† | | | (368,362 | )† | | | (581,716 | ) | | | (1,378,770 | )*† | | | (884,989 | )† |
| | | | | | | | | | | | | | | | | | | | | | | | |
Net Increase (Decrease) from Transactions in Interest | | | (432,475 | ) | | | 387,515 | | | | 1,414,996 | | | | (132,306 | ) | | | (450,892 | ) | | | 846,709 | |
| | | | | | | | | | | | | | | | | | | | | | | | |
Total Increase (Decrease) in Net Assets | | | 769,037 | | | | (3,419,959 | ) | | | 1,293,016 | | | | 1,491,627 | | | | (4,938,384 | ) | | | 2,181,469 | |
Net Assets | | | | | | | | | | | | | | | | | | | | | | | | |
Beginning of Period | | | 6,739,363 | | | | 10,159,322 | | | | 8,866,306 | | | | 4,700,337 | | | | 9,638,721 | | | | 7,457,252 | |
| | | | | | | | | | | | | | | | | | | | | | | | |
End of Period | | $ | 7,508,400 | | | $ | 6,739,363 | | | $ | 10,159,322 | | | $ | 6,191,964 | | | $ | 4,700,337 | | | $ | 9,638,721 | |
| | | | | | | | | | | | | | | | | | | | | | | | |
| * | See Note K in the Notes to Financial Statements. |
| † | See Note A in the Notes to Financial Statements. |
See accompanying Notes to Financial Statements.
56
THE DFA INVESTMENT TRUST COMPANY
FINANCIAL HIGHLIGHTS
| | | | | | | | | | | | | | | | | | | | | | | | | | | | | | | | | | | | | | | | | | | | | | | | |
| | | The U.S. Large Cap Value Series† | | | The DFA International Value Series† | |
| | | | | | | | |
| | | Year Ended Oct. 31, 2009 | | | Period Dec. 1, 2007 to Oct. 31, 2008 | | | Year Ended Nov. 30, 2007 | | | Year Ended Nov. 30,
2006 | | | Year Ended Nov. 30,
2005 | | | Year Ended Nov. 30, 2004 | | | Year Ended Oct. 31, 2009 | | | Period Dec. 1, 2007 to Oct. 31, 2008 | | | Year Ended Nov. 30,
2007 | | | Year Ended Nov. 30,
2006 | | | Year Ended Nov. 30,
2005 | | | Year Ended Nov. 30,
2004 | |
| | |
Total Return | | | 11.90 | % | | | (36.53 | )%(C) | | | (0.32 | )% | | | 18.16 | % | | | 14.66 | % | | | 21.68 | % | | | 35.41 | % | | | (47.87 | )%(C) | | | 17.32 | % | | | 35.73 | % | | | 15.61 | % | | | 32.15 | % |
| | |
Net Assets, End of Period (thousands) | | $ | 7,508,400 | | | $ | 6,739,363 | | | $ | 10,159,322 | | | $ | 8,866,306 | | | $ | 5,831,587 | | | $ | 3,919,913 | | | $ | 6,191,964 | | | $ | 4,700,337 | | | $ | 9,638,721 | | | $ | 7,457,252 | | | $ | 4,367,698 | | | $ | 2,804,043 | |
Ratio of Expenses to Average Net Assets | | | 0.13 | % | | | 0.11 | %(B) | | | 0.11 | % | | | 0.12 | % | | | 0.14 | % | | | 0.15 | % | | | 0.24 | % | | | 0.23 | %(B) | | | 0.23 | % | | | 0.23 | % | | | 0.27 | % | | | 0.28 | % |
Ratio of Net Investment Income to Average Net Assets | | | 2.42 | % | | | 1.97 | %(B) | | | 1.44 | % | | | 1.68 | % | | | 1.56 | % | | | 1.41 | % | | | 3.22 | % | | | 4.15 | %(B) | | | 3.04 | % | | | 3.29 | % | | | 2.71 | % | | | 2.35 | % |
Portfolio Turnover Rate | | | 29 | % | | | 19 | %(C) | | | 9 | % | | | 13 | % | | | 9 | % | | | 7 | % | | | 18 | % | | | 16 | %(C) | | | 16 | % | | | 8 | % | | | 10 | % | | | 15 | % |
| | |
See page 1 for the Definitions of Abbreviations and Footnotes.
† See Note A in the Notes to Financial Statements.
See accompanying Notes to Financial Statements.
57
THE DFA INVESTMENT TRUST COMPANY
NOTES TO FINANCIAL STATEMENTS
A. Organization:
The DFA Investment Trust Company (the “Trust”) is an open-end management investment company registered under the Investment Company Act of 1940. The Trust consists of twelve investment portfolios, of which two (the “Series”) are presented in this report.
Effective December 31, 2008, The U.S. Large Cap Value Series and on November 1, 2008, The DFA International Value Series, each a master fund in a RIC/RIC master-feeder structure, elected with the consent of their respective Holder(s) to change their U.S. federal income tax classification from that of an association taxable as a corporation to a partnership pursuant to Treasury Regulation § 301.7701-3. The change in capital structure and retroactive reclassification of the statement of changes in net assets and financial highlights for the respective funds is a result of the treatment of a partnership for book purposes. Each Series/Portfolio will maintain its books and records and present its financial statements in accordance with generally accepted accounting principles for investment partnerships.
At a regular meeting of the Board of Directors/Trustees (the “Board”) on September 16, 2008, the Board voted to change the fiscal and tax year ends of the Series from November 30 to October 31.
B. Significant Accounting Policies:
The following significant accounting policies are in conformity with accounting principles generally accepted in the United States of America. Such policies are consistently followed by the Trust in preparation of its financial statements. The preparation of financial statements in accordance with accounting principles generally accepted in the United States of America requires management to make estimates and assumptions that affect the reported amounts of assets and liabilities and disclosure of contingent assets and liabilities at the date of the financial statements and the reported amounts of increases and decreases in net assets from operations during the reporting period. Actual results could differ from those estimates and those differences could be material.
1. Security Valuation: Securities held by the Series (including over-the-counter securities) are valued at the last quoted sale price of the day. Securities held by the Series that are listed on Nasdaq are valued at the Nasdaq Official Closing Price (“NOCP”). If there is no last reported sale price or NOCP for the day, the Series value the securities at the mean of the most recent quoted bid and asked prices. Price information on listed securities is taken from the exchange where the security is primarily traded. Generally, securities issued by open-end investment companies are valued using their respective net asset values or public offering prices, as appropriate, for purchase orders placed at the close of the New York Stock Exchange (NYSE).
Securities for which no market quotations are readily available (including restricted securities), or for which market quotations have become unreliable, are valued in good faith at fair value in accordance with procedures adopted by the Board of Directors/Trustees. Fair value pricing may also be used if events that have a significant effect on the value of an investment (as determined in the discretion of the Investment Committee of the Advisor) occur before the net asset value is calculated. When fair value pricing is used, the prices of securities used by the Series may differ from the quoted or published prices for the same securities on their primary markets or exchanges.
The DFA International Value Series (the “International Series”) will also fair value price in the circumstances described below. Generally, trading in foreign securities markets is completed each day at various times prior to the close of the NYSE. For example, trading in the Japanese securities markets is completed each day at the close of the Tokyo Stock Exchange (normally 11:00 p.m. PT), which is fourteen hours prior to the close of the NYSE (normally 1:00 p.m. PT) and the time that the net asset value of the International Series is computed. Due to the time differences between the closings of the relevant foreign securities exchanges and the time the International Series prices its shares at the close of the NYSE, the International Series will fair value its foreign investments when it is determined that the market quotations for the foreign investments are either unreliable or not readily available. The fair value
58
prices will attempt to reflect the impact of the U.S. financial markets’ perceptions and trading activities on the International Series’ foreign investments since the last closing prices of the foreign investments were calculated on their primary foreign securities markets or exchanges. For these purposes, the Board of Directors/Trustees of the International Series has determined that movements in relevant indices or other appropriate market indicators, after the close of the Tokyo Stock Exchange or the London Stock Exchange, demonstrate that market quotations may be unreliable. Fair valuation of portfolio securities may occur on a daily basis. The fair value pricing by the International Series utilizes data furnished by an independent pricing service (and that data draws upon, among other information, the market values of foreign investments). The fair value prices of portfolio securities generally will be used when it is determined that the use of such prices will have a material impact on the net asset value of the International Series. When the International Series uses fair value pricing, the values assigned to the International Series’ foreign investments may not be the quoted or published prices of the investments on their primary markets or exchanges.
Futures contracts held by the Series are valued using the settlement price established each day on the exchange on which they are traded.
The Series utilizes a fair value hierarchy which prioritizes the inputs to valuation techniques used to measure fair value into three broad levels described below:
— Level 1 – quoted prices in active markets for identical securities
— Level 2 – other significant observable inputs (including quoted prices for similar securities, interest rates, prepayment speeds, credit risk, etc.)
— Level 3 – significant unobservable inputs (including the Series’ own assumptions in determining the fair value of investments)
A summary of the inputs used to value the Series’ net assets by each major security type, industry and/or country is disclosed at the end of the Summary Schedule of Portfolio Holdings. The inputs or methodology used for valuing securities are not necessarily an indication of the risk associated with investing in those securities.
2. Foreign Currency Translation: Securities and other assets and liabilities of The DFA International Value Series whose values are initially expressed in foreign currencies, are translated to U.S. dollars using the mean between the most recently quoted bid and asked prices for the U.S. dollar as quoted by generally recognized reliable sources. Dividend and interest income and certain expenses are translated to U.S. dollars at the rate of exchange on their respective accrual dates. Receivables and payables denominated in foreign currencies are marked to market daily based on daily exchange rates, and exchange gains or losses are realized upon ultimate receipt or disbursement.
The DFA International Value Series does not isolate the effect of fluctuations in foreign exchange rates from the effect of fluctuations in the market prices of securities held whether realized or unrealized.
Realized gains or losses on foreign currency transactions represent net foreign exchange gains or losses from the disposition of foreign currencies, currency gains or losses realized between the trade and settlement dates on securities transactions, and the difference between amounts of interest, dividends and foreign withholding taxes recorded on The DFA International Value Series books and the U.S. dollar equivalent amounts actually received or paid.
3. Deferred Compensation Plan: Each eligible Trustee of the Trust may elect participation in the Deferred Compensation Plan (the “Plan”). Under the Plan, effective January 1, 2002, such Trustees may defer payment of all or a portion of their total fees earned as a Trustee. These deferred amounts may be treated as though such amounts had been invested in shares of the following funds: U.S. Large Cap Value Portfolio; U.S. Core Equity 1 Portfolio; U.S. Core Equity 2 Portfolio; U.S. Vector Equity Portfolio; U.S. Micro Cap Portfolio; DFA International Value Portfolio; International Core Equity Portfolio; Emerging Markets Portfolio; Emerging Markets Core Equity Portfolio; and/or DFA Two-Year Global Fixed Income Portfolio. Contributions made under the Plan and the change in unrealized appreciation (depreciation) and income, are included in Directors’/Trustees’ Fees & Expenses for the year ended October 31, 2009.
59
Each Trustee has the option to receive their distribution of proceeds in one of the following methods upon one year’s notice: lump sum; annual installments over a period of agreed upon years; or semi-annual installments over a period of agreed upon years. As of October 31, 2009, none of the Trustees have requested distribution of proceeds.
4. Other: Security transactions are accounted for as of the trade date. Costs used in determining realized gains and losses on the sale of investment securities are on the basis of identified cost. Dividend income and distributions to shareholders are recorded on the ex-dividend date. Distributions received on securities that represent a return of capital or capital gain are recorded as a reduction of cost of investments or as a realized gain, respectively. The Series estimate the character of distributions received that may be considered return of capital distributions. Interest income is recorded on the accrual basis. Discount and premium on securities purchased are amortized over the lives of the respective securities utilizing the effective interest method. Expenses directly attributable to a Series are directly charged. Common expenses of the Trust or Series are allocated using methods approved by the Board of Directors/Trustees, generally based on average net assets.
The DFA International Value Series may be subject to taxes imposed by countries in which it invests, with respect to its investments in issuers existing or operating in such countries. Such taxes are generally based on income earned or repatriated and capital gains realized on the sale of such investments. The DFA International Value Series accrues such taxes when the related income or capital gains are earned or throughout the holding period. Some countries require governmental approval for the repatriation of investment income, capital or the proceeds of sales of foreign investors. In addition, if there is a deterioration in a country’s balance of payments or for other reasons, a country may impose temporary restrictions on foreign capital remittances abroad.
C. Investment Advisor:
Dimensional Fund Advisors LP (“Dimensional” or the “Advisor”) provides investment advisory services to the Series. For the year ended October 31, 2009, the investment advisory services fees were accrued daily and paid monthly to the Advisor based on an effective annual rate of 0.10% and 0.20% of average daily net assets for The U.S. Large Cap Value Series and The DFA International Value Series, respectively.
Fees Paid to Officers and Directors/Trustees:
Certain Officers and Directors/Trustees of the Advisor are also Officers and Directors/Trustees of the Funds; however, such Officers and Directors/Trustees (with the exception of the Chief Compliance Officer (“CCO”)) receive no compensation from the Trust. For the year ended October 31, 2009, the total related amounts paid by the Trust to the CCO were $98 (in thousands). The total related amounts paid by each of the Series are included in Other Expenses on the Statement of Operations.
D. Deferred Compensation:
At October 31, 2009, the total liability for deferred compensation to Directors/Trustees is included in Accrued Expenses and Other Liabilities on the Statement of Assets and Liabilities as follows (amounts in thousands):
| | | |
The U.S. Large Cap Value Series | | $ | 183 |
The DFA International Value Series | | | 143 |
E. Purchases and Sales of Securities:
For the year ended October 31, 2009, the Series made the following purchases and sales of investment securities, other than short-term investments and U.S. government securities (amounts in thousands):
| | | | | | |
| | | Purchases | | Sales |
The U.S. Large Cap Value Series | | $ | 1,964,487 | | $ | 1,887,094 |
The DFA International Value Series | | | 1,071,984 | | | 935,775 |
There were no purchases or sales of long-term U.S. government securities.
60
F. Federal Income Taxes:
No provision for federal income taxes is required since the Series’ are treated as partnerships for Federal income tax purposes. Any net investment income and realized and unrealized gains and losses have been deemed to have been “passed down” to their respective partners.
At October 31, 2009, the total cost and aggregate gross unrealized appreciation and (depreciation) of securities for federal income tax purposes were different from amounts reported for financial reporting purposes (amounts in thousands):
| | | | | | | | |
| | | Federal
Tax Cost | | Unrealized
Appreciation | | Unrealized
(Depreciation) | | Net
Unrealized
Appreciation
(Depreciation) |
The U.S. Large Cap Value Series | | $6,877,391 | | $1,296,505 | | $(135,135) | | $1,161,370 |
The DFA International Value Series | | 5,830,471 | | 1,458,762 | | (63,077) | | 1,395,685 |
Accounting for Uncertainty in Income Taxes sets forth a minimum threshold for financial statement recognition of the benefit of a tax position taken or expected to be taken on a tax return. Management has analyzed each Series’ tax positions and has concluded that no provision for income tax is required in any Series’ financial statements. No Series is aware of any tax positions for which it is reasonably possible that the total amounts of unrecognized tax benefits will significantly change in the next twelve months. Each of the Series’ federal tax returns for the prior three fiscal years remain subject to examination by the Internal Revenue Service.
On November 1, 2008, The DFA International Value Series, a master fund in a RIC/RIC master-feeder structure with five RIC feeders and other direct client investor(s), made a “Check-the-box” election for federal income tax purposes pursuant to Treasury Regulation §301.7701-3, to change its federal entity classification from a corporation taxable as a regulated investment company to a partnership. As a result of this election, the master fund is deemed to have distributed all of its assets and liabilities, in a taxable transaction, to its shareholders in liquidation of the master fund. Immediately thereafter, the shareholders contributed all of the distributed assets and liabilities to a newly formed partnership. The final tax year end of The DFA International Value Series was October 31, 2008. For Federal income tax purposes, pursuant to Internal Revenue Code §336(a), the master fund recognizes gain or loss as if the master’s investment securities were sold to its shareholders and, pursuant to IRC Code §331, each of the Portfolios recognizes gain or loss as if it liquidated its investment in the master. As a result of the transaction, The DFA International Value Series recognized a ($2,309,440,866) and ($718,733) capital and currency loss respectively for tax year ended October 31, 2008. For tax purposes, pursuant to IRC Code §334(a), each of the Portfolios will take a fair market value basis in the securities deemed received by them and a new holding period for those securities commences on the deemed liquidation date.
Effective December 31, 2008, The U.S. Large Cap Value Series, a master fund in a RIC/RIC master-feeder structure with four RIC feeders and other direct client investor(s), made a “Check-the-box” election for federal income tax purposes pursuant to Treasury Regulation §301.7701-3, to change its federal entity classification from a corporation taxable as a regulated investment company to a partnership. As a result of this election, the master fund is deemed to have distributed all of its assets and liabilities, in a taxable transaction, to its shareholders in liquidation of the master fund. Immediately thereafter, the shareholders contributed all of the distributed assets and liabilities to a newly formed partnership. The final tax year end of The U.S. Large Cap Value Series was December 30, 2008. For Federal income tax purposes, pursuant to IRC Code §336(a), the master fund recognized a loss as if the master’s investment securities were sold to its shareholders and, pursuant to IRC Code §331, each of the Portfolios recognized a gain as if it liquidated its investment in the master. For tax purposes, pursuant to IRC Code §334(a), each of the Portfolios took a fair market value basis in the securities deemed received by them and a new holding period for those securities commenced on the deemed liquidation date.
61
The master fund had book/tax differences upon its deemed liquidation. The following summary of permanent differences occurred as of the respective effective “Check the Box” election date.
| | | | | | |
Increase
(Decrease)
Paid-in Capital | | Unrealized
Appreciation
(Depreciation)
Investment
Securities | | Increase
(Decrease)
Undistributed
Net Investment
Income | | Increase
(Decrease)
Accumulated
Net Realized
Gains (Losses) |
| $(3,038,312,278) | | $2,303,664,484 | | $(698,899) | | $735,346,693 |
As a result of the transaction, The U.S. Large Cap Value Series recognized a ($2,303,664,484) capital loss for tax year ended December 30, 2008. Additionally, the fund has written off $3,039,011,176 of expired capital loss carryover as a permanent book/tax reporting difference decreasing paid in capital.
G. Financial Instruments:
In accordance with the Series’ investment objectives and policies, the Series may invest in certain financial instruments that have off-balance sheet risk in excess of the amounts recognized in the financial statements and concentrations of credit and market risk. These instruments and their significant corresponding risks are described below:
1. Repurchase Agreements: The Series may purchase certain U.S. Government securities subject to the counterparty’s agreement to repurchase them at an agreed upon date and price. The counterparty will be required on a daily basis to maintain the value of the collateral subject to the agreement at not less than the repurchase price (including accrued interest). The agreements are conditioned upon the collateral being deposited under the Federal Reserve book-entry system with the Trust’s custodian or a third party sub-custodian. In the event of default or bankruptcy by the other party to the agreement, retention of the collateral may be subject to legal proceedings. All open repurchase agreements were entered into on October 30, 2009.
2. Foreign Market Risks: Investments in foreign markets may involve certain consideration and risks not typically associated with investments in the United States of America, including the possibility of future political and economic developments and the level of foreign government supervision and regulation of foreign securities markets. These markets are generally smaller, less liquid and more volatile than the major securities markets in the United States of America. Consequently, acquisition and disposition of securities by the Series may be inhibited.
Derivative Financial Instruments:
Disclosures on derivative instruments and hedging activities are intended to improve financial reporting for derivative instruments by enabling investors to understand how and why a fund uses derivatives, how derivatives are accounted for and how derivative instruments affect a fund’s results of operations and financial position. Summarized below are the specific types of derivative instruments used by the Series.
3. Futures Contracts: The Series may enter into futures contracts to gain market exposure on uninvested cash pending investment in securities or to maintain liquidity to pay redemptions. Upon entering into a futures contract, the Series deposits cash or pledges U.S. Government securities to a broker, equal to the minimum “initial margin” requirements of the exchange on which the contract is traded. Subsequent payments are received from or paid to the broker each day, based on the daily fluctuation in the market value of the contract. These receipts or payments are known as “variation margin” and are recorded daily by the Series as unrealized gains or losses until the contracts are closed. When the contracts are closed, the Series records a realized gain or loss, which is presented in the Statements of Operations as a net realized gain or loss on futures, equal to the difference between the value of the contract at the time it was opened and the value at the time it was closed.
Risks may arise upon entering into futures contracts from potential imperfect price correlations between the futures contracts and the underlying securities, from the possibility of an illiquid secondary market for these instruments and from the possibility that the Series could lose more than the initial margin requirements. The Series entering into stock index futures are subject to equity price risk from those futures contracts. Counterparty credit risk related
62
to exchange-traded futures is minimal because the exchange’s clearinghouse, as counterparty to all exchange-traded futures, guarantees the futures against default.
Additional disclosure on derivative instruments is required showing a summary by primary risk exposure of the derivatives instruments’ (i) location in the balance sheet and fair value at period end and (ii) the location in the Statements of Operations and the realized and change in unrealized gain or loss over the reporting period. The following is a summary of the Series’ derivative instrument holdings for the year ended October 31, 2009.
At October 31, 2009, the Series had no outstanding futures contracts.
The following is a summary of the Series’ location of realized and change in unrealized gains and losses on the Series’ Statements of Operations for the Series’ derivative instrument holdings through the year ended October 31, 2009 (amounts in thousands):
| | | | |
Derivative Type | | | | Location of Gain (Loss) on Derivatives Recognized in Income |
| | |
| Equity contracts | | | | Net Realized Gain (Loss) on: Futures Change in Unrealized Appreciation
(Depreciation) of: Futures |
The following is a summary of the realized and change in unrealized gains and losses from the Series’ derivative instrument holdings categorized by primary risk exposure through the year ended October 31, 2009 (amounts in thousands):
| | |
| | | Realized Gain (Loss)
on Derivatives
Recognized in Income |
| |
| | | Equity
Contracts |
The U.S. Large Cap Value Series* | | $ 7,204 |
The DFA International Value Series* | | (1,125) |
| | |
| | | Change in Unrealized
Appreciation (Depreciation) on
Derivatives Recognized in Income |
| |
| | | Equity
Contracts |
The U.S. Large Cap Value Series* | | $(29) |
*As of October 31, 2009, there were no futures contracts outstanding. During the year ended October 31, 2009, the Series had limited activity in these transactions.
H. Line of Credit:
The Series, together with other Dimensional-advised portfolios, has entered into an amended and restated $250 million unsecured discretionary line of credit effective July 8, 2009 with an affiliate of its domestic custodian bank. Each portfolio is permitted to borrow, subject to its investment limitations, up to a maximum of $250 million, as long as total borrowings under the line of credit do not exceed $250 million in the aggregate. Borrowings under the line of credit are charged interest at the then current Federal Funds Rate plus 1%. Each portfolio is individually, and not jointly, liable for its particular advances under the line of credit. There is no commitment fee on the unused portion of the line of credit. The agreement for the discretionary line of credit may be terminated by either party at any time. The line of credit is scheduled to expire on June 22, 2010.
63
For the year ended October 31, 2009, borrowings under this line of credit by the Series were as follows (amounts in thousands, except percentages and days):
| | | | | | | | | | |
| | | Weighted
Average
Interest Rate | | Weighted
Average
Loan Balance | | Number of
Days
Outstanding | | Interest
Expense
Incurred | | Maximum Amount
Borrowed During
the Period |
The U.S. Large Cap Value Series | | 1.90% | | $11,126 | | 5 | | $3 | | $31,000 |
There were no outstanding borrowings by the Series under this line of credit as of October 31, 2009.
The Series, together with other Dimensional-advised portfolios, has also entered into an additional $500 million unsecured line of credit effective January 15, 2009 with its international custodian bank. Each portfolio is permitted to borrow, subject to its investment limitations, up to a maximum of $500 million, as long as total borrowings under the line of credit do not exceed $500 million in the aggregate. Each portfolio is individually, and not jointly, liable for its particular advances under the line of credit. Borrowings under the line of credit are charged interest at rates agreed to by the parties at the time of borrowing. There is no commitment fee on the unused portion of the line of credit. The agreement for the line of credit expires on January 15, 2010.
For the year ended October 31, 2009, borrowings under this line of credit by the Series were as follows (amounts in thousands, except percentages and days):
| | | | | | | | | | |
| | | Weighted
Average
Interest Rate | | Weighted
Average
Loan Balance | | Number of
Days
Outstanding | | Interest
Expense
Incurred | | Maximum Amount
Borrowed During
the Period |
The DFA International Value Series | | 0.95% | | $8,517 | | 11 | | $2 | | $18,062 |
There were no outstanding borrowings by the Series under this line of credit as of October 31, 2009.
I. Securities Lending:
As of October 31, 2009, some of the Series had securities on loan to brokers/dealers, for which each Series held cash collateral. Each Series invests the cash collateral, as described below, and records a liability for the return of the collateral, during the period the securities are on loan. Loans of securities are expected at all times to be secured by collateral equal to at least (i) 100% of the current market value of the loaned securities with respect to securities of the U.S. government or its agencies, (ii) 102% of the current market value of the loaned securities with respect to U.S. securities, and (iii) 105% of the current market value of the loaned securities with respect to foreign securities. However, daily market fluctuations could cause the Series’ collateral to be lower or higher than the expected thresholds. If this were to occur, the collateral would be adjusted the next business day to ensure adequate collateralization. In the event of default or bankruptcy by the other party to the agreement, realization and/or retention of the collateral may be subject to legal proceedings. If the borrower fails to return loaned securities, and cash collateral being maintained by the borrower is insufficient to cover the value of loaned securities and provided such collateral insufficiency is not the result of investment losses, the lending agent has agreed to pay the amount of the shortfall to the Series or, at the option of the lending agent, to replace the securities.
Subject to each Series’ investment policy, the cash collateral received by the Series from securities on loan is invested in securities of the U.S. government or its agencies, repurchase agreements collateralized by securities of the U.S. government or its agencies or shares of the DFA Short Term Investment Fund LP. Agencies include both agency debentures and agency mortgage backed securities. In addition, each Series will be able to terminate the loan at any time and will receive reasonable interest on the loan, as well as amounts equal to any dividends, interest or other distributions on the loaned securities. However, dividend income received from loaned securities may not be eligible to be taxed at qualified dividend income rates.
J. Indemnitees; Contractual Obligations:
Under the Trust’s organizational documents, its officers and trustees are indemnified against certain liabilities arising out of the performance of their duties to the Trust.
64
In the normal course of business, the Trust enters into contracts that contain a variety of representations and warranties which provide general indemnification. The Trust’s maximum exposure under these arrangements is unknown as this would involve future claims that may be made against the Trust and/or its affiliates that have not yet occurred. However, based on experience, the Trust expects the risk of loss to be remote.
K. In-Kind Redemptions:
In accordance with guidelines described in the Series’ prospectus, the Series may distribute portfolio securities rather than cash as payment for a redemption of fund shares (in-kind redemption). For financial reporting purposes, the Series recognizes a gain on in-kind redemptions to the extent the value of the distributed securities on the date of redemption exceeds the cost of those securities. Gains and losses realized on in-kind redemptions are not recognized for tax purposes and are reclassified from undistributed realized gain (loss) to paid-in capital. During the period December 1, 2007 to October 31, 2008, The U.S. Large Cap Value Series and The DFA International Value Series realized $52,271 and $103,024 (in thousands) of net gain.
L. Subsequent Event Evaluations:
Management has evaluated the impact of all subsequent events on the Series through December 23, 2009, the date the financial statements were available for issuance, and has determined that there are no subsequent events requiring recognition or disclosure in the financial statements.
65
REPORT OF INDEPENDENT REGISTERED PUBLIC ACCOUNTING FIRM
To the Shareholders of the Series, as defined, and
Board of Trustees of The DFA Investment Trust Company:
In our opinion, the accompanying statements of assets and liabilities, including the summary schedules of portfolio holdings, and the related statements of operations and of changes in net assets and the financial highlights present fairly, in all material respects, the financial position of The U.S. Large Cap Value Series and The DFA International Value Series (constituting portfolios within The DFA Investment Trust Company, hereafter referred to as the “Series”) at October 31, 2009, the results of each of their operations for the year then ended, the changes in each of their net assets and the financial highlights for each of the periods indicated, in conformity with accounting principles generally accepted in the United States of America. These financial statements and financial highlights (hereafter referred to as “financial statements”) are the responsibility of the Series’ management; our responsibility is to express an opinion on these financial statements based on our audits. We conducted our audits of these financial statements in accordance with the standards of the Public Company Accounting Oversight Board (United States). Those standards require that we plan and perform the audit to obtain reasonable assurance about whether the financial statements are free of material misstatement. An audit includes examining, on a test basis, evidence supporting the amounts and disclosures in the financial statements, assessing the accounting principles used and significant estimates made by management, and evaluating the overall financial statement presentation. We believe that our audits, which included confirmation of securities at October 31, 2009 by correspondence with the custodians, brokers and the transfer agent of the investee fund, provide a reasonable basis for our opinion.
PricewaterhouseCoopers LLP
Philadelphia, Pennsylvania
December 23, 2009
66
RESULTS OF THE SHAREHOLDER MEETING
On June 2, 2009 and June 5, 2009, The DFA Investment Trust Company (“DFAITC”) held a Special Joint Meeting of Shareholders for the purpose of voting on several proposals affecting DFAITC and the Series, including, among other items, the election of Trustees, the amendment of certain fundamental investment limitations, and the elimination of certain fundamental investment limitations. The shareholders of the Series approved each of the applicable proposals for DFAITC and the Series presented at the Meeting. Listed below are the voting results from the Meeting. Please note that not all Proposals presented at the Meeting were voted on by each Series. Additionally, the Proposal numbers reflected below correlate to the Proposal numbers presented for vote at the Meeting.
DFAITC
| | | | | | | | | | | | | | | | | | | | |
| | | | | Shares Voted | | Percent of Outstanding Shares Voted |
| | | | | For | | % | | Against | | % | | Abstain/WithHold | | % | | For | | Against | | Abstain / WithHold |
Proposal 1: Election of Trustees for DFAITC* |
1a | | David G. Booth | | 2,166,359,402 | | 96.50% | | — | | 0.00% | | 78,661,259 | | 3.50% | | 95.78% | | 0.00% | | 3.48% |
1b | | George M. Constantinides | | 2,169,219,982 | | 96.62% | | — | | 0.00% | | 75,800,679 | | 3.38% | | 95.90% | | 0.00% | | 3.35% |
1c | | John P. Gould | | 2,168,577,186 | | 96.59% | | — | | 0.00% | | 76,443,476 | | 3.41% | | 95.88% | | 0.00% | | 3.38% |
1d | | Roger G. Ibbotson | | 2,169,778,365 | | 96.65% | | — | | 0.00% | | 75,242,297 | | 3.35% | | 95.93% | | 0.00% | | 3.33% |
1e | | Robert C. Merton | | 2,170,124,638 | | 96.66% | | — | | 0.00% | | 74,896,023 | | 3.34% | | 95.94% | | 0.00% | | 3.31% |
1f | | Myron S. Scholes | | 2,169,439,189 | | 96.63% | | — | | 0.00% | | 75,581,473 | | 3.37% | | 95.91% | | 0.00% | | 3.34% |
1g | | Eduardo A. Repetto | | 2,167,010,793 | | 96.53% | | — | | 0.00% | | 78,009,868 | | 3.47% | | 95.81% | | 0.00% | | 3.45% |
1h | | Abbie J. Smith | | 2,169,626,842 | | 96.64% | | — | | 0.00% | | 75,393,820 | | 3.36% | | 95.92% | | 0.00% | | 3.33% |
| | | | | | | | | | | | | | | | | | | | | | |
| | | Shares Voted | | Percent of Outstanding Shares Voted |
| | | For | | % | | Against | | % | | Abstain/WithHold | | % | | NonVote | | % | | For | | Against | | Abstain / WithHold |
Proposal 4: Approval of an Amended and
Restated Agreement and Declaration of
Trust for DFAITC* | | 2,076,877,329 | | 92.43% | | 36,623,148 | | 1.63% | | 133,356,326 | | 5.94% | | NA | | NA | | 91.82% | | 1.62% | | 5.90% |
* Results are for all Series within DFAITC
The U.S. Large Cap Value Series
| | | | | | | | | | | | | | | | | | | | |
| | | | | Shares Voted | | Percent of Outstanding Shares Voted |
| | | | | For | | % | | Against | | % | | Abstain/WithHold | | % | | For | | Against | | Abstain / WithHold |
Proposals: |
5 | | To approve amendments to certain fundamental investment restrictions |
5a | | Borrowing Money | | 450,089,477 | | 90.34% | | 13,835,372 | | 2.78% | | 34,296,468 | | 6.88% | | 90.12% | | 2.77% | | 6.87% |
5b | | Making Loans | | 446,508,610 | | 89.62% | | 17,323,887 | | 3.48% | | 34,388,819 | | 6.90% | | 89.41% | | 3.47% | | 6.89% |
5c | | Investments in Real Estate | | 449,117,076 | | 90.14% | | 14,867,126 | | 2.98% | | 34,237,115 | | 6.87% | | 89.93% | | 2.98% | | 6.86% |
5d | | Investments in Commodities | | 445,240,298 | | 89.37% | | 18,945,498 | | 3.80% | | 34,035,520 | | 6.83% | | 89.15% | | 3.79% | | 6.82% |
5e | | Diversification of Investments | | 450,429,968 | | 90.41% | | 13,968,473 | | 2.80% | | 33,822,876 | | 6.79% | | 90.19% | | 2.80% | | 6.77% |
6 | | To approve the elimination of certain fundamental investment restrictions |
6a | | Pledging, Mortgaging, or Hypothecating Assets | | 442,477,364 | | 88.81% | | 21,095,580 | | 4.23% | | 34,648,372 | | 6.95% | | 88.60% | | 4.22% | | 6.94% |
6b | | Purchasing Securities on Margin | | 442,025,675 | | 88.72% | | 21,654,237 | | 4.35% | | 34,541,405 | | 6.93% | | 88.51% | | 4.34% | | 6.92% |
6c | | Investing in Restricted or Illiquid Securities | | 441,905,416 | | 88.70% | | 21,661,567 | | 4.35% | | 34,654,334 | | 6.96% | | 88.48% | | 4.34% | | 6.94% |
6d | | Investing for the Purpose of Exercising Control | | 446,950,234 | | 89.71% | | 16,844,128 | | 3.38% | | 34,426,955 | | 6.91% | | 89.49% | | 3.37% | | 6.89% |
6e | | Investing in Other Investment Companies | | 446,376,678 | | 89.59% | | 17,480,520 | | 3.51% | | 34,364,119 | | 6.90% | | 89.38% | | 3.50% | | 6.88% |
6f | | Management Ownership of Securities of an Issuer | | 446,904,545 | | 89.70% | | 16,712,196 | | 3.35% | | 34,604,577 | | 6.95% | | 89.49% | | 3.35% | | 6.93% |
6g | | Investing in Oil, Gas, or other Mineral Exploration, Leases or Development Programs | | 445,817,286 | | 89.48% | | 18,271,331 | | 3.67% | | 34,132,700 | | 6.85% | | 89.27% | | 3.66% | | 6.83% |
6h | | Investing in Securities of Unseasoned Issuers | | 445,230,922 | | 89.36% | | 18,304,705 | | 3.67% | | 34,685,690 | | 6.96% | | 89.15% | | 3.67% | | 6.95% |
6i | | Investing in Warrants | | 446,950,388 | | 89.71% | | 16,531,063 | | 3.32% | | 34,739,866 | | 6.97% | | 89.49% | | 3.31% | | 6.96% |
6j | | Writing or Acquiring Options | | 446,696,672 | | 89.66% | | 16,985,456 | | 3.41% | | 34,539,189 | | 6.93% | | 89.44% | | 3.40% | | 6.92% |
67
The DFA International Value Series
| | | | | | | | | | | | | | | | | | | | |
| | | | | Shares Voted | | Percent of Outstanding Shares Voted |
| | | | | For | | % | | Against | | % | | Abstain/WithHold | | % | | For | | Against | | Abstain / WithHold |
Proposals: |
5 | | To approve amendments to certain fundamental investment restrictions |
5a | | Borrowing Money | | 349,117,663 | | 88.20% | | 30,044,848 | | 7.59% | | 16,661,166 | | 4.21% | | 86.14% | | 7.41% | | 4.11% |
5b | | Making Loans | | 348,947,065 | | 88.16% | | 29,971,477 | | 7.57% | | 16,905,135 | | 4.27% | | 86.10% | | 7.40% | | 4.17% |
5c | | Investments in Real Estate | | 351,165,048 | | 88.72% | | 28,070,820 | | 7.09% | | 16,587,809 | | 4.19% | | 86.65% | | 6.93% | | 4.09% |
5d | | Investments in Commodities | | 347,839,401 | | 87.88% | | 31,372,412 | | 7.93% | | 16,611,864 | | 4.20% | | 85.82% | | 7.74% | | 4.10% |
5e | | Diversification of Investments | | 351,038,355 | | 88.69% | | 28,302,302 | | 7.15% | | 16,483,020 | | 4.16% | | 86.61% | | 6.98% | | 4.07% |
6 | | To approve the elimination of certain fundamental investment restrictions |
6a | | Pledging, Mortgaging, or Hypothecating Assets | | 346,783,275 | | 87.61% | | 32,195,687 | | 8.13% | | 16,844,715 | | 4.26% | | 85.56% | | 7.94% | | 4.16% |
6b | | Purchasing Securities on Margin | | 346,279,680 | | 87.48% | | 32,728,442 | | 8.27% | | 16,815,555 | | 4.25% | | 85.44% | | 8.08% | | 4.15% |
6c | | Investing in Restricted or Illiquid Securities | | 346,650,940 | | 87.58% | | 32,506,501 | | 8.21% | | 16,666,236 | | 4.21% | | 85.53% | | 8.02% | | 4.11% |
6d | | Investing for the Purpose of Exercising Control | | 349,242,494 | | 88.23% | | 29,958,913 | | 7.57% | | 16,621,270 | | 4.20% | | 86.17% | | 7.39% | | 4.10% |
6e | | Investing in Other Investment Companies | | 349,373,590 | | 88.26% | | 29,787,506 | | 7.53% | | 16,662,582 | | 4.21% | | 86.20% | | 7.35% | | 4.11% |
6f | | Management Ownership of Securities of an Issuer | | 349,991,995 | | 88.42% | | 28,988,874 | | 7.32% | | 16,842,809 | | 4.26% | | 86.36% | | 7.15% | | 4.16% |
6g | | Investing in Oil, Gas, or other Mineral Exploration, Leases or Development Programs | | 348,999,679 | | 88.17% | | 30,314,009 | | 7.66% | | 16,509,990 | | 4.17% | | 86.11% | | 7.48% | | 4.07% |
6h | | Investing in Securities of Unseasoned Issuers | | 349,376,398 | | 88.27% | | 29,792,320 | | 7.53% | | 16,653,959 | | 4.21% | | 86.20% | | 7.35% | | 4.11% |
6i | | Investing in Warrants | | 349,983,930 | | 88.42% | | 29,092,914 | | 7.35% | | 16,745,833 | | 4.23% | | 86.35% | | 7.18% | | 4.13% |
6j | | Writing or Acquiring Options | | 349,310,900 | | 88.25% | | 29,764,139 | | 7.52% | | 16,747,638 | | 4.23% | | 86.19% | | 7.34% | | 4.13% |
7a | | Proposed Sub-Advisory Agreement among Dimensional Fund Advisors LP, DFA Australia Limited, and the Company | | 355,560,358 | | 89.83% | | 17,051,279 | | 4.31% | | 23,212,041 | | 5.86% | | 87.73% | | 4.21% | | 5.73% |
7b | | Proposed Sub-Advisory Agreement among Dimensional Fund Advisors LP, Dimensional Fund Advisors Ltd., and the Company | | 355,594,969 | | 89.84% | | 16,996,602 | | 4.29% | | 23,232,105 | | 5.87% | | 87.74% | | 4.19% | | 5.73% |
68
FUND MANAGEMENT
Trustees/Directors
Each Board of Trustees/Directors of The DFA Investment Trust Company Inc. (“DFAITC”), DFA Investment Dimensions Group Inc. (“DFAIDG”), Dimensional Investment Group Inc. (“DIG”) and Dimensional Emerging Markets Value Fund (“DEM”) (each, the “Fund” and collectively, the “Funds”) is responsible for establishing the Funds’ policies and for overseeing the management of the Funds. The Trustees/Directors of the Funds, including all of the disinterested Directors, have adopted written procedures to monitor potential conflicts of interest that might develop between portfolios of the Funds (the “Feeder Portfolios”) that invest in certain series of DFAITC or DEM (the “Master Funds”).
Each Board has two standing committees, an Audit Committee and a Portfolio Performance and Service Review Committee (the “Performance Committee”). The Audit Committee is comprised of George M. Constantinides, Roger G. Ibbotson and Abbie J. Smith. Each member of the Audit Committee is a disinterested Director. The Audit Committee oversees the Fund’s accounting and financial reporting policies and practices, the Fund’s internal controls, the Fund’s financial statements and the independent audits thereof and performs other oversight functions as requested by the Board. The Audit Committee recommends the appointment of each Fund’s independent registered certified public accounting firm and also acts as a liaison between the Fund’s independent registered certified public accounting firm and the full Board. There were two Audit Committee meetings held during the fiscal year ended October 31, 2009.
Each Board’s Performance Committee is comprised of Messrs. Constantinides and Ibbotson, Ms. Smith, John P. Gould, Myron S. Scholes and Robert C. Merton. Each member of the Fund’s Performance Committee is a disinterested Director. The Performance Committee regularly reviews and monitors the investment performance of the Fund’s series and reviews the performance of the Fund’s service providers. There were six Performance Committee meetings held during the fiscal year ended October 31, 2009.
Certain biographical information for each disinterested Trustee/Director and each interested Trustee/Director of the Funds is set forth in the tables below, including a description of each Trustee/Director’s experience as a Trustee/ Director of the Funds and as a director or trustee of other funds, as well as other recent professional experience.
The statements of additional information (together, “SAI”) of the Funds include additional information about each Trustee/Director. You may obtain copies of the SAI and prospectus of each Fund advised by Dimensional Fund Advisors LP by calling collect (512) 306-7400 or by mailing a request to Dimensional Fund Advisors LP, 6300 Bee Cave Road, Building One, Austin, Texas 78746. Prospectuses are also available at www.dimensional.com.
| | | | | | |
Name, Position with the Fund,
Address and Age | | Term of Office1 and
Length of Service | | Portfolios within the
DFA Fund Complex2
Overseen | | Principal Occupation(s) During Past 5 Years and Other Directorships of Public Companies Held |
Disinterested Trustees/Directors |
George M. Constantinides Director of DFAIDG, DIG and DEM. Trustee of DFAITC. The University of Chicago Booth School of Business 5807 S. Woodlawn Avenue Chicago, IL 60637 Age: 62 | | DFAITC - since 1993 DFAIDG - since 1983 DIG - since 1993 DEM - since 1993 | | 87 portfolios in 4 investment companies | | Leo Melamed Professor of Finance, The University of Chicago Booth School of Business. |
John P. Gould Director of DFAIDG, DIG and DEM. Trustee of DFAITC. The University of Chicago Booth School of Business 5807 S. Woodlawn Avenue Chicago, IL 60637 Age: 70 | | DFAITC - since 1993 DFAIDG - since 1986 DIG - since 1993 DEM - since 1993 | | 87 portfolios in 4 investment companies | | Steven G. Rothmeier Distinguished Service Professor of Economics, The University of Chicago Booth School of Business (since 1965). Member of the Boards of Milwaukee Mutual Insurance Company (since 1997). Member and Chair, Competitive Markets Advisory Committee, Chicago Mercantile Exchange (futures trading exchange) (since 2004). Formerly, Director of UNext, Inc. (1999-2006). Formerly, Senior Vice-President, Lexecon Inc. (economics, law, strategy and finance consulting) (1994-2004). Trustee, Harbor Fund (registered investment company) (27 Portfolios) (since 1994). |
69
| | | | | | |
Name, Position with the Fund,
Address and Age | | Term of Office1 and
Length of Service | | Portfolios within the
DFA Fund Complex2
Overseen | | Principal Occupation(s) During Past 5 Years and Other Directorships of Public Companies Held |
Roger G. Ibbotson Director of DFAIDG, DIG and DEM. Trustee of DFAITC. Yale School of Management 135 Prospect Street New Haven, CT 06520-8200 Age: 66 | | DFAITC - since 1993 DFAIDG - since 1981 DIG - since 1993 DEM - since 1993 | | 87 portfolios in 4 investment companies | | Professor in Practice of Finance, Yale School of Management (since 1984). Director, BIRR Portfolio Analysis, Inc. (software products) (since 1990). Chairman, CIO and Partner, Zebra Capital Management, LLC (hedge fund manager) (since 2001). Formerly, Chairman, Ibbotson Associates, Inc., Chicago, IL (software data publishing and consulting) (1977-2006). |
Robert C. Merton Director of DFAIDG, DIG and DEM. Trustee of DFAITC. Harvard Business School 353 Baker Library Soldiers Field Boston, MA 02163 Age: 65 | | DFAITC - since 2003 DFAIDG - since 2003 DIG - since 2003 DEM - since 2003 | | 87 portfolios in 4 investment companies | | John and Natty McArthur University Professor, Graduate School of Business Administration, Harvard University (since 1998). Director, MF Risk, Inc. (risk management software) (since 2001). Director, Peninsula Banking Group (bank) (since 2003). Director, Community First Financial Group (bank holding company) (since 2003). Member Competitive Markets Advisory Council, Chicago Mercantile Exchange (futures trading exchange) (since 2004). Chairman and Director, Daedalus Software (medical software) (since 2008). Formerly, Advisory Board Member, Alpha Simplex Group (hedge fund) (2001-2007). Formerly, Chief Science Officer and Director, Trinsum Group, a successor to Integrated Finance Limited (2002-2008). Director, Vical Incorporated (biopharmaceutical product development) (since 2002). |
Myron S. Scholes Director of DFAIDG, DIG and DEM. Trustee of DFAITC. Platinum Grove Asset Management, L.P. Reckson Executive Park 1100 King Street Building 4 Rye Brook, NY 10573 Age: 68 | | DFAITC - since 1993 DFAIDG - since 1981 DIG - since 1993 DEM - since 1993 | | 87 portfolios in 4 investment companies | | Frank E. Buck Professor Emeritus of Finance, Stanford University (since 1981). Chairman, Platinum Grove Asset Management, L.P. (hedge fund) (formerly, Oak Hill Platinum Partners) (since 1999). Formerly, Managing Partner, Oak Hill Capital Management (private equity firm) (until 2004). Formerly, Director, Chicago Mercantile Exchange (2001-2008). Director, American Century Fund Complex (registered investment companies) (37 Portfolios) (since 1981). |
Abbie J. Smith Director of DFAIDG, DIG and DEM. Trustee of DFAITC. The University of Chicago Booth School of Business 5807 S. Woodlawn Avenue Chicago, IL 60637 Age: 56 | | DFAITC - since 2000 DFAIDG - since 2000 DIG - since 2000 DEM - since 2000 | | 87 portfolios in 4 investment companies | | Boris and Irene Stern Professor of Accounting, The University of Chicago Booth School of Business (since 1980), and Co-Director Investment Research, Fundamental Investment Advisors (hedge fund) (since 2008). Director, HNI Corporation (formerly known as HON Industries Inc.) (office furniture) (since 2000). Director, Ryder System Inc. (transportation, logistics and supply-chain management) (since 2003). Director/ Trustee, UBS Funds (fund complex) (5 portfolios) (since 2008). |
70
| | | | | | |
Name, Position with the Fund,
Address and Age | | Term of Office1 and
Length of Service | | Portfolios within the
DFA Fund Complex2 Overseen | | Principal Occupation(s) During Past 5 Years and Other Directorships of Public Companies Held |
Interested Trustees/Directors* |
David G. Booth Chairman, Director, Chief Executive Officer and President of DFAIDG, DIG and DEM. Chairman, Trustee, Chief Executive Officer, Chief Investment Officer and President of DFAITC. 6300 Bee Cave Road, Building One Austin, Texas 78746 Age: 62 | | DFAITC - since 1993 DFAIDG - since 1981 DIG - since 1992 DEM - since 1993 | | 87 portfolios in 4 investment companies | | Chairman, Director/Trustee, President, Chief Executive Officer and formerly Chief Investment Officer of the following companies: Dimensional Holdings Inc., Dimensional Fund Advisors LP, Dimensional Fund Advisors Canada ULC, DFAIDG, DIG, DEM and DFAITC. President and Chief Executive Officer of DFA Securities LLC. Director of Dimensional Fund Advisors Ltd, and formerly Chief Investment Officer. Director and formerly, President and Chief Investment Officer of DFA Australia Ltd. Formerly, Director of Dimensional Funds PLC and Dimensional Fund II PLC. Chairman, Director and Chief Executive Officer of Dimensional Fund Advisors Canada ULC (All Chief Investment Officer positions held starting 1/03 through 3/07 except Dimensional Holdings Inc., which was from 10/06 through 3/07.) Limited Partner, Oak Hill Partners (since 2001) and VSC Investors, LLC (since 2007). Trustee, The University of Chicago Booth School of Business. Formerly, Director, SA Funds (registered investment company). Formerly Director, Assante Corporation (investment management) (until 2002). |
Eduardo A. Repetto Director, Chief Investment Officer and Vice President of DFAIDG, DIG and DEM. Trustee, Chief Investment Officer and Vice President of DFAITC 6300 Bee Cave Road, Building One Austin, TX 78746 Age: 42 | | DFAITC - since 2009 DFAIDG - since 2009 DIG - since 2009 DEM - since 2009 | | 87 portfolios in 4 investment companies | | Director/Trustee (beginning June 2009), Chief Investment Officer (beginning March 2007) and Vice President of DFAIDG, DIG, DEM and DFAITC. Chief Investment Officer (beginning March 2007) and Vice President of all the DFA Entities, DFA Australia Limited and Dimensional Fund Advisors Canada ULC. |
| 1 | Each Trustee/Director holds office for an indefinite term until his or her successor is elected and qualified. |
| 2 | Each Trustee/Director is a director or trustee of each of the four registered investment companies within the DFA Fund Complex, which includes the Funds. |
| * | Interested Trustees/Directors are described as such because they are deemed to be “interested persons,” as that term is defined under the Investment Company Act of 1940, as amended, due to their positions with Dimensional Fund Advisors LP. |
71
Officers
The name, age, information regarding positions with the Funds and the principal occupation for each officer of the Funds are set forth below. Each officer listed below holds the same office (except as otherwise noted) in the following entities: Dimensional Fund Advisors LP (prior to November 3, 2006, Dimensional Fund Advisors Inc.) (“Dimensional”), DFA Securities Inc., DFAIDG, DIG, DFAITC and DEM (collectively, the “DFA Entities”). The address of each officer is: Dimensional Fund Advisors LP, 6300 Bee Cave Road, Building One, Austin, Texas 78746, unless otherwise indicated.
| | | | |
Name, Position with the Fund and Age | | Term of Office1 and Length of Service | | Principal Occupation(s) During Past 5 Years |
Officers |
April A. Aandal Vice President and Chief Learning Officer Age: 46 | | Since 2008 | | Vice President of all the DFA Entities. Chief Learning Officer of Dimensional (since September 2008). Formerly, Regional Director of Dimensional (2004-2008); Vice President of Professional Development at Assante Asset Management (June 2002-January 2005). |
Darryl D. Avery Vice President Age: 43 | | Since 2005 | | Vice President of all the DFA Entities. From June 2002 to January 2005, institutional client service representative of Dimensional. |
Arthur H. Barlow Vice President Age: 53 | | Since 1993 | | Vice President of all the DFA Entities. Formerly, Vice President of DFA Australia Limited and Dimensional Fund Advisors Ltd. |
Scott A. Bosworth Vice President Age: 40 | | Since 2007 | | Vice President of all the DFA Entities. Regional Director of Dimensional (since November 1997). |
Valerie A. Brown Vice President and Assistant Secretary Age: 42 | | Since 2001 | | Vice President and Assistant Secretary of all the DFA Entities, DFA Australia Limited, Dimensional Fund Advisors Ltd., and since June 2003, Dimensional Fund Advisors Canada ULC. |
David P. Butler Vice President Age: 45 | | Since 2007 | | Vice President of all the DFA Entities. Director of Global Financial Services of Dimensional (since 2008). Formerly, Regional Director of Dimensional Fund Advisors LP (January 1995 to January 2005). |
Patrick Carter Vice President Age: 47 | | Since 2007 | | Vice President of all the DFA Entities. Regional Director of Dimensional (since March 2006). Formerly, Director of Merrill Lynch Retirement Group (December 1998 to March 2006). |
Joseph H. Chi Vice President Age: 43 | | Since 2009 | | Vice President of all the DFA Entities. Portfolio Manager for Dimensional Fund Advisors LP (since October 2005). Prior to October 2005, Corporate Counsel at Hewitt Associates (July 2002-August 2005). |
Stephen A. Clark Vice President Age: 37 | | Since 2004 | | Vice President of all the DFA Entities. Formerly, Portfolio Manager of Dimensional (April 2001-April 2004). |
Robert P. Cornell Vice President Age: 60 | | Since 2007 | | Vice President of all the DFA Entities. Regional Director of Financial Services Group of Dimensional (since August 1993). |
Christopher S. Crossan Vice President and Chief Compliance Officer Age: 43 | | Since 2004 | | Vice President and Chief Compliance Officer of all the DFA Entities. |
James L. Davis Vice President Age: 52 | | Since 1999 | | Vice President of all the DFA Entities. Formerly, Vice President of DFA Australia Limited and Dimensional Fund Advisors Ltd. |
Robert T. Deere Vice President Age: 52 | | Since 1994 | | Vice President of all the DFA Entities and DFA Australia Limited. |
Robert W. Dintzner Vice President Age: 39 | | Since 2001 | | Vice President of all the DFA Entities. |
72
| | | | |
Name, Position with the Fund and Age | | Term of Office1 and Length of Service | | Principal Occupation(s) During Past 5 Years |
Kenneth Elmgren Vice President Age: 55 | | Since 2007 | | Vice President of all the DFA Entities. Formerly, Managing Principal of Beverly Capital (May 2004 to September 2006). |
Richard A. Eustice Vice President and Assistant Secretary Age: 44 | | Since 1998 | | Vice President and Assistant Secretary of all the DFA Entities and DFA Australia Limited. Chief Operating Officer of Dimensional Fund Advisors Ltd. (since July 2008). Formerly, Vice President of Dimensional Fund Advisors Ltd. |
Eugene F. Fama, Jr. Vice President Age: 48 | | Since 1993 | | Vice President of all the DFA Entities. Formerly, Vice President of DFA Australia Limited and Dimensional Fund Advisors Ltd. |
Gretchen A. Flicker Vice President Age: 38 | | Since 2004 | | Vice President of all the DFA Entities. Prior to April 2004, institutional client service representative of Dimensional. |
Jed S. Fogdall Vice President Age: 35 | | Since 2008 | | Vice President of all the DFA Entities. Portfolio Manager for Dimensional (since September 2004). Prior to September 2004, Staff Engineer at the Boeing Company (1997-2004). |
Glenn S. Freed Vice President Age: 47 | | Since 2001 | | Vice President of all the DFA Entities. |
Jeremy P. Freeman Vice President Age: 38 | | Since 2009 | | Vice President of all the DFA Entities. Senior Technology Manager for Dimensional Fund Advisors LP (since June 2006). Formerly, Principal at AIM Investments/Amvescap PLC (now Invesco) (June 1998-June 2006). |
Mark R. Gochnour Vice President Age: 42 | | Since 2007 | | Vice President of all the DFA Entities. Regional Director of Dimensional. |
Henry F. Gray Vice President Age: 42 | | Since 2000 | | Vice President of all the DFA Entities. Prior to July 2000, Portfolio Manager of Dimensional. Formerly, Vice President of DFA Australia Limited. |
John T. Gray Vice President Age: 35 | | Since 2007 | | Vice President of all the DFA Entities. Formerly, Regional Director of Dimensional (January 2005 to February 2007). |
Darla Hastings Vice President Age: 54 | | Since 2007 | | Vice President of all the DFA Entities. Chief Marketing Officer of Dimensional. Formerly, Senior Vice President, Customer Experience for Benchmark Assisted Living (May 2005 to April 2006); Executive Vice President and Chief Marketing Officer of State Street Corporation (September 2001 to October 2005). |
Joel H. Hefner Vice President Age: 41 | | Since 2007 | | Vice President of all the DFA Entities. Regional Director of Dimensional (since June 1998). |
Julie Henderson Vice President and Fund Controller Age: 35 | | Since 2005 | | Vice President and Fund Controller of all the DFA Entities. Formerly, Senior Manager at PricewaterhouseCoopers LLP (July 1996 to April 2005). |
Kevin Hight Vice President Age: 41 | | Since 2005 | | Vice President of all the DFA Entities. Formerly, Regional Director of Dimensional (since March 2003 to March 2005). |
Christine W. Ho Vice President Age: 41 | | Since 2004 | | Vice President of all the DFA Entities. Prior to April 2004, Assistant Controller of Dimensional. |
Jeff J. Jeon Vice President Age: 35 | | Since 2004 | | Vice President of all the DFA Entities. Counsel of Dimensional (since September 2001). |
Patrick M. Keating Vice President Age: 54 | | Since 2003 | | Vice President of all the DFA Entities and Chief Operating Officer of Dimensional. Director, Vice President and Chief Privacy Officer of Dimensional Fund Advisors Canada ULC. Director of DFA Australia Limited. |
73
| | | | |
Name, Position with the Fund and Age | | Term of Office1 and Length of Service | | Principal Occupation(s) During Past 5 Years |
Joseph F. Kolerich Vice President Age: 37 | | Since 2004 | | Vice President of all the DFA Entities. Portfolio Manager for Dimensional (since April 2001). |
Michael F. Lane Vice President Age: 42 | | Since 2004 | | Vice President of all the DFA Entities. Formerly, Vice President of Advisor Services at TIAA-CREF (July 2001 to September 2004). |
Kristina M. LaRusso Vice President Age: 34 | | Since 2006 | | Vice President of all DFA Entities. Formerly, Operations Supervisor of Dimensional (March 2003 to December 2006). |
Inmoo Lee Vice President Age: 43 | | Since 2007 | | Vice President of all the DFA Entities. Associate Professor Department of Finance and Accounting, Business School, National University of Singapore (July 2004 to present); Associate Professor, College of Business Administration, Korea University (September 2001 to May 2006). |
Juliet Lee Vice President Age: 38 | | Since 2005 | | Vice President of all the DFA Entities. Human Resources Manager of Dimensional (since January 2004). |
Aaron M. Marcus Vice President & Head of Global Human Resources Age: 39 | | Since 2008 | | Vice President and Head of Global Human Resources of Dimensional. Formerly, Global Head of Recruiting and Vice President of Goldman Sachs & Co. (June 2006 to January 2008); Global Co-Head of HR of the Equities & FICC Division, and Vice President of Goldman Sachs & Co. (May 2005 to May 2006); Head of Americas Campus Recruiting and Vice President of Goldman Sachs & Co. (April 2003 to May 2005). |
David R. Martin Vice President, Chief Financial Officer and Treasurer Age: 52 | | Since 2007 | | Vice President, Chief Financial Officer and Treasurer of all the DFA Entities. Director, Vice President, Chief Financial Officer and Treasurer of Dimensional Fund Advisors Ltd. and DFA Australia Limited. Chief Financial Officer, Treasurer, and Vice President of Dimensional Fund Advisors Canada ULC. Director of Dimensional Funds PLC and Dimensional Funds II PLC. Formerly, Executive Vice President and Chief Financial Officer of Janus Capital Group Inc. (June 2005 to March 2007); Senior Vice President of Finance at Charles Schwab & Co., Inc. (March 1999 to May 2005). |
Catherine L. Newell Vice President and Secretary Age: 45 | | Vice President since 1997 and Secretary since 2000 | | Vice President and Secretary of all the DFA Entities. Director, Vice President and Secretary of DFA Australia Limited and Dimensional Fund Advisors Ltd. (since February 2002, April 1997 and May 2002, respectively). Vice President and Secretary of Dimensional Fund Advisors Canada ULC (since June 2003). Director, Dimensional Funds PLC and Dimensional Funds II PLC (since 2002 and 2006, respectively). Formerly, Assistant Secretary of all DFA Entities, DFA Australia Limited and Dimensional Fund Advisors Ltd. |
Christian Newton Vice President Age: 34 | | Since 2009 | | Vice President of all DFA Entities. Web Services Manager for Dimensional Fund Advisors LP (Since January 2008). Formerly Design Manager (2005-2008) and Web Developer (2002-2005) of Dimensional Fund Advisors LP. |
Gerard K. O’Reilly Vice President Age: 32 | | Since 2007 | | Vice President of all the DFA Entities. Formerly, Research Associate of Dimensional Fund Advisors LP (2004 to 2006); Research Assistant in PhD program, Aeronautics Department California Institute of Technology (1998 to 2004). |
Daniel C. Ong Vice President Age: 35 | | Since 2009 | | Vice President of all the DFA Entities. Portfolio Manager for Dimensional Fund Advisors LP (since July 2005). Prior to 2005, Graduate Student at the University of Chicago Booth School of Business (2003-2005). |
Carmen Palafox Vice President Age: 35 | | Since 2006 | | Vice President of all the DFA Entities. Operations Manager of Dimensional Fund Advisors LP (since May 1996). |
Sonya Park Vice President Age: 37 | | Since 2005 | | Vice President of all the DFA Entities. From February 2002 to January 2005, institutional client service representative of Dimensional. |
74
| | | | |
Name, Position with the Fund and Age | | Term of Office1 and Length of Service | | Principal Occupation(s) During Past 5 Years |
David A. Plecha Vice President Age: 48 | | Since 1993 | | Vice President of all the DFA Entities, DFA Australia Limited and Dimensional Fund Advisors Ltd |
Ted Randall Vice President Age: 36 | | Since 2008 | | Vice President of all the DFA Entities. Formerly, Research Associate of Dimensional (2006-2008). Systems Developer of Dimensional (2001-2006). |
L. Jacobo Rodriguez Vice President Age: 38 | | Since 2005 | | Vice President of all the DFA Entities. From August 2004 to July 2005, institutional client service representative of Dimensional. Formerly, Financial Services Analyst, Cato Institute (September 2001 to June 2004); Book Review Editor, Cato Journal, Cato Institute (May 1996 to June 2004). |
David E. Schneider Vice President Age: 63 | | Since 2001 | | Vice President of all the DFA Entities. Currently, Director of Institutional Services. |
Bruce A. Simmons Vice President Age: 44 | | Since 2009 | | Vice President of all the DFA Entities. Investment Operations Manager for Dimensional Fund Advisors LP (since May 2007). Formerly, Vice President Client and Fund Reporting at Mellon Financial (September 2005-May 2007); Vice President Business Development at CUADPRO Marketing (July 2003-September 2005). |
Ted R. Simpson Vice President Age: 41 | | Since 2007 | | Vice President of all the DFA Entities. Regional Director of Dimensional (since December 2002). |
Bryce D. Skaff Vice President Age: 34 | | Since 2007 | | Vice President of all the DFA Entities. Formerly, Regional Director of Dimensional (December 1999 to January 2007). |
Grady M. Smith Vice President Age: 53 | | Since 2004 | | Vice President of all the DFA Entities. Prior to April 2004, Portfolio Manager of Dimensional. |
Carl G. Snyder Vice President Age: 46 | | Since 2000 | | Vice President of all the DFA Entities. Formerly, Vice President of DFA Australia Limited. |
Lawrence R. Spieth Vice President Age: 61 | | Since 2004 | | Vice President of all the DFA Entities. Prior to April 2004, Regional Director of Dimensional. |
Bradley G. Steiman Vice President Age: 36 | | Since 2004 | | Vice President of all the DFA Entities and Director and Vice President of Dimensional Fund Advisors Canada ULC. |
Robert C. Trotter Vice President Age: 51 | | Since 2009 | | Vice President of all the DFA Entities. Senior Manager Technology for Dimensional Fund Advisors LP (since March 2007). Formerly, Director of Technology at AMVESCAP (2002-2007). |
Karen E. Umland Vice President Age: 43 | | Since 1997 | | Vice President of all the DFA Entities, DFA Australia Limited, Dimensional Fund Advisors Ltd., and Dimensional Fund Advisors Canada ULC. |
Sunil Wahal Vice President Age: 42 | | Since 2009 | | Vice President of all the DFA Entities. Formerly, Research Associate for Dimensional Fund Advisors LP (July 2008-January 2009); Consultant to Dimensional Fund Advisors LP (September 2005-July 2008); Jack D. Furst Professor of Finance at Arizona State University, WP Carey School of Business (July 2005-July 2008); Associate Professor of Finance at Goizueta Business School, Emory University (1997-2005). |
Brian J. Walsh Vice President Age: 39 | | Since 2009 | | Vice President of all the DFA Entities. Portfolio Manager for Dimensional Fund Advisors LP (since 2004). Formerly, Trader for Dimensional Fund Advisors LP (1997-2004). |
Carol W. Wardlaw Vice President Age: 51 | | Since 2004 | | Vice President of all the DFA Entities. Prior to April 2004, Regional Director of Dimensional. |
75
| | | | |
Name, Position with the Fund and Age | | Term of Office1 and Length of Service | | Principal Occupation(s) During Past 5 Years |
Weston J. Wellington Vice President Age: 58 | | Since 1997 | | Vice President of all the DFA Entities. Formerly, Vice President of DFA Australia Limited. |
Daniel M. Wheeler Vice President Age: 64 | | Since 2001 | | Vice President of all the DFA Entities. Prior to 2001 and currently, Director of Financial Advisors Services of Dimensional. Director of Dimensional Fund Advisors Ltd. (since October 2003) and President of Dimensional Fund Advisors Canada ULC (since June 2003). |
Ryan Wiley Vice President Age: 33 | | Since 2007 | | Vice President of all the DFA Entities. Senior Trader of Dimensional. Formerly, Portfolio Manager (2006 to 2007); Trader (2001 to 2006). |
Paul E. Wise Vice President Age: 54 | | Since 2005 | | Vice President of all the DFA Entities. Chief Technology Officer for Dimensional (since 2004). Formerly, Principal of Turnbuckle Management Group (January 2002 to August 2004). |
| 1 | Each officer holds office for an indefinite term at the pleasure of the Boards of Trustees/Directors and until his or her successor is elected and qualified. |
76
VOTING PROXIES ON FUND PORTFOLIO SECURITIES
A description of the policies and procedures that the Fund and the Trust use in voting proxies relating to securities held in the portfolios is available without charge, upon request, by calling collect: (512) 306-7400. Information regarding how the Advisor votes these proxies is available from the EDGAR database on the SEC’s website at http://www.sec.gov and from the Advisor’s website at http://www.dimensional.com and reflects the twelve-month period beginning July 1st and ending June 30th.
77
NOTICE TO SHAREHOLDERS
(Unaudited)
For shareholders that do not have an October 31, 2009 tax year end, this notice is for informational purposes only. For shareholders with an October 31, 2009 tax year end, please consult your tax advisor as to the pertinence of this notice. For the fiscal year November 1, 2008 to October 31, 2009, each Portfolio is designating the following items with regard to distributions paid during the period. All designations are based on financial information available as of the date of this annual report and, accordingly are subject to change. For each item, it is the intention of the Portfolio to designate the maximum amount permitted under the Internal Revenue Code and the regulations thereunder.
| | | | | | | | | | | | | | | | | | | | | | |
Dimensional Investment Group Inc. | | Net
Investment
Income
Distributions | | Short-Term
Capital Gain
Distributions | | Long-Term
Capital Gain
Distributions | | Total
Distributions | | Qualifying
For Corporate
Dividends Received
Deduction(1) | | Qualifying
Dividend
Income(2) | | U.S.
Government
Interest(3) | | Foreign
Tax
Credit(4) | | Foreign
Source
Income(5) | | Qualifying
Interest
Income(6) | | Qualifying
Short-Term
Capital Gain(7) |
LWAS/DFA U.S. High Book to Market Portfolio | | 100% | | — | | — | | 100% | | 100% | | 100% | | — | | — | | — | | 100% | | 100% |
LWAS/DFA Two-Year Fixed Income Portfolio | | 100% | | — | | — | | 100% | | — | | — | | 26% | | — | | — | | 100% | | — |
LWAS/DFA Two-Year Government Portfolio | | 100% | | — | | — | | 100% | | — | | — | | 100% | | — | | — | | 100% | | — |
DFA Investment Dimensions Group Inc. | | | | | | | | | | | | | | | | | | | | | | |
LWAS/DFA International High Book to Market Portfolio | | 7% | | — | | 93% | | 100% | | 100% | | 100% | | — | | 7% | | 113% | | 100% | | 100% |
| | |
| |
(1) | | Qualifying dividends represent dividends which qualify for the corporate dividends received deduction and is reflected as a percentage of ordinary income distributions (the total of short-term capital gain and net investment income distributions). |
| |
(2) | | The percentage in this column represents the amount of “Qualifying Dividend Income” as created by the Jobs and Growth Tax Relief Reconciliation Act of 2003 and is reflected as a percentage of ordinary income distributions (the total of short-term capital gain and net investment income distributions). Please note that these percentages are designated only, refer to your 1099 for actual qualified dividend income. |
| |
(3) | | “U.S. Government Interest” represents the amount of interest that was derived from direct U.S. Government obligations and distributed during the fiscal year. This amount is reflected as a percentage of total ordinary income distributions (the total of short-term capital gain and net investment income distributions). Generally, interest from direct U.S. Government obligations is exempt from state income tax. However, for residents of California, Connecticut and New York, the statutory threshold requirements were not satisfied for LWAS/DFA Two-Year Fixed Income Portfolio to permit exemption of these amounts from state income for this fund. |
| |
(4) | | “Foreign Tax Credit” represents dividends which qualify for the foreign tax credit pass through and is reflected as a percentage of investment company taxable income (the total of short-term capital gain and net investment income distributions). |
| |
(5) | | “Foreign Source Income” represents the portion of dividends derived from foreign sources, and is reflected as a percentage of ordinary income (i.e. the sum of short-term capital gain and net investment income) distributions made during the period. |
| |
(6) | | The percentage in this column represents the amount of “Qualifying Interest Income” as created by The American Jobs Creation Act of 2004. The information is reflected as a percentage of ordinary income distributions (the total of short-term capital gain and net investment income distributions). |
| |
(7) | | The percentage in this column represents the amount of “Qualifying Short-Term Capital Gain” as created by The American Jobs Creation Act of 2004. The information is reflected as a percentage of ordinary income distributions (the total of short-term capital gain and net investment income distributions). |
78


Dimensional Fund Advisors
6300 Bee Cave Road, Building One
Austin, TX 78746
December 2009
Dear Fellow Shareholder,
After sinking to ten-year lows, stock prices around the world rebounded sharply in March 2009 and posted steady gains in the seven months between March and September. March and April were among the best-return months in the life of Dimensional’s equity Funds.
The unexpected turns in the financial markets this year offered some valuable lessons. We were reminded that stock prices are unpredictable. We saw once again the benefits of staying disciplined in the market as it inevitably moves up and down. And I believe these markets showed very clearly why diversification is so important to long-term investment success.
Although diversification can’t prevent losses, it can help investors avoid the extreme outcomes that can result from concentrating investments in individual stocks or market segments. We believe that successful investing is about both increasing wealth and being able to sleep well at night. Investors who understand how markets work and have a realistic understanding of their own tolerance for risk are most likely to have a good overall experience.
More than $10 billion in net long-term assets flowed into Dimensional’s Funds during the first 10 months of 2009, a reflection of the trust our shareholders around the world have placed in us. We are grateful for that trust and want you to know that we take our responsibility as the steward of your investments in Dimensional’s Funds very seriously. We hope to have the opportunity to continue serving your needs for many years to come.
|
Sincerely, |

|
David G. Booth |
Chairman and Chief Executive Officer |
[THIS PAGE INTENTIONALLY LEFT BLANK]
DIMENSIONAL INVESTMENT GROUP INC.
ANNUAL REPORT
Table of Contents
This report is submitted for the information of the Fund’s shareholders. It is not authorized for distribution to prospective investors unless preceded or accompanied by an effective prospectus.
i
[THIS PAGE INTENTIONALLY LEFT BLANK]
DIMENSIONAL INVESTMENT GROUP INC.
DEFINITIONS OF ABBREVIATIONS AND FOOTNOTES
| | |
Schedules of Investments |
|
Investment Footnotes |
| † | | See Note B to Financial Statements. |
|
Financial Highlights |
| |
| (A) | | Computed using average shares outstanding. |
| (B) | | Annualized. |
| (C) | | Non-Annualized. |
| (D) | | Represents the combined ratios for the respective portfolio and its respective pro-rata share of its Master |
| | Fund Series. |
| (E) | | Because of commencement of operations and related preliminary transaction costs, these ratios are not necessarily |
| | indicative of future ratios. |
|
All Statements and Schedules |
| |
| — | | Amounts designated as — are either zero or rounded to zero. |
| SEC | | Securities and Exchange Commission. |
| N/A | | Does not apply to this fund. |
| (a) | | Commencement of Operations. |
1
DIMENSIONAL INVESTMENT GROUP INC.
PERFORMANCE CHARTS
Global Equity Portfolio Institutional Class vs.
MSCI World Index (net dividends)
December 24, 2003-October 31, 2009
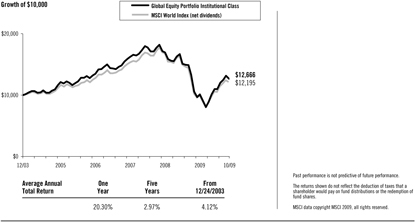
Global 60/40 Portfolio Institutional Class vs.
Global 60/40 Composite Index (MSCI/Citigroup), MSCI World Index (net dividends),
Citigroup World Government Bond Index 1-3 Years (hedged)
December 24, 2003-October 31, 2009
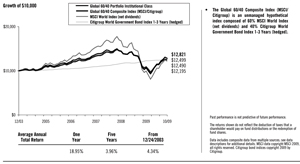
Global 25/75 Portfolio Institutional Class vs.
Global 25/75 Composite Index (MSCI/Citigroup), MSCI World Index (net dividends),
Citigroup World Government Bond Index 1-3 Years (hedged)
December 24, 2003-October 31, 2009
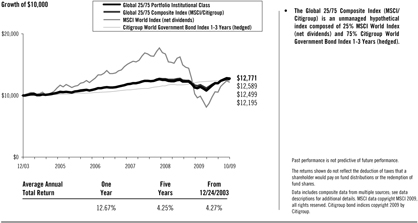
2
DIMENSIONAL INVESTMENT GROUP INC.
PERFORMANCE CHARTS
Global Equity Portfolio Class R2 vs.
MSCI World Index (net dividends)
December 24, 2003-October 31, 2009
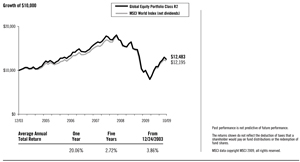
Global 60/40 Portfolio Class R2 vs.
Global 60/40 Composite Index (MSCI/Citigroup), MSCI World Index (net dividends),
Citigroup World Government Bond Index 1-3 Years (hedged)
December 24, 2003-October 31, 2009
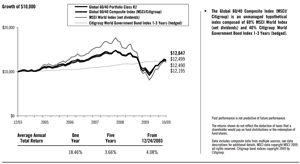
Global 25/75 Portfolio Class R2 vs.
Global 25/75 Composite Index (MSCI/Citigroup), MSCI World Index (net dividends),
Citigroup World Government Bond Index 1-3 Years (hedged)
December 24, 2003-October 31, 2009
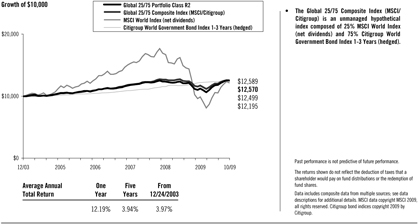
3
MANAGEMENT’S DISCUSSION AND ANALYSIS
Global Equity Portfolio
The Global Equity Portfolio seeks long-term capital appreciation by investing in a combination of mutual funds managed by Dimensional Fund Advisors LP. As of the date of this report, the domestic funds invested in by the Portfolio include the U.S. Core Equity 1 Portfolio, the U.S. Core Equity 2 Portfolio, and the DFA Real Estate Securities Portfolio; and international funds invested in by the Portfolio include the International Core Equity Portfolio, and the Emerging Markets Core Equity Portfolio (collectively, the “Equity Underlying Funds”). As of October 31, 2009, the Portfolio held 11,416 equity securities, indirectly through its underlying funds, in 41 countries.
The investment strategy employs a disciplined, quantitative approach, emphasizing broad diversification and consistent exposure in each Equity Underlying Fund to stocks with desired asset class characteristics. As a result of the Portfolio’s diversified investment approach, performance was determined principally by broad structural trends in global equity markets rather than the behavior of a limited group of stocks in a particular industry or country.
For the 12 months ended October 31, 2009, total returns were 20.30% for the Global Equity Portfolio - Institutional Class, 20.06% for Global Equity Portfolio - Class R2, and 18.42% for the MSCI World Index (net dividends). Relative to the Index, the out-performance of the Portfolio was primarily due to a greater allocation to emerging markets stocks, which outperformed the Index and the Portfolio’s greater allocation to small cap and value stocks during a period of positive small and value premiums globally. During the 12 months ended October 31, 2009, the Portfolio was, on average, exposed through the Underlying Funds to the following asset classes at these approximate levels: 63% U.S. equities, 31% international developed market equities and 6% emerging markets equities.
Global 60/40 Portfolio
The Global 60/40 Portfolio seeks capital appreciation and current income by investing in a combination of mutual funds managed by Dimensional Fund Advisors LP. As of the date of this report, domestic equity funds invested in by the Portfolio include the U.S. Core Equity 1 Portfolio, the U.S. Core Equity 2 Portfolio, and the DFA Real Estate Securities Portfolio; international equity funds invested in by the Portfolio include the International Core Equity Portfolio, and the Emerging Markets Core Equity Portfolio; and fixed income funds invested in by the Portfolio include the DFA Five-Year Global Fixed Income Portfolio, the DFA Inflation Protected Securities Portfolio, the DFA Selectively Hedged Global Fixed Income Portfolio, and the DFA Short-Term Extended Quality Portfolio (collectively, the “Equity and Fixed Income Underlying Funds”). As of October 31, 2009, the Portfolio held 11,416 equity securities, indirectly through its underlying funds, in 41 countries and 443 fixed income securities in 16 countries, excluding supranationals.
The investment strategy employs a disciplined, quantitative approach, emphasizing broad diversification and consistent exposure in each Underlying Fund to equity or fixed income securities with desired asset class characteristics. As a result of the Portfolio’s diversified investment approach, performance was determined principally by broad structural trends in global equity and fixed income markets rather than the behavior of a limited group of securities in a particular industry, country, or asset class.
For the 12 months ended October 31, 2009, total returns were 18.95% for the Global 60/40 Portfolio - Institutional Class, 18.46% for the Global 60/40 Portfolio - Class R2, and 12.98% for a hypothetical composite index composed of 60% MSCI World Index (net dividends) and 40% Citigroup World Government Bond Index 1-3 Years (hedged). Relative to this hypothetical 60/40 Index, outperformance of the equity component was primarily due to a greater allocation to emerging markets stocks, which outperformed the Index and the Portfolio’s greater allocation to small cap and value stocks during a period of positive small and value premiums globally. Outperformance of the fixed income component was due to longer duration of the fixed income component of the Portfolio relative to the index during a period of falling nominal and real interest rates, the Portfolio’s allocation to unhedged fixed
4
income securities during a period when the U.S. Dollar significantly weakened, and the Portfolio’s exposure to government agency and corporate securities during a period when credit spreads narrowed. The fixed income index is composed of short-term U.S. Dollar hedged sovereign government securities. During the 12 months ended October 31, 2009, the Portfolio was exposed through the Underlying Funds to the following asset classes at these approximate levels: 37% U.S. equities, 19% international developed market equities, 4% emerging markets equities, and 40% global bonds.
Global 25/75 Portfolio
The Global 25/75 Portfolio seeks total return consistent with current income and preservation of capital with some capital appreciation by investing in a combination of mutual funds managed by Dimensional Fund Advisors LP. As of the date of this report, the domestic equity funds invested in by the Portfolio include the U.S. Core Equity 1 Portfolio, the U.S. Core Equity 2 Portfolio, and the DFA Real Estate Securities Portfolio; international equity funds invested in by the Portfolio include the International Core Equity Portfolio and the Emerging Markets Core Equity Portfolio; and fixed income funds invested in by the Portfolio include the DFA Two-Year Global Fixed Income Port-folio, the DFA Inflation Protected Securities Portfolio, and the DFA Short Term Extended Quality Portfolio (collectively, the “Equity and Fixed Income Underlying Funds”). As of October 31, 2009, the Portfolio held 11,416 equity securities, indirectly through its underlying funds, in 41 countries and 362 fixed income securities in 15 countries, excluding supranationals.
The investment strategy employs a disciplined, quantitative approach, emphasizing broad diversification and consistent exposure in each Underlying Fund to equity or fixed income securities with desired asset class characteristics. As a result of the Portfolio’s diversified investment approach, performance was determined principally by broad structural trends in global equity and fixed income markets rather than the behavior of a limited group of securities in a particular industry, country, or asset class.
For the 12 months ended October 31, 2009, total returns were 12.67% for the Global 25/75 Portfolio - Institutional Class, 12.19% for the Global 25/75 Portfolio - Class R2 and 7.58% for a hypothetical index composed of 25% MSCI World Index (net dividends) and 75% Citigroup World Government Bond Index 1-3 Years (hedged). Relative to this hypothetical 25/75 Index outperformance of the equity component was primarily due to a greater allocation to emerging markets stocks, which outperformed the Index and the Portfolio’s greater allocation to small cap and value stocks during a period of positive small and value premiums globally. Outperformance of the fixed income component was due to longer duration of the fixed income component of the Portfolio relative to the index during a period of falling nominal and real interest rates and the Portfolio’s exposure to government agency and corporate securities during a period when credit spreads narrowed. The fixed income index is composed of short-term U.S. Dollar hedged sovereign government securities. During the 12 months ended October 31, 2009, the Portfolio was exposed through the Underlying Funds to the following asset classes at these approximate levels: 75% global bonds, 16% U.S. equities, 8% international developed market equities, and 1% emerging markets equities.
5
DIMENSIONAL INVESTMENT GROUP INC.
DISCLOSURE OF FUND EXPENSES
(Unaudited)
The following Expense Tables are shown so that you can understand the impact of fees on your investment. All mutual funds have operating expenses. As a shareholder of the fund, you incur ongoing costs, which include costs for portfolio management, administrative services, and shareholder reports, among others. Operating expenses, legal and audit services, which are deducted from a fund’s gross income, directly reduce the investment return of the fund. A fund’s expenses are expressed as a percentage of its average net assets. This figure is known as the expense ratio. The following examples are intended to help you understand the ongoing costs, in dollars, of investing in the fund and to compare these costs with those of other mutual funds. The examples are based on an investment of $1,000 made at the beginning of the period shown and held for the entire period.
The Expense Tables below illustrate your fund’s costs in two ways.
Actual Fund Return
This section helps you to estimate the actual expenses after fee waivers that you paid over the period. The “Ending Account Value” shown is derived from the fund’s actual return and “Expenses Paid During Period” reflect the dollar amount that would have been paid by an investor who started with $1,000 in the fund. You may use the information here, together with the amount you invested, to estimate the expenses that you paid over the period.
To do so, simply divide your account value by $1,000 (for example, a $7,500 account value divided by $1,000
= 7.5), then multiply the result by the number given for your fund under the heading “Expenses Paid During Period.”
Hypothetical Example for Comparison Purposes
This section is intended to help you compare your fund’s costs with those of other mutual funds. The hypothetical “Ending Account Value” and “Expenses Paid During Period” are derived from the fund’s actual expense ratio and an assumed 5% annual return before expenses. In this case, because the return used is not the fund’s actual return, the results do not apply to your investment. The example is useful in making comparisons because the SEC requires all mutual funds to calculate expenses based on a 5% annual return. You can assess your fund’s costs by comparing this hypothetical example with the hypothetical examples that appear in shareholder reports of other funds.
Please note that the expenses shown in the tables are meant to highlight and help you compare ongoing costs only and do not reflect any transactional costs, if applicable. The “Annualized Expense Ratio” represents the actual expenses for the six-month period indicated.
| | | | | | | | | | | | |
| | | | | Six Months Ended October 31, 2009 |
| EXPENSE TABLES | | | | | | | | | |
| | | Beginning
Account
Value
05/01/09 | | Ending
Account
Value
10/31/09 | | Annualized
Expense
Ratio* | | | Expenses
Paid
During
Period* |
Global Equity Portfolio** | | | | | | | | | | | | |
Actual Fund Return
| | | | | | | | | | | | |
Class R2 Shares | | $ | 1,000.00 | | $ | 1,248.70 | | 0.62 | % | | $ | 3.51 |
Institutional Class Shares | | $ | 1,000.00 | | $ | 1,250.20 | | 0.35 | % | | $ | 1.99 |
Hypothetical 5% Annual Return
| | | | | | | | | | | | |
Class R2 Shares | | $ | 1,000.00 | | $ | 1,022.08 | | 0.62 | % | | $ | 3.16 |
Institutional Class Shares | | $ | 1,000.00 | | $ | 1,023.44 | | 0.35 | % | | $ | 1.79 |
6
| | | | | | | | | | | | |
| DISCLOSURE OF FUND EXPENSES | | | | | | | | | |
| CONTINUED | | | | | | | | | |
| | | Beginning
Account
Value
05/01/09 | | Ending
Account
Value
10/31/09 | | Annualized
Expense
Ratio* | | | Expenses
Paid
During
Period* |
Global 60/40 Portfolio** | | | | | | | | | | | | |
Actual Fund Return | | | | | | | | | | | | |
Class R2 Shares | | $ | 1,000.00 | | $ | 1,178.20 | | 0.61 | % | | $ | 3.35 |
Institutional Class Shares | | $ | 1,000.00 | | $ | 1,181.60 | | 0.34 | % | | $ | 1.87 |
Hypothetical 5% Annual Return
Class R2 Shares | | $ | 1,000.00 | | $ | 1,022.13 | | 0.61 | % | | $ | 3.11 |
Institutional Class Shares | | $ | 1,000.00 | | $ | 1,023.49 | | 0.34 | % | | $ | 1.73 |
| | | | |
Global 25/75 Portfolio** | | | | | | | | | | | | |
Actual Fund Return | | | | | | | | | | | | |
Class R2 Shares | | $ | 1,000.00 | | $ | 1,092.70 | | 0.62 | % | | $ | 3.27 |
Institutional Class Shares | | $ | 1,000.00 | | $ | 1,096.00 | | 0.32 | % | | $ | 1.69 |
Hypothetical 5% Annual Return | | | | | | | | | | | | |
Class R2 Shares | | $ | 1,000.00 | | $ | 1,022.08 | | 0.62 | % | | $ | 3.16 |
Institutional Class Shares | | $ | 1,000.00 | | $ | 1,023.59 | | 0.32 | % | | $ | 1.63 |
| * | Expenses are equal to the fund’s annualized expense ratio for the six-month period, multiplied by the average account value over the period, multiplied by the number of days in the most recent six-month period (184), then divided by the number of days in the year (365) to reflect the six-month period. |
| ** | The Portfolio is a Fund of Funds. The expenses shown reflect the direct expenses of the Fund of Funds and the indirect payment of the Fund of Funds’ portion of the expenses of its Master Funds. |
7
DIMENSIONAL INVESTMENT GROUP INC.
DISCLOSURE OF PORTFOLIO HOLDINGS
(Unaudited)
The SEC requires that all Funds file a complete Schedule of Investments with the SEC for their first and third fiscal quarters on Form N-Q. For Dimensional Investment Group Inc., this would be for the fiscal quarters ending January 31 and July 31. The Form N-Q filing must be made within 60 days of the end of the quarter. Dimensional Investment Group Inc. filed its most recent Form N-Q with the SEC on September 29, 2009. It is available upon request, without charge, by calling collect: (512) 306-7400 or by mailing a request to Dimensional Fund Advisors LP, 6300 Bee Cave Road, Building One, Austin, Texas 78746, or by visiting the SEC’s website at http://www.sec.gov, or they may be reviewed and copied at the SEC’s Public Reference Room in Washington, D.C. (call 1-800-732-0330 for information on the operation of the Public Reference Room).
PORTFOLIO HOLDINGS
The SEC requires that all Funds present their categories of portfolio holdings in a table, chart or graph format in their annual and semi-annual shareholder reports, whether or not a Schedule of Investments is utilized. The following table, which presents portfolio holdings as a percent of total investments before short-term investments and collateral for loaned securities, is provided in compliance with such requirement.
| | |
| | | Affiliated Investment Companies |
Global Equity Portfolio | | 100.0% |
Global 60/40 Portfolio | | 100.0% |
Global 25/75 Portfolio | | 100.0% |
8
DIMENSIONAL INVESTMENT GROUP INC.
GLOBAL EQUITY PORTFOLIO
SCHEDULE OF INVESTMENTS
October 31, 2009
| | | | | |
| | | Shares | | Value† |
AFFILIATED INVESTMENT COMPANIES — (100.0%) | | | | | |
Investment in U.S. Core Equity 2 Portfolio of
DFA Investment Dimensions Group Inc. | | 72,172,916 | | $ | 605,530,765 |
Investment in International Core Equity Portfolio of
DFA Investment Dimensions Group Inc. | | 40,056,141 | | | 392,149,620 |
Investment in U.S. Core Equity 1 Portfolio of
DFA Investment Dimensions Group Inc. | | 22,625,459 | | | 193,221,420 |
Investment in Emerging Markets Core Equity Portfolio of
DFA Investment Dimensions Group Inc. | | 4,845,383 | | | 79,900,366 |
Investment in DFA Real Estate Securities Portfolio of
DFA Investment Dimensions Group Inc. | | 890,757 | | | 13,619,675 |
| | | | | |
TOTAL INVESTMENTS IN AFFILIATED INVESTMENT COMPANIES
(Cost $1,349,208,631) | | | | | 1,284,421,846 |
| | | | | |
| | |
TEMPORARY CASH INVESTMENTS — (0.0%) | | | | | |
BlackRock Liquidity Funds TempCash
Portfolio - Institutional Shares
(Cost $458) | | 458 | | | 458 |
| | | | | |
TOTAL INVESTMENTS - (100.0%) (Cost $1,349,209,089) | | | | $ | 1,284,422,304 |
| | | | | |
Summary of inputs used to value the Global Fund’s net assets as of October 31, 2009 is as follows (See Security Valuation Note):
| | | | | | | | | | |
| | | Valuation Inputs |
| | | Investment in Securities (Market Value) |
| | | Level 1 | | Level 2 | | Level 3 | | Total |
Affiliated Investment Companies | | $ | 1,284,421,846 | | — | | — | | $ | 1,284,421,846 |
Temporary Cash Investments | | | 458 | | — | | — | | | 458 |
| | | | | | | | | | |
TOTAL | | $ | 1,284,422,304 | | — | | — | | $ | 1,284,422,304 |
| | | | | | | | | | |
See accompanying Notes to Financial Statements.
9
DIMENSIONAL INVESTMENT GROUP INC.
GLOBAL 60/40 PORTFOLIO
SCHEDULE OF INVESTMENTS
October 31, 2009
| | | | | |
| | | Shares | | Value† |
AFFILIATED INVESTMENT COMPANIES — (99.9%) | | | | | |
Investment in U.S. Core Equity 2 Portfolio of
DFA Investment Dimensions Group Inc. | | 23,411,382 | | $ | 196,421,495 |
Investment in International Core Equity Portfolio of
DFA Investment Dimensions Group Inc. | | 13,742,591 | | | 134,539,966 |
Investment in DFA Selectively Hedged Global Fixed Income Portfolio of
DFA Investment Dimensions Group Inc. | | 11,329,956 | | | 113,299,560 |
Investment in DFA Short-Term Extended Quality Portfolio of
DFA Investment Dimensions Group Inc. | | 7,286,055 | | | 76,940,741 |
Investment in DFA Five-Year Global Fixed Income Portfolio of
DFA Investment Dimensions Group Inc. | | 6,818,116 | | | 76,840,167 |
Investment in U.S. Core Equity 1 Portfolio of
DFA Investment Dimensions Group Inc. | | 7,428,212 | | | 63,436,930 |
Investment in DFA Inflation-Protected Securities Portfolio of
DFA Investment Dimensions Group Inc. | | 3,532,704 | | | 38,683,109 |
Investment in Emerging Markets Core Equity Portfolio of
DFA Investment Dimensions Group Inc. | | 1,838,030 | | | 30,309,115 |
Investment in DFA Real Estate Securities Portfolio of
DFA Investment Dimensions Group Inc. | | 291,248 | | | 4,453,182 |
| | | | | |
TOTAL INVESTMENTS IN AFFILIATED INVESTMENT COMPANIES
(Cost $775,435,688) | | | | | 734,924,265 |
| | | | | |
| | |
TEMPORARY CASH INVESTMENTS — (0.1%) | | | | | |
BlackRock Liquidity Funds TempCash
Portfolio - Institutional Shares
(Cost $572,864) | | 572,864 | | | 572,864 |
| | | | | |
TOTAL INVESTMENTS - (100.0%)
(Cost $776,008,552) | | | | $ | 735,497,129 |
| | | | | |
Summary of inputs used to value the Global Fund’s net assets as of October 31, 2009 is as follows (See Security Valuation Note):
| | | | | | | | | | |
| | | Valuation Inputs |
| | | Investment in Securities (Market Value) |
| | | Level 1 | | Level 2 | | Level 3 | | Total |
Affiliated Investment Companies | | $ | 734,924,265 | | — | | — | | $ | 734,924,265 |
Temporary Cash Investments | | | 572,864 | | — | | — | | | 572,864 |
| | | | | | | | | | |
TOTAL | | $ | 735,497,129 | | — | | — | | $ | 735,497,129 |
| | | | | | | | | | |
See accompanying Notes to Financial Statements.
10
DIMENSIONAL INVESTMENT GROUP INC.
GLOBAL 25/75 PORTFOLIO
SCHEDULE OF INVESTMENTS
October 31, 2009
| | | | | |
| | | Shares | | Value† |
AFFILIATED INVESTMENT COMPANIES — (99.7%) | | | | | |
| | |
Investment in DFA Short-Term Extended Quality Portfolio of
DFA Investment Dimensions Group Inc. | | 4,623,893 | | $ | 48,828,310 |
| | |
Investment in DFA Two-Year Global Fixed Income Portfolio of
DFA Investment Dimensions Group Inc. | | 4,736,492 | | | 48,643,773 |
| | |
Investment in DFA Inflation-Protected Securities Portfolio of
DFA Investment Dimensions Group Inc. | | 2,231,304 | | | 24,432,779 |
| | |
Investment in U.S. Core Equity 2 Portfolio of
DFA Investment Dimensions Group Inc. | | 2,241,332 | | | 18,804,775 |
| | |
Investment in International Core Equity Portfolio of
DFA Investment Dimensions Group Inc. | | 1,272,344 | | | 12,456,248 |
| | |
Investment in U.S. Core Equity 1 Portfolio of
DFA Investment Dimensions Group Inc. | | 704,303 | | | 6,014,748 |
| | |
Investment in Emerging Markets Core Equity Portfolio of
DFA Investment Dimensions Group Inc. | | 129,918 | | | 2,142,348 |
| | |
Investment in DFA Real Estate Securities Portfolio of
DFA Investment Dimensions Group Inc. | | 29,179 | | | 446,147 |
| | | | | |
TOTAL INVESTMENTS IN AFFILIATED INVESTMENT COMPANIES
(Cost $155,977,722) | | | | | 161,769,128 |
| | | | | |
| | |
TEMPORARY CASH INVESTMENTS — (0.3%) | | | | | |
BlackRock Liquidity Funds TempCash
Portfolio - Institutional Shares
(Cost $518,392) | | 518,392 | | | 518,392 |
| | | | | |
TOTAL INVESTMENTS - (100.0%) (Cost $156,496,114) | | | | $ | 162,287,520 |
| | | | | |
Summary of inputs used to value the Global Fund’s net assets as of October 31, 2009 is as follows (See Security Valuation Note):
| | | | | | | | | | |
| | | Valuation Inputs |
| | | Investment in Securities (Market Value) |
| | | Level 1 | | Level 2 | | Level 3 | | Total |
Affiliated Investment Companies | | $ | 161,769,128 | | — | | — | | $ | 161,769,128 |
Temporary Cash Investments | | | 518,392 | | — | | — | | | 518,392 |
| | | | | | | | | | |
TOTAL | | $ | 162,287,520 | | — | | — | | $ | 162,287,520 |
| | | | | | | | | | |
See accompanying Notes to Financial Statements.
11
DIMENSIONAL INVESTMENT GROUP INC.
STATEMENTS OF ASSETS AND LIABILITIES
OCTOBER 31, 2009
(Amounts in thousands, except share and per share amounts)
| | | | | | | | | | | | |
| | | Global
Equity
Portfolio | | | Global
60/40
Portfolio | | | Global
25/75
Portfolio | |
ASSETS: | | | | | | | | | | | | |
Investments in Affiliated Investment Companies at Value | | $ | 1,284,422 | | | $ | 734,924 | | | $ | 161,769 | |
Temporary Cash Investments at Value & Cost | | | — | | | | 573 | | | | 518 | |
Receivables: | | | | | | | | | | | | |
Affiliated Investment Companies | | | 590 | | | | — | | | | — | |
Fund Shares Sold | | | 2,443 | | | | 912 | | | | 393 | |
Prepaid Expenses and Other Assets | | | 63 | | | | 31 | | | | 25 | |
| | | | | | | | | | | | |
Total Assets | | | 1,287,518 | | | | 736,440 | | | | 162,705 | |
| | | | | | | | | | | | |
LIABILITIES: | | | | | | | | | | | | |
Payables: | | | | | | | | | | | | |
Affiliated Investment Companies | | | — | | | | 256 | | | | 368 | |
Fund Shares Redeemed | | | 688 | | | | 539 | | | | 12 | |
Due to Advisor | | | 14 | | | | 19 | | | | 8 | |
Loan Payable | | | 90 | | | | — | | | | — | |
Accrued Expenses and Other Liabilities | | | 82 | | | | 39 | | | | 11 | |
| | | | | | | | | | | | |
Total Liabilities | | | 874 | | | | 853 | | | | 399 | |
| | | | | | | | | | | | |
NET ASSETS | | $ | 1,286,644 | | | $ | 735,587 | | | $ | 162,306 | |
| | | | | | | | | | | | |
NET ASSET VALUE, OFFERING AND REDEMPTION PRICE PER SHARE: | | | | | | | | | | | | |
Class R2 Shares - based on net assets of $6,782; $5,187; and $1,701, and shares outstanding of 627,061; 465,910; and 155,314, respectively | | $ | 10.82 | | | $ | 11.13 | | | $ | 10.95 | |
| | | | | | | | | | | | |
NUMBER OF SHARES AUTHORIZED | | | 500,000,000 | | | | 300,000,000 | | | | 300,000,000 | |
| | | | | | | | | | | | |
Institutional Class Shares - based on net assets of $1,279,862; $730,400; and $160,605, and shares outstanding of 119,181,056; 65,944,442; and 14,740,696, respectively | | $ | 10.74 | | | $ | 11.08 | | | $ | 10.90 | |
| | | | | | | | | | | | |
NUMBER OF SHARES AUTHORIZED | | | 700,000,000 | | | | 500,000,000 | | | | 300,000,000 | |
| | | | | | | | | | | | |
Investments in Affiliated Investment Companies at Cost | | $ | 1,349,209 | | | $ | 775,435 | | | $ | 155,978 | |
| | | | | | | | | | | | |
NET ASSETS CONSIST OF: | | | | | | | | | | | | |
Paid-In Capital | | $ | 1,517,214 | | | $ | 806,108 | | | $ | 162,051 | |
Undistributed Net Investment Income (Distributions in Excess of Net Investment Income) | | | 2,672 | | | | 248 | | | | 670 | |
Accumulated Net Realized Gain (Loss) | | | (168,455 | ) | | | (30,258 | ) | | | (6,206 | ) |
Net Unrealized Appreciation (Depreciation) | | | (64,787 | ) | | | (40,511 | ) | | | 5,791 | |
| | | | | | | | | | | | |
NET ASSETS | | $ | 1,286,644 | | | $ | 735,587 | | | $ | 162,306 | |
| | | | | | | | | | | | |
See accompanying Notes to Financial Statements.
12
DIMENSIONAL INVESTMENT GROUP INC.
STATEMENTS OF OPERATIONS
FOR THE YEAR ENDED OCTOBER 31, 2009
(Amounts in thousands)
| | | | | | | | | | | | |
| | | Global
Equity
Portfolio | | | Global
60/40
Portfolio | | | Global
25/75
Portfolio | |
Investment Income | | | | | | | | | | | | |
Net Investment Income Received from Affiliated Investment Companies: | | | | | | | | | | | | |
Income Distributions | | $ | 22,873 | | | $ | 10,542 | | | $ | 1,774 | |
*Dividends (Net of Foreign Taxes Withheld of $0, $1 and $0, respectively) | | | 3 | | | | 18 | | | | — | |
*Interest | | | — | | | | 588 | | | | 938 | |
*Income from Securities Lending | | | 1 | | | | 4 | | | | — | |
*Expenses Allocated from Affiliated Investment Companies | | | — | | | | (16 | ) | | | (35 | ) |
| | | | | | | | | | | | |
Total Investment Income Received from Affiliated Investment Companies | | | 22,877 | | | | 11,136 | | | | 2,677 | |
| | | | | | | | | | | | |
Fund Investment Income | | | | | | | | | | | | |
Interest | | | 19 | | | | 8 | | | | 2 | |
| | | | | | | | | | | | |
Fund Expenses | | | | | | | | | | | | |
Administrative Services Fees | | | 3,107 | | | | 1,493 | | | | 279 | |
Accounting & Transfer Agent Fees | | | 34 | | | | 25 | | | | 17 | |
Shareholder Servicing Fees - Class R2 Shares | | | 15 | | | | 13 | | | | 4 | |
Filing Fees | | | 87 | | | | 58 | | | | 33 | |
Shareholders’ Reports | | | 72 | | | | 39 | | | | 8 | |
Directors’/Trustees’ Fees & Expenses | | | 23 | | | | 13 | | | | 3 | |
Professional Fees | | | 25 | | | | 18 | | | | 8 | |
Other | | | 19 | | | | 10 | | | | 6 | |
| | | | | | | | | | | | |
Total Expenses | | | 3,382 | | | | 1,669 | | | | 358 | |
| | | | | | | | | | | | |
Fees Waived, Expenses Reimbursed, and/or Previously Waived Fees Recovered by Advisor (Note C) | | | (3,014 | ) | | | (1,360 | ) | | | (201 | ) |
| | | | | | | | | | | | |
Net Expenses | | | 368 | | | | 309 | | | | 157 | |
| | | | | | | | | | | | |
Net Investment Income (Loss) | | | 22,528 | | | | 10,835 | | | | 2,522 | |
| | | | | | | | | | | | |
Realized and Unrealized Gain (Loss) | | | | | | | | | | | | |
Net Realized Gain (Loss) on: | | | | | | | | | | | | |
**Investment Securities Sold/Affiliated Investment Companies Shares Sold | | | (165,306 | ) | | | (29,775 | ) | | | (4,918 | ) |
*Futures | | | 11 | | | | — | | | | — | |
*Foreign Currency Transactions | | | — | | | | (152 | ) | | | 381 | |
Change in Unrealized Appreciation (Depreciation) of: | | | | | | | | | | | | |
**Investment Securities/Affiliated Investment Companies Shares | | | 347,601 | | | | 121,075 | | | | 18,419 | |
*Futures | | | 78 | | | | (1 | ) | | | — | |
*Translation of Foreign Currency Denominated Amounts | | | (1 | ) | | | — | | | | — | |
*Change in Deferred Thailand Capital Gains Tax | | | 64 | | | | 20 | | | | 1 | |
| | | | | | | | | | | | |
Net Realized and Unrealized Gain (Loss) | | | 182,447 | | | | 91,167 | | | | 13,883 | |
| | | | | | | | | | | | |
Net Increase (Decrease) in Net Assets Resulting from Operations | | $ | 204,975 | | | $ | 102,002 | | | $ | 16,405 | |
| | | | | | | | | | | | |
| * | Allocated from each Portfolio’s respective Master Funds (Affiliated Investment Companies). |
| ** | A portion has been allocated from each Portfolio’s respective Master Funds (Affiliated Investment Companies). |
See accompanying Notes to Financial Statements.
13
DIMENSIONAL INVESTMENT GROUP INC.
STATEMENTS OF CHANGES IN NET ASSETS
(Amounts in thousands)
| | | | | | | | | | | | | | | | | | | | | | | | | | | | | | | | | | | | |
| | | Global Equity Portfolio | | | Global 60/40 Portfolio | | | Global 25/75 Portfolio | |
| | | Year
Ended
Oct. 31,
2009 | | | Period
Dec. 1,
2007 to
Oct. 31,
2008 | | | Year
Ended
Nov. 30,
2007 | | | Year
Ended
Oct. 31,
2009 | | | Period
Dec. 1,
2007 to
Oct. 31,
2008 | | | Year
Ended
Nov. 30,
2007 | | | Year
Ended
Oct. 31,
2009 | | | Period
Dec. 1,
2007 to
Oct. 31,
2008 | | | Year
Ended
Nov. 30,
2007 | |
Increase (Decrease) in Net Assets | | | | | | | | | | | | | | | | | | | | | | | | | | | | | | | | | | | | |
Operations: | | | | | | | | | | | | | | | | | | | | | | | | | | | | | | | | | | | | |
Net Investment Income (Loss) | | $ | 22,528 | | | $ | 25,253 | | | $ | 19,098 | | | $ | 10,835 | | | $ | 16,963 | | | $ | 12,359 | | | $ | 2,522 | | | $ | 4,374 | | | $ | 2,594 | |
Capital Gain Distributions Received from Affiliated Investment Companies | | | — | | | | 10,065 | | | | 10,480 | | | | — | | | | 3,366 | | | | 3,323 | | | | — | | | | 153 | | | | 100 | |
Net Realized Gain (Loss) on: | | | | | | | | | | | | | | | | | | | | | | | | | | | | | | | | | | | | |
**Investment Securities Sold/Affiliated Investment Companies Shares Sold | | | (165,306 | ) | | | (11,504 | ) | | | 16,678 | | | | (29,775 | ) | | | 221 | | | | 4,806 | | | | (4,918 | ) | | | (526 | ) | | | 818 | |
*Futures | | | 11 | | | | (229 | ) | | | 50 | | | | — | | | | (67 | ) | | | 18 | | | | — | | | | — | | | | 1 | |
*Foreign Currency Transactions | | | — | | | | (11 | ) | | | 3 | | | | (152 | ) | | | (3 | ) | | | 1 | | | | 381 | | | | — | | | | — | |
Change in Unrealized Appreciation (Depreciation) of: | | | | | | | | | | | | | | | | | | | | | | | | | | | | | | | | | | | | |
**Investment Securities/Affiliated Investment Companies Shares | | | 347,601 | | | | (582,439 | ) | | | 24,134 | | | | 121,075 | | | | (233,989 | ) | | | 16,892 | | | | 18,419 | | | | (19,682 | ) | | | 3,242 | |
*Futures | | | 78 | | | | 77 | | | | (6 | ) | | | (1 | ) | | | 22 | | | | (2 | ) | | | — | | | | 1 | | | | — | |
*Translation of Foreign Currency Denominated Amounts | | | (1 | ) | | | — | | | | — | | | | — | | | | — | | | | — | | | | — | | | | — | | | | — | |
*Change in Deferred Thailand Capital Gains Tax | | | 64 | | | | 4 | | | | (2 | ) | | | 20 | | | | 3 | | | | (1 | ) | | | 1 | | | | — | | | | — | |
| | | | | | | | | | | | | | | | | | | | | | | | | | | | | | | | | | | | |
Net Increase (Decrease) in Net Assets Resulting from Operations | | | 204,975 | | | | (558,784 | ) | | | 70,435 | | | | 102,002 | | | | (213,484 | ) | | | 37,396 | | | | 16,405 | | | | (15,680 | ) | | | 6,755 | |
| | | | | | | | | | | | | | | | | | | | | | | | | | | | | | | | | | | | |
Distributions From: | | | | | | | | | | | | | | | | | | | | | | | | | | | | | | | | | | | | |
Net Investment Income: | | | | | | | | | | | | | | | | | | | | | | | | | | | | | | | | | | | | |
Class R2 Shares | | | (102 | ) | | | (150 | ) | | | (408 | ) | | | (59 | ) | | | (81 | ) | | | (143 | ) | | | (18 | ) | | | (27 | ) | | | (43 | ) |
Institutional Class Shares | | | (23,361 | ) | | | (23,670 | ) | | | (16,955 | ) | | | (11,206 | ) | | | (14,711 | ) | | | (12,496 | ) | | | (2,554 | ) | | | (4,129 | ) | | | (2,617 | ) |
| | | | | | | | | | | | | | | | | | | | | | | | | | | | | | | | | | | | |
Total Distributions From Net Investment Income | | | (23,463 | ) | | | (23,820 | ) | | | (17,363 | ) | | | (11,265 | ) | | | (14,792 | ) | | | (12,639 | ) | | | (2,572 | ) | | | (4,156 | ) | | | (2,660 | ) |
| | | | | | | | | | | | | | | | | | | | | | | | | | | | | | | | | | | | |
Net Realized Gains: | | | | | | | | | | | | | | | | | | | | | | | | | | | | | | | | | | | | |
Class R2 Shares | | | — | | | | (566 | ) | | | (371 | ) | | | (19 | ) | | | (76 | ) | | | (54 | ) | | | (21 | ) | | | (11 | ) | | | (21 | ) |
Institutional Class Shares | | | — | | | | (24,909 | ) | | | (9,793 | ) | | | (2,205 | ) | | | (7,495 | ) | | | (3,711 | ) | | | (2,016 | ) | | | (962 | ) | | | (800 | ) |
| | | | | | | | | | | | | | | | | | | | | | | | | | | | | | | | | | | | |
Total Distributions From Net Realized Gains | | | — | | | | (25,475 | ) | | | (10,164 | ) | | | (2,224 | ) | | | (7,571 | ) | | | (3,765 | ) | | | (2,037 | ) | | | (973 | ) | | | (821 | ) |
| | | | | | | | | | | | | | | | | | | | | | | | | | | | | | | | | | | | |
Total Distributions to Shareholders | | | (23,463 | ) | | | (49,295 | ) | | | (27,527 | ) | | | (13,489 | ) | | | (22,363 | ) | | | (16,404 | ) | | | (4,609 | ) | | | (5,129 | ) | | | (3,481 | ) |
| | | | | | | | | | | | | | | | | | | | | | | | | | | | | | | | | | | | |
Capital Share Transactions: | | | | | | | | | | | | | | | | | | | | | | | | | | | | | | | | | | | | |
Shares Issued | | | 660,235 | | | | 654,523 | | | | 539,395 | | | | 284,014 | | | | 266,717 | | | | 355,251 | | | | 67,539 | | | | 63,549 | | | | 55,915 | |
Shares Issued in Lieu of Cash Distributions | | | 23,042 | | | | 48,601 | | | | 27,119 | | | | 12,829 | | | | 21,391 | | | | 15,327 | | | | 4,562 | | | | 5,084 | | | | 3,448 | |
Shares Redeemed | | | (563,865 | ) | | | (355,668 | ) | | | (243,370 | ) | | | (242,374 | ) | | | (228,380 | ) | | | (168,594 | ) | | | (49,102 | ) | | | (57,916 | ) | | | (24,929 | ) |
| | | | | | | | | | | | | | | | | | | | | | | | | | | | | | | | | | | | |
Net Increase (Decrease) from Capital Share Transactions | | | 119,412 | | | | 347,456 | | | | 323,144 | | | | 54,469 | | | | 59,728 | | | | 201,984 | | | | 22,999 | | | | 10,717 | | | | 34,434 | |
| | | | | | | | | | | | | | | | | | | | | | | | | | | | | | | | | | | | |
Total Increase (Decrease) in Net Assets | | | 300,924 | | | | (260,623 | ) | | | 366,052 | | | | 142,982 | | | | (176,119 | ) | | | 222,976 | | | | 34,795 | | | | (10,092 | ) | | | 37,708 | |
Net Assets | | | | | | | | | | | | | | | | | | | | | | | | | | | | | | | | | | | | |
Beginning of Period | | | 985,720 | | | | 1,246,343 | | | | 880,291 | | | | 592,605 | | | | 768,724 | | | | 545,748 | | | | 127,511 | | | | 137,603 | | | | 99,895 | |
| | | | | | | | | | | | | | | | | | | | | | | | | | | | | | | | | | | | |
End of Period | | $ | 1,286,644 | | | $ | 985,720 | | | $ | 1,246,343 | | | $ | 735,587 | | | $ | 592,605 | | | $ | 768,724 | | | $ | 162,306 | | | $ | 127,511 | | | $ | 137,603 | |
| | | | | | | | | | | | | | | | | | | | | | | | | | | | | | | | | | | | |
Undistributed Net Investment Income (Distributions in Excess of Net Investment Income) | | $ | 2,672 | | | $ | 3,563 | | | $ | 3,345 | | | $ | 248 | | | $ | 1,351 | | | $ | 934 | | | $ | 670 | | | $ | 354 | | | $ | 195 | |
| * | Allocated from each Portfolio’s respective Master Funds (Affiliated Investment Companies). |
| ** | A portion has been allocated from each Portfolio’s respective Master Funds (Affiliated Investment Companies). |
See accompanying Notes to Financial Statements.
14
DIMENSIONAL INVESTMENT GROUP INC.
FINANCIAL HIGHLIGHTS
(for a share outstanding throughout each period)
Class R2 Shares
| | | | | | | | | | | | | | | | | | | | | | | | | | | | | | | | | | | | | | | | | | | | | | | | |
| | | Global Equity Portfolio | | | Global 60/40 Portfolio | |
| | | Year
Ended
Oct. 31,
2009 | | | Period
Dec. 1,
2007 to
Oct. 31,
2008 | | | Year
Ended
Nov. 30,
2007 | | | Year
Ended
Nov. 30,
2006 | | | Year
Ended
Nov. 30,
2005 | | | Period
Dec. 24,
2003(a) to
Nov. 30,
2004 | | | Year
Ended
Oct. 31,
2009 | | | Period
Dec. 1,
2007 to
Oct. 31,
2008 | | | Year
Ended
Nov. 30,
2007 | | | Year
Ended
Nov. 30,
2006 | | | Year
Ended
Nov. 30,
2005 | | | Period
Dec. 24,
2003(a) to
Nov. 30,
2004 | |
Net Asset Value, Beginning of Period | | $ | 9.17 | | | $ | 15.49 | | | $ | 14.76 | | | $ | 12.90 | | | $ | 11.54 | | | $ | 10.00 | | | $ | 9.55 | | | $ | 13.16 | | | $ | 12.65 | | | $ | 11.58 | | | $ | 10.83 | | | $ | 10.00 | |
| | | | | | | | | | | | | | | | | | | | | | | | | | | | | | | | | | | | | | | | | | | | | | | | |
Income from Investment Operations | | | | | | | | | | | | | | | | | | | | | | | | | | | | | | | | | | | | | | | | | | | | | | | | |
Net Investment Income | | | 0.17 | (A) | | | 0.24 | (A) | | | 0.22 | (A) | | | 0.19 | (A) | | | 0.19 | (A) | | | 0.07 | | | | 0.14 | (A) | | | 0.30 | (A) | | | 0.22 | (A) | | | 0.11 | (A) | | | 0.19 | (A) | | | 0.08 | |
Net Gains (Losses) on Securities (Realized and Unrealized) | | | 1.64 | | | | (6.06 | ) | | | 0.86 | | | | 2.29 | | | | 1.33 | | | | 1.54 | | | | 1.60 | | | | (3.60 | ) | | | 0.60 | | | | 1.40 | | | | 0.73 | | | | 0.84 | |
| | | | | | | | | | | | | | | | | | | | | | | | | | | | | | | | | | | | | | | | | | | | | | | | |
Total from Investment Operations | | | 1.81 | | | | (5.82 | ) | | | 1.08 | | | | 2.48 | | | | 1.52 | | | | 1.61 | | | | 1.74 | | | | (3.30 | ) | | | 0.82 | | | | 1.51 | | | | 0.92 | | | | 0.92 | |
| | | | | | | | | | | | | | | | | | | | | | | | | | | | | | | | | | | | | | | | | | | | | | | | |
Less Distributions | | | | | | | | | | | | | | | | | | | | | | | | | | | | | | | | | | | | | | | | | | | | | | | | |
Net Investment Income | | | (0.16 | ) | | | (0.18 | ) | | | (0.18 | ) | | | (0.18 | ) | | | (0.14 | ) | | | (0.07 | ) | | | (0.12 | ) | | | (0.18 | ) | | | (0.22 | ) | | | (0.18 | ) | | | (0.16 | ) | | | (0.09 | ) |
Net Realized Gains | | | — | | | | (0.32 | ) | | | (0.17 | ) | | | (0.44 | ) | | | (0.02 | ) | | | — | | | | (0.04 | ) | | | (0.13 | ) | | | (0.09 | ) | | | (0.26 | ) | | | (0.01 | ) | | | — | |
| | | | | | | | | | | | | | | | | | | | | | | | | | | | | | | | | | | | | | | | | | | | | | | | |
Total Distributions | | | (0.16 | ) | | | (0.50 | ) | | | (0.35 | ) | | | (0.62 | ) | | | (0.16 | ) | | | (0.07 | ) | | | (0.16 | ) | | | (0.31 | ) | | | (0.31 | ) | | | (0.44 | ) | | | (0.17 | ) | | | (0.09 | ) |
| | | | | | | | | | | | | | | | | | | | | | | | | | | | | | | | | | | | | | | | | | | | | | | | |
Net Asset Value, End of Period | | $ | 10.82 | | | $ | 9.17 | | | $ | 15.49 | | | $ | 14.76 | | | $ | 12.90 | | | $ | 11.54 | | | $ | 11.13 | | | $ | 9.55 | | | $ | 13.16 | | | $ | 12.65 | | | $ | 11.58 | | | $ | 10.83 | |
| | | | | | | | | | | | | | | | | | | | | | | | | | | | | | | | | | | | | | | | | | | | | | | | |
Total Return | | | 20.06 | % | | | (38.72 | )%(C) | | | 7.42 | % | | | 20.04 | % | | | 13.25 | % | | | 16.18 | %(C) | | | 18.46 | % | | | (25.63 | )%(C) | | | 6.50 | % | | | 13.49 | % | | | 8.57 | % | | | 9.29 | %(C) |
| | | | | | | | | | | | | | | | | | | | | | | | | | | | | | | | | | | | | | | | | | | | | | | | |
Net Assets, End of Period (thousands) | | $ | 6,782 | | | $ | 6,819 | | | $ | 27,904 | | | $ | 32,717 | | | $ | 16,092 | | | $ | 14,684 | | | $ | 5,187 | | | $ | 5,081 | | | $ | 7,631 | | | $ | 7,379 | | | $ | 1,857 | | | $ | 1,912 | |
Ratio of Expenses to Average Net Assets (D) | | | 0.62 | % | | | 0.60 | %(B) | | | 0.58 | % | | | 0.62 | % | | | 0.71 | % | | | 0.90 | %(B)(E) | | | 0.60 | % | | | 0.59 | %(B) | | | 0.57 | % | | | 0.65 | % | | | 0.70 | % | | | 0.95 | %(B)(E) |
Ratio of Expenses to Average Net Assets (Excluding Waivers and Assumption of Expenses and/or Recovery of Previously Waived Fees) (D) | | | 0.91 | % | | | 0.87 | %(B) | | | 0.84 | % | | | 0.85 | % | | | 0.80 | % | | | 0.94 | %(B)(E) | | | 0.83 | % | | | 0.80 | %(B) | | | 0.76 | % | | | 0.77 | % | | | 0.80 | % | | | 1.28 | %(B)(E) |
Ratio of Net Investment Income to Average Net Assets | | | 1.83 | % | | | 1.99 | %(B) | | | 1.38 | % | | | 1.38 | % | | | 1.32 | % | | | 0.82 | %(B)(E) | | | 1.42 | % | | | 2.78 | %(B) | | | 1.67 | % | | | 0.89 | % | | | 1.73 | % | | | 0.94 | %(B)(E) |
| | | | | | | | | | | | | | | | | | | | | | | | | | | | | | | | | | | | | | | | | | | | | | | | |
See page 1 for the Definitions of Abbreviations and Footnotes.
See accompanying Notes to Financial Statements.
15
DIMENSIONAL INVESTMENT GROUP INC.
FINANCIAL HIGHLIGHTS
(for a share outstanding throughout each period)
Class R2 Shares
| | | | | | | | | | | | | | | | | | | | | | | | |
| | | Global 25/75 Portfolio | |
| | | Year
Ended
Oct. 31,
2009 | | | Period
Dec. 1,
2007 to
Oct. 31,
2008 | | | Year
Ended
Nov. 30,
2007 | | | Year
Ended
Nov. 30,
2006 | | | Year
Ended
Nov. 30,
2005 | | | Period
Dec. 24,
2003(a) to
Nov. 30,
2004 | |
Net Asset Value, Beginning of Period | | $ | 10.04 | | | $ | 11.42 | | | $ | 11.11 | | | $ | 10.62 | | | $ | 10.33 | | | $ | 10.00 | |
| | | | | | | | | | | | | | | | | | | | | | | | |
Income from Investment Operations | | | | | | | | | | | | | | | | | | | | | | | | |
Net Investment Income | | | 0.15 | (A) | | | 0.30 | (A) | | | 0.19 | (A) | | | 0.03 | (A) | | | 0.20 | (A) | | | 0.07 | |
Net Gains (Losses) on Securities (Realized and Unrealized) | | | 1.06 | | | | (1.39 | ) | | | 0.41 | | | | 0.77 | | | | 0.25 | | | | 0.37 | |
| | | | | | | | | | | | | | | | | | | | | | | | |
Total from Investment Operations | | | 1.21 | | | | (1.09 | ) | | | 0.60 | | | | 0.80 | | | | 0.45 | | | | 0.44 | |
| | | | | | | | | | | | | | | | | | | | | | | | |
Less Distributions | | | | | | | | | | | | | | | | | | | | | | | | |
Net Investment Income | | | (0.14 | ) | | | (0.21 | ) | | | (0.20 | ) | | | (0.20 | ) | | | (0.16 | ) | | | (0.11 | ) |
Net Realized Gains | | | (0.16 | ) | | | (0.08 | ) | | | (0.09 | ) | | | (0.11 | ) | | | — | | | | — | |
| | | | | | | | | | | | | | | | | | | | | | | | |
Total Distributions | | | (0.30 | ) | | | (0.29 | ) | | | (0.29 | ) | | | (0.31 | ) | | | (0.16 | ) | | | (0.11 | ) |
| | | | | | | | | | | | | | | | | | | | | | | | |
Net Asset Value, End of Period | | $ | 10.95 | | | $ | 10.04 | | | $ | 11.42 | | | $ | 11.11 | | | $ | 10.62 | | | $ | 10.33 | |
| | | | | | | | | | | | | | | | | | | | | | | | |
Total Return | | | 12.19 | % | | | (9.72 | )%(C) | | | 5.47 | % | | | 7.75 | % | | | 4.47 | % | | | 4.44 | %(C) |
| | | | | | | | | | | | | | | | | | | | | | | | |
Net Assets, End of Period (thousands) | | $ | 1,701 | | | $ | 1,342 | | | $ | 1,564 | | | $ | 2,701 | | | $ | 46 | | | $ | 65 | |
Ratio of Expenses to Average Net Assets (D) | | | 0.62 | % | | | 0.62 | %(B) | | | 0.62 | % | | | 0.62 | % | | | 0.79 | % | | | 0.95 | %(B)(E) |
Ratio of Expenses to Average Net Assets (Excluding Waivers and Assumption of Expenses and/or Recovery of Previously Waived Fees) (D) | | | 0.77 | % | | | 0.78 | %(B) | | | 0.71 | % | | | 0.74 | % | | | 0.95 | % | | | 6.00 | %(B)(E) |
Ratio of Net Investment Income to Average Net Assets | | | 1.49 | % | | | 3.00 | %(B) | | | 1.66 | % | | | 0.28 | % | | | 2.00 | % | | | 1.03 | %(B)(E) |
| | | | | | | | | | | | | | | | | | | | | | | | |
See page 1 for the Definitions of Abbreviations and Footnotes.
See accompanying Notes to Financial Statements.
16
DIMENSIONAL INVESTMENT GROUP INC.
FINANCIAL HIGHLIGHTS
(for a share outstanding throughout each period)
Institutional Class Shares
| | | | | | | | | | | | | | | | | | | | | | | | | | | | | | | | | | | | | | | | | | | | | | | | |
| | | Global Equity Portfolio | | | Global 60/40 Portfolio | |
| | | Year
Ended
Oct. 31,
2009 | | | Period
Dec. 1,
2007 to
Oct. 31,
2008 | | | Year
Ended
Nov. 30,
2007 | | | Year
Ended
Nov. 30,
2006 | | | Year
Ended
Nov. 30,
2005 | | | Period
Dec. 24,
2003(a)
to
Nov. 30,
2004 | | | Year
Ended
Oct. 31,
2009 | | | Period
Dec. 1,
2007 to
Oct. 31,
2008 | | | Year
Ended
Nov. 30,
2007 | | | Year
Ended
Nov. 30,
2006 | | | Year
Ended
Nov. 30,
2005 | | | Period
Dec. 24,
2003(a)
to
Nov. 30,
2004 | |
Net Asset Value, Beginning of Period | | $ | 9.14 | | | $ | 15.48 | | | $ | 14.78 | | | $ | 12.92 | | | $ | 11.56 | | | $ | 10.00 | | | $ | 9.53 | | | $ | 13.17 | | | $ | 12.67 | | | $ | 11.60 | | | $ | 10.83 | | | $ | 10.00 | |
| | | | | | | | | | | | | | | | | | | | | | | | | | | | | | | | | | | | | | | | | | | | | | | | |
Income from Investment Operations | | | | | | | | | | | | | | | | | | | | | | | | | | | | | | | | | | | | | | | | | | | | | | | | |
Net Investment Income | | | 0.20 | (A) | | | 0.27 | (A) | | | 0.27 | (A) | | | 0.23 | (A) | | | 0.25 | (A) | | | 0.09 | | | | 0.18 | (A) | | | 0.27 | (A) | | | 0.25 | (A) | | | 0.19 | (A) | | | 0.22 | (A) | | | 0.11 | |
Net Gains (Losses) on Securities (Realized and Unrealized) | | | 1.61 | | | | (6.02 | ) | | | 0.85 | | | | 2.28 | | | | 1.29 | | | | 1.55 | | | | 1.59 | | | | (3.54 | ) | | | 0.60 | | | | 1.35 | | | | 0.72 | | | | 0.83 | |
| | | | | | | | | | | | | | | | | | | | | | | | | | | | | | | | | | | | | | | | | | | | | | | | |
Total from Investment Operations | | | 1.81 | | | | (5.75 | ) | | | 1.12 | | | | 2.51 | | | | 1.54 | | | | 1.64 | | | | 1.77 | | | | (3.27 | ) | | | 0.85 | | | | 1.54 | | | | 0.94 | | | | 0.94 | |
| | | | | | | | | | | | | | | | | | | | | | | | | | | | | | | | | | | | | | | | | | | | | | | | |
Less Distributions | | | | | | | | | | | | | | | | | | | | | | | | | | | | | | | | | | | | | | | | | | | | | | | | |
Net Investment Income | | | (0.21 | ) | | | (0.27 | ) | | | (0.25 | ) | | | (0.21 | ) | | | (0.16 | ) | | | (0.08 | ) | | | (0.18 | ) | | | (0.24 | ) | | | (0.26 | ) | | | (0.21 | ) | | | (0.16 | ) | | | (0.11 | ) |
Net Realized Gains | | | — | | | | (0.32 | ) | | | (0.17 | ) | | | (0.44 | ) | | | (0.02 | ) | | | — | | | | (0.04 | ) | | | (0.13 | ) | | | (0.09 | ) | | | (0.26 | ) | | | (0.01 | ) | | | — | |
| | | | | | | | | | | | | | | | | | | | | | | | | | | | | | | | | | | | | | | | | | | | | | | | |
Total Distributions | | | (0.21 | ) | | | (0.59 | ) | | | (0.42 | ) | | | (0.65 | ) | | | (0.18 | ) | | | (0.08 | ) | | | (0.22 | ) | | | (0.37 | ) | | | (0.35 | ) | | | (0.47 | ) | | | (0.17 | ) | | | (0.11 | ) |
| | | | | | | | | | | | | | | | | | | | | | | | | | | | | | | | | | | | | | | | | | | | | | | | |
Net Asset Value, End of Period | | $ | 10.74 | | | $ | 9.14 | | | $ | 15.48 | | | $ | 14.78 | | | $ | 12.92 | | | $ | 11.56 | | | $ | 11.08 | | | $ | 9.53 | | | $ | 13.17 | | | $ | 12.67 | | | $ | 11.60 | | | $ | 10.83 | |
| | | | | | | | | | | | | | | | | | | | | | | | | | | | | | | | | | | | | | | | | | | | | | | | |
Total Return | | | 20.30 | % | | | (38.50 | )%(C) | | | 7.67 | % | | | 20.33 | % | | | 13.47 | % | | | 16.46 | %(C) | | | 18.95 | % | | | (25.47 | )%(C) | | | 6.79 | % | | | 13.78 | % | | | 8.80 | % | | | 9.41 | %(C) |
| | | | | | | | | | | | | | | | | | | | | | | | | | | | | | | | | | | | | | | | | | | | | | | | |
Net Assets, End of Period (thousands) | | $ | 1,279,862 | | | $ | 978,901 | | | $ | 1,218,439 | | | $ | 847,574 | | | $ | 485,301 | | | $ | 179,079 | | | $ | 730,400 | | | $ | 587,524 | | | $ | 761,093 | | | $ | 538,369 | | | $ | 277,269 | | | $ | 102,341 | |
Ratio of Expenses to Average Net Assets (D) | | | 0.35 | % | | | 0.34 | %(B) | | | 0.33 | % | | | 0.37 | % | | | 0.46 | % | | | 0.67 | %(B)(E) | | | 0.33 | % | | | 0.32 | %(B) | | | 0.31 | % | | | 0.35 | % | | | 0.45 | % | | | 0.65 | %(B)(E) |
Ratio of Expenses to Average Net Assets (Excluding Waivers and Assumption of Expenses and/or Recovery of Previously Waived Fees) (D) | | | 0.64 | % | | | 0.61 | %(B) | | | 0.59 | % | | | 0.60 | % | | | 0.56 | % | | | 0.71 | %(B)(E) | | | 0.56 | % | | | 0.53 | %(B) | | | 0.51 | % | | | 0.52 | % | | | 0.55 | % | | | 0.83 | %(B)(E) |
Ratio of Net Investment Income to Average Net Assets | | | 2.17 | % | | | 2.26 | %(B) | | | 1.70 | % | | | 1.72 | % | | | 1.50 | % | | | 1.08 | %(B)(E) | | | 1.82 | % | | | 2.44 | %(B) | | | 1.90 | % | | | 1.56 | % | | | 1.99 | % | | | 1.18 | %(B)(E) |
| | | | | | | | | | | | | | | | | | | | | | | | | | | | | | | | | | | | | | | | | | | | | | | | |
See page 1 for the Definitions of Abbreviations and Footnotes.
See accompanying Notes to Financial Statements.
17
DIMENSIONAL INVESTMENT GROUP INC.
FINANCIAL HIGHLIGHTS
(for a share outstanding throughout each period)
Institutional Class Shares
| | | | | | | | | | | | | | | | | | | | | | | | |
| | | Global 25/75 Portfolio | |
| | | Year
Ended
Oct. 31,
2009 | | | Period
Dec. 1,
2007 to
Oct. 31,
2008 | | | Year
Ended
Nov. 30,
2007 | | | Year
Ended
Nov. 30,
2006 | | | Year
Ended
Nov. 30,
2005 | | | Period
Dec. 24,
2003(a) to
Nov. 30,
2004 | |
Net Asset Value, Beginning of Period | | $ | 10.01 | | | $ | 11.46 | | | $ | 11.15 | | | $ | 10.65 | | | $ | 10.34 | | | $ | 10.00 | |
| | | | | | | | | | | | | | | | | | | | | | | | |
Income from Investment Operations | | | | | | | | | | | | | | | | | | | | | | | | |
Net Investment Income | | | 0.18 | (A) | | | 0.31 | (A) | | | 0.24 | (A) | | | 0.22 | (A) | | | 0.24 | (A) | | | 0.11 | |
Net Gains (Losses) on Securities (Realized and Unrealized) | | | 1.06 | | | | (1.37 | ) | | | 0.40 | | | | 0.60 | | | | 0.24 | | | | 0.36 | |
| | | | | | | | | | | | | | | | | | | | | | | | |
Total from Investment Operations | | | 1.24 | | | | (1.06 | ) | | | 0.64 | | | | 0.82 | | | | 0.48 | | | | 0.47 | |
| | | | | | | | | | | | | | | | | | | | | | | | |
Less Distributions | | | | | | | | | | | | | | | | | | | | | | | | |
Net Investment Income | | | (0.19 | ) | | | (0.31 | ) | | | (0.24 | ) | | | (0.21 | ) | | | (0.17 | ) | | | (0.13 | ) |
Net Realized Gains | | | (0.16 | ) | | | (0.08 | ) | | | (0.09 | ) | | | (0.11 | ) | | | — | | | | — | |
| | | | | | | | | | | | | | | | | | | | | | | | |
Total Distributions | | | (0.35 | ) | | | (0.39 | ) | | | (0.33 | ) | | | (0.32 | ) | | | (0.17 | ) | | | (0.13 | ) |
| | | | | | | | | | | | | | | | | | | | | | | | |
Net Asset Value, End of Period | | $ | 10.90 | | | $ | 10.01 | | | $ | 11.46 | | | $ | 11.15 | | | $ | 10.65 | | | $ | 10.34 | |
| | | | | | | | | | | | | | | | | | | | | | | | |
Total Return | | | 12.67 | % | | | (9.55 | )%(C) | | | 5.85 | % | | | 7.97 | % | | | 4.71 | % | | | 4.73 | %(C) |
| | | | | | | | | | | | | | | | | | | | | | | | |
Net Assets, End of Period (thousands) | | $ | 160,605 | | | $ | 126,169 | | | $ | 136,039 | | | $ | 97,194 | | | $ | 52,699 | | | $ | 31,208 | |
Ratio of Expenses to Average Net Assets(D) | | | 0.31 | % | | | 0.30 | %(B) | | | 0.31 | % | | | 0.37 | % | | | 0.47 | % | | | 0.99 | %(B)(E) |
Ratio of Expenses to Average Net Assets (Excluding Waivers and Assumption of Expenses and/or Recovery of Previously Waived Fees)(D) | | | 0.46 | % | | | 0.46 | %(B) | | | 0.46 | % | | | 0.49 | % | | | 0.71 | % | | | 1.32 | %(B)(E) |
Ratio of Net Investment Income to Average Net Assets | | | 1.81 | % | | | 3.03 | %(B) | | | 2.15 | % | | | 1.59 | % | | | 2.33 | % | | | 0.95 | %(B)(E) |
| | | | | | | | | | | | | | | | | | | | | | | | |
See page 1 for the Definitions of Abbreviations and Footnotes.
See accompanying Notes to Financial Statements.
18
DIMENSIONAL INVESTMENT GROUP INC.
NOTES TO FINANCIAL STATEMENTS
A. Organization:
Dimensional Investment Group Inc. (the “Fund”) is an open-end management investment company registered under the Investment Company Act of 1940, whose shares are offered to institutional investors, retirement plans and clients of registered investment advisors. The Fund currently offers fifteen portfolios, of which Global Equity Portfolio, Global 60/40 Portfolio and Global 25/75 Portfolio (each a “Global Fund” and collectively, the “Global Funds”) are presented in this report.
The Global Funds achieve their investment objectives by primarily investing in other portfolios within DFA Investment Dimensions Group Inc. (“IDG”) (collectively, the “Master Funds”).
| | | | | | |
| | | Global Funds (Percentage of Ownership at October 31, 2009) |
Master Funds | | Global Equity
Portfolio | | Global 60/40
Portfolio | | Global 25/75
Portfolio |
U.S. Core Equity 1 Portfolio (IDG) | | 10% | | 3% | | — |
U.S. Core Equity 2 Portfolio (IDG) | | 16% | | 5% | | — |
DFA Real Estate Securities Portfolio (IDG) | | 1% | | — | | — |
International Core Equity Portfolio (IDG) | | 11% | | 4% | | — |
Emerging Markets Core Equity Portfolio (IDG) | | 3% | | 1% | | — |
DFA Two-Year Global Fixed Income Portfolio (IDG) | | N/A | | N/A | | 1% |
DFA Five-Year Global Fixed Income Portfolio (IDG) | | N/A | | 2% | | N/A |
DFA Selectively Hedged Global Fixed Income Portfolio (IDG) | | N/A | | 37% | | N/A |
DFA Short-Term Extended Quality Portfolio (IDG) | | N/A | | 20% | | 13% |
DFA Inflation-Protected Securities Portfolio (IDG) | | N/A | | 5% | | 3% |
N/A – Global Fund does not have any ownership in Master Fund.
Amounts designated as — are less than 1%
At October 31, 2009, Class R1 shares had not commenced operations. Class R1 shares of the Global Funds have 25,000,000 authorized shares.
At a regular meeting of the Board of Directors/Trustees (the “Board”) on September 16, 2008, the Board voted to change the fiscal and tax year ends of the Global Funds from November 30 to October 31.
B. Significant Accounting Policies:
The following significant accounting policies are in conformity with accounting principles generally accepted in the United States of America. Such policies are consistently followed by the Fund in preparation of its financial statements. The preparation of financial statements in accordance with accounting principles generally accepted in the United States of America requires management to make estimates and assumptions that affect the reported amounts of assets and liabilities and disclosure of contingent assets and liabilities at the date of the financial statements and the reported amounts of increases and decreases in net assets from operations during the reporting period. Actual results could differ from those estimates and those differences could be material.
1. Security Valuation: Master Fund shares held by the Global Funds are valued at their respective daily net asset values, as these Master Funds are treated as regulated investment companies. The Global Funds’ investments in partnerships reflect proportionate interest in the net assets of their corresponding partnerships. At October 31, 2009, the Global Funds held no investments in partnerships.
19
The Portfolios utilize a fair value hierarchy which prioritizes the inputs to valuation techniques used to measure fair value into three broad levels as described below:
• Level 1 – quoted prices in active markets for identical securities
• Level 2 – other significant observable inputs (including quoted prices for similar securities, interest rates, prepayment speeds, credit risk, etc.)
• Level 3 – significant unobservable inputs (including the Global Funds’ own assumptions in determining the fair value of investments)
A summary of the inputs used to value the Portfolios’ net assets by each major type, industry and/or country is disclosed at the end of the Schedule of Investments. The inputs or methodology used for valuing securities are not necessarily an indication of the risk associated with investing in those securities.
2. Deferred Compensation Plan: Each eligible Director of the Fund may elect participation in the Deferred Compensation Plan (the “Plan”). Under the Plan, effective January 1, 2002, such Directors may defer payment of all or a portion of their total fees earned as a Director. These deferred amounts may be treated as though such amounts had been invested in shares of the following funds: U.S. Large Cap Value Portfolio; U.S. Core Equity 1 Portfolio; U.S. Core Equity 2 Portfolio; U.S. Vector Equity Portfolio; U.S. Micro Cap Portfolio; DFA International Value Portfolio; International Core Equity Portfolio; Emerging Markets Portfolio; Emerging Markets Core Equity Portfolio; and/or DFA Two-Year Global Fixed Income Portfolio. Contributions made under the Plan and the change in unrealized appreciation (depreciation) and income are included in Directors’/Trustees’ Fees & Expenses.
Each Director has the option to receive their distribution of proceeds in one of the following methods upon one year’s notice: lump sum; annual installments over a period of agreed upon years; or semi-annual installments over a period of agreed upon years. As of October 31, 2009, none of the Directors have requested distribution of proceeds.
3. Other: Security transactions are accounted for as of the trade date. Costs used in determining realized gains and losses on the sale of affiliated investment company shares are on the basis of identified cost. Dividend income and distributions to shareholders are recorded on the ex-dividend date. Distributions received from the investment in affiliated investment companies that represent a return of capital or capital gain are recorded as a reduction of cost of investments or as a realized gain, respectively. The Global Funds estimate the character of distributions received that may be considered return of capital distributions. Interest income is recorded on the accrual basis. Expenses directly attributable to a Global Fund are directly charged. Common expenses of the Group are allocated using methods approved by the Board of Directors/Trustees, generally based on average net assets.
Class R2 Shares and Institutional Class Shares have equal rights to assets and earnings of its Global Fund. Income, gains and losses, and common expenses of each Global Fund are allocated to each class of shares based on its relative net assets. Each class will bear its own class-specific expenses, if any.
The Global Funds each recognize their pro-rata share of net investment income and realized and unrealized gains/losses on a daily basis, from their respective investments in partnerships.
C. Investment Advisor:
Dimensional Fund Advisors LP (“Dimensional” or the “Advisor”) provides investment advisory services to the Master Funds. The Advisor also provides administrative services to the Global Funds, including supervision of services provided by others, providing information to shareholders and the Board of Directors/Trustees, and other administrative services. For the year ended October 31, 2009, the Global Equity Portfolio, Global 60/40 Portfolio and Global 25/75 Portfolio’s administrative services fees were accrued daily and paid monthly to the Advisor based on an effective annual rate of 0.30%, 0.25%, 0.20%, respectively, of average daily net assets. The Global Funds do not pay separate management fees to the Advisor.
Pursuant to a Fee Waiver and Expense Assumption Agreement, the Advisor has contractually agreed to waive its administrative services fee to the extent necessary to limit the proportionate share of the total combined administrative services fees paid by each of the Global Funds and investment advisory services fees paid by the Master Funds to the Advisor. The Fee Waiver and Expense Assumption Agreement will remain in effect through March 1, 2010, and
20
shall continue to remain in effect from year to year thereafter unless terminated by the Fund or the Advisor. For the year ended October 31, 2009, the Global Funds had the following expense limits based on a percentage of average net assets on an annualized basis.
| | | |
| | | Expense
Limits | |
Global Equity Portfolio | | 0.27 | % |
Global 60/40 Portfolio | | 0.25 | % |
Global 25/75 Portfolio | | 0.22 | % |
The Advisor has also contractually agreed to assume the direct operating expenses of the Institutional Class Shares of each Global Fund (excluding administrative services fees paid to the Advisor), to the extent necessary to limit the total expense ratios (including the expenses that the Institutional Class Shares of each such Global Fund bears as a shareholder of the Master Funds, but excluding expenses from investment in other investment companies) of the Institutional Class Shares. For the year ended October 31, 2009, the Institutional Class Shares had the following expense limits based on a percentage of average net assets on an annualized basis.
| | | |
| | | Expense
Limits | |
Global Equity Portfolio | | 0.44 | % |
Global 60/40 Portfolio | | 0.41 | % |
Global 25/75 Portfolio | | 0.37 | % |
The Fee Waiver and Expense Assumption Agreement will remain in effect through March 1, 2010, and shall continue to remain in effect from year to year thereafter unless terminated by the Fund or the Advisor.
For the Class R2 Shares, the Advisor has contractually agreed to assume the direct operating expenses of the Class R2 Shares of each Global Fund (excluding administrative services fees paid to the Advisor) to the extent necessary to limit the total expense ratios (including the expenses that the Class R2 Shares of each such Global Fund bears as a shareholder of the Master Funds and including Shareholder Servicing Fees, but excluding expenses from investment in other investment companies) of the Class R2 Shares. For the year ended October 31, 2009, the Class R2 Shares had the following expense limits based on a percentage of average net assets on an annualized basis.
| | | |
| | | Expense
Limits | |
Global Equity Portfolio | | 0.69 | % |
Global 60/40 Portfolio | | 0.66 | % |
Global 25/75 Portfolio | | 0.62 | % |
The Fee Waiver and Expense Assumption Agreement will remain in effect through March 1, 2010, and shall continue to remain in effect from year to year thereafter unless terminated by the Fund or the Advisor.
At any time that the rate of the fees and annualized expenses of a Global Fund are less than the rates listed above for a Global Fund on an annualized basis, the Advisor retains the right to recover any fees previously waived and/or expenses previously assumed to the extent that such recovery will not cause the Global Fund’s Institutional Class and Class R2 Shares’ fees or expenses to exceed the fee or expense limitations listed above. Previously waived fees subject to future recovery by the Advisor over periods not exceeding October 31, 2012 are reflected below (amounts in thousands). The Global Funds are not obligated to reimburse the Advisor for fees previously waived or expenses previously assumed by the Advisor more than thirty-six months before the date of recovery.
21
| | | |
| | | Previously
Waived
Fees/Expenses
Assumed
Subject to
Future
Recovery |
Global Equity Portfolio | | | |
Class R2 Shares | | $ | 138 |
Institutional Class Shares | | | 8,959 |
Global 60/40 Portfolio | | | |
Class R2 Shares | | | 38 |
Institutional Class Shares | | | 4,147 |
Global 25/75 Portfolio | | | |
Class R2 Shares | | | 9 |
Institutional Class Shares | | | 622 |
Fees Paid to Officers and Directors/Trustees:
Certain Officers and Directors/Trustees of the Advisor are also Officers and Directors/Trustees of the Fund; however, such Officers and Directors/Trustees (with the exception of the Chief Compliance Officer (“CCO”)) receive no compensation from the Fund. For the year ended October 31, 2009, the total related amounts paid by the Fund to the CCO were $27 (in thousands). The total related amounts paid by each of the Global Funds are included in Other Expenses on the Statement of Operations.
D. Deferred Compensation:
At October 31, 2009, the total liability for deferred compensation to Directors/Trustees is included in Accrued Expenses and Other Liabilities on the Statement of Assets and Liabilities as follows (amounts in thousands):
| | | |
Global Equity Portfolio | | $ | 30 |
Global 60/40 Portfolio | | | 17 |
Global 25/75 Portfolio | | | 4 |
E. Federal Income Taxes:
Each Global Fund has qualified and intends to continue to qualify as a regulated investment company under Subchapter M of the Internal Revenue Code for federal income tax purposes and to distribute substantially all of its taxable income and net capital gains to its shareholders. Accordingly, no provision has been made for federal income taxes.
Distributions from net investment income and net realized capital gains are determined in accordance with U.S. federal income tax regulations, which may differ from those amounts determined under accounting principles generally accepted in the United States of America. These book/tax differences are either temporary or permanent in nature. To the extent these differences are permanent, they are charged or credited to paid-in capital, undistributed net investment income or accumulated net realized gains, as appropriate, in the period that the differences arise. Accordingly, the following permanent differences as of October 31, 2009, primarily attributable to reclassification of distributions and the utilization of accumulated earnings and profits distributed to shareholders on redemptions of shares as part of the dividends paid deduction for income tax purposes, were reclassified to the following accounts. These reclassifications had no effect on net assets or net asset value per share (amounts in thousands):
22
| | | | | | |
| | | Increase
(Decrease)
Paid-In Capital | | Increase
(Decrease)
Undistributed
Net Investment
Income | | Increase
(Decrease)
Accumulated
Net Realized
Gains (Losses) |
Global Equity Portfolio | | $(86) | | $ 44 | | $ 42 |
Global 60/40 Portfolio | | 104 | | (673) | | 569 |
Global 25/75 Portfolio | | 19 | | 323 | | (342) |
The tax character of dividends and distributions declared and paid during the year ended November 30, 2007, the period December 1, 2007 to October 31, 2008 and the year ended October 31, 2009 were as follows (amounts in thousands):
| | | | | | |
| | | Net Investment
Income and
Short-Term
Capital Gains | | Long-Term
Capital Gains | | Total |
Global Equity Portfolio | | | | | | |
2007 | | $20,438 | | $ 9,279 | | $ 29,717 |
2008 | | 26,394 | | 24,056 | | 50,450 |
2009 | | 23,463 | | — | | 23,463 |
Global 60/40 Portfolio | | | | | | |
2007 | | 14,075 | | 3,393 | | 17,468 |
2008 | | 17,159 | | 7,556 | | 24,715 |
2009 | | 11,799 | | 1,690 | | 13,489 |
Global 25/75 Portfolio | | | | | | |
2007 | | 2,739 | | 742 | | 3,481 |
2008 | | 4,258 | | 871 | | 5,129 |
2009 | | 2,629 | | 1,979 | | 4,608 |
At October 31, 2009, the components of distributable earnings/(accumulated losses) were as follows (amounts in thousands):
| | | | | | | | |
| | | Undistributed
Net Investment
Income and
Short-Term
Capital Gains | | Undistributed
Long-Term
Capital Gains | | Capital
Loss
Carryforward | | Total Net
Distributable
Earnings/
(Accumulated
Losses) |
Global Equity Portfolio | | $2,702 | | — | | $(77,056) | | $(74,354) |
Global 60/40 Portfolio | | 265 | | — | | (26,314) | | (26,049) |
Global 25/75 Portfolio | | 675 | | — | | (3,215) | | (2,540) |
For Federal income tax purposes, the Fund measures its capital loss carryforwards annually at October 31, its fiscal year end. Capital loss carryforwards may be carried forward and applied against future capital gains. As of October 31, 2009, the Portfolio had capital loss carryforward available to offset future realized capital gains through the indicated expiration dates (amounts in thousands):
| | | | | | |
| | | Expires on
October 31, | | |
| | | 2016 | | 2017 | | Total |
Global Equity Portfolio | | $2,732 | | $74,324 | | $77,056 |
Global 60/40 Portfolio | | — | | 26,314 | | 26,314 |
Global 25/75 Portfolio | | — | | 3,215 | | 3,215 |
At October 31, 2009, the total cost and aggregate gross unrealized appreciation and (depreciation) of securities for federal income tax purposes were different from amounts reported for financial reporting purposes (amounts in
23
thousands):
| | | | | | | | | | | | | | |
| | | Federal
Tax Cost | | Unrealized
Appreciation | | Unrealized
(Depreciation) | | | Net
Unrealized
Appreciation
(Depreciation) | |
Global Equity Portfolio | | $ | 1,440,618 | | $ | 19,771 | | $ | (175,967 | ) | | $ | (156,196 | ) |
Global 60/40 Portfolio | | | 779,952 | | | 16,647 | | | (61,102 | ) | | | (44,455 | ) |
Global 25/75 Portfolio | | | 159,487 | | | 5,911 | | | (3,111 | ) | | | 2,800 | |
Accounting for Uncertainty in Income Taxes sets forth a minimum threshold for financial statement recognition of the benefit of a tax position taken or expected to be taken in a tax return. Management has analyzed each Global Portfolio’s tax positions and has concluded that no provision for income tax is required in any Global Portfolios’ financial statements. No Global Portfolio is aware of any tax positions for which it is reasonably possible that the total amounts of unrecognized tax benefits will significantly change in the next twelve months. Each of the Global Portfolio’s federal tax returns for the prior three fiscal years remains subject to examination by the Internal Revenue Service.
On November 1, 2008, the DFA Two-Year Global Fixed Income Series, a master fund in a RIC/RIC master-feeder structure with RIC feeders, underlying fund of fund investors and direct client investors, made a “Check-the-Box” election for federal income tax purposes pursuant to Treasury Regulation §301.7701-3, to change its federal entity classifications from a corporation taxable as a regulated investment company to a partnership. As a result of this election, for tax purposes, the master fund is deemed to have distributed all of its assets and liabilities to its shareholders in liquidation of the master fund. Since the master fund has a shareholder owning 80% or more of the fund’s shares, and also has shareholders owning less than 80%, the fund’s respective transaction creates a non-taxable transaction, pursuant to Internal Revenue Code §332 for those owning more than 80%, and a taxable transaction, pursuant to Internal Revenue Code §331, for those shareholders owning less than 80%. Immediately after the deemed liquidation, the shareholders contributed all of the distributed assets and liabilities to the newly formed partnership. The final tax year end of the master fund was October 31, 2008.
For federal income tax purposes, pursuant to IRC §336(a), the master fund recognized gain or loss relative to the investment of the less than 80% shareholders as if the master’s investment securities were sold to those shareholders and, pursuant to IRC §331, each of those shareholders recognized gain or loss as if it liquidated its investment in the master. The Global 60/40 Portfolio and the Global 25/75 Portfolio, each representing a less than 80% owner of The DFA Two-Year Global Fixed Income Series, recognized $3,046,638 and $1,370,411 of net capital gain respectively for their tax year ended October 31, 2008. Pursuant to IRC §334(a), each of these shareholders took a fair market value basis in the securities deemed received by them and a new holding period for those securities commenced on the deemed liquidation date.
F. Capital Share Transactions:
The capital share transactions by class were as follows (amounts in thousands):
| | | | | | | | | | | | | | | | | | | | | |
| | | Year Ended
Oct. 31, 2009 | | | Period Dec. 1, 2007
to
Oct. 31, 2008 | | | Year Ended
Nov. 30, 2007 | |
| | | Amount | | | Shares | | | Amount | | | Shares | | | Amount | | | Shares | |
Global Equity Portfolio | | | | | | | | | | | | | | | | | | | | | |
| | | | | | |
Class R2 Shares | | | | | | | | | | | | | | | | | | | | | |
Shares Issued | | $ | 3,330 | | | 379 | | | $ | 3,702 | | | 324 | | | $ | 15,839 | | | 1,014 | |
Shares Issued in Lieu of Cash Distributions | | | 102 | | | 11 | | | | 716 | | | 49 | | | | 779 | | | 52 | |
Shares Redeemed | | | (4,468 | ) | | (507 | ) | | | (20,911 | ) | | (1,431 | ) | | | (23,027 | ) | | (1,481 | ) |
| | | | | | | | | | | | | | | | | | | | | |
24
| | | | | | | | | | | | | | | | | | | | | |
| | | Year Ended
Oct. 31, 2009 | | | Period Dec. 1, 2007
to
Oct. 31, 2008 | | | Year Ended
Nov. 30, 2007 | |
| | | Amount | | | Shares | | | Amount | | | Shares | | | Amount | | | Shares | |
Net Increase (Decrease) — Class R2 Shares | | $ | (1,036 | ) | | (117 | ) | | $ | (16,493 | ) | | (1,058 | ) | | $ | (6,409 | ) | | (415 | ) |
| | | | | | | | | | | | | | | | | | | | | |
| | | | | | |
Institutional Class Shares | | | | | | | | | | | | | | | | | | | | | |
Shares Issued | | $ | 656,905 | | | 76,215 | | | $ | 650,821 | | | 52,874 | | | $ | 523,556 | | | 33,704 | |
Shares Issued in Lieu of Cash Distributions | | | 22,940 | | | 2,590 | | | | 47,885 | | | 3,401 | | | | 26,340 | | | 1,743 | |
Shares Redeemed | | | (559,397 | ) | | (66,771 | ) | | | (334,757 | ) | | (27,816 | ) | | | (220,343 | ) | | (14,087 | ) |
| | | | | | | | | | | | | | | | | | | | | |
Net Increase | | | | | | | | | | | | | | | | | | | | | |
(Decrease) — Institutional Class Shares | | $ | 120,448 | | | 12,034 | | | $ | 363,949 | | | 28,459 | | | $ | 329,553 | | | 21,360 | |
| | | | | | | | | | | | | | | | | | | | | |
| | | | | | |
Global 60/40 Portfolio | | | | | | | | | | | | | | | | | | | | | |
| | | | | | |
Class R2 Shares | | | | | | | | | | | | | | | | | | | | | |
Shares Issued | | $ | 3,579 | | | 381 | | | $ | 2,885 | | | 283 | | | $ | 4,290 | | | 330 | |
Shares Issued in Lieu of Cash Distributions | | | 79 | | | 8 | | | | 156 | | | 12 | | | | 197 | | | 15 | |
Shares Redeemed | | | (4,402 | ) | | (455 | ) | | | (4,313 | ) | | (343 | ) | | | (4,564 | ) | | (349 | ) |
| | | | | | | | | | | | | | | | | | | | | |
Net Increase (Decrease) — Class R2 Shares | | $ | (744 | ) | | (66 | ) | | $ | (1,272 | ) | | (48 | ) | | $ | (77 | ) | | (4 | ) |
| | | | | | | | | | | | | | | | | | | | | |
| | | | | | |
Institutional Class Shares | | | | | | | | | | | | | | | | | | | | | |
| | | | | | |
Shares Issued | | $ | 280,435 | | | 28,041 | | | $ | 263,832 | | | 21,933 | | | $ | 350,961 | | | 26,609 | |
Shares Issued in Lieu of Cash Distributions | | | 12,750 | | | 1,324 | | | | 21,235 | | | 1,711 | | | | 15,130 | | | 1,178 | |
Shares Redeemed | | | (237,972 | ) | | (25,048 | ) | | | (224,067 | ) | | (19,795 | ) | | | (164,030 | ) | | (12,504 | ) |
| | | | | | | | | | | | | | | | | | | | | |
Net Increase | | | | | | | | | | | | | | | | | | | | | |
(Decrease) — Institutional Class Shares | | $ | 55,213 | | | 4,317 | | | $ | 61,000 | | | 3,849 | | | $ | 202,061 | | | 15,283 | |
| | | | | | | | | | | | | | | | | | | | | |
25
| | | | | | | | | | | | | | | | | | | | | |
| | | Year Ended
Oct. 31, 2009 | | | Period Dec. 1, 2007
to
Oct. 31, 2008 | | | Year Ended
Nov. 30, 2007 | |
| | | Amount | | | Shares | | | Amount | | | Shares | | | Amount | | | Shares | |
| | | | | | |
Global 25/75 Portfolio | | | | | | | | | | | | | | | | | | | | | |
| | | | | | |
Class R2 Shares | | | | | | | | | | | | | | | | | | | | | |
Shares Issued | | $ | 1,156 | | | 113 | | | $ | 739 | | | 70 | | | $ | 1,494 | | | 132 | |
Shares Issued in Lieu of Cash Distributions | | | 39 | | | 4 | | | | 38 | | | 4 | | | | 64 | | | 6 | |
Shares Redeemed | | | (983 | ) | | (96 | ) | | | (836 | ) | | (77 | ) | | | (2,762 | ) | | (244 | ) |
| | | | | | | | | | | | | | | | | | | | | |
Net Increase (Decrease) — Class R2 Shares | | $ | 212 | | | 21 | | | $ | (59 | ) | | (3 | ) | | $ | (1,204 | ) | | (106 | ) |
| | | | | | | | | | | | | | | | | | | | | |
| | | | | | |
Institutional Class Shares | | | | | | | | | | | | | | | | | | | | | |
Shares Issued | | $ | 66,383 | | | 6,523 | | | $ | 62,810 | | | 5,710 | | | $ | 54,421 | | | 4,802 | |
Shares Issued in Lieu of Cash Distributions | | | 4,523 | | | 444 | | | | 5,046 | | | 458 | | | | 3,384 | | | 302 | |
Shares Redeemed | | | (48,119 | ) | | (4,829 | ) | | | (57,080 | ) | | (5,437 | ) | | | (22,167 | ) | | (1,950 | ) |
| | | | | | | | | | | | | | | | | | | | | |
Net Increase | | | | | | | | | | | | | | | | | | | | | |
(Decrease) — Institutional Class Shares | | $ | 22,787 | | | 2,138 | | | $ | 10,776 | | | 731 | | | $ | 35,638 | | | 3,154 | |
| | | | | | | | | | | | | | | | | | | | | |
G. Financial Instruments:
In accordance with the Fund’s investment objectives and policies, the Fund may invest in certain financial instruments that have off-balance sheet risk in excess of the amounts recognized in the financial statements and concentrations of credit and market risk. The instrument and its significant corresponding risks are described below:
Repurchase Agreements: The Global Funds may purchase certain U.S. Government securities subject to the counterparty’s agreement to repurchase them at an agreed upon date and price. The counterparty will be required on a daily basis to maintain the value of the collateral subject to the agreement at not less than the repurchase price, including accrued interest. The agreements are conditioned upon the collateral being deposited under the Federal Reserve book-entry system with the Fund’s custodian or a third party sub-custodian. In the event of default or bankruptcy by the other party to the agreement, retention of the collateral may be subject to legal proceedings. At October 31, 2009, the Funds had no open repurchase agreements.
H. Line of Credit:
The Fund, together with other Dimensional-advised portfolios, has entered into an amended and restated $250 million unsecured discretionary line of credit effective July 8, 2009 with an affiliate of its domestic custodian bank. Each portfolio is permitted to borrow, subject to its investment limitations, up to a maximum of $250 million, as long as total borrowings under the line of credit do not exceed $250 million in the aggregate. Borrowings under the line of credit are charged interest at the then current Federal Funds Rate plus 1%. Each portfolio is individually, and not jointly, liable for its particular advances under the line of credit. There is no commitment fee on the unused portion of the line of credit. The agreement for the discretionary line of credit may be terminated by either party at any time. The line of credit is scheduled to expire on June 22, 2010.
26
For the year ended October 31, 2009, borrowings by the Global Funds under this line of credit were as follows (amounts in thousands, except percentages and days):
| | | | | | | | | | |
| | | Weighted
Average
Interest Rate | | Weighted
Average
Loan Balance | | Number of
Days
Outstanding | | Interest
Expense
Incurred | | Maximum Amount
Borrowed During
the Period |
Global Equity Portfolio | | 2.00% | | $2,674 | | 48 | | $7 | | $22,635 |
Global 60/40 Portfolio | | 2.01% | | 1,022 | | 66 | | 4 | | 11,225 |
Global 25/75 Portfolio | | 1.92% | | 1,068 | | 35 | | 2 | | 9,333 |
At October 31, 2009, Global Equity Portfolio had a loan outstanding in the amount of $90 (in thousands).
The Fund, together with other Dimensional-advised portfolios, has also entered into an additional $500 million unsecured line of credit effective January 15, 2009 with its international custodian bank. Each portfolio is permitted to borrow, subject to its investment limitations, up to a maximum of $500 million, as long as total borrowings under the line of credit do not exceed $500 million in the aggregate. Each portfolio is individually, and not jointly, liable for its particular advances under the line of credit. Borrowings under the line of credit are charged interest at rates agreed to by the parties at the time of borrowing. There is no commitment fee on the unused portion of the line of credit. The agreement for the line of credit expires on January 15, 2010. There were no borrowings by the Global Funds under this line of credit during the year ended October 31, 2009.
I. Shareholder Servicing Fees:
The Class R2 Shares pay a shareholder servicing fee in the amount of 0.25% of their annual average net assets to compensate service agents that provide shareholder servicing, record keeping, account maintenance and other services to investors in the Global Funds’ Class R2 Shares.
J. Indemnitees; Contractual Obligations:
Under the Fund’s organizational documents, its officers and directors are indemnified against certain liabilities arising out of the performance of their duties to the Fund.
In the normal course of business, the Fund enters into contracts that contain a variety of representations and warranties which provide general indemnification. The Fund’s maximum exposure under these arrangements is unknown as this would involve future claims that may be made against the Fund and/or its affiliates that have not yet occurred. However, based on experience, the Fund expects the risk of loss to be remote.
K. Other:
At October 31, 2009, the following number of shareholders held the following approximate percentages of outstanding shares of the Global Funds. One or more of the shareholders may be omnibus accounts, which typically hold shares for the benefit of several other underlying investors.
| | | | |
| | | Number of
Shareholders | | Approximate
Percentage
of Outstanding
Shares |
Global Equity Portfolio — Class R2 Shares | | 3 | | 98% |
Global Equity Portfolio — Institutional Class Shares | | 3 | | 86% |
Global 60/40 Portfolio — Class R2 Shares | | 3 | | 90% |
Global 60/40 Portfolio — Institutional Class Shares | | 2 | | 64% |
Global 25/75 Portfolio — Class R2 Shares | | 2 | | 96% |
Global 25/75 Portfolio — Institutional Class Shares | | 2 | | 79% |
27
L. Subsequent Event Evaluations:
Management has evaluated the impact of all subsequent events on the Portfolios through December 23, 2009, the date the financial statements were available for issuance, and has determined that there are no subsequent events requiring recognition or disclosure in the financial statements.
28
REPORT OF INDEPENDENT REGISTERED PUBLIC ACCOUNTING FIRM
To the Shareholders of the Portfolios, as defined, and
Board of Directors of Dimensional Investment Group Inc.:
In our opinion, the accompanying statements of assets and liabilities, including the schedules of investments, and the related statements of operations and of changes in net assets and the financial highlights present fairly, in all material respects, the financial position of Global Equity Portfolio, Global 60/40 Portfolio and Global 25/75 Portfolio (three of the portfolios constituting Dimensional Investment Group Inc., hereafter referred to as the “Portfolios”) at October 31, 2009, the results of each of their operations for the year then ended, the changes in each of their net assets and the financial highlights for the periods indicated, in conformity with accounting principles generally accepted in the United States of America. These financial statements and financial highlights (hereafter referred to as “financial statements”) are the responsibility of the Portfolios’ management; our responsibility is to express an opinion on these financial statements based on our audits. We conducted our audits of these financial statements in accordance with the standards of the Public Company Accounting Oversight Board (United States). Those standards require that we plan and perform the audit to obtain reasonable assurance about whether the financial statements are free of material misstatement. An audit includes examining, on a test basis, evidence supporting the amounts and disclosures in the financial statements, assessing the accounting principles used and significant estimates made by management, and evaluating the overall financial statement presentation. We believe that our audits, which included confirmation of securities at October 31, 2009 by correspondence with the transfer agent of the investee funds, provide a reasonable basis for our opinion.
PricewaterhouseCoopers LLP
Philadelphia, Pennsylvania
December 23, 2009
29
RESULTS OF THE SHAREHOLDER MEETING
On June 2, 2009, June 5, 2009, and July 8, 2009, Dimensional Investment Group Inc. (“DIG”) held a Special Joint Meeting of Shareholders for the purpose of voting on several proposals affecting DIG and the Portfolios, including, among other items, the election of Directors, the amendment of certain fundamental investment limitations, and the elimination of certain fundamental investment limitations. The shareholders of the Portfolios approved each of the applicable proposals for DIG and the Portfolios presented at the Meeting. Listed below are the voting results from the Meeting. Please note that not all Proposals presented at the Meeting were voted on by each Portfolio. Additionally, the Proposal numbers reflected below correlate to the Proposal numbers presented for vote at the Meeting.
DIG
| | | | | | | | | | | | | | | | | | | | | | | | | | |
| | | | | Shares Voted | | Percent of Outstanding Shares
Voted | |
| | | For | | % | | | Against | | % | | | Abstain/
WithHold | | % | | | For | | | Against | | | Abstain/
WithHold | |
Proposal 1: Election of Directors for DIG* | | | | | | | | | | | | | | | | | | | | | | | | |
1a | | David G. Booth | | 754,612,895 | | 96.26 | % | | — | | 0.00 | % | | 29,301,677 | | 3.74 | % | | 85.87 | % | | 0.00 | % | | 3.33 | % |
1b | | George M. Constantinides | | 753,991,785 | | 96.18 | % | | — | | 0.00 | % | | 29,922,787 | | 3.82 | % | | 85.80 | % | | 0.00 | % | | 3.41 | % |
1c | | John P. Gould | | 753,344,569 | | 96.10 | % | | — | | 0.00 | % | | 30,570,003 | | 3.90 | % | | 85.73 | % | | 0.00 | % | | 3.48 | % |
1d | | Roger G. Ibbotson | | 754,232,365 | | 96.21 | % | | — | | 0.00 | % | | 29,682,207 | | 3.79 | % | | 85.83 | % | | 0.00 | % | | 3.38 | % |
1e | | Robert C. Merton | | 754,598,874 | | 96.26 | % | | — | | 0.00 | % | | 29,315,698 | | 3.74 | % | | 85.87 | % | | 0.00 | % | | 3.34 | % |
1f | | Myron S. Scholes | | 754,057,040 | | 96.19 | % | | — | | 0.00 | % | | 29,857,532 | | 3.81 | % | | 85.81 | % | | 0.00 | % | | 3.40 | % |
1g | | Eduardo A. Repetto | | 753,295,592 | | 96.09 | % | | — | | 0.00 | % | | 30,618,979 | | 3.91 | % | | 85.72 | % | | 0.00 | % | | 3.48 | % |
1h | | Abbie J. Smith | | 754,123,603 | | 96.20 | % | | — | | 0.00 | % | | 29,790,969 | | 3.80 | % | | 85.82 | % | | 0.00 | % | | 3.39 | % |
| | | | | | | | | | | | | | | | | | | | | | | | | | | | |
| | | Shares Voted | | Percent of Outstanding
Shares Voted | |
| | | For | | % | | | Against | | % | | | Abstain/
WithHold | | % | | | NonVote | | % | | For | | | Against | | | Abstain /
WithHold | |
Proposal 2: To approve Articles of Amendment and Restatement for DIG* | | 479,705,048 | | 93.81 | % | | 7,503,436 | | 1.47 | % | | 24,156,664 | | 4.72 | % | | NA | | NA | | 54.59 | % | | 0.85 | % | | 2.75 | % |
* Results are for all Portfolios within DIG
Global Equity Portfolio - Class I, R2
| | | | | | | | | | | | | | | | | | | | | | | | | | | | | | | | |
| | | | | Shares Voted | | Percent of Outstanding Shares
Voted |
| | | | | For | | % | | | Against | | % | | | Abstain/
WithHold | | % | | | NonVote | | % | | For | | | Against | | | Abstain/
WithHold | | | Non-Vote |
Proposals: | | | | | | | | | | | | | | | | | | | | | | | | | | | | | | |
5 | | To approve amendments to certain fundamental investment restrictions |
5a | | Borrowing Money | | 50,703,999 | | 91.20 | % | | 1,235,854 | | 2.22 | % | | 3,654,061 | | 6.57 | % | | NA | | NA | | 46.52 | % | | 1.13 | % | | 3.35 | % | | NA |
5b | | Making Loans | | 50,750,328 | | 91.29 | % | | 1,188,337 | | 2.14 | % | | 3,655,249 | | 6.57 | % | | NA | | NA | | 46.56 | % | | 1.09 | % | | 3.35 | % | | NA |
5c | | Investments in Real Estate | | 50,672,870 | | 91.15 | % | | 1,265,703 | | 2.28 | % | | 3,655,341 | | 6.58 | % | | NA | | NA | | 46.49 | % | | 1.16 | % | | 3.35 | % | | NA |
5d | | Investments in Commodities | | 50,560,455 | | 90.95 | % | | 1,366,866 | | 2.46 | % | | 3,666,593 | | 6.60 | % | | NA | | NA | | 46.39 | % | | 1.25 | % | | 3.36 | % | | NA |
5e | | Diversification of Investments | | 50,960,939 | | 91.67 | % | | 970,505 | | 1.75 | % | | 3,662,470 | | 6.59 | % | | NA | | NA | | 46.75 | % | | 0.89 | % | | 3.36 | % | | NA |
6 | | To approve the elimination of certain fundamental investment restrictions |
6b | | Purchasing Securities on Margin | | 50,037,744 | | 90.01 | % | | 1,770,368 | | 3.18 | % | | 3,785,802 | | 6.81 | % | | NA | | NA | | 45.91 | % | | 1.62 | % | | 3.47 | % | | NA |
Global 60/40 Portfolio
| | | | | | | | | | | | | | | | | | | | | | | | | | | | | | | | |
| | | | | Shares Voted | | Percent of Outstanding Shares
Voted |
| | | | | For | | % | | | Against | | % | | | Abstain/
WithHold | | % | | | NonVote | | % | | For | | | Against | | | Abstain /
WithHold | | | Non-Vote |
Proposals: | | | | | | | | | | | | | | | | | | | | | | | | | | | | | | |
5 | | To approve amendments to certain fundamental investment restrictions |
5a | | Borrowing Money | | 28,552,696 | | 94.54 | % | | 459,158 | | 1.52 | % | | 1,188,626 | | 3.94 | % | | NA | | NA | | 49.19 | % | | 0.79 | % | | 2.05 | % | | NA |
5b | | Making Loans | | 28,551,732 | | 94.54 | % | | 454,059 | | 1.50 | % | | 1,194,689 | | 3.96 | % | | NA | | NA | | 49.19 | % | | 0.78 | % | | 2.06 | % | | NA |
5c | | Investments in Real Estate | | 28,574,874 | | 94.62 | % | | 437,297 | | 1.45 | % | | 1,188,309 | | 3.93 | % | | NA | | NA | | 49.23 | % | | 0.75 | % | | 2.05 | % | | NA |
5d | | Investments in Commodities | | 28,596,781 | | 94.69 | % | | 423,264 | | 1.40 | % | | 1,180,435 | | 3.91 | % | | NA | | NA | | 49.27 | % | | 0.73 | % | | 2.03 | % | | NA |
5e | | Diversification of Investments | | 28,686,057 | | 94.99 | % | | 335,687 | | 1.11 | % | | 1,178,736 | | 3.90 | % | | NA | | NA | | 49.42 | % | | 0.58 | % | | 2.03 | % | | NA |
6 | | To approve the elimination of certain fundamental investment restrictions |
6b | | Purchasing Securities on Margin | | 28,345,469 | | 93.86 | % | | 683,463 | | 2.26 | % | | 1,171,548 | | 3.88 | % | | NA | | NA | | 48.84 | % | | 1.18 | % | | 2.02 | % | | NA |
30
Global 25/75 Portfolio
| | | | | | | | | | | | | | | | | | | | | | | | | | |
| | | | | Shares Voted | | | | Percent of Outstanding Shares Voted |
| | | | | For | | % | | Against | | % | | Abstain/
WithHold | | % | | NonVote | | % | | For | | Against | | Abstain / WithHold | | Non-Vote |
| | | | | | | | | | | | | | | | | | | | | Need for 50% Voted 40Act: |
Proposals: | | | | | | | | | | | | | | | | | | | | | | | | |
5 | | To approve amendments to certain fundamental investment restrictions |
5a | | Borrowing Money | | 8,874,835 | | 98.40% | | 76,551 | | 0.85% | | 67,532 | | 0.75% | | NA | | NA | | 64.99% | | 0.56% | | 0.49% | | NA |
5b | | Making Loans | | 8,863,704 | | 98.28% | | 69,727 | | 0.77% | | 85,487 | | 0.95% | | NA | | NA | | 64.91% | | 0.51% | | 0.63% | | NA |
5c | | Investments in Real Estate | | 8,902,302 | | 98.71% | | 56,114 | | 0.62% | | 60,502 | | 0.67% | | NA | | NA | | 65.19% | | 0.41% | | 0.44% | | NA |
5d | | Investments in Commodities | | 8,875,848 | | 98.41% | | 57,583 | | 0.64% | | 85,487 | | 0.95% | | NA | | NA | | 65.00% | | 0.42% | | 0.63% | | NA |
5e | | Diversification of Investments | | 8,912,286 | | 98.82% | | 46,130 | | 0.51% | | 60,502 | | 0.67% | | NA | | NA | | 65.26% | | 0.34% | | 0.44% | | NA |
6 | | To approve the elimination of certain fundamental investment restrictions |
6b | | Purchasing Securities on Margin | | 8,831,180 | | 97.92% | | 97,268 | | 1.08% | | 90,470 | | 1.00% | | NA | | NA | | 64.67% | | 0.71% | | 0.66% | | NA |
31
FUND MANAGEMENT
Trustees/Directors
Each Board of Trustees/Directors of The DFA Investment Trust Company Inc. (“DFAITC”), DFA Investment Dimensions Group Inc. (“DFAIDG”), Dimensional Investment Group Inc. (“DIG”) and Dimensional Emerging Markets Value Fund (“DEM”) (each, the “Fund” and collectively, the “Funds”) is responsible for establishing the Funds’ policies and for overseeing the management of the Funds. The Trustees/Directors of the Funds, including all of the disinterested Directors, have adopted written procedures to monitor potential conflicts of interest that might develop between portfolios of the Funds (the “Feeder Portfolios”) that invest in certain series of DFAITC or DEM (the “Master Funds”).
Each Board has two standing committees, an Audit Committee and a Portfolio Performance and Service Review Committee (the “Performance Committee”). The Audit Committee is comprised of George M. Constantinides, Roger G. Ibbotson and Abbie J. Smith. Each member of the Audit Committee is a disinterested Director. The Audit Committee oversees the Fund’s accounting and financial reporting policies and practices, the Fund’s internal controls, the Fund’s financial statements and the independent audits thereof and performs other oversight functions as requested by the Board. The Audit Committee recommends the appointment of each Fund’s independent registered certified public accounting firm and also acts as a liaison between the Fund’s independent registered certified public accounting firm and the full Board. There were two Audit Committee meetings held during the fiscal year ended October 31, 2009.
Each Board’s Performance Committee is comprised of Messrs. Constantinides and Ibbotson, Ms. Smith, John P. Gould, Myron S. Scholes and Robert C. Merton. Each member of the Fund’s Performance Committee is a disinterested Director. The Performance Committee regularly reviews and monitors the investment performance of the Fund’s series and reviews the performance of the Fund’s service providers. There were six Performance Committee meetings held during the fiscal year ended October 31, 2009.
Certain biographical information for each disinterested Trustee/Director and each interested Trustee/Director of the Funds is set forth in the tables below, including a description of each Trustee/Director’s experience as a Trustee/ Director of the Funds and as a director or trustee of other funds, as well as other recent professional experience.
The statements of additional information (together, “SAI”) of the Funds include additional information about each Trustee/Director. You may obtain copies of the SAI and prospectus of each Fund advised by Dimensional Fund Advisors LP by calling collect (512) 306-7400 or by mailing a request to Dimensional Fund Advisors LP, 6300 Bee Cave Road, Building One, Austin, Texas 78746. Prospectuses are also available at www.dimensional.com.
| | | | | | |
Name, Position with the Fund, Address and Age | | Term of Office1 and Length of Service | | Portfolios within the DFA Fund Complex2 Overseen | | Principal Occupation(s) During Past 5 Years and
Other Directorships of Public Companies Held |
| Disinterested Trustees/Directors |
George M. Constantinides Director of DFAIDG, DIG and DEM. Trustee of DFAITC. The University of Chicago Booth School of Business 5807 S. Woodlawn Avenue Chicago, IL 60637 Age: 62 | | DFAITC - since 1993 DFAIDG - since 1983 DIG - since 1993 DEM - since 1993 | | 87 portfolios in 4 investment companies | | Leo Melamed Professor of Finance, The University of Chicago Booth School of Business. |
John P. Gould Director of DFAIDG, DIG and DEM. Trustee of DFAITC. The University of Chicago Booth School of Business 5807 S. Woodlawn Avenue Chicago, IL 60637 Age: 70 | | DFAITC - since 1993 DFAIDG - since 1986 DIG - since 1993 DEM - since 1993 | | 87 portfolios in 4 investment companies | | Steven G. Rothmeier Distinguished Service Professor of Economics, The University of Chicago Booth School of Business (since 1965). Member of the Boards of Milwaukee Mutual Insurance Company (since 1997). Member and Chair, Competitive Markets Advisory Committee, Chicago Mercantile Exchange (futures trading exchange) (since 2004). Formerly, Director of UNext, Inc. (1999-2006). Formerly, Senior Vice-President, Lexecon Inc. (economics, law, strategy and finance consulting) (1994-2004). Trustee, Harbor Fund (registered investment company) (27 Portfolios) (since 1994). |
32
| | | | | | |
Name, Position with the Fund, Address and Age | | Term of Office1 and Length of Service | | Portfolios within the DFA Fund Complex2 Overseen | | Principal Occupation(s) During Past 5 Years and
Other Directorships of Public Companies Held |
Roger G. Ibbotson Director of DFAIDG, DIG and DEM. Trustee of DFAITC. Yale School of Management 135 Prospect Street New Haven, CT 06520-8200 Age: 66 | | DFAITC - since 1993 DFAIDG - since 1981 DIG - since 1993 DEM - since 1993 | | 87 portfolios in 4 investment companies | | Professor in Practice of Finance, Yale School of Management (since 1984). Director, BIRR Portfolio Analysis, Inc. (software products) (since 1990). Chairman, CIO and Partner, Zebra Capital Management, LLC (hedge fund manager) (since 2001). Formerly, Chairman, Ibbotson Associates, Inc., Chicago, IL (software data publishing and consulting) (1977-2006). |
Robert C. Merton Director of DFAIDG, DIG and DEM. Trustee of DFAITC. Harvard Business School 353 Baker Library Soldiers Field Boston, MA 02163 Age: 65 | | DFAITC - since 2003 DFAIDG - since 2003 DIG - since 2003 DEM - since 2003 | | 87 portfolios in 4 investment companies | | John and Natty McArthur University Professor, Graduate School of Business Administration, Harvard University (since 1998). Director, MF Risk, Inc. (risk management software) (since 2001). Director, Peninsula Banking Group (bank) (since 2003). Director, Community First Financial Group (bank holding company) (since 2003). Member Competitive Markets Advisory Council, Chicago Mercantile Exchange (futures trading exchange) (since 2004). Chairman and Director, Daedalus Software (medical software) (since 2008). Formerly, Advisory Board Member, Alpha Simplex Group (hedge fund) (2001-2007). Formerly, Chief Science Officer and Director, Trinsum Group, a successor to Integrated Finance Limited (2002-2008). Director, Vical Incorporated (biopharmaceutical product development) (since 2002). |
Myron S. Scholes Director of DFAIDG, DIG and DEM. Trustee of DFAITC. Platinum Grove Asset Management, L.P. Reckson Executive Park 1100 King Street Building 4 Rye Brook, NY 10573 Age: 68 | | DFAITC - since 1993 DFAIDG - since 1981 DIG - since 1993 DEM - since 1993 | | 87 portfolios in 4 investment companies | | Frank E. Buck Professor Emeritus of Finance, Stanford University (since 1981). Chairman, Platinum Grove Asset Management, L.P. (hedge fund) (formerly, Oak Hill Platinum Partners) (since 1999). Formerly, Managing Partner, Oak Hill Capital Management (private equity firm) (until 2004). Formerly, Director, Chicago Mercantile Exchange (2001-2008). Director, American Century Fund Complex (registered investment companies) (37 Portfolios) (since 1981). |
Abbie J. Smith Director of DFAIDG, DIG and DEM. Trustee of DFAITC. The University of Chicago Booth School of Business 5807 S. Woodlawn Avenue Chicago, IL 60637 Age: 56 | | DFAITC - since 2000 DFAIDG - since 2000 DIG - since 2000 DEM - since 2000 | | 87 portfolios in 4 investment companies | | Boris and Irene Stern Professor of Accounting, The University of Chicago Booth School of Business (since 1980), and Co-Director Investment Research, Fundamental Investment Advisors (hedge fund) (since 2008). Director, HNI Corporation (formerly known as HON Industries Inc.) (office furniture) (since 2000). Director, Ryder System Inc. (transportation, logistics and supply-chain management) (since 2003). Director/ Trustee, UBS Funds (fund complex) (5 portfolios) (since 2008). |
33
| | | | | | |
Name, Position with the Fund, Address and Age | | Term of Office1 and Length of Service | | Portfolios within the DFA Fund Complex2 Overseen | | Principal Occupation(s) During Past 5 Years and
Other Directorships of Public Companies Held |
| Interested Trustees/Directors* |
David G. Booth Chairman, Director, Chief Executive Officer and President of DFAIDG, DIG and DEM. Chairman, Trustee, Chief Executive Officer, Chief Investment Officer and President of DFAITC. 6300 Bee Cave Road, Building One Austin, Texas 78746 Age: 62 | | DFAITC - since 1993 DFAIDG - since 1981 DIG - since 1992 DEM - since 1993 | | 87 portfolios in 4 investment companies | | Chairman, Director/Trustee, President, Chief Executive Officer and formerly Chief Investment Officer of the following companies: Dimensional Holdings Inc., Dimensional Fund Advisors LP, Dimensional Fund Advisors Canada ULC, DFAIDG, DIG, DEM and DFAITC. President and Chief Executive Officer of DFA Securities LLC. Director of Dimensional Fund Advisors Ltd, and formerly Chief Investment Officer. Director and formerly, President and Chief Investment Officer of DFA Australia Ltd. Formerly, Director of Dimensional Funds PLC and Dimensional Fund II PLC. Chairman, Director and Chief Executive Officer of Dimensional Fund Advisors Canada ULC (All Chief Investment Officer positions held starting 1/03 through 3/07 except Dimensional Holdings Inc., which was from 10/06 through 3/07.) |
| | | | | | | Limited Partner, Oak Hill Partners (since 2001) and VSC Investors, LLC (since 2007). Trustee, The University of Chicago Booth School of Business. Formerly, Director, SA Funds (registered investment company). Formerly Director, Assante Corporation (investment management) (until 2002). |
Eduardo A. Repetto Director, Chief Investment Officer and Vice President of DFAIDG, DIG and DEM. Trustee, Chief Investment Officer and Vice President of DFAITC 6300 Bee Cave Road, Building One Austin, TX 78746 Age: 42 | | DFAITC - since 2009 DFAIDG - since 2009 DIG - since 2009 DEM - since 2009 | | 87 portfolios in 4 investment companies | | Director/Trustee (beginning June 2009), Chief Investment Officer (beginning March 2007) and Vice President of DFAIDG, DIG, DEM and DFAITC. Chief Investment Officer (beginning March 2007) and Vice President of all the DFA Entities, DFA Australia Limited and Dimensional Fund Advisors Canada ULC. |
| 1 | Each Trustee/Director holds office for an indefinite term until his or her successor is elected and qualified. |
| 2 | Each Trustee/Director is a director or trustee of each of the four registered investment companies within the DFA Fund Complex, which includes the Funds. |
| * | Interested Trustees/Directors are described as such because they are deemed to be “interested persons,” as that term is defined under the Investment Company Act of 1940, as amended, due to their positions with Dimensional Fund Advisors LP. |
34
Officers
The name, age, information regarding positions with the Funds and the principal occupation for each officer of the Funds are set forth below. Each officer listed below holds the same office (except as otherwise noted) in the following entities: Dimensional Fund Advisors LP (prior to November 3, 2006, Dimensional Fund Advisors Inc.) (“Dimensional”), DFA Securities Inc., DFAIDG, DIG, DFAITC and DEM (collectively, the “DFA Entities”). The address of each officer is: Dimensional Fund Advisors LP, 6300 Bee Cave Road, Building One, Austin, Texas 78746, unless otherwise indicated.
| | | | |
Name, Position with the Fund and Age | | Term of Office1 and Length of Service | | Principal Occupation(s) During Past 5 Years |
| Officers |
April A. Aandal Vice President and Chief Learning Officer Age: 46 | | Since 2008 | | Vice President of all the DFA Entities. Chief Learning Officer of Dimensional (since September 2008). Formerly, Regional Director of Dimensional (2004-2008); Vice President of Professional Development at Assante Asset Management (June 2002-January 2005). |
Darryl D. Avery Vice President Age: 43 | | Since 2005 | | Vice President of all the DFA Entities. From June 2002 to January 2005, institutional client service representative of Dimensional. |
Arthur H. Barlow Vice President Age: 53 | | Since 1993 | | Vice President of all the DFA Entities. Formerly, Vice President of DFA Australia Limited and Dimensional Fund Advisors Ltd. |
Scott A. Bosworth Vice President Age: 40 | | Since 2007 | | Vice President of all the DFA Entities. Regional Director of Dimensional (since November 1997). |
Valerie A. Brown Vice President and Assistant Secretary Age: 42 | | Since 2001 | | Vice President and Assistant Secretary of all the DFA Entities, DFA Australia Limited, Dimensional Fund Advisors Ltd., and since June 2003, Dimensional Fund Advisors Canada ULC. |
David P. Butler Vice President Age: 45 | | Since 2007 | | Vice President of all the DFA Entities. Director of Global Financial Services of Dimensional (since 2008). Formerly, Regional Director of Dimensional Fund Advisors LP (January 1995 to January 2005). |
Patrick Carter Vice President Age: 47 | | Since 2007 | | Vice President of all the DFA Entities. Regional Director of Dimensional (since March 2006). Formerly, Director of Merrill Lynch Retirement Group (December 1998 to March 2006). |
Joseph H. Chi Vice President Age: 43 | | Since 2009 | | Vice President of all the DFA Entities. Portfolio Manager for Dimensional Fund Advisors LP (since October 2005). Prior to October 2005, Corporate Counsel at Hewitt Associates (July 2002-August 2005). |
Stephen A. Clark Vice President Age: 37 | | Since 2004 | | Vice President of all the DFA Entities. Formerly, Portfolio Manager of Dimensional (April 2001-April 2004). |
Robert P. Cornell Vice President Age: 60 | | Since 2007 | | Vice President of all the DFA Entities. Regional Director of Financial Services Group of Dimensional (since August 1993). |
Christopher S. Crossan Vice President and Chief Compliance Officer Age: 43 | | Since 2004 | | Vice President and Chief Compliance Officer of all the DFA Entities. |
James L. Davis Vice President Age: 52 | | Since 1999 | | Vice President of all the DFA Entities. Formerly, Vice President of DFA Australia Limited and Dimensional Fund Advisors Ltd. |
Robert T. Deere Vice President Age: 52 | | Since 1994 | | Vice President of all the DFA Entities and DFA Australia Limited. |
Robert W. Dintzner Vice President Age: 39 | | Since 2001 | | Vice President of all the DFA Entities. |
35
| | | | |
Name, Position with the Fund and Age | | Term of Office1 and Length of Service | | Principal Occupation(s) During Past 5 Years |
Kenneth Elmgren Vice President Age: 55 | | Since 2007 | | Vice President of all the DFA Entities. Formerly, Managing Principal of Beverly Capital (May 2004 to September 2006). |
Richard A. Eustice Vice President and Assistant Secretary Age: 44 | | Since 1998 | | Vice President and Assistant Secretary of all the DFA Entities and DFA Australia Limited. Chief Operating Officer of Dimensional Fund Advisors Ltd. (since July 2008). Formerly, Vice President of Dimensional Fund Advisors Ltd. |
Eugene F. Fama, Jr. Vice President Age: 48 | | Since 1993 | | Vice President of all the DFA Entities. Formerly, Vice President of DFA Australia Limited and Dimensional Fund Advisors Ltd. |
Gretchen A. Flicker Vice President Age: 38 | | Since 2004 | | Vice President of all the DFA Entities. Prior to April 2004, institutional client service representative of Dimensional. |
Jed S. Fogdall Vice President Age: 35 | | Since 2008 | | Vice President of all the DFA Entities. Portfolio Manager for Dimensional (since September 2004). Prior to September 2004, Staff Engineer at the Boeing Company (1997-2004). |
Glenn S. Freed Vice President Age: 47 | | Since 2001 | | Vice President of all the DFA Entities. |
Jeremy P. Freeman Vice President Age: 38 | | Since 2009 | | Vice President of all the DFA Entities. Senior Technology Manager for Dimensional Fund Advisors LP (since June 2006). Formerly, Principal at AIM Investments/Amvescap PLC (now Invesco) (June 1998-June 2006). |
Mark R. Gochnour Vice President Age: 42 | | Since 2007 | | Vice President of all the DFA Entities. Regional Director of Dimensional. |
Henry F. Gray Vice President Age: 42 | | Since 2000 | | Vice President of all the DFA Entities. Prior to July 2000, Portfolio Manager of Dimensional. Formerly, Vice President of DFA Australia Limited. |
John T. Gray Vice President Age: 35 | | Since 2007 | | Vice President of all the DFA Entities. Formerly, Regional Director of Dimensional (January 2005 to February 2007). |
Darla Hastings Vice President Age: 54 | | Since 2007 | | Vice President of all the DFA Entities. Chief Marketing Officer of Dimensional. Formerly, Senior Vice President, Customer Experience for Benchmark Assisted Living (May 2005 to April 2006); Executive Vice President and Chief Marketing Officer of State Street Corporation (September 2001 to October 2005). |
Joel H. Hefner Vice President Age: 41 | | Since 2007 | | Vice President of all the DFA Entities. Regional Director of Dimensional (since June 1998). |
Julie Henderson Vice President and Fund Controller Age: 35 | | Since 2005 | | Vice President and Fund Controller of all the DFA Entities. Formerly, Senior Manager at PricewaterhouseCoopers LLP (July 1996 to April 2005). |
Kevin Hight Vice President Age: 41 | | Since 2005 | | Vice President of all the DFA Entities. Formerly, Regional Director of Dimensional (since March 2003 to March 2005). |
Christine W. Ho Vice President Age: 41 | | Since 2004 | | Vice President of all the DFA Entities. Prior to April 2004, Assistant Controller of Dimensional. |
Jeff J. Jeon Vice President Age: 35 | | Since 2004 | | Vice President of all the DFA Entities. Counsel of Dimensional (since September 2001). |
Patrick M. Keating Vice President Age: 54 | | Since 2003 | | Vice President of all the DFA Entities and Chief Operating Officer of Dimensional. Director, Vice President and Chief Privacy Officer of Dimensional Fund Advisors Canada ULC. Director of DFA Australia Limited. |
36
| | | | |
Name, Position with the Fund and Age | | Term of Office1 and Length of Service | | Principal Occupation(s) During Past 5 Years |
Joseph F. Kolerich Vice President Age: 37 | | Since 2004 | | Vice President of all the DFA Entities. Portfolio Manager for Dimensional (since April 2001). |
Michael F. Lane Vice President Age: 42 | | Since 2004 | | Vice President of all the DFA Entities. Formerly, Vice President of Advisor Services at TIAA-CREF (July 2001 to September 2004). |
Kristina M. LaRusso Vice President Age: 34 | | Since 2006 | | Vice President of all DFA Entities. Formerly, Operations Supervisor of Dimensional (March 2003 to December 2006). |
Inmoo Lee Vice President Age: 43 | | Since 2007 | | Vice President of all the DFA Entities. Associate Professor Department of Finance and Accounting, Business School, National University of Singapore (July 2004 to present); Associate Professor, College of Business Administration, Korea University (September 2001 to May 2006). |
Juliet Lee Vice President Age: 38 | | Since 2005 | | Vice President of all the DFA Entities. Human Resources Manager of Dimensional (since January 2004). |
Aaron M. Marcus Vice President & Head of Global Human Resources Age: 39 | | Since 2008 | | Vice President and Head of Global Human Resources of Dimensional. Formerly, Global Head of Recruiting and Vice President of Goldman Sachs & Co. (June 2006 to January 2008); Global Co-Head of HR of the Equities & FICC Division, and Vice President of Goldman Sachs & Co. (May 2005 to May 2006); Head of Americas Campus Recruiting and Vice President of Goldman Sachs & Co. (April 2003 to May 2005). |
David R. Martin Vice President, Chief Financial Officer and Treasurer Age: 52 | | Since 2007 | | Vice President, Chief Financial Officer and Treasurer of all the DFA Entities. Director, Vice President, Chief Financial Officer and Treasurer of Dimensional Fund Advisors Ltd. and DFA Australia Limited. Chief Financial Officer, Treasurer, and Vice President of Dimensional Fund Advisors Canada ULC. Director of Dimensional Funds PLC and Dimensional Funds II PLC. Formerly, Executive Vice President and Chief Financial Officer of Janus Capital Group Inc. (June 2005 to March 2007); Senior Vice President of Finance at Charles Schwab & Co., Inc. (March 1999 to May 2005). |
Catherine L. Newell Vice President and Secretary Age: 45 | | Vice President since 1997 and Secretary since 2000 | | Vice President and Secretary of all the DFA Entities. Director, Vice President and Secretary of DFA Australia Limited and Dimensional Fund Advisors Ltd. (since February 2002, April 1997 and May 2002, respectively). Vice President and Secretary of Dimensional Fund Advisors Canada ULC (since June 2003). Director, Dimensional Funds PLC and Dimensional Funds II PLC (since 2002 and 2006, respectively). Formerly, Assistant Secretary of all DFA Entities, DFA Australia Limited and Dimensional Fund Advisors Ltd. |
Christian Newton Vice President Age: 34 | | Since 2009 | | Vice President of all DFA Entities. Web Services Manager for Dimensional Fund Advisors LP (Since January 2008). Formerly Design Manager (2005-2008) and Web Developer (2002-2005) of Dimensional Fund Advisors LP. |
Gerard K. O’Reilly Vice President Age: 32 | | Since 2007 | | Vice President of all the DFA Entities. Formerly, Research Associate of Dimensional Fund Advisors LP (2004 to 2006); Research Assistant in PhD program, Aeronautics Department California Institute of Technology (1998 to 2004). |
Daniel C. Ong Vice President Age: 35 | | Since 2009 | | Vice President of all the DFA Entities. Portfolio Manager for Dimensional Fund Advisors LP (since July 2005). Prior to 2005, Graduate Student at the University of Chicago Booth School of Business (2003-2005). |
Carmen Palafox Vice President Age: 35 | | Since 2006 | | Vice President of all the DFA Entities. Operations Manager of Dimensional Fund Advisors LP (since May 1996). |
Sonya Park Vice President Age: 37 | | Since 2005 | | Vice President of all the DFA Entities. From February 2002 to January 2005, institutional client service representative of Dimensional. |
37
| | | | |
Name, Position with the Fund and Age | | Term of Office1 and Length of Service | | Principal Occupation(s) During Past 5 Years |
David A. Plecha Vice President Age: 48 | | Since 1993 | | Vice President of all the DFA Entities, DFA Australia Limited and Dimensional Fund Advisors Ltd |
Ted Randall Vice President Age: 36 | | Since 2008 | | Vice President of all the DFA Entities. Formerly, Research Associate of Dimensional (2006-2008). Systems Developer of Dimensional (2001-2006). |
L. Jacobo Rodriguez Vice President Age: 38 | | Since 2005 | | Vice President of all the DFA Entities. From August 2004 to July 2005, institutional client service representative of Dimensional. Formerly, Financial Services Analyst, Cato Institute (September 2001 to June 2004); Book Review Editor, Cato Journal, Cato Institute (May 1996 to June 2004). |
David E. Schneider Vice President Age: 63 | | Since 2001 | | Vice President of all the DFA Entities. Currently, Director of Institutional Services. |
Bruce A. Simmons Vice President Age: 44 | | Since 2009 | | Vice President of all the DFA Entities. Investment Operations Manager for Dimensional Fund Advisors LP (since May 2007). Formerly, Vice President Client and Fund Reporting at Mellon Financial (September 2005-May 2007); Vice President Business Development at CUADPRO Marketing (July 2003-September 2005). |
Ted R. Simpson Vice President Age: 41 | | Since 2007 | | Vice President of all the DFA Entities. Regional Director of Dimensional (since December 2002). |
Bryce D. Skaff Vice President Age: 34 | | Since 2007 | | Vice President of all the DFA Entities. Formerly, Regional Director of Dimensional (December 1999 to January 2007). |
Grady M. Smith Vice President Age: 53 | | Since 2004 | | Vice President of all the DFA Entities. Prior to April 2004, Portfolio Manager of Dimensional. |
Carl G. Snyder Vice President Age: 46 | | Since 2000 | | Vice President of all the DFA Entities. Formerly, Vice President of DFA Australia Limited. |
Lawrence R. Spieth Vice President Age: 61 | | Since 2004 | | Vice President of all the DFA Entities. Prior to April 2004, Regional Director of Dimensional. |
Bradley G. Steiman Vice President Age: 36 | | Since 2004 | | Vice President of all the DFA Entities and Director and Vice President of Dimensional Fund Advisors Canada ULC. |
Robert C. Trotter Vice President Age: 51 | | Since 2009 | | Vice President of all the DFA Entities. Senior Manager Technology for Dimensional Fund Advisors LP (since March 2007). Formerly, Director of Technology at AMVESCAP (2002-2007). |
Karen E. Umland Vice President Age: 43 | | Since 1997 | | Vice President of all the DFA Entities, DFA Australia Limited, Dimensional Fund Advisors Ltd., and Dimensional Fund Advisors Canada ULC. |
Sunil Wahal Vice President Age: 42 | | Since 2009 | | Vice President of all the DFA Entities. Formerly, Research Associate for Dimensional Fund Advisors LP (July 2008-January 2009); Consultant to Dimensional Fund Advisors LP (September 2005-July 2008); Jack D. Furst Professor of Finance at Arizona State University, WP Carey School of Business (July 2005-July 2008); Associate Professor of Finance at Goizueta Business School, Emory University (1997-2005). |
Brian J. Walsh Vice President Age: 39 | | Since 2009 | | Vice President of all the DFA Entities. Portfolio Manager for Dimensional Fund Advisors LP (since 2004). Formerly, Trader for Dimensional Fund Advisors LP (1997-2004). |
Carol W. Wardlaw Vice President Age: 51 | | Since 2004 | | Vice President of all the DFA Entities. Prior to April 2004, Regional Director of Dimensional. |
38
| | | | |
Name, Position with the Fund and Age | | Term of Office1 and Length of Service | | Principal Occupation(s) During Past 5 Years |
Weston J. Wellington Vice President Age: 58 | | Since 1997 | | Vice President of all the DFA Entities. Formerly, Vice President of DFA Australia Limited. |
Daniel M. Wheeler Vice President Age: 64 | | Since 2001 | | Vice President of all the DFA Entities. Prior to 2001 and currently, Director of Financial Advisors Services of Dimensional. Director of Dimensional Fund Advisors Ltd. (since October 2003) and President of Dimensional Fund Advisors Canada ULC (since June 2003). |
Ryan Wiley Vice President Age: 33 | | Since 2007 | | Vice President of all the DFA Entities. Senior Trader of Dimensional. Formerly, Portfolio Manager (2006 to 2007); Trader (2001 to 2006). |
Paul E. Wise Vice President Age: 54 | | Since 2005 | | Vice President of all the DFA Entities. Chief Technology Officer for Dimensional (since 2004). Formerly, Principal of Turnbuckle Management Group (January 2002 to August 2004). |
| 1 | Each officer holds office for an indefinite term at the pleasure of the Boards of Trustees/Directors and until his or her successor is elected and qualified. |
39
VOTING PROXIES ON FUND PORTFOLIO SECURITIES
A description of the policies and procedures that the Master Funds use in voting proxies relating to securities held in the portfolios is available without charge, upon request, by calling collect: (512) 306-7400. Information regarding how the Advisor votes these proxies is available from the EDGAR database on the SEC’s website at http://www.sec.gov and from the Advisor’s website at http://www.dimensional.com and reflects the twelve-month period beginning July 1st and ending June 30th.
40
NOTICE TO SHAREHOLDERS
(Unaudited)
For shareholders that do not have an October 31, 2009 tax year end, this notice is for informational purposes only. For shareholders with an October 31, 2009 tax year end, please consult your tax advisor as to the pertinence of this notice. For the fiscal year November 1, 2008 to October 31, 2009, each Global Fund is designating the following items with regard to distributions paid during the fiscal year. All designations are based on financial information available as of the date of this annual report and, accordingly are subject to change. For each item, it is the intention of the Global Fund to designate the maximum amount permitted under the Internal Revenue Code and the regulations thereunder.
| | | | | | | | | | | | | | | | | | | | |
Dimensional Investment Group Inc. | | Net
Investment
Income
Distributions | | Short-Term
Capital
Gain
Distributions | | Long-Term
Capital
Gain
Distributions | | Total
Distributions | | Qualifying
For
Corporate
Dividends
Received
Deduction(1) | | Qualifying
Dividend
Income(2) | | U.S.
Government
Interest(3) | | Foreign
Tax
Credit(4) | | Qualifying
Interest
Income(5) | | Qualifying
Short-Term
Capital
Gain(6) |
Global Equity Portfolio | | | | | | | | | | | | | | | | | | | | |
Class R2 Shares | | 100% | | — | | — | | 100% | | 100% | | 100% | | — | | — | | 100% | | 100% |
Institutional Class Shares | | 100% | | — | | — | | 100% | | 100% | | 100% | | — | | — | | 100% | | 100% |
| | | | | | | | | | |
Global 60/40 Portfolio | | | | | | | | | | | | | | | | | | | | |
Class R2 Shares | | 87% | | — | | 13% | | 100% | | 100% | | 100% | | — | | — | | 100% | | 100% |
Institutional Class Shares | | 87% | | — | | 13% | | 100% | | 100% | | 100% | | — | | — | | 100% | | 100% |
| | | | | | | | | | |
Global 25/75 Portfolio | | | | | | | | | | | | | | | | | | | | |
Class R2 Shares | | 57% | | — | | 43% | | 100% | | 100% | | 100% | | — | | — | | 100% | | 100% |
Institutional Class Shares | | 57% | | — | | 43% | | 100% | | 100% | | 100% | | — | | — | | 100% | | 100% |
| (1) | Qualifying dividends represent dividends which qualify for the corporate dividends received deduction and is reflected as a percentage of ordinary income distributions (the total of net investment income and short-term capital gain distributions). |
| (2) | The percentage in this column represents the amount of “Qualifying Dividend Income” as created by the Jobs and Growth Tax Relief Reconciliation Act of 2003 and is reflected as a percentage of ordinary income distributions (the total of short-term capital gain and net investment income distributions). Please note that these percentages are designated only, refer to your 1099 for actual qualified dividend income. |
| (3) | “U.S. Government Interest” represents the amount of interest that was derived from direct U.S. Government obligations and distributed during the fiscal year. This amount is reflected as a percentage of total ordinary income distributions (the total of net investment income and short-term capital gain distributions). Generally, interest from direct U.S. Government obligations is exempt from state income tax. However, for residents of California, Connecticut and New York, the statutory threshold requirements were not satisfied to permit exemption of these amounts from state income. |
| (4) | “Foreign Tax Credit” represents dividends which qualify for the foreign tax credit pass through and is reflected as a percentage of investment company taxable income (the total of net investment income and short-term capital gain distributions). |
| (5) | The percentage in this column represents the amount of “Qualifying Interest Income” as created by The American Jobs Creation Act of 2004. The information is reflected as a percentage of ordinary income distributions (the total of net investment income and short-term capital gain distributions). |
| (6) | The percentage in this column represents the amount of “Qualifying Short-Term Capital Gain” as created by The American Jobs Creation Act of 2004. The information is reflected as a percentage of ordinary income distributions (the total of net investment income and short-term capital gain distributions). |
41


Dimensional Fund Advisors
6300 Bee Cave Road, Building One
Austin, TX 78746
December 2009
Dear Fellow Shareholder,
After sinking to ten-year lows, stock prices around the world rebounded sharply in March 2009 and posted steady gains in the seven months between March and September. March and April were among the best-return months in the life of Dimensional’s equity Funds.
The unexpected turns in the financial markets this year offered some valuable lessons. We were reminded that stock prices are unpredictable. We saw once again the benefits of staying disciplined in the market as it inevitably moves up and down. And I believe these markets showed very clearly why diversification is so important to long-term investment success.
Although diversification can’t prevent losses, it can help investors avoid the extreme outcomes that can result from concentrating investments in individual stocks or market segments. We believe that successful investing is about both increasing wealth and being able to sleep well at night. Investors who understand how markets work and have a realistic understanding of their own tolerance for risk are most likely to have a good overall experience.
More than $10 billion in net long-term assets flowed into Dimensional’s Funds during the first 10 months of 2009, a reflection of the trust our shareholders around the world have placed in us. We are grateful for that trust and want you to know that we take our responsibility as the steward of your investments in Dimensional’s Funds very seriously. We hope to have the opportunity to continue serving your needs for many years to come.
|
Sincerely, |
|

|
|
David G. Booth |
Chairman and Chief Executive Officer |
[THIS PAGE INTENTIONALLY LEFT BLANK]
ANNUAL REPORT
Table of Contents
This report is submitted for the information of the Fund’s shareholders. It is not authorized for distribution to prospective investors unless preceded or accompanied by an effective prospectus.
i
[THIS PAGE INTENTIONALLY LEFT BLANK]
DIMENSIONAL INVESTMENT GROUP INC.
THE DFA INVESTMENT TRUST COMPANY
DEFINITIONS OF ABBREVIATIONS AND FOOTNOTES
Statement of Assets and Liabilities/Summary Schedule of Portfolio Holdings
Investment Abbreviations
| | |
FHLMC | | Federal Home Loan Mortgage Corporation |
FNMA | | Federal National Mortgage Association |
Investment Footnotes
| | |
† | | See Note B to Financial Statements. |
** | | Calculated as a percentage of total net assets. Percentages shown parenthetically next to the category headings have been calculated as a percentage of total investments. “Other Securities” are those securities that are not among the top 50 holdings of the Fund or do not represent more than 1.0% of the net assets of the Fund. Some of the individual securities within this category may include Total or Partial Securities on Loan and/or Non-Income Producing Securities. |
* | | Non-Income Producing Securities. |
# | | Total or Partial Securities on Loan. |
@ | | Security purchased with cash proceeds from Securities on Loan. |
(r) | | The adjustable rate shown is effective as of October 31, 2009. |
§ | | Affiliated Fund. |
Financial Highlights
| | |
(A) | | Computed using average shares outstanding. |
(B) | | Annualized |
(C) | | Non-Annualized |
(D) | | Represents the combined ratios for the respective portfolio and its respective pro-rata share of its Master Fund Series. |
All Statements and Schedules
| | |
— | | Amounts designated as — are either zero or rounded to zero. |
SEC | | Securities and Exchange Commission |
1
DIMENSIONAL INVESTMENT GROUP INC.
PERFORMANCE CHART
U.S. Large Cap Value Portfolio II vs.
Russell 1000® Value Index
October 31, 1999-October 31, 2009
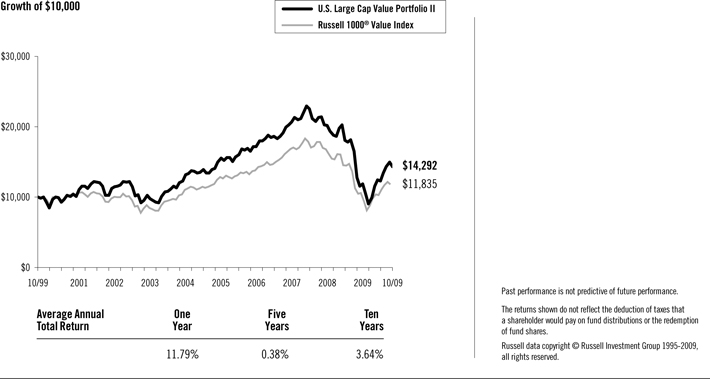
2
DIMENSIONAL INVESTMENT GROUP INC.
MANAGEMENT’S DISCUSSION AND ANALYSIS
| | |
U.S. Equity Market Review | | 12 Months Ended October 31, 2009 |
The year ending October 31, 2009, was among the most volatile periods in U.S. market history. Broad market returns were positive with stocks represented by the mid cap index outperforming those within both small cap and large cap indexes and stocks represented by the growth index outperforming those represented by the value index. Investors moving out of stocks, beginning in late 2008 and extending into early 2009, contributed to high volatility and negative returns over that period. Markets turned sharply higher in March, and the size and value premiums both turned positive over the eight months ending October 2009. Although the large cap index outperformed the small cap index, and the growth index outperformed the value index, returns within the broader market (Russell 3000®Index) demonstrate that there was a positive small size premium and a positive value premium. This counterintuitive result occurred because the stock markets were characterized by extreme volatility, and the indexes, which are reconstituted annually, were not able to rebalance during the course of the year to maintain their intended asset class exposure. Among the most important factors explaining differences in the behavior of diversified equity portfolios are the company size and company value/growth characteristics of the portfolio’s holdings. Size is measured by market capitalization, and value classification is a function of stock price relative to one or more fundamental characteristics. Compared to other stocks, value stocks often have lower market value relative to their earnings, dividends, and book value.
For the 12 months ended October 31, 2009, the total return of the Russell Microcap® Index was 5.06%, the Russell 2000®Index was 6.46%, the CRSP 6-10 Index was 20.94%, and the MSCI US Small Cap 1750 Index was 14.11%. Large cap growth stocks outperformed large cap value stocks, as measured by the Russell 1000®Growth Index and Russell 1000®Value Index. Small cap growth stocks outperformed small cap value stocks, by a lesser amount than in large caps, as measured by the Russell 2000®Growth Index and Russell 2000®Value Index.
Total Return for 12 Months Ended October 31, 2009
| | |
Russell 2000® Index (small cap companies) | | 6.46% |
Russell Midcap® Index (mid cap companies) | | 18.74% |
Russell 1000® Index (large cap companies) | | 11.19% |
Russell 3000® Value Index | | 4.55% |
Russell 3000® Growth Index | | 17.04% |
Further dividing the large, mid, and small cap market segments by value and growth characteristics shows more detail in the performance differences over the period.
Total Return for 12 Months Ended October 31, 2009
| | |
Russell 1000® Value Index (large cap value companies) | | 4.78% |
Russell 1000® Growth Index(large cap growth companies) | | 17.50% |
Russell Midcap® Value Index (mid cap value companies) | | 14.52% |
Russell Midcap® Growth Index (mid cap growth companies) | | 22.48% |
Russell 2500TM Value Index(small/mid cap value companies) | | 8.56% |
Russell 2500TM Growth Index (small/mid cap growth companies) | | 18.20% |
Russell 2000® Value Index (small cap value companies) | | 1.95% |
Russell 2000® Growth Index (small cap growth companies) | | 11.34% |
Source: Russell data copyright © Russell Investment Group 1995-2009, all rights reserved.
Differences in returns for the various Dimensional U.S. equity funds over the 12 months ended October 31, 2009 were attributable primarily to differences in value/growth and size characteristics as well as the exclusion of
3
REIT securities from most Dimensional portfolios, except for the DFA Real Estate Securities Portfolio and portfolios investing in The U.S. Large Company Series. Moreover, the portfolio construction approach used by Dimensional Fund Advisors (the “Advisor”) generally resulted in portfolios with greater emphasis on value or small company characteristics relative to widely used index benchmarks.
Master-Feeder Structure
The portfolio described below, called a “Feeder Fund”, does not buy individual securities directly; instead, the portfolio invests in a corresponding fund called a “Master Fund”. The Master Fund, in turn, purchases stocks and/or other securities.
U.S. Large Cap Value Portfolio II
The U.S. Large Cap Value Portfolio II seeks to capture the returns of U.S. large company value stocks by purchasing shares of a Master Fund that invests in such stocks. The investment strategy employs a disciplined, quantitative approach, emphasizing broad diversification and consistent exposure to large cap value stocks, but does not attempt to track closely a specific equity index. As of October 31, 2009, the Master Fund held 213 stocks and was mostly invested in equities throughout the year: the average non-equitized cash level for the period was less than 1% of the Master Fund’s assets.
As a result of the Master Fund’s diversified investment approach, performance was determined principally by broad structural trends in the U.S. equity market, rather than the behavior of a limited number of stocks. For the 12 months ended October 31, 2009, total returns were 11.79% for the Portfolio and 4.78% for the Russell 1000® Value Index. The Portfolio benefited from a positive size premium and value premium over the last eight months of the period. Relative to the Index, the Master Fund’s greater exposure to stocks with more pronounced value characteristics and composition differences along the value/growth dimension added approximately 4.2% to the relative performance. Differences in sector weights between the Portfolio and Index also contributed to the outperformance. The Master Fund’s larger allocation than the Index to consumer discretionary stocks, due to its strategy of maintaining consistent large cap value exposure, added approximately 3% to relative performance. The Portfolio also benefited from composition differences among the Master Fund’s basket of financial stocks, which added approximately 3.6% to relative performance.
4
DIMENSIONAL INVESTMENT GROUP INC.
U.S. LARGE CAP VALUE PORTFOLIO II
DISCLOSURE OF FUND EXPENSES
(Unaudited)
The following Expense Table is shown so that you can understand the impact of fees on your investment. All mutual funds have operating expenses. As a shareholder of the fund, you incur ongoing costs, which include costs for portfolio management, administrative services, and shareholder reports, among others. Operating expenses, legal and audit services, which are deducted from a fund’s gross income, directly reduce the investment return of the fund. A fund’s expenses are expressed as a percentage of its average net assets. This figure is known as the expense ratio. The following examples are intended to help you understand the ongoing costs, in dollars, of investing in the fund and to compare these costs with those of other mutual funds. The examples are based on an investment of $1,000 made at the beginning of the period shown and held for the entire period.
The Expense Table below illustrates your fund’s costs in two ways.
Actual Fund Return
This section helps you to estimate the actual expenses after fee waivers that you paid over the period. The “Ending Account Value” shown is derived from the fund’s actual return and “Expenses Paid During Period” reflect the dollar amount that would have been paid by an investor who started with $1,000 in the fund. You may use the information here, together with the amount you invested, to estimate the expenses that you paid over the period.
To do so, simply divide your account value by $1,000 (for example, a $7,500 account value divided by $1,000 = 7.5), then multiply the result by the number given for your fund under the heading “Expenses Paid During Period.”
Hypothetical Example for Comparison Purposes
This section is intended to help you compare your fund’s costs with those of other mutual funds. The hypothetical “Ending Account Value” and “Expenses Paid During Period” are derived from the fund’s actual expense ratio and an assumed 5% annual return before expenses. In this case, because the return used is not the fund’s actual return, the results do not apply to your investment. The example is useful in making comparisons because the SEC requires all mutual funds to calculate expenses based on a 5% annual return. You can assess your fund’s costs by comparing this hypothetical example with the hypothetical examples that appear in shareholder reports of other funds.
Please note that the expenses shown in the table are meant to highlight and help you compare ongoing costs only and do not reflect any transactional costs, if applicable. The “Annualized Expense Ratio” represents the actual expenses for the six-month period indicated.
Six Months Ended October 31, 2009
EXPENSE TABLE
| | | | | | | | |
| | | Beginning
Account
Value
05/01/09 | | Ending
Account
Value
10/31/09 | | Annualized
Expense
Ratio* | | Expenses
Paid
During
Period* |
Actual Fund Return | | $1,000.00 | | $1,241.40 | | 0.23% | | $1.30 |
Hypothetical 5% Annual Return | | $1,000.00 | | $1,024.05 | | 0.23% | | $1.17 |
| * | Expenses are equal to the fund’s annualized expense ratio for the six-month period, multiplied by the average account value over the period, multiplied by the number of days in the most recent six-month period (184), then divided by the number of days in the year (365) to reflect the six-month period. The Portfolio is a Feeder Fund. The expenses shown reflect the direct expenses of the Feeder Fund and the indirect payment of the Feeder Fund’s portion of the expenses of its Master Fund. |
5
DIMENSIONAL INVESTMENT GROUP INC.
U.S. LARGE CAP VALUE PORTFOLIO II
DISCLOSURE OF PORTFOLIO HOLDINGS
(Unaudited)
The SEC requires that all Funds file a complete Schedule of Investments with the SEC for their first and third fiscal quarters on Form N-Q. For Dimensional Investment Group Inc., this would be for the fiscal quarters ending January 31 and July 31. The Form N-Q filing must be made within 60 days of the end of the quarter. Dimensional Investment Group Inc. filed its most recent Form N-Q with the SEC on September 29, 2009. It is available upon request, without charge, by calling collect: (512) 306-7400 or by mailing a request to Dimensional Fund Advisors LP, 6300 Bee Cave Road, Building One, Austin, Texas 78746, or by visiting the SEC’s website at http://www.sec.gov, or they may be reviewed and copied at the SEC’s Public Reference Room in Washington, D.C. (call 1-800-732-0330 for information on the operation of the Public Reference Room).
PORTFOLIO HOLDINGS
The SEC requires that all Funds present their categories of portfolio holdings in a table, chart or graph format in their annual and semi-annual shareholder reports, whether or not a Schedule of Investments is utilized. The following table, which presents portfolio holdings as a percent of total investments before short-term investments and collateral for loaned securities, is provided in compliance with such requirement.
The categories of industry classification for the Affiliated Investment Company are represented in the Disclosure of Portfolio Holdings, which are included elsewhere within the report. Refer to the Summary Schedule of Portfolio Holdings for the underlying Master Fund’s holdings which reflect the investments by category.
| | |
Affiliated Investment Companies | | 100.0% |
6
DIMENSIONAL INVESTMENT GROUP INC.
U.S. LARGE CAP VALUE PORTFOLIO II
STATEMENT OF ASSETS AND LIABILITIES
OCTOBER 31, 2009
(Amounts in thousands, except share and per share amounts)
| | | | |
ASSETS: | | | | |
Investments in The U.S. Large Cap Value Series of The DFA Investment Trust Company (Affiliated Investment Company) at Value† | | $ | 100,913 | |
Receivables: | | | | |
Fund Shares Sold | | | 379 | |
Prepaid Expenses and Other Assets | | | 11 | |
| | | | |
Total Assets | | | 101,303 | |
| | | | |
LIABILITIES: | | | | |
Payables: | | | | |
Affiliated Investment Company Purchased | | | 359 | |
Fund Shares Redeemed | | | 20 | |
Due to Advisor | | | 1 | |
Accrued Expenses and Other Liabilities | | | 17 | |
| | | | |
Total Liabilities | | | 397 | |
| | | | |
NET ASSETS | | $ | 100,906 | |
| | | | |
SHARES OUTSTANDING, $0.01 PAR VALUE (1) | | | 13,416,831 | |
| | | | |
NET ASSET VALUE, OFFERING AND REDEMPTION PRICE PER SHARE | | $ | 7.52 | |
| | | | |
Investment in Affiliated Investment Company at Cost | | $ | 85,677 | |
| | | | |
NET ASSETS CONSIST OF: | | | | |
Paid-In Capital | | $ | 136,129 | |
Undistributed Net Investment Income (Distributions in Excess of Net Investment Income) | | | 248 | |
Accumulated Net Realized Gain (Loss) | | | (50,707 | ) |
Net Unrealized Appreciation (Depreciation) | | | 15,236 | |
| | | | |
NET ASSETS | | $ | 100,906 | |
| | | | |
(1) NUMBER OF SHARES AUTHORIZED | | | 300,000,000 | |
| | | | |
See accompanying Notes to Financial Statements.
7
DIMENSIONAL INVESTMENT GROUP INC.
U.S. LARGE CAP VALUE PORTFOLIO II
STATEMENT OF OPERATIONS
FOR THE YEAR ENDED OCTOBER 31, 2009
(Amounts in thousands)
| | | | |
Investment Income | | | | |
Dividends | | $ | 2,046 | |
Interest | | | 2 | |
Income from Securities Lending | | | 177 | |
Expenses Allocated from Affiliated Investment Company | | | (113 | ) |
| | | | |
Total Investment Income | | | 2,112 | |
| | | | |
| |
Expenses | | | | |
Administrative Services Fees | | | 9 | |
Accounting & Transfer Agent Fees | | | 14 | |
Filing Fees | | | 21 | |
Shareholders’ Reports | | | 31 | |
Audit Fees | | | 2 | |
Legal Fees | | | 10 | |
Other | | | 2 | |
| | | | |
Total Expenses | | | 89 | |
| | | | |
Net Investment Income (Loss) | | | 2,023 | |
| | | | |
Realized and Unrealized Gain (Loss) | | | | |
Net Realized Gain (Loss) on Investment Securities Sold | | | (49,627 | ) |
Change in Unrealized Appreciation (Depreciation) of Investment Securities | | | 56,943 | |
| | | | |
Net Realized and Unrealized Gain (Loss) | | | 7,316 | |
| | | | |
Net Increase (Decrease) in Net Assets Resulting from Operations | | $ | 9,339 | |
| | | | |
Investment Income and Realized and Unrealized Gain (Loss) were allocated from the Portfolio’s Master Fund (Affiliated Investment Company).
See accompanying Notes to Financial Statements.
8
DIMENSIONAL INVESTMENT GROUP INC.
U.S. LARGE CAP VALUE PORTFOLIO II
STATEMENTS OF CHANGES IN NET ASSETS
(Amounts in thousands)
| | | | | | | | | | | | |
| | | Year
Ended
Oct. 31,
2009 | | | Period
Dec. 1, 2007
to
Oct. 31, 2008 | | | Year
Ended
Nov. 30,
2007 | |
Increase (Decrease) in Net Assets | | | | | | | | | | | | |
Operations: | | | | | | | | | | | | |
Net Investment Income (Loss) | | $ | 2,023 | | | $ | 2,915 | | | $ | 7,301 | |
Net Realized Gain (Loss) on Investment Securities Sold | | | (49,627 | ) | | | — | | | | 26,666 | † |
Change in Unrealized Appreciation (Depreciation) of Investment Securities | | | 56,943 | | | | (81,625 | )† | | | (36,378 | )† |
| | | | | | | | | | | | |
Net Increase (Decrease) in Net Assets Resulting from Operations | | | 9,339 | | | | (78,710 | ) | | | (2,411 | ) |
| | | | | | | | | | | | |
Distributions From: | | | | | | | | | | | | |
Net Investment Income | | | (2,293 | ) | | | (4,450 | ) | | | (7,401 | ) |
Net Short-Term Gains | | | — | | | | — | | | | (784 | ) |
Net Long-Term Gains | | | (40,902 | ) | | | (24,080 | ) | | | (10,356 | ) |
| | | | | | | | | | | | |
Total Distributions | | | (43,195 | ) | | | (28,530 | ) | | | (18,541 | ) |
| | | | | | | | | | | | |
Capital Share Transactions (1): | | | | | | | | | | | | |
Shares Issued | | | 15,401 | | | | 11,812 | | | | 74,150 | |
Shares Issued in Lieu of Cash Distributions | | | 43,195 | | | | 28,530 | | | | 18,541 | |
Shares Redeemed | | | (18,603 | ) | | | (308,347 | ) | | | (94,641 | ) |
| | | | | | | | | | | | |
Net Increase (Decrease) from Capital Share Transactions | | | 39,993 | | | | (268,005 | ) | | | (1,950 | ) |
| | | | | | | | | | | | |
Total Increase (Decrease) in Net Assets | | | 6,137 | | | | (375,245 | ) | | | (22,902 | ) |
Net Assets | | | | | | | | | | | | |
Beginning of Period | | | 94,769 | | | | 470,014 | | | | 492,916 | |
| | | | | | | | | | | | |
End of Period | | $ | 100,906 | | | $ | 94,769 | | | $ | 470,014 | |
| | | | | | | | | | | | |
| | | |
(1) Shares Issued and Redeemed: | | | | | | | | | | | | |
Shares Issued | | | 2,286 | | | | 628 | | | | 3,044 | |
Shares Issued in Lieu of Cash Distributions | | | 6,967 | | | | 1,358 | | | | 782 | |
Shares Redeemed | | | (2,864 | ) | | | (15,513 | ) | | | (3,984 | ) |
| | | | | | | | | | | | |
Net Increase (Decrease) from Shares Issued and Redeemed | | | 6,389 | | | | (13,527 | ) | | | (158 | ) |
| | | | | | | | | | | | |
| | | |
Undistributed Net Investment Income (Distributions in Excess of Net Investment Income) | | $ | 248 | | | $ | 535 | | | $ | 2,018 | |
† See Note A in the Notes to Financial Statements.
See accompanying Notes to Financial Statements.
9
DIMENSIONAL INVESTMENT GROUP INC.
U.S. LARGE CAP VALUE PORTFOLIO II
FINANCIAL HIGHLIGHTS
(for a share outstanding throughout each period)
| | | | | | | | | | | | | | | | | | | | | | | | |
| | | Year Ended Oct. 31,
2009 | | | Period
Dec. 1, 2007
to Oct. 31, 2008 | | | Year Ended Nov. 30,
2007 | | | Year Ended Nov. 30,
2006 | | | Year Ended Nov. 30,
2005 | | | Year Ended Nov. 30,
2004 | |
| | |
Net Asset Value, Beginning of Period | | $ | 13.48 | | | $ | 22.87 | | | $ | 23.80 | | | $ | 20.53 | | | $ | 18.13 | | | $ | 15.19 | |
| | | | | | | | | | | | | | | | | | | | | | | | |
Income from Investment Operations | | | | | | | | | | | | | | | | | | | | | | | | |
Net Investment Income (Loss) | | | 0.15 | (A) | | | 0.27 | (A) | | | 0.33 | (A) | | | 0.38 | (A) | | | 0.30 | | | | 0.16 | |
Net Gains (Losses) on Securities (Realized and Unrealized) | | | 0.03 | | | | (8.10 | ) | | | (0.39 | ) | | | 3.29 | | | | 2.32 | | | | 3.09 | |
| | | | | | | | | | | | | | | | | | | | | | | | |
Total from Investment Operations | | | 0.18 | | | | (7.83 | ) | | | (0.06 | ) | | | 3.67 | | | | 2.62 | | | | 3.25 | |
| | |
Less Distributions | | | | | | | | | | | | | | | | | | | | | | | | |
Net Investment Income | | | (0.25 | ) | | | (0.37 | ) | | | (0.34 | ) | | | (0.35 | ) | | | (0.22 | ) | | | (0.31 | ) |
Net Realized Gains | | | (5.89 | ) | | | (1.19 | ) | | | (0.53 | ) | | | (0.05 | ) | | | — | | | | — | |
| | | | | | | | | | | | | | | | | | | | | | | | |
Total Distributions | | | (6.14 | ) | | | (1.56 | ) | | | (0.87 | ) | | | (0.40 | ) | | | (0.22 | ) | | | (0.31 | ) |
| | | | | | | | | | | | | | | | | | | | | | | | |
Net Asset Value, End of Period | | $ | 7.52 | | | $ | 13.48 | | | $ | 22.87 | | | $ | 23.80 | | | $ | 20.53 | | | $ | 18.13 | |
| | |
Total Return | | | 11.79 | % | | | (36.60 | )%(C) | | | (0.34 | )% | | | 18.16 | % | | | 14.57 | % | | | 21.66 | % |
| | |
| | | | | | |
Net Assets, End of Period (thousands) | | $ | 100,906 | | | $ | 94,769 | | | $ | 470,014 | | | $ | 492,916 | | | $ | 345,171 | | | $ | 195,975 | |
Ratio of Expenses to Average Net Assets (D) | | | 0.23 | % | | | 0.16 | %(B) | | | 0.14 | % | | | 0.16 | % | | | 0.18 | % | | | 0.21 | % |
Ratio of Net Investment Income to Average Net Assets | | | 2.32 | % | | | 1.44 | %(B) | | | 1.36 | % | | | 1.74 | % | | | 1.60 | % | | | 0.98 | % |
| | |
See page 1 for the Definitions of Abbreviations and Footnotes.
See accompanying Notes to Financial Statements.
10
DIMENSIONAL INVESTMENT GROUP INC.
U.S. LARGE CAP VALUE PORTFOLIO II
NOTES TO FINANCIAL STATEMENTS
A. Organization:
Dimensional Investment Group Inc. (the “Fund”) is an open-end management investment company registered under the Investment Company Act of 1940, whose shares are offered to institutional investors, retirement plans and clients of registered investment advisors. The Fund consists of fifteen portfolios, of which U.S. Large Cap Value Portfolio II (the “Portfolio”) is presented in this report.
The Portfolio primarily invests its assets in The U.S. Large Cap Value Series (the “Series”), a corresponding series of The DFA Investment Trust Company. At October 31, 2009, the Portfolio owned 2% of the Series. The financial statements of the Series are included elsewhere in this report and should be read in conjunction with the financial statements of the Portfolio.
Effective December 31, 2008, The U.S. Large Cap Value Series, a master fund in a RIC/RIC master-feeder structure, elected with the consent of its respective Holder(s) to change its U.S. federal income tax classification from that of an association taxable as a corporation to a partnership pursuant to Treasury Regulation § 301.7701-3. The change in capital structure and retroactive reclassification of the statement of changes in net assets and financial highlights for the fund is a result of the treatment of a partnership for book purposes. The Series/Portfolio will maintain its books and records and present its financial statements in accordance with generally accepted accounting principles for investment partnerships.
At a regular meeting of the Board of Directors/Trustees (the “Board”) on September 16, 2008, the Board voted to change the fiscal and tax year ends of the Portfolio from November 30 to October 31.
B. Significant Accounting Policies:
The following significant accounting policies are in conformity with accounting principles generally accepted in the United States of America. Such policies are consistently followed by the Fund in preparation of its financial statements. The preparation of financial statements in accordance with accounting principles generally accepted in the United States of America requires management to make estimates and assumptions that affect the reported amounts of assets and liabilities and disclosure of contingent assets and liabilities at the date of the financial statements and the reported amounts of increases and decreases in net assets from operations during the reporting period. Actual results could differ from those estimates and those differences could be material.
1. Security Valuation: The Portfolio’s investment reflects its proportionate interest in the net assets of the Series.
The Portfolio utilizes a fair value hierarchy which prioritizes the inputs to valuation techniques used to measure fair value into three broad levels described below:
— Level 1 – quoted prices in active markets for identical securities
— Level 2 – other significant observable inputs (including quoted prices for similar securities, interest rates, prepayment speeds, credit risk, etc.)
— Level 3 – significant unobservable inputs (including the Portfolio’s own assumptions in determining the fair value of investments)
The inputs or methodology used for valuing securities are not necessarily an indication of the risk associated with investing in those securities. A summary of the inputs used to value the Portfolio’s net assets as of October 31, 2009 is listed below (in thousands).
11
| | | | | | | | | | |
| | | Valuation Inputs |
| | | | | Investments in
Securities
(Market Value) | | |
| | | Level 1 | | Level 2 | | Level 3 | | Total |
U.S. Large Cap Value Portfolio II | | $ | 100,913 | | — | | — | | $ | 100,913 |
2. Deferred Compensation Plan: Each eligible Director of the Fund may elect participation in the Deferred Compensation Plan (the “Plan”). Under the Plan, effective January 1, 2002, such Directors may defer payment of all or a portion of their total fees earned as a Director. These deferred amounts may be treated as though such amounts had been invested in shares of the following funds: U.S. Large Cap Value Portfolio; U.S. Core Equity 1 Portfolio; U.S. Core Equity 2 Portfolio; U.S. Vector Equity Portfolio; U.S. Micro Cap Portfolio; DFA International Value Portfolio; International Core Equity Portfolio; Emerging Markets Portfolio; Emerging Markets Core Equity Portfolio; and/or DFA Two-Year Global Fixed Income Portfolio. Contributions made under the Plan and the change in unrealized appreciation (depreciation) and income, are included in Directors’/Trustees’ Fees & Expenses. At October 31, 2009, the total liability for deferred compensation to Directors is included in Accrued Expenses and Other Liabilities on the Statement of Assets and Liabilities in the amount of $2 (in thousands).
Each Director has the option to receive their distribution of proceeds in one of the following methods upon one year’s notice: lump sum; annual installments over a period of agreed upon years; or semi-annual installments over a period of agreed upon years. As of October 31, 2009, none of the Directors have requested distribution of proceeds.
3. Other: The Portfolio recognizes its pro-rata share, on a daily basis, of net investment income and realized and unrealized gains and losses of investment securities from the Series, which is treated as a partnership for federal income tax purposes. Dividend income and distributions to shareholders are recorded on the ex-dividend date. Distributions received on securities that represent a return of capital or capital gain are recorded as a reduction of cost of investments or as a realized gain, respectively. The Portfolio estimates the character of distributions received that may be considered return of capital distributions. Expenses directly attributable to the Portfolio are directly charged. Common expenses of the Fund are allocated using methods approved by the Board of Directors/Trustees, generally based on average net assets.
C. Investment Advisor:
Dimensional Fund Advisors LP (“Dimensional” or the “Advisor”) provides administrative services to the Portfolio, including supervision of services provided by others, providing information to the shareholders and to the Board of Directors/Trustees, and other administrative services. The Advisor provides investment advisory services to the Series. For the year ended October 31, 2009, the Portfolio’s administrative services fees were accrued daily and paid monthly to the Advisor based on an effective annual rate of 0.01% of average daily net assets.
Fees Paid to Officers and Directors/Trustees:
Certain Officers and Directors/Trustees of the Advisor are also Officers and Directors/Trustees of the Fund; however, such Officers and Directors/Trustees (with the exception of the Chief Compliance Officer (“CCO”)) receive no compensation from the Fund. For the year ended October 31, 2009, the total related amounts paid by the Fund to the CCO were $27 (in thousands). The total related amounts paid by the Portfolio are included in Other Expenses on the Statement of Operations.
D. Federal Income Taxes:
The Portfolio has qualified and intends to continue to qualify as a regulated investment company under Subchapter M of the Internal Revenue Code for federal income tax purposes and to distribute substantially all of its taxable income and net capital gains to shareholders. Accordingly, no provision has been made for federal income taxes.
Distributions from net investment income and net realized capital gains are determined in accordance with U.S. federal income tax regulations, which may differ from those amounts determined under accounting principles generally
12
accepted in the United States of America. These book/tax differences are either temporary or permanent in nature. To the extent these differences are permanent, they are charged or credited to paid-in capital, undistributed net investment income or accumulated net realized gains, as appropriate, in the period that the differences arise. Accordingly, the following permanent differences as of October 31, 2009 were classified to the following accounts. The reclassifications had no effect on net assets or net asset value per share (amounts in thousands):
| | |
Increase (Decrease) Undistributed Net Investment Income | | Increase (Decrease) Accumulated Net Realized Gains |
$(17) | | $17 |
The tax character of dividends and distributions declared and paid during the year ended November 30, 2007, the period December 1, 2007 to October 31, 2008 and the year ended October 31, 2009 were as follows (amounts in thousands):
| | | | | | |
| | | Net
Investment
Income and
Short-Term
Capital Gains | | Long-Term
Gains | | Total |
2007 | | $8,185 | | $10,356 | | $18,541 |
2008 | | 4,399 | | 24,131 | | 28,530 |
2009 | | 2,299 | | 40,896 | | 43,195 |
At October 31, 2009, the components of distributable earnings/(accumulated losses) were as follows (amounts in thousands):
| | | | | | |
Undistributed Net Investment Income and Short-Term Capital Gains | | Undistributed Long-Term Capital Gains | | Capital Loss Carryforwards | | Total Net Distributable Earnings/ (Accumulated Losses) |
$251 | | — | | $(50,707) | | $(50,456) |
For federal income tax purposes, the Fund measures its capital loss carryforwards annually at October 31, its fiscal year end. Capital loss carryforwards may be carried forward and applied against future capital gains. As of October 31, 2009, the Portfolio had capital loss carryforwards of $50,707 (in thousands) available to offset future realized capital gains through October 31, 2017.
At October 31, 2009, the total cost and aggregate gross unrealized appreciation and (depreciation) of securities for federal income tax purposes were different from amounts reported for financial reporting purposes (amounts in thousands):
| | | | | | |
Federal Tax Cost | | Unrealized Appreciation | | Unrealized (Depreciation) | | Net Unrealized Appreciation (Depreciation) |
$85,677 | | $17,427 | | $(2,191) | | $15,236 |
Accounting for Uncertainty in Income Taxes sets forth a minimum threshold for financial statement recognition of the benefit of a tax position taken or expected to be in a tax return. Management has analyzed the Portfolio’s tax position and has concluded that no provision for income tax is required in the Portfolio’s financial statements. The Portfolio is not aware of any tax position for which it is reasonably possible that the total amounts of unrecognized tax benefits will significantly change in the next twelve months. The Portfolio’s federal tax returns for the prior three fiscal years remain subject to examination by the Internal Revenue Service.
13
Effective December 31, 2008, The U.S. Large Cap Value Series, a master fund in a RIC/RIC master-feeder structure with four RIC feeders and other direct client investor(s), made a “Check-the-box” election for federal income tax purposes pursuant to Treasury Regulation §301.7701-3, to change its federal entity classification from a corporation taxable as a regulated investment company to a partnership. As a result of this election, the master fund is deemed to have distributed all of its assets and liabilities, in a taxable transaction, to its shareholders in liquidation of the master fund. Immediately thereafter, the shareholders contributed all of the distributed assets and liabilities to a newly formed partnership. The final tax year end of The U.S. Large Cap Value Series was December 30, 2008. For Federal income tax purposes, pursuant to IRC Code §336(a), the master fund recognized a loss as if the master’s investment securities were sold to its shareholders and, pursuant to IRC Code §331, each of the Portfolios recognized a gain as if it liquidated its investment in the master. For tax purposes, pursuant to IRC Code §334(a), each of the Portfolios took a fair market value basis in the securities deemed received by them and a new holding period for those securities commenced on the deemed liquidation date.
The master fund had book/tax differences upon its deemed liquidation. The following summary of permanent differences occurred as of the respective effective “Check the Box” election date.
| | | | | | |
Increase (Decrease) Paid-In Capital | | Unrealized Appreciation (Depreciation) Investment Securities | | Increase (Decrease) Undistributed Net Investment Income | | Increase (Decrease) Accumulated Net Realized Gains (Losses) |
$(3,038,312,278) | | $2,303,664,484 | | $(698,899) | | $735,346,693 |
As a result of the transaction, The U.S. Large Cap Value Series recognized a ($2,303,664,484) capital loss for tax year ended December 30, 2008. Additionally, the fund has written off $3,039,011,176 of expired capital loss carryover as a permanent book/tax reporting difference decreasing paid in capital.
Each Portfolio impacted by the “Check the Box” election also has a permanent book/tax difference resulting from the transaction. Listed below is the permanent difference impacting each respective Portfolio. For financial statement purposes, this adjustment did not result in any changes to each respective fund’s net assets or net asset value per share.
| | | | |
| | | Increase
(Decrease)
Undistributed
Net Investment
Income | | Increase
(Decrease)
Accumulated
Net Realized
Gains (Losses) |
U.S. Large Cap Value Portfolio | | $(606,345) | | $606,345 |
U.S. Large Cap Value Portfolio II | | (10,872) | | 10,872 |
U.S. Large Cap Value Portfolio III | | (139,353) | | 139,353 |
LWAS/DFA U.S. High Book To Market Portfolio | | (7,793) | | 7,793 |
For financial reporting purposes, this transaction had no impact on the net assets of the respective funds.
E. Line of Credit:
The Fund, together with other Dimensional-advised portfolios, has entered into an amended and restated $250 million unsecured discretionary line of credit effective July 8, 2009 with an affiliate of its domestic custodian bank. Each portfolio is permitted to borrow, subject to its investment limitations, up to a maximum of $250 million, as long as total borrowings under the line of credit do not exceed $250 million in the aggregate. Borrowings under the line of credit are charged interest at the then current Federal Funds Rate plus 1%. Each portfolio is individually, and not jointly, liable for its particular advances under the line of credit. There is no commitment fee on the unused portion of the line of credit. The agreement for the discretionary line of credit may be terminated by either party at any time. The line of credit is scheduled to expire on June 22, 2010. There were no borrowings by the Portfolio under this line of credit during the year ended October 31, 2009.
14
The Fund, together with other Dimensional-advised portfolios, has also entered into an additional $500 million unsecured line of credit effective January 15, 2009 with its international custodian bank. Each portfolio is permitted to borrow, subject to its investment limitations, up to a maximum of $500 million, as long as total borrowings under the line of credit do not exceed $500 million in the aggregate. Each portfolio is individually, and not jointly, liable for its particular advances under the line of credit. Borrowings under the line of credit are charged interest at rates agreed to by the parties at the time of borrowing. There is no commitment fee on the unused portion of the line of credit. The agreement for the line of credit expires on January 15, 2010. There were no borrowings by the Portfolio under this line of credit during the year ended October 31, 2009.
F. Indemnitees; Contractual Obligations:
Under the Fund’s organizational documents, its officers and directors are indemnified against certain liabilities arising out of the performance of the duties to the Fund.
In the normal course of business, the Fund enters into contracts that contain a variety of representations and warranties which provide general indemnification. The Fund’s maximum exposure under these arrangements is unknown as this would involve future claims that may be made against the Fund and/or its affiliates that have not yet occurred. However, based on experience, the Fund expects the risk of loss to be remote.
G. Other:
At October 31, 2009, two shareholders held 100% of the outstanding shares of the Portfolio.
H. Subsequent Event Evaluations:
Management has evaluated the impact of all subsequent events on the Portfolio through December 23, 2009, the date the financial statements were available for issuance, and has determined that there are no subsequent events requiring recognition or disclosure in the financial statements.
15
REPORT OF INDEPENDENT REGISTERED PUBLIC ACCOUNTING FIRM
To the Shareholders of U.S. Large Cap Value Portfolio II and
Board of Directors of Dimensional Investment Group Inc.:
In our opinion, the accompanying statement of assets and liabilities, and the related statements of operations and of changes in net assets and the financial highlights present fairly, in all material respects, the financial position of U.S. Large Cap Value Portfolio II (one of the portfolios constituting Dimensional Investment Group Inc., hereafter referred to as the “Portfolio”) at October 31, 2009, the results of its operations for the year then ended, the changes in its net assets and the financial highlights for each of the periods indicated, in conformity with accounting principles generally accepted in the United States of America. These financial statements and financial highlights (hereafter referred to as “financial statements”) are the responsibility of the Portfolio’s management; our responsibility is to express an opinion on these financial statements based on our audits. We conducted our audits of these financial statements in accordance with the standards of the Public Company Accounting Oversight Board (United States). Those standards require that we plan and perform the audit to obtain reasonable assurance about whether the financial statements are free of material misstatement. An audit includes examining, on a test basis, evidence supporting the amounts and disclosures in the financial statements, assessing the accounting principles used and significant estimates made by management, and evaluating the overall financial statement presentation. We believe that our audits, which included confirmation of securities at October 31, 2009 by correspondence with the transfer agent of the investee fund, provide a reasonable basis for our opinion.
PricewaterhouseCoopers LLP
Philadelphia, Pennsylvania
December 23, 2009
16
RESULTS OF THE SHAREHOLDER MEETING
On June 2, 2009, June 5, 2009, and July 8, 2009, Dimensional Investment Group Inc. (“DIG”) held a Special Joint Meeting of Shareholders for the purpose of voting on several proposals affecting DIG and the Portfolio, including, among other items, the election of Directors, the amendment of certain fundamental investment limitations, and the elimination of certain fundamental investment limitations. The shareholders of the Portfolio approved each of the applicable proposals for DIG and the Portfolio presented at the Meeting. Listed below are the voting results from the Meeting. Please note that not all Proposals presented at the Meeting were voted on by the Portfolio. Additionally, the Proposal numbers reflected below correlate to the Proposal numbers presented for vote at the Meeting.
DIG
| | | | | | | | | | | | | | | | | | | | |
| | | | | Shares Voted | | Percent of Outstanding Shares Voted |
| | | | | For | | % | | Against | | % | | Abstain/WithHold | | % | | For | | Against | | Abstain / WithHold |
Proposal 1: Election of Directors for DIG* | | | | | | | | | | | | | | | | | | |
| | | | | | | | | | |
1a | | David G. Booth | | 754,612,895 | | 96.26% | | — | | 0.00% | | 29,301,677 | | 3.74% | | 85.87% | | 0.00% | | 3.33% |
1b | | George M. Constantinides | | 753,991,785 | | 96.18% | | — | | 0.00% | | 29,922,787 | | 3.82% | | 85.80% | | 0.00% | | 3.41% |
1c | | John P. Gould | | 753,344,569 | | 96.10% | | — | | 0.00% | | 30,570,003 | | 3.90% | | 85.73% | | 0.00% | | 3.48% |
1d | | Roger G. Ibbotson | | 754,232,365 | | 96.21% | | — | | 0.00% | | 29,682,207 | | 3.79% | | 85.83% | | 0.00% | | 3.38% |
1e | | Robert C. Merton | | 754,598,874 | | 96.26% | | — | | 0.00% | | 29,315,698 | | 3.74% | | 85.87% | | 0.00% | | 3.34% |
1f | | Myron S. Scholes | | 754,057,040 | | 96.19% | | — | | 0.00% | | 29,857,532 | | 3.81% | | 85.81% | | 0.00% | | 3.40% |
1g | | Eduardo A. Repetto | | 753,295,592 | | 96.09% | | — | | 0.00% | | 30,618,979 | | 3.91% | | 85.72% | | 0.00% | | 3.48% |
1h | | Abbie J. Smith | | 754,123,603 | | 96.20% | | — | | 0.00% | | 29,790,969 | | 3.80% | | 85.82% | | 0.00% | | 3.39% |
| | | | | | | | | | | | | | | | | | | | | | |
| | | Shares Voted | | Percent of Outstanding Shares Voted |
| | | For | | % | | Against | | % | | Abstain/WithHold | | % | | NonVote | | % | | For | | Against | | Abstain / WithHold |
Proposal 2: To approve Articles of Amendment and Restatement for DIG* | | 479,705,048 | | 93.81% | | 7,503,436 | | 1.47% | | 24,156,664 | | 4.72% | | NA | | NA | | 54.59% | | 0.85% | | 2.75% |
* Results are for all Portfolios within DIG
U.S. Large Cap Value Portfolio II
| | | | | | | | | | | | | | | | | | | | |
| | | | | Shares Voted | | Percent of Outstanding Shares Voted |
| | | | | For | | % | | Against | | % | | Abstain/WithHold | | % | | For | | Against | | Abstain / WithHold |
Proposals: | | | | | | | | | | | | | | | | | | |
| | | | | | | |
5 | | To approve amendments to certain fundamental investment restrictions | | | | | | | | | | | | |
5a | | Borrowing Money | | 11,247,089 | | 98.49% | | 123,941 | | 1.09% | | 48,664 | | 0.43% | | 84.01% | | 0.93% | | 0.36% |
5b | | Making Loans | | 11,247,089 | | 98.49% | | 123,941 | | 1.09% | | 48,664 | | 0.43% | | 84.01% | | 0.93% | | 0.36% |
5c | | Investments in Real Estate | | 11,234,115 | | 98.37% | | 136,915 | | 1.20% | | 48,664 | | 0.43% | | 83.91% | | 1.02% | | 0.36% |
5d | | Investments in Commodities | | 11,258,649 | | 98.59% | | 112,381 | | 0.98% | | 48,664 | | 0.43% | | 84.09% | | 0.84% | | 0.36% |
5e | | Diversification of Investments | | 11,285,207 | | 98.82% | | 85,823 | | 0.75% | | 48,664 | | 0.43% | | 84.29% | | 0.64% | | 0.36% |
6 | | To approve the elimination of certain fundamental investment restrictions | | | | | | | | |
6a | | Pledging, Mortgaging, or Hypothecating Assets | | 11,236,234 | | 98.39% | | 134,796 | | 1.18% | | 48,664 | | 0.43% | | 83.92% | | 1.01% | | 0.36% |
6b | | Purchasing Securities on Margin | | 11,248,129 | | 98.50% | | 122,901 | | 1.08% | | 48,664 | | 0.43% | | 84.01% | | 0.92% | | 0.36% |
6c | | Investing in Restricted or Illiquid Securities | | 11,250,029 | | 98.51% | | 121,001 | | 1.06% | | 48,664 | | 0.43% | | 84.03% | | 0.90% | | 0.36% |
6d | | Investing for the Purpose of Exercising Control | | 11,250,029 | | 98.51% | | 121,001 | | 1.06% | | 48,664 | | 0.43% | | 84.03% | | 0.90% | | 0.36% |
6e | | Investing in Other Investment Companies | | 11,244,371 | | 98.46% | | 129,269 | | 1.13% | | 46,054 | | 0.40% | | 83.99% | | 0.97% | | 0.34% |
6f | | Management Ownership of Securities of an Issuer | | 11,271,692 | | 98.70% | | 99,338 | | 0.87% | | 48,664 | | 0.43% | | 84.19% | | 0.74% | | 0.36% |
6g | | Investing in Oil, Gas, or other Mineral Exploration, Leases or Development Programs | | 11,249,055 | | 98.51% | | 121,975 | | 1.07% | | 48,664 | | 0.43% | | 84.02% | | 0.91% | | 0.36% |
6h | | Investing in Securities of Unseasoned Issuers | | 11,249,055 | | 98.51% | | 121,975 | | 1.07% | | 48,664 | | 0.43% | | 84.02% | | 0.91% | | 0.36% |
6i | | Investing in Warrants | | 11,250,133 | | 98.52% | | 120,897 | | 1.06% | | 48,664 | | 0.43% | | 84.03% | | 0.90% | | 0.36% |
6j | | Writing or Acquiring Options | | 11,250,029 | | 98.51% | | 121,001 | | 1.06% | | 48,664 | | 0.43% | | 84.03% | | 0.90% | | 0.36% |
8 | | Approval of Investment Advisory Agreement between Dimensional Fund Advisors LP and the Company | | 11,283,056 | | 98.80% | | 87,974 | | 0.77% | | 48,664 | | 0.43% | | 84.27% | | 0.66% | | 0.36% |
17
THE DFA INVESTMENT TRUST COMPANY
PERFORMANCE CHART
The U.S. Large Cap Value Series vs.
Russell 1000® Value Index
October 31, 1999-October 31, 2009
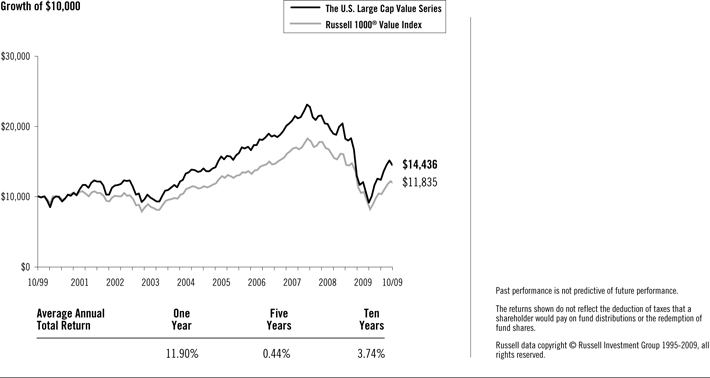
18
THE DFA INVESTMENT TRUST COMPANY
THE U.S. LARGE CAP VALUE SERIES
DISCLOSURE OF FUND EXPENSES
(Unaudited)
The following Expense Table is shown so that you can understand the impact of fees on your investment. All mutual funds have operating expenses. As a shareholder of the fund, you incur ongoing costs, which include costs for portfolio management, administrative services, and shareholder reports, among others. Operating expenses, legal and audit services, which are deducted from a fund’s gross income, directly reduce the investment return of the fund. A fund’s expenses are expressed as a percentage of its average net assets. This figure is known as the expense ratio. The following examples are intended to help you understand the ongoing costs, in dollars, of investing in the fund and to compare these costs with those of other mutual funds. The examples are based on an investment of $1,000 made at the beginning of the period shown and held for the entire period.
The Expense Table below illustrates your fund’s costs in two ways.
Actual Fund Return
This section helps you to estimate the actual expenses after fee waivers that you paid over the period. The “Ending Account Value” shown is derived from the fund’s actual return and “Expenses Paid During Period” reflect the dollar amount that would have been paid by an investor who started with $1,000 in the fund. You may use the information here, together with the amount you invested, to estimate the expenses that you paid over the period.
To do so, simply divide your account value by $1,000 (for example, a $7,500 account value divided by $1,000 = 7.5), then multiply the result by the number given for your fund under the heading “Expenses Paid During Period.”
Hypothetical Example for Comparison Purposes
This section is intended to help you compare your fund’s costs with those of other mutual funds. The hypothetical “Ending Account Value” and “Expenses Paid During Period” are derived from the fund’s actual expense ratio and an assumed 5% annual return before expenses. In this case, because the return used is not the fund’s actual return, the results do not apply to your investment. The example is useful in making comparisons because the SEC requires all mutual funds to calculate expenses based on a 5% annual return. You can assess your fund’s costs by comparing this hypothetical example with the hypothetical examples that appear in shareholder reports of other funds.
Please note that the expenses shown in the table are meant to highlight and help you compare ongoing costs only and do not reflect any transactional costs, if applicable. The “Annualized Expense Ratio” represents the actual expenses for the six-month period indicated.
Six Months Ended October 31, 2009
EXPENSE TABLE
| | | | | | | | |
| | | Beginning
Account
Value
05/01/09 | | Ending
Account
Value
10/31/09 | | Annualized
Expense
Ratio* | | Expenses
Paid
During
Period* |
Actual Fund Return | | $1,000.00 | | $1,242.20 | | 0.14% | | $0.79 |
Hypothetical 5% Annual Return | | $1,000.00 | | $1,024.50 | | 0.14% | | $0.71 |
| * | Expenses are equal to the fund’s annualized expense ratio for the six-month period, multiplied by the average account value over the period, multiplied by the number of days in the most recent six-month period (184), then divided by the number of days in the year (365) to reflect the six-month period. |
19
THE DFA INVESTMENT TRUST COMPANY
THE U.S. LARGE CAP VALUE SERIES
DISCLOSURE OF PORTFOLIO HOLDINGS
(Unaudited)
The SEC requires that all Funds file a complete Schedule of Investments with the SEC for their first and third fiscal quarters on Form N-Q. For The DFA Investment Trust Company, this would be for the fiscal quarters ending January 31 and July 31. The Form N-Q filing must be made within 60 days of the end of the quarter. The DFA Investment Trust Company filed its most recent Form N-Q with the SEC on September 29, 2009. It is available upon request, without charge, by calling collect: (512) 306-7400 or by mailing a request to Dimensional Fund Advisors LP, 6300 Bee Cave Road, Building One, Austin, Texas 78746, or by visiting the SEC’s website at http://www.sec.gov, or they may be reviewed and copied at the SEC’s Public Reference Room in Washington, D.C. (call 1-800-732-0330 for information on the operation of the Public Reference Room).
SEC regulations permit a fund to include in its reports to shareholders a “Summary Schedule of Portfolio Holdings” in lieu of a full Schedule of Investments. The Summary Schedule of Portfolio Holdings reports the fund’s 50 largest holdings in unaffiliated issuers and any investments that exceed one percent of the fund’s net assets at the end of the reporting period. The amendments also require that the Summary Schedule of Portfolio Holdings identify each category of investments that are held.
The fund is required to file a complete Schedule of Investments with the SEC on Form N-CSR within ten days after mailing the annual and semi-annual reports to shareholders. It will be available upon request, without charge, by calling collect: (512) 306-7400 or by mailing a request to Dimensional Fund Advisors LP, 6300 Bee Cave Road, Building One, Austin, Texas 78746, or by visiting the SEC’s website at http://www.sec.gov, or they may be reviewed and copied at the SEC’s Public Reference Room in Washington, D.C. (call 1-800-732-0330 for information on the operation of the Public Reference Room).
PORTFOLIO HOLDINGS
The SEC requires that all Funds present their categories of portfolio holdings in a table, chart or graph format in their annual and semi-annual shareholder reports, whether or not a Schedule of Investments is utilized. The following table, which presents portfolio holdings as a percent of total investments before short-term investments and collateral for loaned securities, is provided in compliance with such requirement. The categories shown below represent broad industry sectors. Each industry sector consists of one or more specific industry classifications.
| | |
| The U.S. Large Cap Value Series |
Consumer Discretionary | | 16.7% |
Consumer Staples | | 6.4% |
Energy | | 13.9% |
Financials | | 31.3% |
Health Care | | 5.5% |
Industrials | | 14.7% |
Information Technology | | 3.6% |
Materials | | 3.8% |
Telecommunication Services | | 3.6% |
Utilities | | 0.5% |
| | |
| | 100.0% |
20
THE U.S. LARGE CAP VALUE SERIES
SUMMARY SCHEDULE OF PORTFOLIO HOLDINGS
October 31, 2009
| | | | | | | |
| | | Shares | | Value† | | Percentage
of Net Assets** |
COMMON STOCKS — (93.1%) | | | | | | | |
Consumer Discretionary — (15.5%) | | | | | | | |
Carnival Corp. | | 2,624,598 | | $ | 76,428,294 | | 1.0% |
CBS Corp. Class B | | 3,870,469 | | | 45,555,420 | | 0.6% |
Comcast Corp. Class A | | 11,512,642 | | | 166,933,309 | | 2.2% |
Comcast Corp. Special Class A | | 3,396,043 | | | 47,612,523 | | 0.6% |
#Disney (Walt) Co. | | 4,577,802 | | | 125,294,441 | | 1.7% |
*Liberty Media Corp. Entertainment Class A | | 2,954,309 | | | 91,051,803 | | 1.2% |
*Liberty Media Corp. Interactive Class A | | 3,585,265 | | | 40,656,905 | | 0.6% |
News Corp. Class A | | 5,810,104 | | | 66,932,398 | | 0.9% |
Time Warner Cable, Inc. | | 1,980,956 | | | 78,128,905 | | 1.0% |
Time Warner, Inc. | | 6,114,193 | | | 184,159,493 | | 2.5% |
Other Securities | | | | | 325,704,783 | | 4.3% |
| | | | | | | |
Total Consumer Discretionary | | | | | 1,248,458,274 | | 16.6% |
| | | | | | | |
| | | |
Consumer Staples — (5.9%) | | | | | | | |
Archer-Daniels-Midland Co. | | 1,723,060 | | | 51,898,567 | | 0.7% |
CVS Caremark Corp. | | 4,840,631 | | | 170,874,274 | | 2.3% |
Kraft Foods, Inc. | | 2,137,904 | | | 58,835,118 | | 0.8% |
Other Securities | | | | | 193,282,891 | | 2.5% |
| | | | | | | |
Total Consumer Staples | | | | | 474,890,850 | | 6.3% |
| | | | | | | |
| | | |
Energy — (13.0%) | | | | | | | |
Anadarko Petroleum Corp. | | 2,760,568 | | | 168,201,408 | | 2.2% |
#Chesapeake Energy Corp. | | 2,647,458 | | | 64,862,721 | | 0.9% |
ConocoPhillips | | 5,213,766 | | | 261,626,778 | | 3.5% |
Marathon Oil Corp. | | 3,280,335 | | | 104,872,310 | | 1.4% |
*National-Oilwell, Inc. | | 1,160,300 | | | 47,560,697 | | 0.6% |
XTO Energy, Inc. | | 2,156,495 | | | 89,623,932 | | 1.2% |
Other Securities | | | | | 306,390,542 | | 4.1% |
| | | | | | | |
Total Energy | | | | | 1,043,138,388 | | 13.9% |
| | | | | | | |
| | | |
Financials — (29.1%) | | | | | | | |
Allstate Corp. | | 2,596,315 | | | 76,773,035 | | 1.0% |
Bank of America Corp. | | 16,675,426 | | | 243,127,711 | | 3.2% |
Bank of New York Mellon Corp. | | 1,972,678 | | | 52,591,595 | | 0.7% |
#Capital One Financial Corp. | | 1,815,684 | | | 66,454,034 | | 0.9% |
Chubb Corp. | | 1,669,873 | | | 81,022,238 | | 1.1% |
Citigroup, Inc. | | 19,573,191 | | | 80,054,351 | | 1.1% |
CME Group, Inc. | | 203,881 | | | 61,696,429 | | 0.8% |
JPMorgan Chase & Co. | | 7,983,370 | | | 333,465,365 | | 4.4% |
#Loews Corp. | | 2,592,160 | | | 85,800,496 | | 1.1% |
MetLife, Inc. | | 4,663,914 | | | 158,712,993 | | 2.1% |
#Morgan Stanley | | 3,619,297 | | | 116,251,820 | | 1.5% |
PNC Financial Services Group, Inc. | | 1,190,568 | | | 58,266,398 | | 0.8% |
Prudential Financial, Inc. | | 1,918,000 | | | 86,751,140 | | 1.2% |
Travelers Cos., Inc. (The) | | 3,328,076 | | | 165,704,904 | | 2.2% |
Unum Group | | 1,898,589 | | | 37,876,851 | | 0.5% |
Other Securities | | | | | 634,916,189 | | 8.5% |
| | | | | | | |
Total Financials | | | | | 2,339,465,549 | | 31.1% |
| | | | | | | |
| | | |
Health Care — (5.1%) | | | | | | | |
*Thermo Fisher Scientific, Inc. | | 1,056,245 | | | 47,531,025 | | 0.7% |
UnitedHealth Group, Inc. | | 2,406,388 | | | 62,445,769 | | 0.8% |
*WellPoint, Inc. | | 2,580,122 | | | 120,646,505 | | 1.6% |
Other Securities | | | | | 181,920,544 | | 2.4% |
| | | | | | | |
Total Health Care | | | | | 412,543,843 | | 5.5% |
| | | | | | | |
21
THE U.S. LARGE CAP VALUE SERIES
CONTINUED
| | | | | | | |
| | | Shares | | Value† | | Percentage
of Net Assets** |
Industrials — (13.7%) | | | | | | | |
Burlington Northern Santa Fe Corp. | | 1,930,415 | | $ | 145,398,858 | | 1.9% |
#CSX Corp. | | 2,287,204 | | | 96,474,265 | | 1.3% |
#FedEx Corp. | | 599,693 | | | 43,591,684 | | 0.6% |
General Electric Co. | | 18,139,800 | | | 258,673,548 | | 3.4% |
Norfolk Southern Corp. | | 2,186,220 | | | 101,921,576 | | 1.4% |
#Northrop Grumman Corp. | | 1,926,678 | | | 96,584,368 | | 1.3% |
Union Pacific Corp. | | 2,835,808 | | | 156,366,453 | | 2.1% |
Other Securities | | | | | 203,214,199 | | 2.7% |
| | | | | | | |
Total Industrials | | | | | 1,102,224,951 | | 14.7% |
| | | | | | | |
| | | |
Information Technology — (3.3%) | | | | | | | |
*Computer Sciences Corp. | | 946,932 | | | 48,018,922 | | 0.7% |
Other Securities | | | | | 219,566,373 | | 2.9% |
| | | | | | | |
Total Information Technology | | | | | 267,585,295 | | 3.6% |
| | | | | | | |
| | | |
Materials — (3.6%) | | | | | | | |
#Alcoa, Inc. | | 4,317,440 | | | 53,622,605 | | 0.7% |
#Dow Chemical Co. | | 3,993,594 | | | 93,769,587 | | 1.3% |
#International Paper Co. | | 1,909,245 | | | 42,595,256 | | 0.6% |
#Weyerhaeuser Co. | | 1,105,551 | | | 40,175,723 | | 0.5% |
Other Securities | | | | | 54,072,078 | | 0.7% |
| | | | | | | |
Total Materials | | | | | 284,235,249 | | 3.8% |
| | | | | | | |
| | | |
Telecommunication Services — (3.4%) | | | | | | | |
#AT&T, Inc. | | 8,438,300 | | | 216,611,161 | | 2.9% |
Other Securities | | | | | 52,619,682 | | 0.7% |
| | | | | | | |
Total Telecommunication Services | | | | | 269,230,843 | | 3.6% |
| | | | | | | |
| | | |
Utilities — (0.5%) | | | | | | | |
Other Securities | | | | | 39,398,283 | | 0.5% |
| | | | | | | |
TOTAL COMMON STOCKS | | | | | 7,481,171,525 | | 99.6% |
| | | | | | | |
| | | |
| | | Face Amount | | | | |
| | | (000) | | | | |
TEMPORARY CASH INVESTMENTS — (0.5%) | | | | | | | |
Repurchase Agreement, PNC Capital Markets, Inc. 0.19%, 11/02/09 (Collateralized by $39,850,000 FNMA 6.50%, 6/25/39, valued at $42,888,563) to be repurchased at $42,250,669 | | $42,250 | | | 42,250,000 | | 0.6% |
| | | | | | | |
| | | |
| | | Shares/ Face Amount | | | | |
| | | (000) | | | | |
SECURITIES LENDING COLLATERAL — (6.4%) | | | | | | | |
§@DFA Short Term Investment Fund LP | | 512,733,772 | | | 512,733,772 | | 6.8% |
@Repurchase Agreement, Deutsche Bank Securities 0.08%, 11/02/09 (Collateralized by $3,853,074 FHLMC 5.793%(r), 01/01/37 & 5.945%(r), 07/01/37, valued at $2,684,003) to be repurchased at $2,605,845 | | $2,606 | | | 2,605,828 | | 0.1% |
| | | | | | | |
TOTAL SECURITIES LENDING COLLATERAL | | | | | 515,339,600 | | 6.9% |
| | | | | | | |
TOTAL INVESTMENTS — (100.0%)
(Cost $6,877,390,667) | | | | | $8,038,761,125 | | 107.1% |
| | | | | | | |
22
THE U.S. LARGE CAP VALUE SERIES
CONTINUED
Summary of inputs used to value the Series’ net assets as of October 31, 2009 is as follows (See Security Valuation Note):
| | | | | | | | | | | |
| | | Valuation Inputs |
| | | Investment in Securities (Market Value) |
| | | Level 1 | | Level 2 | | Level 3 | | Total |
Common Stocks | | | | | | | | | | | |
Consumer Discretionary | | $ | 1,248,458,274 | | $ | — | | — | | $ | 1,248,458,274 |
Consumer Staples | | | 474,890,850 | | | — | | — | | | 474,890,850 |
Energy | | | 1,043,138,388 | | | — | | — | | | 1,043,138,388 |
Financials | | | 2,339,465,549 | | | — | | — | | | 2,339,465,549 |
Health Care | | | 412,543,843 | | | — | | — | | | 412,543,843 |
Industrials | | | 1,102,224,951 | | | — | | — | | | 1,102,224,951 |
Information Technology | | | 267,585,295 | | | — | | — | | | 267,585,295 |
Materials | | | 284,235,249 | | | — | | — | | | 284,235,249 |
Telecommunication Services | | | 269,230,843 | | | — | | — | | | 269,230,843 |
Utilities | | | 39,398,283 | | | — | | — | | | 39,398,283 |
Temporary Cash Investments | | | — | | | 42,250,000 | | — | | | 42,250,000 |
Securities Lending Collateral | | | — | | | 515,339,600 | | — | | | 515,339,600 |
| | | | | | | | | | | |
| | | | |
TOTAL | | $ | 7,481,171,525 | | $ | 557,589,600 | | — | | $ | 8,038,761,125 |
| | | | | | | | | | | |
See accompanying Notes to Financial Statements.
23
THE DFA INVESTMENT TRUST COMPANY
THE U.S. LARGE CAP VALUE SERIES
STATEMENT OF ASSETS AND LIABILITIES
OCTOBER 31, 2009
(Amounts in thousands)
ASSETS:
| | | |
Investments at Value (including $470,665 of securities on loan) | | $ | 7,481,171 |
Temporary Cash Investments at Value & Cost | | | 42,250 |
Collateral Received from Securities on Loan at Value & Cost | | | 515,340 |
Cash | | | 1 |
Receivables: | | | |
Investment Securities Sold | | | 1,660 |
Dividends and Interest | | | 7,943 |
Securities Lending Income | | | 700 |
Fund Shares Sold | | | 365 |
| | | |
Total Assets | | | 8,049,430 |
| | | |
LIABILITIES: | | | |
Payables: | | | |
Upon Return of Securities Loaned | | | 515,340 |
Investment Securities Purchased | | | 22,419 |
Fund Shares Redeemed | | | 2,242 |
Due to Advisor | | | 659 |
Accrued Expenses and Other Liabilities | | | 370 |
| | | |
Total Liabilities | | | 541,030 |
| | | |
NET ASSETS | | $ | 7,508,400 |
| | | |
Investments at Cost | | $ | 6,319,801 |
| | | |
See accompanying Notes to Financial Statements.
24
THE DFA INVESTMENT TRUST COMPANY
THE U.S. LARGE CAP VALUE SERIES
STATEMENT OF OPERATIONS
FOR THE YEAR ENDED OCTOBER 31, 2009
(Amounts in thousands)
Investment Income
| | | | |
Dividends (Net of Foreign Taxes Withheld of $20) | | $ | 150,233 | |
Interest | | | 170 | |
Income from Securities Lending | | | 13,048 | |
| | | | |
Total Investment Income | | | 163,451 | |
| | | | |
| |
Expenses | | | | |
Investment Advisory Services Fees | | | 6,414 | |
Accounting & Transfer Agent Fees | | | 695 | |
Custodian Fees | | | 73 | |
Shareholders’ Reports | | | 66 | |
Directors’/Trustees’ Fees & Expenses | | | 120 | |
Professional Fees | | | 301 | |
Other | | | 702 | |
| | | | |
Total Expenses | | | 8,371 | |
| | | | |
Net Investment Income (Loss) | | | 155,080 | |
| | | | |
| |
Realized and Unrealized Gain (Loss) | | | | |
Net Realized Gain (Loss) on: | | | | |
Investment Securities Sold | | | (122,113 | ) |
Futures | | | 7,204 | |
Change in Unrealized Appreciation (Depreciation) of: | | | | |
Investment Securities | | | 1,161,370 | |
Futures | | | (29 | ) |
| | | | |
Net Realized and Unrealized Gain (Loss) | | | 1,046,432 | |
| | | | |
Net Increase (Decrease) in Net Assets Resulting from Operations | | $ | 1,201,512 | |
| | | | |
See accompanying Notes to Financial Statements.
25
THE DFA INVESTMENT TRUST COMPANY
THE U.S. LARGE CAP VALUE SERIES
STATEMENTS OF CHANGES IN NET ASSETS
(Amounts in thousands)
| | | | | | | | | | | | |
| | | Year
Ended
Oct. 31,
2009 | | | Period
Dec. 1, 2007
to
Oct. 31, 2008 | | | Year
Ended
Nov. 30,
2007 | |
Increase (Decrease) in Net Assets | | | | | | | | | | | | |
Operations: | | | | | | | | | | | | |
Net Investment Income (Loss) | | $ | 155,080 | | | $ | 166,016 | | | $ | 146,991 | |
Net Realized Gain (Loss) on: | | | | | | | | | | | | |
Investment Securities Sold | | | (122,113 | ) | | | (422,637 | ) | | | (118,412 | ) |
Futures | | | 7,204 | | | | (1,861 | ) | | | — | |
In-Kind Redemptions | | | — | | | | 52,271 | * | | | — | |
Change in Unrealized Appreciation (Depreciation) of: | | | | | | | | | | | | |
Investment Securities | | | 1,161,370 | | | | (3,601,292 | ) | | | (150,559 | ) |
Futures | | | (29 | ) | | | 29 | | | | — | |
| | | | | | | | | | | | |
Net Increase (Decrease) in Net Assets Resulting from Operations | | | 1,201,512 | | | | (3,807,474 | ) | | | (121,980 | ) |
| | | | | | | | | | | | |
Transactions in Interest: | | | | | | | | | | | | |
Contributions | | | 734,173 | | | | 1,370,762 | † | | | 1,783,358 | † |
Withdrawals | | | (1,166,648 | ) | | | (983,247 | )*† | | | (368,362 | )† |
| | | | | | | | | | | | |
Net Increase (Decrease) from Transactions in Interest | | | (432,475 | ) | | | 387,515 | | | | 1,414,996 | |
| | | | | | | | | | | | |
Total Increase (Decrease) in Net Assets | | | 769,037 | | | | (3,419,959 | ) | | | 1,293,016 | |
Net Assets | | | | | | | | | | | | |
Beginning of Period | | | 6,739,363 | | | | 10,159,322 | | | | 8,866,306 | |
| | | | | | | | | | | | |
End of Period | | $ | 7,508,400 | | | $ | 6,739,363 | | | $ | 10,159,322 | |
| | | | | | | | | | | | |
| * | See Note J in the Notes to Financial Statements. |
| † | See Note A in the Notes to Financial Statements. |
See accompanying Notes to Financial Statements.
26
THE DFA INVESTMENT TRUST COMPANY
THE U.S. LARGE CAP VALUE SERIES†
FINANCIAL HIGHLIGHTS
(for a share outstanding throughout each period)
| | | | | | | | | | | | | | | | | | | | | | | | |
| | | Year Ended Oct. 31, 2009 | | | Period Dec. 1, 2007 to Oct. 31, 2008 | | | Year Ended Nov. 30, 2007 | | | Year Ended Nov. 30,
2006 | | | Year Ended Nov. 30,
2005 | | | Year Ended
Nov. 30,
2004 | |
Total Return | | | 11.90 | % | | | (36.53 | )%(C) | | | (0.32 | )% | | | 18.16 | % | | | 14.66 | % | | | 21.68 | % |
| | | | | | |
Net Assets, End of Period (thousands) | | $ | 7,508,400 | | | $ | 6,739,363 | | | $ | 10,159,322 | | | $ | 8,866,306 | | | $ | 5,831,587 | | | $ | 3,919,913 | |
Ratio of Expenses to Average Net Assets | | | 0.13 | % | | | 0.11 | %(B) | | | 0.11 | % | | | 0.12 | % | | | 0.14 | % | | | 0.15 | % |
Ratio of Net Investment Income to Average Net Assets | | | 2.42 | % | | | 1.97 | %(B) | | | 1.44 | % | | | 1.68 | % | | | 1.56 | % | | | 1.41 | % |
Portfolio Turnover Rate | | | 29 | % | | | 19 | %(C) | | | 9 | % | | | 13 | % | | | 9 | % | | | 7 | % |
See page 1 for the Definitions of Abbreviations and Footnotes.
† See Note A in the Notes to Financial Statements.
See accompanying Notes to Financial Statements.
27
THE DFA INVESTMENT TRUST COMPANY
THE U.S. LARGE CAP VALUE SERIES
NOTES TO FINANCIAL STATEMENTS
A. Organization:
The DFA Investment Trust Company (the “Trust”) is an open-end management investment company registered under the Investment Company Act of 1940. The Trust consists of twelve investment portfolios, of which The U. S. Large Cap Value Series (the “Series”) is presented in this report.
Effective December 31, 2008, The U.S. Large Cap Value Series, a master fund in a RIC/RIC master-feeder structure, had elected with the consent of its respective Holder(s) to change its U.S. federal income tax classification from that of an association taxable as a corporation to a partnership pursuant to Treasury Regulation §301.7701-3. The change in capital structure and retroactive reclassification of the statement of changes in net assets and financial highlights for the fund is a result of the treatment of a partnership for book purposes. The Series/Portfolio will maintain its books and records and present its financial statements in accordance with generally accepted accounting principles for investment partnerships.
At a regular meeting of the Board of Directors/Trustees (the “Board”) on September 16, 2008, the Board voted to change the fiscal and tax year ends of the Series from November 30 to October 31.
B. Significant Accounting Policies:
The following significant accounting policies are in conformity with accounting principles generally accepted in the United States of America. Such policies are consistently followed by the Trust in preparation of its financial statements. The preparation of financial statements in accordance with accounting principles generally accepted in the United States of America requires management to make estimates and assumptions that affect the reported amounts of assets and liabilities and disclosure of contingent assets and liabilities at the date of the financial statements and the reported amounts of increases and decreases in net assets from operations during the reporting period. Actual results could differ from those estimates and those differences could be material.
1. Security Valuation: Securities held by the Series (including over-the-counter securities) are valued at the last quoted sale price of the day. Securities held by the Series that are listed on Nasdaq are valued at the Nasdaq Official Closing Price (“NOCP”). If there is no last reported sale price or NOCP for the day, the Series values the securities at the mean of the most recent quoted bid and asked prices. Price information on listed securities is taken from the exchange where the security is primarily traded. Generally, securities issued by open-end investment companies are valued using their respective net asset values or public offering prices, as appropriate, for purchase orders placed at the close of the New York Stock Exchange (NYSE).
Securities for which no market quotations are readily available (including restricted securities), or for which market quotations have become unreliable, are valued in good faith at fair value in accordance with procedures adopted by the Board of Directors/Trustees. Fair value pricing may also be used if events that have a significant effect on the value of an investment (as determined in the discretion of the Investment Committee of the Advisor) occur before the net asset value is calculated. When fair value pricing is used, the prices of securities used by the Series may differ from the quoted or published prices for the same securities on their primary markets or exchanges.
Futures contracts held by the Series are valued using the settlement price established each day on the exchange on which they are traded.
The Series utilizes a fair value hierarchy which prioritizes the inputs to valuation techniques used to measure fair value into three broad levels described below:
— Level 1 – quoted prices in active markets for identical securities
28
— Level 2 – other significant observable inputs (including quoted prices for similar securities, interest rates, prepayment speeds, credit risk, etc.)
— Level 3 – significant unobservable inputs (including the Series’ own assumptions in determining the fair value of investments)
A summary of the inputs used to value the Series’ net assets by each major security type, industry and/or country is disclosed at the end of the Summary Schedule of Portfolio Holdings. The inputs or methodology used for valuing securities are not necessarily an indication of the risk associated with investing in those securities.
2. Deferred Compensation Plan: Each eligible Trustee of the Trust may elect participation in the Deferred Compensation Plan (the “Plan”). Under the Plan, effective January 1, 2002, such Trustees may defer payment of all or a portion of their total fees earned as a Trustee. These deferred amounts may be treated as though such amounts had been invested in shares of the following funds: U.S. Large Cap Value Portfolio; U.S. Core Equity 1 Portfolio; U.S. Core Equity 2 Portfolio; U.S.Vector Equity Portfolio; U.S. Micro Cap Portfolio; DFA International Value Portfolio; International Core Equity Portfolio; Emerging Markets Portfolio; Emerging Markets Core Equity Portfolio; and/or DFA Two-Year Global Fixed Income Portfolio. Contributions made under the Plan and the change in unrealized appreciation (depreciation) and income, are included in Directors’/Trustees’ Fees & Expenses. At October 31, 2009, the total liability for deferred compensation to Trustees is included in Accrued Expenses and Other Liabilities on the Statement of Assets and Liabilities in the amount of $183 (in thousands).
Each Trustee has the option to receive their distribution of proceeds in one of the following methods upon one year’s notice: lump sum; annual installments over a period of agreed upon years; or semi-annual installments over a period of agreed upon years. As of October 31, 2009, none of the Trustees have requested distribution of proceeds.
3. Other: Security transactions are accounted for as of the trade date. Costs used in determining realized gains and losses on the sale of investment securities are on the basis of identified cost. Dividend income and distributions to shareholders are recorded on the ex-dividend date. Distributions received on securities that represent a return of capital or capital gain are recorded as a reduction of cost of investments or as a realized gain, respectively. The Series estimates the character of distributions received that may be considered return of capital distributions or capital gain distributions. Interest income is recorded on an accrual basis. Discount and premium on securities purchased are amortized over the lives of the respective securities, utilizing the effective interest method. Expenses directly attributable to a Series are directly charged. Common expenses of the Trust are allocated using methods approved by the Board of Directors/Trustees, generally based on average net assets.
C. Investment Advisor:
Dimensional Fund Advisors LP (“Dimensional” or the “Advisor”) provides investment advisory services to the Series. For the year ended October 31, 2009, the Series’ investment advisory services fees were accrued daily and paid monthly to the Advisor based on an effective annual rate of 0.10% of average daily net assets.
Fees Paid to Officers and Directors/Trustees:
Certain Officers and Directors/Trustees of the Advisor are also Officers and Directors/Trustees of the Trust; however, such Officers and Directors/Trustees (with the exception of the Chief Compliance Officer (“CCO”)) receive no compensation from the Trust. For the year ended October 31, 2009, the total related amounts paid by the Trust to the CCO were $98 (in thousands). The total related amounts paid by the Series are included in Other Expenses on the Statement of Operations.
29
D. Purchases and Sales of Securities:
For the year ended October 31, 2009, the Series made the following purchases and sales of investment securities, other than short-term securities and U.S. government securities (amounts in thousands):
| | | |
Purchases | | $ | 1,964,487 |
Sales | | | 1,887,094 |
There were no purchases or sales of long-term U.S. government securities.
E. Federal Income Taxes:
No provision for federal income taxes is required since the Series is treated as a partnership for Federal income tax purposes. Any net investment income and realized and unrealized gains and losses have been deemed to have been “passed down” to its respective partners.
At October 31, 2009, the total cost and aggregate gross unrealized appreciation and (depreciation) of securities for federal income tax purposes were different from amounts reported for financial reporting purposes (amounts in thousands):
| | | | | | |
Federal Tax Cost | | Unrealized
Appreciation | | Unrealized
(Depreciation) | | Net
Unrealized
Appreciation
(Depreciation) |
| $6,877,391 | | $1,296,505 | | $(135,135) | | $1,161,370 |
Accounting for Uncertainty in Income Taxes sets forth a minimum threshold for financial statement recognition of the benefit of a tax position taken or expected to be in a tax return. Management has analyzed the Series’ tax position and has concluded that no provision for income tax is required in the Series’ financial statements. The Series is not aware of any tax position for which it is reasonably possible that the total amounts of unrecognized tax benefits will significantly change in the next twelve months. The Series’ federal tax returns for the prior three fiscal years remain subject to examination by the Internal Revenue Service.
Effective December 31, 2008, The U.S. Large Cap Value Series, a master fund in a RIC/RIC master-feeder structure with four RIC feeders and other direct client investor(s), made a “Check-the-box” election for federal income tax purposes pursuant to Treasury Regulation §301.7701-3, to change its federal entity classification from a corporation taxable as a regulated investment company to a partnership. As a result of this election, the master fund is deemed to have distributed all of its assets and liabilities, in a taxable transaction, to its shareholders in liquidation of the master fund. Immediately thereafter, the shareholders contributed all of the distributed assets and liabilities to a newly formed partnership. The final tax year end of The U.S. Large Cap Value Series was December 30, 2008. For Federal income tax purposes, pursuant to IRC Code §336(a), the master fund recognized a loss as if the master’s investment securities were sold to its shareholders and, pursuant to IRC Code §331, each of the Portfolios recognized a gain as if it liquidated its investment in the master. For tax purposes, pursuant to IRC Code §334(a), each of the Portfolios took a fair market value basis in the securities deemed received by them and a new holding period for those securities commenced on the deemed liquidation date.
The master fund had book/tax differences upon its deemed liquidation. The following summary of permanent differences occurred as of the respective effective “Check the Box” election date.
| | | | | | |
Increase (Decrease) Paid-In Capital | | Unrealized
Appreciation
(Depreciation)
Investment
Securities | | Increase
(Decrease)
Undistributed
Net Investment
Income | | Increase
(Decrease)
Accumulated
Net Realized
Gains (Losses) |
| $(3,038,312,278) | | $2,303,664,484 | | $(698,899) | | $735,346,693 |
30
As a result of the transaction, The U.S. Large Cap Value Series recognized a ($2,303,664,484) capital loss for tax year ended December 30, 2008. Additionally, the fund has written off $3,039,011,176 of expired capital loss carryover as a permanent book/tax reporting difference decreasing paid in capital.
F. Financial Instruments:
In accordance with the Series’ investment objectives and policies, the Series may invest in certain financial instruments that have off-balance sheet risk in excess of the amounts recognized in the financial statements and concentrations of credit and market risk. These instruments and their significant corresponding risks are described below:
1. Repurchase Agreements: The Series may purchase certain U.S. Government securities subject to the counterparty’s agreement to repurchase them at an agreed upon date and price. The counterparty will be required on a daily basis to maintain the value of the collateral subject to the agreement at not less than the repurchase price (including accrued interest). The agreements are conditioned upon the collateral being deposited under the Federal Reserve book-entry system with the Trust’s custodian or a third party sub-custodian. In the event of default or bankruptcy by the other party to the agreement, retention of the collateral may be subject to legal proceedings. All open repurchase agreements were entered into on October 30, 2009.
Derivative Financial Instruments:
Disclosures on derivative instruments and hedging activities are intended to improve financial reporting for derivative instruments by enabling investors to understand how and why a fund uses derivatives, how derivatives are accounted for and how derivative instruments affect a fund’s results of operations and financial position. Summarized below are the specific types of derivative instruments used by the Series.
2. Futures Contracts: The Series may enter into futures contracts to gain market exposure on uninvested cash pending investment in securities or to maintain liquidity to pay redemptions. Upon entering into a futures contract, the Series deposits cash or pledges U.S. Government securities to a broker, equal to the minimum “initial margin” requirements of the exchange on which the contract is traded. Subsequent payments are received from or paid to the broker each day, based on the daily fluctuation in the market value of the contract. These receipts or payments are known as “variation margin” and are recorded daily by the Series as unrealized gains or losses until the contracts are closed. When the contracts are closed, the Series records a realized gain or loss, which is presented in the Statement of Operations as a net realized gain or loss on futures, equal to the difference between the value of the contract at the time it was opened and the value at the time it was closed.
Risks may arise upon entering into futures contracts from potential imperfect price correlations between the futures contracts and the underlying securities, from the possibility of an illiquid secondary market for these instruments and from the possibility that the Series could lose more than the initial margin requirements. The Series entering into stock index futures are subject to equity price risk from those futures contracts. Counterparty credit risk related to exchange-traded futures is minimal because the exchange’s clearinghouse, as counterparty to all exchange-traded futures, guarantees the futures against default.
Additional disclosure on derivative instruments is required showing a summary by primary risk exposure of the derivatives instruments’ (i) location in the balance sheet and fair value at period end and (ii) the location in the Statement of Operations and the realized and change in unrealized gain or loss over the reporting period. The following is a summary of the Series’ derivative instrument holdings for the year ended October 31, 2009.
At October 31, 2009, the Series had no outstanding futures contracts.
The following is a summary of the location of realized and change in unrealized gains and losses on the Series’ Statement of Operations for the Series’ derivative instrument holdings through the year ended October 31, 2009:
31
| | |
Derivative Type | | Location of Gain (Loss) on Derivatives Recognized in Income |
| |
Equity contracts | | Net Realized Gain (Loss) on: Futures Change in Unrealized Appreciation (Depreciation) of: Futures |
The following is a summary of the Series’ location of realized and change in unrealized gains and losses from the Series’ derivative instrument holdings categorized by primary risk exposure through the year ended October 31, 2009 (amounts in thousands):
| | |
| | | Realized Gain (Loss)
on Derivatives
Recognized in Income |
| |
| | | Equity
Contracts |
The U.S. Large Cap Value Series* | | $7,204 |
| |
| | | Change in Unrealized
Appreciation (Depreciation) on
Derivatives Recognized in Income |
| |
| | | Equity
Contracts |
The U.S. Large Cap Value Series* | | $(29) |
| * | As of October 31, 2009, there were no futures contracts outstanding. During the year ended October 31, 2009, the Series had limited activity in these transactions. |
G. Line of Credit:
The Trust, together with other Dimensional-advised portfolios, has entered into an amended and restated $250 million unsecured discretionary line of credit effective July 8, 2009 with an affiliate of its domestic custodian bank. Each portfolio is permitted to borrow, subject to its investment limitations, up to a maximum of $250 million, as long as total borrowings under the line of credit do not exceed $250 million in the aggregate. Borrowings under the line of credit are charged interest at the then current Federal Funds Rate plus 1%. Each portfolio is individually, and not jointly liable for its particular advances under the line of credit. There is no commitment fee on the unused portion of the line of credit. The agreement for the line of credit may be terminated by either party at any time. The line of credit is scheduled to expire on June 22, 2010.
For the year ended October 31, 2009, borrowings by the Series under this line of credit were as follows (amounts in thousands, except percentages and days):
| | | | | | | | |
Weighted Average Interest Rate | | Weighted
Average
Loan Balance | | Number of
Days
Outstanding | | Interest
Expense
Incurred | | Maximum Amount
Borrowed During
the Period |
1.90% | | $11,126 | | 5 | | $3 | | $31,000 |
There were no outstanding borrowings by the Series under this line of credit as of October 31, 2009.
The Trust, together with other Dimensional-advised portfolios, has also entered into an additional $500 million unsecured line of credit effective January 15, 2009 with its international custodian bank. Each portfolio is permitted to borrow, subject to its investment limitations, up to a maximum of $500 million, as long as total borrowings under the line of credit do not exceed $500 million in the aggregate. Each portfolio is individually, and not jointly, liable for its particular advances under the line of credit. Borrowings under the line of credit are charged interest at rates agreed to by the parties at the time of borrowing. There is no commitment fee on the unused portion of the line of credit. The agreement for the line of credit expires on January 15, 2010. There were no borrowings by the Series under this line of credit during the year ended October 31, 2009.
32
H. Securities Lending:
As of October 31, 2009, the Series had securities on loan to brokers/dealers, for which the Series held cash collateral. The Series invests the cash collateral, as described below, and records a liability for the return of the collateral, during the period the securities are on loan. Loans of securities are expected at all times to be secured by collateral equal to at least (i) 100% of the current market value of the loaned securities with respect to securities of the U.S. government or its agencies, (ii) 102% of the current market value of the loaned securities with respect to U.S. securities, and (iii) 105% of the current market value of the loaned securities with respect to foreign securities. However, daily market fluctuations could cause the Series’ collateral to be lower or higher than the expected thresholds. If this were to occur, the collateral would be adjusted the next business day to ensure adequate collateralization. In the event of default or bankruptcy by the other party to the agreement, realization and/or retention of the collateral may be subject to legal proceedings. If the borrower fails to return loaned securities, and cash collateral being maintained by the borrower is insufficient to cover the value of loaned securities and provided such collateral insufficiency is not the result of investment losses, the lending agent has agreed to pay the amount of the shortfall to the Series or, at the option of the lending agent, to replace the securities.
Subject to the Series’ investment policy, the cash collateral received by the Series from securities on loan is invested in securities of the U.S. government or its agencies, repurchase agreements collateralized by securities of the U.S. government or its agencies or shares of the DFA Short Term Investment Fund LP. Agencies include both agency debentures and agency mortgage backed securities. In addition, the Series will be able to terminate the loan at any time and will receive reasonable interest on the loan, as well as amounts equal to any dividends, interest or other distributions on the loaned securities. However, dividend income received from loaned securities may not be eligible to be taxed at qualified dividend income rates.
I. Indemnitees; Contractual Obligations:
Under the Trust’s organizational documents, its officers and trustees are indemnified against certain liabilities arising out of the performance of their duties to the Trust.
In the normal course of business, the Trust enters into contracts that contain a variety of representations and warranties which provide general indemnification. The Trust’s maximum exposure under these arrangements is unknown as this would involve future claims that may be made against the Trust and/or its affiliates that have not yet occurred. However, based on experience, the Trust expects the risk of loss to be remote.
J. In-Kind Redemptions:
In accordance with guidelines described in the Series’ prospectus, the Series may distribute portfolio securities rather than cash as payment for a redemption of fund shares (in-kind redemption). For financial reporting purposes, the Series recognizes a gain on in-kind redemptions to the extent the value of the distributed securities on the date of redemption exceeds the cost of those securities. Gains and losses realized on in-kind redemptions are not recognized for tax purposes and are reclassified from undistributed realized gain (loss) to paid-in capital. During the period December 1, 2007 to October 31, 2008, the Series realized $52,271 (in thousands) of net gain.
K. Subsequent Event Evaluations:
Management has evaluated the impact of all subsequent events on the Series through December 23, 2009, the date the financial statements were available for issuance, and has determined that there are no subsequent events requiring recognition or disclosure in the financial statements.
33
REPORT OF INDEPENDENT REGISTERED PUBLIC ACCOUNTING FIRM
To the Shareholders of The U.S. Large Cap Value Series and
Board of Trustees of The DFA Investment Trust Company:
In our opinion, the accompanying statements of assets and liabilities, including the summary schedules of portfolio holdings, and the related statements of operations and of changes in net assets and the financial highlights presents fairly, in all material respects, the financial position of The U.S. Large Cap Value Series (one of the portfolios constituting The DFA Investment Trust Company, hereafter referred to as the “Series”) at October 31, 2009, the results of its operations for the year then ended, the changes in its net assets and the financial highlights for each of the periods indicated, in conformity with accounting principles generally accepted in the United States of America. These financial statements and financial highlights (hereafter referred to as “financial statements”) are the responsibility of the Series’ management; our responsibility is to express an opinion on these financial statements based on our audits. We conducted our audits of these financial statements in accordance with the standards of the Public Company Accounting Oversight Board (United States). Those standards require that we plan and perform the audit to obtain reasonable assurance about whether the financial statements are free of material misstatement. An audit includes examining, on a test basis, evidence supporting the amounts and disclosures in the financial statements, assessing the accounting principles used and significant estimates made by management, and evaluating the overall financial statement presentation. We believe that our audits, which included confirmation of securities at October 31, 2009 by correspondence with the custodian, brokers and the transfer agent of the investee fund, provide a reasonable basis for our opinion.
PricewaterhouseCoopers LLP
Philadelphia, Pennsylvania
December 23, 2009
34
RESULTS OF THE SHAREHOLDER MEETING
On June 2, 2009 and June 5, 2009, The DFA Investment Trust Company (“DFAITC”) held a Special Joint Meeting of Shareholders for the purpose of voting on several proposals affecting DFAITC and the Series, including, among other items, the election of Trustees, the amendment of certain fundamental investment limitations, and the elimination of certain fundamental investment limitations. The shareholders of the Series approved each of the applicable proposals for DFAITC and the Series presented at the Meeting. Listed below are the voting results from the Meeting. Please note that not all Proposals presented at the Meeting were voted on by the Series. Additionally, the Proposal numbers reflected below correlate to the Proposal numbers presented for vote at the Meeting.
DFAITC
| | | | | | | | | | | | | | | | | | | | |
| | | | | Shares Voted | | Percent of Outstanding Shares Voted |
| | | | | For | | % | | Against | | % | | Abstain/WithHold | | % | | For | | Against | | Abstain / WithHold |
Proposal 1: Election of Trustees for DFAITC* | | | | | | | | | | Need for 50% Voted 40Act: |
| | | | | | | | | | |
1a | | David G. Booth | | 2,166,359,402 | | 96.50% | | — | | 0.00% | | 78,661,259 | | 3.50% | | 95.78% | | 0.00% | | 3.48% |
1b | | George M. Constantinides | | 2,169,219,982 | | 96.62% | | — | | 0.00% | | 75,800,679 | | 3.38% | | 95.90% | | 0.00% | | 3.35% |
1c | | John P. Gould | | 2,168,577,186 | | 96.59% | | — | | 0.00% | | 76,443,476 | | 3.41% | | 95.88% | | 0.00% | | 3.38% |
1d | | Roger G. Ibbotson | | 2,169,778,365 | | 96.65% | | — | | 0.00% | | 75,242,297 | | 3.35% | | 95.93% | | 0.00% | | 3.33% |
1e | | Robert C. Merton | | 2,170,124,638 | | 96.66% | | — | | 0.00% | | 74,896,023 | | 3.34% | | 95.94% | | 0.00% | | 3.31% |
1f | | Myron S. Scholes | | 2,169,439,189 | | 96.63% | | — | | 0.00% | | 75,581,473 | | 3.37% | | 95.91% | | 0.00% | | 3.34% |
1g | | Eduardo A. Repetto | | 2,167,010,793 | | 96.53% | | — | | 0.00% | | 78,009,868 | | 3.47% | | 95.81% | | 0.00% | | 3.45% |
1h | | Abbie J. Smith | | 2,169,626,842 | | 96.64% | | — | | 0.00% | | 75,393,820 | | 3.36% | | 95.92% | | 0.00% | | 3.33% |
| | | | | | | | | | | | | | | | | | | | | | | | | | | | |
| | | Shares Voted | | Percent of Outstanding Shares Voted | |
| | | For | | % | | | Against | | % | | | Abstain/WithHold | | % | | | NonVote | | % | | For | | | Against | | | Abstain / WithHold | |
Proposal 4: Approval of an Amended and Restated Agreement and Declaration of Trust for DFAITC* | | 2,076,877,329 | | 92.43 | % | | 36,623,148 | | 1.63 | % | | 133,356,326 | | 5.94 | % | | NA | | NA | | 91.82 | % | | 1.62 | % | | 5.90 | % |
* Results are for all Series within DFAITC
The U.S. Large Cap Value Series
| | | | | | | | | | | | | | | | | | | | |
| | | | | Shares Voted | | Percent of Outstanding Shares Voted |
| | | | | For | | % | | Against | | % | | Abstain/WithHold | | % | | For | | Against | | Abstain / WithHold |
Proposals: | | | | | | | | | | | | | | | | |
| |
5 | | To approve amendments to certain fundamental investment restrictions |
5a | | Borrowing Money | | 450,089,477 | | 90.34% | | 13,835,372 | | 2.78% | | 34,296,468 | | 6.88% | | 90.12% | | 2.77% | | 6.87% |
5b | | Making Loans | | 446,508,610 | | 89.62% | | 17,323,887 | | 3.48% | | 34,388,819 | | 6.90% | | 89.41% | | 3.47% | | 6.89% |
5c | | Investments in Real Estate | | 449,117,076 | | 90.14% | | 14,867,126 | | 2.98% | | 34,237,115 | | 6.87% | | 89.93% | | 2.98% | | 6.86% |
5d | | Investments in Commodities | | 445,240,298 | | 89.37% | | 18,945,498 | | 3.80% | | 34,035,520 | | 6.83% | | 89.15% | | 3.79% | | 6.82% |
5e | | Diversification of Investments | | 450,429,968 | | 90.41% | | 13,968,473 | | 2.80% | | 33,822,876 | | 6.79% | | 90.19% | | 2.80% | | 6.77% |
6 | | To approve the elimination of certain fundamental investment restrictions |
6a | | Pledging, Mortgaging, or Hypothecating Assets | | 442,477,364 | | 88.81% | | 21,095,580 | | 4.23% | | 34,648,372 | | 6.95% | | 88.60% | | 4.22% | | 6.94% |
6b | | Purchasing Securities on Margin | | 442,025,675 | | 88.72% | | 21,654,237 | | 4.35% | | 34,541,405 | | 6.93% | | 88.51% | | 4.34% | | 6.92% |
6c | | Investing in Restricted or Illiquid Securities | | 441,905,416 | | 88.70% | | 21,661,567 | | 4.35% | | 34,654,334 | | 6.96% | | 88.48% | | 4.34% | | 6.94% |
6d | | Investing for the Purpose of Exercising Control | | 446,950,234 | | 89.71% | | 16,844,128 | | 3.38% | | 34,426,955 | | 6.91% | | 89.49% | | 3.37% | | 6.89% |
6e | | Investing in Other Investment Companies | | 446,376,678 | | 89.59% | | 17,480,520 | | 3.51% | | 34,364,119 | | 6.90% | | 89.38% | | 3.50% | | 6.88% |
6f | | Management Ownership of Securities of an Issuer | | 446,904,545 | | 89.70% | | 16,712,196 | | 3.35% | | 34,604,577 | | 6.95% | | 89.49% | | 3.35% | | 6.93% |
6g | | Investing in Oil, Gas, or other Mineral Exploration, Leases or Development Programs | | 445,817,286 | | 89.48% | | 18,271,331 | | 3.67% | | 34,132,700 | | 6.85% | | 89.27% | | 3.66% | | 6.83% |
6h | | Investing in Securities of Unseasoned Issuers | | 445,230,922 | | 89.36% | | 18,304,705 | | 3.67% | | 34,685,690 | | 6.96% | | 89.15% | | 3.67% | | 6.95% |
6i | | Investing in Warrants | | 446,950,388 | | 89.71% | | 16,531,063 | | 3.32% | | 34,739,866 | | 6.97% | | 89.49% | | 3.31% | | 6.96% |
6j | | Writing or Acquiring Options | | 446,696,672 | | 89.66% | | 16,985,456 | | 3.41% | | 34,539,189 | | 6.93% | | 89.44% | | 3.40% | | 6.92% |
35
FUND MANAGEMENT
Trustees/Directors
Each Board of Trustees/Directors of The DFA Investment Trust Company Inc. (“DFAITC”), DFA Investment Dimensions Group Inc. (“DFAIDG”), Dimensional Investment Group Inc. (“DIG”) and Dimensional Emerging Markets Value Fund (“DEM”) (each, the “Fund” and collectively, the “Funds”) is responsible for establishing the Funds’ policies and for overseeing the management of the Funds. The Trustees/Directors of the Funds, including all of the disinterested Directors, have adopted written procedures to monitor potential conflicts of interest that might develop between portfolios of the Funds (the “Feeder Portfolios”) that invest in certain series of DFAITC or DEM (the “Master Funds”).
Each Board has two standing committees, an Audit Committee and a Portfolio Performance and Service Review Committee (the “Performance Committee”). The Audit Committee is comprised of George M. Constantinides, Roger G. Ibbotson and Abbie J. Smith. Each member of the Audit Committee is a disinterested Director. The Audit Committee oversees the Fund’s accounting and financial reporting policies and practices, the Fund’s internal controls, the Fund’s financial statements and the independent audits thereof and performs other oversight functions as requested by the Board. The Audit Committee recommends the appointment of each Fund’s independent registered certified public accounting firm and also acts as a liaison between the Fund’s independent registered certified public accounting firm and the full Board. There were two Audit Committee meetings held during the fiscal year ended October 31, 2009.
Each Board’s Performance Committee is comprised of Messrs. Constantinides and Ibbotson, Ms. Smith, John P. Gould, Myron S. Scholes and Robert C. Merton. Each member of the Fund’s Performance Committee is a disinterested Director. The Performance Committee regularly reviews and monitors the investment performance of the Fund’s series and reviews the performance of the Fund’s service providers. There were six Performance Committee meetings held during the fiscal year ended October 31, 2009.
Certain biographical information for each disinterested Trustee/Director and each interested Trustee/Director of the Funds is set forth in the tables below, including a description of each Trustee/Director’s experience as a Trustee/ Director of the Funds and as a director or trustee of other funds, as well as other recent professional experience.
The statements of additional information (together, “SAI”) of the Funds include additional information about each Trustee/Director. You may obtain copies of the SAI and prospectus of each Fund advised by Dimensional Fund Advisors LP by calling collect (512) 306-7400 or by mailing a request to Dimensional Fund Advisors LP, 6300 Bee Cave Road, Building One, Austin, Texas 78746. Prospectuses are also available at www.dimensional.com.
| | | | | | |
Name, Position with the Fund, Address and Age | | Term of Office1 and Length of Service | | Portfolios within the DFA Fund Complex2 Overseen | | Principal Occupation(s) During Past 5 Years and
Other Directorships of Public Companies Held |
| Disinterested Trustees/Directors |
George M. Constantinides Director of DFAIDG, DIG and DEM. Trustee of DFAITC. The University of Chicago Booth School of Business 5807 S. Woodlawn Avenue Chicago, IL 60637 Age: 62 | | DFAITC - since 1993 DFAIDG - since 1983 DIG - since 1993 DEM - since 1993 | | 87 portfolios in 4 investment companies | | Leo Melamed Professor of Finance, The University of Chicago Booth School of Business. |
John P. Gould Director of DFAIDG, DIG and DEM. Trustee of DFAITC. The University of Chicago Booth School of Business 5807 S. Woodlawn Avenue Chicago, IL 60637 Age: 70 | | DFAITC - since 1993 DFAIDG - since 1986 DIG - since 1993 DEM - since 1993 | | 87 portfolios in 4 investment companies | | Steven G. Rothmeier Distinguished Service Professor of Economics, The University of Chicago Booth School of Business (since 1965). Member of the Boards of Milwaukee Mutual Insurance Company (since 1997). Member and Chair, Competitive Markets Advisory Committee, Chicago Mercantile Exchange (futures trading exchange) (since 2004). Formerly, Director of UNext, Inc. (1999-2006). Formerly, Senior Vice-President, Lexecon Inc. (economics, law, strategy and finance consulting) (1994-2004). Trustee, Harbor Fund (registered investment company) (27 Portfolios) (since 1994). |
36
| | | | | | |
Name, Position with the Fund, Address and Age | | Term of Office1 and
Length of Service | | Portfolios within the DFA Fund Complex2 Overseen | | Principal Occupation(s) During Past 5 Years and
Other Directorships of Public Companies Held |
Roger G. Ibbotson Director of DFAIDG, DIG and DEM. Trustee of DFAITC. Yale School of Management 135 Prospect Street New Haven, CT 06520-8200 Age: 66 | | DFAITC - since 1993 DFAIDG - since 1981 DIG - since 1993 DEM - since 1993 | | 87 portfolios in 4 investment companies | | Professor in Practice of Finance, Yale School of Management (since 1984). Director, BIRR Portfolio Analysis, Inc. (software products) (since 1990). Chairman, CIO and Partner, Zebra Capital Management, LLC (hedge fund manager) (since 2001). Formerly, Chairman, Ibbotson Associates, Inc., Chicago, IL (software data publishing and consulting) (1977-2006). |
Robert C. Merton Director of DFAIDG, DIG and DEM. Trustee of DFAITC. Harvard Business School 353 Baker Library Soldiers Field Boston, MA 02163 Age: 65 | | DFAITC - since 2003 DFAIDG - since 2003 DIG - since 2003 DEM - since 2003 | | 87 portfolios in 4 investment companies | | John and Natty McArthur University Professor, Graduate School of Business Administration, Harvard University (since 1998). Director, MF Risk, Inc. (risk management software) (since 2001). Director, Peninsula Banking Group (bank) (since 2003). Director, Community First Financial Group (bank holding company) (since 2003). Member Competitive Markets Advisory Council, Chicago Mercantile Exchange (futures trading exchange) (since 2004). Chairman and Director, Daedalus Software (medical software) (since 2008). Formerly, Advisory Board Member, Alpha Simplex Group (hedge fund) (2001-2007). Formerly, Chief Science Officer and Director, Trinsum Group, a successor to Integrated Finance Limited (2002-2008). Director, Vical Incorporated (biopharmaceutical product development) (since 2002). |
Myron S. Scholes Director of DFAIDG, DIG and DEM. Trustee of DFAITC. Platinum Grove Asset Management, L.P. Reckson Executive Park 1100 King Street Building 4 Rye Brook, NY 10573 Age: 68 | | DFAITC - since 1993 DFAIDG - since 1981 DIG - since 1993 DEM - since 1993 | | 87 portfolios in 4 investment companies | | Frank E. Buck Professor Emeritus of Finance, Stanford University (since 1981). Chairman, Platinum Grove Asset Management, L.P. (hedge fund) (formerly, Oak Hill Platinum Partners) (since 1999). Formerly, Managing Partner, Oak Hill Capital Management (private equity firm) (until 2004). Formerly, Director, Chicago Mercantile Exchange (2001-2008). Director, American Century Fund Complex (registered investment companies) (37 Portfolios) (since 1981). |
Abbie J. Smith Director of DFAIDG, DIG and DEM. Trustee of DFAITC. The University of Chicago Booth School of Business 5807 S. Woodlawn Avenue Chicago, IL 60637 Age: 56 | | DFAITC - since 2000 DFAIDG - since 2000 DIG - since 2000 DEM - since 2000 | | 87 portfolios in 4 investment companies | | Boris and Irene Stern Professor of Accounting, The University of Chicago Booth School of Business (since 1980), and Co-Director Investment Research, Fundamental Investment Advisors (hedge fund) (since 2008). Director, HNI Corporation (formerly known as HON Industries Inc.) (office furniture) (since 2000). Director, Ryder System Inc. (transportation, logistics and supply-chain management) (since 2003). Director/ Trustee, UBS Funds (fund complex) (5 portfolios) (since 2008). |
37
| | | | | | |
Name, Position with the Fund, Address and Age | | Term of Office1 and Length of Service | | Portfolios within the DFA Fund Complex2 Overseen | | Principal Occupation(s) During Past 5 Years and Other Directorships of Public Companies Held |
| Interested Trustees/Directors* |
David G. Booth Chairman, Director, Chief Executive Officer and President of DFAIDG, DIG and DEM. Chairman, Trustee, Chief Executive Officer, Chief Investment Officer and President of DFAITC. 6300 Bee Cave Road, Building One Austin, Texas 78746 Age: 62 | | DFAITC - since 1993 DFAIDG - since 1981 DIG - since 1992 DEM - since 1993 | | 87 portfolios in 4 investment companies | | Chairman, Director/Trustee, President, Chief Executive Officer and formerly Chief Investment Officer of the following companies: Dimensional Holdings Inc., Dimensional Fund Advisors LP, Dimensional Fund Advisors Canada ULC, DFAIDG, DIG, DEM and DFAITC. President and Chief Executive Officer of DFA Securities LLC. Director of Dimensional Fund Advisors Ltd, and formerly Chief Investment Officer. Director and formerly, President and Chief Investment Officer of DFA Australia Ltd. Formerly, Director of Dimensional Funds PLC and Dimensional Fund II PLC. Chairman, Director and Chief Executive Officer of Dimensional Fund Advisors Canada ULC (All Chief Investment Officer positions held starting 1/03 through 3/07 except Dimensional Holdings Inc., which was from 10/06 through 3/07.) Limited Partner, Oak Hill Partners (since 2001) and VSC Investors, LLC (since 2007). Trustee, The University of Chicago Booth School of Business. Formerly, Director, SA Funds (registered investment company). Formerly Director, Assante Corporation (investment management) (until 2002). |
Eduardo A. Repetto Director, Chief Investment Officer and Vice President of DFAIDG, DIG and DEM. Trustee, Chief Investment Officer and Vice President of DFAITC 6300 Bee Cave Road, Building One Austin, TX 78746 Age: 42 | | DFAITC - since 2009 DFAIDG - since 2009 DIG - since 2009 DEM - since 2009 | | 87 portfolios in 4 investment companies | | Director/Trustee (beginning June 2009), Chief Investment Officer (beginning March 2007) and Vice President of DFAIDG, DIG, DEM and DFAITC. Chief Investment Officer (beginning March 2007) and Vice President of all the DFA Entities, DFA Australia Limited and Dimensional Fund Advisors Canada ULC. |
| 1 | Each Trustee/Director holds office for an indefinite term until his or her successor is elected and qualified. |
| 2 | Each Trustee/Director is a director or trustee of each of the four registered investment companies within the DFA Fund Complex, which includes the Funds. |
| * | Interested Trustees/Directors are described as such because they are deemed to be “interested persons,” as that term is defined under the Investment Company Act of 1940, as amended, due to their positions with Dimensional Fund Advisors LP. |
38
Officers
The name, age, information regarding positions with the Funds and the principal occupation for each officer of the Funds are set forth below. Each officer listed below holds the same office (except as otherwise noted) in the following entities: Dimensional Fund Advisors LP (prior to November 3, 2006, Dimensional Fund Advisors Inc.) (“Dimensional”), DFA Securities Inc., DFAIDG, DIG, DFAITC and DEM (collectively, the “DFA Entities”). The address of each officer is: Dimensional Fund Advisors LP, 6300 Bee Cave Road, Building One, Austin, Texas 78746, unless otherwise indicated.
| | | | |
Name, Position with the Fund and Age | | Term of Office1 and Length of Service | | Principal Occupation(s) During Past 5 Years |
| Officers |
April A. Aandal Vice President and Chief Learning Officer Age: 46 | | Since 2008 | | Vice President of all the DFA Entities. Chief Learning Officer of Dimensional (since September 2008). Formerly, Regional Director of Dimensional (2004-2008); Vice President of Professional Development at Assante Asset Management (June 2002-January 2005). |
Darryl D. Avery Vice President Age: 43 | | Since 2005 | | Vice President of all the DFA Entities. From June 2002 to January 2005, institutional client service representative of Dimensional. |
Arthur H. Barlow Vice President Age: 53 | | Since 1993 | | Vice President of all the DFA Entities. Formerly, Vice President of DFA Australia Limited and Dimensional Fund Advisors Ltd. |
Scott A. Bosworth Vice President Age: 40 | | Since 2007 | | Vice President of all the DFA Entities. Regional Director of Dimensional (since November 1997). |
Valerie A. Brown Vice President and Assistant Secretary Age: 42 | | Since 2001 | | Vice President and Assistant Secretary of all the DFA Entities, DFA Australia Limited, Dimensional Fund Advisors Ltd., and since June 2003, Dimensional Fund Advisors Canada ULC. |
David P. Butler Vice President Age: 45 | | Since 2007 | | Vice President of all the DFA Entities. Director of Global Financial Services of Dimensional (since 2008). Formerly, Regional Director of Dimensional Fund Advisors LP (January 1995 to January 2005). |
Patrick Carter Vice President Age: 47 | | Since 2007 | | Vice President of all the DFA Entities. Regional Director of Dimensional (since March 2006). Formerly, Director of Merrill Lynch Retirement Group (December 1998 to March 2006). |
Joseph H. Chi Vice President Age: 43 | | Since 2009 | | Vice President of all the DFA Entities. Portfolio Manager for Dimensional Fund Advisors LP (since October 2005). Prior to October 2005, Corporate Counsel at Hewitt Associates (July 2002-August 2005). |
Stephen A. Clark Vice President Age: 37 | | Since 2004 | | Vice President of all the DFA Entities. Formerly, Portfolio Manager of Dimensional (April 2001-April 2004). |
Robert P. Cornell Vice President Age: 60 | | Since 2007 | | Vice President of all the DFA Entities. Regional Director of Financial Services Group of Dimensional (since August 1993). |
Christopher S. Crossan Vice President and Chief Compliance Officer Age: 43 | | Since 2004 | | Vice President and Chief Compliance Officer of all the DFA Entities. |
James L. Davis Vice President Age: 52 | | Since 1999 | | Vice President of all the DFA Entities. Formerly, Vice President of DFA Australia Limited and Dimensional Fund Advisors Ltd. |
Robert T. Deere Vice President Age: 52 | | Since 1994 | | Vice President of all the DFA Entities and DFA Australia Limited. |
Robert W. Dintzner Vice President Age: 39 | | Since 2001 | | Vice President of all the DFA Entities. |
39
| | | | |
Name, Position with the Fund and Age | | Term of Office1 and Length of Service | | Principal Occupation(s) During Past 5 Years |
Kenneth Elmgren Vice President Age: 55 | | Since 2007 | | Vice President of all the DFA Entities. Formerly, Managing Principal of Beverly Capital (May 2004 to September 2006). |
Richard A. Eustice Vice President and Assistant Secretary Age: 44 | | Since 1998 | | Vice President and Assistant Secretary of all the DFA Entities and DFA Australia Limited. Chief Operating Officer of Dimensional Fund Advisors Ltd. (since July 2008). Formerly, Vice President of Dimensional Fund Advisors Ltd. |
Eugene F. Fama, Jr. Vice President Age: 48 | | Since 1993 | | Vice President of all the DFA Entities. Formerly, Vice President of DFA Australia Limited and Dimensional Fund Advisors Ltd. |
Gretchen A. Flicker Vice President Age: 38 | | Since 2004 | | Vice President of all the DFA Entities. Prior to April 2004, institutional client service representative of Dimensional. |
Jed S. Fogdall Vice President Age: 35 | | Since 2008 | | Vice President of all the DFA Entities. Portfolio Manager for Dimensional (since September 2004). Prior to September 2004, Staff Engineer at the Boeing Company (1997-2004). |
Glenn S. Freed Vice President Age: 47 | | Since 2001 | | Vice President of all the DFA Entities. |
Jeremy P. Freeman Vice President Age: 38 | | Since 2009 | | Vice President of all the DFA Entities. Senior Technology Manager for Dimensional Fund Advisors LP (since June 2006). Formerly, Principal at AIM Investments/Amvescap PLC (now Invesco) (June 1998-June 2006). |
Mark R. Gochnour Vice President Age: 42 | | Since 2007 | | Vice President of all the DFA Entities. Regional Director of Dimensional. |
Henry F. Gray Vice President Age: 42 | | Since 2000 | | Vice President of all the DFA Entities. Prior to July 2000, Portfolio Manager of Dimensional. Formerly, Vice President of DFA Australia Limited. |
John T. Gray Vice President Age: 35 | | Since 2007 | | Vice President of all the DFA Entities. Formerly, Regional Director of Dimensional (January 2005 to February 2007). |
Darla Hastings Vice President Age: 54 | | Since 2007 | | Vice President of all the DFA Entities. Chief Marketing Officer of Dimensional. Formerly, Senior Vice President, Customer Experience for Benchmark Assisted Living (May 2005 to April 2006); Executive Vice President and Chief Marketing Officer of State Street Corporation (September 2001 to October 2005). |
Joel H. Hefner Vice President Age: 41 | | Since 2007 | | Vice President of all the DFA Entities. Regional Director of Dimensional (since June 1998). |
Julie Henderson Vice President and Fund Controller Age: 35 | | Since 2005 | | Vice President and Fund Controller of all the DFA Entities. Formerly, Senior Manager at PricewaterhouseCoopers LLP (July 1996 to April 2005). |
Kevin Hight Vice President Age: 41 | | Since 2005 | | Vice President of all the DFA Entities. Formerly, Regional Director of Dimensional (since March 2003 to March 2005). |
Christine W. Ho Vice President Age: 41 | | Since 2004 | | Vice President of all the DFA Entities. Prior to April 2004, Assistant Controller of Dimensional. |
Jeff J. Jeon Vice President Age: 35 | | Since 2004 | | Vice President of all the DFA Entities. Counsel of Dimensional (since September 2001). |
Patrick M. Keating Vice President Age: 54 | | Since 2003 | | Vice President of all the DFA Entities and Chief Operating Officer of Dimensional. Director, Vice President and Chief Privacy Officer of Dimensional Fund Advisors Canada ULC. Director of DFA Australia Limited. |
40
| | | | |
Name, Position with the Fund and Age | | Term of Office1 and Length of Service | | Principal Occupation(s) During Past 5 Years |
Joseph F. Kolerich Vice President Age: 37 | | Since 2004 | | Vice President of all the DFA Entities. Portfolio Manager for Dimensional (since April 2001). |
Michael F. Lane Vice President Age: 42 | | Since 2004 | | Vice President of all the DFA Entities. Formerly, Vice President of Advisor Services at TIAA-CREF (July 2001 to September 2004). |
Kristina M. LaRusso Vice President Age: 34 | | Since 2006 | | Vice President of all DFA Entities. Formerly, Operations Supervisor of Dimensional (March 2003 to December 2006). |
Inmoo Lee Vice President Age: 43 | | Since 2007 | | Vice President of all the DFA Entities. Associate Professor Department of Finance and Accounting, Business School, National University of Singapore (July 2004 to present); Associate Professor, College of Business Administration, Korea University (September 2001 to May 2006). |
Juliet Lee Vice President Age: 38 | | Since 2005 | | Vice President of all the DFA Entities. Human Resources Manager of Dimensional (since January 2004). |
Aaron M. Marcus Vice President & Head of Global Human Resources Age: 39 | | Since 2008 | | Vice President and Head of Global Human Resources of Dimensional. Formerly, Global Head of Recruiting and Vice President of Goldman Sachs & Co. (June 2006 to January 2008); Global Co-Head of HR of the Equities & FICC Division, and Vice President of Goldman Sachs & Co. (May 2005 to May 2006); Head of Americas Campus Recruiting and Vice President of Goldman Sachs & Co. (April 2003 to May 2005). |
David R. Martin Vice President, Chief Financial Officer and Treasurer Age: 52 | | Since 2007 | | Vice President, Chief Financial Officer and Treasurer of all the DFA Entities. Director, Vice President, Chief Financial Officer and Treasurer of Dimensional Fund Advisors Ltd. and DFA Australia Limited. Chief Financial Officer, Treasurer, and Vice President of Dimensional Fund Advisors Canada ULC. Director of Dimensional Funds PLC and Dimensional Funds II PLC. Formerly, Executive Vice President and Chief Financial Officer of Janus Capital Group Inc. (June 2005 to March 2007); Senior Vice President of Finance at Charles Schwab & Co., Inc. (March 1999 to May 2005). |
Catherine L. Newell Vice President and Secretary Age: 45 | | Vice President since 1997 and Secretary since 2000 | | Vice President and Secretary of all the DFA Entities. Director, Vice President and Secretary of DFA Australia Limited and Dimensional Fund Advisors Ltd. (since February 2002, April 1997 and May 2002, respectively). Vice President and Secretary of Dimensional Fund Advisors Canada ULC (since June 2003). Director, Dimensional Funds PLC and Dimensional Funds II PLC (since 2002 and 2006, respectively). Formerly, Assistant Secretary of all DFA Entities, DFA Australia Limited and Dimensional Fund Advisors Ltd. |
Christian Newton Vice President Age: 34 | | Since 2009 | | Vice President of all DFA Entities. Web Services Manager for Dimensional Fund Advisors LP (Since January 2008). Formerly Design Manager (2005-2008) and Web Developer (2002-2005) of Dimensional Fund Advisors LP. |
Gerard K. O’Reilly Vice President Age: 32 | | Since 2007 | | Vice President of all the DFA Entities. Formerly, Research Associate of Dimensional Fund Advisors LP (2004 to 2006); Research Assistant in PhD program, Aeronautics Department California Institute of Technology (1998 to 2004). |
Daniel C. Ong Vice President Age: 35 | | Since 2009 | | Vice President of all the DFA Entities. Portfolio Manager for Dimensional Fund Advisors LP (since July 2005). Prior to 2005, Graduate Student at the University of Chicago Booth School of Business (2003-2005). |
Carmen Palafox Vice President Age: 35 | | Since 2006 | | Vice President of all the DFA Entities. Operations Manager of Dimensional Fund Advisors LP (since May 1996). |
Sonya Park Vice President Age: 37 | | Since 2005 | | Vice President of all the DFA Entities. From February 2002 to January 2005, institutional client service representative of Dimensional. |
41
| | | | |
Name, Position with the Fund and Age | | Term of Office1 and Length of Service | | Principal Occupation(s) During Past 5 Years |
David A. Plecha Vice President Age: 48 | | Since 1993 | | Vice President of all the DFA Entities, DFA Australia Limited and Dimensional Fund Advisors Ltd |
Ted Randall Vice President Age: 36 | | Since 2008 | | Vice President of all the DFA Entities. Formerly, Research Associate of Dimensional (2006-2008). Systems Developer of Dimensional (2001-2006). |
L. Jacobo Rodriguez Vice President Age: 38 | | Since 2005 | | Vice President of all the DFA Entities. From August 2004 to July 2005, institutional client service representative of Dimensional. Formerly, Financial Services Analyst, Cato Institute (September 2001 to June 2004); Book Review Editor, Cato Journal, Cato Institute (May 1996 to June 2004). |
David E. Schneider Vice President Age: 63 | | Since 2001 | | Vice President of all the DFA Entities. Currently, Director of Institutional Services. |
Bruce A. Simmons Vice President Age: 44 | | Since 2009 | | Vice President of all the DFA Entities. Investment Operations Manager for Dimensional Fund Advisors LP (since May 2007). Formerly, Vice President Client and Fund Reporting at Mellon Financial (September 2005-May 2007); Vice President Business Development at CUADPRO Marketing (July 2003-September 2005). |
Ted R. Simpson Vice President Age: 41 | | Since 2007 | | Vice President of all the DFA Entities. Regional Director of Dimensional (since December 2002). |
Bryce D. Skaff Vice President Age: 34 | | Since 2007 | | Vice President of all the DFA Entities. Formerly, Regional Director of Dimensional (December 1999 to January 2007). |
Grady M. Smith Vice President Age: 53 | | Since 2004 | | Vice President of all the DFA Entities. Prior to April 2004, Portfolio Manager of Dimensional. |
Carl G. Snyder Vice President Age: 46 | | Since 2000 | | Vice President of all the DFA Entities. Formerly, Vice President of DFA Australia Limited. |
Lawrence R. Spieth Vice President Age: 61 | | Since 2004 | | Vice President of all the DFA Entities. Prior to April 2004, Regional Director of Dimensional. |
Bradley G. Steiman Vice President Age: 36 | | Since 2004 | | Vice President of all the DFA Entities and Director and Vice President of Dimensional Fund Advisors Canada ULC. |
Robert C. Trotter Vice President Age: 51 | | Since 2009 | | Vice President of all the DFA Entities. Senior Manager Technology for Dimensional Fund Advisors LP (since March 2007). Formerly, Director of Technology at AMVESCAP (2002-2007). |
Karen E. Umland Vice President Age: 43 | | Since 1997 | | Vice President of all the DFA Entities, DFA Australia Limited, Dimensional Fund Advisors Ltd., and Dimensional Fund Advisors Canada ULC. |
Sunil Wahal Vice President Age: 42 | | Since 2009 | | Vice President of all the DFA Entities. Formerly, Research Associate for Dimensional Fund Advisors LP (July 2008-January 2009); Consultant to Dimensional Fund Advisors LP (September 2005-July 2008); Jack D. Furst Professor of Finance at Arizona State University, WP Carey School of Business (July 2005-July 2008); Associate Professor of Finance at Goizueta Business School, Emory University (1997-2005). |
Brian J. Walsh Vice President Age: 39 | | Since 2009 | | Vice President of all the DFA Entities. Portfolio Manager for Dimensional Fund Advisors LP (since 2004). Formerly, Trader for Dimensional Fund Advisors LP (1997-2004). |
Carol W. Wardlaw Vice President Age: 51 | | Since 2004 | | Vice President of all the DFA Entities. Prior to April 2004, Regional Director of Dimensional. |
42
| | | | |
Name, Position with the Fund and Age | | Term of Office1 and Length of Service | | Principal Occupation(s) During Past 5 Years |
Weston J. Wellington Vice President Age: 58 | | Since 1997 | | Vice President of all the DFA Entities. Formerly, Vice President of DFA Australia Limited. |
Daniel M. Wheeler Vice President Age: 64 | | Since 2001 | | Vice President of all the DFA Entities. Prior to 2001 and currently, Director of Financial Advisors Services of Dimensional. Director of Dimensional Fund Advisors Ltd. (since October 2003) and President of Dimensional Fund Advisors Canada ULC (since June 2003). |
Ryan Wiley Vice President Age: 33 | | Since 2007 | | Vice President of all the DFA Entities. Senior Trader of Dimensional. Formerly, Portfolio Manager (2006 to 2007); Trader (2001 to 2006). |
Paul E. Wise Vice President Age: 54 | | Since 2005 | | Vice President of all the DFA Entities. Chief Technology Officer for Dimensional (since 2004). Formerly, Principal of Turnbuckle Management Group (January 2002 to August 2004). |
| 1 | Each officer holds office for an indefinite term at the pleasure of the Boards of Trustees/Directors and until his or her successor is elected and qualified. |
43
VOTING PROXIES ON FUND PORTFOLIO SECURITIES
A description of the policies and procedures that the Trust uses in voting proxies relating to securities held in the portfolio is available without charge, upon request, by calling collect: (512) 306-7400. Information regarding how the Advisor votes these proxies is available from the EDGAR database on the SEC’s website at http://www.sec.gov and from the Advisor’s website at http://www.dimensional.com and reflects the twelve-month period beginning July 1st and ending June 30th.
44
NOTICE TO SHAREHOLDERS
(Unaudited)
For shareholders that do not have an October 31, 2009 tax year end, this notice is for informational purposes only. For shareholders with an October 31, 2009 tax year end, please consult your tax advisor as to the pertinence of this notice. For the fiscal year November 1, 2008 to October 31, 2009, the Portfolio is designating the following items with regard to distributions paid during the period. All designations are based on financial information available as of the date of this annual report and, accordingly are subject to change. For each item, it is the intention of the Portfolio to designate the maximum amount permitted under the Internal Revenue Code and the regulations thereunder.
| | | | | | | | | | | | | | | | |
Dimensional Investment Group Inc. | | Net
Investment
Income
Distributions | | Short-Term
Capital Gain
Distributions | | Long-Term
Capital Gain
Distributions | | Total
Distributions | | Qualifying
For Corporate
Dividends
Received
Deduction(1) | | Qualifying
Dividend
Income(2) | | Qualifying
Interest
Income(3) | | Qualifying
Short-Term
Capital Gain(4) |
U.S. Large Cap Value Portfolio II | | 5% | | — | | 95% | | 100% | | 100% | | 100% | | 100% | | 100% |
| (1) | Qualifying dividends represent dividends which qualify for the corporate dividends received deduction and is reflected as a percentage of ordinary income distributions (the total of short-term capital gain and net investment income distributions). |
| (2) | The percentage in this column represents the amount of “Qualifying Dividend Income” as created by the Jobs and Growth Tax Relief Reconciliation Act of 2003 and is reflected as a percentage of ordinary income distributions (the total of short-term capital gain and net investment income distributions). |
| (3) | The percentage in this column represents the amount of “Qualifying Interest Income” as created by The American Jobs Creation Act of 2004. The information is reflected as a percentage of ordinary income distributions (the total of short-term capital gain and net investment income distributions). |
| (4) | The percentage in this column represents the amount of “Qualifying Short-Term Capital Gain” as created by The American Jobs Creation Act of 2004. The information is reflected as a percentage of ordinary income distributions (the total of short-term capital gain and net investment income distributions). |
45


Dimensional Fund Advisors
6300 Bee Cave Road, Building One
Austin, TX 78746
December 2009
Dear Fellow Shareholder,
After sinking to ten-year lows, stock prices around the world rebounded sharply in March 2009 and posted steady gains in the seven months between March and September. March and April were among the best-return months in the life of Dimensional’s equity Funds.
The unexpected turns in the financial markets this year offered some valuable lessons. We were reminded that stock prices are unpredictable. We saw once again the benefits of staying disciplined in the market as it inevitably moves up and down. And I believe these markets showed very clearly why diversification is so important to long-term investment success.
Although diversification can’t prevent losses, it can help investors avoid the extreme outcomes that can result from concentrating investments in individual stocks or market segments. We believe that successful investing is about both increasing wealth and being able to sleep well at night. Investors who understand how markets work and have a realistic understanding of their own tolerance for risk are most likely to have a good overall experience.
More than $10 billion in net long-term assets flowed into Dimensional’s Funds during the first 10 months of 2009, a reflection of the trust our shareholders around the world have placed in us. We are grateful for that trust and want you to know that we take our responsibility as the steward of your investments in Dimensional’s Funds very seriously. We hope to have the opportunity to continue serving your needs for many years to come.
Sincerely,

David G. Booth
Chairman and Chief Executive Officer
[THIS PAGE INTENTIONALLY LEFT BLANK]
ANNUAL REPORT
Table of Contents
This report is submitted for the information of the Fund’s shareholders. It is not authorized for distribution to prospective investors unless preceded or accompanied by an effective prospectus.
i
[THIS PAGE INTENTIONALLY LEFT BLANK]
DIMENSIONAL INVESTMENT GROUP INC.
THE DFA INVESTMENT TRUST COMPANY
DEFINITIONS OF ABBREVIATIONS AND FOOTNOTES
Statement of Assets and Liabilities/Summary Schedule of Portfolio Holdings
| | |
Investment Abbreviations |
FHLMC | | Federal Home Loan Mortgage Corporation |
FNMA | | Federal National Mortgage Association |
|
Investment Footnotes |
† | | See Note B to Financial Statements. |
** | | Calculated as a percentage of total net assets. Percentages shown parenthetically next to the category headings have been calculated as a percentage of total investments. “Other Securities” are those securities that are not among the top 50 holdings of the Fund or do not represent more than 1.0% of the net assets of the Fund. Some of the individual securities within this category may include Total or Partial Securities on Loan and/or Non-Income Producing Securities. |
* | | Non-Income Producing Securities. |
# | | Total or Partial Securities on Loan. |
@ | | Security purchased with cash proceeds from Securities on Loan. |
(r) | | The adjustable rate shown is effective as of October 31, 2009. |
§ | | Affiliated Fund. |
|
| Financial Highlights |
(A) | | Computed using average shares outstanding. |
(B) | | Annualized |
(C) | | Non-Annualized |
(D) | | Represents the combined ratios for the respective portfolio and its respective pro-rata share of its Master Fund Series. |
|
| All Statements and Schedules |
— | | Amounts designated as — are either zero or rounded to zero. |
REIT | | Real Estate Investment Trust |
SEC | | Securities and Exchange Commission |
1
DIMENSIONAL INVESTMENT GROUP INC.
PERFORMANCE CHART
U.S. Large Cap Value Portfolio III vs.
Russell 1000® Value Index
October 31, 1999-October 31, 2009
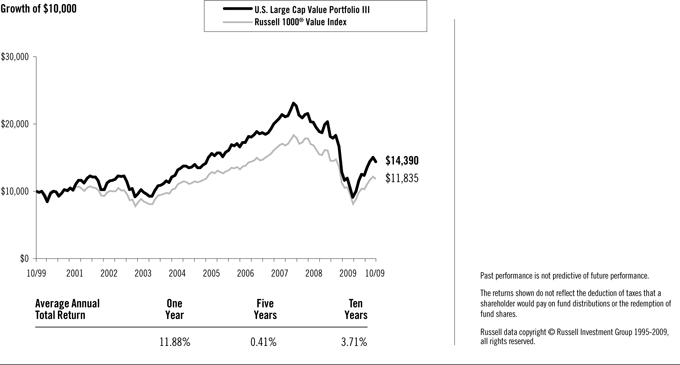
2
DIMENSIONAL INVESTMENT GROUP INC.
MANAGEMENT’S DISCUSSION AND ANALYSIS
U.S. Equity Market Review | 12 Months Ended October 31, 2009 |
The year ending October 31, 2009, was among the most volatile periods in U.S. market history. Broad market returns were positive with stocks represented by the mid cap index outperforming those within both small cap and large cap indexes and stocks represented by the growth index outperforming those represented by the value index. Investors moving out of stocks, beginning in late 2008 and extending into early 2009, contributed to high volatility and negative returns over that period. Markets turned sharply higher in March, and the size and value premiums both turned positive over the eight months ending October 2009. Although the large cap index outperformed the small cap index, and the growth index outperformed the value index, returns within the broader market (Russell 3000® Index) demonstrate that there was a positive small size premium and a positive value premium. This counterintuitive result occurred because the stock markets were characterized by extreme volatility, and the indexes, which are reconstituted annually, were not able to rebalance during the course of the year to maintain their intended asset class exposure. Among the most important factors explaining differences in the behavior of diversified equity portfolios are the company size and company value/growth characteristics of the portfolio’s holdings. Size is measured by market capitalization, and value classification is a function of stock price relative to one or more fundamental characteristics. Compared to other stocks, value stocks often have lower market value relative to their earnings, dividends, and book value.
For the 12 months ended October 31, 2009, the total return of the Russell Microcap® Index was 5.06%, the Russell 2000® Index was 6.46%, the CRSP 6-10 Index was 20.94%, and the MSCI US Small Cap 1750 Index was 14.11%. Large cap growth stocks outperformed large cap value stocks, as measured by the Russell 1000® Growth Index and Russell 1000® Value Index. Small cap growth stocks outperformed small cap value stocks, by a lesser amount than in large caps, as measured by the Russell 2000 Growth® Index and Russell 2000® Value Index.
| | |
Total Return for 12 Months Ended October 31, 2009 | | |
Russell 2000® Index (small cap companies) | | 6.46% |
Russell Midcap® Index (mid cap companies) | | 18.74% |
Russell 1000® Index (large cap companies) | | 11.19% |
Russell 3000® Value Index | | 4.55% |
Russell 3000® Growth Index | | 17.04% |
Further dividing the large, mid, and small cap market segments by value and growth characteristics shows more detail in the performance differences over the period.
| | |
Total Return for 12 Months Ended October 31, 2009 | | |
Russell 1000® Value Index (large cap value companies) | | 4.78% |
Russell 1000® Growth Index (large cap growth companies) | | 17.50% |
Russell Midcap® Value Index (mid cap value companies) | | 14.52% |
Russell Midcap® Growth Index (mid cap growth companies) | | 22.48% |
Russell 2500TM Value Index (small/mid cap value companies) | | 8.56% |
Russell 2500TM Growth Index (small/mid cap growth companies) | | 18.20% |
Russell 2000® Value Index (small cap value companies) | | 1.95% |
Russell 2000® Growth Index (small cap growth companies) | | 11.34% |
Source: Russell data copyright © Russell Investment Group 1995-2009, all rights reserved.
Differences in returns for the various Dimensional U.S. equity funds over the 12 months ended October 31, 2009 were attributable primarily to differences in value/growth and size characteristics as well as the exclusion of
3
REIT securities from most Dimensional portfolios, except for the DFA Real Estate Securities Portfolio and portfolios investing in the U.S. Large Company Series. Moreover, the portfolio construction approach used by Dimensional Fund Advisors (the “Advisor”) generally resulted in portfolios with greater emphasis on value or small company characteristics relative to widely used index benchmarks.
Master-Feeder Structure
The portfolio described below, called a “Feeder Fund”, does not buy individual securities directly; instead, the portfolio invests in a corresponding fund called a “Master Fund”. The Master Fund, in turn, purchases stocks and/or other securities.
U.S. Large Cap Value Portfolio III
The U.S. Large Cap Value Portfolio III seeks to capture the returns of U.S. large company value stocks by purchasing shares of a Master Fund that invests in such stocks. The investment strategy employs a disciplined, quantitative approach, emphasizing broad diversification and consistent exposure to large cap value stocks, but does not attempt to track closely a specific equity index. As of October 31, 2009, the Master Fund held 213 stocks and was mostly invested in equities throughout the year: the average non-equitized cash level for the period was less than 1% of the Master Fund’s assets.
As a result of the Master Fund’s diversified investment approach, performance was determined principally by broad structural trends in the U.S. equity market, rather than the behavior of a limited number of stocks. For the 12 months ended October 31, 2009, total returns were 11.88% for the Portfolio and 4.78% for the Russell 1000® Value Index. The Portfolio benefited from a positive size premium and value premium over the last eight months of the period. Relative to the Index, the Master Fund’s greater exposure to stocks with more pronounced value characteristics and composition differences along the value/growth dimension added approximately 4.2% to the relative performance. Differences in sector weights between the Portfolio and Index also contributed to the outperformance. The Master Fund’s larger allocation than the Index to consumer discretionary stocks, due to its strategy of maintaining consistent large cap value exposure, added approximately 3% to relative performance. The Portfolio also benefited from composition differences among the Master Fund’s basket of financial stocks, which added approximately 3.6% to relative performance.
4
DIMENSIONAL INVESTMENT GROUP INC.
U.S. LARGE CAP VALUE PORTFOLIO III
DISCLOSURE OF FUND EXPENSES
(Unaudited)
The following Expense Table is shown so that you can understand the impact of fees on your investment. All mutual funds have operating expenses. As a shareholder of the fund, you incur ongoing costs, which include costs for portfolio management, administrative services, and shareholder reports, among others. Operating expenses, legal and audit services, which are deducted from a fund’s gross income, directly reduce the investment return of the fund. A fund’s expenses are expressed as a percentage of its average net assets. This figure is known as the expense ratio. The following examples are intended to help you understand the ongoing costs, in dollars, of investing in the fund and to compare these costs with those of other mutual funds. The examples are based on an investment of $1,000 made at the beginning of the period shown and held for the entire period.
The Expense Table below illustrates your fund’s costs in two ways.
Actual Fund Return
This section helps you to estimate the actual expenses after fee waivers that you paid over the period. The “Ending Account Value” shown is derived from the fund’s actual return and “Expenses Paid During Period” reflect the dollar amount that would have been paid by an investor who started with $1,000 in the fund. You may use the information here, together with the amount you invested, to estimate the expenses that you paid over the period.
To do so, simply divide your account value by $1,000 (for example, a $7,500 account value divided by $1,000 = 7.5), then multiply the result by the number given for your fund under the heading “Expenses Paid During Period.”
Hypothetical Example for Comparison Purposes
This section is intended to help you compare your fund’s costs with those of other mutual funds. The hypothetical “Ending Account Value” and “Expenses Paid During Period” are derived from the fund’s actual expense ratio and an assumed 5% annual return before expenses. In this case, because the return used is not the fund’s actual return, the results do not apply to your investment. The example is useful in making comparisons because the SEC requires all mutual funds to calculate expenses based on a 5% annual return. You can assess your fund’s costs by comparing this hypothetical example with the hypothetical examples that appear in shareholder reports of other funds.
Please note that the expenses shown in the table are meant to highlight and help you compare ongoing costs only and do not reflect any transactional costs, if applicable. The “Annualized Expense Ratio” represents the actual expenses for the six-month period indicated.
| | | | | | | | |
| | | | Six Months Ended October 31, 2009 |
| EXPENSE TABLE | | | | | | | | |
| | | Beginning
Account
Value
05/01/09 | | Ending
Account
Value
10/31/09 | | Annualized
Expense
Ratio* | | Expenses
Paid
During
Period* |
Actual Fund Return | | $1,000.00 | | $1,242.30 | | 0.17% | | $0.96 |
Hypothetical 5% Annual Return | | $1,000.00 | | $1,024.35 | | 0.17% | | $0.87 |
| * | Expenses are equal to the fund’s annualized expense ratio for the six-month period, multiplied by the average account value over the period, multiplied by the number of days in the most recent six-month period (184), then divided by the number of days in the year (365) to reflect the six-month period. The Portfolio is a Feeder Fund. The expenses shown reflect the direct expenses of the Feeder Fund and the indirect payment of the Feeder Fund’s portion of the expenses of its Master Fund. |
5
DIMENSIONAL INVESTMENT GROUP INC.
U.S. LARGE CAP VALUE PORTFOLIO III
DISCLOSURE OF PORTFOLIO HOLDINGS
(Unaudited)
The SEC requires that all Funds file a complete Schedule of Investments with the SEC for their first and third fiscal quarters on Form N-Q. For Dimensional Investment Group Inc., this would be for the fiscal quarters ending January 31 and July 31. The Form N-Q filing must be made within 60 days of the end of the quarter. Dimensional Investment Group Inc. filed its most recent Form N-Q with the SEC on September 29, 2009. It is available upon request, without charge, by calling collect: (512) 306-7400 or by mailing a request to Dimensional Fund Advisors LP, 6300 Bee Cave Road, Building One, Austin, Texas 78746, or by visiting the SEC’s website at http://www.sec.gov, or they may be reviewed and copied at the SEC’s Public Reference Room in Washington, D.C. (call 1-800-732-0330 for information on the operation of the Public Reference Room).
PORTFOLIO HOLDINGS
The SEC requires that all Funds present their categories of portfolio holdings in a table, chart or graph format in their annual and semi-annual shareholder reports, whether or not a Schedule of Investments is utilized. The following table, which presents portfolio holdings as a percent of total investments before short-term investments and collateral for loaned securities, is provided in compliance with such requirement.
The categories of industry classification for the Affiliated Investment Company are represented in the Disclosure of Portfolio Holdings, which are included elsewhere within the report. Refer to the Summary Schedule of Portfolio Holdings for the underlying Master Fund’s holdings which reflect the investments by category.
| | | |
Affiliated Investment Company | | 100.0 | % |
6
DIMENSIONAL INVESTMENT GROUP INC.
U.S. LARGE CAP VALUE PORTFOLIO III
STATEMENT OF ASSETS AND LIABILITIES
OCTOBER 31, 2009
(Amounts in thousands, except share and per share amounts)
| | | | |
ASSETS: | | | | |
Investments in The U.S. Large Cap Value Series of The DFA Investment Trust Company
(Affiliated Investment Company) at Value† | | $ | 1,457,793 | |
Receivables: | | | | |
Affiliated Investment Company Sold | | | 367 | |
Fund Shares Sold | | | 760 | |
Prepaid Expenses and Other Assets | | | 31 | |
| | | | |
Total Assets | | | 1,458,951 | |
| | | | |
LIABILITIES: | | | | |
Payables: | | | | |
Fund Shares Redeemed | | | 1,127 | |
Due to Advisor | | | 13 | |
Accrued Expenses and Other Liabilities | | | 110 | |
| | | | |
Total Liabilities | | | 1,250 | |
| | | | |
NET ASSETS | | $ | 1,457,701 | |
| | | | |
SHARES OUTSTANDING, $0.01 PAR VALUE (1) | | | 120,445,639 | |
| | | | |
NET ASSET VALUE, OFFERING AND REDEMPTION PRICE PER SHARE | | $ | 12.10 | |
| | | | |
Investment in Affiliated Investment Company at Cost | | $ | 1,230,529 | |
| | | | |
NET ASSETS CONSIST OF: | | | | |
Paid-In Capital | | $ | 1,654,251 | |
Undistributed Net Investment Income (Distributions in Excess of Net Investment Income) | | | 3,703 | |
Accumulated Net Realized Gain (Loss) | | | (427,518 | ) |
Net Unrealized Appreciation (Depreciation) | | | 227,265 | |
| | | | |
NET ASSETS | | $ | 1,457,701 | |
| | | | |
(1) NUMBER OF SHARES AUTHORIZED | | | 700,000,000 | |
| | | | |
See accompanying Notes to Financial Statements.
7
DIMENSIONAL INVESTMENT GROUP INC.
U.S. LARGE CAP VALUE PORTFOLIO III
STATEMENT OF OPERATIONS
FOR THE YEAR ENDED OCTOBER 31, 2009
(Amounts in thousands)
| | | | |
Investment Income | | | | |
Dividends | | $ | 28,847 | |
Interest | | | 32 | |
Income from Securities Lending | | | 2,508 | |
Expenses Allocated from Affiliated Investment Company | | | (1,612 | ) |
| | | | |
Total Investment Income | | | 29,775 | |
| | | | |
Expenses | | | | |
Administrative Services Fees | | | 124 | |
Accounting & Transfer Agent Fees | | | 35 | |
Filing Fees | | | 87 | |
Shareholders’ Reports | | | 84 | |
Directors’/Trustees’ Fees & Expenses | | | 25 | |
Audit Fees | | | 3 | |
Legal Fees | | | 53 | |
Other | | | 15 | |
| | | | |
Total Expenses | | | 426 | |
| | | | |
Net Investment Income (Loss) | | | 29,349 | |
| | | | |
Realized and Unrealized Gain (Loss) | | | | |
Net Realized Gain (Loss) on Investment Securities Sold | | | (396,703 | ) |
Change in Unrealized Appreciation (Depreciation) of Investment Securities | | | 523,538 | |
| | | | |
Net Realized and Unrealized Gain (Loss) | | | 126,835 | |
| | | | |
Net Increase (Decrease) in Net Assets Resulting from Operations | | $ | 156,184 | |
| | | | |
Investment Income and Realized and Unrealized Gain (Loss) were allocated from the Portfolio’s Master Fund (Affiliated Investment Company).
See accompanying Notes to Financial Statements.
8
DIMENSIONAL INVESTMENT GROUP INC.
U.S. LARGE CAP VALUE PORTFOLIO III
STATEMENTS OF CHANGES IN NET ASSETS
(Amounts in thousands)
| | | | | | | | | | | | |
| | | Year
Ended
Oct. 31,
2009 | | | Period
Dec. 1, 2007
to
Oct. 31, 2008 | | | Year
Ended
Nov. 30,
2007 | |
Increase (Decrease) in Net Assets | | | | | | | | | | | | |
Operations: | | | | | | | | | | | | |
Net Investment Income (Loss) | | $ | 29,349 | | | $ | 29,655 | | | $ | 24,308 | |
Net Realized Gain (Loss) on Investment Securities Sold | | | (396,703 | ) | | | — | | | | 83,262 | † |
Change in Unrealized Appreciation (Depreciation) of Investment Securities | | | 523,538 | | | | (697,115 | )† | | | (122,940 | )† |
| | | | | | | | | | | | |
Net Increase (Decrease) in Net Assets Resulting from Operations | | | 156,184 | | | | (667,460 | ) | | | (15,370 | ) |
| | | | | | | | | | | | |
Distributions From: | | | | | | | | | | | | |
Net Investment Income | | | (31,595 | ) | | | (29,233 | ) | | | (23,042 | ) |
Net Short-Term Gains | | | (337 | ) | | | (463 | ) | | | (2,528 | ) |
Net Long-Term Gains | | | — | | | | (77,610 | ) | | | (35,469 | ) |
| | | | | | | | | | | | |
Total Distributions | | | (31,932 | ) | | | (107,306 | ) | | | (61,039 | ) |
| | | | | | | | | | | | |
Capital Share Transactions (1): | | | | | | | | | | | | |
Shares Issued | | | 443,167 | | | | 573,859 | | | | 386,999 | |
Shares Issued in Lieu of Cash Distributions | | | 30,294 | | | | 106,838 | | | | 61,039 | |
Shares Redeemed | | | (367,343 | ) | | | (409,826 | ) | | | (188,907 | ) |
| | | | | | | | | | | | |
Net Increase (Decrease) from Capital Share Transactions | | | 106,118 | | | | 270,871 | | | | 259,131 | |
| | | | | | | | | | | | |
Total Increase (Decrease) in Net Assets | | | 230,370 | | | | (503,895 | ) | | | 182,722 | |
Net Assets | | | | | | | | | | | | |
Beginning of Period | | | 1,227,331 | | | | 1,731,226 | | | | 1,548,504 | |
| | | | | | | | | | | | |
End of Period | | $ | 1,457,701 | | | $ | 1,227,331 | | | $ | 1,731,226 | |
| | | | | | | | | | | | |
(1) Shares Issued and Redeemed: | | | | | | | | | | | | |
Shares Issued | | | 44,182 | | | | 37,800 | | | | 19,491 | |
Shares Issued in Lieu of Cash Distributions | | | 3,379 | | | | 6,224 | | | | 3,141 | |
Shares Redeemed | | | (37,163 | ) | | | (26,294 | ) | | | (9,517 | ) |
| | | | | | | | | | | | |
Net Increase (Decrease) from Shares Issued and Redeemed | | | 10,398 | | | | 17,730 | | | | 13,115 | |
| | | | | | | | | | | | |
Undistributed Net Investment Income (Distributions in Excess of Net Investment Income) | | $ | 3,703 | | | $ | 6,093 | | | $ | 6,580 | |
| † | See Note A in the Notes to Financial Statements. |
See accompanying Notes to Financial Statements.
9
DIMENSIONAL INVESTMENT GROUP INC.
U.S. LARGE CAP VALUE PORTFOLIO III
FINANCIAL HIGHLIGHTS
(for a share outstanding throughout each period)
| | | | | | | | | | | | | | | | | | | | | | | | |
| | | Year
Ended
Oct. 31,
2009 | | | Period
Dec. 1, 2007
to
Oct. 31, 2008 | | | Year
Ended
Nov. 30,
2007 | | | Year
Ended
Nov. 30,
2006 | | | Year
Ended
Nov. 30,
2005 | | | Year
Ended
Nov. 30,
2004 | |
Net Asset Value, Beginning of Period | | $ | 11.15 | | | $ | 18.75 | | | $ | 19.55 | | | $ | 16.89 | | | $ | 14.91 | | | $ | 12.50 | |
| | | | | | | | | | | | | | | | | | | | | | | | |
Income from Investment Operations | | | | | | | | | | | | | | | | | | | | | | | | |
Net Investment Income (Loss) | | | 0.25 | (A) | | | 0.29 | (A) | | | 0.28 | (A) | | | 0.31 | (A) | | | 0.25 | | | | 0.14 | |
Net Gains (Losses) on Securities (Realized and Unrealized) | | | 0.97 | | | | (6.76 | ) | | | (0.33 | ) | | | 2.69 | | | | 1.91 | | | | 2.54 | |
| | | | | | | | | | | | | | | | | | | | | | | | |
Total from Investment Operations | | | 1.22 | | | | (6.47 | ) | | | (0.05 | ) | | | 3.00 | | | | 2.16 | | | | 2.68 | |
| | | | | | | | | | | | | | | | | | | | | | | | |
Less Distributions | | | | | | | | | | | | | | | | | | | | | | | | |
Net Investment Income | | | (0.27 | ) | | | (0.29 | ) | | | (0.27 | ) | | | (0.29 | ) | | | (0.18 | ) | | | (0.27 | ) |
Net Realized Gains | | | — | | | | (0.84 | ) | | | (0.48 | ) | | | (0.05 | ) | | | — | | | | — | |
| | | | | | | | | | | | | | | | | | | | | | | | |
Total Distributions | | | (0.27 | ) | | | (1.13 | ) | | | (0.75 | ) | | | (0.34 | ) | | | (0.18 | ) | | | (0.27 | ) |
| | | | | | | | | | | | | | | | | | | | | | | | |
Net Asset Value, End of Period | | $ | 12.10 | | | $ | 11.15 | | | $ | 18.75 | | | $ | 19.55 | | | $ | 16.89 | | | $ | 14.91 | |
| | | | | | | | | | | | | | | | | | | | | | | | |
Total Return | | | 11.88 | % | | | (36.55 | )%(C) | | | (0.35 | )% | | | 18.10 | % | | | 14.62 | % | | | 21.72 | % |
| | | | | | | | | | | | | | | | | | | | | | | | |
Net Assets, End of Period (thousands) | | $ | 1,457,701 | | | $ | 1,227,331 | | | $ | 1,731,226 | | | $ | 1,548,504 | | | $ | 1,122,582 | | | $ | 821,194 | |
Ratio of Expenses to Average Net Assets (D) | | | 0.16 | % | | | 0.14 | %(B) | | | 0.14 | % | | | 0.14 | % | | | 0.17 | % | | | 0.19 | % |
Ratio of Net Investment Income to Average Net Assets | | | 2.37 | % | | | 1.98 | %(B) | | | 1.41 | % | | | 1.75 | % | | | 1.60 | % | | | 1.02 | % |
| | | | | | | | | | | | | | | | | | | | | | | | |
See page 1 for the Definitions of Abbreviations and Footnotes.
See accompanying Notes to Financial Statements.
10
DIMENSIONAL INVESTMENT GROUP INC.
U.S. LARGE CAP VALUE PORTFOLIO III
NOTES TO FINANCIAL STATEMENTS
A. Organization:
Dimensional Investment Group Inc. (the “Fund”) is an open-end management investment company registered under the Investment Company Act of 1940, whose shares are offered to institutional investors, retirement plans and clients of registered investment advisors. The Fund consists of fifteen portfolios, of which U.S. Large Cap Value Portfolio III (the “Portfolio”) is presented in this report.
The Portfolio primarily invests its assets in The U.S. Large Cap Value Series (the “Series”), a corresponding series of The DFA Investment Trust Company. At October 31, 2009, the Portfolio owned 19% of the Series. The financial statements of the Series are included elsewhere in this report and should be read in conjunction with the financial statements of the Portfolio.
Effective December 31, 2008, The U.S. Large Cap Value Series, a master fund in a RIC/RIC master-feeder structure, elected with the consent of its respective Holder(s) to change its U.S. federal income tax classification from that of an association taxable as a corporation to a partnership pursuant to Treasury Regulation § 301.7701-3. The change in capital structure and retroactive reclassification of the statement of changes in net assets and financial highlights for the fund is a result of the treatment of a partnership for book purposes. The Series/Portfolio will maintain its books and records and present its financial statements in accordance with generally accepted accounting principles for investment partnerships.
At a regular meeting of the Board of Directors/Trustees (the “Board”) on September 16, 2008, the Board voted to change the fiscal and tax year ends of the Portfolio from November 30 to October 31.
B. Significant Accounting Policies:
The following significant accounting policies are in conformity with accounting principles generally accepted in the United States of America. Such policies are consistently followed by the Fund in preparation of its financial statements. The preparation of financial statements in accordance with accounting principles generally accepted in the United States of America requires management to make estimates and assumptions that affect the reported amounts of assets and liabilities and disclosure of contingent assets and liabilities at the date of the financial statements and the reported amounts of increases and decreases in net assets from operations during the reporting period. Actual results could differ from those estimates and those differences could be material.
1. Security Valuation: The Portfolio’s investment reflects its proportionate interest in the net assets of the Series.
The Portfolio utilizes a fair value hierarchy which prioritizes the inputs to valuation techniques used to measure fair value into three broad level as described below:
• Level 1 – quoted prices in active markets for identical securities
• Level 2 – other significant observable inputs (including quoted prices for similar securities, interest rates, prepayment speeds, credit risk, etc.)
• Level 3 – significant unobservable inputs (including the Portfolio’s own assumptions in determining the fair value of investments)
The inputs or methodology used for valuing securities are not necessarily an indication of the risk associated with investing in those securities. A summary of the inputs used to value the Portfolio’s net assets as of October 31, 2009 is listed below (in thousands).
11
| | | | | | | | | | |
| | | Valuation Inputs |
| | | Investments in
Securities
(Market Value) |
| | | Level 1 | | Level 2 | | Level 3 | | Total |
U.S. Large Cap Value Portfolio III | | $ | 1,457,793 | | — | | — | | $ | 1,457,793 |
2. Deferred Compensation Plan: Each eligible Director of the Fund may elect participation in the Deferred Compensation Plan (the “Plan”). Under the Plan, effective January 1, 2002, such Directors may defer payment of all or a portion of their total fees earned as a Director. These deferred amounts may be treated as though such amounts had been invested in shares of the following funds: U.S. Large Cap Value Portfolio; U.S. Core Equity 1 Portfolio; U.S. Core Equity 2 Portfolio; U.S. Vector Equity Portfolio; U.S. Micro Cap Portfolio; DFA International Value Portfolio; International Core Equity Portfolio; Emerging Markets Portfolio; Emerging Markets Core Equity Portfolio; and/or DFA Two-Year Global Fixed Income Portfolio. Contributions made under the Plan and the change in unrealized appreciation (depreciation) and income, are included in Directors’/Trustees’ Fees & Expenses. At October 31, 2009, the total liability for deferred compensation to Directors is included in Accrued Expenses and Other Liabilities on the Statement of Assets and Liabilities in the amount of $35 (in thousands).
Each Director has the option to receive their distribution of proceeds in one of the following methods upon one year’s notice: lump sum; annual installments over a period of agreed upon years; or semi-annual installments over a period of agreed upon years. As of October 31, 2009, none of the Directors have requested distribution of proceeds.
3. Other: The Portfolio recognizes its pro-rata share, on a daily basis, of net investment income and realized and unrealized gains and losses of investment securities from the Series, which is treated as a partnership for federal income tax purposes. Dividend income and distributions to shareholders are recorded on the ex-dividend date. Distributions received on securities that represent a return of capital or capital gain are recorded as a reduction of cost of investments or as a realized gain, respectively. The Portfolio estimates the character of distributions received that may be considered return of capital distributions. Expenses directly attributable to the Portfolio are directly charged. Common expenses of the Fund are allocated using methods approved by the Board of Directors/Trustees, generally based on average net assets.
C. Investment Advisor:
Dimensional Fund Advisors LP (“Dimensional” or the “Advisor”) provides administrative services to the Portfolio, including supervision of services provided by others, providing information to the shareholders and to the Board of Directors/Trustees, and other administrative services. The Advisor provides investment advisory services to the Series. For the year ended October 31, 2009, the Portfolio’s administrative services fees were accrued daily and paid monthly to the Advisor based on an effective annual rate of 0.01% of average daily net assets.
Fees Paid to Officers and Directors/Trustees:
Certain Officers and Directors/Trustees of the Advisor are also Officers and Directors/Trustees of the Fund; however, such Officers and Directors/Trustees (with the exception of the Chief Compliance Officer (“CCO”)) receive no compensation from the Fund. For the year ended October 31, 2009, the total related amounts paid by the Fund to the CCO were $27 (in thousands). The total related amounts paid by the Portfolio are included in Other Expenses on the Statement of Operations.
D. Federal Income Taxes:
The Portfolio has qualified and intends to continue to qualify as a regulated investment company under Subchapter M of the Internal Revenue Code for federal income tax purposes and to distribute substantially all of its taxable income and net capital gains to shareholders. Accordingly, no provision has been made for federal income taxes.
Distributions from net investment income and net realized capital gains are determined in accordance with U.S. federal income tax regulations, which may differ from those amounts determined under accounting principles generally
12
accepted in the United States of America. These book/tax differences are either temporary or permanent in nature. To the extent these differences are permanent, they are charged or credited to paid-in capital, undistributed net investment income or accumulated net realized gains, as appropriate, in the period that the differences arise. Accordingly, the following permanent differences as of October 31, 2009, primarily attributable to the utilization of accumulated earnings and profits distributed to shareholders on redemptions of shares as part of the dividends paid deduction for income tax purposes were reclassified to the following accounts. These reclassifications had no effect on net assets or net asset value per share. (amounts in thousands):
| | |
Increase (Decrease) Undistributed Net Investment Income | | Increase (Decrease) Accumulated Net Realized Gains (Losses) |
| $(143) | | $143 |
The tax character of dividends and distributions declared and paid during the year ended November 30, 2007, the period December 1, 2007 to October 31, 2008 and the year ended October 31, 2009 were as follows (amounts in thousands):
| | | | | | |
| | | Net Investment
Income and
Short-Term
Capital Gains | | Long-Term
Capital Gains | | Total |
2007 | | $26,436 | | $38,031 | | $64,467 |
2008 | | 29,705 | | 77,601 | | 107,306 |
2009 | | 31,932 | | — | | 31,932 |
At October 31, 2009, the components of distributable earnings/(accumulated losses) were as follows (amounts in thousands):
| | | | | | |
Undistributed Net Investment
Income and
Short-Term
Capital Gains | | Undistributed
Long-Term
Capital Gains | | Capital
Loss
Carryforwards | | Total Net
Distributable
Earnings
(Accumulated
Losses) |
| $3,739 | | — | | (427,518) | | $(423,779) |
For federal income tax purposes, the Fund measures its capital loss carryforwards annually at October 31, its fiscal year end. Capital loss carryforwards may be carried forward and applied against future capital gains. As of October 31, 2009, the Portfolio had capital loss carryforwards of $427,518 (in thousands) available to offset future realized capital gains through October 31, 2017.
At October 31, 2009, the total cost and aggregate gross unrealized appreciation and (depreciation) of securities for federal income tax purposes were different from amounts reported for financial reporting purposes (amounts in thousands):
| | | | | | |
Federal
Tax Cost | | Unrealized
Appreciation | | Unrealized
(Depreciation) | | Net
Unrealized
Appreciation
(Depreciation) |
| $1,230,529 | | $251,314 | | $(24,050) | | $227,264 |
Accounting for Uncertainty in Income Taxes sets forth a minimum threshold for financial statement recognition of the benefit of a tax position taken or expected to be in a tax return. Management has analyzed the Portfolio’s tax position and has concluded that no provision for income tax is required in the Portfolio’s financial statements. The Portfolio is not aware of any tax position for which it is reasonably possible that the total amounts of unrecognized
13
tax benefit will significantly change in the next twelve months. The Portfolio’s federal tax returns for the prior three fiscal years remain subject to examination by the Internal Revenue Service.
Effective December 31, 2008, The U.S. Large Cap Value Series, a master fund in a RIC/RIC master-feeder structure with four RIC feeders and other direct client investor(s), made a “Check-the-box” election for federal income tax purposes pursuant to Treasury Regulation §301.7701-3, to change its federal entity classification from a corporation taxable as a regulated investment company to a partnership. As a result of this election, the master fund is deemed to have distributed all of its assets and liabilities, in a taxable transaction, to its shareholders in liquidation of the master fund. Immediately thereafter, the shareholders contributed all of the distributed assets and liabilities to a newly formed partnership. The final tax year end of The U.S. Large Cap Value Series was December 30, 2008. For Federal income tax purposes, pursuant to IRC Code §336(a), the master fund recognized a loss as if the master’s investment securities were sold to its shareholders and, pursuant to IRC Code §331, each of the Portfolios recognized a gain as if it liquidated its investment in the master. For tax purposes, pursuant to IRC Code §334(a), each of the Portfolios took a fair market value basis in the securities deemed received by them and a new holding period for those securities commenced on the deemed liquidation date.
The master fund had book/tax differences upon its deemed liquidation. The following summary of permanent differences occurred as of the respective effective “Check the Box” election date.
| | | | | | |
Increase (Decrease) Paid-In Capital | | Unrealized
Appreciation
(Depreciation)
Investment
Securities | | Increase
(Decrease)
Undistributed
Net Investment
Income | | Increase
(Decrease)
Accumulated
Net Realized
Gains (Losses) |
$(3,038,312,278) | | $2,303,664,484 | | $(698,899) | | $735,346,693 |
As a result of the transaction, The U.S. Large Cap Value Series recognized a ($2,303,664,484) capital loss for tax year ended December 30, 2008. Additionally, the fund has written off $3,039,011,176 of expired capital loss carryover as a permanent book/tax reporting difference decreasing paid in capital.
Each Portfolio impacted by the “Check the Box” election also has a permanent book/tax difference resulting from the transaction. Listed below is the permanent difference impacting each respective Portfolio. For financial statement purposes, this adjustment did not result in any changes to each respective fund’s net assets or net asset value per share.
| | | | | |
| | | Increase
(Decrease)
Undistributed
Net Investment
Income | | | Increase
(Decrease)
Accumulated
Net Realized
Gains (Losses) |
U.S. Large Cap Value Portfolio | | $(606,345) | | | $606,345 |
U.S. Large Cap Value Portfolio II | | (10,872 | ) | | 10,872 |
U.S. Large Cap Value Portfolio III | | (139,353 | ) | | 139,353 |
LWAS/DFA U.S. High Book To Market Portfolio | | (7,793 | ) | | 7,793 |
For financial reporting purposes, this transaction had no impact on the net assets of the respective funds.
E. Line of Credit:
The Fund, together with other Dimensional-advised portfolios, has entered into an amended and restated $250 million unsecured discretionary line of credit effective July 8, 2009 with an affiliate of its domestic custodian bank. Each portfolio is permitted to borrow, subject to its investment limitations, up to a maximum of $250 million, as long as total borrowings under the line of credit do not exceed $250 million in the aggregate. Borrowings under the line of credit are charged interest at the then current Federal Funds Rate plus 1%. Each portfolio is individually, and not jointly, liable for its particular advances under the line of credit. There is no commitment fee on the unused portion of the line of credit. The agreement for the discretionary line of credit may be terminated by either party at any time.
14
The line of credit is scheduled to expire on June 22, 2010. There were no borrowings by the Portfolio under this line of credit during the year ended October 31, 2009.
The Fund, together with other Dimensional-advised portfolios, has also entered into an additional $500 million unsecured line of credit effective January 15, 2009 with its international custodian bank. Each portfolio is permitted to borrow, subject to its investment limitations, up to a maximum of $500 million, as long as total borrowings under the line of credit do not exceed $500 million in the aggregate. Each portfolio is individually, and not jointly, liable for its particular advances under the line of credit. Borrowings under the line of credit are charged interest at rates agreed to by the parties at the time of borrowing. There is no commitment fee on the unused portion of the line of credit. The agreement of the line of credit expires on January 15, 2010. There were no borrowings by the Portfolio under this line of credit during the year ended October 31, 2009 .
F. Indemnitees; Contractual Obligations:
Under the Fund’s organizational documents, its officers and directors are indemnified against certain liabilities arising out of the performance of their duties to the Fund.
In the normal course of business, the Fund enters into contracts that contain a variety of representations and warranties which provide general indemnification. The Fund’s maximum exposure under these arrangements is unknown as this would involve future claims that may be made against the Fund and/or its affiliates that have not yet occurred. However, based on experience, the Fund expects the risk of loss to be remote.
G. Other:
At October 31, 2009, one shareholder held approximately 71% of the outstanding shares of the Portfolio. One or more of the shareholders is an omnibus account, which typically hold shares for the benefit of several other underlying investors.
H. Subsequent Event Evaluations:
Management has evaluated the impact of all subsequent events on the Portfolio through December 23, 2009, the date the financial statements were available for issuance, and has determined that there are no subsequent events requiring recognition or disclosure in the financial statements.
15
REPORT OF INDEPENDENT REGISTERED PUBLIC ACCOUNTING FIRM
To the Shareholders of U.S. Large Cap Value Portfolio III and
Board of Directors of Dimensional Investment Group Inc.:
In our opinion, the accompanying statement of assets and liabilities, and the related statements of operations and of changes in net assets and the financial highlights present fairly, in all material respects, the financial position of U.S. Large Cap Value Portfolio III (one of the portfolios constituting Dimensional Investment Group Inc., hereafter referred to as the “Portfolio”) at October 31, 2009, the results of its operations for the year then ended, the changes in its net assets and the financial highlights for each of the periods indicated, in conformity with accounting principles generally accepted in the United States of America. These financial statements and financial highlights (hereafter referred to as “financial statements”) are the responsibility of the Portfolio’s management; our responsibility is to express an opinion on these financial statements based on our audits. We conducted our audits of these financial statements in accordance with the standards of the Public Company Accounting Oversight Board (United States). Those standards require that we plan and perform the audit to obtain reasonable assurance about whether the financial statements are free of material misstatement. An audit includes examining, on a test basis, evidence supporting the amounts and disclosures in the financial statements, assessing the accounting principles used and significant estimates made by management, and evaluating the overall financial statement presentation. We believe that our audits, which included confirmation of securities at October 31, 2009 by correspondence with the transfer agent of the investee fund, provide a reasonable basis for our opinion.
PricewaterhouseCoopers LLP
Philadelphia, Pennsylvania
December 23, 2009
16
RESULTS OF THE SHAREHOLDER MEETING
On June 2, 2009, June 5, 2009, and July 8, 2009, Dimensional Investment Group Inc. (“DIG”) held a Special Joint Meeting of Shareholders for the purpose of voting on several proposals affecting DIG and the Portfolio, including, among other items, the election of Directors, the amendment of certain fundamental investment limitations, and the elimination of certain fundamental investment limitations. The shareholders of the Portfolio approved each of the applicable proposals for DIG and the Portfolio presented at the Meeting. Listed below are the voting results from the Meeting. Please note that not all Proposals presented at the Meeting were voted on by the Portfolio. Additionally, the Proposal numbers reflected below correlate to the Proposal numbers presented for vote at the Meeting.
DIG
| | | | | | | | | | | | | | | | | | | | | | | |
| | | Shares Voted | | | Percent of Outstanding Shares Voted |
| | | For | | % | | | Against | | % | | | Abstain/
WithHold | | % | | | For | | | Against | | | Abstain/
WithHold |
Proposal 1: Election of Directors for DIG* | | | | | | | | | | | | | | | | | | | | | | | |
1a David G. Booth | | 754,612,895 | | 96.26 | % | | — | | 0.00 | % | | 29,301,677 | | 3.74 | % | | 85.87 | % | | 0.00 | % | | 3.33% |
1b George M. Constantinides | | 753,991,785 | | 96.18 | % | | — | | 0.00 | % | | 29,922,787 | | 3.82 | % | | 85.80 | % | | 0.00 | % | | 3.41% |
1c John P. Gould | | 753,344,569 | | 96.10 | % | | — | | 0.00 | % | | 30,570,003 | | 3.90 | % | | 85.73 | % | | 0.00 | % | | 3.48% |
1d Roger G. Ibbotson | | 754,232,365 | | 96.21 | % | | — | | 0.00 | % | | 29,682,207 | | 3.79 | % | | 85.83 | % | | 0.00 | % | | 3.38% |
1e Robert C. Merton | | 754,598,874 | | 96.26 | % | | — | | 0.00 | % | | 29,315,698 | | 3.74 | % | | 85.87 | % | | 0.00 | % | | 3.34% |
1f Myron S. Scholes | | 754,057,040 | | 96.19 | % | | — | | 0.00 | % | | 29,857,532 | | 3.81 | % | | 85.81 | % | | 0.00 | % | | 3.40% |
1g Eduardo A. Repetto | | 753,295,592 | | 96.09 | % | | — | | 0.00 | % | | 30,618,979 | | 3.91 | % | | 85.72 | % | | 0.00 | % | | 3.48% |
1h Abbie J. Smith | | 754,123,603 | | 96.20 | % | | — | | 0.00 | % | | 29,790,969 | | 3.80 | % | | 85.82 | % | | 0.00 | % | | 3.39% |
| | | | | | | | | | | | | | | | | | | | | | |
| | | Shares Voted | | Percent of Outstanding Shares Voted |
| | | For | | % | | Against | | % | | Abstain/
WithHold | | % | | NonVote | | % | | For | | Against | | Abstain/
WithHold |
Proposal 2: To approve Articles of Amendment and Restatement for DIG* | | 479,705,048 | | 93.81% | | 7,503,436 | | 1.47% | | 24,156,664 | | 4.72% | | NA | | NA | | 54.59% | | 0.85% | | 2.75% |
| * | Results are for all Portfolios within DIG |
U.S. Large Cap Value Portfolio III
| | | | | | | | | | | | | | | | | | | | | | | | | | | | | | |
| | | Shares Voted | | Percent of Outstanding Shares Voted |
| | | For | | % | | | Against | | % | | | Abstain/
WithHold | | % | | | NonVote | | % | | For | | | Against | | | Abstain/
WithHold | | | Non-
Vote |
Proposals: | | | | | | | | | | | | | | | | | | | | | | | | | | | | | | |
|
5 To approve amendments to certain fundamental investment restrictions |
5a Borrowing Money | | 58,143,575 | | 93.51 | % | | 1,625,867 | | 2.61 | % | | 2,408,936 | | 3.87 | % | | NA | | NA | | 48.59 | % | | 1.36 | % | | 2.01 | % | | NA |
5b Making Loans | | 58,177,317 | | 93.57 | % | | 1,578,105 | | 2.54 | % | | 2,422,954 | | 3.90 | % | | NA | | NA | | 48.62 | % | | 1.32 | % | | 2.02 | % | | NA |
5c Investments in Real Estate | | 56,688,520 | | 91.17 | % | | 3,045,589 | | 4.90 | % | | 2,444,269 | | 3.93 | % | | NA | | NA | | 47.37 | % | | 2.55 | % | | 2.04 | % | | NA |
5d Investments in Commodities | | 56,607,923 | | 91.04 | % | | 3,160,852 | | 5.08 | % | | 2,409,603 | | 3.88 | % | | NA | | NA | | 47.31 | % | | 2.64 | % | | 2.01 | % | | NA |
5e Diversification of Investments | | 58,601,288 | | 94.25 | % | | 1,193,719 | | 1.92 | % | | 2,383,371 | | 3.83 | % | | NA | | NA | | 48.97 | % | | 1.00 | % | | 1.99 | % | | NA |
|
6 To approve the elimination of certain fundamental investment restrictions |
6a Pledging, Mortgaging, or Hypothecating Assets | | 56,302,806 | | 90.55 | % | | 3,427,284 | | 5.51 | % | | 2,448,288 | | 3.94 | % | | NA | | NA | | 47.05 | % | | 2.86 | % | | 2.05 | % | | NA |
6b Purchasing Securities on Margin | | 56,194,130 | | 90.38 | % | | 3,555,084 | | 5.72 | % | | 2,429,164 | | 3.91 | % | | NA | | NA | | 46.96 | % | | 2.97 | % | | 2.03 | % | | NA |
6c Investing in Restricted or Illiquid Securities | | 56,250,759 | | 90.47 | % | | 3,518,423 | | 5.66 | % | | 2,409,196 | | 3.87 | % | | NA | | NA | | 47.01 | % | | 2.94 | % | | 2.01 | % | | NA |
6d Investing for the Purpose of Exercising Control | | 58,236,644 | | 93.66 | % | | 1,536,653 | | 2.47 | % | | 2,405,081 | | 3.87 | % | | NA | | NA | | 48.67 | % | | 1.28 | % | | 2.01 | % | | NA |
6e Investing in Other Investment Companies | | 58,133,472 | | 93.49 | % | | 1,611,603 | | 2.59 | % | | 2,433,303 | | 3.91 | % | | NA | | NA | | 48.58 | % | | 1.35 | % | | 2.03 | % | | NA |
6f Management Ownership of Securities of an Issuer | | 58,179,394 | | 93.57 | % | | 1,541,736 | | 2.48 | % | | 2,457,248 | | 3.95 | % | | NA | | NA | | 48.62 | % | | 1.29 | % | | 2.05 | % | | NA |
6g Investing in Oil, Gas, or other Mineral Exploration, Leases or Development Programs | | 56,722,284 | | 91.23 | % | | 3,056,514 | | 4.92 | % | | 2,399,580 | | 3.86 | % | | NA | | NA | | 47.40 | % | | 2.55 | % | | 2.01 | % | | NA |
6h Investing in Securities of Unseasoned Issuers | | 57,935,331 | | 93.18 | % | | 1,821,612 | | 2.93 | % | | 2,421,435 | | 3.89 | % | | NA | | NA | | 48.42 | % | | 1.52 | % | | 2.02 | % | | NA |
6i Investing in Warrants | | 58,207,826 | | 93.61 | % | | 1,537,460 | | 2.47 | % | | 2,433,092 | | 3.91 | % | | NA | | NA | | 48.64 | % | | 1.28 | % | | 2.03 | % | | NA |
6j Writing or Acquiring Options | | 58,133,427 | | 93.49 | % | | 1,617,729 | | 2.60 | % | | 2,427,222 | | 3.90 | % | | NA | | NA | | 48.58 | % | | 1.35 | % | | 2.03 | % | | NA |
8 Approval of Investment Advisory Agreement between Dimensional Fund Advisors LP and the Company | | 58,620,666 | | 94.28 | % | | 1,071,257 | | 1.72 | % | | 2,486,455 | | 4.00 | % | | NA | | NA | | 48.99 | % | | 0.90 | % | | 2.08 | % | | NA |
17
THE DFA INVESTMENT TRUST COMPANY
PERFORMANCE CHART
The U.S. Large Cap Value Series vs.
Russell 1000® Value Index
October 31, 1999-October 31, 2009

18
THE DFA INVESTMENT TRUST COMPANY
THE U.S. LARGE CAP VALUE SERIES
DISCLOSURE OF FUND EXPENSES
(Unaudited)
The following Expense Table is shown so that you can understand the impact of fees on your investment. All mutual funds have operating expenses. As a shareholder of the fund, you incur ongoing costs, which include costs for portfolio management, administrative services, and shareholder reports, among others. Operating expenses, legal and audit services, which are deducted from a fund’s gross income, directly reduce the investment return of the fund. A fund’s expenses are expressed as a percentage of its average net assets. This figure is known as the expense ratio. The following examples are intended to help you understand the ongoing costs, in dollars, of investing in the fund and to compare these costs with those of other mutual funds. The examples are based on an investment of $1,000 made at the beginning of the period shown and held for the entire period.
The Expense Table below illustrates your fund’s costs in two ways.
Actual Fund Return
This section helps you to estimate the actual expenses after fee waivers that you paid over the period. The “Ending Account Value” shown is derived from the fund’s actual return and “Expenses Paid During Period” reflect the dollar amount that would have been paid by an investor who started with $1,000 in the fund. You may use the information here, together with the amount you invested, to estimate the expenses that you paid over the period.
To do so, simply divide your account value by $1,000 (for example, a $7,500 account value divided by $1,000 = 7.5), then multiply the result by the number given for your fund under the heading “Expenses Paid During Period.”
Hypothetical Example for Comparison Purposes
This section is intended to help you compare your fund’s costs with those of other mutual funds. The hypothetical “Ending Account Value” and “Expenses Paid During Period” are derived from the fund’s actual expense ratio and an assumed 5% annual return before expenses. In this case, because the return used is not the fund’s actual return, the results do not apply to your investment. The example is useful in making comparisons because the SEC requires all mutual funds to calculate expenses based on a 5% annual return. You can assess your fund’s cost by comparing this hypothetical example with the hypothetical examples that appear in shareholder reports of other funds.
Please note that the expenses shown in the table are meant to highlight and help you compare ongoing costs only and do not reflect any transactional costs, if applicable. The “Annualized Expense Ratio” represents the actual expenses for the six-month period indicated.
| | | | | | | | | | | |
| | | Six Months Ended October 31, 2009 |
| EXPENSE TABLE | | | | | | | | | | | |
| | | Beginning
Account
Value
05/01/09 | | Ending
Account
Value
10/31/09 | | Annualized
Expense
Ratio* | | | Expenses
Paid
During
Period* |
Actual Fund Return | | $ | 1,000.00 | | $ | 1,242.20 | | 0.14 | % | | $0.79 |
Hypothetical 5% Annual Return | | $ | 1,000.00 | | $ | 1,024.50 | | 0.14 | % | | $0.71 |
| * | Expenses are equal to the fund’s annualized expense ratio for the six-month period, multiplied by the average account value over the period, multiplied by the number of days in the most recent six-month period (184), then divided by the number of days in the year (365) to reflect the six-month period. |
19
THE DFA INVESTMENT TRUST COMPANY
THE U.S. LARGE CAP VALUE SERIES
DISCLOSURE OF PORTFOLIO HOLDINGS
(Unaudited)
The SEC requires that all Funds file a complete Schedule of Investments with the SEC for their first and third fiscal quarters on Form N-Q. For The DFA Investment Trust Company, this would be for the fiscal quarters ending January 31 and July 31. The Form N-Q filing must be made within 60 days of the end of the quarter. The DFA Investment Trust Company filed its most recent Form N-Q with the SEC on September 29, 2009. It is available upon request, without charge, by calling collect: (512) 306-7400 or by mailing a request to Dimensional Fund Advisors LP, 6300 Bee Cave Road, Building One, Austin, Texas 78746, or by visiting the SEC’s website at http://www.sec.gov, or they may be reviewed and copied at the SEC’s Public Reference Room in Washington, D.C. (call 1-800-732-0330 for information on the operation of the Public Reference Room).
SEC regulations permit a fund to include in its reports to shareholders a “Summary Schedule of Portfolio Holdings” in lieu of a full Schedule of Investments. The Summary Schedule of Portfolio Holdings reports the fund’s 50 largest holdings in unaffiliated issuers and any investments that exceed one percent of the fund’s net assets at the end of the reporting period. The amendments also require that the Summary Schedule of Portfolio Holdings identify each category of investments that are held.
The fund is required to file a complete Schedule of Investments with the SEC on Form N-CSR within ten days after mailing the annual and semi-annual reports to shareholders. It will be available upon request, without charge, by calling collect: (512) 306-7400 or by mailing a request to Dimensional Fund Advisors LP, 6300 Bee Cave Road, Building One, Austin, Texas 78746, or by visiting the SEC’s website at http://www.sec.gov, or they may be reviewed and copied at the SEC’s Public Reference Room in Washington, D.C. (call 1-800-732-0330 for information on the operation of the Public Reference Room).
PORTFOLIO HOLDINGS
The SEC requires that all Funds present their categories of portfolio holdings in a table, chart or graph format in their annual and semi-annual shareholder reports, whether or not a Schedule of Investments is utilized. The following table, which presents portfolio holdings as a percent of total investments before short-term investments and collateral for loaned securities, is provided in compliance with such requirement. The categories shown below represent broad industry sectors. Each industry sector consists of one or more specific industry classifications.
| | | |
The U.S. Large Cap Value Series | |
Consumer Discretionary | | 16.7 | % |
Consumer Staples | | 6.4 | % |
Energy | | 13.9 | % |
Financials | | 31.3 | % |
Health Care | | 5.5 | % |
Industrials | | 14.7 | % |
Information Technology | | 3.6 | % |
Materials | | 3.8 | % |
Telecommunication Services | | 3.6 | % |
Utilities | | 0.5 | % |
| | | |
| | 100.0 | % |
20
THE U.S. LARGE CAP VALUE SERIES
SUMMARY SCHEDULE OF PORTFOLIO HOLDINGS
October 31, 2009
| | | | | | | | |
| | | Shares | | Value† | | Percentage
of Net Assets** | |
COMMON STOCKS — (93.1%) | | | | | | | | |
Consumer Discretionary — (15.5%) | | | | | | | | |
Carnival Corp. | | 2,624,598 | | $ | 76,428,294 | | 1.0 | % |
CBS Corp. Class B | | 3,870,469 | | | 45,555,420 | | 0.6 | % |
Comcast Corp. Class A | | 11,512,642 | | | 166,933,309 | | 2.2 | % |
Comcast Corp. Special Class A | | 3,396,043 | | | 47,612,523 | | 0.6 | % |
#Disney (Walt) Co. | | 4,577,802 | | | 125,294,441 | | 1.7 | % |
*Liberty Media Corp. Entertainment Class A | | 2,954,309 | | | 91,051,803 | | 1.2 | % |
*Liberty Media Corp. Interactive Class A | | 3,585,265 | | | 40,656,905 | | 0.6 | % |
News Corp. Class A | | 5,810,104 | | | 66,932,398 | | 0.9 | % |
Time Warner Cable, Inc. | | 1,980,956 | | | 78,128,905 | | 1.0 | % |
Time Warner, Inc. | | 6,114,193 | | | 184,159,493 | | 2.5 | % |
Other Securities | | | | | 325,704,783 | | 4.3 | % |
| | | | | | | | |
Total Consumer Discretionary | | | | | 1,248,458,274 | | 16.6 | % |
| | | | | | | | |
| | | |
Consumer Staples — (5.9%) | | | | | | | | |
Archer-Daniels-Midland Co. | | 1,723,060 | | | 51,898,567 | | 0.7 | % |
CVS Caremark Corp. | | 4,840,631 | | | 170,874,274 | | 2.3 | % |
Kraft Foods, Inc. | | 2,137,904 | | | 58,835,118 | | 0.8 | % |
Other Securities | | | | | 193,282,891 | | 2.5 | % |
| | | | | | | | |
Total Consumer Staples | | | | | 474,890,850 | | 6.3 | % |
| | | | | | | | |
| | | |
Energy — (13.0%) | | | | | | | | |
Anadarko Petroleum Corp. | | 2,760,568 | | | 168,201,408 | | 2.2 | % |
#Chesapeake Energy Corp. | | 2,647,458 | | | 64,862,721 | | 0.9 | % |
ConocoPhillips | | 5,213,766 | | | 261,626,778 | | 3.5 | % |
Marathon Oil Corp. | | 3,280,335 | | | 104,872,310 | | 1.4 | % |
*National-Oilwell, Inc. | | 1,160,300 | | | 47,560,697 | | 0.6 | % |
XTO Energy, Inc. | | 2,156,495 | | | 89,623,932 | | 1.2 | % |
Other Securities | | | | | 306,390,542 | | 4.1 | % |
| | | | | | | | |
Total Energy | | | | | 1,043,138,388 | | 13.9 | % |
| | | | | | | | |
| | | |
Financials — (29.1%) | | | | | | | | |
Allstate Corp. | | 2,596,315 | | | 76,773,035 | | 1.0 | % |
Bank of America Corp. | | 16,675,426 | | | 243,127,711 | | 3.2 | % |
Bank of New York Mellon Corp. | | 1,972,678 | | | 52,591,595 | | 0.7 | % |
#Capital One Financial Corp. | | 1,815,684 | | | 66,454,034 | | 0.9 | % |
Chubb Corp. | | 1,669,873 | | | 81,022,238 | | 1.1 | % |
Citigroup, Inc. | | 19,573,191 | | | 80,054,351 | | 1.1 | % |
CME Group, Inc | | 203,881 | | | 61,696,429 | | 0.8 | % |
JPMorgan Chase & Co. | | 7,983,370 | | | 333,465,365 | | 4.4 | % |
#Loews Corp. | | 2,592,160 | | | 85,800,496 | | 1.1 | % |
MetLife, Inc. | | 4,663,914 | | | 158,712,993 | | 2.1 | % |
#Morgan Stanley | | 3,619,297 | | | 116,251,820 | | 1.5 | % |
PNC Financial Services Group, Inc. | | 1,190,568 | | | 58,266,398 | | 0.8 | % |
Prudential Financial, Inc. | | 1,918,000 | | | 86,751,140 | | 1.2 | % |
Travelers Cos., Inc. (The) | | 3,328,076 | | | 165,704,904 | | 2.2 | % |
Unum Group | | 1,898,589 | | | 37,876,851 | | 0.5 | % |
Other Securities | | | | | 634,916,189 | | 8.5 | % |
| | | | | | | | |
Total Financials | | | | | 2,339,465,549 | | 31.1 | % |
| | | | | | | | |
| | | |
Health Care — (5.1%) | | | | | | | | |
*Thermo Fisher Scientific, Inc. | | 1,056,245 | | | 47,531,025 | | 0.7 | % |
UnitedHealth Group, Inc. | | 2,406,388 | | | 62,445,769 | | 0.8 | % |
*WellPoint, Inc. | | 2,580,122 | | | 120,646,505 | | 1.6 | % |
Other Securities | | | | | 181,920,544 | | 2.4 | % |
| | | | | | | | |
Total Health Care | | | | | 412,543,843 | | 5.5 | % |
| | | | | | | | |
21
THE U.S. LARGE CAP VALUE SERIES
CONTINUED
| | | | | | | | | |
| | | Shares | | Value† | | Percentage
of Net Assets** | |
Industrials — (13.7%) | | | | | | | | | |
Burlington Northern Santa Fe Corp. | | | 1,930,415 | | $ | 145,398,858 | | 1.9 | % |
#CSX Corp. | | | 2,287,204 | | | 96,474,265 | | 1.3 | % |
#FedEx Corp. | | | 599,693 | | | 43,591,684 | | 0.6 | % |
General Electric Co. | | | 18,139,800 | | | 258,673,548 | | 3.4 | % |
Norfolk Southern Corp. | | | 2,186,220 | | | 101,921,576 | | 1.4 | % |
#Northrop Grumman Corp. | | | 1,926,678 | | | 96,584,368 | | 1.3 | % |
Union Pacific Corp. | | | 2,835,808 | | | 156,366,453 | | 2.1 | % |
Other Securities | | | | | | 203,214,199 | | 2.7 | % |
| | | | | | | | | |
Total Industrials | | | | | | 1,102,224,951 | | 14.7 | % |
| | | | | | | | | |
| | | |
Information Technology — (3.3%) | | | | | | | | | |
*Computer Sciences Corp. | | | 946,932 | | | 48,018,922 | | 0.7 | % |
Other Securities | | | | | | 219,566,373 | | 2.9 | % |
| | | | | | | | | |
Total Information Technology | | | | | | 267,585,295 | | 3.6 | % |
| | | | | | | | | |
| | | |
Materials — (3.6%) | | | | | | | | | |
#Alcoa, Inc. | | | 4,317,440 | | | 53,622,605 | | 0.7 | % |
#Dow Chemical Co. | | | 3,993,594 | | | 93,769,587 | | 1.3 | % |
#International Paper Co. | | | 1,909,245 | | | 42,595,256 | | 0.6 | % |
#Weyerhaeuser Co. | | | 1,105,551 | | | 40,175,723 | | 0.5 | % |
Other Securities | | | | | | 54,072,078 | | 0.7 | % |
| | | | | | | | | |
Total Materials | | | | | | 284,235,249 | | 3.8 | % |
| | | | | | | | | |
| | | |
Telecommunication Services — (3.4%) | | | | | | | | | |
#AT&T, Inc. | | | 8,438,300 | | | 216,611,161 | | 2.9 | % |
Other Securities | | | | | | 52,619,682 | | 0.7 | % |
| | | | | | | | | |
Total Telecommunication Services | | | | | | 269,230,843 | | 3.6 | % |
| | | | | | | | | |
| | | |
Utilities — (0.5%) | | | | | | | | | |
Other Securities | | | | | | 39,398,283 | | 0.5 | % |
| | | | | | | | | |
TOTAL COMMON STOCKS | | | | | | 7,481,171,525 | | 99.6 | % |
| | | | | | | | | |
| | | |
| | | Face
Amount | | | | | |
| | | (000) | | | | | | |
TEMPORARY CASH INVESTMENTS — (0.5%) | | | | | | | | | |
Repurchase Agreement, PNC Capital Markets, Inc. 0.19%, 11/02/09 (Collateralized by $39,850,000 FNMA 6.50%, 6/25/39, valued at $42,888,563) to be repurchased at $42,250,669 | | | $42,250 | | | 42,250,000 | | 0.6 | % |
| | | | | | | | | |
| | | |
| | | Shares/
Face
Amount | | | | | |
| | | (000) | | | | | | |
SECURITIES LENDING COLLATERAL — (6.4%) | | | | | | | | | |
§@DFA Short Term Investment Fund LP. | | | 512,733,772 | | | 512,733,772 | | 6.8 | % |
@Repurchase Agreement, Deutsche Bank Securities 0.08%, 11/02/09 (Collateralized by $3,853,074 FHLMC 5.793%(r), 01/01/37 & 5.945%(r), 07/01/37, valued at $2,684,003) to be repurchased at $2,605,845 | | $ | 2,606 | | | 2,605,828 | | 0.1 | % |
| | | | | | | | | |
TOTAL SECURITIES LENDING COLLATERAL | | | | | | 515,339,600 | | 6.9 | % |
| | | | | | | | | |
TOTAL INVESTMENTS — (100.0%) | | | | | | | | | |
(Cost $6,877,390,667) | | | | | | $8,038,761,125 | | 107.1 | % |
| | | | | | | | | |
22
THE U.S. LARGE CAP VALUE SERIES
CONTINUED
Summary of inputs used to value the Series’ net assets as of October 31, 2009 is as follows (See Security Valuation Note):
| | | | | | | | | | | |
| | | Valuation Inputs |
| | | Investment in Securities (Market Value) |
| | | Level 1 | | Level 2 | | Level 3 | | Total |
Common Stocks | | | | | | | | | | | |
Consumer Discretionary | | $ | 1,248,458,274 | | $ | — | | — | | $ | 1,248,458,274 |
Consumer Staples | | | 474,890,850 | | | — | | — | | | 474,890,850 |
Energy | | | 1,043,138,388 | | | — | | — | | | 1,043,138,388 |
Financials | | | 2,339,465,549 | | | — | | — | | | 2,339,465,549 |
Health Care | | | 412,543,843 | | | — | | — | | | 412,543,843 |
Industrials | | | 1,102,224,951 | | | — | | — | | | 1,102,224,951 |
Information Technology | | | 267,585,295 | | | — | | — | | | 267,585,295 |
Materials | | | 284,235,249 | | | — | | — | | | 284,235,249 |
Telecommunication Services | | | 269,230,843 | | | — | | — | | | 269,230,843 |
Utilities | | | 39,398,283 | | | — | | — | | | 39,398,283 |
Temporary Cash Investments | | | — | | | 42,250,000 | | — | | | 42,250,000 |
Securities Lending Collateral | | | — | | | 515,339,600 | | — | | | 515,339,600 |
| | | | | | | | | | | |
TOTAL | | $ | 7,481,171,525 | | $ | 557,589,600 | | — | | $ | 8,038,761,125 |
| | | | | | | | | | | |
See accompanying Notes to Financial Statements.
23
THE DFA INVESTMENT TRUST COMPANY
THE U.S. LARGE CAP VALUE SERIES
STATEMENT OF ASSETS AND LIABILITIES
OCTOBER 31, 2009
(Amounts in thousands)
| | | |
ASSETS: | | | |
Investments at Value (including $470,665 of securities on loan) | | $ | 7,481,171 |
Temporary Cash Investments at Value & Cost | | | 42,250 |
Collateral Received from Securities on Loan at Value & Cost | | | 515,340 |
Cash | | | 1 |
Receivables: | | | |
Investment Securities Sold | | | 1,660 |
Dividends and Interest | | | 7,943 |
Securities Lending Income | | | 700 |
Fund Shares Sold | | | 365 |
| | | |
Total Assets | | | 8,049,430 |
| | | |
| |
LIABILITIES: | | | |
Payables: | | | |
Upon Return of Securities Loaned | | | 515,340 |
Investment Securities Purchased | | | 22,419 |
Fund Shares Redeemed | | | 2,242 |
Due to Advisor | | | 659 |
Accrued Expenses and Other Liabilities | | | 370 |
| | | |
Total Liabilities | | | 541,030 |
| | | |
NET ASSETS | | $ | 7,508,400 |
| | | |
Investments at Cost | | $ | 6,319,801 |
| | | |
See accompanying Notes to Financial Statements.
24
THE DFA INVESTMENT TRUST COMPANY
THE U.S. LARGE CAP VALUE SERIES
STATEMENT OF OPERATIONS
FOR THE YEAR ENDED OCTOBER 31, 2009
(Amounts in thousands)
| | | | |
Investment Income | | | | |
Dividends (Net of Foreign Taxes Withheld of $20) | | $ | 150,233 | |
Interest | | | 170 | |
Income from Securities Lending | | | 13,048 | |
| | | | |
Total Investment Income | | | 163,451 | |
| | | | |
Expenses | | | | |
Investment Advisory Services Fees | | | 6,414 | |
Accounting & Transfer Agent Fees | | | 695 | |
Custodian Fees | | | 73 | |
Shareholders’ Reports | | | 66 | |
Directors’/Trustees’ Fees & Expenses | | | 120 | |
Professional Fees | | | 301 | |
Other | | | 702 | |
| | | | |
Total Expenses | | | 8,371 | |
| | | | |
Net Investment Income (Loss) | | | 155,080 | |
| | | | |
| |
Realized and Unrealized Gain (Loss) | | | | |
Net Realized Gain (Loss) on: | | | | |
Investment Securities Sold | | | (122,113 | ) |
Futures | | | 7,204 | |
Change in Unrealized Appreciation (Depreciation) of: | | | | |
Investment Securities | | | 1,161,370 | |
Futures | | | (29 | ) |
| | | | |
Net Realized and Unrealized Gain (Loss) | | | 1,046,432 | |
| | | | |
Net Increase (Decrease) in Net Assets Resulting from Operations | | $ | 1,201,512 | |
| | | | |
See accompanying Notes to Financial Statements.
25
THE DFA INVESTMENT TRUST COMPANY
THE U.S. LARGE CAP VALUE SERIES
STATEMENTS OF CHANGES IN NET ASSETS
(Amounts in thousands)
| | | | | | | | | | | | |
| | | Year
Ended
Oct. 31,
2009 | | | Period
Dec. 1, 2007
to
Oct. 31, 2008 | | | Year
Ended
Nov. 30,
2007 | |
Increase (Decrease) in Net Assets | | | | | | | | | | | | |
Operations: | | | | | | | | | | | | |
Net Investment Income (Loss) | | $ | 155,080 | | | $ | 166,016 | | | $ | 146,991 | |
Net Realized Gain (Loss) on: | | | | | | | | | | | | |
Investment Securities Sold | | | (122,113 | ) | | | (422,637 | ) | | | (118,412 | ) |
Futures | | | 7,204 | | | | (1,861 | ) | | | — | |
In-Kind Redemptions | | | — | | | | 52,271 | * | | | — | |
Change in Unrealized Appreciation (Depreciation) of: | | | | | | | | | | | | |
Investment Securities | | | 1,161,370 | | | | (3,601,292 | ) | | | (150,559 | ) |
Futures | | | (29 | ) | | | 29 | | | | — | |
| | | | | | | | | | | | |
Net Increase (Decrease) in Net Assets Resulting from Operations | | | 1,201,512 | | | | (3,807,474 | ) | | | (121,980 | ) |
| | | | | | | | | | | | |
Transactions in Interest: | | | | | | | | | | | | |
Contributions | | | 734,173 | | | | 1,370,762 | † | | | 1,783,358 | † |
Withdrawals | | | (1,166,648 | ) | | | (983,247 | )*† | | | (368,362 | )† |
| | | | | | | | | | | | |
Net Increase (Decrease) from Transactions in Interest | | | (432,475 | ) | | | 387,515 | | | | 1,414,996 | |
| | | | | | | | | | | | |
Total Increase (Decrease) in Net Assets | | | 769,037 | | | | (3,419,959 | ) | | | 1,293,016 | |
Net Assets | | | | | | | | | | | | |
Beginning of Period | | | 6,739,363 | | | | 10,159,322 | | | | 8,866,306 | |
| | | | | | | | | | | | |
End of Period | | $ | 7,508,400 | | | $ | 6,739,363 | | | $ | 10,159,322 | |
| | | | | | | | | | | | |
| * | See Note J in the Notes to Financial Statements. |
| † | See Note A in the Notes to Financial Statements. |
See accompanying Notes to Financial Statements.
26
THE DFA INVESTMENT TRUST COMPANY
THE U.S. LARGE CAP VALUE SERIES†
FINANCIAL HIGHLIGHTS
(for a share outstanding throughout each period)
| | | | | | | | | | | | | | | | | | | | | | | | |
| | | Year
Ended
Oct. 31,
2009 | | | Period
Dec. 1, 2007
to
Oct. 31, 2008 | | | Year
Ended
Nov. 30,
2007 | | | Year
Ended
Nov. 30,
2006 | | | Year
Ended
Nov. 30,
2005 | | | Year
Ended
Nov. 30,
2004 | |
Total Return | | | 11.90 | % | | | (36.53 | )%(C) | | | (0.32 | )% | | | 18.16 | % | | | 14.66 | % | | | 21.68 | % |
| | | | | | | | | | | | | | | | | | | | | | | | |
| | | | | | |
Net Assets, End of Period (thousands) | | $ | 7,508,400 | | | $ | 6,739,363 | | | $ | 10,159,322 | | | $ | 8,866,306 | | | $ | 5,831,587 | | | $ | 3,919,913 | |
Ratio of Expenses to Average Net Assets | | | 0.13 | % | | | 0.11 | %(B) | | | 0.11 | % | | | 0.12 | % | | | 0.14 | % | | | 0.15 | % |
Ratio of Net Investment Income to Average Net Assets | | | 2.42 | % | | | 1.97 | %(B) | | | 1.44 | % | | | 1.68 | % | | | 1.56 | % | | | 1.41 | % |
Portfolio Turnover Rate | | | 29 | % | | | 19 | %(C) | | | 9 | % | | | 13 | % | | | 9 | % | | | 7 | % |
| | | | | | | | | | | | | | | | | | | | | | | | |
See page 1 for the Definitions of Abbreviations and Footnotes.
| † | See Note A in the Notes to Financial Statements. |
See accompanying Notes to Financial Statements.
27
THE DFA INVESTMENT TRUST COMPANY
THE U.S. LARGE CAP VALUE SERIES
NOTES TO FINANCIAL STATEMENTS
A. Organization:
The DFA Investment Trust Company (the “Trust”) is an open-end management investment company registered under the Investment Company Act of 1940. The Trust consists of twelve investment portfolios, of which The U.S. Large Cap Value Series (the “Series”) is presented in this report.
Effective December 31, 2008, The U.S. Large Cap Value Series, a master fund in a RIC/RIC master-feeder structure, had elected with the consent of its respective Holder(s) to change its U.S. federal income tax classification from that of an association taxable as a corporation to a partnership pursuant to Treasury Regulation §301.7701-3. The change in capital structure and retroactive reclassification of the statement of changes in net assets and financial highlights for the fund is a result of the treatment of a partnership for book purposes. The Series/Portfolio will maintain its books and records and present its financial statements in accordance with generally accepted accounting principles for investment partnerships.
At a regular meeting of the Board of Directors/Trustees (the “Board”) on September 16, 2008, the Board voted to change the fiscal and tax year ends of the Series from November 30 to October 31.
B. Significant Accounting Policies:
The following significant accounting policies are in conformity with accounting principles generally accepted in the United States of America. Such policies are consistently followed by the Trust in preparation of its financial statements. The preparation of financial statements in accordance with accounting principles generally accepted in the United States of America requires management to make estimates and assumptions that affect the reported amounts of assets and liabilities and disclosure of contingent assets and liabilities at the date of the financial statements and the reported amounts of increases and decreases in net assets from operations during the reporting period. Actual results could differ from those estimates and those differences could be material.
1. Security Valuation: Securities held by the Series (including over-the-counter securities) are valued at the last quoted sale price of the day. Securities held by the Series that are listed on Nasdaq are valued at the Nasdaq Official Closing Price (“NOCP”). If there is no last reported sale price or NOCP for the day, the Series values the securities at the mean of the most recent quoted bid and asked prices. Price information on listed securities is taken from the exchange where the security is primarily traded. Generally, securities issued by open-end investment companies are valued using their respective net asset values or public offering prices, as appropriate, for purchase orders placed at the close of the New York Stock Exchange (NYSE).
Securities for which no market quotations are readily available (including restricted securities), or for which market quotations have become unreliable, are valued in good faith at fair value in accordance with procedures adopted by the Board of Directors/Trustees. Fair value pricing may also be used if events that have a significant effect on the value of an investment (as determined in the discretion of the Investment Committee of the Advisor) occur before the net asset value is calculated. When fair value pricing is used, the prices of securities used by the Series may differ from the quoted or published prices for the same securities on their primary markets or exchanges.
Futures contracts held by the Series are valued using the settlement price established each day on the exchange on which they are traded.
The Series utilizes a fair value hierarchy which prioritizes the inputs to valuation techniques used to measure fair value into three broad levels described below:
• Level 1 – quoted prices in active markets for identical securities
28
• Level 2 – other significant observable inputs (including quoted prices for similar securities, interest rates, prepayment speeds, credit risk, etc.)
• Level 3 – significant unobservable inputs (including the Series’ own assumptions in determining the fair value of investments)
A summary of the inputs used to value the Series’ net assets by each major security type, industry and/or country is disclosed at the end of the Summary Schedule of Portfolio Holdings. The inputs or methodology used for valuing securities are not necessarily an indication of the risk associated with investing in those securities.
2. Deferred Compensation Plan: Each eligible Trustee of the Trust may elect participation in the Deferred Compensation Plan (the “Plan”). Under the Plan, effective January 1, 2002, such Trustees may defer payment of all or a portion of their total fees earned as a Trustee. These deferred amounts may be treated as though such amounts had been invested in shares of the following funds: U.S. Large Cap Value Portfolio; U.S. Core Equity 1 Portfolio; U.S. Core Equity 2 Portfolio; U.S.Vector Equity Portfolio; U.S. Micro Cap Portfolio; DFA International Value Portfolio; International Core Equity Portfolio; Emerging Markets Portfolio; Emerging Markets Core Equity Portfolio; and/or DFA Two-Year Global Fixed Income Portfolio. Contributions made under the Plan and the change in unrealized appreciation (depreciation) and income, are included in Directors’/Trustees’ Fees & Expenses. At October 31, 2009, the total liability for deferred compensation to Trustees is included in Accrued Expenses and Other Liabilities on the Statement of Assets and Liabilities in the amount of $183 (in thousands).
Each Trustee has the option to receive their distribution of proceeds in one of the following methods upon one year’s notice: lump sum; annual installments over a period of agreed upon years; or semi-annual installments over a period of agreed upon years. As of October 31, 2009, none of the Trustees have requested distribution of proceeds.
3. Other: Security transactions are accounted for as of the trade date. Costs used in determining realized gains and losses on the sale of investment securities are on the basis of identified cost. Dividend income and distributions to shareholders are recorded on the ex-dividend date. Distributions received on securities that represent a return of capital or capital gain are recorded as a reduction of cost of investments or as a realized gain, respectively. The Series estimates the character of distributions received that may be considered return of capital distributions or capital gain distributions. Interest income is recorded on an accrual basis. Discount and premium on securities purchased are amortized over the lives of the respective securities, utilizing the effective interest method. Expenses directly attributable to a Series are directly charged. Common expenses of the Trust are allocated using methods approved by the Board of Directors/Trustees, generally based on average net assets.
C. Investment Advisor:
Dimensional Fund Advisors LP (“Dimensional” or the “Advisor”) provides investment advisory services to the Series. For the year ended October 31, 2009, the Series’ investment advisory services fees were accrued daily and paid monthly to the Advisor based on an effective annual rate of 0.10% of average daily net assets.
Fees Paid to Officers and Directors/Trustees:
Certain Officers and Directors/Trustees of the Advisor are also Officers and Directors/Trustees of the Trust; however, such Officers and Directors/Trustees (with the exception of the Chief Compliance Officer (“CCO”)) receive no compensation from the Trust. For the year ended October 31, 2009, the total related amounts paid by the Trust to the CCO were $98 (in thousands). The total related amounts paid by the Series are included in Other Expenses on the Statement of Operations.
29
D. Purchases and Sales of Securities:
For the year ended October 31, 2009, the Series made the following purchases and sales of investment securities, other than short-term securities and U.S. government securities (amounts in thousands):
| | | |
Purchases | | $ | 1,964,487 |
Sales | | | 1,887,094 |
There were no purchases or sales of long-term U.S. government securities.
E. Federal Income Taxes:
No provision for federal income taxes is required since the Series is treated as a partnership for Federal income tax purposes. Any net investment income and realized and unrealized gains and losses have been deemed to have been “passed down” to its respective partners.
At October 31, 2009, the total cost and aggregate gross unrealized appreciation and (depreciation) of securities for federal income tax purposes were different from amounts reported for financial reporting purposes (amounts in thousands):
| | | | | | |
Federal Tax Cost | | Unrealized Appreciation | | Unrealized (Depreciation) | | Net Unrealized Appreciation (Depreciation) |
$6,877,391 | | $1,296,505 | | $(135,135) | | $1,161,370 |
Accounting for Uncertainty in Income Taxes sets forth a minimum threshold for financial statement recognition of the benefit of a tax position taken or expected to be in a tax return. Management has analyzed the Series’ tax position and has concluded that no provision for income tax is required in the Series’ financial statements. The Series is not aware of any tax position for which it is reasonably possible that the total amounts of unrecognized tax benefits will significantly change in the next twelve months. The Series’ federal tax returns for the prior three fiscal years remain subject to examination by the Internal Revenue Service.
Effective December 31, 2008, The U.S. Large Cap Value Series, a master fund in a RIC/RIC master-feeder structure with four RIC feeders and other direct client investor(s), made a “Check-the-box” election for federal income tax purposes pursuant to Treasury Regulation §301.7701-3, to change its federal entity classification from a corporation taxable as a regulated investment company to a partnership. As a result of this election, the master fund is deemed to have distributed all of its assets and liabilities, in a taxable transaction, to its shareholders in liquidation of the master fund. Immediately thereafter, the shareholders contributed all of the distributed assets and liabilities to a newly formed partnership. The final tax year end of The U.S. Large Cap Value Series was December 30, 2008. For Federal income tax purposes, pursuant to IRC Code §336(a), the master fund recognized a loss as if the master’s investment securities were sold to its shareholders and, pursuant to IRC Code §331, each of the Portfolios recognized a gain as if it liquidated its investment in the master. For tax purposes, pursuant to IRC Code §334(a), each of the Portfolios took fair market value basis in the securities deemed received by them and a new holding period for those securities commenced on the deemed liquidation date.
The master fund had book/tax differences upon its deemed liquidation. The following summary of permanent differences occurred as of the respective effective “Check the Box” election date.
| | | | | | |
Increase (Decrease) Paid-In Capital | | Unrealized Appreciation (Depreciation) Investment Securities | | Increase (Decrease) Undistributed Net Investment Income | | Increase (Decrease) Accumulated Net Realized Gains (Losses) |
$(3,038,312,278) | | $2,303,664,484 | | $(698,899) | | $735,346,693 |
30
As a result of the transaction, The U.S. Large Cap Value Series recognized a ($2,303,664,484) capital loss for tax year ended December 30, 2008. Additionally, the fund has written off $3,039,011,176 of expired capital loss carryover as a permanent book/tax reporting difference decreasing paid in capital.
F. Financial Instruments:
In accordance with the Series’ investment objectives and policies, the Series may invest in certain financial instruments that have off-balance sheet risk in excess of the amounts recognized in the financial statements and concentrations of credit and market risk. These instruments and their significant corresponding risks are described below:
1. Repurchase Agreements: The Series may purchase certain U.S. Government securities subject to the counterparty’s agreement to repurchase them at an agreed upon date and price. The counterparty will be required on a daily basis to maintain the value of the collateral subject to the agreement at not less than the repurchase price (including accrued interest). The agreements are conditioned upon the collateral being deposited under the Federal Reserve book-entry system with the Trust’s custodian or a third party sub-custodian. In the event of default or bankruptcy by the other party to the agreement, retention of the collateral may be subject to legal proceedings. All open repurchase agreements were entered into on October 30, 2009.
Derivative Financial Instruments:
Disclosures on derivative instruments and hedging activities are intended to improve financial reporting for derivative instruments by enabling investors to understand how and why a fund uses derivatives, how derivatives are accounted for and how derivative instruments affect a fund’s results of operations and financial position. Summarized below are the specific types of derivative instruments used by the Series.
2. Futures Contracts: The Series may enter into futures contracts to gain market exposure on uninvested cash pending investment in securities or to maintain liquidity to pay redemptions. Upon entering into a futures contract, the Series deposits cash or pledges U.S. Government securities to a broker, equal to the minimum “initial margin” requirements of the exchange on which the contract is traded. Subsequent payments are received from or paid to the broker each day, based on the daily fluctuation in the market value of the contract. These receipts or payments are known as “variation margin” and are recorded daily by the Series as unrealized gains or losses until the contracts are closed. When the contracts are closed, the Series records a realized gain or loss, which is presented in the Statement of Operations as a net realized gain or loss on futures, equal to the difference between the value of the contract at the time it was opened and the value at the time it was closed.
Risks may arise upon entering into futures contracts from potential imperfect price correlations between the futures contracts and the underlying securities, from the possibility of an illiquid secondary market for these instruments and from the possibility that the Series could lose more than the initial margin requirements. The Series entering into stock index futures are subject to equity price risk from those futures contracts. Counterparty credit risk related to exchange-traded futures is minimal because the exchange’s clearinghouse, as counterparty to all exchange-traded futures, guarantees the futures against default.
Additional disclosure on derivative instruments is required showing a summary by primary risk exposure of the derivatives instruments’ (i) location in the balance sheet and fair value at period end and (ii) the location in the Statement of Operations and the realized and change in unrealized gain or loss over the reporting period. The following is a summary of the Series’ derivative instrument holdings for the year ended October 31, 2009.
At October 31, 2009, the Series had no outstanding futures contracts.
The following is a summary of the location of realized and change in unrealized gains and losses on the Series’ Statement of Operations for the Series’ derivative instrument holdings through the year ended October 31, 2009:
31
| | |
Derivative Type | | Location of Gain (Loss) on Derivatives Recognized in Income |
Equity contracts | | Net Realized Gain (Loss) on: Futures Change in Unrealized Appreciation (Depreciation) of: Futures |
The following is a summary of the Series’ location of realized and change in unrealized gains and losses from the Series’ derivative instrument holdings categorized by primary risk exposure through the year ended October 31, 2009 (amounts in thousands):
| | | | | | |
| | | | | Realized Gain (Loss)
on Derivatives
Recognized in Income | | |
| | | | | Equity
Contracts | | |
The U.S. Large Cap Value Series* | | | | $7,204 | | |
| | |
| | | Change in Unrealized
Appreciation (Depreciation) on
Derivatives Recognized in Income |
| | | Equity
Contracts |
The U.S. Large Cap Value Series* | | $(29) |
| * | As of October 31, 2009, there were no futures contracts outstanding. During the year ended October 31, 2009, the Series had limited activity in these transactions. |
G. Line of Credit:
The Trust, together with other Dimensional-advised portfolios, has entered into an amended and restated $250 million unsecured discretionary line of credit effective July 8, 2009 with an affiliate of its domestic custodian bank. Each portfolio is permitted to borrow, subject to its investment limitations, up to a maximum of $250 million, as long as total borrowings under the line of credit do not exceed $250 million in the aggregate. Borrowings under the line of credit are charged interest at the then current Federal Funds Rate plus 1%. Each portfolio is individually, and not jointly, liable for its particular advances under the line of credit. There is no commitment fee on the unused portion of the line of credit. The agreement for the line of credit may be terminated by either party at any time. The line of credit is scheduled to expire on June 22, 2010.
For the year ended October 31, 2009, borrowings by the Series under this line of credit were as follows (amounts in thousands, except percentages and days):
| | | | | | | | |
Weighted Average Interest Rate | | Weighted Average Loan Balance | | Number of Days Outstanding | | Interest Expense Incurred | | Maximum Amount
Borrowed During the Period |
1.90% | | $11,126 | | 5 | | $3 | | $31,000 |
There were no outstanding borrowings by the Series under this line of credit as of October 31, 2009.
The Trust, together with other Dimensional-advised portfolios, has also entered into an additional $500 million unsecured line of credit effective January 15, 2009 with its international custodian bank. Each portfolio is permitted to borrow, subject to its investment limitations, up to a maximum of $500 million, as long as total borrowings under the line of credit do not exceed $500 million in the aggregate. Each portfolio is individually, and not jointly, liable for its particular advances under the line of credit. Borrowings under the line of credit are charged interest at rates agreed to by the parties at the time of borrowing. There is no commitment fee on the unused portion of the line of credit. The agreement for the line of credit expires on January 15, 2010. There were no borrowings by the Series under this line of credit during the year ended October 31, 2009.
32
H. Securities Lending:
As of October 31, 2009, the Series had securities on loan to brokers/dealers, for which the Series held cash collateral. The Series invests the cash collateral, as described below, and records a liability for the return of the collateral, during the period the securities are on loan. Loans of securities are expected at all times to be secured by collateral equal to at least (i) 100% of the current market value of the loaned securities with respect to securities of the U.S. government or its agencies, (ii) 102% of the current market value of the loaned securities with respect to U.S. securities, and (iii) 105% of the current market value of the loaned securities with respect to foreign securities. However, daily market fluctuations could cause the Series’ collateral to be lower or higher than the expected thresholds. If this were to occur, the collateral would be adjusted the next business day to ensure adequate collateralization. In the event of default or bankruptcy by the other party to the agreement, realization and/or retention of the collateral may be subject to legal proceedings. If the borrower fails to return loaned securities, and cash collateral being maintained by the borrower is insufficient to cover the value of loaned securities and provided such collateral insufficiency is not the result of investment losses, the lending agent has agreed to pay the amount of the shortfall to the Series or, at the option of the lending agent, to replace the securities.
Subject to the Series’ investment policy, the cash collateral received by the Series from securities on loan is invested in securities of the U.S. government or its agencies, repurchase agreements collateralized by securities of the U.S. government or its agencies or shares of the DFA Short Term Investment Fund LP. Agencies include both agency debentures and agency mortgage backed securities. In addition, the Series will be able to terminate the loan at any time and will receive reasonable interest on the loan, as well as amounts equal to any dividends, interest or other distributions on the loaned securities. However, dividend income received from loaned securities may not be eligible to be taxed at qualified dividend income rates.
I. Indemnitees; Contractual Obligations:
Under the Trust’s organizational documents, its officers and trustees are indemnified against certain liabilities arising out of the performance of their duties to the Trust.
In the normal course of business, the Trust enters into contracts that contain a variety of representations and warranties which provide general indemnification. The Trust’s maximum exposure under these arrangements is unknown as this would involve future claims that may be made against the Trust and/or its affiliates that have not yet occurred. However, based on experience, the Trust expects the risk of loss to be remote.
J. In-Kind Redemptions:
In accordance with guidelines described in the Series’ prospectus, the Series may distribute portfolio securities rather than cash as payment for a redemption of fund shares (in-kind redemption). For financial reporting purposes, the Series recognizes a gain on in-kind redemptions to the extent the value of the distributed securities on the date of redemption exceeds the cost of those securities. Gains and losses realized on in-kind redemptions are not recognized for tax purposes and are reclassified from undistributed realized gain (loss) to paid-in capital. During the period December 1, 2007 to October 31, 2008, the Series realized $52,271 (in thousands) of net gain.
K. Subsequent Event Evaluations:
Management has evaluated the impact of all subsequent events on the Series through December 23, 2009, the date the financial statements were available for issuance, and has determined that there are no subsequent events requiring recognition or disclosure in the financial statements.
33
REPORT OF INDEPENDENT REGISTERED PUBLIC ACCOUNTING FIRM
To the Shareholders of The U.S. Large Cap Value Series and
Board of Trustees of The DFA Investment Trust Company:
In our opinion, the accompanying statements of assets and liabilities, including the summary schedules of portfolio holdings, and the related statements of operations and of changes in net assets and the financial highlights presents fairly, in all material respects, the financial position of The U.S. Large Cap Value Series (one of the portfolios constituting The DFA Investment Trust Company, hereafter referred to as the “Series”) at October 31, 2009, the results of its operations for the year then ended, the changes in its net assets and the financial highlights for each of the periods indicated, in conformity with accounting principles generally accepted in the United States of America. These financial statements and financial highlights (hereafter referred to as “financial statements”) are the responsibility of the Series’ management; our responsibility is to express an opinion on these financial statements based on our audits. We conducted our audits of these financial statements in accordance with the standards of the Public Company Accounting Oversight Board (United States). Those standards require that we plan and perform the audit to obtain reasonable assurance about whether the financial statements are free of material misstatement. An audit includes examining, on a test basis, evidence supporting the amounts and disclosures in the financial statements, assessing the accounting principles used and significant estimates made by management, and evaluating the overall financial statement presentation. We believe that our audits, which included confirmation of securities at October 31, 2009 by correspondence with the custodian, brokers and the transfer agent of the investee fund, provide a reasonable basis for our opinion.
PricewaterhouseCoopers LLP
Philadelphia, Pennsylvania
December 23, 2009
34
RESULTS OF THE SHAREHOLDER MEETING
On June 2, 2009 and June 5, 2009, The DFA Investment Trust Company (“DFAITC”) held a Special Joint Meeting of Shareholders for the purpose of voting on several proposals affecting DFAITC and the Series, including, among other items, the election of Trustees, the amendment of certain fundamental investment limitations, and the elimination of certain fundamental investment limitations. The shareholders of the Series approved each of the applicable proposals for DFAITC and the Series presented at the Meeting. Listed below are the voting results from the Meeting. Please note that not all Proposals presented at the Meeting were voted on by the Series. Additionally, the Proposal numbers reflected below correlate to the Proposal numbers presented for vote at the Meeting.
DFAITC
| | | | | | | | | | | | | | | | | | | | | | | |
| | | Shares Voted | | | Percent of Outstanding Shares Voted |
| | | For | | % | | | Against | | % | | | Abstain/WithHold | | % | | | For | | | Against | | | Abstain /WithHold |
Proposal 1: Election of Trustees for DFAITC* | | | | | | | | | | | | | | | | | | | | Need for 50% Voted 40Act: |
1a David G. Booth | | 2,166,359,402 | | 96.50 | % | | — | | 0.00 | % | | 78,661,259 | | 3.50 | % | | 95.78 | % | | 0.00 | % | | 3.48% |
1b George M. Constantinides | | 2,169,219,982 | | 96.62 | % | | — | | 0.00 | % | | 75,800,679 | | 3.38 | % | | 95.90 | % | | 0.00 | % | | 3.35% |
1c John P. Gould | | 2,168,577,186 | | 96.59 | % | | — | | 0.00 | % | | 76,443,476 | | 3.41 | % | | 95.88 | % | | 0.00 | % | | 3.38% |
1d Roger G. Ibbotson | | 2,169,778,365 | | 96.65 | % | | — | | 0.00 | % | | 75,242,297 | | 3.35 | % | | 95.93 | % | | 0.00 | % | | 3.33% |
1e Robert C. Merton | | 2,170,124,638 | | 96.66 | % | | — | | 0.00 | % | | 74,896,023 | | 3.34 | % | | 95.94 | % | | 0.00 | % | | 3.31% |
1f Myron S. Scholes | | 2,169,439,189 | | 96.63 | % | | — | | 0.00 | % | | 75,581,473 | | 3.37 | % | | 95.91 | % | | 0.00 | % | | 3.34% |
1g Eduardo A. Repetto | | 2,167,010,793 | | 96.53 | % | | — | | 0.00 | % | | 78,009,868 | | 3.47 | % | | 95.81 | % | | 0.00 | % | | 3.45% |
1h Abbie J. Smith | | 2,169,626,842 | | 96.64 | % | | — | | 0.00 | % | | 75,393,820 | | 3.36 | % | | 95.92 | % | | 0.00 | % | | 3.33% |
| | | | | | | | | | | | | | | | | | | | | | | | | | | |
| | | Shares Voted | | Percent of Outstanding Shares Voted |
| | | For | | % | | | Against | | % | | | Abstain/WithHold | | % | | | NonVote | | % | | For | | | Against | | | Abstain /WithHold |
Proposal 4: Approval of an Amended and Restated Agreement and Declaration of Trust for DFAITC* | | 2,076,877,329 | | 92.43 | % | | 36,623,148 | | 1.63 | % | | 133,356,326 | | 5.94 | % | | NA | | NA | | 91.82 | % | | 1.62 | % | | 5.90% |
| * | Results are for all Series within DFAITC |
The U.S. Large Cap Value Series
| | | | | | | | | | | | | | | | | | | | | | | |
| | | Shares Voted | | | Percent of Outstanding Shares Voted |
| | | For | | % | | | Against | | % | | | Abstain/WithHold | | % | | | For | | | Against | | | Abstain /WithHold |
Proposals: | | | | | | | | | | | | | | | | | | | | | | | |
5 To approve amendments to certain fundamental investment restrictions |
5a Borrowing Money | | 450,089,477 | | 90.34 | % | | 13,835,372 | | 2.78 | % | | 34,296,468 | | 6.88 | % | | 90.12 | % | | 2.77 | % | | 6.87% |
5b Making Loans | | 446,508,610 | | 89.62 | % | | 17,323,887 | | 3.48 | % | | 34,388,819 | | 6.90 | % | | 89.41 | % | | 3.47 | % | | 6.89% |
5c Investments in Real Estate | | 449,117,076 | | 90.14 | % | | 14,867,126 | | 2.98 | % | | 34,237,115 | | 6.87 | % | | 89.93 | % | | 2.98 | % | | 6.86% |
5d Investments in Commodities | | 445,240,298 | | 89.37 | % | | 18,945,498 | | 3.80 | % | | 34,035,520 | | 6.83 | % | | 89.15 | % | | 3.79 | % | | 6.82% |
5e Diversification of Investments | | 450,429,968 | | 90.41 | % | | 13,968,473 | | 2.80 | % | | 33,822,876 | | 6.79 | % | | 90.19 | % | | 2.80 | % | | 6.77% |
|
6 To approve the elimination of certain fundamental investment restrictions |
6a Pledging, Mortgaging, or Hypothecating Assets | | 442,477,364 | | 88.81 | % | | 21,095,580 | | 4.23 | % | | 34,648,372 | | 6.95 | % | | 88.60 | % | | 4.22 | % | | 6.94% |
6b Purchasing Securities on Margin | | 442,025,675 | | 88.72 | % | | 21,654,237 | | 4.35 | % | | 34,541,405 | | 6.93 | % | | 88.51 | % | | 4.34 | % | | 6.92% |
6c Investing in Restricted or Illiquid Securities | | 441,905,416 | | 88.70 | % | | 21,661,567 | | 4.35 | % | | 34,654,334 | | 6.96 | % | | 88.48 | % | | 4.34 | % | | 6.94% |
6d Investing for the Purpose of Exercising Control | | 446,950,234 | | 89.71 | % | | 16,844,128 | | 3.38 | % | | 34,426,955 | | 6.91 | % | | 89.49 | % | | 3.37 | % | | 6.89% |
6e Investing in Other Investment Companies | | 446,376,678 | | 89.59 | % | | 17,480,520 | | 3.51 | % | | 34,364,119 | | 6.90 | % | | 89.38 | % | | 3.50 | % | | 6.88% |
6f Management Ownership of Securities of an Issuer | | 446,904,545 | | 89.70 | % | | 16,712,196 | | 3.35 | % | | 34,604,577 | | 6.95 | % | | 89.49 | % | | 3.35 | % | | 6.93% |
6g Investing in Oil, Gas, or other Mineral Exploration, Leases or Development Programs | | 445,817,286 | | 89.48 | % | | 18,271,331 | | 3.67 | % | | 34,132,700 | | 6.85 | % | | 89.27 | % | | 3.66 | % | | 6.83% |
6h Investing in Securities of Unseasoned Issuers | | 445,230,922 | | 89.36 | % | | 18,304,705 | | 3.67 | % | | 34,685,690 | | 6.96 | % | | 89.15 | % | | 3.67 | % | | 6.95% |
6i Investing in Warrants | | 446,950,388 | | 89.71 | % | | 16,531,063 | | 3.32 | % | | 34,739,866 | | 6.97 | % | | 89.49 | % | | 3.31 | % | | 6.96% |
6j Writing or Acquiring Options | | 446,696,672 | | 89.66 | % | | 16,985,456 | | 3.41 | % | | 34,539,189 | | 6.93 | % | | 89.44 | % | | 3.40 | % | | 6.92% |
35
FUND MANAGEMENT
Trustees/Directors
Each Board of Trustees/Directors of The DFA Investment Trust Company Inc. (“DFAITC”), DFA Investment Dimensions Group Inc. (“DFAIDG”), Dimensional Investment Group Inc. (“DIG”) and Dimensional Emerging Markets Value Fund (“DEM”) (each, the “Fund” and collectively, the “Funds”) is responsible for establishing the Funds’ policies and for overseeing the management of the Funds. The Trustees/Directors of the Funds, including all of the disinterested Directors, have adopted written procedures to monitor potential conflicts of interest that might develop between portfolios of the Funds (the “Feeder Portfolios”) that invest in certain series of DFAITC or DEM (the “Master Funds”).
Each Board has two standing committees, an Audit Committee and a Portfolio Performance and Service Review Committee (the “Performance Committee”). The Audit Committee is comprised of George M. Constantinides, Roger G. Ibbotson and Abbie J. Smith. Each member of the Audit Committee is a disinterested Director. The Audit Committee oversees the Fund’s accounting and financial reporting policies and practices, the Fund’s internal controls, the Fund’s financial statements and the independent audits thereof and performs other oversight functions as requested by the Board. The Audit Committee recommends the appointment of each Fund’s independent registered certified public accounting firm and also acts as a liaison between the Fund’s independent registered certified public accounting firm and the full Board. There were two Audit Committee meetings held during the fiscal year ended October 31, 2009.
Each Board’s Performance Committee is comprised of Messrs. Constantinides and Ibbotson, Ms. Smith, John P. Gould, Myron S. Scholes and Robert C. Merton. Each member of the Fund’s Performance Committee is a disinterested Director. The Performance Committee regularly reviews and monitors the investment performance of the Fund’s series and reviews the performance of the Fund’s service providers. There were six Performance Committee meetings held during the fiscal year ended October 31, 2009.
Certain biographical information for each disinterested Trustee/Director and each interested Trustee/Director of the Funds is set forth in the tables below, including a description of each Trustee/Director’s experience as a Trustee/ Director of the Funds and as a director or trustee of other funds, as well as other recent professional experience.
The statements of additional information (together, “SAI”) of the Funds include additional information about each Trustee/Director. You may obtain copies of the SAI and prospectus of each Fund advised by Dimensional Fund Advisors LP by calling collect (512) 306-7400 or by mailing a request to Dimensional Fund Advisors LP, 6300 Bee Cave Road, Building One, Austin, Texas 78746. Prospectuses are also available at www.dimensional.com.
| | | | | | |
Name, Position with the Fund, Address and Age | | Term of Office1 and Length of Service | | Portfolios within the DFA Fund Complex2 Overseen | | Principal Occupation(s) During Past 5 Years and Other Directorships of Public Companies Held |
Disinterested Trustees/Directors |
George M. Constantinides Director of DFAIDG, DIG and DEM. Trustee of DFAITC. The University of Chicago Booth School of Business 5807 S. Woodlawn Avenue Chicago, IL 60637 Age: 62 | | DFAITC - since 1993 DFAIDG - since 1983 DIG - since 1993 DEM - since 1993 | | 87 portfolios in 4 investment companies | | Leo Melamed Professor of Finance, The University of Chicago Booth School of Business. |
John P. Gould Director of DFAIDG, DIG and DEM. Trustee of DFAITC. The University of Chicago Booth School of Business 5807 S. Woodlawn Avenue Chicago, IL 60637 Age: 70 | | DFAITC - since 1993 DFAIDG - since 1986 DIG - since 1993 DEM - since 1993 | | 87 portfolios in 4 investment companies | | Steven G. Rothmeier Distinguished Service Professor of Economics, The University of Chicago Booth School of Business (since 1965). Member of the Boards of Milwaukee Mutual Insurance Company (since 1997). Member and Chair, Competitive Markets Advisory Committee, Chicago Mercantile Exchange (futures trading exchange) (since 2004). Formerly, Director of UNext, Inc. (1999-2006). Formerly, Senior Vice-President, Lexecon Inc. (economics, law, strategy and finance consulting) (1994-2004). Trustee, Harbor Fund (registered investment company) (27 Portfolios) (since 1994). |
36
| | | | | | |
Name, Position with the Fund, Address and Age | | Term of Office1 and Length of Service | | Portfolios within the DFA Fund Complex2 Overseen | | Principal Occupation(s) During Past 5 Years and Other Directorships of Public Companies Held |
Roger G. Ibbotson Director of DFAIDG, DIG and DEM. Trustee of DFAITC. Yale School of Management 135 Prospect Street New Haven, CT 06520-8200 Age: 66 | | DFAITC - since 1993 DFAIDG - since 1981 DIG - since 1993 DEM - since 1993 | | 87 portfolios in 4 investment companies | | Professor in Practice of Finance, Yale School of Management (since 1984). Director, BIRR Portfolio Analysis, Inc. (software products) (since 1990). Chairman, CIO and Partner, Zebra Capital Management, LLC (hedge fund manager) (since 2001). Formerly, Chairman, Ibbotson Associates, Inc., Chicago, IL (software data publishing and consulting) (1977-2006). |
Robert C. Merton Director of DFAIDG, DIG and DEM. Trustee of DFAITC. Harvard Business School 353 Baker Library Soldiers Field Boston, MA 02163 Age: 65 | | DFAITC - since 2003 DFAIDG - since 2003 DIG - since 2003 DEM - since 2003 | | 87 portfolios in 4 investment companies | | John and Natty McArthur University Professor, Graduate School of Business Administration, Harvard University (since 1998). Director, MF Risk, Inc. (risk management software) (since 2001). Director, Peninsula Banking Group (bank) (since 2003). Director, Community First Financial Group (bank holding company) (since 2003). Member Competitive Markets Advisory Council, Chicago Mercantile Exchange (futures trading exchange) (since 2004). Chairman and Director, Daedalus Software (medical software) (since 2008). Formerly, Advisory Board Member, Alpha Simplex Group (hedge fund) (2001-2007). Formerly, Chief Science Officer and Director, Trinsum Group, a successor to Integrated Finance Limited (2002-2008). Director, Vical Incorporated (biopharmaceutical product development) (since 2002). |
Myron S. Scholes Director of DFAIDG, DIG and DEM. Trustee of DFAITC. Platinum Grove Asset Management, L.P. Reckson Executive Park 1100 King Street Building 4 Rye Brook, NY 10573 Age: 68 | | DFAITC - since 1993 DFAIDG - since 1981 DIG - since 1993 DEM - since 1993 | | 87 portfolios in 4 investment companies | | Frank E. Buck Professor Emeritus of Finance, Stanford University (since 1981). Chairman, Platinum Grove Asset Management, L.P. (hedge fund) (formerly, Oak Hill Platinum Partners) (since 1999). Formerly, Managing Partner, Oak Hill Capital Management (private equity firm) (until 2004). Formerly, Director, Chicago Mercantile Exchange (2001-2008). Director, American Century Fund Complex (registered investment companies) (37 Portfolios) (since 1981). |
Abbie J. Smith Director of DFAIDG, DIG and DEM. Trustee of DFAITC. The University of Chicago Booth School of Business 5807 S. Woodlawn Avenue Chicago, IL 60637 Age: 56 | | DFAITC - since 2000 DFAIDG - since 2000 DIG - since 2000 DEM - since 2000 | | 87 portfolios in 4 investment companies | | Boris and Irene Stern Professor of Accounting, The University of Chicago Booth School of Business (since 1980), and Co-Director Investment Research, Fundamental Investment Advisors (hedge fund) (since 2008). Director, HNI Corporation (formerly known as HON Industries Inc.) (office furniture) (since 2000). Director, Ryder System Inc. (transportation, logistics and supply-chain management) (since 2003). Director/ Trustee, UBS Funds (fund complex) (5 portfolios) (since 2008). |
37
| | | | | | |
Name, Position with the Fund, Address and Age | | Term of Office1 and Length of Service | | Portfolios within the DFA Fund Complex2 Overseen | | Principal Occupation(s) During Past 5 Years and Other Directorships of Public Companies Held |
Interested Trustees/Directors* |
David G. Booth Chairman, Director, Chief Executive Officer and President of DFAIDG, DIG and DEM. Chairman, Trustee, Chief Executive Officer, Chief Investment Officer and President of DFAITC. 6300 Bee Cave Road, Building One Austin, Texas 78746 Age: 62 | | DFAITC - since 1993 DFAIDG - since 1981 DIG - since 1992 DEM - since 1993 | | 87 portfolios in 4 investment companies | | Chairman, Director/Trustee, President, Chief Executive Officer and formerly Chief Investment Officer of the following companies: Dimensional Holdings Inc., Dimensional Fund Advisors LP, Dimensional Fund Advisors Canada ULC, DFAIDG, DIG, DEM and DFAITC. President and Chief Executive Officer of DFA Securities LLC. Director of Dimensional Fund Advisors Ltd, and formerly Chief Investment Officer. Director and formerly, President and Chief Investment Officer of DFA Australia Ltd. Formerly, Director of Dimensional Funds PLC and Dimensional Fund II PLC. Chairman, Director and Chief Executive Officer of Dimensional Fund Advisors Canada ULC (All Chief Investment Officer positions held starting 1/03 through 3/07 except Dimensional Holdings Inc., which was from 10/06 through 3/07.) Limited Partner, Oak Hill Partners (since 2001) and VSC Investors, LLC (since 2007). Trustee, The University of Chicago Booth School of Business. Formerly, Director, SA Funds (registered investment company). Formerly Director, Assante Corporation (investment management) (until 2002). |
Eduardo A. Repetto Director, Chief Investment Officer and Vice President of DFAIDG, DIG and DEM. Trustee, Chief Investment Officer and Vice President of DFAITC
6300 Bee Cave Road, Building One Austin, TX 78746 Age: 42 | | DFAITC - since 2009 DFAIDG - since 2009 DIG - since 2009 DEM - since 2009 | | 87 portfolios in 4 investment companies | | Director/Trustee (beginning June 2009), Chief Investment Officer (beginning March 2007) and Vice President of DFAIDG, DIG, DEM and DFAITC. Chief Investment Officer (beginning March 2007) and Vice President of all the DFA Entities, DFA Australia Limited and Dimensional Fund Advisors Canada ULC. |
| 1 | Each Trustee/Director holds office for an indefinite term until his or her successor is elected and qualified. |
| 2 | Each Trustee/Director is a director or trustee of each of the four registered investment companies within the DFA Fund Complex, which includes the Funds. |
| * | Interested Trustees/Directors are described as such because they are deemed to be “interested persons,” as that term is defined under the Investment Company Act of 1940, as amended, due to their positions with Dimensional Fund Advisors LP. |
38
Officers
The name, age, information regarding positions with the Funds and the principal occupation for each officer of the Funds are set forth below. Each officer listed below holds the same office (except as otherwise noted) in the following entities: Dimensional Fund Advisors LP (prior to November 3, 2006, Dimensional Fund Advisors Inc.) (“Dimensional”), DFA Securities Inc., DFAIDG, DIG, DFAITC and DEM (collectively, the “DFA Entities”). The address of each officer is: Dimensional Fund Advisors LP, 6300 Bee Cave Road, Building One, Austin, Texas 78746, unless otherwise indicated.
| | | | |
Name, Position with the Fund and Age | | Term of Office1 and Length of Service | | Principal Occupation(s) During Past 5 Years |
Officers |
April A. Aandal Vice President and Chief Learning Officer Age: 46 | | Since 2008 | | Vice President of all the DFA Entities. Chief Learning Officer of Dimensional (since September 2008). Formerly, Regional Director of Dimensional (2004-2008); Vice President of Professional Development at Assante Asset Management (June 2002-January 2005). |
Darryl D. Avery Vice President Age: 43 | | Since 2005 | | Vice President of all the DFA Entities. From June 2002 to January 2005, institutional client service representative of Dimensional. |
Arthur H. Barlow Vice President Age: 53 | | Since 1993 | | Vice President of all the DFA Entities. Formerly, Vice President of DFA Australia Limited and Dimensional Fund Advisors Ltd. |
Scott A. Bosworth Vice President Age: 40 | | Since 2007 | | Vice President of all the DFA Entities. Regional Director of Dimensional (since November 1997). |
Valerie A. Brown Vice President and Assistant Secretary Age: 42 | | Since 2001 | | Vice President and Assistant Secretary of all the DFA Entities, DFA Australia Limited, Dimensional Fund Advisors Ltd., and since June 2003, Dimensional Fund Advisors Canada ULC. |
David P. Butler Vice President Age: 45 | | Since 2007 | | Vice President of all the DFA Entities. Director of Global Financial Services of Dimensional (since 2008). Formerly, Regional Director of Dimensional Fund Advisors LP (January 1995 to January 2005). |
Patrick Carter Vice President Age: 47 | | Since 2007 | | Vice President of all the DFA Entities. Regional Director of Dimensional (since March 2006). Formerly, Director of Merrill Lynch Retirement Group (December 1998 to March 2006). |
Joseph H. Chi Vice President Age: 43 | | Since 2009 | | Vice President of all the DFA Entities. Portfolio Manager for Dimensional Fund Advisors LP (since October 2005). Prior to October 2005, Corporate Counsel at Hewitt Associates (July 2002-August 2005). |
Stephen A. Clark Vice President Age: 37 | | Since 2004 | | Vice President of all the DFA Entities. Formerly, Portfolio Manager of Dimensional (April 2001-April 2004). |
Robert P. Cornell Vice President Age: 60 | | Since 2007 | | Vice President of all the DFA Entities. Regional Director of Financial Services Group of Dimensional (since August 1993). |
Christopher S. Crossan Vice President and Chief Compliance Officer Age: 43 | | Since 2004 | | Vice President and Chief Compliance Officer of all the DFA Entities. |
James L. Davis Vice President Age: 52 | | Since 1999 | | Vice President of all the DFA Entities. Formerly, Vice President of DFA Australia Limited and Dimensional Fund Advisors Ltd. |
Robert T. Deere Vice President Age: 52 | | Since 1994 | | Vice President of all the DFA Entities and DFA Australia Limited. |
Robert W. Dintzner Vice President Age: 39 | | Since 2001 | | Vice President of all the DFA Entities. |
39
| | | | |
Name, Position with the Fund and Age | | Term of Office1 and Length of Service | | Principal Occupation(s) During Past 5 Years |
Kenneth Elmgren Vice President Age: 55 | | Since 2007 | | Vice President of all the DFA Entities. Formerly, Managing Principal of Beverly Capital (May 2004 to September 2006). |
Richard A. Eustice Vice President and Assistant Secretary Age: 44 | | Since 1998 | | Vice President and Assistant Secretary of all the DFA Entities and DFA Australia Limited. Chief Operating Officer of Dimensional Fund Advisors Ltd. (since July 2008). Formerly, Vice President of Dimensional Fund Advisors Ltd. |
Eugene F. Fama, Jr. Vice President Age: 48 | | Since 1993 | | Vice President of all the DFA Entities. Formerly, Vice President of DFA Australia Limited and Dimensional Fund Advisors Ltd. |
Gretchen A. Flicker Vice President Age: 38 | | Since 2004 | | Vice President of all the DFA Entities. Prior to April 2004, institutional client service representative of Dimensional. |
Jed S. Fogdall Vice President Age: 35 | | Since 2008 | | Vice President of all the DFA Entities. Portfolio Manager for Dimensional (since September 2004). Prior to September 2004, Staff Engineer at the Boeing Company (1997-2004). |
Glenn S. Freed Vice President Age: 47 | | Since 2001 | | Vice President of all the DFA Entities. |
Jeremy P. Freeman Vice President Age: 38 | | Since 2009 | | Vice President of all the DFA Entities. Senior Technology Manager for Dimensional Fund Advisors LP (since June 2006). Formerly, Principal at AIM Investments/Amvescap PLC (now Invesco) (June 1998-June 2006). |
Mark R. Gochnour Vice President Age: 42 | | Since 2007 | | Vice President of all the DFA Entities. Regional Director of Dimensional. |
Henry F. Gray Vice President Age: 42 | | Since 2000 | | Vice President of all the DFA Entities. Prior to July 2000, Portfolio Manager of Dimensional. Formerly, Vice President of DFA Australia Limited. |
John T. Gray Vice President Age: 35 | | Since 2007 | | Vice President of all the DFA Entities. Formerly, Regional Director of Dimensional (January 2005 to February 2007). |
Darla Hastings Vice President Age: 54 | | Since 2007 | | Vice President of all the DFA Entities. Chief Marketing Officer of Dimensional. Formerly, Senior Vice President, Customer Experience for Benchmark Assisted Living (May 2005 to April 2006); Executive Vice President and Chief Marketing Officer of State Street Corporation (September 2001 to October 2005). |
Joel H. Hefner Vice President Age: 41 | | Since 2007 | | Vice President of all the DFA Entities. Regional Director of Dimensional (since June 1998). |
Julie Henderson Vice President and Fund Controller Age: 35 | | Since 2005 | | Vice President and Fund Controller of all the DFA Entities. Formerly, Senior Manager at PricewaterhouseCoopers LLP (July 1996 to April 2005). |
Kevin Hight Vice President Age: 41 | | Since 2005 | | Vice President of all the DFA Entities. Formerly, Regional Director of Dimensional (since March 2003 to March 2005). |
Christine W. Ho Vice President Age: 41 | | Since 2004 | | Vice President of all the DFA Entities. Prior to April 2004, Assistant Controller of Dimensional. |
Jeff J. Jeon Vice President Age: 35 | | Since 2004 | | Vice President of all the DFA Entities. Counsel of Dimensional (since September 2001). |
Patrick M. Keating Vice President Age: 54 | | Since 2003 | | Vice President of all the DFA Entities and Chief Operating Officer of Dimensional. Director, Vice President and Chief Privacy Officer of Dimensional Fund Advisors Canada ULC. Director of DFA Australia Limited. |
40
| | | | |
Name, Position with the Fund and Age | | Term of Office1 and Length of Service | | Principal Occupation(s) During Past 5 Years |
Joseph F. Kolerich Vice President Age: 37 | | Since 2004 | | Vice President of all the DFA Entities. Portfolio Manager for Dimensional (since April 2001). |
Michael F. Lane Vice President Age: 42 | | Since 2004 | | Vice President of all the DFA Entities. Formerly, Vice President of Advisor Services at TIAA-CREF (July 2001 to September 2004). |
Kristina M. LaRusso Vice President Age: 34 | | Since 2006 | | Vice President of all DFA Entities. Formerly, Operations Supervisor of Dimensional (March 2003 to December 2006). |
Inmoo Lee Vice President Age: 43 | | Since 2007 | | Vice President of all the DFA Entities. Associate Professor Department of Finance and Accounting, Business School, National University of Singapore (July 2004 to present); Associate Professor, College of Business Administration, Korea University (September 2001 to May 2006). |
Juliet Lee Vice President Age: 38 | | Since 2005 | | Vice President of all the DFA Entities. Human Resources Manager of Dimensional (since January 2004). |
Aaron M. Marcus Vice President & Head of Global Human Resources Age: 39 | | Since 2008 | | Vice President and Head of Global Human Resources of Dimensional. Formerly, Global Head of Recruiting and Vice President of Goldman Sachs & Co. (June 2006 to January 2008); Global Co-Head of HR of the Equities & FICC Division, and Vice President of Goldman Sachs & Co. (May 2005 to May 2006); Head of Americas Campus Recruiting and Vice President of Goldman Sachs & Co. (April 2003 to May 2005). |
David R. Martin Vice President, Chief Financial Officer and Treasurer Age: 52 | | Since 2007 | | Vice President, Chief Financial Officer and Treasurer of all the DFA Entities. Director, Vice President, Chief Financial Officer and Treasurer of Dimensional Fund Advisors Ltd. and DFA Australia Limited. Chief Financial Officer, Treasurer, and Vice President of Dimensional Fund Advisors Canada ULC. Director of Dimensional Funds PLC and Dimensional Funds II PLC. Formerly, Executive Vice President and Chief Financial Officer of Janus Capital Group Inc. (June 2005 to March 2007); Senior Vice President of Finance at Charles Schwab & Co., Inc. (March 1999 to May 2005). |
Catherine L. Newell Vice President and Secretary Age: 45 | | Vice President since 1997 and Secretary since 2000 | | Vice President and Secretary of all the DFA Entities. Director, Vice President and Secretary of DFA Australia Limited and Dimensional Fund Advisors Ltd. (since February 2002, April 1997 and May 2002, respectively). Vice President and Secretary of Dimensional Fund Advisors Canada ULC (since June 2003). Director, Dimensional Funds PLC and Dimensional Funds II PLC (since 2002 and 2006, respectively). Formerly, Assistant Secretary of all DFA Entities, DFA Australia Limited and Dimensional Fund Advisors Ltd. |
Christian Newton Vice President Age: 34 | | Since 2009 | | Vice President of all DFA Entities. Web Services Manager for Dimensional Fund Advisors LP (Since January 2008). Formerly Design Manager (2005-2008) and Web Developer (2002-2005) of Dimensional Fund Advisors LP. |
Gerard K. O’Reilly Vice President Age: 32 | | Since 2007 | | Vice President of all the DFA Entities. Formerly, Research Associate of Dimensional Fund Advisors LP (2004 to 2006); Research Assistant in PhD program, Aeronautics Department California Institute of Technology (1998 to 2004). |
Daniel C. Ong Vice President Age: 35 | | Since 2009 | | Vice President of all the DFA Entities. Portfolio Manager for Dimensional Fund Advisors LP (since July 2005). Prior to 2005, Graduate Student at the University of Chicago Booth School of Business (2003-2005). |
Carmen Palafox Vice President Age: 35 | | Since 2006 | | Vice President of all the DFA Entities. Operations Manager of Dimensional Fund Advisors LP (since May 1996). |
Sonya Park Vice President Age: 37 | | Since 2005 | | Vice President of all the DFA Entities. From February 2002 to January 2005, institutional client service representative of Dimensional. |
41
| | | | |
Name, Position with the Fund and Age | | Term of Office1 and Length of Service | | Principal Occupation(s) During Past 5 Years |
David A. Plecha Vice President Age: 48 | | Since 1993 | | Vice President of all the DFA Entities, DFA Australia Limited and Dimensional Fund Advisors Ltd |
Ted Randall Vice President Age: 36 | | Since 2008 | | Vice President of all the DFA Entities. Formerly, Research Associate of Dimensional (2006-2008). Systems Developer of Dimensional (2001-2006). |
L. Jacobo Rodriguez Vice President Age: 38 | | Since 2005 | | Vice President of all the DFA Entities. From August 2004 to July 2005, institutional client service representative of Dimensional. Formerly, Financial Services Analyst, Cato Institute (September 2001 to June 2004); Book Review Editor, Cato Journal, Cato Institute (May 1996 to June 2004). |
David E. Schneider Vice President Age: 63 | | Since 2001 | | Vice President of all the DFA Entities. Currently, Director of Institutional Services. |
Bruce A. Simmons Vice President Age: 44 | | Since 2009 | | Vice President of all the DFA Entities. Investment Operations Manager for Dimensional Fund Advisors LP (since May 2007). Formerly, Vice President Client and Fund Reporting at Mellon Financial (September 2005-May 2007); Vice President Business Development at CUADPRO Marketing (July 2003-September 2005). |
Ted R. Simpson Vice President Age: 41 | | Since 2007 | | Vice President of all the DFA Entities. Regional Director of Dimensional (since December 2002). |
Bryce D. Skaff Vice President Age: 34 | | Since 2007 | | Vice President of all the DFA Entities. Formerly, Regional Director of Dimensional (December 1999 to January 2007). |
Grady M. Smith Vice President Age: 53 | | Since 2004 | | Vice President of all the DFA Entities. Prior to April 2004, Portfolio Manager of Dimensional. |
Carl G. Snyder Vice President Age: 46 | | Since 2000 | | Vice President of all the DFA Entities. Formerly, Vice President of DFA Australia Limited. |
Lawrence R. Spieth Vice President Age: 61 | | Since 2004 | | Vice President of all the DFA Entities. Prior to April 2004, Regional Director of Dimensional. |
Bradley G. Steiman Vice President Age: 36 | | Since 2004 | | Vice President of all the DFA Entities and Director and Vice President of Dimensional Fund Advisors Canada ULC. |
Robert C. Trotter Vice President Age: 51 | | Since 2009 | | Vice President of all the DFA Entities. Senior Manager Technology for Dimensional Fund Advisors LP (since March 2007). Formerly, Director of Technology at AMVESCAP (2002-2007). |
Karen E. Umland Vice President Age: 43 | | Since 1997 | | Vice President of all the DFA Entities, DFA Australia Limited, Dimensional Fund Advisors Ltd., and Dimensional Fund Advisors Canada ULC. |
Sunil Wahal Vice President Age: 42 | | Since 2009 | | Vice President of all the DFA Entities. Formerly, Research Associate for Dimensional Fund Advisors LP (July 2008-January 2009); Consultant to Dimensional Fund Advisors LP (September 2005-July 2008); Jack D. Furst Professor of Finance at Arizona State University, WP Carey School of Business (July 2005-July 2008); Associate Professor of Finance at Goizueta Business School, Emory University (1997-2005). |
Brian J. Walsh Vice President Age: 39 | | Since 2009 | | Vice President of all the DFA Entities. Portfolio Manager for Dimensional Fund Advisors LP (since 2004). Formerly, Trader for Dimensional Fund Advisors LP (1997-2004). |
Carol W. Wardlaw Vice President Age: 51 | | Since 2004 | | Vice President of all the DFA Entities. Prior to April 2004, Regional Director of Dimensional. |
42
| | | | |
Name, Position with the Fund and Age | | Term of Office1 and Length of Service | | Principal Occupation(s) During Past 5 Years |
Weston J. Wellington Vice President Age: 58 | | Since 1997 | | Vice President of all the DFA Entities. Formerly, Vice President of DFA Australia Limited. |
Daniel M. Wheeler Vice President Age: 64 | | Since 2001 | | Vice President of all the DFA Entities. Prior to 2001 and currently, Director of Financial Advisors Services of Dimensional. Director of Dimensional Fund Advisors Ltd. (since October 2003) and President of Dimensional Fund Advisors Canada ULC (since June 2003). |
Ryan Wiley Vice President Age: 33 | | Since 2007 | | Vice President of all the DFA Entities. Senior Trader of Dimensional. Formerly, Portfolio Manager (2006 to 2007); Trader (2001 to 2006). |
Paul E. Wise Vice President Age: 54 | | Since 2005 | | Vice President of all the DFA Entities. Chief Technology Officer for Dimensional (since 2004). Formerly, Principal of Turnbuckle Management Group (January 2002 to August 2004). |
| 1 | Each officer holds office for an indefinite term at the pleasure of the Boards of Trustees/Directors and until his or her successor is elected and qualified. |
43
VOTING PROXIES ON FUND PORTFOLIO SECURITIES
A description of the policies and procedures that the Trust uses in voting proxies relating to securities held in the portfolio is available without charge, upon request, by calling collect: (512) 306-7400. Information regarding how the Advisor votes these proxies is available from the EDGAR database on the SEC’s website at http://www.sec.gov and from the Advisor’s website at http://www.dimensional.com and reflects the twelve-month period beginning July 1st and ending June 30th.
44
NOTICE TO SHAREHOLDERS
(Unaudited)
For shareholders that do not have an October 31, 2009 tax year end, this notice is for informational purposes only. For shareholders with an October 31, 2009 tax year end, please consult your tax advisor as to the pertinence of this notice. For the fiscal year November 1, 2008 to October 31, 2009, the Portfolio is designating the following items with regard to distributions paid during the period. All designations are based on financial information available as of the date of this annual report and, accordingly are subject to change. For each item, it is the intention of the Portfolio to designate the maximum amount permitted under the Internal Revenue Code and the regulations thereunder.
| | | | | | | | | | | | | | | | |
Dimensional
Investment Group
Inc. | | Net
Investment
Income
Distributions | | Short-Term
Capital Gain
Distributions | | Long-Term
Capital Gain
Distributions | | Total
Distributions | | Qualifying
For Corporate
Dividends
Received
Deduction(1) | | Qualifying
Dividend
Income(2) | | Qualifying
Interest
Income(3) | | Qualifying
Short-Term
Capital Gain(4) |
U.S. Large Cap Value Portfolio III | | 99% | | 1% | | — | | 100% | | 100% | | 100% | | 100% | | 100% |
| (1) | Qualifying dividends represent dividends which qualify for the corporate dividends received deduction and is reflected as a percentage of ordinary income distributions (the total of short-term capital gain and net investment income distributions). |
| (2) | The percentage in this column represents the amount of “Qualifying Dividend Income” as created by the Jobs and Growth Tax Relief Reconciliation Act of 2003 and is reflected as a percentage of ordinary income distributions (the total of short-term capital gain and net investment income distributions). |
| (3) | The percentage in this column represents the amount of “Qualifying Interest Income” as created by The American Jobs Creation Act of 2004. The information is reflected as a percentage of ordinary income distributions (the total of short-term capital gain and net investment income distributions). |
| (4) | The percentage in this column represents the amount of “Qualifying Short-Term Capital Gain” as created by The American Jobs Creation Act of 2004. The information is reflected as a percentage of ordinary income distributions (the total of short-term capital gain and net investment income distributions). |
45


Dimensional Fund Advisors
6300 Bee Cave Road, Building One
Austin, TX 78746
December 2009
Dear Fellow Shareholder,
After sinking to ten-year lows, stock prices around the world rebounded sharply in March 2009 and posted steady gains in the seven months between March and September. March and April were among the best-return months in the life of Dimensional’s equity Funds.
The unexpected turns in the financial markets this year offered some valuable lessons. We were reminded that stock prices are unpredictable. We saw once again the benefits of staying disciplined in the market as it inevitably moves up and down. And I believe these markets showed very clearly why diversification is so important to long-term investment success.
Although diversification can’t prevent losses, it can help investors avoid the extreme outcomes that can result from concentrating investments in individual stocks or market segments. We believe that successful investing is about both increasing wealth and being able to sleep well at night. Investors who understand how markets work and have a realistic understanding of their own tolerance for risk are most likely to have a good overall experience.
More than $10 billion in net long-term assets flowed into Dimensional’s Funds during the first 10 months of 2009, a reflection of the trust our shareholders around the world have placed in us. We are grateful for that trust and want you to know that we take our responsibility as the steward of your investments in Dimensional’s Funds very seriously. We hope to have the opportunity to continue serving your needs for many years to come.
|
Sincerely, |
 |
David G. Booth |
Chairman and Chief Executive Officer |
[THIS PAGE INTENTIONALLY LEFT BLANK]
ANNUAL REPORT
Table of Contents
This report is submitted for the information of the Fund’s shareholders. It is not authorized for distribution to prospective investors unless preceded or accompanied by an effective prospectus.
i
[THIS PAGE INTENTIONALLY LEFT BLANK]
DIMENSIONAL INVESTMENT GROUP INC.
THE DFA INVESTMENT TRUST COMPANY
DEFINITIONS OF ABBREVIATIONS AND FOOTNOTES
Statement of Assets and Liabilities/Summary Schedule of Portfolio Holdings
| | |
Investment Abbreviations |
ADR | | American Depositary Receipt |
FNMA | | Federal National Mortgage Association |
P.L.C. | | Public Limited Company |
|
| Investment Footnotes |
† | | See Note B to Financial Statements. |
†† | | Securities have generally been fair valued. See Note B to Financial Statements. |
** | | Calculated as a percentage of total net assets. Percentages shown parenthetically next to the category headings have been calculated as a percentage of total investments. “Other Securities” are those securities that are not among the top 50 holdings of the Fund or do not represent more than 1.0% of the net assets of the Fund. Some of the individual securities within this category may be Non-Income Producing Securities. |
* | | Non-Income Producing Securities. |
# | | Total or Partial Securities on Loan. |
@ | | Security purchased with cash proceeds from Securities on Loan. |
§ | | Affiliated Fund. |
|
| Financial Highlights |
(A) | | Computed using average shares outstanding. |
(B) | | Annualized |
(C) | | Non-Annualized |
(D) | | Represents the combined ratios for the respective portfolio and its respective pro-rata share of its Master Fund Series. |
|
| All Statements and Schedules |
— | | Amounts designated as — are either zero or rounded to zero. |
SEC | | Securities and Exchange Commission |
1
DIMENSIONAL INVESTMENT GROUP INC.
PERFORMANCE CHART
Emerging Markets Portfolio II vs.
MSCI Emerging Markets Index (net dividends)
October 31, 1999-October 31, 2009
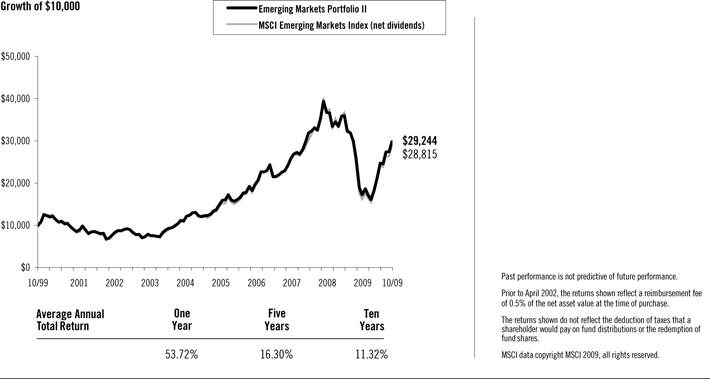
2
DIMENSIONAL INVESTMENT GROUP INC.
MANAGEMENT’S DISCUSSION AND ANALYSIS
| | |
| International Equity Market Review | | 12 Months Ended October 31, 2009 |
The one-year period ending October 31, 2009, was characterized by unprecedented volatility in non-US developed markets. Non-US developed markets lost 18.87% from November 2008 through February 2009, as measured by the MSCI World ex USA Index (net dividends). From March through October 2009 these same markets gained 57.56%. In April 2009, the Index had its largest-ever monthly gain (12.90%) since October 1990.
From November 2008 through February 2009, developed markets returns were negative across all asset classes. The US dollar rallied against most currencies, reversing a general trend of depreciation dating back to 2006. From March through October 2009 the market reversed course, with small cap and value stocks strongly outperforming large cap and growth stocks. The US dollar depreciated against most major currencies. The rally drove strong positive returns for the 12-month period, with small cap stocks significantly outperforming large cap stocks and value stocks outperforming growth stocks, as measured by the MSCI indexes.
12 Months Ended October 31, 2009
| | | | |
Ten Largest Foreign Developed Markets by Market Cap (BB) | | Local
Currency
Return | | U.S. Dollar
Return |
Japan ($2,432) | | 6.03% | | 15.20% |
United Kingdom ($2,328) | | 23.19% | | 25.68% |
France ($1,106) | | 10.09% | | 28.10% |
Canada ($1,060) | | 17.46% | | 32.58% |
Australia ($912) | | 21.91% | | 66.97% |
Germany ($843) | | 6.37% | | 23.77% |
Switzerland ($821) | | 5.78% | | 20.63% |
Spain ($488) | | 33.27% | | 55.06% |
Italy ($388) | | 7.57% | | 25.17% |
Netherlands ($277) | | 20.17% | | 39.83% |
Country market capitalizations (in parentheses) are in USD billions. Source: Returns are of MSCI indices net of foreign withholding taxes on dividends. Country market capitalizations are based on country carve-outs of the MSCI All-Country World Investable Market Index. MSCI data copyright MSCI 2009, all rights reserved.
Small company stocks were the best-performing asset class in international markets, while growth stocks had the worst relative results.
12 Months Ended October 31, 2009
| | |
| | | U.S. Dollar
Return |
MSCI World ex USA Small Cap Index | | 50.01% |
MSCI World ex USA Value Index | | 31.71% |
MSCI World ex USA Index | | 27.83% |
MSCI World ex USA Growth Index | | 24.03% |
Source: MSCI indices are net of foreign withholding taxes on dividends, copyright MSCI 2009, all rights reserved.
Gains in emerging markets were better, on average, than in developed markets, although results varied widely among the individual emerging markets countries. For the 12-month period, returns in U.S. dollars were 64.13% for the MSCI Emerging Markets Index (net dividends) and 27.83% for the MSCI World ex USA Index (net dividends).
3
12 Months Ended October 31, 2009
| | |
Country | | U.S. Dollar
Return |
Argentina | | 53.21% |
Brazil | | 91.55% |
Chile | | 61.68% |
China | | 82.16% |
Czech Republic | | 26.83% |
Hungary | | 63.54% |
India | | 77.12% |
Indonesia | | 127.39% |
Israel | | 31.43% |
Malaysia | | 56.99% |
Mexico | | 39.79% |
Philippines | | 50.71% |
Poland | | 23.09% |
South Africa | | 61.69% |
South Korea | | 56.17% |
Taiwan | | 48.86% |
Thailand | | 78.58% |
Turkey | | 68.21% |
Source: Returns are of MSCI indices net of foreign withholding taxes on dividends, copyright MSCI 2009, all rights reserved.
Master-Feeder Structure
The Portfolio described below, called a “Feeder Fund”, does not buy individual securities directly; instead, the Portfolio invests in a corresponding fund called a “Master Fund”. The Master Fund, in turn, purchases stocks and/or other securities.
Emerging Markets Portfolio II
The Emerging Markets Portfolio II seeks to capture the returns of large company stocks in selected emerging markets by purchasing shares of a Master Fund investing in such firms. The investment strategy employs a disciplined quantitative approach, emphasizing broad diversification and consistent exposure to large company emerging markets stocks, but does not attempt to track closely a specific equity index. As of October 31, 2009, the Master Fund held 654 stocks across 18 emerging countries and was mostly invested in equities throughout the year: the average non-equitized cash level for the period was less than 1% of the Portfolio’s assets. The Master Fund’s target country weights are capped at a ceiling set by the manager in order to limit single-country risk exposure.
As a result of the Master Fund’s diversified approach, performance was generally determined by structural trends in emerging country stock markets, rather than the behavior of a limited number of stocks. For the 12 months ended October 31, 2009, total returns were 53.72% for the Portfolio and 64.13% for the MSCI Emerging Markets Index (net dividends). The Portfolio’s relative underperformance was primarily due to differences in country weights and in the composition of the Master Fund’s holdings relative to the Index. Over the period, there was a wider than usual performance difference between the best and worst performing stocks within countries, industry sectors, and asset classes, consequently, slight differences in weights or in holdings between the Portfolio and Index had a significant impact on relative performance.
4
DIMENSIONAL INVESTMENT GROUP INC.
EMERGING MARKETS PORTFOLIO II
DISCLOSURE OF FUND EXPENSES
(Unaudited)
The following Expense Table is shown so that you can understand the impact of fees on your investment. All mutual funds have operating expenses. As a shareholder of the fund, you incur ongoing costs, which include costs for portfolio management, administrative services, and shareholder reports, among others. Operating expenses, legal and audit services, which are deducted from a fund’s gross income, directly reduce the investment return of the fund. A fund’s expenses are expressed as a percentage of its average net assets. This figure is known as the expense ratio. The following examples are intended to help you understand the ongoing costs, in dollars, of investing in the fund and to compare these costs with those of other mutual funds. The examples are based on an investment of $1,000 made at the beginning of the period shown and held for the entire period.
The Expense Table below illustrates your fund’s costs in two ways.
Actual Fund Return
This section helps you to estimate the actual expenses after fee waivers that you paid over the period. The “Ending Account Value” shown is derived from the fund’s actual return and “Expenses Paid During Period” reflect the dollar amount that would have been paid by an investor who started with $1,000 in the fund. You may use the information here, together with the amount you invested, to estimate the expenses that you paid over the period.
To do so, simply divide your account value by $1,000 (for example, a $7,500 account value divided by $1,000 = 7.5), then multiply the result by the number given for your fund under the heading “Expenses Paid During Period.”
Hypothetical Example for Comparison Purposes
This section is intended to help you compare your fund’s costs with those of other mutual funds. The hypothetical “Ending Account Value” and “Expenses Paid During Period” are derived from the fund’s actual expense ratio and an assumed 5% annual return before expenses. In this case, because the return used is not the fund’s actual return, the results do not apply to your investment. The example is useful in making comparisons because the SEC requires all mutual funds to calculate expenses based on a 5% annual return. You can assess your fund’s costs by comparing this hypothetical example with the hypothetical examples that appear in shareholder reports of other funds.
Please note that the expenses shown in the table are meant to highlight and help you compare ongoing costs only and do not reflect any transactional costs, if applicable. The “Annualized Expense Ratio” represents the actual expenses for the six-month period indicated.
Six Months Ended October 31, 2009
EXPENSE TABLE
| | | | | | | | | | |
| | | Beginning
Account
Value
05/01/09 | | Ending
Account
Value
10/31/09 | | Annualized
Expense
Ratio* | | Expenses
Paid
During
Period* |
Actual Fund Return | | $ | 1,000.00 | | $ | 1,382.30 | | 0.38% | | $2.28 |
Hypothetical 5% Annual Return | | $ | 1,000.00 | | $ | 1,023.29 | | 0.38% | | $1.94 |
| * | Expenses are equal to the fund’s annualized expense ratio for the six-month period, multiplied by the average account value over the period, multiplied by the number of days in the most recent six-month period (184), then divided by the number of days in the year (365) to reflect the six-month period. The Portfolio is a Feeder Fund. The expenses shown reflect the direct expenses of the Feeder Fund and the indirect payment of the Feeder Fund’s portion of the expenses of its Master Fund. |
5
DIMENSIONAL INVESTMENT GROUP INC.
EMERGING MARKETS PORTFOLIO II
DISCLOSURE OF PORTFOLIO HOLDINGS
(Unaudited)
The SEC requires that all Funds file a complete Schedule of Investments with the SEC for their first and third fiscal quarters on Form N-Q. For Dimensional Investment Group Inc., this would be for the fiscal quarters ending January 31 and July 31. The Form N-Q filing must be made within 60 days of the end of the quarter. Dimensional Investment Group Inc. filed its most recent Form N-Q with the SEC on September 29, 2009. It is available upon request, without charge, by calling collect: (512) 306-7400 or by mailing a request to Dimensional Fund Advisors LP, 6300 Bee Cave Road, Building One, Austin, Texas 78746, or by visiting the SEC’s website at http://www.sec.gov, or they may be reviewed and copied at the SEC’s Public Reference Room in Washington, D.C. (call 1-800-732-0330 for information on the operation of the Public Reference Room).
PORTFOLIO HOLDINGS
The SEC requires that all Funds present their categories of portfolio holdings in a table, chart or graph format in their annual and semi-annual shareholder reports, whether or not a Schedule of Investments is utilized. The following table, which presents portfolio holdings as a percent of total investments before short-term investments and collateral for loaned securities, is provided in compliance with such requirement.
The categories of industry classification for the Affiliated Investment Company are represented in the Disclosure of Portfolio Holdings, which are included elsewhere within the report. Refer to the Summary Schedule of Portfolio Holdings for the underlying Master Fund’s holdings which reflect the investments by country.
| | | |
Affiliated Investment Company | | 100.0 | % |
6
DIMENSIONAL INVESTMENT GROUP INC.
EMERGING MARKETS PORTFOLIO II
STATEMENT OF ASSETS AND LIABILITIES
OCTOBER 31, 2009
(Amounts in thousands, except share and per share amounts)
| | | | |
ASSETS: | | | | |
Investment in The Emerging Markets Series of The DFA Investment Trust Company (Affiliated Investment Company) at Value† | | $ | 142,232 | |
Receivable for Fund Shares Sold | | | 182 | |
Prepaid Expenses and Other Assets | | | 9 | |
| | | | |
Total Assets | | | 142,423 | |
| | | | |
LIABILITIES: | | | | |
Payables: | | | | |
Affiliated Investment Company Purchased | | | 182 | |
Due to Advisor | | | 19 | |
Accrued Expenses and Other Liabilities | | | 16 | |
| | | | |
Total Liabilities | | | 217 | |
| | | | |
NET ASSETS | | $ | 142,206 | |
| | | | |
SHARES OUTSTANDING, $0.01 PAR VALUE (1) | | | 6,426,134 | |
| | | | |
NET ASSET VALUE, OFFERING AND REDEMPTION PRICE PER SHARE | | $ | 22.13 | |
| | | | |
Investment in Affiliated Investment Company at Cost | | $ | 65,197 | |
| | | | |
NET ASSETS CONSIST OF: | | | | |
Paid-In Capital | | $ | 146,429 | |
Undistributed Net Investment Income (Distributions in Excess of Net Investment Income) | | | 2,685 | |
Accumulated Net Realized Gain (Loss) | | | (83,942 | ) |
Deferred Thailand Capital Gains Tax | | | (5 | ) |
Net Unrealized Foreign Exchange Gain (Loss) | | | 4 | |
Net Unrealized Appreciation (Depreciation) | | | 77,035 | |
| | | | |
NET ASSETS | | $ | 142,206 | |
| | | | |
(1) NUMBER OF SHARES AUTHORIZED | | | 300,000,000 | |
| | | | |
See accompanying Notes to Financial Statements.
7
DIMENSIONAL INVESTMENT GROUP INC.
EMERGING MARKETS PORTFOLIO II
STATEMENT OF OPERATIONS
FOR THE YEAR ENDED OCTOBER 31, 2009
(Amounts in thousands)
| | | | |
Investment Income | | | | |
Dividends (Net of Foreign Taxes Withheld of $356) | | $ | 3,182 | |
Interest | | | 5 | |
Income from Securities Lending | | | 242 | |
Expenses Allocated from Affiliated Investment Company | | | (242 | ) |
| | | | |
Total Investment Income | | | 3,187 | |
| | | | |
Expenses | | | | |
Administrative Services Fees | | | 183 | |
Accounting & Transfer Agent Fees | | | 15 | |
Filing Fees | | | 16 | |
Shareholders’ Reports | | | 18 | |
Directors’/Trustees’ Fees & Expenses | | | 1 | |
Professional Fees | | | 3 | |
| | | | |
Total Expenses | | | 236 | |
| | | | |
Net Investment Income (Loss) | | | 2,951 | |
| | | | |
Realized and Unrealized Gain (Loss) | | | | |
Net Realized Gain (Loss) on: | | | | |
Investment Securities Sold | | | 3,063 | |
Futures | | | (198 | ) |
Foreign Currency Transactions | | | 5 | |
Change in Unrealized Appreciation (Depreciation) of: | | | | |
Investment Securities and Foreign Currency | | | 49,707 | |
Futures | | | (2 | ) |
Translation of Foreign Currency Denominated Amounts | | | 14 | |
Change in Deferred Thailand Capital Gains Tax | | | (102 | ) |
| | | | |
Net Realized and Unrealized Gain (Loss) | | | 52,487 | |
| | | | |
Net Increase (Decrease) in Net Assets Resulting from Operations | | $ | 55,438 | |
| | | | |
Investment Income and Realized and Unrealized Gain (Loss) were allocated from the Portfolio’s Master Fund (Affiliated Investment Company).
See accompanying Notes to Financial Statements.
8
DIMENSIONAL INVESTMENT GROUP INC.
EMERGING MARKETS PORTFOLIO II
STATEMENTS OF CHANGES IN NET ASSETS
(Amounts in thousands)
| | | | | | | | | | | | |
| | | Year
Ended
Oct. 31,
2009 | | | Period
Dec. 1, 2007
to
Oct. 31, 2008 | | | Year
Ended
Nov. 30,
2007 | |
Increase (Decrease) in Net Assets | | | | | | | | | | | | |
Operations: | | | | | | | | | | | | |
Net Investment Income (Loss) | | $ | 2,951 | | | $ | 6,318 | | | $ | 2,898 | |
Net Realized Gain (Loss) on: | | | | | | | | | | | | |
Investment Securities Sold | | | 3,063 | | | | (86,714 | ) | | | 3,885 | |
Futures | | | (198 | ) | | | (12 | ) | | | — | |
Foreign Currency Transactions | | | 5 | | | | (214 | ) | | | 5 | |
Change in Unrealized Appreciation (Depreciation) of: | | | | | | | | | | | | |
Investment Securities and Foreign Currency | | | 49,707 | | | | (45,036 | ) | | | 47,846 | |
Futures | | | (2 | ) | | | 2 | | | | — | |
Translation of Foreign Currency Denominated Amounts | | | 14 | | | | (10 | ) | | | (1 | ) |
Change in Deferred Thailand Capital Gains Tax | | | (102 | ) | | | 190 | | | | (57 | ) |
| | | | | | | | | | | | |
Net Increase (Decrease) in Net Assets Resulting from Operations | | | 55,438 | | | | (125,476 | ) | | | 54,576 | |
| | | | | | | | | | | | |
Distributions From: | | | | | | | | | | | | |
Net Investment Income | | | (5,915 | ) | | | (3,152 | ) | | | (1,289 | ) |
Net Long-Term Gains | | | — | | | | (2,284 | ) | | | — | |
| | | | | | | | | | | | |
Total Distributions | | | (5,915 | ) | | | (5,436 | ) | | | (1,289 | ) |
| | | | | | | | | | | | |
Capital Share Transactions (1): | | | | | | | | | | | | |
Shares Issued | | | 30,454 | | | | 30,359 | | | | 240,044 | |
Shares Issued in Lieu of Cash Distributions | | | 5,915 | | | | 5,436 | | | | 1,289 | |
Shares Redeemed | | | (56,278 | ) | | | (102,918 | ) | | | (46,626 | ) |
| | | | | | | | | | | | |
Net Increase (Decrease) from Capital Share Transactions | | | (19,909 | ) | | | (67,123 | ) | | | 194,707 | |
| | | | | | | | | | | | |
Total Increase (Decrease) in Net Assets | | | 29,614 | | | | (198,035 | ) | | | 247,994 | |
Net Assets | | | | | | | | | | | | |
Beginning of Period | | | 112,592 | | | | 310,627 | | | | 62,633 | |
| | | | | | | | | | | | |
End of Period | | $ | 142,206 | | | $ | 112,592 | | | $ | 310,627 | |
| | | | | | | | | | | | |
(1) Shares Issued and Redeemed: | | | | | | | | | | | | |
Shares Issued | | | 2,003 | | | | 1,149 | | | | 9,033 | |
Shares Issued in Lieu of Cash Distributions | | | 430 | | | | 192 | | | | 59 | |
Shares Redeemed | | | (3,396 | ) | | | (4,304 | ) | | | (1,655 | ) |
| | | | | | | | | | | | |
Net Increase (Decrease) from Shares Issued and Redeemed | | | (963 | ) | | | (2,963 | ) | | | 7,437 | |
| | | | | | | | | | | | |
Undistributed Net Investment Income (Distributions in Excess of Net Investment Income) | | $ | 2,685 | | | $ | 5,645 | | | $ | 2,703 | |
See accompanying Notes to Financial Statements.
9
DIMENSIONAL INVESTMENT GROUP INC.
EMERGING MARKETS PORTFOLIO II
FINANCIAL HIGHLIGHTS
(for a share outstanding throughout each period)
| | | | | | | | | | | | | | | | | | | | | | | | |
| | | Year Ended
Oct. 31,
2009 | | | Period Dec. 1, 2007 to Oct. 31, 2008 | | | Year Ended Nov. 30, 2007 | | | Year Ended Nov. 30, 2006 | | | Year Ended Nov. 30, 2005 | | | Year Ended Nov. 30, 2004 | |
Net Asset Value, Beginning of Period | | $ | 15.24 | | | $ | 30.01 | | | $ | 21.50 | | | $ | 16.79 | | | $ | 13.03 | | | $ | 9.78 | |
| | | | | | | | | | | | | | | | | | | | | | | | |
Income from Investment Operations | | | | | | | | | | | | | | | | | | | | | | | | |
Net Investment Income (Loss) | | | 0.41 | (A) | | | 0.68 | (A) | | | 0.53 | (A) | | | 0.45 | (A) | | | 0.53 | (A) | | | 0.24 | |
Net Gains (Losses) on Securities (Realized and Unrealized) | | | 7.29 | | | | (14.92 | ) | | | 8.42 | | | | 4.74 | | | | 3.47 | | | | 3.18 | |
| | | | | | | | | | | | | | | | | | | | | | | | |
Total from Investment Operations | | | 7.70 | | | | (14.24 | ) | | | 8.95 | | | | 5.19 | | | | 4.00 | | | | 3.42 | |
Less Distributions | | | | | | | | | | | | | | | | | | | | | | | | |
Net Investment Income | | | (0.81 | ) | | | (0.31 | ) | | | (0.44 | ) | | | (0.48 | ) | | | (0.24 | ) | | | (0.17 | ) |
Net Realized Gains | | | — | | | | (0.22 | ) | | | — | | | | — | | | | — | | | | — | |
| | | | | | | | | | | | | | | | | | | | | | | | |
Total Distributions | | | (0.81 | ) | | | (0.53 | ) | | | (0.44 | ) | | | (0.48 | ) | | | (0.24 | ) | | | (0.17 | ) |
Net Asset Value, End of Period | | $ | 22.13 | | | $ | 15.24 | | | $ | 30.01 | | | $ | 21.50 | | | $ | 16.79 | | | $ | 13.03 | |
| | | | | | | | | | | | | | | | | | | | | | | | | |
Total Return | | | 53.72 | % | | | (48.27 | )%(C) | | | 42.40 | % | | | 31.67 | % | | | 31.22 | % | | | 35.39 | % |
Net Assets, End of Period (thousands) | | $ | 142,206 | | | $ | 112,592 | | | $ | 310,627 | | | $ | 62,633 | | | $ | 33,940 | | | $ | 22,778 | |
Ratio of Expenses to Average Net Assets (D) | | | 0.39 | % | | | 0.35 | %(B) | | | 0.39 | % | | | 0.35 | % | | | 0.41 | % | | | 0.53 | % |
Ratio of Expenses to Average Net Assets (Excluding Waivers and Assumption of Expenses and/or Recovery of Previously Waived Fees) (D) | | | 0.39 | % | | | 0.35 | %(B) | | | 0.43 | % | | | 0.74 | % | | | 0.81 | % | | | 0.93 | % |
Ratio of Net Investment Income to Average Net Assets | | | 2.42 | % | | | 2.82 | %(B) | | | 2.13 | % | | | 2.38 | % | | | 3.60 | % | | | 2.43 | % |
See page 1 for the Definitions of Abbreviations and Footnotes.
See accompanying Notes to Financial Statements.
10
DIMENSIONAL INVESTMENT GROUP INC.
EMERGING MARKETS PORTFOLIO II
NOTES TO FINANCIAL STATEMENTS
A. Organization:
Dimensional Investment Group Inc. (the “Fund”) is an open-end management investment company registered under the Investment Company Act of 1940, whose shares are generally offered to institutional investors, retirement plans and clients of registered investment advisors. The Fund consists of fifteen portfolios, of which the Emerging Markets Portfolio II (the “Portfolio”) is presented in this report.
The Portfolio primarily invests its assets in The Emerging Markets Series (the “Series”), a series of The DFA Investment Trust Company. At October 31, 2009, the Portfolio owned 7% of the Series. The financial statements of the Series are included elsewhere in this report and should be read in conjunction with the financial statements of the Portfolio.
At a regular meeting of the Board of Directors/Trustees (the “Board”) on September 16, 2008, the Board voted to change the fiscal and tax year ends of the Portfolio from November 30 to October 31.
B. Significant Accounting Policies:
The following significant accounting policies are in conformity with accounting principles generally accepted in the United States of America. Such policies are consistently followed by the Fund in preparation of its financial statements. The preparation of financial statements in accordance with accounting principles generally accepted in the United States of America requires management to make estimates and assumptions that affect the reported amounts of assets and liabilities and disclosure of contingent assets and liabilities at the date of the financial statements and the reported amounts of increases and decreases in net assets from operations during the reporting period. Actual results could differ from those estimates and those differences could be material.
1. Security Valuation: The Portfolio’s investment reflects its proportionate interest in the net assets of the Series.
The Portfolio utilizes a fair value hierarchy which prioritizes the inputs to valuation techniques used to measure fair value into three broad levels listed below:
| | • | | Level 1 – quoted prices in active markets for identical securities |
| | • | | Level 2 – other significant observable inputs (including quoted prices for similar securities, interest rates, prepayment speeds, credit risk, etc.) |
| | • | | Level 3 – significant unobservable inputs (including the Portfolio’s own assumptions in determining the fair value of investments) |
The inputs or methodology used for valuing securities are not necessarily an indication of the risk associated with investing in those securities. A summary of the inputs used to value the Portfolio’s net assets as of October 31, 2009 is listed below (in thousands).
| | | | | | | | | | |
| | | Valuation Inputs |
| | | Investments in
Securities
(Market Value) |
| | | Level 1 | | Level 2 | | Level 3 | | Total |
Emerging Markets Portfolio II | | $ | 142,232 | | — | | — | | $ | 142,232 |
2. Deferred Compensation Plan: Each eligible Director of the Fund may elect participation in the Deferred Compensation Plan (the “Plan”). Under the Plan, effective January 1, 2002, such Directors may defer payment of all or a portion of their total fees earned as a Director. These deferred amounts may be treated as though such amounts had been invested in shares of the following funds: U.S. Large Cap Value Portfolio; U.S. Core Equity 1
11
Portfolio; U.S. Core Equity 2 Portfolio; U.S. Vector Equity Portfolio; U.S. Micro Cap Portfolio; DFA International Value Portfolio; International Core Equity Portfolio; Emerging Markets Portfolio; Emerging Markets Core Equity Portfolio; and/or DFA Two-Year Global Fixed Income Portfolio. Contributions made under the Plan and the change in unrealized appreciation (depreciation) and income, are included in Directors’/Trustees’ Fees & Expenses. At October 31, 2009, the total liability for deferred compensation to Directors is included in Accrued Expenses and Other Liabilities on the Statement of Assets and Liabilities in the amount of $3 (in thousands).
Each Director has the option to receive their distribution of proceeds in one of the following methods upon one year’s notice: lump sum; annual installments over a period of agreed upon years; or semi-annual installments over a period of agreed upon years. As of October 31, 2009, none of the Directors have requested distribution of proceeds.
3. Other: The Portfolio recognizes its pro-rata share, on a daily basis, of net investment income and realized and unrealized gains and losses of investment securities and foreign currency from the Series, which is treated as a partnership for federal income tax purposes. Dividend income and distributions to shareholders are recorded on the ex-dividend date. Distributions received on securities that represent a return of capital or capital gain are recorded as a reduction of cost of investments or as a realized gain, respectively. The Portfolio estimates the character of distributions received that may be considered return of capital distributions. Expenses directly attributable to the Portfolio are directly charged. Common expenses of the Fund are allocated using methods approved by the Board of Directors/Trustees, generally based on average net assets.
C. Investment Advisor:
Dimensional Fund Advisors LP (“Dimensional” or the “Advisor”) provides administrative services to the Portfolio, including supervision of services provided by others, providing information to the shareholders and to the Board of Directors/Trustees, and other administrative services. The Advisor provides investment advisory services to the Series. For the year ended October 31, 2009, the Portfolio’s administrative services fees were accrued daily and paid monthly to the Advisor based on an effective annual rate of 0.15% of average daily net assets of the Portfolio.
Fees Paid to Officers and Directors/Trustees:
Certain Officers and Directors/Trustees of the Advisor are also Officers and Directors/Trustees of the Fund; however, such Officers and Directors/Trustees (with the exception of the Chief Compliance Officer (“CCO”)) receive no compensation from the Fund. For the year ended October 31, 2009, the total related amounts paid by the Fund to the CCO were $27 (in thousands). The total related amount paid by the Portfolio is included in Other Expenses on the Statement of Operations.
D. Federal Income Taxes:
The Portfolio has qualified and intends to continue to qualify as a regulated investment company under Subchapter M of the Internal Revenue Code for federal income tax purposes and to distribute substantially all of its taxable income and net capital gains to its shareholders. Accordingly, no provision has been made for federal income taxes.
Distributions from net investment income and net realized capital gains are determined in accordance with U.S. federal income tax regulations, which may differ from those amounts determined under accounting principles generally accepted in the United States of America. These book/tax differences are either temporary or permanent in nature. To the extent these differences are permanent, they are charged or credited to paid-in capital, undistributed net investment income or accumulated net realized gains, as appropriate, in the period that the differences arise. Accordingly, the following permanent differences as of October 31, 2009, primarily attributable to realized net foreign currency gains/losses were classified to the following accounts. These reclassifications had no effect on net assets or net asset value per share (amounts in thousands):
12
| | |
Increase (Decrease) Undistributed Net Investment Income | | Increase (Decrease)
Accumulated
Net Realized
Gains (Losses) |
| $4 | | $(4) |
The tax character of dividends and distributions declared and paid during and the year ended November 30, 2007, the period December 1, 2007 to October 31, 2008 and the year ended October 31, 2009 were as follows (amounts in thousands):
| | | | | | |
| | | Net Investment
Income and
Short-Term
Capital Gains | | Long-Term
Capital Gains | | Total |
2007 | | $1,289 | | — | | $1,289 |
2008 | | 3,162 | | $2,274 | | 5,436 |
2009 | | 5,915 | | — | | 5,915 |
At October 31, 2009, the components of distributable earnings/(accumulated losses) were as follows (amounts in thousands):
| | | | | | |
Undistributed Net Investment Income and Short-Term Capital Gains | | Undistributed
Long-Term
Capital Gains | | Capital
Loss
Carryforward | | Total Net
Distributable Earnings/
(Accumulated Losses) |
| $2,688 | | — | | $(83,995) | | $(81,307) |
For federal income tax purposes, the Fund measures its capital loss carryforwards annually at October 31, its fiscal year end. Capital loss carryforwards may be carried forward and applied against future capital gains. At October 31, 2009, the Portfolio had capital loss carryforwards of $83,995 (in thousands) available to offset future realized capital gains through October 31, 2016. During the year ended October 31, 2009, the Portfolio utilized capital loss carryforwards to offset realized capital gains for federal income tax purposes in the amount of $2,927 (in thousands).
At October 31, 2009, the total cost and aggregate gross unrealized appreciation and (depreciation) of securities for federal income tax purposes were different from amounts reported for financial reporting purposes (amounts in thousands):
| | | | | | |
Federal Tax Cost | | Unrealized
Appreciation | | Unrealized
(Depreciation) | | Net
Unrealized
Appreciation
(Depreciation) |
| $65,143 | | $77,089 | | — | | $77,089 |
Accounting for Uncertainty in Income Taxes sets forth a minimum threshold for financial statement recognition of the benefit of a tax position taken or expected to be taken in a tax return. Management has analyzed the Portfolio’s tax position and has concluded that no provision for income tax is required in the Portfolio’s financial statements. The Portfolio is not aware of any tax position for which it is reasonably possible that the total amounts of unrecognized tax benefits will significantly change in the next twelve months. The Portfolio’s federal tax returns for the prior three fiscal years remain subject to examination by the Internal Revenue Service.
E. Line of Credit:
The Fund, together with other Dimensional-advised portfolios, has entered into an amended and restated $250 million unsecured discretionary line of credit effective July 8, 2009 with an affiliate of its domestic custodian bank. Each portfolio is permitted to borrow, subject to its investment limitations, up to a maximum of $250 million, as long as total borrowings under the line of credit do not exceed $250 million in the aggregate. Borrowings under the line
13
of credit are charged interest at the then current Federal Funds Rate plus 1%. Each portfolio is individually, and not jointly, liable for its particular advances under the line of credit. There is no commitment fee on the unused portion of the line of credit. The agreement for the discretionary line of credit may be terminated by either party at any time. The line of credit is scheduled to expire on June 22, 2010. There were no borrowings by the Portfolio under this line of credit during the year ended October 31, 2009.
The Fund, together with other Dimensional-advised portfolios, has also entered into an additional $500 million unsecured line of credit effective January 15, 2009 with its international custodian bank. Each portfolio is permitted to borrow, subject to its investment limitations, up to a maximum of $500 million, as long as total borrowings under the line of credit do not exceed $500 million in the aggregate. Each portfolio is individually, and not jointly, liable for its particular advances under the line of credit. Borrowings under the line of credit are charged interest at rates agreed to by the parties at the time of borrowing. There is no commitment fee on the unused portion of the line of credit. The agreement of the line of credit expires on January 15, 2010. There were no borrowings by the Portfolio under this line of credit during the year ended October 31, 2009.
F. Indemnitees; Contractual Obligations:
Under the Fund’s organizational documents, its officers and directors are indemnified against certain liabilities arising out of the performance of their duties to the Fund.
In the normal course of business, the Fund enters into contracts that contain a variety of representations and warranties which provide general indemnification. The Fund’s maximum exposure under these arrangements is unknown as this would involve future claims that may be made against the Fund and/or its affiliates that have not yet occurred. However, based on experience, the Fund expects the risk of loss to be remote.
G. Other:
At October 31, 2009, two shareholders held 100% of the outstanding shares of the Portfolio.
H. Subsequent Event Evaluations:
Management has evaluated the impact of all subsequent events on the Portfolio through December 23, 2009, the date the financial statements were available for issuance, and has determined that there are no subsequent events requiring recognition or disclosure in the financial statements.
14
REPORT OF INDEPENDENT REGISTERED PUBLIC ACCOUNTING FIRM
To the Shareholders of Emerging Markets Portfolio II and
Board of Directors of Dimensional Investment Group Inc.:
In our opinion, the accompanying statement of assets and liabilities, and the related statements of operations and of changes in net assets and the financial highlights present fairly, in all material respects, the financial position of Emerging Markets Portfolio II (one of the portfolios constituting Dimensional Investment Group Inc., hereafter referred to as the “Portfolio”) at October 31, 2009, the results of its operations for the year then ended, the changes in its net assets and the financial highlights for each of the periods indicated, in conformity with accounting principles generally accepted in the United States of America. These financial statements and financial highlights (hereafter referred to as “financial statements”) are the responsibility of the Portfolio’s management; our responsibility is to express an opinion on these financial statements based on our audits. We conducted our audits of these financial statements in accordance with the standards of the Public Company Accounting Oversight Board (United States). Those standards require that we plan and perform the audit to obtain reasonable assurance about whether the financial statements are free of material misstatement. An audit includes examining, on a test basis, evidence supporting the amounts and disclosures in the financial statements, assessing the accounting principles used and significant estimates made by management, and evaluating the overall financial statement presentation. We believe that our audits, which included confirmation of securities at October 31, 2009 by correspondence with the transfer agent of the investee fund, provide a reasonable basis for our opinion.
PricewaterhouseCoopers LLP
Philadelphia, Pennsylvania
December 23, 2009
15
RESULTS OF THE SHAREHOLDER MEETING
On June 2, 2009, June 5, 2009, and July 8, 2009 Dimensional Investment Group Inc. (“DIG”) held a Special Joint Meeting of Shareholders for the purpose of voting on several proposals affecting DIG and the Portfolio, including, among other items, the election of Directors, the amendment of certain fundamental investment limitations, and the elimination of certain fundamental investment limitations. The shareholders of the Portfolio approved each of the applicable proposals for DIG and the Portfolio presented at the Meeting. Listed below are the voting results from the Meeting. Please note that not all Proposals presented at the Meeting were voted on by the Portfolio. Additionally, the Proposal numbers reflected below correlate to the Proposal numbers presented for vote at the Meeting.
DIG
| | | | | | | | | | | | | | | | | | | | | | | | | | | | | | | | | | | | | | | | | | |
| | | | | Shares Voted | | | | | | Percent of Outstanding Shares Voted |
| | | | | For | | | | | | % | | | | Against | | | | % | | | | Abstain/WithHold | | | | | | % | | | | | | For | | | | Against | | | | Abstain / WithHold |
| Proposal 1: Election of Directors for DIG* | | | | | | | | | | | | | | | | | | | | | | | | | | | | | | | | | | | | | | | | |
| | | | | | | | | | | | | | | | | | | | | |
1a | | David G. Booth | | 754,612,895 | | | | | | 96.26% | | | | — | | | | 0.00% | | | | 29,301,677 | | | | | | 3.74% | | | | | | 85.87% | | | | 0.00% | | | | 3.33% |
1b | | George M. Constantinides | | 753,991,785 | | | | | | 96.18% | | | | — | | | | 0.00% | | | | 29,922,787 | | | | | | 3.82% | | | | | | 85.80% | | | | 0.00% | | | | 3.41% |
1c | | John P. Gould | | 753,344,569 | | | | | | 96.10% | | | | — | | | | 0.00% | | | | 30,570,003 | | | | | | 3.90% | | | | | | 85.73% | | | | 0.00% | | | | 3.48% |
1d | | Roger G. Ibbotson | | 754,232,365 | | | | | | 96.21% | | | | — | | | | 0.00% | | | | 29,682,207 | | | | | | 3.79% | | | | | | 85.83% | | | | 0.00% | | | | 3.38% |
1e | | Robert C. Merton | | 754,598,874 | | | | | | 96.26% | | | | — | | | | 0.00% | | | | 29,315,698 | | | | | | 3.74% | | | | | | 85.87% | | | | 0.00% | | | | 3.34% |
1f | | Myron S. Scholes | | 754,057,040 | | | | | | 96.19% | | | | — | | | | 0.00% | | | | 29,857,532 | | | | | | 3.81% | | | | | | 85.81% | | | | 0.00% | | | | 3.40% |
1g | | Eduardo A. Repetto | | 753,295,592 | | | | | | 96.09% | | | | — | | | | 0.00% | | | | 30,618,979 | | | | | | 3.91% | | | | | | 85.72% | | | | 0.00% | | | | 3.48% |
1h | | Abbie J. Smith | | 754,123,603 | | | | | | 96.20% | | | | — | | | | 0.00% | | | | 29,790,969 | | | | | | 3.80% | | | | | | 85.82% | | | | 0.00% | | | | 3.39% |
| | | | | | | | | | | | | | | | | | | | | | |
| | | Shares Voted | | Percent of Outstanding Shares Voted |
| | | For | | % | | Against | | % | | Abstain/WithHold | | % | | NonVote | | % | | For | | Against | | Abstain / WithHold |
| Proposal 2: To approve Articles of Amendment and Restatement for DIG* | | 479,705,048 | | 93.81% | | 7,503,436 | | 1.47% | | 24,156,664 | | 4.72% | | NA | | NA | | 54.59% | | 0.85% | | 2.75% |
| * | Results are for all Portfolios within DIG |
Emerging Markets Portfolio II
| | | | | | | | | | | | | | | | | | | | | | | | | | | | | | | | | | | | | | | | | | |
| | | | | Shares Voted | | | | | | Percent of Outstanding Shares Voted |
| | | | | For | | | | | | % | | | | Against | | | | % | | | | Abstain/WithHold | | | | % | | | | | | For | | | | | | Against | | | | Abstain / WithHold |
Proposals: | | | | | | | | | | | | | | | | | | | | | | | | | | | | | | | | | | | | | | | | |
| | | | |
5 | | To approve amendments to certain fundamental investment restrictions | | | | | | |
5a | | Borrowing Money | | 7,146,343 | | | | | | 100.00% | | | | — | | | | 0.00% | | | | — | | | | 0.00% | | | | | | 100.00% | | | | | | 0.00% | | | | 0.00% |
5b | | Making Loans | | 7,146,343 | | | | | | 100.00% | | | | — | | | | 0.00% | | | | — | | | | 0.00% | | | | | | 100.00% | | | | | | 0.00% | | | | 0.00% |
5c | | Investments in Real Estate | | 7,146,343 | | | | | | 100.00% | | | | — | | | | 0.00% | | | | — | | | | 0.00% | | | | | | 100.00% | | | | | | 0.00% | | | | 0.00% |
5d | | Investments in Commodities | | 7,146,343 | | | | | | 100.00% | | | | — | | | | 0.00% | | | | — | | | | 0.00% | | | | | | 100.00% | | | | | | 0.00% | | | | 0.00% |
5e | | Diversification of Investments | | 7,146,343 | | | | | | 100.00% | | | | — | | | | 0.00% | | | | — | | | | 0.00% | | | | | | 100.00% | | | | | | 0.00% | | | | 0.00% |
6 | | To approve the elimination of certain fundamental investment restrictions | | | | | | |
6a | | Pledging, Mortgaging, or Hypothecating Assets | | 7,146,343 | | | | | | 100.00% | | | | — | | | | 0.00% | | | | — | | | | 0.00% | | | | | | 100.00% | | | | | | 0.00% | | | | 0.00% |
6b | | Purchasing Securities on Margin | | 7,146,343 | | | | | | 100.00% | | | | — | | | | 0.00% | | | | — | | | | 0.00% | | | | | | 100.00% | | | | | | 0.00% | | | | 0.00% |
6c | | Investing in Restricted or Illiquid Securities | | 7,146,343 | | | | | | 100.00% | | | | — | | | | 0.00% | | | | — | | | | 0.00% | | | | | | 100.00% | | | | | | 0.00% | | | | 0.00% |
6d | | Investing for the Purpose of Exercising Control | | 7,146,343 | | | | | | 100.00% | | | | — | | | | 0.00% | | | | — | | | | 0.00% | | | | | | 100.00% | | | | | | 0.00% | | | | 0.00% |
6e | | Investing in Other Investment Companies | | 7,146,343 | | | | | | 100.00% | | | | — | | | | 0.00% | | | | — | | | | 0.00% | | | | | | 100.00% | | | | | | 0.00% | | | | 0.00% |
6f | | Management Ownership of Securities of an Issuer | | 7,146,343 | | | | | | 100.00% | | | | — | | | | 0.00% | | | | — | | | | 0.00% | | | | | | 100.00% | | | | | | 0.00% | | | | 0.00% |
6g | | Investing in Oil, Gas, or other Mineral Exploration, Leases or Development Programs | | 7,146,343 | | | | | | 100.00% | | | | — | | | | 0.00% | | | | — | | | | 0.00% | | | | | | 100.00% | | | | | | 0.00% | | | | 0.00% |
6h | | Investing in Securities of Unseasoned Issuers | | 7,146,343 | | | | | | 100.00% | | | | — | | | | 0.00% | | | | — | | | | 0.00% | | | | | | 100.00% | | | | | | 0.00% | | | | 0.00% |
6i | | Investing in Warrants | | 7,146,343 | | | | | | 100.00% | | | | — | | | | 0.00% | | | | — | | | | 0.00% | | | | | | 100.00% | | | | | | 0.00% | | | | 0.00% |
6j | | Writing or Acquiring Options | | 7,146,343 | | | | | | 100.00% | | | | — | | | | 0.00% | | | | — | | | | 0.00% | | | | | | 100.00% | | | | | | 0.00% | | | | 0.00% |
8 | | Approval of Investment Advisory Agreement between Dimensional Fund Advisors LP and the Company | | 7,146,343 | | | | | | 100.00% | | | | — | | | | 0.00% | | | | — | | | | 0.00% | | | | | | 100.00% | | | | | | 0.00% | | | | 0.00% |
16
THE DFA INVESTMENT TRUST COMPANY
PERFORMANCE CHART
The Emerging Markets Series vs.
MSCI Emerging Markets Index (net dividends)
October 31, 1999-October 31, 2009
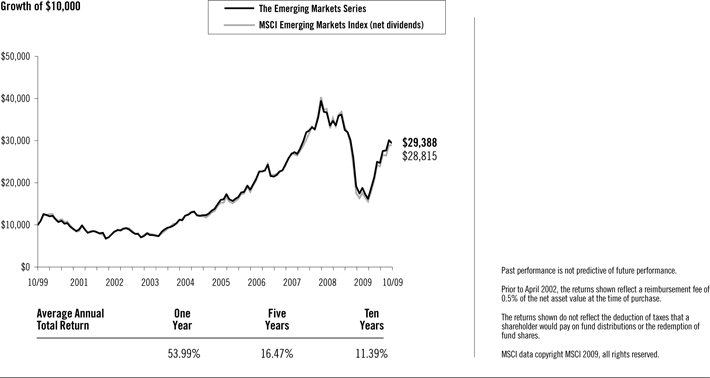
17
THE DFA INVESTMENT TRUST COMPANY
THE EMERGING MARKETS SERIES
DISCLOSURE OF FUND EXPENSES
(Unaudited)
The following Expense Table is shown so that you can understand the impact of fees on your investment. All mutual funds have operating expenses. As a shareholder of the fund, you incur ongoing costs, which include costs for portfolio management, administrative services, and shareholder reports, among others. Operating expenses, legal and audit services, which are deducted from a fund’s gross income, directly reduce the investment return of the fund. A fund’s expenses are expressed as a percentage of its average net assets. This figure is known as the expense ratio. The following examples are intended to help you understand the ongoing costs, in dollars, of investing in the fund and to compare these costs with those of other mutual funds. The examples are based on an investment of $1,000 made at the beginning of the period shown and held for the entire period.
The Expense Table below illustrates your fund’s costs in two ways.
Actual Fund Return
This section helps you to estimate the actual expenses after fee waivers that you paid over the period. The “Ending Account Value” shown is derived from the fund’s actual return and “Expenses Paid During Period” reflect the dollar amount that would have been paid by an investor who started with $1,000 in the fund. You may use the information here, together with the amount you invested, to estimate the expenses that you paid over the period.
To do so, simply divide your account value by $1,000 (for example, a $7,500 account value divided by $1,000 = 7.5), then multiply the result by the number given for your fund under the heading “Expenses Paid During Period.”
Hypothetical Example for Comparison Purposes
This section is intended to help you compare your fund’s costs with those of other mutual funds. The hypothetical “Ending Account Value” and “Expenses Paid During Period” are derived from the fund’s actual expense ratio and an assumed 5% annual return before expenses. In this case, because the return used is not the fund’s actual return, the results do not apply to your investment. The example is useful in making comparisons because the SEC requires all mutual funds to calculate expenses based on a 5% annual return. You can assess your fund’s costs by comparing this hypothetical example with the hypothetical examples that appear in shareholder reports of other funds.
Please note that the expenses shown in the table are meant to highlight and help you compare ongoing costs only and do not reflect any transactional costs, if applicable. The “Annualized Expense Ratio” represents the actual expenses for the six-month period indicated.
Six Months Ended October 31, 2009
EXPENSE TABLE
| | | | | | | | |
| | | Beginning
Account
Value
05/01/09 | | Ending
Account
Value
10/31/09 | | Annualized
Expense
Ratio* | | Expenses
Paid
During
Period* |
Actual Fund Return | | $1,000.00 | | $1,383.70 | | 0.21% | | $1.26 |
Hypothetical 5% Annual Return | | $1,000.00 | | $1,024.15 | | 0.21% | | $1.07 |
| * | Expenses are equal to the fund’s annualized expense ratio for the six-month period, multiplied by the average account value over the period, multiplied by the number of days in the most recent six-month period (184), then divided by the number of days in the year (365) to reflect the six-month period. |
18
THE DFA INVESTMENT TRUST COMPANY
THE EMERGING MARKETS SERIES
DISCLOSURE OF PORTFOLIO HOLDINGS
(Unaudited)
The SEC requires that all Funds file a complete Schedule of Investments with the SEC for their first and third fiscal quarters on Form N-Q. For The DFA Investment Trust Company, this would be for the fiscal quarters ending January 31 and July 31. The Form N-Q filing must be made within 60 days of the end of the quarter. The DFA Investment Trust Company filed its most recent Form N-Q with the SEC on September 29, 2009. It is available upon request, without charge, by calling collect: (512) 306-7400 or by mailing a request to Dimensional Fund Advisors LP, 6300 Bee Cave Road, Building One, Austin, Texas 78746, or by visiting the SEC’s website at http://www.sec.gov, or they may be reviewed and copied at the SEC’s Public Reference Room in Washington, D.C. (call 1-800-732-0330 for information on the operation of the Public Reference Room).
SEC regulations permit a fund to include in its reports to shareholders a “Summary Schedule of Portfolio Holdings” in lieu of a full Schedule of Investments. The Summary Schedule of Portfolio Holdings reports the fund’s 50 largest holdings in unaffiliated issuers and any investments that exceed one percent of the fund’s net assets at the end of the reporting period. The amendments also require that the Summary Schedule of Portfolio Holdings identify each category of investments that are held.
The fund is required to file a complete Schedule of Investments with the SEC on Form N-CSR within ten days after mailing the annual and semi-annual reports to shareholders. It will be available upon request, without charge, by calling collect: (512) 306-7400 or by mailing a request to Dimensional Fund Advisors LP, 6300 Bee Cave Road, Building One, Austin, Texas 78746, or by visiting the SEC’s website at http://www.sec.gov, or they may be reviewed and copied at the SEC’s Public Reference Room in Washington, D.C. (call 1-800-732-0330 for information on the operation of the Public Reference Room).
PORTFOLIO HOLDINGS
The SEC requires that all Funds present their categories of portfolio holdings in a table, chart or graph format in their annual and semi-annual shareholder reports, whether or not a Schedule of Investments is utilized. The following table, which presents portfolio holdings as a percent of total investments before short-term investments and collateral for loaned securities, is provided in compliance with such requirement. The categories shown below represent broad industry sectors. Each industry sector consists of one or more specific industry classifications.
| | |
| The Emerging Market Series |
Consumer Discretionary | | 6.3% |
Consumer Staples | | 8.5% |
Energy | | 12.9% |
Financials | | 20.7% |
Health Care | | 3.4% |
Industrials | | 6.5% |
Information Technology | | 13.7% |
Materials | | 13.5% |
Other | | — |
Telecommunication Services | | 10.7% |
Utilities | | 3.8% |
| | |
| | 100.0% |
19
THE EMERGING MARKETS SERIES
SUMMARY SCHEDULE OF PORTFOLIO HOLDINGS
October 31, 2009
| | | | | | | |
| | | Shares | | Value†† | | Percentage
of Net Assets** |
COMMON STOCKS — (82.9%) | | | | | | | |
ARGENTINA — (0.1%) | | | | | | | |
Other Securities | | | | $ | 1,818,247 | | 0.1% |
| | | | | | | |
| | | |
BRAZIL — (5.8%) | | | | | | | |
Companhia Siderurgica Nacional SA | | 367,276 | | | 12,132,034 | | 0.6% |
Petroleo Brasilerio SA ADR (71654V101) | | 1,256,219 | | | 50,399,506 | | 2.4% |
Petroleo Brasilerio SA ADR (71654V408) | | 914,546 | | | 42,270,316 | | 2.0% |
Other Securities | | | | | 30,983,709 | | 1.4% |
| | | | | | | |
TOTAL BRAZIL | | | | | 135,785,565 | | 6.4% |
| | | | | | | |
| | | |
CHILE — (1.7%) | | | | | | | |
Empresa Nacional de Electricidad SA Sponsored ADR | | 207,763 | | | 9,534,244 | | 0.4% |
Other Securities | | | | | 29,219,969 | | 1.4% |
| | | | | | | |
TOTAL CHILE | | | | | 38,754,213 | | 1.8% |
| | | | | | | |
| | | |
CHINA — (9.4%) | | | | | | | |
Bank of China, Ltd. | | 56,691,000 | | | 32,598,740 | | 1.6% |
#China Life Insurance Co., Ltd. ADR | | 250,705 | | | 17,200,870 | | 0.8% |
China Mobile, Ltd. Sponsored ADR | | 696,697 | | | 32,556,651 | | 1.5% |
#CNOOC, Ltd. ADR | | 67,956 | | | 10,121,367 | | 0.5% |
*Industrial & Commercial Bank of China, Ltd. | | 34,093,000 | | | 27,124,901 | | 1.3% |
#PetroChina Co., Ltd. ADR | | 115,210 | | | 13,829,808 | | 0.7% |
Tencent Holdings, Ltd. | | 700,600 | | | 12,199,255 | | 0.6% |
Other Securities | | | | | 74,618,243 | | 3.5% |
| | | | | | | |
TOTAL CHINA | | | | | 220,249,835 | | 10.5% |
| | | | | | | |
| | | |
CZECH REPUBLIC — (1.0%) | | | | | | | |
CEZ A.S. | | 301,862 | | | 14,864,947 | | 0.7% |
Other Securities | | | | | 8,518,048 | | 0.4% |
| | | | | | | |
TOTAL CZECH REPUBLIC | | | | | 23,382,995 | | 1.1% |
| | | | | | | |
| | | |
HUNGARY — (1.5%) | | | | | | | |
#*OTP Bank NYRT | | 618,710 | | | 17,397,809 | | 0.8% |
Other Securities | | | | | 17,906,431 | | 0.9% |
| | | | | | | |
TOTAL HUNGARY | | | | | 35,304,240 | | 1.7% |
| | | | | | | |
| | | |
INDIA — (11.2%) | | | | | | | |
HDFC Bank, Ltd. | | 386,733 | | | 13,175,290 | | 0.6% |
Hindustan Unilever, Ltd. | | 1,633,609 | | | 9,748,048 | | 0.5% |
Infosys Technologies, Ltd. | | 657,429 | | | 30,520,259 | | 1.4% |
Infosys Technologies, Ltd. Sponsored ADR | | 233,496 | | | 10,740,816 | | 0.5% |
ITC, Ltd. | | 2,007,345 | | | 10,823,298 | | 0.5% |
Larsen & Toubro, Ltd. | | 371,281 | | | 12,248,925 | | 0.6% |
*Reliance Industries, Ltd. | | 1,030,847 | | | 41,707,940 | | 2.0% |
Tata Consultancy Services, Ltd. | | 756,974 | | | 10,030,279 | | 0.5% |
Other Securities | | | | | 122,736,201 | | 5.8% |
| | | | | | | |
TOTAL INDIA | | | | | 261,731,056 | | 12.4% |
| | | | | | | |
| | | |
INDONESIA — (2.2%) | | | | | | | |
PT Astra International Tbk. | | 4,017,561 | | | 12,925,685 | | 0.6% |
PT Telekomunikasi Indonesia Tbk. | | 14,011,140 | | | 12,065,191 | | 0.6% |
Other Securities | | | | | 25,780,160 | | 1.2% |
| | | | | | | |
TOTAL INDONESIA | | | | | 50,771,036 | | 2.4% |
| | | | | | | |
| | | |
ISRAEL — (3.6%) | | | | | | | |
Israel Chemicals, Ltd. | | 780,753 | | | 9,119,540 | | 0.5% |
Teva Pharmaceutical Industries, Ltd. Sponsored ADR | | 888,925 | | | 44,872,934 | | 2.1% |
20
THE EMERGING MARKETS SERIES
CONTINUED
| | | | | | | |
| | | Shares | | Value†† | | Percentage of Net Assets** |
ISRAEL — (Continued) | | | | | | | |
Other Securities | | | | $ | 29,303,182 | | 1.4% |
| | | | | | | |
TOTAL ISRAEL | | | | | 83,295,656 | | 4.0% |
| | | | | | | |
| | | | | | | |
MALAYSIA — (4.4%) | | | | | | | |
CIMB Group Holdings Berhad | | 3,095,227 | | | 11,229,284 | | 0.5% |
Other Securities | | | | | 92,150,262 | | 4.4% |
| | | | | | | |
TOTAL MALAYSIA | | | | | 103,379,546 | | 4.9% |
| | | | | | | |
| | | | | | | |
MEXICO — (6.8%) | | | | | | | |
#America Movil S.A.B. de C.V. Series L | | 17,737,259 | | | 39,145,222 | | 1.8% |
#Fomento Economico Mexicano S.A.B. de C.V. Series B & D | | 2,109,900 | | | 9,132,314 | | 0.4% |
#*Grupo Mexico S.A.B. de C.V. Series B | | 9,098,785 | | | 18,192,402 | | 0.9% |
#Wal-Mart de Mexico S.A.B. de C.V. Series V | | 4,372,680 | | | 15,250,358 | | 0.7% |
Other Securities | | | | | 77,158,719 | | 3.7% |
| | | | | | | |
TOTAL MEXICO | | | | | 158,879,015 | | 7.5% |
| | | | | | | |
| | | |
PHILIPPINES — (0.6%) | | | | | | | |
Other Securities | | | | | 13,288,391 | | 0.6% |
| | | | | | | |
| | | |
POLAND — (1.3%) | | | | | | | |
Other Securities | | | | | 30,821,592 | | 1.5% |
| | | | | | | |
| | | |
RUSSIA — (0.6%) | | | | | | | |
Other Securities | | | | | 13,599,374 | | 0.7% |
| | | | | | | |
| | | |
SINGAPORE — (0.0%) | | | | | | | |
Other Securities | | | | | 513,710 | | 0.0% |
| | | | | | | |
| | | |
SOUTH AFRICA — (8.2%) | | | | | | | |
*Anglo American Platinum Corp., Ltd. | | 114,526 | | | 9,954,766 | | 0.5% |
Impala Platinum Holdings, Ltd. | | 478,692 | | | 10,402,919 | | 0.5% |
MTN Group, Ltd. | | 1,659,950 | | | 24,715,390 | | 1.2% |
Naspers, Ltd. Series N | | 324,237 | | | 11,698,218 | | 0.5% |
#Sasol, Ltd. Sponsored ADR | | 1,270,370 | | | 47,499,134 | | 2.2% |
#Standard Bank Group, Ltd. | | 843,110 | | | 10,570,537 | | 0.5% |
Other Securities | | | | | 77,167,798 | | 3.7% |
| | | | | | | |
TOTAL SOUTH AFRICA | | | | | 192,008,762 | | 9.1% |
| | | | | | | |
| | | |
SOUTH KOREA — (11.5%) | | | | | | | |
POSCO | | 46,060 | | | 19,088,540 | | 0.9% |
#Samsung Electronics Co., Ltd. | | 97,139 | | | 58,451,752 | | 2.8% |
*Samsung Electronics Co., Ltd. GDR | | 49,372 | | | 14,972,842 | | 0.7% |
Other Securities | | | | | 174,979,885 | | 8.3% |
| | | | | | | |
TOTAL SOUTH KOREA | | | | | 267,493,019 | | 12.7% |
| | | | | | | |
| | | |
TAIWAN — (9.6%) | | | | | | | |
Formosa Plastics Corp. | | 5,051,649 | | | 9,689,505 | | 0.5% |
Hon Hai Precision Industry Co., Ltd. | | 4,590,177 | | | 17,978,933 | | 0.9% |
Media Tek, Inc. | | 735,527 | | | 10,294,431 | | 0.5% |
Nan Ya Plastic Corp. | | 7,084,565 | | | 11,269,977 | | 0.5% |
Taiwan Semiconductor Manufacturing Co., Ltd. | | 22,386,808 | | | 40,609,637 | | 1.9% |
Other Securities | | | | | 133,066,226 | | 6.3% |
| | | | | | | |
TOTAL TAIWAN | | | | | 222,908,709 | | 10.6% |
| | | | | | | |
| | | |
THAILAND — (1.4%) | | | | | | | |
Other Securities | | | | | 32,436,355 | | 1.5% |
| | | | | | | |
| | | |
TURKEY — (2.0%) | | | | | | | |
Turkiye Garanti Bankasi A.S. | | 2,842,585 | | | 10,322,968 | | 0.5% |
21
THE EMERGING MARKETS SERIES
CONTINUED
| | | | | | | | | | |
| | | Shares | | | | Value†† | | | | Percentage
of Net Assets** |
TURKEY — (Continued) | | | | | | | | | | |
Other Securities | | | | | | $36,814,452 | | | | 1.7% |
| | | | | | | | | | |
TOTAL TURKEY | | | | | | 47,137,420 | | | | 2.2% |
| | | | | | | | | | |
TOTAL COMMON STOCKS | | | | | | 1,933,558,736 | | | | 91.7% |
| | | | | | | | | | |
PREFERRED STOCKS — (7.1%) | | | | | | | | | | |
BRAZIL — (7.1%) | | | | | | | | | | |
Banco Bradesco SA | | 1,309,200 | | | | 25,610,259 | | | | 1.2% |
#Companhia de Bebidas das Americas Preferred ADR | | 151,600 | | | | 13,656,128 | | | | 0.7% |
Gerdau SA | | 756,268 | | | | 11,398,113 | | | | 0.5% |
Itau Unibanco Holding SA | | 1,765,755 | | | | 33,589,042 | | | | 1.6% |
Vale SA Series A | | 1,412,691 | | | | 31,796,775 | | | | 1.5% |
Other Securities | | | | | | 49,632,382 | | | | 2.4% |
| | | | | | | | | | |
TOTAL BRAZIL | | | | | | 165,682,699 | | | | 7.9% |
| | | | | | | | | | |
TOTAL PREFERRED STOCKS | | | | | | 165,682,699 | | | | 7.9% |
| | | | | | | | | | |
RIGHTS/WARRANTS — (0.0%) | | | | | | | | | | |
SOUTH AFRICA — (0.0%) | | | | | | | | | | |
Other Securities | | | | | | 40,450 | | | | 0.0% |
| | | | | | | | | | |
| | | | | |
TAIWAN — (0.0%) | | | | | | | | | | |
Other Securities | | | | | | 8,490 | | | | 0.0% |
| | | | | | | | | | |
TOTAL RIGHTS/WARRANTS | | | | | | 48,940 | | | | 0.0% |
| | | | | | | | | | |
| | | | | |
| | | Face Amount | | | | | | | | |
| | | (000) | | | | Value† | | | | |
TEMPORARY CASH INVESTMENTS — (0.0%) | | | | | | | | | | |
Repurchase Agreement, PNC Capital Markets, Inc. 0.19%, 11/02/09 (Collateralized by $310,000 FNMA 6.50%, 06/25/39, valued at $326,275) to be repurchased at $317,005 | | $317 | | | | 317,000 | | | | 0.0% |
| | | | | | | | | | |
| | | | | |
| | | Shares/ Face Amount | | | | | | | | |
| | | (000) | | | | | | | | |
SECURITIES LENDING COLLATERAL — (10.0%) | | | | | | | | | | |
§@DFA Short Term Investment Fund LP | | 226,669,881 | | | | 226,669,881 | | | | 10.7% |
@Repurchase Agreement, Deutsche Bank Securities 0.07%, 11/02/09 (Collateralized by various corporate obligations, ranging in par value from $4,247,617 to $16,429,280, rates ranging from 5.000% to 7.000%, maturities ranging from 03/01/37 to 10/01/39, valued at $6,420,547) to be repurchased at $6,294,691 | | $6,295 | | | | 6,294,654 | | | | 0.3% |
| | | | | | | | | | |
| | | | | |
TOTAL SECURITIES LENDING COLLATERAL | | | | | | 232,964,535 | | | | 11.0% |
| | | | | | | | | | |
| | | | | |
TOTAL INVESTMENTS — (100.0%) (Cost $1,297,590,646) | | | | | | $2,332,571,910 | | | | 110.6% |
| | | | | | | | | | |
22
THE EMERGING MARKETS SERIES
CONTINUED
Summary of inputs used to value the Series’ net assets as of October 31, 2009 is as follows (See Security Valuation Note):
| | | | | | | | | | | |
| | | Valuation Inputs |
| | | Investment in Securities (Market Value) |
| | | | |
| | | Level 1 | | Level 2 | | Level 3 | | Total |
Common Stocks | | | | | | | | | | | |
Argentina | | $ | 1,818,247 | | | — | | — | | $ | 1,818,247 |
Brazil | | | 135,785,565 | | | — | | — | | | 135,785,565 |
Chile | | | 38,754,213 | | | — | | — | | | 38,754,213 |
China | | | 81,011,010 | | $ | 139,238,825 | | — | | | 220,249,835 |
Czech Republic | | | — | | | 23,382,995 | | — | | | 23,382,995 |
Hungary | | | — | | | 35,304,240 | | — | | | 35,304,240 |
India | | | 16,626,590 | | | 245,104,466 | | — | | | 261,731,056 |
Indonesia | | | — | | | 50,771,036 | | — | | | 50,771,036 |
Israel | | | 44,872,934 | | | 38,422,722 | | — | | | 83,295,656 |
Malaysia | | | — | | | 103,379,546 | | — | | | 103,379,546 |
Mexico | | | 158,715,803 | | | 163,212 | | — | | | 158,879,015 |
Philippines | | | — | | | 13,288,391 | | — | | | 13,288,391 |
Poland | | | — | | | 30,821,592 | | — | | | 30,821,592 |
Russia | | | 206,569 | | | 13,392,805 | | — | | | 13,599,374 |
Singapore | | | — | | | 513,710 | | — | | | 513,710 |
South Africa | | | 64,231,071 | | | 127,777,691 | | — | | | 192,008,762 |
South Korea | | | 2,797,395 | | | 264,695,624 | | — | | | 267,493,019 |
Taiwan | | | 3,072,894 | | | 219,835,815 | | — | | | 222,908,709 |
Thailand | | | 32,436,355 | | | — | | — | | | 32,436,355 |
Turkey | | | — | | | 47,137,420 | | — | | | 47,137,420 |
Preferred Stocks | | | | | | | | | | | |
Brazil | | | 165,682,699 | | | — | | — | | | 165,682,699 |
Rights/Warrants | | | | | | | | | | | |
South Africa | | | 40,450 | | | — | | — | | | 40,450 |
Taiwan | | | — | | | 8,490 | | — | | | 8,490 |
Temporary Cash Investments | | | — | | | 317,000 | | — | | | 317,000 |
Securities Lending Collateral | | | — | | | 232,964,535 | | — | | | 232,964,535 |
| | | | | | | | | | | |
| | | | |
TOTAL | | $ | 746,051,795 | | $ | 1,586,520,115 | | — | | $ | 2,332,571,910 |
| | | | | | | | | | | |
See accompanying Notes to Financial Statements.
23
THE DFA INVESTMENT TRUST COMPANY
THE EMERGING MARKETS SERIES
STATEMENT OF ASSETS AND LIABILITIES
OCTOBER 31, 2009
(Amounts in thousands)
| | | |
ASSETS: | | | |
Investments at Value (including $213,269 of securities on loan) | | $ | 2,099,290 |
Temporary Cash Investments at Value & Cost | | | 317 |
Collateral Received from Securities on Loan at Value & Cost | | | 232,965 |
Foreign Currencies at Value | | | 1,950 |
Cash | | | 21 |
Receivables: | | | |
Investment Securities Sold | | | 6,815 |
Dividends, Interest and Tax Reclaims | | | 3,192 |
Securities Lending Income | | | 185 |
Fund Shares Sold | | | 188 |
Unrealized Gain on Foreign Currency Contracts | | | 6 |
| | | |
Total Assets | | | 2,344,929 |
| | | |
LIABILITIES: | | | |
Payables: | | | |
Upon Return of Securities Loaned | | | 232,965 |
Fund Shares Redeemed | | | 67 |
Due to Advisor | | | 184 |
Deferred Thailand Capital Gains Tax | | | 2,154 |
Accrued Expenses and Other Liabilities | | | 243 |
| | | |
Total Liabilities | | | 235,613 |
| | | |
NET ASSETS | | $ | 2,109,316 |
| | | |
Investments at Cost | | $ | 1,064,309 |
| | | |
Foreign Currencies at Cost | | $ | 1,958 |
| | | |
See accompanying Notes to Financial Statements.
24
THE DFA INVESTMENT TRUST COMPANY
THE EMERGING MARKETS SERIES
STATEMENT OF OPERATIONS
FOR THE YEAR ENDED OCTOBER 31, 2009
(Amounts in thousands)
| | | | |
Investment Income | | | | |
Dividends (Net of Foreign Taxes Withheld of $4,972) | | $ | 43,658 | |
Interest | | | 73 | |
Income from Securities Lending | | | 3,350 | |
| | | | |
Total Investment Income | | | 47,081 | |
| | | | |
Expenses | | | | |
Investment Advisory Services Fees | | | 1,697 | |
Accounting & Transfer Agent Fees | | | 203 | |
Custodian Fees | | | 1,105 | |
Shareholders’ Reports | | | 17 | |
Directors’/Trustees’ Fees & Expenses | | | 22 | |
Professional Fees | | | 127 | |
Other | | | 210 | |
| | | | |
Total Expenses | | | 3,381 | |
| | | | |
Net Investment Income (Loss) | | | 43,700 | |
| | | | |
Realized and Unrealized Gain (Loss) | | | | |
Net Realized Gain (Loss) on: | | | | |
Investment Securities Sold | | | 40,421 | |
Futures | | | (2,920 | ) |
Foreign Currency Transactions | | | (24 | ) |
In-Kind Redemptions | | | 17,805 | * |
Change in Unrealized Appreciation (Depreciation) of: | | | | |
Investment Securities and Foreign Currency | | | 642,058 | |
Futures | | | (32 | ) |
Translation of Foreign Currency Denominated Amounts | | | 210 | |
Change in Deferred Thailand Capital Gains Tax | | | (1,366 | ) |
| | | | |
Net Realized and Unrealized Gain (Loss) | | | 696,152 | |
| | | | |
Net Increase (Decrease) in Net Assets Resulting from Operations | | $ | 739,852 | |
| | | | |
| * | See Note J in the Notes to Financial Statements. |
See accompanying Notes to Financial Statements.
25
THE DFA INVESTMENT TRUST COMPANY
THE EMERGING MARKETS SERIES
STATEMENTS OF CHANGES IN NET ASSETS
(Amounts in thousands)
| | | | | | | | | | | | |
| | | Year
Ended
Oct. 31,
2009 | | | Period
Dec. 1, 2007
to
Oct. 31, 2008 | | | Year
Ended
Nov. 30,
2007 | |
Increase (Decrease) in Net Assets | | | | | | | | | | | | |
Operations: | | | | | | | | | | | | |
Net Investment Income (Loss) | | $ | 43,700 | | | $ | 82,436 | | | $ | 76,347 | |
Net Realized Gain (Loss) on: | | | | | | | | | | | | |
Investment Securities Sold | | | 40,421 | | | | (59,927 | ) | | | 143,019 | |
Futures | | | (2,920 | ) | | | (361 | ) | | | — | |
Foreign Currency Transactions | | | (24 | ) | | | (1,036 | ) | | | (111 | ) |
In-Kind Redemptions | | | 17,805 | * | | | — | | | | — | |
Change in Unrealized Appreciation (Depreciation) of: | | | | | | | | | | | | |
Investment Securities and Foreign Currency | | | 642,058 | | | | (1,612,126 | ) | | | 859,017 | |
Futures | | | (32 | ) | | | 32 | | | | — | |
Translation of Foreign Currency Denominated Amounts | | | 210 | | | | (139 | ) | | | (27 | ) |
Change in Deferred Thailand Capital Gains Tax | | | (1,366 | ) | | | 2,797 | | | | (884 | ) |
| | | | | | | | | | | | |
Net Increase (Decrease) in Net Assets Resulting from Operations | | | 739,852 | | | | (1,588,324 | ) | | | 1,077,361 | |
| | | | | | | | | | | | |
Transactions in Interest: | | | | | | | | | | | | |
Contributions | | | 162,102 | | | | 197,789 | | | | 481,891 | |
Withdrawals | | | (417,162 | )* | | | (692,731 | ) | | | (266,433 | ) |
| | | | | | | | | | | | |
Net Increase (Decrease) from Transactions in Interest | | | (255,060 | ) | | | (494,942 | ) | | | 215,458 | |
| | | | | | | | | | | | |
Total Increase (Decrease) in Net Assets | | | 484,792 | | | | (2,083,266 | ) | | | 1,292,819 | |
Net Assets | | | | | | | | | | | | |
Beginning of Period | | | 1,624,524 | | | | 3,707,790 | | | | 2,414,971 | |
| | | | | | | | | | | | |
End of Period | | $ | 2,109,316 | | | $ | 1,624,524 | | | $ | 3,707,790 | |
| | | | | | | | | | | | |
| * | See Note J in the Notes to Financial Statements. |
See accompanying Notes to Financial Statements.
26
THE DFA INVESTMENT TRUST COMPANY
THE EMERGING MARKETS SERIES
FINANCIAL HIGHLIGHTS
| | | | | | | | | | | | | | | | | | | | | | | | |
| | | Year Ended Oct. 31, 2009 | | | Period Dec. 1, 2007 to Oct. 31, 2008 | | | Year Ended Nov. 30,
2007 | | | Year Ended Nov. 30,
2006 | | | Year Ended Nov. 30,
2005 | | | Year Ended
Nov. 30,
2004 | |
Total Return | | | 53.99 | % | | | (48.15 | )%(C) | | | 42.62 | % | | | 31.87 | % | | | 31.23 | % | | | 35.47 | % |
Net Assets, End of Period (thousands) | | $ | 2,109,316 | | | $ | 1,624,524 | | | $ | 3,707,790 | | | $ | 2,414,971 | | | $ | 1,852,565 | | | $ | 1,160,262 | |
Ratio of Expenses to Average Net Assets | | | 0.20 | % | | | 0.18 | %(B) | | | 0.19 | % | | | 0.20 | % | | | 0.27 | % | | | 0.31 | % |
Ratio of Net Investment Income to Average Net Assets | | | 2.57 | % | | | 3.00 | %(B) | | | 2.52 | % | | | 2.54 | % | | | 3.70 | % | | | 2.63 | % |
Portfolio Turnover Rate | | | 14 | % | | | 19 | %(C) | | | 7 | % | | | 11 | % | | | 9 | % | | | 2 | % |
See page 1 for the Definitions of Abbreviations and Footnotes.
See accompanying Notes to Financial Statements.
27
THE DFA INVESTMENT TRUST COMPANY
THE EMERGING MARKETS SERIES
NOTES TO FINANCIAL STATEMENTS
A. Organization:
The DFA Investment Trust Company (the “Trust”) is an open-end management investment company registered under the Investment Company Act of 1940. The Trust consists of twelve investment portfolios, of which The Emerging Markets Series (the “Series”) is presented in this report.
At a regular meeting of the Board of Directors/Trustees (the “Board”) on September 16, 2008, the Board voted to change the fiscal and tax year ends of the Series from November 30 to October 31.
B. Significant Accounting Policies:
The following significant accounting policies are in conformity with accounting principles generally accepted in the United States of America. Such policies are consistently followed by the Trust in preparation of its financial statements. The preparation of financial statements in accordance with accounting principles generally accepted in the United States of America requires management to make estimates and assumptions that affect the reported amounts of assets and liabilities and disclosure of contingent assets and liabilities at the date of the financial statements and the reported amounts of increases and decreases in net assets from operations during the reporting period. Actual results could differ from those estimates and those differences could be material.
1. Security Valuation: Securities held by the Series (including over-the-counter securities) are valued at the last quoted sale price of the day. Securities held by the Series that are listed on Nasdaq are valued at the Nasdaq Official Closing Price (“NOCP”). If there is no last reported sale price or NOCP for the day, the Series values the securities at the mean of the most recent quoted bid and asked prices. Price information on listed securities is taken from the exchange where the security is primarily traded. Generally, securities issued by open-end investment companies are valued using their respective net asset values or public offering prices, as appropriate, for purchase orders placed at the close of the New York Stock Exchange (NYSE).
Securities for which no market quotations are readily available (including restricted securities), or for which market quotations have become unreliable, are valued in good faith at fair value in accordance with procedures adopted by the Board of Directors/Trustees. Fair value pricing may also be used if events that have a significant effect on the value of an investment (as determined in the discretion of the Investment Committee of the Advisor) occur before the net asset value is calculated. When fair value pricing is used, the prices of securities used by the Series may differ from the quoted or published prices for the same securities on their primary markets or exchanges.
The Series will also fair value price in the circumstances described below. Generally, trading in foreign securities markets is completed each day at various times prior to the close of the NYSE. For example, trading in the Japanese securities markets is completed each day at the close of Tokyo Stock Exchange (normally 11:00 p.m. PT), which is fourteen hours prior to the close of the NYSE (normally 1:00 p.m. PT) and the time that the net asset value of the Series is computed. Due to the time differences between the closings of the relevant foreign securities exchanges and the time the Series prices its shares at the close of the NYSE, the Series will fair value its foreign investments when it is determined that the market quotations for the foreign investments are either unreliable or not readily available. The fair value prices will attempt to reflect the impact of the U.S. financial markets’ perceptions and trading activities on the Series’ foreign investments since the last closing prices of the foreign investments were calculated on their primary foreign securities markets or exchanges. For these purposes, the Board of Directors/Trustees of the Series has determined that movements in relevant indices or other appropriate market indicators, after the close of the Tokyo Stock Exchange or the London Stock Exchange, demonstrate that market quotations may be unreliable. Fair valuation of portfolio securities may occur on a daily basis. The fair value pricing by the Series utilizes data furnished by an independent pricing service (and that data draws upon, among other information, the
28
market values of foreign investments). When the Series uses fair value pricing, the values assigned to the Series’ foreign investments may not be the quoted or published prices of the investments on their primary markets or exchanges.
Futures contracts held by the Series are valued using the settlement price established each day on the exchange on which they are traded.
The Series utilizes a fair value hierarchy which prioritizes the inputs to valuation techniques used to measure fair value into three broad levels described below:
| | • | Level 1 – quoted prices in active markets for identical securities |
| | • | Level 2 – other significant observable inputs (including quoted prices for similar securities, interest rates, prepayment speeds, credit risk, etc.) |
| | • | Level 3 – significant unobservable inputs (including the Series’ own assumptions in determining the fair value of investments) |
A summary of the inputs used to value the Series’ net assets by each major security type, industry and/or country is disclosed at the end of the Summary Schedule of Portfolio Holdings. The inputs or methodology used for valuing securities are not necessarily an indication of the risk associated with investing in those securities.
2. Foreign Currency Translation: Securities and other assets and liabilities of the Series whose values are initially expressed in foreign currencies are translated to U.S. dollars using the mean between the most recently quoted bid and asked prices for the U.S. dollar as quoted by generally recognized reliable sources. Dividend and interest income and certain expenses are translated to U.S. dollars at the rate of exchange on their respective accrual dates. Receivables and payables denominated in foreign currencies are marked to market daily based on daily exchange rates and exchange gains or losses are realized upon ultimate receipt or disbursement.
The Series does not isolate the effect of fluctuations in foreign exchange rates from the effect of fluctuations in the market prices of securities held whether realized or unrealized.
Realized gains or losses on foreign currency transactions represent net foreign exchange gains or losses from the disposition of foreign currencies, currency gains or losses realized between the trade and settlement dates on securities transactions, and the difference between amounts of interest, dividends and foreign withholding taxes recorded on the books of the Series and the U.S. dollar equivalent amounts actually received or paid.
3. Deferred Compensation Plan: Each eligible Trustee of the Trust may elect participation in the Deferred Compensation Plan (the “Plan”). Under the Plan, effective January 1, 2002, such Trustees may defer payment of all or a portion of their total fees earned as a Trustee. These deferred amounts may be treated as though such amounts had been invested in shares of the following funds: U.S. Large Cap Value Portfolio; U.S. Core Equity 1 Portfolio; U.S. Core Equity 2 Portfolio; U.S. Vector Equity Portfolio; U.S. Micro Cap Portfolio; DFA International Value Portfolio; International Core Equity Portfolio; Emerging Markets Portfolio; Emerging Markets Core Equity Portfolio; and/or DFA Two-Year Global Fixed Income Portfolio. Contributions made under the Plan and the change in unrealized appreciation (depreciation) and income, are included in Directors’/Trustees’ Fees & Expenses. At October 31, 2009, the total liability for deferred compensation to Trustees is included in Accrued Expenses and Other Liabilities on the Statement of Assets and Liabilities in the amount of $48 (in thousands).
Each Trustee has the option to receive their distribution of proceeds in one of the following methods upon one year’s notice: lump sum; annual installments over a period of agreed upon years; or semi-annual installments over a period of agreed upon years. As of October 31, 2009, none of the Trustees have requested distribution of proceeds.
4. Other: Security transactions are accounted for as of the trade date. Costs used in determining realized gains and losses on the sale of investment securities are on the basis of identified cost. Dividend income and distributions to shareholders are recorded on the ex-dividend date. Distributions received on securities that represent a return of capital or capital gain are recorded as a reduction of cost of investments or as a realized gain, respectively. The Series estimates the character of distributions received that may be considered return of capital distributions. Interest income is recorded on the accrual basis. Discount and premium on securities
29
purchased are amortized over the lives of the respective securities utilizing the effective interest method. Expenses directly attributable to the Series are directly charged. Common expenses of the Trust are allocated using methods approved by the Board of Directors/Trustees, generally based on average net assets.
The Series may be subject to taxes imposed by countries in which they invest, with respect to their investments in issuers existing or operating in such countries. Such taxes are generally based on income earned or repatriated and capital gains realized on the sale of such investments. The Series accrues such taxes when the related income or capital gains are earned or throughout the holding period. Some countries require governmental approval for the repatriation of investment income, capital or the proceeds of sales earned by foreign investors. In addition, if there is a deterioration in a country’s balance of payments or for other reasons, a country may impose temporary restrictions on foreign capital remittances abroad.
The Series’ investments in Thailand are subject to a 15% governmental capital gains tax. Such taxes are due upon sale of individual securities. The Series accrues for taxes on the capital gains throughout the holding period based on the unrealized gain of the underlying securities. The Series is also subject to a 15% governmental capital gains tax on short-term capital gains for investments in India. Such taxes are due upon sale of individual securities. The taxes for the capital gains are accrued when the capital gains are earned.
C. Investment Advisor:
Dimensional Fund Advisors LP (“Dimensional” or the “Advisor”) provides investment advisory services to the Series. For the year ended October 31, 2009, the Series’ investment advisory services fees were accrued daily and paid monthly to the Advisor based on an effective annual rate of 0.10% of average daily net assets.
Fees Paid to Officers and Directors/Trustees:
Certain Officers and Directors/Trustees of the Advisor are also Officers and Directors/Trustees of the Trust; however, such Officers and Directors/Trustees (with the exception of the Chief Compliance Officer (“CCO”)) receive no compensation from the Trust. For the year ended October 31, 2009, the total related amounts paid by the Trust to the CCO were $98 (in thousands). The total related amount paid by the Series is included in Other Expenses on the Statement of Operations.
D. Purchases and Sales of Securities:
For the year ended October 31, 2009, the Series made the following purchases and sales of investment securities, other than short-term securities and U.S. government securities (amounts in thousands):
| | | |
Purchases | | $ | 230,547 |
Sales | | | 367,789 |
There were no purchases or sales of long-term U.S. government securities.
E. Federal Income Tax:
No provision for federal income taxes is required since the Series is treated as a partnership for federal income tax purposes. Any net investment income and realized and unrealized gains and losses have been deemed to have been “passed down” to its partners.
Some of the Series’ investments are in securities considered to be “passive foreign investment companies” for which any unrealized appreciation (depreciation) (mark to market) and/or realized gains are required to be included in distributable net investment income for tax purposes. At October 31, 2009, the Series had no cumulative unrealized appreciation (depreciation) (mark to market) to be included in distributable net investment income for federal tax purposes. For the year ended October 31, 2009, there were no realized gains on the sale of passive foreign investment companies to be reclassified from accumulated net realized gains to accumulated net investment income for federal tax purposes.
30
At October 31, 2009, the total cost and aggregate gross unrealized appreciation and (depreciation) of securities for federal income tax purposes were different from amounts reported for financial reporting purposes (amounts in thousands):
| | | | | | |
Federal
Tax Cost | | Unrealized
Appreciation | | Unrealized
(Depreciation) | | Net
Unrealized
Appreciation
(Depreciation) |
| $1,299,053 | | $1,057,665 | | $(24,146) | | $1,033,519 |
Accounting for Uncertainty in Income Taxes sets forth a minimum threshold for financial statement recognition of the benefit of a tax position taken or expected to be taken on a tax return. Management has analyzed the Series’ tax position and has concluded that no provision for income tax is required in the Series’ financial statements. The Series is not aware of any tax position for which it is reasonably possible that the total amounts of unrecognized tax benefits will significantly change in the next twelve months. The Series’ federal tax returns for the prior three fiscal years remain subject to examination by the Internal Revenue Service.
F. Financial Instruments:
In accordance with the Series’ investment objectives and policies, the Series may invest in certain financial instruments that have off-balance sheet risk in excess of the amounts recognized in the financial statements and concentrations of credit and market risk. These instruments and their significant corresponding risks are described below:
1. Repurchase Agreements: The Series may purchase certain U.S. Government securities subject to the counterparty’s agreement to repurchase them at an agreed upon date and price. The counterparty will be required on a daily basis to maintain the value of the collateral subject to the agreement at not less than the repurchase price (including accrued interest). The agreements are conditioned upon the collateral being deposited under the Federal Reserve book-entry system with the Trust’s custodian or a third party sub-custodian. In the event of default or bankruptcy by the other party to the agreement, retention of the collateral may be subject to legal proceedings. All open repurchase agreements were entered into on October 30, 2009.
2. Foreign Market Risks: Investments in foreign markets may involve certain considerations and risks not typically associated with investments in the United States of America, including the possibility of future political and economic developments and the level of foreign government supervision and regulation of foreign securities markets. These markets are generally smaller, less liquid and more volatile than the major securities markets in the United States of America. Consequently, acquisition and disposition of securities by the Series may be inhibited.
Derivative Financial Instruments:
Disclosures on derivative instruments and hedging activities are intended to improve financial reporting for derivative instruments by enabling investors to understand how and why a fund uses derivatives, how derivatives are accounted for and how derivative instruments affect a fund’s results of operations and financial position. Summarized below are the specific types of derivative instruments used by the Series.
3. Futures Contracts: The Series may enter into futures contracts to gain market exposure on uninvested cash pending investment in securities or to maintain liquidity to pay redemptions. Upon entering into a futures contract, the Series deposits cash or pledges U.S. Government securities to a broker, equal to the minimum “initial margin” requirements of the exchange on which the contract is traded. Subsequent payments are received from or paid to the broker each day, based on the daily fluctuation in the market value of the contract. These receipts or payments are known as “variation margin” and are recorded daily by the Series as unrealized gains or losses until the contracts are closed. When the contracts are closed, the Series records a realized gain or loss, which is presented in the Statement of Operations as a net realized gain or loss on futures, equal to the difference between the value of the contract at the time it was opened and the value at the time it was closed.
31
Risks may arise upon entering into futures contracts from potential imperfect price correlations between the futures contracts and the underlying securities, from the possibility of an illiquid secondary market for these instruments and from the possibility that the Series could lose more than the initial margin requirements. The Series entering into stock index futures are subject to equity price risk from those futures contracts. Counterparty credit risk related to exchange-traded futures is minimal because the exchange’s clearinghouse, as counterparty to all exchange-traded futures, guarantees the futures against default.
Additional disclosure on derivative instruments is required showing a summary by primary risk exposure of the derivatives instruments’ (i) location in the balance sheet and fair value at period end and (ii) the location in the Statement of Operations and the realized and change in unrealized gain or loss over the reporting period. The following is a summary of the Series’ derivative instrument holdings for the year ended October 31, 2009.
At October 31, 2009, the Series had no outstanding futures contracts.
The following is a summary of the Series’ location and value of realized gains and losses on the Series’ Statement of Operations for the Series’ derivative instrument holdings through the year ended October 31, 2009:
| | |
Derivative Type | | Location of Gain (Loss) on Derivatives Recognized in Income |
| |
Equity contracts | | Net Realized Gain (Loss) on: Futures Change in Unrealized Appreciation
(Depreciation) of: Futures |
The following is a summary of the location of realized and change in unrealized gains and losses on the Series’ Statements of Operations for the Series’ derivative instrument holdings categorized by primary risk exposure through the year ended October 31, 2009 (amounts in thousands):
| | |
| | | Realized Gain (Loss)
on Derivatives
Recognized in Income |
| |
| | | Equity
Contracts |
The Emerging Markets Series* | | $(2,920) |
| | |
| |
| | | Change in Unrealized
Appreciation (Depreciation) on
Derivatives Recognized in Income |
| |
| | | Equity
Contracts |
The Emerging Markets Series* | | $(32) |
| * | As of October 31, 2009, there were no futures contracts outstanding. During the year ended October 31, 2009, the Series had limited activity in these transactions. |
G. Line of Credit:
The Trust, together with other Dimensional-advised portfolios, has entered into an amended and restated $250 million unsecured discretionary line of credit effective July 8, 2009 with an affiliate of its domestic custodian bank. Each portfolio is permitted to borrow, subject to its investment limitations, up to a maximum of $250 million, as long as total borrowings under the line of credit do not exceed $250 million in the aggregate. Borrowings under the line of credit are charged interest at the then current Federal Funds Rate plus 1%. Each portfolio is individually, and not jointly, liable for its particular advances under the line of credit. There is no commitment fee on the unused portion of the line of credit. The agreement for the discretionary line of credit may be terminated by either party at any time. The line of credit is scheduled to expire on June 22, 2010. There were no borrowings by the Series under this line of credit during the year ended October 31, 2009.
The Trust, together with other Dimensional-advised portfolios, has also entered into an additional $500 million unsecured line of credit effective January 15, 2009 with its international custodian bank. Each portfolio is permitted
32
to borrow, subject to its investment limitations, up to a maximum of $500 million, as long as total borrowings under the line of credit do not exceed $500 million in the aggregate. Each portfolio is individually, and not jointly, liable for its particular advances under the line of credit. Borrowings under the line of credit are charged interest at rates agreed to by the parties at the time of borrowing. There is no commitment fee on the unused portion of the line of credit. The agreement of the line of credit expires on January 15, 2010.
For the year ended October 31, 2009, borrowings by the Series under this line of credit were as follows (amounts in thousands, except percentage and days):
| | | | | | | | |
Weighted
Average
Interest Rate | | Weighted
Average
Loan Balance | | Number of
Days
Outstanding | | Interest
Expense
Incurred | | Maximum Amount
Borrowed During
the Period |
0.91% | | $3,365 | | 87 | | $7 | | $13,587 |
There were no outstanding borrowings by the Series under this line of credit as of October 31, 2009.
H. Securities Lending:
As of October 31, 2009, the Series had securities on loan to brokers/dealers, for which the Series held cash collateral. The Series invests the cash collateral, as described below, and records a liability for the return of the collateral, during the period the securities are on loan. Loans of securities are expected at all times to be secured by collateral equal to at least (i) 100% of the current market value of the loaned securities with respect to securities of the U.S. government or its agencies, (ii) 102% of the current market value of the loaned securities with respect to U.S. securities, and (iii) 105% of the current market value of the loaned securities with respect to foreign securities. However, daily market fluctuations could cause the Series’ collateral to be lower or higher than the expected thresholds. If this were to occur, the collateral would be adjusted the next business day to ensure adequate collateralization. In the event of default or bankruptcy by the other party to the agreement, realization and/or retention of the collateral may be subject to legal proceedings. If the borrower fails to return loaned securities, and cash collateral being maintained by the borrower is insufficient to cover the value of loaned securities and provided such collateral insufficiency is not the result of investment losses, the lending agent has agreed to pay the amount of the shortfall to the Series or, at the option of the lending agent, to replace the securities.
Subject to the Series’ investment policy, the cash collateral received by the Series from securities on loan is invested in securities of the U.S. government or its agencies, repurchase agreements collateralized by securities of the U.S. government or its agencies or shares of the DFA Short Term Investment Fund LP. Agencies include both agency debentures and agency mortgage backed securities. In addition, the Series will be able to terminate the loan at any time and will receive reasonable interest on the loan, as well as amounts equal to any dividends, interest or other distributions on the loaned securities. However, dividend income received from loaned securities may not be eligible to be taxed at qualified dividend income rates.
I. Indemnitees; Contractual Obligations:
Under the Fund’s organizational documents, its officers and directors are indemnified against certain liabilities arising out of the performance of their duties to the Fund.
In the normal course of business, the Fund enters into contracts that contain a variety of representations and warranties which provide general indemnification. The Fund’s maximum exposure under these arrangements is unknown as this would involve future claims that may be made against the Fund and/or its affiliates that have not yet occurred. However, based on experience, the Fund expects the risk of loss to be remote.
J. In-Kind Redemptions:
In accordance with guidelines described in the Series’ prospectus, the Series may distribute portfolio securities rather than cash as payment for a redemption of fund shares (In-Kind redemption). For financial reporting purposes, the Series recognizes a gain on In-Kind redemptions to the extent the value of the distributed securities on the date of redemption exceeds the cost of those securities. Gains and losses realized on In-Kind redemptions are not
33
recognized for tax purposes and are reclassified from undistributed realized gain (loss) to paid-in-capital. During the year ended October 31, 2009, the Series realized $17,805 (in thousands) of net gain.
K. Subsequent Event Evaluations:
Management has evaluated the impact of all subsequent events on the Series through December 23, 2009, the date the financial statements were available for issuance, and has determined that there are no subsequent events requiring recognition or disclosure in the financial statements.
34
REPORT OF INDEPENDENT REGISTERED PUBLIC ACCOUNTING FIRM
To the Shareholders of The Emerging Markets Series and
Board of Trustees of The DFA Investment Trust Company:
In our opinion, the accompanying statement of assets and liabilities, including the summary schedule of portfolio holdings, and the related statements of operations and of changes in net assets and the financial highlights present fairly, in all material respects, the financial position of The Emerging Markets Series (one of the portfolios constituting The DFA Investment Trust Company, hereafter referred to as the “Series”) at October 31, 2009, the results of its operations for the year then ended, the changes in its net assets and the financial highlights for each of the periods indicated, in conformity with accounting principles generally accepted in the United States of America. These financial statements and financial highlights (hereafter referred to as “financial statements”) are the responsibility of the Series’ management; our responsibility is to express an opinion on these financial statements based on our audits. We conducted our audits of these financial statements in accordance with the standards of the Public Company Accounting Oversight Board (United States). Those standards require that we plan and perform the audit to obtain reasonable assurance about whether the financial statements are free of material misstatement. An audit includes examining, on a test basis, evidence supporting the amounts and disclosures in the financial statements, assessing the accounting principles used and significant estimates made by management, and evaluating the overall financial statement presentation. We believe that our audits, which included confirmation of securities at October 31, 2009 by correspondence with the custodian, broker and the transfer agent of the investee fund, provide a reasonable basis for our opinion.
PricewaterhouseCoopers LLP
Philadelphia, Pennsylvania
December 23, 2009
35
RESULTS OF THE SHAREHOLDER MEETING
On June 2, 2009 and June 5, 2009, The DFA Investment Trust Company (“DFAITC”) held a Special Joint Meeting of Shareholders for the purpose of voting on several proposals affecting DFAITC and the Series, including, among other items, the election of Trustees, the amendment of certain fundamental investment limitations, and the elimination of certain fundamental investment limitations. The shareholders of the Series approved each of the applicable proposals for DFAITC and the Series presented at the Meeting. Listed below are the voting results from the Meeting. Please note that not all Proposals presented at the Meeting were voted on by the Series. Additionally, the Proposal numbers reflected below correlate to the Proposal numbers presented for vote at the Meeting.
DFAITC
| | | | | | | | | | | | | | | | | | | | | | | | | | | | | | | | | | | | | | | | | | | | |
| | | | | Shares Voted | | | | | | Percent of Outstanding Shares Voted |
| | | | | For | | | | | | % | | | | Against | | | | | | % | | | | | | Abstain/WithHold | | | | % | | | | | | For | | | | Against | | | | Abstain / WithHold |
Proposal 1: Election of Trustees for DFAITC* | | | | | | | | | | | | | | |
| 1a | | David G. Booth | | 2,166,359,402 | | | | | | 96.50% | | | | — | | | | | | 0.00% | | | | | | 78,661,259 | | | | 3.50% | | | | | | 95.78% | | | | 0.00% | | | | 3.48% |
| 1b | | George M. Constantinides | | 2,169,219,982 | | | | | | 96.62% | | | | — | | | | | | 0.00% | | | | | | 75,800,679 | | | | 3.38% | | | | | | 95.90% | | | | 0.00% | | | | 3.35% |
| 1c | | John P. Gould | | 2,168,577,186 | | | | | | 96.59% | | | | — | | | | | | 0.00% | | | | | | 76,443,476 | | | | 3.41% | | | | | | 95.88% | | | | 0.00% | | | | 3.38% |
| 1d | | Roger G. Ibbotson | | 2,169,778,365 | | | | | | 96.65% | | | | — | | | | | | 0.00% | | | | | | 75,242,297 | | | | 3.35% | | | | | | 95.93% | | | | 0.00% | | | | 3.33% |
| 1e | | Robert C. Merton | | 2,170,124,638 | | | | | | 96.66% | | | | — | | | | | | 0.00% | | | | | | 74,896,023 | | | | 3.34% | | | | | | 95.94% | | | | 0.00% | | | | 3.31% |
| 1f | | Myron S. Scholes | | 2,169,439,189 | | | | | | 96.63% | | | | — | | | | | | 0.00% | | | | | | 75,581,473 | | | | 3.37% | | | | | | 95.91% | | | | 0.00% | | | | 3.34% |
| 1g | | Eduardo A. Repetto | | 2,167,010,793 | | | | | | 96.53% | | | | — | | | | | | 0.00% | | | | | | 78,009,868 | | | | 3.47% | | | | | | 95.81% | | | | 0.00% | | | | 3.45% |
| 1h | | Abbie J. Smith | | 2,169,626,842 | | | | | | 96.64% | | | | — | | | | | | 0.00% | | | | | | 75,393,820 | | | | 3.36% | | | | | | 95.92% | | | | 0.00% | | | | 3.33% |
| | | | | | | | | | | | | | | | | | | | | | |
| | | Shares Voted | | Percent of Outstanding Shares Voted |
| | | For | | % | | Against | | % | | Abstain/WithHold | | % | | NonVote | | % | | For | | Against | | Abstain / WithHold |
Proposal 4: Approval of an Amended and Restated Agreement and Declaration of Trust for DFAITC* | | 2,076,877,329 | | 92.43% | | 36,623,148 | | 1.63% | | 133,356,326 | | 5.94% | | NA | | NA | | 91.82% | | 1.62% | | 5.90% |
| * | Results are for all Series within DFAITC |
The Emerging Markets Series
| | | | | | | | | | | | | | | | | | | | | | | | | | | | | | | | | | | | |
| | | | | Shares Voted | | | | | | Percent of Outstanding Shares Voted |
| | | | | For | | | | % | | | | Against | | | | % | | | | Abstain/WithHold | | % | | | | | | For | | | | Against | | | | Abstain / WithHold |
Proposals: | | | | | | | | | | | | | | | | | | | | | | | | | | | | | | | | | | |
| 5 | | To approve amendments to certain fundamental investment restrictions | | | | | | | | |
| 5a | | Borrowing Money | | 52,121,556 | | | | 93.84% | | | | 1,664,956 | | | | 3.00% | | | | 1,757,089 | | 3.16% | | | | | | 87.03% | | | | 2.78% | | | | 2.93% |
| 5b | | Making Loans | | 52,099,490 | | | | 93.80% | | | | 1,648,888 | | | | 2.97% | | | | 1,795,223 | | 3.23% | | | | | | 86.99% | | | | 2.75% | | | | 3.00% |
| 5c | | Investments in Real Estate | | 52,397,882 | | | | 94.34% | | | | 1,398,009 | | | | 2.52% | | | | 1,747,709 | | 3.15% | | | | | | 87.49% | | | | 2.33% | | | | 2.92% |
| 5d | | Investments in Commodities | | 52,040,226 | | | | 93.69% | | | | 1,748,233 | | | | 3.15% | | | | 1,755,143 | | 3.16% | | | | | | 86.89% | | | | 2.92% | | | | 2.93% |
| 5e | | Diversification of Investments | | 52,611,281 | | | | 94.72% | | | | 1,181,063 | | | | 2.13% | | | | 1,751,257 | | 3.15% | | | | | | 87.85% | | | | 1.97% | | | | 2.92% |
| 6 | | To approve the elimination of certain fundamental investment restrictions | | | | | | | | |
| 6a | | Pledging, Mortgaging, or Hypothecating Assets | | 51,861,192 | | | | 93.37% | | | | 1,894,995 | | | | 3.41% | | | | 1,787,414 | | 3.22% | | | | | | 86.60% | | | | 3.16% | | | | 2.98% |
| 6b | | Purchasing Securities on Margin | | 51,912,008 | | | | 93.46% | | | | 1,862,926 | | | | 3.35% | | | | 1,768,666 | | 3.18% | | | | | | 86.68% | | | | 3.11% | | | | 2.95% |
| 6c | | Investing in Restricted or Illiquid Securities | | 51,782,840 | | | | 93.23% | | | | 1,972,942 | | | | 3.55% | | | | 1,787,818 | | 3.22% | | | | | | 86.47% | | | | 3.29% | | | | 2.99% |
| 6d | | Investing for the Purpose of Exercising Control | | 52,148,416 | | | | 93.89% | | | | 1,633,661 | | | | 2.94% | | | | 1,761,524 | | 3.17% | | | | | | 87.08% | | | | 2.73% | | | | 2.94% |
| 6e | | Investing in Other Investment Companies | | 52,226,140 | | | | 94.03% | | | | 1,552,404 | | | | 2.79% | | | | 1,765,057 | | 3.18% | | | | | | 87.21% | | | | 2.59% | | | | 2.95% |
| 6f | | Management Ownership of Securities of an Issuer | | 52,340,283 | | | | 94.23% | | | | 1,414,052 | | | | 2.55% | | | | 1,789,266 | | 3.22% | | | | | | 87.40% | | | | 2.36% | | | | 2.99% |
| 6g | | Investing in Oil, Gas, or other Mineral Exploration, Leases or Development Programs | | 49,027,368 | | | | 88.27% | | | | 4,764,525 | | | | 8.58% | | | | 1,751,708 | | 3.15% | | | | | | 81.86% | | | | 7.96% | | | | 2.92% |
| 6h | | Investing in Securities of Unseasoned Issuers | | 52,200,460 | | | | 93.98% | | | | 1,550,569 | | | | 2.79% | | | | 1,792,572 | | 3.23% | | | | | | 87.16% | | | | 2.59% | | | | 2.99% |
| 6i | | Investing in Warrants | | 52,426,418 | | | | 94.39% | | | | 1,350,164 | | | | 2.43% | | | | 1,767,018 | | 3.18% | | | | | | 87.54% | | | | 2.25% | | | | 2.95% |
| 6j | | Writing or Acquiring Options | | 52,093,118 | | | | 93.79% | | | | 1,682,479 | | | | 3.03% | | | | 1,768,004 | | 3.18% | | | | | | 86.98% | | | | 2.81% | | | | 2.95% |
| 7a | | Proposed Sub-Advisory Agreement among Dimensional Fund Advisors LP, DFA Australia Limited, and the Company | | 52,843,359 | | | | 95.14% | | | | 879,647 | | | | 1.58% | | | | 1,820,595 | | 3.28% | | | | | | 88.24% | | | | 1.47% | | | | 3.04% |
36
| | | | | | | | | | | | | | | | | | | | |
| | | | | Shares Voted | | Percent of Outstanding Shares Voted |
| | | | | For | | % | | Against | | % | | Abstain/WithHold | | % | | For | | Against | | Abstain / WithHold |
Proposals: | | | | | | | | | | | | | | | | | | |
| 7b | | Proposed Sub-Advisory Agreement among Dimensional Fund Advisors LP, Dimensional Fund Advisors Ltd., and the Company | | 52,852,461 | | 95.15% | | 862,958 | | 1.55% | | 1,828,182 | | 3.29% | | 88.25% | | 1.44% | | 3.05% |
37
FUND MANAGEMENT
Trustees/Directors
Each Board of Trustees/Directors of The DFA Investment Trust Company Inc. (“DFAITC”), DFA Investment Dimensions Group Inc. (“DFAIDG”), Dimensional Investment Group Inc. (“DIG”) and Dimensional Emerging Markets Value Fund (“DEM”) (each, the “Fund” and collectively, the “Funds”) is responsible for establishing the Funds’ policies and for overseeing the management of the Funds. The Trustees/Directors of the Funds, including all of the disinterested Directors, have adopted written procedures to monitor potential conflicts of interest that might develop between portfolios of the Funds (the “Feeder Portfolios”) that invest in certain series of DFAITC or DEM (the “Master Funds”).
Each Board has two standing committees, an Audit Committee and a Portfolio Performance and Service Review Committee (the “Performance Committee”). The Audit Committee is comprised of George M. Constantinides, Roger G. Ibbotson and Abbie J. Smith. Each member of the Audit Committee is a disinterested Director. The Audit Committee oversees the Fund’s accounting and financial reporting policies and practices, the Fund’s internal controls, the Fund’s financial statements and the independent audits thereof and performs other oversight functions as requested by the Board. The Audit Committee recommends the appointment of each Fund’s independent registered certified public accounting firm and also acts as a liaison between the Fund’s independent registered certified public accounting firm and the full Board. There were two Audit Committee meetings held during the fiscal year ended October 31, 2009.
Each Board’s Performance Committee is comprised of Messrs. Constantinides and Ibbotson, Ms. Smith, John P. Gould, Myron S. Scholes and Robert C. Merton. Each member of the Fund’s Performance Committee is a disinterested Director. The Performance Committee regularly reviews and monitors the investment performance of the Fund’s series and reviews the performance of the Fund’s service providers. There were six Performance Committee meetings held during the fiscal year ended October 31, 2009.
Certain biographical information for each disinterested Trustee/Director and each interested Trustee/Director of the Funds is set forth in the tables below, including a description of each Trustee/Director’s experience as a Trustee/ Director of the Funds and as a director or trustee of other funds, as well as other recent professional experience.
The statements of additional information (together, “SAI”) of the Funds include additional information about each Trustee/Director. You may obtain copies of the SAI and prospectus of each Fund advised by Dimensional Fund Advisors LP by calling collect (512) 306-7400 or by mailing a request to Dimensional Fund Advisors LP, 6300 Bee Cave Road, Building One, Austin, Texas 78746. Prospectuses are also available at www.dimensional.com.
| | | | | | |
Name, Position with the Fund, Address and Age | | Term of Office1 and Length of Service | | Portfolios within the DFA Fund Complex2 Overseen | | Principal Occupation(s) During Past 5 Years and Other Directorships of Public Companies Held |
Disinterested Trustees/Directors |
George M. Constantinides Director of DFAIDG, DIG and DEM. Trustee of DFAITC. The University of Chicago Booth School of Business 5807 S. Woodlawn Avenue Chicago, IL 60637 Age: 62 | | DFAITC - since 1993 DFAIDG - since 1983 DIG - since 1993 DEM - since 1993 | | 87 portfolios in 4 investment companies | | Leo Melamed Professor of Finance, The University of Chicago Booth School of Business. |
John P. Gould Director of DFAIDG, DIG and DEM. Trustee of DFAITC. The University of Chicago Booth School of Business 5807 S. Woodlawn Avenue Chicago, IL 60637 Age: 70 | | DFAITC - since 1993 DFAIDG - since 1986 DIG - since 1993 DEM - since 1993 | | 87 portfolios in 4 investment companies | | Steven G. Rothmeier Distinguished Service Professor of Economics, The University of Chicago Booth School of Business (since 1965). Member of the Boards of Milwaukee Mutual Insurance Company (since 1997). Member and Chair, Competitive Markets Advisory Committee, Chicago Mercantile Exchange (futures trading exchange) (since 2004). Formerly, Director of UNext, Inc. (1999-2006). Formerly, Senior Vice-President, Lexecon Inc. (economics, law, strategy and finance consulting) (1994-2004). Trustee, Harbor Fund (registered investment company) (27 Portfolios) (since 1994). |
38
| | | | | | |
Name, Position with the Fund, Address and Age | | Term of Office1 and Length of Service | | Portfolios within the DFA Fund Complex2 Overseen | | Principal Occupation(s) During Past 5 Years and Other Directorships of Public Companies Held |
Roger G. Ibbotson Director of DFAIDG, DIG and DEM. Trustee of DFAITC. Yale School of Management 135 Prospect Street New Haven, CT 06520-8200 Age: 66 | | DFAITC - since 1993 DFAIDG - since 1981 DIG - since 1993 DEM - since 1993 | | 87 portfolios in 4 investment companies | | Professor in Practice of Finance, Yale School of Management (since 1984). Director, BIRR Portfolio Analysis, Inc. (software products) (since 1990). Chairman, CIO and Partner, Zebra Capital Management, LLC (hedge fund manager) (since 2001). Formerly, Chairman, Ibbotson Associates, Inc., Chicago, IL (software data publishing and consulting) (1977-2006). |
Robert C. Merton Director of DFAIDG, DIG and DEM. Trustee of DFAITC. Harvard Business School 353 Baker Library Soldiers Field Boston, MA 02163 Age: 65 | | DFAITC - since 2003 DFAIDG - since 2003 DIG - since 2003 DEM - since 2003 | | 87 portfolios in 4 investment companies | | John and Natty McArthur University Professor, Graduate School of Business Administration, Harvard University (since 1998). Director, MF Risk, Inc. (risk management software) (since 2001). Director, Peninsula Banking Group (bank) (since 2003). Director, Community First Financial Group (bank holding company) (since 2003). Member Competitive Markets Advisory Council, Chicago Mercantile Exchange (futures trading exchange) (since 2004). Chairman and Director, Daedalus Software (medical software) (since 2008). Formerly, Advisory Board Member, Alpha Simplex Group (hedge fund) (2001-2007). Formerly, Chief Science Officer and Director, Trinsum Group, a successor to Integrated Finance Limited (2002-2008). Director, Vical Incorporated (biopharmaceutical product development) (since 2002). |
Myron S. Scholes Director of DFAIDG, DIG and DEM. Trustee of DFAITC. Platinum Grove Asset Management, L.P. Reckson Executive Park 1100 King Street Building 4 Rye Brook, NY 10573 Age: 68 | | DFAITC - since 1993 DFAIDG - since 1981 DIG - since 1993 DEM - since 1993 | | 87 portfolios in 4 investment companies | | Frank E. Buck Professor Emeritus of Finance, Stanford University (since 1981). Chairman, Platinum Grove Asset Management, L.P. (hedge fund) (formerly, Oak Hill Platinum Partners) (since 1999). Formerly, Managing Partner, Oak Hill Capital Management (private equity firm) (until 2004). Formerly, Director, Chicago Mercantile Exchange (2001-2008). Director, American Century Fund Complex (registered investment companies) (37 Portfolios) (since 1981). |
Abbie J. Smith Director of DFAIDG, DIG and DEM. Trustee of DFAITC. The University of Chicago Booth School of Business 5807 S. Woodlawn Avenue Chicago, IL 60637 Age: 56 | | DFAITC - since 2000 DFAIDG - since 2000 DIG - since 2000 DEM - since 2000 | | 87 portfolios in 4 investment companies | | Boris and Irene Stern Professor of Accounting, The University of Chicago Booth School of Business (since 1980), and Co-Director Investment Research, Fundamental Investment Advisors (hedge fund) (since 2008). Director, HNI Corporation (formerly known as HON Industries Inc.) (office furniture) (since 2000). Director, Ryder System Inc. (transportation, logistics and supply-chain management) (since 2003). Director/ Trustee, UBS Funds (fund complex) (5 portfolios) (since 2008). |
39
| | | | | | |
Name, Position with the Fund, Address and Age | | Term of Office1 and Length of Service | | Portfolios within the DFA Fund Complex2 Overseen | | Principal Occupation(s) During Past 5 Years and Other Directorships of Public Companies Held |
Interested Trustees/Directors* |
David G. Booth Chairman, Director, Chief Executive Officer and President of DFAIDG, DIG and DEM. Chairman, Trustee, Chief Executive Officer, Chief Investment Officer and President of DFAITC. 6300 Bee Cave Road, Building One Austin, Texas 78746 Age: 62 | | DFAITC - since 1993 DFAIDG - since 1981 DIG - since 1992 DEM - since 1993 | | 87 portfolios in 4 investment companies | | Chairman, Director/Trustee, President, Chief Executive Officer and formerly Chief Investment Officer of the following companies: Dimensional Holdings Inc., Dimensional Fund Advisors LP, Dimensional Fund Advisors Canada ULC, DFAIDG, DIG, DEM and DFAITC. President and Chief Executive Officer of DFA Securities LLC. Director of Dimensional Fund Advisors Ltd, and formerly Chief Investment Officer. Director and formerly, President and Chief Investment Officer of DFA Australia Ltd. Formerly, Director of Dimensional Funds PLC and Dimensional Fund II PLC. Chairman, Director and Chief Executive Officer of Dimensional Fund Advisors Canada ULC (All Chief Investment Officer positions held starting 1/03 through 3/07 except Dimensional Holdings Inc., which was from 10/06 through 3/07.) Limited Partner, Oak Hill Partners (since 2001) and VSC Investors, LLC (since 2007). Trustee, The University of Chicago Booth School of Business. Formerly, Director, SA Funds (registered investment company). Formerly Director, Assante Corporation (investment management) (until 2002). |
Eduardo A. Repetto Director, Chief Investment Officer and Vice President of DFAIDG, DIG and DEM. Trustee, Chief Investment Officer and Vice President of DFAITC 6300 Bee Cave Road, Building One Austin, TX 78746 Age: 42 | | DFAITC - since 2009 DFAIDG - since 2009 DIG - since 2009 DEM - since 2009 | | 87 portfolios in 4 investment companies | | Director/Trustee (beginning June 2009), Chief Investment Officer (beginning March 2007) and Vice President of DFAIDG, DIG, DEM and DFAITC. Chief Investment Officer (beginning March 2007) and Vice President of all the DFA Entities, DFA Australia Limited and Dimensional Fund Advisors Canada ULC. |
| 1 | Each Trustee/Director holds office for an indefinite term until his or her successor is elected and qualified. |
| 2 | Each Trustee/Director is a director or trustee of each of the four registered investment companies within the DFA Fund Complex, which includes the Funds. |
| * | Interested Trustees/Directors are described as such because they are deemed to be “interested persons,” as that term is defined under the Investment Company Act of 1940, as amended, due to their positions with Dimensional Fund Advisors LP. |
40
Officers
The name, age, information regarding positions with the Funds and the principal occupation for each officer of the Funds are set forth below. Each officer listed below holds the same office (except as otherwise noted) in the following entities: Dimensional Fund Advisors LP (prior to November 3, 2006, Dimensional Fund Advisors Inc.) (“Dimensional”), DFA Securities Inc., DFAIDG, DIG, DFAITC and DEM (collectively, the “DFA Entities”). The address of each officer is: Dimensional Fund Advisors LP, 6300 Bee Cave Road, Building One, Austin, Texas 78746, unless otherwise indicated.
| | | | |
Name, Position with the Fund and Age | | Term of Office1 and Length of Service | | Principal Occupation(s) During Past 5 Years |
Officers |
April A. Aandal Vice President and Chief Learning Officer Age: 46 | | Since 2008 | | Vice President of all the DFA Entities. Chief Learning Officer of Dimensional (since September 2008). Formerly, Regional Director of Dimensional (2004-2008); Vice President of Professional Development at Assante Asset Management (June 2002-January 2005). |
Darryl D. Avery Vice President Age: 43 | | Since 2005 | | Vice President of all the DFA Entities. From June 2002 to January 2005, institutional client service representative of Dimensional. |
Arthur H. Barlow Vice President Age: 53 | | Since 1993 | | Vice President of all the DFA Entities. Formerly, Vice President of DFA Australia Limited and Dimensional Fund Advisors Ltd. |
Scott A. Bosworth Vice President Age: 40 | | Since 2007 | | Vice President of all the DFA Entities. Regional Director of Dimensional (since November 1997). |
Valerie A. Brown Vice President and Assistant Secretary Age: 42 | | Since 2001 | | Vice President and Assistant Secretary of all the DFA Entities, DFA Australia Limited, Dimensional Fund Advisors Ltd., and since June 2003, Dimensional Fund Advisors Canada ULC. |
David P. Butler Vice President Age: 45 | | Since 2007 | | Vice President of all the DFA Entities. Director of Global Financial Services of Dimensional (since 2008). Formerly, Regional Director of Dimensional Fund Advisors LP (January 1995 to January 2005). |
Patrick Carter Vice President Age: 47 | | Since 2007 | | Vice President of all the DFA Entities. Regional Director of Dimensional (since March 2006). Formerly, Director of Merrill Lynch Retirement Group (December 1998 to March 2006). |
Joseph H. Chi Vice President Age: 43 | | Since 2009 | | Vice President of all the DFA Entities. Portfolio Manager for Dimensional Fund Advisors LP (since October 2005). Prior to October 2005, Corporate Counsel at Hewitt Associates (July 2002-August 2005). |
Stephen A. Clark Vice President Age: 37 | | Since 2004 | | Vice President of all the DFA Entities. Formerly, Portfolio Manager of Dimensional (April 2001-April 2004). |
Robert P. Cornell Vice President Age: 60 | | Since 2007 | | Vice President of all the DFA Entities. Regional Director of Financial Services Group of Dimensional (since August 1993). |
Christopher S. Crossan Vice President and Chief Compliance Officer Age: 43 | | Since 2004 | | Vice President and Chief Compliance Officer of all the DFA Entities. |
James L. Davis Vice President Age: 52 | | Since 1999 | | Vice President of all the DFA Entities. Formerly, Vice President of DFA Australia Limited and Dimensional Fund Advisors Ltd. |
Robert T. Deere Vice President Age: 52 | | Since 1994 | | Vice President of all the DFA Entities and DFA Australia Limited. |
Robert W. Dintzner Vice President Age: 39 | | Since 2001 | | Vice President of all the DFA Entities. |
41
| | | | |
Name, Position with the Fund and Age | | Term of Office1 and Length of Service | | Principal Occupation(s) During Past 5 Years |
Kenneth Elmgren Vice President Age: 55 | | Since 2007 | | Vice President of all the DFA Entities. Formerly, Managing Principal of Beverly Capital (May 2004 to September 2006). |
Richard A. Eustice Vice President and Assistant Secretary Age: 44 | | Since 1998 | | Vice President and Assistant Secretary of all the DFA Entities and DFA Australia Limited. Chief Operating Officer of Dimensional Fund Advisors Ltd. (since July 2008). Formerly, Vice President of Dimensional Fund Advisors Ltd. |
Eugene F. Fama, Jr. Vice President Age: 48 | | Since 1993 | | Vice President of all the DFA Entities. Formerly, Vice President of DFA Australia Limited and Dimensional Fund Advisors Ltd. |
Gretchen A. Flicker Vice President Age: 38 | | Since 2004 | | Vice President of all the DFA Entities. Prior to April 2004, institutional client service representative of Dimensional. |
Jed S. Fogdall Vice President Age: 35 | | Since 2008 | | Vice President of all the DFA Entities. Portfolio Manager for Dimensional (since September 2004). Prior to September 2004, Staff Engineer at the Boeing Company (1997-2004). |
Glenn S. Freed Vice President Age: 47 | | Since 2001 | | Vice President of all the DFA Entities. |
Jeremy P. Freeman Vice President Age: 38 | | Since 2009 | | Vice President of all the DFA Entities. Senior Technology Manager for Dimensional Fund Advisors LP (since June 2006). Formerly, Principal at AIM Investments/Amvescap PLC (now Invesco) (June 1998-June 2006). |
Mark R. Gochnour Vice President Age: 42 | | Since 2007 | | Vice President of all the DFA Entities. Regional Director of Dimensional. |
Henry F. Gray Vice President Age: 42 | | Since 2000 | | Vice President of all the DFA Entities. Prior to July 2000, Portfolio Manager of Dimensional. Formerly, Vice President of DFA Australia Limited. |
John T. Gray Vice President Age: 35 | | Since 2007 | | Vice President of all the DFA Entities. Formerly, Regional Director of Dimensional (January 2005 to February 2007). |
Darla Hastings Vice President Age: 54 | | Since 2007 | | Vice President of all the DFA Entities. Chief Marketing Officer of Dimensional. Formerly, Senior Vice President, Customer Experience for Benchmark Assisted Living (May 2005 to April 2006); Executive Vice President and Chief Marketing Officer of State Street Corporation (September 2001 to October 2005). |
Joel H. Hefner Vice President Age: 41 | | Since 2007 | | Vice President of all the DFA Entities. Regional Director of Dimensional (since June 1998). |
Julie Henderson Vice President and Fund Controller Age: 35 | | Since 2005 | | Vice President and Fund Controller of all the DFA Entities. Formerly, Senior Manager at PricewaterhouseCoopers LLP (July 1996 to April 2005). |
Kevin Hight Vice President Age: 41 | | Since 2005 | | Vice President of all the DFA Entities. Formerly, Regional Director of Dimensional (since March 2003 to March 2005). |
Christine W. Ho Vice President Age: 41 | | Since 2004 | | Vice President of all the DFA Entities. Prior to April 2004, Assistant Controller of Dimensional. |
Jeff J. Jeon Vice President Age: 35 | | Since 2004 | | Vice President of all the DFA Entities. Counsel of Dimensional (since September 2001). |
Patrick M. Keating Vice President Age: 54 | | Since 2003 | | Vice President of all the DFA Entities and Chief Operating Officer of Dimensional. Director, Vice President and Chief Privacy Officer of Dimensional Fund Advisors Canada ULC. Director of DFA Australia Limited. |
42
| | | | |
Name, Position with the Fund and Age | | Term of Office1 and Length of Service | | Principal Occupation(s) During Past 5 Years |
Joseph F. Kolerich Vice President Age: 37 | | Since 2004 | | Vice President of all the DFA Entities. Portfolio Manager for Dimensional (since April 2001). |
Michael F. Lane Vice President Age: 42 | | Since 2004 | | Vice President of all the DFA Entities. Formerly, Vice President of Advisor Services at TIAA-CREF (July 2001 to September 2004). |
Kristina M. LaRusso Vice President Age: 34 | | Since 2006 | | Vice President of all DFA Entities. Formerly, Operations Supervisor of Dimensional (March 2003 to December 2006). |
Inmoo Lee Vice President Age: 43 | | Since 2007 | | Vice President of all the DFA Entities. Associate Professor Department of Finance and Accounting, Business School, National University of Singapore (July 2004 to present); Associate Professor, College of Business Administration, Korea University (September 2001 to May 2006). |
Juliet Lee Vice President Age: 38 | | Since 2005 | | Vice President of all the DFA Entities. Human Resources Manager of Dimensional (since January 2004). |
Aaron M. Marcus Vice President & Head of Global Human Resources Age: 39 | | Since 2008 | | Vice President and Head of Global Human Resources of Dimensional. Formerly, Global Head of Recruiting and Vice President of Goldman Sachs & Co. (June 2006 to January 2008); Global Co-Head of HR of the Equities & FICC Division, and Vice President of Goldman Sachs & Co. (May 2005 to May 2006); Head of Americas Campus Recruiting and Vice President of Goldman Sachs & Co. (April 2003 to May 2005). |
David R. Martin Vice President, Chief Financial Officer and Treasurer Age: 52 | | Since 2007 | | Vice President, Chief Financial Officer and Treasurer of all the DFA Entities. Director, Vice President, Chief Financial Officer and Treasurer of Dimensional Fund Advisors Ltd. and DFA Australia Limited. Chief Financial Officer, Treasurer, and Vice President of Dimensional Fund Advisors Canada ULC. Director of Dimensional Funds PLC and Dimensional Funds II PLC. Formerly, Executive Vice President and Chief Financial Officer of Janus Capital Group Inc. (June 2005 to March 2007); Senior Vice President of Finance at Charles Schwab & Co., Inc. (March 1999 to May 2005). |
Catherine L. Newell Vice President and Secretary Age: 45 | | Vice President since 1997 and Secretary since 2000 | | Vice President and Secretary of all the DFA Entities. Director, Vice President and Secretary of DFA Australia Limited and Dimensional Fund Advisors Ltd. (since February 2002, April 1997 and May 2002, respectively). Vice President and Secretary of Dimensional Fund Advisors Canada ULC (since June 2003). Director, Dimensional Funds PLC and Dimensional Funds II PLC (since 2002 and 2006, respectively). Formerly, Assistant Secretary of all DFA Entities, DFA Australia Limited and Dimensional Fund Advisors Ltd. |
Christian Newton Vice President Age: 34 | | Since 2009 | | Vice President of all DFA Entities. Web Services Manager for Dimensional Fund Advisors LP (Since January 2008). Formerly Design Manager (2005-2008) and Web Developer (2002-2005) of Dimensional Fund Advisors LP. |
Gerard K. O’Reilly Vice President Age: 32 | | Since 2007 | | Vice President of all the DFA Entities. Formerly, Research Associate of Dimensional Fund Advisors LP (2004 to 2006); Research Assistant in PhD program, Aeronautics Department California Institute of Technology (1998 to 2004). |
Daniel C. Ong Vice President Age: 35 | | Since 2009 | | Vice President of all the DFA Entities. Portfolio Manager for Dimensional Fund Advisors LP (since July 2005). Prior to 2005, Graduate Student at the University of Chicago Booth School of Business (2003-2005). |
Carmen Palafox Vice President Age: 35 | | Since 2006 | | Vice President of all the DFA Entities. Operations Manager of Dimensional Fund Advisors LP (since May 1996). |
Sonya Park Vice President Age: 37 | | Since 2005 | | Vice President of all the DFA Entities. From February 2002 to January 2005, institutional client service representative of Dimensional. |
43
| | | | |
Name, Position with the Fund and Age | | Term of Office1 and Length of Service | | Principal Occupation(s) During Past 5 Years |
David A. Plecha Vice President Age: 48 | | Since 1993 | | Vice President of all the DFA Entities, DFA Australia Limited and Dimensional Fund Advisors Ltd |
Ted Randall Vice President Age: 36 | | Since 2008 | | Vice President of all the DFA Entities. Formerly, Research Associate of Dimensional (2006-2008). Systems Developer of Dimensional (2001-2006). |
L. Jacobo Rodriguez Vice President Age: 38 | | Since 2005 | | Vice President of all the DFA Entities. From August 2004 to July 2005, institutional client service representative of Dimensional. Formerly, Financial Services Analyst, Cato Institute (September 2001 to June 2004); Book Review Editor, Cato Journal, Cato Institute (May 1996 to June 2004). |
David E. Schneider Vice President Age: 63 | | Since 2001 | | Vice President of all the DFA Entities. Currently, Director of Institutional Services. |
Bruce A. Simmons Vice President Age: 44 | | Since 2009 | | Vice President of all the DFA Entities. Investment Operations Manager for Dimensional Fund Advisors LP (since May 2007). Formerly, Vice President Client and Fund Reporting at Mellon Financial (September 2005-May 2007); Vice President Business Development at CUADPRO Marketing (July 2003-September 2005). |
Ted R. Simpson Vice President Age: 41 | | Since 2007 | | Vice President of all the DFA Entities. Regional Director of Dimensional (since December 2002). |
Bryce D. Skaff Vice President Age: 34 | | Since 2007 | | Vice President of all the DFA Entities. Formerly, Regional Director of Dimensional (December 1999 to January 2007). |
Grady M. Smith Vice President Age: 53 | | Since 2004 | | Vice President of all the DFA Entities. Prior to April 2004, Portfolio Manager of Dimensional. |
Carl G. Snyder Vice President Age: 46 | | Since 2000 | | Vice President of all the DFA Entities. Formerly, Vice President of DFA Australia Limited. |
Lawrence R. Spieth Vice President Age: 61 | | Since 2004 | | Vice President of all the DFA Entities. Prior to April 2004, Regional Director of Dimensional. |
Bradley G. Steiman Vice President Age: 36 | | Since 2004 | | Vice President of all the DFA Entities and Director and Vice President of Dimensional Fund Advisors Canada ULC. |
Robert C. Trotter Vice President Age: 51 | | Since 2009 | | Vice President of all the DFA Entities. Senior Manager Technology for Dimensional Fund Advisors LP (since March 2007). Formerly, Director of Technology at AMVESCAP (2002-2007). |
Karen E. Umland Vice President Age: 43 | | Since 1997 | | Vice President of all the DFA Entities, DFA Australia Limited, Dimensional Fund Advisors Ltd., and Dimensional Fund Advisors Canada ULC. |
Sunil Wahal Vice President Age: 42 | | Since 2009 | | Vice President of all the DFA Entities. Formerly, Research Associate for Dimensional Fund Advisors LP (July 2008-January 2009); Consultant to Dimensional Fund Advisors LP (September 2005-July 2008); Jack D. Furst Professor of Finance at Arizona State University, WP Carey School of Business (July 2005-July 2008); Associate Professor of Finance at Goizueta Business School, Emory University (1997-2005). |
Brian J. Walsh Vice President Age: 39 | | Since 2009 | | Vice President of all the DFA Entities. Portfolio Manager for Dimensional Fund Advisors LP (since 2004). Formerly, Trader for Dimensional Fund Advisors LP (1997-2004). |
Carol W. Wardlaw Vice President Age: 51 | | Since 2004 | | Vice President of all the DFA Entities. Prior to April 2004, Regional Director of Dimensional. |
44
| | | | |
Name, Position with the Fund and Age | | Term of Office1 and Length of Service | | Principal Occupation(s) During Past 5 Years |
Weston J. Wellington Vice President Age: 58 | | Since 1997 | | Vice President of all the DFA Entities. Formerly, Vice President of DFA Australia Limited. |
Daniel M. Wheeler Vice President Age: 64 | | Since 2001 | | Vice President of all the DFA Entities. Prior to 2001 and currently, Director of Financial Advisors Services of Dimensional. Director of Dimensional Fund Advisors Ltd. (since October 2003) and President of Dimensional Fund Advisors Canada ULC (since June 2003). |
Ryan Wiley Vice President Age: 33 | | Since 2007 | | Vice President of all the DFA Entities. Senior Trader of Dimensional. Formerly, Portfolio Manager (2006 to 2007); Trader (2001 to 2006). |
Paul E. Wise Vice President Age: 54 | | Since 2005 | | Vice President of all the DFA Entities. Chief Technology Officer for Dimensional (since 2004). Formerly, Principal of Turnbuckle Management Group (January 2002 to August 2004). |
| 1 | Each officer holds office for an indefinite term at the pleasure of the Boards of Trustees/Directors and until his or her successor is elected and qualified. |
45
VOTING PROXIES ON FUND PORTFOLIO SECURITIES
A description of the policies and procedures that the Trust uses in voting proxies relating to securities held in the portfolio is available without charge, upon request, by calling collect: (512) 306-7400. Information regarding how the Advisor votes these proxies is available from the EDGAR database on the SEC’s website at http://www.sec.gov and from the Advisor’s website at http://www.dimensional.com and reflects the twelve-month period beginning July 1st and ending June 30th.
46
NOTICE TO SHAREHOLDERS
(Unaudited)
For shareholders that do not have an October 31, 2009 tax year end, this notice is for informational purposes only. For shareholders with an October 31, 2009 tax year end, please consult your tax advisor as to the pertinence of this notice. For the fiscal year November 1, 2008 to October 31, 2009, the Portfolio is designating the following items with regard to distributions paid during the period. All designations are based on financial information available as of the date of this annual report and, accordingly are subject to change. For each item, it is the intention of the Portfolio to designate the maximum amount permitted under the Internal Revenue Code and the regulations thereunder.
| | | | | | | | | | | | | | | | | | |
Dimensional Investment Group Inc. | | Net
Investment
Income
Distributions | | Long-Term
Capital Gain
Distributions | | Total
Distributions | | Qualifying
For Corporate
Dividends
Received
Deduction(1) | | Qualifying
Dividend
Income(2) | | Foreign
Tax
Credit(3) | | Foreign
Source
Income(4) | | Qualifying
Interest
Income(5) | | Qualifying
Short-Term
Capital Gain(6) |
Emerging Markets Portfolio II | | 100% | | — | | 100% | | 100% | | 100% | | 4% | | 60% | | 100% | | 100% |
| (1) | Qualifying dividends represent dividends which qualify for the corporate dividends received deduction and is reflected as a percentage of ordinary income distributions (the total of short-term capital gain and net investment income distributions). |
| (2) | The percentage in this column represents the amount of “Qualifying Dividend Income” as created by the Jobs and Growth Tax Relief Reconciliation Act of 2003 and is reflected as a percentage of ordinary income distributions (the total of short-term capital gain and net investment income distributions). Please note that these percentages are designated only, refer to your 1099 for actual qualified dividend income. |
| (3) | “Foreign Tax Credit” represents dividends which qualify for the foreign tax credit pass through and is reflected as a percentage of investment company taxable income (the total of short-term capital gain and net investment income distributions). |
| (4) | “Foreign Source Income” represents the portion of dividends derived from foreign sources, and is reflected as a percentage of ordinary income (i.e., the sum of short-term capital gain and net investment income) distributions made during the period. |
| (5) | The percentage in this column represents the amount of “Qualifying Interest Income” as created by The American Jobs Creation Act of 2004. The information is reflected as a percentage of ordinary income distributions (the total of short-term capital gain and net investment income distributions). |
| (6) | The percentage in this column represents the amount of “Qualifying Short-Term Capital Gain” as created by The American Jobs Creation Act of 2004. The information is reflected as a percentage of ordinary income distributions (the total of short-term capital gain and net investment income distributions). |
47


Dimensional Fund Advisors
6300 Bee Cave Road, Building One
Austin, TX 78746
December 2009
Dear Fellow Shareholder,
After sinking to ten-year lows, stock prices around the world rebounded sharply in March 2009 and posted steady gains in the seven months between March and September. March and April were among the best-return months in the life of Dimensional’s equity Funds.
The unexpected turns in the financial markets this year offered some valuable lessons. We were reminded that stock prices are unpredictable. We saw once again the benefits of staying disciplined in the market as it inevitably moves up and down. And I believe these markets showed very clearly why diversification is so important to long-term investment success.
Although diversification can’t prevent losses, it can help investors avoid the extreme outcomes that can result from concentrating investments in individual stocks or market segments. We believe that successful investing is about both increasing wealth and being able to sleep well at night. Investors who understand how markets work and have a realistic understanding of their own tolerance for risk are most likely to have a good overall experience.
More than $10 billion in net long-term assets flowed into Dimensional’s Funds during the first 10 months of 2009, a reflection of the trust our shareholders around the world have placed in us. We are grateful for that trust and want you to know that we take our responsibility as the steward of your investments in Dimensional’s Funds very seriously. We hope to have the opportunity to continue serving your needs for many years to come.
|
| Sincerely, |
|
 |
|
| David G. Booth |
| Chairman and Chief Executive Officer |
[THIS PAGE INTENTIONALLY LEFT BLANK]
ANNUAL REPORT
Table of Contents
This report is submitted for the information of the Fund’s shareholders. It is not authorized for distribution to prospective investors unless preceded or accompanied by an effective prospectus.
i
[THIS PAGE INTENTIONALLY LEFT BLANK]
DIMENSIONAL INVESTMENT GROUP INC.
THE DFA INVESTMENT TRUST COMPANY
DEFINITIONS OF ABBREVIATIONS AND FOOTNOTES
Statement of Assets and Liabilities/Summary Schedule of Portfolio Holdings
Investment Abbreviations
| | | | |
| | FHLMC | | Federal Home Loan Mortgage Corporation |
Investment Footnotes
| | | | |
| | † | | See Note B to Financial Statements. |
| | ** | | Calculated as a percentage of total net assets. Percentages shown parenthetically next to the category headings have been calculated as a percentage of total investments. “Other Securities” are those securities that are not among the top 50 holdings of the Fund or do not represent more than 1.0% of the net assets of the Fund. Some of the individual securities within this category may include Total or Partial Securities on Loan and/or Non-Income Producing Securities. |
| | * | | Non-Income Producing Securities. |
| | # | | Total or Partial Securities on Loan. |
| | @ | | Security purchased with cash proceeds from Securities on Loan. |
| | (r) | | The adjustable rate shown is effective as of October 31, 2009. |
| | (y) | | The rate shown is the effective yield. |
| | § | | Affiliated Fund. |
Financial Highlights
| | | | |
| | (A) | | Computed using average shares outstanding. |
| | (B) | | Annualized |
| | (C) | | Non-Annualized |
| | (D) | | Represents the combined ratios for the respective portfolio and its respective pro-rata share of its Master Fund Series. |
All Statements and Schedules
| | | | |
| | — | | Amounts designated as — are either zero or rounded to zero. |
| | REIT | | Real Estate Investment Trust |
| | SEC | | Securities and Exchange Commission |
1
DIMENSIONAL INVESTMENT GROUP INC.
PERFORMANCE CHART
Tax-Managed U.S. Marketwide Value Portfolio II vs.
Russell 3000® Value Index
October 31, 1999-October 31, 2009

2
DIMENSIONAL INVESTMENT GROUP INC.
MANAGEMENT’S DISCUSSION AND ANALYSIS
| | |
| U.S. Equity Market Review | | 12 Months Ended October 31, 2009 |
The year ending October 31, 2009, was among the most volatile periods in U.S. market history. Broad market returns were positive with stocks represented by the mid cap index outperforming those within both small cap and large cap indexes and stocks represented by the growth index outperforming those represented by the value index. Investors moving out of stocks, beginning in late 2008 and extending into early 2009, contributed to high volatility and negative returns over that period. Markets turned sharply higher in March, and the size and value premiums both turned positive over the eight months ending October 2009. Although the large cap index outperformed the small cap index, and the growth index outperformed the value index, returns within the broader market (Russell 3000® Index) demonstrate that there was a positive small size premium and a positive value premium. This counterintuitive result occurred because the stock markets were characterized by extreme volatility, and the indexes, which are reconstituted annually, were not able to rebalance during the course of the year to maintain their intended asset class exposure. Among the most important factors explaining differences in the behavior of diversified equity portfolios are the company size and company value/growth characteristics of the portfolio’s holdings. Size is measured by market capitalization, and value classification is a function of stock price relative to one or more fundamental characteristics. Compared to other stocks, value stocks often have lower market value relative to their earnings, dividends, and book value.
For the 12 months ended October 31, 2009, the total return of the Russell Microcap® Index was 5.06%, the Russell 2000® Index was 6.46%, the CRSP 6-10 Index was 20.94%, and the MSCI US Small Cap 1750 Index was 14.11%. Large cap growth stocks outperformed large cap value stocks, as measured by the Russell 1000® Growth Index and Russell 1000® Value Index. Small cap growth stocks outperformed small cap value stocks, by a lesser amount than in large caps, as measured by the Russell 2000® Growth Index and Russell 2000® Index.
Total Return for 12 Months Ended October 31, 2009
| | | |
Russell 2000® Index (small cap companies) | | 6.46 | % |
Russell Midcap® Index (mid cap companies) | | 18.74 | % |
Russell 1000® Index (large cap companies) | | 11.19 | % |
Russell 3000® Value Index | | 4.55 | % |
Russell 3000® Growth Index | | 17.04 | % |
Further dividing the large, mid, and small cap market segments by value and growth characteristics shows more detail in the performance differences over the period.
Total Return for 12 Months Ended October 31, 2009
| | | |
Russell 1000® Value Index (large cap value companies) | | 4.78 | % |
Russell 1000® Growth Index (large cap growth companies) | | 17.50 | % |
Russell Midcap® Value Index (mid cap value companies) | | 14.52 | % |
Russell Midcap® Growth Index (mid cap growth companies) | | 22.48 | % |
Russell 2500TM Value Index (small/mid cap value companies) | | 8.56 | % |
Russell 2500TM Growth Index (small/mid cap growth companies) | | 18.20 | % |
Russell 2000® Value Index (small cap value companies) | | 1.95 | % |
Russell 2000® Growth Index (small cap growth companies) | | 11.34 | % |
Source: Russell data copyright © Russell Investment Group 1995-2009, all rights reserved.
Differences in returns for the various Dimensional U.S. equity funds over the 12 months ended October 31, 2009 were attributable primarily to differences in value/growth and size characteristics as well as the exclusion of
3
REIT securities from most Dimensional portfolios, except for the DFA Real Estate Securities Portfolio and portfolios investing in The U.S. Large Company Series. Moreover, the portfolio construction approach used by Dimensional Fund Advisors (the “Advisor”) generally resulted in portfolios with greater emphasis on value or small company characteristics relative to widely used index benchmarks.
Master-Feeder Structure
The portfolio described below, called a “Feeder Fund”, does not buy individual securities directly; instead, the portfolio invests in a corresponding fund called a “Master Fund”. The Master Fund, in turn, purchases stocks and/or other securities.
Tax-Managed U.S. Marketwide Value Portfolio II
The Tax-Managed U.S. Marketwide Value Portfolio II seeks to capture the returns of U.S. value stocks by purchasing shares of a Master Fund that invests in such stocks. The Portfolio also seeks to maximize the after-tax value of a shareholder’s investment. The investment strategy employs a disciplined, quantitative approach, emphasizing broad diversification and consistent exposure to U.S. value stocks, but does not attempt to track closely a specific equity index. As of October 31, 2009, the Portfolio held 1,410 stocks and was mostly invested in equities throughout the year: the average non-equitized cash level for the period was less than 1% of the Portfolio’s assets.
As a result of the Master Fund’s diversified investment approach, performance principally was determined by broad structural trends in the U.S. equity market, rather than the behavior of a limited number of stocks. For the 12 months ended October 31, 2009, total returns were 12.64% for the Portfolio and 4.55% for the Russell 3000® Value Index. The Portfolio benefited from a positive size premium and value premium over the last eight months of the period. Relative to the Index, the Portfolio’s greater exposure to stocks with more pronounced value characteristics added more than 8% to the outperformance. The Portfolio is more inclusive than the Index across the market cap spectrum, particularly in the micro cap range, resulting in a slight size tilt for the Portfolio which also contributed to outperformance.
4
DIMENSIONAL INVESTMENT GROUP INC.
TAX-MANAGED U.S. MARKETWIDE VALUE PORTFOLIO II
DISCLOSURE OF FUND EXPENSES
(Unaudited)
The following Expense Table is shown so that you can understand the impact of fees on your investment. All mutual funds have operating expenses. As a shareholder of the fund, you incur ongoing costs, which include costs for portfolio management, administrative services, and shareholder reports, among others. Operating expenses, legal and audit services, which are deducted from a fund’s gross income, directly reduce the investment return of the fund. A fund’s expenses are expressed as a percentage of its average net assets. This figure is known as the expense ratio. The following examples are intended to help you understand the ongoing costs, in dollars, of investing in the fund and to compare these costs with those of other mutual funds. The examples are based on an investment of $1,000 made at the beginning of the period shown and held for the entire period.
The Expense Table below illustrates your fund’s costs in two ways.
Actual Fund Return
This section helps you to estimate the actual expenses after fee waivers that you paid over the period. The “Ending Account Value” shown is derived from the fund’s actual return and “Expenses Paid During Period” reflect the dollar amount that would have been paid by an investor who started with $1,000 in the fund. You may use the information here, together with the amount you invested, to estimate the expenses that you paid over the period.
To do so, simply divide your account value by $1,000 (for example, a $7,500 account value divided by $1,000 = 7.5), then multiply the result by the number given for your fund under the heading “Expenses Paid During Period.”
Hypothetical Example for Comparison Purposes
This section is intended to help you compare your fund’s costs with those of other mutual funds. The hypothetical “Ending Account Value” and “Expenses Paid During Period” are derived from the fund’s actual expense ratio and an assumed 5% annual return before expenses. In this case, because the return used is not the fund’s actual return, the results do not apply to your investment. The example is useful in making comparisons because the SEC requires all mutual funds to calculate expenses based on a 5% annual return. You can assess your fund’s costs by comparing this hypothetical example with the hypothetical examples that appear in shareholder reports of other funds.
Please note that the expenses shown in the table are meant to highlight and help you compare ongoing costs only and do not reflect any transactional costs, if applicable. The “Annualized Expense Ratio” represents the actual expenses for the six-month period indicated.
Six Months Ended October 31, 2009
EXPENSE TABLE
| | | | | | | | |
| | | Beginning
Account
Value
05/01/09 | | Ending
Account
Value
10/31/09 | | Annualized
Expense
Ratio* | | Expenses
Paid
During
Period* |
Actual Fund Return | | $1,000.00 | | $1,238.60 | | 0.26% | | $1.47 |
Hypothetical 5% Annual Return | | $1,000.00 | | $1,023.89 | | 0.26% | | $1.33 |
| * | Expenses are equal to the fund’s annualized expense ratio for the six-month period, multiplied by the average account value over the period, multiplied by the number of days in the most recent six-month period (184), then divided by the number of days in the year (365) to reflect the six-month period. The Portfolio is a Feeder Fund. The expenses shown reflect the direct expenses of the Feeder Fund and the indirect payment of the Feeder Fund’s portion of the expenses of its Master Fund. |
5
DIMENSIONAL INVESTMENT GROUP INC.
TAX-MANAGED U.S. MARKETWIDE VALUE PORTFOLIO II
DISCLOSURE OF PORTFOLIO HOLDINGS
(Unaudited)
The SEC requires that all Funds file a complete Schedule of Investments with the SEC for their first and third fiscal quarters on Form N-Q. For Dimensional Investment Group Inc., this would be for the fiscal quarters ending January 31 and July 31. The Form N-Q filing must be made within 60 days of the end of the quarter. Dimensional Investment Group Inc. filed its most recent Form N-Q with the SEC on September 29, 2009. It is available upon request, without charge, by calling collect: (512) 306-7400 or by mailing a request to Dimensional Fund Advisors LP, 6300 Bee Cave Road, Building One, Austin, Texas 78746, or by visiting the SEC’s website at http://www.sec.gov, or they may be reviewed and copied at the SEC’s Public Reference Room in Washington, D.C. (call 1-800-732-0330 for information on the operation of the Public Reference Room).
PORTFOLIO HOLDINGS
The SEC requires that all Funds present their categories of portfolio holdings in a table, chart or graph format in their annual and semi-annual shareholder reports, whether or not a Schedule of Investments is utilized. The following table, which presents portfolio holdings as a percent of total investments before short-term investments and collateral for loaned securities, is provided in compliance with such requirement.
The categories of industry classification for the Affiliated Investment Company are represented in the Disclosure of Portfolio Holdings, which are included elsewhere within the report. Refer to the Summary Schedule of Portfolio Holdings for the underlying Master Fund’s holdings which reflect the investments by category.
| | | |
Affiliated Investment Company | | 100.0 | % |
6
DIMENSIONAL INVESTMENT GROUP INC.
TAX-MANAGED U.S. MARKETWIDE VALUE PORTFOLIO II
STATEMENT OF ASSETS AND LIABILITIES
OCTOBER 31, 2009
(Amounts in thousands, except share and per share amounts)
| | | | |
ASSETS: | | | | |
Investments in The Tax-Managed U.S. Marketwide Value Series of The DFA Investment Trust Company (Affiliated Investment Company) at Value† | | $ | 671,411 | |
Receivables: | | | | |
Fund Shares Sold | | | 326 | |
Prepaid Expenses and Other Assets | | | 35 | |
| | | | |
Total Assets | | | 671,772 | |
| | | | |
LIABILITIES: | | | | |
Payables: | | | | |
Affiliated Investment Company Purchased | | | 53 | |
Fund Shares Redeemed | | | 273 | |
Accrued Expenses and Other Liabilities | | | 43 | |
| | | | |
Total Liabilities | | | 369 | |
| | | | |
NET ASSETS | | $ | 671,403 | |
| | | | |
SHARES OUTSTANDING, $0.01 PAR VALUE (1) | | | 60,094,293 | |
| | | | |
NET ASSET VALUE, OFFERING AND REDEMPTION PRICE PER SHARE | | $ | 11.17 | |
| | | | |
Investment in Affiliated Investment Company at Cost | | $ | 675,425 | |
| | | | |
NET ASSETS CONSIST OF: | | | | |
Paid-In Capital | | $ | 763,429 | |
Undistributed Net Investment Income (Distributions in Excess of Net Investment Income) | | | 1,610 | |
Accumulated Net Realized Gain (Loss) | | | (89,622 | ) |
Net Unrealized Appreciation (Depreciation) | | | (4,014 | ) |
| | | | |
NET ASSETS | | $ | 671,403 | |
| | | | |
(1) NUMBER OF SHARES AUTHORIZED | | | 500,000,000 | |
| | | | |
See accompanying Notes to Financial Statements.
7
DIMENSIONAL INVESTMENT GROUP INC.
TAX-MANAGED U.S. MARKETWIDE VALUE PORTFOLIO II
STATEMENT OF OPERATIONS
FOR THE YEAR ENDED OCTOBER 31, 2009
(Amounts in thousands)
| | | | |
Investment Income | | | | |
Dividends | | $ | 11,449 | |
Interest | | | 44 | |
Income from Securities Lending | | | 1,565 | |
Expenses Allocated from Affiliated Investment Company | | | (1,252 | ) |
| | | | |
Total Investment Income | | | 11,806 | |
| | | | |
Expenses | | | | |
Accounting & Transfer Agent Fees | | | 23 | |
Filing Fees | | | 59 | |
Shareholders’ Reports | | | 35 | |
Directors’/Trustees’ Fees & Expenses | | | 7 | |
Audit Fees | | | 2 | |
Legal Fees | | | 5 | |
Other | | | 7 | |
| | | | |
Total Expenses | | | 138 | |
| | | | |
Net Investment Income (Loss) | | | 11,668 | |
| | | | |
Realized and Unrealized Gain (Loss) | | | | |
Net Realized Gain (Loss) on: | | | | |
Investment Securities Sold | | | (54,176 | ) |
Futures | | | 436 | |
Change in Unrealized Appreciation (Depreciation) of: | | | | |
Investment Securities | | | 124,690 | |
Futures | | | (4 | ) |
| | | | |
Net Realized and Unrealized Gain (Loss) | | | 70,946 | |
| | | | |
Net Increase (Decrease) in Net Assets Resulting from Operations | | $ | 82,614 | |
| | | | |
Investment Income and Realized and Unrealized Gain (Loss) were allocated from the Portfolio’s Master Fund (Affiliated Investment Company).
See accompanying Notes to Financial Statements.
8
DIMENSIONAL INVESTMENT GROUP INC.
TAX-MANAGED U.S. MARKETWIDE VALUE PORTFOLIO II
STATEMENTS OF CHANGES IN NET ASSETS
(Amounts in thousands)
| | | | | | | | | | | | |
| | | Year
Ended
Oct. 31,
2009 | | | Period
Dec. 1, 2007
to
Oct. 31, 2008 | | | Year
Ended
Nov. 30,
2007 | |
Increase (Decrease) in Net Assets | | | | | | | | | | | | |
Operations: | | | | | | | | | | | | |
Net Investment Income (Loss) | | $ | 11,668 | | | $ | 17,946 | | | $ | 18,204 | |
Net Realized Gain (Loss) on: | | | | | | | | | | | | |
Investment Securities Sold | | | (54,176 | ) | | | (34,948 | ) | | | 58,675 | |
Futures | | | 436 | | | | (793 | ) | | | — | |
Change in Unrealized Appreciation (Depreciation) of: | | | | | | | | | | | | |
Investment Securities | | | 124,690 | | | | (378,517 | ) | | | (76,760 | ) |
Futures | | | (4 | ) | | | 4 | | | | — | |
| | | | | | | | | | | | |
Net Increase (Decrease) in Net Assets Resulting from Operations | | | 82,614 | | | | (396,308 | ) | | | 119 | |
| | | | | | | | | | | | |
Distributions From: | | | | | | | | | | | | |
Net Investment Income | | | (13,703 | ) | | | (19,059 | ) | | | (17,542 | ) |
Net Long-Term Gains | | | — | | | | (43,810 | ) | | | — | |
| | | | | | | | | | | | |
Total Distributions | | | (13,703 | ) | | | (62,869 | ) | | | (17,542 | ) |
| | | | | | | | | | | | |
Capital Share Transactions (1): | | | | | | | | | | | | |
Shares Issued | | | 351,837 | | | | 370,753 | | | | 209,281 | |
Shares Issued in Lieu of Cash Distributions | | | 13,698 | | | | 62,846 | | | | 17,537 | |
Shares Redeemed | | | (376,733 | ) | | | (470,998 | ) | | | (114,505 | ) |
| | | | | | | | | | | | |
Net Increase (Decrease) from Capital Share Transactions | | | (11,198 | ) | | | (37,399 | ) | | | 112,313 | |
| | | | | | | | | | | | |
Total Increase (Decrease) in Net Assets | | | 57,713 | | | | (496,576 | ) | | | 94,890 | |
Net Assets | | | | | | | | | | | | |
Beginning of Period | | | 613,690 | | | | 1,110,266 | | | | 1,015,376 | |
| | | | | | | | | | | | |
End of Period | | $ | 671,403 | | | $ | 613,690 | | | $ | 1,110,266 | |
| | | | | | | | | | | | |
(1) Shares Issued and Redeemed: | | | | | | | | | | | | |
Shares Issued | | | 40,341 | | | | 26,390 | | | | 11,360 | |
Shares Issued in Lieu of Cash Distributions | | | 1,482 | | | | 3,963 | | | | 966 | |
Shares Redeemed | | | (41,909 | ) | | | (33,945 | ) | | | (6,345 | ) |
| | | | | | | | | | | | |
Net Increase (Decrease) from Shares Issued and Redeemed | | | (86 | ) | | | (3,592 | ) | | | 5,981 | |
| | | | | | | | | | | | |
Undistributed Net Investment Income (Distributions in Excess of Net Investment Income) | | $ | 1,610 | | | $ | 3,645 | | | $ | 4,811 | |
See accompanying Notes to Financial Statements.
9
DIMENSIONAL INVESTMENT GROUP INC.
TAX-MANAGED U.S. MARKETWIDE VALUE PORTFOLIO II
FINANCIAL HIGHLIGHTS
(for a share outstanding throughout each period)
| | | | | | | | | | | | | | | | | | | | | | | | |
| | | Year
Ended
Oct. 31, 2009 | | | Period Dec. 1, 2007 to Oct. 31, 2008 | | | Year Ended Nov. 30, 2007 | | | Year Ended Nov. 30, 2006 | | | Year
Ended
Nov. 30, 2005 | | | Year
Ended
Nov. 30, 2004 | |
| | |
Net Asset Value, Beginning of Period | | $ | 10.20 | | | $ | 17.41 | | | $ | 17.57 | | | $ | 15.17 | | | $ | 13.20 | | | $ | 11.08 | |
| | | | | | | | | | | | | | | | | | | | | | | | |
Income from Investment Operations | | | | | | | | | | | | | | | | | | | | | | | | |
Net Investment Income (Loss) | | | 0.21 | (A) | | | 0.28 | (A) | | | 0.29 | (A) | | | 0.26 | (A) | | | 0.20 | | | | 0.13 | |
Net Gains (Losses) on Securities | | | | | | | | | | | | | | | | | | | | | | | | |
(Realized and Unrealized) | | | 1.02 | | | | (6.42 | ) | | | (0.16 | ) | | | 2.39 | | | | 1.94 | | | | 2.12 | |
| | | | | | | | | | | | | | | | | | | | | | | | |
Total from Investment Operations | | | 1.23 | | | | (6.14 | ) | | | 0.13 | | | | 2.65 | | | | 2.14 | | | | 2.25 | |
| | |
Less Distributions | | | | | | | | | | | | | | | | | | | | | | | | |
Net Investment Income | | | (0.26 | ) | | | (0.31 | ) | | | (0.29 | ) | | | (0.25 | ) | | | (0.17 | ) | | | (0.13 | ) |
Net Realized Gains | | | — | | | | (0.76 | ) | | | — | | | | — | | | | — | | | | — | |
| | | | | | | | | | | | | | | | | | | | | | | | |
Total Distributions | | | (0.26 | ) | | | (1.07 | ) | | | (0.29 | ) | | | (0.25 | ) | | | (0.17 | ) | | | (0.13 | ) |
| | |
Net Asset Value, End of Period | | $ | 11.17 | | | $ | 10.20 | | | $ | 17.41 | | | $ | 17.57 | | | $ | 15.17 | | | $ | 13.20 | |
| | |
Total Return | | | 12.64 | % | | | (37.46 | )%(C) | | | 0.67 | % | | | 17.67 | % | | | 16.36 | % | | | 20.41 | % |
| | |
| | | | | | |
Net Assets, End of Period (thousands) | | $ | 671,403 | | | $ | 613,690 | | | $ | 1,110,266 | | | $ | 1,015,376 | | | $ | 721,743 | | | $ | 505,147 | |
Ratio of Expenses to Average Net Assets (D) | | | 0.26 | % | | | 0.23 | %(B) | | | 0.23 | % | | | 0.24 | % | | | 0.26 | % | | | 0.28 | % |
Ratio of Net Investment Income to Average Net Assets | | | 2.16 | % | | | 2.07 | %(B) | | | 1.59 | % | | | 1.61 | % | | | 1.49 | % | | | 1.11 | % |
| | |
See page 1 for the Definitions of Abbreviations and Footnotes.
See accompanying Notes to Financial Statements.
10
DIMENSIONAL INVESTMENT GROUP INC.
TAX-MANAGED U.S. MARKETWIDE VALUE PORTFOLIO II
NOTES TO FINANCIAL STATEMENTS
A. Organization:
Dimensional Investment Group Inc. (the “Fund”) is an open-end management investment company registered under the Investment Company Act of 1940, whose shares are generally offered to institutional investors, retirement plans and clients of registered investment advisors. The Fund consists of fifteen portfolios, of which Tax-Managed U.S. Marketwide Value Portfolio II (the “Portfolio”) is presented in this report.
The Portfolio primarily invests its assets in The Tax-Managed U.S. Marketwide Value Series (the “Series”), a corresponding series of The DFA Investment Trust Company. At October 31, 2009, the Portfolio owned 29% of the Series. The financial statements of the Series are included elsewhere in this report and should be read in conjunction with the financial statements of the Portfolio.
At a regular meeting of the Board of Directors/Trustees (the “Board”) on September 16, 2008, the Board voted to change the fiscal and tax year ends of the Portfolio from November 30 to October 31.
B. Significant Accounting Policies:
The following significant accounting policies are in conformity with accounting principles generally accepted in the United States of America. Such policies are consistently followed by the Fund in preparation of its financial statements. The preparation of financial statements in accordance with accounting principles generally accepted in the United States of America requires management to make estimates and assumptions that affect the reported amounts of assets and liabilities and disclosure of contingent assets and liabilities at the date of the financial statements and the reported amounts of increases and decreases in net assets from operations during the reporting period. Actual results could differ from those estimates and those differences could be material.
1. Security Valuation: The Portfolio’s investment reflects its proportionate interest in the net assets of the Series.
The Portfolio utilizes a fair value hierarchy which prioritizes the inputs to valuation techniques used to measure fair value into three broad levels described below:
— Level 1 – quoted prices in active markets for identical securities
— Level 2 – other significant observable inputs (including quoted prices for similar securities, interest rates, prepayment speeds, credit risk, etc.)
— Level 3 – significant unobservable inputs (including the Portfolio’s own assumptions in determining the fair value of investments)
The inputs or methodology used for valuing securities are not necessarily an indication of the risk associated with investing in those securities. A summary of the inputs used to value the Portfolio’s net assets as of October 31, 2009 is listed below (in thousands).
| | | | | | | | | | |
| | | Valuation Inputs |
| |
| | | Investments in
Securities
(Market Value) |
| | | Level 1 | | Level 2 | | Level 3 | | Total |
Tax-Managed U.S. Marketwide Value Portfolio II | | $ | 671,411 | | — | | — | | $ | 671,411 |
2. Deferred Compensation Plan: Each eligible Director of the Fund may elect participation in the Deferred Compensation Plan (the “Plan”). Under the Plan, effective January 1, 2002, such Directors may defer payment of
11
all or a portion of their total fees earned as a Director. These deferred amounts may be treated as though such amounts had been invested in shares of the following funds: U.S. Large Cap Value Portfolio; U.S. Core Equity 1 Portfolio; U.S. Core Equity 2 Portfolio; U.S. Vector Equity Portfolio; U.S. Micro Cap Portfolio; DFA International Value Portfolio; International Core Equity Portfolio; Emerging Markets Portfolio; Emerging Markets Core Equity Portfolio; and/or DFA Two-Year Global Fixed Income Portfolio. Contributions made under the Plan and the change in unrealized appreciation (depreciation) and income, are included in Directors’/Trustees’ Fees & Expenses. At October 31, 2009, the total liability for deferred compensation to Directors is included in Accrued Expenses and Other Liabilities on the Statement of Assets and Liabilities in the amount of $15 (in thousands).
Each Director has the option to receive their distribution of proceeds in one of the following methods upon one year’s notice: lump sum; annual installments over a period of agreed upon years; or semi-annual installments over a period of agreed upon years. As of October 31, 2009, none of the Directors have requested distribution of proceeds.
3. Other: The Portfolio recognizes its pro-rata share, on a daily basis, of net investment income and realized and unrealized gains and losses of investment securities from the Series, which is treated as a partnership for federal income tax purposes. Dividend income and distributions to shareholders are recorded on the ex-dividend date. Distributions received on securities that represent a return of capital or capital gain are recorded as a reduction of cost of investments or as a realized gain, respectively. The Portfolio estimates the character of distributions received that may be considered return of capital distributions. Expenses directly attributable to the Portfolio are directly charged. Common expenses of the Fund are allocated using methods approved by the Board of Directors/Trustees, generally based on average net assets.
C. Investment Advisor:
Dimensional Fund Advisors LP (“Dimensional” or the “Advisor”) provides administrative services to the Portfolio, including supervision of services provided by others, providing information to the shareholders and to the Board of Directors/Trustees, and other administrative services. The Portfolio is not charged a fee for these services. The Advisor provides investment advisory services to the Series.
Fees Paid to Officers and Directors/Trustees:
Certain Officers and Directors/Trustees of the Advisor are also Officers and Directors/Trustees of the Fund; however, such Officers and Directors/Trustees (with the exception of the Chief Compliance Officer (“CCO”)) receive no compensation from the Fund. For the year ended October 31, 2009, the total related amounts paid by the Fund to the CCO were $27 (in thousands). The total related amounts paid by the Portfolio are included in Other Expenses on the Statement of Operations.
D. Federal Income Taxes:
The Portfolio has qualified and intends to continue to qualify as a regulated investment company under Subchapter M of the Internal Revenue Code for federal income tax purposes and to distribute substantially all of its taxable income and net capital gains to its shareholders. Accordingly, no provision has been made for federal income taxes.
Distributions from net investment income and net realized capital gains are determined in accordance with U.S. federal income tax regulations, which may differ from those amounts determined under accounting principles generally accepted in the United States of America. These book/tax differences are either temporary or permanent in nature. To the extent these differences are permanent, they are charged or credited to paid-in capital, undistributed net investment income or accumulated net realized gains, as appropriate, in the period that the differences arise.
12
The tax character of dividends and distributions declared and paid during the year ended November 30, 2007, the period December 1, 2007 to October 31, 2008 and the year ended October 31, 2009 were as follows (amounts in thousands):
| | | | | | |
| | | Net Investment
Income and
Short-Term
Capital Gains | | Long-Term
Capital Gain | | Total |
2007 | | $18,012 | | $ 1,514 | | $19,526 |
2008 | | 19,112 | | 43,757 | | 62,869 |
2009 | | 13,703 | | — | | 13,703 |
At October 31, 2009, the components of distributable earnings/(accumulated losses) were as follows (amounts in thousands):
| | | | | | |
Undistributed Net Investment Income and Short-Term Capital Gains | | Undistributed Long-Term
Capital Gains | | Capital Loss Carryforward | | Total Net Distributable Earnings (Accumulated Losses) |
$1,584 | | — | | $(89,694) | | $(88,110) |
For federal income tax purposes, the Fund measures its capital loss carryforwards annually at October 31, its fiscal year end. Capital loss carryforwards may be carried forward and applied against future capital gains. At October 31, 2009, the Portfolio had capital loss carryforwards available to offset future realized capital gains through October 31, 2017 (amounts in thousands):
| | | | | | |
| Expires on October 31, | | | | |
2016 | | 2017 | | | | Total |
$35,999 | | $53,695 | | | | $89,694 |
At October 31, 2009, the total cost and aggregate gross unrealized appreciation and (depreciation) of securities for federal income tax purposes were different from amounts reported for financial reporting purposes (amounts in thousands):
| | | | | | |
Federal Tax Cost | | Unrealized
Appreciation | | Unrealized
(Depreciation) | | Net Unrealized
Appreciation
(Depreciation) |
$675,310 | | $109,754 | | $(113,653) | | $(3,899) |
Accounting for Uncertainty in Income Taxes sets forth a minimum threshold for financial statement recognition of the benefit of a tax position taken or expected to be taken in a tax return. Management has analyzed the Portfolio’s tax position and has concluded that no provision for income tax is required in the Portfolio’s financial statements. The Portfolio is not aware of any tax position for which it is reasonably possible that the total amounts of unrecognized tax benefits will significantly change in the next twelve months. The Portfolio’s federal tax returns for the prior three fiscal years remain subject to examination by the Internal Revenue Service.
13
E. Line of Credit:
The Fund, together with other Dimensional-advised portfolios, has entered into an amended and restated $250 million unsecured discretionary line of credit effective July 8, 2009 with an affiliate of its domestic custodian bank. Each portfolio is permitted to borrow, subject to its investment limitations, up to a maximum of $250 million, as long as total borrowings under the line of credit do not exceed $250 million in the aggregate. Borrowings under the line of credit are charged interest at the then current Federal Funds Rate plus 1%. Each portfolio is individually, and not jointly, liable for its particular advances under the line of credit. There is no commitment fee on the unused portion of the line of credit. The agreement for the discretionary line of credit may be terminated by either party at any time. The line of credit is scheduled to expire on June 22, 2010. There were no borrowings by the Portfolio under this line of credit during the year ended October 31, 2009.
The Fund, together with other Dimensional-advised portfolios, has also entered into an additional $500 million unsecured line of credit effective January 15, 2009 with its international custodian bank. Each portfolio is permitted to borrow, subject to its investment limitations, up to a maximum of $500 million, as long as total borrowings under the line of credit do not exceed $500 million in the aggregate. Each portfolio is individually, and not jointly, liable for its particular advances under the line of credit. Borrowings under the line of credit are charged interest at rates agreed to by the parties at the time of borrowing. There is no commitment fee on the unused portion of the line of credit. The agreement of the line of credit expires on January 15, 2010. There were no borrowings by the Portfolio under this line of credit during the year ended October 31, 2009.
F. Indemnitees; Contractual Obligations:
Under the Fund’s organizational documents, its officers and directors are indemnified against certain liabilities arising out of the performance of their duties to the Fund.
In the normal course of business, the Fund enters into contracts that contain a variety of representations and warranties which provide general indemnification. The Fund’s maximum exposure under these arrangements is unknown as this would involve future claims that may be made against the Fund and/or its affiliates that have not yet occurred. However, based on experience, the Fund expects the risk of loss to be remote.
G. Other:
At October 31, 2009, two shareholders held approximately 93% of the outstanding shares of the Portfolio. One or more of the shareholders is an omnibus account, which typically hold shares for the benefit of several other underlying investors.
H. Subsequent Event Evaluations:
Management has evaluated the impact of all subsequent events on the Portfolio through December 23, 2009, the date the financial statements were available for issuance, and has determined that there are no subsequent events requiring recognition or disclosure in the financial statements.
14
REPORT OF INDEPENDENT REGISTERED PUBLIC ACCOUNTING FIRM
To the Shareholders of Tax-Managed U.S. Marketwide Value Portfolio II and
Board of Directors of Dimensional Investment Group Inc.:
In our opinion, the accompanying statement of assets and liabilities, and the related statements of operations and of changes in net assets and the financial highlights present fairly, in all material respects, the financial position of Tax-Managed U.S. Marketwide Value Portfolio II (one of the portfolios constituting Dimensional Investment Group Inc., hereafter referred to as the “Portfolio”) at October 31, 2009, the results of its operations for the year then ended, the changes in its net assets and the financial highlights for each of the periods indicated, in conformity with accounting principles generally accepted in the United States of America. These financial statements and financial highlights (hereafter referred to as “financial statements”) are the responsibility of the Portfolio’s management; our responsibility is to express an opinion on these financial statements based on our audits. We conducted our audits of these financial statements in accordance with the standards of the Public Company Accounting Oversight Board (United States). Those standards require that we plan and perform the audit to obtain reasonable assurance about whether the financial statements are free of material misstatement. An audit includes examining, on a test basis, evidence supporting the amounts and disclosures in the financial statements, assessing the accounting principles used and significant estimates made by management, and evaluating the overall financial statement presentation. We believe that our audits, which included confirmation of securities at October 31, 2009 by correspondence with the transfer agent of the investee fund, provide a reasonable basis for our opinion.
PricewaterhouseCoopers LLP
Philadelphia, Pennsylvania
December 23, 2009
15
RESULTS OF THE SHAREHOLDER MEETING
On June 2, 2009, June 5, 2009, and July 8, 2009, Dimensional Investment Group Inc. (“DIG”) held a Special Joint Meeting of Shareholders for the purpose of voting on several proposals affecting DIG and the Portfolio, including, among other items, the election of Directors, the amendment of certain fundamental investment limitations, and the elimination of certain fundamental investment limitations. The shareholders of the Portfolio approved each of the applicable proposals for DIG and the Portfolio presented at the Meeting. Listed below are the voting results from the Meeting. Please note that not all Proposals presented at the Meeting were voted on by the Portfolio. Additionally, the Proposal numbers reflected below correlate to the Proposal numbers presented for vote at the Meeting.
DIG
| | | | | | | | | | | | | | | | | | | | |
| | | | | Shares Voted | | Percent of Outstanding Shares Voted |
| | | | | For | | % | | Against | | % | | Abstain/ WithHold | | % | | For | | Against | | Abstain / WithHold |
Proposal 1: Election of Directors for DIG* | | | | | | | | | | | | | | | | | | |
1a | | David G. Booth | | 754,612,895 | | 96.26% | | — | | 0.00% | | 29,301,677 | | 3.74% | | 85.87% | | 0.00% | | 3.33% |
1b | | George M. Constantinides | | 753,991,785 | | 96.18% | | — | | 0.00% | | 29,922,787 | | 3.82% | | 85.80% | | 0.00% | | 3.41% |
1c | | John P. Gould | | 753,344,569 | | 96.10% | | — | | 0.00% | | 30,570,003 | | 3.90% | | 85.73% | | 0.00% | | 3.48% |
1d | | Roger G. Ibbotson | | 754,232,365 | | 96.21% | | — | | 0.00% | | 29,682,207 | | 3.79% | | 85.83% | | 0.00% | | 3.38% |
1e | | Robert C. Merton | | 754,598,874 | | 96.26% | | — | | 0.00% | | 29,315,698 | | 3.74% | | 85.87% | | 0.00% | | 3.34% |
1f | | Myron S. Scholes | | 754,057,040 | | 96.19% | | — | | 0.00% | | 29,857,532 | | 3.81% | | 85.81% | | 0.00% | | 3.40% |
1g | | Eduardo A. Repetto | | 753,295,592 | | 96.09% | | — | | 0.00% | | 30,618,979 | | 3.91% | | 85.72% | | 0.00% | | 3.48% |
1h | | Abbie J. Smith | | 754,123,603 | | 96.20% | | — | | 0.00% | | 29,790,969 | | 3.80% | | 85.82% | | 0.00% | | 3.39% |
| | | | | | | | | | | | | | | | | | | | | | |
| | | Shares Voted | | Percent of Outstanding Shares Voted |
| | | For | | % | | Against | | % | | Abstain/WithHold | | % | | NonVote | | % | | For | | Against | | Abstain /WithHold |
Proposal 2: To approve Articles of Amendment and Restatement for DIG* | | 479,705,048 | | 93.81% | | 7,503,436 | | 1.47% | | 24,156,664 | | 4.72% | | NA | | NA | | 54.59% | | 0.85% | | 2.75% |
| * | Results are for all Portfolios within DIG |
Tax-Managed U.S. Marketwide Value Portfolio II
| | | | | | | | | | | | | | | | | | | | | | | | | | |
| | | | | Shares Voted | | Percent of Outstanding Shares Voted |
| | | | | For | | % | | Against | | % | | Abstain/WithHold | | % | | NonVote | | % | | For | | Against | | Abstain /WithHold | | Non-Vote |
Proposals: | | | | | | | | Need for 50% Voted 40Act: |
5 | | To approve amendments to certain fundamental investment restrictions |
5a | | Borrowing Money | | 28,659,923 | | 90.51% | | 747,072 | | 2.36% | | 2,257,992 | | 7.13% | | NA | | NA | | 51.84% | | 1.35% | | 4.08% | | NA |
5b | | Making Loans | | 28,618,641 | | 90.38% | | 827,827 | | 2.61% | | 2,218,519 | | 7.01% | | NA | | NA | | 51.76% | | 1.50% | | 4.01% | | NA |
5c | | Investments in Real Estate | | 28,492,602 | | 89.98% | | 922,745 | | 2.91% | | 2,249,640 | | 7.10% | | NA | | NA | | 51.54% | | 1.67% | | 4.07% | | NA |
5d | | Investments in Commodities | | 28,551,376 | | 90.17% | | 900,839 | | 2.84% | | 2,212,772 | | 6.99% | | NA | | NA | | 51.64% | | 1.63% | | 4.00% | | NA |
5e | | Diversification of Investments | | 28,849,234 | | 91.11% | | 593,874 | | 1.88% | | 2,221,879 | | 7.02% | | NA | | NA | | 52.18% | | 1.07% | | 4.02% | | NA |
6 | | To approve the elimination of certain fundamental investment restrictions |
6b | | Purchasing Securities on Margin | | 28,190,349 | | 89.03% | | 1,232,888 | | 3.89% | | 2,241,750 | | 7.08% | | NA | | NA | | 50.99% | | 2.23% | | 4.05% | | NA |
6e | | Investing in Other Investment Companies | | 28,524,847 | | 90.08% | | 873,101 | | 2.76% | | 2,267,039 | | 7.16% | | NA | | NA | | 51.59% | | 1.58% | | 4.10% | | NA |
6g | | Investing in Oil, Gas, or other Mineral Exploration, Leases or Development Programs | | 28,506,817 | | 90.03% | | 962,759 | | 3.04% | | 2,195,411 | | 6.93% | | NA | | NA | | 51.56% | | 1.74% | | 3.97% | | NA |
8 | | Approval of Investment Advisory Agreement between Dimensional Fund Advisors LP and the Company | | 28,826,207 | | 91.03% | | 620,446 | | 1.96% | | 2,218,334 | | 7.01% | | NA | | NA | | 52.14% | | 1.12% | | 4.01% | | NA |
16
THE DFA INVESTMENT TRUST COMPANY
PERFORMANCE CHART
The Tax-Managed U.S. Marketwide Value Series vs.
Russell 3000® Value Index
October 31, 1999-October 31, 2009
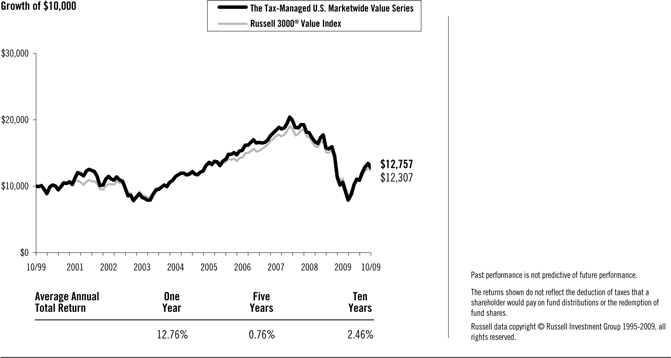
17
THE DFA INVESTMENT TRUST COMPANY
THE TAX-MANAGED U.S. MARKETWIDE VALUE SERIES
DISCLOSURE OF FUND EXPENSES
(Unaudited)
The following Expense Table is shown so that you can understand the impact of fees on your investment. All mutual funds have operating expenses. As a shareholder of the fund, you incur ongoing costs, which include costs for portfolio management, administrative services, and shareholder reports, among others. Operating expenses, legal and audit services, which are deducted from a fund’s gross income, directly reduce the investment return of the fund. A fund’s expenses are expressed as a percentage of its average net assets. This figure is known as the expense ratio. The following examples are intended to help you understand the ongoing costs, in dollars, of investing in the fund and to compare these costs with those of other mutual funds. The examples are based on an investment of $1,000 made at the beginning of the period shown and held for the entire period.
The Expense Table below illustrates your fund’s costs in two ways.
Actual Fund Return
This section helps you to estimate the actual expenses after fee waivers that you paid over the period. The “Ending Account Value” shown is derived from the fund’s actual return and “Expenses Paid During Period” reflect the dollar amount that would have been paid by an investor who started with $1,000 in the fund. You may use the information here, together with the amount you invested, to estimate the expenses that you paid over the period.
To do so, simply divide your account value by $1,000 (for example, a $7,500 account value divided by $1,000 = 7.5), then multiply the result by the number given for your fund under the heading “Expenses Paid During Period.”
Hypothetical Example for Comparison Purposes
This section is intended to help you compare your fund’s costs with those of other mutual funds. The hypothetical “Ending Account Value” and “Expenses Paid During Period” are derived from the fund’s actual expense ratio and an assumed 5% annual return before expenses. In this case, because the return used is not the fund’s actual return, the results do not apply to your investment. The example is useful in making comparisons because the SEC requires all mutual funds to calculate expenses based on a 5% annual return. You can assess your fund’s costs by comparing this hypothetical example with the hypothetical examples that appear in shareholder reports of other funds.
Please note that the expenses shown in the table are meant to highlight and help you compare ongoing costs only and do not reflect any transactional costs, if applicable. The “Annualized Expense Ratio” represents the actual expenses for the six-month period indicated.
Six Months Ended October 31, 2009
EXPENSE TABLE
| | | | | | | | |
| | | Beginning
Account
Value
05/01/09 | | Ending
Account
Value
10/31/09 | | Annualized
Expense
Ratio* | | Expenses
Paid
During
Period* |
Actual Fund Return | | $1,000.00 | | $1,240.10 | | 0.24% | | $1.36 |
Hypothetical 5% Annual Return | | $1,000.00 | | $1,024.00 | | 0.24% | | $1.22 |
| * | Expenses are equal to the fund’s annualized expense ratio for the six-month period, multiplied by the average account value over the period, multiplied by the number of days in the most recent six-month period (184), then divided by the number of days in the year (365) to reflect the six-month period. |
18
THE DFA INVESTMENT TRUST COMPANY
THE TAX-MANAGED U.S. MARKETWIDE VALUE SERIES
DISCLOSURE OF PORTFOLIO HOLDINGS
(Unaudited)
The SEC requires that all Funds file a complete Schedule of Investments with the SEC for their first and third fiscal quarters on Form N-Q. For The DFA Investment Trust Company, this would be for the fiscal quarters ending January 31 and July 31. The Form N-Q filing must be made within 60 days of the end of the quarter. The DFA Investment Trust Company filed its most recent Form N-Q with the SEC on September 29, 2009. It is available upon request, without charge, by calling collect: (512) 306-7400 or by mailing a request to Dimensional Fund Advisors LP, 6300 Bee Cave Road, Building One, Austin, Texas 78746, or by visiting the SEC’s website at http://www.sec.gov, or they may be reviewed and copied at the SEC’s Public Reference Room in Washington, D.C. (call 1-800-732-0330 for information on the operation of the Public Reference Room).
SEC regulations permit a fund to include in its reports to shareholders a “Summary Schedule of Portfolio Holdings” in lieu of a full Schedule of Investments. The Summary Schedule of Portfolio Holdings reports the fund’s 50 largest holdings in unaffiliated issuers and any investments that exceed one percent of the fund’s net assets at the end of the reporting period. The amendments also require that the Summary Schedule of Portfolio Holdings identify each category of investments that are held.
The fund is required to file a complete Schedule of Investments with the SEC on Form N-CSR within ten days after mailing the annual and semi-annual reports to shareholders. It will be available upon request, without charge, by calling collect: (512) 306-7400 or by mailing a request to Dimensional Fund Advisors LP, 6300 Bee Cave Road, Building One, Austin, Texas 78746, or by visiting the SEC’s website at http://www.sec.gov, or they may be reviewed and copied at the SEC’s Public Reference Room in Washington, D.C. (call 1-800-732-0330 for information on the operation of the Public Reference Room).
PORTFOLIO HOLDINGS
The SEC requires that all Funds present their categories of portfolio holdings in a table, chart or graph format in their annual and semi-annual shareholder reports, whether or not a Schedule of Investments is utilized. The following table, which presents portfolio holdings as a percent of total investments before short-term investments and collateral for loaned securities, is provided in compliance with such requirement. The categories shown below represent broad industry sectors. Each industry sector consists of one or more specific industry classifications.
| | |
| The Tax-Managed U.S. Marketwide Value Series |
Consumer Discretionary | | 18.5% |
Consumer Staples | | 5.3% |
Energy | | 14.0% |
Financials | | 30.2% |
Health Care | | 4.5% |
Industrials | | 12.2% |
Information Technology | | 6.8% |
Materials | | 3.3% |
Other | | — |
Telecommunication Services | | 4.3% |
Utilities | | 0.9% |
| |
| | |
| | 100.0% |
19
THE TAX-MANAGED U.S. MARKETWIDE VALUE SERIES
SUMMARY SCHEDULE OF PORTFOLIO HOLDINGS
October 31, 2009
| | | | | | | |
| | | Shares | | Value† | | Percentage
of Net Assets** |
COMMON STOCKS — (91.3%) | | | | | | | |
Consumer Discretionary — (16.9%) | | | | | | | |
Carnival Corp. | | 688,708 | | $ | 20,055,177 | | 0.9% |
Comcast Corp. Class A | | 3,570,978 | | | 51,779,181 | | 2.3% |
Comcast Corp. Special Class A | | 1,432,185 | | | 20,079,234 | | 0.9% |
#Disney (Walt) Co. | | 1,135,556 | | | 31,080,168 | | 1.3% |
*Liberty Media Corp. Entertainment Class A | | 578,364 | | | 17,825,178 | | 0.8% |
News Corp. Class A | | 1,864,745 | | | 21,481,862 | | 0.9% |
#News Corp. Class B | | 855,872 | | | 11,639,859 | | 0.5% |
Time Warner Cable, Inc. | | 693,942 | | | 27,369,072 | | 1.2% |
Time Warner, Inc. | | 1,534,860 | | | 46,229,983 | | 2.0% |
Other Securities | | | | | 173,853,500 | | 7.6% |
| | | | | | | |
Total Consumer Discretionary | | | | | 421,393,214 | | 18.4% |
| | | | | | | |
| | | |
Consumer Staples — (4.8%) | | | | | | | |
Archer-Daniels-Midland Co. | | 487,589 | | | 14,686,181 | | 0.6% |
CVS Caremark Corp. | | 866,755 | | | 30,596,452 | | 1.3% |
#Kraft Foods, Inc. | | 1,077,208 | | | 29,644,764 | | 1.3% |
Other Securities | | | | | 45,163,659 | | 2.0% |
| | | | | | | |
Total Consumer Staples | | | | | 120,091,056 | | 5.2% |
| | | | | | | |
| | | |
Energy — (12.8%) | | | | | | | |
Anadarko Petroleum Corp. | | 845,068 | | | 51,489,993 | | 2.2% |
Apache Corp. | | 185,830 | | | 17,490,320 | | 0.8% |
#Chesapeake Energy Corp. | | 618,000 | | | 15,141,000 | | 0.7% |
ConocoPhillips | | 1,496,850 | | | 75,111,933 | | 3.3% |
Marathon Oil Corp. | | 856,737 | | | 27,389,882 | | 1.2% |
Valero Energy Corp. | | 714,360 | | | 12,929,916 | | 0.6% |
XTO Energy, Inc. | | 397,536 | | | 16,521,596 | | 0.7% |
Other Securities | | | | | 103,389,457 | | 4.5% |
| | | | | | | |
Total Energy | | | | | 319,464,097 | | 14.0% |
| | | | | | | |
| | | |
Financials — (27.6%) | | | | | | | |
Allstate Corp. | | 501,660 | | | 14,834,086 | | 0.6% |
Bank of America Corp. | | 4,536,955 | | | 66,148,804 | | 2.9% |
Capital One Financial Corp. | | 401,285 | | | 14,687,031 | | 0.6% |
Chubb Corp. | | 390,477 | | | 18,945,944 | | 0.8% |
Citigroup, Inc. | | 3,545,800 | | | 14,502,322 | | 0.6% |
CME Group, Inc. | | 67,810 | | | 20,519,984 | | 0.9% |
JPMorgan Chase & Co. | | 2,495,918 | | | 104,254,495 | | 4.6% |
Lincoln National Corp. | | 464,693 | | | 11,073,634 | | 0.5% |
Loews Corp. | | 747,772 | | | 24,751,253 | | 1.1% |
MetLife, Inc. | | 847,339 | | | 28,834,946 | | 1.3% |
Morgan Stanley | | 628,799 | | | 20,197,024 | | 0.9% |
PNC Financial Services Group, Inc. | | 263,050 | | | 12,873,667 | | 0.6% |
Prudential Financial, Inc. | | 430,708 | | | 19,480,923 | | 0.8% |
Travelers Cos., Inc. (The) | | 769,714 | | | 38,324,060 | | 1.7% |
Wells Fargo & Co. | | 529,123 | | | 14,561,465 | | 0.6% |
Other Securities | | | | | 265,392,627 | | 11.6% |
| | | | | | | |
Total Financials | | | | | 689,382,265 | | 30.1% |
| | | | | | | |
| | | |
Health Care — (4.1%) | | | | | | | |
*Thermo Fisher Scientific, Inc. | | 321,928 | | | 14,486,760 | | 0.6% |
*WellPoint, Inc. | | 440,420 | | | 20,594,039 | | 0.9% |
Other Securities | | | | | 67,176,867 | | 3.0% |
| | | | | | | |
Total Health Care | | | | | 102,257,666 | | 4.5% |
| | | | | | | |
20
THE TAX-MANAGED U.S. MARKETWIDE VALUE SERIES
CONTINUED
| | | | | | | |
| | | Shares | | Value† | | Percentage
of Net Assets** |
Industrials — (11.1%) | | | | | | | |
Burlington Northern Santa Fe Corp. | | 248,329 | | $ | 18,704,140 | | 0.8% |
CSX Corp. | | 562,627 | | | 23,731,607 | | 1.0% |
FedEx Corp. | | 184,382 | | | 13,402,728 | | 0.6% |
General Electric Co. | | 2,283,412 | | | 32,561,455 | | 1.4% |
Norfolk Southern Corp. | | 333,288 | | | 15,537,887 | | 0.7% |
Tyco International, Ltd. | | 456,370 | | | 15,311,214 | | 0.7% |
#Union Pacific Corp. | | 489,811 | | | 27,008,179 | | 1.2% |
Other Securities | | | | | 131,483,405 | | 5.7% |
| | | | | | | |
Total Industrials | | | | | 277,740,615 | | 12.1% |
| | | | | | | |
| | | |
Information Technology — (6.2%) | | | | | | | |
*Computer Sciences Corp. | | 225,553 | | | 11,437,793 | | 0.5% |
#Motorola, Inc. | | 2,108,701 | | | 18,071,568 | | 0.8% |
Tyco Electronics, Ltd. | | 549,298 | | | 11,672,583 | | 0.5% |
Other Securities | | | | | 112,756,385 | | 4.9% |
| | | | | | | |
Total Information Technology | | | | | 153,938,329 | | 6.7% |
| | | | | | | |
| | | |
Materials — (3.0%) | | | | | | | |
Dow Chemical Co. | | 578,018 | | | 13,571,863 | | 0.6% |
Weyerhaeuser Co. | | 311,975 | | | 11,337,172 | | 0.5% |
Other Securities | | | | | 49,738,377 | | 2.2% |
| | | | | | | |
Total Materials | | | | | 74,647,412 | | 3.3% |
| | | | | | | |
| | | |
Other — (0.0%) | | | | | | | |
Other Securities | | | | | 54 | | 0.0% |
| | | | | | | |
| | | |
Telecommunication Services — (3.9%) | | | | | | | |
AT&T, Inc. | | 2,510,122 | | | 64,434,832 | | 2.8% |
Verizon Communications, Inc. | | 566,352 | | | 16,758,356 | | 0.7% |
Other Securities | | | | | 17,187,908 | | 0.8% |
| | | | | | | |
Total Telecommunication Services | | | | | 98,381,096 | | 4.3% |
| | | | | | | |
| | | |
Utilities — (0.9%) | | | | | | | |
Other Securities | | | | | 21,258,951 | | 0.9% |
| | | | | | | |
TOTAL COMMON STOCKS | | | | | 2,278,554,755 | | 99.5% |
| | | | | | | |
RIGHTS/WARRANTS — (0.0%) | | | | | | | |
Other Securities | | | | | — | | 0.0% |
| | | | | | | |
| | | |
TEMPORARY CASH INVESTMENTS — (0.5%) | | | | | | | |
BlackRock Liquidity Funds Tempcash Portfolio - Institutional Shares | | 13,814,176 | | | 13,814,176 | | 0.6% |
| | | | | | | |
| | | |
| | | Shares/
Face
Amount | | | | |
| | | (000) | | | | |
SECURITIES LENDING COLLATERAL — (8.2%) | | | | | | | |
§@DFA Short Term Investment Fund LP | | 202,493,142 | | | 202,493,142 | | 8.8% |
@Repurchase Agreement, Deutsche Bank Securities 0.08%, | | | | | | | |
11/02/09 (Collateralized by $1,886,910 FHLMC 5.793%(r), | | | | | | | |
01/01/37, valued at $1,059,989) to be repurchased at | | | | | | | |
$1,029,122 | | $1,029 | | | 1,029,115 | | 0.1% |
| | | | | | | |
TOTAL SECURITIES LENDING COLLATERAL | | | | | 203,522,257 | | 8.9% |
| | | | | | | |
TOTAL INVESTMENTS — (100.0%)
(Cost $2,552,893,037) | | | | $ | 2,495,891,188 | | 109.0% |
| | | | | | | |
21
THE TAX-MANAGED U.S. MARKETWIDE VALUE SERIES
CONTINUED
Summary of inputs used to value the Series’ net assets as of October 31, 2009 is as follows (See Security Valuation Note):
| | | | | | | | | | | |
| | | Valuation Inputs |
| |
| | | Investment in Securities (Market Value) |
| | | Level 1 | | Level 2 | | Level 3 | | Total |
Common Stocks | | | | | | | | | | | |
Consumer Discretionary | | $ | 421,361,264 | | $ | 31,950 | | — | | $ | 421,393,214 |
Consumer Staples | | | 120,091,056 | | | — | | — | | | 120,091,056 |
Energy | | | 319,464,097 | | | — | | — | | | 319,464,097 |
Financials | | | 689,382,265 | | | — | | — | | | 689,382,265 |
Health Care | | | 102,257,666 | | | — | | — | | | 102,257,666 |
Industrials | | | 277,740,615 | | | — | | — | | | 277,740,615 |
Information Technology | | | 153,931,809 | | | 6,520 | | — | | | 153,938,329 |
Materials | | | 74,647,412 | | | — | | — | | | 74,647,412 |
Other | | | — | | | 54 | | — | | | 54 |
Telecommunication Services | | | 98,381,096 | | | — | | — | | | 98,381,096 |
Utilities | | | 21,258,951 | | | — | | — | | | 21,258,951 |
Rights/Warrants | | | — | | | — | | — | | | — |
Temporary Cash Investments | | | 13,814,176 | | | — | | — | | | 13,814,176 |
Securities Lending Collateral | | | — | | | 203,522,257 | | — | | | 203,522,257 |
| | | | | | | | | | | |
TOTAL | | $ | 2,292,330,407 | | $ | 203,560,781 | | — | | $ | 2,495,891,188 |
| | | | | | | | | | | |
See accompanying Notes to Financial Statements.
22
THE DFA INVESTMENT TRUST COMPANY
THE TAX-MANAGED U.S. MARKETWIDE VALUE SERIES
STATEMENT OF ASSETS AND LIABILITIES
OCTOBER 31, 2009
(Amounts in thousands)
| | | |
ASSETS: | | | |
Investments at Value (including $185,881 of securities on loan) | | $ | 2,278,555 |
Temporary Cash Investments at Value & Cost | | | 13,814 |
Collateral Received from Securities on Loan at Value & Cost | | | 203,522 |
Receivables: | | | |
Investment Securities Sold | | | 2,290 |
Dividends and Interest | | | 2,664 |
Securities Lending Income | | | 210 |
Fund Shares Sold | | | 53 |
| | | |
Total Assets | | | 2,501,108 |
| | | |
LIABILITIES: | | | |
Payables: | | | |
Upon Return of Securities Loaned | | | 203,522 |
Investment Securities Purchased | | | 6,575 |
Fund Shares Redeemed | | | 570 |
Due to Advisor | | | 403 |
Accrued Expenses and Other Liabilities | | | 111 |
| | | |
Total Liabilities | | | 211,181 |
| | | |
NET ASSETS | | $ | 2,289,927 |
| | | |
Investments at Cost | | $ | 2,335,557 |
| | | |
See accompanying Notes to Financial Statements.
23
THE DFA INVESTMENT TRUST COMPANY
THE TAX-MANAGED U.S. MARKETWIDE VALUE SERIES
STATEMENT OF OPERATIONS
FOR THE YEAR ENDED OCTOBER 31, 2009
(Amounts in thousands)
| | | | |
Investment Income | | | | |
Dividends | | $ | 41,661 | |
Interest | | | 169 | |
Income from Securities Lending | | | 5,646 | |
| | | | |
Total Investment Income | | | 47,476 | |
| | | | |
Expenses | | | | |
Investment Advisory Services Fees | | | 3,861 | |
Accounting & Transfer Agent Fees | | | 223 | |
Custodian Fees | | | 41 | |
Shareholders’ Reports | | | 11 | |
Directors’/Trustees’ Fees & Expenses | | | 28 | |
Professional Fees | | | 85 | |
Other | | | 218 | |
| | | | |
Total Expenses | | | 4,467 | |
| | | | |
Net Investment Income (Loss) | | | 43,009 | |
| | | | |
Realized and Unrealized Gain (Loss) | | | | |
Net Realized Gain (Loss) on: | | | | |
Investment Securities Sold | | | (224,739 | ) |
Futures | | | 2,063 | |
Change in Unrealized Appreciation (Depreciation) of: | | | | |
Investment Securities | | | 417,983 | |
Futures | | | (16 | ) |
| | | | |
Net Realized and Unrealized Gain (Loss) | | | 195,291 | |
| | | | |
Net Increase (Decrease) in Net Assets Resulting from Operations | | $ | 238,300 | |
| | | | |
See accompanying Notes to Financial Statements.
24
THE DFA INVESTMENT TRUST COMPANY
THE TAX-MANAGED U.S. MARKETWIDE VALUE SERIES
STATEMENTS OF CHANGES IN NET ASSETS
(Amounts in thousands)
| | | | | | | | | | | | |
| | | Year
Ended
Oct. 31,
2009 | | | Period
Dec. 1, 2007
to
Oct. 31, 2008 | | | Year
Ended
Nov. 30,
2007 | |
Increase (Decrease) in Net Assets | | | | | | | | | | | | |
Operations: | | | | | | | | | | | | |
Net Investment Income (Loss) | | $ | 43,009 | | | $ | 63,704 | | | $ | 63,884 | |
Net Realized Gain (Loss) on: | | | | | | | | | | | | |
Investment Securities Sold | | | (224,739 | ) | | | (152,733 | ) | | | 197,904 | |
Futures | | | 2,063 | | | | (2,752 | ) | | | — | |
Change in Unrealized Appreciation (Depreciation) of: | | | | | | | | | | | | |
Investment Securities | | | 417,983 | | | | (1,321,745 | ) | | | (257,139 | ) |
Futures | | | (16 | ) | | | 16 | | | | — | |
| | | | | | | | | | | | |
Net Increase (Decrease) in Net Assets Resulting from Operations | | | 238,300 | | | | (1,413,510 | ) | | | 4,649 | |
| | | | | | | | | | | | |
Transactions in Interest: | | | | | | | | | | | | |
Contributions | | | 347,943 | | | | 457,034 | | | | 478,784 | |
Withdrawals | | | (487,040 | ) | | | (711,380 | ) | | | (146,412 | ) |
| | | | | | | | | | | | |
Net Increase (Decrease) from Transactions in Interest | | | (139,097 | ) | | | (254,346 | ) | | | 332,372 | |
| | | | | | | | | | | | |
Total Increase (Decrease) in Net Assets | | | 99,203 | | | | (1,667,856 | ) | | | 337,021 | |
Net Assets | | | | | | | | | | | | |
Beginning of Period | | | 2,190,724 | | | | 3,858,580 | | | | 3,521,559 | |
| | | | | | | | | | | | |
End of Period | | $ | 2,289,927 | | | $ | 2,190,724 | | | $ | 3,858,580 | |
| | | | | | | | | | | | |
See accompanying Notes to Financial Statements.
25
THE DFA INVESTMENT TRUST COMPANY
THE TAX-MANAGED U.S. MARKETWIDE VALUE SERIES
FINANCIAL HIGHLIGHTS
| | | | | | | | | | | | | | | | | | | | | | | | |
| | | Year Ended Oct. 31, 2009 | | | Period Dec. 1, 2007 to Oct. 31, 2008 | | | Year Ended Nov. 30, 2007 | | | Year Ended Nov. 30, 2006 | | | Year Ended Nov. 30, 2005 | | | Year Ended Nov. 30, 2004 | |
Total Return | | | 12.76 | % | | | (37.44 | )%(C) | | | 0.67 | % | | | 17.70 | % | | | 16.44 | % | | | 20.49 | % |
Net Assets, End of Period (thousands) | | $ | 2,289,927 | | | $ | 2,190,724 | | | $ | 3,858,580 | | | $ | 3,521,559 | | | $ | 2,476,387 | | | $ | 1,702,613 | |
Ratio of Expenses to Average Net Assets | | | 0.23 | % | | | 0.22 | %(B) | | | 0.22 | % | | | 0.22 | % | | | 0.24 | % | | | 0.25 | % |
Ratio of Net Investment Income to Average Net Assets | | | 2.23 | % | | | 2.09 | %(B) | | | 1.61 | % | | | 1.63 | % | | | 1.52 | % | | | 1.14 | % |
Portfolio Turnover Rate | | | 28 | % | | | 40 | %(C) | | | 21 | % | | | 21 | % | | | 12 | % | | | 5 | % |
See page 1 for the Definitions of Abbreviations and Footnotes.
See accompanying Notes to Financial Statements.
26
THE DFA INVESTMENT TRUST COMPANY
THE TAX-MANAGED U.S. MARKETWIDE VALUE SERIES
NOTES TO FINANCIAL STATEMENTS
A. Organization:
The DFA Investment Trust Company (the “Trust”) is an open-end management investment company registered under the Investment Company Act of 1940. The Trust consists of twelve investment portfolios, of which The Tax-Managed U.S. Marketwide Value Series (the “Series”) is presented in this report.
At a regular meeting of the Board of Directors/Trustees (the “Board”) on September 16, 2008, the Board voted to change the fiscal and tax year ends of the Series from November 30 to October 31.
B. Significant Accounting Policies:
The following significant accounting policies are in conformity with accounting principles generally accepted in the United States of America. Such policies are consistently followed by the Trust in preparation of its financial statements. The preparation of financial statements in accordance with accounting principles generally accepted in the United States of America requires management to make estimates and assumptions that affect the reported amounts of assets and liabilities and disclosure of contingent assets and liabilities at the date of the financial statements and the reported amounts of increases and decreases in net assets from operations during the reporting period. Actual results could differ from those estimates and those differences could be material.
1. Security Valuation: Securities held by the Series (including over-the-counter securities) are valued at the last quoted sale price of the day. Securities held by the Series that are listed on Nasdaq are valued at the Nasdaq Official Closing Price (“NOCP”). If there is no last reported sale price or NOCP for the day, the Series values the securities at the mean of the most recent quoted bid and asked prices. Price information on listed securities is taken from the exchange where the security is primarily traded. Generally, securities issued by open-end investment companies are valued using their respective net asset values or public offering prices, as appropriate, for purchase orders placed at the close of the New York Stock Exchange (NYSE).
Securities for which no market quotations are readily available (including restricted securities), or for which market quotations have become unreliable, are valued in good faith at fair value in accordance with procedures adopted by the Board of Directors/Trustees. Fair value pricing may also be used if events that have a significant effect on the value of an investment (as determined in the discretion of the Investment Committee of the Advisor) occur before the net asset value is calculated. When fair value pricing is used, the prices of securities used by the Series may differ from the quoted or published prices for the same securities on their primary markets or exchanges.
Futures contracts held by the Series are valued using the settlement price established each day on the exchange on which they are traded.
The Series utilizes a fair value hierarchy which prioritizes the inputs to valuation techniques used to measure fair value into three broad levels described below:
— Level 1 – quoted prices in active markets for identical securities
— Level 2 – other significant observable inputs (including quoted prices for similar securities, interest rates, prepayment speeds, credit risk, etc.)
— Level 3 – significant unobservable inputs (including the Series’ own assumptions in determining the fair value of investments)
A summary of the inputs used to value the Series’ net assets by each major security type, industry and/or country is disclosed at the end of the Summary Schedule of Portfolio Holdings. The inputs or methodology used for valuing securities are not necessarily an indication of the risk associated with investing in those securities.
27
2. Deferred Compensation Plan: Each eligible Trustee of the Trust may elect participation in the Deferred Compensation Plan (the “Plan”). Under the Plan, effective January 1, 2002, such Trustees may defer payment of all or a portion of their total fees earned as a Trustee. These deferred amounts may be treated as though such amounts had been invested in shares of the following funds: U.S. Large Cap Value Portfolio; U.S. Core Equity 1 Portfolio; U.S. Core Equity 2 Portfolio; U.S. Vector Equity Portfolio; U.S. Micro Cap Portfolio; DFA International Value Portfolio; International Core Equity Portfolio; Emerging Markets Portfolio; Emerging Markets Core Equity Portfolio; and/or DFA Two-Year Global Fixed Income Portfolio. Contributions made under the Plan and the change in unrealized appreciation (depreciation) and income, are included in Directors’/Trustees’ Fees & Expenses. At October 31, 2009, the total liability for deferred compensation to Trustees is included in Accrued Expenses and Other Liabilities on the Statement of Assets and Liabilities in the amount of $55 (in thousands).
Each Trustee has the option to receive their distribution of proceeds in one of the following methods upon one year’s notice: lump sum; annual installments over a period of agreed upon years; or semi-annual installments over a period of agreed upon years. As of October 31, 2009, none of the Trustees have requested distribution of proceeds.
3. Other: Security transactions are accounted for as of the trade date. Costs used in determining realized gains and losses on the sale of investment securities are on the basis of identified cost sold. Dividend income and distributions to shareholders are recorded on the ex-dividend date. Distributions received on securities that represent a return of capital or capital gain are recorded as a reduction of cost of investments or as a realized gain, respectively. The Series estimates the character of distributions received that may be considered return of capital distributions. Interest income is recorded on the accrual basis. Discount and premium on securities purchased are amortized over the lives of the respective securities utilizing the effective interest method. Expenses directly attributable to a Series are directly charged. Common expenses of the Trust are allocated using methods approved by the Board of Directors/Trustees, generally based on average net assets.
C. Investment Advisor:
Dimensional Fund Advisors LP (“Dimensional” or the “Advisor”) provides investment advisory services to the Series. For the year ended October 31, 2009, the Series’ investment advisory services fees were accrued daily and paid monthly to the Advisor based on an effective annual rate of 0.20% of average daily net assets.
Fees Paid to Officers and Directors/Trustees:
Certain Officers and Directors/Trustees of the Advisor are also Officers and Directors/Trustees of the Trust; however, such Officers and Directors/Trustees (with the exception of the Chief Compliance Officer (“CCO”)) receive no compensation from the Trust. For the year ended October 31, 2009, the total related amounts paid by the Trust to the CCO were $98 (in thousands). The total related amounts paid by the Series are included in Other Expenses on the Statement of Operations.
D. Purchases and Sales of Securities:
For the year ended October 31, 2009, the Series made the following purchases and sales of investment securities, other than short-term securities and U.S. government securities (amounts in thousands):
| | | |
Purchases | | $ | 549,371 |
Sales | | | 583,865 |
There were no purchases or sales of long-term U.S. government securities.
28
E. Federal Income Tax:
No provision for federal income taxes is required since the Series is treated as a partnership for federal income tax purposes. Any net investment income and net realized and unrealized gains and losses have been deemed to have been “passed down” to its partners.
At October 31, 2009, the total cost and aggregate gross unrealized appreciation and (depreciation) of securities for federal income tax purposes were different from amounts reported for financial reporting purposes (amounts in thousands):
| | | | | | |
Federal Tax Cost | | Unrealized Appreciation | | Unrealized (Depreciation) | | Net Unrealized Appreciation (Depreciation) |
$2,553,643 | | $383,784 | | $(441,536) | | $(57,752) |
Accounting for Uncertainty in Income Taxes sets forth a minimum threshold for financial statement recognition of the benefit of a tax position taken or expected to be taken in a tax return. Management has analyzed the Series’ tax position and has concluded that no provision for income tax is required in the Series’ financial statements. The Series is not aware of any tax position for which it is reasonably possible that the total amounts of unrecognized tax benefits will significantly change in the next twelve months. The Series’ federal tax returns for the prior three fiscal years remain subject to examination by the Internal Revenue Service.
F. Financial Instruments:
In accordance with the Series’ investment objectives and policies, the Series may invest in certain financial instruments that have off-balance sheet risk in excess of the amounts recognized in the financial statements and concentrations of credit and market risk. These instruments and their significant corresponding risks are described below:
1. Repurchase Agreements: The Series may purchase certain U.S. Government securities subject to the counterparty’s agreement to repurchase them at an agreed upon date and price. The counterparty will be required on a daily basis to maintain the value of the collateral subject to the agreement at not less than the repurchase price (including accrued interest). The agreements are conditioned upon the collateral being deposited under the Federal Reserve book-entry system with the Trust’s custodian or a third party sub-custodian. In the event of default or bankruptcy by the other party to the agreement, retention of the collateral may be subject to legal proceedings. All open repurchase agreements were entered into on October 30, 2009.
Derivative Financial Instruments:
Disclosures on derivative instruments and hedging activities are intended to improve financial reporting for derivative instruments by enabling investors to understand how and why a fund uses derivatives, how derivatives are accounted for and how derivative instruments affect a fund’s results of operations and financial position. Summarized below are the specific types of derivative instruments used by the Series.
2. Futures Contracts: The Series may enter into futures contracts to gain market exposure on uninvested cash pending investment in securities or to maintain liquidity to pay redemptions. Upon entering into a futures contract, the Series deposits cash or pledges U.S. Government securities to a broker, equal to the minimum “initial margin” requirements of the exchange on which the contract is traded. Subsequent payments are received from or paid to the broker each day, based on the daily fluctuation in the market value of the contract. These receipts or payments are known as “variation margin” and are recorded daily by the Series as unrealized gains or losses until the contracts are closed. When the contracts are closed, the Series records a realized gain or loss, which is presented in the Statement of Operations as a net realized gain or loss on futures, equal to the difference between the value of the contract at the time it was opened and the value at the time it was closed.
29
Risks may arise upon entering into futures contracts from potential imperfect price correlations between the futures contracts and the underlying securities, from the possibility of an illiquid secondary market for these instruments and from the possibility that the Series could lose more than the initial margin requirements. The Series entering into stock index futures are subject to equity price risk from those futures contracts. Counterparty credit risk related to exchange-traded futures is minimal because the exchange’s clearinghouse, as counterparty to all exchange-traded futures, guarantees the futures against default.
Additional disclosure on derivative instruments is required showing a summary by primary risk exposure of the derivatives instruments’ (i) location in the balance sheet and fair value at period end and (ii) the location in the Statement of Operations and the realized and change in unrealized gain or loss over the reporting period. The following is a summary of the Series’ derivative instrument holdings for the year ended October 31, 2009.
At October 31, 2009, the Series had no outstanding futures contracts.
The following is a summary of the Series location of realized and change in unrealized gains and losses on the Series’ Statement of Operations for the Series’ derivative instrument holdings through the year ended October 31, 2009 (amounts in thousands):
| | |
Derivative Type | | Location of Gain (Loss) on Derivatives Recognized in Income |
Equity contracts | | Net Realized Gain (Loss) on: Futures
Change in Unrealized Appreciation (Depreciation) of: Futures |
The following is a summary of the realized and change in unrealized gains and losses from the Series’ derivative instrument holdings categorized by primary risk exposure through the year ended October 31, 2009 (amounts in thousands):
| | |
| | | Realized Gain (Loss)
on Derivatives
Recognized in Income |
| | | Equity
Contracts |
The Tax-Managed U.S. Marketwide Value Series* | | $2,063 |
| |
| | | Change in Unrealized
Appreciation (Depreciation) on
Derivatives Recognized in Income |
| | | Equity
Contracts |
The Tax-Managed U.S. Marketwide Value Series* | | $(16) |
| * | As of October 31, 2009, there were no futures contracts outstanding. During the year ended October 31, 2009, the Series had limited activity in these transactions. |
G. Line of Credit:
The Trust, together with other Dimensional-advised portfolios, has entered into an amended and restated $250 million unsecured discretionary line of credit effective July 8, 2009 with an affiliate of its domestic custodian bank. Each portfolio is permitted to borrow, subject to its investment limitations, up to a maximum of $250 million, as long as total borrowings under the line of credit do not exceed $250 million in the aggregate. Borrowings under the line of credit are charged interest at the then current Federal Funds Rate plus 1%. Each portfolio is individually, and not jointly, liable for its particular advances under the line of credit. There is no commitment fee on the unused portion of the line of credit. The agreement for the discretionary line of credit may be terminated by either party at any time. The line of credit is scheduled to expire on June 22, 2010.
30
For the year ended October 31, 2009, borrowings by the Series under this line of credit were as follows (amounts in thousands, except percentages and days):
| | | | | | | | |
Weighted
Average
Interest Rate | | Weighted
Average
Loan Balance | | Number of
Days
Outstanding | | Interest
Expense
Incurred | | Maximum Amount
Borrowed During
the Period |
1.96% | | $8,120 | | 19 | | $8 | | $18,993 |
There were no outstanding borrowings by the Series under this line of credit as of October 31, 2009.
The Trust, together with other Dimensional-advised portfolios, has also entered into an additional $500 million unsecured line of credit effective January 15, 2009 with its international custodian bank. Each portfolio is permitted to borrow, subject to its investment limitations, up to a maximum of $500 million, as long as total borrowings under the line of credit do not exceed $500 million in the aggregate. Each portfolio is individually, and not jointly, liable for its particular advances under the line of credit. Borrowings under the line of credit are charged interest at rates agreed to by the parties at the time of borrowing. There is no commitment fee on the unused portion of the line of credit. The agreement of the line of credit expires on January 15, 2010. There were no borrowings by the Series under this line of credit during the year ended October 31, 2009.
H. Securities Lending:
As of October 31, 2009, the Series had securities on loan to brokers/dealers, for which the Series held cash collateral. The Series invests the cash collateral, as described below, and records a liability for the return of the collateral, during the period the securities are on loan. Loans of securities are expected at all times to be secured by collateral equal to at least (i) 100% of the current market value of the loaned securities with respect to securities of the U.S. government or its agencies, (ii) 102% of the current market value of the loaned securities with respect to U.S. securities, and (iii) 105% of the current market value of the loaned securities with respect to foreign securities. However, daily market fluctuations could cause the Series’ collateral to be lower or higher than the expected thresholds. If this were to occur, the collateral would be adjusted the next business day to ensure adequate collateralization. In the event of default or bankruptcy by the other party to the agreement, realization and/or retention of the collateral may be subject to legal proceedings. If the borrower fails to return loaned securities, and cash collateral being maintained by the borrower is insufficient to cover the value of loaned securities and provided such collateral insufficiency is not the result of investment losses, the lending agent has agreed to pay the amount of the shortfall to the Series or, at the option of the lending agent, to replace the securities.
Subject to the Series’ investment policy, the cash collateral received by the Series from securities on loan is invested in securities of the U.S. government or its agencies, repurchase agreements collateralized by securities of the U.S. government or its agencies or shares of the DFA Short Term Investment Fund LP. Agencies include both agency debentures and agency mortgage backed securities. In addition, the Series will be able to terminate the loan at any time and will receive reasonable interest on the loan, as well as amounts equal to any dividends, interest or other distributions on the loaned securities. However, dividend income received from loaned securities may not be eligible to be taxed at qualified dividend income rates.
I. Indemnitees; Contractual Obligations:
Under the Trust’s organizational documents, its officers and trustees are indemnified against certain liabilities arising out of the performance of their duties to the Trust.
In the normal course of business, the Trust enters into contracts that contain a variety of representations and warranties which provide general indemnification. The Trust’s maximum exposure under these arrangements is unknown as this would involve future claims that may be made against the Trust and/or its affiliates that have not yet occurred. However, based on experience, the Trust expects the risk of loss to be remote.
31
J. Subsequent Event Evaluations:
Management has evaluated the impact of all subsequent events on the Series through December 23, 2009, the date the financial statements were available for issuance, and has determined that there are no subsequent events requiring recognition or disclosure in the financial statements.
32
REPORT OF INDEPENDENT REGISTERED PUBLIC ACCOUNTING FIRM
To the Shareholders of The Tax-Managed U.S. Marketwide Value Series and
Board of Trustees of The DFA Investment Trust Company:
In our opinion, the accompanying statements of assets and liabilities, including the summary schedules of portfolio holdings, and the related statements of operations and of changes in net assets and the financial highlights presents fairly, in all material respects, the financial position of The Tax-Managed U.S. Marketwide Value Series (one of the portfolios constituting The DFA Investment Trust Company, hereafter referred to as the “Series”) at October 31, 2009, the results of its operations for the year then ended, the changes in its net assets and the financial highlights for each of the periods indicated, in conformity with accounting principles generally accepted in the United States of America. These financial statements and financial highlights (hereafter referred to as “financial statements”) are the responsibility of the Series’ management; our responsibility is to express an opinion on these financial statements based on our audits. We conducted our audits of these financial statements in accordance with the standards of the Public Company Accounting Oversight Board (United States). Those standards require that we plan and perform the audit to obtain reasonable assurance about whether the financial statements are free of material misstatement. An audit includes examining, on a test basis, evidence supporting the amounts and disclosures in the financial statements, assessing the accounting principles used and significant estimates made by management, and evaluating the overall financial statement presentation. We believe that our audits, which included confirmation of securities at October 31, 2009 by correspondence with the custodian, brokers and the transfer agent of the investee fund, provide a reasonable basis for our opinion.
PricewaterhouseCoopers LLP
Philadelphia, Pennsylvania
December 23, 2009
33
RESULTS OF THE SHAREHOLDER MEETING
On June 2, 2009 and June 5, 2009, The DFA Investment Trust Company (“DFAITC”) held a Special Joint Meeting of Shareholders for the purpose of voting on several proposals affecting DFAITC and the Series, including, among other items, the election of Trustees, the amendment of certain fundamental investment limitations, and the elimination of certain fundamental investment limitations. The shareholders of the Series approved each of the applicable proposals for DFAITC and the Series presented at the Meeting. Listed below are the voting results from the Meeting. Please note that not all Proposals presented at the Meeting were voted on by the Series. Additionally, the Proposal numbers reflected below correlate to the Proposal numbers presented for vote at the Meeting.
DFAITC
| | | | | | | | | | | | | | | | | | | | |
| | | | | Shares Voted | | Percent of Outstanding Shares Voted |
| | | | | For | | % | | Against | | % | | Abstain/WithHold | | % | | For | | Against | | Abstain/WithHold |
Proposal 1: Election of Trustees for DFAITC* |
1a | | David G. Booth | | 2,166,359,402 | | 96.50% | | — | | 0.00% | | 78,661,259 | | 3.50% | | 95.78% | | 0.00% | | 3.48% |
1b | | George M. Constantinides | | 2,169,219,982 | | 96.62% | | — | | 0.00% | | 75,800,679 | | 3.38% | | 95.90% | | 0.00% | | 3.35% |
1c | | John P. Gould | | 2,168,577,186 | | 96.59% | | — | | 0.00% | | 76,443,476 | | 3.41% | | 95.88% | | 0.00% | | 3.38% |
1d | | Roger G. Ibbotson | | 2,169,778,365 | | 96.65% | | — | | 0.00% | | 75,242,297 | | 3.35% | | 95.93% | | 0.00% | | 3.33% |
1e | | Robert C. Merton | | 2,170,124,638 | | 96.66% | | — | | 0.00% | | 74,896,023 | | 3.34% | | 95.94% | | 0.00% | | 3.31% |
1f | | Myron S. Scholes | | 2,169,439,189 | | 96.63% | | — | | 0.00% | | 75,581,473 | | 3.37% | | 95.91% | | 0.00% | | 3.34% |
1g | | Eduardo A. Repetto | | 2,167,010,793 | | 96.53% | | — | | 0.00% | | 78,009,868 | | 3.47% | | 95.81% | | 0.00% | | 3.45% |
1h | | Abbie J. Smith | | 2,169,626,842 | | 96.64% | | — | | 0.00% | | 75,393,820 | | 3.36% | | 95.92% | | 0.00% | | 3.33% |
| | | | | | | | | | | | | | | | | | | | | | |
| | | Shares Voted | | Percent of Outstanding Shares Voted |
| | | For | | % | | Against | | % | | Abstain/WithHold | | % | | NonVote | | % | | For | | Against | | Abstain/WithHold |
Proposal 4: Approval of an Amended and Restated Agreement and Declaration of Trust for DFAITC* | | 2,076,877,329 | | 92.43% | | 36,623,148 | | 1.63% | | 133,356,326 | | 5.94% | | NA | | NA | | 91.82% | | 1.62% | | 5.90% |
| * | Results are for all Series within DFAITC |
The Tax-Managed U.S. Marketwide Value Series
| | | | | | | | | | | | | | | | | | | | |
| | | Shares Voted | | Percent of Outstanding Shares Voted |
| | | For | | % | | Against | | % | | Abstain/WithHold | | % | | For | | Against | | Abstain/WithHold |
Proposals: | | | | | | | | | | | | | | | | | | |
5 | | To approve amendments to certain fundamental investment restrictions |
5a | | Borrowing Money | | 146,890,401 | | 90.32% | | 4,215,416 | | 2.59% | | 11,527,664 | | 7.09% | | 90.32% | | 2.59% | | 7.09% |
5b | | Making Loans | | 146,648,973 | | 90.17% | | 4,349,979 | | 2.67% | | 11,634,529 | | 7.15% | | 90.17% | | 2.67% | | 7.15% |
5c | | Investments in Real Estate | | 146,728,379 | | 90.22% | | 4,371,378 | | 2.69% | | 11,533,725 | | 7.09% | | 90.22% | | 2.69% | | 7.09% |
5d | | Investments in Commodities | | 146,688,336 | | 90.20% | | 4,544,246 | | 2.79% | | 11,400,899 | | 7.01% | | 90.20% | | 2.79% | | 7.01% |
5e | | Diversification of Investments | | 148,013,098 | | 91.01% | | 3,279,120 | | 2.02% | | 11,341,263 | | 6.97% | | 91.01% | | 2.02% | | 6.97% |
6 | | To approve the elimination of certain fundamental investment restrictions |
6b | | Purchasing Securities on Margin | | 145,363,087 | | 89.38% | | 5,839,478 | | 3.59% | | 11,430,917 | | 7.03% | | 89.38% | | 3.59% | | 7.03% |
6e | | Investing in Other Investment Companies | | 147,177,599 | | 90.50% | | 4,082,139 | | 2.51% | | 11,373,744 | | 6.99% | | 90.50% | | 2.51% | | 6.99% |
6g | | Investing in Oil, Gas, or other Mineral Exploration, Leases or Development Programs | | 147,268,382 | | 90.55% | | 3,924,367 | | 2.41% | | 11,440,733 | | 7.03% | | 90.55% | | 2.41% | | 7.03% |
34
FUND MANAGEMENT
Trustees/Directors
Each Board of Trustees/Directors of The DFA Investment Trust Company Inc. (“DFAITC”), DFA Investment Dimensions Group Inc. (“DFAIDG”), Dimensional Investment Group Inc. (“DIG”) and Dimensional Emerging Markets Value Fund (“DEM”) (each, the “Fund” and collectively, the “Funds”) is responsible for establishing the Funds’ policies and for overseeing the management of the Funds. The Trustees/Directors of the Funds, including all of the disinterested Directors, have adopted written procedures to monitor potential conflicts of interest that might develop between portfolios of the Funds (the “Feeder Portfolios”) that invest in certain series of DFAITC or DEM (the “Master Funds”).
Each Board has two standing committees, an Audit Committee and a Portfolio Performance and Service Review Committee (the “Performance Committee”). The Audit Committee is comprised of George M. Constantinides, Roger G. Ibbotson and Abbie J. Smith. Each member of the Audit Committee is a disinterested Director. The Audit Committee oversees the Fund’s accounting and financial reporting policies and practices, the Fund’s internal controls, the Fund’s financial statements and the independent audits thereof and performs other oversight functions as requested by the Board. The Audit Committee recommends the appointment of each Fund’s independent registered certified public accounting firm and also acts as a liaison between the Fund’s independent registered certified public accounting firm and the full Board. There were two Audit Committee meetings held during the fiscal year ended October 31, 2009.
Each Board’s Performance Committee is comprised of Messrs. Constantinides and Ibbotson, Ms. Smith, John P. Gould, Myron S. Scholes and Robert C. Merton. Each member of the Fund’s Performance Committee is a disinterested Director. The Performance Committee regularly reviews and monitors the investment performance of the Fund’s series and reviews the performance of the Fund’s service providers. There were six Performance Committee meetings held during the fiscal year ended October 31, 2009.
Certain biographical information for each disinterested Trustee/Director and each interested Trustee/Director of the Funds is set forth in the tables below, including a description of each Trustee/Director’s experience as a Trustee/ Director of the Funds and as a director or trustee of other funds, as well as other recent professional experience.
The statements of additional information (together, “SAI”) of the Funds include additional information about each Trustee/Director. You may obtain copies of the SAI and prospectus of each Fund advised by Dimensional Fund Advisors LP by calling collect (512) 306-7400 or by mailing a request to Dimensional Fund Advisors LP, 6300 Bee Cave Road, Building One, Austin, Texas 78746. Prospectuses are also available at www.dimensional.com.
| | | | | | |
Name, Position
with the Fund,
Address and Age | | Term of Office1 and
Length of Service | | Portfolios within the
DFA Fund Complex2
Overseen | | Principal Occupation(s) During Past 5 Years and
Other Directorships of Public Companies Held |
Disinterested Trustees/Directors |
George M. Constantinides Director of DFAIDG, DIG and DEM.
Trustee of DFAITC.
The University of Chicago Booth School of Business 5807 S. Woodlawn
Avenue
Chicago, IL 60637
Age: 62 | | DFAITC - since 1993
DFAIDG - since 1983
DIG - since 1993
DEM - since 1993 | | 87 portfolios in 4
investment companies | | Leo Melamed Professor of Finance, The University of Chicago Booth School of Business. |
John P. Gould
Director of DFAIDG, DIG and DEM.
Trustee of DFAITC.
The University of Chicago Booth School of Business
5807 S. Woodlawn
Avenue
Chicago, IL 60637
Age: 70 | | DFAITC - since 1993
DFAIDG - since 1986
DIG - since 1993
DEM - since 1993 | | 87 portfolios in 4
investment companies | | Steven G. Rothmeier Distinguished Service Professor of Economics, The University of Chicago Booth School of Business (since 1965). Member of the Boards of Milwaukee Mutual Insurance Company (since 1997). Member and Chair, Competitive Markets Advisory Committee, Chicago Mercantile Exchange (futures trading exchange) (since 2004). Formerly, Director of UNext, Inc. (1999-2006). Formerly, Senior Vice-President, Lexecon Inc. (economics, law, strategy and finance consulting) (1994-2004). Trustee, Harbor Fund (registered investment company) (27 Portfolios) (since 1994). |
35
| | | | | | |
Name, Position
with the Fund,
Address and Age | | Term of Office1 and
Length of Service | | Portfolios within the
DFA Fund Complex2
Overseen | | Principal Occupation(s) During Past 5 Years and Other Directorships of Public Companies Held |
Roger G. Ibbotson
Director of DFAIDG, DIG
and DEM.
Trustee of DFAITC.
Yale School of
Management
135 Prospect Street
New Haven, CT
06520-8200
Age: 66 | | DFAITC - since 1993
DFAIDG - since 1981
DIG - since 1993
DEM - since 1993 | | 87 portfolios in 4
investment companies | | Professor in Practice of Finance, Yale School of Management (since 1984). Director, BIRR Portfolio Analysis, Inc. (software products) (since 1990). Chairman, CIO and Partner, Zebra Capital Management, LLC (hedge fund manager) (since 2001). Formerly, Chairman, Ibbotson Associates, Inc., Chicago, IL (software data publishing and consulting) (1977-2006). |
Robert C. Merton
Director of DFAIDG, DIG
and DEM.
Trustee of DFAITC.
Harvard Business School
353 Baker Library
Soldiers Field
Boston, MA 02163
Age: 65 | | DFAITC - - since 2003
DFAIDG - since 2003
DIG - since 2003
DEM - since 2003 | | 87 portfolios in 4
investment companies | | John and Natty McArthur University Professor, Graduate School of Business Administration, Harvard University (since 1998). Director, MF Risk, Inc. (risk management software) (since 2001). Director, Peninsula Banking Group (bank) (since 2003). Director, Community First Financial Group (bank holding company) (since 2003). Member Competitive Markets Advisory Council, Chicago Mercantile Exchange (futures trading exchange) (since 2004). Chairman and Director, Daedalus Software (medical software) (since 2008). Formerly, Advisory Board Member, Alpha Simplex Group (hedge fund) (2001-2007). Formerly, Chief Science Officer and Director, Trinsum Group, a successor to Integrated Finance Limited (2002-2008). Director, Vical Incorporated (biopharmaceutical product development) (since 2002). |
Myron S. Scholes
Director of DFAIDG, DIG
and DEM.
Trustee of DFAITC.
Platinum Grove Asset
Management, L.P.
Reckson Executive Park
1100 King Street
Building 4
Rye Brook, NY 10573
Age: 68 | | DFAITC - since 1993
DFAIDG - since 1981
DIG - since 1993
DEM - since 1993 | | 87 portfolios in 4
investment companies | | Frank E. Buck Professor Emeritus of Finance, Stanford University (since 1981). Chairman, Platinum Grove Asset Management, L.P. (hedge fund) (formerly, Oak Hill Platinum Partners) (since 1999). Formerly, Managing Partner, Oak Hill Capital Management (private equity firm) (until 2004). Formerly, Director, Chicago Mercantile Exchange (2001-2008). Director, American Century Fund Complex (registered investment companies) (37 Portfolios) (since 1981). |
Abbie J. Smith
Director of DFAIDG, DIG
and DEM.
Trustee of DFAITC.
The University of Chicago
Booth School of Business
5807 S. Woodlawn
Avenue
Chicago, IL 60637
Age: 56 | | DFAITC - - since 2000
DFAIDG - since 2000
DIG - since 2000
DEM - since 2000 | | 87 portfolios in 4
investment companies | | Boris and Irene Stern Professor of Accounting, The University of Chicago Booth School of Business (since 1980), and Co-Director Investment Research, Fundamental Investment Advisors (hedge fund) (since 2008). Director, HNI Corporation (formerly known as HON Industries Inc.) (office furniture) (since 2000). Director, Ryder System Inc. (transportation, logistics and supply-chain management) (since 2003). Director/ Trustee, UBS Funds (fund complex) (5 portfolios) (since 2008). |
36
| | | | | | |
Name, Position with the Fund, Address and Age | | Term of Office1 and Length of Service | | Portfolios within the DFA Fund Complex2 Overseen | | Principal Occupation(s) During Past 5 Years and Other Directorships of Public Companies Held |
Interested Trustees/Directors* |
David G. Booth
Chairman, Director, Chief
Executive Officer and
President of DFAIDG, DIG
and DEM. Chairman,
Trustee, Chief Executive
Officer, Chief Investment
Officer and President of
DFAITC.
6300 Bee Cave Road,
Building One
Austin, Texas 78746
Age: 62 | | DFAITC - since 1993
DFAIDG - since 1981
DIG - since 1992
DEM - since 1993 | | 87 portfolios in 4
investment companies | | Chairman, Director/Trustee, President, Chief Executive Officer and formerly Chief Investment Officer of the following companies: Dimensional Holdings Inc., Dimensional Fund Advisors LP, Dimensional Fund Advisors Canada ULC, DFAIDG, DIG, DEM and DFAITC. President and Chief Executive Officer of DFA Securities LLC. Director of Dimensional Fund Advisors Ltd, and formerly Chief Investment Officer. Director and formerly, President and Chief Investment Officer of DFA Australia Ltd. Formerly, Director of Dimensional Funds PLC and Dimensional Fund II PLC. Chairman, Director and Chief Executive Officer of Dimensional Fund Advisors Canada ULC (All Chief Investment Officer positions held starting 1/03 through 3/07 except Dimensional Holdings Inc., which was from 10/06 through 3/07.) Limited Partner, Oak Hill Partners (since 2001) and VSC Investors, LLC (since 2007). Trustee, The University of Chicago Booth School of Business. Formerly, Director, SA Funds (registered investment company). Formerly Director, Assante Corporation (investment management) (until 2002). |
Eduardo A. Repetto
Director, Chief Investment
Officer and Vice President
of DFAIDG, DIG and
DEM.
Trustee, Chief Investment
Officer and Vice President
of DFAITC
6300 Bee Cave Road,
Building One
Austin, TX 78746
Age: 42 | | DFAITC - since 2009
DFAIDG - since 2009
DIG - since 2009
DEM - since 2009 | | 87 portfolios in 4
investment companies | | Director/Trustee (beginning June 2009), Chief Investment Officer (beginning March 2007) and Vice President of DFAIDG, DIG, DEM and DFAITC. Chief Investment Officer (beginning March 2007) and Vice President of all the DFA Entities, DFA Australia Limited and Dimensional Fund Advisors Canada ULC. |
| | 1 | Each Trustee/Director holds office for an indefinite term until his or her successor is elected and qualified. |
| | 2 | Each Trustee/Director is a director or trustee of each of the four registered investment companies within the DFA Fund Complex, which includes the Funds. |
| | * | Interested Trustees/Directors are described as such because they are deemed to be “interested persons,” as that term is defined under the Investment Company Act of 1940, as amended, due to their positions with Dimensional Fund Advisors LP. |
37
Officers
The name, age, information regarding positions with the Funds and the principal occupation for each officer of the Funds are set forth below. Each officer listed below holds the same office (except as otherwise noted) in the following entities: Dimensional Fund Advisors LP (prior to November 3, 2006, Dimensional Fund Advisors Inc.) (“Dimensional”), DFA Securities Inc., DFAIDG, DIG, DFAITC and DEM (collectively, the “DFA Entities”). The address of each officer is: Dimensional Fund Advisors LP, 6300 Bee Cave Road, Building One, Austin, Texas 78746, unless otherwise indicated.
| | | | |
Name, Position with the Fund
and Age | | Term of Office1
and Length of
Service | | Principal Occupation(s) During Past 5 Years |
Officers |
April A. Aandal
Vice President and Chief Learning Officer
Age: 46 | | Since 2008 | | Vice President of all the DFA Entities. Chief Learning Officer of Dimensional (since September 2008). Formerly, Regional Director of Dimensional (2004-2008); Vice President of Professional Development at Assante Asset Management (June 2002-January 2005). |
Darryl D. Avery
Vice President
Age: 43 | | Since 2005 | | Vice President of all the DFA Entities. From June 2002 to January 2005, institutional client service representative of Dimensional. |
Arthur H. Barlow
Vice President
Age: 53 | | Since 1993 | | Vice President of all the DFA Entities. Formerly, Vice President of DFA Australia Limited and Dimensional Fund Advisors Ltd. |
Scott A. Bosworth
Vice President
Age: 40 | | Since 2007 | | Vice President of all the DFA Entities. Regional Director of Dimensional (since November 1997). |
Valerie A. Brown
Vice President and Assistant Secretary
Age: 42 | | Since 2001 | | Vice President and Assistant Secretary of all the DFA Entities, DFA Australia Limited, Dimensional Fund Advisors Ltd., and since June 2003, Dimensional Fund Advisors Canada ULC. |
David P. Butler
Vice President
Age: 45 | | Since 2007 | | Vice President of all the DFA Entities. Director of Global Financial Services of Dimensional (since 2008). Formerly, Regional Director of Dimensional Fund Advisors LP (January 1995 to January 2005). |
Patrick Carter
Vice President
Age: 47 | | Since 2007 | | Vice President of all the DFA Entities. Regional Director of Dimensional (since March 2006). Formerly, Director of Merrill Lynch Retirement Group (December 1998 to March 2006). |
Joseph H. Chi
Vice President
Age: 43 | | Since 2009 | | Vice President of all the DFA Entities. Portfolio Manager for Dimensional Fund Advisors LP (since October 2005). Prior to October 2005, Corporate Counsel at Hewitt Associates (July 2002-August 2005). |
Stephen A. Clark
Vice President
Age: 37 | | Since 2004 | | Vice President of all the DFA Entities. Formerly, Portfolio Manager of Dimensional (April 2001-April 2004). |
Robert P. Cornell
Vice President
Age: 60 | | Since 2007 | | Vice President of all the DFA Entities. Regional Director of Financial Services Group of Dimensional (since August 1993). |
Christopher S. Crossan
Vice President and Chief Compliance Officer
Age: 43 | | Since 2004 | | Vice President and Chief Compliance Officer of all the DFA Entities. |
James L. Davis
Vice President
Age: 52 | | Since 1999 | | Vice President of all the DFA Entities. Formerly, Vice President of DFA Australia Limited and Dimensional Fund Advisors Ltd. |
Robert T. Deere
Vice President
Age: 52 | | Since 1994 | | Vice President of all the DFA Entities and DFA Australia Limited. |
Robert W. Dintzner
Vice President
Age: 39 | | Since 2001 | | Vice President of all the DFA Entities. |
38
| | | | |
Name, Position with the Fund
and Age | | Term of Office1
and Length of
Service | | Principal Occupation(s) During Past 5 Years |
Kenneth Elmgren
Vice President
Age: 55 | | Since 2007 | | Vice President of all the DFA Entities. Formerly, Managing Principal of Beverly Capital (May 2004 to September 2006). |
Richard A. Eustice
Vice President and Assistant
Secretary
Age: 44 | | Since 1998 | | Vice President and Assistant Secretary of all the DFA Entities and DFA Australia Limited. Chief Operating Officer of Dimensional Fund Advisors Ltd. (since July 2008). Formerly, Vice President of Dimensional Fund Advisors Ltd. |
Eugene F. Fama, Jr.
Vice President
Age: 48 | | Since 1993 | | Vice President of all the DFA Entities. Formerly, Vice President of DFA Australia Limited and Dimensional Fund Advisors Ltd. |
Gretchen A. Flicker
Vice President
Age: 38 | | Since 2004 | | Vice President of all the DFA Entities. Prior to April 2004, institutional client service representative of Dimensional. |
Jed S. Fogdall
Vice President
Age: 35 | | Since 2008 | | Vice President of all the DFA Entities. Portfolio Manager for Dimensional (since September 2004). Prior to September 2004, Staff Engineer at the Boeing Company (1997-2004). |
Glenn S. Freed
Vice President
Age: 47 | | Since 2001 | | Vice President of all the DFA Entities. |
Jeremy P. Freeman
Vice President
Age: 38 | | Since 2009 | | Vice President of all the DFA Entities. Senior Technology Manager for Dimensional Fund Advisors LP (since June 2006). Formerly, Principal at AIM Investments/Amvescap PLC (now Invesco) (June 1998-June 2006). |
Mark R. Gochnour
Vice President
Age: 42 | | Since 2007 | | Vice President of all the DFA Entities. Regional Director of Dimensional. |
Henry F. Gray
Vice President
Age: 42 | | Since 2000 | | Vice President of all the DFA Entities. Prior to July 2000, Portfolio Manager of Dimensional. Formerly, Vice President of DFA Australia Limited. |
John T. Gray
Vice President
Age: 35 | | Since 2007 | | Vice President of all the DFA Entities. Formerly, Regional Director of Dimensional (January 2005 to February 2007). |
Darla Hastings
Vice President
Age: 54 | | Since 2007 | | Vice President of all the DFA Entities. Chief Marketing Officer of Dimensional. Formerly, Senior Vice President, Customer Experience for Benchmark Assisted Living (May 2005 to April 2006); Executive Vice President and Chief Marketing Officer of State Street Corporation (September 2001 to October 2005). |
Joel H. Hefner
Vice President
Age: 41 | | Since 2007 | | Vice President of all the DFA Entities. Regional Director of Dimensional (since June 1998). |
Julie Henderson
Vice President and Fund Controller
Age: 35 | | Since 2005 | | Vice President and Fund Controller of all the DFA Entities. Formerly, Senior Manager at PricewaterhouseCoopers LLP (July 1996 to April 2005). |
Kevin Hight Vice President
Age: 41 | | Since 2005 | | Vice President of all the DFA Entities. Formerly, Regional Director of Dimensional (since March 2003 to March 2005). |
Christine W. Ho
Vice President
Age: 41 | | Since 2004 | | Vice President of all the DFA Entities. Prior to April 2004, Assistant Controller of Dimensional. |
Jeff J. Jeon
Vice President
Age: 35 | | Since 2004 | | Vice President of all the DFA Entities. Counsel of Dimensional (since September 2001). |
Patrick M. Keating
Vice President
Age: 54 | | Since 2003 | | Vice President of all the DFA Entities and Chief Operating Officer of Dimensional. Director, Vice President and Chief Privacy Officer of Dimensional Fund Advisors Canada ULC. Director of DFA Australia Limited. |
39
| | | | |
Name, Position with the Fund
and Age | | Term of Office1
and Length of
Service | | Principal Occupation(s) During Past 5 Years |
Joseph F. Kolerich
Vice President
Age: 37 | | Since 2004 | | Vice President of all the DFA Entities. Portfolio Manager for Dimensional (since April 2001). |
Michael F. Lane
Vice President
Age: 42 | | Since 2004 | | Vice President of all the DFA Entities. Formerly, Vice President of Advisor Services at TIAA-CREF (July 2001 to September 2004). |
Kristina M. LaRusso
Vice President
Age: 34 | | Since 2006 | | Vice President of all DFA Entities. Formerly, Operations Supervisor of Dimensional (March 2003 to December 2006). |
Inmoo Lee
Vice President
Age: 43 | | Since 2007 | | Vice President of all the DFA Entities. Associate Professor Department of Finance and Accounting, Business School, National University of Singapore (July 2004 to present); Associate Professor, College of Business Administration, Korea University (September 2001 to May 2006). |
Juliet Lee Vice President
Age: 38 | | Since 2005 | | Vice President of all the DFA Entities. Human Resources Manager of Dimensional (since January 2004). |
Aaron M. Marcus
Vice President & Head of Global
Human Resources
Age: 39 | | Since 2008 | | Vice President and Head of Global Human Resources of Dimensional. Formerly, Global Head of Recruiting and Vice President of Goldman Sachs & Co. (June 2006 to January 2008); Global Co-Head of HR of the Equities & FICC Division, and Vice President of Goldman Sachs & Co. (May 2005 to May 2006); Head of Americas Campus Recruiting and Vice President of Goldman Sachs & Co. (April 2003 to May 2005). |
David R. Martin
Vice President, Chief Financial Officer
and Treasurer
Age: 52 | | Since 2007 | | Vice President, Chief Financial Officer and Treasurer of all the DFA Entities. Director, Vice President, Chief Financial Officer and Treasurer of Dimensional Fund Advisors Ltd. and DFA Australia Limited. Chief Financial Officer, Treasurer, and Vice President of Dimensional Fund Advisors Canada ULC. Director of Dimensional Funds PLC and Dimensional Funds II PLC. Formerly, Executive Vice President and Chief Financial Officer of Janus Capital Group Inc. (June 2005 to March 2007); Senior Vice President of Finance at Charles Schwab & Co., Inc. (March 1999 to May 2005). |
Catherine L. Newell
Vice President and Secretary
Age: 45 | | Vice President since 1997 and Secretary since 2000 | | Vice President and Secretary of all the DFA Entities. Director, Vice President and Secretary of DFA Australia Limited and Dimensional Fund Advisors Ltd. (since February 2002, April 1997 and May 2002, respectively). Vice President and Secretary of Dimensional Fund Advisors Canada ULC (since June 2003). Director, Dimensional Funds PLC and Dimensional Funds II PLC (since 2002 and 2006, respectively). Formerly, Assistant Secretary of all DFA Entities, DFA Australia Limited and Dimensional Fund Advisors Ltd. |
Christian Newton
Vice President
Age: 34 | | Since 2009 | | Vice President of all DFA Entities. Web Services Manager for Dimensional Fund Advisors LP (Since January 2008). Formerly Design Manager (2005-2008) and Web Developer (2002-2005) of Dimensional Fund Advisors LP. |
Gerard K. O’Reilly
Vice President
Age: 32 | | Since 2007 | | Vice President of all the DFA Entities. Formerly, Research Associate of Dimensional Fund Advisors LP (2004 to 2006); Research Assistant in PhD program, Aeronautics Department California Institute of Technology (1998 to 2004). |
Daniel C. Ong
Vice President
Age: 35 | | Since 2009 | | Vice President of all the DFA Entities. Portfolio Manager for Dimensional Fund Advisors LP (since July 2005). Prior to 2005, Graduate Student at the University of Chicago Booth School of Business (2003-2005). |
Carmen Palafox
Vice President
Age: 35 | | Since 2006 | | Vice President of all the DFA Entities. Operations Manager of Dimensional Fund Advisors LP (since May 1996). |
Sonya Park
Vice President
Age: 37 | | Since 2005 | | Vice President of all the DFA Entities. From February 2002 to January 2005, institutional client service representative of Dimensional. |
40
| | | | |
Name, Position with the Fund
and Age | | Term of Office1
and Length of Service | | Principal Occupation(s) During Past 5 Years |
David A. Plecha
Vice President
Age: 48 | | Since 1993 | | Vice President of all the DFA Entities, DFA Australia Limited and Dimensional Fund Advisors Ltd |
Ted Randall
Vice President
Age: 36 | | Since 2008 | | Vice President of all the DFA Entities. Formerly, Research Associate of Dimensional (2006-2008). Systems Developer of Dimensional (2001-2006). |
L. Jacobo Rodriguez
Vice President
Age: 38 | | Since 2005 | | Vice President of all the DFA Entities. From August 2004 to July 2005, institutional client service representative of Dimensional. Formerly, Financial Services Analyst, Cato Institute (September 2001 to June 2004); Book Review Editor, Cato Journal, Cato Institute (May 1996 to June 2004). |
David E. Schneider
Vice President
Age: 63 | | Since 2001 | | Vice President of all the DFA Entities. Currently, Director of Institutional Services. |
Bruce A. Simmons
Vice President
Age: 44 | | Since 2009 | | Vice President of all the DFA Entities. Investment Operations Manager for Dimensional Fund Advisors LP (since May 2007). Formerly, Vice President Client and Fund Reporting at Mellon Financial (September 2005-May 2007); Vice President Business Development at CUADPRO Marketing (July 2003-September 2005). |
Ted R. Simpson
Vice President
Age: 41 | | Since 2007 | | Vice President of all the DFA Entities. Regional Director of Dimensional (since December 2002). |
Bryce D. Skaff
Vice President
Age: 34 | | Since 2007 | | Vice President of all the DFA Entities. Formerly, Regional Director of Dimensional (December 1999 to January 2007). |
Grady M. Smith
Vice President
Age: 53 | | Since 2004 | | Vice President of all the DFA Entities. Prior to April 2004, Portfolio Manager of Dimensional. |
Carl G. Snyder
Vice President
Age: 46 | | Since 2000 | | Vice President of all the DFA Entities. Formerly, Vice President of DFA Australia Limited. |
Lawrence R. Spieth
Vice President
Age: 61 | | Since 2004 | | Vice President of all the DFA Entities. Prior to April 2004, Regional Director of Dimensional. |
Bradley G. Steiman
Vice President
Age: 36 | | Since 2004 | | Vice President of all the DFA Entities and Director and Vice President of Dimensional Fund Advisors Canada ULC. |
Robert C. Trotter
Vice President
Age: 51 | | Since 2009 | | Vice President of all the DFA Entities. Senior Manager Technology for Dimensional Fund Advisors LP (since March 2007). Formerly, Director of Technology at AMVESCAP (2002-2007). |
Karen E. Umland
Vice President
Age: 43 | | Since 1997 | | Vice President of all the DFA Entities, DFA Australia Limited, Dimensional Fund Advisors Ltd., and Dimensional Fund Advisors Canada ULC. |
Sunil Wahal
Vice President
Age: 42 | | Since 2009 | | Vice President of all the DFA Entities. Formerly, Research Associate for Dimensional Fund Advisors LP (July 2008-January 2009); Consultant to Dimensional Fund Advisors LP (September 2005-July 2008); Jack D. Furst Professor of Finance at Arizona State University, WP Carey School of Business (July 2005-July 2008); Associate Professor of Finance at Goizueta Business School, Emory University (1997-2005). |
Brian J. Walsh
Vice President
Age: 39 | | Since 2009 | | Vice President of all the DFA Entities. Portfolio Manager for Dimensional Fund Advisors LP (since 2004). Formerly, Trader for Dimensional Fund Advisors LP (1997-2004). |
Carol W. Wardlaw
Vice President
Age: 51 | | Since 2004 | | Vice President of all the DFA Entities. Prior to April 2004, Regional Director of Dimensional. |
41
| | | | |
Name, Position with the Fund
and Age | | Term of Office1 and Length of Service | | Principal Occupation(s) During Past 5 Years |
Weston J. Wellington
Vice President
Age: 58 | | Since 1997 | | Vice President of all the DFA Entities. Formerly, Vice President of DFA Australia Limited. |
Daniel M. Wheeler
Vice President
Age: 64 | | Since 2001 | | Vice President of all the DFA Entities. Prior to 2001 and currently, Director of Financial Advisors Services of Dimensional. Director of Dimensional Fund Advisors Ltd. (since October 2003) and President of Dimensional Fund Advisors Canada ULC (since June 2003). |
Ryan Wiley
Vice President
Age: 33 | | Since 2007 | | Vice President of all the DFA Entities. Senior Trader of Dimensional. Formerly, Portfolio Manager (2006 to 2007); Trader (2001 to 2006). |
Paul E. Wise
Vice President
Age: 54 | | Since 2005 | | Vice President of all the DFA Entities. Chief Technology Officer for Dimensional (since 2004). Formerly, Principal of Turnbuckle Management Group (January 2002 to August 2004). |
| | 1 | Each officer holds office for an indefinite term at the pleasure of the Boards of Trustees/Directors and until his or her successor is elected and qualified. |
42
VOTING PROXIES ON FUND PORTFOLIO SECURITIES
A description of the policies and procedures that the Trust uses in voting proxies relating to securities held in the portfolio is available without charge, upon request, by calling collect: (512) 306-7400. Information regarding how the Advisor votes these proxies is available from the EDGAR database on the SEC’s website at http://www.sec.gov and from the Advisor’s website at http://www.dimensional.com and reflects the twelve-month period beginning July 1st and ending June 30th.
43
NOTICE TO SHAREHOLDERS
(Unaudited)
For shareholders that do not have an October 31, 2009 tax year end, this notice is for informational purposes only. For shareholders with an October 31, 2009 tax year end, please consult your tax advisor as to the pertinence of this notice. For the fiscal year November 1, 2008 to October 31, 2009, the Portfolio is designating the following items with regard to distributions paid during the period. All designations are based on financial information available as of the date of this annual report and, accordingly are subject to change. For each item, it is the intention of the Portfolio to designate the maximum amount permitted under the Internal Revenue Code and the regulations thereunder.
| | | | | | | | | | | | | | |
Dimensional Investment Group Inc. | | Net
Investment
Income
Distributions | | Long-Term
Capital Gain
Distributions | | Total
Distributions | | Qualifying
For Corporate
Dividends
Received
Deduction(1) | | Qualifying
Dividend
Income(2) | | Qualifying
Interest
Income(3) | | Qualifying
Short-Term
Capital Gain(4) |
Tax-Managed U.S. Marketwide Value Portfolio II | | 100% | | — | | 100% | | 100% | | 100% | | 100% | | 100% |
| (1) | Qualifying dividends represent dividends which qualify for the corporate dividends received deduction and is reflected as a percentage of ordinary income distributions (the total of short-term capital gain and net investment income distributions). |
| (2) | The percentage in this column represents the amount of “Qualifying Dividend Income” as created by the Jobs and Growth Tax Relief Reconciliation Act of 2003 and is reflected as a percentage of ordinary income distributions (the total of short term capital gain and net investment income distributions). |
| (3) | The percentage in this column represents the amount of “Qualifying Interest Income” as created by The American Jobs Creation Act of 2004. The information is reflected as a percentage of ordinary income distributions (the total of short-term capital gain and net investment income distributions). |
| (4) | The percentage in this column represents the amount of “Qualifying Short-Term Capital Gain” as created by The American Jobs Creation Act of 2004. The information is reflected as a percentage of ordinary income distributions (the total of short-term capital gain and net investment income distributions). |
44


Dimensional Fund Advisors
6300 Bee Cave Road, Building One
Austin, TX 78746
December 2009
Dear Fellow Shareholder,
After sinking to ten-year lows, stock prices around the world rebounded sharply in March 2009 and posted steady gains in the seven months between March and September. March and April were among the best-return months in the life of Dimensional’s equity Funds.
The unexpected turns in the financial markets this year offered some valuable lessons. We were reminded that stock prices are unpredictable. We saw once again the benefits of staying disciplined in the market as it inevitably moves up and down. And I believe these markets showed very clearly why diversification is so important to long-term investment success.
Although diversification can’t prevent losses, it can help investors avoid the extreme outcomes that can result from concentrating investments in individual stocks or market segments. We believe that successful investing is about both increasing wealth and being able to sleep well at night. Investors who understand how markets work and have a realistic understanding of their own tolerance for risk are most likely to have a good overall experience.
More than $10 billion in net long-term assets flowed into Dimensional’s Funds during the first 10 months of 2009, a reflection of the trust our shareholders around the world have placed in us. We are grateful for that trust and want you to know that we take our responsibility as the steward of your investments in Dimensional’s Funds very seriously. We hope to have the opportunity to continue serving your needs for many years to come.
Sincerely,

David G. Booth
Chairman and Chief Executive Officer
[THIS PAGE INTENTIONALLY LEFT BLANK]
ANNUAL REPORT
Table of Contents
This report is submitted for the information of the Fund’s shareholders. It is not authorized for distribution to prospective investors unless preceded or accompanied by an effective prospectus.
i
[THIS PAGE INTENTIONALLY LEFT BLANK]
DIMENSIONAL INVESTMENT GROUP INC.
THE DFA INVESTMENT TRUST COMPANY
DEFINITIONS OF ABBREVIATIONS AND FOOTNOTES
Statement of Assets and Liabilities/Summary Schedule of Portfolio Holdings
Investment Abbreviations
| | ADR | American Depositary Receipt |
| | FNMA | Federal National Mortgage Association |
| | P.L.C. | Public Limited Company |
Investment Footnotes
| | † | See Note B to Financial Statements. |
| | †† | Securities have generally been fair valued. See Note B to Financial Statements. |
| | ** | Calculated as a percentage of total net assets. Percentages shown parenthetically next to the category headings have been calculated as a percentage of total investments. “Other Securities” are those securities that are not among the top 50 holdings of the Fund or do not represent more than 1.0% of the net assets of the Fund. Some of the individual securities within this category may include Total or Partial Securities on Loan and/or Non-Income Producing Securities. |
| | * | Non-Income Producing Securities. |
| | # | Total or Partial Securities on Loan. |
| | @ | Security purchased with cash proceeds from Securities on Loan. |
Financial Highlights
| | (A) | Computed using average shares outstanding. |
| | (D) | Represents the combined ratios for the respective portfolio and its respective pro-rata share of its Master Fund Series. |
All Statements and Schedules
| | — | Amounts designated as — are either zero or rounded to zero. |
| | RIC | Registered Investment Company |
| | SEC | Securities and Exchange Commission |
1
DIMENSIONAL INVESTMENT GROUP INC.
PERFORMANCE CHART
DFA International Value Portfolio II vs.
MSCI World ex USA Index (net dividends)
October 31, 1999-October 31, 2009
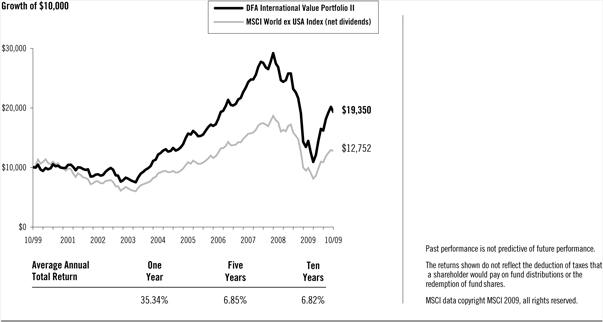
2
DIMENSIONAL INVESTMENT GROUP INC.
MANAGEMENT’S DISCUSSION AND ANALYSIS
International Equity Market Review | 12 Months Ended October 31, 2009 |
The one-year period ending October 31, 2009, was characterized by unprecedented volatility in non-US developed markets. Non-US developed markets lost 18.87% from November 2008 through February 2009, as measured by the MSCI World ex USA Index (net dividends). From March through October 2009 these same markets gained 57.56%. In April 2009, the Index had its largest-ever monthly gain (12.90%) since October 1990.
From November 2008 through February 2009, developed markets returns were negative across all asset classes. The US dollar rallied against most currencies, reversing a general trend of depreciation dating back to 2006. From March through October 2009 the market reversed course, with small cap and value stocks strongly outperforming large cap and growth stocks. The US dollar depreciated against most major currencies. The rally drove strong positive returns for the 12-month period, with small cap stocks significantly outperforming large cap stocks and value stocks outperforming growth stocks, as measured by the MSCI indexes.
| | | | | | |
12 Months Ended October 31, 2009 | |
Ten Largest Foreign Developed Markets by Market Cap (BB) | | Local
Currency
Return | | | U.S. Dollar
Return | |
Japan ($2,432) | | 6.03 | % | | 15.20 | % |
United Kingdom ($2,328) | | 23.19 | % | | 25.68 | % |
France ($1,106) | | 10.09 | % | | 28.10 | % |
Canada ($1,060) | | 17.46 | % | | 32.58 | % |
Australia ($912) | | 21.91 | % | | 66.97 | % |
Germany ($843) | | 6.37 | % | | 23.77 | % |
Switzerland ($821) | | 5.78 | % | | 20.63 | % |
Spain ($488) | | 33.27 | % | | 55.06 | % |
Italy ($388) | | 7.57 | % | | 25.17 | % |
Netherlands ($277) | | 20.17 | % | | 39.83 | % |
Country market capitalizations (in parentheses) are in USD billions. Source: Returns are of MSCI indices net of foreign withholding taxes on dividends. Country market capitalizations are based on country carve-outs of the MSCI All-Country World Investable Market Index. MSCI data copyright MSCI 2009, all rights reserved.
Small company stocks were the best-performing asset class in international markets, while growth stocks had the worst relative results.
| | | |
12 Months Ended October 31, 2009 | |
| | | U.S. Dollar
Return | |
MSCI World ex USA Small Cap Index | | 50.01 | % |
MSCI World ex USA Value Index | | 31.71 | % |
MSCI World ex USA Index | | 27.83 | % |
MSCI World ex USA Growth Index | | 24.03 | % |
Source: MSCI indices are net of foreign withholding taxes on dividends, copyright MSCI 2009, all rights reserved.
3
Master-Feeder Structure
The Portfolio described below, called a “Feeder Fund,” does not buy individual securities directly; instead, the Portfolio invests in a corresponding fund called a “Master Fund”. The Master Fund, in turn, purchases stocks and/or other securities.
International Equity Portfolio Performance Overview
DFA International Value Portfolio II
The DFA International Value Portfolio II seeks to capture the returns of international large company value stocks by purchasing shares of a Master Fund that invests in such stocks. The investment strategy employs a disciplined, quantitative approach, emphasizing broad diversification and consistent exposure to large cap value stocks, but does not attempt to track closely a specific equity index. As of October 31, 2009, the Master Fund held 465 stocks in 22 developed countries and was mostly invested in equities throughout the year: the average non-equitized cash level for the period was less than 1% of the Master Fund’s assets.
As a result of the Master Fund’s diversified investment approach, performance was determined principally by broad structural trends in global equity markets rather than the behavior of a limited number of stocks. For the 12 months ended October 31, 2009, value stocks outperformed growth stocks in international developed markets. Total returns were 35.34% for the Portfolio and 27.83% for the MSCI World ex USA Index (net dividends). The Master Fund’s greater allocation than the Index to value stocks (66% on average vs. 26% in the Index) added approximately 6.7% to the relative performance.
4
DIMENSIONAL INVESTMENT GROUP INC.
DFA INTERNATIONAL VALUE PORTFOLIO II
DISCLOSURE OF FUND EXPENSES
(Unaudited)
The following Expense Table is shown so that you can understand the impact of fees on your investment. All mutual funds have operating expenses. As a shareholder of the fund, you incur ongoing costs, which include costs for portfolio management, administrative services, and shareholder reports, among others. Operating expenses, legal and audit services, which are deducted from a fund’s gross income, directly reduce the investment return of the fund. A fund’s expenses are expressed as a percentage of its average net assets. This figure is known as the expense ratio. The following examples are intended to help you understand the ongoing costs, in dollars, of investing in the fund and to compare these costs with those of other mutual funds. The examples are based on an investment of $1,000 made at the beginning of the period shown and held for the entire period.
The Expense Table below illustrates your fund’s costs in two ways.
Actual Fund Return
This section helps you to estimate the actual expenses after fee waivers that you paid over the period. The “Ending Account Value” shown is derived from the fund’s actual return and “Expenses Paid During Period” reflect the dollar amount that would have been paid by an investor who started with $1,000 in the fund. You may use the information here, together with the amount you invested, to estimate the expenses that you paid over the period.
To do so, simply divide your account value by $1,000 (for example, a $7,500 account value divided by $1,000 = 7.5), then multiply the result by the number given for your fund under the heading “Expenses Paid During Period.”
Hypothetical Example for Comparison Purposes
This section is intended to help you compare your fund’s costs with those of other mutual funds. The hypothetical “Ending Account Value” and “Expenses Paid During Period” are derived from the fund’s actual expense ratio and an assumed 5% annual return before expenses. In this case, because the return used is not the fund’s actual return, the results do not apply to your investment. The example is useful in making comparisons because the SEC requires all mutual funds to calculate expenses based on a 5% annual return. You can assess your fund’s costs by comparing this hypothetical example with the hypothetical examples that appear in shareholder reports of other funds.
Please note that the expenses shown in the table are meant to highlight and help you compare ongoing costs only and do not reflect any transactional costs, if applicable. The “Annualized Expense Ratio” represents the actual expenses for the six-month period indicated.
| | | | | | | | | | | | |
| Six Months Ended October 31, 2009 |
EXPENSE TABLE | | | | | | | | | | | | |
| | | Beginning
Account
Value
05/01/09 | | Ending
Account
Value
10/31/09 | | Annualized
Expense
Ratio* | | | Expenses
Paid
During
Period* |
Actual Fund Return | | $ | 1,000.00 | | $ | 1,350.30 | | 0.33 | % | | $ | 1.95 |
Hypothetical 5% Annual Return | | $ | 1,000.00 | | $ | 1,023.54 | | 0.33 | % | | $ | 1.68 |
| * | Expenses are equal to the fund’s annualized expense ratio for the six-month period, multiplied by the average account value over the period, multiplied by the number of days in the most recent six-month period (184), then divided by the number of days in the year (365) to reflect the six-month period. The Portfolio is a Feeder Fund. The expenses shown reflect the direct expenses of the Feeder Fund and the indirect payment of the Feeder Fund’s portion of the expenses of its Master Fund. |
5
DIMENSIONAL INVESTMENT GROUP INC.
DFA INTERNATIONAL VALUE PORTFOLIO II
DISCLOSURE OF PORTFOLIO HOLDINGS
(Unaudited)
The SEC requires that all Funds file a complete Schedule of Investments with the SEC for their first and third fiscal quarters on Form N-Q. For Dimensional Investment Group Inc., this would be for the fiscal quarters ending January 31 and July 31. The Form N-Q filing must be made within 60 days of the end of the quarter. Dimensional Investment Group Inc. filed its most recent Form N-Q with the SEC on September 29, 2009. It is available upon request, without charge, by calling collect: (512) 306-7400 or by mailing a request to Dimensional Fund Advisors LP, 6300 Bee Cave Road, Building One, Austin, Texas 78746, or by visiting the SEC’s website at http://www.sec.gov, or they may be reviewed and copied at the SEC’s Public Reference Room in Washington, D.C. (call 1-800-732-0330 for information on the operation of the Public Reference Room).
PORTFOLIO HOLDINGS
The SEC requires that all Funds present their categories of portfolio holdings in a table, chart or graph format in their annual and semi-annual shareholder reports, whether or not a Schedule of Investments is utilized. The following table, which presents portfolio holdings as a percent of total investments before short-term investments and collateral for loaned securities, is provided in compliance with such requirement.
The categories of industry classification for the Affiliated Investment Company are represented in the Disclosure of Portfolio Holdings, which are included elsewhere within the report. Refer to the Summary Schedule of Portfolio Holdings for the underlying Master Fund’s holdings which reflect the investments by country.
| | | |
Affiliated Investment Company | | 100.0 | % |
6
DIMENSIONAL INVESTMENT GROUP INC.
DFA INTERNATIONAL VALUE PORTFOLIO II
STATEMENT OF ASSETS AND LIABILITIES
OCTOBER 31, 2009
(Amounts in thousands, except share and per share amounts)
| | | |
ASSETS: | | | |
Investment in The DFA International Value Series of The DFA Investment Trust Company (Affiliated Investment Company) at Value† | | $ | 143,907 |
Receivables: | | | |
Affiliated Investment Company Shares Sold | | | 47 |
Prepaid Expenses and Other Assets | | | 12 |
| | | |
Total Assets | | | 143,966 |
| | | |
LIABILITIES: | | | |
Payables: | | | |
Fund Shares Redeemed | | | 47 |
Due to Advisor | | | 1 |
Accrued Expenses and Other Liabilities | | | 20 |
| | | |
Total Liabilities | | | 68 |
| | | |
NET ASSETS | | $ | 143,898 |
| | | |
SHARES OUTSTANDING, $0.01 PAR VALUE (1) | | | 23,284,863 |
| | | |
NET ASSET VALUE, OFFERING AND REDEMPTION PRICE PER SHARE | | $ | 6.18 |
| | | |
Investment in Affiliated Investment Company at Cost | | $ | 114,008 |
| | | |
NET ASSETS CONSIST OF: | | | |
Paid-In Capital | | $ | 112,330 |
Undistributed Net Investment Income (Distributions in Excess of Net Investment Income) | | | 464 |
Accumulated Net Realized Gain (Loss) | | | 1,200 |
Net Unrealized Foreign Exchange Gain (Loss) | | | 5 |
Net Unrealized Appreciation (Depreciation) | | | 29,899 |
| | | |
NET ASSETS | | $ | 143,898 |
| | | |
(1) NUMBER OF SHARES AUTHORIZED | | | 300,000,000 |
| | | |
See accompanying Notes to Financial Statements.
7
DIMENSIONAL INVESTMENT GROUP INC.
DFA INTERNATIONAL VALUE PORTFOLIO II
STATEMENT OF OPERATIONS
FOR THE YEAR ENDED OCTOBER 31, 2009
(Amounts in thousands)
| | | | |
Investment Income | | | | |
Dividends (Net of Foreign Taxes Withheld of $325) | | $ | 3,642 | |
Interest | | | 5 | |
Income from Securities Lending | | | 297 | |
Expenses Allocated from Affiliated Investment Company | | | (279 | ) |
| | | | |
Total Investment Income | | | 3,665 | |
| | | | |
Expenses | | | | |
Administrative Services Fees | | | 11 | |
Accounting & Transfer Agent Fees | | | 14 | |
Filing Fees | | | 22 | |
Shareholders’ Reports | | | 36 | |
Audit Fees | | | 2 | |
Legal Fees | | | 12 | |
Other | | | 3 | |
| | | | |
Total Expenses | | | 100 | |
| | | | |
Net Investment Income (Loss) | | | 3,565 | |
| | | | |
Realized and Unrealized Gain (Loss) | | | | |
Net Realized Gain (Loss) on: | | | | |
Investment Securities Sold | | | 1,232 | |
Futures | | | (33 | ) |
Foreign Currency Transactions | | | 86 | |
Change in Unrealized Appreciation (Depreciation) of: | | | | |
Investment Securities and Foreign Currency | | | 29,899 | |
Translation of Foreign Currency Denominated Amounts | | | 5 | |
| | | | |
Net Realized and Unrealized Gain (Loss) | | | 31,189 | |
| | | | |
Net Increase (Decrease) in Net Assets Resulting from Operations | | $ | 34,754 | |
| | | | |
Investment Income and Realized and Unrealized Gain (Loss) were allocated from the Portfolio’s Master Fund (Affiliated Investment Company).
See accompanying Notes to Financial Statements.
8
DIMENSIONAL INVESTMENT GROUP INC.
DFA INTERNATIONAL VALUE PORTFOLIO II
STATEMENTS OF CHANGES IN NET ASSETS
(Amounts in thousands)
| | | | | | | | | | | | |
| | | Year
Ended
Oct. 31,
2009 | | | Period
Dec. 1, 2007
to
Oct. 31, 2008 | | | Year Ended
Nov. 30,
2007 | |
Increase (Decrease) in Net Assets | | | | | | | | | | | | |
Operations: | | | | | | | | | | | | |
Net Investment Income (Loss) | | $ | 3,565 | | | $ | 8,667 | | | $ | 22,404 | |
Net Realized Gain (Loss) on: | | | | | | | | | | | | |
Investment Securities Sold | | | 1,232 | | | | 50,083 | † | | | 16,900 | † |
Futures | | | (33 | ) | | | — | | | | — | |
Foreign Currency Transactions | | | 86 | | | | — | | | | — | |
Change in Unrealized Appreciation (Depreciation) of: | | | | | | | | | | | | |
Investment Securities and Foreign Currency | | | 29,899 | | | | (229,363 | )† | | | 70,139 | † |
Translation of Foreign Currency Denominated Amounts | | | 5 | | | | — | | | | — | |
| | | | | | | | | | | | |
Net Increase (Decrease) in Net Assets Resulting from Operations | | | 34,754 | | | | (170,613 | ) | | | 109,443 | |
| | | | | | | | | | | | |
Distributions From: | | | | | | | | | | | | |
Net Investment Income | | | (3,548 | ) | | | (12,482 | ) | | | (20,432 | ) |
Net Short-Term Gains | | | — | | | | (1,773 | ) | | | (1,258 | ) |
Net Long-Term Gains | | | (63,588 | ) | | | (14,297 | ) | | | (8,778 | ) |
| | | | | | | | | | | | |
Total Distributions | | | (67,136 | ) | | | (28,552 | ) | | | (30,468 | ) |
| | | | | | | | | | | | |
Capital Share Transactions (1): | | | | | | | | | | | | |
Shares Issued | | | 20,479 | | | | 18,325 | | | | 157,119 | |
Shares Issued in Lieu of Cash Distributions | | | 67,136 | | | | 28,552 | | | | 30,468 | |
Shares Redeemed | | | (24,551 | ) | | | (497,259 | ) | | | (125,013 | ) |
| | | | | | | | | | | | |
Net Increase (Decrease) from Capital Share Transactions | | | 63,064 | | | | (450,382 | ) | | | 62,574 | |
| | | | | | | | | | | | |
Total Increase (Decrease) in Net Assets | | | 30,682 | | | | (649,547 | ) | | | 141,549 | |
Net Assets | | | | | | | | | | | | |
Beginning of Period | | | 113,216 | | | | 762,763 | | | | 621,214 | |
| | | | | | | | | | | | |
End of Period | | $ | 143,898 | | | $ | 113,216 | | | $ | 762,763 | |
| | | | | | | | | | | | |
(1) Shares Issued and Redeemed: | | | | | | | | | | | | |
Shares Issued | | | 3,777 | | | | 948 | | | | 6,917 | |
Shares Issued in Lieu of Cash Distributions | | | 14,796 | | | | 1,356 | | | | 1,362 | |
Shares Redeemed | | | (5,062 | ) | | | (24,678 | ) | | | (5,535 | ) |
| | | | | | | | | | | | |
Net Increase (Decrease) from Shares Issued and Redeemed | | | 13,511 | | | | (22,374 | ) | | | 2,744 | |
| | | | | | | | | | | | |
Undistributed Net Investment Income (Distributions in Excess of Net Investment Income) | | $ | 464 | | | $ | 365 | | | $ | 3,680 | |
| † | See Note A in the Notes to Financial Statements. |
See accompanying Notes to Financial Statements.
9
DIMENSIONAL INVESTMENT GROUP INC.
DFA INTERNATIONAL VALUE PORTFOLIO II
FINANCIAL HIGHLIGHTS
(for a share outstanding throughout each period)
| | | | | | | | | | | | | | | | | | | | | | | | |
| | | Year
Ended
Oct. 31,
2009 | | | Period
Dec. 1, 2007
to
Oct. 31, 2008 | | | Year
Ended
Nov. 30,
2007 | | | Year
Ended
Nov. 30,
2006 | | | Year
Ended
Nov. 30,
2005 | | | Year
Ended
Nov. 30,
2004 | |
| | | | | | | | | (Unaudited) | | | | | | | | | | |
Net Asset Value, Beginning of Period | | $ | 11.58 | | | $ | 23.73 | | | $ | 21.13 | | | $ | 16.50 | | | $ | 14.69 | | | $ | 11.54 | |
| | | | | | | | | | | | | | | | | | | | | | | | |
Income from Investment Operations | | | | | | | | | | | | | | | | | | | | | | | | |
Net Investment Income (Loss) | | | 0.17 | (A) | | | 0.54 | (A) | | | 0.70 | (A) | | | 0.65 | (A) | | | 0.48 | | | | 0.25 | |
Net Gains (Losses) on Securities (Realized and Unrealized) | | | 1.23 | | | | (11.35 | ) | | | 2.88 | | | | 5.01 | | | | 1.76 | | | | 3.37 | |
| | | | | | | | | | | | | | | | | | | | | | | | |
Total from Investment Operations | | | 1.40 | | | | (10.81 | ) | | | 3.58 | | | | 5.66 | | | | 2.24 | | | | 3.62 | |
| | | | | | | | | | | | | | | | | | | | | | | | |
Less Distributions | | | | | | | | | | | | | | | | | | | | | | | | |
Net Investment Income | | | (0.21 | ) | | | (0.84 | ) | | | (0.64 | ) | | | (0.64 | ) | | | (0.41 | ) | | | (0.44 | ) |
Net Realized Gains | | | (6.59 | ) | | | (0.50 | ) | | | (0.34 | ) | | | (0.39 | ) | | | (0.02 | ) | | | (0.03 | ) |
| | | | | | | | | | | | | | | | | | | | | | | | |
Total Distributions | | | (6.80 | ) | | | (1.34 | ) | | | (0.98 | ) | | | (1.03 | ) | | | (0.43 | ) | | | (0.47 | ) |
| | | | | | | | | | | | | | | | | | | | | | | | |
Net Asset Value, End of Period | | $ | 6.18 | | | $ | 11.58 | | | $ | 23.73 | | | $ | 21.13 | | | $ | 16.50 | | | $ | 14.69 | |
| | | | | | | | | | | | | | | | | | | | | | | | |
Total Return | | | 35.34 | % | | | (47.93 | )%(C) | | | 17.29 | % | | | 35.74 | % | | | 15.50 | % | | | 32.11 | % |
| | | | | | | | | | | | | | | | | | | | | | | | |
Net Assets, End of Period (thousands) | | $ | 143,898 | | | $ | 113,216 | | | $ | 762,763 | | | $ | 621,214 | | | $ | 340,467 | | | $ | 189,176 | |
Ratio of Expenses to Average Net Assets (D) | | | 0.33 | % | | | 0.26 | %(B) | | | 0.25 | % | | | 0.27 | % | | | 0.31 | % | | | 0.37 | % |
Ratio of Net Investment Income to Average Net Assets | | | 3.10 | % | | | 2.84 | %(B) | | | 3.02 | % | | | 3.41 | % | | | 3.06 | % | | | 1.98 | % |
| | | | | | | | | | | | | | | | | | | | | | | | |
See page 1 for the Definitions of Abbreviations and Footnotes.
See accompanying Notes to Financial Statements.
10
DIMENSIONAL INVESTMENT GROUP INC.
DFA INTERNATIONAL VALUE PORTFOLIO II
NOTES TO FINANCIAL STATEMENTS
A. Organization:
Dimensional Investment Group Inc. (the “Fund”) is an open-end management investment company registered under the Investment Company Act of 1940, whose shares are offered to institutional investors, retirement plans and clients of registered investment advisors. The Fund consists of fifteen portfolios, of which the DFA International Value Portfolio II (the “Portfolio”) is presented in this report.
The Portfolio primarily invests its assets in The DFA International Value Series (the “Series”), a corresponding series of The DFA Investment Trust Company. At October 31, 2009, the Portfolio owned 2% of the Series. The financial statements of the Series are included elsewhere in this report and should be read in conjunction with the financial statements of the Portfolio.
On November 1, 2008, The DFA International Value Series, a master fund in a RIC/RIC master-feeder structure, elected with the consent of its respective Holder(s) to change its U.S. federal income tax classification from that of an association taxable as a corporation to a partnership pursuant to Treasury Regulation § 301.7701-3. The change in capital structure and retroactive reclassification of the statement of changes in net assets and financial highlights for the respective funds is a result of the treatment of a partnership for book purposes. The Series/Portfolio will maintain its books and records and present its financial statements in accordance with generally accepted accounting principles for investment partnerships.
At a regular meeting of the Board of Directors/Trustees (the “Board”) on September 16, 2008, the Board voted to change the fiscal and tax year ends of the Portfolio from November 30 to October 31.
B. Significant Accounting Policies:
The following significant accounting policies are in conformity with accounting principles generally accepted in the United States of America. Such policies are consistently followed by the Fund in preparation of its financial statements. The preparation of financial statements in accordance with accounting principles generally accepted in the United States of America requires management to make estimates and assumptions that affect the reported amounts of assets and liabilities and disclosure of contingent assets and liabilities at the date of the financial statements and the reported amounts of increases and decreases in net assets from operations during the reporting period. Actual results could differ from those estimates and those differences could be material.
1. Security Valuation: The Portfolio’s investment reflects its proportionate interest in the net assets of the Series.
The Portfolio utilizes a fair value hierarchy which prioritizes the inputs to valuation techniques used to measure fair value into three broad levels described below:
• Level 1 – quoted prices in active markets for identical securities
• Level 2 – other significant observable inputs (including quoted prices for similar securities, interest rates, prepayment speeds, credit risk, etc.)
• Level 3 – significant unobservable inputs (including the Portfolio’s own assumptions in determining the fair value of investments)
The inputs or methodology used for valuing securities are not necessarily an indication of the risk associated with investing in those securities. A summary of the inputs used to value the Portfolio’s net assets as of October 31, 2009 are listed below (in thousands).
11
| | | | | | | | | | |
| | | Valuation Inputs |
| | Investments in
Securities
(Market Value) |
| | Level 1 | | Level 2 | | Level 3 | | Total |
DFA International Value Portfolio II | | $ | 143,907 | | — | | — | | $ | 143,907 |
2. Deferred Compensation Plan: Each eligible Director of the Fund may elect participation in the Deferred Compensation Plan (the “Plan”). Under the Plan, effective January 1, 2002, such Directors may defer payment of all or a portion of their total fees earned as a Director. These deferred amounts may be treated as though such amounts had been invested in shares of the following funds: U.S. Large Cap Value Portfolio; U.S. Core Equity 1 Portfolio; U.S. Core Equity 2 Portfolio; U.S. Vector Equity Portfolio; U.S. Micro Cap Portfolio; DFA International Value Portfolio; International Core Equity Portfolio; Emerging Markets Portfolio; Emerging Markets Core Equity Portfolio; and/or DFA Two-Year Global Fixed Income Portfolio. Contributions made under the Plan and the change in unrealized appreciation (depreciation) and income are included in Other Expenses. At October 31, 2009, the total liability for deferred compensation to Directors is included in Accrued Expenses and Other Liabilities on the Statement of Assets and Liabilities in the amount of $3 (in thousands).
Each Director has the option to receive their distribution of proceeds in one of the following methods upon one year’s notice: lump sum; annual installments over a period of agreed upon years; or semi-annual installments over a period of agreed upon years. As of October 31, 2009, none of the Directors have requested distribution of proceeds.
3. Other: The Portfolio recognizes its pro-rata share, on a daily basis, of net investment income and realized and unrealized gains and losses of investment securities and foreign currency from the Series, which is treated as a partnership for federal income tax purposes. Dividend income and distributions to shareholders are recorded on the ex-dividend date. Distributions received on securities that represent a return of capital or capital gain are recorded as a reduction of cost of investments or as a realized gain, respectively. The Portfolio estimates the character of distributions received that may be considered return of capital distributions. Expenses directly attributable to the Portfolio are directly charged. Common expenses of the Fund are allocated using methods approved by the Board of Directors/Trustees, generally based on average net assets.
C. Investment Advisor:
Dimensional Fund Advisors LP (“Dimensional” or the “Advisor”) provides administrative services to the Portfolio, including supervision of services provided by others, providing information to the shareholders and to the Board of Directors/Trustees, and other administrative services. The Advisor provides investment advisory services to the Series. For the year ended October 31, 2009, the Portfolio’s administrative services fees were accrued daily and paid monthly to the Advisor based on an effective annual rate of 0.01% of average daily net assets of the Portfolio.
Fees Paid to Officers and Directors/Trustees:
Certain Officers and Directors/Trustees of the Advisor are also Officers and Directors/Trustees of the Fund; however, such Officers and Directors/Trustees (with the exception of the Chief Compliance Officer (“CCO”)) receive no compensation from the Fund. For the year ended October 31, 2009, the total related amounts paid by the Fund to the CCO were $27 (in thousands). The total related amounts paid by the Portfolio are included in Other Expenses on the Statement of Operations.
D. Federal Income Taxes:
The Portfolio has qualified and intends to continue to qualify as a regulated investment company under Subchapter M of the Internal Revenue Code for federal income tax purposes and to distribute substantially all of its taxable income and net capital gains to its shareholders. Accordingly, no provision has been made for federal income taxes.
Distributions from net investment income and net realized capital gains are determined in accordance with U.S. federal income tax regulations, which may differ from those amounts determined under accounting principles generally
12
accepted in the United States of America. These book/tax differences are either temporary or permanent in nature. To the extent these differences are permanent, they are charged or credited to paid-in capital, undistributed net investment income, accumulated net realized gains or unrealized appreciation, as appropriate, in the period that the differences arise. Accordingly, the following permanent differences as of October 31, 2009, primarily attributable to a reclassification of distributions were classified to the following accounts. These reclassifications had no effect on net assets or net asset value per share (amounts in thousands):
| | |
Increase (Decrease) Undistributed Net Investment Income | | Increase (Decrease) Accumulated Net Realized Gains (Losses) |
$82 | | $(82) |
The tax character of dividends and distributions declared and paid during the year ended November 30, 2007, the period December 1, 2007 to October 31, 2008 and the year ended October 31, 2009 were as follows (amounts in thousands):
| | | | | | |
| | | Net Investment
Income and
Short-Term
Capital Gains | | Long-Term
Capital Gains | | Total |
2007 | | $21,690 | | $ 8,778 | | $30,468 |
2008 | | 13,755 | | 14,797 | | 28,552 |
2009 | | 3,552 | | 63,584 | | 67,136 |
At October 31, 2009, the components of distributable earnings (accumulated losses) were as follows (amounts in thousands):
| | | | |
Undistributed Net Investment Income and Short-Term Capital Gains | | Undistributed Long-Term Capital Gains | | Total Net Distributable Earnings (Accumulated Losses) |
$1,671 | | — | | $1,671 |
For federal income tax purposes, the Fund measures its capital loss carryforwards annually at October 31, its fiscal year end. Capital loss carryforwards may be carried forward and applied against future capital gains. As of October 31, 2009, the Portfolio had no capital loss carryforwards available to offset future realized capital gains.
At October 31, 2009, the total cost and aggregate gross unrealized appreciation and (depreciation) of securities for federal income tax purposes were different from amounts reported for financial reporting purposes (amounts in thousands):
| | | | | | |
Federal Tax Cost | | Unrealized
Appreciation | | Unrealized
(Depreciation) | | Net
Unrealized
Appreciation
(Depreciation) |
$114,012 | | $32,855 | | $(2,960) | | $29,895 |
Accounting for Uncertainty in Income Taxes sets forth a minimum threshold for financial statement recognition of the benefit of a tax position taken or expected to be taken in a tax return. Management has analyzed the Portfolio’s tax position and has concluded that no provision for income tax is required in the Portfolio’s financial statements. The Portfolio is not aware of any tax position for which it is reasonably possible that the total amounts of unrecognized tax benefits will significantly change in the next twelve months. The Portfolio’s federal tax returns for the prior three fiscal years remain subject to examination by the Internal Revenue Service.
13
On November 1, 2008, The DFA International Value Series, a master fund in a RIC/RIC master-feeder structure with five RIC feeders and other direct client investor(s), made a “Check-the-box” election for federal income tax purposes pursuant to Treasury Regulation §301.7701-3, to change its federal entity classification from a corporation taxable as a regulated investment company to a partnership. As a result of this election, the master fund is deemed to have distributed all of its assets and liabilities, in a taxable transaction, to its shareholders in liquidation of the master fund. Immediately thereafter, the shareholders contributed all of the distributed assets and liabilities to a newly formed partnership. The final tax year end of The DFA International Value Series was October 31, 2008. For Federal income tax purposes, pursuant to Internal Revenue Code §336(a), the master fund recognizes gain or loss as if the master’s investment securities were sold to its shareholders and, pursuant to IRC Code §331, each of the Portfolios recognizes gain or loss as if it liquidated its investment in the master. As a result of the transaction, The DFA International Value Series recognized a ($2,309,440,866) and ($718,733) capital and currency loss respectively for tax year ended October 31, 2008. For tax purposes, pursuant to IRC Code §334(a), each of the Portfolios will take a fair market value basis in the securities deemed received by them and a new holding period for those securities commences on the deemed liquidation date.
E. Line of Credit:
The Fund, together with other Dimensional-advised portfolios, has entered into an amended and restated $250 million unsecured discretionary line of credit effective July 8, 2009 with an affiliate of its domestic custodian bank. Each portfolio is permitted to borrow, subject to its investment limitations, up to a maximum of $250 million, as long as total borrowings under the line of credit do not exceed $250 million in the aggregate. Borrowings under the line of credit are charged interest at the then current Federal Funds Rate plus 1%. Each portfolio is individually, and not jointly, liable for its particular advances under the line of credit. There is no commitment fee on the unused portion of the line of credit. The agreement for the discretionary line of credit may be terminated by either party at any time. The line of credit is scheduled to expire on June 22, 2010. There were no borrowings by the Portfolio under this line of credit during the year ended October 31, 2009.
The Fund, together with other Dimensional-advised portfolios, has also entered into an additional $500 million unsecured line of credit effective January 15, 2009 with its international custodian bank. Each portfolio is permitted to borrow, subject to its investment limitations, up to a maximum of $500 million, as long as total borrowings under the line of credit do not exceed $500 million in the aggregate. Borrowings under the line of credit are charged interest at rates agreed to by the parties at the time of borrowing. Each portfolio is individually, and not jointly, liable for its particular advances under the line of credit. There is no commitment fee on the unused portion of the line of credit. The agreement of the line of credit expires on January 15, 2010. There were no borrowings by the Portfolio under this line of credit during the year ended October 31, 2009.
F. Indemnities; Contractual Obligations:
Under the Fund’s organizational documents, its officers and directors are indemnified against certain liabilities arising out of the performance of their duties to the Fund.
In the normal course of business, the Fund enters into contracts that contain a variety of representations and warranties which provide general indemnification. The Fund’s maximum exposure under these arrangements is unknown as this would involve future claims that may be made against the Fund and/or its affiliates that have not yet occurred. However, based on experience, the Fund expects the risk of loss to be remote.
G. Other:
At October 31, 2009, two shareholders held 100% of the outstanding shares of the Portfolio.
H. Subsequent Event Evaluations:
Management has evaluated the impact of all subsequent events on the Portfolio through December 23, 2009, the date the financial statements were available for issuance, and has determined that there are no subsequent events requiring recognition or disclosure in the financial statements.
14
REPORT OF INDEPENDENT REGISTERED PUBLIC ACCOUNTING FIRM
To the Shareholders of DFA International Value Portfolio II and
Board of Directors of Dimensional Investment Group Inc.:
In our opinion, the accompanying statement of assets and liabilities, and the related statements of operations and of changes in net assets and the financial highlights present fairly, in all material respects, the financial position of DFA International Value Portfolio II (one of the portfolios constituting Dimensional Investment Group Inc., hereafter referred to as the “Portfolio”) at October 31, 2009, the results of its operations for the year then ended, the changes in its net assets and the financial highlights for each of the periods indicated, in conformity with accounting principles generally accepted in the United States of America. These financial statements and financial highlights (hereafter referred to as “financial statements”) are the responsibility of the Portfolio’s management; our responsibility is to express an opinion on these financial statements based on our audits. We conducted our audits of these financial statements in accordance with the standards of the Public Company Accounting Oversight Board (United States). Those standards require that we plan and perform the audit to obtain reasonable assurance about whether the financial statements are free of material misstatement. An audit includes examining, on a test basis, evidence supporting the amounts and disclosures in the financial statements, assessing the accounting principles used and significant estimates made by management, and evaluating the overall financial statement presentation. We believe that our audits, which included confirmation of securities at October 31, 2009 by correspondence with the transfer agent of the investee fund, provide a reasonable basis for our opinion.
PricewaterhouseCoopers LLP
Philadelphia, Pennsylvania
December 23, 2009
15
RESULTS OF THE SHAREHOLDER MEETING
On June 2, 2009, June 5, 2009, and July 8, 2009, Dimensional Investment Group Inc. (“DIG”) held a Special Joint Meeting of Shareholders for the purpose of voting on several proposals affecting DIG and the Portfolio, including, among other items, the election of Directors, the amendment of certain fundamental investment limitations, and the elimination of certain fundamental investment limitations. The shareholders of the Portfolio approved each of the applicable proposals for DIG and the Portfolio presented at the Meeting. Listed below are the voting results from the Meeting. Please note that not all Proposals presented at the Meeting were voted on by the Portfolio. Additionally, the Proposal numbers reflected below correlate to the Proposal numbers presented for vote at the Meeting.
DIG
| | | | | | | | | | | | | | | | | | | | |
| | | | | Shares Voted | | Percent of Outstanding Shares Voted |
| | | | | For | | % | | Against | | % | | Abstain/
WithHold | | % | | For | | Against | | Abstain/
WithHold |
Proposal 1: Election of Directors for DIG* | | | | | | | | | | | | | | | | | | |
1a | | David G. Booth | | 754,612,895 | | 96.26% | | — | | 0.00% | | 29,301,677 | | 3.74% | | 85.87% | | 0.00% | | 3.33% |
1b | | George M. Constantinides | | 753,991,785 | | 96.18% | | — | | 0.00% | | 29,922,787 | | 3.82% | | 85.80% | | 0.00% | | 3.41% |
1c | | John P. Gould | | 753,344,569 | | 96.10% | | — | | 0.00% | | 30,570,003 | | 3.90% | | 85.73% | | 0.00% | | 3.48% |
1d | | Roger G. Ibbotson | | 754,232,365 | | 96.21% | | — | | 0.00% | | 29,682,207 | | 3.79% | | 85.83% | | 0.00% | | 3.38% |
1e | | Robert C. Merton | | 754,598,874 | | 96.26% | | — | | 0.00% | | 29,315,698 | | 3.74% | | 85.87% | | 0.00% | | 3.34% |
1f | | Myron S. Scholes | | 754,057,040 | | 96.19% | | — | | 0.00% | | 29,857,532 | | 3.81% | | 85.81% | | 0.00% | | 3.40% |
1g | | Eduardo A. Repetto | | 753,295,592 | | 96.09% | | — | | 0.00% | | 30,618,979 | | 3.91% | | 85.72% | | 0.00% | | 3.48% |
1h | | Abbie J. Smith | | 754,123,603 | | 96.20% | | — | | 0.00% | | 29,790,969 | | 3.80% | | 85.82% | | 0.00% | | 3.39% |
| | | | | | | | | | | | | | | | | | | | | | | | | | | | |
| | | Shares Voted | | Percent of Outstanding Shares Voted | |
| | | For | | % | | | Against | | % | | | Abstain/
WithHold | | % | | | NonVote | | % | | For | | | Against | | | Abstain/
WithHold | |
Proposal 2: To approve Articles of Amendment and Restatement for DIG* | | 479,705,048 | | 93.81 | % | | 7,503,436 | | 1.47 | % | | 24,156,664 | | 4.72 | % | | NA | | NA | | 54.59 | % | | 0.85 | % | | 2.75 | % |
* Results are for all Portfolios within DIG
DFA International Value Portfolio II
| | | | | | | | | | | | | | | | | | | | |
| | | | | Shares Voted | | Percent of Outstanding Shares Voted |
| | | | | For | | % | | Against | | % | | Abstain/
WithHold | | % | | For | | Against | | Abstain/
WithHold |
Proposals: | | | | | | | | | | | | | | | | | | |
5 | | To approve amendments to certain fundamental investment restrictions | | | | | | | | |
5a | | Borrowing Money | | 18,170,366 | | 97.32% | | 385,907 | | 2.07% | | 113,647 | | 0.61% | | 80.98% | | 1.72% | | 0.51% |
5b | | Making Loans | | 18,186,645 | | 97.41% | | 358,566 | | 1.92% | | 124,709 | | 0.67% | | 81.06% | | 1.60% | | 0.56% |
5c | | Investments in Real Estate | | 18,171,107 | | 97.33% | | 385,166 | | 2.06% | | 113,647 | | 0.61% | | 80.99% | | 1.72% | | 0.51% |
5d | | Investments in Commodities | | 18,220,908 | | 97.59% | | 337,584 | | 1.81% | | 111,428 | | 0.60% | | 81.21% | | 1.50% | | 0.50% |
5e | | Diversification of Investments | | 18,239,106 | | 97.69% | | 317,167 | | 1.70% | | 113,647 | | 0.61% | | 81.29% | | 1.41% | | 0.51% |
6 | | To approve the elimination of certain fundamental investment restrictions | | | | | | | | |
6a | | Pledging, Mortgaging, or | | | | | | | | | | | | | | | | | | |
| | Hypothecating Assets | | 18,204,336 | | 97.51% | | 349,355 | | 1.87% | | 116,229 | | 0.62% | | 81.13% | | 1.56% | | 0.52% |
6b | | Purchasing Securities on Margin | | 18,158,736 | | 97.26% | | 406,017 | | 2.17% | | 105,167 | | 0.56% | | 80.93% | | 1.81% | | 0.47% |
6c | | Investing in Restricted or Illiquid Securities | | 18,178,228 | | 97.37% | | 386,525 | | 2.07% | | 105,167 | | 0.56% | | 81.02% | | 1.72% | | 0.47% |
6d | | Investing for the Purpose of Exercising Control | | 18,189,241 | | 97.43% | | 367,032 | | 1.97% | | 113,647 | | 0.61% | | 81.07% | | 1.64% | | 0.51% |
6e | | Investing in Other Investment Companies | | 18,195,856 | | 97.46% | | 255,262 | | 1.37% | | 218,802 | | 1.17% | | 81.10% | | 1.14% | | 0.98% |
6f | | Management Ownership of Securities of an Issuer | | 18,192,321 | | 97.44% | | 250,317 | | 1.34% | | 227,282 | | 1.22% | | 81.08% | | 1.12% | | 1.01% |
6g | | Investing in Oil, Gas, or other Mineral Exploration, Leases or Development Programs | | 18,254,364 | | 97.77% | | 216,665 | | 1.16% | | 198,891 | | 1.07% | | 81.36% | | 0.97% | | 0.89% |
6h | | Investing in Securities of Unseasoned Issuers | | 18,196,712 | | 97.47% | | 263,255 | | 1.41% | | 209,953 | | 1.12% | | 81.10% | | 1.17% | | 0.94% |
6i | | Investing in Warrants | | 18,224,492 | | 97.61% | | 329,199 | | 1.76% | | 116,229 | | 0.62% | | 81.22% | | 1.47% | | 0.52% |
6j | | Writing or Acquiring Options | | 18,208,672 | | 97.53% | | 345,019 | | 1.85% | | 116,229 | | 0.62% | | 81.15% | | 1.54% | | 0.52% |
8 | | Approval of Investment Advisory Agreement between Dimensional Fund Advisors LP and the Company | | 18,229,347 | | 97.64% | | 304,433 | | 1.63% | | 136,140 | | 0.73% | | 81.25% | | 1.36% | | 0.61% |
16
THE DFA INVESTMENT TRUST COMPANY
PERFORMANCE CHART
The DFA International Value Series vs.
MSCI World ex USA Index (net dividends)
October 31, 1999-October 31, 2009
17
THE DFA INVESTMENT TRUST COMPANY
THE DFA INTERNATIONAL VALUE SERIES
DISCLOSURE OF FUND EXPENSES
(Unaudited)
The following Expense Table is shown so that you can understand the impact of fees on your investment. All mutual funds have operating expenses. As a shareholder of the fund, you incur ongoing costs, which include costs for portfolio management, administrative services, and shareholder reports, among others. Operating expenses, legal and audit services, which are deducted from a fund’s gross income, directly reduce the investment return of the fund. A fund’s expenses are expressed as a percentage of its average net assets. This figure is known as the expense ratio. The following examples are intended to help you understand the ongoing costs, in dollars, of investing in the fund and to compare these costs with those of other mutual funds. The examples are based on an investment of $1,000 made at the beginning of the period shown and held for the entire period.
The Expense Table below illustrates your fund’s costs in two ways.
Actual fund return
This section helps you to estimate the actual expenses after fee waivers that you paid over the period. The “Ending Account Value” shown is derived from the fund’s actual return and “Expenses Paid During Period” reflect the dollar amount that would have been paid by an investor who started with $1,000 in the fund. You may use the information here, together with the amount you invested, to estimate the expenses that you paid over the period.
To do so, simply divide your account value by $1,000 (for example, a $7,500 account value divided by $1,000 = 7.5), then multiply the result by the number given for your fund under the heading “Expenses Paid During Period.”
Hypothetical example for comparison purposes
This section is intended to help you compare your fund’s costs with those of other mutual funds. The hypothetical “Ending Account Value” and “Expenses Paid During Period” are derived from the fund’s actual expense ratio and an assumed 5% annual return before expenses. In this case, because the return used is not the fund’s actual return, the results do not apply to your investment. The example is useful in making comparisons because the SEC requires all mutual funds to calculate expenses based on a 5% annual return. You can assess your fund’s costs by comparing this hypothetical example with the hypothetical examples that appear in shareholder reports of other funds.
Please note that the expenses shown in the table are meant to highlight and help you compare ongoing costs only and do not reflect any transactional costs, if applicable. The “Annualized Expense Ratio” represents the actual expenses for the six-month period indicated.
| | | | | | | | |
| | | | | Six Months Ended October 31, 2009 |
EXPENSE TABLE | | | | |
| | | Beginning
Account
Value
05/01/09 | | Ending Account Value 10/31/09 | | Annualized
Expense
Ratio* | | Expenses
Paid
During
Period* |
| | | | |
| | | | |
| | | | |
Actual Fund Return | | $1,000.00 | | $1,350.50 | | 0.25% | | $1.48 |
Hypothetical 5% Annual Return | | $1,000.00 | | $1,023.95 | | 0.25% | | $1.28 |
| * | Expenses are equal to the fund’s annualized expense ratio for the six-month period, multiplied by the average account value over the period, multiplied by the number of days in the most recent six-month period (184), then divided by the number of days in the year (365) to reflect the six-month period. |
18
THE DFA INVESTMENT TRUST COMPANY
THE DFA INTERNATIONAL VALUE SERIES
DISCLOSURE OF PORTFOLIO HOLDINGS
(Unaudited)
The SEC requires that all Funds file a complete Schedule of Investments with the SEC for their first and third fiscal quarters on Form N-Q. For The DFA Investment Trust Company, this would be for the fiscal quarters ending January 31 and July 31. The Form N-Q filing must be made within 60 days of the end of the quarter. The DFA Investment Trust Company filed its most recent Form N-Q with the SEC on September 29, 2009. It is available upon request, without charge, by calling collect: (512) 306-7400 or by mailing a request to Dimensional Fund Advisors LP, 6300 Bee Cave Road, Building One, Austin, Texas 78746, or by visiting the SEC’s website at http://www.sec.gov, or they may be reviewed and copied at the SEC’s Public Reference Room in Washington, D.C. (call 1-800-732-0330 for information on the operation of the Public Reference Room).
SEC regulations permit a fund to include in its reports to shareholders a “Summary Schedule of Portfolio Holdings” in lieu of a full Schedule of Investments. The Summary Schedule of Portfolio Holdings reports the fund’s 50 largest holdings in unaffiliated issuers and any investments that exceed one percent of the fund’s net assets at the end of the reporting period. The amendments also require that the Summary Schedule of Portfolio Holdings identify each category of investments that are held.
The fund is required to file a complete Schedule of Investments with the SEC on Form N-CSR within ten days after mailing the annual and semi-annual reports to shareholders. It will be available upon request, without charge, by calling collect: (512) 306-7400 or by mailing a request to Dimensional Fund Advisors LP, 6300 Bee Cave Road, Building One, Austin, Texas 78746, or by visiting the SEC’s website at http://www.sec.gov, or they may be reviewed and copied at the SEC’s Public Reference Room in Washington, D.C. (call 1-800-732-0330 for information on the operation of the Public Reference Room).
PORTFOLIO HOLDINGS
The SEC requires that all Funds present their categories of portfolio holdings in a table, chart or graph format in their annual and semi-annual shareholder reports, whether or not a Schedule of Investments is utilized. The following table, which presents portfolio holdings as a percent of total investments before short-term investments and collateral for loaned securities, is provided in compliance with such requirement. The categories shown below represent broad industry sectors. Each industry sector consists of one or more specific industry classifications.
| | | |
| The DFA International Value Series | |
Consumer Discretionary | | 13.2 | % |
Consumer Staples | | 4.9 | % |
Energy | | 6.0 | % |
Financials | | 42.8 | % |
Health Care | | 0.4 | % |
Industrials | | 10.3 | % |
Information Technology | | 3.1 | % |
Materials | | 11.2 | % |
Other | | — | |
Telecommunication Services | | 6.9 | % |
Utilities | | 1.2 | % |
| | | |
| | 100.0 | % |
19
THE DFA INTERNATIONAL VALUE SERIES
SUMMARY SCHEDULE OF PORTFOLIO HOLDINGS
October 31, 2009
| | | | | | | | |
| | | Shares | | Value†† | | Percentage
of Net Assets** | |
COMMON STOCKS — (85.2%) | | | | | | | | |
AUSTRALIA — (4.5%) | | | | | | | | |
Australia & New Zealand Banking Group, Ltd. | | 3,343,351 | | $ | 68,191,374 | | 1.1 | % |
National Australia Bank, Ltd. | | 2,465,437 | | | 65,140,887 | | 1.0 | % |
Wesfarmers, Ltd. | | 1,898,047 | | | 47,362,464 | | 0.8 | % |
Other Securities | | | | | 141,329,082 | | 2.3 | % |
| | | | | | | | |
TOTAL AUSTRALIA | | | | | 322,023,807 | | 5.2 | % |
| | | | | | | | |
AUSTRIA — (0.5%) | | | | | | | | |
Other Securities | | | | | 34,182,743 | | 0.6 | % |
| | | | | | | | |
BELGIUM — (0.5%) | | | | | | | | |
Other Securities | | | | | 38,019,953 | | 0.6 | % |
| | | | | | | | |
CANADA — (7.6%) | | | | | | | | |
EnCana Corp. | | 671,498 | | | 37,234,767 | | 0.6 | % |
#Manulife Financial Corp. | | 2,074,478 | | | 38,918,630 | | 0.6 | % |
*Teck Resources, Ltd. Class B | | 1,418,230 | | | 41,168,712 | | 0.7 | % |
#Thomson Reuters Corp. | | 1,832,184 | | | 58,281,755 | | 0.9 | % |
#Toronto Dominion Bank | | 944,998 | | | 53,867,637 | | 0.9 | % |
Other Securities | | | | | 318,836,929 | | 5.2 | % |
| | | | | | | | |
TOTAL CANADA | | | | | 548,308,430 | | 8.9 | % |
| | | | | | | | |
DENMARK — (1.1%) | | | | | | | | |
Other Securities | | | | | 77,023,723 | | 1.2 | % |
| | | | | | | | |
FINLAND — (0.6%) | | | | | | | | |
Other Securities | | | | | 40,451,320 | | 0.7 | % |
| | | | | | | | |
FRANCE — (8.3%) | | | | | | | | |
#AXA SA | | 2,818,397 | | | 70,093,978 | | 1.1 | % |
BNP Paribas SA | | 913,891 | | | 68,847,185 | | 1.1 | % |
#Compagnie de Saint-Gobain SA | | 846,142 | | | 41,232,265 | | 0.7 | % |
#Lafarge SA | | 467,217 | | | 37,923,901 | | 0.6 | % |
#Societe Generale Paris SA | | 913,312 | | | 60,662,002 | | 1.0 | % |
Vivendi SA | | 2,686,677 | | | 74,534,678 | | 1.2 | % |
Other Securities | | | | | 244,803,391 | | 4.0 | % |
| | | | | | | | |
TOTAL FRANCE | | | | | 598,097,400 | | 9.7 | % |
| | | | | | | | |
GERMANY — (7.4%) | | | | | | | | |
Allianz SE | | 442,712 | | | 50,712,808 | | 0.8 | % |
#Bayerische Motoren Werke AG | | 915,762 | | | 44,797,554 | | 0.7 | % |
#Daimler AG | | 1,684,003 | | | 81,364,327 | | 1.3 | % |
#Deutsche Bank AG | | 774,190 | | | 56,245,973 | | 0.9 | % |
#Deutsche Telekom AG | | 2,621,866 | | | 35,693,819 | | 0.6 | % |
Deutsche Telekom AG Sponsored ADR | | 2,809,150 | | | 38,035,891 | | 0.6 | % |
Munchener Rueckversicherungs-Gesellschaft AG | | 388,934 | | | 61,534,351 | | 1.0 | % |
Other Securities | | | | | 167,080,419 | | 2.7 | % |
| | | | | | | | |
TOTAL GERMANY | | | | | 535,465,142 | | 8.6 | % |
| | | | | | | | |
GREECE — (0.3%) | | | | | | | | |
Other Securities | | | | | 19,019,902 | | 0.3 | % |
| | | | | | | | |
HONG KONG — (2.7%) | | | | | | | | |
Cheung Kong Holdings, Ltd. | | 3,224,000 | | | 41,120,708 | | 0.7 | % |
Hutchison Whampoa, Ltd. | | 5,568,000 | | | 39,081,157 | | 0.6 | % |
Other Securities | | | | | 117,731,620 | | 1.9 | % |
| | | | | | | | |
TOTAL HONG KONG | | | | | 197,933,485 | | 3.2 | % |
| | | | | | | | |
20
THE DFA INTERNATIONAL VALUE SERIES
CONTINUED
| | | | | | | | |
| | | Shares | | Value†† | | Percentage
of Net Assets** | |
IRELAND — (0.0%) | | | | | | | | |
Other Securities | | | | $ | 57,893 | | 0.0 | % |
| | | | | | | | |
ITALY — (2.9%) | | | | | | | | |
#*Intesa Sanpaolo SpA | | 11,201,860 | | | 47,142,793 | | 0.8 | % |
*UniCredito SpA | | 19,413,366 | | | 65,038,767 | | 1.0 | % |
Other Securities | | | | | 98,411,874 | | 1.6 | % |
| | | | | | | | |
TOTAL ITALY | | | | | 210,593,434 | | 3.4 | % |
| | | | | | | | |
JAPAN — (11.7%) | | | | | | | | |
FUJIFILM Holdings Corp. | | 1,257,700 | | | 35,755,504 | | 0.6 | % |
*Nissan Motor Co., Ltd. | | 4,991,500 | | | 36,119,215 | | 0.6 | % |
Sony Corp. Sponsored ADR | | 1,725,386 | | | 50,709,095 | | 0.8 | % |
Other Securities | | | | | 726,760,636 | | 11.7 | % |
| | | | | | | | |
TOTAL JAPAN | | | | | 849,344,450 | | 13.7 | % |
| | | | | | | | |
MALAYSIA — (0.0%) | | | | | | | | |
Other Securities | | | | | — | | 0.0 | % |
| | | | | | | | |
NETHERLANDS — (3.7%) | | | | | | | | |
#ArcelorMittal NV | | 2,446,831 | | | 82,806,981 | | 1.3 | % |
*ING Groep NV | | 3,093,625 | | | 40,259,293 | | 0.7 | % |
Philips Electronics NV | | 3,072,622 | | | 77,186,781 | | 1.2 | % |
Other Securities | | | | | 69,089,143 | | 1.1 | % |
| | | | | | | | |
TOTAL NETHERLANDS | | | | | 269,342,198 | | 4.3 | % |
| | | | | | | | |
NEW ZEALAND — (0.1%) | | | | | | | | |
Other Securities | | | | | 8,185,686 | | 0.1 | % |
| | | | | | | | |
NORWAY — (1.0%) | | | | | | | | |
Other Securities | | | | | 75,691,447 | | 1.2 | % |
| | | | | | | | |
PORTUGAL — (0.2%) | | | | | | | | |
Other Securities | | | | | 13,072,321 | | 0.2 | % |
| | | | | | | | |
SINGAPORE — (1.6%) | | | | | | | | |
DBS Group Holdings, Ltd. | | 4,164,750 | | | 38,138,997 | | 0.6 | % |
Other Securities | | | | | 78,569,480 | | 1.3 | % |
| | | | | | | | |
TOTAL SINGAPORE | | | | | 116,708,477 | | 1.9 | % |
| | | | | | | | |
SPAIN — (4.7%) | | | | | | | | |
Banco Santander SA | | 5,654,108 | | | 90,987,342 | | 1.5 | % |
Banco Santander SA Sponsored ADR | | 5,549,048 | | | 89,117,711 | | 1.4 | % |
#Repsol YPF SA Sponsored ADR | | 1,332,613 | | | 35,447,506 | | 0.6 | % |
Other Securities | | | | | 120,997,642 | | 1.9 | % |
| | | | | | | | |
TOTAL SPAIN | | | | | 336,550,201 | | 5.4 | % |
| | | | | | | | |
SWEDEN — (2.9%) | | | | | | | | |
#Nordea Bank AB | | 6,583,962 | | | 70,668,421 | | 1.2 | % |
Other Securities | | | | | 138,442,067 | | 2.2 | % |
| | | | | | | | |
TOTAL SWEDEN | | | | | 209,110,488 | | 3.4 | % |
| | | | | | | | |
SWITZERLAND — (6.3%) | | | | | | | | |
Credit Suisse Group AG | | 1,755,349 | | | 93,836,004 | | 1.5 | % |
#Credit Suisse Group AG Sponsored ADR | | 840,377 | | | 44,792,094 | | 0.7 | % |
#*Holcim, Ltd. | | 650,248 | | | 41,384,888 | | 0.7 | % |
*UBS AG | | 3,481,616 | | | 58,055,052 | | 1.0 | % |
Zurich Financial Services AG | | 322,012 | | | 73,738,360 | | 1.2 | % |
Other Securities | | | | | 144,088,911 | | 2.3 | % |
| | | | | | | | |
TOTAL SWITZERLAND | | | | | 455,895,309 | | 7.4 | % |
| | | | | | | | |
21
THE DFA INTERNATIONAL VALUE SERIES
CONTINUED
| | | | | | | | | |
| | | Shares | | Value†† | | Percentage
of Net Assets** | |
UNITED KINGDOM — (16.6%) | | | | | | | | | |
*Anglo American P.L.C. | | | 1,329,421 | | $ | 48,102,581 | | 0.8 | % |
Aviva P.L.C. | | | 7,396,866 | | | 46,253,871 | | 0.7 | % |
#*Barclays P.L.C. Sponsored ADR | | | 2,451,654 | | | 51,239,569 | | 0.8 | % |
#HSBC Holdings P.L.C. Sponsored ADR | | | 3,278,400 | | | 181,590,576 | | 2.9 | % |
Kingfisher P.L.C. | | | 9,743,172 | | | 35,612,473 | | 0.6 | % |
#Royal Dutch Shell P.L.C. ADR | | | 2,252,783 | | | 131,021,859 | | 2.1 | % |
Vodafone Group P.L.C. | | | 34,976,333 | | | 77,082,062 | | 1.2 | % |
#Vodafone Group P.L.C. Sponsored ADR | | | 7,395,974 | | | 164,116,663 | | 2.7 | % |
*Xstrata P.L.C. | | | 3,245,577 | | | 46,747,872 | | 0.8 | % |
Other Securities | | | | | | 419,126,814 | | 6.8 | % |
| | | | | | | | | |
TOTAL UNITED KINGDOM | | | | | | 1,200,894,340 | | 19.4 | % |
| | | | | | | | | |
TOTAL COMMON STOCKS | | | | | | 6,155,972,149 | | 99.4 | % |
| | | | | | | | | |
RIGHTS/WARRANTS — (0.0%) | | | | | | | | | |
GERMANY — (0.0%) | | | | | | | | | |
Other Securities | | | | | | 41,059 | | 0.0 | % |
| | | | | | | | | |
ITALY — (0.0%) | | | | | | | | | |
Other Securities | | | | | | 76,976 | | 0.0 | % |
| | | | | | | | | |
TOTAL RIGHTS/WARRANTS | | | | | | 118,035 | | 0.0 | % |
| | | | | | | | | |
| | | |
| | | Face
Amount | | Value† | | | |
| | | (000) | | | | | |
TEMPORARY CASH INVESTMENTS — (0.2%) | | | | | | | | | |
Repurchase Agreement, PNC Capital Markets, Inc. 0.19%, 11/02/09 (Collateralized by $13,010,000 FNMA 6.50%, 06/25/39, valued at $14,002,013) to be repurchased at $13,790,218 | | $ | 13,790 | | | 13,790,000 | | 0.2 | % |
| | | | | | | | | |
| | | |
| | | Shares/
Face
Amount | | | | | |
| | | (000) | | | | | |
SECURITIES LENDING COLLATERAL — (14.6%) | | | | | | | | | |
§@DFA Short Term Investment Fund LP | | | 1,055,086,714 | | | 1,055,086,714 | | 17.1 | % |
@Repurchase Agreement, Deutsche Bank Securities 0.07%, 11/02/09 (Collateralized by various corporate obligations, ranging in par value from $4,247,617 to $16,429,280, rates ranging from 5.000% to 7.000%, maturities ranging from 03/01/37 to 10/01/39, valued at $1,212,860) to be repurchased at $1,189,085 | | $ | 1,189 | | | 1,189,078 | | 0.0 | % |
| | | | | | | | | |
TOTAL SECURITIES LENDING COLLATERAL | | | | | | 1,056,275,792 | | 17.1 | % |
| | | | | | | | | |
TOTAL INVESTMENTS — (100.0%)
(Cost $5,830,288,347) | | | | | $ | 7,226,155,976 | | 116.7 | % |
| | | | | | | | | |
22
THE DFA INTERNATIONAL VALUE SERIES
CONTINUED
Summary of inputs used to value the Series’ net assets as of October 31, 2009 is as follows (See Security Valuation Note):
| | | | | | | | | | | |
| | | Valuation Inputs |
| | | Investment in Securities (Market Value) |
| | | Level 1 | | Level 2 | | Level 3 | | Total |
Common Stocks | | | | | | | | | | | |
Australia | | $ | 2,073,789 | | $ | 319,950,018 | | — | | $ | 322,023,807 |
Austria | | | — | | | 34,182,743 | | — | | | 34,182,743 |
Belgium | | | 3,586,620 | | | 34,433,333 | | — | | | 38,019,953 |
Canada | | | 548,308,430 | | | — | | — | | | 548,308,430 |
Denmark | | | — | | | 77,023,723 | | — | | | 77,023,723 |
Finland | | | 1,516,659 | | | 38,934,661 | | — | | | 40,451,320 |
France | | | 3,494,320 | | | 594,603,080 | | — | | | 598,097,400 |
Germany | | | 98,912,195 | | | 436,552,947 | | — | | | 535,465,142 |
Greece | | | 4,501,802 | | | 14,518,100 | | — | | | 19,019,902 |
Hong Kong | | | — | | | 197,933,485 | | — | | | 197,933,485 |
Ireland | | | 57,893 | | | — | | — | | | 57,893 |
Italy | | | 29,729,570 | | | 180,863,864 | | — | | | 210,593,434 |
Japan | | | 56,497,996 | | | 792,846,454 | | — | | | 849,344,450 |
Malaysia | | | — | | | — | | — | | | — |
Netherlands | | | 10,297,313 | | | 259,044,885 | | — | | | 269,342,198 |
New Zealand | | | — | | | 8,185,686 | | — | | | 8,185,686 |
Norway | | | 401,330 | | | 75,290,117 | | — | | | 75,691,447 |
Portugal | | | — | | | 13,072,321 | | — | | | 13,072,321 |
Singapore | | | — | | | 116,708,477 | | — | | | 116,708,477 |
Spain | | | 131,434,682 | | | 205,115,519 | | — | | | 336,550,201 |
Sweden | | | 7,351,053 | | | 201,759,435 | | — | | | 209,110,488 |
Switzerland | | | 46,226,255 | | | 409,669,054 | | — | | | 455,895,309 |
United Kingdom | | | 564,527,406 | | | 636,366,934 | | — | | | 1,200,894,340 |
Rights/Warrants | | | | | | | | | | | |
Germany | | | — | | | 41,059 | | — | | | 41,059 |
Italy | | | 76,976 | | | — | | — | | | 76,976 |
Temporary Cash Investments | | | — | | | 13,790,000 | | — | | | 13,790,000 |
Securities Lending Collateral | | | — | | | 1,056,275,792 | | — | | | 1,056,275,792 |
| | | | | | | | | | | |
TOTAL | | $ | 1,508,994,289 | | $ | 5,717,161,687 | | — | | $ | 7,226,155,976 |
| | | | | | | | | | | |
See accompanying Notes to Financial Statements.
23
THE DFA INVESTMENT TRUST COMPANY
THE DFA INTERNATIONAL VALUE SERIES
STATEMENT OF ASSETS AND LIABILITIES
OCTOBER 31, 2009
(Amounts in thousands)
| | | |
ASSETS: | | | |
Investments at Value (including $1,004,314 of securities on loan) | | $ | 6,156,090 |
Temporary Cash Investments at Value & Cost | | | 13,790 |
Collateral Received from Securities on Loan at Value & Cost | | | 1,056,276 |
Foreign Currencies at Value | | | 19,131 |
Cash | | | 16 |
Receivables: | | | |
Investment Securities Sold | | | 10,656 |
Dividends, Interest and Tax Reclaims | | | 10,784 |
Securities Lending Income | | | 444 |
Fund Shares Sold | | | 724 |
Unrealized Gain on Foreign Currency Contracts | | | 19 |
| | | |
Total Assets | | | 7,267,930 |
| | | |
LIABILITIES: | | | |
Payables: | | | |
Upon Return of Securities Loaned | | | 1,056,276 |
Investment Securities Purchased | | | 14,723 |
Fund Shares Redeemed | | | 3,518 |
Due to Advisor | | | 1,084 |
Accrued Expenses and Other Liabilities | | | 365 |
| | | |
Total Liabilities | | | 1,075,966 |
| | | |
NET ASSETS | | $ | 6,191,964 |
| | | |
Investments at Cost | | $ | 4,760,222 |
| | | |
Foreign Currencies at Cost | | $ | 19,163 |
| | | |
See accompanying Notes to Financial Statements.
24
THE DFA INVESTMENT TRUST COMPANY
THE DFA INTERNATIONAL VALUE SERIES
STATEMENT OF OPERATIONS
FOR THE YEAR ENDED OCTOBER 31, 2009
(Amounts in thousands)
| | | | |
Investment Income | | | | |
Dividends (Net of Foreign Taxes Withheld of $14,384) | | $ | 160,091 | |
Interest | | | 197 | |
Income from Securities Lending | | | 13,032 | |
| | | | |
Total Investment Income | | | 173,320 | |
| | | | |
Expenses | | | | |
Investment Advisory Services Fees | | | 9,991 | |
Accounting & Transfer Agent Fees | | | 549 | |
Custodian Fees | | | 688 | |
Shareholders’ Reports | | | 49 | |
Directors’/Trustees’ Fees & Expenses | | | 78 | |
Professional Fees | | | 221 | |
Other | | | 574 | |
| | | | |
Total Expenses | | | 12,150 | |
| | | | |
Net Investment Income (Loss) | | | 161,170 | |
| | | | |
Realized and Unrealized Gain (Loss) | | | | |
Net Realized Gain (Loss) on: | | | | |
Investment Securities Sold | | | 63,984 | |
Futures | | | (1,125 | ) |
Foreign Currency Transactions | | | 3,828 | |
Change in Unrealized Appreciation (Depreciation) of: | | | | |
Investment Securities and Foreign Currency | | | 1,395,836 | |
Translation of Foreign Currency Denominated Amounts | | | 240 | |
| | | | |
Net Realized and Unrealized Gain (Loss) | | | 1,462,763 | |
| | | | |
Net Increase (Decrease) in Net Assets Resulting from Operations | | $ | 1,623,933 | |
| | | | |
See accompanying Notes to Financial Statements.
25
THE DFA INVESTMENT TRUST COMPANY
THE DFA INTERNATIONAL VALUE SERIES
STATEMENTS OF CHANGES IN NET ASSETS
(Amounts in thousands)
| | | | | | | | | | | | |
| | | Year
Ended
Oct. 31,
2009 | | | Period
Dec. 1, 2007
to
Oct. 31, 2008 | | | Year
Ended
Nov. 30,
2007 | |
Increase (Decrease) in Net Assets | | | | | | | | | | | | |
Operations: | | | | | | | | | | | | |
Net Investment Income (Loss) | | $ | 161,170 | | | $ | 304,387 | | | $ | 274,613 | |
Net Realized Gain (Loss) on: | | | | | | | | | | | | |
Investment Securities Sold | | | 63,984 | | | | 137,811 | | | | 654,522 | |
Futures | | | (1,125 | ) | | | (1,153 | ) | | | — | |
Foreign Currency Transactions | | | 3,828 | | | | (4,593 | ) | | | 2,498 | |
In-Kind Redemptions | | | — | | | | 103,024 | * | | | — | |
Change in Unrealized Appreciation (Depreciation) of: | | | | | | | | | | | | |
Investment Securities and Foreign Currency | | | 1,395,836 | | | | (5,026,911 | ) | | | 403,307 | |
Futures | | | — | | | | 19 | | | | — | |
Translation of Foreign Currency Denominated Amounts | | | 240 | | | | (76 | ) | | | (180 | ) |
| | | | | | | | | | | | |
Net Increase (Decrease) in Net Assets Resulting from Operations | | | 1,623,933 | | | | (4,487,492 | ) | | | 1,334,760 | |
| | | | | | | | | | | | |
Transactions in Interest: | | | | | | | | | | | | |
Contributions | | | 449,410 | | | | 927,878 | † | | | 1,731,698 | † |
Withdrawals | | | (581,716 | ) | | | (1,378,770 | )*† | | | (884,989 | )† |
| | | | | | | | | | | | |
Net Increase (Decrease) from Transactions in Interest | | | (132,306 | ) | | | (450,892 | ) | | | 846,709 | |
| | | | | | | | | | | | |
Total Increase (Decrease) in Net Assets | | | 1,491,627 | | | | (4,938,384 | ) | | | 2,181,469 | |
Net Assets | | | | | | | | | | | | |
Beginning of Period | | | 4,700,337 | | | | 9,638,721 | | | | 7,457,252 | |
| | | | | | | | | | | | |
End of Period | | $ | 6,191,964 | | | $ | 4,700,337 | | | $ | 9,638,721 | |
| | | | | | | | | | | | |
| * | See Note J in the Notes to Financial Statements. |
| † | See Note A in the Notes to Financial Statements. |
See accompanying Notes to Financial Statements.
26
THE DFA INVESTMENT TRUST COMPANY
THE DFA INTERNATIONAL VALUE SERIES†
FINANCIAL HIGHLIGHTS
| | | | | | | | | | | | | | | | | | | | | | | | |
| | | Year
Ended
Oct. 31,
2009 | | | Period
Dec. 1, 2007
to
Oct. 31, 2008 | | | Year
Ended
Nov. 30,
2007 | | | Year
Ended
Nov. 30,
2006 | | | Year
Ended
Nov. 30,
2005 | | | Year
Ended
Nov. 30,
2004 | |
Total Return | | | 35.41 | % | | | (47.87 | )%(C) | | | 17.32 | % | | | 35.73 | % | | | 15.61 | % | | | 32.15 | % |
| | | | | | | | | | | | | | | | | | | | | | | | |
Net Assets, End of Period (thousands) | | $ | 6,191,964 | | | $ | 4,700,337 | | | $ | 9,638,721 | | | $ | 7,457,252 | | | $ | 4,367,698 | | | $ | 2,804,043 | |
Ratio of Expenses to Average Net Assets | | | 0.24 | % | | | 0.23 | %(B) | | | 0.23 | % | | | 0.23 | % | | | 0.27 | % | | | 0.28 | % |
Ratio of Net Investment Income to Average Net Assets | | | 3.22 | % | | | 4.15 | %(B) | | | 3.04 | % | | | 3.29 | % | | | 2.71 | % | | | 2.35 | % |
Portfolio Turnover Rate | | | 18 | % | | | 16 | %(C) | | | 16 | % | | | 8 | % | | | 10 | % | | | 15 | % |
| | | | | | | | | | | | | | | | | | | | | | | | |
See page 1 for the Definitions of Abbreviations and Footnotes.
†See Note A in the Notes to Financial Statements.
See accompanying Notes to Financial Statements.
27
THE DFA INVESTMENT TRUST COMPANY
THE DFA INTERNATIONAL VALUE SERIES
NOTES TO FINANCIAL STATEMENTS
A. Organization:
The DFA Investment Trust Company (the “Trust”) is an open-end management investment company registered under the Investment Company Act of 1940. The Trust consists of twelve investment portfolios, of which The DFA International Value Series (the “Series”) is presented in this report.
On November 1, 2008, The DFA International Value Series, a master fund in a RIC/RIC master-feeder structure, elected with the consent of its respective Holder(s) to change its U.S. federal income tax classification from that of an association taxable as a corporation to a partnership pursuant to Treasury Regulation § 301.7701-3. The change in capital structure and retroactive reclassification of the statement of changes in net assets and financial highlights for the respective funds is a result of the treatment of a partnership for book purposes. The Series/Portfolio will maintain its books and records and present its financial statements in accordance with generally accepted accounting principles for investment partnerships.
At a regular meeting of the Board of Directors/Trustees (the “Board”) on September 16, 2008, the Board voted to change the fiscal and tax year ends of the Series from November 30 to October 31.
B. Significant Accounting Policies:
The following significant accounting policies are in conformity with accounting principles generally accepted in the United States of America. Such policies are consistently followed by the Trust in preparation of its financial statements. The preparation of financial statements in accordance with accounting principles generally accepted in the United States of America requires management to make estimates and assumptions that affect the reported amounts of assets and liabilities and disclosure of contingent assets and liabilities at the date of the financial statements and the reported amounts of increases and decreases in net assets from operations during the reporting period. Actual results could differ from those estimates and those differences could be material.
1. Security Valuation: Securities held by the Series (including over-the-counter securities) are valued at the last quoted sale price of the day. Securities held by the Series that are listed on Nasdaq are valued at the Nasdaq Official Closing Price (“NOCP”). If there is no last reported sale price or NOCP for the day, the Series values the securities at the mean of the most recent quoted bid and asked prices. Price information on listed securities is taken from the exchange where the security is primarily traded. Generally, securities issued by open-end investment companies are valued using their respective net asset values or public offering prices, as appropriate, for purchase orders placed at the close of the New York Stock Exchange (NYSE).
Securities for which no market quotations are readily available (including restricted securities), or for which market quotations have become unreliable, are valued in good faith at fair value in accordance with procedures adopted by the Board of Directors/Trustees. Fair value pricing may also be used if events that have a significant effect on the value of an investment (as determined in the discretion of the Investment Committee of the Advisor) occur before the net asset value is calculated. When fair value pricing is used, the prices of securities used by the Series may differ from the quoted or published prices for the same securities on their primary markets or exchanges.
The Series will also fair value price in the circumstances described below. Generally, trading in foreign securities markets is completed each day at various times prior to the close of the NYSE. For example, trading in the Japanese securities markets is completed each day at the close of Tokyo Stock Exchange (normally 11:00 p.m. PT), which is fourteen hours prior to the close of the NYSE (normally 1:00 p.m. PT) and the time that the net asset value of the Series is computed. Due to the time differences between the closings of the relevant foreign securities exchanges and the time the Series prices its shares at the close of the NYSE, the Series will fair value its foreign investments when it is determined that the market quotations for the foreign investments are either unreliable or not readily available. The fair value prices will attempt to reflect the impact of the U.S. financial markets’ perceptions and
28
trading activities on the Series’ foreign investments since the last closing prices of the foreign investments were calculated on their primary foreign securities markets or exchanges. For these purposes, the Board of Directors/Trustees of the Series has determined that movements in relevant indices or other appropriate market indicators, after the close of the Tokyo Stock Exchange or the London Stock Exchange, demonstrate that market quotations may be unreliable. Fair valuation of portfolio securities may occur on a daily basis. The fair value pricing by the Series utilizes data furnished by an independent pricing service (and that data draws upon, among other information, the market values of foreign investments). When the Series uses fair value pricing, the values assigned to the Series’ foreign investments may not be the quoted or published prices of the investments on their primary markets or exchanges.
Futures contracts held by the Series are valued using the settlement price established each day on the exchange on which they are traded.
The Series utilizes a fair value hierarchy which prioritizes the inputs to valuation techniques used to measure fair value into three broad levels described below:
• Level 1 – quoted prices in active markets for identical securities
• Level 2 – other significant observable inputs (including quoted prices for similar securities, interest rates, prepayment speeds, credit risk, etc.)
• Level 3 – significant unobservable inputs (including the Series’ own assumptions in determining the fair value of investments)
A summary of the inputs used to value the Series’ net assets by each major security type, industry and/or country is disclosed at the end of the Summary Schedule of Portfolio Holdings. The inputs or methodology used for valuing securities are not necessarily an indication of the risk associated with investing in those securities.
2. Foreign Currency Translation: Securities and other assets and liabilities of the Series whose values are initially expressed in foreign currencies are translated to U.S. dollars using the mean between the most recently quoted bid and asked prices for the U.S. dollar as quoted by generally recognized reliable sources. Dividend and interest income and certain expenses are translated to U.S. dollars at the rate of exchange on their respective accrual dates. Receivables and payables denominated in foreign currencies are marked to market daily based on daily exchange rates. Exchange gains or losses are realized upon ultimate receipt or disbursement.
The Series does not isolate the effect of fluctuations in foreign exchange rates from the effect of fluctuations in the market prices of securities held whether realized or unrealized.
Realized gains or losses on foreign currency transactions represent net foreign exchange gains or losses from the disposition of foreign currencies, currency gains or losses realized between the trade and settlement dates on securities transactions, and the difference between amounts of interest, dividends and foreign withholding taxes recorded on the books of the Series and the U.S. dollar equivalent amounts actually received or paid.
3. Deferred Compensation Plan: Each eligible Trustee of the Trust may elect participation in the Deferred Compensation Plan (the “Plan”). Under the Plan, effective January 1, 2002, such Trustees may defer payment of all or a portion of their total fees earned as a Trustee. These deferred amounts may be treated as though such amounts had been invested in shares of the following funds: U.S. Large Cap Value Portfolio; U.S. Core Equity 1 Portfolio; U.S. Core Equity 2 Portfolio; U.S. Vector Equity Portfolio; U.S. Micro Cap Portfolio; DFA International Value Portfolio; International Core Equity Portfolio; Emerging Markets Portfolio; Emerging Markets Core Equity Portfolio; and/or DFA Two-Year Global Fixed Income Portfolio. Contributions made under the Plan and the change in unrealized appreciation (depreciation) and income are included in Directors’/Trustees’ Fees & Expenses. At October 31, 2009, the total liability for deferred compensation to Trustees is included in Accrued Expenses and Other Liabilities on the Statement of Assets and Liabilities in the amount of $143 (in thousands).
Each Trustee has the option to receive their distribution of proceeds in one of the following methods upon one year’s notice: lump sum; annual installments over a period of agreed upon years; or semi-annual installments over a period of agreed upon years. As of October 31, 2009, none of the Trustees have requested distribution of proceeds.
29
4. Other: Security transactions are accounted for as of the trade date. Costs used in determining realized gains and losses on the sale of investment securities are on the basis of identified cost. Dividend income and distributions to shareholders are recorded on the ex-dividend date. Distributions received on securities that represent a return of capital or capital gains are recorded as a reduction of cost of investments or as a realized gain, respectively. The Series estimates the character of distributions received that may be considered return of capital distributions or capital gain distributions. Interest income is recorded on the accrual basis. Discount and premium on securities purchased are amortized over the lives of the respective securities utilizing the effective interest method. Expenses directly attributable to a Series are directly charged. Common expenses of the Trust are allocated using methods approved by the Board of Directors/Trustees, generally based on average net assets.
The Series may be subject to taxes imposed by countries in which it invests, with respect to its investments in issuers exiting or operating in such countries. Such taxes are generally based on income earned or repatriated and capital gains realized on the sale of such investments. The Series accrues such taxes when the related income or capital gains are earned or throughout the holding period. Some countries require governmental approval for the repatriation of investment income, capital or the proceeds of sales earned by foreign investors. In addition, if there is a deterioration in a country’s balance of payments or for other reasons, a country may impose temporary restrictions on foreign capital remittances abroad.
C. Investment Advisor:
Dimensional Fund Advisors LP (“Dimensional” or the “Advisor”) provides investment advisory services to the Series. For the year ended October 31, 2009, the Series’ investment advisory services fees were accrued daily and paid monthly to the Advisor based on an effective annual rate of 0.20% of average daily net assets of the Series.
Fees Paid to Officers and Directors/Trustees:
Certain Officers and Directors/Trustees of the Advisor are also Officers and Directors/Trustees of the Trust; however, such Officers and Directors/Trustees (with the exception of the Chief Compliance Officer (“CCO”)) receive no compensation from the Trust. For the year ended October 31, 2009, the total related amounts paid by the Trust to the CCO were $98 (in thousands). The total related amounts paid by the Series are included in Other Expenses on the Statement of Operations.
D. Purchases and Sales of Securities:
For the year ended October 31, 2009, the Series made the following purchases and sales of investment securities, other than short-term securities and U.S. government securities (amounts in thousands):
| | | |
Purchases | | $ | 1,071,984 |
Sales | | | 935,775 |
There were no purchases or sales of long-term U.S. government securities.
E. Federal Income Taxes:
No provision for federal income taxes is required since the Series is treated as a partnership for federal income tax purposes. Any net investment income and realized and unrealized gains and losses have been deemed to have been “passed down” to its partners.
30
At October 31, 2009, the total cost and aggregate gross unrealized appreciation and (depreciation) of securities for federal income tax purposes were different from amounts reported for financial reporting purposes (amounts in thousands):
| | | | | | |
Federal Tax Cost | | Unrealized
Appreciation | | Unrealized
(Depreciation) | | Net Unrealized
Appreciation
(Depreciation) |
$5,830,471 | | $1,458,762 | | $(63,077) | | $1,395,685 |
Accounting for Uncertainty in Income Taxes sets forth a minimum threshold for financial statement recognition of the benefit of a tax position taken or expected to be taken on a tax return. Management has analyzed the Series’ tax position and has concluded that no provision for income tax is required in the Series’ financial statements. The Series’ is not aware of any tax position for which it is reasonably possible that the total amounts of unrecognized tax benefits will significantly change in the next twelve months. The Series’ federal tax returns for the prior three fiscal years remain subject to examination by the Internal Revenue Service.
On November 1, 2008, The DFA International Value Series, a master fund in a RIC/RIC master-feeder structure with five RIC feeders and other direct client investor(s), made a “Check-the-box” election for federal income tax purposes pursuant to Treasury Regulation §301.7701-3, to change its federal entity classification from a corporation taxable as a regulated investment company to a partnership. As a result of this election, the master fund is deemed to have distributed all of its assets and liabilities, in a taxable transaction, to its shareholders in liquidation of the master fund. Immediately thereafter, the shareholders contributed all of the distributed assets and liabilities to a newly formed partnership. The final tax year end of The DFA International Value Series was October 31, 2008. For Federal income tax purposes, pursuant to Internal Revenue Code §336(a), the master fund recognizes gain or loss as if the master’s investment securities were sold to its shareholders and, pursuant to IRC Code §331, each of the Portfolios recognizes gain or loss as if it liquidated its investment in the master. As a result of the transaction, The DFA International Value Series recognized a ($2,309,440,866) and ($718,733) capital and currency loss respectively for tax year ended October 31, 2008. For tax purposes, pursuant to IRC Code §334(a), each of the Portfolios will take a fair market value basis in the securities deemed received by them and a new holding period for those securities commences on the deemed liquidation date.
F. Financial Instruments:
In accordance with the Series’ investment objectives and policies, the Series may invest in certain financial instruments that have off-balance sheet risk in excess of the amounts recognized in the financial statements and concentrations of credit and market risk. These instruments and their significant corresponding risks are described below:
1. Repurchase Agreements: The Series may purchase certain U.S. Government securities subject to the counterparty’s agreement to repurchase them at an agreed upon date and price. The counterparty will be required on a daily basis to maintain the value of the collateral subject to the agreement at not less than the repurchase price (including accrued interest). The agreements are conditioned upon the collateral being deposited under the Federal Reserve book-entry system with the Trust’s custodian or a third party sub-custodian. In the event of default or bankruptcy by the other party to the agreement, retention of the collateral may be subject to legal proceedings. All open repurchase agreements were entered into on October 30, 2009.
2. Foreign Market Risks: Investments in foreign markets may involve certain considerations and risks not typically associated with investments in the United States of America, including the possibility of future political and economic developments and the level of foreign government supervision and regulation of foreign securities markets. These markets are generally smaller, less liquid and more volatile than the major securities markets in the United States of America. Consequently, acquisition and disposition of securities by the Series may be inhibited.
31
Derivative Financial Instruments:
Disclosures on derivative instruments and hedging activities are intended to improve financial reporting for derivative instruments by enabling investors to understand how and why a fund uses derivatives, how derivatives are accounted for and how derivative instruments affect a fund’s results of operations and financial position. Summarized below are the specific types of derivative instruments used by the Series.
3. Futures Contracts: The Series may enter into futures contracts to gain market exposure on uninvested cash pending investment in securities or to maintain liquidity to pay redemptions. Upon entering into a futures contract, the Series deposits cash or pledges U.S. Government securities to a broker, equal to the minimum “initial margin” requirements of the exchange on which the contract is traded. Subsequent payments are received from or paid to the broker each day, based on the daily fluctuation in the market value of the contract. These receipts or payments are known as “variation margin” and are recorded daily by the Series as unrealized gains or losses until the contracts are closed. When the contracts are closed, the Series records a realized gain or loss, which is presented in the Statement of Operations as a net realized gain or loss on futures, equal to the difference between the value of the contract at the time it was opened and the value at the time it was closed.
Risks may arise upon entering into futures contracts from potential imperfect price correlations between the futures contracts and the underlying securities, from the possibility of an illiquid secondary market for these instruments and from the possibility that the Series could lose more than the initial margin requirements. The Series entering into stock index futures are subject to equity price risk from those futures contracts. Counterparty credit risk related to exchange-traded futures is minimal because the exchange’s clearinghouse, as counterparty to all exchange-traded futures, guarantees the futures against default.
Additional disclosure on derivative instruments is required showing a summary by primary risk exposure of the derivatives instruments’ (i) location in the balance sheet and fair value at period end and (ii) the location in the Statement of Operations and the realized and change in unrealized gain or loss over the reporting period. The following is a summary of the Series’ derivative instrument holdings for the year ended October 31, 2009.
At October 31, 2009, the Series had no outstanding futures contracts.
The following is a summary of the Series’ location and value of realized gains and losses on the Series’ Statement of Operations for the Series’ derivative instrument holdings through the year ended October 31, 2009 (amounts in thousands):
| | | | |
| | | Location on the Statement of Operations | | Realized Gain (Loss)
on Derivatives
Recognized in Income |
| | | | Equity
Contracts |
The DFA International Value Series* | | Net Realized Gain (Loss) on:
Futures | | $(1,125) |
| * | As of October 31, 2009, there were no futures contracts outstanding. During the year ended October 31, 2009, the Series had limited activity in these transactions. |
G. Line of Credit:
The Trust, together with other Dimensional-advised portfolios, has entered into an amended and restated $250 million unsecured discretionary line of credit effective July 8, 2009 with an affiliate of its domestic custodian bank. Each portfolio is permitted to borrow, subject to its investment limitations, up to a maximum of $250 million, as long as total borrowings under the line of credit do not exceed $250 million in the aggregate. Borrowings under the line of credit are charged interest at the then current Federal Funds Rate plus 1%. Each portfolio is individually, and not jointly, liable for its particular advances under the line of credit. There is no commitment fee on the unused portion of the line of credit. The agreement for the discretionary line of credit may be terminated by either party at any time.
32
The line of credit is scheduled to expire on June 22, 2010. There were no borrowings by the Series under this line of credit during the year ended October 31, 2009.
The Trust, together with other Dimensional-advised portfolios, has also entered into an additional $500 million unsecured line of credit effective January 15, 2009 with its international custodian bank. Each portfolio is permitted to borrow, subject to its investment limitations, up to a maximum of $500 million, as long as total borrowings under the line of credit do not exceed $500 million in the aggregate. Borrowings under the line of credit are charged interest at rates agreed to by the parties at the time of borrowing. Each portfolio is individually, and not jointly, liable for its particular advances under the line of credit. There is no commitment fee on the unused portion of the line of credit. The agreement for the line of credit expires on January 15, 2010.
For the year ended October 31, 2009, borrowings by the Series under this line of credit were as follows (amounts in thousands, except percentages and days):
| | | | | | | | |
Weighted Average Interest Rate | | Weighted
Average Loan Balance | | Number of Days
Outstanding | | Interest Expense
Incurred | | Maximum Amount
Borrowed During
the Period |
0.95% | | $8,517 | | 11 | | $2 | | $18,062 |
There were no outstanding borrowings by the Series under this line of credit as of October 31, 2009.
H. Securities Lending:
As of October 31, 2009, the Series had securities on loan to brokers/dealers, for which the Series held cash collateral. The Series invests the cash collateral, as described below, and records a liability for the return of the collateral, during the period the securities are on loan. Loans of securities are expected at all times to be secured by collateral equal to at least (i) 100% of the current market value of the loaned securities with respect to securities of the U.S. government or its agencies, (ii) 102% of the current market value of the loaned securities with respect to U.S. securities, and (iii) 105% of the current market value of the loaned securities with respect to foreign securities. However, daily market fluctuations could cause the Series’ collateral to be lower or higher than the expected thresholds. If this were to occur, the collateral would be adjusted the next business day to ensure adequate collateralization. In the event of default or bankruptcy by the other party to the agreement, realization and/or retention of the collateral may be subject to legal proceedings. If the borrower fails to return loaned securities, and cash collateral being maintained by the borrower is insufficient to cover the value of loaned securities and provided such collateral insufficiency is not the result of investment losses, the lending agent has agreed to pay the amount of the shortfall to the Series or, at the option of the lending agent, to replace the securities.
Subject to the Series’ investment policy, the cash collateral received by the Series from securities on loan is invested in securities of the U.S. government or its agencies, repurchase agreements collateralized by securities of the U.S. government or its agencies or shares of the DFA Short-Term Investment Fund LP. Agencies include both agency debentures and agency mortgage backed securities. In addition, the Series will be able to terminate the loan at any time and will receive reasonable interest on the loan, as well as amounts equal to any dividends, interest or other distributions on the loaned securities. However, dividend income received from loaned securities may not be eligible to be taxed at qualified dividend income rates.
I. Indemnities; Contractual Obligations:
Under the Trust’s organizational documents, its officers and directors are indemnified against certain liabilities arising out of the performance of their duties to the Trust.
In the normal course of business, the Trust enters into contracts that contain a variety of representations and warranties which provide general indemnification. The Trust’s maximum exposure under these arrangements is unknown as this would involve future claims that may be made against the Trust and/or its affiliates that have not yet occurred. However, based on experience, the Trust expects the risk of loss to be remote.
33
J. In-Kind Redemptions:
In accordance with guidelines described in the Series’ prospectus, the Series may distribute portfolio securities rather than cash as payment for a redemption of fund shares (In-Kind redemption). For financial reporting purposes, the Series recognizes a gain on In-Kind redemptions to the extent the value of the distributed securities on the date of redemption exceeds the cost of those securities. Gains and losses realized on In-Kind redemptions are not recognized for tax purposes and are reclassified from undistributed realized gain (loss) to paid-in capital. During the period December 1, 2007 to October 31, 2008, the Series realized $103,024 (in thousands) of net gain.
K. Subsequent Event Evaluations:
Management has evaluated the impact of all subsequent events on the Series through December 23, 2009, the date the financial statements were available for issuance, and has determined that there are no subsequent events requiring recognition or disclosure in the financial statements.
34
REPORT OF INDEPENDENT REGISTERED PUBLIC ACCOUNTING FIRM
To the Shareholders of The DFA International Value Series and
Board of Trustees of The DFA Investment Trust Company:
In our opinion, the accompanying statements of assets and liabilities, including the summary schedules of portfolio holdings, and the related statements of operations and of changes in net assets and the financial highlights presents fairly, in all material respects, the financial position of The DFA International Value Series (one of the portfolios constituting The DFA Investment Trust Company, hereafter referred to as the “Series”) at October 31, 2009, the results of its operations for the year then ended, the changes in its net assets and the financial highlights for each of the periods indicated, in conformity with accounting principles generally accepted in the United States of America. These financial statements and financial highlights (hereafter referred to as “financial statements”) are the responsibility of the Series’ management; our responsibility is to express an opinion on these financial statements based on our audits. We conducted our audits of these financial statements in accordance with the standards of the Public Company Accounting Oversight Board (United States). Those standards require that we plan and perform the audit to obtain reasonable assurance about whether the financial statements are free of material misstatement. An audit includes examining, on a test basis, evidence supporting the amounts and disclosures in the financial statements, assessing the accounting principles used and significant estimates made by management, and evaluating the overall financial statement presentation. We believe that our audits, which included confirmation of securities at October 31, 2009 by correspondence with the custodian, brokers and the transfer agent of the investee fund, provide a reasonable basis for our opinion.
PricewaterhouseCoopers LLP
Philadelphia, Pennsylvania
December 23, 2009
35
RESULTS OF THE SHAREHOLDER MEETING
On June 2, 2009 and June 5, 2009, The DFA Investment Trust Company (“DFAITC”) held a Special Joint Meeting of Shareholders for the purpose of voting on several proposals affecting DFAITC and the Series, including, among other items, the election of Trustees, the amendment of certain fundamental investment limitations, and the elimination of certain fundamental investment limitations. The shareholders of the Series approved each of the applicable proposals for DFAITC and the Series presented at the Meeting. Listed below are the voting results from the Meeting. Please note that not all Proposals presented at the Meeting were voted on by the Series. Additionally, the Proposal numbers reflected below correlate to the Proposal numbers presented for vote at the Meeting.
DFAITC
| | | | | | | | | | | | | | | | | | | | |
| | | | | Shares Voted | | Percent of Outstanding Shares Voted |
| | | | | For | | % | | Against | | % | | Abstain/
WithHold | | % | | For | | Against | | Abstain/
WithHold |
Proposal 1: Election of Trustees
for DFAITC* | | | | | | | | | | | | | | | | | | |
1a | | David G. Booth | | 2,166,359,402 | | 96.50% | | — | | 0.00% | | 78,661,259 | | 3.50% | | 95.78% | | 0.00% | | 3.48% |
1b | | George M. Constantinides | | 2,169,219,982 | | 96.62% | | — | | 0.00% | | 75,800,679 | | 3.38% | | 95.90% | | 0.00% | | 3.35% |
1c | | John P. Gould | | 2,168,577,186 | | 96.59% | | — | | 0.00% | | 76,443,476 | | 3.41% | | 95.88% | | 0.00% | | 3.38% |
1d | | Roger G. Ibbotson | | 2,169,778,365 | | 96.65% | | — | | 0.00% | | 75,242,297 | | 3.35% | | 95.93% | | 0.00% | | 3.33% |
1e | | Robert C. Merton | | 2,170,124,638 | | 96.66% | | — | | 0.00% | | 74,896,023 | | 3.34% | | 95.94% | | 0.00% | | 3.31% |
1f | | Myron S. Scholes | | 2,169,439,189 | | 96.63% | | — | | 0.00% | | 75,581,473 | | 3.37% | | 95.91% | | 0.00% | | 3.34% |
1g | | Eduardo A. Repetto | | 2,167,010,793 | | 96.53% | | — | | 0.00% | | 78,009,868 | | 3.47% | | 95.81% | | 0.00% | | 3.45% |
1h | | Abbie J. Smith | | 2,169,626,842 | | 96.64% | | — | | 0.00% | | 75,393,820 | | 3.36% | | 95.92% | | 0.00% | | 3.33% |
| | | | | | | | | | | | | | | | | | | | | | | | | | | | |
| | | Shares Voted | | Percent of Outstanding Shares Voted | |
| | | For | | % | | | Against | | % | | | Abstain/
WithHold | | % | | | NonVote | | % | | For | | | Against | | | Abstain /
WithHold | |
Proposal 4: Approval of an Amended and Restated Agreement and Declaration of Trust for DFAITC* | | 2,076,877,329 | | 92.43 | % | | 36,623,148 | | 1.63 | % | | 133,356,326 | | 5.94 | % | | NA | | NA | | 91.82 | % | | 1.62 | % | | 5.90 | % |
* Results are for all Series within DFAITC
The DFA International Value Series
| | | | | | | | | | | | | | | | | | | | |
| | | | | Shares Voted | | Percent of Outstanding Shares Voted |
| | | | | For | | % | | Against | | % | | Abstain/
WithHold | | % | | For | | Against | | Abstain/
WithHold |
Proposals: | | | | | | | | | | | | | | | | | | |
5 | | To approve amendments to certain fundamental investment restrictions | | | | | | | | |
5a | | Borrowing Money | | 349,117,663 | | 88.20% | | 30,044,848 | | 7.59% | | 16,661,166 | | 4.21% | | 86.14% | | 7.41% | | 4.11% |
5b | | Making Loans | | 348,947,065 | | 88.16% | | 29,971,477 | | 7.57% | | 16,905,135 | | 4.27% | | 86.10% | | 7.40% | | 4.17% |
5c | | Investments in Real Estate | | 351,165,048 | | 88.72% | | 28,070,820 | | 7.09% | | 16,587,809 | | 4.19% | | 86.65% | | 6.93% | | 4.09% |
5d | | Investments in Commodities | | 347,839,401 | | 87.88% | | 31,372,412 | | 7.93% | | 16,611,864 | | 4.20% | | 85.82% | | 7.74% | | 4.10% |
5e | | Diversification of Investments | | 351,038,355 | | 88.69% | | 28,302,302 | | 7.15% | | 16,483,020 | | 4.16% | | 86.61% | | 6.98% | | 4.07% |
6 | | To approve the elimination of certain fundamental investment restrictions | | | | | | | | |
6a | | Pledging, Mortgaging, or Hypothecating Assets | | 346,783,275 | | 87.61% | | 32,195,687 | | 8.13% | | 16,844,715 | | 4.26% | | 85.56% | | 7.94% | | 4.16% |
6b | | Purchasing Securities on Margin | | 346,279,680 | | 87.48% | | 32,728,442 | | 8.27% | | 16,815,555 | | 4.25% | | 85.44% | | 8.08% | | 4.15% |
6c | | Investing in Restricted or Illiquid Securities | | 346,650,940 | | 87.58% | | 32,506,501 | | 8.21% | | 16,666,236 | | 4.21% | | 85.53% | | 8.02% | | 4.11% |
6d | | Investing for the Purpose of Exercising Control | | 349,242,494 | | 88.23% | | 29,958,913 | | 7.57% | | 16,621,270 | | 4.20% | | 86.17% | | 7.39% | | 4.10% |
6e | | Investing in Other Investment Companies | | 349,373,590 | | 88.26% | | 29,787,506 | | 7.53% | | 16,662,582 | | 4.21% | | 86.20% | | 7.35% | | 4.11% |
6f | | Management Ownership of Securities of an Issuer | | 349,991,995 | | 88.42% | | 28,988,874 | | 7.32% | | 16,842,809 | | 4.26% | | 86.36% | | 7.15% | | 4.16% |
6g | | Investing in Oil, Gas, or other Mineral Exploration, Leases or Development Programs | | 348,999,679 | | 88.17% | | 30,314,009 | | 7.66% | | 16,509,990 | | 4.17% | | 86.11% | | 7.48% | | 4.07% |
6h | | Investing in Securities of Unseasoned Issuers | | 349,376,398 | | 88.27% | | 29,792,320 | | 7.53% | | 16,653,959 | | 4.21% | | 86.20% | | 7.35% | | 4.11% |
6i | | Investing in Warrants | | 349,983,930 | | 88.42% | | 29,092,914 | | 7.35% | | 16,745,833 | | 4.23% | | 86.35% | | 7.18% | | 4.13% |
6j | | Writing or Acquiring Options | | 349,310,900 | | 88.25% | | 29,764,139 | | 7.52% | | 16,747,638 | | 4.23% | | 86.19% | | 7.34% | | 4.13% |
7a | | Proposed Sub-Advisory Agreement among Dimensional Fund Advisors LP, DFA Australia Limited, and the Company | | 355,560,358 | | 89.83% | | 17,051,279 | | 4.31% | | 23,212,041 | | 5.86% | | 87.73% | | 4.21% | | 5.73% |
36
| | | | | | | | | | | | | | | | | | | | | | | | | | |
| | | | | Shares Voted | | | Percent of Outstanding Shares Voted | |
| | | | | For | | % | | | Against | | % | | | Abstain/
WithHold | | % | | | For | | | Against | | | Abstain /
WithHold | |
Proposals: | | | | | | | | | | | | | | | | | | | | | | | | |
7b | | Proposed Sub-Advisory Agreement among Dimensional Fund Advisors LP, Dimensional Fund Advisors Ltd., and the Company | | 355,594,969 | | 89.84 | % | | 16,996,602 | | 4.29 | % | | 23,232,105 | | 5.87 | % | | 87.74 | % | | 4.19 | % | | 5.73 | % |
37
FUND MANAGEMENT
Trustees/Directors
Each Board of Trustees/Directors of The DFA Investment Trust Company Inc. (“DFAITC”), DFA Investment Dimensions Group Inc. (“DFAIDG”), Dimensional Investment Group Inc. (“DIG”) and Dimensional Emerging Markets Value Fund (“DEM”) (each, the “Fund” and collectively, the “Funds”) is responsible for establishing the Funds’ policies and for overseeing the management of the Funds. The Trustees/Directors of the Funds, including all of the disinterested Directors, have adopted written procedures to monitor potential conflicts of interest that might develop between portfolios of the Funds (the “Feeder Portfolios”) that invest in certain series of DFAITC or DEM (the “Master Funds”).
Each Board has two standing committees, an Audit Committee and a Portfolio Performance and Service Review Committee (the “Performance Committee”). The Audit Committee is comprised of George M. Constantinides, Roger G. Ibbotson and Abbie J. Smith. Each member of the Audit Committee is a disinterested Director. The Audit Committee oversees the Fund’s accounting and financial reporting policies and practices, the Fund’s internal controls, the Fund’s financial statements and the independent audits thereof and performs other oversight functions as requested by the Board. The Audit Committee recommends the appointment of each Fund’s independent registered certified public accounting firm and also acts as a liaison between the Fund’s independent registered certified public accounting firm and the full Board. There were two Audit Committee meetings held during the fiscal year ended October 31, 2009.
Each Board’s Performance Committee is comprised of Messrs. Constantinides and Ibbotson, Ms. Smith, John P. Gould, Myron S. Scholes and Robert C. Merton. Each member of the Fund’s Performance Committee is a disinterested Director. The Performance Committee regularly reviews and monitors the investment performance of the Fund’s series and reviews the performance of the Fund’s service providers. There were six Performance Committee meetings held during the fiscal year ended October 31, 2009.
Certain biographical information for each disinterested Trustee/Director and each interested Trustee/Director of the Funds is set forth in the tables below, including a description of each Trustee/Director’s experience as a Trustee/Director of the Funds and as a director or trustee of other funds, as well as other recent professional experience.
The statements of additional information (together, “SAI”) of the Funds include additional information about each Trustee/Director. You may obtain copies of the SAI and prospectus of each Fund advised by Dimensional Fund Advisors LP by calling collect (512) 306-7400 or by mailing a request to Dimensional Fund Advisors LP, 6300 Bee Cave Road, Building One, Austin, Texas 78746. Prospectuses are also available at www.dimensional.com.
| | | | | | |
Name, Position with the Fund, Address and Age | | Term of Office1 and Length
of Service | | Portfolios within the DFA Fund Complex2 Overseen | | Principal Occupation(s) During Past 5 Years and
Other Directorships of Public Companies Held |
Disinterested Trustees/Directors |
George M. Constantinides Director of DFAIDG, DIG and DEM. Trustee of DFAITC. The University of Chicago Booth School of Business 5807 S. Woodlawn Avenue Chicago, IL 60637 Age: 62 | | DFAITC - since 1993 DFAIDG - since 1983 DIG - since 1993 DEM - since 1993 | | 87 portfolios in 4 investment companies | | Leo Melamed Professor of Finance, The University of Chicago Booth School of Business. |
John P. Gould Director of DFAIDG, DIG and DEM. Trustee of DFAITC. The University of Chicago Booth School of Business 5807 S. Woodlawn Avenue Chicago, IL 60637 Age: 70 | | DFAITC - since 1993 DFAIDG - since 1986 DIG - since 1993 DEM - since 1993 | | 87 portfolios in 4 investment companies | | Steven G. Rothmeier Distinguished Service Professor of Economics, The University of Chicago Booth School of Business (since 1965). Member of the Boards of Milwaukee Mutual Insurance Company (since 1997). Member and Chair, Competitive Markets Advisory Committee, Chicago Mercantile Exchange (futures trading exchange) (since 2004). Formerly, Director of UNext, Inc. (1999-2006). Formerly, Senior Vice-President, Lexecon Inc. (economics, law, strategy and finance consulting) (1994-2004). Trustee, Harbor Fund (registered investment company) (27 Portfolios) (since 1994). |
38
| | | | | | |
Name, Position with the Fund, Address and Age | | Term of Office1 and Length of Service | | Portfolios within the DFA Fund Complex2
Overseen | | Principal Occupation(s) During Past 5 Years and
Other Directorships of Public Companies Held |
Roger G. Ibbotson Director of DFAIDG, DIG and DEM. Trustee of DFAITC. Yale School of Management 135 Prospect Street New Haven, CT 06520-8200 Age: 66 | | DFAITC - since 1993 DFAIDG - since 1981 DIG - since 1993 DEM - since 1993 | | 87 portfolios in 4 investment companies | | Professor in Practice of Finance, Yale School of Management (since 1984). Director, BIRR Portfolio Analysis, Inc. (software products) (since 1990). Chairman, CIO and Partner, Zebra Capital Management, LLC (hedge fund manager) (since 2001). Formerly, Chairman, Ibbotson Associates, Inc., Chicago, IL (software data publishing and consulting) (1977-2006). |
Robert C. Merton Director of DFAIDG, DIG and DEM. Trustee of DFAITC. Harvard Business School 353 Baker Library Soldiers Field Boston, MA 02163 Age: 65 | | DFAITC - since 2003 DFAIDG - since 2003 DIG - since 2003 DEM - since 2003 | | 87 portfolios in 4 investment companies | | John and Natty McArthur University Professor, Graduate School of Business Administration, Harvard University (since 1998). Director, MF Risk, Inc. (risk management software) (since 2001). Director, Peninsula Banking Group (bank) (since 2003). Director, Community First Financial Group (bank holding company) (since 2003). Member Competitive Markets Advisory Council, Chicago Mercantile Exchange (futures trading exchange) (since 2004). Chairman and Director, Daedalus Software (medical software) (since 2008). Formerly, Advisory Board Member, Alpha Simplex Group (hedge fund) (2001-2007). Formerly, Chief Science Officer and Director, Trinsum Group, a successor to Integrated Finance Limited (2002-2008). Director, Vical Incorporated (biopharmaceutical product development) (since 2002). |
Myron S. Scholes Director of DFAIDG, DIG and DEM. Trustee of DFAITC. Platinum Grove Asset Management, L.P. Reckson Executive Park 1100 King Street Building 4 Rye Brook, NY 10573 Age: 68 | | DFAITC - since 1993 DFAIDG - since 1981 DIG - since 1993 DEM - since 1993 | | 87 portfolios in 4 investment companies | | Frank E. Buck Professor Emeritus of Finance, Stanford University (since 1981). Chairman, Platinum Grove Asset Management, L.P. (hedge fund) (formerly, Oak Hill Platinum Partners) (since 1999). Formerly, Managing Partner, Oak Hill Capital Management (private equity firm) (until 2004). Formerly, Director, Chicago Mercantile Exchange (2001-2008). Director, American Century Fund Complex (registered investment companies) (37 Portfolios) (since 1981). |
Abbie J. Smith Director of DFAIDG, DIG and DEM. Trustee of DFAITC. The University of Chicago Booth School of Business 5807 S. Woodlawn Avenue Chicago, IL 60637 Age: 56 | | DFAITC - since 2000 DFAIDG - since 2000 DIG - since 2000 DEM - since 2000 | | 87 portfolios in 4 investment companies | | Boris and Irene Stern Professor of Accounting, The University of Chicago Booth School of Business (since 1980), and Co-Director Investment Research, Fundamental Investment Advisors (hedge fund) (since 2008). Director, HNI Corporation (formerly known as HON Industries Inc.) (office furniture) (since 2000). Director, Ryder System Inc. (transportation, logistics and supply-chain management) (since 2003). Director/Trustee, UBS Funds (fund complex) (5 portfolios) (since 2008). |
39
| | | | | | |
Name, Position with the Fund, Address and Age | | Term of Office1 and Length of Service | | Portfolios within the DFA Fund Complex2
Overseen | | Principal Occupation(s) During Past 5 Years and
Other Directorships of Public Companies Held |
| Interested Trustees/Directors* |
David G. Booth Chairman, Director, Chief Executive Officer and President of DFAIDG, DIG and DEM. Chairman, Trustee, Chief Executive Officer, Chief Investment Officer and President of DFAITC. 6300 Bee Cave Road, Building One Austin, Texas 78746 Age: 62 | | DFAITC - since 1993 DFAIDG - since 1981 DIG - since 1992 DEM - since 1993 | | 87 portfolios in 4 investment companies | | Chairman, Director/Trustee, President, Chief Executive Officer and formerly Chief Investment Officer of the following companies: Dimensional Holdings Inc., Dimensional Fund Advisors LP, Dimensional Fund Advisors Canada ULC, DFAIDG, DIG, DEM and DFAITC. President and Chief Executive Officer of DFA Securities LLC. Director of Dimensional Fund Advisors Ltd, and formerly Chief Investment Officer. Director and formerly, President and Chief Investment Officer of DFA Australia Ltd. Formerly, Director of Dimensional Funds PLC and Dimensional Fund II PLC. Chairman, Director and Chief Executive Officer of Dimensional Fund Advisors Canada ULC (All Chief Investment Officer positions held starting 1/03 through 3/07 except Dimensional Holdings Inc., which was from 10/06 through 3/07.) Limited Partner, Oak Hill Partners (since 2001) and VSC Investors, LLC (since 2007). Trustee, The University of Chicago Booth School of Business. Formerly, Director, SA Funds (registered investment company). Formerly Director, Assante Corporation (investment management) (until 2002). |
Eduardo A. Repetto Director, Chief Investment Officer and Vice President of DFAIDG, DIG and DEM. Trustee, Chief Investment Officer and Vice President of DFAITC 6300 Bee Cave Road, Building One Austin, TX 78746 Age: 42 | | DFAITC - since 2009 DFAIDG - since 2009 DIG - since 2009 DEM - since 2009 | | 87 portfolios in 4 investment companies | | Director/Trustee (beginning June 2009), Chief Investment Officer (beginning March 2007) and Vice President of DFAIDG, DIG, DEM and DFAITC. Chief Investment Officer (beginning March 2007) and Vice President of all the DFA Entities, DFA Australia Limited and Dimensional Fund Advisors Canada ULC. |
| 1 | Each Trustee/Director holds office for an indefinite term until his or her successor is elected and qualified. |
| 2 | Each Trustee/Director is a director or trustee of each of the four registered investment companies within the DFA Fund Complex, which includes the Funds. |
| * | Interested Trustees/Directors are described as such because they are deemed to be “interested persons,” as that term is defined under the Investment Company Act of 1940, as amended, due to their positions with Dimensional Fund Advisors LP. |
40
Officers
The name, age, information regarding positions with the Funds and the principal occupation for each officer of the Funds are set forth below. Each officer listed below holds the same office (except as otherwise noted) in the following entities: Dimensional Fund Advisors LP (prior to November 3, 2006, Dimensional Fund Advisors Inc.) (“Dimensional”), DFA Securities Inc., DFAIDG, DIG, DFAITC and DEM (collectively, the “DFA Entities”). The address of each officer is: Dimensional Fund Advisors LP, 6300 Bee Cave Road, Building One, Austin, Texas 78746, unless otherwise indicated.
| | | | |
Name, Position with the Fund and Age | | Term of Office1 and Length of Service | | Principal Occupation(s) During Past 5 Years |
| Officers |
April A. Aandal Vice President and Chief Learning Officer Age: 46 | | Since 2008 | | Vice President of all the DFA Entities. Chief Learning Officer of Dimensional (since September 2008). Formerly, Regional Director of Dimensional (2004-2008); Vice President of Professional Development at Assante Asset Management (June 2002-January 2005). |
Darryl D. Avery Vice President Age: 43 | | Since 2005 | | Vice President of all the DFA Entities. From June 2002 to January 2005, institutional client service representative of Dimensional. |
Arthur H. Barlow Vice President Age: 53 | | Since 1993 | | Vice President of all the DFA Entities. Formerly, Vice President of DFA Australia Limited and Dimensional Fund Advisors Ltd. |
Scott A. Bosworth Vice President Age: 40 | | Since 2007 | | Vice President of all the DFA Entities. Regional Director of Dimensional (since November 1997). |
Valerie A. Brown Vice President and Assistant Secretary Age: 42 | | Since 2001 | | Vice President and Assistant Secretary of all the DFA Entities, DFA Australia Limited, Dimensional Fund Advisors Ltd., and since June 2003, Dimensional Fund Advisors Canada ULC. |
David P. Butler Vice President Age: 45 | | Since 2007 | | Vice President of all the DFA Entities. Director of Global Financial Services of Dimensional (since 2008). Formerly, Regional Director of Dimensional Fund Advisors LP (January 1995 to January 2005). |
Patrick Carter Vice President Age: 47 | | Since 2007 | | Vice President of all the DFA Entities. Regional Director of Dimensional (since March 2006). Formerly, Director of Merrill Lynch Retirement Group (December 1998 to March 2006). |
Joseph H. Chi Vice President Age: 43 | | Since 2009 | | Vice President of all the DFA Entities. Portfolio Manager for Dimensional Fund Advisors LP (since October 2005). Prior to October 2005, Corporate Counsel at Hewitt Associates (July 2002-August 2005). |
Stephen A. Clark Vice President Age: 37 | | Since 2004 | | Vice President of all the DFA Entities. Formerly, Portfolio Manager of Dimensional (April 2001-April 2004). |
Robert P. Cornell Vice President Age: 60 | | Since 2007 | | Vice President of all the DFA Entities. Regional Director of Financial Services Group of Dimensional (since August 1993). |
Christopher S. Crossan Vice President and Chief Compliance Officer Age: 43 | | Since 2004 | | Vice President and Chief Compliance Officer of all the DFA Entities. |
James L. Davis Vice President Age: 52 | | Since 1999 | | Vice President of all the DFA Entities. Formerly, Vice President of DFA Australia Limited and Dimensional Fund Advisors Ltd. |
Robert T. Deere Vice President Age: 52 | | Since 1994 | | Vice President of all the DFA Entities and DFA Australia Limited. |
Robert W. Dintzner Vice President Age: 39 | | Since 2001 | | Vice President of all the DFA Entities. |
41
| | | | |
Name, Position with the Fund and Age | | Term of Office1 and Length of Service | | Principal Occupation(s) During Past 5 Years |
Kenneth Elmgren Vice President Age: 55 | | Since 2007 | | Vice President of all the DFA Entities. Formerly, Managing Principal of Beverly Capital (May 2004 to September 2006). |
Richard A. Eustice Vice President and Assistant Secretary Age: 44 | | Since 1998 | | Vice President and Assistant Secretary of all the DFA Entities and DFA Australia Limited. Chief Operating Officer of Dimensional Fund Advisors Ltd. (since July 2008). Formerly, Vice President of Dimensional Fund Advisors Ltd. |
Eugene F. Fama, Jr. Vice President Age: 48 | | Since 1993 | | Vice President of all the DFA Entities. Formerly, Vice President of DFA Australia Limited and Dimensional Fund Advisors Ltd. |
Gretchen A. Flicker Vice President Age: 38 | | Since 2004 | | Vice President of all the DFA Entities. Prior to April 2004, institutional client service representative of Dimensional. |
Jed S. Fogdall Vice President Age: 35 | | Since 2008 | | Vice President of all the DFA Entities. Portfolio Manager for Dimensional (since September 2004). Prior to September 2004, Staff Engineer at the Boeing Company (1997-2004). |
Glenn S. Freed Vice President Age: 47 | | Since 2001 | | Vice President of all the DFA Entities. |
Jeremy P. Freeman Vice President Age: 38 | | Since 2009 | | Vice President of all the DFA Entities. Senior Technology Manager for Dimensional Fund Advisors LP (since June 2006). Formerly, Principal at AIM Investments/Amvescap PLC (now Invesco) (June 1998-June 2006). |
Mark R. Gochnour Vice President Age: 42 | | Since 2007 | | Vice President of all the DFA Entities. Regional Director of Dimensional. |
Henry F. Gray Vice President Age: 42 | | Since 2000 | | Vice President of all the DFA Entities. Prior to July 2000, Portfolio Manager of Dimensional. Formerly, Vice President of DFA Australia Limited. |
John T. Gray Vice President Age: 35 | | Since 2007 | | Vice President of all the DFA Entities. Formerly, Regional Director of Dimensional (January 2005 to February 2007). |
Darla Hastings Vice President Age: 54 | | Since 2007 | | Vice President of all the DFA Entities. Chief Marketing Officer of Dimensional. Formerly, Senior Vice President, Customer Experience for Benchmark Assisted Living (May 2005 to April 2006); Executive Vice President and Chief Marketing Officer of State Street Corporation (September 2001 to October 2005). |
Joel H. Hefner Vice President Age: 41 | | Since 2007 | | Vice President of all the DFA Entities. Regional Director of Dimensional (since June 1998). |
Julie Henderson Vice President and Fund Controller Age: 35 | | Since 2005 | | Vice President and Fund Controller of all the DFA Entities. Formerly, Senior Manager at PricewaterhouseCoopers LLP (July 1996 to April 2005). |
Kevin Hight Vice President Age: 41 | | Since 2005 | | Vice President of all the DFA Entities. Formerly, Regional Director of Dimensional (since March 2003 to March 2005). |
Christine W. Ho Vice President Age: 41 | | Since 2004 | | Vice President of all the DFA Entities. Prior to April 2004, Assistant Controller of Dimensional. |
Jeff J. Jeon Vice President Age: 35 | | Since 2004 | | Vice President of all the DFA Entities. Counsel of Dimensional (since September 2001). |
Patrick M. Keating Vice President Age: 54 | | Since 2003 | | Vice President of all the DFA Entities and Chief Operating Officer of Dimensional. Director, Vice President and Chief Privacy Officer of Dimensional Fund Advisors Canada ULC. Director of DFA Australia Limited. |
42
| | | | |
Name, Position with the Fund and Age | | Term of Office1 and Length of Service | | Principal Occupation(s) During Past 5 Years |
Joseph F. Kolerich Vice President Age: 37 | | Since 2004 | �� | Vice President of all the DFA Entities. Portfolio Manager for Dimensional (since April 2001). |
Michael F. Lane Vice President Age: 42 | | Since 2004 | | Vice President of all the DFA Entities. Formerly, Vice President of Advisor Services at TIAA-CREF (July 2001 to September 2004). |
Kristina M. LaRusso Vice President Age: 34 | | Since 2006 | | Vice President of all DFA Entities. Formerly, Operations Supervisor of Dimensional (March 2003 to December 2006). |
Inmoo Lee Vice President Age: 43 | | Since 2007 | | Vice President of all the DFA Entities. Associate Professor Department of Finance and Accounting, Business School, National University of Singapore (July 2004 to present); Associate Professor, College of Business Administration, Korea University (September 2001 to May 2006). |
Juliet Lee Vice President Age: 38 | | Since 2005 | | Vice President of all the DFA Entities. Human Resources Manager of Dimensional (since January 2004). |
Aaron M. Marcus Vice President & Head of Global Human Resources Age: 39 | | Since 2008 | | Vice President and Head of Global Human Resources of Dimensional. Formerly, Global Head of Recruiting and Vice President of Goldman Sachs & Co. (June 2006 to January 2008); Global Co-Head of HR of the Equities & FICC Division, and Vice President of Goldman Sachs & Co. (May 2005 to May 2006); Head of Americas Campus Recruiting and Vice President of Goldman Sachs & Co. (April 2003 to May 2005). |
David R. Martin Vice President, Chief Financial Officer and Treasurer Age: 52 | | Since 2007 | | Vice President, Chief Financial Officer and Treasurer of all the DFA Entities. Director, Vice President, Chief Financial Officer and Treasurer of Dimensional Fund Advisors Ltd. and DFA Australia Limited. Chief Financial Officer, Treasurer, and Vice President of Dimensional Fund Advisors Canada ULC. Director of Dimensional Funds PLC and Dimensional Funds II PLC. Formerly, Executive Vice President and Chief Financial Officer of Janus Capital Group Inc. (June 2005 to March 2007); Senior Vice President of Finance at Charles Schwab & Co., Inc. (March 1999 to May 2005). |
Catherine L. Newell Vice President and Secretary Age: 45 | | Vice President since 1997 and Secretary since 2000 | | Vice President and Secretary of all the DFA Entities. Director, Vice President and Secretary of DFA Australia Limited and Dimensional Fund Advisors Ltd. (since February 2002, April 1997 and May 2002, respectively). Vice President and Secretary of Dimensional Fund Advisors Canada ULC (since June 2003). Director, Dimensional Funds PLC and Dimensional Funds II PLC (since 2002 and 2006, respectively). Formerly, Assistant Secretary of all DFA Entities, DFA Australia Limited and Dimensional Fund Advisors Ltd. |
Christian Newton Vice President Age: 34 | | Since 2009 | | Vice President of all DFA Entities. Web Services Manager for Dimensional Fund Advisors LP (Since January 2008). Formerly Design Manager (2005-2008) and Web Developer (2002-2005) of Dimensional Fund Advisors LP. |
Gerard K. O’Reilly Vice President Age: 32 | | Since 2007 | | Vice President of all the DFA Entities. Formerly, Research Associate of Dimensional Fund Advisors LP (2004 to 2006); Research Assistant in PhD program, Aeronautics Department California Institute of Technology (1998 to 2004). |
Daniel C. Ong Vice President Age: 35 | | Since 2009 | | Vice President of all the DFA Entities. Portfolio Manager for Dimensional Fund Advisors LP (since July 2005). Prior to 2005, Graduate Student at the University of Chicago Booth School of Business (2003-2005). |
Carmen Palafox Vice President Age: 35 | | Since 2006 | | Vice President of all the DFA Entities. Operations Manager of Dimensional Fund Advisors LP (since May 1996). |
Sonya Park Vice President Age: 37 | | Since 2005 | | Vice President of all the DFA Entities. From February 2002 to January 2005, institutional client service representative of Dimensional. |
43
| | | | |
Name, Position with the Fund and Age | | Term of Office1 and Length of Service | | Principal Occupation(s) During Past 5 Years |
David A. Plecha Vice President Age: 48 | | Since 1993 | | Vice President of all the DFA Entities, DFA Australia Limited and Dimensional Fund Advisors Ltd |
Ted Randall Vice President Age: 36 | | Since 2008 | | Vice President of all the DFA Entities. Formerly, Research Associate of Dimensional (2006-2008). Systems Developer of Dimensional (2001-2006). |
L. Jacobo Rodriguez Vice President Age: 38 | | Since 2005 | | Vice President of all the DFA Entities. From August 2004 to July 2005, institutional client service representative of Dimensional. Formerly, Financial Services Analyst, Cato Institute (September 2001 to June 2004); Book Review Editor, Cato Journal, Cato Institute (May 1996 to June 2004). |
David E. Schneider Vice President Age: 63 | | Since 2001 | | Vice President of all the DFA Entities. Currently, Director of Institutional Services. |
Bruce A. Simmons Vice President Age: 44 | | Since 2009 | | Vice President of all the DFA Entities. Investment Operations Manager for Dimensional Fund Advisors LP (since May 2007). Formerly, Vice President Client and Fund Reporting at Mellon Financial (September 2005-May 2007); Vice President Business Development at CUADPRO Marketing (July 2003-September 2005). |
Ted R. Simpson Vice President Age: 41 | | Since 2007 | | Vice President of all the DFA Entities. Regional Director of Dimensional (since December 2002). |
Bryce D. Skaff Vice President Age: 34 | | Since 2007 | | Vice President of all the DFA Entities. Formerly, Regional Director of Dimensional (December 1999 to January 2007). |
Grady M. Smith Vice President Age: 53 | | Since 2004 | | Vice President of all the DFA Entities. Prior to April 2004, Portfolio Manager of Dimensional. |
Carl G. Snyder Vice President Age: 46 | | Since 2000 | | Vice President of all the DFA Entities. Formerly, Vice President of DFA Australia Limited. |
Lawrence R. Spieth Vice President Age: 61 | | Since 2004 | | Vice President of all the DFA Entities. Prior to April 2004, Regional Director of Dimensional. |
Bradley G. Steiman Vice President Age: 36 | | Since 2004 | | Vice President of all the DFA Entities and Director and Vice President of Dimensional Fund Advisors Canada ULC. |
Robert C. Trotter Vice President Age: 51 | | Since 2009 | | Vice President of all the DFA Entities. Senior Manager Technology for Dimensional Fund Advisors LP (since March 2007). Formerly, Director of Technology at AMVESCAP (2002-2007). |
Karen E. Umland Vice President Age: 43 | | Since 1997 | | Vice President of all the DFA Entities, DFA Australia Limited, Dimensional Fund Advisors Ltd., and Dimensional Fund Advisors Canada ULC. |
Sunil Wahal Vice President Age: 42 | | Since 2009 | | Vice President of all the DFA Entities. Formerly, Research Associate for Dimensional Fund Advisors LP (July 2008-January 2009); Consultant to Dimensional Fund Advisors LP (September 2005-July 2008); Jack D. Furst Professor of Finance at Arizona State University, WP Carey School of Business (July 2005-July 2008); Associate Professor of Finance at Goizueta Business School, Emory University (1997-2005). |
Brian J. Walsh Vice President Age: 39 | | Since 2009 | | Vice President of all the DFA Entities. Portfolio Manager for Dimensional Fund Advisors LP (since 2004). Formerly, Trader for Dimensional Fund Advisors LP (1997-2004). |
Carol W. Wardlaw Vice President Age: 51 | | Since 2004 | | Vice President of all the DFA Entities. Prior to April 2004, Regional Director of Dimensional. |
44
| | | | |
Name, Position with the Fund and Age | | Term of Office1 and Length of Service | | Principal Occupation(s) During Past 5 Years |
Weston J. Wellington Vice President Age: 58 | | Since 1997 | | Vice President of all the DFA Entities. Formerly, Vice President of DFA Australia Limited. |
Daniel M. Wheeler Vice President Age: 64 | | Since 2001 | | Vice President of all the DFA Entities. Prior to 2001 and currently, Director of Financial Advisors Services of Dimensional. Director of Dimensional Fund Advisors Ltd. (since October 2003) and President of Dimensional Fund Advisors Canada ULC (since June 2003). |
Ryan Wiley Vice President Age: 33 | | Since 2007 | | Vice President of all the DFA Entities. Senior Trader of Dimensional. Formerly, Portfolio Manager (2006 to 2007); Trader (2001 to 2006). |
Paul E. Wise Vice President Age: 54 | | Since 2005 | | Vice President of all the DFA Entities. Chief Technology Officer for Dimensional (since 2004). Formerly, Principal of Turnbuckle Management Group (January 2002 to August 2004). |
| 1 | Each officer holds office for an indefinite term at the pleasure of the Boards of Trustees/Directors and until his or her successor is elected and qualified. |
45
VOTING PROXIES ON FUND PORTFOLIO SECURITIES
A description of the policies and procedures that the Trust uses in voting proxies relating to securities held in the portfolio is available without charge, upon request, by calling collect: (512) 306-7400. Information regarding how the Advisor votes these proxies is available from the EDGAR database on the SEC’s website at http://www.sec.gov and from the Advisor’s website at http://www.dimensional.com and reflects the twelve-month period beginning July 1st and ending June 30th.
46
NOTICE TO SHAREHOLDERS
(Unaudited)
For shareholders that do not have an October 31, 2009 tax year end, this notice is for informational purposes only. For shareholders with an October 31, 2009 tax year end, please consult your tax advisor as to the pertinence of this notice. For the fiscal year November 1, 2008 to October 31, 2009, the Portfolio is designating the following items with regard to distributions paid during the fiscal year. All designations are based on financial information available as of the date of this annual report and, accordingly are subject to change. For each item, it is the intention of the Portfolio/Series to designate the maximum amount permitted under the Internal Revenue Code and the regulations thereunder.
| | | | | | | | | | | | | | | | | | | | |
Dimensional Investment Group Inc. | | Net
Investment
Income
Distributions | | Short-Term
Capital Gain
Distributions | | Long-Term
Capital Gain
Distributions | | Total
Distributions | | Qualifying
For
Corporate
Dividends
Received
Deduction(1) | | Qualifying
Dividend
Income(2) | | Foreign
Tax
Credit(3) | | Foreign
Source
Income(4) | | Qualifying
Interest
Income(5) | | Qualifying
Short-Term
Capital
Gain(6) |
DFA International Value Portfolio II | | 5% | | — | | 95% | | 100% | | 100% | | 100% | | 7% | | 109% | | 100% | | 100% |
| (1) | Qualifying dividends represent dividends which qualify for the corporate dividends received deduction and is reflected as a percentage of ordinary income distributions (the total of short-term capital gain and net investment income distributions). |
| (2) | The percentage in this column represents the amount of “Qualifying Dividend Income” as created by the Jobs and Growth Tax Relief Reconciliation Act of 2003 and is reflected as a percentage of ordinary income distributions (the total of short-term capital gain and net investment income distributions). Please note that these percentages are designated only, refer to your 1099 for actual qualified dividend income. |
| (3) | “Foreign Tax Credit” represents dividends which qualify for the foreign tax credit pass through and is reflected as a percentage of investment company taxable income (the total of short-term capital gain and net investment income distributions). |
| (4) | “Foreign Source Income” represents the portion of dividends derived from foreign sources, and is reflected as a percentage of ordinary income (i.e., the sum of short-term capital gain and net investment income) distributions made during the period. |
| (5) | The percentage in this column represents the amount of “Qualifying Interest Income” as created by The American Jobs Creation Act of 2004. The information is reflected as a percentage of ordinary income distributions (the total of short-term capital gain and net investment income distributions). |
| (6) | The percentage in this column represents the amount of “Qualifying Short-Term Capital Gain” as created by The American Jobs Creation Act of 2004. The information is reflected as a percentage of ordinary income distributions (the total of short-term capital gain and net investment income distributions). |
47


Dimensional Fund Advisors
6300 Bee Cave Road, Building One
Austin, TX 78746
December 2009
Dear Fellow Shareholder,
After sinking to ten-year lows, stock prices around the world rebounded sharply in March 2009 and posted steady gains in the seven months between March and September. March and April were among the best-return months in the life of Dimensional’s equity Funds.
The unexpected turns in the financial markets this year offered some valuable lessons. We were reminded that stock prices are unpredictable. We saw once again the benefits of staying disciplined in the market as it inevitably moves up and down. And I believe these markets showed very clearly why diversification is so important to long-term investment success.
Although diversification can’t prevent losses, it can help investors avoid the extreme outcomes that can result from concentrating investments in individual stocks or market segments. We believe that successful investing is about both increasing wealth and being able to sleep well at night. Investors who understand how markets work and have a realistic understanding of their own tolerance for risk are most likely to have a good overall experience.
More than $10 billion in net long-term assets flowed into Dimensional’s Funds during the first 10 months of 2009, a reflection of the trust our shareholders around the world have placed in us. We are grateful for that trust and want you to know that we take our responsibility as the steward of your investments in Dimensional’s Funds very seriously. We hope to have the opportunity to continue serving your needs for many years to come.
Sincerely,

David G. Booth
Chairman and Chief Executive Officer
[THIS PAGE INTENTIONALLY LEFT BLANK]
ANNUAL REPORT
Table of Contents
This report is submitted for the information of the Fund’s shareholders. It is not authorized for distribution to prospective investors unless preceded or accompanied by an effective prospectus.
i
[THIS PAGE INTENTIONALLY LEFT BLANK]
DIMENSIONAL INVESTMENT GROUP INC.
THE DFA INVESTMENT TRUST COMPANY
DEFINITIONS OF ABBREVIATIONS AND FOOTNOTES
| | |
| Statement of Assets and Liabilities/Summary Schedule of Portfolio Holdings |
|
Investment Abbreviations |
ADR | | American Depositary Receipt |
FNMA | | Federal National Mortgage Association |
P.L.C. | | Public Limited Company |
|
Investment Footnotes |
† | | See Note B to Financial Statements. |
†† | | Securities have generally been fair valued. See Note B to Financial Statements. |
** | | Calculated as a percentage of total net assets. Percentages shown parenthetically next to the category headings have been calculated as a percentage of total investments. “Other Securities” are those securities that are not among the top 50 holdings of the Fund or do not represent more than 1.0% of the net assets of the Fund. Some of the individual securities within this category may include Total or Partial Securities on Loan and/or Non-Income Producing Securities. |
* | | Non-Income Producing Securities. |
# | | Total or Partial Securities on Loan. |
@ | | Security purchased with cash proceeds from Securities on Loan. |
|
| Financial Highlights |
(A) | | Computed using average shares outstanding. |
(B) | | Annualized |
(C) | | Non-Annualized |
(D) | | Represents the combined ratios for the respective portfolio and its respective pro-rata share of its Master Fund Series. |
|
| All Statements and Schedules |
— | | Amounts designated as — are either zero or rounded to zero. |
RIC | | Registered Investment Company |
SEC | | Securities and Exchange Commission |
1
DIMENSIONAL INVESTMENT GROUP INC.
PERFORMANCE CHART
DFA International Value Portfolio III vs.
MSCI World ex USA Index (net dividends)
October 31, 1999-October 31, 2009
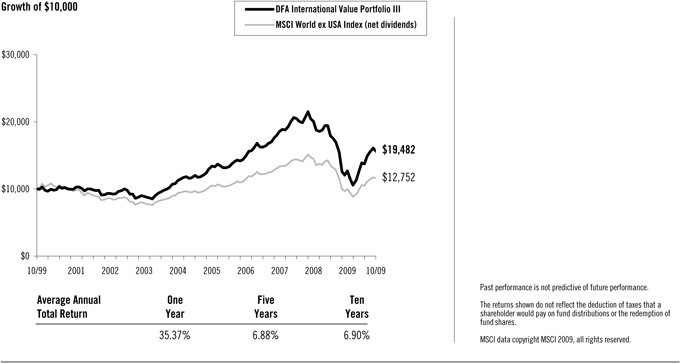
2
DIMENSIONAL INVESTMENT GROUP INC.
MANAGEMENT’S DISCUSSION AND ANALYSIS
| | |
| International Equity Market Review | | 12 Months Ended October 31, 2009 |
The one-year period ending October 31, 2009, was characterized by unprecedented volatility in non-US developed markets. Non-US developed markets lost 18.87% from November 2008 through February 2009, as measured by the MSCI World ex USA Index (net dividends). From March through October 2009 these same markets gained 57.56%. In April 2009, the Index had its largest-ever monthly gain (12.90%) since October 1990.
From November 2008 through February 2009, developed markets returns were negative across all asset classes. The US dollar rallied against most currencies, reversing a general trend of depreciation dating back to 2006. From March through October 2009 the market reversed course, with small cap and value stocks strongly outperforming large cap and growth stocks. The US dollar depreciated against most major currencies. The rally drove strong positive returns for the 12-month period, with small cap stocks significantly outperforming large cap stocks and value stocks outperforming growth stocks, as measured by the MSCI indexes.
12 Months Ended October 31, 2009
| | | | |
Ten Largest Foreign Developed Markets by Market Cap (BB) | | Local
Currency
Return | | U.S. Dollar
Return |
Japan ($2,432) | | 6.03% | | 15.20% |
United Kingdom ($2,328) | | 23.19% | | 25.68% |
France ($1,106) | | 10.09% | | 28.10% |
Canada ($1,060) | | 17.46% | | 32.58% |
Australia ($912) | | 21.91% | | 66.97% |
Germany ($843) | | 6.37% | | 23.77% |
Switzerland ($821) | | 5.78% | | 20.63% |
Spain ($488) | | 33.27% | | 55.06% |
Italy ($388) | | 7.57% | | 25.17% |
Netherlands ($277) | | 20.17% | | 39.83% |
Country market capitalizations (in parentheses) are in USD billions. Source: Returns are of MSCI indices net of foreign withholding taxes on dividends. Country market capitalizations are based on country carve-outs of the MSCI All-Country World Investable Market Index. MSCI data copyright MSCI 2009, all rights reserved.
Small company stocks were the best-performing asset class in international markets, while growth stocks had the worst relative results.
12 Months Ended October 31, 2009
| | |
| | | U.S. Dollar
Return |
MSCI World ex USA Small Cap Index | | 50.01% |
MSCI World ex USA Value Index | | 31.71% |
MSCI World ex USA Index | | 27.83% |
MSCI World ex USA Growth Index | | 24.03% |
Source: MSCI indices are net of foreign withholding taxes on dividends, copyright MSCI 2009, all rights reserved.
3
Master-Feeder Structure
The Portfolio described below, called a “Feeder Fund”, does not buy individual securities directly; instead, the Portfolio invests in a corresponding fund called a “Master Fund”. The Master Fund, in turn, purchases stocks and/or other securities.
International Equity Portfolio Performance Overview
DFA International Value Portfolio III
The DFA International Value Portfolio III seeks to capture the returns of international large company value stocks by purchasing shares of a Master Fund that invests in such stocks. The investment strategy employs a disciplined, quantitative approach, emphasizing broad diversification and consistent exposure to large cap value stocks, but does not attempt to track closely a specific equity index. As of October 31, 2009, the Master Fund held 465 stocks in 22 developed countries and was mostly invested in equities throughout the year: the average non-equitized cash level for the period was less than 1% of the Master Fund’s assets.
As a result of the Master Fund’s diversified investment approach, performance was determined principally by broad structural trends in global equity markets rather than the behavior of a limited number of stocks. For the 12 months ended October 31, 2009, value stocks outperformed growth stocks in international developed markets. Total returns were 35.37% for the Portfolio and 27.83% for the MSCI World ex USA Index (net dividends). The Master Fund’s greater allocation than the Index to value stocks (66% on average vs. 26% in the Index) added approximately 6.7% to the relative performance.
4
DIMENSIONAL INVESTMENT GROUP INC.
DFA INTERNATIONAL VALUE PORTFOLIO III
DISCLOSURE OF FUND EXPENSES
(Unaudited)
The following Expense Table is shown so that you can understand the impact of fees on your investment. All mutual funds have operating expenses. As a shareholder of the fund, you incur ongoing costs, which include costs for portfolio management, administrative services, and shareholder reports, among others. Operating expenses, legal and audit services, which are deducted from a fund’s gross income, directly reduce the investment return of the fund. A fund’s expenses are expressed as a percentage of its average net assets. This figure is known as the expense ratio. The following examples are intended to help you understand the ongoing costs, in dollars, of investing in the fund and to compare these costs with those of other mutual funds. The examples are based on an investment of $1,000 made at the beginning of the period shown and held for the entire period.
The Expense Table below illustrates your fund’s costs in two ways.
Actual Fund Return
This section helps you to estimate the actual expenses after fee waivers that you paid over the period. The “Ending Account Value” shown is derived from the fund’s actual return and “Expenses Paid During Period” reflect the dollar amount that would have been paid by an investor who started with $1,000 in the fund. You may use the information here, together with the amount you invested, to estimate the expenses that you paid over the period.
To do so, simply divide your account value by $1,000 (for example, a $7,500 account value divided by $1,000 = 7.5), then multiply the result by the number given for your fund under the heading “Expenses Paid During Period.”
Hypothetical Example for Comparison Purposes
This section is intended to help you compare your fund’s costs with those of other mutual funds. The hypothetical “Ending Account Value” and “Expenses Paid During Period” are derived from the fund’s actual expense ratio and an assumed 5% annual return before expenses. In this case, because the return used is not the fund’s actual return, the results do not apply to your investment. The example is useful in making comparisons because the SEC requires all mutual funds to calculate expenses based on a 5% annual return. You can assess your fund’s costs by comparing this hypothetical example with the hypothetical examples that appear in shareholder reports of other funds.
Please note that the expenses shown in the table are meant to highlight and help you compare ongoing costs only and do not reflect any transactional costs, if applicable. The “Annualized Expense Ratio” represents the actual expenses for the six-month period indicated.
Six Months Ended October 31, 2009
EXPENSE TABLE
| | | | | | | | | | |
| | | Beginning
Account
Value
05/01/09 | | Ending
Account
Value
10/31/09 | | Annualized
Expense
Ratio* | | Expenses
Paid
During
Period* |
Actual Fund Return | | $ | 1,000.00 | | $ | 1,351.10 | | 0.28% | | $1.66 |
Hypothetical 5% Annual Return | | $ | 1,000.00 | | $ | 1,023.79 | | 0.28% | | $1.43 |
| * | Expenses are equal to the fund’s annualized expense ratio for the six-month period, multiplied by the average account value over the period, multiplied by the number of days in the most recent six-month period (184), then divided by the number of days in the year (365) to reflect the six-month period. The Portfolio is a Feeder Fund. The expenses shown reflect the direct expenses of the Feeder Fund and the indirect payment of the Feeder Fund’s portion of the expenses of its Master Fund. |
5
DIMENSIONAL INVESTMENT GROUP INC.
DFA INTERNATIONAL VALUE PORTFOLIO III
DISCLOSURE OF PORTFOLIO HOLDINGS
(Unaudited)
The SEC requires that all Funds file a complete Schedule of Investments with the SEC for their first and third fiscal quarters on Form N-Q. For Dimensional Investment Group Inc., this would be for the fiscal quarters ending January 31 and July 31. The Form N-Q filing must be made within 60 days of the end of the quarter. Dimensional Investment Group Inc. filed its most recent Form N-Q with the SEC on September 29, 2009. It is available upon request, without charge, by calling collect: (512) 306-7400 or by mailing a request to Dimensional Fund Advisors LP, 6300 Bee Cave Road, Building One, Austin, Texas 78746, or by visiting the SEC’s website at http://www.sec.gov, or they may be reviewed and copied at the SEC’s Public Reference Room in Washington, D.C. (call 1-800-732-0330 for information on the operation of the Public Reference Room).
PORTFOLIO HOLDINGS
The SEC requires that all Funds present their categories of portfolio holdings in a table, chart or graph format in their annual and semi-annual shareholder reports, whether or not a Schedule of Investments is utilized. The following table, which presents portfolio holdings as a percent of total investments before short-term investments and collateral for loaned securities, is provided in compliance with such requirement.
The categories of industry classification for the Affiliated Investment Company are represented in the Disclosure of Portfolio Holdings, which are included elsewhere within the report. Refer to the Summary Schedule of Portfolio Holdings for the underlying Master Fund’s holdings which reflect the investments by country.
| | | |
Affiliated Investment Company | | 100.0 | % |
6
DIMENSIONAL INVESTMENT GROUP INC.
DFA INTERNATIONAL VALUE PORTFOLIO III
STATEMENT OF ASSETS AND LIABILITIES
OCTOBER 31, 2009
(Amounts in thousands, except share and per share amounts)
| | | | |
ASSETS: | | | | |
Investment in The DFA International Value Series of The DFA Investment Trust Company (Affiliated Investment Company) at Value† | | $ | 1,008,248 | |
Receivables: | | | | |
Affiliated Investment Company Sold | | | 207 | |
Fund Shares Sold | | | 420 | |
Prepaid Expenses and Other Assets | | | 21 | |
| | | | |
Total Assets | | | 1,008,896 | |
| | | | |
LIABILITIES: | | | | |
Payables: | | | | |
Fund Shares Redeemed | | | 627 | |
Due to Advisor | | | 9 | |
Accrued Expenses and Other Liabilities | | | 88 | |
| | | | |
Total Liabilities | | | 724 | |
| | | | |
NET ASSETS | | $ | 1,008,172 | |
| | | | |
SHARES OUTSTANDING, $0.01 PAR VALUE (1) | | | 65,444,173 | |
| | | | |
NET ASSET VALUE, OFFERING AND REDEMPTION PRICE PER SHARE | | $ | 15.41 | |
| | | | |
Investment in Affiliated Investment Company at Cost | | $ | 771,326 | |
| | | | |
NET ASSETS CONSIST OF: | | | | |
Paid-In Capital | | $ | 857,590 | |
Undistributed Net Investment Income (Distributions in Excess of Net Investment Income) | | | 3,345 | |
Accumulated Net Realized Gain (Loss) | | | (89,724 | ) |
Net Unrealized Foreign Exchange Gain (Loss) | | | 39 | |
Net Unrealized Appreciation (Depreciation) | | | 236,922 | |
| | | | |
NET ASSETS | | $ | 1,008,172 | |
| | | | |
(1) NUMBER OF SHARES AUTHORIZED | | | 500,000,000 | |
| | | | |
See accompanying Notes to Financial Statements.
7
DIMENSIONAL INVESTMENT GROUP INC.
DFA INTERNATIONAL VALUE PORTFOLIO III
STATEMENT OF OPERATIONS
FOR THE YEAR ENDED OCTOBER 31, 2009
(Amounts in thousands)
| | | | |
Investment Income | | | | |
Dividends (Net of Foreign Taxes Withheld of $2,390) | | $ | 26,489 | |
Interest | | | 32 | |
Income from Securities Lending | | | 2,158 | |
Expenses Allocated from Affiliated Investment Company | | | (2,009 | ) |
| | | | |
Total Investment Income | | | 26,670 | |
| | | | |
Expenses | | | | |
Administrative Services Fees | | | 82 | |
Accounting & Transfer Agent Fees | | | 28 | |
Filing Fees | | | 58 | |
Shareholders’ Reports | | | 84 | |
Directors’/Trustees’ Fees & Expenses | | | 17 | |
Audit Fees | | | 2 | |
Legal Fees | | | 36 | |
Other | | | 9 | |
| | | | |
Total Expenses | | | 316 | |
| | | | |
Net Investment Income (Loss) | | | 26,354 | |
| | | | |
Realized and Unrealized Gain (Loss) | | | | |
Net Realized Gain (Loss) on: | | | | |
Investment Securities Sold | | | 11,250 | |
Futures | | | (135 | ) |
Foreign Currency Transactions | | | 643 | |
Change in Unrealized Appreciation (Depreciation) of: | | | | |
Investment Securities and Foreign Currency | | | 236,922 | |
Translation of Foreign Currency Denominated Amounts | | | 39 | |
| | | | |
Net Realized and Unrealized Gain (Loss) | | | 248,719 | |
| | | | |
Net Increase (Decrease) in Net Assets Resulting from Operations | | $ | 275,073 | |
| | | | |
Investment Income and Realized and Unrealized Gain (Loss) were allocated from the Portfolio’s Master Fund (Affiliated Investment Company).
See accompanying Notes to Financial Statements.
8
DIMENSIONAL INVESTMENT GROUP INC.
DFA INTERNATIONAL VALUE PORTFOLIO III
STATEMENTS OF CHANGES IN NET ASSETS
(Amounts in thousands)
| | | | | | | | | | | | |
| | | Year
Ended
Oct. 31,
2009 | | | Period
Dec. 1, 2007
to
Oct. 31, 2008 | | | Year
Ended
Nov. 30,
2007 | |
Increase (Decrease) in Net Assets | | | | | | | | | | | | |
Operations: | | | | | | | | | | | | |
Net Investment Income (Loss) | | $ | 26,354 | | | $ | 38,665 | | | $ | 34,247 | |
Net Realized Gain (Loss) on: | | | | | | | | | | | | |
Investment Securities Sold | | | 11,250 | | | | 78,527 | † | | | 26,825 | † |
Futures | | | (135 | ) | | | — | | | | — | |
Foreign Currency Transactions | | | 643 | | | | — | | | | — | |
Change in Unrealized Appreciation (Depreciation) of: | | | | | | | | | | | | |
Investment Securities and Foreign Currency | | | 236,922 | | | | (724,193 | )† | | | 113,178 | † |
Translation of Foreign Currency Denominated Amounts | | | 39 | | | | — | | | | — | |
| | | | | | | | | | | | |
Net Increase (Decrease) in Net Assets Resulting from Operations | | | 275,073 | | | | (607,001 | ) | | | 174,250 | |
| | | | | | | | | | | | |
Distributions From: | | | | | | | | | | | | |
Net Investment Income | | | (25,965 | ) | | | (41,959 | ) | | | (30,502 | ) |
Net Short-Term Gains | | | — | | | | (3,276 | ) | | | (2,370 | ) |
Net Long-Term Gains | | | — | | | | (24,865 | ) | | | (17,585 | ) |
| | | | | | | | | | | | |
Total Distributions | | | (25,965 | ) | | | (70,100 | ) | | | (50,457 | ) |
| | | | | | | | | | | | |
Capital Share Transactions (1): | | | | | | | | | | | | |
Shares Issued | | | 260,811 | | | | 395,584 | | | | 215,069 | |
Shares Issued in Lieu of Cash Distributions | | | 24,232 | | | | 69,191 | | | | 50,456 | |
Shares Redeemed | | | (252,040 | ) | | | (251,899 | ) | | | (198,925 | ) |
| | | | | | | | | | | | |
Net Increase (Decrease) from Capital Share Transactions | | | 33,003 | | | | 212,876 | | | | 66,600 | |
| | | | | | | | | | | | |
Total Increase (Decrease) in Net Assets | | | 282,111 | | | | (464,225 | ) | | | 190,393 | |
Net Assets | | | | | | | | | | | | |
Beginning of Period | | | 726,061 | | | | 1,190,286 | | | | 999,893 | |
| | | | | | | | | | | | |
End of Period | | $ | 1,008,172 | | | $ | 726,061 | | | $ | 1,190,286 | |
| | | | | | | | | | | | |
(1) Shares Issued and Redeemed: | | | | | | | | | | | | |
Shares Issued | | | 22,717 | | | | 22,558 | | | | 9,221 | |
Shares Issued in Lieu of Cash Distributions | | | 1,912 | | | | 3,339 | | | | 2,237 | |
Shares Redeemed | | | (21,054 | ) | | | (13,566 | ) | | | (8,503 | ) |
| | | | | | | | | | | | |
Net Increase (Decrease) from Shares Issued and Redeemed | | | 3,575 | | | | 12,331 | | | | 2,955 | |
| | | | | | | | | | | | |
Undistributed Net Investment Income (Distributions in Excess of Net Investment Income) | | $ | 3,345 | | | $ | 2,317 | | | $ | 5,669 | |
| † | See Note A in the Notes to Financial Statements. |
See accompanying Notes to Financial Statements.
9
DIMENSIONAL INVESTMENT GROUP INC.
DFA INTERNATIONAL VALUE PORTFOLIO III
FINANCIAL HIGHLIGHTS
(for a share outstanding throughout each period)
| | | | | | | | | | | | | | | | | | | | | | | | |
| | | Year
Ended
Oct. 31,
2009 | | | Period
Dec. 1, 2007
to
Oct. 31, 2008 | | | Year
Ended
Nov. 30,
2007 | | | Year
Ended
Nov. 30,
2006 | | | Year
Ended
Nov. 30,
2005 | | | Year
Ended
Nov. 30,
2004 | |
Net Asset Value, Beginning of Period | | $ | 11.74 | | | $ | 24.03 | | | $ | 21.46 | | | $ | 16.89 | | | $ | 15.03 | | | $ | 11.83 | |
| | | | | | | | | | | | | | | | | | | | | | | | |
Income from Investment Operations | | | | | | | | | | | | | | | | | | | | | | | | |
Net Investment Income (Loss) | | | 0.40 | (A) | | | 0.72 | (A) | | | 0.71 | (A) | | | 0.64 | (A) | | | 0.49 | | | | 0.27 | |
Net Gains (Losses) on Securities (Realized and Unrealized) | | | 3.66 | | | | (11.64 | ) | | | 2.92 | | | | 5.10 | | | | 1.80 | | | | 3.43 | |
| | | | | | | | | | | | | | | | | | | | | | | | |
Total from Investment Operations | | | 4.06 | | | | (10.92 | ) | | | 3.63 | | | | 5.74 | | | | 2.29 | | | | 3.70 | |
Less Distributions | | | | | | | | | | | | | | | | | | | | | | | | |
Net Investment Income | | | (0.39 | ) | | | (0.80 | ) | | | (0.63 | ) | | | (0.65 | ) | | | (0.42 | ) | | | (0.49 | ) |
Net Realized Gains | | | — | | | | (0.57 | ) | | | (0.43 | ) | | | (0.52 | ) | | | (0.01 | ) | | | (0.01 | ) |
| | | | | | | | | | | | | | | | | | | | | | | | |
Total Distributions | | | (0.39 | ) | | | (1.37 | ) | | | (1.06 | ) | | | (1.17 | ) | | | (0.43 | ) | | | (0.50 | ) |
Net Asset Value, End of Period | | $ | 15.41 | | | $ | 11.74 | | | $ | 24.03 | | | $ | 21.46 | | | $ | 16.89 | | | $ | 15.03 | |
Total Return | | | 35.37 | % | | | (47.87 | )%(C) | | | 17.32 | % | | | 35.67 | % | | | 15.59 | % | | | 32.11 | % |
| | | | | | | |
Net Assets, End of Period (thousands) | | $ | 1,008,172 | | | $ | 726,061 | | | $ | 1,190,286 | | | $ | 999,893 | | | $ | 696,954 | | | $ | 532,647 | |
Ratio of Expenses to Average Net Assets (D) | | | 0.28 | % | | | 0.26 | %(B) | | | 0.25 | % | | | 0.26 | % | | | 0.30 | % | | | 0.33 | % |
Ratio of Net Investment Income to Average Net Assets | | | 3.19 | % | | | 4.03 | %(B) | | | 3.02 | % | | | 3.37 | % | | | 3.08 | % | | | 2.07 | % |
See page 1 for the Definitions of Abbreviations and Footnotes.
See accompanying Notes to Financial Statements.
10
DIMENSIONAL INVESTMENT GROUP INC.
DFA INTERNATIONAL VALUE PORTFOLIO III
NOTES TO FINANCIAL STATEMENTS
A. Organization:
Dimensional Investment Group Inc. (the “Fund”) is an open-end management investment company registered under the Investment Company Act of 1940, whose shares are offered to institutional investors, retirement plans and clients of registered investment advisors. The Fund consists of fifteen portfolios, of which the DFA International Value Portfolio III (the “Portfolio”) is presented in this report.
The Portfolio primarily invests its assets in The DFA International Value Series (the “Series”), a corresponding series of The DFA Investment Trust Company. At October 31, 2009, the Portfolio owned 16% of the Series. The financial statements of the Series are included elsewhere in this report and should be read in conjunction with the financial statements of the Portfolio.
On November 1, 2008, The DFA International Value Series, a master fund in a RIC/RIC master-feeder structure, elected with the consent of its respective Holder(s) to change its U.S. federal income tax classification from that of an association taxable as a corporation to a partnership pursuant to Treasury Regulation § 301.7701-3. The change in capital structure and retroactive reclassification of the statement of changes in net assets and financial highlights for the respective funds is a result of the treatment of a partnership for book purposes. The Series/Portfolio will maintain its books and records and present its financial statements in accordance with generally accepted accounting principles for investment partnerships.
At a regular meeting of the Board of Directors/Trustees (the “Board”) on September 16, 2008, the Board voted to change the fiscal and tax year ends of the Portfolio from November 30 to October 31.
B. Significant Accounting Policies:
The following significant accounting policies are in conformity with accounting principles generally accepted in the United States of America. Such policies are consistently followed by the Fund in preparation of its financial statements. The preparation of financial statements in accordance with accounting principles generally accepted in the United States of America requires management to make estimates and assumptions that affect the reported amounts of assets and liabilities and disclosure of contingent assets and liabilities at the date of the financial statements and the reported amounts of increases and decreases in net assets from operations during the reporting period. Actual results could differ from those estimates and those differences could be material.
1. Security Valuation: The Portfolio’s investment reflects its proportionate interest in the net assets of the Series.
The Portfolio utilizes a fair value hierarchy which prioritizes the inputs to valuation techniques used to measure fair value into three broad levels described below:
| | • | | Level 1 – quoted prices in active markets for identical securities |
| | • | | Level 2 – other significant observable inputs (including quoted prices for similar securities, interest rates, prepayment speeds, credit risk, etc.) |
| | • | | Level 3 – significant unobservable inputs (including the Portfolio’s own assumptions in determining the fair value of investments) |
The inputs or methodology used for valuing securities are not necessarily an indication of the risk associated with investing in those securities. A summary of the inputs used to value the Portfolio’s net assets as of October 31, 2009 is listed below (in thousands).
11
| | | | | | | | | | |
| | | Valuation Inputs |
| | | Investments in
Securities
(Market Value) |
| | | Level 1 | | Level 2 | | Level 3 | | Total |
DFA International Value Portfolio III | | $ | 1,008,248 | | — | | — | | $ | 1,008,248 |
2. Deferred Compensation Plan: Each eligible Director of the Fund may elect participation in the Deferred Compensation Plan (the “Plan”). Under the Plan, effective January 1, 2002, such Directors may defer payment of all or a portion of their total fees earned as a Director. These deferred amounts may be treated as though such amounts had been invested in shares of the following funds: U.S. Large Cap Value Portfolio; U.S. Core Equity 1 Portfolio; U.S. Core Equity 2 Portfolio; U.S. Vector Equity Portfolio; U.S. Micro Cap Portfolio; DFA International Value Portfolio; International Core Equity Portfolio; Emerging Markets Portfolio; Emerging Markets Core Equity Portfolio; and/or DFA Two-Year Global Fixed Income Portfolio. Contributions made under the Plan and the change in unrealized appreciation (depreciation) and income are included in Directors’/Trustees’ Fees & Expenses. At October 31, 2009, the total liability for deferred compensation to Directors is included in Accrued Expenses and Other Liabilities on the Statement of Assets and Liabilities in the amount of $24 (in thousands).
Each Director has the option to receive their distribution of proceeds in one of the following methods upon one year’s notice: lump sum; annual installments over a period of agreed upon years; or semi-annual installments over a period of agreed upon years. As of October 31, 2009, none of the Directors have requested distribution of proceeds.
3. Other: The Portfolio recognizes its pro-rata share, on a daily basis, of net investment income and realized and unrealized gains and losses of investment securities and foreign currency from the Series, which is treated as a partnership for federal income tax purposes. Dividend income and distributions to shareholders are recorded on the ex-dividend date. Distributions received on securities that represent a return of capital or capital gain are recorded as a reduction of cost of investments or as a realized gain, respectively. The Portfolio estimates the character of distributions received that may be considered return of capital distributions. Expenses directly attributable to the Portfolio are directly charged. Common expenses of the Fund are allocated using methods approved by the Board of Directors/Trustees, generally based on average net assets.
C. Investment Advisor:
Dimensional Fund Advisors LP (“Dimensional” or the “Advisor”) provides administrative services to the Portfolio, including supervision of services provided by others, providing information to the shareholders and to the Board of Directors/Trustees, and other administrative services. The Advisor provides investment advisory services to the Series. For the year ended October 31, 2009, the Portfolio’s administrative services fees were accrued daily and paid monthly to the Advisor based on an effective annual rate of 0.01% of average daily net assets.
Fees Paid to Officers and Directors/Trustees:
Certain Officers and Directors/Trustees of the Advisor are also Officers and Directors/Trustees of the Fund; however, such Officers and Directors/Trustees (with the exception of the Chief Compliance Officer (“CCO”)) receive no compensation from the Fund. For the year ended October 31, 2009, the total related amounts paid by the Fund to the CCO were $27 (in thousands). The total related amounts paid by the Portfolio are included in Other Expenses on the Statement of Operations.
D. Federal Income Taxes:
The Portfolio has qualified and intends to continue to qualify as a regulated investment company under Subchapter M of the Internal Revenue Code for federal income tax purposes and to distribute substantially all of its taxable income and net capital gains to its shareholders. Accordingly, no provision has been made for federal income taxes.
Distributions from net investment income and net realized capital gains are determined in accordance with U.S. federal income tax regulations, which may differ from those amounts determined under accounting principles generally
12
accepted in the United States of America. These book/tax differences are either temporary or permanent in nature. To the extent these differences are permanent, they are charged or credited to paid-in capital, undistributed net investment income, accumulated net realized gains or unrealized appreciation (depreciation), as appropriate, in the period that the differences arise. Accordingly, the following permanent differences as of October 31, 2009, primarily attributable to a reclassification of distributions were classified to the following accounts. These reclassifications had no effect on net assets or net value per share (amounts in thousands):
| | |
Increase
(Decrease)
Undistributed
Net Investment Income | | Increase
(Decrease)
Accumulated
Net Realized
Gains (Losses) |
| $639 | | $(639) |
The tax character of dividends and distributions declared and paid during the year ended November 30, 2007, the period December 1, 2007 to October 31, 2008 and the year ended October 31, 2009 were as follows (amounts in thousands):
| | | | | | |
| | | Net Investment
Income and
Short-Term
Capital Gains | | Long-Term
Capital Gains | | Total |
| 2007 | | $32,872 | | $17,585 | | $50,457 |
| 2008 | | 45,275 | | 24,825 | | 70,100 |
| 2009 | | 25,965 | | — | | 25,965 |
At October 31, 2009, the components of distributable earnings (accumulated losses) were as follows (amounts in thousands):
| | | | | | |
Undistributed
Net Investment
Income and
Short-Term
Capital Gains | | Undistributed
Long-Term
Capital Gains | | Capital
Loss
Carryforward | | Total Net
Distributable
Earnings
(Accumulated
Losses) |
| $3,368 | | — | | $(89,694) | | $(86,326) |
For federal income tax purposes, the Fund measures its capital loss carryforwards annually at October 31, its fiscal year end. Capital loss carryforwards may be carried forward and applied against future capital gains. As of October 31, 2009, the Portfolio had capital loss carryforwards available in the amount of $89,694 (in thousands) to offset future realized capital gains expiring in 2016. During the year ended October 31, 2009, the Portfolio utilized capital loss carryforwards to offset realized capital gains for federal income tax purposes in the amount of $11,149 (in thousands).
At October 31, 2009, the total cost and aggregate gross unrealized appreciation and (depreciation) of securities for federal income tax purposes were different from amounts reported for financial reporting purposes (amounts in thousands):
| | | | | | |
Federal
Tax Cost | | Unrealized
Appreciation | | Unrealized
(Depreciation) | | Net
Unrealized
Appreciation
(Depreciation) |
| $771,356 | | $241,980 | | $(5,088) | | $236,892 |
Accounting for Uncertainty in Income Taxes sets forth a minimum threshold for financial statement recognition of the benefit of a tax position taken or expected to be taken in a tax return. Management has analyzed the Portfolio’s tax position and has concluded that no provision for income tax is required in the Portfolio’s financial statements. The Portfolio is not aware of any tax position for which it is reasonably possible that the total amounts of unrecognized tax
13
benefits will significantly change in the next twelve months. The Portfolio’s federal tax returns for the prior three fiscal years remains subject to examination by the Internal Revenue Service.
On November 1, 2008, The DFA International Value Series, a master fund in a RIC/RIC master-feeder structure with five RIC feeders and other direct client investor(s), made a “Check-the-box” election for federal income tax purposes pursuant to Treasury Regulation §301.7701-3, to change its federal entity classification from a corporation taxable as a regulated investment company to a partnership. As a result of this election, the master fund is deemed to have distributed all of its assets and liabilities, in a taxable transaction, to its shareholders in liquidation of the master fund. Immediately thereafter, the shareholders contributed all of the distributed assets and liabilities to a newly formed partnership. The final tax year end of The DFA International Value Series was October 31, 2008. For Federal income tax purposes, pursuant to Internal Revenue Code §336(a), the master fund recognizes gain or loss as if the master’s investment securities were sold to its shareholders and, pursuant to IRC Code §331, each of the Portfolios recognizes gain or loss as if it liquidated its investment in the master. As a result of the transaction, The DFA International Value Series recognized a ($2,309,440,866) and ($718,733) capital and currency loss respectively for tax year ended October 31, 2008. For tax purposes, pursuant to IRC Code §334(a), each of the Portfolios will take a fair market value basis in the securities deemed received by them and a new holding period for those securities commences on the deemed liquidation date.
E. Line of Credit:
The Fund, together with other Dimensional-advised portfolios, has entered into an amended and restated $250 million unsecured discretionary line of credit effective July 8, 2009 with an affiliate of its domestic custodian bank. Each portfolio is permitted to borrow, subject to its investment limitations, up to a maximum of $250 million, as long as total borrowings under the line of credit do not exceed $250 million in the aggregate. Borrowings under the line of credit are charged interest at the then current Federal Funds Rate plus 1%. Each portfolio is individually, and not jointly, liable for its particular advances under the line of credit. There is no commitment fee on the unused portion of the line of credit. The agreement for the discretionary line of credit may be terminated by either party at any time. The line of credit is scheduled to expire on June 22, 2010. There were no borrowings by the Portfolio under this line of credit during the year ended October 31, 2009.
The Fund, together with other Dimensional-advised portfolios, has also entered into an additional $500 million unsecured line of credit effective January 15, 2009 with its international custodian bank. Each portfolio is permitted to borrow, subject to its investment limitations, up to a maximum of $500 million, as long as total borrowings under the line of credit do not exceed $500 million in the aggregate. Borrowings under the line of credit are charged interest at rates agreed to by the parties at the time of borrowing. Each portfolio is individually, and not jointly, liable for its particular advances under the line of credit. There is no commitment fee on the unused portion of the line of credit. The agreement for the line of credit expires on January 15, 2010. There were no borrowings by the Portfolio under this line of credit during the year ended October 31, 2009.
F. Indemnitees; Contractual Obligations:
Under the Fund’s organizational documents, its officers and directors are indemnified against certain liabilities arising out of the performance of their duties to the Fund.
In the normal course of business, the Fund enters into contracts that contain a variety of representations and warranties which provide general indemnification. The Fund’s maximum exposure under these arrangements is unknown as this would involve future claims that may be made against the Fund and/or its affiliates that have not yet occurred. However, based on experience, the Fund expects the risk of loss to be remote.
G. Other:
At October 31, 2009, two shareholders held 78% of the outstanding shares of the Portfolio. One or more of the shareholders is an omnibus account, which typically holds shares for the benefit of several other underlying investors.
14
H. Subsequent Event Evaluations:
Management has evaluated the impact of all subsequent events on the Portfolio through December 23, 2009, the date the financial statements were available for issuance, and has determined that there are no subsequent events requiring recognition or disclosure in the financial statements.
15
REPORT OF INDEPENDENT REGISTERED PUBLIC ACCOUNTING FIRM
To the Shareholders of DFA International Value Portfolio III and
Board of Directors of Dimensional Investment Group Inc.:
In our opinion, the accompanying statement of assets and liabilities, and the related statements of operations and of changes in net assets and the financial highlights present fairly, in all material respects, the financial position of DFA International Value Portfolio III (one of the portfolios constituting Dimensional Investment Group Inc., hereafter referred to as the “Portfolio”) at October 31, 2009, the results of its operations for the year then ended, the changes in its net assets and the financial highlights for each of the periods indicated, in conformity with accounting principles generally accepted in the United States of America. These financial statements and financial highlights (hereafter referred to as “financial statements”) are the responsibility of the Portfolio’s management; our responsibility is to express an opinion on these financial statements based on our audits. We conducted our audits of these financial statements in accordance with the standards of the Public Company Accounting Oversight Board (United States). Those standards require that we plan and perform the audit to obtain reasonable assurance about whether the financial statements are free of material misstatement. An audit includes examining, on a test basis, evidence supporting the amounts and disclosures in the financial statements, assessing the accounting principles used and significant estimates made by management, and evaluating the overall financial statement presentation. We believe that our audits, which included confirmation of securities at October 31, 2009 by correspondence with the transfer agent of the investee fund, provide a reasonable basis for our opinion.
PricewaterhouseCoopers LLP
Philadelphia, Pennsylvania
December 23, 2009
16
RESULTS OF THE SHAREHOLDER MEETING
On June 2, 2009, June 5, 2009, and July 8, 2009, Dimensional Investment Group Inc. (“DIG”) held a Special Joint Meeting of Shareholders for the purpose of voting on several proposals affecting DIG and the Portfolio, including, among other items, the election of Directors, the amendment of certain fundamental investment limitations, and the elimination of certain fundamental investment limitations. The shareholders of the Portfolio approved each of the applicable proposals for DIG and the Portfolio presented at the Meeting. Listed below are the voting results from the Meeting. Please note that not all Proposals presented at the Meeting were voted on by the Portfolio. Additionally, the Proposal numbers reflected below correlate to the Proposal numbers presented for vote at the Meeting.
DIG
| | | | | | | | | | | | | | | | | | | | |
| | | | | Shares Voted | | Percent of Outstanding Shares Voted |
| | | | | For | | % | | Against | | % | | Abstain/WithHold | | % | | For | | Against | | Abstain / WithHold |
Proposal 1: Election of Directors for DIG* | | | | | | | | | | | | | | | | |
| | | | | | | | | | |
1a | | David G. Booth | | 754,612,895 | | 96.26% | | — | | 0.00% | | 29,301,677 | | 3.74% | | 85.87% | | 0.00% | | 3.33% |
1b | | George M. Constantinides | | 753,991,785 | | 96.18% | | — | | 0.00% | | 29,922,787 | | 3.82% | | 85.80% | | 0.00% | | 3.41% |
1c | | John P. Gould | | 753,344,569 | | 96.10% | | — | | 0.00% | | 30,570,003 | | 3.90% | | 85.73% | | 0.00% | | 3.48% |
1d | | Roger G. Ibbotson | | 754,232,365 | | 96.21% | | — | | 0.00% | | 29,682,207 | | 3.79% | | 85.83% | | 0.00% | | 3.38% |
1e | | Robert C. Merton | | 754,598,874 | | 96.26% | | — | | 0.00% | | 29,315,698 | | 3.74% | | 85.87% | | 0.00% | | 3.34% |
1f | | Myron S. Scholes | | 754,057,040 | | 96.19% | | — | | 0.00% | | 29,857,532 | | 3.81% | | 85.81% | | 0.00% | | 3.40% |
1g | | Eduardo A. Repetto | | 753,295,592 | | 96.09% | | — | | 0.00% | | 30,618,979 | | 3.91% | | 85.72% | | 0.00% | | 3.48% |
1h | | Abbie J. Smith | | 754,123,603 | | 96.20% | | — | | 0.00% | | 29,790,969 | | 3.80% | | 85.82% | | 0.00% | | 3.39% |
| | | | | | | | | | | | | | | | | | | | | | |
| | | Shares Voted | | Percent of Outstanding Shares Voted |
| | | For | | % | | Against | | % | | Abstain/WithHold | | % | | NonVote | | % | | For | | Against | | Abstain / WithHold |
Proposal 2: To approve Articles of Amendment and Restatement for DIG* | | 479,705,048 | | 93.81% | | 7,503,436 | | 1.47% | | 24,156,664 | | 4.72% | | NA | | NA | | 54.59% | | 0.85% | | 2.75% |
| * | Results are for all Portfolios within DIG |
DFA International Value Portfolio III
| | | | | | | | | | | | | | | | | | | | | | | | | | |
| | | | | Shares Voted | | Percent of Outstanding Shares Voted |
| | | | | For | | % | | Against | | % | | Abstain/WithHold | | % | | NonVote | | % | | For | | Against | | Abstain / WithHold | | Non-Vote |
Proposals: | | | | | | | | | | | | | | | | | | | | | | | | |
| | | | | | |
5 | | To approve amendments to certain fundamental investment restrictions | | | | | | | | | | |
5a | | Borrowing Money | | 31,855,519 | | 93.27% | | 887,787 | | 2.60% | | 1,410,321 | | 4.13% | | NA | | NA | | 47.67% | | 1.33% | | 2.11% | | NA |
5b | | Making Loans | | 31,861,806 | | 93.29% | | 885,980 | | 2.59% | | 1,405,841 | | 4.12% | | NA | | NA | | 47.68% | | 1.33% | | 2.10% | | NA |
5c | | Investments in Real Estate | | 31,050,489 | | 90.91% | | 1,684,434 | | 4.93% | | 1,418,704 | | 4.15% | | NA | | NA | | 46.47% | | 2.52% | | 2.12% | | NA |
5d | | Investments in Commodities | | 31,064,204 | | 90.95% | | 1,675,144 | | 4.90% | | 1,414,279 | | 4.14% | | NA | | NA | | 46.49% | | 2.51% | | 2.12% | | NA |
5e | | Diversification of Investments | | 32,061,359 | | 93.87% | | 701,738 | | 2.05% | | 1,390,530 | | 4.07% | | NA | | NA | | 47.98% | | 1.05% | | 2.08% | | NA |
6 | | To approve the elimination of certain fundamental investment restrictions | | | | | | | | | | |
6a | | Pledging, Mortgaging, or Hypothecating Assets | | 30,876,560 | | 90.40% | | 1,861,820 | | 5.45% | | 1,415,247 | | 4.14% | | NA | | NA | | 46.21% | | 2.79% | | 2.12% | | NA |
6b | | Purchasing Securities on Margin | | 30,796,978 | | 90.17% | | 1,926,776 | | 5.64% | | 1,429,873 | | 4.19% | | NA | | NA | | 46.09% | | 2.88% | | 2.14% | | NA |
6c | | Investing in Restricted or Illiquid Securities | | 30,820,403 | | 90.24% | | 1,927,884 | | 5.64% | | 1,405,340 | | 4.11% | | NA | | NA | | 46.12% | | 2.89% | | 2.10% | | NA |
6d | | Investing for the Purpose of Exercising Control | | 31,870,954 | | 93.32% | | 868,095 | | 2.54% | | 1,414,578 | | 4.14% | | NA | | NA | | 47.70% | | 1.30% | | 2.12% | | NA |
6e | | Investing in Other Investment Companies | | 31,824,266 | | 93.18% | | 913,237 | | 2.67% | | 1,416,124 | | 4.15% | | NA | | NA | | 47.63% | | 1.37% | | 2.12% | | NA |
6f | | Management Ownership of Securities of an Issuer | | 31,850,249 | | 93.26% | | 886,828 | | 2.60% | | 1,416,550 | | 4.15% | | NA | | NA | | 47.66% | | 1.33% | | 2.12% | | NA |
6g | | Investing in Oil, Gas, or other Mineral Exploration, Leases or Development Programs | | 31,098,372 | | 91.05% | | 1,670,497 | | 4.89% | | 1,384,758 | | 4.05% | | NA | | NA | | 46.54% | | 2.50% | | 2.07% | | NA |
6h | | Investing in Securities of Unseasoned Issuers | | 31,769,113 | | 93.02% | | 996,348 | | 2.92% | | 1,388,166 | | 4.06% | | NA | | NA | | 47.54% | | 1.49% | | 2.08% | | NA |
6i | | Investing in Warrants | | 31,862,801 | | 93.29% | | 879,909 | | 2.58% | | 1,410,917 | | 4.13% | | NA | | NA | | 47.68% | | 1.32% | | 2.11% | | NA |
6j | | Writing or Acquiring Options | | 31,838,943 | | 93.22% | | 917,397 | | 2.69% | | 1,397,287 | | 4.09% | | NA | | NA | | 47.65% | | 1.37% | | 2.09% | | NA |
8 | | Approval of Investment Advisory Agreement between Dimensional Fund Advisors LP and the Company | | 32,098,447 | | 93.98% | | 630,462 | | 1.85% | | 1,424,718 | | 4.17% | | NA | | NA | | 48.04% | | 0.94% | | 2.13% | | NA |
17
THE DFA INVESTMENT TRUST COMPANY
PERFORMANCE CHART
The DFA International Value Series vs.
MSCI World ex USA Index (net dividends)
October 31, 1999-October 31, 2009
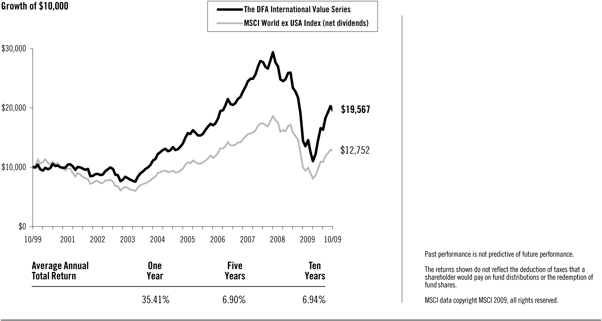
18
THE DFA INVESTMENT TRUST COMPANY
THE DFA INTERNATIONAL VALUE SERIES
DISCLOSURE OF FUND EXPENSES
(Unaudited)
The following Expense Table is shown so that you can understand the impact of fees on your investment. All mutual funds have operating expenses. As a shareholder of the fund, you incur ongoing costs, which include costs for portfolio management, administrative services, and shareholder reports, among others. Operating expenses, legal and audit services, which are deducted from a fund’s gross income, directly reduce the investment return of the fund. A fund’s expenses are expressed as a percentage of its average net assets. This figure is known as the expense ratio. The following examples are intended to help you understand the ongoing costs, in dollars, of investing in the fund and to compare these costs with those of other mutual funds. The examples are based on an investment of $1,000 made at the beginning of the period shown and held for the entire period.
The Expense Table below illustrates your fund’s costs in two ways.
Actual fund return
This section helps you to estimate the actual expenses after fee waivers that you paid over the period. The “Ending Account Value” shown is derived from the fund’s actual return and “Expenses Paid During Period” reflect the dollar amount that would have been paid by an investor who started with $1,000 in the fund. You may use the information here, together with the amount you invested, to estimate the expenses that you paid over the period.
To do so, simply divide your account value by $1,000 (for example, a $7,500 account value divided by $1,000 = 7.5), then multiply the result by the number given for your fund under the heading “Expenses Paid During Period.”
Hypothetical example for comparison purposes
This section is intended to help you compare your fund’s costs with those of other mutual funds. The hypothetical “Ending Account Value” and “Expenses Paid During Period” are derived from the fund’s actual expense ratio and an assumed 5% annual return before expenses. In this case, because the return used is not the fund’s actual return, the results do not apply to your investment. The example is useful in making comparisons because the SEC requires all mutual funds to calculate expenses based on a 5% annual return. You can assess your fund’s costs by comparing this hypothetical example with the hypothetical examples that appear in shareholder reports of other funds.
Please note that the expenses shown in the table are meant to highlight and help you compare ongoing costs only and do not reflect any transactional costs, if applicable. The “Annualized Expense Ratio” represents the actual expenses for the six-month period indicated.
Six Months Ended October 31, 2009
EXPENSE TABLE
| | | | | | | | | | | |
| | | Beginning
Account
Value
05/01/09 | | Ending
Account
Value
10/31/09 | | Annualized
Expense
Ratio* | | | Expenses
Paid
During
Period* |
Actual Fund Return | | $ | 1,000.00 | | $ | 1,350.50 | | 0.25 | % | | $1.48 |
Hypothetical 5% Annual Return | | $ | 1,000.00 | | $ | 1,023.95 | | 0.25 | % | | $1.28 |
| * | Expenses are equal to the fund’s annualized expense ratio for the six-month period, multiplied by the average account value over the period, multiplied by the number of days in the most recent six-month period (184), then divided by the number of days in the year (365) to reflect the six-month period. |
19
THE DFA INVESTMENT TRUST COMPANY
THE DFA INTERNATIONAL VALUE SERIES
DISCLOSURE OF PORTFOLIO HOLDINGS
(Unaudited)
The SEC requires that all Funds file a complete Schedule of Investments with the SEC for their first and third fiscal quarters on Form N-Q. For The DFA Investment Trust Company, this would be for the fiscal quarters ending January 31 and July 31. The Form N-Q filing must be made within 60 days of the end of the quarter. The DFA Investment Trust Company filed its most recent Form N-Q with the SEC on September 29, 2009. It is available upon request, without charge, by calling collect: (512) 306-7400 or by mailing a request to Dimensional Fund Advisors LP, 6300 Bee Cave Road, Building One, Austin, Texas 78746, or by visiting the SEC’s website at http://www.sec.gov, or they may be reviewed and copied at the SEC’s Public Reference Room in Washington, D.C. (call 1-800-732-0330 for information on the operation of the Public Reference Room).
SEC regulations permit a fund to include in its reports to shareholders a “Summary Schedule of Portfolio Holdings” in lieu of a full Schedule of Investments. The Summary Schedule of Portfolio Holdings reports the fund’s 50 largest holdings in unaffiliated issuers and any investments that exceed one percent of the fund’s net assets at the end of the reporting period. The amendments also require that the Summary Schedule of Portfolio Holdings identify each category of investments that are held.
The fund is required to file a complete Schedule of Investments with the SEC on Form N-CSR within ten days after mailing the annual and semi-annual reports to shareholders. It will be available upon request, without charge, by calling collect: (512) 306-7400 or by mailing a request to Dimensional Fund Advisors LP, 6300 Bee Cave Road, Building One, Austin, Texas 78746, or by visiting the SEC’s website at http://www.sec.gov, or they may be reviewed and copied at the SEC’s Public Reference Room in Washington, D.C. (call 1-800-732-0330 for information on the operation of the Public Reference Room).
PORTFOLIO HOLDINGS
The SEC requires that all Funds present their categories of portfolio holdings in a table, chart or graph format in their annual and semi-annual shareholder reports, whether or not a Schedule of Investments is utilized. The following table, which presents portfolio holdings as a percent of total investments before short-term investments and collateral for loaned securities, is provided in compliance with such requirement. The categories shown below represent broad industry sectors. Each industry sector consists of one or more specific industry classifications.
| | |
| The DFA International Value Series |
Consumer Discretionary | | 13.2% |
Consumer Staples | | 4.9% |
Energy | | 6.0% |
Financials | | 42.8% |
Health Care | | 0.4% |
Industrials | | 10.3% |
Information Technology | | 3.1% |
Materials | | 11.2% |
Other | | — |
Telecommunication Services | | 6.9% |
Utilities | | 1.2% |
| | |
| | 100.0% |
20
THE DFA INTERNATIONAL VALUE SERIES
SUMMARY SCHEDULE OF PORTFOLIO HOLDINGS
October 31, 2009
| | | | | | | |
| | | Shares | | Value†† | | Percentage
of Net Assets** |
COMMON STOCKS — (85.2%) | | | | | | | |
AUSTRALIA — (4.5%) | | | | | | | |
Australia & New Zealand Banking Group, Ltd | | 3,343,351 | | $ | 68,191,374 | | 1.1% |
National Australia Bank, Ltd | | 2,465,437 | | | 65,140,887 | | 1.0% |
Wesfarmers, Ltd | | 1,898,047 | | | 47,362,464 | | 0.8% |
Other Securities | | | | | 141,329,082 | | 2.3% |
| | | | | | | |
TOTAL AUSTRALIA | | | | | 322,023,807 | | 5.2% |
| | | | | | | |
| | | |
AUSTRIA — (0.5%) | | | | | | | |
Other Securities | | | | | 34,182,743 | | 0.6% |
| | | | | | | |
| | | |
BELGIUM — (0.5%) | | | | | | | |
Other Securities | | | | | 38,019,953 | | 0.6% |
| | | | | | | |
| | | |
CANADA — (7.6%) | | | | | | | |
EnCana Corp | | 671,498 | | | 37,234,767 | | 0.6% |
#Manulife Financial Corp. | | 2,074,478 | | | 38,918,630 | | 0.6% |
*Teck Resources, Ltd. Class B | | 1,418,230 | | | 41,168,712 | | 0.7% |
#Thomson Reuters Corp. | | 1,832,184 | | | 58,281,755 | | 0.9% |
#Toronto Dominion Bank | | 944,998 | | | 53,867,637 | | 0.9% |
Other Securities | | | | | 318,836,929 | | 5.2% |
| | | | | | | |
TOTAL CANADA | | | | | 548,308,430 | | 8.9% |
| | | | | | | |
| | | |
DENMARK — (1.1%) | | | | | | | |
Other Securities | | | | | 77,023,723 | | 1.2% |
| | | | | | | |
| | | |
FINLAND — (0.6%) | | | | | | | |
Other Securities | | | | | 40,451,320 | | 0.7% |
| | | | | | | |
| | | |
FRANCE — (8.3%) | | | | | | | |
#AXA SA | | 2,818,397 | | | 70,093,978 | | 1.1% |
BNP Paribas SA | | 913,891 | | | 68,847,185 | | 1.1% |
#Compagnie de Saint-Gobain SA | | 846,142 | | | 41,232,265 | | 0.7% |
#Lafarge SA | | 467,217 | | | 37,923,901 | | 0.6% |
#Societe Generale Paris SA | | 913,312 | | | 60,662,002 | | 1.0% |
Vivendi SA | | 2,686,677 | | | 74,534,678 | | 1.2% |
Other Securities | | | | | 244,803,391 | | 4.0% |
| | | | | | | |
TOTAL FRANCE | | | | | 598,097,400 | | 9.7% |
| | | | | | | |
| | | |
GERMANY — (7.4%) | | | | | | | |
Allianz SE | | 442,712 | | | 50,712,808 | | 0.8% |
#Bayerische Motoren Werke AG | | 915,762 | | | 44,797,554 | | 0.7% |
#Daimler AG | | 1,684,003 | | | 81,364,327 | | 1.3% |
#Deutsche Bank AG | | 774,190 | | | 56,245,973 | | 0.9% |
#Deutsche Telekom AG | | 2,621,866 | | | 35,693,819 | | 0.6% |
Deutsche Telekom AG Sponsored ADR | | 2,809,150 | | | 38,035,891 | | 0.6% |
Munchener Rueckversicherungs-Gesellschaft AG | | 388,934 | | | 61,534,351 | | 1.0% |
Other Securities | | | | | 167,080,419 | | 2.7% |
| | | | | | | |
TOTAL GERMANY | | | | | 535,465,142 | | 8.6% |
| | | | | | | |
| | | |
GREECE — (0.3%) | | | | | | | |
Other Securities | | | | | 19,019,902 | | 0.3% |
| | | | | | | |
| | | |
HONG KONG — (2.7%) | | | | | | | |
Cheung Kong Holdings, Ltd. | | 3,224,000 | | | 41,120,708 | | 0.7% |
Hutchison Whampoa, Ltd. | | 5,568,000 | | | 39,081,157 | | 0.6% |
Other Securities | | | | | 117,731,620 | | 1.9% |
| | | | | | | |
TOTAL HONG KONG | | | | | 197,933,485 | | 3.2% |
| | | | | | | |
21
THE DFA INTERNATIONAL VALUE SERIES
CONTINUED
| | | | | | | |
| | | Shares | | Value†† | | Percentage
of Net Assets** |
IRELAND — (0.0%) | | | | | | | |
Other Securities | | | | $ | 57,893 | | 0.0% |
| | | | | | | |
| | | |
ITALY — (2.9%) | | | | | | | |
#*Intesa Sanpaolo SpA | | 11,201,860 | | | 47,142,793 | | 0.8% |
*UniCredito SpA | | 19,413,366 | | | 65,038,767 | | 1.0% |
Other Securities | | | | | 98,411,874 | | 1.6% |
| | | | | | | |
TOTAL ITALY | | | | | 210,593,434 | | 3.4% |
| | | | | | | |
| | | |
JAPAN — (11.7%) | | | | | | | |
FUJIFILMHoldings Corp. | | 1,257,700 | | | 35,755,504 | | 0.6% |
*Nissan Motor Co., Ltd. | | 4,991,500 | | | 36,119,215 | | 0.6% |
Sony Corp. Sponsored ADR | | 1,725,386 | | | 50,709,095 | | 0.8% |
Other Securities | | | | | 726,760,636 | | 11.7% |
| | | | | | | |
TOTAL JAPAN | | | | | 849,344,450 | | 13.7% |
| | | | | | | |
| | | |
MALAYSIA — (0.0%) | | | | | | | |
Other Securities | | | | | — | | 0.0% |
| | | | | | | |
| | | |
NETHERLANDS — (3.7%) | | | | | | | |
#ArcelorMittal NV | | 2,446,831 | | | 82,806,981 | | 1.3% |
*ING Groep NV | | 3,093,625 | | | 40,259,293 | | 0.7% |
Philips Electronics NV | | 3,072,622 | | | 77,186,781 | | 1.2% |
Other Securities | | | | | 69,089,143 | | 1.1% |
| | | | | | | |
TOTAL NETHERLANDS | | | | | 269,342,198 | | 4.3% |
| | | | | | | |
| | | |
NEW ZEALAND — (0.1%) | | | | | | | |
Other Securities | | | | | 8,185,686 | | 0.1% |
| | | | | | | |
| | | |
NORWAY — (1.0%) | | | | | | | |
Other Securities | | | | | 75,691,447 | | 1.2% |
| | | | | | | |
| | | |
PORTUGAL — (0.2%) | | | | | | | |
Other Securities | | | | | 13,072,321 | | 0.2% |
| | | | | | | |
| | | |
SINGAPORE — (1.6%) | | | | | | | |
DBS Group Holdings, Ltd | | 4,164,750 | | | 38,138,997 | | 0.6% |
Other Securities | | | | | 78,569,480 | | 1.3% |
| | | | | | | |
TOTAL SINGAPORE | | | | | 116,708,477 | | 1.9% |
| | | | | | | |
| | | |
SPAIN — (4.7%) | | | | | | | |
Banco Santander SA | | 5,654,108 | | | 90,987,342 | | 1.5% |
Banco Santander SA Sponsored ADR | | 5,549,048 | | | 89,117,711 | | 1.4% |
#Repsol YPF SA Sponsored ADR | | 1,332,613 | | | 35,447,506 | | 0.6% |
Other Securities | | | | | 120,997,642 | | 1.9% |
| | | | | | | |
TOTAL SPAIN | | | | | 336,550,201 | | 5.4% |
| | | | | | | |
| | | |
SWEDEN — (2.9%) | | | | | | | |
#Nordea Bank AB | | 6,583,962 | | | 70,668,421 | | 1.2% |
Other Securities | | | | | 138,442,067 | | 2.2% |
| | | | | | | |
TOTAL SWEDEN | | | | | 209,110,488 | | 3.4% |
| | | | | | | |
| | | |
SWITZERLAND — (6.3%) | | | | | | | |
Credit Suisse Group AG | | 1,755,349 | | | 93,836,004 | | 1.5% |
#Credit Suisse Group AG Sponsored ADR | | 840,377 | | | 44,792,094 | | 0.7% |
#*Holcim, Ltd. | | 650,248 | | | 41,384,888 | | 0.7% |
*UBS AG | | 3,481,616 | | | 58,055,052 | | 1.0% |
Zurich Financial Services AG | | 322,012 | | | 73,738,360 | | 1.2% |
Other Securities | | | | | 144,088,911 | | 2.3% |
| | | | | | | |
TOTAL SWITZERLAND | | | | | 455,895,309 | | 7.4% |
| | | | | | | |
22
THE DFA INTERNATIONAL VALUE SERIES
CONTINUED
| | | | | | | |
| | | Shares | | Value†† | | Percentage
of Net Assets** |
UNITED KINGDOM — (16.6%) | | | | | | | |
*Anglo American P.L.C. | | 1,329,421 | | $ | 48,102,581 | | 0.8% |
Aviva P.L.C. | | 7,396,866 | | | 46,253,871 | | 0.7% |
#*Barclays P.L.C. Sponsored ADR | | 2,451,654 | | | 51,239,569 | | 0.8% |
#HSBC Holdings P.L.C. Sponsored ADR | | 3,278,400 | | | 181,590,576 | | 2.9% |
Kingfisher P.L.C. | | 9,743,172 | | | 35,612,473 | | 0.6% |
#Royal Dutch Shell P.L.C. ADR | | 2,252,783 | | | 131,021,859 | | 2.1% |
Vodafone Group P.L.C. | | 34,976,333 | | | 77,082,062 | | 1.2% |
#Vodafone Group P.L.C. Sponsored ADR | | 7,395,974 | | | 164,116,663 | | 2.7% |
*Xstrata P.L.C. | | 3,245,577 | | | 46,747,872 | | 0.8% |
Other Securities | | | | | 419,126,814 | | 6.8% |
| | | | | | | |
TOTAL UNITED KINGDOM | | | | | 1,200,894,340 | | 19.4% |
| | | | | | | |
TOTAL COMMON STOCKS | | | | | 6,155,972,149 | | 99.4% |
| | | | | | | |
RIGHTS/WARRANTS — (0.0%) | | | | | | | |
GERMANY — (0.0%) | | | | | | | |
Other Securities | | | | | 41,059 | | 0.0% |
| | | | | | | |
| | | |
ITALY — (0.0%) | | | | | | | |
Other Securities | | | | | 76,976 | | 0.0% |
| | | | | | | |
TOTAL RIGHTS/WARRANTS | | | | | 118,035 | | 0.0% |
| | | | | | | |
| | | |
| | | Face
Amount | | Value† | | |
| | | (000) | | | |
TEMPORARY CASH INVESTMENTS — (0.2%) | | | | | | | |
Repurchase Agreement, PNC Capital Markets, Inc. 0.19%, 11/02/09 (Collateralized by $13,010,000 FNMA 6.50%, 06/25/39, valued at $14,002,013) to be repurchased at $13,790,218 | | $13,790 | | | 13,790,000 | | 0.2% |
| | | | | | | |
| | | |
| | | Shares/
Face
Amount | | | | |
| | | (000) | | | | |
SECURITIES LENDING COLLATERAL — (14.6%) | | | | | | | |
§@DFA Short Term Investment Fund LP | | 1,055,086,714 | | | 1,055,086,714 | | 17.1% |
@Repurchase Agreement, Deutsche Bank Securities 0.07%, 11/02/09 (Collateralized by various corporate obligations, ranging in par value from $4,247,617 to $16,429,280, rates ranging from 5.000% to 7.000%, maturities ranging from 03/01/37 to 10/01/39, valued at $1,212,860) to be repurchased at $1,189,085 | | $1,189 | | | 1,189,078 | | 0.0% |
| | | | | | | |
TOTAL SECURITIES LENDING COLLATERAL | | | | | 1,056,275,792 | | 17.1% |
| | | | | | | |
TOTAL INVESTMENTS — (100.0%) | | | | | | | |
(Cost $5,830,288,347) | | | | $ | 7,226,155,976 | | 116.7% |
| | | | | | | |
23
THE DFA INTERNATIONAL VALUE SERIES
CONTINUED
Summary of inputs used to value the Series’ net assets as of October 31, 2009 is as follows (See Security Valuation Note):
| | | | | | | | | | | |
| | | Valuation Inputs |
| | | Investment in Securities (Market Value) |
| | | Level 1 | | Level 2 | | Level 3 | | Total |
Common Stocks | | | | | | | | | | | |
Australia | | $ | 2,073,789 | | $ | 319,950,018 | | — | | $ | 322,023,807 |
Austria | | | — | | | 34,182,743 | | — | | | 34,182,743 |
Belgium | | | 3,586,620 | | | 34,433,333 | | — | | | 38,019,953 |
Canada | | | 548,308,430 | | | — | | — | | | 548,308,430 |
Denmark | | | — | | | 77,023,723 | | — | | | 77,023,723 |
Finland | | | 1,516,659 | | | 38,934,661 | | — | | | 40,451,320 |
France | | | 3,494,320 | | | 594,603,080 | | — | | | 598,097,400 |
Germany | | | 98,912,195 | | | 436,552,947 | | — | | | 535,465,142 |
Greece | | | 4,501,802 | | | 14,518,100 | | — | | | 19,019,902 |
Hong Kong | | | — | | | 197,933,485 | | — | | | 197,933,485 |
Ireland | | | 57,893 | | | — | | — | | | 57,893 |
Italy | | | 29,729,570 | | | 180,863,864 | | — | | | 210,593,434 |
Japan | | | 56,497,996 | | | 792,846,454 | | — | | | 849,344,450 |
Malaysia | | | — | | | — | | — | | | — |
Netherlands | | | 10,297,313 | | | 259,044,885 | | — | | | 269,342,198 |
New Zealand | | | — | | | 8,185,686 | | — | | | 8,185,686 |
Norway | | | 401,330 | | | 75,290,117 | | — | | | 75,691,447 |
Portugal | | | — | | | 13,072,321 | | — | | | 13,072,321 |
Singapore | | | — | | | 116,708,477 | | — | | | 116,708,477 |
Spain | | | 131,434,682 | | | 205,115,519 | | — | | | 336,550,201 |
Sweden | | | 7,351,053 | | | 201,759,435 | | — | | | 209,110,488 |
Switzerland | | | 46,226,255 | | | 409,669,054 | | — | | | 455,895,309 |
United Kingdom | | | 564,527,406 | | | 636,366,934 | | — | | | 1,200,894,340 |
Rights/Warrants | | | | | | | | | | | |
Germany | | | — | | | 41,059 | | — | | | 41,059 |
Italy | | | 76,976 | | | — | | — | | | 76,976 |
Temporary Cash Investments | | | — | | | 13,790,000 | | — | | | 13,790,000 |
Securities Lending Collateral | | | — | | | 1,056,275,792 | | — | | | 1,056,275,792 |
| | | | | | | | | | | |
TOTAL | | $ | 1,508,994,289 | | $ | 5,717,161,687 | | — | | $ | 7,226,155,976 |
| | | | | | | | | | | |
See accompanying Notes to Financial Statements.
24
THE DFA INVESTMENT TRUST COMPANY
THE DFA INTERNATIONAL VALUE SERIES
STATEMENT OF ASSETS AND LIABILITIES
OCTOBER 31, 2009
(Amounts in thousands)
| | | |
ASSETS: | | | |
Investments at Value (including $1,004,314 of securities on loan) | | $ | 6,156,090 |
Temporary Cash Investments at Value & Cost | | | 13,790 |
Collateral Received from Securities on Loan at Value & Cost | | | 1,056,276 |
Foreign Currencies at Value | | | 19,131 |
Cash | | | 16 |
Receivables: | | | |
Investment Securities Sold | | | 10,656 |
Dividends, Interest and Tax Reclaims | | | 10,784 |
Securities Lending Income | | | 444 |
Fund Shares Sold | | | 724 |
Unrealized Gain on Foreign Currency Contracts | | | 19 |
| | | |
Total Assets | | | 7,267,930 |
| | | |
LIABILITIES: | | | |
Payables: | | | |
Upon Return of Securities Loaned | | | 1,056,276 |
Investment Securities Purchased | | | 14,723 |
Fund Shares Redeemed | | | 3,518 |
Due to Advisor | | | 1,084 |
Accrued Expenses and Other Liabilities | | | 365 |
| | | |
Total Liabilities | | | 1,075,966 |
| | | |
NET ASSETS | | $ | 6,191,964 |
| | | |
Investments at Cost | | $ | 4,760,222 |
| | | |
Foreign Currencies at Cost | | $ | 19,163 |
| | | |
See accompanying Notes to Financial Statements.
25
THE DFA INVESTMENT TRUST COMPANY
THE DFA INTERNATIONAL VALUE SERIES
STATEMENT OF OPERATIONS
FOR THE YEAR ENDED OCTOBER 31, 2009
(Amounts in thousands)
| | | |
Investment Income | | | |
Dividends (Net of Foreign Taxes Withheld of $14,384) | | $ | 160,091 |
Interest | | | 197 |
Income from Securities Lending | | | 13,032 |
| | | |
Total Investment Income | | | 173,320 |
| | | |
Expenses | | | |
Investment Advisory Services Fees | | | 9,991 |
Accounting & Transfer Agent Fees | | | 549 |
Custodian Fees | | | 688 |
Shareholders’ Reports | | | 49 |
Directors’/Trustees’ Fees & Expenses | | | 78 |
Professional Fees | | | 221 |
Other | | | 574 |
| | | |
Total Expenses | | | 12,150 |
| | | |
Net Investment Income (Loss) | | | 161,170 |
| | | |
Realized and Unrealized Gain (Loss) | | | |
Net Realized Gain (Loss) on: | | | |
Investment Securities Sold | | | 63,984 |
Futures | | | (1,125) |
Foreign Currency Transactions | | | 3,828 |
Change in Unrealized Appreciation (Depreciation) of: | | | |
Investment Securities and Foreign Currency | | | 1,395,836 |
Translation of Foreign Currency Denominated Amounts | | | 240 |
| | | |
Net Realized and Unrealized Gain (Loss) | | | 1,462,763 |
| | | |
Net Increase (Decrease) in Net Assets Resulting from Operations | | $ | 1,623,933 |
| | | |
See accompanying Notes to Financial Statements.
26
THE DFA INVESTMENT TRUST COMPANY
THE DFA INTERNATIONAL VALUE SERIES
STATEMENTS OF CHANGES IN NET ASSETS
(Amounts in thousands)
| | | | | | | | | | | | |
| | | Year
Ended
Oct. 31,
2009 | | | Period
Dec. 1, 2007
to
Oct. 31, 2008 | | | Year
Ended
Nov. 30,
2007 | |
Increase (Decrease) in Net Assets | | | | | | | | | | | | |
Operations: | | | | | | | | | | | | |
Net Investment Income (Loss) | | $ | 161,170 | | | $ | 304,387 | | | $ | 274,613 | |
Net Realized Gain (Loss) on: | | | | | | | | | | | | |
Investment Securities Sold | | | 63,984 | | | | 137,811 | | | | 654,522 | |
Futures | | | (1,125 | ) | | | (1,153 | ) | | | — | |
Foreign Currency Transactions | | | 3,828 | | | | (4,593 | ) | | | 2,498 | |
In-Kind Redemptions | | | — | | | | 103,024 | * | | | — | |
Change in Unrealized Appreciation (Depreciation) of: | | | | | | | | | | | | |
Investment Securities and Foreign Currency | | | 1,395,836 | | | | (5,026,911 | ) | | | 403,307 | |
Futures | | | — | | | | 19 | | | | — | |
Translation of Foreign Currency Denominated Amounts | | | 240 | | | | (76 | ) | | | (180 | ) |
| | | | | | | | | | | | |
Net Increase (Decrease) in Net Assets Resulting from Operations | | | 1,623,933 | | | | (4,487,492 | ) | | | 1,334,760 | |
| | | | | | | | | | | | |
Transactions in Interest: | | | | | | | | | | | | |
Contributions | | | 449,410 | | | | 927,878 | † | | | 1,731,698 | † |
Withdrawals | | | (581,716 | ) | | | (1,378,770 | )*† | | | (884,989 | )† |
| | | | | | | | | | | | |
Net Increase (Decrease) from Transactions in Interest | | | (132,306 | ) | | | (450,892 | ) | | | 846,709 | |
| | | | | | | | | | | | |
Total Increase (Decrease) in Net Assets | | | 1,491,627 | | | | (4,938,384 | ) | | | 2,181,469 | |
Net Assets | | | | | | | | | | | | |
Beginning of Period | | | 4,700,337 | | | | 9,638,721 | | | | 7,457,252 | |
| | | | | | | | | | | | |
End of Period | | $ | 6,191,964 | | | $ | 4,700,337 | | | $ | 9,638,721 | |
| | | | | | | | | | | | |
| * | See Note J in the Notes to Financial Statements. |
| † | See Note A in the Notes to Financial Statements. |
See accompanying Notes to Financial Statements.
27
THE DFA INVESTMENT TRUST COMPANY
THE DFA INTERNATIONAL VALUE SERIES†
FINANCIAL HIGHLIGHTS
| | | | | | | | | | | | | | | | | | | | | | | | |
| | | Year
Ended
Oct. 31,
2009 | | | Period
Dec. 1, 2007
to
Oct. 31, 2008 | | | Year
Ended
Nov. 30,
2007 | | | Year
Ended
Nov. 30,
2006 | | | Year
Ended
Nov. 30,
2005 | | | Year
Ended
Nov. 30,
2004 | |
Total Return | | | 35.41 | % | | | (47.87 | )%(C) | | | 17.32 | % | | | 35.73 | % | | | 15.61 | % | | | 32.15 | % |
| | | | | | |
Net Assets, End of Period (thousands) | | $ | 6,191,964 | | | $ | 4,700,337 | | | $ | 9,638,721 | | | $ | 7,457,252 | | | $ | 4,367,698 | | | $ | 2,804,043 | |
Ratio of Expenses to Average Net Assets | | | 0.24 | % | | | 0.23 | %(B) | | | 0.23 | % | | | 0.23 | % | | | 0.27 | % | | | 0.28 | % |
Ratio of Net Investment Income to Average Net Assets | | | 3.22 | % | | | 4.15 | %(B) | | | 3.04 | % | | | 3.29 | % | | | 2.71 | % | | | 2.35 | % |
Portfolio Turnover Rate | | | 18 | % | | | 16 | %(C) | | | 16 | % | | | 8 | % | | | 10 | % | | | 15 | % |
| See | page 1 for the Definitions of Abbreviations and Footnotes. |
| † | See Note A in the Notes to Financial Statements. |
See accompanying Notes to Financial Statements.
28
THE DFA INVESTMENT TRUST COMPANY
THE DFA INTERNATIONAL VALUE SERIES
NOTES TO FINANCIAL STATEMENTS
A. Organization:
The DFA Investment Trust Company (the “Trust”) is an open-end management investment company registered under the Investment Company Act of 1940. The Trust consists of twelve investment portfolios, of which The DFA International Value Series (the “Series”) is presented in this report.
On November 1, 2008, The DFA International Value Series, a master fund in a RIC/RIC master-feeder structure, elected with the consent of its respective Holder(s) to change its U.S. federal income tax classification from that of an association taxable as a corporation to a partnership pursuant to Treasury Regulation § 301.7701-3. The change in capital structure and retroactive reclassification of the statement of changes in net assets and financial highlights for the respective funds is a result of the treatment of a partnership for book purposes. The Series/Portfolio will maintain its books and records and present its financial statements in accordance with generally accepted accounting principles for investment partnerships.
At a regular meeting of the Board of Directors/Trustees (the “Board”) on September 16, 2008, the Board voted to change the fiscal and tax year ends of the Series from November 30 to October 31.
B. Significant Accounting Policies:
The following significant accounting policies are in conformity with accounting principles generally accepted in the United States of America. Such policies are consistently followed by the Trust in preparation of its financial statements. The preparation of financial statements in accordance with accounting principles generally accepted in the United States of America requires management to make estimates and assumptions that affect the reported amounts of assets and liabilities and disclosure of contingent assets and liabilities at the date of the financial statements and the reported amounts of increases and decreases in net assets from operations during the reporting period. Actual results could differ from those estimates and those differences could be material.
1. Security Valuation: Securities held by the Series (including over-the-counter securities) are valued at the last quoted sale price of the day. Securities held by the Series that are listed on Nasdaq are valued at the Nasdaq Official Closing Price (“NOCP”). If there is no last reported sale price or NOCP for the day, the Series values the securities at the mean of the most recent quoted bid and asked prices. Price information on listed securities is taken from the exchange where the security is primarily traded. Generally, securities issued by open-end investment companies are valued using their respective net asset values or public offering prices, as appropriate, for purchase orders placed at the close of the New York Stock Exchange (NYSE).
Securities for which no market quotations are readily available (including restricted securities), or for which market quotations have become unreliable, are valued in good faith at fair value in accordance with procedures adopted by the Board of Directors/Trustees. Fair value pricing may also be used if events that have a significant effect on the value of an investment (as determined in the discretion of the Investment Committee of the Advisor) occur before the net asset value is calculated. When fair value pricing is used, the prices of securities used by the Series may differ from the quoted or published prices for the same securities on their primary markets or exchanges.
The Series will also fair value price in the circumstances described below. Generally, trading in foreign securities markets is completed each day at various times prior to the close of the NYSE. For example, trading in the Japanese securities markets is completed each day at the close of Tokyo Stock Exchange (normally 11:00 p.m. PT), which is fourteen hours prior to the close of the NYSE (normally 1:00 p.m. PT) and the time that the net asset value of the Series is computed. Due to the time differences between the closings of the relevant foreign securities exchanges and the time the Series prices its shares at the close of the NYSE, the Series will fair value its foreign investments when it is determined that the market quotations for the foreign investments are either unreliable or not readily available. The fair value prices will attempt to reflect the impact of the U.S. financial markets’ perceptions and
29
trading activities on the Series’ foreign investments since the last closing prices of the foreign investments were calculated on their primary foreign securities markets or exchanges. For these purposes, the Board of Directors/Trustees of the Series has determined that movements in relevant indices or other appropriate market indicators, after the close of the Tokyo Stock Exchange or the London Stock Exchange, demonstrate that market quotations may be unreliable. Fair valuation of portfolio securities may occur on a daily basis. The fair value pricing by the Series utilizes data furnished by an independent pricing service (and that data draws upon, among other information, the market values of foreign investments). When the Series uses fair value pricing, the values assigned to the Series’ foreign investments may not be the quoted or published prices of the investments on their primary markets or exchanges.
Futures contracts held by the Series are valued using the settlement price established each day on the exchange on which they are traded.
The Series utilizes a fair value hierarchy which prioritizes the inputs to valuation techniques used to measure fair value into three broad levels described below:
| | • | | Level 1 – quoted prices in active markets for identical securities |
| | • | | Level 2 – other significant observable inputs (including quoted prices for similar securities, interest rates, prepayment speeds, credit risk, etc.) |
| | • | | Level 3 – significant unobservable inputs (including the Series’ own assumptions in determining the fair value of investments) |
A summary of the inputs used to value the Series’ net assets by each major security type, industry and/or country is disclosed at the end of the Summary Schedule of Portfolio Holdings. The inputs or methodology used for valuing securities are not necessarily an indication of the risk associated with investing in those securities.
2. Foreign Currency Translation: Securities and other assets and liabilities of the Series whose values are initially expressed in foreign currencies are translated to U.S. dollars using the mean between the most recently quoted bid and asked prices for the U.S. dollar as quoted by generally recognized reliable sources. Dividend and interest income and certain expenses are translated to U.S. dollars at the rate of exchange on their respective accrual dates. Receivables and payables denominated in foreign currencies are marked to market daily based on daily exchange rates. Exchange gains or losses are realized upon ultimate receipt or disbursement.
The Series does not isolate the effect of fluctuations in foreign exchange rates from the effect of fluctuations in the market prices of securities held whether realized or unrealized.
Realized gains or losses on foreign currency transactions represent net foreign exchange gains or losses from the disposition of foreign currencies, currency gains or losses realized between the trade and settlement dates on securities transactions, and the difference between amounts of interest, dividends and foreign withholding taxes recorded on the books of the Series and the U.S. dollar equivalent amounts actually received or paid.
3. Deferred Compensation Plan: Each eligible Trustee of the Trust may elect participation in the Deferred Compensation Plan (the “Plan”). Under the Plan, effective January 1, 2002, such Trustees may defer payment of all or a portion of their total fees earned as a Trustee. These deferred amounts may be treated as though such amounts had been invested in shares of the following funds: U.S. Large Cap Value Portfolio; U.S. Core Equity 1 Portfolio; U.S. Core Equity 2 Portfolio; U.S. Vector Equity Portfolio; U.S. Micro Cap Portfolio; DFA International Value Portfolio; International Core Equity Portfolio; Emerging Markets Portfolio; Emerging Markets Core Equity Portfolio; and/or DFA Two-Year Global Fixed Income Portfolio. Contributions made under the Plan and the change in unrealized appreciation (depreciation) and income are included in Directors’/Trustees’ Fees & Expenses. At October 31, 2009, the total liability for deferred compensation to Trustees is included in Accrued Expenses and Other Liabilities on the Statement of Assets and Liabilities in the amount of $143 (in thousands).
Each Trustee has the option to receive their distribution of proceeds in one of the following methods upon one year’s notice: lump sum; annual installments over a period of agreed upon years; or semi-annual installments over a period of agreed upon years. As of October 31, 2009, none of the Trustees have requested distribution of proceeds.
30
4. Other: Security transactions are accounted for as of the trade date. Costs used in determining realized gains and losses on the sale of investment securities are on the basis of identified cost. Dividend income and distributions to shareholders are recorded on the ex-dividend date. Distributions received on securities that represent a return of capital or capital gains are recorded as a reduction of cost of investments or as a realized gain, respectively. The Series estimates the character of distributions received that may be considered return of capital distributions or capital gain distributions. Interest income is recorded on the accrual basis. Discount and premium on securities purchased are amortized over the lives of the respective securities utilizing the effective interest method. Expenses directly attributable to a Series are directly charged. Common expenses of the Trust are allocated using methods approved by the Board of Directors/Trustees, generally based on average net assets.
The Series may be subject to taxes imposed by countries in which it invests, with respect to its investments in issuers exiting or operating in such countries. Such taxes are generally based on income earned or repatriated and capital gains realized on the sale of such investments. The Series accrues such taxes when the related income or capital gains are earned or throughout the holding period. Some countries require governmental approval for the repatriation of investment income, capital or the proceeds of sales earned by foreign investors. In addition, if there is a deterioration in a country’s balance of payments or for other reasons, a country may impose temporary restrictions on foreign capital remittances abroad.
C. Investment Advisor:
Dimensional Fund Advisors LP (“Dimensional” or the “Advisor”) provides investment advisory services to the Series. For the year ended October 31, 2009, the Series’ investment advisory services fees were accrued daily and paid monthly to the Advisor based on an effective annual rate of 0.20% of average daily net assets of the Series.
Fees Paid to Officers and Directors/Trustees:
Certain Officers and Directors/Trustees of the Advisor are also Officers and Directors/Trustees of the Trust; however, such Officers and Directors/Trustees (with the exception of the Chief Compliance Officer (“CCO”)) receive no compensation from the Trust. For the year ended October 31, 2009, the total related amounts paid by the Trust to the CCO were $98 (in thousands). The total related amounts paid by the Series are included in Other Expenses on the Statement of Operations.
D. Purchases and Sales of Securities:
For the year ended October 31, 2009, the Series made the following purchases and sales of investment securities, other than short-term securities and U.S. government securities (amounts in thousands):
| | | |
Purchases | | $ | 1,071,984 |
Sales | | | 935,775 |
There were no purchases or sales of long-term U.S. government securities.
E. Federal Income Taxes:
No provision for federal income taxes is required since the Series is treated as a partnership for federal income tax purposes. Any net investment income and realized and unrealized gains and losses have been deemed to have been “passed down” to its partners.
31
At October 31, 2009, the total cost and aggregate gross unrealized appreciation and (depreciation) of securities for federal income tax purposes were different from amounts reported for financial reporting purposes (amounts in thousands):
| | | | | | | |
Federal
Tax Cost | | Unrealized
Appreciation | | Unrealized
(Depreciation) | | Net
Unrealized
Appreciation
(Depreciation) |
| $5,830,471 | | $ | 1,458,762 | | $(63,077) | | $1,395,685 |
Accounting for Uncertainty in Income Taxes sets forth a minimum threshold for financial statement recognition of the benefit of a tax position taken or expected to be taken on a tax return. Management has analyzed the Series’ tax position and has concluded that no provision for income tax is required in the Series’ financial statements. The Series’ is not aware of any tax position for which it is reasonably possible that the total amounts of unrecognized tax benefits will significantly change in the next twelve months. The Series’ federal tax returns for the prior three fiscal years remain subject to examination by the Internal Revenue Service.
On November 1, 2008, The DFA International Value Series, a master fund in a RIC/RIC master-feeder structure with five RIC feeders and other direct client investor(s), made a “Check-the-box” election for federal income tax purposes pursuant to Treasury Regulation §301.7701-3, to change its federal entity classification from a corporation taxable as a regulated investment company to a partnership. As a result of this election, the master fund is deemed to have distributed all of its assets and liabilities, in a taxable transaction, to its shareholders in liquidation of the master fund. Immediately thereafter, the shareholders contributed all of the distributed assets and liabilities to a newly formed partnership. The final tax year end of The DFA International Value Series was October 31, 2008. For Federal income tax purposes, pursuant to Internal Revenue Code §336(a), the master fund recognizes gain or loss as if the master’s investment securities were sold to its shareholders and, pursuant to IRC Code §331, each of the Portfolios recognizes gain or loss as if it liquidated its investment in the master. As a result of the transaction, The DFA International Value Series recognized a ($2,309,440,866) and ($718,733) capital and currency loss respectively for tax year ended October 31, 2008. For tax purposes, pursuant to IRC Code §334(a), each of the Portfolios will take a fair market value basis in the securities deemed received by them and a new holding period for those securities commences on the deemed liquidation date.
F. Financial Instruments:
In accordance with the Series’ investment objectives and policies, the Series may invest in certain financial instruments that have off-balance sheet risk in excess of the amounts recognized in the financial statements and concentrations of credit and market risk. These instruments and their significant corresponding risks are described below:
1. Repurchase Agreements: The Series may purchase certain U.S. Government securities subject to the counterparty’s agreement to repurchase them at an agreed upon date and price. The counterparty will be required on a daily basis to maintain the value of the collateral subject to the agreement at not less than the repurchase price (including accrued interest). The agreements are conditioned upon the collateral being deposited under the Federal Reserve book-entry system with the Trust’s custodian or a third party sub-custodian. In the event of default or bankruptcy by the other party to the agreement, retention of the collateral may be subject to legal proceedings. All open repurchase agreements were entered into on October 30, 2009.
2. Foreign Market Risks: Investments in foreign markets may involve certain considerations and risks not typically associated with investments in the United States of America, including the possibility of future political and economic developments and the level of foreign government supervision and regulation of foreign securities markets. These markets are generally smaller, less liquid and more volatile than the major securities markets in the United States of America. Consequently, acquisition and disposition of securities by the Series may be inhibited.
32
Derivative Financial Instruments:
Disclosures on derivative instruments and hedging activities are intended to improve financial reporting for derivative instruments by enabling investors to understand how and why a fund uses derivatives, how derivatives are accounted for and how derivative instruments affect a fund’s results of operations and financial position. Summarized below are the specific types of derivative instruments used by the Series.
3. Futures Contracts: The Series may enter into futures contracts to gain market exposure on uninvested cash pending investment in securities or to maintain liquidity to pay redemptions. Upon entering into a futures contract, the Series deposits cash or pledges U.S. Government securities to a broker, equal to the minimum “initial margin” requirements of the exchange on which the contract is traded. Subsequent payments are received from or paid to the broker each day, based on the daily fluctuation in the market value of the contract. These receipts or payments are known as “variation margin” and are recorded daily by the Series as unrealized gains or losses until the contracts are closed. When the contracts are closed, the Series records a realized gain or loss, which is presented in the Statement of Operations as a net realized gain or loss on futures, equal to the difference between the value of the contract at the time it was opened and the value at the time it was closed.
Risks may arise upon entering into futures contracts from potential imperfect price correlations between the futures contracts and the underlying securities, from the possibility of an illiquid secondary market for these instruments and from the possibility that the Series could lose more than the initial margin requirements. The Series entering into stock index futures are subject to equity price risk from those futures contracts. Counterparty credit risk related to exchange-traded futures is minimal because the exchange’s clearinghouse, as counterparty to all exchange-traded futures, guarantees the futures against default.
Additional disclosure on derivative instruments is required showing a summary by primary risk exposure of the derivatives instruments’ (i) location in the balance sheet and fair value at period end and (ii) the location in the Statement of Operations and the realized and change in unrealized gain or loss over the reporting period. The following is a summary of the Series’ derivative instrument holdings for the year ended October 31, 2009.
At October 31, 2009, the Series had no outstanding futures contracts.
The following is a summary of the Series’ location and value of realized gains and losses on the Series’ Statement of Operations for the Series’ derivative instrument holdings through the year ended October 31, 2009 (amounts in thousands):
| | | | |
| | | | | Realized Gain (Loss)
on Derivatives
Recognized in Income |
| | | Location on the Statement
of Operations | | Equity
Contracts |
| | Net Realized Gain (Loss) on: | | |
The DFA International Value Series* | | Futures | | $(1,125) |
| * | As of October 31, 2009, there were no futures contracts outstanding. During the year ended October 31, 2009, the Series had limited activity in these transactions. |
G. Line of Credit:
The Trust, together with other Dimensional-advised portfolios, has entered into an amended and restated $250 million unsecured discretionary line of credit effective July 8, 2009 with an affiliate of its domestic custodian bank. Each portfolio is permitted to borrow, subject to its investment limitations, up to a maximum of $250 million, as long as total borrowings under the line of credit do not exceed $250 million in the aggregate. Borrowings under the line of credit are charged interest at the then current Federal Funds Rate plus 1%. Each portfolio is individually, and not jointly, liable for its particular advances under the line of credit. There is no commitment fee on the unused portion of the line of credit. The agreement for the discretionary line of credit may be terminated by either party at any time.
33
The line of credit is scheduled to expire on June 22, 2010. There were no borrowings by the Series under this line of credit during the year ended October 31, 2009.
The Trust, together with other Dimensional-advised portfolios, has also entered into an additional $500 million unsecured line of credit effective January 15, 2009 with its international custodian bank. Each portfolio is permitted to borrow, subject to its investment limitations, up to a maximum of $500 million, as long as total borrowings under the line of credit do not exceed $500 million in the aggregate. Borrowings under the line of credit are charged interest at rates agreed to by the parties at the time of borrowing. Each portfolio is individually, and not jointly, liable for its particular advances under the line of credit. There is no commitment fee on the unused portion of the line of credit. The agreement for the line of credit expires on January 15, 2010.
For the year ended October 31, 2009, borrowings by the Series under this line of credit were as follows (amounts in thousands, except percentages and days):
| | | | | | | | |
Weighted
Average
Interest Rate | | Weighted
Average
Loan Balance | | Number of
Days
Outstanding | | Interest
Expense
Incurred | | Maximum Amount
Borrowed During
the Period |
| 0.95% | | $8,517 | | 11 | | $2 | | $18,062 |
There were no outstanding borrowings by the Series under this line of credit as of October 31, 2009.
H. Securities Lending:
As of October 31, 2009, the Series had securities on loan to brokers/dealers, for which the Series held cash collateral. The Series invests the cash collateral, as described below, and records a liability for the return of the collateral, during the period the securities are on loan. Loans of securities are expected at all times to be secured by collateral equal to at least (i) 100% of the current market value of the loaned securities with respect to securities of the U.S. government or its agencies, (ii) 102% of the current market value of the loaned securities with respect to U.S. securities, and (iii) 105% of the current market value of the loaned securities with respect to foreign securities. However, daily market fluctuations could cause the Series’ collateral to be lower or higher than the expected thresholds. If this were to occur, the collateral would be adjusted the next business day to ensure adequate collateralization. In the event of default or bankruptcy by the other party to the agreement, realization and/or retention of the collateral may be subject to legal proceedings. If the borrower fails to return loaned securities, and cash collateral being maintained by the borrower is insufficient to cover the value of loaned securities and provided such collateral insufficiency is not the result of investment losses, the lending agent has agreed to pay the amount of the shortfall to the Series or, at the option of the lending agent, to replace the securities.
Subject to the Series’ investment policy, the cash collateral received by the Series from securities on loan is invested in securities of the U.S. government or its agencies, repurchase agreements collateralized by securities of the U.S. government or its agencies or shares of the DFA Short-Term Investment Fund LP. Agencies include both agency debentures and agency mortgage backed securities. In addition, the Series will be able to terminate the loan at any time and will receive reasonable interest on the loan, as well as amounts equal to any dividends, interest or other distributions on the loaned securities. However, dividend income received from loaned securities may not be eligible to be taxed at qualified dividend income rates.
I. Indemnities; Contractual Obligations:
Under the Trust’s organizational documents, its officers and directors are indemnified against certain liabilities arising out of the performance of their duties to the Trust.
In the normal course of business, the Trust enters into contracts that contain a variety of representations and warranties which provide general indemnification. The Trust’s maximum exposure under these arrangements is unknown as this would involve future claims that may be made against the Trust and/or its affiliates that have not yet occurred. However, based on experience, the Trust expects the risk of loss to be remote.
34
J. In-Kind Redemptions:
In accordance with guidelines described in the Series’ prospectus, the Series may distribute portfolio securities rather than cash as payment for a redemption of fund shares (In-Kind redemption). For financial reporting purposes, the Series recognizes a gain on In-Kind redemptions to the extent the value of the distributed securities on the date of redemption exceeds the cost of those securities. Gains and losses realized on In-Kind redemptions are not recognized for tax purposes and are reclassified from undistributed realized gain (loss) to paid-in capital. During the period December 1, 2007 to October 31, 2008, the Series realized $103,024 (in thousands) of net gain.
K. Subsequent Event Evaluations:
Management has evaluated the impact of all subsequent events on the Series through December 23, 2009, the date the financial statements were available for issuance, and has determined that there are no subsequent events requiring recognition or disclosure in the financial statements.
35
REPORT OF INDEPENDENT REGISTERED PUBLIC ACCOUNTING FIRM
To the Shareholders of The DFA International Value Series and
Board of Trustees of The DFA Investment Trust Company:
In our opinion, the accompanying statements of assets and liabilities, including the summary schedules of portfolio holdings, and the related statements of operations and of changes in net assets and the financial highlights presents fairly, in all material respects, the financial position of The DFA International Value Series (one of the portfolios constituting The DFA Investment Trust Company, hereafter referred to as the “Series”) at October 31, 2009, the results of its operations for the year then ended, the changes in its net assets and the financial highlights for each of the periods indicated, in conformity with accounting principles generally accepted in the United States of America. These financial statements and financial highlights (hereafter referred to as “financial statements”) are the responsibility of the Series’ management; our responsibility is to express an opinion on these financial statements based on our audits. We conducted our audits of these financial statements in accordance with the standards of the Public Company Accounting Oversight Board (United States). Those standards require that we plan and perform the audit to obtain reasonable assurance about whether the financial statements are free of material misstatement. An audit includes examining, on a test basis, evidence supporting the amounts and disclosures in the financial statements, assessing the accounting principles used and significant estimates made by management, and evaluating the overall financial statement presentation. We believe that our audits, which included confirmation of securities at October 31, 2009 by correspondence with the custodian, brokers and the transfer agent of the investee fund, provide a reasonable basis for our opinion.
PricewaterhouseCoopers LLP
Philadelphia, Pennsylvania
December 23, 2009
36
RESULTS OF THE SHAREHOLDER MEETING
On June 2, 2009 and June 5, 2009, The DFA Investment Trust Company (“DFAITC”) held a Special Joint Meeting of Shareholders for the purpose of voting on several proposals affecting DFAITC and the Series, including, among other items, the election of Trustees, the amendment of certain fundamental investment limitations, and the elimination of certain fundamental investment limitations. The shareholders of the Series approved each of the applicable proposals for DFAITC and the Series presented at the Meeting. Listed below are the voting results from the Meeting. Please note that not all Proposals presented at the Meeting were voted on by the Series. Additionally, the Proposal numbers reflected below correlate to the Proposal numbers presented for vote at the Meeting.
DFAITC
| | | | | | | | | | | | | | | | | | | | |
| | | | | Shares Voted | | Percent of Outstanding Shares Voted |
| | | | | For | | % | | Against | | % | | Abstain/WithHold | | % | | For | | Against | | Abstain / WithHold |
Proposal 1: Election of Trustees for DFAITC* | | | | | | | | | | | | | | | | | | |
| | | | | | | | | | |
1a | | David G. Booth | | 2,166,359,402 | | 96.50% | | — | | 0.00% | | 78,661,259 | | 3.50% | | 95.78% | | 0.00% | | 3.48% |
1b | | George M. Constantinides | | 2,169,219,982 | | 96.62% | | — | | 0.00% | | 75,800,679 | | 3.38% | | 95.90% | | 0.00% | | 3.35% |
1c | | John P. Gould | | 2,168,577,186 | | 96.59% | | — | | 0.00% | | 76,443,476 | | 3.41% | | 95.88% | | 0.00% | | 3.38% |
1d | | Roger G. Ibbotson | | 2,169,778,365 | | 96.65% | | — | | 0.00% | | 75,242,297 | | 3.35% | | 95.93% | | 0.00% | | 3.33% |
1e | | Robert C. Merton | | 2,170,124,638 | | 96.66% | | — | | 0.00% | | 74,896,023 | | 3.34% | | 95.94% | | 0.00% | | 3.31% |
1f | | Myron S. Scholes | | 2,169,439,189 | | 96.63% | | — | | 0.00% | | 75,581,473 | | 3.37% | | 95.91% | | 0.00% | | 3.34% |
1g | | Eduardo A. Repetto | | 2,167,010,793 | | 96.53% | | — | | 0.00% | | 78,009,868 | | 3.47% | | 95.81% | | 0.00% | | 3.45% |
1h | | Abbie J. Smith | | 2,169,626,842 | | 96.64% | | — | | 0.00% | | 75,393,820 | | 3.36% | | 95.92% | | 0.00% | | 3.33% |
| | | | | | | | | | | | | | | | | | | | | | |
| | | Shares Voted | | Percent of Outstanding Shares Voted |
| | | For | | % | | Against | | % | | Abstain/WithHold | | % | | NonVote | | % | | For | | Against | | Abstain /WithHold |
Proposal 4: Approval of on Amended and Restated Agreement and Declaration of Trust for DFAITC* | | 2,076,877,329 | | 92.43% | | 36,623,148 | | 1.63% | | 133,356,326 | | 5.94% | | NA | | NA | | 91.82% | | 1.62% | | 5.90% |
| * | Results are for all Series within DFAITC |
The DFA International Value Series
| | | | | | | | | | | | | | | | | | | | |
| | | | | Shares Voted | | Percent of Outstanding Shares Voted |
| | | | | For | | % | | Against | | % | | Abstain/WithHold | | % | | For | | Against | | Abstain / WithHold |
Proposals: | | | | | | | | | | | | | | | | | | |
| | | | | |
5 | | To approve amendments to certain fundamental investment restrictions | | | | | | | | |
5a | | Borrowing Money | | 349,117,663 | | 88.20% | | 30,044,848 | | 7.59% | | 16,661,166 | | 4.21% | | 86.14% | | 7.41% | | 4.11% |
5b | | Making Loans | | 348,947,065 | | 88.16% | | 29,971,477 | | 7.57% | | 16,905,135 | | 4.27% | | 86.10% | | 7.40% | | 4.17% |
5c | | Investments in Real Estate | | 351,165,048 | | 88.72% | | 28,070,820 | | 7.09% | | 16,587,809 | | 4.19% | | 86.65% | | 6.93% | | 4.09% |
5d | | Investments in Commodities | | 347,839,401 | | 87.88% | | 31,372,412 | | 7.93% | | 16,611,864 | | 4.20% | | 85.82% | | 7.74% | | 4.10% |
5e | | Diversification of Investments | | 351,038,355 | | 88.69% | | 28,302,302 | | 7.15% | | 16,483,020 | | 4.16% | | 86.61% | | 6.98% | | 4.07% |
6 | | To approve the elimination of certain fundamental investment restrictions | | | | | | | | |
6a | | Pledging, Mortgaging, or Hypothecating Assets | | 346,783,275 | | 87.61% | | 32,195,687 | | 8.13% | | 16,844,715 | | 4.26% | | 85.56% | | 7.94% | | 4.16% |
6b | | Purchasing Securities on Margin | | 346,279,680 | | 87.48% | | 32,728,442 | | 8.27% | | 16,815,555 | | 4.25% | | 85.44% | | 8.08% | | 4.15% |
6c | | Investing in Restricted or Illiquid Securities | | 346,650,940 | | 87.58% | | 32,506,501 | | 8.21% | | 16,666,236 | | 4.21% | | 85.53% | | 8.02% | | 4.11% |
6d | | Investing for the Purpose of Exercising Control | | 349,242,494 | | 88.23% | | 29,958,913 | | 7.57% | | 16,621,270 | | 4.20% | | 86.17% | | 7.39% | | 4.10% |
6e | | Investing in Other Investment Companies | | 349,373,590 | | 88.26% | | 29,787,506 | | 7.53% | | 16,662,582 | | 4.21% | | 86.20% | | 7.35% | | 4.11% |
6f | | Management Ownership of Securities of an Issuer | | 349,991,995 | | 88.42% | | 28,988,874 | | 7.32% | | 16,842,809 | | 4.26% | | 86.36% | | 7.15% | | 4.16% |
6g | | Investing in Oil, Gas, or other Mineral Exploration, Leases or Development Programs | | 348,999,679 | | 88.17% | | 30,314,009 | | 7.66% | | 16,509,990 | | 4.17% | | 86.11% | | 7.48% | | 4.07% |
6h | | Investing in Securities of Unseasoned Issuers | | 349,376,398 | | 88.27% | | 29,792,320 | | 7.53% | | 16,653,959 | | 4.21% | | 86.20% | | 7.35% | | 4.11% |
6i | | Investing in Warrants | | 349,983,930 | | 88.42% | | 29,092,914 | | 7.35% | | 16,745,833 | | 4.23% | | 86.35% | | 7.18% | | 4.13% |
6j | | Writing or Acquiring Options | | 349,310,900 | | 88.25% | | 29,764,139 | | 7.52% | | 16,747,638 | | 4.23% | | 86.19% | | 7.34% | | 4.13% |
7a | | Proposed Sub-Advisory Agreement among Dimensional Fund Advisors LP, DFA Australia Limited, and the Company | | 355,560,358 | | 89.83% | | 17,051,279 | | 4.31% | | 23,212,041 | | 5.86% | | 87.73% | | 4.21% | | 5.73% |
37
| | | | | | | | | | | | | | | | | | | | | | | | | | |
| | | | | Shares Voted | | | Percent of Outstanding Shares Voted | |
| | | | | For | | % | | | Against | | % | | | Abstain/WithHold | | % | | | For | | | Against | | | Abstain /WithHold | |
Proposals: | | | | | | | | | | | | | | | | | | | | | | | | |
7b | | Proposed Sub-Advisory Agreement among Dimensional Fund Advisors LP, Dimensional Fund Advisors Ltd., and the Company | | 355,594,969 | | 89.84 | % | | 16,996,602 | | 4.29 | % | | 23,232,105 | | 5.87 | % | | 87.74 | % | | 4.19 | % | | 5.73 | % |
38
FUND MANAGEMENT
Trustees/Directors
Each Board of Trustees/Directors of The DFA Investment Trust Company Inc. (“DFAITC”), DFA Investment Dimensions Group Inc. (“DFAIDG”), Dimensional Investment Group Inc. (“DIG”) and Dimensional Emerging Markets Value Fund (“DEM”) (each, the “Fund” and collectively, the “Funds”) is responsible for establishing the Funds’ policies and for overseeing the management of the Funds. The Trustees/Directors of the Funds, including all of the disinterested Directors, have adopted written procedures to monitor potential conflicts of interest that might develop between portfolios of the Funds (the “Feeder Portfolios”) that invest in certain series of DFAITC or DEM (the “Master Funds”).
Each Board has two standing committees, an Audit Committee and a Portfolio Performance and Service Review Committee (the “Performance Committee”). The Audit Committee is comprised of George M. Constantinides, Roger G. Ibbotson and Abbie J. Smith. Each member of the Audit Committee is a disinterested Director. The Audit Committee oversees the Fund’s accounting and financial reporting policies and practices, the Fund’s internal controls, the Fund’s financial statements and the independent audits thereof and performs other oversight functions as requested by the Board. The Audit Committee recommends the appointment of each Fund’s independent registered certified public accounting firm and also acts as a liaison between the Fund’s independent registered certified public accounting firm and the full Board. There were two Audit Committee meetings held during the fiscal year ended October 31, 2009.
Each Board’s Performance Committee is comprised of Messrs. Constantinides and Ibbotson, Ms. Smith, John P. Gould, Myron S. Scholes and Robert C. Merton. Each member of the Fund’s Performance Committee is a disinterested Director. The Performance Committee regularly reviews and monitors the investment performance of the Fund’s series and reviews the performance of the Fund’s service providers. There were six Performance Committee meetings held during the fiscal year ended October 31, 2009.
Certain biographical information for each disinterested Trustee/Director and each interested Trustee/Director of the Funds is set forth in the tables below, including a description of each Trustee/Director’s experience as a Trustee/ Director of the Funds and as a director or trustee of other funds, as well as other recent professional experience.
The statements of additional information (together, “SAI”) of the Funds include additional information about each Trustee/Director. You may obtain copies of the SAI and prospectus of each Fund advised by Dimensional Fund Advisors LP by calling collect (512) 306-7400 or by mailing a request to Dimensional Fund Advisors LP, 6300 Bee Cave Road, Building One, Austin, Texas 78746. Prospectuses are also available at www.dimensional.com.
| | | | | | |
Name, Position with the Fund, Address and Age | | Term of Office1 and
Length of Service | | Portfolios within the
DFA Fund Complex2
Overseen | | Principal Occupation(s) During Past 5 Years and
Other Directorships of Public Companies Held |
Disinterested Trustees/Directors |
George M. Constantinides Director of DFAIDG, DIG and DEM. Trustee of DFAITC. The University of Chicago Booth School of Business 5807 S. Woodlawn Avenue Chicago, IL 60637 Age: 62 | | DFAITC - since 1993 DFAIDG - since 1983 DIG - since 1993 DEM - since 1993 | | 87 portfolios in 4 investment companies | | Leo Melamed Professor of Finance, The University of Chicago Booth School of Business. |
John P. Gould Director of DFAIDG, DIG and DEM. Trustee of DFAITC. The University of Chicago Booth School of Business 5807 S. Woodlawn Avenue Chicago, IL 60637 Age: 70 | | DFAITC - since 1993 DFAIDG - since 1986 DIG - since 1993 DEM - since 1993 | | 87 portfolios in 4 investment companies | | Steven G. Rothmeier Distinguished Service Professor of Economics, The University of Chicago Booth School of Business (since 1965). Member of the Boards of Milwaukee Mutual Insurance Company (since 1997). Member and Chair, Competitive Markets Advisory Committee, Chicago Mercantile Exchange (futures trading exchange) (since 2004). Formerly, Director of UNext, Inc. (1999-2006). Formerly, Senior Vice-President, Lexecon Inc. (economics, law, strategy and finance consulting) (1994-2004). Trustee, Harbor Fund (registered investment company) (27 Portfolios) (since 1994). |
39
| | | | | | |
Name, Position with the Fund, Address and Age | | Term of Office1 and
Length of Service | | Portfolios within the
DFA Fund Complex2
Overseen | | Principal Occupation(s) During Past 5 Years and
Other Directorships of Public Companies Held |
Roger G. Ibbotson Director of DFAIDG, DIG and DEM. Trustee of DFAITC. Yale School of Management 135 Prospect Street New Haven, CT 06520-8200 Age: 66 | | DFAITC - since 1993 DFAIDG - since 1981 DIG - since 1993 DEM - since 1993 | | 87 portfolios in 4 investment companies | | Professor in Practice of Finance, Yale School of Management (since 1984). Director, BIRR Portfolio Analysis, Inc. (software products) (since 1990). Chairman, CIO and Partner, Zebra Capital Management, LLC (hedge fund manager) (since 2001). Formerly, Chairman, Ibbotson Associates, Inc., Chicago, IL (software data publishing and consulting) (1977-2006). |
Robert C. Merton Director of DFAIDG, DIG and DEM. Trustee of DFAITC. Harvard Business School 353 Baker Library Soldiers Field Boston, MA 02163 Age: 65 | | DFAITC - since 2003 DFAIDG - since 2003 DIG - since 2003 DEM - since 2003 | | 87 portfolios in 4 investment companies | | John and Natty McArthur University Professor, Graduate School of Business Administration, Harvard University (since 1998). Director, MF Risk, Inc. (risk management software) (since 2001). Director, Peninsula Banking Group (bank) (since 2003). Director, Community First Financial Group (bank holding company) (since 2003). Member Competitive Markets Advisory Council, Chicago Mercantile Exchange (futures trading exchange) (since 2004). Chairman and Director, Daedalus Software (medical software) (since 2008). Formerly, Advisory Board Member, Alpha Simplex Group (hedge fund) (2001-2007). Formerly, Chief Science Officer and Director, Trinsum Group, a successor to Integrated Finance Limited (2002-2008). Director, Vical Incorporated (biopharmaceutical product development) (since 2002). |
Myron S. Scholes Director of DFAIDG, DIG and DEM. Trustee of DFAITC. Platinum Grove Asset Management, L.P. Reckson Executive Park 1100 King Street Building 4 Rye Brook, NY 10573 Age: 68 | | DFAITC - since 1993 DFAIDG - since 1981 DIG - since 1993 DEM - since 1993 | | 87 portfolios in 4 investment companies | | Frank E. Buck Professor Emeritus of Finance, Stanford University (since 1981). Chairman, Platinum Grove Asset Management, L.P. (hedge fund) (formerly, Oak Hill Platinum Partners) (since 1999). Formerly, Managing Partner, Oak Hill Capital Management (private equity firm) (until 2004). Formerly, Director, Chicago Mercantile Exchange (2001-2008). Director, American Century Fund Complex (registered investment companies) (37 Portfolios) (since 1981). |
Abbie J. Smith Director of DFAIDG, DIG and DEM. Trustee of DFAITC. The University of Chicago Booth School of Business 5807 S. Woodlawn Avenue Chicago, IL 60637 Age: 56 | | DFAITC - since 2000 DFAIDG - since 2000 DIG - since 2000 DEM - since 2000 | | 87 portfolios in 4 investment companies | | Boris and Irene Stern Professor of Accounting, The University of Chicago Booth School of Business (since 1980), and Co-Director Investment Research, Fundamental Investment Advisors (hedge fund) (since 2008). Director, HNI Corporation (formerly known as HON Industries Inc.) (office furniture) (since 2000). Director, Ryder System Inc. (transportation, logistics and supply-chain management) (since 2003). Director/ Trustee, UBS Funds (fund complex) (5 portfolios) (since 2008). |
40
| | | | | | |
Name, Position with the Fund, Address and Age | | Term of Office1 and
Length of Service | | Portfolios within the
DFA Fund Complex2
Overseen | | Principal Occupation(s) During Past 5 Years and
Other Directorships of Public Companies Held |
Interested Trustees/Directors* |
David G. Booth Chairman, Director, Chief Executive Officer and President of DFAIDG, DIG and DEM. Chairman, Trustee, Chief Executive Officer, Chief Investment Officer and President of DFAITC. 6300 Bee Cave Road, Building One Austin, Texas 78746 Age: 62 | | DFAITC - since 1993 DFAIDG - since 1981 DIG - since 1992 DEM - since 1993 | | 87 portfolios in 4 investment companies | | Chairman, Director/Trustee, President, Chief Executive Officer and formerly Chief Investment Officer of the following companies: Dimensional Holdings Inc., Dimensional Fund Advisors LP, Dimensional Fund Advisors Canada ULC, DFAIDG, DIG, DEM and DFAITC. President and Chief Executive Officer of DFA Securities LLC. Director of Dimensional Fund Advisors Ltd, and formerly Chief Investment Officer. Director and formerly, President and Chief Investment Officer of DFA Australia Ltd. Formerly, Director of Dimensional Funds PLC and Dimensional Fund II PLC. Chairman, Director and Chief Executive Officer of Dimensional Fund Advisors Canada ULC (All Chief Investment Officer positions held starting 1/03 through 3/07 except Dimensional Holdings Inc., which was from 10/06 through 3/07.) Limited Partner, Oak Hill Partners (since 2001) and VSC Investors, LLC (since 2007). Trustee, The University of Chicago Booth School of Business. Formerly, Director, SA Funds (registered investment company). Formerly Director, Assante Corporation (investment management) (until 2002). |
Eduardo A. Repetto Director, Chief Investment Officer and Vice President of DFAIDG, DIG and DEM. Trustee, Chief Investment Officer and Vice President of DFAITC 6300 Bee Cave Road, Building One Austin, TX 78746 Age: 42 | | DFAITC - since 2009 DFAIDG - since 2009 DIG - since 2009 DEM - since 2009 | | 87 portfolios in 4 investment companies | | Director/Trustee (beginning June 2009), Chief Investment Officer (beginning March 2007) and Vice President of DFAIDG, DIG, DEM and DFAITC. Chief Investment Officer (beginning March 2007) and Vice President of all the DFA Entities, DFA Australia Limited and Dimensional Fund Advisors Canada ULC. |
| 1 | Each Trustee/Director holds office for an indefinite term until his or her successor is elected and qualified. |
| 2 | Each Trustee/Director is a director or trustee of each of the four registered investment companies within the DFA Fund Complex, which includes the Funds. |
| * | Interested Trustees/Directors are described as such because they are deemed to be “interested persons,” as that term is defined under the Investment Company Act of 1940, as amended, due to their positions with Dimensional Fund Advisors LP. |
41
Officers
The name, age, information regarding positions with the Funds and the principal occupation for each officer of the Funds are set forth below. Each officer listed below holds the same office (except as otherwise noted) in the following entities: Dimensional Fund Advisors LP (prior to November 3, 2006, Dimensional Fund Advisors Inc.) (“Dimensional”), DFA Securities Inc., DFAIDG, DIG, DFAITC and DEM (collectively, the “DFA Entities”). The address of each officer is: Dimensional Fund Advisors LP, 6300 Bee Cave Road, Building One, Austin, Texas 78746, unless otherwise indicated.
| | | | |
Name, Position with the Fund
and Age | | Term of Office1
and Length of
Service | | Principal Occupation(s) During Past 5 Years |
| Officers |
April A. Aandal Vice President and Chief Learning Officer Age: 46 | | Since 2008 | | Vice President of all the DFA Entities. Chief Learning Officer of Dimensional (since September 2008). Formerly, Regional Director of Dimensional (2004-2008); Vice President of Professional Development at Assante Asset Management (June 2002-January 2005). |
Darryl D. Avery Vice President Age: 43 | | Since 2005 | | Vice President of all the DFA Entities. From June 2002 to January 2005, institutional client service representative of Dimensional. |
Arthur H. Barlow Vice President Age: 53 | | Since 1993 | | Vice President of all the DFA Entities. Formerly, Vice President of DFA Australia Limited and Dimensional Fund Advisors Ltd. |
Scott A. Bosworth Vice President Age: 40 | | Since 2007 | | Vice President of all the DFA Entities. Regional Director of Dimensional (since November 1997). |
Valerie A. Brown Vice President and Assistant Secretary Age: 42 | | Since 2001 | | Vice President and Assistant Secretary of all the DFA Entities, DFA Australia Limited, Dimensional Fund Advisors Ltd., and since June 2003, Dimensional Fund Advisors Canada ULC. |
David P. Butler Vice President Age: 45 | | Since 2007 | | Vice President of all the DFA Entities. Director of Global Financial Services of Dimensional (since 2008). Formerly, Regional Director of Dimensional Fund Advisors LP (January 1995 to January 2005). |
Patrick Carter Vice President Age: 47 | | Since 2007 | | Vice President of all the DFA Entities. Regional Director of Dimensional (since March 2006). Formerly, Director of Merrill Lynch Retirement Group (December 1998 to March 2006). |
Joseph H. Chi Vice President Age: 43 | | Since 2009 | | Vice President of all the DFA Entities. Portfolio Manager for Dimensional Fund Advisors LP (since October 2005). Prior to October 2005, Corporate Counsel at Hewitt Associates (July 2002-August 2005). |
Stephen A. Clark Vice President Age: 37 | | Since 2004 | | Vice President of all the DFA Entities. Formerly, Portfolio Manager of Dimensional (April 2001-April 2004). |
Robert P. Cornell Vice President Age: 60 | | Since 2007 | | Vice President of all the DFA Entities. Regional Director of Financial Services Group of Dimensional (since August 1993). |
Christopher S. Crossan Vice President and Chief Compliance Officer Age: 43 | | Since 2004 | | Vice President and Chief Compliance Officer of all the DFA Entities. |
James L. Davis Vice President Age: 52 | | Since 1999 | | Vice President of all the DFA Entities. Formerly, Vice President of DFA Australia Limited and Dimensional Fund Advisors Ltd. |
Robert T. Deere Vice President Age: 52 | | Since 1994 | | Vice President of all the DFA Entities and DFA Australia Limited. |
Robert W. Dintzner Vice President Age: 39 | | Since 2001 | | Vice President of all the DFA Entities. |
42
| | | | |
Name, Position with the Fund
and Age | | Term of Office1
and Length of
Service | | Principal Occupation(s) During Past 5 Years |
Kenneth Elmgren Vice President Age: 55 | | Since 2007 | | Vice President of all the DFA Entities. Formerly, Managing Principal of Beverly Capital (May 2004 to September 2006). |
Richard A. Eustice Vice President and Assistant Secretary Age: 44 | | Since 1998 | | Vice President and Assistant Secretary of all the DFA Entities and DFA Australia Limited. Chief Operating Officer of Dimensional Fund Advisors Ltd. (since July 2008). Formerly, Vice President of Dimensional Fund Advisors Ltd. |
Eugene F. Fama, Jr. Vice President Age: 48 | | Since 1993 | | Vice President of all the DFA Entities. Formerly, Vice President of DFA Australia Limited and Dimensional Fund Advisors Ltd. |
Gretchen A. Flicker Vice President Age: 38 | | Since 2004 | | Vice President of all the DFA Entities. Prior to April 2004, institutional client service representative of Dimensional. |
Jed S. Fogdall Vice President Age: 35 | | Since 2008 | | Vice President of all the DFA Entities. Portfolio Manager for Dimensional (since September 2004). Prior to September 2004, Staff Engineer at the Boeing Company (1997-2004). |
Glenn S. Freed Vice President Age: 47 | | Since 2001 | | Vice President of all the DFA Entities. |
Jeremy P. Freeman Vice President Age: 38 | | Since 2009 | | Vice President of all the DFA Entities. Senior Technology Manager for Dimensional Fund Advisors LP (since June 2006). Formerly, Principal at AIM Investments/Amvescap PLC (now Invesco) (June 1998-June 2006). |
Mark R. Gochnour Vice President Age: 42 | | Since 2007 | | Vice President of all the DFA Entities. Regional Director of Dimensional. |
Henry F. Gray Vice President Age: 42 | | Since 2000 | | Vice President of all the DFA Entities. Prior to July 2000, Portfolio Manager of Dimensional. Formerly, Vice President of DFA Australia Limited. |
John T. Gray Vice President Age: 35 | | Since 2007 | | Vice President of all the DFA Entities. Formerly, Regional Director of Dimensional (January 2005 to February 2007). |
Darla Hastings Vice President Age: 54 | | Since 2007 | | Vice President of all the DFA Entities. Chief Marketing Officer of Dimensional. Formerly, Senior Vice President, Customer Experience for Benchmark Assisted Living (May 2005 to April 2006); Executive Vice President and Chief Marketing Officer of State Street Corporation (September 2001 to October 2005). |
Joel H. Hefner Vice President Age: 41 | | Since 2007 | | Vice President of all the DFA Entities. Regional Director of Dimensional (since June 1998). |
Julie Henderson Vice President and Fund Controller Age: 35 | | Since 2005 | | Vice President and Fund Controller of all the DFA Entities. Formerly, Senior Manager at PricewaterhouseCoopers LLP (July 1996 to April 2005). |
Kevin Hight Vice President Age: 41 | | Since 2005 | | Vice President of all the DFA Entities. Formerly, Regional Director of Dimensional (since March 2003 to March 2005). |
Christine W. Ho Vice President Age: 41 | | Since 2004 | | Vice President of all the DFA Entities. Prior to April 2004, Assistant Controller of Dimensional. |
Jeff J. Jeon Vice President Age: 35 | | Since 2004 | | Vice President of all the DFA Entities. Counsel of Dimensional (since September 2001). |
Patrick M. Keating Vice President Age: 54 | | Since 2003 | | Vice President of all the DFA Entities and Chief Operating Officer of Dimensional. Director, Vice President and Chief Privacy Officer of Dimensional Fund Advisors Canada ULC. Director of DFA Australia Limited. |
43
| | | | |
Name, Position with the Fund
and Age | | Term of Office1
and Length of
Service | | Principal Occupation(s) During Past 5 Years |
Joseph F. Kolerich Vice President Age: 37 | | Since 2004 | | Vice President of all the DFA Entities. Portfolio Manager for Dimensional (since April 2001). |
Michael F. Lane Vice President Age: 42 | | Since 2004 | | Vice President of all the DFA Entities. Formerly, Vice President of Advisor Services at TIAA-CREF (July 2001 to September 2004). |
Kristina M. LaRusso Vice President Age: 34 | | Since 2006 | | Vice President of all DFA Entities. Formerly, Operations Supervisor of Dimensional (March 2003 to December 2006). |
Inmoo Lee Vice President Age: 43 | | Since 2007 | | Vice President of all the DFA Entities. Associate Professor Department of Finance and Accounting, Business School, National University of Singapore (July 2004 to present); Associate Professor, College of Business Administration, Korea University (September 2001 to May 2006). |
Juliet Lee Vice President Age: 38 | | Since 2005 | | Vice President of all the DFA Entities. Human Resources Manager of Dimensional (since January 2004). |
Aaron M. Marcus Vice President & Head of Global Human Resources Age: 39 | | Since 2008 | | Vice President and Head of Global Human Resources of Dimensional. Formerly, Global Head of Recruiting and Vice President of Goldman Sachs & Co. (June 2006 to January 2008); Global Co-Head of HR of the Equities & FICC Division, and Vice President of Goldman Sachs & Co. (May 2005 to May 2006); Head of Americas Campus Recruiting and Vice President of Goldman Sachs & Co. (April 2003 to May 2005). |
David R. Martin Vice President, Chief Financial Officer and Treasurer Age: 52 | | Since 2007 | | Vice President, Chief Financial Officer and Treasurer of all the DFA Entities. Director, Vice President, Chief Financial Officer and Treasurer of Dimensional Fund Advisors Ltd. and DFA Australia Limited. Chief Financial Officer, Treasurer, and Vice President of Dimensional Fund Advisors Canada ULC. Director of Dimensional Funds PLC and Dimensional Funds II PLC. Formerly, Executive Vice President and Chief Financial Officer of Janus Capital Group Inc. (June 2005 to March 2007); Senior Vice President of Finance at Charles Schwab & Co., Inc. (March 1999 to May 2005). |
Catherine L. Newell Vice President and Secretary Age: 45 | | Vice President since 1997 and Secretary since 2000 | | Vice President and Secretary of all the DFA Entities. Director, Vice President and Secretary of DFA Australia Limited and Dimensional Fund Advisors Ltd. (since February 2002, April 1997 and May 2002, respectively). Vice President and Secretary of Dimensional Fund Advisors Canada ULC (since June 2003). Director, Dimensional Funds PLC and Dimensional Funds II PLC (since 2002 and 2006, respectively). Formerly, Assistant Secretary of all DFA Entities, DFA Australia Limited and Dimensional Fund Advisors Ltd. |
Christian Newton Vice President Age: 34 | | Since 2009 | | Vice President of all DFA Entities. Web Services Manager for Dimensional Fund Advisors LP (Since January 2008). Formerly Design Manager (2005-2008) and Web Developer (2002-2005) of Dimensional Fund Advisors LP. |
Gerard K. O’Reilly Vice President Age: 32 | | Since 2007 | | Vice President of all the DFA Entities. Formerly, Research Associate of Dimensional Fund Advisors LP (2004 to 2006); Research Assistant in PhD program, Aeronautics Department California Institute of Technology (1998 to 2004). |
Daniel C. Ong Vice President Age: 35 | | Since 2009 | | Vice President of all the DFA Entities. Portfolio Manager for Dimensional Fund Advisors LP (since July 2005). Prior to 2005, Graduate Student at the University of Chicago Booth School of Business (2003-2005). |
Carmen Palafox Vice President Age: 35 | | Since 2006 | | Vice President of all the DFA Entities. Operations Manager of Dimensional Fund Advisors LP (since May 1996). |
Sonya Park Vice President Age: 37 | | Since 2005 | | Vice President of all the DFA Entities. From February 2002 to January 2005, institutional client service representative of Dimensional. |
44
| | | | |
Name, Position with the Fund
and Age | | Term of Office1
and Length of
Service | | Principal Occupation(s) During Past 5 Years |
David A. Plecha Vice President Age: 48 | | Since 1993 | | Vice President of all the DFA Entities, DFA Australia Limited and Dimensional Fund Advisors Ltd |
Ted Randall Vice President Age: 36 | | Since 2008 | | Vice President of all the DFA Entities. Formerly, Research Associate of Dimensional (2006-2008). Systems Developer of Dimensional (2001-2006). |
L. Jacobo Rodriguez Vice President Age: 38 | | Since 2005 | | Vice President of all the DFA Entities. From August 2004 to July 2005, institutional client service representative of Dimensional. Formerly, Financial Services Analyst, Cato Institute (September 2001 to June 2004); Book Review Editor, Cato Journal, Cato Institute (May 1996 to June 2004). |
David E. Schneider Vice President Age: 63 | | Since 2001 | | Vice President of all the DFA Entities. Currently, Director of Institutional Services. |
Bruce A. Simmons Vice President Age: 44 | | Since 2009 | | Vice President of all the DFA Entities. Investment Operations Manager for Dimensional Fund Advisors LP (since May 2007). Formerly, Vice President Client and Fund Reporting at Mellon Financial (September 2005-May 2007); Vice President Business Development at CUADPRO Marketing (July 2003-September 2005). |
Ted R. Simpson Vice President Age: 41 | | Since 2007 | | Vice President of all the DFA Entities. Regional Director of Dimensional (since December 2002). |
Bryce D. Skaff Vice President Age: 34 | | Since 2007 | | Vice President of all the DFA Entities. Formerly, Regional Director of Dimensional (December 1999 to January 2007). |
Grady M. Smith Vice President Age: 53 | | Since 2004 | | Vice President of all the DFA Entities. Prior to April 2004, Portfolio Manager of Dimensional. |
Carl G. Snyder Vice President Age: 46 | | Since 2000 | | Vice President of all the DFA Entities. Formerly, Vice President of DFA Australia Limited. |
Lawrence R. Spieth Vice President Age: 61 | | Since 2004 | | Vice President of all the DFA Entities. Prior to April 2004, Regional Director of Dimensional. |
Bradley G. Steiman Vice President Age: 36 | | Since 2004 | | Vice President of all the DFA Entities and Director and Vice President of Dimensional Fund Advisors Canada ULC. |
Robert C. Trotter Vice President Age: 51 | | Since 2009 | | Vice President of all the DFA Entities. Senior Manager Technology for Dimensional Fund Advisors LP (since March 2007). Formerly, Director of Technology at AMVESCAP (2002-2007). |
Karen E. Umland Vice President Age: 43 | | Since 1997 | | Vice President of all the DFA Entities, DFA Australia Limited, Dimensional Fund Advisors Ltd., and Dimensional Fund Advisors Canada ULC. |
Sunil Wahal Vice President Age: 42 | | Since 2009 | | Vice President of all the DFA Entities. Formerly, Research Associate for Dimensional Fund Advisors LP (July 2008-January 2009); Consultant to Dimensional Fund Advisors LP (September 2005-July 2008); Jack D. Furst Professor of Finance at Arizona State University, WP Carey School of Business (July 2005-July 2008); Associate Professor of Finance at Goizueta Business School, Emory University (1997-2005). |
Brian J. Walsh Vice President Age: 39 | | Since 2009 | | Vice President of all the DFA Entities. Portfolio Manager for Dimensional Fund Advisors LP (since 2004). Formerly, Trader for Dimensional Fund Advisors LP (1997-2004). |
Carol W. Wardlaw Vice President Age: 51 | | Since 2004 | | Vice President of all the DFA Entities. Prior to April 2004, Regional Director of Dimensional. |
45
| | | | |
Name, Position with the Fund
and Age | | Term of Office1
and Length of
Service | | Principal Occupation(s) During Past 5 Years |
Weston J. Wellington Vice President Age: 58 | | Since 1997 | | Vice President of all the DFA Entities. Formerly, Vice President of DFA Australia Limited. |
Daniel M. Wheeler Vice President Age: 64 | | Since 2001 | | Vice President of all the DFA Entities. Prior to 2001 and currently, Director of Financial Advisors Services of Dimensional. Director of Dimensional Fund Advisors Ltd. (since October 2003) and President of Dimensional Fund Advisors Canada ULC (since June 2003). |
Ryan Wiley Vice President Age: 33 | | Since 2007 | | Vice President of all the DFA Entities. Senior Trader of Dimensional. Formerly, Portfolio Manager (2006 to 2007); Trader (2001 to 2006). |
Paul E. Wise Vice President Age: 54 | | Since 2005 | | Vice President of all the DFA Entities. Chief Technology Officer for Dimensional (since 2004). Formerly, Principal of Turnbuckle Management Group (January 2002 to August 2004). |
| 1 | Each officer holds office for an indefinite term at the pleasure of the Boards of Trustees/Directors and until his or her successor is elected and qualified. |
46
VOTING PROXIES ON FUND PORTFOLIO SECURITIES
A description of the policies and procedures that the Trust uses in voting proxies relating to securities held in the portfolio is available without charge, upon request, by calling collect: (512) 306-7400. Information regarding how the Advisor votes these proxies is available from the EDGAR database on the SEC’s website at http://www.sec.gov and from the Advisor’s website at http://www.dimensional.com and reflects the twelve-month period beginning July 1st and ending June 30th.
47
NOTICE TO SHAREHOLDERS
(Unaudited)
For shareholders that do not have an October 31, 2009 tax year end, this notice is for informational purposes only. For shareholders with an October 31, 2009 tax year end, please consult your tax advisor as to the pertinence of this notice. For the fiscal year November 1, 2008 to October 31, 2009, the Portfolio is designating the following items with regard to distributions paid during the period. All designations are based on financial information available as of the date of this annual report and, accordingly are subject to changed. For each item, it is the intention of the Portfolio to designate the maximum amount permitted under the Internal Revenue Code and the regulations thereunder.
| | | | | | | | | | | | | | | | | | | | |
Dimensional
Investment Group Inc. | | Net
Investment
Income
Distributions | | Short-Term
Capital Gain
Distributions | | Long-Term
Capital Gain
Distributions | | Total
Distributions | | Qualifying
For Corporate
Dividends
Received
Deductions(1) | | Qualifying
Dividend
Income(2) | | Foreign
Tax
Credit(3) | | Foreign
Source
Income(4) | | Qualifying
Interest
Income(5) | | Qualifying
Short-Term
Capital Gain(6) |
DFA International Value Portfolio III | | 100% | | — | | — | | 100% | | 100% | | 100% | | 2% | | 112% | | 100% | | 100% |
| (1) | Qualifying dividends represent dividends which qualify for the corporate dividends received deduction and is reflected as a percentage of ordinary income distributions (the total of short-term capital gain and net investment income and distributions). |
| (2) | The percentage in this column represents the amount of “Qualifying Dividend Income” as created by the Jobs and Growth Tax Relief Reconciliation Act of 2003 and is reflected as a percentage of ordinary income distributions (the total of short-term capital gain and net investment income distributions). Please note that these percentages are designated only, refer to your 1099 for actual qualified dividend income. |
| (3) | “Foreign Tax Credit” represents dividends which qualify for the foreign tax credit pass through and is reflected as a percentage of investment company taxable income (the total of short-term capital gain and net investment income distributions). |
| (4) | “Foreign Source Income” represents the portion of dividends derived from foreign sources, and is reflected as a percentage of ordinary income (i.e., the sum of short-term capital gain and net investment income) distributions made during the period. |
| (5) | The percentage in this column represents the amount of “Qualifying Interest Income” as created by The American Jobs Creation Act of 2004. The information is reflected as a percentage of ordinary income distributions (the total of short-term capital gain and net investment income distributions). |
| (6) | The percentage in this column represents the amount of “Qualifying Short-Term Capital Gain” as created by The American Jobs Creation Act of 2004. The information is reflected as a percentage of ordinary income distributions (the total of short-term capital gain and net investment income distributions). |
48


Dimensional Fund Advisors
6300 Bee Cave Road, Building One
Austin, TX 78746
December 2009
Dear Fellow Shareholder,
After sinking to ten-year lows, stock prices around the world rebounded sharply in March 2009 and posted steady gains in the seven months between March and September. March and April were among the best-return months in the life of Dimensional’s equity Funds.
The unexpected turns in the financial markets this year offered some valuable lessons. We were reminded that stock prices are unpredictable. We saw once again the benefits of staying disciplined in the market as it inevitably moves up and down. And I believe these markets showed very clearly why diversification is so important to long-term investment success.
Although diversification can’t prevent losses, it can help investors avoid the extreme outcomes that can result from concentrating investments in individual stocks or market segments. We believe that successful investing is about both increasing wealth and being able to sleep well at night. Investors who understand how markets work and have a realistic understanding of their own tolerance for risk are most likely to have a good overall experience.
More than $10 billion in net long-term assets flowed into Dimensional’s Funds during the first 10 months of 2009, a reflection of the trust our shareholders around the world have placed in us. We are grateful for that trust and want you to know that we take our responsibility as the steward of your investments in Dimensional’s Funds very seriously. We hope to have the opportunity to continue serving your needs for many years to come.
|
| Sincerely, |
|
 |
| David G. Booth |
| Chairman and Chief Executive Officer |
[THIS PAGE INTENTIONALLY LEFT BLANK]
ANNUAL REPORT
Table of Contents
This report is submitted for the information of the Fund’s shareholders. It is not authorized for distribution to prospective investors unless preceded or accompanied by an effective prospectus.
i
[THIS PAGE INTENTIONALLY LEFT BLANK]
DIMENSIONAL INVESTMENT GROUP INC.
THE DFA INVESTMENT TRUST COMPANY
DEFINITIONS OF ABBREVIATIONS AND FOOTNOTES
Statement of Assets and Liabilities/Summary Schedule of Portfolio Holdings
Investment Abbreviations
| | |
| ADR | | American Depositary Receipt |
| FNMA | | Federal National Mortgage Association |
| P.L.C. | | Public Limited Company |
Investment Footnotes
| | † | See Note B to Financial Statements. |
| | †† | Securities have generally been fair valued. See Note B to Financial Statements. |
| | ** | Calculated as a percentage of total net assets. Percentages shown parenthetically next to the category headings have been calculated as a percentage of total investments. “Other Securities” are those securities that are not among the top 50 holdings of the Fund or do not represent more than 1.0% of the net assets of the Fund. Some of the individual securities within this category may include Total or Partial Securities on Loan and/or Non-Income Producing Securities. |
| | * | Non-Income Producing Securities. |
| | # | Total or Partial Securities on Loan. |
| | @ | Security purchased with cash proceeds from Securities on Loan. |
Financial Highlights
| | (A) | Computed using average shares outstanding. |
| | (D) | Represents the combined ratios for the respective portfolio and its respective pro-rata share of its Master Fund Series. |
All Statements and Schedules
| | |
| — | | Amounts designated as — are either zero or rounded to zero. |
| RIC | | Registered Investment Company |
| SEC | | Securities and Exchange Commission |
1
DIMENSIONAL INVESTMENT GROUP INC.
PERFORMANCE CHART
DFA International Value Portfolio IV vs.
MSCI World ex USA Index (net dividends)
October 31, 1999-October 31, 2009
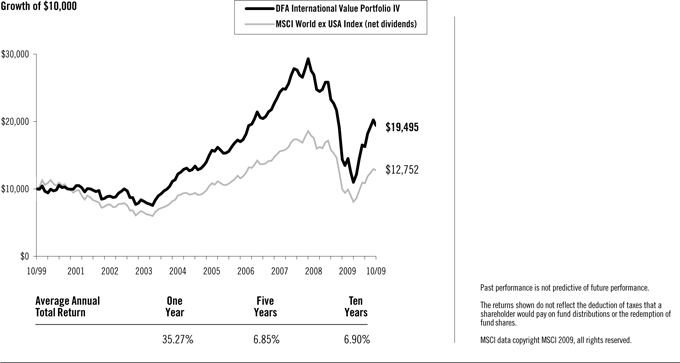
2
DIMENSIONAL INVESTMENT GROUP INC.
MANAGEMENT’S DISCUSSION AND ANALYSIS
| | |
| International Equity Market Review | | 12 Months Ended October 31, 2009 |
The one-year period ending October 31, 2009, was characterized by unprecedented volatility in non-US developed markets. Non-US developed markets lost 18.87% from November 2008 through February 2009, as measured by the MSCI World ex USA Index (net dividends). From March through October 2009 these same markets gained 57.56%. In April 2009, the Index had its largest-ever monthly gain (12.90%) since October 1990.
From November 2008 through February 2009, developed markets returns were negative across all asset classes. The US dollar rallied against most currencies, reversing a general trend of depreciation dating back to 2006. From March through October 2009 the market reversed course, with small cap and value stocks strongly outperforming large cap and growth stocks. The US dollar depreciated against most major currencies. The rally drove strong positive returns for the 12-month period, with small cap stocks significantly outperforming large cap stocks and value stocks outperforming growth stocks, as measured by the MSCI indexes.
12 Months Ended October 31, 2009
| | | | |
Ten Largest Foreign Developed Markets by Market Cap (BB) | | Local
Currency
Return | | U.S. Dollar
Return |
Japan ($2,432) | | 6.03% | | 15.20% |
United Kingdom ($2,328) | | 23.19% | | 25.68% |
France ($1,106) | | 10.09% | | 28.10% |
Canada ($1,060) | | 17.46% | | 32.58% |
Australia ($912) | | 21.91% | | 66.97% |
Germany ($843) | | 6.37% | | 23.77% |
Switzerland ($821) | | 5.78% | | 20.63% |
Spain ($488) | | 33.27% | | 55.06% |
Italy ($388) | | 7.57% | | 25.17% |
Netherlands ($277) | | 20.17% | | 39.83% |
Country market capitalizations (in parentheses) are in USD billions. Source: Returns are of MSCI indices net of foreign withholding taxes on dividends. Country market capitalizations are based on country carve-outs of the MSCI All-Country World Investable Market Index. MSCI data copyright MSCI 2009, all rights reserved.
Small company stocks were the best-performing asset class in international markets, while growth stocks had the worst relative results.
12 Months Ended October 31, 2009
| | |
| | | U.S. Dollar
Return |
MSCI World ex USA Small Cap Index | | 50.01% |
MSCI World ex USA Value Index | | 31.71% |
MSCI World ex USA Index | | 27.83% |
MSCI World ex USA Growth Index | | 24.03% |
Source: MSCI indices are net of foreign withholding taxes on dividends, copyright MSCI 2009, all rights reserved.
3
Master-Feeder Structure
The Portfolio described below, called a “Feeder Fund”, does not buy individual securities directly; instead, the Portfolio invests in a corresponding fund called a “Master Fund”. The Master Fund, in turn, purchases stocks and/or other securities.
International Equity Portfolio Performance Overview
DFA International Value Portfolio IV
The DFA International Value Portfolio IV seeks to capture the returns of international large company value stocks by purchasing shares of a Master Fund that invests in such stocks. The investment strategy employs a disciplined, quantitative approach, emphasizing broad diversification and consistent exposure to large cap value stocks, but does not attempt to track closely a specific equity index. As of October 31, 2009, the Master Fund held 465 stocks in 22 developed countries and was mostly invested in equities throughout the year: the average non-equitized cash level for the period was less than 1% of the Master Fund’s assets.
As a result of the Master Fund’s diversified investment approach, performance was determined principally by broad structural trends in global equity markets rather than the behavior of a limited number of stocks. For the 12 months ended October 31, 2009, value stocks outperformed growth stocks in international developed markets. Total returns were 35.27% for the Portfolio and 27.83% for the MSCI World ex USA Index (net dividends). The Master Fund’s greater allocation than the Index to value stocks (66% on average vs. 26% in the Index) added approximately 6.7% to the relative performance.
4
DIMENSIONAL INVESTMENT GROUP INC.
DFA INTERNATIONAL VALUE PORTFOLIO IV
DISCLOSURE OF FUND EXPENSES
(Unaudited)
The following Expense Table is shown so that you can understand the impact of fees on your investment. All mutual funds have operating expenses. As a shareholder of the fund, you incur ongoing costs, which include costs for portfolio management, administrative services, and shareholder reports, among others. Operating expenses, legal and audit services, which are deducted from a fund’s gross income, directly reduce the investment return of the fund. A fund’s expenses are expressed as a percentage of its average net assets. This figure is known as the expense ratio. The following examples are intended to help you understand the ongoing costs, in dollars, of investing in the fund and to compare these costs with those of other mutual funds. The examples are based on an investment of $1,000 made at the beginning of the period shown and held for the entire period.
The Expense Table below illustrates your fund’s costs in two ways.
Actual Fund Return
This section helps you to estimate the actual expenses after fee waivers that you paid over the period. The “Ending Account Value” shown is derived from the fund’s actual return and “Expenses Paid During Period” reflect the dollar amount that would have been paid by an investor who started with $1,000 in the fund. You may use the information here, together with the amount you invested, to estimate the expenses that you paid over the period.
To do so, simply divide your account value by $1,000 (for example, a $7,500 account value divided by $1,000 = 7.5), then multiply the result by the number given for your fund under the heading “Expenses Paid During Period.”
Hypothetical Example for Comparison Purposes
This section is intended to help you compare your fund’s costs with those of other mutual funds. The hypothetical “Ending Account Value” and “Expenses Paid During Period” are derived from the fund’s actual expense ratio and an assumed 5% annual return before expenses. In this case, because the return used is not the fund’s actual return, the results do not apply to your investment. The example is useful in making comparisons because the SEC requires all mutual funds to calculate expenses based on a 5% annual return. You can assess your fund’s costs by comparing this hypothetical example with the hypothetical examples that appear in shareholder reports of other funds.
Please note that the expenses shown in the table are meant to highlight and help you compare ongoing costs only and do not reflect any transactional costs, if applicable. The “Annualized Expense Ratio” represents the actual expenses for the six-month period indicated.
Six Months Ended October 31, 2009
EXPENSE TABLE
| | | | | | | | |
| | | Beginning
Account
Value
05/01/09 | | Ending
Account
Value
10/31/09 | | Annualized
Expense
Ratio* | | Expenses
Paid
During
Period* |
Actual Fund Return | | $1,000.00 | | $1,349.50 | | 0.29% | | $1.72 |
Hypothetical 5% Annual Return | | $1,000.00 | | $1,023.74 | | 0.29% | | $1.48 |
| * | Expenses are equal to the fund’s annualized expense ratio for the six-month period, multiplied by the average account value over the period, multiplied by the number of days in the most recent six-month period (184), then divided by the number of days in the year (365) to reflect the six-month period. The Portfolio is a Feeder Fund. The expenses shown reflect the direct expenses of the Feeder Fund and the indirect payment of the Feeder Fund’s portion of the expenses of its Master Fund. |
5
DIMENSIONAL INVESTMENT GROUP INC.
DFA INTERNATIONAL VALUE PORTFOLIO IV
DISCLOSURE OF PORTFOLIO HOLDINGS
(Unaudited)
The SEC requires that all Funds file a complete Schedule of Investments with the SEC for their first and third fiscal quarters on Form N-Q. For Dimensional Investment Group Inc., this would be for the fiscal quarters ending January 31 and July 31. The Form N-Q filing must be made within 60 days of the end of the quarter. Dimensional Investment Group Inc. filed its most recent Form N-Q with the SEC on September 29, 2009. It is available upon request, without charge, by calling collect: (512) 306-7400 or by mailing a request to Dimensional Fund Advisors LP, 6300 Bee Cave Road, Building One, Austin, Texas 78746, or by visiting the SEC’s website at http://www.sec.gov, or they may be reviewed and copied at the SEC’s Public Reference Room in Washington, D.C. (call 1-800-732-0330 for information on the operation of the Public Reference Room).
PORTFOLIO HOLDINGS
The SEC requires that all Funds present their categories of portfolio holdings in a table, chart or graph format in their annual and semi-annual shareholder reports, whether or not a Schedule of Investments is utilized. The following table, which presents portfolio holdings as a percent of total investments before short-term investments and collateral for loaned securities, is provided in compliance with such requirement
The categories of industry classification for the Affiliated Investment Company are represented in the Disclosure of Portfolio Holdings, which are included elsewhere within the report. Refer to the Summary Schedule of Portfolio Holdings for the underlying Master Fund’s holdings which reflect the investments by country.
| | | |
Affiliated Investment Company | | 100.0 | % |
6
DIMENSIONAL INVESTMENT GROUP INC.
DFA INTERNATIONAL VALUE PORTFOLIO IV
STATEMENT OF ASSETS AND LIABILITIES
OCTOBER 31, 2009
(Amounts in thousands, except share and per share amounts)
| | | | |
ASSETS: | | | | |
Investment in The DFA International Value Series of The DFA Investment Trust Company
(Affiliated Investment Company) at Value† | | $ | 349,059 | |
Receivables: | | | | |
Fund Shares Sold | | | 638 | |
Prepaid Expenses and Other Assets | | | 12 | |
| | | | |
Total Assets | | | 349,709 | |
| | | | |
LIABILITIES: | | | | |
Payables: | | | | |
Affiliated Investment Company Purchased | | | 638 | |
Due to Advisor | | | 7 | |
Accrued Expenses and Other Liabilities | | | 22 | |
| | | | |
Total Liabilities | | | 667 | |
| | | | |
NET ASSETS | | $ | 349,042 | |
| | | | |
SHARES OUTSTANDING, $0.01 PAR VALUE (1) | | | 26,656,540 | |
| | | | |
NET ASSET VALUE, OFFERING AND REDEMPTION PRICE PER SHARE | | $ | 13.09 | |
| | | | |
Investment in Affiliated Investment Company at Cost | | $ | 264,402 | |
| | | | |
NET ASSETS CONSIST OF: | | | | |
Paid-In Capital | | $ | 352,315 | |
Undistributed Net Investment Income (Distributions in Excess of Net Investment Income) | | | 8,935 | |
Accumulated Net Realized Gain (Loss) | | | (96,879 | ) |
Net Unrealized Foreign Exchange Gain (Loss) | | | 14 | |
Net Unrealized Appreciation (Depreciation) | | | 84,657 | |
| | | | |
NET ASSETS | | $ | 349,042 | |
| | | | |
(1) NUMBER OF SHARES AUTHORIZED | | | 300,000,000 | |
| | | | |
See accompanying Notes to Financial Statements.
7
DIMENSIONAL INVESTMENT GROUP INC.
DFA INTERNATIONAL VALUE PORTFOLIO IV
STATEMENT OF OPERATIONS
(Amounts in thousands)
| | | | |
| Investment Income | | | | |
Dividends (Net of Foreign Taxes Withheld of $909) | | $ | 10,003 | |
Interest | | | 12 | |
Income from Securities Lending | | | 815 | |
Expenses Allocated from Affiliated Investment Company | | | (734 | ) |
| | | | |
Total Investment Income | | | 10,096 | |
| | | | |
Expenses | | | | |
Administrative Services Fees | | | 80 | |
Accounting & Transfer Agent Fees | | | 18 | |
Filing Fees | | | 21 | |
Shareholders’ Reports | | | 23 | |
Directors’/Trustees’ Fees & Expenses | | | 3 | |
Audit Fees | | | 2 | |
Legal Fees | | | 10 | |
Other | | | 4 | |
| | | | |
Total Expenses | | | 161 | |
| | | | |
Net Investment Income (Loss) | | | 9,935 | |
| | | | |
Realized and Unrealized Gain (Loss) | | | | |
Net Realized Gain (Loss) on: | | | | |
Investment Securities Sold | | | 3,826 | |
Futures | | | (102 | ) |
Foreign Currency Transactions | | | 233 | |
Change in Unrealized Appreciation (Depreciation) of: | | | | |
Investment Securities and Foreign Currency | | | 84,657 | |
Translation of Foreign Currency Denominated Amounts | | | 14 | |
| | | | |
Net Realized and Unrealized Gain (Loss) | | | 88,628 | |
| | | | |
Net Increase (Decrease) in Net Assets Resulting from Operations | | $ | 98,563 | |
| | | | |
Investment Income and Realized and Unrealized Gain (Loss) were allocated from the Portfolio’s Master Fund (Affiliated Investment Company).
See accompanying Notes to Financial Statements.
8
DIMENSIONAL INVESTMENT GROUP INC.
DFA INTERNATIONAL VALUE PORTFOLIO IV
STATEMENTS OF CHANGES IN NET ASSETS
(Amounts in thousands)
| | | | | | | | | | | | |
| | | Year
Ended
Oct. 31,
2009 | | | Period
Dec. 1, 2007
to
Oct. 31, 2008 | | | Year
Ended
Nov. 30,
2007 | |
Increase (Decrease) in Net Assets | | | | | | | | | | | | |
Operations: | | | | | | | | | | | | |
Net Investment Income (Loss) | | $ | 9,935 | | | $ | 20,731 | | | $ | 21,939 | |
Net Realized Gain (Loss) on: | | | | | | | | | | | | |
Investment Securities Sold | | | 3,826 | | | | 47,885 | † | | | 15,399 | † |
Futures | | | (102 | ) | | | — | | | | — | |
Foreign Currency Transactions | | | 233 | | | | — | | | | — | |
Change in Unrealized Appreciation (Depreciation) of: | | | | | | | | | | | | |
Investment Securities and Foreign Currency | | | 84,657 | | | | (378,867 | )† | | | 66,391 | † |
Translation of Foreign Currency Denominated Amounts | | | 14 | | | | — | | | | — | |
| | | | | | | | | | | | |
Net Increase (Decrease) in Net Assets Resulting from Operations | | | 98,563 | | | | (310,251 | ) | | | 103,729 | |
| | | | | | | | | | | | |
Distributions From: | | | | | | | | | | | | |
Net Investment Income | | | (21,099 | ) | | | (21,806 | ) | | | (14,495 | ) |
Net Short-Term Gains | | | — | | | | (1,695 | ) | | | (1,177 | ) |
Net Long-Term Gains | | | — | | | | (14,217 | ) | | | (7,928 | ) |
| | | | | | | | | | | | |
Total Distributions | | | (21,099 | ) | | | (37,718 | ) | | | (23,600 | ) |
| | | | | | | | | | | | |
Capital Share Transactions (1): | | | | | | | | | | | | |
Shares Issued | | | 45,547 | | | | 34,072 | | | | 166,017 | |
Shares Issued in Lieu of Cash Distributions | | | 21,099 | | | | 37,718 | | | | 23,600 | |
Shares Redeemed | | | (98,890 | ) | | | (149,620 | ) | | | (105,380 | ) |
| | | | | | | | | | | | |
Net Increase (Decrease) from Capital Share Transactions | | | (32,244 | ) | | | (77,830 | ) | | | 84,237 | |
| | | | | | | | | | | | |
Total Increase (Decrease) in Net Assets | | | 45,220 | | | | (425,799 | ) | | | 164,366 | |
Net Assets | | | | | | | | | | | | |
Beginning of Period | | | 303,822 | | | | 729,621 | | | | 565,255 | |
| | | | | | | | | | | | |
End of Period | | $ | 349,042 | | | $ | 303,822 | | | $ | 729,621 | |
| | | | | | | | | | | | |
(1) Shares Issued and Redeemed: | | | | | | | | | | | | |
Shares Issued | | | 5,144 | | | | 1,932 | | | | 8,266 | |
Shares Issued in Lieu of Cash Distributions | | | 2,259 | | | | 1,981 | | | | 1,270 | |
Shares Redeemed | | | (9,799 | ) | | | (9,233 | ) | | | (5,148 | ) |
| | | | | | | | | | | | |
Net Increase (Decrease) from Shares Issued and Redeemed | | | (2,396 | ) | | | (5,320 | ) | | | 4,388 | |
| | | | | | | | | | | | |
Undistributed Net Investment Income (Distributions in Excess of Net Investment Income) | | $ | 8,935 | | | $ | 19,867 | | | $ | 20,554 | |
† See Note A in the Notes to Financial Statements.
See accompanying Notes to Financial Statements.
9
DIMENSIONAL INVESTMENT GROUP INC.
DFA INTERNATIONAL VALUE PORTFOLIO IV
FINANCIAL HIGHLIGHTS
(for a share outstanding throughout each period)
| | | | | | | | | | | | | | | | | | | | | | | | |
| | | Year Ended Oct. 31, 2009 | | | Period Dec. 1, 2007 to Oct. 31, 2008 | | | Year Ended Nov. 30, 2007 | | | Year Ended Nov. 30, 2006 | | | Year Ended Nov. 30, 2005 | | | Year Ended Nov. 30, 2004 | |
| | |
Net Asset Value, Beginning of Period | | $ | 10.46 | | | $ | 21.23 | | | $ | 18.85 | | | $ | 14.63 | | | $ | 12.94 | | | $ | 10.19 | |
| | | | | | | | | | | | | | | | | | | | | | | | |
Income from Investment Operations | | | | | | | | | | | | | | | | | | | | | | | | |
Net Investment Income (Loss) | | | 0.34 | (A) | | | 0.62 | (A) | | | 0.63 | (A) | | | 0.57 | (A) | | | 0.40 | | | | 0.20 | |
Net Gains (Losses) on Securities (Realized and Unrealized) | | | 3.05 | | | | (10.29 | ) | | | 2.53 | | | | 4.41 | | | | 1.58 | | | | 2.95 | |
| | | | | | | | | | | | | | | | | | | | | | | | |
Total from Investment Operations | | | 3.39 | | | | (9.67 | ) | | | 3.16 | | | | 4.98 | | | | 1.98 | | | | 3.15 | |
| | |
Less Distributions | | | | | | | | | | | | | | | | | | | | | | | | |
Net Investment Income | | | (0.76 | ) | | | (0.64 | ) | | | (0.48 | ) | | | (0.36 | ) | | | (0.27 | ) | | | (0.22 | ) |
Net Realized Gains | | | — | | | | (0.46 | ) | | | (0.30 | ) | | | (0.40 | ) | | | (0.02 | ) | | | (0.18 | ) |
| | | | | | | | | | | | | | | | | | | | | | | | |
Total Distributions | | | (0.76 | ) | | | (1.10 | ) | | | (0.78 | ) | | | (0.76 | ) | | | (0.29 | ) | | | (0.40 | ) |
| | |
Net Asset Value, End of Period | | $ | 13.09 | | | $ | 10.46 | | | $ | 21.23 | | | $ | 18.85 | | | $ | 14.63 | | | $ | 12.94 | |
| | |
Total Return | | | 35.27 | % | | | (47.88 | )%(C) | | | 17.32 | % | | | 35.65 | % | | | 15.58 | % | | | 31.99 | % |
| | |
| | | | | | |
Net Assets, End of Period (thousands) | | $ | 349,042 | | | $ | 303,822 | | | $ | 729,621 | | | $ | 565,255 | | | $ | 304,601 | | | $ | 203,569 | |
Ratio of Expenses to Average Net Assets (D) | | | 0.30 | % | | | 0.26 | %(B) | | | 0.25 | % | | | 0.27 | % | | | 0.32 | % | | | 0.37 | % |
Ratio of Net Investment Income to Average Net Assets | | | 3.28 | % | | | 3.93 | %(B) | | | 3.07 | % | | | 3.42 | % | | | 3.03 | % | | | 2.00 | % |
| | |
See Page 1 for the Definitions of Abbreviations and Footnotes.
See accompanying Notes to Financial Statements.
10
DIMENSIONAL INVESTMENT GROUP INC.
DFA INTERNATIONAL VALUE PORTFOLIO IV
NOTES TO FINANCIAL STATEMENTS
A. Organization:
Dimensional Investment Group Inc. (the “Fund”) is an open-end management investment company registered under the Investment Company Act of 1940, whose shares are offered to institutional investors, retirement plans and clients of registered investment advisors. The Fund consists of fifteen portfolios, of which the DFA International Value Portfolio IV (the “Portfolio”) is presented in this report.
The Portfolio primarily invests its assets in The DFA International Value Series (the “Series”), a corresponding series of The DFA Investment Trust Company. At October 31, 2009, the Portfolio owned 6% of the Series. The financial statements of the Series are included elsewhere in this report and should be read in conjunction with the financial statements of the Portfolio.
On November 1, 2008, The DFA International Value Series, a master fund in a RIC/RIC master-feeder structure, elected with the consent of its respective Holder(s) to change its U.S. federal income tax classification from that of an association taxable as a corporation to a partnership pursuant to Treasury Regulation § 301.7701-3. The change in capital structure and retroactive reclassification of the statement of changes in net assets and financial highlights for the respective funds is a result of the treatment of a partnership for book purposes. The Series/Portfolio will maintain its books and records and present its financial statements in accordance with generally accepted accounting principles for investment partnerships.
At a regular meeting of the Board of Directors/Trustees (the “Board”) on September 16, 2008, the Board voted to change the fiscal and tax year ends of the Portfolio from November 30 to October 31.
B. Significant Accounting Policies:
The following significant accounting policies are in conformity with accounting principles generally accepted in the United States of America. Such policies are consistently followed by the Fund in preparation of its financial statements. The preparation of financial statements in accordance with accounting principles generally accepted in the United States of America requires management to make estimates and assumptions that affect the reported amounts of assets and liabilities and disclosure of contingent assets and liabilities at the date of the financial statements and the reported amounts of increases and decreases in net assets from operations during the reporting period. Actual results could differ from those estimates and those differences could be material.
1. Security Valuation: The Portfolio’s investment reflects its proportionate interest in the net assets of the Series.
The Portfolio utilizes a fair value hierarchy which prioritizes the inputs to valuation techniques used to measure fair value into three levels described below:
— Level 1 – quoted prices in active markets for identical securities
— Level 2 – other significant observable inputs (including quoted prices for similar securities, interest rates, prepayment speeds, credit risk, etc.)
— Level 3 – significant unobservable inputs (including the Portfolio’s own assumptions in determining the fair value of investments)
The inputs or methodolgy used for valuing securities are not necessarily an indication of the risk associated with investing in those securities. A summary of the inputs used to value the Portfolio’s net assets as of October 31, 2009 is listed below (in thousands).
11
| | | | | | | | |
| | | Valuation Inputs |
| | | Investments in
Securities
(Market Value) |
| | | Level 1 | | Level 2 | | Level 3 | | Total |
DFA International Value Portfolio IV | | $349,059 | | — | | — | | $349,059 |
2. Deferred Compensation Plan: Each eligible Director of the Fund may elect participation in the Deferred Compensation Plan (the “Plan”). Under the Plan, effective January 1, 2002, such Directors may defer payment of all or a portion of their total fees earned as a Director. These deferred amounts may be treated as though such amounts had been invested in shares of the following funds: U.S. Large Cap Value Portfolio; U.S. Core Equity 1 Portfolio; U.S. Core Equity 2 Portfolio; U.S. Vector Equity Portfolio; U.S. Micro Cap Portfolio; DFA International Value Portfolio; International Core Equity Portfolio; Emerging Markets Portfolio; Emerging Markets Core Equity Portfolio; and/or DFA Two-Year Global Fixed Income Portfolio. Contributions made under the Plan and the change in unrealized appreciation (depreciation) and income, are included in Directors’/Trustees’ Fees & Expenses. At October 31, 2009, the total liability for deferred compensation to Directors is included in Accrued Expenses and Other Liabilities on the Statement of Assets and Liabilities in the amount of $9 (in thousands).
Each Director has the option to receive their distribution of proceeds in one of the following methods upon one year’s notice: lump sum; annual installments over a period of agreed upon years; or semi-annual installments over a period of agreed upon years. As of October 31, 2009, none of the Directors have requested distribution of proceeds.
3. Other: The Portfolio recognizes its pro-rata share, on a daily basis, of net investment income and realized and unrealized gains and losses of investment securities and foreign currency from the Series, which is treated as a partnership for federal income tax purposes. Dividend income and distributions to shareholders are recorded on the ex-dividend date. Distributions received on securities that represent a return of capital or capital gain are recorded as a reduction of cost of investments or as a realized gain, respectively. The Portfolio estimates the character of distributions received that may be considered return of capital distributions. Expenses directly attributable to the Portfolio are directly charged. Common expenses of the Fund are allocated using methods approved by the Board of Directors/Trustees, generally based on average net assets.
C. Investment Advisor:
Dimensional Fund Advisors LP (“Dimensional” or the “Advisor”) provides administrative services to the Portfolio, including supervision of services provided by others, providing information to the shareholders and to the Board of Directors/Trustees, and other administrative services. The Advisor provides investment advisory services to the Series. For the year ended October 31, 2009, the Portfolio’s administrative services fees were accrued daily and paid monthly to the Advisor based on an effective annual rate of 0.20% of the first $40 million of average daily net assets and no fees on assets exceeding $40 million.
Fees Paid to Officers and Directors/Trustees:
Certain Officers and Directors/Trustees of the Advisor are also Officers and Directors/Trustees of the Fund; however, such Officers and Directors/Trustees (with the exception of the Chief Compliance Officer (“CCO”)) receive no compensation from the Fund. For the year ended October 31, 2009, the total related amounts paid by the Fund to the CCO were $27 (in thousands). The total related amounts paid by the Portfolio are included in Other Expenses on the Statement of Operations.
D. Federal Income Taxes:
The Portfolio has qualified and intends to continue to qualify as a regulated investment company under Subchapter M of the Internal Revenue Code for federal income tax purposes and to distribute substantially all of its taxable income and net capital gains to its shareholders. Accordingly, no provision has been made for federal income taxes.
12
Distributions from net investment income and net realized capital gains are determined in accordance with U.S. federal income tax regulations, which may differ from those amounts determined under accounting principles generally accepted in the United States of America. These book/tax differences are either temporary or permanent in nature. To the extent these differences are permanent, they are charged or credited to paid-in capital, undistributed net investment income, accumulated net realized gains or unrealized appreciation, as appropriate, in the period that the differences arise. Accordingly, the following permanent differences as of October 31, 2009, primarily attributable to a reclassification of distributions were reclassified to the following accounts. These reclassifications had no effect on net assets or net asset value per share (amounts in thousands):
| | |
Increase (Decrease) Undistributed Net Investment Income | | Increase (Decrease) Accumulated Net Realized Gains |
$232 | | $(232) |
The tax character of dividends and distributions declared and paid during the year ended November 30, 2007, the period December 1, 2007 to October 31, 2008 and the year ended October 31, 2009 were as follows (amounts in thousands):
| | | | | | |
| | | Net
Investment
Income and
Short-Term
Capital Gains | | Long-Term
Capital Gains | | Total |
2007 | | $15,672 | | $7,928 | | $23,600 |
2008 | | 23,113 | | 14,605 | | 37,718 |
2009 | | 21,099 | | — | | 21,099 |
At October 31, 2009, the components of distributable earnings (accumulated losses) were as follows (amounts in thousands):
| | | | | | |
Undistributed Net Investment Income and Short-Term Capital Gains | | Undistributed Long-Term Capital Gains | | Capital Loss Carryforward | | Total Net Distributable Earnings/ (Accumulated Losses) |
$8,944 | | — | | $(96,869) | | $(87,925) |
For federal income tax purposes, the Fund measures its capital loss carryforwards annually at October 31, its fiscal year end. Capital loss carryforwards may be carried forward and applied against future capital gains. As of October 31, 2009, the Portfolio had capital loss carryforwards available in the amount of $96,869 (in thousands) to offset future realized capital gains expiring on 2016. During the year ended October 31, 2009, the Portfolio utilized capital loss carryforwards to offset realized capital gains for federal income tax purposes in the amount of $3,736 (in thousands).
At October 31, 2009, the total cost and aggregate gross unrealized appreciation and (depreciation) of securities for federal income tax purposes were different from amounts reported for financial reporting purposes (amounts in thousands):
| | | | | | |
Federal Tax Cost | | Unrealized Appreciation | | Unrealized (Depreciation) | | Net Unrealized Appreciation (Depreciation) |
$264,412 | | $88,379 | | $(3,732) | | $84,647 |
Accounting for Uncertainty in Income Taxes sets forth a minimum threshold for financial statement recognition of the benefit of a tax position taken or expected to be taken in a tax return. Management has analyzed the Portfolio’s tax
13
position and has concluded that no provision for income tax is required in the Portfolio’s financial statements. The Portfolio is not aware of any tax position for which it is reasonably possible that the total amounts of unrecognized tax benefits will significantly change in the next twelve months. The Portfolio’s federal tax returns for the prior three fiscal years remain subject to examination by the Internal Revenue Service.
On November 1, 2008, The DFA International Value Series, a master fund in a RIC/RIC master-feeder structure with five RIC feeders and other direct client investor(s), made a “Check-the-box” election for federal income tax purposes pursuant to Treasury Regulation §301.7701-3, to change its federal entity classification from a corporation taxable as a regulated investment company to a partnership. As a result of this election, the master fund is deemed to have distributed all of its assets and liabilities, in a taxable transaction, to its shareholders in liquidation of the master fund. Immediately thereafter, the shareholders contributed all of the distributed assets and liabilities to a newly formed partnership. The final tax year end of The DFA International Value Series was October 31, 2008. For Federal income tax purposes, pursuant to Internal Revenue Code §336(a), the master fund recognizes gain or loss as if the master’s investment securities were sold to its shareholders and, pursuant to IRC Code §331, each of the Portfolios recognizes gain or loss as if it liquidated its investment in the master. As a result of the transaction, The DFA International Value Series recognized a ($2,309,440,866) and ($718,733) capital and currency loss respectively for tax year ended October 31, 2008. For tax purposes, pursuant to IRC Code §334(a), each of the Portfolios will take a fair market value basis in the securities deemed received by them and a new holding period for those securities commences on the deemed liquidation date.
E. Line of Credit:
The Fund, together with other Dimensional-advised portfolios, has entered into an amended and restated $250 million unsecured discretionary line of credit effective July 8, 2009 with an affiliate of its domestic custodian bank. Each portfolio is permitted to borrow, subject to its investment limitations, up to a maximum of $250 million, as long as total borrowings under the line of credit do not exceed $250 million in the aggregate. Borrowings under the line of credit are charged interest at the then current Federal Funds Rate plus 1%. Each portfolio is individually, and not jointly, liable for its particular advances under the line of credit. There is no commitment fee on the unused portion of the line of credit. The agreement for the discretionary line of credit may be terminated by either party at any time. The line of credit is scheduled to expire on June 22, 2010. There were no borrowings by the Portfolio under this line of credit during the year ended October 31, 2009.
The Fund, together with other Dimensional-advised portfolios, has also entered into an additional $500 million unsecured line of credit effective January 15, 2009 with its international custodian bank. Each portfolio is permitted to borrow, subject to its investment limitations, up to a maximum of $500 million, as long as total borrowings under the line of credit do not exceed $500 million in the aggregate. Borrowings under the line of credit are charged interest at rates agreed to by the parties at the time of borrowing. Each portfolio is individually, and not jointly, liable for its particular advances under the line of credit. There is no commitment fee on the unused portion of the line of credit. The agreement for the line of credit expires on January 15, 2010. There were no borrowings by the Portfolio under this line of credit during the year ended October 31, 2009.
F. Indemnitees; Contractual Obligations:
Under the Fund’s organizational documents, its officers and directors are indemnified against certain liabilities arising out of the performance of their duties to the Fund.
In the normal course of business, the Fund enters into contracts that contain a variety of representations and warranties which provide general indemnification. The Fund’s maximum exposure under these arrangements is unknown as this would involve future claims that may be made against the Fund and/or its affiliates that have not yet occurred. However, based on experience, the Fund expects the risk of loss to be remote.
G. Other:
At October 31, 2009, one shareholder held 100% of the outstanding shares of the Portfolio.
14
H. Subsequent Event Evaluations:
Management has evaluated the impact of all subsequent events on the Portfolio through December 23, 2009, the date the financial statements were available for issuance, and has determined that there are no subsequent events requiring recognition or disclosure in the financial statements.
15
REPORT OF INDEPENDENT REGISTERED PUBLIC ACCOUNTING FIRM
To the Shareholders of DFA International Value Portfolio IV and
Board of Directors of Dimensional Investment Group Inc.:
In our opinion, the accompanying statement of assets and liabilities, and the related statements of operations and of changes in net assets and the financial highlights present fairly, in all material respects, the financial position of DFA International Value Portfolio IV (one of the portfolios constituting Dimensional Investment Group Inc., hereafter referred to as the “Portfolio”) at October 31, 2009, the results of its operations for the year then ended, the changes in its net assets and the financial highlights for each of the periods indicated, in conformity with accounting principles generally accepted in the United States of America. These financial statements and financial highlights (hereafter referred to as “financial statements”) are the responsibility of the Portfolio’s management; our responsibility is to express an opinion on these financial statements based on our audits. We conducted our audits of these financial statements in accordance with the standards of the Public Company Accounting Oversight Board (United States). Those standards require that we plan and perform the audit to obtain reasonable assurance about whether the financial statements are free of material misstatement. An audit includes examining, on a test basis, evidence supporting the amounts and disclosures in the financial statements, assessing the accounting principles used and significant estimates made by management, and evaluating the overall financial statement presentation. We believe that our audits, which included confirmation of securities at October 31, 2009 by correspondence with the transfer agent of the investee fund, provide a reasonable basis for our opinion.
PricewaterhouseCoopers LLP
Philadelphia, Pennsylvania
December 23, 2009
16
RESULTS OF THE SHAREHOLDER MEETING
On June 2, 2009, June 5, 2009, and July 8, 2009, Dimensional Investment Group Inc. (“DIG”) held a Special Joint Meeting of Shareholders for the purpose of voting on several proposals affecting DIG and the Portfolio, including, among other items, the election of Directors, the amendment of certain fundamental investment limitations, and the elimination of certain fundamental investment limitations. The shareholders of the Portfolio approved each of the applicable proposals for DIG and the Portfolio presented at the Meeting. Listed below are the voting results from the Meeting. Please note that not all Proposals presented at the Meeting were voted on by the Portfolio. Additionally, the Proposal numbers reflected below correlate to the Proposal numbers presented for vote at the Meeting.
DIG
| | | | | | | | | | | | | | | | | | | | |
| | | Shares Voted | | Percent of Outstanding Shares Voted |
| | | | | For | | % | | Against | | % | | Abstain/WithHold | | % | | For | | Against | | Abstain / WithHold |
Proposal 1: Election of Directors for DIG* |
| | | | | | | | | | |
1a | | David G. Booth | | 754,612,895 | | 96.26% | | — | | 0.00% | | 29,301,677 | | 3.74% | | 85.87% | | 0.00% | | 3.33% |
1b | | George M. Constantinides | | 753,991,785 | | 96.18% | | — | | 0.00% | | 29,922,787 | | 3.82% | | 85.80% | | 0.00% | | 3.41% |
1c | | John P. Gould | | 753,344,569 | | 96.10% | | — | | 0.00% | | 30,570,003 | | 3.90% | | 85.73% | | 0.00% | | 3.48% |
1d | | Roger G. Ibbotson | | 754,232,365 | | 96.21% | | — | | 0.00% | | 29,682,207 | | 3.79% | | 85.83% | | 0.00% | | 3.38% |
1e | | Robert C. Merton | | 754,598,874 | | 96.26% | | — | | 0.00% | | 29,315,698 | | 3.74% | | 85.87% | | 0.00% | | 3.34% |
1f | | Myron S. Scholes | | 754,057,040 | | 96.19% | | — | | 0.00% | | 29,857,532 | | 3.81% | | 85.81% | | 0.00% | | 3.40% |
1g | | Eduardo A. Repetto | | 753,295,592 | | 96.09% | | — | | 0.00% | | 30,618,979 | | 3.91% | | 85.72% | | 0.00% | | 3.48% |
1h | | Abbie J. Smith | | 754,123,603 | | 96.20% | | — | | 0.00% | | 29,790,969 | | 3.80% | | 85.82% | | 0.00% | | 3.39% |
| | | | | | | | | | | | | | | | | | | | | | |
| | | Shares Voted | | Percent of Outstanding Shares Voted |
| | | For | | % | | Against | | % | | Abstain/WithHold | | % | | NonVote | | % | | For | | Against | | Abstain /WithHold |
Proposal 2: To approve Articles of Amendment and Restatement for DIG* | | 479,705,048 | | 93.81% | | 7,503,436 | | 1.47% | | 24,156,664 | | 4.72% | | NA | | NA | | 54.59% | | 0.85% | | 2.75% |
| * | Results are for all Portfolios within DIG |
DFA International Value Portfolio IV
| | | | | | | | | | | | | | | | | | | | |
| | | | | Shares Voted | | Percent of Outstanding Shares Voted |
| | | | | For | | % | | Against | | % | | Abstain/WithHold | | % | | For | | Against | | Abstain / WithHold |
Proposals: | | | | | | | | | | | | | | | | | | |
| |
5 | | To approve amendments to certain fundamental investment restrictions |
5a | | Borrowing Money | | 29,154,332 | | 100.00% | | — | | 0.00% | | — | | 0.00% | | 100.00% | | 0.00% | | 0.00% |
5b | | Making Loans | | 29,154,332 | | 100.00% | | — | | 0.00% | | — | | 0.00% | | 100.00% | | 0.00% | | 0.00% |
5c | | Investments in Real Estate | | 29,154,332 | | 100.00% | | — | | 0.00% | | — | | 0.00% | | 100.00% | | 0.00% | | 0.00% |
5d | | Investments in Commodities | | 29,154,332 | | 100.00% | | — | | 0.00% | | — | | 0.00% | | 100.00% | | 0.00% | | 0.00% |
5e | | Diversification of Investments | | 29,154,332 | | 100.00% | | — | | 0.00% | | — | | 0.00% | | 100.00% | | 0.00% | | 0.00% |
6 | | To approve the elimination of certain fundamental investment restrictions |
6a | | Pledging, Mortgaging, or Hypothecating Assets | | 29,154,332 | | 100.00% | | — | | 0.00% | | — | | 0.00% | | 100.00% | | 0.00% | | 0.00% |
6b | | Purchasing Securities on Margin | | 29,154,332 | | 100.00% | | — | | 0.00% | | — | | 0.00% | | 100.00% | | 0.00% | | 0.00% |
6c | | Investing in Restricted or Illiquid | | | | | | | | | | | | | | | | | | |
| | Securities | | 29,154,332 | | 100.00% | | — | | 0.00% | | — | | 0.00% | | 100.00% | | 0.00% | | 0.00% |
6d | | Investing for the Purpose of Exercising Control | | 29,154,332 | | 100.00% | | — | | 0.00% | | — | | 0.00% | | 100.00% | | 0.00% | | 0.00% |
6e | | Investing in Other Investment Companies | | 29,154,332 | | 100.00% | | — | | 0.00% | | — | | 0.00% | | 100.00% | | 0.00% | | 0.00% |
6f | | Management Ownership of Securities of an Issuer | | 29,154,332 | | 100.00% | | — | | 0.00% | | — | | 0.00% | | 100.00% | | 0.00% | | 0.00% |
6g | | Investing in Oil, Gas, or other Mineral Exploration, Leases or Development Programs | | 29,154,332 | | 100.00% | | — | | 0.00% | | — | | 0.00% | | 100.00% | | 0.00% | | 0.00% |
6h | | Investing in Securities of Unseasoned Issuers | | 29,154,332 | | 100.00% | | — | | 0.00% | | — | | 0.00% | | 100.00% | | 0.00% | | 0.00% |
6i | | Investing in Warrants | | 29,154,332 | | 100.00% | | — | | 0.00% | | — | | 0.00% | | 100.00% | | 0.00% | | 0.00% |
6j | | Writing or Acquiring Options | | 29,154,332 | | 100.00% | | — | | 0.00% | | — | | 0.00% | | 100.00% | | 0.00% | | 0.00% |
8 | | Approval of Investment Advisory Agreement between Dimensional Fund Advisors LP and the Company | | 29,154,332 | | 100.00% | | — | | 0.00% | | — | | 0.00% | | 100.00% | | 0.00% | | 0.00% |
17
THE DFA INVESTMENT TRUST COMPANY
PERFORMANCE CHART
The DFA International Value Series vs.
MSCI World ex USA Index (net dividends)
October 31, 1999-October 31, 2009

18
THE DFA INVESTMENT TRUST COMPANY
THE DFA INTERNATIONAL VALUE SERIES
DISCLOSURE OF FUND EXPENSES
(Unaudited)
The following Expense Table is shown so that you can understand the impact of fees on your investment. All mutual funds have operating expenses. As a shareholder of the fund, you incur ongoing costs, which include costs for portfolio management, administrative services, and shareholder reports, among others. Operating expenses, legal and audit services, which are deducted from a fund’s gross income, directly reduce the investment return of the fund. A fund’s expenses are expressed as a percentage of its average net assets. This figure is known as the expense ratio. The following examples are intended to help you understand the ongoing costs, in dollars, of investing in the fund and to compare these costs with those of other mutual funds. The examples are based on an investment of $1,000 made at the beginning of the period shown and held for the entire period.
The Expense Table below illustrates your fund’s costs in two ways.
Actual fund return
This section helps you to estimate the actual expenses after fee waivers that you paid over the period. The “Ending Account Value” shown is derived from the fund’s actual return and “Expenses Paid During Period” reflect the dollar amount that would have been paid by an investor who started with $1,000 in the fund. You may use the information here, together with the amount you invested, to estimate the expenses that you paid over the period.
To do so, simply divide your account value by $1,000 (for example, a $7,500 account value divided by $1,000 = 7.5), then multiply the result by the number given for your fund under the heading “Expenses Paid During Period.”
Hypothetical example for comparison purposes
This section is intended to help you compare your fund’s costs with those of other mutual funds. The hypothetical “Ending Account Value” and “Expenses Paid During Period” are derived from the fund’s actual expense ratio and an assumed 5% annual return before expenses. In this case, because the return used is not the fund’s actual return, the results do not apply to your investment. The example is useful in making comparisons because the SEC requires all mutual funds to calculate expenses based on a 5% annual return. You can assess your fund’s costs by comparing this hypothetical example with the hypothetical examples that appear in shareholder reports of other funds.
Please note that the expenses shown in the table are meant to highlight and help you compare ongoing costs only and do not reflect any transactional costs, if applicable. The “Annualized Expense Ratio” represents the actual expenses for the six-month period indicated.
Six Months Ended October 31, 2009
EXPENSE TABLE
| | | | | | | | | | |
| | | Beginning
Account
Value
05/01/09 | | Ending
Account
Value
10/31/09 | | Annualized
Expense
Ratio* | | Expenses
Paid
During
Period* |
Actual Fund Return | | $ | 1,000.00 | | $ | 1,350.50 | | 0.25% | | $1.48 |
Hypothetical 5% Annual Return | | $ | 1,000.00 | | $ | 1,023.95 | | 0.25% | | $1.28 |
| * | Expenses are equal to the fund’s annualized expense ratio for the six-month period, multiplied by the average account value over the period, multiplied by the number of days in the most recent six-month period (184), then divided by the number of days in the year (365) to reflect the six-month period. |
19
THE DFA INVESTMENT TRUST COMPANY
THE DFA INTERNATIONAL VALUE SERIES
DISCLOSURE OF PORTFOLIO HOLDINGS
(Unaudited)
The SEC requires that all Funds file a complete Schedule of Investments with the SEC for their first and third fiscal quarters on Form N-Q. For The DFA Investment Trust Company, this would be for the fiscal quarters ending January 31 and July 31. The Form N-Q filing must be made within 60 days of the end of the quarter. The DFA Investment Trust Company filed its most recent Form N-Q with the SEC on September 29, 2009. It is available upon request, without charge, by calling collect: (512) 306-7400 or by mailing a request to Dimensional Fund Advisors LP, 6300 Bee Cave Road, Building One, Austin, Texas 78746, or by visiting the SEC’s website at http://www.sec.gov, or they may be reviewed and copied at the SEC’s Public Reference Room in Washington, D.C. (call 1-800-732-0330 for information on the operation of the Public Reference Room).
SEC regulations permit a fund to include in its reports to shareholders a “Summary Schedule of Portfolio Holdings” in lieu of a full Schedule of Investments. The Summary Schedule of Portfolio Holdings reports the fund’s 50 largest holdings in unaffiliated issuers and any investments that exceed one percent of the fund’s net assets at the end of the reporting period. The amendments also require that the Summary Schedule of Portfolio Holdings identify each category of investments that are held.
The fund is required to file a complete Schedule of Investments with the SEC on Form N-CSR within ten days after mailing the annual and semi-annual reports to shareholders. It will be available upon request, without charge, by calling collect: (512) 306-7400 or by mailing a request to Dimensional Fund Advisors LP, 6300 Bee Cave Road, Building One, Austin, Texas 78746, or by visiting the SEC’s website at http://www.sec.gov, or they may be reviewed and copied at the SEC’s Public Reference Room in Washington, D.C. (call 1-800-732-0330 for information on the operation of the Public Reference Room).
PORTFOLIO HOLDINGS
The SEC requires that all Funds present their categories of portfolio holdings in a table, chart or graph format in their annual and semi-annual shareholder reports, whether or not a Schedule of Investments is utilized. The following table, which presents portfolio holdings as a percent of total investments before short-term investments and collateral for loaned securities, is provided in compliance with such requirement. The categories shown below represent broad industry sectors. Each industry sector consists of one or more specific industry classifications.
| | |
| The DFA International Value Series |
Consumer Discretionary | | 13.2% |
Consumer Staples | | 4.9% |
Energy | | 6.0% |
Financials | | 42.8% |
Health Care | | 0.4% |
Industrials | | 10.3% |
Information Technology | | 3.1% |
Materials | | 11.2% |
Other | | — |
Telecommunication Services | | 6.9% |
Utilities | | 1.2% |
| | |
| | 100.0% |
20
THE DFA INTERNATIONAL VALUE SERIES
SUMMARY SCHEDULE OF PORTFOLIO HOLDINGS
October 31, 2009
| | | | | | | |
| | | Shares | | Value†† | | Percentage of Net Assets** |
COMMON STOCKS — (85.2%) | | | | | | | |
AUSTRALIA — (4.5%) | | | | | | | |
Australia & New Zealand Banking Group, Ltd. | | 3,343,351 | | $ | 68,191,374 | | 1.1% |
National Australia Bank, Ltd. | | 2,465,437 | | | 65,140,887 | | 1.0% |
Wesfarmers, Ltd. | | 1,898,047 | | | 47,362,464 | | 0.8% |
Other Securities | | | | | 141,329,082 | | 2.3% |
| | | | | | | |
TOTAL AUSTRALIA | | | | | 322,023,807 | | 5.2% |
| | | | | | | |
| | | |
AUSTRIA — (0.5%) | | | | | | | |
Other Securities | | | | | 34,182,743 | | 0.6% |
| | | | | | | |
| | | |
BELGIUM — (0.5%) | | | | | | | |
Other Securities | | | | | 38,019,953 | | 0.6% |
| | | | | | | |
| | | |
CANADA — (7.6%) | | | | | | | |
EnCana Corp | | 671,498 | | | 37,234,767 | | 0.6% |
#Manulife Financial Corp. | | 2,074,478 | | | 38,918,630 | | 0.6% |
*Teck Resources, Ltd. Class B | | 1,418,230 | | | 41,168,712 | | 0.7% |
#Thomson Reuters Corp. | | 1,832,184 | | | 58,281,755 | | 0.9% |
#Toronto Dominion Bank | | 944,998 | | | 53,867,637 | | 0.9% |
Other Securities | | | | | 318,836,929 | | 5.2% |
| | | | | | | |
TOTAL CANADA | | | | | 548,308,430 | | 8.9% |
| | | | | | | |
| | | |
DENMARK — (1.1%) | | | | | | | |
Other Securities | | | | | 77,023,723 | | 1.2% |
| | | | | | | |
| | | |
FINLAND — (0.6%) | | | | | | | |
Other Securities | | | | | 40,451,320 | | 0.7% |
| | | | | | | |
| | | |
FRANCE — (8.3%) | | | | | | | |
#AXA SA | | 2,818,397 | | | 70,093,978 | | 1.1% |
BNP Paribas SA | | 913,891 | | | 68,847,185 | | 1.1% |
#Compagnie de Saint-Gobain SA | | 846,142 | | | 41,232,265 | | 0.7% |
#Lafarge SA | | 467,217 | | | 37,923,901 | | 0.6% |
#Societe Generale Paris SA | | 913,312 | | | 60,662,002 | | 1.0% |
Vivendi SA | | 2,686,677 | | | 74,534,678 | | 1.2% |
Other Securities | | | | | 244,803,391 | | 4.0% |
| | | | | | | |
TOTAL FRANCE | | | | | 598,097,400 | | 9.7% |
| | | | | | | |
| | | |
GERMANY — (7.4%) | | | | | | | |
Allianz SE | | 442,712 | | | 50,712,808 | | 0.8% |
#Bayerische Motoren Werke AG | | 915,762 | | | 44,797,554 | | 0.7% |
#Daimler AG | | 1,684,003 | | | 81,364,327 | | 1.3% |
#Deutsche Bank AG | | 774,190 | | | 56,245,973 | | 0.9% |
#Deutsche Telekom AG | | 2,621,866 | | | 35,693,819 | | 0.6% |
Deutsche Telekom AG Sponsored ADR | | 2,809,150 | | | 38,035,891 | | 0.6% |
Munchener Rueckversicherungs-Gesellschaft AG | | 388,934 | | | 61,534,351 | | 1.0% |
Other Securities | | | | | 167,080,419 | | 2.7% |
| | | | | | | |
TOTAL GERMANY | | | | | 535,465,142 | | 8.6% |
| | | | | | | |
| | | |
GREECE — (0.3%) | | | | | | | |
Other Securities | | | | | 19,019,902 | | 0.3% |
| | | | | | | |
| | | |
HONG KONG — (2.7%) | | | | | | | |
Cheung Kong Holdings, Ltd. | | 3,224,000 | | | 41,120,708 | | 0.7% |
Hutchison Whampoa, Ltd. | | 5,568,000 | | | 39,081,157 | | 0.6% |
Other Securities | | | | | 117,731,620 | | 1.9% |
| | | | | | | |
TOTAL HONG KONG | | | | | 197,933,485 | | 3.2% |
| | | | | | | |
21
THE DFA INTERNATIONAL VALUE SERIES
CONTINUED
| | | | | | | |
| | | Shares | | Value†† | | Percentage of Net Assets** |
IRELAND — (0.0%) | | | | | | | |
Other Securities | | | | $ | 57,893 | | 0.0% |
| | | | | | | |
| | | |
ITALY — (2.9%) | | | | | | | |
#*Intesa Sanpaolo SpA | | 11,201,860 | | | 47,142,793 | | 0.8% |
*UniCredito SpA | | 19,413,366 | | | 65,038,767 | | 1.0% |
Other Securities | | | | | 98,411,874 | | 1.6% |
| | | | | | | |
TOTAL ITALY | | | | | 210,593,434 | | 3.4% |
| | | | | | | |
| | | |
JAPAN — (11.7%) | | | | | | | |
FUJIFILM Holdings Corp. | | 1,257,700 | | | 35,755,504 | | 0.6% |
*Nissan Motor Co., Ltd. | | 4,991,500 | | | 36,119,215 | | 0.6% |
Sony Corp. Sponsored ADR | | 1,725,386 | | | 50,709,095 | | 0.8% |
Other Securities | | | | | 726,760,636 | | 11.7% |
| | | | | | | |
TOTAL JAPAN | | | | | 849,344,450 | | 13.7% |
| | | | | | | |
| | | |
MALAYSIA — (0.0%) | | | | | | | |
Other Securities | | | | | — | | 0.0% |
| | | | | | | |
| | | |
NETHERLANDS — (3.7%) | | | | | | | |
#ArcelorMittal NV | | 2,446,831 | | | 82,806,981 | | 1.3% |
*ING Groep NV | | 3,093,625 | | | 40,259,293 | | 0.7% |
Philips Electronics NV | | 3,072,622 | | | 77,186,781 | | 1.2% |
Other Securities | | | | | 69,089,143 | | 1.1% |
| | | | | | | |
TOTAL NETHERLANDS | | | | | 269,342,198 | | 4.3% |
| | | | | | | |
| | | |
NEW ZEALAND — (0.1%) | | | | | | | |
Other Securities | | | | | 8,185,686 | | 0.1% |
| | | | | | | |
| | | |
NORWAY — (1.0%) | | | | | | | |
Other Securities | | | | | 75,691,447 | | 1.2% |
| | | | | | | |
| | | |
PORTUGAL — (0.2%) | | | | | | | |
Other Securities | | | | | 13,072,321 | | 0.2% |
| | | | | | | |
| | | |
SINGAPORE — (1.6%) | | | | | | | |
DBS Group Holdings, Ltd | | 4,164,750 | | | 38,138,997 | | 0.6% |
Other Securities | | | | | 78,569,480 | | 1.3% |
| | | | | | | |
TOTAL SINGAPORE | | | | | 116,708,477 | | 1.9% |
| | | | | | | |
| | | |
SPAIN — (4.7%) | | | | | | | |
Banco Santander SA | | 5,654,108 | | | 90,987,342 | | 1.5% |
Banco Santander SA Sponsored ADR | | 5,549,048 | | | 89,117,711 | | 1.4% |
#Repsol YPF SA Sponsored ADR | | 1,332,613 | | | 35,447,506 | | 0.6% |
Other Securities | | | | | 120,997,642 | | 1.9% |
| | | | | | | |
TOTAL SPAIN | | | | | 336,550,201 | | 5.4% |
| | | | | | | |
| | | |
SWEDEN — (2.9%) | | | | | | | |
#Nordea Bank AB | | 6,583,962 | | | 70,668,421 | | 1.2% |
Other Securities | | | | | 138,442,067 | | 2.2% |
| | | | | | | |
TOTAL SWEDEN | | | | | 209,110,488 | | 3.4% |
| | | | | | | |
| | | |
SWITZERLAND — (6.3%) | | | | | | | |
Credit Suisse Group AG | | 1,755,349 | | | 93,836,004 | | 1.5% |
#Credit Suisse Group AG Sponsored ADR | | 840,377 | | | 44,792,094 | | 0.7% |
#*Holcim, Ltd. | | 650,248 | | | 41,384,888 | | 0.7% |
*UBS AG | | 3,481,616 | | | 58,055,052 | | 1.0% |
Zurich Financial Services AG | | 322,012 | | | 73,738,360 | | 1.2% |
Other Securities | | | | | 144,088,911 | | 2.3% |
| | | | | | | |
TOTAL SWITZERLAND | | | | | 455,895,309 | | 7.4% |
| | | | | | | |
22
THE DFA INTERNATIONAL VALUE SERIES
CONTINUED
| | | | | | |
| | | Shares | | Value†† | | Percentage of Net Assets** |
UNITED KINGDOM — (16.6%) | | | | | | |
*Anglo American P.L.C. | | 1,329,421 | | $48,102,581 | | 0.8% |
Aviva P.L.C. | | 7,396,866 | | 46,253,871 | | 0.7% |
#*Barclays P.L.C. Sponsored ADR | | 2,451,654 | | 51,239,569 | | 0.8% |
#HSBC Holdings P.L.C. Sponsored ADR | | 3,278,400 | | 181,590,576 | | 2.9% |
Kingfisher P.L.C. | | 9,743,172 | | 35,612,473 | | 0.6% |
#Royal Dutch Shell P.L.C. ADR | | 2,252,783 | | 131,021,859 | | 2.1% |
Vodafone Group P.L.C. | | 34,976,333 | | 77,082,062 | | 1.2% |
#Vodafone Group P.L.C. Sponsored ADR | | 7,395,974 | | 164,116,663 | | 2.7% |
*Xstrata P.L.C. | | 3,245,577 | | 46,747,872 | | 0.8% |
Other Securities | | | | 419,126,814 | | 6.8% |
| | | | | | |
TOTAL UNITED KINGDOM | | | | 1,200,894,340 | | 19.4% |
| | | | | | |
TOTAL COMMON STOCKS | | | | 6,155,972,149 | | 99.4% |
| | | | | | |
RIGHTS/WARRANTS — (0.0%) | | | | | | |
GERMANY — (0.0%) | | | | | | |
Other Securities | | | | 41,059 | | 0.0% |
| | | | | | |
| | | |
ITALY — (0.0%) | | | | | | |
Other Securities | | | | 76,976 | | 0.0% |
| | | | | | |
TOTAL RIGHTS/WARRANTS | | | | 118,035 | | 0.0% |
| | | | | | |
| | | |
| | | Face
Amount | | | | |
| | | (000) | | Value† | | |
TEMPORARY CASH INVESTMENTS — (0.2%) | | | | | | |
Repurchase Agreement, PNC Capital Markets, Inc. 0.19%, 11/02/09 (Collateralized by $13,010,000 FNMA 6.50%, 06/25/39, valued at $14,002,013) to be repurchased at $13,790,218 | | $13,790 | | 13,790,000 | | 0.2% |
| | | | | | |
| | | |
| | | Shares/
Face
Amount | | | | |
| | | (000) | | | | |
SECURITIES LENDING COLLATERAL — (14.6%) | | | | | | |
§@DFA Short Term Investment Fund LP | | 1,055,086,714 | | 1,055,086,714 | | 17.1% |
@Repurchase Agreement, Deutsche Bank Securities 0.07%, 11/02/09 (Collateralized by various corporate obligations, ranging in par value from $4,247,617 to $16,429,280, rates ranging from 5.000% to 7.000%, maturities ranging from 03/01/37 to 10/01/39, valued at $1,212,860) to be repurchased at $1,189,085 | | $1,189 | | 1,189,078 | | 0.0% |
| | | | | | |
TOTAL SECURITIES LENDING COLLATERAL | | | | 1,056,275,792 | | 17.1% |
| | | | | | |
TOTAL INVESTMENTS — (100.0%) | | | | | | |
(Cost $5,830,288,347) | | | | $7,226,155,976 | | 116.7% |
| | | | | | |
23
THE DFA INTERNATIONAL VALUE SERIES
CONTINUED
Summary of inputs used to value the Series’ net assets as of October 31, 2009 is as follows (See Security Valuation Note):
| | | | | | | | | | | |
| | | Valuation Inputs |
| |
| | | Investment in Securities (Market Value) |
| | | Level 1 | | Level 2 | | Level 3 | | Total |
Common Stocks | | | | | | | | | | | |
Australia | | $ | 2,073,789 | | $ | 319,950,018 | | — | | $ | 322,023,807 |
Austria | | | — | | | 34,182,743 | | — | | | 34,182,743 |
Belgium | | | 3,586,620 | | | 34,433,333 | | — | | | 38,019,953 |
Canada | | | 548,308,430 | | | — | | — | | | 548,308,430 |
Denmark | | | — | | | 77,023,723 | | — | | | 77,023,723 |
Finland | | | 1,516,659 | | | 38,934,661 | | — | | | 40,451,320 |
France | | | 3,494,320 | | | 594,603,080 | | — | | | 598,097,400 |
Germany | | | 98,912,195 | | | 436,552,947 | | — | | | 535,465,142 |
Greece | | | 4,501,802 | | | 14,518,100 | | — | | | 19,019,902 |
Hong Kong | | | — | | | 197,933,485 | | — | | | 197,933,485 |
Ireland | | | 57,893 | | | — | | — | | | 57,893 |
Italy | | | 29,729,570 | | | 180,863,864 | | — | | | 210,593,434 |
Japan | | | 56,497,996 | | | 792,846,454 | | — | | | 849,344,450 |
Malaysia | | | — | | | — | | — | | | — |
Netherlands | | | 10,297,313 | | | 259,044,885 | | — | | | 269,342,198 |
New Zealand | | | — | | | 8,185,686 | | — | | | 8,185,686 |
Norway | | | 401,330 | | | 75,290,117 | | — | | | 75,691,447 |
Portugal | | | — | | | 13,072,321 | | — | | | 13,072,321 |
Singapore | | | — | | | 116,708,477 | | — | | | 116,708,477 |
Spain | | | 131,434,682 | | | 205,115,519 | | — | | | 336,550,201 |
Sweden | | | 7,351,053 | | | 201,759,435 | | — | | | 209,110,488 |
Switzerland | | | 46,226,255 | | | 409,669,054 | | — | | | 455,895,309 |
United Kingdom | | | 564,527,406 | | | 636,366,934 | | — | | | 1,200,894,340 |
Rights/Warrants | | | | | | | | | | | |
Germany | | | — | | | 41,059 | | — | | | 41,059 |
Italy | | | 76,976 | | | — | | — | | | 76,976 |
Temporary Cash Investments | | | — | | | 13,790,000 | | — | | | 13,790,000 |
Securities Lending Collateral | | | — | | | 1,056,275,792 | | — | | | 1,056,275,792 |
| | | | | | | | | | | |
TOTAL | | $ | 1,508,994,289 | | $ | 5,717,161,687 | | — | | $ | 7,226,155,976 |
| | | | | | | | | | | |
See accompanying Notes to Financial Statements.
24
THE DFA INVESTMENT TRUST COMPANY
THE DFA INTERNATIONAL VALUE SERIES
STATEMENT OF ASSETS AND LIABILITIES
OCTOBER 31, 2009
(Amounts in thousands)
| | | |
ASSETS: | | | |
Investments at Value (including $1,004,314 of securities on loan) | | $ | 6,156,090 |
Temporary Cash Investments at Value & Cost | | | 13,790 |
Collateral Received from Securities on Loan at Value & Cost | | | 1,056,276 |
Foreign Currencies at Value | | | 19,131 |
Cash | | | 16 |
Receivables: | | | |
Investment Securities Sold | | | 10,656 |
Dividends, Interest and Tax Reclaims | | | 10,784 |
Securities Lending Income | | | 444 |
Fund Shares Sold | | | 724 |
Unrealized Gain on Foreign Currency Contracts | | | 19 |
| | | |
Total Assets | | | 7,267,930 |
| | | |
LIABILITIES: | | | |
Payables: | | | |
Upon Return of Securities Loaned | | | 1,056,276 |
Investment Securities Purchased | | | 14,723 |
Fund Shares Redeemed | | | 3,518 |
Due to Advisor | | | 1,084 |
Accrued Expenses and Other Liabilities | | | 365 |
| | | |
Total Liabilities | | | 1,075,966 |
| | | |
NET ASSETS | | $ | 6,191,964 |
| | | |
Investments at Cost | | $ | 4,760,222 |
| | | |
Foreign Currencies at Cost | | $ | 19,163 |
| | | |
See accompanying Notes to Financial Statements.
25
THE DFA INVESTMENT TRUST COMPANY
THE DFA INTERNATIONAL VALUE SERIES
STATEMENT OF OPERATIONS
FOR THE YEAR ENDED OCTOBER 31, 2009
(Amounts in thousands)
| | | | |
Investment Income | | | | |
Dividends (Net of Foreign Taxes Withheld of $14,384) | | $ | 160,091 | |
Interest | | | 197 | |
Income from Securities Lending | | | 13,032 | |
| | | | |
Total Investment Income | | | 173,320 | |
| | | | |
Expenses | | | | |
Investment Advisory Services Fees | | | 9,991 | |
Accounting & Transfer Agent Fees | | | 549 | |
Custodian Fees | | | 688 | |
Shareholders’ Reports | | | 49 | |
Directors’/Trustees’ Fees & Expenses | | | 78 | |
Professional Fees | | | 221 | |
Other | | | 574 | |
| | | | |
Total Expenses | | | 12,150 | |
| | | | |
Net Investment Income (Loss) | | | 161,170 | |
| | | | |
Realized and Unrealized Gain (Loss) | | | | |
Net Realized Gain (Loss) on: | | | | |
Investment Securities Sold | | | 63,984 | |
Futures | | | (1,125 | ) |
Foreign Currency Transactions | | | 3,828 | |
Change in Unrealized Appreciation (Depreciation) of: | | | | |
Investment Securities and Foreign Currency | | | 1,395,836 | |
Translation of Foreign Currency Denominated Amounts | | | 240 | |
| | | | |
Net Realized and Unrealized Gain (Loss) | | | 1,462,763 | |
| | | | |
Net Increase (Decrease) in Net Assets Resulting from Operations | | $ | 1,623,933 | |
| | | | |
See accompanying Notes to Financial Statements.
26
THE DFA INVESTMENT TRUST COMPANY
THE DFA INTERNATIONAL VALUE SERIES
STATEMENTS OF CHANGES IN NET ASSETS
(Amounts in thousands)
| | | | | | | | | | | | |
| | | Year
Ended
Oct. 31,
2009 | | | Period
Dec. 1, 2007
to
Oct. 31, 2008 | | | Year
Ended
Nov. 30,
2007 | |
Increase (Decrease) in Net Assets | | | | | | | | | | | | |
Operations: | | | | | | | | | | | | |
Net Investment Income (Loss) | | $ | 161,170 | | | $ | 304,387 | | | $ | 274,613 | |
Net Realized Gain (Loss) on: | | | | | | | | | | | | |
Investment Securities Sold | | | 63,984 | | | | 137,811 | | | | 654,522 | |
Futures | | | (1,125 | ) | | | (1,153 | ) | | | — | |
Foreign Currency Transactions | | | 3,828 | | | | (4,593 | ) | | | 2,498 | |
In-Kind Redemptions | | | — | | | | 103,024 | * | | | — | |
Change in Unrealized Appreciation (Depreciation) of: | | | | | | | | | | | | |
Investment Securities and Foreign Currency | | | 1,395,836 | | | | (5,026,911 | ) | | | 403,307 | |
Futures | | | — | | | | 19 | | | | — | |
Translation of Foreign Currency Denominated Amounts | | | 240 | | | | (76 | ) | | | (180 | ) |
| | | | | | | | | | | | |
Net Increase (Decrease) in Net Assets Resulting from Operations | | | 1,623,933 | | | | (4,487,492 | ) | | | 1,334,760 | |
| | | | | | | | | | | | |
Transactions in Interest: | | | | | | | | | | | | |
Contributions | | | 449,410 | | | | 927,878 | † | | | 1,731,698 | † |
Withdrawals | | | (581,716 | ) | | | (1,378,770 | )*† | | | (884,989 | )† |
| | | | | | | | | | | | |
Net Increase (Decrease) from Transactions in Interest | | | (132,306 | ) | | | (450,892 | ) | | | 846,709 | |
| | | | | | | | | | | | |
Total Increase (Decrease) in Net Assets | | | 1,491,627 | | | | (4,938,384 | ) | | | 2,181,469 | |
Net Assets | | | | | | | | | | | | |
Beginning of Period | | | 4,700,337 | | | | 9,638,721 | | | | 7,457,252 | |
| | | | | | | | | | | | |
End of Period | | $ | 6,191,964 | | | $ | 4,700,337 | | | $ | 9,638,721 | |
| | | | | | | | | | | | |
| * | See Note J in the Notes to Financial Statements. |
| † | See Note A in the Notes to Financial Statements. |
See accompanying Notes to Financial Statements.
27
THE DFA INVESTMENT TRUST COMPANY
THE DFA INTERNATIONAL VALUE SERIES†
FINANCIAL HIGHLIGHTS
| | | | | | | | | | | | | | | | | | | | | | | | |
| | | Year Ended Oct. 31, 2009 | | | Period Dec. 1, 2007
to Oct. 31, 2008 | | | Year Ended Nov. 30, 2007 | | | Year Ended Nov. 30, 2006 | | | Year Ended Nov. 30, 2005 | | | Year Ended Nov. 30, 2004 | |
| | |
Total Return | | | 35.41 | % | | | (47.87 | )%(C) | | | 17.32 | % | | | 35.73 | % | | | 15.61 | % | | | 32.15 | % |
| | |
Net Assets, End of Period (thousands) | | $ | 6,191,964 | | | $ | 4,700,337 | | | $ | 9,638,721 | | | $ | 7,457,252 | | | $ | 4,367,698 | | | $ | 2,804,043 | |
Ratio of Expenses to Average Net Assets | | | 0.24 | % | | | 0.23 | %(B) | | | 0.23 | % | | | 0.23 | % | | | 0.27 | % | | | 0.28 | % |
Ratio of Net Investment Income to Average Net Assets | | | 3.22 | % | | | 4.15 | %(B) | | | 3.04 | % | | | 3.29 | % | | | 2.71 | % | | | 2.35 | % |
Portfolio Turnover Rate | | | 18 | % | | | 16 | %(C) | | | 16 | % | | | 8 | % | | | 10 | % | | | 15 | % |
| | |
See page 1 for the Definitions of Abbreviations and Footnotes.
| † | See Note A in the Notes to Financial Statements. |
See accompanying Notes to Financial Statements.
28
THE DFA INVESTMENT TRUST COMPANY
THE DFA INTERNATIONAL VALUE SERIES
NOTES TO FINANCIAL STATEMENTS
A. Organization:
The DFA Investment Trust Company (the “Trust”) is an open-end management investment company registered under the Investment Company Act of 1940. The Trust consists of twelve investment portfolios, of which The DFA International Value Series (the “Series”) is presented in this report.
On November 1, 2008, The DFA International Value Series, a master fund in a RIC/RIC master-feeder structure, elected with the consent of its respective Holder(s) to change its U.S. federal income tax classification from that of an association taxable as a corporation to a partnership pursuant to Treasury Regulation § 301.7701-3. The change in capital structure and retroactive reclassification of the statement of changes in net assets and financial highlights for the respective funds is a result of the treatment of a partnership for book purposes. The Series/Portfolio will maintain its books and records and present its financial statements in accordance with generally accepted accounting principles for investment partnerships.
At a regular meeting of the Board of Directors/Trustees (the “Board”) on September 16, 2008, the Board voted to change the fiscal and tax year ends of the Series from November 30 to October 31.
B. Significant Accounting Policies:
The following significant accounting policies are in conformity with accounting principles generally accepted in the United States of America. Such policies are consistently followed by the Trust in preparation of its financial statements. The preparation of financial statements in accordance with accounting principles generally accepted in the United States of America requires management to make estimates and assumptions that affect the reported amounts of assets and liabilities and disclosure of contingent assets and liabilities at the date of the financial statements and the reported amounts of increases and decreases in net assets from operations during the reporting period. Actual results could differ from those estimates and those differences could be material.
1. Security Valuation: Securities held by the Series (including over-the-counter securities) are valued at the last quoted sale price of the day. Securities held by the Series that are listed on Nasdaq are valued at the Nasdaq Official Closing Price (“NOCP”). If there is no last reported sale price or NOCP for the day, the Series values the securities at the mean of the most recent quoted bid and asked prices. Price information on listed securities is taken from the exchange where the security is primarily traded. Generally, securities issued by open-end investment companies are valued using their respective net asset values or public offering prices, as appropriate, for purchase orders placed at the close of the New York Stock Exchange (NYSE).
Securities for which no market quotations are readily available (including restricted securities), or for which market quotations have become unreliable, are valued in good faith at fair value in accordance with procedures adopted by the Board of Directors/Trustees. Fair value pricing may also be used if events that have a significant effect on the value of an investment (as determined in the discretion of the Investment Committee of the Advisor) occur before the net asset value is calculated. When fair value pricing is used, the prices of securities used by the Series may differ from the quoted or published prices for the same securities on their primary markets or exchanges.
The Series will also fair value price in the circumstances described below. Generally, trading in foreign securities markets is completed each day at various times prior to the close of the NYSE. For example, trading in the Japanese securities markets is completed each day at the close of Tokyo Stock Exchange (normally 11:00 p.m. PT), which is fourteen hours prior to the close of the NYSE (normally 1:00 p.m. PT) and the time that the net asset value of the Series is computed. Due to the time differences between the closings of the relevant foreign securities exchanges and the time the Series prices its shares at the close of the NYSE, the Series will fair value its foreign investments when it is determined that the market quotations for the foreign investments are either unreliable or not readily available. The fair value prices will attempt to reflect the impact of the U.S. financial markets’ perceptions and
29
trading activities on the Series’ foreign investments since the last closing prices of the foreign investments were calculated on their primary foreign securities markets or exchanges. For these purposes, the Board of Directors/Trustees of the Series has determined that movements in relevant indices or other appropriate market indicators, after the close of the Tokyo Stock Exchange or the London Stock Exchange, demonstrate that market quotations may be unreliable. Fair valuation of portfolio securities may occur on a daily basis. The fair value pricing by the Series utilizes data furnished by an independent pricing service (and that data draws upon, among other information, the market values of foreign investments). When the Series uses fair value pricing, the values assigned to the Series’ foreign investments may not be the quoted or published prices of the investments on their primary markets or exchanges.
Futures contracts held by the Series are valued using the settlement price established each day on the exchange on which they are traded.
The Series utilizes a fair value hierarchy which prioritizes the inputs to valuation techniques used to measure fair value into three broad levels described below:
— Level 1 – quoted prices in active markets for identical securities
— Level 2 – other significant observable inputs (including quoted prices for similar securities, interest rates, prepayment speeds, credit risk, etc.)
— Level 3 – significant unobservable inputs (including the Series’ own assumptions in determining the fair value of investments)
A summary of the inputs used to value the Series’ net assets by each major security type, industry and/or country is disclosed at the end of the Summary Schedule of Portfolio Holdings. The inputs or methodology used for valuing securities are not necessarily an indication of the risk associated with investing in those securities.
2. Foreign Currency Translation: Securities and other assets and liabilities of the Series whose values are initially expressed in foreign currencies are translated to U.S. dollars using the mean between the most recently quoted bid and asked prices for the U.S. dollar as quoted by generally recognized reliable sources. Dividend and interest income and certain expenses are translated to U.S. dollars at the rate of exchange on their respective accrual dates. Receivables and payables denominated in foreign currencies are marked to market daily based on daily exchange rates. Exchange gains or losses are realized upon ultimate receipt or disbursement.
The Series does not isolate the effect of fluctuations in foreign exchange rates from the effect of fluctuations in the market prices of securities held whether realized or unrealized.
Realized gains or losses on foreign currency transactions represent net foreign exchange gains or losses from the disposition of foreign currencies, currency gains or losses realized between the trade and settlement dates on securities transactions, and the difference between amounts of interest, dividends and foreign withholding taxes recorded on the books of the Series and the U.S. dollar equivalent amounts actually received or paid.
3. Deferred Compensation Plan: Each eligible Trustee of the Trust may elect participation in the Deferred Compensation Plan (the “Plan”). Under the Plan, effective January 1, 2002, such Trustees may defer payment of all or a portion of their total fees earned as a Trustee. These deferred amounts may be treated as though such amounts had been invested in shares of the following funds: U.S. Large Cap Value Portfolio; U.S. Core Equity 1 Portfolio; U.S. Core Equity 2 Portfolio; U.S. Vector Equity Portfolio; U.S. Micro Cap Portfolio; DFA International Value Portfolio; International Core Equity Portfolio; Emerging Markets Portfolio; Emerging Markets Core Equity Portfolio; and/or DFA Two-Year Global Fixed Income Portfolio. Contributions made under the Plan and the change in unrealized appreciation (depreciation) and income are included in Directors’/Trustees’ Fees & Expenses. At October 31, 2009, the total liability for deferred compensation to Trustees is included in Accrued Expenses and Other Liabilities on the Statement of Assets and Liabilities in the amount of $143 (in thousands).
Each Trustee has the option to receive their distribution of proceeds in one of the following methods upon one year’s notice: lump sum; annual installments over a period of agreed upon years; or semi-annual installments over a period of agreed upon years. As of October 31, 2009, none of the Trustees have requested distribution of proceeds.
30
4. Other: Security transactions are accounted for as of the trade date. Costs used in determining realized gains and losses on the sale of investment securities are on the basis of identified cost. Dividend income and distributions to shareholders are recorded on the ex-dividend date. Distributions received on securities that represent a return of capital or capital gains are recorded as a reduction of cost of investments or as a realized gain, respectively. The Series estimates the character of distributions received that may be considered return of capital distributions or capital gain distributions. Interest income is recorded on the accrual basis. Discount and premium on securities purchased are amortized over the lives of the respective securities utilizing the effective interest method. Expenses directly attributable to a Series are directly charged. Common expenses of the Trust are allocated using methods approved by the Board of Directors/Trustees, generally based on average net assets.
The Series may be subject to taxes imposed by countries in which it invests, with respect to its investments in issuers exiting or operating in such countries. Such taxes are generally based on income earned or repatriated and capital gains realized on the sale of such investments. The Series accrues such taxes when the related income or capital gains are earned or throughout the holding period. Some countries require governmental approval for the repatriation of investment income, capital or the proceeds of sales earned by foreign investors. In addition, if there is a deterioration in a country’s balance of payments or for other reasons, a country may impose temporary restrictions on foreign capital remittances abroad.
C. Investment Advisor:
Dimensional Fund Advisors LP (“Dimensional” or the “Advisor”) provides investment advisory services to the Series. For the year ended October 31, 2009, the Series’ investment advisory services fees were accrued daily and paid monthly to the Advisor based on an effective annual rate of 0.20% of average daily net assets of the Series.
Fees Paid to Officers and Directors/Trustees:
Certain Officers and Directors/Trustees of the Advisor are also Officers and Directors/Trustees of the Trust; however, such Officers and Directors/Trustees (with the exception of the Chief Compliance Officer (“CCO”)) receive no compensation from the Trust. For the year ended October 31, 2009, the total related amounts paid by the Trust to the CCO were $98 (in thousands). The total related amounts paid by the Series are included in Other Expenses on the Statement of Operations.
D. Purchases and Sales of Securities:
For the year ended October 31, 2009, the Series made the following purchases and sales of investment securities, other than short-term securities and U.S. government securities (amounts in thousands):
| | | |
Purchases | | $ | 1,071,984 |
Sales | | | 935,775 |
There were no purchases or sales of long-term U.S. government securities.
E. Federal Income Taxes:
No provision for federal income taxes is required since the Series is treated as a partnership for federal income tax purposes. Any net investment income and realized and unrealized gains and losses have been deemed to have been “passed down” to its partners.
31
At October 31, 2009, the total cost and aggregate gross unrealized appreciation and (depreciation) of securities for federal income tax purposes were different from amounts reported for financial reporting purposes (amounts in thousands):
| | | | | | |
Federal Tax Cost | | Unrealized
Appreciation | | Unrealized
(Depreciation) | | Net
Unrealized
Appreciation
(Depreciation) |
$5,830,471 | | $1,458,762 | | $(63,077) | | $1,395,685 |
Accounting for Uncertainty in Income Taxes sets forth a minimum threshold for financial statement recognition of the benefit of a tax position taken or expected to be taken on a tax return. Management has analyzed the Series’ tax position and has concluded that no provision for income tax is required in the Series’ financial statements. The Series’ is not aware of any tax position for which it is reasonably possible that the total amounts of unrecognized tax benefits will significantly change in the next twelve months. The Series’ federal tax returns for the prior three fiscal years remain subject to examination by the Internal Revenue Service.
On November 1, 2008, The DFA International Value Series, a master fund in a RIC/RIC master-feeder structure with five RIC feeders and other direct client investor(s), made a “Check-the-box” election for federal income tax purposes pursuant to Treasury Regulation §301.7701-3, to change its federal entity classification from a corporation taxable as a regulated investment company to a partnership. As a result of this election, the master fund is deemed to have distributed all of its assets and liabilities, in a taxable transaction, to its shareholders in liquidation of the master fund. Immediately thereafter, the shareholders contributed all of the distributed assets and liabilities to a newly formed partnership. The final tax year end of The DFA International Value Series was October 31, 2008. For Federal income tax purposes, pursuant to Internal Revenue Code §336(a), the master fund recognizes gain or loss as if the master’s investment securities were sold to its shareholders and, pursuant to IRC Code §331, each of the Portfolios recognizes gain or loss as if it liquidated its investment in the master. As a result of the transaction, The DFA International Value Series recognized a ($2,309,440,866) and ($718,733) capital and currency loss respectively for tax year ended October 31, 2008. For tax purposes, pursuant to IRC Code §334(a), each of the Portfolios will take a fair market value basis in the securities deemed received by them and a new holding period for those securities commences on the deemed liquidation date.
F. Financial Instruments:
In accordance with the Series’ investment objectives and policies, the Series may invest in certain financial instruments that have off-balance sheet risk in excess of the amounts recognized in the financial statements and concentrations of credit and market risk. These instruments and their significant corresponding risks are described below:
1. Repurchase Agreements: The Series may purchase certain U.S. Government securities subject to the counterparty’s agreement to repurchase them at an agreed upon date and price. The counterparty will be required on a daily basis to maintain the value of the collateral subject to the agreement at not less than the repurchase price (including accrued interest). The agreements are conditioned upon the collateral being deposited under the Federal Reserve book-entry system with the Trust’s custodian or a third party sub-custodian. In the event of default or bankruptcy by the other party to the agreement, retention of the collateral may be subject to legal proceedings. All open repurchase agreements were entered into on October 30, 2009.
2. Foreign Market Risks: Investments in foreign markets may involve certain considerations and risks not typically associated with investments in the United States of America, including the possibility of future political and economic developments and the level of foreign government supervision and regulation of foreign securities markets. These markets are generally smaller, less liquid and more volatile than the major securities markets in the United States of America. Consequently, acquisition and disposition of securities by the Series may be inhibited.
32
Derivative Financial Instruments:
Disclosures on derivative instruments and hedging activities are intended to improve financial reporting for derivative instruments by enabling investors to understand how and why a fund uses derivatives, how derivatives are accounted for and how derivative instruments affect a fund’s results of operations and financial position. Summarized below are the specific types of derivative instruments used by the Series.
3. Futures Contracts: The Series may enter into futures contracts to gain market exposure on uninvested cash pending investment in securities or to maintain liquidity to pay redemptions. Upon entering into a futures contract, the Series deposits cash or pledges U.S. Government securities to a broker, equal to the minimum “initial margin” requirements of the exchange on which the contract is traded. Subsequent payments are received from or paid to the broker each day, based on the daily fluctuation in the market value of the contract. These receipts or payments are known as “variation margin” and are recorded daily by the Series as unrealized gains or losses until the contracts are closed. When the contracts are closed, the Series records a realized gain or loss, which is presented in the Statement of Operations as a net realized gain or loss on futures, equal to the difference between the value of the contract at the time it was opened and the value at the time it was closed.
Risks may arise upon entering into futures contracts from potential imperfect price correlations between the futures contracts and the underlying securities, from the possibility of an illiquid secondary market for these instruments and from the possibility that the Series could lose more than the initial margin requirements. The Series entering into stock index futures are subject to equity price risk from those futures contracts. Counterparty credit risk related to exchange-traded futures is minimal because the exchange’s clearinghouse, as counterparty to all exchange-traded futures, guarantees the futures against default.
Additional disclosure on derivative instruments is required showing a summary by primary risk exposure of the derivatives instruments’ (i) location in the balance sheet and fair value at period end and (ii) the location in the Statement of Operations and the realized and change in unrealized gain or loss over the reporting period. The following is a summary of the Series’ derivative instrument holdings for the year ended October 31, 2009.
At October 31, 2009, the Series had no outstanding futures contracts.
The following is a summary of the Series’ location and value of realized gains and losses on the Series’ Statement of Operations for the Series’ derivative instrument holdings through the year ended October 31, 2009 (amounts in thousands):
| | | | |
| | | Location on the Statement of Operations | | Realized Gain (Loss)
on Derivatives
Recognized in Income |
| | | Equity
Contracts |
| | Net Realized Gain (Loss) on: | | |
| The DFA International Value Series* | | Futures | | $(1,125) |
| * | As of October 31, 2009, there were no futures contracts outstanding. During the year ended October 31, 2009, the Series had limited activity in these transactions. |
G. Line of Credit:
The Trust, together with other Dimensional-advised portfolios, has entered into an amended and restated $250 million unsecured discretionary line of credit effective July 8, 2009 with an affiliate of its domestic custodian bank. Each portfolio is permitted to borrow, subject to its investment limitations, up to a maximum of $250 million, as long as total borrowings under the line of credit do not exceed $250 million in the aggregate. Borrowings under the line of credit are charged interest at the then current Federal Funds Rate plus 1%. Each portfolio is individually, and not jointly, liable for its particular advances under the line of credit. There is no commitment fee on the unused portion of the line of credit. The agreement for the discretionary line of credit may be terminated by either party at any time.
33
The line of credit is scheduled to expire on June 22, 2010. There were no borrowings by the Series under this line of credit during the year ended October 31, 2009.
The Trust, together with other Dimensional-advised portfolios, has also entered into an additional $500 million unsecured line of credit effective January 15, 2009 with its international custodian bank. Each portfolio is permitted to borrow, subject to its investment limitations, up to a maximum of $500 million, as long as total borrowings under the line of credit do not exceed $500 million in the aggregate. Borrowings under the line of credit are charged interest at rates agreed to by the parties at the time of borrowing. Each portfolio is individually, and not jointly, liable for its particular advances under the line of credit. There is no commitment fee on the unused portion of the line of credit. The agreement for the line of credit expires on January 15, 2010.
For the year ended October 31, 2009, borrowings by the Series under this line of credit were as follows (amounts in thousands, except percentages and days):
| | | | | | | | |
Weighted Average Interest Rate | | Weighted
Average
Loan Balance | | Number of
Days
Outstanding | | Interest
Expense
Incurred | | Maximum Amount
Borrowed During
the Period |
0.95% | | $8,517 | | 11 | | $2 | | $18,062 |
There were no outstanding borrowings by the Series under this line of credit as of October 31, 2009.
H. Securities Lending:
As of October 31, 2009, the Series had securities on loan to brokers/dealers, for which the Series held cash collateral. The Series invests the cash collateral, as described below, and records a liability for the return of the collateral, during the period the securities are on loan. Loans of securities are expected at all times to be secured by collateral equal to at least (i) 100% of the current market value of the loaned securities with respect to securities of the U.S. government or its agencies, (ii) 102% of the current market value of the loaned securities with respect to U.S. securities, and (iii) 105% of the current market value of the loaned securities with respect to foreign securities. However, daily market fluctuations could cause the Series’ collateral to be lower or higher than the expected thresholds. If this were to occur, the collateral would be adjusted the next business day to ensure adequate collateralization. In the event of default or bankruptcy by the other party to the agreement, realization and/or retention of the collateral may be subject to legal proceedings. If the borrower fails to return loaned securities, and cash collateral being maintained by the borrower is insufficient to cover the value of loaned securities and provided such collateral insufficiency is not the result of investment losses, the lending agent has agreed to pay the amount of the shortfall to the Series or, at the option of the lending agent, to replace the securities.
Subject to the Series’ investment policy, the cash collateral received by the Series from securities on loan is invested in securities of the U.S. government or its agencies, repurchase agreements collateralized by securities of the U.S. government or its agencies or shares of the DFA Short-Term Investment Fund LP. Agencies include both agency debentures and agency mortgage backed securities. In addition, the Series will be able to terminate the loan at any time and will receive reasonable interest on the loan, as well as amounts equal to any dividends, interest or other distributions on the loaned securities. However, dividend income received from loaned securities may not be eligible to be taxed at qualified dividend income rates.
I. Indemnities; Contractual Obligations:
Under the Trust’s organizational documents, its officers and directors are indemnified against certain liabilities arising out of the performance of their duties to the Trust.
In the normal course of business, the Trust enters into contracts that contain a variety of representations and warranties which provide general indemnification. The Trust’s maximum exposure under these arrangements is unknown as this would involve future claims that may be made against the Trust and/or its affiliates that have not yet occurred. However, based on experience, the Trust expects the risk of loss to be remote.
34
J. In-Kind Redemptions:
In accordance with guidelines described in the Series’ prospectus, the Series may distribute portfolio securities rather than cash as payment for a redemption of fund shares (In-Kind redemption). For financial reporting purposes, the Series recognizes a gain on In-Kind redemptions to the extent the value of the distributed securities on the date of redemption exceeds the cost of those securities. Gains and losses realized on In-Kind redemptions are not recognized for tax purposes and are reclassified from undistributed realized gain (loss) to paid-in capital. During the period December 1, 2007 to October 31, 2008, the Series realized $103,024 (in thousands) of net gain.
K. Subsequent Event Evaluations:
Management has evaluated the impact of all subsequent events on the Series through December 23, 2009, the date the financial statements were available for issuance, and has determined that there are no subsequent events requiring recognition or disclosure in the financial statements.
35
REPORT OF INDEPENDENT REGISTERED PUBLIC ACCOUNTING FIRM
To the Shareholders of The DFA International Value Series and
Board of Trustees of The DFA Investment Trust Company:
In our opinion, the accompanying statements of assets and liabilities, including the summary schedules of portfolio holdings, and the related statements of operations and of changes in net assets and the financial highlights presents fairly, in all material respects, the financial position of The DFA International Value Series (one of the portfolios constituting The DFA Investment Trust Company, hereafter referred to as the “Series”) at October 31, 2009, the results of its operations for the year then ended, the changes in its net assets and the financial highlights for each of the periods indicated, in conformity with accounting principles generally accepted in the United States of America. These financial statements and financial highlights (hereafter referred to as “financial statements”) are the responsibility of the Series’ management; our responsibility is to express an opinion on these financial statements based on our audits. We conducted our audits of these financial statements in accordance with the standards of the Public Company Accounting Oversight Board (United States). Those standards require that we plan and perform the audit to obtain reasonable assurance about whether the financial statements are free of material misstatement. An audit includes examining, on a test basis, evidence supporting the amounts and disclosures in the financial statements, assessing the accounting principles used and significant estimates made by management, and evaluating the overall financial statement presentation. We believe that our audits, which included confirmation of securities at October 31, 2009 by correspondence with the custodian, brokers and the transfer agent of the investee fund, provide a reasonable basis for our opinion.
PricewaterhouseCoopers LLP
Philadelphia, Pennsylvania
December 23, 2009
36
RESULTS OF THE SHAREHOLDER MEETING
On June 2, 2009 and June 5, 2009, The DFA Investment Trust Company (“DFAITC”) held a Special Joint Meeting of Shareholders for the purpose of voting on several proposals affecting DFAITC and the Series, including, among other items, the election of Trustees, the amendment of certain fundamental investment limitations, and the elimination of certain fundamental investment limitations. The shareholders of the Series approved each of the applicable proposals for DFAITC and the Series presented at the Meeting. Listed below are the voting results from the Meeting. Please note that not all Proposals presented at the Meeting were voted on by the Series. Additionally, the Proposal numbers reflected below correlate to the Proposal numbers presented for vote at the Meeting.
DFAITC
| | | | | | | | | | | | | | | | | | | | |
| | | | | Shares Voted | | Percent of Outstanding Shares Voted |
| | | | | For | | % | | Against | | % | | Abstain/WithHold | | % | | For | | Against | | Abstain / WithHold |
Proposal 1: Election of Trustees for DFAITC* | | | | | | | | | | | | |
1a | | David G. Booth | | 2,166,359,402 | | 96.50% | | — | | 0.00% | | 78,661,259 | | 3.50% | | 95.78% | | 0.00% | | 3.48% |
1b | | George M. Constantinides | | 2,169,219,982 | | 96.62% | | — | | 0.00% | | 75,800,679 | | 3.38% | | 95.90% | | 0.00% | | 3.35% |
1c | | John P. Gould | | 2,168,577,186 | | 96.59% | | — | | 0.00% | | 76,443,476 | | 3.41% | | 95.88% | | 0.00% | | 3.38% |
1d | | Roger G. Ibbotson | | 2,169,778,365 | | 96.65% | | — | | 0.00% | | 75,242,297 | | 3.35% | | 95.93% | | 0.00% | | 3.33% |
1e | | Robert C. Merton | | 2,170,124,638 | | 96.66% | | — | | 0.00% | | 74,896,023 | | 3.34% | | 95.94% | | 0.00% | | 3.31% |
1f | | Myron S. Scholes | | 2,169,439,189 | | 96.63% | | — | | 0.00% | | 75,581,473 | | 3.37% | | 95.91% | | 0.00% | | 3.34% |
1g | | Eduardo A. Repetto | | 2,167,010,793 | | 96.53% | | — | | 0.00% | | 78,009,868 | | 3.47% | | 95.81% | | 0.00% | | 3.45% |
1h | | Abbie J. Smith | | 2,169,626,842 | | 96.64% | | — | | 0.00% | | 75,393,820 | | 3.36% | | 95.92% | | 0.00% | | 3.33% |
| | | | | | | | | | | | | | | | | | | | | | |
| | | Shares Voted | | Percent of Outstanding Shares Voted |
| | | For | | % | | Against | | % | | Abstain/WithHold | | % | | NonVote | | % | | For | | Against | | Abstain / WithHold |
Proposal 4: Approval of an Amended and Restated Agreement and Declaration of Trust for DFAITC* | | 2,076,877,329 | | 92.43% | | 36,623,148 | | 1.63% | | 133,356,326 | | 5.94% | | NA | | NA | | 91.82% | | 1.62% | | 5.90% |
* Results are for all Series within DFAITC
The DFA International Value Series
| | | | | | | | | | | | | | | | | | | | |
| | | | | Shares Voted | | Percent of Outstanding Shares Voted |
| | | | | For | | % | | Against | | % | | Abstain/WithHold | | % | | For | | Against | | Abstain / WithHold |
Proposals: | | | | | | | | | | | | |
5 | | To approve amendments to certain fundamental investment restrictions | | | | | | | | |
5a | | Borrowing Money | | 349,117,663 | | 88.20% | | 30,044,848 | | 7.59% | | 16,661,166 | | 4.21% | | 86.14% | | 7.41% | | 4.11% |
5b | | Making Loans | | 348,947,065 | | 88.16% | | 29,971,477 | | 7.57% | | 16,905,135 | | 4.27% | | 86.10% | | 7.40% | | 4.17% |
5c | | Investments in Real Estate | | 351,165,048 | | 88.72% | | 28,070,820 | | 7.09% | | 16,587,809 | | 4.19% | | 86.65% | | 6.93% | | 4.09% |
5d | | Investments in Commodities | | 347,839,401 | | 87.88% | | 31,372,412 | | 7.93% | | 16,611,864 | | 4.20% | | 85.82% | | 7.74% | | 4.10% |
5e | | Diversification of Investments | | 351,038,355 | | 88.69% | | 28,302,302 | | 7.15% | | 16,483,020 | | 4.16% | | 86.61% | | 6.98% | | 4.07% |
6 | | To approve the elimination of certain fundamental investment restrictions | | | | | | | | |
6a | | Pledging, Mortgaging, or Hypothecating Assets | | 346,783,275 | | 87.61% | | 32,195,687 | | 8.13% | | 16,844,715 | | 4.26% | | 85.56% | | 7.94% | | 4.16% |
6b | | Purchasing Securities on Margin | | 346,279,680 | | 87.48% | | 32,728,442 | | 8.27% | | 16,815,555 | | 4.25% | | 85.44% | | 8.08% | | 4.15% |
6c | | Investing in Restricted or Illiquid Securities | | 346,650,940 | | 87.58% | | 32,506,501 | | 8.21% | | 16,666,236 | | 4.21% | | 85.53% | | 8.02% | | 4.11% |
6d | | Investing for the Purpose of Exercising Control | | 349,242,494 | | 88.23% | | 29,958,913 | | 7.57% | | 16,621,270 | | 4.20% | | 86.17% | | 7.39% | | 4.10% |
6e | | Investing in Other Investment Companies | | 349,373,590 | | 88.26% | | 29,787,506 | | 7.53% | | 16,662,582 | | 4.21% | | 86.20% | | 7.35% | | 4.11% |
6f | | Management Ownership of Securities of an Issuer | | 349,991,995 | | 88.42% | | 28,988,874 | | 7.32% | | 16,842,809 | | 4.26% | | 86.36% | | 7.15% | | 4.16% |
6g | | Investing in Oil, Gas, or other Mineral Exploration, Leases or Development Programs | | 348,999,679 | | 88.17% | | 30,314,009 | | 7.66% | | 16,509,990 | | 4.17% | | 86.11% | | 7.48% | | 4.07% |
6h | | Investing in Securities of Unseasoned Issuers | | 349,376,398 | | 88.27% | | 29,792,320 | | 7.53% | | 16,653,959 | | 4.21% | | 86.20% | | 7.35% | | 4.11% |
6i | | Investing in Warrants | | 349,983,930 | | 88.42% | | 29,092,914 | | 7.35% | | 16,745,833 | | 4.23% | | 86.35% | | 7.18% | | 4.13% |
6j | | Writing or Acquiring Options | | 349,310,900 | | 88.25% | | 29,764,139 | | 7.52% | | 16,747,638 | | 4.23% | | 86.19% | | 7.34% | | 4.13% |
7a | | Proposed Sub-Advisory Agreement among Dimensional Fund Advisors LP, DFA Australia Limited, and the Company | | 355,560,358 | | 89.83% | | 17,051,279 | | 4.31% | | 23,212,041 | | 5.86% | | 87.73% | | 4.21% | | 5.73% |
37
| | | | | | | | | | | | | | | | | | | | |
| | | | | Shares Voted | | Percent of Outstanding Shares Voted |
| | | | | For | | % | | Against | | % | | Abstain/WithHold | | % | | For | | Against | | Abstain / WithHold |
Proposals: | | | | | | | | | | | | | | | | | | |
7b | | Proposed Sub-Advisory Agreement among Dimensional Fund Advisors LP, Dimensional Fund Advisors Ltd., and the Company | | 355,594,969 | | 89.84% | | 16,996,602 | | 4.29% | | 23,232,105 | | 5.87% | | 87.74% | | 4.19% | | 5.73% |
38
FUND MANAGEMENT
Trustees/Directors
Each Board of Trustees/Directors of The DFA Investment Trust Company Inc. (“DFAITC”), DFA Investment Dimensions Group Inc. (“DFAIDG”), Dimensional Investment Group Inc. (“DIG”) and Dimensional Emerging Markets Value Fund (“DEM”) (each, the “Fund” and collectively, the “Funds”) is responsible for establishing the Funds’ policies and for overseeing the management of the Funds. The Trustees/Directors of the Funds, including all of the disinterested Directors, have adopted written procedures to monitor potential conflicts of interest that might develop between portfolios of the Funds (the “Feeder Portfolios”) that invest in certain series of DFAITC or DEM (the “Master Funds”).
Each Board has two standing committees, an Audit Committee and a Portfolio Performance and Service Review Committee (the “Performance Committee”). The Audit Committee is comprised of George M. Constantinides, Roger G. Ibbotson and Abbie J. Smith. Each member of the Audit Committee is a disinterested Director. The Audit Committee oversees the Fund’s accounting and financial reporting policies and practices, the Fund’s internal controls, the Fund’s financial statements and the independent audits thereof and performs other oversight functions as requested by the Board. The Audit Committee recommends the appointment of each Fund’s independent registered certified public accounting firm and also acts as a liaison between the Fund’s independent registered certified public accounting firm and the full Board. There were two Audit Committee meetings held during the fiscal year ended October 31, 2009.
Each Board’s Performance Committee is comprised of Messrs. Constantinides and Ibbotson, Ms. Smith, John P. Gould, Myron S. Scholes and Robert C. Merton. Each member of the Fund’s Performance Committee is a disinterested Director. The Performance Committee regularly reviews and monitors the investment performance of the Fund’s series and reviews the performance of the Fund’s service providers. There were six Performance Committee meetings held during the fiscal year ended October 31, 2009.
Certain biographical information for each disinterested Trustee/Director and each interested Trustee/Director of the Funds is set forth in the tables below, including a description of each Trustee/Director’s experience as a Trustee/ Director of the Funds and as a director or trustee of other funds, as well as other recent professional experience.
The statements of additional information (together, “SAI”) of the Funds include additional information about each Trustee/Director. You may obtain copies of the SAI and prospectus of each Fund advised by Dimensional Fund Advisors LP by calling collect (512) 306-7400 or by mailing a request to Dimensional Fund Advisors LP, 6300 Bee Cave Road, Building One, Austin, Texas 78746. Prospectuses are also available at www.dimensional.com.
| | | | | | |
Name, Position with the Fund, Address and Age | | Term of Office1 and Length of Service | | Portfolios within the DFA Fund Complex2 Overseen | | Principal Occupation(s)
During Past 5 Years and Other Directorships of Public
Companies Held |
| Disinterested Trustees/Directors |
George M. Constantinides Director of DFAIDG, DIG and DEM. Trustee of DFAITC. The University of Chicago Booth School of Business 5807 S. Woodlawn Avenue Chicago, IL 60637 Age: 62 | | DFAITC - since 1993 DFAIDG - since 1983 DIG - since 1993 DEM - since 1993 | | 87 portfolios in 4 investment companies | | Leo Melamed Professor of Finance, The University of Chicago Booth School of Business. |
John P. Gould Director of DFAIDG, DIG and DEM. Trustee of DFAITC. The University of Chicago Booth School of Business 5807 S. Woodlawn Avenue Chicago, IL 60637 Age: 70 | | DFAITC - since 1993 DFAIDG - since 1986 DIG - since 1993 DEM - since 1993 | | 87 portfolios in 4 investment companies | | Steven G. Rothmeier Distinguished Service Professor of Economics, The University of Chicago Booth School of Business (since 1965). Member of the Boards of Milwaukee Mutual Insurance Company (since 1997). Member and Chair, Competitive Markets Advisory Committee, Chicago Mercantile Exchange (futures trading exchange) (since 2004). Formerly, Director of UNext, Inc. (1999-2006). Formerly, Senior Vice-President, Lexecon Inc. (economics, law, strategy and finance consulting) (1994-2004). Trustee, Harbor Fund (registered investment company) (27 Portfolios) (since 1994). |
39
| | | | | | |
Name, Position with the Fund, Address and Age | | Term of Office1 and Length of Service | | Portfolios within the DFA Fund Complex2 Overseen | | Principal Occupation(s)
During Past 5 Years and Other Directorships of Public
Companies Held |
Roger G. Ibbotson Director of DFAIDG, DIG and DEM. Trustee of DFAITC. Yale School of Management 135 Prospect Street New Haven, CT 06520-8200 Age: 66 | | DFAITC - since 1993 DFAIDG - since 1981 DIG - since 1993 DEM - since 1993 | | 87 portfolios in 4 investment companies | | Professor in Practice of Finance, Yale School of Management (since 1984). Director, BIRR Portfolio Analysis, Inc. (software products) (since 1990). Chairman, CIO and Partner, Zebra Capital Management, LLC (hedge fund manager) (since 2001). Formerly, Chairman, Ibbotson Associates, Inc., Chicago, IL (software data publishing and consulting) (1977-2006). |
Robert C. Merton Director of DFAIDG, DIG and DEM. Trustee of DFAITC. Harvard Business School 353 Baker Library Soldiers Field Boston, MA 02163 Age: 65 | | DFAITC - since 2003 DFAIDG - since 2003 DIG - since 2003 DEM - since 2003 | | 87 portfolios in 4 investment companies | | John and Natty McArthur University Professor, Graduate School of Business Administration, Harvard University (since 1998). Director, MF Risk, Inc. (risk management software) (since 2001). Director, Peninsula Banking Group (bank) (since 2003). Director, Community First Financial Group (bank holding company) (since 2003). Member Competitive Markets Advisory Council, Chicago Mercantile Exchange (futures trading exchange) (since 2004). Chairman and Director, Daedalus Software (medical software) (since 2008). Formerly, Advisory Board Member, Alpha Simplex Group (hedge fund) (2001-2007). Formerly, Chief Science Officer and Director, Trinsum Group, a successor to Integrated Finance Limited (2002-2008). Director, Vical Incorporated (biopharmaceutical product development) (since 2002). |
Myron S. Scholes Director of DFAIDG, DIG and DEM. Trustee of DFAITC. Platinum Grove Asset Management, L.P. Reckson Executive Park 1100 King Street Building 4 Rye Brook, NY 10573 Age: 68 | | DFAITC - since 1993 DFAIDG - since 1981 DIG - since 1993 DEM - since 1993 | | 87 portfolios in 4 investment companies | | Frank E. Buck Professor Emeritus of Finance, Stanford University (since 1981). Chairman, Platinum Grove Asset Management, L.P. (hedge fund) (formerly, Oak Hill Platinum Partners) (since 1999). Formerly, Managing Partner, Oak Hill Capital Management (private equity firm) (until 2004). Formerly, Director, Chicago Mercantile Exchange (2001-2008). Director, American Century Fund Complex (registered investment companies) (37 Portfolios) (since 1981). |
Abbie J. Smith Director of DFAIDG, DIG and DEM. Trustee of DFAITC. The University of Chicago Booth School of Business 5807 S. Woodlawn Avenue Chicago, IL 60637 Age: 56 | | DFAITC - since 2000 DFAIDG - since 2000 DIG - since 2000 DEM - since 2000 | | 87 portfolios in 4 investment companies | | Boris and Irene Stern Professor of Accounting, The University of Chicago Booth School of Business (since 1980), and Co-Director Investment Research, Fundamental Investment Advisors (hedge fund) (since 2008). Director, HNI Corporation (formerly known as HON Industries Inc.) (office furniture) (since 2000). Director, Ryder System Inc. (transportation, logistics and supply-chain management) (since 2003). Director/ Trustee, UBS Funds (fund complex) (5 portfolios) (since 2008). |
40
| | | | | | |
Name, Position with the Fund, Address and Age | | Term of Office1 and Length of Service | | Portfolios within the DFA Fund Complex2 Overseen | | Principal Occupation(s) During Past 5 Years and
Other Directorships of Public Companies Held |
| Interested Trustees/Directors* |
David G. Booth Chairman, Director, Chief Executive Officer and President of DFAIDG, DIG and DEM. Chairman, Trustee, Chief Executive Officer, Chief Investment Officer and President of DFAITC. 6300 Bee Cave Road, Building One Austin, Texas 78746 Age: 62 | | DFAITC - since 1993 DFAIDG - since 1981 DIG - since 1992 DEM - since 1993 | | 87 portfolios in 4 investment companies | | Chairman, Director/Trustee, President, Chief Executive Officer and formerly Chief Investment Officer of the following companies: Dimensional Holdings Inc., Dimensional Fund Advisors LP, Dimensional Fund Advisors Canada ULC, DFAIDG, DIG, DEM and DFAITC. President and Chief Executive Officer of DFA Securities LLC. Director of Dimensional Fund Advisors Ltd, and formerly Chief Investment Officer. Director and formerly, President and Chief Investment Officer of DFA Australia Ltd. Formerly, Director of Dimensional Funds PLC and Dimensional Fund II PLC. Chairman, Director and Chief Executive Officer of Dimensional Fund Advisors Canada ULC (All Chief Investment Officer positions held starting 1/03 through 3/07 except Dimensional Holdings Inc., which was from 10/06 through 3/07.) Limited Partner, Oak Hill Partners (since 2001) and VSC Investors, LLC (since 2007). Trustee, The University of Chicago Booth School of Business. Formerly, Director, SA Funds (registered investment company). Formerly Director, Assante Corporation (investment management) (until 2002). |
Eduardo A. Repetto Director, Chief Investment Officer and Vice President of DFAIDG, DIG and DEM. Trustee, Chief Investment Officer and Vice President of DFAITC 6300 Bee Cave Road, Building One Austin, TX 78746 Age: 42 | | DFAITC - since 2009 DFAIDG - since 2009 DIG - since 2009 DEM - since 2009 | | 87 portfolios in 4 investment companies | | Director/Trustee (beginning June 2009), Chief Investment Officer (beginning March 2007) and Vice President of DFAIDG, DIG, DEM and DFAITC. Chief Investment Officer (beginning March 2007) and Vice President of all the DFA Entities, DFA Australia Limited and Dimensional Fund Advisors Canada ULC. |
| 1 | Each Trustee/Director holds office for an indefinite term until his or her successor is elected and qualified. |
| 2 | Each Trustee/Director is a director or trustee of each of the four registered investment companies within the DFA Fund Complex, which includes the Funds. |
| * | Interested Trustees/Directors are described as such because they are deemed to be “interested persons,” as that term is defined under the Investment Company Act of 1940, as amended, due to their positions with Dimensional Fund Advisors LP. |
41
Officers
The name, age, information regarding positions with the Funds and the principal occupation for each officer of the Funds are set forth below. Each officer listed below holds the same office (except as otherwise noted) in the following entities: Dimensional Fund Advisors LP (prior to November 3, 2006, Dimensional Fund Advisors Inc.) (“Dimensional”), DFA Securities Inc., DFAIDG, DIG, DFAITC and DEM (collectively, the “DFA Entities”). The address of each officer is: Dimensional Fund Advisors LP, 6300 Bee Cave Road, Building One, Austin, Texas 78746, unless otherwise indicated.
| | | | |
Name, Position with the Fund and Age | | Term of Office1 and Length of Service | | Principal Occupation(s) During Past 5 Years |
| Officers |
April A. Aandal Vice President and Chief Learning Officer Age: 46 | | Since 2008 | | Vice President of all the DFA Entities. Chief Learning Officer of Dimensional (since September 2008). Formerly, Regional Director of Dimensional (2004-2008); Vice President of Professional Development at Assante Asset Management (June 2002-January 2005). |
Darryl D. Avery Vice President Age: 43 | | Since 2005 | | Vice President of all the DFA Entities. From June 2002 to January 2005, institutional client service representative of Dimensional. |
Arthur H. Barlow Vice President Age: 53 | | Since 1993 | | Vice President of all the DFA Entities. Formerly, Vice President of DFA Australia Limited and Dimensional Fund Advisors Ltd. |
Scott A. Bosworth Vice President Age: 40 | | Since 2007 | | Vice President of all the DFA Entities. Regional Director of Dimensional (since November 1997). |
Valerie A. Brown Vice President and Assistant Secretary Age: 42 | | Since 2001 | | Vice President and Assistant Secretary of all the DFA Entities, DFA Australia Limited, Dimensional Fund Advisors Ltd., and since June 2003, Dimensional Fund Advisors Canada ULC. |
David P. Butler Vice President Age: 45 | | Since 2007 | | Vice President of all the DFA Entities. Director of Global Financial Services of Dimensional (since 2008). Formerly, Regional Director of Dimensional Fund Advisors LP (January 1995 to January 2005). |
Patrick Carter Vice President Age: 47 | | Since 2007 | | Vice President of all the DFA Entities. Regional Director of Dimensional (since March 2006). Formerly, Director of Merrill Lynch Retirement Group (December 1998 to March 2006). |
Joseph H. Chi Vice President Age: 43 | | Since 2009 | | Vice President of all the DFA Entities. Portfolio Manager for Dimensional Fund Advisors LP (since October 2005). Prior to October 2005, Corporate Counsel at Hewitt Associates (July 2002-August 2005). |
Stephen A. Clark Vice President Age: 37 | | Since 2004 | | Vice President of all the DFA Entities. Formerly, Portfolio Manager of Dimensional (April 2001-April 2004). |
Robert P. Cornell Vice President Age: 60 | | Since 2007 | | Vice President of all the DFA Entities. Regional Director of Financial Services Group of Dimensional (since August 1993). |
Christopher S. Crossan Vice President and Chief Compliance Officer Age: 43 | | Since 2004 | | Vice President and Chief Compliance Officer of all the DFA Entities. |
James L. Davis Vice President Age: 52 | | Since 1999 | | Vice President of all the DFA Entities. Formerly, Vice President of DFA Australia Limited and Dimensional Fund Advisors Ltd. |
Robert T. Deere Vice President Age: 52 | | Since 1994 | | Vice President of all the DFA Entities and DFA Australia Limited. |
Robert W. Dintzner Vice President Age: 39 | | Since 2001 | | Vice President of all the DFA Entities. |
42
| | | | |
Name, Position with the Fund and Age | | Term of Office1 and Length of Service | | Principal Occupation(s) During Past 5 Years |
Kenneth Elmgren Vice President Age: 55 | | Since 2007 | | Vice President of all the DFA Entities. Formerly, Managing Principal of Beverly Capital (May 2004 to September 2006). |
Richard A. Eustice Vice President and Assistant Secretary Age: 44 | | Since 1998 | | Vice President and Assistant Secretary of all the DFA Entities and DFA Australia Limited. Chief Operating Officer of Dimensional Fund Advisors Ltd. (since July 2008). Formerly, Vice President of Dimensional Fund Advisors Ltd. |
Eugene F. Fama, Jr. Vice President Age: 48 | | Since 1993 | | Vice President of all the DFA Entities. Formerly, Vice President of DFA Australia Limited and Dimensional Fund Advisors Ltd. |
Gretchen A. Flicker Vice President Age: 38 | | Since 2004 | | Vice President of all the DFA Entities. Prior to April 2004, institutional client service representative of Dimensional. |
Jed S. Fogdall Vice President Age: 35 | | Since 2008 | | Vice President of all the DFA Entities. Portfolio Manager for Dimensional (since September 2004). Prior to September 2004, Staff Engineer at the Boeing Company (1997-2004). |
Glenn S. Freed Vice President Age: 47 | | Since 2001 | | Vice President of all the DFA Entities. |
Jeremy P. Freeman Vice President Age: 38 | | Since 2009 | | Vice President of all the DFA Entities. Senior Technology Manager for Dimensional Fund Advisors LP (since June 2006). Formerly, Principal at AIM Investments/Amvescap PLC (now Invesco) (June 1998-June 2006). |
Mark R. Gochnour Vice President Age: 42 | | Since 2007 | | Vice President of all the DFA Entities. Regional Director of Dimensional. |
Henry F. Gray Vice President Age: 42 | | Since 2000 | | Vice President of all the DFA Entities. Prior to July 2000, Portfolio Manager of Dimensional. Formerly, Vice President of DFA Australia Limited. |
John T. Gray Vice President Age: 35 | | Since 2007 | | Vice President of all the DFA Entities. Formerly, Regional Director of Dimensional (January 2005 to February 2007). |
Darla Hastings Vice President Age: 54 | | Since 2007 | | Vice President of all the DFA Entities. Chief Marketing Officer of Dimensional. Formerly, Senior Vice President, Customer Experience for Benchmark Assisted Living (May 2005 to April 2006); Executive Vice President and Chief Marketing Officer of State Street Corporation (September 2001 to October 2005). |
Joel H. Hefner Vice President Age: 41 | | Since 2007 | | Vice President of all the DFA Entities. Regional Director of Dimensional (since June 1998). |
Julie Henderson Vice President and Fund Controller Age: 35 | | Since 2005 | | Vice President and Fund Controller of all the DFA Entities. Formerly, Senior Manager at PricewaterhouseCoopers LLP (July 1996 to April 2005). |
Kevin Hight Vice President Age: 41 | | Since 2005 | | Vice President of all the DFA Entities. Formerly, Regional Director of Dimensional (since March 2003 to March 2005). |
Christine W. Ho Vice President Age: 41 | | Since 2004 | | Vice President of all the DFA Entities. Prior to April 2004, Assistant Controller of Dimensional. |
Jeff J. Jeon Vice President Age: 35 | | Since 2004 | | Vice President of all the DFA Entities. Counsel of Dimensional (since September 2001). |
Patrick M. Keating Vice President Age: 54 | | Since 2003 | | Vice President of all the DFA Entities and Chief Operating Officer of Dimensional. Director, Vice President and Chief Privacy Officer of Dimensional Fund Advisors Canada ULC. Director of DFA Australia Limited. |
43
| | | | |
Name, Position with the Fund and Age | | Term of Office1 and Length of Service | | Principal Occupation(s) During Past 5 Years |
Joseph F. Kolerich Vice President Age: 37 | | Since 2004 | | Vice President of all the DFA Entities. Portfolio Manager for Dimensional (since April 2001). |
Michael F. Lane Vice President Age: 42 | | Since 2004 | | Vice President of all the DFA Entities. Formerly, Vice President of Advisor Services at TIAA-CREF (July 2001 to September 2004). |
Kristina M. LaRusso Vice President Age: 34 | | Since 2006 | | Vice President of all DFA Entities. Formerly, Operations Supervisor of Dimensional (March 2003 to December 2006). |
Inmoo Lee Vice President Age: 43 | | Since 2007 | | Vice President of all the DFA Entities. Associate Professor Department of Finance and Accounting, Business School, National University of Singapore (July 2004 to present); Associate Professor, College of Business Administration, Korea University (September 2001 to May 2006). |
Juliet Lee Vice President Age: 38 | | Since 2005 | | Vice President of all the DFA Entities. Human Resources Manager of Dimensional (since January 2004). |
Aaron M. Marcus Vice President & Head of Global Human Resources Age: 39 | | Since 2008 | | Vice President and Head of Global Human Resources of Dimensional. Formerly, Global Head of Recruiting and Vice President of Goldman Sachs & Co. (June 2006 to January 2008); Global Co-Head of HR of the Equities & FICC Division, and Vice President of Goldman Sachs & Co. (May 2005 to May 2006); Head of Americas Campus Recruiting and Vice President of Goldman Sachs & Co. (April 2003 to May 2005). |
David R. Martin Vice President, Chief Financial Officer and Treasurer Age: 52 | | Since 2007 | | Vice President, Chief Financial Officer and Treasurer of all the DFA Entities. Director, Vice President, Chief Financial Officer and Treasurer of Dimensional Fund Advisors Ltd. and DFA Australia Limited. Chief Financial Officer, Treasurer, and Vice President of Dimensional Fund Advisors Canada ULC. Director of Dimensional Funds PLC and Dimensional Funds II PLC. Formerly, Executive Vice President and Chief Financial Officer of Janus Capital Group Inc. (June 2005 to March 2007); Senior Vice President of Finance at Charles Schwab & Co., Inc. (March 1999 to May 2005). |
Catherine L. Newell Vice President and Secretary Age: 45 | | Vice President since 1997 and Secretary since 2000 | | Vice President and Secretary of all the DFA Entities. Director, Vice President and Secretary of DFA Australia Limited and Dimensional Fund Advisors Ltd. (since February 2002, April 1997 and May 2002, respectively). Vice President and Secretary of Dimensional Fund Advisors Canada ULC (since June 2003). Director, Dimensional Funds PLC and Dimensional Funds II PLC (since 2002 and 2006, respectively). Formerly, Assistant Secretary of all DFA Entities, DFA Australia Limited and Dimensional Fund Advisors Ltd. |
Christian Newton Vice President Age: 34 | | Since 2009 | | Vice President of all DFA Entities. Web Services Manager for Dimensional Fund Advisors LP (Since January 2008). Formerly Design Manager (2005-2008) and Web Developer (2002-2005) of Dimensional Fund Advisors LP. |
Gerard K. O’Reilly Vice President Age: 32 | | Since 2007 | | Vice President of all the DFA Entities. Formerly, Research Associate of Dimensional Fund Advisors LP (2004 to 2006); Research Assistant in PhD program, Aeronautics Department California Institute of Technology (1998 to 2004). |
Daniel C. Ong Vice President Age: 35 | | Since 2009 | | Vice President of all the DFA Entities. Portfolio Manager for Dimensional Fund Advisors LP (since July 2005). Prior to 2005, Graduate Student at the University of Chicago Booth School of Business (2003-2005). |
Carmen Palafox Vice President Age: 35 | | Since 2006 | | Vice President of all the DFA Entities. Operations Manager of Dimensional Fund Advisors LP (since May 1996). |
Sonya Park Vice President Age: 37 | | Since 2005 | | Vice President of all the DFA Entities. From February 2002 to January 2005, institutional client service representative of Dimensional. |
44
| | | | |
Name, Position with the Fund and Age | | Term of Office1 and Length of Service | | Principal Occupation(s) During Past 5 Years |
David A. Plecha Vice President Age: 48 | | Since 1993 | | Vice President of all the DFA Entities, DFA Australia Limited and Dimensional Fund Advisors Ltd |
Ted Randall Vice President Age: 36 | | Since 2008 | | Vice President of all the DFA Entities. Formerly, Research Associate of Dimensional (2006-2008). Systems Developer of Dimensional (2001-2006). |
L. Jacobo Rodriguez Vice President Age: 38 | | Since 2005 | | Vice President of all the DFA Entities. From August 2004 to July 2005, institutional client service representative of Dimensional. Formerly, Financial Services Analyst, Cato Institute (September 2001 to June 2004); Book Review Editor, Cato Journal, Cato Institute (May 1996 to June 2004). |
David E. Schneider Vice President Age: 63 | | Since 2001 | | Vice President of all the DFA Entities. Currently, Director of Institutional Services. |
Bruce A. Simmons Vice President Age: 44 | | Since 2009 | | Vice President of all the DFA Entities. Investment Operations Manager for Dimensional Fund Advisors LP (since May 2007). Formerly, Vice President Client and Fund Reporting at Mellon Financial (September 2005-May 2007); Vice President Business Development at CUADPRO Marketing (July 2003-September 2005). |
Ted R. Simpson Vice President Age: 41 | | Since 2007 | | Vice President of all the DFA Entities. Regional Director of Dimensional (since December 2002). |
Bryce D. Skaff Vice President Age: 34 | | Since 2007 | | Vice President of all the DFA Entities. Formerly, Regional Director of Dimensional (December 1999 to January 2007). |
Grady M. Smith Vice President Age: 53 | | Since 2004 | | Vice President of all the DFA Entities. Prior to April 2004, Portfolio Manager of Dimensional. |
Carl G. Snyder Vice President Age: 46 | | Since 2000 | | Vice President of all the DFA Entities. Formerly, Vice President of DFA Australia Limited. |
Lawrence R. Spieth Vice President Age: 61 | | Since 2004 | | Vice President of all the DFA Entities. Prior to April 2004, Regional Director of Dimensional. |
Bradley G. Steiman Vice President Age: 36 | | Since 2004 | | Vice President of all the DFA Entities and Director and Vice President of Dimensional Fund Advisors Canada ULC. |
Robert C. Trotter Vice President Age: 51 | | Since 2009 | | Vice President of all the DFA Entities. Senior Manager Technology for Dimensional Fund Advisors LP (since March 2007). Formerly, Director of Technology at AMVESCAP (2002-2007). |
Karen E. Umland Vice President Age: 43 | | Since 1997 | | Vice President of all the DFA Entities, DFA Australia Limited, Dimensional Fund Advisors Ltd., and Dimensional Fund Advisors Canada ULC. |
Sunil Wahal Vice President Age: 42 | | Since 2009 | | Vice President of all the DFA Entities. Formerly, Research Associate for Dimensional Fund Advisors LP (July 2008-January 2009); Consultant to Dimensional Fund Advisors LP (September 2005-July 2008); Jack D. Furst Professor of Finance at Arizona State University, WP Carey School of Business (July 2005-July 2008); Associate Professor of Finance at Goizueta Business School, Emory University (1997-2005). |
Brian J. Walsh Vice President Age: 39 | | Since 2009 | | Vice President of all the DFA Entities. Portfolio Manager for Dimensional Fund Advisors LP (since 2004). Formerly, Trader for Dimensional Fund Advisors LP (1997-2004). |
Carol W. Wardlaw Vice President Age: 51 | | Since 2004 | | Vice President of all the DFA Entities. Prior to April 2004, Regional Director of Dimensional. |
45
| | | | |
Name, Position with the Fund and Age | | Term of Office1 and Length of Service | | Principal Occupation(s) During Past 5 Years |
Weston J. Wellington Vice President Age: 58 | | Since 1997 | | Vice President of all the DFA Entities. Formerly, Vice President of DFA Australia Limited. |
Daniel M. Wheeler Vice President Age: 64 | | Since 2001 | | Vice President of all the DFA Entities. Prior to 2001 and currently, Director of Financial Advisors Services of Dimensional. Director of Dimensional Fund Advisors Ltd. (since October 2003) and President of Dimensional Fund Advisors Canada ULC (since June 2003). |
Ryan Wiley Vice President Age: 33 | | Since 2007 | | Vice President of all the DFA Entities. Senior Trader of Dimensional. Formerly, Portfolio Manager (2006 to 2007); Trader (2001 to 2006). |
Paul E. Wise Vice President Age: 54 | | Since 2005 | | Vice President of all the DFA Entities. Chief Technology Officer for Dimensional (since 2004). Formerly, Principal of Turnbuckle Management Group (January 2002 to August 2004). |
| 1 | Each officer holds office for an indefinite term at the pleasure of the Boards of Trustees/Directors and until his or her successor is elected and qualified. |
46
VOTING PROXIES ON FUND PORTFOLIO SECURITIES
A description of the policies and procedures that the Trust uses in voting proxies relating to securities held in the portfolio is available without charge, upon request, by calling collect: (512) 306-7400. Information regarding how the Advisor votes these proxies is available from the EDGAR database on the SEC’s website at http://www.sec.gov and from the Advisor’s website at http://www.dimensional.com and reflects the twelve-month period beginning July 1st and ending June 30th.
47
NOTICE TO SHAREHOLDERS
(Unaudited)
For shareholders that do not have an October 31, 2009 tax year end, this notice is for informational purposes only. For shareholders with an October 31, 2009 tax year end, please consult your tax advisor as to the pertinence of this notice. For the fiscal year November 1, 2008 to October 31, 2009, the Portfolio is designating the following items with regard to distributions paid during the period. All designations are based on financial information available as of the date of this annual report and, accordingly are subject to change. For each item, it is the intention of the Portfolio/Series to designate the maximum amount permitted under the Internal Revenue Code and the regulations thereunder.
| | | | | | | | | | | | | | | | | | | | |
Dimensional Investment Group Inc. | | Net Investment Income Distributions | | Short-Term Capital Gain Distributions | | Long-Term Capital Gain
Distributions | | Total
Distributions | | Qualifying For Corporate Dividends Received Deduction(1) | | Qualifying Dividend Income(2) | | Foreign Tax
Credit(3) | | Foreign Source Income(4) | | Qualifying Interest Income(5) | | Qualifying Short-Term
Capital Gain(6) |
DFA International Value Portfolio IV | | 100% | | — | | — | | 100% | | 100% | | 100% | | 3% | | 51% | | 100% | | 100% |
| (1) | Qualifying dividends represent dividends which qualify for the corporate dividends received deduction and is reflected as a percentage of ordinary income distributions (the total of short-term capital gain and net investment income distributions). |
| (2) | The percentage in this column represents the amount of “Qualifying Dividend Income” as created by the Jobs and Growth Tax Relief Reconciliation Act of 2003 and is reflected as a percentage of ordinary income distributions (the total of short-term capital gain and net investment income distributions). Please note that these percentages are designated only, refer to your 1099 for actual qualified dividend income. |
| (3) | “Foreign Tax Credit” represents dividends which qualify for the foreign tax credit pass through and is reflected as a percentage of investment company taxable income (the total of short-term capital gain and net investment income distributions). |
| (4) | “Foreign Source Income” represents the portion of dividends derived from foreign sources, and is reflected as a percentage of ordinary income (i.e., the sum of short-term capital gain and net investment income) distributions made during the period. |
| (5) | The percentage in this column represents the amount of “Qualifying Interest Income” as created by The American Jobs Creation Act of 2004. The information is reflected as a percentage of ordinary income distributions (the total of short-term capital gain and net investment income distributions). |
| (6) | The percentage in this column represents the amount of “Qualifying Short-Term Capital Gain” as created by The American Jobs Creation Act of 2004. The information is reflected as a percentage of ordinary income distributions (the total of short-term capital gain and net investment income distributions). |
48

The Registrant has adopted, as of the end of the period covered by this Form N-CSR (the “Report”), a code of ethics that applies to the Registrant’s principal executive officer and principal financial officer (the “Code of Business Ethics”). The Registrant has not made any substantive amendments to the Code of Business Ethics during the period covered by this Report. The Registrant also has not granted any waiver from any provisions of the Code of Business Ethics during the period covered by this Report. A copy of the Code of Business Ethics is filed as an exhibit to this Report.
| ITEM 3. | AUDIT COMMITTEE FINANCIAL EXPERT. |
The Registrant’s Board of Directors has determined that Abbie J. Smith possesses the technical attributes to qualify as an “audit committee financial expert” serving on the Registrant’s Audit Committee and has designated Ms. Smith as the “audit committee financial expert.” Ms. Smith
earned a Ph.D. in Accounting, and has taught Accounting at the graduate level since 1980. Ms. Smith’s education and career have provided her with an understanding of generally accepted accounting principles and financial statements; the ability to assess the general application of such principles in connection with the accounting for estimates, accruals and reserves; and experience preparing, analyzing and evaluating financial statements that present a breadth and level of complexity of issues that can reasonably be expected to be raised by the Registrant’s financial statements. In addition, Ms. Smith has served on the boards of directors and audit committees of entities other than the Registrant. Ms. Smith is independent under the standards set forth in Item 3 of Form N-CSR.
| ITEM 4. | PRINCIPAL ACCOUNTANT FEES AND SERVICES. |
| | |
(a) | | Audit Fees |
| | Fiscal Year Ended October 31, 2009: $87,246 |
| | Fiscal Year Ended October 31, 2008: $82,264 |
| | | | | | | | |
(b) | | Audit-Related Fees | | | | | | |
| | Fees for Registrant | | Fiscal Year Ended October 31, 2009: $17,577 | | |
| | | | Fiscal Year Ended October 31, 2008: $18,227 | | |
For fiscal years ended October 31, 2009 and October 31, 2008, Audited-Related Fees included fees for services related to limited procedures performed in connection with the production of the Registrant’s semi-annual financial statements.
Audit-Related Fees required to be approved pursuant to paragraph (c)(7)(ii) of Rule 2-01 of Regulation S-X
| | | | | | | | |
| | | | Fiscal Year Ended October 31, 2009: $158,695 | | |
| | | | Fiscal Year Ended October 31, 2008: $165,000 | | |
For the fiscal years ended October 31, 2009 and October 31, 2008, Audit-Related Fees required to be approved pursuant to paragraph (c)(7)(ii) of Rule 2-01 of Regulation S-X included fees for services rendered in connection with the issuance of a Type II SAS 70 over controls at the Registrant’s investment adviser.
| | | | | | | | |
(c) | | Tax Fees | | | | | | |
| | Fees for Registrant | | Fiscal Year Ended October 31, 2009: $53,769 | | |
| | | | Fiscal Year Ended October 31, 2008: $58,544 | | |
In the fiscal years ended October 31, 2009 and October 31, 2008, Tax Fees included services in connection with the Registrant’s excise tax calculations and review of the Registrant’s applicable tax returns.
There were no Tax Fees required to be approved pursuant to paragraph (c)(7)(ii) of Rule 2-01 of Regulation S-X during the fiscal years indicated above.
| | | | | | | | |
(d) | | All Other Fees | | | | | | |
| | Fees for Registrant | | Fiscal Year Ended October 31, 2009: $0 | | |
| | | | Fiscal Year Ended October 31, 2008: $0 | | |
There were no “All Other Fees” required to be approved pursuant to paragraph (c)(7)(ii) of Rule 2-01 of Regulation S-X during the fiscal years indicated above.
(e)(1) Audit Committee’s Pre-Approval Policies and Procedures
Pre-Approval Policies and Procedures
as adopted by the
Audit Committees
of
DFA Investment Dimensions Group Inc.
Dimensional Emerging Markets Value Fund
Dimensional Investment Group Inc.
The DFA Investment Trust Company
(together, the “Funds”)
The Sarbanes-Oxley Act of 2002 (the “Act”) and the rules (the “Rules”) adopted by the U.S. Securities and Exchange Commission (the “SEC”) require that the Funds’ Audit Committees (together, the “Committee”) pre-approve all audit services and non-audit services provided to the Funds by their independent registered public accounting firm (the “Auditor”). The Act and the Rules also require that the Committee pre-approve all non-audit services provided by the Auditor to Dimensional Fund Advisors LP (“Dimensional”), the Funds’ investment advisor, and to affiliates of Dimensional that provide ongoing services to the Funds (with Dimensional, together the “Service Affiliates”) if the services directly impact the Funds’ operations and financial reporting.
The following policies and procedures govern the ways in which the Committee will pre-approve audit and various types of non-audit services that the Auditor provides to the Funds and to Service Affiliates. These policies and procedures do not apply in the case of audit services that the Auditor provides to Service Affiliates, nor do they apply to services that an audit firm other than the Auditor provides to such entities.
These policies and procedures comply with the requirements for pre-approval, but also provide a mechanism by which management of the Funds may request and secure pre-approval of audit and non-audit services in an orderly manner with minimal disruption to normal business operations. Pre-approval of non-audit services may be achieved through a combination of the procedures described in Sections C and D below.
| | 1. | The Committee must pre-approve all audit services and non-audit services that the Auditor provides to the Funds. |
| | 2. | The Committee must pre-approve any engagement of the Auditor to provide non-audit services to any Service Affiliate during the period of the Auditor’s engagement to provide audit services to the Funds, if the non-audit services to the Service Affiliate directly impact the Funds’ operations and financial reporting. |
| | B. | Pre-Approval of Audit Services to the Funds |
| | 1. | The Committee shall approve the engagement of an independent registered public accounting firm to certify the Funds’ financial statements for each fiscal year (the “Engagement”). The approval of the Engagement shall not be delegated to a Designated Member (as that term is defined in Section D below). In approving the Engagement, the Committee shall obtain, review and consider sufficient information concerning the proposed Auditor to enable the Committee to make a reasonable evaluation of the Auditor’s qualifications and independence. The Committee also shall consider the Auditor’s proposed fees for the Engagement, in light of the scope and nature of the audit services that the Funds will receive. |
| | 2. | The Committee shall report to the Boards of Directors/Trustees of the Funds (together, the “Board”) regarding its approval of the Engagement and of the proposed fees for the Engagement, and the basis for such approval. |
| | 3. | Unless otherwise in accordance with applicable law, the Engagement, in any event, shall require that the Auditor be selected by the vote, cast in person, of a majority of the members of the Board who are not “interested persons” of the Funds (as that term is defined in Section 2(a)(19) of the Investment Company Act of 1940, as amended) (the “Independent Directors”). |
| | C. | Pre-Approval of Non-Audit Services to the Funds and to Service Affiliates—by Types of Services |
| | 1. | The Committee may pre-approve types of non-audit services to the Funds and their Service Affiliates pursuant to this Section C. |
| | 2. | Annually, at such time as the Committee considers the Engagement of the Auditor, management of the Funds, in consultation with the Auditor, shall provide to the Committee, for its consideration and action, the following: (a) a list of those types of non-audit services, if any, that the Funds may request from the Auditor during the fiscal year; and (b) a list of those types of non-audit services directly impacting the Funds’ operations and financial reporting that Service Affiliates may request from the Auditor during the fiscal year. |
| | 3. | The lists submitted to the Committee shall describe the types of non-audit services in reasonable detail and shall include an estimated budget (or budgeted range) of fees, where possible, and such other information as the Committee may request. |
| | 4. | The Committee’s pre-approval of the types of non-audit services submitted pursuant to this Section C shall constitute authorization for management of the Funds to utilize the Auditor for the types of non-audit services so pre-approved, if needed or desired during the fiscal year. |
| | 5. | A list of the types of non-audit services pre-approved by the Committee pursuant to this Section C will be distributed to management of the Service Affiliates and the appropriate partners of the Auditor. Periodically, the Auditor will discuss with the Committee those non-audit services that have been or are being provided pursuant to this Section C. |
| | D. | Pre-Approval of Non-Audit Services to the Funds and to Service Affiliates—Project-by-Project Basis |
| | 1. | The Committee also may pre-approve non-audit services on a project-by-project basis pursuant to this Section D. |
| | 2. | Management of the Funds, in consultation with the Auditor, may submit either to the Committee or to the Designated Member, as provided in this Section D, for their consideration and action, a pre-approval request identifying one or more non-audit service projects. The request so submitted shall describe the project(s) in reasonable detail and shall include an estimated budget (or budgeted range) of fees and such other information as the Committee or the Designated Member, as appropriate, shall request. |
| | 3. | The Committee, from time to time, shall designate one or more of its members who are Independent Directors (each a “Designated Member”) to consider, on the Committee’s behalf, any non-audit services, whether to the Funds or to any Service Affiliate, that have not been pre-approved by the Committee. The Designated Member also shall review, on the Committee’s behalf, any proposed material change in the nature or extent of any non-audit services previously approved. The Funds’ management, in consultation with the Auditor, shall explain why such non-audit services or material change in non-audit services are necessary and appropriate and the anticipated costs thereof. |
| | 4. | The Designated Member will review the requested non-audit services or proposed material change in such services and will either: |
| | (a) | pre-approve, pre-approve subject to conditions, or disapprove any such requested services, or any proposed material change in services, whether to the Funds or to a Service Affiliate; or |
| | (b) | refer such matter to the Committee for its consideration and action. |
In considering any requested non-audit services or proposed material change in such services, the Designated Member’s authority shall be limited to approving non-audit services or proposed material changes that do not exceed $10,000 in value.
| | 5. | The Designated Member’s pre-approval (or pre-approval subject to conditions) of the requested non-audit services or proposed material change in services pursuant to this Section D shall constitute authorization for the management of the Funds or the Service Affiliate, as the case may be, to utilize the Auditor for the non-audit services so pre-approved. Any action by the Designated Member in approving a requested non-audit service shall be presented for ratification by the Committee not later than at its next scheduled meeting. If the Designated Member does not approve the Auditor providing the requested non-audit service, the matter may be presented to the full Committee for its consideration and action. |
| | E. | Amendment; Annual Review |
| | 1. | The Committee may amend these procedures from time to time. |
| | 2. | These procedures shall be reviewed annually by the Committee. |
| | 1. | The Funds shall maintain a written record of all decisions made by the Committee or by a Designated Member pursuant to these procedures, together with appropriate supporting materials. |
| | 2. | In connection with the approval of any non-audit service pursuant to the de minimis exception provided in the Rules, a record shall be made indicating that each of the conditions for this exception, as set forth in the Rules, has been satisfied. |
| | 3. | A copy of these Procedures (and of any amendments to these Procedures) shall be maintained and preserved permanently in an easily accessible place. The written records referred to in paragraphs 1 and 2 of this Section F shall be maintained and preserved for six years from the end of the fiscal year in which the actions recorded were taken, for at least the first two years in an easily accessible location. |
| | |
(e)(2) | | The fees disclosed in Items 4(b), 4(c) or 4(d) were approved by the Registrant’s Audit Committee but not pursuant to paragraph (c)(7)(i)(C) of Rule 2-01 of Regulation S-X. |
| |
(f) | | The percentage of hours expended on the principal accountant’s engagement to audit the Registrant’s financial statements for the fiscal year ended October 31, |
| | 2009 that were attributed to work performed by persons other than the principal accountant’s full time, permanent employees was not greater than 50%. |
| | |
(g) | | Aggregate Non-Audit Fees |
Fiscal Year Ended October 31, 2009: $584,571
Fiscal Year Ended October 31, 2008: $692,520
| | |
(h) | | The Registrant’s Audit Committee has considered whether the provision of non-audit services that were rendered to the Registrant’s investment adviser, and any entity controlling, controlled by, or under common control with the investment adviser that provides ongoing services to the Registrant, that were not pre-approved pursuant to paragraph (c)(7)(ii) of Rule 2-01 of Regulation S-X is compatible with maintaining the principal accountant’s independence. |
| ITEM 5. | AUDIT COMMITTEE OF LISTED REGISTRANTS. |
This item is not applicable to the Registrant because it is not a listed issuer.
(a) Please see schedules of investments contained in the reports to stockholders included under Item 1 of this Report except as discussed below. Provided below is a complete schedule of investments for each master fund in which a series of the Registrant invests that provided a summary schedule of portfolio holdings in a report to stockholders included under Item 1 in lieu of a complete schedule of investments. The schedules of investments for the following series are provided below:
| | |
Name of Entity for which Schedule of Investments is Provided | | Relationship to Series of the Registrant |
The U.S. Large Company Series | | Master fund for U.S. Large Company Institutional Index Portfolio |
| |
The U.S. Large Cap Value Series | | Master fund for U.S. Large Cap Value Portfolio II, U.S. Large Cap Value Portfolio III and LWAS/DFA U.S. High Book to Market Portfolio |
| |
The DFA International Value Series | | Master fund for DFA International Value Portfolio, DFA International Value Portfolio II, DFA International Value Portfolio III and DFA International Value Portfolio IV |
| |
The Emerging Markets Series | | Master fund for Emerging Markets Portfolio II |
| |
The Tax-Managed U.S. Marketwide Value Series | | Master fund for Tax-Managed U.S. Marketwide Value
Portfolio II |
DIMENSIONAL INVESTMENT GROUP INC.
THE DFA INVESTMENT TRUST COMPANY
DEFINITIONS OF ABBREVIATIONS AND FOOTNOTES
Schedules of Investments
Investment Abbreviations
| | |
| ADR | | American Depositary Receipt |
| FHLMC | | Federal Home Loan Mortgage Corporation |
| FNMA | | Federal National Mortgage Association |
| P.L.C. | | Public Limited Company |
| REIT | | Real Estate Investment Trust |
Investment Footnotes
| | |
| † | | See Note B to Financial Statements. |
| †† | | Securities have generally been fair valued. See Note B to Financial Statements. |
| * | | Non-Income Producing Securities. |
| # | | Total or Partial Securities on Loan. |
| @ | | Security purchased with cash proceeds from Securities on Loan. |
| • | | Security is being fair valued as of October 31, 2009. |
| (r) | | The adjustable rate shown is effective as of October 31, 2009. |
| § | | Affiliated Fund. |
| — | | Amounts designated as — are either zero or rounded to zero. |
1
THE U.S. LARGE COMPANY SERIES
SCHEDULE OF INVESTMENTS
October 31, 2009
| | | | | |
| | | Shares | | Value† |
COMMON STOCKS — (92.1%) | | | | | |
Consumer Discretionary — (8.5%) | | | | | |
#Abercrombie & Fitch Co. | | 33,482 | | $ | 1,098,879 |
*Amazon.com, Inc. | | 126,572 | | | 15,038,019 |
#*Apollo Group, Inc. Class A | | 48,560 | | | 2,772,776 |
#*AutoNation, Inc. | | 35,918 | | | 619,226 |
*Autozone, Inc. | | 11,603 | | | 1,570,002 |
*Bed Bath & Beyond, Inc. | | 99,697 | | | 3,510,331 |
#Best Buy Co., Inc. | | 129,969 | | | 4,962,216 |
*Big Lots, Inc. | | 31,453 | | | 787,898 |
Black & Decker Corp. | | 22,904 | | | 1,081,527 |
Carnival Corp. | | 166,799 | | | 4,857,187 |
CBS Corp. Class B | | 257,996 | | | 3,036,613 |
#Coach, Inc. | | 121,087 | | | 3,992,238 |
Comcast Corp. Class A | | 1,092,473 | | | 15,840,859 |
#D.R. Horton, Inc. | | 105,020 | | | 1,151,019 |
#Darden Restaurants, Inc. | | 53,081 | | | 1,608,885 |
DeVry, Inc. | | 23,569 | | | 1,303,130 |
#*DIRECTV Group, Inc. (The) | | 171,135 | | | 4,500,850 |
Disney (Walt) Co. | | 707,515 | | | 19,364,686 |
#Eastman Kodak Co. | | 102,099 | | | 382,871 |
*Expedia, Inc. | | 80,162 | | | 1,817,273 |
Family Dollar Stores, Inc. | | 53,190 | | | 1,505,277 |
*Ford Motor Co. | | 1,226,281 | | | 8,583,967 |
Fortune Brands, Inc. | | 57,196 | | | 2,227,784 |
#*GameStop Corp. Class A | | 62,688 | | | 1,522,692 |
Gannett Co., Inc. | | 89,365 | | | 877,564 |
Gap, Inc. | | 183,301 | | | 3,911,643 |
#Genuine Parts Co. | | 60,730 | | | 2,124,943 |
*Goodyear Tire & Rubber Co. | | 92,084 | | | 1,186,042 |
H&R Block, Inc. | | 127,644 | | | 2,340,991 |
Harley-Davidson, Inc. | | 89,296 | | | 2,225,256 |
*Harman International Industries, Inc. | | 26,392 | | | 992,603 |
Hasbro, Inc. | | 47,929 | | | 1,307,024 |
#Home Depot, Inc. | | 648,891 | | | 16,280,675 |
International Game Technology | | 112,795 | | | 2,012,263 |
#*Interpublic Group of Cos., Inc. | | 185,053 | | | 1,114,019 |
#J.C. Penney Co., Inc. | | 89,790 | | | 2,974,743 |
Johnson Controls, Inc. | | 255,253 | | | 6,105,652 |
#KB Home | | 28,163 | | | 399,351 |
*Kohl’s Corp. | | 116,329 | | | 6,656,345 |
#Leggett & Platt, Inc. | | 59,438 | | | 1,148,937 |
#Lennar Corp. Class A | | 58,705 | | | 739,683 |
#Limited Brands, Inc. | | 101,642 | | | 1,788,899 |
Lowe’s Cos., Inc. | | 562,477 | | | 11,007,675 |
Macy’s, Inc. | | 160,084 | | | 2,812,676 |
#Marriott International, Inc. Class A | | 95,692 | | | 2,398,042 |
#Mattel, Inc. | | 137,032 | | | 2,594,016 |
McDonald’s Corp. | | 415,454 | | | 24,349,759 |
McGraw-Hill Cos., Inc. | | 119,838 | | | 3,448,938 |
Meredith Corp. | | 13,862 | | | 375,106 |
#*New York Times Co. Class A (The) | | 44,003 | | | 350,704 |
#Newell Rubbermaid, Inc. | | 105,714 | | | 1,533,910 |
News Corp. Class A | | 855,886 | | | 9,859,807 |
#NIKE, Inc. Class B | | 147,987 | | | 9,201,832 |
#Nordstrom, Inc. | | 62,711 | | | 1,992,956 |
*Office Depot, Inc. | | 104,586 | | | 632,745 |
Omnicom Group, Inc. | | 118,302 | | | 4,055,393 |
#*O’Reilly Automotive, Inc. | | 52,054 | | | 1,940,573 |
#Polo Ralph Lauren Corp. | | 22,011 | | | 1,638,059 |
2
THE U.S. LARGE COMPANY SERIES
CONTINUED
| | | | | |
| | | Shares | | Value† |
Consumer Discretionary — (Continued) | | | | | |
#*Pulte Homes, Inc. | | 120,324 | | $ | 1,084,119 |
*RadioShack Corp. | | 47,651 | | | 804,825 |
Scripps Networks Interactive, Inc. | | 33,964 | | | 1,282,481 |
#*Sears Holdings Corp. | | 18,996 | | | 1,289,069 |
#Sherwin-Williams Co. | | 37,184 | | | 2,120,975 |
Snap-On, Inc. | | 21,970 | | | 802,564 |
Stanley Works (The) | | 30,208 | | | 1,366,308 |
#Staples, Inc. | | 274,981 | | | 5,967,088 |
*Starbucks Corp. | | 280,599 | | | 5,325,769 |
#Starwood Hotels & Resorts Worldwide, Inc. | | 71,123 | | | 2,066,834 |
Target Corp. | | 286,217 | | | 13,861,489 |
#Tiffany & Co. | | 47,246 | | | 1,856,295 |
Time Warner Cable, Inc. | | 134,137 | | | 5,290,363 |
Time Warner, Inc. | | 451,338 | | | 13,594,301 |
TJX Cos., Inc. (The) | | 161,352 | | | 6,026,497 |
V.F. Corp. | | 33,941 | | | 2,411,169 |
*Viacom, Inc. Class B | | 231,022 | | | 6,373,897 |
Washington Post Co. | | 2,361 | | | 1,019,952 |
#Whirlpool Corp. | | 28,181 | | | 2,017,478 |
Wyndham Worldwide Corp. | | 67,995 | | | 1,159,315 |
#*Wynn Resorts, Ltd. | | 26,245 | | | 1,423,004 |
Yum! Brands, Inc. | | 177,609 | | | 5,852,217 |
| | | | | |
Total Consumer Discretionary | | | | | 318,511,038 |
| | | | | |
Consumer Staples — (11.0%) | | | | | |
Altria Group, Inc. | | 788,525 | | | 14,280,188 |
Archer-Daniels-Midland Co. | | 244,411 | | | 7,361,659 |
Avon Products, Inc. | | 162,531 | | | 5,209,119 |
#Brown-Forman Corp. Class B | | 42,292 | | | 2,064,273 |
Campbell Soup Co. | | 73,347 | | | 2,328,767 |
Clorox Co. | | 53,046 | | | 3,141,915 |
Coca-Cola Co. | | 882,204 | | | 47,030,295 |
Coca-Cola Enterprises, Inc. | | 120,739 | | | 2,302,493 |
Colgate-Palmolive Co. | | 189,741 | | | 14,919,335 |
ConAgra, Inc. | | 168,296 | | | 3,534,216 |
*Constellation Brands, Inc. Class A | | 75,643 | | | 1,196,672 |
Costco Wholesale Corp. | | 165,550 | | | 9,411,518 |
CVS Caremark Corp. | | 549,409 | | | 19,394,138 |
*Dean Foods Co. | | 68,630 | | | 1,251,125 |
*Dr Pepper Snapple Group, Inc. | | 96,703 | | | 2,636,124 |
Estee Lauder Cos., Inc. | | 44,927 | | | 1,909,398 |
General Mills, Inc. | | 123,879 | | | 8,166,104 |
H.J. Heinz Co. | | 119,985 | | | 4,828,196 |
Hershey Co. (The) | | 63,128 | | | 2,385,607 |
Hormel Foods Corp. | | 26,567 | | | 968,633 |
J.M. Smucker Co. | | 45,279 | | | 2,387,562 |
Kellogg Co. | | 97,646 | | | 5,032,675 |
Kimberly-Clark Corp. | | 157,789 | | | 9,650,375 |
Kraft Foods, Inc. | | 561,489 | | | 15,452,177 |
Kroger Co. (The) | | 247,994 | | | 5,736,101 |
Lorillard, Inc. | | 62,871 | | | 4,886,334 |
#McCormick & Co., Inc. | | 49,749 | | | 1,741,712 |
Molson Coors Brewing Co. | | 59,692 | | | 2,923,117 |
Pepsi Bottling Group, Inc. | | 54,836 | | | 2,053,060 |
PepsiCo, Inc. | | 593,045 | | | 35,908,875 |
Philip Morris International, Inc. | | 736,409 | | | 34,876,330 |
Procter & Gamble Co. | | 1,111,163 | | | 64,447,454 |
Reynolds American, Inc. | | 64,330 | | | 3,118,718 |
Safeway, Inc. | | 158,553 | | | 3,540,488 |
Sara Lee Corp. | | 264,823 | | | 2,989,852 |
SUPERVALU, Inc. | | 80,700 | | | 1,280,709 |
3
THE U.S. LARGE COMPANY SERIES
CONTINUED
| | | | | |
| | | Shares | | Value† |
Consumer Staples — (Continued) | | | | | |
Sysco Corp. | | 224,988 | | $ | 5,950,933 |
#Tyson Foods, Inc. Class A | | 116,228 | | | 1,455,175 |
Walgreen Co. | | 377,779 | | | 14,291,380 |
Wal-Mart Stores, Inc. | | 822,201 | | | 40,846,946 |
*Whole Foods Market, Inc. | | 53,477 | | | 1,714,473 |
| | | | | |
Total Consumer Staples | | | | | 414,604,221 |
| | | | | |
Energy — (11.4%) | | | | | |
Anadarko Petroleum Corp. | | 186,733 | | | 11,377,642 |
Apache Corp. | | 127,812 | | | 12,029,665 |
#Baker Hughes, Inc. | | 117,964 | | | 4,962,745 |
BJ Services Co. | | 111,205 | | | 2,135,136 |
Cabot Oil & Gas Corp. | | 39,455 | | | 1,517,834 |
*Cameron International Corp. | | 83,693 | | | 3,094,130 |
#Chesapeake Energy Corp. | | 244,264 | | | 5,984,468 |
Chevron Corp. | | 763,458 | | | 58,435,075 |
ConocoPhillips | | 564,511 | | | 28,327,162 |
CONSOL Energy, Inc. | | 68,789 | | | 2,944,857 |
#*Denbury Resources, Inc. | | 94,956 | | | 1,386,358 |
Devon Energy Corp. | | 168,945 | | | 10,932,431 |
#Diamond Offshore Drilling, Inc. | | 26,458 | | | 2,520,125 |
El Paso Corp. | | 266,931 | | | 2,618,593 |
ENSCO International, Inc. | | 54,225 | | | 2,482,963 |
EOG Resources, Inc. | | 95,905 | | | 7,831,602 |
Exxon Mobil Corp. | | 1,829,468 | | | 131,117,972 |
*FMC Technologies, Inc. | | 46,615 | | | 2,451,949 |
Halliburton Co. | | 343,265 | | | 10,026,771 |
Hess Corp. | | 110,806 | | | 6,065,520 |
Marathon Oil Corp. | | 269,417 | | | 8,613,261 |
Massey Energy Co. | | 32,536 | | | 946,472 |
Murphy Oil Corp. | | 72,640 | | | 4,441,210 |
#*Nabors Industries, Ltd. | | 108,128 | | | 2,252,306 |
*National-Oilwell, Inc. | | 159,200 | | | 6,525,608 |
Noble Energy, Inc. | | 66,008 | | | 4,332,105 |
Occidental Petroleum Corp. | | 308,646 | | | 23,420,058 |
Peabody Energy Corp. | | 101,888 | | | 4,033,746 |
#Pioneer Natural Resources Co. | | 43,802 | | | 1,800,700 |
Range Resources Corp. | | 59,864 | | | 2,996,193 |
Rowan Cos., Inc. | | 43,300 | | | 1,006,725 |
Schlumberger, Ltd. | | 455,987 | | | 28,362,391 |
#Smith International, Inc. | | 83,954 | | | 2,328,044 |
*Southwestern Energy Co. | | 131,140 | | | 5,715,081 |
Spectra Energy Corp. | | 245,884 | | | 4,701,302 |
Sunoco, Inc. | | 44,501 | | | 1,370,631 |
#Tesoro Petroleum Corp. | | 53,123 | | | 751,159 |
Valero Energy Corp. | | 214,231 | | | 3,877,581 |
Williams Cos., Inc. (The) | | 221,923 | | | 4,183,249 |
XTO Energy, Inc. | | 220,870 | | | 9,179,357 |
| | | | | |
Total Energy | | | | | 429,080,177 |
| | | | | |
Financials — (12.5%) | | | | | |
Aflac, Inc. | | 177,977 | | | 7,384,266 |
Allstate Corp. | | 204,191 | | | 6,037,928 |
American Express Co. | | 452,705 | | | 15,772,242 |
#*American International Group, Inc. | | 51,230 | | | 1,722,353 |
Ameriprise Financial, Inc. | | 97,073 | | | 3,365,521 |
AON Corp. | | 104,489 | | | 4,023,871 |
Assurant, Inc. | | 44,892 | | | 1,343,618 |
Bank of America Corp. | | 3,293,490 | | | 48,019,084 |
Bank of New York Mellon Corp. | | 457,892 | | | 12,207,401 |
BB&T Corp. | | 259,467 | | | 6,203,856 |
4
THE U.S. LARGE COMPANY SERIES
CONTINUED
| | | | | |
| | | Shares | | Value† |
Financials — (Continued) | | | | | |
Capital One Financial Corp. | | 173,196 | | $ | 6,338,974 |
#*CB Richard Ellis Group, Inc. | | 91,429 | | | 946,290 |
Charles Schwab Corp. (The) | | 362,369 | | | 6,283,478 |
Chubb Corp. | | 133,200 | | | 6,462,864 |
Cincinnati Financial Corp. | | 61,911 | | | 1,570,063 |
Citigroup, Inc. | | 4,964,744 | | | 20,305,803 |
CME Group, Inc. | | 25,287 | | | 7,652,099 |
Comerica, Inc. | | 57,526 | | | 1,596,347 |
Discover Financial Services | | 203,931 | | | 2,883,584 |
#*E*TRADE Financial Corp. | | 548,126 | | | 800,264 |
#Federated Investors, Inc. | | 33,679 | | | 884,074 |
Fifth Third Bancorp | | 302,760 | | | 2,706,674 |
*First Horizon National Corp. | | 83,228 | | | 984,587 |
Franklin Resources, Inc. | | 56,992 | | | 5,963,073 |
Genworth Financial, Inc. | | 183,187 | | | 1,945,446 |
Goldman Sachs Group, Inc. | | 194,617 | | | 33,117,975 |
Hartford Financial Services Group, Inc. | | 146,282 | | | 3,586,835 |
Hudson City Bancorp, Inc. | | 179,555 | | | 2,359,353 |
Huntington Bancshares, Inc. | | 271,933 | | | 1,036,065 |
#*IntercontinentalExchange, Inc. | | 27,853 | | | 2,790,592 |
Invesco, Ltd. | | 158,383 | | | 3,349,800 |
#Janus Capital Group, Inc. | | 69,329 | | | 909,596 |
JPMorgan Chase & Co. | | 1,497,052 | | | 62,531,862 |
#KeyCorp | | 334,444 | | | 1,802,653 |
#Legg Mason, Inc. | | 61,819 | | | 1,799,551 |
*Leucadia National Corp. | | 72,360 | | | 1,625,929 |
Lincoln National Corp. | | 115,001 | | | 2,740,474 |
Loews Corp. | | 138,469 | | | 4,583,324 |
#M&T Bank Corp. | | 31,432 | | | 1,975,501 |
#Marsh & McLennan Cos., Inc. | | 199,409 | | | 4,678,135 |
Marshall & Ilsley Corp. | | 191,909 | | | 1,020,956 |
*MBIA, Inc. | | 60,176 | | | 244,315 |
MetLife, Inc. | | 311,639 | | | 10,605,075 |
#Moody’s Corp. | | 74,662 | | | 1,767,996 |
Morgan Stanley | | 517,407 | | | 16,619,113 |
*NASDAQ OMX Group, Inc. (The) | | 54,025 | | | 975,692 |
Northern Trust Corp. | | 91,897 | | | 4,617,824 |
NYSE Euronext, Inc. | | 98,976 | | | 2,558,530 |
#People’s United Financial, Inc. | | 132,618 | | | 2,125,867 |
#Plum Creek Timber Co., Inc. | | 61,979 | | | 1,939,323 |
PNC Financial Services Group, Inc. | | 175,646 | | | 8,596,115 |
#Principal Financial Group, Inc. | | 121,412 | | | 3,040,156 |
*Progressive Corp. | | 258,329 | | | 4,133,264 |
Prudential Financial, Inc. | | 176,254 | | | 7,971,968 |
Regions Financial Corp. | | 452,320 | | | 2,189,229 |
*SLM Corp. | | 178,009 | | | 1,726,687 |
State Street Corp. | | 188,242 | | | 7,902,399 |
#SunTrust Banks, Inc. | | 189,893 | | | 3,628,855 |
T. Rowe Price Group, Inc. | | 97,500 | | | 4,751,175 |
#Torchmark Corp. | | 31,495 | | | 1,278,697 |
Travelers Cos., Inc. (The) | | 216,059 | | | 10,757,578 |
#U.S. Bancorp | | 727,850 | | | 16,900,677 |
Unum Group | | 126,162 | | | 2,516,932 |
Wells Fargo & Co. | | 1,778,388 | | | 48,941,238 |
XL Capital, Ltd. | | 130,258 | | | 2,137,534 |
Zions Bancorporation | | 48,131 | | | 681,535 |
| | | | | |
Total Financials | | | | | 471,920,135 |
| | | | | |
Health Care — (11.7%) | | | | | |
Abbott Laboratories | | 588,498 | | | 29,760,344 |
Aetna, Inc. | | 166,166 | | | 4,325,301 |
5
THE U.S. LARGE COMPANY SERIES
CONTINUED
| | | | | |
| | | Shares | | Value† |
Health Care — (Continued) | | | | | |
Allergan, Inc. | | 117,063 | | $ | 6,584,794 |
AmerisourceBergen Corp. | | 113,159 | | | 2,506,472 |
*Amgen, Inc. | | 386,571 | | | 20,770,460 |
Bard (C.R.), Inc. | | 37,160 | | | 2,789,601 |
Baxter International, Inc. | | 229,440 | | | 12,403,526 |
Becton Dickinson & Co. | | 91,131 | | | 6,229,715 |
*Biogen Idec, Inc. | | 109,961 | | | 4,632,657 |
*Boston Scientific Corp. | | 573,874 | | | 4,659,857 |
Bristol-Myers Squibb Co. | | 754,098 | | | 16,439,336 |
Cardinal Health, Inc. | | 136,924 | | | 3,880,426 |
*CareFusion Corp. | | 68,526 | | | 1,532,927 |
*Celgene Corp. | | 174,588 | | | 8,912,717 |
*Cephalon, Inc. | | 28,416 | | | 1,550,945 |
Cigna Corp. | | 103,813 | | | 2,890,154 |
*Coventry Health Care, Inc. | | 56,940 | | | 1,129,120 |
*DaVita, Inc. | | 39,590 | | | 2,099,458 |
#DENTSPLY International, Inc. | | 56,566 | | | 1,864,415 |
Eli Lilly & Co. | | 384,920 | | | 13,091,129 |
*Express Scripts, Inc. | | 104,464 | | | 8,348,763 |
*Forest Laboratories, Inc. | | 114,842 | | | 3,177,678 |
*Genzyme Corp. | | 102,900 | | | 5,206,740 |
*Gilead Sciences, Inc. | | 344,234 | | | 14,647,157 |
*Hospira, Inc. | | 61,322 | | | 2,737,414 |
*Humana, Inc. | | 64,585 | | | 2,427,104 |
IMS Health, Inc. | | 69,431 | | | 1,137,974 |
#*Intuitive Surgical, Inc. | | 14,441 | | | 3,557,540 |
Johnson & Johnson | | 1,049,083 | | | 61,948,351 |
*King Pharmaceuticals, Inc. | | 94,460 | | | 956,880 |
*Laboratory Corp. of America Holdings | | 41,227 | | | 2,840,128 |
*Life Technologies Corp. | | 67,129 | | | 3,166,475 |
McKesson Corp. | | 101,314 | | | 5,950,171 |
*Medco Health Solutions, Inc. | | 180,344 | | | 10,120,905 |
Medtronic, Inc. | | 421,338 | | | 15,041,767 |
#Merck & Co., Inc. | | 802,803 | | | 24,830,697 |
*Millipore Corp. | | 21,145 | | | 1,416,926 |
#*Mylan, Inc. | | 116,233 | | | 1,887,624 |
#*Patterson Cos., Inc. | | 35,388 | | | 903,456 |
PerkinElmer, Inc. | | 44,426 | | | 826,768 |
Pfizer, Inc. | | 3,069,869 | | | 52,279,869 |
Quest Diagnostics, Inc. | | 59,396 | | | 3,322,018 |
Schering-Plough Corp. | | 622,008 | | | 17,540,626 |
*St. Jude Medical, Inc. | | 132,469 | | | 4,514,544 |
Stryker Corp. | | 107,450 | | | 4,942,700 |
*Tenet Healthcare Corp. | | 164,825 | | | 843,904 |
*Thermo Fisher Scientific, Inc. | | 155,375 | | | 6,991,875 |
UnitedHealth Group, Inc. | | 442,510 | | | 11,483,134 |
#*Varian Medical Systems, Inc. | | 47,787 | | | 1,958,311 |
*Waters Corp. | | 36,361 | | | 2,088,212 |
*Watson Pharmaceuticals, Inc. | | 40,248 | | | 1,385,336 |
*WellPoint, Inc. | | 180,844 | | | 8,456,265 |
*Zimmer Holdings, Inc. | | 81,581 | | | 4,288,713 |
| | | | | |
Total Health Care | | | | | 439,279,379 |
| | | | | |
Industrials — (9.2%) | | | | | |
3M Co. | | 265,836 | | | 19,557,555 |
Avery Dennison Corp. | | 42,919 | | | 1,530,062 |
B.F. Goodrich Co. | | 47,197 | | | 2,565,157 |
#Boeing Co. | | 276,538 | | | 13,218,516 |
Burlington Northern Santa Fe Corp. | | 99,669 | | | 7,507,069 |
#C.H. Robinson Worldwide, Inc. | | 64,098 | | | 3,532,441 |
#Caterpillar, Inc. | | 236,514 | | | 13,022,461 |
6
THE U.S. LARGE COMPANY SERIES
CONTINUED
| | | | | |
| | | Shares | | Value† |
Industrials — (Continued) | | | | | |
Cintas Corp. | | 50,021 | | $ | 1,385,082 |
CSX Corp. | | 149,236 | | | 6,294,774 |
#Cummins, Inc. | | 76,823 | | | 3,307,998 |
#Danaher Corp. | | 98,591 | | | 6,726,864 |
Deere & Co. | | 161,007 | | | 7,333,869 |
#Dover Corp. | | 70,857 | | | 2,669,892 |
#Dun & Bradstreet Corp. (The) | | 20,085 | | | 1,537,708 |
Eaton Corp. | | 63,040 | | | 3,810,768 |
Emerson Electric Co. | | 286,115 | | | 10,800,841 |
Equifax, Inc. | | 48,108 | | | 1,317,197 |
#Expeditors International of Washington, Inc. | | 80,754 | | | 2,601,894 |
#Fastenal Co. | | 50,323 | | | 1,736,144 |
FedEx Corp. | | 118,899 | | | 8,642,768 |
*First Solar, Inc. | | 18,365 | | | 2,239,244 |
Flowserve Corp. | | 21,290 | | | 2,090,891 |
Fluor Corp. | | 68,471 | | | 3,041,482 |
General Dynamics Corp. | | 146,596 | | | 9,191,569 |
General Electric Co. | | 4,045,427 | | | 57,687,789 |
Honeywell International, Inc. | | 286,292 | | | 10,275,020 |
Illinois Tool Works, Inc. | | 146,604 | | | 6,732,056 |
#*Iron Mountain, Inc. | | 68,608 | | | 1,676,093 |
ITT Industries, Inc. | | 69,436 | | | 3,520,405 |
#*Jacobs Engineering Group, Inc. | | 47,170 | | | 1,994,819 |
L-3 Communications Holdings, Inc. | | 44,378 | | | 3,208,086 |
Lockheed Martin Corp. | | 122,905 | | | 8,454,635 |
Masco Corp. | | 136,740 | | | 1,606,695 |
#*Monster Worldwide, Inc. | | 47,928 | | | 695,915 |
Norfolk Southern Corp. | | 139,952 | | | 6,524,562 |
Northrop Grumman Corp. | | 121,097 | | | 6,070,593 |
#Paccar, Inc. | | 138,308 | | | 5,174,102 |
Pall Corp. | | 44,893 | | | 1,424,904 |
Parker Hannifin Corp. | | 61,106 | | | 3,236,174 |
Pitney Bowes, Inc. | | 78,820 | | | 1,931,090 |
Precision Castparts Corp. | | 53,378 | | | 5,091,194 |
#*Quanta Services, Inc. | | 79,648 | | | 1,688,538 |
R. R. Donnelley & Sons Co. | | 78,153 | | | 1,569,312 |
#Raytheon Co. | | 148,232 | | | 6,711,945 |
Republic Services, Inc. | | 122,699 | | | 3,179,131 |
#Robert Half International, Inc. | | 57,812 | | | 1,341,238 |
#Rockwell Automation, Inc. | | 54,040 | | | 2,212,938 |
#Rockwell Collins, Inc. | | 60,012 | | | 3,023,405 |
Ryder System, Inc. | | 21,300 | | | 863,715 |
Southwest Airlines Co. | | 282,254 | | | 2,370,934 |
#*Stericycle, Inc. | | 32,377 | | | 1,695,583 |
#Textron, Inc. | | 102,873 | | | 1,829,082 |
Union Pacific Corp. | | 191,978 | | | 10,585,667 |
United Parcel Service, Inc. | | 378,570 | | | 20,321,638 |
United Technologies Corp. | | 358,323 | | | 22,018,948 |
#W.W. Grainger, Inc. | | 23,822 | | | 2,232,836 |
#Waste Management, Inc. | | 187,557 | | | 5,604,203 |
| | | | | |
Total Industrials | | | | | 348,215,491 |
| | | | | |
Information Technology — (17.5%) | | | | | |
#*Adobe Systems, Inc. | | 199,856 | | | 6,583,257 |
#*Advanced Micro Devices, Inc. | | 213,484 | | | 982,026 |
*Affiliated Computer Services, Inc. Class A | | 37,170 | | | 1,936,185 |
*Agilent Technologies, Inc. | | 131,377 | | | 3,250,267 |
#*Akamai Technologies, Inc. | | 65,629 | | | 1,443,838 |
Altera Corp. | | 111,990 | | | 2,216,282 |
#Amphenol Corp. | | 65,255 | | | 2,618,031 |
Analog Devices, Inc. | | 110,986 | | | 2,844,571 |
7
THE U.S. LARGE COMPANY SERIES
CONTINUED
| | | | | |
| | | Shares | | Value† |
Information Technology — (Continued) | | | | | |
*Apple, Inc. | | 341,019 | | $ | 64,282,082 |
Applied Materials, Inc. | | 507,718 | | | 6,194,160 |
*Autodesk, Inc. | | 87,454 | | | 2,180,228 |
Automatic Data Processing, Inc. | | 191,159 | | | 7,608,128 |
*BMC Software, Inc. | | 70,040 | | | 2,602,686 |
*Broadcom Corp. | | 164,237 | | | 4,370,347 |
CA, Inc. | | 151,544 | | | 3,170,300 |
#*Ciena Corp. | | 34,849 | | | 408,779 |
*Cisco Sytems, Inc. | | 2,195,717 | | | 50,172,133 |
*Citrix Systems, Inc. | | 69,681 | | | 2,561,474 |
*Cognizant Technology Solutions Corp. | | 111,619 | | | 4,314,074 |
*Computer Sciences Corp. | | 57,749 | | | 2,928,452 |
*Compuware Corp. | | 90,425 | | | 638,401 |
*Convergys Corp. | | 46,766 | | | 507,411 |
#Corning, Inc. | | 591,800 | | | 8,646,198 |
*Dell, Inc. | | 655,130 | | | 9,492,834 |
*eBay, Inc. | | 427,370 | | | 9,517,530 |
*Electronic Arts, Inc. | | 123,158 | | | 2,246,402 |
*EMC Corp. | | 769,753 | | | 12,677,832 |
Fidelity National Information Services, Inc. | | 118,567 | | | 2,580,018 |
*Fiserv, Inc. | | 58,769 | | | 2,695,734 |
*FLIR Systems, Inc. | | 57,665 | | | 1,603,664 |
*Google, Inc. | | 91,589 | | | 49,102,695 |
Harris Corp. | | 49,895 | | | 2,081,619 |
Hewlett-Packard Co. | | 902,618 | | | 42,838,250 |
Intel Corp. | | 2,131,047 | | | 40,724,308 |
International Business Machines Corp. | | 499,027 | | | 60,187,646 |
*Intuit, Inc. | | 122,984 | | | 3,575,145 |
Jabil Circuit, Inc. | | 70,197 | | | 939,236 |
*JDS Uniphase Corp. | | 82,608 | | | 461,779 |
#*Juniper Networks, Inc. | | 199,558 | | | 5,090,725 |
#KLA-Tencor Corp. | | 64,969 | | | 2,112,142 |
#*Lexmark International, Inc. | | 29,727 | | | 758,038 |
#Linear Technology Corp. | | 84,622 | | | 2,190,017 |
*LSI Corp. | | 248,171 | | | 1,270,636 |
MasterCard, Inc. Class A | | 36,526 | | | 7,999,925 |
*McAfee, Inc. | | 59,842 | | | 2,506,183 |
*MEMC Electronic Materials, Inc. | | 85,101 | | | 1,056,954 |
#Microchip Technology, Inc. | | 69,645 | | | 1,668,694 |
*Micron Technology, Inc. | | 322,377 | | | 2,188,940 |
Microsoft Corp. | | 2,951,141 | | | 81,835,140 |
#Molex, Inc. | | 51,741 | | | 966,004 |
Motorola, Inc. | | 873,799 | | | 7,488,457 |
#National Semiconductor Corp. | | 89,101 | | | 1,152,967 |
*NetApp, Inc. | | 128,047 | | | 3,463,671 |
*Novell, Inc. | | 132,018 | | | 539,954 |
*Novellus Systems, Inc. | | 37,149 | | | 764,526 |
*Nvidia Corp. | | 208,536 | | | 2,494,091 |
Oracle Corp. | | 1,486,799 | | | 31,371,459 |
#Paychex, Inc. | | 122,300 | | | 3,474,543 |
*QLogic Corp. | | 44,958 | | | 788,563 |
QUALCOMM, Inc. | | 632,808 | | | 26,204,579 |
*Red Hat, Inc. | | 71,570 | | | 1,847,222 |
#*Salesforce.com, Inc. | | 41,539 | | | 2,357,338 |
*Sandisk Corp. | | 86,436 | | | 1,770,209 |
*Sun Microsystems, Inc. | | 286,790 | | | 2,345,942 |
*Symantec Corp. | | 310,065 | | | 5,450,943 |
*Tellabs, Inc. | | 150,815 | | | 907,906 |
*Teradata Corp. | | 65,400 | | | 1,823,352 |
#*Teradyne, Inc. | | 66,456 | | | 556,237 |
Texas Instruments, Inc. | | 480,199 | | | 11,260,667 |
8
THE U.S. LARGE COMPANY SERIES
CONTINUED
| | | | | |
| | | Shares | | Value† |
Information Technology — (Continued) | | | | | |
Total System Services, Inc. | | 75,049 | | $ | 1,198,533 |
#*VeriSign, Inc. | | 73,421 | | | 1,674,733 |
*Western Digital Corp. | | 85,533 | | | 2,880,751 |
Western Union Co. | | 267,065 | | | 4,852,571 |
Xerox Corp. | | 330,841 | | | 2,487,924 |
#Xilinx, Inc. | | 105,073 | | | 2,285,338 |
*Yahoo!, Inc. | | 454,106 | | | 7,220,285 |
| | | | | |
Total Information Technology | | | | | 661,490,161 |
| | | | | |
Materials — (3.1%) | | | | | |
Air Products & Chemicals, Inc. | | 79,974 | | | 6,168,395 |
Airgas, Inc. | | 31,087 | | | 1,379,019 |
AK Steel Holding Corp. | | 41,643 | | | 660,874 |
#Alcoa, Inc. | | 370,924 | | | 4,606,876 |
Allegheny Technologies, Inc. | | 37,334 | | | 1,152,127 |
#Ball Corp. | | 35,828 | | | 1,767,395 |
Bemis Co., Inc. | | 41,111 | | | 1,061,897 |
CF Industries Holdings, Inc. | | 18,088 | | | 1,505,826 |
Dow Chemical Co. | | 435,353 | | | 10,222,088 |
du Pont (E.I.) de Nemours & Co. | | 343,985 | | | 10,945,603 |
Eastman Chemical Co. | | 27,662 | | | 1,452,532 |
#Ecolab, Inc. | | 90,154 | | | 3,963,170 |
FMC Corp. | | 27,596 | | | 1,410,156 |
Freeport-McMoRan Copper & Gold, Inc. Class B | | 156,762 | | | 11,500,060 |
#International Flavors & Fragrances, Inc. | | 30,070 | | | 1,145,366 |
International Paper Co. | | 164,743 | | | 3,675,416 |
MeadWestavco Corp. | | 65,139 | | | 1,487,123 |
Monsanto Co. | | 207,818 | | | 13,961,213 |
Newmont Mining Corp. | | 186,532 | | | 8,106,681 |
Nucor Corp. | | 119,789 | | | 4,773,592 |
*Owens-Illinois, Inc. | | 64,099 | | | 2,043,476 |
*Pactiv Corp. | | 50,236 | | | 1,159,949 |
PPG Industries, Inc. | | 62,777 | | | 3,542,506 |
Praxair, Inc. | | 116,791 | | | 9,277,877 |
Sealed Air Corp. | | 60,443 | | | 1,162,319 |
#Sigma-Aldrich Corp. | | 46,372 | | | 2,408,098 |
#*Titanium Metals Corp. | | 32,306 | | | 277,832 |
#United States Steel Corp. | | 54,560 | | | 1,881,774 |
#Vulcan Materials Co. | | 47,580 | | | 2,190,107 |
#Weyerhaeuser Co. | | 80,459 | | | 2,923,880 |
| | | | | |
Total Materials | | | | | 117,813,227 |
| | | | | |
Real Estate Investment Trusts — (1.0%) | | | | | |
#Apartment Investment & Management Co. Class A | | 44,555 | | | 550,254 |
#AvalonBay Communities, Inc. | | 30,429 | | | 2,092,907 |
Boston Properties, Inc. | | 52,756 | | | 3,205,982 |
#Equity Residential | | 104,297 | | | 3,012,097 |
#HCP, Inc. | | 111,576 | | | 3,301,534 |
#Health Care REIT, Inc. | | 45,638 | | | 2,024,958 |
Host Marriott Corp. | | 229,891 | | | 2,324,198 |
#Kimco Realty Corp. | | 143,275 | | | 1,810,996 |
#ProLogis | | 168,564 | | | 1,909,830 |
#Public Storage | | 51,624 | | | 3,799,526 |
Simon Property Group, Inc. | | 107,758 | | | 7,315,691 |
#Ventas, Inc. | | 59,591 | | | 2,391,387 |
Vornado Realty Trust | | 59,432 | | | 3,539,770 |
| | | | | |
Total Real Estate Investment Trusts | | | | | 37,279,130 |
| | | | | |
Telecommunication Services — (2.8%) | | | | | |
*American Tower Corp. | | 150,228 | | | 5,531,395 |
9
THE U.S. LARGE COMPANY SERIES
CONTINUED
| | | | | | |
| | | Shares | | Value† |
Telecommunication Services — (Continued) | | | | | | |
AT&T, Inc. | | | 2,246,012 | | $ | 57,655,128 |
CenturyTel, Inc. | | | 113,161 | | | 3,673,206 |
Frontier Communications Corp. | | | 118,909 | | | 852,578 |
#*MetroPCS Communications, Inc. | | | 99,201 | | | 618,022 |
#Qwest Communications International, Inc. | | | 564,344 | | | 2,025,995 |
*Sprint Nextel Corp. | | | 1,094,778 | | | 3,240,543 |
Verizon Communications, Inc. | | | 1,081,364 | | | 31,997,561 |
Windstream Corp. | | | 166,246 | | | 1,602,611 |
| | | | | | |
Total Telecommunication Services | | | | | | 107,197,039 |
| | | | | | |
Utilities — (3.4%) | | | | | | |
*AES Corp. | | | 253,916 | | | 3,318,682 |
Allegheny Energy, Inc. | | | 64,518 | | | 1,472,301 |
#Ameren Corp. | | | 88,840 | | | 2,162,366 |
American Electric Power Co., Inc. | | | 181,504 | | | 5,485,051 |
CenterPoint Energy, Inc. | | | 147,094 | | | 1,853,384 |
#CMS Energy Corp. | | | 87,144 | | | 1,159,015 |
#Consolidated Edison, Inc. | | | 104,681 | | | 4,258,423 |
Constellation Energy Group, Inc. | | | 76,375 | | | 2,361,515 |
#Dominion Resources, Inc. | | | 226,600 | | | 7,724,794 |
#DTE Energy Co. | | | 62,611 | | | 2,315,355 |
Duke Energy Corp. | | | 493,637 | | | 7,809,337 |
#*Dynegy, Inc. | | | 192,997 | | | 385,994 |
Edison International, Inc. | | | 124,029 | | | 3,946,603 |
Entergy Corp. | | | 74,534 | | | 5,718,248 |
EQT Corp. | | | 49,832 | | | 2,085,968 |
Exelon Corp. | | | 250,898 | | | 11,782,170 |
FirstEnergy Corp. | | | 116,044 | | | 5,022,384 |
FPL Group, Inc. | | | 156,635 | | | 7,690,778 |
#Integrys Energy Group, Inc. | | | 29,092 | | | 1,006,583 |
#Nicor, Inc. | | | 17,215 | | | 638,332 |
NiSource, Inc. | | | 104,816 | | | 1,354,223 |
Northeast Utilities, Inc. | | | 66,726 | | | 1,538,034 |
Pepco Holdings, Inc. | | | 84,062 | | | 1,255,046 |
PG&E Corp. | | | 141,113 | | | 5,770,111 |
Pinnacle West Capital Corp. | | | 38,525 | | | 1,206,603 |
PPL Corp. | | | 143,356 | | | 4,220,401 |
Progress Energy, Inc. | | | 106,323 | | | 3,990,302 |
*Public Service Enterprise Group, Inc. | | | 192,617 | | | 5,739,987 |
Questar Corp. | | | 66,325 | | | 2,642,388 |
SCANA Corp. | | | 41,976 | | | 1,420,468 |
Sempra Energy. | | | 93,395 | | | 4,805,173 |
Southern Co. | | | 303,041 | | | 9,451,849 |
#TECO Energy, Inc. | | | 81,368 | | | 1,166,817 |
#Wisconsin Energy Corp. | | | 44,506 | | | 1,943,577 |
#Xcel Energy, Inc. | | | 173,485 | | | 3,268,457 |
| | | | | | |
Total Utilities | | | | | | 127,970,719 |
| | | | | | |
TOTAL COMMON STOCKS | | | | | | 3,473,360,717 |
| | | | | | |
| | |
| | | Face
Amount | | |
| | | (000) | | |
TEMPORARY CASH INVESTMENTS — (0.7%) | | | | | | |
Repurchase Agreement, PNC Capital Markets, Inc. 0.19%, 11/02/09 (Collateralized by $25,855,000, FNMA 6.50%, 06/25/39 valued at $27,826,444) to be repurchased at $27,414,434 | | $ | 27,414 | | | 27,414,000 |
| | | | | | |
10
THE U.S. LARGE COMPANY SERIES
CONTINUED
| | | | | | |
| | | Shares/
Face
Amount | | Value† |
| | | (000) | | |
SECURITIES LENDING COLLATERAL — (7.2%) | | | | | | |
§@DFA Short Term Investment Fund LP | | | 269,088,352 | | $ | 269,088,352 |
@Repurchase Agreement, Deutsche Bank Securities 0.08%, 11/02/09 (Collateralized by $2,507,470 FHLMC 5.793%(r), 01/01/37, valued at $1,408,594) to be repurchased at $1,367,576 | | $ | 1,368 | | | 1,367,567 |
| | | | | | |
TOTAL SECURITIES LENDING COLLATERAL | | | | | | 270,455,919 |
| | | | | | |
TOTAL INVESTMENTS — (100.0%)
(Cost $3,544,033,089) | | | | | $ | 3,771,230,636 |
| | | | | | |
See accompanying Notes to Financial Statements.
11
THE U.S. LARGE CAP VALUE SERIES
SCHEDULE OF INVESTMENTS
October 31, 2009
| | | | | |
| | | Shares | | Value† |
COMMON STOCKS — (93.1%) | | | | | |
Consumer Discretionary — (15.5%) | | | | | |
#*AutoNation, Inc. | | 307,114 | | $ | 5,294,645 |
Carnival Corp. | | 2,624,598 | | | 76,428,294 |
CBS Corp. | | 4,758 | | | 56,144 |
CBS Corp. Class B | | 3,870,469 | | | 45,555,420 |
#*Clear Channel Outdoor Holdings, Inc. | | 94,100 | | | 641,762 |
Comcast Corp. Class A | | 11,512,642 | | | 166,933,309 |
Comcast Corp. Special Class A | | 3,396,043 | | | 47,612,523 |
#*Discovery Communications, Inc. (25470F104) | | 584,895 | | | 16,084,612 |
*Discovery Communications, Inc. (25470F302) | | 563,115 | | | 13,526,022 |
#Disney (Walt) Co. | | 4,577,802 | | | 125,294,441 |
#*Expedia, Inc. | | 1,028,174 | | | 23,308,705 |
Fortune Brands, Inc. | | 669,010 | | | 26,057,940 |
#J.C. Penney Co., Inc. | | 815,260 | | | 27,009,564 |
#Lennar Corp. Class A | | 180,100 | | | 2,269,260 |
#*Liberty Global, Inc. Class A | | 529,579 | | | 10,872,257 |
#*Liberty Global, Inc. Series C | | 383,654 | | | 7,895,599 |
*Liberty Media Corp. Entertainment Class A | | 2,954,309 | | | 91,051,803 |
*Liberty Media Corp. Interactive Class A | | 3,585,265 | | | 40,656,905 |
#Macy’s, Inc. | | 1,848,030 | | | 32,469,887 |
*MGM Mirage | | 149,600 | | | 1,386,792 |
#*Mohawk Industries, Inc. | | 392,417 | | | 16,807,220 |
News Corp. Class A | | 5,810,104 | | | 66,932,398 |
#News Corp. Class B | | 2,307,061 | | | 31,376,030 |
#*Royal Caribbean Cruises, Ltd. | | 663,875 | | | 13,430,191 |
#*Sears Holdings Corp. | | 539,227 | | | 36,591,944 |
*Ticketmaster Entertainment, Inc. | | 73,729 | | | 711,485 |
Time Warner Cable, Inc. | | 1,980,956 | | | 78,128,905 |
Time Warner, Inc. | | 6,114,193 | | | 184,159,493 |
#*Toll Brothers, Inc. | | 904,000 | | | 15,657,280 |
Washington Post Co. | | 24,866 | | | 10,742,112 |
Wendy’s/Arby’s Group, Inc. | | 834,900 | | | 3,297,855 |
#Whirlpool Corp. | | 322,215 | | | 23,067,372 |
#Wyndham Worldwide Corp. | | 419,361 | | | 7,150,105 |
| | | | | |
Total Consumer Discretionary | | | | | 1,248,458,274 |
| | | | | |
Consumer Staples — (5.9%) | | | | | |
Archer-Daniels-Midland Co. | | 1,723,060 | | | 51,898,567 |
#Bunge, Ltd. | | 245,372 | | | 14,000,926 |
*Constellation Brands, Inc. Class A | | 855,902 | | | 13,540,370 |
Corn Products International, Inc. | | 428,526 | | | 12,075,863 |
CVS Caremark Corp. | | 4,840,631 | | | 170,874,274 |
Del Monte Foods Co. | | 150,209 | | | 1,622,257 |
J.M. Smucker Co. | | 526,102 | | | 27,741,358 |
Kraft Foods, Inc. | | 2,137,904 | | | 58,835,118 |
Molson Coors Brewing Co. | | 757,690 | | | 37,104,079 |
PepsiAmericas, Inc. | | 521,775 | | | 15,256,701 |
*Ralcorp Holdings, Inc. | | 79,900 | | | 4,290,630 |
Safeway, Inc. | | 1,005,594 | | | 22,454,914 |
SUPERVALU, Inc. | | 1,327,679 | | | 21,070,266 |
#Tyson Foods, Inc. Class A | | 1,926,959 | | | 24,125,527 |
| | | | | |
Total Consumer Staples | | | | | 474,890,850 |
| | | | | |
Energy — (13.0%) | | | | | |
Anadarko Petroleum Corp. | | 2,760,568 | | | 168,201,408 |
BJ Services Co. | | 567,800 | | | 10,901,760 |
Cabot Oil & Gas Corp. | | 214,857 | | | 8,265,549 |
#Chesapeake Energy Corp. | | 2,647,458 | | | 64,862,721 |
#Cimarex Energy Co. | | 368,647 | | | 14,436,217 |
12
THE U.S. LARGE CAP VALUE SERIES
CONTINUED
| | | | | |
| | | Shares | | Value† |
Energy — (Continued) | | | | | |
ConocoPhillips | | 5,213,766 | | $ | 261,626,778 |
ENSCO International, Inc. | | 614,773 | | | 28,150,456 |
#Helmerich & Payne, Inc. | | 470,183 | | | 17,876,358 |
Hess Corp. | | 624,400 | | | 34,179,656 |
Marathon Oil Corp. | | 3,280,335 | | | 104,872,310 |
#*Nabors Industries, Ltd. | | 649,438 | | | 13,527,794 |
*National-Oilwell, Inc. | | 1,160,300 | | | 47,560,697 |
Noble Energy, Inc. | | 464,500 | | | 30,485,135 |
#Patterson-UTI Energy, Inc. | | 419,900 | | | 6,542,042 |
#Pioneer Natural Resources Co. | | 650,933 | | | 26,759,856 |
*Plains Exploration & Production Co. | | 345,600 | | | 9,158,400 |
*Pride International, Inc. | | 644,204 | | | 19,042,670 |
Rowan Cos., Inc. | | 456,566 | | | 10,615,160 |
#Smith International, Inc. | | 631,653 | | | 17,515,738 |
Sunoco, Inc. | | 155,000 | | | 4,774,000 |
#Tesoro Petroleum Corp. | | 321,700 | | | 4,548,838 |
#Tidewater, Inc. | | 273,715 | | | 11,405,704 |
Valero Energy Corp. | | 1,735,295 | | | 31,408,840 |
#*Whiting Petroleum Corp. | | 120,503 | | | 6,796,369 |
XTO Energy, Inc. | | 2,156,495 | | | 89,623,932 |
| | | | | |
Total Energy | | | | | 1,043,138,388 |
| | | | | |
Financials — (29.1%) | | | | | |
*Allegheny Corp. | | 36,844 | | | 9,211,000 |
Allied World Assurance Co. Holdings, Ltd. | | 45,300 | | | 2,027,628 |
Allstate Corp. | | 2,596,315 | | | 76,773,035 |
American Financial Group, Inc. | | 689,393 | | | 16,959,068 |
#American National Insurance Co. | | 92,588 | | | 7,730,172 |
#*AmeriCredit Corp. | | 88,688 | | | 1,565,343 |
Ameriprise Financial, Inc. | | 283,766 | | | 9,838,167 |
*Arch Capital Group, Ltd. | | 57,368 | | | 3,864,882 |
Aspen Insurance Holdings, Ltd. | | 176,521 | | | 4,554,242 |
Assurant, Inc. | | 294,109 | | | 8,802,682 |
Axis Capital Holdings, Ltd. | | 305,766 | | | 8,833,580 |
Bank of America Corp. | | 16,675,426 | | | 243,127,711 |
Bank of New York Mellon Corp. | | 1,972,678 | | | 52,591,595 |
#BB&T Corp. | | 273,886 | | | 6,548,614 |
#Capital One Financial Corp. | | 1,815,684 | | | 66,454,034 |
Chubb Corp. | | 1,669,873 | | | 81,022,238 |
Cincinnati Financial Corp. | | 990,152 | | | 25,110,255 |
Citigroup, Inc. | | 19,573,191 | | | 80,054,351 |
#City National Corp. | | 60,935 | | | 2,295,421 |
CME Group, Inc. | | 203,881 | | | 61,696,429 |
#*CNA Financial Corp. | | 1,676,585 | | | 36,499,255 |
#Comerica, Inc. | | 630,208 | | | 17,488,272 |
Discover Financial Services | | 1,976,830 | | | 27,952,376 |
Endurance Specialty Holdings, Ltd. | | 7,900 | | | 284,321 |
#Everest Re Group, Ltd. | | 181,300 | | | 15,861,937 |
Fidelity National Financial, Inc. | | 945,859 | | | 12,835,307 |
Fifth Third Bancorp | | 2,042,900 | | | 18,263,526 |
First American Corp. | | 567,231 | | | 17,238,150 |
*First Horizon National Corp. | | 631,085 | | | 7,465,736 |
First Niagara Financial Group, Inc. | | 100,726 | | | 1,293,322 |
Genworth Financial, Inc. | | 1,169,100 | | | 12,415,842 |
Hanover Insurance Group, Inc. | | 304,654 | | | 12,813,747 |
Hartford Financial Services Group, Inc. | | 1,483,798 | | | 36,382,727 |
#HCC Insurance Holdings, Inc. | | 468,789 | | | 12,371,342 |
Huntington Bancshares, Inc. | | 726,500 | | | 2,767,965 |
Invesco, Ltd. | | 752,003 | | | 15,904,863 |
JPMorgan Chase & Co. | | 7,983,370 | | | 333,465,365 |
KeyCorp | | 1,129,300 | | | 6,086,927 |
13
THE U.S. LARGE CAP VALUE SERIES
CONTINUED
| | | | | |
| | | Shares | | Value† |
Financials — (Continued) | | | | | |
#Legg Mason, Inc. | | 433,647 | | $ | 12,623,464 |
Lincoln National Corp. | | 1,331,373 | | | 31,726,619 |
#Loews Corp. | | 2,592,160 | | | 85,800,496 |
#M&T Bank Corp. | | 474,420 | | | 29,817,297 |
#*Markel Corp. | | 7,885 | | | 2,544,490 |
Marshall & Ilsley Corp. | | 221,900 | | | 1,180,508 |
#Mercury General Corp. | | 171,128 | | | 6,239,327 |
MetLife, Inc. | | 4,663,914 | | | 158,712,993 |
#Morgan Stanley | | 3,619,297 | | | 116,251,820 |
*NASDAQ OMX Group, Inc. (The) | | 200,000 | | | 3,612,000 |
#New York Community Bancorp, Inc. | | 2,039,500 | | | 22,026,600 |
NYSE Euronext, Inc. | | 1,013,866 | | | 26,208,436 |
#Old Republic International Corp. | | 1,432,884 | | | 15,303,201 |
PartnerRe, Ltd. | | 90,832 | | | 6,946,831 |
People’s United Financial, Inc. | | 252,479 | | | 4,047,238 |
PNC Financial Services Group, Inc. | | 1,190,568 | | | 58,266,398 |
Prudential Financial, Inc. | | 1,918,000 | | | 86,751,140 |
#Raymond James Financial, Inc. | | 35,371 | | | 835,109 |
Regions Financial Corp. | | 1,100,600 | | | 5,326,904 |
Reinsurance Group of America, Inc. | | 509,512 | | | 23,488,503 |
RenaissanceRe Holdings, Ltd. | | 106,328 | | | 5,582,220 |
#SunTrust Banks, Inc. | | 1,508,760 | | | 28,832,404 |
Transatlantic Holdings, Inc. | | 295,249 | | | 14,910,074 |
Travelers Cos., Inc. (The) | | 3,328,076 | | | 165,704,904 |
Unum Group | | 1,898,589 | | | 37,876,851 |
#W. R. Berkley Corp. | | 667,640 | | | 16,504,061 |
#Wesco Financial Corp. | | 19,877 | | | 6,519,656 |
White Mountains Insurance Group, Ltd. | | 30,224 | | | 9,374,578 |
| | | | | |
Total Financials | | | | | 2,339,465,549 |
| | | | | |
Health Care — (5.1%) | | | | | |
Aetna, Inc. | | 1,077,768 | | | 28,054,301 |
*Boston Scientific Corp. | | 4,237,207 | | | 34,406,121 |
Cardinal Health, Inc. | | 380,120 | | | 10,772,601 |
*CareFusion Corp. | | 164,010 | | | 3,668,904 |
#*Community Health Systems, Inc. | | 370,974 | | | 11,604,067 |
*Coventry Health Care, Inc. | | 343,613 | | | 6,813,846 |
#*Hologic, Inc. | | 697,338 | | | 10,306,656 |
*Humana, Inc. | | 283,046 | | | 10,636,869 |
*Inverness Medical Innovations, Inc. | | 223,740 | | | 8,504,357 |
*King Pharmaceuticals, Inc. | | 1,215,010 | | | 12,308,051 |
#Omnicare, Inc. | | 582,523 | | | 12,623,273 |
#PerkinElmer, Inc. | | 424,381 | | | 7,897,730 |
Teleflex, Inc. | | 52,080 | | | 2,590,980 |
*Thermo Fisher Scientific, Inc. | | 1,056,245 | | | 47,531,025 |
UnitedHealth Group, Inc. | | 2,406,388 | | | 62,445,769 |
*Watson Pharmaceuticals, Inc. | | 631,400 | | | 21,732,788 |
*WellPoint, Inc. | | 2,580,122 | | | 120,646,505 |
| | | | | |
Total Health Care | | | | | 412,543,843 |
| | | | | |
Industrials — (13.7%) | | | | | |
#*AGCO Corp. | | 126,940 | | | 3,568,283 |
Burlington Northern Santa Fe Corp. | | 1,930,415 | | | 145,398,858 |
#CSX Corp. | | 2,287,204 | | | 96,474,265 |
#Eaton Corp. | | 395,650 | | | 23,917,042 |
#FedEx Corp. | | 599,693 | | | 43,591,684 |
General Electric Co. | | 18,139,800 | | | 258,673,548 |
#*Hertz Global Holdings, Inc. | | 820,911 | | | 7,642,681 |
#Ingersoll-Rand P.L.C. | | 635,764 | | | 20,083,785 |
#*Kansas City Southern | | 206,873 | | | 5,012,533 |
#Masco Corp. | | 1,592,858 | | | 18,716,082 |
14
THE U.S. LARGE CAP VALUE SERIES
CONTINUED
| | | | | |
| | | Shares | | Value† |
Industrials — (Continued) | | | | | |
Norfolk Southern Corp. | | 2,186,220 | | $ | 101,921,576 |
#Northrop Grumman Corp. | | 1,926,678 | | | 96,584,368 |
#Pentair, Inc. | | 341,927 | | | 9,950,076 |
R. R. Donnelley & Sons Co. | | 920,372 | | | 18,481,070 |
Republic Services, Inc. | | 548,028 | | | 14,199,405 |
#Ryder System, Inc. | | 319,005 | | | 12,935,653 |
Southwest Airlines Co. | | 4,297,932 | | | 36,102,629 |
SPX Corp. | | 50,000 | | | 2,639,000 |
Timken Co. | | 217,642 | | | 4,794,653 |
Tyco International, Ltd. | | 336,967 | | | 11,305,243 |
Union Pacific Corp. | | 2,835,808 | | | 156,366,453 |
*URS Corp. | | 356,821 | | | 13,866,064 |
| | | | | |
Total Industrials | | | | | 1,102,224,951 |
| | | | | |
Information Technology — (3.3%) | | | | | |
*Activision Blizzard, Inc. | | 1,656,656 | | | 17,941,584 |
*Arrow Electronics, Inc. | | 505,000 | | | 12,796,700 |
*Avnet, Inc. | | 860,267 | | | 21,317,416 |
AVX Corp. | | 179,574 | | | 2,032,778 |
*Computer Sciences Corp. | | 946,932 | | | 48,018,922 |
Fidelity National Information Services, Inc. | | 935,123 | | | 20,348,276 |
*IAC/InterActiveCorp | | 815,025 | | | 15,436,574 |
*Ingram Micro, Inc. | | 969,555 | | | 17,112,646 |
#*Micron Technology, Inc. | | 3,863,757 | | | 26,234,910 |
*Sandisk Corp. | | 606,339 | | | 12,417,823 |
*Tellabs, Inc. | | 1,931,218 | | | 11,625,932 |
Tyco Electronics, Ltd. | | 1,547,828 | | | 32,891,345 |
#Xerox Corp. | | 3,910,956 | | | 29,410,389 |
| | | | | |
Total Information Technology | | | | | 267,585,295 |
| | | | | |
Materials — (3.6%) | | | | | |
#Alcoa, Inc. | | 4,317,440 | | | 53,622,605 |
Ashland, Inc. | | 160,300 | | | 5,536,762 |
Commercial Metals Co. | | 104,500 | | | 1,550,780 |
#Dow Chemical Co. | | 3,993,594 | | | 93,769,587 |
#International Paper Co. | | 1,909,245 | | | 42,595,256 |
MeadWestavco Corp. | | 1,023,001 | | | 23,355,113 |
Reliance Steel & Aluminum Co. | | 300,700 | | | 10,969,536 |
Steel Dynamics, Inc. | | 52,700 | | | 705,653 |
#United States Steel Corp. | | 346,600 | | | 11,954,234 |
#Weyerhaeuser Co. | | 1,105,551 | | | 40,175,723 |
| | | | | |
Total Materials | | | | | 284,235,249 |
| | | | | |
Telecommunication Services — (3.4%) | | | | | |
#AT&T, Inc. | | 8,438,300 | | | 216,611,161 |
#*Sprint Nextel Corp. | | 9,790,408 | | | 28,979,608 |
Telephone & Data Systems, Inc. | | 309,373 | | | 9,163,628 |
Telephone & Data Systems, Inc. Special Shares | | 174,000 | | | 4,802,400 |
*United States Cellular Corp. | | 264,225 | | | 9,673,277 |
Verizon Communications, Inc. | | 26 | | | 769 |
| | | | | |
Total Telecommunication Services | | | | | 269,230,843 |
| | | | | |
Utilities — (0.5%) | | | | | |
*AES Corp. | | 528,748 | | | 6,910,736 |
*Calpine Corp. | | 989,786 | | | 11,125,195 |
#*Mirant Corp. | | 321,125 | | | 4,489,328 |
*NRG Energy, Inc. | | 103,100 | | | 2,370,269 |
*Public Service Enterprise Group, Inc. | | 62,200 | | | 1,853,560 |
Questar Corp. | | 207,166 | | | 8,253,493 |
15
THE U.S. LARGE CAP VALUE SERIES
CONTINUED
| | | | | | |
| | | Shares | | Value† |
Utilities — (Continued) | | | | | | |
*RRI Energy, Inc. | | | 834,099 | | $ | 4,395,702 |
| | | | | | |
Total Utilities | | | | | | 39,398,283 |
| | | | | | |
TOTAL COMMON STOCKS | | | | | | 7,481,171,525 |
| | | | | | |
| | |
| | | Face
Amount | | |
| | | (000) | | |
TEMPORARY CASH INVESTMENTS — (0.5%) | | | | | | |
Repurchase Agreement, PNC Capital Markets, Inc. 0.19%, 11/02/09 (Collateralized by $39,850,000 FNMA 6.50%, 6/25/39, valued at $42,888,563) to be repurchased at $42,250,669 | | $ | 42,250 | | | 42,250,000 |
| | | | | | |
| | |
| | | Shares/
Face
Amount | | |
| | | (000) | | |
SECURITIES LENDING COLLATERAL — (6.4%) | | | | | | |
§@DFA Short Term Investment Fund LP | | | 512,733,772 | | | 512,733,772 |
@Repurchase Agreement, Deutsche Bank Securities 0.08%, 11/02/09 (Collateralized by $3,853,074 FHLMC 5.793%(r), 01/01/37 & 5.945%(r), 07/01/37, valued at $2,684,003) to be repurchased at $2,605,845 | | $ | 2,606 | | | 2,605,828 |
| | | | | | |
TOTAL SECURITIES LENDING COLLATERAL | | | | | | 515,339,600 |
| | | | | | |
TOTAL INVESTMENTS — (100.0%)
(Cost $6,877,390,667) | | | | | $ | 8,038,761,125 |
| | | | | | |
See accompanying Notes to Financial Statements.
16
THE DFA INTERNATIONAL VALUE SERIES
SCHEDULE OF INVESTMENTS
October 31, 2009
| | | | | |
| | | Shares | | Value†† |
COMMON STOCKS — (85.2%) | | | | | |
AUSTRALIA — (4.5%) | | | | | |
#*Alumina, Ltd. Sponsored ADR | | 87,059 | | $ | 503,201 |
Amcor, Ltd. | | 2,026,464 | | | 10,435,306 |
Amcor, Ltd. Sponsored ADR | | 77,103 | | | 1,570,588 |
Australia & New Zealand Banking Group, Ltd. | | 3,343,351 | | | 68,191,374 |
#Bendigo Bank, Ltd. | | 238,547 | | | 1,933,236 |
BlueScope Steel, Ltd. | | 2,708,973 | | | 7,179,189 |
#Boral, Ltd. | | 1,212,600 | | | 6,185,111 |
#*Caltex Australia, Ltd. | | 265,507 | | | 2,407,251 |
#Crown, Ltd. | | 726,400 | | | 5,287,521 |
CSR, Ltd. (6238645) | | 2,438,600 | | | 4,147,596 |
CSR, Ltd. (B58VXV1) | | 426,755 | | | 739,474 |
#Downer EDI, Ltd. | | 480,526 | | | 3,657,956 |
#Fairfax Media, Ltd. | | 2,908,662 | | | 4,122,034 |
Goodman Fielder, Ltd. | | 2,376,765 | | | 3,409,367 |
Harvey Norman Holdings, Ltd. | | 113,157 | | | 400,883 |
*Incitec Pivot, Ltd. | | 2,357,913 | | | 5,500,234 |
Insurance Australia Group, Ltd. | | 2,620,594 | | | 8,815,390 |
Lend Lease Corp., Ltd. | | 629,285 | | | 5,216,216 |
#Macquarie Group, Ltd. | | 410,696 | | | 17,986,733 |
National Australia Bank, Ltd. | | 2,465,437 | | | 65,140,887 |
OneSteel, Ltd. | | 1,673,037 | | | 4,542,208 |
Origin Energy, Ltd. | | 167,471 | | | 2,401,339 |
*OZ Minerals, Ltd. | | 3,889,713 | | | 4,067,350 |
Qantas Airways, Ltd. | | 2,226,972 | | | 5,537,350 |
#Sims Metal Management, Ltd. | | 90,490 | | | 1,595,361 |
Suncorp-Metway, Ltd. | | 2,617,468 | | | 20,473,493 |
TABCORP Holdings, Ltd. | | 1,277,891 | | | 8,151,750 |
Tatts Group, Ltd. | | 1,434,845 | | | 3,177,050 |
#Toll Holdings, Ltd. | | 69,091 | | | 523,719 |
#Washington H. Soul Pattinson & Co., Ltd. | | 113,801 | | | 1,362,176 |
Wesfarmers, Ltd. | | 1,898,047 | | | 47,362,464 |
| | | | | |
TOTAL AUSTRALIA | | | | | 322,023,807 |
| | | | | |
AUSTRIA — (0.5%) | | | | | |
#Erste Group Bank AG | | 303,609 | | | 12,205,974 |
OMV AG | | 383,710 | | | 15,812,244 |
Voestalpine AG | | 180,281 | | | 6,164,525 |
| | | | | |
TOTAL AUSTRIA | | | | | 34,182,743 |
| | | | | |
BELGIUM — (0.5%) | | | | | |
Delhaize Group SA | | 201,237 | | | 13,670,396 |
#Delhaize Group SA Sponsored ADR | | 52,900 | | | 3,586,620 |
#*KBC Groep NV | | 78,843 | | | 3,375,020 |
Solvay SA | | 55,827 | | | 5,482,055 |
#UCB SA | | 278,888 | | | 11,905,862 |
| | | | | |
TOTAL BELGIUM | | | | | 38,019,953 |
| | | | | |
CANADA — (7.6%) | | | | | |
Astral Media, Inc. Class A | | 40,138 | | | 1,188,505 |
#Bank of Montreal | | 764,416 | | | 35,364,969 |
Barrick Gold Corp. | | 375,441 | | | 13,518,027 |
BCE, Inc. | | 651,325 | | | 15,584,127 |
Canadian Pacific Railway, Ltd. | | 427,751 | | | 18,540,291 |
#Canadian Tire Corp. Class A | | 166,647 | | | 8,422,831 |
*CGI Group, Inc. | | 400,789 | | | 4,896,660 |
#Empire Co., Ltd. Class A | | 65,500 | | | 2,602,324 |
EnCana Corp. | | 671,498 | | | 37,234,767 |
Ensign Energy Services, Inc. | | 128,319 | | | 1,840,498 |
17
THE DFA INTERNATIONAL VALUE SERIES
CONTINUED
| | | | | |
| | | Shares | | Value†† |
CANADA — (Continued) | | | | | |
Fairfax Financial Holdings, Inc. | | 46,500 | | $ | 16,633,940 |
#George Weston, Ltd. | | 109,600 | | | 5,587,113 |
Gerdau Ameristeel Corp. | | 403,761 | | | 2,746,343 |
Goldcorp, Inc. | | 442,407 | | | 16,264,452 |
Industrial Alliance Insurance & Financial Services, Inc. | | 140,300 | | | 3,601,991 |
Inmet Mining Corp. | | 87,300 | | | 4,626,202 |
Intact Financial Corp. | | 128,700 | | | 3,913,156 |
Loblaw Cos., Ltd. | | 184,013 | | | 5,077,980 |
Magna International, Inc. Class A | | 243,268 | | | 9,602,122 |
Manitoba Telecom Services, Inc. | | 40,500 | | | 1,175,643 |
#Manulife Financial Corp. | | 2,074,478 | | | 38,918,630 |
Metro, Inc. Class A | | 137,300 | | | 4,282,496 |
National Bank of Canada | | 135,767 | | | 7,075,367 |
Onex Corp. | | 110,200 | | | 2,486,005 |
*Sino-Forest Corp. | | 278,730 | | | 3,923,162 |
#Sun Life Financial, Inc. | | 1,262,400 | | | 34,918,564 |
Suncor Energy, Inc. | | 1,020,281 | | | 33,869,501 |
Talisman Energy, Inc. | | 1,787,820 | | | 30,500,584 |
*Teck Resources, Ltd. Class B | | 1,418,230 | | | 41,168,712 |
#Thomson Reuters Corp. | | 1,832,184 | | | 58,281,755 |
#Toronto Dominion Bank | | 944,998 | | | 53,867,637 |
TransCanada Corp. | | 292,621 | | | 8,967,527 |
#*Viterra, Inc. | | 460,598 | | | 4,384,418 |
Yamana Gold, Inc. | | 1,625,161 | | | 17,242,131 |
| | | | | |
TOTAL CANADA | | | | | 548,308,430 |
| | | | | |
DENMARK — (1.1%) | | | | | |
A.P. Moller - Maersk A.S. | | 3,478 | | | 23,747,910 |
Carlsberg A.S. Series B | | 277,074 | | | 19,425,578 |
#Danisco A.S. | | 107,780 | | | 6,721,474 |
*Danske Bank A.S. | | 965,053 | | | 22,163,991 |
*Jyske Bank A.S. | | 93,150 | | | 3,476,738 |
#*Sydbank A.S. | | 60,841 | | | 1,488,032 |
| | | | | |
TOTAL DENMARK | | | | | 77,023,723 |
| | | | | |
FINLAND — (0.6%) | | | | | |
Kesko Oyj | | 152,447 | | | 5,073,299 |
Sampo Oyj | | 503,782 | | | 12,058,152 |
Stora Enso Oyj Series R | | 1,183,538 | | | 8,958,178 |
Stora Enso Oyj Sponsored ADR | | 91,500 | | | 689,910 |
#UPM-Kymmene Oyj | | 1,070,295 | | | 12,845,032 |
UPM-Kymmene Oyj Sponsored ADR | | 69,300 | | | 826,749 |
| | | | | |
TOTAL FINLAND | | | | | 40,451,320 |
| | | | | |
FRANCE — (8.3%) | | | | | |
#*Air France-KLM SA | | 320,673 | | | 4,916,514 |
#AXA SA | | 2,818,397 | | | 70,093,978 |
#AXA SA Sponsored ADR | | 140,900 | | | 3,494,320 |
BNP Paribas SA | | 913,891 | | | 68,847,185 |
Capgemini SA | | 259,094 | | | 12,002,899 |
#Casino Guichard Perrachon SA | | 93,798 | | | 7,453,321 |
Ciments Francais SA | | 26,702 | | | 2,909,965 |
CNP Assurances SA | | 72,302 | | | 6,986,719 |
#Compagnie de Saint-Gobain SA | | 846,142 | | | 41,232,265 |
Compagnie Generale des Establissements Michelin SA Series B | | 218,195 | | | 16,163,226 |
Credit Agricole SA | | 1,845,722 | | | 35,355,091 |
#European Aeronautic Defence & Space Co. EADS NV | | 968,650 | | | 18,138,440 |
France Telecom SA | | 690,822 | | | 17,117,707 |
*GDF Suez SA | | 100,344 | | | 4,195,124 |
#Lafarge SA | | 467,217 | | | 37,923,901 |
18
THE DFA INTERNATIONAL VALUE SERIES
CONTINUED
| | | | | |
| | | Shares | | Value†† |
FRANCE — (Continued) | | | | | |
Lagardere SCA | | 238,722 | | $ | 10,785,307 |
#*Peugeot SA | | 325,797 | | | 10,612,551 |
PPR SA | | 161,317 | | | 17,580,856 |
#*Renault SA | | 500,084 | | | 22,379,134 |
Safran SA | | 312,438 | | | 5,040,487 |
#Schneider Electric SA | | 311,215 | | | 32,362,873 |
SCOR SE | | 193,766 | | | 4,931,514 |
#Societe Generale Paris SA | | 913,312 | | | 60,662,002 |
#STMicroelectronics NV | | 1,542,301 | | | 12,377,343 |
Vivendi SA | | 2,686,677 | | | 74,534,678 |
| | | | | |
TOTAL FRANCE | | | | | 598,097,400 |
| | | | | |
GERMANY — (7.4%) | | | | | |
Allianz SE | | 442,712 | | | 50,712,808 |
Allianz SE Sponsored ADR | | 2,834,240 | | | 32,168,624 |
#Bayerische Motoren Werke AG | | 915,762 | | | 44,797,554 |
#*Commerzbank AG | | 1,089,462 | | | 11,355,014 |
#Daimler AG (5529027) | | 1,684,003 | | | 81,364,327 |
#Daimler AG (D1668R123) | | 404,583 | | | 19,513,038 |
#Deutsche Bank AG (5750355) | | 774,190 | | | 56,245,973 |
#Deutsche Bank AG (D18190898) | | 128,363 | | | 9,194,642 |
#Deutsche Lufthansa AG | | 464,311 | | | 7,169,646 |
#*Deutsche Postbank AG | | 14,003 | | | 434,041 |
#Deutsche Telekom AG | | 2,621,866 | | | 35,693,819 |
Deutsche Telekom AG Sponsored ADR | | 2,809,150 | | | 38,035,891 |
E.ON AG | | 545,840 | | | 20,855,107 |
#Fraport AG | | 41,329 | | | 1,945,832 |
Generali Deutschland Holding AG | | 33,484 | | | 3,149,955 |
#*Hannover Rueckversicherung AG | | 110,141 | | | 4,994,555 |
Heidelberger Zement AG | | 58,318 | | | 3,475,436 |
Hochtief AG | | 8,774 | | | 656,241 |
#Linde AG | | 133,956 | | | 13,925,660 |
Munchener Rueckversicherungs-Gesellschaft AG | | 388,934 | | | 61,534,351 |
Porsche Automobil Holding SE | | 190,907 | | | 14,602,883 |
*Salzgitter AG | | 79,216 | | | 7,128,508 |
SCA Hygiene Products SE | | 3,195 | | | 1,522,487 |
#ThyssenKrupp AG | | 409,120 | | | 13,148,388 |
#*TUI AG | | 265,715 | | | 1,840,362 |
| | | | | |
TOTAL GERMANY | | | | | 535,465,142 |
| | | | | |
GREECE — (0.3%) | | | | | |
*Agricultural Bank of Greece S.A. | | 285,278 | | | 808,603 |
*Alpha Bank A.E. | | 214,210 | | | 4,129,970 |
*EFG Eurobank Ergasias S.A. | | 61,225 | | | 969,817 |
Hellenic Petroleum S.A. | | 355,700 | | | 4,311,585 |
Marfin Investment Group S.A. | | 323,492 | | | 1,288,925 |
#National Bank of Greece S.A. ADR | | 619,230 | | | 4,501,802 |
*Piraeus Bank S.A. | | 174,541 | | | 3,009,200 |
| | | | | |
TOTAL GREECE | | | | | 19,019,902 |
| | | | | |
HONG KONG — (2.7%) | | | | | |
*Cathay Pacific Airways, Ltd. | | 2,498,000 | | | 4,047,441 |
Cheung Kong Holdings, Ltd. | | 3,224,000 | | | 41,120,708 |
*Dah Sing Financial Holdings, Ltd. | | 176,400 | | | 995,902 |
Great Eagle Holdings, Ltd. | | 471,721 | | | 1,232,322 |
Hang Lung Group, Ltd. | | 1,737,000 | | | 8,795,011 |
Henderson Land Development Co., Ltd. | | 1,995,000 | | | 14,116,669 |
Hong Kong & Shanghai Hotels, Ltd. | | 1,164,505 | | | 1,666,562 |
Hopewell Holdings, Ltd. | | 1,129,000 | | | 3,587,647 |
Hutchison Whampoa, Ltd. | | 5,568,000 | | | 39,081,157 |
19
THE DFA INTERNATIONAL VALUE SERIES
CONTINUED
| | | | | |
| | | Shares | | Value†† |
HONG KONG — (Continued) | | | | | |
Hysan Development Co., Ltd. | | 1,029,302 | | $ | 3,020,220 |
New World Development Co., Ltd. | | 4,135,660 | | | 8,891,315 |
Pacific Basin Shipping, Ltd. | | 301,000 | | | 221,579 |
#Sino Land Co., Ltd. | | 2,559,315 | | | 4,900,059 |
Sinotrans Shipping, Ltd. | | 1,275,000 | | | 572,602 |
Sun Hung Kai Properties, Ltd. | | 2,274,000 | | | 34,337,122 |
Wharf Holdings, Ltd. | | 3,509,740 | | | 19,030,072 |
Wheelock & Co., Ltd. | | 3,482,000 | | | 11,231,223 |
Wheelock Properties, Ltd. | | 1,565,000 | | | 1,085,874 |
| | | | | |
TOTAL HONG KONG | | | | | 197,933,485 |
| | | | | |
IRELAND — (0.0%) | | | | | |
CRH P.L.C. Sponsored ADR | | 2,341 | | | 57,893 |
| | | | | |
ITALY — (2.9%) | | | | | |
Banca Monte Dei Paschi di Siena SpA | | 5,698,737 | | | 10,828,144 |
Banca Popolare di Milano Scarl | | 982,340 | | | 7,308,954 |
*Banco Popolare Scarl | | 426,228 | | | 3,702,705 |
#*Fiat SpA | | 443,245 | | | 6,598,916 |
Fondiaria - SAI SpA | | 167,605 | | | 3,054,740 |
#*Intesa Sanpaolo SpA | | 11,201,860 | | | 47,142,793 |
#Italcementi SpA | | 273,413 | | | 3,935,555 |
Telecom Italia SpA | | 5,476,933 | | | 8,700,840 |
#Telecom Italia SpA Sponsored ADR | | 1,874,500 | | | 29,729,570 |
*UniCredito SpA | | 19,413,366 | | | 65,038,767 |
Unione di Banche Italiane ScpA | | 1,533,872 | | | 21,909,611 |
#*Unipol Gruppo Finanziario SpA | | 1,822,774 | | | 2,642,839 |
| | | | | |
TOTAL ITALY | | | | | 210,593,434 |
| | | | | |
JAPAN — (11.7%) | | | | | |
#77 Bank, Ltd. (The) | | 737,372 | | | 4,243,571 |
#*AEON Co., Ltd. | | 1,607,900 | | | 14,341,543 |
Aisin Seiki Co., Ltd. | | 282,500 | | | 7,182,732 |
Ajinomoto Co., Inc. | | 1,130,000 | | | 10,605,762 |
Amada Co., Ltd. | | 631,000 | | | 3,860,332 |
Aoyama Trading Co., Ltd. | | 105,500 | | | 1,690,680 |
*Aozora Bank, Ltd. | | 943,000 | | | 1,114,962 |
Asahi Glass Co., Ltd. | | 1,414,000 | | | 11,912,693 |
#Asatsu-DK, Inc. | | 32,500 | | | 640,929 |
Awa Bank, Ltd. (The) | | 65,600 | | | 341,777 |
Bank of Iwate, Ltd. (The) | | 19,600 | | | 1,161,271 |
Bank of Kyoto, Ltd. (The) | | 353,400 | | | 3,206,866 |
Bridgestone Corp. | | 807,000 | | | 13,308,004 |
Canon Marketing Japan, Inc. | | 124,900 | | | 2,023,563 |
#Chiba Bank, Ltd. (The) | | 823,000 | | | 5,075,357 |
Chudenko Corp. | | 41,100 | | | 608,129 |
Chugoku Bank, Ltd. (The) | | 240,800 | | | 3,251,522 |
Citizen Holdings Co., Ltd. | | 377,500 | | | 2,124,119 |
#Coca-Cola West Co., Ltd. | | 90,707 | | | 1,684,922 |
Comsys Holdings Corp. | | 149,000 | | | 1,472,604 |
Cosmo Oil Co., Ltd. | | 1,085,364 | | | 2,851,115 |
Credit Saison Co., Ltd. | | 168,300 | | | 1,881,426 |
Dai Nippon Printing Co., Ltd. | | 1,348,000 | | | 16,889,628 |
Daicel Chemical Industries, Ltd. | | 515,000 | | | 3,109,942 |
#Daido Steel Co., Ltd. | | 398,000 | | | 1,354,628 |
Daishi Bank, Ltd. (The) | | 573,932 | | | 2,090,712 |
Daiwa House Industry Co., Ltd. | | 916,000 | | | 9,786,139 |
#Dentsu, Inc. | | 52,700 | | | 1,129,049 |
DIC Corp. | | 596,000 | | | 975,467 |
*Elpida Memory, Inc. | | 39,200 | | | 512,150 |
*Fuji Electric Holdings Co., Ltd. | | 181,780 | | | 337,791 |
20
THE DFA INTERNATIONAL VALUE SERIES
CONTINUED
| | | | | |
| | | Shares | | Value†† |
JAPAN — (Continued) | | | | | |
*Fuji Heavy Industries, Ltd. | | 1,286,000 | | $ | 5,025,424 |
*Fuji Television Network, Inc. | | 555 | | | 815,489 |
FUJIFILM Holdings Corp. | | 1,257,700 | | | 35,755,504 |
Fujikura, Ltd. | | 609,000 | | | 2,936,354 |
Fukuoka Financial Group, Inc. | | 1,446,000 | | | 5,287,134 |
Glory, Ltd. | | 75,400 | | | 1,659,103 |
Gunma Bank, Ltd. (The) | | 585,397 | | | 3,049,802 |
#H2O Retailing Corp. | | 198,000 | | | 1,203,406 |
Hachijuni Bank, Ltd. (The) | | 993,231 | | | 5,876,067 |
#Hakuhodo Dy Holdings, Inc. | | 29,940 | | | 1,503,793 |
Higo Bank, Ltd. (The) | | 376,000 | | | 2,225,776 |
*Hino Motors, Ltd. | | 217,000 | | | 802,194 |
Hitachi Chemical Co., Ltd. | | 6,300 | | | 125,072 |
Hitachi High-Technologies Corp. | | 35,600 | | | 589,672 |
#Hitachi Transport System, Ltd. | | 111,000 | | | 1,455,965 |
*Hitachi, Ltd. | | 6,574,000 | | | 21,226,498 |
*Hitachi, Ltd. Sponsored ADR | | 144,840 | | | 4,653,709 |
Hokkoku Bank, Ltd. (The) | | 435,409 | | | 1,708,616 |
#House Foods Corp. | | 117,000 | | | 1,863,018 |
Hyakugo Bank, Ltd. (The) | | 475,028 | | | 2,271,711 |
Hyakujishi Bank, Ltd. (The) | | 329,000 | | | 1,355,835 |
#Idemitsu Kosan Co., Ltd. | | 46,924 | | | 3,441,084 |
#Isetan Mitsukoshi Holdings, Ltd. | | 705,700 | | | 6,763,322 |
*Isuzu Motors, Ltd. | | 1,099,000 | | | 2,323,674 |
Itochu Corp. | | 343,000 | | | 2,168,029 |
#*J Front Retailing Co., Ltd. | | 905,000 | | | 4,289,809 |
Joyo Bank, Ltd. (The) | | 842,000 | | | 3,704,175 |
JS Group Corp. | | 561,100 | | | 9,157,444 |
JTEKT Corp. | | 208,300 | | | 2,200,452 |
Juroku Bank, Ltd. | | 400,000 | | | 1,431,060 |
Kagoshima Bank, Ltd. (The) | | 358,143 | | | 2,644,699 |
Kajima Corp. | | 1,104,000 | | | 2,584,767 |
Kamigumi Co., Ltd. | | 488,000 | | | 3,665,658 |
#Kandenko Co., Ltd. | | 129,000 | | | 795,619 |
Kaneka Corp. | | 580,542 | | | 3,779,424 |
Kansai Paint Co., Ltd. | | 64,000 | | | 541,552 |
#*Kawasaki Kisen Kaisha, Ltd. | | 753,087 | | | 2,744,038 |
Keiyo Bank, Ltd. (The) | | 317,000 | | | 1,523,545 |
Kinden Corp. | | 285,000 | | | 2,314,625 |
*Kobe Steel, Ltd. | | 3,785,000 | | | 6,878,464 |
Kuraray Co., Ltd. | | 30,500 | | | 314,864 |
Kyocera Corp. | | 327,900 | | | 27,505,650 |
#Kyocera Corp. Sponsored ADR | | 13,600 | | | 1,135,192 |
#Marui Group Co., Ltd. | | 542,642 | | | 3,117,172 |
#Mazda Motor Corp. | | 2,017,000 | | | 4,552,092 |
Medipal Holdings Corp. | | 168,100 | | | 2,347,503 |
*Meiji Holdings Co., Ltd. | | 51,095 | | | 2,081,051 |
Mitsubishi Chemical Holdings Corp. | | 2,412,500 | | | 8,958,586 |
*Mitsubishi Gas Chemical Co., Inc. | | 566,000 | | | 2,610,761 |
Mitsubishi Heavy Industries, Ltd. | | 7,188,000 | | | 25,417,348 |
Mitsubishi Logistics Corp. | | 199,000 | | | 2,165,109 |
*Mitsubishi Materials Corp. | | 1,745,000 | | | 4,601,377 |
#Mitsubishi Rayon Co., Ltd. | | 307,000 | | | 1,060,452 |
Mitsubishi Tanabe Pharma Corp. | | 385,000 | | | 4,915,204 |
#Mitsui Chemicals, Inc. | | 1,351,800 | | | 4,642,520 |
*Mitsui Mining & Smelting Co., Ltd. | | 385,000 | | | 992,054 |
Musashino Bank, Ltd. | | 37,500 | | | 1,071,868 |
Nagase & Co., Ltd. | | 235,889 | | | 2,869,101 |
Namco Bandai Holdings, Inc. | | 162,600 | | | 1,662,560 |
Nanto Bank, Ltd. (The) | | 263,000 | | | 1,427,559 |
#*NEC Corp. | | 4,453,101 | | | 12,657,266 |
21
THE DFA INTERNATIONAL VALUE SERIES
CONTINUED
| | | | | |
| | | Shares | | Value†† |
JAPAN — (Continued) | | | | | |
#NGK Spark Plug Co., Ltd. | | 145,000 | | $ | 1,643,333 |
Nippon Express Co., Ltd. | | 1,602,238 | | | 6,560,618 |
Nippon Kayaku Co., Ltd. | | 7,000 | | | 62,623 |
#Nippon Meat Packers, Inc. | | 360,536 | | | 4,227,230 |
Nippon Mining Holdings, Inc. | | 1,899,050 | | | 8,472,073 |
Nippon Oil Corp. | | 3,113,050 | | | 15,340,349 |
Nippon Paper Group, Inc. | | 188,900 | | | 5,012,951 |
Nippon Sheet Glass Co., Ltd. | | 1,141,739 | | | 3,364,278 |
Nippon Shokubai Co., Ltd. | | 231,000 | | | 1,941,496 |
Nippon Television Network Corp. | | 10,680 | | | 1,391,886 |
*Nippon Yusen K.K. | | 1,279,000 | | | 4,721,208 |
Nishi-Nippon Bank, Ltd. | | 1,193,569 | | | 2,952,678 |
*Nissan Motor Co., Ltd. | | 4,991,500 | | | 36,119,215 |
#Nissay Dowa General Insurance Co., Ltd. | | 383,000 | | | 1,699,964 |
Nisshin Steel Co., Ltd. | | 1,226,000 | | | 2,046,021 |
#Nisshinbo Holdings, Inc. | | 305,000 | | | 2,997,718 |
NOK Corp. | | 112,600 | | | 1,494,005 |
NSK, Ltd. | | 477,000 | | | 2,771,257 |
NTN Corp. | | 70,000 | | | 264,315 |
#Obayashi Corp. | | 1,393,682 | | | 5,262,857 |
Ogaki Kyoritsu Bank, Ltd. (The) | | 334,000 | | | 1,144,275 |
#Oji Paper Co., Ltd. | | 1,756,000 | | | 7,641,694 |
#Onward Holdings Co., Ltd. | | 278,000 | | | 1,725,747 |
#Panasonic Electric Works Co., Ltd. | | 575,000 | | | 7,258,163 |
Ricoh Co., Ltd. | | 1,423,000 | | | 19,338,909 |
Rohm Co., Ltd. | | 178,000 | | | 11,804,415 |
San-in Godo Bank, Ltd. (The) | | 309,900 | | | 2,694,654 |
#Sapporo Hokuyo Holdings, Inc. | | 428,000 | | | 1,444,752 |
#SBI Holdings, Inc. | | 17,223 | | | 3,164,679 |
#Seiko Epson Corp. | | 249,600 | | | 3,858,497 |
Seino Holdings Co., Ltd. | | 295,000 | | | 2,182,953 |
Sekisui Chemical Co., Ltd. | | 849,000 | | | 5,135,210 |
Sekisui House, Ltd. | | 1,147,000 | | | 9,918,951 |
#Sharp Corp. | | 706,000 | | | 7,532,589 |
Shiga Bank, Ltd. | | 326,185 | | | 2,023,578 |
Shimachu Co., Ltd. | | 70,700 | | | 1,671,411 |
#Shimizu Corp. | | 831,000 | | | 3,186,498 |
#*Shinsei Bank, Ltd. | | 1,290,000 | | | 1,682,910 |
#Shizuoka Bank, Ltd. | | 38,000 | | | 377,567 |
#Showa Denko K.K. | | 1,456,000 | | | 2,802,507 |
Sohgo Security Services Co., Ltd. | | 101,300 | | | 1,172,377 |
Sojitz Corp. | | 2,136,700 | | | 3,944,714 |
Sony Corp. | | 652,500 | | | 19,267,546 |
Sony Corp. Sponsored ADR | | 1,725,386 | | | 50,709,095 |
Sumco Corp. | | 59,600 | | | 1,137,368 |
Sumitomo Bakelite Co., Ltd. | | 347,000 | | | 1,636,368 |
Sumitomo Chemical Co., Ltd. | | 1,982,000 | | | 7,896,805 |
Sumitomo Corp. | | 2,756,900 | | | 26,763,189 |
Sumitomo Electric Industries, Ltd. | | 1,567,000 | | | 19,015,183 |
Sumitomo Forestry Co., Ltd. | | 158,000 | | | 1,210,489 |
*Sumitomo Heavy Industries, Ltd. | | 384,000 | | | 1,742,238 |
Sumitomo Rubber Industries, Ltd. | | 230,300 | | | 2,122,983 |
#Sumitomo Trust & Banking Co., Ltd. | | 2,806,000 | | | 14,619,243 |
Suzuken Co., Ltd. | | 94,400 | | | 3,340,722 |
#*Taiheiyo Cement Corp. | | 1,638,800 | | | 1,902,677 |
Taisei Corp. | | 1,831,703 | | | 3,594,713 |
#Takashimaya Co., Ltd. | | 459,634 | | | 3,099,092 |
TDK Corp. | | 208,700 | | | 11,999,382 |
#Teijin, Ltd. | | 1,866,862 | | | 5,486,727 |
Toda Corp. | | 385,000 | | | 1,283,405 |
Tokuyama Corp. | | 382,000 | | | 2,400,336 |
22
THE DFA INTERNATIONAL VALUE SERIES
CONTINUED
| | | | | |
| | | Shares | | Value†† |
JAPAN — (Continued) | | | | | |
Tokyo Broadcasting System, Inc. | | 60,700 | | $ | 905,383 |
Tokyo Steel Manufacturing Co., Ltd. | | 191,400 | | | 2,506,851 |
Toppan Printing Co., Ltd. | | 1,218,000 | | | 10,885,786 |
#Tosoh Corp. | | 884,000 | | | 2,376,873 |
#Toyo Seikan Kaisha, Ltd. | | 342,249 | | | 5,749,746 |
Toyobo Co., Ltd. | | 743,000 | | | 1,152,667 |
Toyota Auto Body Co., Ltd. | | 105,100 | | | 1,952,084 |
*Toyota Tsusho Corp. | | 435,400 | | | 6,225,376 |
TV Asahi Corp. | | 755 | | | 1,147,958 |
UNY Co., Ltd. | | 323,750 | | | 2,404,752 |
Yamaguchi Financial Group, Inc. | | 362,148 | | | 3,460,012 |
Yamaha Corp. | | 285,400 | | | 2,948,457 |
#Yamaha Motor Co., Ltd. | | 397,300 | | | 4,731,153 |
*Yokogawa Electric Corp. | | 74,600 | | | 604,619 |
Yokohama Rubber Co., Ltd. | | 410,000 | | | 1,795,791 |
| | | | | |
TOTAL JAPAN | | | | | 849,344,450 |
| | | | | |
MALAYSIA — (0.0%) | | | | | |
*Rekapacific Berhad | | 691,000 | | | — |
| | | | | |
NETHERLANDS — (3.7%) | | | | | |
*Aegon NV | | 3,202,429 | | | 22,761,054 |
#ArcelorMittal NV | | 2,446,831 | | | 82,806,981 |
*ING Groep NV | | 3,093,625 | | | 40,259,293 |
#*ING Groep NV Sponsored ADR | | 538,200 | | | 6,942,780 |
Koninklijke Ahold NV | | 1,318,845 | | | 16,612,403 |
Koninklijke DSM NV | | 443,200 | | | 19,418,373 |
Philips Electronics NV | | 3,072,622 | | | 77,186,781 |
Philips Electronics NV ADR | | 133,700 | | | 3,354,533 |
| | | | | |
TOTAL NETHERLANDS | | | | | 269,342,198 |
| | | | | |
NEW ZEALAND — (0.1%) | | | | | |
Contact Energy, Ltd. | | 929,259 | | | 4,138,385 |
Fletcher Building, Ltd. | | 685,164 | | | 4,047,301 |
| | | | | |
TOTAL NEW ZEALAND | | | | | 8,185,686 |
| | | | | |
NORWAY — (1.0%) | | | | | |
#*DnB NOR ASA Series A | | 2,507,294 | | | 28,722,407 |
#*Marine Harvest ASA | | 5,002,000 | | | 3,629,062 |
#*Norsk Hydro ASA | | 2,002,345 | | | 13,123,305 |
*Norsk Hydro ASA Sponsored ADR | | 59,900 | | | 401,330 |
#Orkla ASA | | 2,700,350 | | | 24,964,057 |
#*Storebrand ASA | | 713,900 | | | 4,851,286 |
| | | | | |
TOTAL NORWAY | | | | | 75,691,447 |
| | | | | |
PORTUGAL — (0.2%) | | | | | |
Banco BPI SA | | 275,646 | | | 929,774 |
#Banco Comercial Portugues SA | | 3,941,284 | | | 5,618,638 |
Banco Espirito Santo SA | | 747,704 | | | 5,518,458 |
Cimpor Cimentos de Portugal SA | | 129,009 | | | 1,005,451 |
| | | | | |
TOTAL PORTUGAL | | | | | 13,072,321 |
| | | | | |
SINGAPORE — (1.6%) | | | | | |
#Capitaland, Ltd. | | 5,173,000 | | | 15,001,103 |
City Developments, Ltd. | | 884,000 | | | 6,193,525 |
DBS Group Holdings, Ltd. | | 4,164,750 | | | 38,138,997 |
Fraser & Neave, Ltd. | | 2,351,450 | | | 6,402,182 |
Jardine Cycle & Carriage, Ltd. | | 28,324 | | | 465,142 |
Neptune Orient Lines, Ltd. | | 1,457,000 | | | 1,621,584 |
#Overseas-Chinese Banking Corp., Ltd. | | 3,238,777 | | | 17,453,380 |
23
THE DFA INTERNATIONAL VALUE SERIES
CONTINUED
| | | | | |
| | | Shares | | Value†† |
SINGAPORE — (Continued) | | | | | |
#Singapore Airlines, Ltd. | | 1,568,600 | | $ | 15,042,479 |
#*Singapore Airport Terminal Services, Ltd. | | 1,145,078 | | | 2,001,087 |
Singapore Land, Ltd. | | 532,000 | | | 2,082,638 |
United Industrial Corp., Ltd. | | 1,391,000 | | | 1,795,865 |
United Overseas Bank, Ltd. | | 528,000 | | | 6,329,063 |
UOL Group, Ltd. | | 1,376,600 | | | 3,284,172 |
Venture Corp., Ltd. | | 48,000 | | | 306,205 |
Wheelock Properties, Ltd. | | 476,000 | | | 591,055 |
| | | | | |
TOTAL SINGAPORE | | | | | 116,708,477 |
| | | | | |
SPAIN — (4.7%) | | | | | |
Acciona SA | | 73,176 | | | 8,914,017 |
Acerinox SA | | 155,237 | | | 3,087,220 |
#Banco Bilbao Vizcaya SA Sponsored ADR | | 385,925 | | | 6,869,465 |
#Banco de Sabadell SA | | 2,431,718 | | | 16,416,332 |
#Banco Espanol de Credito SA | | 218,246 | | | 2,762,397 |
#Banco Popular Espanol SA | | 2,035,899 | | | 18,134,989 |
Banco Santander SA | | 5,654,108 | | | 90,987,342 |
Banco Santander SA Sponsored ADR | | 5,549,048 | | | 89,117,711 |
Criteria Caixacorp SA | | 1,702,347 | | | 8,298,618 |
#Fomento de Construcciones y Contratas SA | | 38,756 | | | 1,576,531 |
Gas Natural SDG SA | | 549,680 | | | 11,043,487 |
Iberdrola Renovables SA | | 1,953,105 | | | 8,681,835 |
#Mapfre SA | | 359,181 | | | 1,539,222 |
Repsol YPF SA | | 1,204,043 | | | 32,053,183 |
#Repsol YPF SA Sponsored ADR | | 1,332,613 | | | 35,447,506 |
*Sacyr Vallehermoso SA | | 107,104 | | | 1,620,346 |
| | | | | |
TOTAL SPAIN | | | | | 336,550,201 |
| | | | | |
SWEDEN — (2.9%) | | | | | |
#Boliden AB | | 91,703 | | | 1,104,224 |
Holmen AB Series A | | 6,300 | | | 176,579 |
Holmen AB Series B | | 146,100 | | | 3,942,996 |
#Nordea Bank AB | | 6,583,962 | | | 70,668,421 |
#*Skandinaviska Enskilda Banken AB Series A | | 2,552,148 | | | 15,458,949 |
*Skandinaviska Enskilda Banken AB Series C | | 9,800 | | | 66,633 |
#SSAB AB Series A | | 507,586 | | | 7,737,518 |
#SSAB AB Series B | | 233,785 | | | 3,268,952 |
Svenska Cellulosa AB | | 57,000 | | | 781,203 |
Svenska Cellulosa AB Series B | | 1,586,671 | | | 21,802,524 |
#Svenska Handelsbanken AB Series A | | 740,000 | | | 19,123,005 |
#*Swedbank AB Series A | | 363,437 | | | 3,130,853 |
Tele2 AB Series B | | 857,471 | | | 12,498,320 |
#Telefonaktiebolaget LM Erricson AB Sponsored ADR | | 706,832 | | | 7,351,053 |
TeliaSonera AB | | 3,615,084 | | | 23,960,555 |
#Volvo AB Series A | | 898,101 | | | 8,294,065 |
Volvo AB Series B | | 1,028,966 | | | 9,744,638 |
| | | | | |
TOTAL SWEDEN | | | | | 209,110,488 |
| | | | | |
SWITZERLAND — (6.3%) | | | | | |
#Adecco SA | | 366,804 | | | 16,390,414 |
Baloise-Holding AG | | 200,163 | | | 17,138,340 |
Banque Cantonale Vaudoise | | 7,063 | | | 2,660,418 |
Compagnie Financiere Richemont SA Series A | | 1,205,682 | | | 33,751,706 |
Credit Suisse Group AG | | 1,755,349 | | | 93,836,004 |
#Credit Suisse Group AG Sponsored ADR | | 840,377 | | | 44,792,094 |
GAM Holdings, Ltd. | | 38,097 | | | 464,786 |
Givaudan SA | | 15,362 | | | 11,403,803 |
#*Holcim, Ltd. | | 650,248 | | | 41,384,888 |
*Julius Baer Group, Ltd. | | 38,097 | | | 1,434,161 |
24
THE DFA INTERNATIONAL VALUE SERIES
CONTINUED
| | | | | |
| | | Shares | | Value†† |
SWITZERLAND — (Continued) | | | | | |
#PSP Swiss Property AG | | 95,780 | | $ | 5,374,738 |
St. Galler Kantonalbank AG | | 5,534 | | | 2,519,876 |
#Swatch Group AG | | 34,658 | | | 8,092,532 |
Swiss Life Holding AG | | 123,557 | | | 14,800,026 |
Swiss Reinsurance Co., Ltd. AG | | 738,155 | | | 30,058,111 |
*UBS AG | | 3,481,616 | | | 58,055,052 |
Zurich Financial Services AG | | 322,012 | | | 73,738,360 |
| | | | | |
TOTAL SWITZERLAND | | | | | 455,895,309 |
| | | | | |
UNITED KINGDOM — (16.6%) | | | | | |
*Anglo American P.L.C. | | 1,329,421 | | | 48,102,581 |
Associated British Foods P.L.C. | | 1,637,844 | | | 22,178,287 |
Aviva P.L.C. | | 7,396,866 | | | 46,253,871 |
#*Barclays P.L.C. Sponsored ADR | | 2,451,654 | | | 51,239,569 |
#*British Airways P.L.C. | | 2,372,765 | | | 7,046,439 |
Carnival P.L.C. | | 658,867 | | | 20,425,788 |
#Carnival P.L.C. ADR | | 218,000 | | | 6,753,640 |
*easyJet P.L.C. | | 687,918 | | | 4,049,542 |
Friends Provident Group P.L.C. | | 5,399,716 | | | 7,199,159 |
#HSBC Holdings P.L.C. Sponsored ADR | | 3,278,400 | | | 181,590,576 |
International Power P.L.C. | | 6,384,014 | | | 26,504,435 |
Investec P.L.C. | | 1,003,281 | | | 7,161,546 |
*Kazakhmys P.L.C. | | 729,615 | | | 12,984,716 |
Kingfisher P.L.C. | | 9,743,172 | | | 35,612,473 |
#Ladbrokes P.L.C. | | 861,132 | | | 1,715,434 |
Legal & General Group P.L.C. | | 15,758,133 | | | 20,219,946 |
Mondi P.L.C. | | 877,217 | | | 4,841,991 |
Old Mutual P.L.C. | | 9,616,350 | | | 16,690,338 |
Pearson P.L.C. | | 820,157 | | | 11,148,222 |
#Pearson P.L.C. Sponsored ADR | | 1,845,066 | | | 25,111,348 |
Rexam P.L.C. | | 3,544,129 | | | 16,048,596 |
*Rolls-Royce Group P.L.C. (3283648) | | 1,317,228 | | | 9,714,334 |
*Rolls-Royce Group P.L.C. (B3XLQZ7) | | 79,033,680 | | | 129,714 |
*Royal Bank of Scotland Group P.L.C. | | 15,142,602 | | | 10,347,950 |
#Royal Dutch Shell P.L.C. ADR | | 2,252,783 | | | 131,021,859 |
RSA Insurance Group P.L.C. | | 13,252,463 | | | 26,261,469 |
SABmiller P.L.C. | | 1,174,082 | | | 30,774,654 |
Sainsbury (J.) P.L.C. | | 5,000,726 | | | 26,987,115 |
Schroders P.L.C. | | 123,678 | | | 2,223,821 |
Schroders P.L.C. Non-Voting | | 63,155 | | | 932,375 |
Standard Chartered P.L.C. | | 927,972 | | | 22,765,064 |
Thomas Cook Group P.L.C. | | 1,861,207 | | | 6,232,613 |
Tomkins P.L.C. Sponsored ADR | | 330,800 | | | 3,599,104 |
Vodafone Group P.L.C. | | 34,976,333 | | | 77,082,062 |
#Vodafone Group P.L.C. Sponsored ADR | | 7,395,974 | | | 164,116,663 |
Whitbread P.L.C. | | 653,031 | | | 13,585,022 |
William Morrison Supermarkets P.L.C. | | 6,906,878 | | | 31,655,641 |
*Wolseley P.L.C. | | 566,229 | | | 11,453,707 |
WPP P.L.C. | | 1,259,793 | | | 11,290,157 |
#WPP P.L.C. Sponsored ADR | | 24,445 | | | 1,094,647 |
*Xstrata P.L.C. | | 3,245,577 | | | 46,747,872 |
| | | | | |
TOTAL UNITED KINGDOM | | | | | 1,200,894,340 |
| | | | | |
TOTAL COMMON STOCKS | | | | | 6,155,972,149 |
| | | | | |
RIGHTS/WARRANTS — (0.0%) | | | | | |
GERMANY — (0.0%) | | | | | |
*TUI AG Rights 11/11/09 | | 265,715 | | | 41,059 |
| | | | | |
ITALY — (0.0%) | | | | | |
*Unione di Banche Italiane ScpA Warrants 06/30/11 | | 817,282 | | | 76,976 |
| | | | | |
TOTAL RIGHTS/WARRANTS | | | | | 118,035 |
| | | | | |
25
THE DFA INTERNATIONAL VALUE SERIES
CONTINUED
| | | | | | |
| | | Face
Amount | | Value† |
| | | (000) | | |
TEMPORARY CASH INVESTMENTS — (0.2%) | | | | | | |
Repurchase Agreement, PNC Capital Markets, Inc. 0.19%, 11/02/09 (Collateralized by $13,010,000 FNMA 6.50%, 06/25/39, valued at $14,002,013) to be repurchased at $13,790,218 | | $ | 13,790 | | $ | 13,790,000 |
| | | | | | |
| | |
| | | Shares/
Face
Amount | | |
| | | (000) | | |
SECURITIES LENDING COLLATERAL — (14.6%) | | | | | | |
§@DFA Short Term Investment Fund LP | | | 1,055,086,714 | | | 1,055,086,714 |
@Repurchase Agreement, Deutsche Bank Securities 0.07%, 11/02/09 (Collateralized by various corporate obligations, ranging in par value from $4,247,617 to $16,429,280, rates ranging from 5.000% to 7.000%, maturities ranging from 03/01/37 to 10/01/39, valued at $1,212,860) to be repurchased at $1,189,085 | | $ | 1,189 | | | 1,189,078 |
| | | | | | |
TOTAL SECURITIES LENDING COLLATERAL | | | | | | 1,056,275,792 |
| | | | | | |
TOTAL INVESTMENTS — (100.0%)
(Cost $5,830,288,347) | | | | | $ | 7,226,155,976 |
| | | | | | |
See accompanying Notes to Financial Statements.
26
THE EMERGING MARKETS SERIES
SCHEDULE OF INVESTMENTS
October 31, 2009
| | | | | |
| | | Shares | | Value†† |
COMMON STOCKS — (82.9%) | | | | | |
ARGENTINA — (0.1%) | | | | | |
*Petrobras Energia Participaciones SA ADR | | 106,144 | | $ | 1,818,247 |
| | | | | |
BRAZIL — (5.8%) | | | | | |
#*BRF - Brasil Foods SA ADR | | 173,299 | | | 8,382,473 |
Companhia de Bebidas das Americas | | 66,744 | | | 5,076,651 |
Companhia Siderurgica Nacional SA | | 367,276 | | | 12,132,034 |
CPFL Energia SA | | 1,935 | | | 33,887 |
*Empresa Brasileira de Aeronautica SA ADR | | 130,800 | | | 2,648,700 |
Itau Unibanco Holding SA ADR | | 271,347 | | | 5,193,580 |
Petroleo Brasilerio SA ADR (71654V101) | | 1,256,219 | | | 50,399,506 |
Petroleo Brasilerio SA ADR (71654V408) | | 914,546 | | | 42,270,316 |
Souza Cruz SA | | 95,874 | | | 3,402,613 |
Tele Norte Leste Participacoes SA | | 59,254 | | | 1,335,368 |
Tractebel Energia SA | | 140,100 | | | 1,709,894 |
Vivo Participacoes SA | | 16,288 | | | 401,282 |
Vivo Participacoes SA ADR | | 2,500 | | | 60,625 |
Weg Industrias SA | | 278,866 | | | 2,738,636 |
| | | | | |
TOTAL BRAZIL | | | | | 135,785,565 |
| | | | | |
CHILE — (1.7%) | | | | | |
#Banco de Chile Series F ADR | | 47,993 | | | 2,231,654 |
Banco Santander Chile SA ADR | | 68,948 | | | 3,629,423 |
Colbun SA | | 1,731,270 | | | 407,588 |
Compania Cervecerias Unidas SA ADR | | 53,246 | | | 1,885,973 |
#Embotelladora Andina SA Series A ADR | | 26,368 | | | 395,520 |
#Embotelladora Andina SA Series B ADR | | 41,533 | | | 757,977 |
Empresa Nacional de Electricidad SA Sponsored ADR | | 207,763 | | | 9,534,244 |
Empresas Copec SA | | 20,500 | | | 275,911 |
Enersis SA Sponsored ADR | | 487,951 | | | 8,626,974 |
#Lan Airlines SA Sponsored ADR | | 264,595 | | | 3,548,219 |
Masisa SA | | 165,507 | | | 24,551 |
Sociedad Quimica y Minera de Chile SA Sponsored ADR | | 169,117 | | | 6,215,050 |
#Vina Concha Y Toro SA Sponsored ADR | | 28,665 | | | 1,221,129 |
| | | | | |
TOTAL CHILE | | | | | 38,754,213 |
| | | | | |
CHINA — (9.4%) | | | | | |
*Air China, Ltd. | | 262,000 | | | 141,822 |
Alibaba.com, Ltd. | | 59,500 | | | 137,388 |
#*Aluminum Corp. of China, Ltd. ADR | | 26,300 | | | 715,360 |
#Angang Steel Co., Ltd. | | 142,000 | | | 262,465 |
Anhui Conch Cement Co., Ltd. | | 72,000 | | | 465,864 |
Bank of China, Ltd. | | 56,691,000 | | | 32,598,740 |
Bank of Communications Co., Ltd. | | 1,206,000 | | | 1,443,515 |
*Beijing Capital International Airport Co., Ltd. | | 3,368,000 | | | 2,264,943 |
Beijing Enterprises Holdings, Ltd. | | 50,000 | | | 298,021 |
Belle International Holdings, Ltd. | | 1,948,000 | | | 1,969,215 |
#*Byd Co., Ltd. | | 395,886 | | | 3,629,462 |
China Citic Bank | | 932,000 | | | 695,295 |
China Coal Energy Co. | | 356,000 | | | 492,608 |
China Communications Construction Co., Ltd. | | 502,000 | | | 540,323 |
China Construction Bank Corp. | | 9,048,000 | | | 7,800,567 |
#China COSCO Holdings Co., Ltd. | | 415,500 | | | 511,585 |
China High Speed Transmission Equipment Group Co., Ltd. | | 523,000 | | | 1,048,871 |
#China Life Insurance Co., Ltd. ADR | | 250,705 | | | 17,200,870 |
China Merchants Bank Co., Ltd. | | 1,078,350 | | | 2,758,788 |
China Merchants Holdings (International) Co., Ltd. | | 133,652 | | | 427,103 |
China Mobile, Ltd. Sponsored ADR | | 696,697 | | | 32,556,651 |
China National Building Material Co., Ltd. | | 72,000 | | | 154,950 |
27
THE EMERGING MARKETS SERIES
CONTINUED
| | | | | |
| | | Shares | | Value†† |
CHINA — (Continued) | | | | | |
China Oilfield Services, Ltd. | | 168,000 | | $ | 181,527 |
China Overseas Land & Investment, Ltd. | | 1,550,000 | | | 3,341,659 |
China Petroleum and Chemical Corp. (Sinopec) ADR | | 41,800 | | | 3,526,248 |
*China Power International Development, Ltd. | | 839,000 | | | 232,111 |
*China Railway Construction Corp., Ltd. | | 116,500 | | | 154,128 |
*China Railway Group, Ltd. | | 441,000 | | | 346,625 |
China Resources Enterprise, Ltd. | | 2,219,000 | | | 7,445,893 |
China Resources Land, Ltd. | | 748,000 | | | 1,803,752 |
China Resources Power Holdings Co., Ltd. | | 920,000 | | | 1,910,581 |
China Shenhua Energy Co., Ltd. | | 786,000 | | | 3,521,138 |
#*China Shipping Container Lines Co., Ltd. | | 292,000 | | | 104,500 |
China Shipping Development Co., Ltd. | | 98,000 | | | 138,537 |
*China Southern Airlines Co., Ltd. ADR | | 4,600 | | | 66,010 |
*China Taiping Insurance Holdings Co., Ltd. | | 17,000 | | | 60,024 |
#China Telecom Corp., Ltd. ADR | | 20,200 | | | 888,396 |
China Travel International Investment Hong Kong, Ltd. | | 1,992,000 | | | 406,637 |
China Unicom Hong Kong, Ltd. ADR | | 88,800 | | | 1,123,320 |
CITIC Pacific, Ltd. | | 1,898,000 | | | 4,879,271 |
*CITIC Resources Holdings, Ltd. | | 2,180,000 | | | 609,934 |
CNOOC, Ltd. | | 45,000 | | | 66,721 |
#CNOOC, Ltd. ADR | | 67,956 | | | 10,121,367 |
#Country Garden Holdings Co. | | 2,232,000 | | | 855,794 |
Dalian Port (PDA) Co., Ltd. | | 596,000 | | | 216,320 |
Datang International Power Generation Co., Ltd. | | 380,000 | | | 177,571 |
Dongfeng Motor Corp. | | 204,000 | | | 242,800 |
#*FU JI Food & Catering Services | | 289,000 | | | 283,399 |
*GOME Electrical Appliances Holdings, Ltd. | | 181,000 | | | 53,020 |
#Guangshen Railway Co., Ltd. Sponsored ADR | | 1,400 | | | 28,070 |
Guangzhou R&F Properties Co., Ltd. | | 67,200 | | | 125,921 |
Harbin Power Equipment Co., Ltd. | | 494,000 | | | 458,896 |
Hengan International Group Co., Ltd. | | 36,000 | | | 231,739 |
#HKC (Holdings), Ltd. | | 3,062,634 | | | 240,291 |
Hopson Development Holdings, Ltd. | | 420,000 | | | 730,772 |
#*Huadian Power International Corp. | | 694,000 | | | 192,726 |
#Huaneng Power International, Inc. ADR | | 8,800 | | | 224,488 |
*Industrial & Commercial Bank of China, Ltd. | | 34,093,000 | | | 27,124,901 |
Jiangsu Express Co., Ltd. | | 764,000 | | | 677,471 |
Jiangxi Copper Co., Ltd. | | 135,000 | | | 305,876 |
#Lenovo Group, Ltd. | | 114,000 | | | 64,280 |
#Li Ning Co., Ltd. | | 435,500 | | | 1,184,311 |
#*Maanshan Iron & Steel Co., Ltd. | | 124,000 | | | 74,646 |
#PetroChina Co., Ltd. ADR | | 115,210 | | | 13,829,808 |
#*PICC Property & Casualty Co., Ltd. | | 168,000 | | | 123,954 |
Ping An Insurance (Group) Co. of China, Ltd. | | 248,500 | | | 2,176,260 |
#*Semiconductor Manufacturing International Corp. ADR | | 255,943 | | | 619,382 |
#Shanghai Electric Group Co., Ltd. | | 2,392,000 | | | 1,123,350 |
Shenzhen Expressway Co., Ltd. | | 744,000 | | | 355,210 |
Shenzhen International Holdings, Ltd. | | 6,415,000 | | | 448,560 |
Shimao Property Holdings, Ltd. | | 157,500 | | | 292,966 |
Sino-Ocean Land Holdings, Ltd. | | 291,000 | | | 282,630 |
*Sinopec Shanghai Petrochemical Co., Ltd. Sponsored ADR | | 1,188 | | | 46,760 |
Sinotrans, Ltd. | | 951,000 | | | 249,261 |
Tencent Holdings, Ltd. | | 700,600 | | | 12,199,255 |
#Tingyi (Cayman Islands) Holding Corp. | | 1,072,000 | | | 2,391,885 |
TPV Technology, Ltd. | | 802,000 | | | 519,091 |
Weichai Power Co., Ltd. | | 8,000 | | | 51,766 |
Zijin Mining Group Co., Ltd. | | 428,000 | | | 414,277 |
#ZTE Corp. | | 465,688 | | | 2,589,343 |
| | | | | |
TOTAL CHINA | | | | | 220,249,835 |
| | | | | |
28
THE EMERGING MARKETS SERIES
CONTINUED
| | | | | |
| | | Shares | | Value†† |
CZECH REPUBLIC — (1.0%) | | | | | |
CEZ A.S. | | 301,862 | | $ | 14,864,947 |
Komercni Banka A.S. | | 14,663 | | | 2,875,426 |
Telefonica 02 Czech Republic A.S. | | 239,489 | | | 5,642,622 |
| | | | | |
TOTAL CZECH REPUBLIC | | | | | 23,382,995 |
| | | | | |
HUNGARY — (1.5%) | | | | | |
ELMU NYRT | | 185 | | | 28,698 |
Magyar Telekom Telecommunications P.L.C. | | 665,618 | | | 2,869,587 |
#*MOL Hungarian Oil & Gas NYRT | | 100,838 | | | 8,424,427 |
#*OTP Bank NYRT | | 618,710 | | | 17,397,809 |
#Richter Gedeon NYRT | | 28,511 | | | 5,937,751 |
Tisza Chemical Group NYRT | | 40,321 | | | 645,968 |
| | | | | |
TOTAL HUNGARY | | | | | 35,304,240 |
| | | | | |
INDIA — (11.2%) | | | | | |
*ACC, Ltd. | | 43,053 | | | 677,843 |
Adani Enterprises, Ltd. | | 51,000 | | | 769,346 |
Aditya Birla Nuvo, Ltd. | | 5,819 | | | 96,679 |
Ambuja Cements, Ltd. | | 1,162,146 | | | 2,176,996 |
Asea Brown Boveri India, Ltd. | | 97,291 | | | 1,573,395 |
Asian Paints, Ltd. | | 60,748 | | | 2,099,916 |
Aventis Pharma, Ltd. | | 3,628 | | | 120,838 |
Axis Bank, Ltd. | | 349,044 | | | 6,648,124 |
Bajaj Auto, Ltd. | | 83,940 | | | 2,476,506 |
Bajaj Finserv, Ltd. | | 59,835 | | | 387,988 |
Bajaj Holdings & Investment, Ltd. | | 37,300 | | | 382,989 |
Bharat Electronics, Ltd. | | 7,300 | | | 221,456 |
Bharti Airtel, Ltd. | | 852,924 | | | 5,259,701 |
Bosch, Ltd. | | 20,203 | | | 1,807,356 |
Cipla, Ltd. | | 639,901 | | | 3,883,604 |
Colgate-Palmolive (India), Ltd. | | 68,534 | | | 1,015,777 |
Crompton Greaves, Ltd. | | 184,828 | | | 1,484,210 |
Cummins India, Ltd. | | 37,898 | | | 299,507 |
Dabur India, Ltd. | | 308,253 | | | 987,668 |
Divi’s Laboratories, Ltd. | | 63,020 | | | 706,277 |
Dr. Reddy’s Laboratories, Ltd. | | 128,934 | | | 2,754,964 |
#Dr. Reddy’s Laboratories, Ltd. ADR | | 83,498 | | | 1,814,412 |
EIH, Ltd. | | 129,641 | | | 335,943 |
Exide Industries, Ltd. | | 202,666 | | | 419,505 |
GAIL India, Ltd. | | 57,000 | | | 418,868 |
GAIL India, Ltd. Sponsored GDR | | 28,791 | | | 1,280,929 |
GlaxoSmithKline Pharmaceuticals, Ltd. | | 42,501 | | | 1,421,145 |
Glenmark Pharmaceuticals, Ltd. | | 99,187 | | | 468,235 |
Godrej Consumer Products, Ltd. | | 109,632 | | | 627,737 |
Grasim Industries, Ltd. | | 6,300 | | | 289,938 |
HCL Technologies, Ltd. | | 311,688 | | | 1,996,102 |
HDFC Bank, Ltd. | | 386,733 | | | 13,175,290 |
Hero Honda Motors, Ltd. Series B | | 158,834 | | | 5,246,290 |
Hindustan Unilever, Ltd. | | 1,633,609 | | | 9,748,048 |
ICICI Bank, Ltd. Sponsored ADR | | 88,726 | | | 2,790,433 |
Infosys Technologies, Ltd. | | 657,429 | | | 30,520,259 |
Infosys Technologies, Ltd. Sponsored ADR | | 233,496 | | | 10,740,816 |
Infrastructure Development Finance Co., Ltd. | | 1,931 | | | 5,959 |
ITC, Ltd. | | 2,007,345 | | | 10,823,298 |
Jindal Steel & Power, Ltd. | | 627,060 | | | 8,432,190 |
JSW Steel, Ltd. | | 106,526 | | | 1,688,039 |
Jubilant Organosys, Ltd. | | 66,060 | | | 326,175 |
Larsen & Toubro, Ltd. | | 371,281 | | | 12,248,925 |
Lupin, Ltd. | | 44,351 | | | 1,149,244 |
Mahanagar Telephone Nigam, Ltd. | | 130,940 | | | 190,092 |
Mahindra & Mahindra, Ltd. | | 254,183 | | | 4,918,411 |
29
THE EMERGING MARKETS SERIES
CONTINUED
| | | | | |
| | | Shares | | Value†† |
INDIA — (Continued) | | | | | |
Mangalore Refinery & Petrochemicals, Ltd. | | 846,013 | | $ | 1,324,041 |
Maruti Suzuki India, Ltd. | | 129,741 | | | 3,833,424 |
Nirma, Ltd. | | 66,235 | | | 245,854 |
*Oracle Financial Services Software, Ltd. | | 14,000 | | | 625,545 |
Pantaloon Retail India, Ltd. | | 9,760 | | | 64,289 |
*Pantaloon Retail India, Ltd. Class B | | 976 | | | 4,776 |
Petronet LNG, Ltd. | | 97,953 | | | 133,402 |
Piramal Healthcare, Ltd. | | 76,008 | | | 613,837 |
Proctor & Gamble Hygiene & Health Care, Ltd. | | 11,227 | | | 343,654 |
*Ranbaxy Laboratories, Ltd. | | 213,395 | | | 1,757,722 |
Reliance Capital, Ltd. | | 101,317 | | | 1,584,442 |
Reliance Communications, Ltd. | | 1,071,955 | | | 3,953,396 |
Reliance Energy, Ltd. | | 191,590 | | | 4,247,845 |
*Reliance Industries, Ltd. | | 1,030,847 | | | 41,707,940 |
*Reliance Natural Resources, Ltd. | | 1,099,793 | | | 1,474,126 |
Satyam Computer Services, Ltd. | | 772,898 | | | 1,671,873 |
Sesa Goa, Ltd. | | 534,990 | | | 3,380,627 |
Shree Cement, Ltd. | | 2,872 | | | 93,631 |
Shriram Transport Finance Co., Ltd. | | 2,300 | | | 19,078 |
Siemens India, Ltd. | | 153,743 | | | 1,661,564 |
Sterling Biotech, Ltd. | | 68,760 | | | 131,356 |
Sterlite Industries (India), Ltd. Series A | | 431,495 | | | 6,977,657 |
Sun Pharmaceuticals Industries, Ltd. | | 138,878 | | | 4,050,120 |
Sun TV Network, Ltd. | | 25,000 | | | 165,404 |
Tata Chemicals, Ltd. | | 62,804 | | | 347,497 |
Tata Consultancy Services, Ltd. | | 756,974 | | | 10,030,279 |
Tata Power Co., Ltd. | | 144,515 | | | 4,075,894 |
Tata Steel, Ltd. | | 88,890 | | | 878,630 |
Tata Tea, Ltd. | | 8,903 | | | 161,651 |
*Tech Mahindra, Ltd. | | 6,379 | | | 124,774 |
Titan Industries, Ltd. | | 7,547 | | | 199,158 |
United Phosphorus, Ltd. | | 69,388 | | | 210,431 |
United Spirits, Ltd. | | 21,912 | | | 493,446 |
Videsh Sanchar Nigam, Ltd. | | 75,115 | | | 614,909 |
Wipro, Ltd. | | 440,456 | | | 5,629,808 |
Zee Entertainment Enterprises, Ltd. | | 402,083 | | | 1,950,192 |
Zydus Wellness, Ltd. | | 11,485 | | | 41,361 |
| | | | | |
TOTAL INDIA | | | | | 261,731,056 |
| | | | | |
INDONESIA — (2.2%) | | | | | |
PT Aneka Tambang Tbk | | 2,782,000 | | | 646,516 |
PT Astra Agro Lestari Tbk | | 195,500 | | | 434,005 |
PT Astra International Tbk | | 4,017,561 | | | 12,925,685 |
*PT Bakrie & Brothers Tbk | | 21,200,000 | | | 215,254 |
PT Bank Central Asia Tbk | | 9,187,000 | | | 4,326,175 |
PT Bank Danamon Indonesia Tbk | | 2,719,740 | | | 1,268,775 |
PT Bank Mandiri Persero Tbk | | 2,325,000 | | | 1,115,662 |
*PT Bank Pan Indonesia Tbk | | 8,711,500 | | | 699,402 |
PT Bank Rakyat Indonesia Tbk | | 1,910,000 | | | 1,389,902 |
PT Bumi Resources Tbk | | 15,481,000 | | | 3,726,858 |
PT Gudang Garam Tbk | | 56,500 | | | 83,113 |
*PT Holcim Indonesia Tbk | | 2,854,500 | | | 474,620 |
*PT Indo Tambangraya Megah Tbk | | 179,000 | | | 417,398 |
PT Indocement Tunggal Prakarsa Tbk | | 815,500 | | | 928,583 |
PT Indofood Sukses Makmur Tbk | | 87,500 | | | 27,653 |
PT Indosat Tbk | | 2,332,000 | | | 1,238,711 |
*PT International Nickel Indonesia Tbk | | 1,038,000 | | | 430,157 |
PT Kalbe Farma Tbk | | 3,591,000 | | | 450,366 |
*PT Lippo Karawaci Tbk | | 11,865,250 | | | 802,615 |
*PT Panasia Indosyntec Tbk | | 75,100 | | | 1,848 |
*PT Perusahaan Gas Negara Tbk | | 100,000 | | | 37,208 |
30
THE EMERGING MARKETS SERIES
CONTINUED
| | | | | |
| | | Shares | | Value†† |
INDONESIA — (Continued) | | | | | |
PT Semen Gresik Tbk | | 2,976,500 | | $ | 2,103,504 |
PT Sinar Mas Agro Resources & Technology Tbk | | 1,152,500 | | | 373,570 |
*PT Tambang Batubara Bukit Asam Tbk | | 234,500 | | | 365,322 |
PT Telekomunikasi Indonesia Tbk | | 14,011,140 | | | 12,065,191 |
PT Unilever Indonesia Tbk | | 3,087,000 | | | 3,228,631 |
PT United Tractors Tbk | | 648,500 | | | 994,312 |
| | | | | |
TOTAL INDONESIA | | | | | 50,771,036 |
| | | | | |
ISRAEL — (3.6%) | | | | | |
*Bank Hapoalim B.M. | | 1,922,358 | | | 7,018,046 |
*Bank Leumi Le-Israel B.M. | | 2,275,389 | | | 8,886,498 |
Bezeq Israeli Telecommunication Corp., Ltd. | | 2,044,881 | | | 4,563,602 |
*Clal Industries, Ltd. | | 23,420 | | | 119,479 |
*Clal Insurance Enterprise Holdings, Ltd. | | 1,996 | | | 42,255 |
Discount Investment Corp. | | 32,858 | | | 772,085 |
Elbit Systems, Ltd. | | 40,946 | | | 2,480,757 |
IDB Holding Corp., Ltd. | | — | | | 9 |
Israel Chemicals, Ltd. | | 780,753 | | | 9,119,540 |
Koor Industries, Ltd. | | 1 | | | 15 |
Makhteshim-Agan Industries, Ltd. | | 245,728 | | | 1,148,509 |
*Migdal Insurance & Financial Holdings, Ltd. | | 261,456 | | | 409,788 |
*Mizrahi Tefahot Bank, Ltd. | | 141,699 | | | 1,151,620 |
Osem Investment, Ltd. | | 33,175 | | | 430,358 |
Partner Communications Co., Ltd. | | 115,542 | | | 2,190,776 |
Strauss Group, Ltd. | | 6,896 | | | 89,385 |
Teva Pharmaceutical Industries, Ltd. Sponsored ADR | | 888,925 | | | 44,872,934 |
| | | | | |
TOTAL ISRAEL | | | | | 83,295,656 |
| | | | | |
MALAYSIA — (4.4%) | | | | | |
Affin Holdings Berhad | | 312,600 | | | 185,744 |
Alliance Financial Group Berhad | | 301,700 | | | 215,568 |
AMMB Holdings Berhad | | 874,959 | | | 1,202,999 |
*Axiata Group Berhad | | 4,359,375 | | | 3,712,616 |
Batu Kawan Berhad | | 15,000 | | | 43,499 |
Berjaya Corp. Berhad | | 734,800 | | | 251,736 |
Berjaya Sports Toto Berhad | | 803,464 | | | 1,012,749 |
Boustead Holdings Berhad | | 159,460 | | | 158,802 |
British American Tobacco Malaysia Berhad | | 239,100 | | | 3,140,052 |
CIMB Group Holdings Berhad | | 3,095,227 | | | 11,229,284 |
Digi.Com Berhad | | 495,162 | | | 3,161,925 |
EON Capital Berhad | | 175,500 | | | 286,640 |
Fraser & Neave Holdings Berhad | | 61,000 | | | 189,010 |
Gamuda Berhad | | 805,700 | | | 735,639 |
Genting Berhad | | 3,086,500 | | | 6,488,243 |
Genting Malaysia Berhad | | 4,928,500 | | | 3,936,659 |
Genting Plantations Berhad | | 276,600 | | | 494,513 |
Hong Leong Bank Berhad | | 820,150 | | | 1,793,395 |
Hong Leong Financial Group Berhad | | 548,429 | | | 992,196 |
IJM Corp. Berhad | | 336,560 | | | 469,447 |
IOI Corp. Berhad | | 5,328,755 | | | 8,262,279 |
KLCC Property Holdings Berhad | | 778,600 | | | 743,780 |
Kuala Lumpur Kepong Berhad | | 814,200 | | | 3,555,718 |
Lafarge Malayan Cement Berhad | | 259,580 | | | 458,076 |
Malayan Banking Berhad | | 780,353 | | | 1,511,306 |
*Malaysian Airlines System Berhad | | 599,367 | | | 542,627 |
Malaysian Bulk Carriers Berhad | | 63,000 | | | 57,288 |
Malaysian Pacific Industries Berhad | | 22,100 | | | 36,258 |
MISC Berhad | | 2,124,832 | | | 5,523,974 |
MMC Corp. Berhad | | 1,503,800 | | | 1,089,840 |
Nestle (Malaysia) Berhad | | 217,200 | | | 2,112,520 |
Oriental Holdings Berhad | | 241,300 | | | 391,152 |
31
THE EMERGING MARKETS SERIES
CONTINUED
| | | | | |
| | | Shares | | Value†† |
MALAYSIA — (Continued) | | | | | |
Parkson Holdings Berhad | | 182,650 | | $ | 270,993 |
Petronas Dagangan Berhad | | 445,100 | | | 1,157,880 |
Petronas Gas Berhad | | 886,800 | | | 2,534,794 |
Plus Expressways Berhad | | 2,589,600 | | | 2,496,163 |
PPB Group Berhad | | 889,100 | | | 3,926,339 |
Public Bank Berhad (B012W42) | | 44,291 | | | 138,418 |
Public Bank Berhad (B012W53) | | 1,550,201 | | | 4,829,053 |
RHB Capital Berhad | | 525,900 | | | 825,042 |
Sarawak Energy Berhad | | 430,200 | | | 325,623 |
Shell Refining Co. Federation of Malaysia Berhad | | 227,000 | | | 710,978 |
Sime Darby Berhad | | 3,457,620 | | | 8,940,046 |
SP Setia Berhad | | 971,150 | | | 1,092,051 |
Star Publications (Malaysia) Berhad | | 411,600 | | | 409,557 |
Telekom Malaysia Berhad | | 1,816,400 | | | 1,596,307 |
Tenaga Nasional Berhad | | 2,121,000 | | | 5,198,622 |
*UEM Land Holdings Berhad | | 700,625 | | | 339,368 |
UMW Holdings Berhad | | 729,066 | | | 1,342,730 |
YTL Corp. Berhad | | 1,449,385 | | | 3,082,191 |
YTL Power International Berhad | | 283,040 | | | 177,857 |
| | | | | |
TOTAL MALAYSIA | | | | | 103,379,546 |
| | | | | |
MEXICO — (6.8%) | | | | | |
#America Movil S.A.B. de C.V. Series L | | 17,737,259 | | | 39,145,222 |
#*Carso Global Telecom S.A.B. de C.V. Telecom Series A1 | | 1,166,771 | | | 4,538,511 |
*Cementos de Mexico S.A.B de C.V. Series B | | 267,800 | | | 278,271 |
*Cemex S.A.B. de C.V. Sponsored ADR | | 12,500 | | | 129,750 |
#Coca-Cola Femsa S.A.B. de C.V. Series L | | 517,300 | | | 2,790,276 |
*Corporacion Interamericana de Entramiento S.A.B. de C.V. Series B | | 28,827 | | | 14,333 |
*Corporacion Mexicana de Restaurantes S.A.B. de C.V. Series B | | 1,107 | | | 246 |
Corporativo Fragua S.A.B. de C.V. Series B | | 21 | | | 155 |
*Dine S.A.B. de C.V. | | 116,965 | | | 51,822 |
El Puerto de Liverpool S.A.B. de C.V. Series C1 | | 289,300 | | | 1,205,074 |
Embotelladora Arca S.A.B. de C.V. | | 385,803 | | | 970,077 |
*Empresas ICA S.A.B. de C.V. | | 50 | | | 110 |
#Fomento Economico Mexicano S.A.B. de C.V. Series B & D | | 2,109,900 | | | 9,132,314 |
#*Gruma S.A.B. de C.V. ADR | | 82,911 | | | 591,985 |
#Grupo Carso S.A.B. de C.V. Series A-1 | | 990,932 | | | 2,926,922 |
#Grupo Elektra S.A. de C.V. | | 117,475 | | | 4,608,694 |
*Grupo Financiero Banorte S.A.B. de C.V. | | 2,827,109 | | | 9,035,615 |
#Grupo Financiero Inbursa S.A.B. de C.V. Series O | | 1,426,864 | | | 4,020,020 |
Grupo Gigante S.A.B. de C.V. Series B | | 62,282 | | | 64,175 |
#Grupo Industrial Bimbo S.A.B. de C.V. Series A | | 626,600 | | | 3,649,383 |
Grupo Industrial Maseca S.A.B. de C.V. Series B | | 229,000 | | | 155,919 |
*Grupo Kuo S.A.B. de C.V. Series B | | 68 | | | 44 |
#*Grupo Mexico S.A.B. de C.V. Series B | | 9,098,785 | | | 18,192,402 |
#*Grupo Modelo S.A.B. de C.V. Series C | | 924,700 | | | 4,197,086 |
*Grupo Nutrisa S.A. de C.V. | | 129 | | | 274 |
*Grupo Qumma S.A. de C.V. Series B | | 1,591 | | | 22 |
Grupo Televisa S.A. de C.V. | | 1,704,800 | | | 6,604,224 |
Grupo Televisa S.A. de C.V. Sponsored ADR | | 109,820 | | | 2,126,115 |
#*Impulsora Del Desarrollo Y El Empleo en America Latina S.A. de C.V. | | 2,945,976 | | | 2,855,893 |
#Industrias Penoles S.A.B. de C.V. | | 194,550 | | | 3,552,623 |
#Kimberly Clark de Mexico S.A.B. de C.V. Series A | | 690,100 | | | 2,733,483 |
#*Organizacion Soriana S.A.B. de C.V. Series B | | 2,134,000 | | | 4,720,942 |
*Promotora y Operadora de Infraestructura S.A. de C.V. | | 2,085 | | | 3,790 |
*Savia S.A. de C.V. | | 120,000 | | | 7,271 |
Telefonos de Mexico S.A. de C.V. Series A | | 200,000 | | | 166,619 |
#Telefonos de Mexico S.A.B. de C.V. | | 9,705,800 | | | 8,093,220 |
Telmex Internacional S.A.B. de C.V. (B39SQ41) | | 200,000 | | | 131,781 |
#Telmex Internacional S.A.B. de C.V. (B39SR26) | | 9,705,800 | | | 6,527,502 |
Telmex Internacional S.A.B. de C.V. ADR | | 30,200 | | | 406,492 |
32
THE EMERGING MARKETS SERIES
CONTINUED
| | | | | |
| | | Shares | | Value†† |
MEXICO — (Continued) | | | | | |
#Wal-Mart de Mexico S.A.B. de C.V. Series V | | 4,372,680 | | $ | 15,250,358 |
| | | | | |
TOTAL MEXICO | | | | | 158,879,015 |
| | | | | |
PHILIPPINES — (0.6%) | | | | | |
Aboitiz Equity Ventures, Inc. | | 2,671,000 | | | 461,066 |
*Aboitiz Power Corp. | | 530,000 | | | 82,355 |
Ayala Corp. Series A | | 313,453 | | | 1,896,672 |
Ayala Land, Inc. | | 9,214,518 | | | 1,992,395 |
Banco de Oro Unibank, Inc. | | 1,292,908 | | | 938,466 |
Bank of the Philippine Islands | | 2,320,456 | | | 2,257,761 |
*Energy Development Corp. | | 1,212,500 | | | 104,718 |
*Filipina Water Bottling Corp. | | 2,006,957 | | | — |
*Jollibee Food Corp. | | 65,000 | | | 69,146 |
Metro Bank & Trust Co. | | 257,100 | | | 217,483 |
Philippine Long Distance Telephone Co. | | 95,200 | | | 5,116,460 |
Robinson’s Land Corp. Series B | | 183,100 | | | 46,494 |
SM Prime Holdings, Inc. | | 508,168 | | | 105,375 |
| | | | | |
TOTAL PHILIPPINES | | | | | 13,288,391 |
| | | | | |
POLAND — (1.3%) | | | | | |
Asseco Poland SA | | 29,080 | | | 584,279 |
*Bank Handlowy w Warszawie SA | | 17,748 | | | 389,219 |
*Bank Pekao SA | | 163,030 | | | 8,750,507 |
*Bank Przemyslowo Handlowy BPH SA | | 2,029 | | | 48,398 |
*Bank Zackodni WBK SA | | 37,228 | | | 1,987,437 |
Browary Zywiec SA | | 13,634 | | | 2,291,069 |
*Getin Holdings SA | | 100,000 | | | 284,600 |
KGHM Polska Miedz SA | | 61,000 | | | 2,053,300 |
*Kredyt Bank SA | | 88,259 | | | 370,012 |
*Mondi Packaging Paper Swiecie SA | | 26,883 | | | 656,504 |
*PBG SA | | 5,605 | | | 436,581 |
*Polski Koncern Naftowy Orlen SA | | 267,237 | | | 2,781,598 |
Polskie Gornictwo Naftowe I Gazownictwo SA | | 718,661 | | | 875,101 |
Powszechna Kasa Oszczednosci Bank Polski SA | | 220,087 | | | 2,607,810 |
Telekomunikacja Polska SA | | 1,112,400 | | | 6,528,358 |
TVN SA | | 35,681 | | | 176,819 |
| | | | | |
TOTAL POLAND | | | | | 30,821,592 |
| | | | | |
RUSSIA — (0.6%) | | | | | |
*Gazprom OAO Sponsored ADR | | 176,802 | | | 4,240,075 |
*Gazpromneft JSC Sponsored ADR | | 3,783 | | | 98,021 |
*Lukoil OAO Sponsored ADR | | 66,901 | | | 3,881,038 |
*Magnitogorsk Iron & Steel Works Sponsored GDR | | 7,844 | | | 74,105 |
*MMC Norilsk Nickel JSC ADR | | 62,016 | | | 814,674 |
*Novolipetsk Steel OJSC GDR | | 8,565 | | | 223,086 |
*Novorossiysk Sea Trade Port GDR | | 137 | | | 1,562 |
*Polymetal GDR | | 3,453 | | | 30,451 |
*Rosneft Oil Co. GDR | | 214,884 | | | 1,633,941 |
*RusHydro Sponsored ADR | | 58,025 | | | 206,569 |
*Severstal GDR | | 40,100 | | | 289,256 |
*Surgutneftegaz Sponsored ADR | | 88,866 | | | 784,306 |
*Tatneft Sponsored ADR | | 18,577 | | | 481,087 |
*TMK OAO GDR | | 10,067 | | | 181,859 |
*Uralkali Sponsored GDR | | 14,556 | | | 327,635 |
*VTB Bank OJSC GDR | | 83,338 | | | 331,709 |
| | | | | |
TOTAL RUSSIA | | | | | 13,599,374 |
| | | | | |
SINGAPORE — (0.0%) | | | | | |
*Genting Singapore P.L.C. | | 672,420 | | | 513,710 |
| | | | | |
33
THE EMERGING MARKETS SERIES
CONTINUED
| | | | | |
| | | Shares | | Value†† |
SOUTH AFRICA — (8.2%) | | | | | |
ABSA Group, Ltd. | | 362,514 | | $ | 5,832,653 |
Adcock Ingram Holdings, Ltd. | | 5,100 | | | 34,703 |
African Bank Investments, Ltd. | | 318,206 | | | 1,228,688 |
African Rainbow Minerals, Ltd. | | 277,277 | | | 5,368,620 |
*Anglo American Platinum Corp., Ltd. | | 114,526 | | | 9,954,766 |
#AngloGold Ashanti, Ltd. Sponsored ADR | | 197,922 | | | 7,429,992 |
ArcelorMittal South Africa, Ltd. | | 330,893 | | | 4,452,959 |
*Aspen Pharmacare Holdings, Ltd. | | 37,154 | | | 313,129 |
Aveng, Ltd. | | 49,466 | | | 262,341 |
Barloworld, Ltd. | | 4,883 | | | 30,445 |
Bidvest Group, Ltd. | | 182,111 | | | 2,851,668 |
Data Tec, Ltd. | | 10,700 | | | 39,054 |
Discovery Holdings, Ltd. | | 391,199 | | | 1,531,869 |
Exxaro Resources, Ltd. | | 83,898 | | | 937,185 |
FirstRand, Ltd. | | 1,540,707 | | | 3,444,914 |
Freeworld Coatings, Ltd. | | 117,583 | | | 131,598 |
Gold Fields, Ltd. Sponsored ADR | | 425,086 | | | 5,419,846 |
Harmony Gold Mining Co., Ltd. | | 387,997 | | | 3,879,325 |
Harmony Gold Mining Co., Ltd. Sponsored ADR | | 389,769 | | | 3,882,099 |
Impala Platinum Holdings, Ltd. | | 478,692 | | | 10,402,919 |
Investec, Ltd. | | 118,615 | | | 877,719 |
Kumba Iron Ore, Ltd. | | 15,092 | | | 451,320 |
Liberty Holdings, Ltd. | | 209,134 | | | 1,808,161 |
Massmart Holdings, Ltd. | | 124,452 | | | 1,437,809 |
Mondi, Ltd. | | 11,693 | | | 65,843 |
MTN Group, Ltd. | | 1,659,950 | | | 24,715,390 |
Murray & Roberts Holdings, Ltd. | | 107,838 | | | 749,834 |
Naspers, Ltd. Series N | | 324,237 | | | 11,698,218 |
Nedbank Group, Ltd. | | 54,403 | | | 840,133 |
Network Healthcare Holdings, Ltd. | | 374,194 | | | 553,217 |
Pick’n Pay Stores, Ltd. | | 288,558 | | | 1,515,842 |
Pretoria Portland Cement Co., Ltd. | | 753,899 | | | 3,205,776 |
PSG Group, Ltd. | | 189,027 | | | 530,740 |
Sanlam, Ltd. | | 961,639 | | | 2,638,963 |
#Sasol, Ltd. Sponsored ADR | | 1,270,370 | | | 47,499,134 |
Shoprite Holdings, Ltd. | | 596,920 | | | 4,864,260 |
#Standard Bank Group, Ltd. | | 843,110 | | | 10,570,537 |
Steinhoff International Holdings, Ltd. | | 694,492 | | | 1,678,287 |
*Super Group, Ltd. | | 513,680 | | | 40,380 |
Telkom South Africa, Ltd. | | 521,362 | | | 2,921,082 |
Tiger Brands, Ltd. | | 76,245 | | | 1,511,714 |
Truworths International, Ltd. | | 138,004 | | | 790,579 |
*Vodacom Group Pty, Ltd. | | 521,362 | | | 3,615,051 |
| | | | | |
TOTAL SOUTH AFRICA | | | | | 192,008,762 |
| | | | | |
SOUTH KOREA — (11.5%) | | | | | |
Amorepacific Corp. | | 3,527 | | | 2,434,041 |
Cheil Industrial, Inc. | | 20,690 | | | 771,898 |
#Daewoo Engineering & Construction Co., Ltd. | | 207,178 | | | 2,110,624 |
#Daewoo International Corp. | | 47,246 | | | 1,290,461 |
Daewoo Securities Co., Ltd. | | 103,195 | | | 1,567,960 |
#Daewoo Shipbuilding & Marine Engineering Co., Ltd. | | 142,290 | | | 1,871,598 |
#Doosan Heavy Industries & Construction Co., Ltd. | | 14,950 | | | 802,291 |
#Doosan Infracore Co., Ltd. | | 82,000 | | | 1,166,820 |
#Glovis Co., Ltd. | | 6,360 | | | 554,620 |
*GS Engineering & Construction Corp. | | 27,320 | | | 2,395,751 |
GS Holdings Corp. | | 42,945 | | | 1,063,760 |
Hana Financial Group, Inc. | | 112,261 | | | 3,329,396 |
Hankook Tire Manufacturing Co., Ltd. | | 84,420 | | | 1,613,639 |
#Hite Brewery Co., Ltd. | | 6,098 | | | 829,741 |
#*Hynix Semiconductor, Inc. | | 163,310 | | | 2,424,588 |
34
THE EMERGING MARKETS SERIES
CONTINUED
| | | | | |
| | | Shares | | Value†† |
SOUTH KOREA — (Continued) | | | | | |
Hyundai Department Store Co., Ltd. | | 3,893 | | $ | 372,113 |
#Hyundai Development Co. | | 33,870 | | | 1,002,429 |
#Hyundai Heavy Industries Co., Ltd. | | 49,890 | | | 6,833,593 |
#Hyundai Merchant Marine Co., Ltd. | | 24,600 | | | 504,302 |
Hyundai Mobis | | 53,070 | | | 7,076,531 |
#Hyundai Motor Co., Ltd. | | 95,919 | | | 8,700,283 |
Hyundai Securities Co., Ltd. | | 18,410 | | | 209,021 |
Hyundai Steel Co. | | 58,560 | | | 3,720,090 |
*Industrial Bank of Korea, Ltd. | | 78,210 | | | 947,488 |
Kangwon Land, Inc. | | 150,410 | | | 2,009,728 |
*KB Financial Group, Inc. | | 139,085 | | | 6,689,974 |
#KCC Corp. | | 7,410 | | | 2,136,122 |
#*Kia Motors Corp. | | 225,130 | | | 3,343,977 |
*Korea Electric Power Corp. | | 295,290 | | | 8,367,346 |
Korea Exchange Bank | | 200,200 | | | 2,275,087 |
Korea Gas Corp. | | 35,793 | | | 1,510,254 |
Korea Investment Holdings Co., Ltd. | | 6,730 | | | 179,486 |
KT Corp. | | 195,930 | | | 6,386,780 |
KT&G Corp. | | 103,590 | | | 6,032,838 |
LG Chemical, Ltd. | | 32,392 | | | 5,582,128 |
#LG Corp. | | 129,413 | | | 7,331,661 |
*LG Display Co., Ltd. ADR | | 128,466 | | | 1,528,745 |
#LG Electronics, Inc. | | 88,910 | | | 8,265,115 |
#*LG Hausys, Ltd. | | 4,382 | | | 438,083 |
#LG Household & Healthcare Co., Ltd. | | 5,120 | | | 1,063,382 |
*LG Telecom, Ltd. | | 44,600 | | | 334,154 |
#Lotte Confectionary Co., Ltd. | | 315 | | | 316,777 |
*LS Industrial Systems Co., Ltd. | | 1,000 | | | 74,910 |
Macquarie Korea Infrastructure Fund | | 75,002 | | | 315,776 |
*Mirae Asset Securities Co., Ltd. | | 7,275 | | | 380,272 |
#*NCsoft Corp. | | 4,529 | | | 484,356 |
*OCI Co., Ltd. | | 780 | | | 137,033 |
POSCO | | 46,060 | | | 19,088,540 |
S1 Corp. | | 3,130 | | | 125,286 |
Samsung Card Co., Ltd. | | 23,720 | | | 939,781 |
Samsung Corp. | | 100,930 | | | 4,107,927 |
#Samsung Electro-Mechanics Co., Ltd. | | 37,767 | | | 3,140,135 |
#Samsung Electronics Co., Ltd. | | 97,139 | | | 58,451,752 |
*Samsung Electronics Co., Ltd. GDR | | 49,372 | | | 14,972,842 |
#*Samsung Engineering Co., Ltd. | | 6,628 | | | 586,001 |
Samsung Fire & Marine Insurance, Ltd. | | 35,022 | | | 6,376,598 |
#Samsung Heavy Industries Co., Ltd. | | 126,000 | | | 2,383,568 |
Samsung SDI Co., Ltd. | | 20,352 | | | 2,323,439 |
Samsung Securities Co., Ltd. | | 33,780 | | | 1,655,772 |
*Samsung Techwin Co., Ltd. | | 7,702 | | | 589,756 |
*Shinhan Financial Group Co., Ltd. | | 218,686 | | | 8,297,155 |
Shinhan Financial Group Co., Ltd. ADR | | 16,770 | | | 1,268,650 |
Shinsegae Co., Ltd. | | 12,596 | | | 5,438,180 |
#SK Co., Ltd. | | 21,194 | | | 1,681,277 |
SK Energy Co., Ltd. | | 51,889 | | | 4,765,922 |
SK Telecom Co., Ltd. | | 56,085 | | | 8,541,662 |
S-Oil Corp. | | 47,310 | | | 2,288,654 |
*STX Pan Ocean Co., Ltd. | | 30,480 | | | 277,740 |
Woongjin Coway Co., Ltd. | | 13,260 | | | 443,263 |
Woori Investment & Securities Co., Ltd. | | 67,386 | | | 847,114 |
Yuhan Corp. | | 776 | | | 124,983 |
| | | | | |
TOTAL SOUTH KOREA | | | | | 267,493,019 |
| | | | | |
TAIWAN — (9.6%) | | | | | |
Acer, Inc. | | 2,802,239 | | | 6,605,262 |
Advanced Semiconductor Engineering, Inc. | | 2,990,899 | | | 2,357,252 |
35
THE EMERGING MARKETS SERIES
CONTINUED
| | | | | |
| | | Shares | | Value†† |
TAIWAN — (Continued) | | | | | |
Advantech Co., Ltd. | | 73,609 | | $ | 131,013 |
Asia Cement Corp. | | 2,452,114 | | | 2,574,670 |
Asustek Computer, Inc. | | 2,968,206 | | | 5,451,570 |
AU Optronics Corp. | | 1,332,874 | | | 1,181,930 |
#AU Optronics Corp. Sponsored ADR | | 348,006 | | | 3,072,894 |
Catcher Co., Ltd. | | 191,430 | | | 463,409 |
*Cathay Financial Holdings Co., Ltd. | | 2,746,761 | | | 4,710,330 |
Chang Hwa Commercial Bank | | 1,962,000 | | | 853,660 |
Cheng Shin Rubber Industry Co., Ltd. | | 1,078,790 | | | 2,216,776 |
Cheng Uei Precision Industry Co., Ltd. | | 233,232 | | | 443,098 |
*Chi Mei Optoelectronic Corp. | | 1,814,000 | | | 904,977 |
Chicony Electronics Co., Ltd. | | 199,368 | | | 435,993 |
*China Development Financial Holding Corp. | | 3,970,000 | | | 1,034,191 |
China Steel Corp. | | 8,747,669 | | | 7,766,540 |
Chinatrust Financial Holdings Co., Ltd. | | 2,380,770 | | | 1,430,065 |
*Chungwa Picture Tubes Co., Ltd. | | 2,846,000 | | | 291,962 |
*Clevo Co. | | 471,643 | | | 588,614 |
Compal Electronics, Inc. | | 3,708,375 | | | 4,636,228 |
Delta Electronics Industrial Co., Ltd. | | 1,812,367 | | | 5,032,454 |
*E.Sun Financial Holding Co., Ltd. | | 1,125,790 | | | 438,224 |
Epistar Corp. | | 224,000 | | | 652,289 |
Eternal Chemical Co., Ltd. | | 254,520 | | | 235,853 |
*Evergreen International Storage & Transport Corp. | | 357,000 | | | 288,928 |
*Evergreen Marine Corp., Ltd. | | 481,869 | | | 243,377 |
Everlight Electronics Co., Ltd. | | 146,000 | | | 399,114 |
Far East Textile, Ltd. | | 4,292,007 | | | 5,061,208 |
*Far EasTone Telecommunications Co., Ltd. | | 446,000 | | | 501,795 |
Feng Hsin Iron & Steel Co., Ltd. | | 170,000 | | | 257,027 |
First Financial Holding Co., Ltd. | | 5,210,574 | | | 3,010,102 |
Formosa Chemicals & Fiber Co., Ltd. | | 4,748,445 | | | 8,848,806 |
Formosa International Hotels Corp. | | 35,200 | | | 439,195 |
Formosa Plastics Corp. | | 5,051,649 | | | 9,689,505 |
Formosa Taffeta Co., Ltd. | | 605,000 | | | 410,142 |
Foxconn Technology Co., Ltd. | | 684,791 | | | 2,281,263 |
*Fubon Financial Holding Co., Ltd. | | 5,940,052 | | | 6,591,267 |
Giant Manufacture Co., Ltd. | | 201,600 | | | 522,777 |
*HannStar Display Corp. | | 1,337,000 | | | 252,089 |
Hon Hai Precision Industry Co., Ltd. | | 4,590,177 | | | 17,978,933 |
Hotai Motor Co., Ltd. | | 387,000 | | | 899,036 |
HTC Corp. | | 527,200 | | | 5,235,375 |
Hua Nan Financial Holding Co., Ltd. | | 5,725,898 | | | 3,326,863 |
Innolux Display Corp. | | 1,748,940 | | | 2,303,546 |
Inventec Corp. | | 1,732,722 | | | 958,531 |
Kinsus Interconnect Technology Corp. | | 78,000 | | | 195,531 |
Largan Precision Co., Ltd. | | 43,860 | | | 502,322 |
Lee Chang Yung Chemical Industry Corp. | | 312,825 | | | 346,941 |
Lite-On Technology Corp. | | 506,520 | | | 667,118 |
Macronix International Co., Ltd. | | 1,794,825 | | | 909,789 |
Media Tek, Inc. | | 735,527 | | | 10,294,431 |
Mega Financial Holding Co., Ltd. | | 4,537,000 | | | 2,526,558 |
Mitac International Corp. | | 209,288 | | | 97,884 |
Nan Ya Plastic Corp. | | 7,084,565 | | | 11,269,977 |
Nan Ya Printed Circuit Board Corp. | | 200,940 | | | 625,293 |
*Polaris Securities Co., Ltd. | | 673,000 | | | 345,336 |
Pou Chen Corp. | | 2,007,342 | | | 1,376,278 |
President Chain Store Corp. | | 881,831 | | | 1,995,217 |
Shihlin Electric & Engineering Corp. | | 235,000 | | | 282,551 |
*Shin Kong Financial Holding Co., Ltd. | | 1,800,619 | | | 732,597 |
Siliconware Precision Industries Co., Ltd. | | 2,347,324 | | | 3,086,123 |
*SinoPac Holdings Co., Ltd. | | 2,807,000 | | | 1,036,665 |
Synnex Technology International Corp. | | 927,700 | | | 1,755,182 |
36
THE EMERGING MARKETS SERIES
CONTINUED
| | | | | |
| | | Shares | | Value†† |
TAIWAN — (Continued) | | | | | |
*Taishin Financial Holdings Co., Ltd. | | 1,609,000 | | $ | 629,681 |
*Taiwan Business Bank | | 921,000 | | | 224,884 |
Taiwan Cement Corp. | | 2,415,895 | | | 2,478,577 |
Taiwan Cooperative Bank | | 2,997,634 | | | 1,768,718 |
Taiwan Fertilizer Co., Ltd. | | 133,000 | | | 412,896 |
Taiwan Glass Industrial Corp. | | 1,309,200 | | | 1,006,462 |
Taiwan Secom Co., Ltd. | | 150,000 | | | 229,289 |
Taiwan Semiconductor Manufacturing Co., Ltd. | | 22,386,808 | | | 40,609,637 |
*Tatung Co., Ltd. | | 1,058,000 | | | 233,017 |
Ton Yi Industrial Corp. | | 220,000 | | | 76,652 |
Transcend Information, Inc. | | 131,181 | | | 410,279 |
TSRC Corp. | | 368,000 | | | 428,664 |
Tung Ho Steel Enterprise Corp. | | 216,000 | | | 205,317 |
U-Ming Marine Transport Corp. | | 648,860 | | | 1,176,881 |
*Unimicron Technology Corp. | | 200,000 | | | 228,196 |
Uni-President Enterprises Corp. | | 3,496,347 | | | 3,901,188 |
*United Microelectronics Corp. | | 5,956,000 | | | 2,863,129 |
*Walsin Lihwa Corp. | | 2,278,539 | | | 738,384 |
*Wan Hai Lines Co., Ltd. | | 543,209 | | | 249,909 |
Wistron Corp. | | 1,251,699 | | | 2,095,430 |
WPG Holdings Co., Ltd. | | 201,000 | | | 274,992 |
Yang Ming Marine Transport Corp. | | 341,131 | | | 120,503 |
*Young Fast Optoelectronics Co., Ltd. | | 4,000 | | | 45,768 |
Yuanta Financial Holding Co., Ltd. | | 1,945,885 | | | 1,284,145 |
Yulon Motor Co., Ltd. | | 145,000 | | | 162,185 |
| | | | | |
TOTAL TAIWAN | | | | | 222,908,709 |
| | | | | |
THAILAND — (1.4%) | | | | | |
Advance Info Service PCL (Foreign) | | 1,541,800 | | | 3,978,467 |
Bangkok Bank PCL (Foreign) NVDR | | 286,400 | | | 959,665 |
Bangkok Dusit Medical Services PCL (Foreign) | | 586,600 | | | 424,704 |
Bank of Ayudhya PCL (Foreign) | | 2,590,200 | | | 1,394,872 |
Banpu PCL (Foreign) | | 115,100 | | | 1,508,266 |
BEC World PCL (Foreign) | | 1,097,600 | | | 735,564 |
Bumrungrad Hospital PCL (Foreign) | | 297,000 | | | 248,796 |
C.P. ALL PCL (Foreign) | | 2,436,200 | | | 1,384,826 |
Charoen Pokphand Foods PCL (Foreign) | | 4,181,300 | | | 1,207,167 |
Delta Electronics (Thailand) PCL (Foreign) | | 622,510 | | | 322,197 |
Electricity Generating PCL (Foreign) NVDR | | 60,000 | | | 134,630 |
Glow Energy PCL (Foreign) | | 119,000 | | | 113,927 |
IRPC PCL (Foreign) | | 4,240,300 | | | 487,143 |
Kasikornbank PCL (Foreign) | | 1,612,200 | | | 3,955,135 |
Krung Thai Bank PCL (Foreign) | | 7,726,870 | | | 2,034,299 |
Land & Houses PCL (Foreign) NVDR | | 790,000 | | | 133,538 |
PTT Aromatics & Refining PCL (Foreign) | | 1,287,137 | | | 820,225 |
PTT Chemical PCL (Foreign) | | 1,037,460 | | | 1,939,903 |
PTT Exploration & Production PCL (Foreign) | | 592,000 | | | 2,568,138 |
PTT PCL (Foreign) | | 218,400 | | | 1,568,168 |
Ratchaburi Electricity Generating Holding PCL (Foreign) | | 864,300 | | | 956,742 |
Siam Cement PCL (Foreign) (The) | | 117,100 | | | 732,203 |
Siam Cement PCL (Foreign) NVDR (The) | | 41,600 | | | 253,894 |
Siam City Bank PCL (Foreign) | | 833,100 | | | 590,710 |
Siam City Cement PCL (Foreign) | | 156,413 | | | 1,034,174 |
Siam Commercial Bank PCL (Foreign) | | 1,001,366 | | | 2,314,301 |
Siam Makro PCL (Foreign) | | 112,500 | | | 268,418 |
Thai Oil PCL (Foreign) | | 196,000 | | | 241,885 |
*TMB Bank PCL (Foreign) | | 3,780,000 | | | 124,398 |
| | | | | |
TOTAL THAILAND | | | | | 32,436,355 |
| | | | | |
TURKEY — (2.0%) | | | | | |
Akbank T.A.S. | | 1,190,899 | | | 6,432,963 |
37
THE EMERGING MARKETS SERIES
CONTINUED
| | | | | |
| | | Shares | | Value†† |
TURKEY — (Continued) | | | | | |
Aksigorta A.S. | | 97,752 | | $ | 295,221 |
Anadolu Efes Biracilik ve Malt Sanayi A.S. | | 385,869 | | | 4,408,477 |
*Asya Katilim Bankasi A.S. | | 151,578 | | | 313,514 |
Aygaz A.S. | | — | | | 1 |
BIM BirlesikMagazalar A.S. | | 17,544 | | | 636,076 |
*Dogan Sirketler Grubu Holding A.S. | | 1,908,886 | | | 1,255,854 |
*Dogan Yayin Holding A.S. | | 3 | | | 2 |
Enka Insaat ve Sanayi A.S. | | 385,612 | | | 1,556,083 |
*Eregli Demir ve Celik Fabrikalari Turk A.S. | | 874,563 | | | 2,374,127 |
Ford Otomotiv Sanayi A.S. | | 114,792 | | | 721,907 |
*Koc Holding A.S. Series B | | 1,063,963 | | | 2,710,397 |
*TAV Havalimanlari Holding A.S. | | 48,000 | | | 131,261 |
Tofas Turk Otomobil Fabrikasi A.S. | | 1 | | | 2 |
Tupras-Turkiye Petrol Rafinerileri A.S. | | 216,078 | | | 3,711,354 |
*Turk Ekonomi Bankasi A.S. | | — | | | — |
*Turk Hava Yollari A.S. | | 131,400 | | | 366,838 |
*Turk Sise ve Cam Fabrikalari A.S. | | 531,423 | | | 557,699 |
Turkcell Iletisim Hizmetleri A.S. | | 240,093 | | | 1,588,542 |
Turkiye Garanti Bankasi A.S. | | 2,842,585 | | | 10,322,968 |
Turkiye Halk Bankasi A.S. | | 139,950 | | | 837,551 |
Turkiye Is Bankasi A.S. | | 1,429,127 | | | 5,412,568 |
*Turkiye Vakiflar Bankasi T.A.O. | | 385,861 | | | 935,743 |
*Yapi ve Kredi Bankasi A.S. | | 1,249,137 | | | 2,568,272 |
| | | | | |
TOTAL TURKEY | | | | | 47,137,420 |
| | | | | |
TOTAL COMMON STOCKS | | | | | 1,933,558,736 |
| | | | | |
PREFERRED STOCKS — (7.1%) | | | | | |
BRAZIL — (7.1%) | | | | | |
*Aracruz Celulose SA Series B | | 102,635 | | | 191,683 |
Banco Bradesco SA | | 1,309,200 | | | 25,610,259 |
Brasil Telecom Participacoes SA | | 222,326 | | | 2,246,482 |
Brasil Telecom Participacoes SA ADR | | 9,465 | | | 476,373 |
Brasil Telecom SA | | 234,762 | | | 2,000,328 |
*Braskem SA Preferred A Sponsored ADR | | 39,323 | | | 515,918 |
#Cia Vale do Rio Doce | | 302,400 | | | 6,985,440 |
#Companhia Brasileira de Distribuicao Grupo Pao de Acucar Sponsored ADR | | 81,000 | | | 4,899,690 |
Companhia de Bebidas das Americas | | 83 | | | 7,536 |
#Companhia de Bebidas das Americas Preferred ADR | | 151,600 | | | 13,656,128 |
Companhia Energetica de Minas Gerais SA | | 409,748 | | | 6,431,380 |
#Companhia Energetica de Minas Gerais SA Sponsored ADR | | 25,925 | | | 409,356 |
Empresa Nasional de Comercio Redito e Participacoes SA | | 480 | | | 4,223 |
Gerdau SA | | 756,268 | | | 11,398,113 |
Itau Unibanco Holding SA | | 1,765,755 | | | 33,589,042 |
Net Servicos de Comunicacao SA Preferred ADR | | 197,391 | | | 2,425,935 |
Tele Norte Leste Participacoes SA | | 180,034 | | | 3,423,671 |
#Tele Norte Leste Participacoes SA ADR | | 127,600 | | | 2,432,056 |
Telecomunicacoes de Sao Paulo SA | | 96,700 | | | 2,397,189 |
Telemar Norte Leste SA | | 37,912 | | | 1,193,143 |
Ultrapar Participacoes SA Sponsored ADR | | 113,254 | | | 4,992,236 |
Usinas Siderurgicas de Minas Gerais SA Series A | | 193,962 | | | 5,064,857 |
Vale SA Series A | | 1,412,691 | | | 31,796,775 |
Vale SA Series B | | 81,160 | | | — |
Vivo Participacoes SA | | 134,958 | | | 3,285,081 |
*Votorantim Celulose e Papel SA Sponsored ADR | | 18,181 | | | 249,805 |
| | | | | |
TOTAL BRAZIL | | | | | 165,682,699 |
| | | | | |
TOTAL PREFERRED STOCKS | | | | | 165,682,699 |
| | | | | |
38
THE EMERGING MARKETS SERIES
CONTINUED
| | | | | | |
| | | Shares | | Value†† |
RIGHTS/WARRANTS — (0.0%) | | | | | | |
SOUTH AFRICA — (0.0%) | | | | | | |
*Super Group, Ltd. Rights 11/20/09 | | | 2,106,088 | | | 40,450 |
| | | | | | |
TAIWAN — (0.0%) | | | | | | |
*Shin Kong Financial Holding Co., Ltd. Rights 12/07/09 | | | 92,039 | | | 8,490 |
| | | | | | |
TOTAL RIGHTS/WARRANTS | | | | | | 48,940 |
| | | | | | |
| | |
| | | Face
Amount | | Value† |
| | | (000) | | |
TEMPORARY CASH INVESTMENTS — (0.0%) | | | | | | |
Repurchase Agreement, PNC Capital Markets, Inc. 0.19%, 11/02/09 (Collateralized by $310,000 FNMA 6.50%, 06/25/39, valued at $326,275) to be repurchased at $317,005 | | $ | 317 | | | 317,000 |
| | | | | | |
| | |
| | | Shares/
Face
Amount | | |
| | | (000) | | |
SECURITIES LENDING COLLATERAL — (10.0%) | | | | | | |
§@DFA Short Term Investment Fund LP | | | 226,669,881 | | | 226,669,881 |
@Repurchase Agreement, Deutsche Bank Securities 0.07%, 11/02/09 (Collateralized byvarious corporate obligations, ranging in par value from $4,247,617 to $16,429,280,rates ranging from 5.000% to 7.000%, maturities ranging from 03/01/37 to 10/01/39,valued at $6,420,547) to be repurchased at $6,294,691 | | $ | 6,295 | | | 6,294,654 |
| | | | | | |
TOTAL SECURITIES LENDING COLLATERAL | | | | | | 232,964,535 |
| | | | | | |
TOTAL INVESTMENTS — (100.0%)
(Cost $1,297,590,646) | | | | | $ | 2,332,571,910 |
| | | | | | |
See accompanying Notes to Financial Statements.
39
THE TAX-MANAGED U.S. MARKETWIDE VALUE SERIES
SCHEDULE OF INVESTMENTS
October 31, 2009
| | | | | |
| | | Shares | | Value† |
COMMON STOCKS — (91.3%) | | | | | |
Consumer Discretionary — (16.9%) | | | | | |
*4Kids Entertainment, Inc. | | 200 | | $ | 360 |
#*99 Cents Only Stores | | 12,430 | | | 141,329 |
*AC Moore Arts & Crafts, Inc. | | 25,417 | | | 121,493 |
Acme United Corp. | | 1,030 | | | 8,652 |
*Aldila, Inc. | | 6,471 | | | 19,154 |
*Alloy, Inc. | | 16,956 | | | 111,570 |
American Greetings Corp. Class A | | 73,700 | | | 1,499,058 |
*America’s Car-Mart, Inc. | | 2,770 | | | 57,422 |
Ameristar Casinos, Inc. | | 200 | | | 2,944 |
*AnnTaylor Stores Corp. | | 14,100 | | | 182,877 |
#*Arctic Cat, Inc. | | 19,566 | | | 116,222 |
*Asbury Automotive Group, Inc. | | 49,069 | | | 477,932 |
*Ascent Media Corp. | | 162 | | | 2,823 |
*Atrinsic, Inc. | | 948 | | | 939 |
*Audiovox Corp. Class A | | 23,289 | | | 150,447 |
#*AutoNation, Inc. | | 305,400 | | | 5,265,096 |
*Ballantyne Strong, Inc. | | 8,032 | | | 27,309 |
#Barnes & Noble, Inc. | | 38,682 | | | 642,508 |
*Beasley Broadcast Group, Inc. | | 9,802 | | | 33,425 |
#*Beazer Homes USA, Inc. | | 9,300 | | | 40,827 |
bebe stores, inc. | | 1,900 | | | 11,894 |
*Benihana, Inc. | | 3,200 | | | 19,648 |
*Bluegreen Corp. | | 14,675 | | | 42,117 |
Blyth, Inc. | | 4,825 | | | 170,950 |
Bob Evans Farms, Inc. | | 52,387 | | | 1,376,206 |
#*Bon-Ton Stores, Inc. (The) | | 14,849 | | | 137,353 |
Books-A-Million, Inc. | | 21,400 | | | 185,324 |
*Boyd Gaming Corp. | | 20,700 | | | 152,352 |
#*Brookfield Homes Corp. | | 39,865 | | | 224,440 |
Brown Shoe Co., Inc. | | 74,175 | | | 769,195 |
*Brunswick Corp. | | 112,200 | | | 1,063,656 |
*Build-A-Bear-Workshop, Inc. | | 25,190 | | | 130,484 |
#*Cabela’s, Inc. | | 109,175 | | | 1,372,330 |
*Cache, Inc. | | 9,000 | | | 43,290 |
#*California Coastal Communities, Inc. | | 3,309 | | | 2,780 |
#Callaway Golf Co. | | 91,170 | | | 623,603 |
*Canterbury Park Holding Corp. | | 2,755 | | | 19,313 |
*Caribou Coffee Co., Inc. | | 3,840 | | | 31,450 |
*Carmike Cinemas, Inc. | | 9,095 | | | 89,404 |
Carnival Corp. | | 688,708 | | | 20,055,177 |
*Carriage Services, Inc. | | 19,056 | | | 72,413 |
*Cavco Industries, Inc. | | 9,633 | | | 292,843 |
CBS Corp. | | 16,200 | | | 191,160 |
CBS Corp. Class B | | 483,866 | | | 5,695,103 |
#*Charming Shoppes, Inc. | | 26,798 | | | 121,395 |
#*Chico’s FAS, Inc. | | 190,700 | | | 2,278,865 |
Christopher & Banks Corp. | | 56,231 | | | 342,447 |
*Churchill Downs, Inc. | | 3,137 | | | 98,439 |
Cinemark Holdings, Inc. | | 82,874 | | | 960,510 |
*Coldwater Creek, Inc. | | 1,100 | | | 6,325 |
#*Collective Brands, Inc. | | 59,190 | | | 1,097,975 |
Comcast Corp. Class A | | 3,570,978 | | | 51,779,181 |
Comcast Corp. Special Class A | | 1,432,185 | | | 20,079,234 |
*Concord Camera Corp. | | — | | | 1 |
#*Conn’s, Inc. | | 21,820 | | | 137,684 |
#Cooper Tire & Rubber Co. | | 147,627 | | | 2,252,788 |
#*Core-Mark Holding Co., Inc. | | 24,894 | | | 681,349 |
*Craftmade International, Inc. | | 2,799 | | | 7,389 |
40
THE TAX-MANAGED U.S. MARKETWIDE VALUE SERIES
CONTINUED
| | | | | |
| | | Shares | | Value† |
Consumer Discretionary — (Continued) | | | | | |
CSS Industries, Inc. | | 16,792 | | $ | 340,878 |
*Culp, Inc. | | 21,913 | | | 126,438 |
*Cybex International, Inc. | | 29,933 | | | 41,008 |
#D.R. Horton, Inc. | | 121,320 | | | 1,329,667 |
*dELiA*s, Inc. | | 22,143 | | | 46,943 |
*Delta Apparel, Inc. | | 6,832 | | | 60,395 |
*Destination Maternity Corp. | | 11,725 | | | 235,086 |
#Dillard’s, Inc. | | 120,300 | | | 1,638,486 |
*DineEquity, Inc. | | 49,683 | | | 1,051,292 |
#*Discovery Communications, Inc. (25470F104) | | 40,480 | | | 1,113,200 |
#*Discovery Communications, Inc. (25470F203) | | 3,937 | | | 108,012 |
*Discovery Communications, Inc. (25470F302) | | 163,880 | | | 3,936,398 |
#Disney (Walt) Co. | | 1,135,556 | | | 31,080,168 |
*Dixie Group, Inc. | | 11,800 | | | 34,220 |
*Dorman Products, Inc. | | 12,347 | | | 180,513 |
Dover Motorsports, Inc. | | 15,200 | | | 21,128 |
#*Drew Industries, Inc. | | 57,500 | | | 1,100,550 |
#*DSW, Inc. | | 2,000 | | | 38,400 |
*Duckwall-ALCO Stores, Inc. | | 700 | | | 12,110 |
Educational Development Corp. | | 2,100 | | | 11,025 |
#Ethan Allen Interiors, Inc. | | 20,300 | | | 252,938 |
*Exide Technologies | | 12,623 | | | 77,253 |
#*Federal Mogul Corp. | | 6,900 | | | 76,935 |
Finish Line, Inc. Class A | | 99,209 | | | 1,005,979 |
*Fisher Communications, Inc. | | 15,023 | | | 292,798 |
*Flanigan’s Enterprises, Inc. | | 865 | | | 4,931 |
Flexsteel Industries, Inc. | | 1,719 | | | 13,872 |
Foot Locker, Inc. | | 177,119 | | | 1,856,207 |
Fortune Brands, Inc. | | 149,626 | | | 5,827,933 |
FortuNet, Inc. | | 900 | | | 1,224 |
*Franklin Electronic Publishers, Inc. | | 4,850 | | | 11,931 |
Fred’s, Inc. | | 41,937 | | | 496,534 |
Frisch’s Restaurants, Inc. | | 600 | | | 14,070 |
*Full House Resorts, Inc. | | 700 | | | 1,680 |
*Furniture Brands International, Inc. | | 71,463 | | | 303,718 |
*GameTech International, Inc. | | 5,360 | | | 7,129 |
*Gaming Partners International Corp. | | 500 | | | 2,255 |
*Gander Mountain Co. | | 42,828 | | | 213,712 |
Gannett Co., Inc. | | 31,300 | | | 307,366 |
#*Gaylord Entertainment Co. | | 28,382 | | | 426,581 |
*Genesco, Inc. | | 51,445 | | | 1,341,171 |
*G-III Apparel Group, Ltd. | | 19,700 | | | 315,397 |
*Great Wolf Resorts, Inc. | | 34,400 | | | 114,896 |
*Group 1 Automotive, Inc. | | 63,000 | | | 1,601,460 |
Harte-Hanks, Inc. | | 6,300 | | | 73,962 |
*Hastings Entertainment, Inc. | | 1,572 | | | 6,744 |
*Haverty Furniture Cos., Inc. | | 38,589 | | | 467,313 |
*Heelys, Inc. | | 24,120 | | | 53,546 |
*Helen of Troy, Ltd. | | 64,389 | | | 1,470,645 |
*Hollywood Media Corp. | | 28,505 | | | 42,758 |
Hooker Furniture Corp. | | 4,341 | | | 55,608 |
#*Hot Topic, Inc. | | 1,540 | | | 11,858 |
*HSN, Inc. | | 60,525 | | | 904,244 |
*Iconix Brand Group, Inc. | | 95,450 | | | 1,112,947 |
*Isle of Capri Casinos, Inc. | | 15,000 | | | 116,250 |
*J. Alexander’s Corp. | | 9,296 | | | 39,415 |
#J.C. Penney Co., Inc. | | 214,499 | | | 7,106,352 |
*JAKKS Pacific, Inc. | | 15,024 | | | 213,792 |
Jarden Corp. | | 108,050 | | | 2,959,490 |
*Jo-Ann Stores, Inc. | | 45,950 | | | 1,223,189 |
Johnson Controls, Inc. | | 3,600 | | | 86,112 |
41
THE TAX-MANAGED U.S. MARKETWIDE VALUE SERIES
CONTINUED
| | | | | |
| | | Shares | | Value† |
Consumer Discretionary — (Continued) | | | | | |
*Johnson Outdoors, Inc. | | 12,128 | | $ | 106,120 |
Jones Apparel Group, Inc. | | 35,815 | | | 640,730 |
*Kenneth Cole Productions, Inc. Class A | | 10,174 | | | 96,755 |
*Kid Brands, Inc. | | 24,676 | | | 122,640 |
KSW, Inc. | | 446 | | | 1,534 |
#*K-Swiss, Inc. Class A | | 11,908 | | | 97,169 |
Lacrosse Footwear, Inc. | | 495 | | | 5,811 |
*Lakeland Industries, Inc. | | 11,757 | | | 86,532 |
*Lakes Entertainment, Inc. | | 23,964 | | | 58,951 |
*Landry’s Restaurants, Inc. | | 23,900 | | | 260,510 |
•*Lazare Kaplan International, Inc. | | 12,780 | | | 31,950 |
Lennar Corp. Class A | | 160,100 | | | 2,017,260 |
#*Liberty Global, Inc. Class A | | 68,111 | | | 1,398,319 |
#*Liberty Global, Inc. Series C | | 64,637 | | | 1,330,229 |
*Liberty Media Corp. Capital Class A | | 217,289 | | | 4,495,709 |
*Liberty Media Corp. Capital Class B | | 6,066 | | | 125,809 |
*Liberty Media Corp. Entertainment Class A | | 578,364 | | | 17,825,178 |
*Liberty Media Corp. Entertainment Class B | | 17,188 | | | 547,610 |
*Liberty Media Corp. Interactive Class A | | 882,463 | | | 10,007,130 |
*Liberty Media Corp. Interactive Class B | | 35,506 | | | 401,573 |
#*Life Time Fitness, Inc. | | 10,700 | | | 230,585 |
*Lifetime Brands, Inc. | | 13,658 | | | 82,904 |
*Lithia Motors, Inc. | | 37,982 | | | 316,770 |
*Live Nation, Inc. | | 130,962 | | �� | 872,207 |
#*Liz Claiborne, Inc. | | 22,114 | | | 126,934 |
*Lodgian, Inc. | | 21,628 | | | 38,065 |
*Luby’s, Inc. | | 46,323 | | | 165,373 |
*M/I Homes, Inc. | | 37,930 | | | 423,678 |
*Mac-Gray Corp. | | 13,247 | | | 107,698 |
Macy’s, Inc. | | 391,800 | | | 6,883,926 |
Marcus Corp. | | 9,332 | | | 109,184 |
*MarineMax, Inc. | | 16,594 | | | 113,005 |
*McCormick & Schmick’s Seafood Restaurants, Inc. | | 15,712 | | | 94,586 |
*Media General, Inc. | | 20,200 | | | 167,458 |
Men’s Wearhouse, Inc. (The) | | 82,560 | | | 1,912,915 |
Meredith Corp. | | 58,650 | | | 1,587,069 |
*Meritage Homes Corp. | | 56,983 | | | 1,039,370 |
*Modine Manufacturing Co. | | 42,200 | | | 434,660 |
#*Mohawk Industries, Inc. | | 98,740 | | | 4,229,034 |
*Morton’s Restaurant Group, Inc. | | 16,226 | | | 60,685 |
*Movado Group, Inc. | | 30,500 | | | 319,640 |
*MTR Gaming Group, Inc. | | 35,575 | | | 77,198 |
*Multimedia Games, Inc. | | 34,039 | | | 167,131 |
*Nautilus, Inc. | | 24,965 | | | 44,687 |
*New Frontier Media, Inc. | | 22,735 | | | 44,106 |
*New York & Co., Inc. | | 34,900 | | | 153,560 |
News Corp. Class A | | 1,864,745 | | | 21,481,862 |
#News Corp. Class B | | 855,872 | | | 11,639,859 |
*O’Charleys, Inc. | | 28,308 | | | 198,439 |
*Office Depot, Inc. | | 233,937 | | | 1,415,319 |
*OfficeMax, Inc. | | 5,000 | | | 57,150 |
*Orbitz Worldwide, Inc. | | 41,101 | | | 214,958 |
#*Orient-Express Hotels, Ltd. | | 2,500 | | | 21,500 |
#*Orleans Homebuilders, Inc. | | 21,771 | | | 47,461 |
#*Outdoor Channel Holdings, Inc. | | 42,955 | | | 297,249 |
Oxford Industries, Inc. | | 34,709 | | | 671,619 |
*Palm Harbor Homes, Inc. | | 2,600 | | | 5,746 |
#*Penske Automotive Group, Inc. | | 87,002 | | | 1,362,451 |
Pep Boys - Manny, Moe & Jack (The) | | 81,600 | | | 715,632 |
*Perry Ellis International, Inc. | | 28,161 | | | 384,961 |
Phillips-Van Heusen Corp. | | 84,340 | | | 3,386,251 |
42
THE TAX-MANAGED U.S. MARKETWIDE VALUE SERIES
CONTINUED
| | | | | |
| | | Shares | | Value† |
Consumer Discretionary — (Continued) | | | | | |
*Pinnacle Entertainment, Inc. | | 94,530 | | $ | 798,778 |
*Pomeroy IT Solutions, Inc. | | 10,282 | | | 66,730 |
#*Pulte Homes, Inc. | | 95,570 | | | 861,086 |
*Quiksilver, Inc. | | 124,972 | | | 248,694 |
*RC2 Corp. | | 6,724 | | | 87,815 |
*Red Lion Hotels Corp. | | 28,076 | | | 133,923 |
*Red Robin Gourmet Burgers, Inc. | | 41,775 | | | 698,060 |
#Regis Corp. | | 55,200 | | | 896,448 |
#*Rent-A-Center, Inc. | | 40,770 | | | 748,537 |
*Retail Ventures, Inc. | | 80,824 | | | 518,082 |
*Rex Stores Corp. | | 4,050 | | | 50,018 |
RG Barry Corp. | | 700 | | | 5,992 |
*Rick’s Cabaret International, Inc. | | 5,300 | | | 38,743 |
#*Rocky Brands, Inc. | | 9,337 | | | 77,590 |
#*Royal Caribbean Cruises, Ltd. | | 322,500 | | | 6,524,175 |
*Rubio’s Restaurants, Inc. | | 12,912 | | | 94,128 |
*Ruby Tuesday, Inc. | | 11,600 | | | 77,256 |
*Saga Communications, Inc. | | 6,520 | | | 83,130 |
*Saks, Inc. | | 400 | | | 2,244 |
*Salem Communications Corp. | | 731 | | | 2,244 |
Scholastic Corp. | | 38,300 | | | 952,521 |
#*Sears Holdings Corp. | | 137,330 | | | 9,319,214 |
Service Corp. International | | 260,071 | | | 1,786,688 |
*Shiloh Industries, Inc. | | 25,710 | | | 115,695 |
*Shoe Carnival, Inc. | | 31,193 | | | 468,207 |
*Sinclair Broadcast Group, Inc. Class A | | 99,274 | | | 391,140 |
*Skechers U.S.A., Inc. Class A | | 49,610 | | | 1,082,490 |
Skyline Corp. | | 5,123 | | | 89,601 |
Spartan Motors, Inc. | | 10,400 | | | 51,896 |
Speedway Motorsports, Inc. | | 71,417 | | | 966,986 |
*Sport Chalet, Inc. Class A | | 875 | | | 1,461 |
*Sport Chalet, Inc. Class B | | 400 | | | 1,360 |
Sport Supply Group, Inc. | | 22,269 | | | 229,816 |
Stage Stores, Inc. | | 60,550 | | | 714,490 |
*Standard Motor Products, Inc. | | 23,500 | | | 196,460 |
*Standard Pacific Corp. | | 19,894 | | | 59,682 |
*Stanley Furniture, Inc. | | 12,564 | | | 98,753 |
#*Steak n Shake Co. (The) | | 68,906 | | | 802,755 |
*Steinway Musical Instruments, Inc. | | 6,246 | | | 73,203 |
Stewart Enterprises, Inc. | | 27,202 | | | 124,585 |
*Stoneridge, Inc. | | 17,667 | | | 129,852 |
*Strattec Security Corp. | | 5,656 | | | 79,184 |
Superior Industries International, Inc. | | 38,400 | | | 509,952 |
*Syms Corp. | | 5,500 | | | 38,665 |
#*Systemax, Inc. | | 7,773 | | | 104,780 |
*Tandy Brands Accessories, Inc. | | 10,432 | | | 41,206 |
*Tandy Leather Factory, Inc. | | 500 | | | 1,645 |
*Timberland Co. Class A | | 3,300 | | | 53,394 |
Time Warner Cable, Inc. | | 693,942 | | | 27,369,072 |
Time Warner, Inc. | | 1,534,860 | | | 46,229,983 |
#*Toll Brothers, Inc. | | 238,999 | | | 4,139,463 |
*Trans World Entertainment Corp. | | 5,781 | | | 7,978 |
*TRW Automotive Holdings Corp. | | 153,112 | | | 2,396,203 |
*Tuesday Morning Corp. | | 100 | | | 323 |
*Tween Brands, Inc. | | 1,700 | | | 14,416 |
*Unifi, Inc. | | 163,482 | | | 454,480 |
UniFirst Corp. | | 14,720 | | | 619,712 |
#*Vail Resorts, Inc. | | 8,370 | | | 288,263 |
*Valassis Communications, Inc. | | 12,367 | | | 225,450 |
Washington Post Co. | | 4,880 | | | 2,108,160 |
#*West Marine, Inc. | | 22,463 | | | 171,168 |
43
THE TAX-MANAGED U.S. MARKETWIDE VALUE SERIES
CONTINUED
| | | | | |
| | | Shares | | Value† |
Consumer Discretionary — (Continued) | | | | | |
#Whirlpool Corp. | | 88,001 | | $ | 6,299,992 |
Williams-Sonoma, Inc. | | 11,805 | | | 221,698 |
*WPT Enterprises, Inc. | | 1,185 | | | 1,315 |
Wyndham Worldwide Corp. | | 240,716 | | | 4,104,208 |
*Zale Corp. | | 72,940 | | | 345,006 |
| | | | | |
Total Consumer Discretionary | | | | | 421,393,214 |
| | | | | |
Consumer Staples — (4.8%) | | | | | |
Andersons, Inc. (The) | | 9,100 | | | 282,373 |
Archer-Daniels-Midland Co. | | 487,589 | | | 14,686,181 |
B&G Foods, Inc. | | 62,773 | | | 490,257 |
Bunge, Ltd. | | 71,000 | | | 4,051,260 |
*Cagle’s, Inc. Class A | | 600 | | | 2,400 |
CCA Industries, Inc. | | 7,023 | | | 31,884 |
*Central European Distribution Corp. | | 2,400 | | | 74,664 |
*Central Garden & Pet Co. | | 37,832 | | | 375,293 |
*Central Garden & Pet Co. Class A | | 15,054 | | | 142,411 |
*Chiquita Brands International, Inc. | | 70,190 | | | 1,136,376 |
*Constellation Brands, Inc. Class A | | 91,650 | | | 1,449,903 |
#*Constellation Brands, Inc. Class B | | 12,715 | | | 204,076 |
Corn Products International, Inc. | | 63,717 | | | 1,795,545 |
*Craft Brewers Alliance, Inc. | | 2,446 | | | 8,096 |
CVS Caremark Corp. | | 866,755 | | | 30,596,452 |
Del Monte Foods Co. | | 342,870 | | | 3,702,996 |
*Dr Pepper Snapple Group, Inc. | | 77,894 | | | 2,123,390 |
*Elizabeth Arden, Inc. | | 2,400 | | | 25,560 |
Farmer Brothers Co. | | 23,593 | | | 445,908 |
#*Great Atlantic & Pacific Tea Co. | | 10,300 | | | 102,073 |
Griffin Land & Nurseries, Inc. Class A | | 1,500 | | | 44,535 |
#*Hain Celestial Group, Inc. | | 63,205 | | | 1,108,616 |
*HQ Sustainable Maritime Industries, Inc. | | 10,070 | | | 76,230 |
Imperial Sugar Co. | | 14,662 | | | 183,128 |
Ingles Markets, Inc. | | 5,338 | | | 82,098 |
Inter Parfums, Inc. | | 3,525 | | | 43,287 |
J.M. Smucker Co. | | 31,800 | | | 1,676,814 |
#Kraft Foods, Inc. | | 1,077,208 | | | 29,644,764 |
Mannatech, Inc. | | 14,038 | | | 47,729 |
*MGP Ingredients, Inc. | | 7,362 | | | 31,951 |
Molson Coors Brewing Co. | | 190,750 | | | 9,341,028 |
Molson Coors Brewing Co. Class A | | 1,908 | | | 92,624 |
*NBTY, Inc. | | 70,000 | | | 2,548,700 |
*Nutraceutical International Corp. | | 20,022 | | | 217,839 |
*Omega Protein Corp. | | 34,625 | | | 144,040 |
*Pantry, Inc. | | 14,500 | | | 204,595 |
*Parlux Fragrances, Inc. | | 556 | | | 1,073 |
*PC Group, Inc. | | 3,618 | | | 1,809 |
*Physicians Formula Holdings, Inc. | | 947 | | | 2,074 |
*Prestige Brands Holdings, Inc. | | 116,810 | | | 789,636 |
#*Ralcorp Holdings, Inc. | | 15,700 | | | 843,090 |
Safeway, Inc. | | 81,400 | | | 1,817,662 |
*Sanfilippo (John B.) & Son, Inc. | | 9,100 | | | 124,852 |
*Seneca Foods Corp. Class B | | 300 | | | 8,505 |
#*Smart Balance, Inc. | | 28,450 | | | 150,216 |
#*Smithfield Foods, Inc. | | 154,673 | | | 2,063,338 |
#SUPERVALU, Inc. | | 18,300 | | | 290,421 |
*Susser Holdings Corp. | | 9,700 | | | 115,333 |
Tasty Baking Co. | | 10,988 | | | 70,433 |
#Tyson Foods, Inc. Class A | | 405,030 | | | 5,070,976 |
Universal Corp. | | 11,590 | | | 482,028 |
#*Winn-Dixie Stores, Inc. | | 92,300 | | | 1,023,607 |
44
THE TAX-MANAGED U.S. MARKETWIDE VALUE SERIES
CONTINUED
| | | | | |
| | | Shares | | Value† |
Consumer Staples — (Continued) | | | | | |
*Zapata Corp. | | 3,064 | | $ | 20,927 |
| | | | | |
Total Consumer Staples | | | | | 120,091,056 |
| | | | | |
Energy — (12.8%) | | | | | |
*Adams Resources & Energy, Inc. | | 6,758 | | | 153,407 |
*Allis-Chalmers Energy, Inc. | | 58,826 | | | 204,714 |
#Alon USA Energy, Inc. | | 36,500 | | | 306,600 |
Anadarko Petroleum Corp. | | 845,068 | | | 51,489,993 |
Apache Corp. | | 185,830 | | | 17,490,320 |
*Atlas Energy, Inc. | | 6,800 | | | 178,024 |
*Barnwell Industries, Inc. | | 5,190 | | | 23,615 |
*Basic Energy Services, Inc. | | 58,596 | | | 410,172 |
Berry Petroleum Corp. Class A | | 7,074 | | | 179,397 |
*Bill Barrett Corp. | | 6,540 | | | 202,609 |
BJ Services Co. | | 158,482 | | | 3,042,854 |
#*Brigham Exploration Co. | | 37,193 | | | 353,334 |
*Bristow Group, Inc. | | 40,500 | | | 1,180,575 |
*Bronco Drilling Co., Inc. | | 26,439 | | | 167,094 |
Cabot Oil & Gas Corp. | | 15,905 | | | 611,865 |
*Cal Dive International, Inc. | | 53,900 | | | 413,952 |
#*Carrizo Oil & Gas, Inc. | | 4,500 | | | 104,310 |
#Chesapeake Energy Corp. | | 618,000 | | | 15,141,000 |
Chevron Corp. | | 9,400 | | | 719,476 |
Cimarex Energy Co. | | 105,300 | | | 4,123,548 |
*Complete Production Services, Inc. | | 57,027 | | | 543,467 |
ConocoPhillips | | 1,496,850 | | | 75,111,933 |
*CREDO Petroleum Corp. | | 700 | | | 6,818 |
*CVR Energy, Inc. | | 8,500 | | | 89,420 |
Delek US Holdings, Inc. | | 68,089 | | | 459,601 |
Devon Energy Corp. | | 120,755 | | | 7,814,056 |
*Double Eagle Petroleum Co. | | 3,969 | | | 18,773 |
*Encore Acquisition Co. | | 44,278 | | | 1,641,385 |
#ENSCO International, Inc. | | 59,067 | | | 2,704,678 |
#*Exterran Holdings, Inc. | | 62,389 | | | 1,274,607 |
#General Maritime Corp. | | 6,600 | | | 45,474 |
*Geokinetics, Inc. | | 12,504 | | | 201,064 |
*GeoMet, Inc. | | 64,409 | | | 121,089 |
*GeoResources, Inc. | | 300 | | | 3,327 |
*Global Industries, Ltd. | | 15,300 | | | 111,537 |
#*GulfMark Offshore, Inc. | | 37,045 | | | 1,025,035 |
*Harvest Natural Resources, Inc. | | 27,900 | | | 153,171 |
#*Helix Energy Solutions Group, Inc. | | 17,000 | | | 233,410 |
Helmerich & Payne, Inc. | | 64,234 | | | 2,442,177 |
*Hercules Offshore, Inc. | | 94,700 | | | 485,811 |
Hess Corp. | | 73,197 | | | 4,006,804 |
*HKN, Inc. | | 17,831 | | | 58,842 |
#Holly Corp. | | 8,300 | | | 240,783 |
*Hornbeck Offshore Services, Inc. | | 9,800 | | | 238,238 |
#*International Coal Group, Inc. | | 2,500 | | | 10,225 |
*Key Energy Services, Inc. | | 16,700 | | | 122,077 |
Lufkin Industries, Inc. | | 600 | | | 34,230 |
Marathon Oil Corp. | | 856,737 | | | 27,389,882 |
*Mitcham Industries, Inc. | | 5,676 | | | 41,151 |
#*Nabors Industries, Ltd. | | 83,107 | | | 1,731,119 |
*National-Oilwell, Inc. | | 239,591 | | | 9,820,835 |
*Natural Gas Services Group, Inc. | | 15,260 | | | 257,436 |
*Newfield Exploration Co. | | 148,740 | | | 6,101,315 |
*Newpark Resources, Inc. | | 89,420 | | | 269,154 |
Noble Energy, Inc. | | 138,742 | | | 9,105,637 |
*Oil States International, Inc. | | 39,000 | | | 1,343,160 |
*OMNI Energy Services Corp. | | 1,000 | | | 1,420 |
45
THE TAX-MANAGED U.S. MARKETWIDE VALUE SERIES
CONTINUED
| | | | | |
| | | Shares | | Value† |
Energy — (Continued) | | | | | |
Overseas Shipholding Group, Inc. | | 31,009 | | $ | 1,217,103 |
*OYO Geospace Corp. | | 2,501 | | | 65,651 |
*Parker Drilling Co. | | 87,100 | | | 452,920 |
#*Patriot Coal Corp. | | 13,500 | | | 152,550 |
Patterson-UTI Energy, Inc. | | 111,625 | | | 1,739,118 |
*Petroleum Development Corp. | | 4,070 | | | 67,969 |
*PHI, Inc. Non-Voting | | 23,117 | | | 397,150 |
*PHI, Inc. Voting | | 200 | | | 3,620 |
*Pioneer Drilling Co. | | 62,027 | | | 414,961 |
Pioneer Natural Resources Co. | | 164,693 | | | 6,770,529 |
*Plains Exploration & Production Co. | | 162,430 | | | 4,304,395 |
#*Pride International, Inc. | | 64,020 | | | 1,892,431 |
*Rosetta Resources, Inc. | | 79,112 | | | 1,070,385 |
Rowan Cos., Inc. | | 44,876 | | | 1,043,367 |
#*SEACOR Holdings, Inc. | | 36,653 | | | 2,978,789 |
#*Seahawk Drilling, Inc. | | 4,268 | | | 115,236 |
#Smith International, Inc. | | 56,185 | | | 1,558,010 |
Southern Union Co. | | — | | | — |
*Stone Energy Corp. | | 44,236 | | | 678,138 |
Sunoco, Inc. | | 70,498 | | | 2,171,338 |
*Swift Energy Corp. | | 32,130 | | | 680,513 |
*T-3 Energy Services, Inc. | | 1,100 | | | 22,022 |
#Tesoro Petroleum Corp. | | 122,780 | | | 1,736,109 |
*Tetra Technologies, Inc. | | 13,000 | | | 122,980 |
*TGC Industries, Inc. | | 787 | | | 3,423 |
Tidewater, Inc. | | 22,100 | | | 920,907 |
*Toreador Resources Corp. | | 9,565 | | | 81,589 |
*Trico Marine Services, Inc. | | 32,915 | | | 200,782 |
*Union Drilling, Inc. | | 31,871 | | | 243,494 |
#*Unit Corp. | | 57,000 | | | 2,227,560 |
#*USEC, Inc. | | 163,200 | | | 629,952 |
Valero Energy Corp. | | 714,360 | | | 12,929,916 |
#*Western Refining, Inc. | | 55,400 | | | 310,794 |
*Whiting Petroleum Corp. | | 69,755 | | | 3,934,182 |
#*Willbros Group, Inc. | | 3,700 | | | 48,618 |
XTO Energy, Inc. | | 397,536 | | | 16,521,596 |
| | | | | |
Total Energy | | | | | 319,464,097 |
| | | | | |
Financials — (27.6%) | | | | | |
1st Source Corp. | | 47,839 | | | 708,974 |
21st Century Holding Co. | | 19,667 | | | 90,272 |
Abington Bancorp, Inc. | | 68,562 | | | 470,335 |
Access National Corp. | | 600 | | | 3,636 |
*Affirmative Insurance Holdings, Inc. | | 12,124 | | | 48,496 |
*Allegheny Corp. | | 14,836 | | | 3,709,000 |
Alliance Bancorp, Inc. of Pennsylvania | | 700 | | | 6,024 |
Allstate Corp. | | 501,660 | | | 14,834,086 |
*Altisource Portfolio Solutions SA | | 700 | | | 10,675 |
#American Capital, Ltd. | | 84,768 | | | 227,178 |
*American Equity Investment Life Holding Co. | | 88,700 | | | 582,759 |
American Financial Group, Inc. | | 199,200 | | | 4,900,320 |
*American Independence Corp. | | 866 | | | 3,810 |
American National Insurance Co. | | 48,061 | | | 4,012,613 |
*American Safety Insurance Holdings, Ltd. | | 11,675 | | | 173,024 |
#*AmeriCredit Corp. | | 224,750 | | | 3,966,838 |
Ameriprise Financial, Inc. | | 148,012 | | | 5,131,576 |
Ameris Bancorp | | 35,719 | | | 210,385 |
*AMERISAFE, Inc. | | 18,913 | | | 350,647 |
*AmeriServe Financial, Inc. | | 33,075 | | | 57,881 |
*Arch Capital Group, Ltd. | | 2,438 | | | 164,248 |
*Argo Group International Holdings, Ltd. | | 34,700 | | | 1,178,412 |
46
THE TAX-MANAGED U.S. MARKETWIDE VALUE SERIES
CONTINUED
| | | | | |
| | | Shares | | Value† |
Financials — (Continued) | | | | | |
Aspen Insurance Holdings, Ltd. | | 89,116 | | $ | 2,299,193 |
#*Asset Acceptance Capital Corp. | | 6,790 | | | 49,363 |
Associated Banc-Corp. | | 105,623 | | | 1,353,031 |
#Assured Guaranty, Ltd. | | 152,510 | | | 2,528,616 |
ASTA Funding, Inc. | | 4,938 | | | 32,245 |
Atlantic Coast Federal Corp. | | 4,355 | | | 6,315 |
*Atlantic Southern Financial Group, Inc. | | 390 | | | 679 |
*Avatar Holdings, Inc. | | 21,050 | | | 343,115 |
Axis Capital Holdings, Ltd. | | 14,900 | | | 430,461 |
#*B of I Holding, Inc. | | 13,154 | | | 109,704 |
Baldwin & Lyons, Inc. | | 300 | | | 6,861 |
Baldwin & Lyons, Inc. Class B | | 8,413 | | | 191,901 |
Bancorp Rhode Island, Inc. | | 1,300 | | | 33,176 |
*Bancorp, Inc. | | 21,975 | | | 112,073 |
#BancTrust Financial Group, Inc. | | 34,553 | | | 110,915 |
Bank Mutual Corp. | | 51,800 | | | 363,636 |
Bank of America Corp. | | 4,536,955 | | | 66,148,804 |
*Bank of Florida Corp. | | 23,074 | | | 33,688 |
*Bank of Granite Corp. | | 24,999 | | | 12,999 |
Bank of New York Mellon Corp. | | 15,200 | | | 405,232 |
*BankAtlantic Bancorp, Inc. | | 45,976 | | | 67,585 |
BankFinancial Corp. | | 43,669 | | | 412,235 |
#Banner Corp. | | 13,022 | | | 39,978 |
Bar Harbor Bankshares | | 2,200 | | | 62,480 |
BB&T Corp. | | 238,480 | | | 5,702,057 |
*Beach First National Bancshares, Inc. | | 7,596 | | | 9,039 |
Berkshire Hills Bancorp, Inc. | | 22,974 | | | 472,116 |
#BlackRock, Inc. | | 11,600 | | | 2,511,284 |
Boston Private Financial Holdings, Inc. | | 94,618 | | | 562,977 |
Brookline Bancorp, Inc. | | 60,704 | | | 594,292 |
Cadence Financial Corp. | | 27,481 | | | 45,344 |
Capital City Bank Group, Inc. | | 14,196 | | | 166,661 |
Capital One Financial Corp. | | 401,285 | | | 14,687,031 |
Capital Southwest Corp. | | 7,359 | | | 546,479 |
CapitalSource, Inc. | | 9,700 | | | 34,532 |
#*Capitol Bancorp, Ltd. | | 30,014 | | | 67,532 |
Cardinal Financial Corp. | | 26,257 | | | 213,995 |
#Carver Bancorp, Inc. | | 600 | | | 4,170 |
Cascade Financial Corp. | | 10,277 | | | 20,348 |
Cathay General Bancorp | | 50,900 | | | 449,447 |
Center Bancorp, Inc. | | 1,346 | | | 10,472 |
*Center Financial Corp. | | 40,776 | | | 171,667 |
CenterState Banks of Florida, Inc. | | 400 | | | 3,012 |
*Central Jersey Bancorp | | 8,049 | | | 39,038 |
#*Central Pacific Financial Corp. | | 9,380 | | | 13,226 |
Centrue Financial Corp. | | 1,000 | | | 1,980 |
Century Bancorp, Inc. Class A | | 1,206 | | | 29,342 |
CFS Bancorp, Inc. | | 14,148 | | | 66,496 |
Chemical Financial Corp. | | 33,175 | | | 728,191 |
*Chicopee Bancorp, Inc. | | 1,000 | | | 12,580 |
Chubb Corp. | | 390,477 | | | 18,945,944 |
Cincinnati Financial Corp. | | 230,743 | | | 5,851,642 |
#*CIT Group, Inc. | | 25,600 | | | 18,432 |
Citigroup, Inc. | | 3,545,800 | | | 14,502,322 |
Citizens Community Bancorp, Inc. | | 10,355 | | | 41,731 |
Citizens South Banking Corp. | | 1,842 | | | 11,126 |
City National Corp. | | 37,300 | | | 1,405,091 |
CME Group, Inc. | | 67,810 | | | 20,519,984 |
#*CNA Financial Corp. | | 313,566 | | | 6,826,332 |
*CNA Surety Corp. | | 59,978 | | | 867,282 |
CoBiz Financial, Inc. | | 37,574 | | | 179,228 |
47
THE TAX-MANAGED U.S. MARKETWIDE VALUE SERIES
CONTINUED
| | | | | |
| | | Shares | | Value† |
Financials — (Continued) | | | | | |
Codorus Valley Bancorp, Inc. | | 115 | | $ | 679 |
Colony Bankcorp, Inc. | | 300 | | | 1,635 |
Columbia Banking System, Inc. | | 49,127 | | | 722,167 |
#Comerica, Inc. | | 195,322 | | | 5,420,186 |
Commonwealth Bankshares, Inc. | | 1,300 | | | 5,720 |
Community Bank System, Inc. | | 1,686 | | | 31,376 |
*Community West Bancshares | | 400 | | | 1,098 |
Compass Diversified Holdings | | 22,392 | | | 229,070 |
#*CompuCredit Holdings Corp. | | 89,574 | | | 293,803 |
#*Conseco, Inc. | | 60 | | | 313 |
*Cowen Group, Inc. | | 4,400 | | | 33,220 |
*Crescent Financial Corp. | | 19,040 | | | 77,493 |
#CVB Financial Corp. | | 2,102 | | | 16,837 |
Danvers Bancorp, Inc. | | 3,600 | | | 49,428 |
*Dearborn Bancorp, Inc. | | 4,983 | | | 2,442 |
Delphi Financial Group, Inc. Class A | | 68,878 | | | 1,494,653 |
Discover Financial Services | | 719,953 | | | 10,180,135 |
Donegal Group, Inc. Class A | | 39,155 | | | 571,663 |
Donegal Group, Inc. Class B | | 300 | | | 5,253 |
#*Doral Financial Corp. | | 11,332 | | | 32,183 |
East West Bancorp, Inc. | | 100,365 | | | 906,296 |
Eastern Insurance Holdings, Inc. | | 23,777 | | | 167,866 |
Eastern Virginia Bankshares, Inc. | | 300 | | | 2,187 |
EMC Insurance Group, Inc. | | 20,727 | | | 426,562 |
*Encore Bancshares, Inc. | | 5,200 | | | 40,040 |
*Encore Capital Group, Inc. | | 38,372 | | | 574,429 |
Endurance Specialty Holdings, Ltd. | | 76,288 | | | 2,745,605 |
*Enstar Group, Ltd. | | 900 | | | 54,900 |
Enterprise Bancorp, Inc. | | 600 | | | 6,402 |
Enterprise Financial Services Corp. | | 18,728 | | | 159,750 |
ESB Financial Corp. | | 1,000 | | | 11,660 |
ESSA Bancorp, Inc. | | 21,670 | | | 259,390 |
Evans Bancorp, Inc. | | 400 | | | 5,008 |
Everest Re Group, Ltd. | | 22,900 | | | 2,003,521 |
F.N.B. Corp. | | 135,507 | | | 959,390 |
Farmers Capital Bank Corp. | | 1,900 | | | 21,128 |
FBL Financial Group, Inc. Class A | | 40,435 | | | 814,765 |
Federal Agricultural Mortgage Corp. | | 4,457 | | | 35,790 |
Federal Agricultural Mortgage Corp. Class A | | 177 | | | 1,066 |
Fidelity Bancorp, Inc. | | 400 | | | 2,370 |
Fidelity National Financial, Inc. | | 246,259 | | | 3,341,735 |
*Fidelity Southern Corp. | | 6,391 | | | 24,860 |
Fifth Third Bancorp | | 911,741 | | | 8,150,965 |
Financial Institutions, Inc. | | 6,350 | | | 67,056 |
*First Acceptance Corp. | | 39,006 | | | 85,813 |
First American Corp. | | 155,240 | | | 4,717,744 |
#First Bancorp (318672102) | | 106,576 | | | 201,429 |
First Bancorp (318910106) | | 12,302 | | | 166,815 |
*First Bancshares, Inc. (318687100) | | 400 | | | 3,520 |
*First Bancshares, Inc. (318916103) | | 300 | | | 2,190 |
First Busey Corp. | | 63,046 | | | 243,988 |
First Business Financial Services, Inc. | | 300 | | | 2,787 |
First Citizens BancShares, Inc. | | 18,375 | | | 2,737,875 |
First Defiance Financial Corp. | | 10,257 | | | 147,906 |
First Federal Bancshares of Arkansas, Inc. | | 1,300 | | | 4,888 |
*First Federal of Northern Michigan Bancorp, Inc. | | 1,100 | | | 2,090 |
First Financial Holdings, Inc. | | 2,652 | | | 35,775 |
First Financial Northwest, Inc. | | 26,672 | | | 157,898 |
First Financial Service Corp. | | 900 | | | 8,244 |
*First Horizon National Corp. | | 273,010 | | | 3,229,708 |
First M&F Corp. | | 100 | | | 203 |
48
THE TAX-MANAGED U.S. MARKETWIDE VALUE SERIES
CONTINUED
| | | | | |
| | | Shares | | Value† |
Financials — (Continued) | | | | | |
First Merchants Corp. | | 28,481 | | $ | 174,304 |
First Mercury Financial Corp. | | 16,714 | | | 212,268 |
First Midwest Bancorp, Inc. | | 58,300 | | | 606,320 |
First Niagara Financial Group, Inc. | | 191,382 | | | 2,457,345 |
First PacTrust Bancorp, Inc. | | 900 | | | 4,482 |
First Place Financial Corp. | | 24,003 | | | 72,969 |
First Security Group, Inc. | | 17,516 | | | 47,293 |
First South Bancorp, Inc. | | 1,699 | | | 17,992 |
#*First State Bancorporation | | 4,530 | | | 4,439 |
First United Corp. | | 600 | | | 6,600 |
*FirstCity Financial Corp. | | 5,952 | | | 40,176 |
Flagstone Reinsurance Holdings, Ltd. | | 22,733 | | | 248,926 |
Flushing Financial Corp. | | 47,920 | | | 538,142 |
#FNB United Corp. | | 20,931 | | | 34,536 |
*Forest City Enterprises, Inc. Class A | | 8,900 | | | 77,608 |
*FPIC Insurance Group, Inc. | | 10,398 | | | 351,764 |
Fulton Financial Corp. | | 169,790 | | | 1,402,465 |
German American Bancorp, Inc. | | 13,358 | | | 200,904 |
GFI Group, Inc. | | 16,600 | | | 85,490 |
Goldman Sachs Group, Inc. | | 16,500 | | | 2,807,805 |
#Great Southern Bancorp, Inc. | | 10,762 | | | 246,665 |
#*Greene Bancshares, Inc. | | 25,523 | | | 105,665 |
*Greenlight Capital Re, Ltd. | | 5,300 | | | 98,898 |
GS Financial Corp. | | 400 | | | 6,000 |
*Guaranty Bancorp | | 111,190 | | | 145,659 |
*Guaranty Federal Bancshares, Inc. | | 1,684 | | | 10,188 |
*Hallmark Financial Services, Inc. | | 27,334 | | | 209,652 |
Hampden Bancorp, Inc. | | 5,786 | | | 62,778 |
#Hampton Roads Bankshares, Inc. | | 12,469 | | | 25,561 |
*Hanmi Financial Corp. | | 4,001 | | | 6,122 |
Hanover Insurance Group, Inc. | | 94,280 | | | 3,965,417 |
Harleysville National Corp. | | 66,871 | | | 385,177 |
*Harrington West Financial Group, Inc. | | 400 | | | 272 |
*Harris & Harris Group, Inc. | | 60,335 | | | 258,837 |
#Hartford Financial Services Group, Inc. | | 358,609 | | | 8,793,093 |
HCC Insurance Holdings, Inc. | | 163,623 | | | 4,318,011 |
Heartland Financial USA, Inc. | | 13,016 | | | 167,125 |
*Heritage Commerce Corp. | | 26,836 | | | 70,847 |
*Heritage Financial Corp. | | 8,911 | | | 111,477 |
HF Financial Corp. | | 400 | | | 4,360 |
*Hilltop Holdings, Inc. | | 38,627 | | | 457,344 |
Hingham Institution for Savings | | 500 | | | 14,813 |
*HMN Financial, Inc. | | 3,996 | | | 22,857 |
Home Federal Bancorp, Inc. | | 29,247 | | | 337,803 |
HopFed Bancorp, Inc. | | 4,019 | | | 40,753 |
Horace Mann Educators Corp. | | 54,928 | | | 682,755 |
Horizon Bancorp | | 300 | | | 4,950 |
Huntington Bancshares, Inc. | | 257,100 | | | 979,551 |
IBERIABANK Corp. | | 1,140 | | | 49,373 |
Independence Holding Co. | | 22,770 | | | 126,374 |
Independent Bank Corp. (453836108) | | 27,357 | | | 581,883 |
Independent Bank Corp. (453838104) | | 38,685 | | | 45,648 |
Infinity Property & Casualty Corp. | | 32,000 | | | 1,237,440 |
Integra Bank Corp. | | 20,387 | | | 17,533 |
#*Intervest Bancshares Corp. | | 4,036 | | | 13,359 |
Invesco, Ltd. | | 204,200 | | | 4,318,830 |
*Investment Technology Group, Inc. | | 4,490 | | | 96,849 |
*Investors Bancorp, Inc. | | 8,766 | | | 95,023 |
Investors Title Co. | | 1,100 | | | 34,100 |
Jones Lang LaSalle, Inc. | | 25,800 | | | 1,208,730 |
JPMorgan Chase & Co. | | 2,495,918 | | | 104,254,495 |
49
THE TAX-MANAGED U.S. MARKETWIDE VALUE SERIES
CONTINUED
| | | | | |
| | | Shares | | Value† |
Financials — (Continued) | | | | | |
Kentucky First Federal Bancorp | | 3,100 | | $ | 32,581 |
#KeyCorp | | 380,192 | | | 2,049,235 |
*LaBranche & Co., Inc. | | 2,500 | | | 6,900 |
Lakeland Bancorp, Inc. | | 14,567 | | | 88,567 |
Lakeland Financial Corp. | | 1,997 | | | 41,078 |
Landmark Bancorp, Inc. | | 1,543 | | | 24,788 |
Legacy Bancorp, Inc. | | 22,079 | | | 211,075 |
Legg Mason, Inc. | | 119,817 | | | 3,487,873 |
*Leucadia National Corp. | | 95,372 | | | 2,143,009 |
Lincoln National Corp. | | 464,693 | | | 11,073,634 |
LNB Bancorp, Inc. | | 12,489 | | | 69,064 |
Loews Corp. | | 747,772 | | | 24,751,253 |
#*Louisiana Bancorp, Inc. | | 5,606 | | | 80,054 |
LSB Corp. | | 800 | | | 8,384 |
#M&T Bank Corp. | | 80,954 | | | 5,087,959 |
#*Macatawa Bank Corp. | | 33,467 | | | 64,257 |
*Magyar Bancorp, Inc. | | 500 | | | 1,675 |
MainSource Financial Group, Inc. | | 50,993 | | | 297,289 |
*Marlin Business Services Corp. | | 3,393 | | | 22,767 |
Marshall & Ilsley Corp. | | 114,660 | | | 609,991 |
#*Maui Land & Pineapple Co., Inc. | | 4,100 | | | 25,174 |
Max Capital Group, Ltd. | | 47,537 | | | 981,639 |
MB Financial, Inc. | | 42,349 | | | 757,200 |
*MBIA, Inc. | | 337,600 | | | 1,370,656 |
MBT Financial Corp. | | 23,713 | | | 48,137 |
Meadowbrook Insurance Group, Inc. | | 112,475 | | | 756,957 |
Medallion Financial Corp. | | 24,860 | | | 195,151 |
#*Mercantile Bancorp, Inc. | | 282 | | | 635 |
Mercantile Bank Corp. | | 3,316 | | | 11,838 |
Mercer Insurance Group, Inc. | | 15,286 | | | 284,014 |
*Meridian Interstate Bancorp, Inc. | | 1,700 | | | 14,620 |
Meta Financial Group, Inc. | | 1,601 | | | 34,918 |
MetLife, Inc. | | 847,339 | | | 28,834,946 |
*Metro Bancorp, Inc. | | 1,121 | | | 13,261 |
MetroCorp Bancshares, Inc. | | 2,600 | | | 9,360 |
*MF Global, Ltd. | | 8,600 | | | 61,232 |
*MGIC Investment Corp. | | 8,500 | | | 36,635 |
MicroFinancial, Inc. | | 5,300 | | | 17,967 |
Morgan Stanley | | 628,799 | | | 20,197,024 |
MutualFirst Financial, Inc. | | 2,300 | | | 14,375 |
*Nara Bancorp, Inc. | | 42,957 | | | 316,164 |
*National Financial Partners Corp. | | 4,200 | | | 34,230 |
National Penn Bancshares, Inc. | | 44,875 | | | 252,198 |
*National Western Life Insurance Co. Class A | | 900 | | | 158,544 |
*Navigators Group, Inc. | | 4,074 | | | 216,207 |
*Nelnet, Inc. Class A | | 36,200 | | | 507,886 |
*New Century Bancorp, Inc. | | 600 | | | 3,390 |
New Hampshire Thrift Bancshares, Inc. | | 2,300 | | | 21,275 |
New Westfield Financial, Inc. | | 41,439 | | | 333,584 |
#New York Community Bancorp, Inc. | | 33,564 | | | 362,491 |
NewAlliance Bancshares, Inc. | | 169,860 | | | 1,882,049 |
*NewBridge Bancorp | | 6,101 | | | 14,642 |
*Newport Bancorp, Inc. | | 700 | | | 8,680 |
*NewStar Financial, Inc. | | 43,749 | | | 109,810 |
*North Valley Bancorp | | 4,538 | | | 12,570 |
Northeast Community Bancorp, Inc. | | 18,190 | | | 121,873 |
Northfield Bancorp, Inc. | | 2,770 | | | 34,431 |
Northrim Bancorp, Inc. | | 6,315 | | | 94,978 |
NYMAGIC, Inc. | | 13,520 | | | 193,201 |
NYSE Euronext, Inc. | | 181,031 | | | 4,679,651 |
OceanFirst Financial Corp. | | 2,500 | | | 23,750 |
50
THE TAX-MANAGED U.S. MARKETWIDE VALUE SERIES
CONTINUED
| | | | | |
| | | Shares | | Value† |
Financials — (Continued) | | | | | |
*Ocwen Financial Corp. | | 2,100 | | $ | 22,953 |
Old National Bancorp | | 2,000 | | | 20,740 |
Old Republic International Corp. | | 333,632 | | | 3,563,190 |
#Old Second Bancorp, Inc. | | 25,516 | | | 136,511 |
OneBeacon Insurance Group, Ltd. | | 24,760 | | | 295,139 |
Osage Bancshares, Inc. | | 600 | | | 4,617 |
#Pacific Capital Bancorp | | 80,780 | | | 104,206 |
Pacific Continental Corp. | | 4,430 | | | 48,287 |
*Pacific Mercantile Bancorp | | 16,884 | | | 50,145 |
*Pacific Premier Bancorp, Inc. | | 200 | | | 744 |
#PacWest Bancorp | | 1,071 | | | 18,186 |
Pamrapo Bancorp, Inc. | | 2,200 | | | 14,850 |
Parkvale Financial Corp. | | 500 | | | 4,505 |
PartnerRe, Ltd. | | 5,900 | | | 451,232 |
#Patriot National Bancorp | | 2,700 | | | 5,170 |
#*Penson Worldwide, Inc. | | 33,200 | | | 323,700 |
Peoples Bancorp of North Carolina | | 300 | | | 1,830 |
Peoples Bancorp, Inc. | | 19,892 | | | 213,640 |
#*PHH Corp. | | 91,687 | | | 1,481,662 |
*PICO Holdings, Inc. | | 6,383 | | | 216,639 |
*Pinnacle Financial Partners, Inc. | | 27,599 | | | 350,507 |
*PMA Capital Corp. | | 38,357 | | | 183,346 |
PNC Financial Services Group, Inc. | | 263,050 | | | 12,873,667 |
Porter Bancorp, Inc. | | 1,575 | | | 25,074 |
*Preferred Bank | | 9,898 | | | 25,042 |
Premier Financial Bancorp, Inc. | | 1,301 | | | 8,177 |
Presidential Life Corp. | | 23,158 | | | 216,064 |
Princeton National Bancorp, Inc. | | 1,100 | | | 16,544 |
*ProAssurance Corp. | | 40,933 | | | 2,058,111 |
Prosperity Bancshares, Inc. | | 75,055 | | | 2,686,218 |
Protective Life Corp. | | 75,553 | | | 1,454,395 |
Provident Financial Holdings, Inc. | | 8,307 | | | 58,149 |
Provident Financial Services, Inc. | | 97,245 | | | 1,045,384 |
Provident New York Bancorp | | 79,163 | | | 675,260 |
Prudential Financial, Inc. | | 430,708 | | | 19,480,923 |
Pulaski Financial Corp. | | 5,450 | | | 40,003 |
#Radian Group, Inc. | | 217,050 | | | 1,256,720 |
Regions Financial Corp. | | 344,216 | | | 1,666,005 |
Reinsurance Group of America, Inc. | | 169,166 | | | 7,798,553 |
Renasant Corp. | | 57,659 | | | 844,128 |
*Republic First Bancorp, Inc. | | 7,211 | | | 31,728 |
Resource America, Inc. | | 22,388 | | | 86,418 |
*Riverview Bancorp, Inc. | | 17,187 | | | 55,170 |
Rome Bancorp, Inc. | | 12,761 | | | 106,873 |
*Royal Bancshares of Pennsylvania, Inc. Class A | | 900 | | | 954 |
Safety Insurance Group, Inc. | | 25,435 | | | 851,309 |
Sanders Morris Harris Group, Inc. | | 56,186 | | | 326,441 |
Sandy Spring Bancorp, Inc. | | 43,518 | | | 503,068 |
*Seabright Insurance Holdings | | 54,746 | | | 612,060 |
Seacoast Banking Corp. of Florida | | 28,781 | | | 42,884 |
Selective Insurance Group, Inc. | | 82,800 | | | 1,268,496 |
SI Financial Group, Inc. | | 6,062 | | | 26,370 |
#Simmons First National Corp. Class A | | 12,255 | | | 358,581 |
Somerset Hills Bancorp | | 4,111 | | | 32,518 |
South Financial Group, Inc. | | 2,082 | | | 1,666 |
*Southcoast Financial Corp. | | 700 | | | 2,978 |
*Southern Community Financial Corp. | | 29,890 | | | 69,644 |
*Southern First Bancshares, Inc. | | 900 | | | 7,065 |
Southwest Bancorp, Inc. | | 32,685 | | | 321,620 |
*Specialty Underwriters’ Alliance, Inc. | | 2,510 | | | 17,118 |
State Auto Financial Corp. | | 68,262 | | | 1,109,940 |
51
THE TAX-MANAGED U.S. MARKETWIDE VALUE SERIES
CONTINUED
| | | | | |
| | | Shares | | Value† |
Financials — (Continued) | | | | | |
StellarOne Corp. | | 19,587 | | $ | 207,818 |
Sterling Bancshares, Inc. | | 55,670 | | | 310,082 |
#*Sterling Financial Corp. | | 10,529 | | | 8,423 |
#*Stewart Information Services Corp. | | 18,452 | | | 164,961 |
*Stratus Properties, Inc. | | 3,069 | | | 29,156 |
Student Loan Corp. | | 1,100 | | | 46,255 |
*Sun Bancorp, Inc. | | 33,558 | | | 136,245 |
#SunTrust Banks, Inc. | | 411,103 | | | 7,856,178 |
#*Superior Bancorp | | 5,062 | | | 10,731 |
Susquehanna Bancshares, Inc. | | 124,870 | | | 688,034 |
#*SVB Financial Group | | 3,400 | | | 140,250 |
SWS Group, Inc. | | 24,945 | | | 333,764 |
#*Taylor Capital Group, Inc. | | 13,335 | | | 76,010 |
Teche Holding Co. | | 600 | | | 18,630 |
#*Texas Capital Bancshares, Inc. | | 25,614 | | | 373,196 |
TF Financial Corp. | | 600 | | | 11,160 |
*Thomas Weisel Partners Group, Inc. | | 33,535 | | | 151,914 |
*TIB Financial Corp. | | 7,112 | | | 7,539 |
*Tidelands Bancshares, Inc. | | 400 | | | 1,400 |
*TierOne Corp. | | 10,513 | | | 20,921 |
Timberland Bancorp, Inc. | | 3,000 | | | 13,710 |
Tower Group, Inc. | | 2,807 | | | 68,996 |
#TowneBank | | 4,300 | | | 49,622 |
Transatlantic Holdings, Inc. | | 91,903 | | | 4,641,102 |
Travelers Cos., Inc. (The) | | 769,714 | | | 38,324,060 |
*Tree.com, Inc. | | 4,680 | | | 36,551 |
Trustmark Corp. | | 50,524 | | | 957,430 |
Umpqua Holdings Corp. | | 89,305 | | | 885,013 |
Unico American Corp. | | 1,900 | | | 18,962 |
Union Bankshares Corp. | | 15,866 | | | 195,469 |
*United America Indemnity, Ltd. | | 19,928 | | | 139,695 |
United Bankshares, Inc. | | 2,100 | | | 37,485 |
*United Community Banks, Inc. | | 67,631 | | | 274,582 |
United Financial Bancorp, Inc. | | 27,089 | | | 348,094 |
United Fire & Casualty Co. | | 41,412 | | | 723,882 |
*United PanAm Financial Corp. | | 14,353 | | | 43,059 |
*United Security Bancshares | | 339 | | | 848 |
Unitrin, Inc. | | 90,527 | | | 1,774,329 |
*Unity Bancorp, Inc. | | 2,925 | | | 11,963 |
Unum Group | | 530,100 | | | 10,575,495 |
#*Validus Holdings, Ltd. | | 51,844 | | | 1,311,653 |
#*Virginia Commerce Bancorp, Inc. | | 36,036 | | | 144,865 |
W. R. Berkley Corp. | | 80,768 | | | 1,996,585 |
Washington Banking Co. | | 5,191 | | | 48,899 |
Washington Federal, Inc. | | 118,236 | | | 2,027,747 |
Washington Trust Bancorp, Inc. | | 3,300 | | | 49,566 |
*Waterstone Financial, Inc. | | 1,300 | | | 4,433 |
Webster Financial Corp. | | 25,570 | | | 289,197 |
Wells Fargo & Co. | | 529,123 | | | 14,561,465 |
WesBanco, Inc. | | 32,017 | | | 453,041 |
Wesco Financial Corp. | | 12,881 | | | 4,224,968 |
West Bancorporation | | 19,399 | | | 85,356 |
West Coast Bancorp | | 3,775 | | | 8,720 |
#*Western Alliance Bancorp | | 28,882 | | | 125,637 |
White Mountains Insurance Group, Ltd. | | 18,685 | | | 5,795,526 |
*White River Capital, Inc. | | 300 | | | 3,630 |
#Whitney Holding Corp. | | 70,532 | | | 566,372 |
Wilmington Trust Corp. | | 6,400 | | | 77,120 |
Wilshire Bancorp, Inc. | | 17,744 | | | 124,918 |
#Wintrust Financial Corp. | | 42,047 | | | 1,186,146 |
#*World Acceptance Corp. | | 3,300 | | | 82,797 |
52
THE TAX-MANAGED U.S. MARKETWIDE VALUE SERIES
CONTINUED
| | | | | |
| | | Shares | | Value† |
Financials — (Continued) | | | | | |
WSB Holdings, Inc. | | 100 | | $ | 219 |
Yadkin Valley Financial Corp. | | 18,686 | | | 68,764 |
Zenith National Insurance Corp. | | 1,900 | | | 54,207 |
#Zions Bancorporation | | 37,412 | | | 529,754 |
*ZipRealty, Inc. | | 11,417 | | | 42,814 |
| | | | | |
Total Financials | | | | | 689,382,265 |
| | | | | |
Health Care — (4.1%) | | | | | |
*A.D.A.M., Inc. | | 7,504 | | | 24,613 |
*Adolor Corp. | | 14,642 | | | 21,231 |
Aetna, Inc. | | 153,637 | | | 3,999,171 |
#*Affymetrix, Inc. | | 10,978 | | | 57,415 |
*Albany Molecular Research, Inc. | | 33,600 | | | 273,504 |
*Allied Healthcare International, Inc. | | 57,415 | | | 152,724 |
*Allied Healthcare Products, Inc. | | 1,000 | | | 5,470 |
*Allion Healthcare, Inc. | | 40,273 | | | 259,358 |
*American Dental Partners, Inc. | | 23,799 | | | 282,970 |
*AMICAS, Inc. | | 91,876 | | | 289,409 |
*AMN Healthcare Services, Inc. | | 26,800 | | | 222,976 |
*Amsurg Corp. | | 9,300 | | | 195,951 |
Analogic Corp. | | 2,988 | | | 111,572 |
*AngioDynamics, Inc. | | 37,093 | | | 560,104 |
*Anika Therapeutics, Inc. | | 19,285 | | | 141,166 |
*ARCA Biopharma, Inc. | | 1,740 | | | 4,611 |
*Arena Pharmaceuticals, Inc. | | 8,200 | | | 28,946 |
*Arrhythmia Research Technology, Inc. | | 1,200 | | | 4,932 |
*Assisted Living Concepts, Inc. | | 12,487 | | | 258,731 |
*BioClinica, Inc. | | 8,850 | | | 39,471 |
*BioScrip, Inc. | | 60,081 | | | 453,011 |
#*BMP Sunstone Corp. | | 6,967 | | | 25,360 |
*Boston Scientific Corp. | | 1,019,920 | | | 8,281,750 |
#*Brookdale Senior Living, Inc. | | 112,800 | | | 1,899,552 |
*Cambrex Corp. | | 4,200 | | | 25,200 |
*Cantel Medical Corp. | | 20,806 | | | 334,144 |
*Capital Senior Living Corp. | | 45,075 | | | 238,447 |
*Cardiac Science Corp. | | 32,003 | | | 112,011 |
Cardinal Health, Inc. | | 208,009 | | | 5,894,975 |
*CareFusion Corp. | | 43,350 | | | 969,740 |
#*Celera Corp. | | 39,414 | | | 243,973 |
#*Community Health Systems, Inc. | | 151,474 | | | 4,738,107 |
*CONMED Corp. | | 43,239 | | | 916,234 |
#Cooper Cos., Inc. | | 52,556 | | | 1,472,094 |
*Coventry Health Care, Inc. | | 24,800 | | | 491,784 |
*Cross Country Healthcare, Inc. | | 31,940 | | | 263,824 |
*Cutera, Inc. | | 22,676 | | | 204,311 |
Daxor Corp. | | 900 | | | 12,195 |
*Digirad Corp. | | 17,648 | | | 43,238 |
#*Dynacq Healthcare, Inc. | | 909 | | | 2,927 |
#*Emeritus Corp. | | 26,084 | | | 486,727 |
*ev3, Inc. | | 114,429 | | | 1,347,974 |
*Five Star Quality Care, Inc. | | 9,500 | | | 32,775 |
*Gentiva Health Services, Inc. | | 13,810 | | | 331,440 |
#*Greatbatch, Inc. | | 17,658 | | | 347,333 |
*Health Net, Inc. | | 5,900 | | | 87,969 |
*HealthSpring, Inc. | | 86,917 | | | 1,245,521 |
*HealthTronics, Inc. | | 58,694 | | | 134,409 |
*Healthways, Inc. | | 15,427 | | | 248,066 |
Hill-Rom Holdings, Inc. | | 85,074 | | | 1,666,600 |
*Hi-Tech Pharmacal Co., Inc. | | 9,080 | | | 165,619 |
#*Hologic, Inc. | | 288,724 | | | 4,267,341 |
*Home Diagnostics, Inc. | | 15,923 | | | 99,519 |
53
THE TAX-MANAGED U.S. MARKETWIDE VALUE SERIES
CONTINUED
| | | | | |
| | | Shares | | Value† |
Health Care — (Continued) | | | | | |
#*Humana, Inc. | | 66,100 | | $ | 2,484,038 |
*I-Flow Corp. | | 5,812 | | | 73,347 |
*IntegraMed America, Inc. | | 3,874 | | | 32,929 |
Invacare Corp. | | 10,870 | | | 243,814 |
*InVentiv Health, Inc. | | 15,200 | | | 258,096 |
*Inverness Medical Innovations, Inc. | | 45,100 | | | 1,714,251 |
Kewaunee Scientific Corp. | | 1,631 | | | 21,138 |
*Kindred Healthcare, Inc. | | 43,118 | | | 633,835 |
*King Pharmaceuticals, Inc. | | 426,520 | | | 4,320,648 |
*Lannet Co., Inc. | | 574 | | | 3,857 |
*LCA-Vision, Inc. | | 29,200 | | | 131,400 |
*LeMaitre Vascular, Inc. | | 5,200 | | | 22,204 |
#*LifePoint Hospitals, Inc. | | 82,208 | | | 2,328,953 |
*Martek Biosciences Corp. | | 10,600 | | | 190,376 |
*Maxygen, Inc. | | 5,200 | | | 29,016 |
*MedCath Corp. | | 32,364 | | | 265,708 |
*Medical Action Industries, Inc. | | 1,524 | | | 16,673 |
*MediciNova, Inc. | | 623 | | | 3,866 |
Medicis Pharmaceutical Corp. Class A | | 600 | | | 12,702 |
*MEDTOX Scientific, Inc. | | 4,767 | | | 47,575 |
*Misonix, Inc. | | 4,083 | | | 10,371 |
#*Molina Healthcare, Inc. | | 12,070 | | | 225,950 |
*Nanosphere, Inc. | | 2,402 | | | 16,045 |
*National Dentex Corp. | | 400 | | | 3,200 |
*Natus Medical, Inc. | | 1,300 | | | 18,057 |
*Nighthawk Radiology Holdings, Inc. | | 11,000 | | | 65,890 |
#*NovaMed, Inc. | | 27,004 | | | 108,826 |
*NxStage Medical, Inc. | | 22,100 | | | 123,318 |
Omnicare, Inc. | | 197,388 | | | 4,277,398 |
*Osteotech, Inc. | | 24,810 | | | 107,179 |
*Palomar Medical Technologies, Inc. | | 4,400 | | | 44,704 |
*Par Pharmaceutical Cos., Inc. | | 27,889 | | | 584,832 |
*PDI, Inc. | | 15,476 | | | 77,690 |
PerkinElmer, Inc. | | 6,600 | | | 122,826 |
*Prospect Medical Holdings, Inc. | | 14,274 | | | 57,096 |
#*Psychiatric Solutions, Inc. | | 2,600 | | | 53,664 |
*Regeneration Technologies, Inc. | | 31,152 | | | 122,116 |
*RehabCare Group, Inc. | | 25,081 | | | 470,269 |
#*Res-Care, Inc. | | 40,983 | | | 493,025 |
#*Sirona Dental Systems, Inc. | | 21,400 | | | 575,874 |
*Skilled Healthcare Group, Inc. | | 29,820 | | | 239,753 |
*SonoSite, Inc. | | 2,287 | | | 56,695 |
*Spectranetics Corp. | | 25,700 | | | 146,490 |
*SRI/Surgical Express, Inc. | | 1,600 | | | 3,776 |
*Sun Healthcare Group, Inc. | | 15,900 | | | 144,372 |
*SunLink Health Systems, Inc. | | 1,750 | | | 4,112 |
#*Sunrise Senior Living, Inc. | | 2,900 | | | 12,064 |
*Symmetry Medical, Inc. | | 5,028 | | | 40,224 |
Teleflex, Inc. | | 1,500 | | | 74,625 |
*Theragenics Corp. | | 21,383 | | | 28,867 |
*Thermo Fisher Scientific, Inc. | | 321,928 | | | 14,486,760 |
*Tomotherapy, Inc. | | 2,900 | | | 9,628 |
*Triple-S Management Corp. | | 9,640 | | | 160,988 |
*Universal American Corp. | | 85,628 | | | 856,280 |
*Viropharma, Inc. | | 58,354 | | | 439,989 |
*Vital Images, Inc. | | 20,279 | | | 231,383 |
*WellCare Health Plans, Inc. | | 9,700 | | | 253,461 |
*WellPoint, Inc. | | 440,420 | | | 20,594,039 |
Young Innovations, Inc. | | 2,660 | | | 62,909 |
| | | | | |
Total Health Care | | | | | 102,257,666 |
| | | | | |
54
THE TAX-MANAGED U.S. MARKETWIDE VALUE SERIES
CONTINUED
| | | | | |
| | | Shares | | Value† |
Industrials — (11.1%) | | | | | |
#*AAR Corp. | | 5,400 | | $ | 105,894 |
*ACCO Brands Corp. | | 9,019 | | | 54,655 |
Aceto Corp. | | 9,213 | | | 51,040 |
Aircastle, Ltd. | | 47,000 | | | 372,240 |
#*AirTran Holdings, Inc. | | 12,900 | | | 54,567 |
Alamo Group, Inc. | | 25,037 | | | 343,007 |
*Alaska Air Group, Inc. | | 59,445 | | | 1,528,925 |
Albany International Corp. | | 28,323 | | | 471,861 |
Alexander & Baldwin, Inc. | | 66,441 | | | 1,915,494 |
*Allied Defense Group, Inc. | | 16,161 | | | 101,814 |
*Allied Motion Technologies, Inc. | | 262 | | | 590 |
*Altra Holdings, Inc. | | 3,245 | | | 28,459 |
*Amerco, Inc. | | 30,877 | | | 1,305,171 |
American Railcar Industries, Inc. | | 14,200 | | | 142,000 |
*American Reprographics Co. | | 5,977 | | | 35,862 |
Ameron International Corp. | | 7,300 | | | 430,554 |
*AMREP Corp. | | 866 | | | 10,539 |
Apogee Enterprises, Inc. | | 3,300 | | | 43,692 |
Applied Industrial Technologies, Inc. | | 53,325 | | | 1,078,765 |
Arkansas Best Corp. | | 25,200 | | | 650,664 |
#*Armstrong World Industries, Inc. | | 94,043 | | | 3,503,102 |
*AT Cross Co. | | 18,431 | | | 69,116 |
*ATC Technology Corp. | | 23,952 | | | 500,597 |
*Atlas Air Worldwide Holdings, Inc. | | 1,600 | | | 42,064 |
Baldor Electric Co. | | 3,280 | | | 84,788 |
Barnes Group, Inc. | | 42,700 | | | 676,795 |
Barrett Business Services, Inc. | | 14,200 | | | 164,720 |
*BE Aerospace, Inc. | | 16,300 | | | 288,999 |
#*BlueLinx Holdings, Inc. | | 51,324 | | | 150,379 |
*Bowne & Co., Inc. | | 20,451 | | | 133,545 |
Brady Co. Class A | | 2,936 | | | 79,507 |
Briggs & Stratton Corp. | | 50,961 | | | 952,971 |
*BTU International, Inc. | | 1,900 | | | 9,652 |
*Builders FirstSource, Inc. | | 49,478 | | | 192,469 |
Burlington Northern Santa Fe Corp. | | 248,329 | | | 18,704,140 |
#*C&D Technologies, Inc. | | 29,838 | | | 54,604 |
*CAI International, Inc. | | 5,100 | | | 38,250 |
Cascade Corp. | | 5,900 | | | 146,556 |
*Casella Waste Systems, Inc. | | 5,416 | | | 15,111 |
CDI Corp. | | 57,209 | | | 696,806 |
*CECO Environmental Corp. | | 9,578 | | | 35,726 |
*Celadon Group, Inc. | | 39,349 | | | 384,046 |
#*Cenveo, Inc. | | 100 | | | 708 |
*Ceradyne, Inc. | | 3,400 | | | 54,808 |
*Champion Industries, Inc. | | 4,486 | | | 8,165 |
*Chart Industries, Inc. | | 3,000 | | | 59,310 |
Chicago Rivet & Machine Co. | | 300 | | | 3,645 |
CIRCOR International, Inc. | | 12,350 | | | 336,538 |
*Columbus McKinnon Corp. | | 58,123 | | | 961,936 |
Comfort Systems USA, Inc. | | 2,600 | | | 28,340 |
CompX International, Inc. | | 700 | | | 4,921 |
*Consolidated Graphics, Inc. | | 33,700 | | | 676,022 |
*Cornell Cos., Inc. | | 2,500 | | | 57,100 |
Courier Corp. | | 2,371 | | | 35,162 |
*Covenant Transportation Group, Inc. | | 6,518 | | | 32,851 |
*CPI Aerostructures, Inc. | | 5,826 | | | 39,850 |
CSX Corp. | | 562,627 | | | 23,731,607 |
Ducommun, Inc. | | 16,159 | | | 275,026 |
*Dycom Industries, Inc. | | 35,250 | | | 348,270 |
#*Eagle Bulk Shipping, Inc. | | 1,600 | | | 7,584 |
Eastern Co. | | 10,193 | | | 162,782 |
55
THE TAX-MANAGED U.S. MARKETWIDE VALUE SERIES
CONTINUED
| | | | | |
| | | Shares | | Value† |
Industrials — (Continued) | | | | | |
Eaton Corp. | | 109,451 | | $ | 6,616,313 |
Ecology & Environment, Inc. Class A | | 900 | | | 13,050 |
#Encore Wire Corp. | | 2,148 | | | 44,571 |
*EnerSys, Inc. | | 60,439 | | | 1,335,702 |
Ennis, Inc. | | 43,200 | | | 654,480 |
#*EnPro Industries, Inc. | | 18,755 | | | 423,488 |
Espey Manufacturing & Electronics Corp. | | 2,464 | | | 47,802 |
*Esterline Technologies Corp. | | 24,194 | | | 1,018,809 |
*ExpressJet Holdings, Inc. | | 1,060 | | | 3,180 |
Federal Signal Corp. | | 21,047 | | | 129,229 |
FedEx Corp. | | 184,382 | | | 13,402,728 |
*First Advantage Corp. | | 14,062 | | | 247,491 |
*Flow International Corp. | | 3,900 | | | 9,399 |
*Franklin Covey Co. | | 11,816 | | | 61,680 |
Frozen Food Express Industries, Inc. | | 8,986 | | | 26,059 |
G & K Services, Inc. Class A | | 29,714 | | | 658,165 |
*Gardner Denver Machinery, Inc. | | 3,295 | | | 118,323 |
GATX Corp. | | 65,445 | | | 1,778,795 |
#*Genco Shipping & Trading, Ltd. | | 1,100 | | | 21,879 |
*Gencor Industries, Inc. | | 8,666 | | | 64,995 |
General Electric Co. | | 2,283,412 | | | 32,561,455 |
*Gibraltar Industries, Inc. | | 53,888 | | | 583,068 |
*GP Strategies Corp. | | 16,800 | | | 118,272 |
Great Lakes Dredge & Dock Corp. | | 65,383 | | | 400,798 |
*Greenbrier Cos., Inc. | | 13,077 | | | 116,124 |
*Griffon Corp. | | 45,266 | | | 396,983 |
*H&E Equipment Services, Inc. | | 66,829 | | | 708,387 |
Hardinge, Inc. | | 25,790 | | | 135,398 |
Heidrick & Struggles International, Inc. | | 2,100 | | | 57,456 |
*Herley Industries, Inc. | | 5,800 | | | 65,598 |
#*Hertz Global Holdings, Inc. | | 389,227 | | | 3,623,703 |
HNI Corp. | | 200 | | | 5,264 |
#*Hoku Scientific, Inc. | | 400 | | | 880 |
Horizon Lines, Inc. | | 3,300 | | | 17,325 |
*Hudson Highland Group, Inc. | | 35,619 | | | 115,406 |
#*Hurco Cos., Inc. | | 6,200 | | | 98,580 |
*ICT Group, Inc. | | 8,739 | | | 138,513 |
Ingersoll-Rand P.L.C. | | 309,696 | | | 9,783,297 |
*Insituform Technologies, Inc. Class A | | 700 | | | 14,840 |
Insteel Industries, Inc. | | 4,889 | | | 54,366 |
#*Interline Brands, Inc. | | 74,162 | | | 1,082,765 |
International Shipholding Corp. | | 8,797 | | | 291,621 |
*Intersections, Inc. | | 34,678 | | | 197,665 |
#*JetBlue Airways Corp. | | 152,100 | | | 754,416 |
*Kadant, Inc. | | 4,057 | | | 52,295 |
#*Kansas City Southern | | 10,954 | | | 265,415 |
KBR, Inc. | | 748 | | | 15,312 |
*Kelly Services, Inc. Class A | | 44,445 | | | 492,451 |
Kennametal, Inc. | | 10,600 | | | 249,736 |
*Key Technology, Inc. | | 2,124 | | | 23,045 |
*Kforce, Inc. | | 18,078 | | | 212,055 |
Kimball International, Inc. Class B | | 24,527 | | | 183,953 |
*Korn/Ferry International | | 8,500 | | | 135,660 |
L.S. Starrett Co. Class A | | 4,097 | | | 41,994 |
L-3 Communications Holdings, Inc. | | 23,933 | | | 1,730,117 |
*Ladish Co., Inc. | | 45,562 | | | 590,484 |
Lawson Products, Inc. | | 1,959 | | | 30,462 |
*Layne Christensen Co. | | 2,100 | | | 54,390 |
*LECG Corp. | | 28,048 | | | 96,766 |
*LGL Group, Inc. | | 400 | | | 1,144 |
*LMI Aerospace, Inc. | | 11,300 | | | 121,701 |
56
THE TAX-MANAGED U.S. MARKETWIDE VALUE SERIES
CONTINUED
| | | | | |
| | | Shares | | Value† |
Industrials — (Continued) | | | | | |
LSI Industries, Inc. | | 24,254 | | $ | 169,535 |
*Lydall, Inc. | | 10,301 | | | 51,505 |
*M&F Worldwide Corp. | | 29,869 | | | 635,612 |
#Manitowoc Co., Inc. (The) | | 4,200 | | | 38,388 |
#Manpower, Inc. | | 40,067 | | | 1,899,576 |
*Marten Transport, Ltd. | | 31,777 | | | 557,369 |
Masco Corp. | | 155,344 | | | 1,825,292 |
McGrath Rentcorp | | 2,900 | | | 57,275 |
*Metalico, Inc. | | 22,900 | | | 92,516 |
*MFRI, Inc. | | 7,300 | | | 49,056 |
*Miller Industries, Inc. | | 18,210 | | | 183,010 |
#*Mobile Mini, Inc. | | 54,461 | | | 789,684 |
*Moog, Inc. | | 7,683 | | | 191,845 |
*MPS Group, Inc. | | 112,578 | | | 1,522,055 |
Mueller Industries, Inc. | | 18,063 | | | 427,371 |
Mueller Water Products, Inc. | | 150,535 | | | 674,397 |
NACCO Industries, Inc. Class A | | 10,965 | | | 653,514 |
National Technical Systems, Inc. | | 15,400 | | | 87,472 |
Norfolk Southern Corp. | | 333,288 | | | 15,537,887 |
Northrop Grumman Corp. | | 211,819 | | | 10,618,486 |
#*Northwest Pipe Co. | | 12,085 | | | 363,758 |
#*Ocean Power Technologies, Inc. | | 1,500 | | | 9,090 |
*On Assignment, Inc. | | 57,765 | | | 348,901 |
*Oshkosh Truck Corp. Class B | | 61,610 | | | 1,925,929 |
#*Owens Corning, Inc. | | 152,823 | | | 3,378,917 |
*P.A.M. Transportation Services, Inc. | | 20,690 | | | 160,554 |
*Park-Ohio Holdings Corp. | | 5,647 | | | 35,124 |
Pentair, Inc. | | 3,773 | | | 109,794 |
*PGT, Inc. | | 7,271 | | | 17,959 |
*Pike Electric Corp. | | 3,700 | | | 46,435 |
*Pinnacle Airlines Corp. | | 8,182 | | | 49,337 |
#*Polypore International, Inc. | | 500 | | | 5,480 |
Portec Rail Products, Inc. | | 7,087 | | | 61,728 |
*PowerSecure International, Inc. | | 26,900 | | | 223,808 |
Providence & Worcester Railroad Co. | | 1,000 | | | 11,125 |
Quanex Building Products Corp. | | 2,800 | | | 41,636 |
R. R. Donnelley & Sons Co. | | 182,554 | | | 3,665,684 |
*RCM Technologies, Inc. | | 16,740 | | | 38,000 |
*Republic Airways Holdings, Inc. | | 48,800 | | | 390,888 |
Republic Services, Inc. | | 252,623 | | | 6,545,462 |
*Rush Enterprises, Inc. Class A | | 31,175 | | | 340,431 |
*Rush Enterprises, Inc. Class B | | 18,522 | | | 169,476 |
Ryder System, Inc. | | 89,844 | | | 3,643,174 |
*Saia, Inc. | | 10,800 | | | 158,328 |
*Sauer-Danfoss, Inc. | | 6,000 | | | 43,200 |
Schawk, Inc. | | 51,516 | | | 505,887 |
#*School Specialty, Inc. | | 27,776 | | | 618,016 |
Seaboard Corp. | | 2,041 | | | 2,757,391 |
*SIFCO Industries, Inc. | | 6,623 | | | 88,417 |
SkyWest, Inc. | | 93,838 | | | 1,310,917 |
*SL Industries, Inc. | | 300 | | | 2,460 |
Southwest Airlines Co. | | 1,077,730 | | | 9,052,932 |
*Sparton Corp. | | 3,557 | | | 14,762 |
*Spherion Corp. | | 46,700 | | | 231,165 |
#SPX Corp. | | 13,500 | | | 712,530 |
Standex International Corp. | | 29,500 | | | 518,610 |
Steelcase, Inc. Class A | | 85,520 | | | 493,450 |
*Sunair Electronics, Inc. | | 1,500 | | | 4,005 |
Superior Uniform Group, Inc. | | 8,978 | | | 79,006 |
*Supreme Industries, Inc. | | 1,140 | | | 2,690 |
*Sypris Solutions, Inc. | | 8,651 | | | 26,818 |
57
THE TAX-MANAGED U.S. MARKETWIDE VALUE SERIES
CONTINUED
| | | | | |
| | | Shares | | Value† |
Industrials — (Continued) | | | | | |
TAL International Group, Inc. | | 27,396 | | $ | 324,917 |
*Tech/Ops Sevcon, Inc. | | 774 | | | 2,167 |
Technology Research Corp. | | 11,621 | | | 41,836 |
*Tecumseh Products Co. Class A | | 11,200 | | | 117,040 |
*Tecumseh Products Co. Class B | | 1,400 | | | 14,518 |
#Textainer Group Holdings, Ltd. | | 200 | | | 3,012 |
Timken Co. | | 131,078 | | | 2,887,648 |
Titan International, Inc. | | 8,801 | | | 73,928 |
#*Titan Machinery, Inc. | | 2,900 | | | 31,117 |
Todd Shipyards Corp. | | 9,546 | | | 159,227 |
*TRC Cos., Inc. | | 31,413 | | | 99,579 |
Tredegar Industries, Inc. | | 40,177 | | | 547,613 |
*Trimas Corp. | | 6,336 | | | 28,512 |
Trinity Industries, Inc. | | 85,250 | | | 1,439,020 |
Triumph Group, Inc. | | 7,736 | | | 362,122 |
*Tufco Technologies, Inc. | | 1,000 | | | 2,510 |
*Tutor Perini Corp. | | 40,023 | | | 706,406 |
Twin Disc, Inc. | | 8,794 | | | 82,576 |
Tyco International, Ltd. | | 456,370 | | | 15,311,214 |
*U.S. Home Systems, Inc. | | 4,314 | | | 10,181 |
#Union Pacific Corp. | | 489,811 | | | 27,008,179 |
*United Capital Corp. | | 300 | | | 5,448 |
#*United Rentals, Inc. | | 70,481 | | | 668,865 |
*United Stationers, Inc. | | 100 | | | 4,714 |
Universal Forest Products, Inc. | | 31,800 | | | 1,134,624 |
*URS Corp. | | 84,698 | | | 3,291,364 |
*USA Truck, Inc. | | 15,305 | | | 171,875 |
#*USG Corp. | | 5,400 | | | 70,956 |
*Valpey Fisher Corp. | | 1,464 | | | 1,786 |
*Versar, Inc. | | 6,026 | | | 23,140 |
Viad Corp. | | 27,199 | | | 475,982 |
Virco Manufacturing Corp. | | 12,601 | | | 35,031 |
*Volt Information Sciences, Inc. | | 44,159 | | | 358,129 |
*Waste Services, Inc. | | 32,675 | | | 214,348 |
Watts Water Technologies, Inc. | | 53,615 | | | 1,514,624 |
*WCA Waste Corp. | | 29,254 | | | 117,309 |
Werner Enterprises, Inc. | | 64,932 | | | 1,217,475 |
*WESCO International, Inc. | | 2,010 | | | 51,376 |
*Willdan Group, Inc. | | 1,000 | | | 2,540 |
*Willis Lease Finance Corp. | | 7,300 | | | 92,929 |
| | | | | |
Total Industrials | | | | | 277,740,615 |
| | | | | |
Information Technology — (6.2%) | | | | | |
*3Com Corp. | | 78,700 | | | 404,518 |
*Acorn Energy, Inc. | | 1,230 | | | 8,598 |
*Actel Corp. | | 22,878 | | | 272,706 |
*ActivIdentity Corp. | | 60,201 | | | 136,656 |
*Activision Blizzard, Inc. | | 697,227 | | | 7,550,968 |
*Adaptec, Inc. | | 166,097 | | | 529,849 |
*Adept Technology, Inc. | | 700 | | | 1,680 |
*Advanced Analogic Technologies, Inc. | | 15,762 | | | 49,650 |
Agilysys, Inc. | | 21,014 | | | 98,976 |
*Amtech Systems, Inc. | | 10,600 | | | 57,240 |
*Anadigics, Inc. | | 400 | | | 1,284 |
*Applied Micro Circuits Corp. | | 65,224 | | | 510,052 |
#*Arris Group, Inc. | | 198,932 | | | 2,041,042 |
*Arrow Electronics, Inc. | | 182,170 | | | 4,616,188 |
Astro-Med, Inc. | | 2,626 | | | 16,281 |
#*ATMI, Inc. | | 3,100 | | | 46,965 |
*Avid Technology, Inc. | | 54,450 | | | 687,704 |
*Avnet, Inc. | | 112,932 | | | 2,798,455 |
58
THE TAX-MANAGED U.S. MARKETWIDE VALUE SERIES
CONTINUED
| | | | | |
| | | Shares | | Value† |
Information Technology — (Continued) | | | | | |
*Avocent Corp. | | 70,720 | | $ | 1,758,806 |
AVX Corp. | | 293,831 | | | 3,326,167 |
*Aware, Inc. | | 22,140 | | | 51,808 |
*AXT, Inc. | | 17,200 | | | 39,732 |
Bel Fuse, Inc. Class A | | 4,174 | | | 74,130 |
Bel Fuse, Inc. Class B | | 20,997 | | | 380,046 |
*Benchmark Electronics, Inc. | | 93,903 | | | 1,577,570 |
Black Box Corp. | | 26,600 | | | 705,166 |
*Brightpoint, Inc. | | 17,400 | | | 128,238 |
#*Brooks Automation, Inc. | | 91,316 | | | 628,254 |
*BSQUARE Corp. | | 3,500 | | | 8,120 |
*Cadence Design Systems, Inc. | | 65,000 | | | 397,150 |
*California Micro Devices Corp. | | 34,898 | | | 104,345 |
*Cascade Microtech, Inc. | | 23,771 | | | 128,363 |
*Checkpoint Systems, Inc. | | 40,000 | | | 542,800 |
*Ciber, Inc. | | 31,700 | | | 102,074 |
Cognex Corp. | | 3,890 | | | 62,590 |
Cohu, Inc. | | 41,402 | | | 471,155 |
*Comarco, Inc. | | 5,608 | | | 17,665 |
Communications Systems, Inc. | | 12,053 | | | 132,342 |
*Computer Sciences Corp. | | 225,553 | | | 11,437,793 |
*Concurrent Computer Corp. | | 13,740 | | | 52,762 |
*Convergys Corp. | | 197,364 | | | 2,141,399 |
*CPI International, Inc. | | 19,208 | | | 190,159 |
*Cray, Inc. | | 18,873 | | | 140,793 |
*CSP, Inc. | | 2,414 | | | 8,884 |
CTS Corp. | | 34,200 | | | 306,432 |
*CyberOptics Corp. | | 9,134 | | | 55,078 |
*Cypress Semiconductor Corp. | | 224,209 | | | 1,890,082 |
*Datalink Corp. | | 5,600 | | | 22,288 |
*Dataram Corp. | | 11,134 | | | 29,950 |
*DDi Corp. | | 30,020 | | | 121,581 |
#*DealerTrack Holdings, Inc. | | 3,829 | | | 63,102 |
*Digi International, Inc. | | 35,811 | | | 284,697 |
*DSP Group, Inc. | | 59,734 | | | 345,263 |
*Dynamics Research Corp. | | 16,586 | | | 212,467 |
*Edgewater Technology, Inc. | | 15,903 | | | 45,324 |
Electro Rent Corp. | | 46,027 | | | 492,949 |
*Electro Scientific Industries, Inc. | | 34,300 | | | 375,242 |
*Electronics for Imaging, Inc. | | 72,920 | | | 850,247 |
*EMS Technologies, Inc. | | 1,490 | | | 25,971 |
*Emulex Corp. | | 8,000 | | | 80,800 |
*Endwave Corp. | | 16,615 | | | 38,713 |
#*Epicor Software Corp. | | 107,892 | | | 832,926 |
*ePlus, Inc. | | 6,354 | | | 95,564 |
*Euronet Worldwide, Inc. | | 33,370 | | | 789,201 |
*Exar Corp. | | 39,600 | | | 273,240 |
Fair Isaac Corp. | | 4,800 | | | 97,584 |
*Fairchild Semiconductor Corp. Class A | | 144,238 | | | 1,078,900 |
Fidelity National Information Services, Inc. | | 166,320 | | | 3,619,123 |
*Frequency Electronics, Inc. | | 16,953 | | | 74,593 |
*Gerber Scientific, Inc. | | 50,097 | | | 231,448 |
*Globecomm Systems, Inc. | | 41,466 | | | 280,310 |
*GSI Technology, Inc. | | 27,494 | | | 99,253 |
*GTSI Corp. | | 8,203 | | | 61,112 |
*Hackett Group, Inc. | | 50,220 | | | 156,686 |
*Harris Stratex Networks, Inc. Class A | | 38,192 | | | 240,610 |
*Henry Bros. Electronics, Inc. | | 8,085 | | | 38,323 |
*Hutchinson Technology, Inc. | | 44,671 | | | 259,985 |
*Hypercom Corp. | | 66,500 | | | 189,525 |
*I.D. Systems, Inc. | | 13,298 | | | 48,538 |
59
THE TAX-MANAGED U.S. MARKETWIDE VALUE SERIES
CONTINUED
| | | | | |
| | | Shares | | Value† |
Information Technology — (Continued) | | | | | |
*IAC/InterActiveCorp | | 178,991 | | $ | 3,390,090 |
*Ikanos Communications, Inc. | | 2,371 | | | 4,102 |
*Imation Corp. | | 49,331 | | | 435,099 |
*Immersion Corp. | | 11,256 | | | 41,310 |
*infoGROUP, Inc. | | 28,026 | | | 183,851 |
*InfoSpace, Inc. | | 65,156 | | | 558,387 |
*Ingram Micro, Inc. | | 277,679 | | | 4,901,034 |
*Insight Enterprises, Inc. | | 23,900 | | | 251,428 |
*Integrated Device Technology, Inc. | | 18,820 | | | 110,662 |
*Integrated Silicon Solution, Inc. | | 27,577 | | | 96,520 |
*Internap Network Services Corp. | | 35,546 | | | 113,747 |
*International Rectifier Corp. | | 80,500 | | | 1,471,540 |
*Internet Brands, Inc. | | 28,066 | | | 208,811 |
*Internet Capital Group, Inc. | | 58,172 | | | 422,910 |
*Interphase Corp. | | 4,460 | | | 10,615 |
*Intevac, Inc. | | 34,801 | | | 354,970 |
*IntriCon Corp. | | 2,835 | | | 9,568 |
*INX, Inc. | | 500 | | | 3,360 |
iPass, Inc. | | 26,936 | | | 35,017 |
*IXYS Corp. | | 16,391 | | | 109,820 |
Jabil Circuit, Inc. | | 139,658 | | | 1,868,624 |
*JDS Uniphase Corp. | | 137,990 | | | 771,364 |
Keithley Instruments, Inc. | | 9,443 | | | 30,784 |
*KEY Tronic Corp. | | 15,546 | | | 35,134 |
*Keynote Systems, Inc. | | 18,330 | | | 187,333 |
*Kopin Corp. | | 20,076 | | | 89,137 |
*KVH Industries, Inc. | | 9,179 | | | 96,380 |
#*L-1 Identity Solutions, Inc. | | 127,178 | | | 751,622 |
*Lattice Semiconductor Corp. | | 131,578 | | | 251,314 |
*Littlefuse, Inc. | | 2,763 | | | 76,148 |
*LoJack Corp. | | 5,158 | | | 21,767 |
*LookSmart, Ltd. | | 34,780 | | | 45,562 |
*Loral Space & Communications, Inc. | | 35,669 | | | 942,375 |
*Mace Security International, Inc. | | 1,291 | | | 1,084 |
Marchex, Inc. Class B | | 34,253 | | | 155,166 |
*Measurement Specialties, Inc. | | 4,190 | | | 32,305 |
*Mentor Graphics Corp. | | 16,127 | | | 117,727 |
*Mercury Computer Systems, Inc. | | 18,900 | | | 202,230 |
*Merrimac Industries, Inc. | | 2,600 | | | 20,540 |
Methode Electronics, Inc. | | 79,571 | | | 576,890 |
*Micron Technology, Inc. | | 990,716 | | | 6,726,962 |
*Microtune, Inc. | | 12,031 | | | 20,573 |
*MKS Instruments, Inc. | | 82,222 | | | 1,285,952 |
*ModusLink Global Solutions, Inc. | | 68,955 | | | 566,810 |
*MoSys, Inc. | | 11,829 | | | 27,916 |
#Motorola, Inc. | | 2,108,701 | | | 18,071,568 |
*Nanometrics, Inc. | | 46,005 | | | 377,241 |
*Newport Corp. | | 56,016 | | | 416,759 |
*Nu Horizons Electronics Corp. | | 13,732 | | | 53,417 |
*Occam Networks, Inc. | | 27,224 | | | 81,128 |
*OmniVision Technologies, Inc. | | 38,897 | | | 476,877 |
*Oplink Communications, Inc. | | 33,986 | | | 504,012 |
*Opnext, Inc. | | 37,258 | | | 91,655 |
*Optelecom-NKF, Inc. | | 4,329 | | | 17,013 |
*Optical Cable Corp. | | 9,195 | | | 27,769 |
*ORBCOMM, Inc. | | 11,500 | | | 27,255 |
*PAR Technology Corp. | | 23,205 | | | 126,467 |
*PC Connection, Inc. | | 50,013 | | | 294,076 |
*PC Mall, Inc. | | 10,070 | | | 71,396 |
*PC-Tel, Inc. | | 50,569 | | | 296,334 |
*PDF Solutions, Inc. | | 793 | | | 2,807 |
60
THE TAX-MANAGED U.S. MARKETWIDE VALUE SERIES
CONTINUED
| | | | | |
| | | Shares | | Value† |
Information Technology — (Continued) | | | | | |
*Perceptron, Inc. | | 4,904 | | $ | 16,526 |
*Perficient, Inc. | | 14,478 | | | 117,851 |
*Performance Technologies, Inc. | | 25,851 | | | 72,641 |
*Pericom Semiconductor Corp. | | 12,868 | | | 121,088 |
*Pervasive Software, Inc. | | 35,664 | | | 174,754 |
*Phoenix Technologies, Ltd. | | 200 | | | 468 |
Plantronics, Inc. | | 19,000 | | | 458,090 |
*Presstek, Inc. | | 7,000 | | | 11,900 |
•*Price Communications Liquidation Trust | | 47,738 | | | 6,520 |
Qualstar Corp. | | 12,400 | | | 23,684 |
*RadiSys Corp. | | 37,693 | | | 320,767 |
*RealNetworks, Inc. | | 167,359 | | | 597,472 |
Richardson Electronics, Ltd. | | 20,479 | | | 115,706 |
#*Rofin-Sinar Technologies, Inc. | | 11,100 | | | 238,095 |
*Rovi Corp. | | 129,011 | | | 3,554,253 |
*Rudolph Technologies, Inc. | | 69,020 | | | 437,587 |
#*Sandisk Corp. | | 197,936 | | | 4,053,729 |
*SCM Microsystems, Inc. | | 18,612 | | | 46,902 |
*SeaChange International, Inc. | | 27,986 | | | 189,465 |
*Semitool, Inc. | | 10,407 | | | 73,473 |
Servidyne, Inc. | | 7,283 | | | 15,258 |
#*Sigma Designs, Inc. | | 2,475 | | | 29,725 |
*Silicon Image, Inc. | | 29,804 | | | 62,886 |
*Silicon Storage Technology, Inc. | | 147,812 | | | 300,058 |
#*Skyworks Solutions, Inc. | | 35,404 | | | 369,264 |
*Smart Modular Technologies (WWH), Inc. | | 20,400 | | | 82,824 |
*Smith Micro Software, Inc. | | 8,495 | | | 77,135 |
*SonicWALL, Inc. | | 159,432 | | | 1,265,890 |
*Spectrum Control, Inc. | | 20,295 | | | 171,493 |
*Standard Microsystems Corp. | | 33,319 | | | 641,724 |
*StarTek, Inc. | | 31,481 | | | 182,590 |
*Support.com, Inc. | | 37,208 | | | 89,299 |
#*Sycamore Networks, Inc. | | 493,647 | | | 1,406,894 |
*Symmetricom, Inc. | | 91,342 | | | 437,528 |
*Symyx Technologies, Inc. | | 40,492 | | | 237,688 |
#*SYNNEX Corp. | | 60,100 | | | 1,546,373 |
#*Tech Data Corp. | | 85,452 | | | 3,283,920 |
Technitrol, Inc. | | 5,403 | | | 42,089 |
*TechTarget, Inc. | | 7,400 | | | 46,620 |
*TechTeam Global, Inc. | | 19,326 | | | 151,323 |
*Tellabs, Inc. | | 24,344 | | | 146,551 |
*Telular Corp. | | 24,670 | | | 73,270 |
#*Teradyne, Inc. | | 126,050 | | | 1,055,038 |
Tessco Technologies, Inc. | | 10,246 | | | 173,670 |
TheStreet.com, Inc. | | 34,407 | | | 85,673 |
*Tier Technologies, Inc. Class B | | 5,660 | | | 46,299 |
*Tollgrade Communications, Inc. | | 19,226 | | | 114,395 |
*Track Data Corp. | | 1,932 | | | 7,747 |
*Trident Microsystems, Inc. | | 2,123 | | | 3,991 |
*Triquint Semiconductor, Inc. | | 147,914 | | | 797,256 |
*TSR, Inc. | | 1,300 | | | 2,782 |
*TTM Technologies, Inc. | | 62,699 | | | 637,649 |
Tyco Electronics, Ltd. | | 549,298 | | | 11,672,583 |
*Ultra Clean Holdings, Inc. | | 2,816 | | | 15,516 |
United Online, Inc. | | 51,420 | | | 411,360 |
*UTStarcom, Inc. | | 192,273 | | | 348,014 |
*Vicon Industries, Inc. | | 5,787 | | | 39,062 |
*Video Display Corp. | | 600 | | | 2,931 |
*Virage Logic Corp. | | 29,928 | | | 176,575 |
*Virtusa Corp. | | 39,100 | | | 351,118 |
*Vishay Intertechnology, Inc. | | 213,119 | | | 1,327,731 |
61
THE TAX-MANAGED U.S. MARKETWIDE VALUE SERIES
CONTINUED
| | | | | |
| | | Shares | | Value† |
Information Technology — (Continued) | | | | | |
*Web.com Group, Inc. | | 54,075 | | $ | 380,688 |
*WPCS International, Inc. | | 9,861 | | | 29,780 |
#Xerox Corp. | | 974,182 | | | 7,325,849 |
*Zoran Corp. | | 82,007 | | | 727,402 |
*Zygo Corp. | | 31,737 | | | 219,303 |
| | | | | |
Total Information Technology | | | | | 153,938,329 |
| | | | | |
Materials — (3.0%) | | | | | |
A. Schulman, Inc. | | 25,252 | | | 438,627 |
A.M. Castle & Co. | | 43,846 | | | 494,144 |
Alcoa, Inc. | | 504,639 | | | 6,267,616 |
*American Pacific Corp. | | 5,747 | | | 40,689 |
Ashland, Inc. | | 112,560 | | | 3,887,822 |
*Brush Engineered Materials, Inc. | | 38,767 | | | 715,251 |
*Buckeye Technologies, Inc. | | 22,600 | | | 202,496 |
*BWAY Holding Co. | | 43,508 | | | 773,137 |
Cabot Corp. | | 110,278 | | | 2,418,397 |
Carpenter Technology Corp. | | 3,300 | | | 69,399 |
#*Coeur d’Alene Mines Corp. | | 1,400 | | | 28,112 |
Commercial Metals Co. | | 19,325 | | | 286,783 |
*Continental Materials Corp. | | 100 | | | 1,100 |
*Core Molding Technologies, Inc. | | 2,488 | | | 6,991 |
Cytec Industries, Inc. | | 64,700 | | | 2,146,099 |
Dow Chemical Co. | | 578,018 | | | 13,571,863 |
Eastman Chemical Co. | | 2,800 | | | 147,028 |
*Ferro Corp. | | 49,500 | | | 303,435 |
*Flotek Industries, Inc. | | 15,089 | | | 24,293 |
Friedman Industries, Inc. | | 17,753 | | | 102,435 |
*Graphic Packaging Holding Co. | | 1,716 | | | 3,930 |
*Haynes International, Inc. | | 800 | | | 22,656 |
*Headwaters, Inc. | | 53,696 | | | 221,228 |
#*Hecla Mining Co. | | 9,000 | | | 36,990 |
*Horsehead Holding Corp. | | 16,770 | | | 159,818 |
*ICO, Inc. | | 20,858 | | | 80,095 |
*Innospec, Inc. | | 2,811 | | | 33,226 |
International Paper Co. | | 460,475 | | | 10,273,197 |
Kaiser Aluminum Corp. | | 27,181 | | | 1,085,881 |
*KapStone Paper & Packaging Corp. | | 1,140 | | | 7,912 |
KMG Chemicals, Inc. | | 2,795 | | | 34,379 |
*Kronos Worldwide, Inc. | | 3,319 | | | 44,375 |
#*Louisiana-Pacific Corp. | | 153,257 | | | 804,599 |
MeadWestavco Corp. | | 188,451 | | | 4,302,336 |
Minerals Technologies, Inc. | | 2,900 | | | 142,854 |
*Mod-Pac Corp. | | 1,091 | | | 3,153 |
Myers Industries, Inc. | | 65,520 | | | 574,610 |
Neenah Paper, Inc. | | 23,100 | | | 239,085 |
NL Industries, Inc. | | 59,918 | | | 371,492 |
#*Northern Technologies International Corp. | | 3,000 | | | 23,250 |
Olympic Steel, Inc. | | 2,500 | | | 63,250 |
#*OM Group, Inc. | | 42,299 | | | 1,142,919 |
P.H. Glatfelter Co. | | 50,000 | | | 528,500 |
*Penford Corp. | | 38,934 | | | 229,711 |
*PolyOne Corp. | | 117,993 | | | 658,401 |
Quaker Chemical Corp. | | 2,300 | | | 47,380 |
*Ready Mix, Inc. | | 3,839 | | | 11,901 |
Reliance Steel & Aluminum Co. | | 50,700 | | | 1,849,536 |
*Rock of Ages Corp. | | 1,200 | | | 4,272 |
#*Rockwood Holdings, Inc. | | 14,772 | | | 293,667 |
*RTI International Metals, Inc. | | 35,400 | | | 733,134 |
#Schnitzer Steel Industries, Inc. Class A | | 5,700 | | | 246,468 |
Schweitzer-Maudoit International, Inc. | | 17,415 | | | 899,485 |
62
THE TAX-MANAGED U.S. MARKETWIDE VALUE SERIES
CONTINUED
| | | | | |
| | | Shares | | Value† |
Materials — (Continued) | | | | | |
*Solutia, Inc. | | 2,500 | | $ | 27,500 |
*Spartech Corp. | | 18,620 | | | 178,193 |
#*Stillwater Mining Co. | | 22,462 | | | 139,264 |
*Synalloy Corp. | | 4,995 | | | 45,155 |
Temple-Inland, Inc. | | 44,500 | | | 687,525 |
Texas Industries, Inc. | | 46,594 | | | 1,551,114 |
#*Titanium Metals Corp. | | 7,100 | | | 61,060 |
*U.S. Concrete, Inc. | | 68,202 | | | 109,805 |
*Universal Stainless & Alloy Products, Inc. | | 6,709 | | | 101,239 |
Westlake Chemical Corp. | | 105,000 | | | 2,550,450 |
Weyerhaeuser Co. | | 311,975 | | | 11,337,172 |
Worthington Industries, Inc. | | 64,670 | | | 714,604 |
#*Zoltek Cos., Inc. | | 5,042 | | | 44,924 |
| | | | | |
Total Materials | | | | | 74,647,412 |
| | | | | |
Other — (0.0%) | | | | | |
•#*ePresence, Inc. Escrow Shares | | 6,400 | | | — |
•*MAIR Holdings, Inc. Escrow Shares | | 1,415 | | | — |
•#*Pelican Financial, Inc. Escrow Shares | | 300 | | | — |
•*Petrocorp, Inc. Escrow Shares | | 900 | | | 54 |
| | | | | |
Total Other | | | | | 54 |
| | | | | |
Telecommunication Services — (3.9%) | | | | | |
*Arbinet Corp. | | 3,200 | | | 7,008 |
AT&T, Inc. | | 2,510,122 | | | 64,434,832 |
CenturyTel, Inc. | | 16,863 | | | 547,373 |
D&E Communications, Inc. | | 23,654 | | | 264,925 |
*General Communications, Inc. Class A | | 44,592 | | | 274,241 |
#*Sprint Nextel Corp. | | 3,528,077 | | | 10,443,108 |
*SureWest Communications | | 15,836 | | | 139,674 |
Telephone & Data Systems, Inc. | | 80,200 | | | 2,375,524 |
Telephone & Data Systems, Inc. Special Shares | | 67,452 | | | 1,861,675 |
*United States Cellular Corp. | | 33,568 | | | 1,228,924 |
Verizon Communications, Inc. | | 566,352 | | | 16,758,356 |
*Xeta Corp. | | 18,366 | | | 45,456 |
| | | | | |
Total Telecommunication Services | | | | | 98,381,096 |
| | | | | |
Utilities — (0.9%) | | | | | |
*AES Corp. | | 425,099 | | | 5,556,044 |
*Calpine Corp. | | 201,943 | | | 2,269,839 |
Maine & Maritimes Corp. | | 1,600 | | | 58,000 |
*Mirant Corp. | | 172,860 | | | 2,416,583 |
*Public Service Enterprise Group, Inc. | | 175,933 | | | 5,242,803 |
Questar Corp. | | 83,700 | | | 3,334,608 |
#*RRI Energy, Inc. | | 444,750 | | | 2,343,832 |
Unitil Corp. | | 1,800 | | | 37,242 |
| | | | | |
Total Utilities | | | | | 21,258,951 |
| | | | | |
TOTAL COMMON STOCKS | | | | | 2,278,554,755 |
| | | | | |
RIGHTS/WARRANTS — (0.0%) | | | | | |
•*Enterprise Bancorp, Inc. Rights 11/19/09 | | 600 | | | — |
•*Lantronix, Inc. Warrants | | 33 | | | — |
| | | | | |
TOTAL RIGHTS/WARRANTS | | | | | — |
| | | | | |
TEMPORARY CASH INVESTMENTS — (0.5%) | | | | | |
BlackRock Liquidity Funds Tempcash Portfolio - Institutional Shares | | 13,814,176 | | | 13,814,176 |
| | | | | |
63
THE TAX-MANAGED U.S. MARKETWIDE VALUE SERIES
CONTINUED
| | | | | | |
| | | Shares/
Face
Amount | | Value† |
| | | (000) | | |
SECURITIES LENDING COLLATERAL — (8.2%) | | | | | | |
§@DFA Short Term Investment Fund LP | | | 202,493,142 | | $ | 202,493,142 |
@Repurchase Agreement, Deutsche Bank Securities 0.08%, 11/02/09 (Collateralized by $1,886,910 FHLMC 5.793%(r), 01/01/37, valued at $1,059,989) to be repurchased at $1,029,122 | | $ | 1,029 | | | 1,029,115 |
| | | | | | |
TOTAL SECURITIES LENDING COLLATERAL | | | | | | 203,522,257 |
| | | | | | |
TOTAL INVESTMENTS — (100.0%)
(Cost $2,552,893,037) | | | | | $ | 2,495,891,188 |
| | | | | | |
See accompanying Notes to Financial Statements.
64
Report of Independent Registered Public Accounting Firm
To the Board of Trustees and Shareholders of
The DFA Investment Trust Company
We have audited, in accordance with the standards of the Public Company Accounting Oversight Board (United States), the financial statements of The U.S. Large Cap Value Series, The DFA International Value Series, The DFA Emerging Markets Small Cap Series, The Canadian Small Company Series, The Japanese Small Company Series, The United Kingdom Small Company Series, The Continental Small Company Series, The Asia Pacific Small Company Series, The U.S. Large Company Series, The Emerging Markets Series, The Tax-Managed U.S. Equity Series, and The Tax-Managed U.S. Marketwide Value Series (constituting series within The DFA Investment Trust Company, hereafter referred to as the “Series”) as of October 31, 2009, and for the year then ended and have issued our unqualified report thereon dated December 23, 2009 (which report and financial statements are included in Item 1 of this Certified Shareholder Report on Form N-CSR). Our audits included an audit of the Series’ investment portfolios (the “Portfolios”) as of October 31, 2009 appearing in Item 6 of this Form N-CSR. These Portfolios are the responsibility of the Series’ management. Our responsibility is to express an opinion on these Portfolios based on our audits. In our opinion, the Portfolios referred to above, when read in conjunction with the financial statements of the Series referred to above, present fairly, in all material respects, the information set forth therein.
PricewaterhouseCoopers LLP
Philadelphia, Pennsylvania
December 23, 2009
| ITEM 7. | DISCLOSURE OF PROXY VOTING POLICIES AND PROCEDURES FOR CLOSED-END MANAGEMENT INVESTMENT COMPANIES. |
This item is not applicable to the Registrant, which is an open-end management investment company.
| ITEM 8. | PORTFOLIO MANAGERS OF CLOSED-END MANAGEMENT INVESTMENT COMPANIES. |
This item is not applicable to the Registrant, which is an open-end management investment company.
| ITEM 9. | PURCHASES OF EQUITY SECURITIES BY CLOSED-END MANAGEMENT INVESTMENT COMPANY AND AFFILIATED PURCHASERS |
This item is not applicable to the Registrant, which is an open-end management investment company.
| ITEM 10. | SUBMISSION OF MATTERS TO A VOTE OF SECURITY HOLDERS. |
None.
| ITEM 11. | CONTROLS AND PROCEDURES. |
| | (a) | Based on their evaluation of the Registrant’s disclosure controls and procedures as of a date within 90 days of the filing date of this Report, the Registrant’s Principal Executive Officer and Principal Financial Officer believe that the disclosure controls and procedures (as defined in Rule 30a-3(c) under the Investment Company Act of 1940, as amended) are effectively designed to ensure that information required to be disclosed by the Registrant in the Report is recorded, processed, summarized and reported by the filing date, including ensuring that information required to be disclosed in the Report is accumulated and communicated to the Registrant’s officers that are making certifications in the Report, as appropriate, to allow timely decisions regarding required disclosure. The Registrant’s management, including the Principal Executive Officer and the Principal Financial Officer, recognizes that any set of controls and procedures, no matter how well designed and operated, can provide only reasonable assurance of achieving the desired control objectives. |
| | (b) | There were no changes in the Registrant’s internal control over financial reporting (as defined in Rule 30a-3(d) under the Investment Company Act of 1940, as amended) that occurred during the second fiscal quarter of the period covered by |
| | this Report that have materially affected, or are reasonably likely to materially affect, the Registrant’s internal control over financial reporting. |
| | |
(a)(1) | | Code of Ethics is filed herewith. |
| |
(a)(2) | | Certifications pursuant to Section 302 of the Sarbanes-Oxley Act of 2002 are filed herewith. |
| |
(a)(3) | | This item is not applicable. |
| |
(b) | | Certifications pursuant to Section 906 of the Sarbanes-Oxley Act of 2002 are filed herewith. |
SIGNATURES
Pursuant to the requirements of the Securities Exchange Act of 1934 and the Investment Company Act of 1940, the Registrant has duly caused this Report to be signed on its behalf by the undersigned, thereunto duly authorized.
Dimensional Investment Group Inc.
| | |
By: | | /s/ DAVID G. BOOTH |
| | David G. Booth |
| | Chairman, Director, President and |
| | Chief Executive Officer |
Date: January 4, 2010
Pursuant to the requirements of the Securities Exchange Act of 1934 and the Investment Company Act of 1940, this Report has been signed below by the following persons on behalf of the Registrant and in the capacities and on the dates indicated.
| | |
By: | | /s/ DAVID G. BOOTH |
| | David G. Booth |
| | Principal Executive Officer |
| | Dimensional Investment Group Inc. |
Date: January 4, 2010
| | |
By: | | /s/ DAVID R. MARTIN |
| | David R. Martin |
| | Principal Financial Officer |
| | Dimensional Investment Group Inc. |
Date: January 4, 2010