UNITED STATES
SECURITIES AND EXCHANGE COMMISSION
WASHINGTON, D. C. 20549
FORM N-CSR
Investment Company Act file number: 811-06073
Cash Management Portfolio
(Exact Name of Registrant as Specified in Charter)
345 Park Avenue
New York, NY 10154-0004
(Address of Principal Executive Offices) (Zip Code)
Registrant’s Telephone Number, including Area Code: (212) 250-3220
Paul Schubert
60 Wall Street
New York, NY 10005
(Name and Address of Agent for Service)
| Date of fiscal year end: | 12/31 |
| | |
| Date of reporting period: | 12/31/2015 |
| ITEM 1. | REPORT TO STOCKHOLDERS |

December 31, 2015
Annual Report
to Shareholders
Cash Management Fund
Institutional Shares

Contents
Cash Management Fund 3 Portfolio Management Review 7 Statement of Assets and Liabilities 8 Statement of Operations 9 Statement of Changes in Net Assets 10 Financial Highlights 11 Notes to Financial Statements 17 Report of Independent Registered Public Accounting Firm 18 Information About Your Fund's Expenses 19 Tax Information Cash Management Portfolio 21 Investment Portfolio 34 Statement of Assets and Liabilities 35 Statement of Operations 36 Statement of Changes in Net Assets 37 Financial Highlights 38 Notes to Financial Statements 44 Report of Independent Registered Public Accounting Firm 45 Shareholder Meeting Results 46 Advisory Agreement Board Considerations and Fee Evaluation 51 Board Members and Officers 56 Account Management Resources |
This report must be preceded or accompanied by a prospectus. To obtain a summary prospectus, if available, or prospectus for any of our funds, refer to the Account Management Resources information provided in the back of this booklet. We advise you to consider the fund's objectives, risks, charges and expenses carefully before investing. The summary prospectus and prospectus contain this and other important information about the fund. Please read the prospectus carefully before you invest.
An investment in this fund is not insured or guaranteed by the Federal Deposit Insurance Corporation (FDIC) or by any other government agency. Although the fund seeks to preserve the value of your investment at $1.00 per share, it is possible to lose money by investing in the fund. The share price of money market funds can fall below the $1.00 share price. You should not rely on or expect the Advisor to enter into support agreements or take other actions to maintain the fund's $1.00 share price. The credit quality of the fund's holdings can change rapidly in certain markets, and the default of a single holding could have an adverse impact on the fund's share price. The fund's share price can also be negatively affected during periods of high redemption pressures and/or illiquid markets. The actions of a few large investors of the fund may have a significant adverse effect on the share price of the fund. See the prospectus for specific details regarding the fund's risk profile.
NOT FDIC/NCUA INSURED NO BANK GUARANTEE MAY LOSE VALUE NOT A DEPOSIT NOT INSURED BY ANY FEDERAL GOVERNMENT AGENCY
Portfolio Management Review (Unaudited)
Market Overview
All performance information below is historical and does not guarantee future results. Investment return and principal fluctuate, so your shares may be worth more or less when redeemed. Current performance may differ from performance data shown. Please visit deutscheliquidity.com/US for the fund's most recent month-end performance. The 7-day current yield refers to the income paid by the fund over a 7-day period expressed as an annual percentage rate of the fund's shares outstanding. Yields fluctuate and are not guaranteed.
Investment Objective The fund seeks to provide a high level of current income consistent with liquidity and the preservation of capital. The fund is a feeder fund that invests substantially all of its assets in a "master portfolio," the Cash Management Portfolio, which will invest directly in securities and other instruments. The Cash Management Portfolio has the same investment objective as the fund. |
Over the 12 months ended December 31, 2015, rate levels within the money market yield curve — including short-term money market rates — fluctuated based on varying economic reports, investors' interest rate expectations, geopolitical uncertainty and evolving U.S. Federal Reserve Board (the Fed) statements. In March 2015, the Fed removed the word "patient" from its statement regarding the timing of a possible rate hike. Despite temporary conditions such as the harsh winter weather that many said was to blame for disappointing first-quarter 2015 U.S. gross domestic product (GDP) growth, in April the Fed anticipated that U.S. economic conditions would improve. A second-quarter rebound in U.S. GDP growth set the stage for a possible rate hike as early as September of 2015. In late August, the focus shifted to China, as news of that country’s economic slowdown spurred additional market volatility. In September, the Fed declined to raise rates, citing concerns over China’s stumbling economy. However, in October the comments by the Fed turned more hawkish, not mentioning China but expressing the desire to raise rates at the next Federal Open Market Committee (FOMC) meeting. This set the stage for short-term rates to rise as markets "priced in" an eventual raising of the federal funds rate by 25 basis points in mid-December.

Fund Performance (as of December 31, 2015) Performance is historical and does not guarantee future results. Current performance may be lower or higher than the performance data quoted. An investment in this fund is not insured or guaranteed by the FDIC or by any other government agency. Although the fund seeks to preserve the value of your investment at $1.00 per share, it is possible to lose money by investing in the fund. The share price of money market funds can fall below the $1.00 share price. |
| 7-Day Current Yield |
| December 31, 2015 | .11%* |
| December 31, 2014 | .01%* |
* The investment advisor has agreed to waive fees/reimburse expenses. Without such fee waivers/expense reimbursements, the 7-day current yield would have been lower. Yields are historical, will fluctuate and do not guarantee future performance. The 7-day current yield refers to the income paid by the portfolio over a 7-day period expressed as an annual percentage rate of the fund's shares outstanding. Please visit our Web site at deutscheliquidity.com/US for the product's most recent month-end performance. |
Positive Contributors to Fund Performance
We were able to maintain a competitive yield for the fund during the annual period ended December 31, 2015. We continued to seek ample liquidity, high credit quality and strong diversification across sectors and geographic regions by maintaining a neutral portfolio duration (or interest rate sensitivity). We pursued this strategy in light of the outlook for continued near-zero short-term interest rates and limited money market supply. In addition, we looked to keep the fund's cash position relatively low in order to take advantage of higher yields available from six-month-to-one-year money market securities.
Negative Contributors to Fund Performance
The types of securities that we were investing in tended to have lower yields than issues carrying more risk. We preferred to be cautious during a time of market uncertainty. In the end this cost the fund some yield, but we believe that this represented a prudent approach to preserving principal.
Outlook and Positioning
Within money markets, we believe the current balance of tight supply and heavy demand will most likely persist. These technical market conditions, along with issues surrounding money market reform, should in our view create a steeper money market yield curve, keeping yields low at the short end of the curve. Our current forecast is for the federal funds rate to be raised two to three additional times during 2016. In preparation, we are maintaining a cautious approach, with a shorter duration, an emphasis on short fixed maturities and floating-rate notes, and increased selectivity regarding longer maturities. Our goal, as always, is to maintain ample liquidity, high credit quality and strong diversification across geographic regions and market sectors.
We continue our insistence on the highest credit quality within the fund. We also plan to maintain our conservative investment strategies and standards under the current market conditions. We continue to apply a careful approach to investing on behalf of the fund and to seek competitive yield for our shareholders.
Portfolio Management Team
A group of investment professionals is responsible for the day-to-day management of the fund. These investment professionals have a broad range of experience managing money market funds.
The views expressed reflect those of the portfolio management team only through the end of the period of the report as stated on the cover. The management team's views are subject to change at any time based on market and other conditions and should not be construed as a recommendation. Past performance is no guarantee of future results. Current and future portfolio holdings are subject to risk.
Terms to Know
The yield curve is a graphical representation of how yields on bonds of different maturities compare. Normally, yield curves slant up, as bonds with longer maturities typically offer higher yields than short-term bonds.
GDP, or gross domestic product, is the value of all goods and services produced by a country's economy.
Floating-rate securities are debt instruments with floating-rate coupons that generally reset every 30 to 90 days. While floating-rate loans are senior to equity and fixed-income securities, there is no guaranteed return of principal in case of default. Floating-rate loans often have less interest-rate risk than other fixed-income investments. Floating-rate loans are most often secured assets, generally senior to a company's secured debt and can be transferred to debt holders, providing potential downside potential.
The accompanying notes are an integral part of the financial statements.
Statement of Assets and Liabilities
| as of December 31, 2015 |
| Assets |
| Investment in Cash Management Portfolio, at value | $ 2,202,406,007 |
| Receivable for Fund shares sold | 2,952 |
| Due from Advisor | 453 |
| Other assets | 10,411 |
| Total assets | 2,202,419,823 |
| Liabilities |
| Distributions payable | 6,122 |
| Accrued Trustees' fees | 1,138 |
| Other accrued expenses and payables | 473,265 |
| Total liabilities | 480,525 |
| Net assets, at value | $ 2,201,939,298 |
| Net Assets Consist of |
| Accumulated net realized gain (loss) | (124,196) |
| Paid-in capital | 2,202,063,494 |
| Net assets, at value | $ 2,201,939,298 |
| Net Asset Value |
Institutional Shares Net Asset Value, offering and redemption price per share ($2,201,939,298 ÷ 2,202,139,523 outstanding shares of beneficial interest, $.01 par value, unlimited number of shares authorized) | $ 1.00 |
The accompanying notes are an integral part of the financial statements.
Statement of Operations
| for the year ended December 31, 2015 |
| Investment Income |
Income and expenses allocated from Cash Management Portfolio: Interest | $ 4,162,986 |
| Expenses* | (2,270,943) |
| Net investment income allocated from Cash Management Portfolio | 1,892,043 |
Expenses: Administration fee | 1,621,629 |
| Services to shareholders | 58,446 |
| Service fees | 996,507 |
| Professional fees | 50,690 |
| Reports to shareholders | 31,294 |
| Registration fees | 25,411 |
| Trustees' fees and expenses | 5,020 |
| Other | 12,865 |
| Total expenses before expense reductions | 2,801,862 |
| Expense reductions | (1,165,939) |
| Total expenses after expense reductions | 1,635,923 |
| Net investment income | 256,120 |
| Net realized gain (loss) allocated from Cash Management Portfolio | 30,277 |
| Net increase (decrease) in net assets resulting from operations | $ 286,397 |
* Net of $408,191 Advisor reimbursement allocated from Cash Management Portfolio for the year ended December 31, 2015.
The accompanying notes are an integral part of the financial statements.
Statement of Changes in Net Assets
| Increase (Decrease) in Net Assets | Years Ended December 31, |
| 2015 | 2014 |
Operations: Net investment income | $ 256,120 | $ 151,473 |
| Net realized gain (loss) | 30,277 | 2,337 |
| Net increase (decrease) in net assets resulting from operations | 286,397 | 153,810 |
Distributions to shareholders from: Net investment income | (257,613) | (152,573) |
Fund share transactions: Proceeds from shares sold | 5,505,541,370 | 6,395,570,874 |
| Reinvestment of distributions | 230,399 | 132,776 |
| Payments for shares redeemed | (4,215,113,404) | (7,020,946,718) |
| Net increase (decrease) in net assets from Fund share transactions | 1,290,658,365 | (625,243,068) |
| Increase (decrease) in net assets | 1,290,687,149 | (625,241,831) |
| Net assets at beginning of period | 911,252,149 | 1,536,493,980 |
| Net assets at end of period (including undistributed net investment income of $0 and $0, respectively) | $ 2,201,939,298 | $ 911,252,149 |
| Other Information |
| Shares outstanding at beginning of period | 911,481,158 | 1,536,724,226 |
| Shares sold | 5,505,541,370 | 6,395,570,874 |
| Shares issued to shareholders in reinvestment of distributions | 230,399 | 132,776 |
| Shares redeemed | (4,215,113,404) | (7,020,946,718) |
| Net increase (decrease) in Fund shares | 1,290,658,365 | (625,243,068) |
| Shares outstanding at end of period | 2,202,139,523 | 911,481,158 |
The accompanying notes are an integral part of the financial statements.
Financial Highlights
| Institutional Shares |
| | |
Years Ended December 31, |
| 2015 | 2014 | 2013 | 2012 | 2011 |
| Selected Per Share Data |
| Net asset value, beginning of period | $ 1.00 | $ 1.00 | $ 1.00 | $ 1.00 | $ 1.00 |
Income from investment operations: Net investment income | .000* | .000* | .000* | .000* | .000* |
| Net realized gain (loss) | .000* | .000* | .000* | .000* | .000* |
| Total from investment operations | .000* | .000* | .000* | .000* | .000* |
Less distributions from: Net investment income | (.000)* | (.000)* | (.000)* | (.000)* | (.000)* |
| Net asset value, end of period | $ 1.00 | $ 1.00 | $ 1.00 | $ 1.00 | $ 1.00 |
| Total Return (%)a | .01 | .01 | .01 | .01 | .01 |
| Ratios to Average Net Assets and Supplemental Data |
| Net assets, end of period ($ millions) | 2,202 | 911 | 1,536 | 2,476 | 2,269 |
| Ratio of expenses before expense reductions, including expenses allocated from Cash Management Portfolio (%) | .34 | .34 | .33 | .33 | .33 |
| Ratio of expenses after expense reductions, including expenses allocated from Cash Management Portfolio (%) | .24 | .18 | .21 | .27 | .24 |
| Ratio of net investment income (%) | .02 | .01 | .01 | .01 | .01 |
a Total return would have been lower had certain expenses not been reduced. * Amount is less than $.0005. |
Notes to Financial Statements
A. Organization and Significant Accounting Policies
Cash Management Fund (the "Fund") is a diversified series of DWS Money Market Trust (the "Trust"), which is registered under the Investment Company Act of 1940, as amended (the "1940 Act"), as an open-end management investment company organized as a Massachusetts business trust. The Fund currently offers one class of shares, Institutional Shares, to investors.
The Fund is a feeder fund that seeks to achieve its investment objective by investing substantially all of its investable assets in a master portfolio, the Cash Management Portfolio (the "Portfolio"), an open-end management investment company registered under the 1940 Act and organized as a New York trust advised by Deutsche Investment Management Americas Inc. ("DIMA" or the "Advisor"), an indirect, wholly owned subsidiary of Deutsche Bank AG. A master/feeder fund structure is one in which a fund (a "feeder fund"), instead of investing directly in a portfolio of securities, invests most or all of its investment assets in a separate registered investment company (the "master fund") with substantially the same investment objective and policies as the feeder fund. Such a structure permits the pooling of assets of two or more feeder funds, preserving separate identities or distribution channels at the feeder fund level. At December 31, 2015, the Fund owned approximately 12% of the Portfolio.
The Fund's financial statements are prepared in accordance with accounting principles generally accepted in the United States of America which require the use of management estimates. Actual results could differ from those estimates. The policies described below are followed consistently by the Fund in the preparation of its financial statements. The financial statements of the Portfolio, including the Investment Portfolio, are contained elsewhere in this report and should be read in conjunction with the Fund's financial statements.
Security Valuation. The Fund records its investment in the Portfolio at value, which reflects its proportionate interest in the net assets of the Portfolio. Valuation of the securities held by the Portfolio is discussed in the notes to the Portfolio's financial statements included elsewhere in this report.
Disclosure about the classification of fair value measurements is included in a table following the Portfolio's Investment Portfolio.
Federal Income Taxes. The Fund's policy is to comply with the requirements of the Internal Revenue Code, as amended, which are applicable to regulated investment companies, and to distribute all of its taxable income to its shareholders.
Under the Regulated Investment Company Modernization Act of 2010, net capital losses incurred post-enactment may be carried forward indefinitely, and their character is retained as short-term and/or long-term. Previously, net capital losses were carried forward for eight years and treated as short-term losses. As a transition rule, the Act requires that post-enactment net capital losses be used before pre-enactment net capital losses.
At December 31, 2015, the Fund had a net tax basis capital loss carryforward of approximately $123,000 of pre-enactment losses, which may be applied against any realized net taxable capital gains of each succeeding year until fully utilized or until December 31, 2016, the expiration date, whichever occurs first.
From November 1, 2015 through December 31, 2015, the Fund elects to defer qualified late year losses of approximately $700 of net short-term realized capital losses, and treat them as arising in the fiscal year ending December 31, 2016.
The Fund has reviewed the tax positions for the open tax years as of December 31, 2015 and has determined that no provision for income tax and/or uncertain tax provisions is required in the Fund's financial statements. The Fund's federal tax returns for the prior three fiscal years remain open subject to examination by the Internal Revenue Service.
Distribution of Income and Gains. Net investment income of the Fund is declared as a daily dividend and is distributed to shareholders monthly. The Fund may take into account capital gains and losses in its daily dividend declarations. The Fund may also make additional distributions for tax purposes if necessary.
Permanent book and tax differences relating to shareholder distributions will result in reclassifications to paid in capital. Temporary book and tax differences will reverse in a subsequent period. There were no significant book to tax differences for the Fund.
At December 31, 2015, the Fund's components of distributable earnings (accumulated losses) on a tax basis were as follows:
| Capital loss carryforward | $ (123,000) |
In addition, the tax character of distributions paid to shareholders by the Fund is summarized as follows:
| | Years Ended December 31, |
| | 2015 | 2014 |
| Distributions from ordinary income* | $ 257,613 | $ 152,573 |
* For tax purposes, short-term capital gain distributions are considered ordinary income distributions.
Contingencies. In the normal course of business, the Fund may enter into contracts with service providers that contain general indemnification clauses. The Fund's maximum exposure under these arrangements is unknown as this would involve future claims that may be made against the Fund that have not yet been made. However, based on experience, the Fund expects the risk of loss to be remote.
Other. The Fund receives an allocation of the Portfolio's net investment income and net realized gains and losses in proportion to its investment in the Portfolio. Expenses directly attributed to a fund are charged to that fund, while expenses which are attributable to the Trust are allocated among the funds in the Trust on the basis of relative net assets.
B. Fees and Transactions with Affiliates
Management Agreement. Under the Investment Management Agreement with Deutsche Investment Management Americas Inc. ("DIMA" or the "Advisor"), an indirect, wholly owned subsidiary of Deutsche Bank AG, the Advisor serves as the investment manager to the Fund. The Advisor receives a management fee from the Portfolio pursuant to the master/feeder structure listed above in Note A.
Administration Fee. Pursuant to an Administrative Services Agreement, DIMA provides most administrative services to the Fund. For all services provided under the Administrative Services Agreement, the Fund pays the Advisor an annual fee ("Administration Fee") of 0.10% of the Fund's average daily net assets, computed and accrued daily and payable monthly.
For the period from January 1, 2015 through September 30, 2016, DIMA has contractually agreed to waive its fees and/or reimburse certain operating expenses of the Fund, including expenses of the Portfolio allocated to the Fund, to the extent necessary to maintain the total annual operating expenses (excluding certain expenses such as extraordinary expenses, taxes, brokerage and interest) at 0.30% of the Fund's average daily net assets.
In addition, the Advisor has agreed to voluntarily waive additional expenses. The waiver may be changed or terminated at any time without notice. Under this arrangement, the Advisor waived certain expenses of the Fund.
For the year ended December 31, 2015, the Administration Fee was $1,621,629, of which $115,190 was waived and $286,015 is unpaid.
Service Provider Fees. DeAWM Service Company ("DSC"), an affiliate of the Advisor, is the transfer agent, dividend-paying agent and shareholder service agent for the Fund. Pursuant to a sub-transfer agency agreement between DSC and DST Systems, Inc. ("DST"), DSC has delegated certain transfer agent, dividend-paying agent and shareholder service agent functions to DST. DSC compensates DST out of the shareholder servicing fee it receives from the Fund. For the year ended December 31, 2015, the amount charged to the Fund by DSC aggregated $54,242, all of which was waived.
Shareholder Servicing Fee. DeAWM Distributors, Inc. ("DDI"), an affiliate of the Advisor, provides information and administrative services for a fee ("Service Fee") to shareholders at an annual rate of up to 0.25% of average daily net assets. DDI in turn has various agreements with financial services firms that provide these services and pays these fees based upon the assets of shareholder accounts the firm services. For the year ended December 31, 2015, the Service Fee was as follows:
| | Total Aggregated | Waived | Annual Effective Rate |
| Cash Management Fund | $ 996,507 | $ 996,507 | .00% |
Typesetting and Filing Service Fees. Under an agreement with DIMA, DIMA is compensated for providing typesetting and certain regulatory filing services to the Fund. For the year ended December 31, 2015, the amount charged to the Fund by DIMA included in the Statement of Operations under "Reports to shareholders" aggregated $17,560, of which $7,592 is unpaid.
Trustees' Fees and Expenses. The Fund paid retainer fees to each Trustee not affiliated with the Advisor, plus specified amounts to the Board Chairperson and Vice Chairperson and to each committee Chairperson.
C. Concentration of Ownership
From time to time, the Fund may have a concentration of several shareholder accounts holding a significant percentage of shares outstanding. Investment activities of these shareholders could have a material impact on the Fund.
At December 31, 2015, there were two shareholder accounts that each held approximately 64% and 15% of the outstanding shares of the Fund, respectively.
D. Additional Information
Effective on or about May 2, 2016, the Fund will operate as a government money market fund under the amendments to Rule 2a-7 under the Investment Company Act of 1940, as amended, that were adopted in July 2014 with final compliance dates ranging between July 2015 and October 2016. As currently structured, on the final compliance date for the Rule 2a-7 amendments, the Fund would be required to implement a floating net asset value and would be allowed, and in certain situations, required, to implement liquidity fees and/or redemption gates. As a government money market fund, the Fund will continue to seek to maintain a stable $1.00 net asset value (although the Fund will seek to maintain a $1.00 net asset value, there is no guarantee that it will be able to do so and if the net asset value falls below $1.00, you would lose money) and the Fund will not be required to implement liquidity fees and/or redemption gates. As a government money market fund, the Fund will invest at least 99.5% of the Fund’s total assets in cash, US government securities, and/or repurchase agreements that are collateralized by these same securities.
In order for the Fund to operate as a government money market fund, shareholders approved revisions to the Fund’s fundamental investment policy relating to concentration (the "Concentration Policy") such that the Fund would no longer be required to invest more than 25% of its total assets in obligations of banks and other financial institutions. If not revised, the current Concentration Policy would have precluded the Fund from operating as a government money market fund. The Fund is a "feeder" fund that pursues its investment objective by investing substantially all of its assets in a "master portfolio," the Cash Management Portfolio (the "Portfolio"), under a master-feeder structure. The Portfolio invests directly in securities and other instruments and the Fund has the same investment objective and policies as the Portfolio. Effective on or about May 2, 2016, the Portfolio will also operate as a government money market fund.
In addition to the revised Concentration Policy, the following changes to the Fund for it to operate as a government money market fund will also take effect on May 2, 2016:
(i) A revised investment objective, as follows:
"The fund seeks maximum current income to the extent consistent with stability of principal."
(ii) The adoption of a principal investment strategy to invest at least 99.5% of the Fund’s total assets in cash, government securities, and/or repurchase agreements that are collateralized by these same securities.
(iii) Name changes, as follows:
| Current Name | | New Name |
| Cash Management Portfolio | | Government Cash Management Portfolio |
| DWS Money Market Trust | | Deutsche Money Market Trust |
| Cash Management Fund | | Deutsche Government Cash Management Fund |
(iv) The adoption of a principal investment strategy to invest a least 80% of net assets, plus the amount of any borrowings for investment purposes, in government securities and/or repurchase agreements that are collateralized by government securities; and
(v) A reduction in the management fee rate paid by the Portfolio to DIMA, the investment advisor to the Fund and the Portfolio. Pursuant to the master-feeder structure noted above, DIMA receives a management fee from the Portfolio.
To ensure an orderly transition to a government money market fund, DIMA anticipates that it will begin to gradually implement changes to the Portfolio beginning in the first quarter of 2016. As a result, it is expected that the Portfolio gradually will allocate a larger percentage of its assets to government securities over time until it reaches its new allocation on or about May 2, 2016. Because the yields on government securities generally may be expected to be lower than the yields on comparable non-government securities, it should be expected that the Fund's yield may decrease as more assets are invested in government securities.
Report of Independent Registered Public Accounting Firm
To the Board of Trustees of DWS Money Market Trust and Shareholders of Cash Management Fund:
In our opinion, the accompanying statement of assets and liabilities and the related statements of operations and of changes in net assets and the financial highlights present fairly, in all material respects, the financial position of Cash Management Fund ( the "Fund") at December 31, 2015, and the results of its operations, the changes in its net assets and the financial highlights for each of the periods indicated therein, in conformity with accounting principles generally accepted in the United States of America. These financial statements and financial highlights (hereafter referred to as "financial statements") are the responsibility of the Fund's management. Our responsibility is to express an opinion on these financial statements based on our audits. We conducted our audits of these financial statements in accordance with the standards of the Public Company Accounting Oversight Board (United States). Those standards require that we plan and perform the audits to obtain reasonable assurance about whether the financial statements are free of material misstatement. An audit includes examining, on a test basis, evidence supporting the amounts and disclosures in the financial statements, assessing the accounting principles used and significant estimates made by management, and evaluating the overall financial statement presentation. We believe that our audits, which included confirmation of securities at December 31, 2015 by correspondence with the transfer agent, provide a reasonable basis for our opinion.
Boston, Massachusetts
February 23, 2016 | PricewaterhouseCoopers LLP |
Information About Your Fund's Expenses
As an investor of the Fund, you incur two types of costs: ongoing expenses and transaction costs. Ongoing expenses include management fees and other Fund expenses. Examples of transaction costs include account maintenance fees, which are not shown in this section. The following tables are intended to help you understand your ongoing expenses (in dollars) of investing in the Fund and to help you compare these expenses with the ongoing expenses of investing in other mutual funds. In the most recent six-month period, the Fund limited these expenses; had it not done so, expenses would have been higher. The example in the table is based on an investment of $1,000 invested at the beginning of the six-month period and held for the entire period (July 1, 2015 to December 31, 2015).
The tables illustrate your Fund's expenses in two ways:
— Actual Fund Return. This helps you estimate the actual dollar amount of ongoing expenses (but not transaction costs) paid on a $1,000 investment in the Fund using the Fund's actual return during the period. To estimate the expenses you paid over the period, simply divide your account value by $1,000 (for example, an $8,600 account value divided by $1,000 = 8.6), then multiply the result by the number in the "Expenses Paid per $1,000" line under the share class you hold.
— Hypothetical 5% Fund Return. This helps you to compare your Fund's ongoing expenses (but not transaction costs) with those of other mutual funds using the Fund's actual expense ratio and a hypothetical rate of return of 5% per year before expenses. Examples using a 5% hypothetical fund return may be found in the shareholder reports of other mutual funds. The hypothetical account values and expenses may not be used to estimate the actual ending account balance or expenses you paid for the period.
Please note that the expenses shown in these tables are meant to highlight your ongoing expenses only and do not reflect any transaction costs. The "Expenses Paid per $1,000" line of the tables is useful in comparing ongoing expenses only and will not help you determine the relative total expense of owning different funds. If these transaction costs had been included, your costs would have been higher.
Expenses and Value of a $1,000 Investment
for the six months ended December 31, 2015 (Unaudited) |
| Actual Fund Return* | Institutional Shares |
| Beginning Account Value 7/1/15 | $ 1,000.00 |
| Ending Account Value 12/31/15 | $ 1,000.09 |
| Expenses Paid per $1,000** | $ 1.31 |
| Hypothetical 5% Fund Return* | Institutional Shares |
| Beginning Account Value 7/1/15 | $ 1,000.00 |
| Ending Account Value 12/31/15 | $ 1,023.89 |
| Expenses Paid per $1,000** | $ 1.33 |
* Expenses include amounts allocated proportionally from the master portfolio.
** Expenses are equal to the Fund's annualized expense ratio, multiplied by the average account value over the period, multiplied by 184 (the number of days in the most recent six-month period), then divided by 365.
| Annualized Expense Ratio | Institutional Shares |
| Cash Management Fund | .26% |
For more information, please refer to the Fund's prospectus.
For an analysis of the fees associated with an investment in the Fund or similar funds, please refer to http://apps.finra.org/fundanalyzer/1/fa.aspx.
Tax Information (Unaudited)
A total of 2.60% of the dividends distributed during the fiscal year was derived from interest on U.S. government securities, which is generally exempt from state income tax.
Please contact a tax advisor if you have questions about federal or state income tax laws, or on how to prepare your tax returns. If you have specific questions about your account, please call (800) 728-3337.
(The following financial statements of the Cash Management Portfolio should be read in conjunction with the Fund's financial statements.)
Investment Portfolio as of December 31, 2015
| | Principal Amount ($) | Value ($) |
| | | | |
| Certificates of Deposit and Bank Notes 22.2% |
| Banco del Estado de Chile: |
| | 0.52%, 2/29/2016 | 25,000,000 | 25,000,000 |
| | 0.57%, 4/28/2016 | 110,600,000 | 110,600,000 |
| | 0.652%, 2/29/2016 | 75,000,000 | 75,000,000 |
| Bank of Montreal: |
| | 0.3%, 1/4/2016 | 108,500,000 | 108,500,000 |
| | 0.389%, 1/7/2016 | 95,000,000 | 95,000,000 |
| | 0.56%, 4/18/2016 | 65,000,000 | 65,000,000 |
| Bank of Nova Scotia: |
| | 0.55%, 3/18/2016 | 45,000,000 | 45,000,000 |
| | 0.612%, 4/28/2016 | 38,500,000 | 38,500,000 |
| Canadian Imperial Bank of Commerce, 0.65%, 6/30/2016 | 106,075,000 | 106,075,000 |
| Citibank NA, 0.37%, 1/8/2016 | 6,813,000 | 6,813,000 |
| Cooperatieve Centrale Raiffeisen-Boerenleenbank BA: |
| | 0.43%, 3/4/2016 | 125,800,000 | 125,800,000 |
| | 0.497%, 4/14/2016 | 187,000,000 | 187,000,000 |
| Dexia Credit Local: |
| | 0.431%, 5/4/2016 | 100,000,000 | 100,000,000 |
| | 144A, 0.432%, 2/26/2016 | 28,500,000 | 28,500,000 |
| DZ Bank AG: |
| | 0.36%, 1/4/2016 | 86,587,000 | 86,587,000 |
| | 0.38%, 1/29/2016 | 171,715,000 | 171,715,000 |
| | 0.4%, 2/11/2016 | 119,000,000 | 119,000,000 |
| | 0.45%, 12/15/2016 | 25,000,000 | 25,000,000 |
| Mitsubishi UFJ Trust & Banking Corp.: |
| | 0.38%, 1/19/2016 | 50,000,000 | 50,000,000 |
| | 0.46%, 3/17/2016 | 88,500,000 | 88,500,000 |
| Mizuho Bank Ltd.: |
| | 0.29%, 1/20/2016 | 34,000,000 | 34,000,000 |
| | 0.29%, 1/29/2016 | 123,500,000 | 123,500,000 |
| | 0.3%, 2/11/2016 | 85,000,000 | 85,000,000 |
| | 0.4%, 2/17/2016 | 115,000,000 | 115,000,000 |
| Nordea Bank Finland PLC: |
| | 0.3%, 2/8/2016 | 200,000,000 | 200,000,000 |
| | 0.45%, 3/18/2016 | 136,500,000 | 136,500,000 |
| | 0.467%, 2/12/2016 | 200,000,000 | 200,000,000 |
| | 0.487%, 5/13/2016 | 100,000,000 | 100,000,000 |
| | 0.5%, 3/9/2016 | 33,000,000 | 33,000,000 |
| Norinchukin Bank, 0.31%, 1/19/2016 | 110,000,000 | 110,001,645 |
| Royal Bank of Canada, 0.71%, 5/2/2016 | 92,500,000 | 92,500,000 |
| Sumitomo Mitsui Banking Corp.: |
| | 0.35%, 2/12/2016 | 50,000,000 | 50,000,000 |
| | 0.4%, 2/18/2016 | 100,000,000 | 100,000,000 |
| | 0.54%, 3/16/2016 | 85,500,000 | 85,500,000 |
| Svenska Handelsbanken AB: |
| | 0.491%, 4/15/2016 | 125,000,000 | 125,000,000 |
| | 0.495%, 2/29/2016 | 120,000,000 | 120,000,981 |
| Swedbank AB, 0.453%, 3/10/2016 | 125,000,000 | 125,000,000 |
| Toronto-Dominion Bank: |
| | 0.43%, 3/2/2016 | 141,000,000 | 141,000,000 |
| | 0.65%, 4/28/2016 | 110,000,000 | 110,000,000 |
| Wells Fargo Bank NA: |
| | 0.394%, 6/3/2016 | 50,000,000 | 50,000,000 |
| | 0.457%, 4/11/2016 | 63,000,000 | 63,000,000 |
| Westpac Banking Corp., 0.552%, 5/27/2016 | 135,000,000 | 135,000,000 |
| Total Certificates of Deposit and Bank Notes (Cost $3,991,592,626) | 3,991,592,626 |
| |
| Commercial Paper 34.0% |
| Issued at Discount** 21.7% |
| Albion Capital LLC, 0.35%, 1/20/2016 | 106,900,000 | 106,880,253 |
| Bank Nederlandse Gemeenten, 0.381%, 3/4/2016 | 142,000,000 | 141,905,570 |
| Caisse Centrale Desjardins du Quebec, 0.37%, 2/2/2016 | 82,000,000 | 81,973,031 |
| Caisse des Depots et Consignations: |
| | 0.31%, 2/16/2016 | 150,000,000 | 149,940,583 |
| | 0.346%, 3/15/2016 | 47,000,000 | 46,966,669 |
| Chevron Corp., 0.4%, 2/5/2016 | 74,400,000 | 74,371,067 |
| China Construction Bank Corp., 0.42%, 1/4/2016 | 17,000,000 | 16,999,405 |
| Coca-Cola Co., 0.511%, 3/18/2016 | 72,500,000 | 72,420,915 |
| Collateralized Commercial Paper II Co., LLC: |
| | 0.481%, 4/6/2016 | 71,270,000 | 71,178,774 |
| | 0.481%, 4/5/2016 | 65,000,000 | 64,917,667 |
| | 0.481%, 4/20/2016 | 100,000,000 | 99,853,333 |
| Cooperatieve Centrale Raiffeisen-Boerenleenbank BA, 0.416%, 3/14/2016 | 50,000,000 | 49,957,924 |
| CPPIB Capital, Inc., 0.3%, 2/3/2016 | 23,763,000 | 23,756,465 |
| Crown Point Capital Co., LLC, 0.621%, 3/14/2016 | 50,000,000 | 49,937,139 |
| DBS Bank Ltd.: |
| | 0.28%, 1/5/2016 | 70,000,000 | 69,997,822 |
| | 0.34%, 1/28/2016 | 50,000,000 | 49,987,250 |
| Erste Abwicklungsanstalt: |
| | 0.33%, 2/3/2016 | 43,500,000 | 43,486,841 |
| | 0.33%, 2/18/2016 | 20,000,000 | 19,991,200 |
| | 0.33%, 3/7/2016 | 55,000,000 | 54,966,725 |
| | 0.531%, 4/4/2016 | 107,000,000 | 106,851,924 |
| Export Development Canada, 0.381%, 1/11/2016 | 68,980,000 | 68,972,719 |
| Exxon Mobil Corp.: |
| | 0.4%, 1/19/2016 | 58,000,000 | 57,988,400 |
| | 0.45%, 2/1/2016 | 155,000,000 | 154,939,937 |
| Gotham Funding Corp.: |
| | 0.4%, 1/11/2016 | 75,000,000 | 74,991,667 |
| | 0.4%, 1/15/2016 | 57,500,000 | 57,491,056 |
| Kells Funding LLC: |
| | 0.32%, 3/8/2016 | 50,000,000 | 49,970,222 |
| | 0.37%, 2/2/2016 | 43,459,000 | 43,445,866 |
| | 144A, 0.401%, 3/14/2016 | 145,000,000 | 144,882,389 |
| | 144A, 0.401%, 1/8/2016 | 50,000,000 | 49,996,111 |
| | 0.431%, 3/14/2016 | 5,000,000 | 4,995,640 |
| Manhattan Asset Funding Co., LLC: |
| | 0.27%, 1/11/2016 | 40,000,000 | 39,997,000 |
| | 0.38%, 1/27/2016 | 32,000,000 | 31,991,218 |
| | 0.48%, 1/28/2016 | 1,536,000 | 1,535,447 |
| MetLife Short Term Funding LLC: |
| | 0.23%, 1/4/2016 | 4,700,000 | 4,699,910 |
| | 0.401%, 4/29/2016 | 80,000,000 | 79,894,222 |
| Microsoft Corp., 0.19%, 1/6/2016 | 57,950,000 | 57,948,471 |
| Nestle Capital Corp., 0.27%, 2/26/2016 | 142,000,000 | 141,940,360 |
| Nieuw Amsterdam Receivables Corp., 0.24%, 1/19/2016 | 36,267,000 | 36,262,648 |
| Nordea Bank AB, 0.305%, 2/8/2016 | 9,000,000 | 8,997,103 |
| Old Line Funding LLC: |
| | 0.481%, 4/12/2016 | 40,000,000 | 39,945,600 |
| | 0.521%, 4/29/2016 | 60,000,000 | 59,896,867 |
| | 144A, 0.552%, 5/16/2016 | 150,000,000 | 149,688,333 |
| | 0.652%, 5/2/2016 | 62,500,000 | 62,362,326 |
| PSP Capital, Inc, 0.23%, 1/22/2016 | 7,600,000 | 7,598,980 |
| PSP Capital, Inc., 0.42%, 1/8/2016 | 32,200,000 | 32,197,370 |
| Regency Markets No. 1 LLC: |
| | 0.45%, 1/20/2016 | 65,000,000 | 64,984,562 |
| | 0.47%, 1/27/2016 | 37,763,000 | 37,750,182 |
| Sinopec Century Bright Capital Investment Ltd.: |
| | 0.5%, 1/8/2016 | 22,500,000 | 22,497,812 |
| | 0.5%, 1/11/2016 | 127,600,000 | 127,582,278 |
| Standard Chartered Bank: |
| | 0.401%, 1/13/2016 | 150,000,000 | 149,980,000 |
| | 0.42%, 1/8/2016 | 145,000,000 | 144,988,158 |
| | 0.501%, 4/5/2016 | 100,000,000 | 99,868,056 |
| Swedbank AB, 0.366%, 2/1/2016 | 44,000,000 | 43,986,171 |
| Total Capital Canada Ltd., 0.21%, 1/4/2016 | 404,000 | 403,993 |
| Victory Receivables Corp.: |
| | 0.4%, 1/15/2016 | 54,407,000 | 54,398,537 |
| | 0.41%, 1/20/2016 | 26,638,000 | 26,632,236 |
| Walt Disney Co.: |
| | 0.19%, 1/25/2016 | 100,000,000 | 99,987,333 |
| | 0.3%, 2/25/2016 | 50,000,000 | 49,977,083 |
| Working Capital Management Co.: |
| | 0.44%, 1/20/2016 | 67,000,000 | 66,984,441 |
| | 0.45%, 1/15/2016 | 50,000,000 | 49,991,250 |
| | 3,898,982,511 |
| Issued at Par 12.3% |
| Australia & New Zealand Banking Group Ltd., 0.441%, 1/15/2016 | 50,000,000 | 50,000,014 |
| Bank Nederlandse Gemeenten: |
| | 0.439%, 5/6/2016 | 87,000,000 | 87,000,000 |
| | 0.522%, 2/25/2016 | 100,000,000 | 100,000,000 |
| Bank of Nova Scotia, 0.57%, 2/12/2016 | 183,800,000 | 183,800,000 |
| Bedford Row Funding Corp.: |
| | 0.351%, 1/14/2016 | 28,000,000 | 28,000,000 |
| | 0.416%, 4/8/2016 | 40,000,000 | 40,000,000 |
| | 144A, 0.517%, 4/12/2016 | 90,500,000 | 90,500,000 |
| | 144A, 0.525%, 3/14/2016 | 15,500,000 | 15,500,000 |
| BNZ International Funding Ltd., 0.497%, 6/14/2016 | 15,000,000 | 15,000,000 |
| Commonwealth Bank of Australia: |
| | 0.379%, 4/7/2016 | 82,000,000 | 81,998,639 |
| | 0.389%, 5/6/2016 | 100,000,000 | 99,997,783 |
| | 0.396%, 4/29/2016 | 38,000,000 | 37,998,847 |
| | 0.396%, 5/4/2016 | 75,000,000 | 75,000,000 |
| | 0.42%, 3/4/2016 | 36,000,000 | 36,000,000 |
| | 144A, 0.532%, 3/29/2016 | 23,000,000 | 22,996,171 |
| Crown Point Capital Co., LLC, 0.722%, 8/25/2016 | 142,800,000 | 142,800,000 |
| Erste Abwicklungsanstalt: |
| | 0.411%, 3/4/2016 | 80,000,000 | 79,999,169 |
| | 0.511%, 3/17/2016 | 120,000,000 | 119,997,494 |
| | 144A, 0.552%, 1/19/2016 | 41,000,000 | 41,000,000 |
| | 144A, 0.562%, 4/19/2016 | 68,250,000 | 68,249,508 |
| HSBC Bank PLC, 144A, 0.678%, 6/24/2016 | 113,250,000 | 113,250,000 |
| Macquarie Bank Ltd., 0.652%, 3/21/2016 | 70,000,000 | 70,000,000 |
| Nederlandse Waterschapsbank NV, 144A, 0.53%, 3/18/2016 | 117,500,000 | 117,500,000 |
| Old Line Funding LLC: |
| | 144A, 0.487%, 5/6/2016 | 50,000,000 | 50,000,000 |
| | 144A, 0.496%, 2/8/2016 | 100,000,000 | 100,000,000 |
| | 144A, 0.613%, 3/22/2016 | 66,000,000 | 66,000,000 |
| Thunder Bay Funding LLC: |
| | 0.476%, 3/8/2016 | 20,000,000 | 20,000,000 |
| | 0.517%, 4/12/2016 | 69,000,000 | 69,000,000 |
| Westpac Banking Corp., 144A, 0.53%, 3/18/2016 | 200,000,000 | 200,000,000 |
| | 2,221,587,625 |
| Total Commercial Paper (Cost $6,120,570,136) | 6,120,570,136 |
| Government & Agency Obligations 9.7% |
| U.S. Government Sponsored Agencies 6.5% |
| Federal Farm Credit Bank: |
| | 0.224%*, 3/3/2016 | 35,000,000 | 35,000,000 |
| | 0.346%*, 2/8/2017 | 15,000,000 | 15,000,000 |
| | 0.382%*, 5/20/2016 | 75,000,000 | 75,000,466 |
| Federal Home Loan Bank: |
| | 0.18%**, 3/1/2016 | 15,000,000 | 14,995,500 |
| | 0.22%**, 4/5/2016 | 29,500,000 | 29,482,874 |
| | 0.23%**, 1/20/2016 | 15,000,000 | 14,998,179 |
| | 0.24%**, 4/4/2016 | 50,000,000 | 49,968,667 |
| | 0.251%**, 3/7/2016 | 43,000,000 | 42,980,291 |
| | 0.255%**, 2/9/2016 | 50,000,000 | 49,986,188 |
| | 0.26%**, 4/11/2016 | 25,000,000 | 24,981,764 |
| | 0.264%*, 10/7/2016 | 7,500,000 | 7,500,000 |
| | 0.27%**, 2/16/2016 | 25,000,000 | 24,991,375 |
| | 0.305%**, 2/29/2016 | 20,000,000 | 19,990,003 |
| | 0.311%**, 6/28/2016 | 50,000,000 | 49,922,931 |
| | 0.341%**, 4/18/2016 | 50,000,000 | 49,949,000 |
| | 0.38%**, 3/22/2016 | 25,000,000 | 24,978,625 |
| | 0.391%**, 7/15/2016 | 25,000,000 | 24,946,917 |
| | 0.392%*, 8/26/2016 | 25,000,000 | 25,000,000 |
| | 0.4%**, 7/1/2016 | 80,000,000 | 79,838,222 |
| | 0.445%**, 2/26/2016 | 32,700,000 | 32,677,364 |
| | 0.471%**, 6/13/2016 | 25,000,000 | 24,946,472 |
| | 0.476%**, 3/9/2016 | 28,609,000 | 28,583,331 |
| | 0.501%**, 6/13/2016 | 75,000,000 | 74,829,169 |
| Federal Home Loan Mortgage Corp.: |
| | 0.2%**, 2/23/2016 | 20,000,000 | 19,994,111 |
| | 0.23%**, 1/12/2016 | 27,500,000 | 27,498,067 |
| | 0.235%**, 4/15/2016 | 21,000,000 | 20,985,607 |
| | 0.511%**, 4/27/2016 | 150,000,000 | 149,751,375 |
| Federal National Mortgage Association: |
| | 0.225%**, 5/23/2016 | 25,000,000 | 24,977,656 |
| | 0.255%**, 2/2/2016 | 26,500,000 | 26,493,993 |
| | 0.422%*, 7/20/2017 | 80,000,000 | 79,993,717 |
| | 1,170,241,864 |
| U.S. Treasury Obligations 3.2% |
| U.S. Treasury Bills: |
| | 0.117%**, 2/11/2016 | 125,000,000 | 124,983,344 |
| | 0.24%**, 2/25/2016 | 25,000,000 | 24,990,833 |
| U.S. Treasury Floating Rate Notes, 0.428%*, 10/31/2017 | 100,000,000 | 99,944,515 |
| U.S. Treasury Notes: |
| | 0.25%, 4/15/2016 | 12,500,000 | 12,496,131 |
| | 0.25%, 5/15/2016 | 45,000,000 | 45,008,955 |
| | 0.375%, 3/15/2016 | 75,000,000 | 75,033,232 |
| | 0.625%, 7/15/2016 | 25,000,000 | 25,044,613 |
| | 2.0%, 1/31/2016 | 50,000,000 | 50,073,604 |
| | 2.0%, 4/30/2016 | 25,000,000 | 25,139,036 |
| | 4.5%, 2/15/2016 | 100,000,000 | 100,535,070 |
| | 583,249,333 |
| Total Government & Agency Obligations (Cost $1,753,491,197) | 1,753,491,197 |
| |
| Short-Term Notes 4.0% |
| Bank of Nova Scotia: |
| | 0.912%*, 3/15/2016 | 1,100,000 | 1,100,570 |
| | 2.9%, 3/29/2016 | 18,000,000 | 18,101,271 |
| GE Capital International Funding Co.: |
| | 144A, 0.964%, 4/15/2016 | 227,289,000 | 227,589,900 |
| | 0.964%, 4/15/2016 | 217,500,000 | 217,750,999 |
| General Electric Capital Corp.: |
| | 0.551%*, 1/14/2016 | 20,500,000 | 20,501,417 |
| | 1.0%, 1/8/2016 | 17,843,000 | 17,844,970 |
| | 1.214%*, 5/9/2016 | 1,000,000 | 1,003,027 |
| | 2.95%, 5/9/2016 | 24,659,000 | 24,866,367 |
| Home Depot, Inc., 5.4%, 3/1/2016 | 67,299,000 | 67,838,287 |
| JPMorgan Chase Bank NA, 0.48%*, 11/22/2016 | 45,750,000 | 45,750,000 |
| Province of Ontario Canada, 4.75%, 1/19/2016 | 25,000,000 | 25,054,768 |
| Wal-Mart Stores, Inc., 5.313%*, 6/1/2016 | 55,000,000 | 56,124,032 |
| Total Short-Term Notes (Cost $723,525,608) | 723,525,608 |
| |
| Municipal Bonds and Notes 3.3% |
| Catawba County, NC, Hospital Revenue, Valley Medical Center, 144A, 0.4%***, 10/1/2034, LOC: Branch Banking & Trust | 2,500,000 | 2,500,000 |
| Georgia, JPMorgan Chase Putters/Drivers Trust, Series SGT05, 0.45%***, 1/1/2035, INS: FGIC, NATL, LIQ: Societe Generale, LOC: Societe Generale | 22,000,000 | 22,000,000 |
| Los Angeles, CA, Metro Transportation Authority, TECP, 0.3%, 1/4/2016, LOC: Sumitomo Mitsui Banking | 22,500,000 | 22,500,000 |
| Metropolitan Government Nashville & Davidson County, TN, Vanderbilt University, TECP, 0.15%, 2/22/2016 | 15,000,000 | 15,000,000 |
| Michigan, State Finance Authority Revenue, School Loan, Series B, 0.35%***, 9/1/2050, LOC: PNC Bank NA | 10,000,000 | 10,000,000 |
| Minnesota, State Office of Higher Education Revenue, Supplementary Student, Series A, 0.4%***, 12/1/2043, LOC: U.S. Bank NA | 11,500,000 | 11,500,000 |
| New Hampshire, State Health & Education Facilities Authority Revenue, Higher Education Loan Corp., Series A, 0.38%***, 12/1/2032, LOC: Royal Bank of Canada | 13,961,000 | 13,961,000 |
| New Jersey, RBC Municipal Products, Inc. Trust, Series E-60, 144A, 0.42%***, 6/28/2016, LOC: Royal Bank of Canada | 152,500,000 | 152,500,000 |
| New Jersey, State Housing & Mortgage Finance Agency, Multi-Family Housing Revenue, Series C, 0.35%***, 11/1/2039, LOC: Bank of America NA | 9,570,000 | 9,570,000 |
| New York, State Housing Finance Agency Revenue, 605 West 42nd Street, Series B, 144A, 0.45%***, 5/1/2048, LOC: Bank of China | 125,010,000 | 125,010,000 |
| New York, State Housing Finance Agency Revenue, 88 Leonard Street, Series A, 144A, 0.42%***, 11/1/2037, LOC: Landesbank Hessen-Thuringen | 11,750,000 | 11,750,000 |
| New York, State Housing Finance Agency Revenue, BAM South Housing, Series B, 144A, 0.4%***, 11/1/2048, LOC: JPMorgan Chase Bank NA | 12,500,000 | 12,500,000 |
| New York City, NY, Municipal Water Finance Authority, Water & Sewer Systems Revenue, Series TR-T30001-I, 144A, 0.41%***, 6/15/2044 | 8,000,000 | 8,000,000 |
| San Jose, CA, Financing Authority Lease Revenue: |
| | TECP, 0.34%, 2/19/2016, LOC: State Street Bank & Trust Co. | 7,113,000 | 7,113,000 |
| | TECP, 0.34%, 2/19/2016, LOC: U.S. Bank NA | 7,114,000 | 7,114,000 |
| University of California: |
| | TECP, 0.4%, 1/5/2016 | 45,000,000 | 44,998,000 |
| | TECP, 0.4%, 1/5/2016, LOC: JPMorgan Chase Bank NA | 25,000,000 | 24,998,889 |
| | TECP, 0.4%, 1/19/2016 | 25,000,000 | 25,000,000 |
| University of Colorado, Hospital Authority Revenue: |
| | Series C, 0.19%*, 11/15/2024 | 18,425,000 | 18,425,000 |
| | Series A, 0.19%*, 11/15/2046 | 20,450,000 | 20,450,000 |
| University of Houston, TECP, 0.49%, 2/9/2016 | 20,497,000 | 20,497,000 |
| Vanderbilt University, TECP, 0.4%, 4/7/2016 | 10,000,000 | 9,989,222 |
| Total Municipal Bonds and Notes (Cost $595,376,111) | 595,376,111 |
| |
| Repurchase Agreements 24.3% |
| BNP Paribas, 0.27%, dated 6/10/2015, to be repurchased at $200,358,500 on 2/4/2016 (a) (b) | 200,000,000 | 200,000,000 |
| BNP Paribas, 0.28%, dated 12/31/2015, to be repurchased at $5,000,156 on 1/4/2016 (c) | 5,000,000 | 5,000,000 |
| Federal Reserve Bank of New York, 0.25%, dated 12/31/2015, to be repurchased at $3,500,097,222 on 1/4/2016 (d) | 3,500,000,000 | 3,500,000,000 |
| JPMorgan Securities, Inc., 0.475%, dated 4/30/2015, to be repurchased at $187,075,708 on 3/31/2016 (a) (e) | 186,250,000 | 186,250,000 |
| JPMorgan Securities, Inc., 0.506%, dated 8/12/2015, to be repurchased at $373,714,681 on 3/31/2016 (a) (f) | 372,500,000 | 372,500,000 |
| Wells Fargo Securities LLC, 0.43%, dated 10/28/2015, to be repurchased at $122,631,688 on 1/26/2016 (a) (g) | 122,500,000 | 122,500,000 |
| Total Repurchase Agreements (Cost $4,386,250,000) | 4,386,250,000 |
| | % of Net Assets | Value ($) |
| | |
| Total Investment Portfolio (Cost $17,570,805,678)† | 97.5 | 17,570,805,678 |
| Other Assets and Liabilities, Net | 2.5 | 450,226,390 |
| Net Assets | 100.0 | 18,021,032,068 |
* Floating rate securities' yields vary with a designated market index or market rate, such as the coupon-equivalent of the U.S. Treasury Bill rate. These securities are shown at their current rate as of December 31, 2015.
** Annualized yield at time of purchase; not a coupon rate.
*** Variable rate demand notes and variable rate demand preferred shares are securities whose interest rates are reset periodically at market levels. These securities are payable on demand and are shown at their current rates as of December 31, 2015.
† The cost for federal income tax purposes was $17,570,805,678.
(a) Open maturity repurchase agreement whose interest rate resets periodically and is shown at the current rate as of December 31, 2015. The dated date is the original day the repurchase agreement was entered into, the maturity date represents the next repurchase date. Upon notice, both the Portfolio and counterparty have the right to terminate the repurchase agreement at any time.
(b) Collateralized by:
| Principal Amount ($) | Security | Rate (%) | Maturity Date | Collateral Value ($) |
| 7,815,000 | Cent CLO Ltd. | 1.8 | 1/25/2026 | 7,749,274 |
| 10,000,000 | ECP CLO Ltd. | 1.867 | 4/20/2027 | 10,377,164 |
| 35,000,000 | Galaxy XV CLO Ltd. | 1.571 | 4/15/2025 | 34,589,993 |
| 36,462,354 | Goldentree Loan Opportunities X Ltd. | 1.612 | 7/20/2027 | 38,141,107 |
| 11,000,000 | KKR Financial CLO Ltd. | 1.471 | 7/15/2025 | 10,785,548 |
| 10,000,000 | LCM XII LP | 1.575 | 10/19/2022 | 9,935,740 |
| 5,000,000 | Mountain Hawk II CLO Ltd. | 1.477 | 7/22/2024 | 4,906,470 |
| 7,455,000 | Nomad CLO Ltd. | 1.822 | 1/15/2025 | 7,317,902 |
| 15,000,000 | Northwoods Capital XIV Ltd. | 1.956 | 11/12/2025 | 14,913,637 |
| 10,000,000 | Ocean Trails CLO IV | 1.659 | 8/13/2025 | 9,791,408 |
| 24,500,000 | OCP CLO Ltd. | 1.765 | 7/17/2026 | 24,253,735 |
| 11,800,000 | Oracle Corp. | 4.125 | 5/15/2045 | 11,220,040 |
| 10,250,000 | Race Point VII CLO Ltd. | 1.764 | 11/8/2024 | 10,181,304 |
| 12,000,000 | Saranac CLO I Ltd. | 1.8 | 10/26/2024 | 11,836,679 |
| Total Collateral Value | 206,000,001 |
(c) Collateralized by:
| Principal Amount ($) | Security | Rate (%) | Maturity Date | Collateral Value ($) |
| 1,366,300 | U.S. Treasury Note | 0.25–3.25 | 4/15/2016–
3/31/2022 | 1,352,559 |
| 6,773,320 | U.S. Treasury STRIPS | Zero Coupon | 2/15/2019–
11/15/2043 | 3,747,441 |
| Total Collateral Value | 5,100,000 |
(d) Collateralized by $3,475,939,500 U.S. Treasury Note, 2.0%, maturing on 2/15/2022 with a value of $3,500,097,280.
(e) Collateralized by $184,332,264 Federal Home Loan Mortgage Corp., with the various coupon rates from 3.0–8.0%, with various maturity dates of 10/1/2031–12/1/2042 with a value of $189,978,835.
(f) Collateralized by:
| Principal Amount ($) | Security | Rate (%) | Maturity Date | Collateral Value ($) |
| 33,390,892 | Ally Auto Receivables Trust | 1.06 | 5/15/2017 | 33,408,636 |
| 177,667 | CAL Funding II Ltd. | 3.47 | 10/25/2027 | 174,988 |
| 1 | Carlyle High Yield Partners X Ltd. | 0.53 | 4/19/2022 | 1 |
| 267,228 | College Loan Corp. Trust | 0.752 | 4/15/2025 | 266,413 |
| 139,339,175 | Federal Home Loan Mortgage Corp. | 3.0–9.0 | 1/1/2017–
7/1/2044 | 147,678,359 |
| 398,522,983 | Federal Home Loan Mortgage Corp. — Interest Only | 3.0–5.5 | 1/15/2039–
8/15/2045 | 58,134,245 |
| 37 | Federal National Mortgage Association — Interest Only | 1007 | 12/25/2021 | 435 |
| 688,637 | GCO Education Loan Funding Trust | 0.523 | 5/25/2025 | 705,343 |
| 681,483 | Goal Capital Funding Trust | 0.563 | 5/28/2030 | 668,743 |
| 84,448 | GSAMP Trust | 1.102 | 11/25/2034 | 81,210 |
| 34,332 | Higher Education Funding I | 0.523 | 2/25/2025 | 34,268 |
| 125,475,000 | JPMorgan Chase & Co. | 0.953–5.0 | 7/5/2016–
11/8/2030 | 128,653,345 |
| 12,037 | KeyCorp Student Loan Trust | 0.933 | 12/27/2029 | 15,690 |
| 2,204,365 | KnowledgeWorks Foundation | 1.343 | 2/25/2042 | 2,171,767 |
| 5,272,898 | LA Arena Funding LLC | 7.656 | 12/15/2026 | 5,818,794 |
| 343,223 | Morgan Stanley ABS Capital I, Inc. Trust | 1.042 | 12/25/2034 | 319,129 |
| 591 | National Collegiate Student Loan Trust | 0.863 | 6/25/2027 | 587 |
| 3,657,750 | TAL Advantage V LLC | 2.83–3.51 | 2/22/2038–
2/22/2039 | 3,618,432 |
| Total Collateral Value | 381,750,385 |
(g) Collateralized by:
| Principal Amount ($) | Security | Rate (%) | Maturity Date | Collateral Value ($) |
| 94,111,209 | International Bank for Reconstruction & Development | 1.06–2.5 | 1/11/2018–
2/25/2028 | 93,756,192 |
| 500,000 | Kaiser Foundation Hospitals | Zero Coupon | 1/6/2016 | 499,955 |
| 31,597,000 | Wells Fargo Bank NA | 0.397–0.87 | 1/11/2016–
10/13/2016 | 31,604,108 |
| Total Collateral Value | 125,860,255 |
144A: Security exempt from registration under Rule 144A of the Securities Act of 1933. These securities may be resold in transactions exempt from registration, normally to qualified institutional buyers.
FGIC: Financial Guaranty Insurance Co.
INS: Insured
LIQ: Liquidity Facility
LOC: Letter of Credit
NATL: National Public Finance Guarantee Corp.
STRIPS: Separate Trading of Registered Interest and Principal Securities
TECP: Tax Exempt Commercial Paper
Fair Value Measurements
Various inputs are used in determining the value of the Portfolio's investments. These inputs are summarized in three broad levels. Level 1 includes quoted prices in active markets for identical securities. Level 2 includes other significant observable inputs (including quoted prices for similar securities, interest rates, prepayment speeds and credit risk). Level 3 includes significant unobservable inputs (including the Portfolio's own assumptions in determining the fair value of investments). The level assigned to the securities valuations may not be an indication of the risk or liquidity associated with investing in those securities. Securities held by the Portfolio are reflected as Level 2 because the securities are valued at amortized cost (which approximates fair value) and, accordingly, the inputs used to determine value are not quoted prices in an active market.
The following is a summary of the inputs used as of December 31, 2015 in valuing the Portfolio's investments. For information on the Portfolio's policy regarding the valuation of investments, please refer to the Security Valuation section of Note A in the accompanying Notes to Financial Statements.
| Assets | Level 1 | Level 2 | Level 3 | Total |
| |
| Investments in Securities (h) | $ — | $ 13,184,555,678 | $ — | $ 13,184,555,678 |
| Repurchase Agreements | — | 4,386,250,000 | — | 4,386,250,000 |
| Total | $ — | $ 17,570,805,678 | $ — | $ 17,570,805,678 |
There have been no transfers between fair value measurement levels during the year ended December 31, 2015.
(h) See Investment Portfolio for additional detailed categorizations.
The accompanying notes are an integral part of the financial statements.
Statement of Assets and Liabilities
| as of December 31, 2015 |
| Assets |
| Investments in non-affiliated securities, valued at amortized cost | $ 13,184,555,678 |
| Repurchase agreements, valued at amortized cost | 4,386,250,000 |
| Investments in securities, at value (cost $17,570,805,678) | 17,570,805,678 |
| Cash | 441,893,919 |
| Interest receivable | 10,878,280 |
| Other assets | 242,926 |
| Total assets | 18,023,820,803 |
| Liabilities |
| Accrued management fee | 1,952,540 |
| Accrued Trustees' fees | 111,726 |
| Other accrued expenses and payables | 724,469 |
| Total liabilities | 2,788,735 |
| Net assets, at value | $ 18,021,032,068 |
The accompanying notes are an integral part of the financial statements.
Statement of Operations
| for the year ended December 31, 2015 |
| Investment Income |
Income: Interest | $ 48,582,219 |
Expenses: Management fee | 25,037,507 |
| Administration fee | 5,893,752 |
| Custodian fee | 217,313 |
| Professional fees | 276,941 |
| Reports to shareholders | 17,789 |
| Trustees' fees and expenses | 505,861 |
| Other | 499,461 |
| Total expenses before expense reductions | 32,448,624 |
| Expense reductions | (4,944,455) |
| Total expenses after expense reductions | 27,504,169 |
| Net investment income | 21,078,050 |
| Net realized gain (loss) from investments | 452,645 |
| Net increase (decrease) in net assets resulting from operations | $ 21,530,695 |
The accompanying notes are an integral part of the financial statements.
Statement of Changes in Net Assets
| Increase (Decrease) in Net Assets | Years Ended December 31, |
| 2015 | 2014 |
Operations: Net investment income | $ 21,078,050 | $ 9,791,086 |
| Net realized gain (loss) | 452,645 | 38,382 |
| Net increase (decrease) in net assets resulting from operations | 21,530,695 | 9,829,468 |
Capital transactions in shares of beneficial interest: Proceeds from capital invested | 317,351,519,324 | 177,895,822,788 |
| Value of capital withdrawn | (319,269,518,924) | (178,202,393,435) |
| Net increase (decrease) in net assets from capital transactions in shares of beneficial interest | (1,917,999,600) | (306,570,647) |
| Increase (decrease) in net assets | (1,896,468,905) | (296,741,179) |
| Net assets at beginning of period | 19,917,500,973 | 20,214,242,152 |
| Net assets at end of period | $ 18,021,032,068 | $ 19,917,500,973 |
The accompanying notes are an integral part of the financial statements.
Financial Highlights
| | |
Years Ended December 31, |
| 2015 | 2014 | 2013 | 2012 | 2011 |
| Ratios to Average Net Assets and Supplemental Data |
| Net assets, end of period ($ millions) | 18,021 | 19,918 | 20,214 | 24,810 | 20,784 |
| Ratio of expenses before expense reductions (%) | .17 | .17 | .16 | .17 | .16 |
| Ratio of expenses after expense reductions (%) | .14 | .14 | .14 | .14 | .15 |
| Ratio of net investment income (%) | .11 | .05 | .08 | .14 | .10 |
| Total Return (%)a,b | .11 | .05 | .08 | .14 | .11 |
a Total return would have been lower had certain expenses not been reduced. b Total return for the Portfolio was derived from the performance of Cash Reserves Fund Institutional. |
Notes to Financial Statements
A. Organization and Significant Accounting Policies
Cash Management Portfolio (the "Portfolio") is registered under the Investment Company Act of 1940, as amended (the "1940 Act"), as an open-end management investment company organized as a New York trust.
The Portfolio is a master fund. A master/feeder fund structure is one in which a fund (a "feeder fund"), instead of investing directly in a portfolio of securities, invests most or all of its investment assets in a separate registered investment company (the "master fund") with substantially the same investment objective and policies as the feeder fund. Such a structure permits the pooling of assets of two or more feeder funds, preserving separate identities or distribution channels at the feeder fund level. The Portfolio may have several feeder funds, including affiliated Deutsche feeder funds and unaffiliated feeder funds; with a significant ownership percentage of the Portfolio's net assets. Investment activities of these feeder funds could have a material impact on the Portfolio. As of December 31, 2015, Cash Management Fund, Cash Reserves Fund Institutional, Cash Reserves Fund — Prime Series and Deutsche Money Market Series owned approximately 12%, 11%, 5% and 69%, respectively, of the Portfolio.
The Portfolio's financial statements are prepared in accordance with accounting principles generally accepted in the United States of America which require the use of management estimates. Actual results could differ from those estimates. The policies described below are followed consistently by the Portfolio in the preparation of its financial statements.
Security Valuation. Various inputs are used in determining the value of the Portfolio's investments. These inputs are summarized in three broad levels. Level 1 includes quoted prices in active markets for identical securities. Level 2 includes other significant observable inputs (including quoted prices for similar securities, interest rates, prepayment speeds and credit risk). Level 3 includes significant unobservable inputs (including the Portfolio's own assumptions in determining the fair value of investments). The level assigned to the securities valuations may not be an indication of the risk or liquidity associated with investing in those securities. Securities held by the Portfolio are reflected as Level 2 because the securities are valued at amortized cost (which approximates fair value) and, accordingly, the inputs used to determine value are not quoted prices in an active market.
The Portfolio values all securities utilizing the amortized cost method permitted in accordance with Rule 2a-7 under the 1940 Act and certain conditions therein. Under this method, which does not take into account unrealized capital gains or losses on securities, an instrument is initially valued at its cost and thereafter assumes a constant accretion/amortization rate to maturity of any discount or premium. Securities held by the Portfolio are reflected as Level 2 because the securities are valued at amortized cost (which approximates fair value) and, accordingly, the inputs used to determine value are not quoted prices in an active market.
Repurchase Agreements. The Portfolio may enter into repurchase agreements, under the terms of a Master Repurchase Agreement, with certain banks and broker/dealers whereby the Portfolio, through its custodian or a sub-custodian bank, receives delivery of the underlying securities, the amount of which at the time of purchase and each subsequent business day is required to be maintained at such a level that the value is equal to at least the principal amount of the repurchase price plus accrued interest. The custodian bank or another designated subcustodian holds the collateral in a separate account until the agreement matures. If the value of the securities falls below the principal amount of the repurchase agreement plus accrued interest, the financial institution deposits additional collateral by the following business day. If the financial institution either fails to deposit the required additional collateral or fails to repurchase the securities as agreed, the Portfolio has the right to sell the securities and recover any resulting loss from the financial institution. If the financial institution enters into bankruptcy, the Portfolio's claims on the collateral may be subject to legal proceedings.
As of December 31, 2015, the Portfolio held repurchase agreements with a gross value of $4,386,250,000. The value of the related collateral exceeded the value of the repurchase agreements at period end. The detail of the related collateral is included in the footnotes following the Portfolio's Investment Portfolio.
Federal Income Taxes. The Portfolio is considered a Partnership under the Internal Revenue Code, as amended. Therefore, no federal income tax provision is necessary.
It is intended that the Portfolio's assets, income and distributions will be managed in such a way that an investor in the Portfolio will be able to satisfy the requirements of Subchapter M of the Code, assuming that the investor invested all of its assets in the Portfolio.
The Portfolio has reviewed the tax positions for the open tax years as of December 31, 2015 and has determined that no provision for income tax and/or uncertain tax provisions is required in the Portfolio's financial statements. The Portfolio's federal tax returns for the prior three fiscal years remain open subject to examination by the Internal Revenue Service.
Contingencies. In the normal course of business, the Portfolio may enter into contracts with service providers that contain general indemnification clauses. The Portfolio's maximum exposure under these arrangements is unknown as this would involve future claims that may be made against the Portfolio that have not yet been made. However, based on experience, the Portfolio expects the risk of loss to be remote.
Other. Investment transactions are accounted for on trade date. Interest income is recorded on the accrual basis. Realized gains and losses from investment transactions are recorded on an identified cost basis. All discounts and premiums are accreted/amortized for both tax and financial reporting purposes.
The Portfolio makes an allocation of its net investment income and realized gains and losses from securities transactions to its investors in proportion to their investment in the Portfolio.
B. Fees and Transactions with Affiliates
Management Agreement. Under the Investment Management Agreement with Deutsche Investment Management Americas Inc. ("DIMA" or the "Advisor"), an indirect, wholly owned subsidiary of Deutsche Bank AG, the Advisor determines the securities, instruments and other contracts relating to investments to be purchased, sold or entered into by the Portfolio.
Under the Investment Management Agreement, the Portfolio pays the Advisor a monthly management fee based on its average daily net assets, computed and accrued daily and payable monthly, at the following annual rates:
| First $3.0 billion of the Portfolio's average daily net assets | .1500% |
| Next $4.5 billion of such net assets | .1325% |
| Over $7.5 billion of such net assets | .1200% |
For the period from January 1, 2015 through December 31, 2015, the Advisor has voluntarily agreed to waive its fees and/or reimburse certain operating expenses to the extent necessary to maintain the total annual operating expenses (excluding certain expenses such as extraordinary expenses, taxes, brokerage and interest) at 0.14% of the Portfolio's average daily net assets. This voluntary waiver or reimbursement may be terminated at any time at the option of the Advisor.
For the year ended December 31, 2015, the Advisor waived a portion of its management fee aggregating $4,944,455, and the amount charged aggregated $20,093,052, which was equivalent to an annual effective rate of 0.10%.
Administration Fee. Pursuant to an Administrative Services Agreement, DIMA provides most administrative services to the Portfolio. For all services provided under the Administrative Services Agreement, the Portfolio pays the Advisor an annual fee ("Administration Fee") of 0.03% of the Portfolio's average daily net assets, computed and accrued daily and payable monthly. For the year ended December 31, 2015, the Administration Fee was $5,893,752, of which $511,827 is unpaid.
Filing Service Fees. Under an agreement with DIMA, DIMA is compensated for providing certain regulatory filing services to the Portfolio. For the year ended December 31, 2015, the amount charged to the Portfolio by DIMA included in the Statement of Operations under "Reports to shareholders" aggregated $516, all of which is unpaid.
Trustees' Fees and Expenses. The Portfolio paid retainer fees to each Trustee not affiliated with the Advisor, plus specified amounts to the Board Chairperson and Vice Chairperson and to each committee Chairperson.
Transactions with Affiliates. The Fund may purchase securities from, or sell securities to, an affiliated fund provided the affiliation is solely due to having a common investment adviser, common officers, or common trustees. During the year ended December 31, 2015, the Fund engaged in securities purchases of $308,260,000 and securities sales of $286,435,000 with an affiliated fund in compliance with Rule 17a-7 under the 1940 Act.
C. Line of Credit
The Portfolio and other affiliated funds (the "Participants") share in a $400 million revolving credit facility provided by a syndication of banks. The Portfolio may borrow for temporary or emergency purposes, including the meeting of redemption requests that otherwise might require the untimely disposition of securities. The Participants are charged an annual commitment fee which is allocated based on net assets, among each of the Participants. Interest is calculated at a rate per annum equal to the sum of the Federal Funds Rate plus 1.25 percent plus if the one-month LIBOR exceeds the Federal Funds Rate, the amount of such excess. The Portfolio may borrow up to a maximum of 33 percent of its net assets under the agreement. The Portfolio had no outstanding loans at December 31, 2015.
D. Additional Information
Effective on or about May 2, 2016, the Portfolio will operate as a government money market fund under the amendments to Rule 2a-7 under the Investment Company Act of 1940, as amended, that were adopted in July 2014 with final compliance dates ranging between July 2015 and October 2016. As currently structured, on the final compliance date for the Rule 2a-7 amendments, the Portfolio would be required to implement a floating net asset value and would be allowed, and in certain situations, required, to implement liquidity fees and/or redemption gates. As a government money market fund, the Portfolio will continue to utilize amortized cost to value its securities and the Portfolio will not be required to implement liquidity fees and/or redemption gates. As a government money market fund, the Portfolio will invest at least 99.5% of the Portfolio’s total assets in cash, US government securities, and/or repurchase agreements that are collateralized by these same securities.
In order for the Portfolio to operate as a government money market fund, shareholders approved revisions to the Portfolio’s fundamental investment policy relating to concentration (the "Concentration Policy") such that the Portfolio would no longer be required to invest more than 25% of its total assets in obligations of banks and other financial institutions. If not revised, the current Concentration Policy would have precluded the Portfolio from operating as a government money market fund.
In addition to the revised Concentration Policy, the following changes to the Portfolio for it to operate as a government money market fund will also take effect on May 2, 2016:
(i) A revised investment objective, as follows:
"The fund seeks maximum current income to the extent consistent with stability of principal."
(ii) The adoption of a principal investment strategy to invest at least 99.5% of the Portfolio’s total assets in cash, government securities, and/or repurchase agreements that are collateralized by these same securities.
(iii) Name changes as follows:
| Current Name | New Name |
| Cash Management Portfolio | Government Cash Management Portfolio |
(iv) The adoption of a principal investment strategy to invest at least 80% of net assets, plus the amount of any borrowings for investment purposes, in government securities and/or repurchase agreements that are collateralize by government securities; and
(v) A reduction in the management fee rate paid by the Portfolio to DIMA, the investment advisor to the Portfolio. Pursuant to the master-feeder structure noted above, DIMA receives a management fee from the Portfolio. The revised management fee rate schedule is set forth below:
| Current Management Fee Rate Schedule | | Revised Management Fee Rate Schedule |
| Average Daily Assets | Management Fee Rate | | Average Daily Assets | Management Fee Rate |
| First $3 Billion | .1500% | | First $3 Billion | .1200% |
| Next $4.5 Billion | .1325% | | Next $4.5 Billion | .1025% |
| Over $7.5 Billion | .1200% | | Over $7.5 Billion | .0900% |
To ensure an orderly transition to a government money market fund, DIMA anticipates that it will begin to gradually implement changes to the Portfolio beginning in the first quarter of 2016. As a result, it is expected that the Portfolio gradually will allocate a larger percentage of its assets to government securities over time until it reaches its new allocation on or about May 2, 2016. Because the yields on government securities generally may be expected to be lower than the yields on comparable non-government securities, it should be expected that the Portfolio’s yield may decrease as more assets are invested in government securities.
Report of Independent Registered Public Accounting Firm
To the Board of Trustees and Holders of Beneficial Interest of Cash Management Portfolio:
In our opinion, the accompanying statement of assets and liabilities, including the portfolio of investments, and the related statements of operations and of changes in net assets and the financial highlights presents fairly, in all material respects, the financial position of Cash Management Portfolio (the "Portfolio") at December 31, 2015, and the results of its operations, the changes in its net assets and the financial highlights for each of the periods indicated therein, in conformity with accounting principles generally accepted in the United States of America. These financial statements and financial highlights (hereafter referred to as "financial statements") are the responsibility of the Portfolio's management. Our responsibility is to express an opinion on these financial statements based on our audits. We conducted our audits of these financial statements in accordance with the standards of the Public Company Accounting Oversight Board (United States). Those standards require that we plan and perform the audits to obtain reasonable assurance about whether the financial statements are free of material misstatement. An audit includes examining, on a test basis, evidence supporting the amounts and disclosures in the financial statements, assessing the accounting principles used and significant estimates made by management, and evaluating the overall financial statement presentation. We believe that our audits, which included confirmation of securities at December 31, 2015 by correspondence with the custodian, brokers and transfer agent, and the application of alternative auditing procedures where such confirmations had not been received, provide a reasonable basis for our opinion.
Boston, Massachusetts
February 23, 2016 | PricewaterhouseCoopers LLP |
Shareholder Meeting Results (Unaudited)
A special Meeting of Shareholders (the "Meeting") of Cash Management Fund (the "Fund") was called to order on December 21, 2015 at the offices of Deutsche Investment Management Americas Inc., 345 Park Avenue, New York, New York 10154. At the Meeting, the following matter was voted upon by the shareholders of the Fund (the resulting votes are presented below.
1. Approval of a Revised Fundamental Investment Policy Relating to Concentration.
| Number of Votes: |
| For | Against | Abstain | Broker Non-Votes* |
| 1,384,235,794 | 0 | 0 | 0 |
* Broker non-votes are proxies received by the funds from brokers or nominees when the broker or nominee neither has received instructions from the beneficial owner or other persons entitled to vote nor has discretionary power to vote in a particular matter.
Cash Management Fund, Cash Reserves Fund Institutional, Deutsche Money Market Series, Money Market ProFund and Prime Series are each a "feeder fund" that pursues its investment objecting by investing substantially of its assets in a "master portfolio," the Cash Management Portfolio (the "Portfolio"). The Portfolio also held a meeting of its shareholders on December 21, 2015, which was adjourned until, and reconvened on, January 28, 2016. At the meeting of the Portfolio, each feeder fund also approved the revised fundamental investment policy relating to concentration on behalf of the Portfolio.
Advisory Agreement Board Considerations and Fee Evaluation
Cash Management Fund (the "Fund"), a series of DWS Money Market Trust, invests substantially all of its assets in Cash Management Portfolio (the "Portfolio") in order to achieve its investment objective. The Portfolio’s Board of Trustees approved the renewal of the Portfolio’s investment management agreement (the "Portfolio Agreement") with Deutsche Investment Management Americas Inc. ("DIMA") and the Fund’s Board of Trustees (which consists of the same members as the Board of Trustees of the Portfolio) approved the renewal of the Fund’s investment management agreement with DIMA (the "Fund Agreement," and together with the Portfolio Agreement, the "Agreements") in September 2015. The Portfolio’s Board of Trustees and the Fund’s Board of Trustees are collectively referred to as the "Board."
In terms of the process that the Board followed prior to approving the Agreements, shareholders should know that:
— In September 2015, all of the Portfolio’s and the Fund’s Trustees were independent of DIMA and its affiliates.
— The Trustees met frequently during the past year to discuss fund matters and dedicated a substantial amount of time to contract review matters. Over the course of several months, the Board’s Contract Committee reviewed comprehensive materials received from DIMA, independent third parties and independent counsel. These materials included an analysis of performance, fees and expenses, and profitability from a fee consultant retained by the Portfolio’s and the Fund’s Independent Trustees (the "Fee Consultant"). The Board also received extensive information throughout the year regarding performance of the Portfolio and the Fund.
— The Independent Trustees regularly meet privately with counsel to discuss contract review and other matters. In addition, the Independent Trustees were advised by the Fee Consultant in the course of their review of the Portfolio’s and the Fund’s contractual arrangements and considered a comprehensive report prepared by the Fee Consultant in connection with their deliberations.
— In connection with reviewing the Agreements, the Board also reviewed the terms of the Fund’s distribution agreement, administrative services agreement, transfer agency agreement and other material service agreements.
— Based on its evaluation of the information provided, the Contract Committee presented its findings and recommendations to the Board. The Board then reviewed the Contract Committee’s findings and recommendations.
In connection with the contract review process, the Contract Committee and the Board considered the factors discussed below, among others. The Board also considered that DIMA and its predecessors have managed the Portfolio and the Fund since their inception, and the Board believes that a long-term relationship with a capable, conscientious advisor is in the best interests of the Portfolio and the Fund. The Board considered, generally, that shareholders chose to invest or remain invested in the Fund knowing that DIMA managed the Portfolio and the Fund. DIMA is part of Deutsche Bank AG’s ("Deutsche Bank") Asset and Wealth Management ("Deutsche AWM") division. Deutsche AWM is a global asset management business that offers a wide range of investing expertise and resources, including research capabilities in many countries throughout the world. Deutsche Bank has advised the Independent Trustees that the U.S. asset management business continues to be a critical and integral part of Deutsche Bank, and that Deutsche Bank will continue to make significant investments in Deutsche AWM, including ongoing enhancements to Deutsche AWM’s investment platform. Deutsche Bank also has confirmed its commitment to maintaining strong legal and compliance groups within the Deutsche AWM division.
As part of the contract review process, the Board carefully considered the fees and expenses of each Deutsche fund overseen by the Board in light of the fund’s performance. In many cases, this led to the negotiation and implementation of expense caps. As part of these negotiations, the Board indicated that it would consider relaxing these caps in future years following sustained improvements in performance, among other considerations.
While shareholders may focus primarily on fund performance and fees, the Board considers these and many other factors, including the quality and integrity of DIMA’s personnel and such other issues as back-office operations, fund valuations, and compliance policies and procedures.
Nature, Quality and Extent of Services. The Board considered the terms of the Agreements, including the scope of advisory services provided under the Agreements. The Board noted that, under the Agreements, DIMA provides portfolio management services to the Portfolio and the Fund and that, pursuant to separate administrative services agreements, DIMA provides administrative services to the Portfolio and the Fund. The Board considered the experience and skills of senior management and investment personnel, the resources made available to such personnel, the ability of DIMA to attract and retain high-quality personnel, and the organizational depth and stability of DIMA. The Board reviewed the Portfolio’s and the Fund’s performance over short-term and long-term periods and compared those returns to various agreed-upon performance measures, including a peer universe compiled using information supplied by iMoneyNet, an independent fund data service. The Board also noted that it has put into place a process of identifying "Focus Funds" (e.g., funds performing poorly relative to a peer universe), and receives additional reporting from DIMA regarding such funds and, where appropriate, DIMA’s plans to address underperformance. The Board believes this process is an effective manner of identifying and addressing underperforming funds. Based on the information provided, the Board noted that for the one- and three-year periods ended December 31, 2014, the Fund’s gross performance (Institutional Shares) was in the 3rd quartile of the applicable iMoneyNet universe (the 1st quartile being the best performers and the 4th quartile being the worst performers).
Fees and Expenses. The Board considered the Portfolio’s and the Fund’s investment management fee schedules and the Fund’s operating expenses and total expense ratios, and comparative information provided by Lipper Inc. ("Lipper") and the Fee Consultant regarding investment management fee rates paid to other investment advisors by similar funds (1st quartile being the most favorable and 4th quartile being the least favorable). With respect to management fees paid to other investment advisors by similar funds, the Board noted that the contractual fee rates paid by the Portfolio and the Fund, which include 0.03% and 0.10% fees paid to DIMA under the respective administrative services agreements, were lower than the median (2nd quartile) of the applicable Lipper peer group (based on Lipper data provided as of December 31, 2014). The Board considered that the Portfolio’s management fee would be reduced by 0.03% at all breakpoint levels if shareholders approve a proposal that would result in the Portfolio and the Fund being restructured into government money market funds. The Board noted that, although shareholders of the Fund indirectly bear the Portfolio’s management fee, the Fund does not charge an additional investment management fee. Based on Lipper data provided as of December 31, 2014, the Board noted that the Fund’s total (net) operating expenses, which include Portfolio expenses allocated to the Fund, were lower than the median of the applicable Lipper expense universe for Institutional Shares (2nd quartile). The Board noted the expense limitation agreed to by DIMA. The Board also noted the significant voluntary fee waivers implemented by DIMA to ensure the Fund maintained a positive yield. The Board considered the management fee rate as compared to fees charged by DIMA to comparable Deutsche U.S. registered funds ("Deutsche Funds") and considered differences between the Portfolio and the Fund and the comparable Deutsche Funds. The information requested by the Board as part of its review of fees and expenses also included information about institutional accounts (including any sub-advised funds and accounts) and funds offered primarily to European investors ("Deutsche Europe funds") managed by Deutsche AWM. The Board noted that DIMA indicated that Deutsche AWM does not manage any institutional accounts or Deutsche Europe funds comparable to the Portfolio or the Fund.
On the basis of the information provided, the Board concluded that management fees were reasonable and appropriate in light of the nature, quality and extent of services provided by DIMA.
Profitability. The Board reviewed detailed information regarding revenues received by DIMA under the Agreements. The Board considered the estimated costs and pre-tax profits realized by DIMA from advising the Deutsche Funds, as well as estimates of the pre-tax profits attributable to managing the Fund in particular. The Board also received information regarding the estimated enterprise-wide profitability of DIMA and its affiliates with respect to all fund services in totality and by fund. The Board and the Fee Consultant reviewed DIMA’s methodology in allocating its costs to the management of the Fund. Based on the information provided, the Board concluded that the pre-tax profits realized by DIMA in connection with the management of the Fund were not unreasonable. The Board also reviewed certain publicly available information regarding the profitability of certain similar investment management firms. The Board noted that while information regarding the profitability of such firms is limited (and in some cases is not necessarily prepared on a comparable basis), DIMA and its affiliates’ overall profitability with respect to the Deutsche Funds (after taking into account distribution and other services provided to the funds by DIMA and its affiliates) was lower than the overall profitability levels of most comparable firms for which such data was available.
Economies of Scale. The Board considered whether there are economies of scale with respect to the management of the Portfolio and the Fund and whether the Portfolio and the Fund benefit from any economies of scale. The Board noted that the Portfolio’s and the Fund’s investment management fee schedule includes fee breakpoints. The Board concluded that the Portfolio’s and the Fund’s fee schedule represents an appropriate sharing between the Portfolio and the Fund and DIMA of such economies of scale as may exist in the management of the Portfolio and the Fund at current asset levels.
Other Benefits to DIMA and Its Affiliates. The Board also considered the character and amount of other incidental benefits received by DIMA and its affiliates, including any fees received by DIMA for administrative services provided to the Portfolio and the Fund. The Board also considered benefits to DIMA related to brokerage and soft-dollar allocations, including allocating brokerage to pay for research generated by parties other than the executing broker dealers, which pertain primarily to funds investing in equity securities, along with the incidental public relations benefits to DIMA related to Deutsche Funds advertising and cross-selling opportunities among DIMA products and services. The Board considered these benefits in reaching its conclusion that the Fund’s management fees were reasonable.
Compliance. The Board considered the significant attention and resources dedicated by DIMA to documenting and enhancing its compliance processes in recent years. The Board noted in particular (i) the experience and seniority of the individual serving as DIMA’s and the Fund’s chief compliance officer; (ii) the large number of DIMA compliance personnel; and (iii) the substantial commitment of resources by DIMA and its affiliates to compliance matters.
Based on all of the information considered and the conclusions reached, the Board unanimously determined that the continuation of the Agreements is in the best interests of the Portfolio and the Fund. In making this determination, the Board did not give particular weight to any single factor identified above. The Board considered these factors over the course of numerous meetings, certain of which were in executive session with only the Independent Trustees and counsel present. It is possible that individual Trustees may have weighed these factors differently in reaching their individual decisions to approve the continuation of the Agreements.
Board Members and Officers
The following table presents certain information regarding the Board Members and Officers of the fund. Each Board Member's year of birth is set forth in parentheses after his or her name. Unless otherwise noted, (i) each Board Member has engaged in the principal occupation(s) noted in the table for at least the most recent five years, although not necessarily in the same capacity; and (ii) the address of each Independent Board Member is c/o Kenneth C. Froewiss, Chairman, Deutsche Mutual Funds, P.O. Box 390601, Cambridge, MA 02139. Except as otherwise noted below, the term of office for each Board Member is until the election and qualification of a successor, or until such Board Member sooner dies, resigns, is removed or as otherwise provided in the governing documents of the fund. Because the fund does not hold an annual meeting of shareholders, each Board Member will hold office for an indeterminate period. The Board Members may also serve in similar capacities with other funds in the fund complex.
| Independent Board Members |
| Name, Year of Birth, Position with the Fund and Length of Time Served1 | Business Experience and Directorships During the Past Five Years | Number of Funds in Deutsche Fund Complex Overseen | Other Directorships Held by Board Member |
Kenneth C. Froewiss (1945) Chairperson since 2013, and Board Member since 2001 | Retired Clinical Professor of Finance, NYU Stern School of Business (1997–2014); Member, Finance Committee, Association for Asian Studies (2002–present); Director, Mitsui Sumitomo Insurance Group (US) (2004–present); prior thereto, Managing Director, J.P. Morgan (investment banking firm) (until 1996) | 106 | — |
William McClayton (1944) Vice Chairperson since 2013, and Board Member since 2004 | Private equity investor (since October 2009); previously, Managing Director, Diamond Management & Technology Consultants, Inc. (global consulting firm) (2001–2009); Directorship: Board of Managers, YMCA of Metropolitan Chicago; formerly: Senior Partner, Arthur Andersen LLP (accounting) (1966–2001); Trustee, Ravinia Festival | 106 | — |
John W. Ballantine (1946) Board Member since 1999 | Retired; formerly, Executive Vice President and Chief Risk Management Officer, First Chicago NBD Corporation/The First National Bank of Chicago (1996–1998); Executive Vice President and Head of International Banking (1995–1996); former Directorships: Director and former Chairman of the Board, Healthways, Inc.2 (provider of disease and care management services) (2003–2014); Stockwell Capital Investments PLC (private equity); First Oak Brook Bancshares, Inc. and Oak Brook Bank; Prisma Energy International | 106 | Portland General Electric2 (utility company) (2003– present) |
Henry P. Becton, Jr. (1943) Board Member since 1990 | Vice Chair and former President, WGBH Educational Foundation. Directorships: Public Radio International; Public Radio Exchange (PRX); former Directorships: Belo Corporation2 (media company); The PBS Foundation; Association of Public Television Stations; Boston Museum of Science; American Public Television; Concord Academy; New England Aquarium; Mass. Corporation for Educational Telecommunications; Committee for Economic Development; Public Broadcasting Service; Connecticut College; North Bennett Street School (Boston) | 106 | Director, Becton Dickinson and Company2 (medical technology company) |
Dawn-Marie Driscoll (1946) Board Member since 1987 | Emeritus Executive Fellow, Center for Business Ethics, Bentley University; formerly: President, Driscoll Associates (consulting firm); Partner, Palmer & Dodge (law firm) (1988–1990); Vice President of Corporate Affairs and General Counsel, Filene's (retail) (1978–1988). Directorships: Director of ICI Mutual Insurance Company (since 2007); Advisory Board, Center for Business Ethics, Bentley University; Trustee and former Chairman of the Board, Southwest Florida Community Foundation (charitable organization); former Directorships: Sun Capital Advisers Trust (mutual funds) (2007–2012), Investment Company Institute (audit, executive, nominating committees) and Independent Directors Council (governance, executive committees) | 106 | — |
Keith R. Fox, CFA (1954) Board Member since 1996 | Managing General Partner, Exeter Capital Partners (a series of private investment funds) (since 1986). Directorships: Progressive International Corporation (kitchen goods importer and distributor); The Kennel Shop (retailer); former Chairman, National Association of Small Business Investment Companies; former Directorships: BoxTop Media Inc. (advertising); Sun Capital Advisers Trust (mutual funds) (2011–2012) | 106 | — |
Paul K. Freeman (1950) Board Member since 1993 | Consultant, World Bank/Inter-American Development Bank; Chair, Independent Directors Council; Investment Company Institute (executive and nominating committees); formerly, Chairman of Education Committee of Independent Directors Council; Project Leader, International Institute for Applied Systems Analysis (1998–2001); Chief Executive Officer, The Eric Group, Inc. (environmental insurance) (1986–1998); Directorships: Denver Zoo Foundation (December 2012–present); former Directorships: Prisma Energy International | 106 | — |
Richard J. Herring (1946) Board Member since 1990 | Jacob Safra Professor of International Banking and Professor, Finance Department, The Wharton School, University of Pennsylvania (since July 1972); Co-Director, Wharton Financial Institutions Center; Co-Chair, U.S. Shadow Financial Regulatory Committee; Executive Director, Financial Economists Roundtable; formerly: Vice Dean and Director, Wharton Undergraduate Division (July 1995–June 2000); Director, Lauder Institute of International Management Studies (July 2000–June 2006) | 106 | Director, Aberdeen Singapore and Japan Funds (since 2007); Independent Director of Barclays Bank Delaware (since September 2010) |
Rebecca W. Rimel (1951) Board Member since 1995 | President and Chief Executive Officer, The Pew Charitable Trusts (charitable organization) (1994 to present); formerly: Executive Vice President, The Glenmede Trust Company (investment trust and wealth management) (1983–2004); Board Member, Investor Education (charitable organization) (2004–2005); Trustee, Executive Committee, Philadelphia Chamber of Commerce (2001–2007); Director, Viasys Health Care2 (January 2007–June 2007); Trustee, Thomas Jefferson Foundation (charitable organization) (1994–2012) | 106 | Director, Becton Dickinson and Company2 (medical technology company) (2012– present); Director, BioTelemetry Inc.2 (health care) (2009– present) |
William N. Searcy, Jr. (1946) Board Member since 1993 | Private investor since October 2003; formerly: Pension & Savings Trust Officer, Sprint Corporation2 (telecommunications) (November 1989–September 2003); Trustee, Sun Capital Advisers Trust (mutual funds) (1998–2012) | 106 | — |
Jean Gleason Stromberg (1943) Board Member since 1997 | Retired. Formerly, Consultant (1997–2001); Director, Financial Markets U.S. Government Accountability Office (1996–1997); Partner, Norton Rose Fulbright, L.L.P. (law firm) (1978–1996). Directorships: The William and Flora Hewlett Foundation (charitable organization); former Directorships: Service Source, Inc. (nonprofit), Mutual Fund Directors Forum (2002–2004), American Bar Retirement Association (funding vehicle for retirement plans) (1987–1990 and 1994–1996) | 106 | — |
| Officers4 |
| Name, Year of Birth, Position with the Fund and Length of Time Served5 | Business Experience and Directorships During the Past Five Years |
Brian E. Binder8 (1972) President and Chief Executive Officer, 2013–present | Managing Director3 and Head of Fund Administration, Deutsche Asset Management (2013–present); formerly: Head of Business Management and Consulting at Invesco, Ltd. (2010–2012) |
John Millette7 (1962) Vice President and Secretary, 1999–present | Director,3 Deutsche Asset Management; Chief Legal Officer and Secretary, Deutsche Investment Management Americas Inc. (since 2015); and Director and Vice President, DeAWM Trust Company (since 2016) |
Melinda Morrow6 (1970) Vice President, 2012–present | Director,3 Deutsche Asset Management |
Paul H. Schubert6 (1963) Chief Financial Officer, 2004–present Treasurer, 2005–present | Managing Director,3 Deutsche Asset Management; and Chairman, Director and President, DeAWM Trust Company (since 2013); formerly, Director, DeAWM Trust Company (2004–2013) |
Caroline Pearson7 (1962) Chief Legal Officer, 2010–present | Managing Director,3 Deutsche Asset Management; Secretary, DeAWM Distributors, Inc.; and Secretary, DeAWM Service Company |
Robert Kloby6 (1962) Chief Compliance Officer, 2006–present | Managing Director,3 Deutsche Asset Management |
Wayne Salit6 (1967) Anti-Money Laundering Compliance Officer, 2014–present | Director,3 Deutsche Asset Management; formerly: Managing Director, AML Compliance Officer at BNY Mellon (2011–2014); and Director, AML Compliance Officer at Deutsche Bank (2004–2011) |
Hepsen Uzcan6 (1974) Assistant Secretary, 2013–present | Director,3 Deutsche Asset Management |
Paul Antosca7 (1957) Assistant Treasurer, 2007–present | Director,3 Deutsche Asset Management |
Jack Clark7 (1967) Assistant Treasurer, 2007–present | Director,3 Deutsche Asset Management |
Diane Kenneally7 (1966) Assistant Treasurer, 2007–present | Director,3 Deutsche Asset Management |
1 The length of time served represents the year in which the Board Member joined the board of one or more Deutsche funds currently overseen by the Board.
2 A publicly held company with securities registered pursuant to Section 12 of the Securities Exchange Act of 1934.
3 Executive title, not a board directorship.
4 As a result of their respective positions held with the Advisor, these individuals are considered "interested persons" of the Advisor within the meaning of the 1940 Act. Interested persons receive no compensation from the fund.
5 The length of time served represents the year in which the officer was first elected in such capacity for one or more Deutsche funds.
6 Address: 60 Wall Street, New York, NY 10005.
7 Address: One Beacon Street, Boston, MA 02108.
8 Address: 222 South Riverside Plaza, Chicago, IL 60606.
The fund's Statement of Additional Information ("SAI") includes additional information about the Board Members. The SAI is available, without charge, upon request. If you would like to request a copy of the SAI, you may do so by calling the following toll-free number: (800) 728-3337.
Account Management Resources
| |
| Automated Information Line | Institutional Investor Services (800) 730-1313 Personalized account information, information on other Deutsche funds and services via touchtone telephone and the ability to exchange or redeem shares. |
| Web Site | deutscheliquidity.com/US View your account transactions and balances, trade shares, monitor your asset allocation, subscribe to fund and account updates by e-mail, and change your address, 24 hours a day. Obtain prospectuses and applications, blank forms, interactive worksheets, news about the funds, retirement planning information, and more. |
| For More Information | (800) 730-1313, option 1 To speak with a fund service representative. |
| Written Correspondence | Deutsche Asset Management PO Box 219210
Kansas City, MO
64121-9210 |
| Proxy Voting | The fund's policies and procedures for voting proxies for portfolio securities and information about how the fund voted proxies related to its portfolio securities during the 12-month period ended June 30 are available on our Web site — deutschefunds.com (click on "proxy voting"at the bottom of the page) — or on the SEC's Web site — sec.gov. To obtain a written copy of the fund's policies and procedures without charge, upon request, call us toll free at 800) 728-3337. |
| Portfolio Holdings | Following the fund's fiscal first and third quarter-end, a complete portfolio holdings listing is filed with the SEC on Form N-Q. In addition, each month, information about the fund and its portfolio holdings is filed with the SEC on Form N-MFP. The SEC delays the public availability of the information filed on Form N-MFP for 60 days after the end of the reporting period included in the filing. These forms will be available on the SEC's Web site at sec.gov, and they may also be reviewed and copied at the SEC's Public Reference Room in Washington, D.C. Information on the operation of the SEC's Public Reference Room may be obtained by calling (800) SEC-0330. The fund's portfolio holdings are also posted on deutschefunds.com from time to time. Please see the fund's current prospectus for more information. |
| Principal Underwriter | If you have questions, comments or complaints, contact: DeAWM Distributors, Inc. 222 South Riverside Plaza
Chicago, IL 60606-5808 (800) 621-1148 |
| Investment Management | Deutsche Investment Management Americas Inc. ("DIMA" or the "Advisor"), which is part of Deutsche Asset Management, is the investment advisor for the fund. DIMA and its predecessors have more than 80 years of experience managing mutual funds and DIMA provides a full range of investment advisory services to both institutional and retail clients. DIMA is an indirect, wholly owned subsidiary of Deutsche Bank AG. Deutsche Bank AG is a major global banking institution engaged in a wide variety of financial services, including investment management, retail, private and commercial banking, investment banking and insurance. Deutsche Asset Management is the retail brand name in the U.S. for the asset management activities of Deutsche Bank AG and DIMA. Deutsche Asset Management is committed to delivering the investing expertise, insight and resources of this global investment platform to American investors. |
| Nasdaq Symbol | BICXX |
| CUSIP Number | 23337T 110 |
| Fund Number | 541 |
Notes


December 31, 2015
Annual Report
to Shareholders
Cash Reserves Fund Institutional

Contents
Cash Reserves Fund Institutional 3 Portfolio Management Review 7 Statement of Assets and Liabilities 8 Statement of Operations 9 Statement of Changes in Net Assets 10 Financial Highlights 11 Notes to Financial Statements 17 Report of Independent Registered Public Accounting Firm 18 Information About Your Fund's Expenses 19 Tax Information Cash Management Portfolio 21 Investment Portfolio 34 Statement of Assets and Liabilities 35 Statement of Operations 36 Statement of Changes in Net Assets 37 Financial Highlights 38 Notes to Financial Statements 44 Report of Independent Registered Public Accounting Firm 45 Shareholder Meeting Results 46 Advisory Agreement Board Considerations and Fee Evaluation 51 Board Members and Officers 56 Account Management Resources |
This report must be preceded or accompanied by a prospectus. To obtain a summary prospectus, if available, or prospectus for any of our funds, refer to the Account Management Resources information provided in the back of this booklet. We advise you to consider the fund's objectives, risks, charges and expenses carefully before investing. The summary prospectus and prospectus contain this and other important information about the fund. Please read the prospectus carefully before you invest.
An investment in this fund is not insured or guaranteed by the Federal Deposit Insurance Corporation (FDIC) or by any other government agency. Although the fund seeks to preserve the value of your investment at $1.00 per share, it is possible to lose money by investing in the fund. The share price of money market funds can fall below the $1.00 share price. You should not rely on or expect the Advisor to enter into support agreements or take other actions to maintain the fund's $1.00 share price. The credit quality of the fund's holdings can change rapidly in certain markets, and the default of a single holding could have an adverse impact on the fund's share price. The fund's share price can also be negatively affected during periods of high redemption pressures and/or illiquid markets. The actions of a few large investors of the fund may have a significant adverse effect on the share price of the fund. See the prospectus for specific details regarding the fund's risk profile.
NOT FDIC/NCUA INSURED NO BANK GUARANTEE MAY LOSE VALUE NOT A DEPOSIT NOT INSURED BY ANY FEDERAL GOVERNMENT AGENCY
Portfolio Management Review (Unaudited)
Market Overview
All performance information below is historical and does not guarantee future results. Investment return and principal fluctuate, so your shares may be worth more or less when redeemed. Current performance may differ from performance data shown. Please visit deutscheliquidity.com/US for the fund's most recent month-end performance. The 7-day current yield refers to the income paid by the fund over a 7-day period expressed as an annual percentage rate of the fund's shares outstanding. Yields fluctuate and are not guaranteed.
Investment Objective The fund seeks to provide a high level of current income consistent with liquidity and the preservation of capital. The fund is a feeder fund that invests substantially all of its assets in a "master portfolio," the Cash Management Portfolio, which will invest directly in securities and other instruments. The Cash Management Portfolio has the same investment objective as the fund. |
Over the 12 months ended December 31, 2015, rate levels within the money market yield curve — including short-term money market rates — fluctuated based on varying economic reports, investors' interest rate expectations, geopolitical uncertainty and evolving U.S. Federal Reserve Board (the Fed) statements. In March 2015, the Fed removed the word "patient" from its statement regarding the timing of a possible rate hike. Despite temporary conditions such as the harsh winter weather that many said was to blame for disappointing first-quarter 2015 U.S. gross domestic product (GDP) growth, in April the Fed anticipated that U.S. economic conditions would improve. A second-quarter rebound in U.S. GDP growth set the stage for a possible rate hike as early as September of 2015. In late August, the focus shifted to China, as news of that country’s economic slowdown spurred additional market volatility. In September, the Fed declined to raise rates, citing concerns over China’s stumbling economy. However, in October the comments by the Fed turned more hawkish, not mentioning China but expressing the desire to raise rates at the next Federal Open Market Committee (FOMC) meeting. This set the stage for short-term rates to rise as markets "priced in" an eventual raising of the federal funds rate by 25 basis points in mid-December.
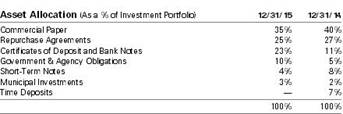
Fund Performance (as of December 31, 2015) Performance is historical and does not guarantee future results. Current performance may be lower or higher than the performance data quoted. An investment in this fund is not insured or guaranteed by the FDIC or by any other government agency. Although the fund seeks to preserve the value of your investment at $1.00 per share, it is possible to lose money by investing in the fund. The share price of money market funds can fall below the $1.00 share price. |
| 7-Day Current Yield |
| December 31, 2015 | .20%* |
| December 31, 2014 | .01%* |
* The investment advisor has agreed to waive fees/reimburse expenses. Without such fee waivers/expense reimbursements, the 7-day current yield would have been lower. Yields are historical, will fluctuate and do not guarantee future performance. The 7-day current yield refers to the income paid by the portfolio over a 7-day period expressed as an annual percentage rate of the fund's shares outstanding. Please visit our Web site at deutscheliquidity.com/US for the product's most recent month-end performance. |
Positive Contributors to Fund Performance
We were able to maintain a competitive yield for the fund during the annual period ended December 31, 2015. We continued to seek ample liquidity, high credit quality and strong diversification across sectors and geographic regions by maintaining a neutral portfolio duration (or interest rate sensitivity). We pursued this strategy in light of the outlook for continued near-zero short-term interest rates and limited money market supply. In addition, we looked to keep the fund's cash position relatively low in order to take advantage of higher yields available from six-month-to-one-year money market securities.
Negative Contributors to Fund Performance
The types of securities that we were investing in tended to have lower yields than issues carrying more risk. We preferred to be cautious during a time of market uncertainty. In the end this cost the fund some yield, but we believe that this represented a prudent approach to preserving principal.
Outlook and Positioning
Within money markets, we believe the current balance of tight supply and heavy demand will most likely persist. These technical market conditions, along with issues surrounding money market reform, should in our view create a steeper money market yield curve, keeping yields low at the short end of the curve. Our current forecast is for the federal funds rate to be raised two to three additional times during 2016. In preparation, we are maintaining a cautious approach, with a shorter duration, an emphasis on short fixed maturities and floating-rate notes, and increased selectivity regarding longer maturities. Our goal, as always, is to maintain ample liquidity, high credit quality and strong diversification across geographic regions and market sectors.
We continue our insistence on the highest credit quality within the fund. We also plan to maintain our conservative investment strategies and standards under the current market conditions. We continue to apply a careful approach to investing on behalf of the fund and to seek competitive yield for our shareholders.
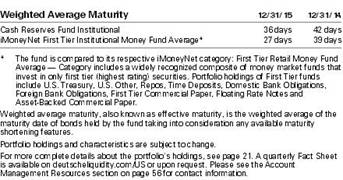
Portfolio Management Team
A group of investment professionals is responsible for the day-to-day management of the fund. These investment professionals have a broad range of experience managing money market funds.
The views expressed reflect those of the portfolio management team only through the end of the period of the report as stated on the cover. The management team's views are subject to change at any time based on market and other conditions and should not be construed as a recommendation. Past performance is no guarantee of future results. Current and future portfolio holdings are subject to risk.
Terms to Know
The yield curve is a graphical representation of how yields on bonds of different maturities compare. Normally, yield curves slant up, as bonds with longer maturities typically offer higher yields than short-term bonds.
GDP, or gross domestic product, is the value of all goods and services produced by a country's economy.
Floating-rate securities are debt instruments with floating-rate coupons that generally reset every 30 to 90 days. While floating-rate loans are senior to equity and fixed-income securities, there is no guaranteed return of principal in case of default. Floating-rate loans often have less interest-rate risk than other fixed-income investments. Floating-rate loans are most often secured assets, generally senior to a company's secured debt and can be transferred to debt holders, providing potential downside potential.
Statement of Assets and Liabilities
| as of December 31, 2015 |
| Assets |
| Investment in Cash Management Portfolio, at value | $ 1,927,194,546 |
| Receivable for Fund shares sold | 9,035 |
| Other assets | 3,027 |
| Total assets | 1,927,206,608 |
| Liabilities |
| Payable for Fund shares redeemed | 8,187 |
| Accrued Trustees' fees | 1,185 |
| Other accrued expenses and payables | 151,040 |
| Total liabilities | 160,412 |
| Net assets, at value | $ 1,927,046,196 |
| Net Assets Consist of |
| Accumulated net realized gain (loss) | (210,736) |
| Paid-in capital | 1,927,256,932 |
| Net assets, at value | $ 1,927,046,196 |
| Net Asset Value |
| Net Asset Value, offering and redemption price per share ($1,927,046,196 ÷ 1,927,469,351 outstanding shares of beneficial interest, $.01 par value, unlimited number of shares authorized) | $ 1.00 |
The accompanying notes are an integral part of the financial statements.
Statement of Operations
| for the year ended December 31, 2015 |
| Investment Income |
Income and expenses allocated from Cash Management Portfolio: Interest | $ 3,209,275 |
| Expenses* | (1,782,284) |
| Net investment income allocated from Cash Management Portfolio | 1,426,991 |
Expenses: Administration fee | 1,272,862 |
| Services to shareholders | 50,319 |
| Service fees | 3,457 |
| Professional fees | 49,399 |
| Reports to shareholders | 30,161 |
| Registration fees | 24,351 |
| Trustees' fees and expenses | 4,525 |
| Other | 13,924 |
| Total expenses before expense reductions | 1,448,998 |
| Expense reductions | (590,804) |
| Total expenses after expense reductions | 858,194 |
| Net investment income | 568,797 |
| Net realized gain (loss) allocated from Cash Management Portfolio | 25,634 |
| Net increase (decrease) in net assets resulting from operations | $ 594,431 |
* Net of $320,401 Advisor reimbursement allocated from Cash Management Portfolio for the year ended December 31, 2015.
The accompanying notes are an integral part of the financial statements.
Statement of Changes in Net Assets
| Increase (Decrease) in Net Assets | Years Ended December 31, |
| 2015 | 2014 |
Operations: Net investment income | $ 568,797 | $ 137,374 |
| Net realized gain (loss) | 25,634 | 2,534 |
| Net increase (decrease) in net assets resulting from operations | 594,431 | 139,908 |
Distributions to shareholders from: Net investment income | (571,441) | (137,375) |
Fund share transactions: Proceeds from shares sold | 18,992,375,113 | 15,172,065,365 |
| Reinvestment of distributions | 438,877 | 90,460 |
| Payments for shares redeemed | (18,074,412,334) | (15,530,184,273) |
| Net increase (decrease) in net assets from Fund share transactions | 918,401,656 | (358,028,448) |
| Increase (decrease) in net assets | 918,424,646 | (358,025,915) |
| Net assets at beginning of period | 1,008,621,550 | 1,366,647,465 |
| Net assets at end of period (including undistributed net investment income of $0 and $0, respectively) | $ 1,927,046,196 | $ 1,008,621,550 |
| Other Information |
| Shares outstanding at beginning of period | 1,009,067,695 | 1,367,096,143 |
| Shares sold | 18,992,375,113 | 15,172,065,365 |
| Shares issued to shareholders in reinvestment of distributions | 438,877 | 90,460 |
| Shares redeemed | (18,074,412,334) | (15,530,184,273) |
| Net increase (decrease) in Fund shares | 918,401,656 | (358,028,448) |
| Shares outstanding at end of period | 1,927,469,351 | 1,009,067,695 |
The accompanying notes are an integral part of the financial statements.
Financial Highlights
| | |
Years Ended December 31, |
| 2015 | 2014 | 2013 | 2012 | 2011 |
| Selected Per Share Data |
| Net asset value, beginning of period | $ 1.00 | $ 1.00 | $ 1.00 | $ 1.00 | $ 1.00 |
Income from investment operations: Net investment income | .000* | .000* | .000* | .001 | .000* |
| Net realized gain (loss) | .000* | .000* | .000* | .000* | .000* |
| Total from investment operations | .000* | .000* | .000* | .001 | .000* |
Less distributions from: Net investment income | (.000)* | (.000)* | (.000)* | (.001) | (.000)* |
| Net asset value, end of period | $ 1.00 | $ 1.00 | $ 1.00 | $ 1.00 | $ 1.00 |
| Total Return (%)a | .04 | .01 | .02 | .07 | .05 |
| Ratios to Average Net Assets and Supplemental Data |
| Net assets, end of period ($ millions) | 1,927 | 1,009 | 1,367 | 1,657 | 1,993 |
| Ratio of expenses before expense reductions, including expenses allocated from Cash Management Portfolio (%) | .28 | .28 | .27 | .28 | .28 |
| Ratio of expenses after expense reductions, including expenses allocated from Cash Management Portfolio (%) | .21 | .18 | .20 | .21 | .21 |
| Ratio of net investment income (%) | .04 | .01 | .02 | .07 | .05 |
a Total return would have been lower had certain expenses not been reduced. * Amount is less than $.0005. |
Notes to Financial Statements
A. Organization and Significant Accounting Policies
Cash Reserves Fund Institutional (the "Fund") is a diversified series of DWS Money Market Trust (the "Trust"), which is registered under the Investment Company Act of 1940, as amended (the "1940 Act"), as an open-end management investment company organized as a Massachusetts business trust.
The Fund is a feeder fund that seeks to achieve its investment objective by investing substantially all of its investable assets in a master portfolio, the Cash Management Portfolio (the "Portfolio"), an open-end management investment company registered under the 1940 Act and organized as a New York trust advised by Deutsche Investment Management Americas Inc. ("DIMA" or the "Advisor"), an indirect, wholly owned subsidiary of Deutsche Bank AG. A master/feeder fund structure is one in which a fund (a "feeder fund"), instead of investing directly in a portfolio of securities, invests most or all of its investment assets in a separate registered investment company (the "master fund") with substantially the same investment objective and policies as the feeder fund. Such a structure permits the pooling of assets of two or more feeder funds, preserving separate identities or distribution channels at the feeder fund level. At December 31, 2015, the Fund owned approximately 11% of the Portfolio.
The Fund's financial statements are prepared in accordance with accounting principles generally accepted in the United States of America which require the use of management estimates. Actual results could differ from those estimates. The policies described below are followed consistently by the Fund in the preparation of its financial statements. The financial statements of the Portfolio, including the Investment Portfolio, are contained elsewhere in this report and should be read in conjunction with the Fund's financial statements.
Security Valuation. The Fund records its investment in the Portfolio at value, which reflects its proportionate interest in the net assets of the Portfolio. Valuation of the securities held by the Portfolio is discussed in the notes to the Portfolio's financial statements included elsewhere in this report.
Disclosure about the classification of fair value measurements is included in a table following the Portfolio's Investment Portfolio.
Federal Income Taxes. The Fund's policy is to comply with the requirements of the Internal Revenue Code, as amended, which are applicable to regulated investment companies, and to distribute all of its taxable income to its shareholders.
Under the Regulated Investment Company Modernization Act of 2010, net capital losses incurred post-enactment may be carried forward indefinitely, and their character is retained as short-term and/or long-term. Previously, net capital losses were carried forward for eight years and treated as short-term losses. As a transition rule, the Act requires that post-enactment net capital losses be used before pre-enactment net capital losses.
At December 31, 2015, the Fund had a net tax basis capital loss carryforward of approximately $211,000 of pre-enactment losses, which may be applied against any realized net taxable capital gains of each succeeding year until fully utilized or until December 31, 2016, the expiration date, whichever occurs first.
The Fund has reviewed the tax positions for the open tax years as of December 31, 2015, and has determined that no provision for income tax and/or uncertain tax provisions is required in the Fund's financial statements. The Fund's federal tax returns for the prior three fiscal years remain open subject to examination by the Internal Revenue Service.
Distribution of Income and Gains. Net investment income of the Fund is declared as a daily dividend and is distributed to shareholders monthly. The Fund may take into account capital gains and losses in its daily dividend declarations. The Fund may also make additional distributions for tax purposes if necessary.
Permanent book and tax differences relating to shareholder distributions will result in reclassifications to paid in capital. Temporary book and tax differences will reverse in a subsequent period. There were no significant book to tax differences for the Fund.
At December 31, 2015, the Fund's components of distributable earnings (accumulated losses) on a tax basis were as follows:
| Capital loss carryforward | $ (211,000) |
In addition, the tax character of distributions paid to shareholders by the Fund is summarized as follows:
| | Years Ended December 31, |
| | 2015 | 2014 |
| Distributions from ordinary income* | $ 571,441 | $ 137,375 |
* For tax purposes, short-term capital gain distributions are considered ordinary income distributions.
Contingencies. In the normal course of business, the Fund may enter into contracts with service providers that contain general indemnification clauses. The Fund's maximum exposure under these arrangements is unknown as this would involve future claims that may be made against the Fund that have not yet been made. However, based on experience, the Fund expects the risk of loss to be remote.
Other. The Fund receives an allocation of the Portfolio's net investment income and net realized gains and losses in proportion to its investment in the Portfolio. Expenses directly attributed to a fund are charged to that fund, while expenses which are attributable to the Trust are allocated among the funds in the Trust on the basis of relative net assets.
B. Fees and Transactions with Affiliates
Management Agreement. Under the Investment Management Agreement with Deutsche Investment Management Americas Inc. ("DIMA" or the "Advisor"), an indirect, wholly owned subsidiary of Deutsche Bank AG, the Advisor serves as the investment manager to the Fund. The Advisor receives a management fee from the Portfolio pursuant to the master/feeder structure listed above in Note A.
Administration Fee. Pursuant to an Administrative Services Agreement, DIMA provides most administrative services to the Fund. For all services provided under the Administrative Services Agreement, the Fund pays the Advisor an annual fee ("Administration Fee") of 0.10% of the Fund's average daily net assets, computed and accrued daily and payable monthly.
For the period from January 1, 2015 through September 30, 2016, DIMA has contractually agreed to waive its fees and/or reimburse certain operating expenses of the Fund, including expenses of the Portfolio allocated to the Fund, to the extent necessary to maintain the total annual operating expenses (excluding certain expenses such as extraordinary expenses, taxes, brokerage and interest) at 0.21% of the Fund's average daily net assets.
In addition, the Advisor has agreed to voluntarily waive additional expenses. The waiver may be changed or terminated at any time without notice. Under this arrangement, the Advisor waived certain expenses of the Fund.
For the year ended December 31, 2015, the Administration Fee was $1,272,862, of which $541,201 was waived and $88,753 is unpaid.
Service Provider Fees. DeAWM Service Company ("DSC"), an affiliate of the Advisor, is the transfer agent, dividend-paying agent and shareholder service agent for the Fund. Pursuant to a sub-transfer agency agreement between DSC and DST Systems, Inc. ("DST"), DSC has delegated certain transfer agent, dividend-paying agent and shareholder service agent functions to DST. DSC compensates DST out of the shareholder servicing fee it receives from the Fund. For the year ended December 31, 2015, the amount charged to the Fund by DSC aggregated $46,146, all of which was waived.
Shareholder Servicing Fee. DeAWM Distributors, Inc. ("DDI"), an affiliate of the Advisor, provides information and administrative services for a fee ("Service Fee") to shareholders at an annual rate of up to 0.25% of average daily net assets. DDI in turn has various agreements with financial services firms that provide these services and pays these fees based upon the assets of shareholder accounts the firm services. For the year ended December 31, 2015, the Service Fee was as follows:
| | Total Aggregated | Waived | Annual Effective Rate |
| Cash Reserves Fund Institutional | $ 3,457 | $ 3,457 | .00% |
Typesetting and Filing Service Fees. Under an agreement with DIMA, DIMA is compensated for providing typesetting and certain regulatory filing services to the Fund. For the year ended December 31, 2015, the amount charged to the Fund by DIMA included in Statement of Operations under "Reports to shareholders" aggregated $17,605, of which $7,585 is unpaid.
Trustees' Fees and Expenses. The Fund paid retainer fees to each Trustee not affiliated with the Advisor, plus specified amounts to the Board Chairperson and Vice Chairperson and to each committee Chairperson.
C. Concentration of Ownership
From time to time, the Fund may have a concentration of several shareholder accounts holding a significant percentage of shares outstanding. Investment activities of these shareholders could have a material impact on the Fund.
At December 31, 2015, there were four shareholder accounts that held approximately 25%, 19%, 17% and 10% of the outstanding shares of the Fund, respectively.
D. Additional Information
Effective on or about May 2, 2016, the Fund will operate as a government money market fund under the amendments to Rule 2a-7 under the Investment Company Act of 1940, as amended, that were adopted in July 2014 with final compliance dates ranging between July 2015 and October 2016. As currently structured, on the final compliance date for the Rule 2a-7 amendments, the Fund would be required to implement a floating net asset value and would be allowed, and in certain situations, required, to implement liquidity fees and/or redemption gates. As a government money market fund, the Fund will continue to seek to maintain a stable $1.00 net asset value (although the Fund will seek to maintain a $1.00 net asset value, there is no guarantee that it will be able to do so and if the net asset value falls below $1.00, you would lose money) and the Fund will not be required to implement liquidity fees and/or redemption gates. As a government money market fund, the Fund will invest at least 99.5% of the Fund’s total assets in cash, US government securities, and/or repurchase agreements that are collateralized by these same securities.
In order for the Fund to operate as a government money market fund, shareholders approved revisions to the Fund’s fundamental investment policy relating to concentration (the "Concentration Policy") such that the Fund would no longer be required to invest more than 25% of its total assets in obligations of banks and other financial institutions. If not revised, the current Concentration Policy would have precluded the Fund from operating as a government money market fund. The Fund is a "feeder" fund that pursues its investment objective by investing substantially all of its assets in a "master portfolio," the Cash Management Portfolio (the "Portfolio"), under a master-feeder structure. The Portfolio invests directly in securities and other instruments and the Fund has the same investment objective and policies as the Portfolio. Effective on or about May 2, 2016, the Portfolio will also operate as a government money market fund.
In addition to the revised Concentration Policy, the following changes to the Fund for it to operate as a government money market fund will also take effect on May 2, 2016:
(i) A revised investment objective, as follows:
"The fund seeks maximum current income to the extent consistent with stability of principal."
(ii) The adoption of a principal investment strategy to invest at least 99.5% of the Fund’s total assets in cash, government securities, and/or repurchase agreements that are collateralized by these same securities.
(iii) Name changes, as follows:
| Current Name | | New Name |
| Cash Management Portfolio | | Government Cash Management Portfolio |
| DWS Money Market Trust | | Deutsche Money Market Trust |
| Cash Reserves Fund Institutional | | Deutsche Government Cash Reserves Fund Institutional |
(iv) A reduction in the management fee rate paid by the Portfolio to DIMA, the investment advisor to the Fund and the Portfolio. Pursuant to the master-feeder structure noted above, DIMA receives a management fee from the Portfolio.
To ensure an orderly transition to a government money market fund, DIMA anticipates that it will begin to gradually implement changes to the Portfolio beginning in the first quarter of 2016. As a result, it is expected that the Portfolio gradually will allocate a larger percentage of its assets to government securities over time until it reaches its new allocation on or about May 2, 2016. Because the yields on government securities generally may be expected to be lower than the yields on comparable non-government securities, it should be expected that the Fund's yield may decrease as more assets are invested in government securities.
Report of Independent Registered Public Accounting Firm
To the Board of Trustees of DWS Money Market Trust and Shareholders of Cash Reserves Fund Institutional:
In our opinion, the accompanying statement of assets and liabilities and the related statements of operations and of changes in net assets and the financial highlights present fairly, in all material respects, the financial position of Cash Reserves Fund Institutional (the "Fund") at December 31, 2015, and the results of its operations, the changes in its net assets and the financial highlights for each of the periods indicated therein, in conformity with accounting principles generally accepted in the United States of America. These financial statements and financial highlights (hereafter referred to as "financial statements") are the responsibility of the Fund's management. Our responsibility is to express an opinion on these financial statements based on our audits. We conducted our audits of these financial statements in accordance with the standards of the Public Company Accounting Oversight Board (United States). Those standards require that we plan and perform the audits to obtain reasonable assurance about whether the financial statements are free of material misstatement. An audit includes examining, on a test basis, evidence supporting the amounts and disclosures in the financial statements, assessing the accounting principles used and significant estimates made by management, and evaluating the overall financial statement presentation. We believe that our audits, which included confirmation of securities at December 31, 2015 by correspondence with the transfer agent, provide a reasonable basis for our opinion.
Boston, Massachusetts
February 23, 2016 | PricewaterhouseCoopers LLP |
Information About Your Fund's Expenses
As an investor of the Fund, you incur two types of costs: ongoing expenses and transaction costs. Ongoing expenses include management fees and other Fund expenses. Examples of transaction costs include account maintenance fees, which are not shown in this section. The following tables are intended to help you understand your ongoing expenses (in dollars) of investing in the Fund and to help you compare these expenses with the ongoing expenses of investing in other mutual funds. In the most recent six-month period, the Fund limited these expenses; had it not done so, expenses would have been higher. The example in the table is based on an investment of $1,000 invested at the beginning of the six-month period and held for the entire period (July 1, 2015 to December 31, 2015).
The tables illustrate your Fund's expenses in two ways:
— Actual Fund Return. This helps you estimate the actual dollar amount of ongoing expenses (but not transaction costs) paid on a $1,000 investment in the Fund using the Fund's actual return during the period. To estimate the expenses you paid over the period, simply divide your account value by $1,000 (for example, an $8,600 account value divided by $1,000 = 8.6), then multiply the result by the number in the "Expenses Paid per $1,000" line under the share class you hold.
— Hypothetical 5% Fund Return. This helps you to compare your Fund's ongoing expenses (but not transaction costs) with those of other mutual funds using the Fund's actual expense ratio and a hypothetical rate of return of 5% per year before expenses. Examples using a 5% hypothetical fund return may be found in the shareholder reports of other mutual funds. The hypothetical account values and expenses may not be used to estimate the actual ending account balance or expenses you paid for the period.
Please note that the expenses shown in these tables are meant to highlight your ongoing expenses only and do not reflect any transaction costs. The "Expenses Paid per $1,000" line of the tables is useful in comparing ongoing expenses only and will not help you determine the relative total expense of owning different funds. If these transaction costs had been included, your costs would have been higher.
Expenses and Value of a $1,000 Investment
for the six months ended December 31, 2015 (Unaudited) |
| Actual Fund Return* | |
| Beginning Account Value 7/1/15 | $ 1,000.00 |
| Ending Account Value 12/31/15 | $ 1,000.33 |
| Expenses Paid per $1,000** | $ 1.06 |
| Hypothetical 5% Fund Return* | |
| Beginning Account Value 7/1/15 | $ 1,000.00 |
| Ending Account Value 12/31/15 | $ 1,024.15 |
| Expenses Paid per $1,000** | $ 1.07 |
* Expenses include amounts allocated proportionally from the master portfolio.
** Expenses are equal to the Fund's annualized expense ratio, multiplied by the average account value over the period, multiplied by 184 (the number of days in the most recent six-month period), then divided by 365.
| Annualized Expense Ratio | |
| Cash Reserves Fund Institutional | .21% |
For more information, please refer to the Fund's prospectus.
For an analysis of the fees associated with an investment in the Fund or similar funds, please refer to http://apps.finra.org/fundanalyzer/1/fa.aspx.
Tax Information (Unaudited)
A total of 2.60% of the dividends distributed during the fiscal year was derived from interest on U.S. government securities, which is generally exempt from state income tax.
Please contact a tax advisor if you have questions about federal or state income tax laws, or on how to prepare your tax returns. If you have specific questions about your account, please call (800) 728-3337.
(The following financial statements of the Cash Management Portfolio should be read in conjunction with the Fund's financial statements.)
Investment Portfolio as of December 31, 2015
| | Principal Amount ($) | Value ($) |
| | | | |
| Certificates of Deposit and Bank Notes 22.2% |
| Banco del Estado de Chile: |
| | 0.52%, 2/29/2016 | 25,000,000 | 25,000,000 |
| | 0.57%, 4/28/2016 | 110,600,000 | 110,600,000 |
| | 0.652%, 2/29/2016 | 75,000,000 | 75,000,000 |
| Bank of Montreal: |
| | 0.3%, 1/4/2016 | 108,500,000 | 108,500,000 |
| | 0.389%, 1/7/2016 | 95,000,000 | 95,000,000 |
| | 0.56%, 4/18/2016 | 65,000,000 | 65,000,000 |
| Bank of Nova Scotia: |
| | 0.55%, 3/18/2016 | 45,000,000 | 45,000,000 |
| | 0.612%, 4/28/2016 | 38,500,000 | 38,500,000 |
| Canadian Imperial Bank of Commerce, 0.65%, 6/30/2016 | 106,075,000 | 106,075,000 |
| Citibank NA, 0.37%, 1/8/2016 | 6,813,000 | 6,813,000 |
| Cooperatieve Centrale Raiffeisen-Boerenleenbank BA: |
| | 0.43%, 3/4/2016 | 125,800,000 | 125,800,000 |
| | 0.497%, 4/14/2016 | 187,000,000 | 187,000,000 |
| Dexia Credit Local: |
| | 0.431%, 5/4/2016 | 100,000,000 | 100,000,000 |
| | 144A, 0.432%, 2/26/2016 | 28,500,000 | 28,500,000 |
| DZ Bank AG: |
| | 0.36%, 1/4/2016 | 86,587,000 | 86,587,000 |
| | 0.38%, 1/29/2016 | 171,715,000 | 171,715,000 |
| | 0.4%, 2/11/2016 | 119,000,000 | 119,000,000 |
| | 0.45%, 12/15/2016 | 25,000,000 | 25,000,000 |
| Mitsubishi UFJ Trust & Banking Corp.: |
| | 0.38%, 1/19/2016 | 50,000,000 | 50,000,000 |
| | 0.46%, 3/17/2016 | 88,500,000 | 88,500,000 |
| Mizuho Bank Ltd.: |
| | 0.29%, 1/20/2016 | 34,000,000 | 34,000,000 |
| | 0.29%, 1/29/2016 | 123,500,000 | 123,500,000 |
| | 0.3%, 2/11/2016 | 85,000,000 | 85,000,000 |
| | 0.4%, 2/17/2016 | 115,000,000 | 115,000,000 |
| Nordea Bank Finland PLC: |
| | 0.3%, 2/8/2016 | 200,000,000 | 200,000,000 |
| | 0.45%, 3/18/2016 | 136,500,000 | 136,500,000 |
| | 0.467%, 2/12/2016 | 200,000,000 | 200,000,000 |
| | 0.487%, 5/13/2016 | 100,000,000 | 100,000,000 |
| | 0.5%, 3/9/2016 | 33,000,000 | 33,000,000 |
| Norinchukin Bank, 0.31%, 1/19/2016 | 110,000,000 | 110,001,645 |
| Royal Bank of Canada, 0.71%, 5/2/2016 | 92,500,000 | 92,500,000 |
| Sumitomo Mitsui Banking Corp.: |
| | 0.35%, 2/12/2016 | 50,000,000 | 50,000,000 |
| | 0.4%, 2/18/2016 | 100,000,000 | 100,000,000 |
| | 0.54%, 3/16/2016 | 85,500,000 | 85,500,000 |
| Svenska Handelsbanken AB: |
| | 0.491%, 4/15/2016 | 125,000,000 | 125,000,000 |
| | 0.495%, 2/29/2016 | 120,000,000 | 120,000,981 |
| Swedbank AB, 0.453%, 3/10/2016 | 125,000,000 | 125,000,000 |
| Toronto-Dominion Bank: |
| | 0.43%, 3/2/2016 | 141,000,000 | 141,000,000 |
| | 0.65%, 4/28/2016 | 110,000,000 | 110,000,000 |
| Wells Fargo Bank NA: |
| | 0.394%, 6/3/2016 | 50,000,000 | 50,000,000 |
| | 0.457%, 4/11/2016 | 63,000,000 | 63,000,000 |
| Westpac Banking Corp., 0.552%, 5/27/2016 | 135,000,000 | 135,000,000 |
| Total Certificates of Deposit and Bank Notes (Cost $3,991,592,626) | 3,991,592,626 |
| |
| Commercial Paper 34.0% |
| Issued at Discount** 21.7% |
| Albion Capital LLC, 0.35%, 1/20/2016 | 106,900,000 | 106,880,253 |
| Bank Nederlandse Gemeenten, 0.381%, 3/4/2016 | 142,000,000 | 141,905,570 |
| Caisse Centrale Desjardins du Quebec, 0.37%, 2/2/2016 | 82,000,000 | 81,973,031 |
| Caisse des Depots et Consignations: |
| | 0.31%, 2/16/2016 | 150,000,000 | 149,940,583 |
| | 0.346%, 3/15/2016 | 47,000,000 | 46,966,669 |
| Chevron Corp., 0.4%, 2/5/2016 | 74,400,000 | 74,371,067 |
| China Construction Bank Corp., 0.42%, 1/4/2016 | 17,000,000 | 16,999,405 |
| Coca-Cola Co., 0.511%, 3/18/2016 | 72,500,000 | 72,420,915 |
| Collateralized Commercial Paper II Co., LLC: |
| | 0.481%, 4/6/2016 | 71,270,000 | 71,178,774 |
| | 0.481%, 4/5/2016 | 65,000,000 | 64,917,667 |
| | 0.481%, 4/20/2016 | 100,000,000 | 99,853,333 |
| Cooperatieve Centrale Raiffeisen-Boerenleenbank BA, 0.416%, 3/14/2016 | 50,000,000 | 49,957,924 |
| CPPIB Capital, Inc., 0.3%, 2/3/2016 | 23,763,000 | 23,756,465 |
| Crown Point Capital Co., LLC, 0.621%, 3/14/2016 | 50,000,000 | 49,937,139 |
| DBS Bank Ltd.: |
| | 0.28%, 1/5/2016 | 70,000,000 | 69,997,822 |
| | 0.34%, 1/28/2016 | 50,000,000 | 49,987,250 |
| Erste Abwicklungsanstalt: |
| | 0.33%, 2/3/2016 | 43,500,000 | 43,486,841 |
| | 0.33%, 2/18/2016 | 20,000,000 | 19,991,200 |
| | 0.33%, 3/7/2016 | 55,000,000 | 54,966,725 |
| | 0.531%, 4/4/2016 | 107,000,000 | 106,851,924 |
| Export Development Canada, 0.381%, 1/11/2016 | 68,980,000 | 68,972,719 |
| Exxon Mobil Corp.: |
| | 0.4%, 1/19/2016 | 58,000,000 | 57,988,400 |
| | 0.45%, 2/1/2016 | 155,000,000 | 154,939,937 |
| Gotham Funding Corp.: |
| | 0.4%, 1/11/2016 | 75,000,000 | 74,991,667 |
| | 0.4%, 1/15/2016 | 57,500,000 | 57,491,056 |
| Kells Funding LLC: |
| | 0.32%, 3/8/2016 | 50,000,000 | 49,970,222 |
| | 0.37%, 2/2/2016 | 43,459,000 | 43,445,866 |
| | 144A, 0.401%, 3/14/2016 | 145,000,000 | 144,882,389 |
| | 144A, 0.401%, 1/8/2016 | 50,000,000 | 49,996,111 |
| | 0.431%, 3/14/2016 | 5,000,000 | 4,995,640 |
| Manhattan Asset Funding Co., LLC: |
| | 0.27%, 1/11/2016 | 40,000,000 | 39,997,000 |
| | 0.38%, 1/27/2016 | 32,000,000 | 31,991,218 |
| | 0.48%, 1/28/2016 | 1,536,000 | 1,535,447 |
| MetLife Short Term Funding LLC: |
| | 0.23%, 1/4/2016 | 4,700,000 | 4,699,910 |
| | 0.401%, 4/29/2016 | 80,000,000 | 79,894,222 |
| Microsoft Corp., 0.19%, 1/6/2016 | 57,950,000 | 57,948,471 |
| Nestle Capital Corp., 0.27%, 2/26/2016 | 142,000,000 | 141,940,360 |
| Nieuw Amsterdam Receivables Corp., 0.24%, 1/19/2016 | 36,267,000 | 36,262,648 |
| Nordea Bank AB, 0.305%, 2/8/2016 | 9,000,000 | 8,997,103 |
| Old Line Funding LLC: |
| | 0.481%, 4/12/2016 | 40,000,000 | 39,945,600 |
| | 0.521%, 4/29/2016 | 60,000,000 | 59,896,867 |
| | 144A, 0.552%, 5/16/2016 | 150,000,000 | 149,688,333 |
| | 0.652%, 5/2/2016 | 62,500,000 | 62,362,326 |
| PSP Capital, Inc, 0.23%, 1/22/2016 | 7,600,000 | 7,598,980 |
| PSP Capital, Inc., 0.42%, 1/8/2016 | 32,200,000 | 32,197,370 |
| Regency Markets No. 1 LLC: |
| | 0.45%, 1/20/2016 | 65,000,000 | 64,984,562 |
| | 0.47%, 1/27/2016 | 37,763,000 | 37,750,182 |
| Sinopec Century Bright Capital Investment Ltd.: |
| | 0.5%, 1/8/2016 | 22,500,000 | 22,497,812 |
| | 0.5%, 1/11/2016 | 127,600,000 | 127,582,278 |
| Standard Chartered Bank: |
| | 0.401%, 1/13/2016 | 150,000,000 | 149,980,000 |
| | 0.42%, 1/8/2016 | 145,000,000 | 144,988,158 |
| | 0.501%, 4/5/2016 | 100,000,000 | 99,868,056 |
| Swedbank AB, 0.366%, 2/1/2016 | 44,000,000 | 43,986,171 |
| Total Capital Canada Ltd., 0.21%, 1/4/2016 | 404,000 | 403,993 |
| Victory Receivables Corp.: |
| | 0.4%, 1/15/2016 | 54,407,000 | 54,398,537 |
| | 0.41%, 1/20/2016 | 26,638,000 | 26,632,236 |
| Walt Disney Co.: |
| | 0.19%, 1/25/2016 | 100,000,000 | 99,987,333 |
| | 0.3%, 2/25/2016 | 50,000,000 | 49,977,083 |
| Working Capital Management Co.: |
| | 0.44%, 1/20/2016 | 67,000,000 | 66,984,441 |
| | 0.45%, 1/15/2016 | 50,000,000 | 49,991,250 |
| | 3,898,982,511 |
| Issued at Par 12.3% |
| Australia & New Zealand Banking Group Ltd., 0.441%, 1/15/2016 | 50,000,000 | 50,000,014 |
| Bank Nederlandse Gemeenten: |
| | 0.439%, 5/6/2016 | 87,000,000 | 87,000,000 |
| | 0.522%, 2/25/2016 | 100,000,000 | 100,000,000 |
| Bank of Nova Scotia, 0.57%, 2/12/2016 | 183,800,000 | 183,800,000 |
| Bedford Row Funding Corp.: |
| | 0.351%, 1/14/2016 | 28,000,000 | 28,000,000 |
| | 0.416%, 4/8/2016 | 40,000,000 | 40,000,000 |
| | 144A, 0.517%, 4/12/2016 | 90,500,000 | 90,500,000 |
| | 144A, 0.525%, 3/14/2016 | 15,500,000 | 15,500,000 |
| BNZ International Funding Ltd., 0.497%, 6/14/2016 | 15,000,000 | 15,000,000 |
| Commonwealth Bank of Australia: |
| | 0.379%, 4/7/2016 | 82,000,000 | 81,998,639 |
| | 0.389%, 5/6/2016 | 100,000,000 | 99,997,783 |
| | 0.396%, 4/29/2016 | 38,000,000 | 37,998,847 |
| | 0.396%, 5/4/2016 | 75,000,000 | 75,000,000 |
| | 0.42%, 3/4/2016 | 36,000,000 | 36,000,000 |
| | 144A, 0.532%, 3/29/2016 | 23,000,000 | 22,996,171 |
| Crown Point Capital Co., LLC, 0.722%, 8/25/2016 | 142,800,000 | 142,800,000 |
| Erste Abwicklungsanstalt: |
| | 0.411%, 3/4/2016 | 80,000,000 | 79,999,169 |
| | 0.511%, 3/17/2016 | 120,000,000 | 119,997,494 |
| | 144A, 0.552%, 1/19/2016 | 41,000,000 | 41,000,000 |
| | 144A, 0.562%, 4/19/2016 | 68,250,000 | 68,249,508 |
| HSBC Bank PLC, 144A, 0.678%, 6/24/2016 | 113,250,000 | 113,250,000 |
| Macquarie Bank Ltd., 0.652%, 3/21/2016 | 70,000,000 | 70,000,000 |
| Nederlandse Waterschapsbank NV, 144A, 0.53%, 3/18/2016 | 117,500,000 | 117,500,000 |
| Old Line Funding LLC: |
| | 144A, 0.487%, 5/6/2016 | 50,000,000 | 50,000,000 |
| | 144A, 0.496%, 2/8/2016 | 100,000,000 | 100,000,000 |
| | 144A, 0.613%, 3/22/2016 | 66,000,000 | 66,000,000 |
| Thunder Bay Funding LLC: |
| | 0.476%, 3/8/2016 | 20,000,000 | 20,000,000 |
| | 0.517%, 4/12/2016 | 69,000,000 | 69,000,000 |
| Westpac Banking Corp., 144A, 0.53%, 3/18/2016 | 200,000,000 | 200,000,000 |
| | 2,221,587,625 |
| Total Commercial Paper (Cost $6,120,570,136) | 6,120,570,136 |
| Government & Agency Obligations 9.7% |
| U.S. Government Sponsored Agencies 6.5% |
| Federal Farm Credit Bank: |
| | 0.224%*, 3/3/2016 | 35,000,000 | 35,000,000 |
| | 0.346%*, 2/8/2017 | 15,000,000 | 15,000,000 |
| | 0.382%*, 5/20/2016 | 75,000,000 | 75,000,466 |
| Federal Home Loan Bank: |
| | 0.18%**, 3/1/2016 | 15,000,000 | 14,995,500 |
| | 0.22%**, 4/5/2016 | 29,500,000 | 29,482,874 |
| | 0.23%**, 1/20/2016 | 15,000,000 | 14,998,179 |
| | 0.24%**, 4/4/2016 | 50,000,000 | 49,968,667 |
| | 0.251%**, 3/7/2016 | 43,000,000 | 42,980,291 |
| | 0.255%**, 2/9/2016 | 50,000,000 | 49,986,188 |
| | 0.26%**, 4/11/2016 | 25,000,000 | 24,981,764 |
| | 0.264%*, 10/7/2016 | 7,500,000 | 7,500,000 |
| | 0.27%**, 2/16/2016 | 25,000,000 | 24,991,375 |
| | 0.305%**, 2/29/2016 | 20,000,000 | 19,990,003 |
| | 0.311%**, 6/28/2016 | 50,000,000 | 49,922,931 |
| | 0.341%**, 4/18/2016 | 50,000,000 | 49,949,000 |
| | 0.38%**, 3/22/2016 | 25,000,000 | 24,978,625 |
| | 0.391%**, 7/15/2016 | 25,000,000 | 24,946,917 |
| | 0.392%*, 8/26/2016 | 25,000,000 | 25,000,000 |
| | 0.4%**, 7/1/2016 | 80,000,000 | 79,838,222 |
| | 0.445%**, 2/26/2016 | 32,700,000 | 32,677,364 |
| | 0.471%**, 6/13/2016 | 25,000,000 | 24,946,472 |
| | 0.476%**, 3/9/2016 | 28,609,000 | 28,583,331 |
| | 0.501%**, 6/13/2016 | 75,000,000 | 74,829,169 |
| Federal Home Loan Mortgage Corp.: |
| | 0.2%**, 2/23/2016 | 20,000,000 | 19,994,111 |
| | 0.23%**, 1/12/2016 | 27,500,000 | 27,498,067 |
| | 0.235%**, 4/15/2016 | 21,000,000 | 20,985,607 |
| | 0.511%**, 4/27/2016 | 150,000,000 | 149,751,375 |
| Federal National Mortgage Association: |
| | 0.225%**, 5/23/2016 | 25,000,000 | 24,977,656 |
| | 0.255%**, 2/2/2016 | 26,500,000 | 26,493,993 |
| | 0.422%*, 7/20/2017 | 80,000,000 | 79,993,717 |
| | 1,170,241,864 |
| U.S. Treasury Obligations 3.2% |
| U.S. Treasury Bills: |
| | 0.117%**, 2/11/2016 | 125,000,000 | 124,983,344 |
| | 0.24%**, 2/25/2016 | 25,000,000 | 24,990,833 |
| U.S. Treasury Floating Rate Notes, 0.428%*, 10/31/2017 | 100,000,000 | 99,944,515 |
| U.S. Treasury Notes: |
| | 0.25%, 4/15/2016 | 12,500,000 | 12,496,131 |
| | 0.25%, 5/15/2016 | 45,000,000 | 45,008,955 |
| | 0.375%, 3/15/2016 | 75,000,000 | 75,033,232 |
| | 0.625%, 7/15/2016 | 25,000,000 | 25,044,613 |
| | 2.0%, 1/31/2016 | 50,000,000 | 50,073,604 |
| | 2.0%, 4/30/2016 | 25,000,000 | 25,139,036 |
| | 4.5%, 2/15/2016 | 100,000,000 | 100,535,070 |
| | 583,249,333 |
| Total Government & Agency Obligations (Cost $1,753,491,197) | 1,753,491,197 |
| |
| Short-Term Notes 4.0% |
| Bank of Nova Scotia: |
| | 0.912%*, 3/15/2016 | 1,100,000 | 1,100,570 |
| | 2.9%, 3/29/2016 | 18,000,000 | 18,101,271 |
| GE Capital International Funding Co.: |
| | 144A, 0.964%, 4/15/2016 | 227,289,000 | 227,589,900 |
| | 0.964%, 4/15/2016 | 217,500,000 | 217,750,999 |
| General Electric Capital Corp.: |
| | 0.551%*, 1/14/2016 | 20,500,000 | 20,501,417 |
| | 1.0%, 1/8/2016 | 17,843,000 | 17,844,970 |
| | 1.214%*, 5/9/2016 | 1,000,000 | 1,003,027 |
| | 2.95%, 5/9/2016 | 24,659,000 | 24,866,367 |
| Home Depot, Inc., 5.4%, 3/1/2016 | 67,299,000 | 67,838,287 |
| JPMorgan Chase Bank NA, 0.48%*, 11/22/2016 | 45,750,000 | 45,750,000 |
| Province of Ontario Canada, 4.75%, 1/19/2016 | 25,000,000 | 25,054,768 |
| Wal-Mart Stores, Inc., 5.313%*, 6/1/2016 | 55,000,000 | 56,124,032 |
| Total Short-Term Notes (Cost $723,525,608) | 723,525,608 |
| |
| Municipal Bonds and Notes 3.3% |
| Catawba County, NC, Hospital Revenue, Valley Medical Center, 144A, 0.4%***, 10/1/2034, LOC: Branch Banking & Trust | 2,500,000 | 2,500,000 |
| Georgia, JPMorgan Chase Putters/Drivers Trust, Series SGT05, 0.45%***, 1/1/2035, INS: FGIC, NATL, LIQ: Societe Generale, LOC: Societe Generale | 22,000,000 | 22,000,000 |
| Los Angeles, CA, Metro Transportation Authority, TECP, 0.3%, 1/4/2016, LOC: Sumitomo Mitsui Banking | 22,500,000 | 22,500,000 |
| Metropolitan Government Nashville & Davidson County, TN, Vanderbilt University, TECP, 0.15%, 2/22/2016 | 15,000,000 | 15,000,000 |
| Michigan, State Finance Authority Revenue, School Loan, Series B, 0.35%***, 9/1/2050, LOC: PNC Bank NA | 10,000,000 | 10,000,000 |
| Minnesota, State Office of Higher Education Revenue, Supplementary Student, Series A, 0.4%***, 12/1/2043, LOC: U.S. Bank NA | 11,500,000 | 11,500,000 |
| New Hampshire, State Health & Education Facilities Authority Revenue, Higher Education Loan Corp., Series A, 0.38%***, 12/1/2032, LOC: Royal Bank of Canada | 13,961,000 | 13,961,000 |
| New Jersey, RBC Municipal Products, Inc. Trust, Series E-60, 144A, 0.42%***, 6/28/2016, LOC: Royal Bank of Canada | 152,500,000 | 152,500,000 |
| New Jersey, State Housing & Mortgage Finance Agency, Multi-Family Housing Revenue, Series C, 0.35%***, 11/1/2039, LOC: Bank of America NA | 9,570,000 | 9,570,000 |
| New York, State Housing Finance Agency Revenue, 605 West 42nd Street, Series B, 144A, 0.45%***, 5/1/2048, LOC: Bank of China | 125,010,000 | 125,010,000 |
| New York, State Housing Finance Agency Revenue, 88 Leonard Street, Series A, 144A, 0.42%***, 11/1/2037, LOC: Landesbank Hessen-Thuringen | 11,750,000 | 11,750,000 |
| New York, State Housing Finance Agency Revenue, BAM South Housing, Series B, 144A, 0.4%***, 11/1/2048, LOC: JPMorgan Chase Bank NA | 12,500,000 | 12,500,000 |
| New York City, NY, Municipal Water Finance Authority, Water & Sewer Systems Revenue, Series TR-T30001-I, 144A, 0.41%***, 6/15/2044 | 8,000,000 | 8,000,000 |
| San Jose, CA, Financing Authority Lease Revenue: |
| | TECP, 0.34%, 2/19/2016, LOC: State Street Bank & Trust Co. | 7,113,000 | 7,113,000 |
| | TECP, 0.34%, 2/19/2016, LOC: U.S. Bank NA | 7,114,000 | 7,114,000 |
| University of California: |
| | TECP, 0.4%, 1/5/2016 | 45,000,000 | 44,998,000 |
| | TECP, 0.4%, 1/5/2016, LOC: JPMorgan Chase Bank NA | 25,000,000 | 24,998,889 |
| | TECP, 0.4%, 1/19/2016 | 25,000,000 | 25,000,000 |
| University of Colorado, Hospital Authority Revenue: |
| | Series C, 0.19%*, 11/15/2024 | 18,425,000 | 18,425,000 |
| | Series A, 0.19%*, 11/15/2046 | 20,450,000 | 20,450,000 |
| University of Houston, TECP, 0.49%, 2/9/2016 | 20,497,000 | 20,497,000 |
| Vanderbilt University, TECP, 0.4%, 4/7/2016 | 10,000,000 | 9,989,222 |
| Total Municipal Bonds and Notes (Cost $595,376,111) | 595,376,111 |
| |
| Repurchase Agreements 24.3% |
| BNP Paribas, 0.27%, dated 6/10/2015, to be repurchased at $200,358,500 on 2/4/2016 (a) (b) | 200,000,000 | 200,000,000 |
| BNP Paribas, 0.28%, dated 12/31/2015, to be repurchased at $5,000,156 on 1/4/2016 (c) | 5,000,000 | 5,000,000 |
| Federal Reserve Bank of New York, 0.25%, dated 12/31/2015, to be repurchased at $3,500,097,222 on 1/4/2016 (d) | 3,500,000,000 | 3,500,000,000 |
| JPMorgan Securities, Inc., 0.475%, dated 4/30/2015, to be repurchased at $187,075,708 on 3/31/2016 (a) (e) | 186,250,000 | 186,250,000 |
| JPMorgan Securities, Inc., 0.506%, dated 8/12/2015, to be repurchased at $373,714,681 on 3/31/2016 (a) (f) | 372,500,000 | 372,500,000 |
| Wells Fargo Securities LLC, 0.43%, dated 10/28/2015, to be repurchased at $122,631,688 on 1/26/2016 (a) (g) | 122,500,000 | 122,500,000 |
| Total Repurchase Agreements (Cost $4,386,250,000) | 4,386,250,000 |
| | % of Net Assets | Value ($) |
| | |
| Total Investment Portfolio (Cost $17,570,805,678)† | 97.5 | 17,570,805,678 |
| Other Assets and Liabilities, Net | 2.5 | 450,226,390 |
| Net Assets | 100.0 | 18,021,032,068 |
* Floating rate securities' yields vary with a designated market index or market rate, such as the coupon-equivalent of the U.S. Treasury Bill rate. These securities are shown at their current rate as of December 31, 2015.
** Annualized yield at time of purchase; not a coupon rate.
*** Variable rate demand notes and variable rate demand preferred shares are securities whose interest rates are reset periodically at market levels. These securities are payable on demand and are shown at their current rates as of December 31, 2015.
† The cost for federal income tax purposes was $17,570,805,678.
(a) Open maturity repurchase agreement whose interest rate resets periodically and is shown at the current rate as of December 31, 2015. The dated date is the original day the repurchase agreement was entered into, the maturity date represents the next repurchase date. Upon notice, both the Portfolio and counterparty have the right to terminate the repurchase agreement at any time.
(b) Collateralized by:
| Principal Amount ($) | Security | Rate (%) | Maturity Date | Collateral Value ($) |
| 7,815,000 | Cent CLO Ltd. | 1.8 | 1/25/2026 | 7,749,274 |
| 10,000,000 | ECP CLO Ltd. | 1.867 | 4/20/2027 | 10,377,164 |
| 35,000,000 | Galaxy XV CLO Ltd. | 1.571 | 4/15/2025 | 34,589,993 |
| 36,462,354 | Goldentree Loan Opportunities X Ltd. | 1.612 | 7/20/2027 | 38,141,107 |
| 11,000,000 | KKR Financial CLO Ltd. | 1.471 | 7/15/2025 | 10,785,548 |
| 10,000,000 | LCM XII LP | 1.575 | 10/19/2022 | 9,935,740 |
| 5,000,000 | Mountain Hawk II CLO Ltd. | 1.477 | 7/22/2024 | 4,906,470 |
| 7,455,000 | Nomad CLO Ltd. | 1.822 | 1/15/2025 | 7,317,902 |
| 15,000,000 | Northwoods Capital XIV Ltd. | 1.956 | 11/12/2025 | 14,913,637 |
| 10,000,000 | Ocean Trails CLO IV | 1.659 | 8/13/2025 | 9,791,408 |
| 24,500,000 | OCP CLO Ltd. | 1.765 | 7/17/2026 | 24,253,735 |
| 11,800,000 | Oracle Corp. | 4.125 | 5/15/2045 | 11,220,040 |
| 10,250,000 | Race Point VII CLO Ltd. | 1.764 | 11/8/2024 | 10,181,304 |
| 12,000,000 | Saranac CLO I Ltd. | 1.8 | 10/26/2024 | 11,836,679 |
| Total Collateral Value | 206,000,001 |
(c) Collateralized by:
| Principal Amount ($) | Security | Rate (%) | Maturity Date | Collateral Value ($) |
| 1,366,300 | U.S. Treasury Note | 0.25–3.25 | 4/15/2016–
3/31/2022 | 1,352,559 |
| 6,773,320 | U.S. Treasury STRIPS | Zero Coupon | 2/15/2019–
11/15/2043 | 3,747,441 |
| Total Collateral Value | 5,100,000 |
(d) Collateralized by $3,475,939,500 U.S. Treasury Note, 2.0%, maturing on 2/15/2022 with a value of $3,500,097,280.
(e) Collateralized by $184,332,264 Federal Home Loan Mortgage Corp., with the various coupon rates from 3.0–8.0%, with various maturity dates of 10/1/2031–12/1/2042 with a value of $189,978,835.
(f) Collateralized by:
| Principal Amount ($) | Security | Rate (%) | Maturity Date | Collateral Value ($) |
| 33,390,892 | Ally Auto Receivables Trust | 1.06 | 5/15/2017 | 33,408,636 |
| 177,667 | CAL Funding II Ltd. | 3.47 | 10/25/2027 | 174,988 |
| 1 | Carlyle High Yield Partners X Ltd. | 0.53 | 4/19/2022 | 1 |
| 267,228 | College Loan Corp. Trust | 0.752 | 4/15/2025 | 266,413 |
| 139,339,175 | Federal Home Loan Mortgage Corp. | 3.0–9.0 | 1/1/2017–
7/1/2044 | 147,678,359 |
| 398,522,983 | Federal Home Loan Mortgage Corp. — Interest Only | 3.0–5.5 | 1/15/2039–
8/15/2045 | 58,134,245 |
| 37 | Federal National Mortgage Association — Interest Only | 1007 | 12/25/2021 | 435 |
| 688,637 | GCO Education Loan Funding Trust | 0.523 | 5/25/2025 | 705,343 |
| 681,483 | Goal Capital Funding Trust | 0.563 | 5/28/2030 | 668,743 |
| 84,448 | GSAMP Trust | 1.102 | 11/25/2034 | 81,210 |
| 34,332 | Higher Education Funding I | 0.523 | 2/25/2025 | 34,268 |
| 125,475,000 | JPMorgan Chase & Co. | 0.953–5.0 | 7/5/2016–
11/8/2030 | 128,653,345 |
| 12,037 | KeyCorp Student Loan Trust | 0.933 | 12/27/2029 | 15,690 |
| 2,204,365 | KnowledgeWorks Foundation | 1.343 | 2/25/2042 | 2,171,767 |
| 5,272,898 | LA Arena Funding LLC | 7.656 | 12/15/2026 | 5,818,794 |
| 343,223 | Morgan Stanley ABS Capital I, Inc. Trust | 1.042 | 12/25/2034 | 319,129 |
| 591 | National Collegiate Student Loan Trust | 0.863 | 6/25/2027 | 587 |
| 3,657,750 | TAL Advantage V LLC | 2.83–3.51 | 2/22/2038–
2/22/2039 | 3,618,432 |
| Total Collateral Value | 381,750,385 |
(g) Collateralized by:
| Principal Amount ($) | Security | Rate (%) | Maturity Date | Collateral Value ($) |
| 94,111,209 | International Bank for Reconstruction & Development | 1.06–2.5 | 1/11/2018–
2/25/2028 | 93,756,192 |
| 500,000 | Kaiser Foundation Hospitals | Zero Coupon | 1/6/2016 | 499,955 |
| 31,597,000 | Wells Fargo Bank NA | 0.397–0.87 | 1/11/2016–
10/13/2016 | 31,604,108 |
| Total Collateral Value | 125,860,255 |
144A: Security exempt from registration under Rule 144A of the Securities Act of 1933. These securities may be resold in transactions exempt from registration, normally to qualified institutional buyers.
FGIC: Financial Guaranty Insurance Co.
INS: Insured
LIQ: Liquidity Facility
LOC: Letter of Credit
NATL: National Public Finance Guarantee Corp.
STRIPS: Separate Trading of Registered Interest and Principal Securities
TECP: Tax Exempt Commercial Paper
Fair Value Measurements
Various inputs are used in determining the value of the Portfolio's investments. These inputs are summarized in three broad levels. Level 1 includes quoted prices in active markets for identical securities. Level 2 includes other significant observable inputs (including quoted prices for similar securities, interest rates, prepayment speeds and credit risk). Level 3 includes significant unobservable inputs (including the Portfolio's own assumptions in determining the fair value of investments). The level assigned to the securities valuations may not be an indication of the risk or liquidity associated with investing in those securities. Securities held by the Portfolio are reflected as Level 2 because the securities are valued at amortized cost (which approximates fair value) and, accordingly, the inputs used to determine value are not quoted prices in an active market.
The following is a summary of the inputs used as of December 31, 2015 in valuing the Portfolio's investments. For information on the Portfolio's policy regarding the valuation of investments, please refer to the Security Valuation section of Note A in the accompanying Notes to Financial Statements.
| Assets | Level 1 | Level 2 | Level 3 | Total |
| |
| Investments in Securities (h) | $ — | $ 13,184,555,678 | $ — | $ 13,184,555,678 |
| Repurchase Agreements | — | 4,386,250,000 | — | 4,386,250,000 |
| Total | $ — | $ 17,570,805,678 | $ — | $ 17,570,805,678 |
There have been no transfers between fair value measurement levels during the year ended December 31, 2015.
(h) See Investment Portfolio for additional detailed categorizations.
The accompanying notes are an integral part of the financial statements.
Statement of Assets and Liabilities
| as of December 31, 2015 |
| Assets |
| Investments in non-affiliated securities, valued at amortized cost | $ 13,184,555,678 |
| Repurchase agreements, valued at amortized cost | 4,386,250,000 |
| Investments in securities, at value (cost $17,570,805,678) | 17,570,805,678 |
| Cash | 441,893,919 |
| Interest receivable | 10,878,280 |
| Other assets | 242,926 |
| Total assets | 18,023,820,803 |
| Liabilities |
| Accrued management fee | 1,952,540 |
| Accrued Trustees' fees | 111,726 |
| Other accrued expenses and payables | 724,469 |
| Total liabilities | 2,788,735 |
| Net assets, at value | $ 18,021,032,068 |
The accompanying notes are an integral part of the financial statements.
Statement of Operations
| for the year ended December 31, 2015 |
| Investment Income |
Income: Interest | $ 48,582,219 |
Expenses: Management fee | 25,037,507 |
| Administration fee | 5,893,752 |
| Custodian fee | 217,313 |
| Professional fees | 276,941 |
| Reports to shareholders | 17,789 |
| Trustees' fees and expenses | 505,861 |
| Other | 499,461 |
| Total expenses before expense reductions | 32,448,624 |
| Expense reductions | (4,944,455) |
| Total expenses after expense reductions | 27,504,169 |
| Net investment income | 21,078,050 |
| Net realized gain (loss) from investments | 452,645 |
| Net increase (decrease) in net assets resulting from operations | $ 21,530,695 |
The accompanying notes are an integral part of the financial statements.
Statement of Changes in Net Assets
| Increase (Decrease) in Net Assets | Years Ended December 31, |
| 2015 | 2014 |
Operations: Net investment income | $ 21,078,050 | $ 9,791,086 |
| Net realized gain (loss) | 452,645 | 38,382 |
| Net increase (decrease) in net assets resulting from operations | 21,530,695 | 9,829,468 |
Capital transactions in shares of beneficial interest: Proceeds from capital invested | 317,351,519,324 | 177,895,822,788 |
| Value of capital withdrawn | (319,269,518,924) | (178,202,393,435) |
| Net increase (decrease) in net assets from capital transactions in shares of beneficial interest | (1,917,999,600) | (306,570,647) |
| Increase (decrease) in net assets | (1,896,468,905) | (296,741,179) |
| Net assets at beginning of period | 19,917,500,973 | 20,214,242,152 |
| Net assets at end of period | $ 18,021,032,068 | $ 19,917,500,973 |
The accompanying notes are an integral part of the financial statements.
Financial Highlights
| | |
Years Ended December 31, |
| 2015 | 2014 | 2013 | 2012 | 2011 |
| Ratios to Average Net Assets and Supplemental Data |
| Net assets, end of period ($ millions) | 18,021 | 19,918 | 20,214 | 24,810 | 20,784 |
| Ratio of expenses before expense reductions (%) | .17 | .17 | .16 | .17 | .16 |
| Ratio of expenses after expense reductions (%) | .14 | .14 | .14 | .14 | .15 |
| Ratio of net investment income (%) | .11 | .05 | .08 | .14 | .10 |
| Total Return (%)a,b | .11 | .05 | .08 | .14 | .11 |
a Total return would have been lower had certain expenses not been reduced. b Total return for the Portfolio was derived from the performance of Cash Reserves Fund Institutional. |
Notes to Financial Statements
A. Organization and Significant Accounting Policies
Cash Management Portfolio (the "Portfolio") is registered under the Investment Company Act of 1940, as amended (the "1940 Act"), as an open-end management investment company organized as a New York trust.
The Portfolio is a master fund. A master/feeder fund structure is one in which a fund (a "feeder fund"), instead of investing directly in a portfolio of securities, invests most or all of its investment assets in a separate registered investment company (the "master fund") with substantially the same investment objective and policies as the feeder fund. Such a structure permits the pooling of assets of two or more feeder funds, preserving separate identities or distribution channels at the feeder fund level. The Portfolio may have several feeder funds, including affiliated Deutsche feeder funds and unaffiliated feeder funds; with a significant ownership percentage of the Portfolio's net assets. Investment activities of these feeder funds could have a material impact on the Portfolio. As of December 31, 2015, Cash Management Fund, Cash Reserves Fund Institutional, Cash Reserves Fund — Prime Series and Deutsche Money Market Series owned approximately 12%, 11%, 5% and 69%, respectively, of the Portfolio.
The Portfolio's financial statements are prepared in accordance with accounting principles generally accepted in the United States of America which require the use of management estimates. Actual results could differ from those estimates. The policies described below are followed consistently by the Portfolio in the preparation of its financial statements.
Security Valuation. Various inputs are used in determining the value of the Portfolio's investments. These inputs are summarized in three broad levels. Level 1 includes quoted prices in active markets for identical securities. Level 2 includes other significant observable inputs (including quoted prices for similar securities, interest rates, prepayment speeds and credit risk). Level 3 includes significant unobservable inputs (including the Portfolio's own assumptions in determining the fair value of investments). The level assigned to the securities valuations may not be an indication of the risk or liquidity associated with investing in those securities. Securities held by the Portfolio are reflected as Level 2 because the securities are valued at amortized cost (which approximates fair value) and, accordingly, the inputs used to determine value are not quoted prices in an active market.
The Portfolio values all securities utilizing the amortized cost method permitted in accordance with Rule 2a-7 under the 1940 Act and certain conditions therein. Under this method, which does not take into account unrealized capital gains or losses on securities, an instrument is initially valued at its cost and thereafter assumes a constant accretion/amortization rate to maturity of any discount or premium. Securities held by the Portfolio are reflected as Level 2 because the securities are valued at amortized cost (which approximates fair value) and, accordingly, the inputs used to determine value are not quoted prices in an active market.
Repurchase Agreements. The Portfolio may enter into repurchase agreements, under the terms of a Master Repurchase Agreement, with certain banks and broker/dealers whereby the Portfolio, through its custodian or a sub-custodian bank, receives delivery of the underlying securities, the amount of which at the time of purchase and each subsequent business day is required to be maintained at such a level that the value is equal to at least the principal amount of the repurchase price plus accrued interest. The custodian bank or another designated subcustodian holds the collateral in a separate account until the agreement matures. If the value of the securities falls below the principal amount of the repurchase agreement plus accrued interest, the financial institution deposits additional collateral by the following business day. If the financial institution either fails to deposit the required additional collateral or fails to repurchase the securities as agreed, the Portfolio has the right to sell the securities and recover any resulting loss from the financial institution. If the financial institution enters into bankruptcy, the Portfolio's claims on the collateral may be subject to legal proceedings.
As of December 31, 2015, the Portfolio held repurchase agreements with a gross value of $4,386,250,000. The value of the related collateral exceeded the value of the repurchase agreements at period end. The detail of the related collateral is included in the footnotes following the Portfolio's Investment Portfolio.
Federal Income Taxes. The Portfolio is considered a Partnership under the Internal Revenue Code, as amended. Therefore, no federal income tax provision is necessary.
It is intended that the Portfolio's assets, income and distributions will be managed in such a way that an investor in the Portfolio will be able to satisfy the requirements of Subchapter M of the Code, assuming that the investor invested all of its assets in the Portfolio.
The Portfolio has reviewed the tax positions for the open tax years as of December 31, 2015 and has determined that no provision for income tax and/or uncertain tax provisions is required in the Portfolio's financial statements. The Portfolio's federal tax returns for the prior three fiscal years remain open subject to examination by the Internal Revenue Service.
Contingencies. In the normal course of business, the Portfolio may enter into contracts with service providers that contain general indemnification clauses. The Portfolio's maximum exposure under these arrangements is unknown as this would involve future claims that may be made against the Portfolio that have not yet been made. However, based on experience, the Portfolio expects the risk of loss to be remote.
Other. Investment transactions are accounted for on trade date. Interest income is recorded on the accrual basis. Realized gains and losses from investment transactions are recorded on an identified cost basis. All discounts and premiums are accreted/amortized for both tax and financial reporting purposes.
The Portfolio makes an allocation of its net investment income and realized gains and losses from securities transactions to its investors in proportion to their investment in the Portfolio.
B. Fees and Transactions with Affiliates
Management Agreement. Under the Investment Management Agreement with Deutsche Investment Management Americas Inc. ("DIMA" or the "Advisor"), an indirect, wholly owned subsidiary of Deutsche Bank AG, the Advisor determines the securities, instruments and other contracts relating to investments to be purchased, sold or entered into by the Portfolio.
Under the Investment Management Agreement, the Portfolio pays the Advisor a monthly management fee based on its average daily net assets, computed and accrued daily and payable monthly, at the following annual rates:
| First $3.0 billion of the Portfolio's average daily net assets | .1500% |
| Next $4.5 billion of such net assets | .1325% |
| Over $7.5 billion of such net assets | .1200% |
For the period from January 1, 2015 through December 31, 2015, the Advisor has voluntarily agreed to waive its fees and/or reimburse certain operating expenses to the extent necessary to maintain the total annual operating expenses (excluding certain expenses such as extraordinary expenses, taxes, brokerage and interest) at 0.14% of the Portfolio's average daily net assets. This voluntary waiver or reimbursement may be terminated at any time at the option of the Advisor.
For the year ended December 31, 2015, the Advisor waived a portion of its management fee aggregating $4,944,455, and the amount charged aggregated $20,093,052, which was equivalent to an annual effective rate of 0.10%.
Administration Fee. Pursuant to an Administrative Services Agreement, DIMA provides most administrative services to the Portfolio. For all services provided under the Administrative Services Agreement, the Portfolio pays the Advisor an annual fee ("Administration Fee") of 0.03% of the Portfolio's average daily net assets, computed and accrued daily and payable monthly. For the year ended December 31, 2015, the Administration Fee was $5,893,752, of which $511,827 is unpaid.
Filing Service Fees. Under an agreement with DIMA, DIMA is compensated for providing certain regulatory filing services to the Portfolio. For the year ended December 31, 2015, the amount charged to the Portfolio by DIMA included in the Statement of Operations under "Reports to shareholders" aggregated $516, all of which is unpaid.
Trustees' Fees and Expenses. The Portfolio paid retainer fees to each Trustee not affiliated with the Advisor, plus specified amounts to the Board Chairperson and Vice Chairperson and to each committee Chairperson.
Transactions with Affiliates. The Fund may purchase securities from, or sell securities to, an affiliated fund provided the affiliation is solely due to having a common investment adviser, common officers, or common trustees. During the year ended December 31, 2015, the Fund engaged in securities purchases of $308,260,000 and securities sales of $286,435,000 with an affiliated fund in compliance with Rule 17a-7 under the 1940 Act.
C. Line of Credit
The Portfolio and other affiliated funds (the "Participants") share in a $400 million revolving credit facility provided by a syndication of banks. The Portfolio may borrow for temporary or emergency purposes, including the meeting of redemption requests that otherwise might require the untimely disposition of securities. The Participants are charged an annual commitment fee which is allocated based on net assets, among each of the Participants. Interest is calculated at a rate per annum equal to the sum of the Federal Funds Rate plus 1.25 percent plus if the one-month LIBOR exceeds the Federal Funds Rate, the amount of such excess. The Portfolio may borrow up to a maximum of 33 percent of its net assets under the agreement. The Portfolio had no outstanding loans at December 31, 2015.
D. Additional Information
Effective on or about May 2, 2016, the Portfolio will operate as a government money market fund under the amendments to Rule 2a-7 under the Investment Company Act of 1940, as amended, that were adopted in July 2014 with final compliance dates ranging between July 2015 and October 2016. As currently structured, on the final compliance date for the Rule 2a-7 amendments, the Portfolio would be required to implement a floating net asset value and would be allowed, and in certain situations, required, to implement liquidity fees and/or redemption gates. As a government money market fund, the Portfolio will continue to utilize amortized cost to value its securities and the Portfolio will not be required to implement liquidity fees and/or redemption gates. As a government money market fund, the Portfolio will invest at least 99.5% of the Portfolio’s total assets in cash, US government securities, and/or repurchase agreements that are collateralized by these same securities.
In order for the Portfolio to operate as a government money market fund, shareholders approved revisions to the Portfolio’s fundamental investment policy relating to concentration (the "Concentration Policy") such that the Portfolio would no longer be required to invest more than 25% of its total assets in obligations of banks and other financial institutions. If not revised, the current Concentration Policy would have precluded the Portfolio from operating as a government money market fund.
In addition to the revised Concentration Policy, the following changes to the Portfolio for it to operate as a government money market fund will also take effect on May 2, 2016:
(i) A revised investment objective, as follows:
"The fund seeks maximum current income to the extent consistent with stability of principal."
(ii) The adoption of a principal investment strategy to invest at least 99.5% of the Portfolio’s total assets in cash, government securities, and/or repurchase agreements that are collateralized by these same securities.
(iii) Name changes as follows:
| Current Name | New Name |
| Cash Management Portfolio | Government Cash Management Portfolio |
(iv) The adoption of a principal investment strategy to invest at least 80% of net assets, plus the amount of any borrowings for investment purposes, in government securities and/or repurchase agreements that are collateralize by government securities; and
(v) A reduction in the management fee rate paid by the Portfolio to DIMA, the investment advisor to the Portfolio. Pursuant to the master-feeder structure noted above, DIMA receives a management fee from the Portfolio. The revised management fee rate schedule is set forth below:
| Current Management Fee Rate Schedule | | Revised Management Fee Rate Schedule |
| Average Daily Assets | Management Fee Rate | | Average Daily Assets | Management Fee Rate |
| First $3 Billion | .1500% | | First $3 Billion | .1200% |
| Next $4.5 Billion | .1325% | | Next $4.5 Billion | .1025% |
| Over $7.5 Billion | .1200% | | Over $7.5 Billion | .0900% |
To ensure an orderly transition to a government money market fund, DIMA anticipates that it will begin to gradually implement changes to the Portfolio beginning in the first quarter of 2016. As a result, it is expected that the Portfolio gradually will allocate a larger percentage of its assets to government securities over time until it reaches its new allocation on or about May 2, 2016. Because the yields on government securities generally may be expected to be lower than the yields on comparable non-government securities, it should be expected that the Portfolio’s yield may decrease as more assets are invested in government securities.
Report of Independent Registered Public Accounting Firm
To the Board of Trustees and Holders of Beneficial Interest of Cash Management Portfolio:
In our opinion, the accompanying statement of assets and liabilities, including the portfolio of investments, and the related statements of operations and of changes in net assets and the financial highlights presents fairly, in all material respects, the financial position of Cash Management Portfolio (the "Portfolio") at December 31, 2015, and the results of its operations, the changes in its net assets and the financial highlights for each of the periods indicated therein, in conformity with accounting principles generally accepted in the United States of America. These financial statements and financial highlights (hereafter referred to as "financial statements") are the responsibility of the Portfolio's management. Our responsibility is to express an opinion on these financial statements based on our audits. We conducted our audits of these financial statements in accordance with the standards of the Public Company Accounting Oversight Board (United States). Those standards require that we plan and perform the audits to obtain reasonable assurance about whether the financial statements are free of material misstatement. An audit includes examining, on a test basis, evidence supporting the amounts and disclosures in the financial statements, assessing the accounting principles used and significant estimates made by management, and evaluating the overall financial statement presentation. We believe that our audits, which included confirmation of securities at December 31, 2015 by correspondence with the custodian, brokers and transfer agent, and the application of alternative auditing procedures where such confirmations had not been received, provide a reasonable basis for our opinion.
Boston, Massachusetts
February 23, 2016 | PricewaterhouseCoopers LLP |
Shareholder Meeting Results (Unaudited)
A special Meeting of Shareholders (the "Meeting") of Cash Reserve Fund Institutional (the "Fund") was called to order on December 21, 2015 at the offices of Deutsche Investment Management Americas Inc., 345 Park Avenue, New York, New York 10154. The Meeting was adjourned until, and reconvened on, January 28, 2016 to permit the solicitation of additional votes. At the Meeting, the following matter was voted upon by the shareholders of the Fund (the resulting votes are presented below).
1. Approval of a Revised Fundamental Investment Policy Relating to Concentration.
| Number of Votes: |
| For | Against | Abstain | Broker Non-Votes* |
| 645,776,447 | 361,997 | 0 | 0 |
* Broker non-votes are proxies received by the funds from brokers or nominees when the broker or nominee neither has received instructions from the beneficial owner or other persons entitled to vote nor has discretionary power to vote in a particular matter.
Cash Management Fund, Cash Reserves Fund Institutional, Deutsche Money Market Series, Money Market ProFund and Prime Series are each a "feeder fund" that pursues its investment objecting by investing substantially of its assets in a "master portfolio," the Cash Management Portfolio (the "Portfolio"). The Portfolio also held a meeting of its shareholders on December 21, 2015, which was adjourned until, and reconvened on, January 28, 2016. At the meeting of the Portfolio, each feeder fund also approved the revised fundamental investment policy relating to concentration on behalf of the Portfolio.
Advisory Agreement Board Considerations and Fee Evaluation
Cash Reserves Fund Institutional (the "Fund"), a series of DWS Money Market Trust, invests substantially all of its assets in Cash Management Portfolio (the "Portfolio") in order to achieve its investment objective. The Portfolio’s Board of Trustees approved the renewal of the Portfolio’s investment management agreement (the "Portfolio Agreement") with Deutsche Investment Management Americas Inc. ("DIMA") and the Fund’s Board of Trustees (which consists of the same members as the Board of Trustees of the Portfolio) approved the renewal of the Fund’s investment management agreement with DIMA (the "Fund Agreement," and together with the Portfolio Agreement, the "Agreements") in September 2015. The Portfolio’s Board of Trustees and the Fund’s Board of Trustees are collectively referred to as the "Board."
In terms of the process that the Board followed prior to approving the Agreements, shareholders should know that:
— In September 2015, all of the Portfolio’s and the Fund’s Trustees were independent of DIMA and its affiliates.
— The Trustees met frequently during the past year to discuss fund matters and dedicated a substantial amount of time to contract review matters. Over the course of several months, the Board’s Contract Committee reviewed comprehensive materials received from DIMA, independent third parties and independent counsel. These materials included an analysis of performance, fees and expenses, and profitability from a fee consultant retained by the Portfolio’s and the Fund’s Independent Trustees (the "Fee Consultant"). The Board also received extensive information throughout the year regarding performance of the Portfolio and the Fund.
— The Independent Trustees regularly meet privately with counsel to discuss contract review and other matters. In addition, the Independent Trustees were advised by the Fee Consultant in the course of their review of the Portfolio’s and the Fund’s contractual arrangements and considered a comprehensive report prepared by the Fee Consultant in connection with their deliberations.
— In connection with reviewing the Agreements, the Board also reviewed the terms of the Fund’s distribution agreement, administrative services agreement, transfer agency agreement and other material service agreements.
— Based on its evaluation of the information provided, the Contract Committee presented its findings and recommendations to the Board. The Board then reviewed the Contract Committee’s findings and recommendations.
In connection with the contract review process, the Contract Committee and the Board considered the factors discussed below, among others. The Board also considered that DIMA and its predecessors have managed the Portfolio and the Fund since their inception, and the Board believes that a long-term relationship with a capable, conscientious advisor is in the best interests of the Portfolio and the Fund. The Board considered, generally, that shareholders chose to invest or remain invested in the Fund knowing that DIMA managed the Portfolio and the Fund. DIMA is part of Deutsche Bank AG’s ("Deutsche Bank") Asset and Wealth Management ("Deutsche AWM") division. Deutsche AWM is a global asset management business that offers a wide range of investing expertise and resources, including research capabilities in many countries throughout the world. Deutsche Bank has advised the Independent Trustees that the U.S. asset management business continues to be a critical and integral part of Deutsche Bank, and that Deutsche Bank will continue to make significant investments in Deutsche AWM, including ongoing enhancements to Deutsche AWM’s investment platform. Deutsche Bank also has confirmed its commitment to maintaining strong legal and compliance groups within the Deutsche AWM division.
As part of the contract review process, the Board carefully considered the fees and expenses of each Deutsche fund overseen by the Board in light of the fund’s performance. In many cases, this led to the negotiation and implementation of expense caps. As part of these negotiations, the Board indicated that it would consider relaxing these caps in future years following sustained improvements in performance, among other considerations.
While shareholders may focus primarily on fund performance and fees, the Board considers these and many other factors, including the quality and integrity of DIMA’s personnel and such other issues as back-office operations, fund valuations, and compliance policies and procedures.
Nature, Quality and Extent of Services. The Board considered the terms of the Agreements, including the scope of advisory services provided under the Agreements. The Board noted that, under the Agreements, DIMA provides portfolio management services to the Portfolio and the Fund and that, pursuant to separate administrative services agreements, DIMA provides administrative services to the Portfolio and the Fund. The Board considered the experience and skills of senior management and investment personnel, the resources made available to such personnel, the ability of DIMA to attract and retain high-quality personnel, and the organizational depth and stability of DIMA. The Board reviewed the Portfolio’s and the Fund’s performance over short-term and long-term periods and compared those returns to various agreed-upon performance measures, including a peer universe compiled using information supplied by iMoneyNet, an independent fund data service. The Board also noted that it has put into place a process of identifying "Focus Funds" (e.g., funds performing poorly relative to a peer universe), and receives additional reporting from DIMA regarding such funds and, where appropriate, DIMA’s plans to address underperformance. The Board believes this process is an effective manner of identifying and addressing underperforming funds. Based on the information provided, the Board noted that for the one- and three-year periods ended December 31, 2014, the Fund’s gross performance (Institutional Class shares) was in the 3rd quartile of the applicable iMoneyNet universe (the 1st quartile being the best performers and the 4th quartile being the worst performers).
Fees and Expenses. The Board considered the Portfolio’s and the Fund’s investment management fee schedules and the Fund’s operating expenses and total expense ratios, and comparative information provided by Lipper Inc. ("Lipper") and the Fee Consultant regarding investment management fee rates paid to other investment advisors by similar funds (1st quartile being the most favorable and 4th quartile being the least favorable). With respect to management fees paid to other investment advisors by similar funds, the Board noted that the contractual fee rates paid by the Portfolio and the Fund, which include 0.03% and 0.10% fees paid to DIMA under the respective administrative services agreements, were lower than the median (2nd quartile) of the applicable Lipper peer group (based on Lipper data provided as of December 31, 2014). The Board considered that the Portfolio’s management fee would be reduced by 0.03% at all breakpoint levels if shareholders approve a proposal that would result in the Portfolio and the Fund being restructured into government money market funds. The Board noted that, although shareholders of the Fund indirectly bear the Portfolio’s management fee, the Fund does not charge an additional investment management fee. Based on Lipper data provided as of December 31, 2014, the Board noted that the Fund’s total (net) operating expenses, which include Portfolio expenses allocated to the Fund, were lower than the median of the applicable Lipper expense universe for Institutional Class shares (2nd quartile). The Board noted the expense limitation agreed to by DIMA. The Board also noted the significant voluntary fee waivers implemented by DIMA to ensure the Fund maintained a positive yield. The Board considered the management fee rate as compared to fees charged by DIMA to comparable Deutsche U.S. registered funds ("Deutsche Funds") and considered differences between the Portfolio and the Fund and the comparable Deutsche Funds. The information requested by the Board as part of its review of fees and expenses also included information about institutional accounts (including any sub-advised funds and accounts) and funds offered primarily to European investors ("Deutsche Europe funds") managed by Deutsche AWM. The Board noted that DIMA indicated that Deutsche AWM does not manage any institutional accounts or Deutsche Europe funds comparable to the Portfolio or the Fund.
On the basis of the information provided, the Board concluded that management fees were reasonable and appropriate in light of the nature, quality and extent of services provided by DIMA.
Profitability. The Board reviewed detailed information regarding revenues received by DIMA under the Agreements. The Board considered the estimated costs and pre-tax profits realized by DIMA from advising the Deutsche Funds, as well as estimates of the pre-tax profits attributable to managing the Fund in particular. The Board also received information regarding the estimated enterprise-wide profitability of DIMA and its affiliates with respect to all fund services in totality and by fund. The Board and the Fee Consultant reviewed DIMA’s methodology in allocating its costs to the management of the Fund. Based on the information provided, the Board concluded that the pre-tax profits realized by DIMA in connection with the management of the Fund were not unreasonable. The Board also reviewed certain publicly available information regarding the profitability of certain similar investment management firms. The Board noted that while information regarding the profitability of such firms is limited (and in some cases is not necessarily prepared on a comparable basis), DIMA and its affiliates’ overall profitability with respect to the Deutsche Funds (after taking into account distribution and other services provided to the funds by DIMA and its affiliates) was lower than the overall profitability levels of most comparable firms for which such data was available.
Economies of Scale. The Board considered whether there are economies of scale with respect to the management of the Portfolio and the Fund and whether the Portfolio and the Fund benefit from any economies of scale. The Board noted that the Portfolio’s and the Fund’s investment management fee schedule includes fee breakpoints. The Board concluded that the Portfolio’s and the Fund’s fee schedule represents an appropriate sharing between the Portfolio and the Fund and DIMA of such economies of scale as may exist in the management of the Portfolio and the Fund at current asset levels.
Other Benefits to DIMA and Its Affiliates. The Board also considered the character and amount of other incidental benefits received by DIMA and its affiliates, including any fees received by DIMA for administrative services provided to the Portfolio and the Fund. The Board also considered benefits to DIMA related to brokerage and soft-dollar allocations, including allocating brokerage to pay for research generated by parties other than the executing broker dealers, which pertain primarily to funds investing in equity securities, along with the incidental public relations benefits to DIMA related to Deutsche Funds advertising and cross-selling opportunities among DIMA products and services. The Board considered these benefits in reaching its conclusion that the Fund’s management fees were reasonable.
Compliance. The Board considered the significant attention and resources dedicated by DIMA to documenting and enhancing its compliance processes in recent years. The Board noted in particular (i) the experience and seniority of the individual serving as DIMA’s and the Fund’s chief compliance officer; (ii) the large number of DIMA compliance personnel; and (iii) the substantial commitment of resources by DIMA and its affiliates to compliance matters.
Based on all of the information considered and the conclusions reached, the Board unanimously determined that the continuation of the Agreements is in the best interests of the Portfolio and the Fund. In making this determination, the Board did not give particular weight to any single factor identified above. The Board considered these factors over the course of numerous meetings, certain of which were in executive session with only the Independent Trustees and counsel present. It is possible that individual Trustees may have weighed these factors differently in reaching their individual decisions to approve the continuation of the Agreements.
Board Members and Officers
The following table presents certain information regarding the Board Members and Officers of the fund. Each Board Member's year of birth is set forth in parentheses after his or her name. Unless otherwise noted, (i) each Board Member has engaged in the principal occupation(s) noted in the table for at least the most recent five years, although not necessarily in the same capacity; and (ii) the address of each Independent Board Member is c/o Kenneth C. Froewiss, Chairman, Deutsche Mutual Funds, P.O. Box 390601, Cambridge, MA 02139. Except as otherwise noted below, the term of office for each Board Member is until the election and qualification of a successor, or until such Board Member sooner dies, resigns, is removed or as otherwise provided in the governing documents of the fund. Because the fund does not hold an annual meeting of shareholders, each Board Member will hold office for an indeterminate period. The Board Members may also serve in similar capacities with other funds in the fund complex.
| Independent Board Members |
| Name, Year of Birth, Position with the Fund and Length of Time Served1 | Business Experience and Directorships During the Past Five Years | Number of Funds in Deutsche Fund Complex Overseen | Other Directorships Held by Board Member |
Kenneth C. Froewiss (1945) Chairperson since 2013, and Board Member since 2001 | Retired Clinical Professor of Finance, NYU Stern School of Business (1997–2014); Member, Finance Committee, Association for Asian Studies (2002–present); Director, Mitsui Sumitomo Insurance Group (US) (2004–present); prior thereto, Managing Director, J.P. Morgan (investment banking firm) (until 1996) | 106 | — |
William McClayton (1944) Vice Chairperson since 2013, and Board Member since 2004 | Private equity investor (since October 2009); previously, Managing Director, Diamond Management & Technology Consultants, Inc. (global consulting firm) (2001–2009); Directorship: Board of Managers, YMCA of Metropolitan Chicago; formerly: Senior Partner, Arthur Andersen LLP (accounting) (1966–2001); Trustee, Ravinia Festival | 106 | — |
John W. Ballantine (1946) Board Member since 1999 | Retired; formerly, Executive Vice President and Chief Risk Management Officer, First Chicago NBD Corporation/The First National Bank of Chicago (1996–1998); Executive Vice President and Head of International Banking (1995–1996); former Directorships: Director and former Chairman of the Board, Healthways, Inc.2 (provider of disease and care management services) (2003–2014); Stockwell Capital Investments PLC (private equity); First Oak Brook Bancshares, Inc. and Oak Brook Bank; Prisma Energy International | 106 | Portland General Electric2 (utility company) (2003– present) |
Henry P. Becton, Jr. (1943) Board Member since 1990 | Vice Chair and former President, WGBH Educational Foundation. Directorships: Public Radio International; Public Radio Exchange (PRX); former Directorships: Belo Corporation2 (media company); The PBS Foundation; Association of Public Television Stations; Boston Museum of Science; American Public Television; Concord Academy; New England Aquarium; Mass. Corporation for Educational Telecommunications; Committee for Economic Development; Public Broadcasting Service; Connecticut College; North Bennett Street School (Boston) | 106 | Director, Becton Dickinson and Company2 (medical technology company) |
Dawn-Marie Driscoll (1946) Board Member since 1987 | Emeritus Executive Fellow, Center for Business Ethics, Bentley University; formerly: President, Driscoll Associates (consulting firm); Partner, Palmer & Dodge (law firm) (1988–1990); Vice President of Corporate Affairs and General Counsel, Filene's (retail) (1978–1988). Directorships: Director of ICI Mutual Insurance Company (since 2007); Advisory Board, Center for Business Ethics, Bentley University; Trustee and former Chairman of the Board, Southwest Florida Community Foundation (charitable organization); former Directorships: Sun Capital Advisers Trust (mutual funds) (2007–2012), Investment Company Institute (audit, executive, nominating committees) and Independent Directors Council (governance, executive committees) | 106 | — |
Keith R. Fox, CFA (1954) Board Member since 1996 | Managing General Partner, Exeter Capital Partners (a series of private investment funds) (since 1986). Directorships: Progressive International Corporation (kitchen goods importer and distributor); The Kennel Shop (retailer); former Chairman, National Association of Small Business Investment Companies; former Directorships: BoxTop Media Inc. (advertising); Sun Capital Advisers Trust (mutual funds) (2011–2012) | 106 | — |
Paul K. Freeman (1950) Board Member since 1993 | Consultant, World Bank/Inter-American Development Bank; Chair, Independent Directors Council; Investment Company Institute (executive and nominating committees); formerly, Chairman of Education Committee of Independent Directors Council; Project Leader, International Institute for Applied Systems Analysis (1998–2001); Chief Executive Officer, The Eric Group, Inc. (environmental insurance) (1986–1998); Directorships: Denver Zoo Foundation (December 2012–present); former Directorships: Prisma Energy International | 106 | — |
Richard J. Herring (1946) Board Member since 1990 | Jacob Safra Professor of International Banking and Professor, Finance Department, The Wharton School, University of Pennsylvania (since July 1972); Co-Director, Wharton Financial Institutions Center; Co-Chair, U.S. Shadow Financial Regulatory Committee; Executive Director, Financial Economists Roundtable; formerly: Vice Dean and Director, Wharton Undergraduate Division (July 1995–June 2000); Director, Lauder Institute of International Management Studies (July 2000–June 2006) | 106 | Director, Aberdeen Singapore and Japan Funds (since 2007); Independent Director of Barclays Bank Delaware (since September 2010) |
Rebecca W. Rimel (1951) Board Member since 1995 | President and Chief Executive Officer, The Pew Charitable Trusts (charitable organization) (1994 to present); formerly: Executive Vice President, The Glenmede Trust Company (investment trust and wealth management) (1983–2004); Board Member, Investor Education (charitable organization) (2004–2005); Trustee, Executive Committee, Philadelphia Chamber of Commerce (2001–2007); Director, Viasys Health Care2 (January 2007–June 2007); Trustee, Thomas Jefferson Foundation (charitable organization) (1994–2012) | 106 | Director, Becton Dickinson and Company2 (medical technology company) (2012– present); Director, BioTelemetry Inc.2 (health care) (2009– present) |
William N. Searcy, Jr. (1946) Board Member since 1993 | Private investor since October 2003; formerly: Pension & Savings Trust Officer, Sprint Corporation2 (telecommunications) (November 1989–September 2003); Trustee, Sun Capital Advisers Trust (mutual funds) (1998–2012) | 106 | — |
Jean Gleason Stromberg (1943) Board Member since 1997 | Retired. Formerly, Consultant (1997–2001); Director, Financial Markets U.S. Government Accountability Office (1996–1997); Partner, Norton Rose Fulbright, L.L.P. (law firm) (1978–1996). Directorships: The William and Flora Hewlett Foundation (charitable organization); former Directorships: Service Source, Inc. (nonprofit), Mutual Fund Directors Forum (2002–2004), American Bar Retirement Association (funding vehicle for retirement plans) (1987–1990 and 1994–1996) | 106 | — |
| Officers4 |
| Name, Year of Birth, Position with the Fund and Length of Time Served5 | Business Experience and Directorships During the Past Five Years |
Brian E. Binder8 (1972) President and Chief Executive Officer, 2013–present | Managing Director3 and Head of Fund Administration, Deutsche Asset Management (2013–present); formerly: Head of Business Management and Consulting at Invesco, Ltd. (2010–2012) |
John Millette7 (1962) Vice President and Secretary, 1999–present | Director,3 Deutsche Asset Management; Chief Legal Officer and Secretary, Deutsche Investment Management Americas Inc. (since 2015); and Director and Vice President, DeAWM Trust Company (since 2016) |
Melinda Morrow6 (1970) Vice President, 2012–present | Director,3 Deutsche Asset Management |
Paul H. Schubert6 (1963) Chief Financial Officer, 2004–present Treasurer, 2005–present | Managing Director,3 Deutsche Asset Management; and Chairman, Director and President, DeAWM Trust Company (since 2013); formerly, Director, DeAWM Trust Company (2004–2013) |
Caroline Pearson7 (1962) Chief Legal Officer, 2010–present | Managing Director,3 Deutsche Asset Management; Secretary, DeAWM Distributors, Inc.; and Secretary, DeAWM Service Company |
Robert Kloby6 (1962) Chief Compliance Officer, 2006–present | Managing Director,3 Deutsche Asset Management |
Wayne Salit6 (1967) Anti-Money Laundering Compliance Officer, 2014–present | Director,3 Deutsche Asset Management; formerly: Managing Director, AML Compliance Officer at BNY Mellon (2011–2014); and Director, AML Compliance Officer at Deutsche Bank (2004–2011) |
Hepsen Uzcan6 (1974) Assistant Secretary, 2013–present | Director,3 Deutsche Asset Management |
Paul Antosca7 (1957) Assistant Treasurer, 2007–present | Director,3 Deutsche Asset Management |
Jack Clark7 (1967) Assistant Treasurer, 2007–present | Director,3 Deutsche Asset Management |
Diane Kenneally7 (1966) Assistant Treasurer, 2007–present | Director,3 Deutsche Asset Management |
1 The length of time served represents the year in which the Board Member joined the board of one or more Deutsche funds currently overseen by the Board.
2 A publicly held company with securities registered pursuant to Section 12 of the Securities Exchange Act of 1934.
3 Executive title, not a board directorship.
4 As a result of their respective positions held with the Advisor, these individuals are considered "interested persons" of the Advisor within the meaning of the 1940 Act. Interested persons receive no compensation from the fund.
5 The length of time served represents the year in which the officer was first elected in such capacity for one or more Deutsche funds.
6 Address: 60 Wall Street, New York, NY 10005.
7 Address: One Beacon Street, Boston, MA 02108.
8 Address: 222 South Riverside Plaza, Chicago, IL 60606.
The fund's Statement of Additional Information ("SAI") includes additional information about the Board Members. The SAI is available, without charge, upon request. If you would like to request a copy of the SAI, you may do so by calling the following toll-free number: (800) 728-3337.
Account Management Resources
| |
| Automated Information Line | Institutional Investor Services (800) 730-1313 Personalized account information, information on other Deutsche funds and services via touchtone telephone and the ability to exchange or redeem shares. |
| Web Site | deutscheliquidity.com/US View your account transactions and balances, trade shares, monitor your asset allocation, subscribe to fund and account updates by e-mail, and change your address, 24 hours a day. Obtain prospectuses and applications, blank forms, interactive worksheets, news about the funds, retirement planning information, and more. |
| For More Information | (800) 730-1313, option 1 To speak with a fund service representative. |
| Written Correspondence | Deutsche Asset Management PO Box 219210
Kansas City, MO
64121-9210 |
| Proxy Voting | The fund's policies and procedures for voting proxies for portfolio securities and information about how the fund voted proxies related to its portfolio securities during the 12-month period ended June 30 are available on our Web site — deutschefunds.com (click on "proxy voting"at the bottom of the page) — or on the SEC's Web site — sec.gov. To obtain a written copy of the fund's policies and procedures without charge, upon request, call us toll free at 800) 728-3337. |
| Portfolio Holdings | Following the fund's fiscal first and third quarter-end, a complete portfolio holdings listing is filed with the SEC on Form N-Q. In addition, each month, information about the fund and its portfolio holdings is filed with the SEC on Form N-MFP. The SEC delays the public availability of the information filed on Form N-MFP for 60 days after the end of the reporting period included in the filing. These forms will be available on the SEC's Web site at sec.gov, and they may also be reviewed and copied at the SEC's Public Reference Room in Washington, D.C. Information on the operation of the SEC's Public Reference Room may be obtained by calling (800) SEC-0330. The fund's portfolio holdings are also posted on deutschefunds.com from time to time. Please see the fund's current prospectus for more information. |
| Principal Underwriter | If you have questions, comments or complaints, contact: DeAWM Distributors, Inc. 222 South Riverside Plaza
Chicago, IL 60606-5808 (800) 621-1148 |
| Investment Management | Deutsche Investment Management Americas Inc. ("DIMA" or the "Advisor"), which is part of Deutsche Asset Management, is the investment advisor for the fund. DIMA and its predecessors have more than 80 years of experience managing mutual funds and DIMA provides a full range of investment advisory services to both institutional and retail clients. DIMA is an indirect, wholly owned subsidiary of Deutsche Bank AG. Deutsche Bank AG is a major global banking institution engaged in a wide variety of financial services, including investment management, retail, private and commercial banking, investment banking and insurance. Deutsche Asset Management is the retail brand name in the U.S. for the asset management activities of Deutsche Bank AG and DIMA. Deutsche Asset Management is committed to delivering the investing expertise, insight and resources of this global investment platform to American investors. |
| Nasdaq Symbol | BIRXX |
| CUSIP Number | 23337T 128 |
| Fund Number | 500 |
Notes

December 31, 2015
Annual Report
to Shareholders
Cash Reserve Fund
Prime Series
Contents
Cash Reserve Fund — Prime Series 3 Portfolio Management Review 7 Statement of Assets and Liabilities 8 Statement of Operations 9 Statement of Changes in Net Assets 10 Financial Highlights 12 Notes to Financial Statements 19 Report of Independent Registered Public Accounting Firm 20 Information About Your Fund's Expenses 21 Tax Information Cash Management Portfolio 23 Investment Portfolio 36 Statement of Assets and Liabilities 37 Statement of Operations 38 Statement of Changes in Net Assets 39 Financial Highlights 40 Notes to Financial Statements 46 Report of Independent Registered Public Accounting Firm 47 Other Information 48 Shareholder Meeting Results 49 Advisory Agreement Board Considerations and Fee Evaluation 54 Board Members and Officers |
This report must be preceded or accompanied by a prospectus. To obtain a summary prospectus, if available, or prospectus for any of our funds, visit deutschefunds.com. We advise you to consider the fund's objectives, risks, charges and expenses carefully before investing. The summary prospectus and prospectus contain this and other important information about the fund. Please read the prospectus carefully before you invest.
An investment in this fund is not insured or guaranteed by the Federal Deposit Insurance Corporation (FDIC) or by any other government agency. Although the fund seeks to preserve the value of your investment at $1.00 per share, it is possible to lose money by investing in the fund. The share price of money market funds can fall below the $1.00 share price. You should not rely on or expect the Advisor to enter into support agreements or take other actions to maintain the fund's $1.00 share price. The credit quality of the fund's holdings can change rapidly in certain markets, and the default of a single holding could have an adverse impact on the fund's share price. The fund's share price can also be negatively affected during periods of high redemption pressures and/or illiquid markets. The actions of a few large investors in one class of shares of the fund may have a significant adverse effect on the share prices of all classes of shares of the fund. See the prospectus for specific details regarding the fund's risk profile.
NOT FDIC/NCUA INSURED NO BANK GUARANTEE MAY LOSE VALUE NOT A DEPOSIT NOT INSURED BY ANY FEDERAL GOVERNMENT AGENCY
Portfolio Management Review (Unaudited)
Market Overview
All performance information below is historical and does not guarantee future results. Investment return and principal fluctuate, so your shares may be worth more or less when redeemed. Current performance may differ from performance data shown. Please visit deutscheliquidity.com/US for the fund's most recent month-end performance. The 7-day current yield refers to the income paid by the fund over a 7-day period expressed as an annual percentage rate of the fund's shares outstanding. Yields fluctuate and are not guaranteed.
Investment Objective The fund seeks to provide a high level of current income consistent with liquidity and the preservation of capital. The fund is a feeder fund that invests substantially all of its assets in a "master portfolio," the Cash Management Portfolio, which will invest directly in securities and other instruments. The Cash Management Portfolio has the same investment objective as the fund. |
Over the 12 months ended December 31, 2015, rate levels within the money market yield curve — including short-term money market rates — fluctuated based on varying economic reports, investors' interest rate expectations, geopolitical uncertainty and evolving U.S. Federal Reserve Board (the Fed) statements. In March 2015, the Fed removed the word "patient" from its statement regarding the timing of a possible rate hike. Despite temporary conditions such as the harsh winter weather that many said was to blame for disappointing first-quarter 2015 U.S. gross domestic product (GDP) growth, in April the Fed anticipated that U.S. economic conditions would improve. A second-quarter rebound in U.S. GDP growth set the stage for a possible rate hike as early as September of 2015. In late August, the focus shifted to China, as news of that country’s economic slowdown spurred additional market volatility. In September, the Fed declined to raise rates, citing concerns over China’s stumbling economy. However, in October the comments by the Fed turned more hawkish, not mentioning China but expressing the desire to raise rates at the next Federal Open Market Committee (FOMC) meeting. This set the stage for short-term rates to rise as markets "priced in" an eventual raising of the federal funds rate by 25 basis points in mid-December.

Fund Performance (as of December 31, 2015) Performance is historical and does not guarantee future results. Current performance may be lower or higher than the performance data quoted. An investment in this fund is not insured or guaranteed by the FDIC or by any other government agency. Although the fund seeks to preserve the value of your investment at $1.00 per share, it is possible to lose money by investing in the fund. The share price of money market funds can fall below the $1.00 share price. |
| 7-Day Current Yield |
Prime Shares December 31, 2015 | .01%* |
| December 31, 2014 | .01%* |
Prime Institutional Shares December 31, 2015 | .10%* |
| December 31, 2014 | .01%* |
* The investment advisor has agreed to waive fees/reimburse expenses. Without such fee waivers/expense reimbursements, the 7-day current yield would have been lower. Yields are historical, will fluctuate and do not guarantee future performance. The 7-day current yield refers to the income paid by the portfolio over a 7-day period expressed as an annual percentage rate of the fund's shares outstanding. Please visit our Web site at deutscheliquidity.com/US for the product's most recent month-end performance. |
Positive Contributors to Fund Performance
We were able to maintain a competitive yield for the fund during the annual period ended December 31, 2015. We continued to seek ample liquidity, high credit quality and strong diversification across sectors and geographic regions by maintaining a neutral portfolio duration (or interest rate sensitivity). We pursued this strategy in light of the outlook for continued near-zero short-term interest rates and limited money market supply. In addition, we looked to keep the fund's cash position relatively low in order to take advantage of higher yields available from six-month-to-one-year money market securities.
Negative Contributors to Fund Performance
The types of securities that we were investing in tended to have lower yields than issues carrying more risk. We preferred to be cautious during a time of market uncertainty. In the end this cost the fund some yield, but we believe that this represented a prudent approach to preserving principal.
Outlook and Positioning
Within money markets, we believe the current balance of tight supply and heavy demand will most likely persist. These technical market conditions, along with issues surrounding money market reform, should in our view create a steeper money market yield curve, keeping yields low at the short end of the curve. Our current forecast is for the federal funds rate to be raised two to three additional times during 2016. In preparation, we are maintaining a cautious approach, with a shorter duration, an emphasis on short fixed maturities and floating-rate notes, and increased selectivity regarding longer maturities. Our goal, as always, is to maintain ample liquidity, high credit quality and strong diversification across geographic regions and market sectors.
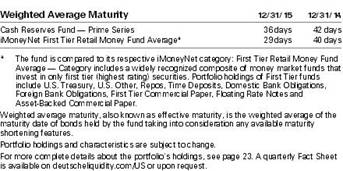
We continue our insistence on the highest credit quality within the fund. We also plan to maintain our conservative investment strategies and standards under the current market conditions. We continue to apply a careful approach to investing on behalf of the fund and to seek competitive yield for our shareholders.
Portfolio Management Team
A group of investment professionals is responsible for the day-to-day management of the fund. These investment professionals have a broad range of experience managing money market funds.
The views expressed reflect those of the portfolio management team only through the end of the period of the report as stated on the cover. The management team's views are subject to change at any time based on market and other conditions and should not be construed as a recommendation. Past performance is no guarantee of future results. Current and future portfolio holdings are subject to risk.
Terms to Know
The yield curve is a graphical representation of how yields on bonds of different maturities compare. Normally, yield curves slant up, as bonds with longer maturities typically offer higher yields than short-term bonds.
GDP, or gross domestic product, is the value of all goods and services produced by a country's economy.
Floating-rate securities are debt instruments with floating-rate coupons that generally reset every 30 to 90 days. While floating-rate loans are senior to equity and fixed-income securities, there is no guaranteed return of principal in case of default. Floating-rate loans often have less interest-rate risk than other fixed-income investments. Floating-rate loans are most often secured assets, generally senior to a company's secured debt and can be transferred to debt holders, providing potential downside potential.
Statement of Assets and Liabilities
| as of December 31, 2015 |
| Assets |
| Investment in Cash Management Portfolio, at value | $ 981,537,517 |
| Receivable for Fund shares sold | 42,197 |
| Other assets | 289,488 |
| Total assets | 981,869,202 |
| Liabilities |
| Distributions payable | 6,348 |
| Accrued Directors' fees | 1,196 |
| Other accrued expenses and payables | 194,403 |
| Total liabilities | 201,947 |
| Net assets, at value | $ 981,667,255 |
| Net Assets Consist of |
| Undistributed net investment income | 41,536 |
| Accumulated net realized gain (loss) | 19,690 |
| Paid-in capital | 981,606,029 |
| Net assets, at value | $ 981,667,255 |
| Net Asset Value |
Prime Shares Net Asset Value, offering and redemption price per share ($743,190,068 ÷ 743,298,015 outstanding shares of beneficial interest, $.001 par value, 9,000,000,000 shares authorized) | $ 1.00 |
Prime Institutional Shares Net Asset Value, offering and redemption price per share ($238,477,187 ÷ 238,536,624 outstanding shares of beneficial interest, $.001 par value, 3,200,000,000 shares authorized) | $ 1.00 |
The accompanying notes are an integral part of the financial statements.
Statement of Operations
| for the year ended December 31, 2015 |
| Investment Income | |
Income and expenses allocated from Cash Management Portfolio: Interest | $ 2,125,561 |
| Expenses* | (1,203,645) |
| Net investment income allocated from Cash Management Portfolio | 921,916 |
Expenses: Administration fee | 859,400 |
| Services to shareholders | 433,071 |
| Distribution and service fees | 1,904,136 |
| Professional fees | 49,710 |
| Reports to shareholders | 48,355 |
| Registration fees | 140,739 |
| Directors' fees and expenses | 4,627 |
| Other | 29,523 |
| Total expenses before expense reductions | 3,469,561 |
| Expense reductions | (2,642,052) |
| Total expenses after expense reductions | 827,509 |
| Net investment income (loss) | 94,407 |
| Net realized gain (loss) allocated from Cash Management Portfolio | 19,690 |
| Net increase (decrease) in net assets resulting from operations | $ 114,097 |
* Net of $216,325 Advisor reimbursement allocated from Cash Management Portfolio for the year ended December 31, 2015.
The accompanying notes are an integral part of the financial statements.
Statement of Changes in Net Assets
| Increase (Decrease) in Net Assets | Years Ended December 31, |
| 2015 | 2014 |
Operations: Net investment income | $ 94,407 | $ 85,393 |
| Net realized gain (loss) | 19,690 | 1,766 |
| Net increase (decrease) in net assets resulting from operations | 114,097 | 87,159 |
Distributions to shareholders from: Net investment income: Prime Shares | (59,589) | (60,670) |
| Prime Institutional Shares | (36,178) | (24,723) |
Net realized gains: Prime Shares | (8,395) | (7,088) |
| Prime Institutional Shares | (3,305) | (3,217) |
| Total distributions | (107,467) | (95,698) |
Fund share transactions: Proceeds from shares sold | 2,216,900,616 | 2,022,972,618 |
| Reinvestment of distributions | 88,783 | 83,002 |
| Payments for shares redeemed | (2,138,084,726) | (1,961,386,944) |
| Net increase (decrease) in net assets from Fund share transactions | 78,904,673 | 61,668,676 |
| Increase (decrease) in net assets | 78,911,303 | 61,660,137 |
| Net assets at beginning of period | 902,755,952 | 841,095,815 |
| Net assets at end of period (including undistributed net investment income of $41,536 and $53,130, respectively) | $ 981,667,255 | $ 902,755,952 |
The accompanying notes are an integral part of the financial statements.
Financial Highlights
| Prime Shares |
| | |
Years Ended December 31, |
| 2015 | 2014 | 2013 | 2012 | 2011 |
| Selected Per Share Data |
| Net asset value, beginning of period | $ 1.00 | $ 1.00 | $ 1.00 | $ 1.00 | $ 1.00 |
Income from investment operations: Net investment income | .000* | .000* | .000* | .000* | .000* |
| Net realized gain (loss) | .000* | .000* | .000* | .000* | .000* |
| Total from investment operations | .000* | .000* | .000* | .000* | .000* |
Less distributions from: Net investment income | (.000)* | (.000)* | (.000)* | (.000)* | (.000)* |
| Net realized gains | (.000)* | (.000)* | (.000)* | (.000)* | — |
| Total distributions | (.000)* | (.000)* | (.000)* | (.000)* | (.000)* |
| Net asset value, end of period | $ 1.00 | $ 1.00 | $ 1.00 | $ 1.00 | $ 1.00 |
| Total Return (%)a | .01 | .01 | .01 | .01 | .02 |
| Ratios to Average Net Assets and Supplemental Data |
| Net assets, end of period ($ millions) | 743 | 629 | 652 | 659 | 620 |
| Ratio of expenses before expense reductions, including expenses allocated from Cash Management Portfolio (%) | .69 | .70 | .68 | .68 | .69 |
| Ratio of expenses after expense reductions, including expenses allocated from Cash Management Portfolio (%) | .24 | .18 | .21 | .28 | .24 |
| Ratio of net investment income (%) | .01 | .01 | .01 | .01 | .01 |
a Total return would have been lower had certain expenses not been reduced. * Amount is less than $.0005. |
| Prime Institutional Shares |
| | |
Years Ended December 31, |
| 2015 | 2014 | 2013 | 2012 | 2011 |
| Selected Per Share Data |
| Net asset value, beginning of period | $ 1.00 | $ 1.00 | $ 1.00 | $ 1.00 | $ 1.00 |
Income from investment operations: Net investment income | .000* | .000* | .000* | .000* | .000* |
| Net realized gain (loss) | .000* | .000* | .000* | .000* | .000* |
| Total from investment operations | .000* | .000* | .000* | .000* | .000* |
Less distributions from: Net investment income | (.000)* | (.000)* | (.000)* | (.000)* | (.000)* |
| Net realized gains | (.000)* | (.000)* | (.000)* | (.000)* | — |
| Total distributions | (.000)* | (.000)* | (.000)* | (.000)* | (.000)* |
| Net asset value, end of period | $ 1.00 | $ 1.00 | $ 1.00 | $ 1.00 | $ 1.00 |
| Total Return (%)a | .02 | .01 | .01 | .02 | .02 |
| Ratios to Average Net Assets and Supplemental Data |
| Net assets, end of period ($ millions) | 238 | 274 | 189 | 247 | 514 |
| Ratio of expenses before expense reductions, including expenses allocated from Cash Management Portfolio (%) | .31 | .31 | .30 | .30 | .30 |
| Ratio of expenses after expense reductions, including expenses allocated from Cash Management Portfolio (%) | .23 | .18 | .21 | .27 | .24 |
| Ratio of net investment income (%) | .01 | .01 | .01 | .02 | .01 |
a Total return would have been lower had certain expenses not been reduced. * Amount is less than $.0005. |
Notes to Financial Statements
A. Organization and Significant Accounting Policies
Cash Reserve Fund — Prime Series (the "Fund") is a diversified series of Cash Reserve Fund, Inc., (the "Corporation") which is registered under the Investment Company Act of 1940, as amended (the "1940 Act"), as a diversified, open-end management investment company and is organized as a corporation under the laws of the state of Maryland.
The Fund is a feeder fund that seeks to achieve its investment objective by investing substantially all of its investable assets in a master portfolio, the Cash Management Portfolio (the "Portfolio"), an open-end management investment company registered under the 1940 Act and organized as a New York trust advised by Deutsche Investment Management Americas Inc. ("DIMA" or the "Advisor"), an indirect, wholly owned subsidiary of Deutsche Bank AG. A master/feeder fund structure is one in which a fund (a "feeder fund"), instead of investing directly in a portfolio of securities, invests most or all of its investment assets in a separate registered investment company (the "master fund") with substantially the same investment objective and policies as the feeder fund. Such a structure permits the pooling of assets of two or more feeder funds, preserving separate identities or distribution channels at the feeder fund level. At December 31, 2015, the Fund owned approximately 5% of the Portfolio.
The Fund offers two classes of shares to investors: Cash Reserve Prime Shares ("Prime Shares") and Cash Reserve Prime Institutional Shares ("Prime Institutional Shares").
Investment income, realized gains and losses, and certain fund-level expenses and expense reductions, if any, were borne pro rata on the basis of relative net assets by the holders of all classes of shares, except that each class bears certain expenses unique to that class such as distribution and service fees, services to shareholders and certain other class-specific expenses. Differences in class-level expenses may result in payment of different per share dividends by class. All shares of the Fund have equal rights with respect to voting subject to class-specific arrangements.
The Fund's financial statements are prepared in accordance with accounting principles generally accepted in the United States of America which require the use of management estimates. Actual results could differ from those estimates. The policies described below are followed consistently by the Fund in the preparation of its financial statements. The financial statements of the Portfolio, including the Investment Portfolio, are contained elsewhere in this report and should be read in conjunction with the Fund's financial statements.
Security Valuation. The Fund records its investment in the Portfolio at value, which reflects its proportionate interest in the net assets of the Portfolio. Valuation of the securities held by the Portfolio is discussed in the notes to the Portfolio's financial statements included elsewhere in this report.
Disclosure about the classification of fair value measurements is included in a table following the Portfolio's investment Portfolio.
Federal Income Taxes. The Fund's policy is to comply with the requirements of the Internal Revenue Code, as amended, which are applicable to regulated investment companies, and to distribute all of its taxable income to its shareholders.
The Fund has reviewed the tax positions for the open tax years as of December 31, 2015 and has determined that no provision for income tax and/or uncertain tax provisions is required in the Fund's financial statements. The Fund's federal tax returns for the prior three fiscal periods/years remain open subject to examination by the Internal Revenue Service.
Distribution of Income and Gains. Net investment income of the Fund is declared as a daily dividend and is distributed to shareholders monthly. The Fund may take into account capital gains and losses in its daily dividend declarations. The Fund may also make additional distributions for tax purposes if necessary.
Permanent book and tax differences relating to shareholder distributions will result in reclassifications to paid in capital. Temporary book and tax differences will reverse in a subsequent period. There were no significant book to tax differences for the Fund.
At December 31, 2015, the Fund's components of distributable earnings (accumulated losses) on a tax basis were as follows:
| Undistributed ordinary income | $ 61,226 |
In addition, the tax character of the distributions was characterized as follows:
| | Years Ended December 31, |
| | 2015 | 2014 |
| Distributions from ordinary income* | $ 107,467 | $ 95,698 |
* For tax purposes, short-term capital gain distributions are considered ordinary income distributions.
Contingencies. In the normal course of business, the Fund may enter into contracts with service providers that contain general indemnification clauses. The Fund's maximum exposure under these arrangements is unknown as this would involve future claims that may be made against the Fund that have not yet been made. However, based on experience, the Fund expects the risk of loss to be remote.
Other. The Fund receives an allocation of the Portfolio's net investment income and net realized gains and losses in proportion to its investment in the Portfolio. Expenses directly attributed to a fund are charged to that fund, while expenses which are attributable to the Corporation are allocated among the Funds in the Corporation on the basis of relative net assets.
B. Fees and Transactions with Affiliates
Management Agreement. Under the Investment Management Agreement with Deutsche Investment Management Americas Inc. ("DIMA" or the "Advisor"), an indirect, wholly owned subsidiary of Deutsche Bank AG, the Advisor serves as the investment manager to the Fund. The Advisor receives a management fee from the Portfolio pursuant to the master/feeder structure listed above in Note A.
Administration Fee. Pursuant to an Administrative Services Agreement, DIMA provides most administrative services to the Fund. For all services provided under the Administrative Services Agreement, the Fund pays the Advisor an annual fee ("Administration Fee") of 0.10% of the Fund's average daily net assets, computed and accrued daily and payable monthly.
For the period from January 1, 2015 through December 31, 2015, the Advisor has agreed to voluntarily waive additional expenses. The waiver may be changed or terminated at any time without notice. Under this arrangement, the Advisor waived certain expenses of the Fund.
For the year ended December 31, 2015, the Administration Fee was $859,400, of which $345,186 was waived and $76,025 is unpaid.
Service Provider Fees. DeAWM Service Company ("DSC"), an affiliate of the Advisor, is the transfer agent, dividend-paying agent and shareholder service agent for the Fund. Pursuant to a sub-transfer agency agreement between DSC and DST Systems, Inc. ("DST"). DSC has delegated certain transfer agent, dividend-paying agent and shareholder service agent functions to DST. DSC compensates DST out of the shareholder servicing fee it receives from the Fund. For the year ended December 31, 2015, the amounts charged to the Fund by DSC were as follows:
| | Total Aggregated | Waived | Unpaid at December 31, 2015 |
| Prime Shares | $ 398,597 | $ 368,742 | $ 29,855 |
| Prime Institutional Shares | 23,988 | 23,988 | — |
| | $ 422,585 | $ 392,730 | $ 29,855 |
Distribution and Service Fees. DeAWM Distributors, Inc. ("DDI") is the Fund's Distributor. The Fund pays the Distributor an annual fee, pursuant to a Rule 12b-1 plan, based on its average daily net assets, which is calculated daily and payable monthly at 0.25% of Prime Shares average daily net assets. For the year ended December 31, 2015, the Distribution Fee was as follows:
| | Total Aggregated | Waived | Annual
Effective Rate |
| Prime Shares | $ 1,487,606 | $ 1,487,606 | .00% |
The Fund pays the Distributor a shareholder servicing fee based on the average daily net assets which is calculated daily and paid monthly at a rate of 0.07% of Prime Shares. The Distributor uses this fee to compensate third parties that provide shareholder services to their clients who own shares. For the year ended December 31, 2015, the shareholder servicing fee was as follows:
| | Total Aggregated | Waived | Annual Effective Rate |
| Prime Shares | $ 416,530 | $ 416,530 | .00% |
Typesetting and Filing Service Fees. Under an agreement with DIMA, DIMA is compensated for providing typesetting and certain regulatory filing services to the Fund. For the year ended December 31, 2015, the amount charged to the Fund by DIMA included in Statement of Operations under "Reports to shareholders" aggregated $19,415, of which $7,818 is unpaid.
Directors' Fees and Expenses. The Fund paid retainer fees to each Director not affiliated with the Advisor, plus specified amounts to the Board Chairperson and Vice Chairperson and to each committee Chairperson.
C. Share Transactions
The following table summarizes share and dollar activity in the Fund:
| | Year Ended December 31, 2015 | Year Ended December 31, 2014 |
| | Shares | Dollars | Shares | Dollars |
| Shares sold |
| Prime Shares | 940,683,269 | $ 940,683,269 | 699,616,891 | $ 699,616,891 |
| Prime Institutional Shares | 1,276,217,347 | 1,276,217,347 | 1,323,355,727 | 1,323,355,727 |
| | | $ 2,216,900,616 | | $ 2,022,972,618 |
| Shares issued to shareholders in reinvestment of distributions |
| Prime Shares | 61,814 | $ 61,814 | 61,143 | $ 61,143 |
| Prime Institutional Shares | 26,969 | 26,969 | 21,859 | 21,859 |
| | | $ 88,783 | | $ 83,002 |
| Shares redeemed |
| Prime Shares | (826,670,114) | $ (826,670,114) | (722,351,595) | $ (722,351,595) |
| Prime Institutional Shares | (1,311,414,612) | (1,311,414,612) | (1,239,031,347) | (1,239,031,347) |
| Managed Shares* | — | — | (4,002) | (4,002) |
| | | $ (2,138,084,726) | | $ (1,961,386,944) |
| Net increase (decrease) |
| Prime Shares | 114,074,969 | $ 114,074,969 | (22,673,561) | $ (22,673,561) |
| Prime Institutional Shares | (35,170,296) | (35,170,296) | 84,346,239 | 84,346,239 |
| Managed Shares* | — | — | (4,002) | (4,002) |
| | | $ 78,904,673 | | $ 61,668,676 |
* On December 1, 2014, the sole shareholder of the Managed Shares class of the Fund redeemed their entire account. On January 13, 2015, the Managed Shares class was terminated and is no longer offered.
D. Additional Information
Effective on or about May 2, 2016, the Fund will operate as a government money market fund under the amendments to Rule 2a-7 under the Investment Company Act of 1940, as amended, that were adopted in July 2014 with final compliance dates ranging between July 2015 and October 2016. As currently structured, on the final compliance date for the Rule 2a-7 amendments, the Fund would be required to implement a floating net asset value and would be allowed, and in certain situations, required, to implement liquidity fees and/or redemption gates. As a government money market fund, the Fund will continue to seek to maintain a stable $1.00 net asset value (although the Fund will seek to maintain a $1.00 net asset value, there is no guarantee that it will be able to do so and if the net asset value falls below $1.00, you would lose money) and the Fund will not be required to implement liquidity fees and/or redemption gates. As a government money market fund, the Fund will invest at least 99.5% of the Fund’s total assets in cash, US government securities, and/or repurchase agreements that are collateralized by these same securities.
In order for the Fund to operate as a government money market fund, shareholders approved revisions to the Fund’s fundamental investment policy relating to concentration (the "Concentration Policy") such that the Fund would no longer be required to invest more than 25% of its total assets in obligations of banks and other financial institutions. If not revised, the current Concentration Policy would have precluded the Fund from operating as a government money market fund. The Fund is a "feeder" fund that pursues its investment objective by investing substantially all of its assets in a "master portfolio," the Cash Management Portfolio (the "Portfolio"), under a master-feeder structure. The Portfolio invests directly in securities and other instruments and the Fund has the same investment objective and policies as the Portfolio. Effective on or about May 2, 2016, the Portfolio will also operate as a government money market fund.
In addition to the revised Concentration Policy, the following changes to the Fund for it to operate as a government money market fund will also take effect on May 2, 2016:
(i) A revised investment objective, as follows:
"The fund seeks maximum current income to the extent consistent with stability of principal."
(ii) The adoption of a principal investment strategy to invest at least 99.5% of the Fund’s total assets in cash, government securities, and/or repurchase agreements that are collateralized by these same securities.
(iii) Name changes, as follows:
| Current Name | | New Name |
| Cash Management Portfolio | | Government Cash Management Portfolio |
| Cash Reserve Fund, Inc. | | Cash Reserve Fund, Inc. (No Change) |
| Prime Series | | Deutsche Government Series |
| Cash Reserve Prime Shares | | Cash Reserve Government Shares |
| Cash Reserve Prime Institutional Shares | | Cash Reserve Government Institutional Shares |
(iv) The adoption of a principal investment strategy to invest at least 80% of net assets, plus the amount of any borrowings for investment purposes, in government securities and/or repurchase agreements that are collateralized by government securities; and
(v) A reduction in the management fee rate paid by the Portfolio to DIMA, the investment advisor to the Fund and the Portfolio. Pursuant to the master-feeder structure noted above, DIMA receives a management fee from the Portfolio.
To ensure an orderly transition to a government money market fund, DIMA anticipates that it will begin to gradually implement changes to the Portfolio beginning in the first quarter of 2016. As a result, it is expected that the Portfolio gradually will allocate a larger percentage of its assets to government securities over time until it reaches its new allocation on or about May 2, 2016. Because the yields on government securities generally may be expected to be lower than the yields on comparable non-government securities, it should be expected that the Fund's yield may decrease as more assets are invested in government securities.
Report of Independent Registered Public Accounting Firm
To the Board of Directors of Cash Reserve Fund, Inc. and Shareholders of Cash Reserve Fund — Prime Series:
In our opinion, the accompanying statement of assets and liabilities and the related statements of operations and of changes in net assets and the financial highlights present fairly, in all material respects, the financial position of Cash Reserve Fund — Prime Series (the "Fund") at December 31, 2015, and the results of its operations, the changes in its net assets and the financial highlights for each of the periods indicated therein, in conformity with accounting principles generally accepted in the United States of America. These financial statements and financial highlights (hereafter referred to as "financial statements") are the responsibility of the Fund's management. Our responsibility is to express an opinion on these financial statements based on our audits. We conducted our audits of these financial statements in accordance with the standards of the Public Company Accounting Oversight Board (United States). Those standards require that we plan and perform the audits to obtain reasonable assurance about whether the financial statements are free of material misstatement. An audit includes examining, on a test basis, evidence supporting the amounts and disclosures in the financial statements, assessing the accounting principles used and significant estimates made by management, and evaluating the overall financial statement presentation. We believe that our audits, which included confirmation of securities at December 31, 2015 by correspondence with the transfer agent, provide a reasonable basis for our opinion.
Boston, Massachusetts
February 23, 2016 | PricewaterhouseCoopers LLP |
Information About Your Fund's Expenses
As an investor of the Fund, you incur two types of costs: ongoing expenses and transaction costs. Ongoing expenses include management fees and other Fund expenses. Examples of transaction costs include account maintenance fees, which are not shown in this section. The following tables are intended to help you understand your ongoing expenses (in dollars) of investing in the Fund and to help you compare these expenses with the ongoing expenses of investing in other mutual funds. In the most recent six-month period, the Fund limited these expenses; had it not done so, expenses would have been higher. The example in the table is based on an investment of $1,000 invested at the beginning of the six-month period and held for the entire period (July 1, 2015 to December 31, 2015).
The tables illustrate your Fund's expenses in two ways:
— Actual Fund Return. This helps you estimate the actual dollar amount of ongoing expenses (but not transaction costs) paid on a $1,000 investment in the Fund using the Fund's actual return during the period. To estimate the expenses you paid over the period, simply divide your account value by $1,000 (for example, an $8,600 account value divided by $1,000 = 8.6), then multiply the result by the number in the "Expenses Paid per $1,000" line under the share class you hold.
— Hypothetical 5% Fund Return. This helps you to compare your Fund's ongoing expenses (but not transaction costs) with those of other mutual funds using the Fund's actual expense ratio and a hypothetical rate of return of 5% per year before expenses. Examples using a 5% hypothetical fund return may be found in the shareholder reports of other mutual funds. The hypothetical account values and expenses may not be used to estimate the actual ending account balance or expenses you paid for the period.
Please note that the expenses shown in these tables are meant to highlight your ongoing expenses only and do not reflect any transaction costs. The "Expenses Paid per $1,000" line of the tables is useful in comparing ongoing expenses only and will not help you determine the relative total expense of owning different funds. If these transaction costs had been included, your costs would have been higher.
Expenses and Value of a $1,000 Investment
for the six months ended December 31, 2015 (Unaudited) |
| Actual Fund Return* | Prime Shares | Prime Institutional Shares |
| Beginning Account Value 7/1/15 | $ 1,000.00 | $ 1,000.00 |
| Ending Account Value 12/31/15 | $ 1,000.08 | $ 1,000.12 |
| Expenses Paid per $1,000** | $ 1.36 | $ 1.31 |
| Hypothetical 5% Fund Return* | Prime Shares | Prime Institutional Shares |
| Beginning Account Value 7/1/15 | $ 1,000.00 | $ 1,000.00 |
| Ending Account Value 12/31/15 | $ 1,023.84 | $ 1,023.89 |
| Expenses Paid per $1,000** | $ 1.38 | $ 1.33 |
* Expenses include amounts allocated proportionally from the master portfolio.
** Expenses are equal to the Fund's annualized expense ratio for each share class, multiplied by the average account value over the period, multiplied by 184 (the number of days in the most recent six-month period), then divided by 365.
| Annualized Expense Ratios | Prime Shares | Prime Institutional Shares |
| Cash Reserve Fund — Prime Series | .27% | .26% |
For more information, please refer to the Fund's prospectus.
For an analysis of the fees associated with an investment in the Fund or similar funds, please refer to http://apps.finra.org/fundanalyzer/1/fa.aspx.
Tax Information (Unaudited)
A total of 2.32% of the dividends distributed during the fiscal year was derived from interest on U.S. government securities, which is generally exempt from state income tax.
Please contact a tax advisor if you have questions about federal or state income tax laws, or on how to prepare your tax returns. If you have specific questions about your account, please call (800) 728-3337.
(The following financial statements of the Cash Management Portfolio should be read in conjunction with the Fund's financial statements.)
Investment Portfolio as of December 31, 2015
| | Principal Amount ($) | Value ($) |
| | | | |
| Certificates of Deposit and Bank Notes 22.2% |
| Banco del Estado de Chile: |
| | 0.52%, 2/29/2016 | 25,000,000 | 25,000,000 |
| | 0.57%, 4/28/2016 | 110,600,000 | 110,600,000 |
| | 0.652%, 2/29/2016 | 75,000,000 | 75,000,000 |
| Bank of Montreal: |
| | 0.3%, 1/4/2016 | 108,500,000 | 108,500,000 |
| | 0.389%, 1/7/2016 | 95,000,000 | 95,000,000 |
| | 0.56%, 4/18/2016 | 65,000,000 | 65,000,000 |
| Bank of Nova Scotia: |
| | 0.55%, 3/18/2016 | 45,000,000 | 45,000,000 |
| | 0.612%, 4/28/2016 | 38,500,000 | 38,500,000 |
| Canadian Imperial Bank of Commerce, 0.65%, 6/30/2016 | 106,075,000 | 106,075,000 |
| Citibank NA, 0.37%, 1/8/2016 | 6,813,000 | 6,813,000 |
| Cooperatieve Centrale Raiffeisen-Boerenleenbank BA: |
| | 0.43%, 3/4/2016 | 125,800,000 | 125,800,000 |
| | 0.497%, 4/14/2016 | 187,000,000 | 187,000,000 |
| Dexia Credit Local: |
| | 0.431%, 5/4/2016 | 100,000,000 | 100,000,000 |
| | 144A, 0.432%, 2/26/2016 | 28,500,000 | 28,500,000 |
| DZ Bank AG: |
| | 0.36%, 1/4/2016 | 86,587,000 | 86,587,000 |
| | 0.38%, 1/29/2016 | 171,715,000 | 171,715,000 |
| | 0.4%, 2/11/2016 | 119,000,000 | 119,000,000 |
| | 0.45%, 12/15/2016 | 25,000,000 | 25,000,000 |
| Mitsubishi UFJ Trust & Banking Corp.: |
| | 0.38%, 1/19/2016 | 50,000,000 | 50,000,000 |
| | 0.46%, 3/17/2016 | 88,500,000 | 88,500,000 |
| Mizuho Bank Ltd.: |
| | 0.29%, 1/20/2016 | 34,000,000 | 34,000,000 |
| | 0.29%, 1/29/2016 | 123,500,000 | 123,500,000 |
| | 0.3%, 2/11/2016 | 85,000,000 | 85,000,000 |
| | 0.4%, 2/17/2016 | 115,000,000 | 115,000,000 |
| Nordea Bank Finland PLC: |
| | 0.3%, 2/8/2016 | 200,000,000 | 200,000,000 |
| | 0.45%, 3/18/2016 | 136,500,000 | 136,500,000 |
| | 0.467%, 2/12/2016 | 200,000,000 | 200,000,000 |
| | 0.487%, 5/13/2016 | 100,000,000 | 100,000,000 |
| | 0.5%, 3/9/2016 | 33,000,000 | 33,000,000 |
| Norinchukin Bank, 0.31%, 1/19/2016 | 110,000,000 | 110,001,645 |
| Royal Bank of Canada, 0.71%, 5/2/2016 | 92,500,000 | 92,500,000 |
| Sumitomo Mitsui Banking Corp.: |
| | 0.35%, 2/12/2016 | 50,000,000 | 50,000,000 |
| | 0.4%, 2/18/2016 | 100,000,000 | 100,000,000 |
| | 0.54%, 3/16/2016 | 85,500,000 | 85,500,000 |
| Svenska Handelsbanken AB: |
| | 0.491%, 4/15/2016 | 125,000,000 | 125,000,000 |
| | 0.495%, 2/29/2016 | 120,000,000 | 120,000,981 |
| Swedbank AB, 0.453%, 3/10/2016 | 125,000,000 | 125,000,000 |
| Toronto-Dominion Bank: |
| | 0.43%, 3/2/2016 | 141,000,000 | 141,000,000 |
| | 0.65%, 4/28/2016 | 110,000,000 | 110,000,000 |
| Wells Fargo Bank NA: |
| | 0.394%, 6/3/2016 | 50,000,000 | 50,000,000 |
| | 0.457%, 4/11/2016 | 63,000,000 | 63,000,000 |
| Westpac Banking Corp., 0.552%, 5/27/2016 | 135,000,000 | 135,000,000 |
| Total Certificates of Deposit and Bank Notes (Cost $3,991,592,626) | 3,991,592,626 |
| |
| Commercial Paper 34.0% |
| Issued at Discount** 21.7% |
| Albion Capital LLC, 0.35%, 1/20/2016 | 106,900,000 | 106,880,253 |
| Bank Nederlandse Gemeenten, 0.381%, 3/4/2016 | 142,000,000 | 141,905,570 |
| Caisse Centrale Desjardins du Quebec, 0.37%, 2/2/2016 | 82,000,000 | 81,973,031 |
| Caisse des Depots et Consignations: |
| | 0.31%, 2/16/2016 | 150,000,000 | 149,940,583 |
| | 0.346%, 3/15/2016 | 47,000,000 | 46,966,669 |
| Chevron Corp., 0.4%, 2/5/2016 | 74,400,000 | 74,371,067 |
| China Construction Bank Corp., 0.42%, 1/4/2016 | 17,000,000 | 16,999,405 |
| Coca-Cola Co., 0.511%, 3/18/2016 | 72,500,000 | 72,420,915 |
| Collateralized Commercial Paper II Co., LLC: |
| | 0.481%, 4/6/2016 | 71,270,000 | 71,178,774 |
| | 0.481%, 4/5/2016 | 65,000,000 | 64,917,667 |
| | 0.481%, 4/20/2016 | 100,000,000 | 99,853,333 |
| Cooperatieve Centrale Raiffeisen-Boerenleenbank BA, 0.416%, 3/14/2016 | 50,000,000 | 49,957,924 |
| CPPIB Capital, Inc., 0.3%, 2/3/2016 | 23,763,000 | 23,756,465 |
| Crown Point Capital Co., LLC, 0.621%, 3/14/2016 | 50,000,000 | 49,937,139 |
| DBS Bank Ltd.: |
| | 0.28%, 1/5/2016 | 70,000,000 | 69,997,822 |
| | 0.34%, 1/28/2016 | 50,000,000 | 49,987,250 |
| Erste Abwicklungsanstalt: |
| | 0.33%, 2/3/2016 | 43,500,000 | 43,486,841 |
| | 0.33%, 2/18/2016 | 20,000,000 | 19,991,200 |
| | 0.33%, 3/7/2016 | 55,000,000 | 54,966,725 |
| | 0.531%, 4/4/2016 | 107,000,000 | 106,851,924 |
| Export Development Canada, 0.381%, 1/11/2016 | 68,980,000 | 68,972,719 |
| Exxon Mobil Corp.: |
| | 0.4%, 1/19/2016 | 58,000,000 | 57,988,400 |
| | 0.45%, 2/1/2016 | 155,000,000 | 154,939,937 |
| Gotham Funding Corp.: |
| | 0.4%, 1/11/2016 | 75,000,000 | 74,991,667 |
| | 0.4%, 1/15/2016 | 57,500,000 | 57,491,056 |
| Kells Funding LLC: |
| | 0.32%, 3/8/2016 | 50,000,000 | 49,970,222 |
| | 0.37%, 2/2/2016 | 43,459,000 | 43,445,866 |
| | 144A, 0.401%, 3/14/2016 | 145,000,000 | 144,882,389 |
| | 144A, 0.401%, 1/8/2016 | 50,000,000 | 49,996,111 |
| | 0.431%, 3/14/2016 | 5,000,000 | 4,995,640 |
| Manhattan Asset Funding Co., LLC: |
| | 0.27%, 1/11/2016 | 40,000,000 | 39,997,000 |
| | 0.38%, 1/27/2016 | 32,000,000 | 31,991,218 |
| | 0.48%, 1/28/2016 | 1,536,000 | 1,535,447 |
| MetLife Short Term Funding LLC: |
| | 0.23%, 1/4/2016 | 4,700,000 | 4,699,910 |
| | 0.401%, 4/29/2016 | 80,000,000 | 79,894,222 |
| Microsoft Corp., 0.19%, 1/6/2016 | 57,950,000 | 57,948,471 |
| Nestle Capital Corp., 0.27%, 2/26/2016 | 142,000,000 | 141,940,360 |
| Nieuw Amsterdam Receivables Corp., 0.24%, 1/19/2016 | 36,267,000 | 36,262,648 |
| Nordea Bank AB, 0.305%, 2/8/2016 | 9,000,000 | 8,997,103 |
| Old Line Funding LLC: |
| | 0.481%, 4/12/2016 | 40,000,000 | 39,945,600 |
| | 0.521%, 4/29/2016 | 60,000,000 | 59,896,867 |
| | 144A, 0.552%, 5/16/2016 | 150,000,000 | 149,688,333 |
| | 0.652%, 5/2/2016 | 62,500,000 | 62,362,326 |
| PSP Capital, Inc, 0.23%, 1/22/2016 | 7,600,000 | 7,598,980 |
| PSP Capital, Inc., 0.42%, 1/8/2016 | 32,200,000 | 32,197,370 |
| Regency Markets No. 1 LLC: |
| | 0.45%, 1/20/2016 | 65,000,000 | 64,984,562 |
| | 0.47%, 1/27/2016 | 37,763,000 | 37,750,182 |
| Sinopec Century Bright Capital Investment Ltd.: |
| | 0.5%, 1/8/2016 | 22,500,000 | 22,497,812 |
| | 0.5%, 1/11/2016 | 127,600,000 | 127,582,278 |
| Standard Chartered Bank: |
| | 0.401%, 1/13/2016 | 150,000,000 | 149,980,000 |
| | 0.42%, 1/8/2016 | 145,000,000 | 144,988,158 |
| | 0.501%, 4/5/2016 | 100,000,000 | 99,868,056 |
| Swedbank AB, 0.366%, 2/1/2016 | 44,000,000 | 43,986,171 |
| Total Capital Canada Ltd., 0.21%, 1/4/2016 | 404,000 | 403,993 |
| Victory Receivables Corp.: |
| | 0.4%, 1/15/2016 | 54,407,000 | 54,398,537 |
| | 0.41%, 1/20/2016 | 26,638,000 | 26,632,236 |
| Walt Disney Co.: |
| | 0.19%, 1/25/2016 | 100,000,000 | 99,987,333 |
| | 0.3%, 2/25/2016 | 50,000,000 | 49,977,083 |
| Working Capital Management Co.: |
| | 0.44%, 1/20/2016 | 67,000,000 | 66,984,441 |
| | 0.45%, 1/15/2016 | 50,000,000 | 49,991,250 |
| | 3,898,982,511 |
| Issued at Par 12.3% |
| Australia & New Zealand Banking Group Ltd., 0.441%, 1/15/2016 | 50,000,000 | 50,000,014 |
| Bank Nederlandse Gemeenten: |
| | 0.439%, 5/6/2016 | 87,000,000 | 87,000,000 |
| | 0.522%, 2/25/2016 | 100,000,000 | 100,000,000 |
| Bank of Nova Scotia, 0.57%, 2/12/2016 | 183,800,000 | 183,800,000 |
| Bedford Row Funding Corp.: |
| | 0.351%, 1/14/2016 | 28,000,000 | 28,000,000 |
| | 0.416%, 4/8/2016 | 40,000,000 | 40,000,000 |
| | 144A, 0.517%, 4/12/2016 | 90,500,000 | 90,500,000 |
| | 144A, 0.525%, 3/14/2016 | 15,500,000 | 15,500,000 |
| BNZ International Funding Ltd., 0.497%, 6/14/2016 | 15,000,000 | 15,000,000 |
| Commonwealth Bank of Australia: |
| | 0.379%, 4/7/2016 | 82,000,000 | 81,998,639 |
| | 0.389%, 5/6/2016 | 100,000,000 | 99,997,783 |
| | 0.396%, 4/29/2016 | 38,000,000 | 37,998,847 |
| | 0.396%, 5/4/2016 | 75,000,000 | 75,000,000 |
| | 0.42%, 3/4/2016 | 36,000,000 | 36,000,000 |
| | 144A, 0.532%, 3/29/2016 | 23,000,000 | 22,996,171 |
| Crown Point Capital Co., LLC, 0.722%, 8/25/2016 | 142,800,000 | 142,800,000 |
| Erste Abwicklungsanstalt: |
| | 0.411%, 3/4/2016 | 80,000,000 | 79,999,169 |
| | 0.511%, 3/17/2016 | 120,000,000 | 119,997,494 |
| | 144A, 0.552%, 1/19/2016 | 41,000,000 | 41,000,000 |
| | 144A, 0.562%, 4/19/2016 | 68,250,000 | 68,249,508 |
| HSBC Bank PLC, 144A, 0.678%, 6/24/2016 | 113,250,000 | 113,250,000 |
| Macquarie Bank Ltd., 0.652%, 3/21/2016 | 70,000,000 | 70,000,000 |
| Nederlandse Waterschapsbank NV, 144A, 0.53%, 3/18/2016 | 117,500,000 | 117,500,000 |
| Old Line Funding LLC: |
| | 144A, 0.487%, 5/6/2016 | 50,000,000 | 50,000,000 |
| | 144A, 0.496%, 2/8/2016 | 100,000,000 | 100,000,000 |
| | 144A, 0.613%, 3/22/2016 | 66,000,000 | 66,000,000 |
| Thunder Bay Funding LLC: |
| | 0.476%, 3/8/2016 | 20,000,000 | 20,000,000 |
| | 0.517%, 4/12/2016 | 69,000,000 | 69,000,000 |
| Westpac Banking Corp., 144A, 0.53%, 3/18/2016 | 200,000,000 | 200,000,000 |
| | 2,221,587,625 |
| Total Commercial Paper (Cost $6,120,570,136) | 6,120,570,136 |
| Government & Agency Obligations 9.7% |
| U.S. Government Sponsored Agencies 6.5% |
| Federal Farm Credit Bank: |
| | 0.224%*, 3/3/2016 | 35,000,000 | 35,000,000 |
| | 0.346%*, 2/8/2017 | 15,000,000 | 15,000,000 |
| | 0.382%*, 5/20/2016 | 75,000,000 | 75,000,466 |
| Federal Home Loan Bank: |
| | 0.18%**, 3/1/2016 | 15,000,000 | 14,995,500 |
| | 0.22%**, 4/5/2016 | 29,500,000 | 29,482,874 |
| | 0.23%**, 1/20/2016 | 15,000,000 | 14,998,179 |
| | 0.24%**, 4/4/2016 | 50,000,000 | 49,968,667 |
| | 0.251%**, 3/7/2016 | 43,000,000 | 42,980,291 |
| | 0.255%**, 2/9/2016 | 50,000,000 | 49,986,188 |
| | 0.26%**, 4/11/2016 | 25,000,000 | 24,981,764 |
| | 0.264%*, 10/7/2016 | 7,500,000 | 7,500,000 |
| | 0.27%**, 2/16/2016 | 25,000,000 | 24,991,375 |
| | 0.305%**, 2/29/2016 | 20,000,000 | 19,990,003 |
| | 0.311%**, 6/28/2016 | 50,000,000 | 49,922,931 |
| | 0.341%**, 4/18/2016 | 50,000,000 | 49,949,000 |
| | 0.38%**, 3/22/2016 | 25,000,000 | 24,978,625 |
| | 0.391%**, 7/15/2016 | 25,000,000 | 24,946,917 |
| | 0.392%*, 8/26/2016 | 25,000,000 | 25,000,000 |
| | 0.4%**, 7/1/2016 | 80,000,000 | 79,838,222 |
| | 0.445%**, 2/26/2016 | 32,700,000 | 32,677,364 |
| | 0.471%**, 6/13/2016 | 25,000,000 | 24,946,472 |
| | 0.476%**, 3/9/2016 | 28,609,000 | 28,583,331 |
| | 0.501%**, 6/13/2016 | 75,000,000 | 74,829,169 |
| Federal Home Loan Mortgage Corp.: |
| | 0.2%**, 2/23/2016 | 20,000,000 | 19,994,111 |
| | 0.23%**, 1/12/2016 | 27,500,000 | 27,498,067 |
| | 0.235%**, 4/15/2016 | 21,000,000 | 20,985,607 |
| | 0.511%**, 4/27/2016 | 150,000,000 | 149,751,375 |
| Federal National Mortgage Association: |
| | 0.225%**, 5/23/2016 | 25,000,000 | 24,977,656 |
| | 0.255%**, 2/2/2016 | 26,500,000 | 26,493,993 |
| | 0.422%*, 7/20/2017 | 80,000,000 | 79,993,717 |
| | 1,170,241,864 |
| U.S. Treasury Obligations 3.2% |
| U.S. Treasury Bills: |
| | 0.117%**, 2/11/2016 | 125,000,000 | 124,983,344 |
| | 0.24%**, 2/25/2016 | 25,000,000 | 24,990,833 |
| U.S. Treasury Floating Rate Notes, 0.428%*, 10/31/2017 | 100,000,000 | 99,944,515 |
| U.S. Treasury Notes: |
| | 0.25%, 4/15/2016 | 12,500,000 | 12,496,131 |
| | 0.25%, 5/15/2016 | 45,000,000 | 45,008,955 |
| | 0.375%, 3/15/2016 | 75,000,000 | 75,033,232 |
| | 0.625%, 7/15/2016 | 25,000,000 | 25,044,613 |
| | 2.0%, 1/31/2016 | 50,000,000 | 50,073,604 |
| | 2.0%, 4/30/2016 | 25,000,000 | 25,139,036 |
| | 4.5%, 2/15/2016 | 100,000,000 | 100,535,070 |
| | 583,249,333 |
| Total Government & Agency Obligations (Cost $1,753,491,197) | 1,753,491,197 |
| |
| Short-Term Notes 4.0% |
| Bank of Nova Scotia: |
| | 0.912%*, 3/15/2016 | 1,100,000 | 1,100,570 |
| | 2.9%, 3/29/2016 | 18,000,000 | 18,101,271 |
| GE Capital International Funding Co.: |
| | 144A, 0.964%, 4/15/2016 | 227,289,000 | 227,589,900 |
| | 0.964%, 4/15/2016 | 217,500,000 | 217,750,999 |
| General Electric Capital Corp.: |
| | 0.551%*, 1/14/2016 | 20,500,000 | 20,501,417 |
| | 1.0%, 1/8/2016 | 17,843,000 | 17,844,970 |
| | 1.214%*, 5/9/2016 | 1,000,000 | 1,003,027 |
| | 2.95%, 5/9/2016 | 24,659,000 | 24,866,367 |
| Home Depot, Inc., 5.4%, 3/1/2016 | 67,299,000 | 67,838,287 |
| JPMorgan Chase Bank NA, 0.48%*, 11/22/2016 | 45,750,000 | 45,750,000 |
| Province of Ontario Canada, 4.75%, 1/19/2016 | 25,000,000 | 25,054,768 |
| Wal-Mart Stores, Inc., 5.313%*, 6/1/2016 | 55,000,000 | 56,124,032 |
| Total Short-Term Notes (Cost $723,525,608) | 723,525,608 |
| |
| Municipal Bonds and Notes 3.3% |
| Catawba County, NC, Hospital Revenue, Valley Medical Center, 144A, 0.4%***, 10/1/2034, LOC: Branch Banking & Trust | 2,500,000 | 2,500,000 |
| Georgia, JPMorgan Chase Putters/Drivers Trust, Series SGT05, 0.45%***, 1/1/2035, INS: FGIC, NATL, LIQ: Societe Generale, LOC: Societe Generale | 22,000,000 | 22,000,000 |
| Los Angeles, CA, Metro Transportation Authority, TECP, 0.3%, 1/4/2016, LOC: Sumitomo Mitsui Banking | 22,500,000 | 22,500,000 |
| Metropolitan Government Nashville & Davidson County, TN, Vanderbilt University, TECP, 0.15%, 2/22/2016 | 15,000,000 | 15,000,000 |
| Michigan, State Finance Authority Revenue, School Loan, Series B, 0.35%***, 9/1/2050, LOC: PNC Bank NA | 10,000,000 | 10,000,000 |
| Minnesota, State Office of Higher Education Revenue, Supplementary Student, Series A, 0.4%***, 12/1/2043, LOC: U.S. Bank NA | 11,500,000 | 11,500,000 |
| New Hampshire, State Health & Education Facilities Authority Revenue, Higher Education Loan Corp., Series A, 0.38%***, 12/1/2032, LOC: Royal Bank of Canada | 13,961,000 | 13,961,000 |
| New Jersey, RBC Municipal Products, Inc. Trust, Series E-60, 144A, 0.42%***, 6/28/2016, LOC: Royal Bank of Canada | 152,500,000 | 152,500,000 |
| New Jersey, State Housing & Mortgage Finance Agency, Multi-Family Housing Revenue, Series C, 0.35%***, 11/1/2039, LOC: Bank of America NA | 9,570,000 | 9,570,000 |
| New York, State Housing Finance Agency Revenue, 605 West 42nd Street, Series B, 144A, 0.45%***, 5/1/2048, LOC: Bank of China | 125,010,000 | 125,010,000 |
| New York, State Housing Finance Agency Revenue, 88 Leonard Street, Series A, 144A, 0.42%***, 11/1/2037, LOC: Landesbank Hessen-Thuringen | 11,750,000 | 11,750,000 |
| New York, State Housing Finance Agency Revenue, BAM South Housing, Series B, 144A, 0.4%***, 11/1/2048, LOC: JPMorgan Chase Bank NA | 12,500,000 | 12,500,000 |
| New York City, NY, Municipal Water Finance Authority, Water & Sewer Systems Revenue, Series TR-T30001-I, 144A, 0.41%***, 6/15/2044 | 8,000,000 | 8,000,000 |
| San Jose, CA, Financing Authority Lease Revenue: |
| | TECP, 0.34%, 2/19/2016, LOC: State Street Bank & Trust Co. | 7,113,000 | 7,113,000 |
| | TECP, 0.34%, 2/19/2016, LOC: U.S. Bank NA | 7,114,000 | 7,114,000 |
| University of California: |
| | TECP, 0.4%, 1/5/2016 | 45,000,000 | 44,998,000 |
| | TECP, 0.4%, 1/5/2016, LOC: JPMorgan Chase Bank NA | 25,000,000 | 24,998,889 |
| | TECP, 0.4%, 1/19/2016 | 25,000,000 | 25,000,000 |
| University of Colorado, Hospital Authority Revenue: |
| | Series C, 0.19%*, 11/15/2024 | 18,425,000 | 18,425,000 |
| | Series A, 0.19%*, 11/15/2046 | 20,450,000 | 20,450,000 |
| University of Houston, TECP, 0.49%, 2/9/2016 | 20,497,000 | 20,497,000 |
| Vanderbilt University, TECP, 0.4%, 4/7/2016 | 10,000,000 | 9,989,222 |
| Total Municipal Bonds and Notes (Cost $595,376,111) | 595,376,111 |
| |
| Repurchase Agreements 24.3% |
| BNP Paribas, 0.27%, dated 6/10/2015, to be repurchased at $200,358,500 on 2/4/2016 (a) (b) | 200,000,000 | 200,000,000 |
| BNP Paribas, 0.28%, dated 12/31/2015, to be repurchased at $5,000,156 on 1/4/2016 (c) | 5,000,000 | 5,000,000 |
| Federal Reserve Bank of New York, 0.25%, dated 12/31/2015, to be repurchased at $3,500,097,222 on 1/4/2016 (d) | 3,500,000,000 | 3,500,000,000 |
| JPMorgan Securities, Inc., 0.475%, dated 4/30/2015, to be repurchased at $187,075,708 on 3/31/2016 (a) (e) | 186,250,000 | 186,250,000 |
| JPMorgan Securities, Inc., 0.506%, dated 8/12/2015, to be repurchased at $373,714,681 on 3/31/2016 (a) (f) | 372,500,000 | 372,500,000 |
| Wells Fargo Securities LLC, 0.43%, dated 10/28/2015, to be repurchased at $122,631,688 on 1/26/2016 (a) (g) | 122,500,000 | 122,500,000 |
| Total Repurchase Agreements (Cost $4,386,250,000) | 4,386,250,000 |
| | % of Net Assets | Value ($) |
| | |
| Total Investment Portfolio (Cost $17,570,805,678)† | 97.5 | 17,570,805,678 |
| Other Assets and Liabilities, Net | 2.5 | 450,226,390 |
| Net Assets | 100.0 | 18,021,032,068 |
* Floating rate securities' yields vary with a designated market index or market rate, such as the coupon-equivalent of the U.S. Treasury Bill rate. These securities are shown at their current rate as of December 31, 2015.
** Annualized yield at time of purchase; not a coupon rate.
*** Variable rate demand notes and variable rate demand preferred shares are securities whose interest rates are reset periodically at market levels. These securities are payable on demand and are shown at their current rates as of December 31, 2015.
† The cost for federal income tax purposes was $17,570,805,678.
(a) Open maturity repurchase agreement whose interest rate resets periodically and is shown at the current rate as of December 31, 2015. The dated date is the original day the repurchase agreement was entered into, the maturity date represents the next repurchase date. Upon notice, both the Portfolio and counterparty have the right to terminate the repurchase agreement at any time.
(b) Collateralized by:
| Principal Amount ($) | Security | Rate (%) | Maturity Date | Collateral Value ($) |
| 7,815,000 | Cent CLO Ltd. | 1.8 | 1/25/2026 | 7,749,274 |
| 10,000,000 | ECP CLO Ltd. | 1.867 | 4/20/2027 | 10,377,164 |
| 35,000,000 | Galaxy XV CLO Ltd. | 1.571 | 4/15/2025 | 34,589,993 |
| 36,462,354 | Goldentree Loan Opportunities X Ltd. | 1.612 | 7/20/2027 | 38,141,107 |
| 11,000,000 | KKR Financial CLO Ltd. | 1.471 | 7/15/2025 | 10,785,548 |
| 10,000,000 | LCM XII LP | 1.575 | 10/19/2022 | 9,935,740 |
| 5,000,000 | Mountain Hawk II CLO Ltd. | 1.477 | 7/22/2024 | 4,906,470 |
| 7,455,000 | Nomad CLO Ltd. | 1.822 | 1/15/2025 | 7,317,902 |
| 15,000,000 | Northwoods Capital XIV Ltd. | 1.956 | 11/12/2025 | 14,913,637 |
| 10,000,000 | Ocean Trails CLO IV | 1.659 | 8/13/2025 | 9,791,408 |
| 24,500,000 | OCP CLO Ltd. | 1.765 | 7/17/2026 | 24,253,735 |
| 11,800,000 | Oracle Corp. | 4.125 | 5/15/2045 | 11,220,040 |
| 10,250,000 | Race Point VII CLO Ltd. | 1.764 | 11/8/2024 | 10,181,304 |
| 12,000,000 | Saranac CLO I Ltd. | 1.8 | 10/26/2024 | 11,836,679 |
| Total Collateral Value | 206,000,001 |
(c) Collateralized by:
| Principal Amount ($) | Security | Rate (%) | Maturity Date | Collateral Value ($) |
| 1,366,300 | U.S. Treasury Note | 0.25–3.25 | 4/15/2016–
3/31/2022 | 1,352,559 |
| 6,773,320 | U.S. Treasury STRIPS | Zero Coupon | 2/15/2019–
11/15/2043 | 3,747,441 |
| Total Collateral Value | 5,100,000 |
(d) Collateralized by $3,475,939,500 U.S. Treasury Note, 2.0%, maturing on 2/15/2022 with a value of $3,500,097,280.
(e) Collateralized by $184,332,264 Federal Home Loan Mortgage Corp., with the various coupon rates from 3.0–8.0%, with various maturity dates of 10/1/2031–12/1/2042 with a value of $189,978,835.
(f) Collateralized by:
| Principal Amount ($) | Security | Rate (%) | Maturity Date | Collateral Value ($) |
| 33,390,892 | Ally Auto Receivables Trust | 1.06 | 5/15/2017 | 33,408,636 |
| 177,667 | CAL Funding II Ltd. | 3.47 | 10/25/2027 | 174,988 |
| 1 | Carlyle High Yield Partners X Ltd. | 0.53 | 4/19/2022 | 1 |
| 267,228 | College Loan Corp. Trust | 0.752 | 4/15/2025 | 266,413 |
| 139,339,175 | Federal Home Loan Mortgage Corp. | 3.0–9.0 | 1/1/2017–
7/1/2044 | 147,678,359 |
| 398,522,983 | Federal Home Loan Mortgage Corp. — Interest Only | 3.0–5.5 | 1/15/2039–
8/15/2045 | 58,134,245 |
| 37 | Federal National Mortgage Association — Interest Only | 1007 | 12/25/2021 | 435 |
| 688,637 | GCO Education Loan Funding Trust | 0.523 | 5/25/2025 | 705,343 |
| 681,483 | Goal Capital Funding Trust | 0.563 | 5/28/2030 | 668,743 |
| 84,448 | GSAMP Trust | 1.102 | 11/25/2034 | 81,210 |
| 34,332 | Higher Education Funding I | 0.523 | 2/25/2025 | 34,268 |
| 125,475,000 | JPMorgan Chase & Co. | 0.953–5.0 | 7/5/2016–
11/8/2030 | 128,653,345 |
| 12,037 | KeyCorp Student Loan Trust | 0.933 | 12/27/2029 | 15,690 |
| 2,204,365 | KnowledgeWorks Foundation | 1.343 | 2/25/2042 | 2,171,767 |
| 5,272,898 | LA Arena Funding LLC | 7.656 | 12/15/2026 | 5,818,794 |
| 343,223 | Morgan Stanley ABS Capital I, Inc. Trust | 1.042 | 12/25/2034 | 319,129 |
| 591 | National Collegiate Student Loan Trust | 0.863 | 6/25/2027 | 587 |
| 3,657,750 | TAL Advantage V LLC | 2.83–3.51 | 2/22/2038–
2/22/2039 | 3,618,432 |
| Total Collateral Value | 381,750,385 |
(g) Collateralized by:
| Principal Amount ($) | Security | Rate (%) | Maturity Date | Collateral Value ($) |
| 94,111,209 | International Bank for Reconstruction & Development | 1.06–2.5 | 1/11/2018–
2/25/2028 | 93,756,192 |
| 500,000 | Kaiser Foundation Hospitals | Zero Coupon | 1/6/2016 | 499,955 |
| 31,597,000 | Wells Fargo Bank NA | 0.397–0.87 | 1/11/2016–
10/13/2016 | 31,604,108 |
| Total Collateral Value | 125,860,255 |
144A: Security exempt from registration under Rule 144A of the Securities Act of 1933. These securities may be resold in transactions exempt from registration, normally to qualified institutional buyers.
FGIC: Financial Guaranty Insurance Co.
INS: Insured
LIQ: Liquidity Facility
LOC: Letter of Credit
NATL: National Public Finance Guarantee Corp.
STRIPS: Separate Trading of Registered Interest and Principal Securities
TECP: Tax Exempt Commercial Paper
Fair Value Measurements
Various inputs are used in determining the value of the Portfolio's investments. These inputs are summarized in three broad levels. Level 1 includes quoted prices in active markets for identical securities. Level 2 includes other significant observable inputs (including quoted prices for similar securities, interest rates, prepayment speeds and credit risk). Level 3 includes significant unobservable inputs (including the Portfolio's own assumptions in determining the fair value of investments). The level assigned to the securities valuations may not be an indication of the risk or liquidity associated with investing in those securities. Securities held by the Portfolio are reflected as Level 2 because the securities are valued at amortized cost (which approximates fair value) and, accordingly, the inputs used to determine value are not quoted prices in an active market.
The following is a summary of the inputs used as of December 31, 2015 in valuing the Portfolio's investments. For information on the Portfolio's policy regarding the valuation of investments, please refer to the Security Valuation section of Note A in the accompanying Notes to Financial Statements.
| Assets | Level 1 | Level 2 | Level 3 | Total |
| |
| Investments in Securities (h) | $ — | $ 13,184,555,678 | $ — | $ 13,184,555,678 |
| Repurchase Agreements | — | 4,386,250,000 | — | 4,386,250,000 |
| Total | $ — | $ 17,570,805,678 | $ — | $ 17,570,805,678 |
There have been no transfers between fair value measurement levels during the year ended December 31, 2015.
(h) See Investment Portfolio for additional detailed categorizations.
The accompanying notes are an integral part of the financial statements.
Statement of Assets and Liabilities
| as of December 31, 2015 |
| Assets |
| Investments in non-affiliated securities, valued at amortized cost | $ 13,184,555,678 |
| Repurchase agreements, valued at amortized cost | 4,386,250,000 |
| Investments in securities, at value (cost $17,570,805,678) | 17,570,805,678 |
| Cash | 441,893,919 |
| Interest receivable | 10,878,280 |
| Other assets | 242,926 |
| Total assets | 18,023,820,803 |
| Liabilities |
| Accrued management fee | 1,952,540 |
| Accrued Trustees' fees | 111,726 |
| Other accrued expenses and payables | 724,469 |
| Total liabilities | 2,788,735 |
| Net assets, at value | $ 18,021,032,068 |
The accompanying notes are an integral part of the financial statements.
Statement of Operations
| for the year ended December 31, 2015 |
| Investment Income |
Income: Interest | $ 48,582,219 |
Expenses: Management fee | 25,037,507 |
| Administration fee | 5,893,752 |
| Custodian fee | 217,313 |
| Professional fees | 276,941 |
| Reports to shareholders | 17,789 |
| Trustees' fees and expenses | 505,861 |
| Other | 499,461 |
| Total expenses before expense reductions | 32,448,624 |
| Expense reductions | (4,944,455) |
| Total expenses after expense reductions | 27,504,169 |
| Net investment income | 21,078,050 |
| Net realized gain (loss) from investments | 452,645 |
| Net increase (decrease) in net assets resulting from operations | $ 21,530,695 |
The accompanying notes are an integral part of the financial statements.
Statement of Changes in Net Assets
| Increase (Decrease) in Net Assets | Years Ended December 31, |
| 2015 | 2014 |
Operations: Net investment income | $ 21,078,050 | $ 9,791,086 |
| Net realized gain (loss) | 452,645 | 38,382 |
| Net increase (decrease) in net assets resulting from operations | 21,530,695 | 9,829,468 |
Capital transactions in shares of beneficial interest: Proceeds from capital invested | 317,351,519,324 | 177,895,822,788 |
| Value of capital withdrawn | (319,269,518,924) | (178,202,393,435) |
| Net increase (decrease) in net assets from capital transactions in shares of beneficial interest | (1,917,999,600) | (306,570,647) |
| Increase (decrease) in net assets | (1,896,468,905) | (296,741,179) |
| Net assets at beginning of period | 19,917,500,973 | 20,214,242,152 |
| Net assets at end of period | $ 18,021,032,068 | $ 19,917,500,973 |
The accompanying notes are an integral part of the financial statements.
Financial Highlights
| | |
Years Ended December 31, |
| 2015 | 2014 | 2013 | 2012 | 2011 |
| Ratios to Average Net Assets and Supplemental Data |
| Net assets, end of period ($ millions) | 18,021 | 19,918 | 20,214 | 24,810 | 20,784 |
| Ratio of expenses before expense reductions (%) | .17 | .17 | .16 | .17 | .16 |
| Ratio of expenses after expense reductions (%) | .14 | .14 | .14 | .14 | .15 |
| Ratio of net investment income (%) | .11 | .05 | .08 | .14 | .10 |
| Total Return (%)a,b | .11 | .05 | .08 | .14 | .11 |
a Total return would have been lower had certain expenses not been reduced. b Total return for the Portfolio was derived from the performance of Cash Reserves Fund Institutional. |
Notes to Financial Statements
A. Organization and Significant Accounting Policies
Cash Management Portfolio (the "Portfolio") is registered under the Investment Company Act of 1940, as amended (the "1940 Act"), as an open-end management investment company organized as a New York trust.
The Portfolio is a master fund. A master/feeder fund structure is one in which a fund (a "feeder fund"), instead of investing directly in a portfolio of securities, invests most or all of its investment assets in a separate registered investment company (the "master fund") with substantially the same investment objective and policies as the feeder fund. Such a structure permits the pooling of assets of two or more feeder funds, preserving separate identities or distribution channels at the feeder fund level. The Portfolio may have several feeder funds, including affiliated Deutsche feeder funds and unaffiliated feeder funds; with a significant ownership percentage of the Portfolio's net assets. Investment activities of these feeder funds could have a material impact on the Portfolio. As of December 31, 2015, Cash Management Fund, Cash Reserves Fund Institutional, Cash Reserves Fund — Prime Series and Deutsche Money Market Series owned approximately 12%, 11%, 5% and 69%, respectively, of the Portfolio.
The Portfolio's financial statements are prepared in accordance with accounting principles generally accepted in the United States of America which require the use of management estimates. Actual results could differ from those estimates. The policies described below are followed consistently by the Portfolio in the preparation of its financial statements.
Security Valuation. Various inputs are used in determining the value of the Portfolio's investments. These inputs are summarized in three broad levels. Level 1 includes quoted prices in active markets for identical securities. Level 2 includes other significant observable inputs (including quoted prices for similar securities, interest rates, prepayment speeds and credit risk). Level 3 includes significant unobservable inputs (including the Portfolio's own assumptions in determining the fair value of investments). The level assigned to the securities valuations may not be an indication of the risk or liquidity associated with investing in those securities. Securities held by the Portfolio are reflected as Level 2 because the securities are valued at amortized cost (which approximates fair value) and, accordingly, the inputs used to determine value are not quoted prices in an active market.
The Portfolio values all securities utilizing the amortized cost method permitted in accordance with Rule 2a-7 under the 1940 Act and certain conditions therein. Under this method, which does not take into account unrealized capital gains or losses on securities, an instrument is initially valued at its cost and thereafter assumes a constant accretion/amortization rate to maturity of any discount or premium. Securities held by the Portfolio are reflected as Level 2 because the securities are valued at amortized cost (which approximates fair value) and, accordingly, the inputs used to determine value are not quoted prices in an active market.
Repurchase Agreements. The Portfolio may enter into repurchase agreements, under the terms of a Master Repurchase Agreement, with certain banks and broker/dealers whereby the Portfolio, through its custodian or a sub-custodian bank, receives delivery of the underlying securities, the amount of which at the time of purchase and each subsequent business day is required to be maintained at such a level that the value is equal to at least the principal amount of the repurchase price plus accrued interest. The custodian bank or another designated subcustodian holds the collateral in a separate account until the agreement matures. If the value of the securities falls below the principal amount of the repurchase agreement plus accrued interest, the financial institution deposits additional collateral by the following business day. If the financial institution either fails to deposit the required additional collateral or fails to repurchase the securities as agreed, the Portfolio has the right to sell the securities and recover any resulting loss from the financial institution. If the financial institution enters into bankruptcy, the Portfolio's claims on the collateral may be subject to legal proceedings.
As of December 31, 2015, the Portfolio held repurchase agreements with a gross value of $4,386,250,000. The value of the related collateral exceeded the value of the repurchase agreements at period end. The detail of the related collateral is included in the footnotes following the Portfolio's Investment Portfolio.
Federal Income Taxes. The Portfolio is considered a Partnership under the Internal Revenue Code, as amended. Therefore, no federal income tax provision is necessary.
It is intended that the Portfolio's assets, income and distributions will be managed in such a way that an investor in the Portfolio will be able to satisfy the requirements of Subchapter M of the Code, assuming that the investor invested all of its assets in the Portfolio.
The Portfolio has reviewed the tax positions for the open tax years as of December 31, 2015 and has determined that no provision for income tax and/or uncertain tax provisions is required in the Portfolio's financial statements. The Portfolio's federal tax returns for the prior three fiscal years remain open subject to examination by the Internal Revenue Service.
Contingencies. In the normal course of business, the Portfolio may enter into contracts with service providers that contain general indemnification clauses. The Portfolio's maximum exposure under these arrangements is unknown as this would involve future claims that may be made against the Portfolio that have not yet been made. However, based on experience, the Portfolio expects the risk of loss to be remote.
Other. Investment transactions are accounted for on trade date. Interest income is recorded on the accrual basis. Realized gains and losses from investment transactions are recorded on an identified cost basis. All discounts and premiums are accreted/amortized for both tax and financial reporting purposes.
The Portfolio makes an allocation of its net investment income and realized gains and losses from securities transactions to its investors in proportion to their investment in the Portfolio.
B. Fees and Transactions with Affiliates
Management Agreement. Under the Investment Management Agreement with Deutsche Investment Management Americas Inc. ("DIMA" or the "Advisor"), an indirect, wholly owned subsidiary of Deutsche Bank AG, the Advisor determines the securities, instruments and other contracts relating to investments to be purchased, sold or entered into by the Portfolio.
Under the Investment Management Agreement, the Portfolio pays the Advisor a monthly management fee based on its average daily net assets, computed and accrued daily and payable monthly, at the following annual rates:
| First $3.0 billion of the Portfolio's average daily net assets | .1500% |
| Next $4.5 billion of such net assets | .1325% |
| Over $7.5 billion of such net assets | .1200% |
For the period from January 1, 2015 through December 31, 2015, the Advisor has voluntarily agreed to waive its fees and/or reimburse certain operating expenses to the extent necessary to maintain the total annual operating expenses (excluding certain expenses such as extraordinary expenses, taxes, brokerage and interest) at 0.14% of the Portfolio's average daily net assets. This voluntary waiver or reimbursement may be terminated at any time at the option of the Advisor.
For the year ended December 31, 2015, the Advisor waived a portion of its management fee aggregating $4,944,455, and the amount charged aggregated $20,093,052, which was equivalent to an annual effective rate of 0.10%.
Administration Fee. Pursuant to an Administrative Services Agreement, DIMA provides most administrative services to the Portfolio. For all services provided under the Administrative Services Agreement, the Portfolio pays the Advisor an annual fee ("Administration Fee") of 0.03% of the Portfolio's average daily net assets, computed and accrued daily and payable monthly. For the year ended December 31, 2015, the Administration Fee was $5,893,752, of which $511,827 is unpaid.
Filing Service Fees. Under an agreement with DIMA, DIMA is compensated for providing certain regulatory filing services to the Portfolio. For the year ended December 31, 2015, the amount charged to the Portfolio by DIMA included in the Statement of Operations under "Reports to shareholders" aggregated $516, all of which is unpaid.
Trustees' Fees and Expenses. The Portfolio paid retainer fees to each Trustee not affiliated with the Advisor, plus specified amounts to the Board Chairperson and Vice Chairperson and to each committee Chairperson.
Transactions with Affiliates. The Fund may purchase securities from, or sell securities to, an affiliated fund provided the affiliation is solely due to having a common investment adviser, common officers, or common trustees. During the year ended December 31, 2015, the Fund engaged in securities purchases of $308,260,000 and securities sales of $286,435,000 with an affiliated fund in compliance with Rule 17a-7 under the 1940 Act.
C. Line of Credit
The Portfolio and other affiliated funds (the "Participants") share in a $400 million revolving credit facility provided by a syndication of banks. The Portfolio may borrow for temporary or emergency purposes, including the meeting of redemption requests that otherwise might require the untimely disposition of securities. The Participants are charged an annual commitment fee which is allocated based on net assets, among each of the Participants. Interest is calculated at a rate per annum equal to the sum of the Federal Funds Rate plus 1.25 percent plus if the one-month LIBOR exceeds the Federal Funds Rate, the amount of such excess. The Portfolio may borrow up to a maximum of 33 percent of its net assets under the agreement. The Portfolio had no outstanding loans at December 31, 2015.
D. Additional Information
Effective on or about May 2, 2016, the Portfolio will operate as a government money market fund under the amendments to Rule 2a-7 under the Investment Company Act of 1940, as amended, that were adopted in July 2014 with final compliance dates ranging between July 2015 and October 2016. As currently structured, on the final compliance date for the Rule 2a-7 amendments, the Portfolio would be required to implement a floating net asset value and would be allowed, and in certain situations, required, to implement liquidity fees and/or redemption gates. As a government money market fund, the Portfolio will continue to utilize amortized cost to value its securities and the Portfolio will not be required to implement liquidity fees and/or redemption gates. As a government money market fund, the Portfolio will invest at least 99.5% of the Portfolio’s total assets in cash, US government securities, and/or repurchase agreements that are collateralized by these same securities.
In order for the Portfolio to operate as a government money market fund, shareholders approved revisions to the Portfolio’s fundamental investment policy relating to concentration (the "Concentration Policy") such that the Portfolio would no longer be required to invest more than 25% of its total assets in obligations of banks and other financial institutions. If not revised, the current Concentration Policy would have precluded the Portfolio from operating as a government money market fund.
In addition to the revised Concentration Policy, the following changes to the Portfolio for it to operate as a government money market fund will also take effect on May 2, 2016:
(i) A revised investment objective, as follows:
"The fund seeks maximum current income to the extent consistent with stability of principal."
(ii) The adoption of a principal investment strategy to invest at least 99.5% of the Portfolio’s total assets in cash, government securities, and/or repurchase agreements that are collateralized by these same securities.
(iii) Name changes as follows:
| Current Name | New Name |
| Cash Management Portfolio | Government Cash Management Portfolio |
(iv) The adoption of a principal investment strategy to invest at least 80% of net assets, plus the amount of any borrowings for investment purposes, in government securities and/or repurchase agreements that are collateralize by government securities; and
(v) A reduction in the management fee rate paid by the Portfolio to DIMA, the investment advisor to the Portfolio. Pursuant to the master-feeder structure noted above, DIMA receives a management fee from the Portfolio. The revised management fee rate schedule is set forth below:
| Current Management Fee Rate Schedule | | Revised Management Fee Rate Schedule |
| Average Daily Assets | Management Fee Rate | | Average Daily Assets | Management Fee Rate |
| First $3 Billion | .1500% | | First $3 Billion | .1200% |
| Next $4.5 Billion | .1325% | | Next $4.5 Billion | .1025% |
| Over $7.5 Billion | .1200% | | Over $7.5 Billion | .0900% |
To ensure an orderly transition to a government money market fund, DIMA anticipates that it will begin to gradually implement changes to the Portfolio beginning in the first quarter of 2016. As a result, it is expected that the Portfolio gradually will allocate a larger percentage of its assets to government securities over time until it reaches its new allocation on or about May 2, 2016. Because the yields on government securities generally may be expected to be lower than the yields on comparable non-government securities, it should be expected that the Portfolio’s yield may decrease as more assets are invested in government securities.
Report of Independent Registered Public Accounting Firm
To the Board of Trustees and Holders of Beneficial Interest of Cash Management Portfolio:
In our opinion, the accompanying statement of assets and liabilities, including the portfolio of investments, and the related statements of operations and of changes in net assets and the financial highlights presents fairly, in all material respects, the financial position of Cash Management Portfolio (the "Portfolio") at December 31, 2015, and the results of its operations, the changes in its net assets and the financial highlights for each of the periods indicated therein, in conformity with accounting principles generally accepted in the United States of America. These financial statements and financial highlights (hereafter referred to as "financial statements") are the responsibility of the Portfolio's management. Our responsibility is to express an opinion on these financial statements based on our audits. We conducted our audits of these financial statements in accordance with the standards of the Public Company Accounting Oversight Board (United States). Those standards require that we plan and perform the audits to obtain reasonable assurance about whether the financial statements are free of material misstatement. An audit includes examining, on a test basis, evidence supporting the amounts and disclosures in the financial statements, assessing the accounting principles used and significant estimates made by management, and evaluating the overall financial statement presentation. We believe that our audits, which included confirmation of securities at December 31, 2015 by correspondence with the custodian, brokers and transfer agent, and the application of alternative auditing procedures where such confirmations had not been received, provide a reasonable basis for our opinion.
Boston, Massachusetts
February 23, 2016 | PricewaterhouseCoopers LLP |
Other Information
Proxy Voting
The fund's policies and procedures for voting proxies for portfolio securities and information about how the fund's voted proxies related to its portfolio securities during the 12-month period ended June 30 are available on our Web site — deutschefunds.com (click on "proxy voting"at the bottom of the page) — or on the SEC's Web site — sec.gov. To obtain a written copy of each fund's policies and procedures without charge, upon request, call us toll free at (800) 728-3337.
Portfolio Holdings
Following the Fund's fiscal first and third quarter-end, a complete portfolio holdings listing is filed with the SEC on Form N-Q. In addition, each month, information about the Fund and its portfolio holdings is filed with the SEC on Form N-MFP. The SEC delays the public availability of the information filed on Form N-MFP for 60 days after the end of the reporting period included in the filing. These forms will be available on the SEC's Web site at sec.gov, and they may also be reviewed and copied at the SEC's Public Reference Room in Washington, D.C. Information on the operation of the SEC's Public Reference Room may be obtained by calling (800) SEC-0330. The Fund's portfolio holdings are also posted on deutschefunds.com from time to time. Please see the Fund's current prospectus for more information.
Shareholder Meeting Results (Unaudited)
A special Meeting of Shareholders (the "Meeting") of Cash Reserve Fund Prime Series (the "Fund") was called to order on December 21, 2015 at the offices of Deutsche Investment Management Americas Inc., 345 Park Avenue, New York, New York 10154. The Meeting was adjourned until, and reconvened on, January 28, 2016 to permit the solicitation of additional votes. At the Meeting, the following matter was voted upon by the shareholders of the Fund (the resulting votes are presented below).
1. Approval of a Revised Fundamental Investment Policy Relating to Concentration.
| Number of Votes: |
| For | Against | Abstain | Broker Non-Votes* |
| 342,075,898 | 8,715,211 | 72,969,439 | 0 |
* Broker non-votes are proxies received by the funds from brokers or nominees when the broker or nominee neither has received instructions from the beneficial owner or other persons entitled to vote nor has discretionary power to vote in a particular matter.
Cash Management Fund, Cash Reserves Fund Institutional, Deutsche Money Market Series, Money Market ProFund and Prime Series are each a "feeder fund" that pursues its investment objecting by investing substantially of its assets in a "master portfolio," the Cash Management Portfolio (the "Portfolio"). The Portfolio also held a meeting of its shareholders on December 21, 2015, which was adjourned until, and reconvened on, January 28, 2016. At the meeting of the Portfolio, each feeder fund also approved the revised fundamental investment policy relating to concentration on behalf of the Portfolio.
Advisory Agreement Board Considerations and Fee Evaluation
Cash Reserve Fund – Prime Series (the "Fund"), a series of Cash Reserve Fund, Inc., invests substantially all of its assets in Cash Management Portfolio (the "Portfolio") in order to achieve its investment objective. The Portfolio’s Board of Trustees approved the renewal of the Portfolio’s investment management agreement (the "Portfolio Agreement") with Deutsche Investment Management Americas Inc. ("DIMA") and the Fund’s Board of Directors (which consists of the same members as the Board of Trustees of the Portfolio) approved the renewal of the Fund’s investment management agreement with DIMA (the "Fund Agreement," and together with the Portfolio Agreement, the "Agreements") in September 2015. The Portfolio’s Board of Trustees and the Fund’s Board of Directors are collectively referred to as the "Board."
In terms of the process that the Board followed prior to approving the Agreements, shareholders should know that:
— In September 2015, all of the Portfolio’s Trustees and the Fund’s Directors were independent of DIMA and its affiliates.
— The Board met frequently during the past year to discuss fund matters and dedicated a substantial amount of time to contract review matters. Over the course of several months, the Board’s Contract Committee reviewed comprehensive materials received from DIMA, independent third parties and independent counsel. These materials included an analysis of performance, fees and expenses, and profitability from a fee consultant retained by the Portfolio’s and the Fund’s Independent Trustees/Directors (the "Fee Consultant"). The Board also received extensive information throughout the year regarding performance of the Portfolio and the Fund.
— The Independent Trustees/Directors regularly meet privately with counsel to discuss contract review and other matters. In addition, the Independent Trustees/Directors were advised by the Fee Consultant in the course of their review of the Portfolio’s and the Fund’s contractual arrangements and considered a comprehensive report prepared by the Fee Consultant in connection with their deliberations.
— In connection with reviewing the Agreements, the Board also reviewed the terms of the Fund’s Rule 12b-1 plan, distribution agreement, administrative services agreement, transfer agency agreement and other material service agreements.
— Based on its evaluation of the information provided, the Contract Committee presented its findings and recommendations to the Board. The Board then reviewed the Contract Committee’s findings and recommendations.
In connection with the contract review process, the Contract Committee and the Board considered the factors discussed below, among others. The Board also considered that DIMA and its predecessors have managed the Portfolio and the Fund since their inception, and the Board believes that a long-term relationship with a capable, conscientious advisor is in the best interests of the Portfolio and the Fund. The Board considered, generally, that shareholders chose to invest or remain invested in the Fund knowing that DIMA managed the Portfolio and the Fund, and that the Fund Agreement was approved by the Fund’s shareholders. DIMA is part of Deutsche Bank AG’s ("Deutsche Bank") Asset and Wealth Management ("Deutsche AWM") division. Deutsche AWM is a global asset management business that offers a wide range of investing expertise and resources, including research capabilities in many countries throughout the world. Deutsche Bank has advised the Independent Trustees that the U.S. asset management business continues to be a critical and integral part of Deutsche Bank, and that Deutsche Bank will continue to make significant investments in Deutsche AWM, including ongoing enhancements to Deutsche AWM’s investment platform. Deutsche Bank also has confirmed its commitment to maintaining strong legal and compliance groups within the Deutsche AWM division.
As part of the contract review process, the Board carefully considered the fees and expenses of each Deutsche fund overseen by the Board in light of the fund’s performance. In many cases, this led to the negotiation and implementation of expense caps. As part of these negotiations, the Board indicated that it would consider relaxing these caps in future years following sustained improvements in performance, among other considerations.
While shareholders may focus primarily on fund performance and fees, the Board considers these and many other factors, including the quality and integrity of DIMA’s personnel and such other issues as back-office operations, fund valuations, and compliance policies and procedures.
Nature, Quality and Extent of Services. The Board considered the terms of the Agreements, including the scope of advisory services provided under the Agreements. The Board noted that, under the Agreements, DIMA provides portfolio management services to the Portfolio and the Fund and that, pursuant to separate administrative services agreements, DIMA provides administrative services to the Portfolio and the Fund. The Board considered the experience and skills of senior management and investment personnel, the resources made available to such personnel, the ability of DIMA to attract and retain high-quality personnel, and the organizational depth and stability of DIMA. The Board reviewed the Portfolio’s and the Fund’s performance over short-term and long-term periods and compared those returns to various agreed-upon performance measures, including a peer universe compiled using information supplied by iMoneyNet, an independent fund data service. The Board also noted that it has put into place a process of identifying "Focus Funds" (e.g., funds performing poorly relative to a peer universe), and receives additional reporting from DIMA regarding such funds and, where appropriate, DIMA’s plans to address underperformance. The Board believes this process is an effective manner of identifying and addressing underperforming funds. Based on the information provided, the Board noted that for the one- and three-year periods ended December 31, 2014, the Fund’s gross performance (Cash Reserve Prime Institutional Shares) was in the 3rd quartile of the applicable iMoneyNet universe (the 1st quartile being the best performers and the 4th quartile being the worst performers).
Fees and Expenses. The Board considered the Portfolio’s and the Fund’s investment management fee schedules and the Fund’s operating expenses and total expense ratios, and comparative information provided by Lipper Inc. ("Lipper") and the Fee Consultant regarding investment management fee rates paid to other investment advisors by similar funds (1st quartile being the most favorable and 4th quartile being the least favorable). With respect to management fees paid to other investment advisors by similar funds, the Board noted that the contractual fee rates paid by the Portfolio and the Fund, which include 0.03% and 0.10% fees paid to DIMA under the respective administrative services agreements, were higher than the median (3rd quartile) of the applicable Lipper peer group (based on Lipper data provided as of December 31, 2014). The Board considered that the Portfolio’s management fee would be reduced by 0.03% at all breakpoint levels if shareholders approve a proposal that would result in the Portfolio and the Fund being restructured into government money market funds. The Board noted that, although shareholders of the Fund indirectly bear the Portfolio’s management fee, the Fund does not charge an additional investment management fee. Based on Lipper data provided as of December 31, 2014, the Board noted that the Fund’s total (net) operating expenses, which include Portfolio expenses allocated to the Fund, were approximately the same as the median of the applicable Lipper expense universe for the Cash Reserve Prime Institutional Shares (3rd quartile) and Cash Reserve Prime Shares (3rd quartile). The Board noted the significant voluntary fee waivers implemented by DIMA to ensure the Fund maintained a positive yield. The Board considered the management fee rate as compared to fees charged by DIMA to comparable Deutsche U.S. registered funds ("Deutsche Funds") and considered differences between the Portfolio and the Fund and the comparable Deutsche Funds. The information requested by the Board as part of its review of fees and expenses also included information about institutional accounts (including any sub-advised funds and accounts) and funds offered primarily to European investors ("Deutsche Europe funds") managed by Deutsche AWM. The Board noted that DIMA indicated that Deutsche AWM does not manage any institutional accounts or Deutsche Europe funds comparable to the Portfolio or the Fund.
On the basis of the information provided, the Board concluded that management fees were reasonable and appropriate in light of the nature, quality and extent of services provided by DIMA.
Profitability. The Board reviewed detailed information regarding revenues received by DIMA under the Agreements. The Board considered the estimated costs and pre-tax profits realized by DIMA from advising the Deutsche Funds, as well as estimates of the pre-tax profits attributable to managing the Fund in particular. The Board also received information regarding the estimated enterprise-wide profitability of DIMA and its affiliates with respect to all fund services in totality and by fund. The Board and the Fee Consultant reviewed DIMA’s methodology in allocating its costs to the management of the Fund. Based on the information provided, the Board concluded that the pre-tax profits realized by DIMA in connection with the management of the Fund were not unreasonable. The Board also reviewed certain publicly available information regarding the profitability of certain similar investment management firms. The Board noted that while information regarding the profitability of such firms is limited (and in some cases is not necessarily prepared on a comparable basis), DIMA and its affiliates’ overall profitability with respect to the Deutsche Funds (after taking into account distribution and other services provided to the funds by DIMA and its affiliates) was lower than the overall profitability levels of most comparable firms for which such data was available.
Economies of Scale. The Board considered whether there are economies of scale with respect to the management of the Portfolio and the Fund and whether the Portfolio and the Fund benefit from any economies of scale. The Board noted that the Portfolio’s and the Fund’s investment management fee schedule includes fee breakpoints. The Board concluded that the Portfolio’s and the Fund’s fee schedule represents an appropriate sharing between the Portfolio and the Fund and DIMA of such economies of scale as may exist in the management of the Portfolio and the Fund at current asset levels.
Other Benefits to DIMA and Its Affiliates. The Board also considered the character and amount of other incidental benefits received by DIMA and its affiliates, including any fees received by DIMA for administrative services provided to the Portfolio and the Fund and any fees received by an affiliate of DIMA for distribution services. The Board also considered benefits to DIMA related to brokerage and soft-dollar allocations, including allocating brokerage to pay for research generated by parties other than the executing broker dealers, which pertain primarily to funds investing in equity securities, along with the incidental public relations benefits to DIMA related to Deutsche Funds advertising and cross-selling opportunities among DIMA products and services. The Board considered these benefits in reaching its conclusion that the Fund’s management fees were reasonable.
Compliance. The Board considered the significant attention and resources dedicated by DIMA to documenting and enhancing its compliance processes in recent years. The Board noted in particular (i) the experience and seniority of the individual serving as DIMA’s and the Fund’s chief compliance officer; (ii) the large number of DIMA compliance personnel; and (iii) the substantial commitment of resources by DIMA and its affiliates to compliance matters.
Based on all of the information considered and the conclusions reached, the Board unanimously determined that the continuation of the Agreements is in the best interests of the Portfolio and the Fund. In making this determination, the Board did not give particular weight to any single factor identified above. The Board considered these factors over the course of numerous meetings, certain of which were in executive session with only the Independent Trustees/Directors and counsel present. It is possible that individual Trustees/Directors may have weighed these factors differently in reaching their individual decisions to approve the continuation of the Agreements.
Board Members and Officers
The following table presents certain information regarding the Board Members and Officers of the fund. Each Board Member's year of birth is set forth in parentheses after his or her name. Unless otherwise noted, (i) each Board Member has engaged in the principal occupation(s) noted in the table for at least the most recent five years, although not necessarily in the same capacity; and (ii) the address of each Independent Board Member is c/o Kenneth C. Froewiss, Chairman, Deutsche Mutual Funds, P.O. Box 390601, Cambridge, MA 02139. Except as otherwise noted below, the term of office for each Board Member is until the election and qualification of a successor, or until such Board Member sooner dies, resigns, is removed or as otherwise provided in the governing documents of the fund. Because the fund does not hold an annual meeting of shareholders, each Board Member will hold office for an indeterminate period. The Board Members may also serve in similar capacities with other funds in the fund complex.
| Independent Board Members |
| Name, Year of Birth, Position with the Fund and Length of Time Served1 | Business Experience and Directorships During the Past Five Years | Number of Funds in Deutsche Fund Complex Overseen | Other Directorships Held by Board Member |
Kenneth C. Froewiss (1945) Chairperson since 2013, and Board Member since 2001 | Retired Clinical Professor of Finance, NYU Stern School of Business (1997–2014); Member, Finance Committee, Association for Asian Studies (2002–present); Director, Mitsui Sumitomo Insurance Group (US) (2004–present); prior thereto, Managing Director, J.P. Morgan (investment banking firm) (until 1996) | 106 | — |
William McClayton (1944) Vice Chairperson since 2013, and Board Member since 2004 | Private equity investor (since October 2009); previously, Managing Director, Diamond Management & Technology Consultants, Inc. (global consulting firm) (2001–2009); Directorship: Board of Managers, YMCA of Metropolitan Chicago; formerly: Senior Partner, Arthur Andersen LLP (accounting) (1966–2001); Trustee, Ravinia Festival | 106 | — |
John W. Ballantine (1946) Board Member since 1999 | Retired; formerly, Executive Vice President and Chief Risk Management Officer, First Chicago NBD Corporation/The First National Bank of Chicago (1996–1998); Executive Vice President and Head of International Banking (1995–1996); former Directorships: Director and former Chairman of the Board, Healthways, Inc.2 (provider of disease and care management services) (2003–2014); Stockwell Capital Investments PLC (private equity); First Oak Brook Bancshares, Inc. and Oak Brook Bank; Prisma Energy International | 106 | Portland General Electric2 (utility company) (2003– present) |
Henry P. Becton, Jr. (1943) Board Member since 1990 | Vice Chair and former President, WGBH Educational Foundation. Directorships: Public Radio International; Public Radio Exchange (PRX); former Directorships: Belo Corporation2 (media company); The PBS Foundation; Association of Public Television Stations; Boston Museum of Science; American Public Television; Concord Academy; New England Aquarium; Mass. Corporation for Educational Telecommunications; Committee for Economic Development; Public Broadcasting Service; Connecticut College; North Bennett Street School (Boston) | 106 | Director, Becton Dickinson and Company2 (medical technology company) |
Dawn-Marie Driscoll (1946) Board Member since 1987 | Emeritus Executive Fellow, Center for Business Ethics, Bentley University; formerly: President, Driscoll Associates (consulting firm); Partner, Palmer & Dodge (law firm) (1988–1990); Vice President of Corporate Affairs and General Counsel, Filene's (retail) (1978–1988). Directorships: Director of ICI Mutual Insurance Company (since 2007); Advisory Board, Center for Business Ethics, Bentley University; Trustee and former Chairman of the Board, Southwest Florida Community Foundation (charitable organization); former Directorships: Sun Capital Advisers Trust (mutual funds) (2007–2012), Investment Company Institute (audit, executive, nominating committees) and Independent Directors Council (governance, executive committees) | 106 | — |
Keith R. Fox, CFA (1954) Board Member since 1996 | Managing General Partner, Exeter Capital Partners (a series of private investment funds) (since 1986). Directorships: Progressive International Corporation (kitchen goods importer and distributor); The Kennel Shop (retailer); former Chairman, National Association of Small Business Investment Companies; former Directorships: BoxTop Media Inc. (advertising); Sun Capital Advisers Trust (mutual funds) (2011–2012) | 106 | — |
Paul K. Freeman (1950) Board Member since 1993 | Consultant, World Bank/Inter-American Development Bank; Chair, Independent Directors Council; Investment Company Institute (executive and nominating committees); formerly, Chairman of Education Committee of Independent Directors Council; Project Leader, International Institute for Applied Systems Analysis (1998–2001); Chief Executive Officer, The Eric Group, Inc. (environmental insurance) (1986–1998); Directorships: Denver Zoo Foundation (December 2012–present); former Directorships: Prisma Energy International | 106 | — |
Richard J. Herring (1946) Board Member since 1990 | Jacob Safra Professor of International Banking and Professor, Finance Department, The Wharton School, University of Pennsylvania (since July 1972); Co-Director, Wharton Financial Institutions Center; Co-Chair, U.S. Shadow Financial Regulatory Committee; Executive Director, Financial Economists Roundtable; formerly: Vice Dean and Director, Wharton Undergraduate Division (July 1995–June 2000); Director, Lauder Institute of International Management Studies (July 2000–June 2006) | 106 | Director, Aberdeen Singapore and Japan Funds (since 2007); Independent Director of Barclays Bank Delaware (since September 2010) |
Rebecca W. Rimel (1951) Board Member since 1995 | President and Chief Executive Officer, The Pew Charitable Trusts (charitable organization) (1994 to present); formerly: Executive Vice President, The Glenmede Trust Company (investment trust and wealth management) (1983–2004); Board Member, Investor Education (charitable organization) (2004–2005); Trustee, Executive Committee, Philadelphia Chamber of Commerce (2001–2007); Director, Viasys Health Care2 (January 2007–June 2007); Trustee, Thomas Jefferson Foundation (charitable organization) (1994–2012) | 106 | Director, Becton Dickinson and Company2 (medical technology company) (2012– present); Director, BioTelemetry Inc.2 (health care) (2009– present) |
William N. Searcy, Jr. (1946) Board Member since 1993 | Private investor since October 2003; formerly: Pension & Savings Trust Officer, Sprint Corporation2 (telecommunications) (November 1989–September 2003); Trustee, Sun Capital Advisers Trust (mutual funds) (1998–2012) | 106 | — |
Jean Gleason Stromberg (1943) Board Member since 1997 | Retired. Formerly, Consultant (1997–2001); Director, Financial Markets U.S. Government Accountability Office (1996–1997); Partner, Norton Rose Fulbright, L.L.P. (law firm) (1978–1996). Directorships: The William and Flora Hewlett Foundation (charitable organization); former Directorships: Service Source, Inc. (nonprofit), Mutual Fund Directors Forum (2002–2004), American Bar Retirement Association (funding vehicle for retirement plans) (1987–1990 and 1994–1996) | 106 | — |
| Officers4 |
| Name, Year of Birth, Position with the Fund and Length of Time Served5 | Business Experience and Directorships During the Past Five Years |
Brian E. Binder8 (1972) President and Chief Executive Officer, 2013–present | Managing Director3 and Head of Fund Administration, Deutsche Asset Management (2013–present); formerly: Head of Business Management and Consulting at Invesco, Ltd. (2010–2012) |
John Millette7 (1962) Vice President and Secretary, 1999–present | Director,3 Deutsche Asset Management; Chief Legal Officer and Secretary, Deutsche Investment Management Americas Inc. (since 2015); and Director and Vice President, DeAWM Trust Company (since 2016) |
Melinda Morrow6 (1970) Vice President, 2012–present | Director,3 Deutsche Asset Management |
Paul H. Schubert6 (1963) Chief Financial Officer, 2004–present Treasurer, 2005–present | Managing Director,3 Deutsche Asset Management; and Chairman, Director and President, DeAWM Trust Company (since 2013); formerly, Director, DeAWM Trust Company (2004–2013) |
Caroline Pearson7 (1962) Chief Legal Officer, 2010–present | Managing Director,3 Deutsche Asset Management; Secretary, DeAWM Distributors, Inc.; and Secretary, DeAWM Service Company |
Robert Kloby6 (1962) Chief Compliance Officer, 2006–present | Managing Director,3 Deutsche Asset Management |
Wayne Salit6 (1967) Anti-Money Laundering Compliance Officer, 2014–present | Director,3 Deutsche Asset Management; formerly: Managing Director, AML Compliance Officer at BNY Mellon (2011–2014); and Director, AML Compliance Officer at Deutsche Bank (2004–2011) |
Hepsen Uzcan6 (1974) Assistant Secretary, 2013–present | Director,3 Deutsche Asset Management |
Paul Antosca7 (1957) Assistant Treasurer, 2007–present | Director,3 Deutsche Asset Management |
Jack Clark7 (1967) Assistant Treasurer, 2007–present | Director,3 Deutsche Asset Management |
Diane Kenneally7 (1966) Assistant Treasurer, 2007–present | Director,3 Deutsche Asset Management |
1 The length of time served represents the year in which the Board Member joined the board of one or more Deutsche funds currently overseen by the Board.
2 A publicly held company with securities registered pursuant to Section 12 of the Securities Exchange Act of 1934.
3 Executive title, not a board directorship.
4 As a result of their respective positions held with the Advisor, these individuals are considered "interested persons" of the Advisor within the meaning of the 1940 Act. Interested persons receive no compensation from the fund.
5 The length of time served represents the year in which the officer was first elected in such capacity for one or more Deutsche funds.
6 Address: 60 Wall Street, New York, NY 10005.
7 Address: One Beacon Street, Boston, MA 02108.
8 Address: 222 South Riverside Plaza, Chicago, IL 60606.
The fund's Statement of Additional Information ("SAI") includes additional information about the Board Members. The SAI is available, without charge, upon request. If you would like to request a copy of the SAI, you may do so by calling the following toll-free number: (800) 728-3337.


December 31, 2015
Annual Report
to Shareholders
Deutsche Money Market Series

Contents
Deutsche Money Market Series 3 Portfolio Management Review 7 Statement of Assets and Liabilities 8 Statement of Operations 9 Statement of Changes in Net Assets 10 Financial Highlights 11 Notes to Financial Statements 18 Report of Independent Registered Public Accounting Firm 19 Information About Your Fund's Expenses 20 Tax Information Cash Management Portfolio 22 Investment Portfolio 35 Statement of Assets and Liabilities 36 Statement of Operations 37 Statement of Changes in Net Assets 38 Financial Highlights 39 Notes to Financial Statements 45 Report of Independent Registered Public Accounting Firm 46 Shareholder Meeting Results 47 Advisory Agreement Board Considerations and Fee Evaluation 52 Board Members and Officers 57 Account Management Resources |
This report must be preceded or accompanied by a prospectus. To obtain a summary prospectus, if available, or prospectus for any of our funds, refer to the Account Management Resources information provided in the back of this booklet. We advise you to consider the fund's objectives, risks, charges and expenses carefully before investing. The summary prospectus and prospectus contain this and other important information about the fund. Please read the prospectus carefully before you invest.
An investment in this fund is not insured or guaranteed by the Federal Deposit Insurance Corporation (FDIC) or by any other government agency. Although the fund seeks to preserve the value of your investment at $1.00 per share, it is possible to lose money by investing in the fund. The share price of money market funds can fall below the $1.00 share price. You should not rely on or expect the Advisor to enter into support agreements or take other actions to maintain the fund's $1.00 share price. The credit quality of the fund's holdings can change rapidly in certain markets, and the default of a single holding could have an adverse impact on the fund's share price. The fund's share price can also be negatively affected during periods of high redemption pressures and/or illiquid markets. The actions of a few large investors of the fund may have a significant adverse effect on the share price of the fund. See the prospectus for specific details regarding the fund's risk profile.
Deutsche Asset Management represents the asset management activities conducted by Deutsche Bank AG or any of its subsidiaries.
NOT FDIC/NCUA INSURED NO BANK GUARANTEE MAY LOSE VALUE NOT A DEPOSIT NOT INSURED BY ANY FEDERAL GOVERNMENT AGENCY
Portfolio Management Review (Unaudited)
Market Overview
All performance information below is historical and does not guarantee future results. Investment return and principal fluctuate, so your shares may be worth more or less when redeemed. Current performance may differ from performance data shown. Please visit deutscheliquidity.com/US for the fund's most recent month-end performance. The 7-day current yield refers to the income paid by the fund over a 7-day period expressed as an annual percentage rate of the fund's shares outstanding. Yields fluctuate and are not guaranteed.
Investment Objective The fund seeks to provide a high level of current income consistent with liquidity and the preservation of capital. The fund is a feeder fund that invests substantially all of its assets in a "master portfolio," the Cash Management Portfolio, which will invest directly in securities and other instruments. The Cash Management Portfolio has the same investment objective as the fund. |
Over the 12 months ended December 31, 2015, rate levels within the money market yield curve — including short-term money market rates — fluctuated based on varying economic reports, investors' interest rate expectations, geopolitical uncertainty and evolving U.S. Federal Reserve Board (the Fed) statements. In March 2015, the Fed removed the word "patient" from its statement regarding the timing of a possible rate hike. Despite temporary conditions such as the harsh winter weather that many said was to blame for disappointing first-quarter 2015 U.S. gross domestic product (GDP) growth, in April the Fed anticipated that U.S. economic conditions would improve. A second-quarter rebound in U.S. GDP growth set the stage for a possible rate hike as early as September of 2015. In late August, the focus shifted to China, as news of that country’s economic slowdown spurred additional market volatility. In September, the Fed declined to raise rates, citing concerns over China’s stumbling economy. However, in October the comments by the Fed turned more hawkish, not mentioning China but expressing the desire to raise rates at the next Federal Open Market Committee (FOMC) meeting. This set the stage for short-term rates to rise as markets "priced in" an eventual raising of the federal funds rate by 25 basis points in mid-December.

Fund Performance (as of December 31, 2015) Performance is historical and does not guarantee future results. Current performance may be lower or higher than the performance data quoted. An investment in this fund is not insured or guaranteed by the FDIC or by any other government agency. Although the fund seeks to preserve the value of your investment at $1.00 per share, it is possible to lose money by investing in the fund. The share price of money market funds can fall below the $1.00 share price. |
| 7-Day Current Yield |
| December 31, 2015 | .15%* |
| December 31, 2014 | .06%* |
* The investment advisor has agreed to waive fees/reimburse expenses. Without such fee waivers/expense reimbursements, the 7-day current yield would have been lower. Yields are historical, will fluctuate and do not guarantee future performance. The 7-day current yield refers to the income paid by the portfolio over a 7-day period expressed as an annual percentage rate of the fund's shares outstanding. Please visit our Web site at deutscheliquidity.com/US for the product's most recent month-end performance. |
Positive Contributors to Fund Performance
We were able to maintain a competitive yield for the fund during the annual period ended December 31, 2015. We continued to seek ample liquidity, high credit quality and strong diversification across sectors and geographic regions by maintaining a neutral portfolio duration (or interest rate sensitivity). We pursued this strategy in light of the outlook for continued near-zero short-term interest rates and limited money market supply. In addition, we looked to keep the fund's cash position relatively low in order to take advantage of higher yields available from six-month-to-one-year money market securities.
Negative Contributors to Fund Performance
The types of securities that we were investing in tended to have lower yields than issues carrying more risk. We preferred to be cautious during a time of market uncertainty. In the end this cost the fund some yield, but we believe that this represented a prudent approach to preserving principal.
Outlook and Positioning
Within money markets, we believe the current balance of tight supply and heavy demand will most likely persist. These technical market conditions, along with issues surrounding money market reform, should in our view create a steeper money market yield curve, keeping yields low at the short end of the curve. Our current forecast is for the federal funds rate to be raised two to three additional times during 2016. In preparation, we are maintaining a cautious approach, with a shorter duration, an emphasis on short fixed maturities and floating-rate notes, and increased selectivity regarding longer maturities. Our goal, as always, is to maintain ample liquidity, high credit quality and strong diversification across geographic regions and market sectors.
We continue our insistence on the highest credit quality within the fund. We also plan to maintain our conservative investment strategies and standards under the current market conditions. We continue to apply a careful approach to investing on behalf of the fund and to seek competitive yield for our shareholders.
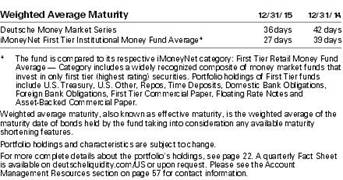
Portfolio Management Team
A group of investment professionals is responsible for the day-to-day management of the fund. These investment professionals have a broad range of experience managing money market funds.
The views expressed reflect those of the portfolio management team only through the end of the period of the report as stated on the cover. The management team's views are subject to change at any time based on market and other conditions and should not be construed as a recommendation. Past performance is no guarantee of future results. Current and future portfolio holdings are subject to risk.
Terms to Know
The yield curve is a graphical representation of how yields on bonds of different maturities compare. Normally, yield curves slant up, as bonds with longer maturities typically offer higher yields than short-term bonds.
GDP, or gross domestic product, is the value of all goods and services produced by a country's economy.
Floating-rate securities are debt instruments with floating-rate coupons that generally reset every 30 to 90 days. While floating-rate loans are senior to equity and fixed-income securities, there is no guaranteed return of principal in case of default. Floating-rate loans often have less interest-rate risk than other fixed-income investments. Floating-rate loans are most often secured assets, generally senior to a company's secured debt and can be transferred to debt holders, providing potential downside potential.
Statement of Assets and Liabilities
| as of December 31, 2015 |
| Assets |
| Investment in Cash Management Portfolio, at value | $ 12,428,224,722 |
| Receivable for Fund shares sold | 64,316 |
| Due from Advisor | 159,644 |
| Other assets | 8,284 |
| Total assets | 12,428,456,966 |
| Liabilities |
| Payable for Fund shares redeemed | 374,651 |
| Distributions payable | 824,201 |
| Accrued Trustees' fees | 20 |
| Other accrued expenses and payables | 61,016 |
| Total liabilities | 1,259,888 |
| Net assets, at value | $ 12,427,197,078 |
| Net Assets Consist of |
| Accumulated net realized gain (loss) | (371,167) |
| Paid-in capital | 12,427,568,245 |
| Net assets, at value | $ 12,427,197,078 |
| Net Asset Value |
Institutional Shares Net Asset Value, offering and redemption price per share ($12,427,197,078 ÷ 12,428,274,817 outstanding shares of beneficial interest, $.01 par value, unlimited number of shares authorized) | $ 1.00 |
The accompanying notes are an integral part of the financial statements.
Statement of Operations
| for the year ended December 31, 2015 |
| Investment Income | |
Income and expenses allocated from Cash Management Portfolio: Interest | $ 38,006,439 |
| Expenses* | (21,640,619) |
| Net investment income allocated from Cash Management Portfolio | 16,365,820 |
Expenses: Administration fee | 15,455,868 |
| Services to shareholders | 1,480,915 |
| Professional fees | 49,983 |
| Reports to shareholders | 38,285 |
| Registration fees | 40,886 |
| Trustees' fees and expenses | 9,378 |
| Other | 105,933 |
| Total expenses before expense reductions | 17,181,248 |
| Expense reductions | (17,181,248) |
| Total expenses after expense reductions | — |
| Net investment income (loss) | 16,365,820 |
| Net realized gain (loss) allocated from Cash Management Portfolio | 368,189 |
| Net increase (decrease) in net assets resulting from operations | $ 16,734,009 |
* Net of $3,890,502 Advisor reimbursement allocated from Cash Management Portfolio for the year ended December 31, 2015.
The accompanying notes are an integral part of the financial statements.
Statement of Changes in Net Assets
| Increase (Decrease) in Net Assets | Years Ended December 31, |
| 2015 | 2014 |
Operations: Net investment income | $ 16,365,820 | $ 7,732,824 |
| Net realized gain (loss) | 368,189 | 31,078 |
| Net increase (decrease) in net assets resulting from operations | 16,734,009 | 7,763,902 |
Distributions to shareholders from: Net investment income: Institutional Shares Total distributions | (16,383,174) | (7,732,828) |
Fund share transactions: Proceeds from shares sold | 283,170,126,606 | 147,004,138,094 |
| Reinvestment of distributions | 9,905,267 | 5,280,501 |
| Payments for shares redeemed | (287,511,215,903) | (146,230,119,653) |
| Net increase (decrease) in net assets from Fund share transactions | (4,331,184,030) | 779,298,942 |
| Increase (decrease) in net assets | (4,330,833,195) | 779,330,016 |
| Net assets at beginning of period | 16,758,030,273 | 15,978,700,257 |
| Net assets at end of period (including undistributed net investment income of $0 and $0, respectively) | $ 12,427,197,078 | $ 16,758,030,273 |
| Other Information |
| Shares outstanding at beginning of period | 16,759,458,847 | 15,980,159,905 |
| Shares sold | 283,170,126,606 | 147,004,138,094 |
| Shares issued to shareholders in reinvestment of distributions | 9,905,267 | 5,280,501 |
| Shares redeemed | (287,511,215,903) | (146,230,119,653) |
| Net increase (decrease) in Fund shares | (4,331,184,030) | 779,298,942 |
| Shares outstanding at end of period | 12,428,274,817 | 16,759,458,847 |
The accompanying notes are an integral part of the financial statements.
Financial Highlights
| Institutional Shares |
| | |
Years Ended December 31, |
| 2015 | 2014 | 2013 | 2012 | 2011 |
| Selected Per Share Data |
| Net asset value, beginning of period | $ 1.00 | $ 1.00 | $ 1.00 | $ 1.00 | $ 1.00 |
Income from investment operations: Net investment income | .001 | .000* | .001 | .001 | .001 |
| Net realized gain (loss) | .000* | .000* | .000* | .000* | .000* |
| Total from investment operations | .001 | .000* | .001 | .001 | .001 |
Less distributions from: Net investment income | (.001) | (.000)* | (.001) | (.001) | (.001) |
| Net asset value, end of period | $ 1.00 | $ 1.00 | $ 1.00 | $ 1.00 | $ 1.00 |
| Total Return (%)a | .11 | .05 | .08 | .15 | .10 |
| Ratios to Average Net Assets and Supplemental Data |
| Net assets, end of period ($ millions) | 12,427 | 16,758 | 15,979 | 19,293 | 14,887 |
| Ratio of expenses before expense reductions, including expenses allocated from Cash Management Portfolio (%) | .28 | .27 | .27 | .27 | .27 |
| Ratio of expenses after expense reductions, including expenses allocated from Cash Management Portfolio (%) | .14 | .14 | .14 | .14 | .15 |
| Ratio of net investment income (%) | .11 | .05 | .08 | .14 | .10 |
a Total returns would have been lower had certain expenses not been reduced. * Amount is less than $.0005. |
Notes to Financial Statements
A. Organization and Significant Accounting Policies
Deutsche Money Market Series (the "Fund") is a diversified investment portfolio of DWS Money Market Trust (the "Trust"), which is registered under the Investment Company Act of 1940, as amended (the "1940 Act"), as an open-end management investment company organized as a Massachusetts business trust. The Fund currently offers one class of shares, Institutional Shares, to investors.
The Fund is a feeder fund that seeks to achieve its investment objective by investing substantially all of its investable assets in a master portfolio, the Cash Management Portfolio (the "Portfolio"), an open-end management investment company registered under the 1940 Act and organized as a New York trust advised by Deutsche Investment Management Americas Inc. ("DIMA" or the "Advisor"), an indirect, wholly owned subsidiary of Deutsche Bank AG. A master/feeder fund structure is one in which a fund (a "feeder fund"), instead of investing directly in a portfolio of securities, invests most or all of its investment assets in a separate registered investment company (the "master fund") with substantially the same investment objective and policies as the feeder fund. Such a structure permits the pooling of assets of two or more feeder funds, preserving separate identities or distribution channels at the feeder fund level. At December 31, 2015, the Fund owned approximately 69% of the Portfolio.
The Fund's financial statements are prepared in accordance with accounting principles generally accepted in the United States of America which require the use of management estimates. Actual results could differ from those estimates. The policies described below are followed consistently by the Fund in the preparation of its financial statements. The financial statements of the Portfolio, including the Investment Portfolio, are contained elsewhere in this report and should be read in conjunction with the Fund's financial statements.
Security Valuation. The Fund records its investment in the Portfolio at value, which reflects its proportionate interest in the net assets of the Portfolio. Valuation of the securities held by the Portfolio is discussed in the notes to the Portfolio's financial statements included elsewhere in this report.
Disclosure about the classification of fair value measurements is included in a table following the Portfolio's Investment Portfolio.
Federal Income Taxes. The Fund's policy is to comply with the requirements of the Internal Revenue Code, as amended, which are applicable to regulated investment companies, and to distribute all of its taxable income to its shareholders.
Under the Regulated Investment Company Modernization Act of 2010, net capital losses incurred post-enactment may be carried forward indefinitely, and their character is retained as short-term and/or long-term. Previously, net capital losses were carried forward for eight years and treated as short-term losses. As a transition rule, the Act requires that post-enactment net capital losses be used before pre-enactment net capital losses.
At December 31, 2015, the Fund had a net tax basis capital loss carryforward of approximately $369,000 of pre-enactment losses, which may be applied against any realized net taxable capital gains of each succeeding year until fully utilized or until December 31, 2018, the expiration date, whichever occurs first.
From November 1, 2015 through December 31, 2015, the Fund elects to defer qualified late year losses of approximately $2,500 of net short-term realized capital losses, and treat them as arising in the fiscal year ending December 31, 2016.
The Fund has reviewed the tax positions for the open tax years as of December 31, 2015 and has determined that no provision for income tax and/or uncertain tax provisions is required in the Fund's financial statements. The Fund's federal tax returns for the prior three fiscal periods/years remain open subject to examination by the Internal Revenue Service.
Distribution of Income and Gains. Net investment income of the Fund is declared as a daily dividend and is distributed to shareholders monthly. The Fund may take into account capital gains and losses in its daily dividend declarations. The Fund may also make additional distributions for tax purposes if necessary.
Permanent book and tax differences relating to shareholder distributions will result in reclassifications to paid in capital. Temporary book and tax differences will reverse in a subsequent period. There were no significant book to tax differences for the Fund.
At December 31, 2015, the Fund's components of distributable earnings (accumulated losses) on a tax basis were as follows:
| Capital loss carryforward | $ (369,000) |
In addition, during the year ended December 31, 2015, the tax character of distributions paid to shareholders by the Fund is summarized as follows:
| | Years Ended December 31, |
| | 2015 | 2014 |
| Distributions from ordinary income* | $ 16,383,174 | $7,732,828 |
* For tax purposes, short-term capital gain distributions are considered ordinary income distributions.
Contingencies. In the normal course of business, the Fund may enter into contracts with service providers that contain general indemnification clauses. The Fund's maximum exposure under these arrangements is unknown as this would involve future claims that may be made against the Fund that have not yet been made. However, based on experience, the Fund expects the risk of loss to be remote.
Other. The Fund receives an allocation of the Portfolio's net investment income and net realized gains and losses in proportion to its investment in the Portfolio. Expenses directly attributed to a fund are charged to that fund, while expenses which are attributable to the Trust are allocated among the funds in the Trust on the basis of relative net assets.
B. Fees and Transactions with Affiliates
Management Agreement. Under the Investment Management Agreement with Deutsche Investment Management Americas Inc. ("DIMA" or the "Advisor"), an indirect, wholly owned subsidiary of Deutsche Bank AG, the Advisor serves as the Investment Manager to the Fund. The Advisor receives a management fee from the Portfolio pursuant to the master/feeder structure listed above in Note A.
Pursuant to the Investment Management Agreement, the Fund pays no management fee to the Advisor so long as the Fund is a feeder fund that invests substantially all of its assets in the Portfolio. In the event the Board of Trustees determines it is in the best interest of the Fund to withdraw its investment from the Portfolio, the Advisor may become responsible for directly managing the assets of the Fund under the Investment Management Agreement. In such event, the Fund would pay the Advisor a management fee as follows:
| First $1.5 billion of the Fund's average daily net assets | .1650% |
| Next $1.75 billion of such net assets | .1500% |
| Next $1.75 billion of such net assets | .1350% |
| Over $5 billion of such net assets | .1200% |
Administration Fee. Pursuant to an Administrative Services Agreement, DIMA provides most administrative services to the Fund. For all services provided under the Administrative Services Agreement, the Fund pays the Advisor an annual fee ("Administration Fee") of 0.10% of the Fund's average daily net assets, computed and accrued daily and payable monthly.
For the period from January 1, 2015 through September 30, 2016, DIMA has contractually agreed to waive its fees and/or reimburse certain operating expenses of the Fund, including expenses of the Portfolio allocated to the Fund, to the extent necessary to maintain the total annual operating expenses (excluding certain expenses such as extraordinary expenses, taxes, brokerage and interest) at 0.18% of the Fund's average daily net assets.
In addition, for the period from January 1, 2015 through December 31, 2015, the Advisor has voluntarily agreed to waive its fees and/or reimburse certain operating expenses to the extent necessary to maintain the total annual operating expenses (excluding certain expenses such as extraordinary expenses, taxes, brokerage and interest) at 0.14% of the Fund's average daily net assets. This voluntary waiver or reimbursement may be terminated at any time at the option of the Advisor.
For the year ended December 31, 2015, the Administration Fee was $15,455,868, all of which was waived.
In addition, the Advisor reimbursed $317,506 of other expenses.
Service Provider Fees. DeAWM Service Company ("DSC"), an affiliate of the Advisor, is the transfer agent, dividend-paying agent and shareholder service agent of the Fund. Pursuant to a sub-transfer agency agreement between DSC and DST Systems. Inc. ("DST"), DSC has delegated certain transfer agent, dividend-paying agent and shareholder service agent functions to DST. DSC compensates DST out of the shareholder servicing fee it receives from the Fund. For the year ended December 31, 2015, the amounts charged to the Fund by DSC aggregated $1,406,080, all of which was waived.
For the year ended December 31, 2015, the Advisor reimbursed the Fund $1,794 of sub-recordkeeping expense.
Typesetting and Filing Service Fees. Under an agreement with DIMA, DIMA is compensated for providing typesetting and certain regulatory filing services to the Fund. For the year ended December 31, 2015, the amount charged to the Fund by DIMA included in the Statement of Operations under "Reports to shareholders" aggregated $17,696, of which $7,720 is unpaid.
Trustees' Fees and Expenses. The Fund paid retainer fees to each Trustee not affiliated with the Advisor, plus specified amounts to the Board Chairperson and Vice Chairperson and to each committee Chairperson.
C. Concentration of Ownership
From time to time the Fund may have a concentration of several shareholder accounts holding a significant percentage of shares outstanding. Investment activities of these shareholders could have a material impact on the Fund.
At December 31, 2015, there were two shareholder accounts that held approximately 16% and 14% of the outstanding shares of the Fund, respectively.
D. Additional Information
Effective on or about May 2, 2016, the Fund will operate as a government money market fund under the amendments to Rule 2a-7 under the Investment Company Act of 1940, as amended, that were adopted in July 2014 with final compliance dates ranging between July 2015 and October 2016. As currently structured, on the final compliance date for the Rule 2a-7 amendments, the Fund would be required to implement a floating net asset value and would be allowed, and in certain situations, required, to implement liquidity fees and/or redemption gates. As a government money market fund, the Fund will continue to seek to maintain a stable $1.00 net asset value (although the Fund will seek to maintain a $1.00 net asset value, there is no guarantee that it will be able to do so and if the net asset value falls below $1.00, you would lose money) and the Fund will not be required to implement liquidity fees and/or redemption gates. As a government money market fund, the Fund will invest at least 99.5% of the Fund’s total assets in cash, US government securities, and/or repurchase agreements that are collateralized by these same securities.
In order for the Fund to operate as a government money market fund, shareholders approved revisions to the Fund’s fundamental investment policy relating to concentration (the "Concentration Policy") such that the Fund would no longer be required to invest more than 25% of its total assets in obligations of banks and other financial institutions. If not revised, the current Concentration Policy would have precluded the Fund from operating as a government money market fund. The Fund is a "feeder" fund that pursues its investment objective by investing substantially all of its assets in a "master portfolio," the Cash Management Portfolio (the "Portfolio"), under a master-feeder structure. The Portfolio invests directly in securities and other instruments and the Fund has the same investment objective and policies as the Portfolio. Effective on or about May 2, 2016, the Portfolio will also operate as a government money market fund.
In addition to the revised Concentration Policy, the following changes to the Fund for it to operate as a government money market fund will also take effect on May 2, 2016:
(i) A revised investment objective, as follows:
"The fund seeks maximum current income to the extent consistent with stability of principal."
(ii) The adoption of a principal investment strategy to invest at least 99.5% of the Fund’s total assets in cash, government securities, and/or repurchase agreements that are collateralized by these same securities.
(iii) Name changes, as follows:
| Current Name | | New Name |
| Cash Management Portfolio | | Government Cash Management Portfolio |
| DWS Money Market Trust | | Deutsche Money Market Trust |
| Deutsche Money Market Series | | Deutsche Government Money Market Series |
(iv) A reduction in the management fee rate paid by the Portfolio to DIMA, the investment advisor to the Fund and the Portfolio. Pursuant to the master-feeder structure noted above, DIMA receives a management fee from the Portfolio.
Deutsche Money Market Series has a management fee rate of 0% so long as the Fund invests in the Portfolio under a master-feeder structure. If Deutsche Money Market Series were to no longer invest in the Portfolio, the Fund's management fee rate would be revised as follows:
| Current Management Fee Rate Schedule | | Revised Management Fee Rate Schedule |
| Average Daily Assets | Management Fee Rate | | Average Daily Assets | Management Fee Rate |
| First $1.5 Billion | .1650% | | First $3 Billion | .1200% |
| Next $1.75 Billion | .1500% | | Next $4.5 Billion | .1025% |
| Next $1.75 Billion | .1350% | | Over $7.5 Billion | .0900% |
| Over $5 Billion | .1200% | | | |
To ensure an orderly transition to a government money market fund, DIMA anticipates that it will begin to gradually implement changes to the Portfolio beginning in the first quarter of 2016. As a result, it is expected that the Portfolio gradually will allocate a larger percentage of its assets to government securities over time until it reaches its new allocation on or about May 2, 2016. Because the yields on government securities generally may be expected to be lower than the yields on comparable non-government securities, it should be expected that the Fund's yield may decrease as more assets are invested in government securities.
Report of Independent Registered Public Accounting Firm
To the Board of Trustees of DWS Money Market Trust and Shareholders of Deutsche Money Market Series:
In our opinion, the accompanying statement of assets and liabilities, and the related statements of operations and of changes in net assets and the financial highlights present fairly, in all material respects, the financial position of Deutsche Money Market Series (the "Fund") at December 31, 2015, and the results of its operations, the changes in its net assets and the financial highlights for each of the periods indicated therein, in conformity with accounting principles generally accepted in the United States of America. These financial statements and financial highlights (hereafter referred to as "financial statements") are the responsibility of the Fund's management. Our responsibility is to express an opinion on these financial statements based on our audits. We conducted our audits of these financial statements in accordance with the standards of the Public Company Accounting Oversight Board (United States). Those standards require that we plan and perform the audit to obtain reasonable assurance about whether the financial statements are free of material misstatement. An audit includes examining, on a test basis, evidence supporting the amounts and disclosures in the financial statements, assessing the accounting principles used and significant estimates made by management, and evaluating the overall financial statement presentation. We believe that our audits, which included confirmation of securities at December 31, 2015 by correspondence with the transfer agent, provide a reasonable basis for our opinion.
Boston, Massachusetts
February 23, 2016 | PricewaterhouseCoopers LLP |
Information About Your Fund's Expenses
As an investor of the Fund, you incur two types of costs: ongoing expenses and transaction costs. Ongoing expenses include management fees and other Fund expenses. Examples of transaction costs include account maintenance fees, which are not shown in this section. The following tables are intended to help you understand your ongoing expenses (in dollars) of investing in the Fund and to help you compare these expenses with the ongoing expenses of investing in other mutual funds. In the most recent six-month period, the Fund limited these expenses; had it not done so, expenses would have been higher. The example in the table is based on an investment of $1,000 invested at the beginning of the six-month period and held for the entire period (July 1, 2015 to December 31, 2015).
The tables illustrate your Fund's expenses in two ways:
— Actual Fund Return. This helps you estimate the actual dollar amount of ongoing expenses (but not transaction costs) paid on a $1,000 investment in the Fund using the Fund's actual return during the period. To estimate the expenses you paid over the period, simply divide your account value by $1,000 (for example, an $8,600 account value divided by $1,000 = 8.6), then multiply the result by the number in the "Expenses Paid per $1,000" line under the share class you hold.
— Hypothetical 5% Fund Return. This helps you to compare your Fund's ongoing expenses (but not transaction costs) with those of other mutual funds using the Fund's actual expense ratio and a hypothetical rate of return of 5% per year before expenses. Examples using a 5% hypothetical fund return may be found in the shareholder reports of other mutual funds. The hypothetical account values and expenses may not be used to estimate the actual ending account balance or expenses you paid for the period.
Please note that the expenses shown in these tables are meant to highlight your ongoing expenses only and do not reflect any transaction costs. The "Expenses Paid per $1,000" line of the tables is useful in comparing ongoing expenses only and will not help you determine the relative total expense of owning different funds. If these transaction costs had been included, your costs would have been higher.
Expenses and Value of a $1,000 Investment
for the six months ended December 31, 2015 (Unaudited) |
| Actual Fund Return* | Institutional Shares |
| Beginning Account Value 7/1/15 | $ 1,000.00 |
| Ending Account Value 12/31/15 | $ 1,000.68 |
| Expenses Paid per $1,000** | $ .71 |
| Hypothetical 5% Fund Return* | Institutional Shares |
| Beginning Account Value 7/1/15 | $ 1,000.00 |
| Ending Account Value 12/31/15 | $ 1,024.50 |
| Expenses Paid per $1,000** | $ .71 |
* Expenses include amounts allocated proportionally from the master portfolio.
** Expenses are equal to the Fund's annualized expense ratio multiplied by the average account value over the period, multiplied by 184 (the number of days in the most recent six-month period), then divided by 365.
| Annualized Expense Ratio | Institutional Shares |
| Deutsche Money Market Series | .14% |
For more information, please refer to the Fund's prospectus.
For an analysis of the fees associated with an investment in the Fund or similar funds, please refer to http://apps.finra.org/fundanalyzer/1/fa.aspx.
Tax Information (Unaudited)
A total of 2.60% of the dividends distributed during the fiscal year was derived from interest on U.S. government securities, which is generally exempt from state income tax.
Please consult a tax advisor if you have questions about federal or state income tax laws, or on how to prepare your tax returns. If you have specific questions about your account, please call (800) 728-3337.
(The following financial statements of the Cash Management Portfolio should be read in conjunction with the Fund's financial statements.)
Investment Portfolio as of December 31, 2015
| | Principal Amount ($) | Value ($) |
| | | | |
| Certificates of Deposit and Bank Notes 22.2% |
| Banco del Estado de Chile: |
| | 0.52%, 2/29/2016 | 25,000,000 | 25,000,000 |
| | 0.57%, 4/28/2016 | 110,600,000 | 110,600,000 |
| | 0.652%, 2/29/2016 | 75,000,000 | 75,000,000 |
| Bank of Montreal: |
| | 0.3%, 1/4/2016 | 108,500,000 | 108,500,000 |
| | 0.389%, 1/7/2016 | 95,000,000 | 95,000,000 |
| | 0.56%, 4/18/2016 | 65,000,000 | 65,000,000 |
| Bank of Nova Scotia: |
| | 0.55%, 3/18/2016 | 45,000,000 | 45,000,000 |
| | 0.612%, 4/28/2016 | 38,500,000 | 38,500,000 |
| Canadian Imperial Bank of Commerce, 0.65%, 6/30/2016 | 106,075,000 | 106,075,000 |
| Citibank NA, 0.37%, 1/8/2016 | 6,813,000 | 6,813,000 |
| Cooperatieve Centrale Raiffeisen-Boerenleenbank BA: |
| | 0.43%, 3/4/2016 | 125,800,000 | 125,800,000 |
| | 0.497%, 4/14/2016 | 187,000,000 | 187,000,000 |
| Dexia Credit Local: |
| | 0.431%, 5/4/2016 | 100,000,000 | 100,000,000 |
| | 144A, 0.432%, 2/26/2016 | 28,500,000 | 28,500,000 |
| DZ Bank AG: |
| | 0.36%, 1/4/2016 | 86,587,000 | 86,587,000 |
| | 0.38%, 1/29/2016 | 171,715,000 | 171,715,000 |
| | 0.4%, 2/11/2016 | 119,000,000 | 119,000,000 |
| | 0.45%, 12/15/2016 | 25,000,000 | 25,000,000 |
| Mitsubishi UFJ Trust & Banking Corp.: |
| | 0.38%, 1/19/2016 | 50,000,000 | 50,000,000 |
| | 0.46%, 3/17/2016 | 88,500,000 | 88,500,000 |
| Mizuho Bank Ltd.: |
| | 0.29%, 1/20/2016 | 34,000,000 | 34,000,000 |
| | 0.29%, 1/29/2016 | 123,500,000 | 123,500,000 |
| | 0.3%, 2/11/2016 | 85,000,000 | 85,000,000 |
| | 0.4%, 2/17/2016 | 115,000,000 | 115,000,000 |
| Nordea Bank Finland PLC: |
| | 0.3%, 2/8/2016 | 200,000,000 | 200,000,000 |
| | 0.45%, 3/18/2016 | 136,500,000 | 136,500,000 |
| | 0.467%, 2/12/2016 | 200,000,000 | 200,000,000 |
| | 0.487%, 5/13/2016 | 100,000,000 | 100,000,000 |
| | 0.5%, 3/9/2016 | 33,000,000 | 33,000,000 |
| Norinchukin Bank, 0.31%, 1/19/2016 | 110,000,000 | 110,001,645 |
| Royal Bank of Canada, 0.71%, 5/2/2016 | 92,500,000 | 92,500,000 |
| Sumitomo Mitsui Banking Corp.: |
| | 0.35%, 2/12/2016 | 50,000,000 | 50,000,000 |
| | 0.4%, 2/18/2016 | 100,000,000 | 100,000,000 |
| | 0.54%, 3/16/2016 | 85,500,000 | 85,500,000 |
| Svenska Handelsbanken AB: |
| | 0.491%, 4/15/2016 | 125,000,000 | 125,000,000 |
| | 0.495%, 2/29/2016 | 120,000,000 | 120,000,981 |
| Swedbank AB, 0.453%, 3/10/2016 | 125,000,000 | 125,000,000 |
| Toronto-Dominion Bank: |
| | 0.43%, 3/2/2016 | 141,000,000 | 141,000,000 |
| | 0.65%, 4/28/2016 | 110,000,000 | 110,000,000 |
| Wells Fargo Bank NA: |
| | 0.394%, 6/3/2016 | 50,000,000 | 50,000,000 |
| | 0.457%, 4/11/2016 | 63,000,000 | 63,000,000 |
| Westpac Banking Corp., 0.552%, 5/27/2016 | 135,000,000 | 135,000,000 |
| Total Certificates of Deposit and Bank Notes (Cost $3,991,592,626) | 3,991,592,626 |
| |
| Commercial Paper 34.0% |
| Issued at Discount** 21.7% |
| Albion Capital LLC, 0.35%, 1/20/2016 | 106,900,000 | 106,880,253 |
| Bank Nederlandse Gemeenten, 0.381%, 3/4/2016 | 142,000,000 | 141,905,570 |
| Caisse Centrale Desjardins du Quebec, 0.37%, 2/2/2016 | 82,000,000 | 81,973,031 |
| Caisse des Depots et Consignations: |
| | 0.31%, 2/16/2016 | 150,000,000 | 149,940,583 |
| | 0.346%, 3/15/2016 | 47,000,000 | 46,966,669 |
| Chevron Corp., 0.4%, 2/5/2016 | 74,400,000 | 74,371,067 |
| China Construction Bank Corp., 0.42%, 1/4/2016 | 17,000,000 | 16,999,405 |
| Coca-Cola Co., 0.511%, 3/18/2016 | 72,500,000 | 72,420,915 |
| Collateralized Commercial Paper II Co., LLC: |
| | 0.481%, 4/6/2016 | 71,270,000 | 71,178,774 |
| | 0.481%, 4/5/2016 | 65,000,000 | 64,917,667 |
| | 0.481%, 4/20/2016 | 100,000,000 | 99,853,333 |
| Cooperatieve Centrale Raiffeisen-Boerenleenbank BA, 0.416%, 3/14/2016 | 50,000,000 | 49,957,924 |
| CPPIB Capital, Inc., 0.3%, 2/3/2016 | 23,763,000 | 23,756,465 |
| Crown Point Capital Co., LLC, 0.621%, 3/14/2016 | 50,000,000 | 49,937,139 |
| DBS Bank Ltd.: |
| | 0.28%, 1/5/2016 | 70,000,000 | 69,997,822 |
| | 0.34%, 1/28/2016 | 50,000,000 | 49,987,250 |
| Erste Abwicklungsanstalt: |
| | 0.33%, 2/3/2016 | 43,500,000 | 43,486,841 |
| | 0.33%, 2/18/2016 | 20,000,000 | 19,991,200 |
| | 0.33%, 3/7/2016 | 55,000,000 | 54,966,725 |
| | 0.531%, 4/4/2016 | 107,000,000 | 106,851,924 |
| Export Development Canada, 0.381%, 1/11/2016 | 68,980,000 | 68,972,719 |
| Exxon Mobil Corp.: |
| | 0.4%, 1/19/2016 | 58,000,000 | 57,988,400 |
| | 0.45%, 2/1/2016 | 155,000,000 | 154,939,937 |
| Gotham Funding Corp.: |
| | 0.4%, 1/11/2016 | 75,000,000 | 74,991,667 |
| | 0.4%, 1/15/2016 | 57,500,000 | 57,491,056 |
| Kells Funding LLC: |
| | 0.32%, 3/8/2016 | 50,000,000 | 49,970,222 |
| | 0.37%, 2/2/2016 | 43,459,000 | 43,445,866 |
| | 144A, 0.401%, 3/14/2016 | 145,000,000 | 144,882,389 |
| | 144A, 0.401%, 1/8/2016 | 50,000,000 | 49,996,111 |
| | 0.431%, 3/14/2016 | 5,000,000 | 4,995,640 |
| Manhattan Asset Funding Co., LLC: |
| | 0.27%, 1/11/2016 | 40,000,000 | 39,997,000 |
| | 0.38%, 1/27/2016 | 32,000,000 | 31,991,218 |
| | 0.48%, 1/28/2016 | 1,536,000 | 1,535,447 |
| MetLife Short Term Funding LLC: |
| | 0.23%, 1/4/2016 | 4,700,000 | 4,699,910 |
| | 0.401%, 4/29/2016 | 80,000,000 | 79,894,222 |
| Microsoft Corp., 0.19%, 1/6/2016 | 57,950,000 | 57,948,471 |
| Nestle Capital Corp., 0.27%, 2/26/2016 | 142,000,000 | 141,940,360 |
| Nieuw Amsterdam Receivables Corp., 0.24%, 1/19/2016 | 36,267,000 | 36,262,648 |
| Nordea Bank AB, 0.305%, 2/8/2016 | 9,000,000 | 8,997,103 |
| Old Line Funding LLC: |
| | 0.481%, 4/12/2016 | 40,000,000 | 39,945,600 |
| | 0.521%, 4/29/2016 | 60,000,000 | 59,896,867 |
| | 144A, 0.552%, 5/16/2016 | 150,000,000 | 149,688,333 |
| | 0.652%, 5/2/2016 | 62,500,000 | 62,362,326 |
| PSP Capital, Inc, 0.23%, 1/22/2016 | 7,600,000 | 7,598,980 |
| PSP Capital, Inc., 0.42%, 1/8/2016 | 32,200,000 | 32,197,370 |
| Regency Markets No. 1 LLC: |
| | 0.45%, 1/20/2016 | 65,000,000 | 64,984,562 |
| | 0.47%, 1/27/2016 | 37,763,000 | 37,750,182 |
| Sinopec Century Bright Capital Investment Ltd.: |
| | 0.5%, 1/8/2016 | 22,500,000 | 22,497,812 |
| | 0.5%, 1/11/2016 | 127,600,000 | 127,582,278 |
| Standard Chartered Bank: |
| | 0.401%, 1/13/2016 | 150,000,000 | 149,980,000 |
| | 0.42%, 1/8/2016 | 145,000,000 | 144,988,158 |
| | 0.501%, 4/5/2016 | 100,000,000 | 99,868,056 |
| Swedbank AB, 0.366%, 2/1/2016 | 44,000,000 | 43,986,171 |
| Total Capital Canada Ltd., 0.21%, 1/4/2016 | 404,000 | 403,993 |
| Victory Receivables Corp.: |
| | 0.4%, 1/15/2016 | 54,407,000 | 54,398,537 |
| | 0.41%, 1/20/2016 | 26,638,000 | 26,632,236 |
| Walt Disney Co.: |
| | 0.19%, 1/25/2016 | 100,000,000 | 99,987,333 |
| | 0.3%, 2/25/2016 | 50,000,000 | 49,977,083 |
| Working Capital Management Co.: |
| | 0.44%, 1/20/2016 | 67,000,000 | 66,984,441 |
| | 0.45%, 1/15/2016 | 50,000,000 | 49,991,250 |
| | 3,898,982,511 |
| Issued at Par 12.3% |
| Australia & New Zealand Banking Group Ltd., 0.441%, 1/15/2016 | 50,000,000 | 50,000,014 |
| Bank Nederlandse Gemeenten: |
| | 0.439%, 5/6/2016 | 87,000,000 | 87,000,000 |
| | 0.522%, 2/25/2016 | 100,000,000 | 100,000,000 |
| Bank of Nova Scotia, 0.57%, 2/12/2016 | 183,800,000 | 183,800,000 |
| Bedford Row Funding Corp.: |
| | 0.351%, 1/14/2016 | 28,000,000 | 28,000,000 |
| | 0.416%, 4/8/2016 | 40,000,000 | 40,000,000 |
| | 144A, 0.517%, 4/12/2016 | 90,500,000 | 90,500,000 |
| | 144A, 0.525%, 3/14/2016 | 15,500,000 | 15,500,000 |
| BNZ International Funding Ltd., 0.497%, 6/14/2016 | 15,000,000 | 15,000,000 |
| Commonwealth Bank of Australia: |
| | 0.379%, 4/7/2016 | 82,000,000 | 81,998,639 |
| | 0.389%, 5/6/2016 | 100,000,000 | 99,997,783 |
| | 0.396%, 4/29/2016 | 38,000,000 | 37,998,847 |
| | 0.396%, 5/4/2016 | 75,000,000 | 75,000,000 |
| | 0.42%, 3/4/2016 | 36,000,000 | 36,000,000 |
| | 144A, 0.532%, 3/29/2016 | 23,000,000 | 22,996,171 |
| Crown Point Capital Co., LLC, 0.722%, 8/25/2016 | 142,800,000 | 142,800,000 |
| Erste Abwicklungsanstalt: |
| | 0.411%, 3/4/2016 | 80,000,000 | 79,999,169 |
| | 0.511%, 3/17/2016 | 120,000,000 | 119,997,494 |
| | 144A, 0.552%, 1/19/2016 | 41,000,000 | 41,000,000 |
| | 144A, 0.562%, 4/19/2016 | 68,250,000 | 68,249,508 |
| HSBC Bank PLC, 144A, 0.678%, 6/24/2016 | 113,250,000 | 113,250,000 |
| Macquarie Bank Ltd., 0.652%, 3/21/2016 | 70,000,000 | 70,000,000 |
| Nederlandse Waterschapsbank NV, 144A, 0.53%, 3/18/2016 | 117,500,000 | 117,500,000 |
| Old Line Funding LLC: |
| | 144A, 0.487%, 5/6/2016 | 50,000,000 | 50,000,000 |
| | 144A, 0.496%, 2/8/2016 | 100,000,000 | 100,000,000 |
| | 144A, 0.613%, 3/22/2016 | 66,000,000 | 66,000,000 |
| Thunder Bay Funding LLC: |
| | 0.476%, 3/8/2016 | 20,000,000 | 20,000,000 |
| | 0.517%, 4/12/2016 | 69,000,000 | 69,000,000 |
| Westpac Banking Corp., 144A, 0.53%, 3/18/2016 | 200,000,000 | 200,000,000 |
| | 2,221,587,625 |
| Total Commercial Paper (Cost $6,120,570,136) | 6,120,570,136 |
| Government & Agency Obligations 9.7% |
| U.S. Government Sponsored Agencies 6.5% |
| Federal Farm Credit Bank: |
| | 0.224%*, 3/3/2016 | 35,000,000 | 35,000,000 |
| | 0.346%*, 2/8/2017 | 15,000,000 | 15,000,000 |
| | 0.382%*, 5/20/2016 | 75,000,000 | 75,000,466 |
| Federal Home Loan Bank: |
| | 0.18%**, 3/1/2016 | 15,000,000 | 14,995,500 |
| | 0.22%**, 4/5/2016 | 29,500,000 | 29,482,874 |
| | 0.23%**, 1/20/2016 | 15,000,000 | 14,998,179 |
| | 0.24%**, 4/4/2016 | 50,000,000 | 49,968,667 |
| | 0.251%**, 3/7/2016 | 43,000,000 | 42,980,291 |
| | 0.255%**, 2/9/2016 | 50,000,000 | 49,986,188 |
| | 0.26%**, 4/11/2016 | 25,000,000 | 24,981,764 |
| | 0.264%*, 10/7/2016 | 7,500,000 | 7,500,000 |
| | 0.27%**, 2/16/2016 | 25,000,000 | 24,991,375 |
| | 0.305%**, 2/29/2016 | 20,000,000 | 19,990,003 |
| | 0.311%**, 6/28/2016 | 50,000,000 | 49,922,931 |
| | 0.341%**, 4/18/2016 | 50,000,000 | 49,949,000 |
| | 0.38%**, 3/22/2016 | 25,000,000 | 24,978,625 |
| | 0.391%**, 7/15/2016 | 25,000,000 | 24,946,917 |
| | 0.392%*, 8/26/2016 | 25,000,000 | 25,000,000 |
| | 0.4%**, 7/1/2016 | 80,000,000 | 79,838,222 |
| | 0.445%**, 2/26/2016 | 32,700,000 | 32,677,364 |
| | 0.471%**, 6/13/2016 | 25,000,000 | 24,946,472 |
| | 0.476%**, 3/9/2016 | 28,609,000 | 28,583,331 |
| | 0.501%**, 6/13/2016 | 75,000,000 | 74,829,169 |
| Federal Home Loan Mortgage Corp.: |
| | 0.2%**, 2/23/2016 | 20,000,000 | 19,994,111 |
| | 0.23%**, 1/12/2016 | 27,500,000 | 27,498,067 |
| | 0.235%**, 4/15/2016 | 21,000,000 | 20,985,607 |
| | 0.511%**, 4/27/2016 | 150,000,000 | 149,751,375 |
| Federal National Mortgage Association: |
| | 0.225%**, 5/23/2016 | 25,000,000 | 24,977,656 |
| | 0.255%**, 2/2/2016 | 26,500,000 | 26,493,993 |
| | 0.422%*, 7/20/2017 | 80,000,000 | 79,993,717 |
| | 1,170,241,864 |
| U.S. Treasury Obligations 3.2% |
| U.S. Treasury Bills: |
| | 0.117%**, 2/11/2016 | 125,000,000 | 124,983,344 |
| | 0.24%**, 2/25/2016 | 25,000,000 | 24,990,833 |
| U.S. Treasury Floating Rate Notes, 0.428%*, 10/31/2017 | 100,000,000 | 99,944,515 |
| U.S. Treasury Notes: |
| | 0.25%, 4/15/2016 | 12,500,000 | 12,496,131 |
| | 0.25%, 5/15/2016 | 45,000,000 | 45,008,955 |
| | 0.375%, 3/15/2016 | 75,000,000 | 75,033,232 |
| | 0.625%, 7/15/2016 | 25,000,000 | 25,044,613 |
| | 2.0%, 1/31/2016 | 50,000,000 | 50,073,604 |
| | 2.0%, 4/30/2016 | 25,000,000 | 25,139,036 |
| | 4.5%, 2/15/2016 | 100,000,000 | 100,535,070 |
| | 583,249,333 |
| Total Government & Agency Obligations (Cost $1,753,491,197) | 1,753,491,197 |
| |
| Short-Term Notes 4.0% |
| Bank of Nova Scotia: |
| | 0.912%*, 3/15/2016 | 1,100,000 | 1,100,570 |
| | 2.9%, 3/29/2016 | 18,000,000 | 18,101,271 |
| GE Capital International Funding Co.: |
| | 144A, 0.964%, 4/15/2016 | 227,289,000 | 227,589,900 |
| | 0.964%, 4/15/2016 | 217,500,000 | 217,750,999 |
| General Electric Capital Corp.: |
| | 0.551%*, 1/14/2016 | 20,500,000 | 20,501,417 |
| | 1.0%, 1/8/2016 | 17,843,000 | 17,844,970 |
| | 1.214%*, 5/9/2016 | 1,000,000 | 1,003,027 |
| | 2.95%, 5/9/2016 | 24,659,000 | 24,866,367 |
| Home Depot, Inc., 5.4%, 3/1/2016 | 67,299,000 | 67,838,287 |
| JPMorgan Chase Bank NA, 0.48%*, 11/22/2016 | 45,750,000 | 45,750,000 |
| Province of Ontario Canada, 4.75%, 1/19/2016 | 25,000,000 | 25,054,768 |
| Wal-Mart Stores, Inc., 5.313%*, 6/1/2016 | 55,000,000 | 56,124,032 |
| Total Short-Term Notes (Cost $723,525,608) | 723,525,608 |
| |
| Municipal Bonds and Notes 3.3% |
| Catawba County, NC, Hospital Revenue, Valley Medical Center, 144A, 0.4%***, 10/1/2034, LOC: Branch Banking & Trust | 2,500,000 | 2,500,000 |
| Georgia, JPMorgan Chase Putters/Drivers Trust, Series SGT05, 0.45%***, 1/1/2035, INS: FGIC, NATL, LIQ: Societe Generale, LOC: Societe Generale | 22,000,000 | 22,000,000 |
| Los Angeles, CA, Metro Transportation Authority, TECP, 0.3%, 1/4/2016, LOC: Sumitomo Mitsui Banking | 22,500,000 | 22,500,000 |
| Metropolitan Government Nashville & Davidson County, TN, Vanderbilt University, TECP, 0.15%, 2/22/2016 | 15,000,000 | 15,000,000 |
| Michigan, State Finance Authority Revenue, School Loan, Series B, 0.35%***, 9/1/2050, LOC: PNC Bank NA | 10,000,000 | 10,000,000 |
| Minnesota, State Office of Higher Education Revenue, Supplementary Student, Series A, 0.4%***, 12/1/2043, LOC: U.S. Bank NA | 11,500,000 | 11,500,000 |
| New Hampshire, State Health & Education Facilities Authority Revenue, Higher Education Loan Corp., Series A, 0.38%***, 12/1/2032, LOC: Royal Bank of Canada | 13,961,000 | 13,961,000 |
| New Jersey, RBC Municipal Products, Inc. Trust, Series E-60, 144A, 0.42%***, 6/28/2016, LOC: Royal Bank of Canada | 152,500,000 | 152,500,000 |
| New Jersey, State Housing & Mortgage Finance Agency, Multi-Family Housing Revenue, Series C, 0.35%***, 11/1/2039, LOC: Bank of America NA | 9,570,000 | 9,570,000 |
| New York, State Housing Finance Agency Revenue, 605 West 42nd Street, Series B, 144A, 0.45%***, 5/1/2048, LOC: Bank of China | 125,010,000 | 125,010,000 |
| New York, State Housing Finance Agency Revenue, 88 Leonard Street, Series A, 144A, 0.42%***, 11/1/2037, LOC: Landesbank Hessen-Thuringen | 11,750,000 | 11,750,000 |
| New York, State Housing Finance Agency Revenue, BAM South Housing, Series B, 144A, 0.4%***, 11/1/2048, LOC: JPMorgan Chase Bank NA | 12,500,000 | 12,500,000 |
| New York City, NY, Municipal Water Finance Authority, Water & Sewer Systems Revenue, Series TR-T30001-I, 144A, 0.41%***, 6/15/2044 | 8,000,000 | 8,000,000 |
| San Jose, CA, Financing Authority Lease Revenue: |
| | TECP, 0.34%, 2/19/2016, LOC: State Street Bank & Trust Co. | 7,113,000 | 7,113,000 |
| | TECP, 0.34%, 2/19/2016, LOC: U.S. Bank NA | 7,114,000 | 7,114,000 |
| University of California: |
| | TECP, 0.4%, 1/5/2016 | 45,000,000 | 44,998,000 |
| | TECP, 0.4%, 1/5/2016, LOC: JPMorgan Chase Bank NA | 25,000,000 | 24,998,889 |
| | TECP, 0.4%, 1/19/2016 | 25,000,000 | 25,000,000 |
| University of Colorado, Hospital Authority Revenue: |
| | Series C, 0.19%*, 11/15/2024 | 18,425,000 | 18,425,000 |
| | Series A, 0.19%*, 11/15/2046 | 20,450,000 | 20,450,000 |
| University of Houston, TECP, 0.49%, 2/9/2016 | 20,497,000 | 20,497,000 |
| Vanderbilt University, TECP, 0.4%, 4/7/2016 | 10,000,000 | 9,989,222 |
| Total Municipal Bonds and Notes (Cost $595,376,111) | 595,376,111 |
| |
| Repurchase Agreements 24.3% |
| BNP Paribas, 0.27%, dated 6/10/2015, to be repurchased at $200,358,500 on 2/4/2016 (a) (b) | 200,000,000 | 200,000,000 |
| BNP Paribas, 0.28%, dated 12/31/2015, to be repurchased at $5,000,156 on 1/4/2016 (c) | 5,000,000 | 5,000,000 |
| Federal Reserve Bank of New York, 0.25%, dated 12/31/2015, to be repurchased at $3,500,097,222 on 1/4/2016 (d) | 3,500,000,000 | 3,500,000,000 |
| JPMorgan Securities, Inc., 0.475%, dated 4/30/2015, to be repurchased at $187,075,708 on 3/31/2016 (a) (e) | 186,250,000 | 186,250,000 |
| JPMorgan Securities, Inc., 0.506%, dated 8/12/2015, to be repurchased at $373,714,681 on 3/31/2016 (a) (f) | 372,500,000 | 372,500,000 |
| Wells Fargo Securities LLC, 0.43%, dated 10/28/2015, to be repurchased at $122,631,688 on 1/26/2016 (a) (g) | 122,500,000 | 122,500,000 |
| Total Repurchase Agreements (Cost $4,386,250,000) | 4,386,250,000 |
| | % of Net Assets | Value ($) |
| | |
| Total Investment Portfolio (Cost $17,570,805,678)† | 97.5 | 17,570,805,678 |
| Other Assets and Liabilities, Net | 2.5 | 450,226,390 |
| Net Assets | 100.0 | 18,021,032,068 |
* Floating rate securities' yields vary with a designated market index or market rate, such as the coupon-equivalent of the U.S. Treasury Bill rate. These securities are shown at their current rate as of December 31, 2015.
** Annualized yield at time of purchase; not a coupon rate.
*** Variable rate demand notes and variable rate demand preferred shares are securities whose interest rates are reset periodically at market levels. These securities are payable on demand and are shown at their current rates as of December 31, 2015.
† The cost for federal income tax purposes was $17,570,805,678.
(a) Open maturity repurchase agreement whose interest rate resets periodically and is shown at the current rate as of December 31, 2015. The dated date is the original day the repurchase agreement was entered into, the maturity date represents the next repurchase date. Upon notice, both the Portfolio and counterparty have the right to terminate the repurchase agreement at any time.
(b) Collateralized by:
| Principal Amount ($) | Security | Rate (%) | Maturity Date | Collateral Value ($) |
| 7,815,000 | Cent CLO Ltd. | 1.8 | 1/25/2026 | 7,749,274 |
| 10,000,000 | ECP CLO Ltd. | 1.867 | 4/20/2027 | 10,377,164 |
| 35,000,000 | Galaxy XV CLO Ltd. | 1.571 | 4/15/2025 | 34,589,993 |
| 36,462,354 | Goldentree Loan Opportunities X Ltd. | 1.612 | 7/20/2027 | 38,141,107 |
| 11,000,000 | KKR Financial CLO Ltd. | 1.471 | 7/15/2025 | 10,785,548 |
| 10,000,000 | LCM XII LP | 1.575 | 10/19/2022 | 9,935,740 |
| 5,000,000 | Mountain Hawk II CLO Ltd. | 1.477 | 7/22/2024 | 4,906,470 |
| 7,455,000 | Nomad CLO Ltd. | 1.822 | 1/15/2025 | 7,317,902 |
| 15,000,000 | Northwoods Capital XIV Ltd. | 1.956 | 11/12/2025 | 14,913,637 |
| 10,000,000 | Ocean Trails CLO IV | 1.659 | 8/13/2025 | 9,791,408 |
| 24,500,000 | OCP CLO Ltd. | 1.765 | 7/17/2026 | 24,253,735 |
| 11,800,000 | Oracle Corp. | 4.125 | 5/15/2045 | 11,220,040 |
| 10,250,000 | Race Point VII CLO Ltd. | 1.764 | 11/8/2024 | 10,181,304 |
| 12,000,000 | Saranac CLO I Ltd. | 1.8 | 10/26/2024 | 11,836,679 |
| Total Collateral Value | 206,000,001 |
(c) Collateralized by:
| Principal Amount ($) | Security | Rate (%) | Maturity Date | Collateral Value ($) |
| 1,366,300 | U.S. Treasury Note | 0.25–3.25 | 4/15/2016–
3/31/2022 | 1,352,559 |
| 6,773,320 | U.S. Treasury STRIPS | Zero Coupon | 2/15/2019–
11/15/2043 | 3,747,441 |
| Total Collateral Value | 5,100,000 |
(d) Collateralized by $3,475,939,500 U.S. Treasury Note, 2.0%, maturing on 2/15/2022 with a value of $3,500,097,280.
(e) Collateralized by $184,332,264 Federal Home Loan Mortgage Corp., with the various coupon rates from 3.0–8.0%, with various maturity dates of 10/1/2031–12/1/2042 with a value of $189,978,835.
(f) Collateralized by:
| Principal Amount ($) | Security | Rate (%) | Maturity Date | Collateral Value ($) |
| 33,390,892 | Ally Auto Receivables Trust | 1.06 | 5/15/2017 | 33,408,636 |
| 177,667 | CAL Funding II Ltd. | 3.47 | 10/25/2027 | 174,988 |
| 1 | Carlyle High Yield Partners X Ltd. | 0.53 | 4/19/2022 | 1 |
| 267,228 | College Loan Corp. Trust | 0.752 | 4/15/2025 | 266,413 |
| 139,339,175 | Federal Home Loan Mortgage Corp. | 3.0–9.0 | 1/1/2017–
7/1/2044 | 147,678,359 |
| 398,522,983 | Federal Home Loan Mortgage Corp. — Interest Only | 3.0–5.5 | 1/15/2039–
8/15/2045 | 58,134,245 |
| 37 | Federal National Mortgage Association — Interest Only | 1007 | 12/25/2021 | 435 |
| 688,637 | GCO Education Loan Funding Trust | 0.523 | 5/25/2025 | 705,343 |
| 681,483 | Goal Capital Funding Trust | 0.563 | 5/28/2030 | 668,743 |
| 84,448 | GSAMP Trust | 1.102 | 11/25/2034 | 81,210 |
| 34,332 | Higher Education Funding I | 0.523 | 2/25/2025 | 34,268 |
| 125,475,000 | JPMorgan Chase & Co. | 0.953–5.0 | 7/5/2016–
11/8/2030 | 128,653,345 |
| 12,037 | KeyCorp Student Loan Trust | 0.933 | 12/27/2029 | 15,690 |
| 2,204,365 | KnowledgeWorks Foundation | 1.343 | 2/25/2042 | 2,171,767 |
| 5,272,898 | LA Arena Funding LLC | 7.656 | 12/15/2026 | 5,818,794 |
| 343,223 | Morgan Stanley ABS Capital I, Inc. Trust | 1.042 | 12/25/2034 | 319,129 |
| 591 | National Collegiate Student Loan Trust | 0.863 | 6/25/2027 | 587 |
| 3,657,750 | TAL Advantage V LLC | 2.83–3.51 | 2/22/2038–
2/22/2039 | 3,618,432 |
| Total Collateral Value | 381,750,385 |
(g) Collateralized by:
| Principal Amount ($) | Security | Rate (%) | Maturity Date | Collateral Value ($) |
| 94,111,209 | International Bank for Reconstruction & Development | 1.06–2.5 | 1/11/2018–
2/25/2028 | 93,756,192 |
| 500,000 | Kaiser Foundation Hospitals | Zero Coupon | 1/6/2016 | 499,955 |
| 31,597,000 | Wells Fargo Bank NA | 0.397–0.87 | 1/11/2016–
10/13/2016 | 31,604,108 |
| Total Collateral Value | 125,860,255 |
144A: Security exempt from registration under Rule 144A of the Securities Act of 1933. These securities may be resold in transactions exempt from registration, normally to qualified institutional buyers.
FGIC: Financial Guaranty Insurance Co.
INS: Insured
LIQ: Liquidity Facility
LOC: Letter of Credit
NATL: National Public Finance Guarantee Corp.
STRIPS: Separate Trading of Registered Interest and Principal Securities
TECP: Tax Exempt Commercial Paper
Fair Value Measurements
Various inputs are used in determining the value of the Portfolio's investments. These inputs are summarized in three broad levels. Level 1 includes quoted prices in active markets for identical securities. Level 2 includes other significant observable inputs (including quoted prices for similar securities, interest rates, prepayment speeds and credit risk). Level 3 includes significant unobservable inputs (including the Portfolio's own assumptions in determining the fair value of investments). The level assigned to the securities valuations may not be an indication of the risk or liquidity associated with investing in those securities. Securities held by the Portfolio are reflected as Level 2 because the securities are valued at amortized cost (which approximates fair value) and, accordingly, the inputs used to determine value are not quoted prices in an active market.
The following is a summary of the inputs used as of December 31, 2015 in valuing the Portfolio's investments. For information on the Portfolio's policy regarding the valuation of investments, please refer to the Security Valuation section of Note A in the accompanying Notes to Financial Statements.
| Assets | Level 1 | Level 2 | Level 3 | Total |
| |
| Investments in Securities (h) | $ — | $ 13,184,555,678 | $ — | $ 13,184,555,678 |
| Repurchase Agreements | — | 4,386,250,000 | — | 4,386,250,000 |
| Total | $ — | $ 17,570,805,678 | $ — | $ 17,570,805,678 |
There have been no transfers between fair value measurement levels during the year ended December 31, 2015.
(h) See Investment Portfolio for additional detailed categorizations.
The accompanying notes are an integral part of the financial statements.
Statement of Assets and Liabilities
| as of December 31, 2015 |
| Assets |
| Investments in non-affiliated securities, valued at amortized cost | $ 13,184,555,678 |
| Repurchase agreements, valued at amortized cost | 4,386,250,000 |
| Investments in securities, at value (cost $17,570,805,678) | 17,570,805,678 |
| Cash | 441,893,919 |
| Interest receivable | 10,878,280 |
| Other assets | 242,926 |
| Total assets | 18,023,820,803 |
| Liabilities |
| Accrued management fee | 1,952,540 |
| Accrued Trustees' fees | 111,726 |
| Other accrued expenses and payables | 724,469 |
| Total liabilities | 2,788,735 |
| Net assets, at value | $ 18,021,032,068 |
The accompanying notes are an integral part of the financial statements.
Statement of Operations
| for the year ended December 31, 2015 |
| Investment Income |
Income: Interest | $ 48,582,219 |
Expenses: Management fee | 25,037,507 |
| Administration fee | 5,893,752 |
| Custodian fee | 217,313 |
| Professional fees | 276,941 |
| Reports to shareholders | 17,789 |
| Trustees' fees and expenses | 505,861 |
| Other | 499,461 |
| Total expenses before expense reductions | 32,448,624 |
| Expense reductions | (4,944,455) |
| Total expenses after expense reductions | 27,504,169 |
| Net investment income | 21,078,050 |
| Net realized gain (loss) from investments | 452,645 |
| Net increase (decrease) in net assets resulting from operations | $ 21,530,695 |
The accompanying notes are an integral part of the financial statements.
Statement of Changes in Net Assets
| Increase (Decrease) in Net Assets | Years Ended December 31, |
| 2015 | 2014 |
Operations: Net investment income | $ 21,078,050 | $ 9,791,086 |
| Net realized gain (loss) | 452,645 | 38,382 |
| Net increase (decrease) in net assets resulting from operations | 21,530,695 | 9,829,468 |
Capital transactions in shares of beneficial interest: Proceeds from capital invested | 317,351,519,324 | 177,895,822,788 |
| Value of capital withdrawn | (319,269,518,924) | (178,202,393,435) |
| Net increase (decrease) in net assets from capital transactions in shares of beneficial interest | (1,917,999,600) | (306,570,647) |
| Increase (decrease) in net assets | (1,896,468,905) | (296,741,179) |
| Net assets at beginning of period | 19,917,500,973 | 20,214,242,152 |
| Net assets at end of period | $ 18,021,032,068 | $ 19,917,500,973 |
The accompanying notes are an integral part of the financial statements.
Financial Highlights
| | |
Years Ended December 31, |
| 2015 | 2014 | 2013 | 2012 | 2011 |
| Ratios to Average Net Assets and Supplemental Data |
| Net assets, end of period ($ millions) | 18,021 | 19,918 | 20,214 | 24,810 | 20,784 |
| Ratio of expenses before expense reductions (%) | .17 | .17 | .16 | .17 | .16 |
| Ratio of expenses after expense reductions (%) | .14 | .14 | .14 | .14 | .15 |
| Ratio of net investment income (%) | .11 | .05 | .08 | .14 | .10 |
| Total Return (%)a,b | .11 | .05 | .08 | .14 | .11 |
a Total return would have been lower had certain expenses not been reduced. b Total return for the Portfolio was derived from the performance of Cash Reserves Fund Institutional. |
Notes to Financial Statements
A. Organization and Significant Accounting Policies
Cash Management Portfolio (the "Portfolio") is registered under the Investment Company Act of 1940, as amended (the "1940 Act"), as an open-end management investment company organized as a New York trust.
The Portfolio is a master fund. A master/feeder fund structure is one in which a fund (a "feeder fund"), instead of investing directly in a portfolio of securities, invests most or all of its investment assets in a separate registered investment company (the "master fund") with substantially the same investment objective and policies as the feeder fund. Such a structure permits the pooling of assets of two or more feeder funds, preserving separate identities or distribution channels at the feeder fund level. The Portfolio may have several feeder funds, including affiliated Deutsche feeder funds and unaffiliated feeder funds; with a significant ownership percentage of the Portfolio's net assets. Investment activities of these feeder funds could have a material impact on the Portfolio. As of December 31, 2015, Cash Management Fund, Cash Reserves Fund Institutional, Cash Reserves Fund — Prime Series and Deutsche Money Market Series owned approximately 12%, 11%, 5% and 69%, respectively, of the Portfolio.
The Portfolio's financial statements are prepared in accordance with accounting principles generally accepted in the United States of America which require the use of management estimates. Actual results could differ from those estimates. The policies described below are followed consistently by the Portfolio in the preparation of its financial statements.
Security Valuation. Various inputs are used in determining the value of the Portfolio's investments. These inputs are summarized in three broad levels. Level 1 includes quoted prices in active markets for identical securities. Level 2 includes other significant observable inputs (including quoted prices for similar securities, interest rates, prepayment speeds and credit risk). Level 3 includes significant unobservable inputs (including the Portfolio's own assumptions in determining the fair value of investments). The level assigned to the securities valuations may not be an indication of the risk or liquidity associated with investing in those securities. Securities held by the Portfolio are reflected as Level 2 because the securities are valued at amortized cost (which approximates fair value) and, accordingly, the inputs used to determine value are not quoted prices in an active market.
The Portfolio values all securities utilizing the amortized cost method permitted in accordance with Rule 2a-7 under the 1940 Act and certain conditions therein. Under this method, which does not take into account unrealized capital gains or losses on securities, an instrument is initially valued at its cost and thereafter assumes a constant accretion/amortization rate to maturity of any discount or premium. Securities held by the Portfolio are reflected as Level 2 because the securities are valued at amortized cost (which approximates fair value) and, accordingly, the inputs used to determine value are not quoted prices in an active market.
Repurchase Agreements. The Portfolio may enter into repurchase agreements, under the terms of a Master Repurchase Agreement, with certain banks and broker/dealers whereby the Portfolio, through its custodian or a sub-custodian bank, receives delivery of the underlying securities, the amount of which at the time of purchase and each subsequent business day is required to be maintained at such a level that the value is equal to at least the principal amount of the repurchase price plus accrued interest. The custodian bank or another designated subcustodian holds the collateral in a separate account until the agreement matures. If the value of the securities falls below the principal amount of the repurchase agreement plus accrued interest, the financial institution deposits additional collateral by the following business day. If the financial institution either fails to deposit the required additional collateral or fails to repurchase the securities as agreed, the Portfolio has the right to sell the securities and recover any resulting loss from the financial institution. If the financial institution enters into bankruptcy, the Portfolio's claims on the collateral may be subject to legal proceedings.
As of December 31, 2015, the Portfolio held repurchase agreements with a gross value of $4,386,250,000. The value of the related collateral exceeded the value of the repurchase agreements at period end. The detail of the related collateral is included in the footnotes following the Portfolio's Investment Portfolio.
Federal Income Taxes. The Portfolio is considered a Partnership under the Internal Revenue Code, as amended. Therefore, no federal income tax provision is necessary.
It is intended that the Portfolio's assets, income and distributions will be managed in such a way that an investor in the Portfolio will be able to satisfy the requirements of Subchapter M of the Code, assuming that the investor invested all of its assets in the Portfolio.
The Portfolio has reviewed the tax positions for the open tax years as of December 31, 2015 and has determined that no provision for income tax and/or uncertain tax provisions is required in the Portfolio's financial statements. The Portfolio's federal tax returns for the prior three fiscal years remain open subject to examination by the Internal Revenue Service.
Contingencies. In the normal course of business, the Portfolio may enter into contracts with service providers that contain general indemnification clauses. The Portfolio's maximum exposure under these arrangements is unknown as this would involve future claims that may be made against the Portfolio that have not yet been made. However, based on experience, the Portfolio expects the risk of loss to be remote.
Other. Investment transactions are accounted for on trade date. Interest income is recorded on the accrual basis. Realized gains and losses from investment transactions are recorded on an identified cost basis. All discounts and premiums are accreted/amortized for both tax and financial reporting purposes.
The Portfolio makes an allocation of its net investment income and realized gains and losses from securities transactions to its investors in proportion to their investment in the Portfolio.
B. Fees and Transactions with Affiliates
Management Agreement. Under the Investment Management Agreement with Deutsche Investment Management Americas Inc. ("DIMA" or the "Advisor"), an indirect, wholly owned subsidiary of Deutsche Bank AG, the Advisor determines the securities, instruments and other contracts relating to investments to be purchased, sold or entered into by the Portfolio.
Under the Investment Management Agreement, the Portfolio pays the Advisor a monthly management fee based on its average daily net assets, computed and accrued daily and payable monthly, at the following annual rates:
| First $3.0 billion of the Portfolio's average daily net assets | .1500% |
| Next $4.5 billion of such net assets | .1325% |
| Over $7.5 billion of such net assets | .1200% |
For the period from January 1, 2015 through December 31, 2015, the Advisor has voluntarily agreed to waive its fees and/or reimburse certain operating expenses to the extent necessary to maintain the total annual operating expenses (excluding certain expenses such as extraordinary expenses, taxes, brokerage and interest) at 0.14% of the Portfolio's average daily net assets. This voluntary waiver or reimbursement may be terminated at any time at the option of the Advisor.
For the year ended December 31, 2015, the Advisor waived a portion of its management fee aggregating $4,944,455, and the amount charged aggregated $20,093,052, which was equivalent to an annual effective rate of 0.10%.
Administration Fee. Pursuant to an Administrative Services Agreement, DIMA provides most administrative services to the Portfolio. For all services provided under the Administrative Services Agreement, the Portfolio pays the Advisor an annual fee ("Administration Fee") of 0.03% of the Portfolio's average daily net assets, computed and accrued daily and payable monthly. For the year ended December 31, 2015, the Administration Fee was $5,893,752, of which $511,827 is unpaid.
Filing Service Fees. Under an agreement with DIMA, DIMA is compensated for providing certain regulatory filing services to the Portfolio. For the year ended December 31, 2015, the amount charged to the Portfolio by DIMA included in the Statement of Operations under "Reports to shareholders" aggregated $516, all of which is unpaid.
Trustees' Fees and Expenses. The Portfolio paid retainer fees to each Trustee not affiliated with the Advisor, plus specified amounts to the Board Chairperson and Vice Chairperson and to each committee Chairperson.
Transactions with Affiliates. The Fund may purchase securities from, or sell securities to, an affiliated fund provided the affiliation is solely due to having a common investment adviser, common officers, or common trustees. During the year ended December 31, 2015, the Fund engaged in securities purchases of $308,260,000 and securities sales of $286,435,000 with an affiliated fund in compliance with Rule 17a-7 under the 1940 Act.
C. Line of Credit
The Portfolio and other affiliated funds (the "Participants") share in a $400 million revolving credit facility provided by a syndication of banks. The Portfolio may borrow for temporary or emergency purposes, including the meeting of redemption requests that otherwise might require the untimely disposition of securities. The Participants are charged an annual commitment fee which is allocated based on net assets, among each of the Participants. Interest is calculated at a rate per annum equal to the sum of the Federal Funds Rate plus 1.25 percent plus if the one-month LIBOR exceeds the Federal Funds Rate, the amount of such excess. The Portfolio may borrow up to a maximum of 33 percent of its net assets under the agreement. The Portfolio had no outstanding loans at December 31, 2015.
D. Additional Information
Effective on or about May 2, 2016, the Portfolio will operate as a government money market fund under the amendments to Rule 2a-7 under the Investment Company Act of 1940, as amended, that were adopted in July 2014 with final compliance dates ranging between July 2015 and October 2016. As currently structured, on the final compliance date for the Rule 2a-7 amendments, the Portfolio would be required to implement a floating net asset value and would be allowed, and in certain situations, required, to implement liquidity fees and/or redemption gates. As a government money market fund, the Portfolio will continue to utilize amortized cost to value its securities and the Portfolio will not be required to implement liquidity fees and/or redemption gates. As a government money market fund, the Portfolio will invest at least 99.5% of the Portfolio’s total assets in cash, US government securities, and/or repurchase agreements that are collateralized by these same securities.
In order for the Portfolio to operate as a government money market fund, shareholders approved revisions to the Portfolio’s fundamental investment policy relating to concentration (the "Concentration Policy") such that the Portfolio would no longer be required to invest more than 25% of its total assets in obligations of banks and other financial institutions. If not revised, the current Concentration Policy would have precluded the Portfolio from operating as a government money market fund.
In addition to the revised Concentration Policy, the following changes to the Portfolio for it to operate as a government money market fund will also take effect on May 2, 2016:
(i) A revised investment objective, as follows:
"The fund seeks maximum current income to the extent consistent with stability of principal."
(ii) The adoption of a principal investment strategy to invest at least 99.5% of the Portfolio’s total assets in cash, government securities, and/or repurchase agreements that are collateralized by these same securities.
(iii) Name changes as follows:
| Current Name | New Name |
| Cash Management Portfolio | Government Cash Management Portfolio |
(iv) The adoption of a principal investment strategy to invest at least 80% of net assets, plus the amount of any borrowings for investment purposes, in government securities and/or repurchase agreements that are collateralize by government securities; and
(v) A reduction in the management fee rate paid by the Portfolio to DIMA, the investment advisor to the Portfolio. Pursuant to the master-feeder structure noted above, DIMA receives a management fee from the Portfolio. The revised management fee rate schedule is set forth below:
| Current Management Fee Rate Schedule | | Revised Management Fee Rate Schedule |
| Average Daily Assets | Management Fee Rate | | Average Daily Assets | Management Fee Rate |
| First $3 Billion | .1500% | | First $3 Billion | .1200% |
| Next $4.5 Billion | .1325% | | Next $4.5 Billion | .1025% |
| Over $7.5 Billion | .1200% | | Over $7.5 Billion | .0900% |
To ensure an orderly transition to a government money market fund, DIMA anticipates that it will begin to gradually implement changes to the Portfolio beginning in the first quarter of 2016. As a result, it is expected that the Portfolio gradually will allocate a larger percentage of its assets to government securities over time until it reaches its new allocation on or about May 2, 2016. Because the yields on government securities generally may be expected to be lower than the yields on comparable non-government securities, it should be expected that the Portfolio’s yield may decrease as more assets are invested in government securities.
Report of Independent Registered Public Accounting Firm
To the Board of Trustees and Holders of Beneficial Interest of Cash Management Portfolio:
In our opinion, the accompanying statement of assets and liabilities, including the portfolio of investments, and the related statements of operations and of changes in net assets and the financial highlights presents fairly, in all material respects, the financial position of Cash Management Portfolio (the "Portfolio") at December 31, 2015, and the results of its operations, the changes in its net assets and the financial highlights for each of the periods indicated therein, in conformity with accounting principles generally accepted in the United States of America. These financial statements and financial highlights (hereafter referred to as "financial statements") are the responsibility of the Portfolio's management. Our responsibility is to express an opinion on these financial statements based on our audits. We conducted our audits of these financial statements in accordance with the standards of the Public Company Accounting Oversight Board (United States). Those standards require that we plan and perform the audits to obtain reasonable assurance about whether the financial statements are free of material misstatement. An audit includes examining, on a test basis, evidence supporting the amounts and disclosures in the financial statements, assessing the accounting principles used and significant estimates made by management, and evaluating the overall financial statement presentation. We believe that our audits, which included confirmation of securities at December 31, 2015 by correspondence with the custodian, brokers and transfer agent, and the application of alternative auditing procedures where such confirmations had not been received, provide a reasonable basis for our opinion.
Boston, Massachusetts
February 23, 2016 | PricewaterhouseCoopers LLP |
Shareholder Meeting Results (Unaudited)
A special Meeting of Shareholders (the "Meeting") of Deutsche Money Market Series (the "Fund") was called to order on December 21, 2015 at the offices of Deutsche Investment Management Americas Inc., 345 Park Avenue, New York, New York 10154. The Meeting was adjourned until, and reconvened on, January 28, 2016 to permit the solicitation of additional votes. At the Meeting, the following matter was voted upon by the shareholders of the Fund (the resulting votes are presented below).
1. Approval of a Revised Fundamental Investment Policy Relating to Concentration.
| Number of Votes: |
| For | Against | Abstain | Broker Non-Votes* |
| 6,182,079,911 | 4,371,436 | 2,197,324,943 | 0 |
* Broker non-votes are proxies received by the funds from brokers or nominees when the broker or nominee neither has received instructions from the beneficial owner or other persons entitled to vote nor has discretionary power to vote in a particular matter.
Cash Management Fund, Cash Reserves Fund Institutional, Deutsche Money Market Series, Money Market ProFund and Prime Series are each a "feeder fund" that pursues its investment objecting by investing substantially of its assets in a "master portfolio," the Cash Management Portfolio (the "Portfolio"). The Portfolio also held a meeting of its shareholders on December 21, 2015, which was adjourned until, and reconvened on, January 28, 2016. At the meeting of the Portfolio, each feeder fund also approved the revised fundamental investment policy relating to concentration on behalf of the Portfolio.
Advisory Agreement Board Considerations and Fee Evaluation
Deutsche Money Market Series (the "Fund"), a series of DWS Money Market Trust, invests substantially all of its assets in Cash Management Portfolio (the "Portfolio") in order to achieve its investment objective. The Portfolio’s Board of Trustees approved the renewal of the Portfolio’s investment management agreement (the "Portfolio Agreement") with Deutsche Investment Management Americas Inc. ("DIMA") and the Fund’s Board of Trustees (which consists of the same members as the Board of Trustees of the Portfolio) approved the renewal of the Fund’s investment management agreement with DIMA (the "Fund Agreement," and together with the Portfolio Agreement, the "Agreements") in September 2015. The Portfolio’s Board of Trustees and the Fund’s Board of Trustees are collectively referred to as the "Board."
In terms of the process that the Board followed prior to approving the Agreements, shareholders should know that:
— In September 2015, all of the Portfolio’s and the Fund’s Trustees were independent of DIMA and its affiliates.
— The Trustees met frequently during the past year to discuss fund matters and dedicated a substantial amount of time to contract review matters. Over the course of several months, the Board’s Contract Committee reviewed comprehensive materials received from DIMA, independent third parties and independent counsel. These materials included an analysis of performance, fees and expenses, and profitability from a fee consultant retained by the Portfolio’s and the Fund’s Independent Trustees (the "Fee Consultant"). The Board also received extensive information throughout the year regarding performance of the Portfolio and the Fund.
— The Independent Trustees regularly meet privately with counsel to discuss contract review and other matters. In addition, the Independent Trustees were advised by the Fee Consultant in the course of their review of the Portfolio’s and the Fund’s contractual arrangements and considered a comprehensive report prepared by the Fee Consultant in connection with their deliberations.
— In connection with reviewing the Agreements, the Board also reviewed the terms of the Fund’s distribution agreement, administrative services agreement, transfer agency agreement and other material service agreements.
— Based on its evaluation of the information provided, the Contract Committee presented its findings and recommendations to the Board. The Board then reviewed the Contract Committee’s findings and recommendations.
In connection with the contract review process, the Contract Committee and the Board considered the factors discussed below, among others. The Board also considered that DIMA and its predecessors have managed the Portfolio and the Fund since their inception, and the Board believes that a long-term relationship with a capable, conscientious advisor is in the best interests of the Portfolio and the Fund. The Board considered, generally, that shareholders chose to invest or remain invested in the Fund knowing that DIMA managed the Portfolio and the Fund, and that the Fund Agreement was approved by the Fund’s shareholders. DIMA is part of Deutsche Bank AG’s ("Deutsche Bank") Asset and Wealth Management ("Deutsche AWM") division. Deutsche AWM is a global asset management business that offers a wide range of investing expertise and resources, including research capabilities in many countries throughout the world. Deutsche Bank has advised the Independent Trustees that the U.S. asset management business continues to be a critical and integral part of Deutsche Bank, and that Deutsche Bank will continue to make significant investments in Deutsche AWM, including ongoing enhancements to Deutsche AWM’s investment platform. Deutsche Bank also has confirmed its commitment to maintaining strong legal and compliance groups within the Deutsche AWM division.
As part of the contract review process, the Board carefully considered the fees and expenses of each Deutsche fund overseen by the Board in light of the fund’s performance. In many cases, this led to the negotiation and implementation of expense caps. As part of these negotiations, the Board indicated that it would consider relaxing these caps in future years following sustained improvements in performance, among other considerations.
While shareholders may focus primarily on fund performance and fees, the Board considers these and many other factors, including the quality and integrity of DIMA’s personnel and such other issues as back-office operations, fund valuations, and compliance policies and procedures.
Nature, Quality and Extent of Services. The Board considered the terms of the Agreements, including the scope of advisory services provided under the Agreements. The Board noted that, under the Agreements, DIMA provides portfolio management services to the Portfolio and the Fund and that, pursuant to separate administrative services agreements, DIMA provides administrative services to the Portfolio and the Fund. The Board considered the experience and skills of senior management and investment personnel, the resources made available to such personnel, the ability of DIMA to attract and retain high-quality personnel, and the organizational depth and stability of DIMA. The Board reviewed the Portfolio’s and the Fund’s performance over short-term and long-term periods and compared those returns to various agreed-upon performance measures, including a peer universe compiled using information supplied by iMoneyNet, an independent fund data service. The Board also noted that it has put into place a process of identifying "Focus Funds" (e.g., funds performing poorly relative to a peer universe), and receives additional reporting from DIMA regarding such funds and, where appropriate, DIMA’s plans to address underperformance. The Board believes this process is an effective manner of identifying and addressing underperforming funds. Based on the information provided, the Board noted that for the one- and three-year periods ended December 31, 2014, the Fund’s gross performance (Institutional Shares) was in the 3rd quartile of the applicable iMoneyNet universe (the 1st quartile being the best performers and the 4th quartile being the worst performers).
Fees and Expenses. The Board considered the Portfolio’s and the Fund’s investment management fee schedules and the Fund’s operating expenses and total expense ratios, and comparative information provided by Lipper Inc. ("Lipper") and the Fee Consultant regarding investment management fee rates paid to other investment advisors by similar funds (1st quartile being the most favorable and 4th quartile being the least favorable). With respect to management fees paid to other investment advisors by similar funds, the Board noted that the contractual fee rates paid by the Portfolio and the Fund, which include 0.03% and 0.10% fees paid to DIMA under the respective administrative services agreements, were higher than the median (4th quartile) of the applicable Lipper peer group (based on Lipper data provided as of December 31, 2014). The Board considered that the Portfolio’s management fee would be reduced by 0.03% at all breakpoint levels if shareholders approve a proposal that would result in the Portfolio and the Fund being restructured into government money market funds. The Board noted that, although shareholders of the Fund indirectly bear the Portfolio’s management fee, the Fund does not charge an additional investment management fee. Based on Lipper data provided as of December 31, 2014, the Board noted that the Fund’s total (net) operating expenses, which include Portfolio expenses allocated to the Fund, were lower than the median of the applicable Lipper expense universe for Institutional Shares (1st quartile). The Board noted the expense limitation agreed to by DIMA. The Board also noted the significant voluntary fee waivers implemented by DIMA to ensure the Fund maintained a positive yield. The Board considered the management fee rate as compared to fees charged by DIMA to comparable Deutsche U.S. registered funds ("Deutsche Funds") and considered differences between the Portfolio and the Fund and the comparable Deutsche Funds. The information requested by the Board as part of its review of fees and expenses also included information about institutional accounts (including any sub-advised funds and accounts) and funds offered primarily to European investors ("Deutsche Europe funds") managed by Deutsche AWM. The Board noted that DIMA indicated that Deutsche AWM does not manage any institutional accounts or Deutsche Europe funds comparable to the Portfolio or the Fund.
On the basis of the information provided, the Board concluded that management fees were reasonable and appropriate in light of the nature, quality and extent of services provided by DIMA.
Profitability. The Board reviewed detailed information regarding revenues received by DIMA under the Agreements. The Board considered the estimated costs and pre-tax profits realized by DIMA from advising the Deutsche Funds, as well as estimates of the pre-tax profits attributable to managing the Fund in particular. The Board also received information regarding the estimated enterprise-wide profitability of DIMA and its affiliates with respect to all fund services in totality and by fund. The Board and the Fee Consultant reviewed DIMA’s methodology in allocating its costs to the management of the Fund. Based on the information provided, the Board concluded that the pre-tax profits realized by DIMA in connection with the management of the Fund were not unreasonable. The Board also reviewed certain publicly available information regarding the profitability of certain similar investment management firms. The Board noted that while information regarding the profitability of such firms is limited (and in some cases is not necessarily prepared on a comparable basis), DIMA and its affiliates’ overall profitability with respect to the Deutsche Funds (after taking into account distribution and other services provided to the funds by DIMA and its affiliates) was lower than the overall profitability levels of most comparable firms for which such data was available.
Economies of Scale. The Board considered whether there are economies of scale with respect to the management of the Portfolio and the Fund and whether the Portfolio and the Fund benefit from any economies of scale. The Board noted that the Portfolio’s and the Fund’s investment management fee schedule includes fee breakpoints. The Board concluded that the Portfolio’s and the Fund’s fee schedule represents an appropriate sharing between the Portfolio and the Fund and DIMA of such economies of scale as may exist in the management of the Portfolio and the Fund at current asset levels.
Other Benefits to DIMA and Its Affiliates. The Board also considered the character and amount of other incidental benefits received by DIMA and its affiliates, including any fees received by DIMA for administrative services provided to the Portfolio and the Fund. The Board also considered benefits to DIMA related to brokerage and soft-dollar allocations, including allocating brokerage to pay for research generated by parties other than the executing broker dealers, which pertain primarily to funds investing in equity securities, along with the incidental public relations benefits to DIMA related to Deutsche Funds advertising and cross-selling opportunities among DIMA products and services. The Board considered these benefits in reaching its conclusion that the Fund’s management fees were reasonable.
Compliance. The Board considered the significant attention and resources dedicated by DIMA to documenting and enhancing its compliance processes in recent years. The Board noted in particular (i) the experience and seniority of the individual serving as DIMA’s and the Fund’s chief compliance officer; (ii) the large number of DIMA compliance personnel; and (iii) the substantial commitment of resources by DIMA and its affiliates to compliance matters.
Based on all of the information considered and the conclusions reached, the Board unanimously determined that the continuation of the Agreements is in the best interests of the Portfolio and the Fund. In making this determination, the Board did not give particular weight to any single factor identified above. The Board considered these factors over the course of numerous meetings, certain of which were in executive session with only the Independent Trustees and counsel present. It is possible that individual Trustees may have weighed these factors differently in reaching their individual decisions to approve the continuation of the Agreements.
Board Members and Officers
The following table presents certain information regarding the Board Members and Officers of the fund. Each Board Member's year of birth is set forth in parentheses after his or her name. Unless otherwise noted, (i) each Board Member has engaged in the principal occupation(s) noted in the table for at least the most recent five years, although not necessarily in the same capacity; and (ii) the address of each Independent Board Member is c/o Kenneth C. Froewiss, Chairman, Deutsche Mutual Funds, P.O. Box 390601, Cambridge, MA 02139. Except as otherwise noted below, the term of office for each Board Member is until the election and qualification of a successor, or until such Board Member sooner dies, resigns, is removed or as otherwise provided in the governing documents of the fund. Because the fund does not hold an annual meeting of shareholders, each Board Member will hold office for an indeterminate period. The Board Members may also serve in similar capacities with other funds in the fund complex.
| Independent Board Members |
| Name, Year of Birth, Position with the Fund and Length of Time Served1 | Business Experience and Directorships During the Past Five Years | Number of Funds in Deutsche Fund Complex Overseen | Other Directorships Held by Board Member |
Kenneth C. Froewiss (1945) Chairperson since 2013, and Board Member since 2001 | Retired Clinical Professor of Finance, NYU Stern School of Business (1997–2014); Member, Finance Committee, Association for Asian Studies (2002–present); Director, Mitsui Sumitomo Insurance Group (US) (2004–present); prior thereto, Managing Director, J.P. Morgan (investment banking firm) (until 1996) | 106 | — |
William McClayton (1944) Vice Chairperson since 2013, and Board Member since 2004 | Private equity investor (since October 2009); previously, Managing Director, Diamond Management & Technology Consultants, Inc. (global consulting firm) (2001–2009); Directorship: Board of Managers, YMCA of Metropolitan Chicago; formerly: Senior Partner, Arthur Andersen LLP (accounting) (1966–2001); Trustee, Ravinia Festival | 106 | — |
John W. Ballantine (1946) Board Member since 1999 | Retired; formerly, Executive Vice President and Chief Risk Management Officer, First Chicago NBD Corporation/The First National Bank of Chicago (1996–1998); Executive Vice President and Head of International Banking (1995–1996); former Directorships: Director and former Chairman of the Board, Healthways, Inc.2 (provider of disease and care management services) (2003–2014); Stockwell Capital Investments PLC (private equity); First Oak Brook Bancshares, Inc. and Oak Brook Bank; Prisma Energy International | 106 | Portland General Electric2 (utility company) (2003– present) |
Henry P. Becton, Jr. (1943) Board Member since 1990 | Vice Chair and former President, WGBH Educational Foundation. Directorships: Public Radio International; Public Radio Exchange (PRX); former Directorships: Belo Corporation2 (media company); The PBS Foundation; Association of Public Television Stations; Boston Museum of Science; American Public Television; Concord Academy; New England Aquarium; Mass. Corporation for Educational Telecommunications; Committee for Economic Development; Public Broadcasting Service; Connecticut College; North Bennett Street School (Boston) | 106 | Director, Becton Dickinson and Company2 (medical technology company) |
Dawn-Marie Driscoll (1946) Board Member since 1987 | Emeritus Executive Fellow, Center for Business Ethics, Bentley University; formerly: President, Driscoll Associates (consulting firm); Partner, Palmer & Dodge (law firm) (1988–1990); Vice President of Corporate Affairs and General Counsel, Filene's (retail) (1978–1988). Directorships: Director of ICI Mutual Insurance Company (since 2007); Advisory Board, Center for Business Ethics, Bentley University; Trustee and former Chairman of the Board, Southwest Florida Community Foundation (charitable organization); former Directorships: Sun Capital Advisers Trust (mutual funds) (2007–2012), Investment Company Institute (audit, executive, nominating committees) and Independent Directors Council (governance, executive committees) | 106 | — |
Keith R. Fox, CFA (1954) Board Member since 1996 | Managing General Partner, Exeter Capital Partners (a series of private investment funds) (since 1986). Directorships: Progressive International Corporation (kitchen goods importer and distributor); The Kennel Shop (retailer); former Chairman, National Association of Small Business Investment Companies; former Directorships: BoxTop Media Inc. (advertising); Sun Capital Advisers Trust (mutual funds) (2011–2012) | 106 | — |
Paul K. Freeman (1950) Board Member since 1993 | Consultant, World Bank/Inter-American Development Bank; Chair, Independent Directors Council; Investment Company Institute (executive and nominating committees); formerly, Chairman of Education Committee of Independent Directors Council; Project Leader, International Institute for Applied Systems Analysis (1998–2001); Chief Executive Officer, The Eric Group, Inc. (environmental insurance) (1986–1998); Directorships: Denver Zoo Foundation (December 2012–present); former Directorships: Prisma Energy International | 106 | — |
Richard J. Herring (1946) Board Member since 1990 | Jacob Safra Professor of International Banking and Professor, Finance Department, The Wharton School, University of Pennsylvania (since July 1972); Co-Director, Wharton Financial Institutions Center; Co-Chair, U.S. Shadow Financial Regulatory Committee; Executive Director, Financial Economists Roundtable; formerly: Vice Dean and Director, Wharton Undergraduate Division (July 1995–June 2000); Director, Lauder Institute of International Management Studies (July 2000–June 2006) | 106 | Director, Aberdeen Singapore and Japan Funds (since 2007); Independent Director of Barclays Bank Delaware (since September 2010) |
Rebecca W. Rimel (1951) Board Member since 1995 | President and Chief Executive Officer, The Pew Charitable Trusts (charitable organization) (1994 to present); formerly: Executive Vice President, The Glenmede Trust Company (investment trust and wealth management) (1983–2004); Board Member, Investor Education (charitable organization) (2004–2005); Trustee, Executive Committee, Philadelphia Chamber of Commerce (2001–2007); Director, Viasys Health Care2 (January 2007–June 2007); Trustee, Thomas Jefferson Foundation (charitable organization) (1994–2012) | 106 | Director, Becton Dickinson and Company2 (medical technology company) (2012– present); Director, BioTelemetry Inc.2 (health care) (2009– present) |
William N. Searcy, Jr. (1946) Board Member since 1993 | Private investor since October 2003; formerly: Pension & Savings Trust Officer, Sprint Corporation2 (telecommunications) (November 1989–September 2003); Trustee, Sun Capital Advisers Trust (mutual funds) (1998–2012) | 106 | — |
Jean Gleason Stromberg (1943) Board Member since 1997 | Retired. Formerly, Consultant (1997–2001); Director, Financial Markets U.S. Government Accountability Office (1996–1997); Partner, Norton Rose Fulbright, L.L.P. (law firm) (1978–1996). Directorships: The William and Flora Hewlett Foundation (charitable organization); former Directorships: Service Source, Inc. (nonprofit), Mutual Fund Directors Forum (2002–2004), American Bar Retirement Association (funding vehicle for retirement plans) (1987–1990 and 1994–1996) | 106 | — |
| Officers4 |
| Name, Year of Birth, Position with the Fund and Length of Time Served5 | Business Experience and Directorships During the Past Five Years |
Brian E. Binder8 (1972) President and Chief Executive Officer, 2013–present | Managing Director3 and Head of Fund Administration, Deutsche Asset Management (2013–present); formerly: Head of Business Management and Consulting at Invesco, Ltd. (2010–2012) |
John Millette7 (1962) Vice President and Secretary, 1999–present | Director,3 Deutsche Asset Management; Chief Legal Officer and Secretary, Deutsche Investment Management Americas Inc. (since 2015); and Director and Vice President, DeAWM Trust Company (since 2016) |
Melinda Morrow6 (1970) Vice President, 2012–present | Director,3 Deutsche Asset Management |
Paul H. Schubert6 (1963) Chief Financial Officer, 2004–present Treasurer, 2005–present | Managing Director,3 Deutsche Asset Management; and Chairman, Director and President, DeAWM Trust Company (since 2013); formerly, Director, DeAWM Trust Company (2004–2013) |
Caroline Pearson7 (1962) Chief Legal Officer, 2010–present | Managing Director,3 Deutsche Asset Management; Secretary, DeAWM Distributors, Inc.; and Secretary, DeAWM Service Company |
Robert Kloby6 (1962) Chief Compliance Officer, 2006–present | Managing Director,3 Deutsche Asset Management |
Wayne Salit6 (1967) Anti-Money Laundering Compliance Officer, 2014–present | Director,3 Deutsche Asset Management; formerly: Managing Director, AML Compliance Officer at BNY Mellon (2011–2014); and Director, AML Compliance Officer at Deutsche Bank (2004–2011) |
Hepsen Uzcan6 (1974) Assistant Secretary, 2013–present | Director,3 Deutsche Asset Management |
Paul Antosca7 (1957) Assistant Treasurer, 2007–present | Director,3 Deutsche Asset Management |
Jack Clark7 (1967) Assistant Treasurer, 2007–present | Director,3 Deutsche Asset Management |
Diane Kenneally7 (1966) Assistant Treasurer, 2007–present | Director,3 Deutsche Asset Management |
1 The length of time served represents the year in which the Board Member joined the board of one or more Deutsche funds currently overseen by the Board.
2 A publicly held company with securities registered pursuant to Section 12 of the Securities Exchange Act of 1934.
3 Executive title, not a board directorship.
4 As a result of their respective positions held with the Advisor, these individuals are considered "interested persons" of the Advisor within the meaning of the 1940 Act. Interested persons receive no compensation from the fund.
5 The length of time served represents the year in which the officer was first elected in such capacity for one or more Deutsche funds.
6 Address: 60 Wall Street, New York, NY 10005.
7 Address: One Beacon Street, Boston, MA 02108.
8 Address: 222 South Riverside Plaza, Chicago, IL 60606.
The fund's Statement of Additional Information ("SAI") includes additional information about the Board Members. The SAI is available, without charge, upon request. If you would like to request a copy of the SAI, you may do so by calling the following toll-free number: (800) 728-3337.
Account Management Resources
| |
| Investment Management | Deutsche Investment Management Americas Inc. ("DIMA" or the "Advisor"), which is part of Deutsche Asset Management, is the investment advisor for the fund. DIMA and its predecessors have more than 80 years of experience managing mutual funds and DIMA provides a full range of investment advisory services to both institutional and retail clients. DIMA is an indirect, wholly owned subsidiary of Deutsche Bank AG. Deutsche Bank AG is a major global banking institution engaged in a wide variety of financial services, including investment management, retail, private and commercial banking, investment banking and insurance. Deutsche Asset Management is the retail brand name in the U.S. for the asset management activities of Deutsche Bank AG and DIMA. Deutsche Asset Management is committed to delivering the investing expertise, insight and resources of this global investment platform to American investors. |
| Proxy Voting | The fund's policies and procedures for voting proxies for portfolio securities and information about how the fund voted proxies related to its portfolio securities during the 12-month period ended June 30 are available on our Web site — deutschefunds.com (click on "proxy voting"at the bottom of the page) — or on the SEC's Web site — sec.gov. To obtain a written copy of the fund's policies and procedures without charge, upon request, call us toll free at (800) 728-3337. |
| Portfolio Holdings | Following the fund's fiscal first and third quarter-end, a complete portfolio holdings listing is filed with the SEC on Form N-Q. In addition, each month, information about the fund and its portfolio holdings is filed with the SEC on Form N-MFP. The SEC delays the public availability of the information filed on Form N-MFP for 60 days after the end of the reporting period included in the filing. These forms will be available on the SEC's Web site at sec.gov, and they may also be reviewed and copied at the SEC's Public Reference Room in Washington, D.C. Information on the operation of the SEC's Public Reference Room may be obtained by calling (800) SEC-0330. The fund's portfolio holdings are also posted on deutschefunds.com from time to time. Please see the fund's current prospectus for more information. |
| Principal Underwriter | If you have questions, comments or complaints, contact: DeAWM Distributors, Inc. 222 South Riverside Plaza
Chicago, IL 60606-5808 (800) 621-1148 |
| For shareholders of Institutional Shares and Institutional Shares MGD: |
| For More Information | (800) 730-1313 To speak with a Shareholder Service representative. |
| Web Site | deutscheliquidity.com/US View your account transactions and balances, trade shares, monitor your asset allocation, subscribe to fund and account updates by e-mail, and change your address, 24 hours a day. Obtain prospectuses and applications, blank forms, interactive worksheets, news about Deutsche funds, retirement planning information, and more. |
| Written Correspondence | DeAWM Service Company
Institutional Money Funds — Client Services PO Box 219210
Kansas City, MO 64121-9210 ifunds@db.com |
| For shareholders of Institutional Shares PS and Institutional Shares PRS: |
| For More Information | (800) 728-3337 To speak with a Shareholder Service representative. |
| Web Site | deutschefunds.com View your account transactions and balances, trade shares, monitor your asset allocation, subscribe to fund and account updates by e-mail, and change your address, 24 hours a day. Obtain prospectuses and applications, blank forms, interactive worksheets, news about Deutsche funds, retirement planning information, and more. |
| Written Correspondence | Deutsche Asset Management PO Box 219151
Kansas City, MO 64121-9151 |
| | Institutional Shares | Institutional Shares MGD | Institutional Shares PS | Institutional Shares PRS |
| Nasdaq Symbol | ICAXX | MCAXX | SPMXX | SCRXX |
| Fund Number | 2403 | 2023 | 2402 | 2309 |
The fund currently offers one class of shares, Institutional Shares. Managed Shares ("Institutional Shares MGD"), Prime Reserve Class S Shares ("Institutional Shares PRS") and Premium Class S Shares ("Institutional Shares PS") (the "legacy classes") were combined into Institutional Shares as of the close of business on October 1, 2008. The legacy classes are no longer offered separately. Because the eligibility and minimum investment requirements for each of the legacy classes differ from the Institutional Shares, shareholders of the fund who were shareholders of a legacy class may continue to purchase shares of the fund in accordance with the investment requirements in effect for each applicable legacy class prior to the share classes being combined. Any account privileges previously available to shareholders of the legacy classes remain unchanged.

| | |
| ITEM 2. | CODE OF ETHICS |
| | |
| | As of the end of the period covered by this report, the registrant has adopted a code of ethics, as defined in Item 2 of Form N-CSR, that applies to its Principal Executive Officer and Principal Financial Officer. There have been no amendments to, or waivers from, a provision of the code of ethics during the period covered by this report that would require disclosure under Item 2. A copy of the code of ethics is filed as an exhibit to this Form N-CSR. |
| | |
| ITEM 3. | AUDIT COMMITTEE FINANCIAL EXPERT |
| | |
| | The fund’s audit committee is comprised solely of trustees who are "independent" (as such term has been defined by the Securities and Exchange Commission ("SEC") in regulations implementing Section 407 of the Sarbanes-Oxley Act (the "Regulations")). The fund’s Board of Trustees has determined that there are several "audit committee financial experts" (as such term has been defined by the Regulations) serving on the fund’s audit committee including Mr. Paul K. Freeman, the chair of the fund’s audit committee. An “audit committee financial expert” is not an “expert” for any purpose, including for purposes of Section 11 of the Securities Act of 1933 and the designation or identification of a person as an “audit committee financial expert” does not impose on such person any duties, obligations or liability that are greater than the duties, obligations and liability imposed on such person as a member of the audit committee and board of directors in the absence of such designation or identification. |
| | |
| ITEM 4. | PRINCIPAL ACCOUNTANT FEES AND SERVICES |
| | |
Cash management portfolio
form n-csr disclosure re: AUDIT FEES
The following table shows the amount of fees that PricewaterhouseCoopers, LLP (“PWC”), the Fund’s independent registered public accounting firm, billed to the Fund during the Fund’s last two fiscal years. The Audit Committee approved in advance all audit services and non-audit services that PWC provided to the Fund.
Services that the Fund’s Independent Registered Public Accounting Firm Billed to the Fund
Fiscal Year
Ended
December 31, | Audit Fees Billed to Fund | Audit-Related
Fees Billed to Fund | Tax Fees Billed to Fund | All
Other Fees Billed to Fund |
| 2015 | $60,078 | $0 | $0 | $0 |
| 2014 | $58,738 | $0 | $0 | $0 |
Services that the Fund’s Independent Registered Public Accounting Firm Billed to the Adviser and Affiliated Fund Service Providers
The following table shows the amount of fees billed by PWC to Deutsche Investment Management Americas Inc. (“DIMA” or the “Adviser”), and any entity controlling, controlled by or under common control with DIMA (“Control Affiliate”) that provides ongoing services to the Fund (“Affiliated Fund Service Provider”), for engagements directly related to the Fund’s operations and financial reporting, during the Fund’s last two fiscal years.
Fiscal Year Ended
December 31, | Audit-Related
Fees Billed to Adviser and Affiliated Fund Service Providers | Tax Fees Billed to Adviser and Affiliated Fund Service Providers | All
Other Fees Billed to Adviser and Affiliated Fund Service Providers |
| 2015 | $0 | $30,661 | $0 |
| 2014 | $0 | $63,439 | $0 |
The “Tax Fees Billed to the Advisor” were billed for services associated with foreign tax filings.
Non-Audit Services
The following table shows the amount of fees that PWC billed during the Fund’s last two fiscal years for non-audit services. The Audit Committee pre-approved all non-audit services that PWC provided to the Adviser and any Affiliated Fund Service Provider that related directly to the Fund’s operations and financial reporting. The Audit Committee requested and received information from PWC about any non-audit services that PWC rendered during the Fund’s last fiscal year to the Adviser and any Affiliated Fund Service Provider. The Committee considered this information in evaluating PWC’s independence.
Fiscal Year
Ended
December 31, | Total
Non-Audit Fees Billed to Fund (A) | Total Non-Audit Fees billed to Adviser and Affiliated Fund Service Providers (engagements related directly to the operations and financial reporting of the Fund) (B) | Total Non-Audit Fees billed to Adviser and Affiliated Fund Service Providers (all other engagements) (C) | Total of (A), (B)
and (C) |
| 2015 | $0 | $30,661 | $0 | $30,661 |
| 2014 | $0 | $63,439 | $0 | $63,439 |
Audit Committee Pre-Approval Policies and Procedures. Generally, each Fund’s Audit Committee must pre approve (i) all services to be performed for a Fund by a Fund’s Independent Registered Public Accounting Firm and (ii) all non-audit services to be performed by a Fund’s Independent Registered Public Accounting Firm for the DIMA Entities with respect to operations and financial reporting of the Fund, except that the Chairperson or Vice Chairperson of each Fund’s Audit Committee may grant the pre-approval for non-audit services described in items (i) and (ii) above for non-prohibited services for engagements of less than $100,000. All such delegated pre approvals shall be presented to each Fund’s Audit Committee no later than the next Audit Committee meeting.
There were no amounts that were approved by the Audit Committee pursuant to the de minimis exception under Rule 2-01 of Regulation S-X.
According to the registrant’s principal Independent Registered Public Accounting Firm, substantially all of the principal Independent Registered Public Accounting Firm's hours spent on auditing the registrant's financial statements were attributed to work performed by full-time permanent employees of the principal Independent Registered Public Accounting Firm.
***
In connection with the audit of the 2014 and 2015 financial statements, the Fund entered into an engagement letter with PwC. The terms of the 2015 engagement letter required by PwC, and agreed to by the Fund’s Audit Committee, include a provision mandating the use of mediation and arbitration to resolve any controversy or claim between the parties arising out of or relating to the engagement letter or the services provided there-under.
| | |
| ITEM 5. | AUDIT COMMITTEE OF LISTED REGISTRANTS |
| | |
| | Not applicable |
| | |
| ITEM 6. | SCHEDULE OF INVESTMENTS |
| | |
| | Not applicable |
| | |
| ITEM 7. | DISCLOSURE OF PROXY VOTING POLICIES AND PROCEDURES FOR CLOSED-END MANAGEMENT INVESTMENT COMPANIES |
| | |
| | Not applicable |
| | |
| ITEM 8. | PORTFOLIO MANAGERS OF CLOSED-END MANAGEMENT INVESTMENT COMPANIES |
| | |
| | Not applicable |
| | |
| ITEM 9. | PURCHASES OF EQUITY SECURITIES BY CLOSED-END MANAGEMENT INVESTMENT COMPANY AND AFFILIATED PURCHASERS |
| | |
| | Not applicable |
| | |
| ITEM 10. | SUBMISSION OF MATTERS TO A VOTE OF SECURITY HOLDERS |
| | |
| | There were no material changes to the procedures by which shareholders may recommend nominees to the Fund’s Board. The primary function of the Nominating and Governance Committee is to identify and recommend individuals for membership on the Board and oversee the administration of the Board Governance Guidelines. Shareholders may recommend candidates for Board positions by forwarding their correspondence by U.S. mail or courier service to Kenneth C. Froewiss, Independent Chairman, Deutsche Mutual Funds, P.O. Box 390601, Cambridge, MA 02139. |
| | |
| ITEM 11. | CONTROLS AND PROCEDURES |
| | |
| | (a) | The Chief Executive and Financial Officers concluded that the Registrant’s Disclosure Controls and Procedures are effective based on the evaluation of the Disclosure Controls and Procedures as of a date within 90 days of the filing date of this report. |
| | |
| | (b) | There have been no changes in the registrant’s internal control over financial reporting that occurred during the second fiscal quarter of the period covered by this report that has materially affected, or is reasonably likely to materially affect, the registrant’s internal controls over financial reporting. |
| | |
| ITEM 12. | EXHIBITS |
| | |
| | (a)(1) | Code of Ethics pursuant to Item 2 of Form N-CSR is filed and attached hereto as EX-99.CODE ETH. |
| | |
| | (a)(2) | Certification pursuant to Rule 30a-2(a) under the Investment Company Act of 1940 (17 CFR 270.30a-2(a)) is filed and attached hereto as Exhibit 99.CERT. |
| | |
| | (b) | Certification pursuant to Rule 30a-2(b) under the Investment Company Act of 1940 (17 CFR 270.30a-2(b)) is furnished and attached hereto as Exhibit 99.906CERT. |
SIGNATURES
Pursuant to the requirements of the Securities Exchange Act of 1934 and the Investment Company Act of 1940, the registrant has duly caused this report to be signed on its behalf by the undersigned, thereunto duly authorized.
| Registrant: | Cash Management Portfolio |
| | |
| | |
| By: | /s/Brian E. Binder Brian E. Binder President |
| | |
| Date: | February 29, 2016 |
Pursuant to the requirements of the Securities Exchange Act of 1934 and the Investment Company Act of 1940, this report has been signed below by the following persons on behalf of the registrant and in the capacities and on the dates indicated.
| By: | /s/Brian E. Binder Brian E. Binder President |
| | |
| Date: | February 29, 2016 |
| | |
| | |
| | |
| By: | /s/Paul Schubert Paul Schubert Chief Financial Officer and Treasurer |
| | |
| Date: | February 29, 2016 |