UNITED STATES
SECURITIES AND EXCHANGE COMMISSION
WASHINGTON, D. C. 20549
FORM N-CSR
Investment Company Act file number: 811-06071
Deutsche DWS Institutional Funds
(Exact Name of Registrant as Specified in Charter)
345 Park Avenue
New York, NY 10154-0004
(Address of Principal Executive Offices) (Zip Code)
Registrant’s Telephone Number, including Area Code: (212) 250-2500
Diane Kenneally
One International Place
Boston, MA 02110
(Name and Address of Agent for Service)
| Date of fiscal year end: | 8/31 |
| Date of reporting period: | 8/31/2018 |
| ITEM 1. | REPORT TO STOCKHOLDERS |
Table of Contents

August 31, 2018
Annual Report
to Shareholders
DWS U.S. Multi-Factor Fund
(formerly Deutsche U.S. Multi-Factor Fund)

Table of Contents
This report must be preceded or accompanied by a prospectus. To obtain a summary prospectus, if available, or prospectus for any of our Funds, refer to the Account Management Resources information provided in the back of this booklet. We advise you to consider the Fund’s objectives, risks, charges and expenses carefully before investing. The summary prospectus and prospectus contain this and other important information about the Fund. Please read the prospectus carefully before you invest.
Investing involves risk, including possible loss of principal. Stocks may decline in value. Funds investing in a single industry, country or in a limited geographic region generally are more volatile than more diversified funds. Because the Fund seeks to provide exposure to stocks based on the following multifactors — value, momentum, quality, low volatility and size — it is expected exposure to such investment factors will detract from performance in some market environments, as more fully explained in the Fund’s prospectus. Performance of the Fund may diverge from that of the Underlying Index due to operating expenses, transaction costs, cash flows, use of sampling strategies or operational inefficiencies. An investment in any fund should be considered only as a supplement to a complete investment program for those investors willing to accept the risks associated with that fund. Please read the prospectus for details.
The brand DWS represents DWS Group GmbH & Co. KGaA and any of its subsidiaries such as DWS Distributors, Inc. which offers investment products or DWS Investment Management Americas, Inc. and RREEF America L.L.C. which offer advisory services.
NOT FDIC/NCUA INSURED NO BANK GUARANTEE MAY LOSE VALUE NOT A DEPOSIT NOT INSURED BY ANY FEDERAL GOVERNMENT AGENCY
| 2 | | | DWS U.S. Multi-Factor Fund |
Table of Contents
Dear Shareholder:
Earlier this year, we adopted our existing European brand, DWS, globally. In connection with that change, “DWS” has replaced “Deutsche” in most of our open-end mutual fund names, including share classes for certain money market funds which previously included the “Deutsche” in their names.
Building on more than 60 years of experience and a reputation for excellence in Germany and across Europe, DWS is known for the values that we see as core elements to our investors’ success: Excellence, Entrepreneurship, Sustainability and Integrity. We aim to demonstrate these qualities in all that we do.
Please remember that, as part of this name change, our website also has a new address: DWS.com. For your convenience, the deutschefunds.com address will remain live and automatically redirect you to our new site. As always, we invite you to visit us online frequently to access the most current insights from our CIO, economists and investment specialists.
Thank you for your ongoing trust in us. We look forward to bringing you the very best in investment insight, strategies and solutions for many years to come.
Best regards,
 |
Hepsen Uzcan
President, DWS Funds |

Assumptions, estimates and opinions contained in this document constitute our judgment as of the date of the document and are subject to change without notice. Any projections are based on a number of assumptions as to market conditions and there can be no guarantee that any projected results will be achieved. Past performance is not a guarantee of future results.
| DWS U.S. Multi-Factor Fund | | | 3 |
Table of Contents
| Portfolio Management Review | (Unaudited) |
Market Overview and Fund Performance
All performance information below is historical and does not guarantee future results. Returns shown are for Institutional Class shares, unadjusted for sales charges. Investment return and principal fluctuate, so your shares may be worth more or less when redeemed. Current performance may differ from performance data shown. Please visit dws.com for the most recent month-end performance of all share classes. Fund performance includes reinvestment of all distributions. Unadjusted returns do not reflect sales charges and would have been lower if they had.
The Fund posted a total return of 16.76% in the 12-month period ended August 31, 2018. During the same interval, the Fund’s benchmark — the Russell 1000 Comprehensive Factor Index — returned 17.15%. Since our strategy is to replicate the performance of the index before the deduction of expenses, the Fund’s return is normally close to that of the index.
U.S. equities produced a sizable gain over the past 12 months in response to the steady improvement in economic and corporate fundamentals. The period began on a positive note with a strong, lengthy rally that lasted from September through January. During this time, investors were cheered by improving economic conditions overseas, which raised hopes for the emergence of synchronized global growth. The markets also reacted very favorably to the passage of a long-awaited bill that reduced both corporate and individual tax rates in the United States. Not least, the combination of rising corporate profits, meaningful upgrades to future earnings estimates, and notable improvements in companies’ balance sheets propelled stocks through the latter part of 2017 and into January.
At this point, the rally lost steam and stocks traded lower in a volatile fashion through the end of the first calendar quarter. The market, which was vulnerable to adverse headlines due to the extent of its prior rally, weakened on concerns about rising interest rates and the possibility that overseas growth was not as healthy as it appeared in late 2017. However, the market regained its footing in April and proceeded to move gradually higher until the close of the period. Although various issues periodically fueled heightened volatility — including the shifting outlook for U.S. trade policy and disruptions in the emerging markets — equities remained well supported by the combination of hearty domestic growth and the continued gains in corporate earnings.
| 4 | | | DWS U.S. Multi-Factor Fund |
Table of Contents
Investment Strategy and Process
The Fund, using a “passive” or indexing investment approach, seeks investment results, before fees and expenses, that correspond generally to the performance of the Russell 1000 Comprehensive Factor Index (the “Underlying Index”), which is designed to track the equity market performance of companies in the United States selected on the investment style criteria (“factors”) of value, momentum, quality, low volatility and size. The companies eligible for the Underlying Index are derived from its starting universe, the Russell 1000 Index, which is comprised of large-cap equity securities from issuers in the United States. The index provider, Frank Russell Company (“Index Provider”), selects companies from the starting universe for the Underlying Index by applying a consistent rules-based methodology to achieve exposure to companies demonstrating the factors listed below, while considering levels of diversification and capacity:
Value. Value investing generally refers to a strategy that buys stocks whose price is lower than the fundamental value of the stock. The Index Provider’s methodology for measuring the value factor attempts to identify stocks that have low prices relative to their fundamental value and that provide the possibility of excess returns. The value score is calculated by measuring a company’s valuation based on, among other things, cash-flow yield, earnings yield and sales to price and then comparing it to the company’s valuation based on share price.
Momentum. Momentum style investing emphasizes investing in securities that have had higher recent price performance compared to other securities, with the expectation that this will continue to produce short-term excess returns in the future. The momentum score is calculated based on each company’s cumulative 11 month return. The Index Provider’s methodology for measuring the momentum factor attempts to identify stocks with stronger past performance over the short-term.
Quality. The Index Provider’s methodology for measuring the quality factor attempts to identify stocks that are characterized by low debt, stable earnings growth, and other “quality” metrics, with the expectation that these will provide the possibility of excess returns. The quality score is calculated from a company’s leverage and profitability (e.g., return on assets, asset turnover and accruals).
Low Volatility. Volatility is a statistical measurement of the magnitude of increases or decreases in a stock’s price over time. The low volatility score is calculated based on the standard deviation of five years of weekly total returns. Low volatility investing is a strategy based on the concept that stocks that exhibit low volatility tend to perform better than stocks with higher volatility. The Index Provider’s methodology for measuring the low volatility factor attempts to identify stocks with a historically lower risk (and higher return) profile relative to those with higher risk.
Size. The size factor seeks to capture excess returns of smaller companies relative to larger counterparts. The size score is calculated based on the full market capitalization of a company. The Index Provider’s methodology for measuring the size factor attempts to identify stocks of smaller companies relative to their larger counterparts, with the expectation that these will provide the possibility of excess returns.
Companies are weighted in the Underlying Index based on their relative exposure to all five factors with companies that have higher factor scores receiving larger weightings.
| DWS U.S. Multi-Factor Fund | | | 5 |
Table of Contents
At the factor level, momentum performed very well amid investors’ healthy appetite for risk and preference for stocks with strong recent price performance. Quality and size also outpaced the broader market, while the value and low volatility factors lagged. The Russell 1000 Comprehensive Factor Index, while posting a double-digit gain, trailed the 19.82% return of the Russell 1000 Index due largely to its underweights or zero weightings in many of the mega-cap technology stocks that drove the returns of the broader market.
| “At | the factor level, momentum performed very well amid investors’ healthy appetite for risk and preference for stocks with strong recent price performance.” |
Fund Performance
We continue to follow a passive strategy designed to provide returns that approximate those of the benchmark. Since we use a passive strategy, the following discussion refers to both the Fund and the index.
Within the benchmark, energy stocks generated the strongest total returns as the sector rebounded from previously depressed levels due to the advance in oil prices. However, the rally in energy had a limited effect on index performance due to the sector’s low weighting of 3.1% (as of August 31, 2018). Technology stocks also produced above-average gains and made a large contribution to overall returns due to their higher benchmark weighting. The tech sector was propelled by the combination of rising end-market demand and investors’ general preference for growth stocks. The health care sector, which was led by services companies and mid-cap biotechnology stocks, also performed very well. The index was further boosted by the relative strength of stocks with a higher degree of economic sensitivity, including those in the industrials and consumer discretionary sectors.
On the other end of the spectrum, the real estate, utilities, and telecommunications services sectors registered positive returns but finished well behind the benchmark. All three groups were pressured by their defensive characteristics and higher degree of interest-rate sensitivity — traits that were out of step with the trends driving the broader market. Materials and consumer staples stocks also failed to keep pace with the index.
| 6 | | | DWS U.S. Multi-Factor Fund |
Table of Contents
At the individual stock level, NetApp, Inc., Progressive Corp., and Ross Stores, Inc., were the leading contributors in the past 12 months. PG&E Corp., Manpower, Inc., and Mohawk Industries, Inc., were the largest detractors.
The Fund used derivatives, primarily futures contracts on domestic stock indexes. The purpose of these holdings was to add equity exposure rather than holding cash. The use of derivatives had no material impact on the Fund’s relative performance.
Outlook and Positioning
The Fund’s largest sector weightings as of August 31, 2018 were consumer discretionary, industrials, information technology, and financials, and its top individual holdings were Target Corp., Dollar General Corp., and Ross Stores, Inc.
Portfolio Management Team
Bryan Richards, CFA, Managing Director
Portfolio Manager of the Fund. Began managing the Fund in 2017.
| – | Joined DWS in 2011 with 11 years of industry experience. Prior to his current role, he served as the primary portfolio manager for the PowerShares DB Commodity ETFs until their sale in 2015. Prior to joining DWS he served as an equity analyst for Fairhaven Capital LLC, a long/short equity fund, and at XShares Advisors, an ETF issuer based in New York. |
| – | Head of Passive Portfolio Management, Americas: New York. |
| – | BS in Finance, Boston College. |
Patrick Dwyer, Director
Portfolio Manager of the Fund. Began managing the Fund in 2017.
| – | Joined DWS in 2016 with 16 years of industry experience. Prior to joining DWS, he was the head of Northern Trust’s Equity Index, ETF, and Overlay portfolio management team in Chicago, managing portfolios for North American based clients. His time at Northern Trust included working in New York, Chicago, and in Hong Kong building a portfolio management desk. Prior to joining Northern Trust in 2003, he participated in the Deutsche Asset Management graduate training program. He rotated through the domestic fixed income and US structured equity fund management groups. |
| – | Lead Equity Portfolio Manager, US Passive Equities: New York. |
| – | BS in Finance, Rutgers University. |
Navid Sohrabi, CFA, Vice President
Portfolio Manager of the Fund. Began managing the Fund in December 2017.
| – | Joined DWS in 2015 with 13 years of industry experience. Prior to his current role, he was a portfolio manager and quantitative multi-asset strategist since 2015. Prior to joining DWS, he served as a derivatives trader since 2005 for several institutional asset managers and commodity trading advisors where he developed and managed systematic risk and trading strategies in equities, options, foreign exchange and futures. |
| – | Equity Portfolio Manager, US Passive Equities: New York. |
| – | BA in Neurobiology, University of California, Berkeley. Masters of Financial Engineering, University of California, Los Angeles. |
| DWS U.S. Multi-Factor Fund | | | 7 |
Table of Contents
Shlomo Bassous, Vice President
Portfolio Manager of the Fund. Began managing the Fund in December 2017.
| – | Joined DWS in 2017 with 13 years of industry experience. Prior to joining DWS, Mr. Bassous worked at Northern Trust where he filled a variety of operational functions supporting portfolio management. In 2010 he began managing equity portfolios on behalf of institutional clients across a variety of global benchmarks. Before joining Northern Trust in 2007, he worked at The Bank of New York Mellon and Morgan Stanley in a variety of roles supporting equity trading and portfolio management. |
| – | Equity Portfolio Manager, US Passive Equities: New York. |
| – | BS in Finance, Yeshiva University. |
Charlotte Cipolletti, Associate
Portfolio Manager of the Fund. Began managing the Fund in December 2017.
| – | Joined DWS in 2015. Prior to joining, she served in an internship capacity at Deutsche Asset Management, Deutsche Wealth Management, Private Banking and National Financial Partners. |
| – | Equity Portfolio Manager, US Passive Equities, New York. |
| – | BA in Sustainable Development, Columbia University. |
The views expressed reflect those of the portfolio management team only through the end of the period of the report as stated on the cover. The management team’s views are subject to change at any time based on market and other conditions and should not be construed as a recommendation. Past performance is no guarantee of future results. Current and future portfolio holdings are subject to risk.
Terms to Know
The Russell 1000® Comprehensive Factor Index (the “Underlying Index”) is an unmanaged index which is designed to provide exposure to the US large-cap equities based on five investment style factors — Value, Momentum, Quality, Low Volatility and Size.
The Russell 1000 Index is an unmanaged index that measures the performance of the 1,000 largest companies in the Russell 3000® Index, which represents approximately 92% of the total market capitalization of the Russell 3000 Index. Index returns do not reflect any fees or expenses and it is not possible to invest directly into an index.
Contribution and detraction incorporate both a stock’s total return and its weighting in the Fund.
Derivatives are contracts whose values can be based on a variety of instruments, including indices, currencies or securities. They can be utilized for a variety of reasons, including for hedging purposes, for risk management; for non-hedging purposes to seek to enhance potential gains, or as a substitute for direct investment in a particular asset class or to keep cash on hand to meet shareholder redemptions. Investing in derivatives entails special risks relating to liquidity, leverage and credit that may reduce returns and/or increase volatility.
Futures contracts are contractual agreements to buy or sell a particular commodity or financial instrument at a predetermined price in the future.
| 8 | | | DWS U.S. Multi-Factor Fund |
Table of Contents
| Performance Summary | August 31, 2018 (Unaudited) |
| Class R6 | 1-Year | Life of Fund* | ||||||
| Average Annual Total Returns as of 8/31/18 | ||||||||
| No Sales Charges | 16.78% | 14.31% | ||||||
| Russell 1000® Comprehensive Factor Index† | 17.15% | 20.05% | ||||||
| Institutional Class | 1-Year | Life of Fund* | ||||||
| Average Annual Total Returns as of 8/31/18 | ||||||||
| No Sales Charges | 16.76% | 14.30% | ||||||
| Russell 1000® Comprehensive Factor Index† | 17.15% | 20.05% | ||||||
Performance in the Average Annual Total Returns table above and the Growth of an Assumed $1,000,000 Investment line graph that follows is historical and does not guarantee future results. Investment return and principal fluctuate, so your shares may be worth more or less when redeemed. Current performance may differ from performance data shown. Please visit dws.com for the Fund’s most recent month-end performance. Fund performance includes reinvestment of all distributions.
The gross expense ratios of the Fund, as stated in the fee table of the prospectus dated December 21, 2017 are 0.62% and 0.68% for Class R6 and Institutional Class shares, respectively, and may differ from the expense ratio disclosed in the Financial Highlights table in this report.
Index returns do not reflect any fees or expenses and it is not possible to invest directly into an index.
Performance figures do not reflect the deduction of taxes that a shareholder would pay on fund distributions or the redemption of fund shares.
Generally accepted accounting principles require adjustments to be made to the net assets of the Fund at period end for financial reporting purposes only, and as such, the total return based on the unadjusted net asset value per share may differ from the total return reported in the financial highlights.
| DWS U.S. Multi-Factor Fund | | | 9 |
Table of Contents
| Growth of an Assumed $1,000,000 Investment |
The growth of $1,000,000 is cumulative.
The minimum initial investment for Institutional Class shares is $1,000,000.
| * | The Fund commenced operations on May 1, 2017. The performance shown for the index is for the time period of April 30, 2017 through August 31, 2018, which is based on the performance period of the life of the Fund. |
| † | Russell 1000® Comprehensive Factor Index (the “Underlying Index”) is an unmanaged index which is designed to provide exposure to the US large-cap equities based on five investment style factors — Value, Momentum, Quality, Low Volatility and Size. |
| Class R6 | Institutional Class | |||||||
| Net Asset Value | ||||||||
| 8/31/18 | $ | 11.77 | $ | 11.77 | ||||
| 8/31/17 | $ | 10.22 | $ | 10.22 | ||||
| Distribution Information as of 8/31/18 | ||||||||
| Income Dividends, Twelve Months | $ | .14 | $ | .14 | ||||
| Capital Gain Distributions, Twelve Months | $ | .01 | $ | .01 | ||||
| 10 | | | DWS U.S. Multi-Factor Fund |
Table of Contents
| DWS U.S. Multi-Factor Fund | | | 11 |
Table of Contents
| Ten Largest Equity Holdings at August 31, 2018 (7.2% of Net Assets) | Percent | |||||
| 1 | Target Corp. | 1.0% | ||||
| Operator of general merchandise and discount stores | ||||||
| 2 | Dollar General Corp. | 0.9% | ||||
| Operates a chain of discount retail stores | ||||||
| 3 | Ross Stores, Inc. | 0.8% | ||||
| Operates a multi-chain of retail stores | ||||||
| 4 | Lear Corp. | 0.7% | ||||
| Manufactures automobile parts | ||||||
| 5 | Torchmark Corp. | 0.7% | ||||
| Provider of insurance and financial services | ||||||
| 6 | Centene Corp. | 0.7% | ||||
| Multi-line managed care organization that provides Medicaid and Medicaid-related programs | ||||||
| 7 | LyondellBasell Industries NV | 0.6% | ||||
| Multinational chemical company | ||||||
| 8 | Valero Energy Corp. | 0.6% | ||||
| Owns and operates refineries | ||||||
| 9 | CDW Corp. | 0.6% | ||||
| Provides information technology products and services | ||||||
| 10 | Phillips 66 | 0.6% | ||||
| Diversified energy manufacturing and logistics company | ||||||
Portfolio holdings and characteristics are subject to change.
For more complete details about the Fund’s investment portfolio, see page 13. A quarterly Fact Sheet is available on dws.com or upon request. Please see the Account Management Resources section on page 63 for contact information.
| 12 | | | DWS U.S. Multi-Factor Fund |
Table of Contents
| Investment Portfolio | as of August 31, 2018 |
| Shares | Value ($) | |||||||
| Common Stocks 98.1% | ||||||||
| Consumer Discretionary 18.9% | ||||||||
Auto Components 1.9% | ||||||||
Adient PLC | 1,378 | 59,653 | ||||||
Aptiv PLC | 6,121 | 538,709 | ||||||
BorgWarner, Inc. | 19,600 | 857,892 | ||||||
Gentex Corp. | 58,218 | 1,361,137 | ||||||
Goodyear Tire & Rubber Co. | 2,239 | 50,803 | ||||||
Lear Corp. | 15,189 | 2,463,656 | ||||||
Visteon Corp.* | 7,269 | 802,425 | ||||||
|
| |||||||
| 6,134,275 | ||||||||
Automobiles 0.4% | ||||||||
Ford Motor Co. | 40,353 | 382,546 | ||||||
General Motors Co. | 10,398 | 374,848 | ||||||
Harley-Davidson, Inc. | 3,185 | 135,745 | ||||||
Thor Industries, Inc. | 5,863 | 559,565 | ||||||
|
| |||||||
| 1,452,704 | ||||||||
Distributors 0.3% | ||||||||
Genuine Parts Co. | 2,110 | 210,684 | ||||||
LKQ Corp.* | 6,135 | 211,780 | ||||||
Pool Corp. | 4,347 | 714,038 | ||||||
|
| |||||||
| 1,136,502 | ||||||||
Diversified Consumer Services 0.8% | ||||||||
Bright Horizons Family Solutions, Inc.* | 3,582 | 427,798 | ||||||
Graham Holdings Co. “B” | 344 | 193,552 | ||||||
Grand Canyon Education, Inc.* | 5,102 | 607,852 | ||||||
H&R Block, Inc. | 8,548 | 231,309 | ||||||
Service Corp. International | 16,451 | 690,284 | ||||||
ServiceMaster Global Holdings, Inc.* | 6,240 | 376,085 | ||||||
|
| |||||||
| 2,526,880 | ||||||||
Hotels, Restaurants & Leisure 2.6% | ||||||||
Aramark | 10,247 | 420,947 | ||||||
Carnival Corp. | 8,929 | 549,044 | ||||||
Chipotle Mexican Grill, Inc.* | 194 | 92,185 | ||||||
Choice Hotels International, Inc. | 3,234 | 252,414 | ||||||
Darden Restaurants, Inc. | 7,584 | 880,047 | ||||||
Domino’s Pizza, Inc. | 1,989 | 593,836 | ||||||
Dunkin’ Brands Group, Inc. | 3,071 | 223,845 | ||||||
Extended Stay America, Inc. (Units) | 7,646 | 154,296 | ||||||
Hilton Grand Vacations, Inc.* | 6,302 | 205,823 | ||||||
Hilton Worldwide Holdings, Inc. | 4,441 | 344,710 | ||||||
The accompanying notes are an integral part of the financial statements.
| DWS U.S. Multi-Factor Fund | | | 13 |
Table of Contents
| Shares | Value ($) | |||||||
Hyatt Hotels Corp. “A” | 5,824 | 450,545 | ||||||
International Game Technology PLC | 973 | 20,472 | ||||||
Las Vegas Sands Corp. | 1,746 | 114,223 | ||||||
Marriott International, Inc. “A” | 4,454 | 563,297 | ||||||
McDonald’s Corp. | 1,042 | 169,044 | ||||||
MGM Resorts International | 3,669 | 106,364 | ||||||
Norwegian Cruise Line Holdings Ltd.* | 4,128 | 221,302 | ||||||
Royal Caribbean Cruises Ltd. | 2,669 | 327,166 | ||||||
Six Flags Entertainment Corp. | 6,201 | 418,878 | ||||||
Starbucks Corp. | 5,900 | 315,355 | ||||||
The Wendy’s Co. | 3,661 | 64,617 | ||||||
Vail Resorts, Inc. | 193 | 57,524 | ||||||
Wyndham Destinations, Inc. | 8,407 | 371,589 | ||||||
Wyndham Hotels & Resorts, Inc. | 6,932 | 393,391 | ||||||
Wynn Resorts Ltd. | 214 | 31,745 | ||||||
Yum China Holdings, Inc. | 4,191 | 162,108 | ||||||
Yum! Brands, Inc. | 12,262 | 1,065,445 | ||||||
|
| |||||||
| 8,570,212 | ||||||||
Household Durables 1.7% | ||||||||
D.R. Horton, Inc. | 16,553 | 736,774 | ||||||
Garmin Ltd. | 13,706 | 933,927 | ||||||
Leggett & Platt, Inc. | 5,121 | 232,698 | ||||||
Lennar Corp. “A” | 4,150 | 214,431 | ||||||
Mohawk Industries, Inc.* | 1,429 | 273,782 | ||||||
NVR, Inc.* | 448 | 1,195,466 | ||||||
PulteGroup, Inc. | 39,258 | 1,097,261 | ||||||
Toll Brothers, Inc. | 19,036 | 689,674 | ||||||
Whirlpool Corp. | 1,786 | 223,214 | ||||||
|
| |||||||
| 5,597,227 | ||||||||
Internet & Direct Marketing Retail 0.1% | ||||||||
Booking Holdings, Inc.* | 70 | 136,609 | ||||||
Expedia Group, Inc. | 274 | 35,757 | ||||||
Qurate Retail, Inc. “A”* | 3,447 | 71,663 | ||||||
|
| |||||||
| 244,029 | ||||||||
Leisure Products 0.4% | ||||||||
Brunswick Corp. | 5,910 | 392,542 | ||||||
Hasbro, Inc. | 3,070 | 304,882 | ||||||
Polaris Industries, Inc. | 5,983 | 648,856 | ||||||
|
| |||||||
| 1,346,280 | ||||||||
Media 1.8% | ||||||||
AMC Networks, Inc. “A”* | 2,751 | 172,790 | ||||||
Cable One, Inc. | 44 | 36,860 | ||||||
CBS Corp. “B” | 4,391 | 232,811 | ||||||
Charter Communications, Inc. “A”* | 334 | 103,674 | ||||||
The accompanying notes are an integral part of the financial statements.
| 14 | | | DWS U.S. Multi-Factor Fund |
Table of Contents
| Shares | Value ($) | |||||||
Cinemark Holdings, Inc. | 4,687 | 174,919 | ||||||
Comcast Corp. “A” | 2,872 | 106,235 | ||||||
Discovery, Inc. “A”* | 779 | 21,680 | ||||||
Discovery, Inc. “C”* | 4,090 | 104,868 | ||||||
Interpublic Group of Companies, Inc. | 32,629 | 761,887 | ||||||
John Wiley & Sons, Inc. “A” | 9,543 | 616,001 | ||||||
Liberty Broadband Corp. “C”* | 2,611 | 211,726 | ||||||
Liberty Media Corp.-Liberty SiriusXM “A”* | 3,370 | 157,514 | ||||||
Liberty Media Corp.-Liberty SiriusXM “C”* | 6,827 | 321,142 | ||||||
Lions Gate Entertainment Corp. “B” | 2,609 | 58,572 | ||||||
Live Nation Entertainment, Inc.* | 10,736 | 533,364 | ||||||
Madison Square Garden Co. “A”* | 1,177 | 355,383 | ||||||
News Corp. “A” | 11,156 | 145,809 | ||||||
Omnicom Group, Inc. | 9,520 | 659,926 | ||||||
Sirius XM Holdings, Inc. (a) | 32,716 | 232,284 | ||||||
Tribune Media Co. “A” | 121 | 4,464 | ||||||
Twenty-First Century Fox, Inc. “A” | 7,413 | 336,550 | ||||||
Twenty-First Century Fox, Inc. “B” | 3,602 | 161,730 | ||||||
Viacom, Inc. “B” | 3,319 | 97,180 | ||||||
Walt Disney Co. | 2,129 | 238,491 | ||||||
|
| |||||||
| 5,845,860 | ||||||||
Multiline Retail 2.8% | ||||||||
Dollar General Corp. | 26,201 | 2,822,634 | ||||||
Dollar Tree, Inc.* | 14,669 | 1,181,001 | ||||||
Kohl’s Corp. | 14,022 | 1,109,280 | ||||||
Macy’s, Inc. | 12,718 | 464,843 | ||||||
Nordstrom, Inc. | 6,633 | 416,884 | ||||||
Target Corp. | 37,891 | 3,315,463 | ||||||
|
| |||||||
| 9,310,105 | ||||||||
Specialty Retail 4.4% | ||||||||
Advance Auto Parts, Inc. | 1,401 | 229,806 | ||||||
AutoNation, Inc.* | 4,253 | 192,874 | ||||||
AutoZone, Inc.* | 1,791 | 1,373,482 | ||||||
Best Buy Co., Inc. | 12,115 | 963,869 | ||||||
Burlington Stores, Inc.* | 3,757 | 631,852 | ||||||
CarMax, Inc.* | 3,293 | 257,019 | ||||||
Dick’s Sporting Goods, Inc. | 1,689 | 63,236 | ||||||
Foot Locker, Inc. | 2,629 | 129,610 | ||||||
Home Depot, Inc. | 1,069 | 214,623 | ||||||
L Brands, Inc. | 1,878 | 49,635 | ||||||
Lowe’s Companies, Inc. | 6,144 | 668,160 | ||||||
O’Reilly Automotive, Inc.* | 4,232 | 1,419,497 | ||||||
Penske Automotive Group, Inc. | 373 | 19,631 | ||||||
Ross Stores, Inc. | 25,970 | 2,487,407 | ||||||
The Gap, Inc. | 19,173 | 581,901 | ||||||
The accompanying notes are an integral part of the financial statements.
| DWS U.S. Multi-Factor Fund | | | 15 |
Table of Contents
| Shares | Value ($) | |||||||
The Michaels Companies, Inc.* | 5,585 | 94,889 | ||||||
Tiffany & Co. | 4,587 | 562,596 | ||||||
TJX Companies, Inc. | 14,337 | 1,576,640 | ||||||
Tractor Supply Co. | 20,416 | 1,802,324 | ||||||
Ulta Salon, Cosmetics & Fragrance, Inc.* | 509 | 132,340 | ||||||
Urban Outfitters, Inc.* | 4,159 | 193,310 | ||||||
Williams-Sonoma, Inc. (a) | 10,151 | 712,905 | ||||||
|
| |||||||
| 14,357,606 | ||||||||
Textiles, Apparel & Luxury Goods 1.7% | ||||||||
Carter’s, Inc. | 8,972 | 950,404 | ||||||
Columbia Sportswear Co. | 1,760 | 159,632 | ||||||
Hanesbrands, Inc. | 8,098 | 142,039 | ||||||
Lululemon Athletica, Inc.* | 1,584 | 245,409 | ||||||
Michael Kors Holdings Ltd.* | 6,317 | 458,740 | ||||||
NIKE, Inc. “B” | 8,524 | 700,673 | ||||||
PVH Corp. | 3,032 | 434,061 | ||||||
Ralph Lauren Corp. | 5,918 | 785,970 | ||||||
Tapestry, Inc. | 9,330 | 472,938 | ||||||
VF Corp. | 12,249 | 1,128,500 | ||||||
|
| |||||||
| 5,478,366 | ||||||||
| Consumer Staples 5.5% | ||||||||
Beverages 0.4% | ||||||||
Brown-Forman Corp. “A” | 1,034 | 54,430 | ||||||
Brown-Forman Corp. “B” | 7,109 | 371,232 | ||||||
Constellation Brands, Inc. “A” | 2,362 | 491,768 | ||||||
Molson Coors Brewing Co. “B” | 2,162 | 144,292 | ||||||
Monster Beverage Corp.* | 2,273 | 138,403 | ||||||
PepsiCo, Inc. | 604 | 67,654 | ||||||
|
| |||||||
| 1,267,779 | ||||||||
Food & Staples Retailing 2.2% | ||||||||
Casey’s General Stores, Inc. | 3,093 | 353,128 | ||||||
Costco Wholesale Corp. | 6,991 | 1,629,812 | ||||||
Kroger Co. | 47,586 | 1,498,959 | ||||||
Sprouts Farmers Market, Inc.* | 6,971 | 184,522 | ||||||
Sysco Corp. | 21,486 | 1,607,583 | ||||||
U.S. Foods Holding Corp.* | 48,014 | 1,564,776 | ||||||
Walgreens Boots Alliance, Inc. | 4,702 | 322,369 | ||||||
Walmart, Inc. | 1,109 | 106,309 | ||||||
|
| |||||||
| 7,267,458 | ||||||||
Food Products 2.2% | ||||||||
Archer-Daniels-Midland Co. | 19,624 | 989,050 | ||||||
Bunge Ltd. | 6,761 | 439,330 | ||||||
Campbell Soup Co. | 2,496 | 98,467 | ||||||
Conagra Brands, Inc. | 11,614 | 426,814 | ||||||
The accompanying notes are an integral part of the financial statements.
| 16 | | | DWS U.S. Multi-Factor Fund |
Table of Contents
| Shares | Value ($) | |||||||
Flowers Foods, Inc. | 14,003 | 282,160 | ||||||
General Mills, Inc. | 6,264 | 288,207 | ||||||
Hain Celestial Group, Inc.* | 1,624 | 46,381 | ||||||
Hormel Foods Corp. | 13,743 | 538,038 | ||||||
Ingredion, Inc. | 5,275 | 533,144 | ||||||
Kellogg Co. | 2,826 | 202,879 | ||||||
Lamb Weston Holdings, Inc. | 23,847 | 1,612,057 | ||||||
McCormick & Co., Inc. | 399 | 49,827 | ||||||
Mondelez International, Inc. “A” | 4,132 | 176,519 | ||||||
Pinnacle Foods, Inc. | 3,131 | 207,961 | ||||||
Post Holdings, Inc.* | 701 | 68,179 | ||||||
Seaboard Corp. | 15 | 55,272 | ||||||
The Hershey Co. | 3,226 | 324,278 | ||||||
The JM Smucker Co. | 3,970 | 410,419 | ||||||
Tyson Foods, Inc. “A” | 5,238 | 328,999 | ||||||
|
| |||||||
| 7,077,981 | ||||||||
Household Products 0.5% | ||||||||
Church & Dwight Co., Inc. | 3,499 | 197,973 | ||||||
Clorox Co. | 3,029 | 439,144 | ||||||
Colgate-Palmolive Co. | 3,248 | 215,700 | ||||||
Energizer Holdings, Inc. | 3,375 | 214,616 | ||||||
Kimberly-Clark Corp. | 3,253 | 375,852 | ||||||
Procter & Gamble Co. | 1,548 | 128,407 | ||||||
|
| |||||||
| 1,571,692 | ||||||||
Personal Products 0.2% | ||||||||
Estee Lauder Companies, Inc. “A” | 3,903 | 546,888 | ||||||
Herbalife Nutrition Ltd.* | 1,383 | 78,264 | ||||||
Nu Skin Enterprises, Inc. “A” | 238 | 18,945 | ||||||
|
| |||||||
| 644,097 | ||||||||
Tobacco 0.0% | ||||||||
Altria Group, Inc. | 1,526 | 89,301 | ||||||
Philip Morris International, Inc. | 848 | 66,051 | ||||||
|
| |||||||
| 155,352 | ||||||||
| Energy 3.1% | ||||||||
Energy Equipment & Services 0.2% | ||||||||
Apergy Corp.* | 3,803 | 171,972 | ||||||
Halliburton Co. | 5,474 | 218,358 | ||||||
Helmerich & Payne, Inc. | 983 | 64,455 | ||||||
National Oilwell Varco, Inc. | 2,254 | 106,096 | ||||||
Schlumberger Ltd. | 958 | 60,507 | ||||||
|
| |||||||
| 621,388 | ||||||||
The accompanying notes are an integral part of the financial statements.
| DWS U.S. Multi-Factor Fund | | | 17 |
Table of Contents
| Shares | Value ($) | |||||||
Oil, Gas & Consumable Fuels 2.9% | ||||||||
Anadarko Petroleum Corp. | 1,034 | 66,590 | ||||||
Andeavor | 1,006 | 153,707 | ||||||
Antero Resources Corp.* | 2,996 | 55,456 | ||||||
Apache Corp. | 2,889 | 126,625 | ||||||
Cabot Oil & Gas Corp. | 2,799 | 66,700 | ||||||
Centennial Resource Development, Inc. “A”* | 3,961 | 76,328 | ||||||
Cheniere Energy, Inc.* | 1,038 | 69,473 | ||||||
Chevron Corp. | 1,425 | 168,805 | ||||||
Cimarex Energy Co. | 3,653 | 308,605 | ||||||
Concho Resources, Inc.* | 1,735 | 237,955 | ||||||
ConocoPhillips | 3,466 | 254,508 | ||||||
Devon Energy Corp. | 2,976 | 127,760 | ||||||
Diamondback Energy, Inc. | 1,384 | 167,575 | ||||||
Energen Corp.* | 972 | 75,379 | ||||||
EOG Resources, Inc. | 2,194 | 259,397 | ||||||
Exxon Mobil Corp. | 217 | 17,397 | ||||||
HollyFrontier Corp. | 8,069 | 601,302 | ||||||
Kinder Morgan, Inc. | 2,042 | 36,143 | ||||||
Marathon Petroleum Corp. | 16,886 | 1,389,549 | ||||||
Murphy Oil Corp. | 1,816 | 55,987 | ||||||
Occidental Petroleum Corp. | 8,398 | 670,748 | ||||||
ONEOK, Inc. | 1,391 | 91,681 | ||||||
PBF Energy, Inc. “A” | 4,306 | 223,568 | ||||||
Phillips 66 | 15,915 | 1,886,087 | ||||||
Pioneer Natural Resources Co. | 984 | 171,905 | ||||||
Valero Energy Corp. | 17,998 | 2,121,604 | ||||||
|
| |||||||
| 9,480,834 | ||||||||
| Financials 12.6% | ||||||||
Banks 1.7% | ||||||||
Associated Banc-Corp. | 3,286 | 89,544 | ||||||
Bank of Hawaii Corp. | 492 | 40,900 | ||||||
Bank OZK | 1,712 | 69,268 | ||||||
BankUnited, Inc. | 7,602 | 294,882 | ||||||
BB&T Corp. | 5,814 | 300,351 | ||||||
BOK Financial Corp. | 492 | 50,455 | ||||||
CIT Group, Inc. | 2,027 | 109,944 | ||||||
Citigroup, Inc. | 908 | 64,686 | ||||||
Citizens Financial Group, Inc. | 4,458 | 183,491 | ||||||
Comerica, Inc. | 2,512 | 244,870 | ||||||
Commerce Bancshares, Inc. | 1,302 | 92,520 | ||||||
Cullen/Frost Bankers, Inc. | 960 | 106,454 | ||||||
East West Bancorp., Inc. | 2,373 | 150,424 | ||||||
Fifth Third Bancorp. | 14,600 | 429,678 | ||||||
First Citizens BancShares, Inc. “A” | 193 | 91,677 | ||||||
The accompanying notes are an integral part of the financial statements.
| 18 | | | DWS U.S. Multi-Factor Fund |
Table of Contents
| Shares | Value ($) | |||||||
First Horizon National Corp. | 1,462 | 26,930 | ||||||
First Republic Bank | 378 | 38,401 | ||||||
FNB Corp. | 1,761 | 23,685 | ||||||
Huntington Bancshares, Inc. | 15,314 | 248,240 | ||||||
KeyCorp | 8,403 | 177,051 | ||||||
M&T Bank Corp. | 1,688 | 299,029 | ||||||
PacWest Bancorp. | 2,119 | 106,988 | ||||||
People’s United Financial, Inc. | 3,363 | 62,249 | ||||||
Pinnacle Financial Partners, Inc. | 307 | 19,817 | ||||||
PNC Financial Services Group, Inc. | 1,447 | 207,702 | ||||||
Popular, Inc. | 2,361 | 118,853 | ||||||
Prosperity Bancshares, Inc. | 575 | 43,033 | ||||||
Regions Financial Corp. | 18,100 | 352,226 | ||||||
Signature Bank | 305 | 35,301 | ||||||
SunTrust Banks, Inc. | 5,262 | 387,073 | ||||||
SVB Financial Group* | 194 | 62,614 | ||||||
Synovus Financial Corp. | 3,180 | 159,191 | ||||||
TCF Financial Corp. | 4,484 | 113,669 | ||||||
Texas Capital Bancshares, Inc.* | 651 | 57,874 | ||||||
U.S. Bancorp. | 117 | 6,331 | ||||||
Umpqua Holdings Corp. | 5,340 | 114,276 | ||||||
Webster Financial Corp. | 1,847 | 120,757 | ||||||
Western Alliance Bancorp.* | 1,056 | 60,878 | ||||||
Wintrust Financial Corp. | 1,247 | 110,422 | ||||||
Zions Bancorp. | 4,286 | 228,401 | ||||||
|
| |||||||
| 5,500,135 | ||||||||
Capital Markets 4.2% | ||||||||
Affiliated Managers Group, Inc. | 2,981 | 435,494 | ||||||
Ameriprise Financial, Inc. | 1,665 | 236,363 | ||||||
Bank of New York Mellon Corp. | 3,391 | 176,841 | ||||||
BGC Partners, Inc. “A” | 23,852 | 296,242 | ||||||
BlackRock, Inc. | 252 | 120,723 | ||||||
Cboe Global Markets, Inc. | 5,544 | 558,835 | ||||||
Charles Schwab Corp. | 899 | 45,660 | ||||||
CME Group, Inc. | 770 | 134,542 | ||||||
E*TRADE Financial Corp.* | 3,230 | 190,118 | ||||||
Eaton Vance Corp. | 9,738 | 513,485 | ||||||
Evercore, Inc. “A” | 9,532 | 1,011,822 | ||||||
FactSet Research Systems, Inc. | 2,204 | 505,575 | ||||||
Franklin Resources, Inc. | 9,200 | 292,008 | ||||||
Interactive Brokers Group, Inc. “A” | 869 | 54,017 | ||||||
Intercontinental Exchange, Inc. | 2,579 | 196,597 | ||||||
Invesco Ltd. | 6,519 | 157,108 | ||||||
Lazard Ltd. “A” | 28,028 | 1,349,268 | ||||||
Legg Mason, Inc. | 4,040 | 126,048 | ||||||
The accompanying notes are an integral part of the financial statements.
| DWS U.S. Multi-Factor Fund | | | 19 |
Table of Contents
| Shares | Value ($) | |||||||
LPL Financial Holdings, Inc. | 6,621 | 438,575 | ||||||
MarketAxess Holdings, Inc. | 472 | 89,595 | ||||||
Moody’s Corp. | 4,152 | 739,139 | ||||||
Morningstar, Inc. | 3,005 | 427,672 | ||||||
MSCI, Inc. | 5,611 | 1,011,439 | ||||||
Nasdaq, Inc. | 6,181 | 589,915 | ||||||
Northern Trust Corp. | 1,823 | 195,900 | ||||||
Raymond James Financial, Inc. | 3,949 | 367,415 | ||||||
S&P Global, Inc. | 4,271 | 884,310 | ||||||
SEI Investments Co. | 11,469 | 723,464 | ||||||
State Street Corp. | 2,988 | 259,687 | ||||||
T. Rowe Price Group, Inc. | 12,308 | 1,426,374 | ||||||
TD Ameritrade Holding Corp. | 2,070 | 121,240 | ||||||
The Goldman Sachs Group, Inc. | 139 | 33,056 | ||||||
|
| |||||||
| 13,708,527 | ||||||||
Consumer Finance 1.0% | ||||||||
Ally Financial, Inc. | 16,241 | 436,558 | ||||||
American Express Co. | 4,027 | 426,782 | ||||||
Capital One Financial Corp. | 3,804 | 376,938 | ||||||
Credit Acceptance Corp.* | 823 | 375,872 | ||||||
Discover Financial Services | 12,913 | 1,008,764 | ||||||
Santander Consumer U.S.A. Holdings, Inc. | 640 | 13,811 | ||||||
Synchrony Financial | 16,764 | 530,916 | ||||||
|
| |||||||
| 3,169,641 | ||||||||
Diversified Financial Services 0.1% | ||||||||
Jefferies Financial Group, Inc. | 13,619 | 316,233 | ||||||
Voya Financial, Inc. | 397 | 19,878 | ||||||
|
| |||||||
| 336,111 | ||||||||
Insurance 5.2% | ||||||||
Aflac, Inc. | 14,806 | 684,629 | ||||||
Alleghany Corp. | 83 | 52,438 | ||||||
Allstate Corp. | 6,552 | 658,935 | ||||||
American Financial Group, Inc. | 2,792 | 310,917 | ||||||
American National Insurance Co. | 188 | 24,128 | ||||||
Aon PLC | 3,141 | 457,204 | ||||||
Arch Capital Group Ltd.* | 6,467 | 197,696 | ||||||
Arthur J. Gallagher & Co. | 12,433 | 896,917 | ||||||
Assurant, Inc. | 1,154 | 118,654 | ||||||
Assured Guaranty Ltd. | 4,665 | 190,052 | ||||||
Athene Holding Ltd. “A”* | 3,482 | 172,916 | ||||||
Brighthouse Financial, Inc.* | 1,607 | 66,707 | ||||||
Brown & Brown, Inc. | 21,258 | 647,944 | ||||||
Chubb Ltd. | 926 | 125,232 | ||||||
Cincinnati Financial Corp. | 4,663 | 357,512 | ||||||
CNA Financial Corp. | 1,312 | 58,909 | ||||||
The accompanying notes are an integral part of the financial statements.
| 20 | | | DWS U.S. Multi-Factor Fund |
Table of Contents
| Shares | Value ($) | |||||||
Erie Indemnity Co. “A” | 1,426 | 176,154 | ||||||
Everest Re Group Ltd. | 853 | 190,236 | ||||||
Fidelity National Financial, Inc. | 41,439 | 1,661,704 | ||||||
First American Financial Corp. | 13,702 | 779,096 | ||||||
Hanover Insurance Group, Inc. | 3,632 | 444,884 | ||||||
Hartford Financial Services Group, Inc. | 411 | 20,702 | ||||||
Lincoln National Corp. | 1,610 | 105,584 | ||||||
Loews Corp. | 7,354 | 369,980 | ||||||
Markel Corp.* | 46 | 55,605 | ||||||
Marsh & McLennan Companies, Inc. | 9,721 | 822,688 | ||||||
Mercury General Corp. | 757 | 40,802 | ||||||
MetLife, Inc. | 3,482 | 159,789 | ||||||
Old Republic International Corp. | 27,054 | 600,058 | ||||||
Principal Financial Group, Inc. | 3,022 | 166,784 | ||||||
Progressive Corp. | 27,204 | 1,837,086 | ||||||
Prudential Financial, Inc. | 1,622 | 159,361 | ||||||
Reinsurance Group of America, Inc. | 3,705 | 529,259 | ||||||
The Travelers Companies, Inc. | 2,934 | 386,114 | ||||||
Torchmark Corp. | 25,564 | 2,247,587 | ||||||
Unum Group | 2,743 | 101,162 | ||||||
W.R. Berkley Corp. | 4,392 | 343,718 | ||||||
White Mountains Insurance Group Ltd. | 614 | 569,761 | ||||||
Willis Towers Watson PLC | 1,021 | 150,363 | ||||||
XL Group Ltd. | 419 | 24,046 | ||||||
|
| |||||||
| 16,963,313 | ||||||||
Mortgage Real Estate Investment Trusts (REITs) 0.4% | ||||||||
AGNC Investment Corp. | 8,275 | 157,391 | ||||||
Annaly Capital Management, Inc. | 25,671 | 272,626 | ||||||
Chimera Investment Corp. | 15,208 | 283,325 | ||||||
MFA Financial, Inc. | 20,426 | 156,463 | ||||||
New Residential Investment Corp. | 23,213 | 431,065 | ||||||
Two Harbors Investment Corp. | 7,957 | 124,288 | ||||||
|
| |||||||
| 1,425,158 | ||||||||
Thrifts & Mortgage Finance 0.0% | ||||||||
New York Community Bancorp., Inc. | 8,614 | 92,773 | ||||||
| Health Care 9.2% | ||||||||
Biotechnology 0.5% | ||||||||
AbbVie, Inc. | 2,727 | 261,737 | ||||||
Alexion Pharmaceuticals, Inc.* | 647 | 79,089 | ||||||
Amgen, Inc. | 1,708 | 341,276 | ||||||
Biogen, Inc.* | 881 | 311,425 | ||||||
Celgene Corp.* | 353 | 33,341 | ||||||
Gilead Sciences, Inc. | 5,401 | 409,018 | ||||||
United Therapeutics Corp.* | 858 | 105,525 | ||||||
|
| |||||||
| 1,541,411 | ||||||||
The accompanying notes are an integral part of the financial statements.
| DWS U.S. Multi-Factor Fund | | | 21 |
Table of Contents
| Shares | Value ($) | |||||||
Health Care Equipment & Supplies 2.2% | ||||||||
Abbott Laboratories | 731 | 48,860 | ||||||
ABIOMED, Inc.* | 106 | 43,097 | ||||||
Align Technology, Inc.* | 658 | 254,310 | ||||||
Baxter International, Inc. | 10,930 | 812,864 | ||||||
Becton, Dickinson & Co. | 1,081 | 283,081 | ||||||
Boston Scientific Corp.* | 8,046 | 286,116 | ||||||
Cantel Medical Corp. | 2,939 | 285,083 | ||||||
Danaher Corp. | 3,368 | 348,723 | ||||||
Edwards Lifesciences Corp.* | 2,744 | 395,795 | ||||||
Hill-Rom Holdings, Inc. | 2,273 | 221,095 | ||||||
Hologic, Inc.* | 2,126 | 84,530 | ||||||
ICU Medical, Inc.* | 988 | 302,328 | ||||||
IDEXX Laboratories, Inc.* | 1,497 | 380,298 | ||||||
Integra LifeSciences Holdings Corp.* | 934 | 55,545 | ||||||
Intuitive Surgical, Inc.* | 663 | 371,280 | ||||||
Masimo Corp.* | 1,279 | 150,781 | ||||||
Medtronic PLC | 1,033 | 99,592 | ||||||
ResMed, Inc. | 4,365 | 486,305 | ||||||
STERIS PLC | 3,882 | 444,178 | ||||||
Stryker Corp. | 1,460 | 247,368 | ||||||
Teleflex, Inc. | 699 | 172,954 | ||||||
The Cooper Companies, Inc. | 1,236 | 316,144 | ||||||
Varian Medical Systems, Inc.* | 5,642 | 632,017 | ||||||
West Pharmaceutical Services, Inc. | 2,647 | 309,831 | ||||||
Zimmer Biomet Holdings, Inc. | 1,223 | 151,199 | ||||||
|
| |||||||
| 7,183,374 | ||||||||
Health Care Providers & Services 5.0% | ||||||||
Acadia Healthcare Co., Inc.* | 1,411 | 58,599 | ||||||
Aetna, Inc. | 2,694 | 539,527 | ||||||
AmerisourceBergen Corp. | 4,489 | 403,875 | ||||||
Anthem, Inc. | 3,541 | 937,409 | ||||||
Cardinal Health, Inc. | 1,368 | 71,396 | ||||||
Centene Corp.* | 15,319 | 2,243,927 | ||||||
Chemed Corp. | 2,231 | 721,818 | ||||||
Cigna Corp. | 5,890 | 1,109,323 | ||||||
CVS Health Corp. | 5,571 | 419,162 | ||||||
DaVita, Inc.* | 3,190 | 221,035 | ||||||
Encompass Health Corp. | 10,495 | 856,287 | ||||||
Express Scripts Holding Co.* | 18,431 | 1,622,297 | ||||||
HCA Healthcare, Inc. | 9,418 | 1,263,048 | ||||||
Henry Schein, Inc.* | 2,926 | 227,292 | ||||||
Humana, Inc. | 5,409 | 1,802,603 | ||||||
Laboratory Corp. of America Holdings* | 3,776 | 652,757 | ||||||
McKesson Corp. | 4,862 | 625,982 | ||||||
The accompanying notes are an integral part of the financial statements.
| 22 | | | DWS U.S. Multi-Factor Fund |
Table of Contents
| Shares | Value ($) | |||||||
MEDNAX, Inc.* | 2,770 | 131,160 | ||||||
Molina Healthcare, Inc.* | 1,079 | 148,902 | ||||||
Quest Diagnostics, Inc. | 4,224 | 464,556 | ||||||
UnitedHealth Group, Inc. | 633 | 169,935 | ||||||
Universal Health Services, Inc. “B” | 5,659 | 736,575 | ||||||
WellCare Health Plans, Inc.* | 2,942 | 890,161 | ||||||
|
| |||||||
| 16,317,626 | ||||||||
Health Care Technology 0.1% | ||||||||
Cerner Corp.* | 7,339 | 477,842 | ||||||
Veeva Systems, Inc. “A”* | 426 | 44,457 | ||||||
|
| |||||||
| 522,299 | ||||||||
Life Sciences Tools & Services 0.9% | ||||||||
Agilent Technologies, Inc. | 6,942 | 468,863 | ||||||
Bio-Rad Laboratories, Inc. “A”* | 355 | 115,481 | ||||||
Bio-Techne Corp. | 1,631 | 313,429 | ||||||
Bruker Corp. | 3,348 | 119,122 | ||||||
Charles River Laboratories International, Inc.* | 2,719 | 335,824 | ||||||
Illumina, Inc.* | 242 | 85,869 | ||||||
IQVIA Holdings, Inc.* | 3,159 | 401,477 | ||||||
Mettler-Toledo International, Inc.* | 493 | 288,139 | ||||||
PerkinElmer, Inc. | 2,546 | 235,327 | ||||||
QIAGEN NV* | 1,532 | 59,702 | ||||||
Thermo Fisher Scientific, Inc. | 941 | 224,993 | ||||||
Waters Corp.* | 2,325 | 440,541 | ||||||
|
| |||||||
| 3,088,767 | ||||||||
Pharmaceuticals 0.5% | ||||||||
Bristol-Myers Squibb Co. | 4,379 | 265,149 | ||||||
Catalent, Inc.* | 1,483 | 61,989 | ||||||
Eli Lilly & Co. | 1,557 | 164,497 | ||||||
Jazz Pharmaceuticals PLC* | 934 | 159,639 | ||||||
Johnson & Johnson | 55 | 7,408 | ||||||
Merck & Co., Inc. | 1,149 | 78,810 | ||||||
Mylan NV* | 3,298 | 129,051 | ||||||
Perrigo Co. PLC | 1,295 | 99,080 | ||||||
Pfizer, Inc. | 516 | 21,424 | ||||||
Zoetis, Inc. | 6,831 | 618,889 | ||||||
|
| |||||||
| 1,605,936 | ||||||||
| Industrials 17.1% | ||||||||
Aerospace & Defense 3.0% | ||||||||
Boeing Co. | 742 | 254,350 | ||||||
BWX Technologies, Inc. | 8,094 | 496,324 | ||||||
Curtiss-Wright Corp. | 4,939 | 661,579 | ||||||
General Dynamics Corp. | 2,309 | 446,561 | ||||||
Harris Corp. | 2,654 | 431,302 | ||||||
The accompanying notes are an integral part of the financial statements.
| DWS U.S. Multi-Factor Fund | | | 23 |
Table of Contents
| Shares | Value ($) | |||||||
HEICO Corp. | 1,241 | 112,534 | ||||||
HEICO Corp. “A” | 2,803 | 208,823 | ||||||
Hexcel Corp. | 9,755 | 645,001 | ||||||
Huntington Ingalls Industries, Inc. | 5,305 | 1,296,913 | ||||||
L3 Technologies, Inc. | 2,661 | 568,709 | ||||||
Lockheed Martin Corp. | 1,575 | 504,646 | ||||||
Northrop Grumman Corp. | 1,334 | 398,186 | ||||||
Raytheon Co. | 3,482 | 694,450 | ||||||
Rockwell Collins, Inc. | 146 | 19,849 | ||||||
Spirit AeroSystems Holdings, Inc. “A” | 11,593 | 991,201 | ||||||
Teledyne Technologies, Inc.* | 1,984 | 470,724 | ||||||
Textron, Inc. | 13,116 | 905,397 | ||||||
TransDigm Group, Inc. | 1,402 | 490,700 | ||||||
United Technologies Corp. | 1,715 | 225,865 | ||||||
|
| |||||||
| 9,823,114 | ||||||||
Air Freight & Logistics 1.0% | ||||||||
C.H. Robinson Worldwide, Inc. | 13,694 | 1,315,720 | ||||||
Expeditors International of Washington, Inc. | 17,008 | 1,246,346 | ||||||
FedEx Corp. | 2,891 | 705,260 | ||||||
United Parcel Service, Inc. “B” | 1,463 | 179,773 | ||||||
|
| |||||||
| 3,447,099 | ||||||||
Airlines 0.5% | ||||||||
Alaska Air Group, Inc. | 1,682 | 113,518 | ||||||
American Airlines Group, Inc. | 1,612 | 65,254 | ||||||
Copa Holdings SA “A” | 827 | 66,110 | ||||||
Delta Air Lines, Inc. | 10,112 | 591,350 | ||||||
JetBlue Airways Corp.* | 11,370 | 216,940 | ||||||
Southwest Airlines Co. | 7,401 | 453,681 | ||||||
United Continental Holdings, Inc.* | 1,073 | 93,802 | ||||||
|
| |||||||
| 1,600,655 | ||||||||
Building Products 0.8% | ||||||||
A.O. Smith Corp. | 8,631 | 501,288 | ||||||
Allegion PLC | 2,501 | 218,137 | ||||||
Armstrong World Industries, Inc.* | 1,510 | 105,398 | ||||||
Fortune Brands Home & Security, Inc. | 4,761 | 252,238 | ||||||
Johnson Controls International PLC | 3,918 | 147,983 | ||||||
Lennox International, Inc. | 2,049 | 456,538 | ||||||
Masco Corp. | 8,436 | 320,315 | ||||||
Owens Corning | 7,229 | 409,306 | ||||||
USG Corp.* | 3,566 | 153,694 | ||||||
|
| |||||||
| 2,564,897 | ||||||||
Commercial Services & Supplies 1.3% | ||||||||
ADT, Inc. (a) | 10,134 | 90,699 | ||||||
Cintas Corp. | 774 | 165,148 | ||||||
The accompanying notes are an integral part of the financial statements.
| 24 | | | DWS U.S. Multi-Factor Fund |
Table of Contents
| Shares | Value ($) | |||||||
Clean Harbors, Inc.* | 1,308 | 89,716 | ||||||
Copart, Inc.* | 19,004 | 1,222,147 | ||||||
KAR Auction Services, Inc. | 15,461 | 969,250 | ||||||
Republic Services, Inc. | 5,480 | 402,013 | ||||||
Rollins, Inc. | 3,942 | 236,835 | ||||||
Stericycle, Inc.* | 291 | 17,952 | ||||||
Waste Management, Inc. | 13,561 | 1,232,695 | ||||||
|
| |||||||
| 4,426,455 | ||||||||
Construction & Engineering 0.6% | ||||||||
AECOM* | 4,099 | 137,890 | ||||||
Fluor Corp. | 9,993 | 573,698 | ||||||
Jacobs Engineering Group, Inc. | 12,131 | 881,803 | ||||||
Quanta Services, Inc.* | 11,649 | 402,939 | ||||||
Valmont Industries, Inc. | 757 | 106,283 | ||||||
|
| |||||||
| 2,102,613 | ||||||||
Electrical Equipment 1.2% | ||||||||
Acuity Brands, Inc. | 346 | 52,883 | ||||||
AMETEK, Inc. | 7,319 | 563,270 | ||||||
Eaton Corp. PLC | 8,218 | 683,244 | ||||||
Emerson Electric Co. | 8,127 | 623,585 | ||||||
Hubbell, Inc. | 1,919 | 242,485 | ||||||
nVent Electric PLC | 17,614 | 494,777 | ||||||
Regal Beloit Corp. | 1,905 | 159,448 | ||||||
Rockwell Automation, Inc. | 3,361 | 608,207 | ||||||
Sensata Technologies Holding PLC* | 8,164 | 432,284 | ||||||
|
| |||||||
| 3,860,183 | ||||||||
Industrial Conglomerates 0.3% | ||||||||
3M Co. | 654 | 137,942 | ||||||
Carlisle Companies, Inc. | 3,141 | 398,310 | ||||||
Honeywell International, Inc. | 1,132 | 180,056 | ||||||
Roper Technologies, Inc. | 1,177 | 351,181 | ||||||
|
| |||||||
| 1,067,489 | ||||||||
Machinery 4.1% | ||||||||
AGCO Corp. | 4,549 | 271,393 | ||||||
Allison Transmission Holdings, Inc. | 18,151 | 901,379 | ||||||
Caterpillar, Inc. | 1,990 | 276,311 | ||||||
Crane Co. | 3,904 | 356,357 | ||||||
Cummins, Inc. | 5,139 | 728,710 | ||||||
Deere & Co. | 2,626 | 377,619 | ||||||
Donaldson Co., Inc. | 6,511 | 329,457 | ||||||
Dover Corp. | 12,117 | 1,040,487 | ||||||
Flowserve Corp. | 2,088 | 108,827 | ||||||
Fortive Corp. | 4,661 | 391,431 | ||||||
Graco, Inc. | 14,608 | 686,722 | ||||||
The accompanying notes are an integral part of the financial statements.
| DWS U.S. Multi-Factor Fund | | | 25 |
Table of Contents
| Shares | Value ($) | |||||||
IDEX Corp. | 4,236 | 648,998 | ||||||
Illinois Tool Works, Inc. | 2,557 | 355,116 | ||||||
Ingersoll-Rand PLC | 7,552 | 764,942 | ||||||
ITT, Inc. | 12,628 | 746,441 | ||||||
Lincoln Electric Holdings, Inc. | 1,827 | 172,030 | ||||||
Middleby Corp.* | 554 | 67,333 | ||||||
Nordson Corp. | 1,200 | 166,824 | ||||||
Oshkosh Corp. | 3,186 | 223,848 | ||||||
PACCAR, Inc. | 11,692 | 799,967 | ||||||
Parker-Hannifin Corp. | 1,185 | 208,086 | ||||||
Pentair PLC | 11,211 | 487,454 | ||||||
Snap-on, Inc. | 4,095 | 723,914 | ||||||
Stanley Black & Decker, Inc. | 4,483 | 629,996 | ||||||
Timken Co. | 3,729 | 181,416 | ||||||
Toro Co. | 3,810 | 231,610 | ||||||
Trinity Industries, Inc. | 826 | 29,604 | ||||||
WABCO Holdings, Inc.* | 4,111 | 505,982 | ||||||
Wabtec Corp. | 1,389 | 150,456 | ||||||
Welbilt, Inc.* | 2,744 | 60,725 | ||||||
Xylem, Inc. | 10,002 | 759,252 | ||||||
|
| |||||||
| 13,382,687 | ||||||||
Marine 0.2% | ||||||||
Kirby Corp.* | 7,540 | 658,242 | ||||||
Professional Services 1.1% | ||||||||
CoStar Group, Inc.* | 641 | 283,425 | ||||||
Dun & Bradstreet Corp. | 2,398 | 342,722 | ||||||
Equifax, Inc. | 1,628 | 218,103 | ||||||
IHS Markit Ltd.* | 2,850 | 156,750 | ||||||
ManpowerGroup, Inc. | 1,346 | 126,161 | ||||||
Nielsen Holdings PLC | 5,372 | 139,672 | ||||||
Robert Half International, Inc. | 19,683 | 1,538,817 | ||||||
TransUnion | 4,531 | 341,184 | ||||||
Verisk Analytics, Inc.* | 2,879 | 342,860 | ||||||
|
| |||||||
| 3,489,694 | ||||||||
Road & Rail 1.6% | ||||||||
AMERCO | 466 | 174,699 | ||||||
CSX Corp. | 2,844 | 210,911 | ||||||
Genesee & Wyoming, Inc. “A”* | 1,752 | 153,983 | ||||||
J.B. Hunt Transport Services, Inc. | 11,630 | 1,404,323 | ||||||
Kansas City Southern | 3,636 | 421,631 | ||||||
Landstar System, Inc. | 5,710 | 661,218 | ||||||
Norfolk Southern Corp. | 3,460 | 601,486 | ||||||
Old Dominion Freight Line, Inc. | 4,611 | 702,716 | ||||||
Ryder System, Inc. | 2,788 | 214,230 | ||||||
Schneider National, Inc. “B” | 11,221 | 303,528 | ||||||
The accompanying notes are an integral part of the financial statements.
| 26 | | | DWS U.S. Multi-Factor Fund |
Table of Contents
| Shares | Value ($) | |||||||
Union Pacific Corp. | 2,034 | 306,361 | ||||||
|
| |||||||
| 5,155,086 | ||||||||
Trading Companies & Distributors 1.4% | ||||||||
Air Lease Corp. | 6,449 | 298,008 | ||||||
Fastenal Co. | 13,330 | 777,939 | ||||||
HD Supply Holdings, Inc.* | 18,262 | 832,565 | ||||||
MSC Industrial Direct Co., Inc. “A” | 3,362 | 287,384 | ||||||
United Rentals, Inc.* | 1,167 | 181,900 | ||||||
Univar, Inc.* | 1,567 | 43,594 | ||||||
W.W. Grainger, Inc. | 3,337 | 1,181,532 | ||||||
Watsco, Inc. | 4,197 | 734,433 | ||||||
WESCO International, Inc.* | 1,829 | 111,843 | ||||||
|
| |||||||
| 4,449,198 | ||||||||
| Information Technology 16.2% | ||||||||
Communications Equipment 1.3% | ||||||||
Arista Networks, Inc.* | 300 | 89,694 | ||||||
Cisco Systems, Inc. | 4,159 | 198,676 | ||||||
EchoStar Corp. “A”* | 445 | 21,360 | ||||||
F5 Networks, Inc.* | 7,795 | 1,474,190 | ||||||
Juniper Networks, Inc. | 18,974 | 539,431 | ||||||
Motorola Solutions, Inc. | 13,437 | 1,724,773 | ||||||
Palo Alto Networks, Inc.* | 493 | 113,957 | ||||||
|
| |||||||
| 4,162,081 | ||||||||
Electronic Equipment, Instruments & Components 1.8% |
| |||||||
Amphenol Corp. “A” | 7,953 | 752,195 | ||||||
Arrow Electronics, Inc.* | 1,869 | 144,904 | ||||||
CDW Corp. | 21,633 | 1,894,185 | ||||||
Cognex Corp. | 1,761 | 94,742 | ||||||
Corning, Inc. | 4,613 | 154,582 | ||||||
Dolby Laboratories, Inc. “A” | 6,899 | 484,241 | ||||||
FLIR Systems, Inc. | 13,077 | 820,451 | ||||||
IPG Photonics Corp.* | 1,272 | 223,210 | ||||||
Jabil, Inc. | 10,011 | 295,925 | ||||||
Keysight Technologies, Inc.* | 260 | 16,871 | ||||||
Littelfuse, Inc. | 1,883 | 420,963 | ||||||
National Instruments Corp. | 4,804 | 229,391 | ||||||
Trimble, Inc.* | 2,467 | 103,861 | ||||||
Zebra Technologies Corp. “A”* | 987 | 169,507 | ||||||
|
| |||||||
| 5,805,028 | ||||||||
Internet Software & Services 0.8% | ||||||||
Akamai Technologies, Inc.* | 7,547 | 567,082 | ||||||
Alphabet, Inc. “A”* | 33 | 40,649 | ||||||
Alphabet, Inc. “C”* | 49 | 59,691 | ||||||
eBay, Inc.* | 19,573 | 677,422 | ||||||
The accompanying notes are an integral part of the financial statements.
| DWS U.S. Multi-Factor Fund | | | 27 |
Table of Contents
| Shares | Value ($) | |||||||
Facebook, Inc. “A”* | 121 | 21,263 | ||||||
GoDaddy, Inc. “A”* | 1,306 | 106,387 | ||||||
IAC/InterActiveCorp.* | 567 | 111,812 | ||||||
VeriSign, Inc.* | 5,929 | 940,399 | ||||||
|
| |||||||
| 2,524,705 | ||||||||
IT Services 4.1% | ||||||||
Accenture PLC “A” | 2,699 | 456,320 | ||||||
Alliance Data Systems Corp. | 726 | 173,209 | ||||||
Amdocs Ltd. | 15,891 | 1,037,364 | ||||||
Automatic Data Processing, Inc. | 4,659 | 683,708 | ||||||
Black Knight, Inc.* | 1,590 | 84,906 | ||||||
Booz Allen Hamilton Holding Corp. | 14,639 | 748,931 | ||||||
Broadridge Financial Solutions, Inc. | 10,292 | 1,390,861 | ||||||
Cognizant Technology Solutions Corp. “A” | 13,525 | 1,060,766 | ||||||
Conduent, Inc.* | 11,367 | 263,487 | ||||||
CoreLogic, Inc.* | 4,148 | 210,884 | ||||||
DXC Technology Co. | 818 | 74,512 | ||||||
EPAM Systems, Inc.* | 3,806 | 543,992 | ||||||
Euronet Worldwide, Inc.* | 1,363 | 133,301 | ||||||
Fidelity National Information Services, Inc. | 2,550 | 275,833 | ||||||
First Data Corp. “A”* | 1,550 | 39,866 | ||||||
Fiserv, Inc.* | 6,980 | 558,889 | ||||||
FleetCor Technologies, Inc.* | 1,303 | 278,503 | ||||||
Genpact Ltd. | 7,724 | 236,663 | ||||||
Global Payments, Inc. | 648 | 80,728 | ||||||
International Business Machines Corp. | 1,880 | 275,382 | ||||||
Jack Henry & Associates, Inc. | 4,486 | 710,762 | ||||||
Leidos Holdings, Inc. | 13,954 | 987,525 | ||||||
MasterCard, Inc. “A” | 705 | 151,970 | ||||||
Paychex, Inc. | 7,927 | 580,653 | ||||||
PayPal Holdings, Inc.* | 2,137 | 197,309 | ||||||
Sabre Corp. | 11,790 | 307,837 | ||||||
Teradata Corp.* | 5,847 | 242,475 | ||||||
Total System Services, Inc. | 10,671 | 1,036,581 | ||||||
Visa, Inc. “A” | 830 | 121,919 | ||||||
Western Union Co. | 13,778 | 260,680 | ||||||
WEX, Inc.* | 606 | 115,273 | ||||||
Worldpay, Inc. “A”* | 2,676 | 260,616 | ||||||
|
| |||||||
| 13,581,705 | ||||||||
Semiconductors & Semiconductor Equipment 3.0% |
| |||||||
Applied Materials, Inc. | 12,396 | 533,276 | ||||||
Broadcom, Inc. | 246 | 53,881 | ||||||
Cypress Semiconductor Corp. | 4,815 | 82,866 | ||||||
Intel Corp. | 5,524 | 267,527 | ||||||
KLA-Tencor Corp. | 5,429 | 630,904 | ||||||
The accompanying notes are an integral part of the financial statements.
| 28 | | | DWS U.S. Multi-Factor Fund |
Table of Contents
| Shares | Value ($) | |||||||
Lam Research Corp. | 4,219 | 730,267 | ||||||
Marvell Technology Group Ltd. | 20,300 | 419,804 | ||||||
Maxim Integrated Products, Inc. | 14,433 | 872,764 | ||||||
Microchip Technology, Inc. (a) | 6,377 | 548,613 | ||||||
Micron Technology, Inc.* | 116 | 6,092 | ||||||
MKS Instruments, Inc. | 12,812 | 1,190,235 | ||||||
Monolithic Power Systems, Inc. | 2,295 | 343,952 | ||||||
NVIDIA Corp. | 217 | 60,908 | ||||||
NXP Semiconductors NV* | 1,107 | 103,106 | ||||||
ON Semiconductor Corp.* | 16,979 | 362,332 | ||||||
Qorvo, Inc.* | 1,039 | 83,214 | ||||||
QUALCOMM, Inc. | 2,678 | 184,005 | ||||||
Skyworks Solutions, Inc. | 4,121 | 376,247 | ||||||
Teradyne, Inc. | 25,293 | 1,041,819 | ||||||
Texas Instruments, Inc. | 5,821 | 654,280 | ||||||
Versum Materials, Inc. | 10,805 | 429,931 | ||||||
Xilinx, Inc. | 11,965 | 931,236 | ||||||
|
| |||||||
| 9,907,259 | ||||||||
Software 3.9% | ||||||||
Activision Blizzard, Inc. | 3,132 | 225,817 | ||||||
Adobe Systems, Inc.* | 1,105 | 291,178 | ||||||
ANSYS, Inc.* | 5,772 | 1,073,477 | ||||||
Aspen Technology, Inc.* | 8,338 | 961,872 | ||||||
CA, Inc. | 22,218 | 973,148 | ||||||
Cadence Design Systems, Inc.* | 6,945 | 326,693 | ||||||
CDK Global, Inc. | 5,633 | 351,049 | ||||||
Citrix Systems, Inc.* | 9,003 | 1,026,522 | ||||||
Dell Technologies, Inc. “V”* | 6,574 | 632,222 | ||||||
Electronic Arts, Inc.* | 2,487 | 282,051 | ||||||
Fair Isaac Corp.* | 1,950 | 450,411 | ||||||
Fortinet, Inc.* | 8,359 | 700,150 | ||||||
Guidewire Software, Inc.* | 2,418 | 243,178 | ||||||
Intuit, Inc. | 3,727 | 817,965 | ||||||
Manhattan Associates, Inc.* | 2,079 | 120,561 | ||||||
Microsoft Corp. | 1,192 | 133,897 | ||||||
Oracle Corp. | 1,442 | 70,052 | ||||||
PTC, Inc.* | 1,188 | 118,729 | ||||||
Red Hat, Inc.* | 5,036 | 743,968 | ||||||
salesforce.com, Inc.* | 1,490 | 227,493 | ||||||
ServiceNow, Inc.* | 572 | 112,318 | ||||||
SS&C Technologies Holdings, Inc. | 3,385 | 200,866 | ||||||
Synopsys, Inc.* | 9,913 | 1,012,514 | ||||||
Take-Two Interactive Software, Inc.* | 2,710 | 361,948 | ||||||
Tyler Technologies, Inc.* | 1,695 | 418,580 | ||||||
Ultimate Software Group, Inc.* | 785 | 243,091 | ||||||
The accompanying notes are an integral part of the financial statements.
| DWS U.S. Multi-Factor Fund | | | 29 |
Table of Contents
| Shares | Value ($) | |||||||
VMware, Inc. “A”* | 3,640 | 557,866 | ||||||
|
| |||||||
| 12,677,616 | ||||||||
Technology Hardware, Storage & Peripherals 1.3% |
| |||||||
Apple, Inc. | 1,447 | 329,381 | ||||||
Hewlett Packard Enterprise Co. | 40,900 | 676,077 | ||||||
HP, Inc. | 59,108 | 1,457,012 | ||||||
NCR Corp.* | 871 | 24,745 | ||||||
NetApp, Inc. | 18,492 | 1,605,291 | ||||||
Western Digital Corp. | 1,447 | 91,508 | ||||||
Xerox Corp. | 5,126 | 142,810 | ||||||
|
| |||||||
| 4,326,824 | ||||||||
| Materials 5.8% | ||||||||
Chemicals 3.2% | ||||||||
Air Products & Chemicals, Inc. | 2,620 | 435,680 | ||||||
Albemarle Corp. | 1,222 | 116,725 | ||||||
Ashland Global Holdings, Inc. | 1,471 | 123,858 | ||||||
Axalta Coating Systems Ltd.* | 2,914 | 88,877 | ||||||
Cabot Corp. | 8,102 | 525,982 | ||||||
Celanese Corp. “A” | 8,882 | 1,037,684 | ||||||
CF Industries Holdings, Inc. | 7,210 | 374,560 | ||||||
Eastman Chemical Co. | 16,105 | 1,562,668 | ||||||
Ecolab, Inc. | 2,685 | 404,039 | ||||||
FMC Corp. | 1,901 | 162,440 | ||||||
Huntsman Corp. | 995 | 30,338 | ||||||
International Flavors & Fragrances, Inc. | 2,408 | 313,738 | ||||||
LyondellBasell Industries NV “A” | 19,026 | 2,145,752 | ||||||
NewMarket Corp. | 126 | 50,531 | ||||||
Olin Corp. | 7,278 | 223,653 | ||||||
PPG Industries, Inc. | 5,565 | 615,155 | ||||||
Praxair, Inc. | 4,937 | 780,984 | ||||||
RPM International, Inc. | 4,031 | 272,093 | ||||||
Scotts Miracle-Gro Co. | 2,719 | 203,164 | ||||||
The Mosaic Co. | 11,854 | 370,675 | ||||||
The Sherwin-Williams Co. | 67 | 30,524 | ||||||
Valvoline, Inc. | 1,831 | 39,403 | ||||||
W.R. Grace & Co. | 4,161 | 294,016 | ||||||
Westlake Chemical Corp. | 2,646 | 250,232 | ||||||
|
| |||||||
| 10,452,771 | ||||||||
Construction Materials 0.1% | ||||||||
Eagle Materials, Inc. | 2,009 | 185,491 | ||||||
Martin Marietta Materials, Inc. | 506 | 100,552 | ||||||
Vulcan Materials Co. | 952 | 105,482 | ||||||
|
| |||||||
| 391,525 | ||||||||
The accompanying notes are an integral part of the financial statements.
| 30 | | | DWS U.S. Multi-Factor Fund |
Table of Contents
| Shares | Value ($) | |||||||
Containers & Packaging 1.5% | ||||||||
AptarGroup, Inc. | 3,792 | 397,060 | ||||||
Avery Dennison Corp. | 12,593 | 1,324,532 | ||||||
Ball Corp. | 9,768 | 409,084 | ||||||
Bemis Co., Inc. | 4,784 | 235,756 | ||||||
Berry Global Group, Inc.* | 2,086 | 99,565 | ||||||
Crown Holdings, Inc.* | 2,436 | 104,285 | ||||||
Graphic Packaging Holding Co. | 26,214 | 372,763 | ||||||
International Paper Co. | 7,778 | 397,767 | ||||||
Owens-Illinois, Inc.* | 2,794 | 49,370 | ||||||
Packaging Corp. of America | 5,350 | 588,072 | ||||||
Sealed Air Corp. | 4,300 | 172,473 | ||||||
Silgan Holdings, Inc. | 1,407 | 38,341 | ||||||
Sonoco Products Co. | 3,946 | 221,134 | ||||||
WestRock Co. | 7,931 | 436,839 | ||||||
|
| |||||||
| 4,847,041 | ||||||||
Metals & Mining 0.9% | ||||||||
Alcoa Corp.* | 1,631 | 72,857 | ||||||
Newmont Mining Corp. | 2,746 | 85,208 | ||||||
Nucor Corp. | 15,515 | 969,688 | ||||||
Reliance Steel & Aluminum Co. | 12,024 | 1,056,789 | ||||||
Southern Copper Corp. | 500 | 21,820 | ||||||
Steel Dynamics, Inc. | 15,348 | 701,864 | ||||||
|
| |||||||
| 2,908,226 | ||||||||
Paper & Forest Products 0.1% | ||||||||
Domtar Corp. | 8,427 | 428,934 | ||||||
| Real Estate 4.0% | ||||||||
Equity Real Estate Investment Trusts (REITs) 3.1% |
| |||||||
Alexandria Real Estate Equities, Inc. | 485 | 62,250 | ||||||
American Homes 4 Rent “A” | 1,398 | 32,434 | ||||||
American Tower Corp. | 1,067 | 159,111 | ||||||
Apple Hospitality REIT, Inc. | 8,576 | 151,366 | ||||||
AvalonBay Communities, Inc. | 958 | 175,592 | ||||||
Boston Properties, Inc. | 1,041 | 135,798 | ||||||
Brandywine Realty Trust | 1,950 | 32,682 | ||||||
Brixmor Property Group, Inc. | 6,410 | 116,790 | ||||||
Camden Property Trust | 1,351 | 128,426 | ||||||
Columbia Property Trust, Inc. | 3,986 | 95,983 | ||||||
CoreSite Realty Corp. | 748 | 87,120 | ||||||
Crown Castle International Corp. | 751 | 85,637 | ||||||
CubeSmart | 6,950 | 212,322 | ||||||
Digital Realty Trust, Inc. | 421 | 52,322 | ||||||
Douglas Emmett, Inc. | 223 | 8,710 | ||||||
Duke Realty Corp. | 6,433 | 183,276 | ||||||
The accompanying notes are an integral part of the financial statements.
| DWS U.S. Multi-Factor Fund | | | 31 |
Table of Contents
| Shares | Value ($) | |||||||
EPR Properties | 1,794 | 125,903 | ||||||
Equinix, Inc. | 50 | 21,807 | ||||||
Equity LifeStyle Properties, Inc. | 2,648 | 256,538 | ||||||
Equity Residential | 2,034 | 137,803 | ||||||
Essex Property Trust, Inc. | 423 | 104,176 | ||||||
Extra Space Storage, Inc. | 6,333 | 583,966 | ||||||
Federal Realty Investment Trust | 661 | 86,333 | ||||||
Gaming and Leisure Properties, Inc. | 9,488 | 339,576 | ||||||
HCP, Inc. | 2,319 | 62,683 | ||||||
Highwoods Properties, Inc. | 757 | 37,653 | ||||||
Hospitality Properties Trust | 6,271 | 181,796 | ||||||
Host Hotels & Resorts, Inc. | 28,465 | 612,851 | ||||||
Hudson Pacific Properties, Inc. | 1,051 | 35,566 | ||||||
Iron Mountain, Inc. | 2,838 | 102,452 | ||||||
Kilroy Realty Corp. | 1,020 | 74,603 | ||||||
Kimco Realty Corp. | 5,436 | 93,010 | ||||||
Lamar Advertising Co. “A” | 6,023 | 464,072 | ||||||
Liberty Property Trust | 4,904 | 214,550 | ||||||
Life Storage, Inc. | 1,698 | 165,725 | ||||||
Medical Properties Trust, Inc. | 13,798 | 207,660 | ||||||
Mid-America Apartment Communities, Inc. | 631 | 65,346 | ||||||
National Retail Properties, Inc. | 3,979 | 183,392 | ||||||
Omega Healthcare Investors, Inc. | 1,340 | 44,287 | ||||||
Outfront Media, Inc. | 3,240 | 64,379 | ||||||
Park Hotels & Resorts, Inc. | 12,381 | 414,144 | ||||||
Prologis, Inc. | 9,692 | 651,109 | ||||||
Public Storage | 1,828 | 388,596 | ||||||
Rayonier, Inc. | 10,013 | 348,753 | ||||||
Realty Income Corp. | 1,252 | 73,330 | ||||||
Regency Centers Corp. | 1,476 | 97,460 | ||||||
Retail Properties of America, Inc. “A” | 23,221 | 295,603 | ||||||
SBA Communications Corp.* | 846 | 131,325 | ||||||
Senior Housing Properties Trust | 1,927 | 36,825 | ||||||
Simon Property Group, Inc. | 2,389 | 437,259 | ||||||
SL Green Realty Corp. | 340 | 35,496 | ||||||
Spirit Realty Capital, Inc. | 7,465 | 62,482 | ||||||
STORE Capital Corp. | 5,315 | 153,125 | ||||||
Sun Communities, Inc. | 471 | 48,598 | ||||||
Taubman Centers, Inc. | 563 | 36,375 | ||||||
The Macerich Co. | 1,322 | 77,654 | ||||||
UDR, Inc. | 315 | 12,591 | ||||||
Ventas, Inc. | 1,061 | 63,522 | ||||||
VICI Properties, Inc. | 2,958 | 61,852 | ||||||
Vornado Realty Trust | 1,036 | 79,772 | ||||||
Weingarten Realty Investors | 10,622 | 328,538 | ||||||
The accompanying notes are an integral part of the financial statements.
| 32 | | | DWS U.S. Multi-Factor Fund |
Table of Contents
| Shares | Value ($) | |||||||
Weyerhaeuser Co. | 5,598 | 194,307 | ||||||
WP Carey, Inc. | 3,033 | 201,937 | ||||||
|
| |||||||
| 10,216,599 | ||||||||
Real Estate Management & Development 0.9% |
| |||||||
CBRE Group, Inc. “A”* | 32,891 | 1,605,410 | ||||||
Howard Hughes Corp.* | 142 | 18,513 | ||||||
Jones Lang LaSalle, Inc. | 7,437 | 1,134,291 | ||||||
Realogy Holdings Corp. | 2,833 | 60,598 | ||||||
|
| |||||||
| 2,818,812 | ||||||||
| Telecommunication Services 0.2% | ||||||||
Diversified Telecommunication Services 0.1% | ||||||||
AT&T, Inc. | 1,092 | 34,878 | ||||||
CenturyLink, Inc. | 3,432 | 73,308 | ||||||
Verizon Communications, Inc. | 3,320 | 180,508 | ||||||
Zayo Group Holdings, Inc.* | 3,389 | 117,463 | ||||||
|
| |||||||
| 406,157 | ||||||||
Wireless Telecommunication Services 0.1% | ||||||||
T-Mobile U.S., Inc.* | 1,462 | 96,550 | ||||||
Telephone & Data Systems, Inc. | 3,312 | 99,493 | ||||||
|
| |||||||
| 196,043 | ||||||||
| Utilities 5.5% | ||||||||
Electric Utilities 2.4% | ||||||||
Alliant Energy Corp. | 10,408 | 445,879 | ||||||
American Electric Power Co., Inc. | 6,943 | 498,021 | ||||||
Avangrid, Inc. | 792 | 39,077 | ||||||
Duke Energy Corp. | 3,408 | 276,866 | ||||||
Edison International | 4,857 | 319,251 | ||||||
Entergy Corp. | 10,549 | 881,791 | ||||||
Evergy, Inc. | 5,242 | 299,056 | ||||||
Eversource Energy | 7,773 | 485,268 | ||||||
Exelon Corp. | 27,810 | 1,215,575 | ||||||
FirstEnergy Corp. | 24,253 | 906,577 | ||||||
Hawaiian Electric Industries, Inc. | 10,463 | 369,030 | ||||||
NextEra Energy, Inc. | 2,118 | 360,272 | ||||||
OGE Energy Corp. | 8,217 | 302,632 | ||||||
PG&E Corp. | 3,027 | 139,787 | ||||||
Pinnacle West Capital Corp. | 4,677 | 367,378 | ||||||
PPL Corp. | 5,324 | 158,336 | ||||||
Southern Co. | 4,725 | 206,861 | ||||||
Xcel Energy, Inc. | 12,761 | 613,166 | ||||||
|
| |||||||
| 7,884,823 | ||||||||
Gas Utilities 0.4% | ||||||||
Atmos Energy Corp. | 3,373 | 311,092 | ||||||
The accompanying notes are an integral part of the financial statements.
| DWS U.S. Multi-Factor Fund | | | 33 |
Table of Contents
| Shares | Value ($) | |||||||
National Fuel Gas Co. | 4,715 | 261,824 | ||||||
UGI Corp. | 11,388 | 615,521 | ||||||
|
| |||||||
| 1,188,437 | ||||||||
Independent Power & Renewable Electricity Producers 0.4% |
| |||||||
AES Corp. | 30,607 | 411,970 | ||||||
NRG Energy, Inc. | 5,181 | 183,355 | ||||||
Vistra Energy Corp.* | 37,490 | 882,515 | ||||||
|
| |||||||
| 1,477,840 | ||||||||
Multi-Utilities 2.1% | ||||||||
Ameren Corp. | 13,822 | 873,965 | ||||||
CenterPoint Energy, Inc. | 21,987 | 611,019 | ||||||
CMS Energy Corp. | 11,036 | 543,412 | ||||||
Consolidated Edison, Inc. | 12,756 | 1,006,831 | ||||||
Dominion Energy, Inc | 3,187 | 225,544 | ||||||
DTE Energy Co. | 6,192 | 688,179 | ||||||
MDU Resources Group, Inc. | 10,628 | 296,415 | ||||||
NiSource, Inc. | 8,889 | 240,625 | ||||||
Public Service Enterprise Group, Inc. | 17,623 | 922,564 | ||||||
Sempra Energy | 3,971 | 460,954 | ||||||
Vectren Corp. | 7,389 | 526,097 | ||||||
WEC Energy Group, Inc. | 7,907 | 534,355 | ||||||
|
| |||||||
| 6,929,960 | ||||||||
Water Utilities 0.2% | ||||||||
American Water Works Co., Inc. | 5,645 | 494,107 | ||||||
Aqua America, Inc. | 6,604 | 245,537 | ||||||
|
| |||||||
| 739,644 | ||||||||
| Total Common Stocks (Cost $285,686,979) | 321,441,140 | |||||||
| Principal Amount ($) | Value ($) | |||||||
| Government & Agency Obligation 0.2% | ||||||||
| U.S. Treasury Obligation | ||||||||
U.S. Treasury Bill, 2.084%**, 12/27/2018 (b) (Cost $528,397) | 532,000 | 528,397 | ||||||
| Shares | Value ($) | |||||||
| Securities Lending Collateral 0.3% | ||||||||
DWS Government & Agency Securities Portfolio “DWS Government Cash Institutional Shares”, 1.85% (c) (d) (Cost $1,005,789) | 1,005,789 | 1,005,789 | ||||||
| Cash Equivalents 1.7% | ||||||||
DWS Central Cash Management Government Fund, 1.96% (c) (Cost $5,668,691) | 5,668,691 | 5,668,691 | ||||||
The accompanying notes are an integral part of the financial statements.
| 34 | | | DWS U.S. Multi-Factor Fund |
Table of Contents
| % of Net Assets | Value ($) | |||||||
| Total Investment Portfolio (Cost $292,889,856) | 100.3 | 328,644,017 | ||||||
| Other Assets and Liabilities, Net | (0.3 | ) | (1,013,875 | ) | ||||
| ||||||||
| Net Assets | 100.0 | 327,630,142 | ||||||
A summary of the Fund’s transactions with affiliated investments during the year ended August 31, 2018 are as follows:
| Value ($) at 8/31/2017 | Pur- chases ($) | Sales Proceeds | Net Realized ($) | Net Change in Unreal- ized ation (Depreci- ation) ($) | Income ($) | Capital Gain Distri- butions | Number of Shares at 8/31/2018 | Value ($) at 8/31/2018 | ||||||||||||||||||||||||||
| Exchange-Traded Fund | ||||||||||||||||||||||||||||||||||
| Deutsche X-trackers Russell 1000 Comprehensive Factor ETF | ||||||||||||||||||||||||||||||||||
| 2,948 | — | 3,210 | 283 | (21) | 11 | — | — | — | ||||||||||||||||||||||||||
| Securities Lending Collateral 0.3% | ||||||||||||||||||||||||||||||||||
| | DWS Government & Agency Securities Portfolio “DWS Government Cash Institutional Shares”, 1.85% (c) (d) | | ||||||||||||||||||||||||||||||||
| — | 1,005,789 | — | — | — | 7,388 | — | 1,005,789 | 1,005,789 | ||||||||||||||||||||||||||
| Cash Equivalents 1.7% | ||||||||||||||||||||||||||||||||||
| DWS Central Cash Management Government Fund, 1.96% (c) | ||||||||||||||||||||||||||||||||||
| 3,904,489 | 54,876,067 | 53,111,865 | — | — | 91,569 | — | 5,668,691 | 5,668,691 | ||||||||||||||||||||||||||
| 3,907,437 | 55,881,856 | 53,115,075 | 283 | (21) | 98,968 | — | 6,674,480 | 6,674,480 | ||||||||||||||||||||||||||
| * | Non-income producing security. |
| ** | Annualized yield at time of purchase; not a coupon rate. |
| (a) | All or a portion of these securities were on loan. In addition, “Other Assets and Liabilities, Net” may include pending sales that are also on loan. The value of securities loaned at August 31, 2018 amounted to $996,820, which is 0.3% of net assets. |
| (b) | At August 31, 2018, this security has been pledged, in whole or in part, to cover initial margin requirements for open futures contracts. |
| (c) | Affiliated fund managed by DWS Investment Management Americas, Inc. The rate shown is the annualized seven-day yield at period end. |
| (d) | Represents collateral held in connection with securities lending. Income earned by the Fund is net of borrower rebates. Represents the net increase (purchase cost) or decrease (sales proceeds) in the amount invested for the year ended August 31, 2018. |
The accompanying notes are an integral part of the financial statements.
| DWS U.S. Multi-Factor Fund | | | 35 |
Table of Contents
At August 31, 2018, open futures contracts purchased were as follows:
| Futures | Currency | Expiration Date | Contracts | Notional Amount ($) | Notional Value ($) | Unrealized Appreciation ($) | ||||||||||||||||||
| S&P 500 E-Mini Index | USD | 9/21/2018 | 20 | 2,866,634 | 2,902,100 | 35,466 | ||||||||||||||||||
| S&P MidCap 400 E-Mini Index | USD | 9/21/2018 | 16 | 3,227,943 | 3,272,960 | 45,017 | ||||||||||||||||||
| Total unrealized appreciation |
| 80,483 | ||||||||||||||||||||||
For information on the Fund’s policy and additional disclosures regarding futures contracts, please refer to the Derivatives section of Note B in the accompanying Notes to Financial Statements.
USD: United States Dollar
Fair Value Measurements
Various inputs are used in determining the value of the Fund’s investments. These inputs are summarized in three broad levels. Level 1 includes quoted prices in active markets for identical securities. Level 2 includes other significant observable inputs (including quoted prices for similar securities, interest rates, prepayment speeds and credit risk). Level 3 includes significant unobservable inputs (including the Fund’s own assumptions in determining the fair value of investments). The level assigned to the securities valuations may not be an indication of the risk or liquidity associated with investing in those securities.
The following is a summary of the inputs used as of August 31, 2018 in valuing the Fund’s investments. For information on the Fund’s policy regarding the valuation of investments, please refer to the Security Valuation section of Note A in the accompanying Notes to Financial Statements.
| Assets | Level 1 | Level 2 | Level 3 | Total | ||||||||||||
| Common Stocks (e) | $ | 321,441,140 | $ | — | $ | — | $ | 321,441,140 | ||||||||
| Government & Agency Obligation | — | 528,397 | — | 528,397 | ||||||||||||
| Short-Term Investments (e) | 6,674,480 | — | — | 6,674,480 | ||||||||||||
| Derivatives (f) | ||||||||||||||||
Futures Contracts | 80,483 | — | — | 80,483 | ||||||||||||
| Total | $ | 328,196,103 | $ | 528,397 | $ | — | $ | 328,724,500 | ||||||||
There have been no transfers between fair value measurement levels during the year ended August 31, 2018.
| (e) | See Investment Portfolio for additional detailed categorizations. |
| (f) | Derivatives include unrealized appreciation (depreciation) on open futures contracts. |
The accompanying notes are an integral part of the financial statements.
| 36 | | | DWS U.S. Multi-Factor Fund |
Table of Contents
Statement of Assets and Liabilities
| as of August 31, 2018 | ||||
| Assets | ||||
| Investments in non-affiliated securities, at value (cost $286,215,376) — including $996,820 of securities loaned | $ | 321,969,537 | ||
Investment in DWS Government & Agency Securities Portfolio (cost $1,005,789)* | 1,005,789 | |||
Investment in DWS Central Cash Management Government Fund (cost $5,668,691) | 5,668,691 | |||
| Cash | 10,000 | |||
| Dividends receivable | 480,950 | |||
| Interest receivable | 10,314 | |||
| Receivable for variation margin on futures contracts | 8,131 | |||
| Other assets | 17,355 | |||
| Total assets | 329,170,767 | |||
| Liabilities | ||||
| Payable upon return of securities loaned | 1,005,789 | |||
| Payable for Fund shares redeemed | 200,000 | |||
| Accrued management fee | 3,453 | |||
| Accrued Trustees’ fees | 3,819 | |||
| Other accrued expenses and payables | 327,564 | |||
| Total liabilities | 1,540,625 | |||
| Net assets, at value | $ | 327,630,142 | ||
| Net Assets Consist of | ||||
| Undistributed net investment income | 839,209 | |||
| Net unrealized appreciation (depreciation) on: | ||||
Investments | 35,754,161 | |||
Futures | 80,483 | |||
| Accumulated net realized gain (loss) | 2,362,471 | |||
| Paid-in capital | 288,593,818 | |||
| Net assets, at value | $ | 327,630,142 | ||
| Net Asset Value | ||||
Class R6 | ||||
Net Asset Value, offering and redemption price per share ($239,054 ÷ 20,309 shares of capital stock outstanding, $.01 par value, unlimited number of shares authorized) | $ | 11.77 | ||
Institutional Class | ||||
Net Asset Value, offering and redemption price per share ($327,391,088 ÷ 27,814,403 shares of capital stock outstanding, $.01 par value, unlimited number of shares authorized) | $ | 11.77 | ||
| * | Represents collateral on securities loaned. |
The accompanying notes are an integral part of the financial statements.
| DWS U.S. Multi-Factor Fund | | | 37 |
Table of Contents
| for the year ended August 31, 2018 | ||||
| Investment Income | ||||
| Income: | ||||
| Dividends (net of foreign taxes withheld of $118) | $ | 5,025,751 | ||
| Interest | 5,740 | |||
| Income distributions from affiliated investments | 91,580 | |||
| Securities lending income, net of borrower rebates | 7,388 | |||
| Total income | 5,130,459 | |||
| Expenses: | ||||
| Management fee | 431,287 | |||
| Administration fee | 287,525 | |||
| Services to shareholders | 285,128 | |||
| Custodian fee | 32,160 | |||
| Professional fees | 62,951 | |||
| Reports to shareholders | 36,047 | |||
| Registration fees | 67,669 | |||
| Trustees’ fees and expenses | 15,489 | |||
| Licensing fee | 71,881 | |||
| Other | 32,119 | |||
| Total expenses before expense reductions | 1,322,256 | |||
| Expense reductions | (315,916 | ) | ||
| Total expenses after expense reductions | 1,006,340 | |||
| Net investment income | 4,124,119 | |||
| Realized and Unrealized Gain (Loss) | ||||
| Net realized gain (loss) from: | ||||
| Sale of affiliated investments | 283 | |||
| Sale of non-affiliated investments | 1,981,629 | |||
| Futures | 807,722 | |||
| 2,789,634 | ||||
| Change in net unrealized appreciation (depreciation) on: | ||||
| Affiliated investments | (21 | ) | ||
| Non-affiliated investments | 37,299,828 | |||
| Futures | 31,833 | |||
| 37,331,640 | ||||
| Net gain (loss) | 40,121,274 | |||
| Net increase (decrease) in net assets resulting from operations | $ | 44,245,393 | ||
The accompanying notes are an integral part of the financial statements.
| 38 | | | DWS U.S. Multi-Factor Fund |
Table of Contents
Statements of Changes in Net Assets
| Increase (Decrease) in Net Assets | Year Ended August 31, 2018 | Period Ended August 31, 2017* | ||||||
| Operations: | ||||||||
| Net investment income (loss) | $ | 4,124,119 | $ | 388,711 | ||||
| Net realized gain (loss) | 2,789,634 | (189,228 | ) | |||||
| Change in net unrealized appreciation (depreciation) | 37,331,640 | (1,496,996 | ) | |||||
| Net increase (decrease) in net assets resulting from operations | 44,245,393 | (1,297,513 | ) | |||||
| Distributions to shareholders from: | ||||||||
| Net investment income: | ||||||||
Class R6 | (2,881 | ) | (292 | ) | ||||
Institutional Class | (3,641,280 | ) | (2,702 | ) | ||||
| Net realized gains: | ||||||||
Class R6 | (210 | ) | — | |||||
Institutional Class | (264,191 | ) | — | |||||
| Total distributions | (3,908,562 | ) | (2,994 | ) | ||||
| Fund share transactions: | ||||||||
| Proceeds from shares sold | 73,170,090 | 251,957,015 | ||||||
| Reinvestment of distributions | 3,908,561 | 2,994 | ||||||
| Payments for shares redeemed | (33,444,753 | ) | (9,000,089 | ) | ||||
| Net increase (decrease) in net assets from Fund share transactions | 43,633,898 | 242,959,920 | ||||||
| Increase (decrease) in net assets | 83,970,729 | 241,659,413 | ||||||
| Net assets at beginning of period (initial capital) | 243,659,413 | 2,000,000 | ||||||
| Net assets at end of period (including undistributed net investment income of $839,209 and $385,717, respectively) | $ | 327,630,142 | $ | 243,659,413 | ||||
| * | For the period from May 1, 2017 (commencement of operations) to August 31, 2017. |
The accompanying notes are an integral part of the financial statements.
| DWS U.S. Multi-Factor Fund | | | 39 |
Table of Contents
| Class R6 | Year Ended August 31, 2018 | Period Ended 8/31/17a | ||||||
| Selected Per Share Data | ||||||||
| Net asset value, beginning of period | $10.22 | $10.00 | ||||||
| Income (loss) from investment operations: | ||||||||
Net investment income (loss)b | .16 | .06 | ||||||
Net realized and unrealized gain (loss) | 1.54 | .17 | c | |||||
Total from investment operations | 1.70 | .23 | ||||||
| Less distributions from: | ||||||||
Net investment income | (.14 | ) | (.01 | ) | ||||
Net realized gains | (.01 | ) | — | |||||
Total distributions | (.15 | ) | (.01 | ) | ||||
| Net asset value, end of period | $11.77 | $10.22 | ||||||
| Total Return (%)d | 16.78 | 2.35 | ** | |||||
| Ratios to Average Net Assets and Supplemental Data |
| |||||||
| Net assets, end of period ($ millions) | .2 | .2 | ||||||
| Ratio of expenses before expense reductions (%) | .37 | .62 | * | |||||
| Ratio of expenses after expense reductions (%) | .30 | .35 | * | |||||
| Ratio of net investment income (%) | 1.49 | 1.84 | * | |||||
| Portfolio turnover rate (%) | 54 | 10 | ** | |||||
| a | For the period from May 1, 2017 (commencement of operations) to August 31, 2017. |
| b | Based on average shares outstanding during the period. |
| c | The amount of net realized and unrealized gain shown for a share outstanding for the period ended August 31, 2017 does not correspond with the aggregate net loss on investments for the period due to the timing of sales and repurchases of the Fund. |
| d | Total return would have been lower had certain expenses not been reduced. |
| * | Annualized |
| ** | Not annualized |
The accompanying notes are an integral part of the financial statements.
| 40 | | | DWS U.S. Multi-Factor Fund |
Table of Contents
| Institutional Class | Year Ended August 31, 2018 | Period Ended 8/31/17a | ||||||
| Selected Per Share Data | ||||||||
| Net asset value, beginning of period | $10.22 | $10.00 | ||||||
| Income (loss) from investment operations: | ||||||||
Net investment income (loss)b | .16 | .06 | ||||||
Net realized and unrealized gain (loss) | 1.54 | .17 | c | |||||
Total from investment operations | 1.70 | .23 | ||||||
| Less distributions from: | ||||||||
Net investment income | (.14 | ) | (.01 | ) | ||||
Net realized gains | (.01 | ) | — | |||||
Total distributions | (.15 | ) | (.01 | ) | ||||
| Net asset value, end of period | $11.77 | $10.22 | ||||||
| Total Return (%)d | 16.76 | 2.35 | ** | |||||
| Ratios to Average Net Assets and Supplemental Data | ||||||||
| Net assets, end of period ($ millions) | 327 | 243 | ||||||
| Ratio of expenses before expense reductions (%) | .46 | .68 | * | |||||
| Ratio of expenses after expense reductions (%) | .35 | .35 | * | |||||
| Ratio of net investment income (%) | 1.43 | 1.91 | * | |||||
| Portfolio turnover rate (%) | 54 | 10 | ** | |||||
| a | For the period from May 1, 2017 (commencement of operations) to August 31, 2017. |
| b | Based on average shares outstanding during the period. |
| c | The amount of net realized and unrealized gain shown for a share outstanding for the period ended August 31, 2017 does not correspond with the aggregate net loss on investments for the period due to the timing of sales and repurchases of the Fund. |
| d | Total return would have been lower had certain expenses not been reduced. |
| * | Annualized |
| ** | Not annualized |
The accompanying notes are an integral part of the financial statements.
| DWS U.S. Multi-Factor Fund | | | 41 |
Table of Contents
| Notes to Financial Statements |
A. Organization and Significant Accounting Policies
DWS U.S. Multi-Factor Fund (formerly Deutsche U.S. Multi-Factor Fund) (the “Fund”) is a non-diversified series of the Deutsche DWS Institutional Funds (formerly Deutsche Institutional Funds) (the “Trust”), which is registered under the Investment Company Act of 1940, as amended (the “1940 Act”), as an open-end management investment company organized as a Massachusetts business trust.
The Fund offers two classes of shares: Class R6 and Institutional Class. Class R6 shares are not subject to initial or contingent deferred sales charges and are generally available only to certain retirement plans. Institutional Class shares are not subject to initial or contingent deferred sales charges and are generally available only to qualified institutions.
Investment income, realized and unrealized gains and losses, and certain fund-level expenses and expense reductions, if any, are borne pro rata on the basis of relative net assets by the holders of all classes of shares, except that each class bears certain expenses unique to that class such as distribution and service fees, services to shareholders and certain other class-specific expenses. Differences in class-level expenses may result in payment of different per share dividends by class. All shares of the Fund have equal rights with respect to voting, subject to class-specific arrangements.
The Fund’s financial statements are prepared in accordance with accounting principles generally accepted in the United States of America (“U.S. GAAP”) which require the use of management estimates. Actual results could differ from those estimates. The Fund qualifies as an investment company under Topic 946 of Accounting Standards Codification of U.S. GAAP. The policies described below are followed consistently by the Fund in the preparation of its financial statements.
Security Valuation. Investments are stated at value determined as of the close of regular trading on the New York Stock Exchange on each day the exchange is open for trading.
Various inputs are used in determining the value of the Fund’s investments. These inputs are summarized in three broad levels. Level 1 includes quoted prices in active markets for identical securities. Level 2 includes other significant observable inputs (including quoted prices for similar securities, interest rates, prepayment speeds and credit risk). Level 3 includes significant unobservable inputs (including the Fund’s own assumptions in determining the fair value of investments). The level assigned to the securities valuations may not be an indication of the risk or liquidity associated with investing in those securities.
| 42 | | | DWS U.S. Multi-Factor Fund |
Table of Contents
Equity securities are valued at the most recent sale price or official closing price reported on the exchange (U.S. or foreign) or over-the-counter market on which they trade. Securities for which no sales are reported are valued at the calculated mean between the most recent bid and asked quotations on the relevant market or, if a mean cannot be determined, at the most recent bid quotation. Equity securities are generally categorized as Level 1 securities.
Debt securities are valued at prices supplied by independent pricing services approved by the Fund’s Board. Such services may use various pricing techniques which take into account appropriate factors such as yield, quality, coupon rate, maturity, type of issue, trading characteristics, prepayment speeds and other data, as well as broker quotes. If the pricing services are unable to provide valuations, debt securities are valued at the average of the most recent reliable bid quotations or evaluated prices, as applicable, obtained from broker-dealers. These securities are generally categorized as Level 2.
Investments in open-end investment companies are valued at their net asset value each business day and are categorized as Level 1.
Futures contracts are generally valued at the settlement prices established each day on the exchange on which they are traded and are categorized as Level 1.
Securities and other assets for which market quotations are not readily available or for which the above valuation procedures are deemed not to reflect fair value are valued in a manner that is intended to reflect their fair value as determined in accordance with procedures approved by the Board and are generally categorized as Level 3. In accordance with the Fund’s valuation procedures, factors considered in determining value may include, but are not limited to, the type of the security; the size of the holding; the initial cost of the security; the existence of any contractual restrictions on the security’s disposition; the price and extent of public trading in similar securities of the issuer or of comparable companies; quotations or evaluated prices from broker-dealers and/or pricing services; information obtained from the issuer, analysts, and/or the appropriate stock exchange (for exchange-traded securities); an analysis of the company’s or issuer’s financial statements; an evaluation of the forces that influence the issuer and the market(s) in which the security is purchased and sold; and with respect to debt securities, the maturity, coupon, creditworthiness, currency denomination and the movement of the market in which the security is normally traded. The value determined under these procedures may differ from published values for the same securities.
Disclosure about the classification of fair value measurements is included in a table following the Fund’s Investment Portfolio.
| DWS U.S. Multi-Factor Fund | | | 43 |
Table of Contents
Securities Lending. Effective January 9, 2018, Deutsche Bank AG, as lending agent, lends securities of the Fund to certain financial institutions under the terms of its securities lending agreement. During the term of the loans, the Fund continues to receive interest and dividends generated by the securities and to participate in any changes in their market value. The Fund requires the borrowers of the securities to maintain collateral with the Fund consisting of either cash or liquid, unencumbered assets having a value at least equal to the value of the securities loaned. When the collateral falls below specified amounts, the lending agent will use its best effort to obtain additional collateral on the next business day to meet required amounts under the securities lending agreement. As of period end, any securities on loan were collateralized by cash. During the year ended August 31, 2018, the Fund invested the cash collateral into a joint trading account in affiliated money market funds managed by DWS Investment Management Americas, Inc. As of August 31, 2018, the Fund invested the cash collateral in DWS Government & Agency Securities Portfolio. DWS Investment Management Americas, Inc. receives a management/administration fee (0.14% annualized effective rate as of August 31, 2018) on the cash collateral invested in DWS Government & Agency Securities Portfolio. The Fund receives compensation for lending its securities either in the form of fees or by earning interest on invested cash collateral net of borrower rebates and fees paid to a lending agent. Either the Fund or the borrower may terminate the loan at any time, and the borrower, after notice, is required to return borrowed securities within a standard time period. There may be risks of delay and costs in recovery of securities or even loss of rights in the collateral should the borrower of the securities fail financially. If the Fund is not able to recover securities lent, the Fund may sell the collateral and purchase a replacement investment in the market, incurring the risk that the value of the replacement security is greater than the value of the collateral. The Fund is also subject to all investment risks associated with the reinvestment of any cash collateral received, including, but not limited to, interest rate, credit and liquidity risk associated with such investments.
As of August 31, 2018, the Fund had securities on loan, which were classified as common stock in the Investment Portfolio. The value of the related collateral exceeded the value of the securities loaned at period end. As of period end, the remaining contractual maturity of the collateral agreements were overnight and continuous.
Federal Income Taxes. The Fund’s policy is to comply with the requirements of the Internal Revenue Code, as amended, which are applicable to regulated investment companies, and to distribute all of its taxable income to its shareholders.
| 44 | | | DWS U.S. Multi-Factor Fund |
Table of Contents
The Fund has reviewed the tax positions for the open tax years as of August 31, 2018 and has determined that no provision for income tax and/or uncertain tax positions is required in the Fund’s financial statements.
Distribution of Income and Gains. Distributions from net investment income of the Fund are declared and distributed to shareholders quarterly. Net realized gains from investment transactions, in excess of available capital loss carryforwards, would be taxable to the Fund if not distributed, and, therefore, will be distributed to shareholders at least annually. The Fund may also make additional distributions for tax purposes if necessary.
The timing and characterization of certain income and capital gain distributions are determined annually in accordance with federal tax regulations, which may differ from accounting principles generally accepted in the United States of America. These differences primarily relate to income received from REITs. As a result, net investment income (loss) and net realized gain (loss) on investment transactions for a reporting period may differ significantly from distributions during such period. Accordingly, the Fund may periodically make reclassifications among certain of its capital accounts without impacting the net asset value of the Fund.
At August 31, 2018, the Fund’s components of distributable earnings (accumulated losses) on a tax basis were as follows:
| Undistributed ordinary income* | $ | 3,183,810 | ||
| Undistributed long-term capital gains | $ | 418,020 | ||
| Net unrealized appreciation (depreciation) on investments | $ | 35,434,494 |
At August 31, 2018, the aggregate cost of investments for federal income tax purposes was $293,209,523. The net unrealized appreciation for all investments based on tax cost was $35,434,494. This consisted of aggregate gross unrealized appreciation for all investments in which there was an excess of value over tax cost of $40,471,940 and aggregate gross unrealized depreciation for all investments in which there was an excess of tax cost over value of $5,037,446.
In addition, the tax character of distributions paid to shareholders by the Fund is summarized as follows:
| Year Ended August 31, 2018 | Period Ended August 31, 2017** | |||||||
| Distributions from ordinary income* | $ | 3,754,958 | $ | 2,994 | ||||
| Distributions from long-term capital gains | 153,604 | — | ||||||
| * | For tax purposes, short-term capital gain distributions are considered ordinary income distributions. |
| ** | For the period from May 1, 2017 (commencement of operations) to August 31, 2017 |
| DWS U.S. Multi-Factor Fund | | | 45 |
Table of Contents
Expenses. Expenses of the Trust arising in connection with a specific fund are allocated to that fund. Other Trust expenses which cannot be directly attributed to a fund are apportioned among the funds in the Trust based upon the relative net assets or other appropriate measures.
Contingencies. In the normal course of business, the Fund may enter into contracts with service providers that contain general indemnification clauses. The Fund’s maximum exposure under these arrangements is unknown, as this would involve future claims that may be made against the Fund that have not yet been made. However, based on experience, the Fund expects the risk of loss to be remote.
Other. Investment transactions are accounted for on a trade date plus one basis for daily net asset value calculations. However, for financial reporting purposes, investment transactions are reported on trade date. Interest income is recorded on the accrual basis. Dividend income is recorded on the ex-dividend date net of foreign withholding taxes. Realized gains and losses from investment transactions are recorded on an identified cost basis. Proceeds from litigation payments, if any, are included in net realized gain (loss) from investments.
B. Derivative Instruments
Futures Contracts. A futures contract is an agreement between a buyer or seller and an established futures exchange or its clearinghouse in which the buyer or seller agrees to take or make a delivery of a specific amount of a financial instrument at a specified price on a specific date (settlement date). For the year ended August 31, 2018, the Fund entered into futures contracts as a means of gaining exposure to a particular asset class or to keep cash on hand to meet shareholder redemptions or other needs while maintaining exposure to the market.
Upon entering into a futures contract, the Fund is required to deposit with a financial intermediary cash or securities (“initial margin”) in an amount equal to a certain percentage of the face value indicated in the futures contract. Subsequent payments (“variation margin”) are made or received by the Fund dependent upon the daily fluctuations in the value and are recorded for financial reporting purposes as unrealized gains or losses by the Fund. Gains or losses are realized when the contract expires or is closed. Since all futures contracts are exchange traded, counterparty risk is minimized as the exchange’s clearinghouse acts as the counterparty, and guarantees the futures against default.
Certain risks may arise upon entering into futures contracts, including the risk that an illiquid market will limit the Fund’s ability to close out a futures contract prior to the settlement date and the risk that the futures contract is not well correlated with the security, index or currency to which it
| 46 | | | DWS U.S. Multi-Factor Fund |
Table of Contents
relates. Risk of loss may exceed amounts disclosed in the Statement of Assets and Liabilities.
A summary of the open futures contracts as of August 31, 2018, is included in a table following the Fund’s Investment Portfolio. For the year ended August 31, 2018, the investment in futures contracts purchased had a total notional value generally indicative of a range from $4,152,000 to approximately $7,605,000.
The following tables summarize the value of the Fund’s derivative instruments held as of August 31, 2018 and the related location in the accompanying Statement of Assets and Liabilities, presented by primary underlying risk exposure:
| Asset Derivatives | Futures Contracts | |||
| Equity Contracts (a) | $ | 80,483 | ||
The above derivative is located in the following Statement of Assets and Liabilities account:
| (a) | Includes cumulative appreciation of futures contracts as disclosed in the Investment Portfolio. Unsettled variation margin is disclosed separately within the Statement of Assets and Liabilities. |
Additionally, the amount of unrealized and realized gains and losses on derivative instruments recognized in Fund earnings during the year ended August 31, 2018, and the related location in the accompanying Statement of Operations is summarized in the following tables by primary underlying risk exposure:
| Realized Gain (Loss) | Futures Contracts | |||
| Equity Contracts (b) | $ | 807,722 | ||
The above derivative is located in the following Statement of Operations accounts:
(b) Net realized gain (loss) from futures
| Change in Net Unrealized Appreciation (Depreciation) | Futures Contracts | |||
| Equity Contracts (c) | $ | 31,833 | ||
The above derivative is located in the following Statement of Operations accounts:
(c) Change in net unrealized appreciation (depreciation) on futures
C. Purchases and Sales of Securities
During the year ended August 31, 2018, purchases and sales of affiliated Underlying Funds (excluding short-term investments) aggregated $0 and $3,210, respectively. Purchases and sales of non-affiliated Underlying Funds (excluding short-term investments) aggregated $195,501,496 and $151,232,282, respectively.
| DWS U.S. Multi-Factor Fund | | | 47 |
Table of Contents
D. Related Parties
Management Agreement. Under the Investment Management Agreement with DWS Investment Management Americas, Inc. (formerly Deutsche Investment Management Americas Inc.) (“DIMA” or the “Advisor”), an indirect, wholly owned subsidiary of DWS Group GmbH & Co. KGaA (“DWS Group”), the Advisor directs the investments of the Fund in accordance with its investment objectives, policies and restrictions. The Advisor determines the securities, instruments and other contracts relating to investments to be purchased, sold or entered into by the Fund.
The management fee payable under the Investment Management Agreement is equal to an annual rate (exclusive of any applicable waivers/reimbursements) of 0.15% of the Fund’s average daily net assets, computed and accrued daily and payable monthly.
For the period from September 1, 2017 through September 30, 2019, the Advisor has contractually agreed to waive its fees and/or reimburse certain operating expenses of the Fund to the extent necessary to maintain the total annual operating expenses (excluding certain expenses such as extraordinary expenses, taxes, brokerage and interest) of each class as follows:
| Class R6 | .30% | |||
| Institutional Class | .35% |
For the year ended August 31, 2018, fees waived and/or expenses reimbursed for each class are as follows:
| Class R6 | $ | 155 | ||
| Institutional Class | 315,761 | |||
| $ | 315,916 |
Administration Fee. Pursuant to the Administrative Services Agreement, DIMA provides most administrative services to the Fund. For all services provided under the Administrative Services Agreement, the Fund pays the Advisor an annual fee (“Administration Fee”) of 0.10% of the Fund’s average daily net assets, computed and accrued daily and payable monthly. For the year ended August 31, 2018, the Administration Fee was $287,525, of which $27,528 is unpaid.
Service Provider Fees. DWS Service Company (“DSC”), an affiliate of the Advisor, is the transfer agent, dividend-paying agent and shareholder service agent for the Fund. Pursuant to a sub-transfer agency agreement between DSC and DST Systems, Inc. (“DST”), DSC compensates DST out of the shareholder servicing fee it receives from the Fund. DSC has delegated certain transfer agent, dividend-paying agent and shareholder
| 48 | | | DWS U.S. Multi-Factor Fund |
Table of Contents
service agent functions to DST. For the year ended August 31, 2018, the amounts charged to the Fund by DSC were as follows:
| Services to Shareholders | Total Aggregated | Unpaid at August 31, 2018 | ||||||
| Class R6 | $ | 24 | $ | 7 | ||||
| Institutional Class | 6,790 | 1,684 | ||||||
| $ | 6,814 | $ | 1,691 | |||||
In addition, for the year ended August 31, 2018, the amounts charged to
the Fund for recordkeeping and other administrative services provided by
unaffiliated third parties, were as follows:
| Sub-Recordkeeping | Total Aggregated | |||
| Institutional Class | $ | 276,947 | ||
Typesetting and Filing Service Fees. Under an agreement with DIMA, DIMA is compensated for providing certain pre-press and regulatory filing services to the Fund. For the year ended August 31, 2018, the amount charged to the Fund by DIMA included in the Statement of Operations under “Reports to shareholders” aggregated $26,891, of which $11,613 is unpaid.
Trustees’ Fees and Expenses. The Fund paid retainer fees to each Trustee not affiliated with the Advisor, plus specified amounts to the Board Chairperson and Vice Chairperson and to each committee Chairperson.
Affiliated Cash Management Vehicles. The Fund may invest uninvested cash balances in DWS Central Cash Management Government Fund and DWS ESG Liquidity Fund (formerly DWS Variable NAV Money Fund), affiliated money market funds which are managed by the Advisor. Each affiliated money market fund is managed in accordance with Rule 2a-7 under the 1940 Act, which governs the quality, maturity, diversity and liquidity of instruments in which a money market fund may invest. DWS Central Cash Management Government Fund seeks to maintain a stable net asset value, and DWS ESG Liquidity Fund maintains a floating net asset value. The Fund indirectly bears its proportionate share of the expenses of each affiliated money market fund in which it invests. DWS Central Cash Management Government Fund does not pay the Advisor an investment management fee. To the extent that DWS ESG Liquidity Fund pays an investment management fee to the Advisor, the Advisor will waive an amount of the investment management fee payable to the Advisor by the Fund equal to the amount of the investment management fee payable on the Fund’s assets invested in DWS ESG Liquidity Fund.
| DWS U.S. Multi-Factor Fund | | | 49 |
Table of Contents
Security Lending Fees. Deutsche Bank AG serves as lending agent for the Fund. For the year ended August 31, 2018, the Fund incurred lending agent fees to Deutsche Bank AG in the amount of $556.
E. Line of Credit
Effective March 22, 2018 the Fund joined a line of credit agreement with other affiliated funds (the “Participants”) to share in a $400 million revolving credit facility provided by a syndication of banks. The Fund may be able to borrow for temporary or emergency purposes, including the meeting of redemption requests that otherwise might require the untimely disposition of securities. The Participants are charged an annual commitment fee, which is allocated based on net assets, among each of the Participants. Interest is calculated at a rate per annum equal to the sum of the Federal Funds Rate plus 1.25 percent plus if the one-month LIBOR exceeds the Federal Funds Rate, the amount of such excess. The Fund may borrow up to a maximum of 33 percent of its net assets under the agreement. The fund had no outstanding loans at August 31, 2018.
F. Fund Share Transactions
The following table summarizes share and dollar activity in the Fund:
| Year Ended August 31, 2018 | Period Ended August 31, 2017* | |||||||||||||||
| Shares | Dollars | Shares | Dollars | |||||||||||||
| Shares sold | ||||||||||||||||
| Institutional Class | 6,632,549 | $ | 73,170,090 | 24,523,865 | $ | 251,957,015 | ||||||||||
| Shares issued to shareholders in reinvestment of distributions |
| |||||||||||||||
| Class R6 | 280 | $ | 3,091 | 29 | $ | 292 | ||||||||||
| Institutional Class | 353,311 | 3,905,470 | 267 | 2,702 | ||||||||||||
| $ | 3,908,561 | $ | 2,994 | |||||||||||||
| Shares redeemed |
| |||||||||||||||
| Institutional Class | (2,987,967 | ) | $ | (33,444,753 | ) | (887,622 | ) | $ | (9,000,089 | ) | ||||||
| Net increase (decrease) |
| |||||||||||||||
| Class R6 | 280 | $ | 3,091 | 29 | $ | 292 | ||||||||||
| Institutional Class | 3,997,893 | 43,630,807 | 23,636,510 | 242,959,628 | ||||||||||||
| $ | 43,633,898 | $ | 242,959,920 | |||||||||||||
| Initial capital |
| |||||||||||||||
| Class R6 | — | $ | — | 20,000 | $ | 200,000 | ||||||||||
| Institutional Class | — | — | 180,000 | 1,800,000 | ||||||||||||
| $ | — | $ | 2,000,000 | |||||||||||||
| * | For the period from May 1, 2017 (commencement of operations) to August 31, 2017. |
| 50 | | | DWS U.S. Multi-Factor Fund |
Table of Contents
Report of Independent Registered Public Accounting Firm
To the Board of Trustees of Deutsche DWS Institutional Funds and Shareholders of DWS U.S. Multi-Factor Fund:
Opinion on the Financial Statements
We have audited the accompanying statement of assets and liabilities of DWS U.S. Multi-Factor Fund (formerly Deutsche U.S. Multi-Factor Fund) (the “Fund”) (one of the funds constituting Deutsche DWS Institutional Funds (formerly Deutsche Institutional Funds)) (the “Trust”), including the investment portfolio, as of August 31, 2018, and the related statement of operations for the year then ended, the statements of changes in net assets and the financial highlights for the year ended August 31, 2018 and the period from May 1, 2017 (commencement of operations) through August 31, 2017 and the related notes (collectively referred to as the “financial statements”). In our opinion, the financial statements present fairly, in all material respects, the financial position of the Fund (one of the funds constituting Deutsche DWS Institutional Funds) at August 31, 2018, the results of its operations for the year then ended, the changes in its net assets and the financial highlights for the year ended August 31, 2018 and the period from May 1, 2017 (commencement of operations) through August 31, 2017, in conformity with U.S. generally accepted accounting principles.
Basis for Opinion
These financial statements are the responsibility of the Trust’s management. Our responsibility is to express an opinion on the Fund’s financial statements based on our audits. We are a public accounting firm registered with the Public Company Accounting Oversight Board (United States) (“PCAOB”) and are required to be independent with respect to the Trust in accordance with the U.S. federal securities laws and the applicable rules and regulations of the Securities and Exchange Commission and the PCAOB.
We conducted our audits in accordance with the standards of the PCAOB. Those standards require that we plan and perform the audit to obtain reasonable assurance about whether the financial statements are free of material misstatement, whether due to error or fraud. The Trust is not
| DWS U.S. Multi-Factor Fund | | | 51 |
Table of Contents
required to have, nor were we engaged to perform, an audit of the Trust’s internal control over financial reporting. As part of our audits, we are required to obtain an understanding of internal control over financial reporting, but not for the purpose of expressing an opinion on the effectiveness of the Trust’s internal control over financial reporting. Accordingly, we express no such opinion.
Our audits included performing procedures to assess the risks of material misstatement of the financial statements, whether due to error or fraud, and performing procedures that respond to those risks. Such procedures included examining, on a test basis, evidence regarding the amounts and disclosures in the financial statements. Our procedures included confirmation of securities owned as of August 31, 2018, by correspondence with the custodian and brokers. Our audits also included evaluating the accounting principles used and significant estimates made by management, as well as evaluating the overall presentation of the financial statements. We believe that our audits provide a reasonable basis for our opinion.

We have served as the auditor of one or more investment companies in the DWS family of funds since at least 1979, but we are unable to determine the specific year.
Boston, Massachusetts
October 24, 2018
| 52 | | | DWS U.S. Multi-Factor Fund |
Table of Contents
Information About Your Fund’s Expenses
As an investor of the Fund, you incur two types of costs: ongoing expenses and transaction costs. Ongoing expenses include management fees and other Fund expenses. Examples of transaction costs include redemption fees and account maintenance fees, which are not shown in this section. The following tables are intended to help you understand your ongoing expenses (in dollars) of investing in the Fund and to help you compare these expenses with the ongoing expenses of investing in other mutual funds. In the most recent six-month period, the Fund limited these expenses; had it not done so, expenses would have been higher. The example in the table is based on an investment of $1,000 invested at the beginning of the six-month period and held for the entire period (March 1, 2018 to August 31, 2018).
The tables illustrate your Fund’s expenses in two ways:
| – | Actual Fund Return. This helps you estimate the actual dollar amount of ongoing expenses (but not transaction costs) paid on a $1,000 investment in the Fund using the Fund’s actual return during the period. To estimate the expenses you paid over the period, simply divide your account value by $1,000 (for example, an $8,600 account value divided by $1,000 = 8.6), then multiply the result by the number in the “Expenses Paid per $1,000” line under the share class you hold. |
| – | Hypothetical 5% Fund Return. This helps you to compare your Fund’s ongoing expenses (but not transaction costs) with those of other mutual funds using the Fund’s actual expense ratio and a hypothetical rate of return of 5% per year before expenses. Examples using a 5% hypothetical fund return may be found in the shareholder reports of other mutual funds. The hypothetical account values and expenses may not be used to estimate the actual ending account balance or expenses you paid for the period. |
Please note that the expenses shown in these tables are meant to highlight your ongoing expenses only and do not reflect any transaction costs. The “Expenses Paid per $1,000” line of the tables is useful in comparing ongoing expenses only and will not help you determine the relative total expense of owning different funds. If these transaction costs had been included, your costs would have been higher.
| DWS U.S. Multi-Factor Fund | | | 53 |
Table of Contents
| Expenses and Value of a $1,000 Investment for the six months ended August 31, 2018 (Unaudited) | ||||||||
| Actual Fund Return | Class R6 | Institutional Class | ||||||
| Beginning Account Value 3/1/18 | $ | 1,000.00 | $ | 1,000.00 | ||||
| Ending Account Value 8/31/18 | $ | 1,068.90 | $ | 1,068.80 | ||||
| Expenses Paid per $1,000* | $ | 1.56 | $ | 1.83 | ||||
| Hypothetical 5% Fund Return | Class R6 | Institutional Class | ||||||
| Beginning Account Value 3/1/18 | $ | 1,000.00 | $ | 1,000.00 | ||||
| Ending Account Value 8/31/18 | $ | 1,023.69 | $ | 1,023.44 | ||||
| Expenses Paid per $1,000* | $ | 1.53 | $ | 1.79 | ||||
| * | Expenses are equal to the Fund’s annualized expense ratio multiplied by the average account value over the period, multiplied by 184 (the number of days in the most recent six-month period), then divided by 365. |
| Annualized Expense Ratio | Class R6 | Institutional Class | ||||||
| DWS U.S. Multi-Factor Fund | .30 | % | .35 | % | ||||
For more information, please refer to the Fund’s prospectus.
For an analysis of the fees associated with an investment in the Fund or similar funds, please refer to http://apps.finra.org/fundanalyzer/1/fa.aspx.
| Tax Information | (Unaudited) |
The Fund paid distributions of $0.01 per share from net long-term capital gains during its year ended August 31, 2018, of which 100% represents 15% rate gains.
Pursuant to Section 852 of the Internal Revenue Code, the Fund designates $629,000 as capital gain dividends for its year ended August 31, 2018, of which 100% represents 15% rate gains.
For corporate shareholders, 100% of the ordinary dividends (i.e., income dividends plus short-term capital gains) paid during the Fund’s fiscal year ended August 31, 2018, qualified for the dividends received deduction.
For federal Income tax purposes, the Fund designates $5,791,000, or the maximum amount allowable under tax law, as qualified dividend income.
Please consult a tax advisor if you have questions about federal or state income tax laws, or on how to prepare your tax returns. If you have specific questions about your account, please call (800) 728-3337.
| 54 | | | DWS U.S. Multi-Factor Fund |
Table of Contents
Advisory Agreement Board Considerations and Fee Evaluation
The Board of Trustees (hereinafter referred to as the “Board” or “Trustees”) approved the Deutsche U.S. Multi-Factor Fund’s (now known as DWS U.S. Multi-Factor Fund) (the “Fund”) investment management agreement (the “Agreement”) with Deutsche Investment Management Americas Inc. (now known as DWS Investment Management Americas, Inc.) (“DIMA”) in February 2017.
In terms of the process that the Board followed prior to approving the Agreement, shareholders should know that:
| – | In February 2017, all of the Fund’s Trustees were independent of DIMA and its affiliates (the “Independent Trustees”). |
| – | The Board meets frequently to discuss fund matters. The Independent Trustees met privately with counsel to discuss the Agreement and other matters relating to the Fund. The Independent Trustees were also advised by a fee consultant retained by the Independent Trustees (the “Fee Consultant”) in the course of their review of the Agreement and considered a report prepared by the Fee Consultant in connection with their deliberations. |
In determining to approve the Agreement, the Board considered factors discussed below, among others. The Board noted that DIMA is part of Deutsche Bank AG’s (“Deutsche Bank”) Asset Management (“Deutsche AM”) division. Deutsche AM is a global asset management business that offers a wide range of investing expertise and resources, including research capabilities in many countries throughout the world. Deutsche Bank has advised the Board that the U.S. asset management business continues to be a critical and integral part of Deutsche Bank, and that Deutsche Bank will continue to invest in Deutsche AM and seek to enhance Deutsche AM’s investment platform. Deutsche Bank also has confirmed its commitment to maintaining strong legal and compliance groups within the Deutsche AM division.
Nature, Quality and Extent of Services. The Board considered the terms of the Agreement, including the scope of advisory services to be provided under the Agreement. The Board noted that, under the Agreement, DIMA will provide portfolio management services to the Fund and that, pursuant to a separate administrative services agreement, DIMA will provide administrative services to the Fund. The Board considered the experience and skills of senior management and investment personnel and the resources made available to such personnel. Because the Fund had not yet commenced operations, no information relating to the Fund’s past
| DWS U.S. Multi-Factor Fund | | | 55 |
Table of Contents
performance could be considered by the Board. On the basis of this evaluation, the Board concluded that the nature, quality and extent of services are expected to be satisfactory.
Fees and Expenses. The Board considered the Fund’s proposed investment management fee schedule, estimated operating expenses and estimated total expense ratios, and comparative information provided by Broadridge Financial Solutions, Inc. (“Broadridge”) and DIMA. The Board noted that DIMA proposed to cap expenses (excluding certain expenses such as extraordinary expenses, taxes, brokerage and interest expenses) at 0.35% of average net assets of Class R6 and Institutional Class shares for a one year period following the Fund’s commencement of operations. The Board considered the Fund’s management fee rate as compared to fees charged by DIMA to comparable Deutsche U.S. registered funds (“Deutsche Funds”) and considered differences between the Fund and the comparable Deutsche Funds. On the basis of the information provided, including the report provided by the Fee Consultant, the Board concluded that the proposed management fees were reasonable and appropriate in light of the nature, quality and extent of services to be provided by DIMA.
Profitability. The Board considered DIMA’s statement that it expected to have negative profitability at the Fund’s estimated asset levels for the first year of operations. Based on the information provided, the Board concluded the pre-tax profits expected to be realized by DIMA in connection with the management of the Fund were not unreasonable at this time.
Economies of Scale. Given the uncertainty regarding the Fund’s size and related operating costs, the Board deferred evaluation of the economies of scale to a future date. The Board observed that while the Fund’s proposed investment management fee schedule does not include breakpoints, the Board may consider implementation of one or more breakpoints once the Fund reached an efficient operating size.
Other Benefits to DIMA and Its Affiliates. The Board also considered the character and amount of other incidental benefits to be received by DIMA and its affiliates, including any fees to be received by DIMA for administrative services provided to the Fund. The Board also considered benefits to DIMA related to brokerage and soft dollar allocations, including that DIMA may allocate brokerage to pay for research generated by parties other than the executing broker dealers. The Board also noted incidental public relations benefits to DIMA related to Deutsche Funds advertising and cross-selling opportunities among DIMA products and services. The Board considered these benefits in reaching its conclusion that the proposed management fees were reasonable.
| 56 | | | DWS U.S. Multi-Factor Fund |
Table of Contents
Compliance. The Board considered the significant attention and resources dedicated by DIMA to documenting and enhancing its compliance processes in recent years. The Board noted in particular (i) the experience, seniority and time commitment of the individuals serving as DIMA’s and
the Fund’s chief compliance officers; (ii) the large number of DIMA compliance personnel; and (iii) the substantial commitment of resources by DIMA and its affiliates to compliance matters.
Based on all of the information considered and the conclusions reached, the Board unanimously determined to approve the Agreement and concluded that the Agreement was in the best interests of the Fund. In making this determination, the Board did not give particular weight to any single factor identified above. It is possible that individual Independent Trustees may have weighed these factors differently in reaching their individual decisions to approve the Agreement.
| DWS U.S. Multi-Factor Fund | | | 57 |
Table of Contents
The following table presents certain information regarding the Board Members and Officers of the Fund. Each Board Member’s year of birth is set forth in parentheses after his or her name. Unless otherwise noted, (i) each Board Member has engaged in the principal occupation(s) noted in the table for at least the most recent five years, although not necessarily in the same capacity; and (ii) the address of each Independent Board Member is c/o Keith R. Fox, DWS Funds Board Chair, c/o Thomas R. Hiller, Ropes & Gray LLP, Prudential Tower, 800 Boylston Street, Boston, MA 02199-3600. Except as otherwise noted below, the term of office for each Board Member is until the election and qualification of a successor, or until such Board Member sooner dies, resigns, is removed or as otherwise provided in the governing documents of the Fund. Because the Fund does not hold an annual meeting of shareholders, each Board Member will hold office for an indeterminate period. The Board Members may also serve in similar capacities with other funds in the fund complex.
| Independent Board Members | ||||||||
| Name, Year of Birth, Position with the Fund and Length of Time Served1 | Business Experience and Directorships During the Past Five Years | Number of Funds in DWS Fund Complex Overseen | Other Directorships Held by Board Member | |||||
Keith R. Fox, CFA (1954)
Chairperson since 2017, and Board Member since 1996 | Managing General Partner, Exeter Capital Partners (a series of private investment funds) (since 1986). Directorships: Progressive International Corporation (kitchen goods importer and distributor); The Kennel Shop (retailer); former Chairman, National Association of Small Business Investment Companies; former Directorships: BoxTop Media Inc. (advertising); Sun Capital Advisers Trust (mutual funds) (2011–2012) | 86 | — | |||||
John W. Ballantine (1946)
Board Member since 1999 | Retired; formerly, Executive Vice President and Chief Risk Management Officer, First Chicago NBD Corporation/The First National Bank of Chicago (1996–1998); Executive Vice President and Head of International Banking (1995–1996); former Directorships: Director and former Chairman of the Board, Healthways, Inc.2 (population well-being and wellness services) (2003–2014); Stockwell Capital Investments PLC (private equity); Enron Corporation; FNB Corporation; Tokheim Corporation; First Oak Brook Bancshares, Inc. and Oak Brook Bank; Prisma Energy International. Not-for-Profit Director, Trustee: Palm Beach Civic Association; Public Radio International; Window to the World Communications (public media); Harris Theater for Music and Dance (Chicago) | 86 | Portland General Electric2 (utility company) (2003– present) | |||||
| 58 | | | DWS U.S. Multi-Factor Fund |
Table of Contents
| Name, Year of Birth, Position with the Fund and Length of Time Served1 | Business Experience and Directorships During the Past Five Years | Number of Funds in DWS Fund Complex Overseen | Other Directorships Held by Board Member | |||||
Henry P. Becton, Jr. (1943)
Board Member since 1990 | Vice Chair and former President, WGBH Educational Foundation. Directorships: Public Radio International; Public Radio Exchange (PRX); The Pew Charitable Trusts (charitable organization); Massachusetts Humane Society; American Documentary, Inc. (public media); Overseer of the New England Conservatory; former Directorships: Becton Dickinson and Company2 (medical technology company); Belo Corporation2 (media company); The PBS Foundation; Association of Public Television Stations; Boston Museum of Science; American Public Television; Concord Academy; New England Aquarium; Mass. Corporation for Educational Telecommunications; Committee for Economic Development; Public Broadcasting Service; Connecticut College; North Bennett Street School (Boston) | 86 | — | |||||
Dawn-Marie Driscoll (1946)
Board Member since 1987 | Emeritus Executive Fellow, Center for Business Ethics, Bentley University; formerly: President, Driscoll Associates (consulting firm); Partner, Palmer & Dodge (law firm) (1988–1990); Vice President of Corporate Affairs and General Counsel, Filene’s (retail) (1978–1988). Directorships: Advisory Board, Center for Business Ethics, Bentley University; Trustee and former Chairman of the Board, Southwest Florida Community Foundation (charitable organization); former Directorships: ICI Mutual Insurance Company (2007–2015); Sun Capital Advisers Trust (mutual funds) (2007–2012), Investment Company Institute (audit, executive, nominating committees) and Independent Directors Council (governance, executive committees) | 86 | — | |||||
Paul K. Freeman (1950)
Board Member since 1993 | Consultant, World Bank/Inter-American Development Bank; Independent Directors Council (former chair); Investment Company Institute (executive committee); Adjunct Professor, University of Denver Law School (2017–present); formerly: Chairman of Education Committee of Independent Directors Council; Project Leader, International Institute for Applied Systems Analysis (1998–2001); Chief Executive Officer, The Eric Group, Inc. (environmental insurance) (1986–1998); Directorships: Knoebel Institute for Healthy Aging, University of Denver (2017–present); former Directorships: Prisma Energy International; Denver Zoo Foundation (2012–2018) | 86 | — | |||||
| DWS U.S. Multi-Factor Fund | | | 59 |
Table of Contents
| Name, Year of Birth, Position with the Fund and Length of Time Served1 | Business Experience and Directorships During the Past Five Years | Number of Funds in DWS Fund Complex Overseen | Other Directorships Held by Board Member | |||||
Richard J. Herring (1946)
Board Member since 1990 | Jacob Safra Professor of International Banking and Professor, Finance Department, The Wharton School, University of Pennsylvania (since July 1972); Co-Director, Wharton Financial Institutions Center; formerly: Vice Dean and Director, Wharton Undergraduate Division (July 1995–June 2000); Director, Lauder Institute of International Management Studies (July 2000–June 2006) | 86 | Director, Aberdeen Singapore and Japan Funds (since 2007); Independent Director of Barclays Bank Delaware (since September 2010) | |||||
William McClayton (1944)
Board Member since 2004 | Private equity investor (since October 2009); previously, Managing Director, Diamond Management & Technology Consultants, Inc. (global consulting firm) (2001–2009); Directorship: Board of Managers, YMCA of Metropolitan Chicago; formerly: Senior Partner, Arthur Andersen LLP (accounting) (1966–2001); Trustee, Ravinia Festival | 86 | — | |||||
Rebecca W. Rimel (1951)
Board Member since 1995 | President, Chief Executive Officer and Director, The Pew Charitable Trusts (charitable organization) (1994–present); formerly: Executive Vice President, The Glenmede Trust Company (investment trust and wealth management) (1983–2004); Board Member, Investor Education (charitable organization) (2004–2005); Trustee, Executive Committee, Philadelphia Chamber of Commerce (2001–2007); Director, Viasys Health Care2 (January 2007–June 2007); Trustee, Thomas Jefferson Foundation (charitable organization) (1994–2012) | 86 | Director, Becton Dickinson and Company2 (medical technology company) (2012– present); Director, BioTelemetry Inc.2 (health care) (2009– present) | |||||
William N. Searcy, Jr. (1946)
Board Member since 1993 | Private investor since October 2003; formerly: Pension & Savings Trust Officer, Sprint Corporation2 (telecommunications) (November 1989–September 2003); Trustee, Sun Capital Advisers Trust (mutual funds) (1998–2012) | 86 | — | |||||
| 60 | | | DWS U.S. Multi-Factor Fund |
Table of Contents
| Name, Year of Birth, Position with the Fund and Length of Time Served1 | Business Experience and Directorships During the Past Five Years | Number of Funds in DWS Fund Complex Overseen | Other Directorships Held by Board Member | |||||
Jean Gleason Stromberg (1943)
Board Member since 1997 | Retired. Formerly, Consultant (1997–2001); Director, Financial Markets U.S. Government Accountability Office (1996–1997); Partner, Norton Rose Fulbright, L.L.P. (law firm) (1978–1996); former Directorships: The William and Flora Hewlett Foundation (charitable organization) (2000–2015); Service Source, Inc. (nonprofit), Mutual Fund Directors Forum (2002–2004), American Bar Retirement Association (funding vehicle for retirement plans) (1987–1990 and 1994–1996) | 86 | — | |||||
| Officers4 | ||
Name, Year of Birth, Position with the Fund and Length of Time Served5 | Business Experience and Directorships During the Past Five Years | |
Hepsen Uzcan6,9 (1974)
President and Chief Executive Officer, 2017–present
Assistant Secretary, | Managing Director,3 DWS; Secretary, DWS USA Corporation (since March 2018); Assistant Secretary, DWS Distributors, Inc. (since June 25, 2018); Director and Vice President, DWS Service Company (since June 25, 2018); Assistant Secretary, DWS Investment Management Americas, Inc. (since June 25, 2018); and Director and President, DB Investment Managers, Inc. (since June 25, 2018); for the Deutsche funds (2016–2017) | |
John Millette8 (1962)
Vice President and Secretary, | Director,3 DWS; Chief Legal Officer, DWS Investment Management Americas, Inc. (2015–present); and Director and Vice President, DWS Trust Company (2016–present); formerly: Secretary, Deutsche Investment Management Americas Inc. (2015–2017) | |
Diane Kenneally8,10 (1966)
Treasurer and Chief Financial Officer since 2018 | Director,3 DWS; formerly: Assistant Treasurer for the DWS funds (2007–2018) | |
Caroline Pearson8 (1962)
Chief Legal Officer, | Managing Director,3 DWS; formerly: Secretary, Deutsche AM Distributors, Inc. (2002–2017); and Secretary, Deutsche AM Service Company (2010–2017) | |
Scott D. Hogan8 (1970)
Chief Compliance Officer, | Director,3 DWS | |
Wayne Salit7 (1967)
Anti-Money Laundering Compliance Officer, | Director,3 Deutsche Bank; and AML Officer, DWS Trust Company; formerly: Managing Director, AML Compliance Officer at BNY Mellon (2011–2014); and Director, AML Compliance Officer at Deutsche Bank (2004–2011) | |
Sheila Cadogan8 (1966)
Assistant Treasurer, | Director,3 DWS; Director and Vice President, DWS Trust Company (since 2018) |
| DWS U.S. Multi-Factor Fund | | | 61 |
Table of Contents
Name, Year of Birth, Position with the Fund and Length of Time Served5 | Business Experience and Directorships During the Past Five Years | |
Paul Antosca8 (1957)
Assistant Treasurer, | Director,3 DWS |
| 1 | The length of time served represents the year in which the Board Member joined the board of one or more DWS funds currently overseen by the Board. |
| 2 | A publicly held company with securities registered pursuant to Section 12 of the Securities Exchange Act of 1934. |
| 3 | Executive title, not a board directorship. |
| 4 | As a result of their respective positions held with the Advisor or its affiliates, these individuals are considered “interested persons” of the Advisor within the meaning of the 1940 Act. Interested persons receive no compensation from the Fund. |
| 5 | The length of time served represents the year in which the officer was first elected in such capacity for one or more DWS funds. |
| 6 | Address: 345 Park Avenue, New York, NY 10154. |
| 7 | Address: 60 Wall Street, New York, NY 10005. |
| 8 | Address: One International Place, Boston, MA 02110. |
| 9 | Appointed President and Chief Executive Officer effective December 1, 2017. |
| 10 | Appointed Treasurer and Chief Financial Officer effective July 2, 2018. |
The Fund’s Statement of Additional Information (“SAI”) includes additional information about the Board Members. The SAI is available, without charge, upon request. If you would like to request a copy of the SAI, you may do so by calling the following toll-free number: (800) 728-3337.
| 62 | | | DWS U.S. Multi-Factor Fund |
Table of Contents
| For More Information | The automated telephone system allows you to access personalized account information and obtain information on other DWS funds using either your voice or your telephone keypad.
For more information, contact your financial advisor. You may also access our automated telephone system or speak with a Shareholder Service representative by calling:
(800) 728-3337 | |
| Web Site | dws.com
View your account transactions and balances, trade shares, monitor your asset allocation, subscribe to fund and account updates by e-mail, and change your address, 24 hours a day.
Obtain prospectuses and applications, news about DWS funds, insight from DWS economists and investment specialists and access to DWS fund account information. | |
| Written Correspondence | DWS
PO Box 219151 Kansas City, MO 64121-9151 | |
| Proxy Voting | The Fund’s policies and procedures for voting proxies for portfolio securities and information about how the Fund voted proxies related to its portfolio securities during the most recent 12-month period ended June 30 are available on our Web site — dws.com/en-us/resources/proxy-voting — or on the SEC’s Web site — sec.gov. To obtain a written copy of the Fund’s policies and procedures without charge, upon request, call us toll free at (800) 728-3337. | |
| Portfolio Holdings | Following the Fund’s fiscal first and third quarter-end, a complete portfolio holdings listing is filed with the SEC on Form N-Q. This form will be available on the SEC’s Web site at sec.gov, and it also may be reviewed and copied at the SEC’s Public Reference Room in Washington, D.C. Information on the operation of the SEC’s Public Reference Room may be obtained by calling (800) SEC-0330. The Fund’s portfolio holdings are also posted on dws.com from time to time. Please see the Fund’s current prospectus for more information. | |
| Principal Underwriter | If you have questions, comments or complaints, contact:
DWS Distributors, Inc.
222 South Riverside Plaza Chicago, IL 60606-5808 (800) 621-1148 |
| DWS U.S. Multi-Factor Fund | | | 63 |
Table of Contents
| Investment Management | DWS Investment Management Americas, Inc. (“DIMA” or the “Advisor”), which is part of the DWS Group GmbH & Co. KGaA (“DWS Group”), is the investment advisor for the Fund. DIMA and its predecessors have more than 90 years of experience managing mutual funds and DIMA provides a full range of investment advisory services to both institutional and retail clients. DIMA is an indirect, wholly owned subsidiary of DWS Group.
DWS Group is a global organization that offers a wide range of investing expertise and resources, including hundreds of portfolio managers and analysts and an office network that reaches the world’s major investment centers. This well-resourced global investment platform brings together a wide variety of experience and investment insight across industries, regions, asset classes and investing styles. | |
| Institutional Class | ||
| Nasdaq Symbol | DMFJX | |
| CUSIP Number | 25159R 767 | |
| Fund Number | 1467 | |
| For shareholders of Class R6 | ||
| Automated Information Line | DWS/Ascensus Plan Access (800) 728-3337
24-hour access to your retirement plan account. | |
| Web Site | dws.com
Obtain prospectuses and applications, news about DWS funds, insight from DWS economists and investment specialists and access to DWS fund account information.
Log in/register to manage retirement account assets at | |
| For More Information | (800) 728-3337
To speak with a service representative. | |
| Written Correspondence | DWS Service Company
222 South Riverside Plaza Chicago, IL 60606-5806 | |
| Class R6 | ||
| Nasdaq Symbol | DMFRX | |
| CUSIP Number | 25159R 775 | |
| Fund Number | 1667 | |
| 64 | | | DWS U.S. Multi-Factor Fund |
Table of Contents
Notes
Table of Contents
Notes
Table of Contents
Notes
Table of Contents
Notes
Table of Contents
Notes
Table of Contents
Notes
Table of Contents
Notes
Table of Contents
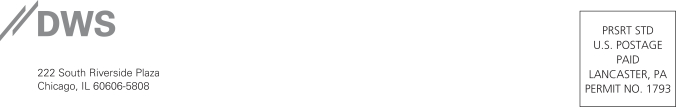
DUMFF-2
(R-052313-3 10/18)
| ITEM 2. | CODE OF ETHICS |
As of the end of the period covered by this report, the registrant has adopted a code of ethics, as defined in Item 2 of Form N-CSR that applies to its Principal Executive Officer and Principal Financial Officer.
There have been no amendments to, or waivers from, a provision of the code of ethics during the period covered by this report that would require disclosure under Item 2.
A copy of the code of ethics is filed as an exhibit to this Form N-CSR. | |
| ITEM 3. | AUDIT COMMITTEE FINANCIAL EXPERT |
| The fund’s audit committee is comprised solely of trustees who are "independent" (as such term has been defined by the Securities and Exchange Commission ("SEC") in regulations implementing Section 407 of the Sarbanes-Oxley Act (the "Regulations")). The fund’s Board of Trustees has determined that there are several "audit committee financial experts" (as such term has been defined by the Regulations) serving on the fund’s audit committee including Mr. Paul K. Freeman, the chair of the fund’s audit committee. An “audit committee financial expert” is not an “expert” for any purpose, including for purposes of Section 11 of the Securities Act of 1933 and the designation or identification of a person as an “audit committee financial expert” does not impose on such person any duties, obligations or liability that are greater than the duties, obligations and liability imposed on such person as a member of the audit committee and board of directors in the absence of such designation or identification. | |
| ITEM 4. | PRINCIPAL ACCOUNTANT FEES AND SERVICES |
DWS U.S. Multi Factor fund form n-csr disclosure re: AUDIT FEES
The following table shows the amount of fees that Ernst & Young LLP (“EY”), the Fund’s Independent Registered Public Accounting Firm, billed to the Fund during the Fund’s last two fiscal years. The Audit Committee approved in advance all audit services and non-audit services that EY provided to the Fund.
Services that the Fund’s Independent Registered Public Accounting Firm Billed to the Fund
| Fiscal Year Ended August 31, | Audit Fees Billed to Fund | Audit-Related Fees Billed to Fund | Tax Fees Billed to Fund | All Other Fees Billed to Fund |
| 2018 | $37,837 | $0 | $5,500 | $0 |
| 2017 | $31,007 | $0 | $5,500 | $0 |
The above “Tax Fees” were billed for professional services rendered for tax return preparation.
Services that the Fund’s Independent Registered Public Accounting Firm Billed to the Adviser and Affiliated Fund Service Providers
The following table shows the amount of fees billed by EY to DWS Investment Management Americas, Inc. (“DIMA” or the “Adviser”), and any entity controlling, controlled by or under common control with DIMA (“Control Affiliate”) that provides ongoing services to the Fund (“Affiliated Fund Service Provider”), for engagements directly related to the Fund’s operations and financial reporting, during the Fund’s last two fiscal years.
| Fiscal Year Ended August 31, | Audit-Related Fees Billed to Adviser and Affiliated Fund Service Providers | Tax Fees Billed to Adviser and Affiliated Fund Service Providers | All Other Fees Billed to Adviser and Affiliated Fund Service Providers |
| 2018 | $0 | $470,936 | $0 |
| 2017 | $0 | $502,238 | $0 |
The above “Tax Fees” were billed in connection with tax compliance services and agreed upon procedures.
Non-Audit Services
The following table shows the amount of fees that EY billed during the Fund’s last two fiscal years for non-audit services. The Audit Committee pre-approved all non-audit services that EY provided to the Adviser and any Affiliated Fund Service Provider that related directly to the Fund’s operations and financial reporting. The Audit Committee requested and received information from EY about any non-audit services that EY rendered during the Fund’s last fiscal year to the Adviser and any Affiliated Fund Service Provider. The Committee considered this information in evaluating EY’s independence.
| Fiscal Year Ended August 31, | Total Non-Audit Fees Billed to Fund (A) | Total Non-Audit Fees billed to Adviser and Affiliated Fund Service Providers (engagements related directly to the operations and financial reporting of the Fund) (B) | Total Non-Audit Fees billed to Adviser and Affiliated Fund Service Providers (all other engagements) (C) | Total of (A), (B) and (C) |
| 2018 | $5,500 | $470,936 | $513,130 | $989,566 |
| 2017 | $5,500 | $502,238 | $606,585 | $1,114,323 |
All other engagement fees were billed for services in connection with agreed upon procedures and tax compliance for DIMA and other related entities.
Audit Committee Pre-Approval Policies and Procedures. Generally, each Fund’s Audit Committee must pre approve (i) all services to be performed for a Fund by a Fund’s Independent Registered Public Accounting Firm and (ii) all non-audit services to be performed by a Fund’s Independent Registered Public Accounting Firm for the DIMA Entities with respect to operations and financial reporting of the Fund, except that the Chairperson or Vice Chairperson of each Fund’s Audit Committee may grant the pre-approval for non-audit services described in items (i) and (ii) above for non-prohibited services for engagements of less than $100,000. All such delegated pre approvals shall be presented to each Fund’s Audit Committee no later than the next Audit Committee meeting.
There were no amounts that were approved by the Audit Committee pursuant to the de minimis exception under Rule 2-01 of Regulation S-X.
According to the registrant’s principal Independent Registered Public Accounting Firm, substantially all of the principal Independent Registered Public Accounting Firm's hours spent on auditing the registrant's financial statements were attributed to work performed by full-time permanent employees of the principal Independent Registered Public Accounting Firm.
***
In connection with the audit of the 2017 and 2018 financial statements, the Fund entered into an engagement letter with EY. The terms of the engagement letter required by EY, and agreed to by the Audit Committee, include a provision mandating the use of mediation and arbitration to resolve any controversy or claim between the parties arising out of or relating to the engagement letter or services provided thereunder.
***
Pursuant to PCAOB Rule 3526, EY is required to describe in writing to the Fund’s Audit Committee, on at least an annual basis, all relationships between EY, or any of its affiliates, and the DWS Funds, including the Fund, or persons in financial reporting oversight roles at the DWS Funds that, as of the date of the communication, may reasonably be thought to bear on EY’s independence. Pursuant to PCAOB Rule 3526, EY has reported the matters set forth below that may reasonably be thought to bear on EY’s independence. With respect to each reported matter, individually and in the aggregate, EY advised the Audit Committee that, after careful consideration of the facts and circumstances and the applicable independence rules, it concluded that the matters do not and will not impair EY’s ability to exercise objective and impartial judgement in connection with the audits of the financial statements for the Fund and a reasonable investor with knowledge of all relevant facts and circumstances would conclude that EY has been and is capable of exercising objective and impartial judgment on all issues encompassed within EY’s audit engagements. EY also confirmed to the Audit Committee that it can continue act as the Independent Registered Public Accounting Firm for the Fund.
| · | EY advised the Fund’s Audit Committee that EY Stiftung e.V., an affiliate of the EY member firm in Germany, and various other covered persons within EY and its affiliates held investments in, or had other financial relationships with, entities within the DWS Funds “investment company complex” (as defined in Regulation S-X) (the “DWS Funds Complex”). EY informed the Audit Committee that these investments and financial relationships were inconsistent with Rule 2-01(c)(1) of Regulation S-X. EY reported that all breaches have been resolved and that none of the breaches involved any investments in the Fund or any professionals who were part of the audit engagement team for the Fund or in a position to influence the audit engagement team. In addition, EY noted that the independence breaches did not (i) create a mutual or conflicting interest with the Fund, (ii) place EY in the position of auditing its own work, (iii) result in EY acting as management or an employee of the Fund, or (iv) place EY in a position of being an advocate of the Fund. |
| · | EY advised the Fund’s Audit Committee of certain lending relationships of EY with owners of greater than 10% of the shares of certain investment companies within the DWS Funds Complex that EY had identified as inconsistent with Rule 2-01(c)(l)(ii)(A) of Regulation S-X (referred to as the “Loan Rule”). The Loan Rule specifically provides that an accounting firm would not be independent if it receives a loan from a lender that is a record or beneficial owner of more than ten percent of an audit client’s equity securities. For purposes of the Loan Rule, an audit client includes the Fund as well as all other investment companies in the DWS Funds Complex. EY’s lending relationships affect EY’s independence under the Loan Rule with respect to all investment companies in the DWS Funds Complex. |
EY stated its belief that, in each lending relationship, the lender is or was not able to impact the impartiality of EY or assert any influence over the investment companies in the DWS Funds Complex whose shares the lender owns or owned, or the applicable investment company’s investment adviser. In addition, on June 20, 2016, the SEC Staff issued a “no-action” letter to another mutual fund complex, Fidelity Management & Research Company et al., SEC Staff No-Action Letter (June 20, 2016) (the “Fidelity Letter”), related to similar Loan Rule issues as those described above. In the Fidelity Letter, the SEC Staff confirmed that it would not recommend enforcement action against an investment company that relied on the audit services performed by an audit firm that was not in compliance with the Loan Rule in certain specified circumstances. With respect to each lending relationship identified by EY, the circumstances described in the Fidelity Letter appear to be substantially similar to the circumstances that affected EY’s independence under the Loan Rule with respect to the Fund, and, in each case, EY confirmed to the Audit Committee that it meets the conditions of the Fidelity Letter.
| ITEM 5. | AUDIT COMMITTEE OF LISTED REGISTRANTS | |
| Not applicable | ||
| ITEM 6. | SCHEDULE OF INVESTMENTS | |
| Not applicable | ||
| ITEM 7. | DISCLOSURE OF PROXY VOTING POLICIES AND PROCEDURES FOR CLOSED-END MANAGEMENT INVESTMENT COMPANIES | |
| Not applicable | ||
| ITEM 8. | PORTFOLIO MANAGERS OF CLOSED-END MANAGEMENT INVESTMENT COMPANIES | |
| Not applicable | ||
| ITEM 9. | PURCHASES OF EQUITY SECURITIES BY CLOSED-END MANAGEMENT INVESTMENT COMPANY AND AFFILIATED PURCHASERS | |
| Not applicable | ||
| ITEM 10. | SUBMISSION OF MATTERS TO A VOTE OF SECURITY HOLDERS | |
| There were no material changes to the procedures by which shareholders may recommend nominees to the Fund’s Board. The primary function of the Nominating and Governance Committee is to identify and recommend individuals for membership on the Board and oversee the administration of the Board Governance Guidelines. Shareholders may recommend candidates for Board positions by forwarding their correspondence by U.S. mail or courier service to Keith R. Fox, DWS Funds Board Chair, c/o Thomas R. Hiller, Ropes & Gray LLP, Prudential Tower, 800 Boylston Street, Boston, MA 02199-3600. | ||
| ITEM 11. | CONTROLS AND PROCEDURES | |
| (a) | The Chief Executive and Financial Officers concluded that the Registrant’s Disclosure Controls and Procedures are effective based on the evaluation of the Disclosure Controls and Procedures as of a date within 90 days of the filing date of this report. | |
| (b) | There have been no changes in the registrant’s internal control over financial reporting that occurred during the second fiscal quarter of the period covered by this report that has materially affected, or is reasonably likely to materially affect, the registrant’s internal controls over financial reporting. | |
| ITEM 12. | Disclosure of Securities Lending Activities for Closed-End Management Investment Companies | |
| Not applicable | ||
| ITEM 13. | EXHIBITS | |
| (a)(1) | Code of Ethics pursuant to Item 2 of Form N-CSR is filed and attached hereto as EX-99.CODE ETH. | |
| (a)(2) | Certification pursuant to Rule 30a-2(a) under the Investment Company Act of 1940 (17 CFR 270.30a-2(a)) is filed and attached hereto as Exhibit 99.CERT. | |
| (b) | Certification pursuant to Rule 30a-2(b) under the Investment Company Act of 1940 (17 CFR 270.30a-2(b)) is furnished and attached hereto as Exhibit 99.906CERT. | |
SIGNATURES
Pursuant to the requirements of the Securities Exchange Act of 1934 and the Investment Company Act of 1940, the registrant has duly caused this report to be signed on its behalf by the undersigned, thereunto duly authorized.
| Registrant: | DWS U.S. Multi-Factor Fund, a series of Deutsche DWS Institutional Funds |
| By: | /s/Hepsen Uzcan Hepsen Uzcan President |
| Date: | 10/30/2018 |
Pursuant to the requirements of the Securities Exchange Act of 1934 and the Investment Company Act of 1940, this report has been signed below by the following persons on behalf of the registrant and in the capacities and on the dates indicated.
| By: | /s/Hepsen Uzcan Hepsen Uzcan President |
| Date: | 10/30/2018 |
| By: | /s/Diane Kenneally Diane Kenneally Chief Financial Officer and Treasurer |
| Date: | 10/30/2018 |