UNITED STATES
SECURITIES AND EXCHANGE COMMISSION
WASHINGTON, D. C. 20549
FORM N-CSR
Investment Company Act file number: 811-06071
Deutsche DWS Institutional Funds
(Exact Name of Registrant as Specified in Charter)
345 Park Avenue
New York, NY 10154-0004
(Address of Principal Executive Offices) (Zip Code)
Registrant’s Telephone Number, including Area Code:(212) 250-2500
Diane Kenneally
One International Place
Boston, MA 02110
(Name and Address of Agent for Service)
| Date of fiscal year end: | 12/31 |
| Date of reporting period: | 12/31/2018 |
| ITEM 1. | REPORT TO STOCKHOLDERS |
Table of Contents

December 31, 2018
Annual Report
to Shareholders
DWS EAFE® Equity Index Fund
(formerly Deutsche EAFE® Equity Index Fund)
Beginning on January 1, 2021, as permitted by regulations adopted by the Securities and Exchange Commission, paper copies of the Fund’s annual and semiannual shareholder reports will no longer be sent by mail, unless you specifically request paper copies of the reports. Instead, the reports will be made available on the Fund’s Web site (dws.com), and you will be notified by mail each time a report is posted and provided with a Web site link to access the report.
If you already elected to receive shareholder reports electronically, you will not be affected by this change and you need not take any action. You may elect to receive shareholder reports and other communications from the Fund electronically anytime by contacting your financial intermediary (such as a broker-dealer or bank), or if you are a direct investor, by calling (800) 728-3337 or sending an email request to service@dws.com.
You may elect to receive all future reports in paper free of charge. If you invest through a financial intermediary, you can contact your financial intermediary to request that you continue to receive paper copies of your shareholder reports. If you invest directly with the Fund, you can call (800) 728-3337 or send an email request to service@dws.com to continue receiving paper copies of your shareholder reports. Your election to receive reports in paper will apply to all funds held in your account if you invest through your financial intermediary or all funds held with DWS if you invest directly with the Fund.

Table of Contents
This report must be preceded or accompanied by a prospectus. To obtain a summary prospectus, if available, or prospectus for any of our funds, refer to the Account Management Resources information provided in the back of this booklet. We advise you to consider the Fund’s objectives, risks, charges and expenses carefully before investing. The summary prospectus and prospectus contain this and other important information about the Fund. Please read the prospectus carefully before you invest.
Investing in foreign securities presents certain risks, such as currency fluctuations, political and economic changes, and market risks. Various factors, including costs, cash flows and security selection, may cause the Fund’s performance to differ from that of the index. The Fund may lend securities to approved institutions. Stocks may decline in value. Please read the prospectus for details.
In June 2016, citizens of the United Kingdom approved a referendum to leave the European Union (EU) and in March 2017, the United Kingdom initiated its withdrawal from the EU, which is expected to take place by March 2019. Significant uncertainty exists regarding the United Kingdom’s anticipated withdrawal from the EU and any adverse economic and political effects such withdrawal may have on the United Kingdom, other EU countries and the global economy.
The brand DWS represents DWS Group GmbH & Co. KGaA and any of its subsidiaries such as DWS Distributors, Inc. which offers investment products or DWS Investment Management Americas, Inc. and RREEF America L.L.C. which offer advisory services.
NOT FDIC/NCUA INSURED NO BANK GUARANTEE MAY LOSE VALUE NOT A DEPOSIT NOT INSURED BY ANY FEDERAL GOVERNMENT AGENCY
| 2 | | | DWS EAFE® Equity Index Fund |
Table of Contents
Dear Shareholder:
The picture for the economy and markets continues to be positive with corporate fundamentals continuing to be solid, a tight labor market and inflation near the Federal Reserve Bank’s target.
Nevertheless, the fourth quarter of 2018 introduced a level of volatility that investors have not seen in quite a while. That trend continues into the new year, triggered by uncertainty around trade conflicts, the withdrawal of liquidity by central banks, higher interest rates and concerns around European hot spots such as Italy and the United Kingdom.
While these issues bear close watching, our Chief investment Officer (“CIO”) and Chief Economist agree that the markets remain broadly attractive. The rate hike cycle appears to be nearing its end, inflation remains under control and recession is not on the near horizon.
The “Insight” section of our Web site, dws.com, is home to a comprehensive library of market and economic views around current developments, opportunities and emerging risks. We invite you to visit us online often to stay apprised of the market landscape and what it may mean for you.
Best regards,
 |
Hepsen Uzcan
President, DWS Funds |

Assumptions, estimates and opinions contained in this document constitute our judgment as of the date of the document and are subject to change without notice. Any projections are based on a number of assumptions as to market conditions and there can be no guarantee that any projected results will be achieved. Past performance is not a guarantee of future results.
| DWS EAFE® Equity Index Fund | | | 3 |
Table of Contents
| Portfolio Management Review | (Unaudited) |
Market Overview and Fund Performance
All performance information below is historical and does not guarantee future results. Returns shown are for Institutional Class shares, unadjusted for sales charges. Investment return and principal fluctuate, so your shares may be worth more or less when redeemed. Current performance may differ from performance data shown. Please visit dws.com for the most recent month-end performance of all share classes. Fund performance includes reinvestment of all distributions. Unadjusted returns do not reflect sales charges and would have been lower if they had. Please refer to pages8 through9 for more complete performance information.
Investment Objective
The Fund seeks to replicate, as closely as possible, before the deduction of expenses, the performance of the Morgan Stanley Capital International (“MSCI”) EAFE Index, which emphasizes stocks of companies in major markets in Europe, Australasia and the Far East.
DWS EAFE® Equity Index Fund returned –13.69% in 2018, which compares with a return of –13.79% for its benchmark, the Morgan Stanley Capital International (MSCI) Europe, Australasia and Far East (EAFE) Index.
International stocks entered January with continued momentum from their strong showing in the prior year. The MSCI EAFE Index posted a gain of 25.02% in 2017, reflecting investor optimism about the prospects for a synchronized global economic recovery. However, the outlook grew gradually less favorable as 2018 progressed due to incoming data showing that growth outside of the United States was in fact decelerating. The foreign markets moved steadily lower throughout the year as a result, causing the index to lag U.S. equities by a wide margin through the middle two calendar quarters. The downturn picked up steam in the final three months of the year, when a sharp increase in investor risk aversion fueled broad-based weakness in equities across the globe. The sell-off caused the index to post its worst return since 2008 and finish behind the U.S. market, as gauged by the –4.38% return of the S&P 500 Index.
Currency translation also had an adverse impact on the returns of international equities for U.S.-based investors, reversing another trend that was in place in the previous year. The MSCI EAFE Index returned
| 4 | | | DWS EAFE® Equity Index Fund |
Table of Contents
–10.99% in local currency terms in 2018, indicating that currency performance detracted nearly three percentage points of return for those measuring results in U.S dollars. Most foreign currencies lost ground against the dollar due to the relative strength of the U.S. economy and the fact that the U.S. Federal Reserve continued to raise rates at a faster pace than other major central banks.
European Markets Underperform
European equities performed poorly and finished behind the index, reflecting the region’s sluggish economic growth and expectations that the European Central Bank would begin to reduce monetary stimulus in 2019. A host of political developments further weighed on the markets, including Italy’s rising government debt, the ongoing Brexit negotiations, and the rise of populist movements across the Continent. Germany was a particularly notable underperformer, with a loss of more than 22% in U.S. dollar terms.
The story was somewhat more favorable in Asia, where Australia and New Zealand outpaced the MSCI EAFE Index. Singapore and Hong Kong, both of which were aided by their close ties to China, also outperformed. Japan, which is the largest index component with a weighting of approximately 25%, generated a modest performance advantage. The country gained a relative benefit from a stable political picture, slow but steady economic growth, and improving corporate results. In addition, investors remained confident that the country’s central bank would maintain an accommodative monetary policy in 2019.
Financials and Cyclical Stocks Weigh on Index Returns
Financial stocks — which have an allocation of approximately 20% in the index — produced the weakest return of the 11 major sectors. Financials lagged due to the effects of slowing growth and the gradual tightening of monetary policy by global central banks. HSBC Holdings PLC (United Kingdom), BNP Paribas SA (France), and Banco Santander SA (Spain) were among the largest detractors from the sector’s performance. (Contribution and detraction incorporate both a stock’s total return and its weighting in the benchmark.)
Uncertainty about economic growth also weighed heavily on the materials, industrials, and consumer discretionary sectors. Commodity
| DWS EAFE® Equity Index Fund | | | 5 |
Table of Contents
prices fell sharply in the fourth quarter due to concerns about the 2019 outlook for global demand, leading to sizable downturns for the majority of the stocks in the materials sector. Industrials, for their part, were hurt by both the slowing economy and questions surrounding U.S. trade policy. Industrial conglomerates such as Siemens AG (Germany), ABB Ltd. (Switzerland), and Komatsu Ltd. (Japan) lagged considerably and dragged down the return of the sector as a whole. The shortfall in the consumer discretionary sector stemmed largely from the weakness in the producers of automobiles, auto components, and tires. Investors grew concerned that global auto sales had peaked and were set to turn lower, causing sizable losses for stocks such as Daimler AG (Germany) and Continental AG (Germany). Shares of companies specializing in luxury brands, including LVMH Moet Hennessy Louis Vuitton SE (France) and Compagnie Financiere Richemont SA (Switzerland), also underperformed due to the broader worries about consumer spending.
On the positive side, utility stocks finished well ahead of the index. The sector experienced strong relative performance in the fourth-quarter market downturn, during which investors gravitated to defensive, dividend-paying equities. Other sectors seen as having defensive qualities, including health care, consumer staples, and real estate, also delivered market-beating returns. Lastly, energy outperformed despite the sharp decline in the price of oil from the beginning of October onward.
Portfolio Positioning
The Fund invested in equity index futures and currency forward contracts during the year, with the goal of keeping the portfolio’s exposures in line with those of the benchmark. This strategy had a neutral impact on results.
We continued to use a passive strategy that seeks to provide returns that approximate those of the benchmark. We made no changes in the Fund’s approach, as our objective is to replicate the return and risk characteristics of the index. To this end, all changes to the index were incorporated in the Fund in order to maintain proper tracking. The index itself provides broad-based exposure to 21 of the largest developed markets outside the United States, across all sectors of the economy.
| 6 | | | DWS EAFE® Equity Index Fund |
Table of Contents
Portfolio Manager
Thomas O’Brien, CFA
Vice President of Northern Trust Investments, Inc. Portfolio Manager of the Fund. Began managing the Fund in 2013.
| — | Portfolio Manager for the International Equity Index group in Chicago. |
| — | Prior to joining Northern Trust in November 2004, he was a Principal at State Street Global Advisors focusing on US index strategies. |
| — | BS, University of Rhode Island; MBA, Suffolk University. |
The views expressed reflect those of the portfolio management team only through the end of the period of the report as stated on the cover. The management team’s views are subject to change at any time based on market and other conditions and should not be construed as a recommendation. Past performance is no guarantee of future results. Current and future portfolio holdings are subject to risk.
Terms to Know
TheMorgan Stanley Capital International (MSCI) Europe, Australasia and Far East (EAFE) Index is an equity index which captures large- andmid-cap representation across developed markets countries around the world, excluding the U.S. and Canada. With 928 constituents, the index covers approximately 85% of the free float adjusted market capitalization in each country. Index returns do not reflect fees or expenses and it is not possible to invest directly into an index.
TheStandard & Poor’s 500 (S&P 500) Index is an unmanaged, capitalization weighted index of 500 stocks. The index is designed to measure performance of the broad domestic economy through changes in the aggregate market value of 500 stocks representing all major industries. Index returns do not reflect fees or expenses and it is not possible to invest directly into an index.
Futures contractsare contractual agreements to buy or sell a particular commodity or financial instrument at apre-determined price in the future.
Currency forward contractsare agreements between two parties to exchange two designated currencies at a specific time in the future.
Theconsumer discretionary sector represents industries that produce goods and services that are not necessities in everyday life.
| DWS EAFE® Equity Index Fund | | | 7 |
Table of Contents
| Performance Summary | December 31, 2018 (Unaudited) |
| Institutional Class | 1-Year | 5-Year | 10-Year | |||||||||
| Average Annual Total Returnsas of 12/31/18 | ||||||||||||
| No Sales Charges | –13.69% | 0.35% | 5.97% | |||||||||
| MSCI EAFE® Index† | –13.79% | 0.53% | 6.32% | |||||||||
Performance in the Average Annual Total Returns table above and the Growth of an Assumed $1,000,000 Investment line graph that follows is historical and does not guarantee future results. Investment return and principal fluctuate, so your shares may be worth more or less when redeemed. Current performance may differ from performance data shown. Please visit dws.com for the Fund’s most recent month-end performance. Fund performance includes reinvestment of all distributions.
The gross expense ratio of the Fund, as stated in the fee table of the prospectus dated May 31, 2018 is 1.10% for Institutional Class shares and may differ from the expense ratio disclosed in the Financial Highlights table in this report.
Index returns do not reflect any fees or expenses and it is not possible to invest directly into an index.
Performance figures do not reflect the deduction of taxes that a shareholder would pay on fund distributions or the redemption of fund shares.
The MSCI EAFE® Index is the exclusive property of Morgan Stanley Capital International, a service of Morgan Stanley, and has been licensed for use by the Fund’s investment advisor. There is no guarantee that the Fund will be able to mirror the MSCI EAFE® Index closely to track its performance.
Generally accepted accounting principles require adjustments to be made to the net assets of the Fund at period end for financial reporting purposes only, and as such, the total return based on the unadjusted net asset value per share may differ from the total return reported in the financial highlights.
| 8 | | | DWS EAFE® Equity Index Fund |
Table of Contents
| Growth of an Assumed $1,000,000 Investment |
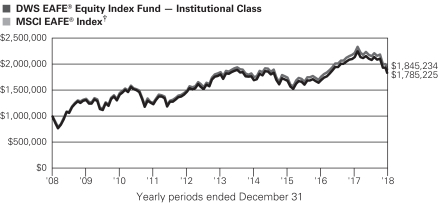
The growth of $1,000,000 is cumulative.
The minimum initial investment for Institutional Class shares is $1,000,000.
| † | MSCI Europe, Australasia and Far East (EAFE) Index is an equity index which captures large and mid cap representation across developed markets countries around the world, excluding the U.S. and Canada. With 928 constituents, the index covers approximately 85% of the free float-adjusted market capitalization in each country. |
| Institutional Class | ||||
| Net Asset Value | ||||
| 12/31/18 | $ | 5.09 | ||
| 12/31/17 | $ | 6.58 | ||
| Distribution Informationas of 12/31/18 | ||||
| Income Dividends, Twelve Months | $ | .18 | ||
| Cap Gain Distributions, Twelve Months | $ | .39 | ||
| DWS EAFE® Equity Index Fund | | | 9 |
Table of Contents
| 10 | | | DWS EAFE® Equity Index Fund |
Table of Contents
| Ten Largest Equity Holdings at December 31, 2018 (12.5% of Net Assets) | Country | Percent | ||||||||
| 1 | Nestle SA | Switzerland | 1.9 | % | ||||||
| Multinational company that markets a wide range of food products | ||||||||||
| 2 | Royal Dutch Shell PLC | Netherlands | 1.9 | % | ||||||
| Explores, produces, and refines petroleum | ||||||||||
| 3 | Novartis AG | Switzerland | 1.4 | % | ||||||
| Manufacturer of pharmaceutical and nutrition products | ||||||||||
| 4 | Roche Holding AG | Switzerland | 1.4 | % | ||||||
| Developer of pharmaceutical and chemical products | ||||||||||
| 5 | HSBC Holdings PLC | United Kingdom | 1.3 | % | ||||||
| Provider of international banking and financial services | ||||||||||
| 6 | Toyota Motor Corp. | Japan | 1.0 | % | ||||||
| Manufacturer of diversified automotive products | ||||||||||
| 7 | TOTAL SA | France | 1.0 | % | ||||||
| Produces, refines, transports and markets oil and natural gas | ||||||||||
| 8 | BP PLC | United Kingdom | 1.0 | % | ||||||
| Exporter and producer of oil and natural gas | ||||||||||
| 9 | AIA Group Ltd. | Hong Kong | 0.8 | % | ||||||
| Offers insurance and financial services | ||||||||||
| 10 | SAP SE | Germany | 0.8 | % | ||||||
| Manufacturer of computer software | ||||||||||
Portfolio holdings and characteristics are subject to change.
For more complete details about the Fund’s investment portfolio, see page 12. A quarterly Fact Sheet is available on dws.com or upon request. Please see the Account Management Resources section on page 68 for contact information.
| DWS EAFE® Equity Index Fund | | | 11 |
Table of Contents
| Investment Portfolio | as of December 31, 2018 |
| Shares | Value ($) | |||||||
| Common Stocks 97.2% | ||||||||
| Australia 6.7% |
| |||||||
AGL Energy Ltd. | 2,078 | 30,085 | ||||||
Alumina Ltd. | 7,671 | 12,406 | ||||||
Amcor Ltd. | 3,726 | 34,702 | ||||||
AMP Ltd. | 9,940 | 17,117 | ||||||
APA Group (Units) | 4,016 | 23,954 | ||||||
Aristocrat Leisure Ltd. | 1,870 | 28,704 | ||||||
ASX Ltd. | 642 | 27,102 | ||||||
Aurizon Holdings Ltd. | 6,538 | 19,696 | ||||||
AusNet Services (Units) | 5,993 | 6,550 | ||||||
Australia & New Zealand Banking Group Ltd. | 9,331 | 160,743 | ||||||
Bank of Queensland Ltd. | 1,515 | 10,354 | ||||||
Bendigo & Adelaide Bank Ltd. | 1,558 | 11,820 | ||||||
BGP Holdings PLC (a)* | 328,818 | 1,454 | ||||||
BHP Group Ltd. | 9,580 | 230,117 | ||||||
BlueScope Steel Ltd. | 1,750 | 13,464 | ||||||
Boral Ltd. | 4,092 | 14,236 | ||||||
Brambles Ltd. | 5,283 | 37,688 | ||||||
Caltex Australia Ltd. | 826 | 14,789 | ||||||
Challenger Ltd. | 1,814 | 12,099 | ||||||
CIMIC Group Ltd. | 372 | 11,330 | ||||||
Coca-Cola Amatil Ltd. | 1,476 | 8,506 | ||||||
Cochlear Ltd. | 183 | 22,371 | ||||||
Coles Group Ltd.* | 3,808 | 31,206 | ||||||
Commonwealth Bank of Australia | 5,729 | 291,746 | ||||||
Computershare Ltd. | 1,467 | 17,747 | ||||||
Crown Resorts Ltd. | 1,323 | 11,024 | ||||||
CSL Ltd. | 1,468 | 191,974 | ||||||
Dexus (REIT) | 3,219 | 24,019 | ||||||
Domino’s Pizza Enterprises Ltd. Series L | 224 | 6,385 | ||||||
Flight Centre Travel Group Ltd. | 196 | 5,911 | ||||||
Fortescue Metals Group Ltd. | 4,850 | 14,305 | ||||||
Goodman Group (REIT) | 5,449 | 40,750 | ||||||
GPT Group (REIT) | 5,745 | 21,571 | ||||||
Harvey Norman Holdings Ltd. | 1,366 | 3,032 | ||||||
Incitec Pivot Ltd. | 4,803 | 11,064 | ||||||
Insurance Australia Group Ltd. | 7,630 | 37,627 | ||||||
LendLease Group (Units) | 1,860 | 15,196 | ||||||
Macquarie Group Ltd. | 1,040 | 79,430 | ||||||
Medibank Private Ltd. | 9,713 | 17,571 | ||||||
Mirvac Group (REIT) (Units) | 11,725 | 18,501 | ||||||
The accompanying notes are an integral part of the financial statements.
| 12 | | | DWS EAFE® Equity Index Fund |
Table of Contents
| Shares | Value ($) | |||||||
National Australia Bank Ltd. | 8,911 | 151,145 | ||||||
Newcrest Mining Ltd. | 2,479 | 38,141 | ||||||
Oil Search Ltd. | 4,422 | 22,184 | ||||||
Orica Ltd. | 1,156 | 14,034 | ||||||
Origin Energy Ltd.* | 5,463 | 24,745 | ||||||
QBE Insurance Group Ltd. | 4,422 | 31,414 | ||||||
Ramsay Health Care Ltd. | 444 | 18,018 | ||||||
REA Group Ltd. | 189 | 9,829 | ||||||
Rio Tinto Ltd. | 1,192 | 65,779 | ||||||
Santos Ltd. | 5,878 | 22,539 | ||||||
Scentre Group (REIT) | 17,628 | 48,358 | ||||||
SEEK Ltd. | 1,040 | 12,375 | ||||||
Sonic Healthcare Ltd. | 1,256 | 19,525 | ||||||
South32 Ltd. | 16,602 | 39,135 | ||||||
Stockland (REIT) (Units) | 7,589 | 18,792 | ||||||
Suncorp Group Ltd. | 4,225 | 37,515 | ||||||
Sydney Airport (Units) | 3,344 | 15,839 | ||||||
TABCORP Holdings Ltd. | 6,018 | 18,162 | ||||||
Telstra Corp., Ltd. | 13,493 | 27,015 | ||||||
TPG Telecom Ltd. | 1,032 | 4,667 | ||||||
Transurban Group (Units) | 8,524 | 69,906 | ||||||
Treasury Wine Estates Ltd. | 2,233 | 23,263 | ||||||
Vicinity Centres (REIT) | 9,779 | 17,892 | ||||||
Washington H Soul Pattinson & Co., Ltd. | 363 | 6,351 | ||||||
Wesfarmers Ltd. | 3,676 | 83,337 | ||||||
Westpac Banking Corp. | 11,179 | 197,088 | ||||||
Woodside Petroleum Ltd. | 3,004 | 65,974 | ||||||
Woolworths Group Ltd. | 4,265 | 88,479 | ||||||
WorleyParsons Ltd. | 1,044 | 8,367 | ||||||
|
| |||||||
(Cost $1,274,016) |
| 2,788,214 | ||||||
| Austria 0.2% |
| |||||||
Andritz AG | 216 | 9,942 | ||||||
Erste Group Bank AG* | 1,012 | 33,762 | ||||||
OMV AG | 483 | 21,180 | ||||||
Raiffeisen Bank International AG | 459 | 11,693 | ||||||
Verbund AG | 236 | 10,034 | ||||||
Voestalpine AG | 360 | 10,824 | ||||||
|
| |||||||
(Cost $51,075) |
| 97,435 | ||||||
| Belgium 0.9% |
| |||||||
Ageas | 592 | 26,660 | ||||||
Anheuser-Busch InBev SA | 2,472 | 163,939 | ||||||
Colruyt SA | 199 | 14,168 | ||||||
Groupe Bruxelles Lambert SA | 259 | 22,601 | ||||||
KBC Group NV | 816 | 53,176 | ||||||
The accompanying notes are an integral part of the financial statements.
| DWS EAFE® Equity Index Fund | | | 13 |
Table of Contents
| Shares | Value ($) | |||||||
Proximus SA | 486 | 13,174 | ||||||
Solvay SA | 244 | 24,451 | ||||||
Telenet Group Holding NV | 151 | 7,030 | ||||||
UCB SA | 415 | 33,918 | ||||||
Umicore SA | 687 | 27,507 | ||||||
|
| |||||||
(Cost $152,441) |
| 386,624 | ||||||
| Bermuda 0.0% |
| |||||||
Dairy Farm International Holdings Ltd. (Cost $9,430) | 1,100 | 9,958 | ||||||
| Chile 0.0% |
| |||||||
Antofagasta PLC (Cost $11,696) | 1,179 | 11,798 | ||||||
| China 0.1% |
| |||||||
BeiGene Ltd. ADR* | 100 | 14,026 | ||||||
Minth Group Ltd. | 2,000 | 6,463 | ||||||
Yangzijiang Shipbuilding Holdings Ltd. | 7,900 | 7,196 | ||||||
|
| |||||||
(Cost $31,755) |
| 27,685 | ||||||
| Denmark 1.7% |
| |||||||
A P Moller-Maersk AS “A” | 12 | 14,210 | ||||||
A P Moller-Maersk AS “B” | 22 | 27,730 | ||||||
Carlsberg AS “B” | 362 | 38,503 | ||||||
Chr Hansen Holding AS | 328 | 29,097 | ||||||
Coloplast AS “B” | 372 | 34,593 | ||||||
Danske Bank AS | 2,366 | 46,985 | ||||||
DSV AS | 599 | 39,565 | ||||||
Genmab AS* | 202 | 33,237 | ||||||
H. Lundbeck AS | 211 | 9,258 | ||||||
ISS AS | 523 | 14,660 | ||||||
Novo Nordisk AS ‘‘B” | 5,900 | 271,042 | ||||||
Novozymes AS “B” | 700 | 31,353 | ||||||
Orsted AS 144A | 629 | 42,151 | ||||||
Pandora AS | 375 | 15,280 | ||||||
Tryg AS | 376 | 9,479 | ||||||
Vestas Wind Systems AS | 640 | 48,487 | ||||||
William Demant Holding AS* | 318 | 9,045 | ||||||
|
| |||||||
(Cost $234,790) |
| 714,675 | ||||||
| Finland 1.2% |
| |||||||
Elisa Oyj | 457 | 18,910 | ||||||
Fortum Oyj | 1,452 | 31,781 | ||||||
Kone Oyj “B” | 1,101 | 52,643 | ||||||
Metso Oyj | 320 | 8,419 | ||||||
Neste Oyj | 419 | 32,396 | ||||||
Nokia Oyj | 18,159 | 105,033 | ||||||
Nokian Renkaat Oyj | 372 | 11,460 | ||||||
The accompanying notes are an integral part of the financial statements.
| 14 | | | DWS EAFE® Equity Index Fund |
Table of Contents
| Shares | Value ($) | |||||||
Nordea Bank Abp | 9,992 | 84,182 | ||||||
Orion Oyj “B” | 334 | 11,634 | ||||||
Sampo Oyj “A” | 1,443 | 63,863 | ||||||
Stora Enso Oyj “R” | 1,825 | 21,218 | ||||||
UPM-Kymmene Oyj | 1,768 | 45,092 | ||||||
Wartsila Oyj | 1,518 | 24,223 | ||||||
|
| |||||||
(Cost $180,887) |
| 510,854 | ||||||
| France 10.6% |
| |||||||
Accor SA | 637 | 27,408 | ||||||
Aeroports de Paris | 94 | 17,865 | ||||||
Air Liquide SA | 1,388 | 172,745 | ||||||
Airbus SE | 1,884 | 181,658 | ||||||
Alstom SA | 510 | 20,639 | ||||||
Amundi SA 144A | 172 | 9,115 | ||||||
Arkema SA | 217 | 18,669 | ||||||
Atos SE | 298 | 24,409 | ||||||
AXA SA | 6,313 | 136,676 | ||||||
BioMerieux | 153 | 10,079 | ||||||
BNP Paribas SA | 3,626 | 164,290 | ||||||
Bollore SA | 2,589 | 10,381 | ||||||
Bouygues SA | 720 | 25,902 | ||||||
Bureau Veritas SA | 848 | 17,304 | ||||||
Capgemini SE | 515 | 51,359 | ||||||
Carrefour SA | 1,878 | 32,089 | ||||||
Casino Guichard-Perrachon SA | 166 | 6,923 | ||||||
Cie de Saint-Gobain | 1,639 | 54,763 | ||||||
Cie Generale des Etablissements Michelin | 556 | 55,287 | ||||||
CNP Assurances | 552 | 11,725 | ||||||
Credit Agricole SA | 3,576 | 38,739 | ||||||
Danone SA | 2,002 | 141,157 | ||||||
Dassault Aviation SA | 8 | 11,131 | ||||||
Dassault Systemes SE | 416 | 49,515 | ||||||
Edenred | 773 | 28,490 | ||||||
Eiffage SA | 251 | 21,008 | ||||||
Electricite de France SA | 1,880 | 29,729 | ||||||
Engie SA | 5,872 | 84,346 | ||||||
EssilorLuxottica SA | 930 | 117,758 | ||||||
Eurazeo SA | 135 | 9,569 | ||||||
Eutelsat Communications SA | 636 | 12,555 | ||||||
Faurecia SA | 222 | 8,426 | ||||||
Fonciere des Regions (REIT) | 128 | 12,365 | ||||||
Gecina SA (REIT) | 152 | 19,706 | ||||||
Getlink | 1,493 | 20,074 | ||||||
Hermes International | 104 | 57,845 | ||||||
Icade (REIT) | 119 | 9,082 | ||||||
The accompanying notes are an integral part of the financial statements.
| DWS EAFE® Equity Index Fund | | | 15 |
Table of Contents
| Shares | Value ($) | |||||||
Iliad SA | 83 | 11,698 | ||||||
Imerys SA | 135 | 6,505 | ||||||
Ingenico Group SA | 198 | 11,252 | ||||||
Ipsen SA | 115 | 14,875 | ||||||
JC Decaux SA | 245 | 6,891 | ||||||
Kering SA | 243 | 114,587 | ||||||
Klepierre SA (REIT) | 703 | 21,747 | ||||||
L’Oreal SA | 819 | 189,217 | ||||||
Legrand SA | 844 | 47,757 | ||||||
LVMH Moet Hennessy Louis Vuitton SE | 905 | 268,238 | ||||||
Natixis SA | 3,215 | 15,185 | ||||||
Orange SA | 6,444 | 104,782 | ||||||
Pernod Ricard SA | 689 | 113,175 | ||||||
Peugeot SA | 1,968 | 42,079 | ||||||
Publicis Groupe | 681 | 39,072 | ||||||
Remy Cointreau SA | 79 | 8,958 | ||||||
Renault SA | 603 | 37,764 | ||||||
Rexel SA | 859 | 9,158 | ||||||
Safran SA | 1,082 | 130,820 | ||||||
Sanofi | 3,663 | 317,710 | ||||||
Sartorius Stedim Biotech | 106 | 10,622 | ||||||
Schneider Electric SE | 1,766 | 121,338 | ||||||
SCOR SE | 530 | 23,926 | ||||||
SEB SA | 63 | 8,148 | ||||||
Societe BIC SA | 82 | 8,380 | ||||||
Societe Generale SA | 2,513 | 80,446 | ||||||
Sodexo SA | 291 | 29,842 | ||||||
Suez | 1,113 | 14,734 | ||||||
Teleperformance | 193 | 30,913 | ||||||
Thales SA | 346 | 40,488 | ||||||
TOTAL SA | 7,794 | 412,442 | ||||||
Ubisoft Entertainment SA* | 240 | 19,419 | ||||||
Unibail-Rodamco-Westfield (CDI)* | 2,600 | 19,533 | ||||||
Unibail-Rodamco-Westfield (REIT)* (b) | 216 | 33,509 | ||||||
Unibail-Rodamco-Westfield (REIT) (b) | 108 | 16,776 | ||||||
Valeo SA | 791 | 23,182 | ||||||
Veolia Environnement SA | 1,734 | 35,724 | ||||||
VINCI SA | 1,655 | 136,674 | ||||||
Vivendi SA | 3,377 | 82,357 | ||||||
Wendel | 81 | 9,725 | ||||||
|
| |||||||
(Cost $2,094,623) |
| 4,390,429 | ||||||
| Germany 8.0% |
| |||||||
1&1 Drillisch AG | 199 | 10,217 | ||||||
adidas AG | 607 | 127,343 | ||||||
Allianz SE (Registered) | 1,393 | 280,633 | ||||||
The accompanying notes are an integral part of the financial statements.
| 16 | | | DWS EAFE® Equity Index Fund |
Table of Contents
| Shares | Value ($) | |||||||
Axel Springer SE | 159 | 9,030 | ||||||
BASF SE | 2,967 | 208,250 | ||||||
Bayer AG (Registered) | 3,027 | 211,924 | ||||||
Bayerische Motoren Werke AG | 1,086 | 88,340 | ||||||
Beiersdorf AG | 329 | 34,423 | ||||||
Brenntag AG | 528 | 22,914 | ||||||
Commerzbank AG* | 3,418 | 22,819 | ||||||
Continental AG | 363 | 50,561 | ||||||
Covestro AG 144A | 602 | 29,952 | ||||||
Daimler AG (Registered) | 2,931 | 154,663 | ||||||
Delivery Hero AG 144A* | 320 | 11,964 | ||||||
Deutsche Bank AG (Registered) (c) | 6,397 | 51,429 | ||||||
Deutsche Boerse AG | 636 | 76,721 | ||||||
Deutsche Lufthansa AG (Registered) | 722 | 16,404 | ||||||
Deutsche Post AG (Registered) | 3,258 | 89,484 | ||||||
Deutsche Telekom AG (Registered) | 10,799 | 184,105 | ||||||
Deutsche Wohnen SE | 1,149 | 52,833 | ||||||
E.ON SE | 7,228 | 71,488 | ||||||
Evonik Industries AG | 500 | 12,537 | ||||||
Fraport AG | 122 | 8,772 | ||||||
Fresenius Medical Care AG & Co. KGaA | 691 | 44,926 | ||||||
Fresenius SE & Co. KGaA | 1,349 | 65,810 | ||||||
GEA Group AG | 547 | 14,183 | ||||||
Hannover Rueck SE | 193 | 26,116 | ||||||
HeidelbergCement AG | 500 | 30,730 | ||||||
Henkel AG & Co. KGaA | 334 | 32,902 | ||||||
HOCHTIEF AG | 70 | 9,472 | ||||||
HUGO BOSS AG | 219 | 13,515 | ||||||
Infineon Technologies AG | 3,666 | 73,402 | ||||||
Innogy SE* | 451 | 19,181 | ||||||
KION Group AG | 249 | 12,692 | ||||||
LANXESS AG | 286 | 13,229 | ||||||
Merck KGaA | 423 | 43,767 | ||||||
METRO AG | 560 | 8,624 | ||||||
MTU Aero Engines AG | 168 | 30,619 | ||||||
Muenchener Rueckversicherungs-Gesellschaft AG (Registered) | 484 | 105,923 | ||||||
OSRAM Licht AG | 349 | 15,253 | ||||||
ProSiebenSat.1 Media SE | 753 | 13,453 | ||||||
Puma SE (b) | 22 | 10,763 | ||||||
Puma SE (b) | 3 | 1,471 | ||||||
RWE AG | 1,753 | 38,191 | ||||||
SAP SE | 3,187 | 319,077 | ||||||
Siemens AG (Registered) | 2,482 | 277,766 | ||||||
Siemens Healthineers AG 144A* | 526 | 22,122 | ||||||
The accompanying notes are an integral part of the financial statements.
| DWS EAFE® Equity Index Fund | | | 17 |
Table of Contents
| Shares | Value ($) | |||||||
Symrise AG | 412 | 30,525 | ||||||
Telefonica Deutschland Holding AG | 2,352 | 9,238 | ||||||
ThyssenKrupp AG | 1,348 | 23,348 | ||||||
TUI AG | 1,449 | 20,815 | ||||||
Uniper SE | 700 | 18,137 | ||||||
United Internet AG (Registered) | 401 | 17,649 | ||||||
Volkswagen AG | 112 | 17,901 | ||||||
Vonovia SE | 1,598 | 72,715 | ||||||
Wirecard AG | 377 | 57,950 | ||||||
Zalando SE 144A* | 349 | 9,010 | ||||||
|
| |||||||
(Cost $1,748,355) |
| 3,347,281 | ||||||
| Hong Kong 3.6% |
| |||||||
AIA Group Ltd. | 39,081 | 324,058 | ||||||
ASM Pacific Technology Ltd. | 1,100 | 10,478 | ||||||
Bank of East Asia Ltd. | 4,234 | 13,415 | ||||||
BOC Hong Kong (Holdings) Ltd. | 12,321 | 45,648 | ||||||
CK Asset Holdings Ltd. | 8,348 | 60,486 | ||||||
CK Hutchison Holdings Ltd. | 8,848 | 84,928 | ||||||
CK Infrastructure Holdings Ltd. | 2,000 | 15,147 | ||||||
CLP Holdings Ltd. | 5,274 | 59,602 | ||||||
Galaxy Entertainment Group Ltd. | 7,497 | 47,275 | ||||||
Hang Lung Group Ltd. | 3,000 | 7,639 | ||||||
Hang Lung Properties Ltd. | 7,000 | 13,338 | ||||||
Hang Seng Bank Ltd. | 2,500 | 55,775 | ||||||
Henderson Land Development Co., Ltd. | 4,276 | 21,287 | ||||||
HK Electric Investments & HK Electric Investments Ltd. “SS”, (Units) | 9,491 | 9,615 | ||||||
HKT Trust & HKT Ltd. “SS”, (Units) | 11,920 | 17,174 | ||||||
Hong Kong & China Gas Co., Ltd. | 30,434 | 62,840 | ||||||
Hong Kong Exchanges & Clearing Ltd. | 3,779 | 109,483 | ||||||
Hongkong Land Holdings Ltd. | 3,800 | 23,925 | ||||||
Hysan Development Co., Ltd. | 1,773 | 8,413 | ||||||
Jardine Matheson Holdings Ltd. | 700 | 48,651 | ||||||
Jardine Strategic Holdings Ltd. | 700 | 25,712 | ||||||
Kerry Properties Ltd. (b) | 2,000 | 6,832 | ||||||
Link (REIT) | 6,653 | 67,315 | ||||||
Melco Resorts & Entertainment Ltd. (ADR) | 783 | 13,796 | ||||||
MGM China Holdings Ltd. | 3,897 | 6,491 | ||||||
MTR Corp., Ltd. | 4,917 | 25,852 | ||||||
New World Development Co., Ltd. | 20,369 | 26,834 | ||||||
NWS Holdings Ltd. | 5,991 | 12,294 | ||||||
PCCW Ltd. | 14,000 | 8,064 | ||||||
Power Assets Holdings Ltd. | 4,500 | 31,278 | ||||||
Shangri-La Asia Ltd. | 4,000 | 5,935 | ||||||
Sino Land Co., Ltd. | 11,367 | 19,440 | ||||||
The accompanying notes are an integral part of the financial statements.
| 18 | | | DWS EAFE® Equity Index Fund |
Table of Contents
| Shares | Value ($) | |||||||
SJM Holdings Ltd. | 8,000 | 7,463 | ||||||
Sun Hung Kai Properties Ltd. | 5,188 | 73,955 | ||||||
Swire Pacific Ltd. “A” | 1,500 | 15,864 | ||||||
Swire Properties Ltd. | 3,800 | 13,337 | ||||||
Techtronic Industries Co., Ltd. | 4,499 | 23,967 | ||||||
WH Group Ltd. 144A | 29,259 | 22,523 | ||||||
Wharf Holdings Ltd. | 3,750 | 9,770 | ||||||
Wharf Real Estate Investment Co., Ltd. | 3,750 | 22,412 | ||||||
Wheelock & Co., Ltd. | 3,000 | 17,159 | ||||||
Yue Yuen Industrial (Holdings) Ltd. | 2,500 | 7,993 | ||||||
|
| |||||||
(Cost $660,236) |
| 1,503,463 | ||||||
| Ireland 1.1% |
| |||||||
AIB Group PLC | 2,423 | 10,241 | ||||||
Bank of Ireland Group PLC | 3,166 | 17,634 | ||||||
CRH PLC | 2,659 | 70,668 | ||||||
DCC PLC | 316 | 24,150 | ||||||
James Hardie Industries SE (CDI) | 1,472 | 15,660 | ||||||
Kerry Group PLC “A” (b) | 2 | 198 | ||||||
Kerry Group PLC “A” (b) | 534 | 52,501 | ||||||
Kingspan Group PLC | 525 | 22,561 | ||||||
Paddy Power Betfair PLC | 288 | 23,654 | ||||||
Shire PLC | 3,085 | 179,989 | ||||||
Smurfit Kappa Group PLC | 784 | 20,911 | ||||||
|
| |||||||
(Cost $317,463) |
| 438,167 | ||||||
| Isle Of Man 0.1% |
| |||||||
GVC Holdings PLC (Cost $25,618) | 1,951 | 16,781 | ||||||
| Israel 0.5% |
| |||||||
Azrieli Group Ltd. | 144 | 6,873 | ||||||
Bank Hapoalim BM | 3,300 | 20,847 | ||||||
Bank LeumiLe-Israel BM | 4,781 | 28,872 | ||||||
Bezeq Israeli Telecommunication Corp., Ltd. | 8,053 | 7,857 | ||||||
Check Point Software Technologies Ltd.* (d) | 423 | 43,421 | ||||||
Elbit Systems Ltd. | 66 | 7,565 | ||||||
Israel Chemicals Ltd. | 2,347 | 13,294 | ||||||
Mizrahi Tefahot Bank Ltd. | 378 | 6,366 | ||||||
Nice Ltd.* | 213 | 22,938 | ||||||
Teva Pharmaceutical Industries Ltd. (ADR) | 3,233 | 49,853 | ||||||
Wix.com Ltd.* (d) | 100 | 9,034 | ||||||
|
| |||||||
(Cost $259,679) |
| 216,920 | ||||||
| Italy 1.9% |
| |||||||
Assicurazioni Generali SpA | 3,812 | 63,949 | ||||||
Atlantia SpA | 1,598 | 33,242 | ||||||
Davide Campari-Milano SpA | 1,899 | 16,086 | ||||||
The accompanying notes are an integral part of the financial statements.
| DWS EAFE® Equity Index Fund | | | 19 |
Table of Contents
| Shares | Value ($) | |||||||
Enel SpA | 26,590 | 154,408 | ||||||
Eni SpA | 8,215 | 129,756 | ||||||
Ferrari NV (b) | 82 | 8,186 | ||||||
Ferrari NV (b) (e) | 324 | 32,219 | ||||||
Intesa Sanpaolo SpA | 48,863 | 109,093 | ||||||
Leonardo SpA | 1,392 | 12,292 | ||||||
Mediobanca Banca di Credito Finanziario SpA | 1,898 | 16,121 | ||||||
Moncler SpA | 610 | 20,381 | ||||||
Pirelli & C SpA 144A* | 1,251 | 8,068 | ||||||
Poste Italiane SpA 144A | 1,837 | 14,753 | ||||||
Prysmian SpA | 722 | 14,029 | ||||||
Recordati SpA | 311 | 10,814 | ||||||
Snam SpA | 7,190 | 31,560 | ||||||
Telecom Italia SpA* | 34,686 | 19,292 | ||||||
Telecom Italia SpA (RSP) | 16,966 | 8,143 | ||||||
Terna Rete Elettrica Nazionale SpA | 4,525 | 25,728 | ||||||
UniCredit SpA | 6,442 | 73,098 | ||||||
|
| |||||||
(Cost $606,284) |
| 801,218 | ||||||
| Japan 23.7% |
| |||||||
ABC-Mart, Inc. | 100 | 5,532 | ||||||
Acom Co., Ltd. | 1,500 | 4,892 | ||||||
Aeon Co., Ltd. | 2,000 | 39,108 | ||||||
AEON Financial Service Co., Ltd. | 430 | 7,635 | ||||||
AEON Mall Co., Ltd. | 400 | 6,356 | ||||||
Air Water, Inc. | 553 | 8,369 | ||||||
Aisin Seiki Co., Ltd. | 500 | 17,202 | ||||||
Ajinomoto Co., Inc. | 1,600 | 28,503 | ||||||
Alfresa Holdings Corp. | 700 | 17,883 | ||||||
Alps Electric Co., Ltd. | 600 | 11,612 | ||||||
Amada Holdings Co., Ltd. | 1,000 | 8,976 | ||||||
ANA Holdings, Inc. | 400 | 14,361 | ||||||
Aozora Bank Ltd. | 400 | 11,931 | ||||||
Asahi Glass Co., Ltd. | 600 | 18,892 | ||||||
Asahi Group Holdings Ltd. | 1,200 | 46,574 | ||||||
Asahi Intecc Co., Ltd. | 300 | 12,620 | ||||||
Asahi Kasei Corp. | 4,200 | 43,215 | ||||||
ASICS Corp. | 600 | 7,648 | ||||||
Astellas Pharma, Inc. | 6,100 | 78,128 | ||||||
Bandai Namco Holdings, Inc. | 650 | 29,137 | ||||||
Benesse Holdings, Inc. | 300 | 7,621 | ||||||
Bridgestone Corp. | 2,000 | 76,994 | ||||||
Brother Industries Ltd. | 700 | 10,364 | ||||||
Calbee, Inc. | 300 | 9,389 | ||||||
Canon, Inc. | 3,300 | 90,110 | ||||||
Casio Computer Co., Ltd. | 700 | 8,257 | ||||||
The accompanying notes are an integral part of the financial statements.
| 20 | | | DWS EAFE® Equity Index Fund |
Table of Contents
| Shares | Value ($) | |||||||
Central Japan Railway Co. | 500 | 105,549 | ||||||
Chubu Electric Power Co., Inc. | 1,900 | 27,034 | ||||||
Chugai Pharmaceutical Co., Ltd. | 700 | 40,671 | ||||||
Chugoku Electric Power Co., Inc. | 800 | 10,410 | ||||||
Coca-Cola Bottlers Japan Holdings, Inc. | 400 | 11,924 | ||||||
Concordia Financial Group Ltd. | 3,100 | 11,897 | ||||||
Credit Saison Co., Ltd. | 500 | 5,863 | ||||||
CyberAgent Inc | 300 | 11,557 | ||||||
Dai Nippon Printing Co., Ltd. | 800 | 16,769 | ||||||
Dai-ichi Life Holdings, Inc. | 3,500 | 54,390 | ||||||
Daicel Corp. | 1,000 | 10,255 | ||||||
Daifuku Co., Ltd. | 300 | 13,654 | ||||||
Daiichi Sankyo Co., Ltd. | 1,800 | 57,483 | ||||||
Daikin Industries Ltd. | 800 | 84,930 | ||||||
Daito Trust Construction Co., Ltd. | 200 | 27,291 | ||||||
Daiwa House Industry Co., Ltd. | 1,800 | 57,176 | ||||||
Daiwa House REIT Investment Corp. (REIT) | 5 | 11,198 | ||||||
Daiwa Securities Group, Inc. | 5,100 | 25,826 | ||||||
DeNA Co., Ltd. | 400 | 6,656 | ||||||
Denso Corp. | 1,400 | 61,896 | ||||||
Dentsu, Inc. | 700 | 31,235 | ||||||
Disco Corp. | 100 | 11,571 | ||||||
Don Quijote Holdings Co., Ltd. | 400 | 24,512 | ||||||
East Japan Railway Co. | 939 | 82,922 | ||||||
Eisai Co., Ltd. | 800 | 61,773 | ||||||
Electric Power Development Co., Ltd. | 500 | 11,843 | ||||||
FamilyMart UNY Holdings Co., Ltd. | 200 | 25,299 | ||||||
FANUC Corp. | 600 | 90,803 | ||||||
Fast Retailing Co., Ltd. | 200 | 102,084 | ||||||
Fuji Electric Co., Ltd. | 400 | 11,767 | ||||||
Fujifilm Holdings Corp. | 1,300 | 50,555 | ||||||
Fujitsu Ltd. | 600 | 37,362 | ||||||
Fukuoka Financial Group, Inc. | 500 | 10,138 | ||||||
Hakuhodo Dy Holdings, Inc. | 700 | 10,005 | ||||||
Hamamatsu Photonics KK | 500 | 16,742 | ||||||
Hankyu Hanshin Holdings, Inc. | 700 | 23,254 | ||||||
Hikari Tsushin, Inc. | 100 | 15,636 | ||||||
Hino Motors Ltd. | 1,000 | 9,425 | ||||||
Hirose Electric Co., Ltd. | 105 | 10,260 | ||||||
Hisamitsu Pharmaceutical Co., Inc. | 200 | 11,052 | ||||||
Hitachi Chemical Co., Ltd. | 400 | 5,920 | ||||||
Hitachi Construction Machinery Co., Ltd. | 400 | 9,328 | ||||||
Hitachi High-Technologies Corp. | 200 | 6,246 | ||||||
Hitachi Ltd. | 3,200 | 84,893 | ||||||
Hitachi Metals Ltd. | 700 | 7,305 | ||||||
The accompanying notes are an integral part of the financial statements.
| DWS EAFE® Equity Index Fund | | | 21 |
Table of Contents
| Shares | Value ($) | |||||||
Honda Motor Co., Ltd. | 5,300 | 139,204 | ||||||
Hoshizaki Corp. | 200 | 12,162 | ||||||
Hoya Corp. | 1,200 | 72,242 | ||||||
Hulic Co., Ltd. | 900 | 8,055 | ||||||
Idemitsu Kosan Co., Ltd. | 400 | 13,083 | ||||||
IHI Corp. | 500 | 13,767 | ||||||
Iida Group Holdings Co., Ltd. | 500 | 8,647 | ||||||
INPEX Corp. | 3,300 | 29,455 | ||||||
Isetan Mitsukoshi Holdings Ltd. | 1,120 | 12,397 | ||||||
Isuzu Motors Ltd. | 1,800 | 25,291 | ||||||
Itochu Corp. | 4,600 | 78,125 | ||||||
J. Front Retailing Co., Ltd. | 700 | 8,020 | ||||||
Japan Airlines Co., Ltd. | 400 | 14,176 | ||||||
Japan Airport Terminal Co., Ltd. | 200 | 6,928 | ||||||
Japan Exchange Group, Inc. | 1,700 | 27,499 | ||||||
Japan Post Bank Co., Ltd. | 1,400 | 15,424 | ||||||
Japan Post Holdings Co., Ltd. | 5,000 | 57,625 | ||||||
Japan Prime Realty Investment Corp. (REIT) | 3 | 11,407 | ||||||
Japan Real Estate Investment Corp. (REIT) | 4 | 22,483 | ||||||
Japan Retail Fund Investment Corp. (REIT) | 8 | 15,995 | ||||||
Japan Tobacco, Inc. | 3,600 | 85,688 | ||||||
JFE Holdings, Inc. | 1,625 | 25,713 | ||||||
JGC Corp. | 600 | 8,425 | ||||||
JSR Corp. | 600 | 8,997 | ||||||
JTEKT Corp. | 600 | 6,650 | ||||||
JXTG Holdings, Inc. | 10,250 | 53,608 | ||||||
Kajima Corp. | 1,500 | 20,088 | ||||||
Kakaku.com, Inc. | 500 | 8,815 | ||||||
Kamigumi Co., Ltd. | 400 | 8,208 | ||||||
Kaneka Corp. | 200 | 7,161 | ||||||
Kansai Electric Power Co., Inc. | 2,300 | 34,540 | ||||||
Kansai Paint Co., Ltd. | 600 | 11,513 | ||||||
Kao Corp. | 1,600 | 118,763 | ||||||
Kawasaki Heavy Industries Ltd. | 400 | 8,542 | ||||||
KDDI Corp. | 5,700 | 136,224 | ||||||
Keihan Holdings Co., Ltd. | 300 | 12,215 | ||||||
Keikyu Corp. | 800 | 13,082 | ||||||
Keio Corp. | 300 | 17,449 | ||||||
Keisei Electric Railway Co., Ltd. | 500 | 15,630 | ||||||
Keyence Corp. | 300 | 151,817 | ||||||
Kikkoman Corp. | 500 | 26,743 | ||||||
Kintetsu Group Holdings Co., Ltd. | 590 | 25,596 | ||||||
Kirin Holdings Co., Ltd. | 2,600 | 54,288 | ||||||
Kobayashi Pharmaceutical Co., Ltd. | 100 | 6,806 | ||||||
Kobe Steel Ltd. | 1,200 | 8,306 | ||||||
The accompanying notes are an integral part of the financial statements.
| 22 | | | DWS EAFE® Equity Index Fund |
Table of Contents
| Shares | Value ($) | |||||||
Koito Manufacturing Co., Ltd. | 358 | 18,353 | ||||||
Komatsu Ltd. | 3,000 | 64,156 | ||||||
Konami Holdings Corp. | 300 | 13,078 | ||||||
Konica Minolta, Inc. | 1,500 | 13,529 | ||||||
Kose Corp. | 100 | 15,660 | ||||||
Kubota Corp. | 3,300 | 46,913 | ||||||
Kuraray Co., Ltd. | 1,100 | 15,462 | ||||||
Kurita Water Industries Ltd. | 400 | 9,648 | ||||||
Kyocera Corp. | 1,000 | 49,915 | ||||||
Kyowa Hakko Kirin Co., Ltd. | 910 | 17,241 | ||||||
Kyushu Electric Power Co., Inc. | 1,300 | 15,496 | ||||||
Kyushu Railway Co. | 500 | 16,913 | ||||||
Lawson, Inc. | 100 | 6,335 | ||||||
LINE Corp.* | 200 | 6,854 | ||||||
Lion Corp. | 800 | 16,516 | ||||||
LIXIL Group Corp. | 848 | 10,486 | ||||||
M3, Inc. | 1,400 | 18,791 | ||||||
Makita Corp. | 700 | 24,857 | ||||||
Marubeni Corp. | 5,100 | 35,734 | ||||||
Marui Group Co., Ltd. | 700 | 13,590 | ||||||
Maruichi Steel Tube Ltd. | 200 | 6,293 | ||||||
Mazda Motor Corp. | 1,900 | 19,542 | ||||||
McDonald’s Holdings Co. (Japan), Ltd. | 200 | 8,494 | ||||||
Mebuki Financial Group, Inc. | 2,700 | 7,153 | ||||||
Medipal Holdings Corp. | 600 | 12,871 | ||||||
MEIJI Holdings Co., Ltd. | 400 | 32,659 | ||||||
Minebea Mitsumi, Inc. | 1,300 | 18,738 | ||||||
MISUMI Group, Inc. | 900 | 18,880 | ||||||
Mitsubishi Chemical Holdings Corp. | 4,000 | 30,220 | ||||||
Mitsubishi Corp. | 4,400 | 120,852 | ||||||
Mitsubishi Electric Corp. | 6,000 | 66,138 | ||||||
Mitsubishi Estate Co., Ltd. | 3,800 | 59,758 | ||||||
Mitsubishi Gas Chemical Co., Inc. | 500 | 7,512 | ||||||
Mitsubishi Heavy Industries Ltd. | 1,000 | 35,916 | ||||||
Mitsubishi Materials Corp. | 300 | 7,879 | ||||||
Mitsubishi Motors Corp. | 2,000 | 10,872 | ||||||
Mitsubishi Tanabe Pharma Corp. | 900 | 12,978 | ||||||
Mitsubishi UFJ Financial Group, Inc. | 38,000 | 186,178 | ||||||
Mitsubishi UFJ Lease & Finance Co., Ltd. | 1,400 | 6,716 | ||||||
Mitsui & Co., Ltd. | 5,400 | 83,006 | ||||||
Mitsui Chemicals, Inc. | 600 | 13,531 | ||||||
Mitsui Fudosan Co., Ltd. | 2,900 | 63,991 | ||||||
Mitsui O.S.K Lines Ltd. | 400 | 8,660 | ||||||
Mizuho Financial Group, Inc. | 77,590 | 120,359 | ||||||
MonotaRO Co., Ltd. | 400 | 9,879 | ||||||
The accompanying notes are an integral part of the financial statements.
| DWS EAFE® Equity Index Fund | | | 23 |
Table of Contents
| Shares | Value ($) | |||||||
MS&AD Insurance Group Holdings, Inc. | 1,500 | 42,780 | ||||||
Murata Manufacturing Co., Ltd. | 600 | 81,449 | ||||||
Nabtesco Corp. | 425 | 9,238 | ||||||
Nagoya Railroad Co., Ltd. | 600 | 15,802 | ||||||
NEC Corp. | 890 | 26,453 | ||||||
Nexon Co., Ltd.* | 1,400 | 17,908 | ||||||
NGK Insulators Ltd. | 1,000 | 13,552 | ||||||
NGK Spark Plug Co., Ltd. | 400 | 7,918 | ||||||
NH Foods Ltd. | 300 | 11,279 | ||||||
Nidec Corp. | 700 | 79,291 | ||||||
Nikon Corp. | 1,000 | 14,815 | ||||||
Nintendo Co., Ltd. | 400 | 106,318 | ||||||
Nippon Building Fund, Inc. (REIT) | 4 | 25,189 | ||||||
Nippon Electric Glass Co., Ltd. | 300 | 7,349 | ||||||
Nippon Express Co., Ltd. | 200 | 11,137 | ||||||
Nippon Paint Holdings Co., Ltd. | 500 | 17,083 | ||||||
Nippon Prologis REIT, Inc. (REIT) | 6 | 12,681 | ||||||
Nippon Steel & Sumitomo Metal Corp. | 2,400 | 41,169 | ||||||
Nippon Telegraph & Telephone Corp. | 2,276 | 92,728 | ||||||
Nippon Yusen Kabushiki Kaisha | 600 | 9,171 | ||||||
Nissan Chemical Industries Ltd. | 400 | 20,884 | ||||||
Nissan Motor Co., Ltd. | 7,600 | 60,842 | ||||||
Nisshin Seifun Group, Inc. | 700 | 14,456 | ||||||
Nissin Foods Holdings Co., Ltd. | 200 | 12,563 | ||||||
Nitori Holdings Co., Ltd. | 300 | 37,517 | ||||||
Nitto Denko Corp. | 500 | 24,994 | ||||||
Nomura Holdings, Inc. | 10,900 | 41,553 | ||||||
Nomura Real Estate Holdings, Inc. | 500 | 9,143 | ||||||
Nomura Real Estate Master Fund, Inc. (REIT) | 13 | 17,113 | ||||||
Nomura Research Institute Ltd. | 400 | 14,798 | ||||||
NSK Ltd. | 1,100 | 9,442 | ||||||
NTT Data Corp. | 2,100 | 22,957 | ||||||
NTT DoCoMo, Inc. | 4,300 | 96,816 | ||||||
Obayashi Corp. | 2,100 | 18,979 | ||||||
Obic Co., Ltd. | 200 | 15,434 | ||||||
Odakyu Electric Railway Co., Ltd. | 900 | 19,773 | ||||||
Oji Holdings Corp. | 3,000 | 15,377 | ||||||
Olympus Corp. | 1,000 | 30,924 | ||||||
Omron Corp. | 600 | 21,778 | ||||||
Ono Pharmaceutical Co., Ltd. | 1,300 | 26,489 | ||||||
Oracle Corp. | 100 | 6,329 | ||||||
Oriental Land Co., Ltd. | 600 | 60,484 | ||||||
ORIX Corp. | 4,300 | 62,626 | ||||||
Osaka Gas Co., Ltd. | 1,300 | 23,765 | ||||||
Otsuka Corp. | 400 | 10,959 | ||||||
The accompanying notes are an integral part of the financial statements.
| 24 | | | DWS EAFE® Equity Index Fund |
Table of Contents
| Shares | Value ($) | |||||||
Otsuka Holdings Co., Ltd. | 1,222 | 50,025 | ||||||
Panasonic Corp. | 7,214 | 64,618 | ||||||
Park24 Co., Ltd. | 400 | 8,781 | ||||||
Persol Holdings Co., Ltd. | 500 | 7,418 | ||||||
Pigeon Corp. | 400 | 17,119 | ||||||
Pola Orbis Holdings, Inc. | 300 | 8,075 | ||||||
Rakuten, Inc. | 3,000 | 20,100 | ||||||
Recruit Holdings Co., Ltd. | 3,600 | 86,911 | ||||||
Renesas Electronics Corp.* | 2,800 | 12,648 | ||||||
Resona Holdings, Inc. | 6,800 | 32,736 | ||||||
Ricoh Co., Ltd. | 2,100 | 20,507 | ||||||
Rinnai Corp. | 100 | 6,576 | ||||||
ROHM Co., Ltd. | 300 | 19,174 | ||||||
Ryohin Keikaku Co., Ltd. | 100 | 24,243 | ||||||
Sankyo Co., Ltd. | 100 | 3,819 | ||||||
Santen Pharmaceutical Co., Ltd. | 1,300 | 18,800 | ||||||
SBI Holdings, Inc. | 744 | 14,539 | ||||||
Secom Co., Ltd. | 700 | 57,961 | ||||||
Sega Sammy Holdings, Inc. | 500 | 7,003 | ||||||
Seibu Holdings, Inc. | 700 | 12,199 | ||||||
Seiko Epson Corp. | 1,000 | 14,052 | ||||||
Sekisui Chemical Co., Ltd. | 1,300 | 19,262 | ||||||
Sekisui House Ltd. | 2,000 | 29,763 | ||||||
Seven & I Holdings Co., Ltd. | 2,500 | 108,641 | ||||||
Seven Bank Ltd. | 1,800 | 5,146 | ||||||
SG Holdings Co., Ltd. | 300 | 7,775 | ||||||
Sharp Corp. | 800 | 8,004 | ||||||
Shimadzu Corp. | 800 | 15,749 | ||||||
Shimamura Co., Ltd. | 100 | 7,643 | ||||||
Shimano, Inc. | 200 | 28,165 | ||||||
Shimizu Corp. | 1,700 | 13,815 | ||||||
Shin-Etsu Chemical Co., Ltd. | 1,100 | 85,100 | ||||||
Shinsei Bank Ltd. | 500 | 5,956 | ||||||
Shionogi & Co., Ltd. | 900 | 51,475 | ||||||
Shiseido Co., Ltd. | 1,200 | 75,108 | ||||||
Showa Denko KK | 400 | 11,881 | ||||||
Showa Shell Sekiyu KK | 600 | 8,389 | ||||||
SMC Corp. | 200 | 60,363 | ||||||
SoftBank Group Corp. | 2,700 | 178,925 | ||||||
Sohgo Security Services Co., Ltd. | 200 | 9,362 | ||||||
Sompo Holdings, Inc. | 1,100 | 37,261 | ||||||
Sony Corp. | 4,100 | 196,893 | ||||||
Sony Financial Holdings, Inc. | 600 | 11,208 | ||||||
Stanley Electric Co., Ltd. | 400 | 11,203 | ||||||
Subaru Corp. | 1,882 | 40,470 | ||||||
The accompanying notes are an integral part of the financial statements.
| DWS EAFE® Equity Index Fund | | | 25 |
Table of Contents
| Shares | Value ($) | |||||||
SUMCO Corp. | 700 | 7,779 | ||||||
Sumitomo Chemical Co., Ltd. | 5,000 | 24,161 | ||||||
Sumitomo Corp. | 3,500 | 49,647 | ||||||
Sumitomo Dainippon Pharma Co., Ltd. | 500 | 15,922 | ||||||
Sumitomo Electric Industries Ltd. | 2,400 | 31,749 | ||||||
Sumitomo Heavy Industries Ltd. | 400 | 11,899 | ||||||
Sumitomo Metal Mining Co., Ltd. | 800 | 21,407 | ||||||
Sumitomo Mitsui Financial Group, Inc. | 4,291 | 142,342 | ||||||
Sumitomo Mitsui Trust Holdings, Inc. | 1,110 | 40,589 | ||||||
Sumitomo Realty & Development Co., Ltd. | 1,200 | 43,885 | ||||||
Sumitomo Rubber Industries Ltd. | 700 | 8,249 | ||||||
Sundrug Co., Ltd. | 200 | 5,946 | ||||||
Suntory Beverage & Food Ltd. | 400 | 18,039 | ||||||
Suzuken Co., Ltd. | 200 | 10,180 | ||||||
Suzuki Motor Corp. | 1,100 | 55,582 | ||||||
Sysmex Corp. | 500 | 24,073 | ||||||
T&D Holdings, Inc. | 1,800 | 20,814 | ||||||
Taiheiyo Cement Corp. | 400 | 12,340 | ||||||
Taisei Corp. | 700 | 29,923 | ||||||
Taisho Pharmaceutical Holdings Co., Ltd. | 100 | 10,034 | ||||||
Taiyo Nippon Sanso Corp. | 400 | 6,495 | ||||||
Takashimaya Co., Ltd. | 500 | 6,382 | ||||||
Takeda Pharmaceutical Co., Ltd. | 2,200 | 74,593 | ||||||
TDK Corp. | 400 | 28,035 | ||||||
Teijin Ltd. | 600 | 9,585 | ||||||
Terumo Corp. | 1,000 | 56,458 | ||||||
The Bank of Kyoto Ltd. | 200 | 8,208 | ||||||
The Chiba Bank Ltd. | 2,000 | 11,127 | ||||||
The Shizuoka Bank Ltd. | 1,500 | 11,755 | ||||||
THK Co., Ltd. | 400 | 7,428 | ||||||
Tobu Railway Co., Ltd. | 700 | 18,865 | ||||||
Toho Co., Ltd. | 400 | 14,493 | ||||||
Toho Gas Co., Ltd. | 200 | 8,439 | ||||||
Tohoku Electric Power Co., Inc. | 1,300 | 17,131 | ||||||
Tokio Marine Holdings, Inc. | 2,200 | 104,456 | ||||||
Tokyo Century Corp. | 100 | 4,393 | ||||||
Tokyo Electric Power Co. Holdings, Inc.* | 4,900 | 29,121 | ||||||
Tokyo Electron Ltd. | 500 | 56,842 | ||||||
Tokyo Gas Co., Ltd. | 1,300 | 32,955 | ||||||
Tokyu Corp. | 1,600 | 26,151 | ||||||
Tokyu Fudosan Holdings Corp. | 1,900 | 9,379 | ||||||
Toppan Printing Co., Ltd. | 800 | 11,739 | ||||||
Toray Industries, Inc. | 4,700 | 33,013 | ||||||
Toshiba Corp. | 2,100 | 59,323 | ||||||
Tosoh Corp. | 800 | 10,373 | ||||||
The accompanying notes are an integral part of the financial statements.
| 26 | | | DWS EAFE® Equity Index Fund |
Table of Contents
| Shares | Value ($) | |||||||
TOTO Ltd. | 500 | 17,237 | ||||||
Toyo Seikan Kaisha Ltd. | 500 | 11,470 | ||||||
Toyo Suisan Kaisha Ltd. | 300 | 10,460 | ||||||
Toyoda Gosei Co., Ltd. | 300 | 5,888 | ||||||
Toyota Industries Corp. | 500 | 22,985 | ||||||
Toyota Motor Corp. | 7,400 | 429,581 | ||||||
Toyota Tsusho Corp. | 700 | 20,601 | ||||||
Trend Micro, Inc. | 400 | 21,652 | ||||||
Tsuruha Holdings, Inc. | 100 | 8,574 | ||||||
Unicharm Corp. | 1,300 | 42,110 | ||||||
United Urban Investment Corp. (REIT) | 9 | 13,971 | ||||||
USS Co., Ltd. | 600 | 10,071 | ||||||
Welcia Holdings Co., Ltd. | 100 | 4,523 | ||||||
West Japan Railway Co. | 500 | 35,320 | ||||||
Yahoo! Japan Corp. | 9,500 | 23,682 | ||||||
Yakult Honsha Co., Ltd. | 400 | 28,115 | ||||||
Yamada Denki Co., Ltd. | 2,000 | 9,590 | ||||||
Yamaguchi Financial Group, Inc. | 600 | 5,743 | ||||||
Yamaha Corp. | 400 | 17,048 | ||||||
Yamaha Motor Co., Ltd. | 800 | 15,628 | ||||||
Yamato Holdings Co., Ltd. | 1,000 | 27,456 | ||||||
Yamazaki Baking Co., Ltd. | 400 | 8,358 | ||||||
Yaskawa Electric Corp. | 800 | 19,484 | ||||||
Yokogawa Electric Corp. | 700 | 12,072 | ||||||
Yokohama Rubber Co., Ltd. | 450 | 8,423 | ||||||
ZOZO, Inc. | 700 | 12,811 | ||||||
|
| |||||||
(Cost $5,204,311) |
| 9,859,440 | ||||||
| Luxembourg 0.4% |
| |||||||
ArcelorMittal | 2,155 | 45,286 | ||||||
Aroundtown SA | 2,660 | 22,076 | ||||||
Eurofins Scientific SE | 40 | 14,958 | ||||||
Millicom International Cellular SA (SDR) | 197 | 12,516 | ||||||
RTL Group SA | 147 | 7,869 | ||||||
SES SA (FDR) | 1,127 | 21,616 | ||||||
Tenaris SA | 1,621 | 17,537 | ||||||
|
| |||||||
(Cost $142,819) |
| 141,858 | ||||||
| Macau 0.1% |
| |||||||
Sands China Ltd. | 7,619 | 33,371 | ||||||
Wynn Macau Ltd. | 5,581 | 12,148 | ||||||
|
| |||||||
(Cost $18,563) |
| 45,519 | ||||||
| Mexico 0.0% |
| |||||||
Fresnillo PLC (Cost $11,265) | 857 | 9,428 | ||||||
The accompanying notes are an integral part of the financial statements.
| DWS EAFE® Equity Index Fund | | | 27 |
Table of Contents
| Shares | Value ($) | |||||||
| Netherlands 4.7% |
| |||||||
ABN AMRO Group NV (CVA) 144A | 1,298 | 30,571 | ||||||
Aegon NV | 5,608 | 26,306 | ||||||
AerCap Holdings NV* (e) | 439 | 17,384 | ||||||
Akzo Nobel NV | 841 | 67,878 | ||||||
ASML Holding NV | 1,328 | 209,549 | ||||||
EXOR NV | 373 | 20,311 | ||||||
Heineken Holding NV | 366 | 31,441 | ||||||
Heineken NV | 863 | 76,444 | ||||||
ING Groep NV | 12,742 | 137,707 | ||||||
Koninklijke (Royal) KPN NV | 11,173 | 32,783 | ||||||
Koninklijke Ahold Delhaize NV | 4,042 | 102,289 | ||||||
Koninklijke DSM NV | 575 | 47,226 | ||||||
Koninklijke Philips NV | 3,077 | 109,084 | ||||||
Koninklijke Vopak NV | 219 | 9,972 | ||||||
NN Group NV | 972 | 38,801 | ||||||
NXP Semiconductors NV (d) | 1,130 | 82,806 | ||||||
QIAGEN NV* | 719 | 24,618 | ||||||
Randstad NV | 387 | 17,824 | ||||||
Royal Dutch Shell PLC “A” | 14,894 | 438,683 | ||||||
Royal Dutch Shell PLC “B” | 12,134 | 362,383 | ||||||
Wolters Kluwer NV | 975 | 57,807 | ||||||
|
| |||||||
(Cost $1,177,537) |
| 1,941,867 | ||||||
| New Zealand 0.2% |
| |||||||
a2 Milk Co., Ltd.* | 2,531 | 18,841 | ||||||
Auckland International Airport Ltd. | 3,070 | 14,766 | ||||||
Fisher & Paykel Healthcare Corp., Ltd. | 1,897 | 16,472 | ||||||
Fletcher Building Ltd.* | 2,416 | 7,896 | ||||||
Meridian Energy Ltd. | 3,728 | 8,502 | ||||||
Ryman Healthcare Ltd. | 1,117 | 8,051 | ||||||
Spark New Zealand Ltd. | 6,338 | 17,642 | ||||||
|
| |||||||
(Cost $61,614) |
| 92,170 | ||||||
| Norway 0.7% |
| |||||||
Aker BP ASA | 396 | 10,052 | ||||||
DNB ASA | 3,099 | 49,779 | ||||||
Gjensidige Forsikring ASA | 584 | 9,156 | ||||||
Marine Harvest ASA | 1,368 | 28,846 | ||||||
Norsk Hydro ASA | 4,490 | 20,453 | ||||||
Orkla ASA | 2,641 | 20,813 | ||||||
Schibsted ASA “B” | 296 | 8,993 | ||||||
Statoil ASA | 3,851 | 81,759 | ||||||
Telenor ASA | 2,499 | 48,609 | ||||||
Yara International ASA | 549 | 21,267 | ||||||
|
| |||||||
(Cost $116,319) |
| 299,727 | ||||||
The accompanying notes are an integral part of the financial statements.
| 28 | | | DWS EAFE® Equity Index Fund |
Table of Contents
| Shares | Value ($) | |||||||
| Portugal 0.2% |
| |||||||
EDP - Energias de Portugal SA | 8,153 | 28,497 | ||||||
Galp Energia, SGPS, SA | 1,616 | 25,589 | ||||||
Jeronimo Martins, SGPS, SA | 729 | 8,645 | ||||||
|
| |||||||
(Cost $44,321) |
| 62,731 | ||||||
| Singapore 1.3% |
| |||||||
Ascendas Real Estate Investment Trust (REIT) | 8,100 | 15,259 | ||||||
CapitaLand Commercial Trust (REIT) | 9,676 | 12,410 | ||||||
CapitaLand Ltd. | 8,125 | 18,488 | ||||||
CapitaLand Mall Trust (REIT) | 7,870 | 13,028 | ||||||
City Developments Ltd. | 1,500 | 8,930 | ||||||
ComfortDelGro Corp., Ltd. | 7,500 | 11,801 | ||||||
DBS Group Holdings Ltd. | 5,759 | 99,970 | ||||||
Genting Singapore Ltd. | 17,995 | 12,891 | ||||||
Golden Agri-Resources Ltd. | 14,673 | 2,623 | ||||||
Jardine Cycle & Carriage Ltd. | 304 | 7,876 | ||||||
Keppel Corp., Ltd. | 4,849 | 20,987 | ||||||
Oversea-Chinese Banking Corp., Ltd. | 10,070 | 83,173 | ||||||
SATS Ltd. | 2,500 | 8,543 | ||||||
Sembcorp Industries Ltd. | 3,149 | 5,844 | ||||||
Singapore Airlines Ltd. | 1,970 | 13,599 | ||||||
Singapore Exchange Ltd. | 2,500 | 13,108 | ||||||
Singapore Press Holdings Ltd. | 5,158 | 8,882 | ||||||
Singapore Technologies Engineering Ltd. | 4,900 | 12,536 | ||||||
Singapore Telecommunications Ltd. | 26,501 | 56,932 | ||||||
Suntec Real Estate Investment Trust (REIT) | 6,100 | 7,963 | ||||||
United Overseas Bank Ltd. | 4,422 | 79,663 | ||||||
UOL Group Ltd. | 1,661 | 7,524 | ||||||
Venture Corp., Ltd. | 900 | 9,203 | ||||||
Wilmar International Ltd. | 6,600 | 15,095 | ||||||
|
| |||||||
(Cost $254,485) |
| 546,328 | ||||||
| South Africa 0.1% |
| |||||||
Mondi PLC (Cost $23,850) | 1,161 | 24,240 | ||||||
| Spain 3.0% |
| |||||||
ACS, Actividades de Construccion y Servicios SA | 842 | 32,681 | ||||||
Aena SME SA 144A | 208 | 32,385 | ||||||
Amadeus IT Group SA | 1,449 | 101,163 | ||||||
Banco Bilbao Vizcaya Argentaria SA | 21,606 | 115,480 | ||||||
Banco de Sabadell SA | 18,577 | 21,319 | ||||||
Banco Santander SA | 52,737 | 241,817 | ||||||
Bankia SA | 3,961 | 11,639 | ||||||
Bankinter SA | 2,126 | 17,125 | ||||||
CaixaBank SA | 11,831 | 43,017 | ||||||
The accompanying notes are an integral part of the financial statements.
| DWS EAFE® Equity Index Fund | | | 29 |
Table of Contents
| Shares | Value ($) | |||||||
Enagas SA | 705 | 19,092 | ||||||
Endesa SA | 1,014 | 23,413 | ||||||
Ferrovial SA | 1,555 | 31,565 | ||||||
Grifols SA | 989 | 25,978 | ||||||
Iberdrola SA | 19,761 | 159,379 | ||||||
Industria de Diseno Textil SA | 3,579 | 91,641 | ||||||
Mapfre SA | 3,866 | 10,293 | ||||||
Naturgy Energy Group SA | 1,160 | 29,612 | ||||||
Red Electrica Corp. SA | 1,404 | 31,426 | ||||||
Repsol SA | 4,472 | 72,411 | ||||||
Siemens Gamesa Renewable Energy SA* | 709 | 8,657 | ||||||
Telefonica SA | 15,200 | 128,105 | ||||||
|
| |||||||
(Cost $878,236) |
| 1,248,198 | ||||||
| Sweden 2.4% |
| |||||||
Alfa Laval AB | 976 | 20,984 | ||||||
Assa Abloy AB “B” | 3,184 | 57,101 | ||||||
Atlas Copco AB “A” | 2,193 | 52,310 | ||||||
Atlas Copco AB “B” | 1,247 | 27,317 | ||||||
Boliden AB | 892 | 19,417 | ||||||
Electrolux AB “B” | 784 | 16,607 | ||||||
Epiroc AB “A”* | 2,048 | 19,428 | ||||||
Epiroc AB “B”* | 1,387 | 12,379 | ||||||
Essity AB “B” | 2,026 | 49,886 | ||||||
Hennes & Mauritz AB “B” | 2,918 | 41,540 | ||||||
Hexagon AB “B” | 848 | 39,228 | ||||||
Husqvarna AB “B” | 1,211 | 9,003 | ||||||
ICA Gruppen AB | 265 | 9,474 | ||||||
Industrivarden AB “C” | 536 | 10,885 | ||||||
Investor AB “B” | 1,512 | 64,340 | ||||||
Kinnevik AB “B” | 761 | 18,389 | ||||||
L E Lundbergforetagen AB “B” | 248 | 7,326 | ||||||
Lundin Petroleum AB | 595 | 14,918 | ||||||
Sandvik AB | 3,517 | 50,636 | ||||||
Securitas AB “B” | 962 | 15,471 | ||||||
Skandinaviska Enskilda Banken AB “A” | 5,429 | 52,900 | ||||||
Skanska AB “B” | 1,127 | 17,997 | ||||||
SKF AB “B” | 1,220 | 18,603 | ||||||
Svenska Handelsbanken AB “A” | 4,967 | 55,484 | ||||||
Swedbank AB “A” | 2,901 | 64,952 | ||||||
Swedish Match AB | 592 | 23,368 | ||||||
Tele2 AB “B” | 1,677 | 21,454 | ||||||
Telefonaktiebolaget LM Ericsson “B” | 10,137 | 90,471 | ||||||
Telia Co. AB | 8,959 | 42,543 | ||||||
Volvo AB “B” | 5,082 | 66,776 | ||||||
|
| |||||||
(Cost $351,379) |
| 1,011,187 | ||||||
The accompanying notes are an integral part of the financial statements.
| 30 | | | DWS EAFE® Equity Index Fund |
Table of Contents
| Shares | Value ($) | |||||||
| Switzerland 9.0% |
| |||||||
ABB Ltd. (Registered) | 5,973 | 114,157 | ||||||
Adecco Group AG (Registered) | 501 | 23,544 | ||||||
Baloise Holding AG (Registered) | 147 | 20,308 | ||||||
Barry Callebaut AG (Registered) | 8 | 12,490 | ||||||
Chocoladefabriken Lindt & Spruengli AG | 3 | 18,578 | ||||||
Cie Financiere Richemont SA (Registered) | 1,699 | 109,920 | ||||||
Clariant AG (Registered)* | 681 | 12,579 | ||||||
Coca-Cola HBC AG* | 626 | 19,586 | ||||||
Credit Suisse Group AG (Registered)* | 8,183 | 89,915 | ||||||
Dufry AG (Registered)* | 104 | 9,866 | ||||||
EMS-Chemie Holding AG (Registered) | 26 | 12,400 | ||||||
Ferguson PLC | 753 | 48,251 | ||||||
Geberit AG (Registered) | 123 | 48,007 | ||||||
Givaudan SA (Registered) | 30 | 69,602 | ||||||
Glencore PLC* | 36,924 | 137,353 | ||||||
Julius Baer Group Ltd.* | 782 | 27,968 | ||||||
Kuehne + Nagel International AG (Registered) | 170 | 21,875 | ||||||
LafargeHolcim Ltd. (Registered)* (b) | 473 | 19,581 | ||||||
LafargeHolcim Ltd. (Registered)* (b) | 1,125 | 46,186 | ||||||
Lonza Group AG (Registered)* | 239 | 62,377 | ||||||
Nestle SA (Registered) | 9,971 | 810,904 | ||||||
Novartis AG (Registered) | 7,050 | 604,933 | ||||||
Pargesa Holding SA (Bearer) | 110 | 7,953 | ||||||
Partners Group Holding AG | 56 | 33,986 | ||||||
Roche Holding AG (Genusschein) | 2,285 | 568,538 | ||||||
Schindler Holding AG | 135 | 26,851 | ||||||
Schindler Holding AG (Registered) | 73 | 14,252 | ||||||
SGS SA (Registered) | 18 | 40,644 | ||||||
Sika AG | 428 | 54,502 | ||||||
Sonova Holding AG (Registered) | 189 | 31,115 | ||||||
STMicroelectronics NV | 2,276 | 32,694 | ||||||
Straumann Holding AG (Registered) | 35 | 22,158 | ||||||
Swatch Group AG (Bearer) | 97 | 28,384 | ||||||
Swatch Group AG (Registered) | 190 | 11,049 | ||||||
Swiss Life Holding AG (Registered)* | 110 | 42,549 | ||||||
Swiss Prime Site AG (Registered)* | 260 | 21,080 | ||||||
Swiss Re AG | 994 | 91,469 | ||||||
Swisscom AG (Registered) | 88 | 42,327 | ||||||
Temenos AG* | 209 | 25,223 | ||||||
UBS Group AG (Registered)* | 12,510 | 156,120 | ||||||
Vifor Pharma AG | 158 | 17,200 | ||||||
Zurich Insurance Group AG | 496 | 148,395 | ||||||
|
| |||||||
(Cost $1,504,052) |
| 3,756,869 | ||||||
The accompanying notes are an integral part of the financial statements.
| DWS EAFE® Equity Index Fund | | | 31 |
Table of Contents
| Shares | Value ($) | |||||||
| United Arab Emirates 0.0% |
| |||||||
NMC Health PLC (Cost $16,533) | 347 | 12,130 | ||||||
| United Kingdom 14.8% |
| |||||||
3i Group PLC | 3,081 | 30,417 | ||||||
Admiral Group PLC | 597 | 15,601 | ||||||
Anglo American PLC | 3,467 | 77,479 | ||||||
Ashtead Group PLC | 1,588 | 33,210 | ||||||
Associated British Foods PLC | 1,181 | 30,784 | ||||||
AstraZeneca PLC | 4,112 | 308,444 | ||||||
Auto Trader Group PLC 144A | 3,320 | 19,282 | ||||||
Aviva PLC | 12,956 | 62,126 | ||||||
Babcock International Group PLC | 908 | 5,674 | ||||||
BAE Systems PLC | 10,502 | 61,591 | ||||||
Barclays PLC | 55,196 | 106,276 | ||||||
Barratt Developments PLC | 3,351 | 19,799 | ||||||
Berkeley Group Holdings PLC | 403 | 17,869 | ||||||
BHP Group PLC | 6,832 | 144,882 | ||||||
BP PLC | 64,793 | 410,251 | ||||||
British American Tobacco PLC | 7,436 | 237,791 | ||||||
British Land Co. PLC (REIT) | 2,865 | 19,517 | ||||||
BT Group PLC | 27,531 | 83,824 | ||||||
Bunzl PLC | 1,127 | 34,075 | ||||||
Burberry Group PLC | 1,292 | 28,602 | ||||||
Carnival PLC | 579 | 27,912 | ||||||
Centrica PLC | 18,729 | 32,256 | ||||||
CNH Industrial NV | 3,243 | 29,642 | ||||||
Coca-Cola European Partners PLC | 863 | 39,823 | ||||||
Compass Group PLC | 5,098 | 107,311 | ||||||
ConvaTec Group PLC 144A | 4,923 | 8,733 | ||||||
Croda International PLC | 419 | 25,075 | ||||||
Diageo PLC | 8,000 | 285,202 | ||||||
Direct Line Insurance Group PLC | 4,420 | 17,924 | ||||||
easyJet PLC | 590 | 8,337 | ||||||
Experian PLC | 3,041 | 73,884 | ||||||
Fiat Chrysler Automobiles NV* (b) (e) | 2,999 | 43,366 | ||||||
Fiat Chrysler Automobiles NV* (b) | 479 | 6,966 | ||||||
G4S PLC | 4,855 | 12,201 | ||||||
GlaxoSmithKline PLC | 16,101 | 306,578 | ||||||
Hammerson PLC (REIT) | 2,640 | 11,093 | ||||||
Hargreaves Lansdown PLC | 884 | 20,904 | ||||||
HSBC Holdings PLC | 64,587 | 533,998 | ||||||
Imperial Brands PLC | 3,118 | 94,550 | ||||||
Informa PLC | 3,949 | 31,756 | ||||||
InterContinental Hotels Group PLC | 568 | 30,737 | ||||||
International Consolidated Airlines Group SA | 1,993 | 15,820 | ||||||
The accompanying notes are an integral part of the financial statements.
| 32 | | | DWS EAFE® Equity Index Fund |
Table of Contents
| Shares | Value ($) | |||||||
Intertek Group PLC | 527 | 32,310 | ||||||
Investec PLC | 2,352 | 13,270 | ||||||
ITV PLC | 11,638 | 18,533 | ||||||
J Sainsbury PLC | 5,636 | 19,054 | ||||||
John Wood Group PLC | 2,324 | 15,029 | ||||||
Johnson Matthey PLC | 600 | 21,434 | ||||||
Kingfisher PLC | 7,108 | 18,811 | ||||||
Land Securities Group PLC (REIT) | 2,455 | 25,198 | ||||||
Legal & General Group PLC | 19,392 | 57,247 | ||||||
Lloyds Banking Group PLC | 230,191 | 151,992 | ||||||
London Stock Exchange Group PLC | 1,030 | 53,419 | ||||||
Marks & Spencer Group PLC | 4,989 | 15,727 | ||||||
Meggitt PLC | 2,644 | 15,903 | ||||||
Melrose Industries PLC | 15,817 | 33,100 | ||||||
Merlin Entertainments PLC 144A | 2,015 | 8,167 | ||||||
Micro Focus International PLC | 1,377 | 24,345 | ||||||
National Grid PLC | 11,049 | 107,600 | ||||||
Next PLC | 489 | 24,897 | ||||||
Pearson PLC | 2,480 | 29,724 | ||||||
Persimmon PLC | 1,041 | 25,667 | ||||||
Prudential PLC | 8,386 | 150,201 | ||||||
Reckitt Benckiser Group PLC | 2,177 | 167,051 | ||||||
RELX PLC | 6,403 | 132,075 | ||||||
Rio Tinto PLC | 3,797 | 181,364 | ||||||
Rolls-Royce Holdings PLC* | 5,530 | 58,616 | ||||||
Royal Bank of Scotland Group PLC | 15,436 | 43,108 | ||||||
Royal Mail PLC | 2,889 | 10,027 | ||||||
RSA Insurance Group PLC | 3,479 | 22,836 | ||||||
Schroders PLC | 417 | 13,008 | ||||||
Segro PLC (REIT) | 3,292 | 24,740 | ||||||
Severn Trent PLC | 724 | 16,770 | ||||||
Smith & Nephew PLC | 2,825 | 52,846 | ||||||
Smiths Group PLC | 1,292 | 22,496 | ||||||
SSE PLC | 3,311 | 45,688 | ||||||
St. James’s Place PLC | 1,794 | 21,632 | ||||||
Standard Chartered PLC | 9,159 | 71,225 | ||||||
Standard Life Aberdeen PLC | 7,441 | 24,381 | ||||||
Taylor Wimpey PLC | 10,238 | 17,794 | ||||||
Tesco PLC | 31,889 | 77,392 | ||||||
The Sage Group PLC | 3,645 | 27,985 | ||||||
The Weir Group PLC | 852 | 14,122 | ||||||
Unilever NV (CVA) | 5,012 | 272,599 | ||||||
Unilever PLC | 3,668 | 192,403 | ||||||
United Utilities Group PLC | 2,116 | 19,889 | ||||||
Vodafone Group PLC | 86,666 | 169,674 | ||||||
The accompanying notes are an integral part of the financial statements.
| DWS EAFE® Equity Index Fund | | | 33 |
Table of Contents
| Shares | Value ($) | |||||||
Whitbread PLC | 624 | 36,473 | ||||||
WM Morrison Supermarkets PLC | 7,081 | 19,259 | ||||||
WPP PLC | 4,060 | 43,937 | ||||||
|
| |||||||
(Cost $3,829,344) |
| 6,172,580 | ||||||
| Total Common Stocks(Cost $21,292,976) |
| 40,485,774 | ||||||
| Preferred Stocks 0.5% |
| |||||||
| Germany |
| |||||||
Bayerische Motoren Werke (BMW) AG | 169 | 12,081 | ||||||
Fuchs Petrolub SE | 208 | 8,603 | ||||||
Henkel AG & Co. KGaA | 588 | 64,396 | ||||||
Porsche Automobil Holding SE | 477 | 28,301 | ||||||
Sartorius AG | 124 | 15,552 | ||||||
Volkswagen AG | 603 | 96,278 | ||||||
| ||||||||
| Total Preferred Stocks(Cost $83,936) |
| 225,211 | ||||||
| Right 0.0% | ||||||||
| Spain |
| |||||||
Repsol SA, Expiration Date 1/14/2019* (Cost $2,088) | 4,472 | 2,049 | ||||||
| Securities Lending Collateral 0.0% |
| |||||||
DWS Government & Agency Securities Portfolio | 405 | 405 | ||||||
| Cash Equivalents 1.4% |
| |||||||
DWS Central Cash Management Government Fund, 2.41% (f) (Cost $575,958) | 575,958 | 575,958 | ||||||
| % of Net Assets | Value ($) | |||||||
| Total Investment Portfolio(Cost $21,955,363) | 99.1 | 41,289,397 | ||||||
| Other Assets and Liabilities, Net | 0.9 | 384,576 | ||||||
| ||||||||
| Net Assets | 100.0 | 41,673,973 | ||||||
The accompanying notes are an integral part of the financial statements.
| 34 | | | DWS EAFE® Equity Index Fund |
Table of Contents
A summary of the Fund’s transactions with affiliated investments during the year ended December 31, 2018 are as follows:
| Value ($) at 12/31/2017 | Pur- chases Cost ($) | Sales Proceeds ($) | Net Real- ized Gain/ (Loss) ($) | Net Change in Unreal- ized Appreci- ation (Depreci- ation) ($) | Income ($) | Capital Gain Distri- butions ($) | Number of Shares at 12/31/2018 | Value ($) at 12/31/2018 | ||||||||||||||||||||||||||
| Common Stocks 0.1% | ||||||||||||||||||||||||||||||||||
| Deutsche Bank AG, (c) | ||||||||||||||||||||||||||||||||||
| 150,039 | — | 19,031 | (25,206) | (54,373) | 674 | — | 6,397 | 51,429 | ||||||||||||||||||||||||||
| Securities Lending Collateral 0.0% | ||||||||||||||||||||||||||||||||||
| | DWS Government & Agency Securities Portfolio “DWS Government Cash Institutional Shares”, 2.29% (f) (g) | | ||||||||||||||||||||||||||||||||
| 831 | — | 426 (h) | — | — | 3,561 | — | 405 | 405 | ||||||||||||||||||||||||||
| Cash Equivalents 1.4% | ||||||||||||||||||||||||||||||||||
| DWS Central Cash Management Government Fund, 2.41% (f) | ||||||||||||||||||||||||||||||||||
| — | 12,073,631 | 11,497,673 | — | — | 8,709 | — | 575,958 | 575,958 | ||||||||||||||||||||||||||
| 150,870 | 12,073,631 | 11,517,130 | (25,206) | (54,373) | 12,944 | — | 582,760 | 627,792 | ||||||||||||||||||||||||||
| * | Non-income producing security. |
| (a) | Investment was valued using significant unobservable inputs. |
| (b) | Securities with the same description are the same corporate entity but trade on different stock exchanges. |
| (c) | Affiliated Issuer. This security is owned in proportion with its representation in the index. |
| (d) | Listed on the NASDAQ Stock Market, Inc. |
| (e) | Listed on the New York Stock Exchange. |
| (f) | Affiliated fund managed by DWS Investment Management Americas, Inc. The rate shown is the annualizedseven-day yield at period end. |
| (g) | Represents collateral held in connection with securities lending. Income earned by the Fund is net of borrower rebates. |
| (h) | Represents the net increase (purchase cost) or decrease (sales proceeds) in the amount invested for the year ended December 31, 2018. |
144A: Security exempt from registration under Rule 144A of the Securities Act of 1933. These securities may be resold in transactions exempt from registration, normally to qualified institutional buyers.
ADR: American Depositary Receipt
CDI: Chess Depositary Interest
CVA: Certificaten Van Aandelen (Certificate of Stock)
FDR: Fiduciary Depositary Receipt
FTSE: Financial Times and the London Stock Exchange
REIT: Real Estate Investment Trust
RSP: Risparmio (Convertible Savings Shares)
SDR: Swedish Depositary Receipt
SGPS: Sociedade Gestora de Participac¸o~ es Sociais (Portuguese Holding Company)
The accompanying notes are an integral part of the financial statements.
| DWS EAFE® Equity Index Fund | | | 35 |
Table of Contents
At December 31, 2018, open futures contracts purchased were as follows:
| Futures | Currency | Expiration Date | Contracts | Notional Amount ($) | Notional Value ($) | Unrealized Appreciation (Depreciation) ($) | ||||||||||||||||||
| Euro Stoxx 50 Index | EUR | 3/15/2019 | 15 | 518,372 | 511,119 | (7,253 | ) | |||||||||||||||||
| FTSE 100 Index | GBP | 3/15/2019 | 3 | 254,333 | 254,627 | 294 | ||||||||||||||||||
| SPI 200 Index | AUD | 3/21/2019 | 2 | 192,716 | 195,845 | 3,129 | ||||||||||||||||||
| TOPIX Index | JPY | 3/7/2019 | 3 | 399,922 | 408,786 | 8,864 | ||||||||||||||||||
| Total net unrealized appreciation |
| 5,034 | ||||||||||||||||||||||
At December 31, 2018, the Fund had the following open forward foreign currency contracts:
| Contracts to Deliver | In Exchange For | Settlement Date | Unrealized Appreciation ($) | Counterparty | ||||||||||||||||
| USD | 9,699 | SGD | 13,277 | 3/20/2019 | 60 | BNP Paribas SA | ||||||||||||||
| USD | 24,413 | SEK | 219,437 | 3/20/2019 | 507 | Bank of New York | ||||||||||||||
| USD | 95,320 | GBP | 75,125 | 3/20/2019 | 810 | Bank of New York | ||||||||||||||
| USD | 90,000 | JPY | 9,930,812 | 3/20/2019 | 1,201 | Toronto-Dominion Bank | ||||||||||||||
| USD | 120,000 | EUR | 104,381 | 3/20/2019 | 410 | Toronto-Dominion Bank | ||||||||||||||
| USD | 40,000 | CHF | 39,304 | 3/20/2019 | 293 | Toronto-Dominion Bank | ||||||||||||||
| USD | 50,000 | GBP | 39,287 | 3/20/2019 | 271 | Toronto-Dominion Bank | ||||||||||||||
| USD | 130,000 | GBP | 101,800 | 3/20/2019 | 264 | Morgan Stanley | ||||||||||||||
| USD | 397,650 | EUR | 346,712 | 3/20/2019 | 2,303 | Morgan Stanley | ||||||||||||||
| USD | 365,638 | JPY | 40,649,685 | 3/20/2019 | 7,675 | Morgan Stanley | ||||||||||||||
| USD | 60,000 | CHF | 58,872 | 3/20/2019 | 355 | Morgan Stanley | ||||||||||||||
| Total unrealized appreciation | 14,149 | |||||||||||||||||||
| Contracts to Deliver | In Exchange For | Settlement Date | Unrealized Depreciation ($) | Counterparty | ||||||||||||||||
| USD | 26,971 | HKD | 210,394 | 3/20/2019 | (38 | ) | BNP Paribas SA | |||||||||||||
| USD | 1,621 | AUD | 2,244 | 3/20/2019 | (39 | ) | Citigroup, Inc. | |||||||||||||
| DKK | 58,900 | USD | 9,029 | 3/20/2019 | (75 | ) | Citigroup, Inc. | |||||||||||||
| CHF | 25,213 | USD | 25,592 | 3/20/2019 | (255 | ) | Morgan Stanley | |||||||||||||
| JPY | 3,361,636 | USD | 30,000 | 3/20/2019 | (872 | ) | Societe Generale | |||||||||||||
| GBP | 23,687 | USD | 30,000 | 3/20/2019 | (309 | ) | BNP Paribas SA | |||||||||||||
| EUR | 43,736 | USD | 50,000 | 3/20/2019 | (452 | ) | UBS AG | |||||||||||||
| SEK | 357,961 | USD | 40,000 | 3/20/2019 | (651 | ) | Bank of New York | |||||||||||||
| GBP | 94,332 | USD | 120,000 | 3/20/2019 | (707 | ) | Bank of New York | |||||||||||||
| EUR | 200,235 | USD | 230,000 | 3/20/2019 | (983 | ) | Bank of New York | |||||||||||||
| HKD | 234,516 | USD | 30,000 | 3/20/2019 | (21 | ) | Bank of Montreal | |||||||||||||
| CHF | 59,014 | USD | 60,000 | 3/20/2019 | (500 | ) | Goldman Sachs & Co. | |||||||||||||
| JPY | 19,877,868 | USD | 180,000 | 3/20/2019 | (2,552 | ) | Goldman Sachs & Co. | |||||||||||||
| Total unrealized depreciation | (7,454 | ) | ||||||||||||||||||
The accompanying notes are an integral part of the financial statements.
| 36 | | | DWS EAFE® Equity Index Fund |
Table of Contents
| Currency Abbreviations | ||
| AUD Australian Dollar | HKD Hong Kong Dollar | |
| CHF Swiss Franc | JPY Japanese Yen | |
| DKK Danish Krone | SEK Swedish Krona | |
| EUR Euro | SGD Singapore Dollar | |
| GBP British Pound | USD United States Dollar |
For information on the Fund’s policy and additional disclosures regarding futures contracts and forward foreign currency contracts, please refer to the Derivatives section of Note B in the accompanying Notes to Financial Statements.
Fair Value Measurements
Various inputs are used in determining the value of the Fund’s investments. These inputs are summarized in three broad levels. Level 1 includes quoted prices in active markets for identical securities. Level 2 includes other significant observable inputs (including quoted prices for similar securities, interest rates, prepayment speeds and credit risk). Level 3 includes significant unobservable inputs (including the Fund’s own assumptions in determining the fair value of investments). The level assigned to the securities valuations may not be an indication of the risk or liquidity associated with investing in those securities.
The following is a summary of the inputs used as of December 31, 2018 in valuing the Fund’s investments. For information on the Fund’s policy regarding the valuation of investments, please refer to the Security Valuation section of Note A in the accompanying Notes to Financial Statements.
Level 1 | Level 2 | Level 3 | Total | |||||||||||||
Common Stocks | ||||||||||||||||
Australia | $ | — | $ | 2,786,760 | $ | 1,454 | $ | 2,788,214 | ||||||||
Austria | — | 97,435 | — | 97,435 | ||||||||||||
Belgium | — | 386,624 | — | 386,624 | ||||||||||||
Bermuda | — | 9,958 | — | 9,958 | ||||||||||||
Chile | — | 11,798 | — | 11,798 | ||||||||||||
China | 14,026 | 13,659 | — | 27,685 | ||||||||||||
Denmark | — | 714,675 | — | 714,675 | ||||||||||||
Finland | — | 510,854 | — | 510,854 | ||||||||||||
France | 33,509 | 4,356,920 | — | 4,390,429 | ||||||||||||
Germany | 10,763 | 3,336,518 | — | 3,347,281 | ||||||||||||
Hong Kong | 13,796 | 1,489,667 | — | 1,503,463 | ||||||||||||
Ireland | — | 438,167 | — | 438,167 | ||||||||||||
Isle Of Man | — | 16,781 | — | 16,781 | ||||||||||||
Israel | 102,308 | 114,612 | — | 216,920 | ||||||||||||
Italy | 32,219 | 768,999 | — | 801,218 | ||||||||||||
Japan | — | 9,859,440 | — | 9,859,440 | ||||||||||||
Luxembourg | — | 141,858 | — | 141,858 | ||||||||||||
Macau | — | 45,519 | — | 45,519 | ||||||||||||
Mexico | — | 9,428 | — | 9,428 | ||||||||||||
Netherlands | 100,190 | 1,841,677 | — | 1,941,867 | ||||||||||||
New Zealand | — | 92,170 | — | 92,170 | ||||||||||||
Norway | — | 299,727 | — | 299,727 | ||||||||||||
Portugal | — | 62,731 | — | 62,731 | ||||||||||||
Singapore | — | 546,328 | — | 546,328 | ||||||||||||
South Africa | — | 24,240 | — | 24,240 | ||||||||||||
Spain | — | 1,248,198 | — | 1,248,198 | ||||||||||||
The accompanying notes are an integral part of the financial statements.
| DWS EAFE® Equity Index Fund | | | 37 |
Table of Contents
| Assets | Level 1 | Level 2 | Level 3 | Total | ||||||||||||
Sweden | $ | — | $ | 1,011,187 | $ | — | $ | 1,011,187 | ||||||||
Switzerland | — | 3,756,869 | — | 3,756,869 | ||||||||||||
United Arab Emirates | — | 12,130 | — | 12,130 | ||||||||||||
United Kingdom | 43,366 | 6,129,214 | — | 6,172,580 | ||||||||||||
Preferred Stocks (i) | — | 225,211 | — | 225,211 | ||||||||||||
Right | 2,049 | — | — | 2,049 | ||||||||||||
Short-Term Investments (i) | 576,363 | — | — | 576,363 | ||||||||||||
Derivatives (j) | ||||||||||||||||
Futures Contracts | 12,287 | — | — | 12,287 | ||||||||||||
Forward Foreign Currency Contracts | — | 14,149 | — | 14,149 | ||||||||||||
Total | $ | 940,876 | $ | 40,373,503 | $ | 1,454 | $ | 41,315,833 | ||||||||
| Liabilities | Level 1 | Level 2 | Level 3 | Total | ||||||||||||
| Derivatives (j) | ||||||||||||||||
Futures Contracts | $ | (7,253 | ) | $ | — | $ | — | $ | (7,253 | ) | ||||||
Forward Foreign Currency Contracts | — | (7,454 | ) | — | (7,454 | ) | ||||||||||
| Total | $ | (7,253 | ) | $ | (7,454 | ) | $ | — | $ | (14,707 | ) | |||||
| (i) | See Investment Portfolio for additional detailed categorizations. |
| (j) | Derivatives include unrealized appreciation (depreciation) on open futures contracts and forward foreign currency exchange contracts. |
The accompanying notes are an integral part of the financial statements.
| 38 | | | DWS EAFE® Equity Index Fund |
Table of Contents
Statement of Assets and Liabilities
| as of December 31, 2018 | ||||
| Assets | ||||
Investments innon-affiliated securities, at value (cost $21,287,349) | $ | 40,661,605 | ||
Investment in DWS Government & Agency Securities Portfolio (cost $405)* | 405 | |||
Investment in affiliated securities, at value (cost $667,609) | 627,387 | |||
Foreign currency, at value (cost $344,687) | 344,183 | |||
Deposit with broker for futures contracts | 84,112 | |||
Receivable for investments sold | 51,769 | |||
Receivable for Fund shares sold | 28,276 | |||
Dividends receivable | 52,838 | |||
Interest receivable | 1,079 | |||
Receivable for variation margin on futures contracts | 6,890 | |||
Unrealized appreciation on forward foreign currency contracts | 14,149 | |||
Foreign taxes recoverable | 121,930 | |||
Due from Advisor | 20,829 | |||
Other assets | 7,299 | |||
Total assets | 42,022,751 | |||
Liabilities | ||||
Payable upon return of securities lending collateral | 405 | |||
Payable for Fund shares redeemed | 161,076 | |||
Unrealized depreciation on forward foreign currency contracts | 7,454 | |||
Accrued Trustees’ fees | 1,833 | |||
Other accrued expenses and payables | 178,010 | |||
Total liabilities | 348,778 | |||
Net assets, at value | $ | 41,673,973 | ||
| Net Assets Consist of | ||||
Distributable earnings (loss) | $ | 17,755,606 | ||
Paid-in capital | 23,918,367 | |||
Net assets, at value | $ | 41,673,973 | ||
Net Asset Value | ||||
Institutional Class | ||||
Net Asset Value offering and redemption price per share ($41,673,973 ÷ 8,180,668 outstanding shares of beneficial interest, $.01 par value, unlimited number of shares authorized) | $ | 5.09 | ||
The accompanying notes are an integral part of the financial statements.
| DWS EAFE® Equity Index Fund | | | 39 |
Table of Contents
| for the year ended December 31, 2018 | ||||
| Investment Income | ||||
| Income: | ||||
| Dividends (net of foreign taxes withheld of $143,551) | $ | 1,549,481 | ||
| Affiliated dividends (net of foreign taxes withheld of $137) | 674 | |||
| Income distributions — DWS Central Cash Management Government Fund | 8,709 | |||
| Securities lending income, net of borrower rebates | 3,561 | |||
| Total income | 1,562,425 | |||
| Expenses: | ||||
| Management fee | 127,272 | |||
| Administration fee | 50,909 | |||
| Services to shareholders | 20,197 | |||
| Custodian fee | 79,487 | |||
| Professional fees | 98,173 | |||
| Reports to shareholders | 41,933 | |||
| Registration fees | 34,552 | |||
| Trustees’ fees and expenses | 4,202 | |||
| Pricing service fee | 66,826 | |||
| Other | 6,597 | |||
| Total expenses before expense reductions | 530,148 | |||
| Expense reductions | (396,831 | ) | ||
| Total expenses after expense reductions | 133,317 | |||
| Net investment income | 1,429,108 | |||
| Realized and Unrealized Gain (Loss) | ||||
| Net realized gain (loss) from: | ||||
| Investments | 3,559,796 | |||
| Sale of affiliated securities | (25,206 | ) | ||
| Futures | (142,804 | ) | ||
| Forward foreign currency contracts | (14,220 | ) | ||
| Foreign currency | (33,512 | ) | ||
| 3,344,054 | ||||
| Change in net unrealized appreciation (depreciation) on: | ||||
Investments | (11,596,344 | ) | ||
| Affiliated securities | (54,373 | ) | ||
| Futures | 7,272 | |||
| Forward foreign currency contracts | 1,675 | |||
| Foreign currency | (851 | ) | ||
| (11,642,621 | ) | |||
| Net gain (loss) | (8,298,567 | ) | ||
| Net increase (decrease) in net assets resulting from operations | $ | (6,869,459 | ) | |
The accompanying notes are an integral part of the financial statements.
| 40 | | | DWS EAFE® Equity Index Fund |
Table of Contents
Statements of Changes in Net Assets
Years Ended December 31, | ||||||||
| Increase (Decrease) in Net Assets | 2018 | 2017 | ||||||
| Operations: | ||||||||
| Net investment income (loss) | $ | 1,429,108 | $ | 1,603,260 | ||||
| Net realized gain (loss) | 3,344,054 | 1,365,496 | ||||||
| Change in net unrealized appreciation (depreciation) | (11,642,621 | ) | 10,518,583 | |||||
| Net increase (decrease) in net assets resulting from operations | (6,869,459 | ) | 13,487,339 | |||||
| Distributions to shareholders: | ||||||||
Institutional Class | (4,346,117 | ) | (1,843,742 | ) | ||||
| Total distributions | (4,346,117 | ) | (1,843,742 | )* | ||||
| Fund share transactions: | ||||||||
| Proceeds from shares sold | 5,725,020 | 9,851,640 | ||||||
| Reinvestment of distributions | 3,934,817 | 1,642,819 | ||||||
| Payments for shares redeemed | (13,414,402 | ) | (27,262,852 | ) | ||||
| Net increase (decrease) in net assets from Fund share transactions | (3,754,565 | ) | (15,768,393 | ) | ||||
| Increase (decrease) in net assets | (14,970,141 | ) | (4,124,796 | ) | ||||
| Net assets at beginning of period | 56,644,114 | 60,768,910 | ||||||
| Net assets at end of period | $ | 41,673,973 | $ | 56,644,114 | ** | |||
| Other Information | ||||||||
| Shares outstanding at beginning of period | 8,608,234 | 11,221,973 | ||||||
| Shares sold | 916,926 | 1,621,440 | ||||||
| Shares issued to shareholders in reinvestment of distributions | 780,488 | 251,196 | ||||||
| Shares redeemed | (2,124,980 | ) | (4,486,375 | ) | ||||
| Net increase (decrease) in Fund shares | (427,566 | ) | (2,613,739 | ) | ||||
| Shares outstanding at end of period | 8,180,668 | 8,608,234 | ||||||
| * | Includes distributions from net investment income. |
| ** | Includes distributions in excess of net investment income of $586,569. |
The accompanying notes are an integral part of the financial statements.
| DWS EAFE® Equity Index Fund | | | 41 |
Table of Contents
Years Ended December 31, | ||||||||||||||||||||
| Institutional Class | 2018 | 2017 | 2016 | 2015 | 2014 | |||||||||||||||
| Selected Per Share Data | ||||||||||||||||||||
| Net asset value, beginning of period | $ | 6.58 | $ | 5.42 | $ | 7.04 | $ | 13.38 | $ | 14.67 | ||||||||||
| Income (loss) from investment operations: | ||||||||||||||||||||
Net investment income (loss)a | .18 | .16 | .19 | d | .45 | .48 | ||||||||||||||
Net realized and unrealized gain (loss) | (1.10 | ) | 1.21 | (.19 | ) | (.51 | ) | (1.33 | ) | |||||||||||
Total from investment operations | (.92 | ) | .1.37 | .00 | * | (.06 | ) | (.85 | ) | |||||||||||
| Less distributions from: | ||||||||||||||||||||
Net investment income | (.18 | ) | (.21 | ) | (.23 | ) | (1.12 | ) | (.44 | ) | ||||||||||
Net realized gains | (.39 | ) | — | (1.39 | ) | (5.16 | ) | — | ||||||||||||
Total distributions | (.57 | ) | (.21 | ) | (1.62 | ) | (6.28 | ) | (.44 | ) | ||||||||||
| Redemption fees | — | — | .00 | * | .00 | * | .00 | * | ||||||||||||
| Net asset value, end of period | $ | 5.09 | $ | 6.58 | $ | 5.42 | $ | 7.04 | $ | 13.38 | ||||||||||
| Total Return (%)b | (13.69 | ) | 25.44 | .75 | d | (.74 | ) | (5.84 | ) | |||||||||||
| Ratios to Average Net Assets and Supplemental Data |
| |||||||||||||||||||
| Net assets, end of period ($ millions) | 42 | 57 | 61 | 58 | 256 | |||||||||||||||
| Ratio of expenses before expense reductions (%) | 1.04 | 1.10 | .95 | .58 | .49 | |||||||||||||||
| Ratio of expenses after expense reductions (%) | .26 | .31 | .33 | .34 | .46 | |||||||||||||||
| Ratio of net investment income (loss) (%) | 2.81 | 2.67 | 3.13 | d | 3.24 | 3.32 | ||||||||||||||
| Portfolio turnover rate (%) | 4 | 5 | 51 | 127 | c | 4 | ||||||||||||||
| a | Based on average shares outstanding during the period. |
| b | Total return would have been lower had certain expenses not been reduced. |
| c | For the year ended December 31, 2015, the portfolio turnover rate includes the effect of a purchase and sale of an exchange traded fund purchased to keep the Fund fully invested while raising cash to fund a large redemption. Turnover without this transaction would have been 12%. |
| d | Includes a non-recurring payment for overbilling of prior years’ custodian out-of-pocket fees. Excluding this payment, net investment income per share, total return and ratio of net investment income to average net assets would have been reduced by $.02, 0.37% and 0.35%, respectively. |
| * | Amount is less than $.005. |
The accompanying notes are an integral part of the financial statements.
| 42 | | | DWS EAFE® Equity Index Fund |
Table of Contents
| Notes to Financial Statements |
A. Organization and Significant Accounting Policies
DWS EAFE® Equity Index Fund (formerly Deutsche EAFE® Equity Index Fund) (the “Fund”) is a diversified series of the Deutsche DWS Institutional Funds (formerly Deutsche Institutional Funds) (the “Trust”), which is registered under the Investment Company Act of 1940, as amended (the “1940 Act”), as an open-end management investment company organized as a Massachusetts business trust.
The Fund’s financial statements are prepared in accordance with accounting principles generally accepted in the United States of America (“U.S. GAAP”) which require the use of management estimates. Actual results could differ from those estimates. The Fund qualifies as an investment company under Topic 946 of Accounting Standards Codification of U.S. GAAP. The policies described below are followed consistently by the Fund in the preparation of its financial statements.
In October 2018, the Securities and Exchange Commission adopted amendments to certain disclosure requirements in Securities Act Release No. 33-10532, Disclosure Update and Simplification, which is intended to facilitate the disclosure of information to investors and simplify compliance without significantly altering the total mix of information provided to investors. Effective with the current reporting period, the Fund adopted the amendments with the impacts being that the Fund is no longer required to present components of distributable earnings on the Statement of Assets and Liabilities or the sources of distributable earnings and the amount of undistributed net investment income on the Statements of Changes in Net Assets.
Security Valuation. Investments are stated at value determined as of the close of regular trading on the New York Stock Exchange on each day the exchange is open for trading.
Various inputs are used in determining the value of the Fund’s investments. These inputs are summarized in three broad levels. Level 1 includes quoted prices in active markets for identical securities. Level 2 includes other significant observable inputs (including quoted prices for similar securities, interest rates, prepayment speeds and credit risk). Level 3 includes significant unobservable inputs (including the Fund’s own assumptions in determining the fair value of investments). The level assigned to the securities valuations may not be an indication of the risk or liquidity associated with investing in those securities.
Equity securities are valued at the most recent sale price or official closing price reported on the exchange (U.S. or foreign) or over-the-counter market on which they trade. Securities for which no sales are reported are
| DWS EAFE® Equity Index Fund | | | 43 |
Table of Contents
valued at the calculated mean between the most recent bid and asked quotations on the relevant market or, if a mean cannot be determined, at the most recent bid quotation. Equity securities are generally categorized as Level 1 securities. For certain international equity securities, in order to adjust for events which may occur between the close of the foreign exchanges and the close of the New York Stock Exchange, a fair valuation model may be used. This fair valuation model takes into account comparisons to the valuation of American Depository Receipts (ADRs), exchange-traded funds, futures contracts and certain indices and these securities are categorized as Level 2.
Investments in open-end investment companies are valued at their net asset value each business day and are categorized as Level 1.
Futures contracts are generally valued at the settlement prices established each day on the exchange on which they are traded and are categorized as Level 1.
Forward currency contracts are valued at the prevailing forward exchange rate of the underlying currencies and are categorized as Level 2.
Securities and other assets for which market quotations are not readily available or for which the above valuation procedures are deemed not to reflect fair value are valued in a manner that is intended to reflect their fair value as determined in accordance with procedures approved by the Board and are generally categorized as Level 3. In accordance with the Fund’s valuation procedures, factors considered in determining value may include, but are not limited to, the type of the security; the size of the holding; the initial cost of the security; the existence of any contractual restrictions on the security’s disposition; the price and extent of public trading in similar securities of the issuer or of comparable companies; quotations or evaluated prices from broker-dealers and/or pricing services; information obtained from the issuer, analysts, and/or the appropriate stock exchange (for exchange-traded securities); an analysis of the company’s or issuer’s financial statements; an evaluation of the forces that influence the issuer and the market(s) in which the security is purchased and sold; and with respect to debt securities, the maturity, coupon, creditworthiness, currency denomination and the movement of the market in which the security is normally traded. The value determined under these procedures may differ from published values for the same securities.
Disclosure about the classification of fair value measurements is included in a table following the Fund’s Investment Portfolio.
Foreign Currency Translations. The books and records of the Fund are maintained in U.S. dollars. Investment securities and other assets and liabilities denominated in a foreign currency are translated into U.S. dollars
| 44 | | | DWS EAFE® Equity Index Fund |
Table of Contents
at the prevailing exchange rates at period end. Purchases and sales of investment securities, income and expenses are translated into U.S. dollars at the prevailing exchange rates on the respective dates of the transactions.
Net realized and unrealized gains and losses on foreign currency transactions represent net gains and losses between trade and settlement dates on securities transactions, the acquisition and disposition of foreign currencies, and the difference between the amount of net investment income accrued and the U.S. dollar amount actually received. The portion of both realized and unrealized gains and losses on investments that results from fluctuations in foreign currency exchange rates is not separately disclosed but is included with net realized and unrealized gain/appreciation and loss/depreciation on investments.
Securities Lending. Deutsche Bank AG, as lending agent, lends securities of the Fund to certain financial institutions under the terms of its securities lending agreement. During the term of the loans, the Fund continues to receive interest and dividends generated by the securities and to participate in any changes in their market value. The Fund requires the borrowers of the securities to maintain collateral with the Fund consisting of either cash or liquid, unencumbered assets having a value at least equal to the value of the securities loaned. When the collateral falls below specified amounts, the lending agent will use its best effort to obtain additional collateral on the next business day to meet required amounts under the securities lending agreement. As of period end, any securities on loan were collateralized by cash. During the year ended December 31, 2018, the Fund invested the cash collateral into a joint trading account in affiliated money market funds managed by DWS Investment Management Americas, Inc. As of December 31, 2018, the Fund invested the cash collateral in DWS Government & Agency Securities Portfolio. DWS Investment Management Americas, Inc. receives a management/administration fee (0.12% annualized effective rate as of December 31, 2018) on the cash collateral invested in DWS Government & Agency Securities Portfolio. The Fund receives compensation for lending its securities either in the form of fees or by earning interest on invested cash collateral net of borrower rebates and fees paid to a lending agent. Either the Fund or the borrower may terminate the loan at any time, and the borrower, after notice, is required to return borrowed securities within a standard time period. There may be risks of delay and costs in recovery of securities or even loss of rights in the collateral should the borrower of the securities fail financially. If the Fund is not able to recover securities lent, the Fund may sell the collateral and purchase a replacement investment in the market, incurring the risk that the value of the replacement security is greater than the value of the collateral. The Fund is also subject to all investment risks associated with
| DWS EAFE® Equity Index Fund | | | 45 |
Table of Contents
the reinvestment of any cash collateral received, including, but not limited to, interest rate, credit and liquidity risk associated with such investments.
As of December 31, 2018, the Fund had no securities on loan.
Taxes. The Fund’s policy is to comply with the requirements of the Internal Revenue Code, as amended, which are applicable to regulated investment companies, and to distribute all of its taxable income to its shareholders.
Additionally, the Fund may be subject to taxes imposed by the governments of countries in which it invests and are generally based on income and/or capital gains earned or repatriated. Estimated tax liabilities on certain foreign securities are recorded on an accrual basis and are reflected as components of interest income or net change in unrealized gain/loss on investments. Tax liabilities realized as a result of security sales are reflected as a component of net realized gain/loss on investments.
The Fund has reviewed the tax positions for the open tax years as of December 31, 2018 and has determined that no provision for income tax and/or uncertain tax positions is required in the Fund’s financial statements. The Fund’s federal tax return for the prior three fiscal years remain open subject to examination by the Internal Revenue Service.
Distribution of Income and Gains. Distributions from net investment income of the Fund are declared and distributed to shareholders annually. Net realized gains from investment transactions, in excess of available capital loss carryforwards, would be taxable to the Fund if not distributed, and, therefore, will be distributed to shareholders at least annually. The Fund may also make additional distributions for tax purposes if necessary.
The timing and characterization of certain income and capital gain distributions are determined annually in accordance with federal tax regulations, which may differ from accounting principles generally accepted in the United States of America. These differences primarily relate to passive foreign investment companies, foreign denominated investments, futures contracts, forward currency contracts, certain securities sold at a loss and recognition of certain foreign currency gains (losses) as ordinary income (loss). As a result, net investment income (loss) and net realized gain (loss) on investment transactions for a reporting period may differ significantly from distributions during such period. Accordingly, the Fund may periodically make reclassifications among certain of its capital accounts without impacting the net asset value of the Fund.
| 46 | | | DWS EAFE® Equity Index Fund |
Table of Contents
At December 31, 2018, the Fund’s components of distributable earnings (accumulated losses) on a tax basis were as follows:
| Undistributed long-term capital gains | $ | 217,440 | ||
| Net unrealized appreciation (depreciation) on investments | $ | 17,539,942 |
At December 31, 2018, the aggregate cost of investments for federal income tax purposes was $23,763,132. The net unrealized appreciation for all investments based on tax cost was $17,539,942. This consisted of aggregate gross unrealized appreciation for all investments which there was an excess of value over tax cost of $20,286,680 aggregate gross unrealized depreciation for all investments in which was an excess of tax cost over value of $2,746,738.
In addition, the tax character of distributions paid to shareholders by the Fund is summarized as follows:
| Years Ended December 31, | ||||||||
| 2018 | 2017 | |||||||
| Distributions from ordinary income* | $ | 1,419,064 | $ | 1,843,742 | ||||
| Distributions from long-term capital gains | $ | 2,927,053 | $ | — | ||||
| * | For tax purposes, short-term capital distributions are considered ordinary income distributions. |
Expenses. Expenses of the Trust arising in connection with a specific fund are allocated to that fund. Other Trust expenses which cannot be directly attributed to a fund are apportioned among the funds in the Trust based upon the relative net assets or other appropriate measures.
Contingencies. In the normal course of business, the Fund may enter into contracts with service providers that contain general indemnification clauses. The Fund’s maximum exposure under these arrangements is unknown, as this would involve future claims that may be made against the Fund that have not yet been made. However, based on experience, the Fund expects the risk of loss to be remote.
Other. Investment transactions are accounted for on a trade date plus one basis for daily net asset value calculations. However, for financial reporting purposes, investment transactions are reported on trade date. Interest income is recorded on the accrual basis. Dividend income is recorded on the ex-dividend date net of foreign withholding taxes. Realized gains and losses from investment transactions are recorded on an identified cost basis. Proceeds from litigation payments, if any, are included in net realized gain (loss) from investments.
| DWS EAFE® Equity Index Fund | | | 47 |
Table of Contents
B. Derivative Instruments
Futures Contracts. A futures contract is an agreement between a buyer or seller and an established futures exchange or its clearinghouse in which the buyer or seller agrees to take or make a delivery of a specific amount of a financial instrument at a specified price on a specific date (settlement date). For the year ended December 31, 2018, the Fund entered into futures contracts as a means of gaining exposure to a particular asset class or to keep cash on hand to meet shareholder redemptions or other needs while maintaining exposure to the market.
Upon entering into a futures contract, the Fund is required to deposit with a financial intermediary cash or securities (“initial margin”) in an amount equal to a certain percentage of the face value indicated in the futures contract. Subsequent payments (“variation margin”) are made or received by the Fund dependent upon the daily fluctuations in the value and are recorded for financial reporting purposes as unrealized gains or losses by the Fund. Gains or losses are realized when the contract expires or is closed. Since all futures contracts are exchange traded, counterparty risk is minimized as the exchange’s clearinghouse acts as the counterparty, and guarantees the futures against default.
Certain risks may arise upon entering into futures contracts, including the risk that an illiquid market will limit the Fund’s ability to close out a futures contract prior to the settlement date and the risk that the futures contract is not well correlated with the security, index or currency to which it relates. Risk of loss may exceed amounts disclosed in the Statement of Assets and Liabilities.
A summary of the open futures contracts as of December 31, 2018, is included in a table following the Fund’s Investment Portfolio. For the year ended December 31, 2018, the investment in futures contracts purchased had a total notional value generally indicative of a range from approximately $1,102,000 to $1,532,000.
Forward Foreign Currency Exchange Contracts. A forward foreign currency exchange contract (“forward currency contract”) is a commitment to purchase or sell a foreign currency at the settlement date at a negotiated rate. For the year ended December 31, 2018, the Fund used forward currency contracts as a means of maintaining the Fund’s currency exposure consistent with that of the EAFE index and to facilitate transactions in foreign currency denominated securities.
Forward currency contracts are valued at the prevailing forward exchange rate of the underlying currencies and unrealized gain (loss) is recorded daily. On the settlement date of the forward currency contract, the Fund records a realized gain or loss equal to the difference between the value of the contract at the time it was opened and the value of the contract at
| 48 | | | DWS EAFE® Equity Index Fund |
Table of Contents
the time it was closed. Certain risks may arise upon entering into forward currency contracts from the potential inability of counterparties to meet the terms of their contracts. The maximum counterparty credit risk to the Fund is measured by the unrealized gain on appreciated contracts. Additionally, when utilizing forward currency contracts to hedge, the Fund gives up the opportunity to profit from favorable exchange rate movements during the term of the contract.
A summary of the open forward currency contracts as of December 31, 2018, is included in a table following the Fund’s Investment Portfolio. For the year ended December 31, 2018, the investment in forward currency contracts U.S. dollars purchased had a total contract value generally indicative of a range from approximately $177,000 to $1,880,000, and the investment in forward currency contracts U.S. dollars sold had a total contract value generally indicative of a range from approximately $773,000 to $2,590,000.
The following tables summarize the value of the Fund’s derivative instruments held as of December 31, 2018 and the related location in the accompanying Statement of Assets and Liabilities, presented by primary underlying risk exposure:
| Asset Derivatives | Forward Contracts | Futures Contracts | Total | |||||||||
| Equity Contracts (a) | $ | — | $ | 12,287 | $ | 12,287 | ||||||
| Foreign Exchange Contracts (b) | 14,149 | — | 14,149 | |||||||||
| $ | 14,149 | $ | 12,287 | $ | 26,436 | |||||||
Each of the above derivatives is located in the following Statement of Assets and Liabilities accounts:
| (a) | Includes cumulative appreciation of futures contracts as disclosed in the Investment Portfolio. Unsettled variation margin is disclosed separately within the Statement of Assets and Liabilities. |
| (b) | Unrealized appreciation on forward foreign currency contracts |
| Liability Derivatives | Forward Contracts | Futures Contracts | Total | |||||||||
| Equity Contracts (c) | $ | — | $ | (7,253 | ) | $ | (7,253 | ) | ||||
| Foreign Exchange Contracts (d) | (7,454 | ) | — | (7,454 | ) | |||||||
| $ | (7,454 | ) | $ | (7,253 | ) | $ | (14,707 | ) | ||||
Each of the above derivatives is located in the following Statement of Assets and Liabilities accounts:
| (c) | Includes cumulative depreciation of futures contracts as disclosed in the Investment Portfolio. Unsettled variation margin is disclosed separately within the Statement of Assets and Liabilities. |
| (d) | Unrealized depreciation on forward foreign currency contracts |
Additionally, the amount of unrealized and realized gains and losses on derivative instruments recognized in Fund earnings during the year ended
| DWS EAFE® Equity Index Fund | | | 49 |
Table of Contents
December 31, 2018 and the related location in the accompanying Statement of Operations is summarized in the following tables by primary underlying risk exposure:
| Realized Gain (Loss) | Forward Contracts | Futures Contracts | Total | |||||||||
| Equity Contracts (e) | $ | — | $ | (142,804 | ) | $ | (142,804 | ) | ||||
| Foreign Exchange Contracts (f) | (14,220 | ) | — | (14,220 | ) | |||||||
| $ | (14,220 | ) | $ | (142,804 | ) | $ | (157,024 | ) | ||||
Each of the above derivatives is located in the following Statement of Operations accounts:
| (e) | Net realized gain (loss) from futures |
| (f) | Net realized gain (loss) from forward foreign currency contracts |
| Change in Net Unrealized Appreciation (Depreciation) | Forward Contracts | Futures Contracts | Total | |||||||||
| Equity Contracts (g) | $ | — | $ | 7,272 | $ | 7,272 | ||||||
| Foreign Exchange Contracts (h) | 1,675 | — | 1,675 | |||||||||
| $ | 1,675 | $ | 7,272 | $ | 8,947 | |||||||
Each of the above derivatives is located in the following Statement of Operations accounts:
| (g) | Change in net unrealized appreciation (depreciation) on futures |
| (h) | Change in net unrealized appreciation (depreciation) on forward foreign currency contracts |
As of December 31, 2018, the Fund has transactions subject to enforceable master netting agreements which govern the terms of certain transactions, and reduce the counterparty risk associated with such transactions. Master netting agreements allow a Fund to close out and net total exposure to a counterparty in the event of a deterioration in the credit quality or contractual default with respect to all of the transactions with a counterparty. As defined by the master netting agreement, the Fund may have collateral agreements with certain counterparties to mitigate risk. For financial reporting purposes the Statement of Assets and Liabilities generally shows derivatives assets and liabilities on a gross basis, which reflects the full risks and exposures prior to netting. A reconciliation of the gross amounts on the Statement of Assets and Liabilities to the net amounts by a counterparty, including any collateral exposure, is included in the following tables:
| Counterparty | Gross Amounts of Assets Presented in the Statement of Assets and Liabilities | Financial Instruments and Derivatives Available for Offset | Collateral Received | Net Amount of Derivative Assets | ||||||||||||
| Bank of New York | $ | 1,317 | $ | (1,317 | ) | $ | — | $ | — | |||||||
| BNP Paribas SA | 60 | (60 | ) | — | — | |||||||||||
| Morgan Stanley | 10,597 | (255 | ) | — | 10,342 | |||||||||||
| Toronto-Dominion Bank | 2,175 | — | — | 2,175 | ||||||||||||
| $ | 14,149 | $ | (1,632 | ) | $ | — | $ | 12,517 | ||||||||
| 50 | | | DWS EAFE® Equity Index Fund |
Table of Contents
| Counterparty | Gross Amounts of Liabilities Presented in the Statement of Assets and Liabilities | Financial Instruments and Derivatives Available for Offset | Collateral Pledged | Net Amount of Derivative Liabilities | ||||||||||||
| Bank of Montreal | $ | 21 | $ | — | $ | — | $ | 21 | ||||||||
| Bank of New York | 2,341 | (1,317 | ) | — | 1,024 | |||||||||||
| BNP Paribas SA | 347 | (60 | ) | — | 287 | |||||||||||
| Citigroup, Inc. | 114 | — | — | 114 | ||||||||||||
| Goldman Sachs & Co. | 3,052 | — | — | 3,052 | ||||||||||||
| Morgan Stanley | 255 | (255 | ) | — | — | |||||||||||
| Societe Generale | 872 | — | — | 872 | ||||||||||||
| UBS AG | 452 | — | — | 452 | ||||||||||||
| $ | 7,454 | $ | (1,632 | ) | $ | — | $ | 5,822 | ||||||||
C. Purchases and Sales of Securities
During the year ended December 31, 2018, purchases and sales of investment securities (excluding short-term investments) aggregated $1,921,831 and $11,484,964, respectively.
D. Related Parties
Management Agreement. Under the Investment Management Agreement with DWS Investment Management Americas, Inc. (formerly Deutsche Investment Management Americas Inc.) (“DIMA” or the “Advisor”), an indirect, wholly owned subsidiary of DWS Group GmbH & Co. KGaA (“DWS Group”), the Advisor determines the securities, instruments and other contracts relating to investments to be purchased, sold, or entered into by the Fund or delegates such responsibility to the Fund’s subadvisor.
Northern Trust Investments, Inc. (“NTI”) serves as subadvisor. As a subadvisor to the Fund, NTI makes investment decisions and buys and sells securities for the Fund. NTI is paid by the Advisor for the services NTI provides to the Fund.
The management fee payable under the Investment Management Agreement is equal to an annual rate (exclusive of any applicable waivers/reimbursements) of 0.25% of the Fund’s average daily net assets, computed and accrued daily and payable monthly.
For the period from January 1, 2018 through April 30, 2019, the Advisor has contractually agreed to waive its fees and/or reimburse certain operating expenses to the extent necessary to maintain the total annual operating expenses (excluding certain expenses such as extraordinary expenses, taxes, brokerage and interest expense) at 0.26% for Institutional Class.
| DWS EAFE® Equity Index Fund | | | 51 |
Table of Contents
For the year ended December 31, 2018, fees waived and/or expenses reimbursed for the Fund were $396,831.
Administration Fee. Pursuant to the Administrative Services Agreement, DIMA provides most administrative services to the Fund. For all services provided under the Administrative Services Agreement, the Fund pays the Advisor an annual fee (“Administration Fee”) of 0.10% of the Fund’s average daily net assets, computed and accrued daily and payable monthly. For the year ended December 31, 2018, the Administration Fee was $50,909, of which $3,673 is unpaid.
Service Provider Fees. DWS Service Company (“DSC”), an affiliate of the Advisor, is the transfer agent, dividend-paying agent and shareholder service agent for the Fund. Pursuant to a sub-transfer agency agreement between DSC and DST Systems, Inc. (“DST”), DSC compensates DST out of the shareholder servicing fee it receives from the Fund. DSC has delegated certain transfer agent, dividend-paying agent and shareholder service agent functions to DST. For the year ended December 31, 2018, the amount charged to the Fund by DSC aggregated $3,224, of which $563 is unpaid.
In addition, for the year ended December 31, 2018, the amounts charged to the Fund for recordkeeping and other administrative services provided by unaffiliated third parties, included in the Statement of Operations under “Services to shareholders”, aggregated $15,150.
Trustees’ Fees and Expenses. The Fund paid retainer fees to each Trustee not affiliated with the Advisor, plus specified amounts to the Board Chairperson and to each committee Chairperson.
Typesetting and Filing Service Fees. Under an agreement with the Fund, DIMA is compensated for providing certain pre-press and regulatory filing services to the Fund. For the year ended December 31, 2018, the amount charged to the Fund by DIMA included in the Statement of Operations under “Reports to shareholders” aggregated $24,394, of which $13,373 is unpaid.
Affiliated Cash Management Vehicles. The Fund may invest uninvested cash balances in DWS Central Cash Management Government Fund and DWS ESG Liquidity Fund, affiliated money market funds which are managed by the Advisor. Each affiliated money market fund is managed in accordance with Rule 2a-7 under the 1940 Act, which governs the quality, maturity, diversity and liquidity of instruments in which a money market fund may invest. DWS Central Cash Management Government Fund seeks to maintain a stable net asset value, and DWS ESG Liquidity Fund maintains a floating net asset value. The Fund indirectly bears its proportionate share of the expenses of each affiliated money market fund in which it invests. DWS Central Cash Management Government Fund
| 52 | | | DWS EAFE® Equity Index Fund |
Table of Contents
does not pay the Advisor an investment management fee. To the extent that DWS ESG Liquidity Fund pays an investment management fee to the Advisor, the Advisor will waive an amount of the investment management fee payable to the Advisor by the Fund equal to the amount of the investment management fee payable on the Fund’s assets invested in DWS ESG Liquidity Fund.
Security Lending Fees. Deutsche Bank AG serves as lending agent for the Fund. For the year ended December 31, 2018, the Fund incurred lending agent fees to Deutsche Bank AG in the amount of $268.
E. Line of Credit
The Fund and other affiliated funds (the “Participants”) share in a $400 million revolving credit facility provided by a syndication of banks. The Fund may borrow for temporary or emergency purposes, including the meeting of redemption requests that otherwise might require the untimely disposition of securities. The Participants are charged an annual commitment fee which is allocated based on net assets, among each of the Participants. Interest is calculated at a rate per annum equal to the sum of the Federal Funds Rate plus 1.25 percent plus if the one-month LIBOR exceeds the Federal Funds Rate, the amount of such excess. The Fund may borrow up to a maximum of 33 percent of its net assets under the agreement. The Fund had no outstanding loans at December 31, 2018.
F. Concentration of Ownership
From time to time, the Fund may have a concentration of several shareholder accounts, including affiliated DWS Funds, holding a significant percentage of shares outstanding. Investment activities of these shareholders could have a material impact on the Fund.
At December 31, 2018, DWS Multi-Asset Global Allocation Fund held approximately 36% of the outstanding shares of the Fund.
| DWS EAFE® Equity Index Fund | | | 53 |
Table of Contents
Report of Independent Registered Public Accounting Firm
To the Board of Trustees of Deutsche DWS Institutional Funds and Shareholders of DWS EAFE® Equity Index Fund
Opinion on the Financial Statements
We have audited the accompanying statement of assets and liabilities, including the investment portfolio, of DWS EAFE® Equity Index Fund (one of the funds constituting Deutsche DWS Institutional Funds, referred to hereafter as the “Fund”) as of December 31, 2018, the related statement of operations for the year ended December 31, 2018, the statements of changes in net assets for each of the two years in the period ended December 31, 2018, including the related notes, and the financial highlights for each of the five years in the period ended December 31, 2018 (collectively referred to as the “financial statements”). In our opinion, the financial statements present fairly, in all material respects, the financial position of the Fund as of December 31, 2018, the results of its operations for the year then ended, the changes in its net assets for each of the two years in the period ended December 31, 2018 and the financial highlights for each of the five years in the period ended December 31, 2018 in conformity with accounting principles generally accepted in the United States of America.
Basis for Opinion
These financial statements are the responsibility of the Fund’s management. Our responsibility is to express an opinion on the Fund’s financial statements based on our audits. We are a public accounting firm registered with the Public Company Accounting Oversight Board (United States) (PCAOB) and are required to be independent with respect to the Fund in accordance with the U.S. federal securities laws and the applicable rules and regulations of the Securities and Exchange Commission and the PCAOB.
We conducted our audits of these financial statements in accordance with the standards of the PCAOB. Those standards require that we plan and perform the audit to obtain reasonable assurance about whether the financial statements are free of material misstatement, whether due to error or fraud.
| 54 | | | DWS EAFE® Equity Index Fund |
Table of Contents
Our audits included performing procedures to assess the risks of material misstatement of the financial statements, whether due to error or fraud, and performing procedures that respond to those risks. Such procedures included examining, on a test basis, evidence regarding the amounts and disclosures in the financial statements. Our audits also included evaluating the accounting principles used and significant estimates made by management, as well as evaluating the overall presentation of the financial statements. Our procedures included confirmation of securities owned as of December 31, 2018 by correspondence with the custodian, transfer agent and brokers. We believe that our audits provide a reasonable basis for our opinion.
PricewaterhouseCoopers LLP
Boston, Massachusetts
February 21, 2019
We have served as the auditor of one or more investment companies in the DWS family of funds since 1930.
| DWS EAFE® Equity Index Fund | | | 55 |
Table of Contents
Information About Your Fund’s Expenses
As an investor of the Fund, you incur two types of costs: ongoing expenses and transaction costs. Ongoing expenses include management fees and other Fund expenses. Examples of transaction costs include account maintenance fees, which are not shown in this section. The following tables are intended to help you understand your ongoing expenses (in dollars) of investing in the Fund and to help you compare these expenses with the ongoing expenses of investing in other mutual funds. In the most recent six-month period, the Fund limited these expenses; had it not done so, expenses would have been higher. The example in the table is based on an investment of $1,000 invested at the beginning of the six-month period and held for the entire period (July 1, 2018 to December 31, 2018).
The tables illustrate your Fund’s expenses in two ways:
| – | Actual Fund Return. This helps you estimate the actual dollar amount of ongoing expenses (but not transaction costs) paid on a $1,000 investment in the Fund using the Fund’s actual return during the period. To estimate the expenses you paid over the period, simply divide your account value by $1,000 (for example, an $8,600 account value divided by $1,000 = 8.6), then multiply the result by the number in the “Expenses Paid per $1,000” line under the share class you hold. |
| – | Hypothetical 5% Fund Return. This helps you to compare your Fund’s ongoing expenses (but not transaction costs) with those of other mutual funds using the Fund’s actual expense ratio and a hypothetical rate of return of 5% per year before expenses. Examples using a 5% hypothetical fund return may be found in the shareholder reports of other mutual funds. The hypothetical account values and expenses may not be used to estimate the actual ending account balance or expenses you paid for the period. |
Please note that the expenses shown in these tables are meant to highlight your ongoing expenses only and do not reflect any transaction costs. The “Expenses Paid per $1,000” line of the tables is useful in comparing ongoing expenses only and will not help you determine the relative total expense of owning different funds. If these transaction costs had been included, your costs would have been higher.
| 56 | | | DWS EAFE® Equity Index Fund |
Table of Contents
| Expenses and Value of a $1,000 Investment for the six months ended December 31, 2018 (Unaudited) | ||||
| Actual Fund Return | Institutional Class | |||
| Beginning Account Value 7/1/18 | $ | 1,000.00 | ||
| Ending Account Value 12/31/18 | $ | 886.40 | ||
| Expenses Paid per $1,000* | $ | 1.24 | ||
| Hypothetical 5% Fund Return | Institutional Class | |||
| Beginning Account Value 7/1/18 | $ | 1,000.00 | ||
| Ending Account Value 12/31/18 | $ | 1,023.89 | ||
| Expenses Paid per $1,000* | $ | 1.33 | ||
| * | Expenses are equal to the Fund’s annualized expense ratio multiplied by the average account value over the period, multiplied by 184 (the number of days in the most recent six-month period), then divided by 365. |
| Annualized Expense Ratio | Institutional Class | |||
| DWS EAFE® Equity Index Fund | .26 | % | ||
For more information, please refer to the Fund’s prospectus.
For an analysis of the fees associated with an investment in the Fund or similar funds, please refer to http://apps.finra.org/fundanalyzer/1/fa.aspx.
| Tax Information | (Unaudited) |
The Fund paid distributions of $0.39 per share from net long-term capital gains during its year ended December 31, 2018.
Pursuant to Section 852 of the Internal Revenue Code, the Fund designates $3,387,000 as capital gain dividends for its year ended December 31, 2018.
For federal income tax purposes, the Fund designates $1,433,000, or the maximum amount allowable under tax law, as qualified dividend income.
The Fund paid foreign taxes of $127,052 and earned $1,456,279 of foreign source income during the year ended December 31, 2018. Pursuant to Section 853 of the Internal Revenue Code, the Fund designates $0.02 per share as foreign taxes paid and $0.20 per share as income earned from foreign sources for the year ended December 31, 2018.
Please consult a tax advisor if you have questions about federal or state income tax laws, or on how to prepare your tax returns. If you have specific questions about your account, please call (800) 728-3337.
| DWS EAFE® Equity Index Fund | | | 57 |
Table of Contents
Advisory Agreement Board Considerations and Fee Evaluation
The Board of Trustees (hereinafter referred to as the “Board” or “Trustees”) approved the renewal of DWS EAFE® Equity Index Fund’s (the “Fund”) investment management agreement (the “Agreement”) with DWS Investment Management Americas, Inc. (“DIMA”) and sub-advisory agreement (the “Sub-Advisory Agreement” and together with the Agreement, the “Agreements”) between DIMA and Northern Trust Investments, Inc. (“NTI”) in September 2018.
In terms of the process that the Board followed prior to approving the Agreements, shareholders should know that:
| – | During the entire process, all of the Fund’s Trustees were independent of DIMA and its affiliates (the “Independent Trustees”). |
| – | The Board met frequently during the past year to discuss fund matters and dedicated a substantial amount of time to contract review matters. Over the course of several months, the Board’s Contract Committee reviewed extensive materials received from DIMA, independent third parties and independent counsel. These materials included an analysis of the Fund’s performance, fees and expenses, and profitability from a fee consultant retained by the Fund’s Independent Trustees (the “Fee Consultant”). Based on its evaluation of the information provided, the Contract Committee presented its findings and recommendations to the Board. The Board then reviewed the Contract Committee’s findings and recommendations. |
| – | The Board also received extensive information throughout the year regarding performance of the Fund. |
| – | The Independent Trustees regularly met privately with counsel to discuss contract review and other matters. In addition, the Independent Trustees were advised by the Fee Consultant in the course of their review of the Fund’s contractual arrangements and considered a comprehensive report prepared by the Fee Consultant in connection with their deliberations. |
| – | In connection with reviewing the Agreements, the Board also reviewed the terms of the Fund’s Rule 12b-1 plan, distribution agreement, administrative services agreement, transfer agency agreement and other material service agreements. |
In connection with the contract review process, the Contract Committee and the Board considered the factors discussed below, among others. The Board also considered that DIMA and its predecessors have managed the Fund since its inception, and the Board believes that a long-term
| 58 | | | DWS EAFE® Equity Index Fund |
Table of Contents
relationship with a capable, conscientious advisor is in the best interests of the Fund. The Board considered, generally, that shareholders chose to invest or remain invested in the Fund knowing that DIMA managed the Fund. DIMA is part of DWS Group GmbH & Co. KGaA (“DWS Group”). DWS Group is a global asset management business that offers a wide range of investing expertise and resources, including research capabilities in many countries throughout the world. In 2018, approximately 20% of DWS Group’s shares were sold in an initial public offering, with Deutsche Bank AG owning the remaining shares.
As part of the contract review process, the Board carefully considered the fees and expenses of each DWS fund overseen by the Board in light of the fund’s performance. In many cases, this led to the negotiation and implementation of expense caps. As part of these negotiations, the Board indicated that it would consider relaxing these caps in future years following sustained improvements in performance, among other considerations.
While shareholders may focus primarily on fund performance and fees, the Fund’s Board considers these and many other factors, including the quality and integrity of DIMA’s and NTI’s personnel and administrative support services provided by DIMA, such as back-office operations, fund valuations, and compliance policies and procedures.
Nature, Quality and Extent of Services. The Board considered the terms of the Agreements, including the scope of advisory services provided under the Agreements. The Board noted that, under the Agreements, DIMA and NTI provide portfolio management services to the Fund and that, pursuant to a separate administrative services agreement, DIMA provides administrative services to the Fund. The Board considered the experience and skills of senior management and investment personnel and the resources made available to such personnel. Throughout the course of the year, the Board also received information regarding DIMA’s oversight of fund sub-advisers, including NTI. The Board reviewed the Fund’s performance over short-term and long-term periods and compared those returns to various agreed-upon performance measures, including market index(es) and a peer universe compiled using information supplied by Morningstar Direct (“Morningstar”), an independent fund data service. The Board also noted that it has put into place a process of identifying “Funds in Review” (e.g., funds performing poorly relative to a peer universe), and receives additional reporting from DIMA regarding such funds and, where appropriate, DIMA’s plans to address underperformance. The Board believes this process is an effective manner of identifying and addressing underperforming funds. Based on the information provided, the Board noted that, for the one-, three- and five-year periods ended December 31, 2017, the Fund’s performance
| DWS EAFE® Equity Index Fund | | | 59 |
Table of Contents
(Institutional Class shares) was in the 3rd quartile of the applicable Morningstar universe (the 1st quartile being the best performers and the 4th quartile being the worst performers).
Fees and Expenses. The Board considered the Fund’s investment management fee schedule, sub-advisory fee schedule, operating expenses and total expense ratios, and comparative information provided by Broadridge Financial Solutions, Inc. (“Broadridge”) and the Fee Consultant regarding investment management fee rates paid to other investment advisors by similar funds (1st quartile being the most favorable and 4th quartile being the least favorable). With respect to management fees paid to other investment advisors by similar funds, the Board noted that the contractual fee rates paid by the Fund, which include a 0.10% fee paid to DIMA under the Fund’s administrative services agreement, were higher than the median (3rd quartile) of the applicable Broadridge peer group (based on Broadridge data provided as of December 31, 2017). With respect to the sub-advisory fee paid to NTI, the Board noted that the fee is paid by DIMA out of its fee and not directly by the Fund. The Board noted that the Fund’s Institutional Class shares total (net) operating expenses were expected to be higher than the median (3rd quartile) of the applicable Broadridge expense universe (based on Broadridge data provided as of December 31, 2017). The Board noted that the expense limitations agreed to by DIMA were expected to help the Fund’s total (net) operating expenses remain competitive. The Board considered the Fund’s management fee rate as compared to fees charged by DIMA to comparable DWS U.S. registered funds (“DWS Funds”) and considered differences between the Fund and the comparable DWS Funds. The information requested by the Board as part of its review of fees and expenses also included information about institutional accounts (including any sub-advised funds and accounts) and funds offered primarily to European investors (“DWS Europe Funds”) managed by DWS Group. The Board noted that DIMA indicated that DWS Group does not manage any institutional accounts or DWS Europe Funds comparable to the Fund.
On the basis of the information provided, the Board concluded that management fees were reasonable and appropriate in light of the nature, quality and extent of services provided by DIMA and NTI.
Profitability. The Board reviewed detailed information regarding revenues received by DIMA under the Agreement. The Board considered the estimated costs to DIMA, and pre-tax profits realized by DIMA, from advising the DWS Funds, as well as estimates of the pre-tax profits attributable to managing the Fund in particular. The Board also received information regarding the estimated enterprise-wide profitability of DIMA and its affiliates with respect to all fund services in totality and by fund.
| 60 | | | DWS EAFE® Equity Index Fund |
Table of Contents
The Board and the Fee Consultant reviewed DIMA’s methodology in allocating its costs to the management of the Fund. Based on the information provided, the Board concluded that the pre-tax profits realized by DIMA in connection with the management of the Fund were not unreasonable. The Board also reviewed certain publicly available information regarding the profitability of certain similar investment management firms. The Board noted that, while information regarding the profitability of such firms is limited (and in some cases is not necessarily prepared on a comparable basis), DIMA and its affiliates’ overall profitability with respect to the DWS Funds (after taking into account distribution and other services provided to the funds by DIMA and its affiliates) was lower than the overall profitability levels of most comparable firms for which such data was available. The Board did not consider the profitability of NTI with respect to the Fund. The Board noted that DIMA pays NTI’s fee out of its management fee, and its understanding that the Fund’s sub-advisory fee schedule was the product of an arm’s length negotiation with DIMA.
Economies of Scale. The Board considered whether there are economies of scale with respect to the management of the Fund and whether the Fund benefits from any economies of scale. In this regard, the Board observed that while the Fund’s current investment management fee schedule does not include breakpoints, the Fund’s fee schedule represents an appropriate sharing between the Fund and DIMA of such economies of scale as may exist in the management of the Fund at current asset levels.
Other Benefits to DIMA and NTI and Their Affiliates. The Board also considered the character and amount of other incidental or “fall-out” benefits received by DIMA and NTI and their affiliates, including any fees received by DIMA for administrative services provided to the Fund, any fees received by an affiliate of DIMA for transfer agency services provided to the Fund and any fees received by an affiliate of DIMA for distribution services. The Board also considered benefits to DIMA and NTI related to brokerage and soft-dollar allocations, including allocating brokerage to pay for research generated by parties other than the executing broker dealers, which pertain primarily to funds investing in equity securities. In addition, the Board considered the incidental public relations benefits to DIMA and NTI related to DWS Funds advertising and cross-selling opportunities among DIMA products and services. The Board considered these benefits in reaching its conclusion that the Fund’s management fees were reasonable.
Compliance. The Board considered the significant attention and resources dedicated by DIMA to its compliance processes in recent years. The Board noted in particular (i) the experience, seniority and time commitment of the individuals serving as DIMA’s and the Fund’s chief
| DWS EAFE® Equity Index Fund | | | 61 |
Table of Contents
compliance officers and (ii) the substantial commitment of resources by DIMA and its affiliates to compliance matters, including the retention of compliance personnel. The Board also considered the attention and resources dedicated by DIMA to the oversight of the investment sub-advisor’s compliance program and compliance with the applicable fund policies and procedures.
Based on all of the information considered and the conclusions reached, the Board unanimously determined that the continuation of the Agreements is in the best interests of the Fund. In making this determination, the Board did not give particular weight to any single factor identified above. The Board considered these factors over the course of numerous meetings, certain of which were in executive session with only the Independent Trustees and counsel present. It is possible that individual Independent Trustees may have weighed these factors differently in reaching their individual decisions to approve the continuation of the Agreements.
| 62 | | | DWS EAFE® Equity Index Fund |
Table of Contents
The following table presents certain information regarding the Board Members and Officers of the Fund. Each Board Member’s year of birth is set forth in parentheses after his or her name. Unless otherwise noted, (i) each Board Member has engaged in the principal occupation(s) noted in the table for at least the most recent five years, although not necessarily in the same capacity; and (ii) the address of each Independent Board Member is c/o Keith R. Fox, DWS Funds Board Chair, c/o Thomas R. Hiller, Ropes & Gray LLP, Prudential Tower, 800 Boylston Street, Boston, MA02199-3600. Except as otherwise noted below, the term of office for each Board Member is until the election and qualification of a successor, or until such Board Member sooner dies, resigns, is removed or as otherwise provided in the governing documents of the Fund. Because the Fund does not hold an annual meeting of shareholders, each Board Member will hold office for an indeterminate period. The Board Members may also serve in similar capacities with other funds in the fund complex.
| Independent Board Members | ||||||||
| Name, Year of Birth, Position with the Fund and Length of Time Served1 | Business Experience and Directorships During the Past Five Years | Number of Funds in DWS Fund Complex Overseen | Other Directorships Held by Board Member | |||||
Keith R. Fox, CFA (1954)
Chairperson since 2017, and Board Member since 1996 | Managing General Partner, Exeter Capital Partners (a series of private investment funds) (since 1986). Directorships: Progressive International Corporation (kitchen goods importer and distributor); The Kennel Shop (retailer); former Chairman, National Association of Small Business Investment Companies; former Directorships: BoxTop Media Inc. (advertising); Sun Capital Advisers Trust (mutual funds) (2011–2012) | 82 | — | |||||
John W. Ballantine (1946)
Board Member since 1999 | Retired; formerly, Executive Vice President and Chief Risk Management Officer, First Chicago NBD Corporation/The First National Bank of Chicago (1996–1998); Executive Vice President and Head of International Banking (1995–1996); former Directorships: Director and former Chairman of the Board, Healthways, Inc.2 (population well-being and wellness services) (2003–2014); Stockwell Capital Investments PLC (private equity); Enron Corporation; FNB Corporation; Tokheim Corporation; First Oak Brook Bancshares, Inc. and Oak Brook Bank; Prisma Energy International; Public Radio International. Not-for-Profit Director, Trustee: Palm Beach Civic Association; Window to the World Communications (public media); Harris Theater for Music and Dance (Chicago); Life Director of Hubbard Street Dance Chicago | 82 | Portland General Electric2 (utility company) (2003– present) | |||||
| DWS EAFE® Equity Index Fund | | | 63 |
Table of Contents
| Name, Year of Birth, Position with the Fund and Length of Time Served1 | Business Experience and Directorships During the Past Five Years | Number of Funds in DWS Fund Complex Overseen | Other Directorships Held by Board Member | |||||
Henry P. Becton, Jr. (1943)
Board Member since 1990 | Vice Chair and former President, WGBH Educational Foundation. Directorships: Public Radio International; Public Radio Exchange (PRX); The Pew Charitable Trusts (charitable organization); Massachusetts Humane Society; Overseer of the New England Conservatory; former Directorships: Becton Dickinson and Company2 (medical technology company); Belo Corporation2 (media company); The PBS Foundation; Association of Public Television Stations; Boston Museum of Science; American Public Television; Concord Academy; New England Aquarium; Mass. Corporation for Educational Telecommunications; Committee for Economic Development; Public Broadcasting Service; Connecticut College; North Bennett Street School (Boston); American Documentary, Inc. (public media) | 82 | — | |||||
Dawn-Marie Driscoll (1946)
Board Member since 1987 | Emeritus Executive Fellow, Center for Business Ethics, Bentley University; formerly: President, Driscoll Associates (consulting firm); Partner, Palmer & Dodge (law firm) (1988–1990); Vice President of Corporate Affairs and General Counsel, Filene’s (retail) (1978–1988). Directorships: Advisory Board, Center for Business Ethics, Bentley University; Trustee and former Chairman of the Board, Southwest Florida Community Foundation (charitable organization); former Directorships: ICI Mutual Insurance Company (2007–2015); Sun Capital Advisers Trust (mutual funds) (2007–2012), Investment Company Institute (audit, executive, nominating committees) and Independent Directors Council (governance, executive committees) | 82 | — | |||||
Paul K. Freeman* (1950)
Board Member since 1993 | Consultant, WorldBank/Inter-American Development Bank; Independent Directors Council (former chair); Investment Company Institute (executive committee); Adjunct Professor, University of Denver Law School (2017–present); formerly: Chairman of Education Committee of Independent Directors Council; Project Leader, International Institute for Applied Systems Analysis (1998–2001); Chief Executive Officer, The Eric Group, Inc. (environmental insurance) (1986–1998); Directorships: Knoebel Institute for Healthy Aging, University of Denver (2017–present); former Directorships: Prisma Energy International; Denver Zoo Foundation (2012–2018) | 82 | — | |||||
| 64 | | | DWS EAFE® Equity Index Fund |
Table of Contents
| Name, Year of Birth, Position with the Fund and Length of Time Served1 | Business Experience and Directorships During the Past Five Years | Number of Funds in DWS Fund Complex Overseen | Other Directorships Held by Board Member | |||||
Richard J. Herring (1946)
Board Member since 1990 | Jacob Safra Professor of International Banking and Professor of Finance, The Wharton School, University of Pennsylvania (since July 1972); Director, The Wharton Financial Institutions Center (since 1994); formerly: Vice Dean and Director, Wharton Undergraduate Division (1995–2000) and Director, The Lauder Institute of International Management Studies (2000–2006); Member FDIC Systemic Risk Advisory Committee since 2011, member Systemic Risk Council since 2012 and member of the Advisory Board at the Yale Program on Financial Stability since 2013; Formerly Co-Chair of the Shadow Financial Regulatory Committee (2003–2015), Executive Director of The Financial Economists Roundtable (2008–2015), Director of The Thai Capital Fund (2007–2013), Director of The Aberdeen Singapore Fund (2007–2018), and Nonexecutive Director of Barclays Bank DE (2010–2018) | 82 | Director, Aberdeen Japan Fund (since 2007) | |||||
William McClayton (1944)
Board Member since 2004 | Private equity investor (since October 2009); previously, Managing Director, Diamond Management & Technology Consultants, Inc. (global consulting firm) (2001–2009); Directorship: Board of Managers, YMCA of Metropolitan Chicago; formerly: Senior Partner, Arthur Andersen LLP (accounting) (1966–2001); Trustee, Ravinia Festival | 82 | — | |||||
Rebecca W. Rimel (1951)
Board Member since 1995 | President, Chief Executive Officer and Director, The Pew Charitable Trusts (charitable organization) (1994–present); formerly: Executive Vice President, The Glenmede Trust Company (investment trust and wealth management) (1983–2004); Board Member, Investor Education (charitable organization) (2004–2005); Trustee, Executive Committee, Philadelphia Chamber of Commerce (2001–2007); Director, Viasys Health Care2 (January 2007–June 2007); Trustee, Thomas Jefferson Foundation (charitable organization) (1994–2012) | 82 | Director, Becton Dickinson and Company2 (medical technology company) (2012– present); Director, BioTelemetry Inc.2(health care) (2009– present) | |||||
William N. Searcy, Jr. (1946)
Board Member since 1993 | Private investor since October 2003; formerly: Pension & Savings Trust Officer, Sprint Corporation2(telecommunications) (November 1989–September 2003); Trustee, Sun Capital Advisers Trust (mutual funds) (1998–2012) | 82 | — | |||||
| DWS EAFE® Equity Index Fund | | | 65 |
Table of Contents
| Name, Year of Birth, Position with the Fund and Length of Time Served1 | Business Experience and Directorships During the Past Five Years | Number of Funds in DWS Fund Complex Overseen | Other Directorships Held by Board Member | |||||
Jean Gleason Stromberg (1943)
Board Member since 1997 | Retired. Formerly, Consultant (1997–2001); Director, Financial Markets U.S. Government Accountability Office (1996–1997); Partner, Norton Rose Fulbright, L.L.P. (law firm) (1978–1996); former Directorships: The William and Flora Hewlett Foundation (charitable organization) (2000–2015); Service Source, Inc. (nonprofit), Mutual Fund Directors Forum (2002–2004), American Bar Retirement Association (funding vehicle for retirement plans) (1987–1990 and 1994–1996) | 82 | — | |||||
| Officers4 | ||
Name, Year of Birth, Position with the Fund and Length of Time Served5 | Business Experience and Directorships During the Past Five Years | |
Hepsen Uzcan6(1974)
President and Chief Executive Officer, 2017–present
Assistant Secretary, 2013–present | Managing Director,3 DWS; Secretary, DWS USA Corporation (since March 2018); Assistant Secretary, DWS Distributors, Inc. (since June 25, 2018); Director and Vice President, DWS Service Company (since June 25, 2018); Assistant Secretary, DWS Investment Management Americas, Inc. (since June 25, 2018); and Director and President, DB Investment Managers, Inc. (since June 25, 2018); formerly: Vice President for the Deutsche funds (2016–2017) | |
John Millette8(1962)
Vice President and Secretary, 1999–present | Director,3DWS; Chief Legal Officer, DWS Investment Management Americas, Inc. (2015–present); and Director and Vice President, DWS Trust Company (2016–present); formerly: Secretary, Deutsche Investment Management Americas Inc. (2015–2017) | |
Diane Kenneally8,9(1966)
Treasurer and Chief Financial Officer since 2018 | Director,3 DWS; formerly: Assistant Treasurer for the DWS funds (2007–2018) | |
Caroline Pearson8(1962)
Chief Legal Officer, 2010–present | Managing Director,3DWS; formerly: Secretary, Deutsche AM Distributors, Inc. (2002–2017); and Secretary, Deutsche AM Service Company (2010–2017) | |
Scott D. Hogan8(1970)
Chief Compliance Officer, 2016–present | Director,3DWS | |
Wayne Salit7(1967)
Anti-Money Laundering Compliance Officer, 2014–present | Director,3 Deutsche Bank; and AML Officer, DWS Trust Company; formerly: Managing Director, AML Compliance Officer at BNY Mellon (2011–2014); and Director, AML Compliance Officer at Deutsche Bank (2004–2011) | |
Sheila Cadogan8(1966)
Assistant Treasurer, 2017–present | Director,3DWS; Director and Vice President, DWS Trust Company (since 2018) |
| 66 | | | DWS EAFE® Equity Index Fund |
Table of Contents
Name, Year of Birth, Position with the Fund and Length of Time Served5 | Business Experience and Directorships During the Past Five Years | |
Paul Antosca8(1957)
Assistant Treasurer, 2007–present | Director,3DWS |
| 1 | The length of time served represents the year in which the Board Member joined the board of one or more DWS funds currently overseen by the Board. |
| 2 | A publicly held company with securities registered pursuant to Section 12 of the Securities Exchange Act of 1934. |
| 3 | Executive title, not a board directorship. |
| 4 | As a result of their respective positions held with the Advisor or its affiliates, these individuals are considered “interested persons” of the Advisor within the meaning of the 1940 Act. Interested persons receive no compensation from the Fund. |
| 5 | The length of time served represents the year in which the officer was first elected in such capacity for one or more DWS funds. |
| 6 | Address: 345 Park Avenue, New York, NY 10154. |
| 7 | Address: 60 Wall Street, New York, NY 10005. |
| 8 | Address: One International Place, Boston, MA 02110. |
| 9 | Appointed Treasurer and Chief Financial Officer effective July 2, 2018. |
| * | Paul K. Freeman retired from the Board effective December 31, 2018. |
The Fund’s Statement of Additional Information (“SAI”) includes additional information about the Board Members. The SAI is available, without charge, upon request. If you would like to request a copy of the SAI, you may do so by calling the followingtoll-free number:(800) 728-3337.
| DWS EAFE® Equity Index Fund | | | 67 |
Table of Contents
| For More Information | The automated telephone system allows you to access personalized account information and obtain information on other DWS funds using either your voice or your telephone keypad.
For more information, contact your financial representative. You may also access our automated telephone system or speak with a Shareholder Service representative by calling:
(800) 728-3337 | |
| Web Site | dws.com
View your account transactions and balances, trade shares, monitor your asset allocation, subscribe to fund and account updates bye-mail, and change your address, 24 hours a day.
Obtain prospectuses and applications, news about DWS funds, insight from DWS economists and investment specialists and access to DWS fund account information. | |
Written Correspondence | DWS
PO Box 219151 Kansas City, MO 64121-9151 | |
| Proxy Voting | The Fund’s policies and procedures for voting proxies for portfolio securities and information about how the Fund voted proxies related to its portfolio securities during the most recent 12-month period ended June 30 are available on our Web site —dws.com/en-us/resources/proxy-voting — or on the SEC’s Web site — sec.gov. To obtain a written copy of the Fund’s policies and procedures without charge, upon request, call us toll free at (800) 728-3337. | |
| Portfolio Holdings | Following the Fund’s fiscal first and third quarter-end, a complete portfolio holdings listing is filed with the SEC on Form N-Q or Form N-PORT (available for filings after March 31, 2019). This Fund’s Form N-Q or Form N-PORT will be available on the SEC’s Web site at sec.gov. The Fund’s portfolio holdings are also posted on dws.com from time to time. Please see the Fund’s current prospectus for more information. | |
| Principal Underwriter | If you have questions, comments or complaints, contact:
DWS Distributors, Inc.
222 South Riverside Plaza Chicago, IL 60606-5808 (800)621-1148 |
| 68 | | | DWS EAFE® Equity Index Fund |
Table of Contents
| Investment Management | DWS Investment Management Americas, Inc. (“DIMA” or the “Advisor”), which is part of the DWS Group GmbH & Co. KGaA (“DWS Group”), is the investment advisor for the Fund. DIMA and its predecessors have more than 90 years of experience managing mutual funds and DIMA provides a full range of investment advisory services to both institutional and retail clients. DIMA is an indirect, wholly owned subsidiary of DWS Group.
DWS Group is a global organization that offers a wide range of investing expertise and resources, including hundreds of portfolio managers and analysts and an office network that reaches the world’s major investment centers. This well-resourced global investment platform brings together a wide variety of experience and investment insight across industries, regions, asset classes and investing styles. | |
| Institutional Class | ||
| Nasdaq Symbol | BTAEX | |
| CUSIP Number | 25159R 601 | |
| Fund Number | 558 | |
| DWS EAFE® Equity Index Fund | | | 69 |
Table of Contents
Notes
Table of Contents
DEAFE-2
(R-025781-8 2/19)
| ITEM 2. | CODE OF ETHICS |
As of the end of the period covered by this report, the registrant has adopted a code of ethics, as defined in Item 2 of Form N-CSR that applies to its Principal Executive Officer and Principal Financial Officer.
There have been no amendments to, or waivers from, a provision of the code of ethics during the period covered by this report that would require disclosure under Item 2.
A copy of the code of ethics is filed as an exhibit to this Form N-CSR. | |
| ITEM 3. | AUDIT COMMITTEE FINANCIAL EXPERT |
| The fund’s audit committee is comprised solely of trustees who are "independent" (as such term has been defined by the Securities and Exchange Commission ("SEC") in regulations implementing Section 407 of the Sarbanes-Oxley Act (the "Regulations")). The fund’s Board of Trustees has determined that there are several "audit committee financial experts" (as such term has been defined by the Regulations) serving on the fund’s audit committee including Mr. William McClayton, the chair of the fund’s audit committee. An “audit committee financial expert” is not an “expert” for any purpose, including for purposes of Section 11 of the Securities Act of 1933 and the designation or identification of a person as an “audit committee financial expert” does not impose on such person any duties, obligations or liability that are greater than the duties, obligations and liability imposed on such person as a member of the audit committee and board of directors in the absence of such designation or identification. | |
| ITEM 4. | PRINCIPAL ACCOUNTANT FEES AND SERVICES |
DWS EAFE EQuity Index Fund
form n-csr disclosure re: AUDIT FEES
The following table shows the amount of fees that PricewaterhouseCoopers, LLP (“PWC”), the Fund’s independent registered public accounting firm, billed to the Fund during the Fund’s last two fiscal years. The Audit Committee approved in advance all audit services and non-audit services that PWC provided to the Fund.
Services that the Fund’s Independent Registered Public Accounting Firm Billed to the Fund
| Fiscal Year Ended December 31, | Audit Fees Billed to Fund | Audit-Related Fees Billed to Fund | Tax Fees Billed to Fund | All Other Fees Billed to Fund |
| 2018 | $75,422 | $0 | $0 | $0 |
| 2017 | $74,307 | $0 | $0 | $0 |
Services that the Fund’s Independent Registered Public Accounting Firm Billed to the Adviser and Affiliated Fund Service Providers
The following table shows the amount of fees billed by PWC to DWS Investment Management Americas Inc. (“DIMA” or the “Adviser”), and any entity controlling, controlled by or under common control with DIMA (“Control Affiliate”) that provides ongoing services to the Fund (“Affiliated Fund Service Provider”), for engagements directly related to the Fund’s operations and financial reporting, during the Fund’s last two fiscal years.
| Fiscal Year Ended December 31, | Audit-Related Fees Billed to Adviser and Affiliated Fund Service Providers | Tax Fees Billed to Adviser and Affiliated Fund Service Providers | All Other Fees Billed to Adviser and Affiliated Fund Service Providers |
| 2018 | $0 | $0 | $0 |
| 2017 | $0 | $0 | $0 |
Non-Audit Services
The following table shows the amount of fees that PWC billed during the Fund’s last two fiscal years for non-audit services. The Audit Committee pre-approved all non-audit services that PWC provided to the Adviser and any Affiliated Fund Service Provider that related directly to the Fund’s operations and financial reporting. The Audit Committee requested and received information from PWC about any non-audit services that PWC rendered during the Fund’s last fiscal year to the Adviser and any Affiliated Fund Service Provider. The Committee considered this information in evaluating PWC’s independence.
| Fiscal Year Ended December 31, | Total (A) | Total Non-Audit Fees billed to Adviser and Affiliated Fund Service Providers (engagements related directly to the operations and financial reporting of the Fund) (B) | Total Non-Audit Fees billed to Adviser and Affiliated Fund Service Providers (all other engagements) (C) | Total of (A), (B) and (C) |
| 2018 | $0 | $0 | $0 | $0 |
| 2017 | $0 | $0 | $0 | $0 |
Audit Committee Pre-Approval Policies and Procedures. Generally, each Fund’s Audit Committee must pre approve (i) all services to be performed for a Fund by a Fund’s Independent Registered Public Accounting Firm and (ii) all non-audit services to be performed by a Fund’s Independent Registered Public Accounting Firm for the DIMA Entities with respect to operations and financial reporting of the Fund, except that the Chairperson or Vice Chairperson of each Fund’s Audit Committee may grant the pre-approval for non-audit services described in items (i) and (ii) above for non-prohibited services for engagements of less than $100,000. All such delegated pre approvals shall be presented to each Fund’s Audit Committee no later than the next Audit Committee meeting.
There were no amounts that were approved by the Audit Committee pursuant to the de minimis exception under Rule 2-01 of Regulation S-X.
According to the registrant’s principal Independent Registered Public Accounting Firm, substantially all of the principal Independent Registered Public Accounting Firm's hours spent on auditing the registrant's financial statements were attributed to work performed by full-time permanent employees of the principal Independent Registered Public Accounting Firm.
***
In connection with the audit of the 2017 and 2018 financial statements, the Fund entered into an engagement letter with PwC. The terms of the engagement letter required by PwC, and agreed to by the Fund’s Audit Committee, include a provision mandating the use of mediation and arbitration to resolve any controversy or claim between the parties arising out of or relating to the engagement letter or the services provided there-under.
***
Pursuant to PCAOB Rule 3526, PwC is required to describe in writing to the Fund’s Audit Committee, on at least an annual basis, all relationships between PwC, or any of its affiliates, and the DWS Funds, including the Fund, or persons in financial reporting oversight roles at the DWS Funds that, as of the date of the communication, may reasonably be thought to bear on PwC’s independence. Pursuant to PCAOB Rule 3526, PwC has reported the matters set forth below that may reasonably be thought to bear on PwC’s independence. In its PCAOB Rule 3526 communications to the Audit Committee, PwC affirmed that they are independent accountants with respect to the DWS Funds, within the meaning of PCAOB Rule 3520. PwC also informed the Audit Committee that they concluded that a reasonable investor with knowledge of all relevant facts and circumstances would conclude that PwC is capable of exercising objective and impartial judgment on all issues encompassed within PwC’s audit of the financial statements of the Fund. Finally, PwC confirmed to the Audit Committee that they can continue to serve as the independent registered public accounting firm for the Fund.
| · | PwC advised the Fund’s Audit Committee that covered persons within PwC that provided non-audit services to entities within the DWS Funds “investment company complex” (as defined in Regulation S-X) (the “DWS Funds Complex”) maintained financial relationships with investment companies within the DWS Funds Complex. PwC informed the Audit Committee that these financial relationships were inconsistent with Rule 2-01(c)(1) of Regulation S-X. PwC reported that the breaches have been resolved and that, among other things, the breaches (i) did not involve professionals who were part of the audit engagement team for the Fund or in a position to influence the audit engagement team, (ii) involved professionals whose non-audit services were not and will not be utilized or relied upon by the audit engagement team in the audit of the financial statements of the Fund and (iii) involved professionals that did not provide any consultation to the audit engagement team of the Fund. |
| · | PwC advised the Fund’s Audit Committee of certain lending relationships of PwC with owners of greater than 10% of the shares of certain investment companies within the DWS Funds Complex that PwC had identified as inconsistent with Rule 2-01(c)(l)(ii)(A) of Regulation S-X (referred to as the “Loan Rule”). The Loan Rule specifically provides that an accounting firm would not be independent if it receives a loan from a lender that is a record or beneficial owner of more than ten percent of an audit client’s equity securities. For purposes of the Loan Rule, an audit client includes the Fund as well as all other investment companies in the DWS Funds Complex. PwC’s lending relationships affect PwC’s independence under the Loan Rule with respect to all investment companies in the DWS Funds Complex. |
PwC stated that, in each lending relationship, (i) PwC believes that it is unlikely the lenders would have any interest in the outcome of the audit of the Fund and therefore would not seek to influence the outcome of the audit, (ii) no third party made an attempt to influence the outcome of the audit of the Fund and even if an attempt was made, PwC professionals are required to disclose any relationships that may raise issues about objectivity, confidentiality, independence, conflicts of interest or favoritism, and (iii) the lenders typically lack influence over the investment adviser, who controls the management of the Fund. In addition, on June 20, 2016, the SEC Staff issued a “no-action” letter to another mutual fund complex, Fidelity Management & Research Company et al., SEC Staff No-Action Letter (June 20, 2016) (the “Fidelity Letter”), related to similar Loan Rule issues as those described above. In the Fidelity Letter, the SEC Staff confirmed that it would not recommend enforcement action against an investment company that relied on the audit services performed by an audit firm that was not in compliance with the Loan Rule in certain specified circumstances. With respect to each lending relationship identified by PwC, the circumstances described in the Fidelity Letter appear to be substantially similar to the circumstances that affected PwC’s independence under the Loan Rule with respect to the Fund. PwC represented that they have complied with PCAOB Rule 3526(b)(1) and (2), which are conditions to the Fund relying on the no action letter, and affirmed that they are independent accountants within the meaning of PCAOB Rule 3520.
| ITEM 5. | AUDIT COMMITTEE OF LISTED REGISTRANTS | |
| Not applicable | ||
| ITEM 6. | SCHEDULE OF INVESTMENTS | |
| Not applicable | ||
| ITEM 7. | DISCLOSURE OF PROXY VOTING POLICIES AND PROCEDURES FOR CLOSED-END MANAGEMENT INVESTMENT COMPANIES | |
| Not applicable | ||
| ITEM 8. | PORTFOLIO MANAGERS OF CLOSED-END MANAGEMENT INVESTMENT COMPANIES | |
| Not applicable | ||
| ITEM 9. | PURCHASES OF EQUITY SECURITIES BY CLOSED-END MANAGEMENT INVESTMENT COMPANY AND AFFILIATED PURCHASERS | |
| Not applicable | ||
| ITEM 10. | SUBMISSION OF MATTERS TO A VOTE OF SECURITY HOLDERS | |
| There were no material changes to the procedures by which shareholders may recommend nominees to the Fund’s Board. The primary function of the Nominating and Governance Committee is to identify and recommend individuals for membership on the Board and oversee the administration of the Board Governance Guidelines. Shareholders may recommend candidates for Board positions by forwarding their correspondence by U.S. mail or courier service to Keith R. Fox, DWS Funds Board Chair, c/o Thomas R. Hiller, Ropes & Gray LLP, Prudential Tower, 800 Boylston Street, Boston, MA 02199-3600. | ||
| ITEM 11. | CONTROLS AND PROCEDURES | |
| (a) | The Chief Executive and Financial Officers concluded that the Registrant’s Disclosure Controls and Procedures are effective based on the evaluation of the Disclosure Controls and Procedures as of a date within 90 days of the filing date of this report. | |
| (b) | There have been no changes in the registrant’s internal control over financial reporting that occurred during the second fiscal quarter of the period covered by this report that has materially affected, or is reasonably likely to materially affect, the registrant’s internal controls over financial reporting. | |
| ITEM 12. | Disclosure of Securities Lending Activities for Closed-End Management Investment Companies | |
| Not applicable | ||
| ITEM 13. | EXHIBITS | |
| (a)(1) | Code of Ethics pursuant to Item 2 of Form N-CSR is filed and attached hereto as EX-99.CODE ETH. | |
| (a)(2) | Certification pursuant to Rule 30a-2(a) under the Investment Company Act of 1940 (17 CFR 270.30a-2(a)) is filed and attached hereto as Exhibit 99.CERT. | |
| (b) | Certification pursuant to Rule 30a-2(b) under the Investment Company Act of 1940 (17 CFR 270.30a-2(b)) is furnished and attached hereto as Exhibit 99.906CERT. | |
SIGNATURES
Pursuant to the requirements of the Securities Exchange Act of 1934 and the Investment Company Act of 1940, the registrant has duly caused this report to be signed on its behalf by the undersigned, thereunto duly authorized.
| Registrant: | DWS EAFE® Equity Index Fund, a series of Deutsche DWS Institutional Funds |
| By: | /s/Hepsen Uzcan Hepsen Uzcan President |
| Date: | 3/1/2019 |
Pursuant to the requirements of the Securities Exchange Act of 1934 and the Investment Company Act of 1940, this report has been signed below by the following persons on behalf of the registrant and in the capacities and on the dates indicated.
| By: | /s/Hepsen Uzcan Hepsen Uzcan President |
| Date: | 3/1/2019 |
| By: | /s/Diane Kenneally Diane Kenneally Chief Financial Officer and Treasurer |
| Date: | 3/1/2019 |