 Click here for a printer-friendly version of this document
![[economy002.gif]](https://capedge.com/proxy/18-KA/0001137171-09-000227/economy002.gif)
The New Brunswick Economy 2009
Published by:
Department of Finance
Province of New Brunswick
P.O. Box 6000
Fredericton, New Brunswick
E3B 5H1
Canada
Internet: www.gnb.ca/0024/index-e.asp
March 17, 2009
Cover:
Communications New Brunswick (CNB 5850)
Translation:
Translation Bureau, Supply and Services
Printing and Binding:
Printing Services, Supply and Services
ISBN 978-1-55396-308-0
ISSN 0548-4073
Printed in New Brunswick
![[economy004.gif]](https://capedge.com/proxy/18-KA/0001137171-09-000227/economy004.gif)
Think Recycling!
Table of Contents
Page
Overview
4
2008 Statistical Summary
5
International Economy
6
Global Economic Indicators
7
International Economy Slows
8
Interest Rates Drop
8
Canadian Economy
9
Canada Economic Indicators
9
Canadian GDP Growth Moderates in 2008
10
Canada’s Labour Market Steady
10
New Brunswick Economy – 2008 Review
11
New Brunswick Economic Indicators
12
New Brunswick GDP Growth Modest in 2008
13
Exports Surpass $12 Billion
13
Inflation Slows
14
Interprovincial Migration Improves
14
Population Continues to Age
15
Employment Attains New High
15
Service Sector Dominates Growth
16
Unemployment Rate Rises
16
Moncton-Richibucto Region Shines
17
Wages and Salaries Keep Climbing
17
Earnings Show Steady Increase
18
Retail Trade Remains Strong
18
Manufacturing Sales Robust
19
Wood Products Still Struggling
19
Housing Market Stable
20
Capital Investment Growth Continues
20
Mining Production Slides
21
Farm Cash Receipts Rebound
21
Transportation Results Mixed
22
Technology and Communication Face Challenges
22
New Brunswick Economy – 2009 Outlook
23
New Brunswick GDP Growth to Moderate in 2009
24
Employment to Decline
24
Major Investment Projects
25
Maps of New Brunswick
27
NOTE: The analysis contained in the document is based on data available as of March 2, 2009; historically comparable data series are used. Numbers may not add due to rounding.
Data will be updated on the Department of Finance website at: http://www.gnb.ca/0024/index-e.asp
3 |
The New Brunswick Economy 2009 |
Overview
·
Due in large part to a US-led collapse in the financial sector, the world economy was caught in the worst financial crisis since the Great Depression. Rising unemployment rates pushed consumer confidence to record lows and weakening global economic growth placed downward pressure on commodity prices, which plummeted in the second half of 2008. Central banks worldwide reduced interest rates to historic lows in response to the economic crisis.
·
Economic activity in Canada slowed significantly in 2008, with real gross domestic product (GDP) growth weakening to 0.5%. With the ongoing financial crisis, governments committed to various forms of fiscal and monetary engagements in order to generate economic stimulus. In Budget 2009, the federal government dedicated $40 billion worth of support over the next two years for a total of 2.5% of GDP.
·
The New Brunswick economy strengthened in the first three quarters of the year before slowing as the year came to a close, leading to an estimated increase of 1.0% in real GDP for 2008. Much of the growth came from the construction sector, which reported double-digit gains in non-residential construction. With labour force growth outpacing employment growth, the unemployment rate jumped 1.1 percentage points to 8.6%.
·
Increases in New Brunswick exports, retail trade, housing starts, average weekly earnings and manufacturing sales surpassed national rates, while growth in wages and salaries was the same as the national increase.
·
Capital investment in the province rose to a record $6.2 billion, powered by public sector investment. The provincial population grew by 0.3% and inflation was below the Canadian average. However, the crumbling of commodity prices significantly impacted the mining industry in New Brunswick, resulting in the closure of two mines in 2008.
·
For 2009, economic growth in North America is expected to contract. While not quite as pronounced as the rest of the country, reduced economic activity will be evident in New Brunswick, with real GDP projected to decline 0.3% as major projects come to an end and weak global demand acts as a drag on domestic exports.
4 |
The New Brunswick Economy 2009 |
2008 Statistical Summary
| | |
2008 Statistical Summary Growth Rates¹ |
| |
| N.B. | Canada |
| (2007 to 2008) |
|
Output | | |
Gross Domestic Product (GDP) | 3.8 | 4.4 |
GDP (real) | 1.0 | 0.5 |
Population and Labour Force | | |
Total Population (July 1) | 0.3 | 1.2 |
Labour Force | 2.1 | 1.7 |
Employment | 0.9 | 1.5 |
Unemployment Rate (%) | 8.6 | 6.1 |
Participation Rate (%) | 64.8 | 67.8 |
Indicators | | |
Foreign Exports | 14.2 | 8.3 |
Retail Trade | 4.9 | 3.2 |
Farm Cash Receipts | 5.4 | 12.9 |
Housing Starts | 0.8 | -7.6 |
Manufacturing Sales | 14.4 | -0.5 |
Sawn Lumber Production | -28.1 | -20.5 |
Value of Mineral Production | -11.2 | 11.7 |
Consumer Price Index | 1.7 | 2.3 |
| | |
¹ Per cent change unless otherwise indicated. |
5 |
The New Brunswick Economy 2009 |
International Economy
·
A US-led meltdown in the financial sector, triggered by the subprime mortgage crisis, pushed many of the world’s largest economies (including the US, the UK, Germany and Japan) into a recession in 2008. The collapse of financial institutions around the globe and the resulting loss of confidence were unprecedented, drawing comparisons to the Great Depression.
·
The warning signs of a crisis in the financial market began early in 2008 when the US Federal Reserve brokered the sale of the investment bank Bear Stearns to JPMorgan Chase. Mounting losses brought about by mortgage delinquencies and foreclosures led to further failures in September and October. These conditions were also evident elsewhere in the world where significant government interventions were required to keep their financial institutions afloat.
·
The global job boom came to an end in 2008. Unemployment rates in many major industrialized countries began climbing during the year as falling demand forced employers to lay off workers. Consumers cut spending as confidence declined.
·
Commodity prices exhibited a great deal of volatility in 2008. Oil prices hit record levels during the summer, topping $147 (US) per barrel, but retreated to below $40 (US) per barrel during the last few months of the year as the economic downturn deepened.
·
With the collapse of housing activity, real residential investment among OECD countries posted a double-digit decline in 2008 due to increased foreclosures and falling house prices.
·
Many developing economies have also been impacted by the downturn in global economic activity. Although still showing growth, the impact of rapidly falling exports has pushed down real GDP growth in newly industrialized economies such as China, India and Brazil.
6 |
The New Brunswick Economy 2009 |
International Economy (continued)
| | | | |
Global Economic Indicators Growth Rates¹, 2007 to 2009 |
|
GDP (real) |
Consumer Price Index |
Unemployment Rate (%) | Private Consumption Expenditure (real) |
United States | | | | |
2007 | 2.0 | 2.9 | 4.6 | 2.8 |
2008f | 1.4 | 4.3 | 5.7 | 0.4 |
2009f | -0.9 | 1.6 | 7.3 | -1.2 |
Japan | | | | |
2007 | 2.1 | 0.1 | 3.9 | 1.5 |
2008f | 0.5 | 1.4 | 4.1 | 0.7 |
2009f | -0.1 | 0.3 | 4.4 | 0.6 |
Euro zone | | | | |
2007 | 2.6 | 2.1 | 7.4 | 1.6 |
2008f | 1.0 | 3.4 | 7.4 | 0.4 |
2009f | -0.6 | 1.4 | 8.6 | 0.2 |
United Kingdom | | | | |
2007 | 3.0 | 2.3 | 5.4 | 3.0 |
2008f | 0.8 | 3.7 | 5.5 | 1.8 |
2009f | -1.1 | 2.7 | 6.8 | -1.0 |
| | | | |
¹ Per cent change unless otherwise indicated. |
f = forecast |
Source: OECD Economic Outlook |
7 |
The New Brunswick Economy 2009 |
International Economy Slows
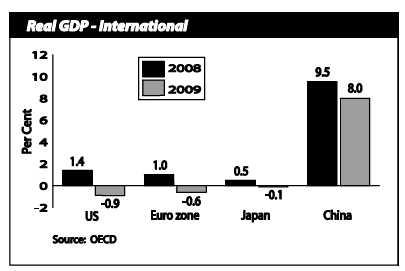 The global economy slowed notably in 2008 as the financial crisis took hold and consumer demand declined. Economic activity began to contract late in the year, erasing nearly all the growth seen earlier.
This slowdown will persist for much of 2009, with a modest recovery expected to start late in the year.
Interest Rates Drop
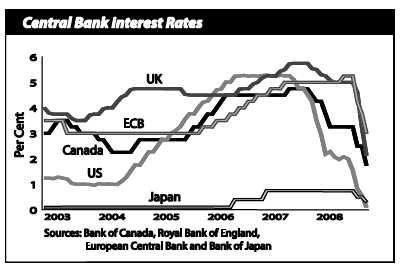 Central banks around the world reduced interest rates to historic lows throughout the year in response to deteriorating financial and economic conditions.
8 |
The New Brunswick Economy 2009 |
Canadian Economy
·
The deterioration in financial markets, faltering commodity prices and a deepening of the US recession impacted the Canadian economy, with real GDP growth slowing to 0.5% from 2.7% posted in 2007.
·
With growth in the service sector more than double growth in the goods-producing sector, total employment increased 1.5% (or 259,400 jobs) in 2008. The unemployment rate inched up 0.1 percentage point to 6.1% from 6.0% in 2007.
·
Canada’s rate of inflation rose 2.3% in 2008, slightly higher than the 2.2% increase the previous year. Tight credit conditions and job losses dropped consumer confidence to levels not seen since the 1991 recession. To stimulate consumer spending, the Bank of Canada lowered its overnight rate by 75 basis points in October and another 75 basis points in December. The Canadian dollar eventually settled in the 80 to 85 cent (US) range from a high of 1.02 dollars (US).
·
While slumping commodity prices took their toll on certain sectors, overall exports were up 8.3% in 2008, supported largely by exports of energy products. Agriculture and fishing products also fuelled the rise.
·
After two years of gains, housing starts declined 7.6% in 2008. Residential building permits were down 10.2%, while non-residential building permits increased 2.4%.
·
According to private sector forecasters, lower employment levels, decreased consumer spending and weakened trade are expected to contribute to a decline in real economic growth for 2009. This negative growth, coupled with falling commodity prices, is expected to keep inflation low, while the unemployment rate is anticipated to increase significantly.
| | | |
Canada Economic Indicators Growth Rates¹, 2007 to 2009 |
| 2007 | 2008 | 2009² |
Gross Domestic Product (GDP) | 5.9 | 4.4 | -2.4 |
GDP (real) | 2.7 | 0.5 | -1.1 |
Employment | 2.3 | 1.5 | -1.2 |
Unemployment Rate (%) | 6.0 | 6.1 | 7.7 |
Consumer Price Index | 2.2 | 2.3 | 0.4 |
| | | |
¹ Per cent change unless otherwise indicated. |
² Average of private sector forecasts. |
9 |
The New Brunswick Economy 2009 |
Canadian GDP Growth Moderates in 2008
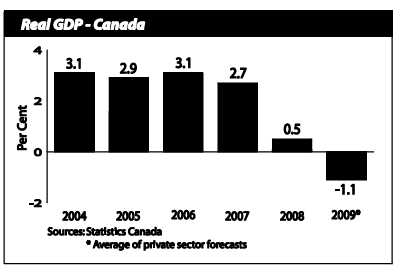 Canadian economic growth advanced by an estimated 0.5% in 2008 supported by healthy performances in the West. Growth in Alberta, Saskatchewan and Manitoba more than offset the decline in Ontario, where the manufacturing sector was battered.
Real GDP growth is expected to decline in 2009 as the global recession is felt across the country.
Canada’s Labour Market Steady
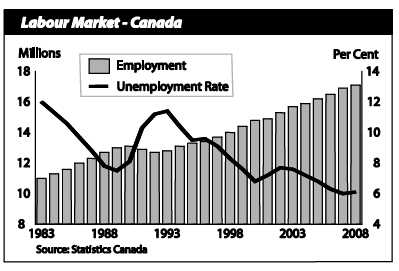 Canada realized employment gains of 259,400 in 2008, as employment rose by 1.5% for the year.
The national unemployment rate edged up slightly to 6.1% following a three-decade low of 6.0% the previous year.
10 |
The New Brunswick Economy 2009 |
New Brunswick Economy – 2008 Review
·
A strong domestic economy throughout the first three quarters of 2008 helped New Brunswick weather the global economic downturn. However, the health of the provincial economy looked very different as the year came to a close.
·
The Department of Finance estimates that real GDP growth in New Brunswick slowed to 1.0% in 2008 from 1.7% in 2007.
·
Much of the stimulus in the economy was created by the construction sector. Double-digit growth in non-residential construction was led by major projects such as the Canaport LNG terminal and the Brunswick Pipeline. This growth, coupled with solid increases in residential construction, contributed significantly to overall economic well-being. However, the pace of activity began to slow late in the year as the economic crisis worsened and major projects began to wind down.
·
The increase in the consumer price index (CPI) for New Brunswick slowed to 1.7% in 2008, remaining below the national rate of inflation for the third year in a row. After years of losses or no growth, the provincial population jumped 0.3% in 2008, the highest rate of demographic growth since 1992.
·
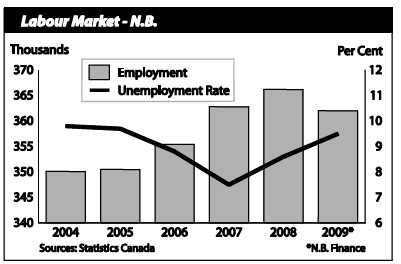
Employment in New Brunswick stood at 366,200 (+0.9%) in 2008, an all-time high. A stronger rise in the labour force (+2.1%), pushed the unemployment rate up 1.1 percentage points to 8.6%. The participation rate peaked at 64.8%.
·
Healthy growth in wages and salaries (up 5.0% in 2008) translated into another banner year overall for New Brunswick retailers, as sales rose 4.9% for the year. The number of new motor vehicle sales increased 6.0%, bucking the national decrease of 0.9%.
·
Zinc prices retreated from the record high set in 2007, falling to levels not seen since 2004. Consequently, Blue Note Mining was forced to cease production at its Caribou and Restigouche mines.
·
Housing activity in the province turned in another solid performance with growth in both new home construction and resale house prices. Difficulties persisted in the forestry sector, however, as evidenced by weakness in the US housing market. Several mills in the province were forced to make production cuts and reduce their labour force.
·
New Brunswick became a producer of wind energy in 2008 with the launch of the
$170-million Kent Hills wind farm. The development of three other wind energy projects in Aulac, Lamèque and Caribou Mountain continues, bringing with them a total investment in excess of $400 million.
11 |
The New Brunswick Economy 2009 |
New Brunswick Economy – 2008 Review (continued)
| | | | | |
New Brunswick Economic Indicators Growth Rates¹, 2005 to 2009 |
| 2005 | 2006 | 2007 | 2008 | 2009² |
Economic Accounts | | | | | |
Gross Domestic Product (GDP) | 4.5 | 4.4 | 4.3 | 3.8 | -1.7 |
Personal Expenditures | 4.3 | 4.9 | 5.7 | 6.6 | 1.3 |
Government Current Expenditures | 8.4 | 6.6 | 5.2 | 5.0 | 4.9 |
Gross Fixed Capital Formation | 6.9 | 19.6 | 8.0 | 8.6 | -5.1 |
GDP (real) | 1.6 | 2.4 | 1.7 | 1.0 | -0.3 |
Income | | | | | |
Personal Income | 3.4 | 3.7 | 4.9 | 3.4 | -0.4 |
Labour Income | 4.1 | 4.0 | 4.9 | 5.0 | -0.1 |
Corporate Profits Before Taxes | 12.7 | 10.7 | 2.8 | -0.2 | -12.9 |
Population and Labour Market | | | | | |
Total Population (July 1) | -0.2 | -0.3 | 0.0 | 0.3 | 0.2 |
Labour Force | 0.1 | 0.4 | 0.7 | 2.1 | -0.2 |
Employment | 0.1 | 1.4 | 2.1 | 0.9 | -1.2 |
Unemployment Rate (%) | 9.7 | 8.8 | 7.5 | 8.6 | 9.5 |
Participation Rate (%) | 63.6 | 63.7 | 64.0 | 64.8 | 64.5 |
Other | | | | | |
Consumer Price Index | 2.4 | 1.7 | 1.9 | 1.7 | 0.7 |
Housing Starts | 0.3 | 3.2 | 3.8 | 0.8 | -18.1 |
| | | | | |
¹ Per cent change unless otherwise indicated. |
² Projections – NB Finance |
12 |
The New Brunswick Economy 2009 |
New Brunswick GDP Growth Modest in 2008
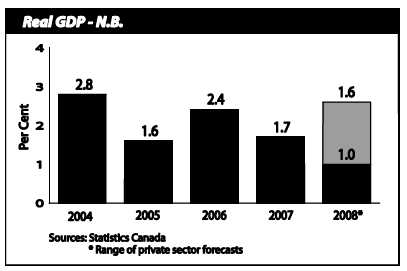 The performance of New Brunswick’s economy is expected to wane a bit from the previous year, with the Department of Finance estimating real GDP growth of 1.0% for 2008, compared to 1.7% in 2007.
Private sector forecasters anticipate growth in the 1.0% to 1.6% range, with an average of 1.1%.
Exports Surpass $12 Billion
 Foreign exports of goods from New Brunswick totalled $12.8 billion in 2008, an increase of 14.2% over 2007. Energy products led the gain with industrial goods and agricultural and fishing products also contributing to the rise.
The majority of the province’s merchandise exports are destined for US markets (82.7%), followed by the Netherlands (4.1%), Belgium (1.9%) and Gibraltar (1.8%).
13 |
The New Brunswick Economy 2009 |
Inflation Slows
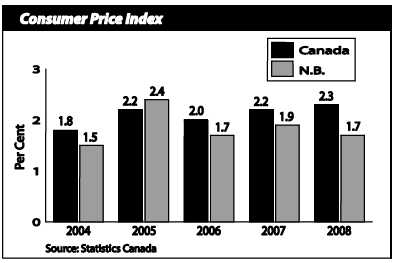 For the third consecutive year, the provincial rate of inflation was below the Canadian rate. Consumer prices in New Brunswick increased 1.7% in 2008 compared to the national rate of 2.3%.
Higher prices were evident in six of the eight major CPI groups in New Brunswick, with food and shelter reporting growth above the provincial increase.
Interprovincial Migration Improves
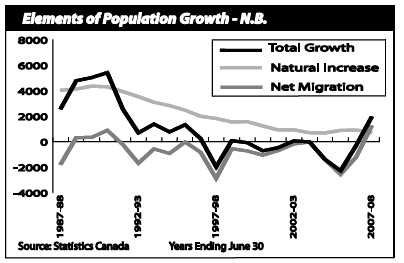 As of July 1, 2008, New Brunswick’s population was estimated at 747,302, a 0.3% increase from July 1, 2007.
Net interprovincial migration improved significantly, with a net outflow of 325 in 2007-2008 compared to a net outflow of 2,632 the previous year.
Fewer births and more deaths caused the natural increase to fall.
14 |
The New Brunswick Economy 2009 |
Population Continues to Age
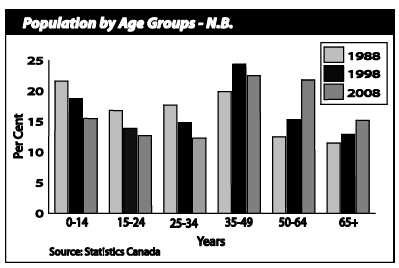 The median age in New Brunswick reached 42.0 years in 2008, 2.6 years older than the national average of 39.4 years.
The proportion of children and young adults continued to decline, while the pre-senior and seniors’ groups increased their shares.
Employment Attains New High
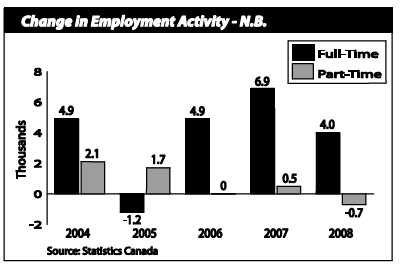 Provincial employment reached a record high of 366,200 in 2008, up 0.9% from 2007. Nationally, the number of employed rose 1.5%.
Employment gains were all in full-time work, which increased by 4,000 (+1.3%) and accounted for 84% of all jobs in the province. Part-time employment fell by 700 (-1.2%).
15 |
The New Brunswick Economy 2009 |
Service Sector Dominates Growth
 Job growth in 2008 was concentrated in the service sector, spearheaded by gains in public administration (+4,100) and health care and social assistance (+2,900).
The goods-producing sector, which was a pillar of employment strength in 2007, suffered job losses in 2008, most notably in manufacturing (-2,700).
Unemployment Rate Rises
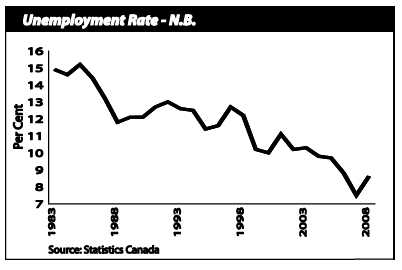 Despite the increase in employment, New Brunswick’s unemployment rate deteriorated from the previous year, rising to 8.6% in 2008, the result of stronger labour force growth.
The unemployment rate for Canada edged up to 6.1% in 2008.
16 |
The New Brunswick Economy 2009 |
Moncton-Richibucto Region Shines
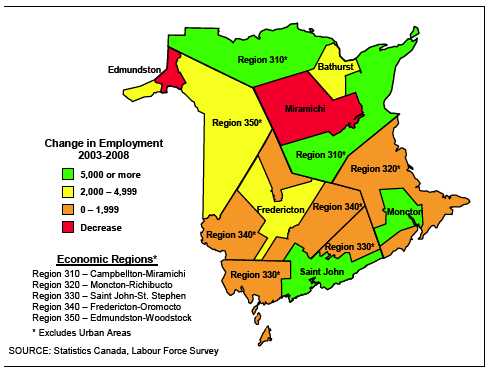
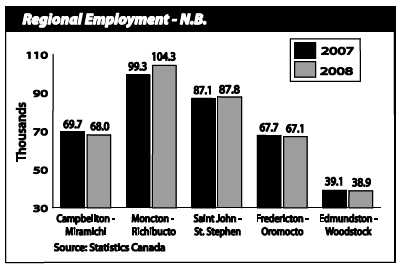 Employment in Moncton-Richibucto rose by 5,000 to surpass 100,000. Saint John-St. Stephen also registered employment gains (+700), while the three remaining regions reported declines.
Campbellton-Miramichi suffered the heaviest job loss (-1,700) and maintained the highest unemployment rate (14.9%).
Wages and Salaries Keep Climbing
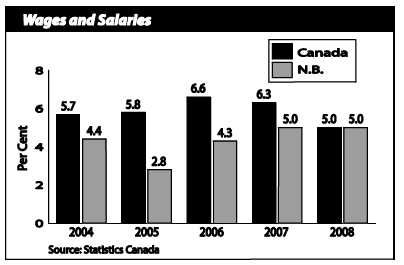 Wages and salaries in New Brunswick increased 5.0% for the second year in a row in 2008 and matched the national increase.
Gains in construction, trade, and health care and social assistance had the most positive impact. Manufacturing was the only industry to exhibit a decrease (-0.3%).
17 |
The New Brunswick Economy 2009 |
Earnings Show Steady Increase
 Average weekly earnings in New Brunswick rose 3.3% in 2008, marking the tenth consecutive year the province has been above the national increase (+2.8% in 2008).
At $730.96, the province’s earnings represented 92.2% of the Canadian average of $792.46.
Provincial earnings ranged from a high of $1,042.29 in public administration to a low of $292.82 in accommodation and food services.
Retail Trade Remains Strong
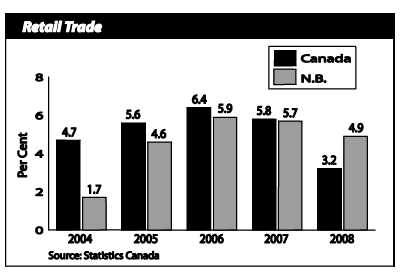 In 2008, growth in New Brunswick’s retail trade remained above 4.5% for the fourth year in a row. This industry accounts for almost 7% of provincial GDP.
Gasoline stations and used and recreational motor vehicle and parts dealers displayed double-digit growth, while sales for new car dealers declined 1.4%.
Nationally, retail sales increased 3.2%.
18 |
The New Brunswick Economy 2009 |
Manufacturing Sales Robust
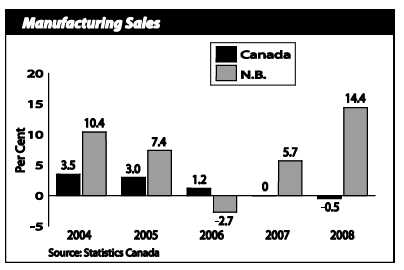 Manufacturing sales in New Brunswick reached a record high of $17.9 billion in 2008, due mainly to high petroleum product prices during most of the year. The sector represents almost 13% of provincial GDP.
Sales of non-durable goods (+17.2%) drove the overall rise in sales as durable goods decreased 0.6%.
Canada’s outcome was significantly below the province’s increase of 14.4%.
Wood Products Still Struggling
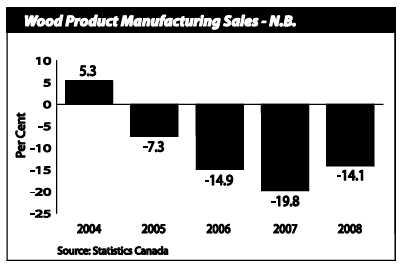 Weak demand negatively influenced New Brunswick’s wood product manufacturers.
Sales, which have totalled more than $1 billion annually for a decade, dropped 14.1% in 2008 to $859.8 million.
Wood products industries represent less than 2% of New Brunswick’s GDP.
19 |
The New Brunswick Economy 2009 |
Housing Market Stable
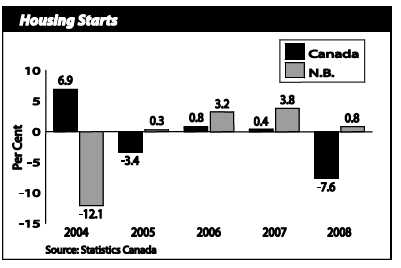 Driven by an increase in housing starts in urban centres, provincial starts bucked the national trend and edged up 0.8% in 2008 to 4,274 units.
Canada’s housing market struggled, with housing starts tumbling 7.6% for the year.
Capital Investment Growth Continues
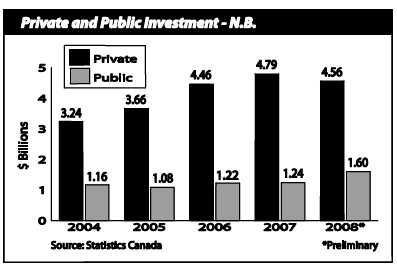 Capital investment in New Brunswick increased 2.2% to a record $6.2 billion in 2008. Investment in the public sector continued to rise while it declined in the private sector.
Higher investment in utilities, public administration, housing and retail trade had the strongest impact on the provincial total.
Nationally, capital investment climbed 5.2%.
20 |
The New Brunswick Economy 2009 |
Mining Production Slides
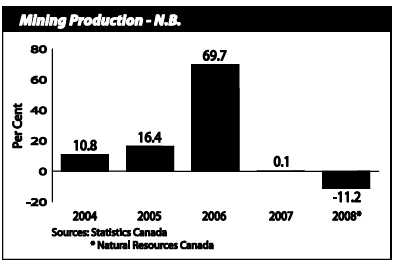 New Brunswick is a major Canadian producer of lead, zinc, silver, potash, peat, antimony, bismuth and cadmium.
In 2008, the overall value of mineral production was estimated to total $1.4 billion, an 11.2% decrease from 2007.
The mining and oil and gas extraction industry represents about 1% of provincial GDP.
Farm Cash Receipts Rebound
 With a 5.4% increase in 2008, New Brunswick’s farm cash receipts rebounded from a decline the previous year. The gain was due to crop receipts jumping 12.1%, as livestock receipts increased 1.4%.
Nationally, farm cash receipts rose 12.9%.
Agriculture represents under 2% of New Brunswick’s GDP.
21 |
The New Brunswick Economy 2009 |
Transportation Results Mixed
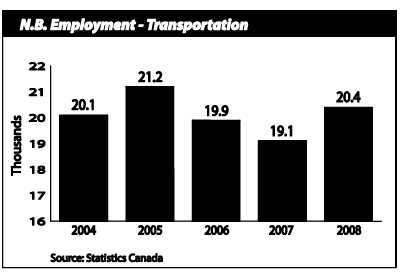 Transportation and warehousing employment increased 6.8% in 2008 even though the trucking component declined. This sector represents 5% of provincial GDP.
Airports serving the three largest centres continued to display improvements in passenger and/or aircraft movements.
The port of Saint John saw a decrease in cargo tonnage but an increase in cruise passengers. Vessel tonnage at the Belledune port was notably higher.
Technology and Communication Face Challenges
 Employment in technology and communication in 2008 returned to a similar level reported in recent years; scientific and technical services exhibited growth while communication showed a decrease.
This sector accounts for about 9% of provincial GDP.
The customer contact sector has roughly 110 sites that employ about 21,000 people throughout the province.
22 |
The New Brunswick Economy 2009 |
New Brunswick Economy – 2009 Outlook
·
With the winding down of some major projects in the energy sector, and with the effects of a global slowdown taking hold, the New Brunswick economy will contract in 2009 for the first time since 1991.
·
The Department of Finance is forecasting real GDP to decline 0.3% for 2009. Private sector forecasters are anticipating growth for the province in the range of -0.6% to 1.2%, averaging negative growth of 0.1%.
·
The investment climate in the province will be weaker than that seen in recent years, as funding for capital projects will be more difficult to acquire. The wrapping up of the LNG terminal, the 145-kilometre Brunswick Pipeline and the Point Lepreau refurbishment project will limit non-residential construction in 2009. Reduced business activity, however, will be partially offset by increased spending on infrastructure projects by all levels of government.
·
Job losses, that began as 2008 came to a close, will persist throughout much of 2009. Weaker employment prospects will translate into little, if any, growth in personal income. As such, New Brunswickers will watch their spending closely.
·
Continued weakness in global commodity prices is expected to curb activity in New Brunswick’s mining, forestry and manufacturing sectors in 2009. Although oil prices are projected to recover somewhat, they will remain well below 2008 levels. Zinc and lumber prices will show minimal growth until global demand from the current slowdown picks up.
·
After three consecutive years of housing starts exceeding 4,000 units, New Brunswick’s housing market will deteriorate in 2009 as dwindling consumer confidence restricts housing demand. New home construction is expected to fall to a nine-year low, as the limited availability of credit slows the pace of apartment construction.
23 |
The New Brunswick Economy 2009 |
New Brunswick GDP Growth to Moderate in 2009
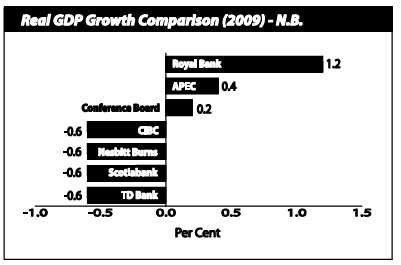 As major construction projects wrap up without significant investment to follow in the near-term, New Brunswick’s economy is expected to decline slightly in 2009, with the Department of Finance forecasting real GDP to decrease 0.3%.
Private sector forecasters peg growth to fall in the - -0.6% to 1.2% range.
Employment to Decline
 The provincial job market will retreat by an estimated 4,000 jobs from the record high set in 2008, as employers struggle to address the challenges of falling demand and weak consumer and business confidence.
As a result, the unemployment rate is expected to increase to 9.5%.
24 |
The New Brunswick Economy 2009 |
Major Investment Projects
Projects valued at $20 million or more that have been announced, are underway or have been completed.
Disclaimer: Project details are obtained from public sources. While every effort has been made to ensure a comprehensive and accurate listing, information may not be available at the time of printing.
| | | | | |
Major Investment Projects for New Brunswick |
Industry | Project | Location | Value ($M) | Start | End |
Mining | Mine - Potash Corporation of Saskatchewan | Sussex | 1,700 | 2008 | 2012 |
Utilities | Nuclear power plant refurbishment - NB Power | Point Lepreau | 1,000 | 2006 | 2009 |
Oil and Gas |
LNG terminal - Canaport | Saint John | 750 | 2005 | 2009 |
Transportation | Brunswick Pipeline (natural gas) - Emera | Southwestern NB | 465 | 2007 | 2009 |
Utilities | Wind farm - SUEZ Renewable Energy NA | Bathurst area | 200 | 2008 | 2009 |
Oil and Gas | Drilling for natural gas - Corridor Resources | Sussex | 190 | 2008 | 2009 |
Utilities |
Wind farm - TransAlta Corporation | Albert County | 170 | 2008 | 2008 |
Public Administration | CFB Gagetown | Oromocto | 140 | 2008 | 2012 |
Utilities | Wind farm - Acciona Wind Energy Canada Inc. | Aulac | 125 | 2008 | 2009 |
Transportation |
Highway 8 bypass | York County | 124 | 2008 | 2013 |
Manufacturing |
Pulp mill upgrade - Fraser Papers | Edmundston | 100 | 2008 | 2010 |
Utilities | Wind farm - Acciona Wind Energy Canada Inc. | Lamèque | 100 | 2008 | 2009 |
Entertainment |
Casino - Sonco Gaming NB Ltd. | Moncton | 90 | 2008 | 2010 |
Manufacturing | Pulp mill refurbishment – AV Nackawic Inc. | Nackawic | 90 | 2007 | 2008 |
Public Administration | Police-justice complex | Saint John | 80 | 2009 | 2011 |
Public Administration | Convention centre, office building and parking garage | Fredericton | 76 | 2008 | 2011 |
Health care |
Hospital expansion | Moncton | 73 | 2009 | 2012 |
Manufacturing |
Tail gas unit - Irving Oil | Saint John | 72 | 2006 | 2008 |
Manufacturing | McCain Foods potato processing plant | Florenceville | 65 | 2007 | 2008 |
25 |
The New Brunswick Economy 2009 |
Major Investment Projects (continued)
Projects valued at $20 million or more that have been announced, are underway or have been completed.
Disclaimer: Project details are obtained from public sources. While every effort has been made to ensure a comprehensive and accurate listing, information may not be available at the time of printing.
| | | | | |
Major Investment Projects for New Brunswick |
Industry | Project | Location | Value ($M) | Start | End |
Education | Fitness and research centre – UNB | Fredericton | 50 | 2008 | 2010 |
Public Administration |
Justice centre | Moncton | 50 | 2009 | 2010 |
Health care |
Ambulatory care centre | Moncton | 47 | 2007 | 2008 |
Transportation |
One Mile House interchange | Saint John | 45 | 2008 | 2011 |
Public Administration | Research centre upgrade – Biological Station | St. Andrews | 45 | 2008 | 2012 |
Education |
NBCC | Saint John | 44 | 2009 | 2011 |
Education |
CCNB | Edmundston | 35 | 2009 | 2011 |
Health care |
Hospital expansion | Saint John | 30 | 2008 | 2010 |
Public Administration | Transit facility | Saint John | 22 | 2008 | 2009 |
Education |
NBCC | Moncton | 20 | 2009 | 2011 |
Recreation |
Stadium | Moncton | 20 | 2008 | 2010 |
26 |
The New Brunswick Economy 2009 |
Maps of New Brunswick
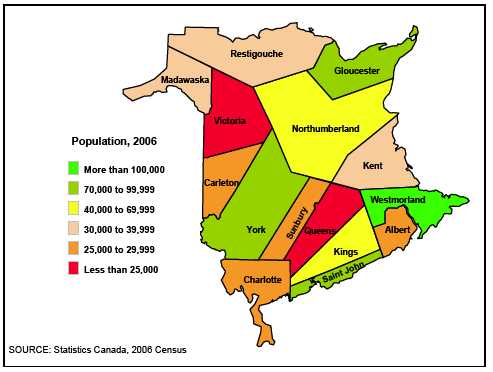
Population Distribution, N.B. Counties
Population Per Cent Change, N.B. Counties

27 |
The New Brunswick Economy 2009 |
Maps of New Brunswick
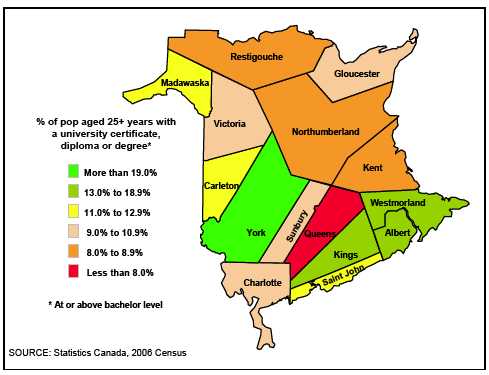
Highest Level of Schooling, N.B. Counties
Change in Employment, N.B. Economic Regions and Urban Areas
28 |
The New Brunswick Economy 2009 |