2013-2014 Second Quarter Report
Published by:
Department of Finance Government of New Brunswick P.O. Box 6000 Fredericton, New Brunswick E3B 5H1 Canada
Internet: www.gnb.ca/finance
December 2013
Translation:
Translation Bureau, Government Services
ISBN 978-1-55396-370-7

Think Recycling!
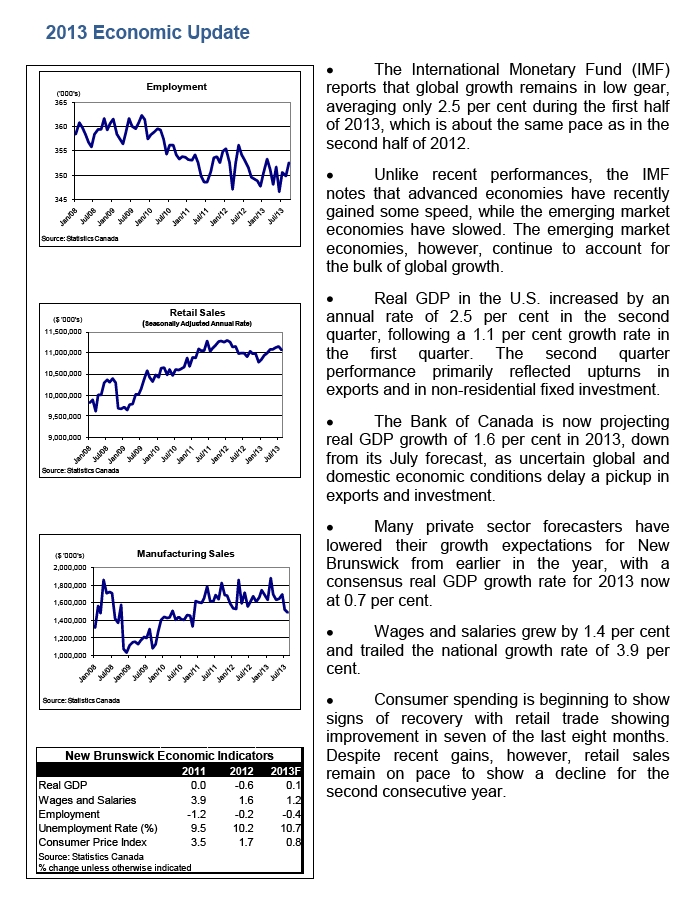
2013 Economic Update
Healthy gains in wood product manufacturing (+11.5%) have helped offset weakness elsewhere in the manufacturing sector which is currently on pace to match the level of sales seen in 2012.
Housing starts in the province’s urban centres are down 19.2 per cent over year-earlier levels with declines in both single family and multi-unit construction.
Consumer inflation in the province has averaged 0.6 per cent, slightly lower than the national growth rate of 0.9 per cent.
2013-2014 Fiscal Update
Based on second quarter information, a revised deficit of $538.2 million is projected for 2013-2014. This is an increase of $59.5 million compared to the budget deficit of $478.7 million.
Relative to first quarter, total expense has improved by $93.2 million, however revenue projections have deteriorated by $131.5 million. This has resulted in an increased deficit of $38.3 million from first quarter.
Net debt is projected to increase $587.2 million year-over-year, a decrease of $7.2 million from the budget estimate of $594.4 million.
Revenues are projected to be $172.9 million lower than budget mainly due to weaker-than-anticipated results for NB Power and reduced tax revenue. The major variances include:
Return on Investment is down $66.3 million mainly due to lower net income for NB Power. This is due to increased costs for fuel and purchased power and pensions.
Personal Income Tax is lower by $43.0 million due to weakened income.
Harmonized Sales Tax is projected to decrease $28.3 million from budget because of an anticipated weakening of New Brunswick’s share allocation of federal HST payments.
Special Operating Agency Account Revenue (net) is down $16.0 million mainly due to lower offsetting expenses related to federal agreements.
Sale of Goods and Services is down $13.0 million from budget which is mainly offset by an increase of $12.7 million in Miscellaneous Revenue. This is mainly due to a realignment of revenue for the Regional Health Authorities.
Provincial Real Property Tax is anticipated to be lower by $11.5 million due to assessments.
Corporate Income Tax is lower by $7.8 million due to an anticipated, negative prior-year adjustment.
Royalties are down by $6.0 million due to lower price and volume for potash.
Canada Health Transfer is projected to increase $13.3 million related to new population data.
2013-2014 Fiscal Update
Total expenses are projected to be $113.4 million lower than budget. The major variances include the following:
General Government ($69.5 million under): Mainly due to various miscellaneous under-expenditures, including lower than budgeted provision for losses, centrally managed funds and consolidated entity expenses.
Health ($26.6 million under): Mainly due to a number of savings and cost containment initiatives in the health care system, including lower than budgeted costs in the prescription drug program, lower than expected costs for blood products, and IT-related expenditure reductions.
Justice and Attorney General ($2.0 million under): Mainly due to the transfer of certain functions to the new Financial and Consumer Services Commission.
Post-Secondary Education, Training and Labour ($8.2 million under): Primarily due to projected under-expenditures in the Student Financial Assistance program due to lower interest rates and provision for loss savings, as well as the Labour Market Development program due to lower than expected uptake for employment programs.
Transportation and Infrastructure ($4.1 million over): Various cost pressures and over-expenditures, including higher than budgeted expenses for Ferry Operations.
Other accounts ($11.2 million under): Mainly due to lower than budgeted expenses in the Regional Development Corporation Special Operating Agency due to project timing changes from budget. This was partially offset by a change in the type of capital work in the Department of Transportation and Infrastructure that resulted in a decrease in capital to be amortized and an increase in capital to be expensed.
| | | | | | | | |
| COMPARATIVE STATEMENT OF SURPLUS OR DEFICIT |
| Thousands |
| $ |
| |
| | Year Ending March 31 | | | |
| | | | | | | | Variance | |
| | 2014 | | 2014 | | 2014 | | from | |
| | Estimate | | 1st Quarter | | 2nd Quarter | | Estimate | |
| |
| Revenue | | | | | | | | |
| Ordinary Account | 7,565,600 | | 7,528,118 | | 7,408,632 | | (156,968 | ) |
| Capital Account | 81,044 | | 82,068 | | 82,079 | | 1,035 | |
| Special Purpose Account. | 61,658 | | 61,094 | | 60,669 | | (989 | ) |
| Special Operating Agency Account (net) | 79,133 | | 74,722 | | 63,112 | | (16,021 | ) |
| Sinking Fund Earnings | 206,500 | | 206,500 | | 206,500 | | 0 | |
| Total Revenue | 7,993,935 | | 7,952,502 | | 7,820,992 | | (172,943 | ) |
| |
| Expense | | | | | | | | |
| Ordinary Account | 7,930,758 | | 7,913,062 | | 7,824,473 | | (106,285 | ) |
| Capital Account | 44,689 | | 47,895 | | 53,701 | | 9,012 | |
| Special Purpose Account | 72,462 | | 72,522 | | 71,818 | | (644 | ) |
| Special Operating Agency Account (net) | 69,199 | | 63,146 | | 53,326 | | (15,873 | ) |
| Amortization of Tangible Capital Assets | 355,520 | | 355,760 | | 355,880 | | 360 | |
| Total Expense | 8,472,628 | | 8,452,385 | | 8,359,198 | | (113,430 | ) |
| |
| |
| Surplus (Deficit) | (478,693 | ) | (499,883 | ) | (538,206 | ) | (59,513 | ) |
7
| | | | | |
| COMPARATIVE STATEMENT OF ORDINARY ACCOUNT REVENUE BY SOURCE |
| Thousands |
| $ |
| |
| | Year Ending March 31 | | |
| | | | | Variance | |
| | 2014 | 2014 | 2014 | from | |
| | Estimate | 1st Quarter | 2nd Quarter | Estimate | |
| |
| Taxes | | | | | |
| Personal Income Tax | 1,416,000 | 1,416,000 | 1,373,000 | (43,000 | ) |
| Corporate Income Tax | 236,400 | 236,400 | 228,600 | (7,800 | ) |
| Metallic Minerals Tax | 2,000 | 0 | 0 | (2,000 | ) |
| Provincial Real Property Tax | 481,500 | 481,500 | 470,000 | (11,500 | ) |
| Harmonized Sales Tax | 1,159,800 | 1,159,800 | 1,131,500 | (28,300 | ) |
| Gasoline and Motive Fuels Tax | 243,000 | 243,000 | 240,000 | (3,000 | ) |
| Tobacco Tax | 157,000 | 157,000 | 157,000 | 0 | |
| Pari-Mutuel Tax | 600 | 600 | 600 | 0 | |
| Insurance Premium Tax | 47,205 | 47,205 | 47,505 | 300 | |
| Real Property Transfer Tax | 11,500 | 11,500 | 13,000 | 1,500 | |
| Large Corporation Capital Tax | 0 | 0 | 0 | 0 | |
| Financial Corporation Capital Tax | 28,000 | 30,000 | 30,000 | 2,000 | |
| Sub-total: Taxes | 3,783,005 | 3,783,005 | 3,691,205 | (91,800 | ) |
| |
| Return on Investment | 326,840 | 294,483 | 260,508 | (66,332 | ) |
| Licences and Permits | 138,267 | 137,756 | 136,989 | (1,278 | ) |
| Sale of Goods and Services | 293,867 | 277,854 | 280,881 | (12,986 | ) |
| Lottery and Gaming Revenues | 153,347 | 153,347 | 151,127 | (2,220 | ) |
| Royalties | 110,855 | 110,855 | 104,855 | (6,000 | ) |
| Fines and Penalties | 8,294 | 8,294 | 8,312 | 18 | |
| Miscellaneous | 36,959 | 50,558 | 49,707 | 12,748 | |
| |
| TOTAL: OWN SOURCE REVENUE | 4,851,434 | 4,816,152 | 4,683,584 | (167,850 | ) |
| |
| Unconditional Grants – Canada | | | | | |
| Fiscal Equalization Payments | 1,562,000 | 1,562,000 | 1,562,000 | 0 | |
| Canada Health Transfer | 664,000 | 664,000 | 677,300 | 13,300 | |
| Canada Social Transfer | 262,300 | 262,300 | 264,300 | 2,000 | |
| Wait Times Reduction Transfer | 5,368 | 5,368 | 5,368 | 0 | |
| Other | 1,866 | 1,866 | 1,866 | 0 | |
| Sub-total: Unconditional Grants – Canada | 2,495,534 | 2,495,534 | 2,510,834 | 15,300 | |
| |
| Conditional Grants – Canada | 218,632 | 216,432 | 214,214 | (4,418 | ) |
| |
| TOTAL: GRANTS FROM CANADA | 2,714,166 | 2,711,966 | 2,725,048 | 10,882 | |
| |
| TOTAL: GROSS ORDINARY REVENUE | 7,565,600 | 7,528,118 | 7,408,632 | (156,968 | ) |
8
| | | | | | | | |
| COMPARATIVE STATEMENT OF ORDINARY ACCOUNT EXPENSE |
| Thousands |
| $ |
| |
| | Year Ending March 31 | | | | | |
| |
| | 2014 | 2014 | 2014 | Variance | | |
| DEPARTMENT | Estimate | 1st Quarter | 2nd Quarter | from Estimate | | |
| | | | | $ | | % | | |
| Agriculture, Aquaculture and Fisheries | 39,882 | 39,882 | 39,882 | 0 | | 0.0 | % | |
| Economic Development | 101,373 | 101,373 | 99,373 | (2,000 | ) | -2.0 | % | ü |
| Education and Early Childhood Development | 1,074,592 | 1,074,592 | 1,074,592 | 0 | | 0.0 | % | |
| Efficiency New Brunswick | 11,649 | 11,649 | 11,649 | 0 | | 0.0 | % | |
| Energy and Mines | 8,061 | 8,061 | 7,961 | (100 | ) | -1.2 | % | ü |
| Environment and Local Government | 139,497 | 139,497 | 138,946 | (551 | ) | -0.4 | % | ü |
| Executive Council Office | 18,370 | 18,260 | 17,765 | (605 | ) | -3.3 | % | ü |
| Finance | 18,949 | 18,949 | 18,699 | (250 | ) | -1.3 | % | ü |
| General Government | 862,873 | 855,175 | 793,374 | (69,499 | ) | -8.1 | % | ü |
| Government Services | 59,597 | 59,597 | 58,997 | (600 | ) | -1.0 | % | ü |
| Health | 2,583,815 | 2,583,815 | 2,557,201 | (26,614 | ) | -1.0 | % | ü |
| Healthy and Inclusive Communities | 17,301 | 17,251 | 17,001 | (300 | ) | -1.7 | % | ü |
| Human Resources | 3,973 | 3,973 | 3,873 | (100 | ) | -2.5 | % | ü |
| Invest NB | 14,638 | 14,638 | 14,638 | 0 | | 0.0 | % | |
| Justice and Attorney General | 62,700 | 59,718 | 60,719 | (1,981 | ) | -3.2 | % | ü |
| Legislative Assembly | 21,659 | 21,659 | 21,659 | 0 | | 0.0 | % | |
| Natural Resources | 101,593 | 101,993 | 101,593 | 0 | | 0.0 | % | |
| Office of the Premier | 1,652 | 1,652 | 1,652 | 0 | | 0.0 | % | |
| Post-Secondary Education, Training and Labour | 604,341 | 594,488 | 596,094 | (8,247 | ) | -1.4 | % | ü |
| Public Safety | 147,581 | 147,581 | 148,131 | 550 | | 0.4 | % | ! |
| Service of the Public Debt | 664,000 | 664,000 | 664,000 | 0 | | 0.0 | % | |
| Social Development | 1,062,734 | 1,062,734 | 1,062,734 | 0 | | 0.0 | % | |
| Tourism, Heritage and Culture | 37,632 | 37,924 | 37,524 | (108 | ) | -0.3 | % | ü |
| Transportation and Infrastructure | 272,296 | 274,601 | 276,416 | 4,120 | | 1.5 | % | ! |
| TOTAL | 7,930,758 | 7,913,062 | 7,824,473 | (106,285 | ) | -1.3 | % | |
| ü | Projected under-expenditure |
| ! | Projected over-expenditure |
9
| | | | | | | | |
| COMPARATIVE STATEMENT OF CHANGE IN NET DEBT |
| Thousands |
| $ |
| | Year Ending March 31 | | | |
| | | | | | | | Variance | |
| | 2014 | | 2014 | | 2014 | | from | |
| | Estimate | | 1st Quarter | | 2nd Quarter | | Estimate | |
| Surplus (Deficit) | (478,693 | ) | (499,883 | ) | (538,206 | ) | (59,513 | ) |
| Acquisition of Tangible Capital Assets | (421,374 | ) | (421,930 | ) | (404,886 | ) | 16,488 | |
| Amortization of Tangible Capital Assets | 355,520 | | 355,760 | | 355,880 | | 360 | |
| Deferred Revenue Related to Tangible Capital Assets* | (49,894 | ) | (53,110 | ) | - | | 49,894 | |
| (Increase) Decrease in Net Debt | (594,441 | ) | (619,163 | ) | (587,212 | ) | 7,229 | |
*Due to a change in the classification of deferred capital contributions on the statement of financial position in 2012/2013, an adjustment to net debt for the change in deferred capital contributions is no longer required.
10