EXHIBIT 99.9
Department of
Finance
The New Brunswick
Economy: 2014 in Review
The New Brunswick Economy: 2014 in Review
Published by:
Department of Finance
Province of New Brunswick
P.O. Box 6000
Fredericton, New Brunswick
E3B 5H1
Canada
Internet: www.gnb.ca/finance
June 2015
Cover:
Department of Finance
Translation:
Translation Bureau, Government Services
ISBN 978-1-4605-0501-4
 | Think Recycling! |
| | | Page | |
| Overview | | | 4 | |
| 2014 Statistical Summary | | | 5 | |
| | | | | |
| International Economy | | | 6 | |
| Global Growth Modest | | | 7 | |
| International Trade Growth Slows | | | 7 | |
| Advanced Economies Performing Below Capacity | | | 8 | |
U.S. Housing Starts Hit Highest Level Since 2007 | | | 8 | |
| | | | | |
| Canadian Economy | | | 9 | |
| Canada Economic Indicators | | | 10 | |
| Canadian Economy Continues to Strengthen | | | 11 | |
| Economic Activity by Industry Diverse | | | 11 | |
| Oil Prices Collapse | | | 12 | |
| Canadian Dollar Weakens | | | 12 | |
Canada-U.S. Employment Gap Narrowing | | | 13 | |
| Residential Construction Investment Increases | | | 13 | |
| | | | | |
New Brunswick Economy – 2014 Review | | | 14 | |
| New Brunswick Economic Indicators | | | 15 | |
| Provincial Economy Stagnant | | | 16 | |
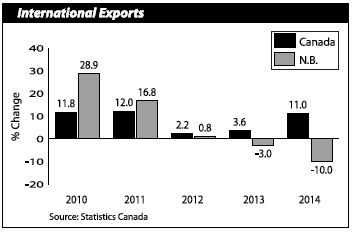
| Exports Face Challenges | | | 16 | |
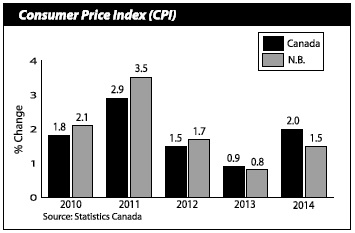
| Consumer Prices Increase | | | 17 | |
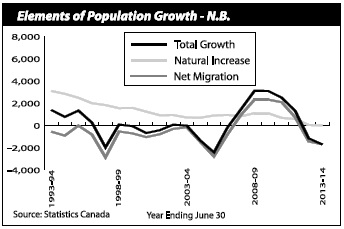
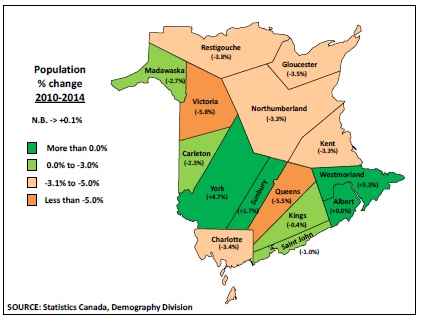
| Population Falls | | | 17 | |
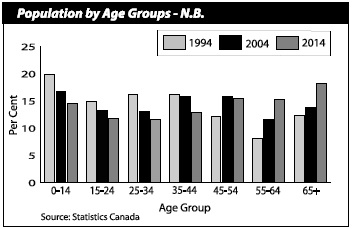
| Boomers Continue to Accelerate Population Aging | | | 18 | |
| Provincial Labour Force Decreases | | | 18 | |
| Employment Growth in Service Sector | | | 19 | |
Full-time Employment Improves | | | 19 | |
| Participation Rate Recedes | | | 20 | |
| Unemployment Rate Falls Below 10% | | | 20 | |
Moncton-Richibucto Enjoys Banner Year | | | 21 | |
| Wages and Salaries Growth Slows | | | 21 | |
| Average Weekly Earnings Turnaround | | | 22 | |
| Retail Trade Growth Stronger | | | 22 | |
| Manufacturing Sales Decline | | | 23 | |
| Wood Product Sales Growth Continues | | | 23 | |
| Housing Sector Weak | | | 24 | |
| Investment in Building Construction Improves | | | 24 | |
| Mining Sector Transitioning | | | 25 | |
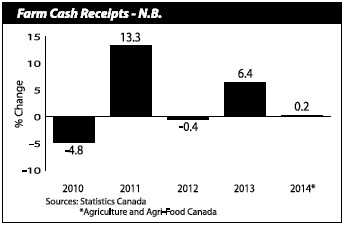
| Farm Cash Receipts Mixed | | | 25 | |
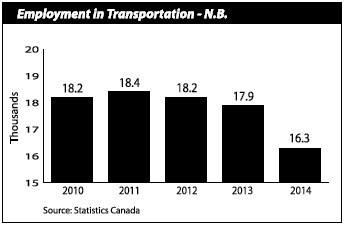
| Transportation Results Varied | | | 26 | |
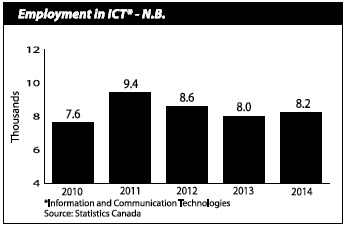
| ICT Sector Stable | | | 26 | |
| | | | | |
| New Brunswick Annual Indicators | | | 27 | |
| | | | | |
| Major Investment Projects | | | 28 | |
| | | | | |
| Maps of New Brunswick | | | 30 | |
NOTE: Unless sourced otherwise, the analysis contained in this document is based on Statistics Canada data available as of April 30, 2015; historically comparable data series are used. Numbers may not add due to rounding.
Data will be updated on the Department of Finance website at: www.gnb.ca/finance
● | The International Monetary Fund (IMF) reported that the global economy grew by 3.4% in 2014. Advanced economies improved on their 2013 performance as the euro zone emerged from negative growth territory. The pace of growth in emerging and developing economies subsided as growth in China slowed and impacted economic activity in the rest of Asia. |
● | The U.S. economy expanded by a stronger-than-expected 2.4% in 2014, a modest improvement over 2013. Consumption, the main driver of growth, has benefited from steady job creation and income growth, lower oil prices and increased consumer confidence. |
● | Canada saw economic activity pick up in 2014, with real Gross Domestic Product (GDP) growth of 2.5%. The rise was supported by household consumption and net trade. Alberta led the provinces in growth followed by British Columbia. |
● | Oil prices declined by 40% over the last six months of 2014 due to an increase in global supply, the end of several major production outages and downward revisions to expected global demand. |
● | Real economic growth in New Brunswick was flat in 2014, an improvement from the 0.5% decline observed in 2013. Growth was negatively impacted by a weak labour market, as well as deteriorating manufacturing and export sales. Stronger consumer expenditures and private sector investment helped offset some of the setback. |
| 2014 Statistical Summary Growth Rates1 | |
| | | | | | | |
| | | N.B. | | | Canada | |
| | | (2013 to 2014) | |
| Output | | | | | | |
| Gross Domestic Product (GDP) * | | | 1.9 | | | | 4.4 | |
| GDP (real) | | | 0.0 | | | | 2.5 | |
| Population and Labour Force | | | | | | | | |
| Total Population (July 1) | | | -0.2 | | | | 1.1 | |
| Labour Force | | | -0.6 | | | | 0.5 | |
| Employment | | | -0.2 | | | | 0.6 | |
| Unemployment Rate (%) | | | 9.9 | | | | 6.9 | |
| Participation Rate (%) | | | 63.2 | | | | 66.0 | |
| Wages and Salaries | | | 0.9 | | | | 3.6 | |
| Indicators | | | | | | | | |
| International Exports | | | -10.0 | | | | 11.0 | |
| Retail Trade | | | 3.8 | | | | 4.6 | |
| Farm Cash Receipts | | | 0.2 | | | | 3.6 | |
| Housing Starts | | | -19.9 | | | | 0.7 | |
| Manufacturing Sales | | | -7.0 | | | | 5.3 | |
| Lumber Shipments | | | 8.5 | | | | 3.8 | |
| Mining Production | | | -36.3 | | | | 2.0 | |
| Consumer Price Index | | | 1.5 | | | | 2.0 | |
| ______________ | | | | | | | | |
| 1 Per cent change unless otherwise indicated. | | | | | | | | |
| * Provincial figure is NB Finance estimate. | | | | | | | | |
| | | | | | | | | |
| Sources: Statistics Canada, Natural Resources Canada and Agriculture and Agri-Food Canada. | | | | | | | | |
| | | | | | | | | |
● | Global economic activity remained stable in 2014. According to the IMF, the global economy grew by 3.4% in 2014, although there was significant growth divergence among major economies. The recovery in the U.S. was stronger than expected, while the economic performance in many other major economies (most notably Japan) fell short of expectations. |
● | Growth in emerging economies slowed, from 5.0% in 2013 to 4.6% in 2014, predominantly due to a slowing of Chinese expansion. Nonetheless, China and India once again led progress among the emerging economies, accelerating by 7.4% and 7.2% respectively in 2014. |
● | Advanced economies grew by 1.8% in 2014, reflecting a modest improvement from the 1.4% pace set in 2013. The IMF reported that all G7 nations continued to underperform relative to their potential. Furthermore, high levels of debt remain present, primarily in Japan, Italy and France. |
● | After contracting in the last two years, growth in the euro zone rose by 0.9% in 2014. Activity picked up in the fourth quarter, with consumption supported by lower oil prices and higher net exports. Germany, the largest economy in the zone, led growth with an increase of 1.6%, while Spain and France grew by 1.4% and 0.4% respectively. Italy’s economy declined by 0.4%, although it appears to be stabilizing. |
● | The Japanese economy fell into a technical recession in the third quarter of 2014. Growth for the year was close to zero (-0.1%), reflecting weak consumption and plummeting residential investment. |
● | After a slow start, the U.S. economy averaged an annualized growth rate of nearly 4.0% over the last three quarters of 2014. This increase in real GDP reflected positive contributions from personal consumption expenditures, residential and non- residential fixed investment, exports, state and local government spending, and private inventory investment. |
● | Payroll employment in the U.S. increased by more than 3.1 million in 2014, following the addition of nearly 2.4 million jobs in 2013. Total employment levels have now surpassed the January 2008 pre-recession peak. The unemployment rate declined for the fourth consecutive year, falling to 6.2% in 2014. |
● | U.S. housing starts surpassed one million for the first time since 2007, an increase of 8.5% over the 2013 level, and the fifth consecutive annual increase following the housing market collapse. Regionally, growth was led by the Northeast (+13.1%). |
| Global economic activity remained modest in 2014, in line with the pace set in 2013. Emerging economies continued to lead growth, although the gap between emerging and advanced economies tightened somewhat. Improving conditions suggest the euro zone might be on the road to recovery as a slight increase in output in 2014 followed two years of declines. | | 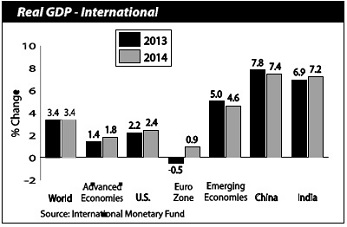 |
| International Trade Growth Slows |
| 2014 marked the fifth straight year that trade volume grew, albeit at a marginally slower pace than the rate observed in 2013. The modest pace of growth reflected weaker trade dynamics in emerging and developing economies, as well as weaker-than- expected GDP growth. | | 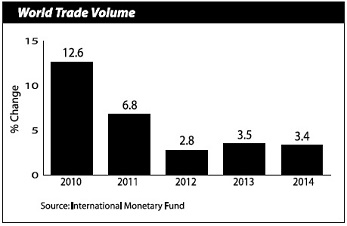 |
| Advanced Economies Performing Below Capacity |
| Advanced economies continued to perform below capacity as potential output was constrained by aging populations, weak investment and lacklustre total factor productivity growth. In 2014, the average output gap (the difference between the actual output and full- capacity output) was -2.0%, well below the 20-year average of -0.6%. | | 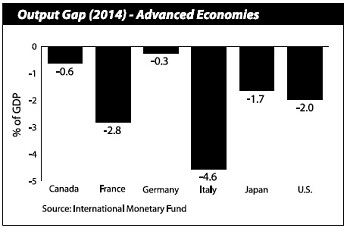 |
U.S. Housing Starts Hit Highest Level Since 2007 |
| The U.S. housing market finished 2014 on a high note as residential construction climbed and housing starts reached one million for the first time since 2007. Nevertheless, housing starts remain well below pre-recession levels. Growing strength and builder confidence in the housing market are an indication that the U.S. economy is well into its recovery phase. | | 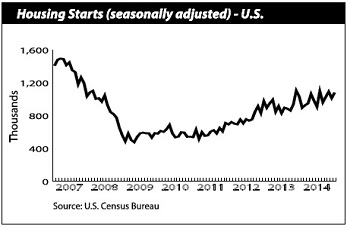 |
| ● | In Canada, economic activity was driven by household consumption and net trade. The Canadian economy expanded by 2.5% in 2014, rising from the past two years of growth around 2.0%. |
| ● | Real GDP growth was led by Alberta (+4.4%) and British Columbia (+2.6%), the only provinces to surpass the national growth rate. |
| ● | Canadian exports rose by 11.0% in 2014, up from 3.6% in 2013. Exports of non- energy goods accelerated 8.9% in 2014 due to a stronger U.S. economy and a weaker dollar. |
| ● | Manufacturing sales grew by 5.3% as capacity utilization increased and the sector entered a rebuilding phase. Sales benefited from a decrease in the value of the Canadian dollar and stronger U.S. demand. Strength was observed in both the durable (+6.3%) and non-durable (+4.3%) goods industries. |
| ● | Housing starts rose by a modest 0.7% in 2014 after declining 12.5% in 2013. Growth in multi-unit construction (+2.5%) was sufficient to offset a decline in single-detached construction (-1.8%). Only three of ten provinces experienced growth in total starts with Alberta out in front (+12.7%). |
| ● | Canada’s unemployment rate improved marginally in 2014, falling to 6.9% from 7.1% in 2013. Saskatchewan posted the lowest unemployment rate (3.8%), followed by Alberta (4.7%) and Manitoba (5.4%). |
| ● | The Canadian labour market added more than 111,000 jobs in 2014, less than half of the total gain in 2013. Nevertheless, with slightly stronger employment growth than labour force growth, the unemployment rate was pushed down for a fifth consecutive year. Part-time employment growth outpaced full-time job growth and the participation rate continued to slide down. |
| ● | The Bank of Canada kept its target for the overnight rate at 1% in 2014, where it has been since September 2010. Low interest rates, in conjunction with moderate income growth and employment gains, continued to support consumer expenditures. |
| ● | The Consumer Price Index (CPI) rose by 2.0% in 2014, led by price increases in non-durable goods as well as services. The depreciation of the Canadian dollar generated upward pressure, compensating for slack in the economy from weak demand, as well as from competition in the retail sector. |
| ● | Due to the steep decline in oil prices, the Canadian dollar ended 2014 at 86 cents U.S., with much of the decline occurring over the last six months of the year. This represented an eight cent decline from the January peak of 94 cents U.S. |
Canadian Economy (continued) |
Canada Economic Indicators Growth Rates1, 2010 to 2014 | |
| | | 2010 | | | 2011 | | | 2012 | | | 2013 | | | 2014 | |
| Economic Accounts | | | | | | | | | | | | | | | |
| Gross Domestic Product (GDP) | | | 6.1 | | | | 6.5 | | | | 3.5 | | | | 3.4 | | | | 4.4 | |
| Household Final Consumption Expenditures | | | 4.9 | | | | 4.4 | | | | 3.3 | | | | 3.8 | | | | 4.7 | |
| Gross Fixed Capital Formation | | | 11.4 | | | | 6.7 | | | | 7.1 | | | | 2.0 | | | | 3.3 | |
| GDP (real) | | | 3.4 | | | | 3.0 | | | | 1.9 | | | | 2.0 | | | | 2.5 | |
| Income | | | | | | | | | | | | | | | | | | | | |
| Primary Household Income | | | 3.1 | | | | 5.5 | | | | 4.6 | | | | 4.0 | | | | 3.7 | |
| Net Operating Surplus: Corporations | | | 31.6 | | | | 15.4 | | | | -4.2 | | | | -0.6 | | | | 9.0 | |
| Population and Labour Force | | | | | | | | | | | | | | | | | | | | |
| Total Population (July 1) | | | 1.1 | | | | 1.0 | | | | 1.2 | | | | 1.2 | | | | 1.1 | |
| Labour Force | | | 1.1 | | | | 0.9 | | | | 1.0 | | | | 1.2 | | | | 0.5 | |
| Employment | | | 1.4 | | | | 1.5 | | | | 1.3 | | | | 1.5 | | | | 0.6 | |
| Unemployment Rate (%) | | | 8.1 | | | | 7.5 | | | | 7.3 | | | | 7.1 | | | | 6.9 | |
| Participation Rate (%) | | | 66.9 | | | | 66.7 | | | | 66.5 | | | | 66.5 | | | | 66.0 | |
| Other | | | | | | | | | | | | | | | | | | | | |
| Consumer Price Index | | | 1.8 | | | | 2.9 | | | | 1.5 | | | | 0.9 | | | | 2.0 | |
| Housing Starts | | | 27.4 | | | | 2.1 | | | | 10.8 | | | | -12.5 | | | | 0.7 | |
| _________________ | | | | | | | | | | | | | | | | | | | | |
1 Per cent change unless otherwise indicated. | | | | | | | | | | | | | | | | | | | | |
| | | | | | | | | | | | | | | | | | | | | |
| Source: Statistics Canada. | | | | | | | | | | | | | | | | | | | | |
Canadian Economy Continues to Strengthen |
Real GDP in Canada advanced 2.5% in 2014, an acceleration from the 2.0% growth in the previous year. Economic activity in 2014 was supported by strength in consumer spending and net trade; business fixed investment, residential investment and government spending remained weak. | | 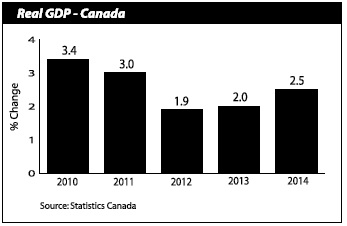 |
Economic Activity by Industry Diverse |
Growth in economic output in Canada was evenly spread between the goods- producing sector (+2.5%) and the service-producing sector (+2.3%) in 2014. Agriculture, forestry, fishing and hunting – the only industry to post negative growth – declined by 6.8% in 2014 after leading with double-digit growth in 2013. The energy sector, which had not yet been impacted by low oil prices, displayed growth of 4.1% in 2014. | | 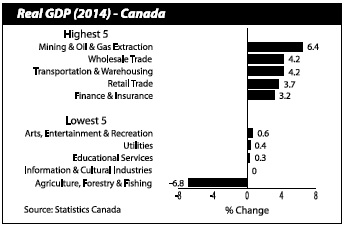 |
After reaching a mid-year high, the price of oil declined rapidly over the final two quarters of 2014, as the market adjusted to robust production that significantly exceeded demand. The price of crude oil tumbled 40% from the 2013 average, dropping to its lowest level in five years. | | 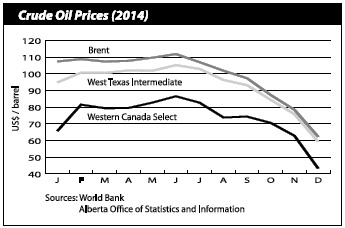 |
The Canadian dollar depreciated against the U.S. dollar in the last half of 2014, falling to 86 cents U.S. by year-end from a peak of 94 cents U.S. in January. The decline reflected the significant drop in oil prices as well as the widespread strength of the U.S. currency. | | 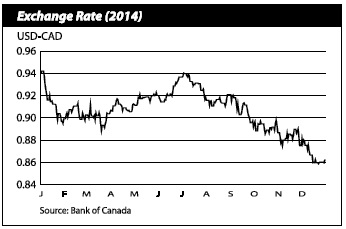 |
Canada–U.S. Employment Gap Narrowing |
After outpacing the U.S. for much of the post-recession period, the gap between U.S. and Canadian employment is closing. The pace of Canadian job growth flattened, while the U.S. job market improved averaging gains of 250,000 per month throughout 2014. | |  |
Residential Construction Investment Increases |
Residential construction investment grew by 3.8% in 2014, largely on the strength of renovations (+7.3%) and mobiles (+6.9%). Investment in non- residential building construction was up 1.8% due to higher spending on the construction of commercial (+3.2%) and institutional and governmental (+2.4%) buildings. Spending on industrial buildings decreased 5.9%. | | 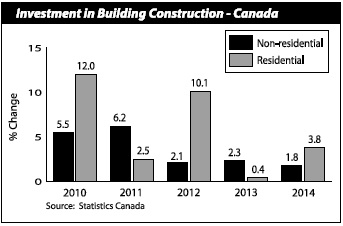 |
New Brunswick Economy – 2014 Review |
| ● | The New Brunswick economy was stagnant in 2014. Mining, quarrying, and oil and gas extraction fell 10.0%, mainly a result of the Brunswick Mine closure in 2013. Manufacturing output as a whole also declined, largely due to maintenance activity at the Saint John refinery and the drop in the price of refined oil products. However, manufacturing of seafood product preparations, meat products, wood products and non-metallic mineral products (excluding cement and concrete products) increased. Modest growth in service-producing industries was not sufficient to push overall GDP growth into positive territory. |
| ● | After two years of weak performances, retail trade grew by 3.8% in 2014, an increase of $421 million. Eight of the eleven subsectors reported higher sales, with the biggest gain (in dollars) registered for motor vehicle and parts dealers, the largest retail subsector. |
| ● | Overall employment edged down slightly in 2014 to 353,900, as the gain in full-time jobs was not sufficient to compensate for the loss in part-time employment. Job growth shifted from the goods-producing sector to the services-producing sector, although the gain in the latter was marginal. The highest gain was observed in professional, scientific and technical services, while the heaviest loss was noted in health care and social assistance. |
| ● | While income growth has been soft, wages and salaries in both goods-producing (+1.5%) and services-producing (+0.8%) industries reported modest gains in 2014. |
| ● | Exports and manufacturing were negatively impacted in 2014 by maintenance activity at the Saint John refinery and the drop in the price of refined oil products. Exports were down for the second year in a row (-10.0%), while manufacturing sales declined 7.0% reflecting substantial declines in non-durable goods industries. Wood product manufacturing was a source of growth, posting a third consecutive annual increase. |
| ● | Private sector investment made some headway in 2014, driven by the substantial upgrade at the pulp and paper mill in Saint John. Overall, investment in non- residential building construction increased by 5.2%, largely due to higher spending in industrial and institutional buildings. |
| ● | Housing starts in New Brunswick fell 19.9% for the year, reflecting lower levels of both single-detached and multiple unit starts. The three major urban centres in the province (Fredericton, Moncton and Saint John) also posted declines. |
| ● | Inflation picked up in 2014, rising by 1.5%. While this was an increase from the 0.8% level achieved in 2013, it was below the 2.0% average for Canada. Only two provinces – Quebec and British Columbia – saw less overall price growth than New Brunswick. |
New Brunswick Economy – 2014 Review (continued) |
New Brunswick Economic Indicators Growth Rates1, 2010 to 2014 | |
| | | 2010 | | | 2011 | | | 2012 | | | 2013 | | | 2014 | |
| Economic Accounts | | | | | | | | | | | | | | | |
| Gross Domestic Product (GDP) * | | | 4.4 | | | | 4.4 | | | | 1.1 | | | | 0.5 | | | | 1.9 | |
| Household Final Consumption Expenditures * | | | 4.2 | | | | 4.6 | | | | 2.0 | | | | 2.8 | | | | 1.6 | |
| Gross Fixed Capital Formation * | | | -1.1 | | | | 8.6 | | | | -13.1 | | | | -14.5 | | | | 1.7 | |
| GDP (real) ** | | | 2.0 | | | | 0.6 | | | | -0.4 | | | | -0.5 | | | | 0.0 | |
| Income | | | | | | | | | | | | | | | | | | | | |
| Primary Household Income * | | | 2.8 | | | | 4.1 | | | | 2.7 | | | | 2.1 | | | | 0.7 | |
| Net Operating Surplus: Corporations * | | | 17.6 | | | | 5.9 | | | | -5.8 | | | | -12.3 | | | | 5.1 | |
| Population and Labour Force | | | | | | | | | | | | | | | | | | | | |
| Total Population (July 1) | | | 0.4 | | | | 0.3 | | | | 0.2 | | | | -0.2 | | | | -0.2 | |
| Labour Force | | | 0.1 | | | | -0.4 | | | | 0.1 | | | | 0.5 | | | | -0.6 | |
| Employment | | | -0.5 | | | | -0.7 | | | | -0.7 | | | | 0.4 | | | | -0.2 | |
| Unemployment Rate (%) | | | 9.2 | | | | 9.5 | | | | 10.2 | | | | 10.3 | | | | 9.9 | |
| Participation Rate (%) | | | 63.9 | | | | 63.3 | | | | 63.2 | | | | 63.5 | | | | 63.2 | |
| Other | | | | | | | | | | | | | | | | | | | | |
| Consumer Price Index | | | 2.1 | | | | 3.5 | | | | 1.7 | | | | 0.8 | | | | 1.5 | |
| Housing Starts | | | 16.5 | | | | -15.8 | | | | -4.4 | | | | -13.8 | | | | -19.9 | |
| ____________ | | | | | | | | | | | | | | | | | | | | |
1 Per cent change unless otherwise indicated. | | | | | | | | | | | | | | | | | | | | |
| * NB Finance estimates for 2014. | | | | | | | | | | | | | | | | | | | | |
| ** 2014 result on an industry accounts basis. | | | | | | | | | | | | | | | | | | | | |
| | | | | | | | | | | | | | | | | | | | | |
| Sources: Statistics Canada and NB Finance. | | | | | | | | | | | | | | | | | | | | |
Provincial Economy Stagnant |
Following two years of negative growth, real GDP in New Brunswick was flat in 2014. Weakness was attributable to the closure of the Brunswick Mine in 2013 and developments in the manufacturing sector. Eleven of twenty sectors showed gains in 2014. Services output advanced 0.2%, while a 1.2% decline was evident among goods- producing industries. | | 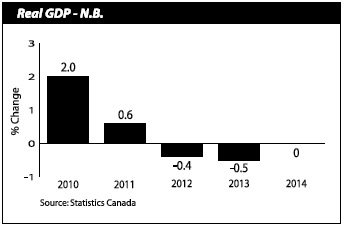 |
Foreign exports of goods from New Brunswick fell 10.0% to $13.0 billion in 2014, mainly due to the lower price in refined oil products and maintenance turnarounds at the refinery in Saint John.
Six of the twelve product groups reported lower levels. Increases in consumer goods and forestry products and building and packaging materials could not offset declines in basic and industrial chemical, plastic and rubber products; energy products; and metal ores and non-metallic minerals.
| | The province’s largest trading partners include the U.S. (91.9%), India (0.7%), China (0.7%), Turkey (0.6%) and Japan (0.6%). |
| | |
New Brunswick’s CPI rose 1.5% in 2014 following a 0.8% increase in 2013. The provincial rate of inflation was below the national average (+2.0%) as well as the rates of the other Atlantic provinces. Prices rose in six of the eight major components of the provincial CPI, led by higher prices for alcoholic beverages and tobacco products (+4.0%). | | Consumers paid less for clothing and footwear (-0.8%), while prices for health and personal care products were unchanged. |
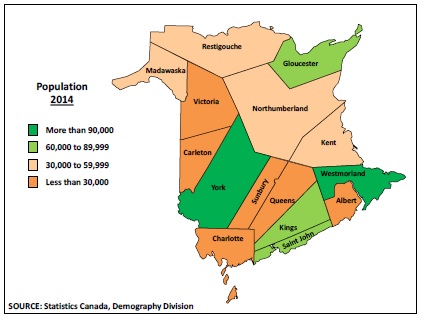
The population of New Brunswick was estimated at 753,914 as of July 1, 2014, a decrease of 0.2% from the previous year. The decline over the 2013- 2014 period was mainly due to a substantial loss in net interprovincial migration (-4,000), with most of the net outflow going to Alberta. On the positive side, the province welcomed a record number of immigrants (2,300). | | During this 12-month period, preliminary estimates showed deaths slightly exceeded births for the first time, forcing the natural increase into negative territory. |
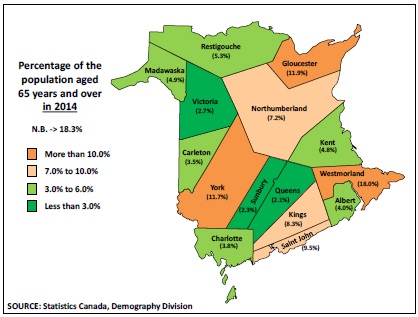
Boomers Continue to Accelerate Population Aging |
In 2014, New Brunswick was tied with Nova Scotia for the oldest population in the country. New Brunswick seniors aged 65 and older were the fastest growing age cohort due to the influence of the baby boomers. Seniors outnumbered children by more than 25,000 and accounted for 18.3% of the population; children 0-14 years represented 14.6%. There were more people aged 55 to 64 than there were aged 15 to 24. The older group (containing people who typically start to leave the labour force) comprised 15.2% of the population, while the younger group (containing people who typically start to enter the labour force) represented 11.8%. | | New Brunswick’s median age reached 44.3 years in 2014, compared with 40.4 years for Canada. |
Provincial Labour Force Decreases |
The number of New Brunswickers in the labour force declined in 2014, falling 0.6% to 393,000. More men than women were in the labour force (203,600 vs 189,400) but the gap is tightening. Labour force levels for both genders fell in 2014, down 0.8% and 0.3% respectively. | | 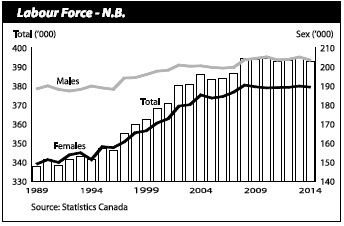 |
Employment Growth in Service Sector |
After suffering a loss the previous year, the services- producing sector reported a gain in 2014 (+900). Employment in this sector was spearheaded by gains in professional, scientific and technical services (+2,400) and business, building and other support services (+2,100). The goods-producing sector slipped in 2014 with only the utilities industry showing signs of growth. | | 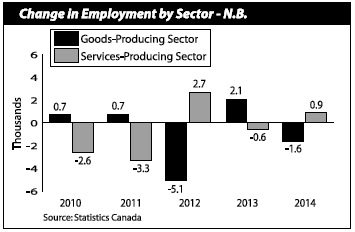 |
Full-time Employment Improves |
Employment in the province remained challenging in 2014, edging down 0.2% to 353,900. Nationally, the number employed rose 0.6%. Full-time employment in New Brunswick rebounded and recovered most of the previous year’s loss, increasing by 600 in 2014. Part-time employment decreased by 1,200. | | 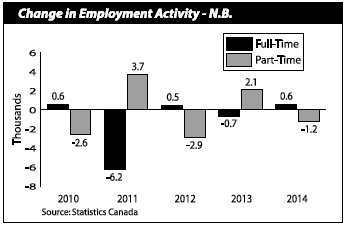 |
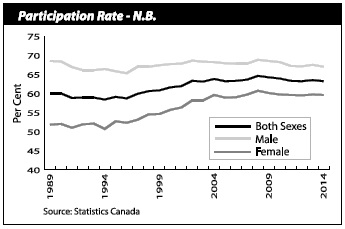
Participation Rate Recedes |
New Brunswick's participation rate, which measures the share of the working-age population in the labour market, stood at 63.2% in 2014, a decline of 0.3 percentage points from 63.5% in 2013. Both men and women lost some ground in 2014, with the participation rate for men falling to 67.0% and that for women edging down to 59.6%. | | Canada’s participation rate fell to 66.0% in 2014, a decrease from 66.5% in 2013. |
Unemployment Rate Falls Below 10% |
With a larger drop in the labour force (-0.6%) than in employment (-0.2%), the provincial unemployment rate dipped into single digits, falling 0.4 percentage points to 9.9% in 2014. The unemployment rate for women held steady at 7.8%, while that for men dropped to 11.9% from 12.6% the previous year. Canada’s jobless rate was 6.9% in 2014, down from 7.1% in 2013. | | 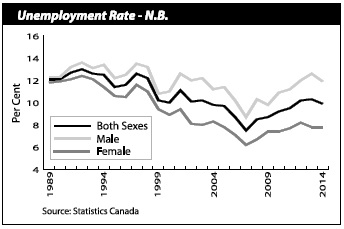 |
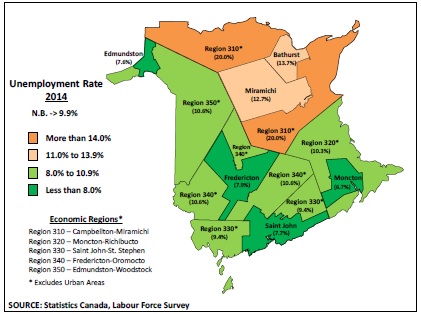
Moncton-Richibucto Enjoys Banner Year |
Moncton-Richibucto boasted the highest employment growth and registered a gain of 3,100 in 2014. Employment also increased in Saint John-St. Stephen (+1,500), while the three remaining regions posted declines. Unemployment rates improved from the previous year in four of the five regions, with Moncton- Richibucto enjoying the lowest rate (7.8%). | | Hardest hit was Fredericton-Oromocto whose rate jumped 2.0 percentage points to 8.5% in 2014. |
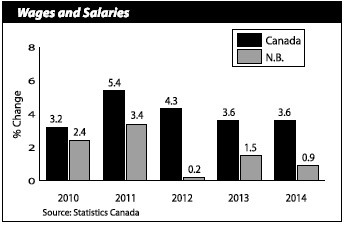
Wages and Salaries Growth Slows |
In 2014, growth in provincial wages and salaries remained below 2% for the third year in a row at 0.9%. The national increase stayed the same at 3.6%. Increases were reported in ten of the fifteen major industries for New Brunswick with the strongest impact from transportation and storage, construction, and health care and social assistance. | | Declines were exhibited in mining and oil and gas extraction, federal government public administration, and finance, real estate and company management. |
Average Weekly Earnings Turnaround |
Average weekly earnings for New Brunswick rose 3.4% in 2014 after declining 0.3% the year before. The national increase was 2.6% in 2014. At $832.23, the province’s weekly earnings represented 89.0% of the Canadian average of $935.31. Provincial weekly earnings ranged from $356.03 in accommodation and food services to $1,182.70 in information and cultural industries. | | 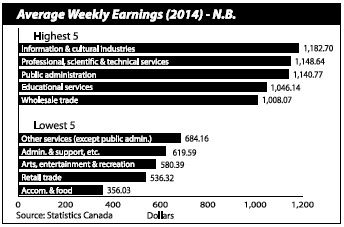 |
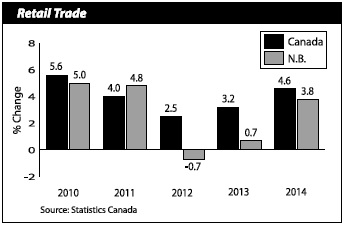
Retail Trade Growth Stronger |
Retail trade in New Brunswick climbed 3.8% to $11.5 billion in 2014, the best performance in the last three years. National sales rose 4.6%. Higher provincial sales (in dollar terms) were reported in eight of eleven subsectors, led by gains in motor vehicle and parts dealers, general merchandise stores and gasoline stations. The largest decrease was in furniture and home furnishing stores. | | Retail trade accounts for over 6% of provincial GDP and in 2014 employed 47,300. |
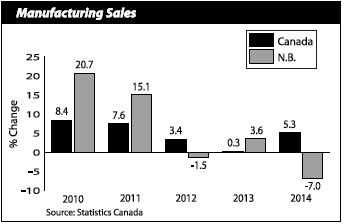
Manufacturing Sales Decline |
Manufacturing sales in New Brunswick decreased 7.0% to $18.9 billion in 2014; the second decline in three years. Sales increased 5.3% for Canada, the best result in the last three years. Provincial sales of non- durable goods, which represent 84.1% of the total, dropped 8.1% and durable goods fell 0.8%. | | The manufacturing sector represents over 11% of provincial GDP and in 2014 employed 28,000. |
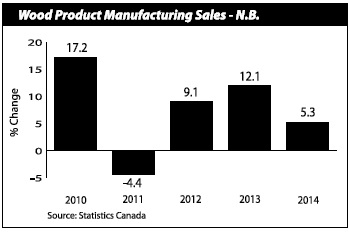
Wood Product Sales Growth Continues |
New Brunswick’s wood product manufacturers saw sales increase for the third consecutive year, rising by 5.3% in 2014. Sales reached $1.1 billion in 2014, well below the pre-recession peak but significantly higher than the 2009 low of $776.6 million. Wood product manufacturing represents just over 1% of New Brunswick’s GDP. | | |
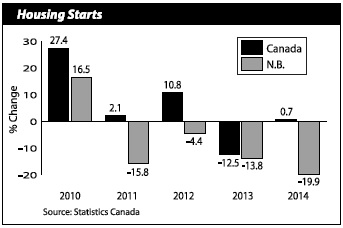
Housing starts in New Brunswick declined for a fourth consecutive year in 2014. The total number of starts tumbled 19.9% to 2,276 units. Canada’s housing market fared better. After dropping sharply in 2013, starts for 2014 turned around and rose 0.7% to 189,329 units. | | |
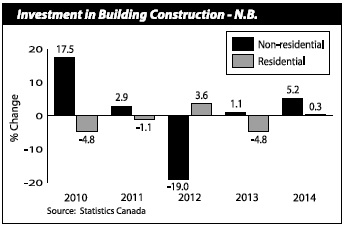
Investment in Building Construction Improves |
Overall investment in building construction for New Brunswick increased 1.8% to $2.3 billion in 2014, following declines the previous two years. The increase was driven by non-residential building construction (+5.2%) with spending increases in industrial (+23.3%) and institutional and governmental (+12.3%). The residential component, which represents 69.1% of the total, was up 0.3%. The construction industry accounts for over 5% of provincial GDP and in 2014 employed 28,200. | | Nationally, investment in building construction rose 3.2% in 2014. |
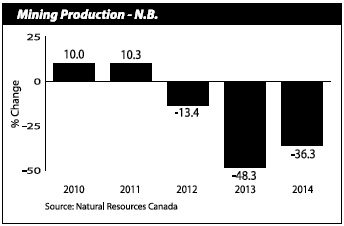
Mining Sector Transitioning |
Mineral production in New Brunswick dropped 36.3% to $380.6 million in 2014, significantly impacted by the wind down in metallic mineral production. This was the third overall decline in three years and the lowest volume of production on record. The mining and oil and gas extraction industry represents less than 2% of provincial GDP and in 2014 employed 5,500. | | |
New Brunswick’s farm cash receipts for 2014 are expected to increase slightly to $574 million. It is anticipated that crop receipts will increase (+3%) while livestock receipts will fall (-1%). Nationally, cash receipts are expected to rise by 4% in 2014. The agriculture industry represents less than 2% of provincial GDP and in 2014 employed 4,100, a decline of 500 from 2013. | | |
Transportation Results Varied |
Transportation and warehousing employment was down 8.9% in 2014, mainly due to a decline in truck transportation. This sector represents over 4% of provincial GDP. In 2014, cargo tonnage at the port of Saint John increased in dry bulk and containers (up 17.2% all together), while liquid bulk declined 15.4%. The number of cruise ship passengers fell 36.1% to 106,505 as calls dropped 23.4%. | | The airports serving the three largest centres each reported increased passenger activity and aircraft movements in 2014. |
Employment in the information and communication technologies (ICT) sector increased 2.5% in 2014. A stronger gain in computer systems design and related services offset a decline in wired telecommunications carriers. The ICT sector accounts for almost 4% of provincial GDP. | | |
New Brunswick Annual Indicators |
| New Brunswick Annual Indicators (as of April 30, 2015) |
| | | | | | | | | | | | | | | % Change | |
| Indicators | | 2011 | | | 2012 | | | 2013 | | | 2014 | | | | 2011-12 | | | | 2012-13 | | | | 2013-14 | |
| Labour | | | | | | | | | | | | | | | | | | | | | | | | |
| Population 15 Years and Over ('000) | | | 620.7 | | | | 622.4 | | | | 622.4 | | | | 621.7 | | | | 0.3 | | | | 0.0 | | | | -0.1 | |
| Labour Force ('000) | | | 392.9 | | | | 393.3 | | | | 395.2 | | | | 393.0 | | | | 0.1 | | | | 0.5 | | | | -0.6 | |
| Employment ('000) | | | 355.5 | | | | 353.1 | | | | 354.5 | | | | 353.9 | | | | -0.7 | | | | 0.4 | | | | -0.2 | |
| Full-time ('000) | | | 297.2 | | | | 297.7 | | | | 297.0 | | | | 297.6 | | | | 0.2 | | | | -0.2 | | | | 0.2 | |
| Part-time ('000) | | | 58.3 | | | | 55.4 | | | | 57.5 | | | | 56.3 | | | | -5.0 | | | | 3.8 | | | | -2.1 | |
| Goods-producing Sector ('000) | | | 80.8 | | | | 75.7 | | | | 77.8 | | | | 76.2 | | | | -6.3 | | | | 2.8 | | | | -2.1 | |
| Services-producing Sector ('000) | | | 274.7 | | | | 277.4 | | | | 276.8 | | | | 277.7 | | | | 1.0 | | | | -0.2 | | | | 0.3 | |
| Unemployment ('000) | | | 37.4 | | | | 40.1 | | | | 40.6 | | | | 39.1 | | | | 7.2 | | | | 1.2 | | | | -3.7 | |
| Participation Rate (%) | | | 63.3 | | | | 63.2 | | | | 63.5 | | | | 63.2 | | | | … | | | | … | | | | … | |
| Employment Rate (%) | | | 57.3 | | | | 56.7 | | | | 57.0 | | | | 56.9 | | | | … | | | | … | | | | … | |
| Unemployment Rate (%) | | | 9.5 | | | | 10.2 | | | | 10.3 | | | | 9.9 | | | | … | | | | … | | | | … | |
| Average Weekly Earnings ($) | | | 787.23 | | | | 806.69 | | | | 804.55 | | | | 832.23 | | | | 2.5 | | | | -0.3 | | | | 3.4 | |
| Wages and Salaries ($M) | | | 13,879.5 | | | | 13,907.7 | | | | 14,117.1 | | | | 14,249.7 | | | | 0.2 | | | | 1.5 | | | | 0.9 | |
| Employment Insurance Beneficiaries | | | 45,601 | | | | 44,648 | | | | 42,000 | | | | 40,500 | | | | -2.1 | | | | -5.9 | | | | -3.6 | |
| Consumers | | | | | | | | | | | | | | | | | | | | | | | | | | | | |
| Retail Trade ($M) | | | 11,103.3 | | | | 11,027.6 | | | | 11,107.4 | | | | 11,528.0 | | | | -0.7 | | | | 0.7 | | | | 3.8 | |
| New Motor Vehicle Sales (units) | | | 39,503 | | | | 39,895 | | | | 41,512 | | | | 42,656 | | | | 1.0 | | | | 4.1 | | | | 2.8 | |
| New Motor Vehicle Sales ($M) | | | 1,222.1 | | | | 1,215.0 | | | | 1,310.5 | | | | 1,367.1 | | | | -0.6 | | | | 7.9 | | | | 4.3 | |
| Food Services and Drinking Places ($M) | | | 962.2 | | | | 973.6 | | | | 972.5 | | | | 1,011.7 | | | | 1.2 | | | | -0.1 | | | | 4.0 | |
| Consumer Price Index (2002=100) | | | 120.0 | | | | 122.0 | | | | 123.0 | | | | 124.8 | | | | 1.7 | | | | 0.8 | | | | 1.5 | |
| Housing | | | | | | | | | | | | | | | | | | | | | | | | | | | | |
| Housing Starts (units) | | | 3,452 | | | | 3,299 | | | | 2,843 | | | | 2,276 | | | | -4.4 | | | | -13.8 | | | | -19.9 | |
| Residential Building Permits ($M) | | | 543.5 | | | | 551.9 | | | | 480.5 | | | | 456.5 | | | | 1.6 | | | | -12.9 | | | | -5.0 | |
MLS® Residential Sales (units) | | | 6,599 | | | | 6,403 | | | | 6,282 | | | | 6,273 | | | | -3.0 | | | | -1.9 | | | | -0.1 | |
| Business | | | | | | | | | | | | | | | | | | | | | | | | | | | | |
| Manufacturing Sales ($M) | | | 19,907.6 | | | | 19,609.0 | | | | 20,313.9 | | | | 18,890.7 | | | | -1.5 | | | | 3.6 | | | | -7.0 | |
| International Exports ($M) | | | 14,789.7 | | | | 14,902.6 | | | | 14,459.7 | | | | 13,007.1 | | | | 0.8 | | | | -3.0 | | | | -10.0 | |
| Non-residential Building Permits ($M) | | | 422.4 | | | | 416.6 | | | | 524.5 | | | | 374.5 | | | | -1.4 | | | | 25.9 | | | | -28.6 | |
| Industrial and Commercial ($M) | | | 273.9 | | | | 253.9 | | | | 250.2 | | | | 250.6 | | | | -7.3 | | | | -1.4 | | | | 0.2 | |
| Institutional and Government ($M) | | | 148.5 | | | | 162.7 | | | | 274.2 | | | | 123.8 | | | | 9.6 | | | | 68.5 | | | | -54.8 | |
| Wholesale Trade ($M) | | | 5,922.0 | | | | 5,945.5 | | | | 5,990.6 | | | | 6,233.0 | | | | 0.4 | | | | 0.8 | | | | 4.0 | |
| Mining Production ($M) | | | 1,334.9 | | | | 1,155.8 | | | | 597.6 | | | | 380.6 | | | | -13.4 | | | | -48.3 | | | | -36.3 | |
| Farm Cash Receipts ($M) | | | 540.8 | | | | 538.7 | | | | 573.1 | | | | 574.3 | | | | -0.4 | | | | 6.4 | | | | 0.2 | |
Lumber Shipments ('000 m3) | | | .. | | | | 2,373.7 | | | | 2,546.0 | | | | 2,761.2 | | | | … | | | | 7.3 | | | | 8.5 | |
| Demographics | | | | | | | | | | | | | | | | | | | | | | | | | | | | |
| Population (July 1) | | | 755,530 | | | | 756,816 | | | | 755,635 | | | | 753,914 | | | | 0.2 | | | | -0.2 | | | | -0.2 | |
| Natural Increase (July 1-June 30) | | | 562 | | | | 277 | | | | -9 | | | | | | | | … | | | | … | | | | … | |
| Net Migration (July 1-June 30) | | | 724 | | | | -1,458 | | | | -1,712 | | | | | | | | … | | | | … | | | | … | |
.. Not available | | | … Not applicable | | | | | | | | | | | | | | | | | |
| | | | | | | | | | | | | | | | | | | | | |
| x Suppressed to meet the confidentiality requirements of the Statistics Act MLS® is a registered trademark of the Canadian Real Estate Association. Sources: Statistics Canada, Natural Resources Canada, Agriculture and Agri-Food Canada, and New Brunswick Real Estate Association. | | | | | |
Major Investment Projects |
Projects valued at $19 million or more that have been announced, are underway or have been completed.
Disclaimer: Project details are obtained from public sources. Every effort has been made to ensure a comprehensive and accurate listing.
| Major Investment Projects for New Brunswick |
| Industry | Project | Location | Value ($M) | Start | End |
| Mining | Mine – Potash Corporation of Saskatchewan | Sussex | 2,180 | 2008 | 2014 |
| Transportation | Energy East Pipeline | New Brunswick | 2,156 | 2013 | 2020 |
| Mining | Sisson Project | Stanley area | 579 | 2013 | 2017 |
| Manufacturing | Irving Pulp and Paper | Saint John | 450 | 2014 | 2017 |
| Mining | Mine – Halfmile Lake – Trevali | Bathurst area | 174 | 2011 | 2014 |
| Health | Restigouche Hospital Centre | Campbellton | 153 | 2011 | 2016 |
| Transportation | Route 8 Marysville-Nashwaak bypass | York County | 120 | 2008 | 2014 |
| Health | Dr. Georges-L.-Dumont University Hospital Centre | Moncton | 104 | 2014 | 2019 |
| Utilities | Harbour clean-up | Saint John | 100 | 2009 | 2014 |
| Utilities | NB Power – high-voltage station upgrade | Dalhousie area | 85 | 2013 | 2014 |
| Mining | Mine – demolition and re-vegetation of Brunswick Mine | Bathurst area | 80 | 2013 | 2018 |
| Manufacturing | J.D. Irving – sawmills and woodlands | Chipman, Doaktown, Saint- Léonard and Kedgwick | 69 | 2014 | 2015 |
| Manufacturing | Irving Oil refinery – turnaround | Saint John | 60 | 2014 | 2014 |
| Health | Loch Lomond Villa | Saint John | 52 | 2011 | 2015 |
| Health | Les Résidences Jodin | Edmundston | 49 | 2013 | 2014 |
| Health | Nursing homes | Mill Cove, Perth- Andover and Saint- Louis de Kent | 48 | 2013 | 2014 |
| Transportation | Route 11 Caraquet bypass | Caraquet | 45 | 2013 | 2017 |
| Education | Schools | Fredericton, Geary and Quispamsis | 44 | 2013 | 2015 |
| Accommodations | Algonquin Resort | St. Andrews | 40 | 2012 | 2014 |
| Education | Schools – Meduxnekeag Consolidated and Townsview (K-8) | Woodstock | 39 | 2013 | 2015 |
| Transportation | CN’s Newcastle Subdivision – rail line | Northern N.B. | 35 | 2014 | 2014 |
| Education | Mount Allison University – Purdy Crawford Centre for the Arts | Sackville | 30 | 2012 | 2014 |
| Health | Parkland Saint John – specialized care | Saint John | 30 | 2013 | 2015 |
Major Investment Projects (continued) |
Projects valued at $19 million or more that have been announced, are underway or have been completed.
Disclaimer: Project details are obtained from public sources. Every effort has been made to ensure a comprehensive and accurate listing.
| Major Investment Projects for New Brunswick |
| Industry | Project | Location | Value ($M) | Start | End |
| Education | School – Moncton High (9-12) | Moncton | 27 | 2013 | 2014 |
| Education | School | Miramichi | 26 | 2014 | 2016 |
| Information | Bell Aliant – data centre | Saint John | 25 | 2014 | 2015 |
| Mining | Corridor Resources | Sussex | 25 | 2014 | 2014 |
| Health | Nursing home | Dalhousie | 23 | 2014 | 2016 |
| Recreation | Fundy Trail | Charlotte and Saint John Counties | 23 | 2014 | 2018 |
| Recreation | YMCA | Saint John | 22 | 2014 | 2015 |
| Recreation | Garcelon Civic Centre | St. Stephen | 21 | 2012 | 2014 |
| Health | Nursing homes | Grand Manan and Miramichi | 20 | 2012 | 2015 |
| Health | Parkland Fredericton – specialized care | Fredericton | 20 | 2013 | 2015 |
| Manufacturing | Irving Oil refinery – turnaround | Saint John | 20 | 2014 | 2014 |
| Health | Nursing homes | Sussex and Woodstock | 20 | 2014 | 2016 |
| Education | École des Pionniers | Quispamsis | 19 | 2012 | 2014 |
| Transportation | Maritime-Ontario Freight Lines Ltd. | Moncton | 19 | 2014 | 2015 |
| Health | Nursing homes | Boiestown and Neguac | 19 | 2014 | 2015 |
Population Distribution, N.B. Counties
Population Change, N.B. Counties
Distribution of Seniors, N.B. Counties
Unemployment Rate, N.B. Economic Regions and Urban Areas
31