EXHIBIT 99.10
Department of
Finance
Economic and Fiscal Update
First Quarter Projections
2015-2016
Economic and Fiscal Update
First Quarter Projections
2015-2016
Published by: Department of
Finance Government of New
Brunswick P.O. Box 6000
Fredericton, New Brunswick
E3B 5H1
Canada
Internet: www.gnb.ca/finance
August 2015
Translation:
Translation Bureau, Government Services
ISBN 978-1-4605-0504-5
 | Think Recycling! |
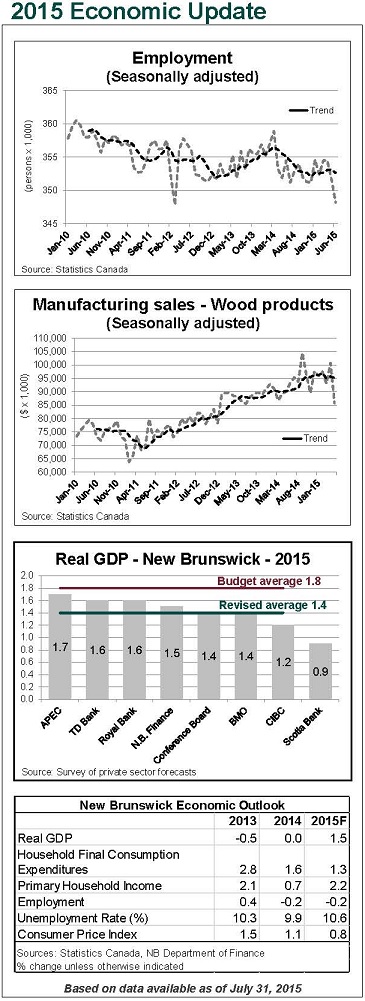
| ● The International Monetary Fund (IMF) is forecasting global economic growth of 3.3 per cent in 2015. This is a downgrade from its forecast in the fall edition of its World Economic Outlook. ● U.S. real GDP increased at an annual rate of 2.3 per cent in the second quarter of 2015, which represents an improvement over first quarter activity. The slow start to the year, however, will result in weaker-than-expected growth for 2015. ● The Bank of Canada estimates that real GDP declined during the first half of 2015. Much of the weakness is related to the decline in oil prices, resulting in slower growth in investment and exports. ● The Department of Finance now projects real GDP growth for New Brunswick of 1.5 per cent for 2015 - a downgrade from the 1.8 per cent projection at budget. This is consistent with the consensus among private sector forecasters, which has trended downwards and currently sits at 1.4 per cent. ● Midway through 2015, employment is down by 0.9 per cent over the year prior. Weakness was concentrated in the goods sector (-7.2%), largely as a result of a slowdown in the construction sector. ● Average weekly earnings are up 3.4 per cent, on a year-to-date basis - above the national growth rate of 2.4 per cent. However, combined with the decline in employment, household income growth is expected to moderate. ● After a slow start to the year, exports are up 2.2 per cent on a year-to-date basis. The largest gains were observed in energy products (+$286.8 million), consumer goods (+$52.1 million) and metal ores and non-metallic minerals (+$43.7 million). ● Manufacturing sales are down by 5.3 per cent compared to prior year levels. Significant growth in durable goods industries (+10.1%) has not been sufficient to offset a decline in the larger non-durable goods industries (-7.8%) grouping. Wood products manufacturing remains a bright spot, posting growth of 4.8%. ● Consumer spending continues to show modest improvement, with retail trade up 1.0 per cent on a year-to-date basis. Gasoline station sales (-15.5%) have been impacted by lower prices for crude-based products. Excluding gasoline station sales, retail trade is up 4.7 per cent. |
2015-2016 Fiscal Update
Based on first quarter information, there is a projected deficit of $470.6 million for 2015-2016. This is an improvement of $6.2 million compared to the budget deficit of $476.8 million.
Net debt is projected to increase $583.9 million to $12,602.2 million, a decrease of $1.6 million from the budget estimate of $12,603.8 million.
Revenue:
Revenue is $4.2 million higher than budget. The major variances include:
| · | Miscellaneous Revenue is up $11.2 million mainly due to increased revenue from the Regional Health Authorities. |
| · | Provincial Real Property Tax is up $10.0 million due to base improvements in the previous year. |
| · | Return on Investment is down $12.6 million primarily as a result of lower projected net income for NB Power. This is mainly due to unanticipated outages at the Point Lepreau Nuclear Power Station. |
| · | Personal Income Tax is lower by $5.0 million attributable to weaker-than-anticipated employment growth. |
Expense:
Total expenses are projected to be $2.0 million lower than budget.
The major variances include the following:
| · | Opportunities New Brunswick ($5.7 million under): Mainly due to lower than anticipated financial assistance to companies. |
| · | Public Safety ($5.3 million over): Due to higher than budgeted expenses under the Disaster Financial Assistance program associated with storm and flood events that occurred in 2014. These expenses are partially offset by increased recoveries from the federal government. |
| · | Tourism, Heritage and Culture ($2.4 million over): Due to costs associated with the completion of an archaeological impact assessment for the proposed Sisson Mine project. |
PROVINCE OF NEW BRUNSWICK
FISCAL UPDATE
Thousands
$
| | | | | | 2015-2016 | | | Variance | |
| | | 2015-2016 | | | 1st Quarter | | | from | |
| | | Budget | | | Projection | | | Budget | |
| | | | | | | | | | | | |
| Revenue | | | | | | | | | | | |
| Ordinary Account | | | 7,984,551 | | | | 7,991,662 | | | | 7,111 | |
| Capital Account | | | 10,705 | | | | 8,424 | | | | (2,281 | ) |
| Special Purpose Account | | | 61,342 | | | | 61,104 | | | | (238 | ) |
| Special Operating Agencies | | | 57,634 | | | | 57,251 | | | | (383 | ) |
| Sinking Fund Earnings | | | 193,700 | | | | 193,700 | | | | 0 | |
| Total Revenue | | | 8,307,932 | | | | 8,312,141 | | | | 4,209 | |
| | | | | | | | | | | | | |
| Expense | | | | | | | | | | | | |
| Ordinary Account | | | 8,007,021 | | | | 8,005,301 | | | | (1,720 | ) |
| Capital Account | | | 82,903 | | | | 85,067 | | | | 2,164 | |
| Special Purpose Account | | | 74,228 | | | | 74,205 | | | | (23 | ) |
| Special Operating Agencies | | | 53,372 | | | | 52,512 | | | | (860 | ) |
| Amortization of Tangible Capital Assets | | | 417,238 | | | | 415,652 | | | | (1,586 | ) |
| Total Expense | | | 8,634,762 | | | | 8,632,737 | | | | (2,025 | ) |
| | | | | | | | | | | | | |
| Contingency Reserve | | | (150,000 | ) | | | (150,000 | ) | | | 0 | |
| | | | | | | | | | | | | |
| Surplus (Deficit) | | | (476,830 | ) | | | (470,596 | ) | | | 6,234 | |
CHANGE IN NET DEBT
Thousands
$
| | | | | | 2015-2016 | | | Variance | |
| | | 2015-2016 | | | 1st Quarter | | | from | |
| | | Budget | | | Projection | | | Budget | |
| | | | | | | | | | | | | |
| Net Debt - Beginning of Year | | | (12,018,306 | ) | | | (12,018,306 | ) | | | 0 | |
| | | | | | | | | | | | | |
| Changes in Year | | | | | | | | | | | | |
| | | | | | | | | | | | | |
| Surplus (Deficit) | | | (476,830 | ) | | | (470,596 | ) | | | 6,234 | |
| | | | | | | | | | | | | |
| Investments in Tangible Capital Assets | | | (525,898 | ) | | | (528,911 | ) | | | (3,013 | ) |
| | | | | | | | | | | | | |
| Amortization of Tangible Capital Assets | | | 417,238 | | | | 415,652 | | | | (1,586 | ) |
| | | | | | | | | | | | | |
| (Increase) Decrease in Net Debt | | | (585,490 | ) | | | (583,855 | ) | | | 1,635 | |
| | | | | | | | | | | | | |
| Net Debt - End of Year | | | (12,603,796 | ) | | | (12,602,161 | ) | | | 1,635 | |
APPENDIX A
ORDINARY ACCOUNT REVENUE BY SOURCE
Thousands
$
| | | | | | 2015-2016 | | | Variance | |
| | | 2015-2016 | | | 1st Quarter | | | from | |
| | | Budget | | | Projection | | | Budget | |
| Taxes | | | | | | | | | | | |
| Personal Income Tax | | | 1,587,000 | | | | 1,582,000 | | | | (5,000 | ) |
| Corporate Income Tax | | | 258,000 | | | | 258,000 | | | | 0 | |
| Provincial Real Property Tax | | | 488,100 | | | | 498,100 | | | | 10,000 | |
| Harmonized Sales Tax | | | 1,184,200 | | | | 1,184,200 | | | | 0 | |
| Gasoline and Motive Fuels Tax | | | 268,200 | | | | 270,200 | | | | 2,000 | |
| Tobacco Tax | | | 135,800 | | | | 135,800 | | | | 0 | |
| Pari-Mutuel Tax | | | 600 | | | | 600 | | | | 0 | |
| Insurance Premium Tax | | | 53,546 | | | | 53,546 | | | | 0 | |
| Real Property Transfer Tax | | | 12,000 | | | | 12,000 | | | | 0 | |
| Financial Corporation Capital Tax | | | 27,000 | | | | 27,000 | | | | 0 | |
| Penalties and Interest | | | 13,000 | | | | 13,000 | | | | 0 | |
| Subtotal - Taxes | | | 4,027,446 | | | | 4,034,446 | | | | 7,000 | �� |
| | | | | | | | | | | | | |
| Return on Investment | | | 295,765 | | | | 283,160 | | | | (12,605 | ) |
| Licences and Permits | | | 148,333 | | | | 148,019 | | | | (314 | ) |
| Sale of Goods and Services | | | 325,187 | | | | 324,221 | | | | (966 | ) |
| Lottery and Gaming Revenues | | | 140,300 | | | | 139,900 | | | | (400 | ) |
| Royalties | | | 107,230 | | | | 107,230 | | | | 0 | |
| Fines and Penalties | | | 8,165 | | | | 8,165 | | | | 0 | |
| Miscellaneous | | | 61,189 | | | | 72,407 | | | | 11,218 | |
| | | | | | | | | | | | | |
| Total - Own Source Revenue | | | 5,113,615 | | | | 5,117,548 | | | | 3,933 | |
| | | | | | | | | | | | | |
| Unconditional Grants – Canada | | | | | | | | | | | | |
| Fiscal Equalization Payments | | | 1,668,900 | | | | 1,668,900 | | | | 0 | |
| Canada Health Transfer | | | 717,800 | | | | 717,800 | | | | 0 | |
| Canada Social Transfer | | | 273,400 | | | | 273,400 | | | | 0 | |
| Other | | | 1,866 | | | | 1,866 | | | | 0 | |
| Subtotal - Unconditional Grants – Canada | | | 2,661,966 | | | | 2,661,966 | | | | 0 | |
| | | | | | | | | | | | | |
| Conditional Grants – Canada | | | 219,252 | | | | 222,143 | | | | 2,891 | |
| | | | | | | | | | | | | |
| Total - Grants from Canada | | | 2,881,218 | | | | 2,884,109 | | | | 2,891 | |
| | | | | | | | | | | | | |
| Subtotal | | | 7,994,833 | | | | 8,001,657 | | | | 6,824 | |
| | | | | | | | | | | | | |
| Inter-account Transactions | | | (10,282 | ) | | | (9,995 | ) | | | 287 | |
| | | | | | | | | | | | | |
| Ordinary Account Revenue | | | 7,984,551 | | | | 7,991,662 | | | | 7,111 | |
APPENDIX B
ORDINARY ACCOUNT EXPENSE
Thousands
$
| | | | | | 2015-2016 | | | Variance | | | | |
| | | 2015-2016 | | | 1st Quarter | | | from | | | | |
| | | Budget | | | Projection | | | Budget | | | % | |
| DEPARTMENT | | | | | | | | | | | | | | |
| Agriculture, Aquaculture and Fisheries | | | 37,495 | | | | 37,495 | | | | 0 | | | | 0.0 | % |
| Education and Early Childhood Development | | | 1,118,623 | | | | 1,118,623 | | | | 0 | | | | 0.0 | % |
| Energy and Mines | | | 8,617 | | | | 8,617 | | | | 0 | | | | 0.0 | % |
| Environment and Local Government | | | 139,381 | | | | 139,381 | | | | 0 | | | | 0.0 | % |
| Executive Council Office | | | 19,148 | | | | 19,038 | | | | (110 | ) | | | -0.6 | % |
| Finance | | | 17,282 | | | | 17,182 | | | | (100 | ) | | | -0.6 | % |
| General Government | | | 554,951 | | | | 553,619 | | | | (1,332 | ) | | | -0.2 | % |
| Government Services | | | 53,657 | | | | 53,657 | | | | 0 | | | | 0.0 | % |
| Health | | | 2,596,039 | | | | 2,596,039 | | | | 0 | | | | 0.0 | % |
| Human Resources | | | 3,421 | | | | 3,421 | | | | 0 | | | | 0.0 | % |
| Justice | | | 42,491 | | | | 42,491 | | | | 0 | | | | 0.0 | % |
| Legislative Assembly | | | 21,721 | | | | 21,721 | | | | 0 | | | | 0.0 | % |
| Natural Resources | | | 93,267 | | | | 93,267 | | | | 0 | | | | 0.0 | % |
| Office of the Attorney General | | | 17,975 | | | | 17,975 | | | | 0 | | | | 0.0 | % |
| Office of the Premier | | | 1,616 | | | | 1,616 | | | | 0 | | | | 0.0 | % |
| Opportunities New Brunswick | | | 50,883 | | | | 45,215 | | | | (5,668 | ) | | | -11.1 | % |
| Other Agencies | | | 259,387 | | | | 258,446 | | | | (941 | ) | | | -0.4 | % |
| Post-Secondary Education, Training and Labour | | | 613,793 | | | | 613,793 | | | | 0 | | | | 0.0 | % |
| Public Safety | | | 166,262 | | | | 171,563 | | | | 5,301 | | | | 3.2 | % |
| Regional Development Corporation | | | 65,012 | | | | 65,012 | | | | 0 | | | | 0.0 | % |
| Service of the Public Debt | | | 685,000 | | | | 685,000 | | | | 0 | | | | 0.0 | % |
| Social Development | | | 1,113,693 | | | | 1,115,218 | | | | 1,525 | | | | 0.1 | % |
| Tourism, Heritage and Culture | | | 52,382 | | | | 54,802 | | | | 2,420 | | | | 4.6 | % |
| Transportation and Infrastructure | | | 296,942 | | | | 296,942 | | | | 0 | | | | 0.0 | % |
| | | | | | | | | | | | | | | | | |
| Subtotal | | | 8,029,038 | | | | 8,030,133 | | | | 1,095 | | | | 0.0 | % |
| | | | | | | | | | | | | | | | | |
| Investment in Tangible Capital Assets | | | (11,735 | ) | | | (14,837 | ) | | | (3,102 | ) | | | 26.4 | % |
| Inter-account Transactions | | | (10,282 | ) | | | (9,995 | ) | | | 287 | | | | -2.8 | % |
| | | | | | | | | | | | | | | | | |
| Ordinary Account Expense | | | 8,007,021 | | | | 8,005,301 | | | | (1,720 | ) | | | 0.0 | % |
APPENDIX C
CAPITAL EXPENDITURES
Thousands
$
| | | | | | 2015-2016 | | | Variance | |
| | | 2015-2016 | | | 1st Quarter | | | from | |
| | | Budget | | | Projection | | | Budget | |
| Regular Capital Investments | | | | | | | | | | | |
| Agriculture, Aquaculture and Fisheries | | | 900 | | | | 500 | | | | (400 | ) |
| Education and Early Childhood Development | | | 77,111 | | | | 76,129 | | | | (982 | ) |
| Environment and Local Government | | | 1,000 | | | | 1,000 | | | | 0 | |
| Health | | | 58,900 | | | | 57,021 | | | | (1,879 | ) |
| Legislative Assembly | | | 735 | | | | 735 | | | | 0 | |
| Natural Resources | | | 1,510 | | | | 1,510 | | | | 0 | |
| Post-Secondary Education, Training and Labour | | | 5,600 | | | | 5,820 | | | | 220 | |
| Regional Development Corporation | | | 5,668 | | | | 5,668 | | | | 0 | |
| Tourism, Heritage and Culture | | | 1,437 | | | | 1,437 | | | | 0 | |
| Transportation and Infrastructure | | | 329,578 | | | | 324,617 | | | | (4,961 | ) |
| Regular Capital Investments | | | 482,439 | | | | 474,437 | | | | (8,002 | ) |
| | | | | | | | | | | | | |
| Strategic Infrastructure Initiative | | | | | | | | | | | | |
| Education and Early Childhood Development | | | 16,250 | | | | 16,891 | | | | 641 | |
| Health | | | 1,300 | | | | 1,300 | | | | 0 | |
| Regional Development Corporation | | | 3,500 | | | | 3,500 | | | | 0 | |
| Tourism, Heritage and Culture | | | 1,127 | | | | 563 | | | | (564 | ) |
| Transportation and Infrastructure | | | 70,610 | | | | 70,610 | | | | 0 | |
| Energy Retrofit and Renewable Energy | | | 11,840 | | | | 11,840 | | | | 0 | |
| New Strategic Projects | | | 10,000 | | | | 10,000 | | | | 0 | |
| Strategic Infrastructure Initiative | | | 114,627 | | | | 114,704 | | | | 77 | |
| | | | | | | | | | | | | |
| Total - Capital Expenditures | | | 597,066 | | | | 589,141 | | | | (7,925 | ) |
| | | | | | | | | | | | | |
| Investments in Tangible Capital Assets | | | (514,163 | ) | | | (504,074 | ) | | | 10,089 | |
| | | | | | | | | | | | | |
| Capital Account Expense | | | 82,903 | | | | 85,067 | | | | 2,164 | |
9