New Brunswick Economic and Fiscal Trends and Sensitivities
New Brunswick Economic and Fiscal Trends and Sensitivities
Published by:
Department of Finance and Treasury Board Government of New Brunswick
16.15. Box 6000
Fredericton, New Brunswick E3B 5H1
Canada
Internet: www.gnb.ca/finance July 2018
Translation:
Translation Bureau, Service New Brunswick
ISBN 978-1-4605-1883-0
Foreword
Government has consistently illustrated its commitment to being open, transparent and accountable. New Brunswick Economic and Fiscal Trends and Sensitivities has been prepared by the Department of Finance and Treasury Board in the spirit of remaining open and transparent and supports the principles outlined in the Transparency in Election Commitments Act.
The Transparency in Election Commitments Act was created in response to a recommendation made by the New Brunswick Commission on Electoral Reform to introduce legislation to strengthen election commitment costing to improve accountability and transparency in the democratic process in the province.
The Act sets out a process for political parties to register platform costings during the election period. This report will assist political parties in complying with their obligations relating to the costing of election commitments and includes baseline sensitivities for revenue and expenses that can help inform the process. However, specific proposals should be costed through the process that has been established with the Legislative Assembly.
This report also provides more information to the people of New Brunswick about the financial implications of election commitments and increases the transparency with respect to election commitments made by political parties in the lead-up to the next general election.
This report is by no means exhaustive and cannot cover all potential commitments. Expense and revenue estimates are high-level and are subject to change based on assumptions and the economy.
| Economic and Fiscal Trends
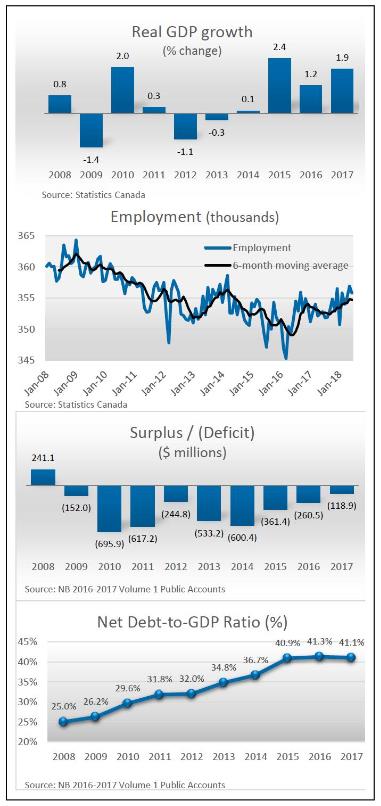
● Over the last decade, the New Brunswick economy expanded by 5.8 per cent. Real GDP growth was concentrated in the 2015-2017 period, reversing the decline experienced during the previous four years, due largely to improvements in the manufacturing and construction sectors. Growth was further supported by exports, wage growth and increased household consumption. ● New Brunswick’s labour market underperformed for much of the last decade with only three years in the last ten showing a year-over-year improvement in employment. Since March 2016, the province has shown steady gains as employment has increased by 10,500. ● Since 2008, New Brunswick has experienced nine consecutive deficits. However, beginning in 2015, the province has seen consistent improvements in the deficit going from a deficit of ● $600.4 million in 2013-2014 to a deficit of $118.9 million in 2016- 2017. ● Over the last 10 years, the province’s ratio of net debt-to-GDP increased from 25.0 per cent to 41.1 per cent. The ratio has trended upwards related to weakened economic circumstances, operating deficits, capital spending, accounting changes and other factors. Over the past few years, the ratio has stabilized and in fact has fallen marginally in 2017. |
Economic Sensitivities
The following provides estimates of the impact of sustained changes in key components of growth on New Brunswick’s real GDP, assuming other factors remain unchanged. The relatively wide range for the impacts reflects uncertainty regarding the factors driving the changes in growth.
| IMPACT OF A 1% CHANGE ON KEY VARIABLES ON REAL GDP GROWTH |
| | Value of change ($ millions) | Increase in Real GDP growth rate (%) | Increase in Real GDP $ millions (2007) |
| PRIMARY HOUSEHOLD INCOME | 240-250 | 0.7-0.8 | 210-225 |
HOUSEHOLD FINAL CONSUMPTION EXPENDITURES | 200-225 | 0.6-0.7 | 175-200 |
| INVESTMENT | 50-75 | 0.1-0.2 | 40-60 |
| EMPLOYMENT* | 3,500 | 0.8-1.0 | 250-300 |
| *Person-years | | | |
There are both positive and negative risks to the economic projections underlying the revenue forecast. The following table highlights some of the key sensitivities that could arise from unexpected changes in economic conditions. These estimates are only guidelines and actual results will vary depending on contributing factors.
| IMPACT OF SELECTED ECONOMIC INDICATORS ON KEY REVENUE SOURCES |
| INDICATOR | Estimated impact | Potential revenue change |
| NOMINAL GDP | $340 million for each percentage point change. Can vary depending on components of growth. | $80-$90 million depending on source of growth. |
PRIMARY HOUSEHOLD INCOME | $240 million for each percentage point change. | $15-$20 million in personal income tax depending on which income tax bracket drives change. |
| RETAIL SALES | $125 million for each percentage point change. | $8-$12 million in HST. |
These “rules of thumb” are high-level estimates only and may only materialize over time. A notable percentage of the province’s own-source revenues are administered by the federal government, while federal transfers account for approximately 36 per cent of provincial revenues. Consequently, a significant portion of provincial revenues are calculated based on lagged economic data. Furthermore, impacts could be offset by changes in the province’s equalization entitlements related to the performance of the economy.
Tax Rate Sensitivities
The following table estimates the approximate tax revenue received from each percentage point or cents/unit of the existing tax rate.
The revenue received per tax per point, however, is not necessarily representative of the potential revenue impact associated with a tax rate change as it does not consider the scope, directionality or potential economic or behavioural impacts, all which need to be taken into consideration.
Larger tax changes (i.e., greater than a one percentage point change) will generally have significantly different revenue effects from smaller tax changes.
The effect of multiple tax changes on revenues will not equate to the sum of the individual tax changes. For example, a one percentage point change in both personal income tax rates and the Harmonized Sales Tax (HST) will not be equal to the sum of the individual revenue impacts. This is due to the interaction of the taxes and the combined impact such changes would have on the overall economy and revenues.
To raise a given amount of revenue, the specific tax or combination of taxes chosen will impact the economy in different ways, while short-run and long-run impacts will also be very different since there is more time for behavioural changes and for markets to adjust in the long-term.
The estimates in the following table are based on information available as of June 14, 2018 and are subject to further revisions.
| | 2018 TAXATION YEAR |
REVENUE SOURCE (All values refer to a one percentage point change except: tobacco tax is a one cent per cigarette/gram change; gasoline tax and diesel tax are a one cent per litre change) | Current Rates | Approximate value ($ millions) |
| PERSONAL INCOME TAX | | |
1st Bracket (up to $41,675) | 9.68% | $73 |
2nd Bracket (between $41,675 and $83,351) | 14.82% | $42 |
3rd Bracket (between $83,351 and $135,510) | 16.52% | $11 |
4th Bracket (between $135,510 and $154,382) | 17.84% | $2 |
| 5th Bracket (above $154,382) | 20.30% | $7 |
| Total (1 percentage point up on all brackets) | | $135 |
| GENERAL CORPORATE INCOME TAX RATE (1) | 14% | $18 |
| SMALL BUSINESS CORPORATE INCOME TAX RATE (2) | 2.5% | $11 |
| FINANCIAL CORPORATION CAPITAL TAX | 4%/5% | $7 |
| INSURANCE PREMIUM TAX | | |
| 3% for property and casualty and 2% for life insurance premiums | 3%/2% | $22 |
| HARMONIZED SALES TAX (3) | 10% | $154 |
TOBACCO TAX (¢ per cigarette/stick/gram) | 25.52₵ | $6 |
GASOLINE TAX (¢ per litre) | 15.5₵ | $10 |
DIESEL TAX (¢ per litre) | 21.5₵ | $6 |
(1)
The above corporate income tax numbers are based on 2015 data. The average over the last five years for the general corporate income tax rate was approximately $18 million.
(2)
The small business corporate income tax rate applies to the first $500,000 of active business income of Canadian Controlled Private Corporations.
(3)
Provincial portion of the HST.
The above table estimates the approximate tax revenue received from each percentage point or cent per unit of the existing tax rate. It does not represent the actual revenue impact of tax changes. They do not reflect potential economic or behavioural impacts, which will impact the potential revenue yield and need to be considered individually for any potential policy change.
Expense Indicators
The table below estimates the approximate impact on expenses resulting from specific changes in programs or capital expenses. It should be cautioned that these estimates are only guidelines, and impacts can vary depending on the design, composition and implementation of the potential changes.
| EXPENSE INDICATOR | ESTIMATED COST |
WILDLIFE FENCING (per kilometre) | $80,000 to $100,000 |
BRUSH CUTTING (per kilometre) | $1,500 to $2,500 |
ROAD CONSTRUCTION (per kilometre) Grading and paving (excluding structures; costs can increase depending on the design, land requirements, condition of terrain, etc.) | |
| Arterial (4-lane) | |
| New alignment with interchanges | $2.9 to $4.2 million |
| Arterial (2-lane) | |
| Full upgrade or new alignment | $1.2 to $2.0 million |
| Minor upgrade (roadbed, etc.) | $0.5 to $1.0 million |
| Collector (2-lane) | |
| Full upgrade or new alignment | $0.9 to $1.2 million |
| Minor upgrade (roadbed, etc.) | $0.6 to $0.8 million |
| Local (2-lane) | |
| Full upgrade or new alignment | $0.7 to $1.0 million |
| Minor upgrade (roadbed, etc.) | $0.5 to $0.7 million |
| Paving (rehabilitation of existing road) per kilometre | $275,000 to $450,000 |
| INCREASING THE COMMUNITY FUNDING AND EQUALIZATION GRANT BY 1% | $680,000 to $750,000 per year |
| COST TO DECREASE THE PUPIL / EDUCATOR RATIO BY 1.0 | $56 million per year |
PRESCHOOL AUTISM INTERVENTIONS (cost per child) | $33,000 per year |
| AVERAGE COST FOR AN EDUCATION ASSISTANT | $35,000 per year |
| INCREASING THE OPERATING GRANT BY 1%: | |
| Universities | $2.25 million per year |
| NBCC and CCNB | $0.97 million per year |
| EXPENSE INDICATOR | ESTIMATED COST |
| INCREASING SOCIAL ASSISTANCE RATES BY 1% | $2 million per year |
INCREASING PERSONAL SERVICE WORKERS WAGES BY $1.00 AN HOUR (Home support, Special Care Homes, Memory care beds) | $15 million per year |
INCREASING THE WAGES OF FAMILY SUPPORT WORKERS BY $1.00 AN HOUR (Family Support, Attendant Care, Community Residences, ADAPT) | $3.5 million per year |
FACILITIES OPERATING COST / SCHOOL (heat, snow removal, etc.) | $187,000 per year |
CONSTRUCTION COSTS – PUBLIC SCHOOLS (excluding land costs): | |
| Grades K-5 facility | $13 to $24 million |
| Grades K-8 facility | $30 to $32 million |
| High school facility | $43 to $48 million |
CONSTRUCTION COSTS – HEALTH FACILITIES (including equipment and furniture costs, excluding land costs): | |
| Health Centre (small, rural) | $225 to $250 per sq. foot |
| Health Centre (large, urban) | $375 to $400 per sq. foot |
| Hospital (45 inpatient beds) | $800 to $850 per sq. foot |
| Hospital (302 inpatient beds) | $860 to $900 per sq. foot |
AVERAGE COST FOR A GENERAL PRACTITIONER (excludes hospital costs) | $287,000 |
AVERAGE COST FOR A SPECIALIST (excludes hospital costs) | $437,000 |
AVERAGE COST FOR A NURSE PRACTITIONER (excludes hospital related or office and administration costs) | $114,000 |
CONSTRUCTION COSTS – NURSING HOMES (including land acquisition costs): | |
| 30-bed facility | $10 million |
| 60-bed facility | $15 million |